
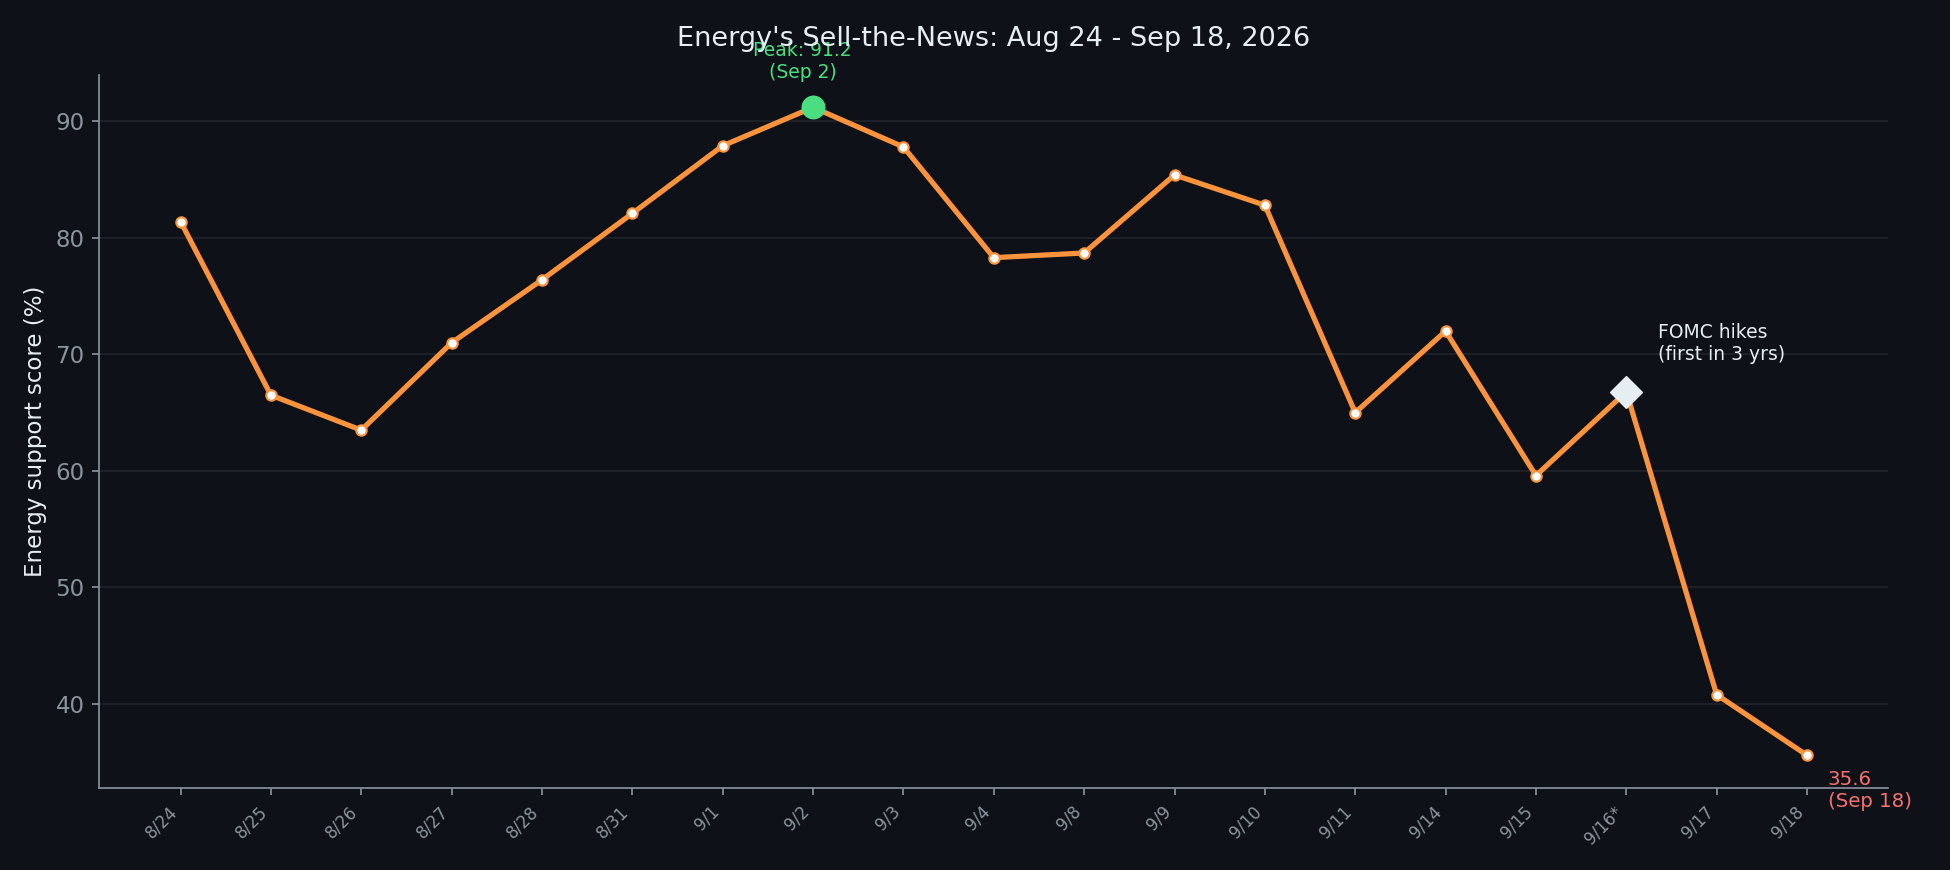
Wednesday, the Federal Reserve raised its target rate for the first time in three years. Energy had been the single strongest sector on my board all month, closing at 91.2 on September 2, its best reading anywhere in this dataset. By Friday, four sessions later, it closed at 35.6, down 36.4 points on the week. That is the largest single-week move, in either direction, I have shown you since all year.
The shape of the week
The sector-average support score closed at 30.6 on Friday. Six straight weeks of lower Friday closes now, all the way back from 64.6 a month ago. Every single day this week traded below the 40 level I marked as the top of a “washout zone” in the piece I published a couple weeks back on what this score has historically meant. Friday’s close sits close enough to the 30 line, historically a very rare capitulatory score, that I’m just going to call it and say we’re basically there.
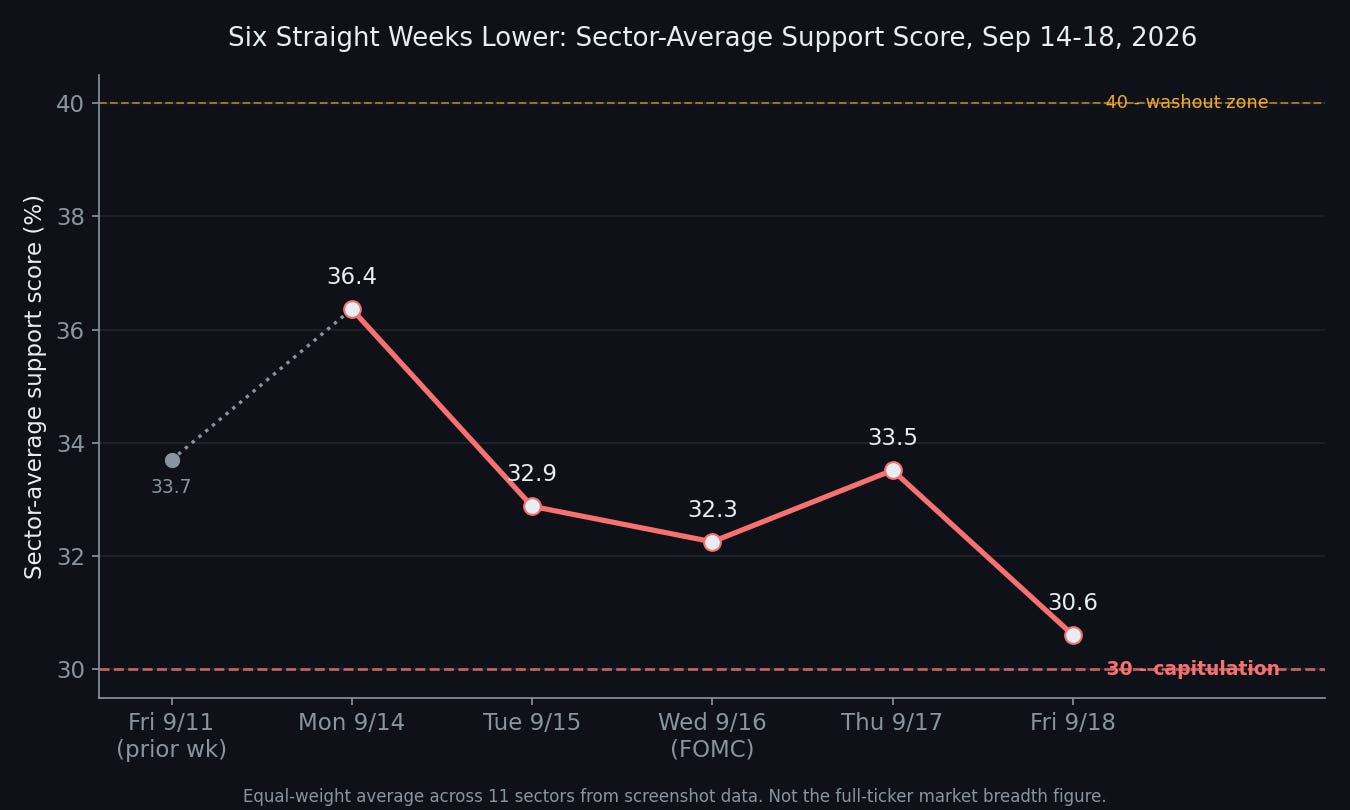
That piece also had two honest halves worth repeating here rather than letting you assume the flattering one. Readings at or below 30 have historically preceded better-than-average returns over the following month, in most cases. They have also failed to mark the bottom during the two genuine bear markets in the ten years of data behind that study, the COVID crash and the 2022 bear market, both of which saw more downside follow a reading this low, not less. I do not know which of those two this is. Six straight weeks of decline, a Fed that just hiked for the first time in three years, and a single sector move of a size I have not shown you before are, at minimum, not the background you’d want if you were hoping this is the ordinary case. “Toto, I’ve a feeling we’re not in Kansas anymore”
What actually happened, and why Energy specifically
The Fed’s hike was not a surprise by Wednesday, markets were already pricing it heavily beforehand. What happened afterward looks like a textbook sell-the-news reaction layered on top of a real change in the oil trade specifically. Crude itself was little changed this week, after two prior weeks of roughly 9 to 10 percent gains each. The trade that had worked for a month, buying the sectors benefiting from an oil-driven inflation scare, lost its reason to keep working the moment the scare’s most obvious outcome, a Fed response, actually arrived. Energy’s support score had been priced for more urgency than the Fed ultimately delivered as an ongoing threat, and once the event resolved, that pricing unwound fast.

It was not just the Fed. The Bank of Japan raised rates, and that follows the European Central Bank’s hike the week before. Three of the world’s most important central banks have now raised rates within roughly two weeks of each other, all responding to the same energy-driven inflation pressure. Markets appear to be pricing an additional three hikes each from the Fed, the ECB, and the BoJ by the summer of 2027. If that pricing is right, this week was not a single event, it was the first move in a multi-year global tightening cycle.
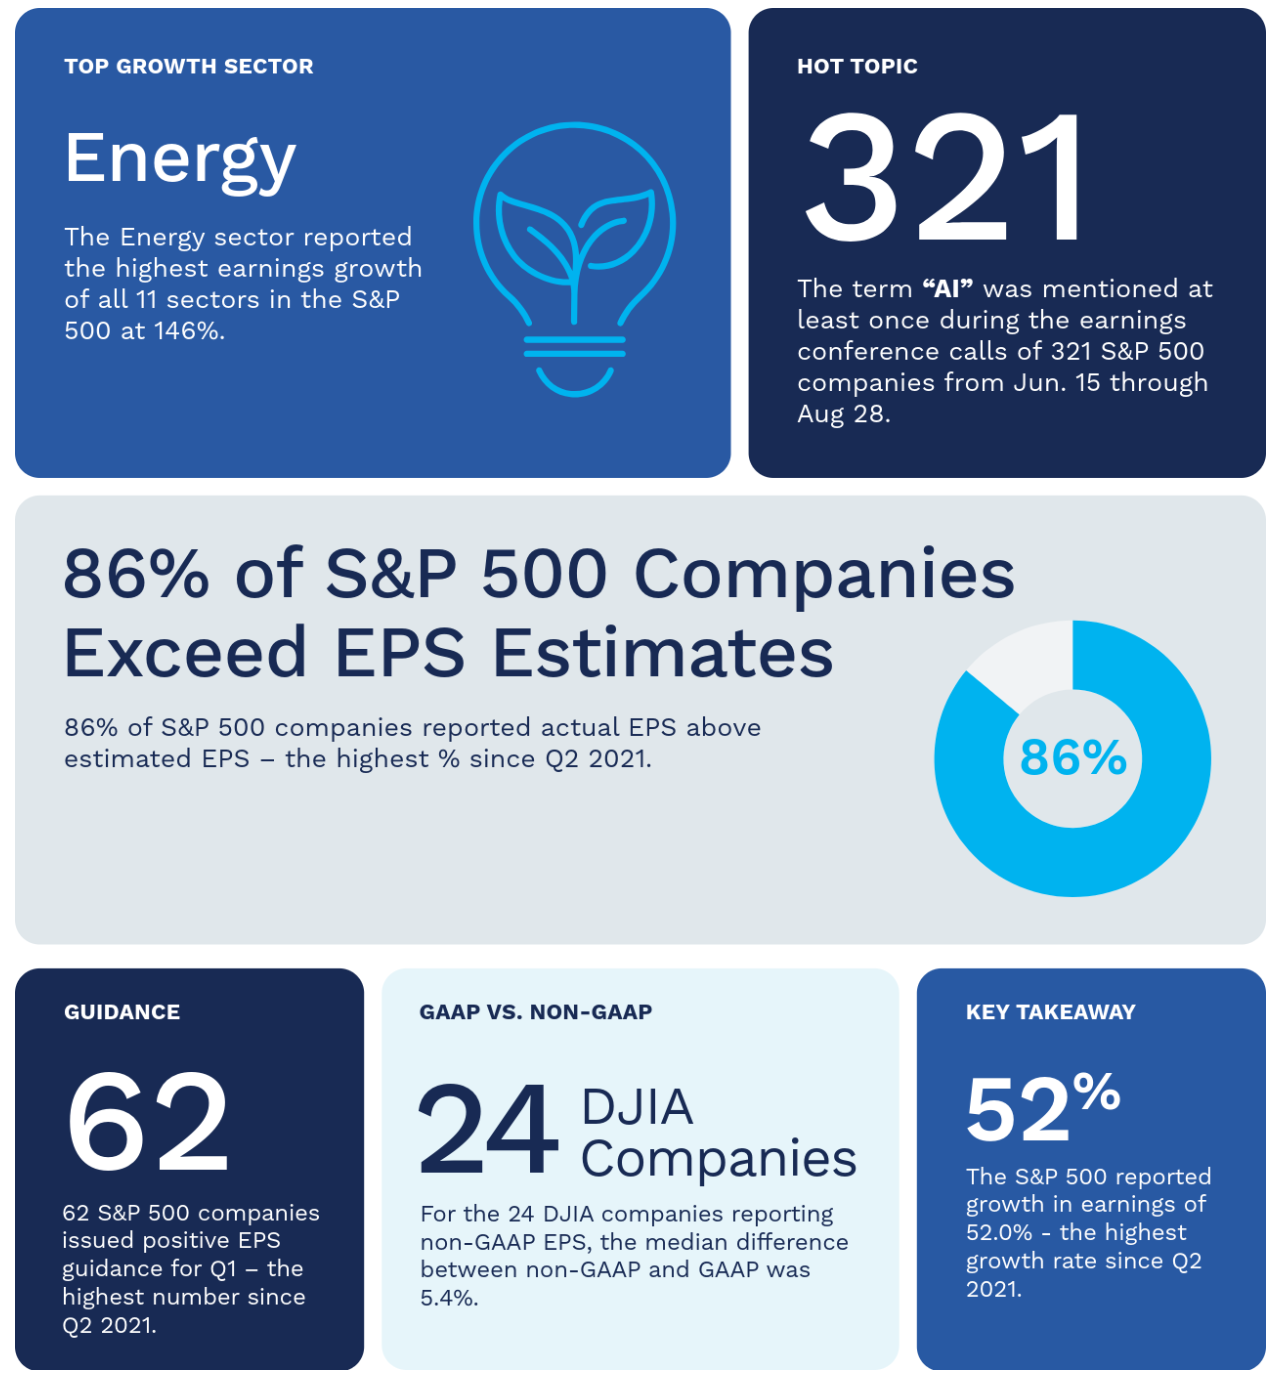
Many are pointing to resilient labor and economic data as giving the Fed room to focus on inflation without derailing growth, alongside continued earnings strength as a genuine offset. That is a real, sourced counterweight to the more alarmed framing elsewhere, worth holding alongside the rest of this issue rather than dismissing.
The cross-asset picture, and one genuine counterpoint
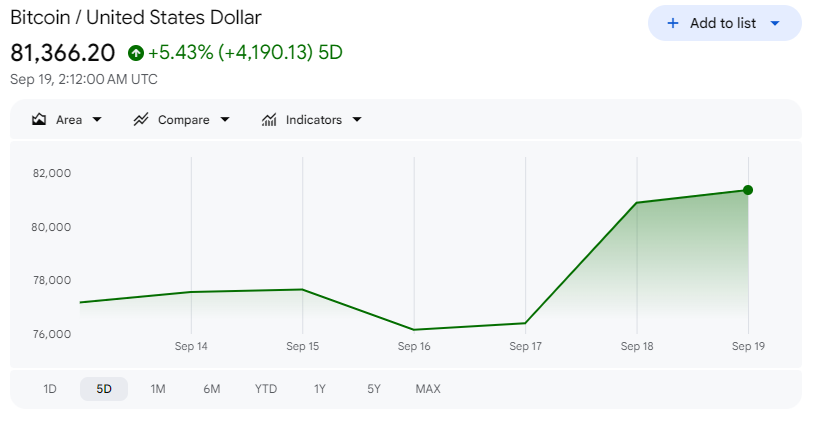
Bitcoin had a wild week and still finished up roughly 3 percent, which undersells what actually happened inside it. Tuesday alone saw an 11.5 percent single-day decline in my Digital Assets data, the sharpest one-day move we’ve seen for that row all summer, followed by a recovery into Friday. That kind of round trip, a violent drawdown and a near-full recovery in the same week, reads more like positioning flushing out ahead of the Fed than a clean directional call on crypto itself.
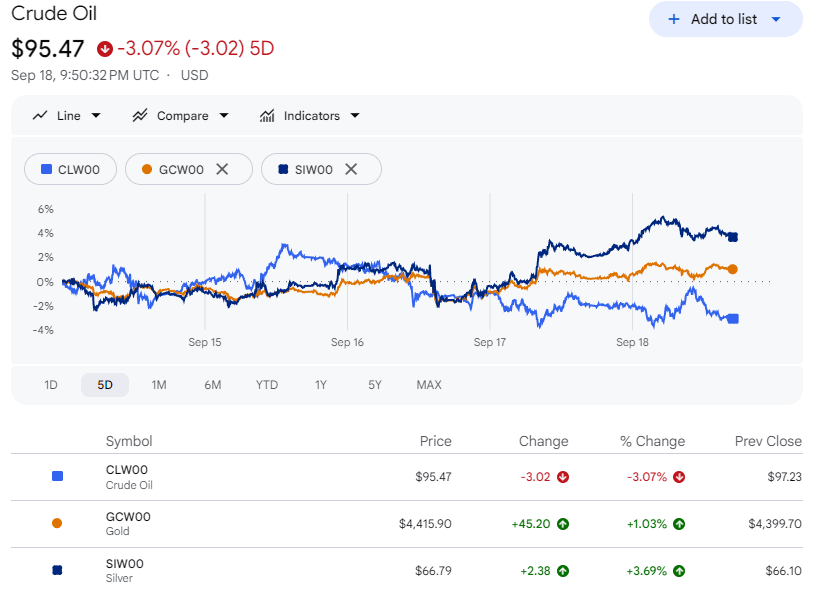
Gold and silver both turned modestly positive this week, a real change from the prior two weeks of consistent declines against oil’s rally. That shift is worth flagging without overreading it: it could mean the debasement-trade logic is starting to matter again now that an actual hiking cycle is underway, or it could just be normal week-to-week noise in two metals that move for a dozen reasons. One week is not enough to call it either way, but after two straight weeks of a clean divergence from oil, a reversal is worth noting the moment it happens.
Historically, this calendar period has been rough mainly when it followed a period of excess. A market that has already been range-bound going in has less air underneath it to lose. I am not fully convinced given everything else in this issue, but it is a real, sourced argument and it deserves a place next to the my more alarmed reads rather than being left out.
Not everything fell, and the rotation is the other half of this story
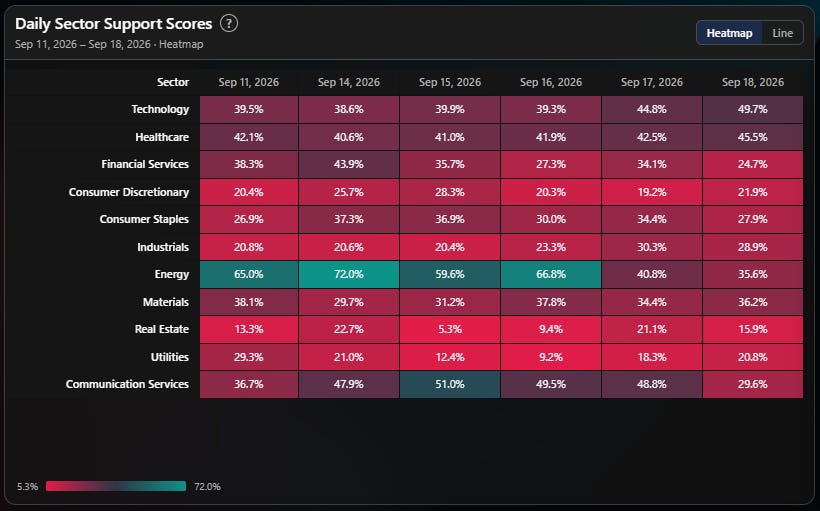
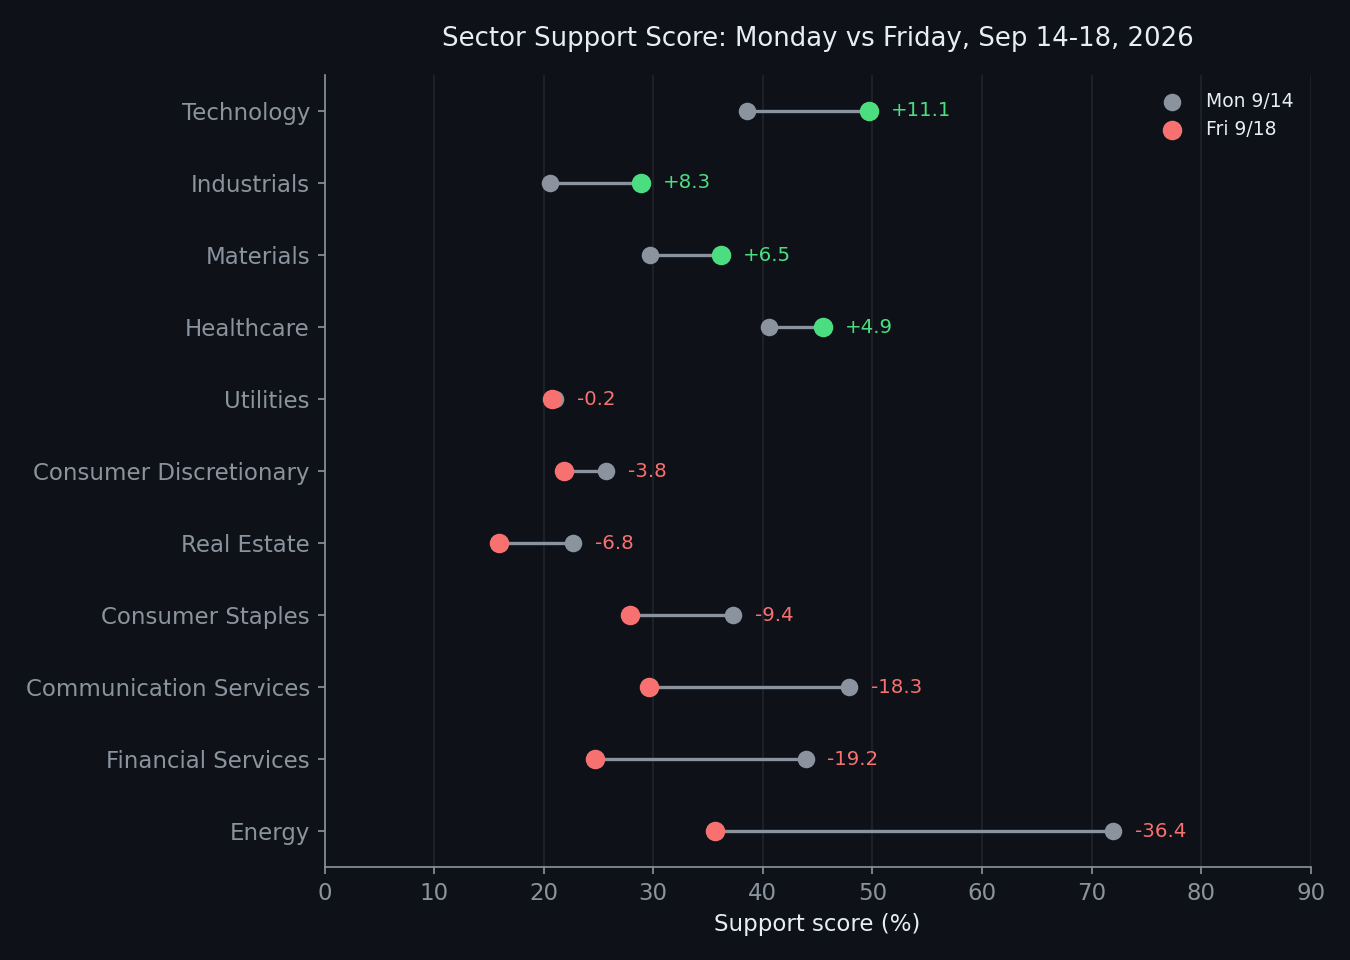
Technology rose 11.1 points this week, the best mover on the board, and Industrials rose 8.3, Materials 6.5, Healthcare 4.9. Communication Services fell 18.3, Financial Services fell 19.2, on top of Energy’s 36.4. This was not a uniform selloff like the one I showed you last week. It reads like real capital rotating out of the inflation and rate-sensitive trade and back into growth and industrial names now that the Fed event has come and gone, a rotation, not a retreat. Follow-thru in coming sessions will matter greatly here.
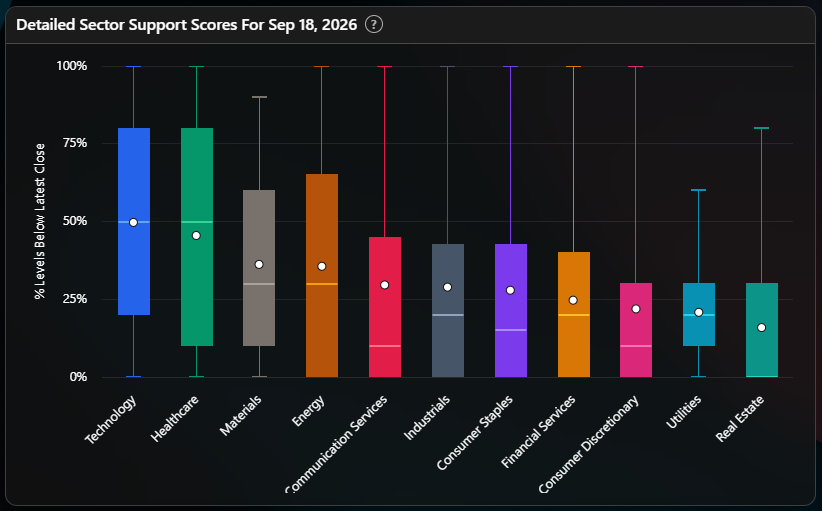
Friday’s detailed breakdown backs that read up in an important way. Energy’s box has changed character since I last described it to you. For weeks its mean sat well below its median, a few weak names dragging an otherwise strong average down. This week median and mean converged near the bottom together, the whole complex weakened, not just a handful of names giving back gains. Real Estate remains the single weakest sector on the board by absolute level, continuing a decline that predates this week entirely. Financial Services, Consumer Discretionary, Consumer Staples, and Utilities all show the now-familiar pattern of means sitting above already-low medians, a handful of stronger names still propping up scores that understate how weak the typical name in each actually is. (Fuller explanation of how to get the most out of this plot here.)
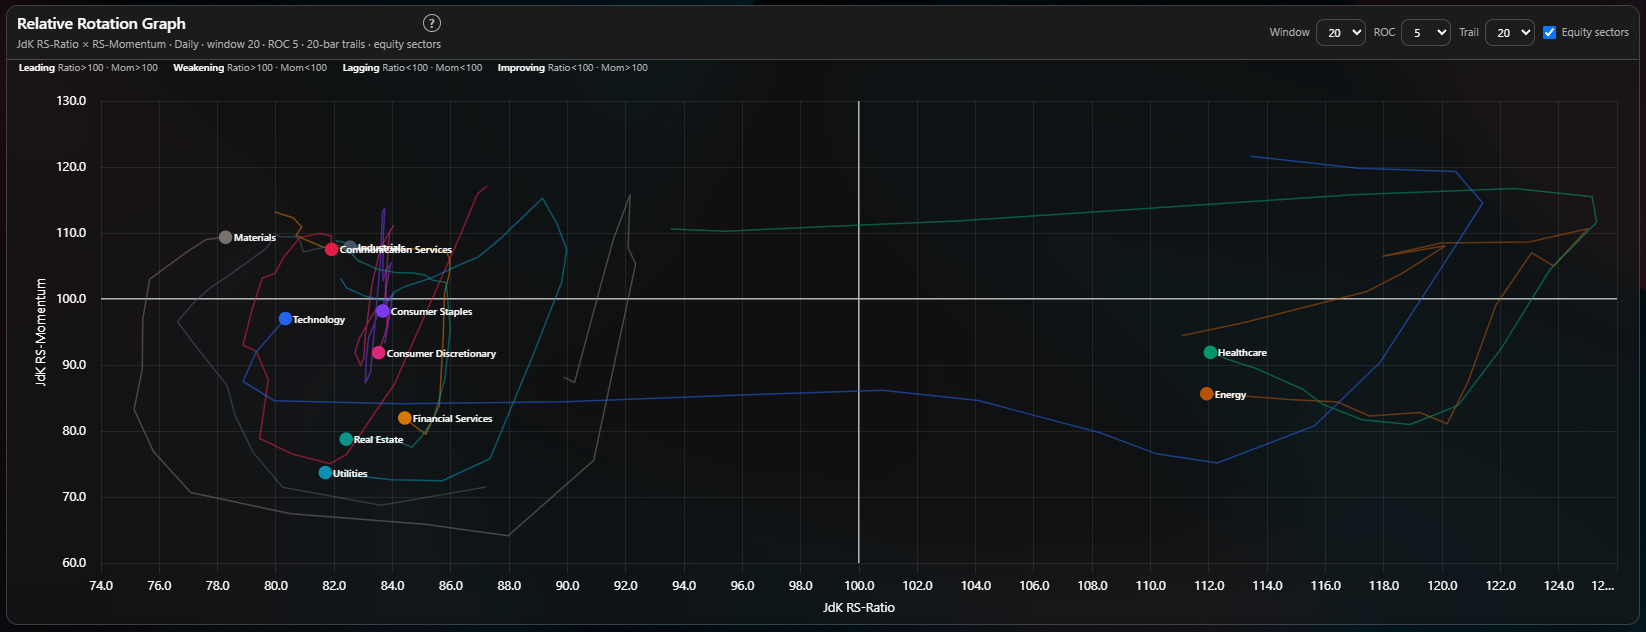
The Relative Rotation Graph agrees with the position data for the first time in weeks on Energy specifically: it has now moved out of Leading territory into Weakening, ratio still elevated, momentum rolled over. No disagreement left to report there. It resolved the way the score already told you it was going to.
What’s on deck
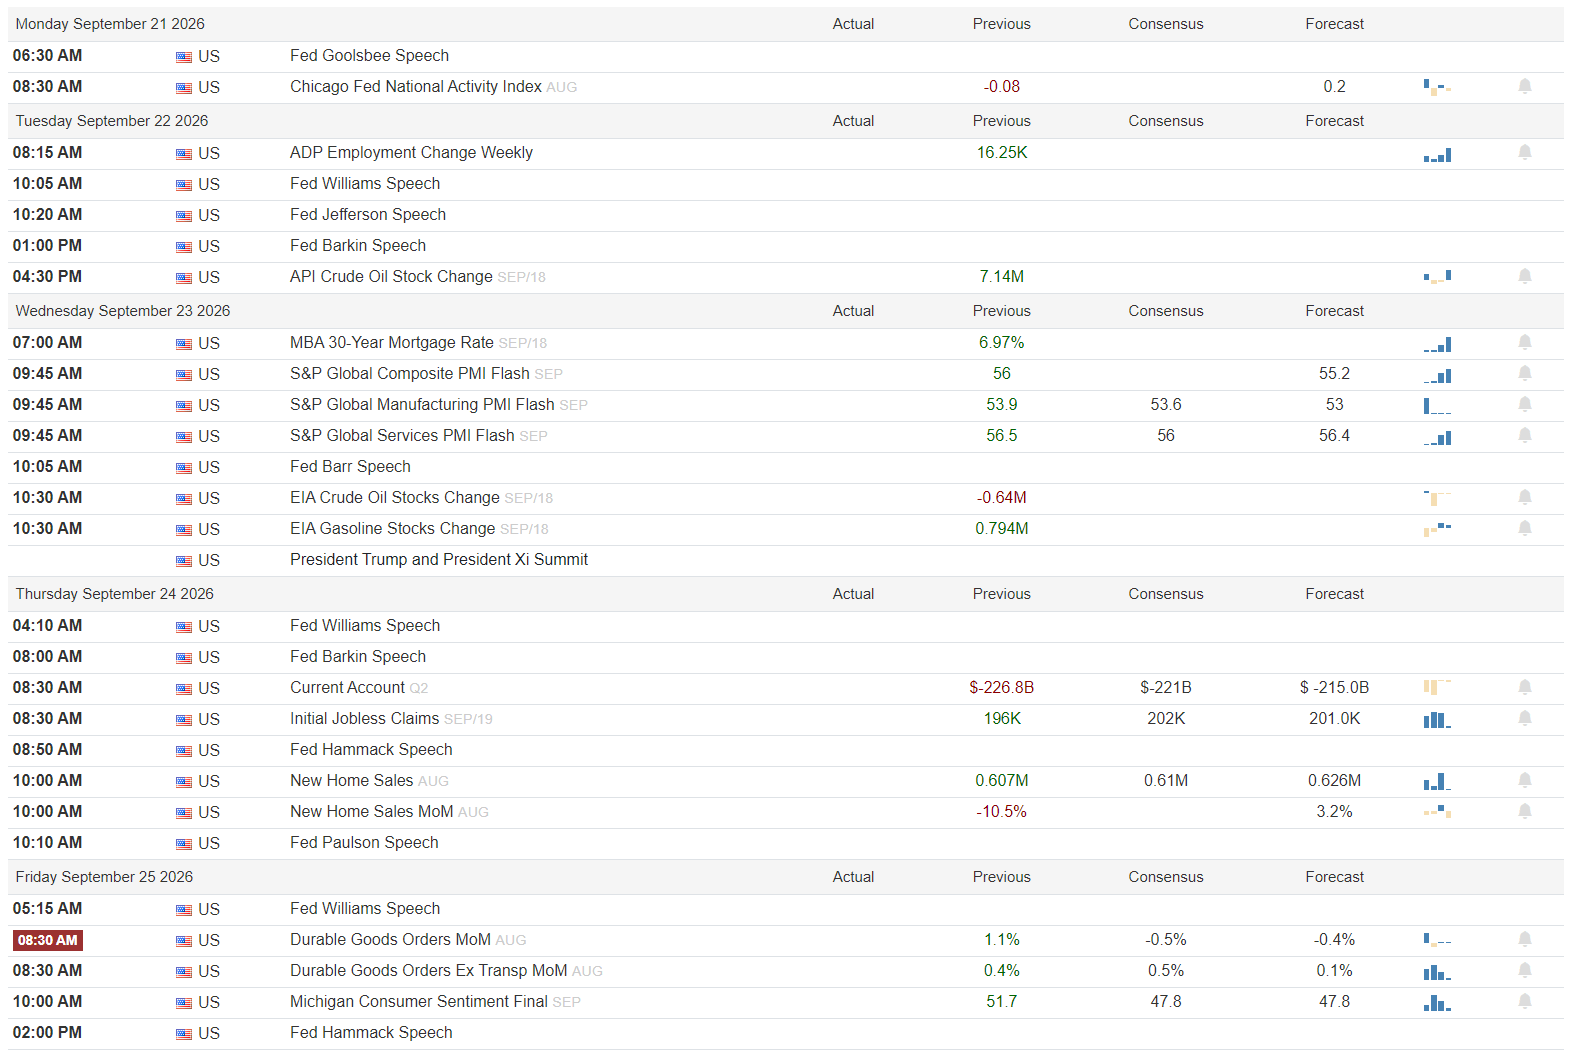
Next week is unusually loaded with Fed communication, a speaker scheduled nearly every day, parsing what this hike means for the path ahead. A Trump-Xi summit lands midweek, a real trade-policy variable on top of everything else, alongside flash PMI data and final Michigan consumer sentiment Friday. Costco reports Thursday after close, one of the clearer reads on whether the “discerning consumer” theme from recent weeks is showing up in an actual bellwether’s numbers rather than just survey data.
What this means, by your clock
If you trade in days to weeks: Energy’s reversal has a clean mechanical explanation, a trade unwinding on its own catalyst resolving, and I would not assume it is done unwinding just because it already fell hard. The rotation into Technology and Industrials this week is potentially real and worth watching for follow-through next week rather than treating as a one-day reaction. The board sitting this close to the capitulation line argues for less conviction in either direction, not more, until it either breaks below 30 decisively or starts to recover.
If you invest in months to years: this is the first week where the macro story stopped being about whether central banks would act and became about how far a synchronized global tightening cycle actually goes. If the market’s pricing of nine more hikes across three central banks by 2027 is anywhere close to right, the entire backdrop for every sector story this newsletter has been covering changes.
Talk soon, Bruce
If you’re not a subscriber yet, I’d love to have you. And if you’ve got questions about VolumeLeaders itself, what the data means, how to read the dashboard, anything, just reach out. Happy to answer them directly.
This newsletter is for informational purposes only and is not investment advice. Nothing here is a recommendation to buy or sell any security. Past patterns in this data are not a guarantee of future results, a point this piece has hopefully made concrete rather than just disclaimed.
Thank you for being part of this community and for investing your time in this week’s edition. The quality of this readership — thoughtful, disciplined, engaged — is what makes this work meaningful. I’m grateful to build alongside you. Here’s to a week of clarity, conviction, and well-executed opportunities.
-VolumeLeaders