

Market Momentum: Your Weekly Financial Forecast & Market Prep
Issue 94 / What to expect June 08, 2026 thru June 12, 2026


Weekly Market-On-Close Report
U.S. equities just reminded everyone that up-and-to-the-right is not a law of nature, it’s a phase. A single session of violent tech unwinds, hotter‑than‑expected macro, and rising yields was enough to flip the prevailing AI euphoria into a proper risk‑off day, even as the underlying growth picture remains surprisingly resilient.
From AI melt‑up to AI shake‑out
The week started with the same script we’ve been running all year: AI optimism, megacap leadership, and new highs for the major indices. Early on, AI‑linked names were still doing the heavy lifting, supported by a still‑solid macro backdrop and an ongoing capex boom around data centers, chips, and infrastructure.
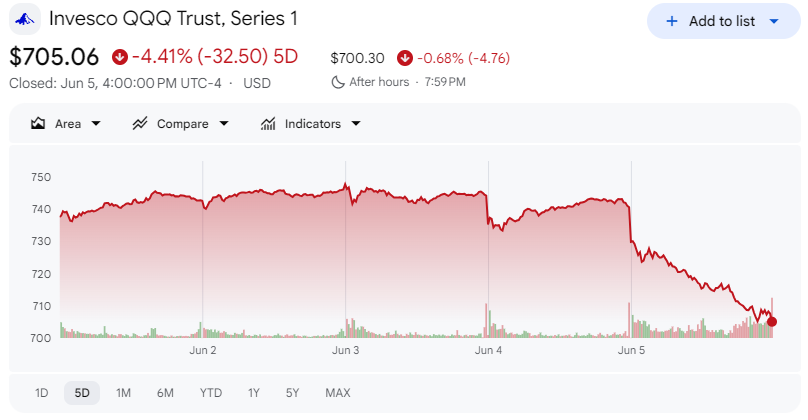
By Friday, that regime cracked. The S&P 500 finished the day down 2.64%, the Nasdaq 100 collapsed 4.77%, and both the S&P and Nasdaq closed at two‑week lows, even though they had set fresh all‑time highs earlier in the week. The Dow held up relatively better—down 1.35% on Friday and just 0.32% for the week—reinforcing the classic pattern: when the market de‑risks, it dials back duration and growth exposure first.
What actually broke on Friday
Friday was not your garden‑variety “tech off 1–2%” kind of move. It was a full‑on de‑rating of the most crowded trade in the market.
The Nasdaq Composite fell 4.68% on the week, leading losses across U.S. indices.
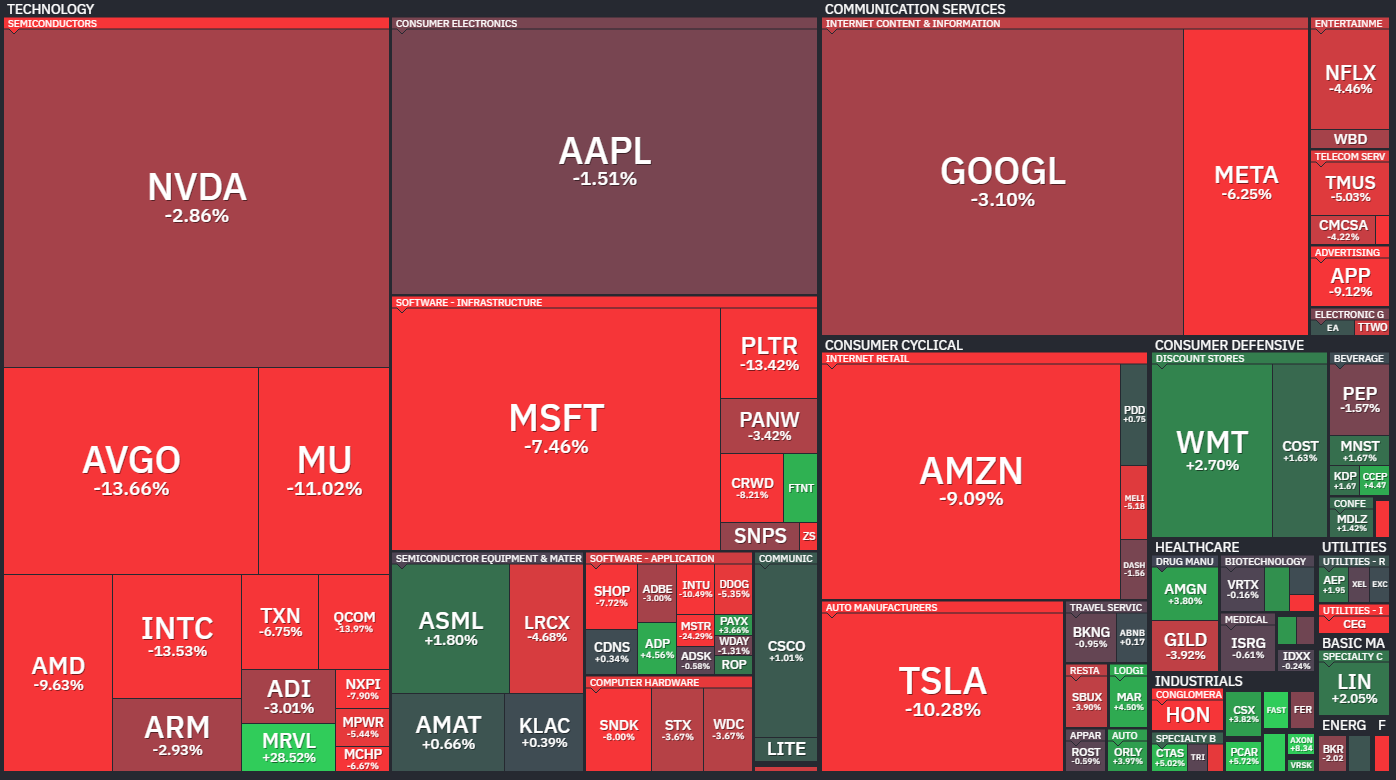
AI‑infrastructure and semis were ground zero. Marvell closed down more than 16%, Micron more than 13%, and a long list of semis and memory names printed double‑digit declines in a single session.
The “Magnificent Seven” finally traded like a source of funds, not a flight to safety: Tesla and Nvidia dropped more than 6%, Meta more than 5%, Amazon more than 3%, Microsoft more than 2%, with Apple and Alphabet down over 1%.
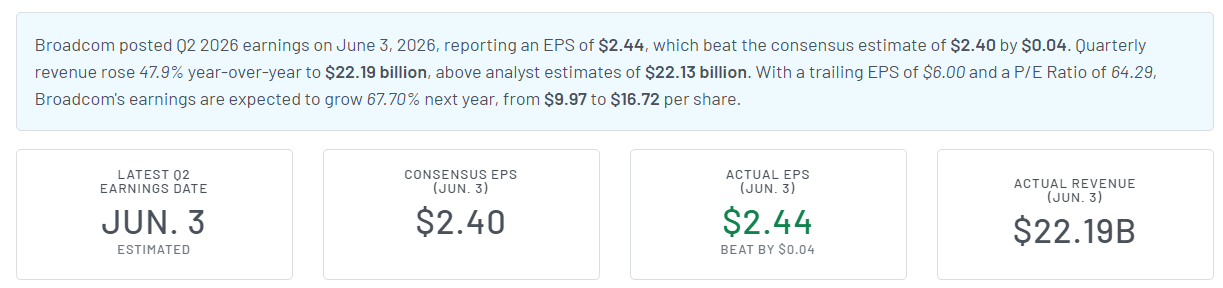
The catalyst was deceptively simple: Broadcom’s outlook for chip sales didn’t clear the bar set by months of AI‑driven euphoria. That single disappointment was enough to trigger long liquidation and profit‑taking across the AI complex, as investors suddenly questioned whether near‑term fundamentals could catch up to the narrative. Pair that with a strong May payrolls report and a jump in yields, and you had the conditions for a one‑day VaR shock: positions that had been grinding higher for months suddenly had to be resized in a hurry.
Macro: resilient growth, unwanted inflation
Under the surface, nothing about the macro tape screams “recession.” If anything, it screams “too hot for comfort.”
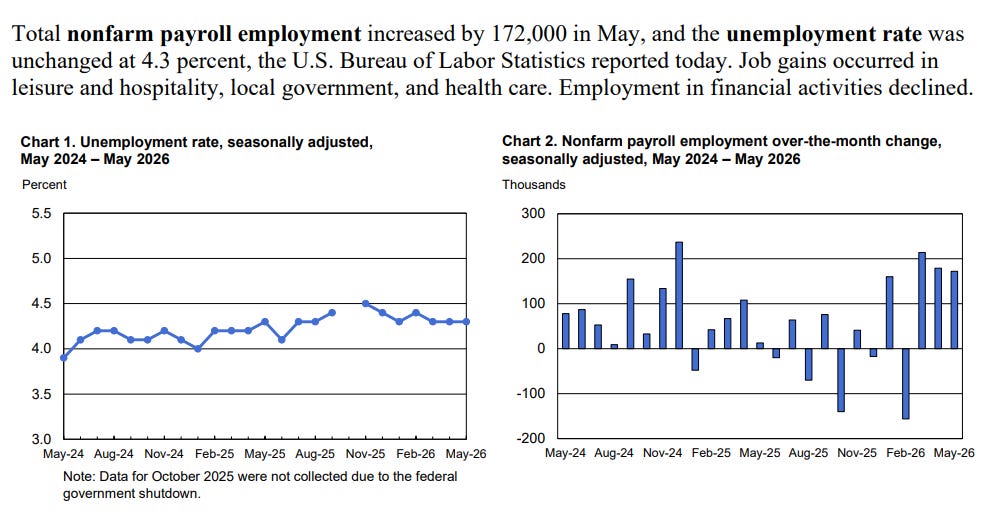
The May U.S. jobs report printed 172,000 nonfarm payrolls versus expectations around 80,000, with April revised up to 179,000. The unemployment rate stayed at 4.3%, and job gains were broad‑based across leisure and hospitality, local government, and health care.
Earlier in the week, JOLTS showed job openings rising to 7.6 million—well above expectations and the highest in nearly two years—while ADP’s measure of private hiring also beat consensus. At the same time, initial jobless claims climbed to 225,000 and announced layoffs rose for a third straight month, with companies explicitly citing AI as the top driver of cuts.
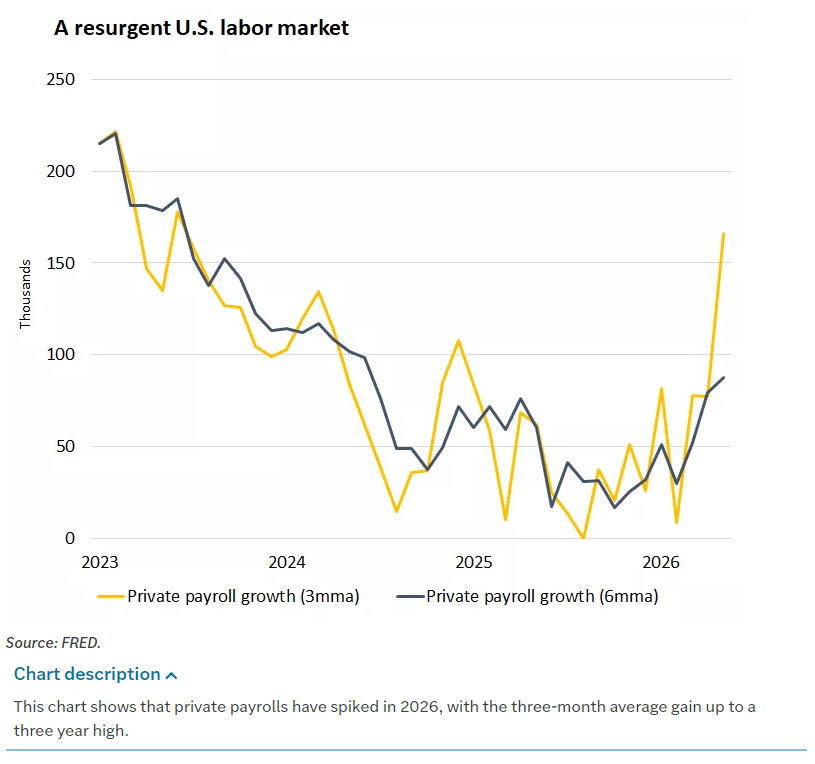
So the labor market is throwing off a mixed but crucial signal: demand for workers is still strong, but employers are reshuffling the deck—less headcount in legacy roles, more capital into AI and automation. That’s bullish for productivity in theory, but it also keeps wage and price pressures alive in the near term.
On the activity side, both ISM manufacturing and services PMIs pushed further into expansion. Manufacturing rose to 54.0 in May—its highest reading in four years—while services climbed to 54.5, with new orders firm in both surveys. Prices paid indices eased a bit but still signaled rising prices for the twentieth month running in manufacturing and hit their highest level since 2022 in services.
Translation: growth is resilient and inflation is sticky. That is not the mix equity investors were pricing during the AI melt‑up.
Yields reprice the dream
With growth holding up and inflation proving stubborn, the bond market did what it always does: it tightened financial conditions.
The 10‑year Treasury yield climbed from roughly 4.44% to around 4.55% over the week and hit a two‑week high after the payrolls surprise. September 10‑year T‑note futures dropped to two‑week lows as yields rose.
Investors are now entertaining the possibility that the Fed’s next move could be a hike, not a cut—even if the market still sees a hike as a tail risk rather than a base case. The personal consumption expenditures (PCE) deflator is running around 3.5% year‑over‑year for Q1, with April data pointing to 3.8% and core PCE still stuck in the mid‑3s.
The message from both the Fed’s Beige Book and recent PMI data is consistent: activity is picking up in most districts, and prices are rising at a “moderate to strong” pace. That’s exactly the kind of backdrop that keeps central banks on hold—or pushes them toward a hawkish bias.
For equities, the problem isn’t that yields are screaming higher in absolute terms. It’s that they’re moving higher at the same time AI‑rich growth stocks are priced for perfection. That combination forces a duration and risk premium reset—and that’s exactly what we saw Friday.
Under the hood: factor and sector tells
Once you strip away the headlines, the cross‑section of returns tells the real story.
High duration, high expectations got smoked. AI‑infrastructure, semis, and the long‑duration megacap complex were the obvious casualties, with a laundry list of names down 7–16% in a day.
Crypto beta traded like levered tech. With Bitcoin down more than 5% to a 20‑month low, crypto‑linked equities like Galaxy Digital, Marathon Digital, Riot, Coinbase, and MicroStrategy fell 6–11%. This is what happens when a speculative risk proxy loses both momentum and macro support at the same time.
Defensives quietly did their job. While everything growth‑y was being derated, consumer staples ripped: Clorox gained more than 5%, Procter & Gamble more than 4%, with similar gains in Kimberly‑Clark, Colgate‑Palmolive, Coca‑Cola, and Tyson Foods. That is classic factor rotation into low‑beta, stable‑cash‑flow names when equity volatility spikes.
On a weekly basis, the rotation is even clearer. The Nasdaq Composite sank 4.68%, the S&P 500 dropped 2.6%, and small caps via the Russell 2000 fell 2.95%, while the Dow slipped just 0.32%. That’s a textbook “reduce cyclicals and growth, hide in quality” reaction to higher rates and macro uncertainty.
The AI capex boom is real, even if the stocks overshot
It’s worth stressing that this downdraft in AI names is happening despite extremely supportive fundamental trends.
Q1 business investment was up 6.4% annualized, with spending on information processing equipment, software, and R&D—i.e., the AI stack—contributing a full percentage point to GDP growth over the last year. That’s the largest capex acceleration since the late‑1990s IT cycle.
Corporate guidance and private valuations are singing the same tune. The note highlights how AI infrastructure spending is increasingly showing up in hard macro data, and even references the near‑trillion‑dollar pre‑IPO valuation chatter around Anthropic as emblematic of where sentiment still sits.
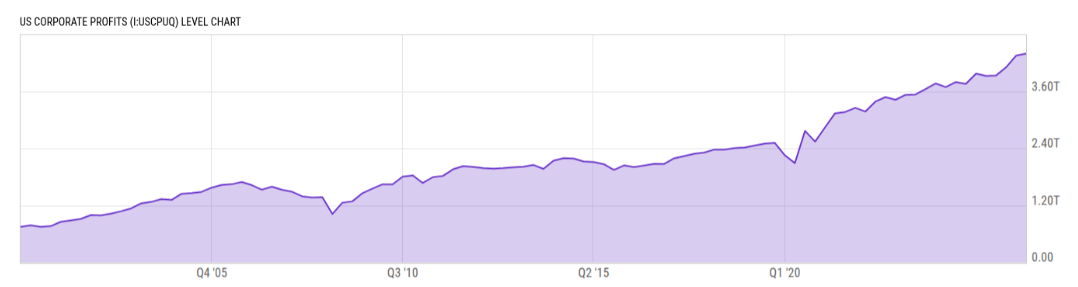
At the earnings level, U.S. corporate profits are up about 12% over the past year, with non‑financial margins around 18%—near post‑pandemic highs and well above pre‑COVID norms. In other words, the AI cycle is already helping to sustain high margins and strong earnings, even as companies reallocate labor and capital.
The sell‑off we just saw looks less like a collapse in the AI thesis and more like a repricing of path and positioning. The structural story is intact; the flows needed a reset.
Global context: synchronized tension, not synchronized crisis
Zooming out, the U.S. is not alone in dealing with the awkward combo of solid growth and uncomfortable inflation.
In Europe, the STOXX Europe 600 fell 0.53% on the week, with Germany’s DAX down 1.38% and the UK’s FTSE 100 off 0.40%, as investors digested weaker euro area growth (Q1 GDP revised to a 0.2% contraction) and softer retail sales.
Eurozone retail volumes declined 0.4% in April, led by non‑food categories, while industrial output in France was essentially flat.
The 10‑year German Bund yield climbed to about 3.05%, and UK gilt yields hovered near 4.9%, reflecting a global move higher in developed‑market rates as central banks keep the inflation fight active.
In Japan, the Nikkei managed a small gain while the broader TOPIX dipped, as investors grappled with hawkish commentary from the Bank of Japan and persistently high energy prices. The 10‑year JGB yield held around 2.66% as Governor Ueda signaled a greater willingness to hike if upside inflation risks outweigh growth concerns. The yen weakened toward 160 per dollar, forcing officials to threaten “decisive” FX intervention after having already spent roughly 11.7 trillion yen on support in late April and May.
China remains in a slow, uneven recovery mode. Official manufacturing PMI slipped to 50.0 in May, right on the expansion/contraction line, while a private survey showed smaller, private‑sector firms still expanding. AI again was a bright spot: Tencent advanced on news it is testing an embedded AI agent for WeChat and preparing for regulatory approval, while the startup DeepSeek reportedly pursued a fundraise at around a 52‑billion‑dollar valuation.
The punchline globally: this is not a growth scare. It’s a policy‑reaction and valuation scare. Central banks are still leaning hawkish; inflation is still an issue; and the risk is not collapse, but a longer period where earnings have to grow into the multiples investors have already paid.
So what now? A trader’s lens
If you strip the narrative down to its bones, last week looks like a classic phase change in a late‑stage bull leg:
Macro remains supportive. U.S. growth (ex‑volatile components) is running closer to 2.2% over the last six months, business investment is strong, and corporate profitability is robust. None of that screams “cycle top.”
Inflation is the constraint. PCE inflation and PMI price gauges are too high for comfort, and oil and geopolitics (U.S.–Iran, Strait of Hormuz risk) keep the energy and inflation narrative alive.
Positioning in AI/growth was crowded. A single miss relative to elevated expectations (Broadcom’s outlook) triggered a chain reaction of profit‑taking and de‑leveraging in the same pockets that had led the tape to record highs.
For traders, that sets up a different playbook than what worked in Q1:
The “own anything with AI in the deck” trade is now under scrutiny. Expect more dispersion within AI—winners will be the names where reported revenue and capex flows actually line up with the narrative.
Factor volatility should stay elevated. High‑beta, high‑duration names are going to trade like an option on every data print and every hawkish soundbite from central banks.
Old‑school defensives and quality will matter again. Staples’ strength on Friday is not an accident; it’s the quant expression of investors paying up for cash flow visibility when both valuations and real rates are high.
From a longer‑term allocation standpoint, the big shops aren’t sounding the alarm. The U.S. economy is resilient and the AI capex cycle is feeding directly into growth and earnings. You can still remain constructive on equities overall—even while acknowledging that returns from here are likely to be “slower and bumpier” and that fixed income faces a cap on upside as long as inflation runs hot.

Weekly Benchmark Breakdown
Title: Breadth bends, leadership breaks
This week was all about stress-testing leadership. Under the hood, breadth is wobbling rather than outright collapsing: you can see more names slipping below shorter moving averages while longer-term cohorts are still hanging on. It feels more like a trend under pressure than a fresh thrust, with risk tone flipping from “buy the AI story” to “prove it with numbers.”
In the S&P 500, the breadth table tells a mixed story. Shorter lookbacks show a noticeable pickup in new lows alongside a drop in the share of names above their near-term moving averages, while longer windows still show new highs ahead of new lows and a decent chunk of the index holding above the 100- to 200-day lines.
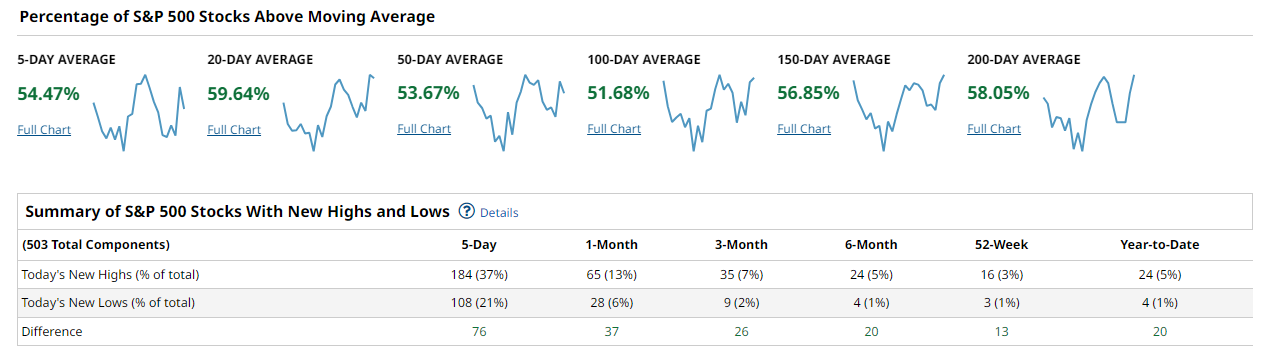
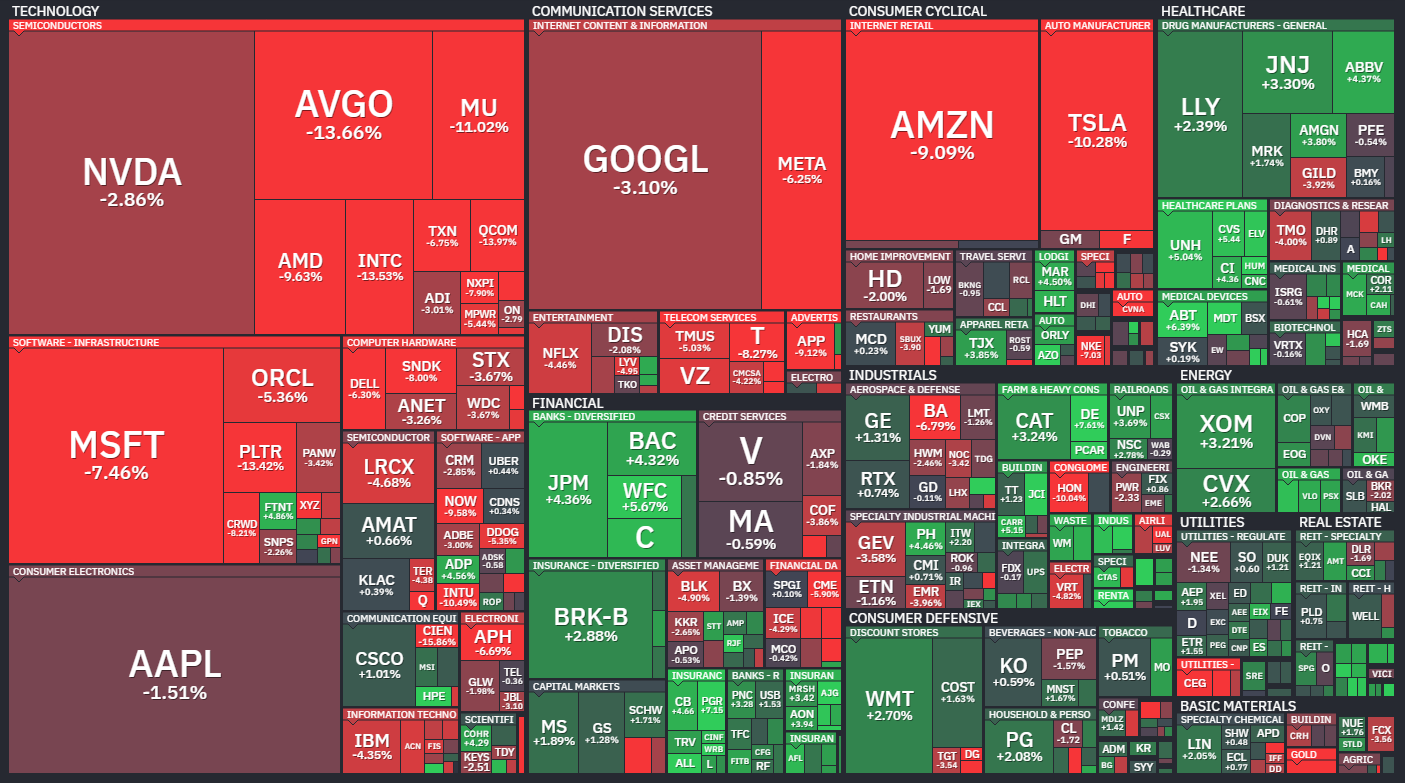
The new highs vs new lows table still leans positive, with today’s new highs outnumbering new lows across most lookbacks, but the edge is not nearly as decisive as it was when the index was effortlessly printing fresh highs. On the one-week heatmap, the selling hit the big, AI-adjacent winners hardest, which is exactly what you would expect when crowded leadership finally gets taken to the woodshed.
For the Nasdaq 100, the tone is weaker and more concentrated. The percentage of constituents above the short- and intermediate-term moving averages is clearly lower than the S&P, and the handful of mega-cap heavyweights doing the damage are large enough that you feel it in the cap-weighted index even if some smaller components are holding up relatively better.
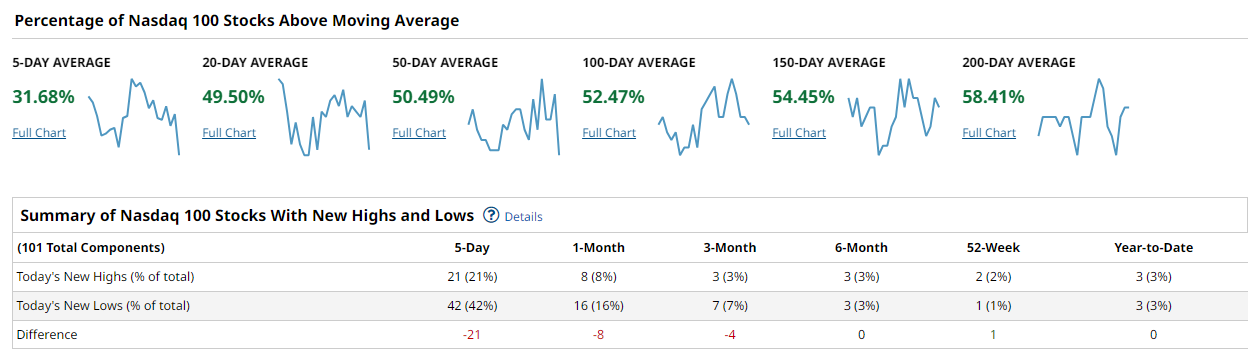
That aligns with what we just saw in the tape: big down days in the core AI and semiconductor names, and a noticeable deterioration in the one-week return map across the largest tiles. The breadth message here is that leadership is being sold hard while the rest of the bench is, at best, just hanging on.
The Dow’s breadth picture is more resilient. With far fewer constituents, you do not see the same dramatic shift in the percentages above the 50- and 200-day moving averages, and recent stats from Barchart still had more than 90 percent of Dow names above their 200-day earlier in the year.
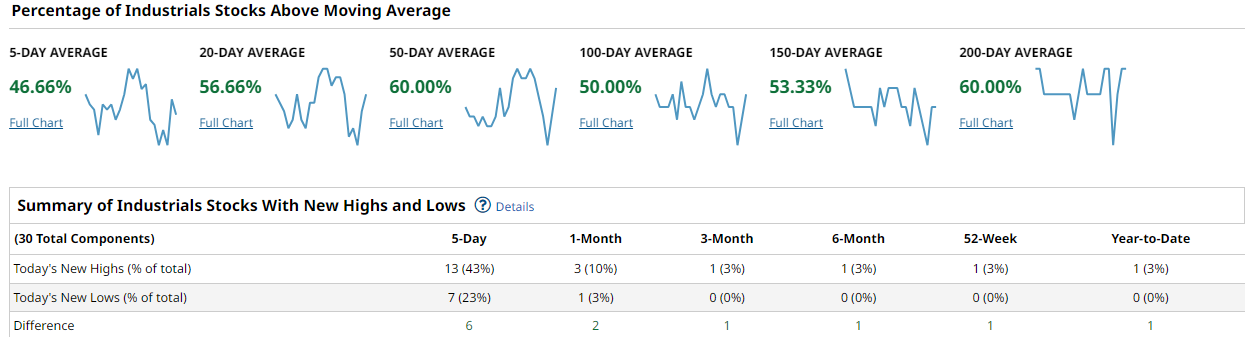
The new high/new low profile is more muted simply because of the smaller universe, but on a one-week basis the return map shows less severe damage and a more balanced mix of modest winners and losers. That fits the price action: the Dow has been the relative-strength haven as investors rotate toward quality, dividends, and stable cash flows.
In the Russell 2000, breadth is softer and more fragile. Historically, the small-cap percentage above the 200-day tends to lag the S&P, and recent data still has that Russell 2000 cohort sitting near the mid-50s rather than the stronger readings you see in large caps.
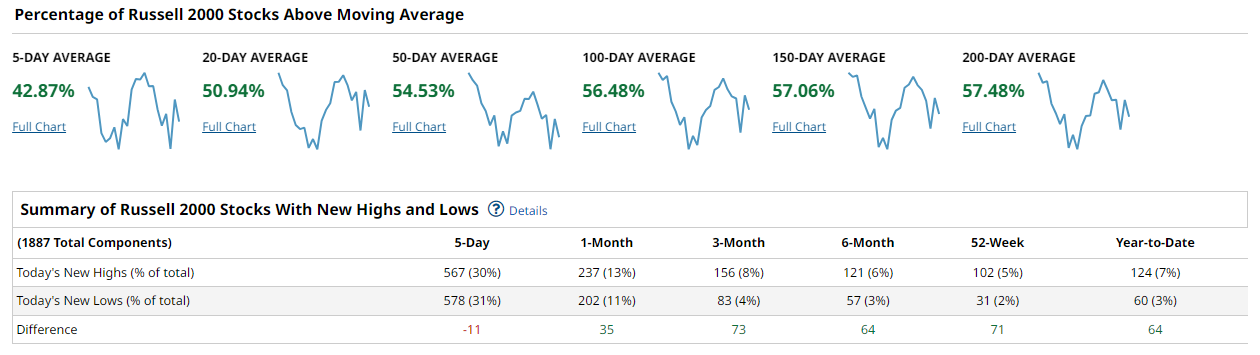
Shorter-term breadth measures look even weaker, with a much smaller slice of the index sitting above its 20- and 50-day lines, and the one-week heatmap shows a broad swath of small and mid caps underperforming while only a narrow set of names manage to swim against the tide. This is not the kind of backdrop that screams risk-on for the high-beta tier.
Putting it all together, this is a classic cap-weight-versus-everyone-else tape. Big tech and AI got hit hard, but the broad market was not exactly in roaring health going into this, with a meaningful share of S&P and Nasdaq names already below their 50- and 100-day moving averages and Russell breadth still mediocre. Participation would need to improve from here to confirm a durable advance: you want to see the 50-day cohorts in all four indices push convincingly north of 60 percent and new highs consistently beating new lows across multiple lookbacks, ideally with small caps joining rather than lagging. If instead we see the long-term cohorts (150- and 200-day) start to roll over and new lows steadily build, that would be a much cleaner warning that the uptrend is transitioning into something more sinister.
The playbook for the week ahead is to respect the damage in leadership without assuming the whole structure is broken. Favor quality large caps and sectors where a solid majority of names are still above their 100- and 200-day moving averages, and be selective rather than heroic in the AI and high-beta complex until the short-term breadth numbers stabilize and new lows stop expanding. Avoid leaning too hard into small caps or speculative corners while Russell breadth is still weak, and keep an eye on whether the S&P and Nasdaq 100 can rebuild their 20- and 50-day cohorts after this shock; if they cannot, the path of least resistance remains choppy to lower rather than a straight V-shaped recovery.
Bottom line: breadth is bent but not broken, and until more of the market can reclaim the 50-day and push new highs meaningfully above new lows, any bounce in the leaders should be treated as a trade first and a trend second.

Investor Sentiment Report
%Bull-Bear Spread
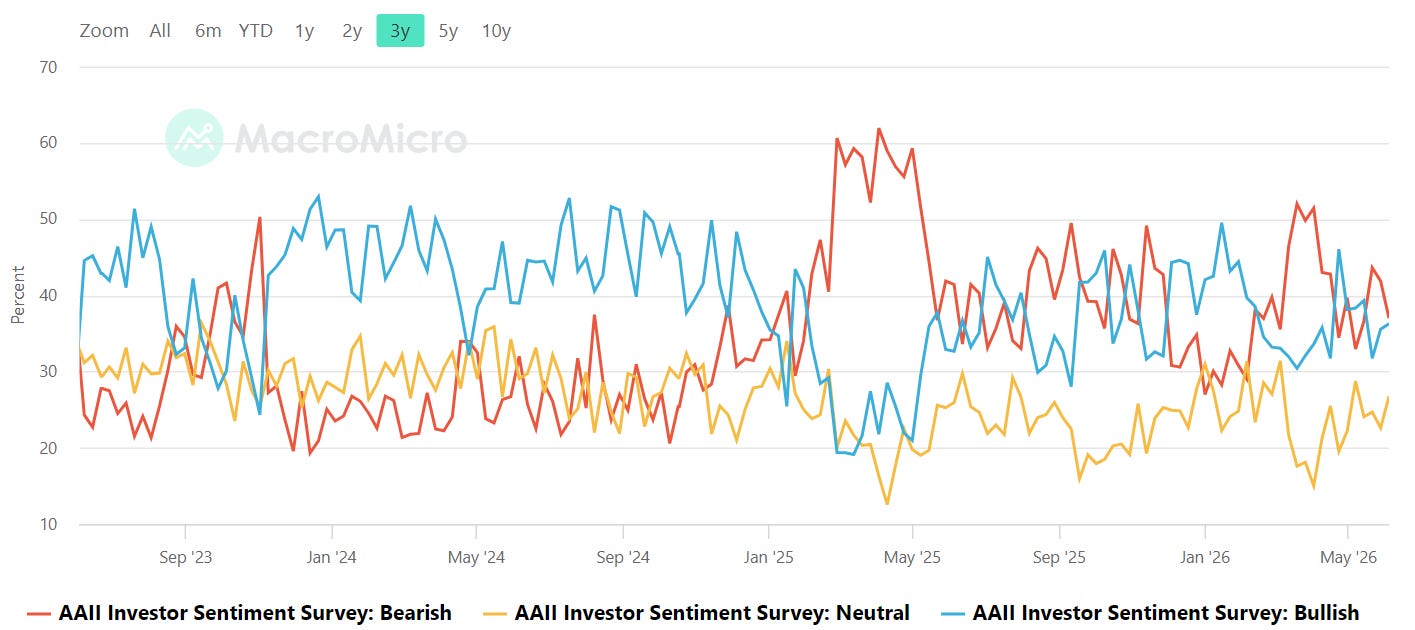
The %Bull-Bear Spread measures the gap between bullish and bearish investor sentiment, often from surveys like AAII. It’s a contrarian indicator—extreme optimism may signal a coming pullback, while extreme pessimism can hint at a potential rally. Large positive or negative spreads often mark market turning points.
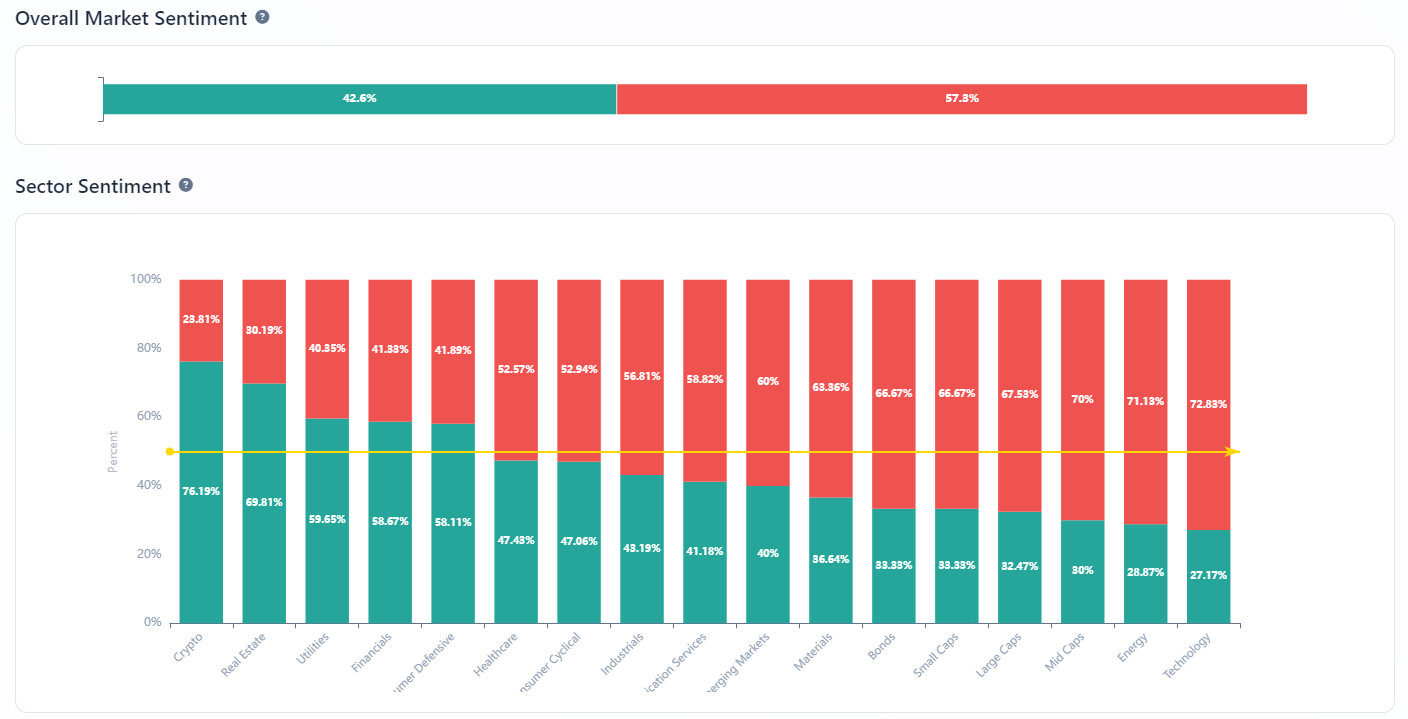
The AAII bull minus bear spread is sitting just below zero at about -0.7%, an improvement from roughly -6% last week and well off the more deeply negative readings we saw in May. That keeps us in a mild pessimism regime: not outright despondent, but definitely not euphoric, and still below the long‑term average spread of around +6%. In practice, a sub‑zero spread has historically been a supportive backdrop for rebounds, especially when it follows a period of persistent negativity, because it means there is skepticism left to fuel squeezes rather than everyone already being all‑in. If the spread were to roll back down toward -10% or worse without a big price break, that would argue for a more durable wall of worry and better risk‑reward to add into weakness; a sustained push back above +20%, on the other hand, would be my cue that sentiment is getting crowded enough to start thinking more seriously about trimming strength rather than chasing it.
NAAIM Exposure Index
The NAAIM Exposure Index (National Association of Active Investment Managers Exposure Index) measures the average exposure to U.S. equity markets as reported by its member firms. These are typically active money managers who provide their equity exposure levels weekly. The index offers insight into how much these managers are investing in equities at any given time, ranging from being fully short (-100%) to leveraged long (up to +200%).
Active managers are still running hot, but they are not quite maxed out anymore.
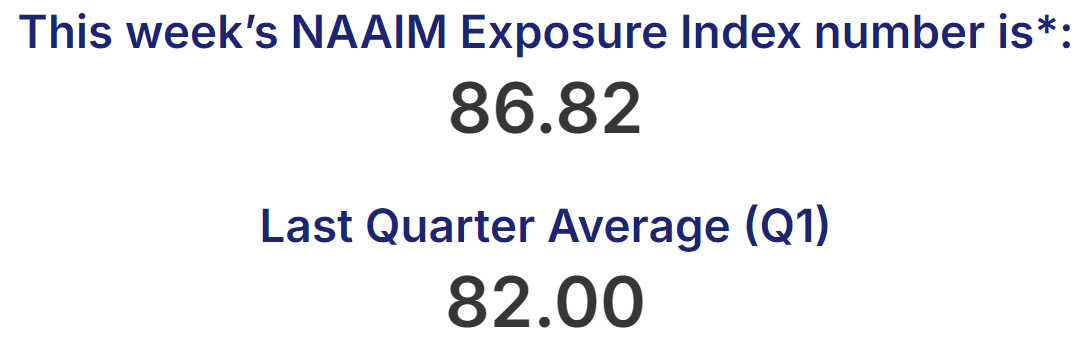
The latest NAAIM Exposure Index print is about 86.8, down from an almost “all‑in” 98.4 last week but still very much in the high‑exposure zone compared with history. That tells you two things at once: there is some evidence of de‑risking at the margin after a big run, but there is not a ton of dry powder left on the sidelines among tactical managers if the market keeps grinding higher. At this level, managers are more vulnerable to being forced sellers on a sharp drawdown than they are positioned to be opportunistic buyers on a dip. A slide in NAAIM into the 50s or low 60s with only mild price damage would reset that skew in a healthier way and reload the buy‑the‑dip impulse; a renewed push back into the 90s would say the “all‑gas, no‑brakes” mentality is back and that any surprise shock could create a more violent air pocket as those exposures get cut.
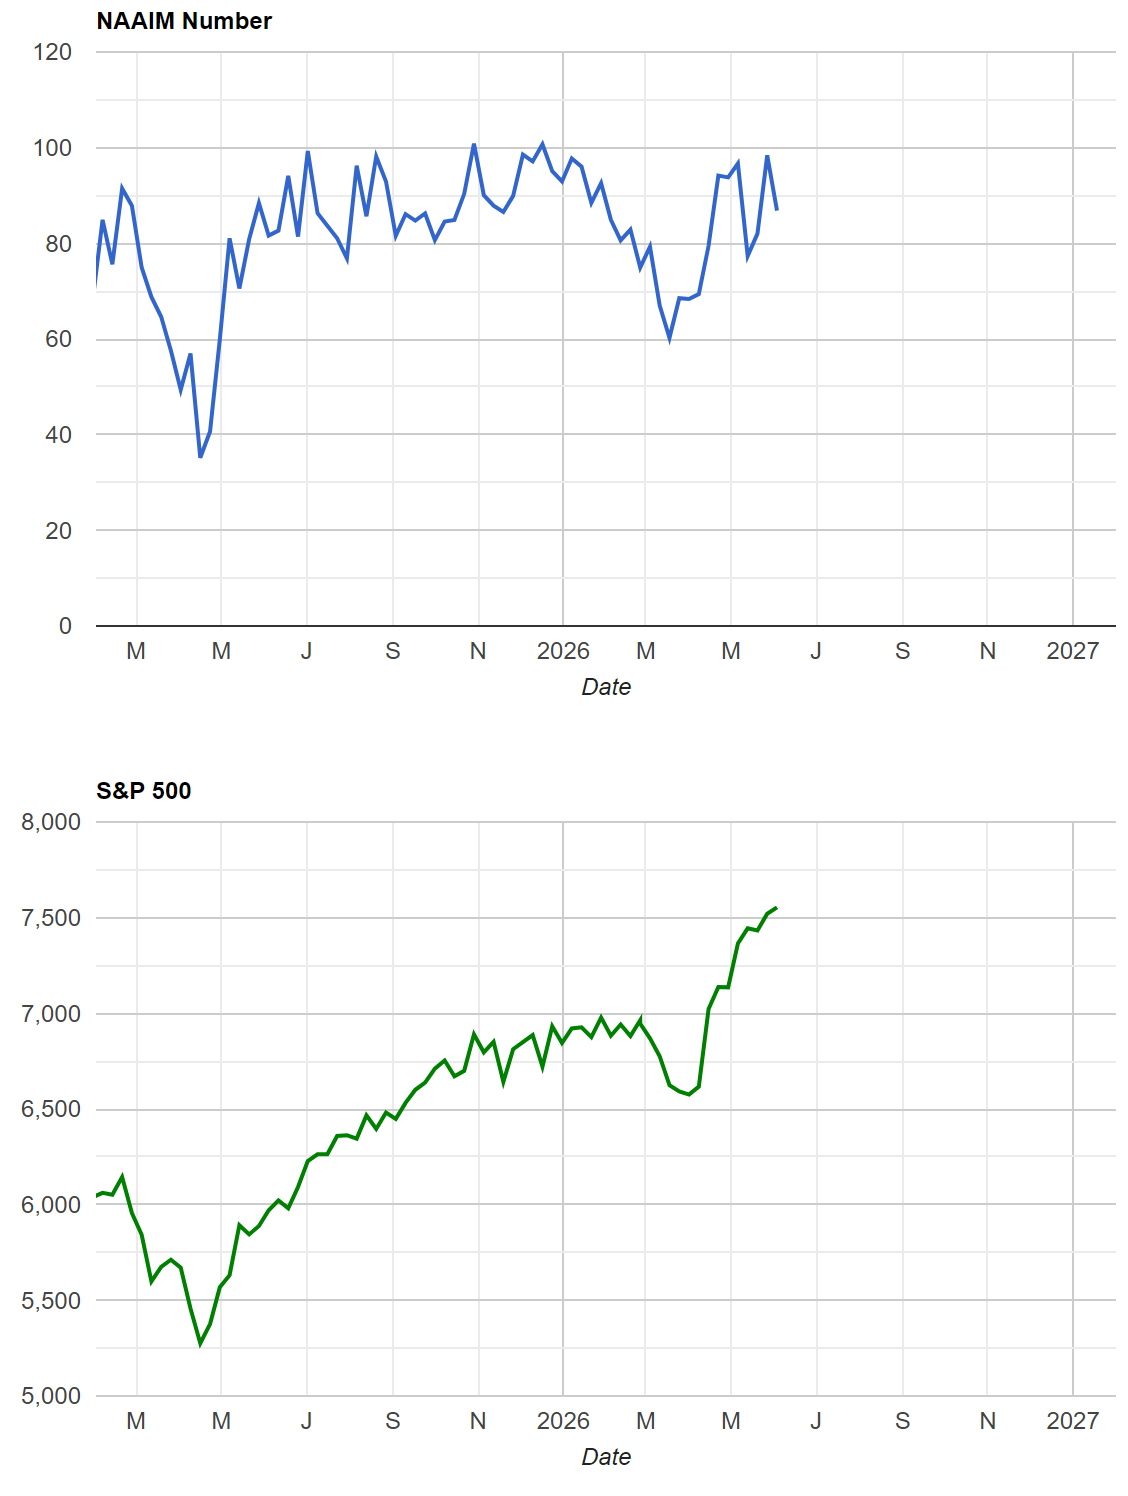
CBOE Total Put/Call Ratio
CBOE's total put/call ratio includes index options and equity options. It's a popular indicator for market sentiment. A high put/call ratio suggests that the market is overly bearish and stocks might rebound. A low put/call ratio suggests that market exuberance could result in a sharp fall.
On the options side, the CBOE total put/call ratio is sitting in a complacent, risk‑on zone. The latest daily read is just under 1.0, with the recent 10‑day moving average highlighted around the high‑0.7s, which lines up with other commentary noting a 0.78 ten‑day average, the lowest since mid‑2025. That kind of sub‑0.8 regime tends to show up when traders are crowding the call side and using fewer index or ETF puts as tail hedges, which usually translates into shallower initial pullbacks but also less downside protection if volatility really kicks up. The fact that this low put/call regime comes after a strong equity run fits the pattern of optimism re‑accelerating just as some of the leadership is getting hit. If the total put/call and its ten‑day average push back above roughly 1.0, that would be my signal that fear is finally starting to show up in actual protection buying and that the tape may be closer to a cleansing low; if the ratio stays pinned in the 0.7–0.8 band while prices chop, it argues for continued vulnerability to a sharper air pocket if another shock arrives.
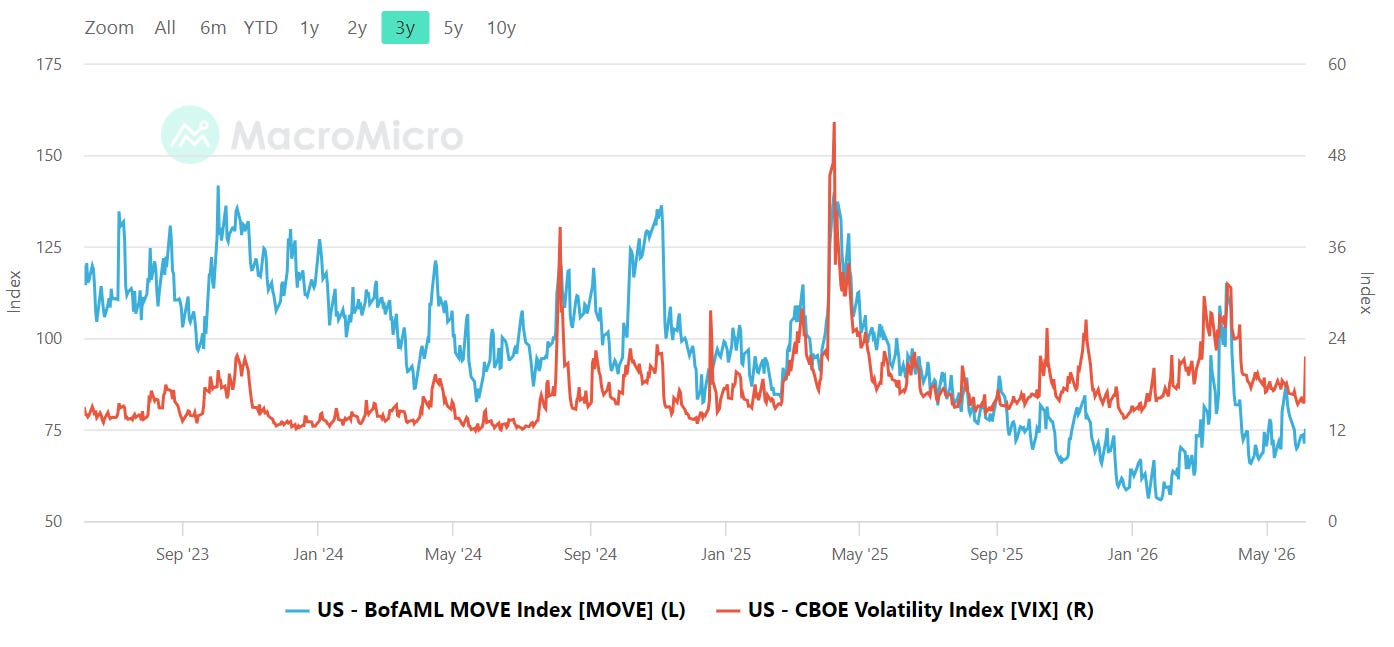
Equity vs Bond Volatility
The Merrill Lynch Option Volatility Estimate [MOVE] Index from BofAML and the CBOE Volatility Index [VIX] respectively represent market volatility of U.S. Treasury futures and the S&P 500 index. They typically move in tandem but when they diverge, an opportunity can emerge from one having to “catch-up” to the other.
Bond volatility and equity volatility are not screaming at each other, but bonds are still the louder voice. The MOVE index is sitting in the low‑70s, while the VIX is around the mid‑teens, roughly 16, which is also what the macro data sets have as the latest VIX print. That configuration says interest‑rate uncertainty is elevated relative to the realized day‑to‑day chop in stocks, but it is not at the kind of extreme where bond vol alone usually pulls the rug on equities. Historically, when MOVE spikes north of about 120 while the VIX is still sleepy, you are on borrowed time in stocks; right now we are nowhere near that, but we are also not in the ultra‑calm, sub‑10 VIX / sub‑60 MOVE world that tends to support carefree risk‑taking. A break higher in MOVE back toward the 90–100 area without a matching move in VIX would be an early warning that the rates market is bracing for something the equity crowd is still shrugging off, while a VIX push into the high teens and beyond would signal that equity traders are finally pricing in more two‑sided risk rather than assuming every wobble will be bought.
CNN Fear & Greed
The CNN Fear & Greed Index has swung down into the fear zone, sitting at 42 today versus a neutral 54 yesterday, and well below the greed readings of 59 a week ago and 67 a month ago. Over the past year the gauge has traced a full cycle: extreme greed last summer, deep fear in late winter, then a sharp rebound back into strong greed in April before rolling over again in recent weeks. Right now we are in that awkward middle ground where sentiment has cooled meaningfully but has not yet washed out into true panic, which means there is some contrarian support building but not the kind of capitulation that tends to mark durable lows.
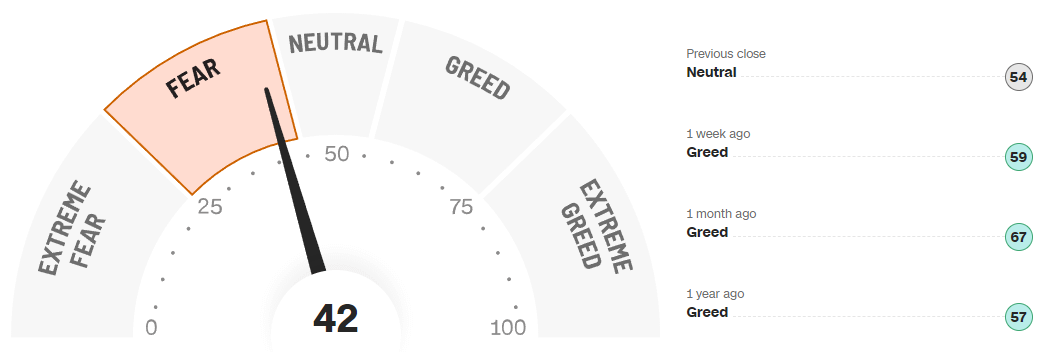
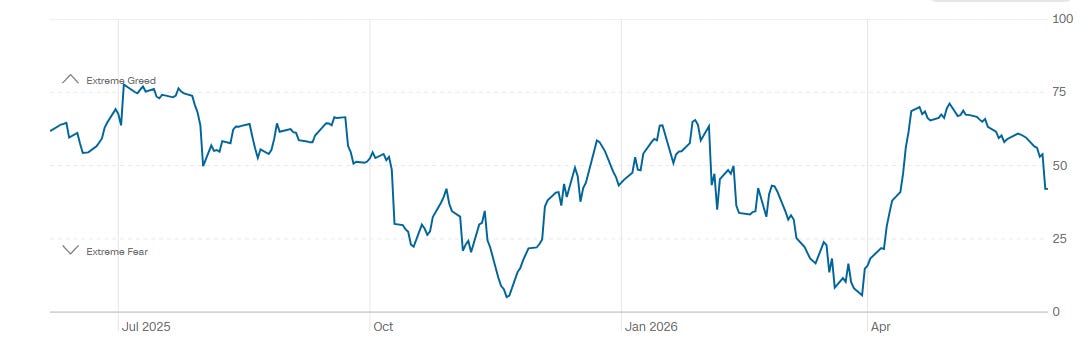
If this indicator slides into the low 30s or below, especially with price under pressure, that would look more like an opportunity to lean into fear; if it snaps back into the 70s from here without much consolidation, that would say greed has reasserted itself quickly and upside becomes more vulnerable to another sentiment hit.
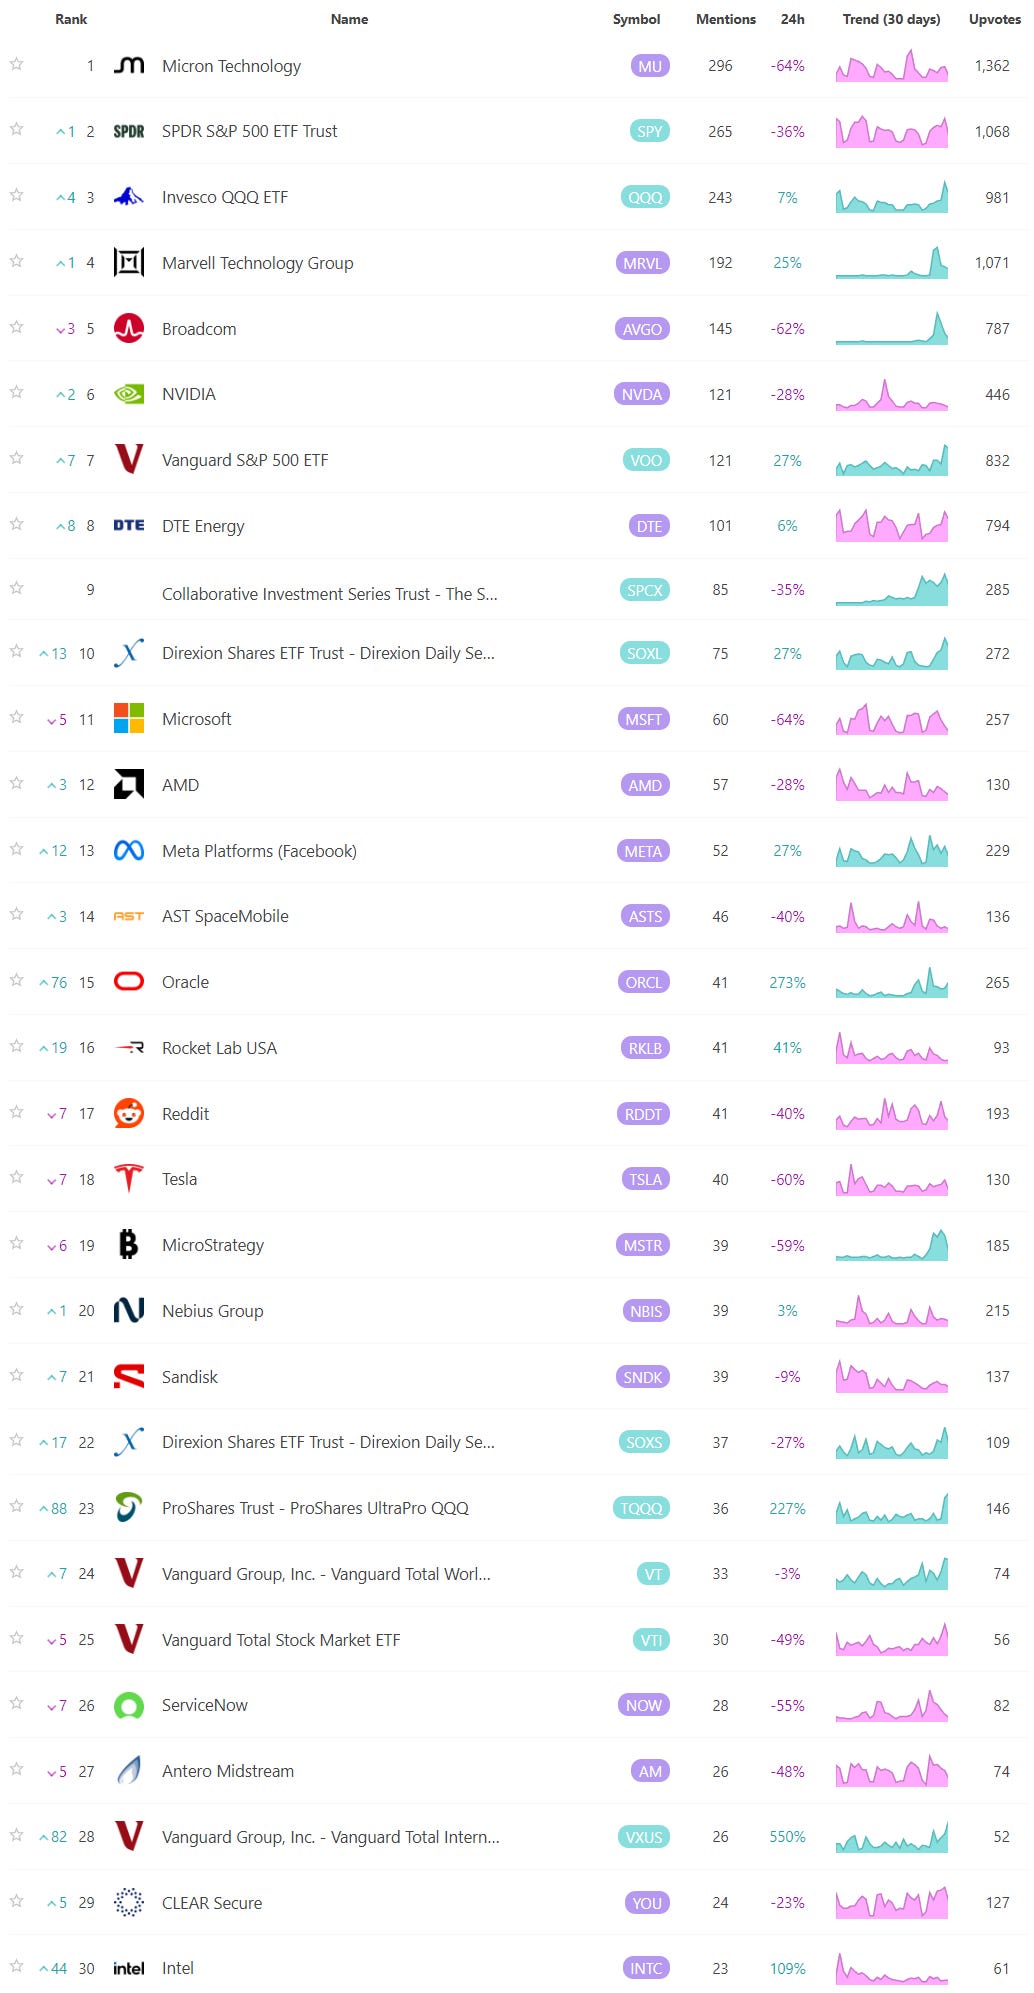
Social Media Favs
Social sentiment offers a real-time view of investor mood, often revealing market shifts before traditional indicators. It can signal momentum changes, spot emerging trends, and gauge retail investor impact—especially in high-volatility names. Tracking sentiment around events or earnings provides actionable insights, and when layered with quantitative models, can enhance predictive accuracy and risk management. Sustained sentiment trends often mirror broader market cycles, making this data a valuable tool for both short-term trades and long-term positioning.
Bottom line: sentiment is still leaning bullish under the surface, but the swing in Fear & Greed from recent greed back down into fear while positioning and options remain complacent says we are in a vulnerable, late‑stage advance where shocks will bite harder, yet a bit more downside and a deeper push toward true fear could actually set up a cleaner, higher‑quality entry.

Technician’s Playbook: Trading the Majors (SPY/QQQ/IWM/DIA)
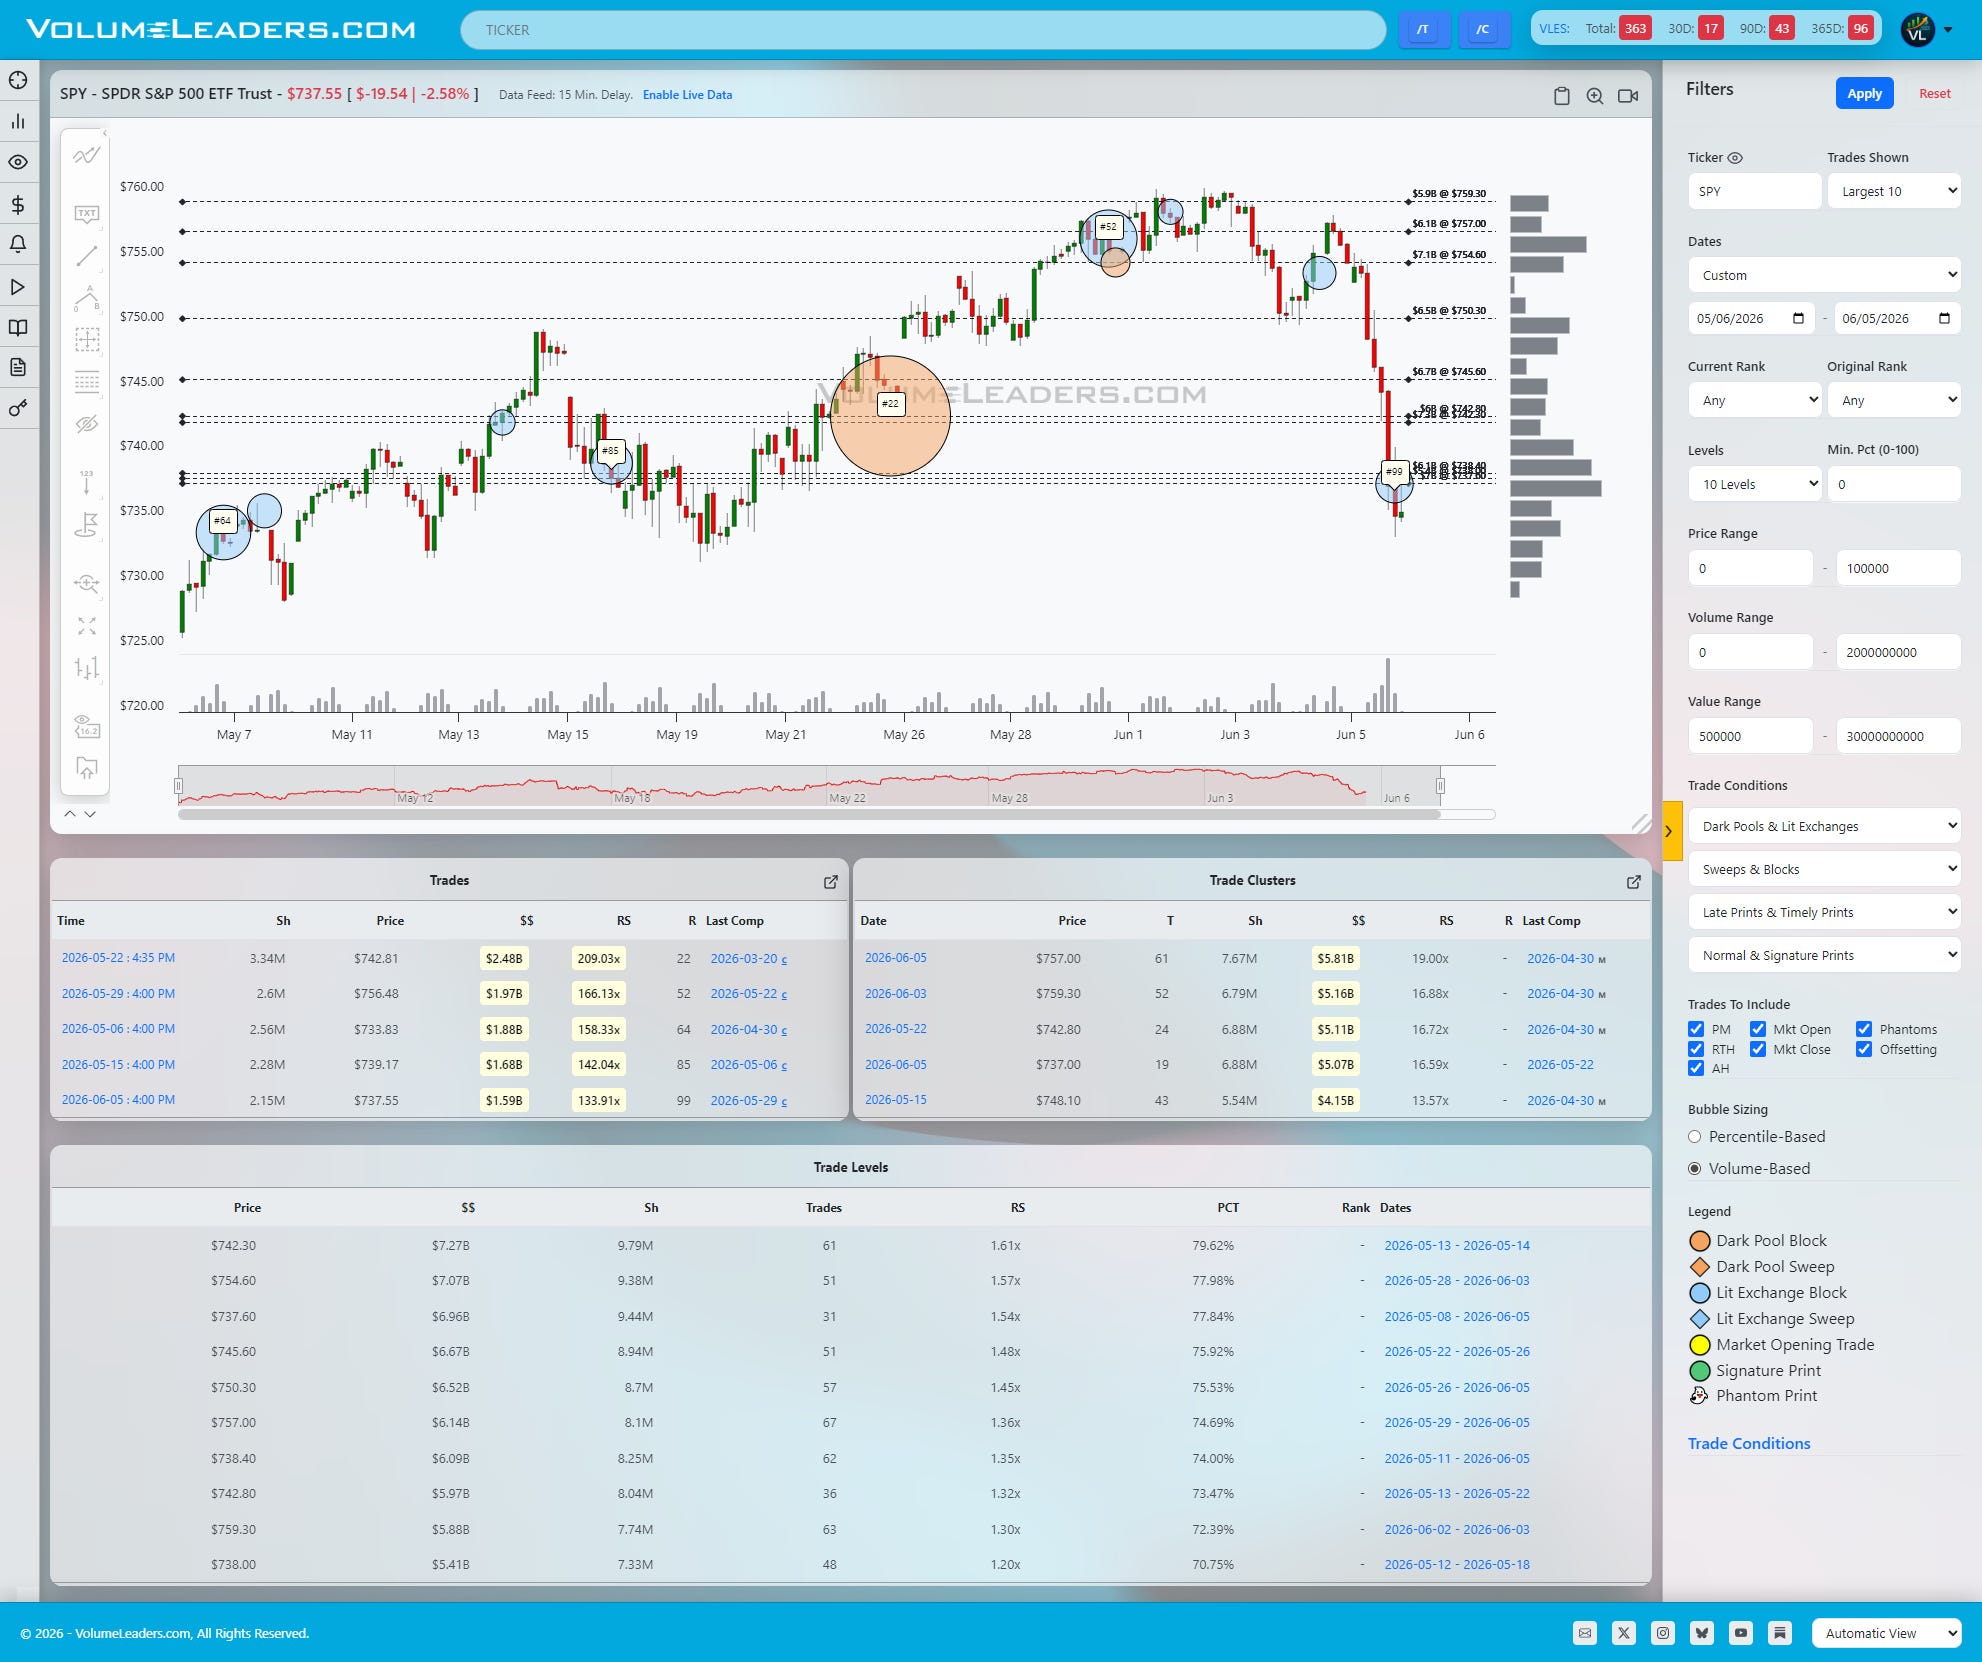
When you’re a large institutional player, your primary goal is to find liquidity - places to do a ton of business with the least amount of slippage possible. VolumeLeaders.com automatically identifies and visually plots the exact spots where institutions are doing business and where they are likely to return for more. It’s one of the primary reasons “support” and “resistance” concepts work and truly one of the reasons “price has memory”.
The tape across the big index ETFs has shifted from a clean uptrend into a hard liquidation with some early signs of responsive buying at obvious volume shelves. This week was less about quiet distribution and more about a straight shot lower into known inventory, and the way large prints behaved around those bands gives you a good roadmap for what matters next.
In SPY, the uptrend off early May lows got capped near 758–760, where you can see a concentration of large trades and a high-dollar Level sitting just above 755. The recent break flushed straight through that area and did not attract much visible absorption, which tells you those buyers either bailed or stepped aside. The first serious attempt to catch the knife shows up down near 738–740, where there is a big late-day print in the highlighted range and a cluster around 739 with solid notional behind it. If price can hold that lower band and start building time above 742–744, you can frame that as a possible new line of scrimmage with 750–755 as the next magnet. Lose the 738 shelf convincingly, and the next obvious demand zone sits several points lower where earlier May inventory first kicked off the last leg up.
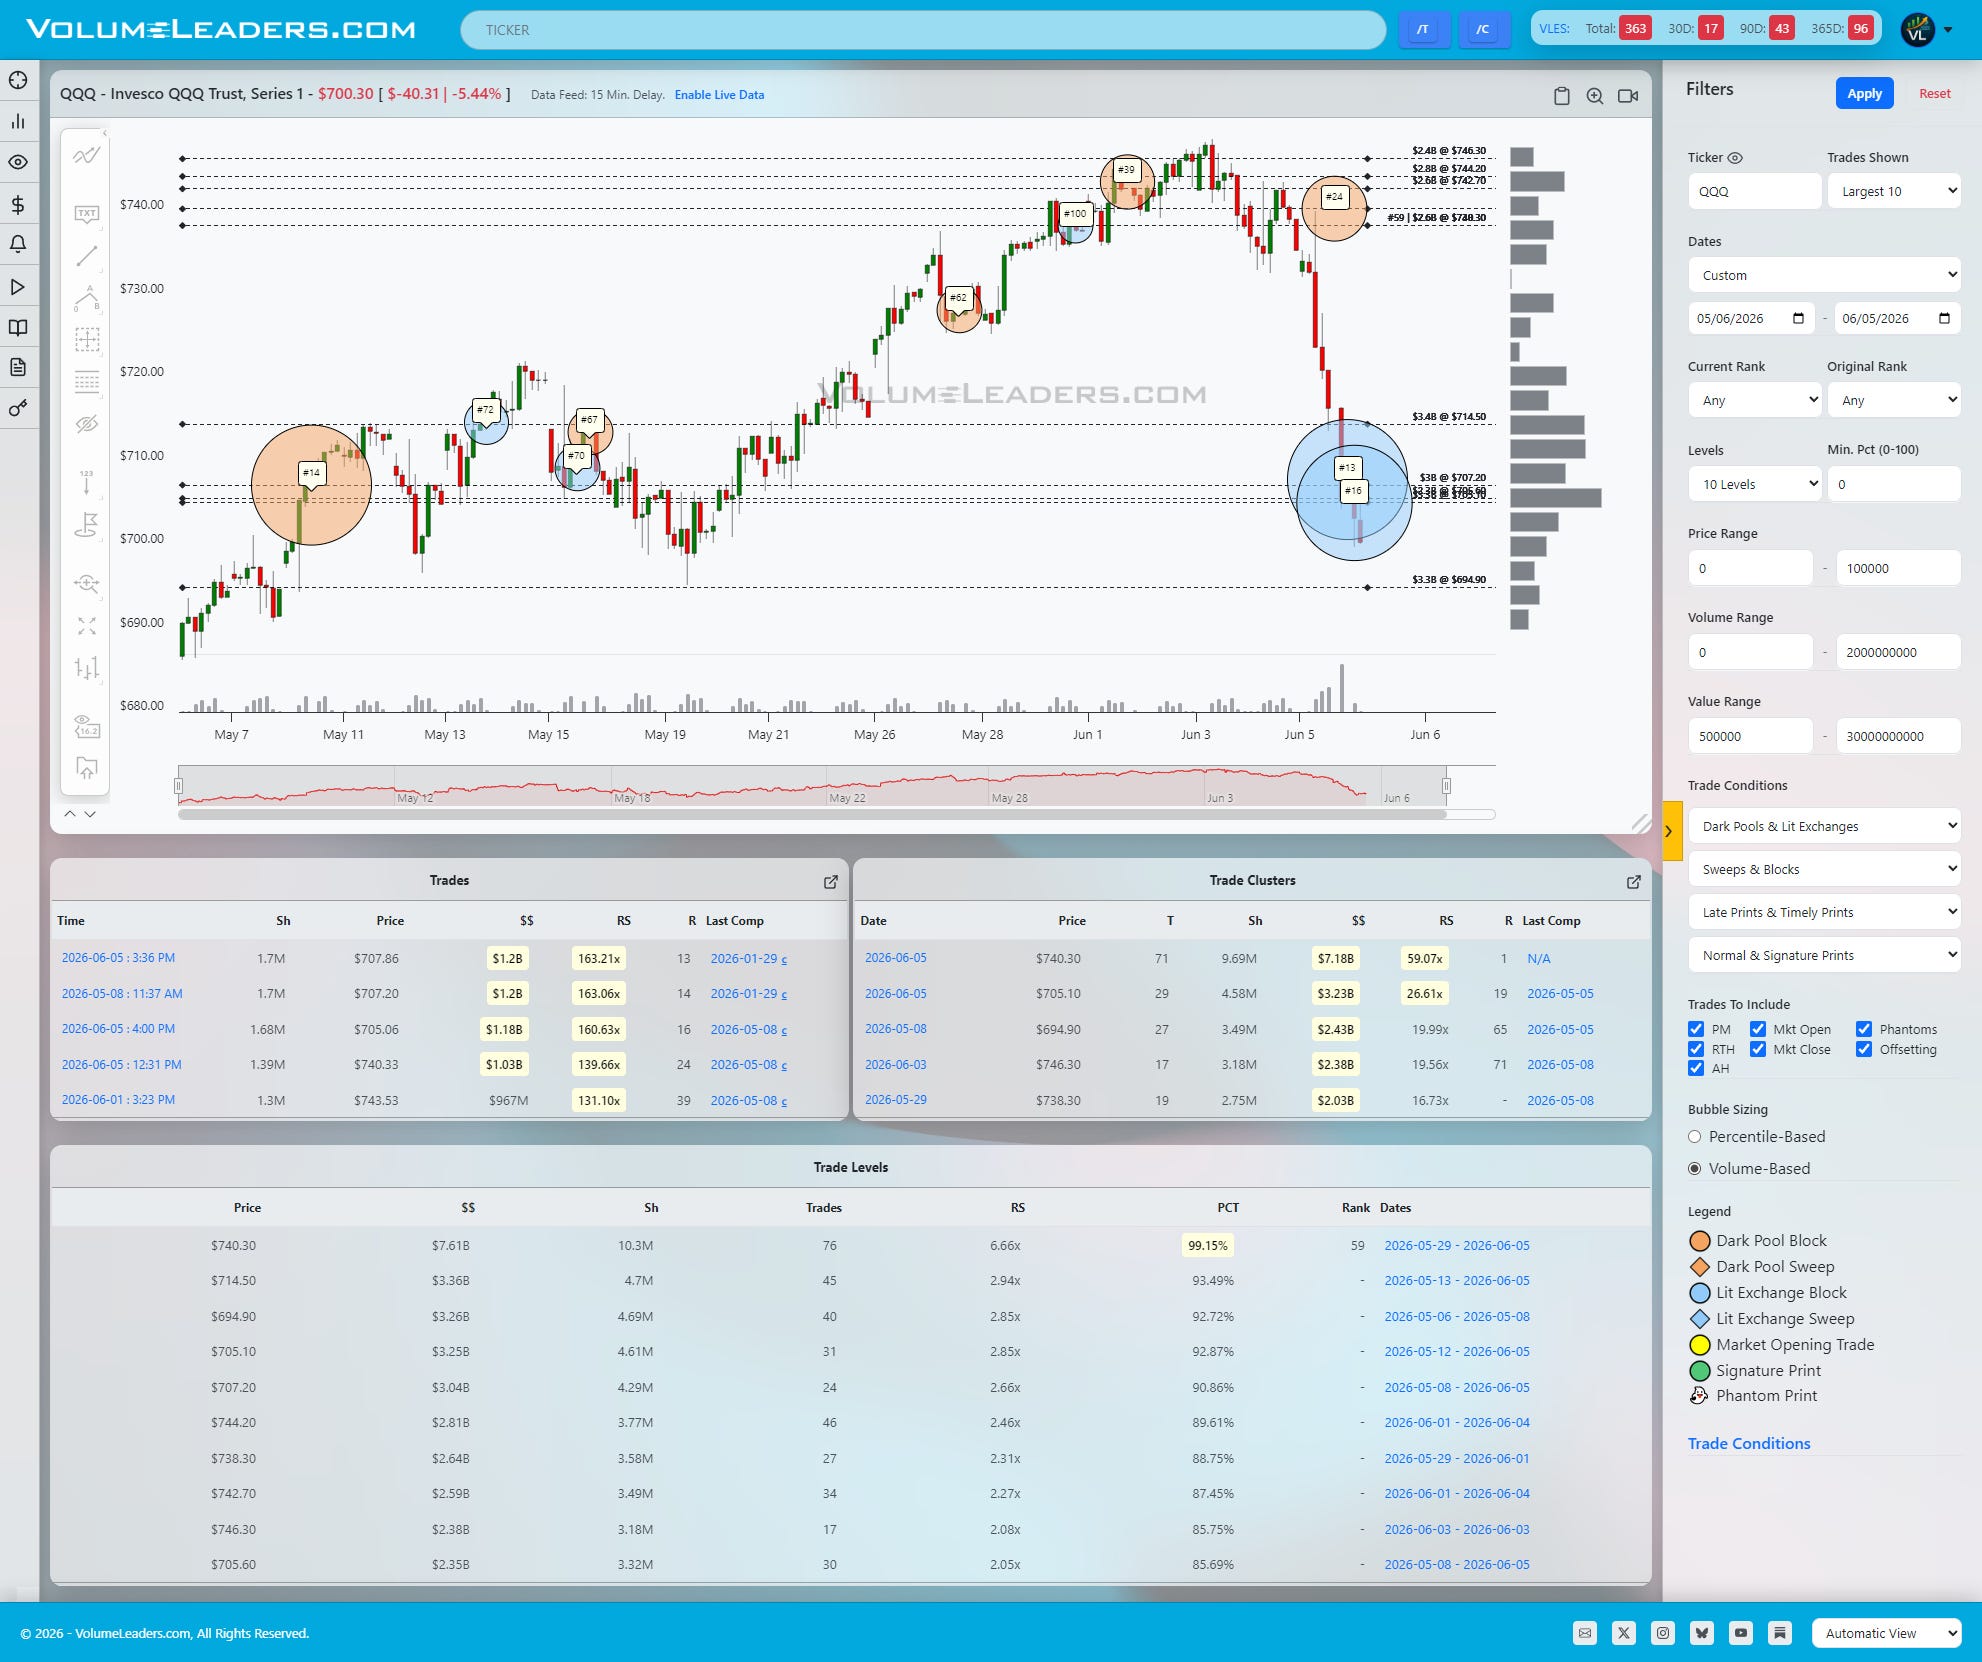
QQQ is the purest expression of panic from extended highs. Sizeable top-100 prints went off near 742–744 at the recent peak, including tags in the low 740s that rank very high historically for the fund, and price then fell in a straight line into the low 700s. Down around 704–707 there is a huge blue bubble tied to one of the largest prints on the chart, suggesting someone with size finally stepped in on the downside. The Level table also shows heavy cumulative volume stacked between roughly 734 and 744, so any bounce that stalls under that band looks more like a retest of broken support than fresh initiative buying. Bulls want to see acceptance back above 720 first, then 734–740; if instead QQQ breaks back under the 704–707 response zone, the door opens to a deeper air pocket toward the high 680s where prior volume built up in May.
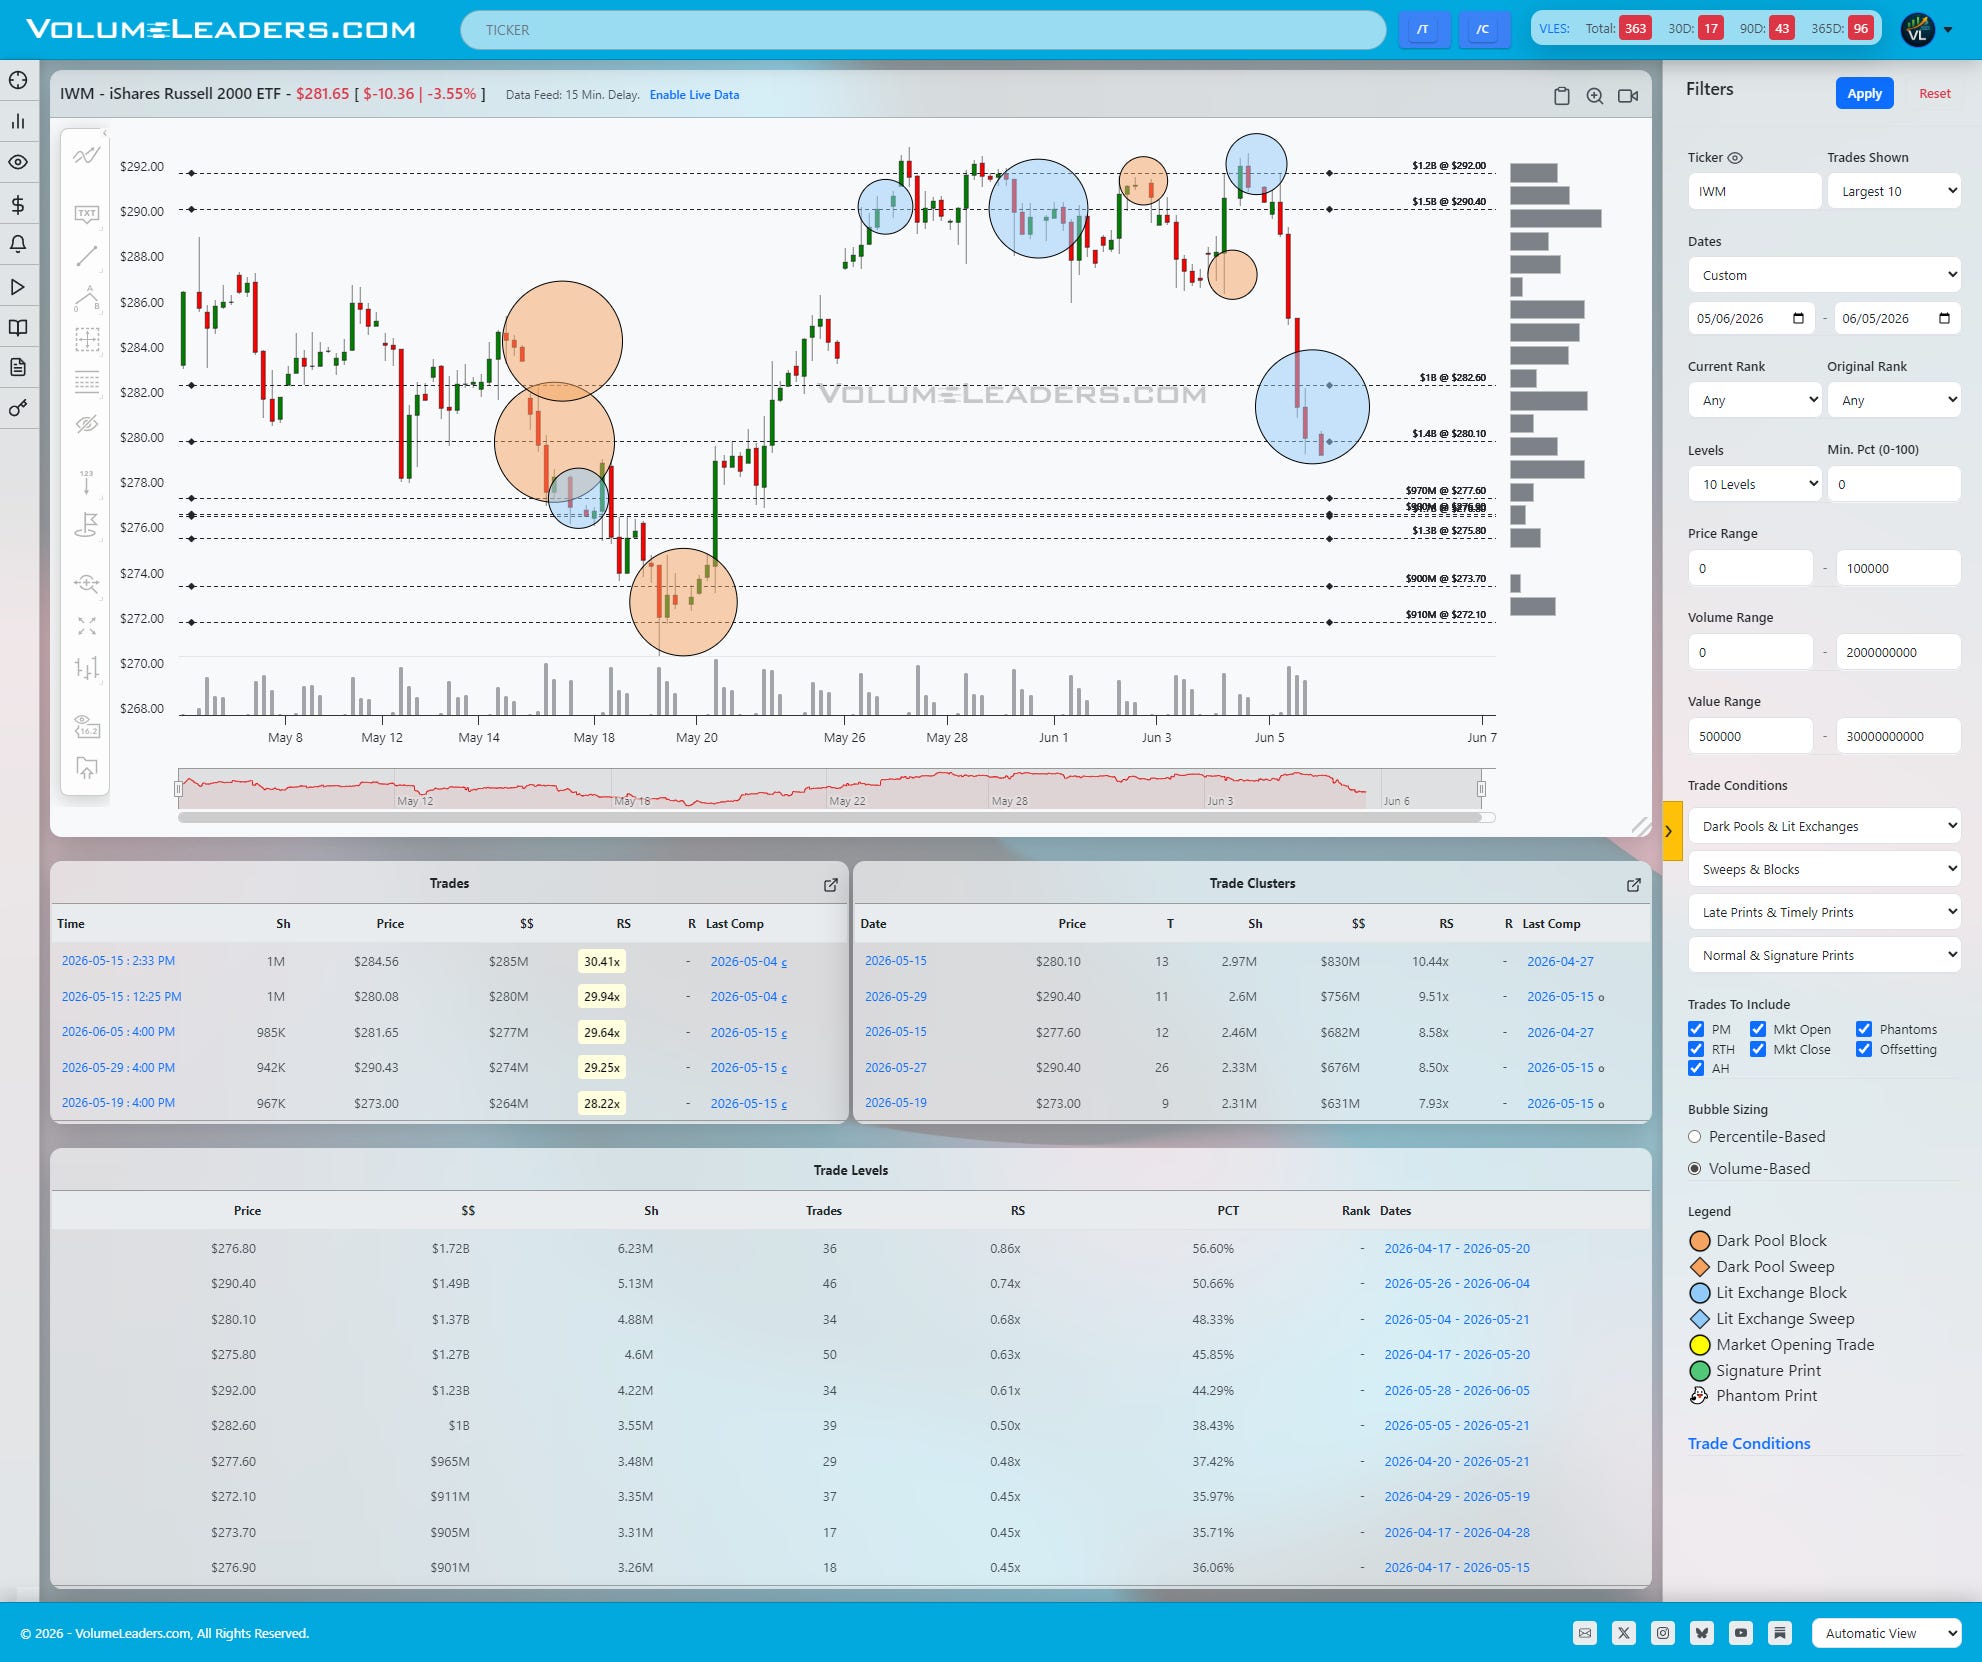
IWM tells a cleaner story of prior distribution turning into air. There are large orange trades and heavy Levels in the 288–292 band from mid-May, which acted as the top of a range before the ETF broke down. The latest leg lower drove price sharply off the recent 296–300 balance area and found its first responsive buying near 281, where a big downside print lines up with a Level in the low 280s. That 280–282 pocket is now the immediate battleground. If buyers can defend it and push back through 286–288, you have room to retrace toward the old range highs near 292–296. If they cannot, the next likely magnet is the prior capitulation area near 272–274, where earlier in May a very large notional print helped reverse a similar flush.
DIA remains the relatively orderly one, but it has also transitioned from steady markup into a corrective phase. The tape shows chunky prints around 503–505 from late May as the ETF pushed toward the recent high near 513, and those buyers are now underwater with DIA trading down around 506–507. Beneath price, the Level table highlights meaningful cumulative volume around 498–500, and there is also a standout historical trade in the high 480s from mid-May that helped launch the last leg higher. The closer shelf at 498–500 is the primary line of scrimmage; hold that zone and recapture 507–510, and bulls can argue this is just a sharp pullback within an ongoing uptrend. Slice through 498 with energy, and eyes shift quickly to that 490–492 band and then the 484–486 area where prior big prints would be tested as support.
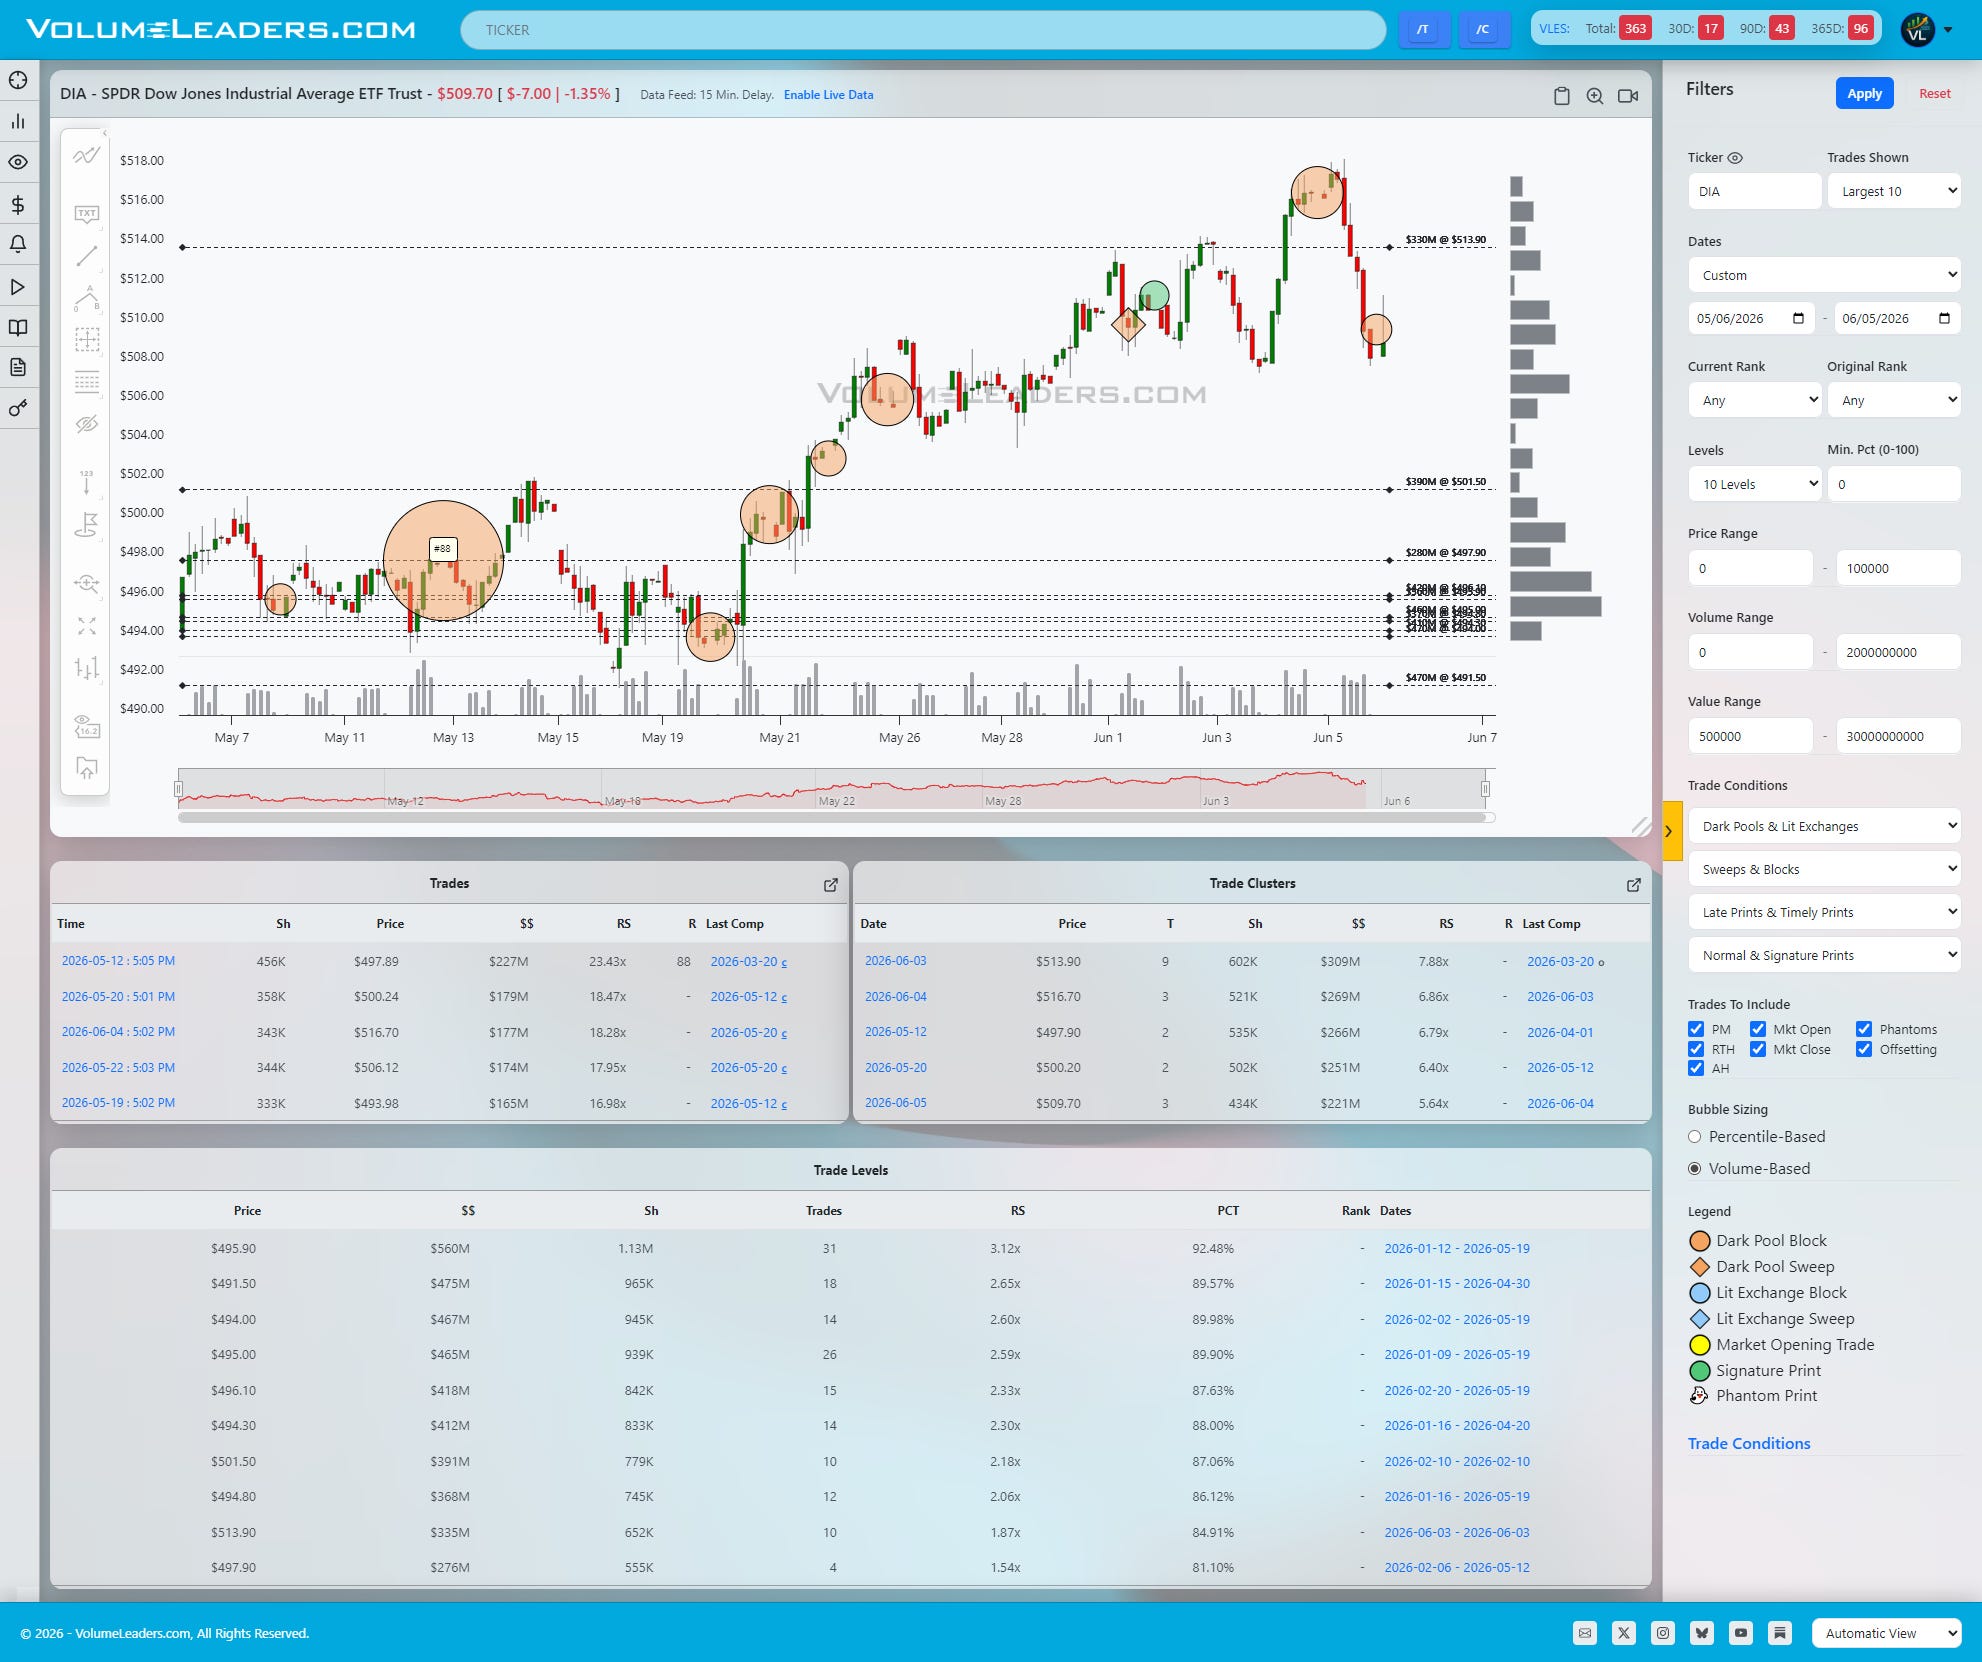
Tactically, a disciplined trader can use these bands to frame trades as simple passes and fails. In SPY and QQQ, you want proof of re-acceptance back above the first resistance shelves before leaning too hard on the long side; otherwise, the higher-$$ clusters overhead are more likely to supply than support. In IWM and DIA, the cleaner defined lower shelves allow for tighter long attempts against 280–282 in IWM and 498–500 in DIA, with invalidation tucked just below and initial targets set back into the nearest heavy Levels overhead. On the short side, failed bounces into those same bands set up defined-risk fades, especially in QQQ if rallies stall below the 734–744 block where some of the largest notional ever recorded is sitting.
Levels To Watch:
SPY: 738–740, 742–744, 750–755
QQQ: 704–707, 720, 734–744
IWM: 280–282, 286–288, 292–296, 272–274
DIA: 498–500, 507–510, 490–492, 484–486

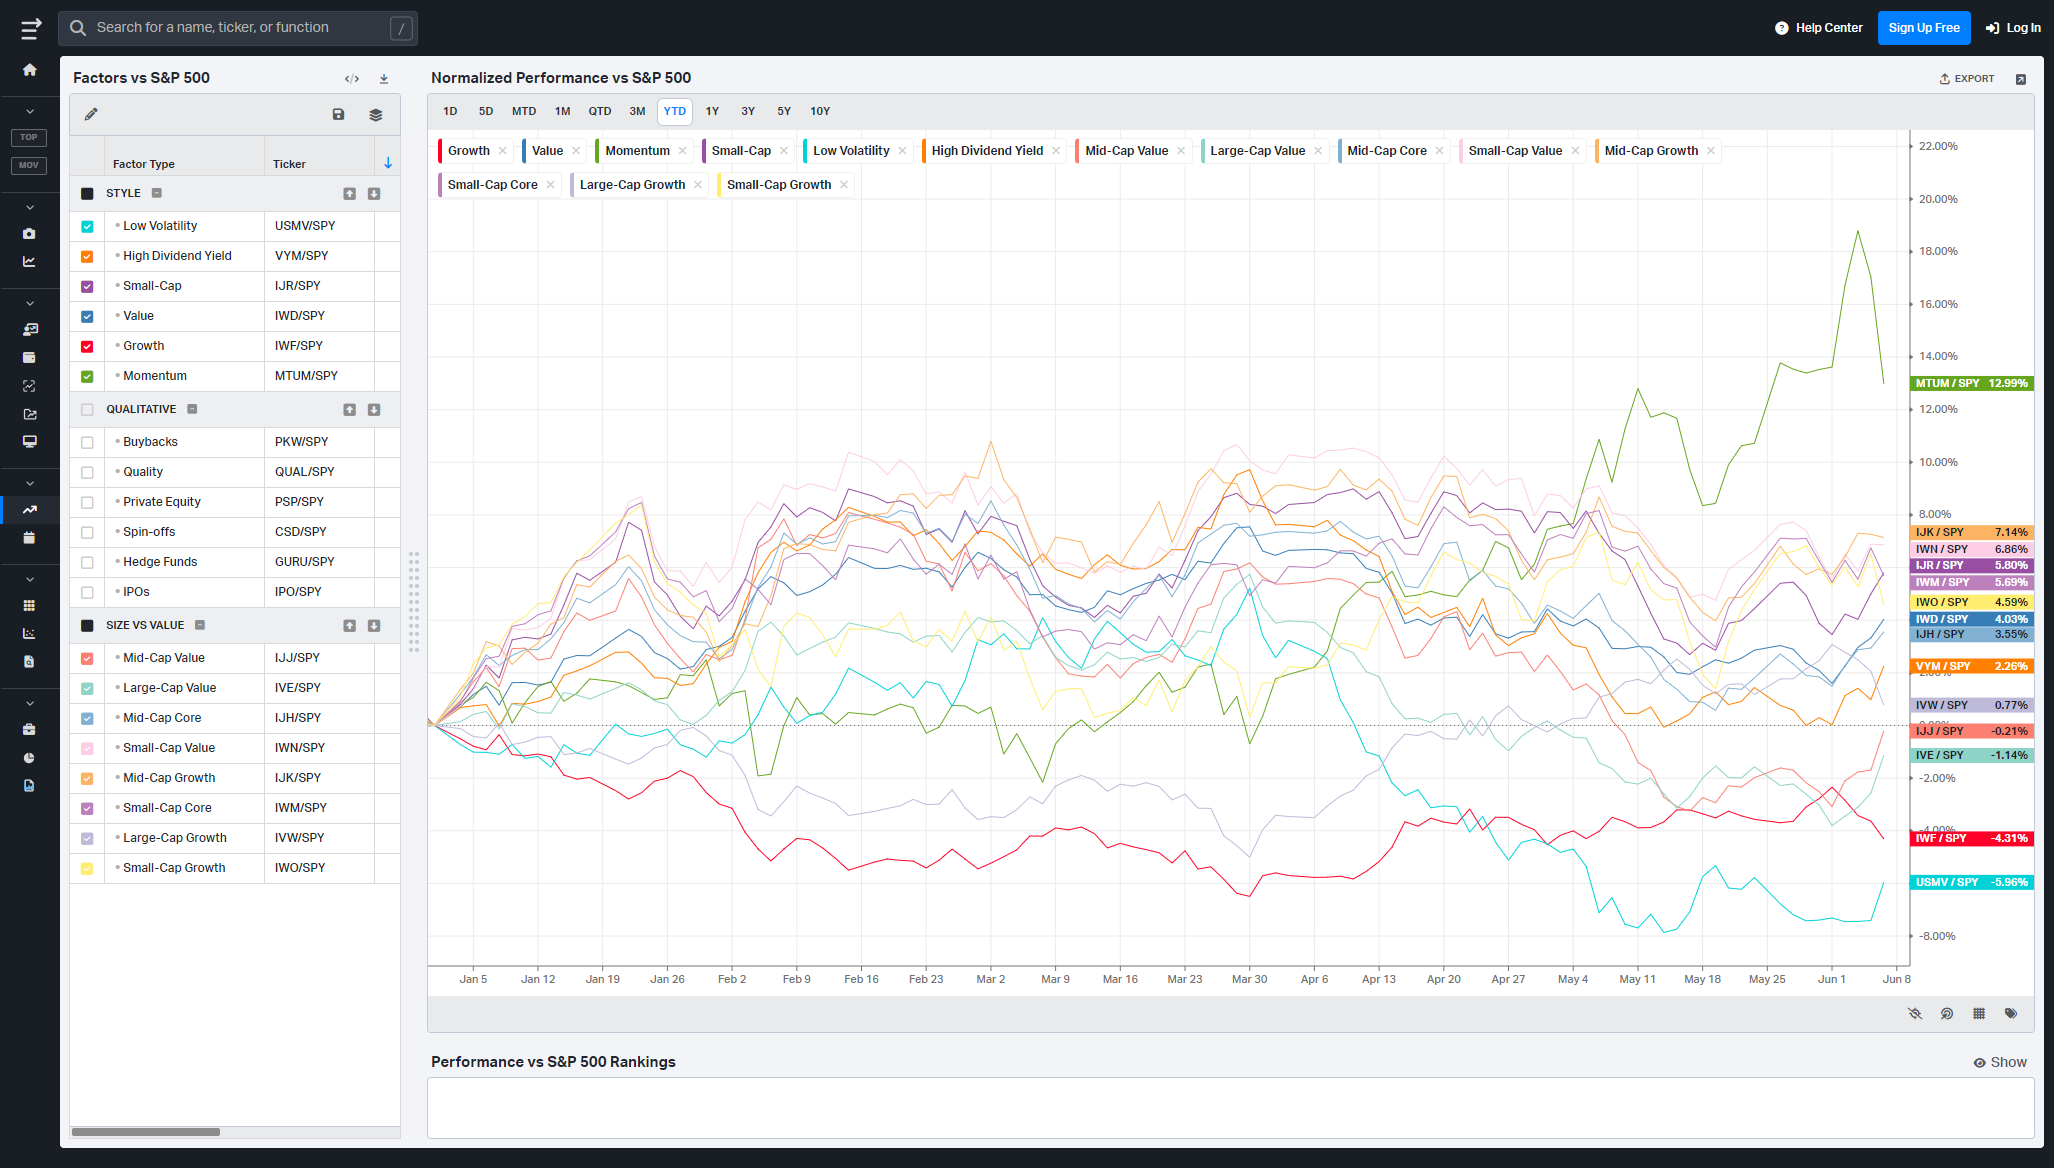
Summary Of Thematic Performance YTD
VolumeLeaders.com offers a robust set of pre-built thematic filters, allowing you to instantly explore specific market segments. These performance snapshots are provided purely for context and inspiration—think about zeroing in on the leaders and laggards within the strongest and weakest sectors, for example.
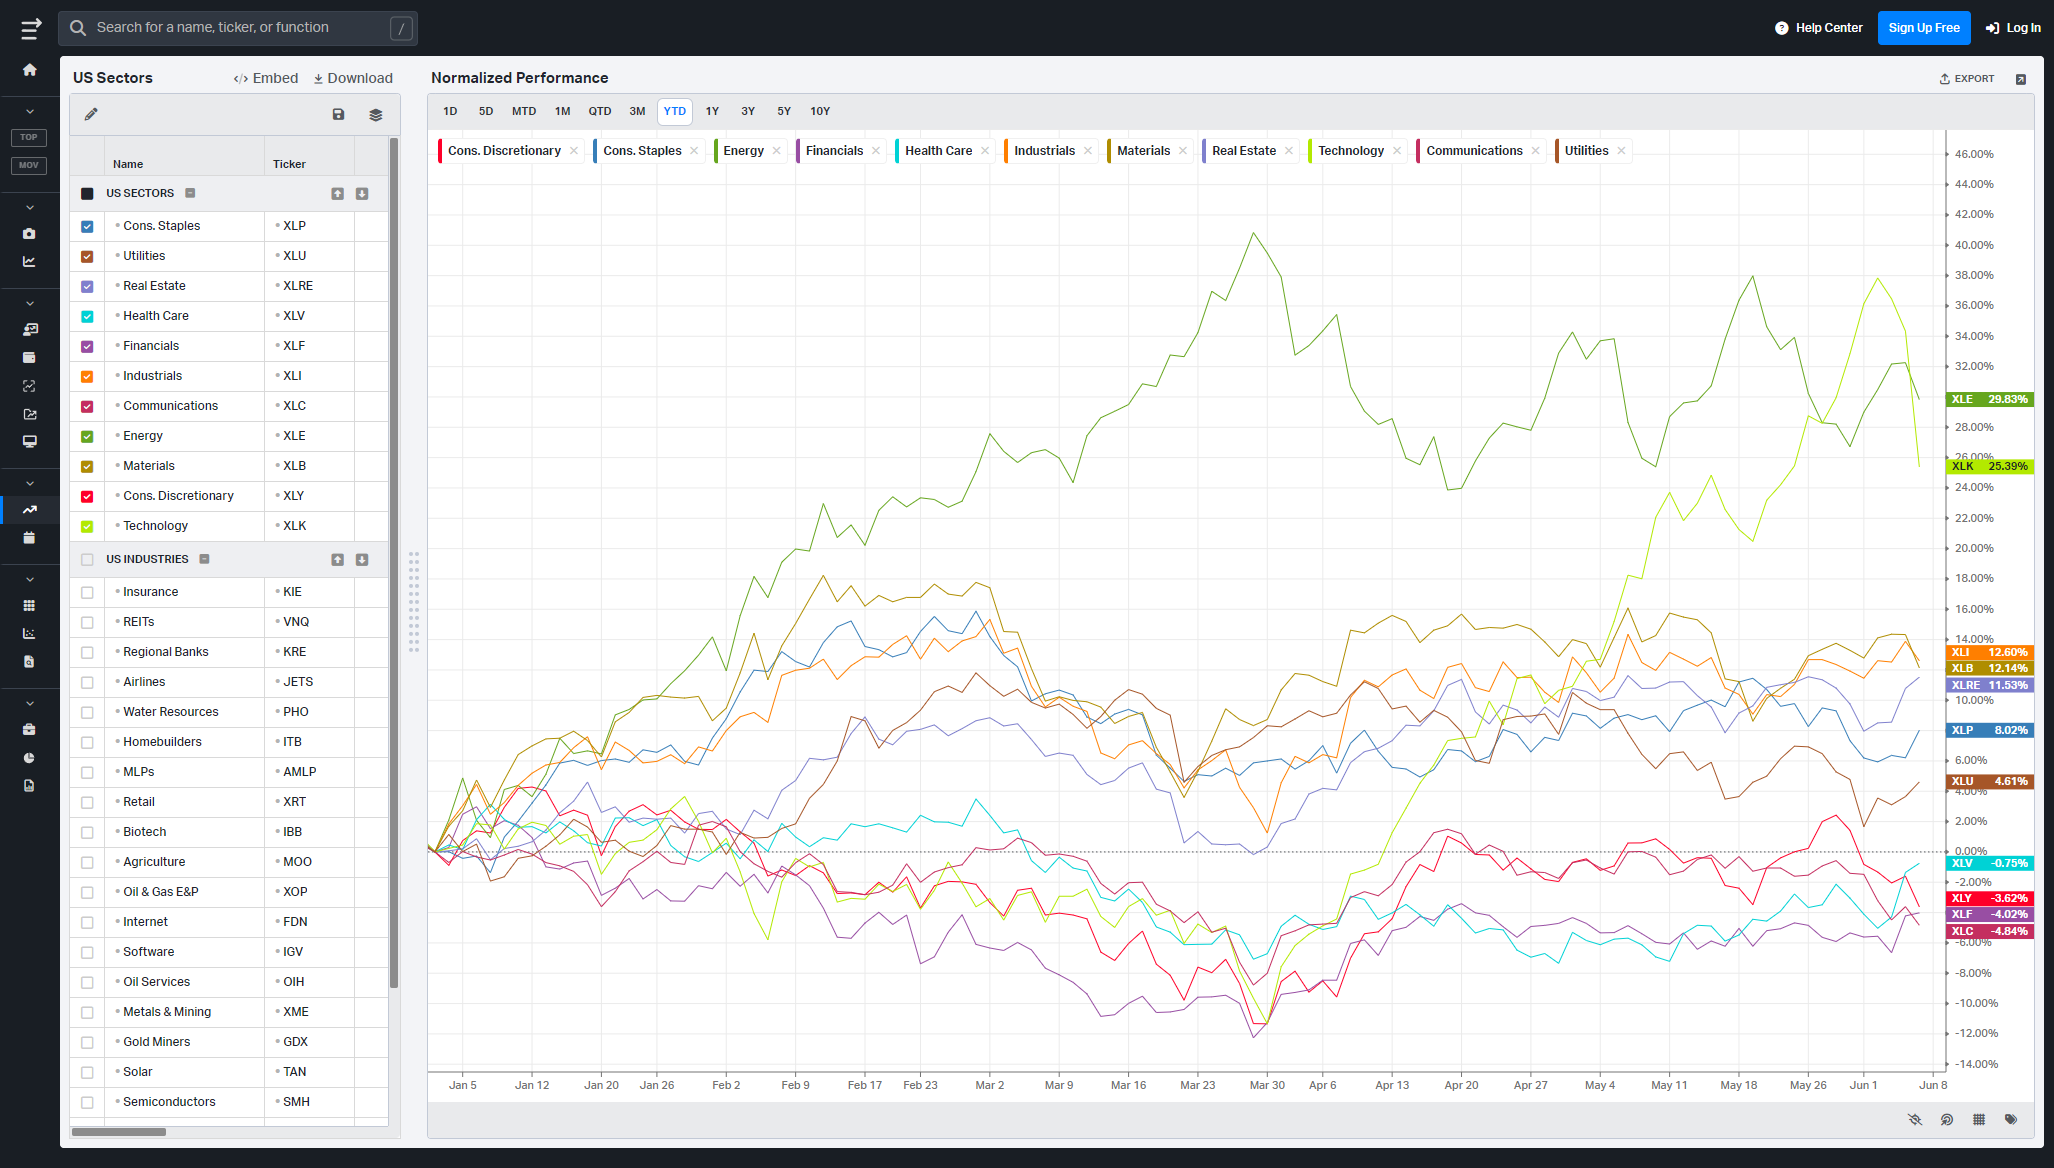
S&P By Sector
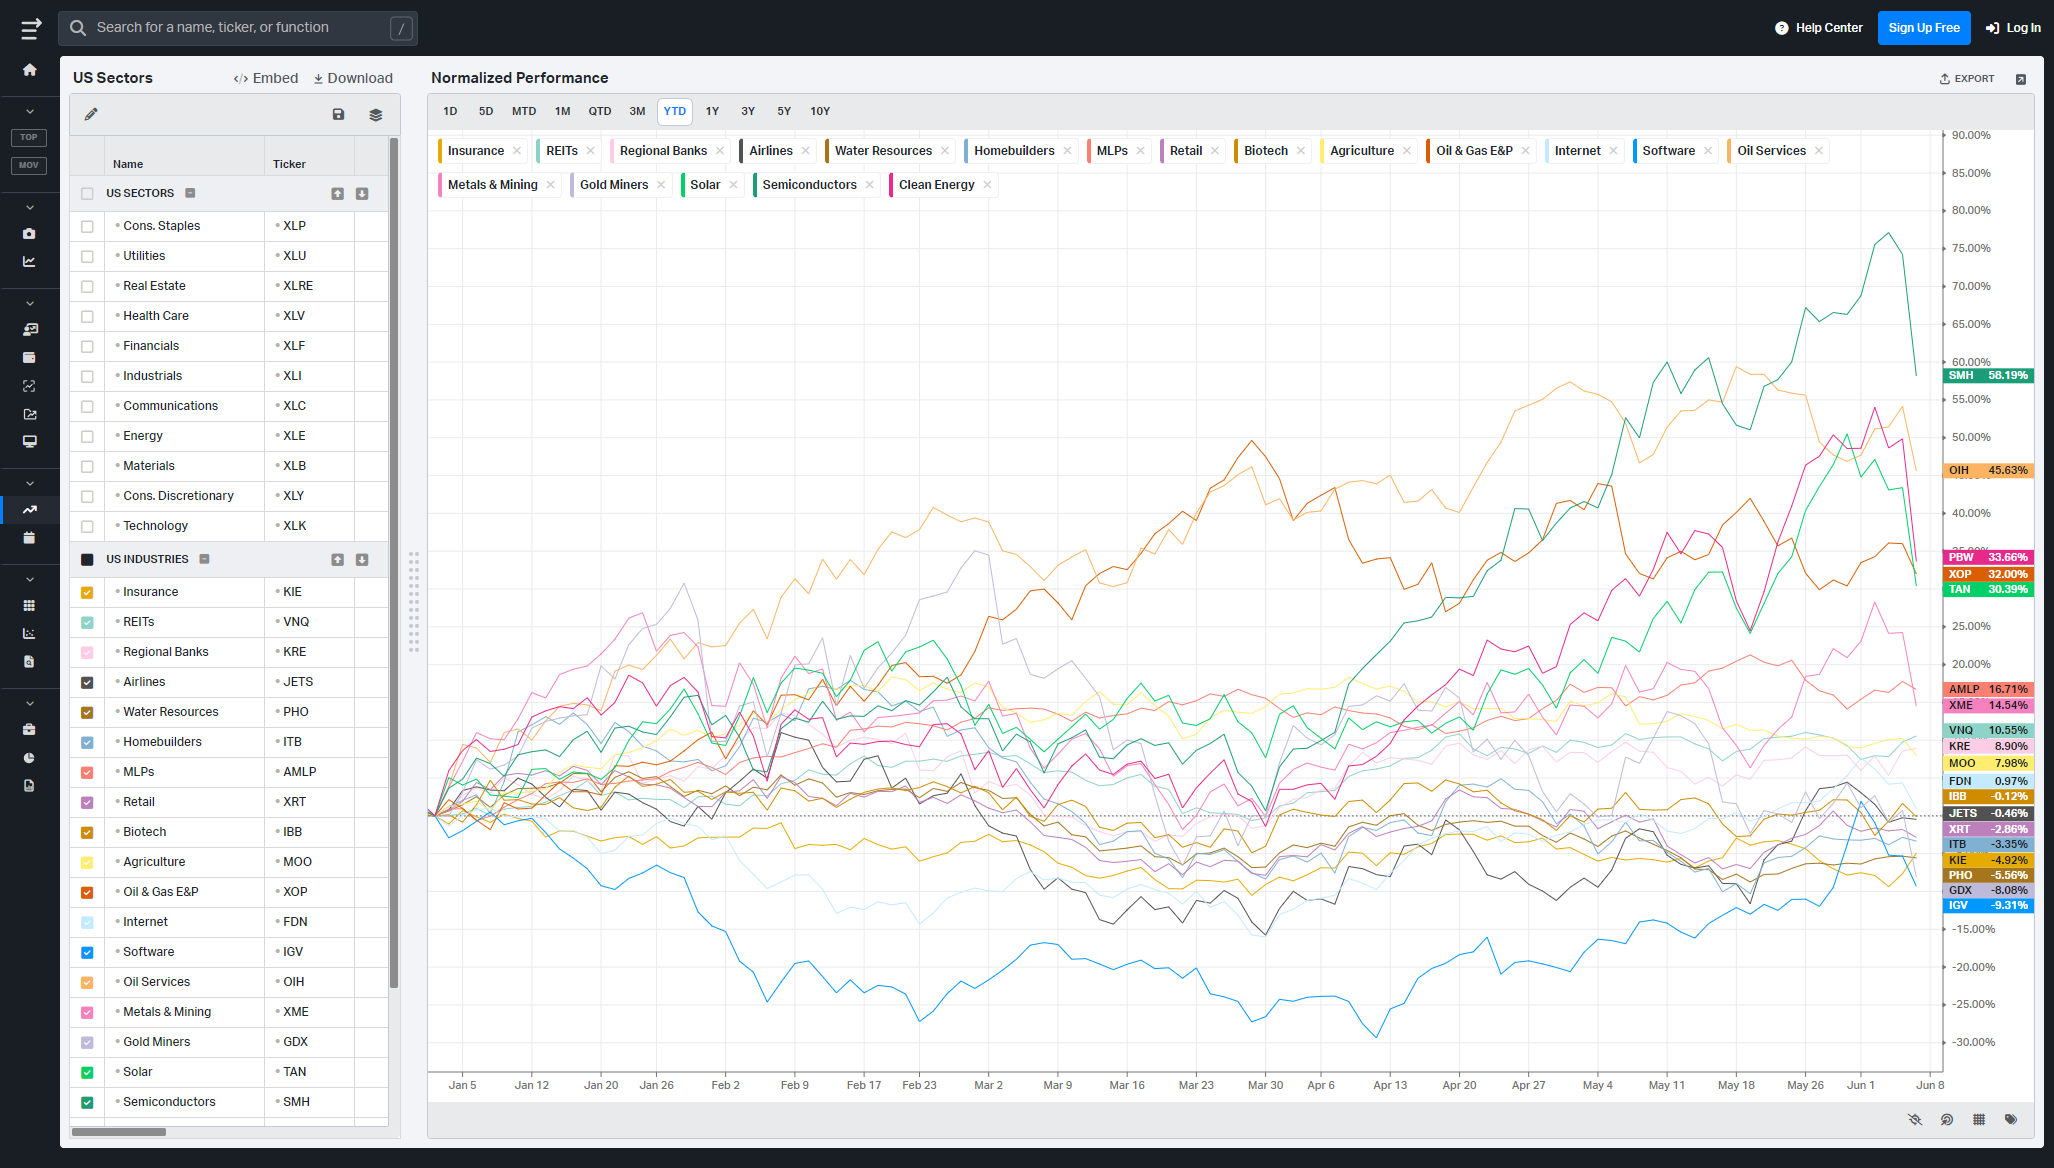
S&P By Industry
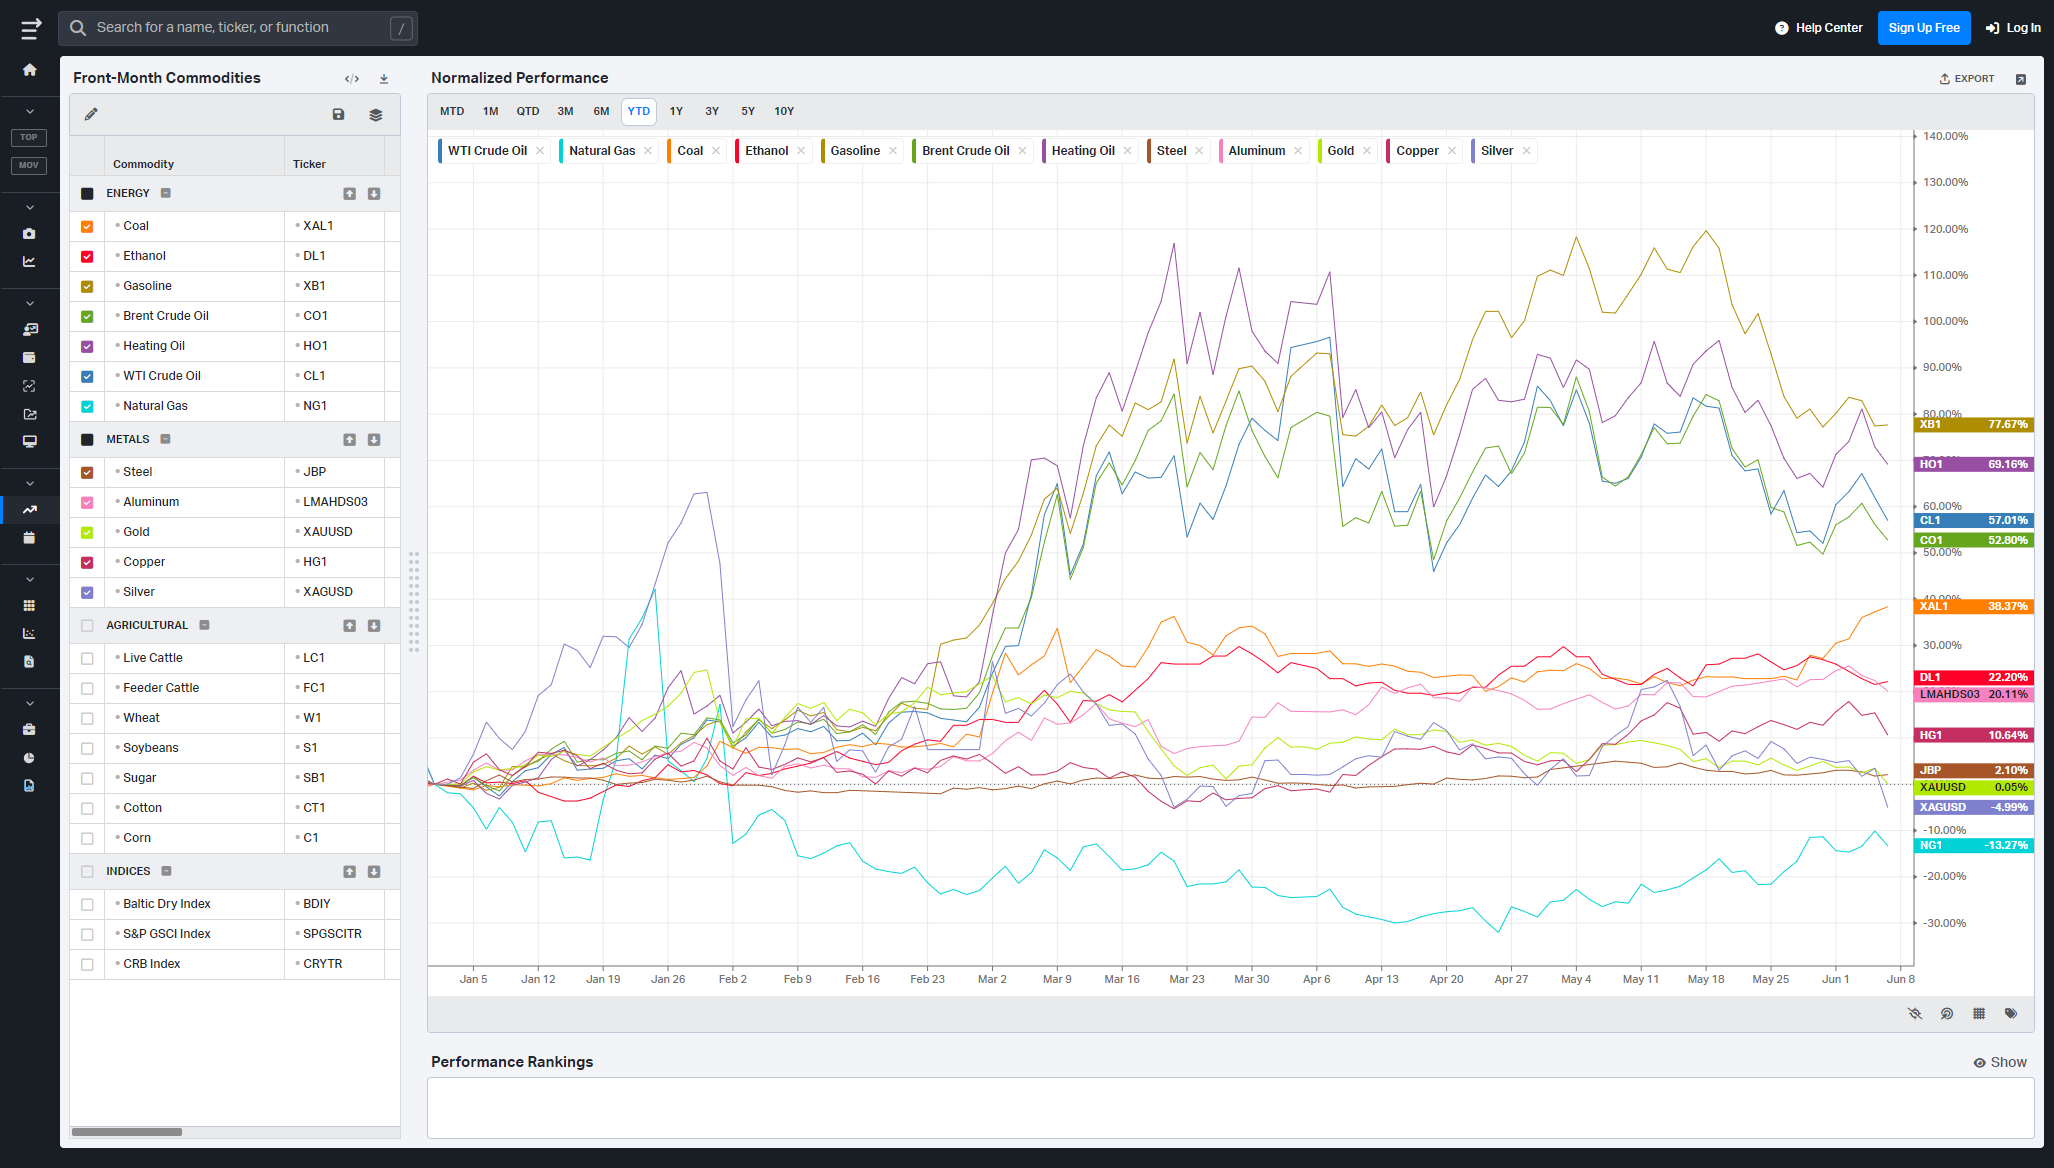
Commodities: Energy & Metals
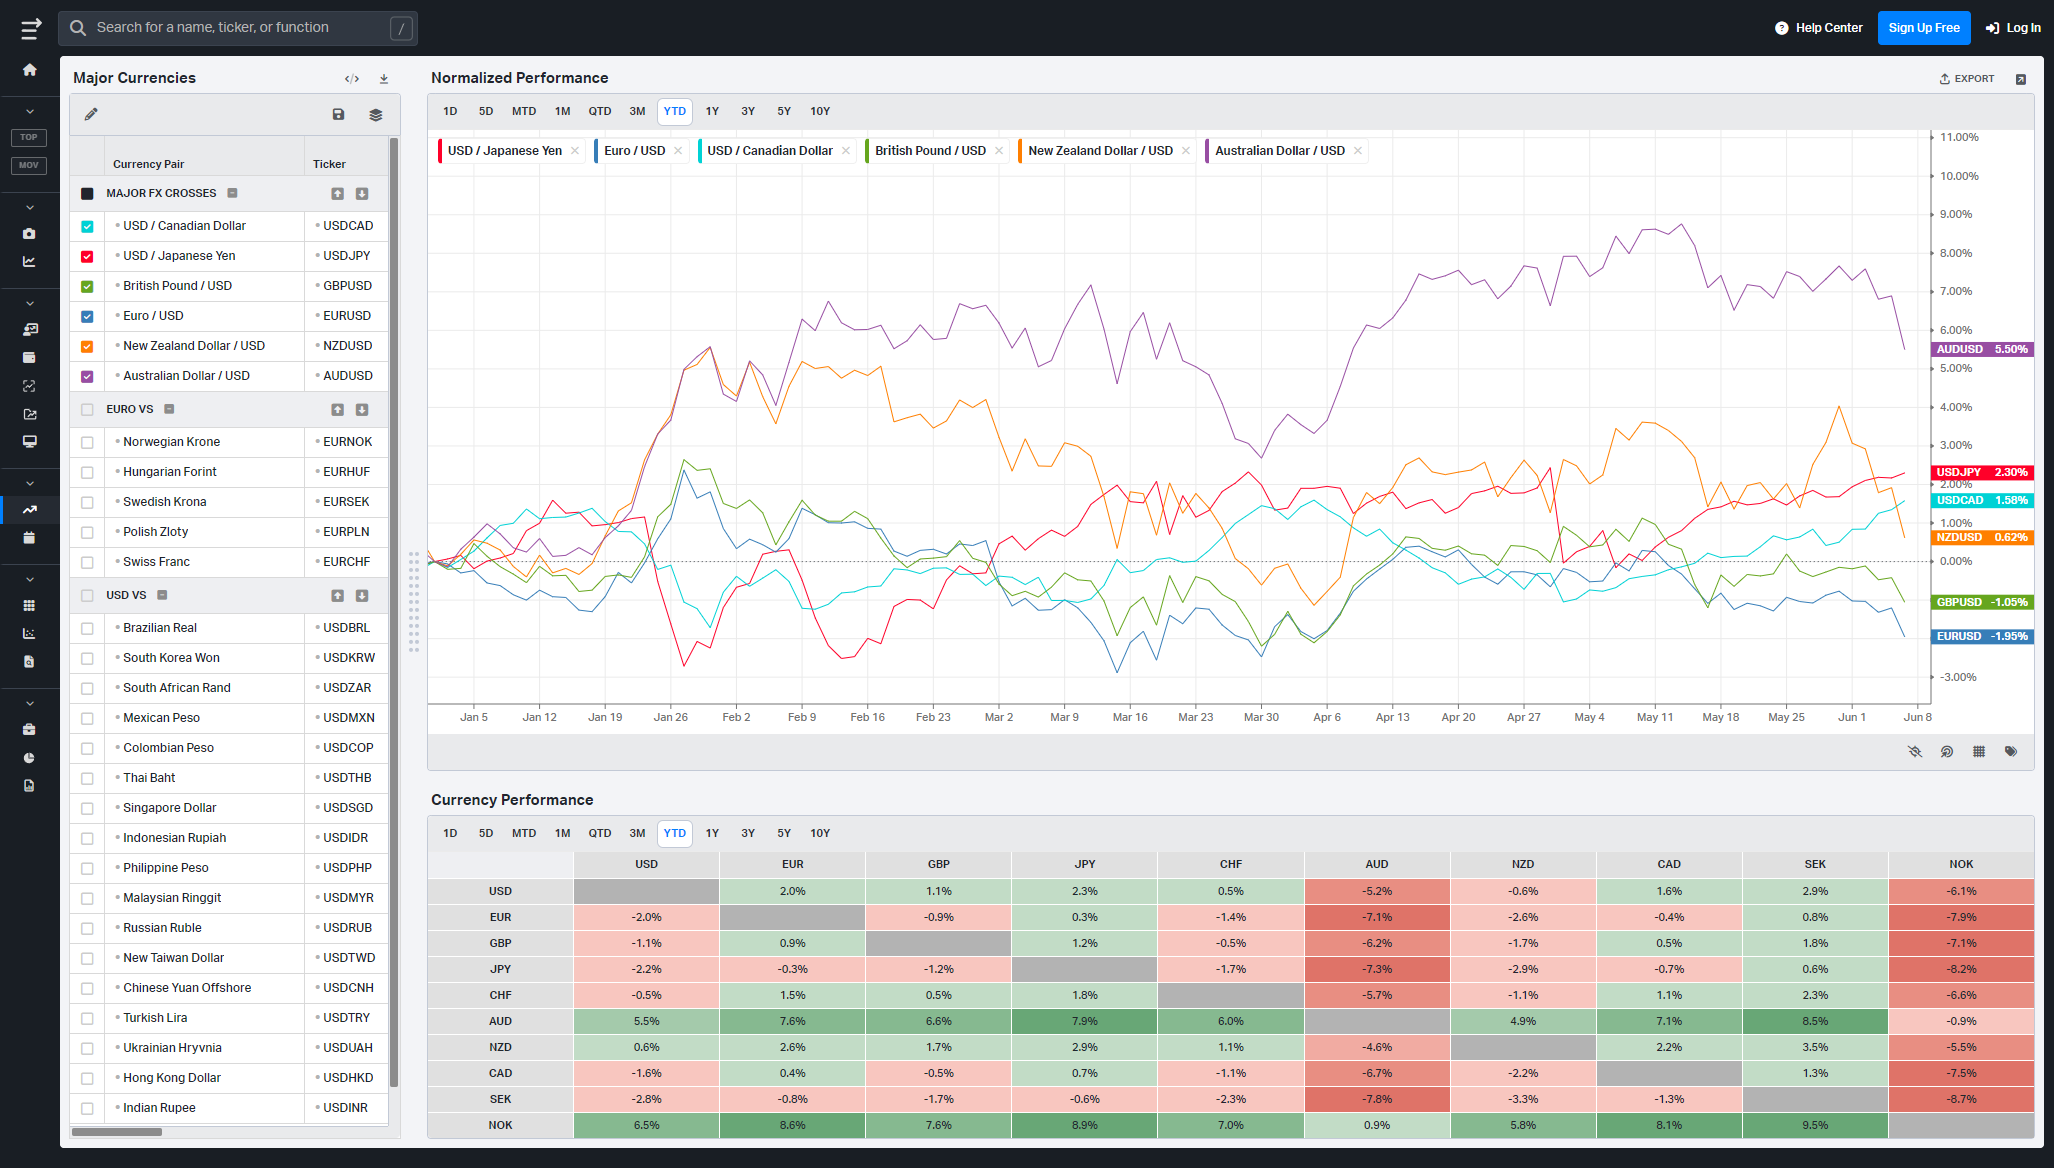
Currencies/Major FX Crosses
Factors: Style vs Size-vs-Value

Events On Deck This Week
Here are key events happening this week that have the potential to cause outsized moves in the market or heightened short-term volatility.
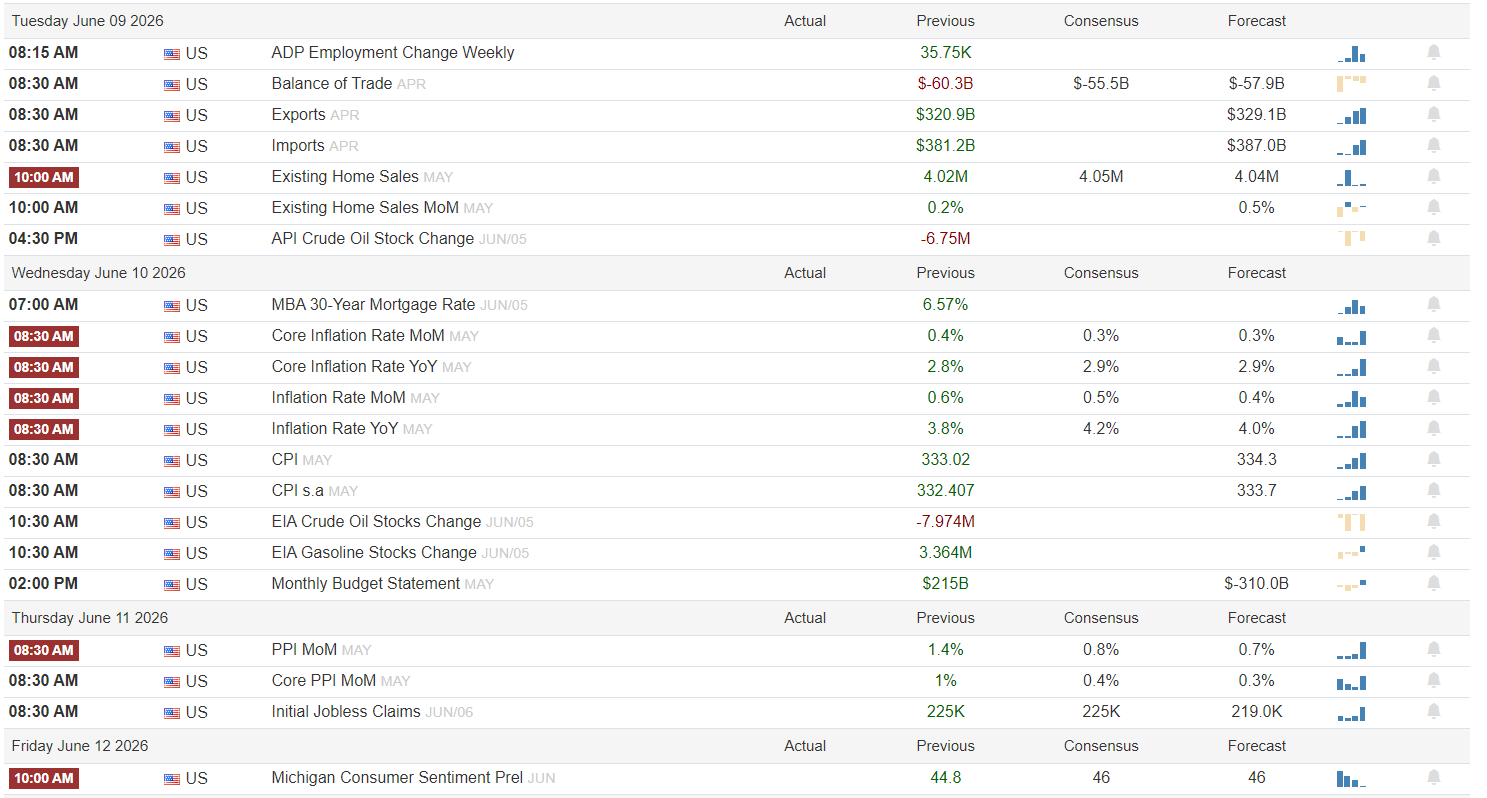
CPI at the center of the storm
Tuesday is the warm-up act, but it is not trivial. ADP employment hits at 8:15 a.m. with a prior reading of 35.75K and an unreadable consensus, followed by April trade data with the deficit previously at -60.3B and expected to narrow toward -55.5B. Exports and imports both have higher forecast bars than the last print, which would signal ongoing global demand rather than a rollover. Existing home sales for May carry a prior 4.02M pace with consensus at 4.05M and a 4.04M forecast. A mix of stronger ADP, a narrower trade gap, and firm housing would skew risk-on for growth cyclicals but also keep pressure on the “too hot” macro narrative, especially if oil reacts to the afternoon API crude stock draw after last week’s -6.75M print.
Wednesday is the main event, with the entire inflation complex hitting at 8:30 a.m. Core inflation MoM for May comes off a 0.4 percent prior with consensus and forecast both at 0.3 percent. Core YoY sits at 2.8 percent with the street looking for an unchanged 2.9 percent. Headline inflation MoM printed 0.6 percent last time with a 0.5 percent consensus and 0.4 percent forecast, while YoY is coming off 3.8 percent against a 4.2 percent prior and 4.0 percent consensus. CPI itself was 333.02 previously with consensus near 334.3, and the seasonally adjusted series shows a similar small uptick. Layer in MBA 30-year mortgage rates still north of 6.5 percent, another EIA crude draw after last week’s -7.974M, and a positive gasoline build, and you have a day where any upside inflation surprise or sticky energy prints are risk-off for long-duration tech and risk-on for dollar and yields. A clean downside surprise in both core and headline would be the green light for another squeeze higher in indices; anything hotter than those 0.3/0.4 handles keeps the Fed hawks in play.
Thursday is the follow-through with producer prices and labor. PPI MoM for May was 1.4 percent previously, with consensus at 0.8 percent and forecast at 0.7 percent, while core PPI came from 1.0 percent with expectations down at 0.4 percent and 0.3 percent. Initial jobless claims last week printed 225K, with the same consensus and a 219K forecast, so any break higher through the mid‑200s would hint at cooling labor just one day after CPI. A softer PPI plus steady claims is risk-on and would confirm that Wednesday’s inflation print is not a one-off; a re-acceleration in PPI while CPI stays sticky brings margin pressure back into the earnings narrative and argues for a more defensive tilt.
Friday finishes with the consumer lens. The preliminary June Michigan Consumer Sentiment index was 44.8 last print, with expectations at 46 for both consensus and forecast. A move above that mid‑40s band would signal that households are slowly looking past last year’s inflation shock, which is supportive for discretionary and housing-related names; a drop back toward the low 40s or below says the real economy is still feeling fragile and would weigh more on cyclicals than on staples and utilities. As usual, the inflation and Fed expectations subcomponents will matter as much as the headline.
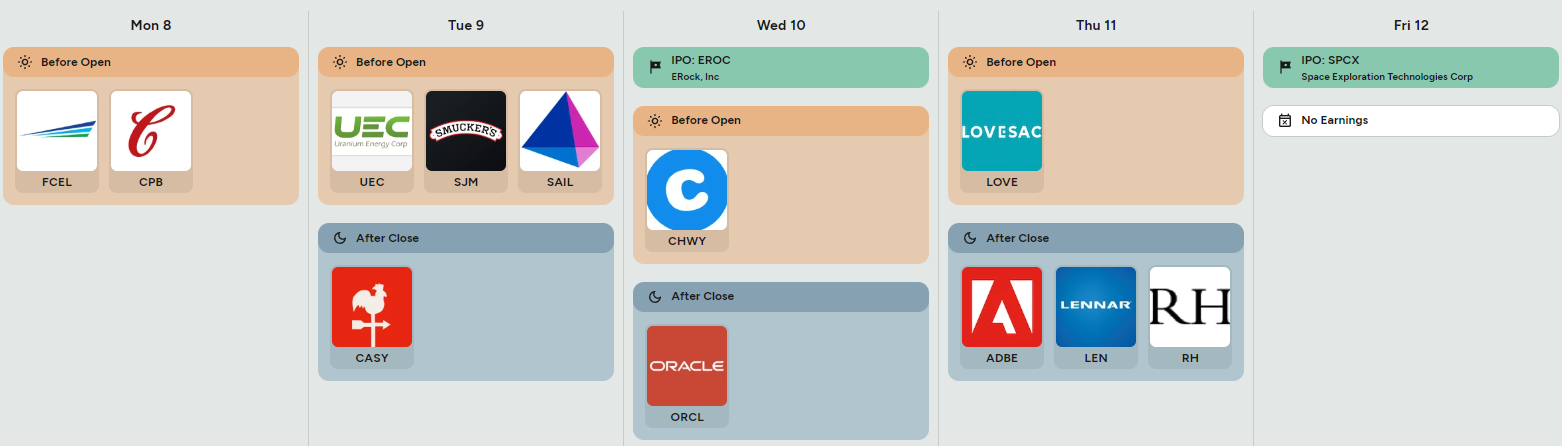
On the micro side, earnings are lighter but not irrelevant. Monday brings Campbell Soup before the open alongside FuelCell, giving you a read on staples pricing power and a high-beta energy/spec squeeze gauge. Tuesday’s pre-market slate features Uranium Energy, Smucker, and SailPoint, which can move sentiment in defensives and software. After the close, Casey’s gives another look at the consumer and fuel margins. Wednesday highlights an IPO from Erock and Chewy before the open, then Oracle after the close, where cloud, AI commentary, and license growth will feed straight into the broader software and AI infrastructure trade. Thursday is a mini housing and luxury check, with Lovesac in the morning and Adobe, Lennar, and RH after the bell. Adobe’s digital demand, Lennar’s orders and margins, and RH’s high-end consumer tone each offer clean macro read-throughs. Friday is quiet on earnings but shows an IPO for SPCX, a Space Exploration Technologies Corp vehicle, which will be a sentiment barometer for the still‑speculative growth pocket.
Three sign-posts for active traders:
Core CPI MoM at 0.3% or lower vs any upside surprise above 0.4%.
PPI MoM staying under 0.8% or snapping back toward the prior 1.4%.
Michigan sentiment holding above 44.8 or breaking down toward 40.
Bottom line: this week is all about whether CPI and PPI agree that disinflation is back on track; if they do, dips get bought, but if both run hot, the market will be forced to reprice the “higher for longer” story in real time.

Order Flow in Focus: Reading Smart Money Tells
Order Flow in Focus: Reading Smart Money Tells is a recurring segment that spotlights unique intraday opportunities revealed through institutional order flow. Each feature dissects a moment when the tape quietly shifted—when large, ranked prints clustered at key liquidity locations and informed players positioned ahead of the move. The goal isn’t hindsight; it’s pattern recognition—learning to spot the footprints of capital that knows before the crowd does.
This PSQ tape is a clean window into how smart money derisks before the rest of the street realizes what is happening.
For most of the week, PSQ was an afterthought. Price drifted sideways around 25.40–25.60, with no meaningful follow‑through and only modest interest at the nearby volume Levels. If you were staring at QQQ, it still looked like a garden‑variety consolidation in a strong uptrend. The shift came when a single, ranked block hit the tape: roughly 4.2 million shares around 25.41, about 109 million dollars of notional, tagged with a #7-historical rank for the ETF and carrying a relative size north of 10x the average Level. That is not a retail hedge; it is a desk making a deliberate decision to raise inverse exposure into strength.
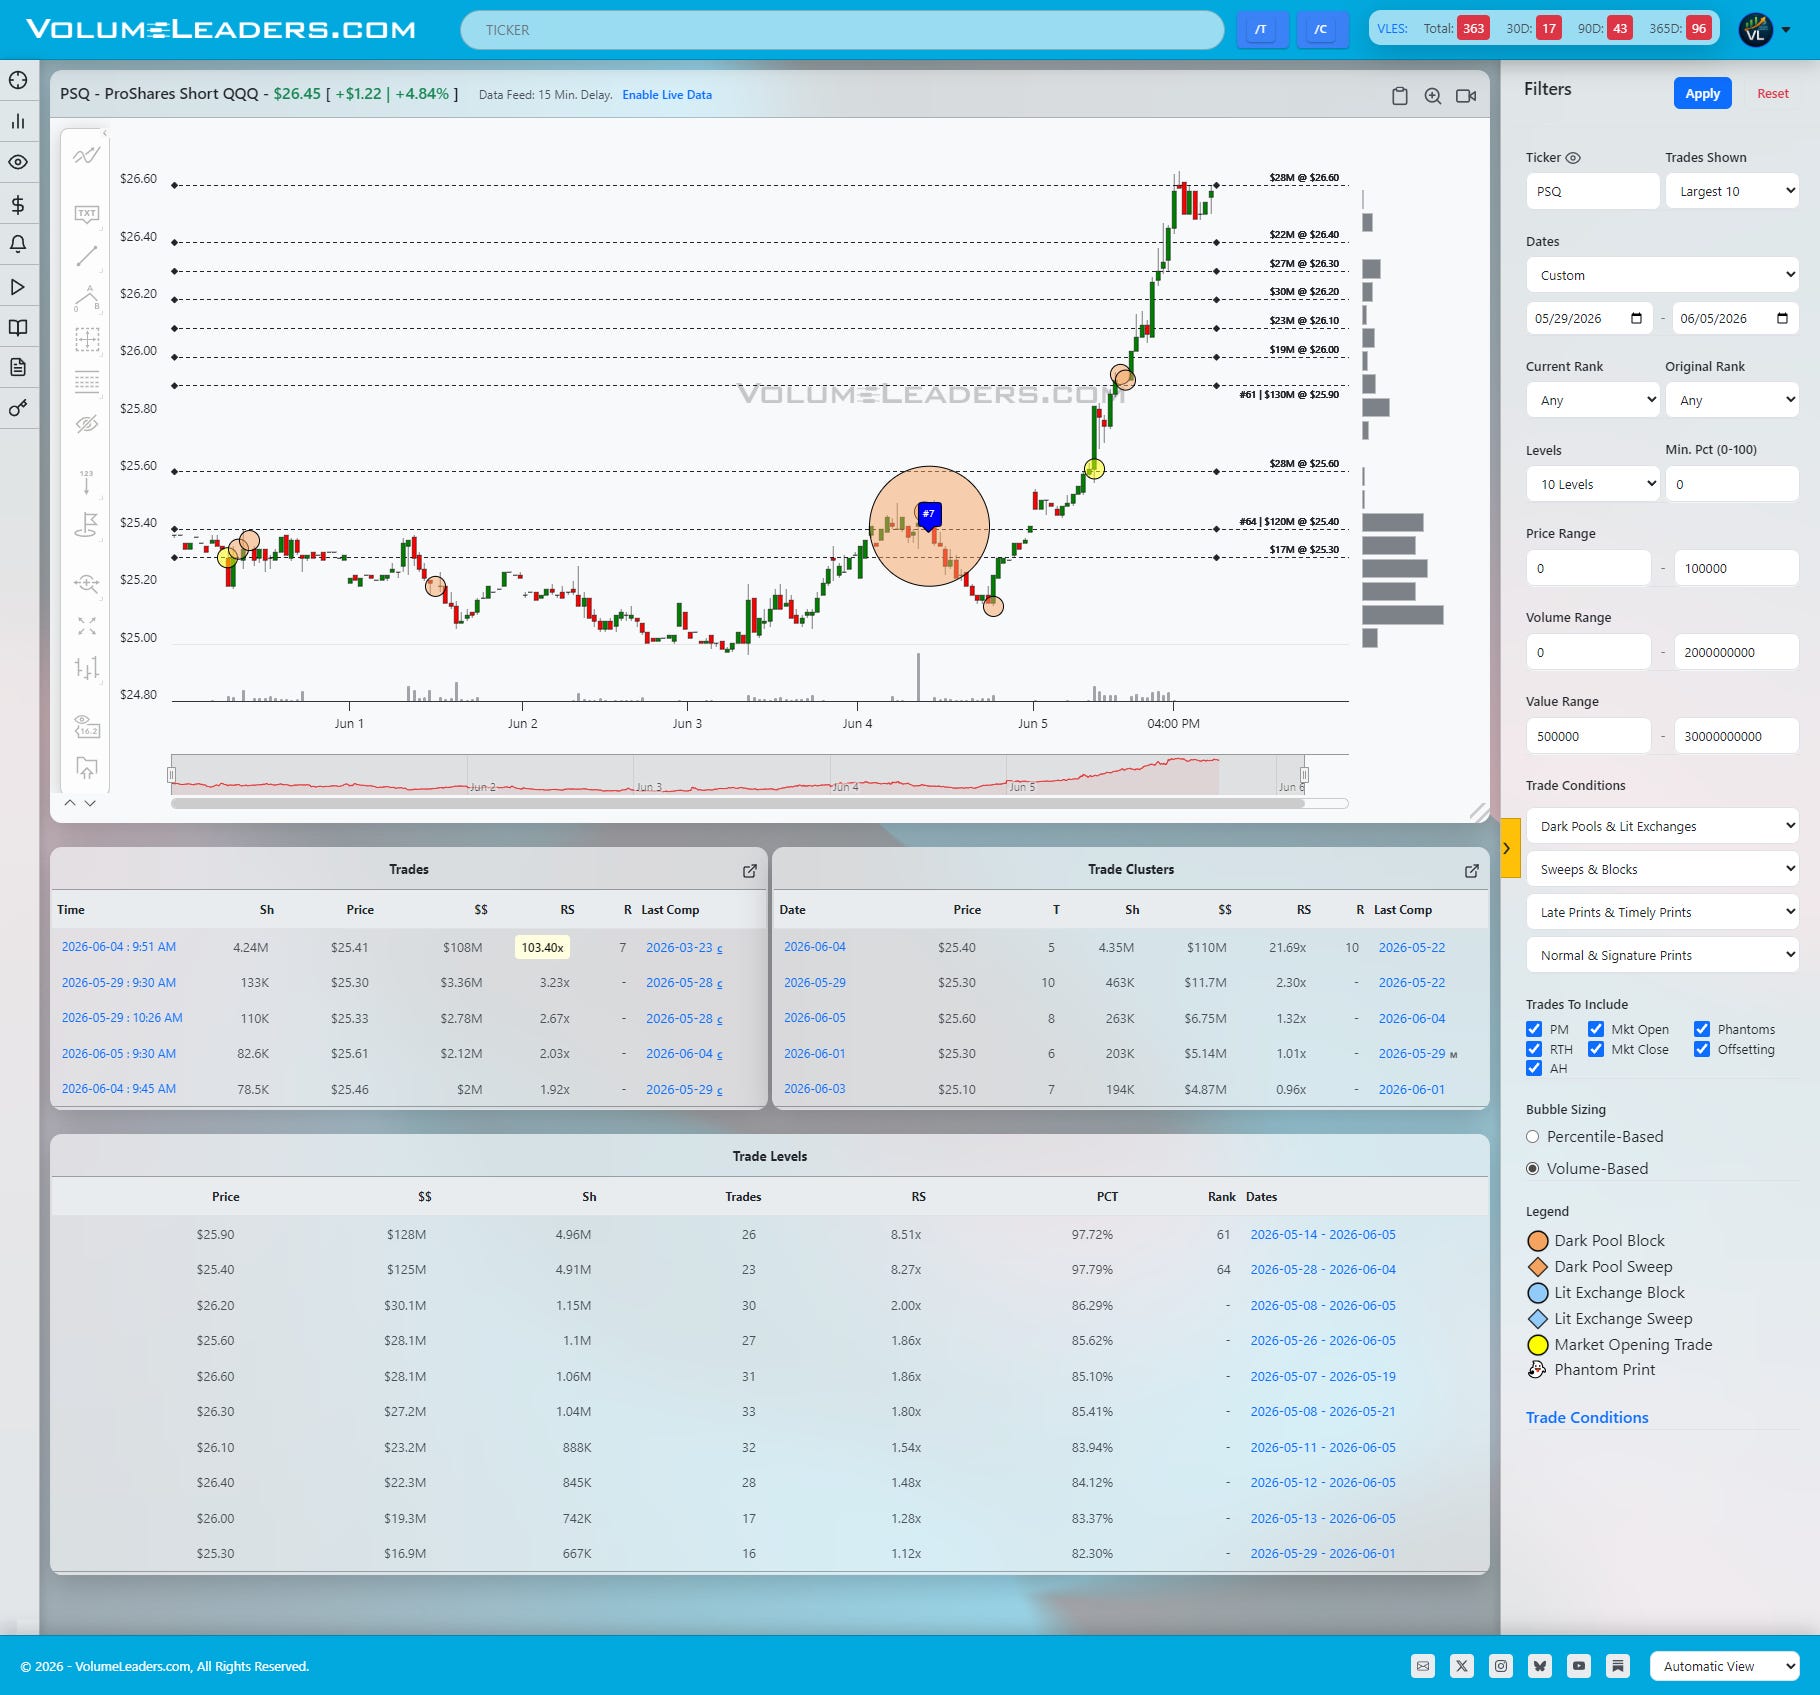
This block did not show up after a big QQQ downdraft; it printed into what still looked like a benign environment, when implied volatility was relatively contained and the broader tape had not yet cracked. The buyer chose PSQ — unlevered inverse QQQ — rather than an options structure or a 3x product, which is exactly what you would expect from someone who wants clean, linear downside participation and, critically, a way to raise cash quickly if the unwind accelerates. In other words, this was not a high‑beta punt; it was a controlled derisking step: add inverse exposure, tighten net, and be ready to sell winners if the market finally stumbles.
Once that block went up, the character of the tape changed. Instead of fading back into the prior range, PSQ started treating that 25.40–25.60 zone as a new floor. Follow‑on prints appeared as it pushed higher, but they were smaller and more frequent, perhaps even suggesting that the initial sponsor was dumping inventory into late buyers on pops. At the same time, the trade‑levels table showed heavy cumulative volume building above 25.80 and then again around 26.40–26.60. This is what a funded derisking plan looks like: get size on at the base, let the market do some of the work, then use the higher Levels to scale or recycle risk while the underlying QQQ starts to bleed.
The real tell is what happened next in QQQ itself. QQQ proceeded to drop roughly 4.8% on the week, with most of the damage compressed into the single session after this print. From the outside, that day looked like a sudden air pocket: megacap tech selling off in unison, volatility finally spiking, and retail participants scrambling for explanations. From the inside, this PSQ tape suggests the move was funded and at least partially anticipated. The inverse exposure was already in place. When the break came, that desk did not have to sell into the hole to raise cash; they could let PSQ mark higher, monetize some of that inverse, and deploy the freed‑up capital later at better prices.
If you had been watching PSQ in real time, the trade leg was less about chasing the inverse ETF for its own sake and more about reading what it signaled. The moment that 4‑million‑share block printed and price refused to give the Level back, you had all the information you needed: someone big was done treating QQQ upside as free. A tactical trader could have taken a measured PSQ long against that 25.40–25.60 floor, trimmed-up the portfolio and raised some cash, and/or bought puts on major indices with preference given to QQQ.
The pattern to file away is simple: when an otherwise sleepy inverse ETF prints a top‑100 historical block at a long‑tested Level and then instantly redefines that price as support, it is not just a hedge — it is often the opening move in a broader derisking sequence. The job is to recognize that tell, understand that it can precede a sharp, single‑day break in the corresponding long product, and decide whether you want to ride along with vastly more informed market participants.

Market Intelligence Report
A desk-grade synthesis of institutional positioning and market structure—unpacking the flows, levels, and emerging themes that shaped the week, and translating them into a model portfolio built the same way professional desks prepare for the week ahead.
MIR Part 1: The Backdrop
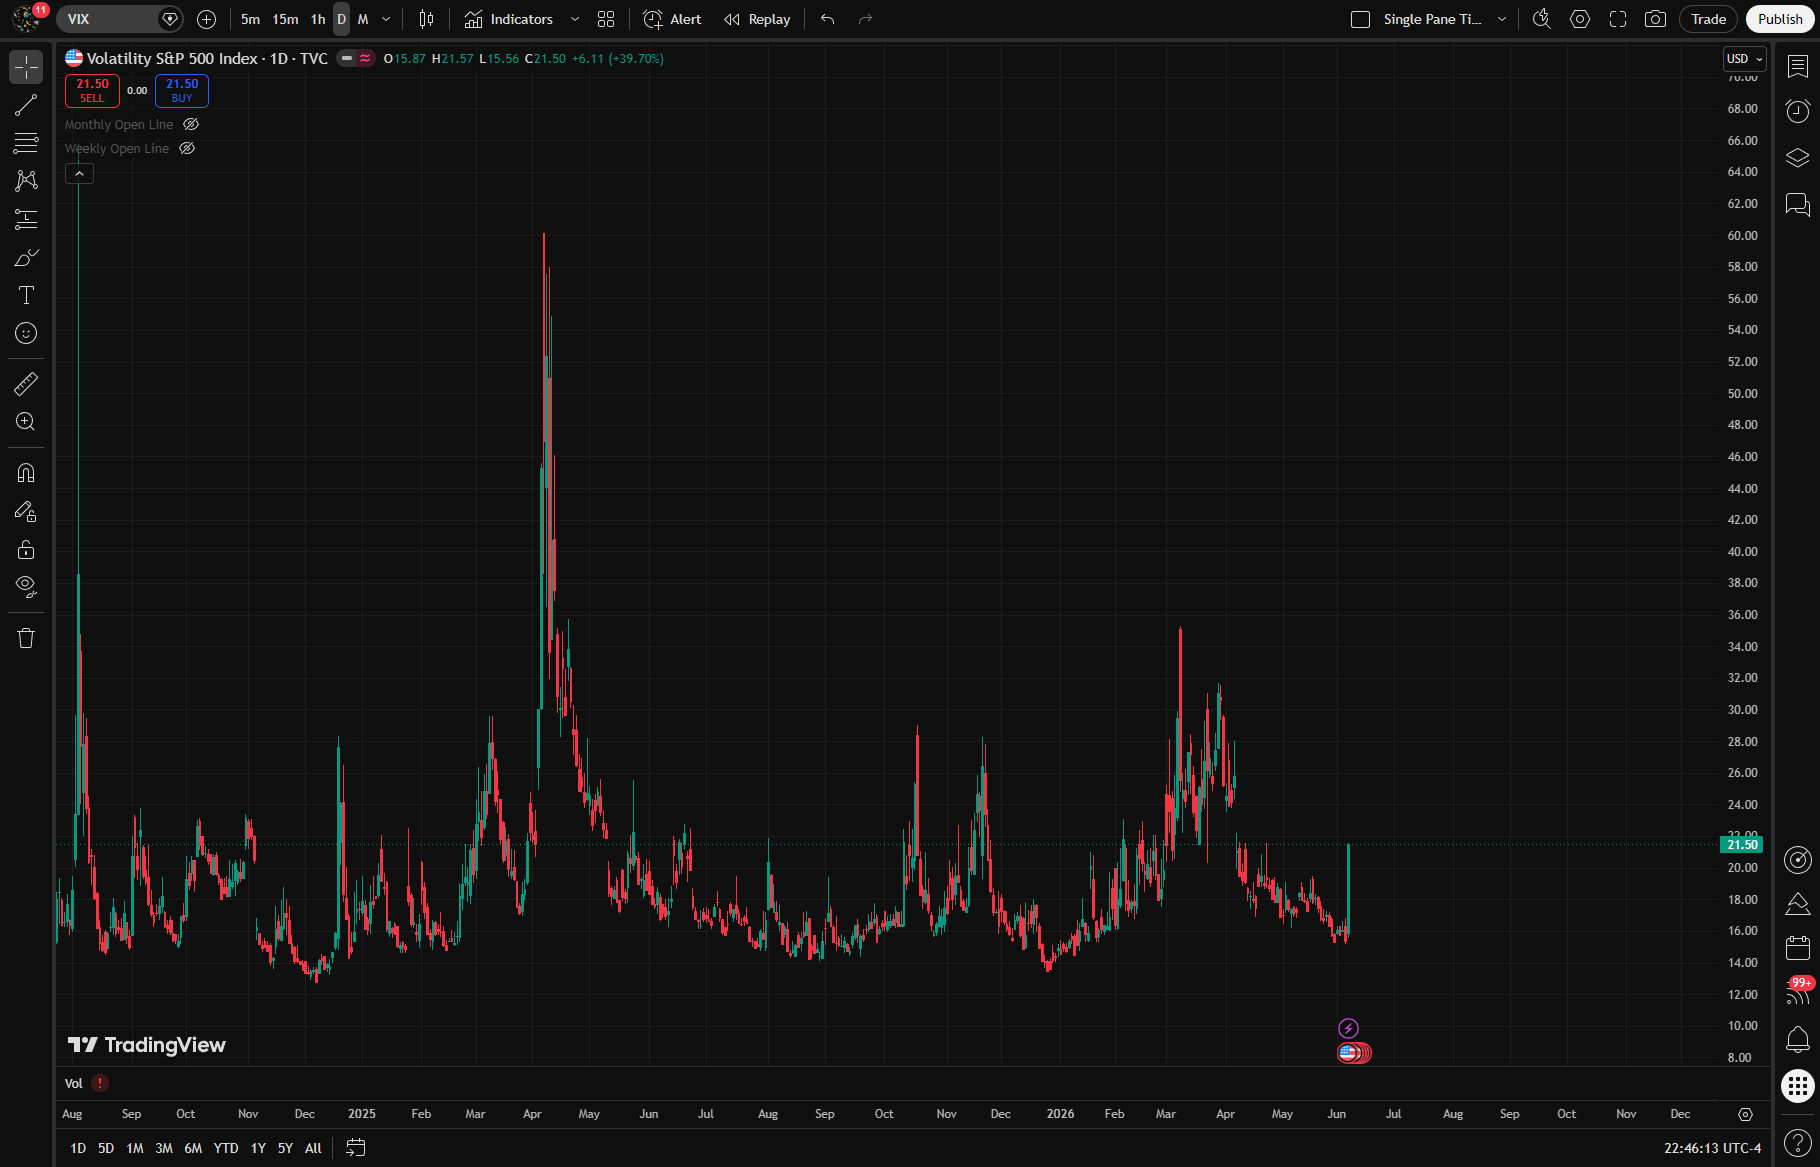
It was a different market by the close of this week than it was at the start. We went from a controlled, selective risk-on environment to a proper stress episode, with SPY now more than 3% off the highs and most of the damage concentrated in Friday’s nearly drive lower. VIX told the same story, exploding from around 16 to about 21.5 intraday, which is not just noise but a regime shift in how the tape is pricing risk. We are still trading inside a larger uptrend, but the character of that trend has changed: volatility has woken up, and the tape is finally punishing crowded positions rather than rewarding every dip.
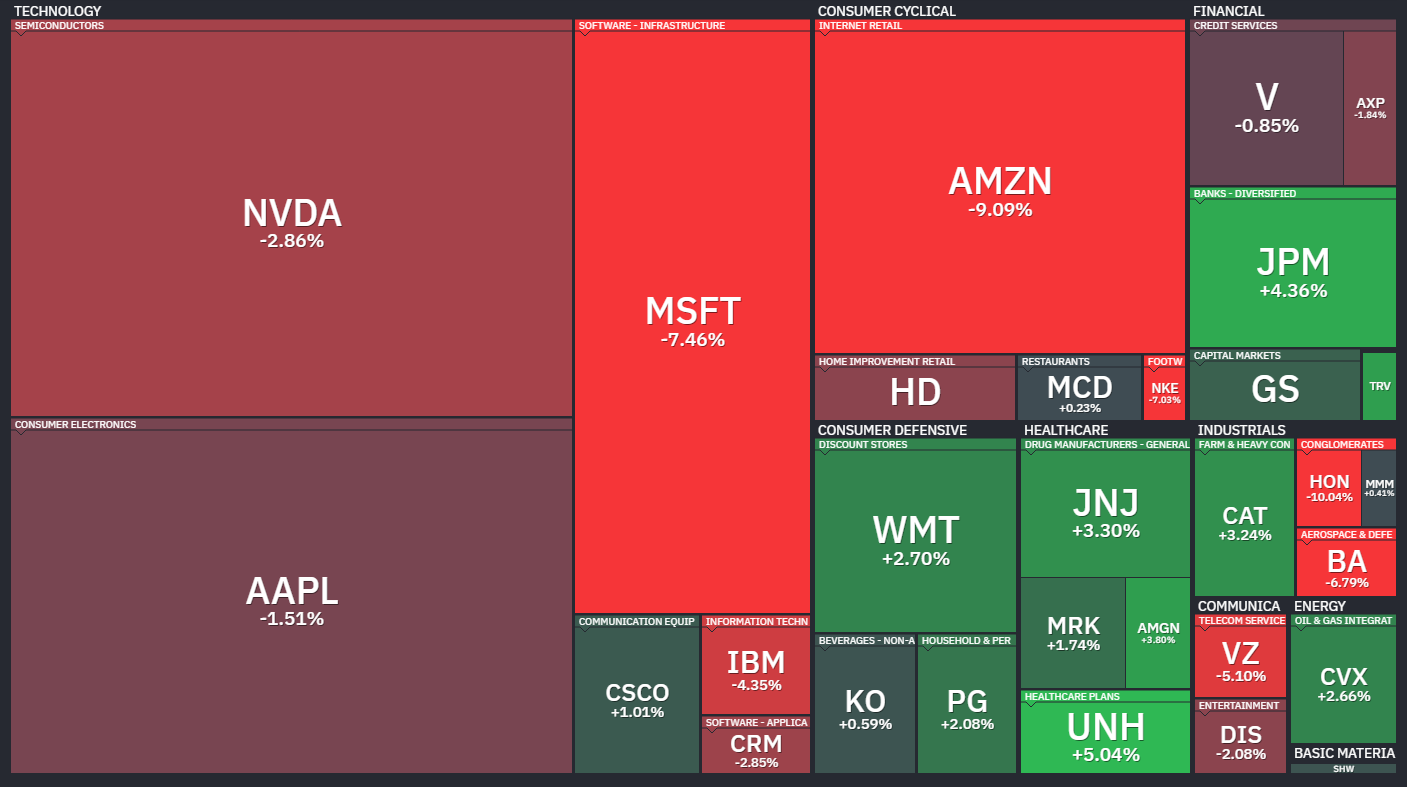
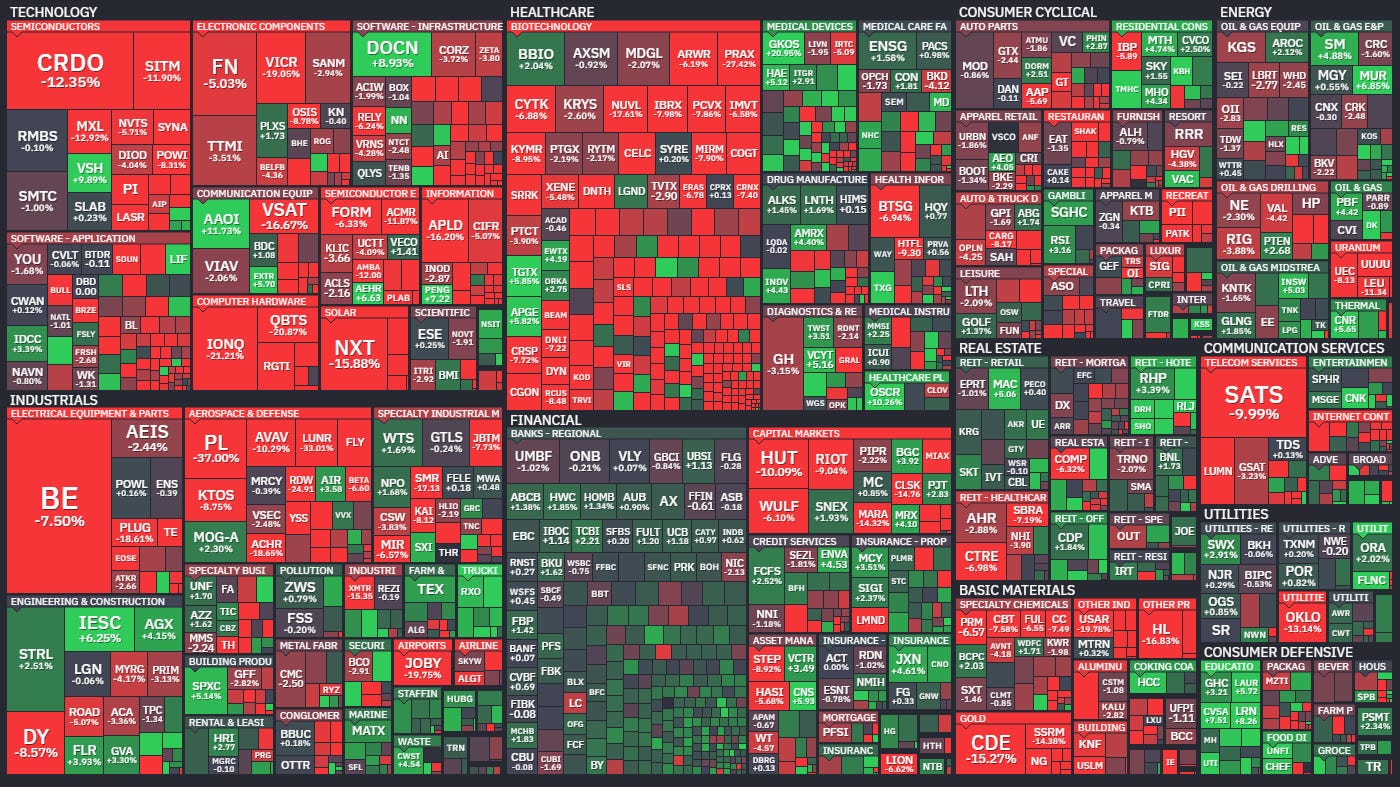
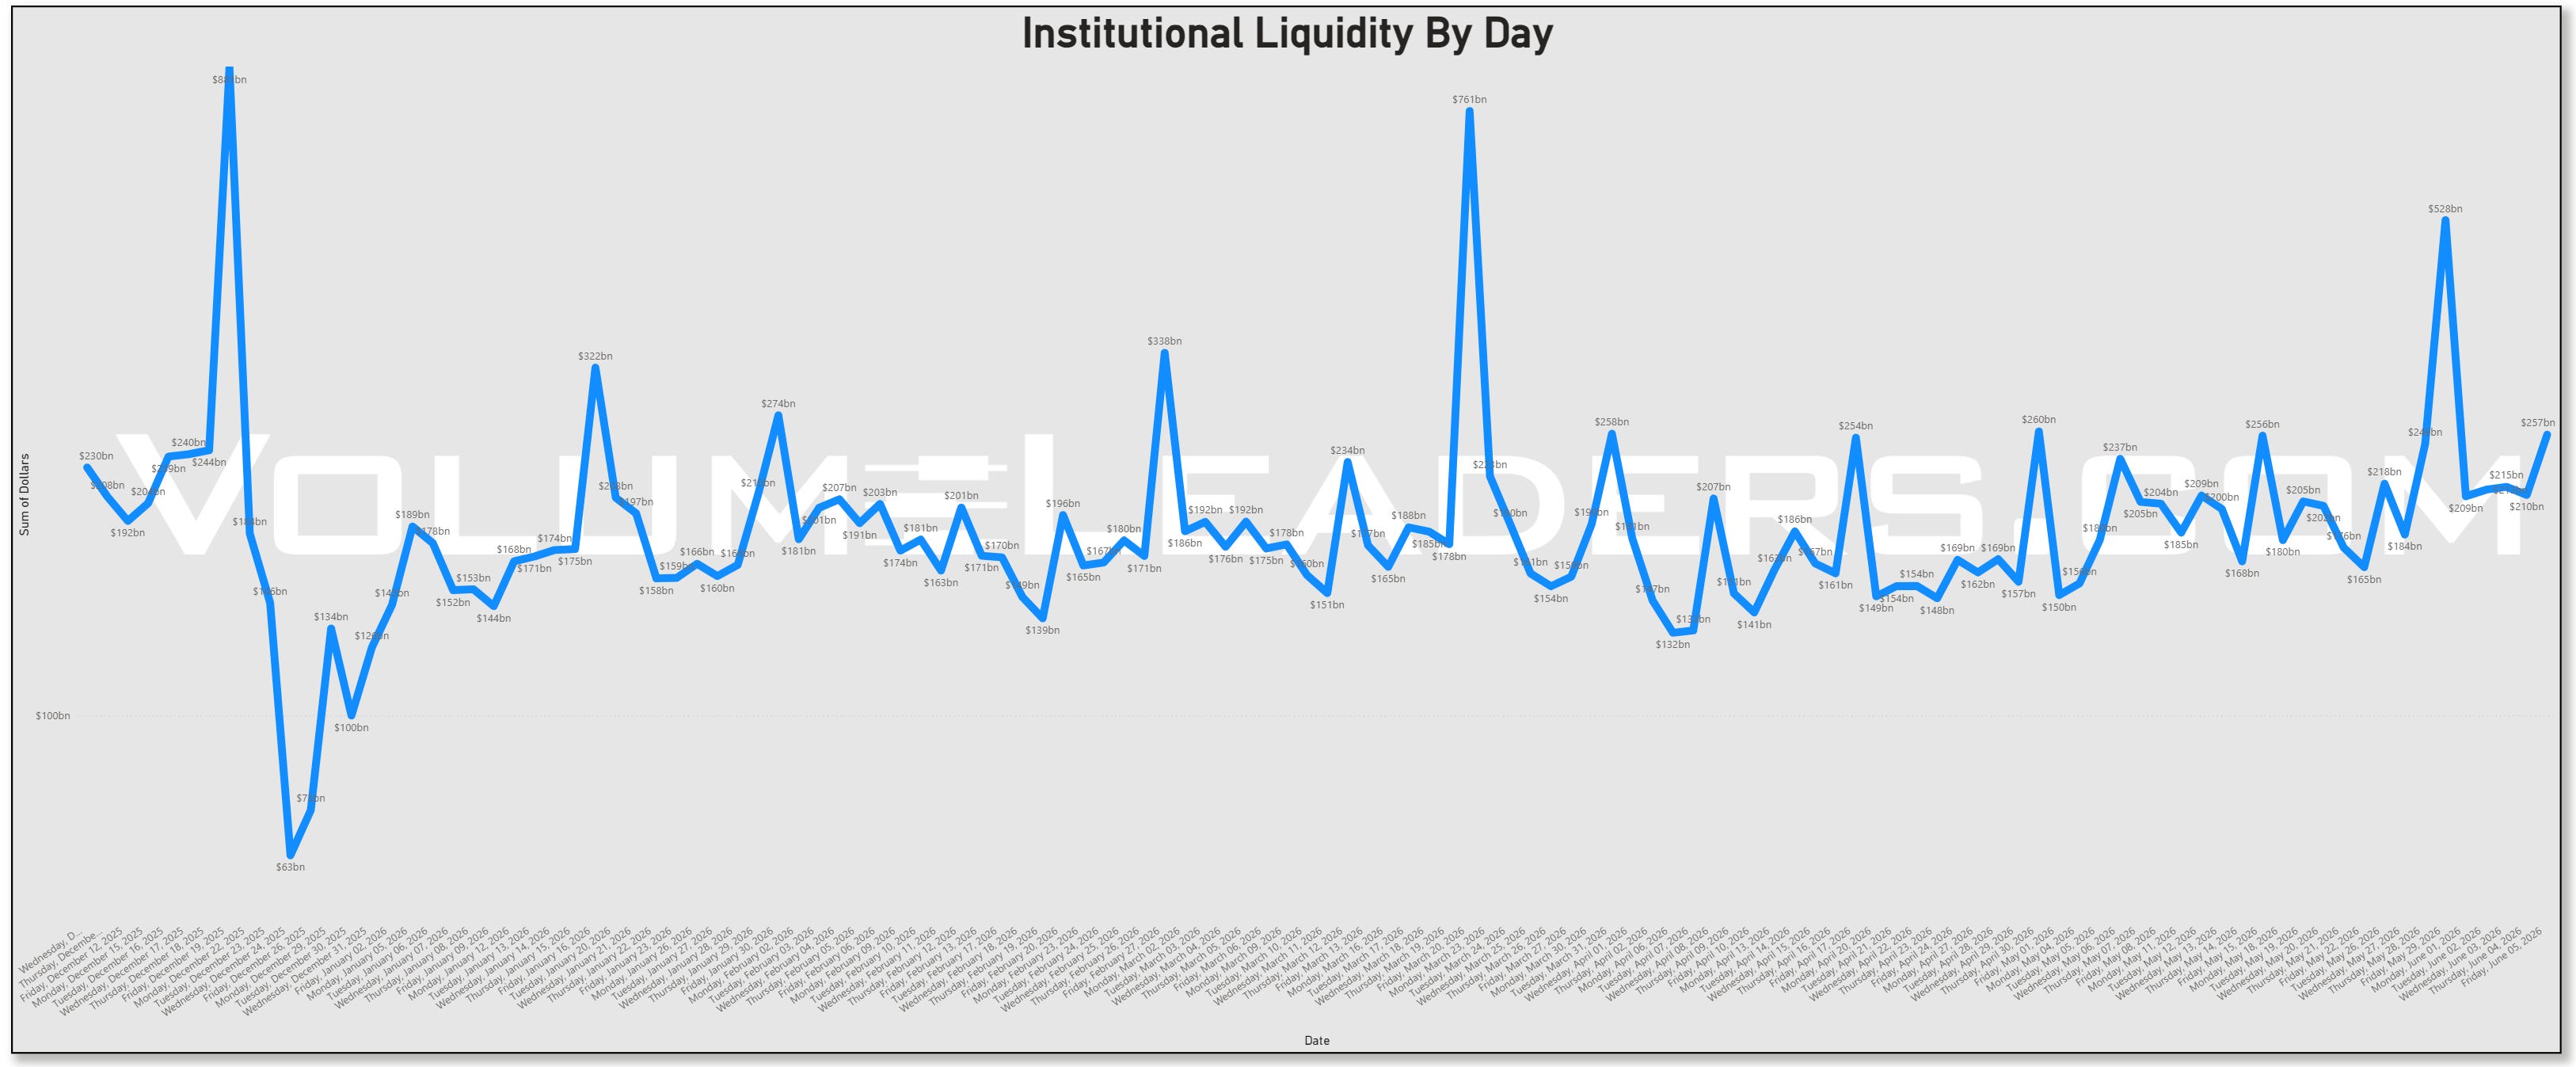
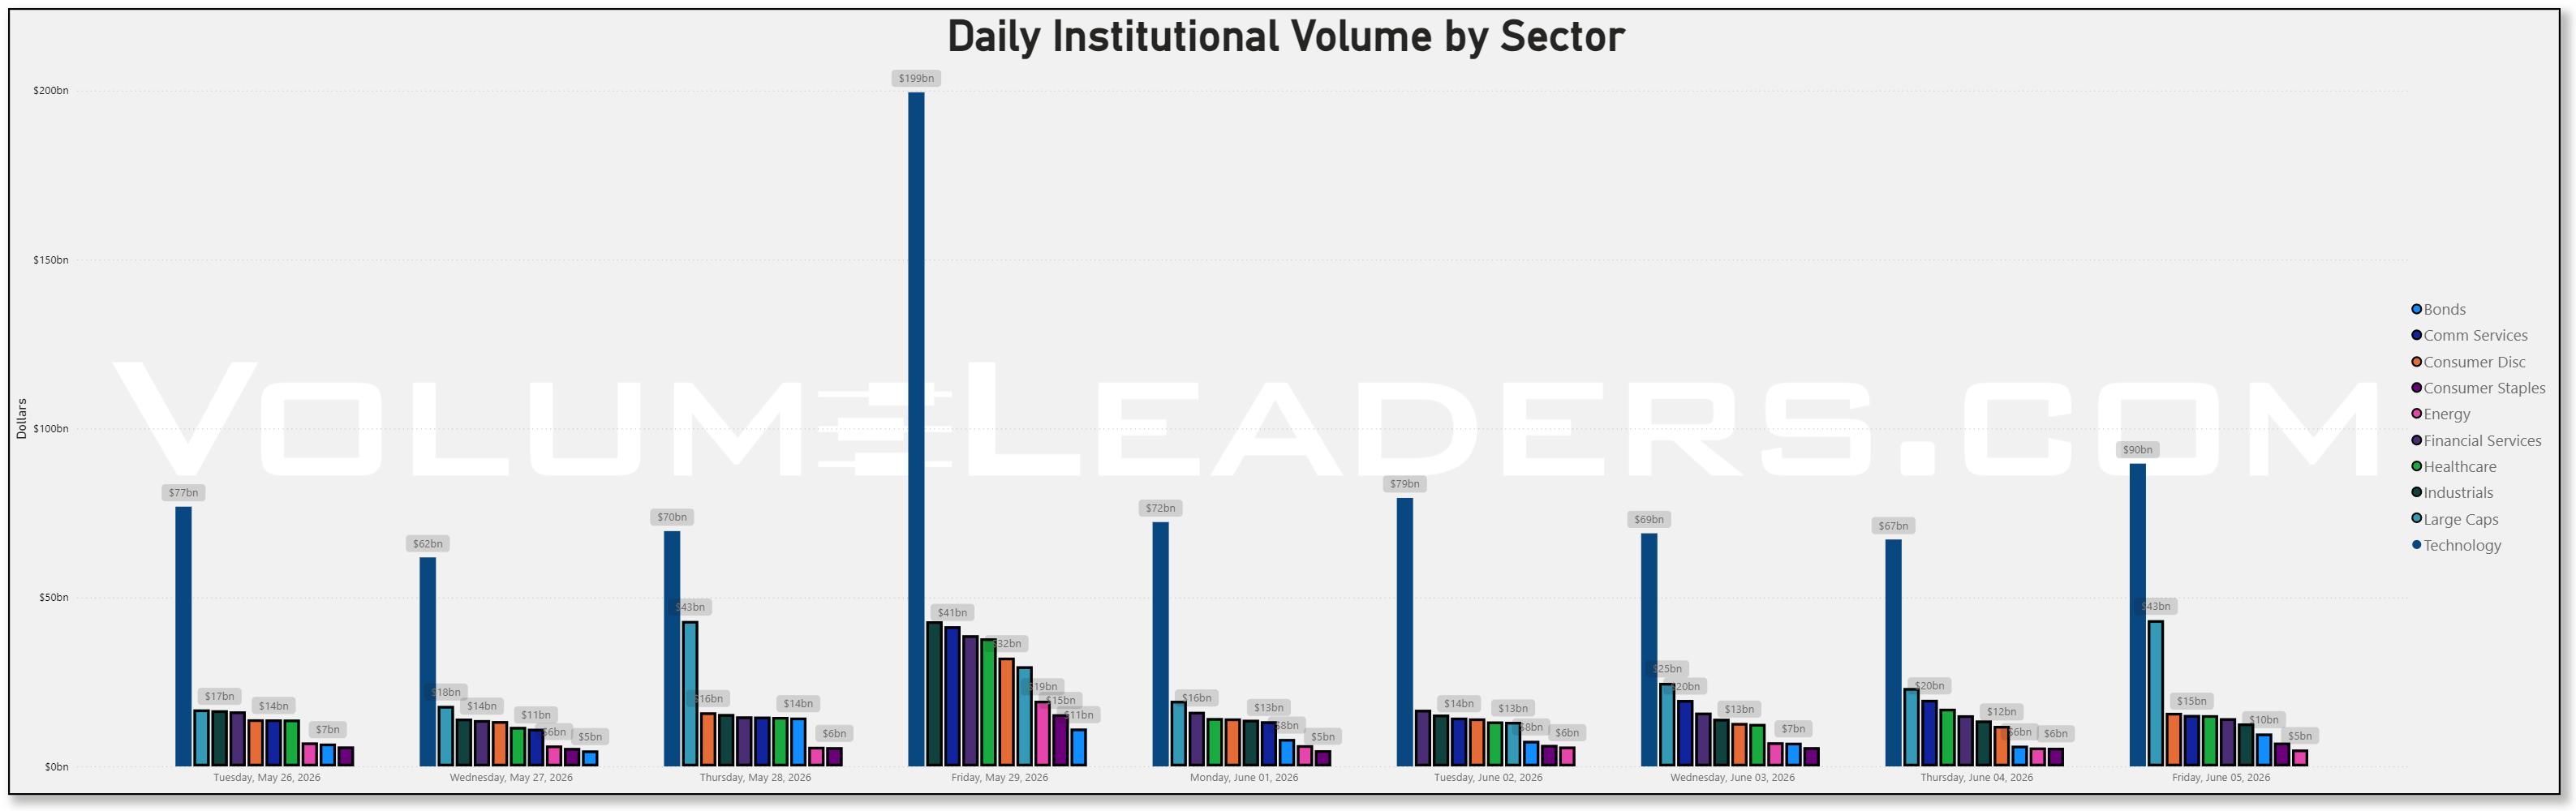
On the flows side, the big picture remains that institutions are expressing risk through a tight cluster of technology and megacap vehicles. Technology is consistently the largest line item trading daily, swinging from the mid‑60s to high‑80s billions this week after a massive 199.5 billion from last Friday’s rebalance. Large caps as a sector sat in the teens to low‑30s billions, with their own high‑water mark on that same Friday. Consumer discretionary, healthcare, and industrials followed with mid‑teens flows, while bonds and credit hovered in the high single‑digit billions. That pattern says the massive risk reset happened into last week’s high, and this week’s selling came from the same concentrated areas, not from broad capitulation. The environment has shifted from melt‑up to shake‑out, but capital has not abandoned the field.
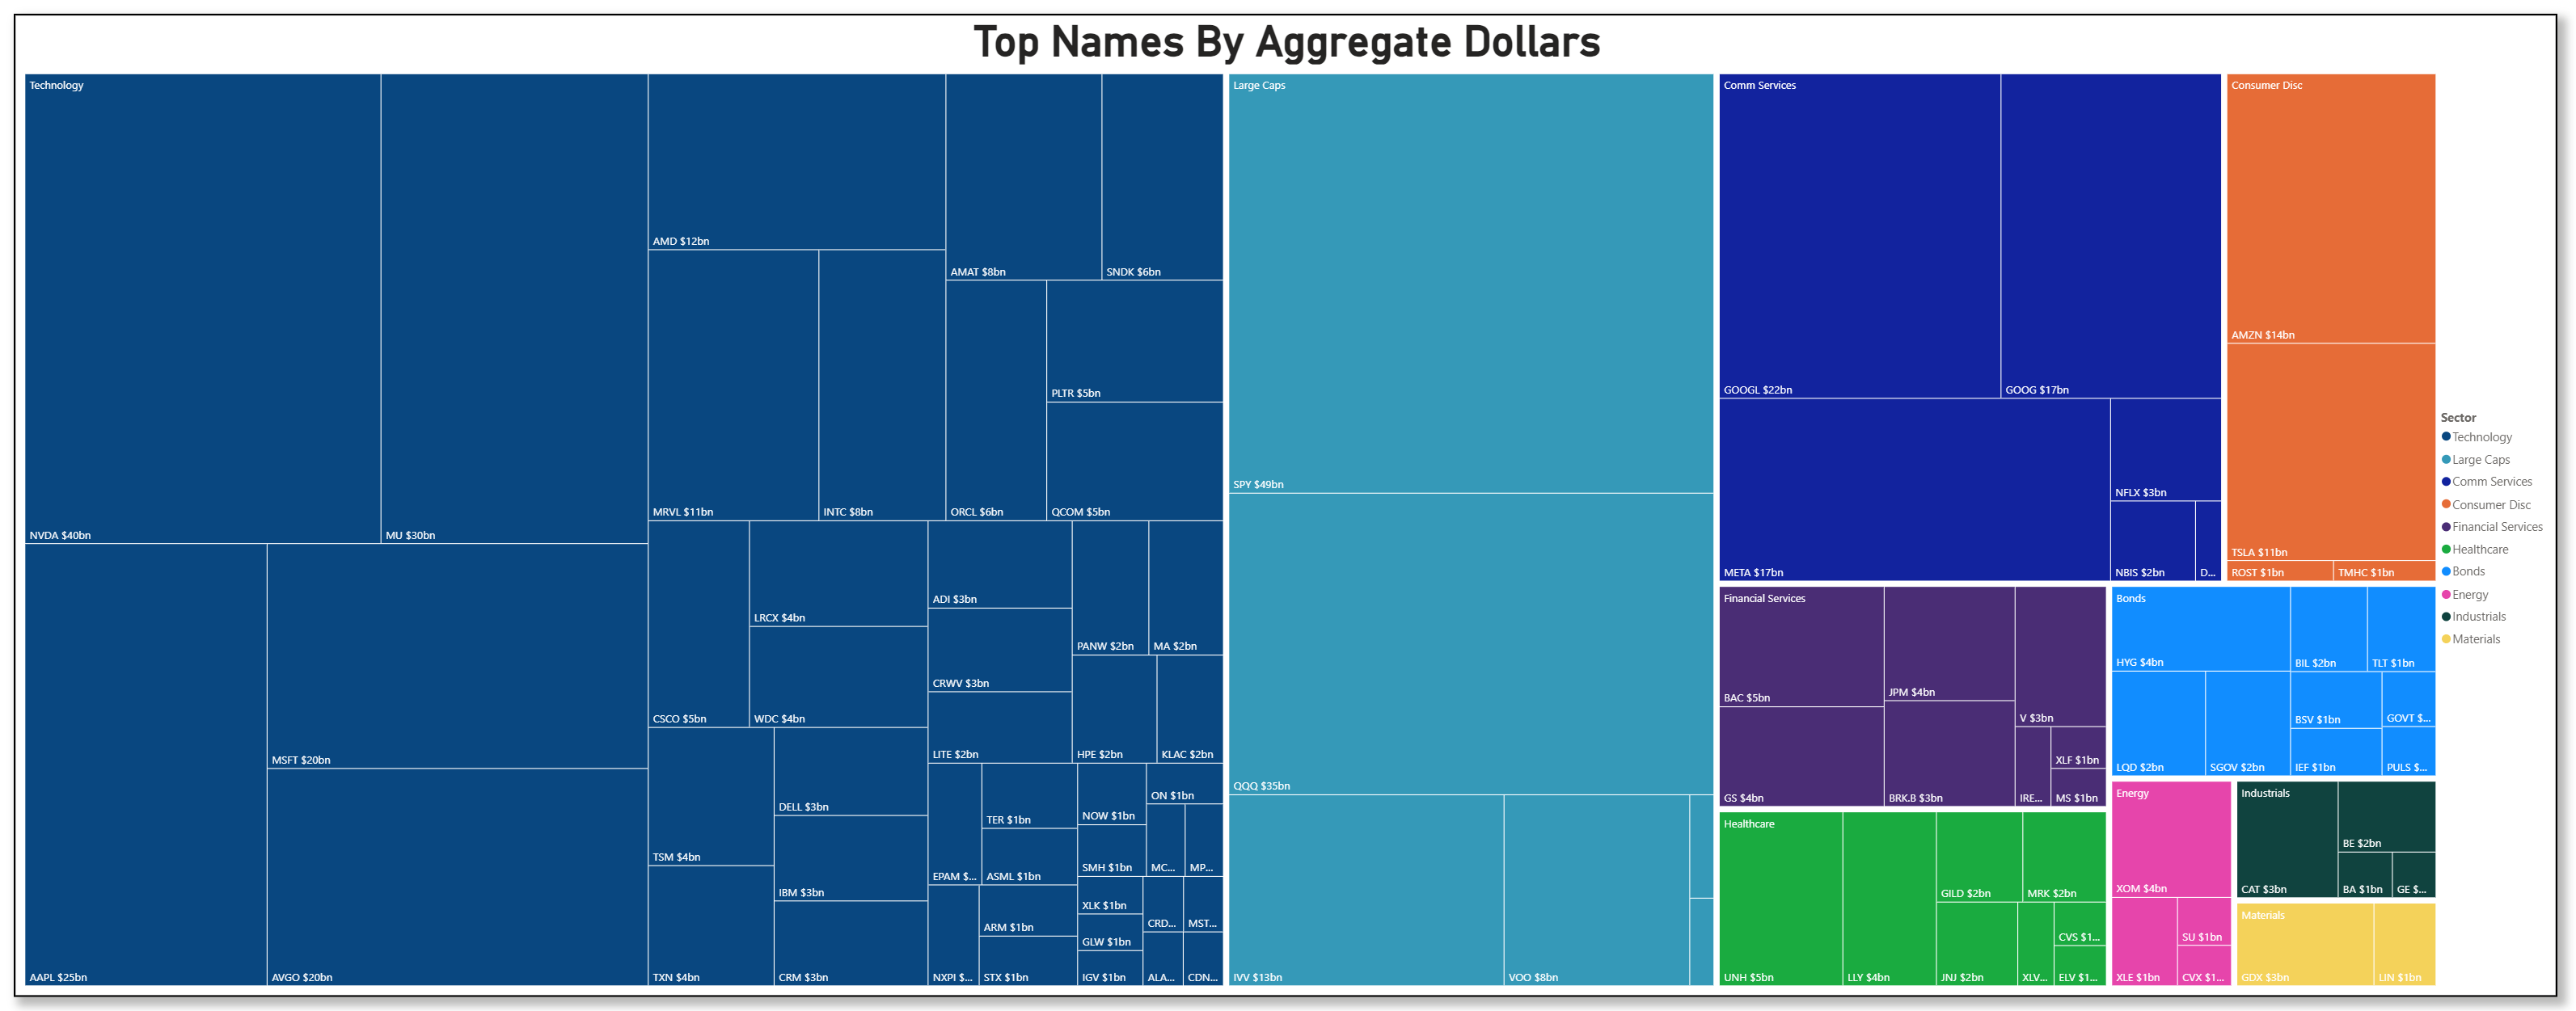
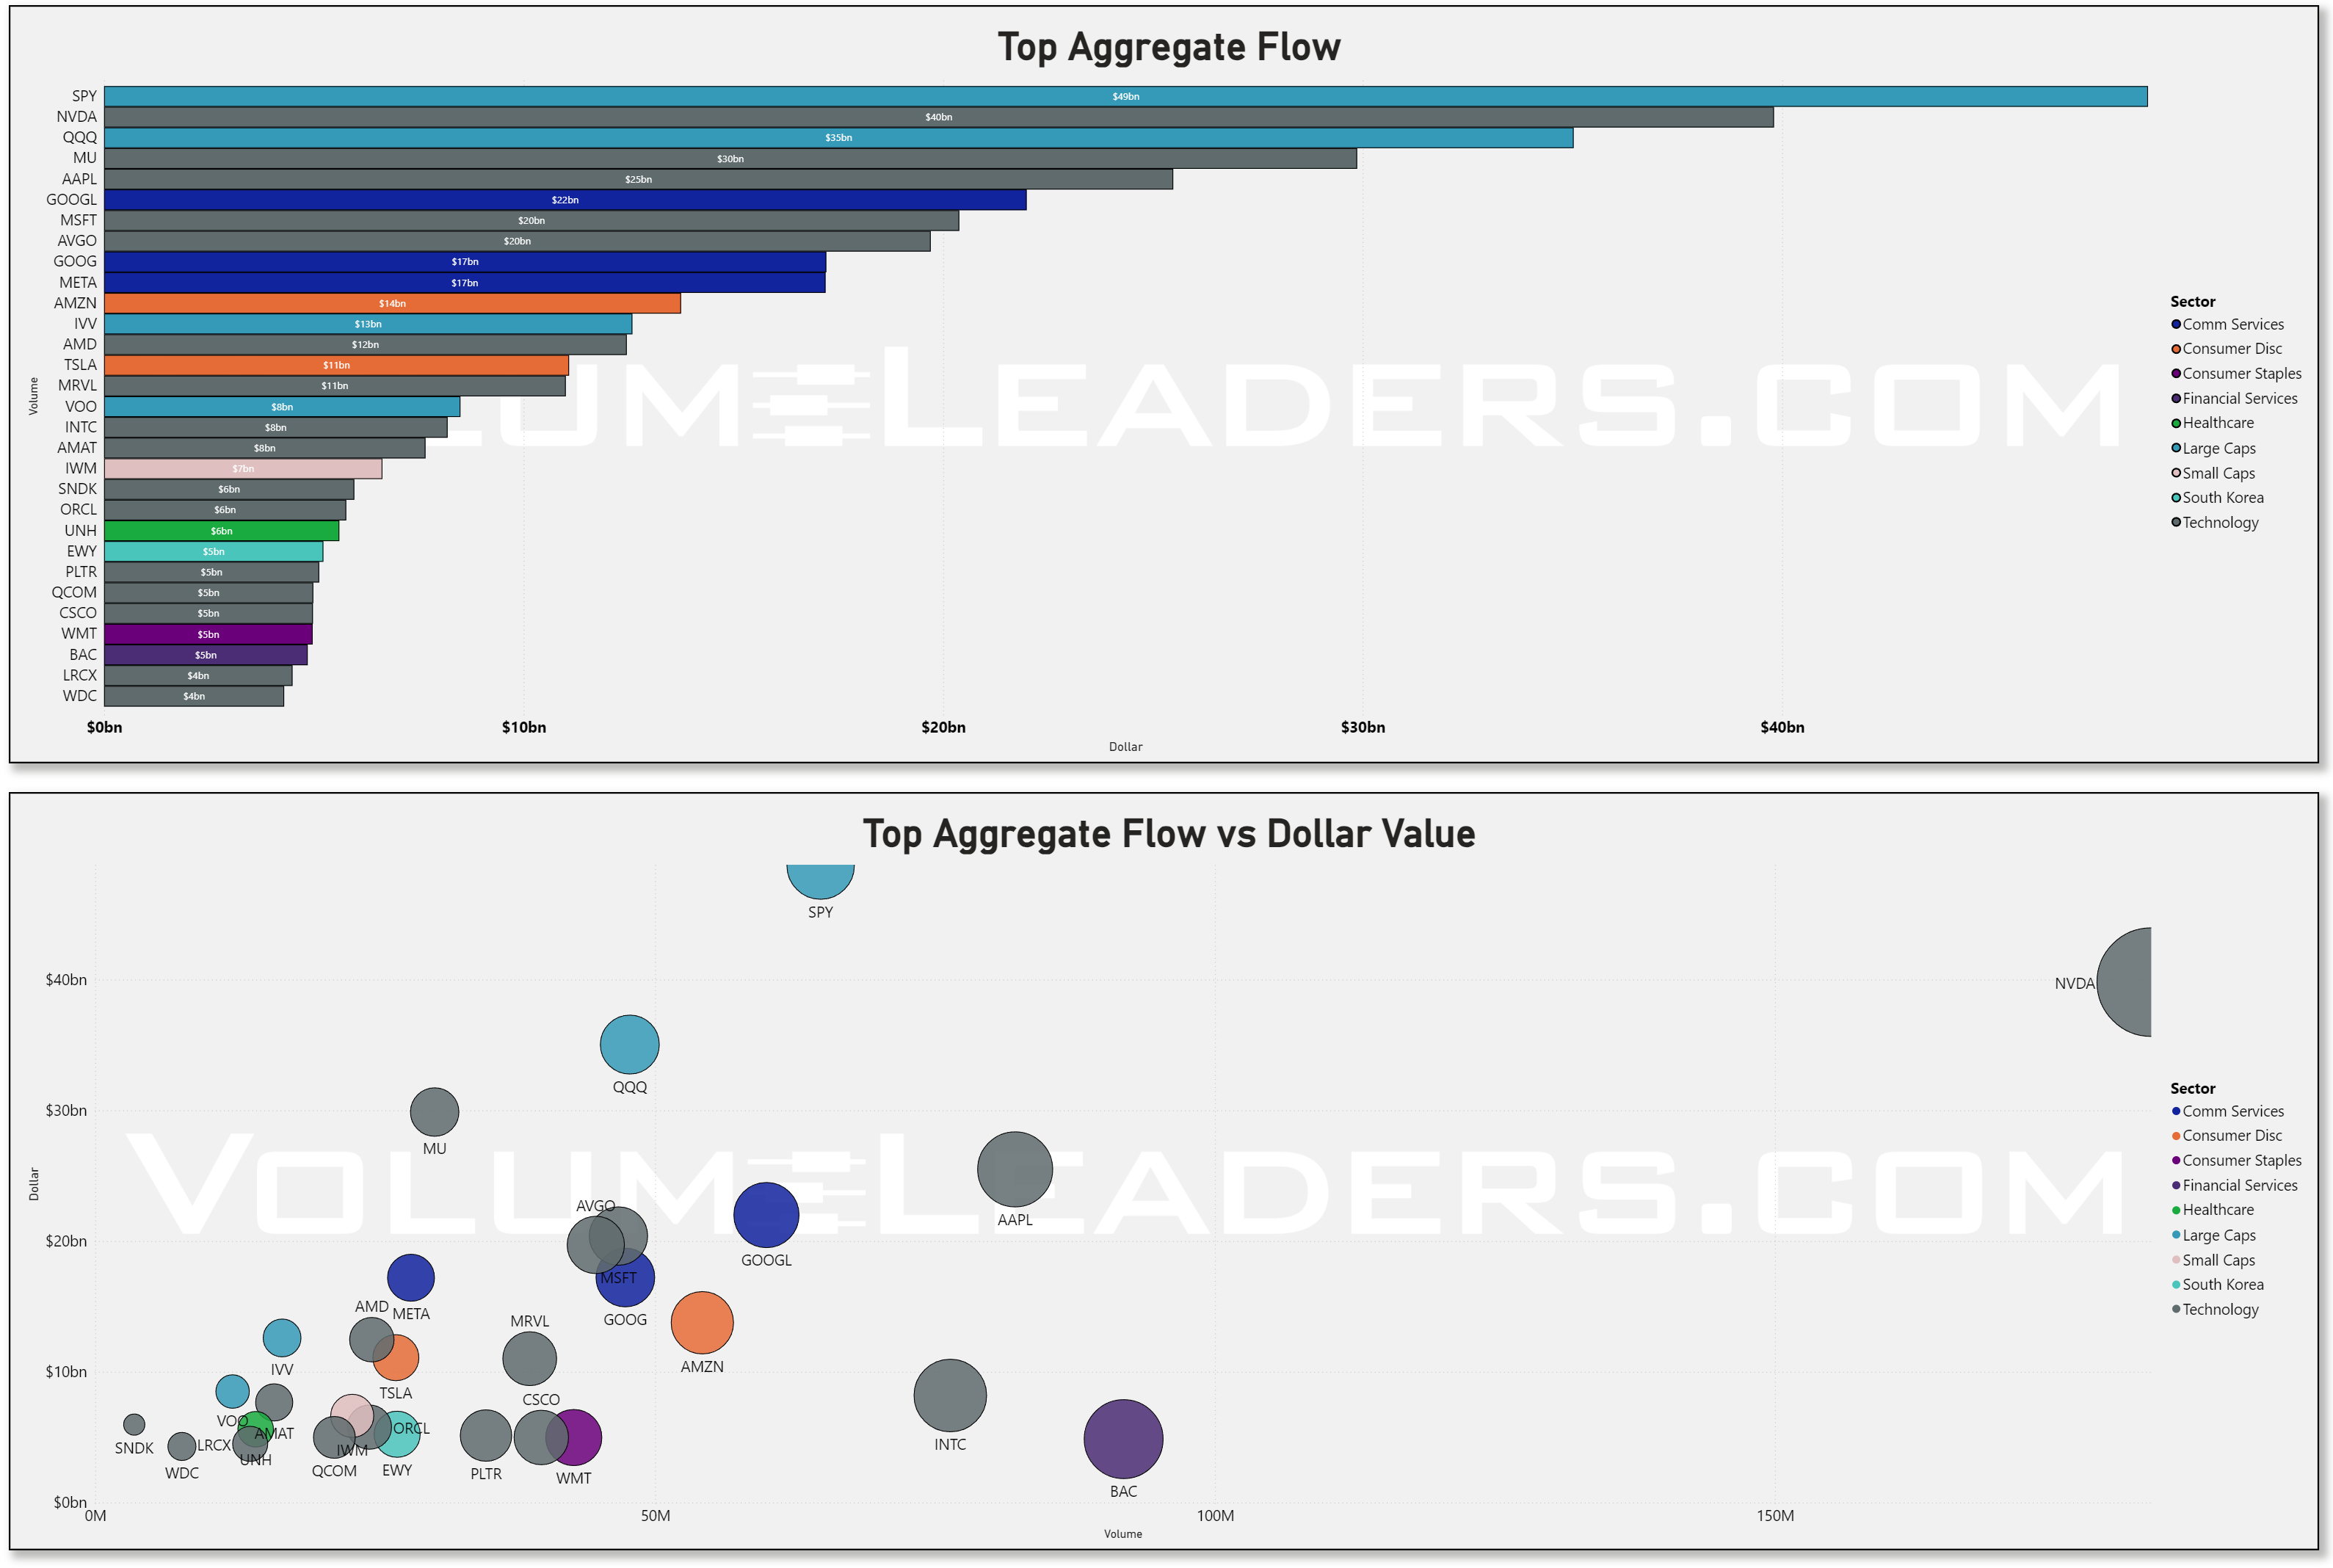
The “Top Names by Aggregate Dollars” treemap is still almost comically dominated by technology. NVDA sits around 40 billion dollars of flow, MU near 30 billion, and a whole bench of semis and hardware names — AMD, MRVL, INTC, AVGO, AMAT, SNDK, PLTR, QCOM, ORCL — cluster between 5 and 12 billion. AAPL, MSFT, and AVGO each print around 20–25 billion. On the index side, SPY carries about 49 billion and QQQ 35 billion, with IVV and VOO adding another 13 and 8 billion. Communication services is effectively a three‑name story in GOOGL at about 22 billion, GOOG at 17 billion, and META around 17 billion. AMZN at 14 billion and TSLA at 11 billion dominate discretionary. Financials and healthcare carry respectable but smaller footprints, with BAC, JPM, UNH, and LLY in the 4–5 billion band. What changed this week is not who the leaders are, but how those same vehicles traded once the vol switch flipped: the same big names that soaked up allocations all spring became the primary sources of liquidity when Friday hit.
Aggregate flow and the dollar‑versus‑volume scatter drive that home. SPY remains the biggest hub at roughly 49 billion of total flow, with NVDA close behind near 46 billion. QQQ carries about 35 billion, MU around 30 billion, and AAPL and GOOGL in the low‑20s. Names like AVGO, MSFT, META, AMZN, and TSLA all show double‑digit billions. On the scatter, SPY plots as enormous dollars against high volume, classic ETF risk expression; NVDA stands out as a high‑dollar, lower‑volume outlier, meaning larger average trade size and more concentrated prints. That is what an AI bellwether looks like when both long‑only and hedge fund money are trying to resize at the same time. With Friday’s flush and the VIX spike, those same vehicles stopped acting like safe havens and started trading like high‑beta proxies for the entire tape, which is exactly what you would expect after a long, one‑way run.
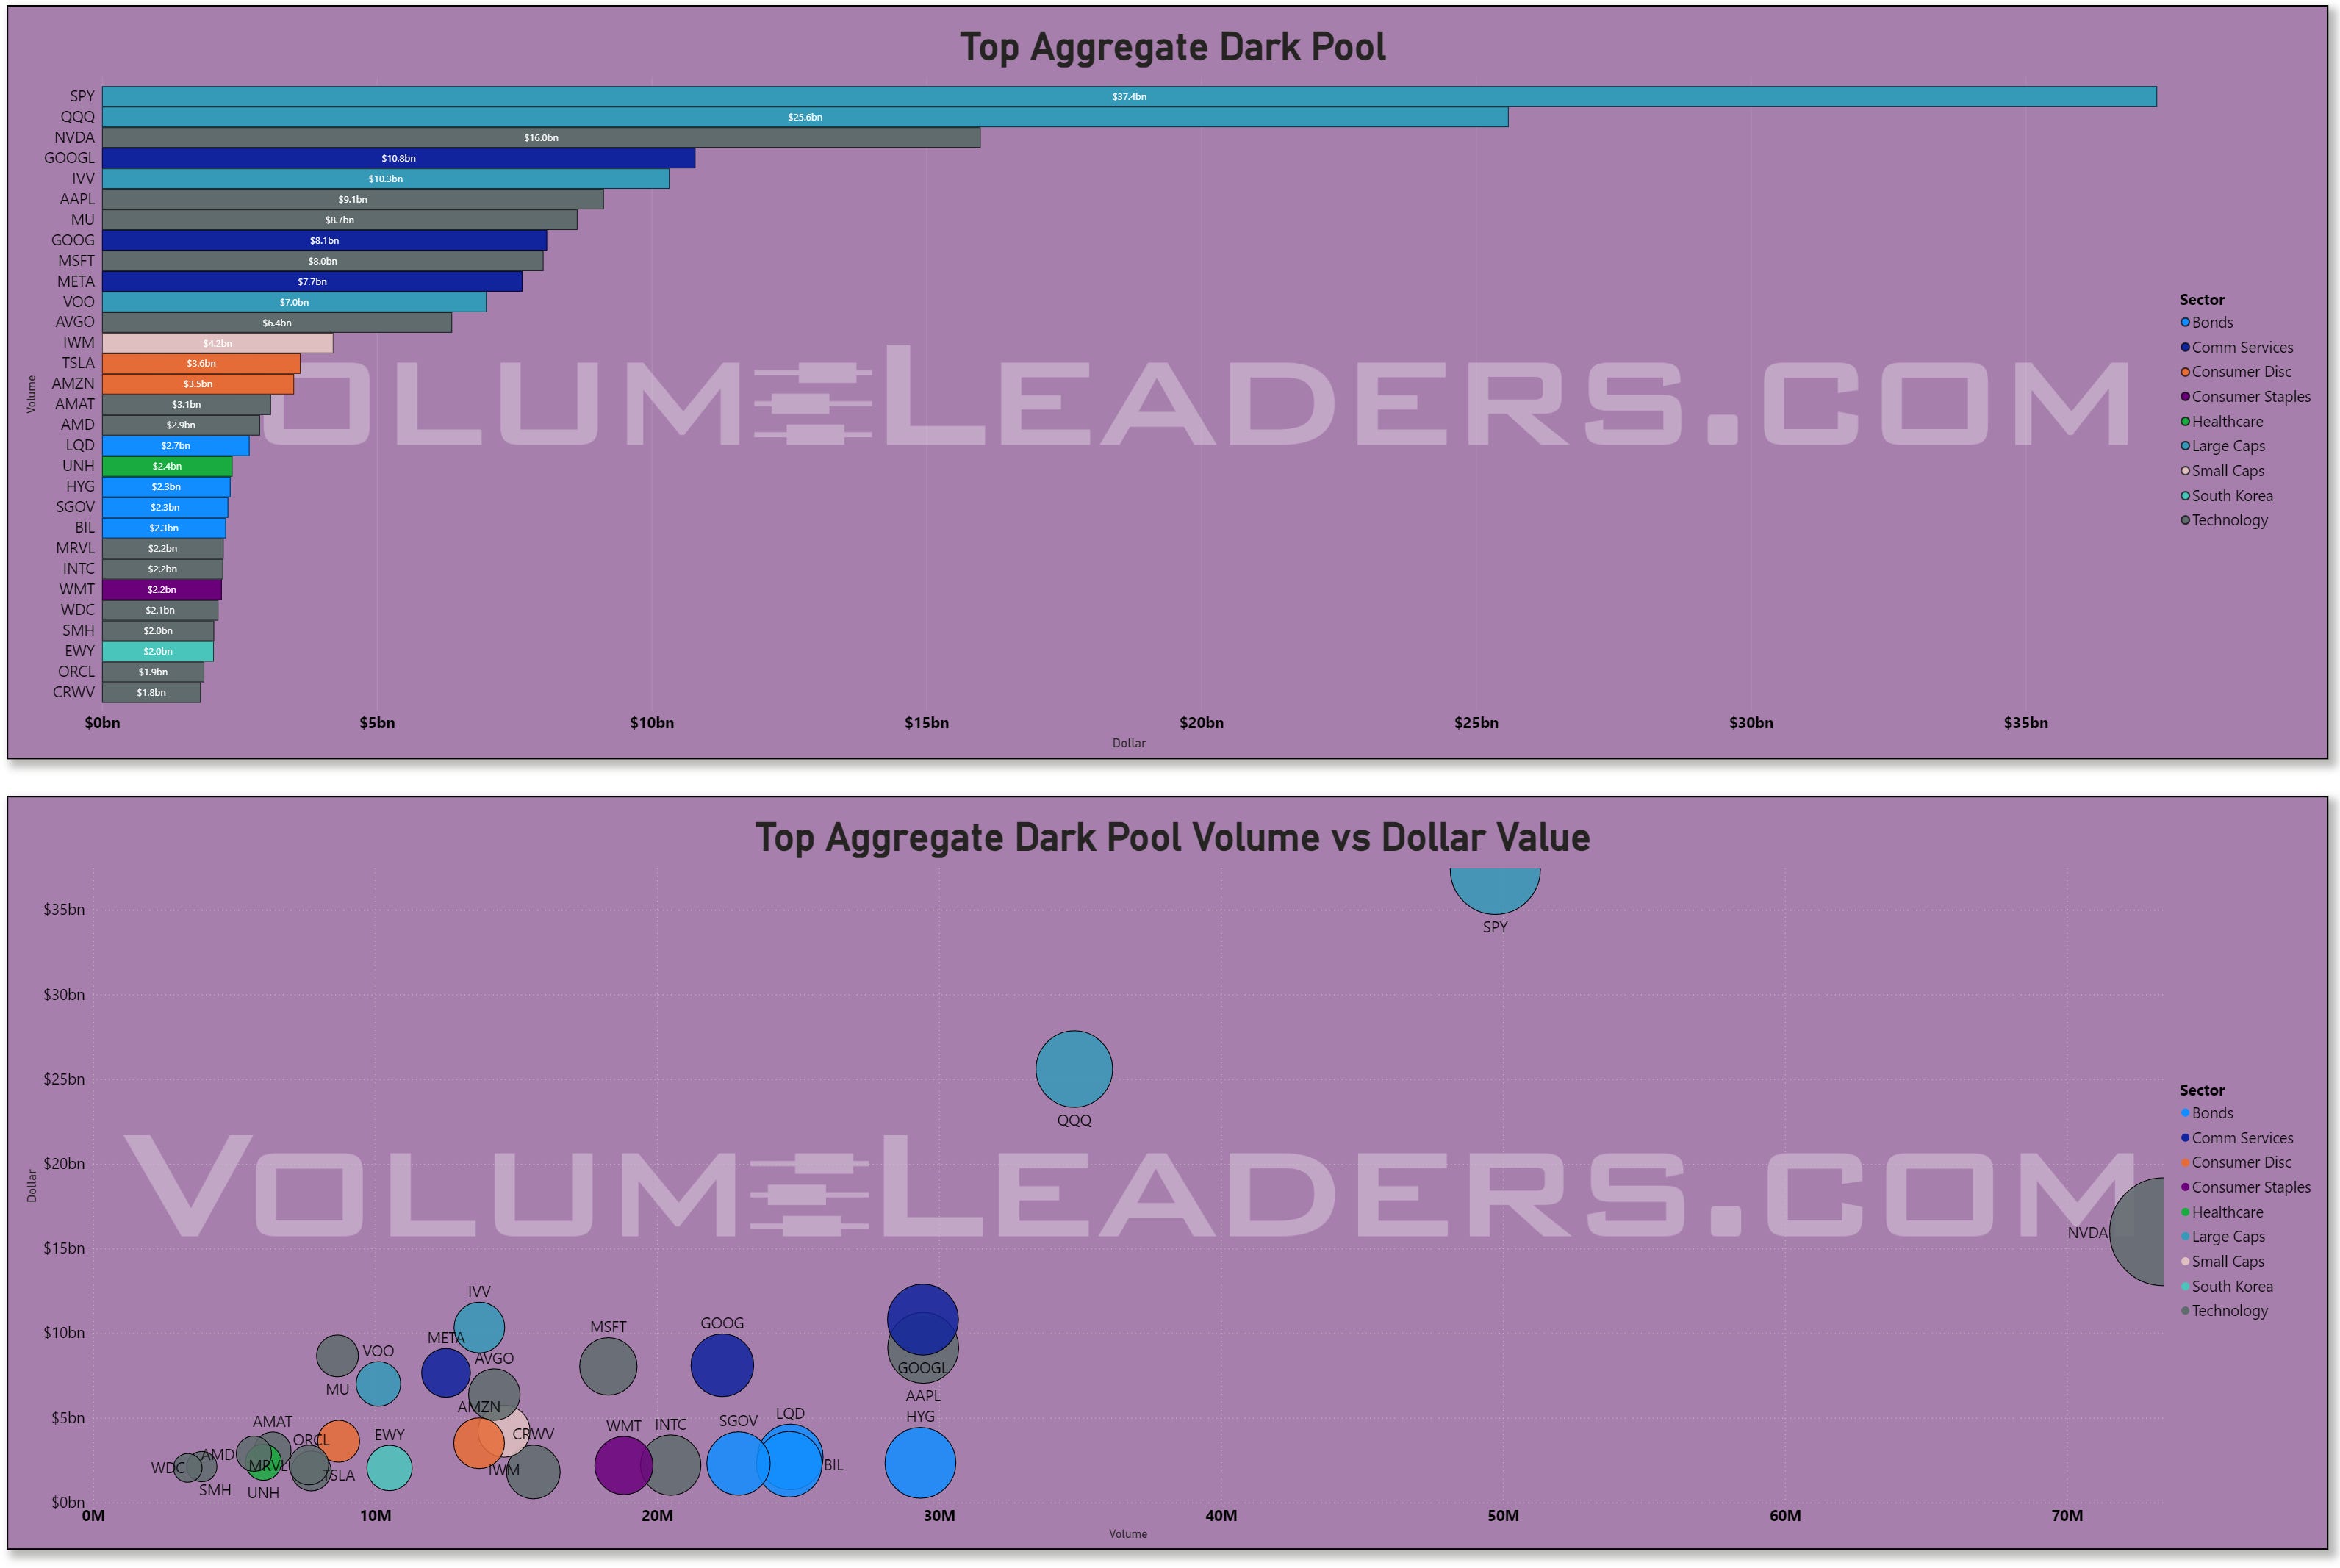
The dark‑pool board shows how quietly that risk was being shifted even before volatility blew out. SPY prints roughly 37.4 billion dollars in dark activity, QQQ around 17.4 billion, and NVDA, GOOGL, IVV, AAPL, MU, MSFT, and META all stack up between 7 and 13 billion. Add in TSLA, AMZN, and a handful of bond ETFs like HYG, LQD, and BIL in the 2–4 billion range, and you get the picture of institutions leaning heavily on block venues to move size in the same names the public tape obsesses over. On the volume/dollar scatter, SPY sits as a huge, high‑volume bubble north of 50 million shares and over 30 billion dollars, QQQ around 40 million shares and mid‑teens billions, and NVDA as a lower‑volume but very high‑dollar node. Before Friday, you could argue that this was balanced redistribution; after a nearly 20‑point SPY flush and a VIX print above 20, the odds tilt toward that dark flow representing meaningful de‑risking by fast money and opportunistic absorption by slower hands rather than pure accumulation.
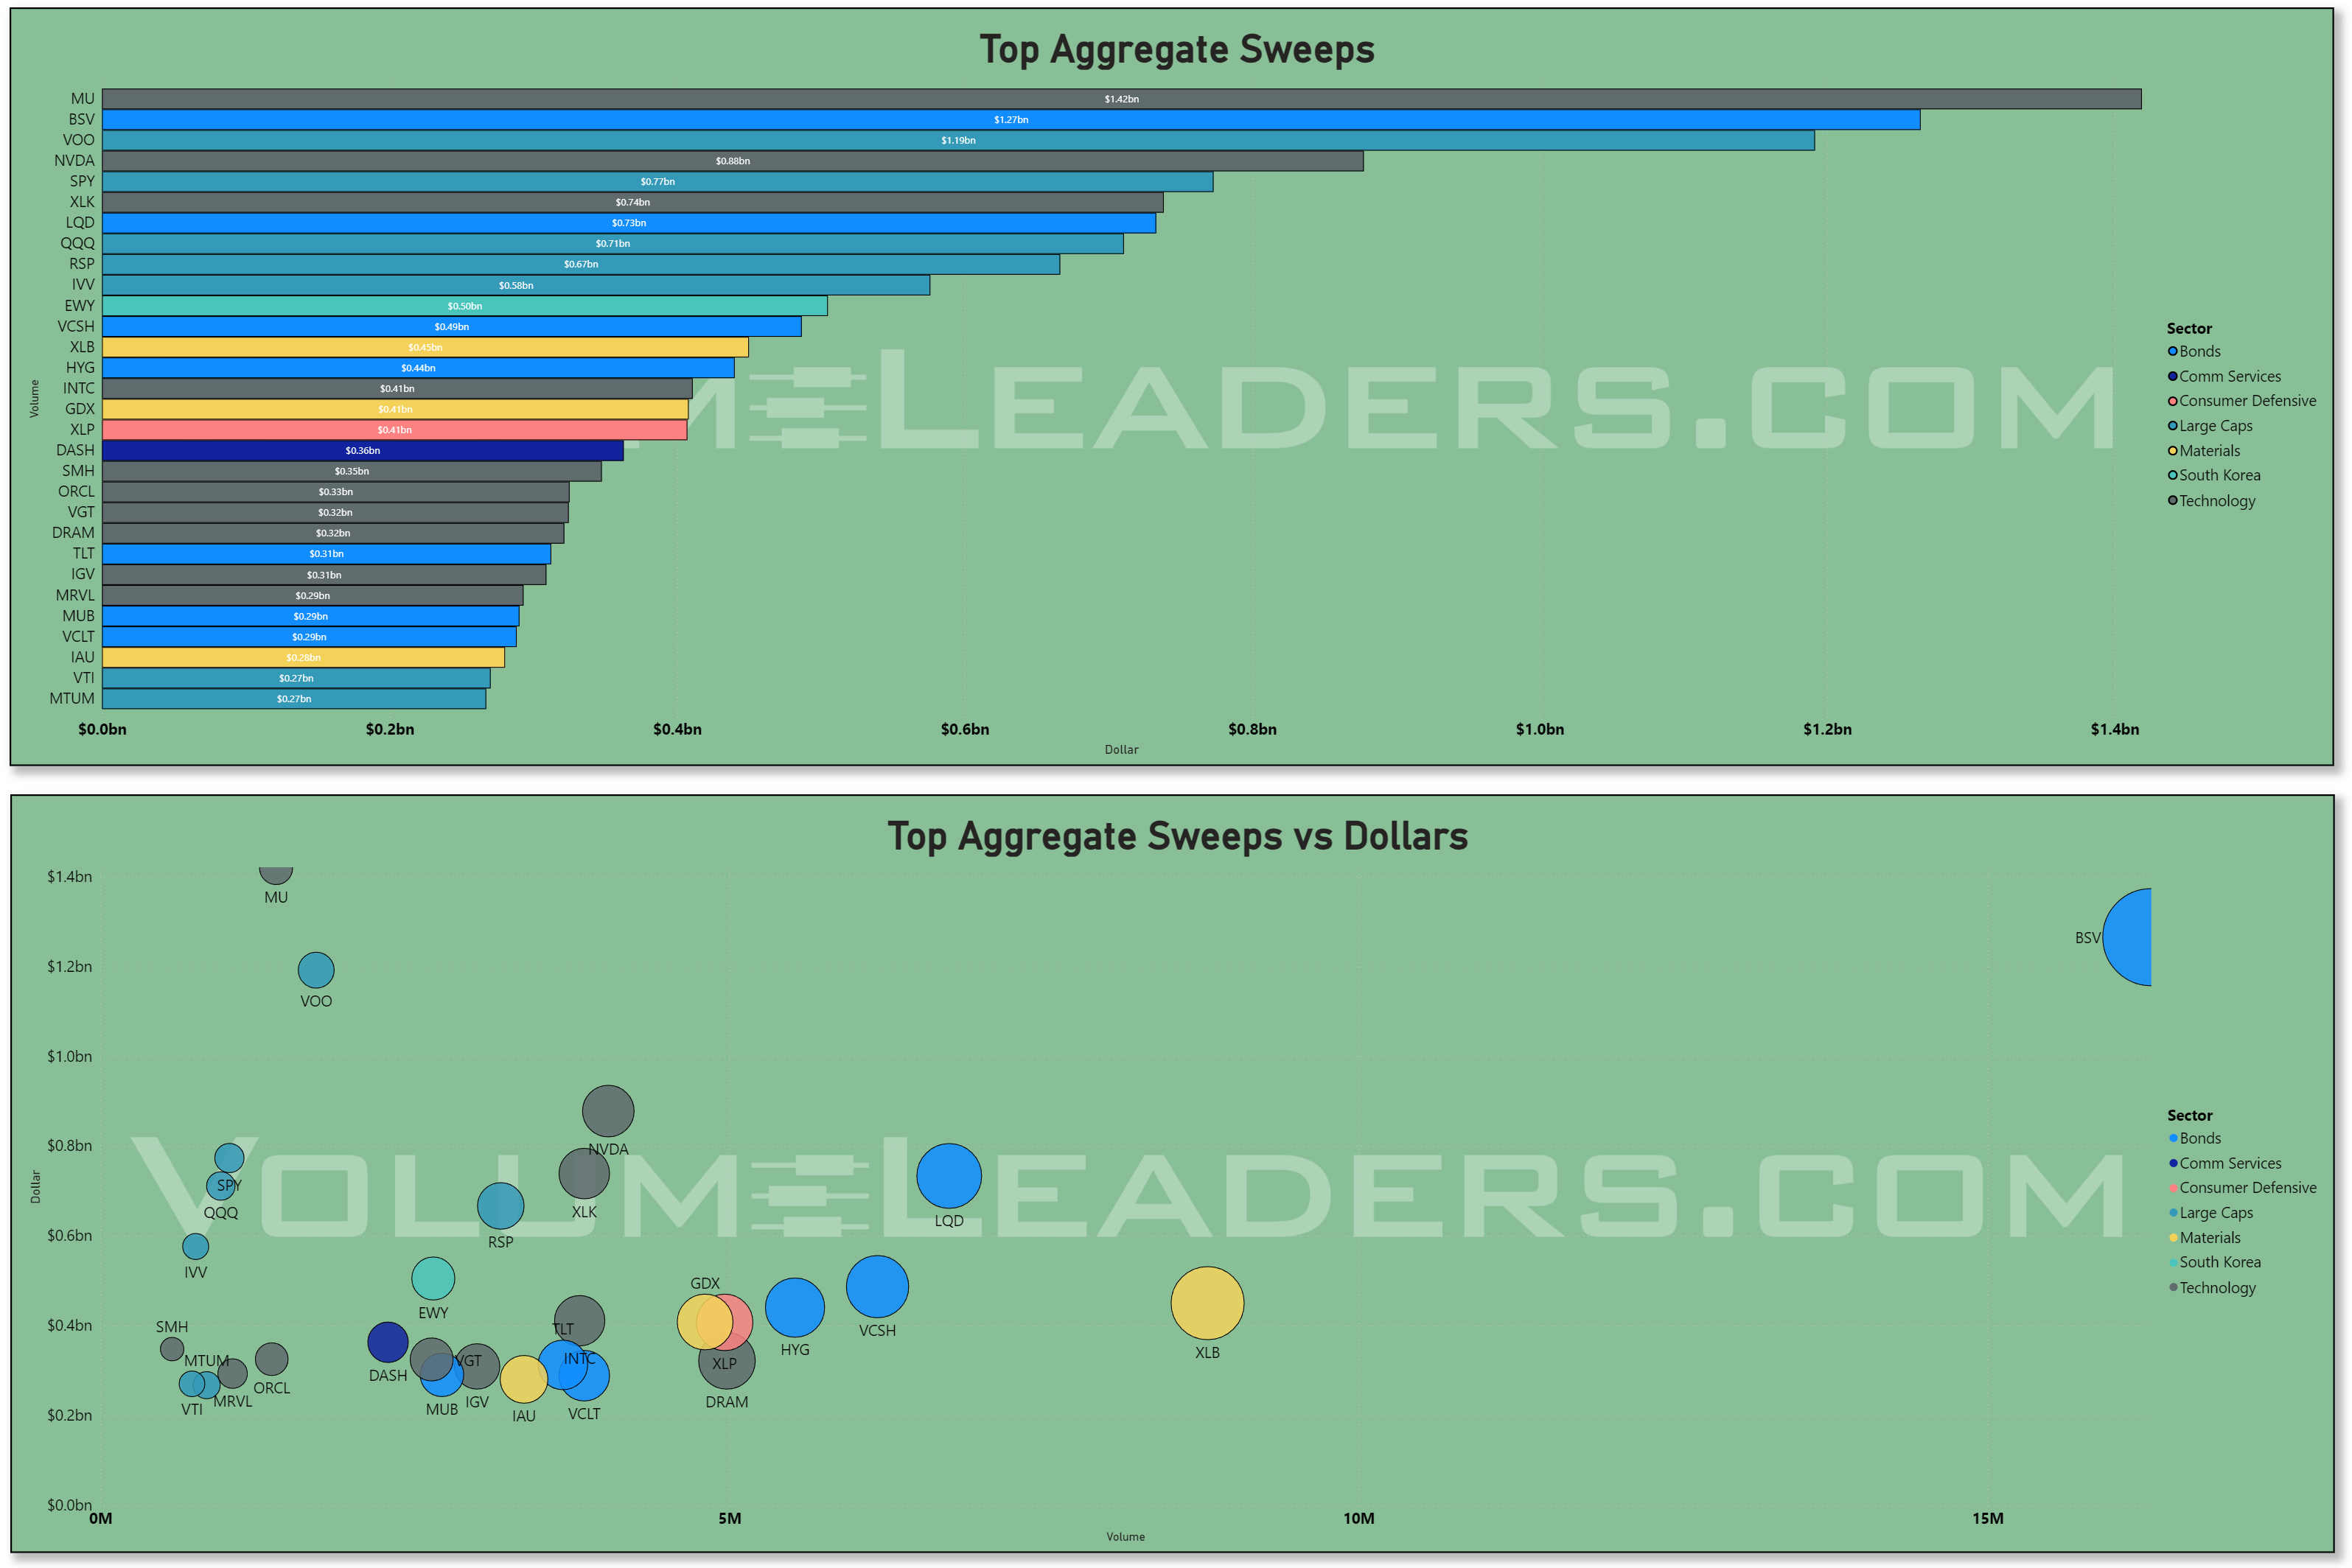
Sweeps give us the tactical lens on how traders reacted as the stress built. MU tops the sweep board with about 1.3 billion dollars in aggregate sweeps, followed by BSV around 1.1 billion. VOO, NVDA, SPY, and XLK each cluster near the 0.6–0.8 billion mark, with LQD, QQQ, RSP, IVV, HYG, and XLB all in the 0.3–0.6 billion range. The scatter shows MU and VOO as high‑dollar sweep magnets, SPY and QQQ as the default hedging vehicles, and bond ETFs like BSV and LQD seeing unusual tactical interest. That pattern fits a week where stronger‑than‑expected jobs data and hot ISM readings pushed the 10‑year yield up into the mid‑4s, keeping the “higher for longer” narrative alive and forcing traders to hedge both equity and rate exposure in real time. Friday’s vol spike is the visible outcome of that shift: what started as controlled rebalancing turned into a full‑fledged VaR shock once flows overwhelmed the available liquidity in the AI and index complex.
From a regime standpoint, the risk backdrop is no longer benign. Earlier in the week, you could argue that volatility ratios were still compressed in the stronger sectors, with up‑moves outpacing down‑moves and risk being rewarded in a reasonably cooperative way. With SPY now 3% off the highs and VIX above 20, the veto layer has tightened. The environment is still compatible with risk — credit has not blown out, breadth is damaged but not collapsed, and macro data still points to resilient growth — but it is now hostile to sloppy risk. Participation remains heavily concentrated in tech and megacaps, and their volatility has shifted from friendly to two‑sided. That means allocation decisions matter more, and execution timing matters a lot more.
Institutions are still deeply engaged in this tape, but the game has shifted from “buy anything with AI and a ticker” to “resize, hedge, and pick your spots.” Big allocators are using SPY, QQQ, NVDA, and the AI complex as their primary levers, with dark‑pool prints and sweeps revealing both de‑risking and opportunistic entry. Bond and credit ETFs are seeing more tactical use as rate volatility picks up, which is consistent with a macro tape where the Fed is openly entertaining the risk of needing to stay restrictive longer while inflation runs above target. For traders, the playbook needs to reflect that shift: this is no longer a regime where every dip can be treated as a low‑volatility gift. It is a regime where you align with the dominant flows, keep size honest, and let volatility confirm or veto your ideas before you press them.
Bottom line: the structural bull story is intact, but after a 3% drawdown, a nearly 20‑point SPY flush, and a VIX spike north of 20, we are now in a high‑energy, de‑risking phase where capital is still concentrated in tech and megacaps, but the tape is finally charging a higher volatility premium for staying in the trade.
MIR Part 2: Individual Names From The Institutional Tape
VolumeLeaders tracks several proprietary signals designed to spotlight names drawing significant institutional interest. Below, we’ve surfaced the latest results and analyzed them to highlight emergent themes. If any of the sectors, narratives, or positioning trends resonate, the names mentioned here offer a strong starting point for deeper research and watchlist consideration.
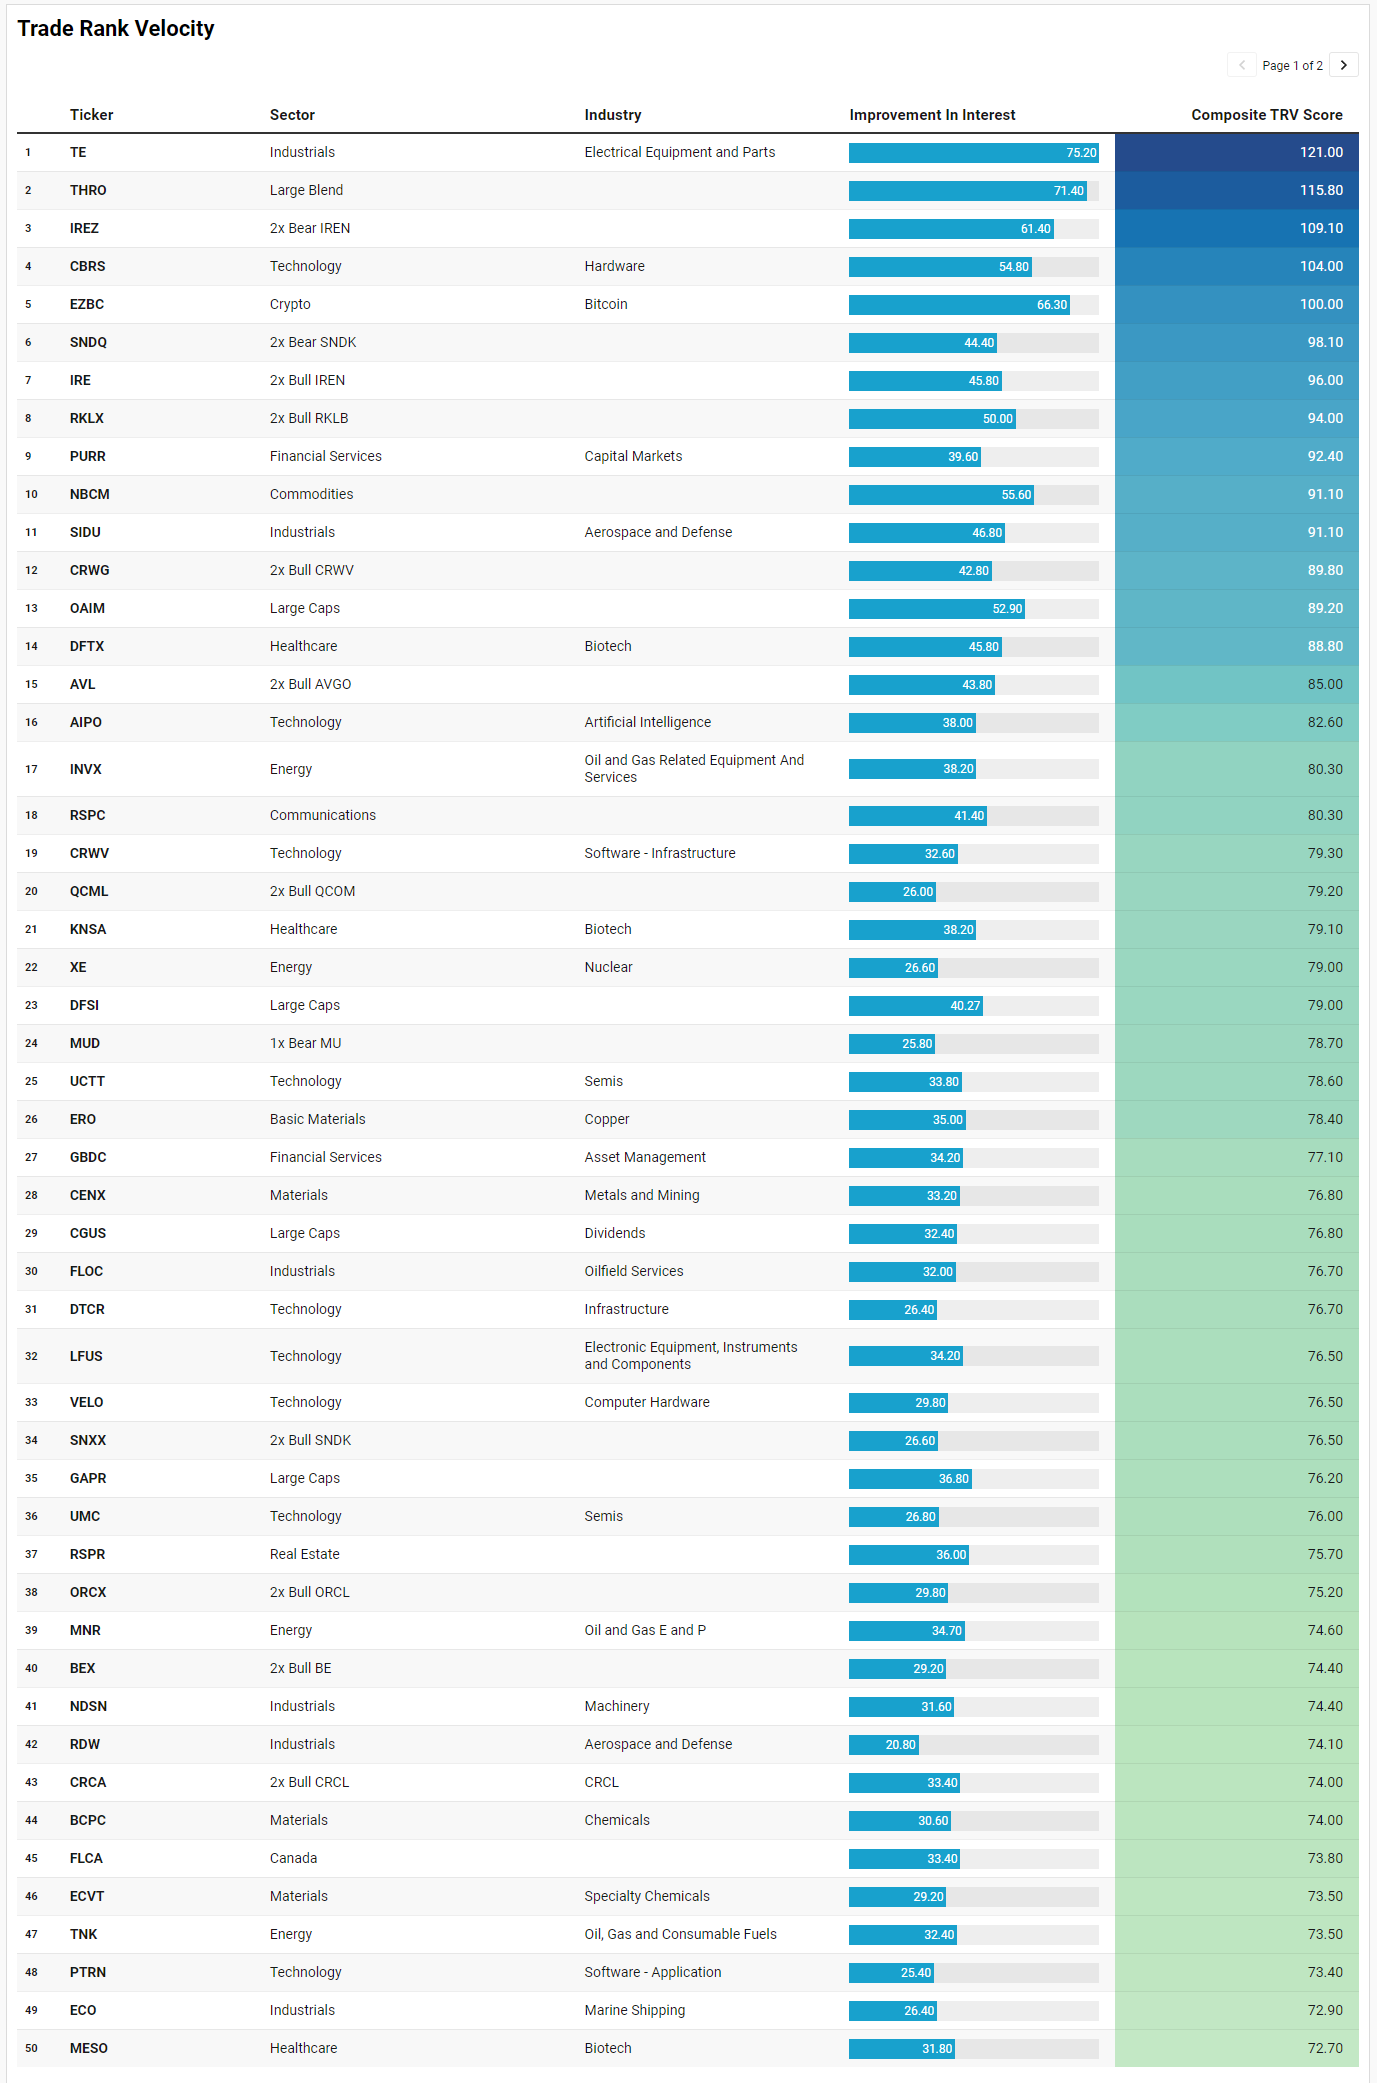
VL Trade Rank Velocity™ (TRV)
TRV is a proprietary metric that measures the recent acceleration or deceleration in institutional trading activity for a given stock by comparing its average trade rank over the past few days to its average in recent weeks. A sharp improvement in TRV typically reflects a notable shift in positioning, often accompanied by sustained trade activity, suggesting institutions are actively engaging with the name and that intensity of activity is rising. This often precludes meaningful price or narrative shifts. This isn’t a buy-list or sell-list; it’s meant to draw your eyes to names where institutions are putting money to work.
There is a pretty clear story hiding in this week’s TRV list, and it lines up almost perfectly with what we have been seeing in the broader tape: a crowded AI and growth complex getting stress‑tested, tactical hedging around the same themes, and renewed interest in hard assets and defense as volatility picks up.
At the top of the list, TE and SIDU sit in industrials, with TE in electrical equipment and SIDU in aerospace and defense. Both show strong improvement in interest and sustained activity, which fits a market that is quietly rotating some attention toward real‑economy infrastructure and defense hardware just as macro data highlight steady growth and lingering geopolitical risk. Names like NDSN, RRX, ARCB, CYD, and a cluster of aerospace/defense tickers (RDW, ARXS, YSS, TDG, EVTL, AXON) round out that theme. The message: even as the AI complex takes a hit, institutions are still willing to pay for earnings visibility leveraged to industrial demand, logistics, and defense budgets.
The second obvious theme is leverage wrapped around the exact megacap and AI names we have been talking about all week. On the bull side you have AVL (2x AVGO), QCML (2x QCOM), MSFL (2x MSFT), MQQQ (2x QQQ), RKLX (2x RKLB), CRWG (2x CRWV), SNXX (2x SNDK), BEX (2x BE), NEBX (2x NBIS), and a long list of other double‑levered products. On the other side of the ledger you see IREZ (2x bear IREN), SNDQ (2x bear SNDK), MUD (1x bear MU), and SMST (1.5x bear MSTR). The fact that both bull and bear expressions in the same complexes are lighting up tells you this is a highly two‑sided, volatility‑driven environment. Traders are not just chasing upside; they are actively playing both directions around the AI, semiconductor, and high‑beta tech ecosystem, which is exactly what you would expect after a week where megacap tech and AI names were hammered while volatility finally repriced.
Within technology proper, you can see how deep the interest runs. CBRS, UCTT, SOXQ, and UMC flag the semiconductor and hardware angle. CRWV, PTRN, GRRR, AEVA, and PENG show up on the software and infrastructure side. AIPO, IGPT, and AGIX bring the artificial intelligence label directly into the list. LFUS, VELO, AEIS, VSAT, NOK, and other components and comms names push the theme further down the stack. That concentration echoes what the institutional flow dashboards were already telling us: AI and its plumbing remain the center of gravity for risk capital, even in the middle of a drawdown. The question is no longer whether capital is there; it is how much of that capital is reallocating versus outright de‑risking.
Another cluster that jumps off the page is energy, resources, and hard assets. INVX and FLOC in oilfield services, MNR and BKV in E&P, LEU and XE on the nuclear and uranium side, ERO in copper, CENX and USAS in metals and mining, ORLA and gold, plus NBCM and FLCA pointing to commodities and Canada more broadly. That tilt toward commodity and resource plays fits both the macro tape and the rate backdrop: oil and gasoline inventories have been tight, PMI price components are still firm, and the Fed is stuck in a “higher for longer” stance as inflation runs above target. When the growth darlings finally wobble and vol spikes, it is not surprising to see more attention on reflation and hard‑asset proxies.
There is also a clear speculative and macro‑overlay thread. EZBC and BKCH flag crypto proxies; both show high improvement in interest, which aligns with a market that still treats Bitcoin and its ecosystem as a high‑beta risk sentiment barometer. IRE and IREZ on IREN, SMST on MSTR, and HIVE on capital markets tie the crypto and AI narratives together. On the fixed‑income side, IUSB and VCRM show up as bond proxies, suggesting someone is using these vehicles to express views on duration risk right as Treasury volatility and the MOVE index stay elevated. That fits the broader story of a market wrestling with resilient growth, sticky inflation, and the prospect of fewer or later rate cuts.
Healthcare and biotech are another important subplot. DFTX, KNSA, MESO, AVNS, OMER, ABVX, TENX, PALI, CPRX, VOR, MASI, AVR, ESTA, LMAT, and LLYVA all populate the list. That is a lot of small and mid‑cap healthcare risk lighting up at the same time that macro volatility is rising. It reads like a combination of event‑driven trading (trials, FDA, M&A) and a search for uncorrelated idiosyncratic upside in a tape where index‑level trades have become crowded.
Finally, there is a consumer and credit undercurrent running through GTX and MOD in auto components, BBW and BOOT in specialty retail, TMHC in homebuilders, SEZL in credit services, and PURR and HIVE in capital markets. With consumer sentiment still choppy and the labor market sending mixed signals, these names give traders a way to express views on the strength or fragility of the real economy without going straight through the mega‑cap index names.
Taken together, the TRV list says the same thing as the institutional flow dashboards and the price action: capital has not left the building, but it has become far more tactical. AI, semis, and megacap tech remain the core battlefield, surrounded by leveraged products on both sides; energy, metals, and nuclear are emerging as secondary arenas for reflation and supply‑shock trades; and smaller pockets in biotech, defense, and consumer credit are offering idiosyncratic edges for those willing to dig. In a world where SPY is 3% off highs and VIX just jumped over 20, that is exactly the mix you would expect — less blind trend‑riding, more deliberate positioning around the same dominant themes.
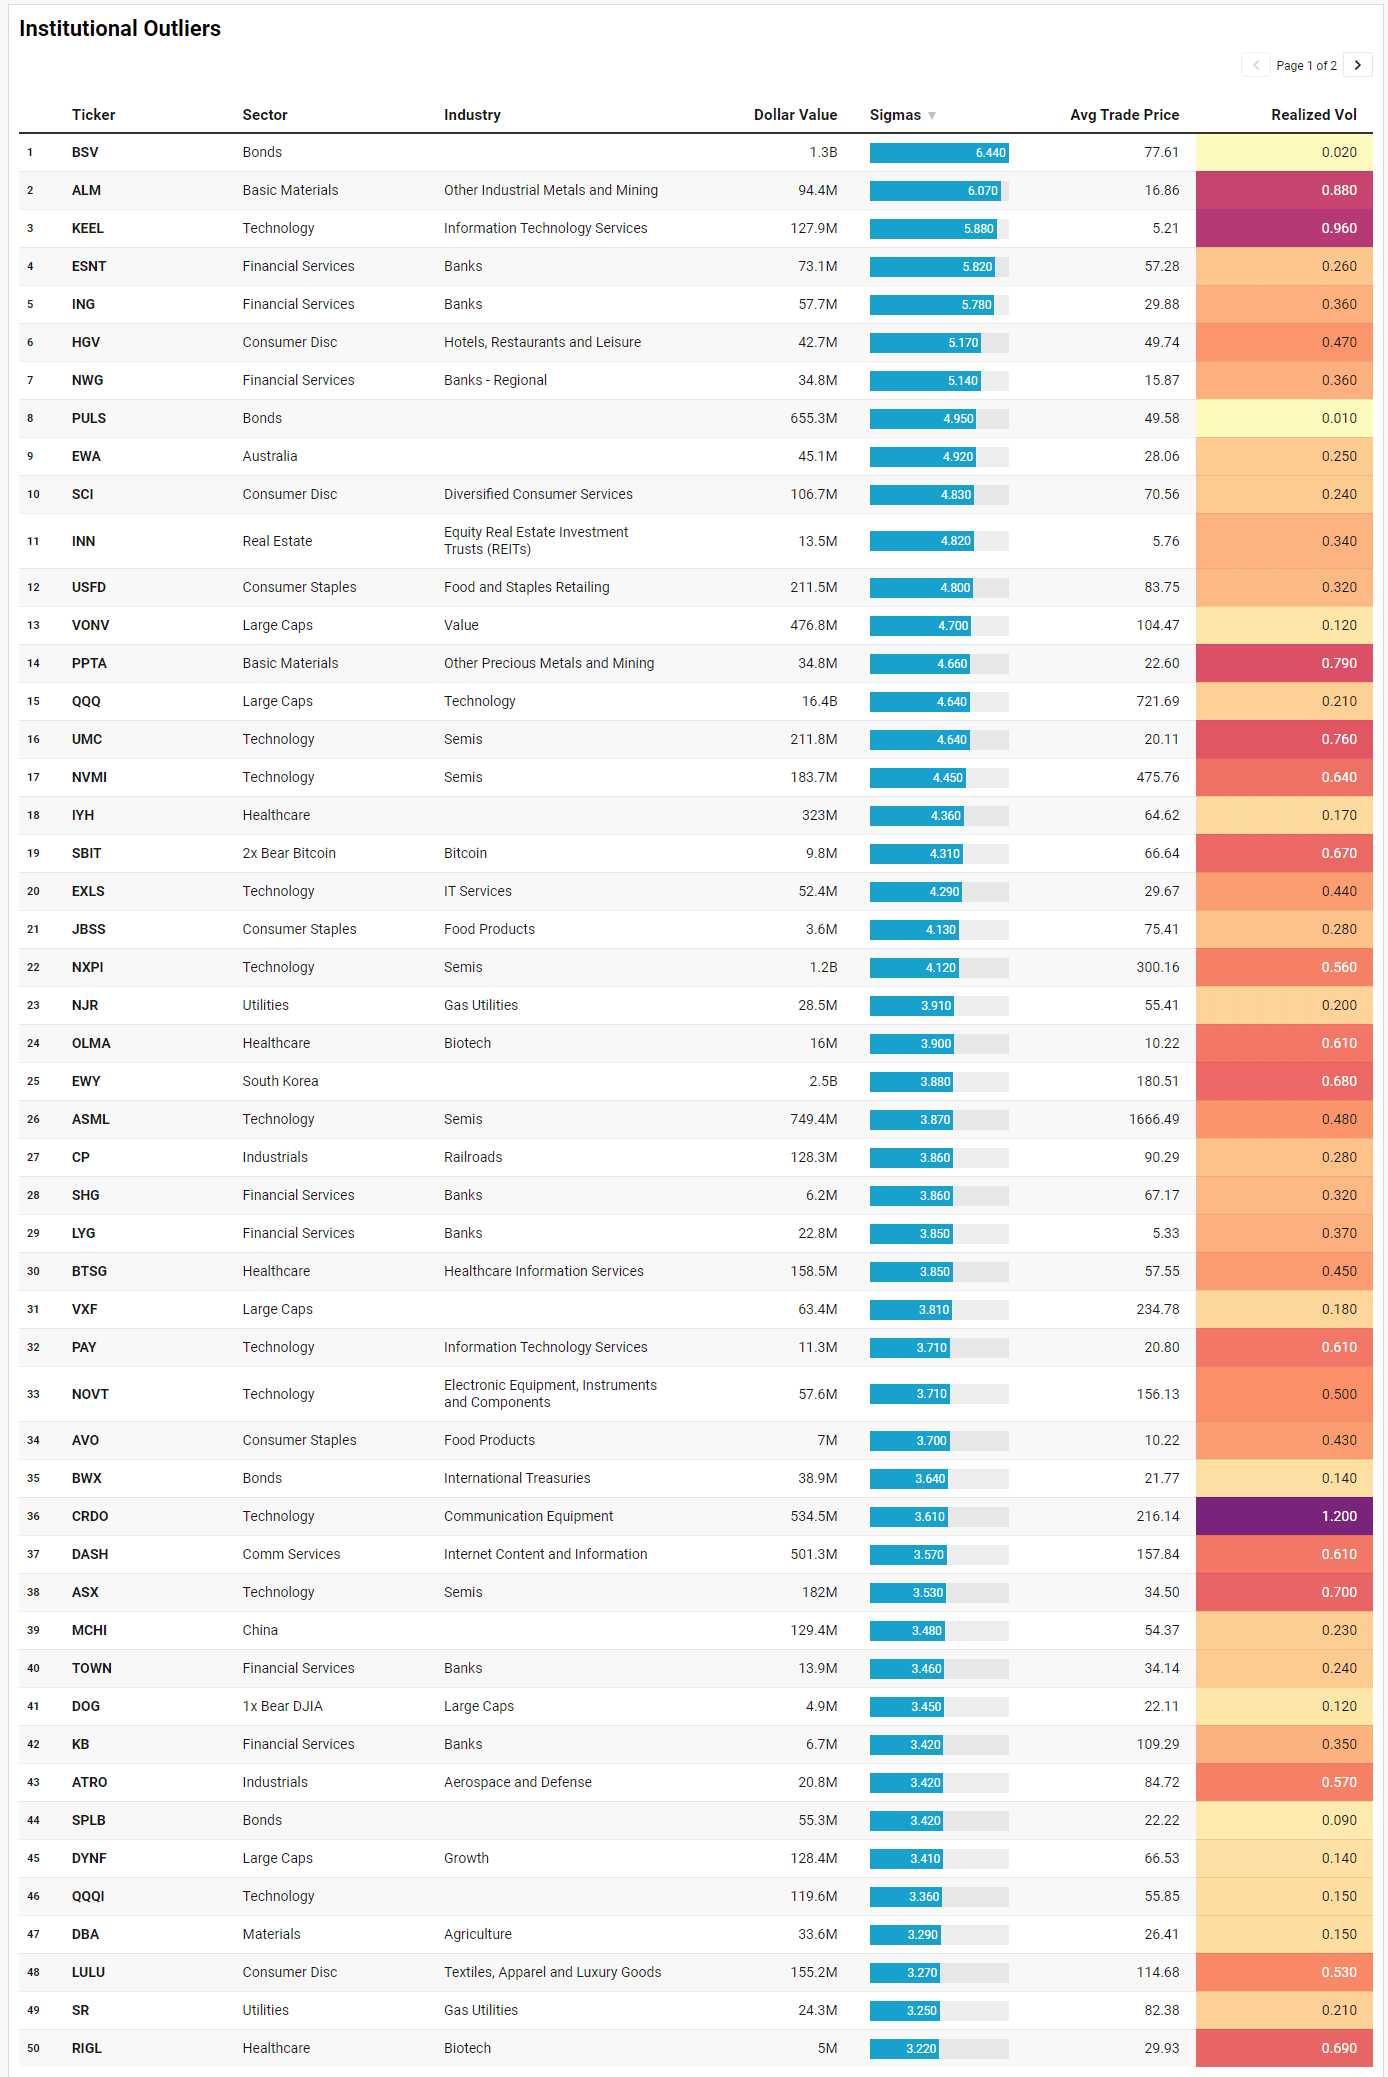
VL Institutional Outliers™ (IO)
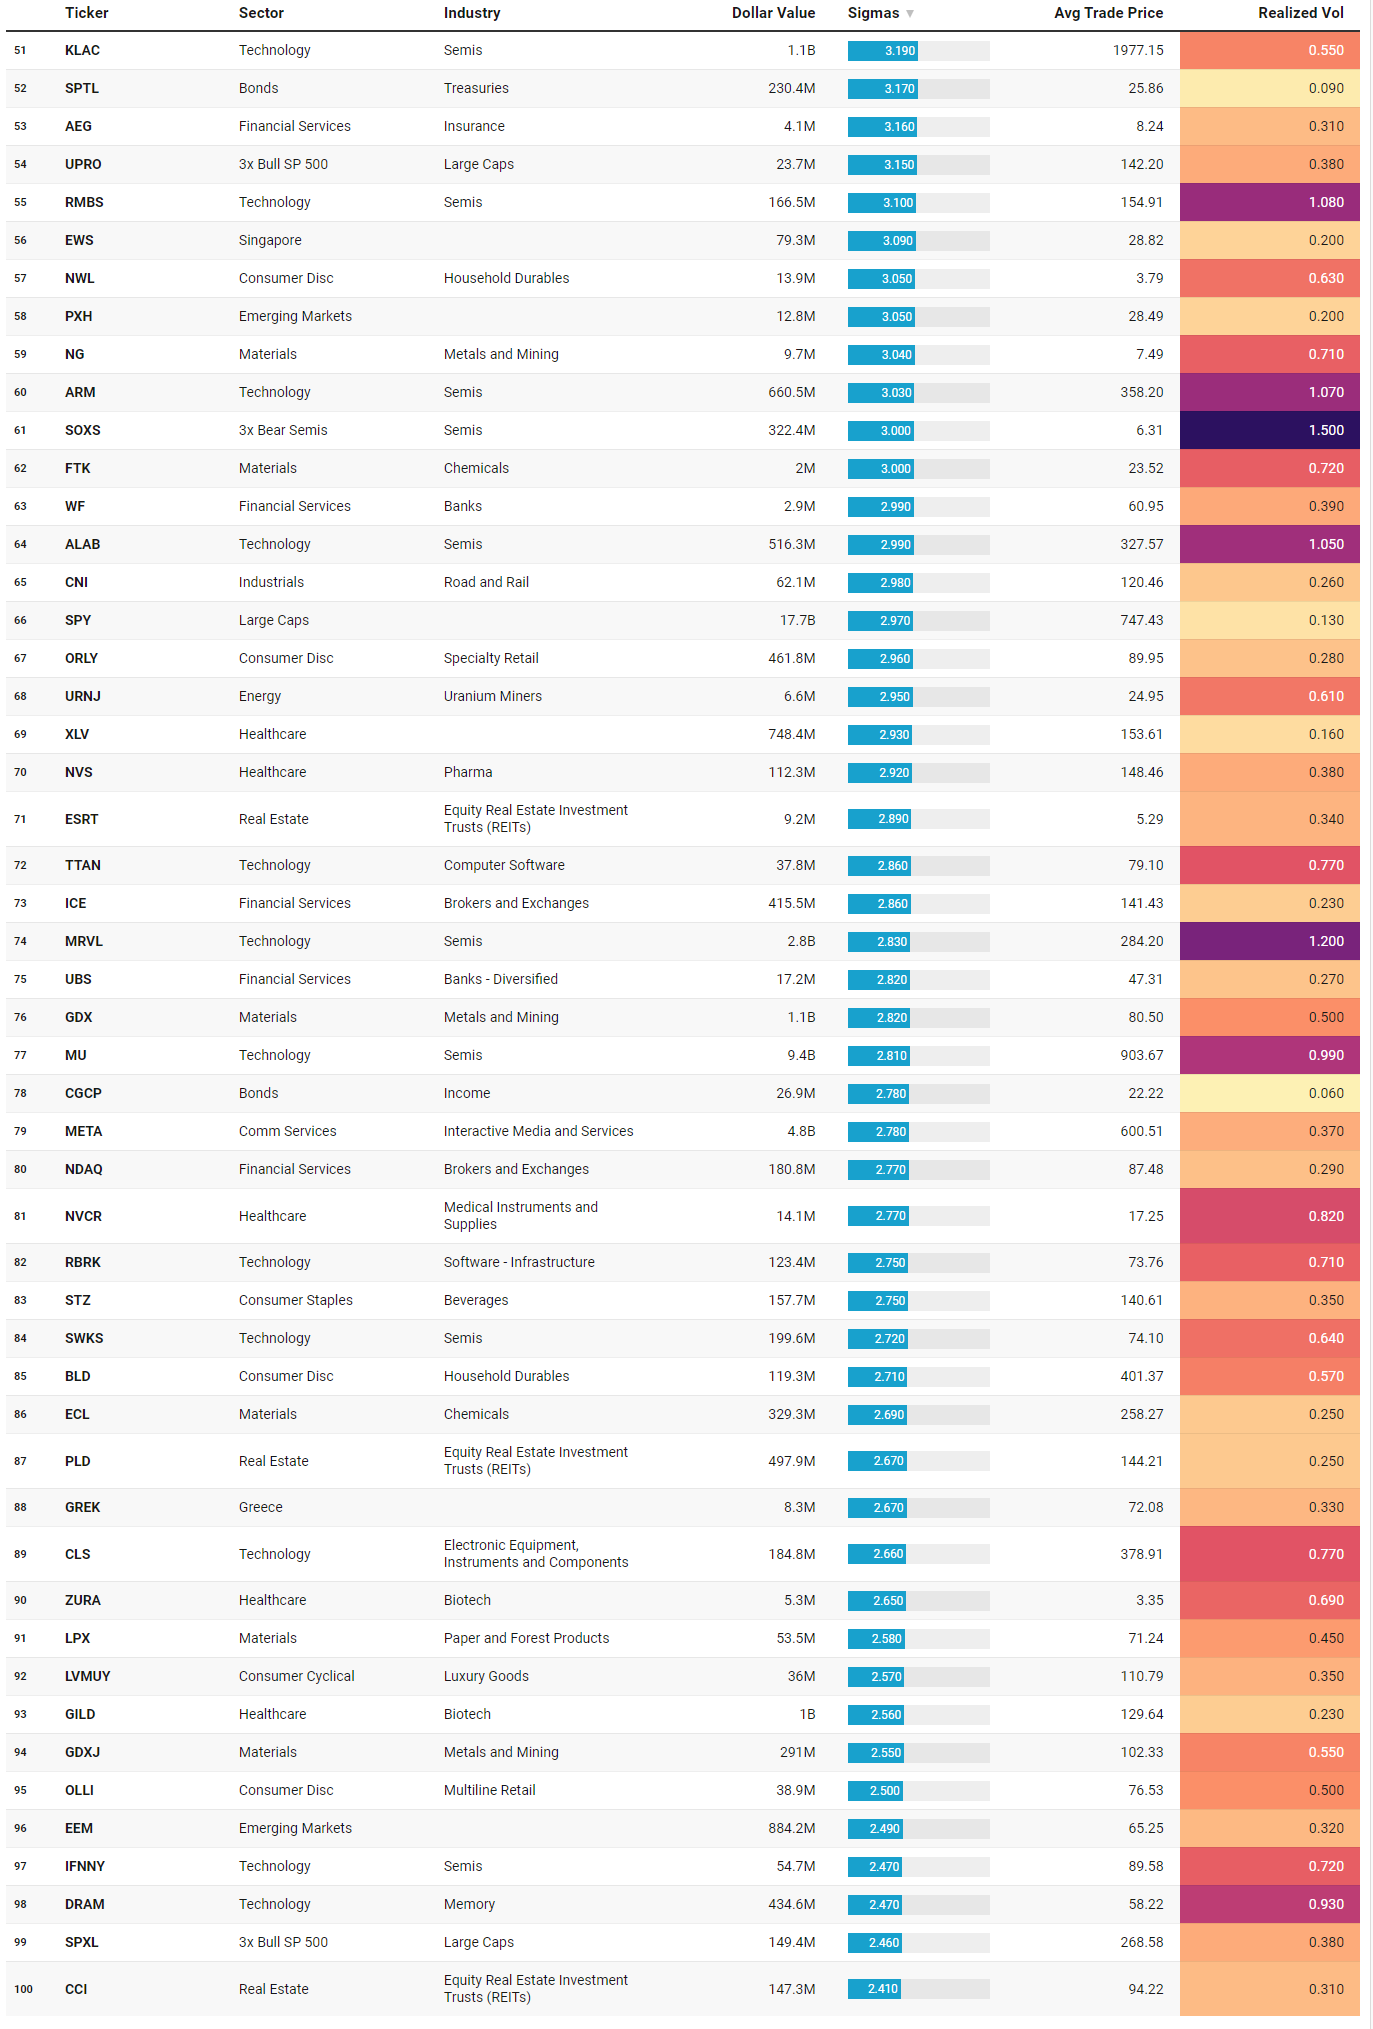
Institutional Outliers is a proprietary metric designed to spotlight trades that significantly exceed a stock’s recent institutional activity—specifically in terms of dollar volume. By comparing current trade size against each security's recent normalized history, the metric flags outlier events that may indicate sudden institutional interest but may be missed because the activity doesn’t raise any flags/alerts when comparing the activity against the ticker’s entire history. For example, it’s conceivable that a ticker today receives the largest trade it has had in the last 6 months but the trade is unranked and would therefore be missed by current alerts built off Trade Ranks. Day traders can use “Realized Vol” to identify tickers that are moving swiftly with large price displacement while others can use it to size your risk appropriately.
The IO list this week reads like a heat map of where institutions were forced to make decisions on Friday’s flush rather than where they were calmly allocating earlier in the week. When SPY drops nearly 20 points in a day and VIX spikes from the mid‑teens into the low‑20s, any name printing four to six sigmas of abnormal dollar flow is telling you something about who is on the other side of that stress.
Start with bonds. BSV, PULS, BWX, SPLB, SPTL, CGCP, and IUSB all show up with elevated sigma scores, led by BSV at about 1.28 billion dollars and 6.44 sigmas and PULS near 655 million and 4.95 sigmas. That is a lot of outlier activity in short‑duration and intermediate fixed income on the same day that rates and macro data kept the “higher for longer” narrative alive. It looks like real de‑risking and hedging in duration: investors parking capital in safer income sleeves or actively trading around Treasury volatility as the MOVE index stays elevated. The low realized vol figures in these ETFs — many in the 0.01–0.14 range — underline that this is capital seeking stability rather than chase.
Equities, by contrast, show outliers in exactly the parts of the market that have been carrying the bull. QQQ prints about 16.4 billion dollars at 4.64 sigmas with realized vol of 0.21, SPY about 17.7 billion at 2.97 sigmas, and SPXL and UPRO — the 3x and 2x bull SP 500 — both register around 2.5–3.2 sigmas. That combination says index‑level risk, and especially levered beta, was being traded aggressively as the market broke. In tech, you see an entire cohort of semis and hardware names lit up: MU at about 9.42 billion dollars and 2.81 sigmas, MRVL at 2.82 billion and 2.83 sigmas, NXPI at 1.23 billion and 4.12 sigmas, KLAC at 1.12 billion and 3.19 sigmas, ARM at 660 million and 3.03 sigmas, ASML at 749 million and 3.87 sigmas, RMBS at 166 million and 3.1 sigmas, SWKS, DRAM, IFNNY, ALAB, NVMI, UMC, and CLS all with elevated outlier scores. Realized vol on these names sits in the 0.5–1.2 range, which is precisely what you would expect when a crowded AI and semiconductor complex gets hit in a single session. The presence of SOXS — a 3x bear semis ETF — at 3 sigmas confirms that some of this was outright hedging or speculative shorting on the downside rather than just long‑only funds cutting risk.
There is also a notable global and EM flavor to the outliers. EEM, MCHI, EWS, EWA, GREK, EWY, and PXH all show abnormal flows, with EWY and EEM particularly large at 2.51 and 0.88 billion dollars respectively. That suggests the de‑risking was not confined to U.S. tech; global equity risk, especially in EM Asia and Europe, was also being resized. With the dollar bid and global yields grinding higher, this fits the usual pattern where EM beta is used as a funding valve whenever U.S. risk wobbles.
On the sector level, financials and exchanges are a quiet but important piece of the story. ESNT, ING, NWG, LYG, SHG, TOWN, KB, WF, UBS, and AEG all show outlier flows among banks and insurers, while ICE and NDAQ appear as significant outliers in brokers and exchanges. These names live at the junction of capital markets and the real economy, so heavy flow here often signals repositioning in response to both rate expectations and trading‑activity sensitivity. In a week where macro data surprised on the upside and rate cut hopes were pushed further out, it is not surprising to see banks, brokers, and exchanges as focal points.
Defensive and real‑asset clusters round out the picture. GDX and GDXJ show elevated flows in gold miners, DBA in agriculture, ALM, PPTA, NG, and LPX in metals, mining, and chemicals, URNJ in uranium miners, and STZ and GILD in beverages and big‑pharma staples. Realized vol here is moderate, not extreme, suggesting these were more measured reallocations into hedges and diversifiers rather than panic trades. Real estate via PLD, CCI, ESRT, and INN also shows up, hinting at investors reassessing rate‑sensitive sectors in light of the latest yield move.
Finally, consumer and discretionary names like LULU, ORLY, BLD, OLLI, LVMUY, NWL, USFD, AVO, SCI, HGV, and BLD appear with outlier flows and moderate realized vol. That fits a tape where the consumer is still holding up in the data, but higher rates and volatility are forcing a rethink of how much cyclicality investors want to carry.
Net‑net, the IO list is exactly what you would expect in a week where SPY is down over 3% from the highs and VIX has finally woken up. Institutions are using bonds and income products as ballast, aggressively trading index and levered beta, hammering or hedging the AI and semiconductor complex, trimming EM and global risk, and selectively rotating into defensives, metals, and gold. It is a classic de‑risking pattern inside an ongoing bull, with the stress now fully visible in both the volatility surface and the outlier flow tape.
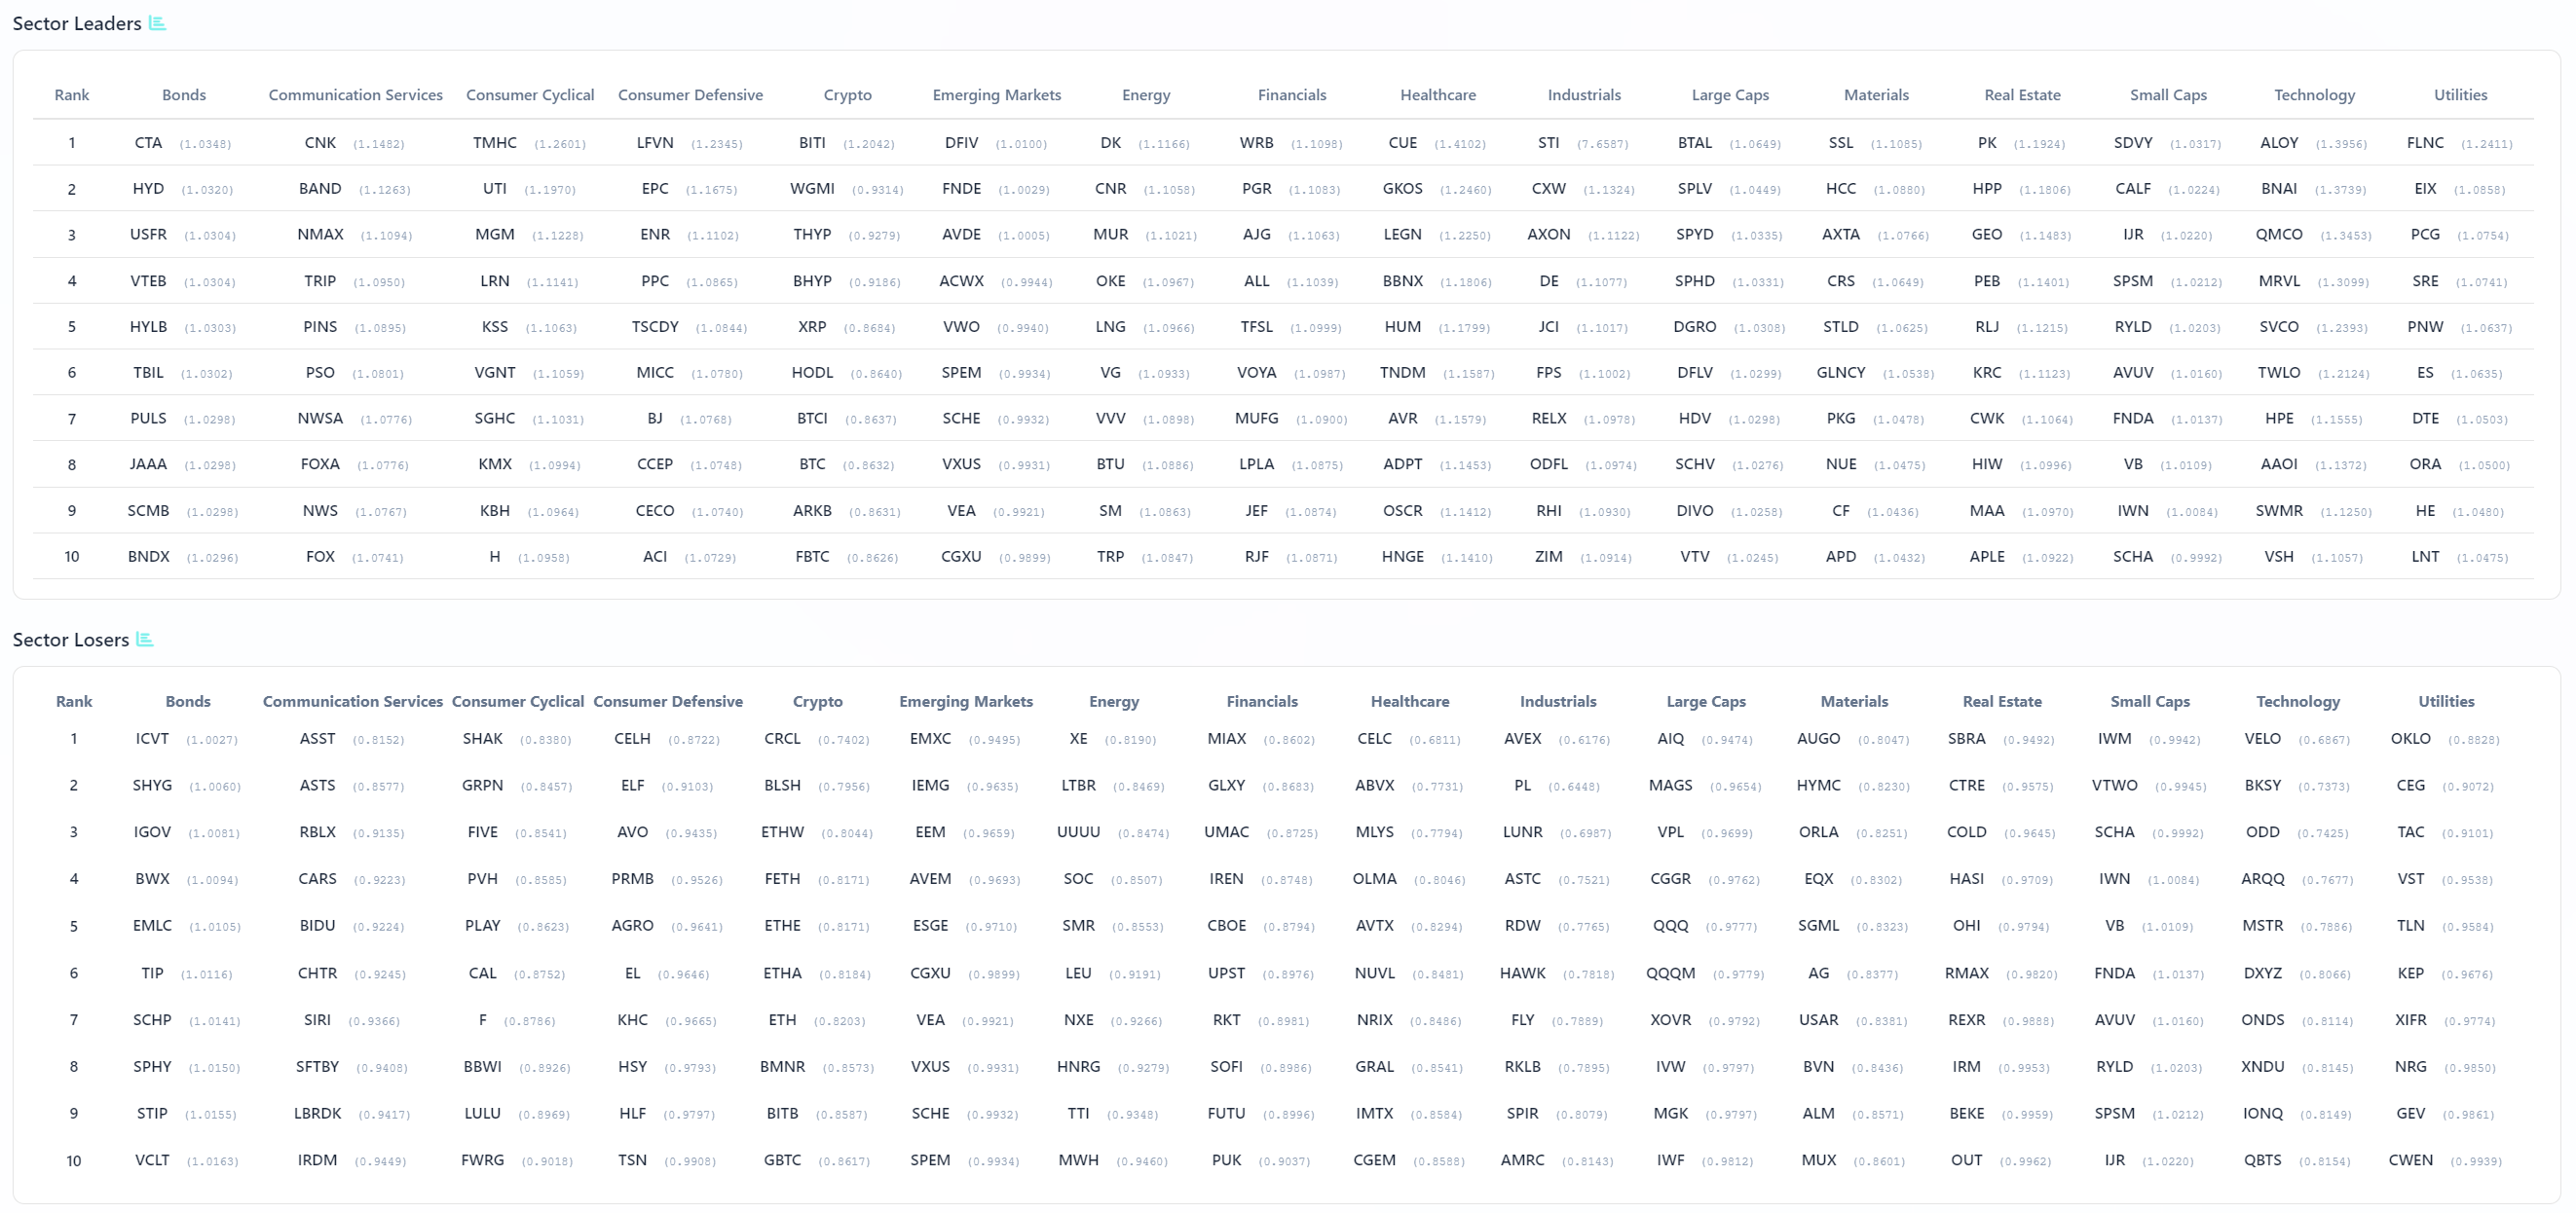
VL Sector Leaders
VL Sector Leaders is a weekly snapshot of where true leadership is asserting itself inside the market, stripped of the distortions that come from broad, style-mixed indices. Rather than asking which stocks look strong in absolute terms, this list focuses on which names are outperforming within the environments they actually compete in.
Each week, we surface the ten stocks demonstrating the most persistent relative strength inside their respective sectors. These are not headline chasers or one-day wonders. They are names that continue to separate themselves from peers through real price behavior, often reflecting sustained demand rather than fleeting attention.
For day traders, this list is a powerful awareness tool. Sector Leaders tend to offer cleaner intraday structure, better follow-through, and more predictable reactions around key levels because they already sit on the right side of relative strength. Even on choppy tape, leadership names often remain tradeable while the rest of the market degrades.
For swing traders, VL Sector Leaders helps narrow the universe to stocks with the highest probability of staying relevant. Relative leaders are more likely to hold trends, survive pullbacks, and reassert themselves after consolidation. When markets rotate, these names are often among the first to resume leadership — or the last to break.
The sector leaders board this week is exactly what you would expect to see after a violent flush from all‑time highs: leadership has not vanished, but it has migrated into pockets of quality, carry, and idiosyncratic strength rather than the broad, high‑beta complex that was driving the tape a month ago. You can almost read the risk preferences line by line.
On the bond side, leaders like CTA, HYD, USFR, VTEB, HYLB, TBIL, PULS, JAAA, SCMB, and BNDX tell you that investors still want yield and ballast. These are not YOLO credit bets; they are a mix of T‑bill and short‑duration Treasury products, high‑yield ladders, and actively managed bond sleeves that tend to attract capital when equities start to wobble. In a week where rates stayed firm and the Fed narrative remained “higher for longer,” it makes sense that leadership in this sleeve is concentrated in vehicles that can clip income while dampening equity volatility. The message is that, even as SPY corrects, allocators are not abandoning risk wholesale; they are re‑anchoring a chunk of it in instruments that can survive a choppy macro path.
In Communications and Consumer land, there is still real momentum. CNK, BAND, NMAX, TRIP, PINS, PSO, NWSA, FOXA, NWS, and FOX sit atop the Communications column, a mix of theaters, media, and content names. On the cyclical side, TMHC, UTI, MGL, LRN, KSS, VGNT, SGHC, KMX, KBH, and H are all leaders, leaning into homebuilders, autos, and education. That is interesting in the context of macro data that continue to show resilient consumption and housing even with higher mortgage rates and sticky inflation. In Consumer Defensive, LFVN, EPC, ENR, PPC, TSCDY, MICC, BJ, CCEP, CECO, and ACI show that staples and defensible business models are working again as volatility rises. Together, these columns say that the market is still willing to sponsor real‑economy stories, especially where pricing power and balance sheets can absorb a higher‑rate backdrop.
Crypto and EM leadership also fits the broader tape. BITI, WGMI, THYP, BHYP, XRP, HODL, BTCI, BTC, ARKB, and FBTC are all in the crypto column, which is almost entirely vehicles that track or inverse Bitcoin. That mix reflects the tug‑of‑war in digital assets: crypto remains a high‑beta expression of risk sentiment, and leadership here can flip quickly depending on whether traders are leaning long or using inverse products to hedge. In Emerging Markets, DFIV, FNDE, AVDE, ACWX, VWO, SPEM, SCHE, VXUS, VEA, and CGXU leading tells you that, even as outlier flows were cutting risk in some EM ETFs, there is still leadership in diversified, factor‑tilted products focused on value and dividends rather than pure beta.
Energy leadership is a little more old school. DK, CNR, MUR, OKE, LNG, VG, WVW, BTU, SM, and TRP dominate that column. You have refiners, pipelines, LNG, coal, and E&P all represented. That lines up with an energy tape where crude and refined products have stayed firm on supply constraints and geopolitical risk, even as broader equities came under pressure. Financials show WRB, PGR, AJG, ALL, TSFL, VOYA, MUFG, LPLA, JEF, and RJF — a run of insurers, brokers, and diversified financials that tend to benefit from higher yields, steeper curves, and increased trading and advisory activity. In other words, the financials that lead in this environment are the ones that can monetize volatility rather than be crushed by it.
Healthcare and Industrials leadership is consistent with that defensive‑quality tilt. CUE, GKOS, AGL, BBNX, HUM, TNDM, AVR, ADPT, OSCR, and HNGE in Healthcare skew toward specialized devices, managed care, and select biotech, not broad beta. On the industrials side STI, CXW, AXON, DE, JCI, FPS, RELX, ODFL, RHI, and ZIM show a blend of security, machinery, logistics, and staffing names — again, businesses with visible demand and often high switching costs. Large‑cap leaders like BTAL, SPLV, SPYD, SPHD, DGRO, DFLV, HDV, SCHV, DIVO, and VTV are exactly the low‑volatility, dividend, and value‑tilted ETFs you would expect to outperform when VIX pops over 20 and the AI complex is getting repriced.
Materials, Real Estate, Small Caps, Technology, and Utilities leadership round out the picture. SSL, HCC, AXTA, CRS, STLD, GLNCY, PKG, NUE, CF, and APD in Materials tilt toward steel, chemicals, and packaging — cyclical, but with pricing power. Real Estate leadership in PK, HPP, GEO, PEB, RLJ, KRC, CWK, HIW, MAA, and APLE leans into selective REITs, not the entire sector, implying the market is differentiating based on balance sheets and asset quality rather than buying the whole space. On the Small Cap side, SDVY, CALF, IJR, SPSM, RYLD, AVUV, FNDA, VB, IWN, and SCHA suggest factor‑tilted small caps with quality and dividend overlays are working better than pure Russell beta.
Technology leadership is particularly telling. ALOY, BNAI, QMCO, MRVL, SVCO, TWLO, HPE, AAOI, VSH, and VCRX sit atop that column. MRVL’s presence alongside HPE and TWLO says the market is still rewarding specific tech names that either sit in the AI capex stack or provide mission‑critical infrastructure, even as broader megacap tech has come under pressure. Utilities leaders like FLNC, EIX, PCG, SRE, PNW, ES, DTE, OGE, HE, and LNT reinforce the overall message: as volatility rises, capital is rotating toward names with regulated cash flows and less earnings uncertainty.
Taken together, this sector‑leaders board is consistent with everything we have seen in price, volatility, and flow. The market has not flipped into full risk‑off; instead, it has become highly selective. Leadership now clusters in quality, yield, defensives, real assets, and a curated subset of tech and industrial names that can justify their risk even with VIX in the low‑20s. The old playbook of “buy any AI or high‑beta growth name” is gone; the new one is about owning the right factors and subsectors inside each sleeve and letting the tape prove which stories deserve capital in a choppier regime.
MIR Part 3: Framing-Up A Trade
This is one of those weeks where the job is less about finding the next clever ticker and more about respecting the regime shift. SPY is over 3% off the highs, Friday was a near 20‑point drive lower, and VIX jumped from the mid‑teens into the low‑20s. The institutional tape says big money has not left the field, but it has stopped treating risk as free. Flows are still concentrated in tech, AI, and the broad index complex, yet bonds, defensives, and hard assets are attracting real dollars. The right response is a portfolio that keeps you in the game but sizes and tilts for a higher‑vol, more selective environment.
I would organize the book into six sleeves, each mapped directly to what we saw in flows, sector leadership, and outliers.
First sleeve: core ballast and income at 28%. Outlier activity in short‑duration bond ETFs like BSV and PULS, plus sizable flows in T‑bill and Treasury products, tells you institutions are rebuilding ballast. I would put 9% into BSV as the main cash‑plus anchor, 7% split between PULS and TBIL to keep some ultra‑short income, 7% into a longer‑duration Treasury sleeve such as SPTL to benefit if growth later wobbles, and 5% split between HYG and LQD for spread carry without going too far down the quality spectrum. This sleeve is there so that if VIX stays north of 20, a meaningful chunk of capital is earning yield and dampening the drawdown rather than riding every equity wiggle.
Second sleeve: quality large‑cap equity and factor tilts at 24%. Leadership among large‑cap ETFs has shifted toward low‑vol, dividend, and value tilts — names like SPLV, SPHD, DIVO, HDV, and VTV dominate the leaders board — while SPY and QQQ remain the primary institutional chassis. I would allocate 9% to SPY or VOO as the core equity anchor, 9% split between SPLV and a dividend product like DIVO or SPHD, and 6% to a value tilt such as VTV or HDV. This combination keeps you aligned with the broad tape but loads the factor deck toward stability and income rather than pure growth beta.
Third sleeve: selective AI and semiconductor exposure at 18%. The flow data say tech and AI remain the center of gravity: NVDA, MU, AVGO, AAPL, MSFT, and QQQ sit at the top of aggregate flow and dark‑pool rankings. The IO list shows outlier activity in MU, MRVL, NXPI, KLAC, ASML, ARM, and others, plus hedges through SOXS and other bearish semis products. That is a stressed but still dominant theme. I would commit 7% to QQQ as the broad AI/tech spine, 7% to a hand‑picked basket of semis with clear institutional sponsorship — for example MU, MRVL, AVGO, and NXPI at roughly equal weights — and 4% to a diversified semis ETF like SOXQ or SMH for breadth. This sleeve acknowledges that the upside path is bumpier, so it is sized smaller than it would have been during the melt‑up, but it keeps you participating if the AI story reasserts itself.
Fourth sleeve: defensive and cash‑flow sectors at 14%. Sector leaders and outliers point to renewed strength in healthcare, staples, and utilities. XLV, IYH, and specific names like GILD show heavy interest; staples leaders such as BJ, CCEP, and STZ are working; utilities names like PCG, SRE, ES, and LNT sit near the top of their column. I would allocate 5% to a healthcare ETF (XLV or IYH), 5% to staples (XLP or a curated basket of BJ, CCEP, and STZ), and 4% to a utilities sleeve (XLU or a PCG/SRE/ES/LNT mix). This sleeve should outperform if the correction deepens and will lag in a straight‑line recovery, which is a trade‑off worth making in a higher‑vol regime.
Fifth sleeve: energy, metals, and hard assets at 8%. Flows into energy and metals have picked up: leaders include DK, MUR, OKE, LNG, BTU, SM, TRP in energy, and SSL, HCC, STLD, GLNCY, PKG, NUE, and APD in materials. GDX, GDXJ, URNJ, NG, and ORLA all showed up as outliers or TRV names, pointing to growing interest in gold and miners. I would put 3% into an energy basket spanning pipelines and producers (for example LNG, OKE, MUR, and TRP), 3% into gold and miners via GDX or a GDX/GDXJ/ORLA combination, and 2% into industrial metals such as a copper name like ERO or a broader metals ETF. This sleeve is a reflation and geopolitical hedge; it will not lead every day, but it hedges the inflation and commodity‑shock scenarios the macro tape still keeps on the table.
Sixth sleeve: tactical and hedges at 8%. The outliers are full of levered and inverse products — SPXL, UPRO, DOG, SOXS, BITI — which is exactly what you would expect when VIX jumps and SPY sells off hard. Rather than mirror every one, I would formalize a modest tactical sleeve: 3% in index hedges via SPY puts or a small allocation to something like DOG or SPXS, 2% in a short‑term volatility or structured product that benefits from continued swings, and 3% left as explicit cash. This sleeve is about flexibility. It gives you the ability to lean into stress when breadth and vol improve, or to keep some downside protection live while the rest of the portfolio stays invested.
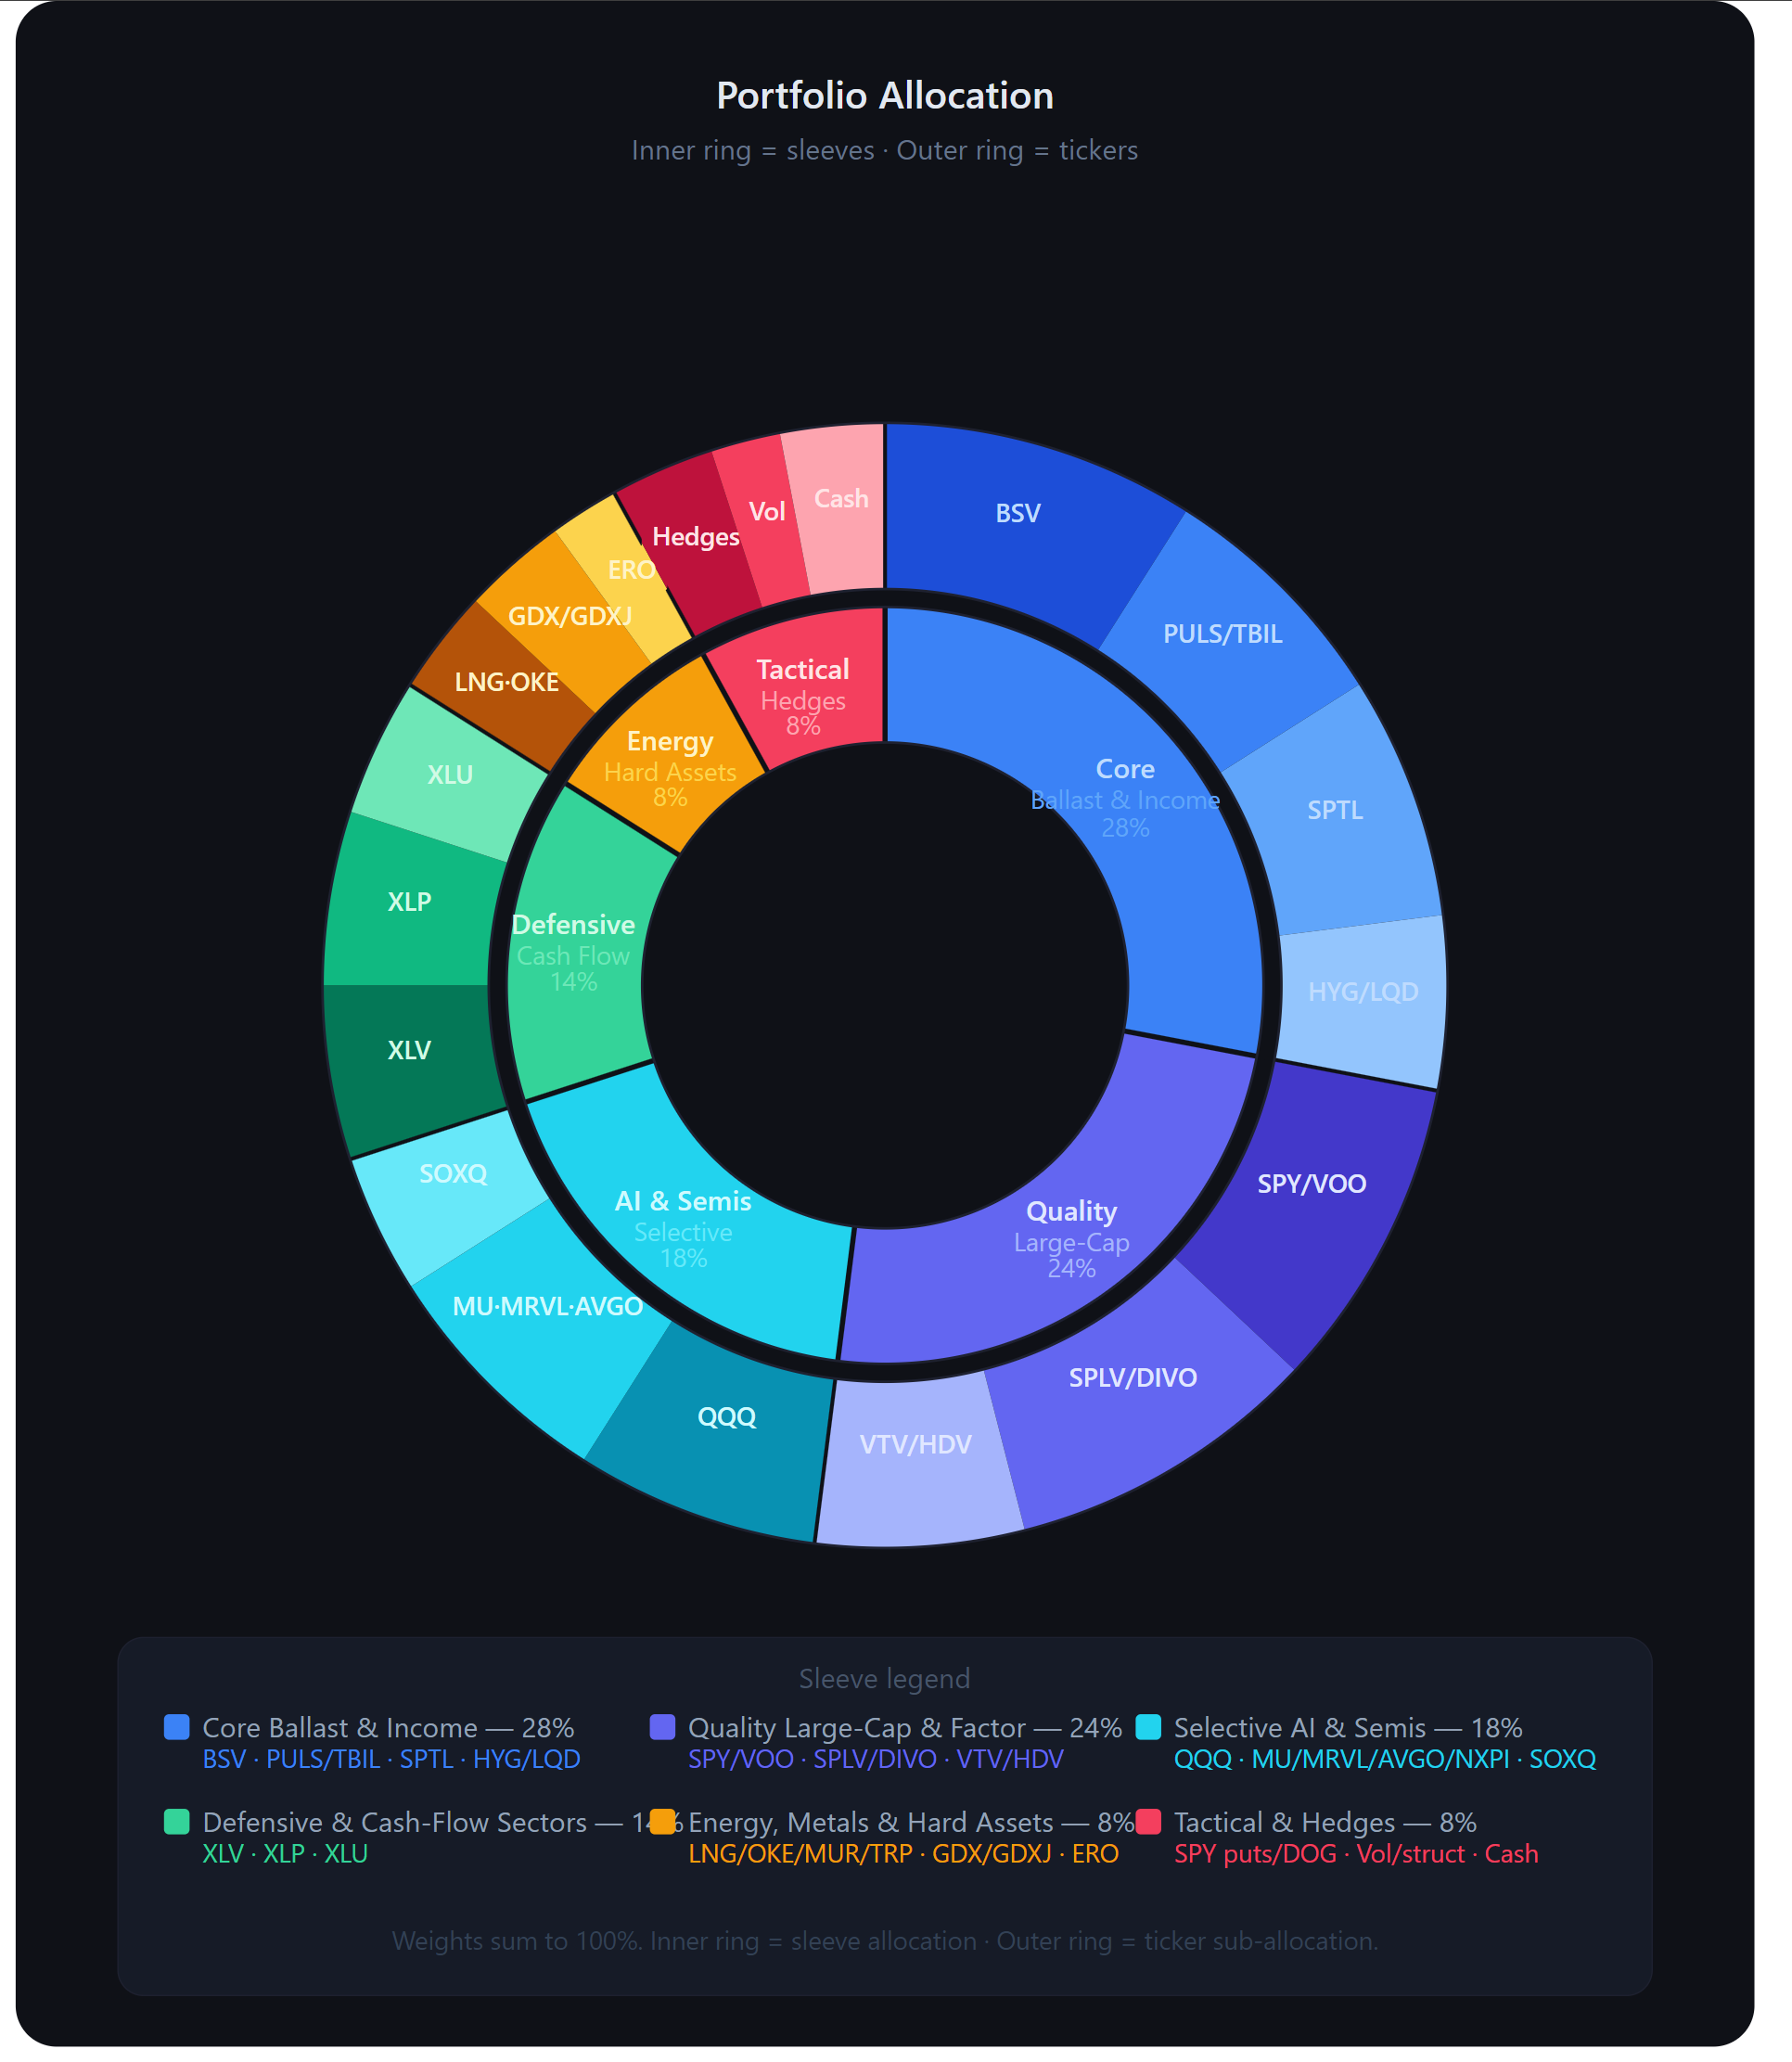
Net‑net, that leaves you with: 28% ballast and income, 24% quality large‑cap beta, 18% curated AI and semis, 14% defensives, 8% hard assets, and 8% tactical/hedges. It is not the cheapest‑gamma version of the market, but it lines up with what the institutional tape is actually doing: staying engaged in the dominant themes, rotating toward quality and income, using bonds and hard assets as ballast, and finally treating volatility as a cost that has to be managed rather than ignored.
Thank you for being part of this community and for investing your time in this week’s edition. The quality of this readership — thoughtful, disciplined, engaged — is what makes this work meaningful. I’m grateful to build alongside you. Here’s to a week of clarity, conviction, and well-executed opportunities.
— VolumeLeaders