Market Momentum: Your Weekly Financial Forecast & Market Prep
Issue 93 / What to expect June 01, 2026 thru June 05, 2026


Weekly Market-On-Close Report
Narrow Breadth, Big Money, And The June Setup
The market finished May in one of those deceptively strong states that can make both bulls and bears uncomfortable. The tape is rising, the headlines feel calmer, and record highs are becoming familiar again, but the underlying message is more selective than celebratory. A combination of easing Middle East tension, another round of AI enthusiasm, and still-solid corporate fundamentals helped push major U.S. indexes to fresh highs into month-end. At the same time, inflation remains sticky enough to keep the Federal Reserve constrained, long-end yields have stayed elevated, and market participation is not as broad as the headline indices suggest.
That is the setup for June: a market with real momentum, but also real fragility. The right way to think about the past week is not that risk has been universally repriced higher. It is that investors have become more comfortable paying up for a very specific cluster of outcomes. Those outcomes are led by AI capex, resilient corporate profits, still-functional U.S. growth, and some moderation in geopolitical tail risk. Everything else remains conditional.
One reason the rally felt so smooth late in the week is that the macro backdrop stopped actively fighting it. Two immediate supports: hopes for a Middle East peace arrangement that would reduce pressure on crude prices, and relentless demand for AI infrastructure after Dell posted a blowout outlook. That combination mattered because it hit both sides of the market’s current anxiety function. Lower oil eases inflation fear at the margin, while stronger AI-linked demand reinforces the idea that a large part of current earnings growth is not speculative narrative but actual spending. In other words, investors were given permission to keep owning growth without feeling like they were ignoring the macro completely.
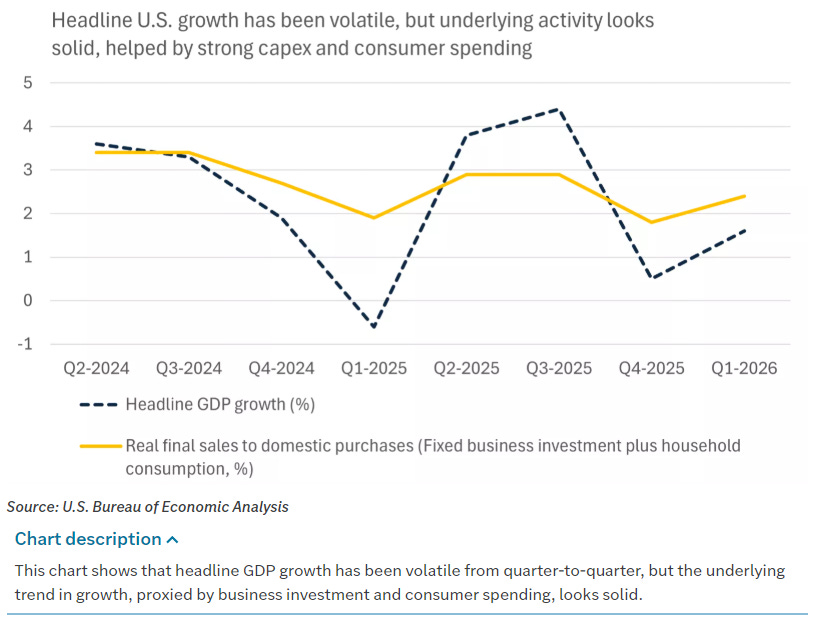
Other weekly market notes struck a similar tone, though with different emphasis. Investors should stay focused on the underlying fundamentals rather than the headline noise, resilient consumer spending, booming business investment, and robust corporate profits even after GDP was revised down to a softer 1.6% annualized pace to start the year. This is a market that has repeatedly worked through conflicting geopolitical and policy headlines, while large caps continue to outpace small caps and policy divergence abroad remain a meaningful driver of cross-asset behavior. This is not a broad, synchronized cyclical melt-up. It is a narrow but credible expansion led by the biggest balance sheets, the heaviest capex spenders, and the companies most directly levered to the AI build-out.
That narrowness is not a footnote. It is the central fact of the tape. Breadth has remained uneven and mega-cap tech has done much of the heavy lifting. While the S&P 500 has historically averaged a 0.6% gain in June with a 64% win rate, the market is entering the month with narrowing breadth and a backdrop that still demands respect for oil and interest-rate risk. The implication is straightforward: the trend is still up, but it is being carried by fewer shoulders.
That observation becomes more useful when paired with the institutional flow picture. The week’s aggregate flow, dark-pool activity, and sweep activity all pointed to concentrated sponsorship in large-cap technology, index wrappers, and selected infrastructure names. NVIDIA, SPY, Microsoft, Apple, and other large-cap growth vehicles dominated the dollar rankings, while dark-pool prints and tactical sweeps showed that institutions were not simply drifting into those names passively. They were actively using every execution venue available to establish, defend, and recalibrate those positions. That matters because leadership driven by real dollars is more durable than leadership driven by retail narrative alone, even if it can still become crowded.
The month-end context makes those readings even more important. The MSCI May 2026 review implemented its changes at the close on May 29, creating a major liquidity event and forcing benchmark-sensitive repositioning across global portfolios. Any attempt to interpret the final session of the month without that in mind will overstate the purity of the directional message. Yet the more interesting point is not that rebalance mechanics boosted activity. It is where institutions chose to use that liquidity. They reinforced exposure to the same themes that had already been leading: AI, semiconductors, software-enablement, logistics, energy, and selected quality income. Rebalance days reveal preference because they give desks the best opportunity to move size with minimal signaling cost. The tape used that window to lean into the existing hierarchy, not overturn it.
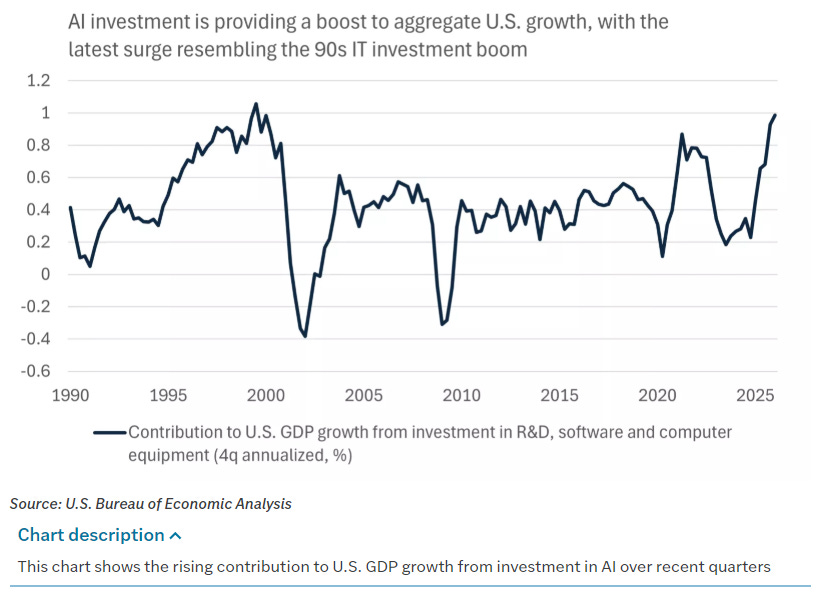
That hierarchy starts with AI, but it does not end there. The most persuasive part of the current bull case is not simply that investors remain willing to pay high multiples for a handful of mega-caps. It is that AI-related spending keeps showing up in multiple places at once. The latest leg can be framed through Dell’s guidance and evidence of ongoing infrastructure demand. IT equipment and software spending alone added roughly 1.5 percentage points to GDP growth, reinforcing the idea that AI capex is becoming macro-relevant rather than niche. When that spending impulse shows up in index leadership, earnings revisions, GDP composition, and institutional flow concentration, it stops looking like a fad and starts looking like the dominant investment cycle of the moment.
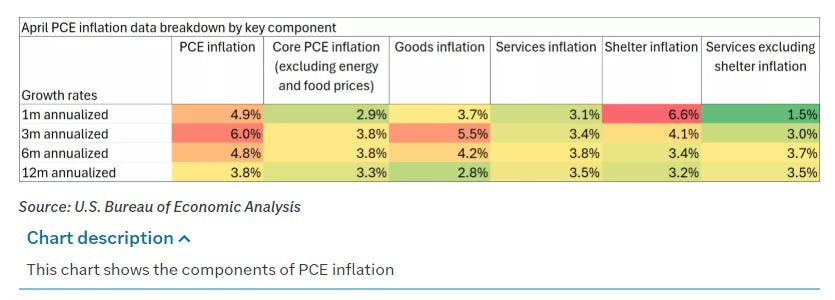
Still, no cycle trades in a vacuum, and the macro guardrails remain tight. April core PCE inflation ran at 3.3% year over year, while the headline PCE measure rose 3.8%. Monthly core inflation came in at 0.2%, which was not hotter than feared, but was hardly the kind of cooling that would let policymakers declare victory. This is the uncomfortable middle zone. Inflation is no longer accelerating in a way that immediately destabilizes risk, but it is also not falling fast enough to justify aggressive rate-cut optimism. That is why the market can rally at the same time that the long end remains sensitive and why quality duration and defensives are still showing up as useful ballast rather than relics of a previous regime.
Oil is the swing variable that connects the macro and micro stories most directly. Throughout May, geopolitical headlines around Iran and the Strait of Hormuz repeatedly fed into inflation expectations and equity sentiment. Hopes for a U.S.-Iran deal or ceasefire extension helped pull crude lower and supported equities. OPEC+ agreed earlier in April to raise output by 206,000 barrels per day for May, a modest increase that did not fundamentally remove supply concerns but did reinforce the sense that policymakers and producers alike wanted to avoid a true energy shock. For equity investors, the message is not that energy has lost relevance. It is that a collapse in oil is not needed for stocks to work; what matters is avoiding a renewed spike that tightens financial conditions and revives inflation panic.
That nuance explains why energy has remained both a leader and a hedge. We’ve repeatedly flagged oil and energy-sector performance as important swing factors for style leadership and relative returns. In the flow data, energy and real-asset names showed persistent institutional interest alongside technology, not in opposition to it. That is a classic late-cycle allocation pattern. If nominal growth and fiscal support remain firm, and if AI capex keeps driving industrial demand for power, cooling, logistics, and grid investment, then energy and infrastructure can rally alongside tech rather than merely serve as defensive alternatives.
The cross-asset backdrop also argues for humility. There exist diverging policy paths across major economies, with Japan facing tightening pressure even as other developed markets remain closer to easing. Currency volatility has also been more active, and a stronger U.S. dollar can still become a headwind for international risk assets and multinational earnings. That makes selective emerging-market exposure more appealing than blanket global beta. It also reinforces the case for focusing on domestic U.S. leadership rather than assuming that a U.S. AI-led rally automatically creates broad international participation.
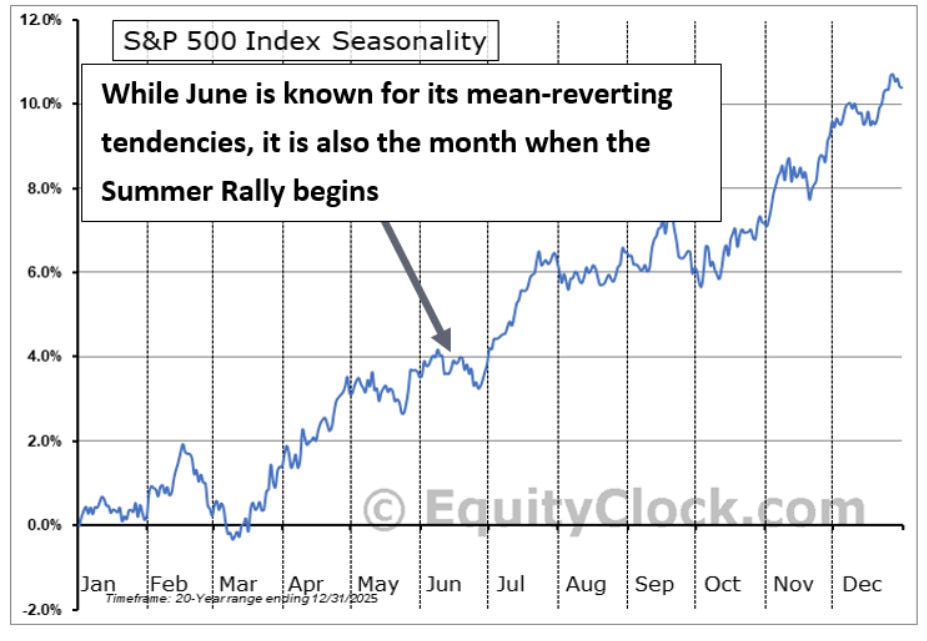
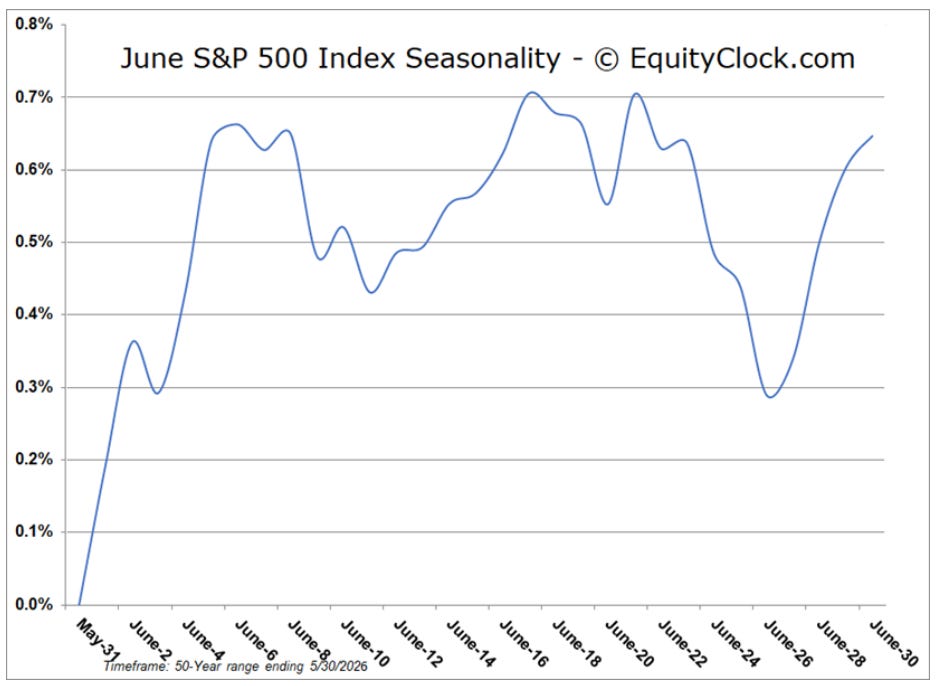
Seasonally, June is constructive but not carefree. Equity Clock’s long-run data suggest that the S&P 500 has historically posted an average June gain of 0.6% with a 64% frequency of positive returns.
That is a decent tailwind, but not enough to override deteriorating breadth or a macro accident. Resistance appears to matter less than support in the current market structure, but a break of nearby support would open the door to a much less comfortable retracement. That is exactly how strong but narrow markets usually behave. They look stable until they are not, and then they test conviction very quickly.
So what should investors do with this? The first step is to separate trend from texture. The trend remains favorable for equities because growth is still positive, earnings are still surprising to the upside, and the AI capex cycle continues to provide a concrete spending engine. The texture, however, is more mixed. Breadth is narrow, inflation is still sticky, and part of the month-end flow surge was mechanical rather than purely discretionary because of the MSCI rebalance. That combination argues for participating in the trend without pretending that every corner of the market is equally healthy.
The second step is to recognize that the current tape is rewarding alignment, not bravado. Large-cap growth and semiconductors still deserve core weight because that is where institutional sponsorship and fundamental reinforcement are strongest. Infrastructure, power, logistics, and selected industrials also fit because they monetize the physical side of the AI cycle. Energy and real assets remain valuable because they hedge the part of the macro that equities cannot control. Quality duration, defensives, and income still belong in the mix because the Fed has not been given a clean inflation exit.
The third step is psychological. Markets at record highs often invite two equal and opposite mistakes: the fear of chasing and the fear of missing. Both are understandable, and both can be expensive. The cleaner framing is to acknowledge that this is a leadership market. Investors do not need to own everything. They need to own what institutions are persistently sponsoring, what earnings and capital spending are validating, and what can survive if June turns choppier than the seasonal average implies. That means fewer heroic contrarian bets and more emphasis on quality, liquidity, and identifiable demand.
A good June roadmap, then, is not to predict whether the next 3% move is up or down. It is to identify the conditions under which the current hierarchy would continue to hold. If oil stays contained, if inflation cools slowly rather than reheating, if AI capex continues to show up in guidance and data, and if breadth stops deteriorating too quickly, then the market can keep levitating on the backs of the same leaders that carried it through May. If those conditions change, the market is unlikely to fail all at once. It will first telegraph stress through participation, rate sensitivity, and the inability of the leaders to absorb more bad news.
That is why the most important takeaway from the week is not simply that the market hit new highs. It is that investors were given a chance to rotate, rebalance, and rethink risk at month-end, and it looks like they may have largely chosen continuity over capitulation. They bought the same narrative they had already been buying: AI, productivity, resilient profits, controlled energy risk, and cautious optimism on growth. That does not eliminate downside but it does tell us where the market still wants to live.
For June, that is enough. The tape is strong, but selective. The macro is manageable, but unresolved. The leadership is narrow, but well-funded. In that kind of environment, the job is not to romanticize breadth that does not exist or to fight sponsorship that clearly does. The job is to stay close to the flow, keep one eye on inflation and oil and remember that underlying fragility can be looked through for some time.

Weekly Benchmark Breakdown
Breadth Pullback vs Execution: Small Caps Lead as Mega Caps Stumble
Market breadth sent a mixed signal this week, and it was the kind of divergence that keeps technicians honest. We saw a short-term thrust deterioration coexisting with a generally healthy longer-term condition. The immediate picture shows stocks losing short-term momentum across all major indices, but the intermediate and long-term participation remains solid, especially in the small-cap space. New highs continue to outnumber new lows across most lookback windows, which tells us the tape is not breaking, just cooling off. This is not a breakdown story, but it is a cautionary one about the limits of leadership concentration.
The S&P 500 breadth picture is where the tension lives. Only 40.15 percent of index constituents are above their 5 day moving average, which is a clear near-term thrust deterioration. That is a crowded room of sellers on the micro timeframe. The 20 day cohort sits at 49.70 percent, barely treading water at the halfway mark. However, the 50 day reads 51.88 percent, the 100 day shows 49.30 percent, and both the 150 and 200 day sit above the line at 54.27 and 54.87 percent respectively. New highs on a 5 day basis were 130 versus 177 new lows, a negative difference of 47, which confirms the short-term weakness was real and not just an artifact.
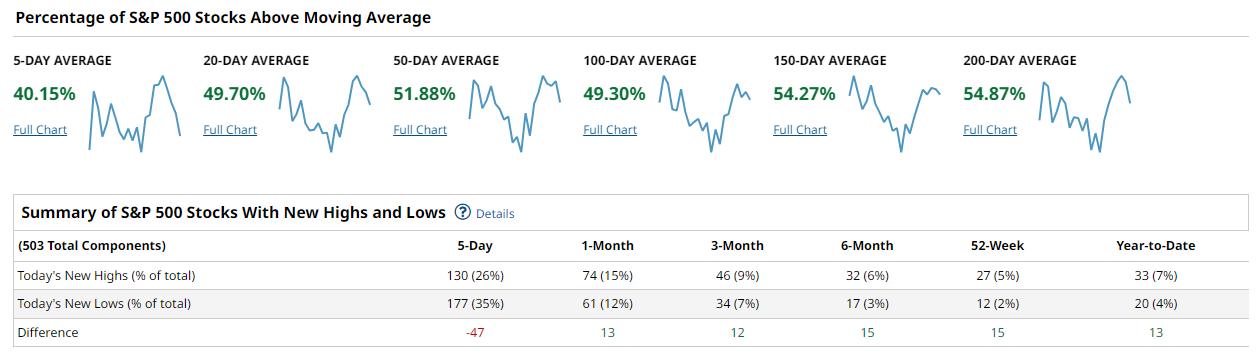
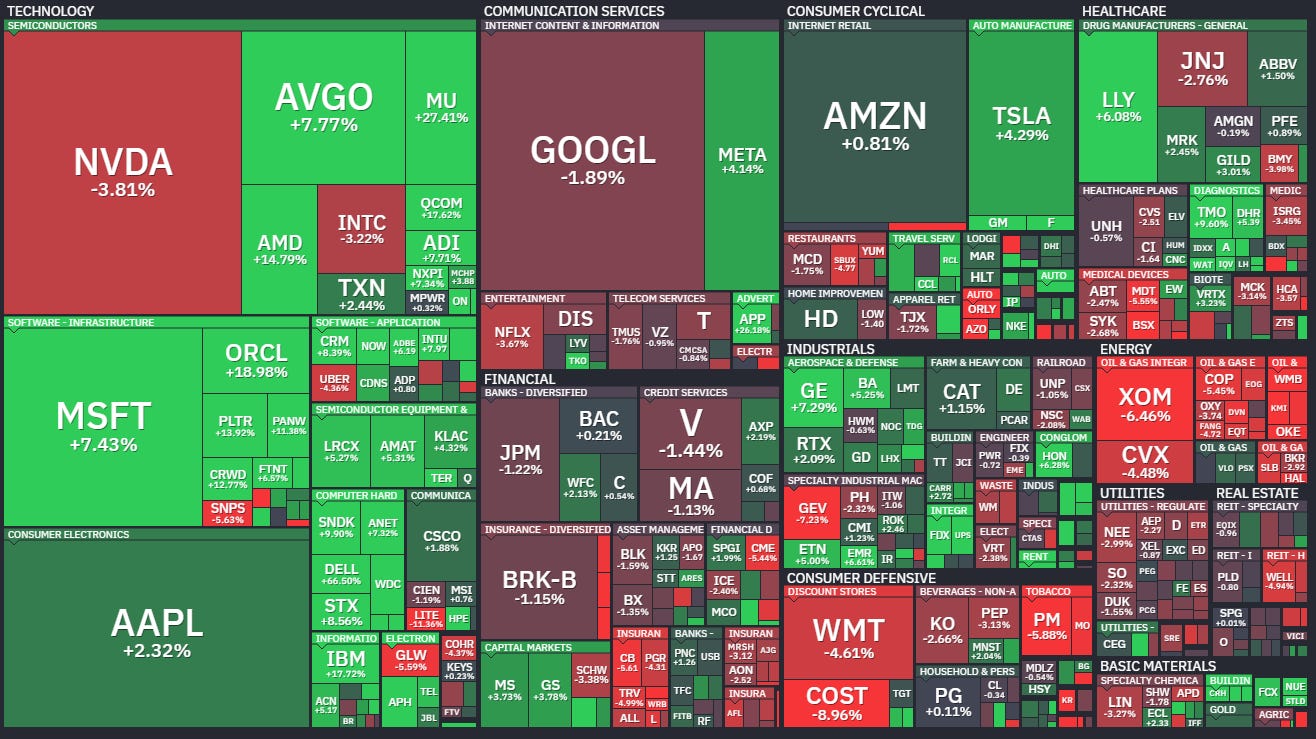
But zoom out, and the picture improves. The 1 month spread is plus 13, the 3 month is plus 12, the 6 month is plus 15, and the 52 week is plus 15. That is not a market losing its footing. On the heatmap, the largest constituents delivered mixed weekly returns with significant dispersion, as some mega-cap tech names posted strong gains while others slipped, creating the uneven quality we saw in the breadth data.
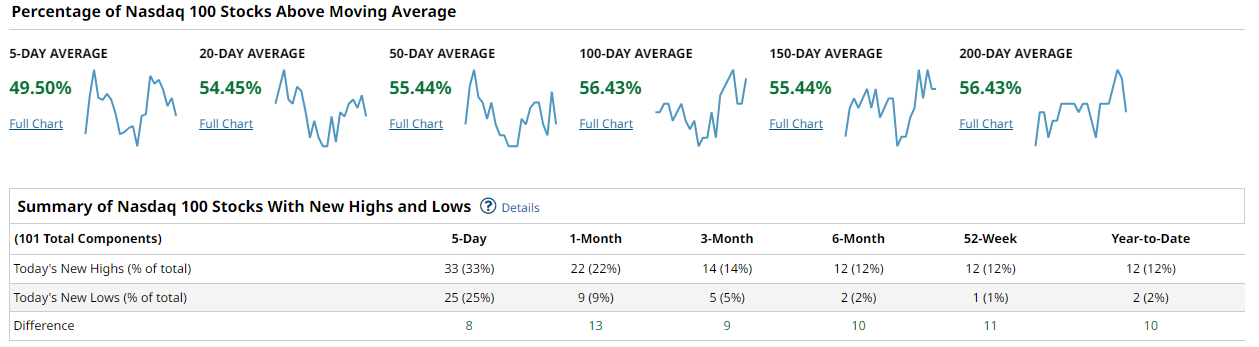
The NASDAQ 100 is the most resilient of the large cap indices on a participation basis. It leads the group with 49.50 percent above the 5 day average, and it is the only index where every moving average cohort above the 50 day sits at or above 55 percent, with the 100 and 200 day both at 56.43 percent. That is genuine intermediate and long-term health beneath the surface. The NH minus NL spread is the cleanest we see on short lookbacks, with 30 new highs against 25 new lows over 5 days for a plus 8 difference, and the longer lookbacks stay decisively positive with spreads of 12 on the 1 month and 9 on the 3 month.
The heatmap tells the same story of internal dispersion, with standout weekly performances clustered in semiconductors and software alongside notable declines in the platform communication names, meaning the index is being held up by specific themes rather than broad participation.
The Dow Jones Industrial Average is the weakest index on the short-term participation metric but looks the strongest on the intermediate timeframe. Only 36.66 percent of the 30 components are above the 5 day average, which is the lowest reading across all four indices. The 20 day cohort improves sharply to 53.33 percent, and the 50 day is the highest intermediate reading we see at 60.00 percent. The 100 day dips to 46.66 percent, which is the only sub fifty reading in the Dow at that lookback, but the 150 and 200 day recover to 53.33 and 56.66 percent. The NH minus NL picture is tight on the 5 day at a minus 1 spread, but the longer lookbacks are clean.
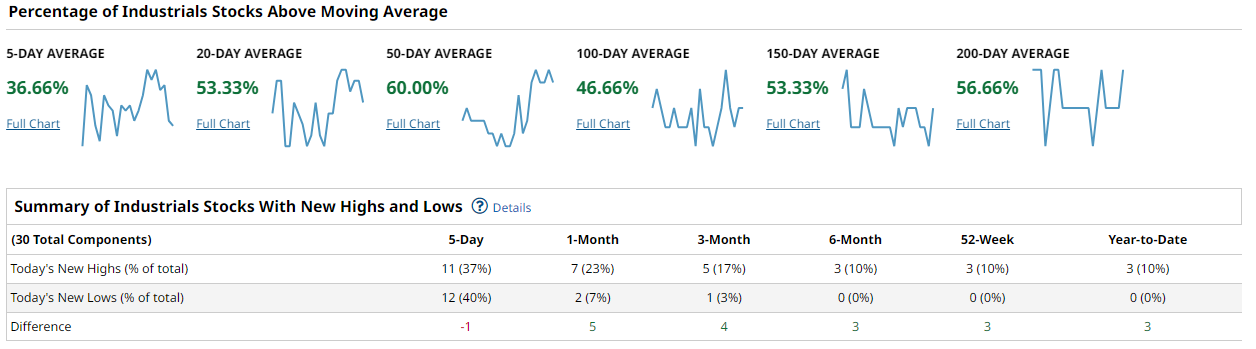
The weekly heatmap showed the expected rotation pattern for the blue chips, with software infrastructure and financial distribution names leading while the cyclical industrials and traditional manufacturers lagged, reflecting the sector rotation that has defined this tape.
The Russell 2000 is the breadth standout and the story of the week. It is the only index with a majority of constituents above the 5 day moving average at 51.79 percent, and every single moving average cohort sits in the sixties. The 20 day reads 63.49 percent, the 50 day sits at 64.11 percent, and the 100, 150, and 200 day all cluster in the 60 to 61 percent range. This is the kind of broad participation that technicians look for as confirmation that an advance has legs. The NH minus NL spread is massive at plus 159 on the 5 day lookback, with 538 new highs against 351 new lows, and every longer lookback remains decisively positive with spreads of 120 on the 1 month, 132 on the 3 month, and 95 on the 6 month.
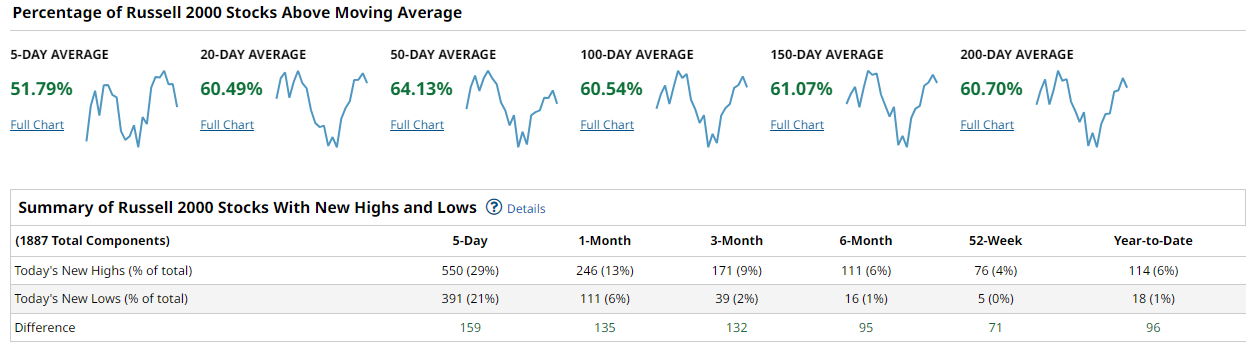
The heatmap confirms the participation story with an overwhelming majority of components posting positive weekly returns and only scattered declines, a pattern that is orders of magnitude greener than what we see in the S&P 500 or NASDAQ 100.
The synthesis is straightforward and important. We have a market where the cap weighted indices are being carried by a subset of large cap names while the small cap universe is genuinely participating on a broad basis. The fact that the Russell 2000 shows 60 plus percent participation across every moving average lookback while the S&P 500 stumbles at 40 percent on the 5 day and barely clears 50 percent on the 20 day is a meaningful divergence. This is not a classic top signal because the NH minus NL spreads remain positive on the intermediate and long-term lookbacks across all indices, and the Russell breadth is genuinely strong. What would confirm a durable advance is the 50 day cohorts in the large cap indices pushing decisively above 60 percent alongside a flip of the 5 day NH minus NL back into positive territory for the S&P 500. What would justify concern is if the 5 day readings continue to deteriorate and start pulling the 20 and 50 day cohorts lower, which would signal the selling is transitioning from short-term exhaustion to something more structural.
The playbook this week should treat the large cap and small cap segments differently. Favor exposure to the small cap universe where the participation confirms the price action, and be cautious about large cap names that are breaking below their 5 and 20 day moving averages without support. Within the large cap space, focus on the sectors where the heatmap shows continuation rather than the names that are fading, as the dispersion creates a stock pickers environment rather than a tide that lifts all boats. Watch for the 5 day NH minus NL in the S&P 500 to flip positive as a near-term confirmation signal, and watch the 20 day percentage cohort as the leading indicator for whether this pullback is building a base or setting up a deeper retreat. The Russell 2000 breadth profile argues for an environment where rotation and stock selection matter more than index beta.
Bottom line: Market breadth shows short-term selling pressure across all indices with resilient intermediate and strong small cap participation, arguing for selective exposure rather than broad risk reduction this week.

Investor Sentiment Report
%Bull-Bear Spread
The %Bull-Bear Spread measures the gap between bullish and bearish investor sentiment, often from surveys like AAII. It’s a contrarian indicator—extreme optimism may signal a coming pullback, while extreme pessimism can hint at a potential rally. Large positive or negative spreads often mark market turning points.
The AAII survey for the week ended May 28 shows bullish sentiment at 35.6 percent, up from 31.7 percent the prior week, while bearish sentiment ticked down to 41.9 percent from 43.6 percent. That puts the bull minus bear spread at minus 6.3 percentage points, an improvement from the prior week's minus 11.9 but still comfortably in negative territory.
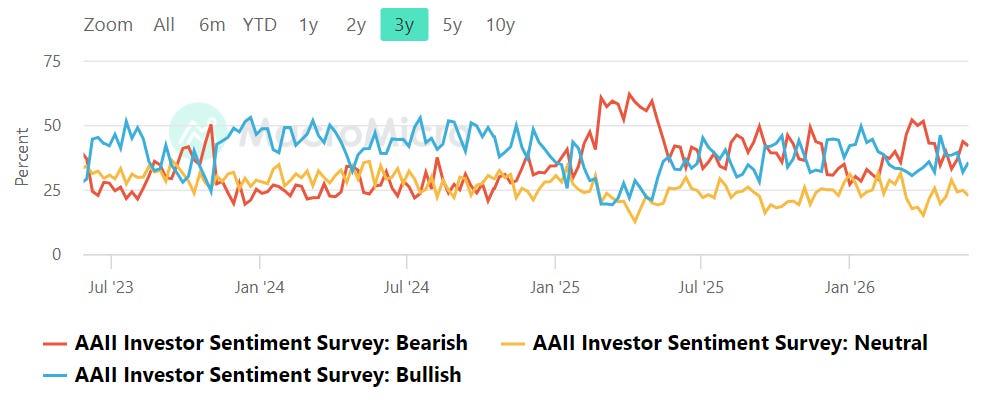
This is the contrarian lane. A spread below zero signals that individual investors remain pessimistic about the six month outlook, which historically has been supportive of continued equity upside rather than a contrarian top indicator. The reading is not yet at an extreme that would signal a compelling long entry on sentiment grounds alone, but the directional shift matters. The spread needs to improve into positive territory, and ideally push toward the historical average of plus 6.5 percent, for the tape to confirm that retail conviction is catching up with price. A drop back toward minus 15 or lower would signal a capitulation zone worth aggressively buying, while a push above plus 20 would flag a crowded long positioning that often precedes a pullback.
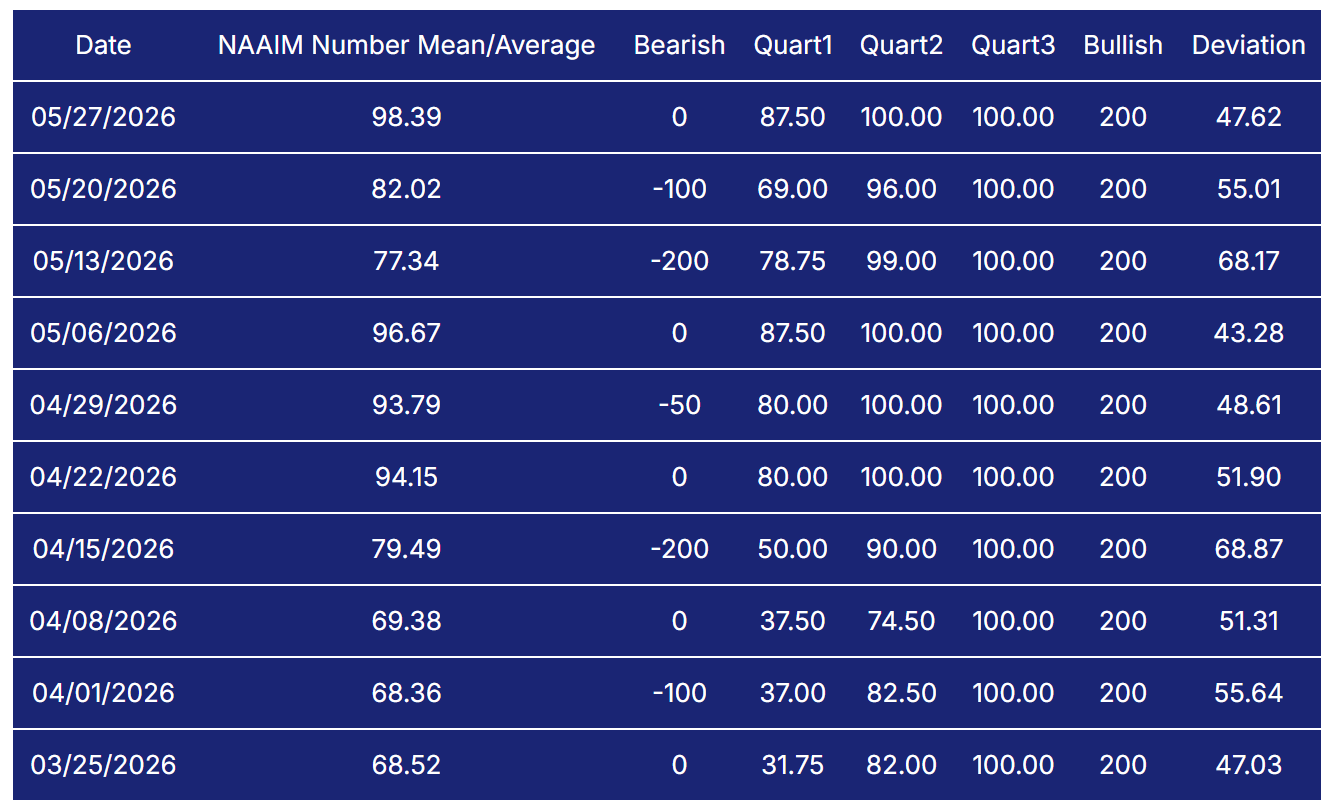
NAAIM Exposure Index
The NAAIM Exposure Index (National Association of Active Investment Managers Exposure Index) measures the average exposure to U.S. equity markets as reported by its member firms. These are typically active money managers who provide their equity exposure levels weekly. The index offers insight into how much these managers are investing in equities at any given time, ranging from being fully short (-100%) to leveraged long (up to +200%).
The NAAIM Exposure Index sits at 98.39 as of May 27, up sharply from 82.02 the prior week and also above the 96.67 reading from earlier in the month.
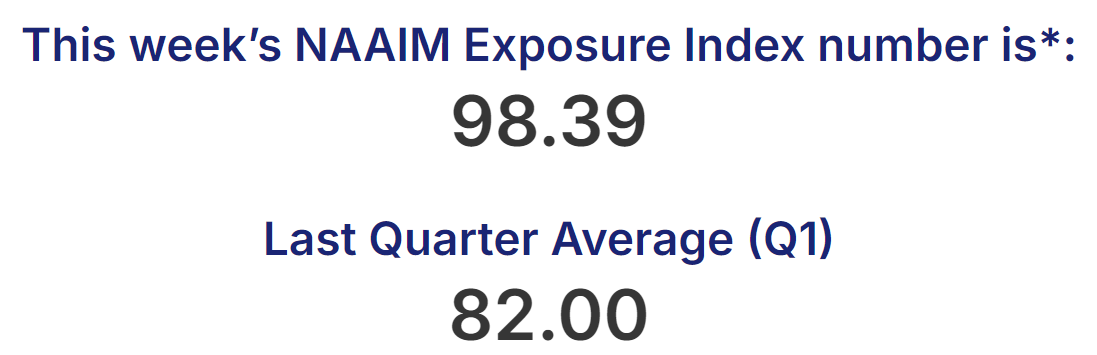
This is near maximum exposure territory. Active managers are running portfolios with virtually no defensive positioning, which means they have bought heavily into the recent advance and have little dry powder left on the sidelines. The jump from 82 to 98 in a single week tells you that professional money managers have fully committed to the tape rather than fading it.
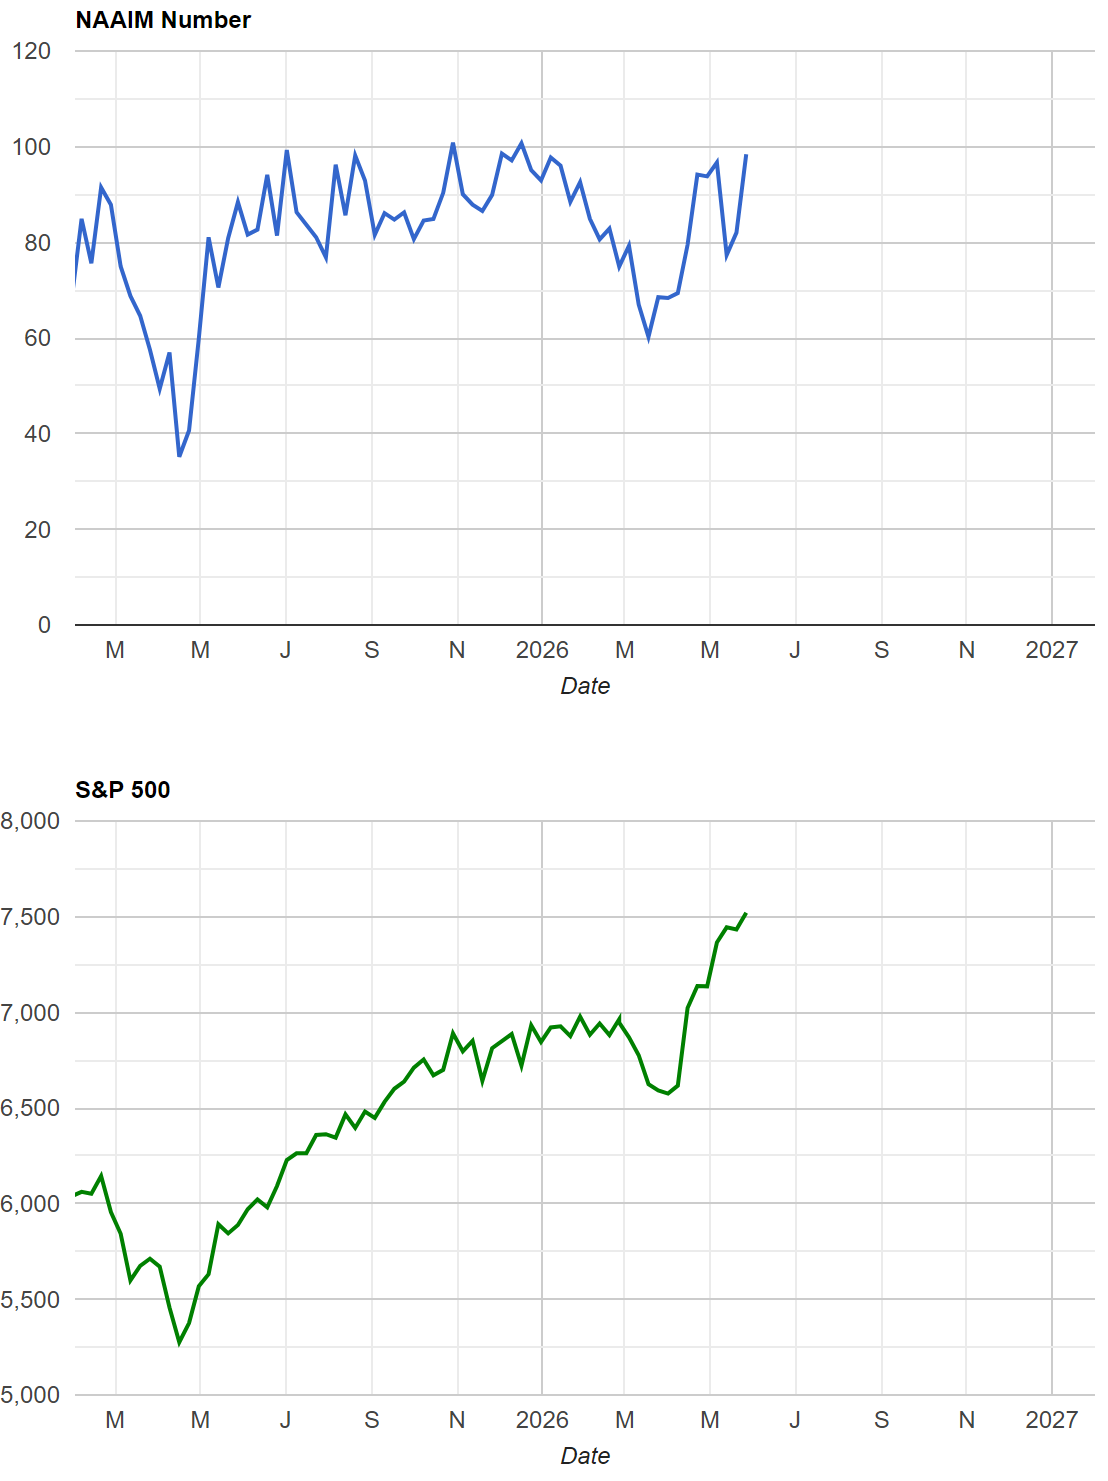
The concern here is straightforward. When exposure readings push into the upper 90s, there is no one left to buy, and any reason to de-risk creates a cascade. A tripwire to watch is a drop back into the 50s on the NAAIM without corresponding price damage, which would signal that managers are hedging aggressively while the market holds firm, a constructive divergence. Conversely, if exposure stays this high and the market moves sideways or lower, the lack of defensive positioning leaves portfolios vulnerable to a sharp de-risking event.
CBOE Total Put/Call Ratio
CBOE's total put/call ratio includes index options and equity options. It's a popular indicator for market sentiment. A high put/call ratio suggests that the market is overly bearish and stocks might rebound. A low put/call ratio suggests that market exuberance could result in a sharp fall.
The CBOE total put/call ratio stands at 0.64 as of May 29, well below the neutral line and in the frothy range. A reading this low means call volume is outpacing put volume by a wide margin, reflecting bullish conviction among options traders. The 10 day average, which smooths out daily noise, would show a similar story given the sustained low readings throughout the month.
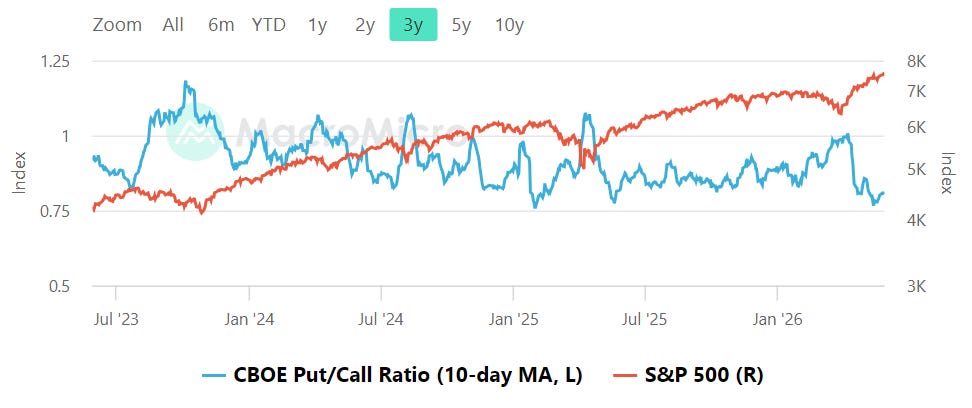
When the total ratio falls below 0.8, the options market is typically signaling a crowded bullish bet rather than fear. This positioning affects the tape in two ways. On the downside, it means there are fewer protective puts in place, which can accelerate a selloff if the direction reverses suddenly. On the upside, it means traders are actively buying calls, which can provide support as dealers hedge their short call exposure. The tripwire here is simple. A push toward 1.0 would signal fear creeping back in and could mark a better entry point. For now, the sub 0.70 reading argues for patience rather than chasing, as the options market is pricing in continued upside rather than hedging risk.
Equity vs Bond Volatility
The Merrill Lynch Option Volatility Estimate [MOVE] Index from BofAML and the CBOE Volatility Index [VIX] respectively represent market volatility of U.S. Treasury futures and the S&P 500 index. They typically move in tandem but when they diverge, an opportunity can emerge from one having to “catch-up” to the other.
The VIX closed at 15.32 on May 29, down from 15.74 the prior session and well below its long term average of 18.55. The MOVE Index, which measures bond market volatility, has been trending lower and sits in the upper 60s to low 70s range after retreating from higher levels earlier in the year.
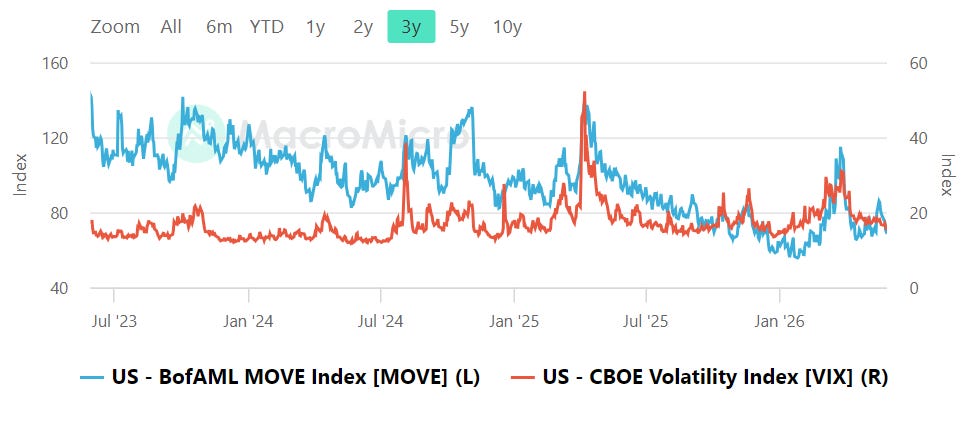
This is the correct configuration for a healthy tape. Both volatility regimes are subdued rather than diverging. When equity volatility is this low and bond volatility is not spiking ahead of it, it signals a market where investors feel confident about both stocks and rates. The ratio of MOVE to VIX is elevated compared to historical norms, meaning bond vol is higher relative to equity vol than usual, but neither is flashing stress. The key tripwire is a MOVE spike above 120 while the VIX remains sleepy, which has historically been a leading indicator of equity stress rather than a coincident signal. For now, the VIX below the high teens and the MOVE in the 65 to 75 range tells you that neither market is pricing in significant disruption.
CNN Fear & Greed
The CNN Fear and Greed Index reads 60, up slightly from 58 a week ago but down from 66 a month ago.
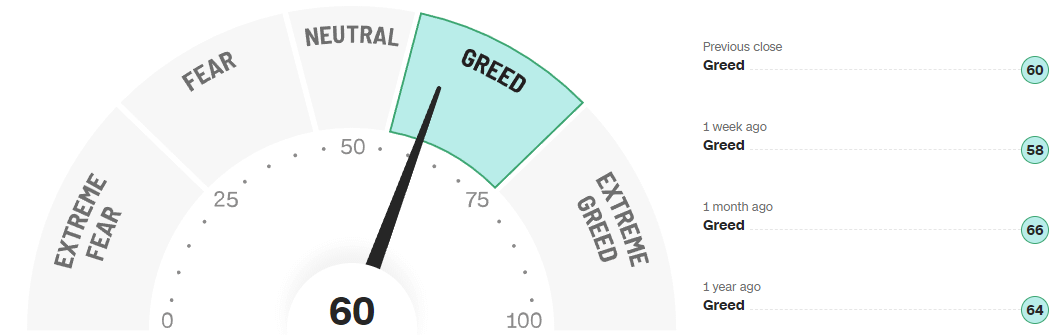
One year ago the reading was 64, so the current level is near the prior year’s reading and sits at the top of the greed range rather than in extreme territory. The composite gauge is being driven by conflicting signals within its components. Market Momentum, Put and Call Options, and Safe Haven Demand all read Extreme Greed, while Stock Price Strength and Stock Price Breadth both read Fear, Market Volatility sits at Neutral, and Junk Bond Demand shows Extreme Fear.
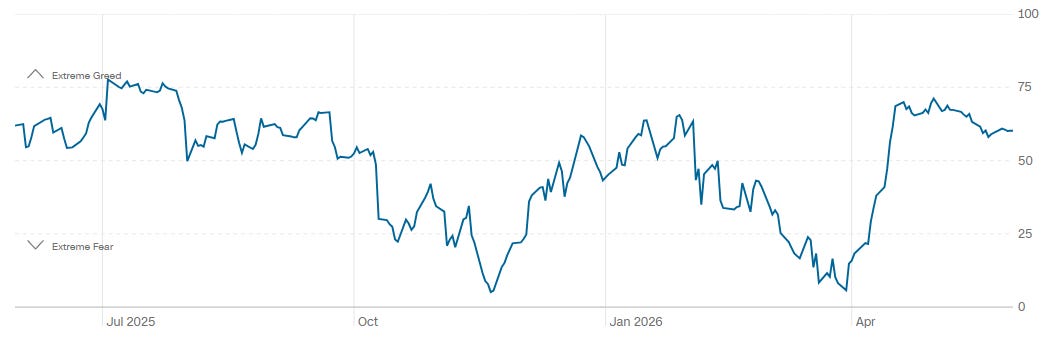
The momentum and options indicators are screaming confidence at current prices, but the internals and junk bond market are sending a cautionary message. On the 1 year trend, the index has oscillated between the mid 40s and the upper 70s without reaching sustained extremes in either direction, which frames the current regime as mid range greed rather than the kind of euphoric top that precedes major drawdowns. A reading pushing above 80 would signal exhaustion worth respecting, while a drop below 40 would mark a better risk/reward entry window for positioning.
Social Media Favs
Social sentiment offers a real-time view of investor mood, often revealing market shifts before traditional indicators. It can signal momentum changes, spot emerging trends, and gauge retail investor impact—especially in high-volatility names. Tracking sentiment around events or earnings provides actionable insights, and when layered with quantitative models, can enhance predictive accuracy and risk management. Sustained sentiment trends often mirror broader market cycles, making this data a valuable tool for both short-term trades and long-term positioning.
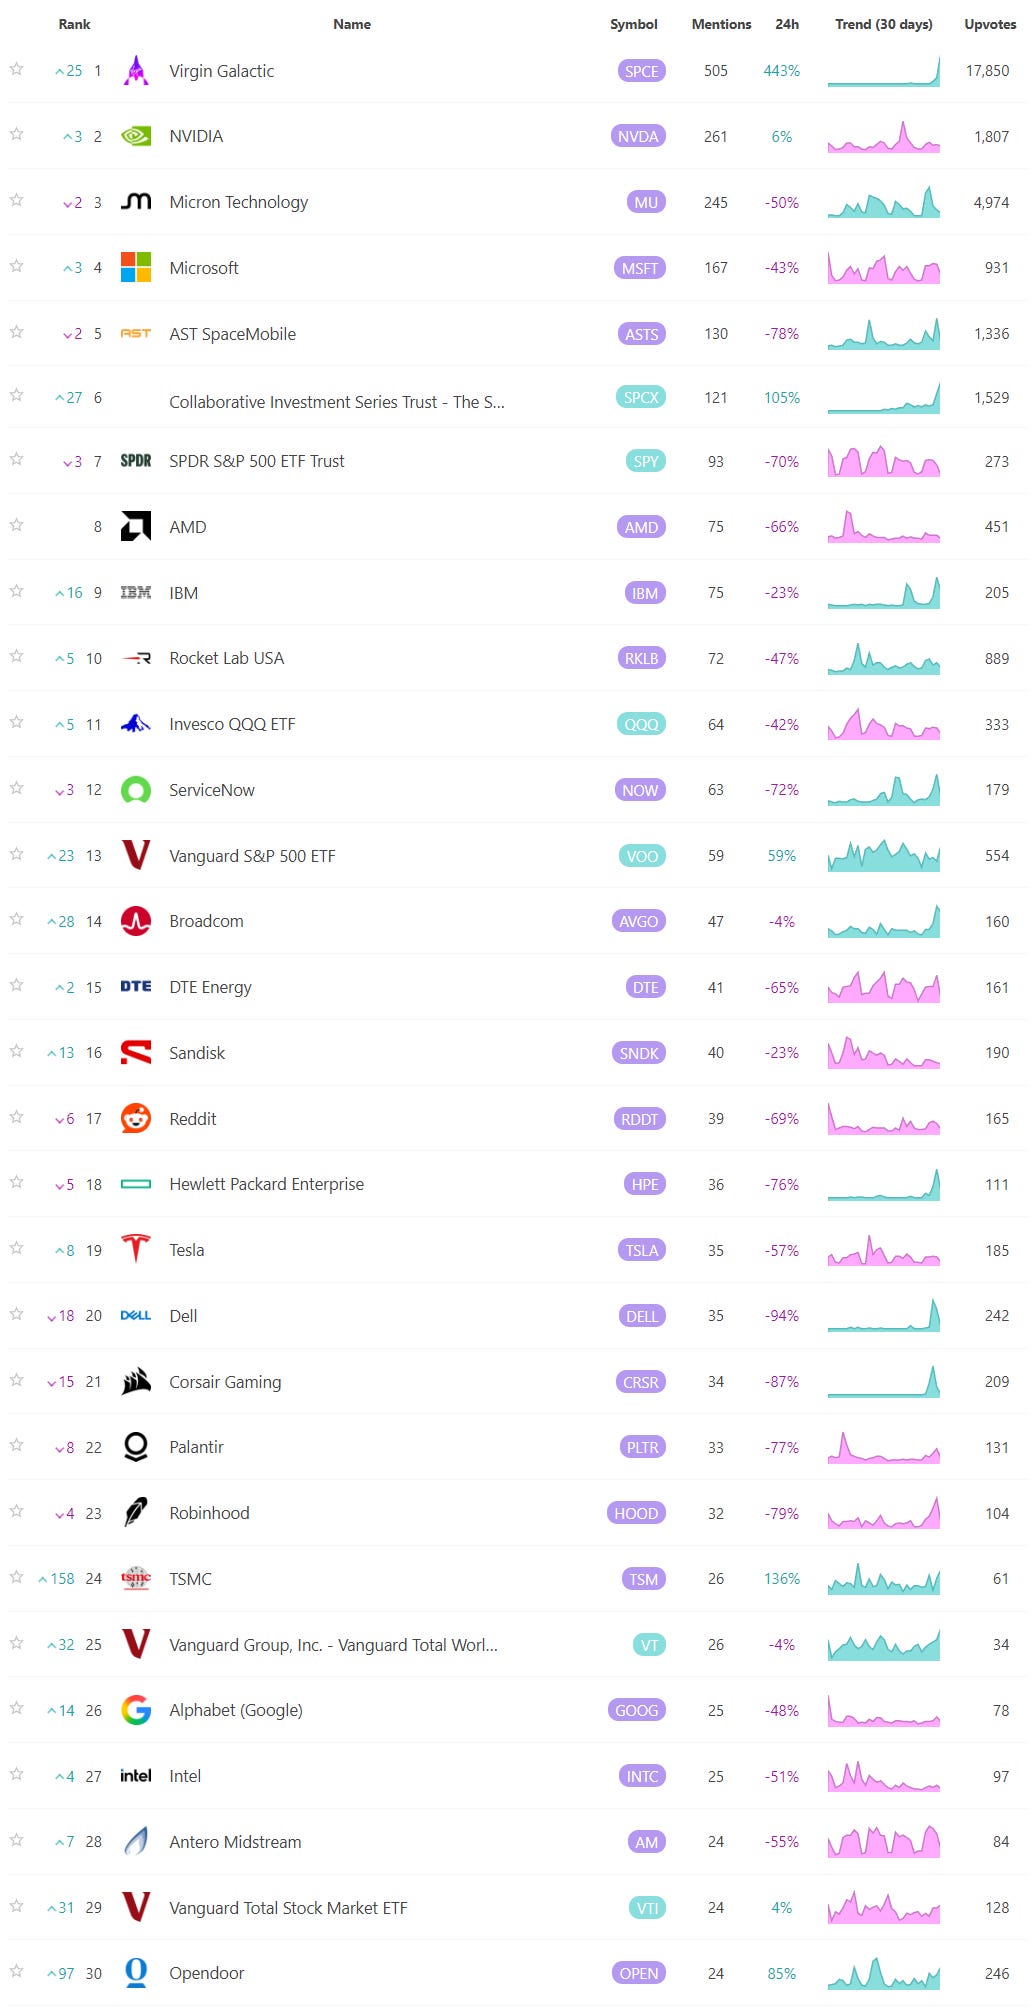
Sentiment shows bullish positioning maximized among active managers while individuals remain cautious and options traders lean heavily toward calls, with low volatility and a mid range greed reading that argues for patience rather than aggressive new risk additions this week.

Technician’s Playbook: Trading the Majors (SPY/QQQ/IWM/DIA)
When you’re a large institutional player, your primary goal is to find liquidity - places to do a ton of business with the least amount of slippage possible. VolumeLeaders.com automatically identifies and visually plots the exact spots where institutions are doing business and where they are likely to return for more. It’s one of the primary reasons “support” and “resistance” concepts work and truly one of the reasons “price has memory”.
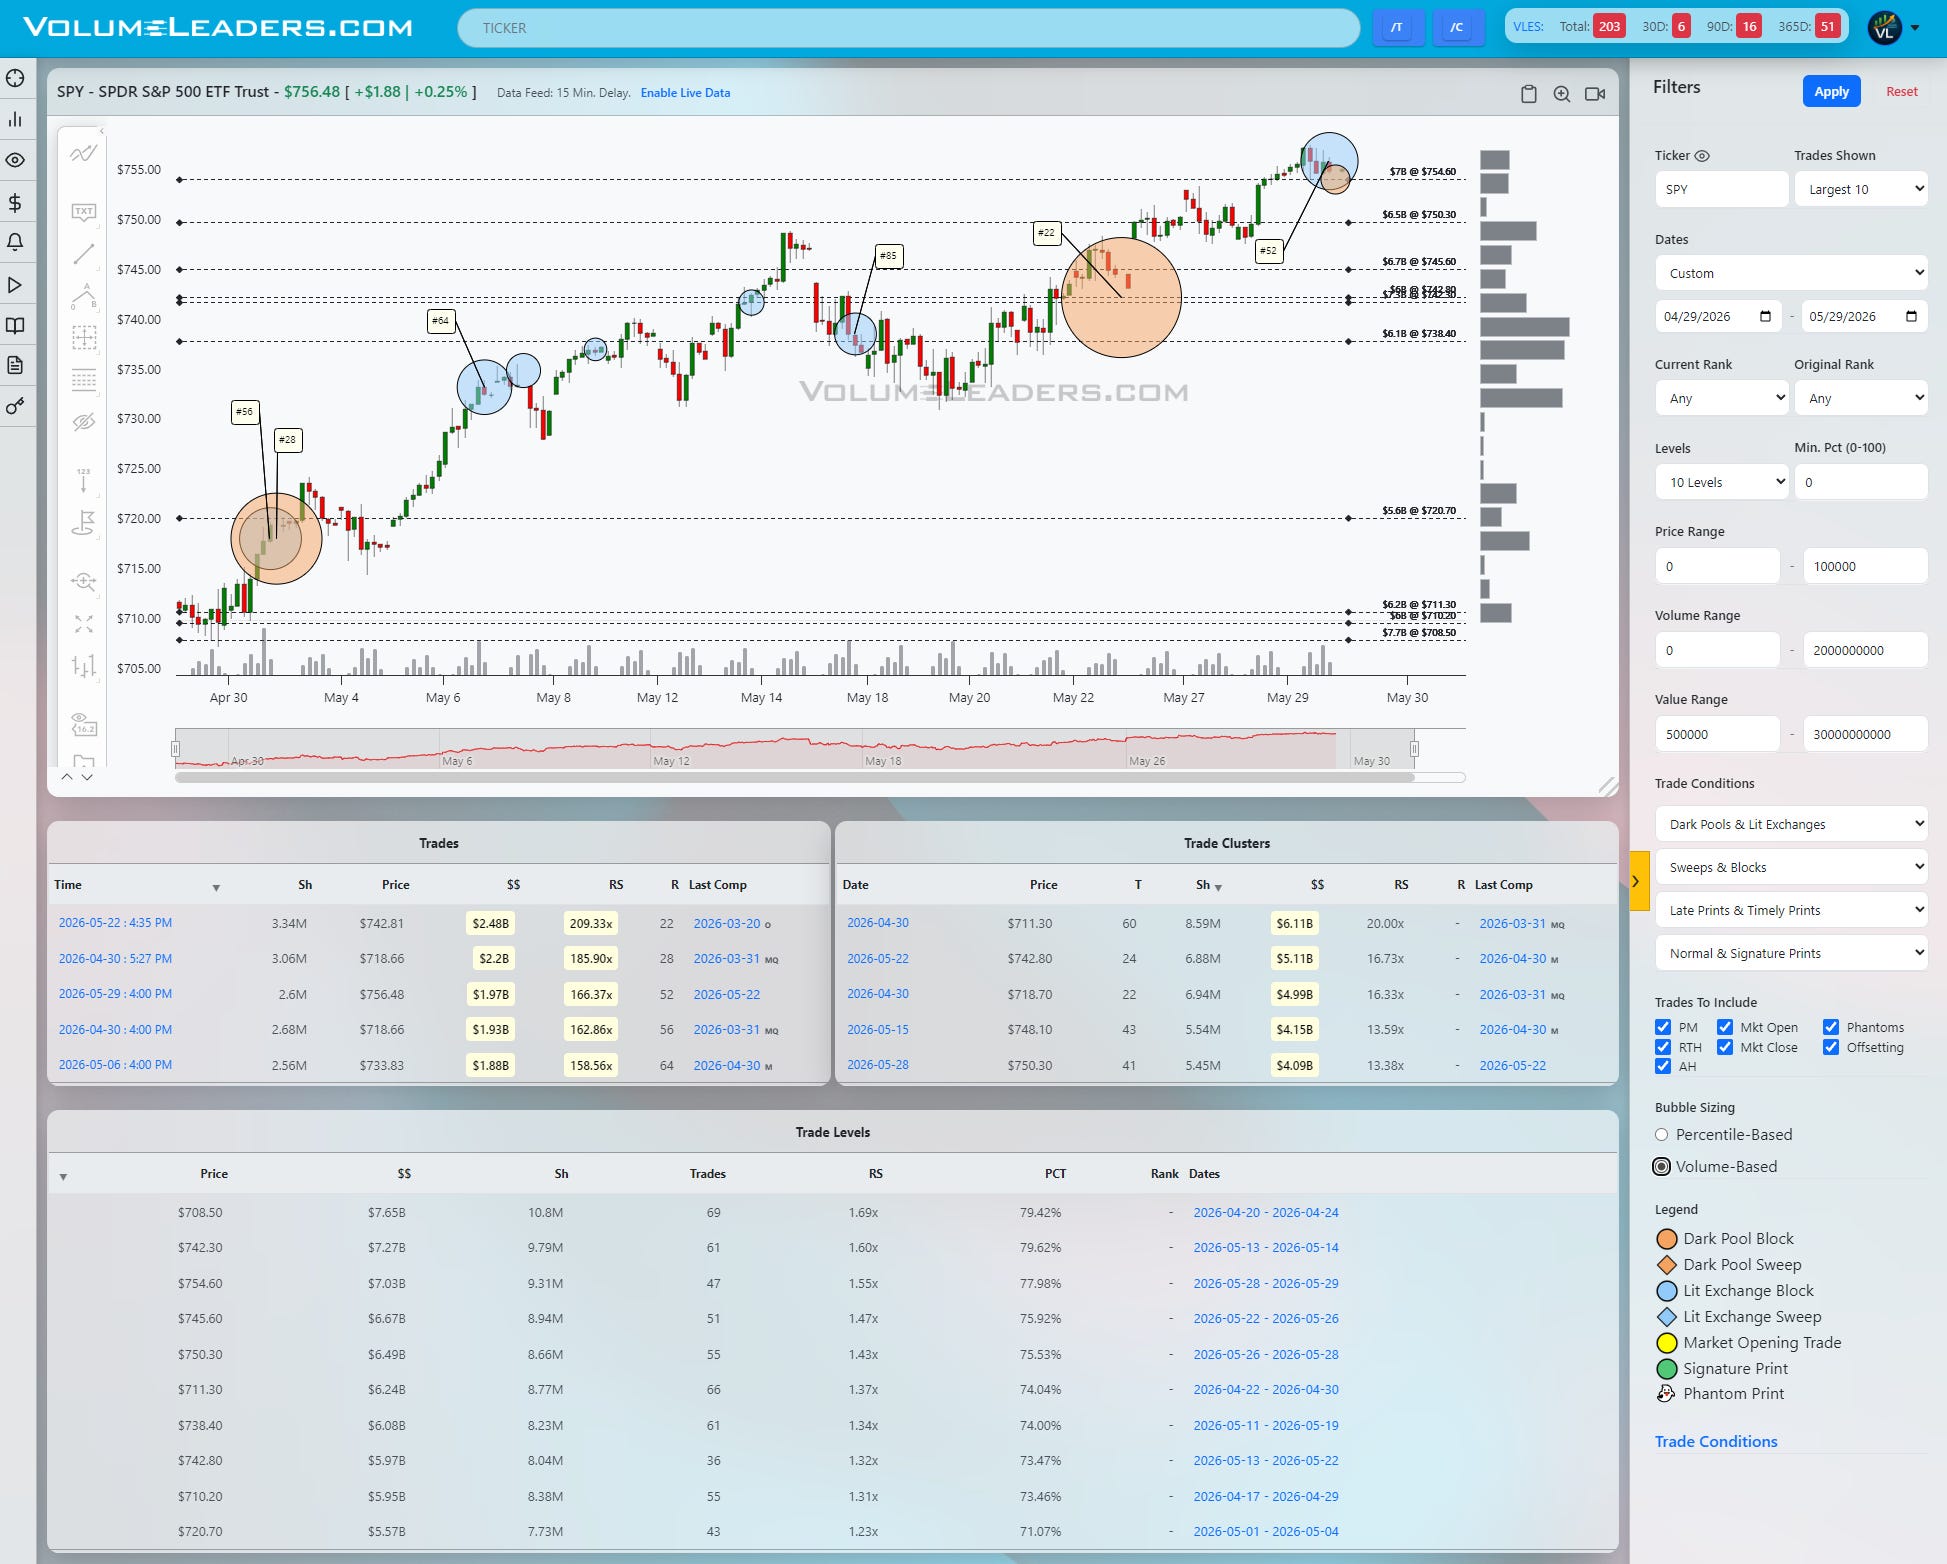
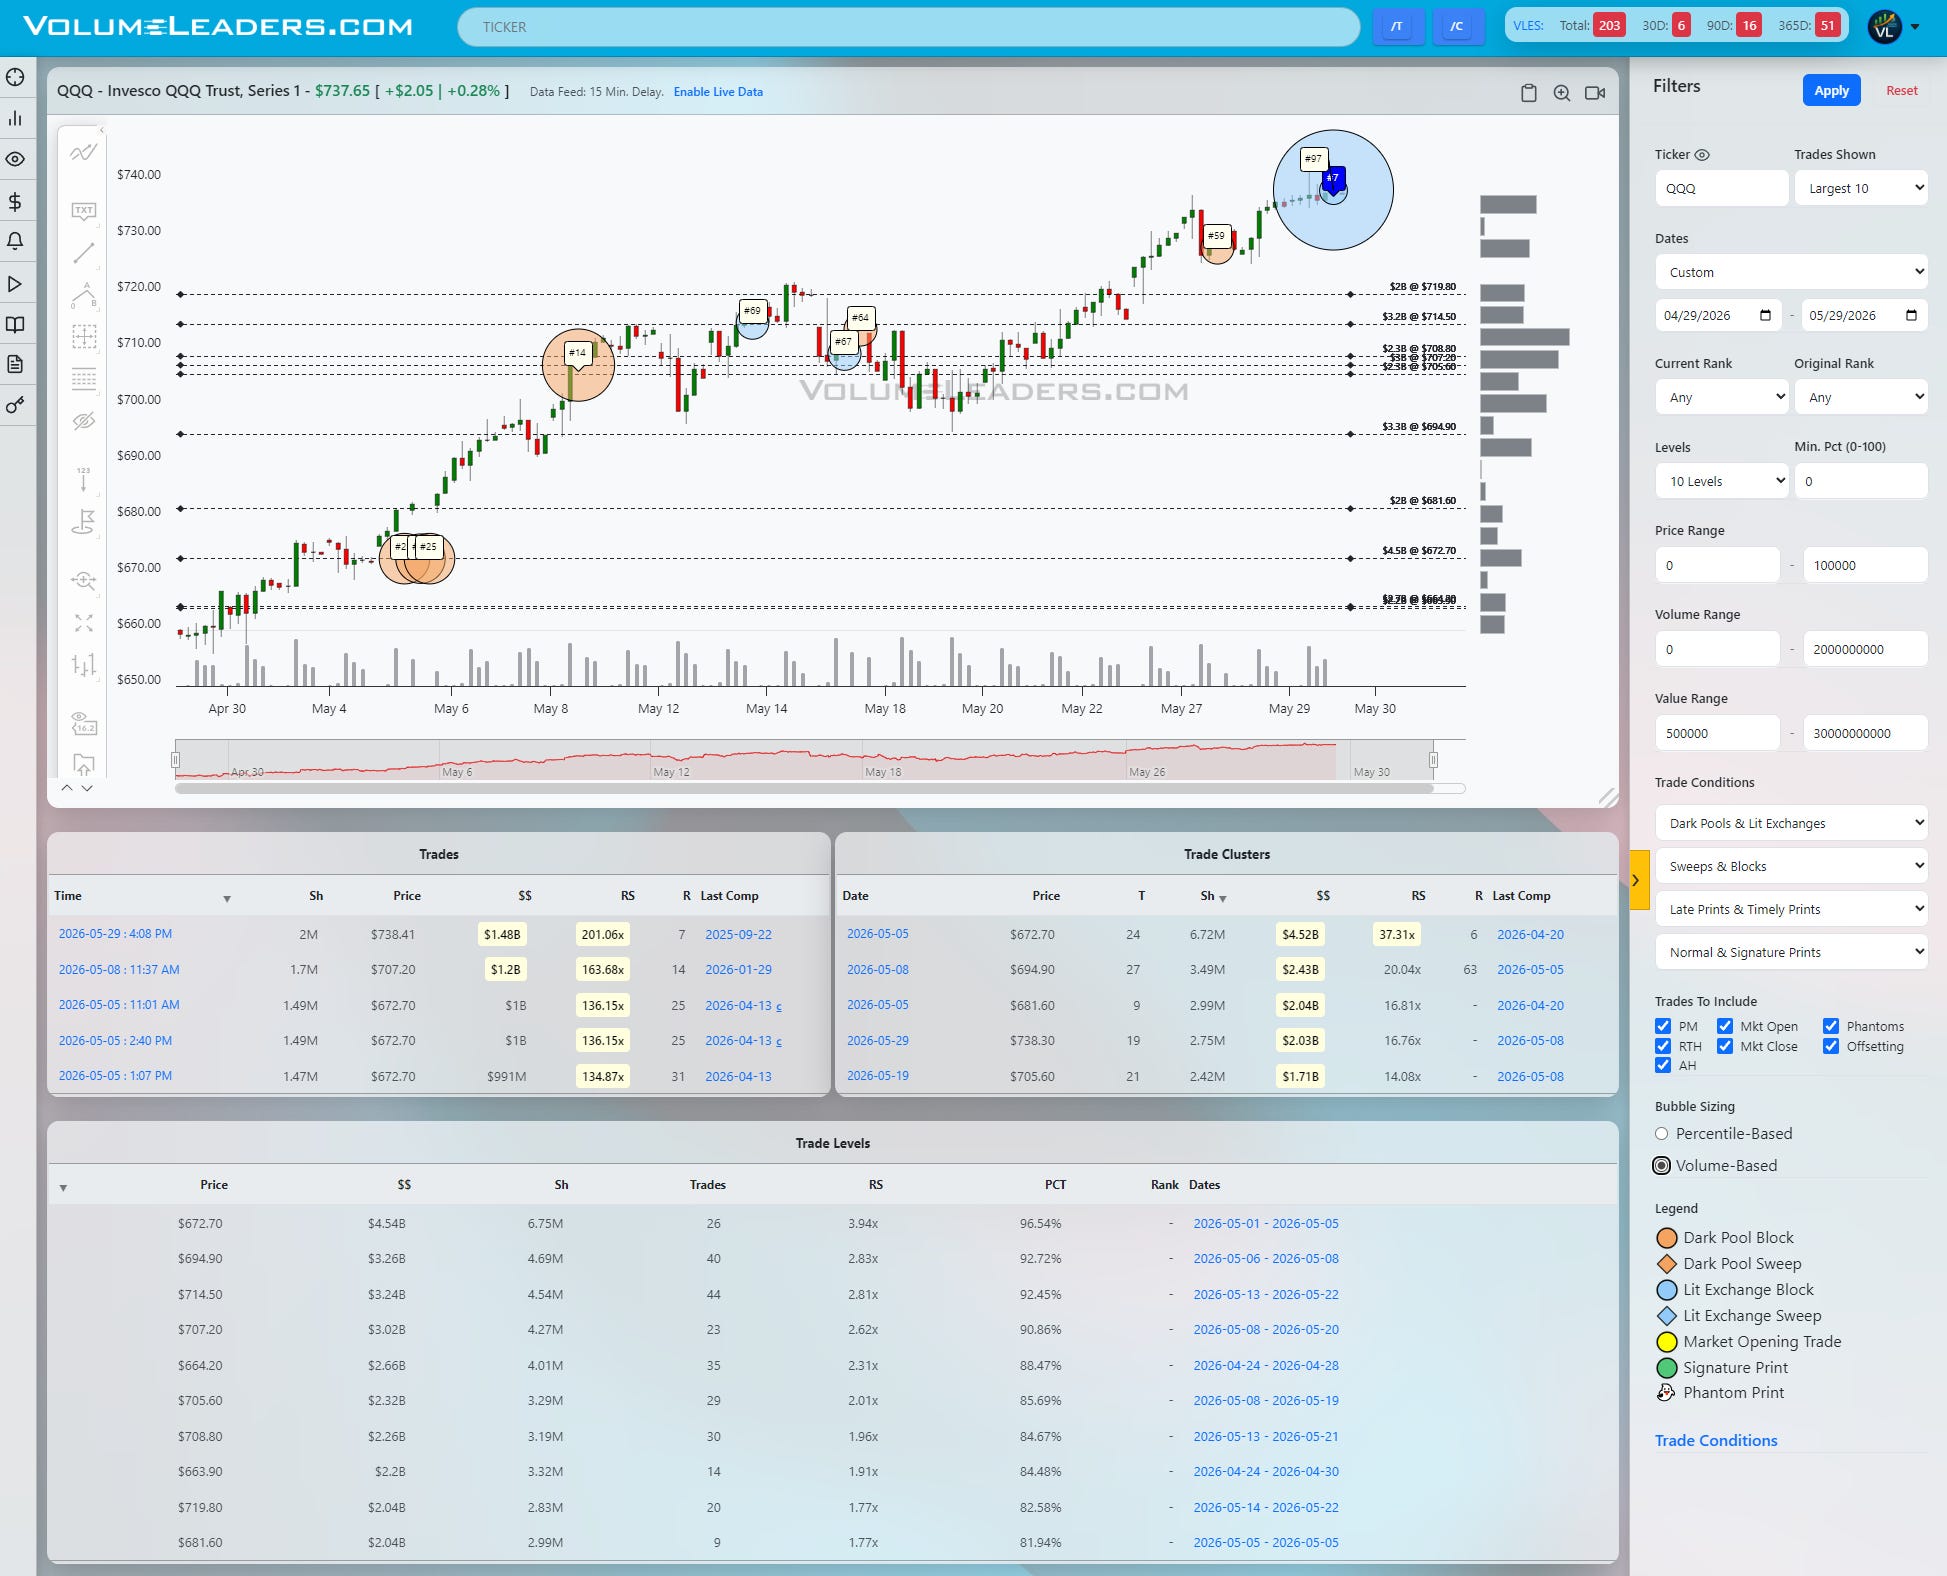
SPY, QQQ, DIA, and IWM are all pushing or testing recent highs, but they are doing it off very different foundations of sponsorship. The tape says “bullish but selective,” with very clear pass/fail shelves for the next leg.
Starting with SPY, the entire visible window is one big impulse leg higher with only shallow, orderly pullbacks. Early May shows a massive block in the low 710s zone, ranked in the top-100 prints and backed by a multi‑billion dollar Level that now acts as structural support. Later in the month, another outsized print fires near the mid‑730s after a minor pullback, signaling buyers absorbing offers rather than getting trapped into exhaustion. The most recent large bubble sits right under the current highs in the high 740s/low 750s, again tied to a high‑dollar Cluster in the table, which marks this area as the current line of scrimmage rather than a momentum blow‑off. As long as SPY holds that 740s band, the path of least resistance is continuation into and through the prior high-volume shelf just above.
QQQ is even cleaner. The chart is essentially a staircase higher, with several top‑100 tags along the way. There is an early May block in the low 660s that kicked off the trend; that Level shows huge notional and a high RS, so any revisit is a big deal. Mid‑May prints around 690–700 show repeated large buyers stepping in on dips, turning those prices into a demand shelf. The standout is the late‑May bubble in the high 730s/around 738–740, marked as an extremely high-ranked print and anchored to the largest recent Cluster. That is your active battleground. Acceptance above that zone turns it into a launchpad toward the 750 handle; failure and sustained trade back under roughly 730 opens the door to a rotation back into the 705–710 demand shelf.
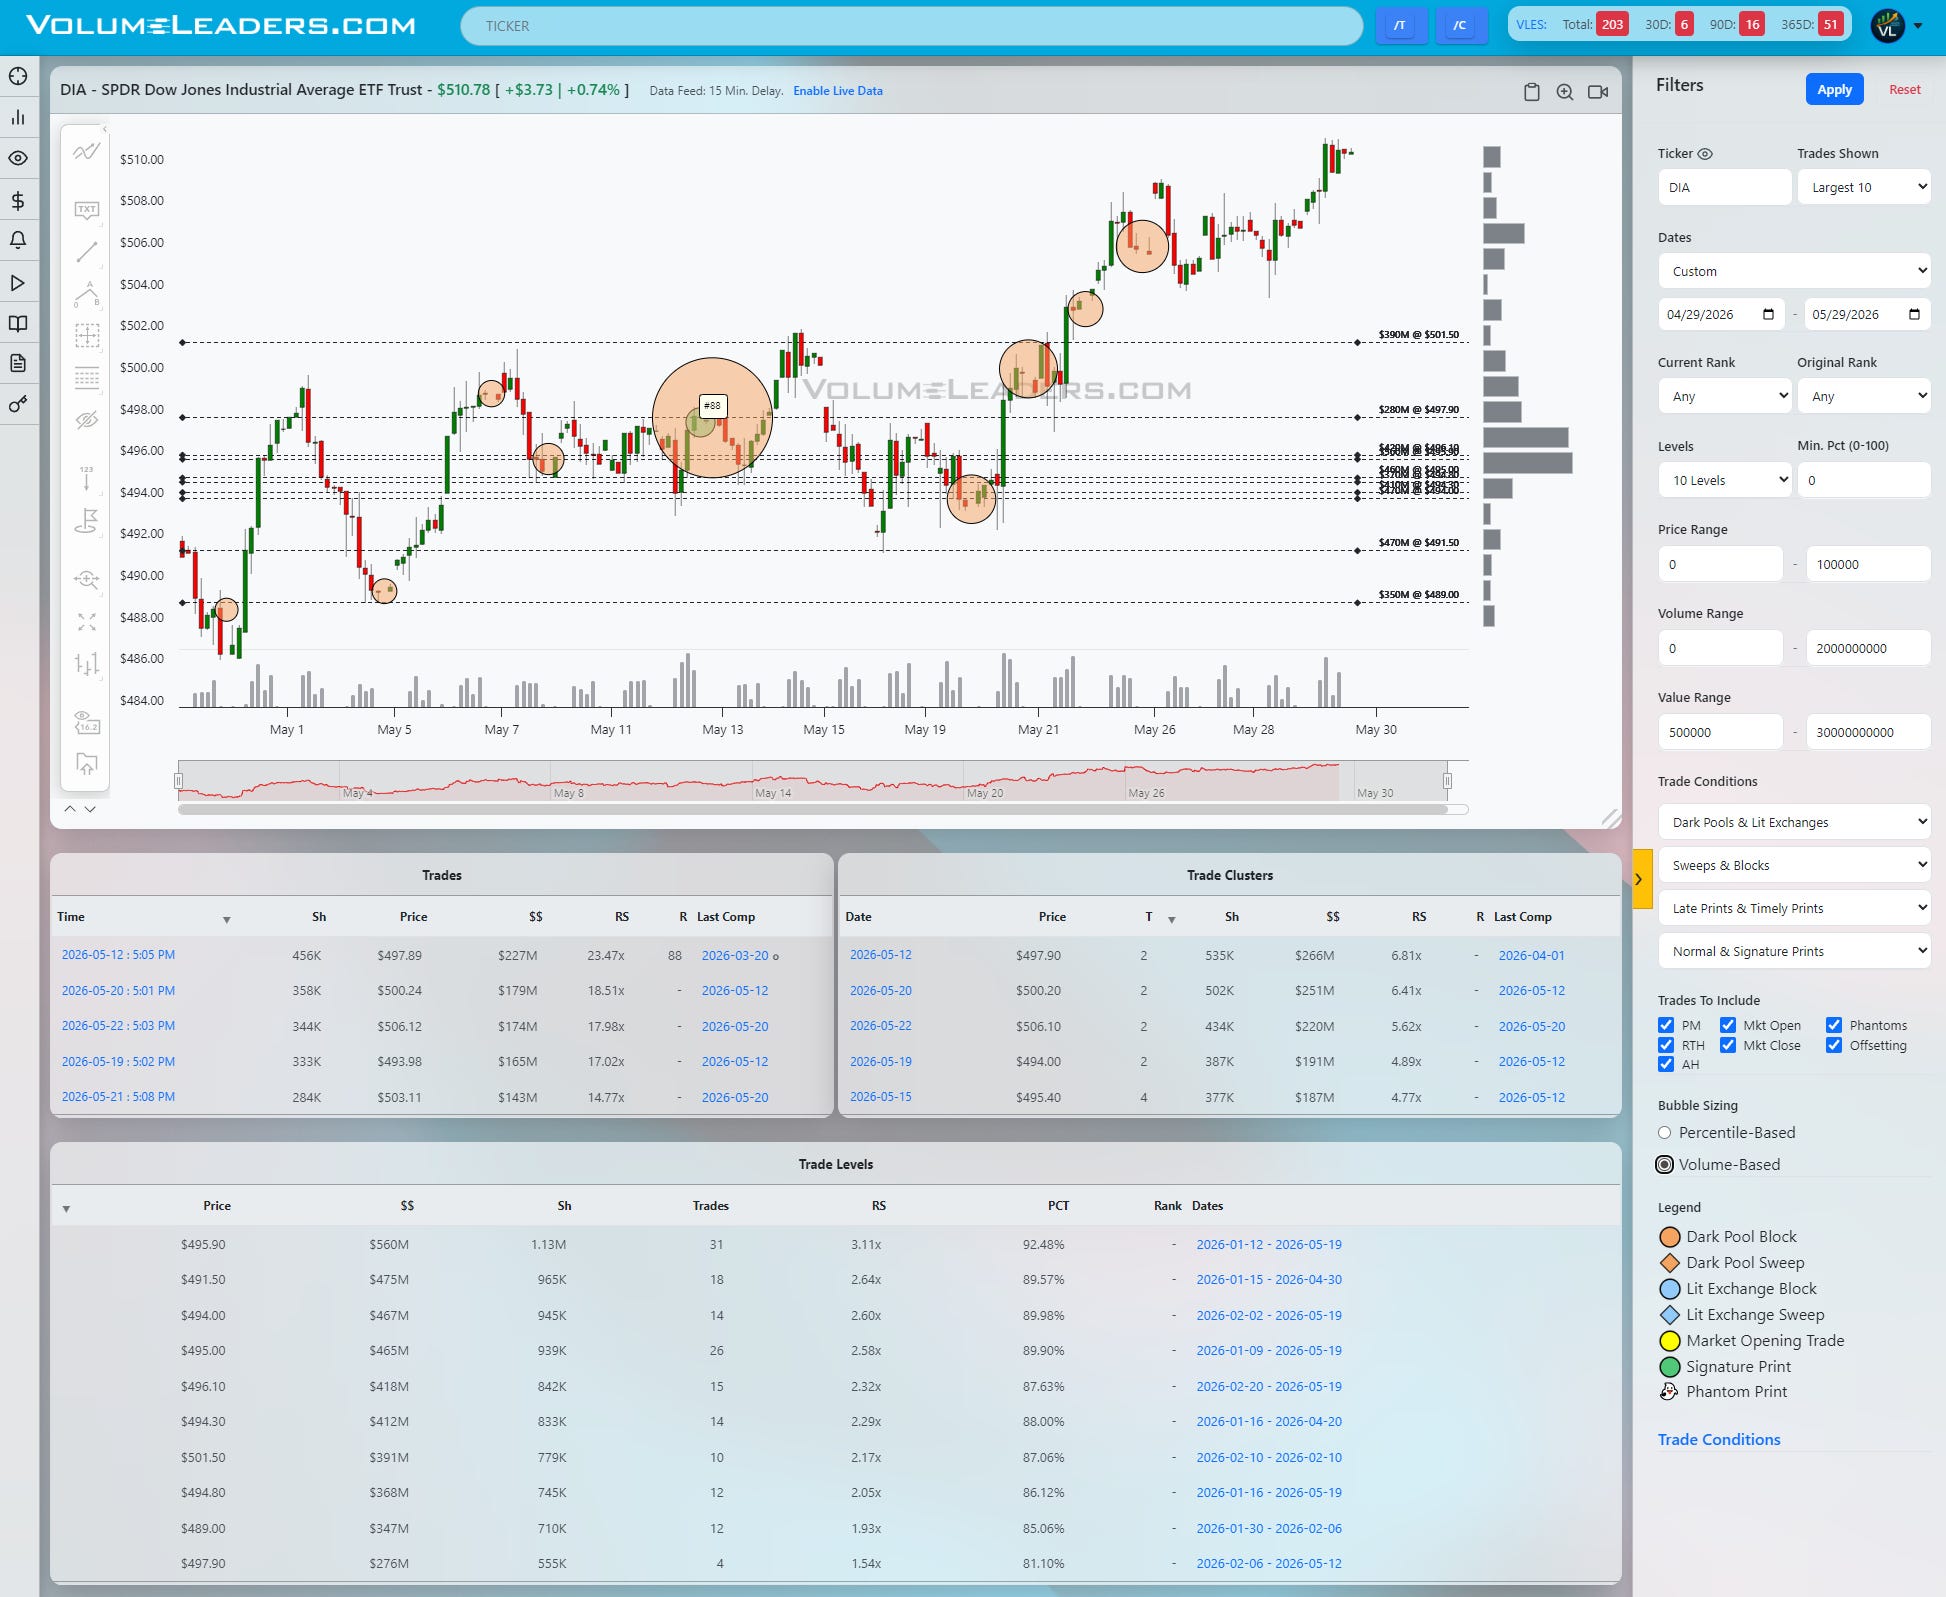
DIA has a more two‑sided character. Early May shows a push up into the 492–495 band, but that area is loaded with big blocks and high‑RS Levels, and price initially backs off. Later, a run of sizable prints stair‑steps higher through 498–502, each time with buyers absorbing and holding the progress. The latest impulse carries DIA into the low 510s, where a fresh large bubble appears. That combination of new highs plus concentrated $$ suggests responsive sellers are trying to defend 510–512, but they are facing a tape that has already proven it can absorb and grind.
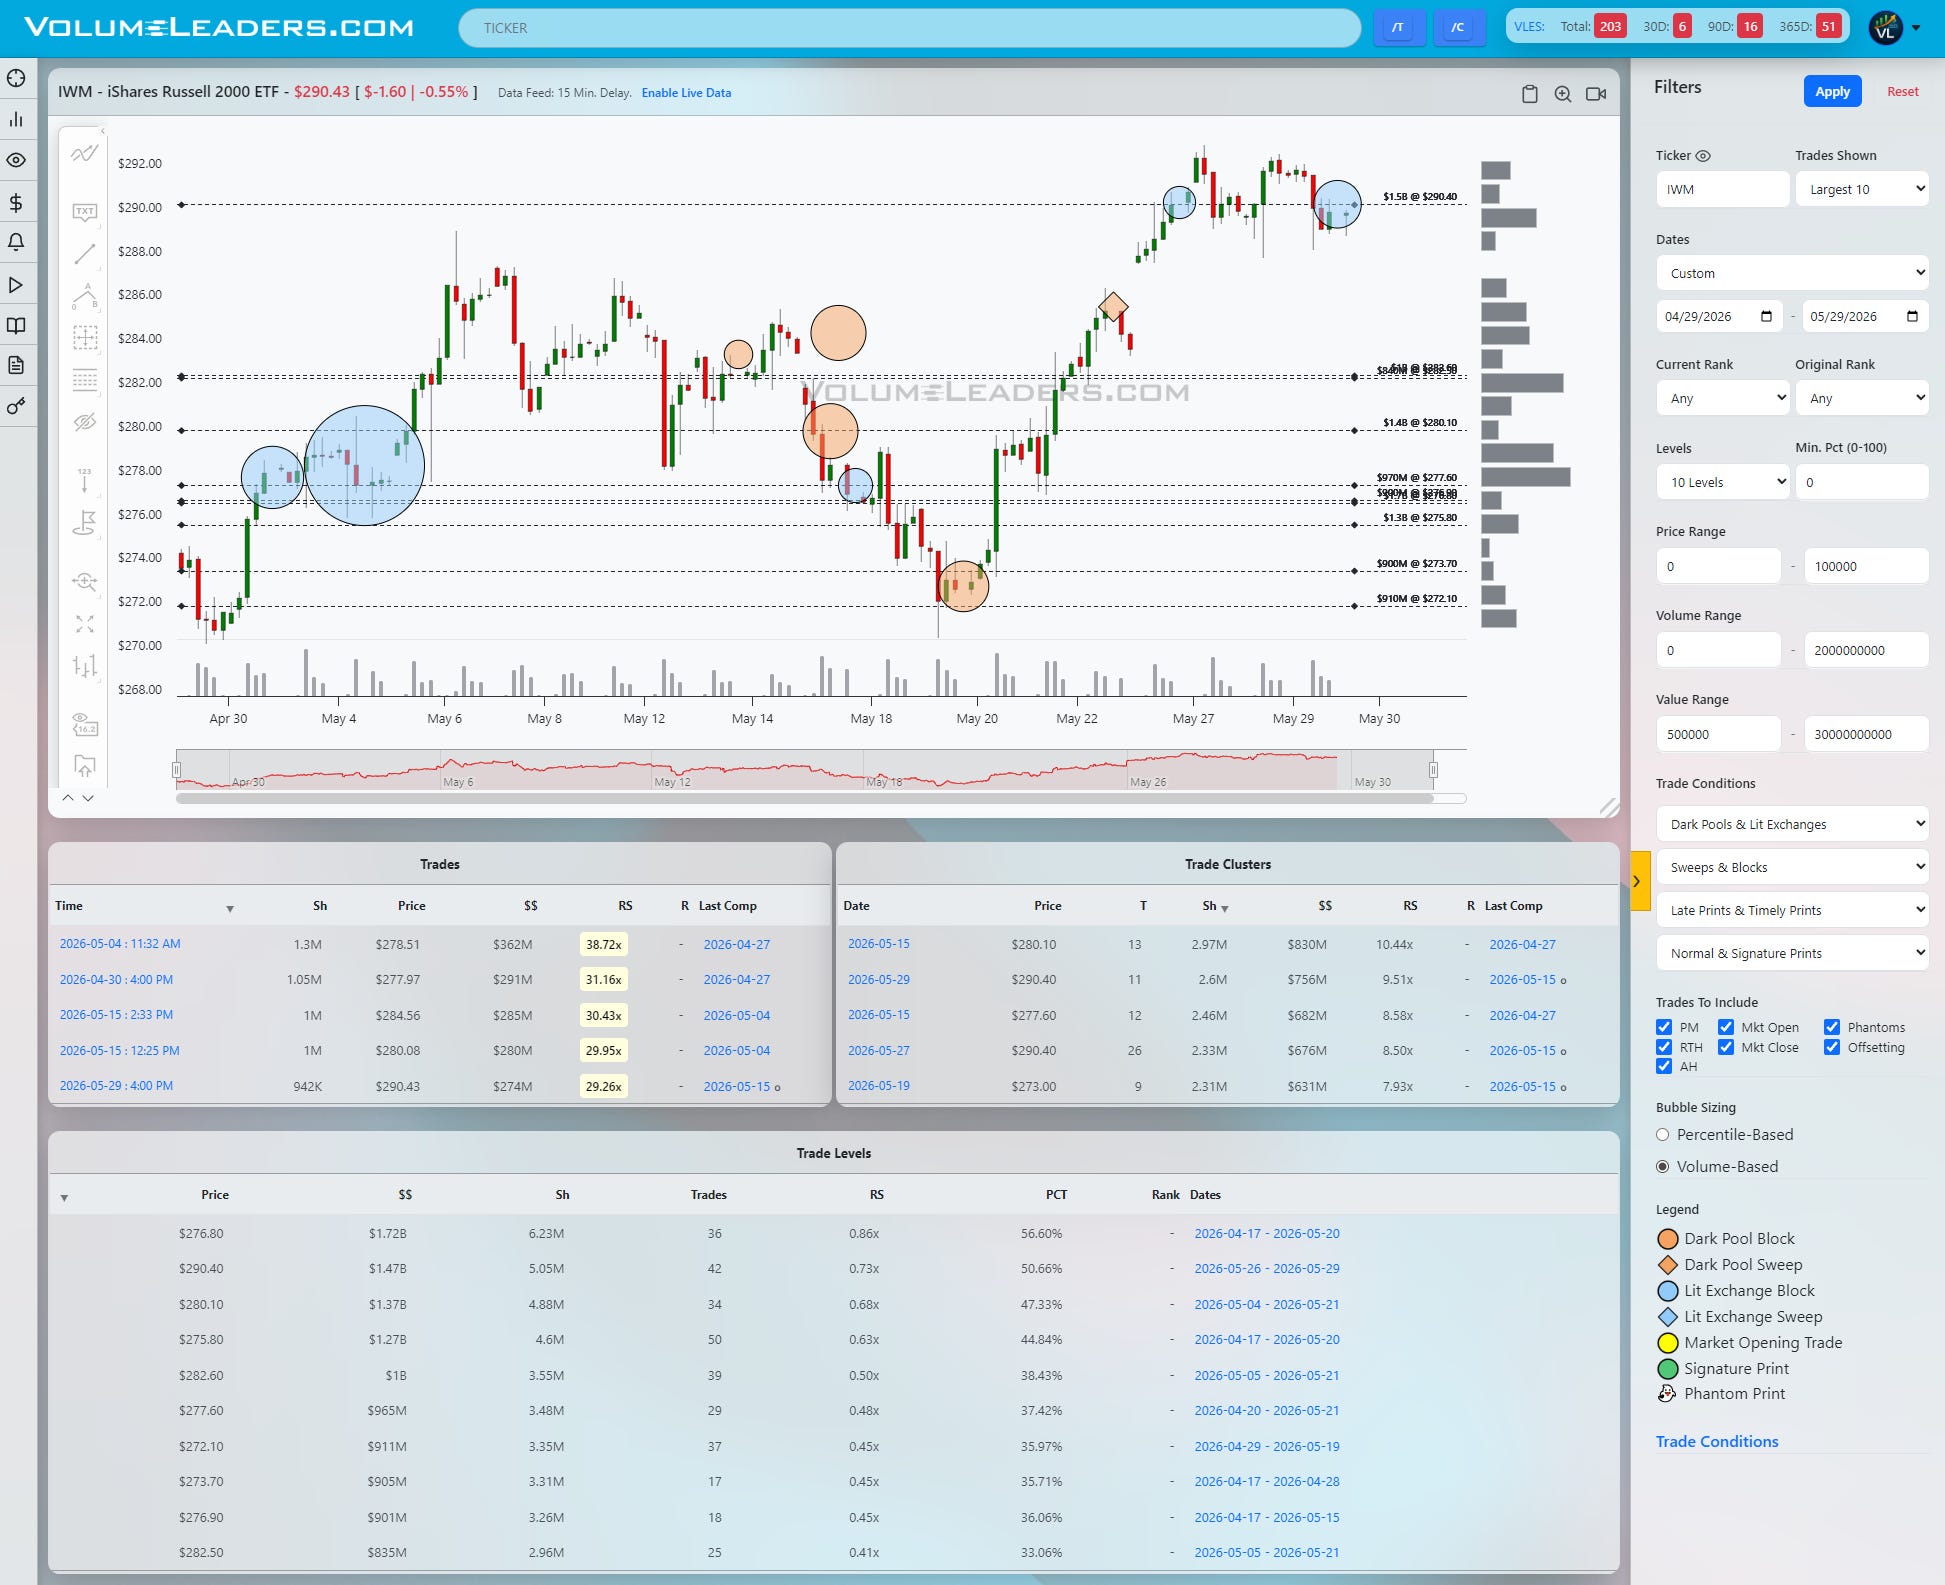
IWM is the outlier and looks the most vulnerable near term. There is an early large Cluster and several bigger prints around 280–284 that built a wide balance area, followed by a break lower into the mid‑270s where another heavy block appears and ultimately holds. The recent rally brings price up into the 288–290 region, where a sizable dark‑colored bubble shows up right at or just off the highs. That is classic “decision” flow: either it is the beginning of distribution after a squeeze, or it is strong hand accumulation before a breakout from the prior 284–286 balance. The table shows 280–282 and 288–290 as the biggest Level bands by notional, so that is the small-cap range that matters.
From a trading perspective, the primary pass/fail bands look like this. For SPY, the line of scrimmage is the 745–750 zone. Acceptance and closing strength above converts that area into support and argues for continuation into higher, thin volume territory; a failed breakout that slips back under roughly 742 with volume turns the tape into a candidate for a quick liquidation break down toward the 730 shelf and, if that fails, the heavy 715–718 Level that started the move. A disciplined trader can frame longs on controlled dips into 742–745 with tight invalidation below 740 and first targets into the prior high prints above 750, or, if the band fails, flip bias and look for short entries against 742–745 with cover plans into 732 and 718.
For QQQ, the key band is centered on about 738–740 with immediate downside shelf near 730 and the next demand magnet around 705–710. Bulls want to see consolidation above 738 followed by continuation on expanding volume; that would validate the late‑May mega‑print as absorption and open a path toward 750+. Bears need a decisive rejection from that zone, a break back under 730, and then follow‑through into 710; a failure to punch through 738 but also an inability to break 730 would just extend balance and chop.
In DIA, the important pass/fail area is 510–512 with nearby support in the 502–505 band and a deeper structural Level around 495. Acceptance above 512, particularly if price can base there intra‑day instead of straight‑up spiking, turns the recent breakout into a new auction higher, with the next upside magnets simply being round‑number extensions beyond the current chart. A failure that pushes DIA back under 505 would say that the latest large buys were not strong hands and could start a rotation that revisits the 495 Level where prior large prints are clustered.
IWM’s pass/fail band is tighter but more binary: 288–290 on the upside versus 280–282 below. A clean breakout and hold above 290, especially if that large recent print ends up below rather than above price, argues that the big player was absorbing and will want higher marks, with 295–300 as the next logical magnet. If instead IWM cannot hold 288 and slips back under 284, then the rally starts to look like a stop‑run back into the old balance and the door opens for a retest of 275–277 and possibly the low‑270s prints.
A tactical operator can simplify it: stalk long ideas in the leading indices on dips into their newly built shelves as long as those shelves keep holding on closing basis, and be much more selective or outright skeptical in IWM until it proves it can reclaim and hold above its recent distribution bubble. Invalidations should sit just on the other side of those shelves; first targets align with the next nearest high‑dollar Level or prior large print.
Levels To Watch:
SPY: 718–720, 730–732, 742–750
QQQ: 705–710, 730, 738–740, 750
DIA: 495, 502–505, 510–512
IWM: 275–277, 280–282, 288–290, 295–300

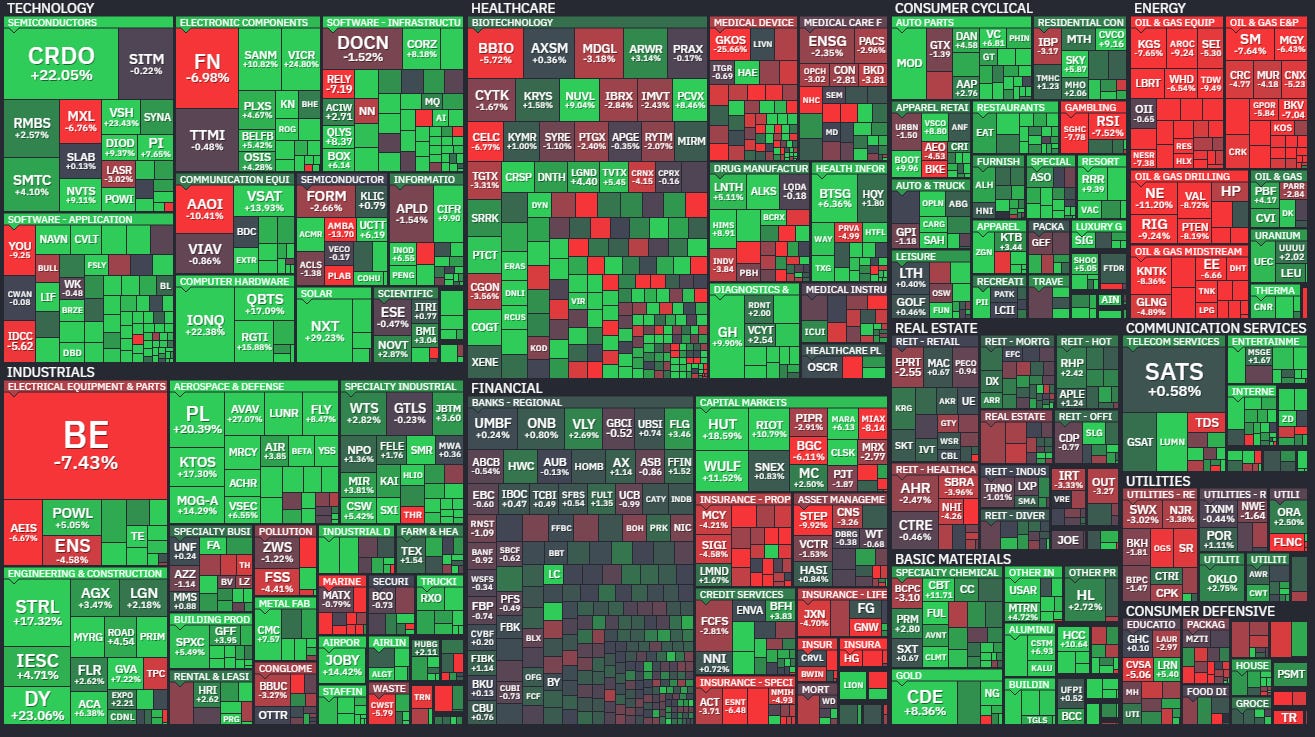
Summary Of Thematic Performance YTD
VolumeLeaders.com offers a robust set of pre-built thematic filters, allowing you to instantly explore specific market segments. These performance snapshots are provided purely for context and inspiration—think about zeroing in on the leaders and laggards within the strongest and weakest sectors, for example.
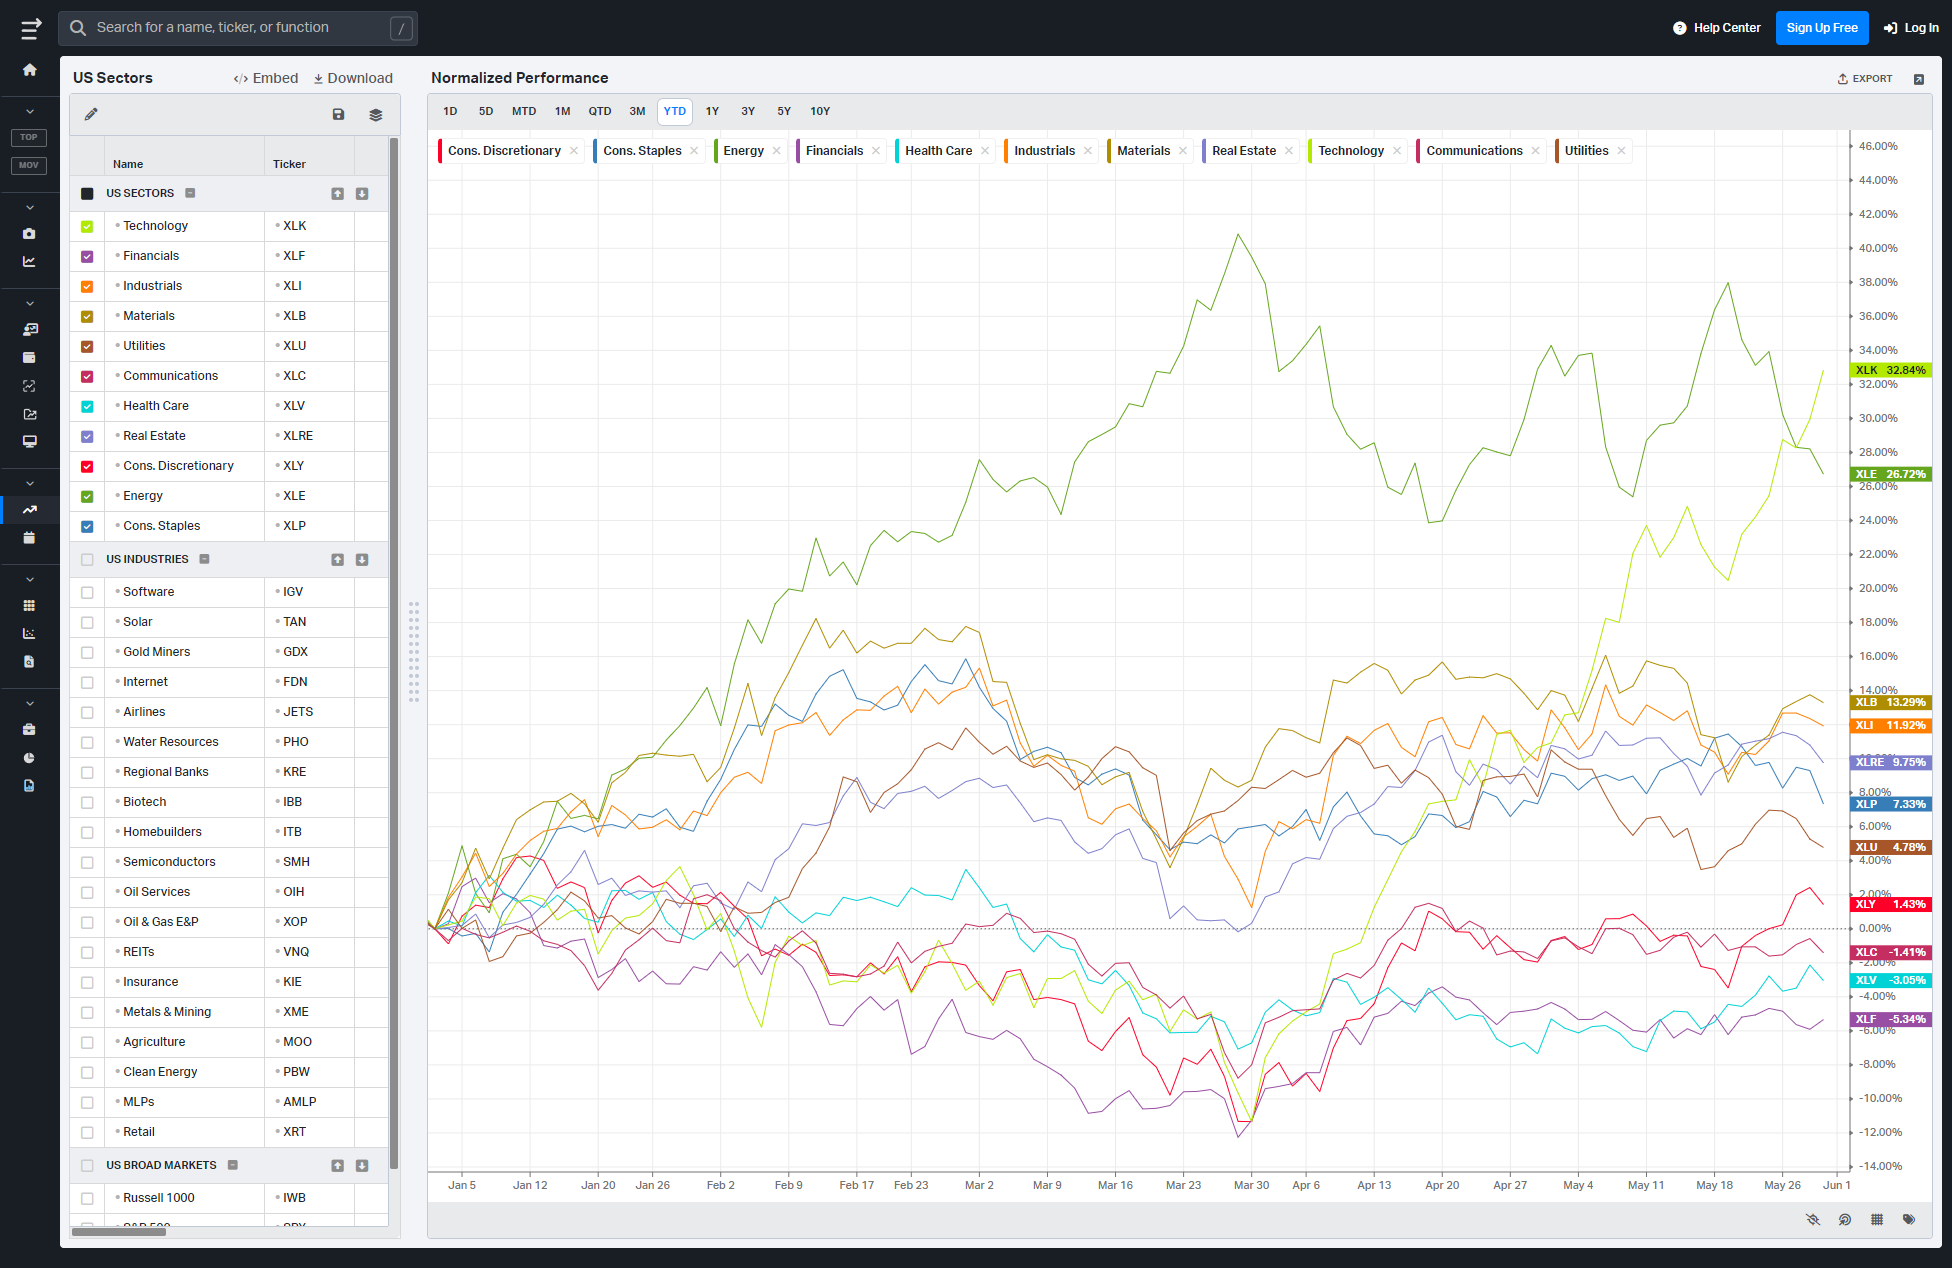
S&P By Sector
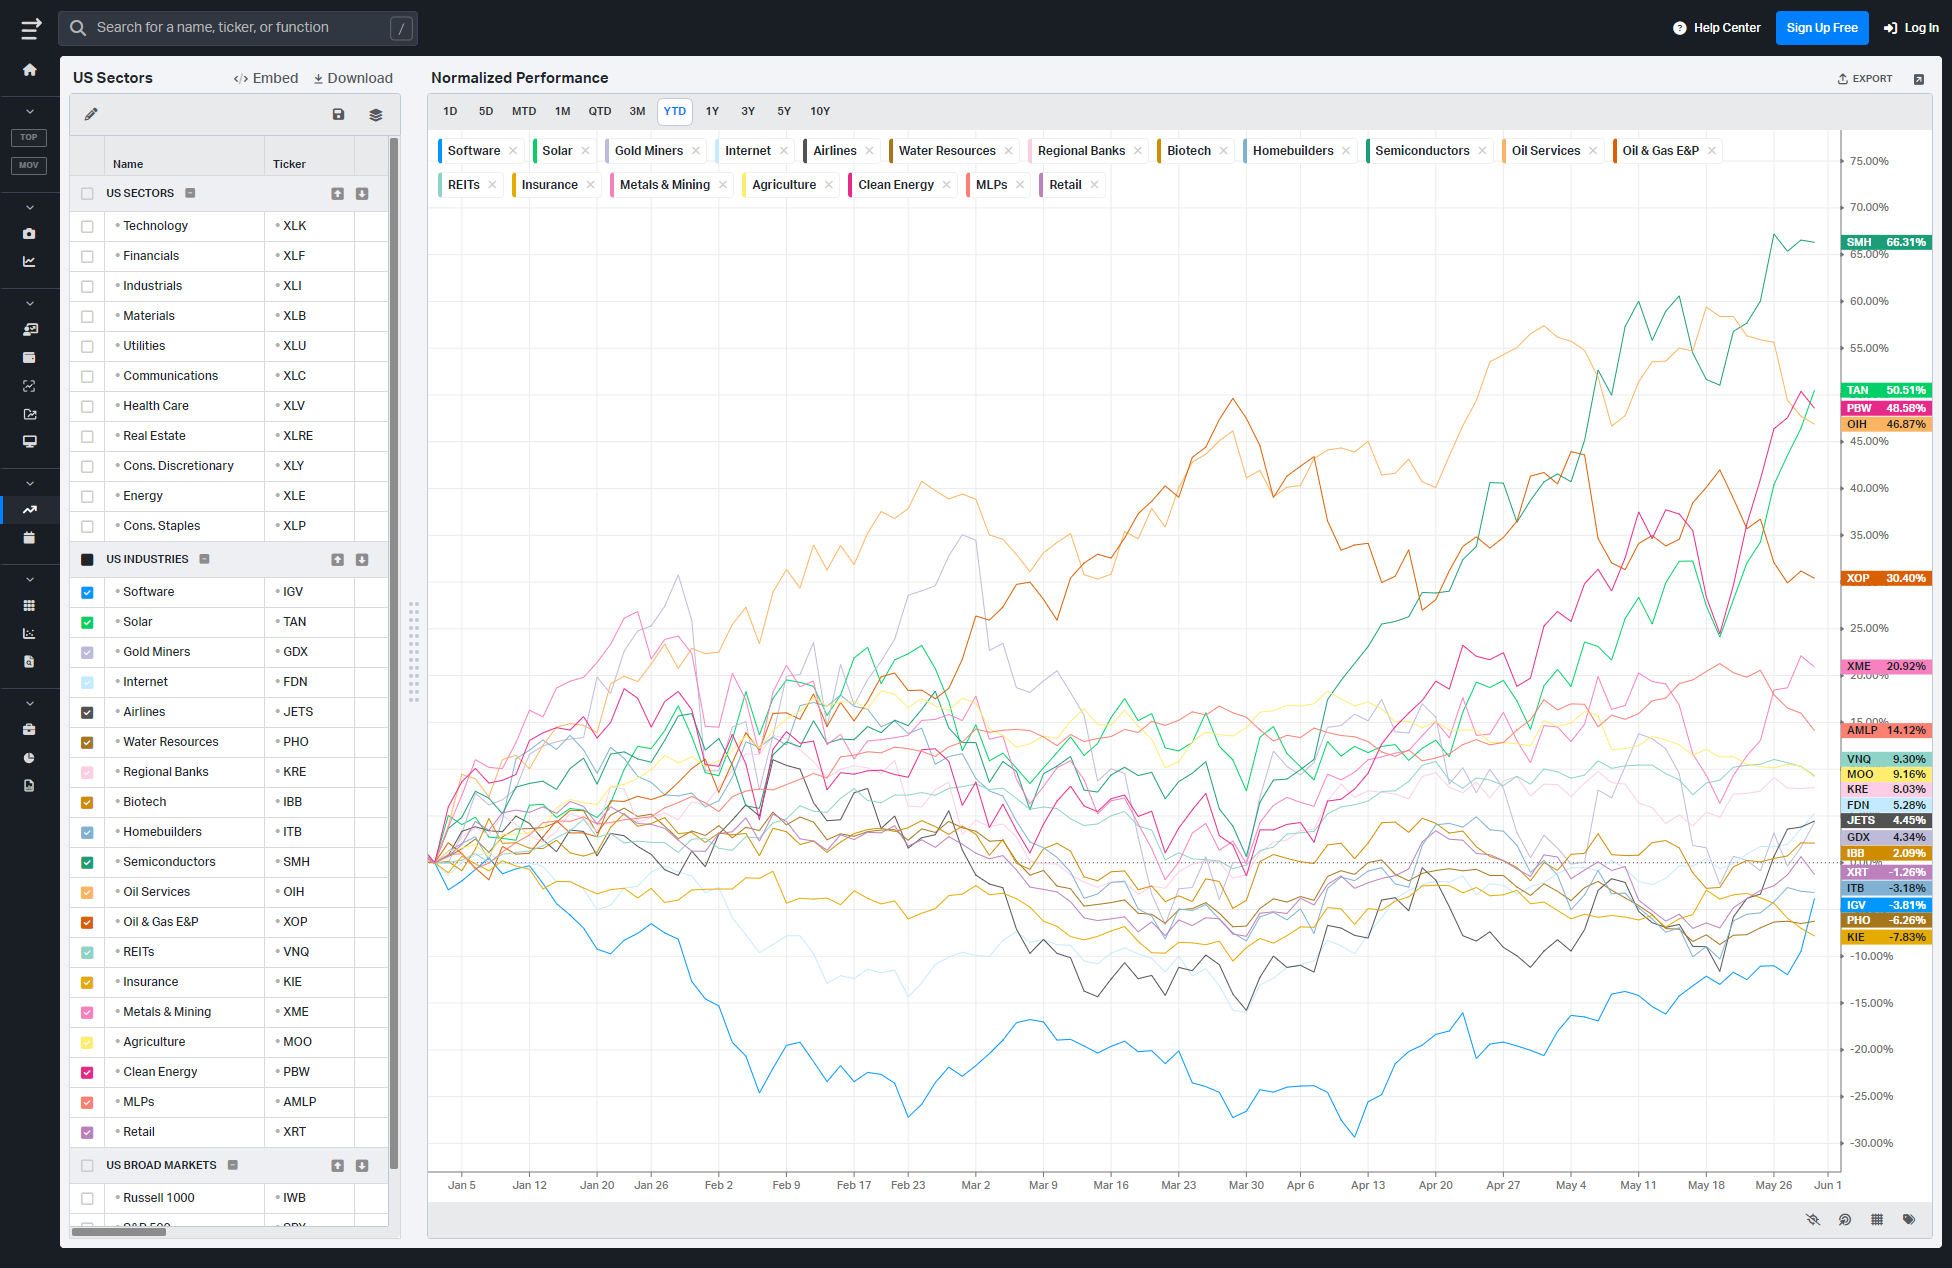
S&P By Industry
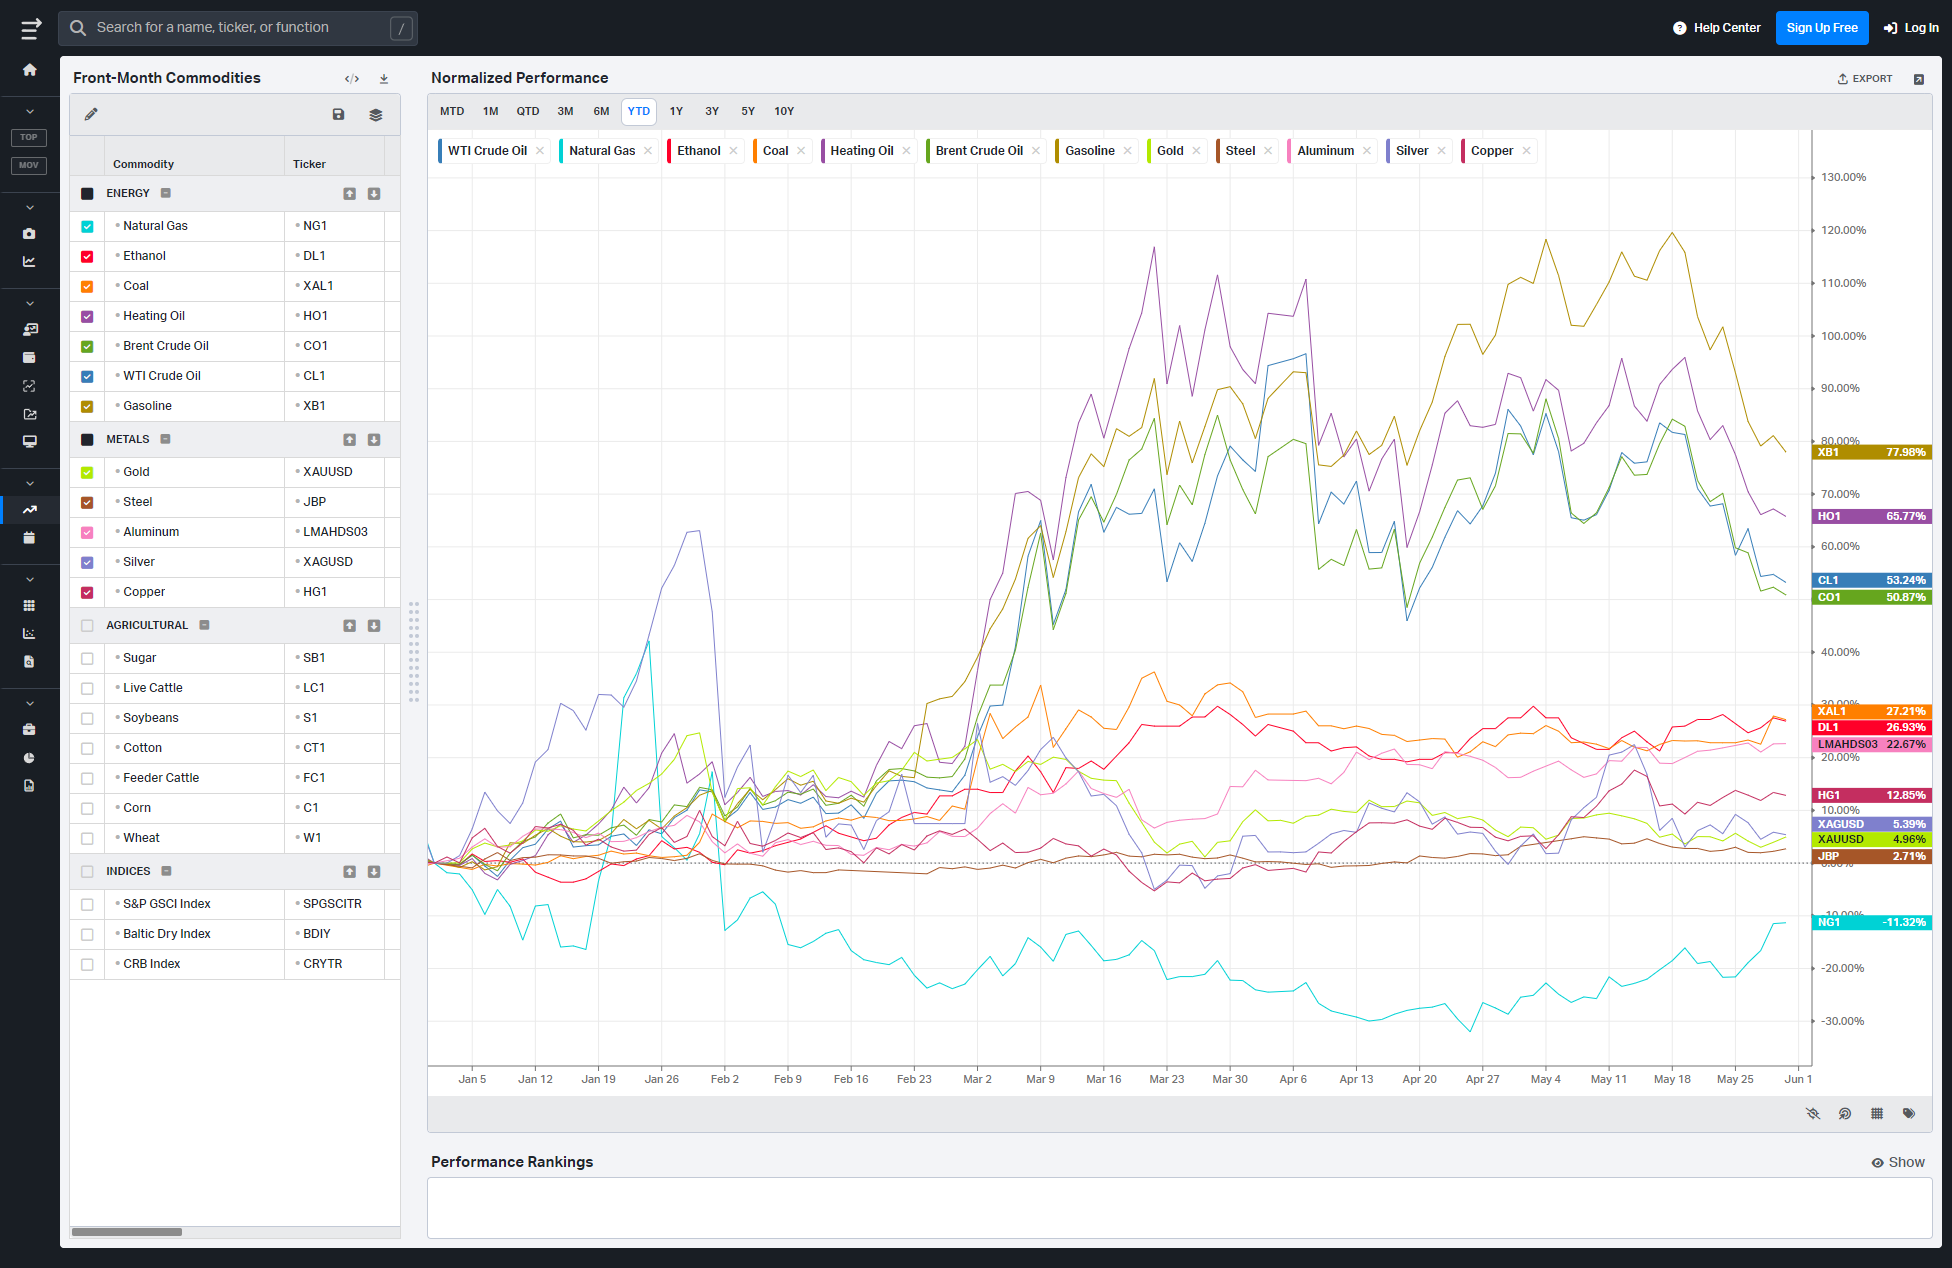
Commodities: Energy & Metals
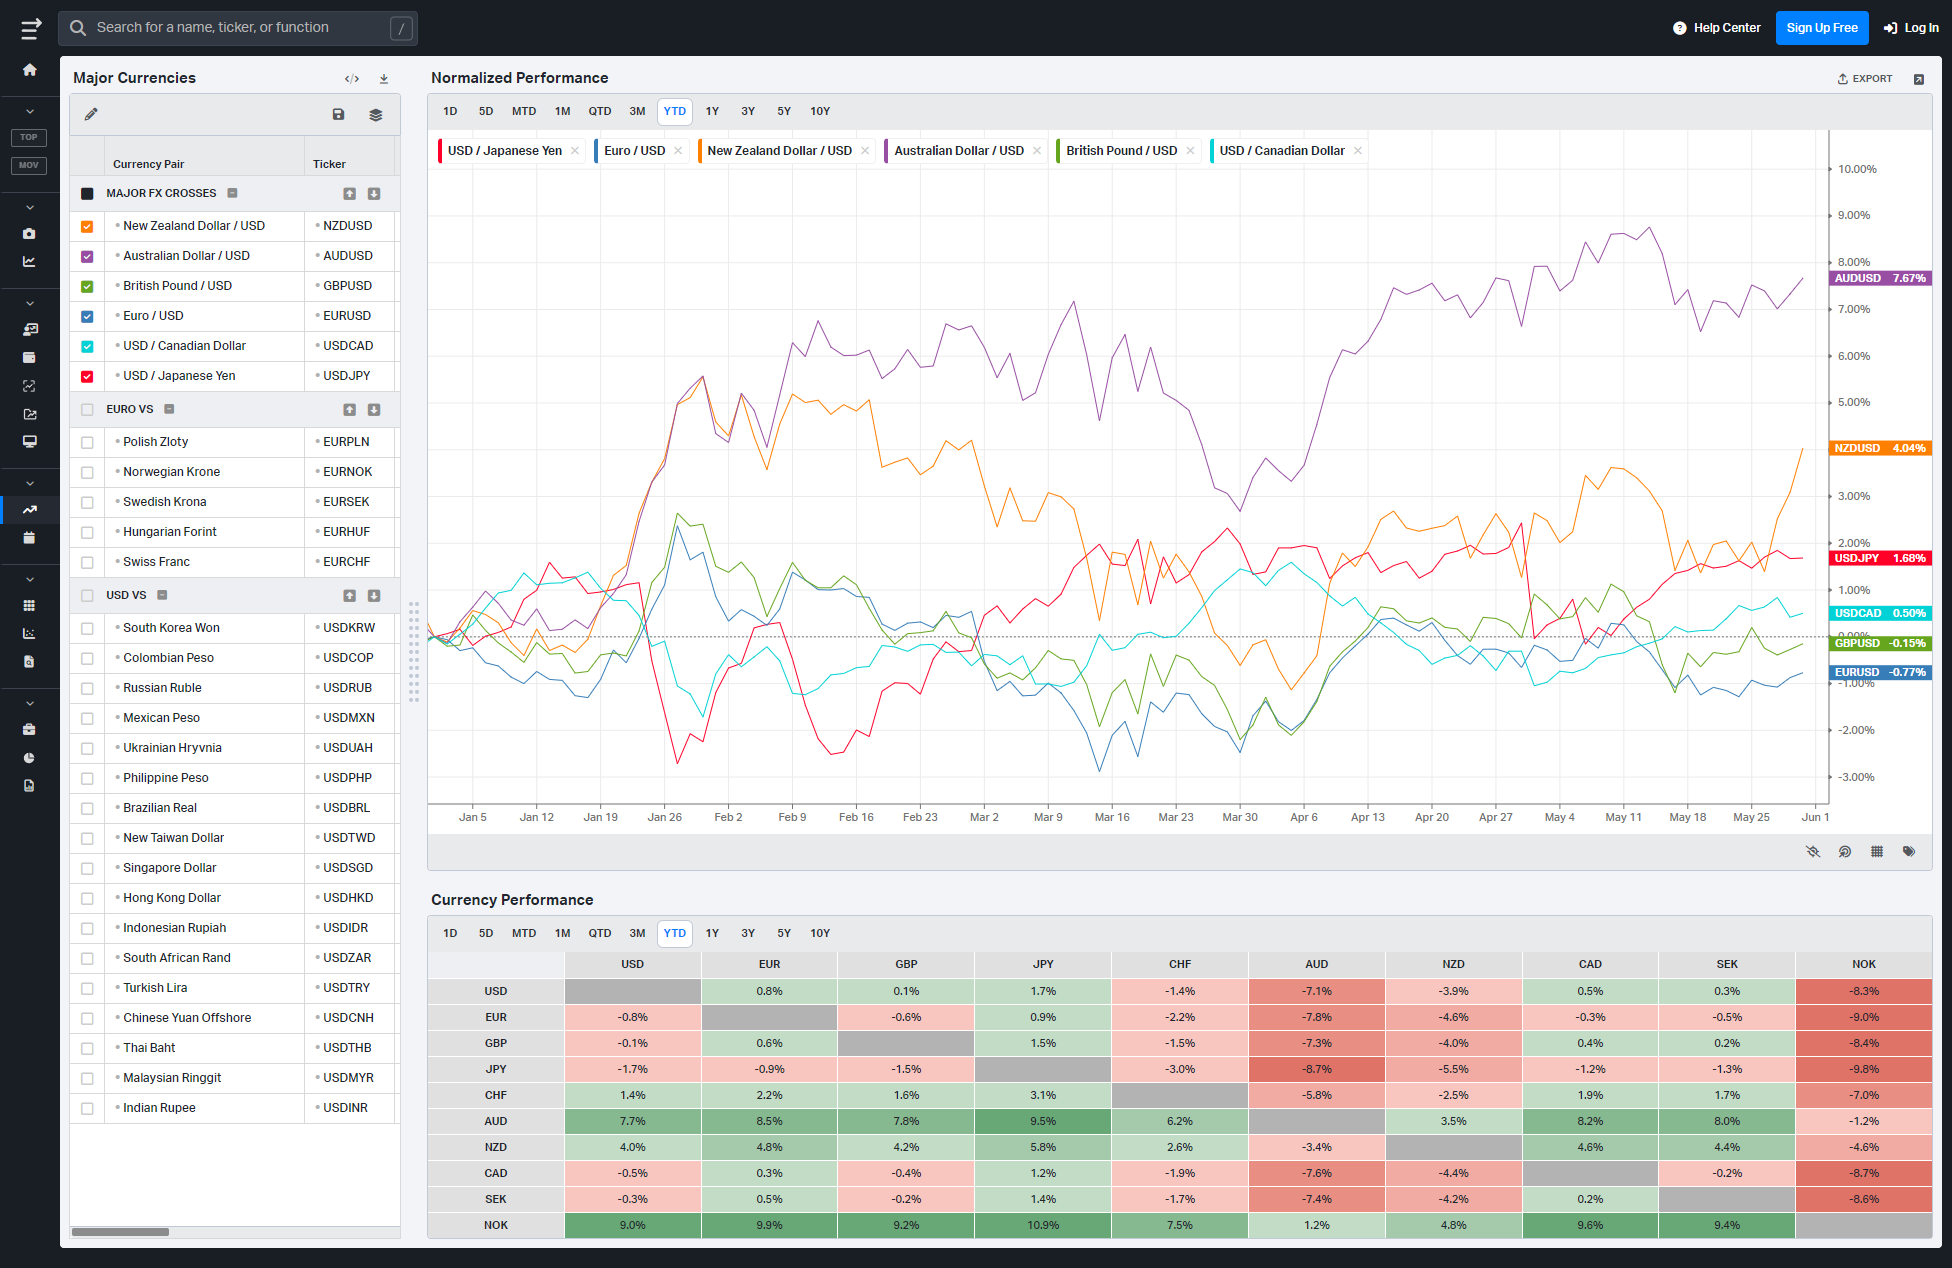
Currencies/Major FX Crosses
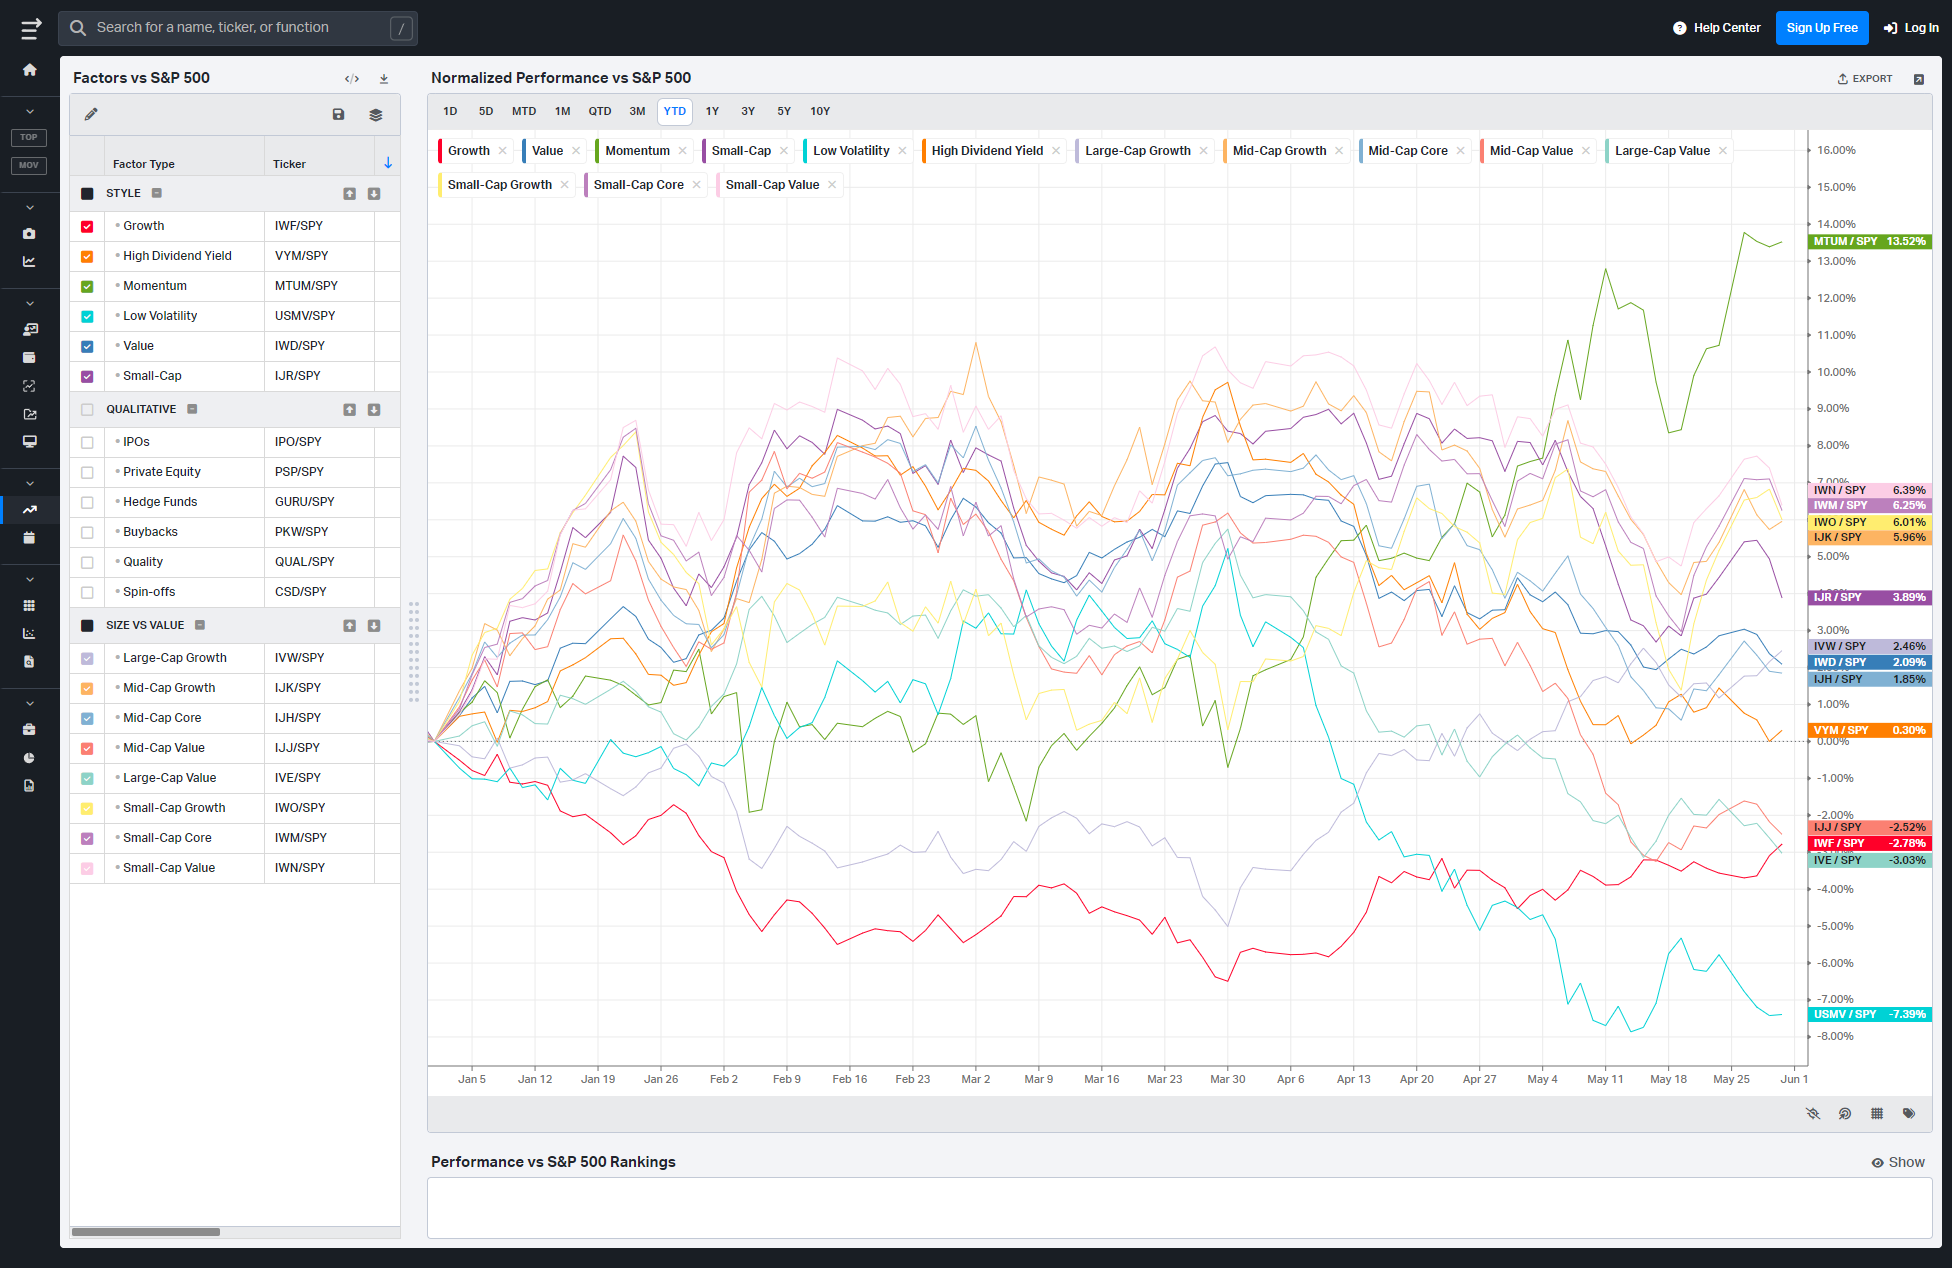
Factors: Style vs Size-vs-Value

Events On Deck This Week
Here are key events happening this week that have the potential to cause outsized moves in the market or heightened short-term volatility.
Growth Vs. Jobs: A Week Of Data With Teeth
Monday opens with the manufacturing side of the story. ISM Manufacturing PMI for May carries a previous reading of 52.7 against consensus 52.6 and forecast 53, so the bar is set for modest expansion rather than a surge. ISM Manufacturing Employment previously printed 46.4 with consensus 46.6, keeping the labor sub‑index in contraction territory even as headline activity holds above 50. Risk‑on is a clean “Goldilocks” mix: PMI near or slightly above 53 with employment stuck sub‑50, which says decent output without rehiring pressure. A hot employment rebound back toward 50+ alongside stronger PMI would be risk‑off for rates, pressing yields and repricing Fed‑cut hopes.
Tuesday shifts the focus squarely to labor demand. JOLTS Job Openings show a previous 6.866M versus consensus 6.87M and forecast 6.8M, essentially flat to mildly softer, while Fed speakers Kashkari and Hammadk both have the mic. A risk‑on tape wants to see openings drift lower toward the forecast, signaling easing labor tightness, paired with a cautious tone from Kashkari on inflation persistence rather than fresh hawkishness. A surprise re‑acceleration in openings well above the 6.8M forecast, especially if Kashkari leans into “higher for longer,” would be risk‑off for duration and high‑multiple growth.
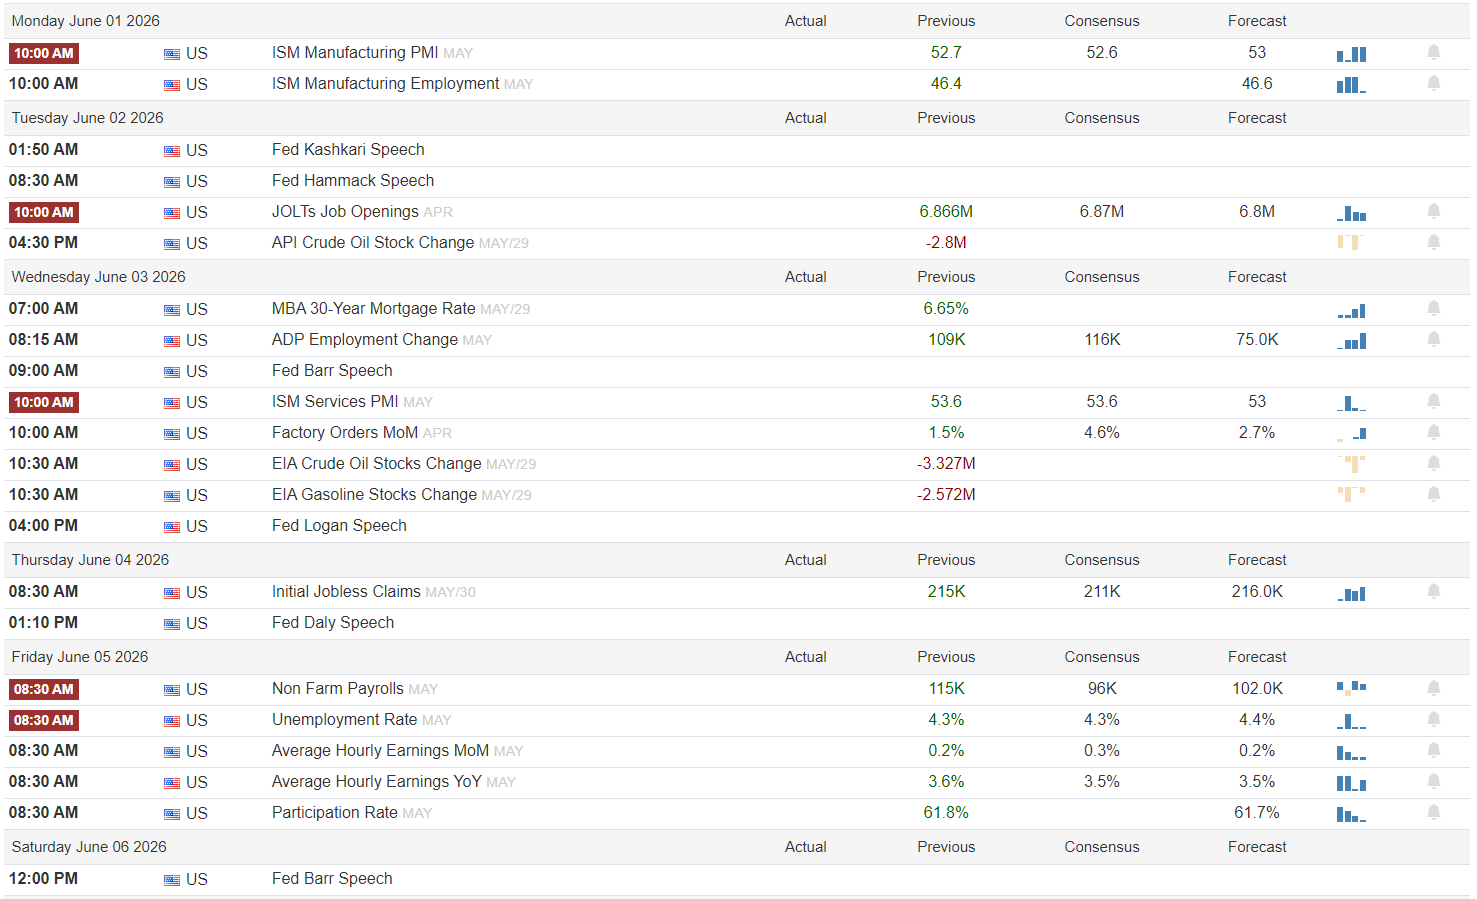
Wednesday is the week’s most loaded cross‑asset day. MBA 30‑year mortgage rates show a previous 6.65%, while ADP Employment Change previously printed 109K versus consensus 116K and a cooler forecast of 75K. ISM Services PMI sits at 53.6 prior, with consensus matching 53.6 and forecast 53, and Factory Orders MoM previously grew 1.5% against consensus 4.6% and forecast 2.7%. Crude and gasoline stock changes are both coming off prior inventory draws of -3.327M and -2.572M, respectively. The risk‑on mix is softer ADP near the 75K forecast, ISM Services holding around 53 without a re‑acceleration, tamer Factory Orders, and crude stocks rebuilding, all of which cools inflation and growth pressures without signaling hard‑landing stress. Any combo of hot ADP, an upside surprise in ISM Services, and another drawdown in gasoline would be risk‑off as it reignites stagflation fears and keeps the Fed on alert.
Thursday offers a cleaner, single print checkpoint with Initial Jobless Claims. Previous claims are 215K versus consensus 211K and forecast 216K, basically steady. A risk‑on outcome is claims hovering in that 210–220K band, reinforcing the soft‑landing narrative. A sharp spike meaningfully above the 216K forecast flips the tape into growth‑scare mode, while a surprise drop under 200K would be bad for bonds and potentially for richly valued tech as the market re‑prices a tighter labor market.
Friday is payrolls day and the real verdict. Non‑Farm Payrolls previously posted 115K versus consensus 96K and forecast 102K, so markets are already adjusting to a cooler hiring trend. The unemployment rate stands at 4.3% with consensus 4.3% and forecast 4.4%, while Average Hourly Earnings MoM and YoY were 0.2% and 3.6%, with consensus at 0.3% and 3.5% and forecasts 0.2% and 3.5%. Participation was 61.8% previously versus a 61.7% forecast. Risk‑on is a mildly soft print: payrolls near or slightly below 102K, unemployment nudging up to 4.4%, earnings holding at 0.2% MoM and drifting toward 3.5% YoY, and participation stable. That combo relaxes inflation and wage‑spiral worries without screaming recession. A risk‑off setup would be strong payrolls back above the prior 115K with unemployment stuck at 4.3% or lower and wages re‑accelerating above 0.3% MoM or 3.6% YoY; that keeps the Fed boxed in. Any upside surprise in participation that coincides with cooler wages leans back toward Goldilocks.
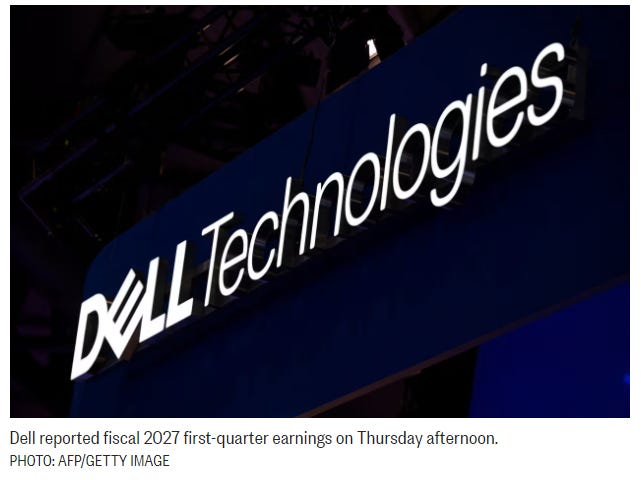
On the earnings and IPO side, the tape has a nice mix of macro‑sensitive names. Monday after the close features Credo (CRDO), Hewlett Packard Enterprise (HPE), and HIVE. HPE is the cleaner macro tell: watch enterprise hardware and AI‑adjacent demand; weak guide there would echo into broader IT spending sentiment. Tuesday brings Dollar General (DG), Victoria’s Secret (VSCO), and Oddity (ODD) before the open, then Palo Alto Networks (PANW), GitLab (GTLB), and Ulta (ULTA) after close. DG and VSCO are the most important for the consumer lens: unit volumes, traffic, and margin commentary will color how healthy the low‑to‑mid income shopper really is, and DG in particular feeds into the “trade down vs trade up” narrative. PANW and GTLB will influence the cybersecurity and dev‑tools complex; strong recurring revenue and billings would help keep high‑multiple software supported. Wednesday is stacked: Medtronic (MDT) and Macy’s (M) before the open, then CrowdStrike (CRWD), Broadcom (AVGO), C3.ai (AI), Veeva (VEEV), Five Below (FIVE), and ChargePoint (CHPT) after hours. Macy’s and Five Below fill out the consumer picture across income tiers; MDT adds a read on medical devices capex, while AVGO and CRWD are bellwethers for semis and security spending. Thursday features a cluster of IPOs — AADX, SFPT, QNT, SSMR, INIO — as well as Ciena (CIEN) before open and a full slate after close: Lululemon (LULU), Rubrik (RBRK), Planet (PL), Docusign (DOCU), Samsara (IOT), and AGX. LULU is key for premium discretionary, CIEN for optical/networking capex, and IOT as a proxy for industrial digitization. New‑issue reception will also speak to risk appetite: hot initial prints and sustained demand for AADX and peers would confirm that the primary market remains open; cold deals will reinforce selectivity.
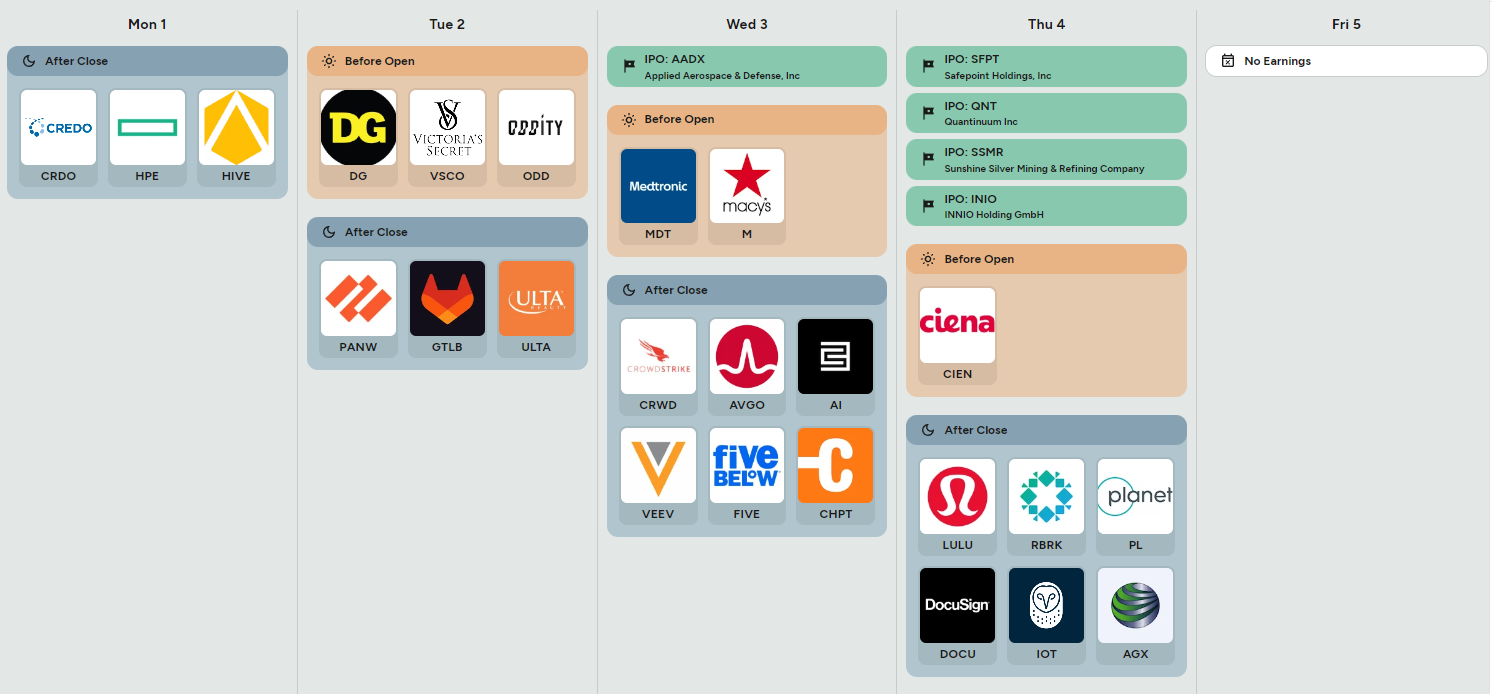
Three sign‑posts for active traders:
ISM manufacturing/employment mix vs 53 / 50 lines on Monday
Friday NFP vs 102K forecast and Average Hourly Earnings vs 0.2% / 3.5%
Reaction to DG, M, FIVE, and LULU as a cross‑section of the US consumer
Bottom line: unless payrolls and wages re‑accelerate, the calendar leans toward a choppy but ultimately constructive week for risk, with the consumer earnings tape deciding how far that can stretch.

Market Intelligence Report
A desk-grade synthesis of institutional positioning and market structure—unpacking the flows, levels, and emerging themes that shaped the week, and translating them into a model portfolio built the same way professional desks prepare for the week ahead.
MIR Part 1: The Backdrop
This week’s tape reads like a market that is still willing to take risk, but only on very specific terms. The higher‑level read is not euphoric; participation is uneven, volatility is elevated enough to demand respect, and the leadership stack is brutally concentrated. The flows say capital wants exposure to quality growth and large caps, but it wants that exposure hedged, staggered, and layered through different execution styles rather than via straight‑line beta.
Start with the day‑by‑day sector volume, keeping in mind that Friday the 29th was not a normal session but a unique liquidity event driven by the MSCI index rebalance, which reliably pulls forward benchmark‑tracking flows and single‑name shuffles around the close, making this the 8th largest day on record based on VL trade data.
Technology completely dominates the board, with this Friday alone printing roughly $200.9b in notional versus about $57.1b on the prior Monday, a more than three‑fold ramp into week‑end positioning. Large Caps follow the same pattern: about $31.1b on Friday versus $19.2b at the start of last week, while Financial Services jump from roughly $12.6b on the first Monday to nearly $38.8b by the latest Friday. Consumer Discretionary also swells from around $11.3b to $32.2b over the same span. Bonds, Staples, and Healthcare put up steady but not explosive gains, with the biggest week‑over‑week step‑up clearly in Tech, Financials, Industrials, and Energy, where Energy notional climbs from about $6.25b last Monday to $19.4b by this Friday.
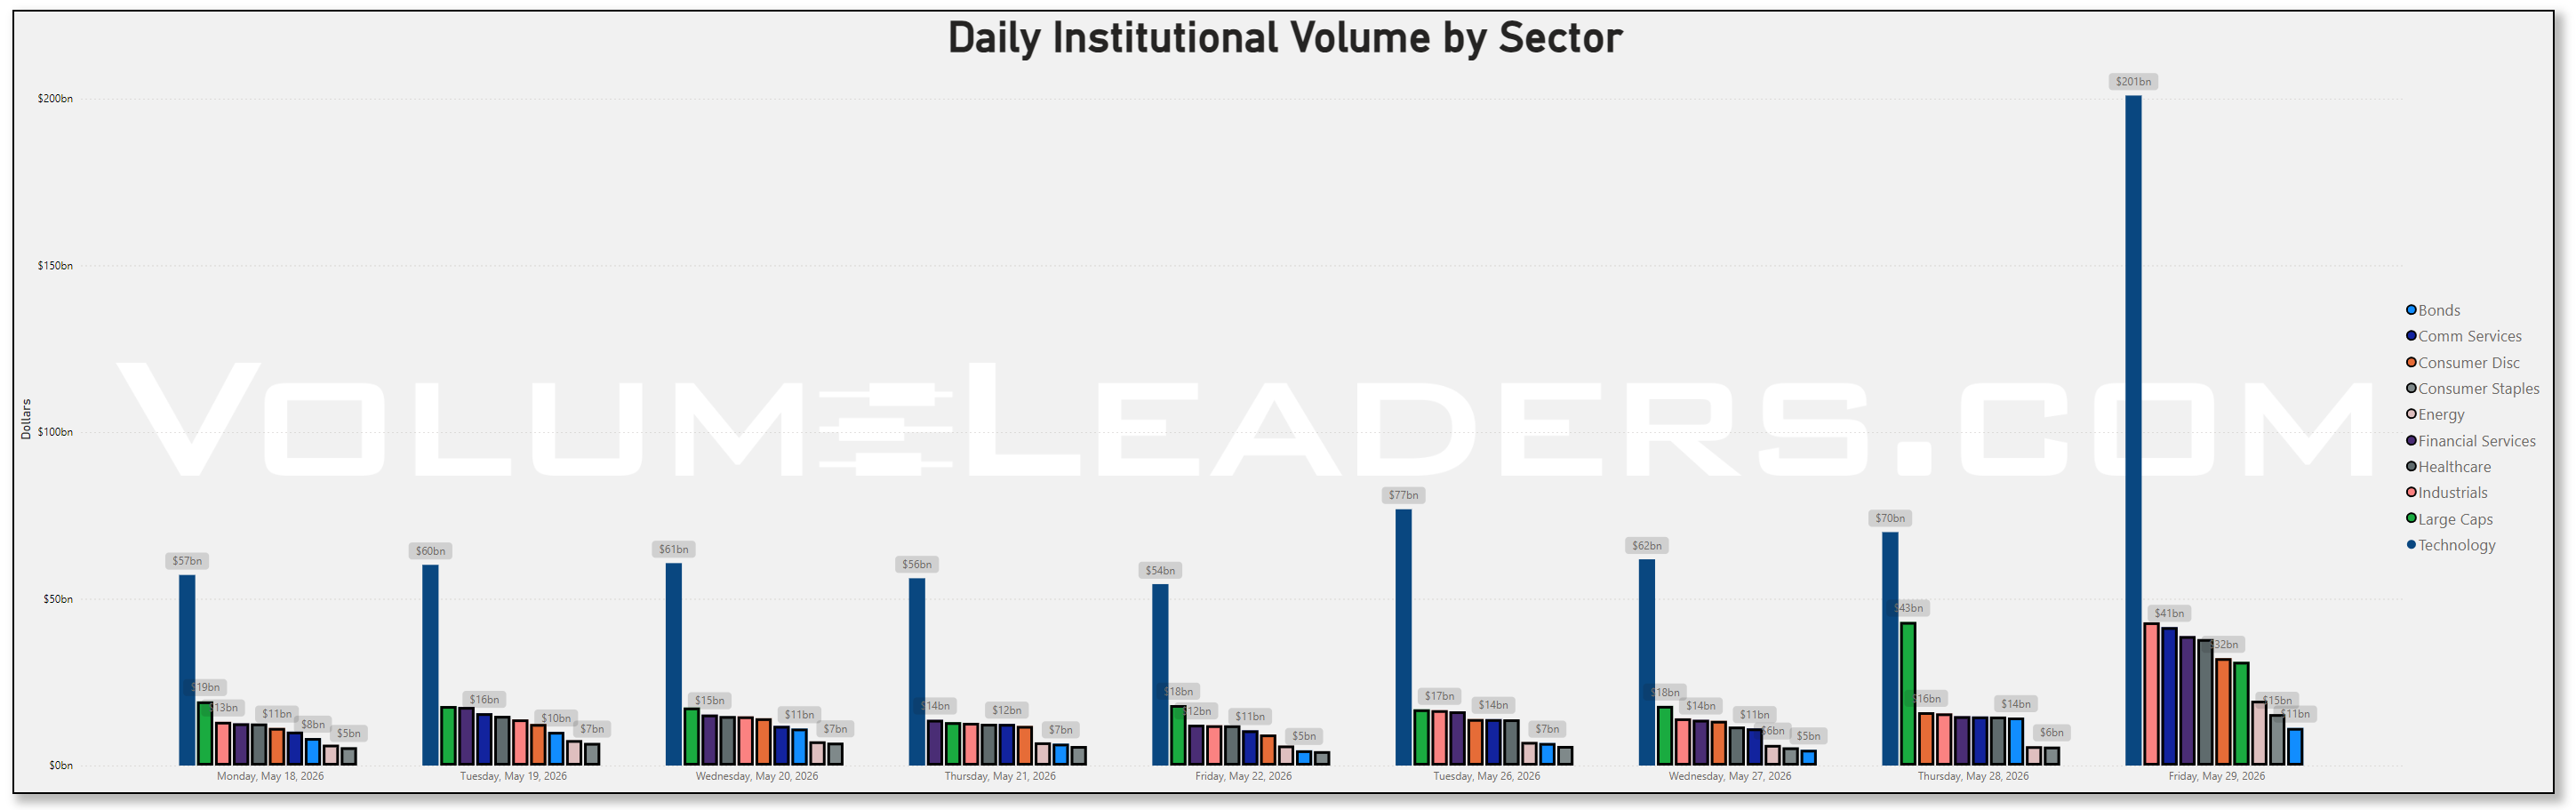
Some of that late‑week surge is pure rebalance mechanics rather than fresh directional conviction, but even after you haircut the rebalance effect, the pattern together with the technical overlays—indices in a neutral‑to‑slightly‑bullish regime, high sector dispersion, and a somewhat elevated volatility backdrop—is the definition of selective risk‑on: investors are not hiding in cash, but they are choosing their battles carefully rather than buying the entire tape at any price.
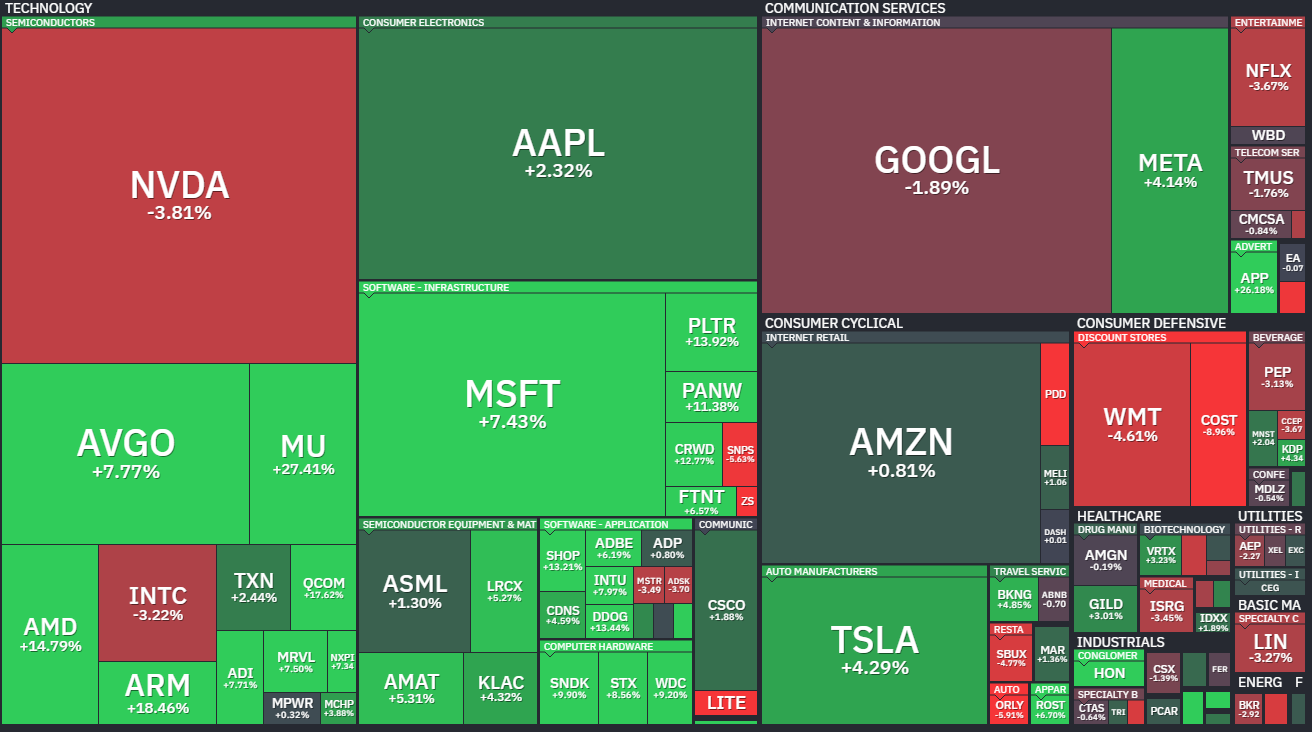
The treemap of top names by aggregate dollars drives that point home. Technology is the super‑cluster, with NVIDIA around $58b, Microsoft and Apple each near $32b, Micron about $26b, and Broadcom roughly $17b. The width of the field underneath is important: Intel at about $16b, AMD around $12b, Qualcomm and Analog Devices in the mid‑single‑digit billions, and a long tail that includes CRM, ServiceNow, and an entire bench of semis and software. SPY and QQQ sit inside a very large “Large Caps” block at about $34b and $19b respectively, while IVV shows up around $12b and VOO near $8b. Amazon at roughly $14b, Tesla near $8b, and Home Depot at about $4b anchor Consumer Discretionary; JPMorgan and Bank of America both around $4b–5b sit near the top of Financials; Eli Lilly at roughly $4b and UnitedHealth around $3b headline Healthcare.
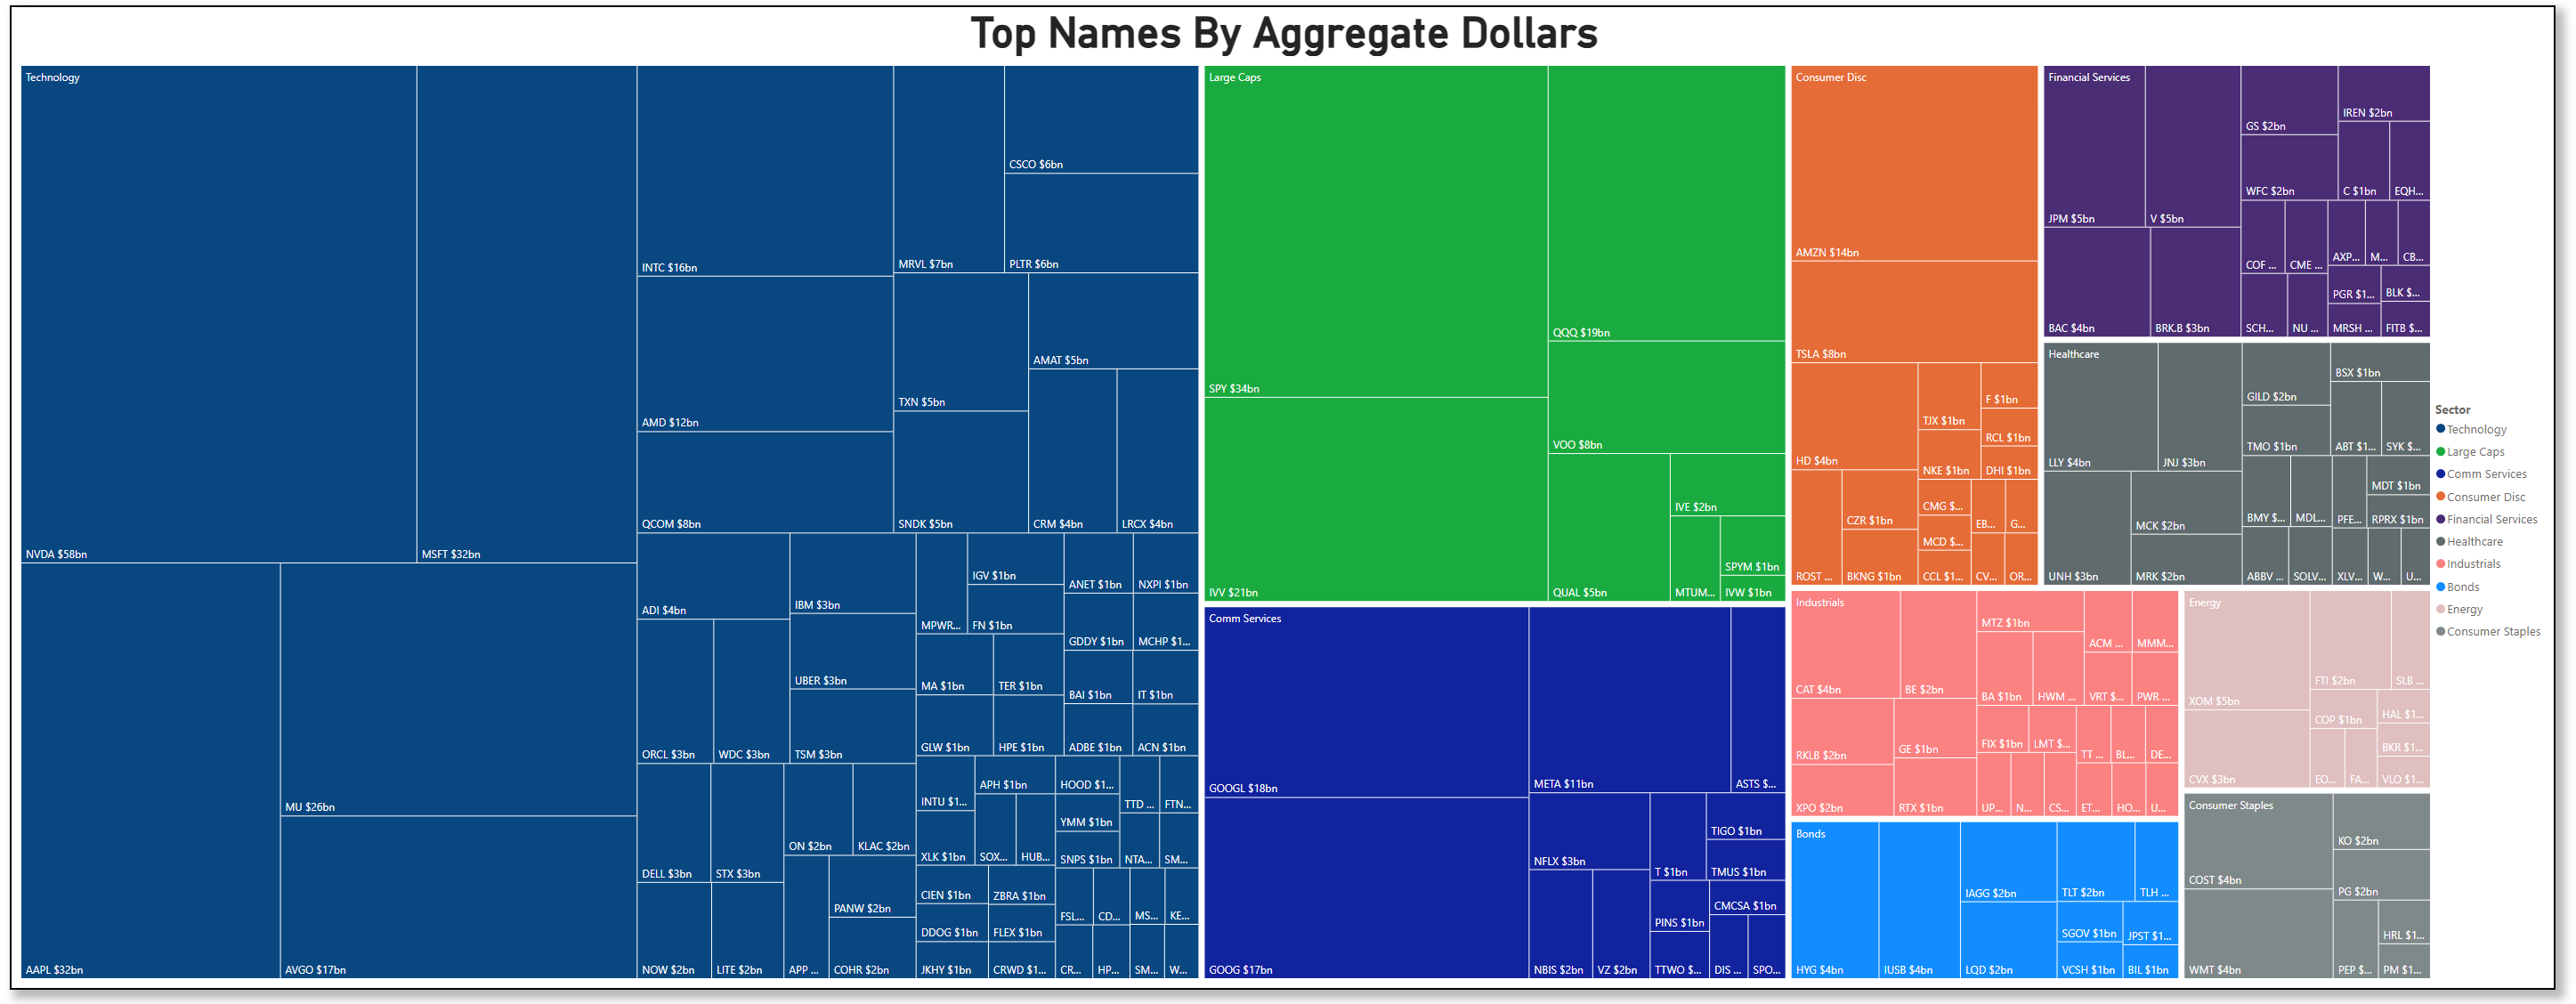
Bonds are represented but modest, with HYG at about $4b and IAGG, TLT, and related tickers clustering mostly in the $1b area. That hierarchy is not the tape of a market rotating away from growth; it is a tape that is doubling down on the biggest growth franchises and index wrappers, even as broader metrics flag heavy inflows into defensives like Utilities and Staples and outflows from more speculative corners like smaller Tech and Biotech.
Aggregate flow across all trade types shows the same concentration. NVIDIA sits alone at the top with roughly $55b, with SPY and MSFT close behind in the $30b+ zone and AAPL in the high‑20s. MU, IVV, QQQ, and GOOGL each cluster in the low‑teens to high‑teens, while AVGO, INTC, and AMZN follow with around $11b–$13b each. The scatter of volume versus dollars makes it clear this is not just a few outsized prints; names like MSFT, AAPL, and SPY pair large notional with heavy share volume, suggesting broad participation across execution styles rather than one‑off blocks.
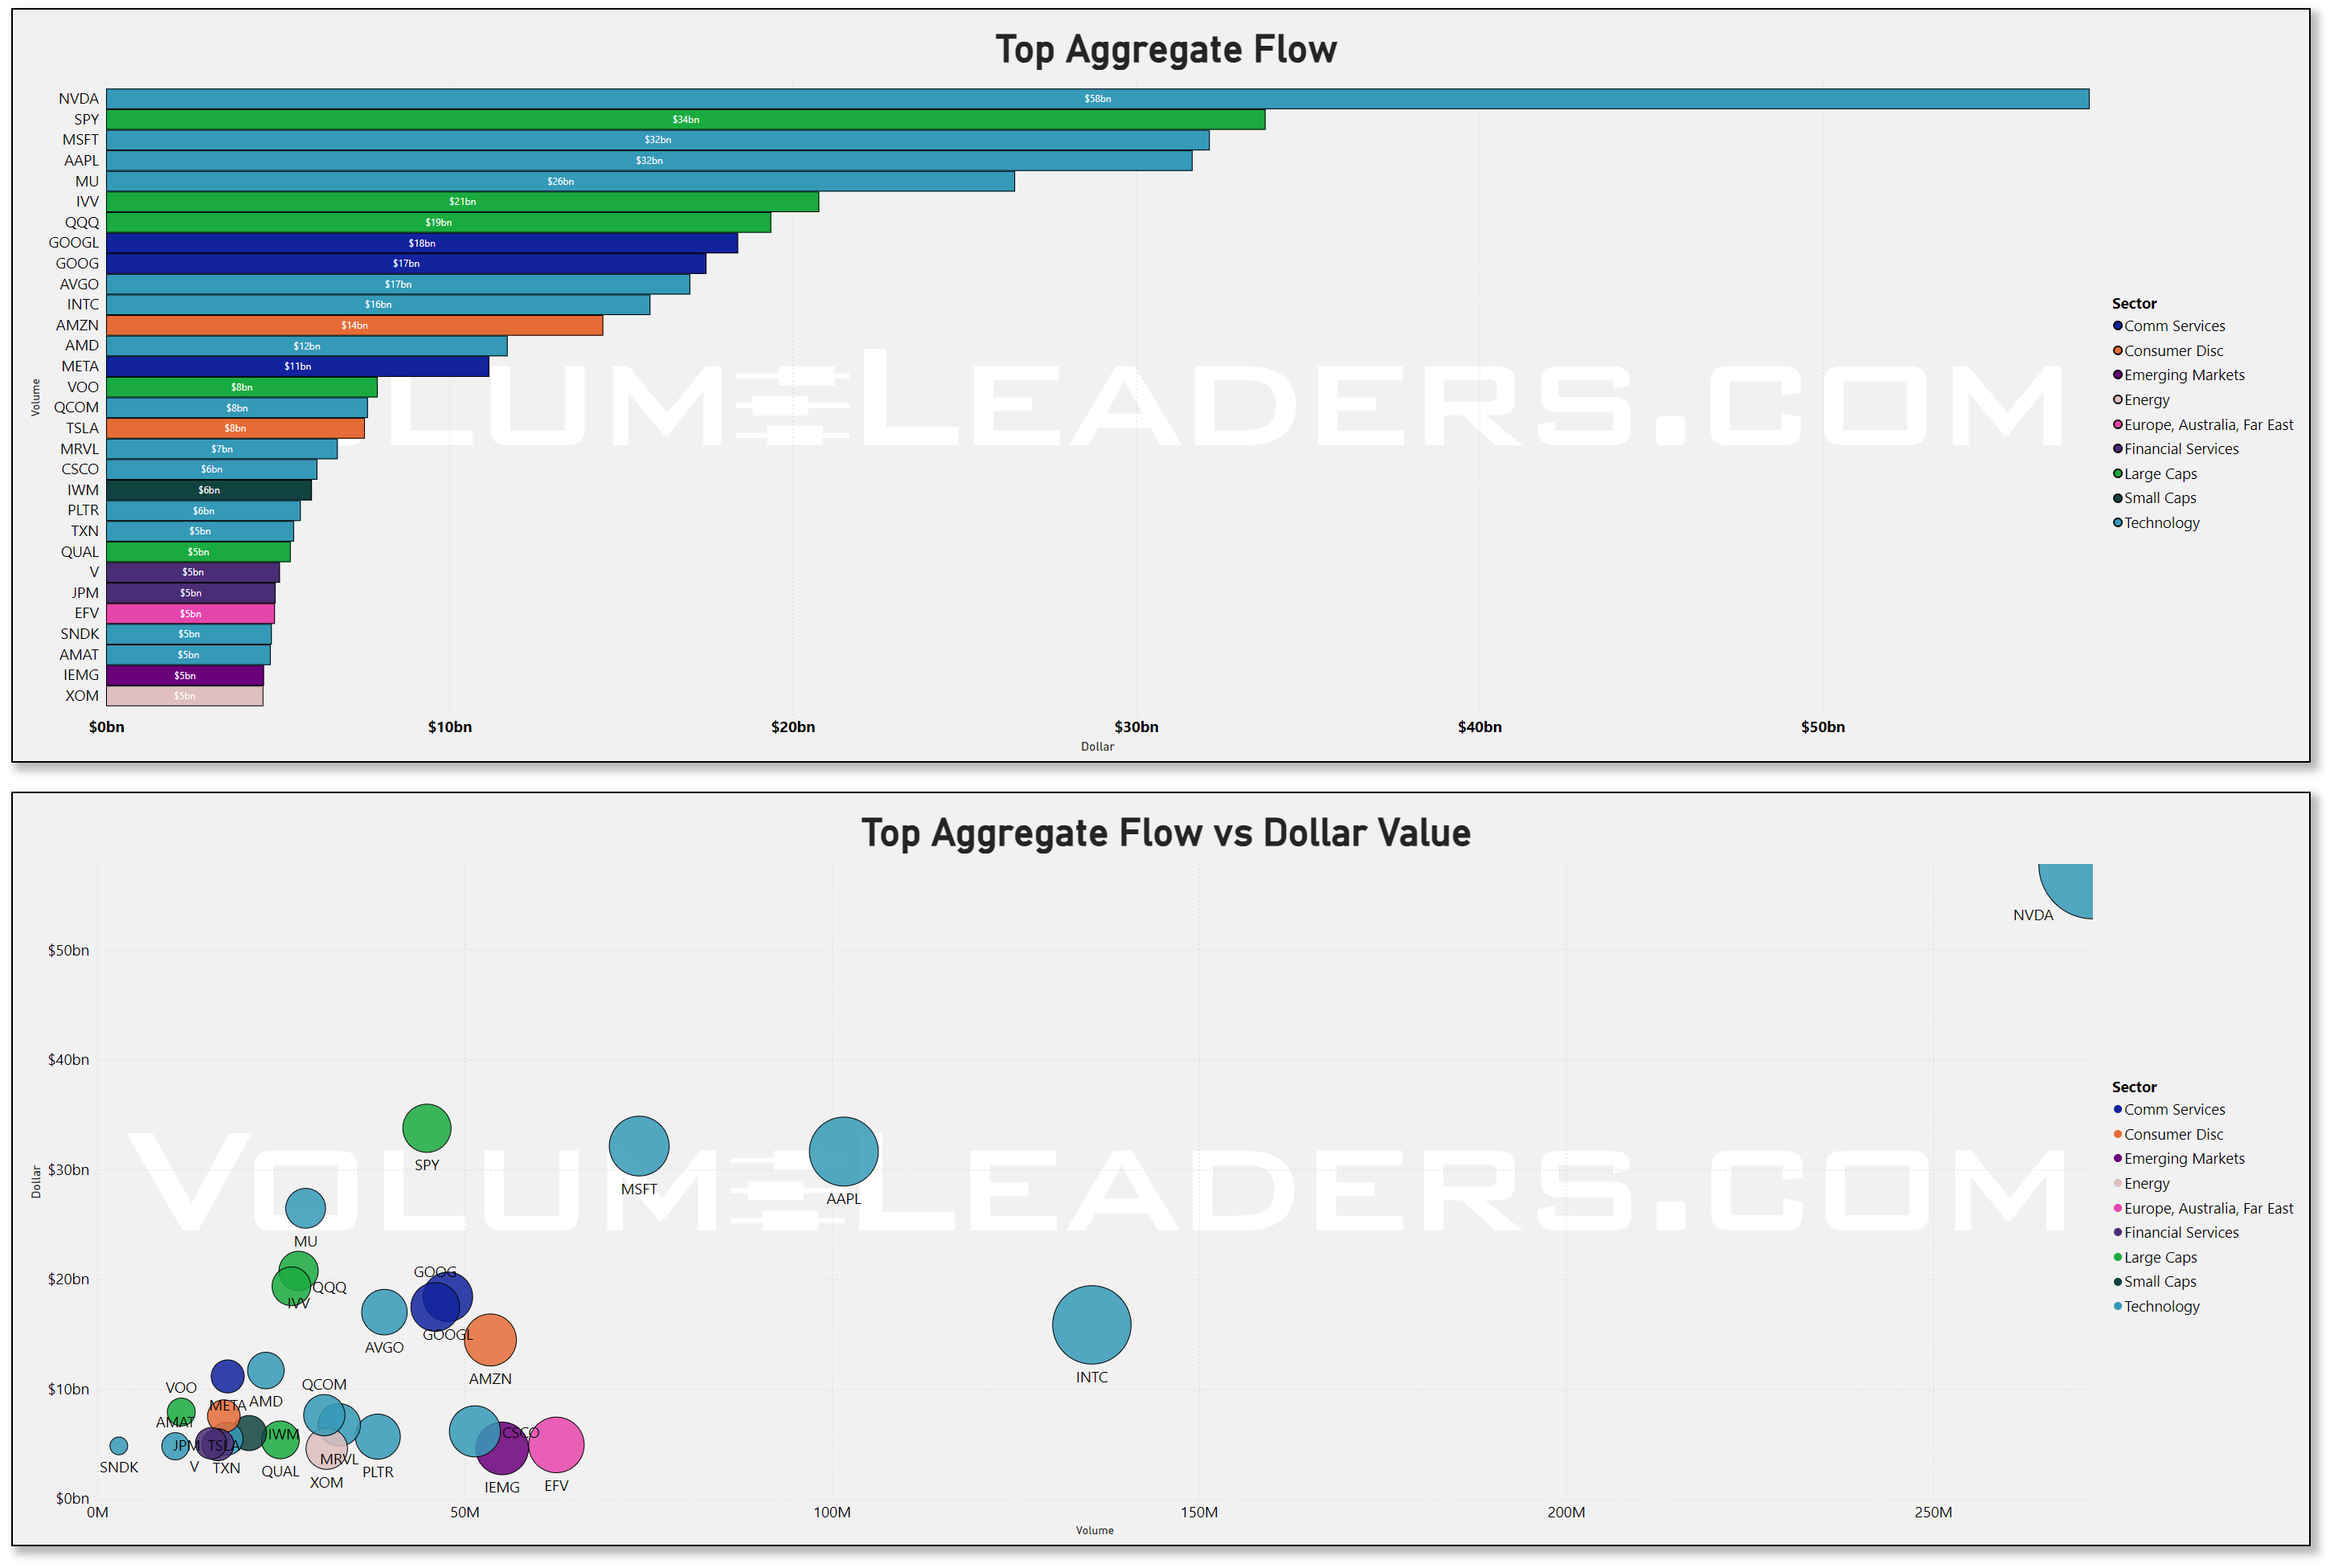
In some terms, that is what a market with genuine leadership looks like: a handful of sectors and tickers with both strong relative performance and real money committed, rather than passive drift. The flip side is that dispersion and realized volatility are high; sector RV ratios are elevated in the more cyclical groups, which means moves can extend quickly in both directions and trades that fight the leadership have to be sized with more humility.
The dark‑pool lens adds nuance. NVIDIA again tops the leaderboard with roughly $27b of dark‑pool dollars, with SPY close to $23b and IVV around $20b. MSFT, AAPL, and MU each log in the low‑teens, and the scatterplot shows SPY and IVV with both high dark‑pool notional and substantial volume, while NVIDIA skews toward extremely high dollar value per unit of volume.
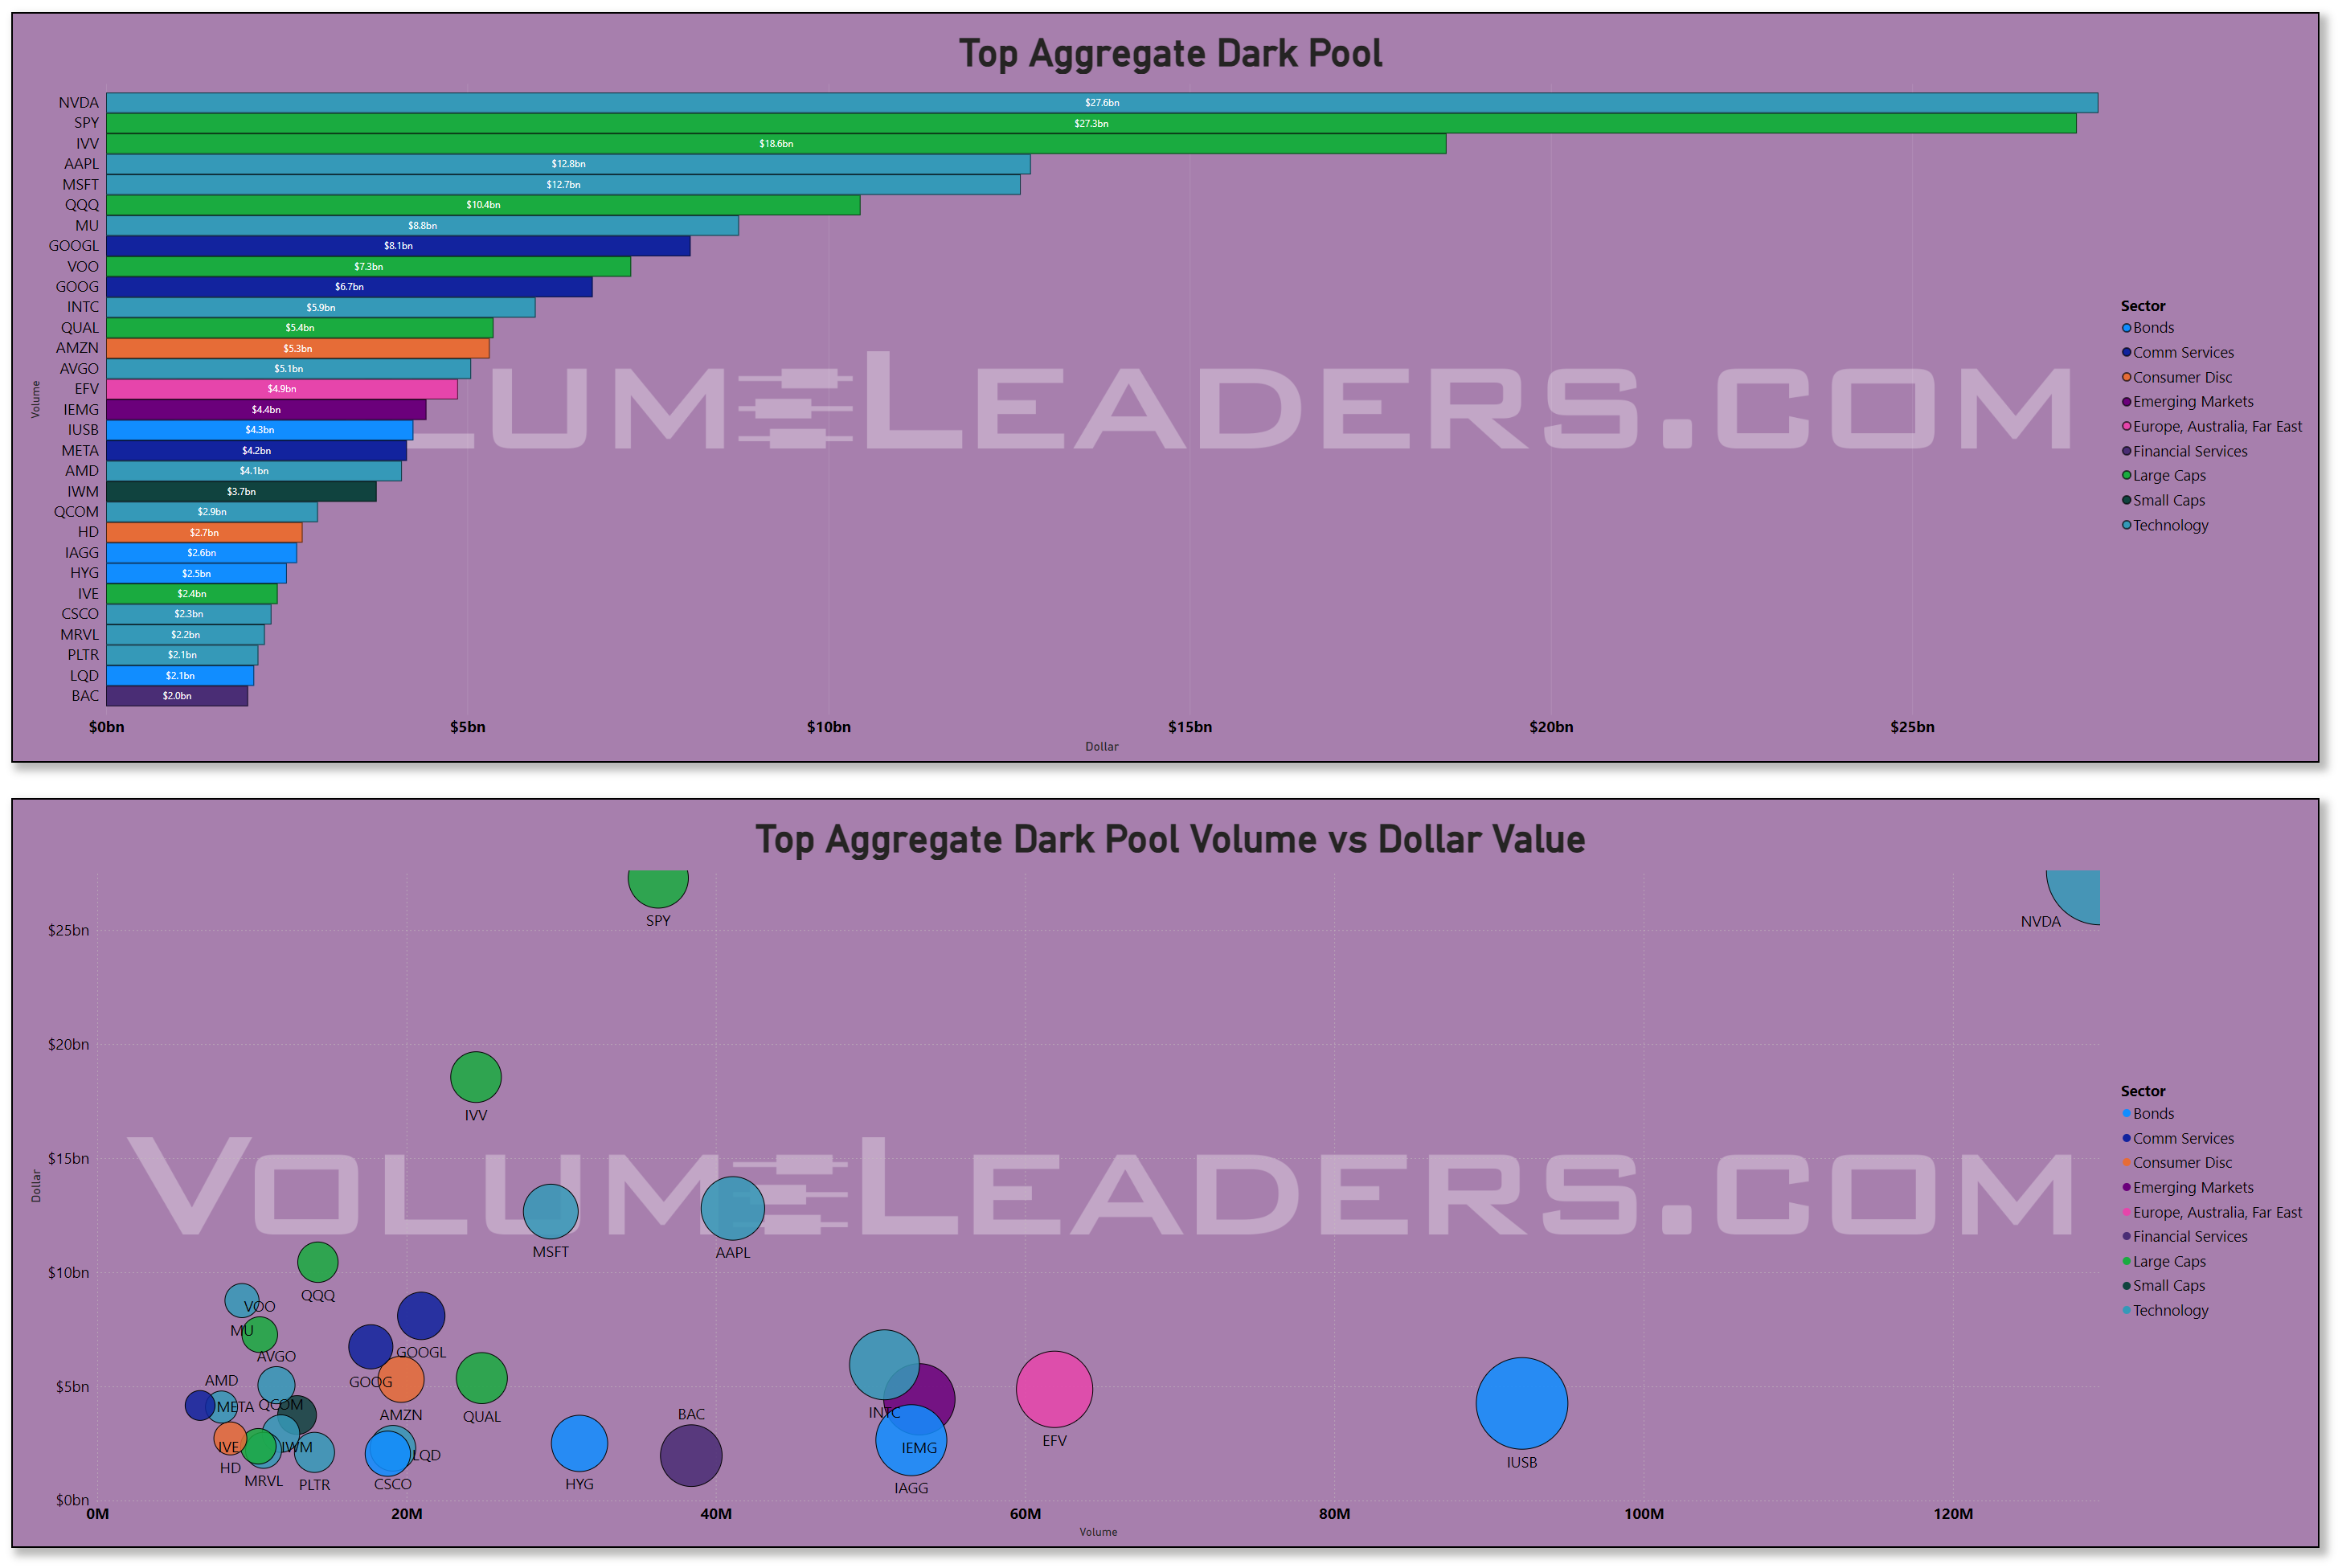
That pattern suggests the hidden venues are being used for both broad index re‑weighting around the MSCI changes and very deliberate block‑sized decisions in the marquee Tech names. Whether that is net buying or selling is not knowable from this alone, but against a macro backdrop where inflation has surprised to the upside in recent prints and markets are reassessing the pace of future Fed cuts, it is reasonable to read this as risk being re‑underwritten rather than abandoned: people are still willing to carry exposure into a stickier‑inflation, higher‑for‑longer world, but they are doing it quietly and in size.
Sweeps, by contrast, look more like the chase and hedge layer, amplified by the rebalance. On the bar chart of top aggregate sweeps, IVV comes in first with about $1.32b, followed by IBIT, the spot bitcoin ETF, around the $1.1b area, and then a stack of Tech and large‑cap vehicles like ETFV, MU, IEMG, VOO, IAGG, QUAL, and VT each between roughly $0.5b and $1b. The scatter of sweeps volume versus dollars shows IBIT way out to the right with very high volume and substantial notional, while IVV sits high on the dollar axis with modest volume, pointing to chunky, high‑urgency orders in core equity beta and crypto exposure.
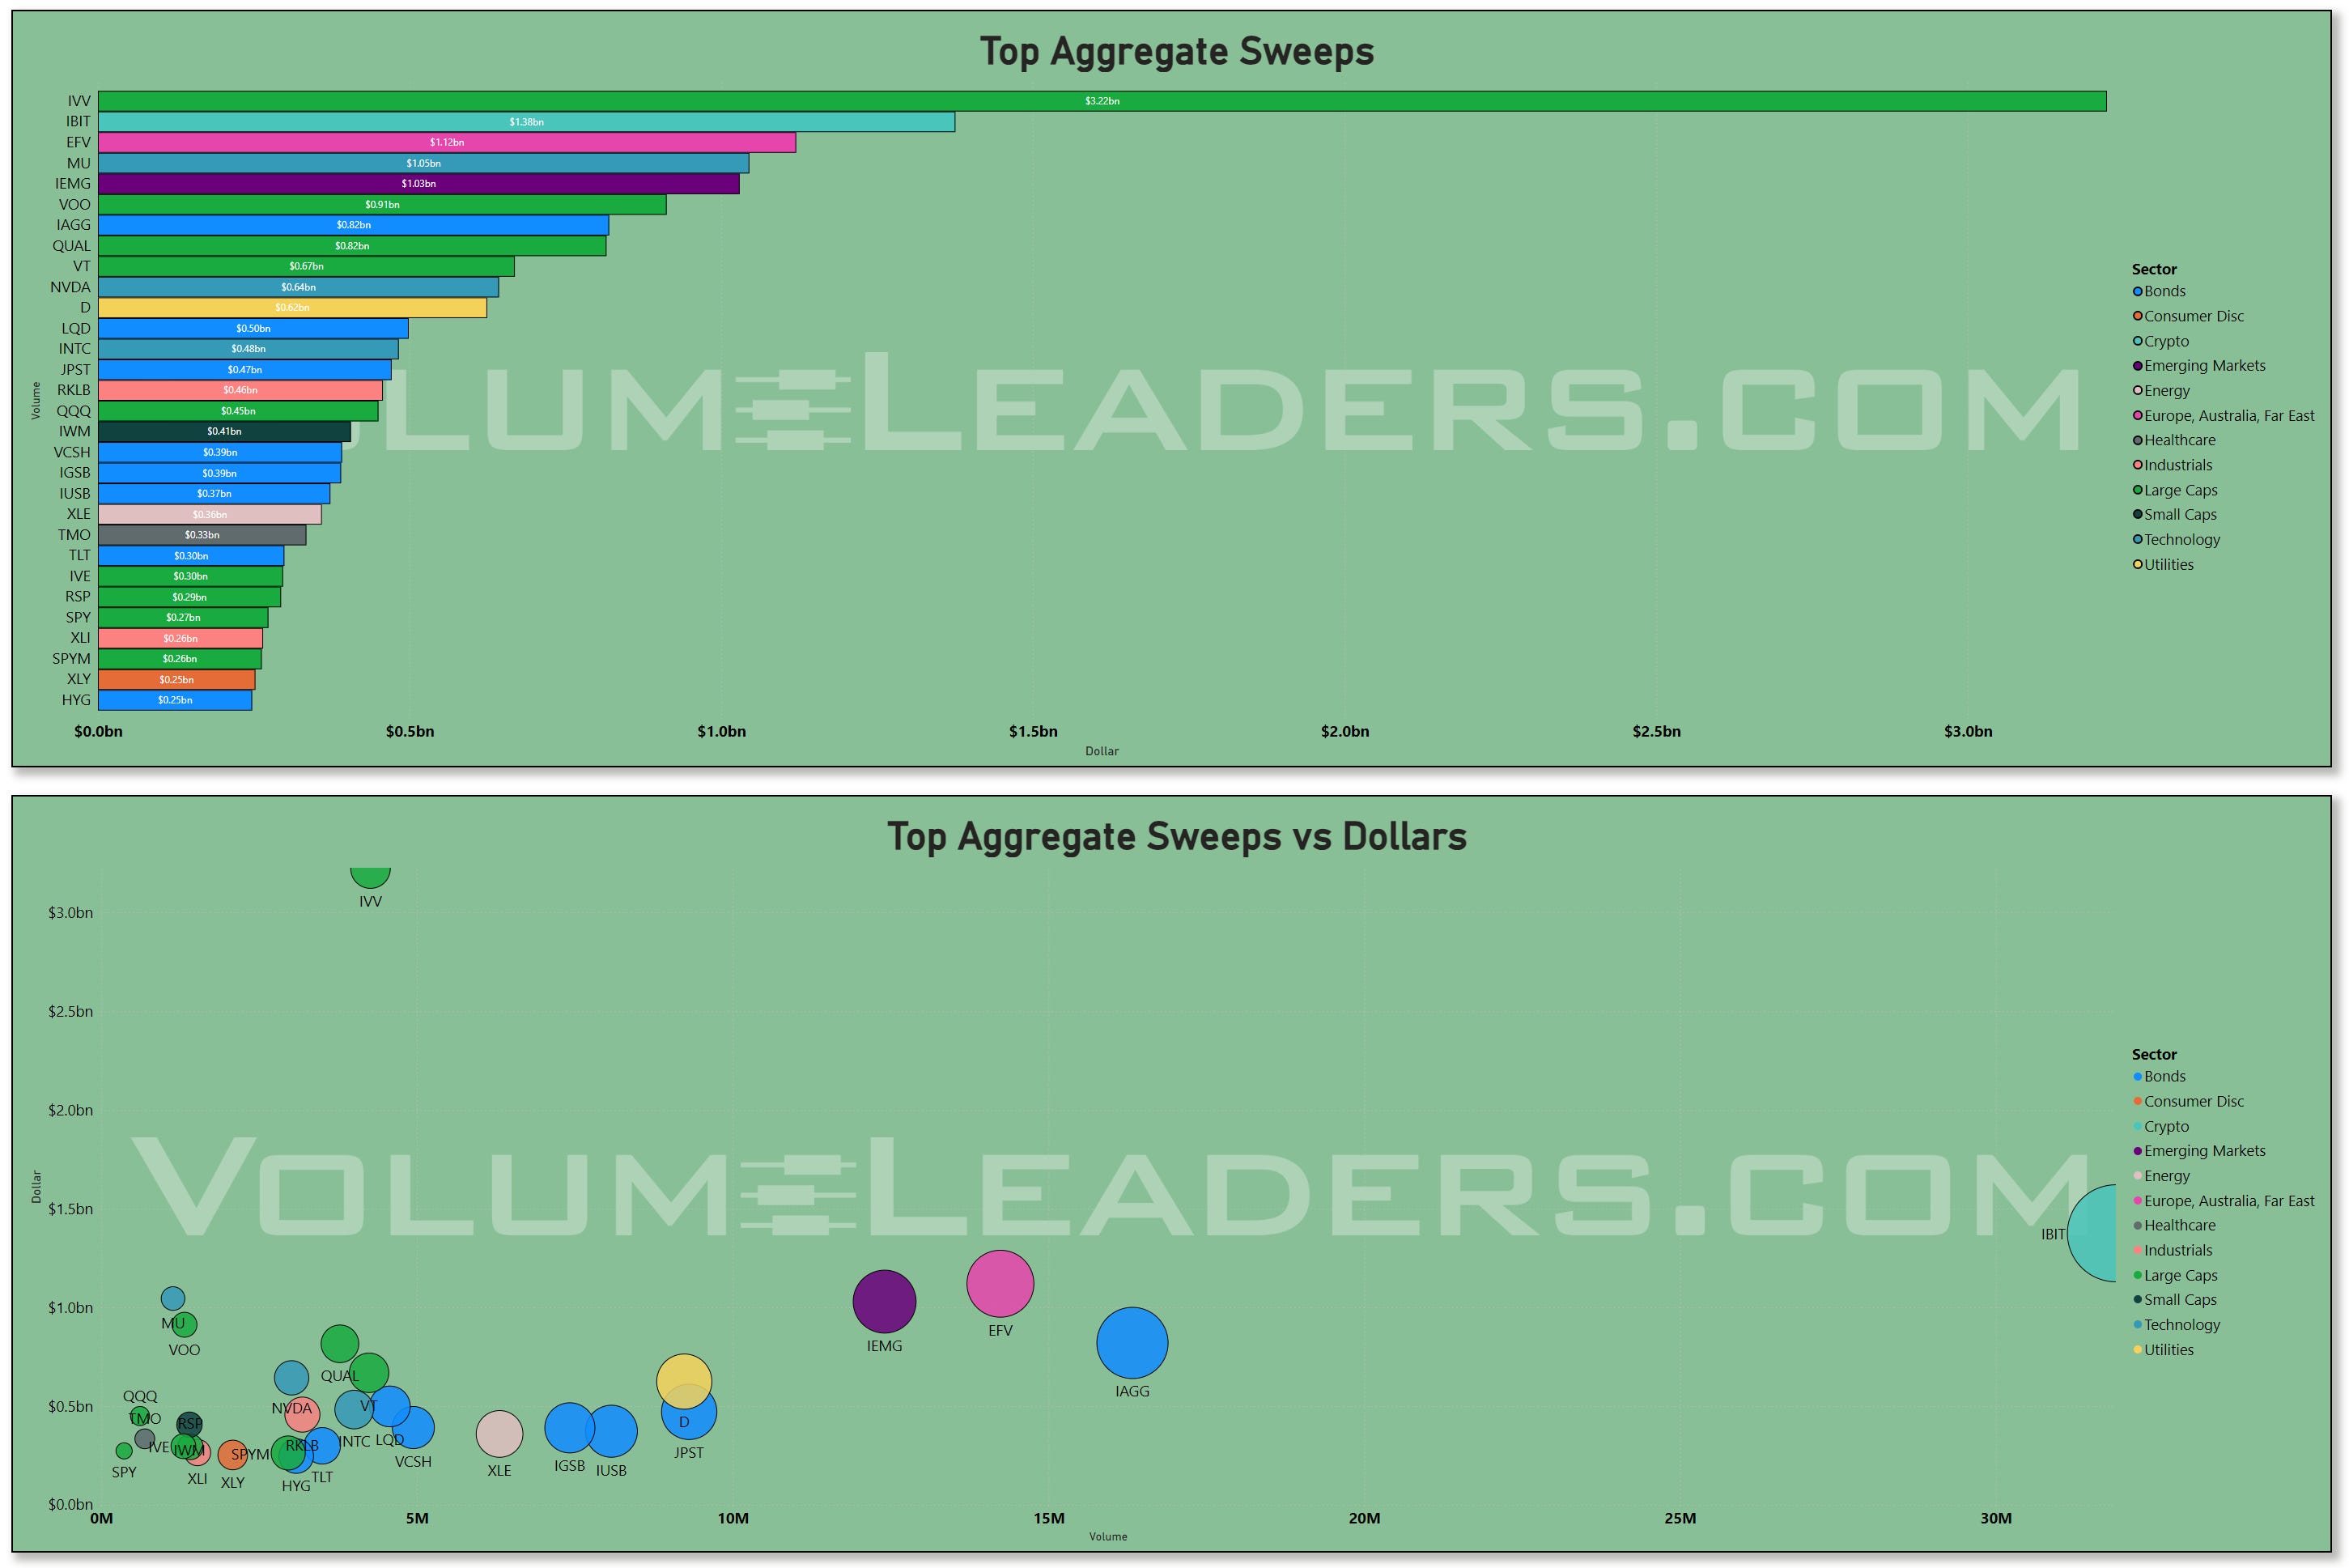
That mix fits the late‑May macro tape where bitcoin has been sensitive to shifting expectations around the broader ETF complex and global risk sentiment, and where rate‑sensitive growth and carry trades are whipsawing as traders handicap the path of policy into year‑end. Sweeps in bond proxies like IAGG and in sector ETFs like XLE and XLU suggest people are actively leaning into and out of duration and defensives intraday, with the MSCI event giving them ample liquidity to adjust exposures without moving the tape too much on their own.
When you overlay all three lenses, the picture is coherent. The broad flow bars and treemap say institutional money is still structurally long large‑cap US growth, with a particular obsession around NVIDIA, the megacap platform names, and index wrappers. Dark‑pool activity in those same tickers points to ongoing negotiation over who actually owns that risk, and at what prices, especially around a calendar‑driven liquidity spike like the MSCI rebalance. Sweeps show that the more tactical cohort is using highly liquid wrappers in US large caps, emerging markets (IEMG), and crypto (IBIT) to adjust exposures quickly as each new data point hits. VL’s read on the environment—that indices are in a neutral‑to‑slightly‑bullish trend, that dispersion and volatility are high, and that defensives are drawing steady interest even as growth sees episodic outflows—fits perfectly with this flows profile: it is a market that rewards riding the dominant trends but punishes complacency on position sizing and timing.
Participation and allocation are clearly skewed toward Technology and Large Caps, with Consumer Discretionary and Financials climbing the ladder as the week progresses and then spiking into the rebalance. The rising notional in Energy and the presence of XOM and CVX in the treemap, even at the lower end of the dollar ranks, line up with the recent bounce in crude prices driven by speculation around OPEC+ supply decisions and still‑resilient demand expectations. Meanwhile, the defensive groups—Staples, Utilities, Healthcare—are not leading the flows, but they are not being abandoned either; they show up in the treemap with steady billion‑dollar tickets and in the sector volume table with consistent, if smaller, daily run‑rates. That is classic “barbell” behavior in a market where the macro regime is uncertain: own the structural winners hard, keep some ballast, and use event‑driven liquidity like the MSCI rebalance to clean up positioning.
Risk validation and execution context argue against treating this as an “all‑clear” regime. With volatility modestly elevated, dispersion high, and relative strength heavily skewed toward defensive sectors on a multi‑week basis even as Tech dominates the dollar flow, it is hard to call this a clean, low‑risk trend environment. The trades that line up best with this week’s flows are those that accept the concentration risk—leaning into the big Tech and index themes that institutions are actually trading—while also respecting the fact that these same names are where the hedging, index rebalancing, and hidden repositioning is occurring. That means expecting sharper swings around data, especially inflation and labor releases that directly impact the Fed path, and recognizing that dark‑pool and sweep activity may be as much about managing drawdown and calendar‑driven benchmark risk as it is about initiations.
For institutional flow‑driven traders, the takeaway is straightforward. The market still wants to be long growth and large caps, and it is using every tool in the execution stack—lit, dark, and sweeps—to calibrate that exposure, with the MSCI rebalance providing an extra layer of liquidity to move size without broadcasting intent. The more defensive, lower‑beta corners of Staples and Utilities remain favored on a relative basis, but they are supporting players rather than the main event. As long as this pattern holds, the default stance is to source ideas from the sectors and tickers garnering institutional attention, scale risk down to account for higher realized volatility, and be prepared to adjust quickly via the same liquid wrappers that the rest of the street is using.
Overall, this week’s flow portrait is of a market that is still likely allocating, not de‑risking, but doing so with an acute awareness that the macro backdrop is noisy, that leadership is narrow enough to be fragile, and that index events like the MSCI rebalance can temporarily distort volume and dollar statistics without changing the underlying hierarchy of where capital truly wants to live.
MIR Part 2: Individual Names From The Institutional Tape
VolumeLeaders tracks several proprietary signals designed to spotlight names drawing significant institutional interest. Below, we’ve surfaced the latest results and analyzed them to highlight emergent themes. If any of the sectors, narratives, or positioning trends resonate, the names mentioned here offer a strong starting point for deeper research and watchlist consideration.
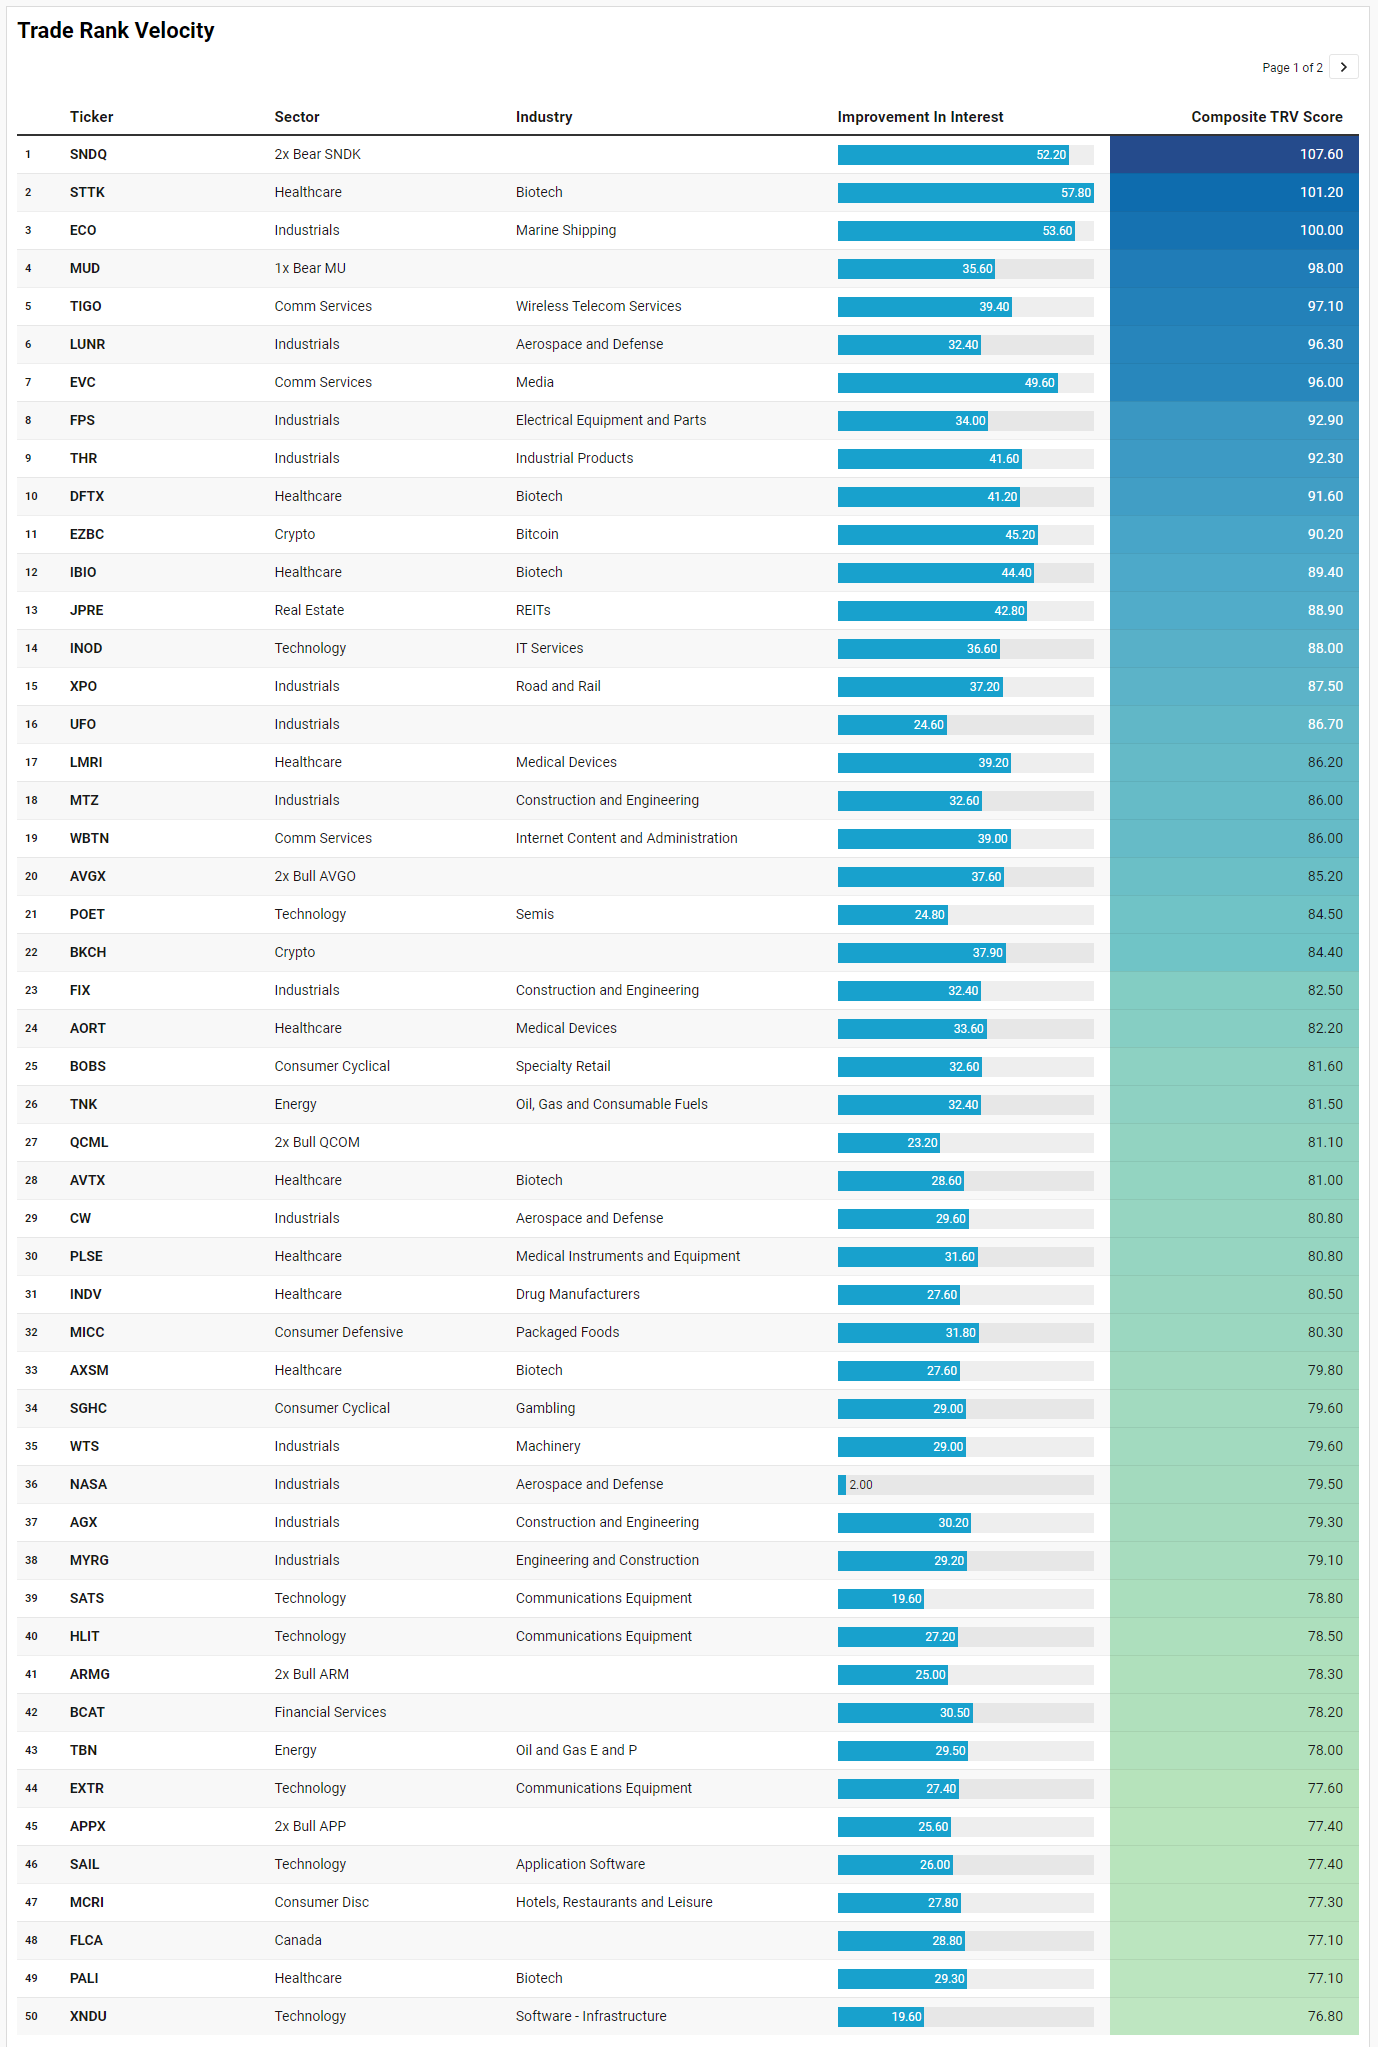
VL Trade Rank Velocity™ (TRV)
TRV is a proprietary metric that measures the recent acceleration or deceleration in institutional trading activity for a given stock by comparing its average trade rank over the past few days to its average in recent weeks. A sharp improvement in TRV typically reflects a notable shift in positioning, often accompanied by sustained trade activity, suggesting institutions are actively engaging with the name and that intensity of activity is rising. This often precludes meaningful price or narrative shifts. This isn’t a buy-list or sell-list; it’s meant to draw your eyes to names where institutions are putting money to work.
The watchlist this week is basically a cross‑section of where the street is leaning harder into the existing regime: concentrated large‑cap growth and semis at the core, energy and shipping as the macro hedge, and a halo of leverage, crypto, and biotech where traders are looking for convexity rather than safety.
You can feel the semiconductor story everywhere. Even though this is a mid‑ and small‑cap heavy list, you have gear directly levered to the big‑cap flow we just walked through. AVGX, ARMG, QCML, TSMX, MUU, and SMU are all leveraged products tied to the same NVIDIA/AVGO/QCOM/TSM/MU complex that dominated aggregate dollars and dark‑pool prints this week. When the entire institutional flow stack is built around a handful of AI supply‑chain names, it makes sense that traders are pressing the edges via 2x wrappers and single‑name synthetics. The presence of SNDQ and MUD, inverse products tied to SNDK and MU, says there is also demand for downside convexity in that same space; people are not blindly long, they are actively trading around a very crowded semiconductor axis rather than treating it as a one‑way street.
Outside of pure chips, there is a clear “picks and shovels for digital and physical infrastructure” theme. On the tech side you have INOD, SAIL, OTEX, CPAY, XNDU, INFQ, and IYW across IT services, security, software, and infrastructure. On the industrial side, the list is packed with construction and equipment names: MTZ, FIX, AGX, MYRG, VMI, LGN, STRL, VRT, FPS, WTS, BW, and a cluster of aerospace and defense tickers like LUNR, CW, NASA, FLY, EVTL, and IDEF. That pairing fits a market narrative where the big CapEx winners are the firms building data centers, grid, and logistics for both AI and reshoring, plus defense names riding higher geopolitical tension and steady budget support. The macro backdrop has been friendly to that story: US fiscal spending on infrastructure remains elevated, governments are leaning into defense, and companies have been guiding to ongoing AI‑driven capex.
Energy, shipping, and materials form the macro hedge sleeve. ECO and TNK on marine shipping, TBN and REPX in exploration and production, DEC in integrated oil, and CRAK on refiners all appear together with metals and mining exposures like UAMY, CRML, and LAR. That lines up with the recent grind higher in crude benchmarks into the latest OPEC+ meeting chatter and ongoing questions about supply discipline, as well as a broader “real asset” bid in an environment where inflation data have come in stickier than ideal and the market is walking back the number of 2026 Fed cuts it once priced. The presence of CMDY as a broad commodity wrapper and VEGI on agriculture extends that idea into a more diversified inflation hedge.
There is also a distinct capital‑markets and rate‑sensitivity angle. JPRE and SILA point to interest in REITs, including healthcare facilities, at a time when long yields have backed up but not broken the economy. VPLS and BCAT add bond and credit flavor, suggesting investors are probing relative value between equity beta and fixed income rather than just bailing on duration. GS on the list reinforces that financials are back in play, which fits with the heavy notional we saw in the sector and the sensitivity of banks to the evolving rate path and credit cycle.
Crypto and higher‑beta speculative growth show up as the optionality wing. EZBC and BKCH tie directly to bitcoin and the mining/infra side, aligning with the surge in sweeps and flows we saw into IBIT and other crypto‑linked instruments as traders react to shifting regulatory and ETF dynamics. On the equity side you see names like BKCH, UFO, BKCH‑adjacent plays, and SGHC in gambling, plus consumer‑facing cyclicals like BOBS, MCRI, UTI, RL, and JBS. That is consistent with the read where the environment is risk‑on but selective: discretionary is not the core allocation, but there is enough appetite for idiosyncratic upside that traders are willing to lean into travel, gaming, and specialty retail when the tape gives them room.
Healthcare and biotech are their own mini‑cluster. STTK sits near the top of the composite score with a big jump in interest, and you have a long tail of smaller biotech and medtech names—DFTX, IBIO, AVTX, AXSM, PALI, CADL, BCAX, CAPR, ZVRA, LMRI, AORT, GRDN, BIOA, LMRI, PLSE—plus facilities exposure via GRDN and SILA. That dovetails with a more defensive relative‑strength profile in Staples and Healthcare even as flows remain tech‑centric; there is clear interest in idiosyncratic, event‑driven upside that is not perfectly correlated with the mega‑cap growth trade.
Finally, a handful of broad wrappers round out the picture. OAIM, QGRW, MTUM, IYW, FLCA, and IQQQ tell you that systematic and factor‑based flows are alive: large‑cap growth, momentum, tech sector exposure, and Canada are all being rotated and re‑weighted, which makes sense into an MSCI rebalance week where benchmarks are literally changing under the surface.
Net‑net, the TRV list is not fighting the institutional flow story we already have—it is amplifying it. The core is levered semis and big‑cap tech infrastructure, surrounded by energy and shipping as macro hedges, plus crypto, biotech, and selective cyclicals for convexity. In a high‑dispersion, neutral‑to‑bullish environment, that is exactly the mix you would expect from traders who want to stay involved in the dominant themes but insist on having multiple ways to express and hedge them.
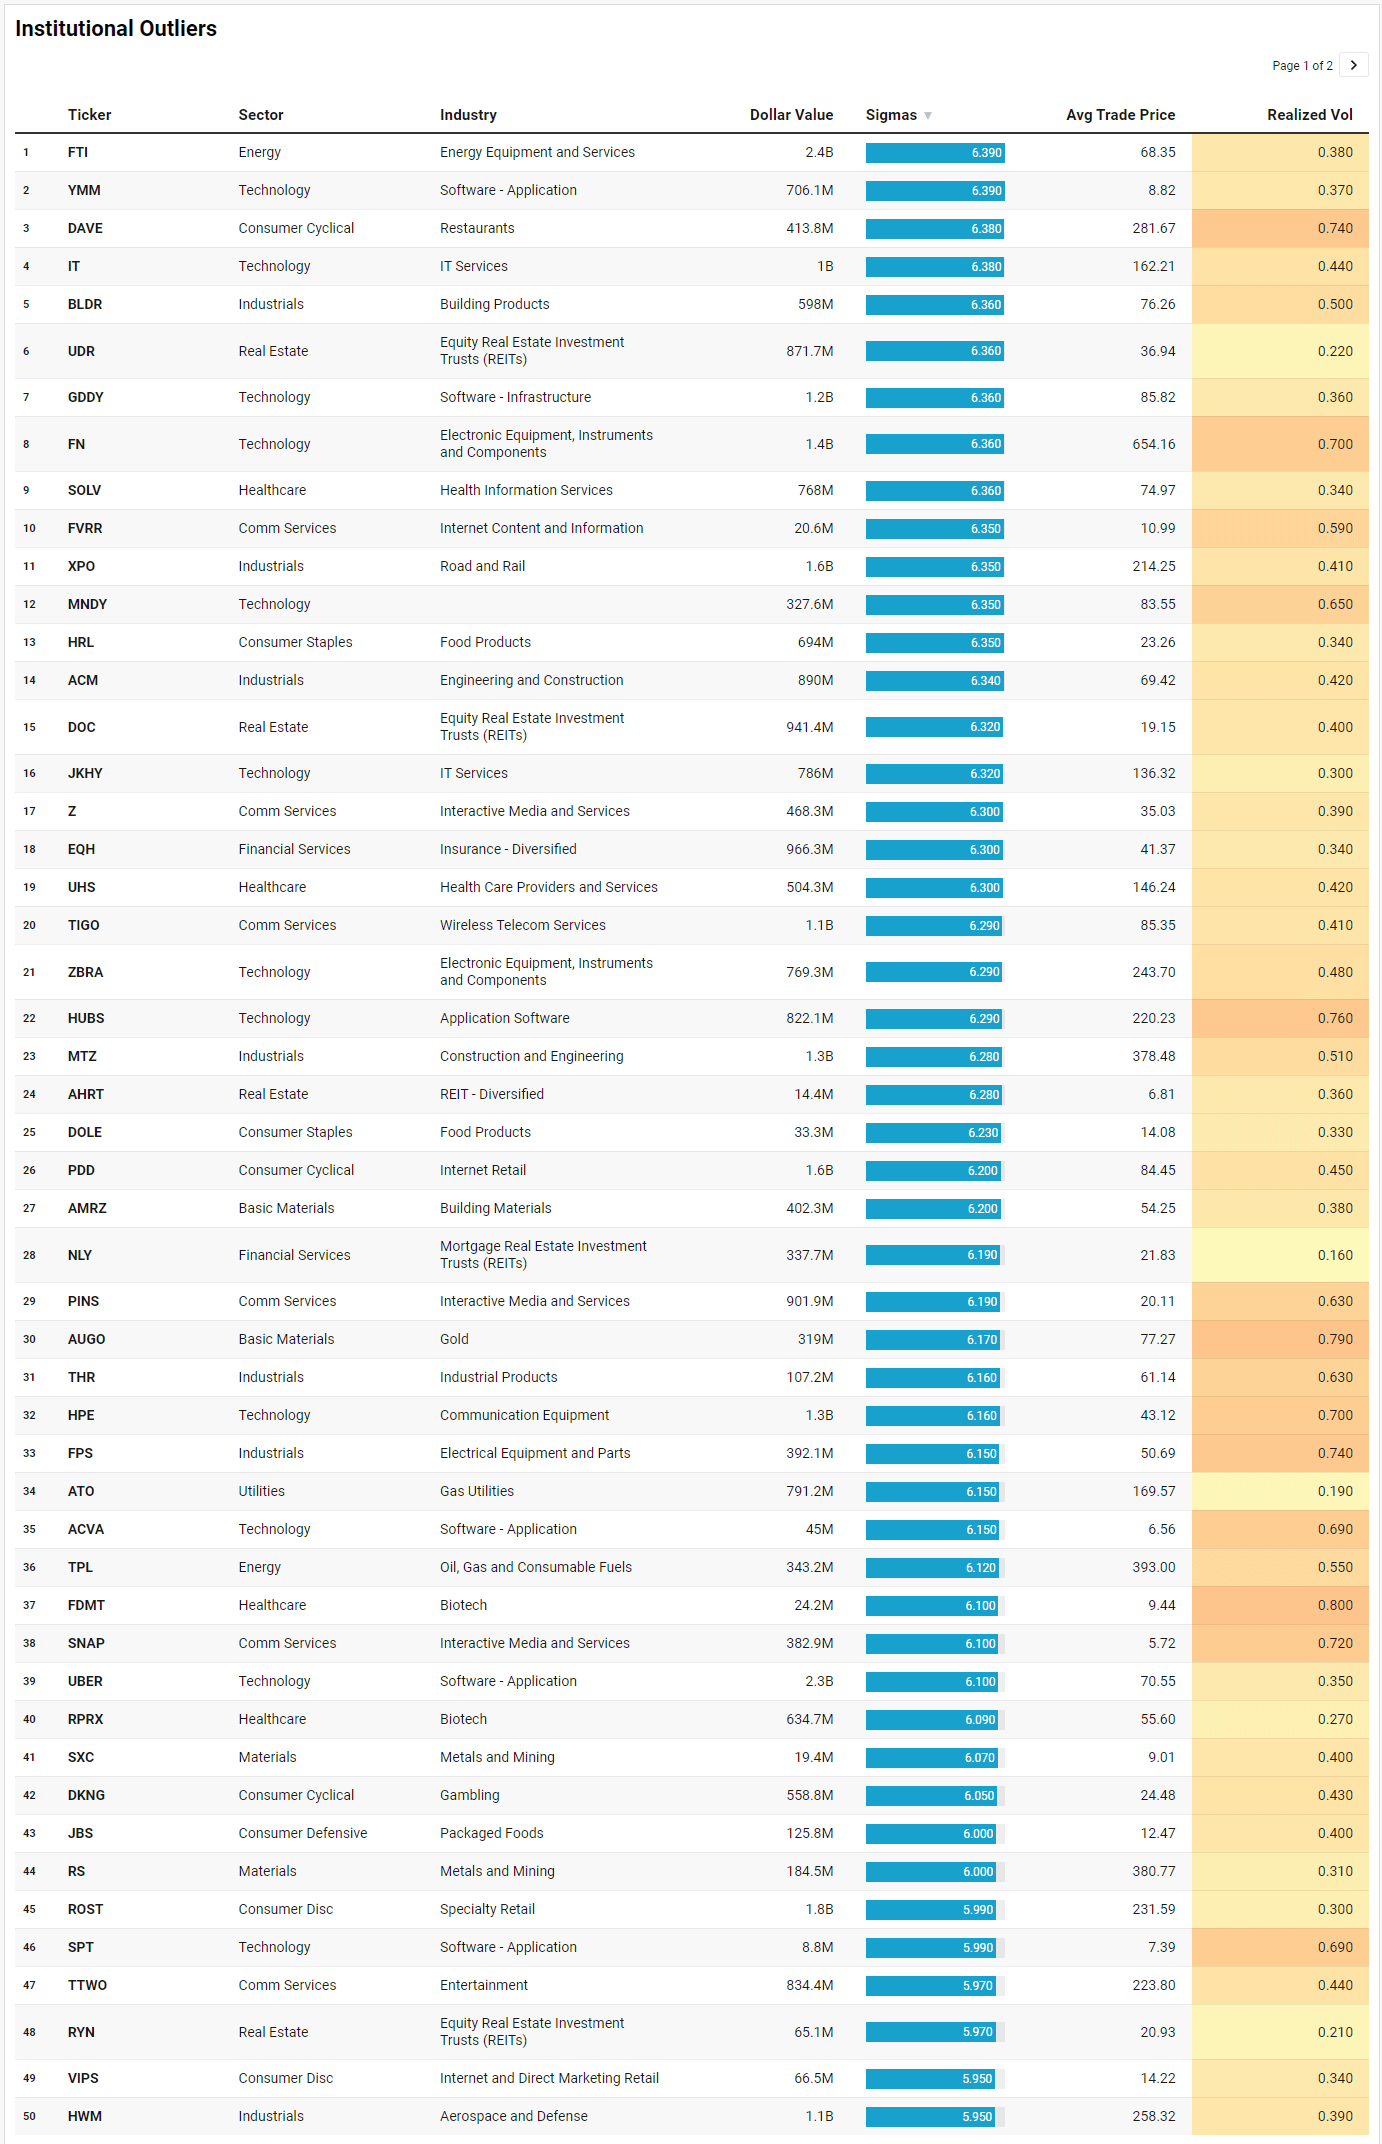
VL Institutional Outliers™ (IO)
Institutional Outliers is a proprietary metric designed to spotlight trades that significantly exceed a stock’s recent institutional activity—specifically in terms of dollar volume. By comparing current trade size against each security's recent normalized history, the metric flags outlier events that may indicate sudden institutional interest but may be missed because the activity doesn’t raise any flags/alerts when comparing the activity against the ticker’s entire history. For example, it’s conceivable that a ticker today receives the largest trade it has had in the last 6 months but the trade is unranked and would therefore be missed by current alerts built off Trade Ranks. Day traders can use “Realized Vol” to identify tickers that are moving swiftly with large price displacement while others can use it to size your risk appropriately.
The IO list this week reads like a who’s‑who of where real money chose to move size into the MSCI rebalance close, rather than just where social media was excited. The overarching theme is reinforcement of the existing large‑cap, infrastructure, and energy narrative, with outlier flows in a handful of idiosyncratic stories that speak to how institutions are positioning under the surface.
At the top of the list, NVDA and INTC are the obvious anchors. NVIDIA traded roughly $30.3b at an average price of about 212.81 with nearly 5.7 sigmas of dollar outflow or inflow; Intel logged about $10.7b around 117.05 with a similar sigma reading. That is exactly what you would expect in a week where semis already dominated aggregate flow and dark‑pool activity: the rebalance simply forced even more decisive re‑weights in the key AI supply‑chain names. GOOG at about $10.8b near 376.72, UBER around $2.25b at 70.55, and DELL just under $2.0b at 419.27 extend that large‑cap growth story into communication platforms, software‑enabled logistics, and hardware. Realized vol in most of these names came in under 1.0 on the day despite the huge prints, suggesting that much of the flow was absorbed orderly rather than chased in panic. That fits a market that is reallocating toward secular winners rather than one that is trying to get out at any price.
Down the market‑cap spectrum, the list picks up many of the same structural themes that showed up in the TRV list. Construction, engineering, and building products are everywhere: BLDR, ACM, MTZ, PWR, IIIN, GGG, and UPS all stand out, with MTZ clearing about $1.33b at 378.48, PWR roughly $749m at 713.09, and XPO around $1.61b at 214.25. Those are not fly‑by‑night meme squeezes; they are the kinds of names you buy or resize when you care about physical infrastructure, grid, and logistics, all of which tie back into data center build‑out, reshoring, and onshoring narratives. The realized vol in this cluster mostly sits in the 0.4–0.6 range, again pointing to deliberate allocation rather than binary speculation.
Energy is the second major pillar. FTI leads with about $2.45b at 68.35, FANG trades roughly $584m at 191.63, TPL about $343m at 393, and there are smaller but still significant flows in MWH and the steel names that supply the sector like NUE and STLD. Given the recent resilience in crude prices into ongoing OPEC+ supply management and steady demand expectations, institutions leaning into energy equipment, E&P, and royalty‑style assets looks like a straightforward expression of “higher‑for‑longer” on both oil and rates. The metals and mining names—RS, STLD, NUE, MTRN, SXC—fit the same hard‑asset, real‑economy bias we see in the TRV list and in broad sector volumes.
Another distinct cluster sits in REITs and rate‑sensitive real assets. UDR, DOC, RYN, SUI, SPG, AHRT, MMI, HPP, and NLY all show up with 5.7–6.3 sigma flows. UDR alone prints around $872m at 36.94, while SPG trades roughly $549m at 204.91. With the yield curve still inverted and markets recalibrating the timing and magnitude of future Fed cuts, it makes sense to see institutions using a high‑liquidity rebalance day to clean up real estate exposure: leaning into higher‑quality REIT platforms, trimming or adding in mortgage REITs, and re‑balancing between defensive utilities like ED, XEL, ATO, and AWK and more cyclical equities. Realized vol in these names is low, often around 0.2–0.3, suggesting this is slow‑money capital structure work rather than speculative trading.
Tech and software outliers beyond the mega‑caps round out the growth side of the list. GDDY at about $1.16b, IT around $1.04b, JKHY roughly $786m, HUBS near $822m, TRMB around $227m, COHR roughly $1.57b, CIEN about $815m, FFIV around $310m, HPQ at $586m, and a handful of smaller application and infrastructure names like YMM, ACVA, SPT, and TSSI all print 5.7+ sigma. These flows line up with what we saw in the aggregate and dark‑pool charts: institutional investors are not just buying the mega‑cap platforms; they are curating a bench of software, hardware, and infrastructure names that sit one or two steps down the market‑cap ladder but are still integral to the AI, cloud, and edge‑compute build‑out. The presence of JEPQ—a large‑cap growth wrapper—on the same list with about $312m at 61.10 underscores that some of this is being done at the ETF level as well, smoothing idiosyncratic risk while keeping style and factor exposure intact.
Finally, there is a tail of idiosyncratic consumer and healthcare names that speak more to stock‑specific stories than to macro themes, but still fit the environment. DAVE at roughly $414m and TTWO at about $834m highlight high‑beta consumer and gaming; ROST, DKNG, PRMB, VIPS, DOLE, HRL, JBS, and TBBB round out specialty retail, gambling, packaged foods, and discount stores. On the healthcare side, WAT, SYK, TEVA, GILD, UHS, COO, and a scattering of biotech names like FDMT, REPL, RPRX, and SLS show that capital is also rotating within defensive growth sectors and pipeline‑driven names. With the data showing defensive sectors holding relative‑strength leadership despite the tech‑heavy dollar flows, this mix suggests institutions are actively re‑balancing both sides of the barbell: pressing structural growth and hard assets, while refining quality and exposure in healthcare, staples, and utilities rather than abandoning them.
Taken together, the IO watchlist says the MSCI rebalance was not just mechanical shuffling; it was used as a high‑liquidity window to reinforce the same themes that have been dominating the tape—AI and digital infrastructure, energy and materials, high‑quality real assets, and selective consumer and healthcare exposure—while quietly upgrading balance sheets and factor tilts under the hood.
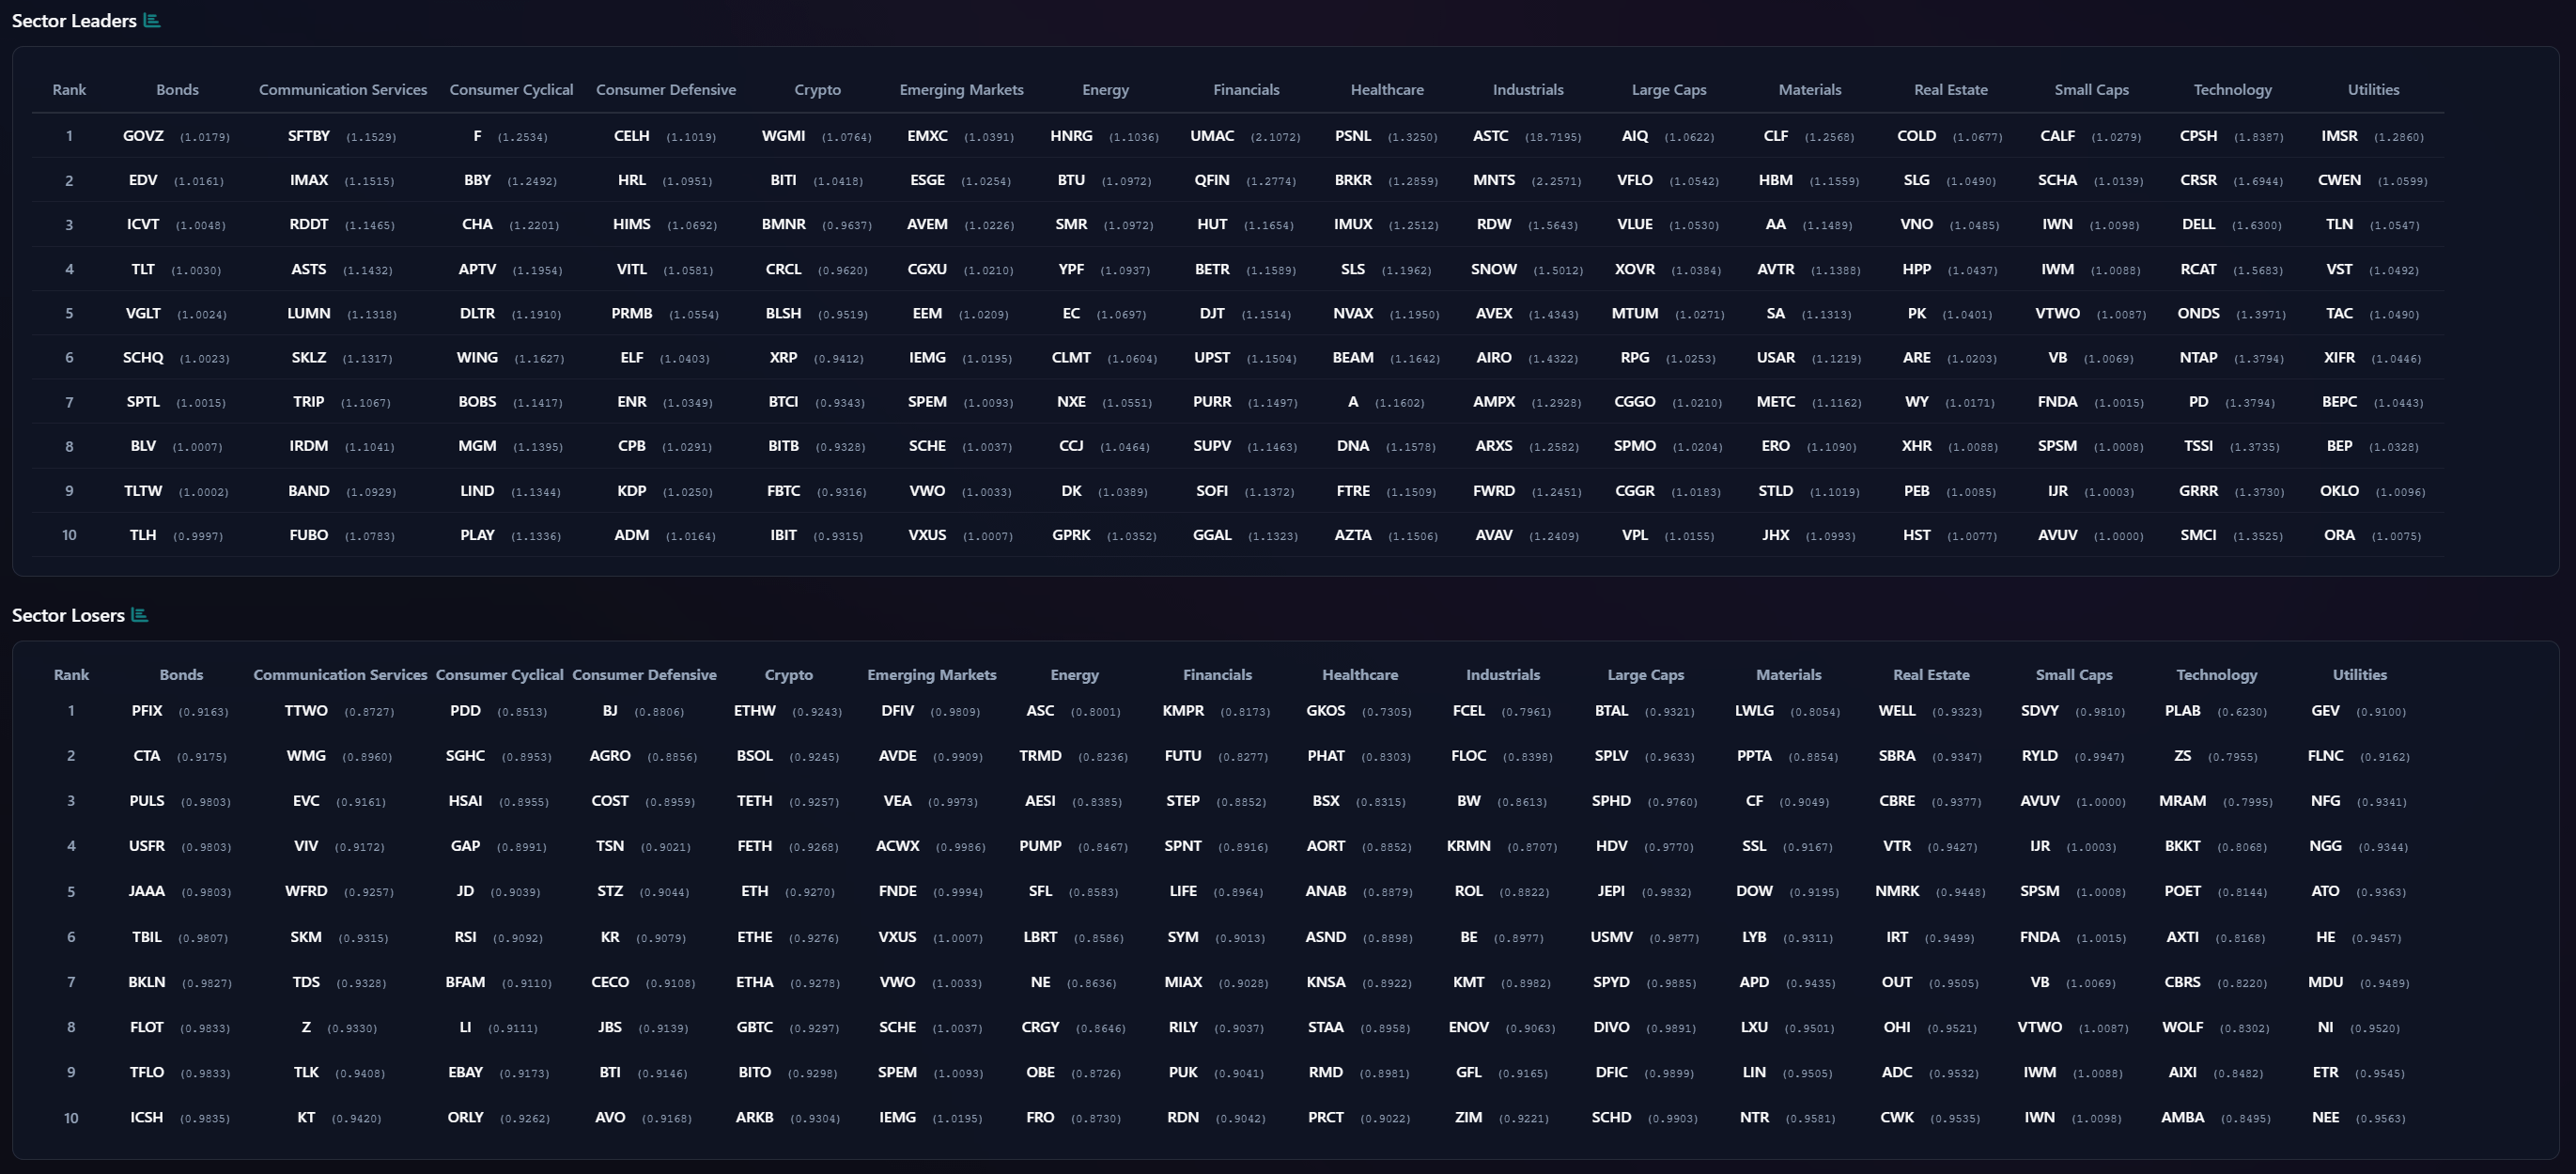
VL Sector Leaders
VL Sector Leaders is a weekly snapshot of where true leadership is asserting itself inside the market, stripped of the distortions that come from broad, style-mixed indices. Rather than asking which stocks look strong in absolute terms, this list focuses on which names are outperforming within the environments they actually compete in.
Each week, we surface the ten stocks demonstrating the most persistent relative strength inside their respective sectors. These are not headline chasers or one-day wonders. They are names that continue to separate themselves from peers through real price behavior, often reflecting sustained demand rather than fleeting attention.
For day traders, this list is a powerful awareness tool. Sector Leaders tend to offer cleaner intraday structure, better follow-through, and more predictable reactions around key levels because they already sit on the right side of relative strength. Even on choppy tape, leadership names often remain tradeable while the rest of the market degrades.
For swing traders, VL Sector Leaders helps narrow the universe to stocks with the highest probability of staying relevant. Relative leaders are more likely to hold trends, survive pullbacks, and reassert themselves after consolidation. When markets rotate, these names are often among the first to resume leadership — or the last to break.
The sector‑leader sheet is basically a heat map of where performance and participation are in sync, and it fits almost perfectly with the flows story we have been tracking. What jumps out first is how broad the leadership is across cyclicals and growth, with defensives and bond proxies quietly doing their job in the background rather than dominating the field.
On the credit and duration side, leaders in the Bonds column run through GOVZ, EDV, ICVT, TLT, VGLT, SCHQ, SPTL, BLV, TLTW, and TLH. That is a stack of long‑duration Treasuries, convertibles, and laddered exposures rather than front‑end, cash‑like product. It tells you that, even with an inverted curve and stickier inflation than the Fed would like, there is still real demand for duration and convexity, especially around a big index event where benchmarks are being reset and liability‑driven players get a clean slate. The fact that these sit in the “leaders” bucket rather than the losers list suggests they are being rewarded for that risk rather than punished by an aggressive repricing higher in yields.
Communication Services leadership skews smaller and more idiosyncratic: SFTBY, IMAX, RDDT, ASTS, LUMN, SKLZ, TRIP, IRDM, BAND, and FUBO at the top, while the laggards are the bigger, benchmark‑friendly names like TTWO, WMG, EVC, VIV, and WFRD. That is a neat inversion of the mega‑cap flow data where GOOG and META carry most of the dollars. Here, performance leadership is coming from more speculative or event‑driven names—streaming, satellite, travel, and niche content—while the big platforms and more traditional media sit on the loser side. In practice, that means institutions are using the mega‑caps for size and liquidity but stock pickers are finding basis‑point outperformance in the smaller, higher‑beta stories.
Consumer Cyclical tells a similar story. Leaders include FR, BBY, CHA, DLTR, WING, BOBS, MGM, LIND, PLAY, and a mix of restaurant and specialty retail names, while the losers list shows PDD, SGHC, HSAI, GAP, JD, RSI, BFAM, CCL, EBAY, and ORLY. Big China internet retail and well‑owned US discretionary franchises are underperforming, but domestic mid‑cap retail, discount, and travel names are punching above their weight. That fits the flow narrative where institutional dollars are not making a wholesale bet on the consumer, but are absolutely willing to pay for idiosyncratic cash‑flow stories and balance‑sheet strength in the middle of the cap stack.
On the defensive side, Consumer Defensive leaders tilt toward growthier or quality‑tilted plays: CELH, HRL, HIMS, VITL, PRMB, ELF, ENR, CPB, KDP, and ADM dominate, while the losers list is populated by BJ, AGRO, COST, TSN, STZ, KR, CCE, BTI, AVO, and ARKB. That is a rotation away from the mega‑cap staples that everyone already owns and toward more focused growth and brand‑expansion assets—functional beverages, wellness, and mid‑cap packaged foods. It aligns with the message of defensives holding relative‑strength leadership, but the style inside the sector clearly favors names that can still compound rather than pure bond proxies.
Crypto and Emerging Markets leadership is noisy but consistent with the risk‑on‑but‑selective regime. WGM, BITI, BMNR, CRCL, BLSH, XRP, BTCI, BITB, FBTC, and IBIT sit at the top for crypto, which is a mix of directional and hedged vehicles rather than just long beta. On the EM side, EMXC, ESGE, AVEM, CCGXU, EEM, IEMG, SPEM, SCHE, VWO, and VXUS lead, while DFIV, AVDE, VEA, ACWX, FNDE, VXUS, SCHE, SPEM, IEMG, and others populate the losers. That speaks to rotation within EM rather than a simple on/off switch: some investors are actively leaning into ESG‑tilted or ex‑China exposures even as broad, value‑tilted EM and developed ex‑US lag under a firm dollar and ongoing growth divergence.
Energy leadership is exactly what you would expect from the weekly flow data. HNRG, BTU, SMR, YPF, EC, CLMT, NXE, CCJ, DK, GPRK, and GGAL sit atop the sector list—coal, uranium, South American integrateds, and niche refiners. The losers feature ASC, TRMD, AESI, PUMP, SFL, LBRT, and OBE, more shipping and traditional OFS. Institutions are rewarding highly levered plays on power and the nuclear transition while backing away from some of the more commoditized service models. That dovetails with the push into energy and metals we saw in the TRV and IO screens.
Financial sector leaders include UMAC, QFIN, HUT, BETR, DJT, UPST, PURR, SUPV, SOFI, and GGAL, a list skewed toward specialty finance, crypto‑adjacent, and cross‑border banks rather than the money‑center names that dominated index flows. Healthcare leaders such as PSNL, BRKR, IMUX, SLS, NVAX, BEAM, A, DNA, FTRE, and AZTA are mostly higher‑beta biotech and tools, again confirming that while defensives have relative‑strength support, price leadership is coming from growthier subsectors.
On the growth/high‑beta side, Technology and Small Caps are loaded with the kinds of names that thrive in a high‑dispersion tape. Tech leaders include CPSH, CRSR, DELL, RCAT, ONDS, NTAP, PD, TSSI, GRRR, SMCI, while losers feature PLAB, ZS, MRAM, BKKT, POET, AXTl, CBRS, WOLF, AIXI, and AMBA. Small‑cap leaders like CALF, SCHA, IWN, VTWO, VB, FNDA, SPSM, IJR, and AVUV line up neatly with the factor‑tilted ETFs on your TRV list, confirming that “quality small” is working even as the Russell as a whole remains choppy.
Taken together, the sector‑leader table reinforces the same message we have been seeing everywhere: institutional money is concentrated in large‑cap growth and hard‑asset plays, but within each sector, relative‑strength leadership is moving down the cap structure toward quality mid‑caps, idiosyncratic growers, and niche cyclicals. Defensives are working, but the market’s real enthusiasm is for anything that can compound within the prevailing AI, infrastructure, and energy narratives without being already maxed out in every benchmark.
MIR Part 3: Framing-Up A Trade
The tape we just walked through is not subtle. Flows, leadership, and outliers are all telling the same story: the market is still willing to pay for large‑cap growth and real‑asset exposure, but it wants that exposure curated, hedged, and expressed through liquid wrappers that can absorb size. Core PCE is still running around 3.3% year‑on‑year, well above the Fed’s 2% target, which keeps the “higher‑for‑longer” backdrop firmly in place and argues against assuming a quick pivot to easier policy. The May MSCI index review, with hundreds of additions and deletions implemented at the close on May 29, gave institutions a rare, deep‑liquidity window to reset factor tilts, and they used it to double‑down on AI, infrastructure, energy, and quality income rather than abandon risk.
If I am framing a portfolio for the coming week off that backdrop, I want to be long those same structural themes, but with humility about narrow leadership and event‑driven noise. The result is a barbell: a core sleeve of large‑cap US growth and semis, a real‑assets and energy sleeve that benefits from higher nominal growth and still‑tight commodity markets, a quality income and duration sleeve, and a tactical sleeve for EM, crypto, and high‑beta satellites.
Core US Large‑Cap Growth and AI (32%)
This is the engine room. I would allocate 15% to QQQ as the primary large‑cap growth wrapper and 8% to SPY or IVV for broad market exposure that captures the institutional preference for mega‑caps without solely concentrating in tech. I can use the levels from the Technician’s Playbook as pass/fail levels and raise cash quickly if things start to sour this week. The remaining 9% goes directly into the AI supply chain: 3% NVDA, 3% MSFT, 3% AAPL. These three names sat atop aggregate flow and dark‑pool rankings this week, with NVIDIA alone logging north of $50b in total notional and about $27b in dark‑pool activity, exactly the kind of sponsorship you want behind core holdings even if you keep position sizes modest.
Semis and Infrastructure Leverage (15%)
The outlier and watchlist data are saturated with semiconductor and infrastructure names—from INTC, MU, AVGO and TSM proxies to construction and engineering plays like MTZ, PWR, BLDR, and XPO. I would dedicate 8% to a diversified semiconductor ETF such as SOXX or SMH to ride the theme without single‑name fragility. The other 7% goes to MTZ (3%), PWR (2%), and XPO (2%). They showed multi‑sigma flows on the rebalance day and sit right at the intersection of grid, data‑center, and logistics build‑out, giving you leverage to AI and reshoring without being pure software beta.
Energy and Real Assets (13%)
Inflation is still too hot for comfort, and OPEC+ has only modestly raised output into a geopolitically tense environment, which keeps a floor under crude and related assets. I would allocate 5% to XLE for broad integrated and major exposure, 3% to an E&P‑tilted ETF like XOP, and then split 5% between FANG (2.5%) and FTI (2.5%). Those two names saw significant institutional outlier flows and give you both commodity‑beta and capital‑spending leverage if oil stays bid or demand surprises to the upside.
Quality Income, Duration, and Defensives (18%)
Bond and rate‑sensitive ETFs like GOVZ, EDV, TLT and long‑duration peers are showing up as sector leaders, and there was meaningful activity in REITs and utilities on the outlier tape. I would run 6% in TLT or a similar long‑duration Treasury ETF for convexity if growth or inflation roll over. Another 5% goes into a quality dividend or low‑volatility equity ETF such as SCHD that tilts toward Staples, Healthcare, and Utilities. The remaining 7% I would allocate across a mix of high‑quality REITs and utilities: roughly 2.5% in a REIT fund like VNQ or a curated basket anchored by SPG and UDR, 2.5% in a utilities wrapper like XLU, and 2% in a water or regulated‑utility name like AWK or ED. This sleeve is there to smooth volatility and provide ballast if rates move sideways or the growth narrative wobbles.
Selective Small‑Cap and Factor Tilt (10%)
Small‑cap leadership is showing up in quality‑tilted ETFs such as CALF, SCHA, IJR, and AVUV even as the broader Russell remains choppy. I would put 6% into a quality‑small wrapper—AVUV or CALF are good fits—to capture that without stock‑picking noise. The remaining 4% I would split between a momentum ETF like MTUM (2%) and a covered‑call or growth‑overlay product such as JEPQ (2%), acknowledging that systematic factor and overlay strategies saw real flow around the MSCI rebalance and will continue to track where institutions are rotating.
Tactical EM, Crypto, and High‑Beta Satellites (12%)
The last sleeve is where I would lean into the high‑dispersion environment without letting it dominate the book. Emerging‑market ETFs like EMXC, EEM, and IEMG are showing up on leadership lists even as value‑tilted EM funds lag under a firm dollar. I would allocate 6% to EM via a mix of EMXC and IEMG skewed toward diversified or ex‑China exposure. Another 3% goes into a spot‑bitcoin ETF such as IBIT, which has seen heavy sweep and leadership activity and offers clean, liquid convexity while real yields remain elevated and macro risk is noisy. The final 3% I would park in a high‑beta single‑name basket drawn from the stronger TRV and IO names—think one or two of HUBS, GDDY, or select biotech tools and platforms—sized small and traded actively with tight risk controls.
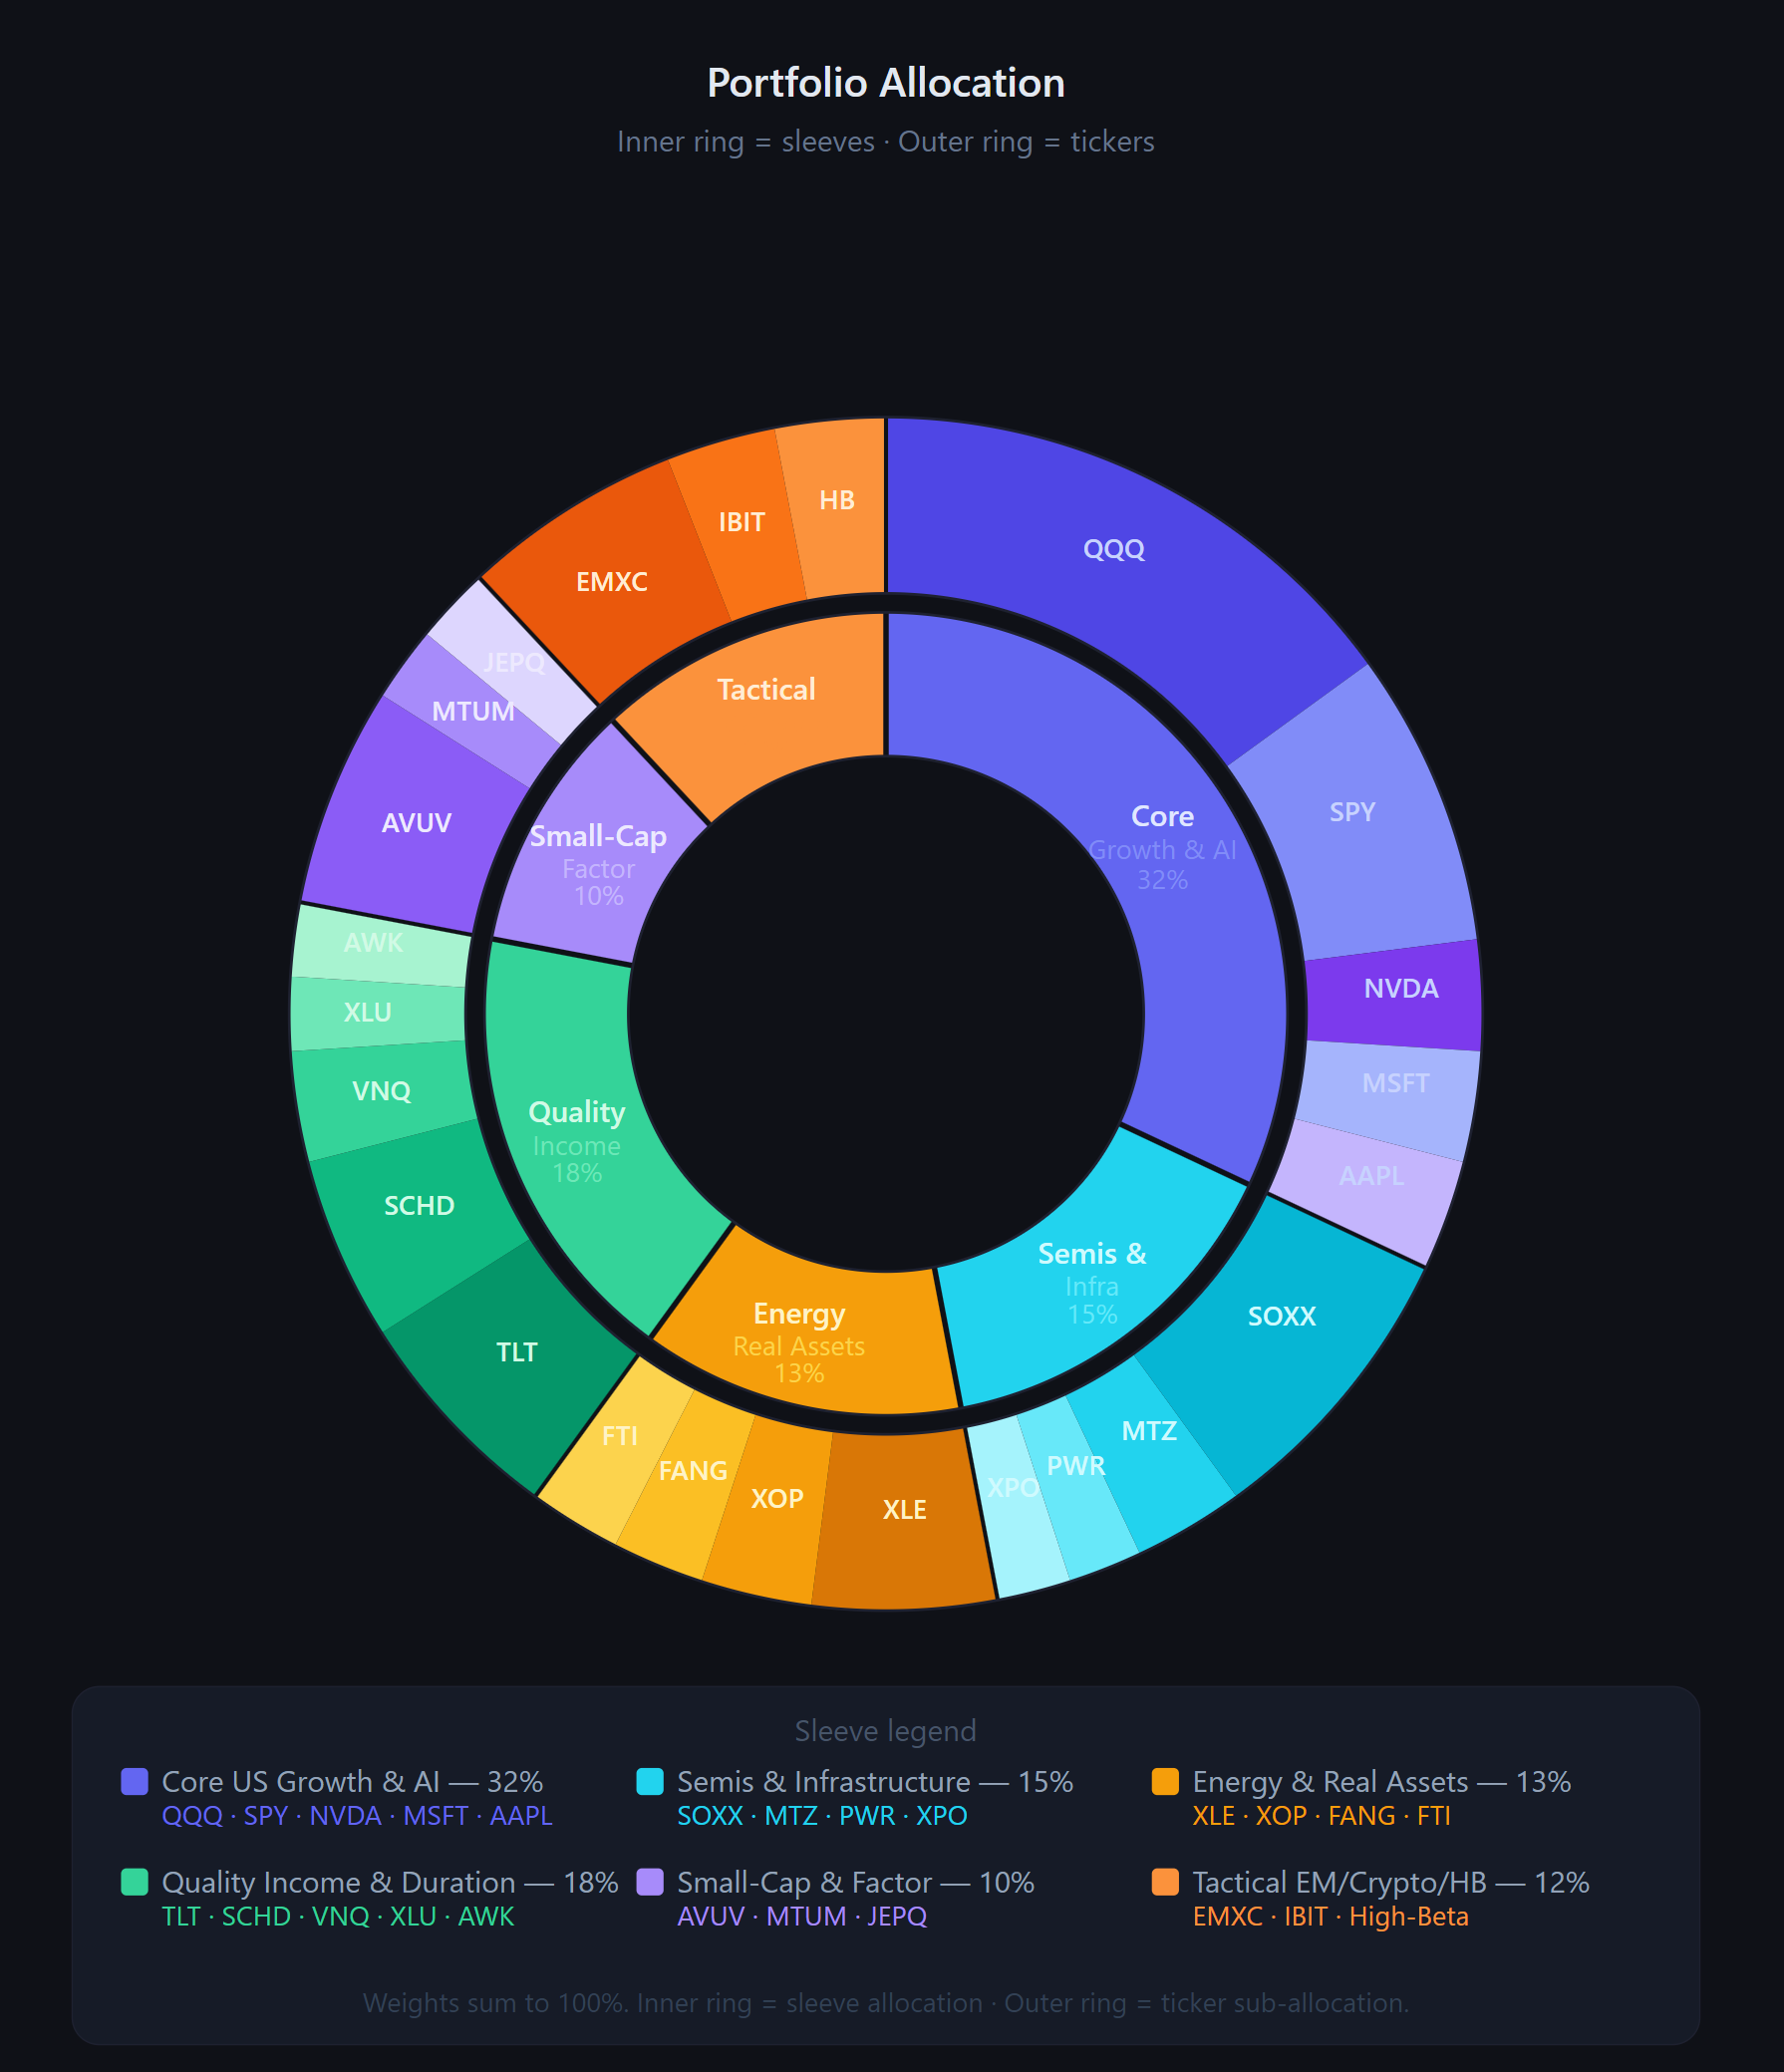
Net‑net, this book captures the way the institutional tape is actually positioned: structurally long AI and digital infrastructure, meaningfully involved in energy and real assets, still respectful of rate risk through duration and quality income, and opportunistic but disciplined in EM, crypto, and higher‑beta satellites. It is not a “set‑and‑forget” allocation; it is a living expression of a market that wants to stay long growth, but only while it can keep one hand on the exit and the other on the hedges.
Thank you for being part of this community and for investing your time in this week’s edition. The quality of this readership — thoughtful, disciplined, engaged — is what makes this work meaningful. I’m grateful to build alongside you. Here’s to a week of clarity, conviction, and well-executed opportunities.
— VolumeLeaders