Market Momentum: Your Weekly Financial Forecast & Market Prep
Issue 92 / What to expect May 25, 2026 thru May 29, 2026


Weekly Market-On-Close Report
U.S. and global equities just logged another up week, powered by a mix of AI euphoria and rising hopes for a U.S.–Iran peace deal, even as macro undercurrents get choppier and sentiment on Main Street hits record pessimism. In other words, the tape still wants to go up, but the wall of worry is getting taller and more interesting by the day.
Risk-on headlines, risk-off foundations
The broad story looks deceptively simple: stocks are higher, again.
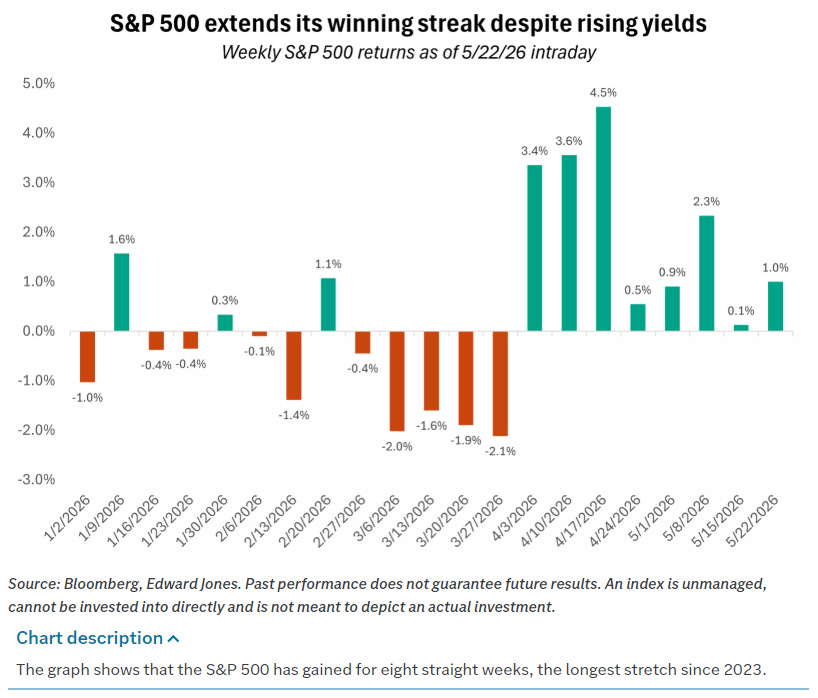
In the U.S., the Dow notched a fresh all‑time high while the S&P 500 and Nasdaq pushed to one‑week highs. The S&P is now on an eight‑week winning streak, its longest since 2023, with gains increasingly broadening beyond the mega‑cap AI complex.
Value and small caps outperformed growth over the week, helped by cyclical sectors and equal‑weight indices finally beating their cap‑weighted benchmarks.
Overseas, Europe, Japan, and several emerging markets followed suit, with the pan‑European STOXX 600 up about 3 percent on the week, Germany’s DAX up nearly 4 percent, and Japan’s Nikkei rallying more than 3 percent.
The immediate catalysts were:
Headlines suggesting the U.S. and Iran are narrowing gaps toward a framework to end the war and reopen the Strait of Hormuz.
Another powerful leg in AI‑linked names, especially semis, as chipmakers delivered upside earnings and guidance that reinforced the “AI infrastructure build‑out” narrative.
But underneath the surface, the inputs to this rally are more conflicted:
Oil remains volatile and elevated, with Brent oscillating around triple‑digit levels as the Strait of Hormuz stays effectively shut and inventories drain at a historic pace.
U.S. consumer sentiment has fallen to an all‑time low in the University of Michigan survey series, with one‑year and long‑run inflation expectations both moving higher.
Bond markets are repricing the Fed path toward “higher for longer,” with rate cuts largely pushed off the table and conversation shifting to whether the next move might actually be up, not down.
That combination—rising equity prices, souring sentiment, and stickier inflation—is exactly the kind of late‑cycle mix that deserves serious respect from anyone managing risk.
Iran, oil, and the new “BI / AI” regime
One of the more useful mental models for this tape is the common framing of “Before Iran / After Iran”—a line in the sand for macro data and price action. Before the conflict escalated, inflation was already proving sticky; after, you’ve layered a real‑time energy supply shock on top of that.
Here’s what that looks like in markets:
Roughly 20 percent of global crude and a significant share of LNG and key fertilizer inputs normally transit the Strait of Hormuz; that corridor remains effectively closed.
The International Energy Agency estimates that global oil inventories have been drawing down at around 4 million barrels per day, with the market likely to stay “severely undersupplied” until at least October even if the conflict ends soon.
Goldman Sachs pegs the cumulative inventory decline at nearly 500 million barrels already, with potential to hit 1 billion barrels by June if disruptions persist.
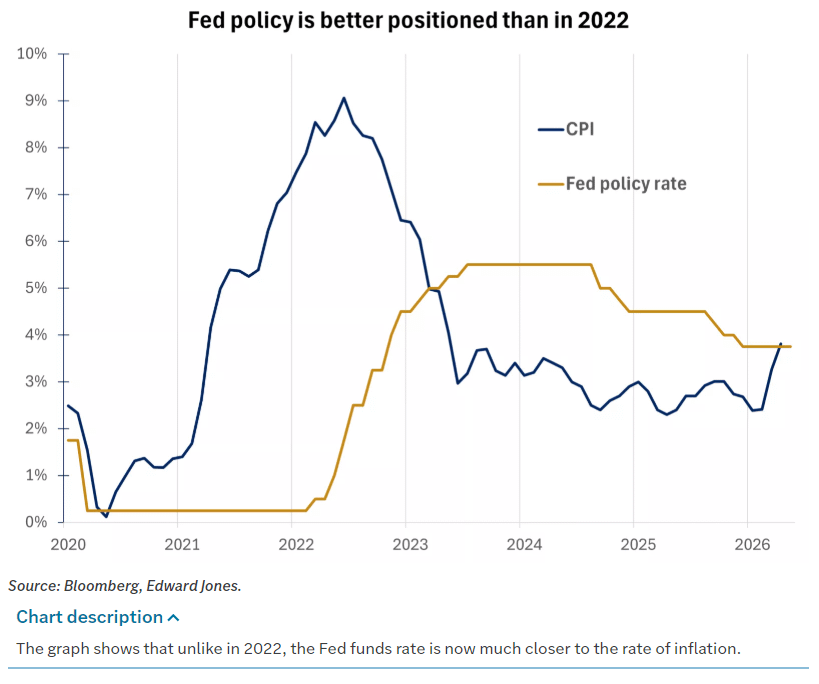
Equities aren’t trading this as an existential shock—for now. The reference point is Russia–Ukraine 2022: back then, the S&P 500 ultimately traded lower in the months following the invasion as the Fed launched an aggressive hike cycle into an inflation spike. This time around, the Fed is already restrictive, the policy rate roughly matches inflation, and the labor market is more balanced.
This gives the Fed more room to be patient, even as war‑driven inflation is something monetary policy can’t easily fix. The market is effectively saying:
If a peace framework reopens Hormuz and lets crude retrace toward prior levels, headline inflation pressure eases and the current equity rally can grow new legs.
If the conflict drags on, oil above 100 and persistently high freight and fertilizer costs start to feel like a “war‑flation” tax on growth, pressuring multiples and pushing the Fed back into a corner.
Right now, the balance of probabilities is tilted toward de‑escalation, which is why risk assets are bidding every hint of diplomatic progress. But the payoff distribution around that path is wide, and it’s increasingly being priced sector by sector rather than index by index.
AI, earnings, and the leadership question
If Iran and oil are the macro plot, AI is still the main character.
This week’s tape had all the hallmarks of a late‑stage tech melt‑up with a twist:
Chipmakers led the advance. Qualcomm, NXP, AMD, and other semi names ripped, with many up 3–11 percent in a single session as investors re‑embraced the AI hardware theme.
AI‑exposed software and cloud names got pulled along, helped by upside results and guidance from names like Workday and Zoom.
Dell rocketed higher after a big target hike from a major sell‑side shop, a reminder that “old‑world” hardware levers like servers and storage are now firmly back in fashion as AI infrastructure plays.
At a higher level, the earnings backdrop is quietly doing a lot of heavy lifting:
Around 83 percent of S&P 500 companies that have reported Q1 earnings have beaten expectations, with aggregate earnings growth tracking around 12 percent year‑on‑year.
Strip out tech, and that growth drops to roughly 3 percent, the weakest ex‑tech print in two years.
That bifurcation is the market in a nutshell. The bull case is straightforward:
The AI capex cycle is real, still early, and increasingly global, touching everything from U.S. hyperscalers to Taiwanese fabs to Japanese and European equipment suppliers.
Productivity data is starting to reflect some of that investment, and the market is willing to pay up for durable earnings growth in an otherwise muddy macro environment.
The bear (or at least skeptical) case is just as clear:
Leadership remains narrow. A small cluster of mega‑caps and AI winners are responsible for a disproportionate share of index‑level gains, even though breadth improved modestly this week.
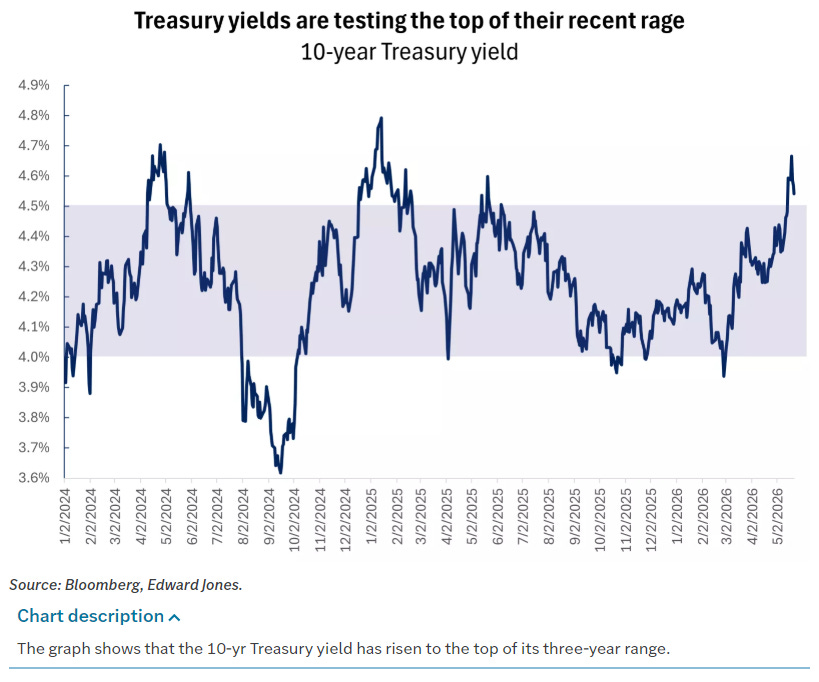
As rates rise and bond yields poke the top of their three‑year range, the equity risk premium compresses, leaving less room for multiple expansion on the most crowded stories.
From here, you should assume that every incremental move in 10‑year yields and every new AI headline will be tested against that earnings foundation. As long as that foundation holds—double‑digit earnings growth led by AI beneficiaries—the path of least resistance remains higher, but volatility around that path is likely to increase.
Sentiment, rates, and why this isn’t 2022
What makes this environment tricky is how conflicting the signals are.
On one side:
The University of Michigan consumer sentiment index just printed a record low of 44.8, with consumers citing cost‑of‑living pressures and war‑related uncertainty.
One‑year inflation expectations jumped to 4.8 percent, and 5‑to‑10‑year expectations rose to 3.9 percent—both their highest levels in months.
Housing remains in a grinding slowdown, with builder sentiment still below the neutral 50 mark for the 25th straight month, housing starts declining, and 30‑year mortgage rates pushing back toward mid‑6s.
On the other:
The S&P 500 is up more than 9 percent year‑to‑date, small caps are up double digits, and cyclicals are catching a bid.
The labor market is cooling but not cracking, and various nowcasting models still point to solid real‑time growth.
Corporate profits, especially in AI‑levered sectors, are running at their fastest pace since 2021.
Rates sit right in the middle of that tug‑of‑war. Since early March:
The 10‑year Treasury yield has climbed from roughly 4.0 to around 4.6–4.7 percent, flirting with the top of its three‑year range.
Market pricing has swung from expecting multiple cuts this year to effectively zero cuts and even a non‑trivial probability of a hike if inflation refuses to budge.
The important nuance is why this still isn’t 2022:
Policy is already restrictive. In 2022 the Fed funds rate was pinned near zero while CPI screamed toward 9 percent; today, policy rates roughly match inflation, giving the Fed space to watch rather than chase.
The labor market is less overheated. Job openings have come down, hiring has cooled, and wage growth is no longer re‑accelerating in a way that would force the Fed’s hand.
Fiscal impulse is fading. Post‑pandemic stimulus is mostly in the rear‑view mirror, even if war‑related spending and energy subsidies are still in play.
That backdrop supports a base case in which the Fed stays on hold this year while watching the Iran–oil–inflation triangle very closely. It also makes the equity market more sensitive to incremental shocks; there’s less “policy put” available if something breaks.
Trading the next chapter: how to be paid to wait
So where does that leave you if you’re trying to position into the back half of May and into summer?
A few practical takeaways from the institutional playbook emerging in this week’s research and floor color:
Respect the trend, but tighten your risk
Technically, the S&P remains in an uptrend, holding above key support in the low 7300s on the new price scale and still well above the 200‑day moving average.
That said breadth has started to narrow again as we balance across the multi-week highs region — classic “uptrend getting tired” behavior.
For a discretionary book, that argues for:
Staying net long, but trimming gross and concentration in the most extended AI winners.
Using obvious support zones as tripwires: if /ES breaks below that 7340 area and can’t reclaim it, the probability of a deeper pullback toward the prior consolidation band rises.
Barbell growth and cyclicals, funded with expensive defensives
The institutional tilt remains toward a barbell of AI‑driven mega‑cap growth and reasonably priced cyclicals, especially in mid‑caps.
Energy and defense have done their job as hedges during the conflict, but the risk‑reward from here depends heavily on your base case for the war and oil.
A portfolio expression consistent with the current cross‑asset signals:
Maintain core exposure to high‑quality AI infrastructure names (semis, select hardware, mission‑critical software), but be picky on valuation and incremental revenue quality.
Add or maintain exposure in cyclicals that benefit from resilient growth without being pure energy beta—think industrials tied to capex and logistics, or select financials that can live with a flatter curve.
Fund that by trimming crowded “safety” trades where valuations already embed a lot of pessimism or where duration risk is underappreciated (certain REITs, low‑growth staples at rich multiples).
Let the bond market pay you to be patient
With 2‑year Treasuries yielding meaningfully more than cash equivalents, there’s finally a tangible pickup for stepping even modestly out the curve.
Short‑term, high‑quality bonds offer income without betting heavily on the exact timing of the first cut—or risking large mark‑to‑market hits if yields back up further.
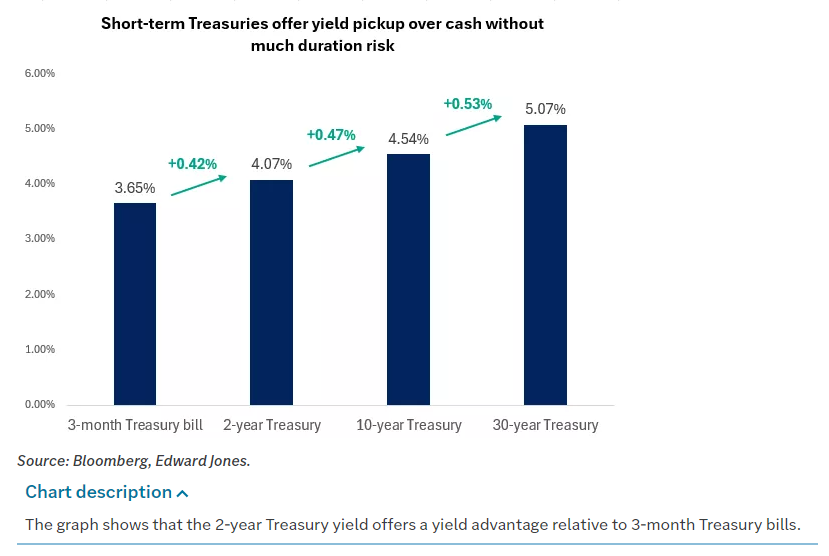
For a multi‑asset allocator, that suggests:
Recycling a portion of idle cash into short‑tenor paper or high‑quality short‑term bond funds, especially if you’ve been sitting overweight money markets since 2022.
Avoiding a big duration grab until you see either clearer evidence of disinflation or meaningful escalation in Iran that threatens growth enough to force the Fed’s hand.
Treat Iran headlines as volatility, not a primary thesis
The conflict is clearly moving prices intraday—every new whisper about talks, ceasefires, or Hormuz transit shows up immediately in crude and index futures.
But the structural drivers of this market—AI capex, earnings breadth, and the evolving inflation regime—will matter more over a six‑ to twelve‑month horizon than any single set of peace headlines.
Practically, that means:
If you’re trading, lean into the volatility: fade over‑reactions in oil and defense on “good” headlines, and look for tactical entries in quality growth when war‑flation scares spike rates and compress multiples.
If you’re investing, make sure your risk posture is consistent with both tails: a faster‑than‑expected peace that rallies cyclicals and compresses energy premia, and a drawn‑out conflict that drags growth and keeps inflation elevated.
If you want a cleaner read on regime shifts than the headline index level, focus on:
Breakeven inflation and the MOVE index: if breakevens and rate‑vol explode higher together, the stagflation tail is getting fatter.
The equal‑weight S&P versus cap‑weight: a sustained break in equal‑weight leadership would signal that the “AI plus a few friends” regime is re‑tightening.
Semis versus software: in the last phase of this rally, semis have repeatedly led software by hundreds of basis points during AI bursts; if that reverses while overall tech stalls, it’s a sign the market is starting to question how much incremental AI capex is left in the tank.
Taken together, this is a market that’s still trending higher, but on thinner ice. You don’t have to be bearish to recognize that the easy beta phase of the post‑Iran‑shock rally is probably behind us. From here, it’s about getting paid for the risk you’re taking—whether that’s in AI, oil, or short‑term bonds—and being ready to adjust quickly as the war and inflation narratives evolve.

Weekly Benchmark Breakdown
Breadth Expands Beneath a Still-Selective Tape
This week felt less like a euphoric breakout and more like a market quietly repairing itself under the surface. Participation improved across nearly every major index on a short-term basis, with especially strong rebounds in the 5-day and 20-day moving average cohorts. The important distinction, however, is that the longer-duration trend measures still sit mostly in the mid-to-upper 50% range rather than at the kind of broad expansion typically associated with a runaway bull phase. In other words, the market is healing faster than it is trending. That keeps the tape constructive, but not yet universally confirmed.
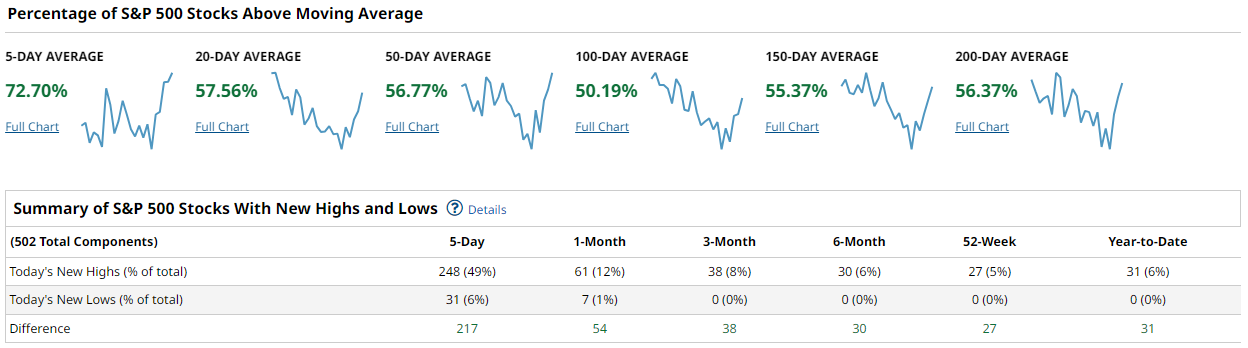
The S&P 500 showed meaningful improvement in short-term participation. Roughly 72.7% of constituents are now above their 5-day moving average, while 57.6% are above the 20-day and 56.8% above the 50-day. The longer-term cohorts remain clustered around 50-56%, including 50.2% above the 100-day and 56.4% above the 200-day. New highs continue to decisively outnumber new lows across every timeframe. The 5-day window showed 248 new highs versus just 31 new lows, a difference of 217. Even the 52-week and year-to-date readings remain firmly positive.
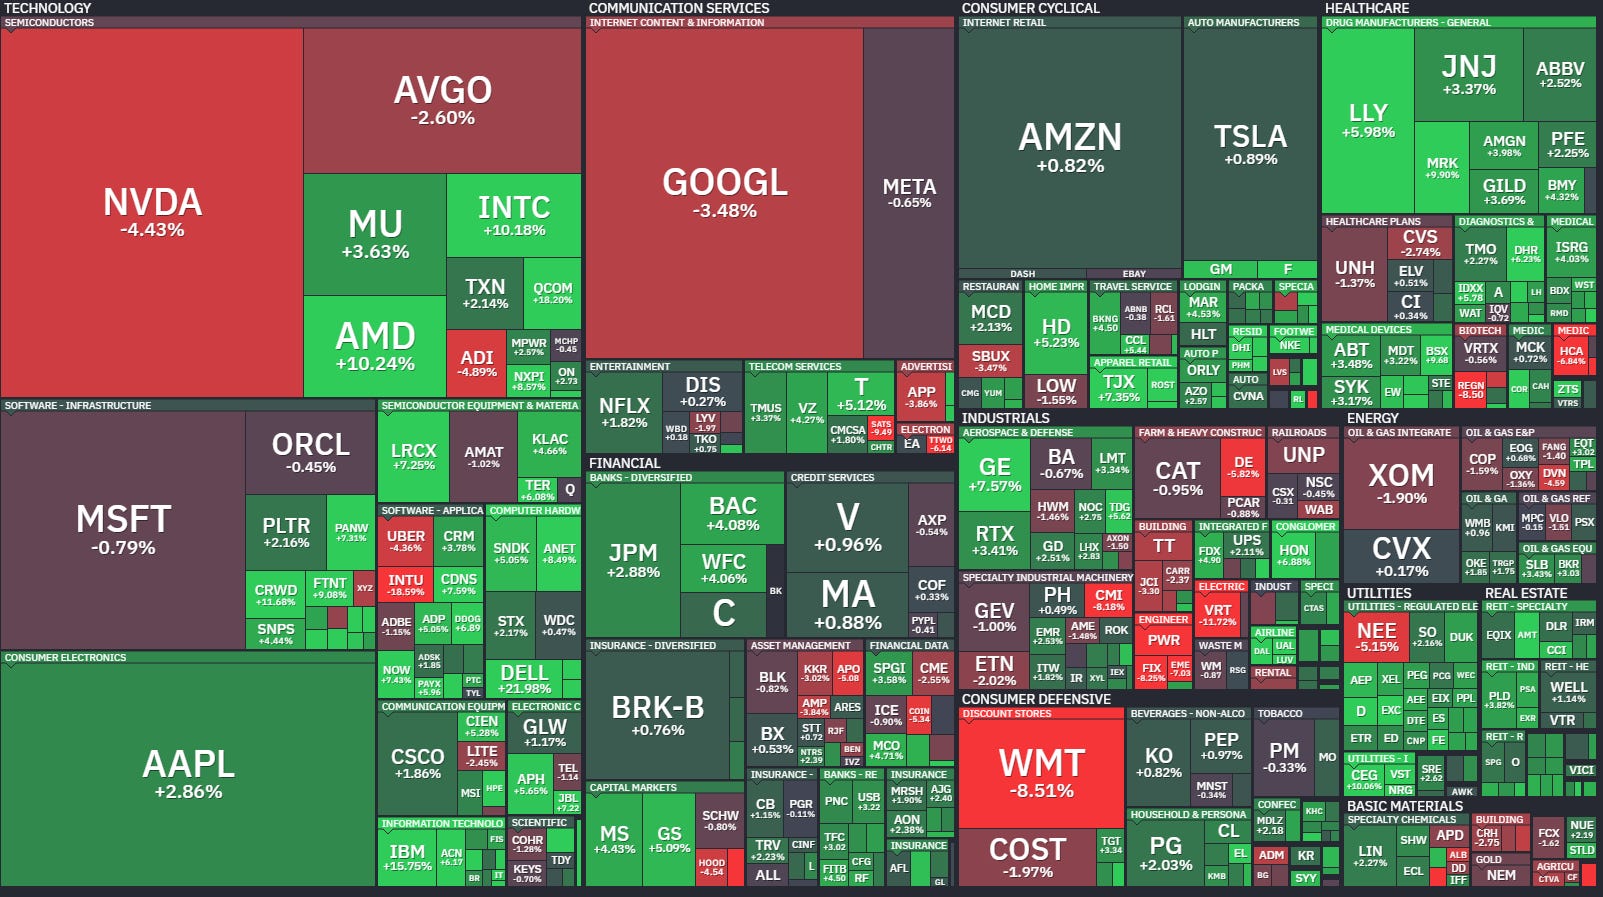
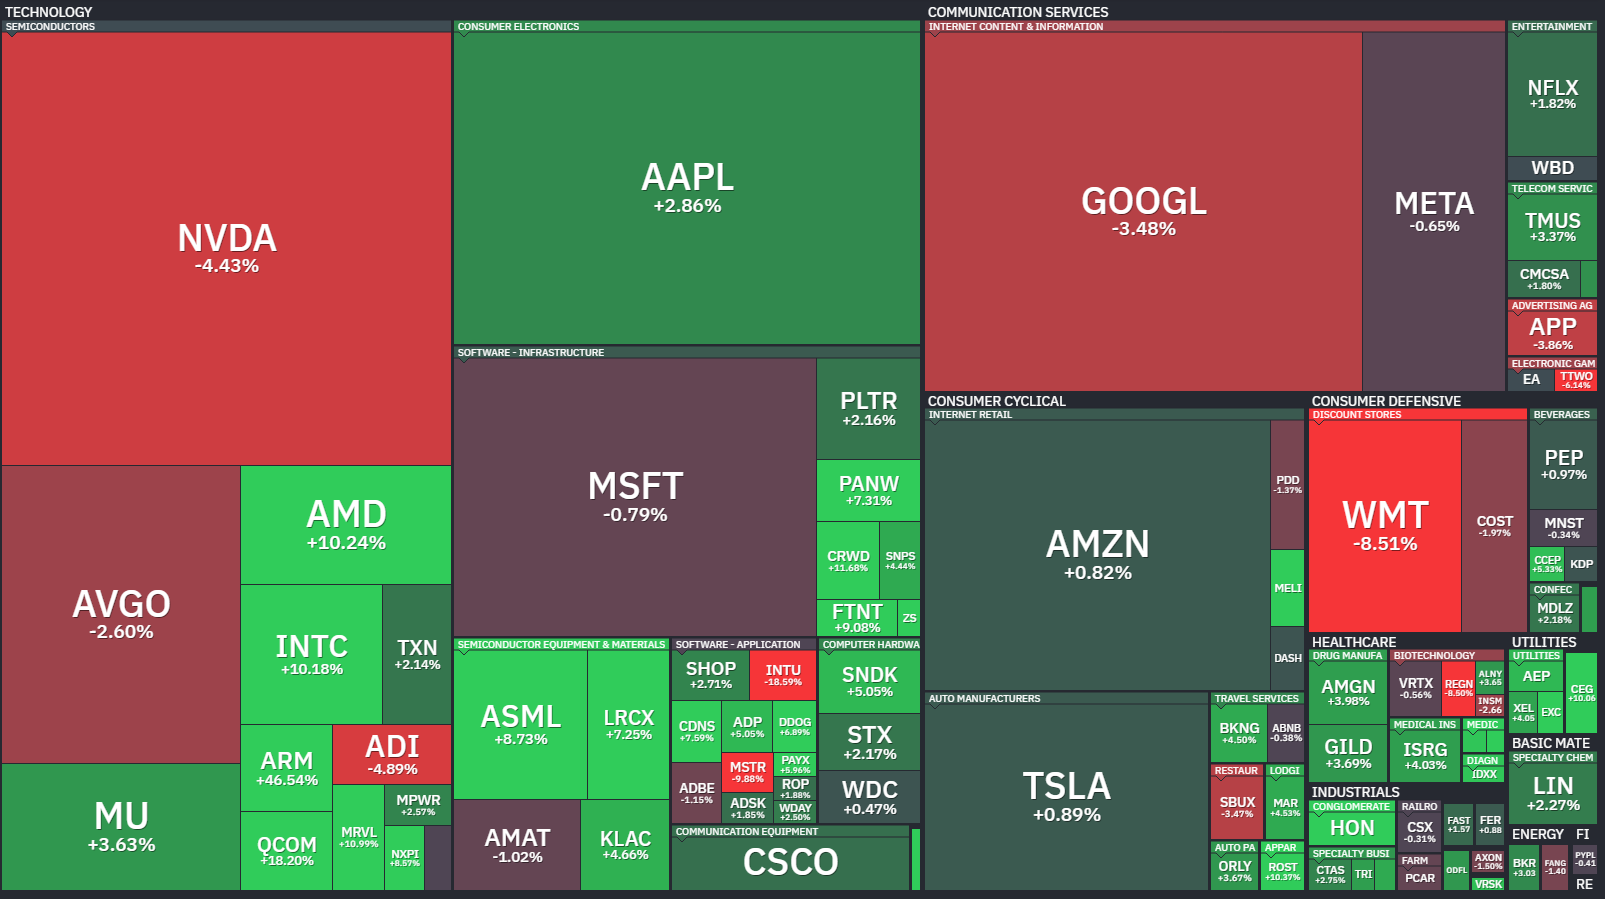
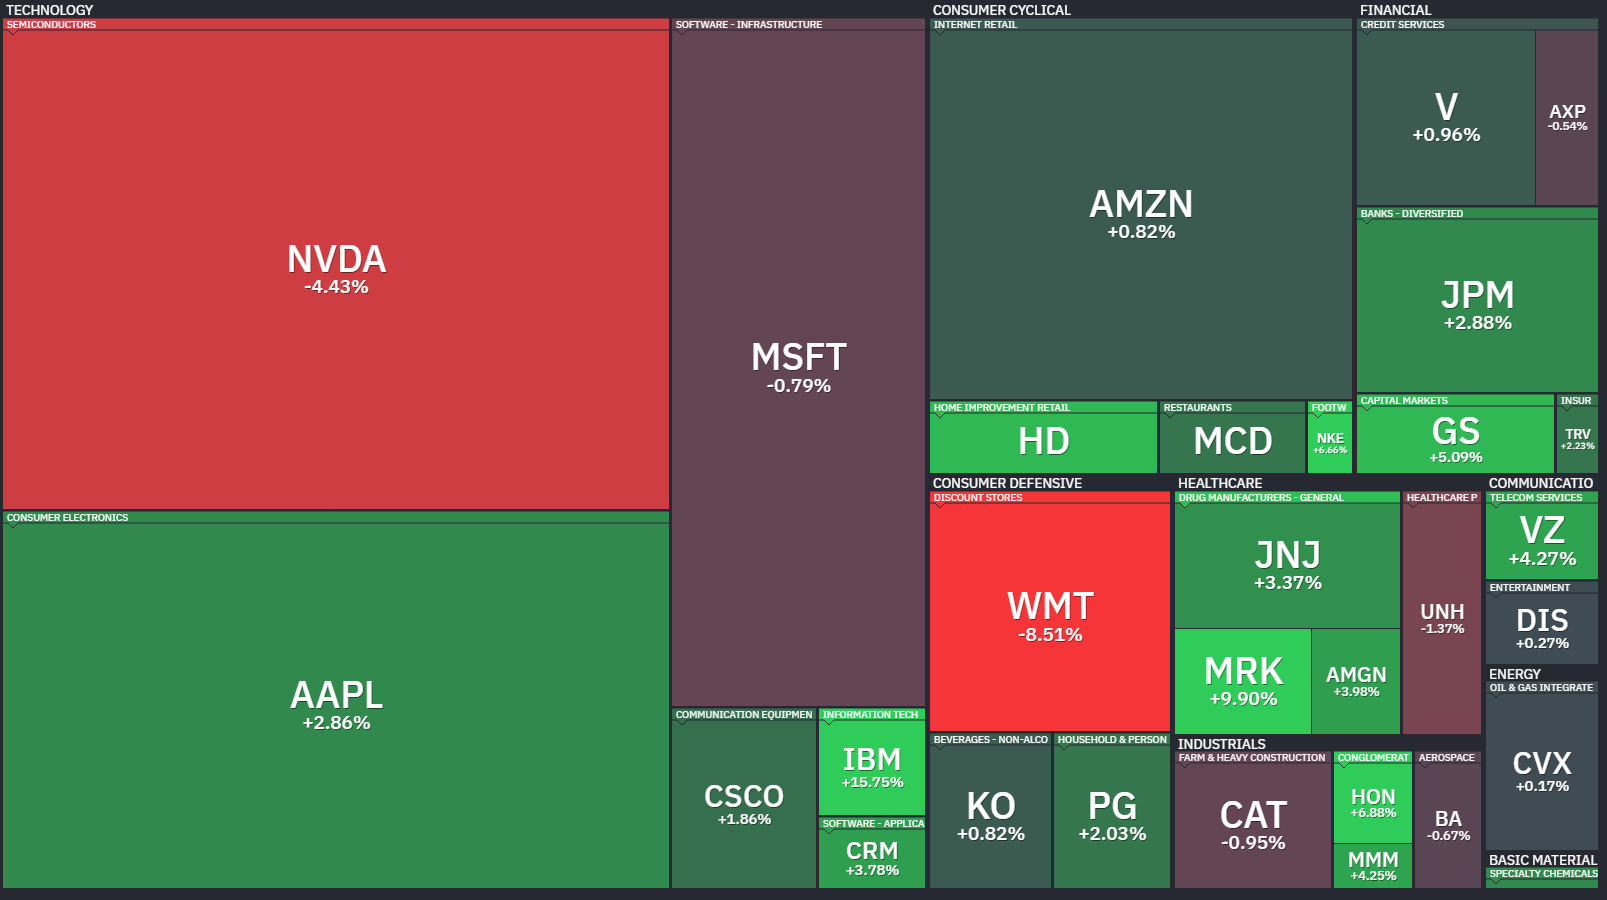
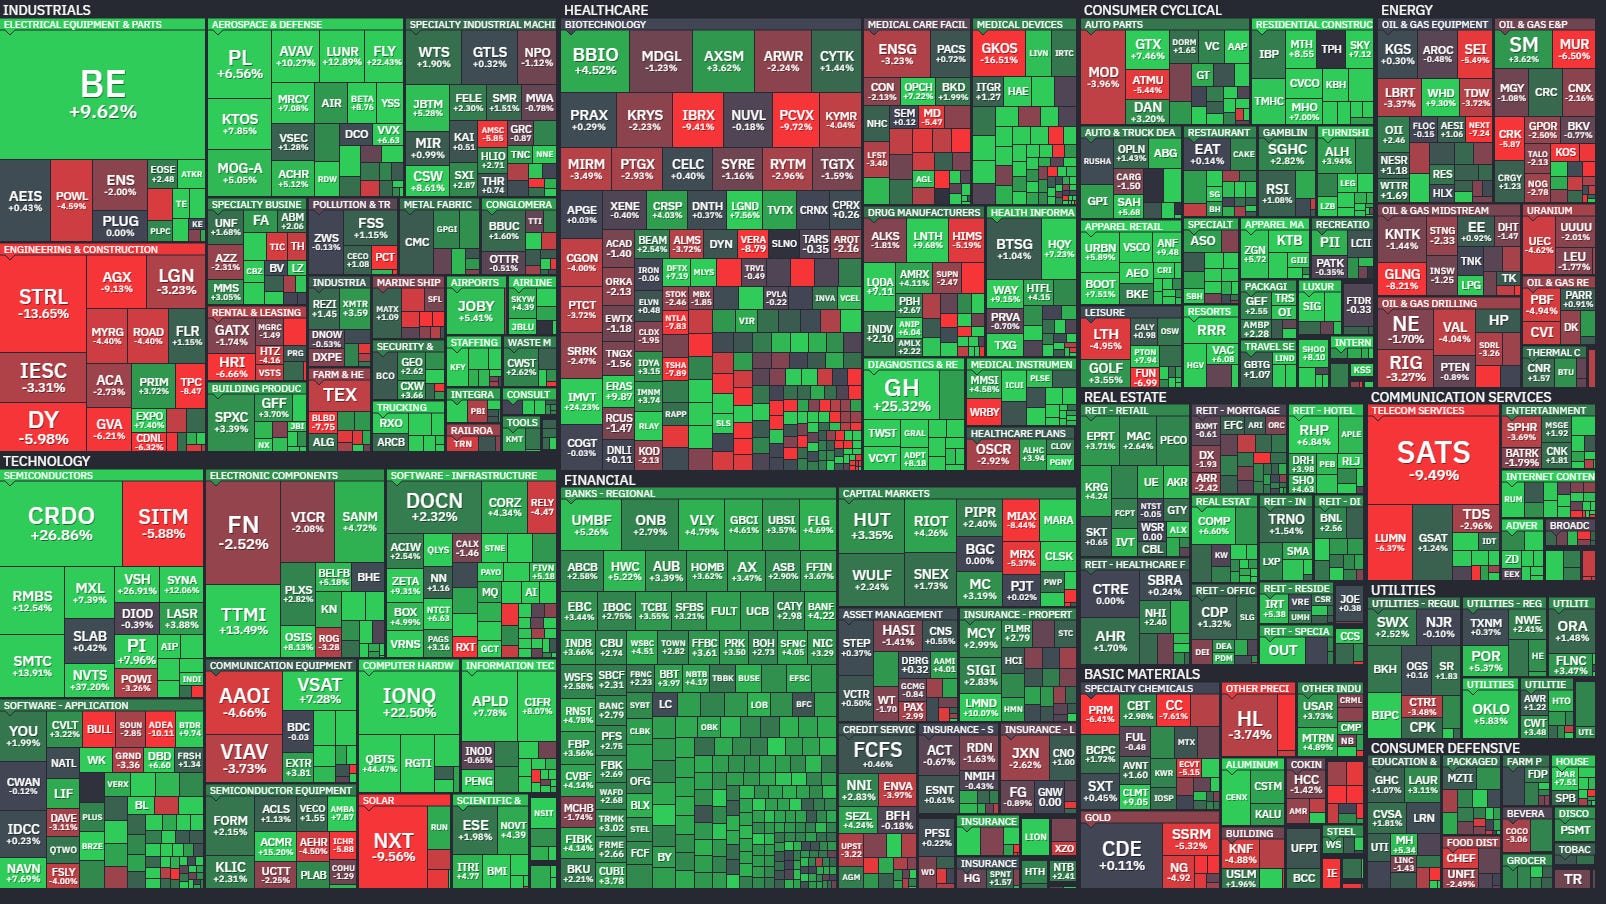
The heatmap reflected a market still dominated by mega-cap influence. Apple, AMD, Broadcom, and portions of financials and healthcare stabilized the tape while Nvidia and Google weighed heavily on index optics. The important takeaway is that weakness in a handful of giants did not collapse participation underneath.
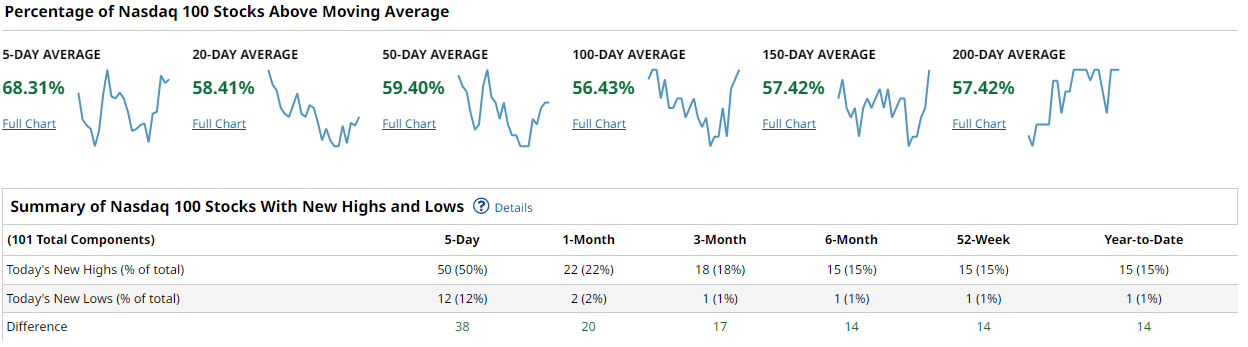
The Nasdaq 100 remains the center of gravity for risk appetite. About 68.3% of constituents are above the 5-day moving average, while the 20-day and 50-day readings improved to 58.4% and 59.4%, respectively. Longer-duration breadth also strengthened, with roughly 56-57% above the 100, 150, and 200-day averages. The new highs versus new lows data remained firmly constructive, with 50 stocks making 5-day highs against just 12 lows.
What stands out here is the rotation occurring beneath the surface. Nvidia and Google posted notable weekly declines, but semiconductors broadly remained healthy through strength in AMD, Intel, Qualcomm, ARM, and equipment names like ASML and Lam Research. That is a healthier structure than a market dependent on a single AI trade carrying the entire complex.
The Dow Industrials displayed some of the strongest breadth readings of the week. More than 76% of components are above their 5-day moving average, while roughly two-thirds sit above the 20-day and 50-day averages. The 100, 150, and 200-day cohorts all hover near 56.7%. The index posted 17 five-day highs versus just 2 lows.
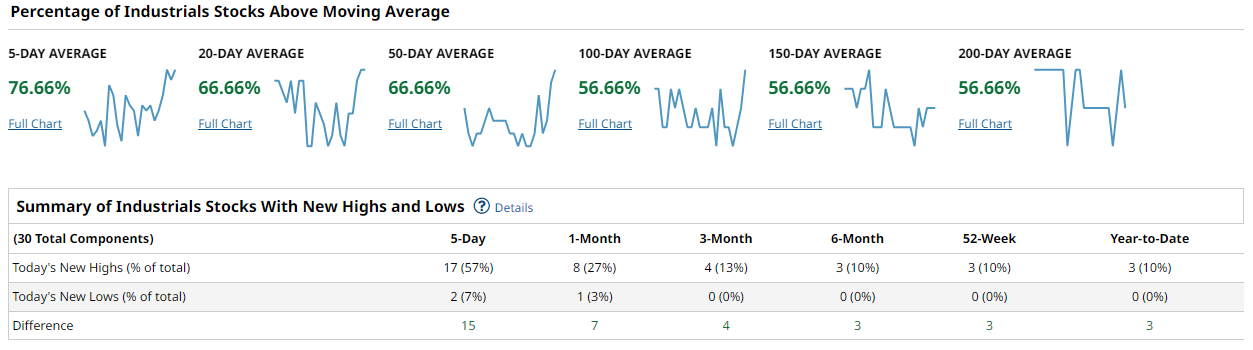
Financials, industrials, and defensive healthcare leadership dominated the heatmap, with Goldman Sachs, JPMorgan, Home Depot, McDonald’s, Merck, and IBM all showing strong relative performance. This continues to support the idea that the market is broadening beyond pure technology leadership.
The Russell 2000 may have delivered the most encouraging signal of all. About 73% of constituents are above the 5-day moving average, though only 52.5% remain above the 20-day. Importantly, 62.3% are above the 50-day moving average, which is one of the stronger intermediate-term breadth readings among the major indexes. New highs crushed new lows across every timeframe, including 931 versus 171 on the 5-day reading.
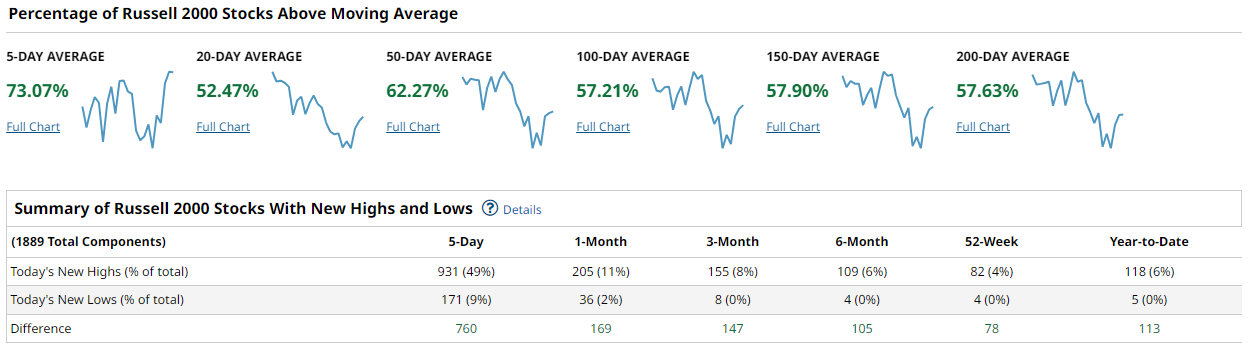
The heatmap confirmed aggressive rotation into select small-cap industrials, regional banks, healthcare, software infrastructure, and energy infrastructure names. While the Russell remains more volatile and uneven than the large-cap indexes, participation is clearly broadening beyond the mega-cap core.
Taken together, the market is showing improving participation rather than narrowing leadership. The strongest advances tend to occur when the 50-day cohorts across major indexes sustainably push above 60% while new highs continue expanding relative to new lows. The S&P 500 and Nasdaq 100 are close to that threshold but not fully there yet. If those intermediate-term breadth measures continue climbing while small caps and cyclicals participate, the rally becomes much harder to dismiss as merely cap-weighted momentum. Concern would rise if the recent thrust fades quickly and the 20-day cohorts roll back over while leadership compresses again into only a handful of mega-cap names.
The playbook this week favors selective risk-taking rather than blind aggression. Industrials, financials, select semiconductors, and improving small-cap leadership deserve attention because participation is broadening there. At the same time, the tape is still rotational enough that chasing overstretched momentum remains dangerous. The best confirmation would come from continued expansion in intermediate-term breadth alongside stabilization in heavyweight technology leadership. If that occurs, the market likely has room to extend meaningfully higher.
Bottom line: breadth is improving fast enough to support the bulls, but the next move depends on whether this short-term thrust can mature into durable intermediate-term participation.

Investor Sentiment Report
AAII Investor Sentiment Survey
The AAII Investor Sentiment Survey tracks the percentage of individual investors who are bullish, neutral, or bearish on the stock market over the next six months. Published weekly every Thursday, it's a widely followed contrarian indicator — historically elevated bearish readings have preceded market recoveries, while extreme optimism has often foreshadowed pullbacks.
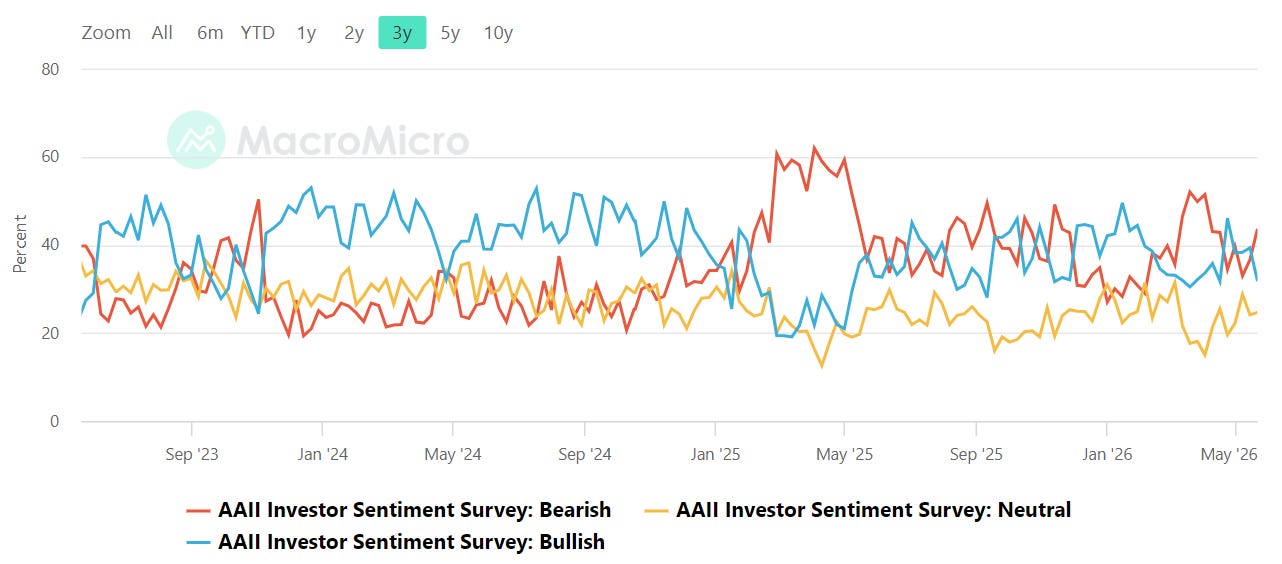
Retail sentiment continues to lean cautiously optimistic, but not euphoric. The latest AAII data shows bullish sentiment sitting roughly in the low-to-mid 30% range while bearish sentiment has climbed back into the low 40s, leaving the bull-minus-bear spread modestly negative again after briefly recovering earlier this spring. Over the past year, the chart shows repeated swings between pessimism spikes and failed attempts at sustained optimism, which is consistent with a market that keeps grinding higher while participants remain psychologically unconvinced. From a contrarian standpoint, that remains more constructive than dangerous. True crowding risk usually develops when bullish readings decisively overwhelm bearish sentiment and the spread pushes above roughly 20 percentage points. We are nowhere near that condition. Instead, the tape still reflects skepticism beneath the surface, which can provide fuel for continued advances if breadth holds up. A further deterioration back toward deeply negative spreads would likely coincide with a meaningful drawdown scare, while a sustained move into strongly positive territory would suggest complacency is finally arriving.
NAAIM Exposure Index
The NAAIM Exposure Index (National Association of Active Investment Managers Exposure Index) measures the average exposure to U.S. equity markets as reported by its member firms. These are typically active money managers who provide their equity exposure levels weekly. The index offers insight into how much these managers are investing in equities at any given time, ranging from being fully short (-100%) to leveraged long (up to +200%).
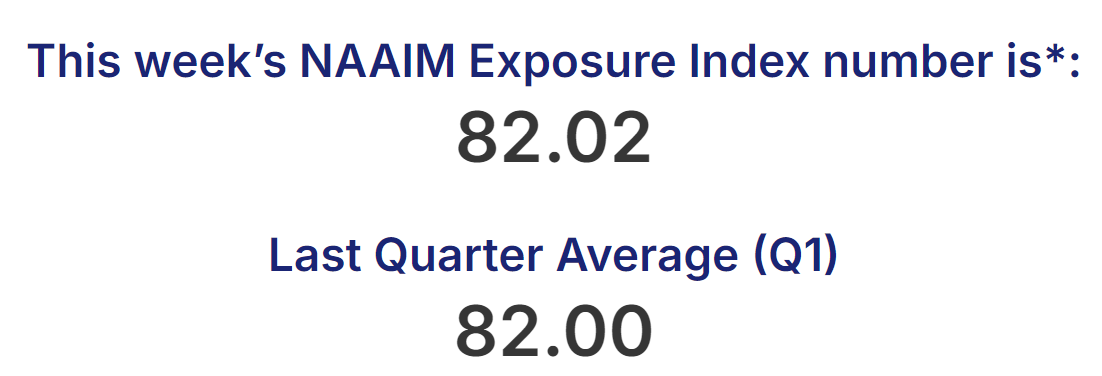
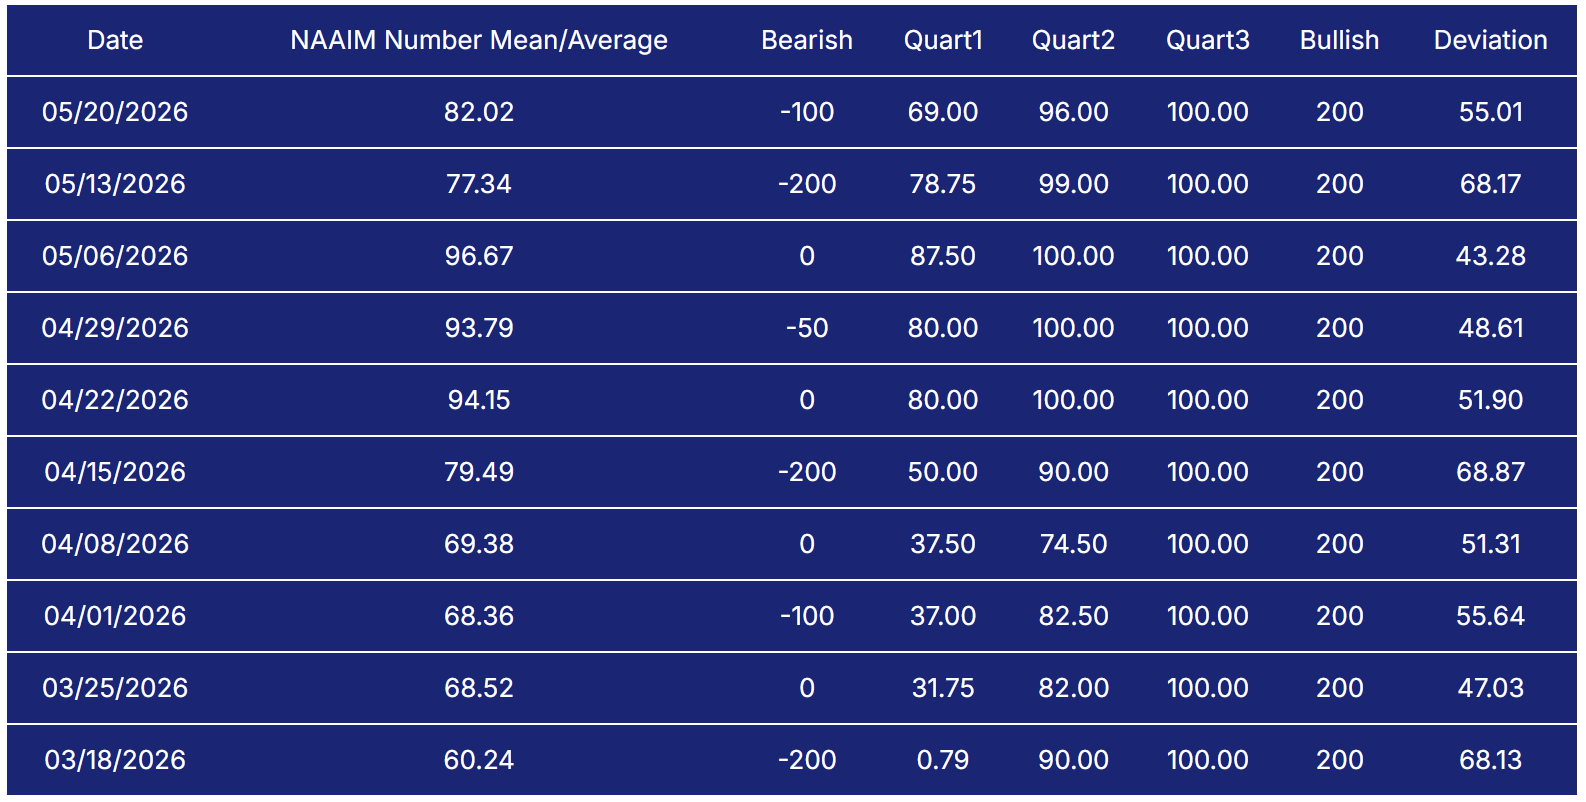
Professional active managers remain heavily exposed, though there has been some cooling at the margin. The latest NAAIM Exposure Index reading came in at 82.02 after printing as high as 96.67 earlier in May. Several recent weeks clustered in the 90s, showing that managers had largely leaned into the rally rather than fighting it. Even after the recent moderation, exposure remains historically elevated and firmly risk-on. That tells us institutional managers still view pullbacks as buyable rather than the start of a larger unwind. The important nuance is that positioning is no longer underinvested. There is less dry powder available than there was earlier in the year, which means future upside increasingly depends on earnings and breadth confirmation rather than simple re-risking flows. The most important tripwire from here would be a sharp drop in exposure into the 50s without meaningful price damage, which would suggest deteriorating confidence beneath the surface. Conversely, another push back toward the upper 90s while indexes remain extended would raise the odds of a more fragile, crowded tape vulnerable to abrupt de-risking.
CBOE Total Put/Call Ratio
CBOE's total put/call ratio includes index options and equity options. It's a popular indicator for market sentiment. A high put/call ratio suggests that the market is overly bearish and stocks might rebound. A low put/call ratio suggests that market exuberance could result in a sharp fall.
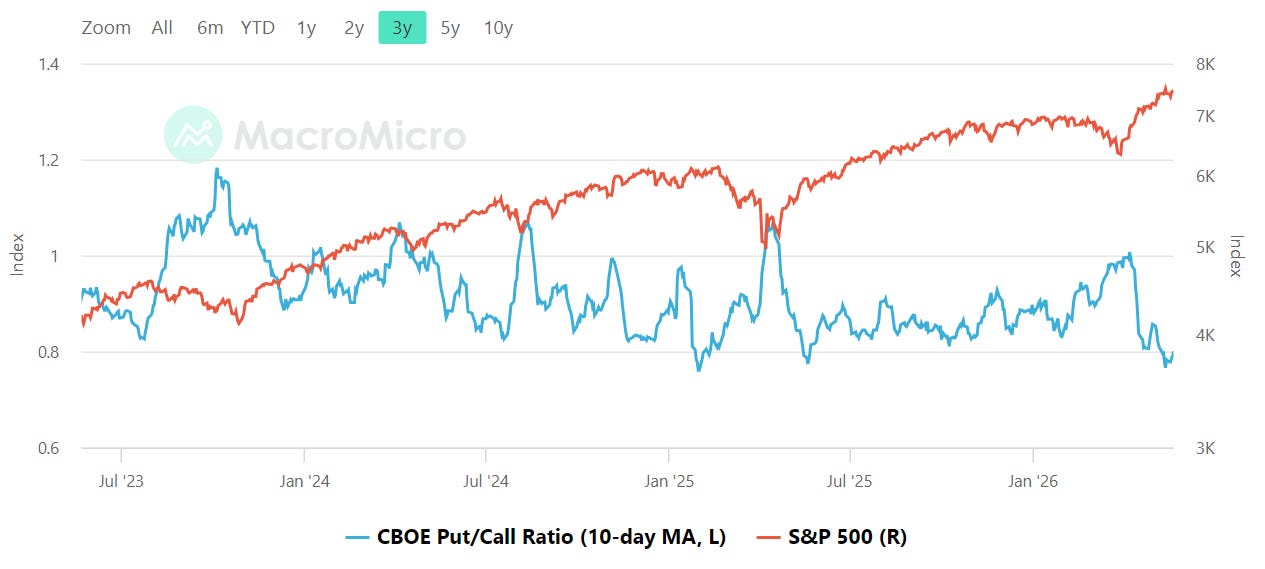
The 10-day moving average of the total put/call ratio has fallen back toward roughly 0.8 after spending much of the past two years oscillating closer to 0.9 and above 1.0 during stress events. That decline matters because it reflects traders steadily reducing downside hedging demand as equities continue to recover. Historically, readings closer to 1.0 align with fear and defensive positioning, while readings approaching 0.8 tend to signal rising comfort and increasingly speculative behavior. The current setup does not yet look wildly euphoric, but it is unquestionably more complacent than fearful. Importantly, the recent decline in put activity has coincided with improving breadth and stable volatility, which usually supports shallower pullbacks and cleaner rebounds. The risk comes if the ratio remains pinned near current levels while leadership narrows and volatility begins quietly rising underneath. A sustained move materially below current levels would start to resemble froth, while a reversal back toward 0.95 or higher would likely signal growing demand for protection and a more defensive tape.
Equity vs Bond Volatility
The Merrill Lynch Option Volatility Estimate [MOVE] Index from BofAML and the CBOE Volatility Index [VIX] respectively represent market volatility of U.S. Treasury futures and the S&P 500 index. They typically move in tandem but when they diverge, an opportunity can emerge from one having to “catch-up” to the other.
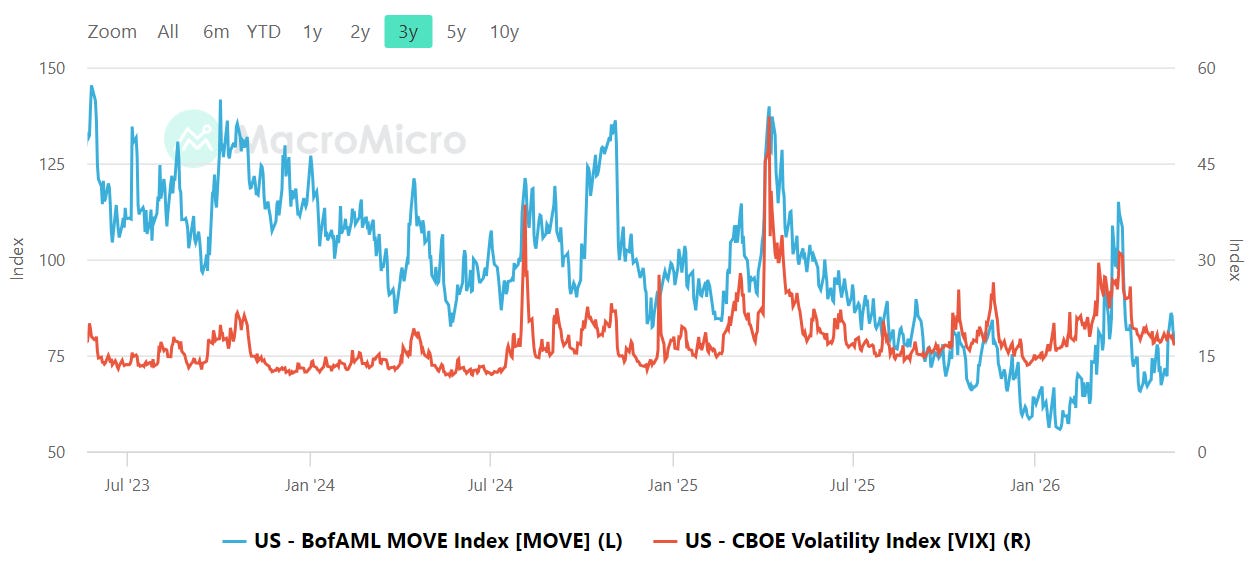
The relationship between MOVE and VIX remains relatively calm compared to the violent spikes seen over the last several years. The VIX currently sits around the mid-teens while the MOVE Index has also compressed significantly from prior stress peaks above 120 and 140. Both markets are signaling a relatively orderly macro environment. That said, bond volatility remains historically elevated relative to the pre-2020 regime, even after its recent decline. This matters because fixed-income stress often leaks into equities with a lag. Several prior episodes on the chart showed MOVE surging first before equities eventually responded through higher VIX readings and broader risk reduction. Right now, that divergence is absent, which supports the constructive risk tone visible in breadth and positioning data. The tripwire to monitor is a MOVE spike back above roughly 120 while the VIX remains sleepy in the mid-teens. That kind of divergence would suggest hidden macro stress building underneath equities. Separately, any VIX move sustainably back into the high teens or beyond would signal that the market is beginning to price a more meaningful volatility regime shift.
CNN Fear & Greed
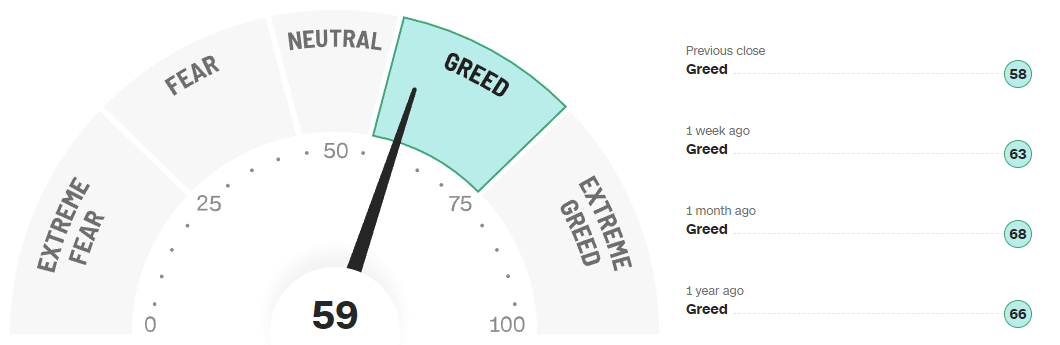
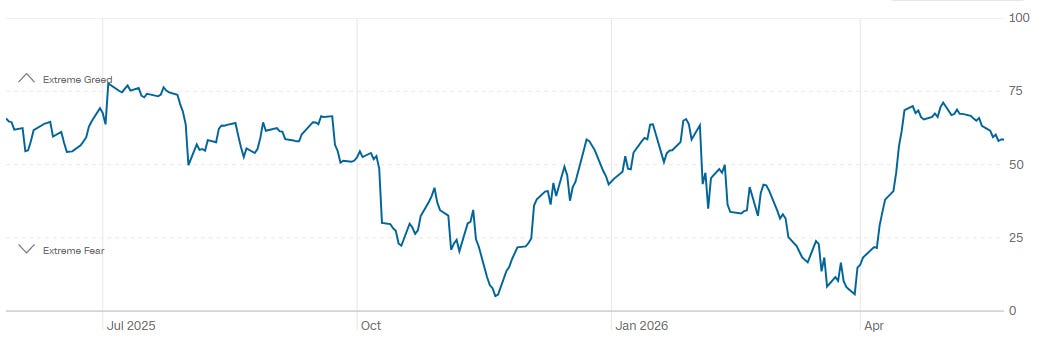
CNN’s Fear and Greed Index currently sits at 59, firmly in the “Greed” category but notably below the more aggressive readings seen earlier this year. The gauge stood at 63 one week ago and 68 one month ago, showing sentiment has cooled modestly even as the broader market remains near highs. The one-year trend reinforces that this has been a highly rotational environment rather than a persistent speculative mania. Sentiment repeatedly swung from fear toward greed and back again instead of remaining pinned in extreme optimism. That is usually healthier for trend durability because it prevents positioning from becoming completely one-sided. The recent pullback from higher greed readings toward the upper-50s suggests enthusiasm has moderated without collapsing. In practical terms, that leaves room for another leg higher if breadth continues expanding. A push back into the upper 70s or extreme greed territory would likely signal a more exhausted and crowded tape, while a retreat toward the 30s or below would probably create a more attractive medium-term entry opportunity.
Bottom line: sentiment remains constructive but not euphoric, with improving participation and still-manageable optimism supporting the bull case as long as volatility stays contained and positioning does not become excessively crowded.
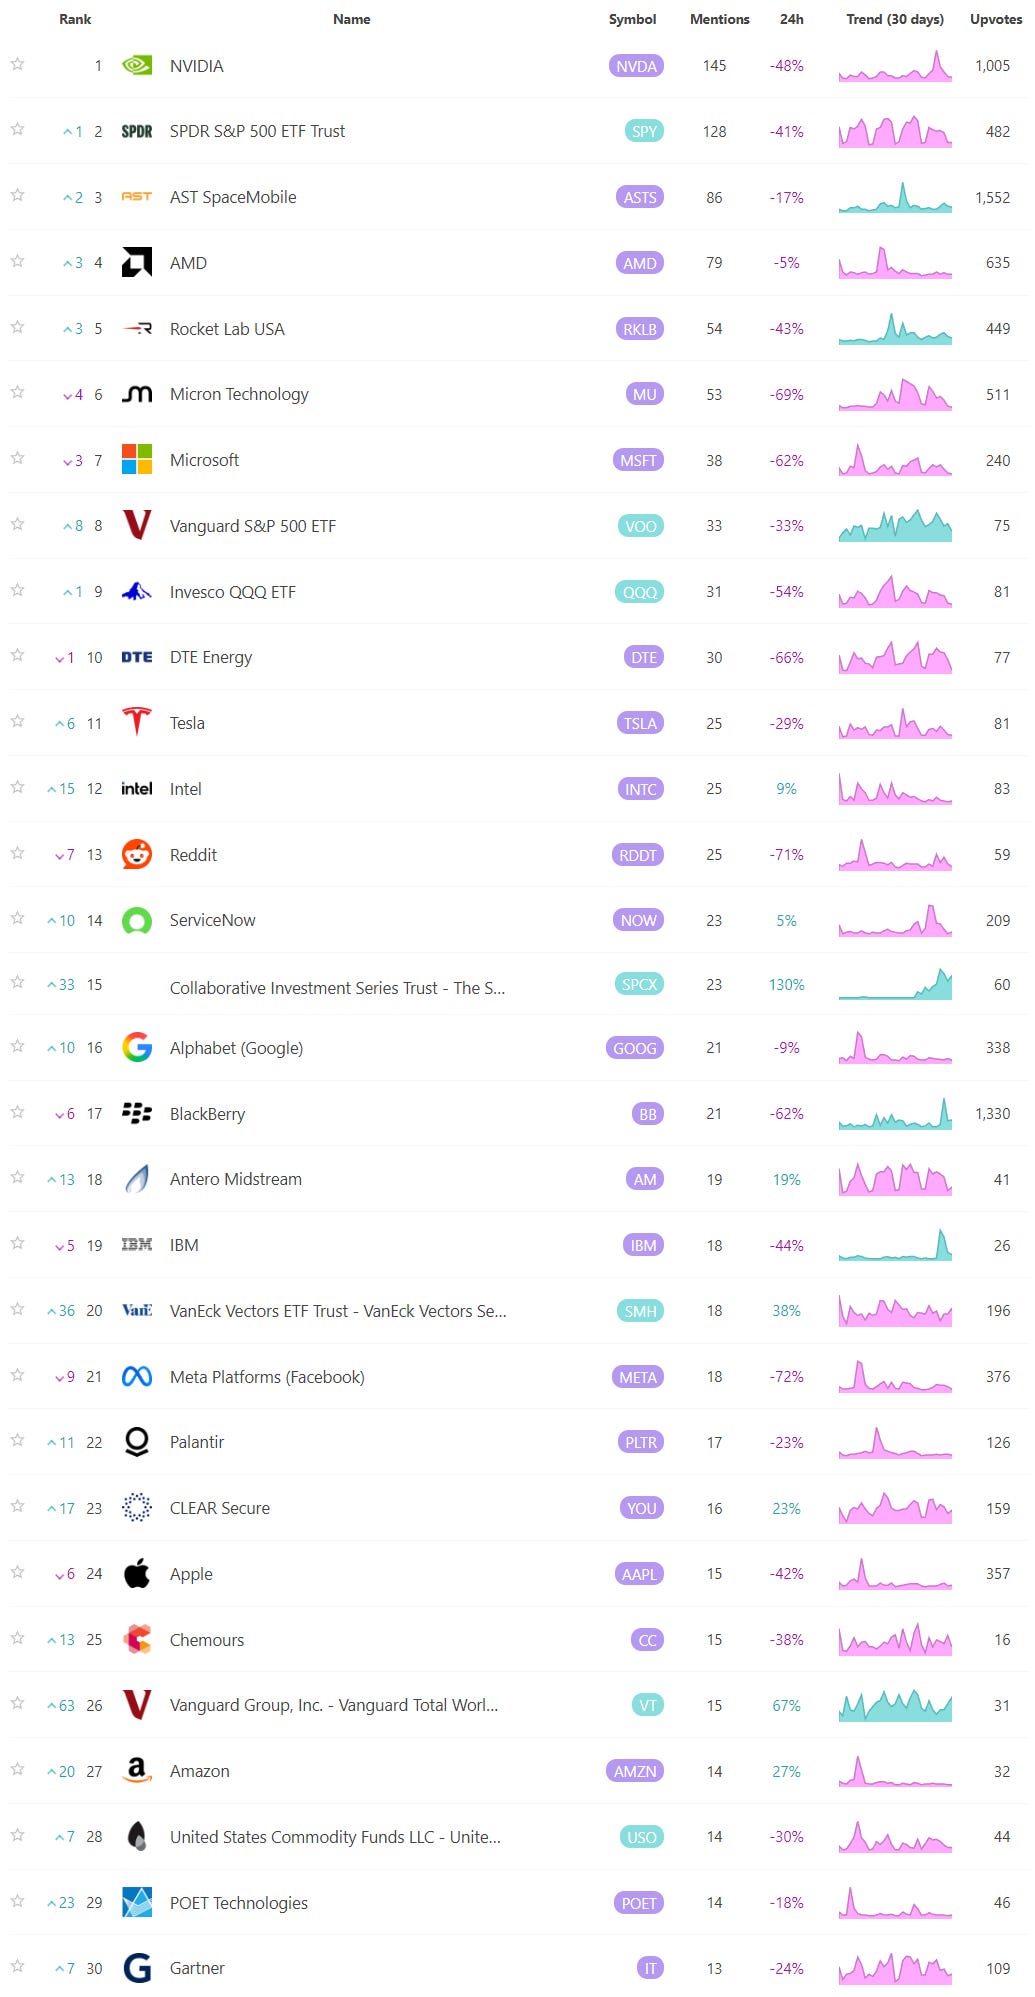
Social Media Favs
Social sentiment offers a real-time view of investor mood, often revealing market shifts before traditional indicators. It can signal momentum changes, spot emerging trends, and gauge retail investor impact—especially in high-volatility names. Tracking sentiment around events or earnings provides actionable insights, and when layered with quantitative models, can enhance predictive accuracy and risk management. Sustained sentiment trends often mirror broader market cycles, making this data a valuable tool for both short-term trades and long-term positioning.

Technician’s Playbook: Trading the Majors (SPY/QQQ/IWM/DIA)
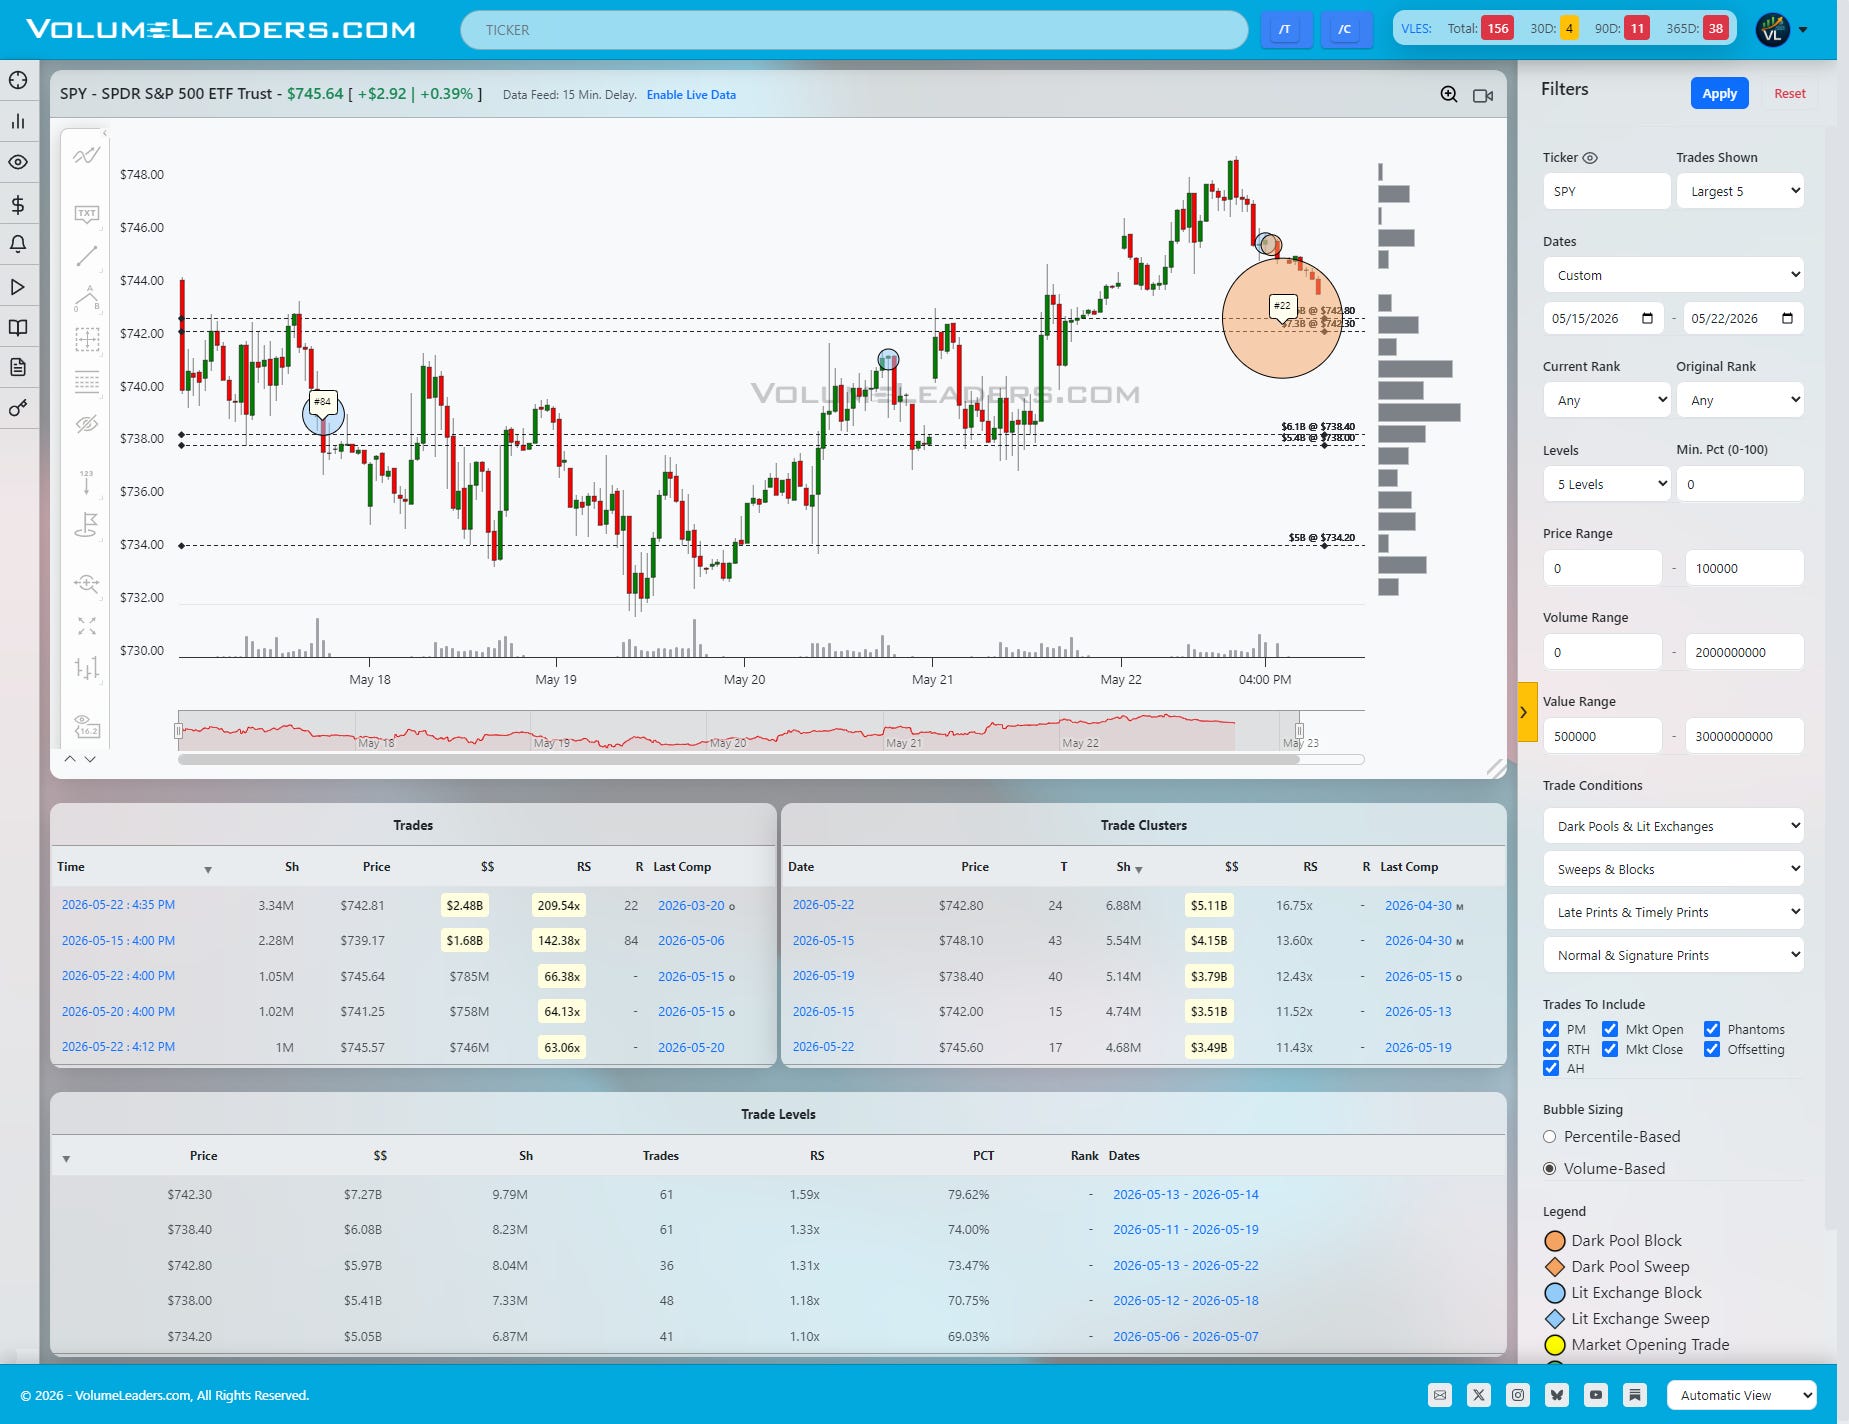
When you’re a large institutional player, your primary goal is to find liquidity - places to do a ton of business with the least amount of slippage possible. VolumeLeaders.com automatically identifies and visually plots the exact spots where institutions are doing business and where they are likely to return for more. It’s one of the primary reasons “support” and “resistance” concepts work and truly one of the reasons “price has memory”.
The tape continues to reward buying dips into institutional inventory rather than chasing emotional extension. Across SPY, QQQ, IWM, and DIA, the dominant structure remains a sequence of impulsive advances followed by shallow rotational pullbacks into previously accumulated volume shelves. The important nuance this week is that price is no longer exploding vertically. Instead, it is beginning to test whether recent breakout areas can transition from resistance into sponsorship.
SPY remains the cleanest broad-market structure. After a relatively straight move from the low $733s into the upper $747s, price rotated lower directly into a dense institutional pocket centered around the $742 level. That shelf matters because the Level table shows roughly $7.27B accumulated there across 61 trades, making it the largest visible inventory zone on the chart. Just beneath it sits another meaningful layer at $738.40 with approximately $6.08B. The notable print this week was the massive $2.48B block near $742.81 carrying a 209x relative-size reading and a top-100 historical tag. That kind of size appearing directly into a pullback often signals absorption rather than panic liquidation. The market essentially paused exactly where large participants had already demonstrated willingness to transact heavily. As long as SPY continues accepting above the $742-$743 region, the path remains constructive with the prior highs near $748 acting as the next magnet. Lose that shelf decisively and the tape likely rotates toward the heavier $738 area where buyers would need to defend again to preserve trend continuity.
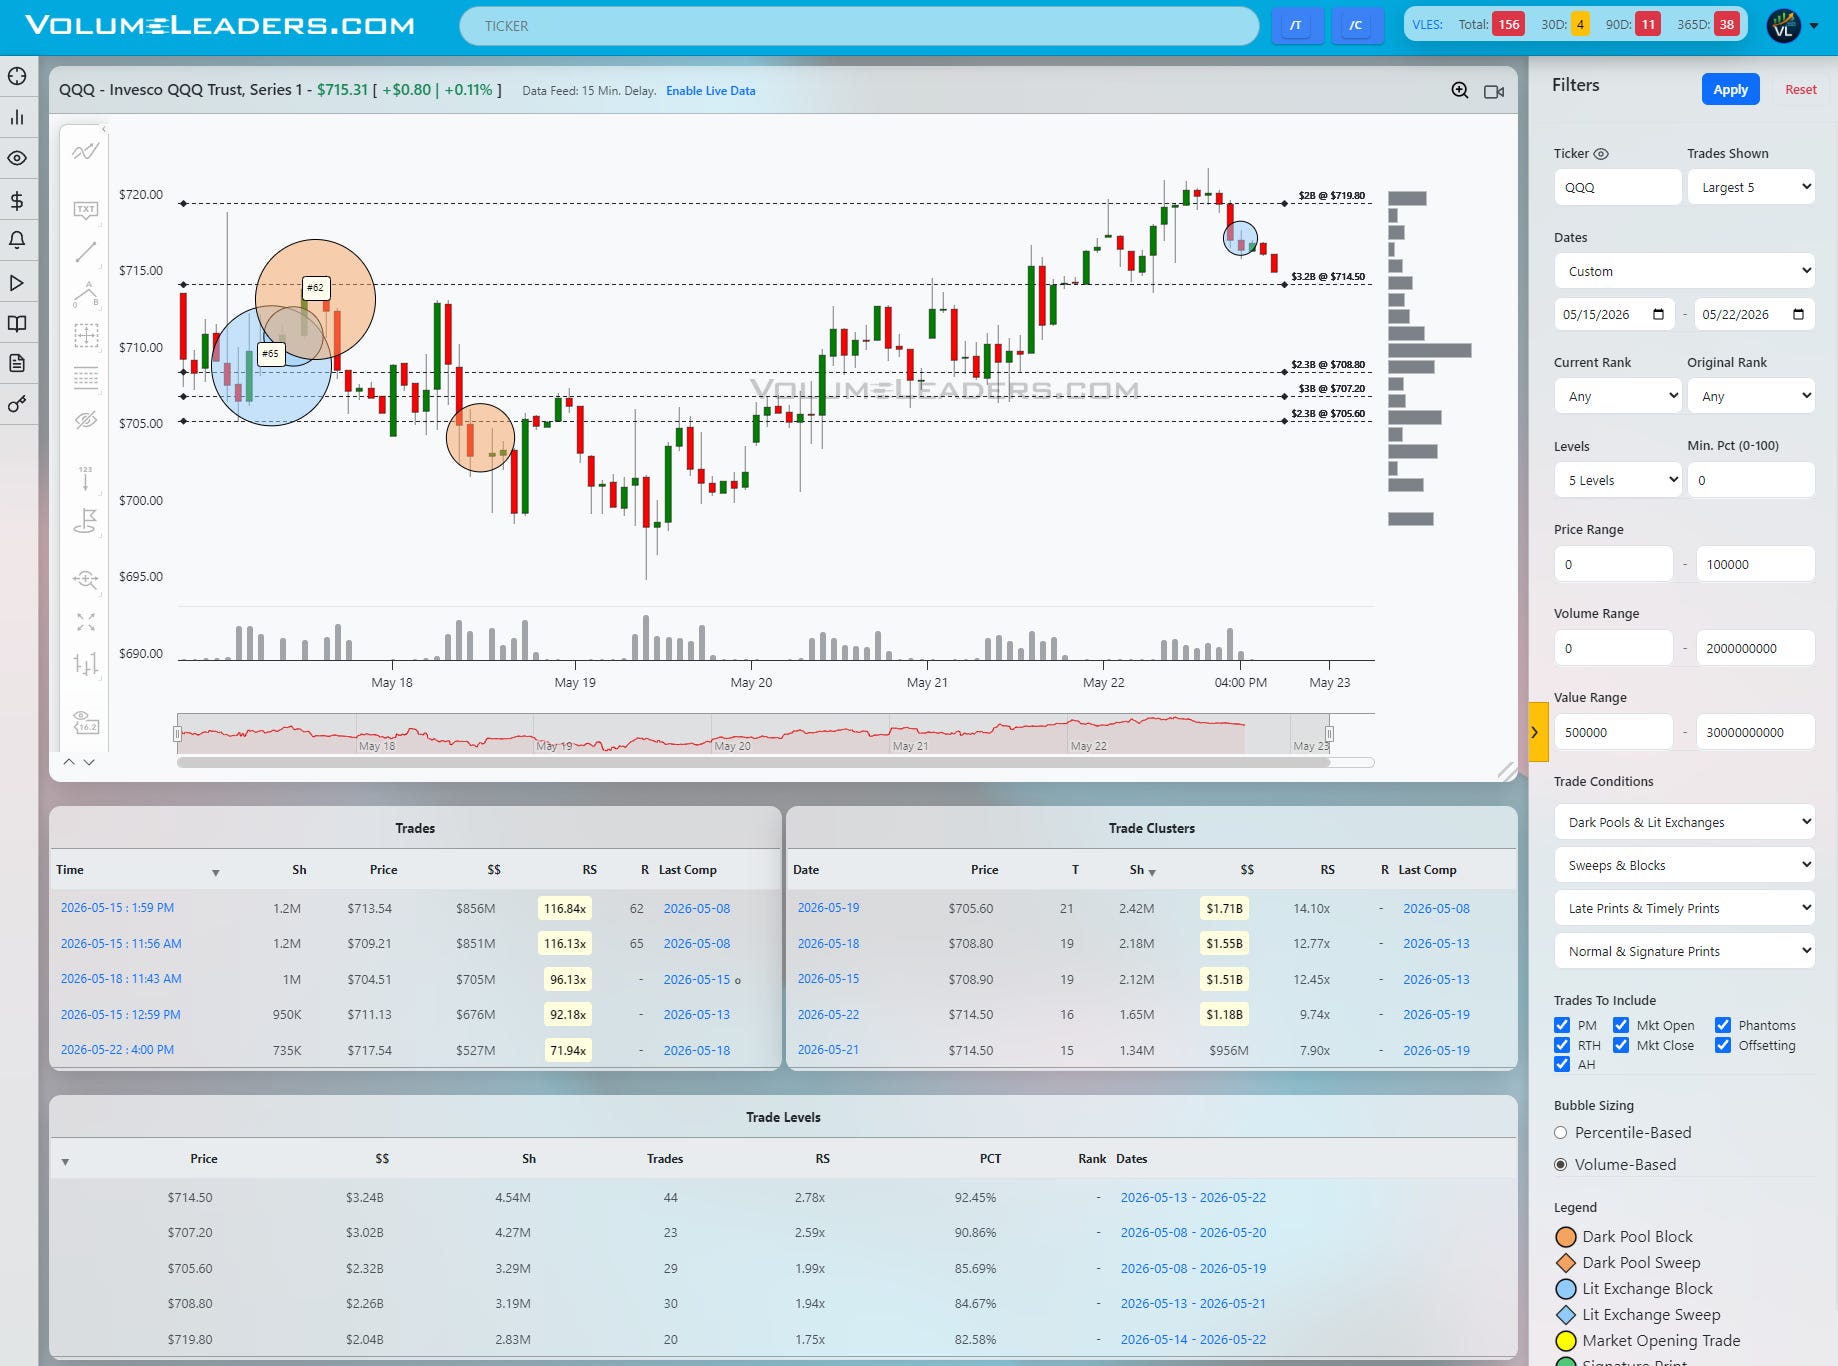
QQQ is structurally similar but more fragile because leadership concentration remains higher. The primary line of scrimmage sits around $714.50 where the chart shows approximately $3.24B accumulated with a very high percentile reading above 92%. Above that sits the recent exhaustion zone near $719.80 with another roughly $2B of historical inventory. The Nasdaq tape clearly encountered supply into that upper shelf as large blue-chip technology names cooled. What stands out, however, is that the pullback into the close remained orderly rather than impulsive. Earlier top-100 historical prints near the $713-$714 area helped define the current battleground, and the recent lit exchange block around $717.50 appears more rotational than distributive for now. Bullishly, sustained acceptance back above $715 likely opens another probe toward the $719-$720 supply zone. Bearishly, failure back below the clustered $708.80-$707.20 region would suggest the recent breakout is reverting back into balance rather than trending higher.
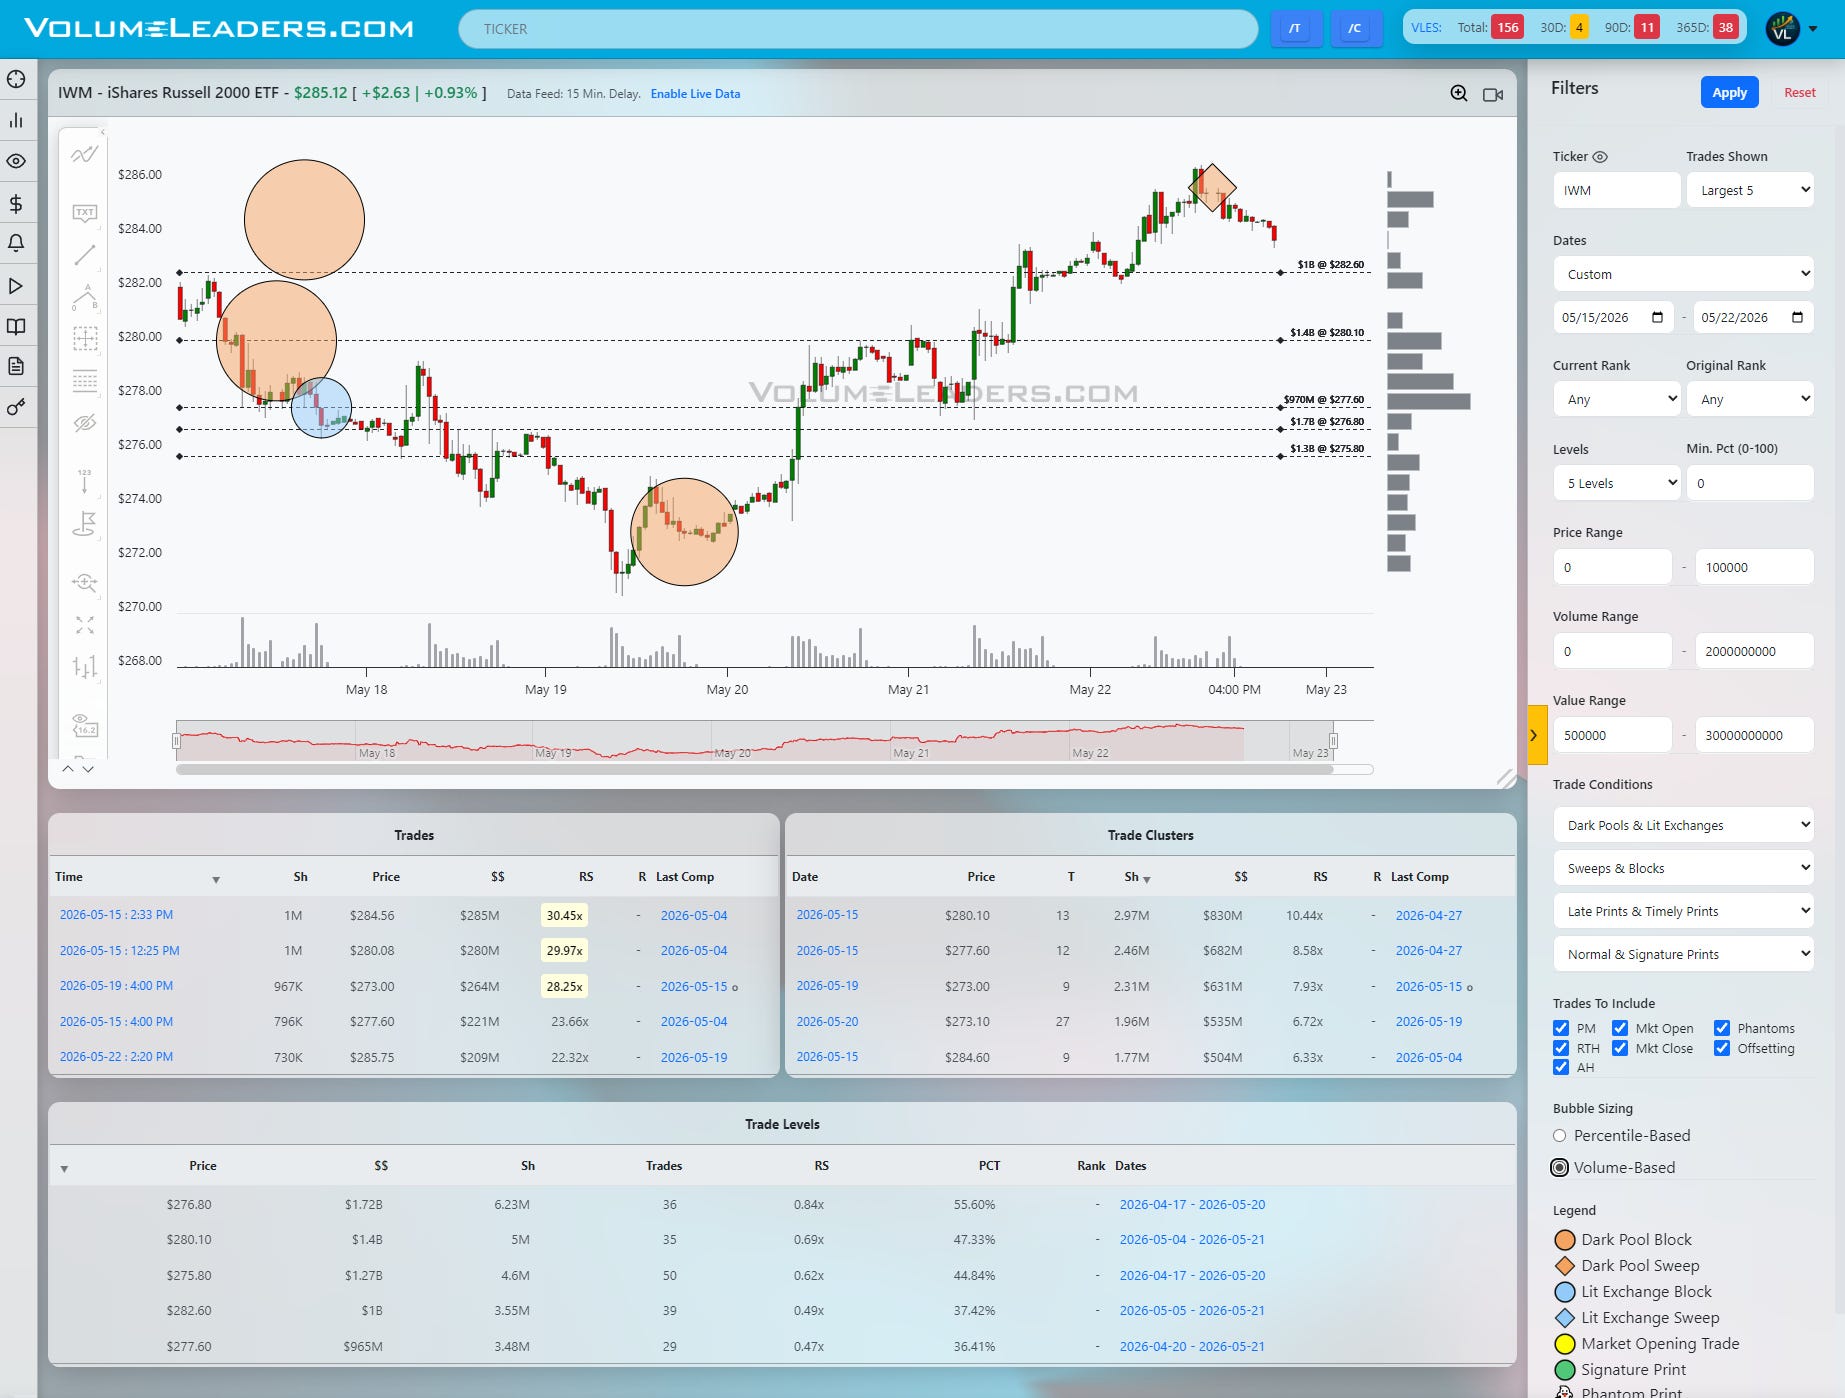
IWM remains the most interesting tape because it continues showing expanding participation despite less dramatic headline performance. Price staged a persistent advance from the low $272s into the mid $285s while repeatedly respecting accumulation zones underneath. The most important visible shelf is near $280.10 where roughly $1.4B accumulated across 35 trades. Another meaningful support band sits between roughly $276.80 and $277.60. Unlike SPY and QQQ, the Russell structure shows repeated large dark-pool activity during pauses rather than after emotional spikes. That usually reflects patient accumulation. The recent sweep near $284.50 arrived directly into local highs and temporarily stalled momentum, but price has not meaningfully broken structure yet. Continued acceptance above $282.60 keeps the path pointed toward another challenge of the highs near $285-$286. Lose $280 and the tape probably transitions into a wider consolidation back toward the upper $277s where stronger sponsorship previously emerged.
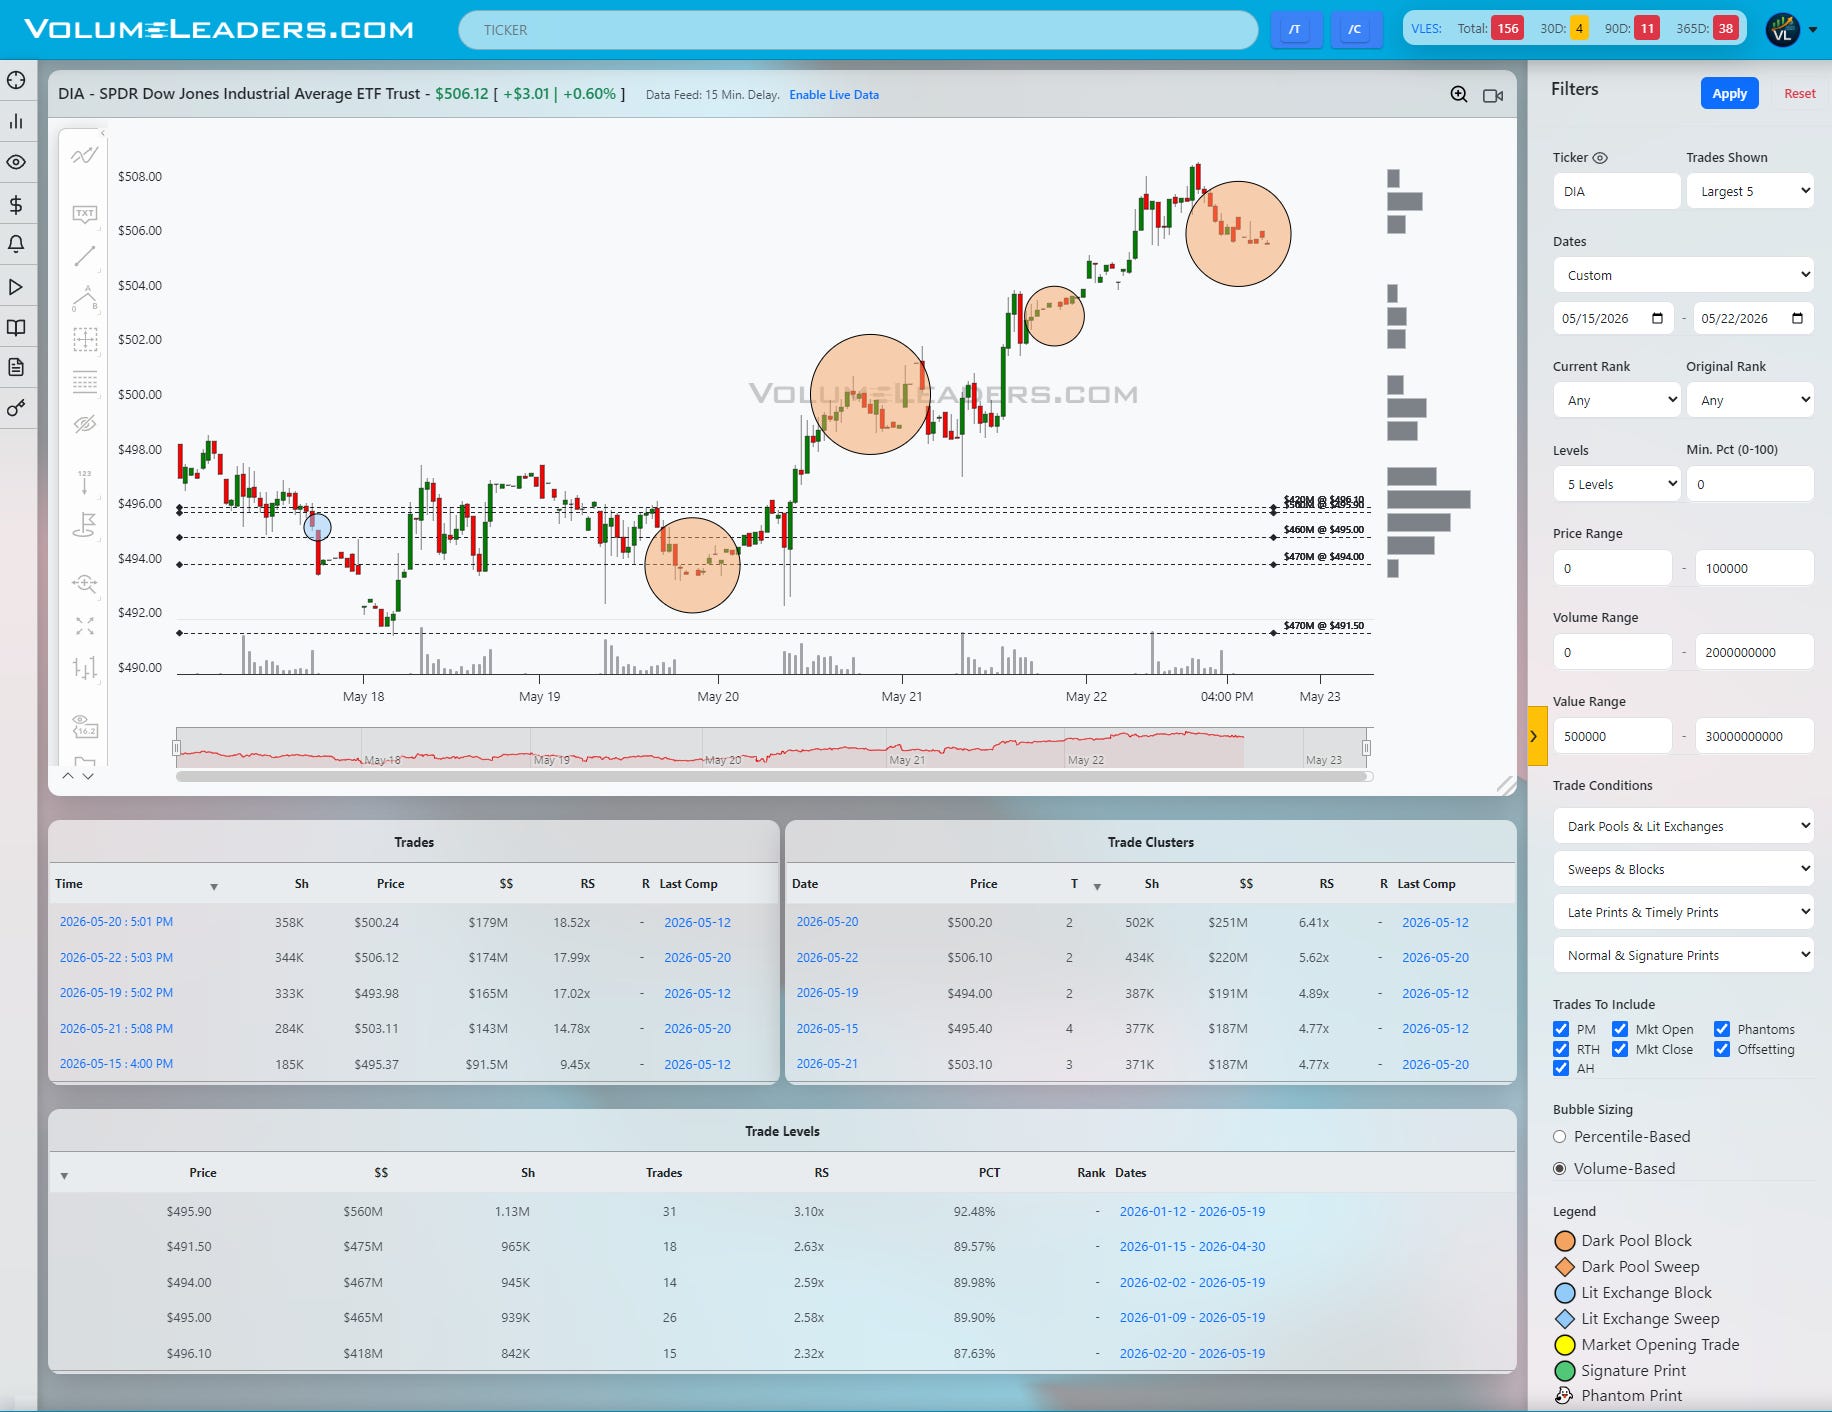
DIA continues to quietly act like the most stable tape of the group. The advance from the low $494s into the $508 area occurred through a stair-step sequence of institutional accumulation rather than momentum chasing. Multiple dark-pool clusters formed during pauses around $494-$500 before price resumed higher. The most important visible support sits near $495.90 where the Level table shows roughly $560M accumulated with a percentile reading above 92%. Above that, the market is now testing whether recent late-session inventory near $506 can hold as higher support. The final large print into the close appeared more like controlled digestion than aggressive selling. Bullishly, holding above $503-$504 likely keeps the path open toward another expansion higher through the recent highs. Bearishly, a loss of $500 followed by failure at $495 would suggest the industrial leadership trade is finally beginning to fatigue.
Taken together, the tape still favors tactical continuation rather than aggressive mean reversion. The key difference now is that indexes are no longer trading in open air. They are interacting directly with large institutional inventory zones, which means acceptance and rejection around these shelves matter far more than headline percentage moves. The disciplined approach here is patience: buy constructive tests into defended inventory, define risk tightly beneath the shelf being defended, and avoid pressing momentum directly into overhead supply unless the tape proves it can absorb it cleanly.

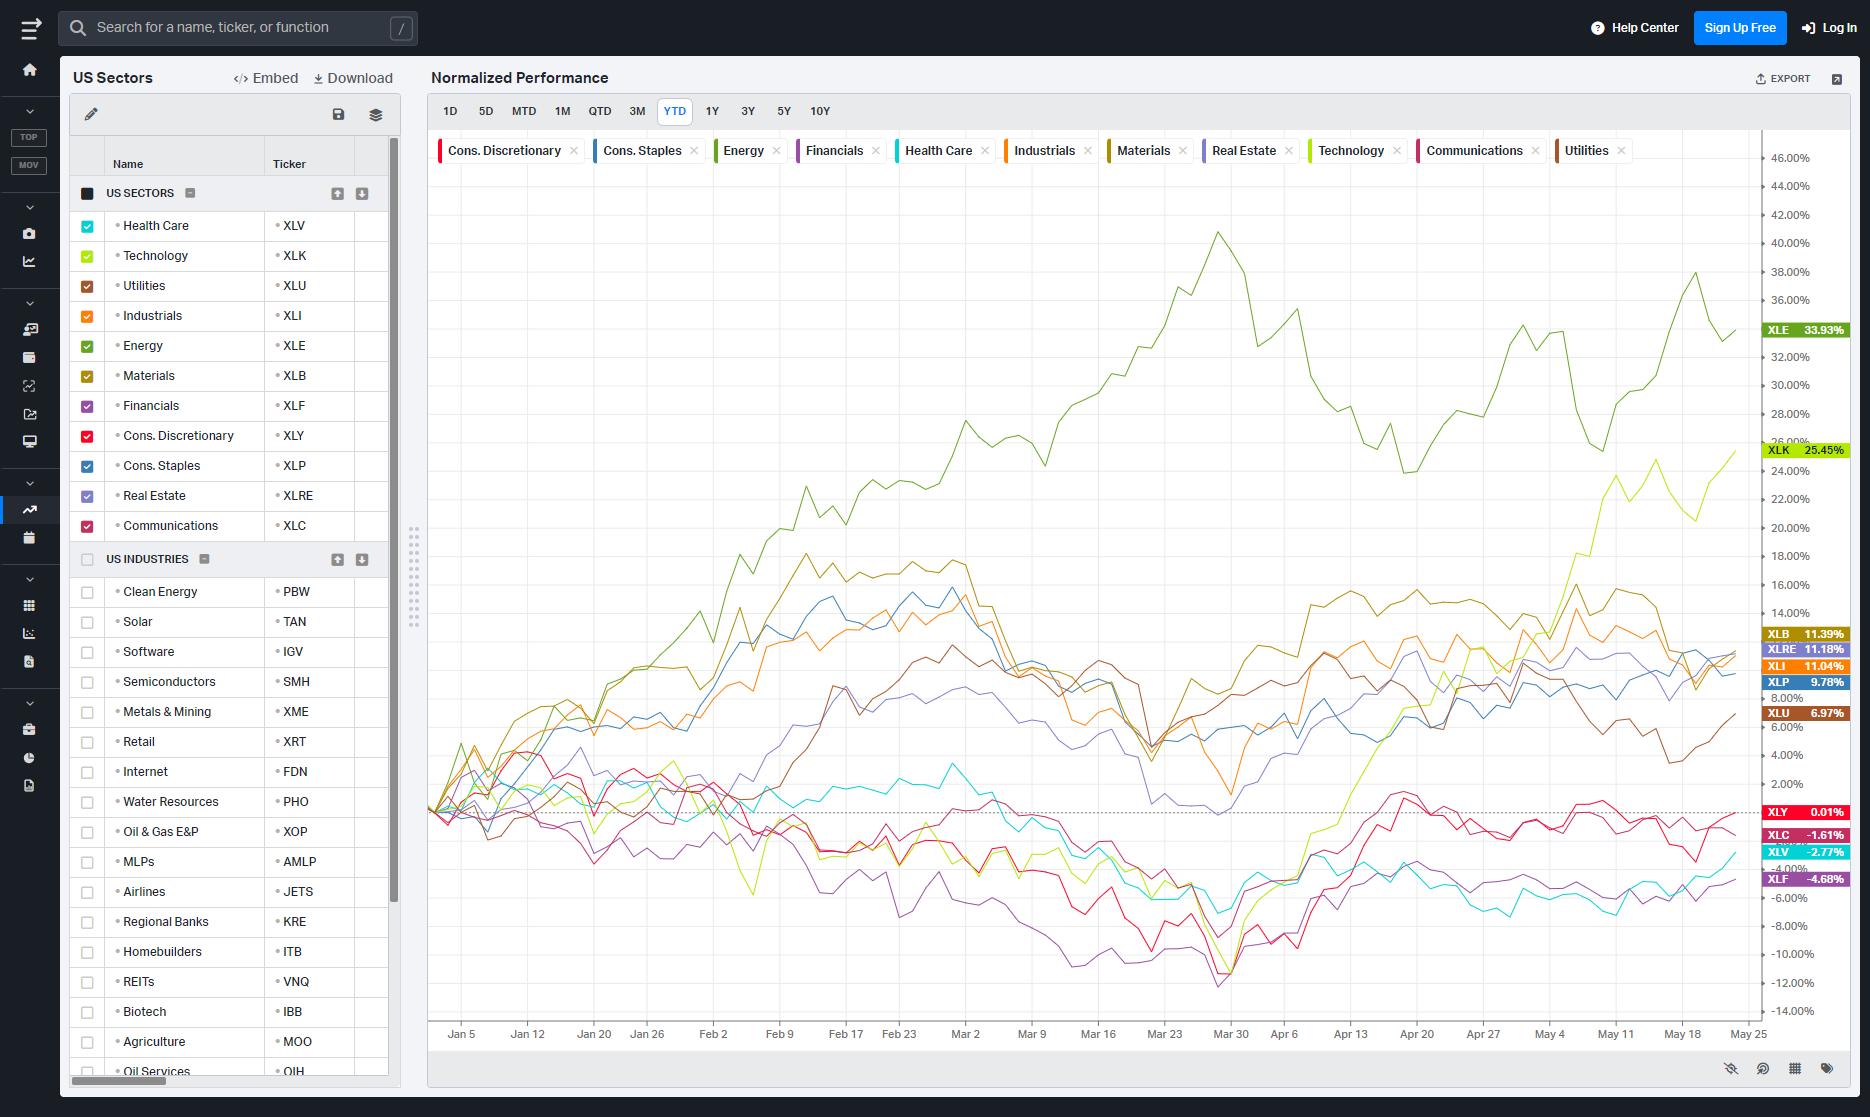
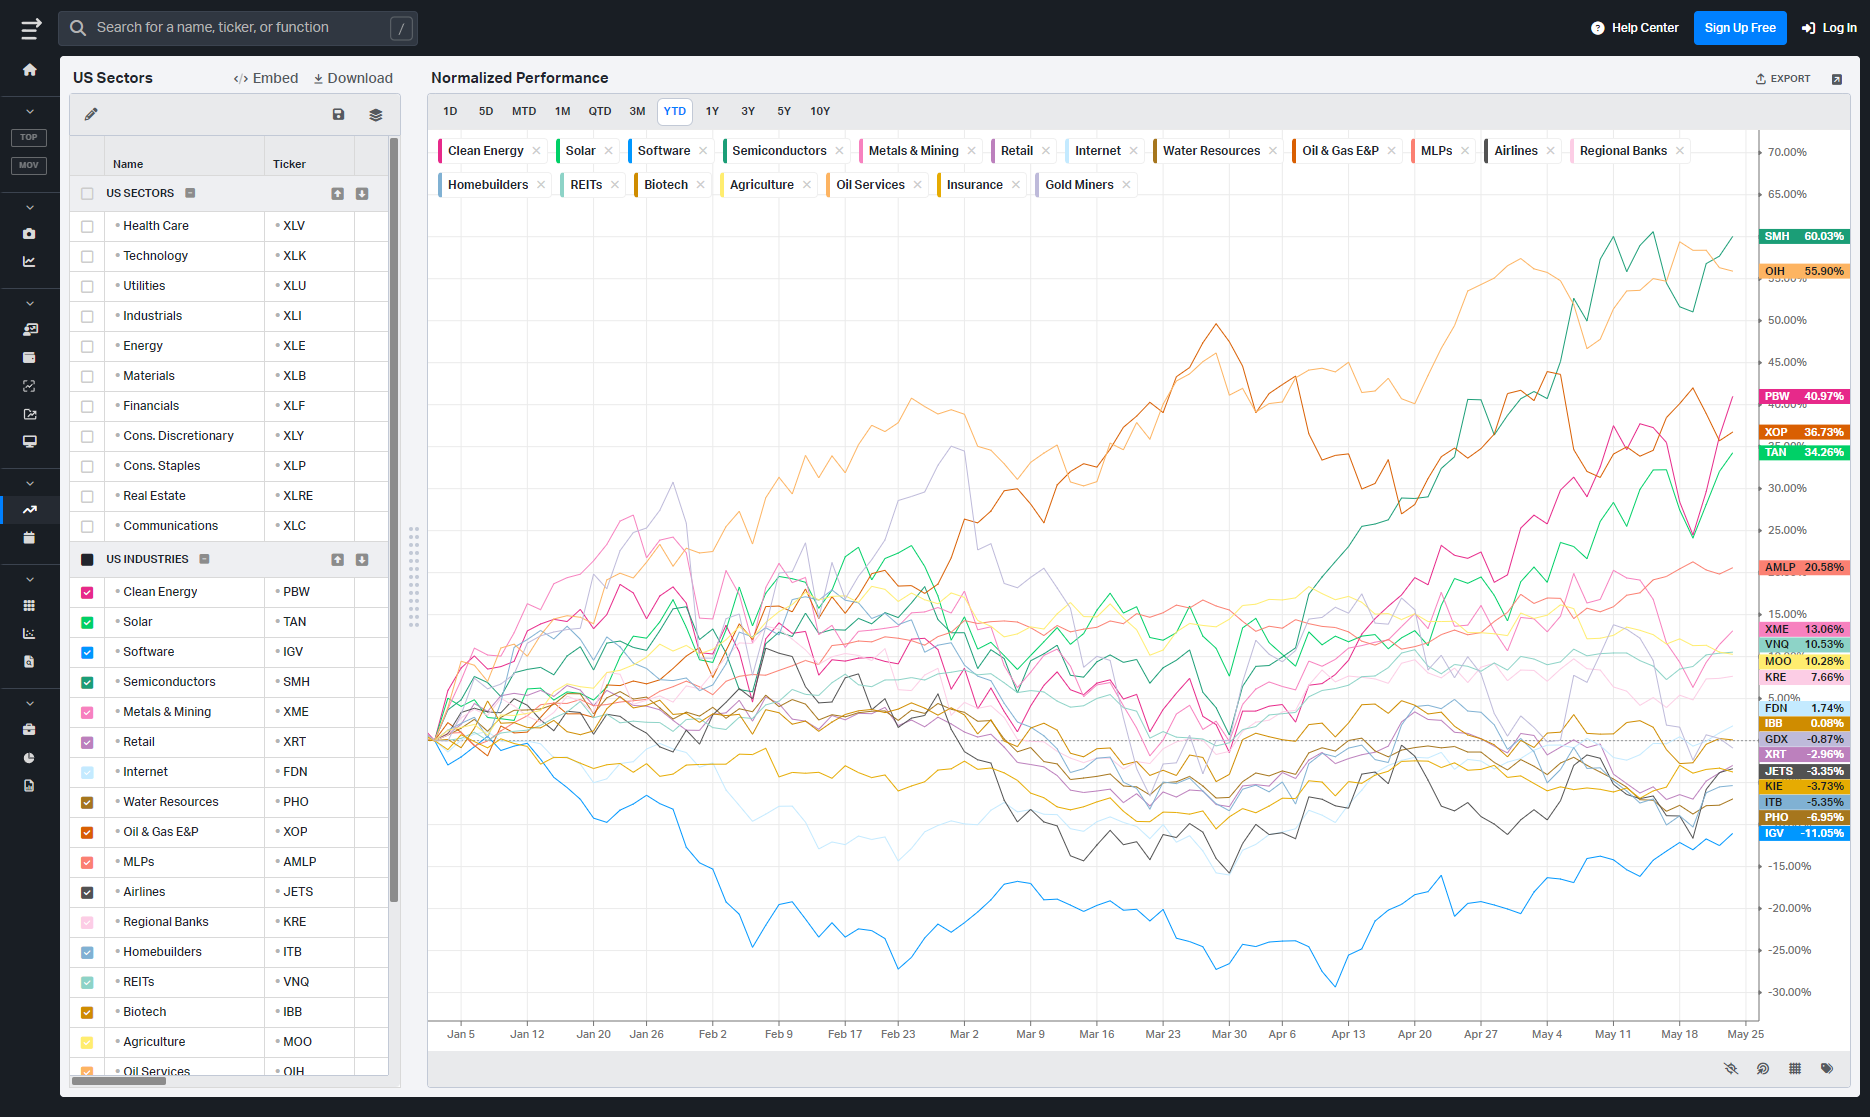
Summary Of Thematic Performance YTD
VolumeLeaders.com offers a robust set of pre-built thematic filters, allowing you to instantly explore specific market segments. These performance snapshots are provided purely for context and inspiration—think about zeroing in on the leaders and laggards within the strongest and weakest sectors, for example.
S&P By Sector
S&P By Industry
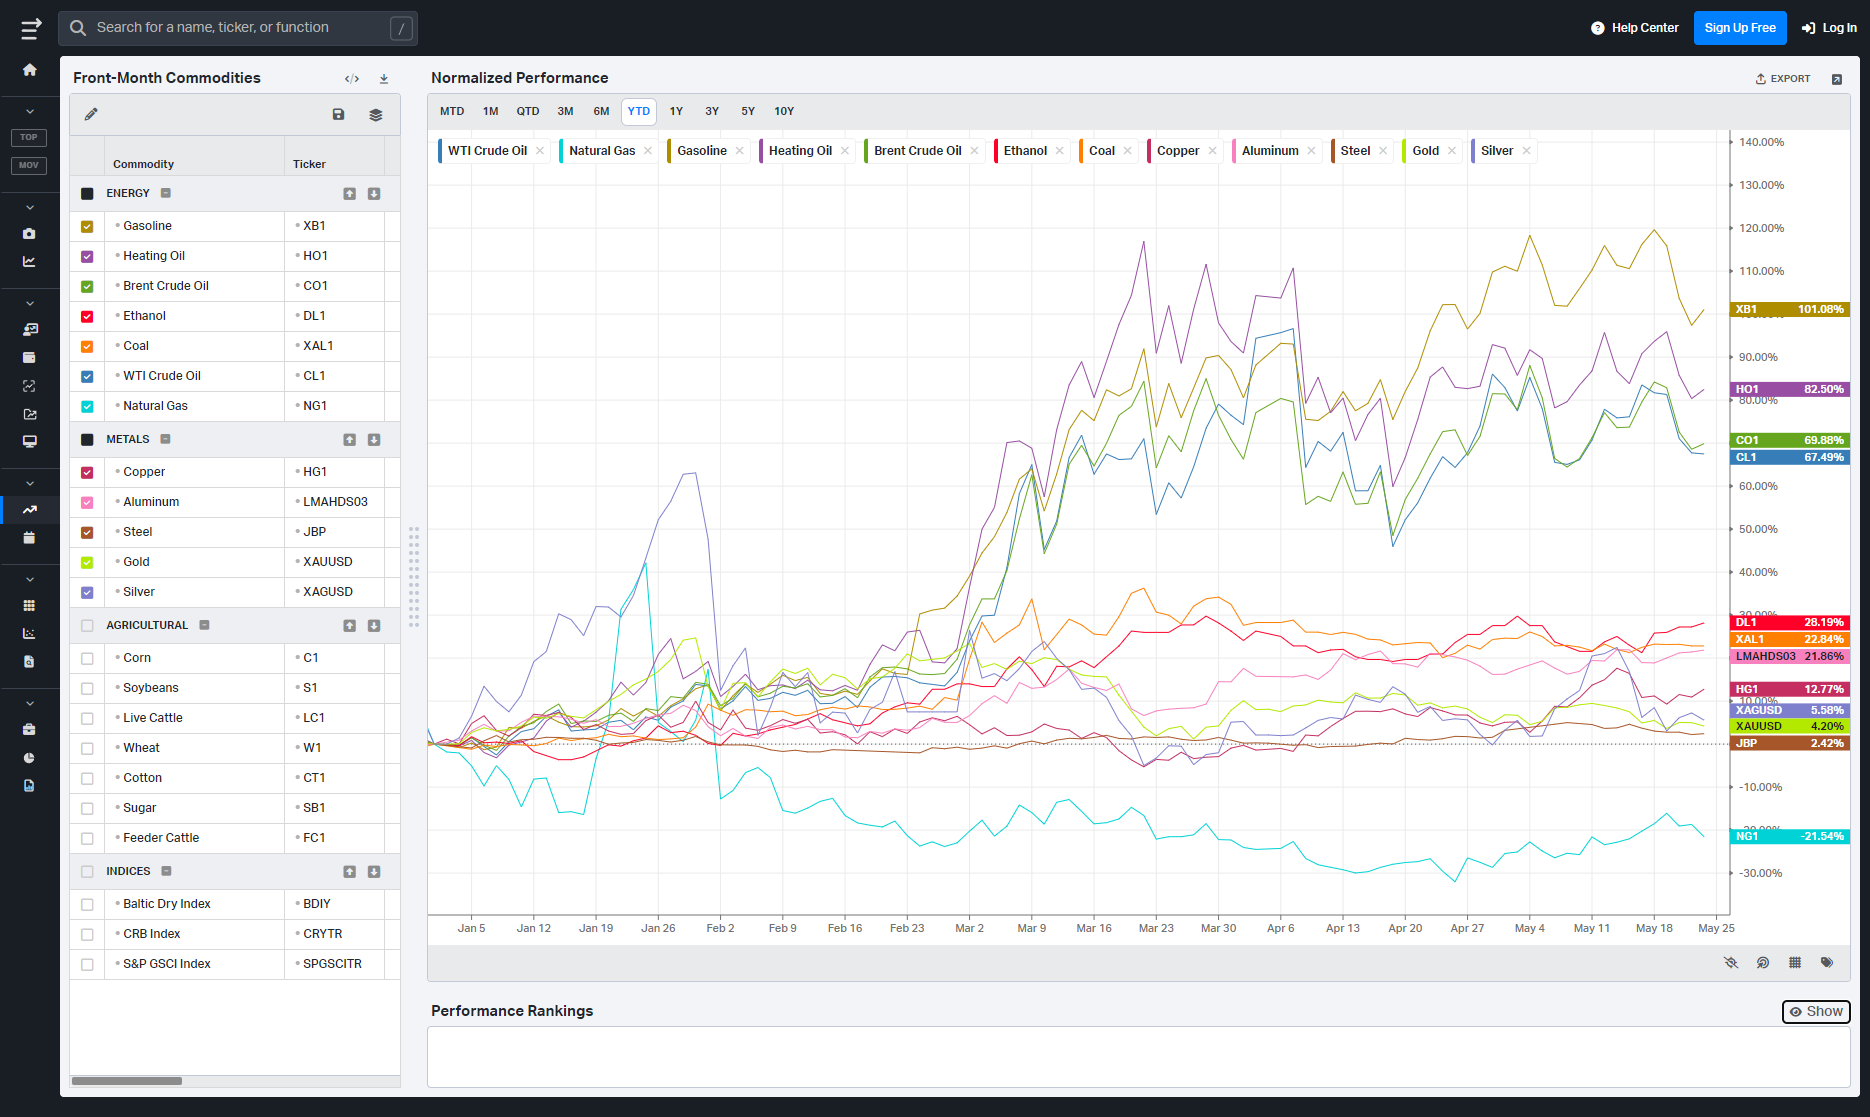
Commodities: Energy & Metals
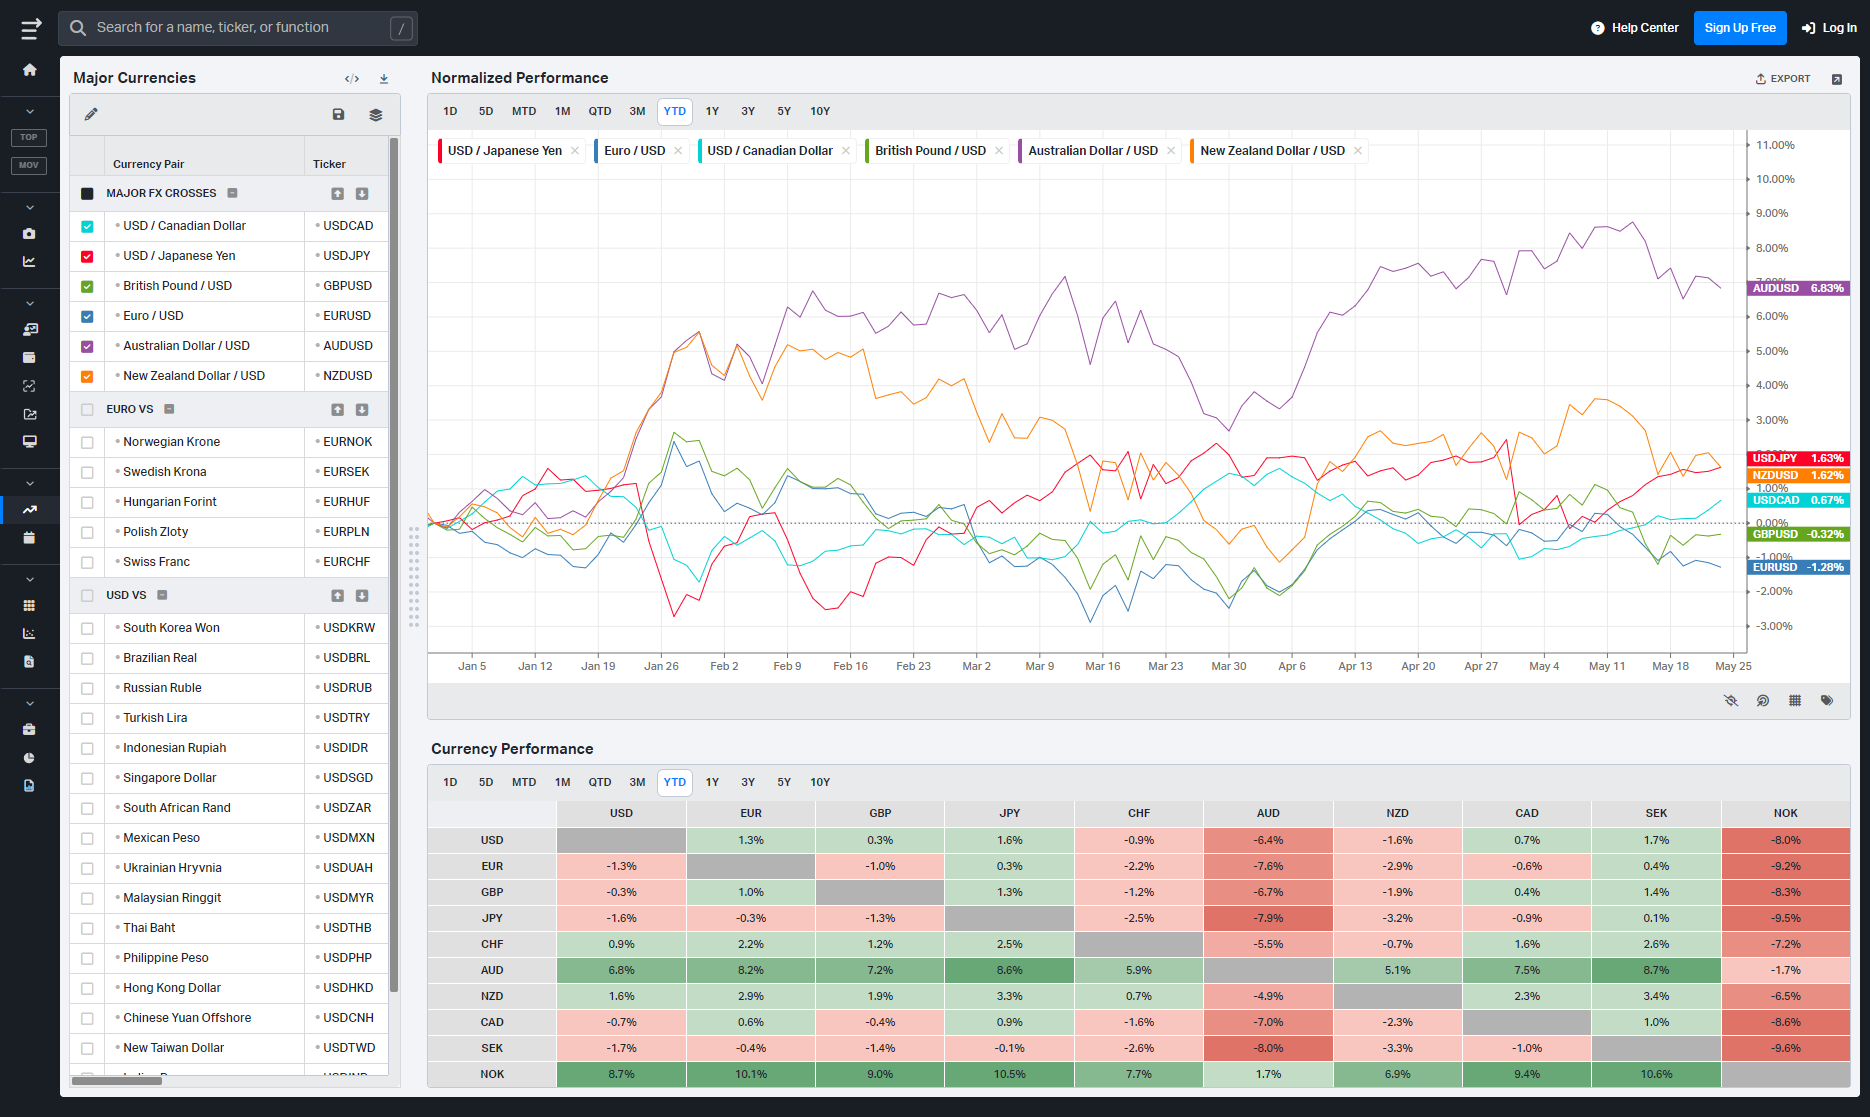
Currencies/Major FX Crosses
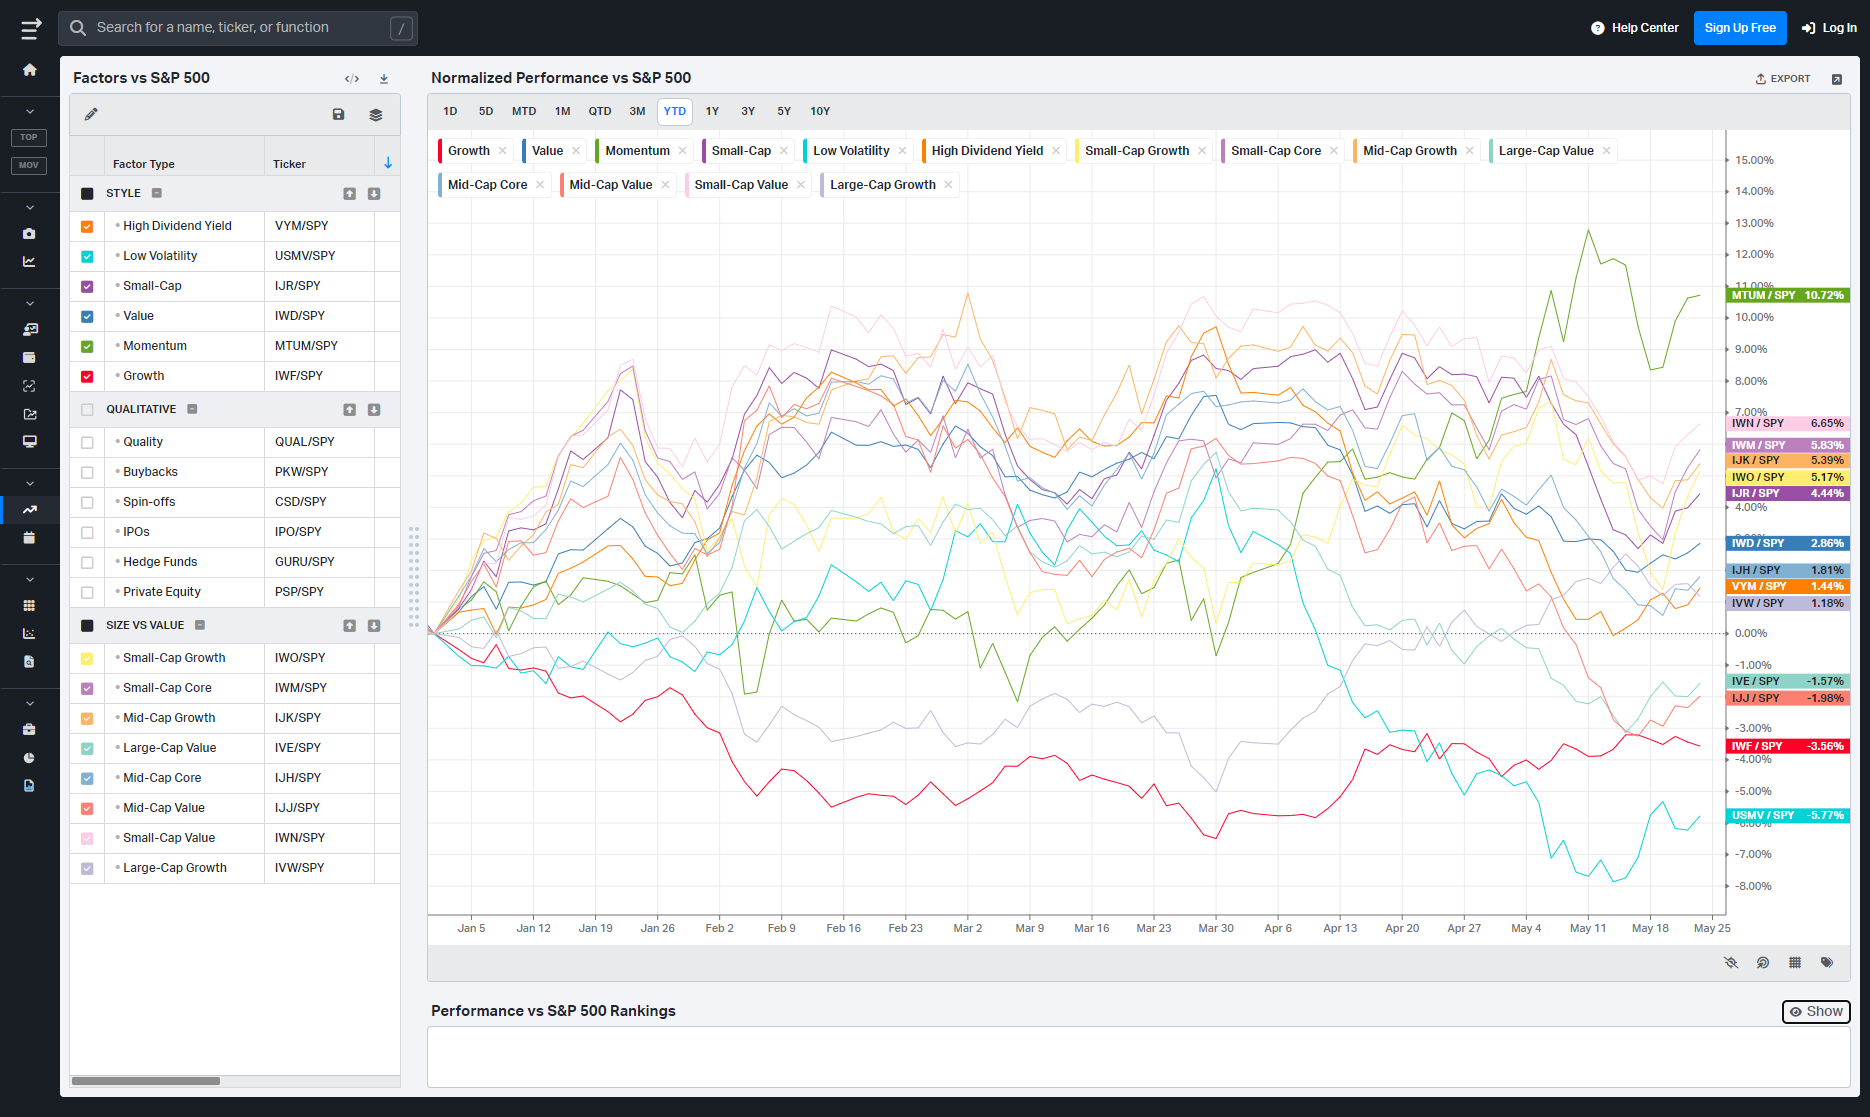
Factors: Style vs Size-vs-Value

Events On Deck This Week
Here are key events happening this week that have the potential to cause outsized moves in the market or heightened short-term volatility.
PCE Week Meets Retail Reality
The market heads into a shortened holiday week with the tape still leaning constructive, but Thursday morning has the potential to reset the entire narrative. Between inflation data, revised GDP figures, consumer spending, crude inventories, and a dense slate of retail and software earnings, this is one of those weeks where macro and micro are tightly intertwined.
Tuesday opens quietly on the surface, but there is still useful read-through in the data. The Chicago Fed National Activity Index comes in with a previous reading of -0.20 and a forecast of -0.3, suggesting expectations for slightly softer activity. Case-Shiller Home Prices are expected around 1.0%-1.1% year-over-year against a prior 0.9%, while Consumer Confidence is expected at 92 versus a previous 92.8. A stronger confidence print alongside stable housing would reinforce the soft-landing narrative. Dallas Fed Manufacturing remains weak with a prior -2.3 and forecast -1, so traders will be watching whether regional manufacturing weakness stabilizes or deepens.
Wednesday becomes more rates-sensitive. Mortgage rates previously sat at 6.56%, while ADP Employment Change showed 42.25K previously, an unusually soft labor print that markets will want to see stabilize without overheating. API crude inventories previously fell by -9.1M barrels, continuing the recent tightening energy trend. Fed speakers Logan, Cook, and Jefferson all hit the tape throughout the day. Traders will care less about outright hawkishness and more about whether officials sound comfortable with current disinflation trends or begin reintroducing concern around sticky services inflation.
Thursday is the center of gravity. Core PCE month-over-month previously printed 0.3% with consensus and forecast also at 0.3%. Headline PCE month-over-month sits at a previous 0.7% with a 0.5% forecast, while year-over-year PCE is expected to cool from 3.8% to 3.5%. At the same time, GDP Growth Rate second estimate remains at 2.0%, personal income is expected at 0.5% versus a prior 0.6%, and spending is forecast at 0.6% after 0.9%. This is the classic balancing act: cooler inflation with still-resilient spending is the bullish outcome. Sticky inflation paired with slowing growth would revive stagflation concerns quickly. Initial claims are expected near 215K against a prior 209K, keeping labor markets firmly in focus. Energy traders will also monitor EIA crude inventories after another large prior draw of -7.864M barrels.
Friday closes the week with trade, inventories, and Chicago PMI. The goods trade balance previously showed -$87.45B against a -$89.0B forecast, while wholesale inventories are expected at 0.7% after a prior 1.3%. Chicago PMI is expected at 49.5 versus a prior 49.2, still below expansion territory but stabilizing. Bowman and Paulson speaking late in the week could matter if Thursday’s inflation data materially surprises.
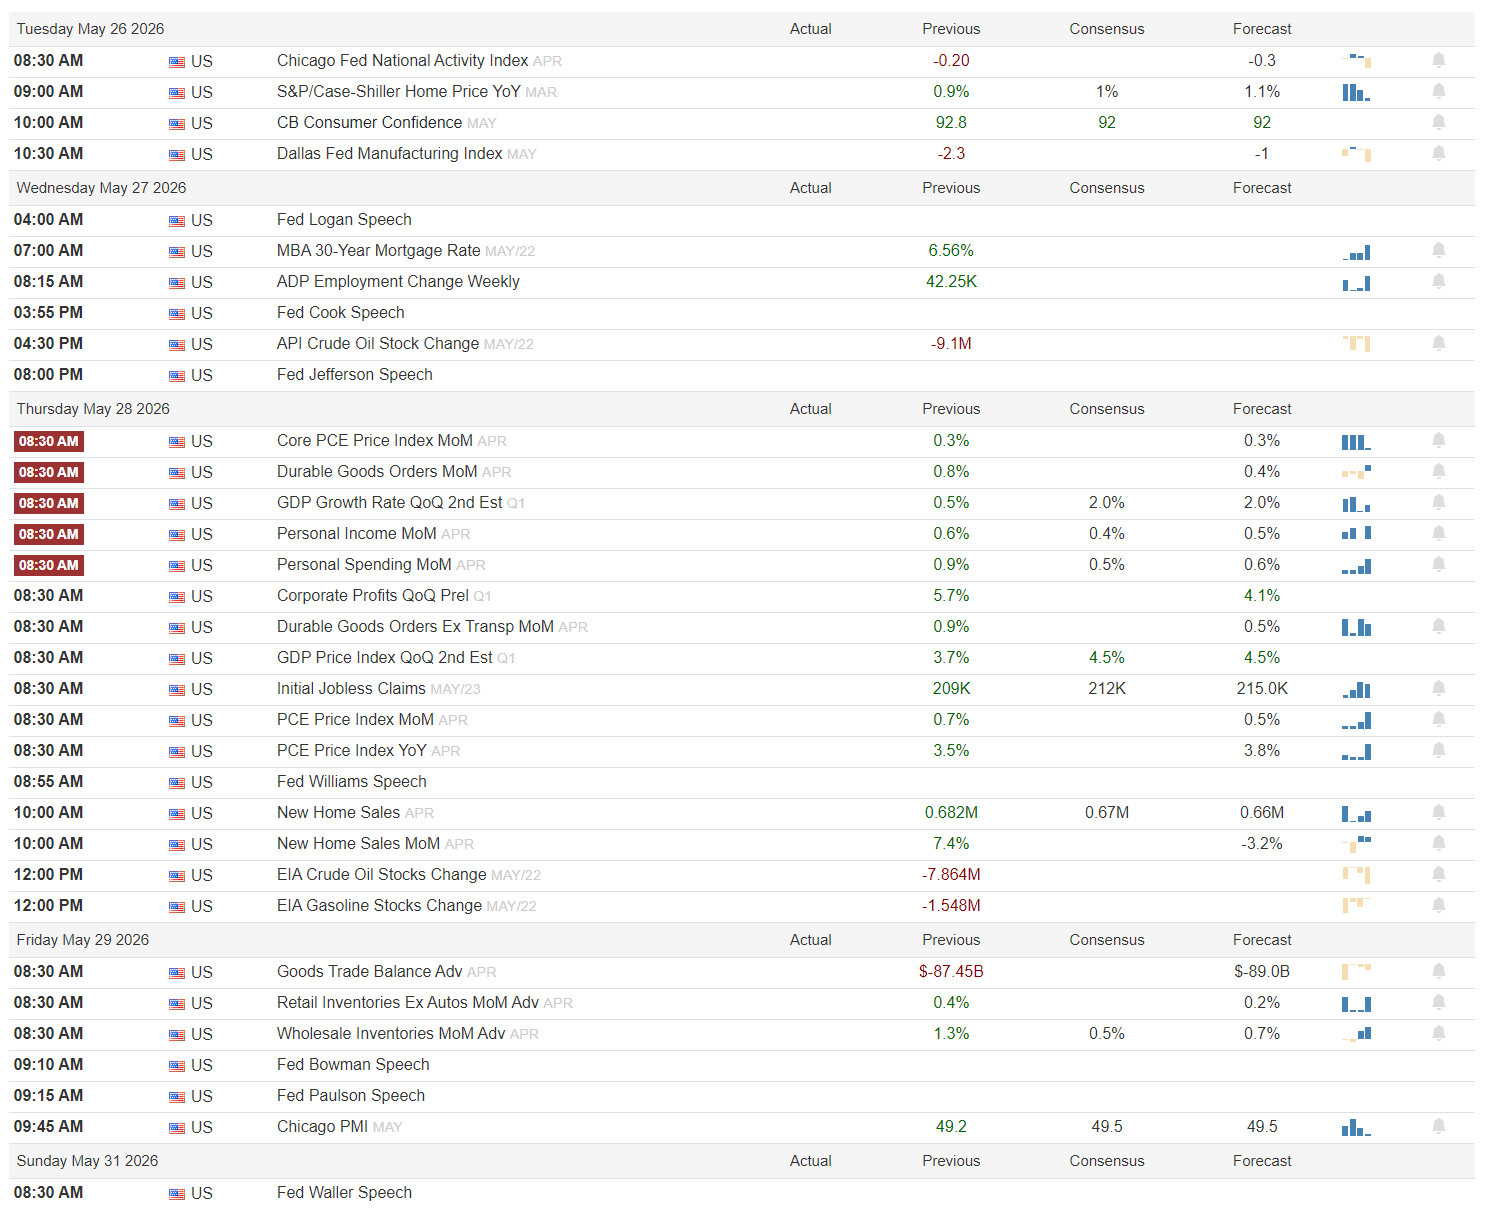
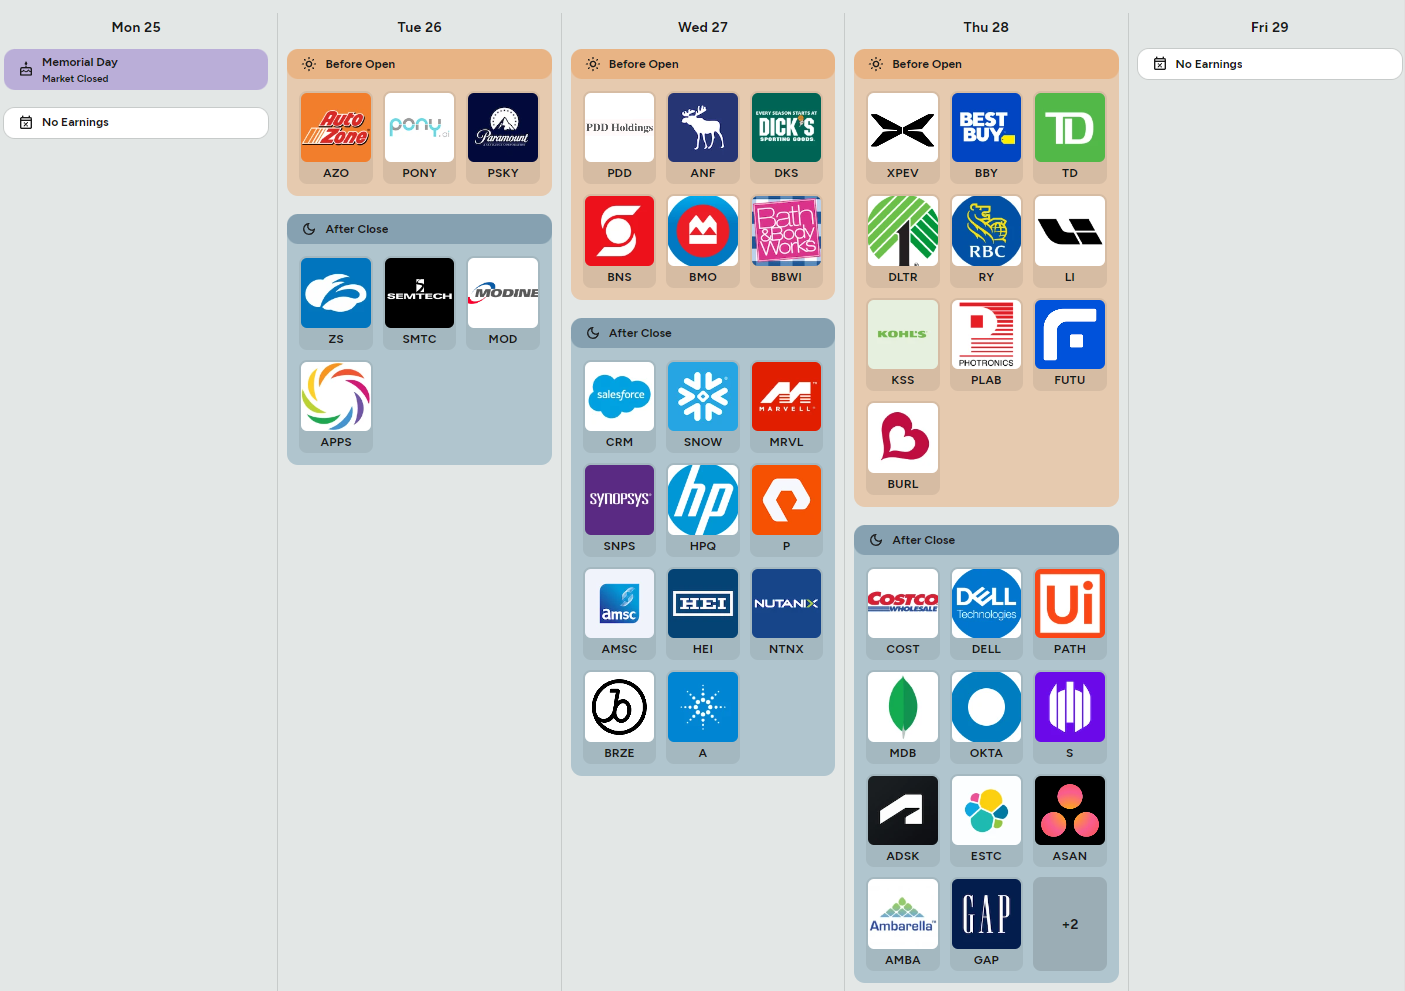
The earnings calendar carries more macro significance than usual. Salesforce, Snowflake, Marvell, Synopsys, and Nutanix will help define whether enterprise AI spending remains durable. Marvell in particular could become a sympathy read-through for semiconductors and AI infrastructure broadly. Costco, Dell, Okta, UiPath, and Elastic provide additional insight into consumer resilience and enterprise software demand. Dick’s Sporting Goods, Best Buy, Kohl’s, Gap, and Burlington will collectively shape the market’s view on discretionary spending and inventory discipline. Meanwhile, AutoZone and Dick’s offer important read-throughs on middle-income consumers, while TD, RBC, and Bank of Montreal add a secondary pulse check on North American credit conditions.
Cooler-than-expected PCE with GDP holding near 2.0% likely reignites the soft-landing trade.
PCE staying hot while claims rise above consensus would likely pressure both duration and equities simultaneously.
Another large crude draw alongside stable growth data keeps the inflation-sensitive energy trade alive.
Bottom line: this is a macro validation week where the market needs inflation to cool without growth rolling over, and every major asset class will likely take its cue from Thursday morning.