Market Momentum: Your Weekly Financial Forecast & Market Prep
Issue 91 / What to expect May 18, 2026 thru May 22, 2026




Weekly Market-On-Close Report
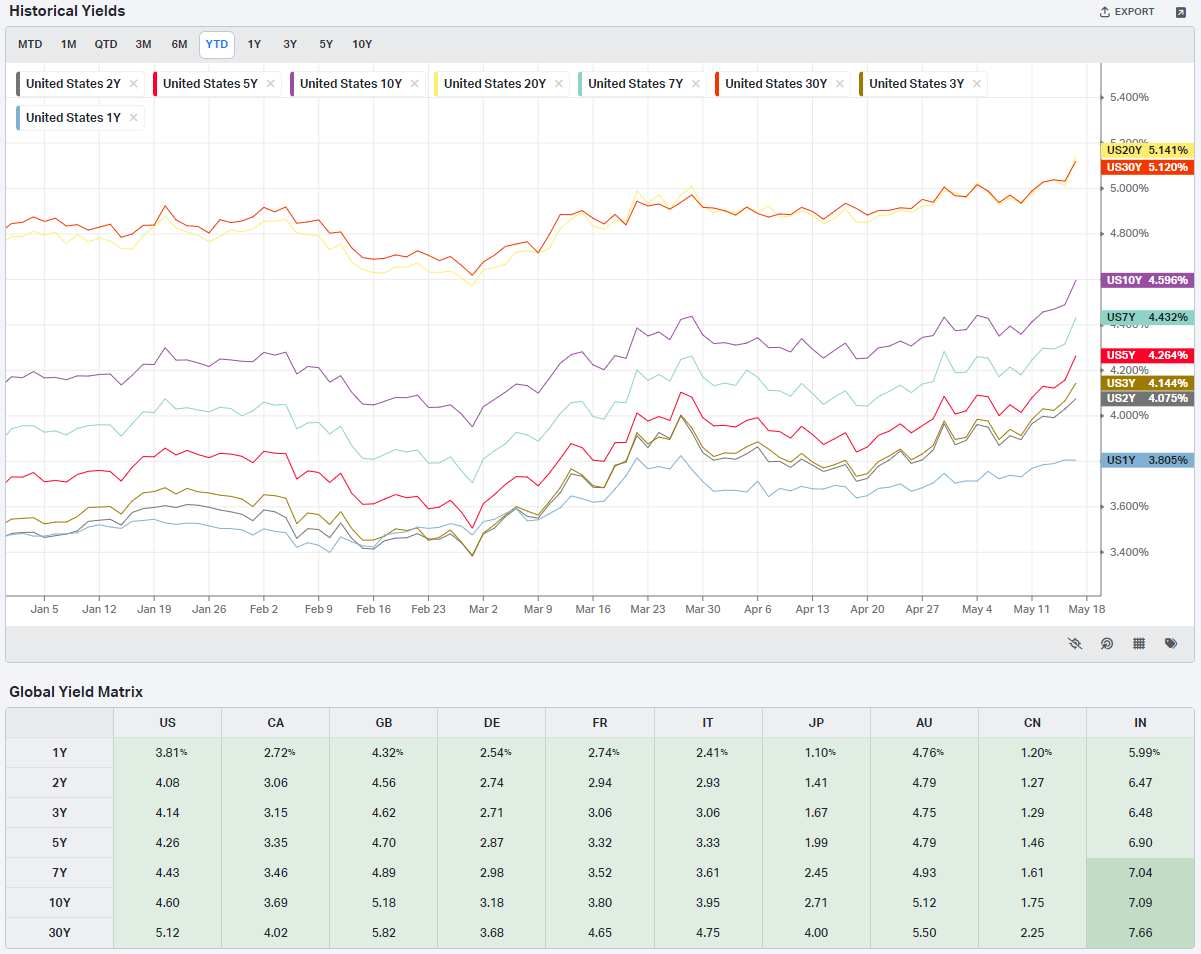
When Bond Yields Bite: A Bull Market Meets Its First Real Test
For most of 2026, the story has been almost insultingly simple: AI euphoria, monster earnings beats, and indices grinding to new highs as every dip gets hoovered up by gamma, buybacks, and flows.
This week finally broke that pattern—at least for a day. A sharp back‑up in global bond yields, driven by an oil shock and revived inflation fears, pushed stocks sharply lower and exposed just how much of this market’s strength has been built on the assumption that rates would glide gently lower over time.
The tension is straightforward:
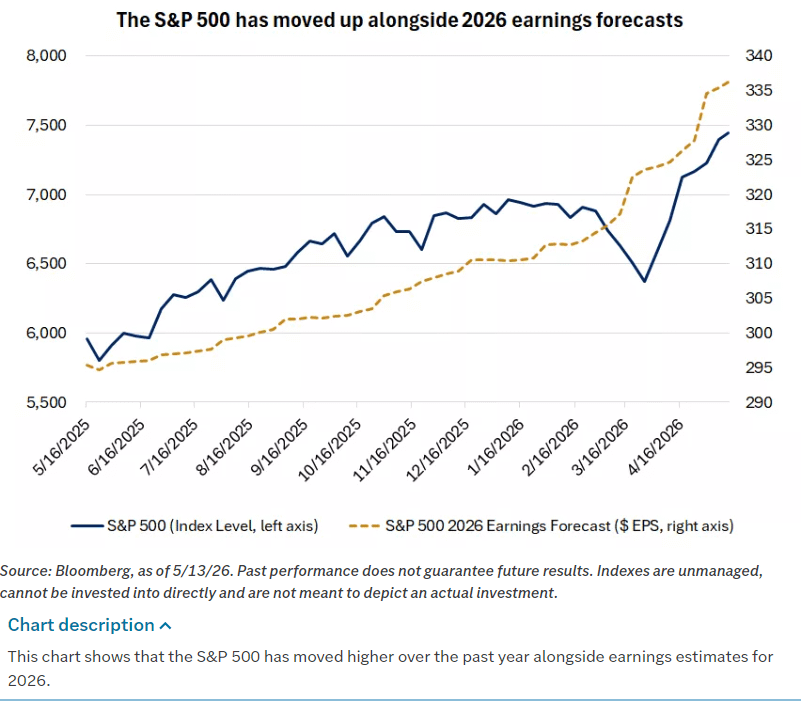
Earnings and growth look better than anyone expected a few months ago.
But oil, tariffs, and geopolitical risk are forcing the bond market to reprice the path of inflation and policy.
The result is a market that’s still structurally bullish—but entering a phase where the cost of capital starts to matter again, leadership narrows, and the tape gets more headline‑sensitive.
The Shock: Oil, Iran, and a Global Rates Spike
The immediate catalyst for Friday’s swoon in equities was not some earnings miss or a sudden growth scare—it was bonds.
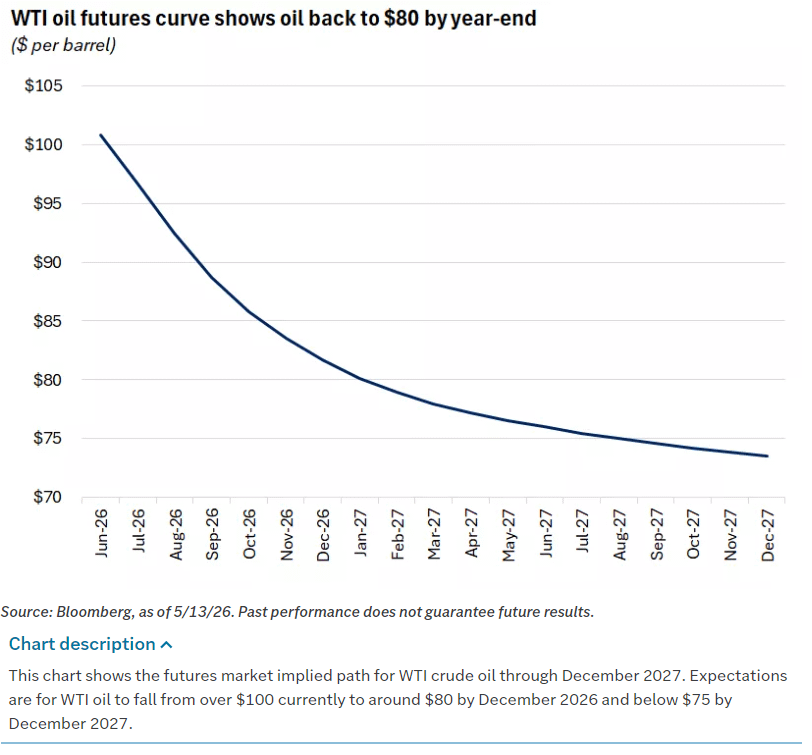
A renewed spike in crude, tied to ongoing conflict in Iran and the effective closure of the Strait of Hormuz, triggered a broad global bond sell‑off. West Texas Intermediate ripped over 4% to a fresh short‑term high, with the International Energy Agency flagging an inventory draw on the order of 4 million barrels per day in March and April and warning that the market is “severely undersupplied” into the fall even under optimistic cease‑fire assumptions.

The key point: this is not just a price spike; it’s a logistics shock. Roughly 20% of world oil and LNG flows through the Strait of Hormuz, and with that artery largely closed, markets are repricing a sustained risk premium on energy rather than a headline‑driven blip.
Bond markets did what they always do when confronted with higher energy and sticky inflation data:
The U.S. 10‑year Treasury yield jumped to the mid‑4.5% area, pushing to a roughly 15‑month high as futures on the 10‑year note hit new price lows.
German bund yields and UK gilts broke to multi‑year highs as investors priced a higher probability of renewed tightening or, at minimum, a much slower easing cycle.
In Japan, a market that’s been slowly crawling out of yield‑curve control, the 10‑year JGB touched its highest level in nearly three decades before easing back earlier in the month; Friday’s risk‑off move still saw yields push up again as the global sell‑off intensified.
When the Strait is effectively closed and oil trades with a three‑handle spread in intraday ranges, the market can’t treat this as noise. In that environment, the usual hedging reflexes get distorted. Historically, conflict shocks have produced both higher oil and lower yields as investors flee into Treasuries. This time, the inflation impulse and the fear of a more hawkish Fed have overwhelmed the safe‑haven bid.
Equities: From “Buy Every Dip” to “Respect the Tape”
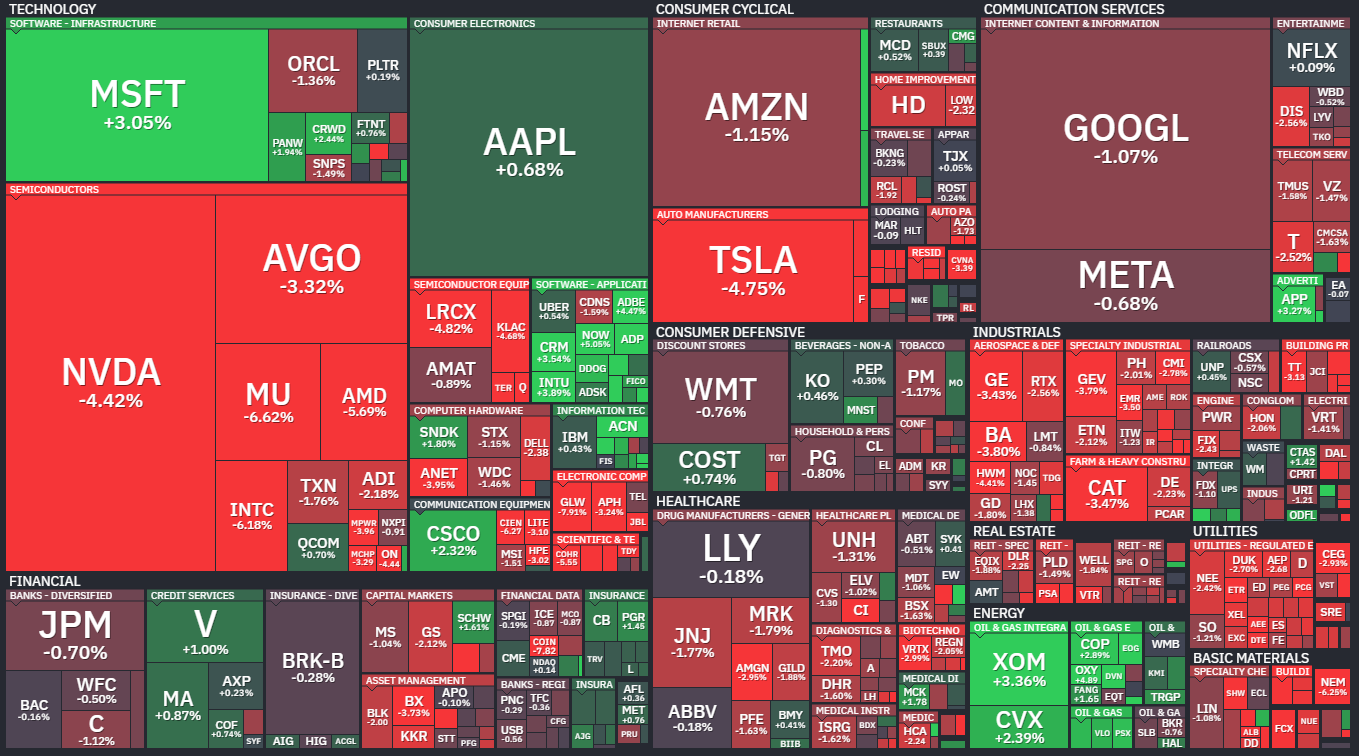
On Friday, the major U.S. indices finally cracked in a way that felt more like risk management than noise.
The S&P 500 fell around 1.2%, with e‑mini futures off a similar amount and the Nasdaq down more than 1%.
The Dow gave up over 1%, dragged by cyclicals and rate‑sensitive sectors.
Earlier in the week, all three were flirting with or setting new highs, with the S&P closing north of 7,500 and the Nasdaq carving fresh records off the back of AI semis.
From a structural point of view, that’s the important context: this sell‑off is coming after an extraordinary run. April delivered one of the strongest months in years for U.S. equities, with the S&P up roughly 10% and the Nasdaq more than 15%, powered by easing geopolitical fears and a ferocious AI‑driven growth rerating.
Add to that the fact that the S&P has been grinding in a steeply rising short‑term channel, with RSI as overbought as at any point since mid‑2024 and multiple unfilled gaps below spot. The lower bound of the current rising channel around 7,350, with a big vacuum between roughly 6,620 and 6,740 and a key prior high near 7,000 serving as the first real structural support.
In other words: this is a market that has run far and fast. The latest flush looks less like a regime change and more like the first honest attempt at a “digestive” phase. We’ll have to wait to see if it grows into something larger.
Under the Hood: Earnings Strength vs. Rate Reality
What makes this tape so tricky is that the fundamental backdrop is not deteriorating in the way a traditional top would.
On the earnings side:
Roughly 85–89% of S&P 500 companies have reported, with 84–85% beating consensus EPS estimates—well above the five‑year average.
Aggregated earnings growth for Q1 is running in the low‑ to mid‑teens in most datasets, with some houses tracking blended growth closer to the high‑20s once you include the “Magnificent 7” megacaps.
Ten of eleven GICS sectors are printing positive year‑over‑year earnings growth, with seven in double digits.
The leadership is exactly where you’d expect:
Information technology, especially semiconductors and AI infrastructure, is carrying index‑level growth.
Energy and utilities have lagged in price terms earlier in the quarter but have caught a bid as the oil shock has intensified.
That earnings strength is being matched by macro data that, while uneven, still points to a resilient U.S. economy:
Payrolls have logged back‑to‑back gains, with April adding 115,000 jobs versus expectations of around 62,000, the strongest two‑month stretch since 2024.
Unemployment sits at 4.3%, with initial claims low and continuing claims at their lowest since 2024.
Construction spending and factory orders are both running ahead of expectations, driven by single‑family housing and surging demand for AI‑related electronics.
At the same time, the consumer is increasingly grumpy. The University of Michigan sentiment index just clocked another low reading, with respondents flagging gasoline prices and tariffs as key worries.
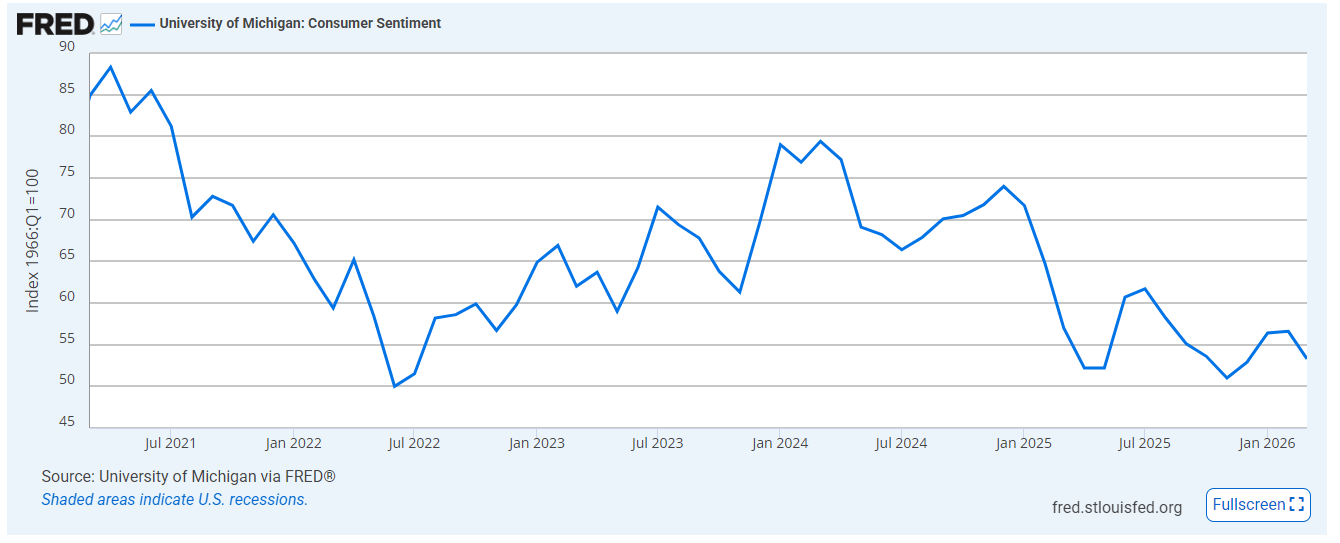
That divergence—solid hard data, weak soft data—is classic late‑cycle. Households are telling you they feel poorer even as jobs and income hold up. Markets are listening: discretionary names and travel‑related stocks came under pressure this week as the latest oil spike bled into growth expectations and disposable income.
Policy and the Fed: From Glide Path to “Higher for Longer”
The real fulcrum here is policy expectations. Coming into the year, the consensus trade was simple: inflation cooling, growth slowing but not collapsing, and the Fed cutting two or more times in 2026. That’s not the tape we have now.
The new reality is clearly:
Headline inflation has popped back to about 3.3% with further acceleration expected in the near term as the latest oil surge feeds through.
They expect inflation to peak somewhere in the 3.5–4% range in Q2 before easing later in 2026, assuming no further escalation.
Markets have effectively priced out 2026 cuts; where futures once implied at least two 25‑basis‑point eases, they now project a “on hold” Fed for the rest of the year unless inflation surprises back to the downside.
The Fed’s own reaction function has shifted to something closer to “wait and see”—Powell’s comments earlier in the year emphasized looking through oil shocks as long as expectations stay anchored, but the combination of a resilient labor market and sticky core inflation is giving the more hawkish members cover to push back on early easing.
You can see the same pattern globally:
The ECB is openly discussing the need for another hike if producer prices and energy‑driven inflation don’t cool—German PPI just recorded its biggest monthly rise since 2022.
In emerging markets like Colombia, central banks have paused planned easing as inflation forecasts now show price growth above target well into 2026.
This is why bonds are struggling even as equities have made new highs: the “lower for longer” story has been replaced by “higher for longer,” at least for the intermediate term.
Global Cross‑Currents: Europe, Asia, and the Trump–Xi Variable
Zooming out, the U.S. isn’t trading in isolation.
Europe is walking a narrow path:
Headline equity indices like the STOXX 600 ended the week modestly higher, but beneath the surface you have energy and utilities offsetting weakness in banks and industrials.
Producer prices jumped 3.4% month‑on‑month in March—driven by energy—raising the risk that the ECB has to lean more hawkish just as growth, especially in manufacturing, is still fragile.
German factory orders are surprisingly strong, up 5% in March, yet construction is in contraction with PMI readings deep below 50.
Asia is even more tethered to the energy story:
Japan’s equity indices just notched record highs earlier this month, powered by tech and AI enthusiasm, but the country’s extreme reliance on imported oil makes it acutely vulnerable to a prolonged Hormuz disruption.
The yen’s weakness around the 160 level versus the dollar keeps imported inflation in focus and increases pressure on the Bank of Japan to accelerate policy normalization—a sharp change after decades of ultra‑easy policy.
China’s equity markets have bounced modestly on better trade data, a resilient services PMI, and a tentative thaw in U.S.–China relations, with the Trump–Xi meeting preparations signaling an effort (on both sides) to avoid a fresh tariff spiral.
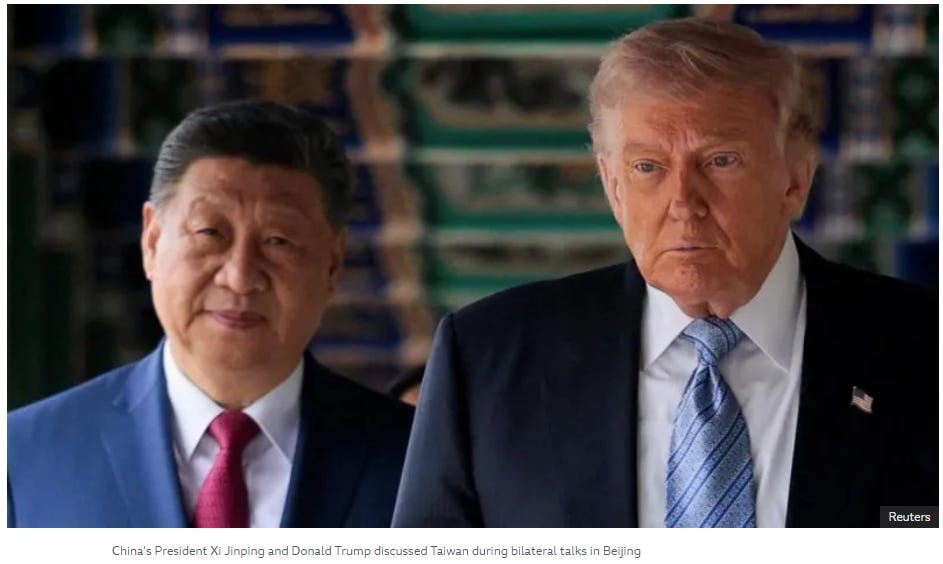
That geopolitical overlay matters. The same administration that is prosecuting the Iran campaign is also threatening “much higher” tariffs on Europe and managing a delicate dance with Beijing over AI, semiconductors, and rare‑earths. The market has largely shrugged off the tariff rhetoric so far, but every additional layer of trade friction reinforces the upside risk to inflation and the downside risk to margins.
Micro Structure: Gamma, Options, and the End of the Tailwind
One under‑discussed feature of this rally has been the sheer mechanical support provided by options flows.
The S&P’s relentless grind higher over the past few weeks has been accompanied by:
A “gamma‑exposed tailwind” from large dealer short‑vol positions that forced systematic buying as spot moved higher.
A string of extremely low put/call readings—Thursday’s close saw a ratio around 0.70—reflecting a market that had largely stopped hedging downside.
Which matters for a couple of reasons:
As soon as you roll through options expiration, that positive gamma disappears, removing an important dampener of volatility and a source of dip‑buying liquidity.
When the market is this overbought—RSI stretched, gaps unfilled, valuations rich—losing that mechanical support can turn a garden‑variety pullback into something more disorderly if a macro shock hits at the wrong time.
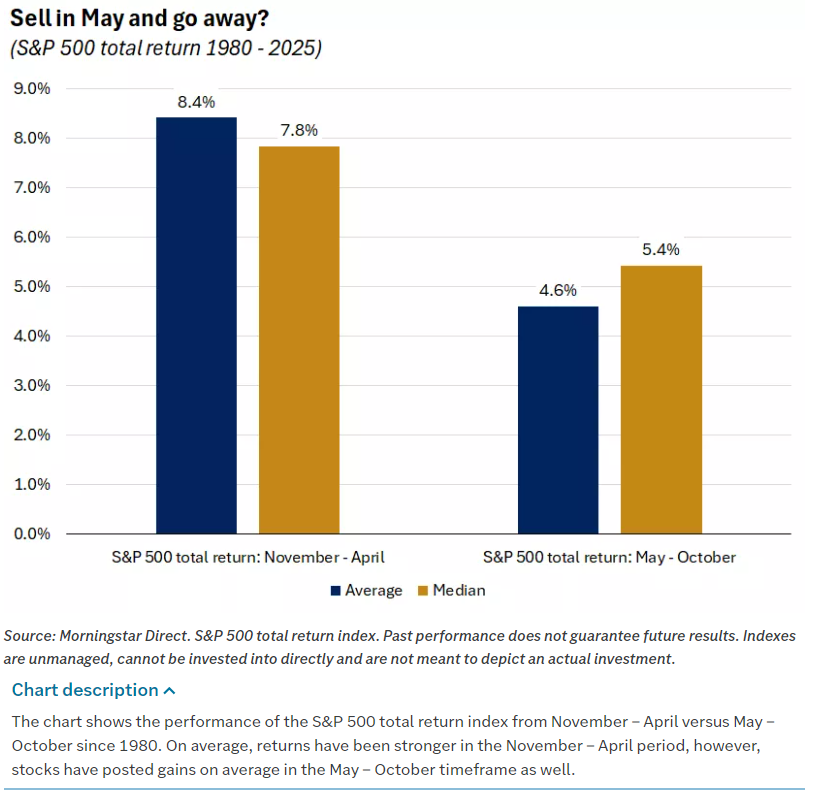
This is where the “sell in May” cliché usually re‑emerges. Despite the seasonal trope, the current setup is more about consolidation than exodus. The path of least resistance is still higher so long as the pattern of higher highs and higher lows holds, but the risk/reward for adding fresh beta up here is deteriorating.
Positioning: From Offensive Beta to Selective Rotation
So what do you do with this? The institutional notes this week actually converge on a similar playbook.
The bull market remains intact, but sustaining the recent pace of gains will be difficult, curb expectations immediately.
Investors should expect a period of slower, bumpier returns characterized by consolidation and mini‑corrections rather than a smooth continuation of the Q1 melt‑up.
The appropriate response is to stay invested but emphasize diversification across size, sector, and geography rather than leaning harder into the AI‑heavy megacap trade.
In practice this could mean:
Not selling out of equities, but rotating within them—reducing sensitivity to broad index moves now that benchmarks have become “stretched to a significant (unsustainable) degree.”
Using the options‑driven tailwind and strength in tech to re‑balance towards areas with cleaner seasonal tailwinds (e.g., select industrials, semis with favorable seasonality, India exposure) while monitoring Iran as the wildcard that could force a more defensive posture.
Under the surface, dispersion is extreme. While indices have only pulled back a few percent at each Iran flare‑up, you’ve seen:
Defensive sectors like utilities and staples acting as relative winners when oil and yields spike.
Energy and defense stocks outperforming on conflict headlines, but often in a more muted way than the oil move would suggest.
High‑beta corners—quantum computing, “neo‑clouds,” speculative biotech—trading like levered options on macro news and systematic de‑risking.
This is a classic stock‑picker’s tape wrapped in an index investor’s bull market. For portfolio construction, it argues for:
Trimming cyclicals and long‑duration growth where multiples have overshot fundamentals.
Maintaining or adding to quality, cash‑generative names that can weather higher funding costs.
Owning some exposure to energy and resource assets as a hedge on prolonged supply disruptions.
The Big Picture: Bull Market, Higher Cost of Capital
Putting it together, the market is transitioning from a pure liquidity + AI story to a more complicated regime where:
Earnings are strong, but cost of capital is rising.
Geopolitics can’t be hand‑waved away when they directly hit energy supply and inflation.
Policy is less predictable—between Iran, tariffs on Europe, and a delicate U.S.–China dance, the macro distribution is wide.
This is not 2022: the Fed isn’t in the early innings of a shock‑and‑awe tightening cycle, and the starting point for earnings and balance sheets is much healthier. But it’s also not 2020–2021: the era of free money and instantly reflexive Fed backstops is over.
For investors, that means the mental model needs to shift from “every dip is a gift” to “every allocation has a cost.” A 4.5–5% risk‑free rate changes the hurdle for equities. When bonds offer a comparable yield with far less risk, the equity risk premium has to do more work—and that’s exactly what the market is now starting to price.
The irony is that this adjustment, painful as it feels in the short term, may ultimately extend the life of the bull market. If valuations compress modestly, speculative froth in the highest‑beta corners bleeds out, and AI‑driven earnings growth actually materializes, you end up with a healthier, more durable advance rather than a parabolic blow‑off that ends in a crash.
For now, though, the message from this week is simple: bond yields matter again. Oil matters again. Geopolitics matters again. The bull market is still here—but it’s finally being forced to pay attention.

Weekly Benchmark Breakdown
Breadth Is Weak Under The Surface, Even As Leadership Still Holds
This week had the look of a market where the index tape is still being carried by leadership, but the average stock is not yet delivering the kind of breadth thrust that confirms a durable advance. Across the major cohorts, the long-term trend gauges are mixed but not broken, while the short-term gauges are soft. The message is not outright risk-off, but it is selective, narrow, and still vulnerable unless participation expands.
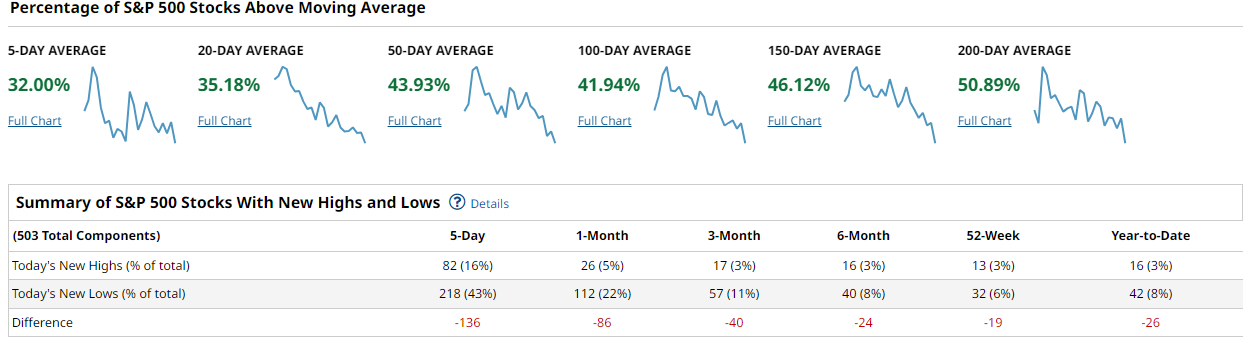
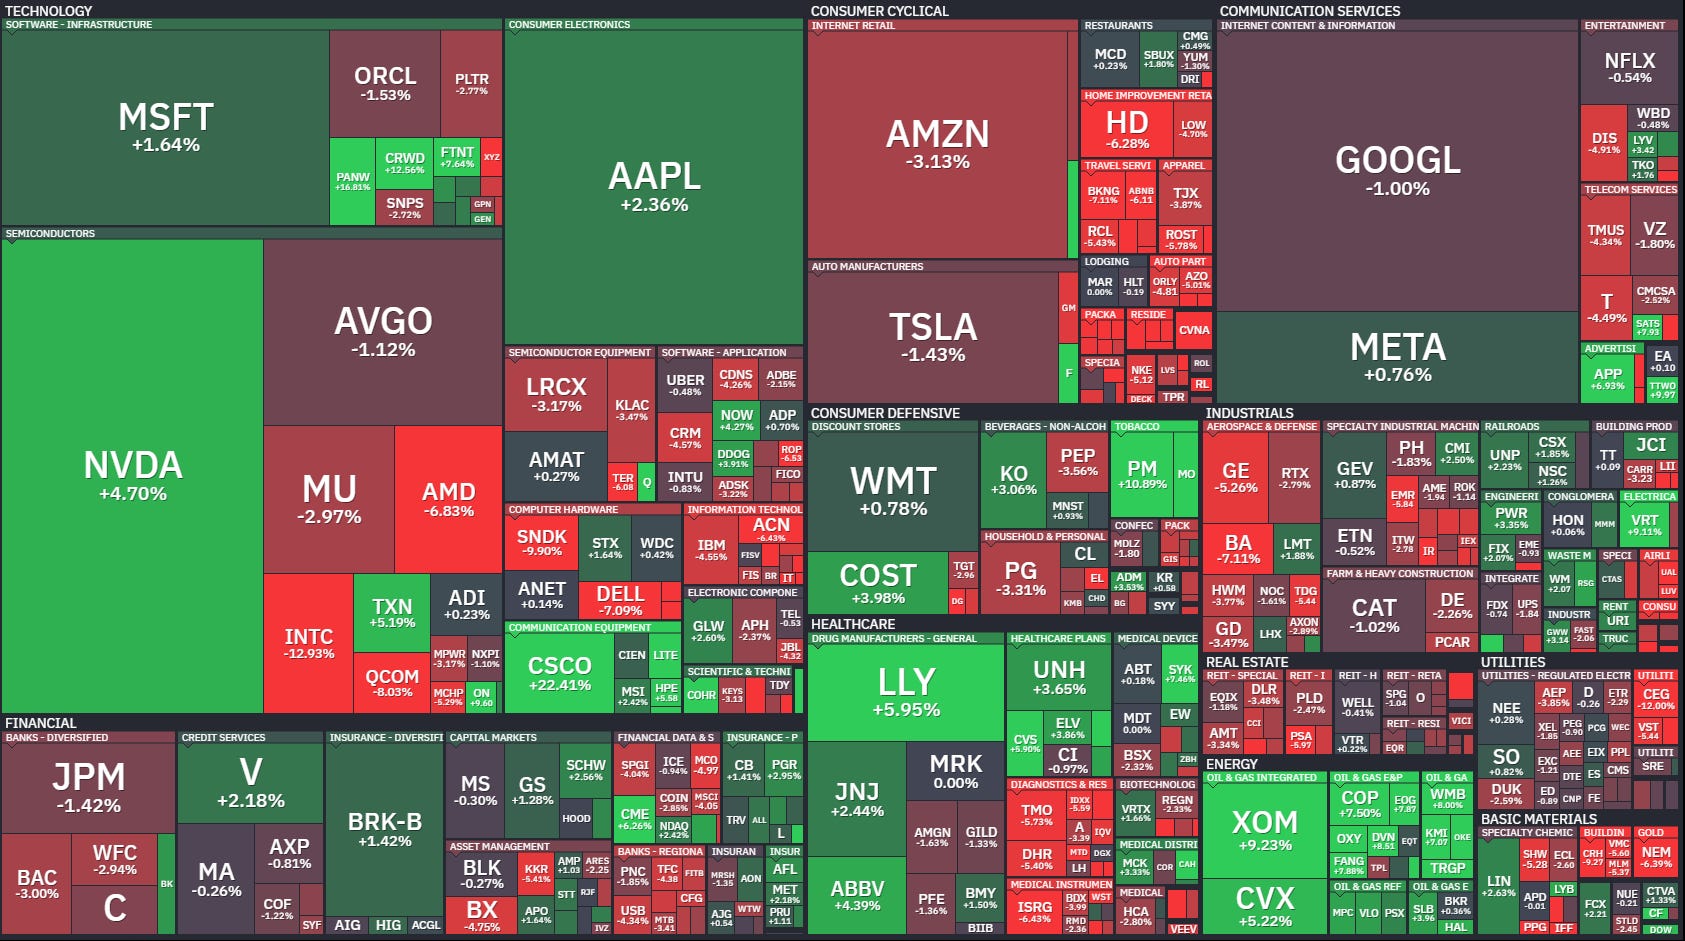
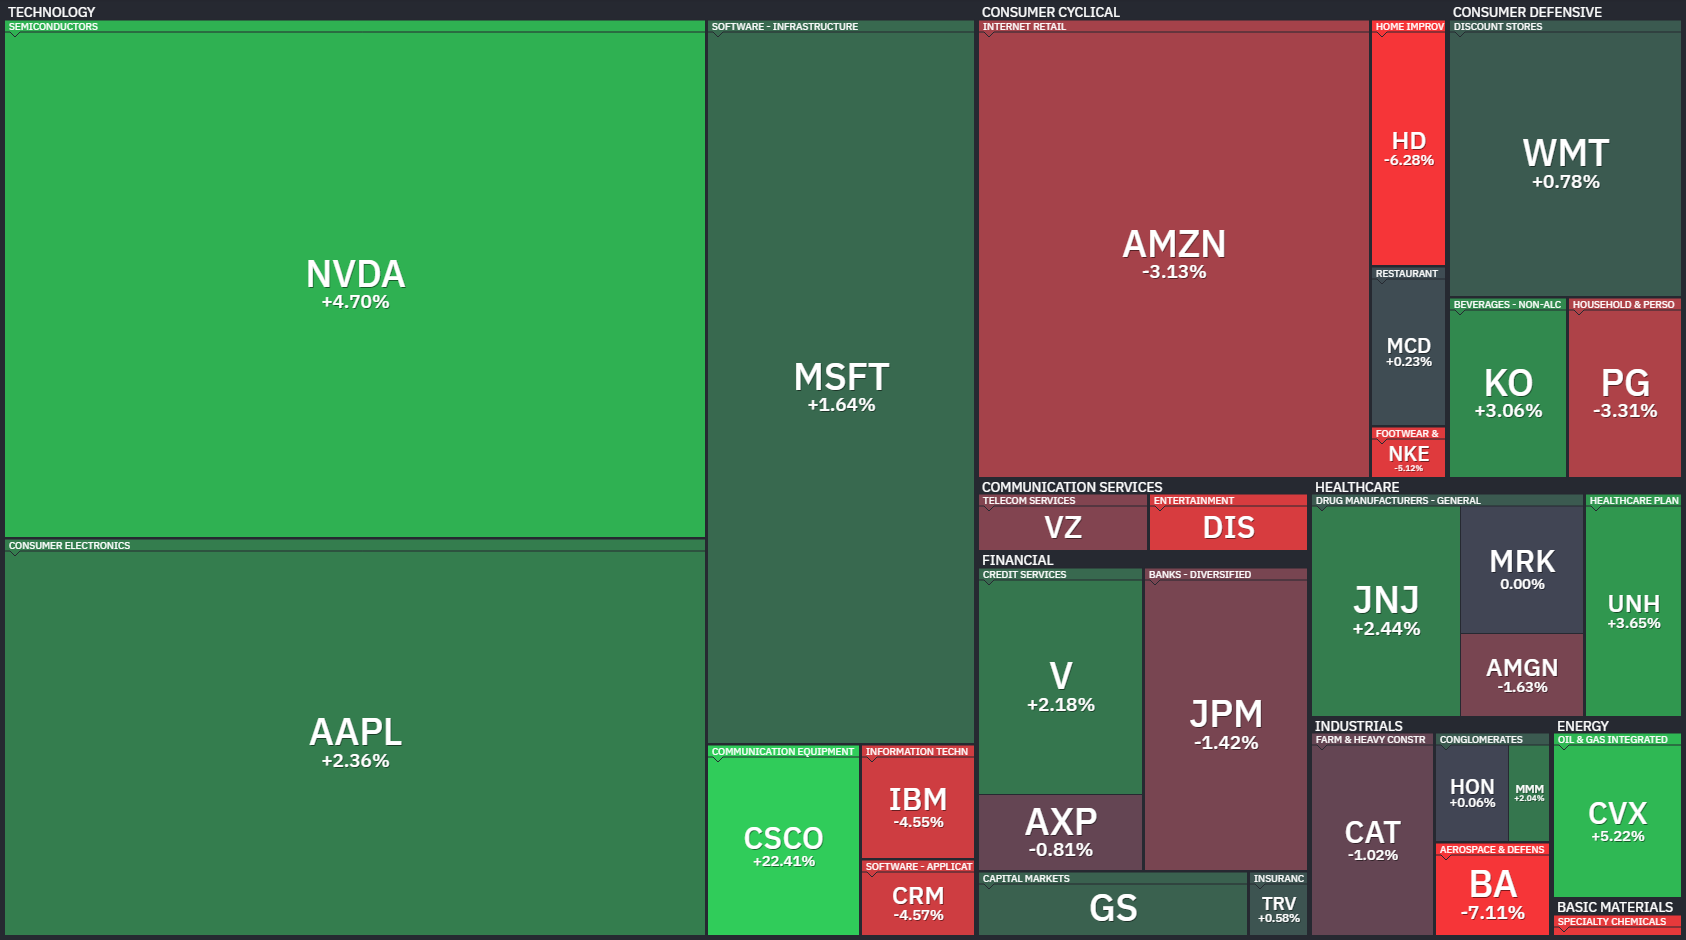
For the S&P 500, only 32.00% of stocks are above the 5-day average and 35.18% are above the 20-day. The intermediate picture is also below the line, with 43.93% above the 50-day, 41.94% above the 100-day, and 46.12% above the 150-day. The only major threshold still holding above 50% is the 200-day at 50.89%. New lows are leading new highs across every visible window, with the 5-day spread at -136, the 1-month spread at -86, and the 52-week spread at -19. The heatmap explains the tension: NVDA, AAPL, MSFT, LLY, PM, XOM, and CVX helped cushion the tape, but AMZN, GOOGL, TSLA, banks, industrials, and pockets of discretionary were heavy.
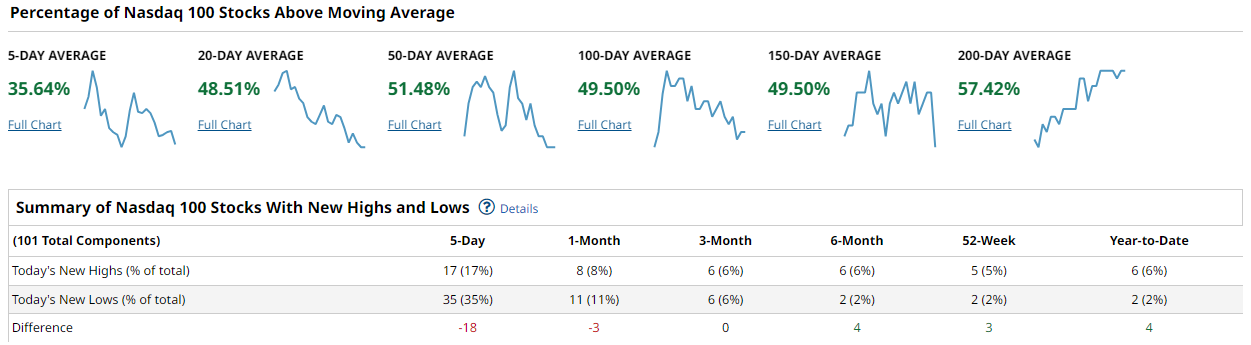
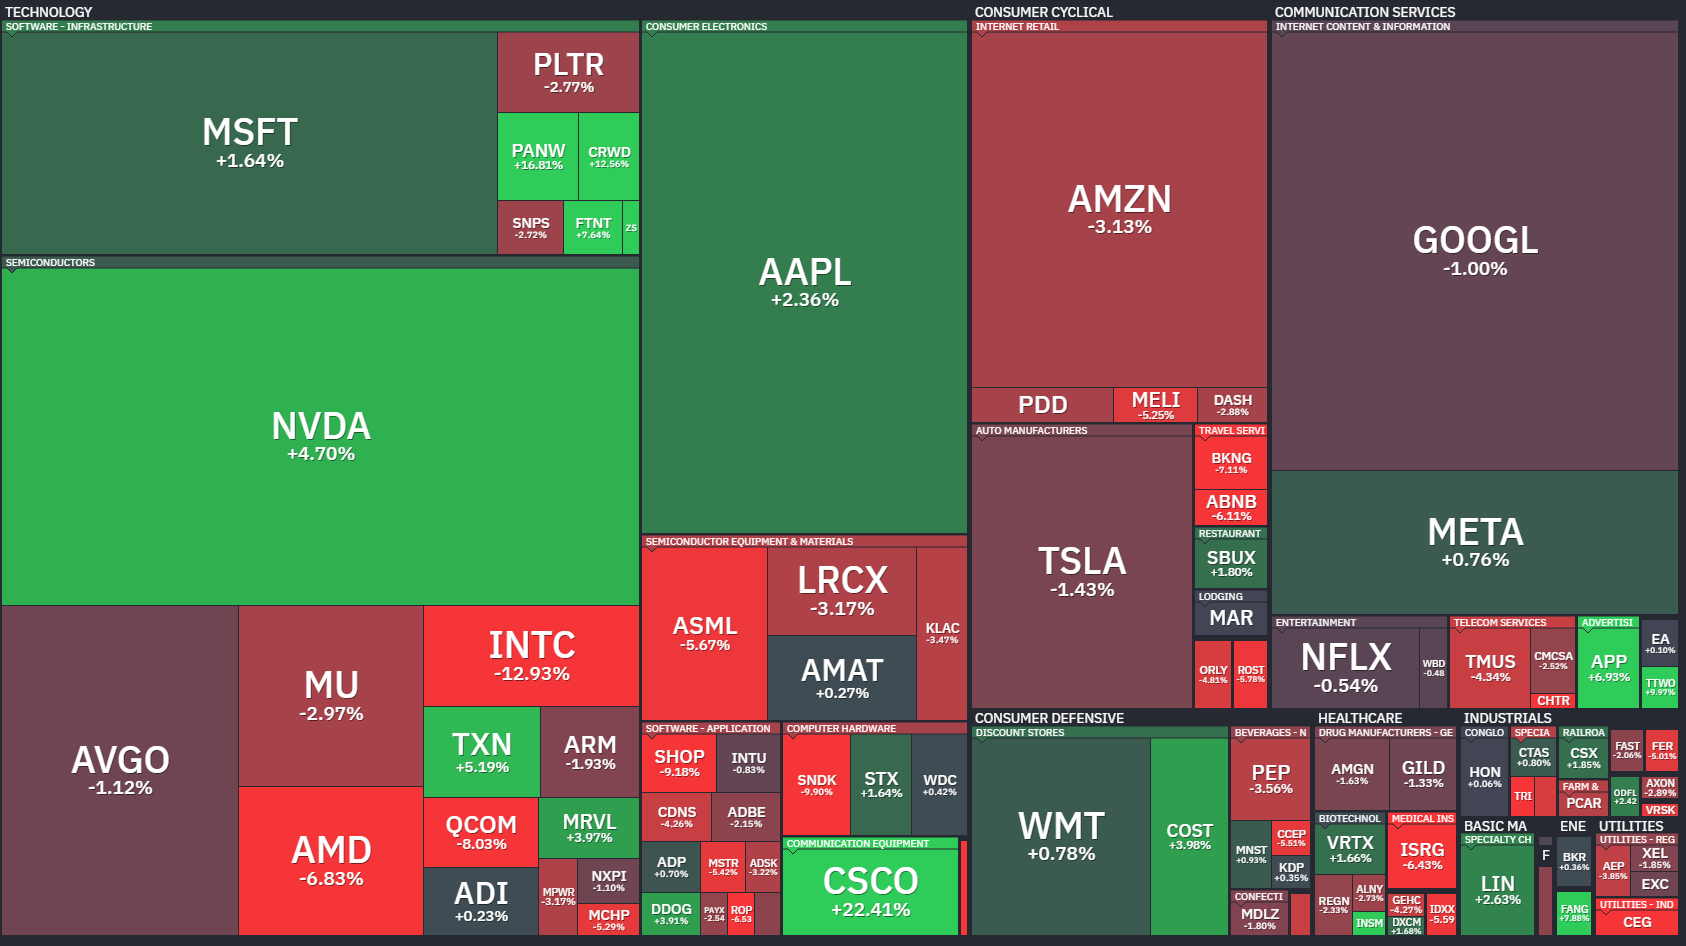
The Nasdaq 100 is stronger on a cap-weighted basis, but its breadth is still not clean. The 5-day reading is 35.64%, while the 20-day is 48.51%, the 50-day is 51.48%, the 100-day is 49.50%, the 150-day is 49.50%, and the 200-day is 57.42%. That says the long-term leadership base is intact, but near-term participation has faded. New highs minus new lows are -18 over 5 days and -3 over 1 month, but the 6-month, 52-week, and year-to-date spreads are positive at 4, 3, and 4. This is still a leadership tape, led by NVDA, AAPL, MSFT, and CSCO, while AMZN, GOOGL, TSLA, and several semis remain drags.
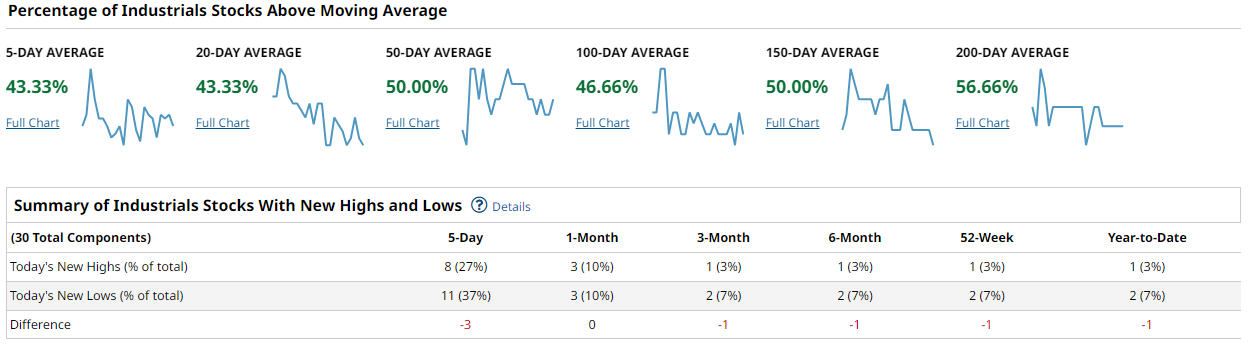
The Dow is steadier, but not strong. Its moving average profile reads 43.33%, 43.33%, 50.00%, 46.66%, 50.00%, and 56.66% across the 5-, 20-, 50-, 100-, 150-, and 200-day windows. New highs minus new lows are -3 over 5 days, flat over 1 month, and slightly negative across the longer windows. That is a sideways, defensive-looking tape, not a broad impulse.
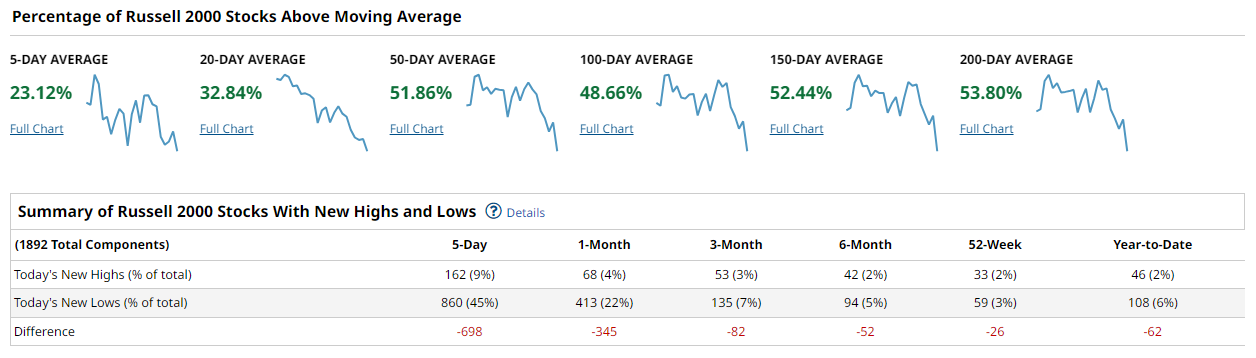
The Russell 2000 is the concern. Only 23.12% of stocks are above the 5-day and 32.84% are above the 20-day, even though 51.86% remain above the 50-day, 48.66% above the 100-day, 52.44% above the 150-day, and 53.80% above the 200-day. The new high/new low table is the real warning: -698 over 5 days, -345 over 1 month, -82 over 3 months, and -62 year-to-date. Small caps are not confirming.
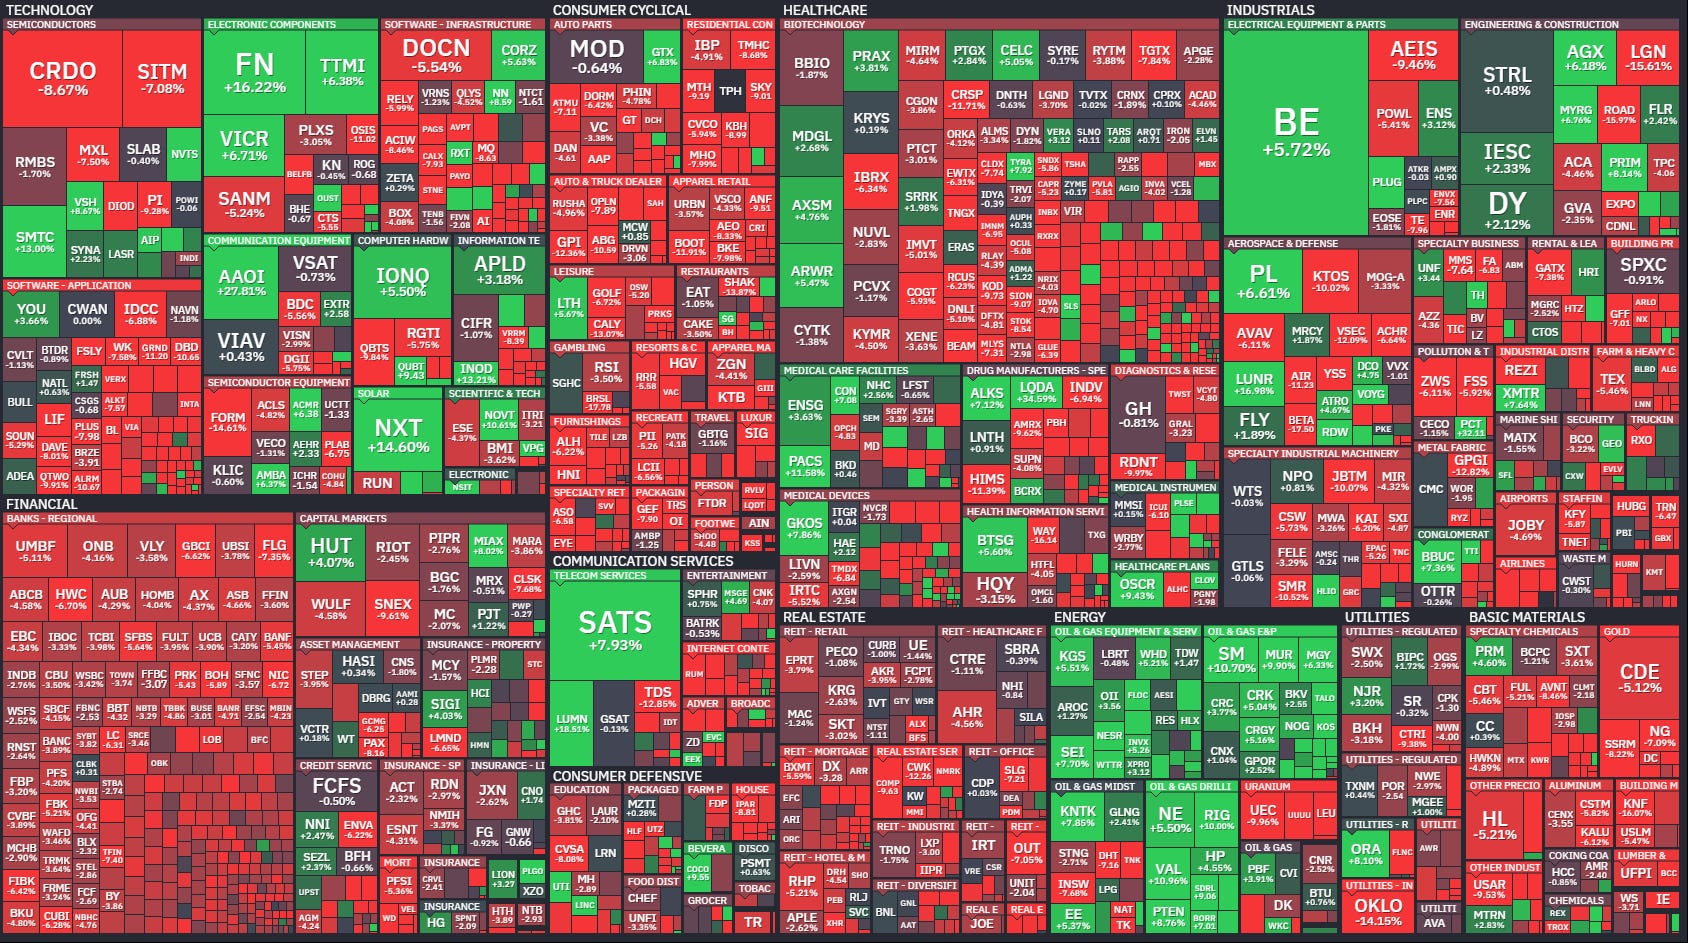
The synthesis is simple: cap-weighted leadership is masking weak underlying participation. A durable advance needs the 50-day cohorts to push above 60% and new highs to consistently outnumber new lows. Until then, this remains a market to respect, not chase.
This week favors selective exposure to profitable large-cap leadership, energy, select healthcare, and the strongest mega-cap tech names, while avoiding broad small-cap beta, weak cyclicals, and discretionary laggards until breadth improves.
Bottom line: the leaders are still working, but the market has not yet earned the benefit of the doubt beneath the surface.

Investor Sentiment Report
AAII Investor Sentiment Survey
The AAII Investor Sentiment Survey tracks the percentage of individual investors who are bullish, neutral, or bearish on the stock market over the next six months. Published weekly every Thursday, it's a widely followed contrarian indicator — historically elevated bearish readings have preceded market recoveries, while extreme optimism has often foreshadowed pullbacks.
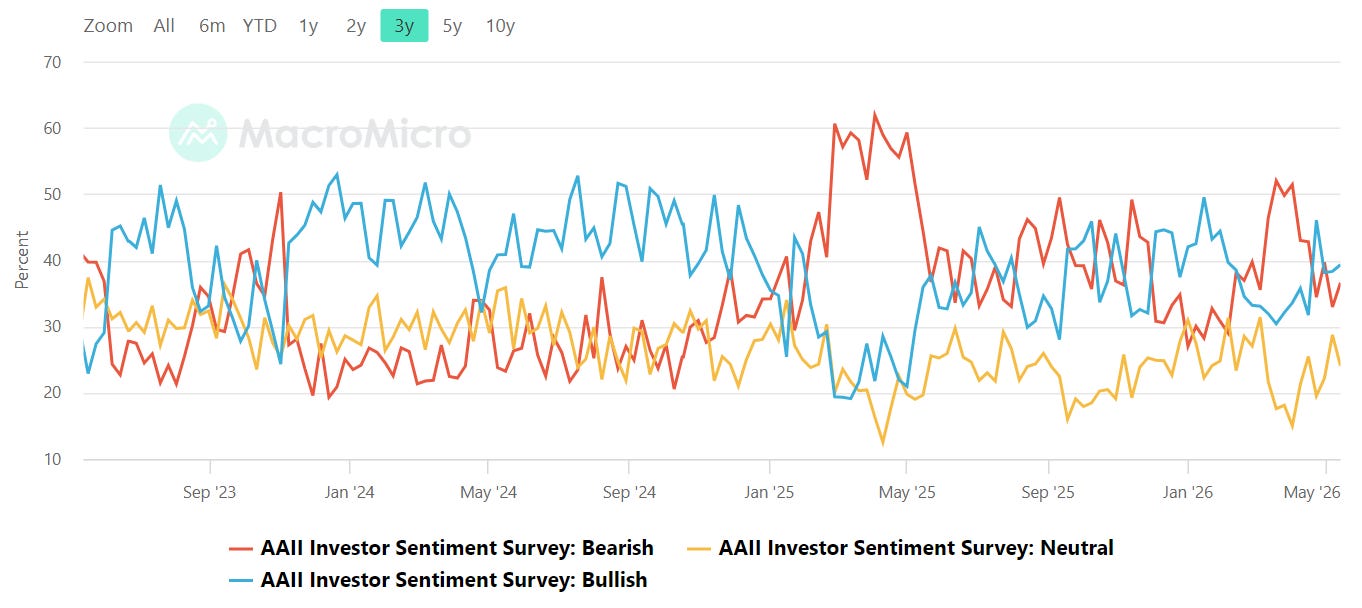
The AAII spread remains conflicted, but it has improved materially from the panic conditions seen earlier this year. Bullish sentiment is sitting near 39% while bearish sentiment is in the mid-30s, leaving the spread modestly positive after spending much of the past year in negative territory. Deeply negative bull-minus-bear readings tend to create fuel for rebounds, while sustained readings above 20% often mark crowded optimism. We are not there yet. Neutral sentiment remains elevated around the mid-20s, which tells you retail participants still do not fully trust the advance.
NAAIM Exposure Index
The NAAIM Exposure Index (National Association of Active Investment Managers Exposure Index) measures the average exposure to U.S. equity markets as reported by its member firms. These are typically active money managers who provide their equity exposure levels weekly. The index offers insight into how much these managers are investing in equities at any given time, ranging from being fully short (-100%) to leveraged long (up to +200%).
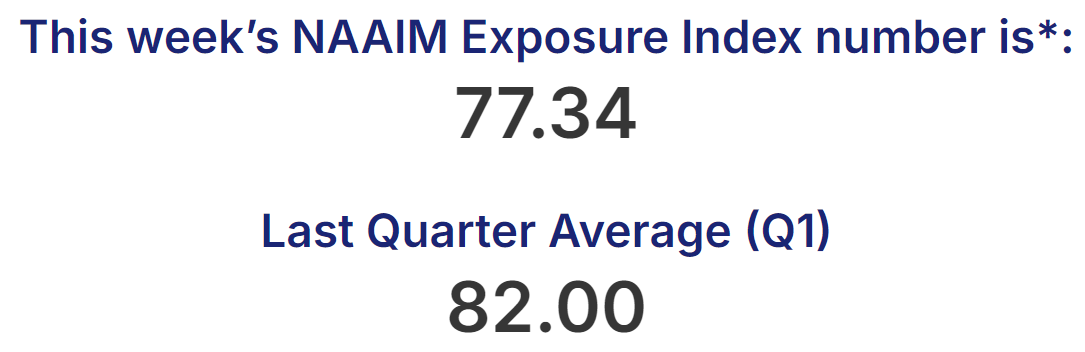
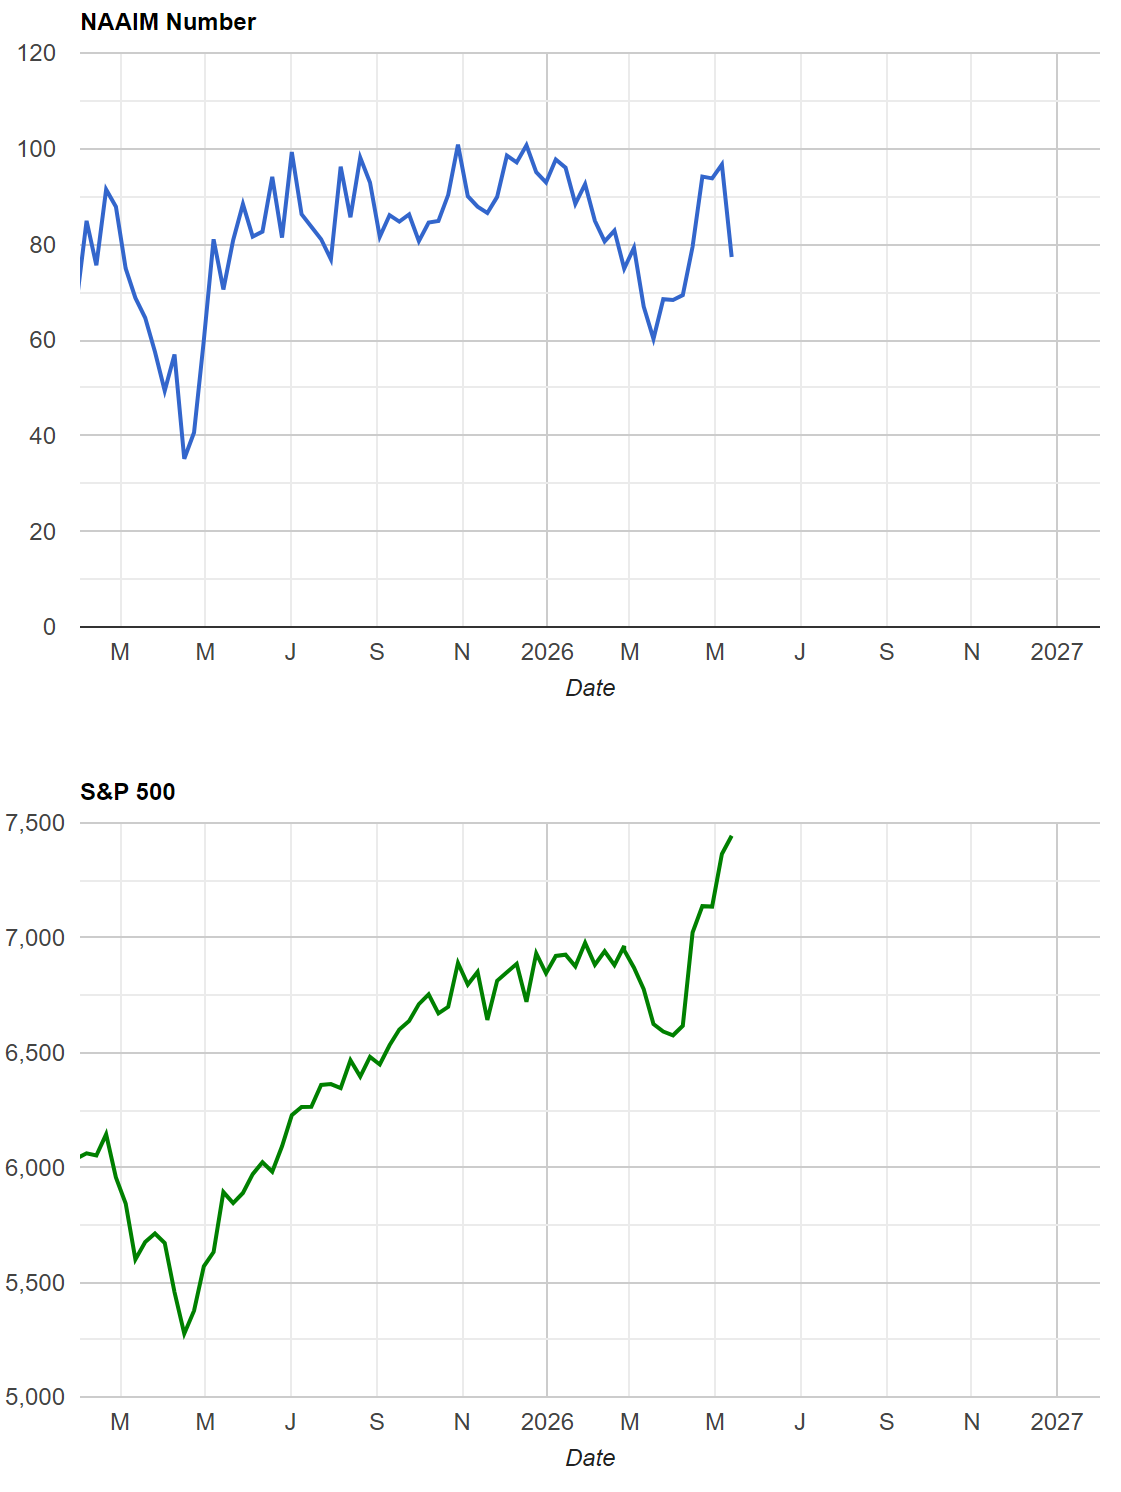
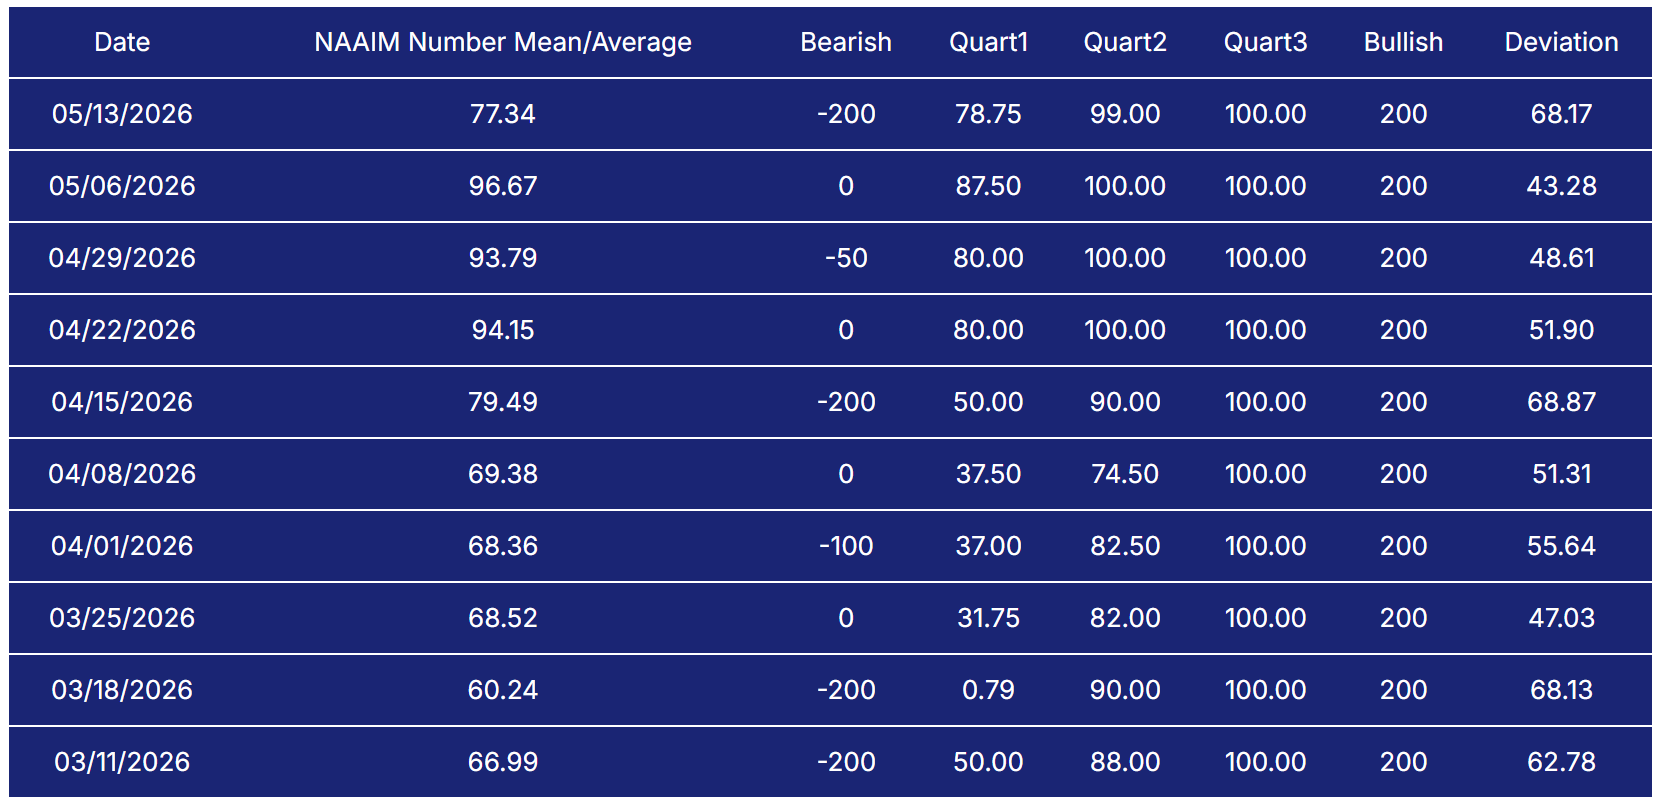
Professional managers remain substantially more aggressive. The latest NAAIM Exposure Index dropped to 77.34 from 96.67 the prior week after several consecutive readings in the 90s. That is still an elevated exposure profile, but the rollback is important because it suggests managers have started trimming risk rather than pressing aggressively into highs. Over the last two months, the index climbed steadily from the low 60s into the mid-to-upper 90s before finally cooling. That leaves the tape in an interesting position: there is still meaningful equity exposure in the system, but also enough dry powder to support pullbacks if price stabilizes. The key tripwire here is whether NAAIM slips into the 50s without major index damage, which would suggest managers are de-risking preemptively. On the upside, a push back toward the 90s would signal renewed institutional confidence and likely support another leg higher in the major averages.
CBOE Total Put/Call Ratio
CBOE's total put/call ratio includes index options and equity options. It's a popular indicator for market sentiment. A high put/call ratio suggests that the market is overly bearish and stocks might rebound. A low put/call ratio suggests that market exuberance could result in a sharp fall.
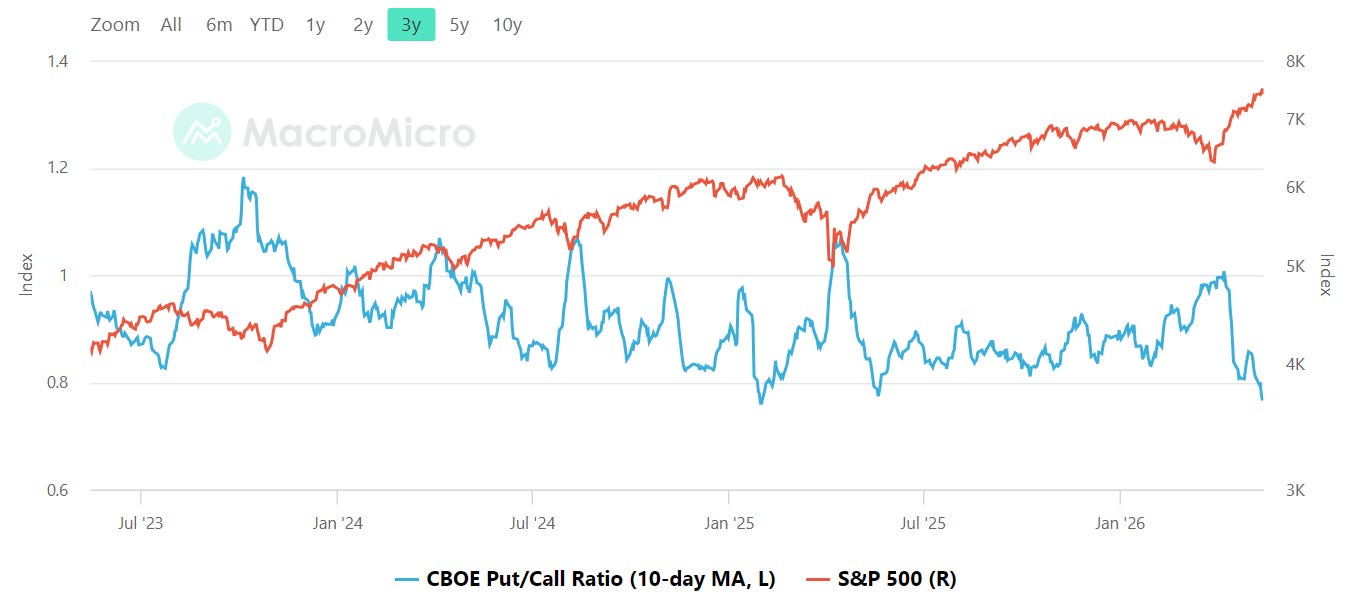
The 10-day moving average of the CBOE total put/call ratio has fallen sharply and now sits near the lower end of its multi-year range, around the high-0.7s to low-0.8s. That is a meaningful shift from the elevated fear readings seen during prior drawdowns. Historically, readings near 1.0 or above tend to accompany defensive positioning and better future rebound conditions, while readings approaching 0.8 reflect increasing comfort and speculative appetite.
Right now the message is clear: traders are leaning back toward calls and directional upside participation. That does not automatically mean the market must reverse lower, but it does imply that downside shocks can travel further because there is less embedded hedging in the system. The recent collapse in the ratio alongside rising equity prices reinforces the idea that investors have become increasingly comfortable buying dips again. The tripwire to watch is whether the ratio can stabilize back toward 0.9 without price damage. If instead it remains compressed while breadth continues to deteriorate beneath the surface, the market becomes increasingly vulnerable to sharper air pockets.
Equity vs Bond Volatility
The Merrill Lynch Option Volatility Estimate [MOVE] Index from BofAML and the CBOE Volatility Index [VIX] respectively represent market volatility of U.S. Treasury futures and the S&P 500 index. They typically move in tandem but when they diverge, an opportunity can emerge from one having to “catch-up” to the other.
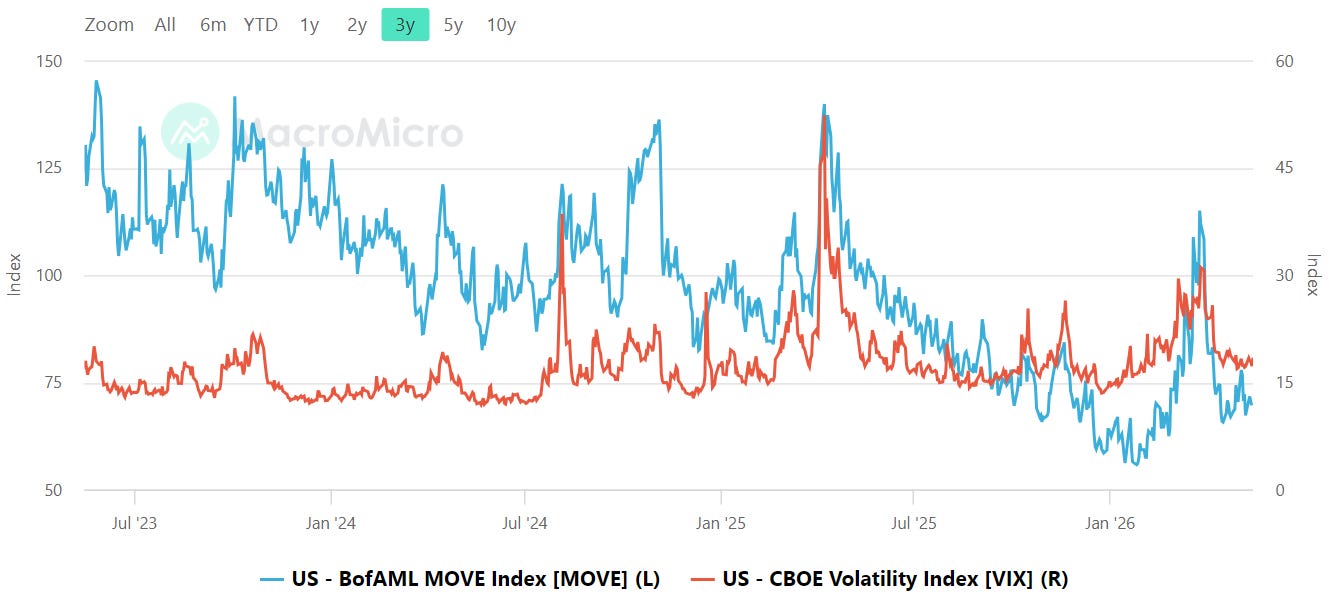
The MOVE Index has cooled dramatically from the elevated stress regimes of the past two years and now sits near the low-70s, while the VIX is hovering around the mid-teens. Both volatility measures are subdued relative to their historical panic zones, but the relationship between them matters more than the outright level. Bond volatility has been trending lower for months, removing a major source of macro instability that repeatedly pressured equities during prior tightening cycles.
That said, the recent MOVE rebound earlier this year showed how quickly stress can re-enter rates markets before equity traders fully react. Historically, MOVE spikes ahead of the VIX have often foreshadowed equity turbulence. Right now that warning signal is absent, which supports the current risk-taking backdrop. The practical tripwire is straightforward: if MOVE starts pushing back toward 120 while the VIX remains sleepy in the mid-teens, equity investors should pay attention. Likewise, a VIX sustained above the high teens would signal that complacency is breaking down and that volatility is spreading beyond rates into broader risk assets.
CNN Fear & Greed
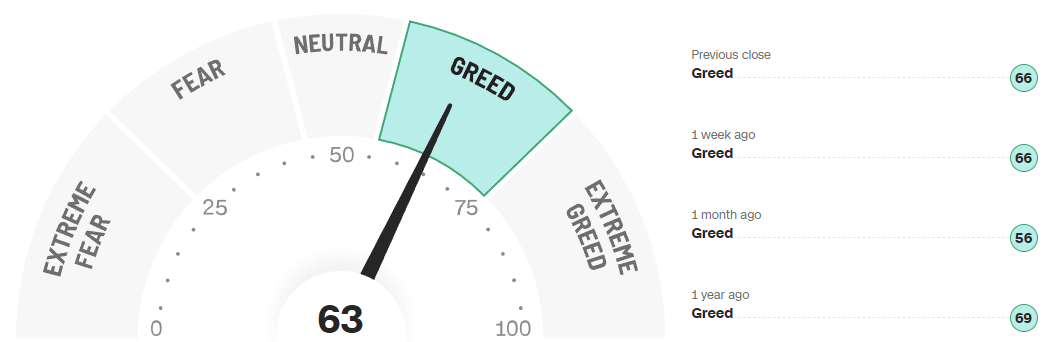
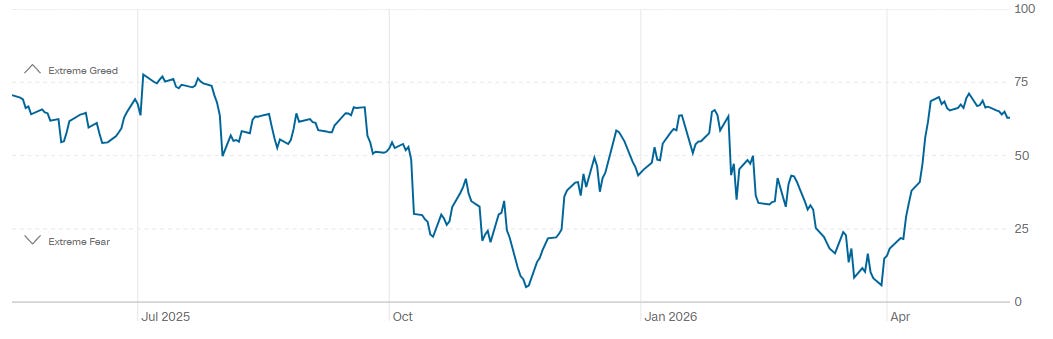
CNN’s Fear and Greed gauge is currently at 63, firmly in the Greed zone. That is unchanged from one week ago and higher than the 56 reading from a month ago, though still below the 69 level seen one year ago. The one-year trend shows sentiment swinging from periods of outright fear late last year back toward optimistic territory over the past several weeks. Importantly, the move has been sharp rather than gradual, with the gauge recovering quickly from near-fear conditions into solid greed territory.
This is not yet the kind of euphoric extreme that typically marks major market tops, but it does confirm that investors have become substantially more comfortable taking risk again. Mid-range greed can support trending markets for extended periods, especially when volatility remains contained, but once the gauge starts pressing into the upper-70s or 80s the market usually becomes increasingly dependent on perfect news flow. On the other side, a retreat back toward the 40s without major price damage would likely reset sentiment in a healthier way and create a stronger base for continuation.
Bottom line: sentiment has shifted back toward constructive risk-taking, but the combination of falling put/call ratios, elevated greed readings, and still-soft breadth argues for selective aggression rather than outright complacency.
Social Media Favs
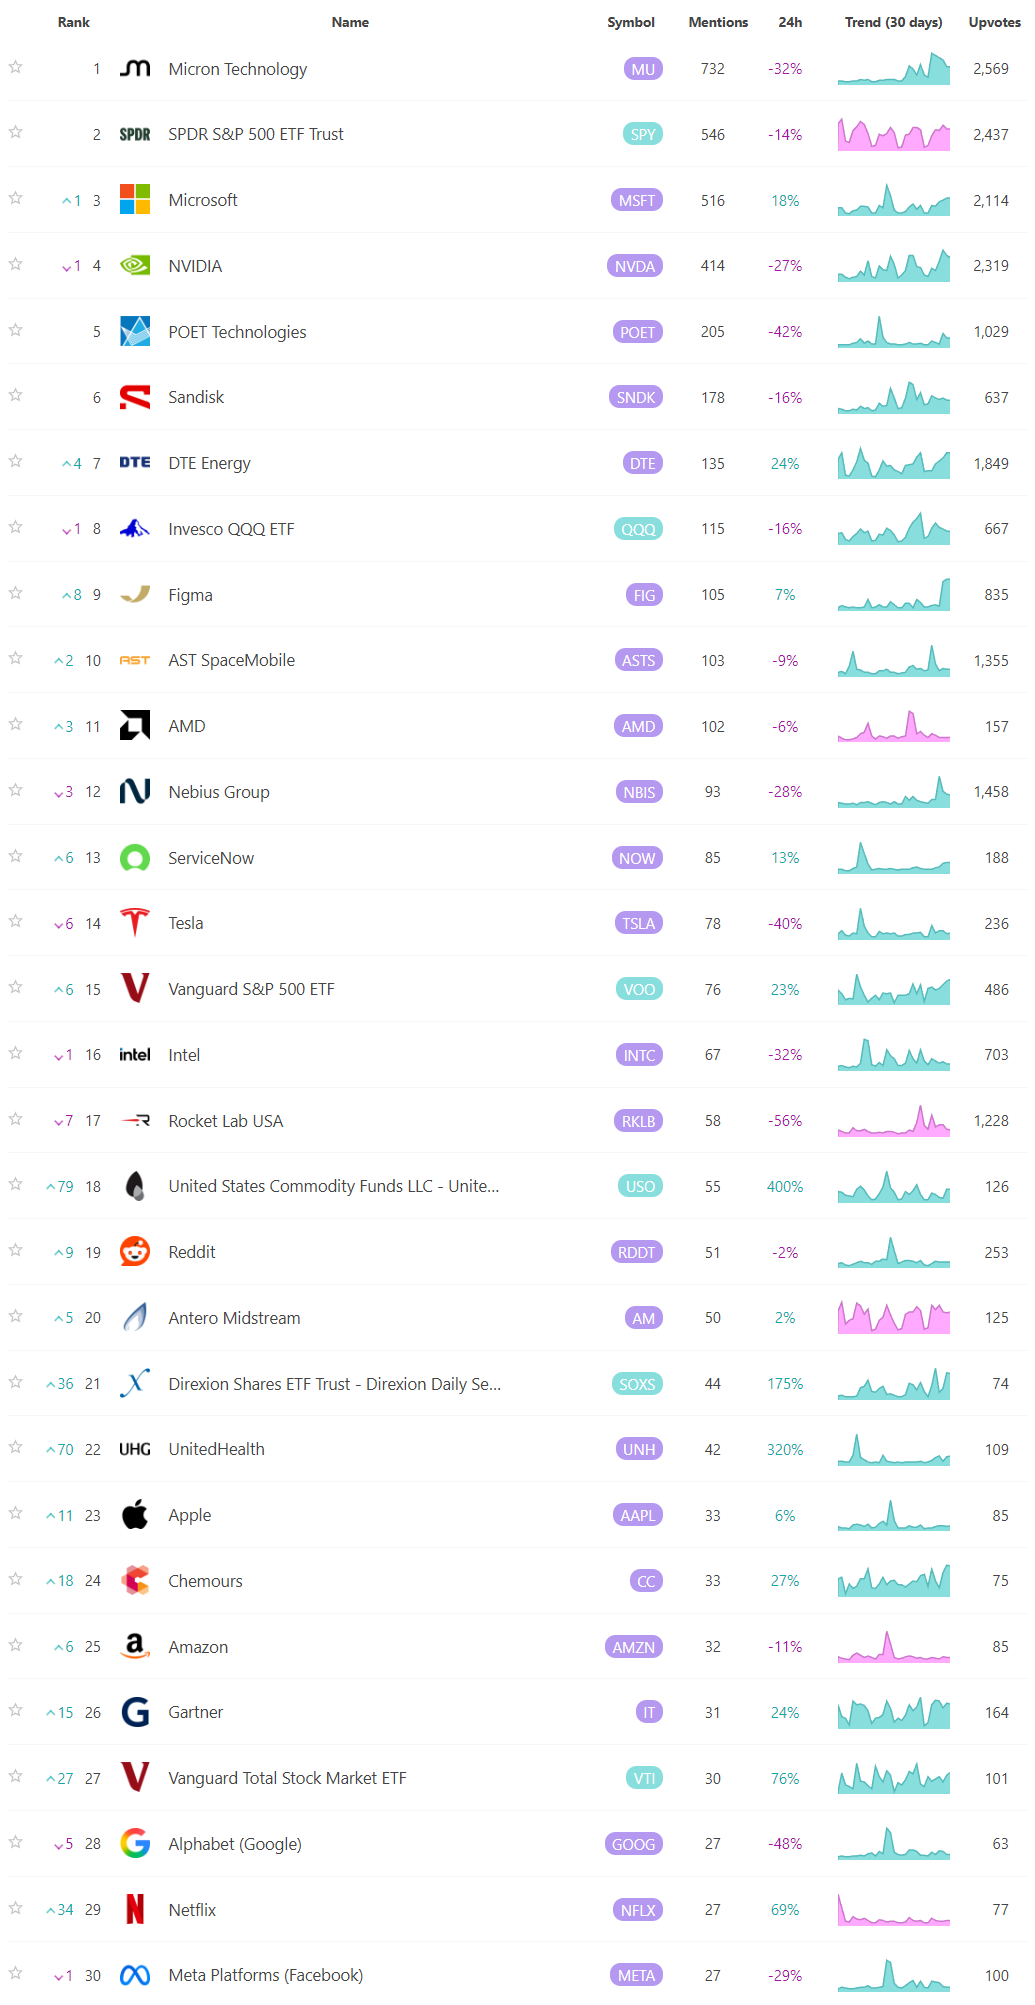
Social sentiment offers a real-time view of investor mood, often revealing market shifts before traditional indicators. It can signal momentum changes, spot emerging trends, and gauge retail investor impact—especially in high-volatility names. Tracking sentiment around events or earnings provides actionable insights, and when layered with quantitative models, can enhance predictive accuracy and risk management. Sustained sentiment trends often mirror broader market cycles, making this data a valuable tool for both short-term trades and long-term positioning.

Technician’s Playbook: Trading the Majors (SPY/QQQ/IWM/DIA)
When you’re a large institutional player, your primary goal is to find liquidity - places to do a ton of business with the least amount of slippage possible. VolumeLeaders.com automatically identifies and visually plots the exact spots where institutions are doing business and where they are likely to return for more. It’s one of the primary reasons “support” and “resistance” concepts work and truly one of the reasons “price has memory”.
The tape is no longer in clean impulse mode. Across the major index ETFs, last week's vertical advance has transitioned into a more rotational and defensive structure, with large institutional prints now clustering around key decision areas rather than chasing price higher. That usually means the market is trying to determine whether this was the beginning of a sustained breakout or simply a momentum burst that now needs time and inventory transfer before continuation.
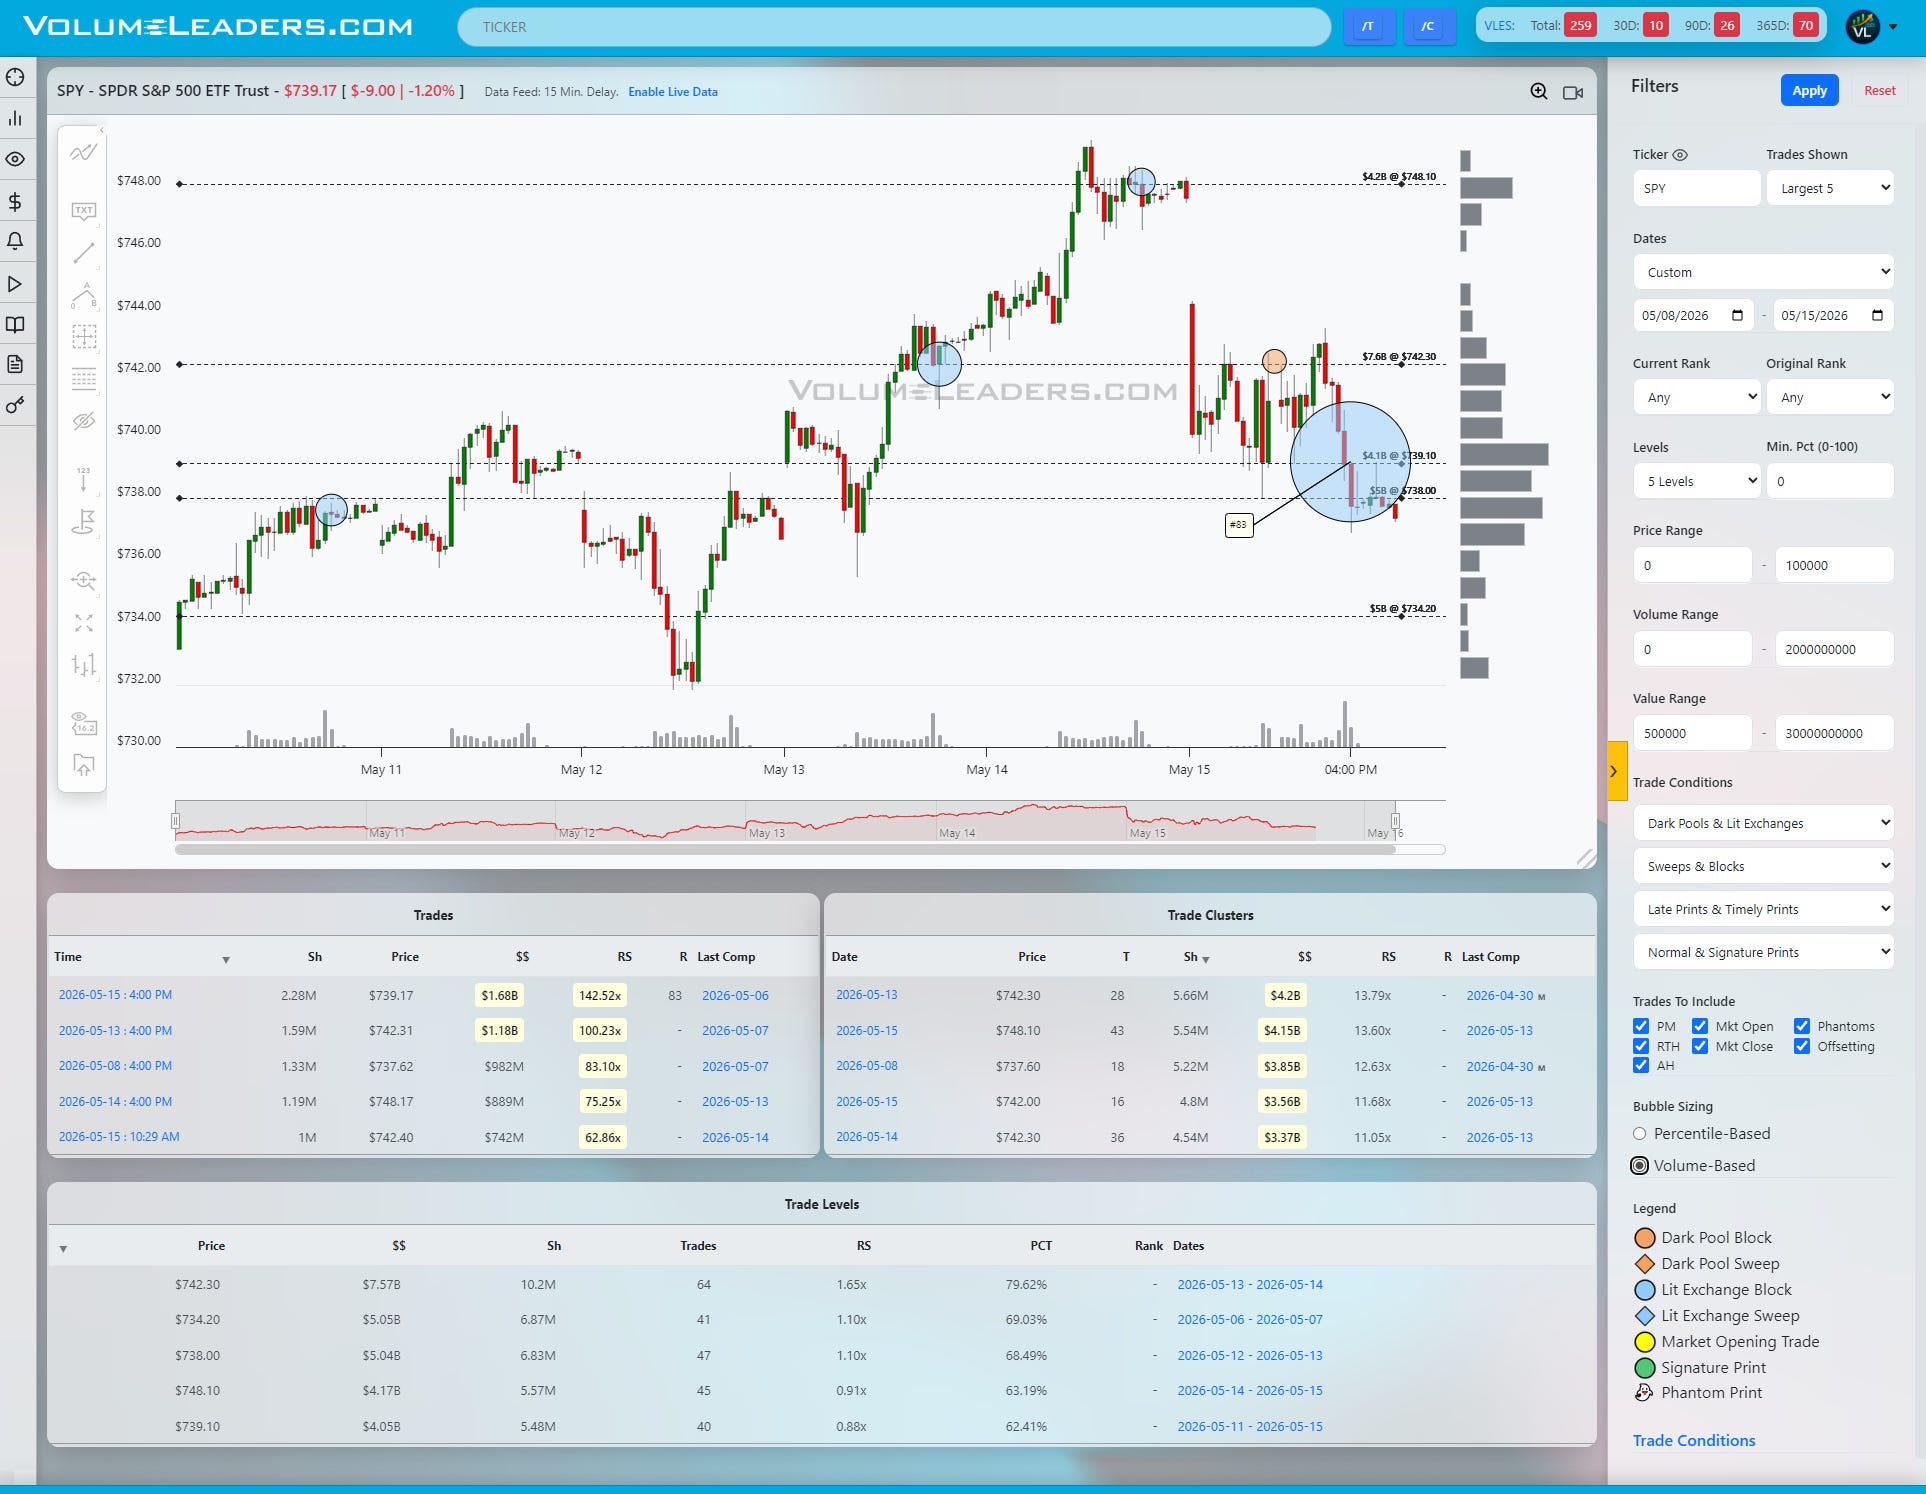
SPY is sitting directly on top of its first major line of scrimmage. The highest visible Level is the $742.30 shelf carrying roughly $7.57B in cumulative notional and a percentile reading near 79.6%, making it the dominant overhead pivot. Beneath that sits another meaningful layer around $739.10 with roughly $4.05B and the psychologically important $738 area carrying just over $5B. The tape rejected sharply from the upper-$742s and immediately found responsive buying near $738, suggesting passive demand is still active there. The notable feature is the concentration of giant recent prints between roughly $739 and $742, including a $1.68B print at $739.17 and a $1.18B print near $742.31. That is not random liquidity. It looks like institutions defending inventory into weakness while simultaneously refusing to materially lift offers above the low-$742s. Acceptance back above $742.30 likely opens another test of the $748.10 Level, which itself carries over $4.1B and represents the next obvious magnet. Failure back below $738 would imply the market is slipping back into balance and expose the heavier demand zone near $734.20.
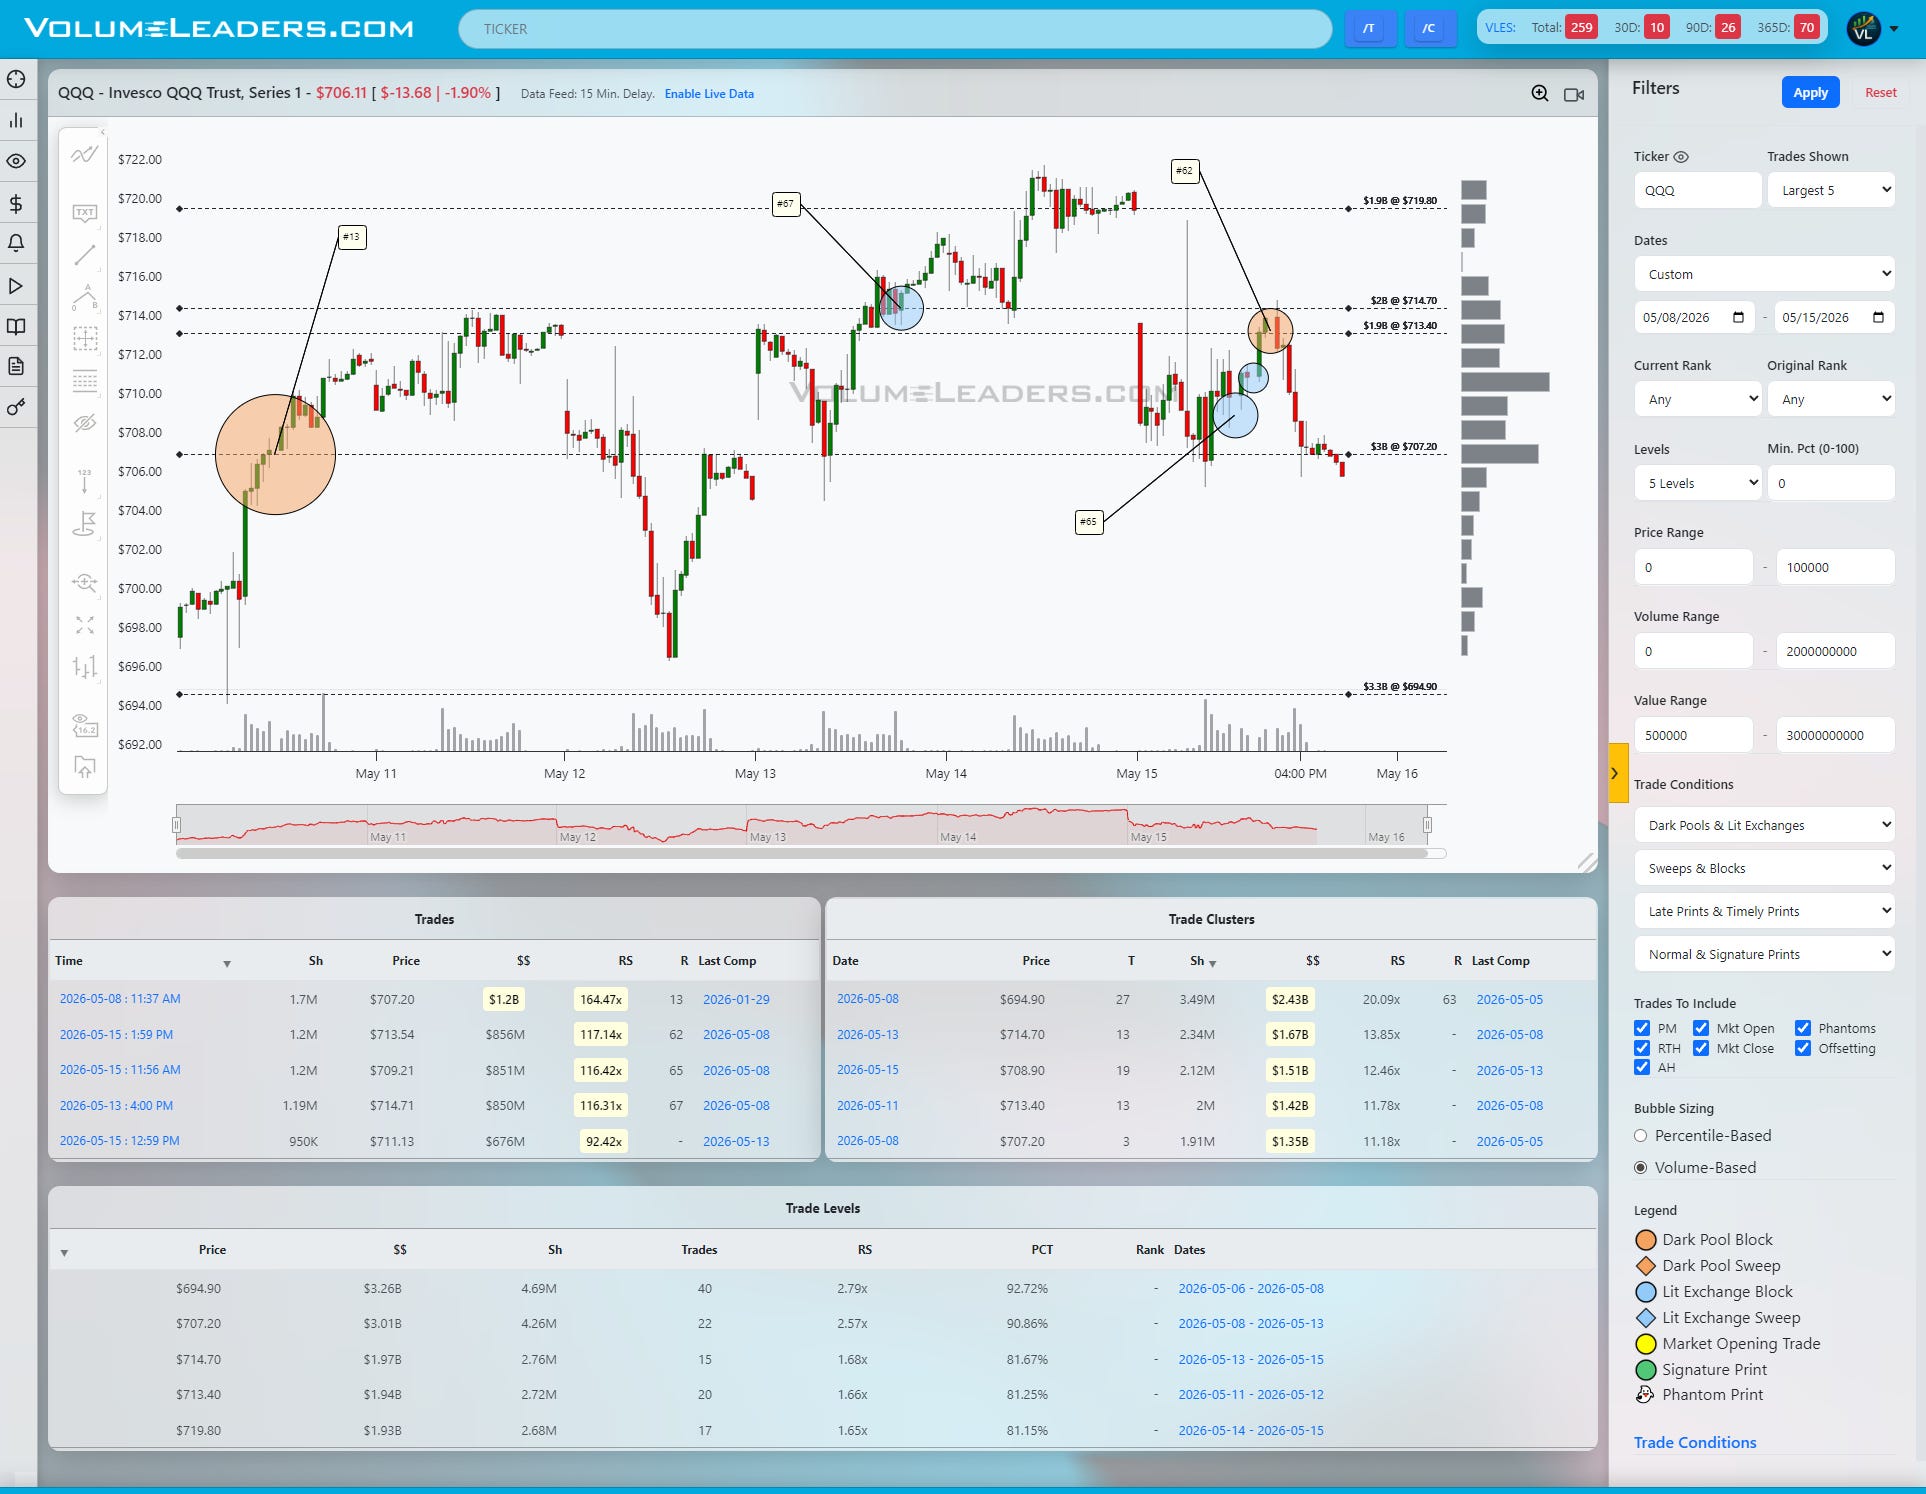
QQQ looks weaker tactically. The ETF failed directly beneath two stacked Levels at roughly $713.40 and $714.70, each carrying close to $2B in notional. The rejection came immediately after a series of very large prints, including a tagged historical trade around $713.54 and another cluster of activity near $709-$711. More important, the tape could not hold the high-$713s despite multiple institutional engagements. That usually signals distribution rather than clean accumulation. The most important structural feature remains the massive $694.90 Level carrying roughly $3.26B and a percentile north of 92%, which still acts as the larger swing support beneath the market. Near term, $707.20 has become the immediate battlefield after absorbing more than $3B cumulatively. If QQQ can reclaim and hold above the $713-$715 zone, the failed breakdown likely morphs into another continuation leg toward $719.80. If not, the path of least resistance probably remains lower toward the low-$700s and potentially the mid-$690s magnet.
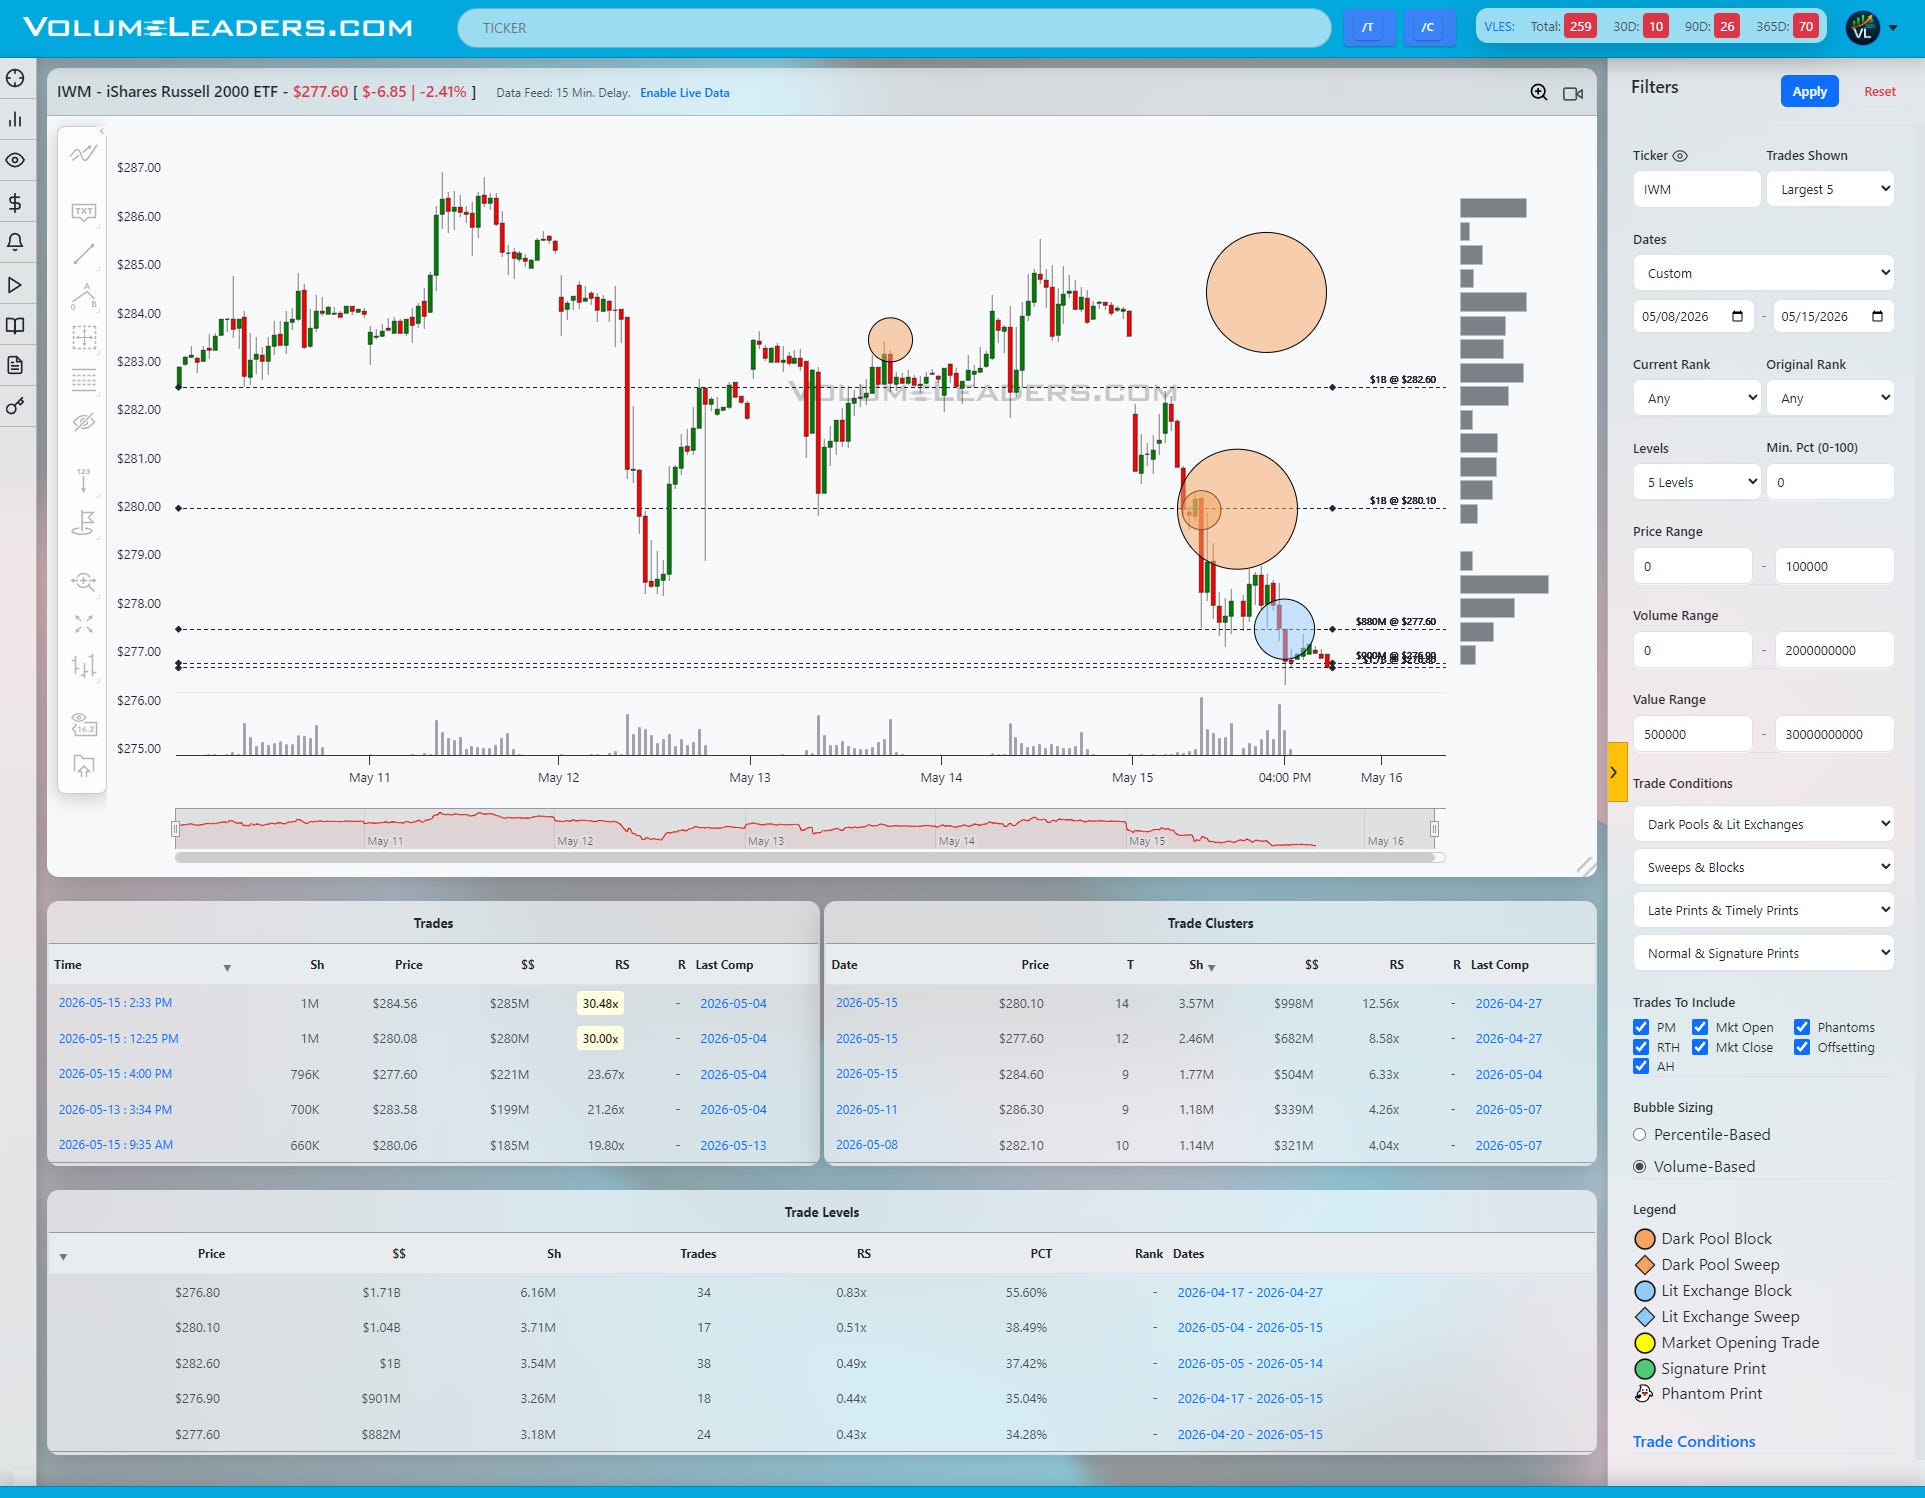
IWM remains the weakest structure of the group. The tape is hugging the lows after repeated failures near the $280.10 and $282.60 Levels, each carrying roughly $1B in cumulative notional. Several oversized dark pool-style circles appeared directly into weakness around those prices, but unlike SPY, they did not produce meaningful upside response. That matters. Large prints without immediate upside continuation often imply absorption rather than aggressive sponsorship. The only nearby shelf with real significance is the $276.80 Level carrying roughly $1.71B across more than 6 million shares. Price is sitting almost directly on top of it now. This is effectively do-or-die support for the Russell. Hold it, and IWM can stabilize back toward $280-$282. Lose it with acceptance, and the tape likely accelerates lower because there is very little visible structural support immediately underneath.
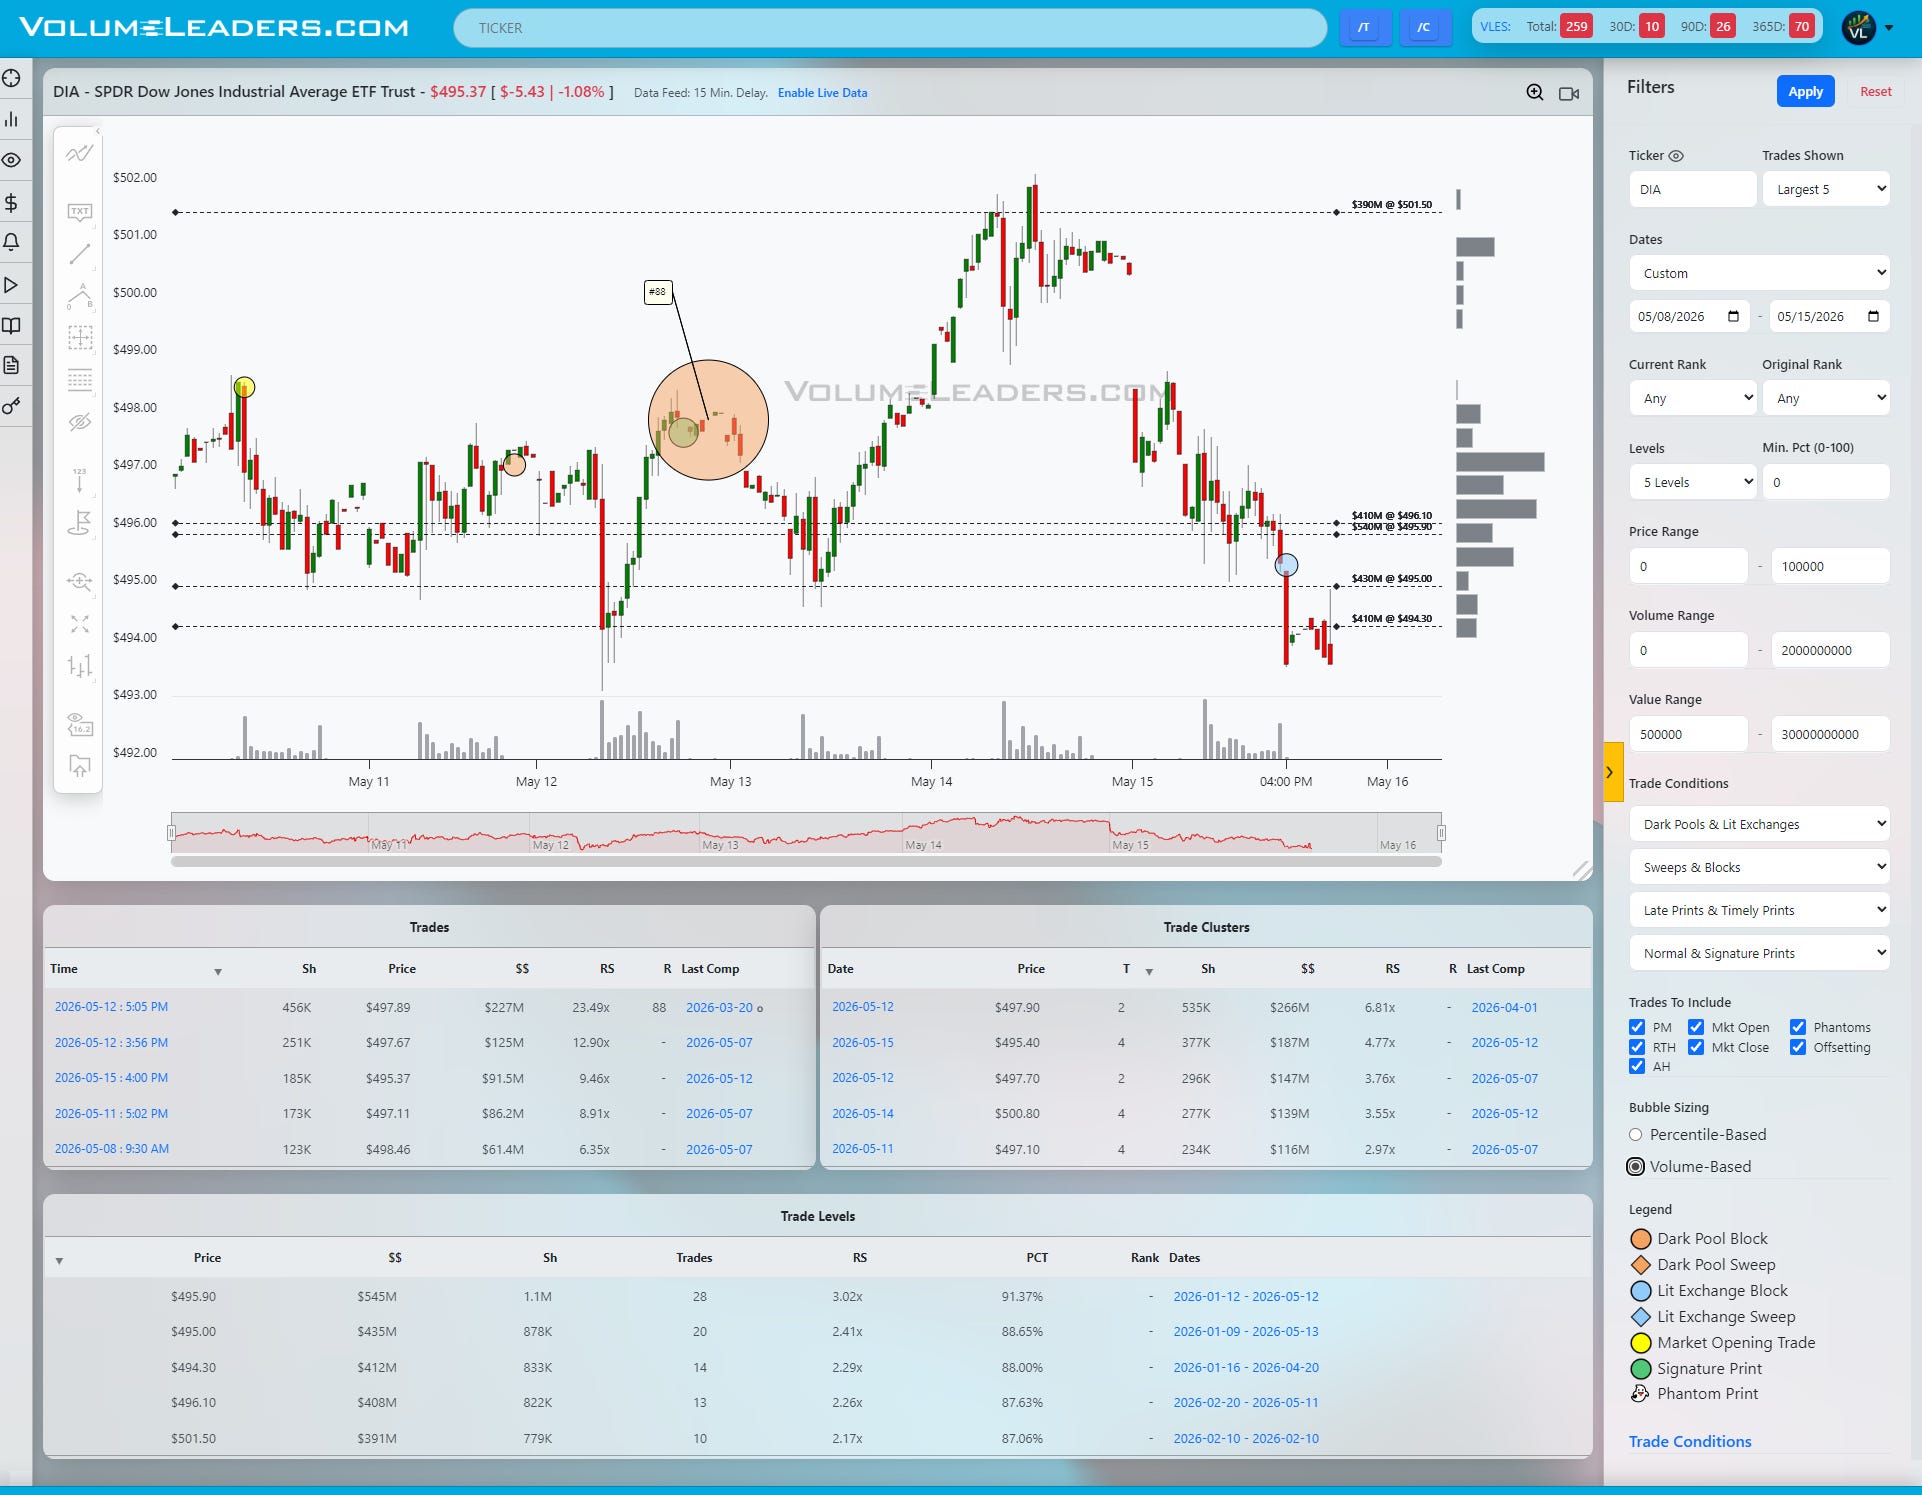
DIA is behaving more like a controlled pullback than outright damage, but the character has clearly softened. The strongest visible Level sits overhead at $501.50 with roughly $391M, while the current battle is concentrated between $495 and $496.10 where multiple Levels overlap with cumulative percentile readings in the high-80s to low-90s. The recent large print around $497.90, tagged as a historical trade, failed to generate continuation and was followed by immediate deterioration back into the lower shelf. That puts the burden back on buyers. As long as DIA holds the $495 area, the structure remains a pullback within a broader advance. Acceptance back above $496.10 likely pulls price back toward the upper-$497s and eventually $500+. But if $495 fails decisively, the tape probably seeks lower inventory and turns this into a deeper retracement phase.
The practical read here is that SPY still has the cleanest institutional defense, QQQ is testing whether recent tech leadership can reassert itself, DIA is stabilizing but losing momentum, and IWM remains the weakest link. A disciplined trader likely frames this environment around acceptance and rejection rather than anticipation. Holding above the key shelves favors continuation trades back toward the higher-volume magnets. Losing them shifts the tape back into rotational mean-reversion behavior where rallies are more likely to be sold than expanded.

Summary Of Thematic Performance YTD
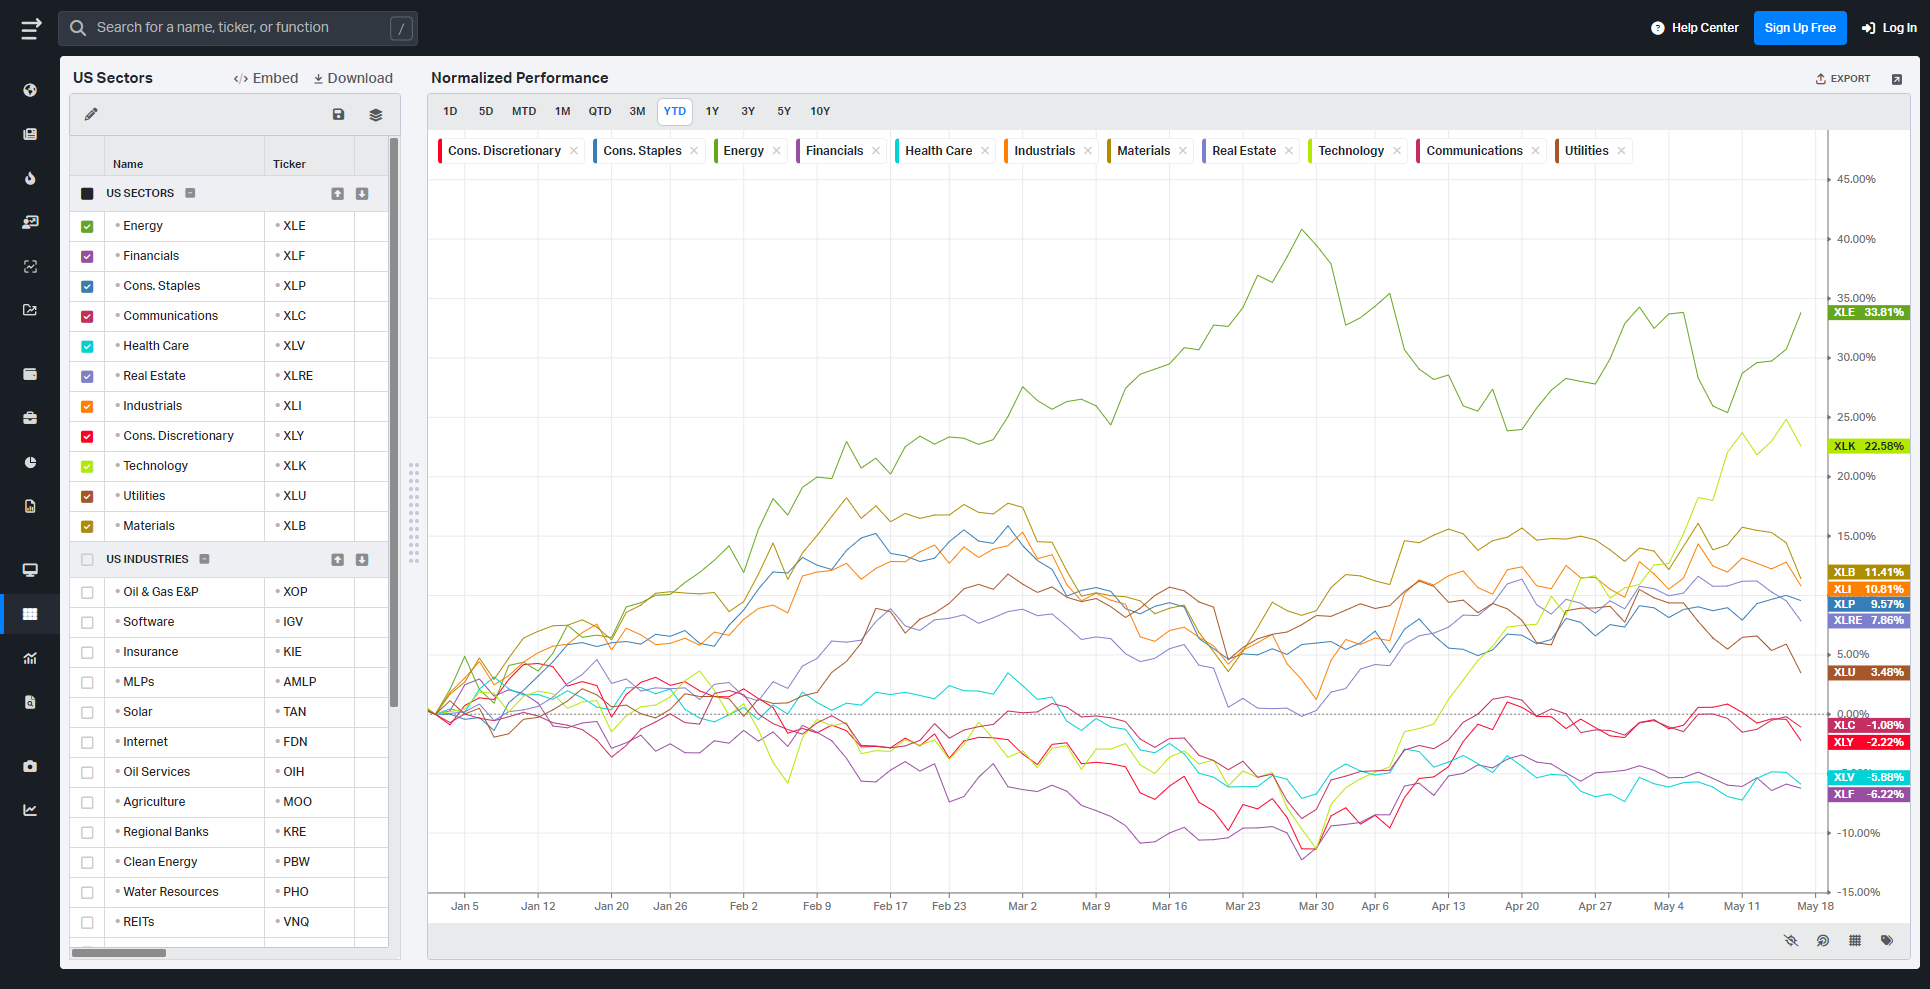
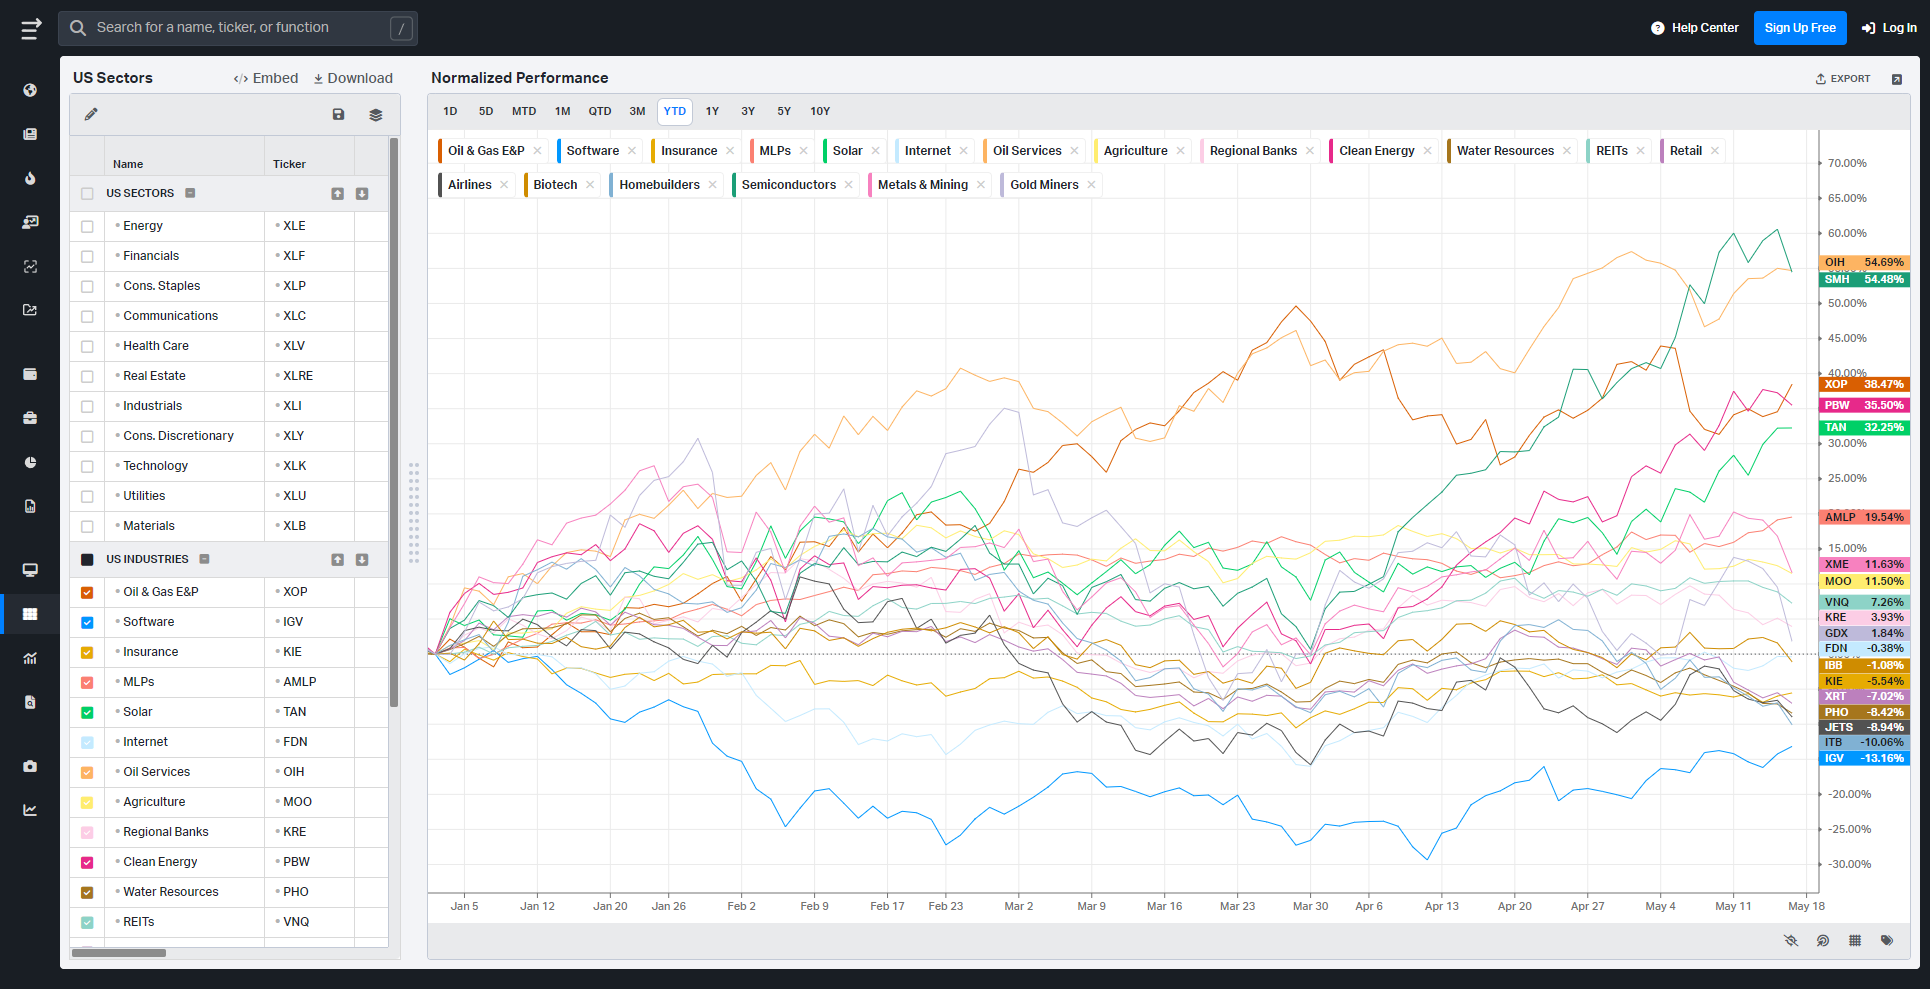
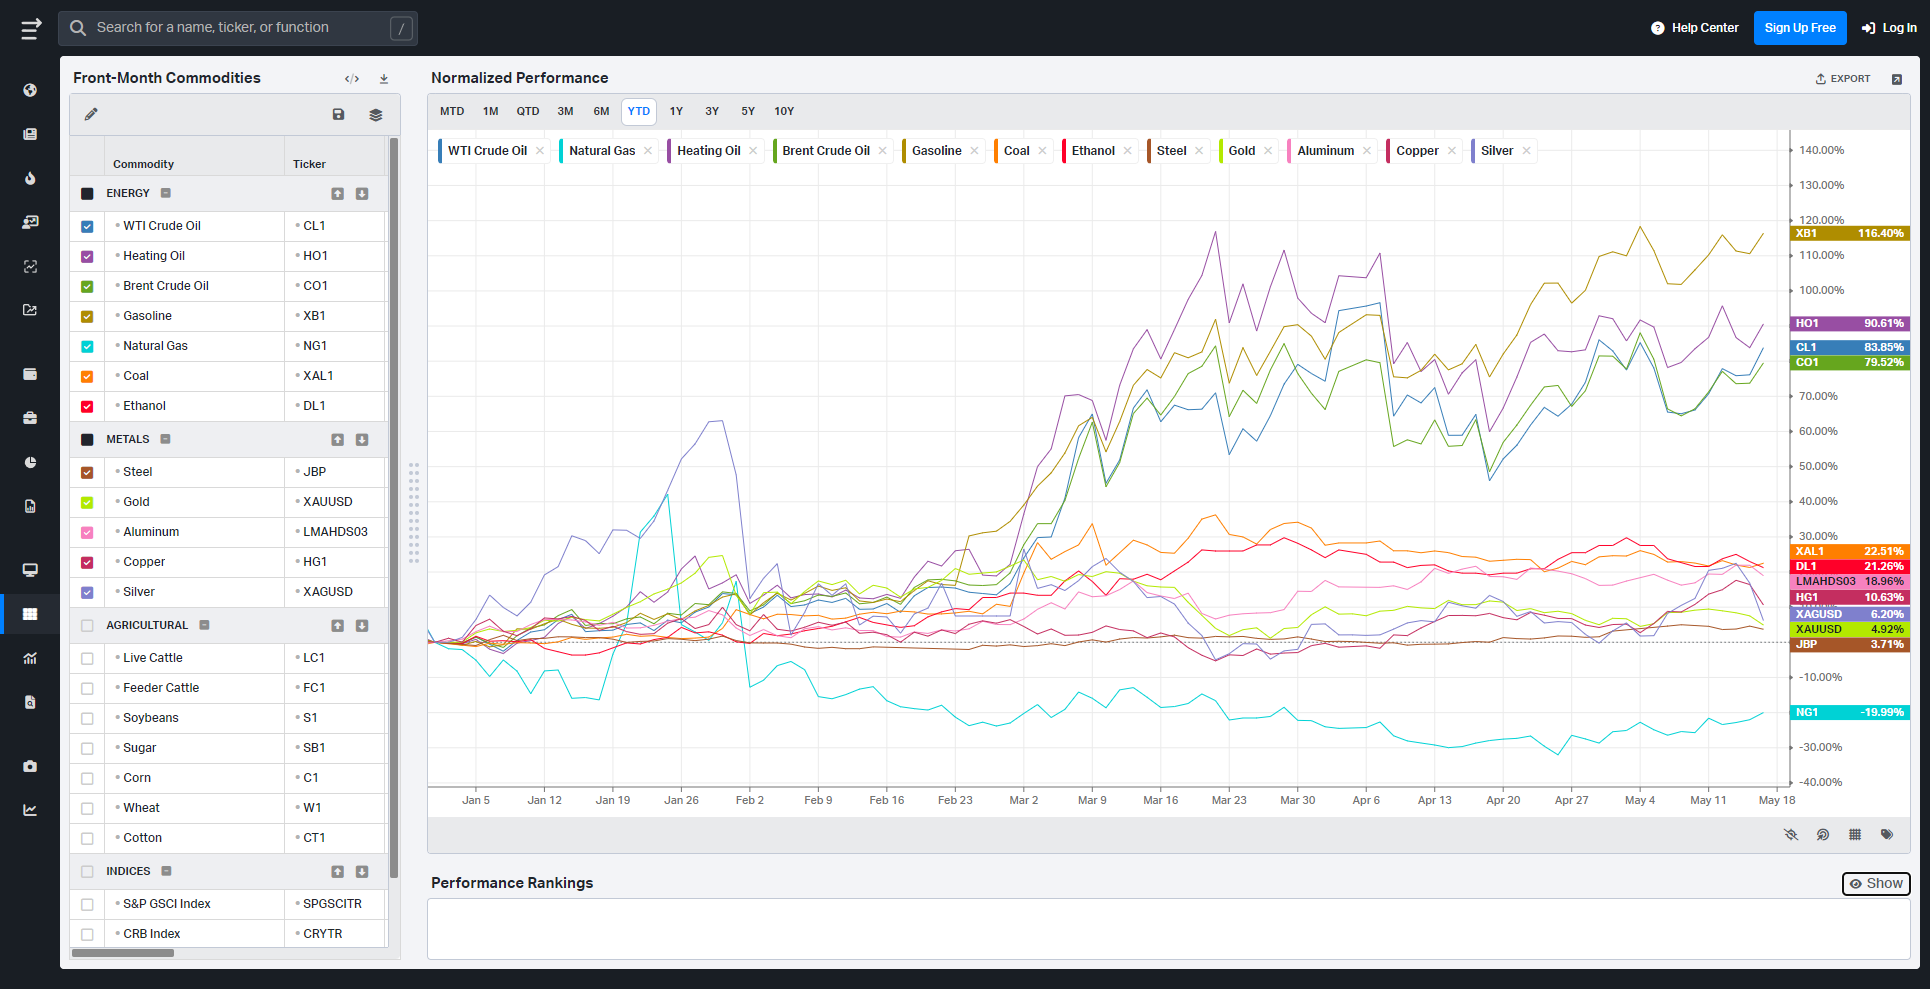
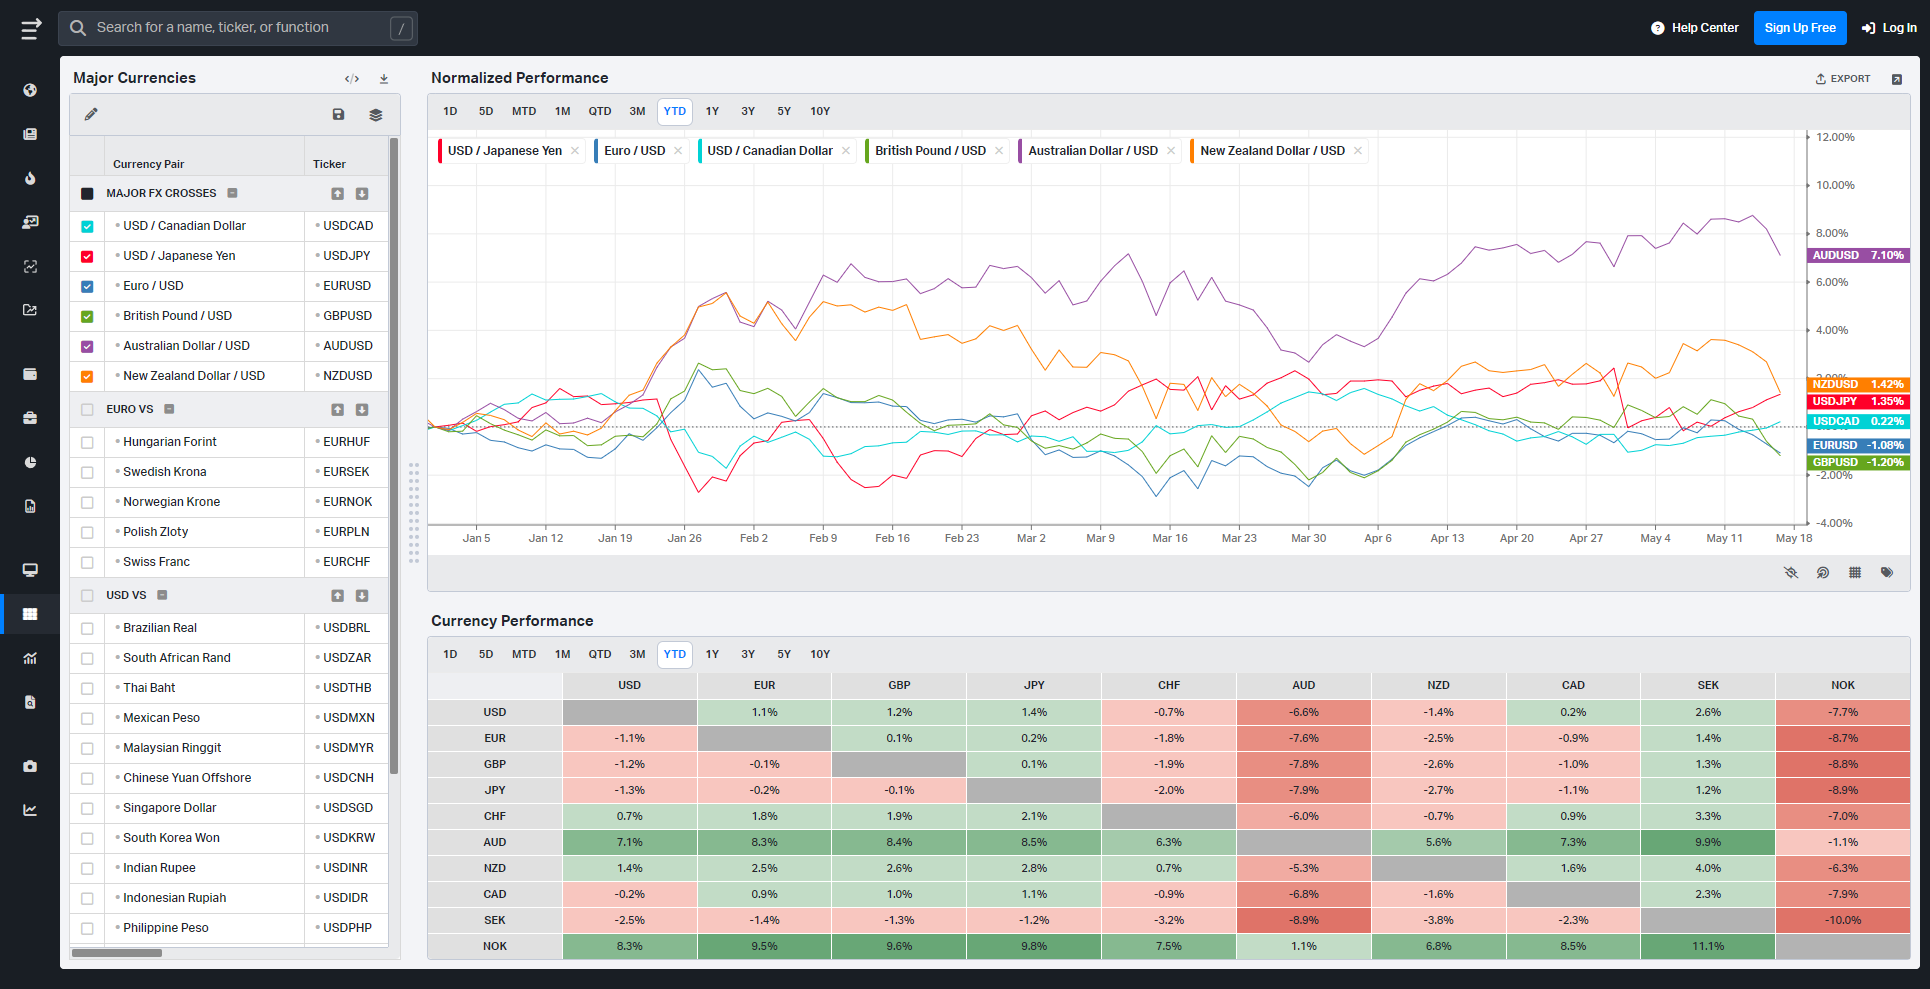
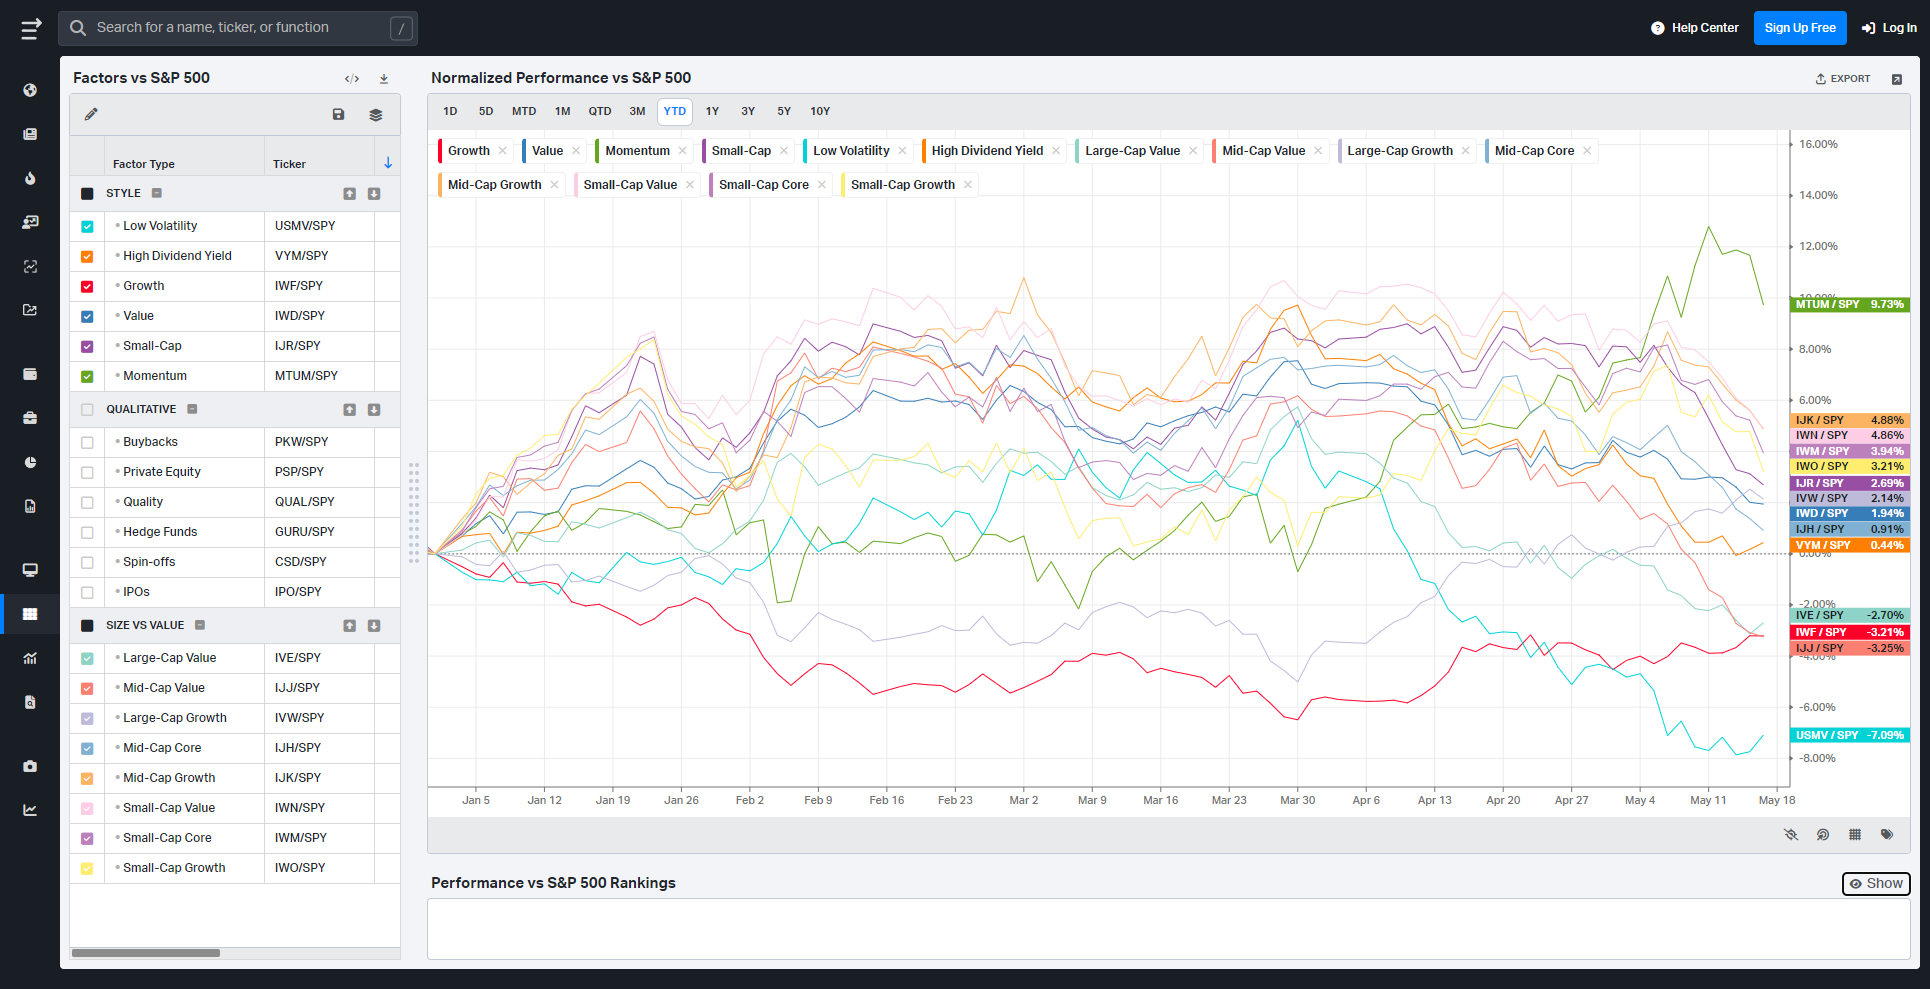
VolumeLeaders.com offers a robust set of pre-built thematic filters, allowing you to instantly explore specific market segments. These performance snapshots are provided purely for context and inspiration—think about zeroing in on the leaders and laggards within the strongest and weakest sectors, for example.
S&P By Sector
S&P By Industry
Commodities: Energy & Metals
Currencies/Major FX Crosses
Factors: Style vs Size-vs-Value

Events On Deck This Week
Here are key events happening this week that have the potential to cause outsized moves in the market or heightened short-term volatility.
Macro Crosscurrents Meet Retail And AI Earnings Test
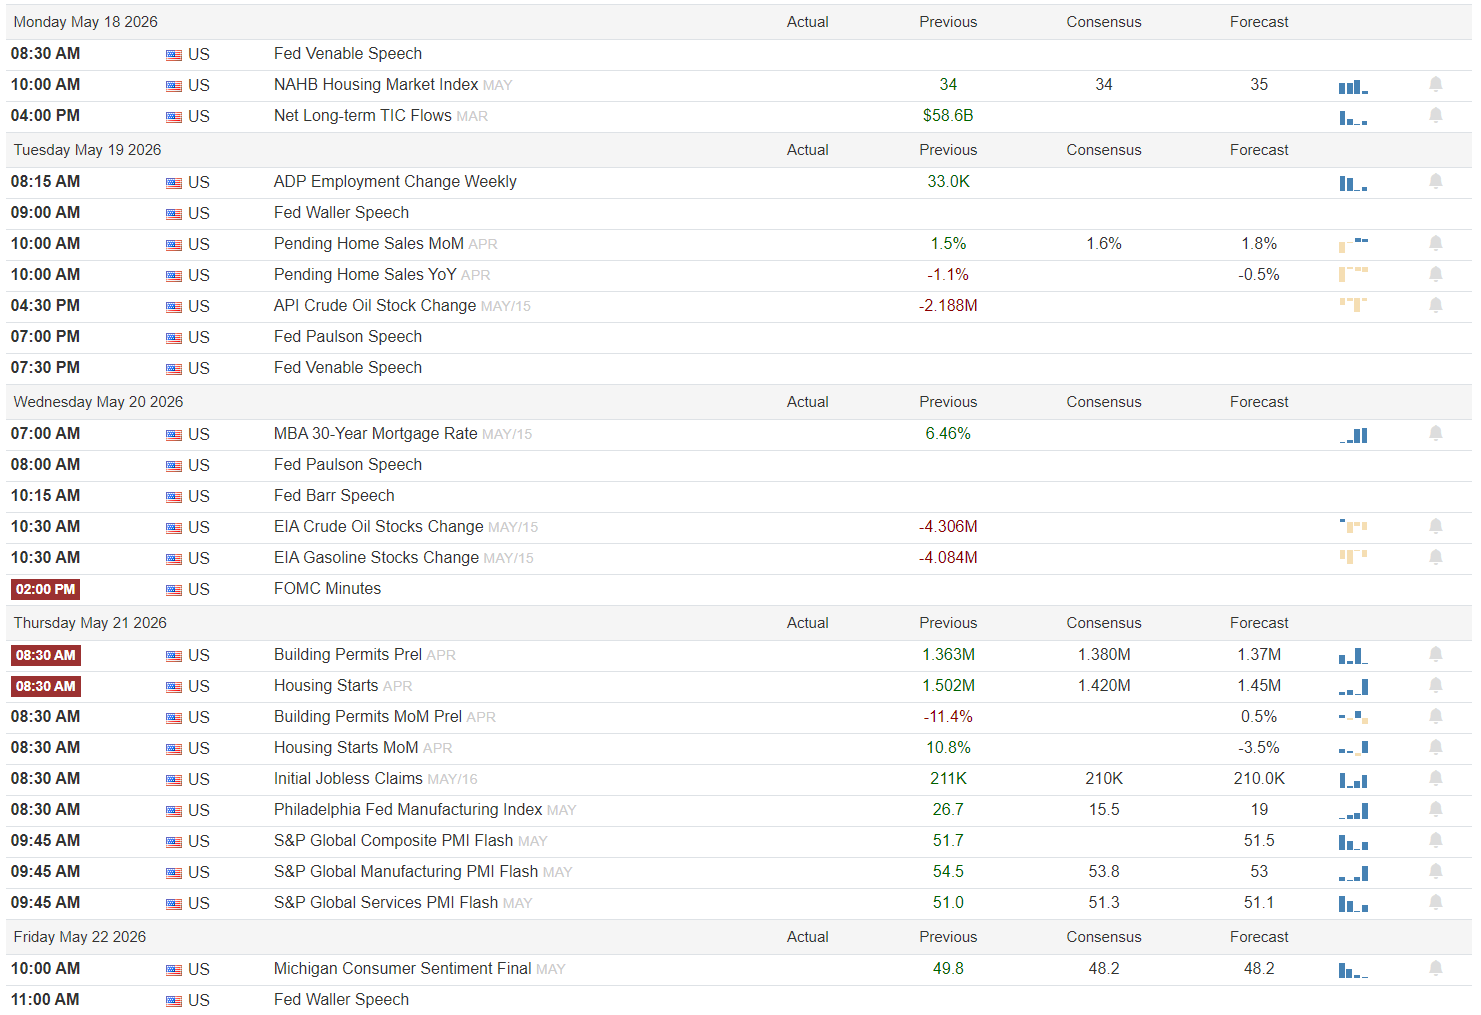
The coming week sets up as a classic transition tape: softer breadth underneath the surface, sentiment leaning back toward optimism, and a calendar that mixes housing, labor, manufacturing, energy, and several high-beta earnings names capable of moving entire sectors.
Monday is quiet on the data front but still important for tone-setting. The NAHB Housing Market Index is expected at 35 versus a prior and consensus reading of 34. A stronger housing print would reinforce the idea that higher mortgage rates are not fully choking demand, while a miss would revive concerns around affordability and consumer fatigue. Fed Governor Lisa Cook speaks early, and the market will likely focus on whether policymakers continue emphasizing patience on rates or begin acknowledging softer pockets in growth.
Tuesday shifts attention toward housing demand and crude inventories. Pending Home Sales are expected at 1.8% month-over-month versus 1.5% previously, while year-over-year sales are expected at -0.5% versus the prior -1.1%. Improvement there would support the soft-landing narrative. API crude inventories previously showed a -2.188M draw, so another tightening energy print would likely support the recent strength in oil equities. Fed speakers Waller, Paulson, and Venable all hit the tape, with traders listening carefully for any pushback against easing financial conditions.
Wednesday revolves around energy and the Fed. Mortgage rates previously sat at 6.46%, still restrictive enough to matter for housing-sensitive equities. The key event is the 2:00 PM release of FOMC Minutes. Markets will want to see whether officials remain worried about inflation persistence or are becoming increasingly attentive to slowing breadth beneath headline indices. Crude and gasoline inventories previously fell by -4.306M and -4.084M respectively, reinforcing the idea that energy markets remain relatively tight.
Thursday is the heaviest macro day of the week. Building permits came in at 1.363M against a 1.380M consensus, while housing starts printed 1.502M versus a 1.420M consensus and 1.45M forecast. That is a mixed but still constructive housing backdrop. Initial claims are expected around 210K after a prior 211K reading. Meanwhile, the Philadelphia Fed Manufacturing Index printed 26.7 against a 15.5 consensus and 19 forecast, and manufacturing PMI came in at 54.5 versus 53 expected. That combination suggests industrial activity remains firmer than many expected. Risk-on would likely require claims remaining contained alongside PMIs holding above expansion territory.
Friday closes with Michigan Consumer Sentiment, previously 49.8 against a 48.2 consensus and forecast. The consumer remains cautious, but stabilization here would support discretionary and retail names heading into summer positioning. Waller speaks again late morning, which could matter if markets react strongly to Thursday’s data.
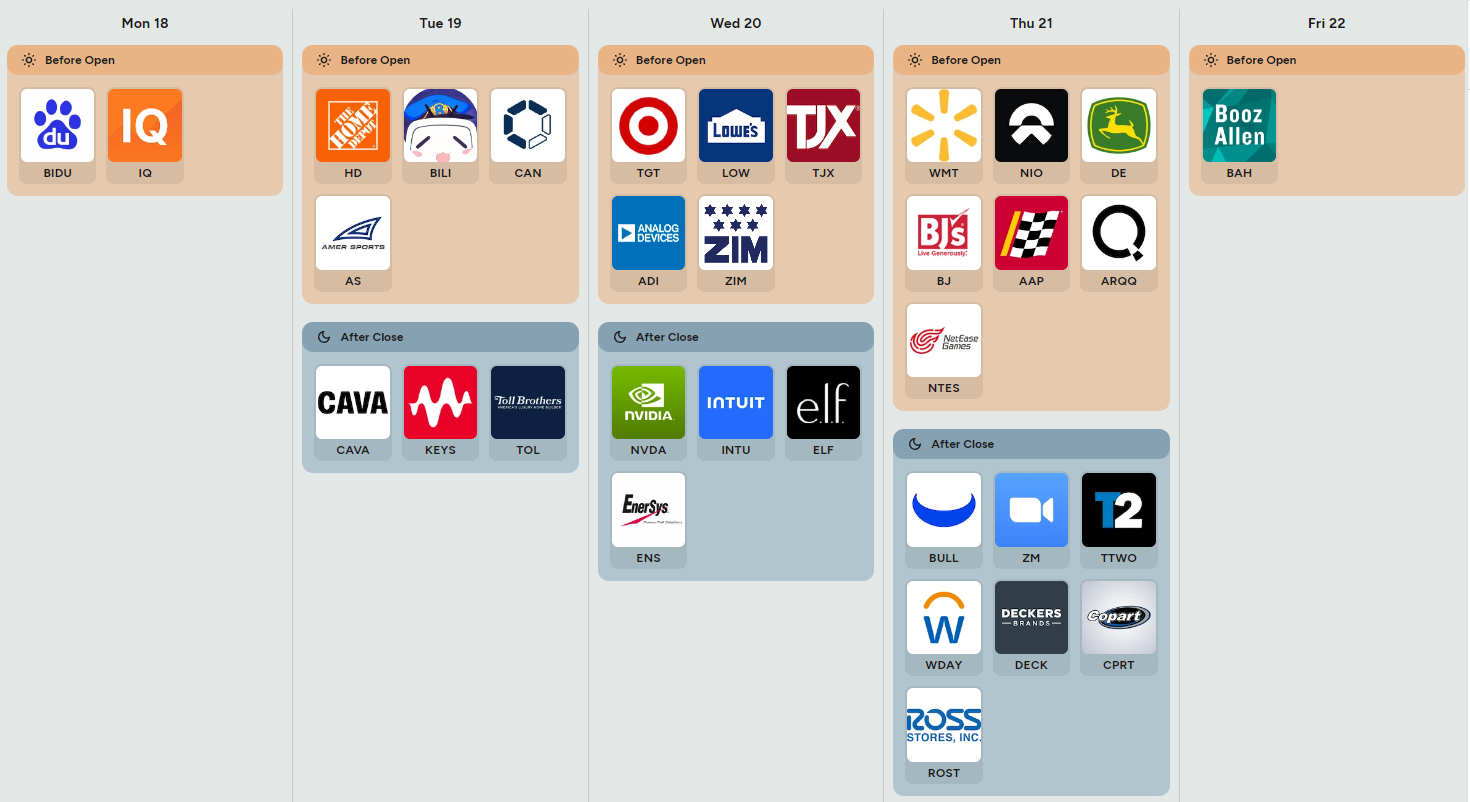
The earnings slate carries several important read-throughs. Home Depot, Lowe’s, Toll Brothers, Target, Walmart, and Ross Stores collectively provide a broad snapshot of the US consumer across income brackets. Nvidia is the obvious centerpiece; guidance around AI demand, hyperscaler spending, and margins will likely dictate semiconductor and growth sentiment for the entire market. Deere offers a window into industrial and agricultural demand, while BJ’s, Zoom, Intuit, Workday, Deckers, and Copart provide additional reads into enterprise spending and consumer resilience. Watch not only headline beats and misses, but inventory commentary, pricing power, and forward guidance.
Strong PMIs plus contained jobless claims likely reinforce the cyclical and industrial rotation.
A dovish interpretation of FOMC Minutes could quickly reignite mega-cap tech leadership.
Weak retail guidance from HD, LOW, TGT, or WMT would pressure the soft-landing narrative.
Bottom line: this is a week where macro resilience and AI leadership need to prove they can coexist with weakening breadth beneath the surface.

Order Flow in Focus: Reading Smart Money Tells
Order Flow in Focus: Reading Smart Money Tells is a recurring segment that spotlights unique intraday opportunities revealed through institutional order flow. Each feature dissects a moment when the tape quietly shifted—when large, ranked prints clustered at key liquidity locations and informed players positioned ahead of the move. The goal isn’t hindsight; it’s pattern recognition—learning to spot the footprints of capital that knows before the crowd does.
One of last week’s cleanest tells did not come from SPY itself. It came from the leveraged positioning underneath it.
As the market flushed on May 12th, SSO washed directly into the mid-$65 area and immediately began attracting oversized institutional participation. The largest visible print hit around $65.45 for roughly $95.9M with a relative size above 56x normal. More importantly, those prints appeared as sweeps directly into weakness near heavy cumulative Levels clustered around $65.20, $65.30, and $65.50.
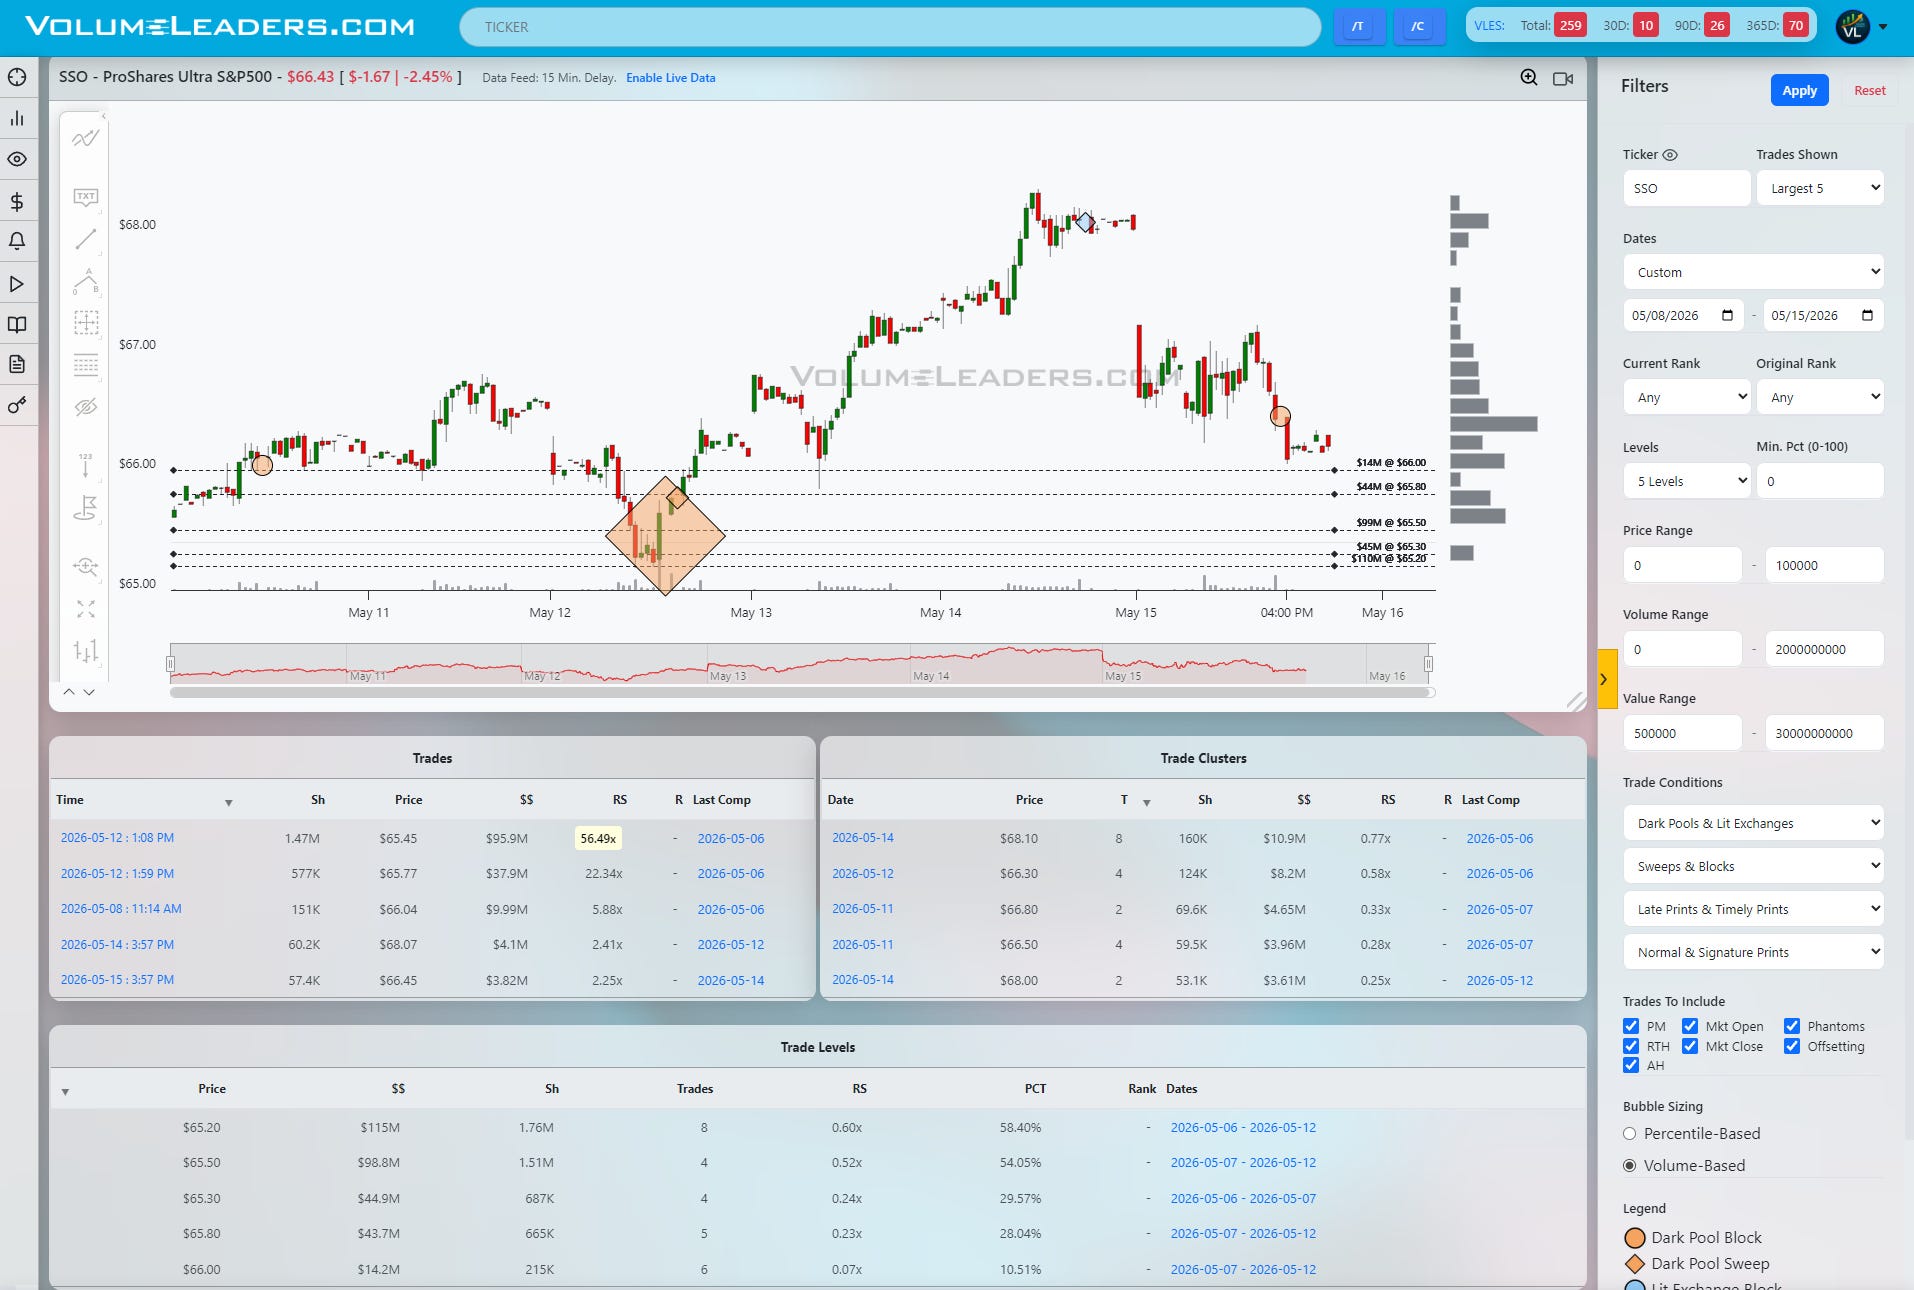
The key was response and follow-through.
Instead of continuing lower, price stabilized almost immediately after the flush, reclaimed nearby shelves, and began building a higher-low structure. That is often the signature of absorption rather than liquidation. The heaviest Level sat at $65.20 carrying roughly $115M, followed closely by $65.50 near $99M. Institutions were clearly willing to defend inventory there.
SPY confirmed the same story shortly after. Price looked below cumulative Levels around $734 and instead of cascading lower through those shelves, price compressed, stabilized and turned back through $734 painting a clear Look-Below-And-Fail.
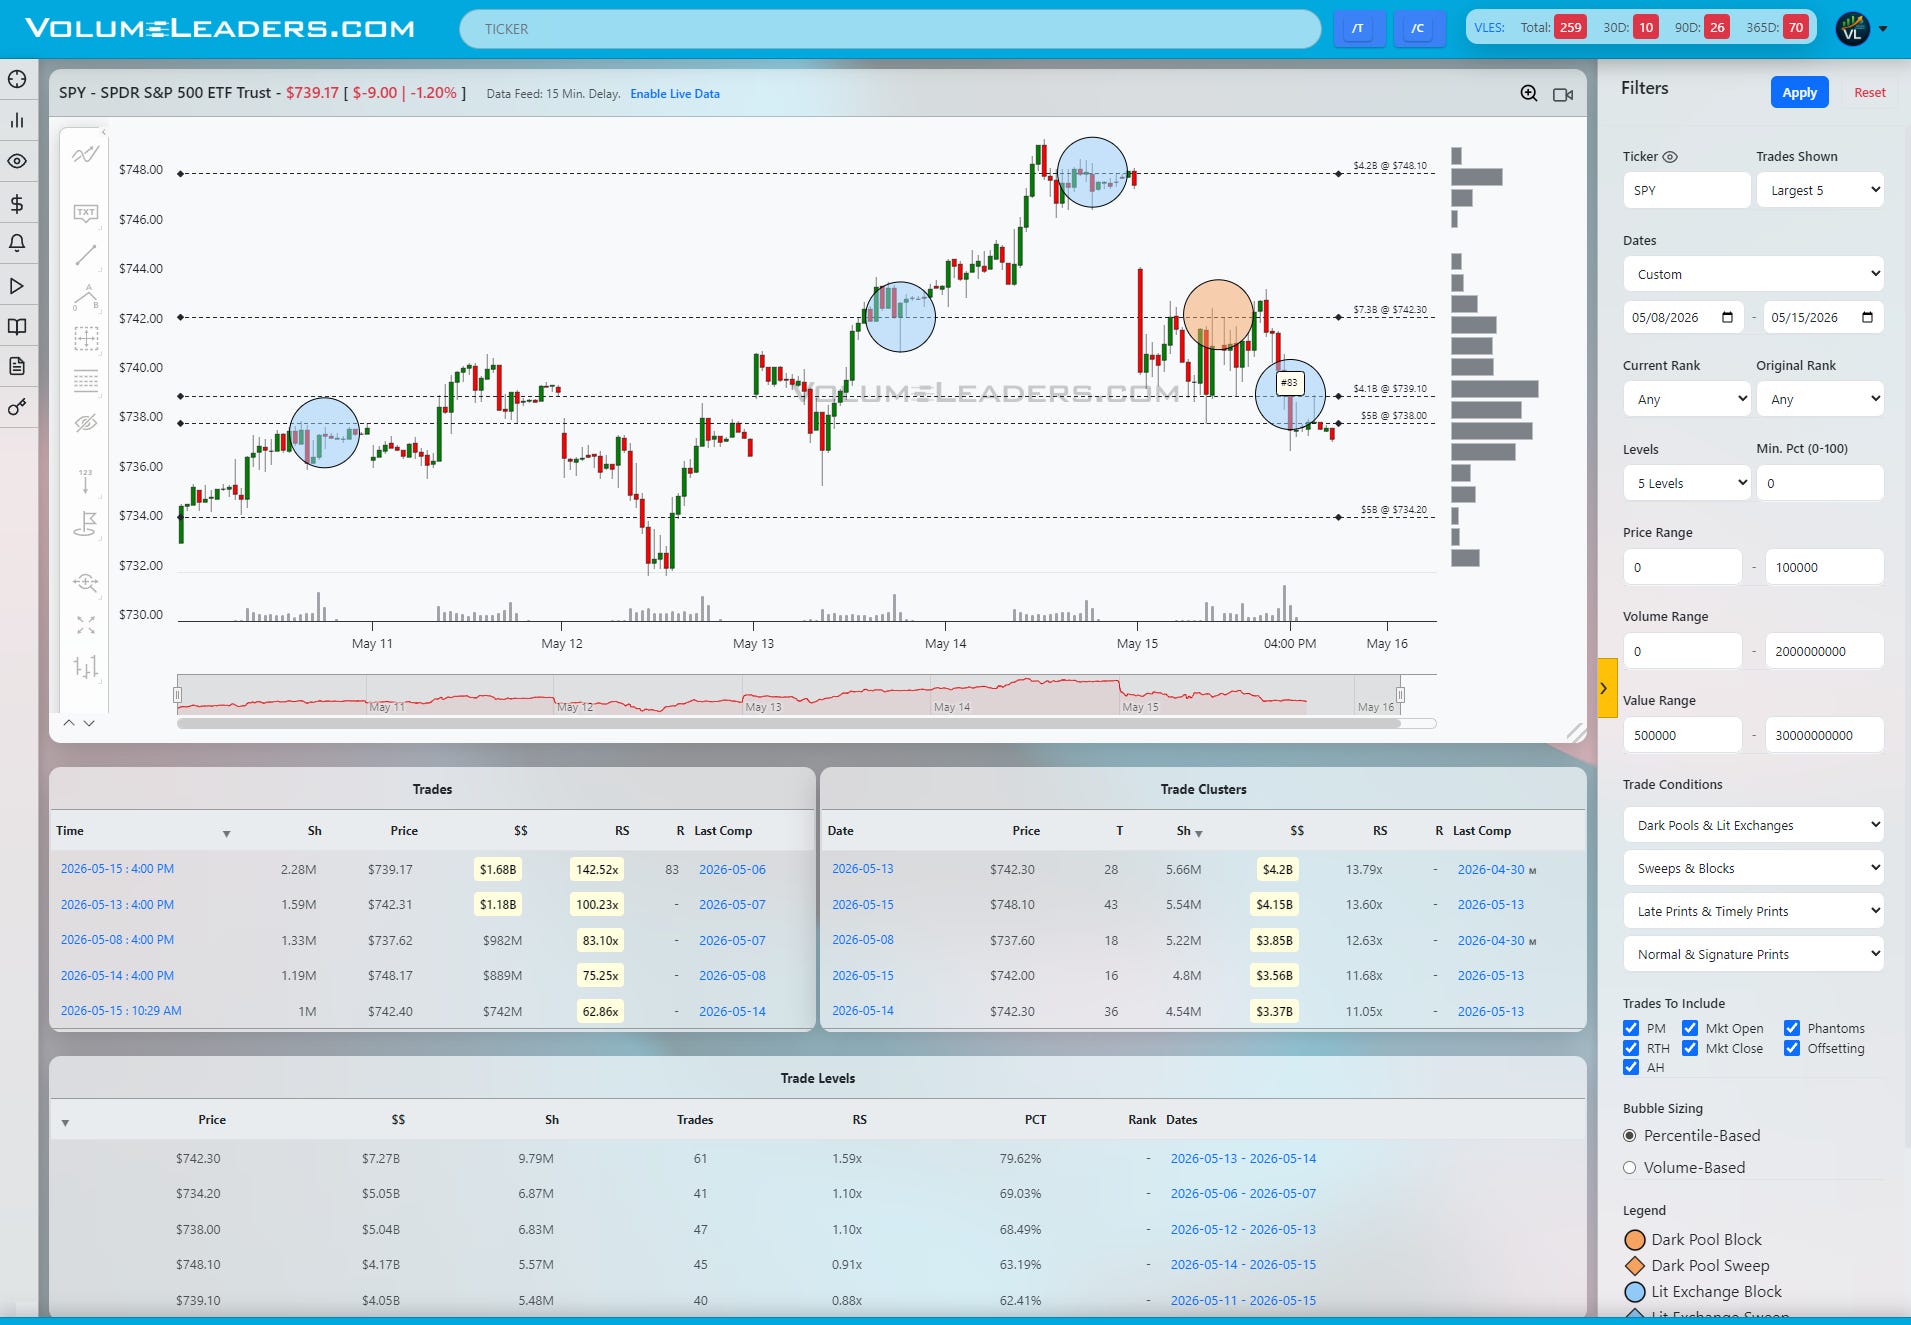
The cleanest trade was not buying the panic itself, but buying the successful retest once the market stopped accepting below support. In SSO, that was the reclaim of the $65.50-$65.80 zone. In SPY, it was the recovery back above $734. The confluence of both made this a high probability dip-buy.
Once those Levels held, the path higher opened quickly. SPY rotated through the massive $742.30 shelf and ultimately ran into the next major magnet near $748.10 as the market pushed toward fresh all-time highs.
The lesson was simple: large prints matter most when they fail to produce further downside. That is often where liquidation quietly becomes accumulation.

Market Intelligence Report
A desk-grade synthesis of institutional positioning and market structure—unpacking the flows, levels, and emerging themes that shaped the week, and translating them into a model portfolio built the same way professional desks prepare for the week ahead.
Part 1: The Backdrop
The institutional tape stayed concentrated, not broad. The market still wants mega-cap technology, index beta, and liquidity, but it is not yet showing the kind of all-clear participation that lets you blindly chase down the capitalization curve. Across all VL metrics the tone was selective: participation is improving in pockets, market-wide volatility is not acting like a broad risk-off tape, and relative strength is still clustered in the areas where large-cap growth and liquid index vehicles dominate. That fits the broader decision-funnel discipline: define whether the environment supports risk, then narrow toward participation, risk validation, allocation, and execution rather than starting with tickers and forcing a thesis afterward.
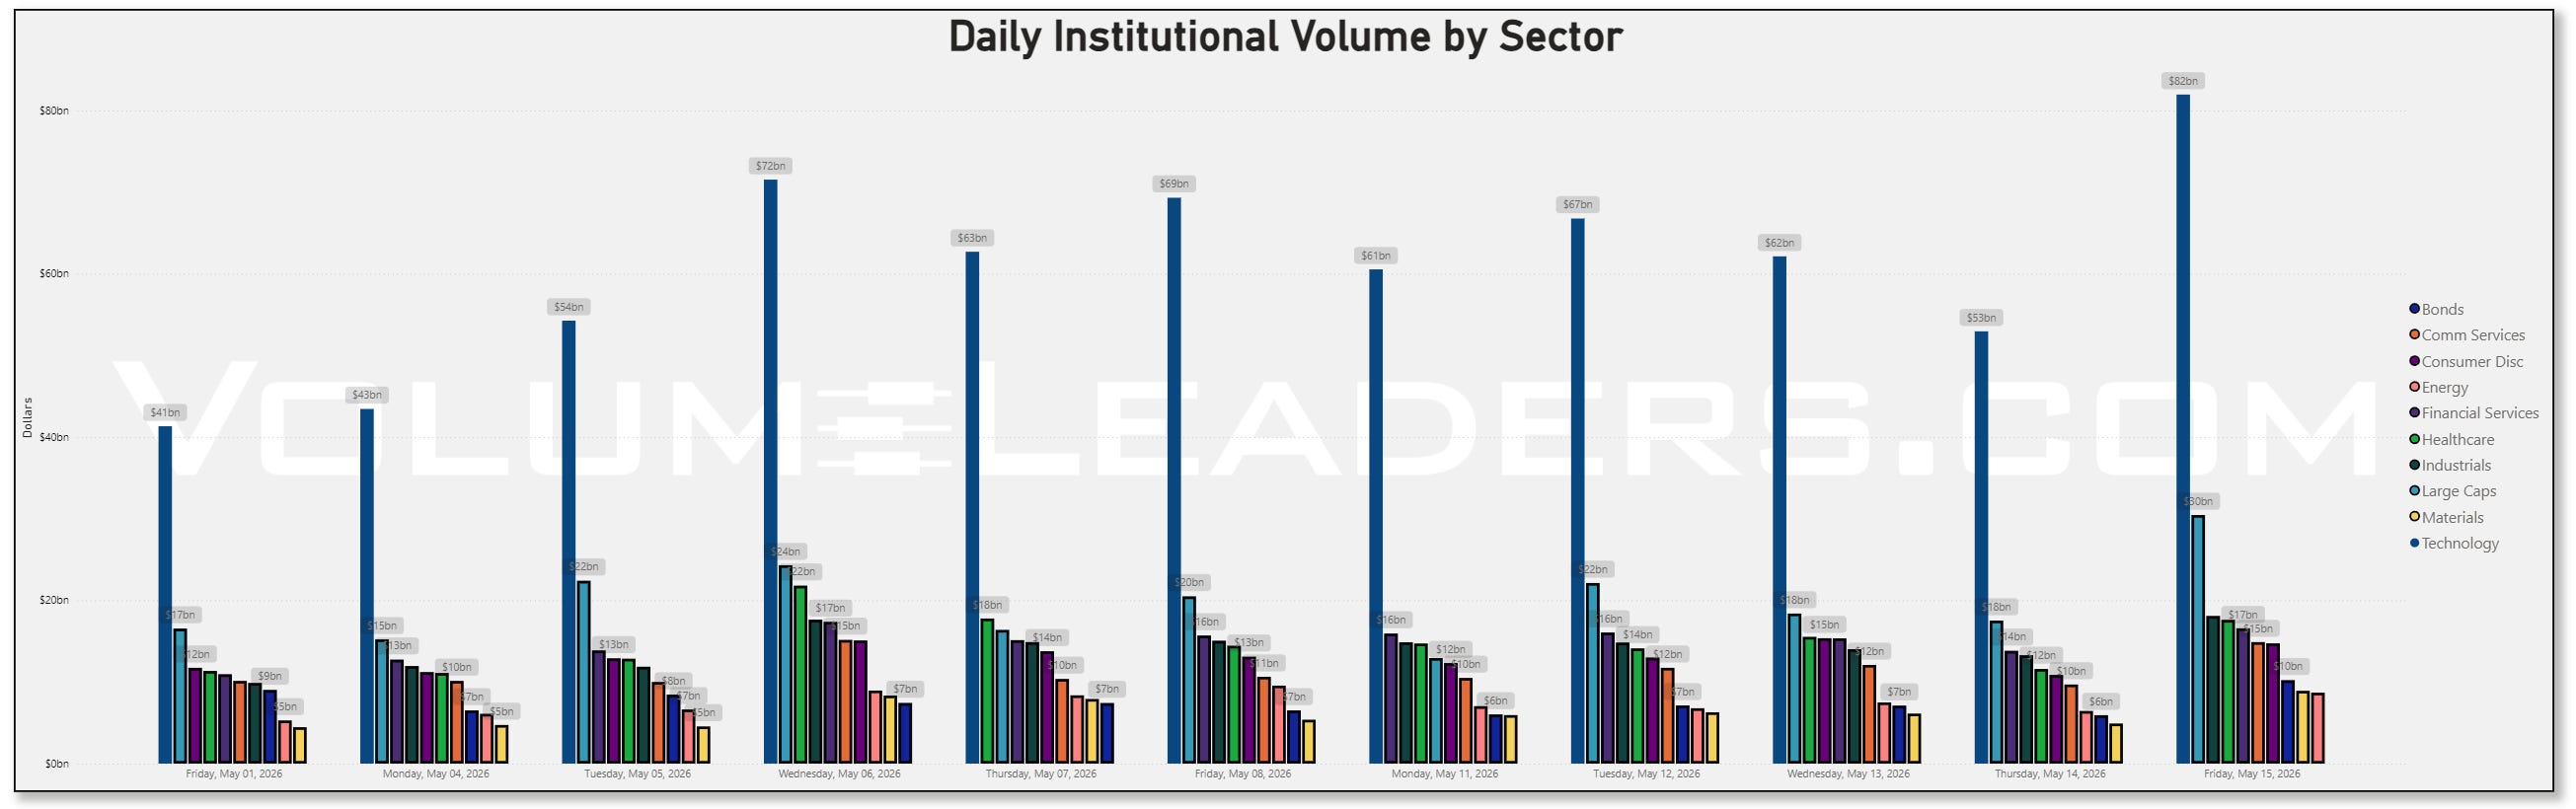
The sector dollar table makes the selectivity obvious without OPEX offering much in the way of surprises. Technology was still the center of gravity, printing $81.95B on Friday, May 15 after $52.95B on Thursday and $62.13B on Wednesday. That was the largest daily sector total on the sheet by a wide margin but small for OPEX flows. Large Caps also re-accelerated into Friday at $30.44B, up from $17.52B the prior day, while Financial Services rose to $16.57B, Healthcare to $17.60B, Industrials to $18.07B, and Communication Services to $14.88B. The market isn’t abandoning risk but it is narrowing into the highest-conviction, most liquid expressions.
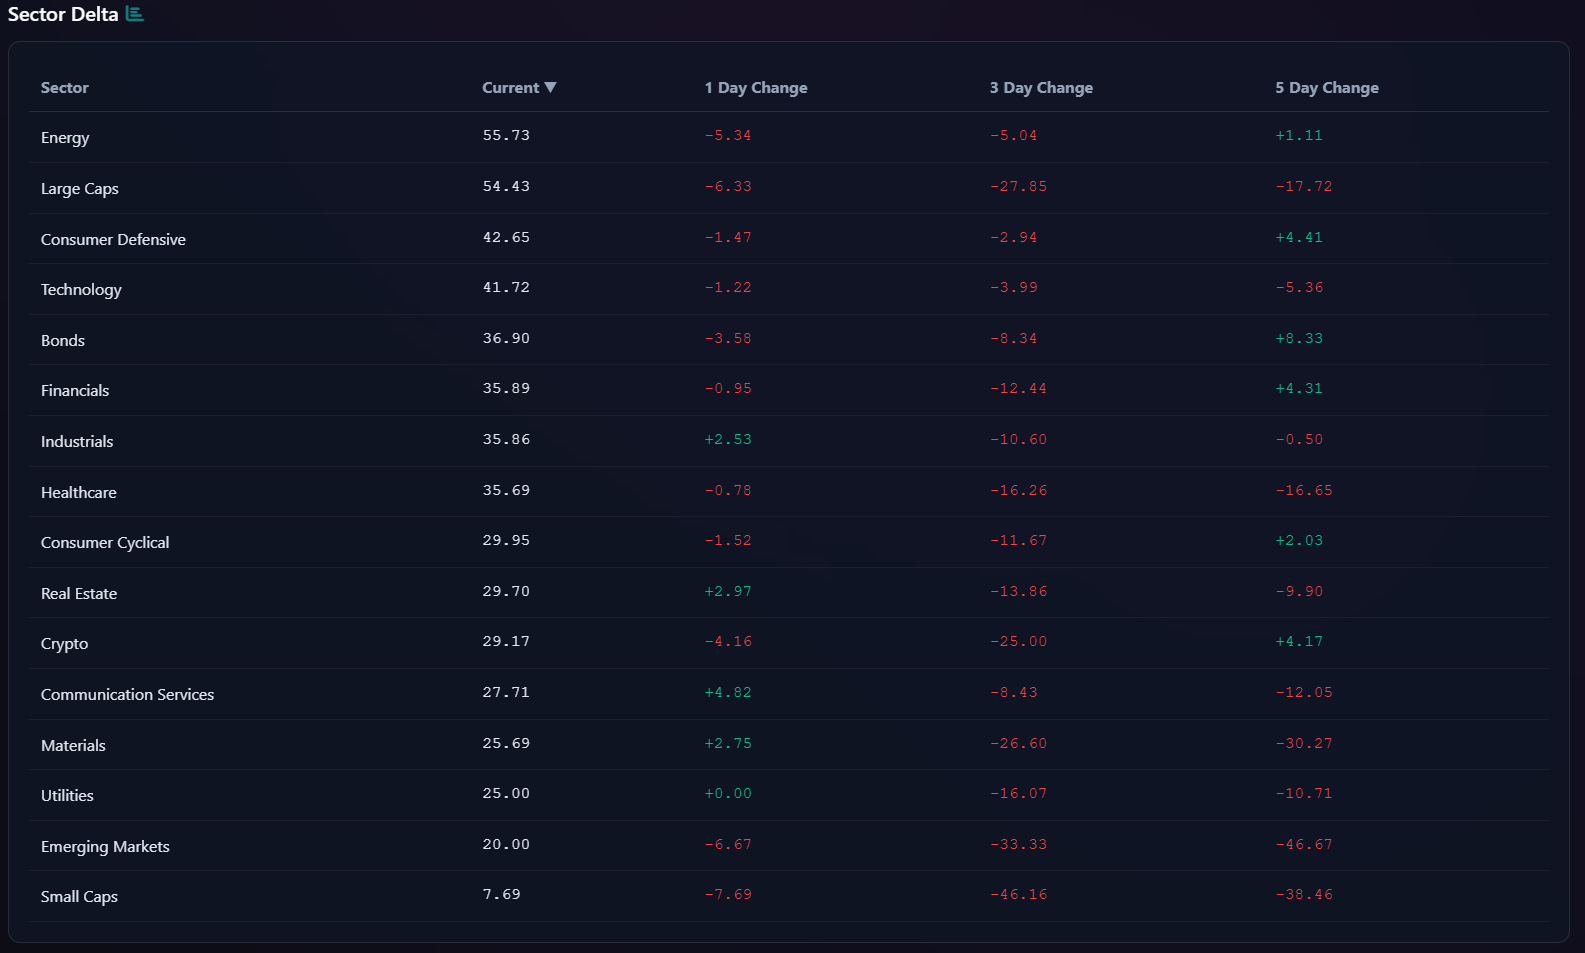
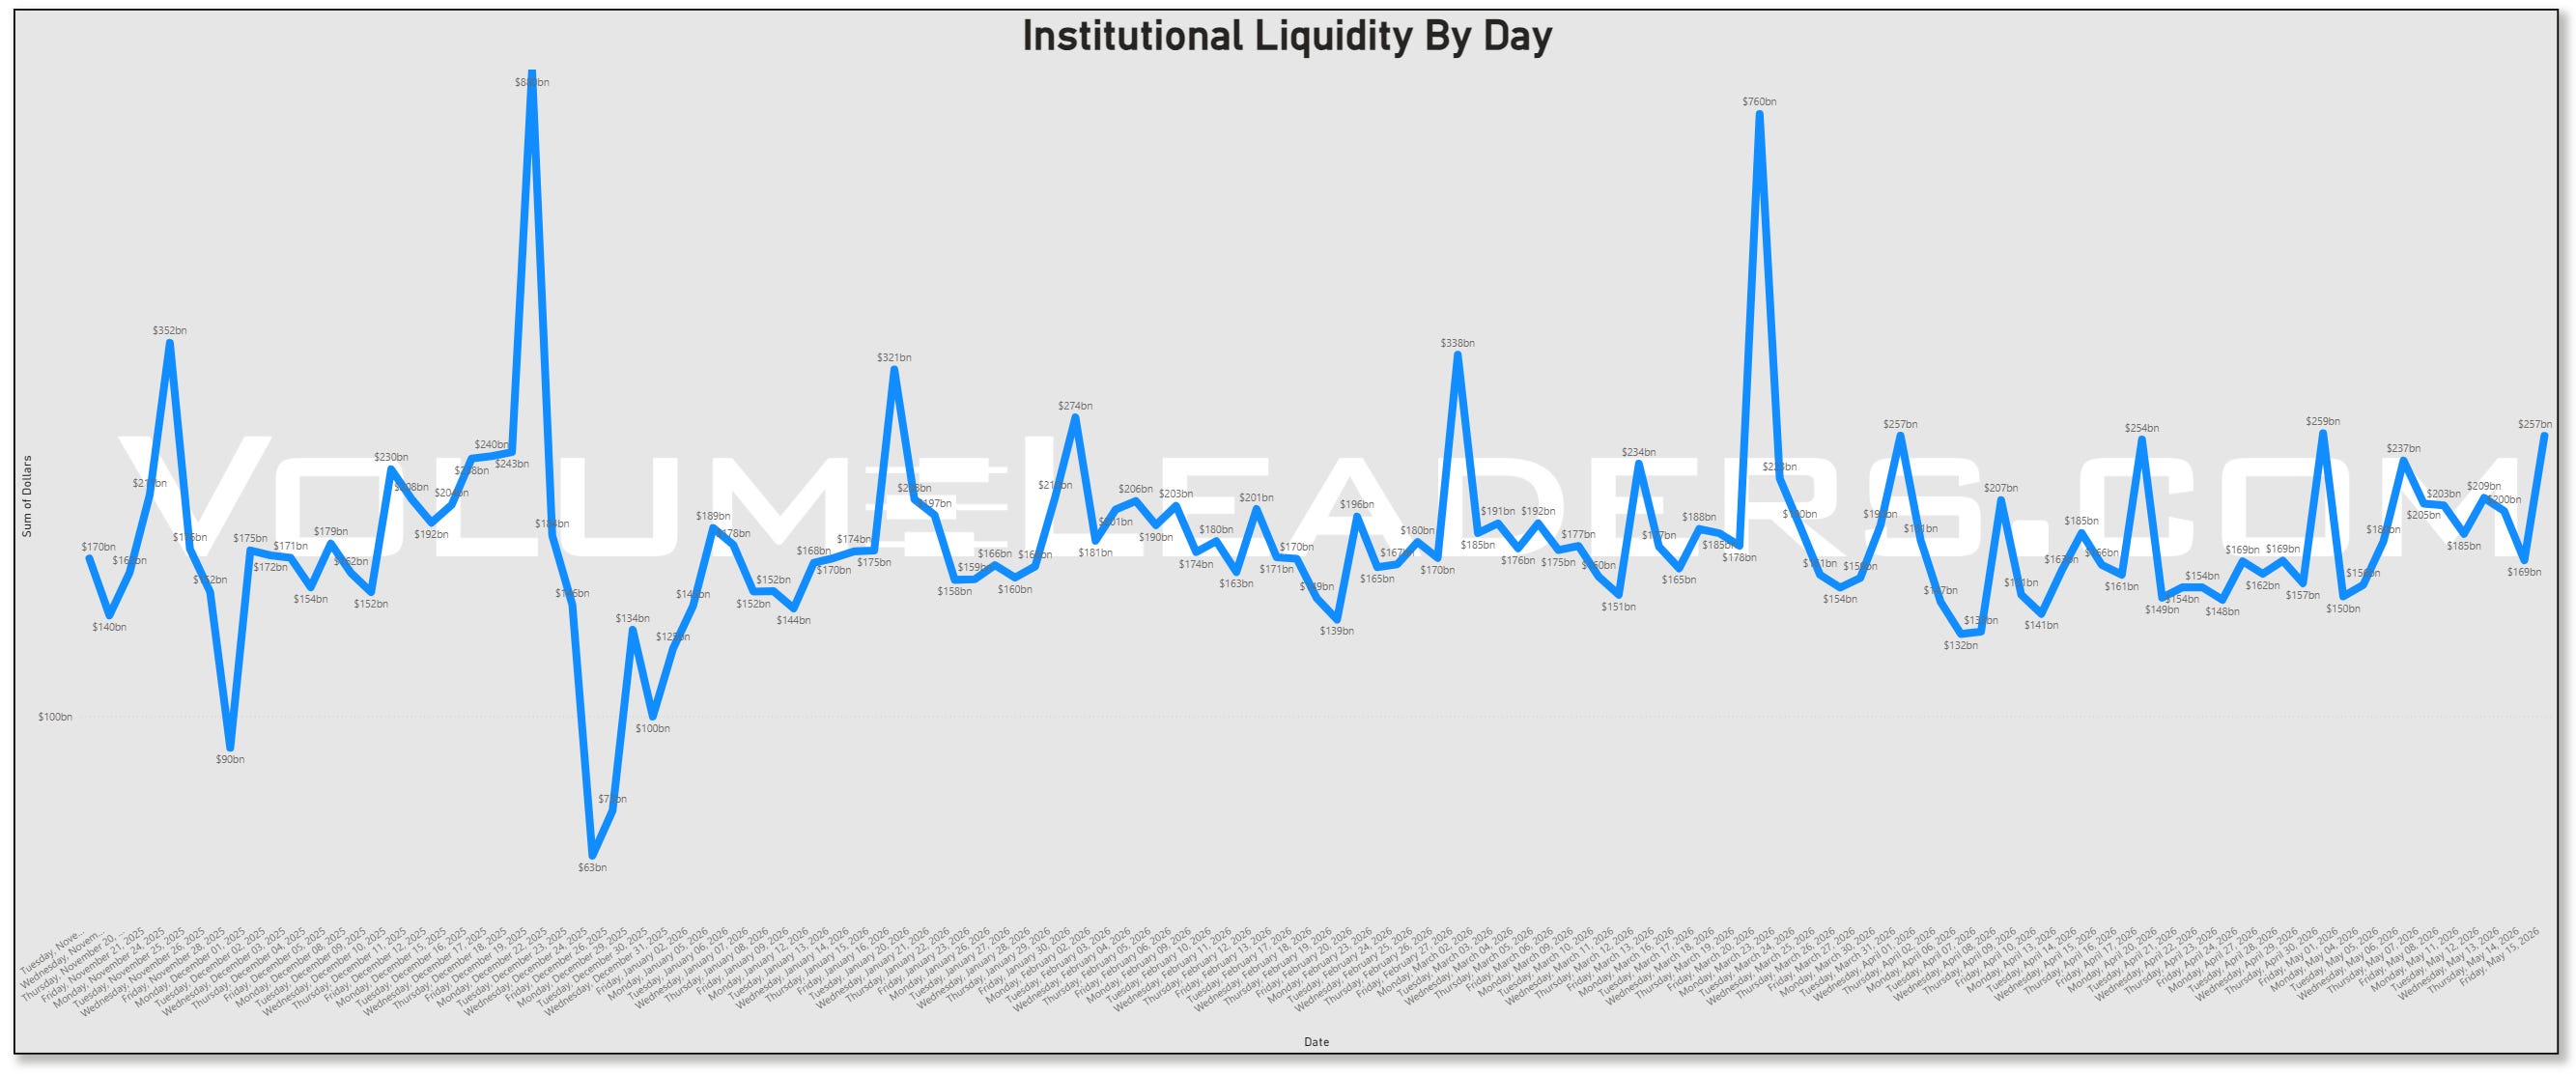
That narrowing makes sense against the macro backdrop. The coming week is centered on Nvidia, AI spending, and the consumer, with Nvidia and major retailers such as Walmart, Home Depot, Target, and TJX are expected to frame the market’s two biggest questions: whether the AI boom still justifies leadership valuations, and whether consumer demand is holding up under inflation pressure. Nvidia shares have risen sharply since late March and the broader rally is relying heavily on a limited group of stocks, which lines up almost perfectly with this week’s tape.
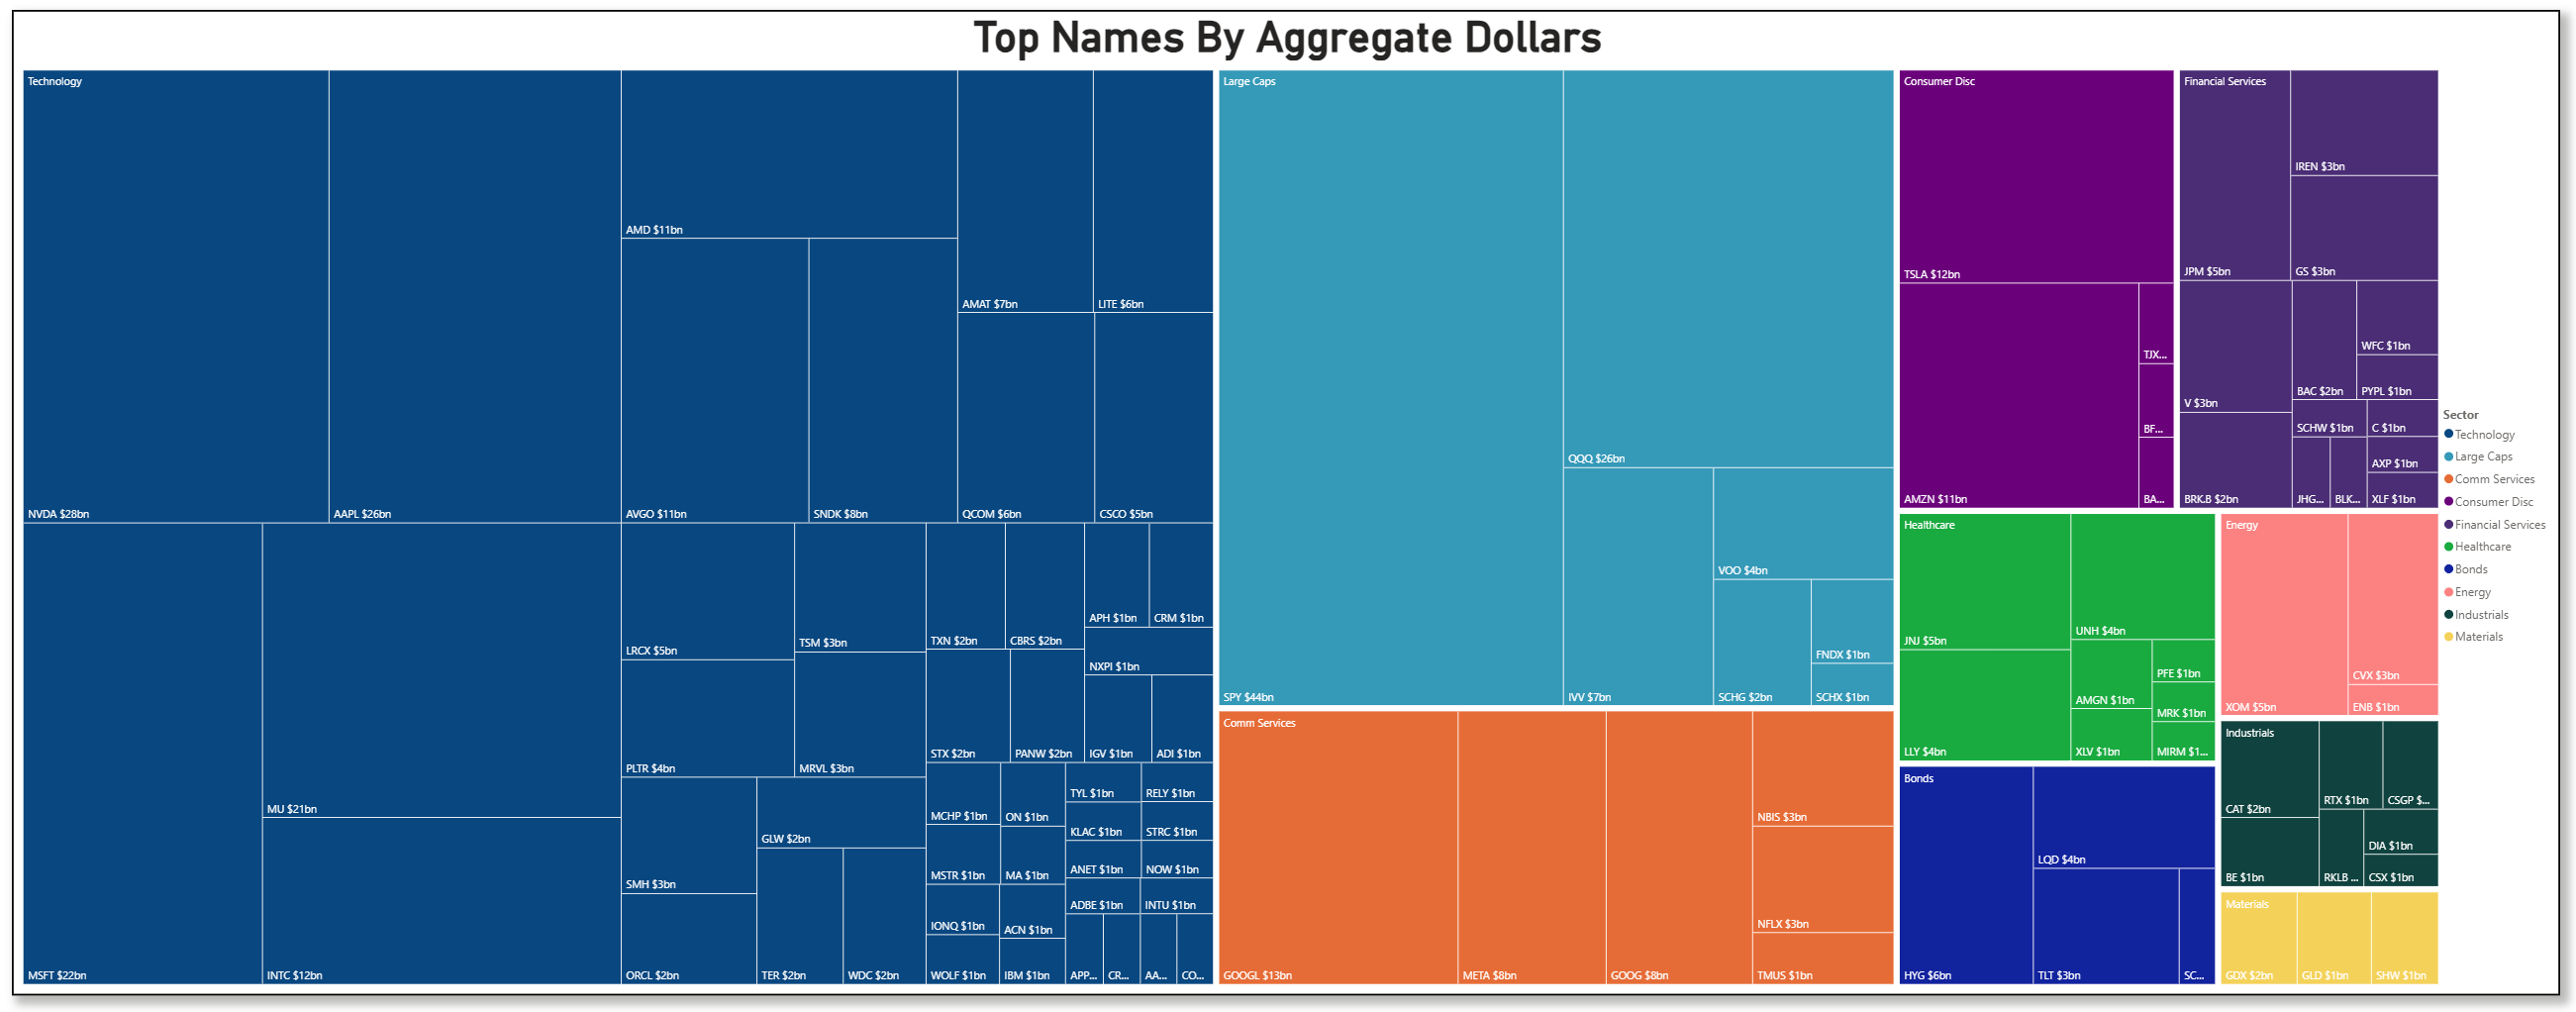
The treemap confirms the same message. NVDA led single-name technology flow at about $28B, followed by AAPL around $26B, MSFT around $22B, MU around $21B, INTC around $12B, AMD around $11B, and AVGO around $11B. On the index side, SPY was the dominant vehicle at roughly $44B, with QQQ around $26B and IVV around $7B. This is broad positioning, but it is broad positioning through the most liquid doors. Institutions were not expressing confidence by spraying dollars evenly across the tape. They were using the index complex and the handful of companies that define index direction.
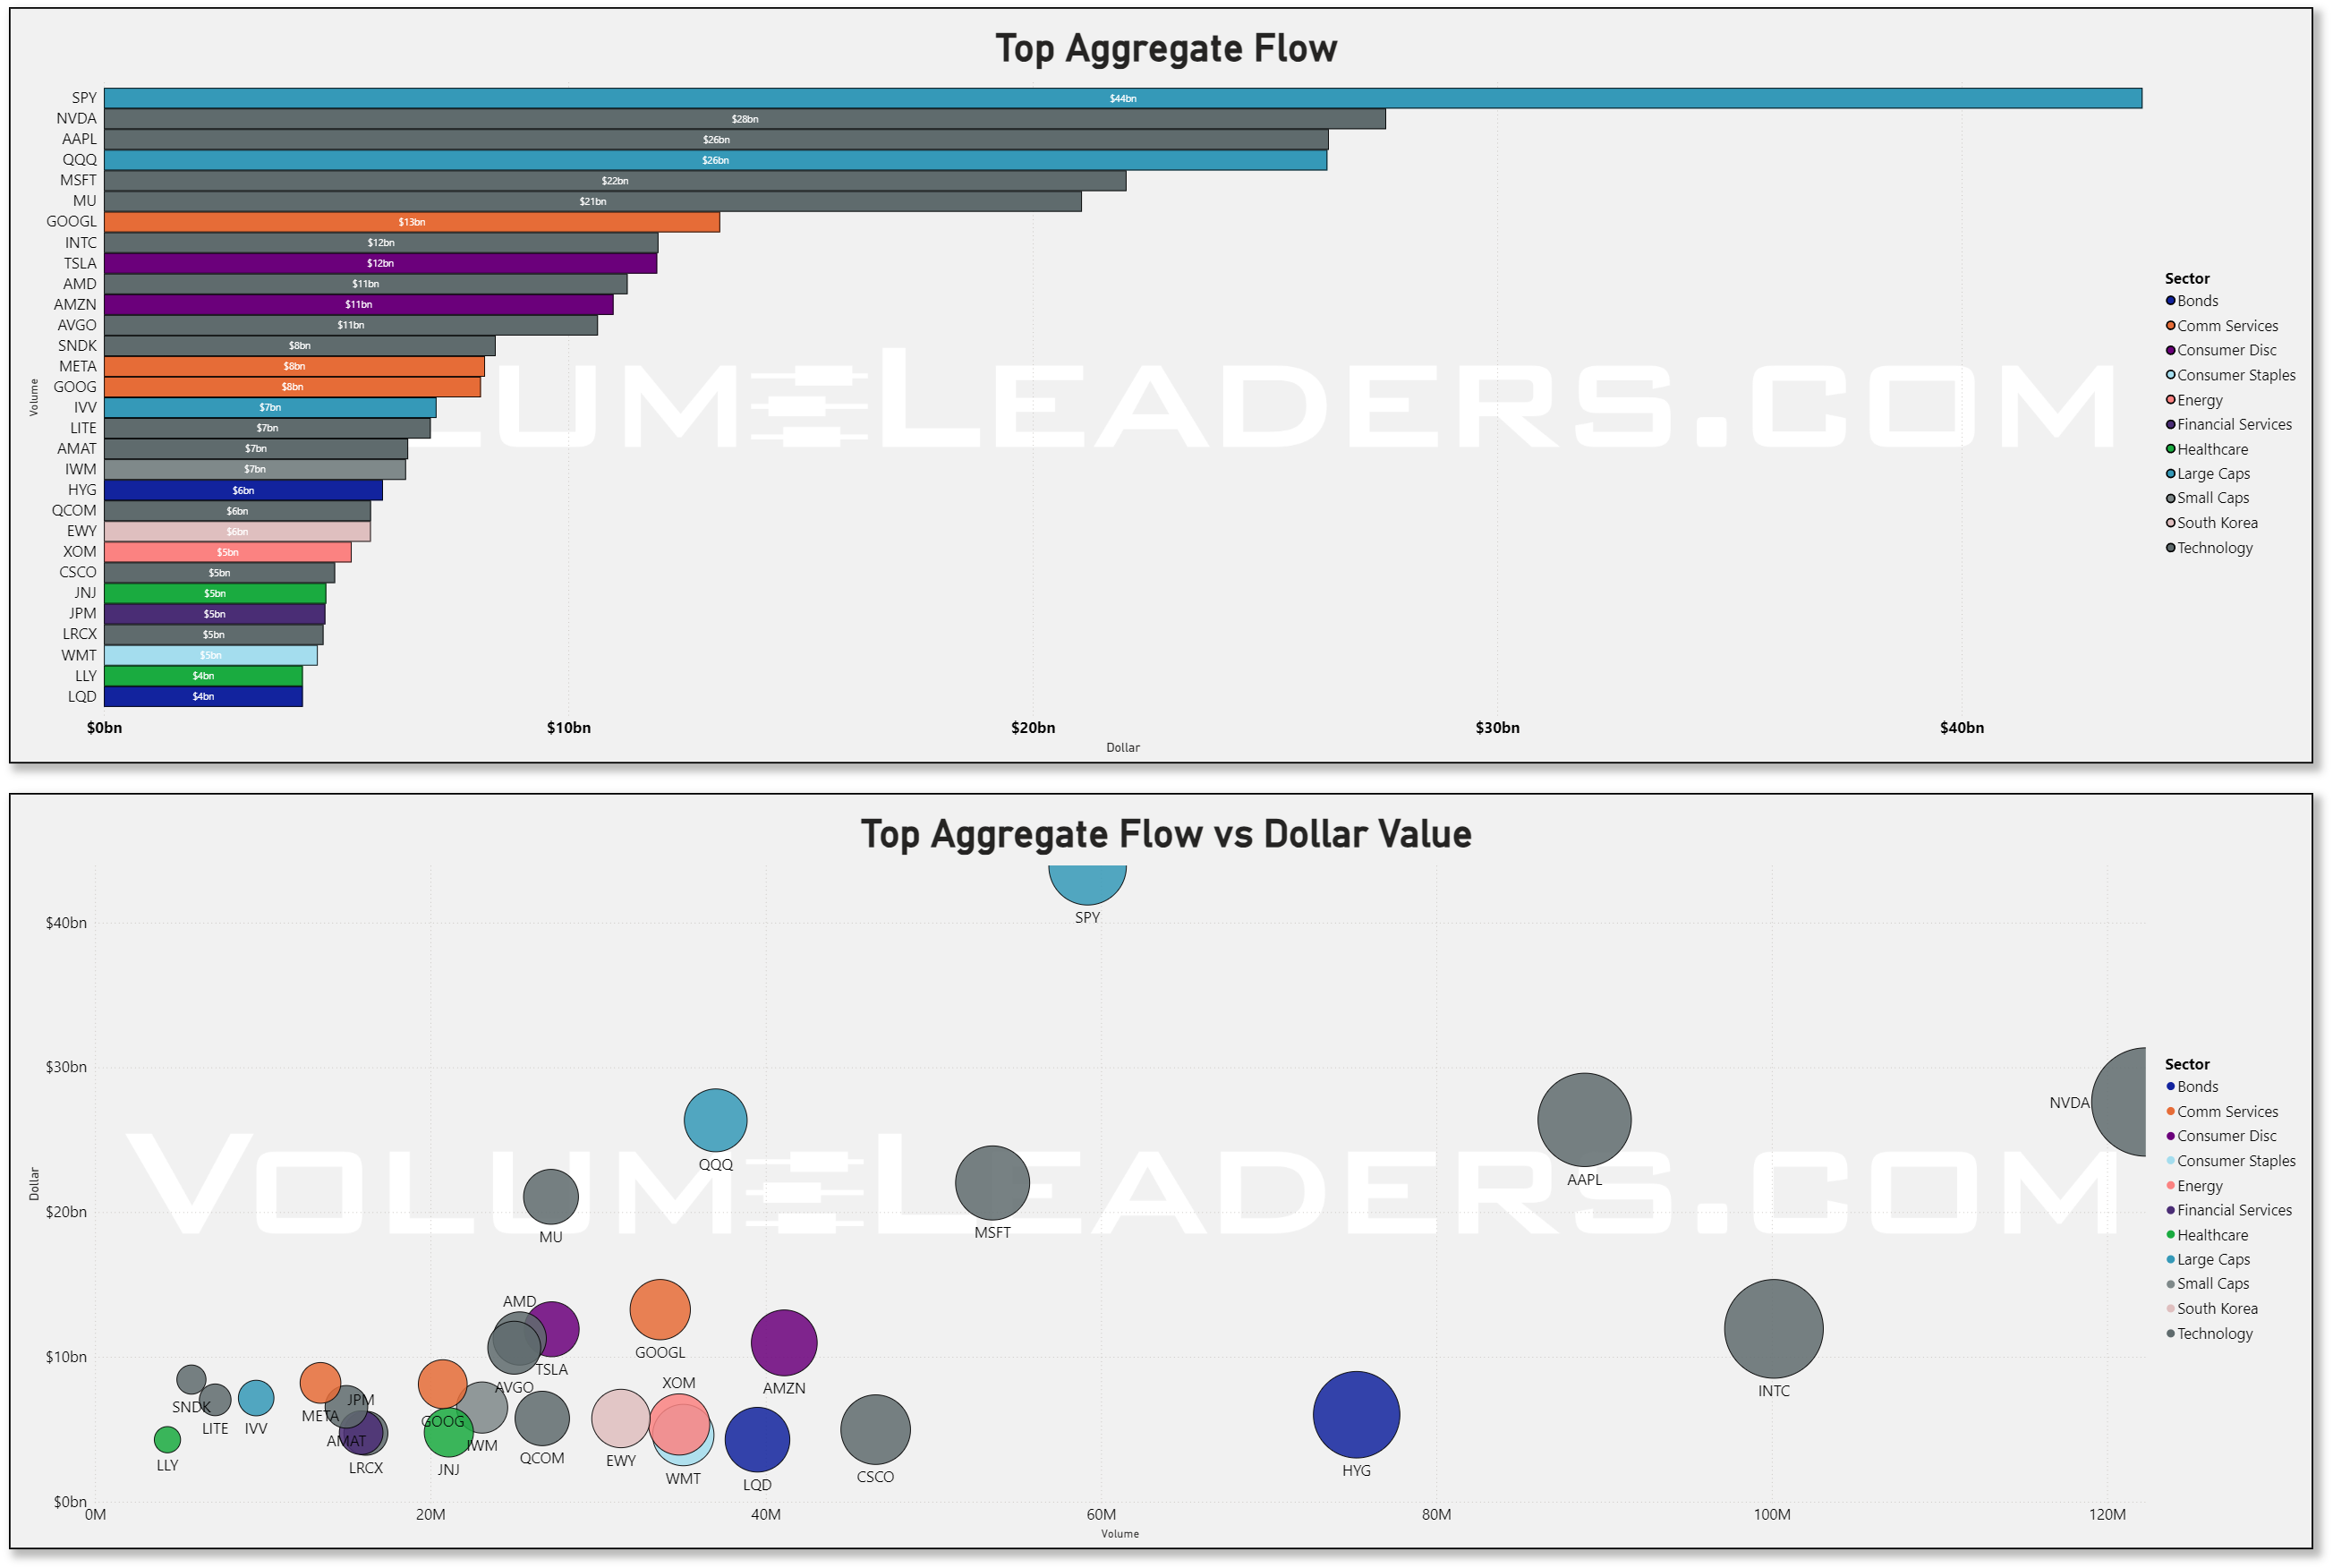
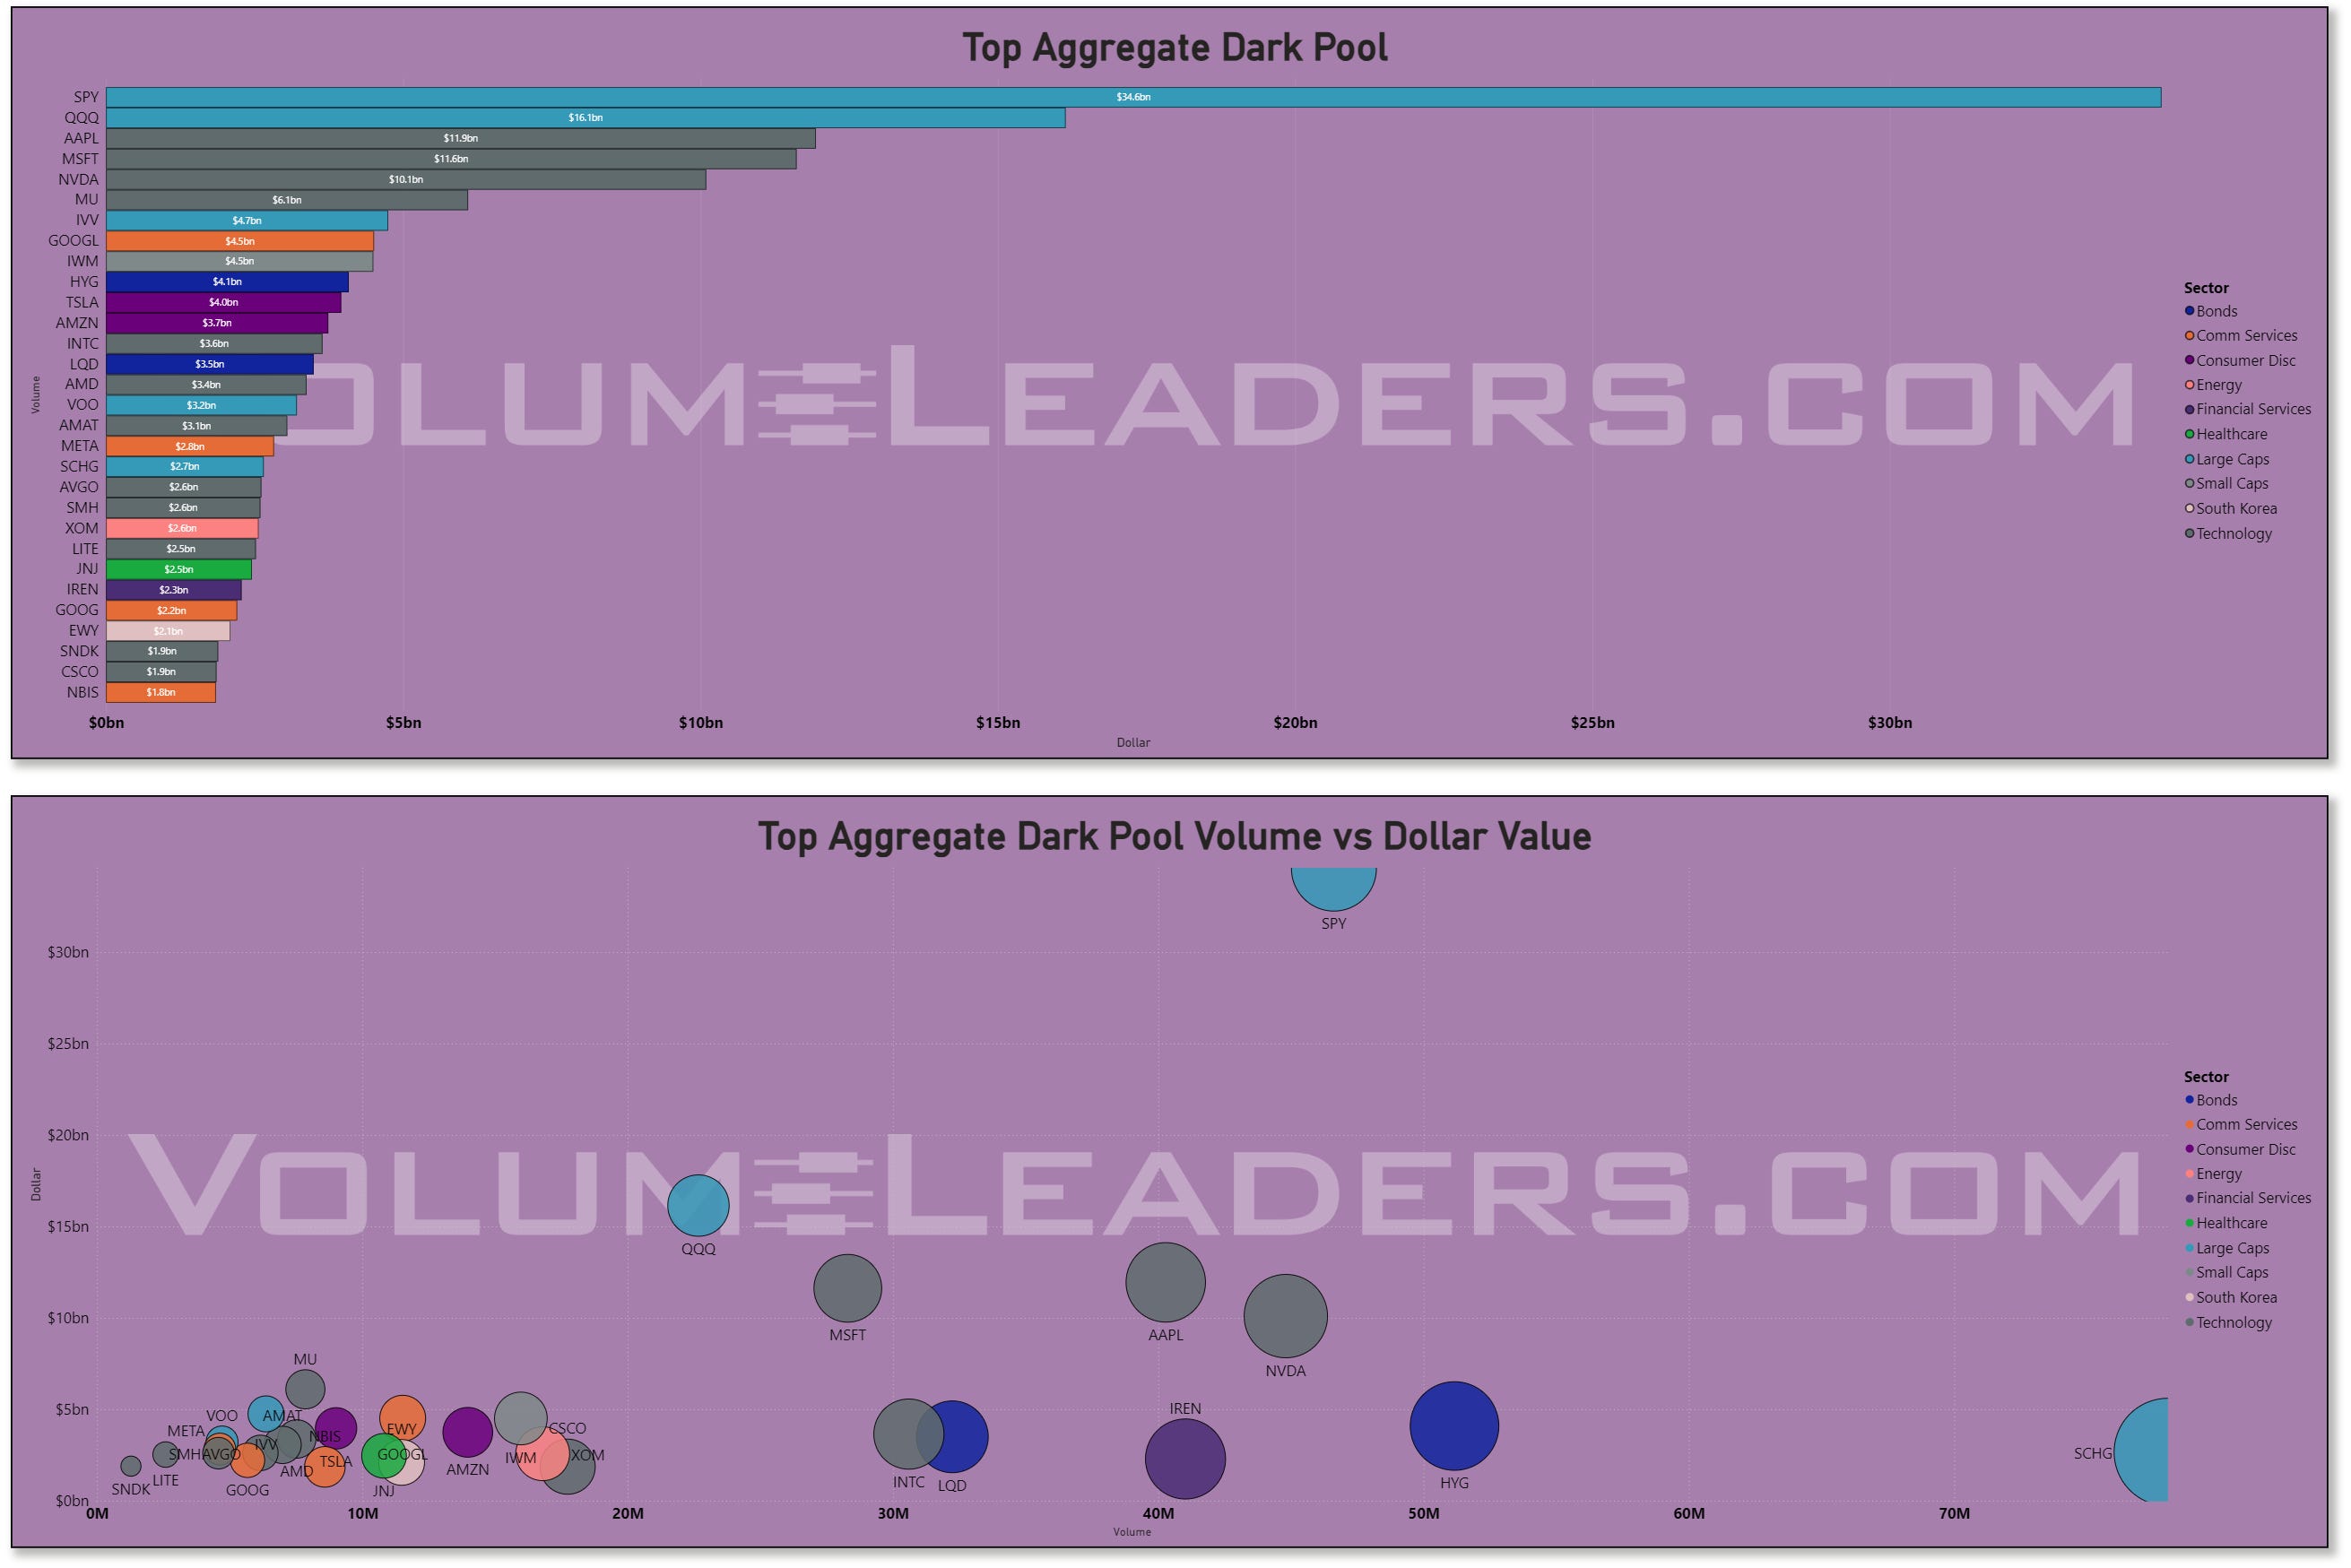
The dark-pool lens reinforces that point. SPY dominated hidden flow at roughly $34.6B, followed by QQQ at $16.1B, AAPL at $11.9B, MSFT at $11.6B, NVDA at $10.1B, and MU at $6.1B. That is the quieter, more patient side of the tape, and it is heavily concentrated in the same leadership stack. Dark-pool concentration of that size does not tell us buy or sell by itself, but it does tell us where institutions needed to transfer size without showing their hand. When those same names also dominate the aggregate tape, the read-through is that the market’s real battlefield is not small-cap breadth or defensive rotation. It is whether mega-cap growth can continue absorbing institutional inventory without price deterioration.
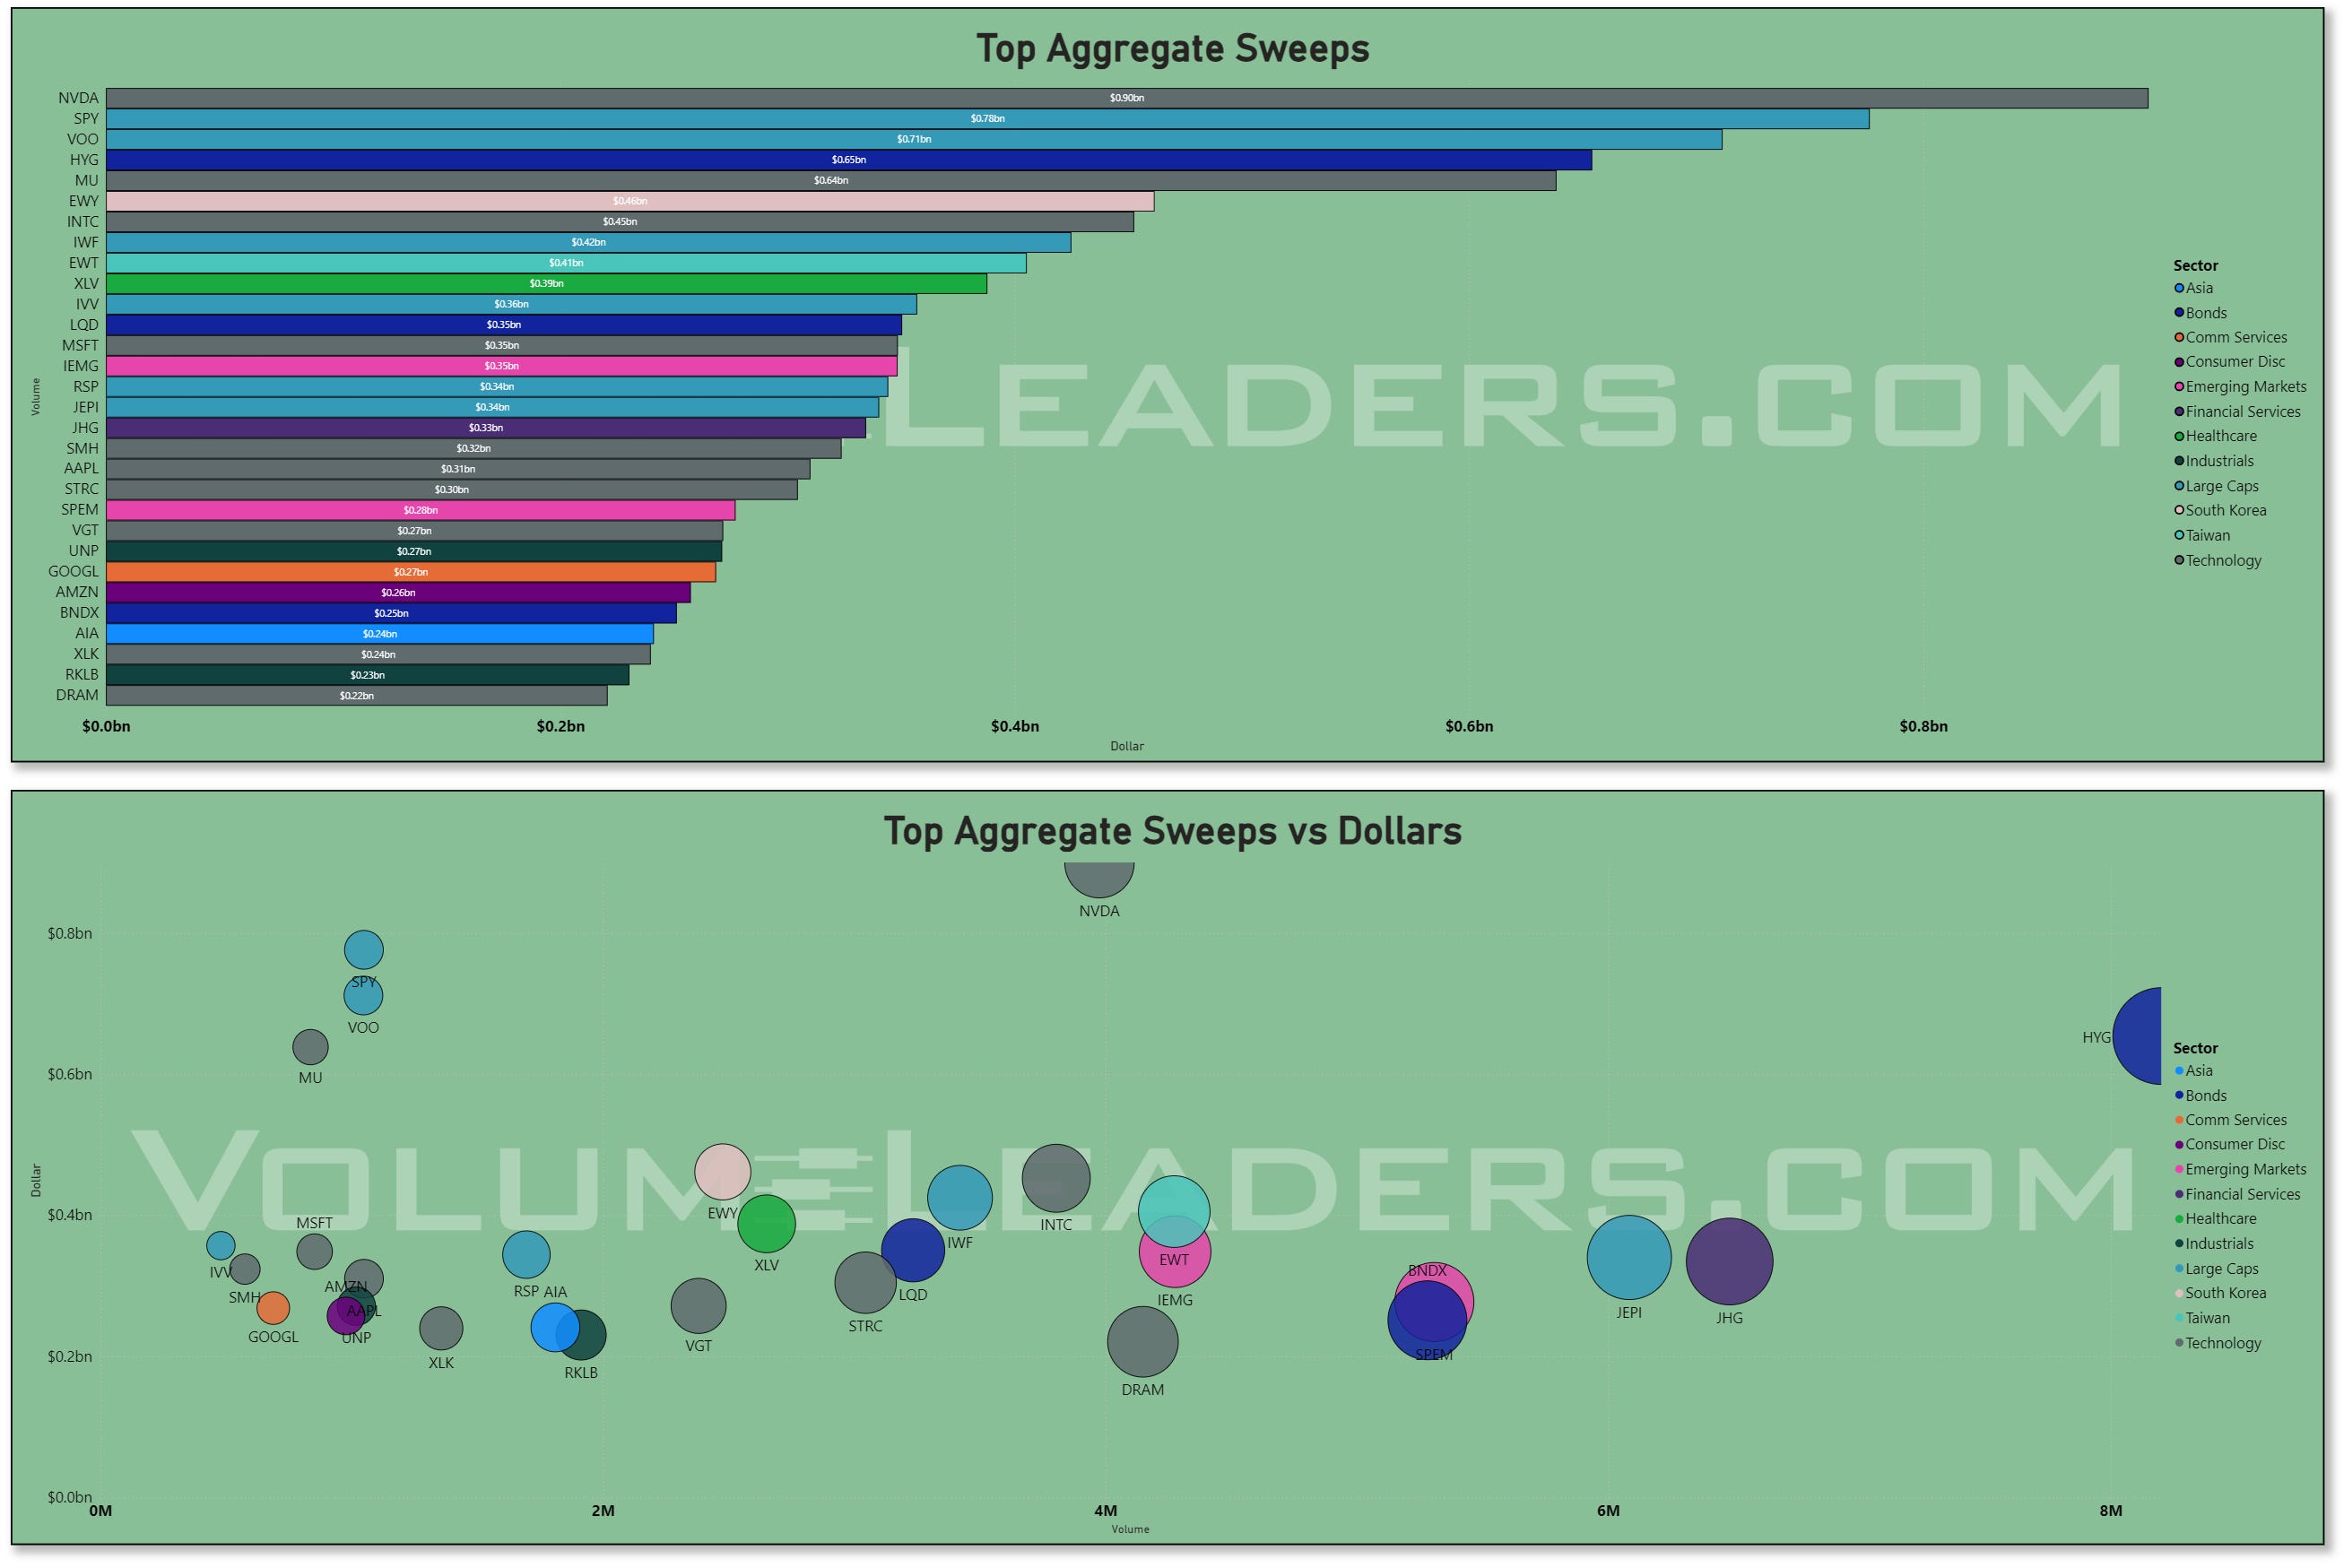
The sweep tape adds the tactical layer. NVDA led sweeps at roughly $0.90B, followed by SPY around $0.78B, VOO around $0.71B, HYG around $0.65B, MU around $0.64B, EWY around $0.46B, INTC around $0.45B, and IWF around $0.42B. Sweeps are the most urgent expression on the board, so seeing NVDA, SPY, VOO, MU, and INTC near the top says traders were not merely reallocating quietly; they were also willing to chase or hedge around the same themes intraday. HYG sitting near the top is notable too. When high yield credit appears prominently beside equity beta, it often points to risk appetite or credit-sensitive hedging rather than a pure equity-only move.
Policy also matters here. Markets are beginning to price the possibility of a Fed hike around the turn of the year after stronger inflation data, even as the Fed’s official posture had retained an easing bias. That kind of reflationary tension helps explain why the tape prefers liquid growth and index exposure over indiscriminate cyclicality. Investors want upside participation, but they do not want to be trapped in weaker balance-sheet or rate-sensitive corners if yields reprice.
Seasonally, this is also the time of year when traders tend to become more selective. The familiar “sell in May and go away” framework is based on the historical tendency for stocks to underperform during the May through October window, even if it is too blunt to use as a trading system by itself. Stock Trader’s Almanac describes its tactical seasonal switching framework as built around the idea that most market gains historically occur from November through April, which helps explain why institutions often demand cleaner confirmation before pressing aggressively into late spring.
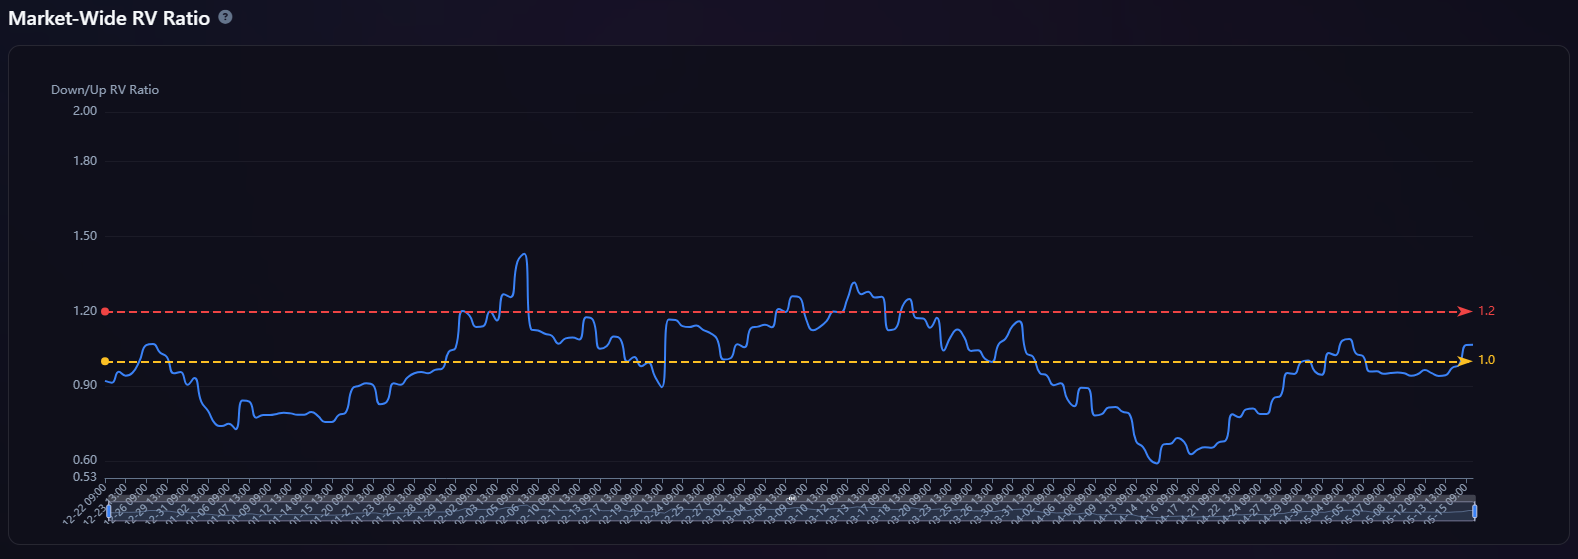
So the through-line is simple: this week+OPEX was positioning, but not broad conviction. Technology remained the preferred home, Large Caps and index vehicles carried the allocation load, dark pools concentrated in SPY, QQQ, AAPL, MSFT, NVDA, and MU, and sweeps confirmed tactical urgency in the same neighborhood. Meanwhile, the broader condition backdrop still argues for discrimination. Stable volatility and pockets of relative strength support taking risk, but the lack of broadening says the right expression is still leadership first, liquidity first, and quality first. Until the flows migrate from index-plus-megacap into wider sector participation, this remains a market where the generals matter more than the army.
Part 2: Individual Names From The Institutional Tape
VolumeLeaders tracks several proprietary signals designed to spotlight names drawing significant institutional interest. Below, we’ve surfaced the latest results and analyzed them to highlight emergent themes. If any of the sectors, narratives, or positioning trends resonate, the names mentioned here offer a strong starting point for deeper research and watchlist consideration.
VL Trade Rank Velocity™ (TRV)
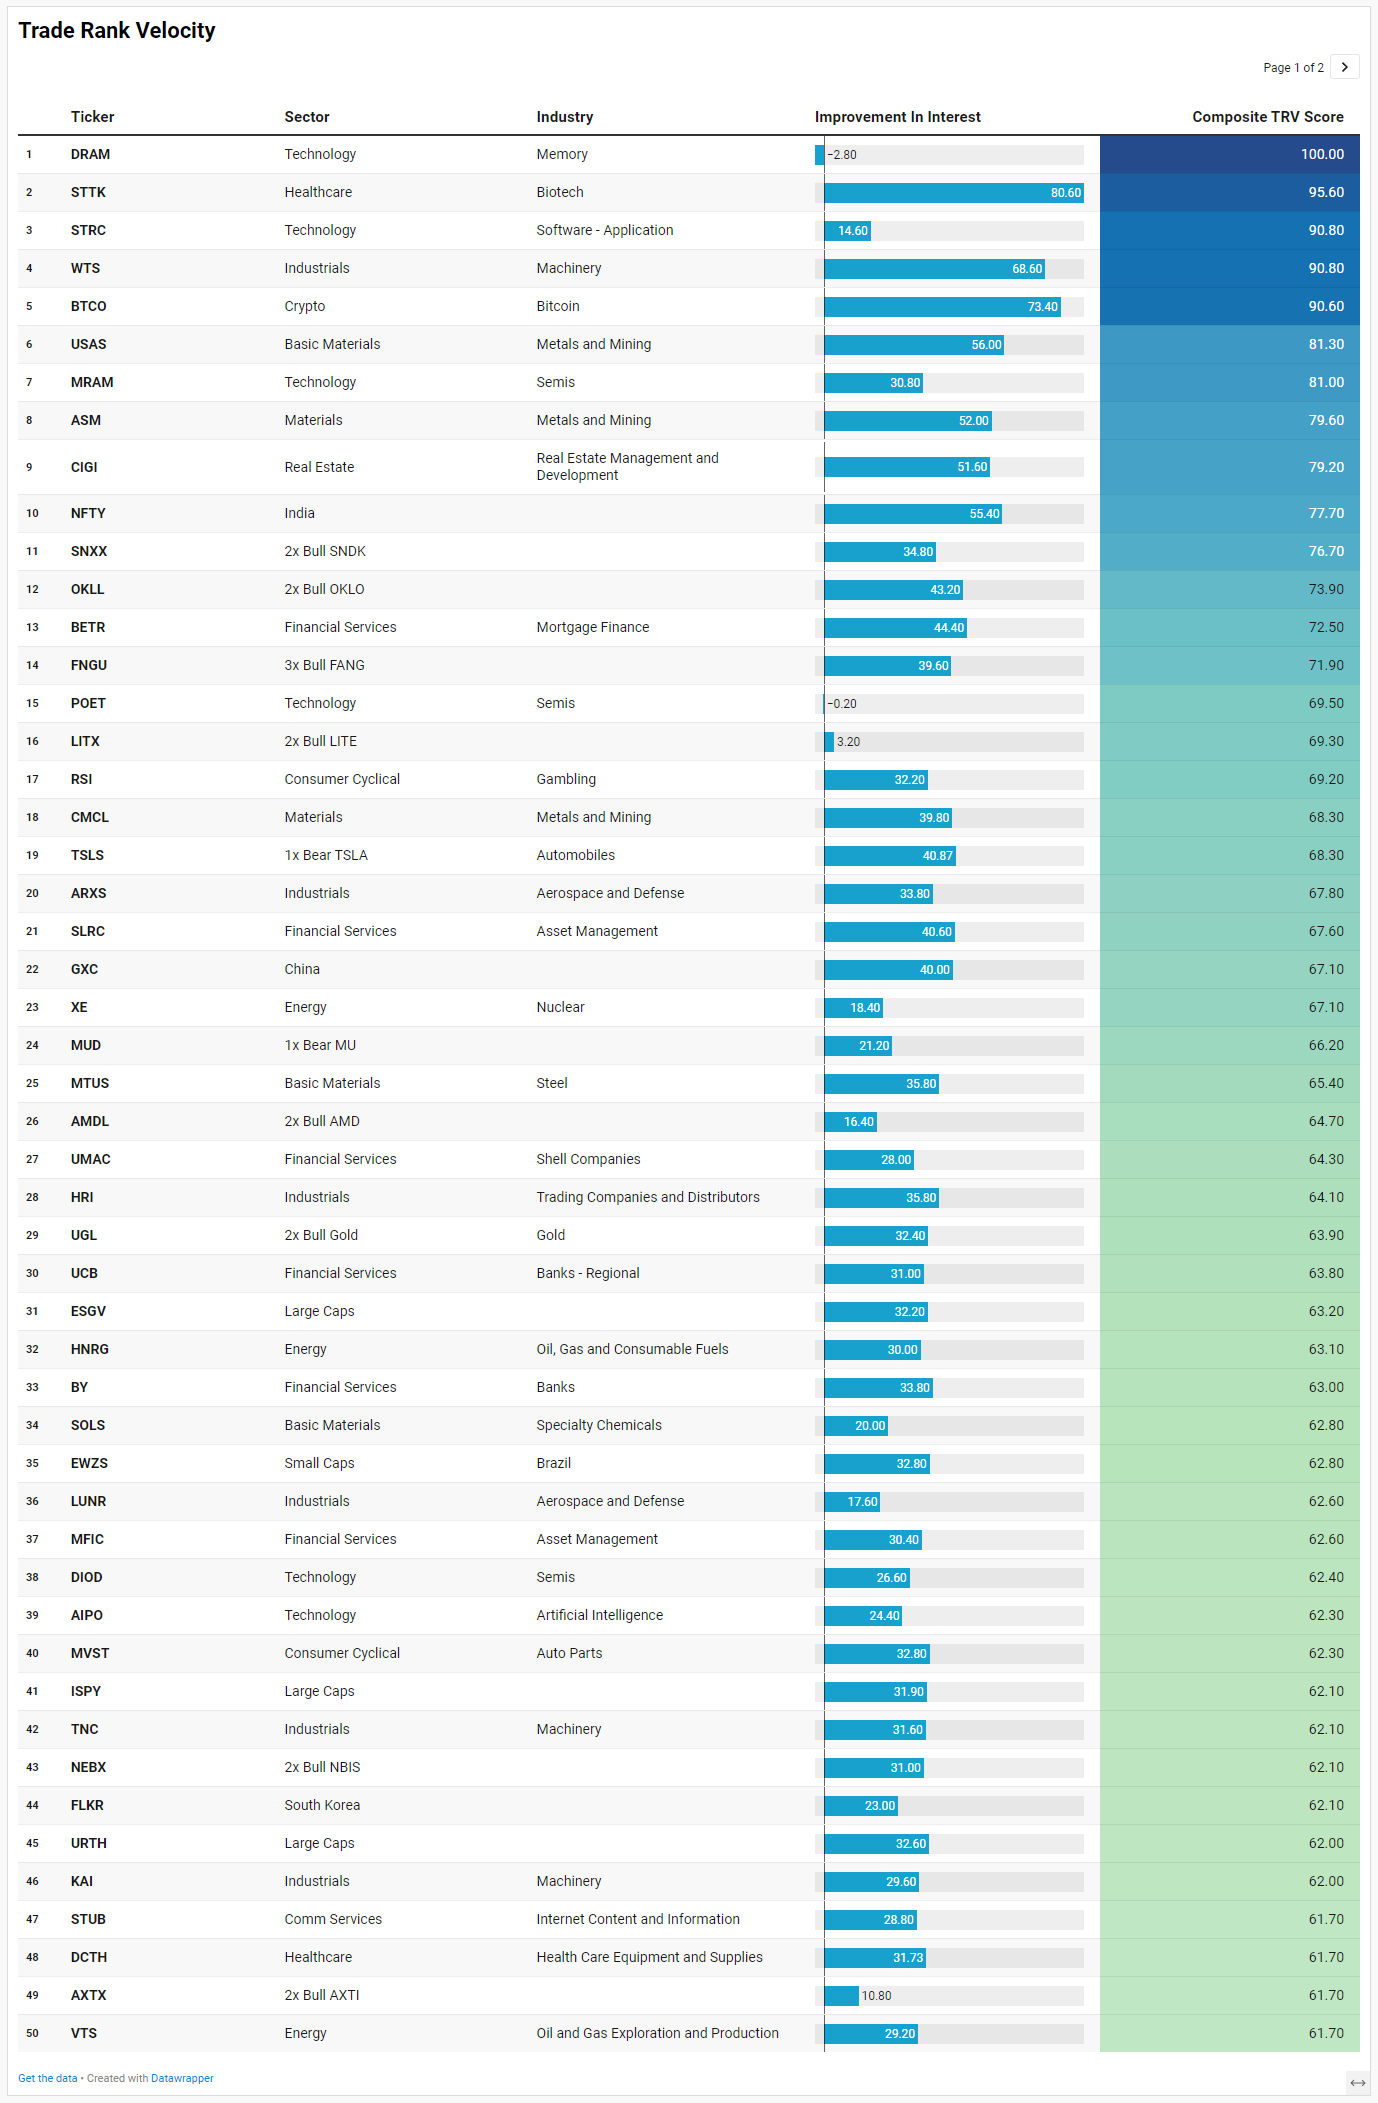
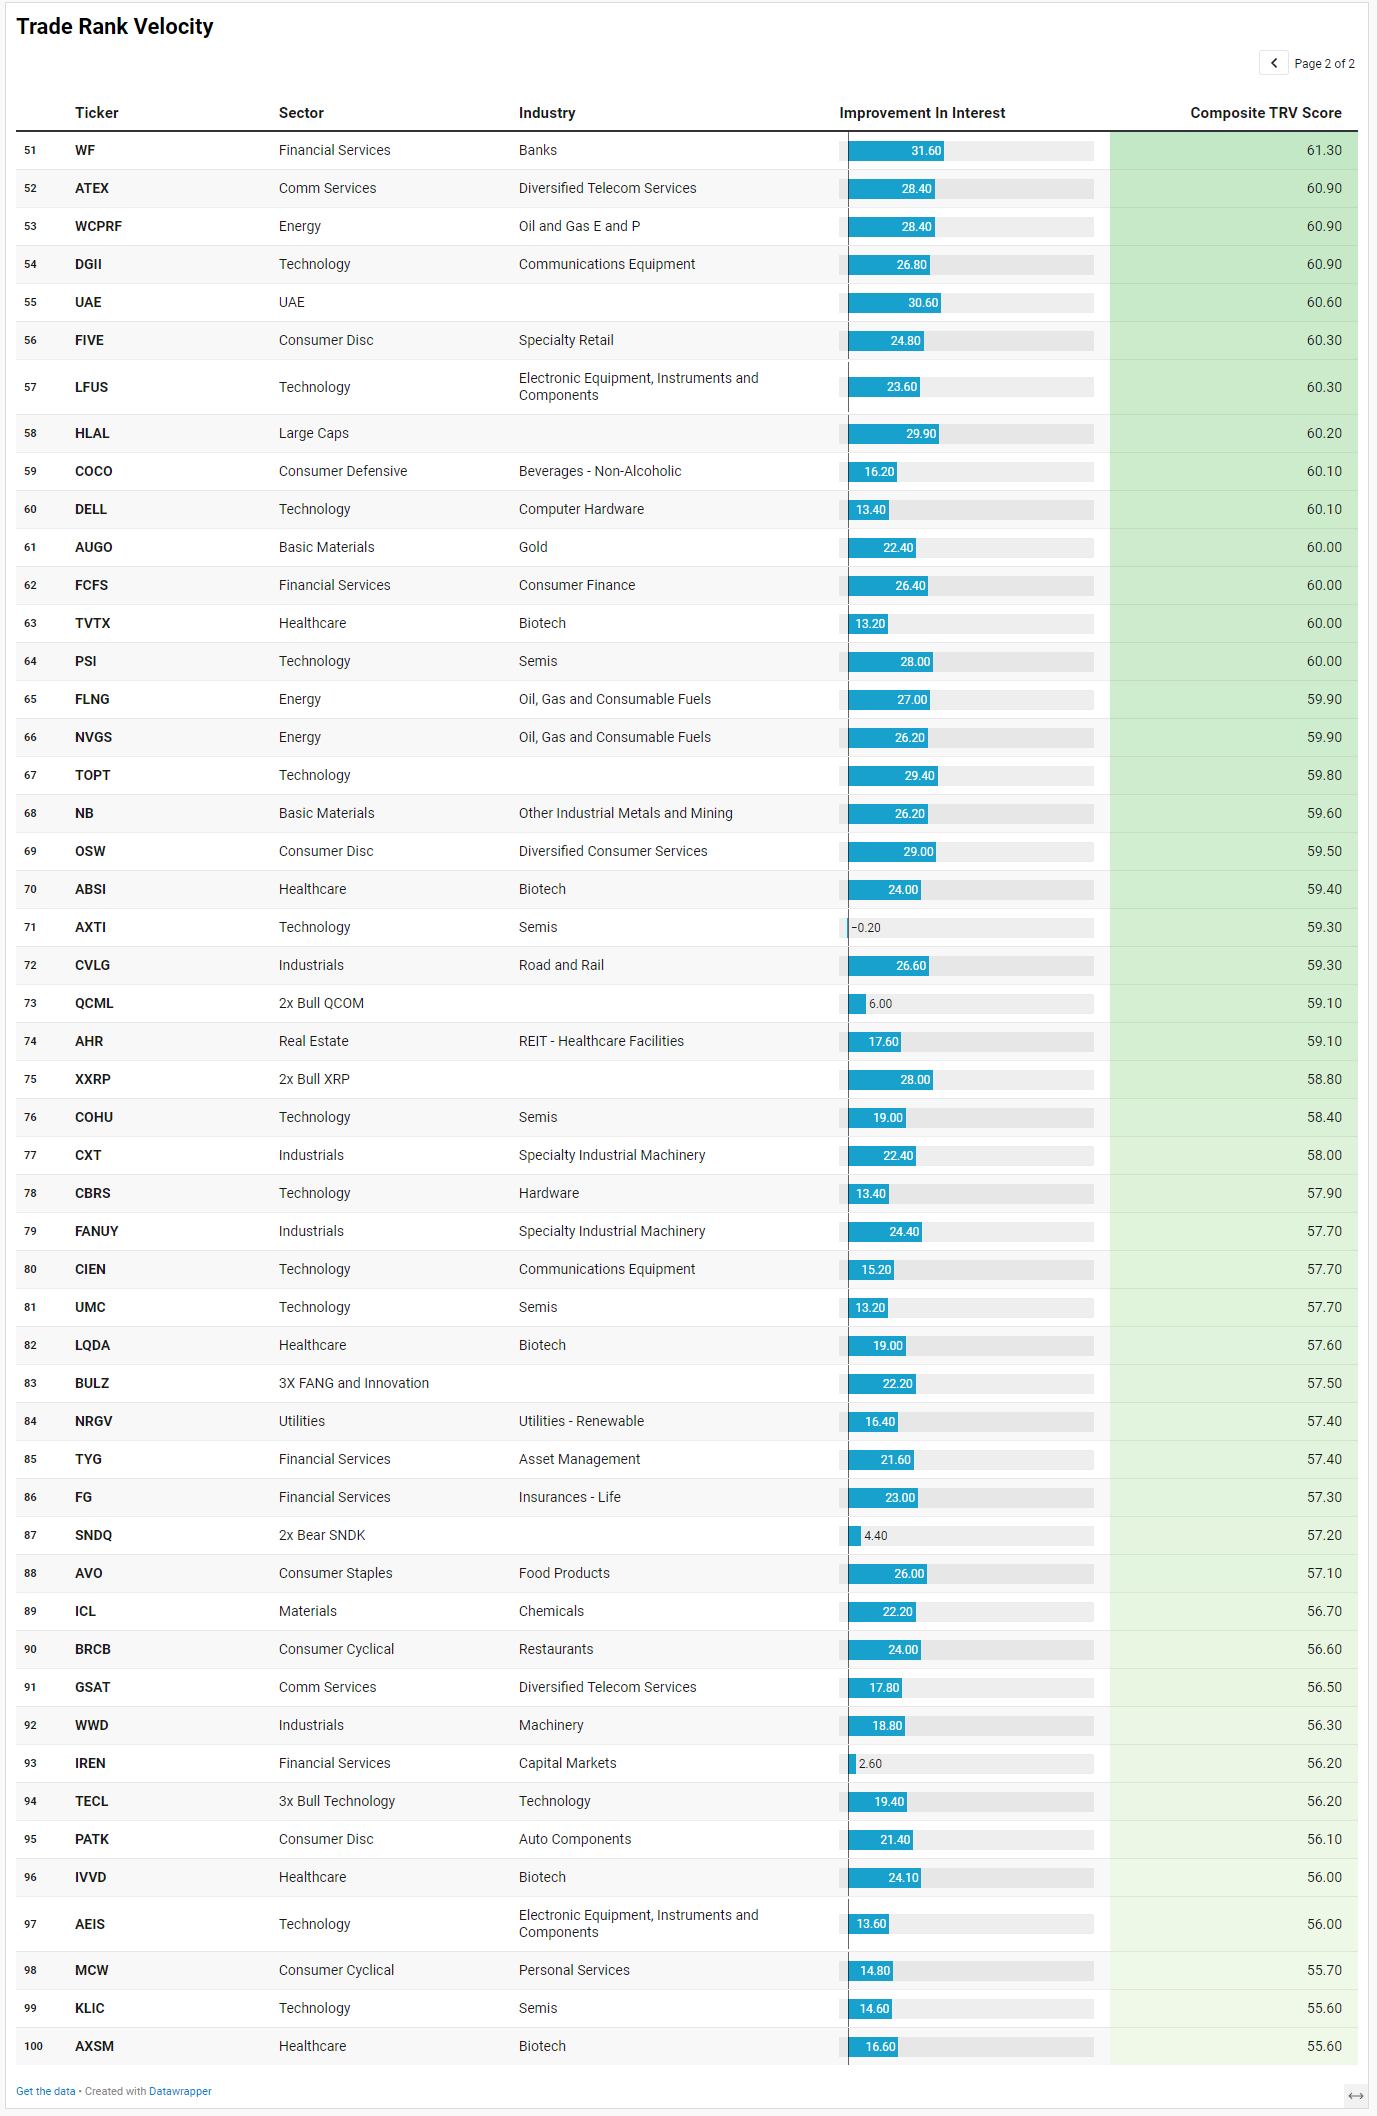
TRV is a proprietary metric that measures the recent acceleration or deceleration in institutional trading activity for a given stock by comparing its average trade rank over the past few days to its average in recent weeks. A sharp improvement in TRV typically reflects a notable shift in positioning, often accompanied by sustained trade activity, suggesting institutions are actively engaging with the name and that intensity of activity is rising. This often precludes meaningful price or narrative shifts. This isn’t a buy-list or sell-list; it’s meant to draw your eyes to names where institutions are putting money to work.
The TRV list fits the same story the broader tape has been telling: institutions are still reaching for risk, but they are doing it through very specific doors rather than buying the whole market indiscriminately. The watchlist is not broad-market confirmation. It is a map of where urgency is appearing.
The clearest theme is still technology, but it is not just mega-cap software. The list is packed with memory, semis, AI, communications equipment, and leveraged expressions tied to the same complex. DRAM ranks first with a composite TRV score of 100 and sustained activity of 224, while STRC, MRAM, SNXX, POET, LITX, AMDL, DIOD, AIPO, AXTX, DELL, PSI, AXTI, QCML, COHU, CBRS, CIEN, UMC, TECL, AEIS, and KLIC all reinforce the point. This lines up with the main flow narrative: the market still wants AI, compute, memory, and hardware infrastructure. The distinction is that TRV is surfacing the second- and third-derivative beneficiaries beneath NVDA, AAPL, MSFT, MU, AMD, and QQQ.
The second theme is speculative beta returning, but in a targeted way. FNGU, BULZ, TECL, AMDL, OKLL, XXRP, BTCO, and several 2x/3x or single-name leveraged products show up prominently. That supports the sentiment read: traders are not in panic mode. They are willing to press convexity, especially where the narrative is already validated by leadership or thematic momentum. But this also means the tape is vulnerable if leadership stalls, because leverage products tend to amplify reversals.
The third theme is hard assets and resource scarcity. USAS, ASM, CMCL, MTUS, UGL, SOLS, AUGO, NB, ICL, plus energy/nuclear names like XE, HNRG, VTS, WCPRF, FLNG, and NVGS suggest institutional attention is not confined to AI. There is a parallel bid developing in metals, mining, gold, steel, nuclear, and energy infrastructure. That fits the macro backdrop of sticky inflation, rate uncertainty, and demand for real-asset exposure.
The fourth theme is industrial durability. WTS, ARXS, HRI, LUNR, TNC, KAI, CVLG, CXT, FANUY, WWD, and AEIS point to machinery, aerospace, defense, logistics, and specialized equipment. This supports the idea that the tape is rewarding select cyclicals, not broad cyclicality.
The takeaway is that TRV confirms a barbell: institutional urgency is concentrated in AI infrastructure and high-beta growth on one side, with hard assets, energy, aerospace, and industrial machinery on the other. The middle of the market still looks less compelling.
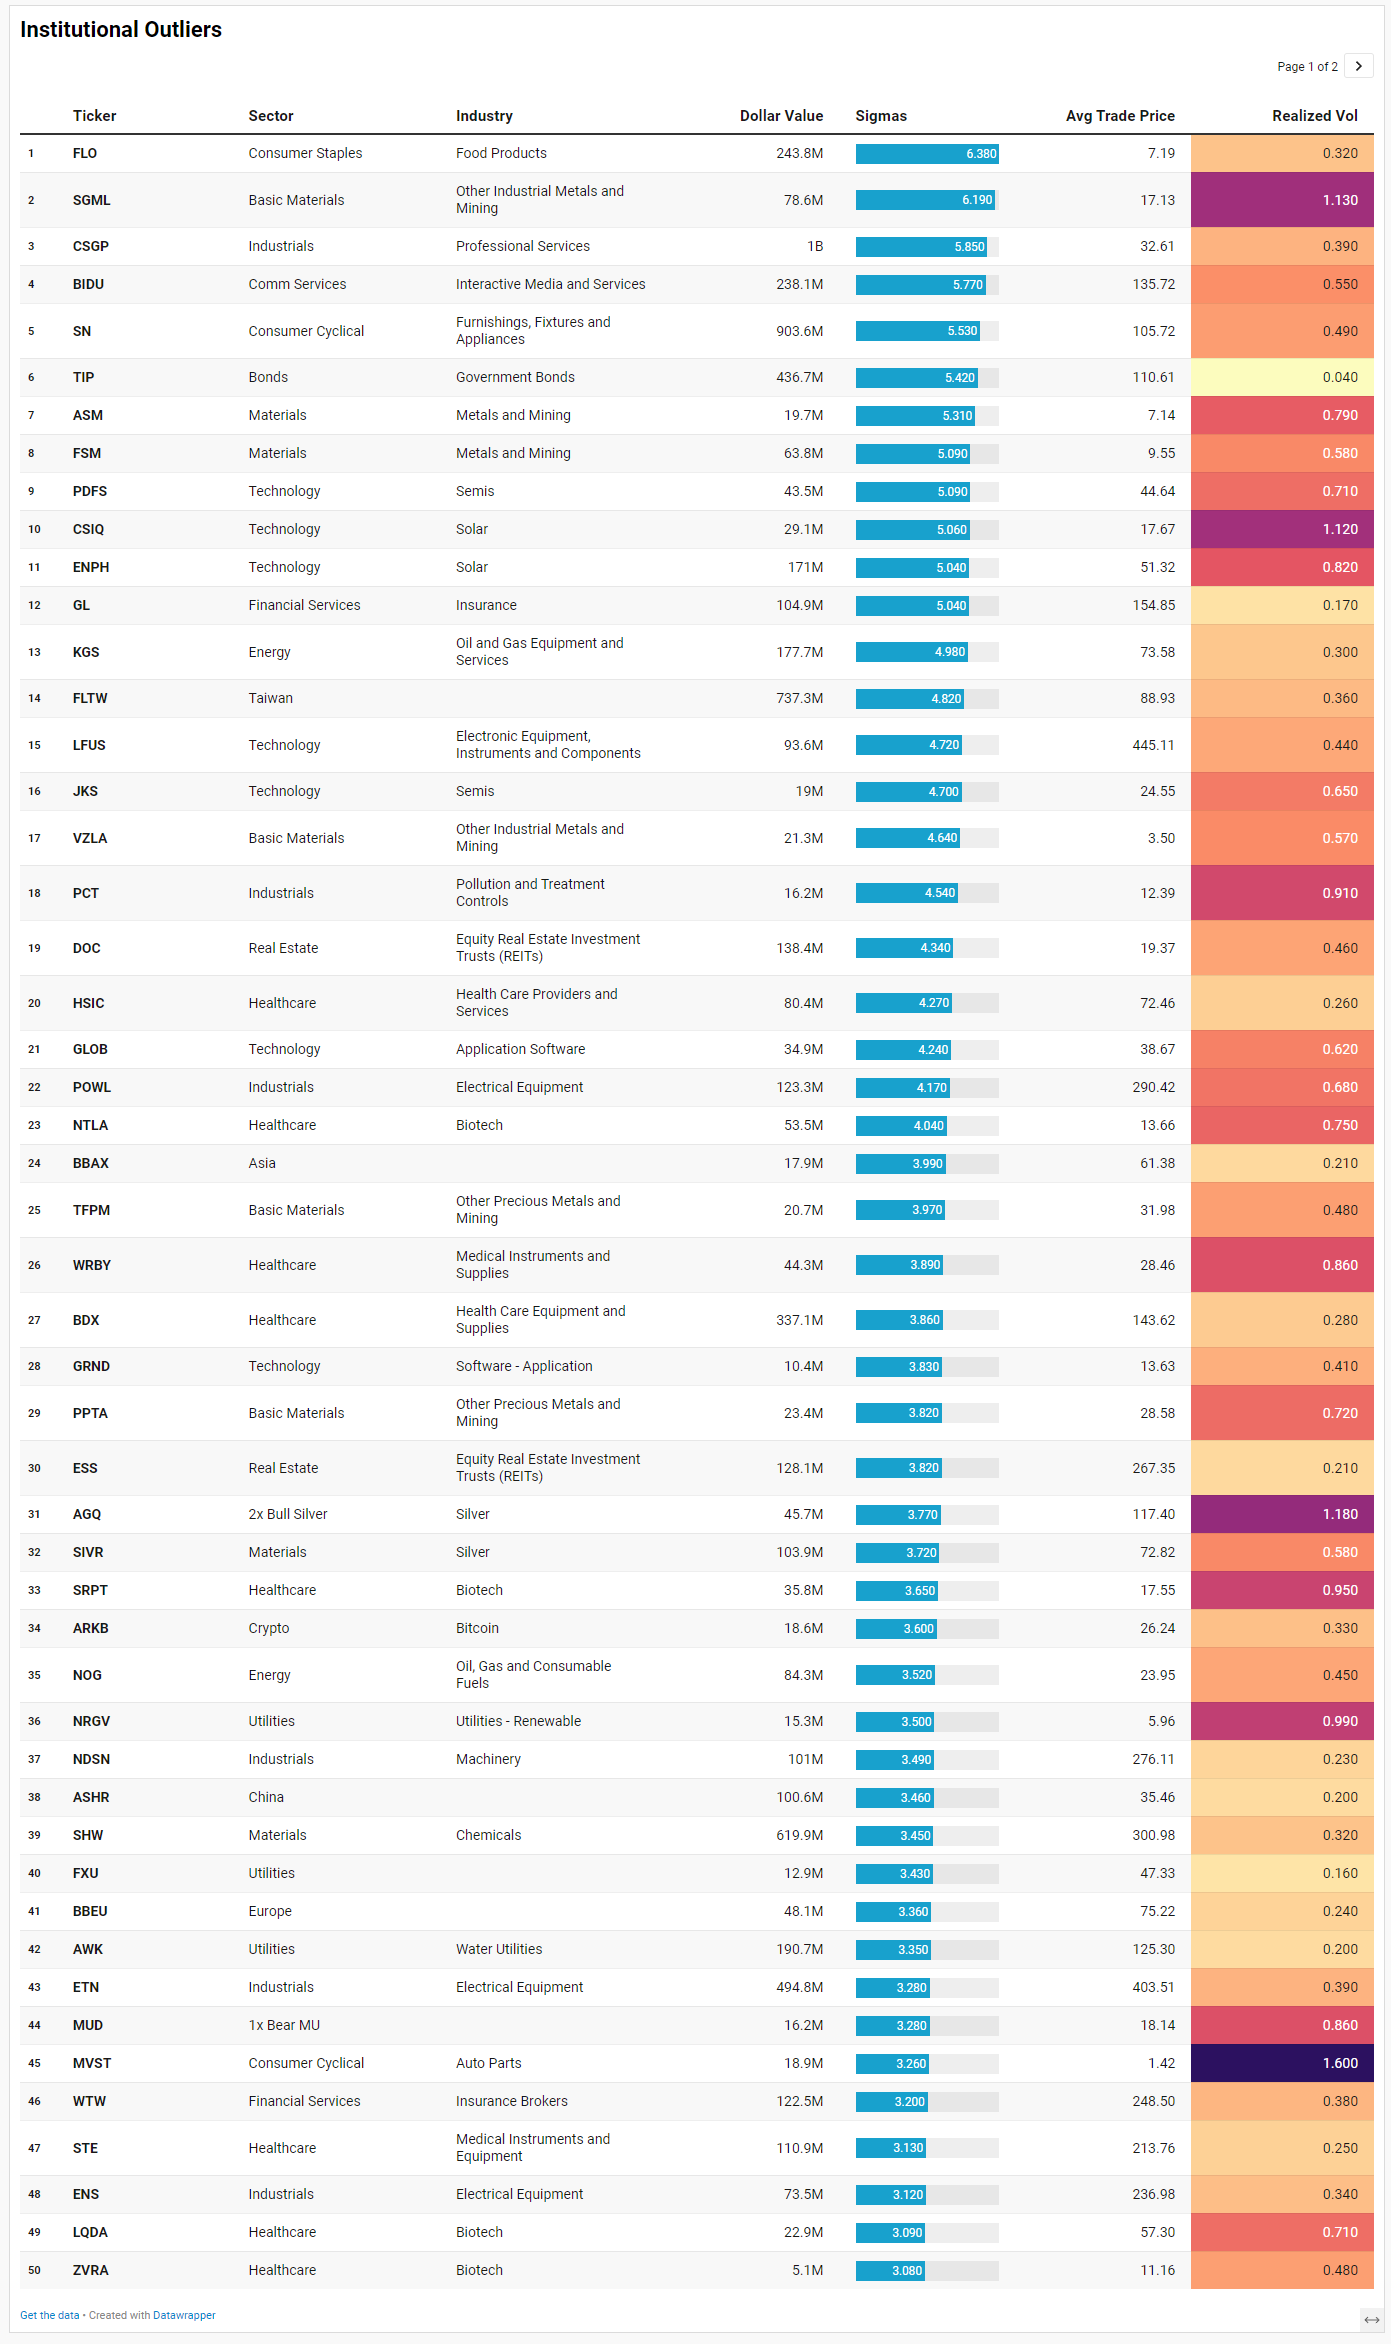
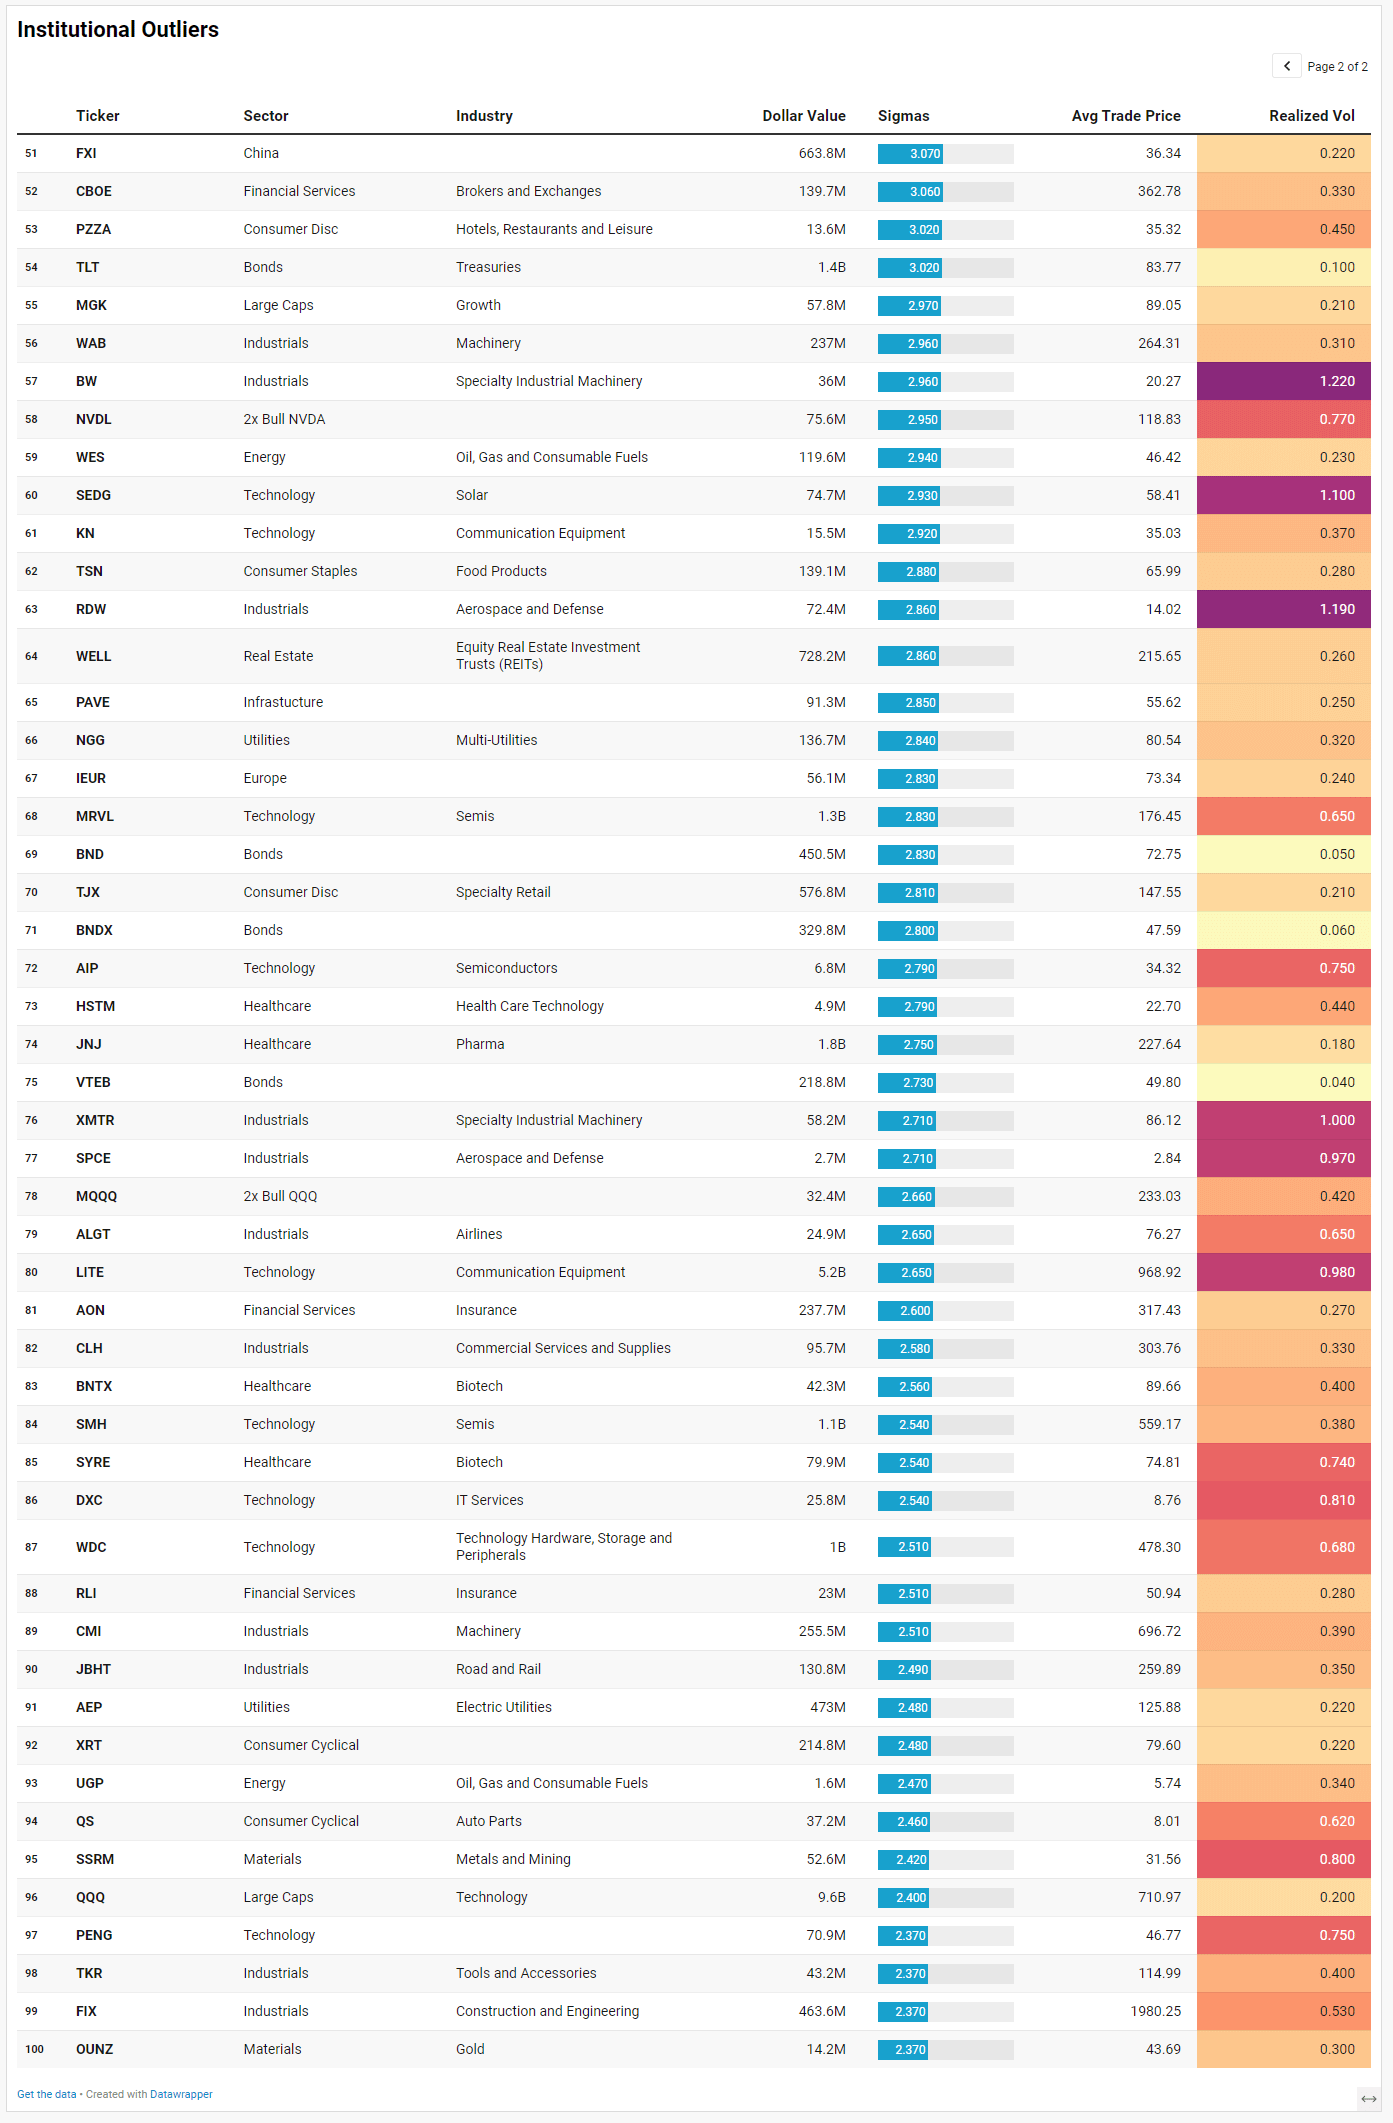
VL Institutional Outliers™ (IO)
Institutional Outliers is a proprietary metric designed to spotlight trades that significantly exceed a stock’s recent institutional activity—specifically in terms of dollar volume. By comparing current trade size against each security’s recent normalized history, the metric flags outlier events that may indicate sudden institutional interest but may be missed because the activity doesn’t raise any flags/alerts when comparing the activity against the ticker’s entire history. For example, it’s conceivable that a ticker today receives the largest trade it has had in the last 6 months but the trade is unranked and would therefore be missed by current alerts built off Trade Ranks. Day traders can use “Realized Vol” to identify tickers that are moving swiftly with large price displacement while others can use it to size your risk appropriately.
The Institutional Outliers list reinforces the idea that this market is not simply chasing index beta anymore. The tape is rotating toward specificity. Capital is targeting pockets where institutions appear willing to size aggressively relative to historical norms, and the dispersion between themes is widening.
The most important continuation from the broader flow narrative is the persistence of infrastructure and enabling technology. LITE stands out immediately with more than $5.1 billion in outlier activity alongside elevated realized volatility near 0.98, while MRVL, WDC, SMH, QQQ, and semiconductor-adjacent names like PDFS, LFUS, JKS, AIP, and PENG reinforce ongoing positioning around compute, networking, storage, and AI infrastructure. The distinction here is that institutions are no longer only buying the obvious hyperscaler trade. They are increasingly reaching deeper into the supply chain. That matches the earlier TRV picture showing deliberate accumulation beneath the mega-cap surface.
What is equally notable, though, is the growing presence of defensive duration and yield-sensitive positioning. TLT printed more than $1.4 billion in outlier flow, TIP saw roughly $437 million, BND another $450 million, and BNDX about $330 million. Utilities also appear repeatedly through AWK, AEP, FXU, and NGG, all with relatively subdued realized volatility. That is not the behavior of a tape fully convinced growth can accelerate uncontested from here. Institutions appear willing to own upside beta, but they are simultaneously layering in ballast through bonds, inflation protection, utilities, and stable cash-flow businesses.
Industrial and infrastructure positioning also remains persistent. ETN, FIX, WAB, CMI, JBHT, ENS, NDSN, CLH, POWL, and PAVE all show meaningful institutional anomalies. This aligns with the broader theme of electrification, grid spending, manufacturing investment, logistics resilience, and long-duration capital expenditure cycles. The flows imply institutions still prefer tangible economic throughput over speculative consumer cyclicality.
Meanwhile, materials and precious metals continue quietly strengthening beneath the surface. ASM, FSM, TFPM, PPTA, SIVR, SSRM, OUNZ, and AGQ collectively suggest increasing institutional attention toward gold, silver, and mining exposure. This is particularly important because it coincides with large Treasury flows rather than replacing them. Institutions appear to be preparing for a world where nominal growth remains uneven but inflation uncertainty and policy volatility persist.
China and international exposures are also becoming harder to ignore. BIDU, FXI, ASHR, FLTW, BBAX, IEUR, and BBEU all appeared as statistically significant anomalies. That suggests global allocators may be broadening exposure outside the crowded US mega-cap complex, particularly toward Asia and Taiwan-linked technology supply chains.
The result is a tape that still rewards growth leadership, but one increasingly hedged with duration, utilities, metals, infrastructure, and international diversification. Institutions do not appear complacent. They appear selectively aggressive.
VL Sector Leaders
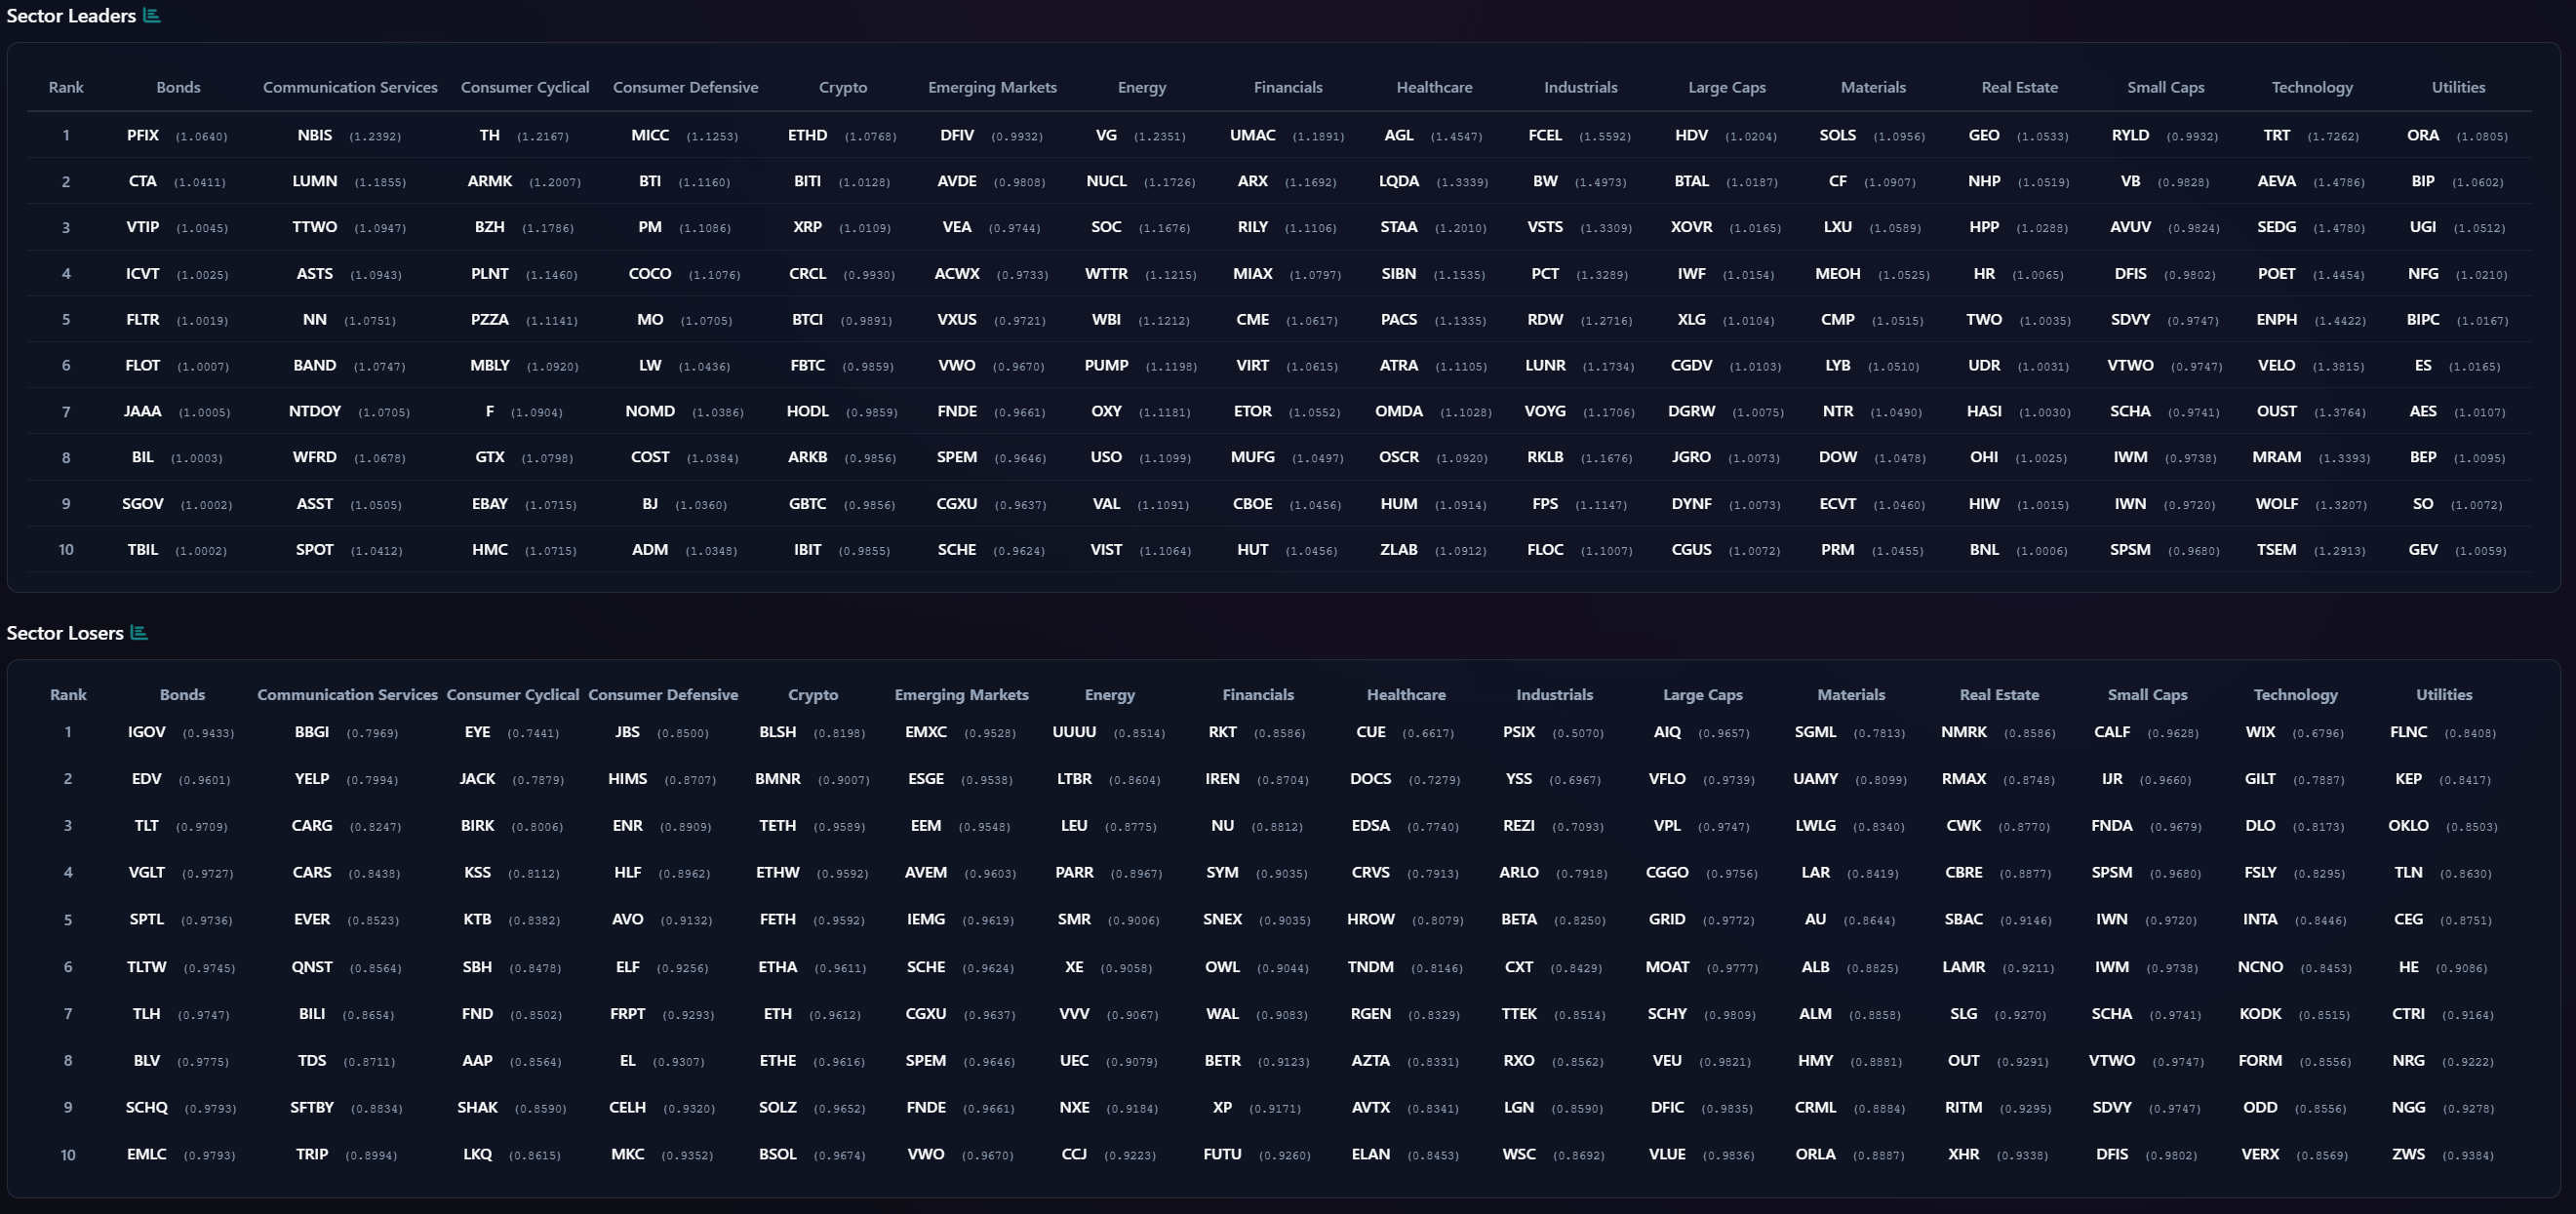
VL Sector Leaders is a weekly snapshot of where true leadership is asserting itself inside the market, stripped of the distortions that come from broad, style-mixed indices. Rather than asking which stocks look strong in absolute terms, this list focuses on which names are outperforming within the environments they actually compete in.
Each week, we surface the ten stocks demonstrating the most persistent relative strength inside their respective sectors. These are not headline chasers or one-day wonders. They are names that continue to separate themselves from peers through real price behavior, often reflecting sustained demand rather than fleeting attention.
For day traders, this list is a powerful awareness tool. Sector Leaders tend to offer cleaner intraday structure, better follow-through, and more predictable reactions around key levels because they already sit on the right side of relative strength. Even on choppy tape, leadership names often remain tradeable while the rest of the market degrades.
For swing traders, VL Sector Leaders helps narrow the universe to stocks with the highest probability of staying relevant. Relative leaders are more likely to hold trends, survive pullbacks, and reassert themselves after consolidation. When markets rotate, these names are often among the first to resume leadership — or the last to break.
The Sector Leaders list confirms that leadership has broadened materially beneath the surface, but not in the way typically associated with euphoric late-cycle risk appetite. What stands out most is the coexistence of offensive growth participation alongside unusually stable defensive leadership. That combination continues reinforcing the broader institutional narrative already emerging from the aggregate flow data.
Technology leadership still dominates the tape, but the character of that leadership has shifted lower in the capitalization stack and deeper into enabling infrastructure. Names like TRT, AEVA, SEDG, POET, ENPH, VELO, OUST, MRAM, WOLF, and TSEM suggest institutions are favoring differentiated component suppliers, optical systems, power management, sensors, and semiconductor infrastructure rather than simply crowding into the largest AI beneficiaries. Even within Communications Services, leadership from NBIS, LUMN, ASTS, and BAND implies the market remains highly focused on bandwidth, connectivity, and data transport themes.
At the same time, Utilities and Bonds quietly remain among the cleanest trending groups on the board. ORA, BIP, UGI, AES, SO, and GEV populate the utility leadership column while short-duration and floating-rate Treasury instruments dominate bond leadership through PFIX, CTA, VTIP, FLTR, FLOT, BIL, SGOV, and TBIL. That is not speculative behavior. It reflects a market still demanding income stability, liquidity, and inflation protection even while equities grind near highs. Institutions appear comfortable taking selective growth exposure, but they are refusing to abandon ballast.
Consumer leadership also tells an interesting story. The winners are not heavily concentrated in discretionary luxury. Instead, leadership leans toward operational efficiency and defensive consumption. PM, COST, ADM, MO, BJ, and LW all appear on the defensive side, while consumer cyclicals show a more selective mix through ARMK, PLNT, PZZA, MBLY, and GTXX. That suggests the market still prefers durable cash-flow generators and experience-oriented spending over purely speculative retail beta.
Industrials continue behaving like a structural accumulation theme rather than a short-term trade. FCEL, BW, VSTS, PCT, LUNR, RKLB, and FPS show leadership tied to electrification, aerospace, industrial automation, and next-generation infrastructure. Energy leadership, meanwhile, is shifting away from integrated majors toward nuclear and specialized energy exposure through VST, NRG, NFG, VIST, WTRG, and USO-related flows.
The loser board may be even more informative than the leaders. Traditional speculative momentum favorites such as HIMS, CELH, CARG, WIX, FSLY, DLO, VERX, and several crypto-linked vehicles are fading relative to the market. Even long-duration Treasury products like TLT and VGLT sit on the weaker side while shorter-duration instruments dominate leadership. That implies institutions still prefer flexibility and carry over outright duration risk.
The result is a market increasingly rewarding operational durability, infrastructure exposure, and stable cash generation while punishing weaker speculative growth. Leadership is broadening, but it remains disciplined rather than euphoric.
Part 3: Framing-Up A Trade
The tape continues describing a market that wants upside exposure, but only selectively and only with protection nearby. Institutions are still allocating aggressively into technology, semis, infrastructure, electrification, and selective international growth, but the simultaneous demand for short-duration Treasuries, utilities, inflation protection, healthcare stability, and defensive cash-flow generators argues this is not a euphoric melt-up tape. It is a controlled risk-taking environment where capital still expects volatility shocks and policy uncertainty to reappear without warning. That changes how I would frame positioning for the coming week.
I do not think this is the environment to chase broad beta indiscriminately. SPY and QQQ continue attracting enormous aggregate and dark-pool positioning, but the leadership underneath them has become more nuanced. The better opportunities appear to be inside the supply chains and secondary beneficiaries of the AI and infrastructure buildout rather than only the mega-cap headlines themselves. At the same time, the broadening participation across utilities, industrials, bonds, healthcare, and defensive consumer names suggests institutions are still preparing for slower nominal growth beneath the surface.
The portfolio I would carry here is therefore balanced toward durable leadership while deliberately reducing exposure to the weakest speculative pockets that continue appearing on the laggard boards.
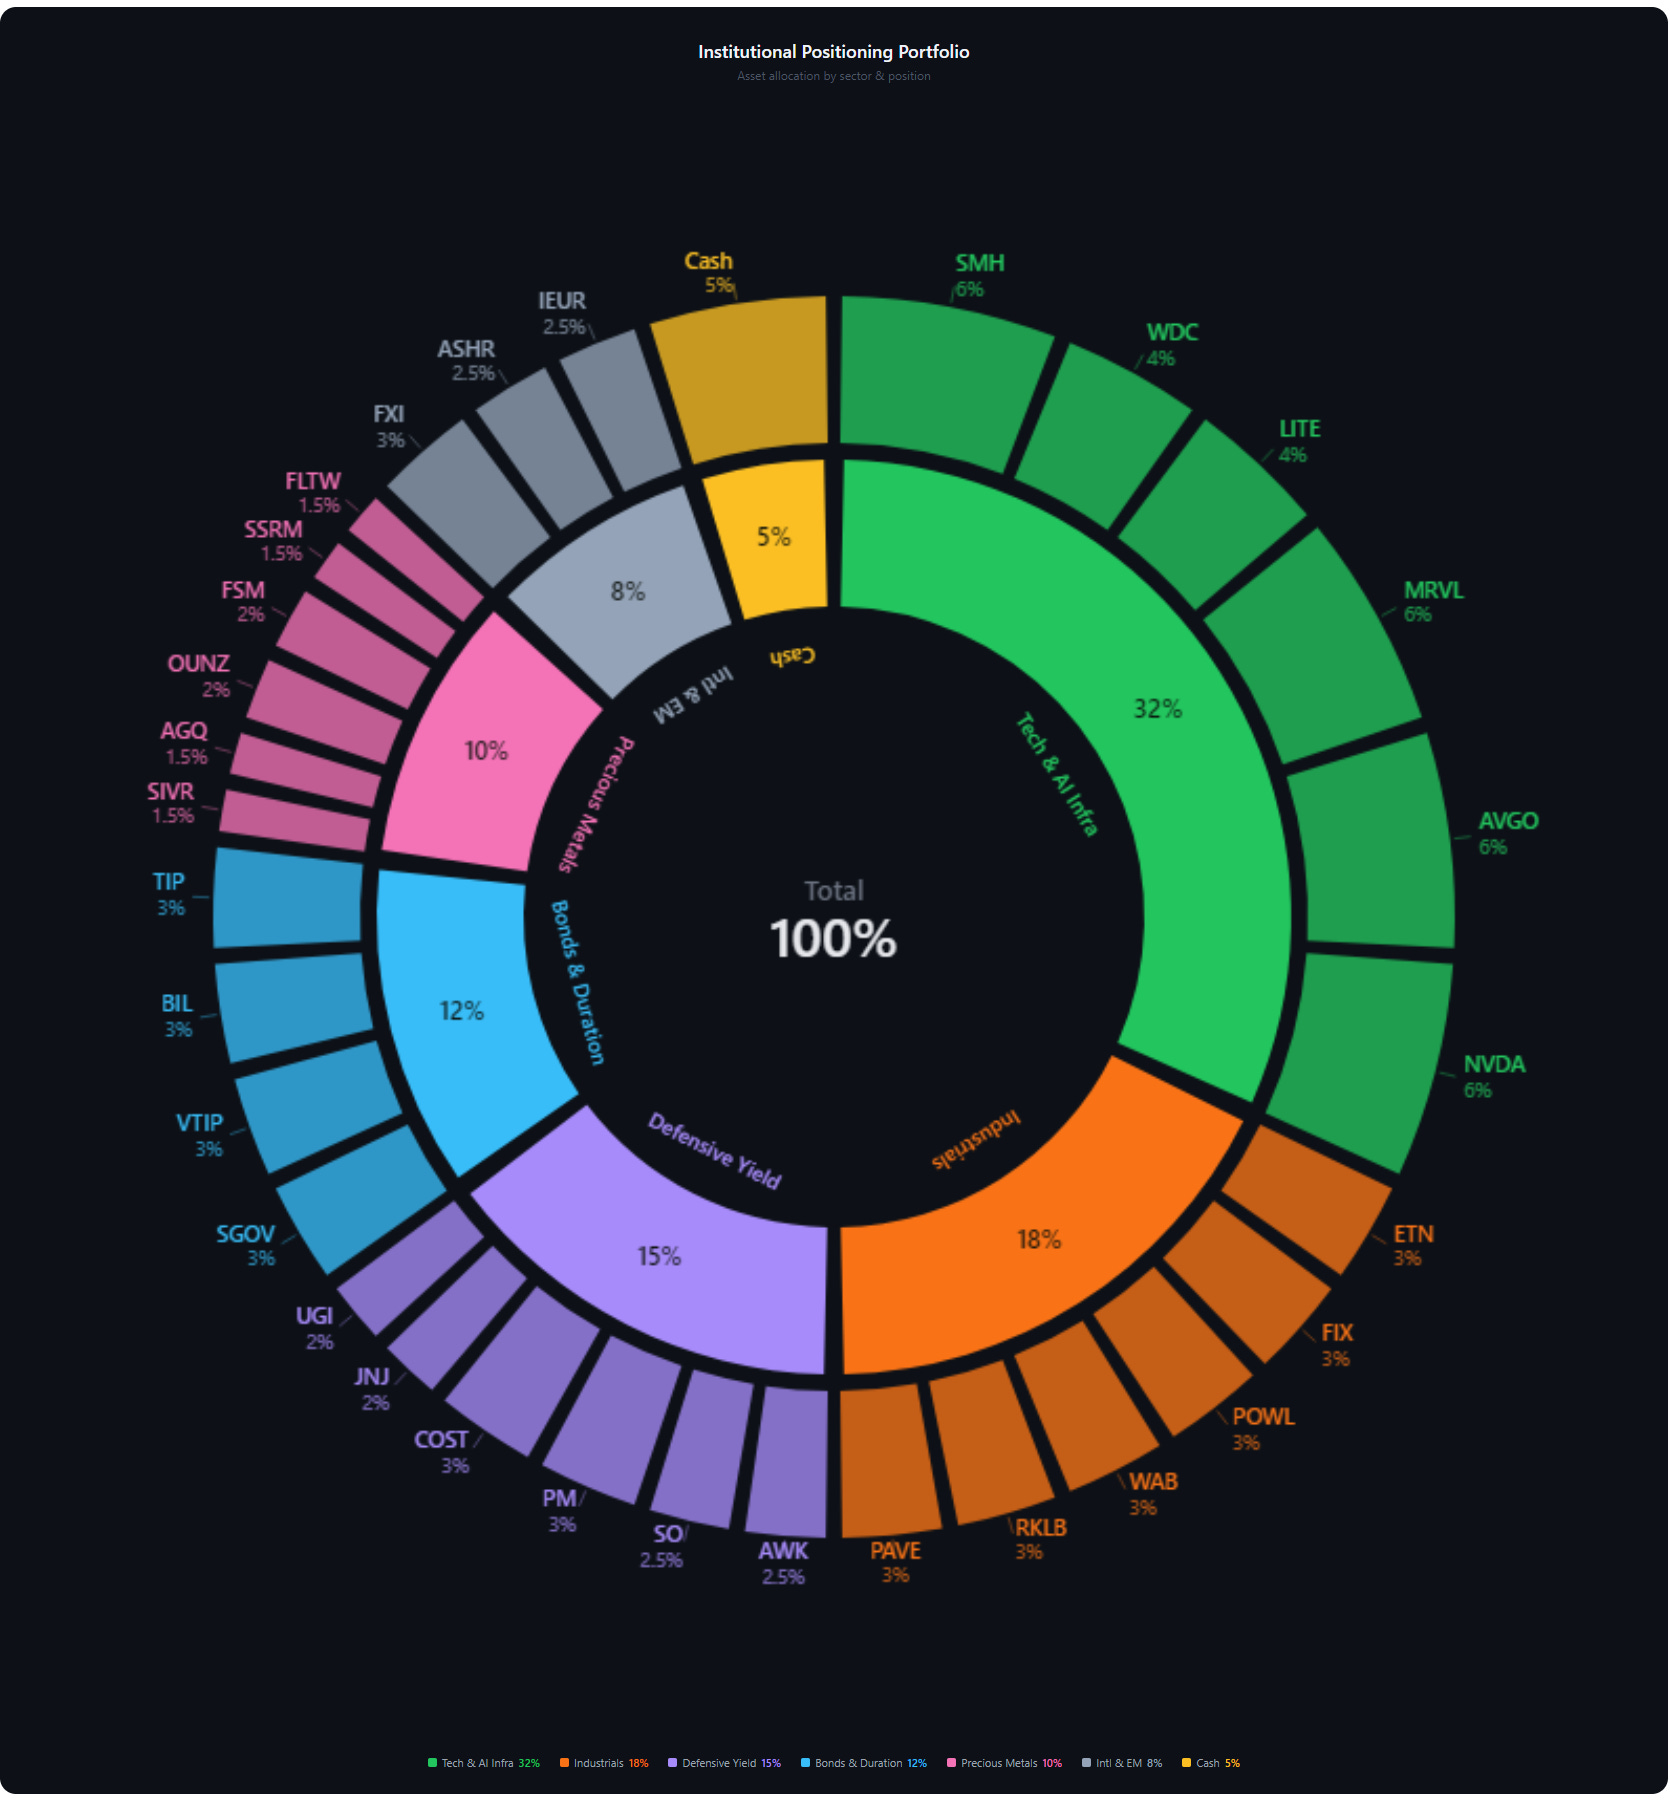
The largest sleeve would remain Technology and AI Infrastructure at 32%. This is still where the cleanest institutional sponsorship exists. I would split this sleeve across NVDA, AVGO, MRVL, WDC, LITE, and SMH. NVDA and AVGO remain the liquidity anchors institutions continue using for broad AI exposure, but MRVL, WDC, and LITE better capture the “second derivative” infrastructure theme now emerging through the outlier lists and leadership tables. SMH stays as the diversified semiconductor expression and provides cleaner participation if breadth continues widening across the chip complex.
The next sleeve would be Industrials and Infrastructure at 18%. This is where the tape continues quietly improving week after week. ETN, FIX, POWL, WAB, RKLB, and PAVE all fit the current institutional narrative around electrification, grid expansion, aerospace, logistics modernization, and reshoring. This sleeve also benefits if the market continues rewarding real-economy throughput instead of purely software multiple expansion.
I would carry 15% in Defensive Yield and Stability. That sleeve would include AWK, SO, PM, COST, JNJ, and UGI. These are not exciting names, but the tape repeatedly shows institutions accumulating exactly these types of businesses during periods when growth leadership becomes crowded. They provide balance if rates or macro volatility reaccelerate.
Another 12% would sit in Bonds and Duration Management, focused primarily on SGOV, VTIP, BIL, and TIP. Importantly, I prefer shorter-duration and inflation-protected exposure over aggressive long-duration Treasury risk. The leadership board strongly favors liquidity and carry rather than outright duration speculation.
I would allocate 10% toward Precious Metals and Hard Asset Exposure through SIVR, AGQ, OUNZ, and selective miners like FSM or SSRM. The simultaneous institutional interest in bonds, inflation protection, utilities, and metals suggests portfolios are quietly hedging against policy instability, currency debasement concerns, and geopolitical uncertainty.
International and Emerging Market exposure would account for 8%, primarily through FLTW, FXI, ASHR, and IEUR. The appearance of Taiwan, China, and Europe-linked products throughout the outlier lists suggests institutions may still be looking to extract more from the final innings of the international thematic.
Finally, I would reserve roughly 5% as tactical cash and optionality. The tape still does not support maximum aggression. We are seeing selective accumulation, not universal participation. Keeping dry powder matters when positioning becomes this concentrated near highs.
From a tactical perspective, the ideal execution remains buying controlled weakness into institutional support rather than chasing vertical momentum. The strongest opportunities this week likely emerge from orderly pullbacks into established high-dollar accumulation zones across semis, infrastructure, and selective defensives. If leadership broadens further and volatility remains contained, this portfolio should participate meaningfully. If macro conditions deteriorate, I’m ok raising cash from the riskier parts of the port while the defensive ballast and short-duration exposure should help cushion the downside, all while preserving flexibility to redeploy quickly.
Good luck this week, VL Crew!