Market Momentum: Your Weekly Financial Forecast & Market Prep
Issue 90 / What to expect May 11, 2026 thru May 15, 2026


Weekly Market-On-Close Report
U.S. stocks just wrapped another strong week, and the market is acting like it wants higher prices, not lower ones. At the same time, it’s doing that in the middle of a war-driven oil spike, sticky inflation, and a Federal Reserve that is very much not in “rescue mode.” That mix – strong tape, messy backdrop – is exactly what makes this moment interesting.
Let’s walk through what actually happened this week, why it matters, and how to think about positioning if you’re trying to put real money to work rather than just watching the S&P ticker crawl.
Good news is finally “good” again
For most of the post‑pandemic cycle, we lived in a weird world where strong economic data made stocks nervous. Better jobs numbers meant fewer rate cuts, which meant lower multiples, which meant “good news is bad news.”
That flipped this week.
The latest jobs report came in clearly stronger than expected: payroll growth beat, the unemployment rate stayed low, and the revisions to prior months were positive. At the same time, wage growth cooled a bit at the margin. That’s kind of the dream combo for equity bulls: the economy isn’t rolling over, but it also isn’t overheating in a way that forces the Fed to slam the brakes.
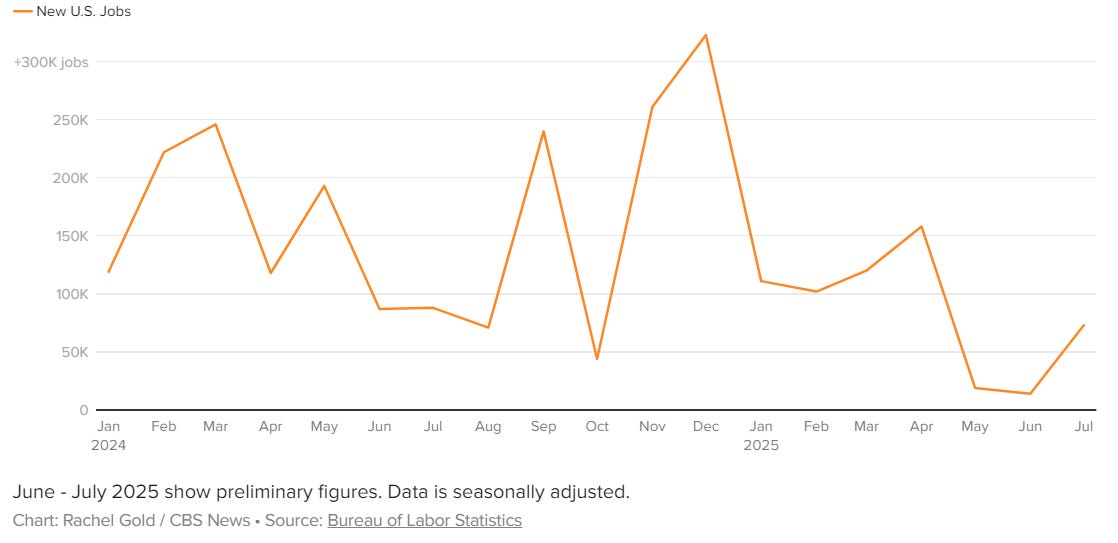
Under the surface, the labor story is more than just one headline number. Private sector hiring has picked back up from last year’s limp pace. More industries are adding jobs than cutting. Claims are low. Surveys say it’s still reasonably possible to find work. Put simply: this does not look like an economy on the verge of collapse. It looks like one grinding forward, even with higher energy prices as a drag.
That’s a subtle but important psychological shift. Instead of every upside surprise in macro data being treated as a threat (“oh no, fewer cuts”), the market is starting to treat solid growth as what it actually is: supportive for earnings and risk assets.
Earnings: better than “better than expected”
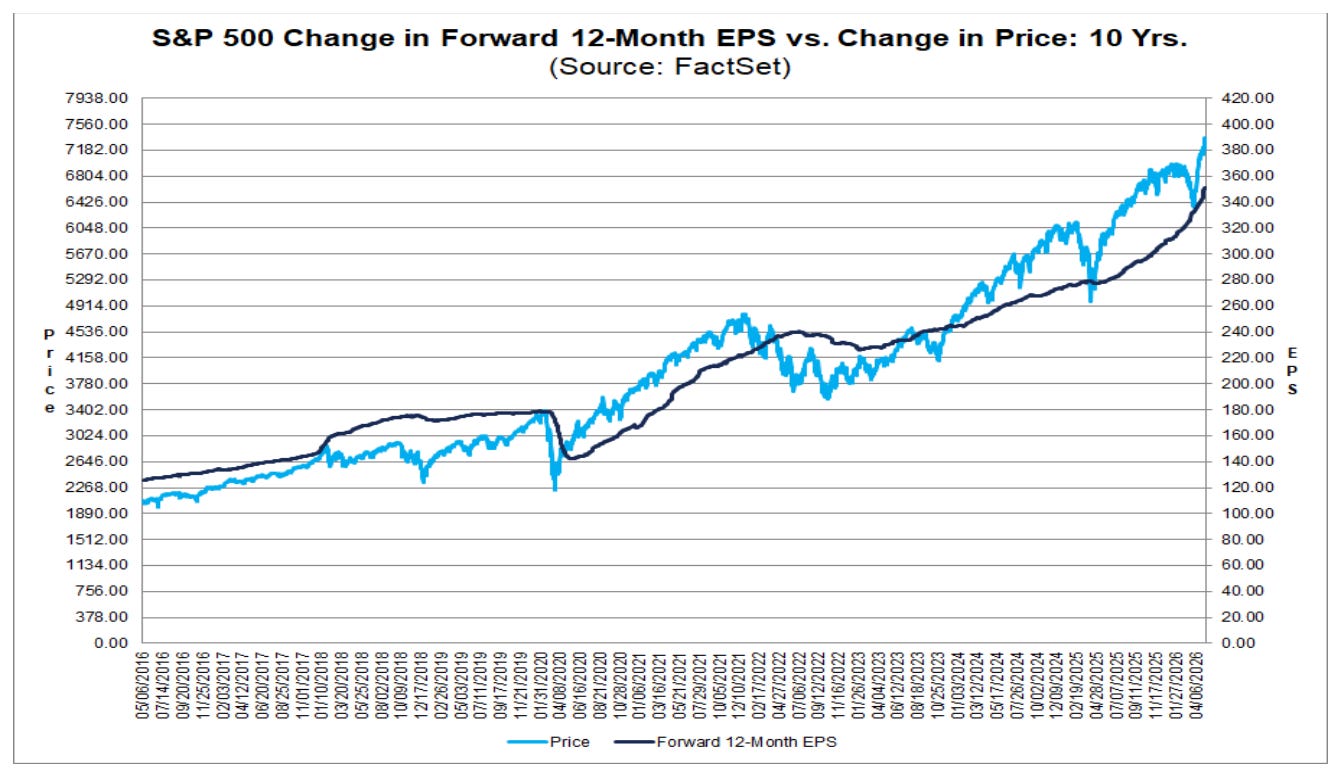
The real engine of this rally isn’t the Fed; it’s earnings.
By now, almost all of the S&P 500 has reported, and the beat rate is genuinely impressive. Roughly four out of every five companies are coming in ahead of expectations, and overall earnings growth is running at the strongest pace since the immediate post‑pandemic recovery.
Tech and AI‑linked names are still the headline stars. Semiconductors have basically gone vertical this year, with another big leg up this week. You can see the AI infrastructure boom – data centers, chips, equipment – turning into actual revenue and profit, not just vibes.
But it’s not just an AI story. Strip out tech, and earnings for the rest of the index are still growing. Consumer names are holding up better than you’d expect with higher rates and higher gas prices. Industrials and materials have real tailwinds from capex and infrastructure. Even within sectors that have been left for dead at various points the last few years, there are plenty of names quietly beating and raising.
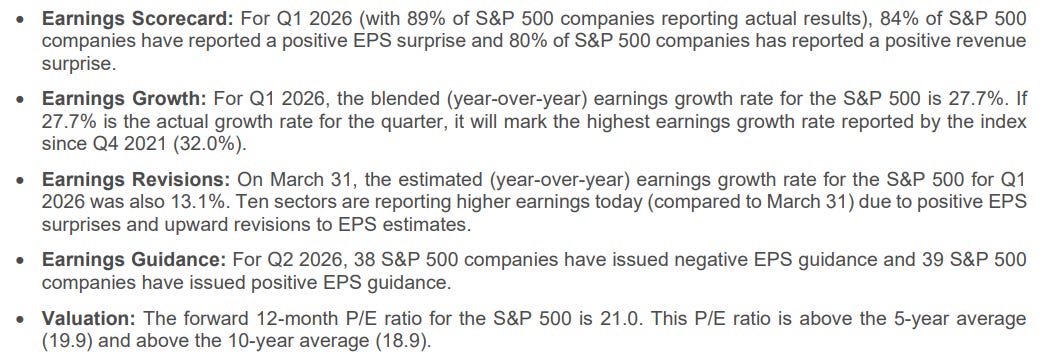
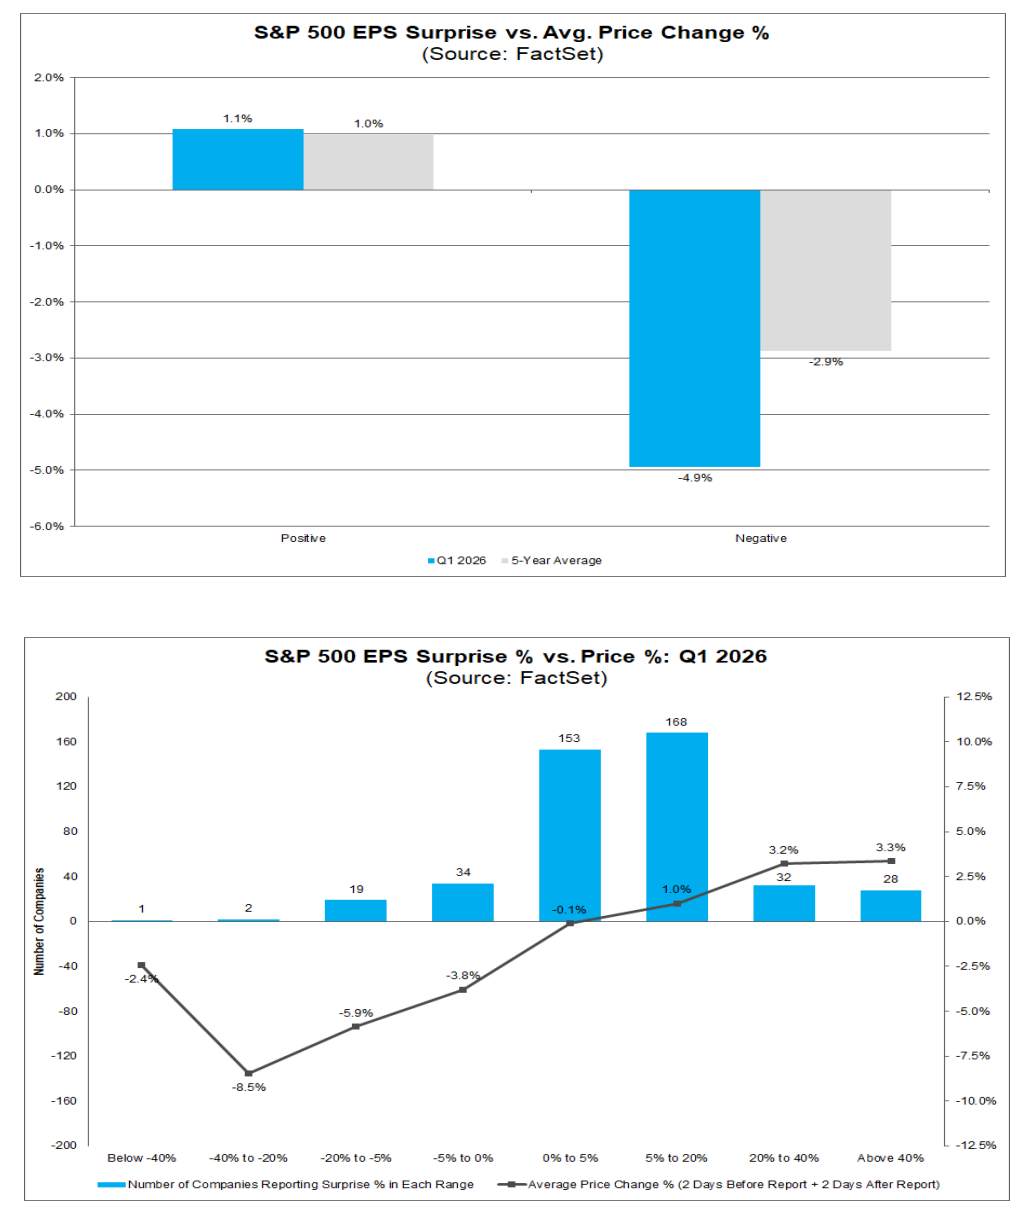
The other thing that stands out this season is the dispersion.
If you have a credible growth story, especially one with clear AI tie‑ins, the market is willing to reward you with big one‑day moves when you beat. We’ve seen individual names ripping 15–25% on an upside surprise plus a convincing guidance hike.
On the flip side, “fine” isn’t enough anymore. Companies that show even a small deceleration, or that guide a hair below consensus, are getting hit hard. We’ve also seen software names get punished if their AI story feels hand‑wavy or if the competitive landscape is getting blurrier.
That’s exactly what late‑cycle bull markets look like: not everyone wins, and the punishment for mediocrity gets harsher.
War, oil, and the “After Iran” regime
All of this bullish action is happening against a backdrop that, on paper, should be much scarier than the way the S&P is trading.
You’ve got a war in the Middle East that has effectively shut down the Strait of Hormuz – a chokepoint for a big chunk of global oil and gas flows. Crude has ripped higher, with spikes well above 100 and options markets pricing in real tail risk. There’s a non‑trivial drawdown in global crude inventories underway, and the forward curve has flipped into a pretty steep backwardation.
Energy shocks like this are messy because they don’t hit everyone the same way:
The U.S. is more energy independent than it used to be and has turned into a major LNG supplier, which blunts the growth hit.
Europe is more exposed; higher input costs hit manufacturing and industry quickly.
Japan and India, and other big energy importers, feel the pinch more directly through trade balances and inflation.

Given that backdrop, it’s honestly impressive that U.S. equities are hovering near all‑time highs instead of sulking.
Part of the explanation is that markets have a long history of looking through geopolitical flare‑ups that don’t directly hit the domestic banking system or household balance sheets. We’ve already seen the pattern several times: escalation headlines hit, futures wobble, then dip buyers show up. Even after major strikes and obvious escalation, the market’s response has been “volatility spike, then back to business.”
That doesn’t mean the risk isn’t real. It does mean the consensus view right now is that the conflict, while serious, is finite; that central banks will treat the inflation spike as largely supply‑driven; and that higher energy prices can be absorbed as long as growth and employment hold up.
The Fed’s new headache: resilience
Now zoom in on the Fed.
The big picture: rates are high, inflation is sticky, and the economy is not rolling over. That’s a nasty combination if you’re trying to justify cutting anytime soon.
Ten‑year yields have drifted back up and are flirting with the mid‑4s again. Earlier this year, the market was still dreaming about multiple cuts. Those dreams have been dialed back hard. The base case now is more like “no cuts for a while unless something breaks.”
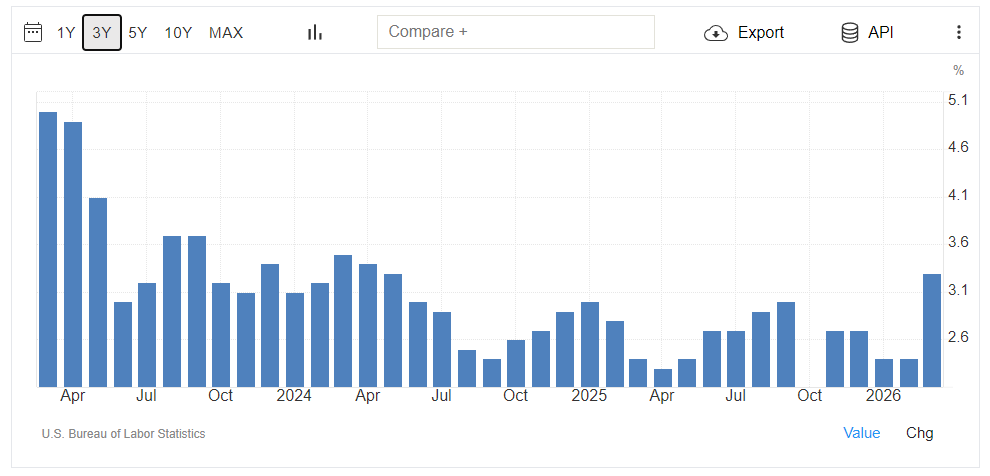
Inflation hasn’t returned to the neat, downward glide path everyone was hoping for. It’s stuck in the low‑3s, and with energy ripping, the next print or two could actually tick back up before easing again later in the year.
So the Fed is stuck between:
Cutting into a stronger economy with inflation running well above 2% (which is hard to justify politically and intellectually), or
Staying on hold while war‑driven oil and higher term premiums quietly tighten financial conditions.
For now, the path of least resistance is to do nothing and talk a lot. That’s basically what we’re seeing: speeches, “data‑dependent” language, and a whole lot of “we’re not there yet” when it comes to cuts.
For markets, that means it’s tough to build a heroic bull case for long‑duration bonds. A 4‑handle on the 10‑year and a Fed that’s mostly on the sidelines is not a disaster, but it’s also not the rocket fuel that powered the 2020–2021 everything rally.
A bull market that’s getting narrower and noisier
Step back and look at the equity market from 30,000 feet.
Indexes: still strong.
New highs: still coming.
Breadth: improving, but uneven.
Volatility: quiet at the index level, noisy under the hood.
There’s a late‑cycle feel to the whole thing.
Mega‑cap tech and AI names are still the main drivers of performance, but the gap between them and the rest of the market isn’t as absurd as it was during peak “Magnificent 7” mania. Earnings breadth has improved. Mid‑caps and small‑caps are finally showing some life. International markets have put up decent numbers too, even with more sensitivity to energy.
At the same time, dispersion is high. The average stock’s range is much bigger than the index’s range. Factor trades (like long semis / short software) have started to whipsaw more. Crowded positioning matters again.
Technically, the character of the tape has changed. A few months ago, every little dip into the 20‑ or 50‑day moving average was instantly bought. More recently, we’ve seen sharper air pockets down, tests of deeper support, and less knee‑jerk mean reversion.
It’s not “the trend is dead.” It’s more like “the trend is fine, but the path is getting rougher.”
Sector and style quick take
Here’s a simple mental map of how the main pieces look right now:
U.S. large‑cap growth: Still the leaders, still expensive, but still delivering. AI, cloud, semis – they’re pulling more than their weight, and the numbers justify at least part of the premium.
U.S. small‑ and mid‑caps: Finally breaking out, helped by broader earnings strength, but more sensitive to rates and any wobble in the economic data.
Energy: Getting a tailwind from higher oil, but interestingly, some energy equities still seem to be discounting a future pullback in crude rather than a permanent regime shift.
Software: Splitting into haves and have‑nots. Names with a sharp AI story and clear monetization path are doing fine. Names with fuzzy AI positioning or slowing growth are getting punished.
Financials: Choppy. Higher long yields help in some ways, but concerns around credit, funding, and pockets of private credit stress keep a lid on enthusiasm.
International: Cheaper and more cyclical, with decent performance so far this year, but more exposed to the energy shock and currency volatility.
This is not an “everything up” environment. It’s a stockpicker’s tape, even inside the big themes like AI and energy.
So what do you do with this?
If you’re trying to actually allocate capital – in a portfolio, a trading book, or just your own account – here are a few takeaways that fall out of this setup.
Stay in the game, but upgrade what you own
The combination of a strong labor market and powerful earnings season does not look like the front edge of a classic recession. Could something break? Sure. But the base case still looks like continued expansion, not imminent collapse.
That argues against going to all cash or trying to hero‑call a top. Instead, it argues for paying attention to what you own:
Tilt toward companies with genuine earnings power and balance sheets that can live with 4–5% yields.
Within growth, favor businesses where AI is an actual revenue driver, not just a keyword on the slide deck.
In cyclicals, focus on those with pricing power and real leverage to capex and infrastructure, not just hope and beta.
Respect concentration and narrative risk
The AI and semiconductor trade has been an amazing place to be. It also carries narrative risk: a lot of future cash flows are being pulled forward into today’s prices. Any wobble in spending, regulation, geopolitics, or sentiment can cause sharp downdrafts.
That doesn’t mean “sell everything AI.” It means:
Don’t let one theme quietly become your entire book.
Make sure you have exposure to other areas that are actually growing earnings too (industrials, select consumer, health care, etc.).
Be honest about how much of your P&L is really just one factor in disguise.
Use volatility as a tool, not a threat
With oil, war headlines, and a twitchy Fed narrative all in the mix, the odds of sharp, fast pullbacks are higher than they were a few months ago.
That’s not a reason to avoid the market. It’s a reason to:
Think about hedges when implied vol is cheap and your exposure is high.
Keep a shopping list of names and levels you actually want to buy on a flush.
Be prepared for moves to your key levels to come faster than you’d like.
Be realistic about bonds
If you were counting on a huge bull market in Treasuries to bail you out, this is not your dream environment. With inflation sticky and the Fed on hold, you’re probably looking at a range‑bound bond market more than a straight‑line rally.
That doesn’t mean bonds are useless. It just means:
Treat them as a diversifier and stabilizer, not your primary return engine.
Size duration so you can live with a world where “higher for longer” actually happens.
Global is interesting, but hedge the rough edges
Valuations abroad are often more attractive than in the U.S., and some foreign markets are highly levered to the same trends driving the U.S. (AI, commodities, reshoring, etc.). But the energy shock and FX swings hit global portfolios harder.
If you’re going global:
Be explicit about how you’re handling currency risk.
Recognize which markets are net winners from higher commodity prices and which are net losers.
Avoid letting “cheap” turn into a euphemism for “uninvestable without a catalyst.”
Where this leaves us
The simplest way to describe where we are:
The economy is sturdier than people feared a year ago.
Corporate America is printing big, broad‑based earnings growth.
The labor market is cooling gently, not breaking.
Oil is high, geopolitics are messy, and inflation is annoying.
The Fed would very much like to not be the main character right now.
That’s a setup where bull markets don’t just suddenly die; they mutate. Leadership rotates, dispersion rises, and risk management starts to matter again. You don’t get paid just for showing up. You get paid for having a process, respecting risk, and being a little more selective.
If you’ve gotten used to a world where “just buy the index and check back in six months” worked like a charm, this is a different game. Not worse. Just different.

Weekly Benchmark Breakdown
Breadth Improves Beneath the Surface
The market continues to climb a wall of mixed participation. This was not a classic momentum-thrust week where everything ripped in unison, but the underlying tape remains healthier than many headline reads would suggest. Mega-cap technology continues to carry a disproportionate amount of the index-level strength, yet beneath that leadership there are signs that participation is broadening in pockets rather than collapsing outright. The key distinction right now is that short-term breadth has softened while intermediate-term breadth is still holding together reasonably well.

The S&P 500 remains caught in that tension. Only 42.62% of components are above their 5-day moving average and 42.03% are above the 20-day, which reflects a market that has lost near-term momentum. But the intermediate-term structure is notably firmer, with 51.19% above the 50-day, 51.99% above the 150-day, and 52.98% above the 200-day. That tells you the average stock has not fully broken down despite recent churn. The concern is visible in the new highs and lows data. Over the 5-day window, new lows outpaced new highs by 53 names, and the 1-month differential remains negative at -19. Leadership inside the S&P was concentrated heavily in semiconductors and large-cap growth. NVIDIA, Apple, Broadcom, Google, Amazon, and select AI infrastructure names did most of the lifting while financials, energy, and portions of healthcare lagged materially.
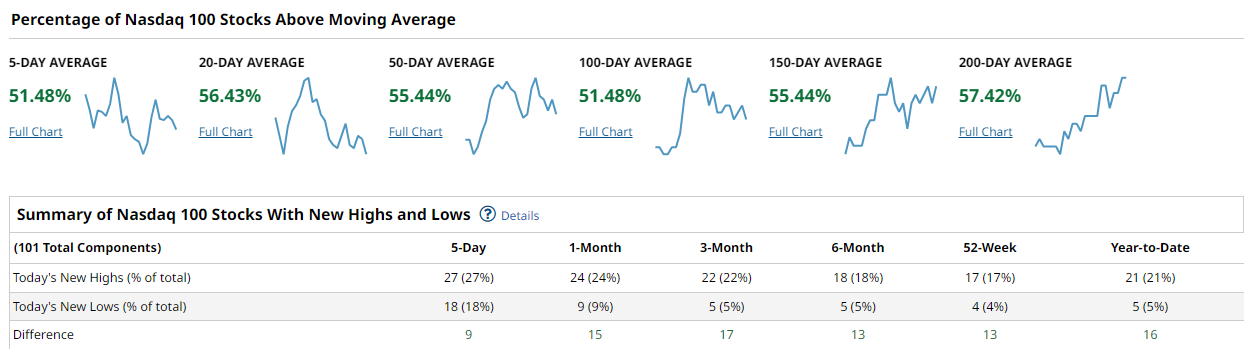
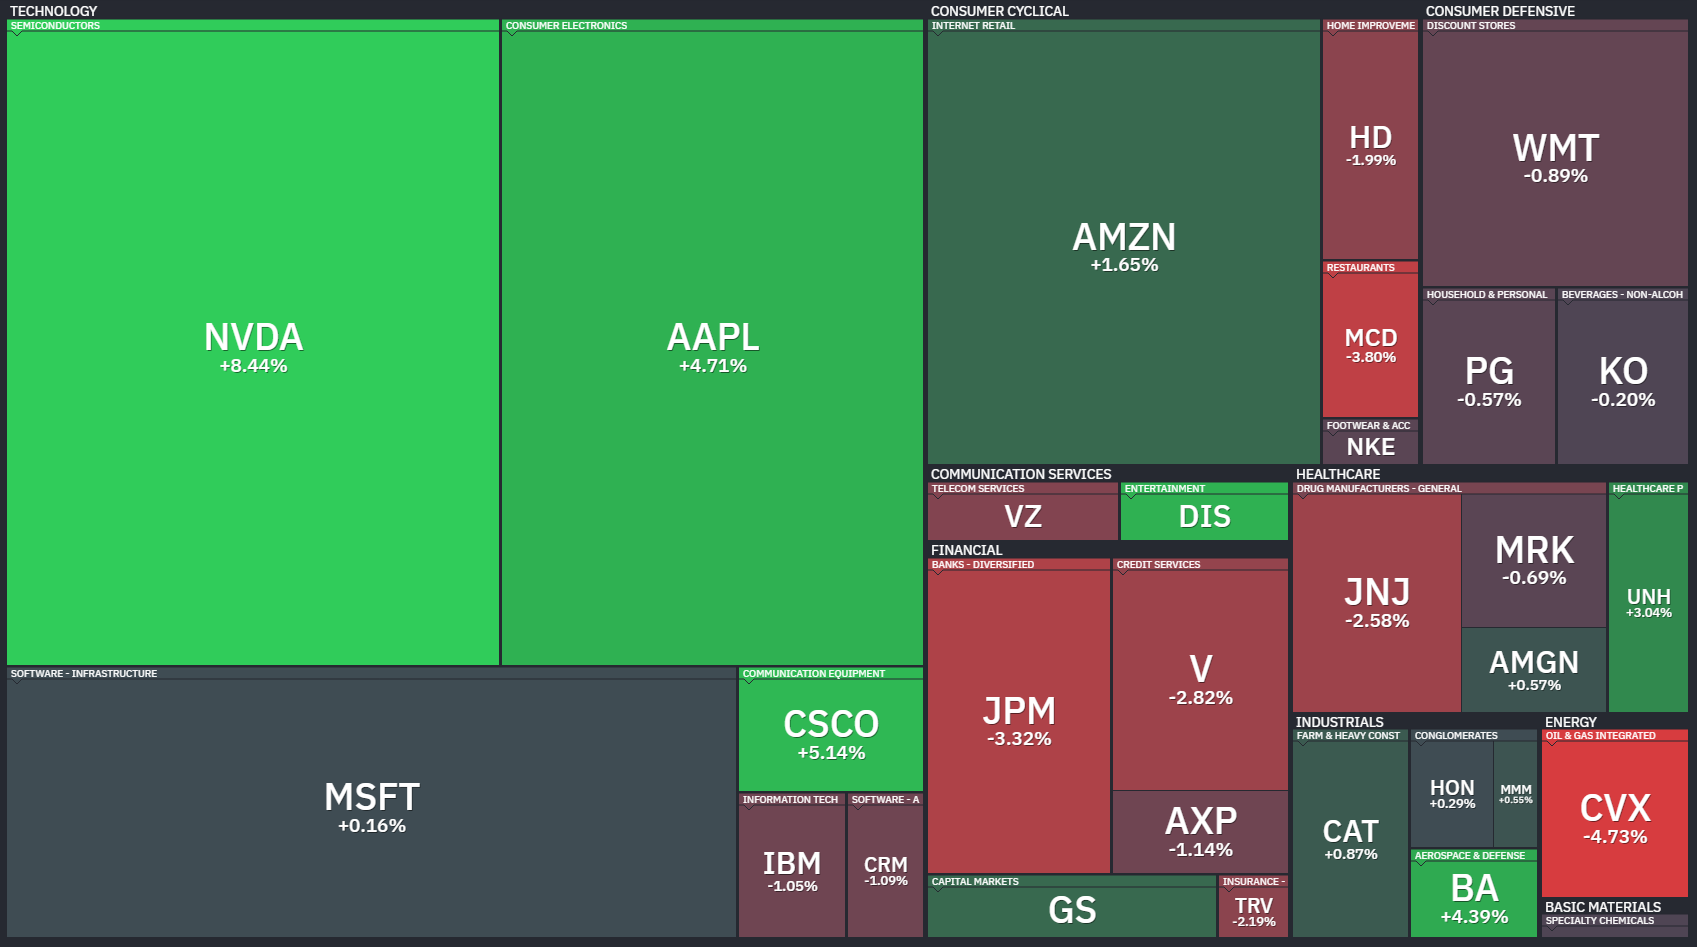
The Nasdaq 100 remains the cleanest index from a breadth perspective. More than half the index is above every major moving average measured, including 57.42% above the 200-day and 55.44% above both the 50-day and 150-day averages. More importantly, the new highs versus new lows data remains decisively positive across every timeframe. The 5-day differential sits at +9, while the 1-month and 3-month readings are +15 and +17 respectively. The leadership profile also looks constructive rather than purely defensive. Semiconductors were dominant again, with NVIDIA, Broadcom, Micron, AMD, ASML, Lam Research, and Applied Materials all posting strong weekly gains. The Nasdaq still looks like the institutional leadership center of the market.
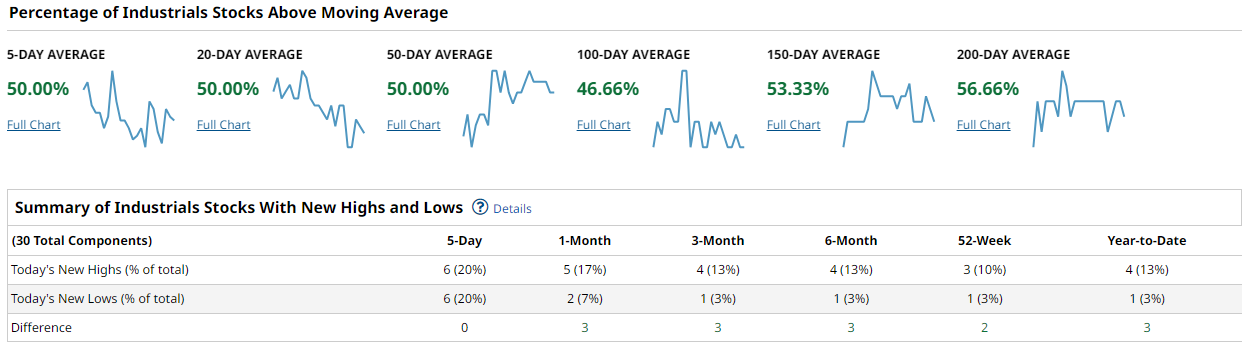
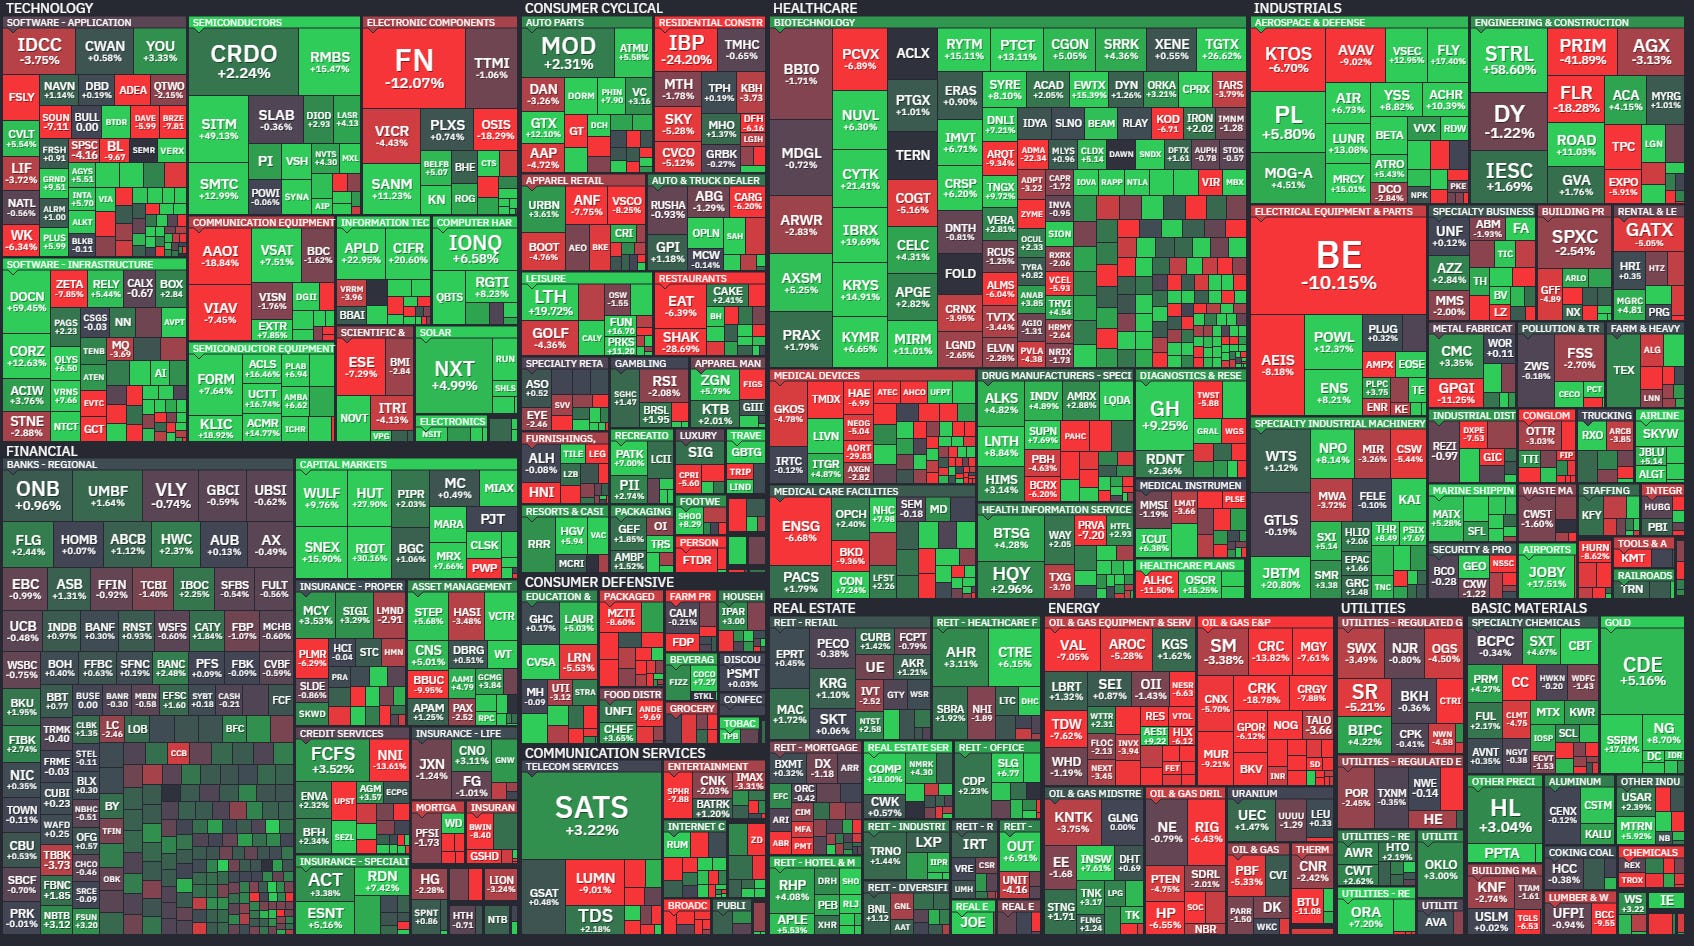
The Dow-style industrial cohort paints a more neutral picture. Breadth readings hover near 50% across most moving average windows, including exactly 50% above the 5-day, 20-day, and 50-day averages. Longer-term participation improves modestly to 56.66% above the 200-day. The new highs and lows table is balanced in the short-term, with a flat 5-day differential, though intermediate lookbacks remain slightly positive. The heatmap showed a fragmented tape. Aerospace and defense names held up well, Boeing notably strong, while financials, healthcare, and consumer defensives weighed on the index.
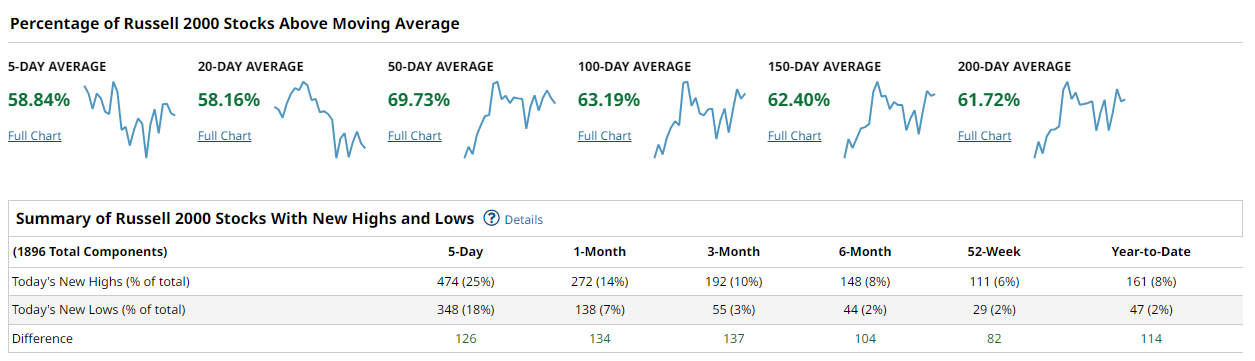
The Russell 2000 quietly remains one of the stronger breadth stories underneath the surface. Nearly 70% of constituents are above their 50-day moving average, while 63.19% and 62.40% remain above the 100-day and 150-day averages respectively. Even the shortest-term measures remain relatively healthy, with 58.84% above the 5-day average. Most importantly, new highs continue to outnumber new lows decisively across every timeframe. The 5-day differential came in at +126 and the 1-month at +134. The small-cap tape is not being driven by a handful of giants either. Participation is much broader across industrials, regional banks, software, biotech, and cyclicals.
Taken together, the message is fairly straightforward. Cap-weight leadership still dominates index performance, but the broader market is not collapsing underneath it. In fact, the Russell data argues that participation may actually be broadening beneath the surface even while the S&P experiences short-term deterioration. What would strengthen the bullish case materially from here is seeing the S&P 500 50-day cohort push decisively above 60% while the new highs versus lows data flips positive again across the 1-month window. What would justify caution is continued narrowing where only mega-cap AI names advance while short-term breadth continues to erode.
The playbook this week still favors relative strength and institutional leadership. Semiconductors, AI infrastructure, and selective cyclicals continue to attract sponsorship. Small caps are becoming increasingly difficult to ignore if breadth continues improving there. Areas showing persistent weakness, particularly energy, portions of healthcare, and some defensive sectors, should be treated cautiously unless they reclaim participation quickly. The most important thing to watch now is whether improving small-cap and intermediate breadth can translate into renewed thrust at the index level.
Bottom line: the market remains leadership-driven, but the broader participation backdrop is healthier than the headline indices alone suggest.

Investor Sentiment Report
AAII Investor Sentiment Survey
The AAII Investor Sentiment Survey tracks the percentage of individual investors who are bullish, neutral, or bearish on the stock market over the next six months. Published weekly every Thursday, it's a widely followed contrarian indicator — historically elevated bearish readings have preceded market recoveries, while extreme optimism has often foreshadowed pullbacks.
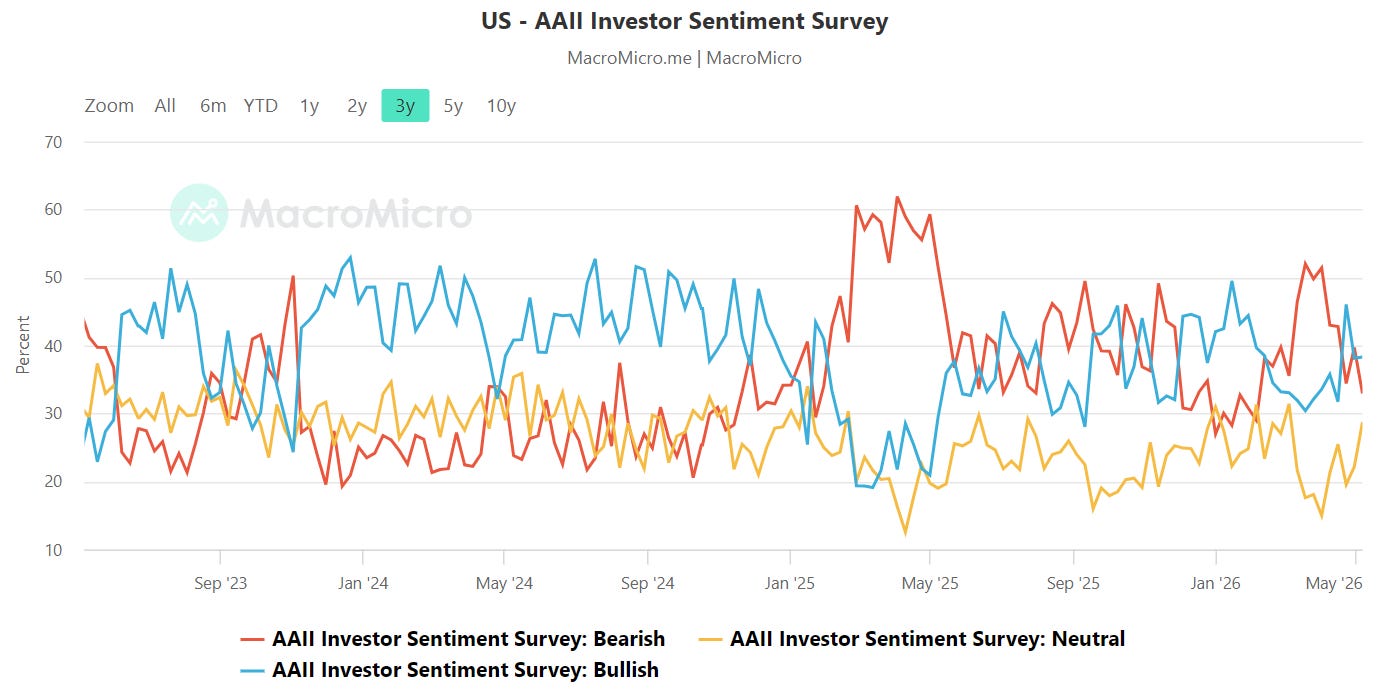
The AAII survey currently shows bullish sentiment roughly around the high-30s while bearish sentiment has slipped back toward the low-to-mid 30s, leaving the bull-minus-bear spread modestly positive after spending portions of the past year deeply negative. That matters because negative spreads often create fuel for rallies, while sustained readings above +20 tend to signal crowding and complacency. We are not there yet. The tone is constructive, but not euphoric despite feelings of a one-way tape in indices and semis this past week.
NAAIM Exposure Index
The NAAIM Exposure Index (National Association of Active Investment Managers Exposure Index) measures the average exposure to U.S. equity markets as reported by its member firms. These are typically active money managers who provide their equity exposure levels weekly. The index offers insight into how much these managers are investing in equities at any given time, ranging from being fully short (-100%) to leveraged long (up to +200%).
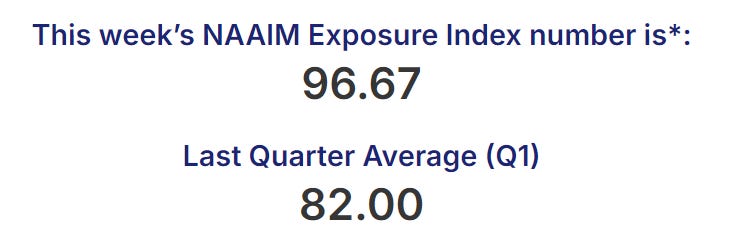
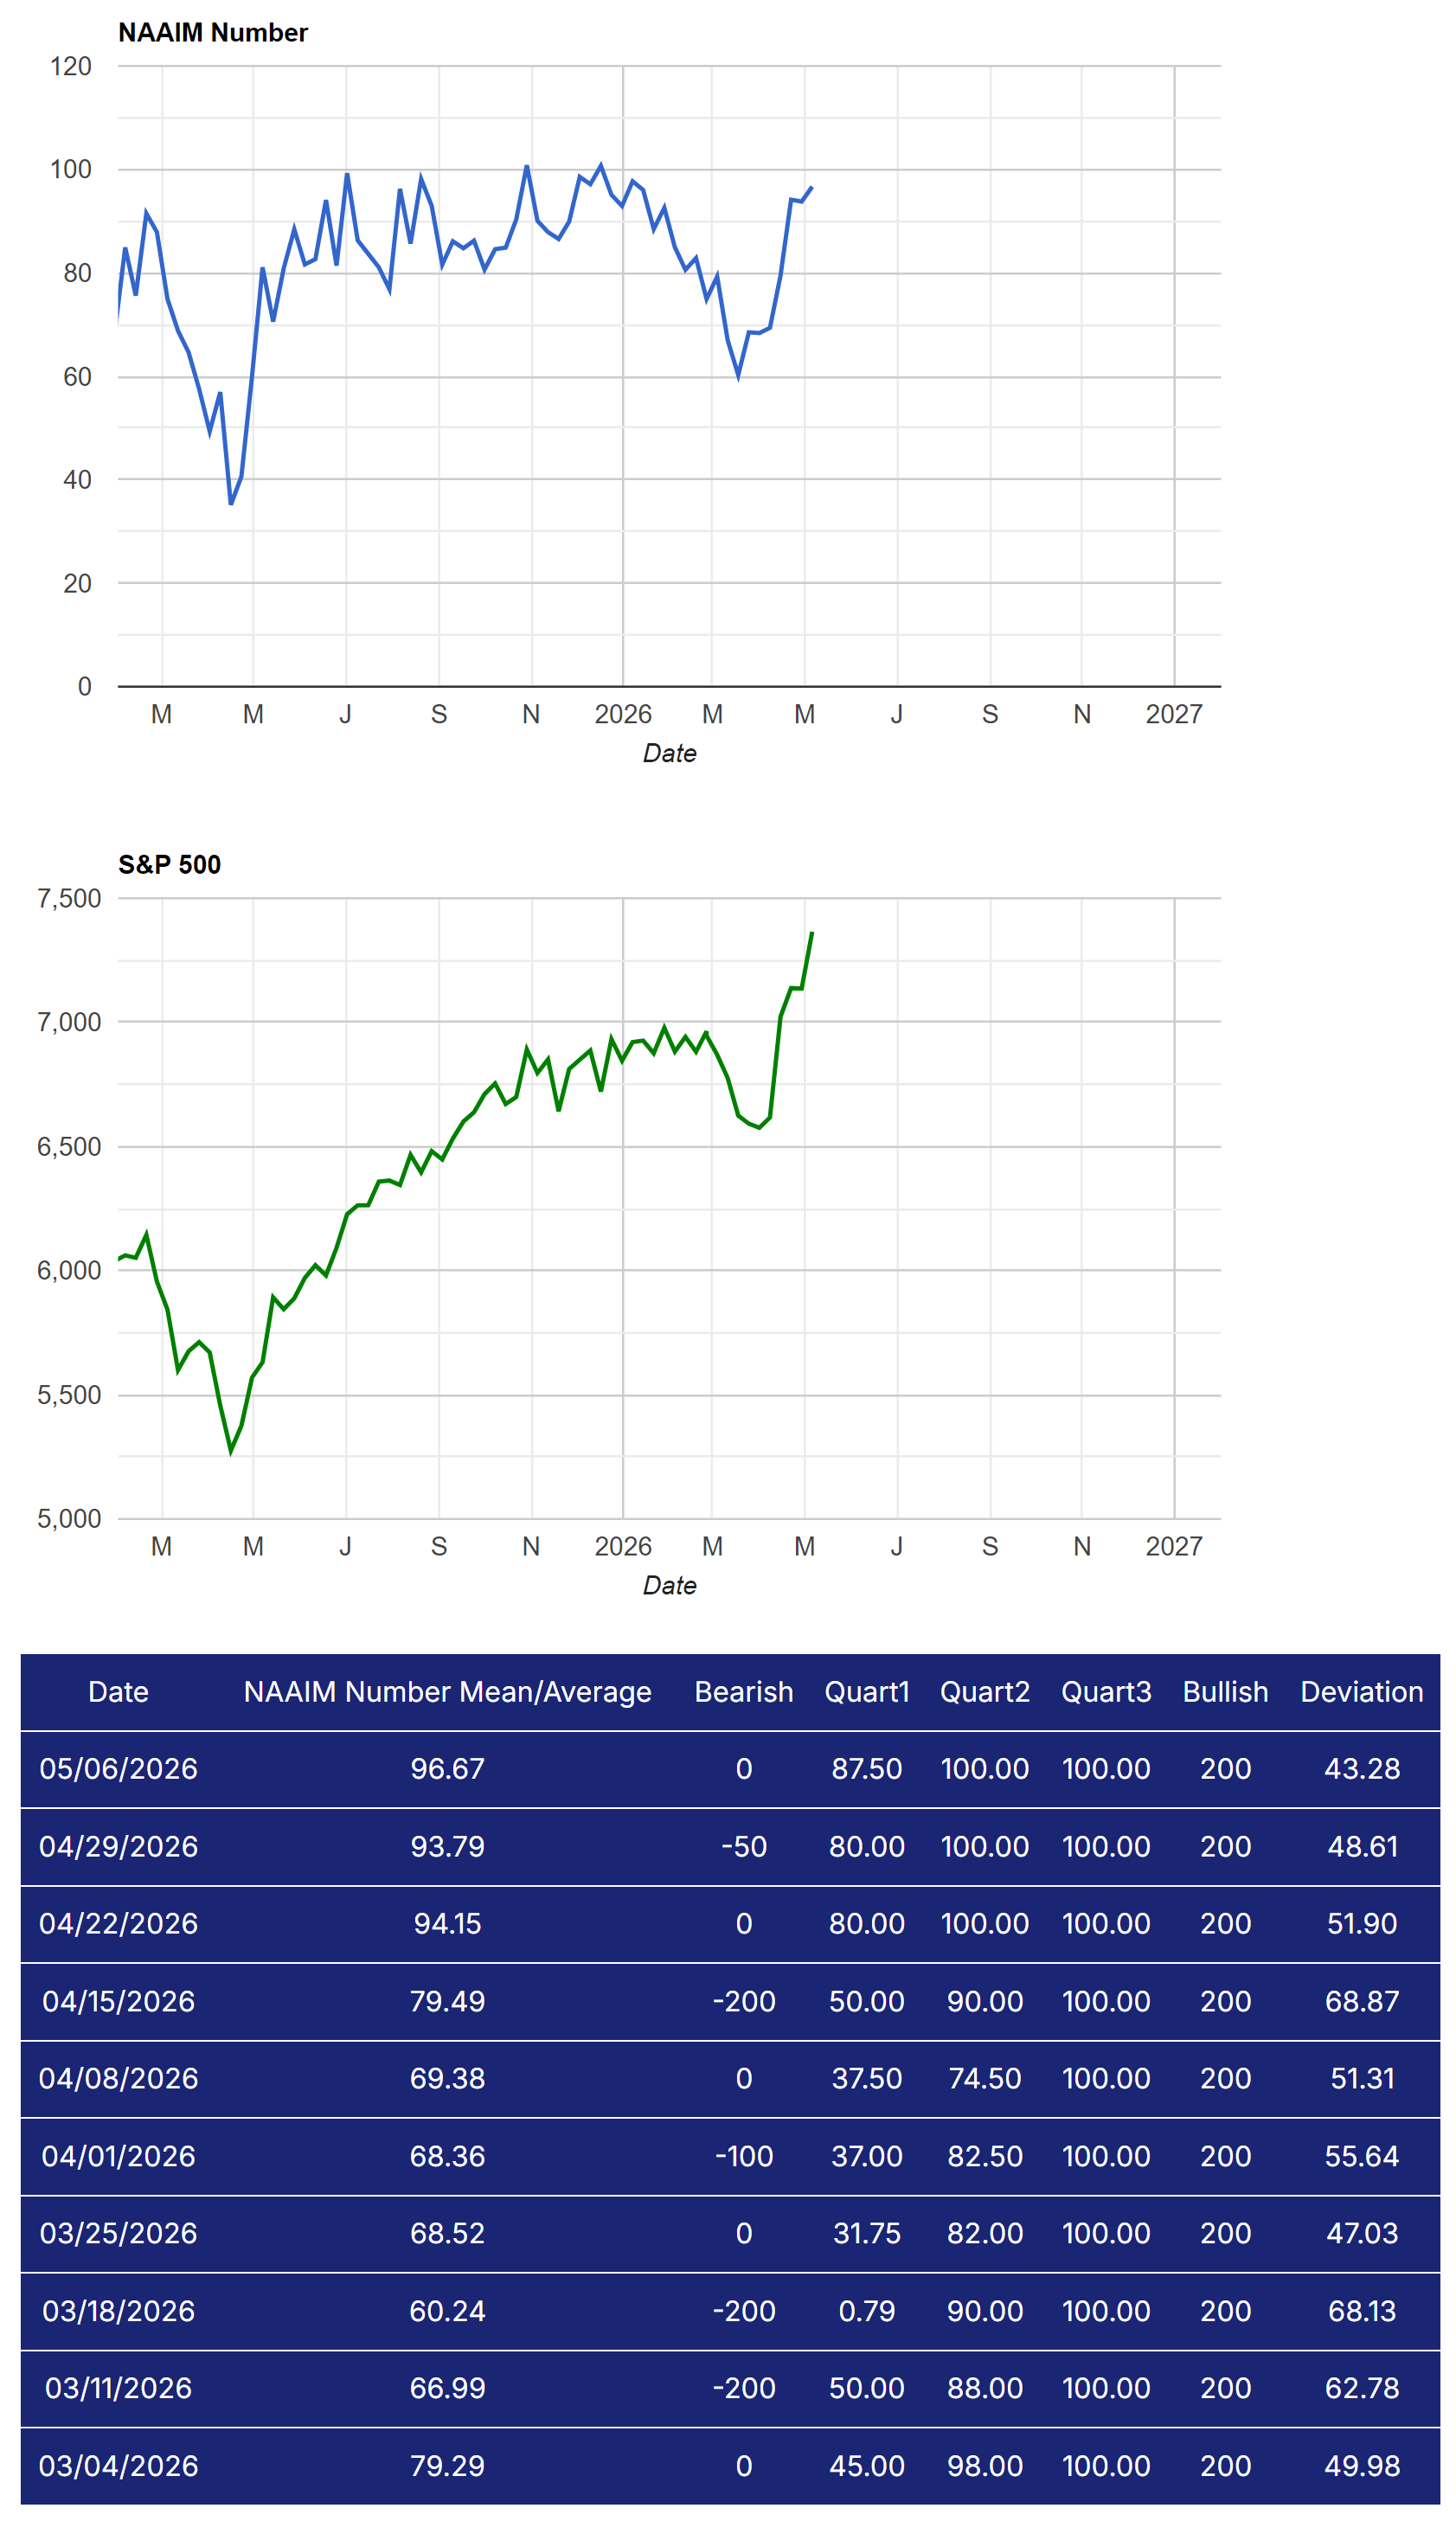
The NAAIM Exposure Index tells a much more aggressive story underneath the surface. Manager exposure has surged back into the mid-to-high 90s, with the latest visible reading at 96.67 after spending much of March and April recovering from the 60s and 70s. Managers have clearly re-risked alongside the sharp recovery in the S&P 500. That means there is less dry powder sitting on the sidelines now than there was a month ago. The bullish interpretation is straightforward: professionals are embracing the breakout rather than fading it. The cautionary angle is that heavily exposed managers become more vulnerable to fast de-risking if momentum stalls. A drop back into the 50s without major price damage would likely signal healthy rotation and consolidation. A persistent hold above 90 keeps the tape firmly in risk-on territory for now.
CBOE Total Put/Call Ratio
CBOE's total put/call ratio includes index options and equity options. It's a popular indicator for market sentiment. A high put/call ratio suggests that the market is overly bearish and stocks might rebound. A low put/call ratio suggests that market exuberance could result in a sharp fall.
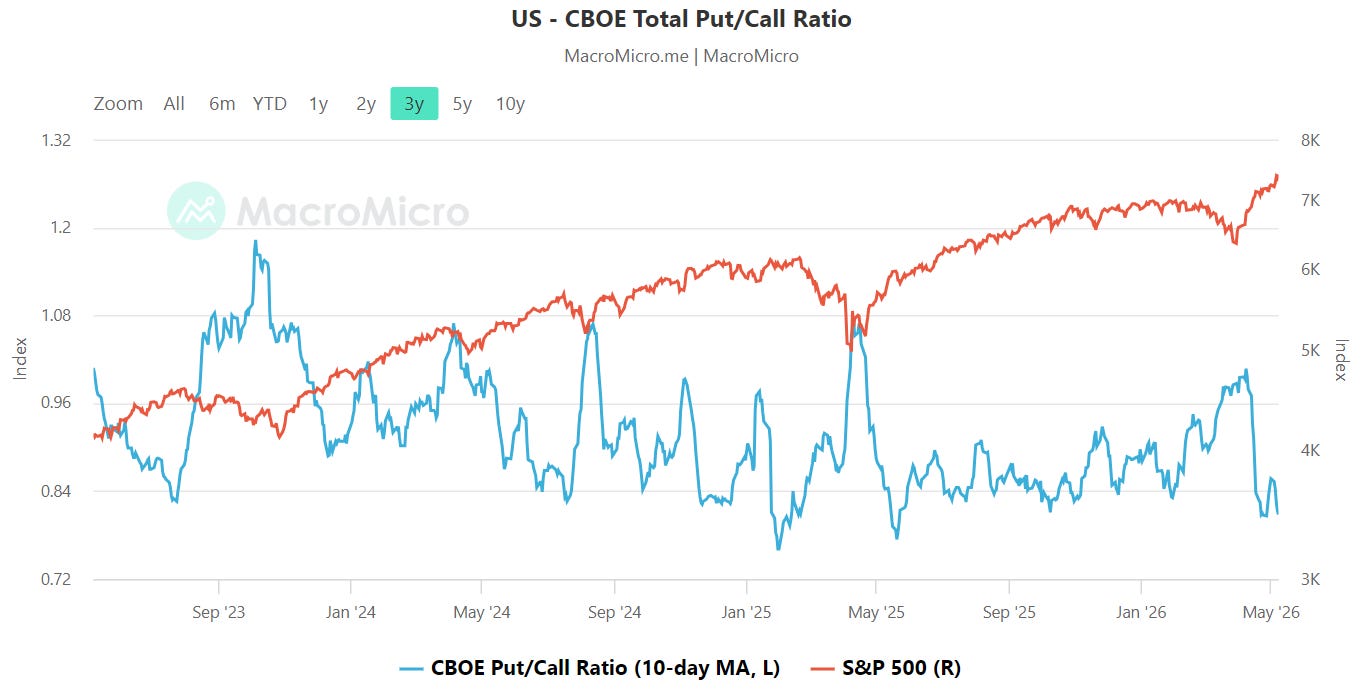
The 10-day average of the CBOE total put/call ratio has fallen back toward the low-0.80s after briefly pushing near 1.0 during the spring volatility spike. Historically, readings around 0.8 suggest traders are leaning back toward call buying and upside participation, while readings closer to or above 1.0 tend to reflect elevated fear and hedging demand. In practical terms, the options market has shifted from defensive to opportunistic again.
That does not automatically imply danger, but it does mean the easy contrarian fuel has likely already been burned. The strongest reflex rallies tend to occur when put/call ratios are elevated and positioning is defensive. That is no longer the setup. Instead, the market now sits in a more balanced environment where upside continuation depends more on earnings follow-through and breadth expansion than on short-covering or panic hedging unwinds. If the ratio were to remain suppressed near the low-0.80 range while price accelerates vertically, that would start to hint at froth. A move back toward or above 1.0 would likely signal fear returning to the tape and potentially create conditions for another tradable rebound.
Equity vs Bond Volatility
The Merrill Lynch Option Volatility Estimate [MOVE] Index from BofAML and the CBOE Volatility Index [VIX] respectively represent market volatility of U.S. Treasury futures and the S&P 500 index. They typically move in tandem but when they diverge, an opportunity can emerge from one having to “catch-up” to the other.
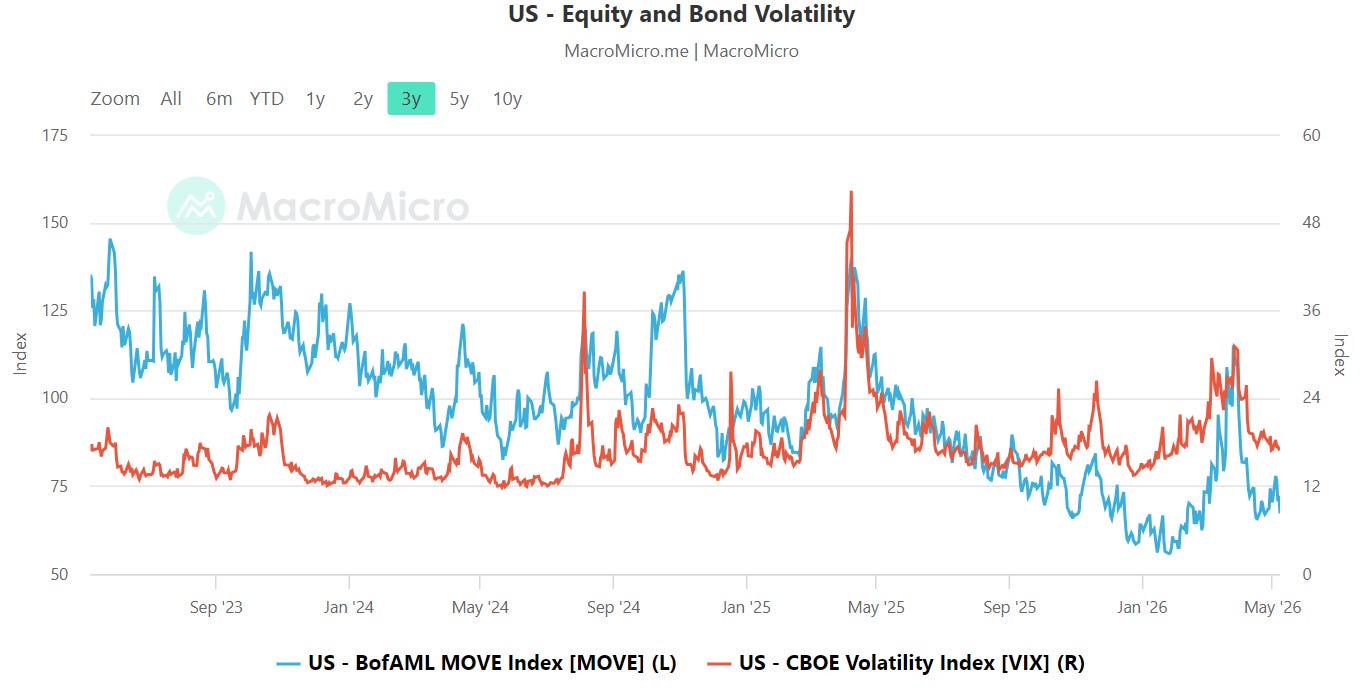
The volatility complex is notably calmer than it was during the spring drawdown, but there are still important crosscurrents beneath the surface. The MOVE Index has collapsed from prior stress highs and now sits closer to the low-70s area, while the VIX has similarly retreated into the mid-teens after briefly spiking into the 20s earlier this year. In other words, both bond volatility and equity volatility have cooled materially alongside the rally in risk assets.
That is generally supportive for equities because major equity drawdowns rarely occur in isolation from rates stress. The encouraging part of the current setup is that bond volatility is not flashing systemic warning signs. The relationship between MOVE and VIX also looks more synchronized now than it did during prior episodes where rates markets were signaling stress ahead of equities. The key tripwire remains any sharp divergence. If MOVE were to suddenly push back above roughly 120 while the VIX stayed subdued, that would suggest the bond market is detecting macro stress that equities are ignoring. Likewise, a sustained VIX move back into the high teens or above 20 would likely indicate the calm regime is breaking down.
CNN Fear & Greed
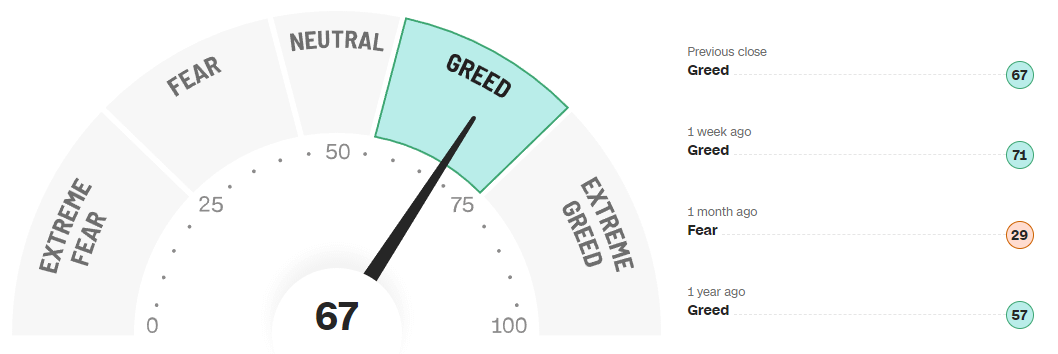
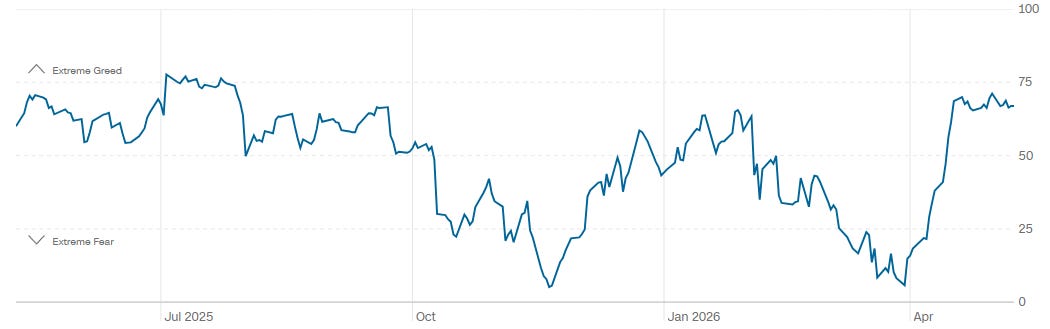
CNN’s Fear and Greed Index currently sits at 67, firmly in the “Greed” zone, though slightly below last week’s reading of 71. One month ago the gauge was sitting at 29, firmly in fear territory, highlighting just how aggressive the sentiment reversal has been over a relatively short period of time. The one-year trend shows a market that has repeatedly swung between optimism and caution without sustaining true panic or true mania for long. The recent move higher has been sharp, but it has not yet reached the type of prolonged extreme-greed regime that typically accompanies major speculative blowoffs.
The important nuance here is that sentiment has normalized much faster than underlying participation metrics have fully broadened. Traders are clearly feeling better about the macro backdrop, volatility has compressed, and positioning has become more constructive. But greed readings in the upper 60s and low 70s are no longer the deeply attractive entry zones that existed when the gauge was below 30. A push toward sustained readings above 80 would start to suggest crowding and complacency. Conversely, a pullback toward neutral while price remains resilient would likely be a healthier development for the longer-term advance.
Bottom line: sentiment has shifted decisively back toward risk-taking, but while optimism is elevated, the tape has not yet crossed into the kind of euphoric excess that typically marks durable market tops.
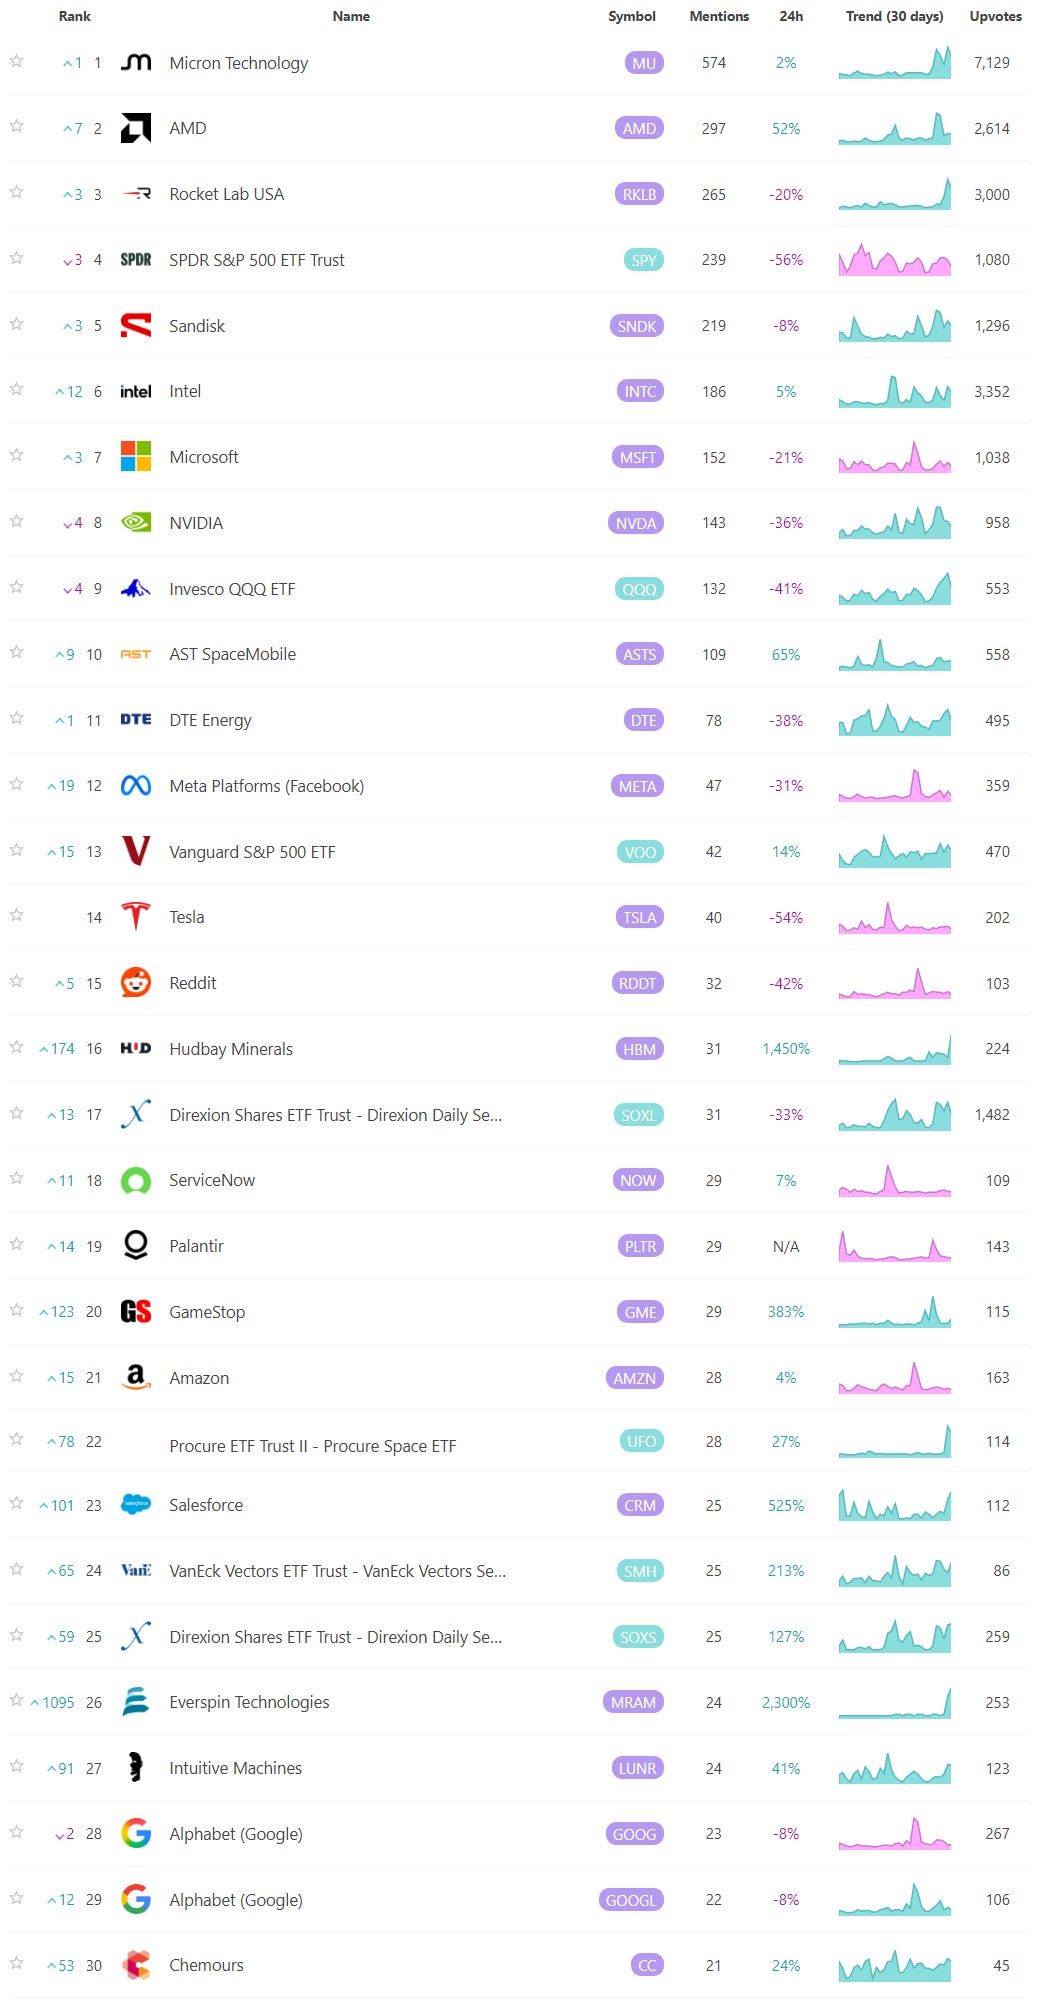
Social Media Favs
Social sentiment offers a real-time view of investor mood, often revealing market shifts before traditional indicators. It can signal momentum changes, spot emerging trends, and gauge retail investor impact—especially in high-volatility names. Tracking sentiment around events or earnings provides actionable insights, and when layered with quantitative models, can enhance predictive accuracy and risk management. Sustained sentiment trends often mirror broader market cycles, making this data a valuable tool for both short-term trades and long-term positioning.

Technician’s Playbook: Trading the Majors (SPY/QQQ/IWM/DIA)
When you’re a large institutional player, your primary goal is to find liquidity - places to do a ton of business with the least amount of slippage possible. VolumeLeaders.com automatically identifies and visually plots the exact spots where institutions are doing business and where they are likely to return for more. It’s one of the primary reasons “support” and “resistance” concepts work and truly one of the reasons “price has memory”.
The tape continues to carry the signature of controlled institutional accumulation rather than emotional chasing. Across SPY, QQQ, IWM, and DIA, the dominant pattern was impulse higher, shallow inventory reset, and then re-engagement near high-dollar shelves. None of the major indices showed aggressive rejection from their largest recent trade zones. Instead, price repeatedly paused, compressed, and continued higher or stabilized directly around those areas. That is usually a sign that large participants are still facilitating inventory transfer rather than distributing aggressively into strength.
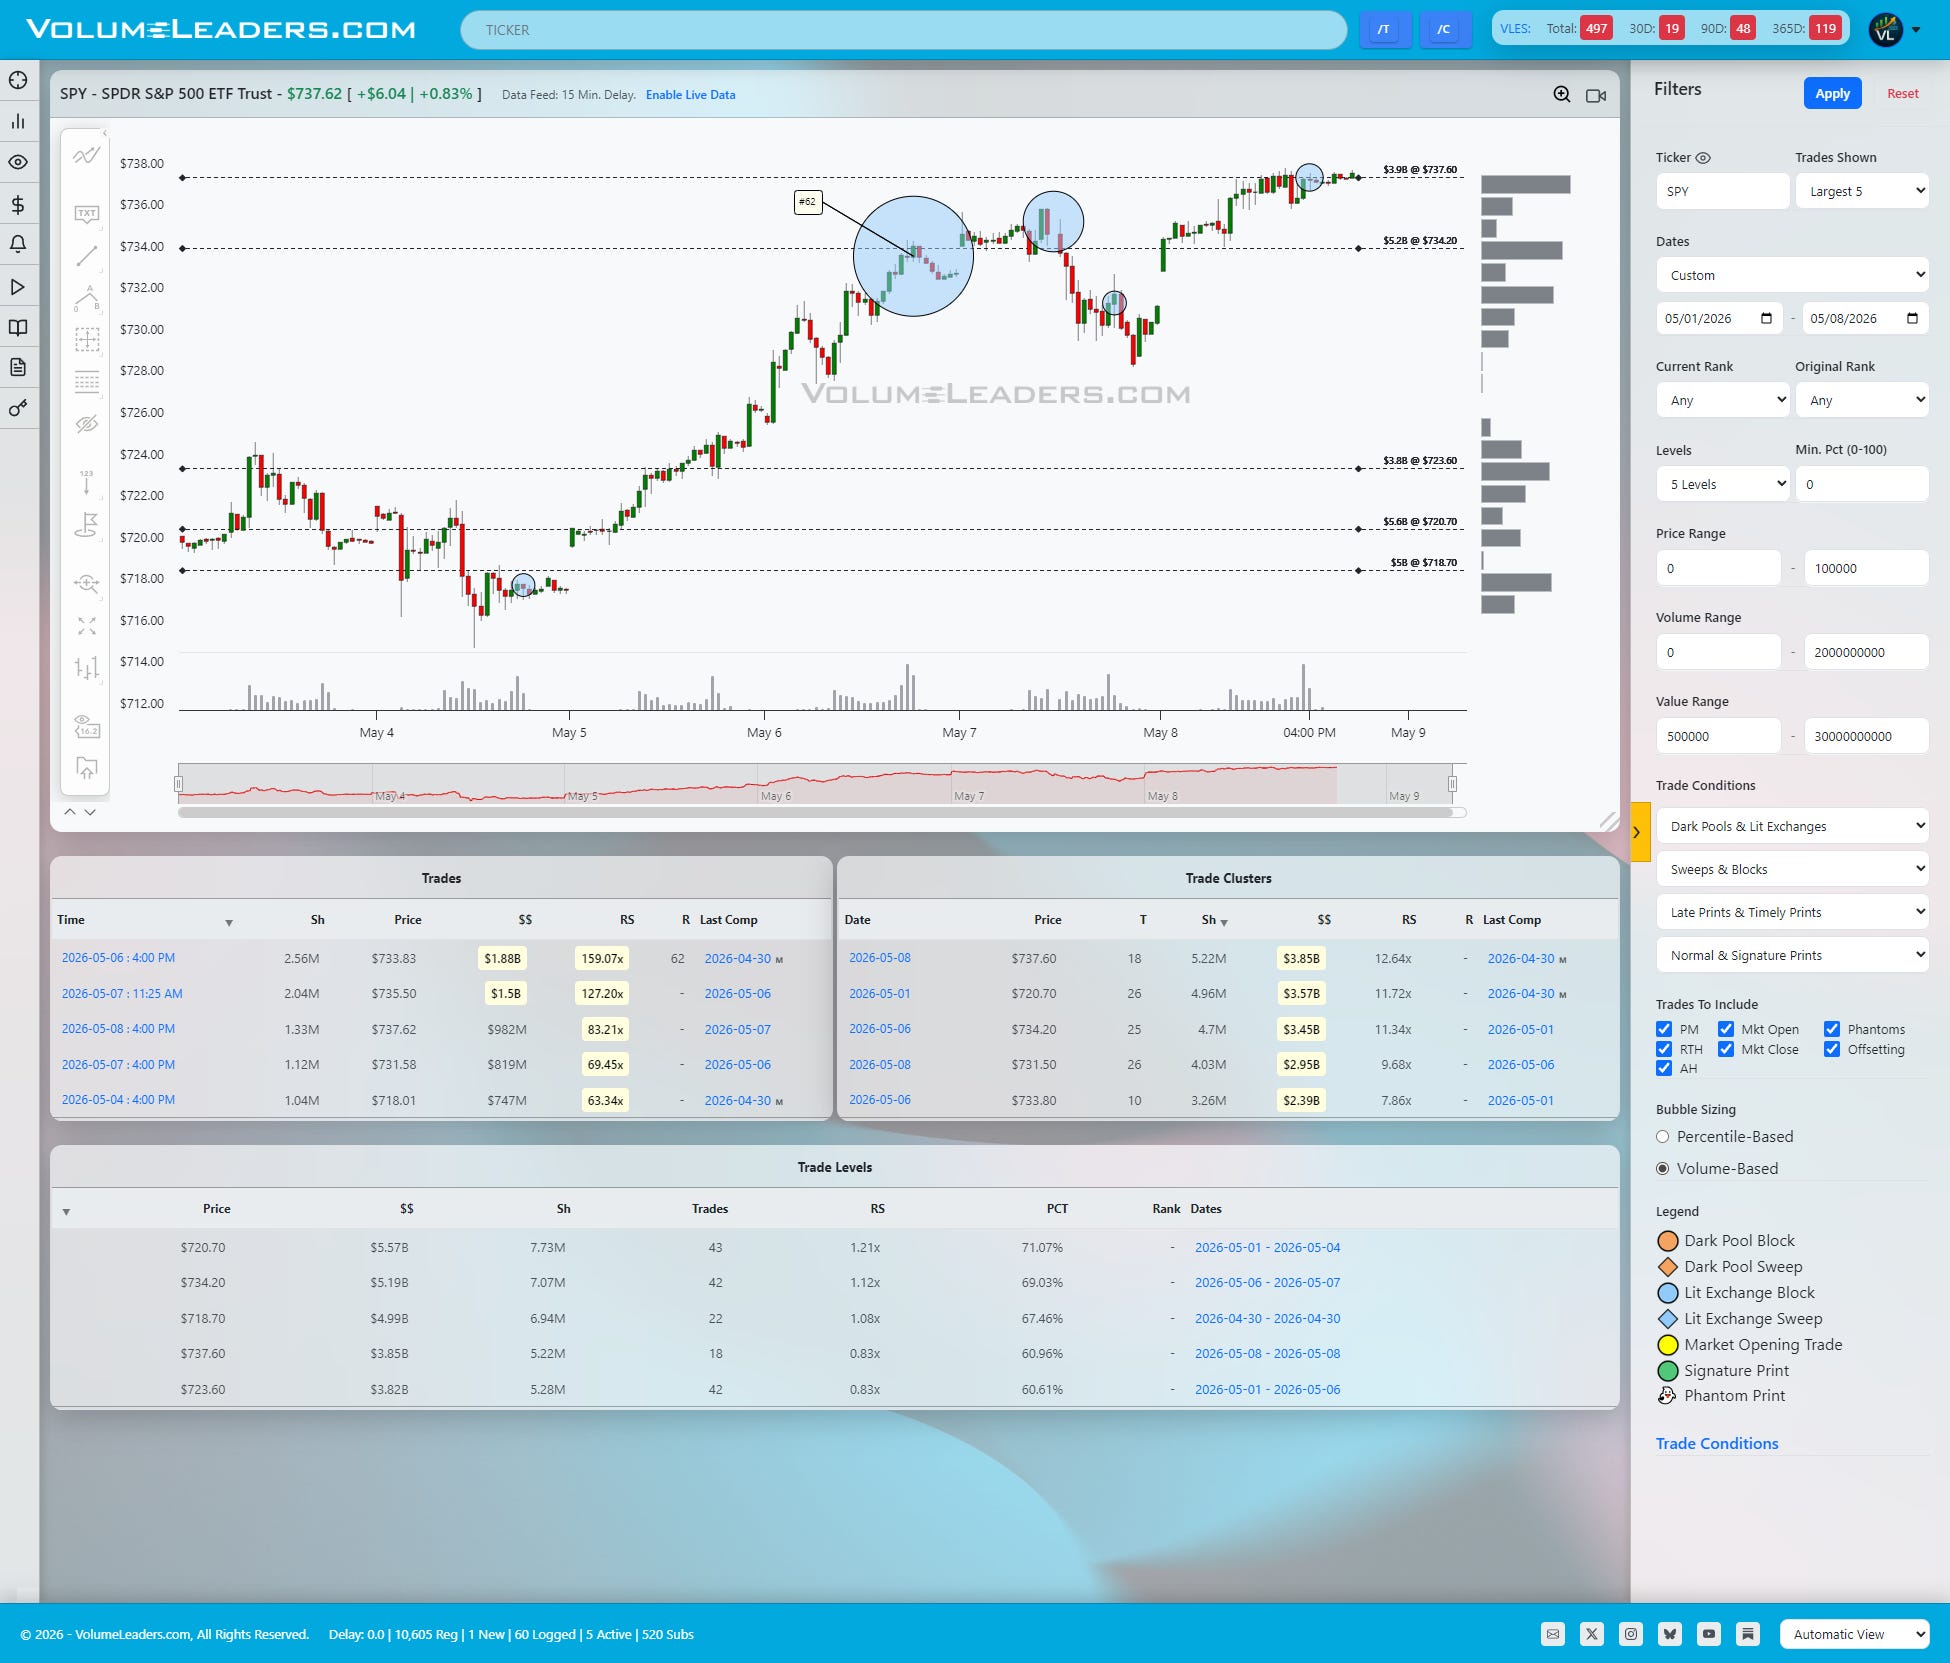
SPY remains the cleanest expression of that behavior. The tape stair-stepped higher throughout the week before consolidating directly beneath the upper $737-$738 region. The most notable print was the tagged #62 historical trade near the low $733s, which coincided with a sharp acceleration higher afterward. That matters because the market did not reject the print; it used it as fuel. The largest visible cluster sits at $737.60 with roughly $3.85B attached, while the broader level structure below shows extremely heavy cumulative interest around $734.20 and $720.70, both carrying more than $5B in notional value. The immediate line of scrimmage is now the mid-$734s. Acceptance above the upper $737 shelf likely opens the door for another expansion leg, while failure back below $734 would suggest the recent breakout impulse is losing sponsorship and rotating back toward the low $730s shelf and possibly back through to the mid $720s to test the breakout from lower levels.
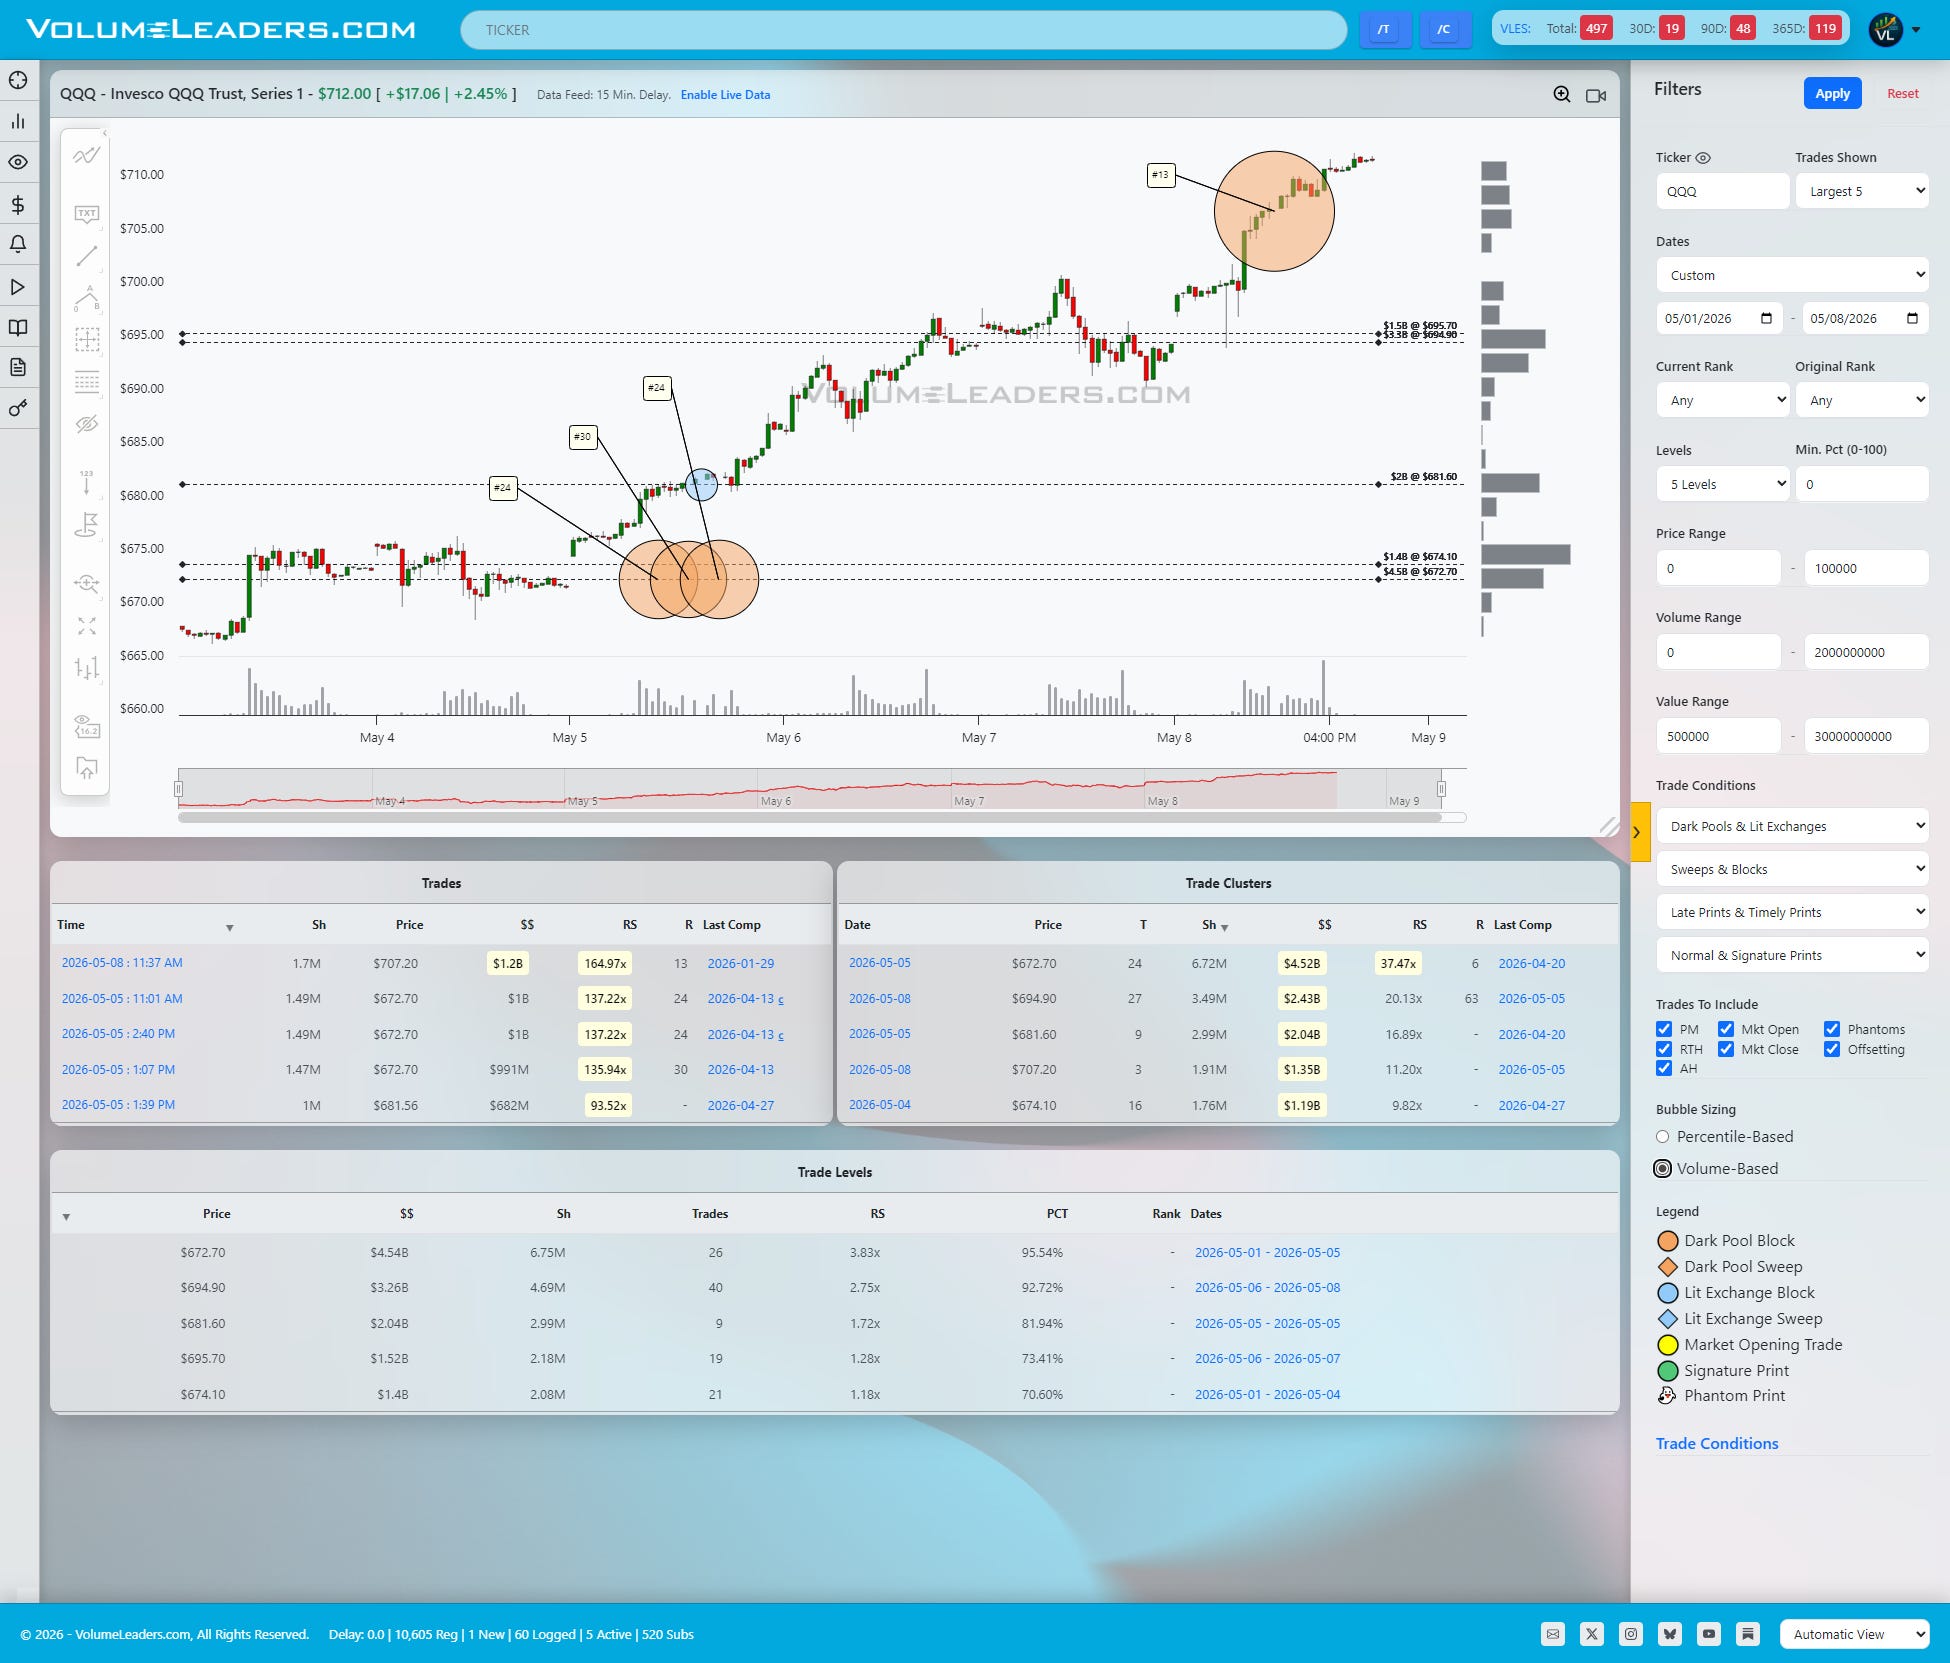
QQQ continues to act like the institutional leadership vehicle. The path here was almost textbook: balance in the low $670s, impulsive repricing higher, then continuation through the upper $690s into the low $700s. The most important structure on the board remains the massive $672.70 cluster carrying approximately $4.52B with an RS multiple above 37x and a percentile reading near 96%. That is not random activity. It represents an area where institutions clearly transacted meaningful size before the expansion higher. The market is now trading materially above that zone, with a newer cluster forming near $694.90 worth roughly $3.26B. The large print around $707 near Friday's highs is notable because price did not meaningfully back away from it. That behavior leans more absorption than exhaustion for now. As long as QQQ holds above the upper $690s, the path of least resistance still points higher. A failure back below $695 would be the first sign momentum is beginning to stall, while a break and hold above $707 likely turns the low $710s into the next magnet.
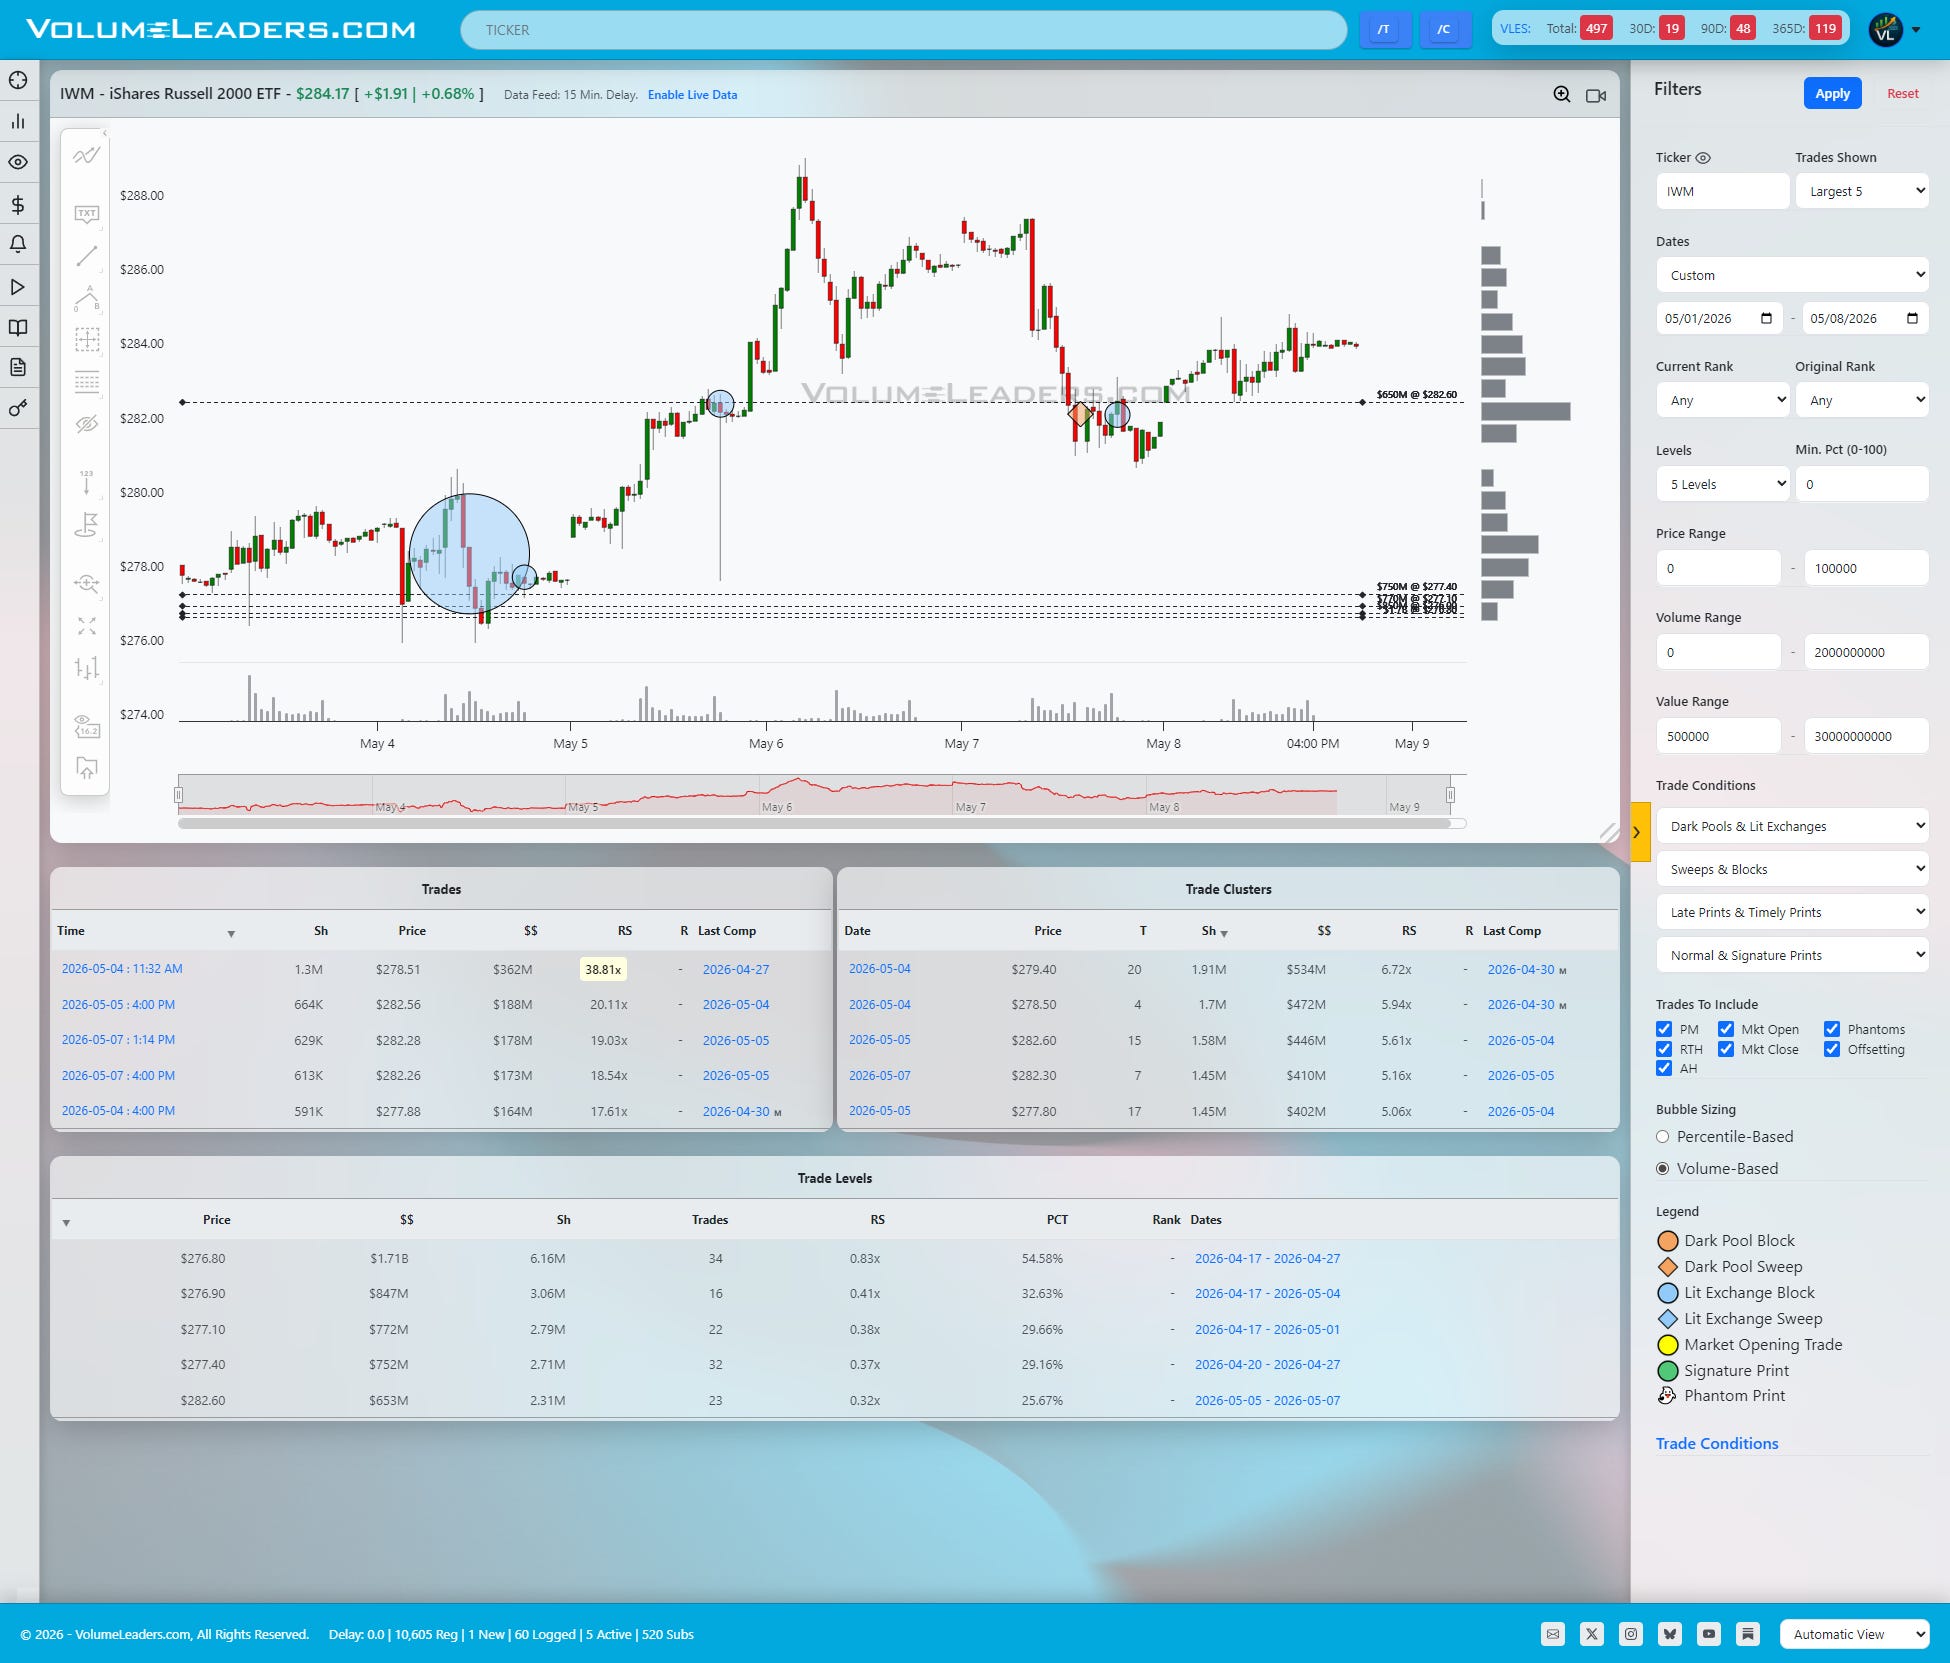
IWM remains much sloppier structurally, but there are signs of stabilization underneath the surface. The dominant feature is the extremely dense support band clustered between roughly $276.80 and $277.40. Multiple cumulative levels sit there, including approximately $1.71B at $276.80, making it the clearest institutional defense zone on the chart. Price repeatedly interacted with that shelf before rotating higher into the low $280s. Unlike QQQ, however, the Russell has not yet produced a convincing impulsive continuation leg after the stabilization phase. The important distinction is that sellers also failed to force meaningful acceptance below support despite several tests. The line of scrimmage now sits near $282.60, where a newer cluster developed. Acceptance above that area would strengthen the case that small caps are finally beginning to participate more aggressively. Failure back through $277 would likely reopen the entire lower balance zone.
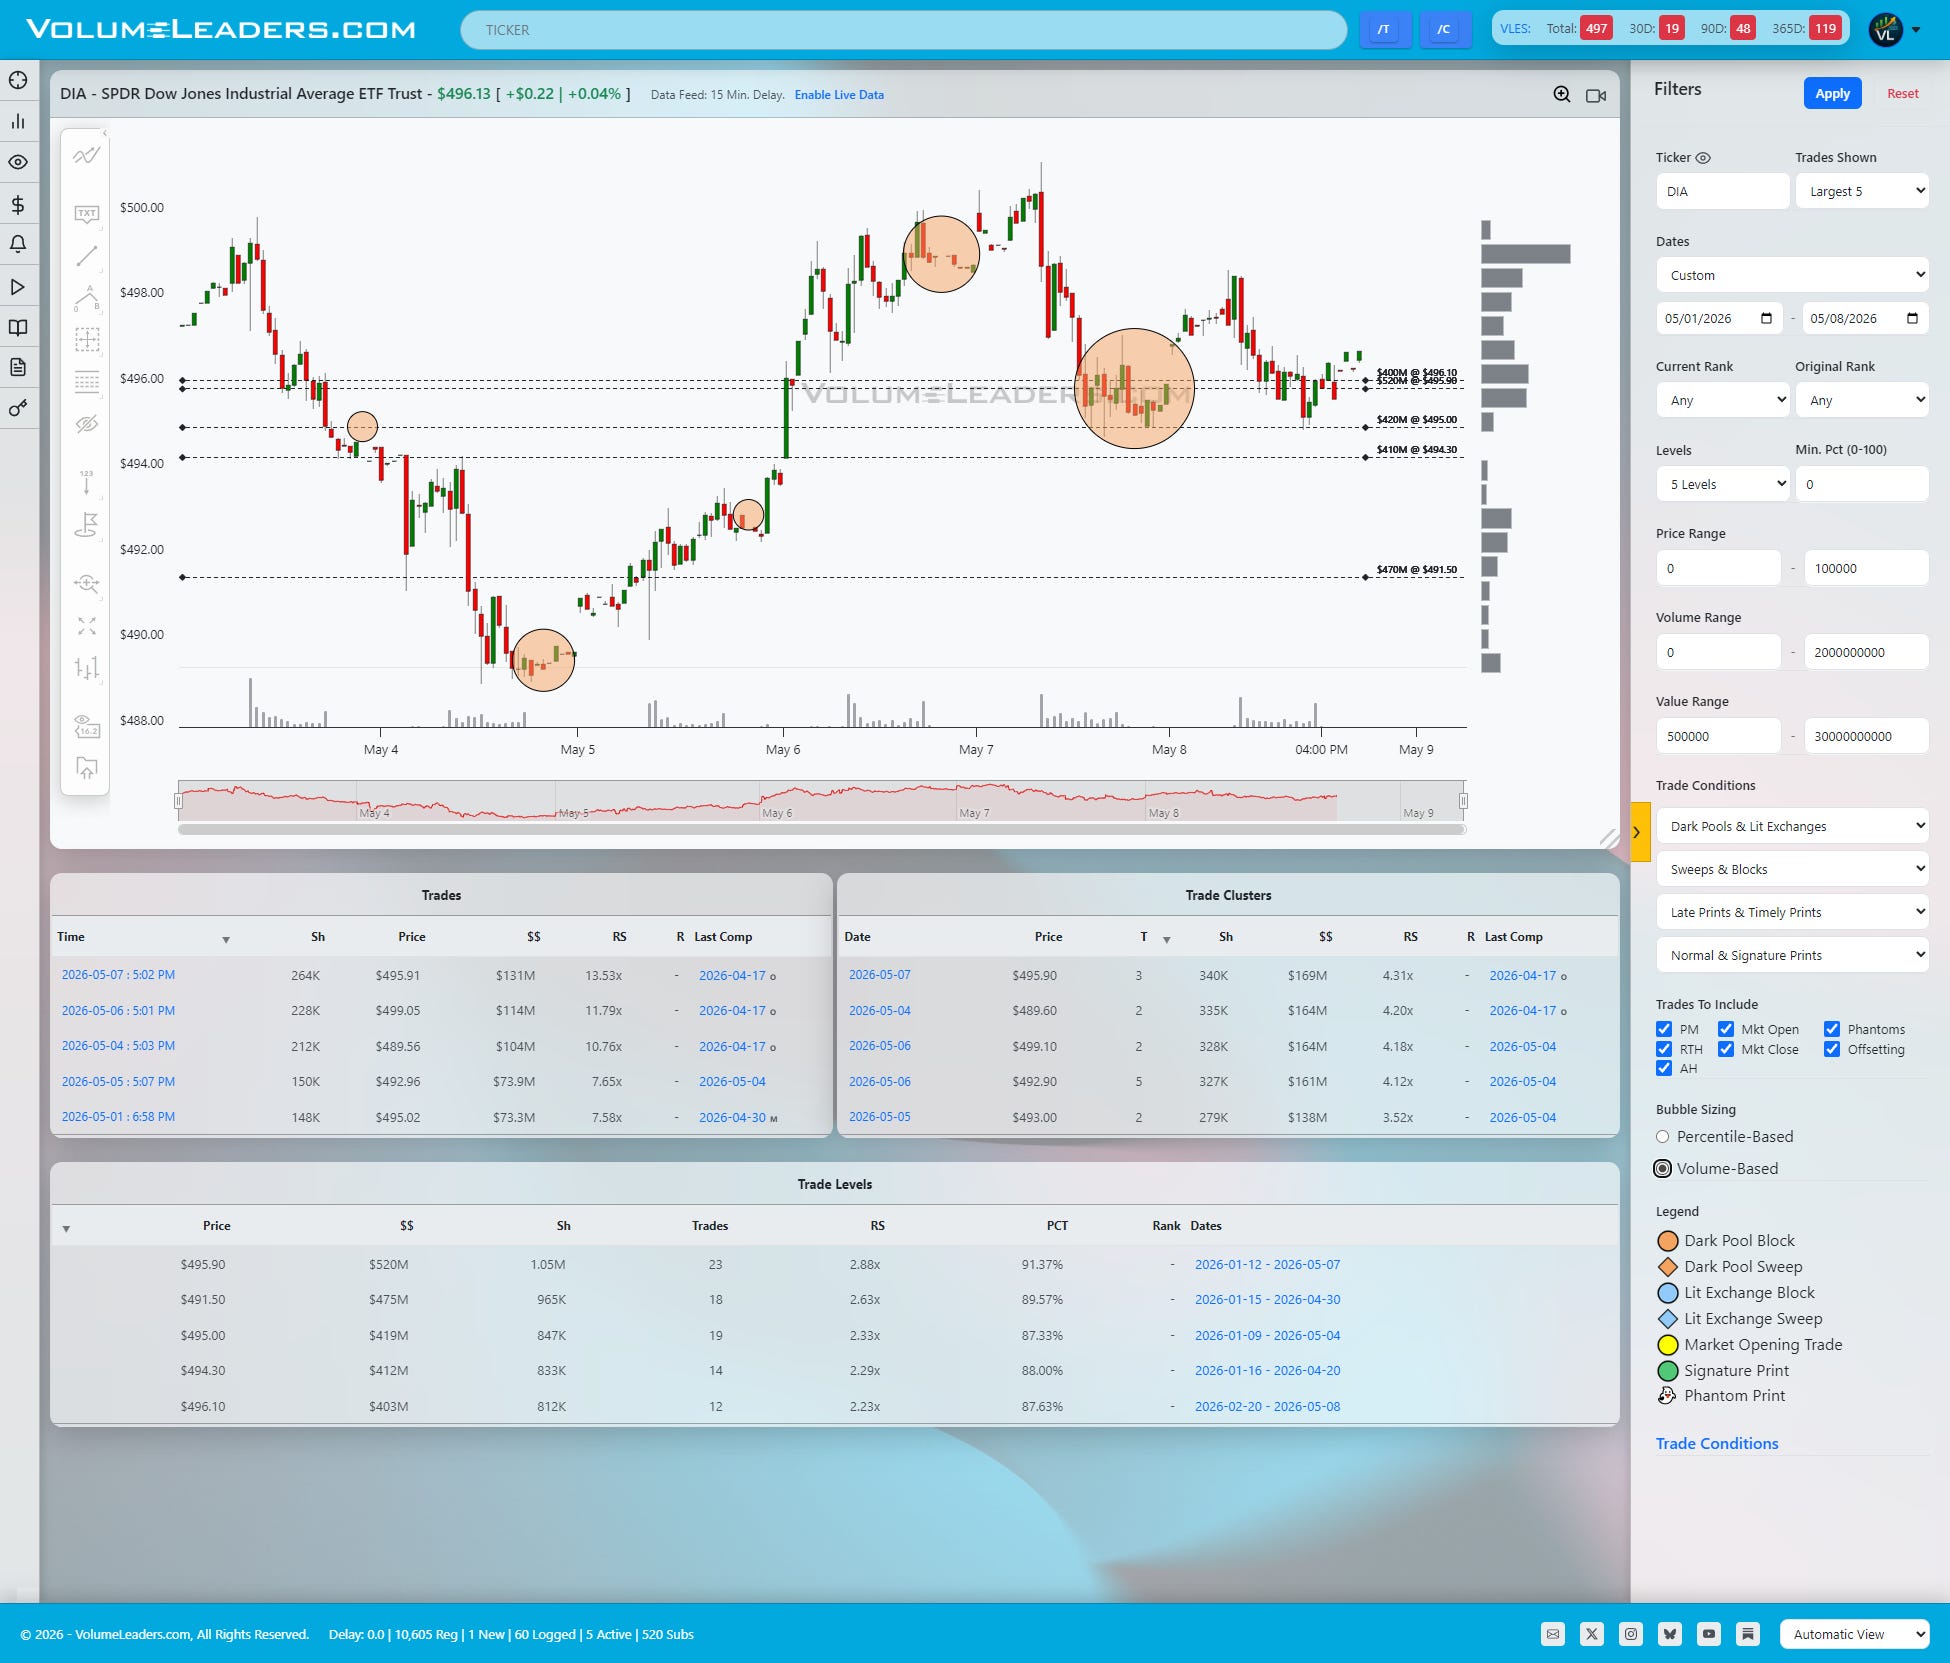
DIA looks like a mature balancing structure rather than a momentum breakout. The Dow repeatedly rotated around the $495-$496 region, where several large clusters and levels overlap. The largest visible level sits near $495.90 with roughly $520M attached and a percentile reading above 91%, while neighboring shelves around $495.00 and $494.30 continue to attract two-way trade. The notable characteristic here is how orderly the rotations became after the sharp selloff from the highs near $500. Buyers repeatedly defended the mid-$495s, but there has not yet been enough urgency to reclaim the highs decisively. For bulls, sustained acceptance back above the upper $496s likely opens another test of the $500 region. For bears, the first meaningful victory would be forcing acceptance beneath $494.30, which would imply the balancing structure is resolving lower rather than preparing for continuation.
The broader message from the tape is that institutions continue to transact size into relatively orderly price action rather than panic. QQQ remains the leadership engine, SPY continues to grind constructively above major support, IWM is attempting to build a durable floor, and DIA is balancing. The most tradeable setups now likely come from watching whether price accepts above these recent high-dollar shelves or fails back beneath them. Right now, the market is still behaving more like inventory accumulation than distribution.

Summary Of Thematic Performance YTD
VolumeLeaders.com offers a robust set of pre-built thematic filters, allowing you to instantly explore specific market segments. These performance snapshots are provided purely for context and inspiration—think about zeroing in on the leaders and laggards within the strongest and weakest sectors, for example.
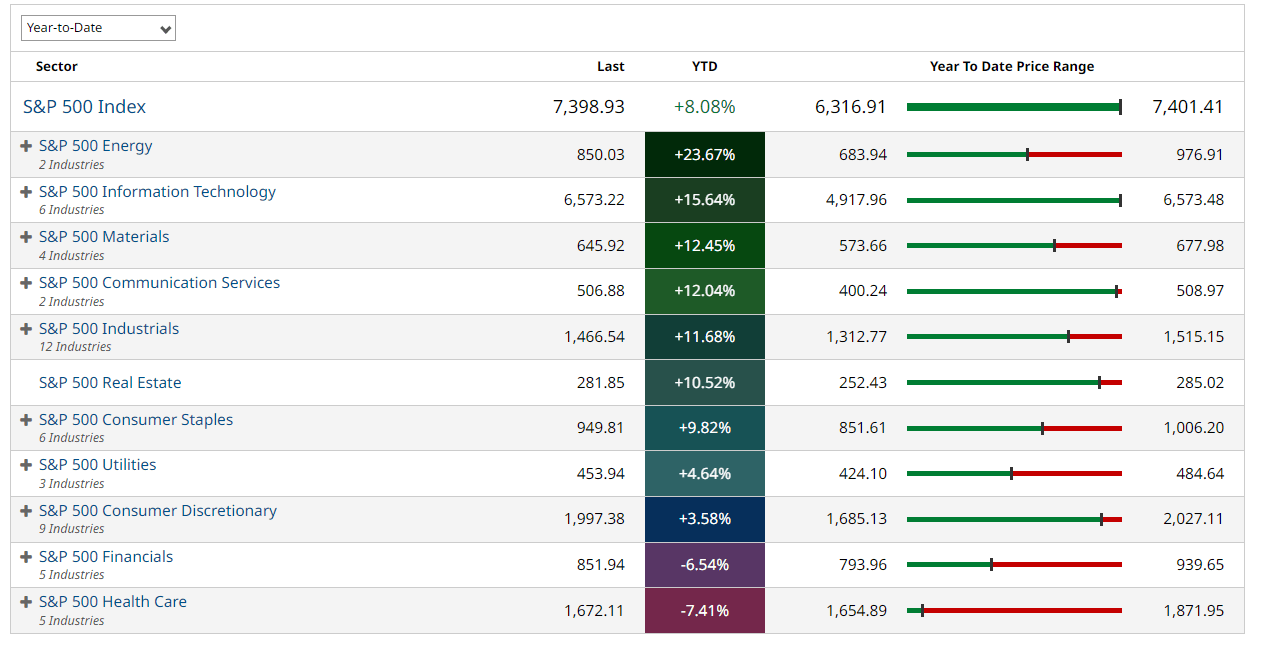
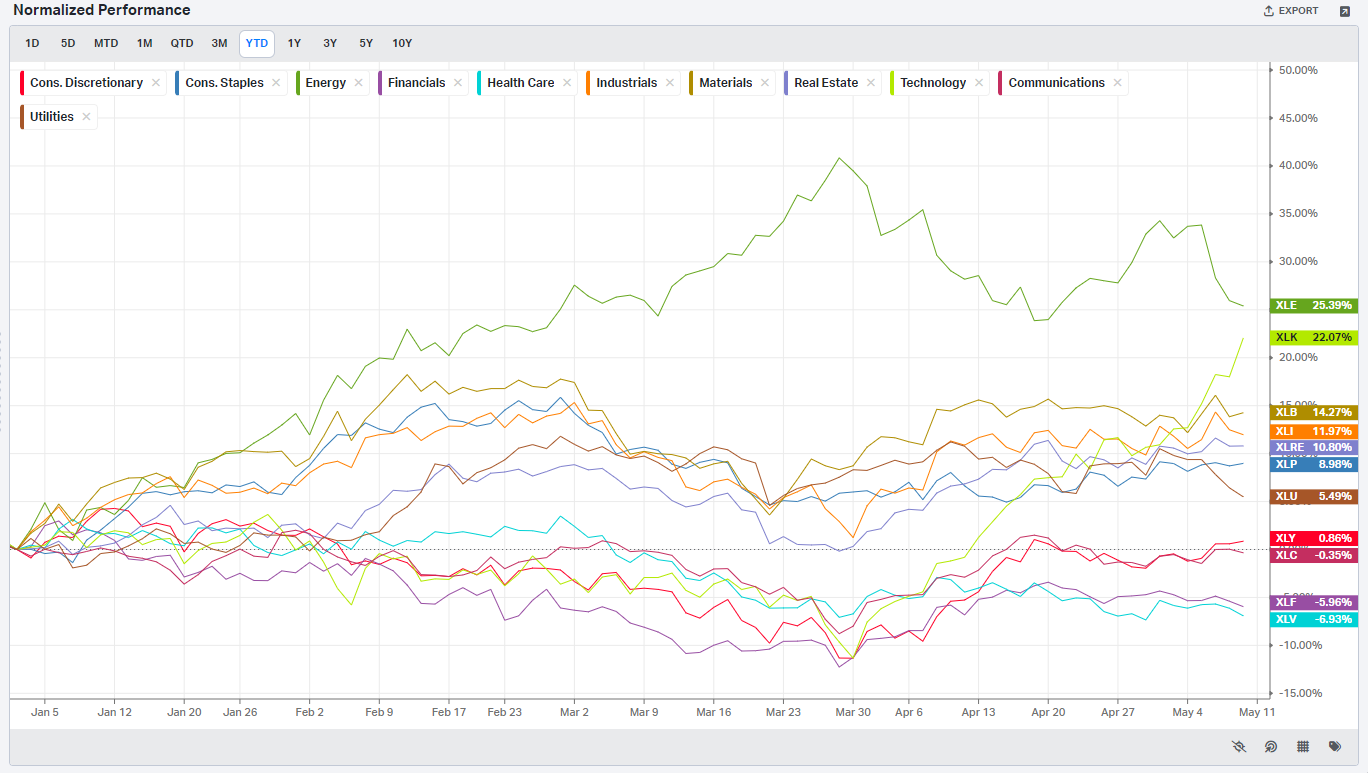
S&P By Sector
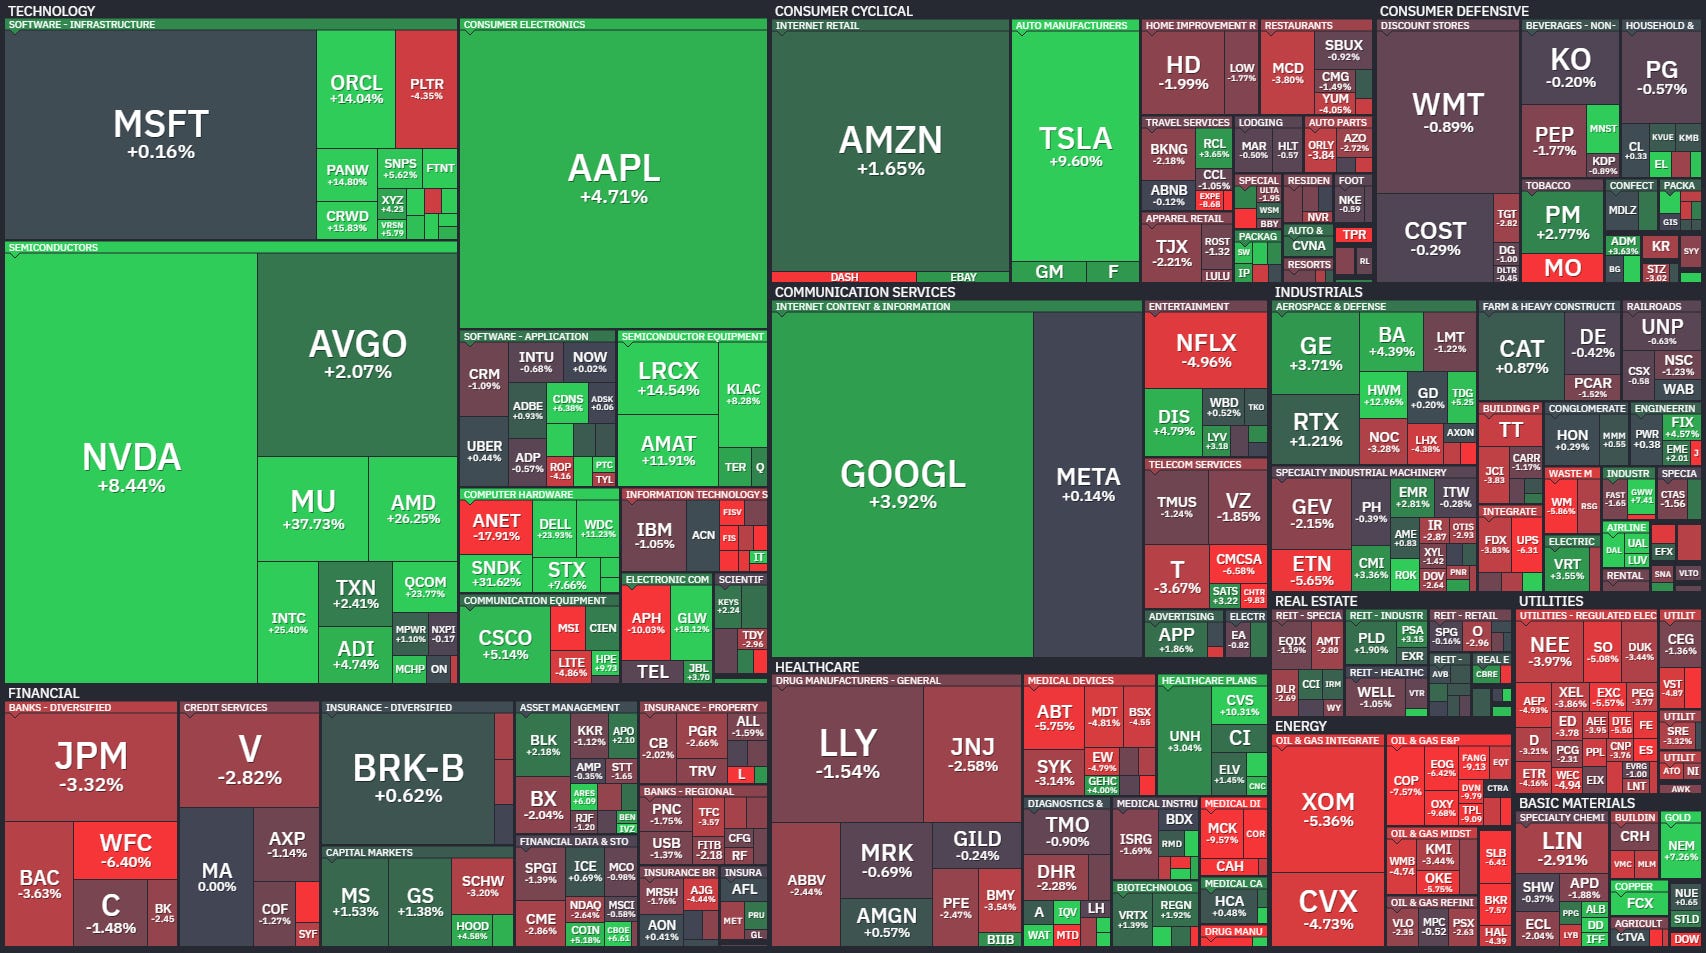
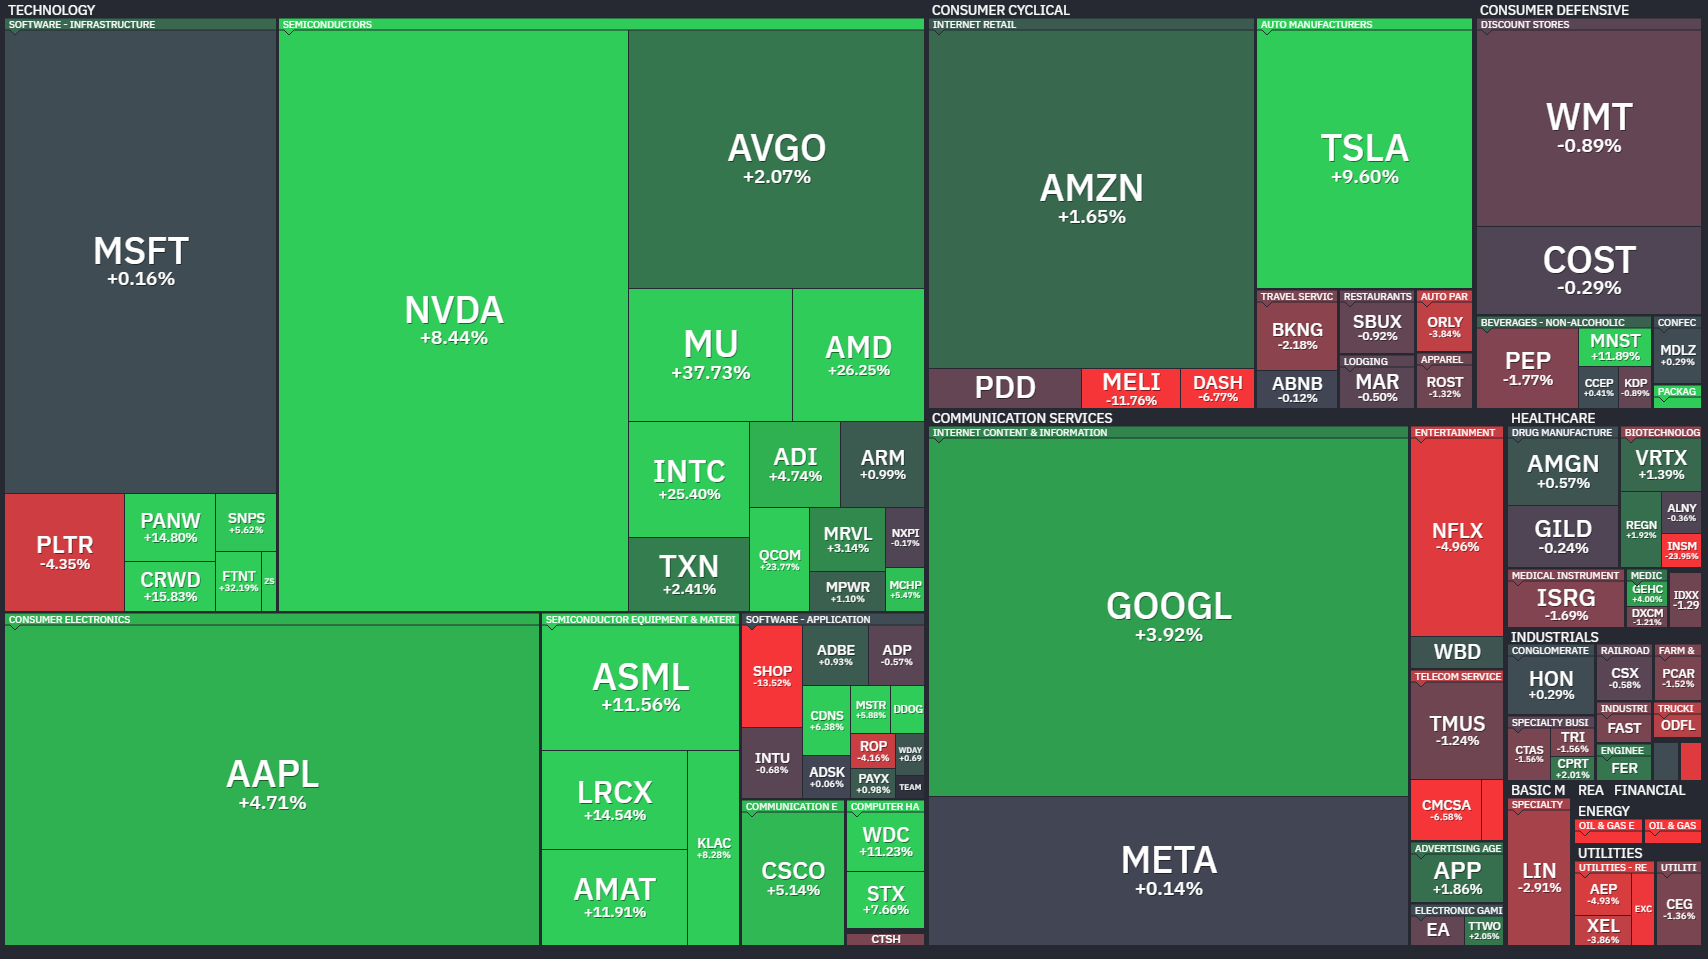
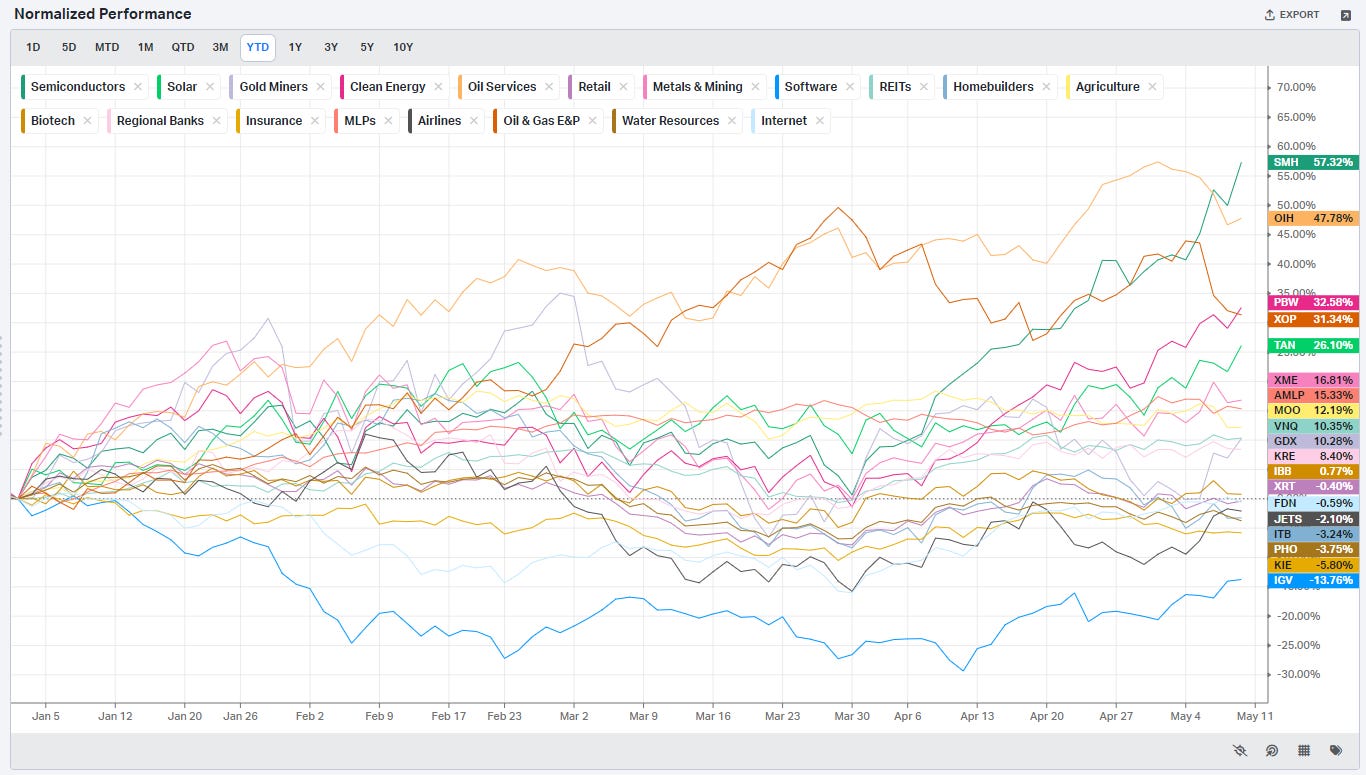
S&P By Industry
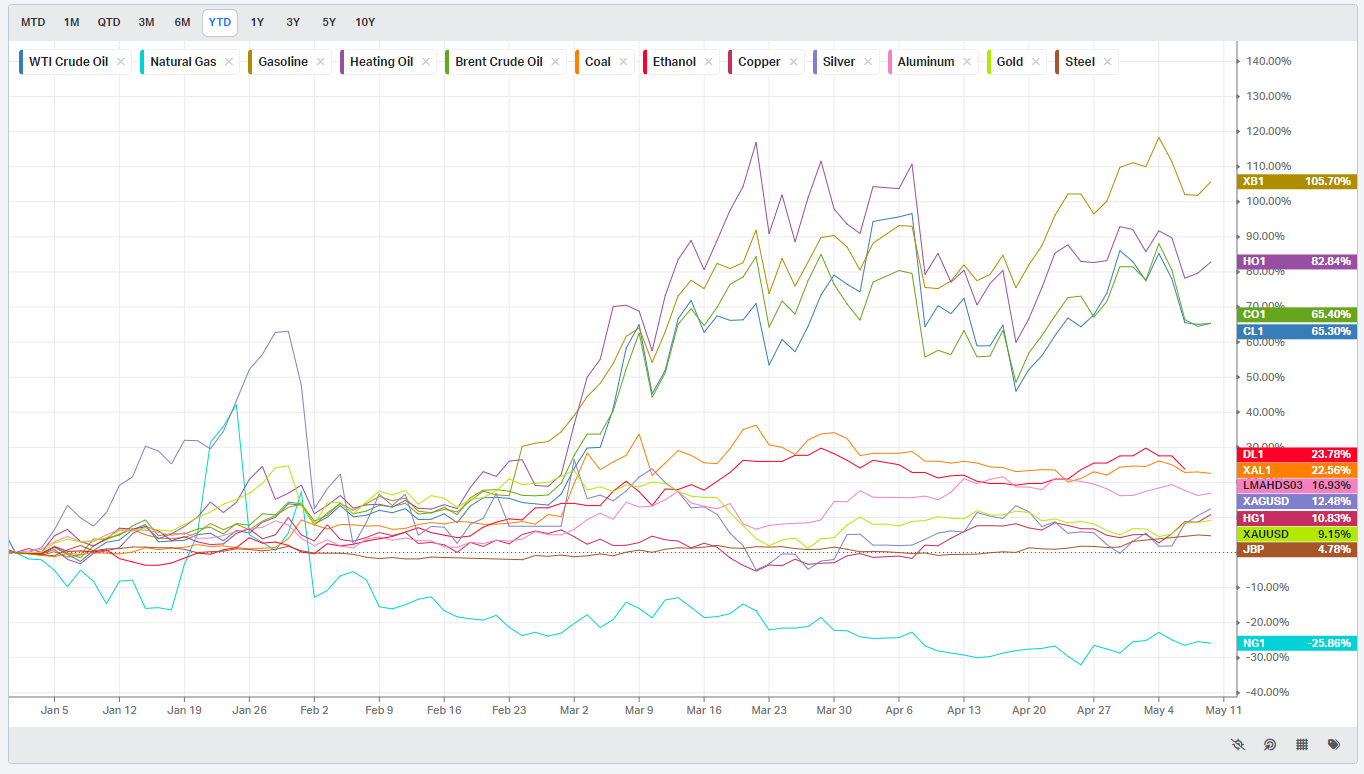
Commodities: Energy & Metals
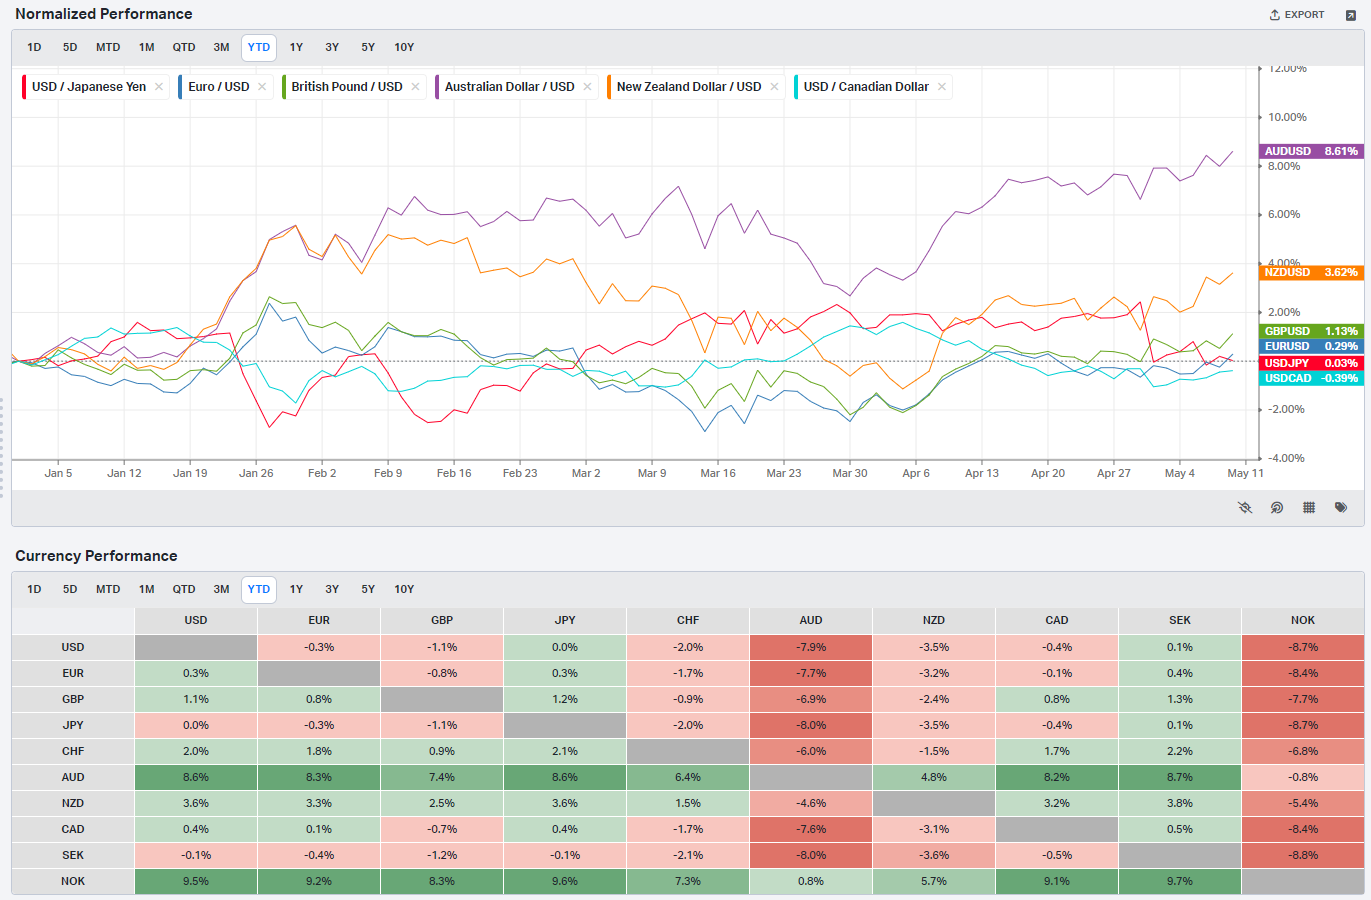
Currencies/Major FX Crosses
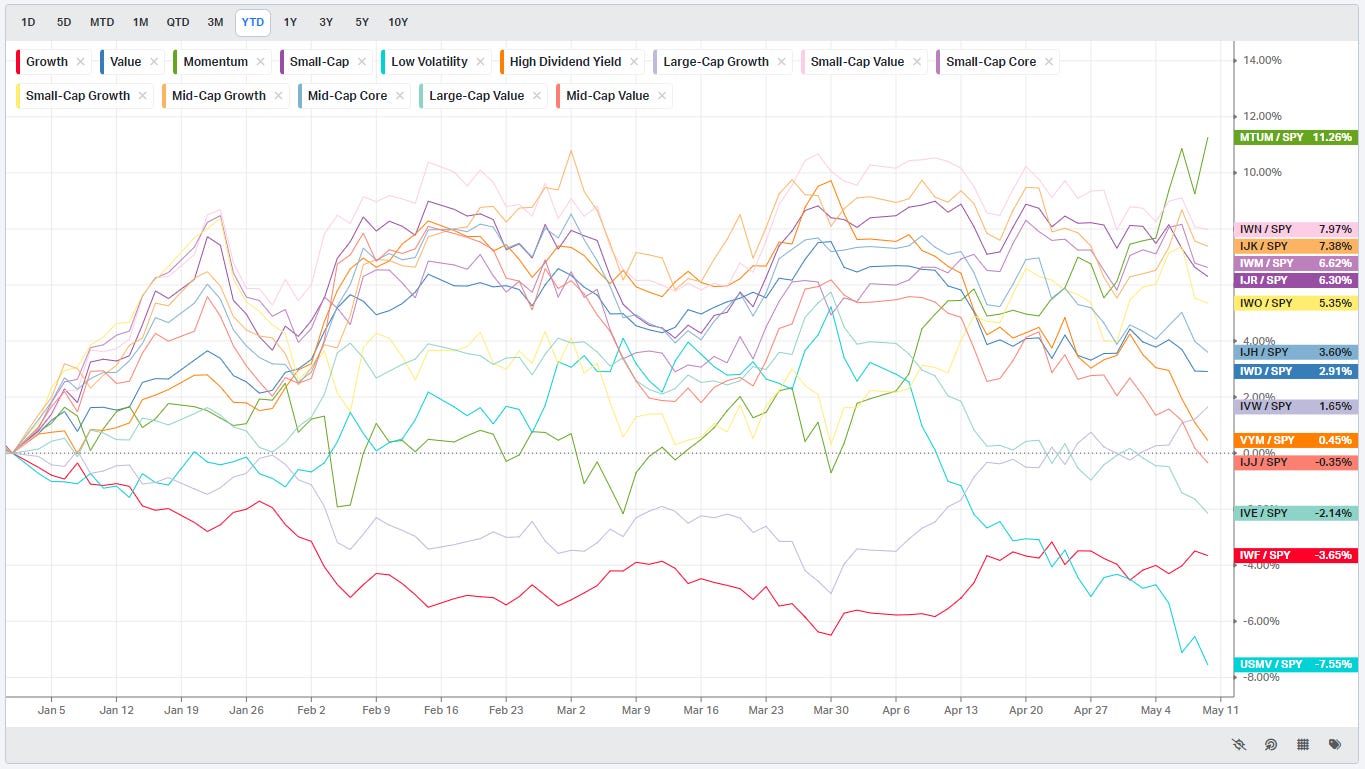
Factors: Style vs Size-vs-Value

Events On Deck This Week
Here are key events happening this week that have the potential to cause outsized moves in the market or heightened short-term volatility.
Inflation Meets Momentum
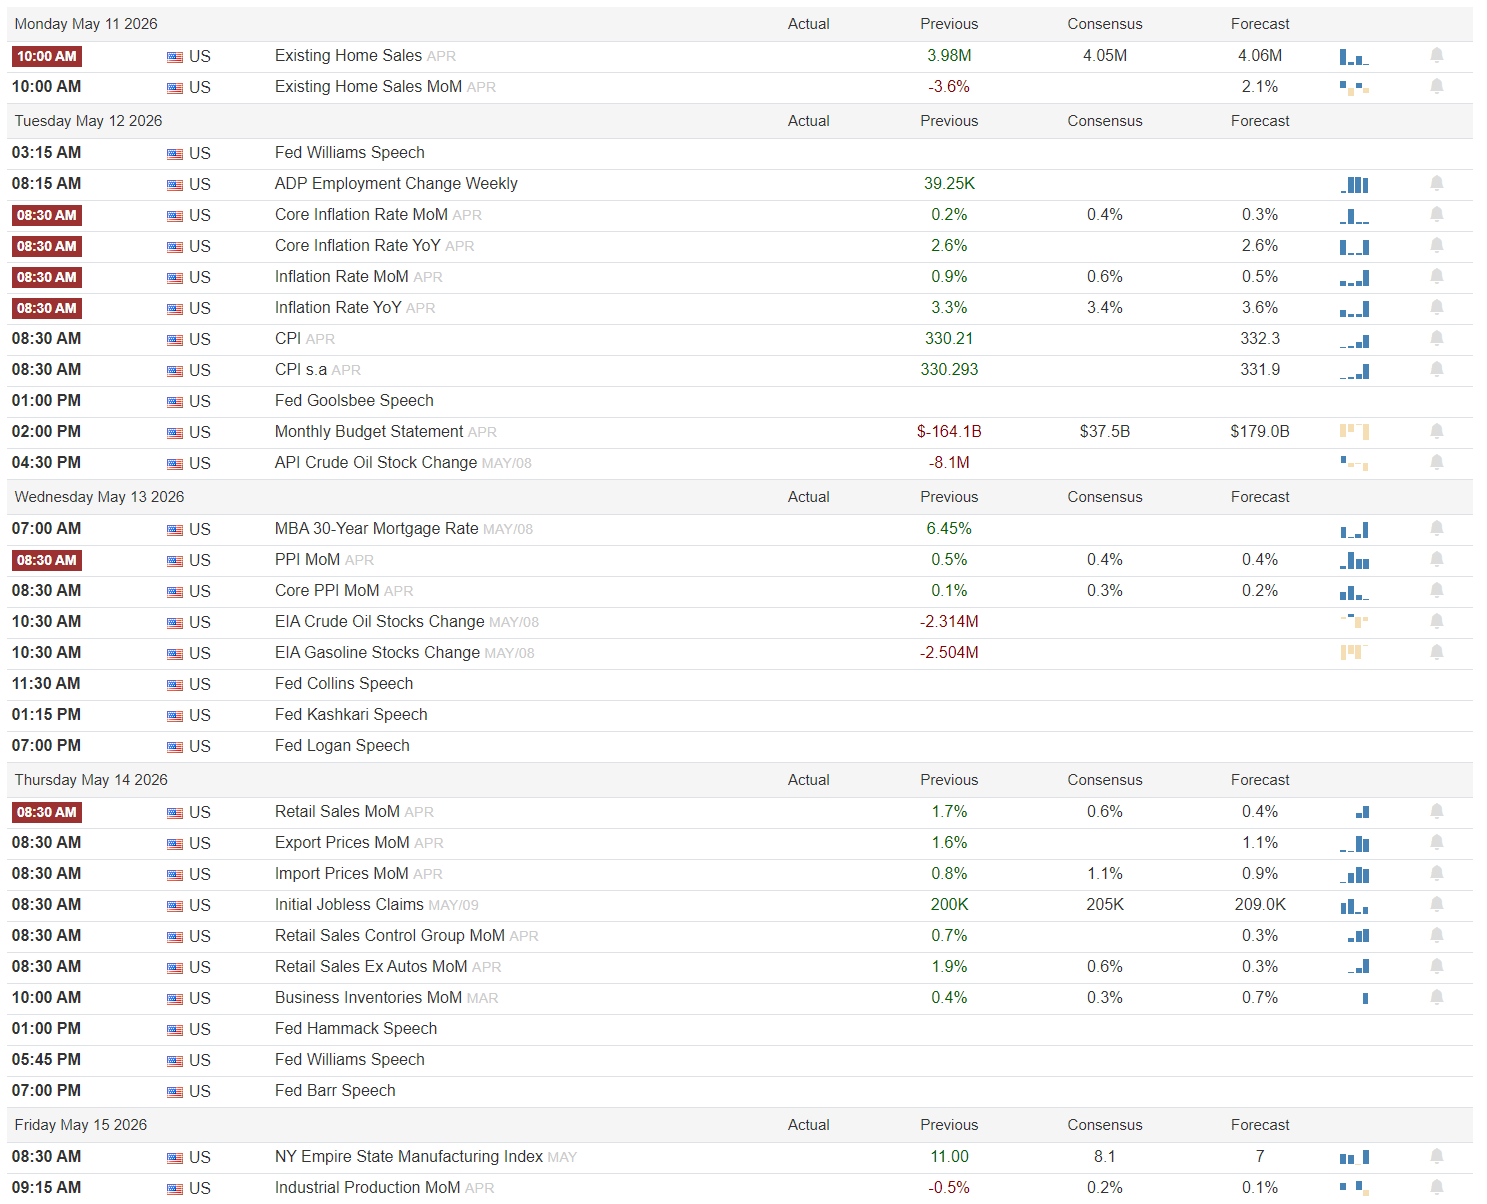
Monday opens quietly but not without signal. Existing home sales are expected at 4.05M against a prior 3.98M reading, while the month-over-month figure is expected to rebound 2.1% after a -3.6% decline. Housing has become one of the cleaner interest-rate sensitivity gauges in the economy. A stronger-than-expected print would reinforce the idea that financial conditions remain loose despite elevated yields, while another soft housing read would revive concerns that growth is beginning to cool beneath the surface.
Tuesday is the week’s first major volatility event. Core CPI month-over-month is expected at 0.4% with a 0.3% forecast after the prior 0.2% reading. Headline CPI month-over-month is expected at 0.6% versus a 0.5% forecast after 0.9% previously, while year-over-year inflation is expected at 3.4% against a 3.6% forecast. The market likely wants cooler sequential inflation without a collapse in activity. Soft inflation alongside resilient labor data would be the cleanest risk-on mix. Hotter inflation paired with strong spending would likely push yields higher and pressure duration-heavy leadership. Fed Williams and Fed Goolsbee both speak, and traders will be listening closely for any shift in tone around cuts versus “higher for longer.” API crude inventories also matter after the prior -8.1M draw, particularly with energy equities already showing renewed relative strength.
Wednesday shifts toward producer pricing and energy. PPI month-over-month is expected at 0.4% after 0.5%, while core PPI is expected at 0.3% after 0.1%. The market will likely tolerate firm wholesale inflation if consumer inflation stabilizes, but another upside surprise would raise concerns that pricing pressure is reaccelerating through the supply chain. EIA crude inventories previously fell -2.314M while gasoline inventories dropped -2.504M, continuing the recent tightening trend in energy balances. Fed Collins, Kashkari, and Logan all speak. Any coordinated pushback against easing expectations would matter.
Thursday is arguably the most important growth day of the week. Retail sales month-over-month are expected at 0.6% after a very strong 1.7% prior reading, while control group sales are expected at 0.3% after 0.7%. Initial jobless claims are expected at 205K versus a 200K prior. Strong retail sales with contained inflation would reinforce the soft-landing narrative. Weak spending or rising claims would quickly shift the market toward growth-scare positioning. Import and export prices also matter here because they feed directly into inflation expectations and margin assumptions. Fed Hammack, Williams, and Barr round out the policy backdrop.
Friday closes the week with manufacturing and production. The Empire State Manufacturing Index is expected at 8.1 versus a prior 11.0, while industrial production month-over-month is expected at 0.2% against a 0.1% forecast after a -0.5% prior reading. The market likely wants stabilization rather than acceleration. A strong rebound in production would reinforce cyclical participation, while another contractionary read would raise concerns that the recent rally is outrunning the underlying economy.
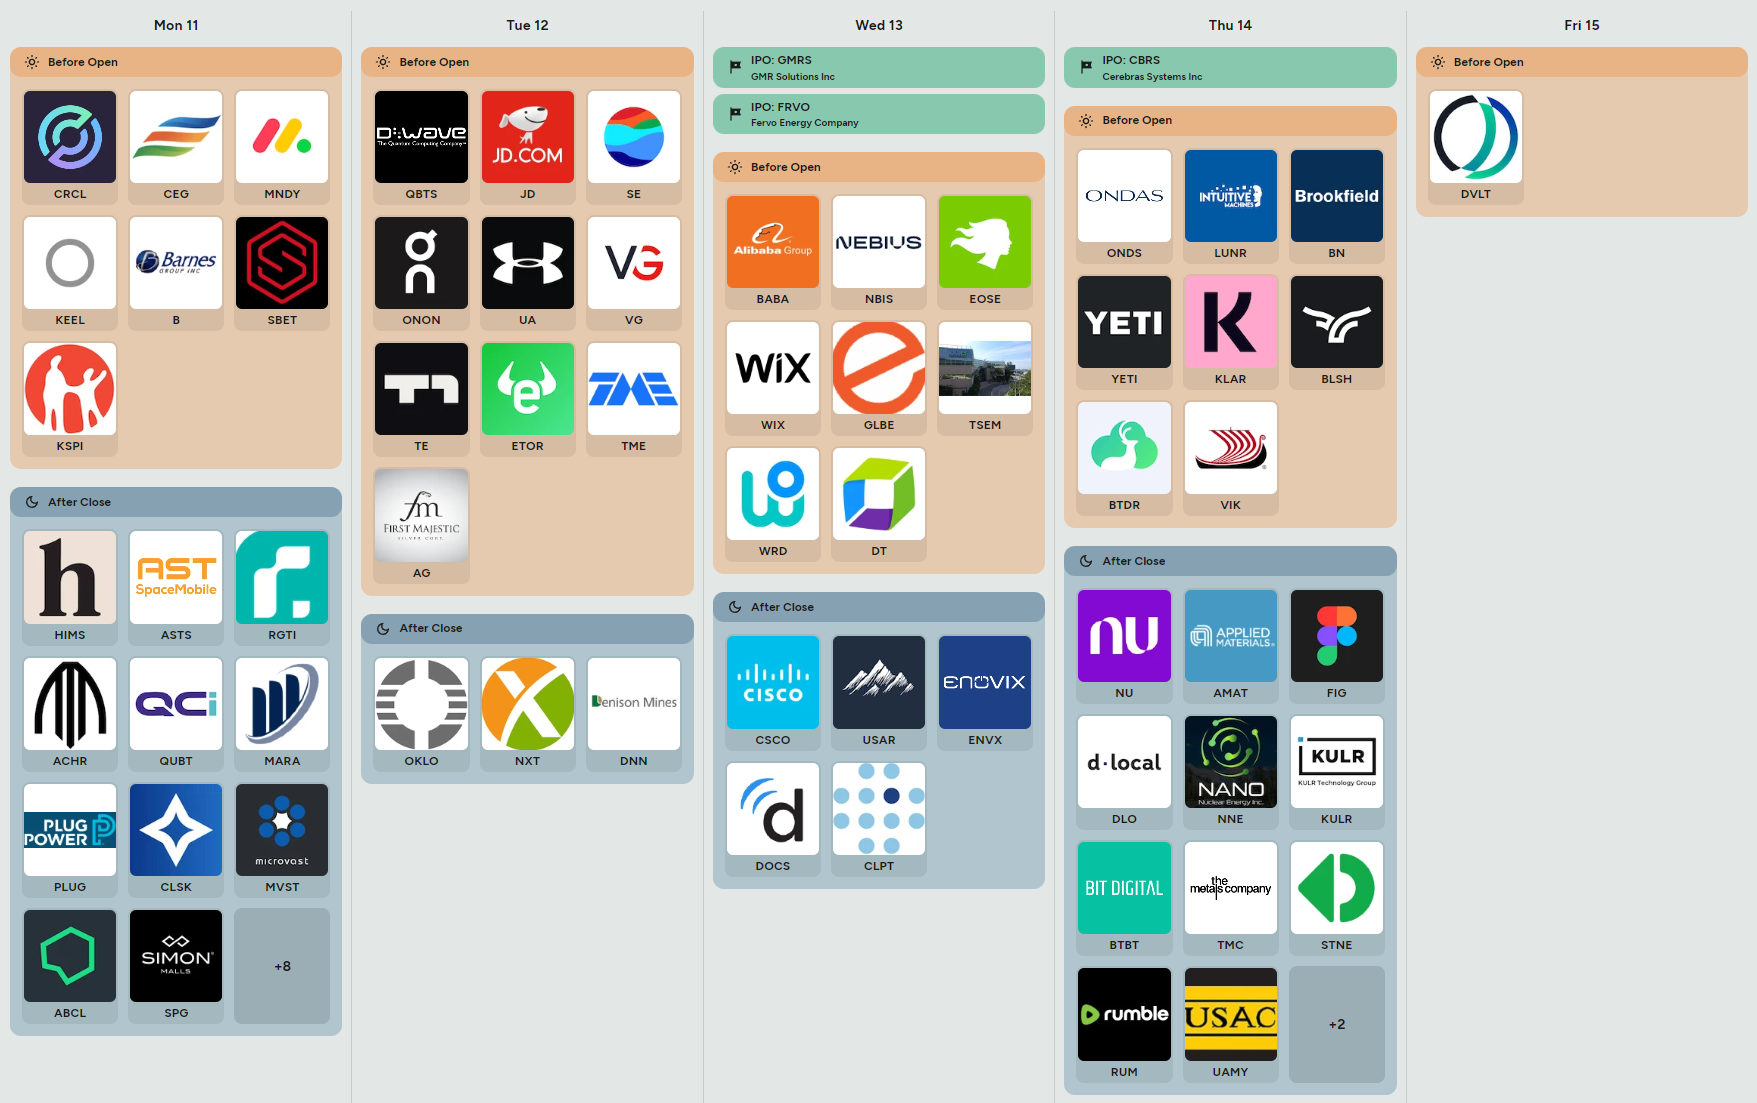
The earnings and IPO slate leans heavily toward AI infrastructure, industrial technology, consumer cyclicals, and speculative growth. Cisco, Applied Materials, D-Wave, Nebius, CoreWeave, and several energy-transition names will be watched closely for AI demand commentary, capex guidance, and hyperscaler spending signals. Applied Materials is particularly important because semiconductor equipment guidance often spills directly into the broader AI supply chain narrative. Alibaba, JD.com, Sea, Tencent Music, and Nu Holdings provide an important read on international consumption and fintech risk appetite. Retail-facing names like Under Armour, YETI, and Simon Property offer a cleaner domestic consumer pulse. Nuclear and power-related names including Oklo, Nano Nuclear, and Cameco-adjacent themes remain important because the market continues to treat electricity demand as structurally tight.
Cooler CPI with retail sales still positive likely reinforces leadership in semis, software, and high-duration growth.
Hot inflation plus rising yields would likely pressure QQQ first while supporting energy and defensive cash-flow sectors.
A sustained move higher in crude inventories after recent draws would weaken the energy momentum trade materially.
Bottom line: this week is about whether inflation can continue cooling without breaking the growth backdrop that has been supporting the rally.

Order Flow in Focus: Reading Smart Money Tells
Order Flow in Focus: Reading Smart Money Tells is a recurring segment that spotlights unique intraday opportunities revealed through institutional order flow. Each feature dissects a moment when the tape quietly shifted—when large, ranked prints clustered at key liquidity locations and informed players positioned ahead of the move. The goal isn’t hindsight; it’s pattern recognition—learning to spot the footprints of capital that knows before the crowd does.
One of the easiest ways to miss a trade is to become emotionally attached to a narrative that has already been fully priced in. Over the last several months, software has become one of the market’s favorite punching bags. The logic sounds clean enough on the surface: AI commoditizes software, margins compress, incumbents lose pricing power, and the entire group deserves structurally lower multiples. Maybe that eventually proves true. But tape-reading is not about debating distant futures. It is about recognizing when positioning and liquidity stop confirming the prevailing story.
IGV began telling that story weeks ago.
The first clue was not price strength. In fact, price still looked terrible when the order flow started changing character. On the 365-day view, software had already suffered a brutal unwind from the $115 region into the upper $70s. Momentum traders were gone. Long-only holders were trapped. Sentiment had fully deteriorated. Yet instead of continuing lower impulsively, the ETF began repeatedly attracting unusually large institutional activity directly into the $80-$87 range.
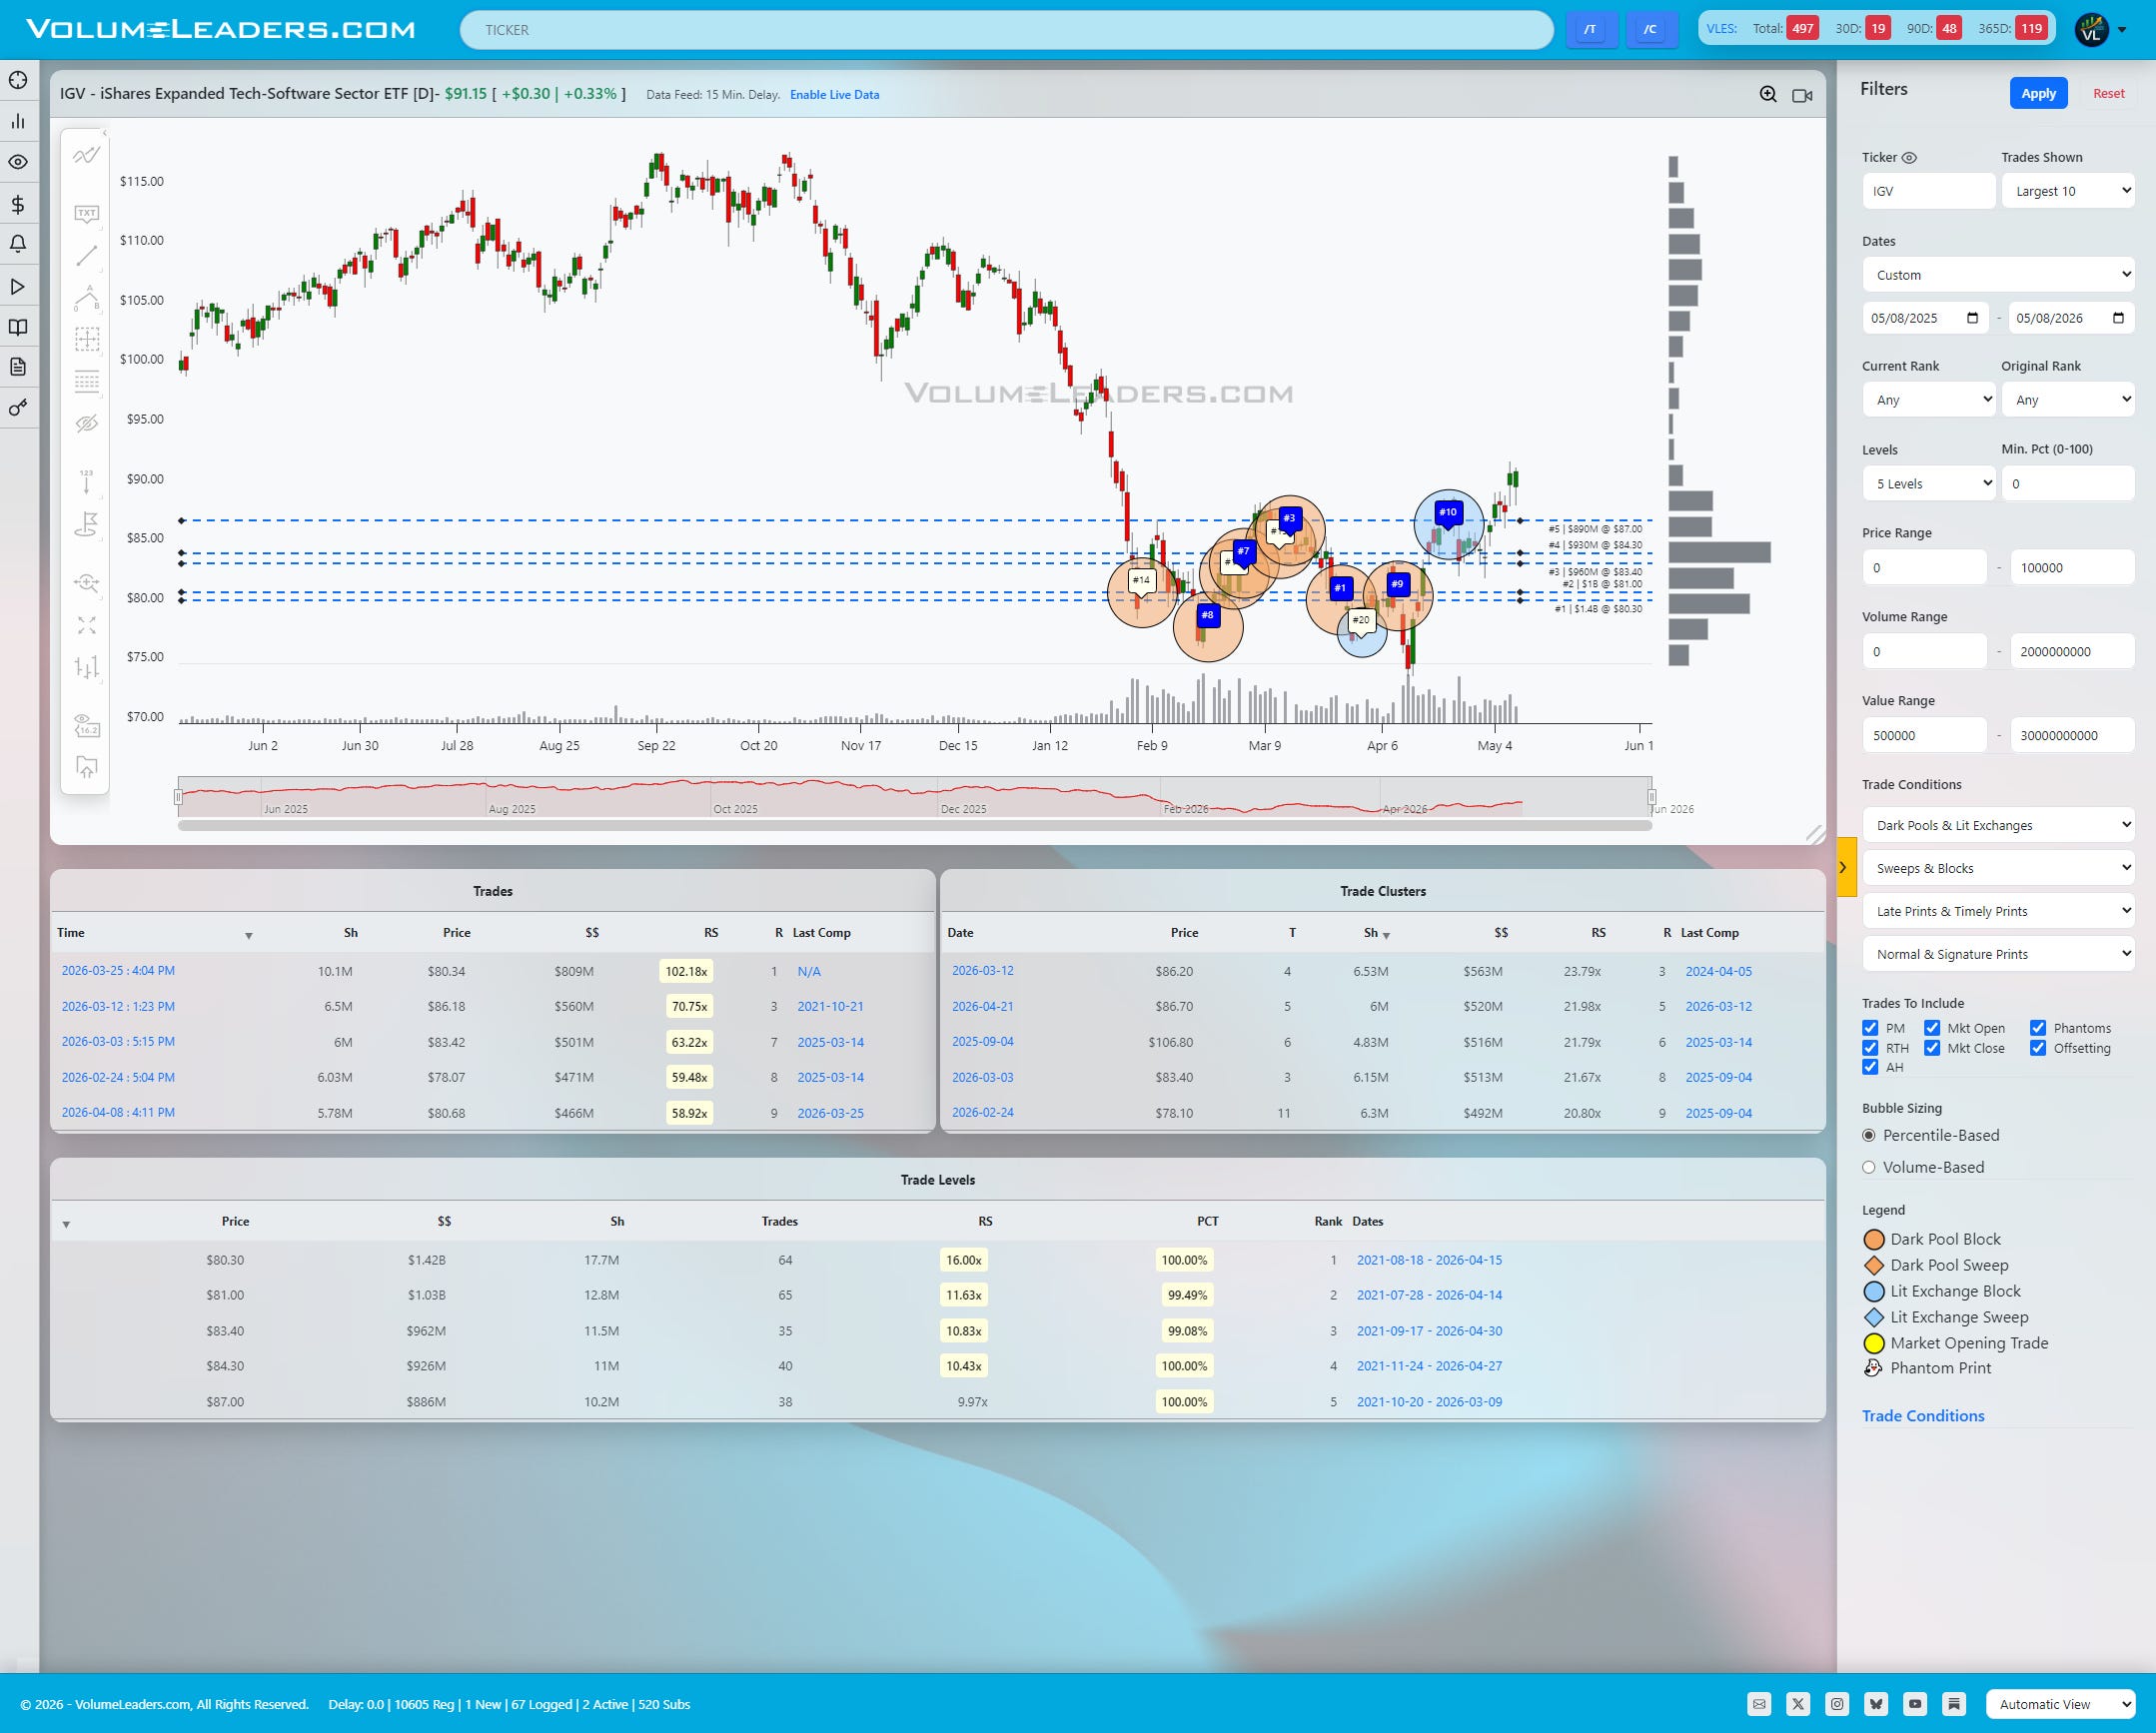
The tape was not showing random one-off blocks. It was showing persistence. The top five cumulative volume levels in the entire history of the instrument all began clustering inside that exact region. $80.30 alone accumulated roughly $1.42B in notional value across 64 trades with a 100th percentile ranking. $81.00 carried another $1.03B. Then came the stacked shelves at $83.40, $84.30, and $87.00, all carrying roughly $900M or more with percentile readings pushing the top of the historical range. That’s not passive activity - that is inventory transfer.
The ranked prints reinforced the message. Several top-10 and top-20 historical prints appeared directly inside the balance zone. The #1 ranked print hit around $80.34 with roughly $809M attached. The #3 print appeared near $86.18. The #7 print developed around $83.42. Multiple additional ranked sweeps and blocks continued firing as price repeatedly washed back and forth through the region.
Importantly, the market kept revisiting those levels and failing to break them.
That is the tell.
If institutions were distributing stock into a dying software narrative, price should have accelerated lower as liquidity gave way. Instead, every flush back into the low $80s found sponsorship. Every push lower was met with more high-ranked activity. Price stopped trending and began balancing. That transition from directional liquidation into rotational trade is often where the best asymmetry develops.
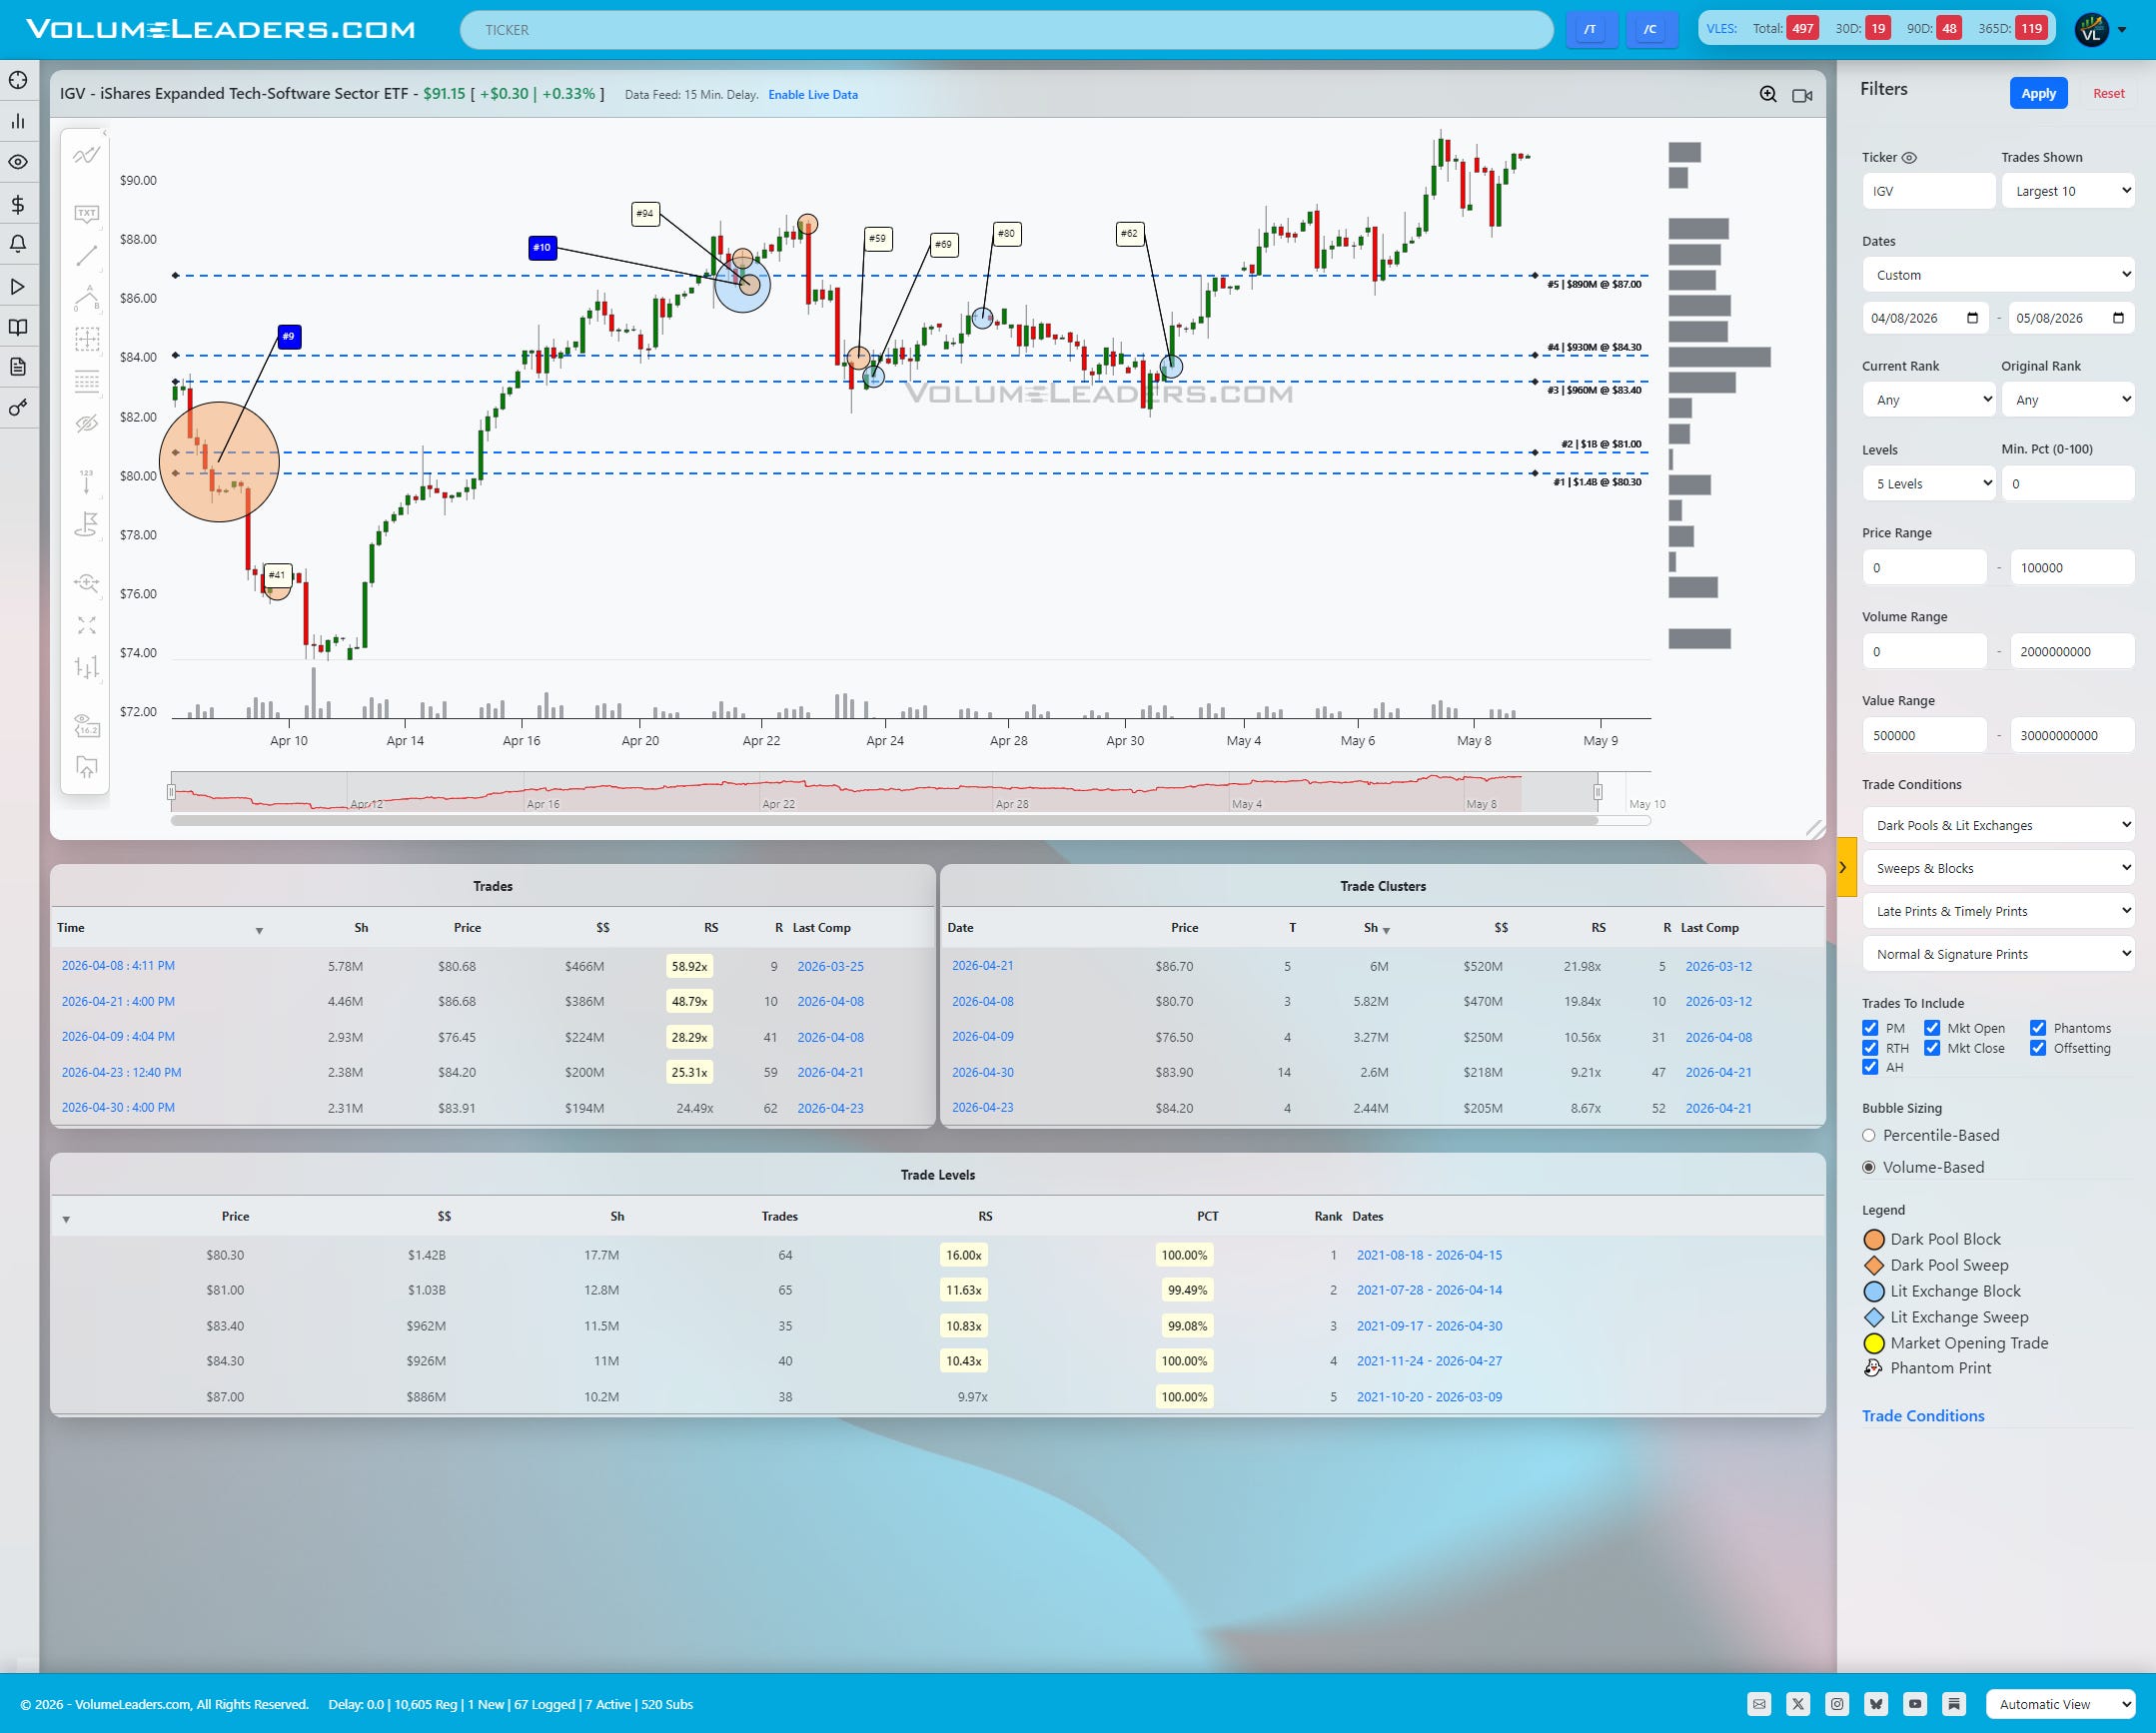
The actual trade entry did not require predicting the bottom tick. In many ways, the cleaner opportunity came later.
Once the repeated absorption became obvious, the line of scrimmage was clearly defined. The entire thesis revolved around whether IGV could maintain acceptance above the stacked $80-$84 shelves. Traders willing to lean against those levels had unusually clean invalidation points because the market had already revealed exactly where institutions cared.
The breakout itself came when price finally reclaimed and held above the upper edge of the range near $87. The 30-day chart shows the transition beautifully. Instead of rejecting resistance, price began stair-stepping higher directly above the prior cluster zone while new institutional prints continued appearing into the move. The recent $86.70 cluster carried roughly $520M with an RS multiple above 21x. Another major cluster formed at $80.70 worth roughly $470M. Even after the breakout, the tape continued confirming acceptance rather than exhaustion.
Weak breakouts immediately lose sponsorship and fall back into prior balance. Strong breakouts compress above former resistance and force sidelined participants to chase. IGV is currently behaving much more like the latter.
From a tactical perspective, the setup became straightforward. As long as price remained above the upper-$84 to $87 transition zone, the market was signaling acceptance above the largest historical inventory shelves on the chart. That flips former resistance into support. A disciplined trader could frame entries either on the initial breakout through $87 or on subsequent pullbacks holding above the region, using failure back into the lower balance as invalidation. If directionally right, there is still plenty of juice left in this trade, targeting $98-$108.
The broader lesson here is not about software specifically. It is about recognizing when the tape stops agreeing with consensus. Narratives matter far less when institutions quietly begin absorbing inventory against them. By the time the headlines improve, the real move is usually already well underway.

Market Intelligence Report
A desk-grade synthesis of institutional positioning and market structure—unpacking the flows, levels, and emerging themes that shaped the week, and translating them into a model portfolio built the same way professional desks prepare for the week ahead.
Part 1: The Backdrop
The market continues to behave like a tape that wants higher prices but is increasingly selective about where risk is being expressed. Participation remains constructive beneath the surface, volatility conditions have stabilized materially from the spring stress episode, and leadership continues to cluster around the same themes that have driven most of the post-drawdown recovery: large-cap technology, AI infrastructure, software, semiconductors, and selective cyclicals tied to industrial power demand. At the same time, the broader backdrop is no longer indiscriminately risk-on. Relative strength and realized volatility trends continue to favor quality leadership over speculative beta. The tape still rewards participation, but it is rewarding precision more than aggression right now.
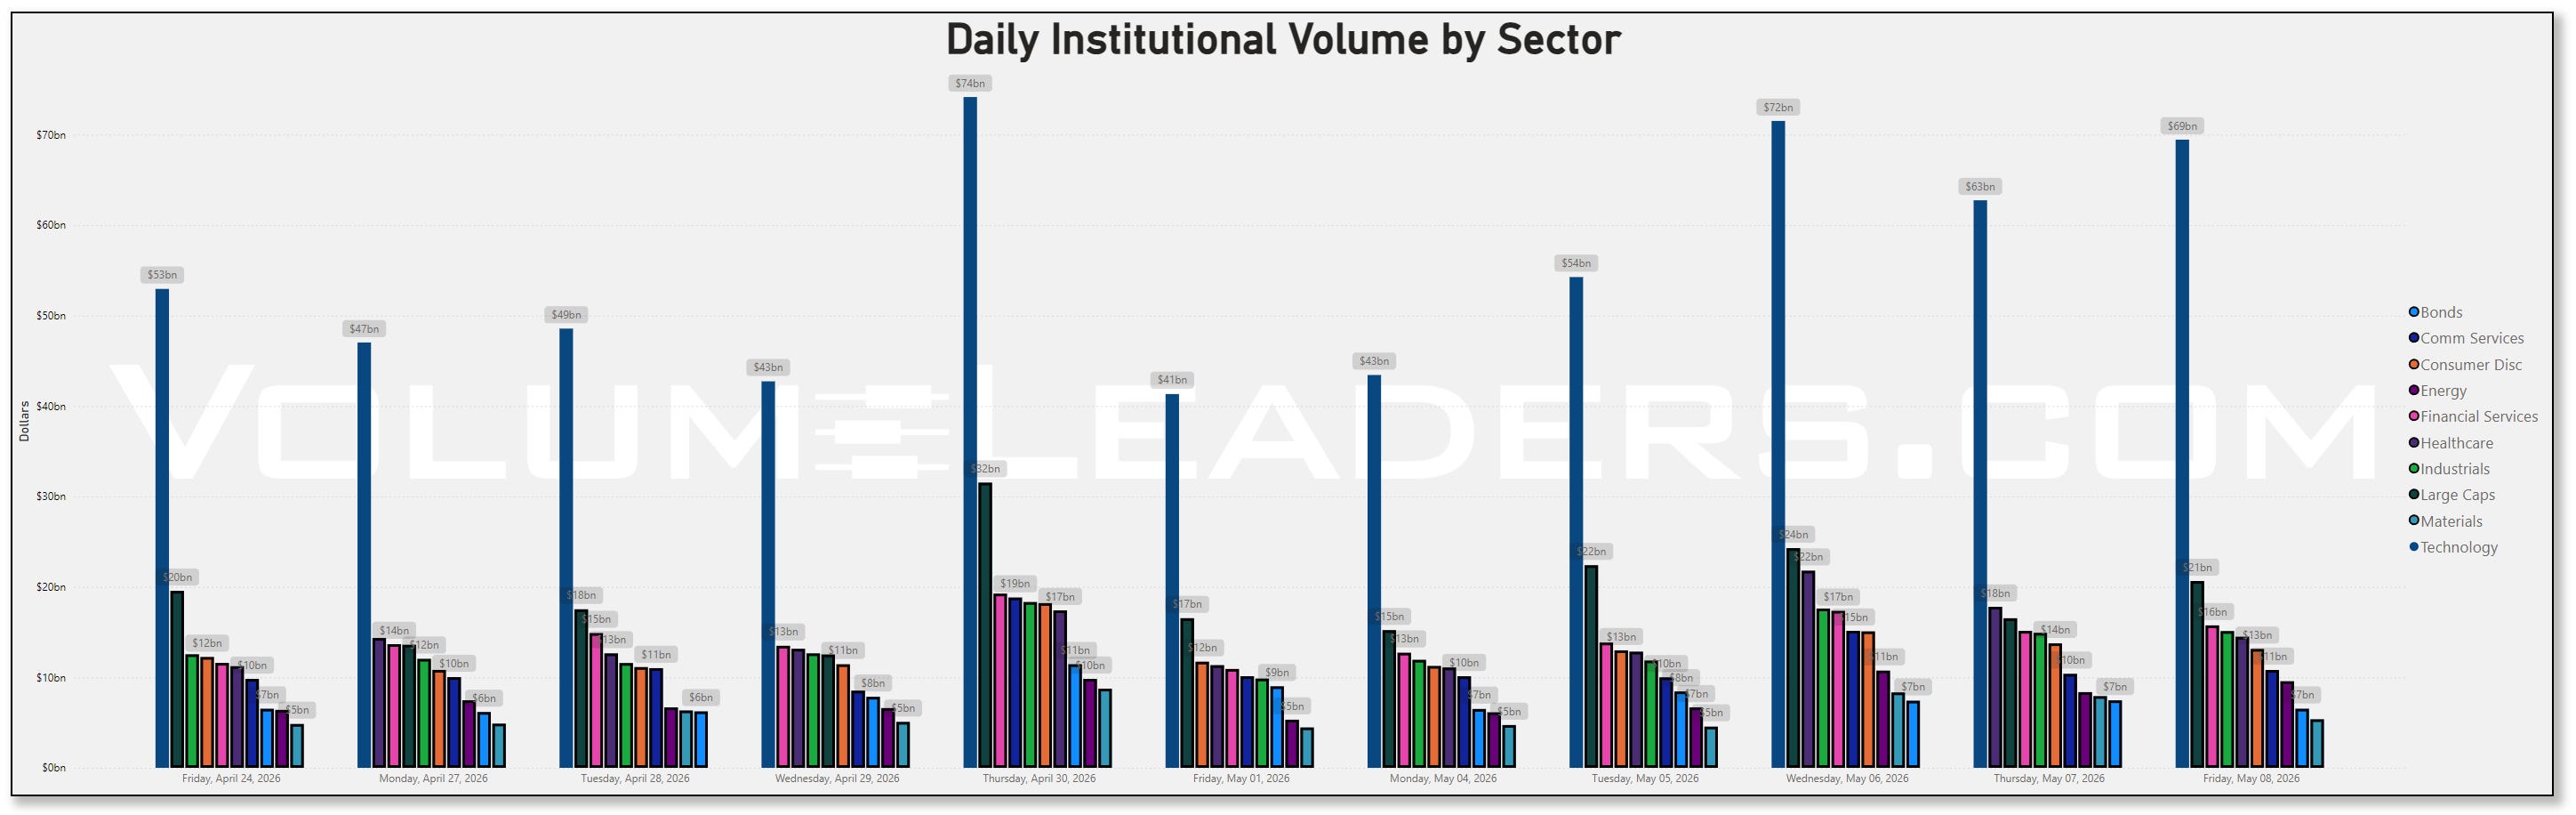
That context matters when looking at the weekly institutional flow data because the concentration remains extraordinary. Technology once again completely dominated aggregate dollars. The sector printed roughly $69.5B Friday after peaking above $71.5B Wednesday, and even the softer sessions still held comfortably above the mid-$40B range seen just two weeks earlier. Large-cap index products also remained heavily involved throughout the week, consistently printing between roughly $16B and $24B daily. Financials quietly improved week-over-week as well, with several sessions pushing into the mid-to-high teens after spending much of late April closer to the low teens. Healthcare participation also accelerated materially midweek, peaking above $21B Wednesday before cooling slightly. Energy flows remained elevated but rotational rather than dominant, largely tracking the ongoing geopolitical oil narrative and inflation concerns surrounding the Iran conflict and higher crude prices.
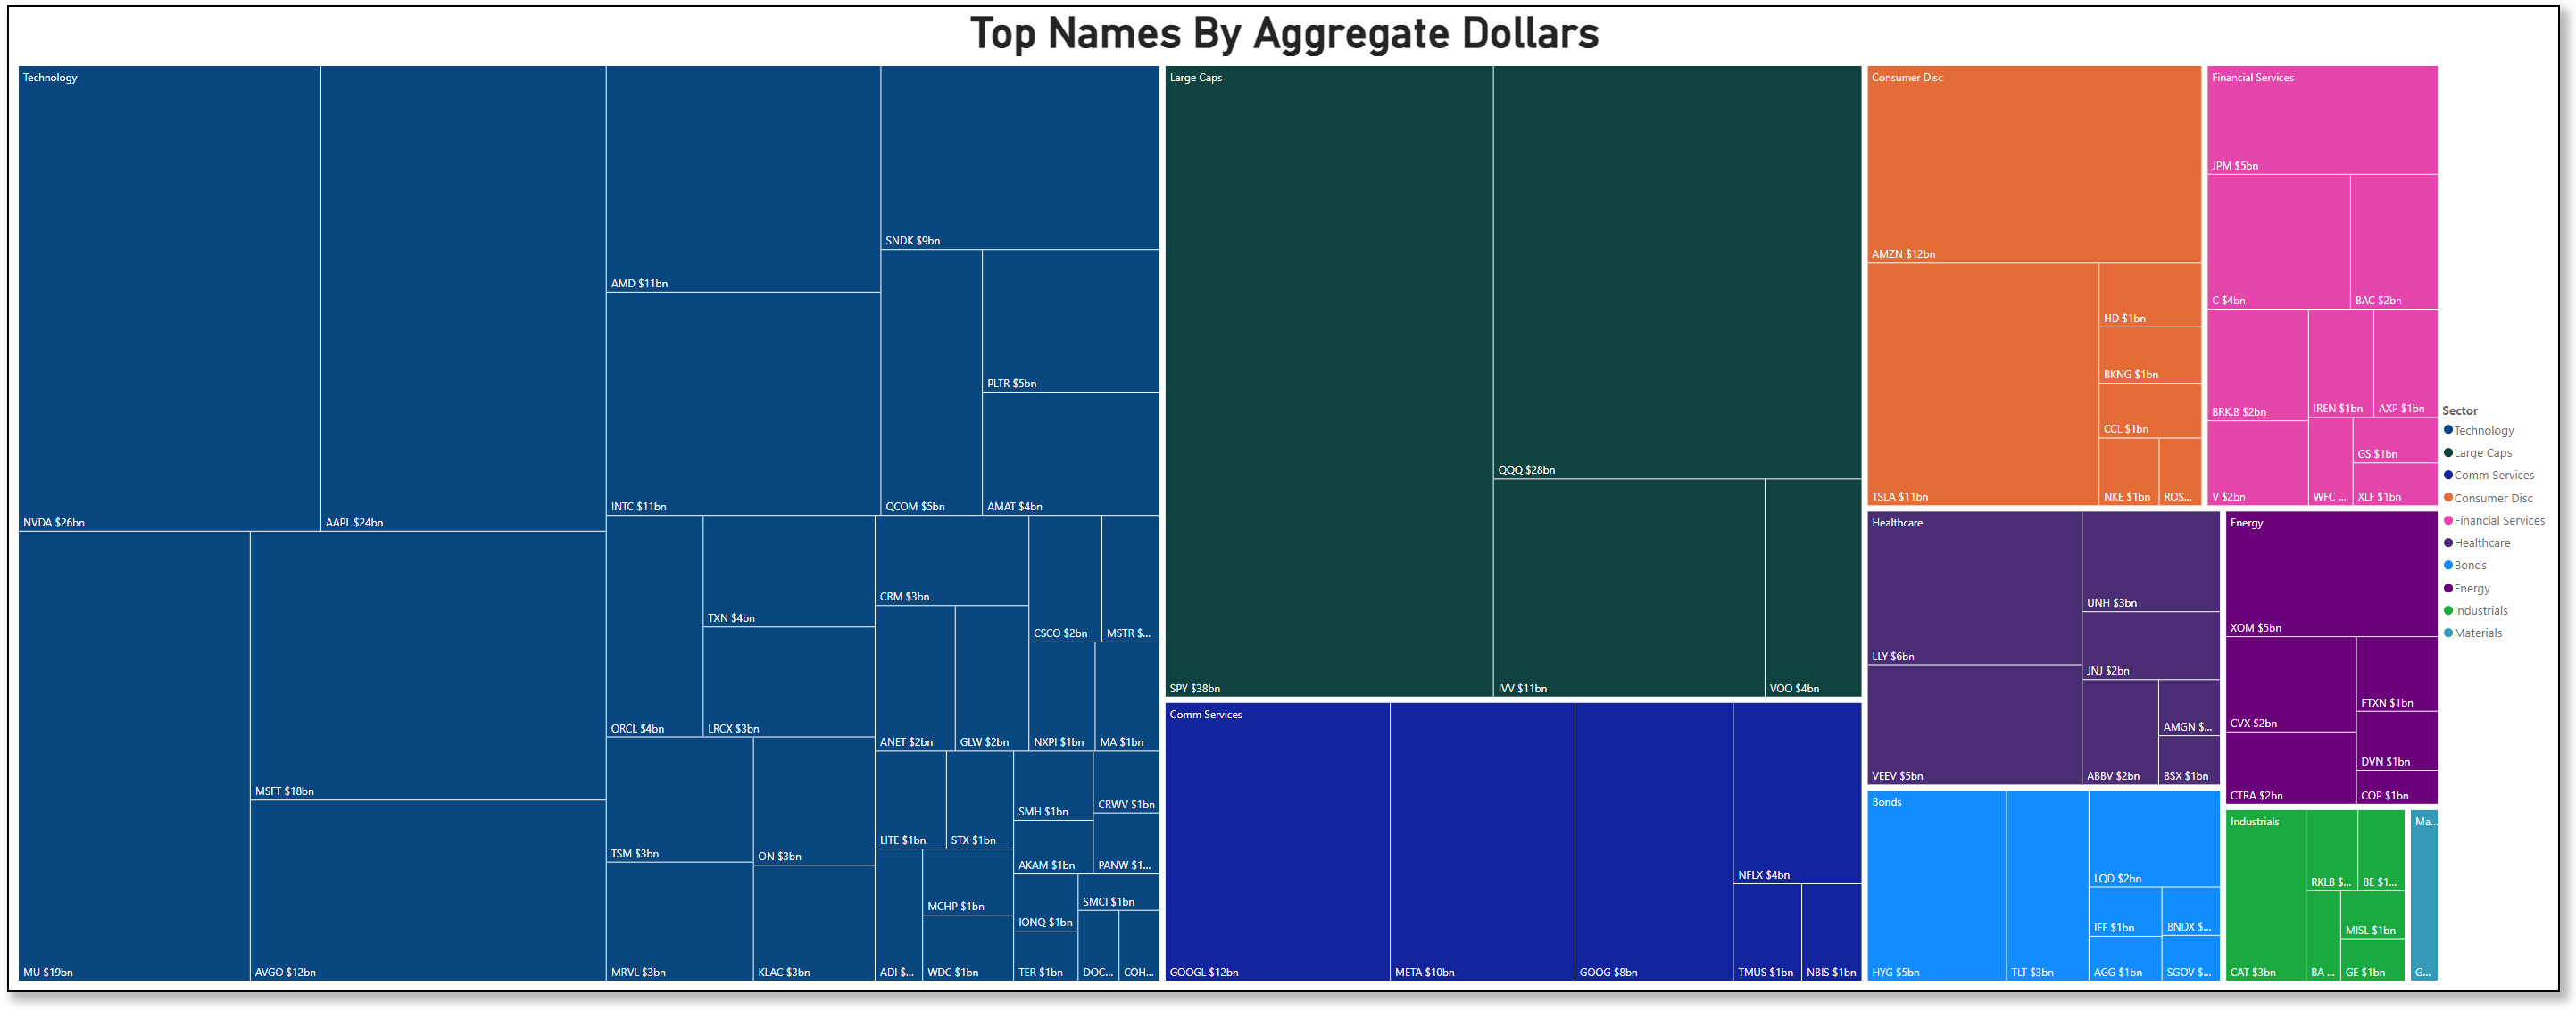
The aggregate dollars leaderboard tells the story even more clearly. SPY led all products at roughly $38B while QQQ followed near $28B, confirming that institutions are still expressing macro exposure primarily through index-level vehicles rather than dispersing aggressively into lower-quality single names. But beneath those indices, the real sponsorship continues clustering around AI infrastructure and semiconductor leadership. NVIDIA printed roughly $26B, Apple $24B, Micron $19B, Microsoft $17.6B, Amazon $12.3B, Broadcom $11.8B, AMD $11.1B, Intel $11.3B, and Tesla roughly $10.5B. Google, Meta, and Broadcom all remained firmly embedded near the top of the board as well.
Importantly, this no longer looks like pure momentum chasing. The scatter relationships between volume and dollars increasingly suggest allocation behavior rather than frantic tactical repositioning. NVIDIA sits in a category almost by itself, pairing the largest dollar value on the board with the largest outright volume participation. Apple and Microsoft continue attracting enormous dollar flows despite comparatively lower share turnover, which usually leans more institutional allocation than speculative churn. Intel is especially notable because its volume participation dramatically exceeded many higher-dollar peers, suggesting institutions are increasingly willing to engage lagging semis rather than only crowding into the established AI winners.
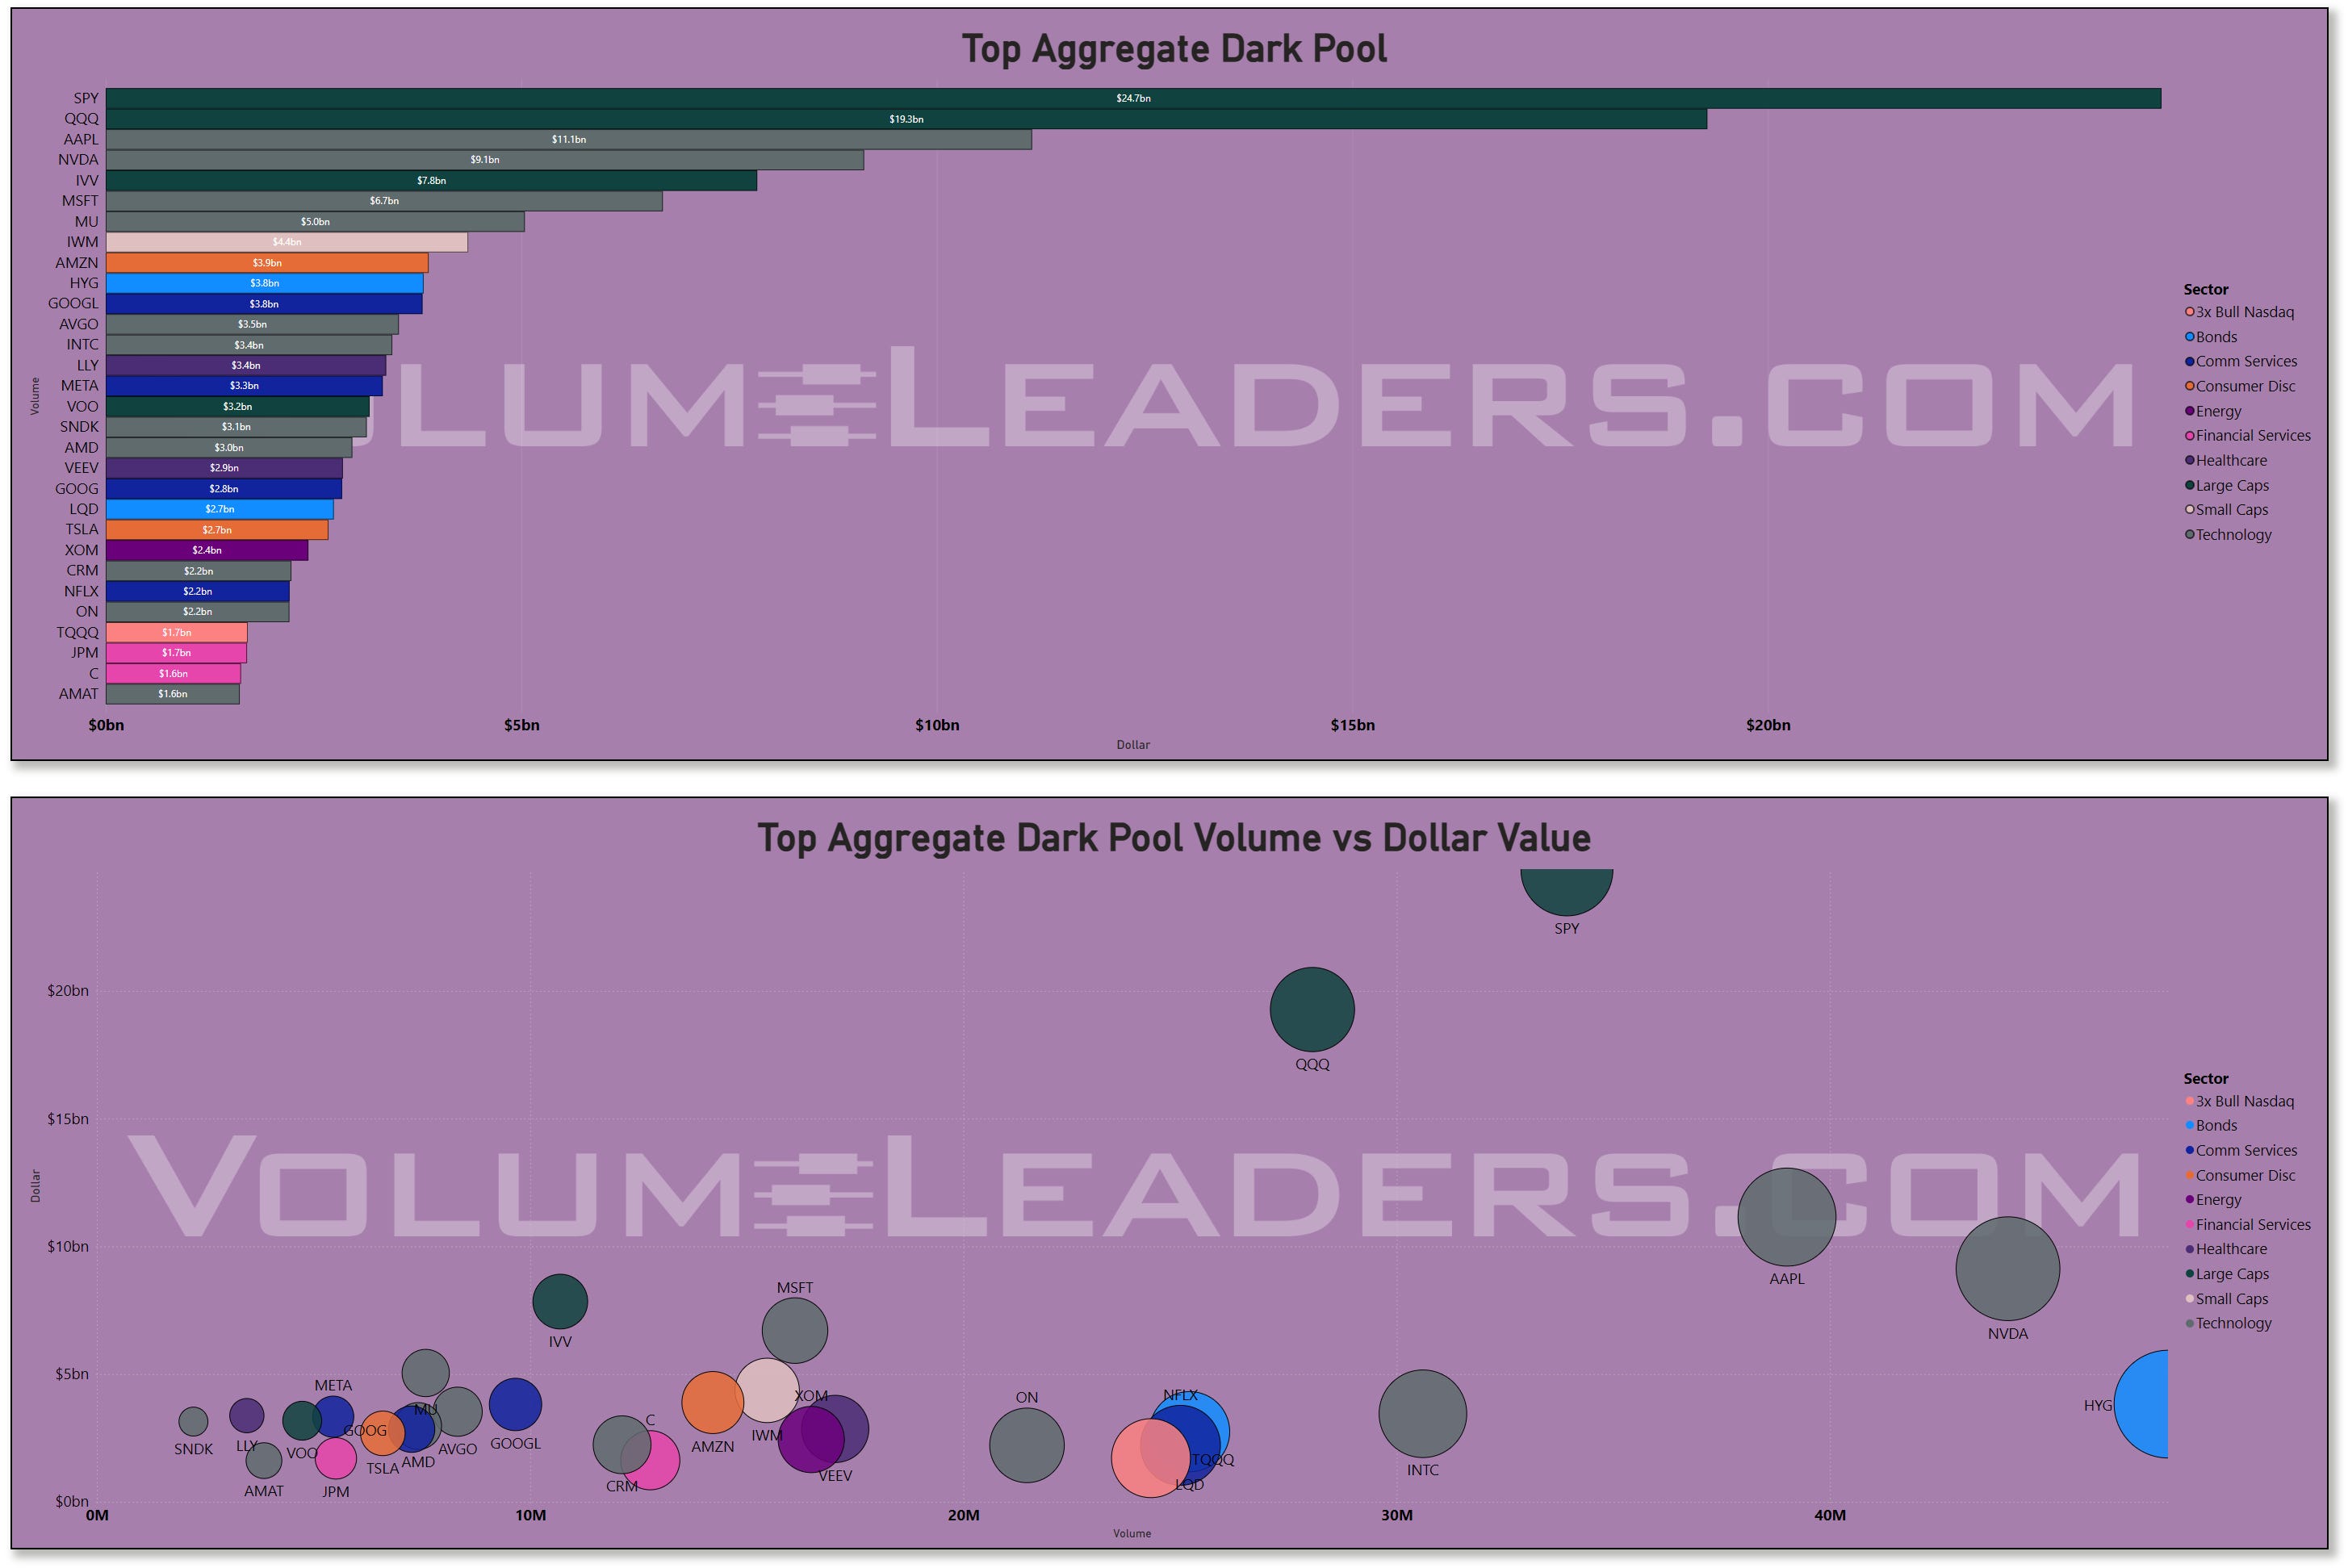
Dark-pool activity reinforced that same interpretation. SPY printed roughly $24.7B in dark-pool flow while QQQ cleared roughly $19.3B. Apple, NVIDIA, IVV, Microsoft, and Micron all remained dominant. What stands out most here is the consistency. The dark-pool leaderboard was not dominated by one-day event-driven spikes. Instead, the same names repeatedly absorbed liquidity all week. That behavior generally aligns more with inventory transfer and positioning than short-term speculation.
There were also important signs of broadening beneath the surface. IWM appeared prominently in both aggregate and dark-pool flow, printing roughly $8B aggregate and roughly $4.4B dark-pool dollars. That lines up with improving participation and relative-strength conditions in smaller-cap cyclicals. Meanwhile, software and networking infrastructure names continued showing persistent institutional engagement. Oracle, Cisco, Salesforce, Arista, and Broadcom all maintained strong positioning activity. The market still clearly prefers scalable cash-flow businesses tied to infrastructure, compute, and enterprise spending rather than highly speculative software beta.
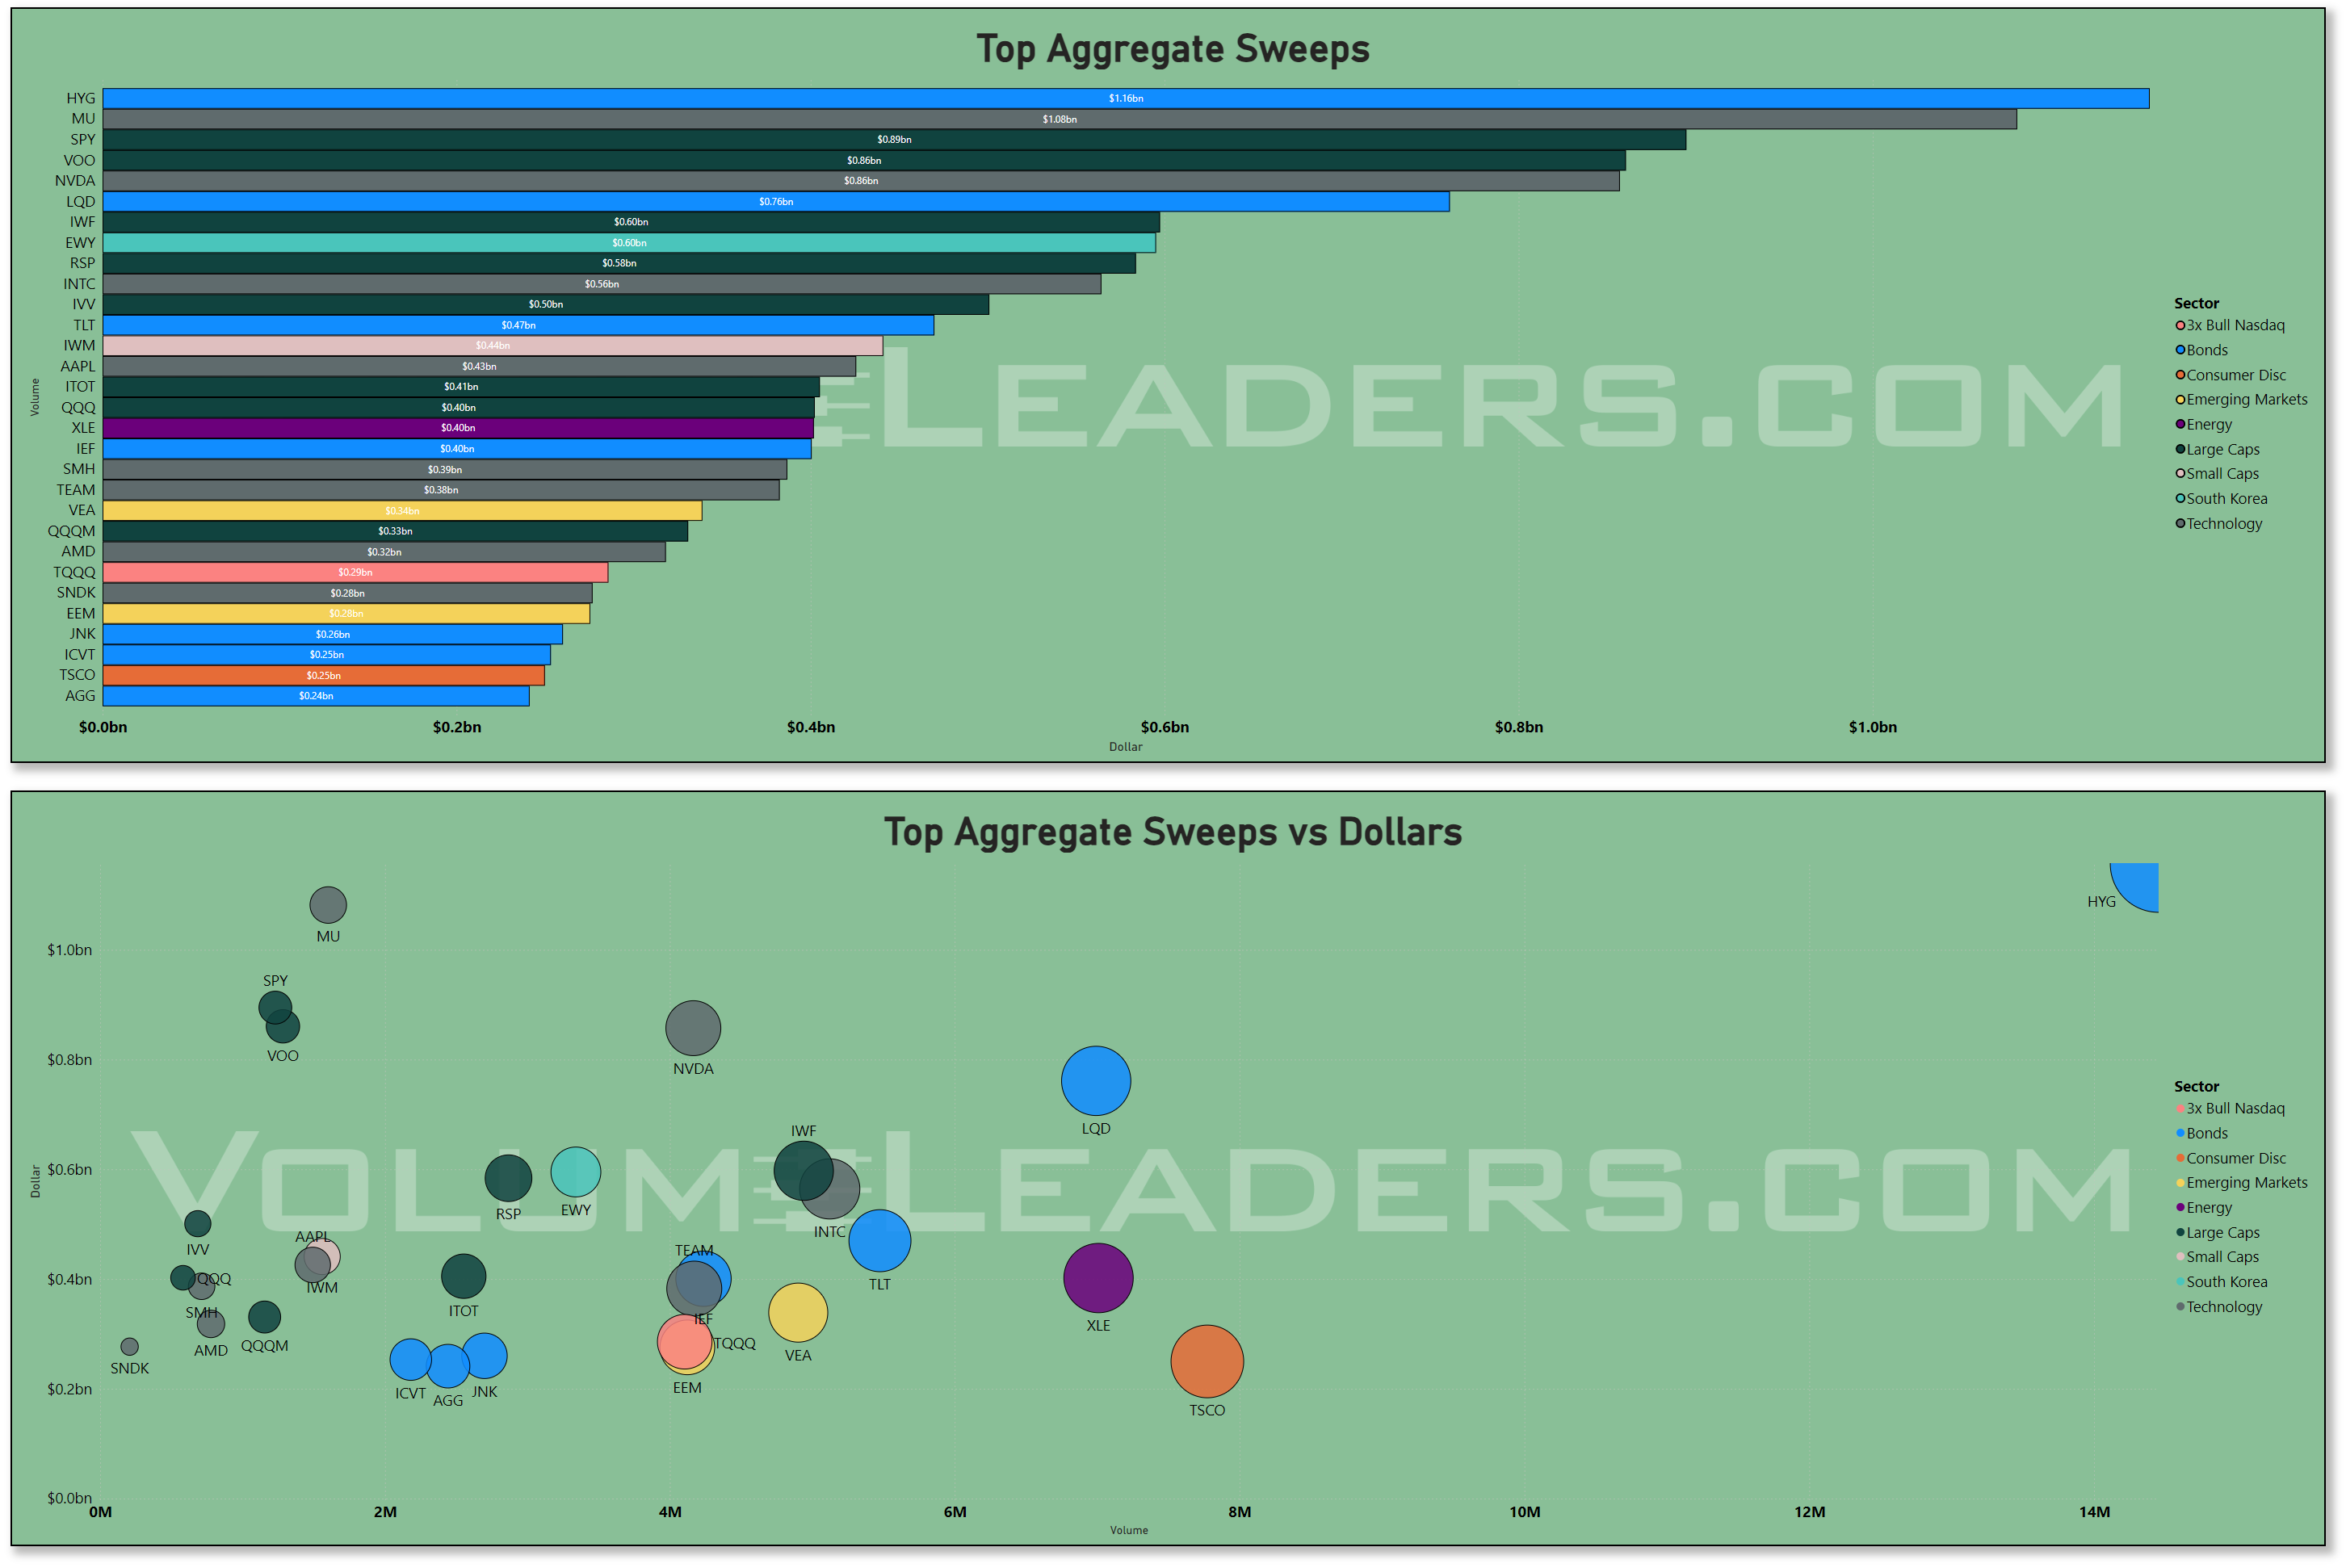
Sweep activity added another layer to the story because the tactical flows became much more diversified than the broader positioning data. HYG unexpectedly led the sweeps board at roughly $1.16B, followed closely by Micron around $1.08B and SPY near $0.89B. The presence of HYG, LQD, TLT, IEF, and AGG throughout the sweeps rankings suggests institutions are increasingly expressing shorter-term macro hedges and duration views alongside their equity exposure. That is important because it indicates the market is not positioned with complete abandon despite the strong equity rebound.
The bond-related sweeps likely reflect the increasingly complicated macro backdrop developing around inflation and Fed policy. Multiple Federal Reserve officials have recently pushed back against premature easing expectations while emphasizing that energy-driven inflation risks may remain persistent amid geopolitical instability and supply-chain concerns. At the same time, labor markets remain resilient and AI-driven capital expenditure continues supporting growth. That combination explains why institutional money continues aggressively allocating toward technology leadership while simultaneously increasing activity in credit and duration products.
Energy positioning also deserves attention because the flows remained constructive even without outright sector leadership. XOM printed roughly $5B aggregate dollars while CVX, COP, DVN, and broader energy ETFs all maintained meaningful participation. Sweeps into XLE approached roughly $0.4B. That likely reflects ongoing concern around the inflationary consequences of elevated oil prices tied to Middle East tensions and tightening inventories. But importantly, energy still trails technology materially in both aggregate and dark-pool sponsorship, which suggests institutions continue treating it more as a macro hedge and cash-flow stabilizer than the primary leadership theme.
The broader participation and volatility backdrop reinforces that interpretation. Market-wide realized volatility continues compressing relative to the spring dislocation, and leadership sectors are generally exhibiting more cooperative upside volatility than destabilizing downside expansion. Technology, communication services, and several large-cap growth segments continue showing the strongest relative participation trends versus SPY, while more defensive and rate-sensitive areas remain comparatively sluggish. The market still prefers exposure to durable earnings visibility, infrastructure scarcity, and secular AI demand over traditional defensives or deep cyclicals.
What continues standing out most is the absence of broad institutional panic despite increasingly noisy macro headlines. The tape keeps rotating, but it does not meaningfully fracture. Money continues recycling into leadership areas rather than abandoning risk entirely. Even where institutions appear cautious, they are generally hedging through rates, credit, and index products instead of aggressively liquidating core growth exposure.
That does not mean the market is invulnerable. Positioning is now much more extended than it was a month ago, and several Fed officials have openly acknowledged growing concern that inflation risks may persist longer than expected because of oil, supply chains, and AI-driven demand pressures. But for now, the institutional tape still looks much more like managed accumulation than broad distribution. The market may no longer be easy, but capital still appears willing to pay for leadership.
Part 2: Individual Names From The Institutional Tape
VolumeLeaders tracks several proprietary signals designed to spotlight names drawing significant institutional interest. Below, we’ve surfaced the latest results and analyzed them to highlight emergent themes. If any of the sectors, narratives, or positioning trends resonate, the names mentioned here offer a strong starting point for deeper research and watchlist consideration.
VL Trade Rank Velocity™ (TRV)
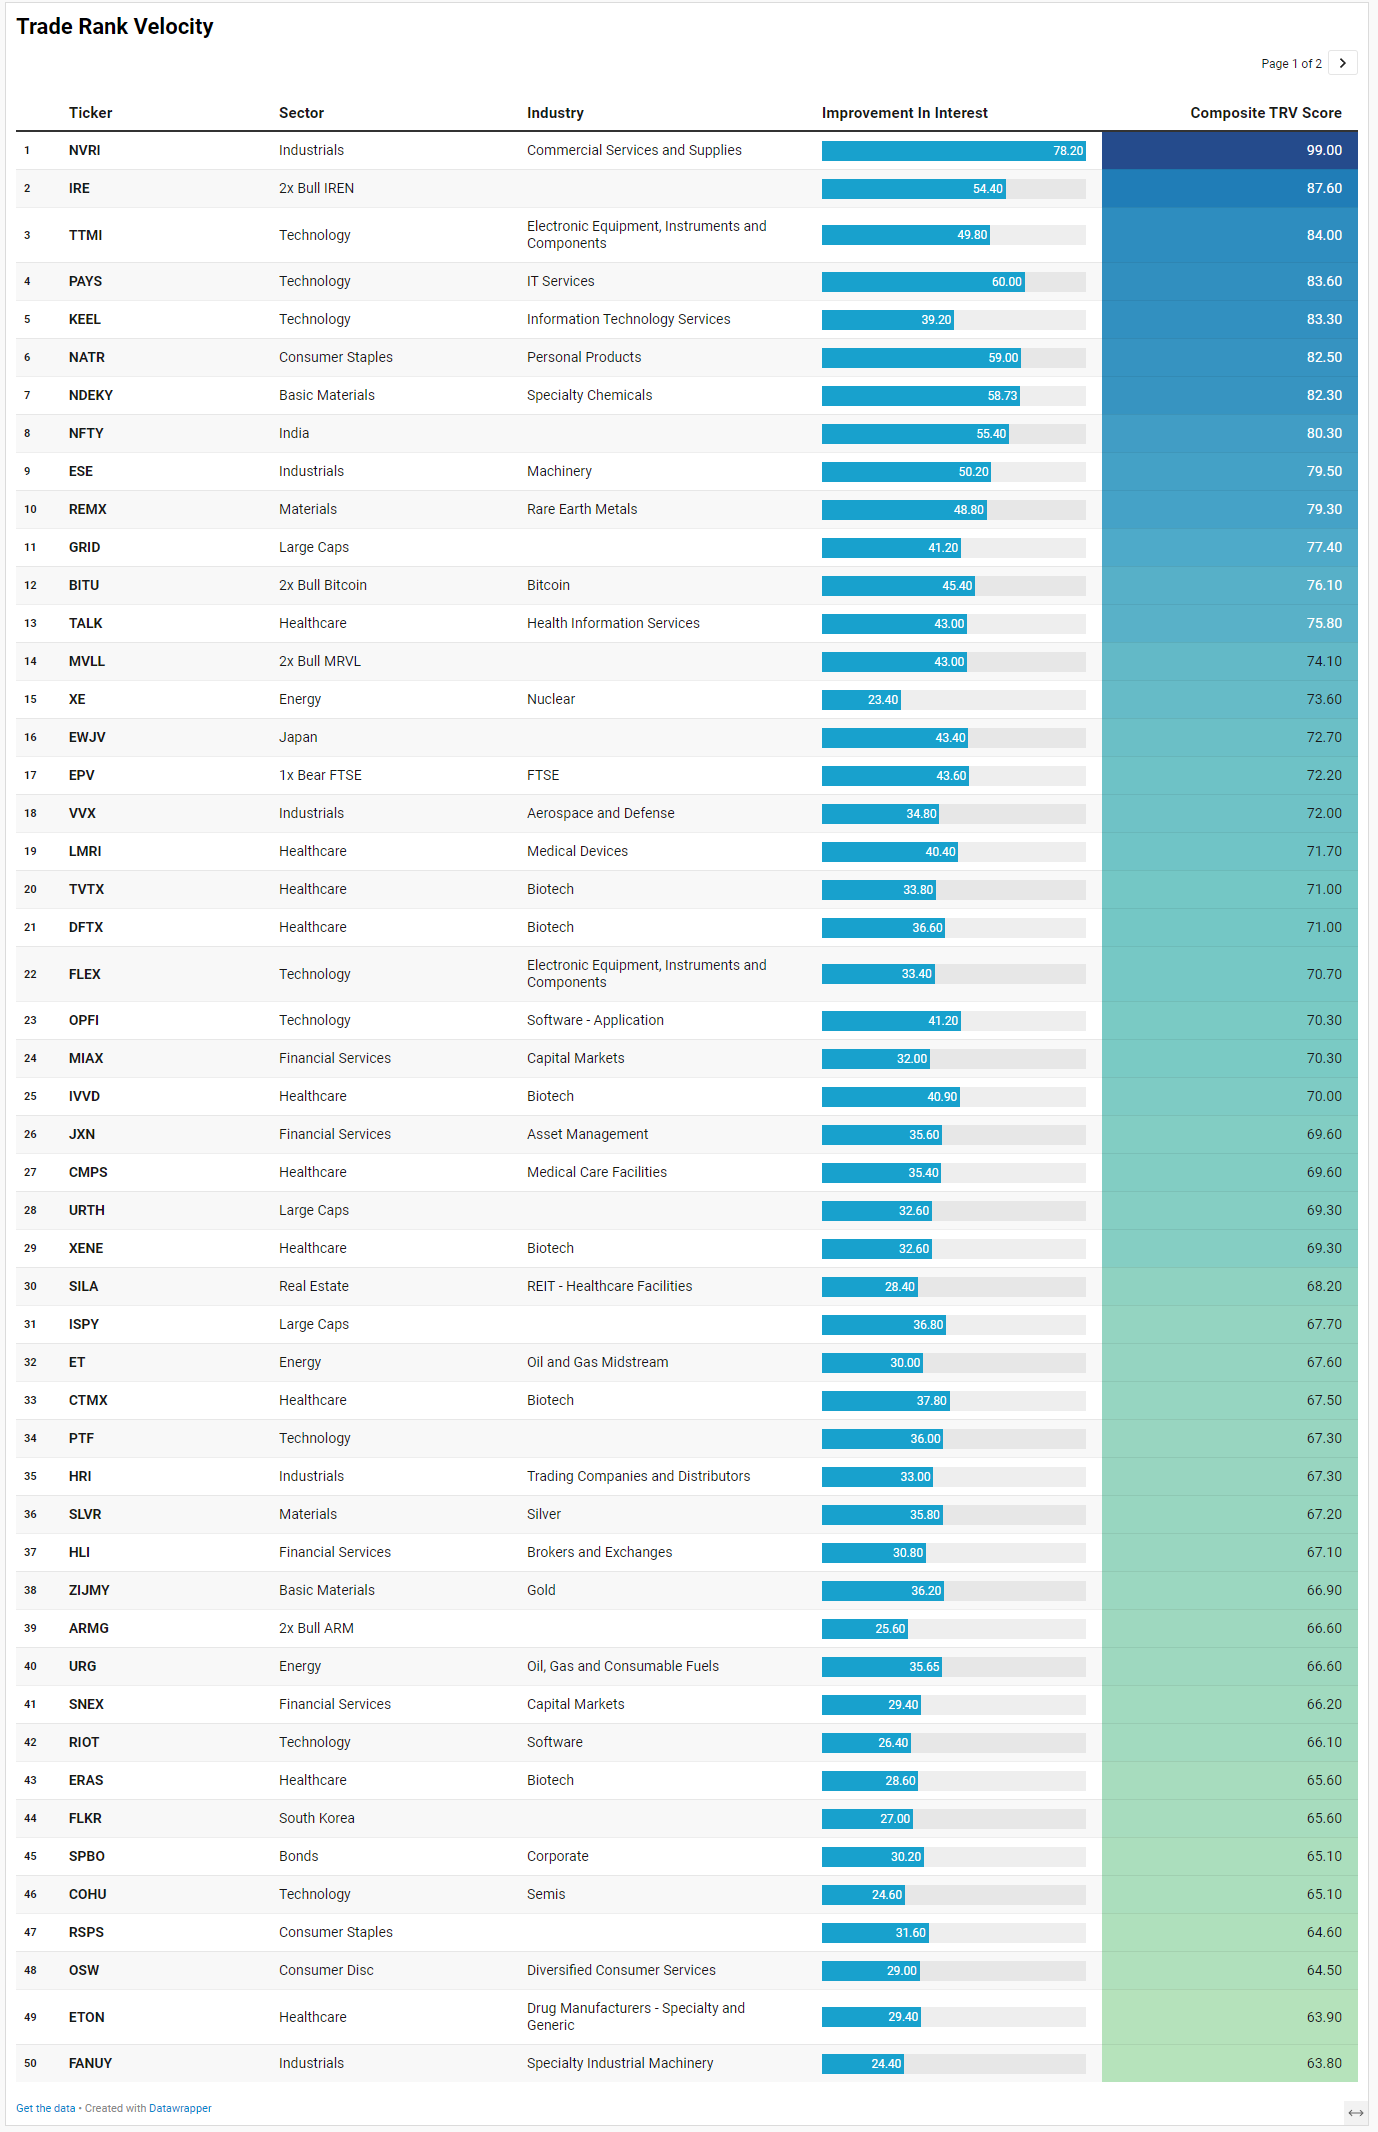
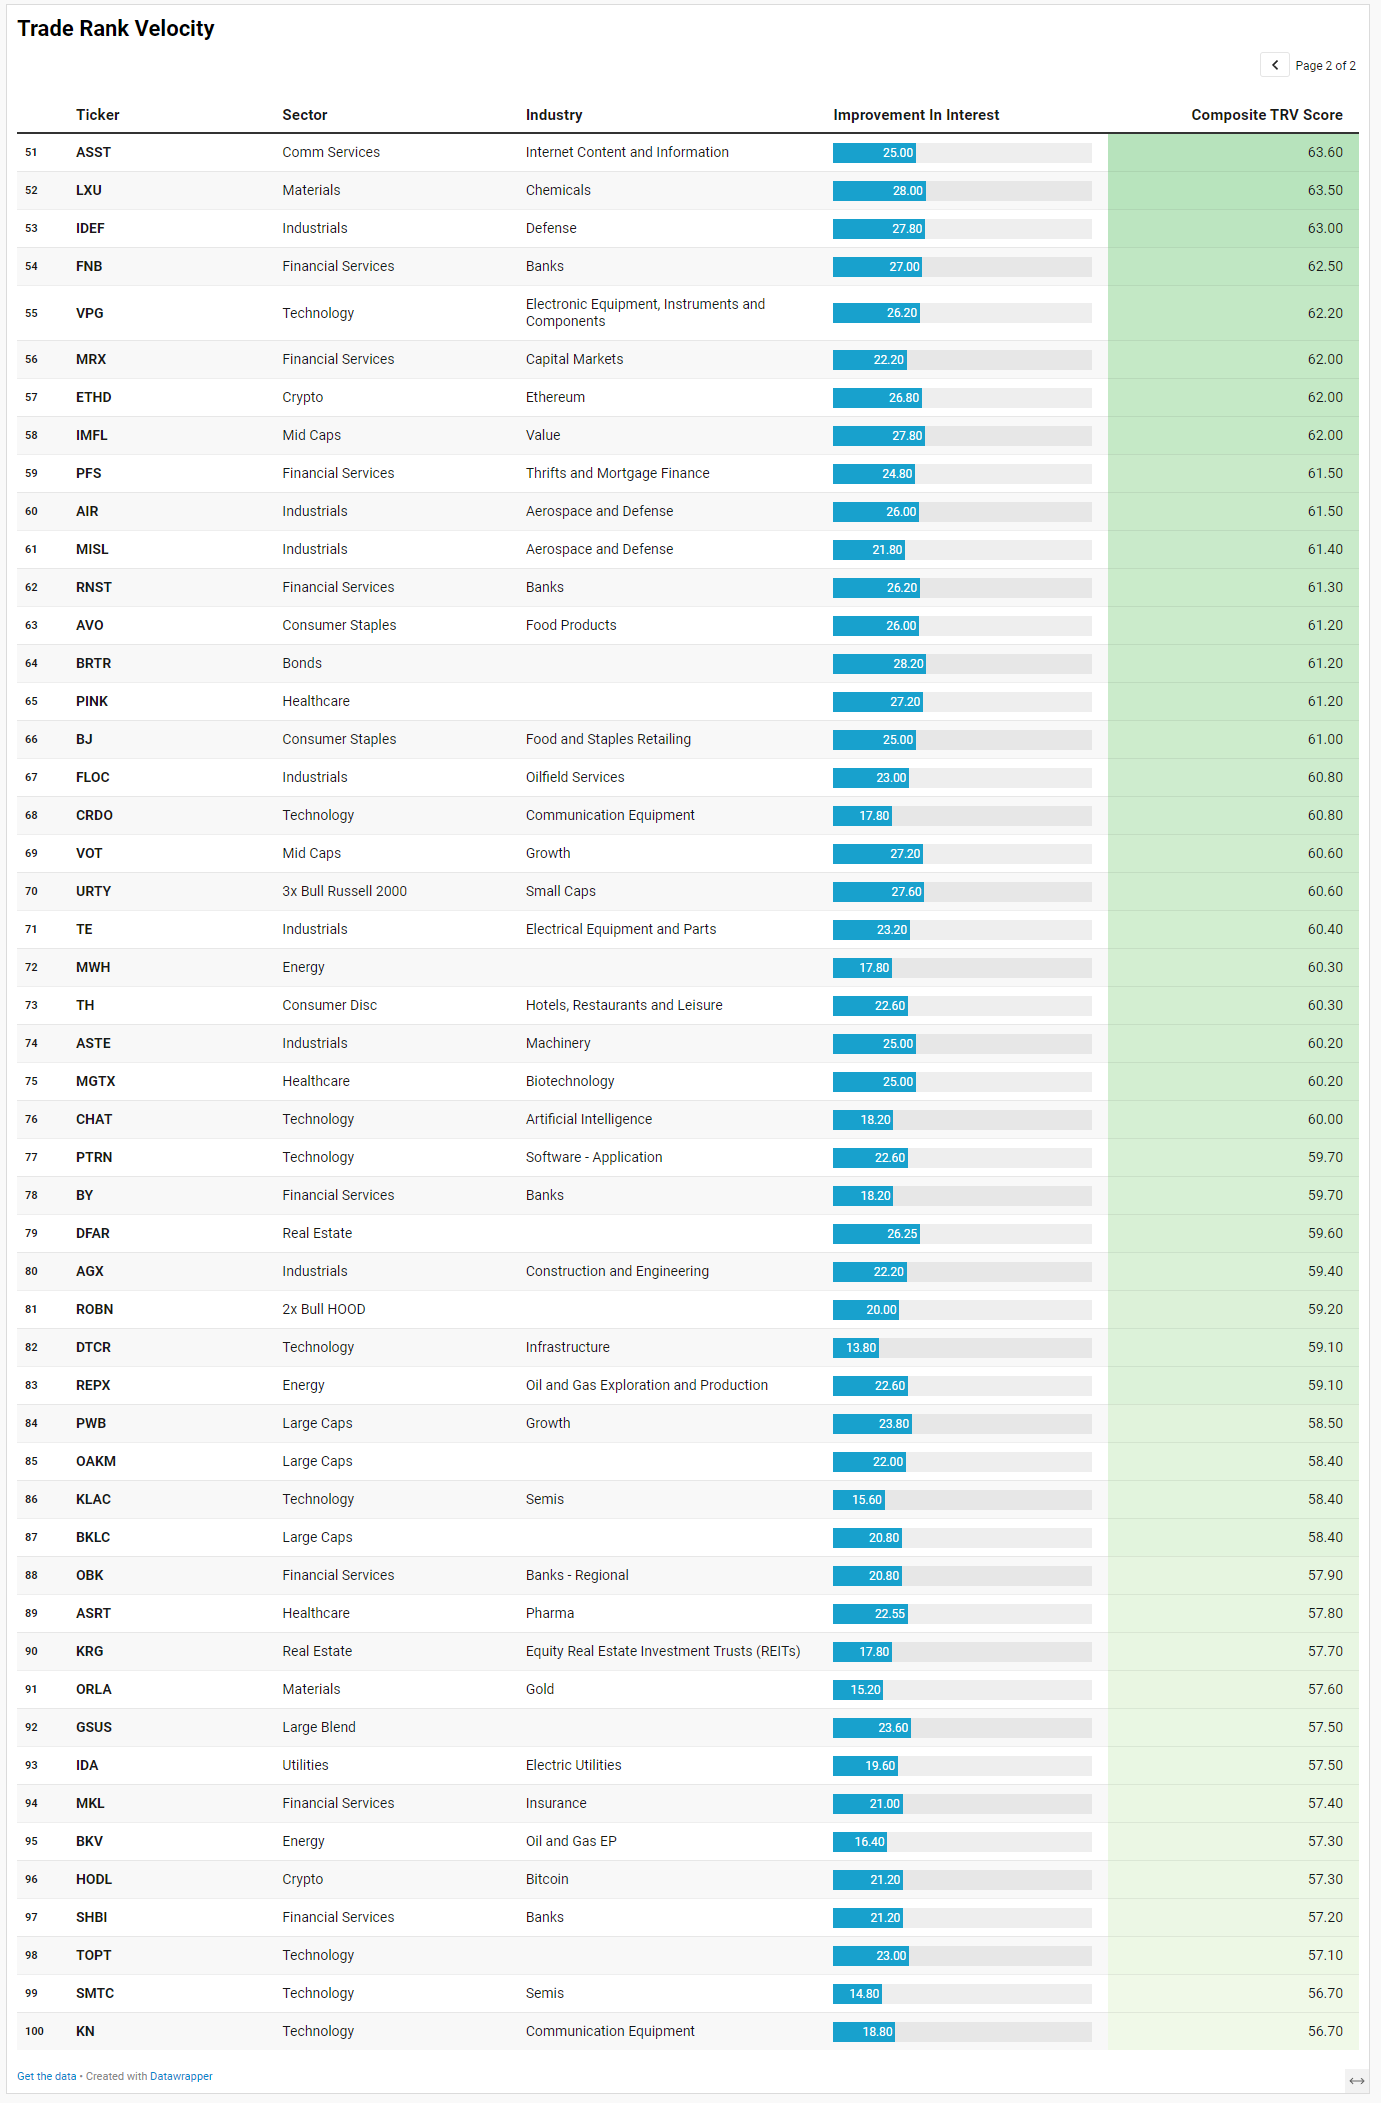
TRV is a proprietary metric that measures the recent acceleration or deceleration in institutional trading activity for a given stock by comparing its average trade rank over the past few days to its average in recent weeks. A sharp improvement in TRV typically reflects a notable shift in positioning, often accompanied by sustained trade activity, suggesting institutions are actively engaging with the name and that intensity of activity is rising. This often precludes meaningful price or narrative shifts. This isn’t a buy-list or sell-list; it’s meant to draw your eyes to names where institutions are putting money to work.
The TRV list reinforces the same message that showed up across the broader tape: the market is not just hiding in mega-cap safety, but it is still being selective about where it is willing to sponsor risk.
The first emergent theme is infrastructure. TTMI, KEEL, FLEX, GRID, VPG, CRDO, DTCR, KN, COHU, KLAC, SMTC, and CHAT all point toward a market still rewarding the plumbing behind AI, compute, electrification, and connectivity. That fits neatly with the broader flow picture where technology dominated aggregate dollars and semiconductors remained the primary institutional battleground. The important distinction is that TRV is surfacing second- and third-layer beneficiaries, not just NVIDIA, Apple, and Microsoft. This is where the tape starts to look less like a single-name AI trade and more like a full infrastructure cycle.
The second theme is power, energy, and resource security. XE, GRID, REMX, URG, ET, MWH, REPX, BKV, IDA, SLVR, ZIJMY, ORLA, and LXU all sit inside the broader scarcity complex: nuclear, electric infrastructure, rare earths, uranium, oil and gas, midstream, silver, gold, and chemicals. That matters because it aligns with the earlier macro read: investors still want AI exposure, but they also recognize that AI requires power, metals, cooling, land, and logistics. This is no longer just a software-and-chips story. The capital stack is expanding into the physical world.
A third cluster is aerospace, defense, and industrial capacity. NVRI leads the entire list with a 99 composite score, while ESE, VVX, AIR, MISL, IDEF, FANUY, AGX, ASTE, TE, HRI, and FLOC suggest persistent interest in industrial execution, defense readiness, machinery, construction, and services. This also fits the broadening message. If small caps and industrials are beginning to participate more meaningfully, these are exactly the types of names that should start showing up.
Healthcare is also unusually well represented, but it is not broad defensive healthcare. It is biotech, medical devices, specialty pharma, and more idiosyncratic innovation: TALK, LMRI, TVTX, DFTX, IVVD, CMPS, XENE, CTMX, ERAS, ETON, MGTX, ASRT, and PINK. That says risk appetite is returning, but it is returning through specific opportunity pockets rather than blanket defensive allocation.
Finally, the speculative risk sleeve is alive again. IRE, BITU, MVLL, ARMG, RIOT, ETHD, ROBN, HODL, and URTY show renewed appetite for leverage, crypto, small caps, and single-theme beta. That is constructive, but also a warning that sentiment is no longer washed out.
The through-line is clear: institutional attention is still anchored in technology leadership, but the emergent edge is migrating into infrastructure, power, defense, resources, financials, and selective high-beta recovery trades.
VL Institutional Outliers™ (IO)
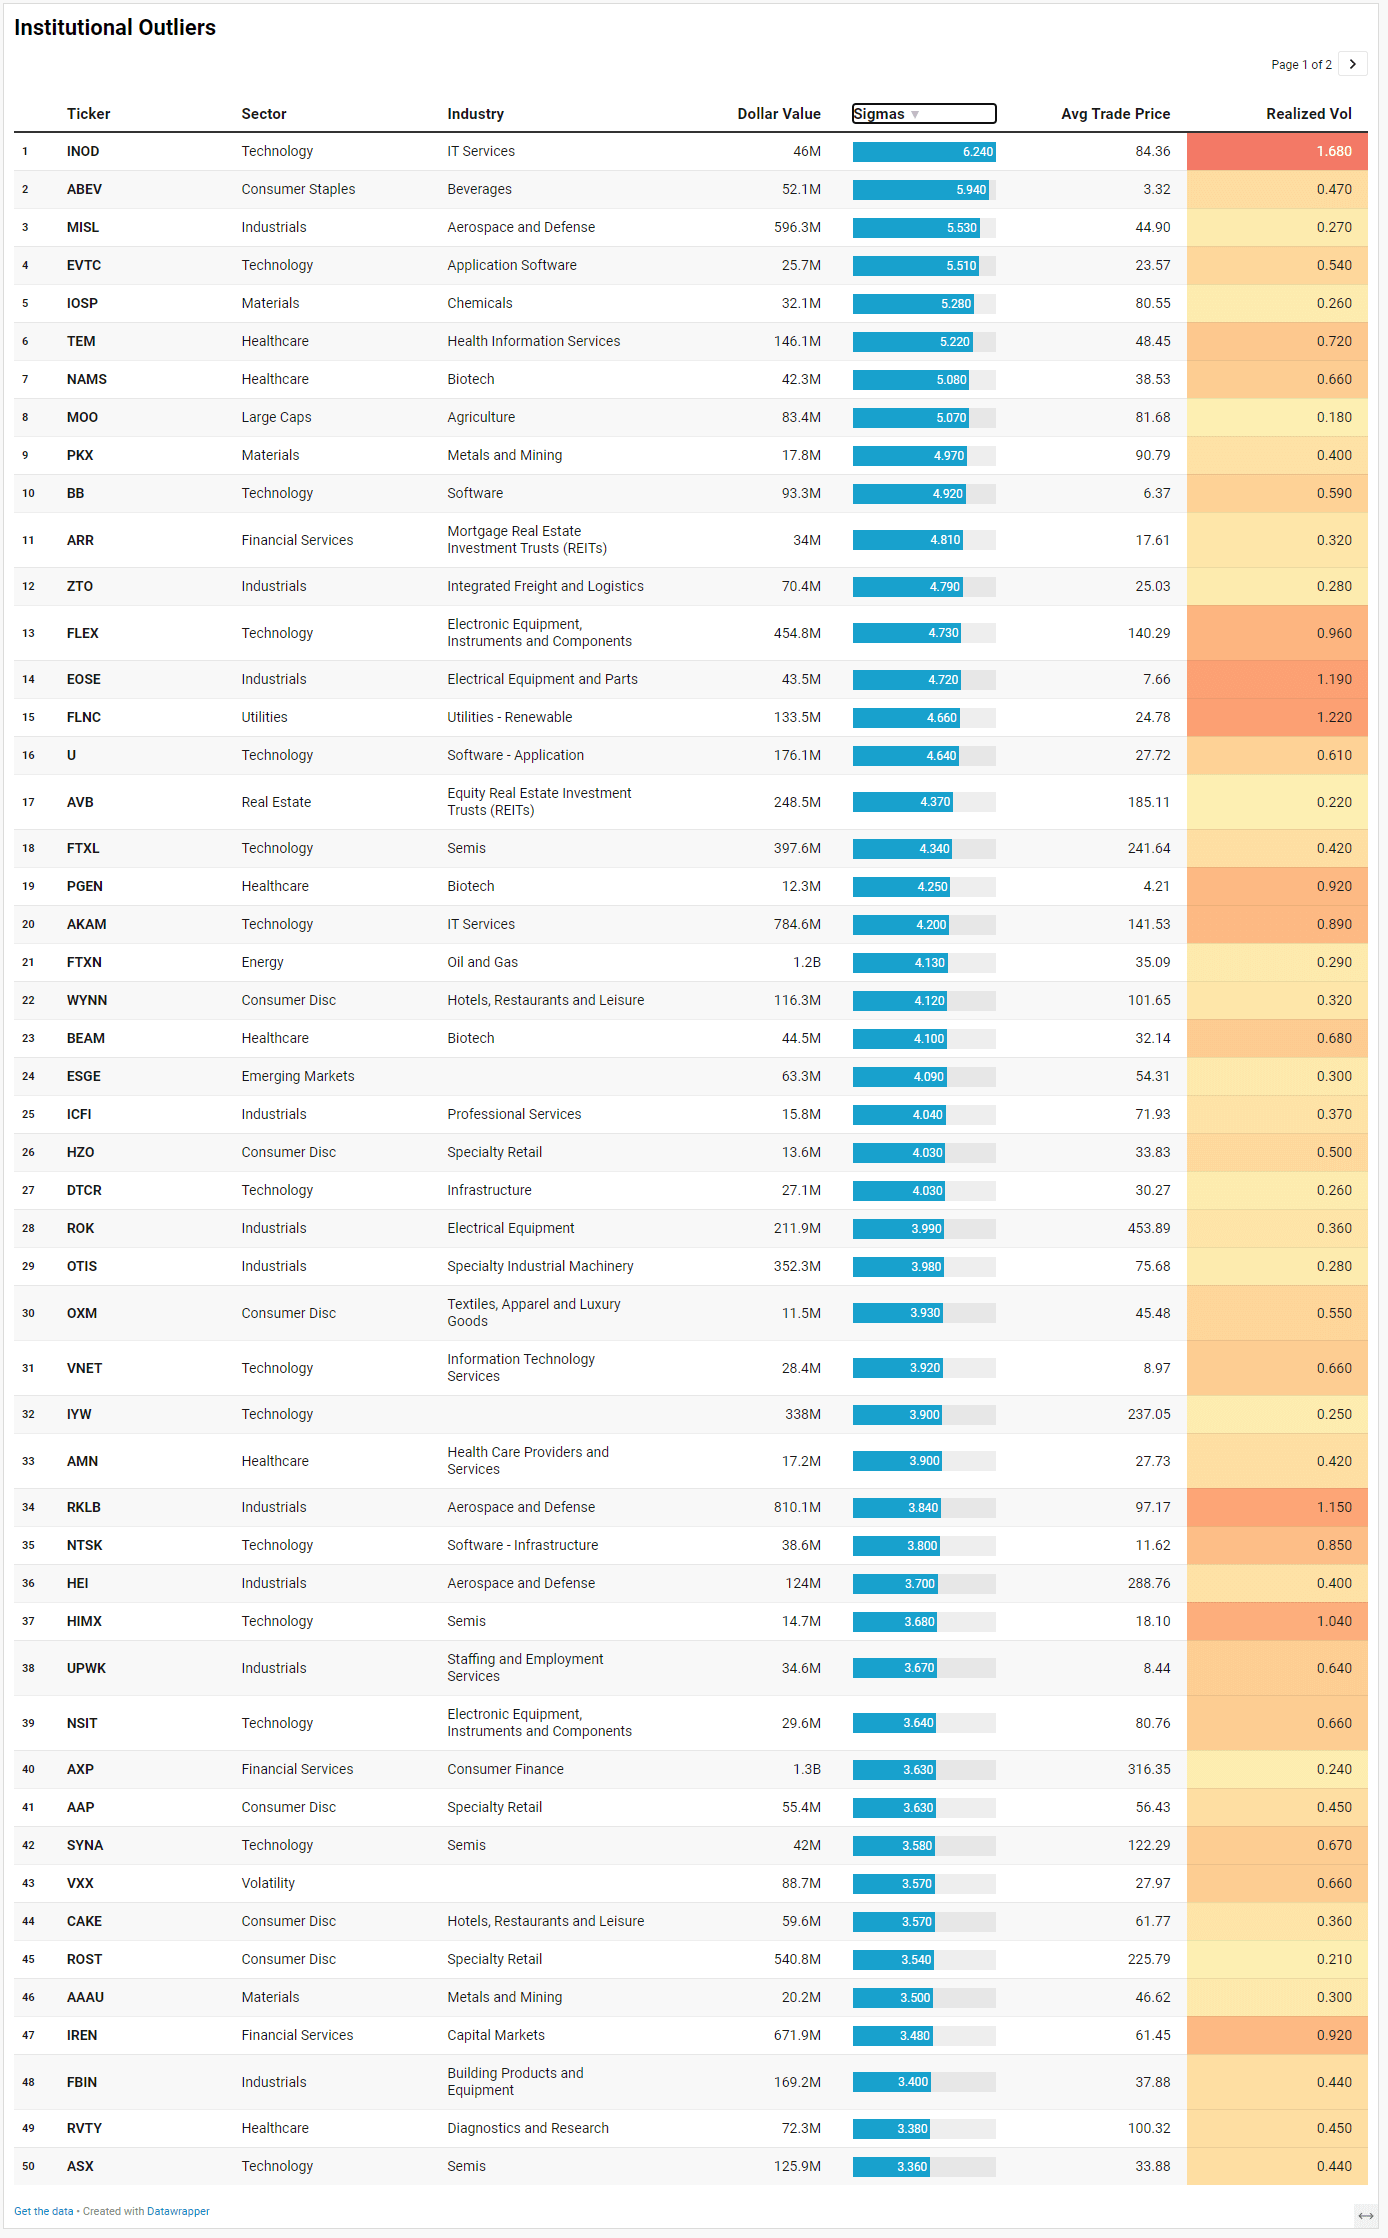
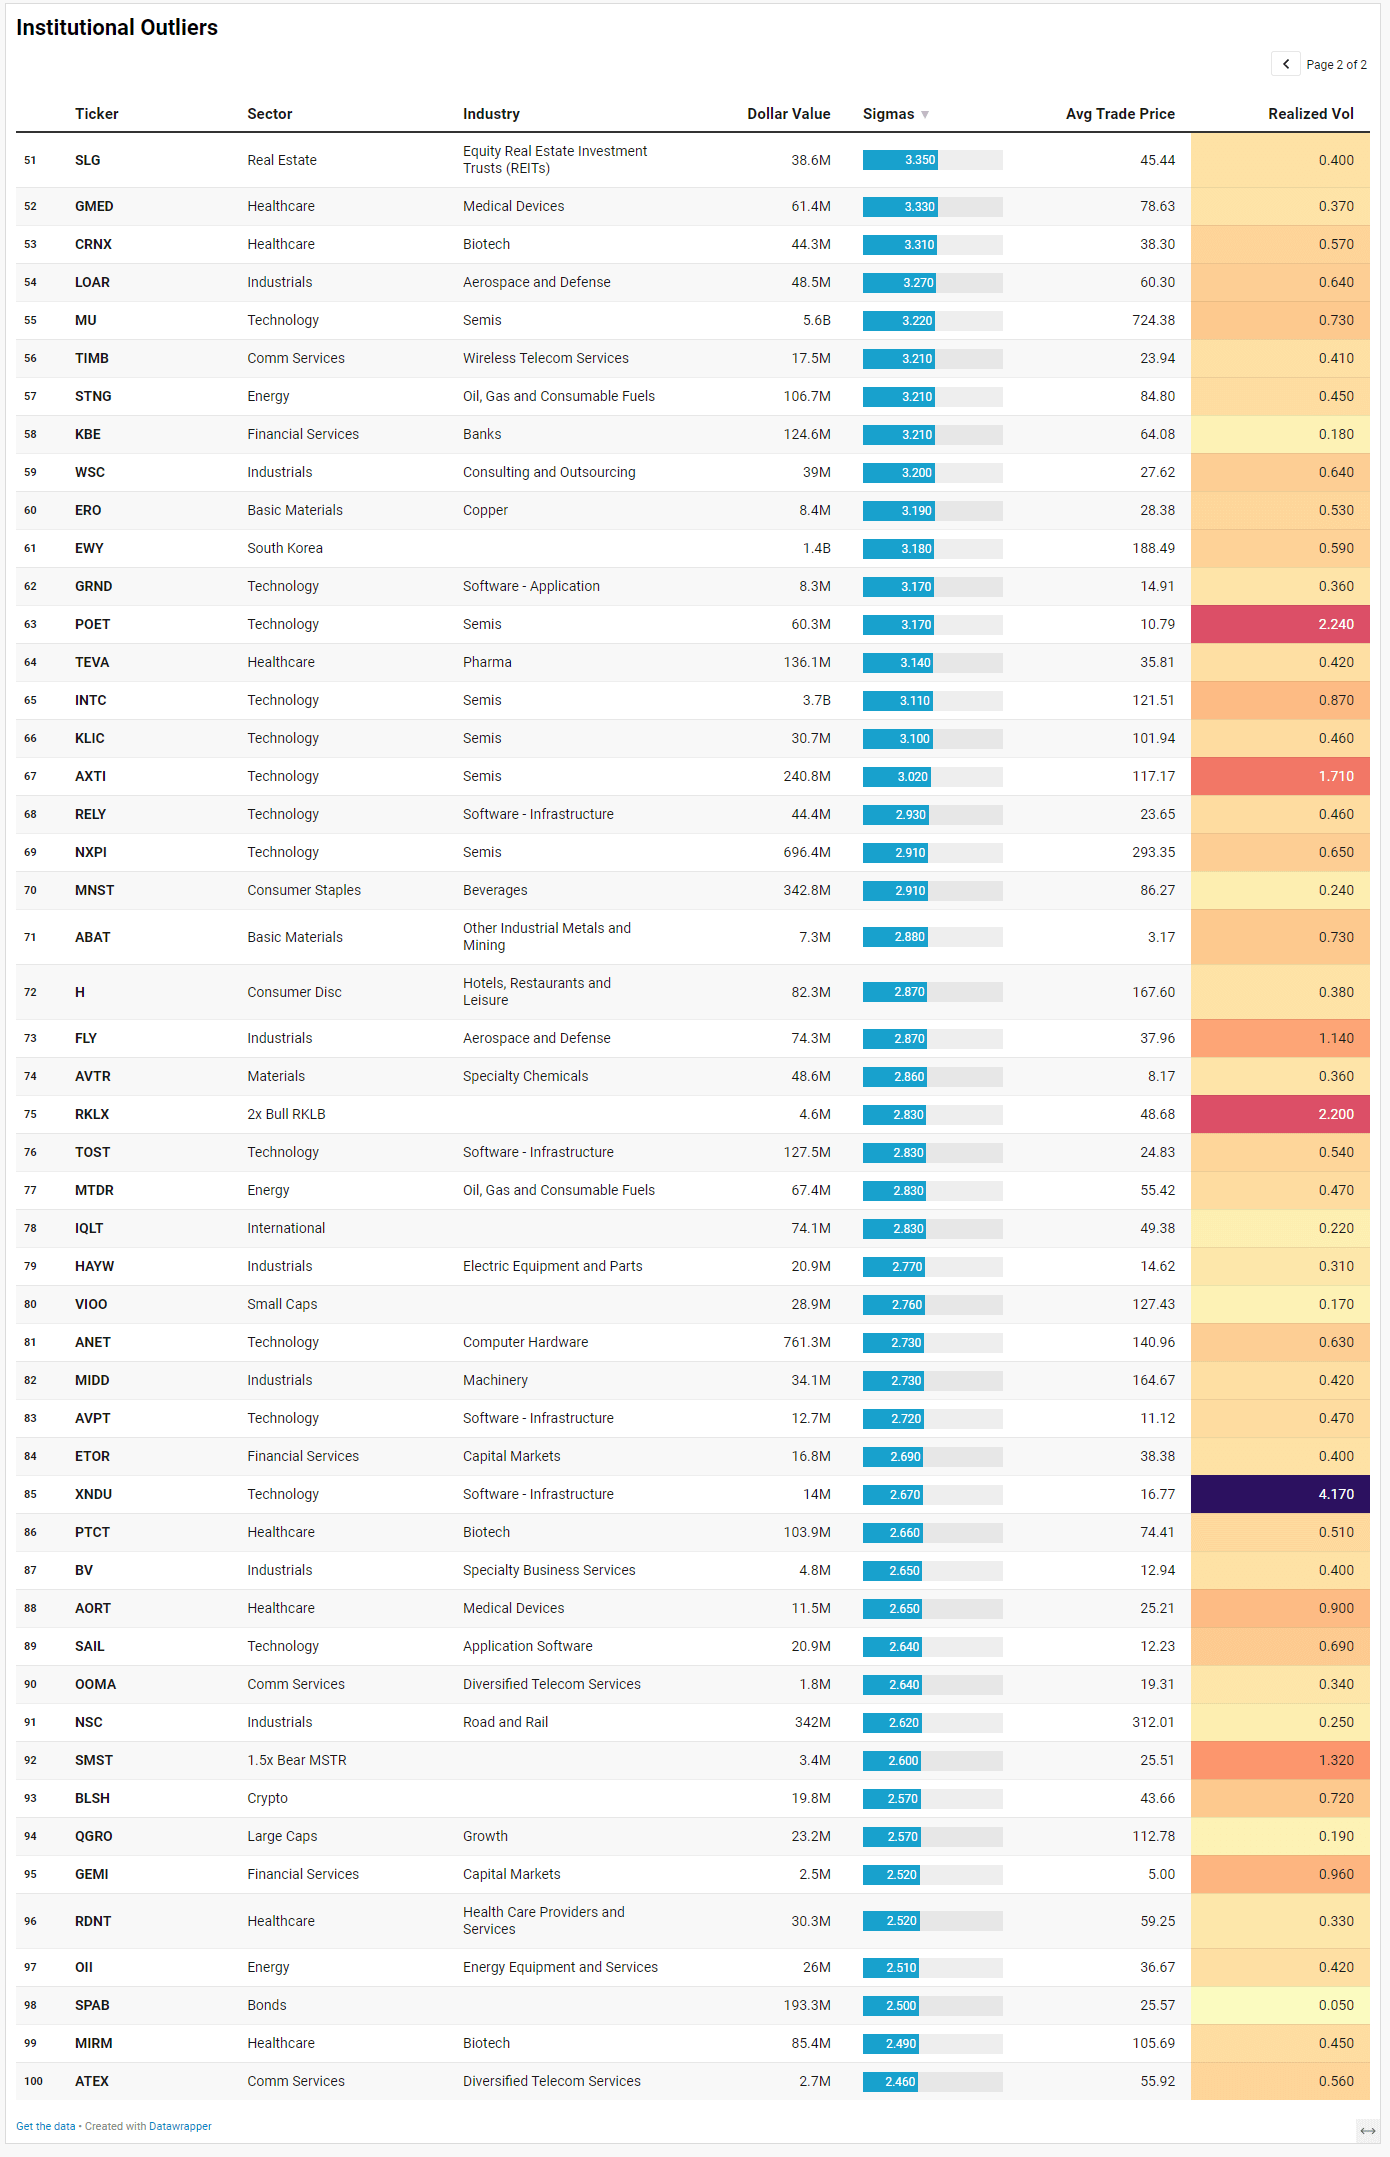
Institutional Outliers is a proprietary metric designed to spotlight trades that significantly exceed a stock’s recent institutional activity—specifically in terms of dollar volume. By comparing current trade size against each security’s recent normalized history, the metric flags outlier events that may indicate sudden institutional interest but may be missed because the activity doesn’t raise any flags/alerts when comparing the activity against the ticker’s entire history. For example, it’s conceivable that a ticker today receives the largest trade it has had in the last 6 months but the trade is unranked and would therefore be missed by current alerts built off Trade Ranks. Day traders can use “Realized Vol” to identify tickers that are moving swiftly with large price displacement while others can use it to size your risk appropriately.
The Institutional Outliers list adds another layer to the story because it isolates where participation became statistically abnormal, not just active. What stands out immediately is that the market is still overwhelmingly rewarding infrastructure over pure narrative. FLEX, AKAM, FTXL, IYW, MU, INTC, NXPI, ANET, ASX, AXTI, KLIC, HIMX, SYNA, and POET all appear with elevated sigma readings and meaningful dollar participation, reinforcing the idea that institutions continue to allocate aggressively into the physical and connective tissue of the compute buildout.
What is especially notable is how broad the semiconductor participation has become. This is no longer just a one-company momentum chase. Micron alone printed roughly $5.6 billion in outlier activity while Intel cleared roughly $3.7 billion. That is significant because both names sit further down the AI quality hierarchy than NVIDIA, which suggests institutions are expanding outward into laggards, memory, manufacturing, networking, and adjacent infrastructure rather than concentrating exclusively in the obvious winners.
The second major theme is defense, aerospace, and industrial capacity. MISL, RKLB, HEI, LOAR, FLY, ROK, OTIS, NSC, HAYW, and ZTO all registered unusually large positioning activity. That lines up with the broader rotation already visible in industrial relative strength and suggests capital is increasingly viewing manufacturing, logistics, transportation, electrification, and defense production as durable macro themes rather than temporary trades.
Energy and resource complexity also remain deeply embedded in the tape. FTXN alone showed more than $1.1 billion in outlier activity, while FLNC, EOSE, PKX, ERO, STNG, MTDR, OII, and AVTR reinforce the same underlying message: power demand, storage, transmission, and raw materials are becoming inseparable from the growth narrative. This matters because it supports the earlier observation that the market increasingly prefers tangible infrastructure exposure over purely conceptual AI enthusiasm.
Another important shift is the growing participation in financials and capital-markets exposure. AXP, IREN, KBE, ETOR, ARR, and GEMI all surfaced as statistically abnormal flows. American Express printing roughly $1.3 billion while IREN approached roughly $672 million suggests institutions are not simply hiding defensively; they are selectively embracing transactional activity, market participation, and speculative infrastructure again.
Finally, there is a subtle but important stabilization developing underneath beaten-down software. U, AKAM, TOST, RELY, SAIL, NTSK, and AVPT all showed abnormal participation despite the dominant narrative that AI permanently destroys software margins. The tape increasingly suggests institutions are differentiating between software categories rather than abandoning the space outright. That is often how durable reversals begin: quietly, unevenly, and long before consensus is comfortable buying them again.
VL Sector Leaders
VL Sector Leaders is a weekly snapshot of where true leadership is asserting itself inside the market, stripped of the distortions that come from broad, style-mixed indices. Rather than asking which stocks look strong in absolute terms, this list focuses on which names are outperforming within the environments they actually compete in.
Each week, we surface the ten stocks demonstrating the most persistent relative strength inside their respective sectors. These are not headline chasers or one-day wonders. They are names that continue to separate themselves from peers through real price behavior, often reflecting sustained demand rather than fleeting attention.
For day traders, this list is a powerful awareness tool. Sector Leaders tend to offer cleaner intraday structure, better follow-through, and more predictable reactions around key levels because they already sit on the right side of relative strength. Even on choppy tape, leadership names often remain tradeable while the rest of the market degrades.
For swing traders, VL Sector Leaders helps narrow the universe to stocks with the highest probability of staying relevant. Relative leaders are more likely to hold trends, survive pullbacks, and reassert themselves after consolidation. When markets rotate, these names are often among the first to resume leadership — or the last to break.
Technology leadership remains heavily concentrated in infrastructure, networking, semiconductors, and enterprise plumbing. INOD sits at the top of the technology leaders table, followed by OSS, DOCN, POET, HIMX, AKAM, and FROG. What stands out is that many of these are not household momentum names. They are data infrastructure, hosting, connectivity, optical, semiconductor-adjacent, and workflow companies. Meanwhile, the technology laggards are populated by more crowded prior-cycle winners and software-heavy beta such as XNDU, KVYO, TSSI, ADTN, WATT, ANET, NICE, and Aeva. That split reinforces the broader narrative that institutions are becoming more selective inside tech itself, preferring infrastructure and enablement over speculative duration-heavy software exposure.
Industrials continue to broaden meaningfully. STRL, XMTR, AAON, RKLB, WSC, PCT, MIDD, RDW, and FLY populate the leadership side, while FWRD, PRIM, CAI, GPGI, AVEX, BE, HNI, and AVAV appear among laggards. The common thread among leaders is tangible exposure to manufacturing, engineering, aerospace, logistics, and industrial modernization. This is increasingly consistent with a market preparing for a longer-cycle capital expenditure environment rather than a short-term momentum chase.
Healthcare leadership also looks notably speculative in a constructive way. AGL, AVTX, QURE, NAMS, URGN, WRBY, and PGNY are leading, while more mature or defensive healthcare exposures like ZTS, INSM, AZTA, INSP, and GMED appear weaker. That usually happens when investors are willing to move further out the risk curve and hunt for asymmetric upside rather than merely hiding in stability.
Energy and utilities continue to send a nuanced message. HNRG, AESI, VVV, MWH, LTBR, and DINO are leadership names, while CRK, APA, MTDR, OBE, and VET sit among laggards. The market still appears interested in power generation, infrastructure, and specialized energy exposure, but less interested in broad commodity beta. Utilities leadership reinforces this distinction with FLNC, XIFR, ORA, BEPC, BIPC, OKLO, and TAC outperforming while more traditional regulated utility exposure lags. The tape increasingly prefers electrification and grid modernization over slow-growth defensives.
Financials also continue to stabilize beneath the surface. IREN, HUT, CIFR, BTGO, and SNEX appear among leaders while PYPL, TSLX, and GSBD lag. That suggests investors still favor transaction-heavy, crypto-adjacent, and capital-markets leverage over slower lending and income-oriented exposure.
The broad message from the leaders and losers tables is that the market is rewarding scarcity, infrastructure, power, logistics, and operational leverage while quietly fading crowded defensives, slower-duration software, and traditional yield-oriented safety. That is not a tape preparing for recession panic. It is a tape rotating toward the next layer of the cycle.
MIR Part 3: Framing-Up A Trade
The tape spent the entire week communicating the same underlying message in different dialects. Broad index participation remained healthy, volatility stayed contained enough to permit risk-taking, institutional positioning continued concentrating in infrastructure and power, and the market repeatedly rewarded names tied to physical enablement rather than conceptual storytelling. This does not look like a market preparing for immediate systemic stress. It looks like a market repricing toward a world where compute, electrification, industrial rebuilding, defense production, and capital efficiency increasingly matter more than simple multiple expansion.
The important distinction is that this is no longer a clean “buy mega-cap tech” environment. Institutions are broadening outward from the obvious winners into second-order beneficiaries, industrial operators, transmission infrastructure, aerospace, logistics, energy systems, and select software names that have already endured severe deratings. That broadening matters because sustainable bull legs almost always require participation beyond the index generals.
The positioning framework here is therefore not maximum aggression into high-beta momentum. It is controlled participation in the strongest institutional themes while keeping enough liquidity and defense to survive an inevitable volatility event. The tape also suggests that institutions are increasingly comfortable buying breakouts if the underlying inventory has already been accumulated. That was visible repeatedly in semiconductors, software infrastructure, aerospace, and utility-adjacent names.
The highest-conviction sleeve remains infrastructure and compute enablement. NVIDIA, Broadcom, Micron, Arista, Akamai, Flex, Intel, and NXPI all continue attracting exceptional institutional sponsorship. NVIDIA still represents the core AI demand engine, but names like FLEX and AKAM increasingly matter because they represent the connective tissue and execution layer behind the buildout. Intel and Micron flows are particularly important because they imply broadening participation into less-loved semiconductor exposure rather than simple crowding into obvious momentum.
The second sleeve centers around electrification, power, and industrial rebuilding. FLNC, OKLO, AESI, MWH, RKLB, STRL, and AAON fit the tape exceptionally well. Institutions appear increasingly willing to underwrite the idea that power demand and infrastructure constraints become structural rather than cyclical. This is also one of the cleaner relative-strength areas across the broader market.
The third sleeve focuses on selective software and beaten-down recovery opportunities. AKAM remains attractive here, but the more important idea is that the market may have become too pessimistic on software broadly. TOST, DOCN, FROG, and U represent areas where institutional activity suggests accumulation is occurring despite a dominant bearish narrative. These are not “story” longs. They are tactical re-rating opportunities with clearly defined invalidation levels.
The fourth sleeve is tactical cyclicals and financial participation. IREN, SNEX, KBE, and AXP all fit a tape that increasingly favors transactional activity, market participation, and selective risk appetite. IREN in particular continues showing unusual sponsorship alongside broader crypto-adjacent positioning. This is not the dominant theme, but it is increasingly difficult to ignore.
Defensively, the tape still argues for carrying duration and volatility protection, but in moderation rather than outright fear positioning. HYG, TLT, and SPAB appearing repeatedly in sweeps and aggregate flow suggests institutions still want hedging exposure available if macro conditions deteriorate unexpectedly. The fact that credit products attracted substantial sweep activity without outright equity liquidation is more consistent with hedged participation than panic.
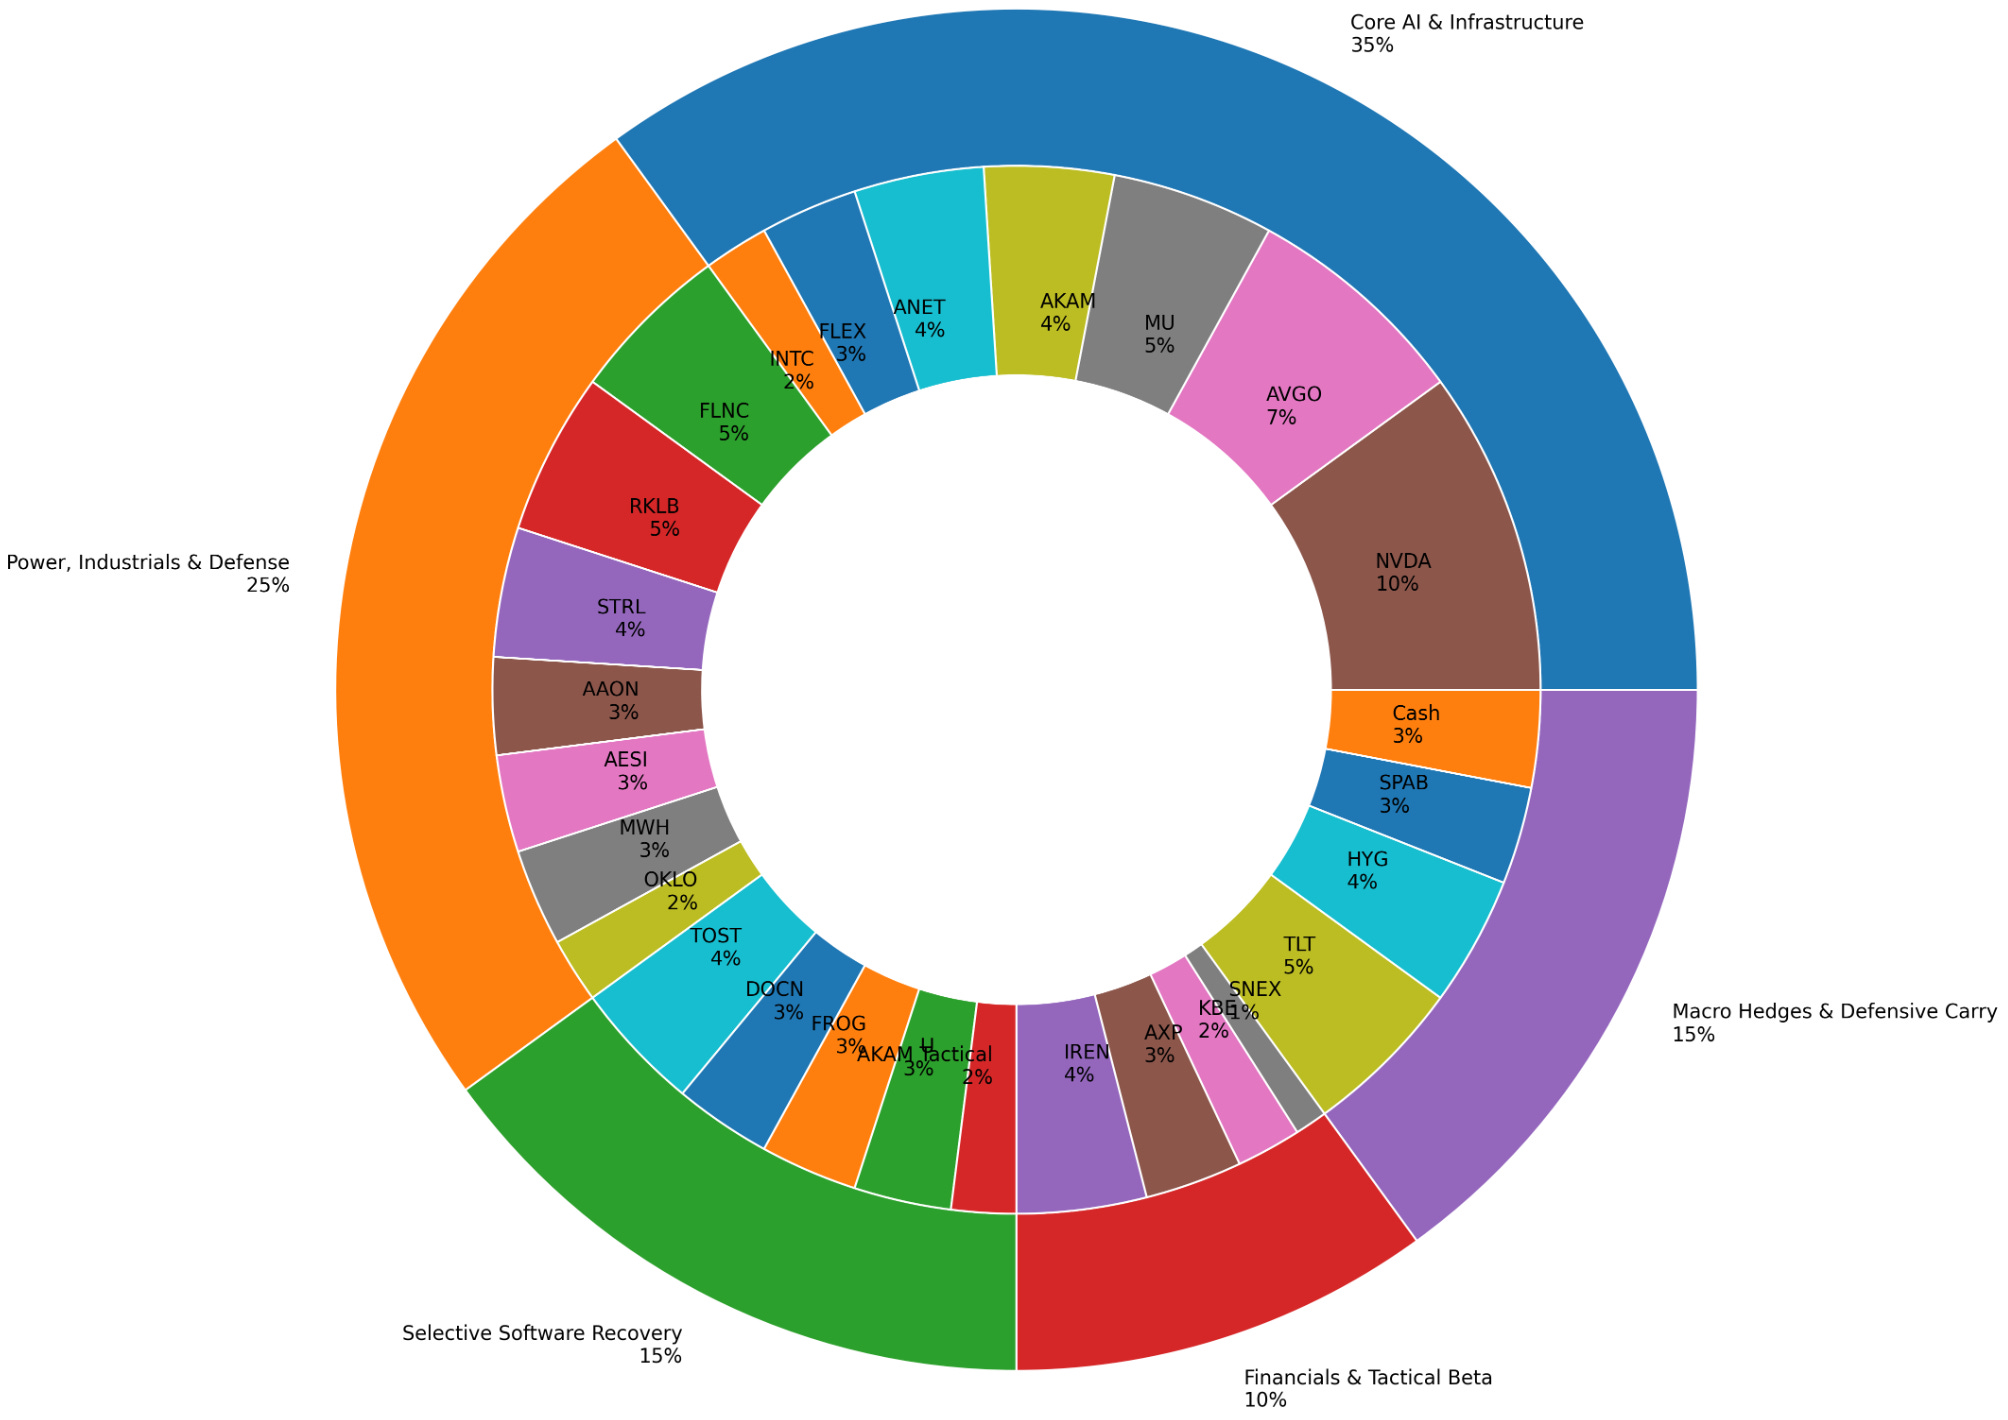
Portfolio Summary (100%)
+++++++++++++++++++++++++++++++++++++++++++++++++++++++++
Core AI and Infrastructure - 35%
NVDA 10%
AVGO 7%
MU 5%
AKAM 4%
ANET 4%
FLEX 3%
INTC 2%
This sleeve captures the dominant institutional trend while diversifying across memory, networking, execution, and infrastructure.
+++++++++++++++++++++++++++++++++++++++++++++++++++++++++
Power, Industrials, and Defense - 25%
FLNC 5%
RKLB 5%
STRL 4%
AAON 3%
AESI 3%
MWH 3%
OKLO 2%
This sleeve aligns with the growing institutional preference for physical infrastructure, electrification, aerospace, and industrial modernization.
+++++++++++++++++++++++++++++++++++++++++++++++++++++++++
Selective Software Recovery - 15%
TOST 4%
DOCN 3%
FROG 3%
U 3%
AKAM additional tactical exposure 2%
This is the contrarian sleeve. The goal is participating in software stabilization without overcommitting to the most crowded AI application trades.
+++++++++++++++++++++++++++++++++++++++++++++++++++++++++
Financials and Tactical Beta - 10%
IREN 4%
AXP 3%
KBE 2%
SNEX 1%
This sleeve reflects improving participation beneath the surface and selective appetite for transactional leverage.
+++++++++++++++++++++++++++++++++++++++++++++++++++++++++
Macro Hedges and Defensive Carry - 15%
TLT 5%
HYG 4%
SPAB 3%
Cash 3%
The purpose here is not bearishness. It is volatility management. The tape still supports upside continuation, but maintaining liquidity and rate-sensitive protection allows the portfolio to absorb an unexpected inflation or growth shock without forced de-risking.The key tactical point for the week ahead is that institutions appear willing to buy strength if the breakout is supported by prior accumulation and improving participation. That means failed breakouts matter enormously. If semiconductors, infrastructure, and industrial leaders begin losing their recent acceptance zones simultaneously, the character of the tape changes quickly. But until that happens, the broader message from the flow remains surprisingly constructive beneath the surface. Good luck this week, VL Crew!
Thank you for being part of this community and for investing your time in this week’s edition. The quality of this readership — thoughtful, disciplined, engaged — is what makes this work meaningful. I’m grateful to build alongside you. Here’s to a week of clarity, conviction, and well-executed opportunities.
— VolumeLeaders