Market Momentum: Your Weekly Financial Forecast & Market Prep
Issue 89 / What to expect May 04, 2026 thru May 08, 2026


Weekly Market-On-Close Report
New Highs, Old Risks – What This Rally Is Really Telling Us
We just watched the S&P 500 and Nasdaq 100 notch fresh all‑time highs again, capping off a month where the S&P is up roughly 10% and the Nasdaq more than 8% year‑to‑date. That sounds like a clean risk‑on story, but the underlying tape is more nuanced. Earnings are doing the heavy lifting, oil and geopolitics keep tugging on the other end of the rope, and central banks are in “hawkish hold” mode rather than riding to the rescue. The result is a market that is levitating on genuine profit growth and AI‑driven capex, even as macro risk premia quietly grind higher.
Let’s walk through what actually pushed us to new highs, how global policy and war risk fit into the picture, and what kind of tape we’re trading as we roll into May.
Why the market keeps making new highs
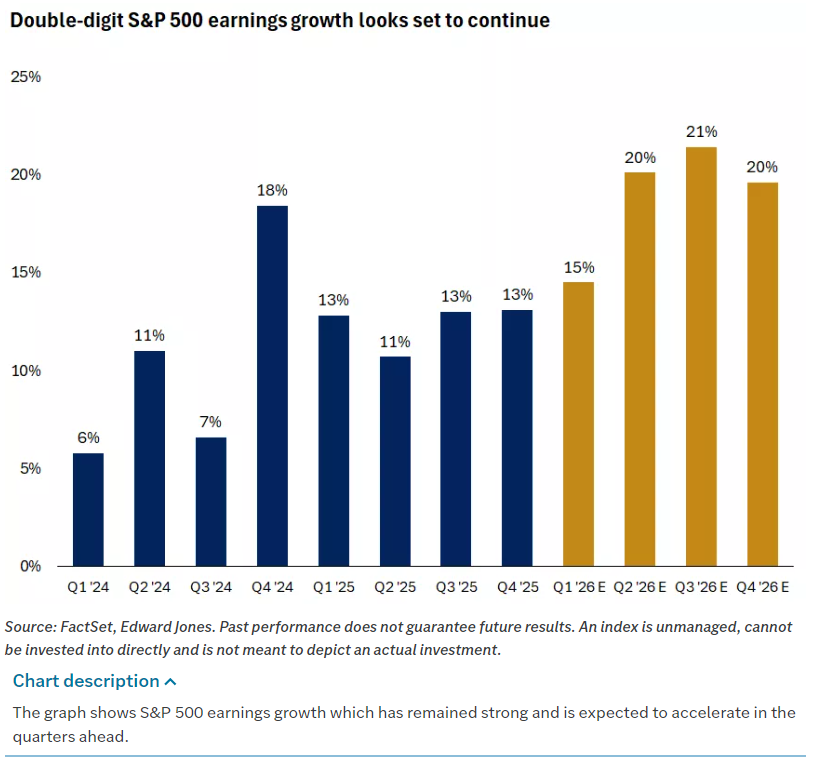
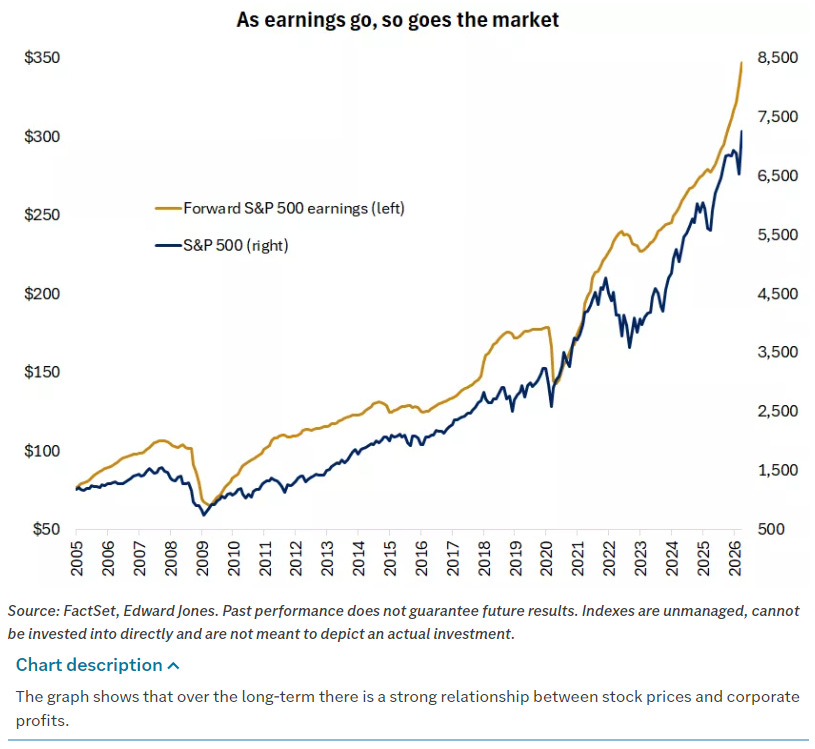
Start with the obvious: corporate profits are booming again. Roughly two‑thirds of S&P 500 companies have reported Q1 earnings, and around 80% have beaten estimates. Aggregate S&P earnings growth is tracking north of 12–14% year‑over‑year, which would be the sixth straight quarter of double‑digit growth. Strip out tech and that number drops to the low single digits, but that’s exactly the point: tech and AI are carrying the index.
We saw that dynamic in miniature this week. Apple jumped more than 3% after guiding Q3 revenue 14–17% above last year, blowing past a consensus that was sitting closer to 9%. Atlassian ripped nearly 30% on a big revenue beat, and a whole sleeve of software names — Oracle, Datadog, Salesforce, ServiceNow, Workday — caught a sympathy bid as investors re‑priced the durability of cloud and AI‑adjacent spend. On the hardware side, SanDisk, Seagate, Intel, Micron and AMD all rallied as a big revenue beat from storage pulled the whole AI‑infrastructure complex higher.
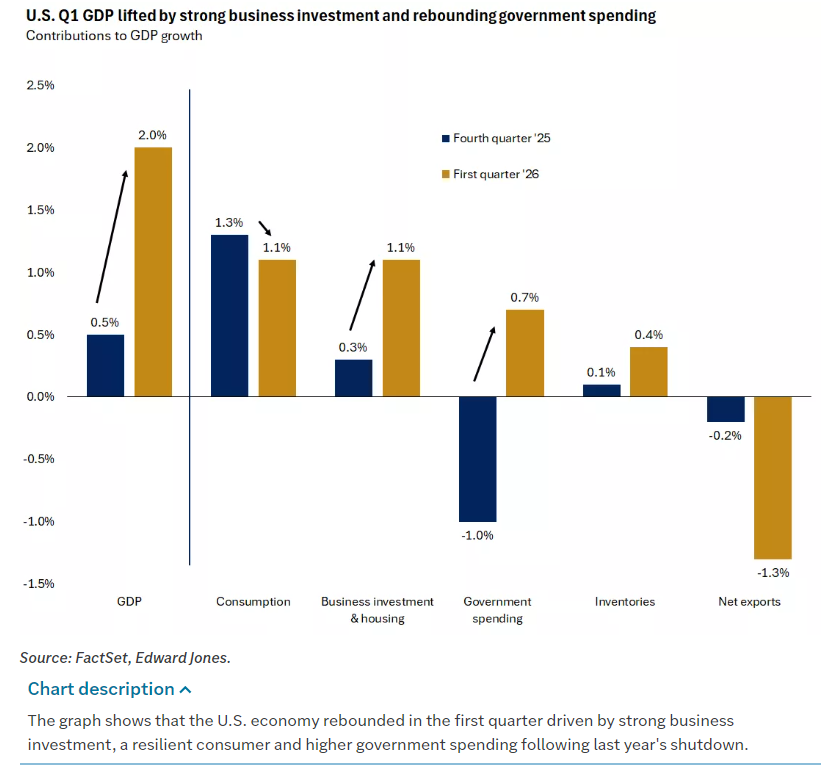
That earnings strength sits on top of a macro backdrop that’s…fine. US real GDP grew at a 2% annualized pace in Q1, with private‑sector final demand closer to 2.5%. Business investment, especially in IT equipment and software, was the standout; by itself, it added roughly 1.5 percentage points to growth. Consumers are slowing but not cracking — card data from Visa, Mastercard and AmEx still shows healthy spending, especially among higher‑income cohorts. It is hard to talk yourself into an imminent recession when the earnings tape and the GDP internals both say “steady expansion with a big AI capex tailwind.”
That’s why the S&P 500 just logged its best month since November 2020 and now sits above former resistance near 7,150. Technically, the market has flipped from a regime where overhead resistance mattered to one where dip buyers are far more focused on support zones. 6,900 is the first meaningful downside reference, with a still‑gaping window from 6,620–6,740 left behind during the April ramp. Momentum is rolling off overbought, not collapsing — classic “we probably need to digest gains” territory, not “the trend has died” territory.
Central banks: hawkish holds and a long runway
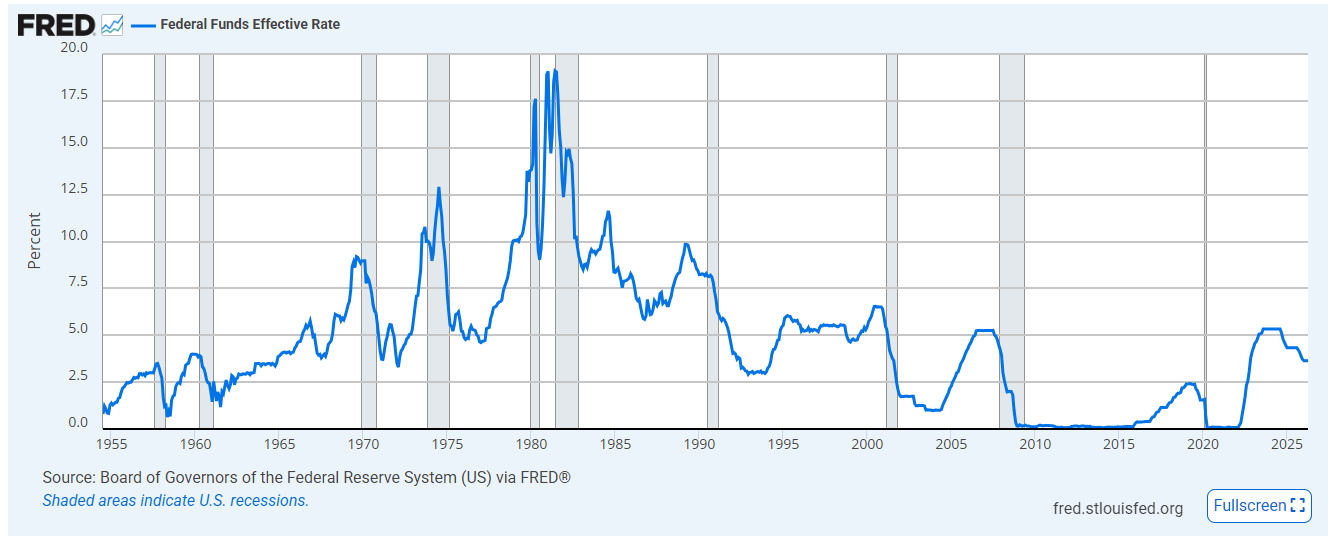
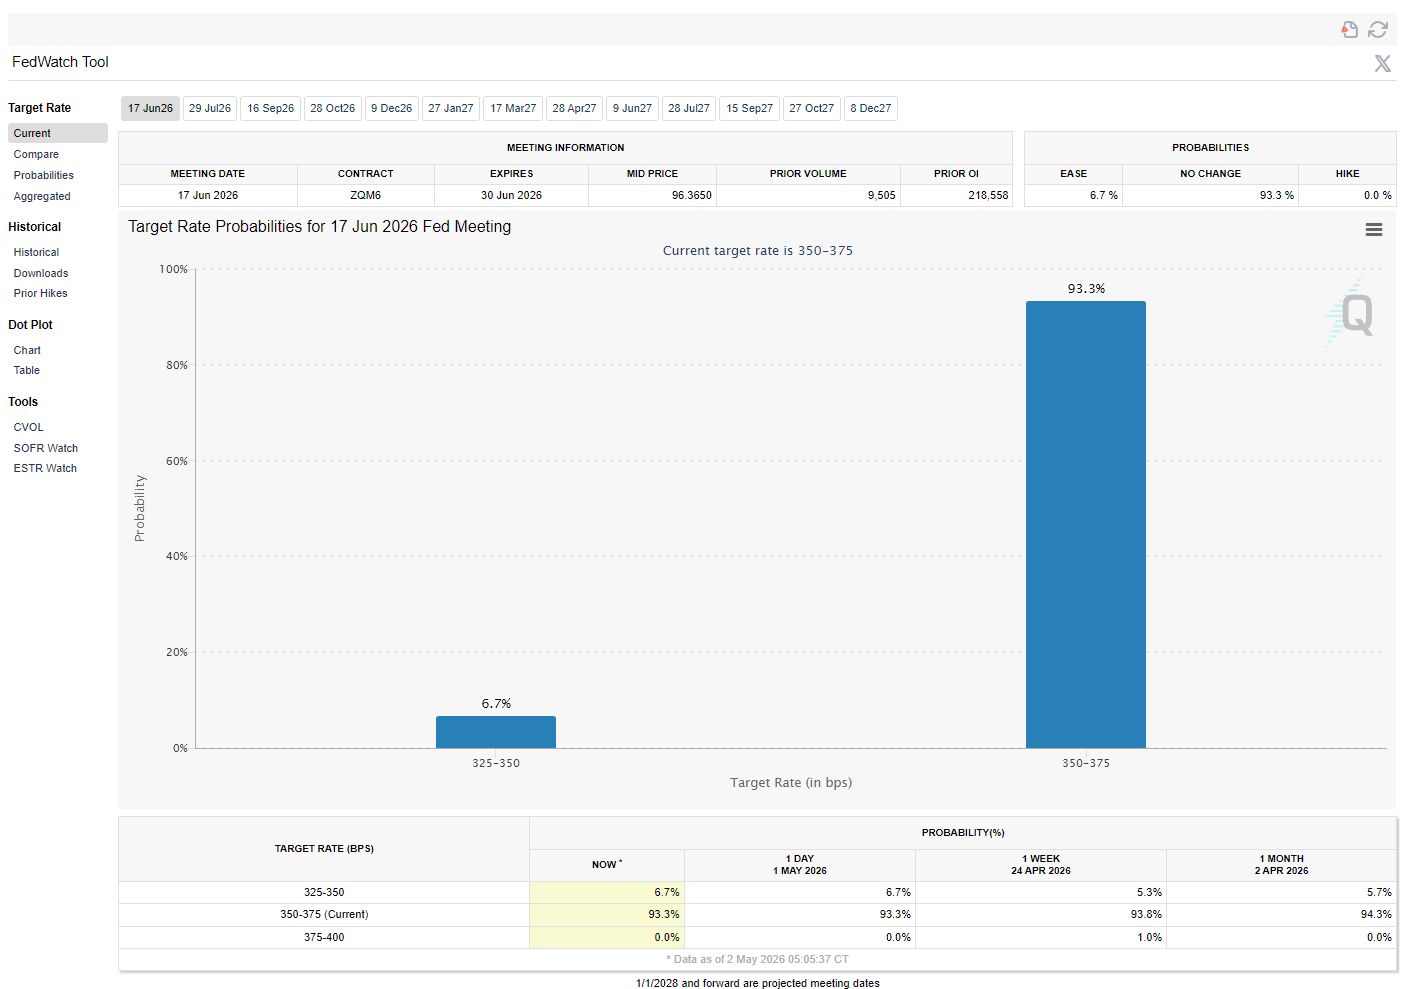
The other big piece of context is policy. The Fed just delivered another “on hold, but edgy” meeting. The funds rate stays in the 3.5–3.75% range, but for the first time in Powell’s tenure we saw three dissenters arguing to drop the easing language, and one wanting an outright cut. That is a remarkable level of disagreement for a committee that usually prides itself on consensus.
Markets read that split as a hawkish signal: the bar for cutting is higher, the bar for hiking again is not zero, and energy‑driven inflation is back on the radar. Core PCE is running around 3.2%, still well above the 2% target, and market‑based breakevens just pushed to about 2.5%, a 14‑month high. Fed‑funds futures now price almost no chance of a move at the June meeting and only a small probability of a single 25‑bp cut late this year, contingent on inflation cooling and oil calming down.
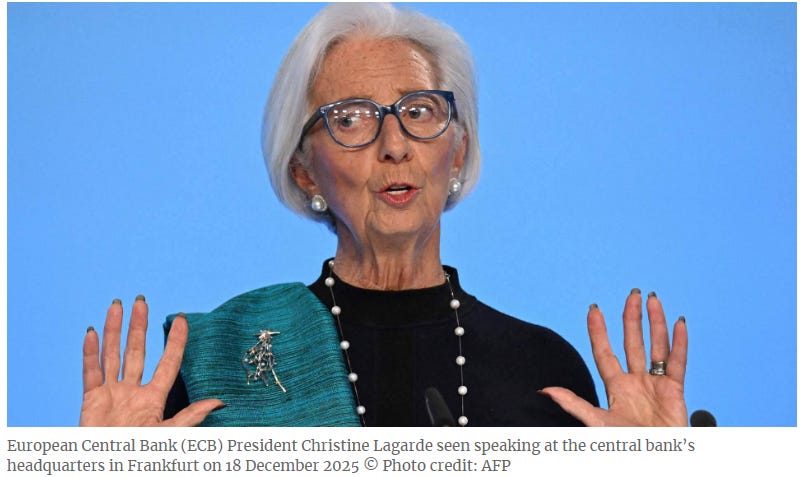
The ECB and Bank of England are in the same uncomfortable boat: policy rates on hold, inflation re‑accelerating at the margin, and energy prices doing them no favors. The ECB left its deposit rate at 2% but openly discussed a potential hike if the inflation outlook does not improve, while German CPI just ticked back up to 2.9% year‑over‑year on higher energy. The BoE kept Bank Rate at 3.75% with a warning that CPI has re‑accelerated to 3.3% and that energy forecasts are “highly uncertain.”
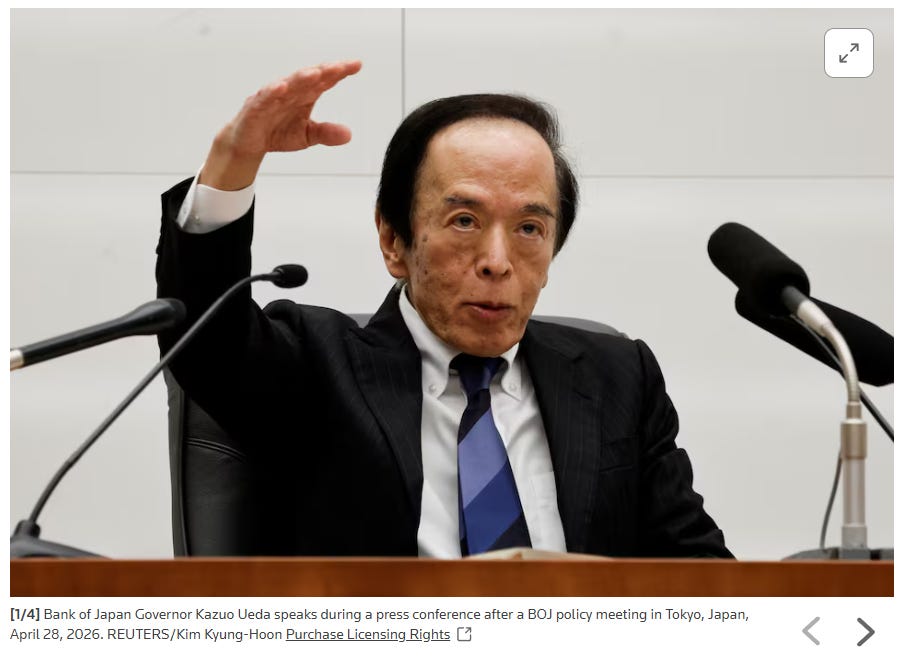
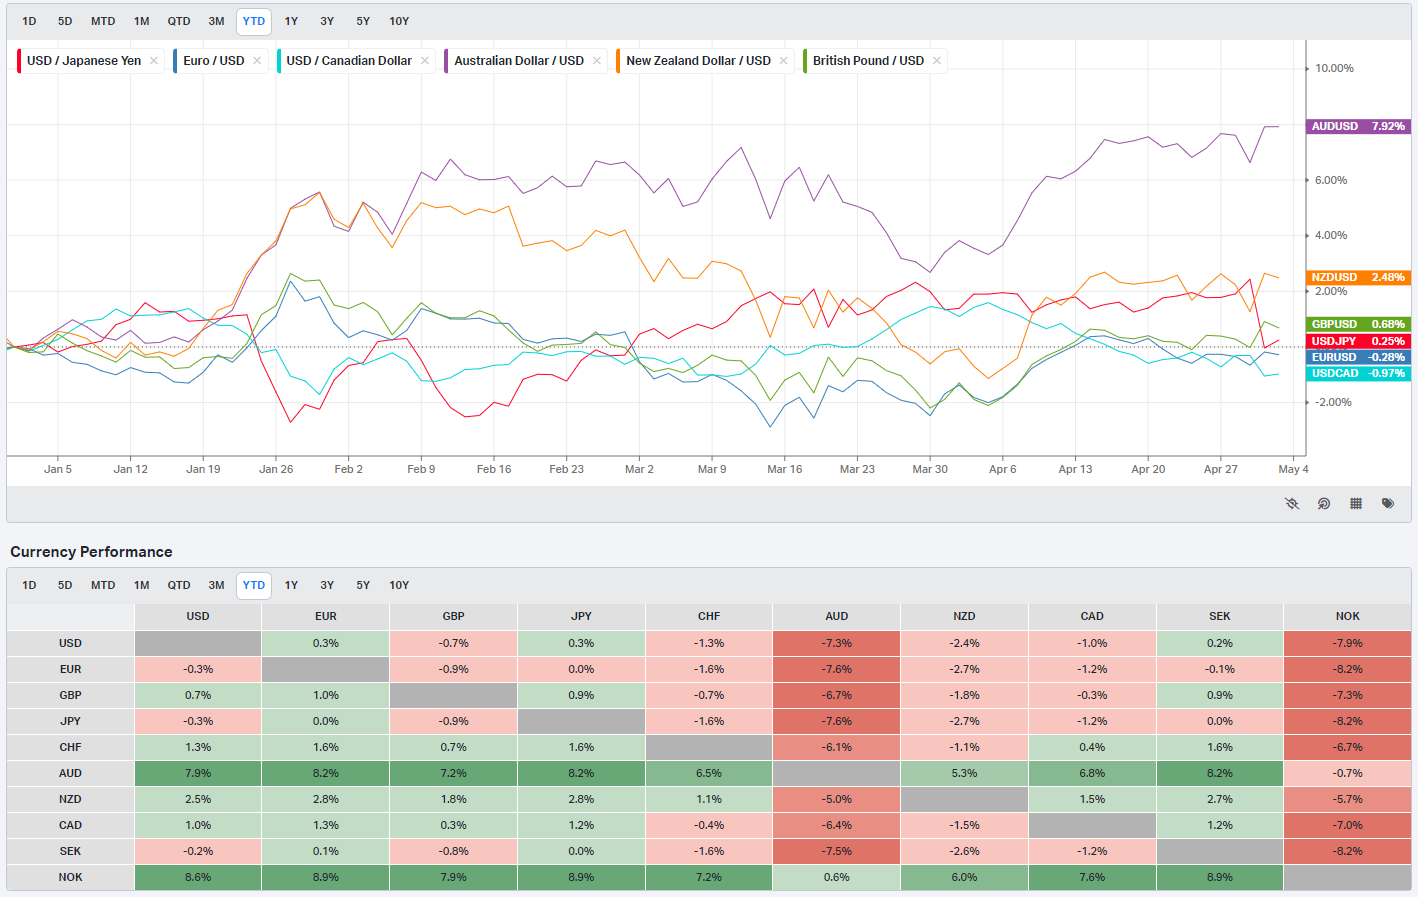
Japan is a different flavor of the same problem. The Bank of Japan left its policy rate near 0.75% but delivered a hawkish hold, with three board members voting for a hike to 1% and the 10‑year JGB yield climbing to 2.5%. A sharp yen rebound around 156–160 versus the dollar screamed “intervention,” reinforcing that policymakers are no longer willing to just sit back and let currency weakness import inflation.
In other words, global central banks are fighting the same battle: sticky underlying inflation, fresh energy shocks linked to the Middle East conflict, and political pressure not to blink too early. No one wants to be the bank that declares victory and then gets blindsided by another wave of oil‑driven CPI.
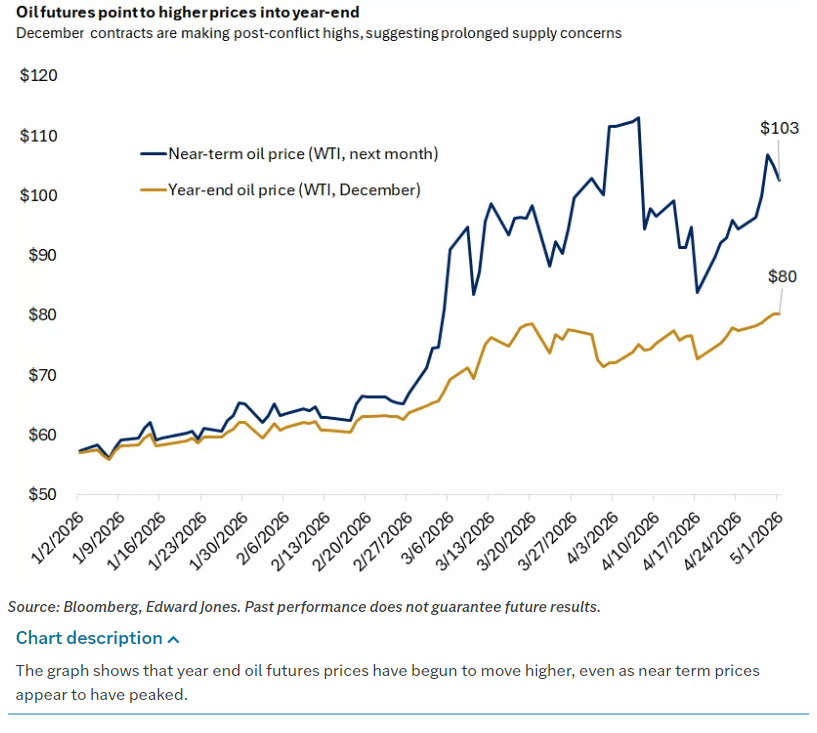
Oil, war, and why the market cares this time
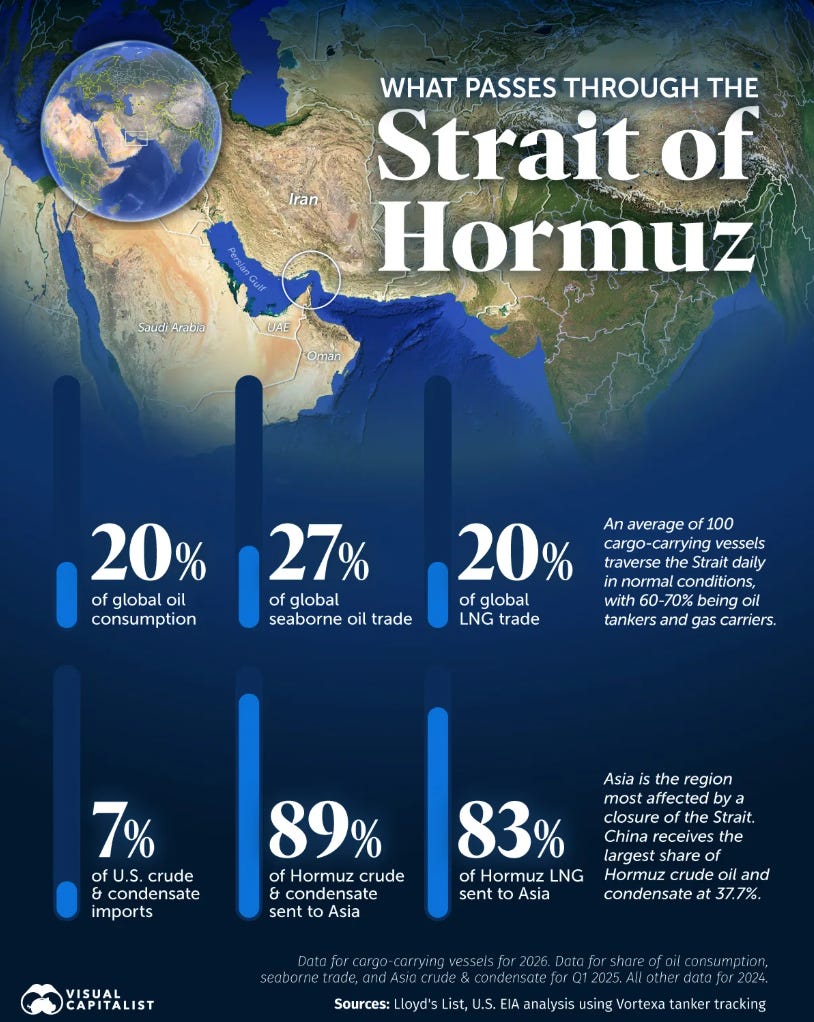
Normally, equity markets move past geopolitical shocks faster than the headlines suggest. We have plenty of episodes where “when the bombs fly, you buy” turned out to be the right playbook. But the Iran conflict and the closure of the Strait of Hormuz are different in scale and duration.
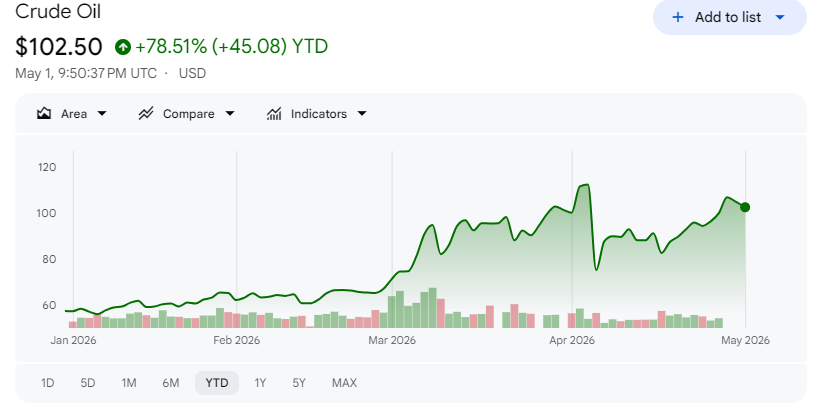
Roughly a fifth of global crude and liquefied natural gas usually transits the Strait. With that chokepoint essentially shut, Goldman estimates that nearly 500 million barrels have already been drawn from global stockpiles, with the number potentially hitting 1 billion by June if disruption persists. Brent has spent time above $100 a barrel, and the entire curve has shifted higher in deep backwardation, signaling that the market expects tight supply through year‑end even if spot prices whip around.
That is why this conflict feels more “macro‑relevant” than many past episodes. Higher oil prices are simultaneously a tax on consumers, a direct input into headline inflation, and a reason for bond markets to demand more yield. We have already seen equity investors rotate toward Energy and Utilities, and bond investors push Treasury yields 15–30 bp higher since the start of the month, even as the S&P ripped to records.
For now, earnings are winning that tug‑of‑war. But the longer oil stays north of 100, the more those inflation and growth headwinds will matter.
Under the surface: dispersion, not melt‑up
One of the more interesting threads across global weekly notes is how narrow the index calm really is. The S&P’s realized range year‑to‑date is tiny — around 2.7% through the first two months, the smallest since at least the mid‑90s — but the average stock’s range is roughly seven times that. That’s a lot of churn under the hood.
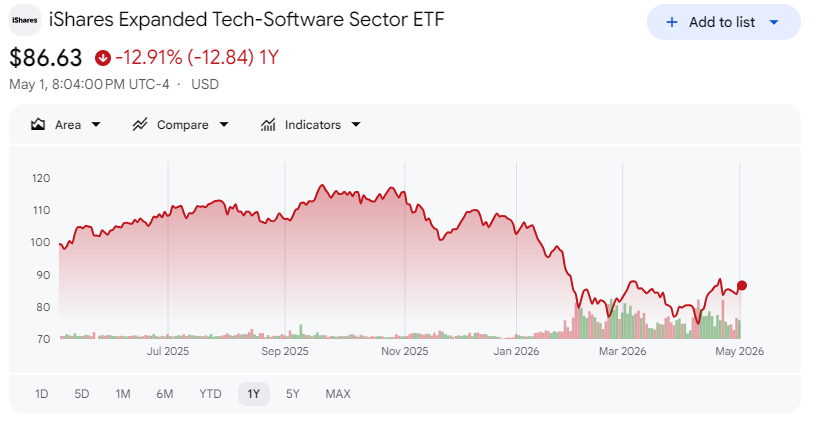
You can see it in sector performance. Technology, Materials, Financials and Industrials are delivering double‑digit earnings growth; Health Care and Energy are lagging on a year‑ago basis, although those declines are expected to reverse later this year. Within tech, semis have re‑asserted leadership over software after a period where AI‑disruption fears hammered anything that looked remotely like “old cloud.” On the week, one NYSE semi index outperformed the IGV software ETF by roughly 700 basis points, as storage, memory and core silicon names rallied and some high‑multiple software names sagged on “good but not great” prints.
Defensive sectors are not behaving like 2020‑style hiding places either. Utilities and Staples have outperformed during the war‑flation scare, but they are not screaming higher; they are simply doing their job as low‑beta ballast while investors stay engaged in cyclicals and AI. Energy is the only sector you could fairly accuse of being bid for macro reasons alone.
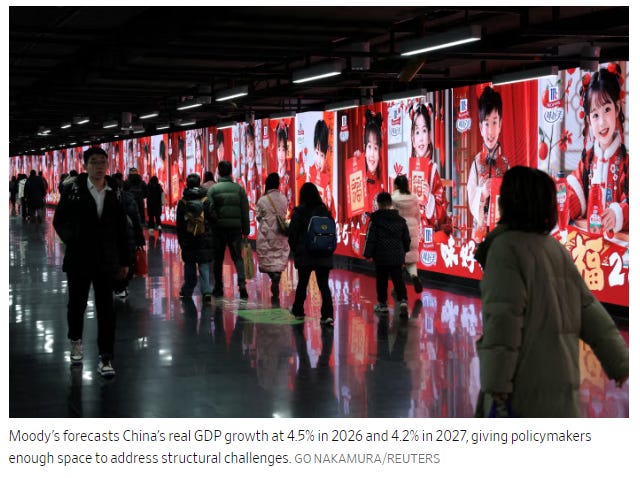
The global picture rhymes. Europe is treading water, with modest gains in Germany and Italy offset by flat or negative returns elsewhere, as energy and Utilities strength battles against Financials and Health Care weakness. Japan is grappling with imported energy inflation and a central bank that is no longer a one‑way liquidity hose. China is a quiet bright spot: Moody’s upgraded the sovereign outlook to “stable,” industrial profits are growing at their fastest pace since 2017, and policy support is flowing toward high‑tech manufacturing and AI‑linked sectors.
This is not a synchronized global melt‑up. It is a selective bull market where AI, US growth, and pockets of industrial and commodity strength offset significant risks in rates, energy, and geopolitics.
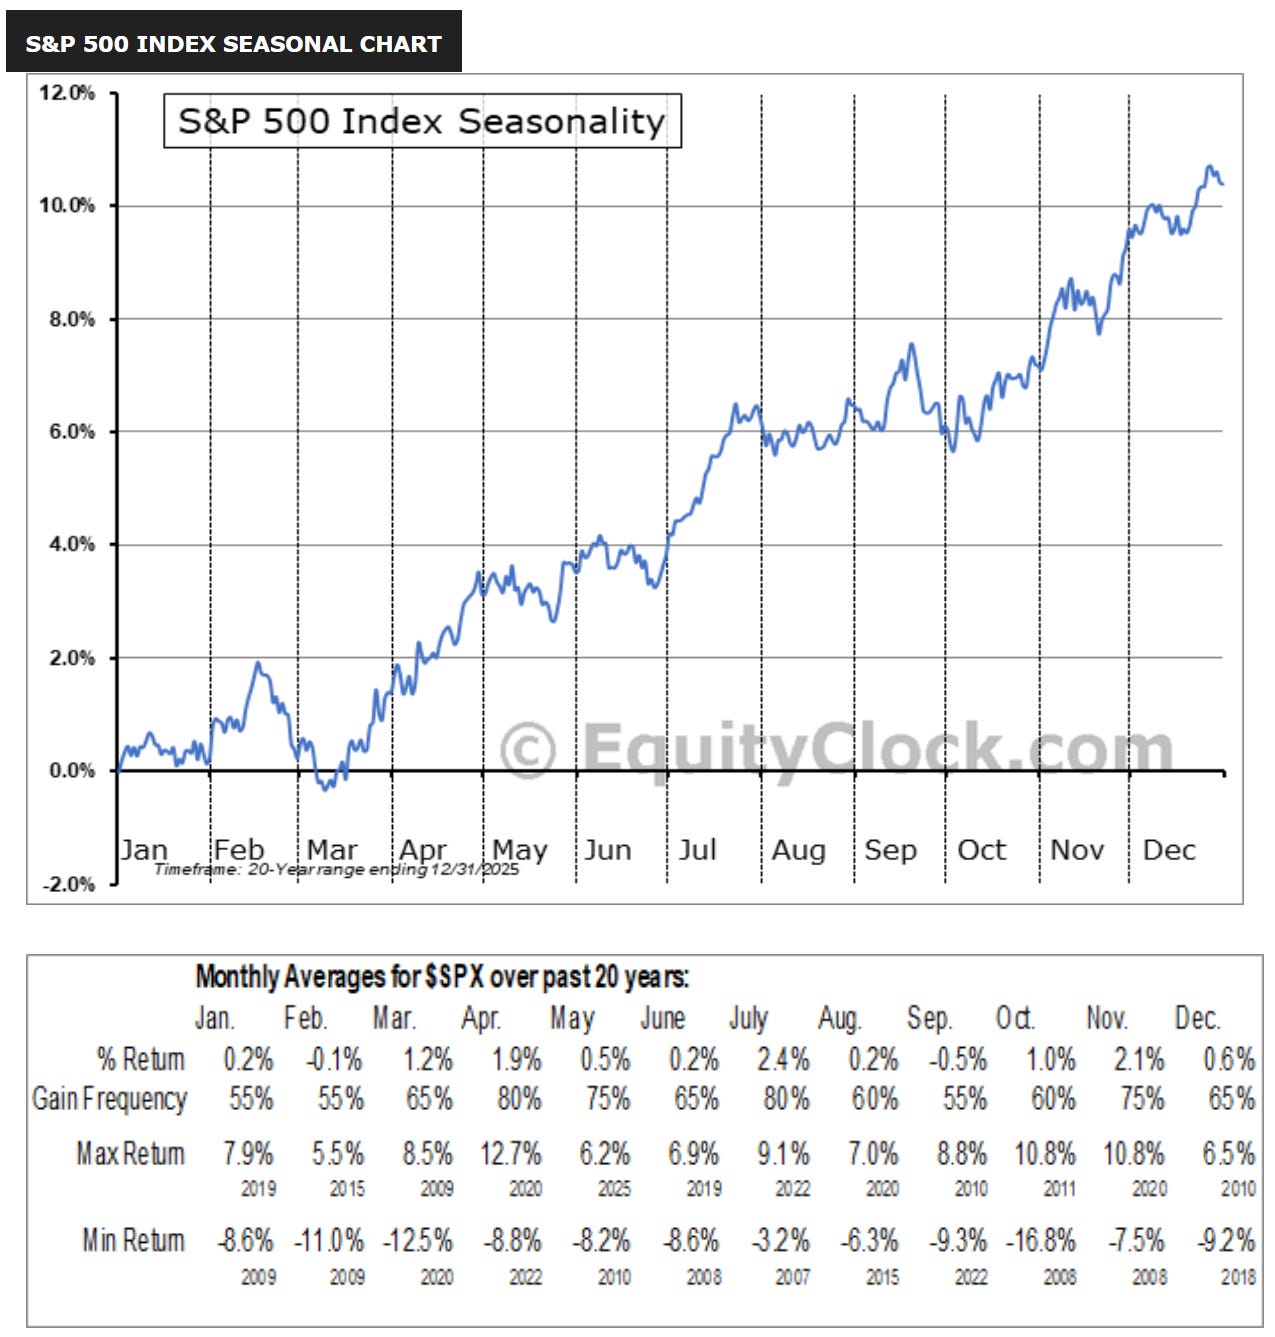
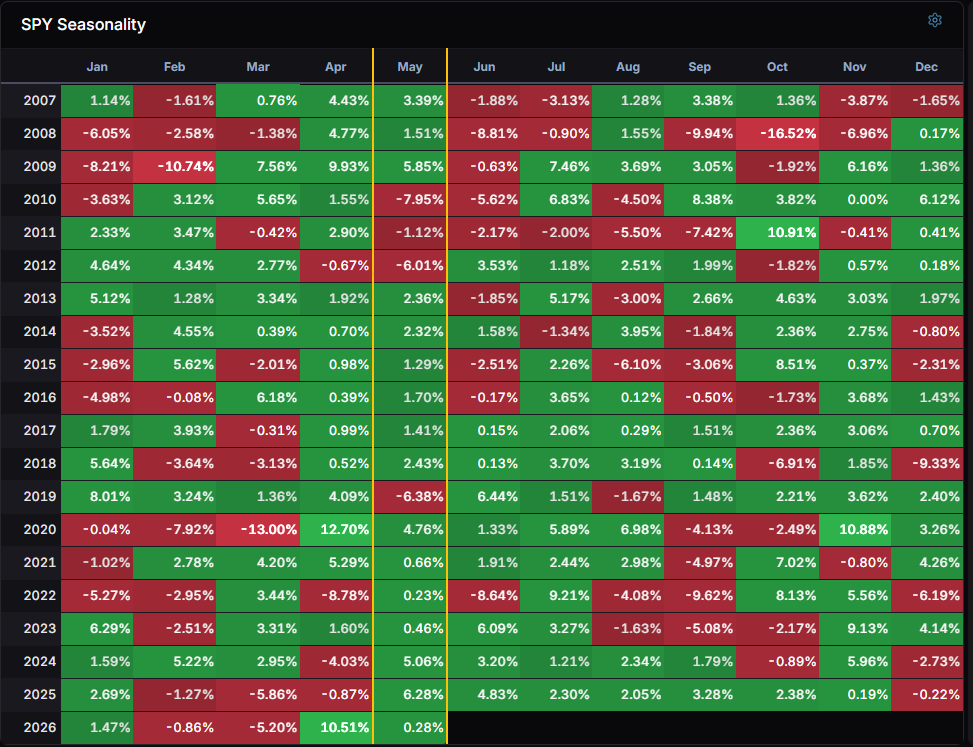
Seasonality and the “Sell in May” question
It’s May, which means the usual “sell in May and go away” chatter is back. Seasonality says we are exiting one of the stronger windows of the year and entering a more mixed period. The S&P now sits comfortably above former resistance near 7,150, but with a series of unfilled gaps below, including that 6,620–6,740 window carved during the earnings ramp. Momentum has rolled off overbought conditions, hinting at a coming digestion phase even if the primary trend stays higher.
On the sector front, the seasonal models show software finally starting to use the 50‑day moving average as support instead of resistance after months of acting like a ceiling — a technical confirmation of the earnings‑driven bid we saw in names like Atlassian, Datadog, and Twilio. There is also a rotation callout from cyclicals toward growth, especially tech, as the preferred leadership into early summer, provided the macro does not break.
Against that backdrop, a blanket “sell in May” doesn’t fit the tape. A more realistic plan is “rebalance in May”: trim stretched winners where expectations have gotten euphoric, lean into the parts of the AI and industrial complex where earnings momentum and positioning still have room, and use hedges or defensive tilts to respect war‑and‑oil risk without walking away from a still‑constructive earnings backdrop.
What this all means for positioning
If you zoom out, the story is simple even if the path is messy. Earnings — especially in tech and AI‑linked capex — are strong enough to justify new highs, and the economy is still expanding at a decent clip. At the same time, the inflation battle is not done, central banks are in no hurry to cut, and the energy shock from Iran and the Strait of Hormuz is a real macro variable, not just a headline.
In that environment, I think of the opportunity set in three buckets:
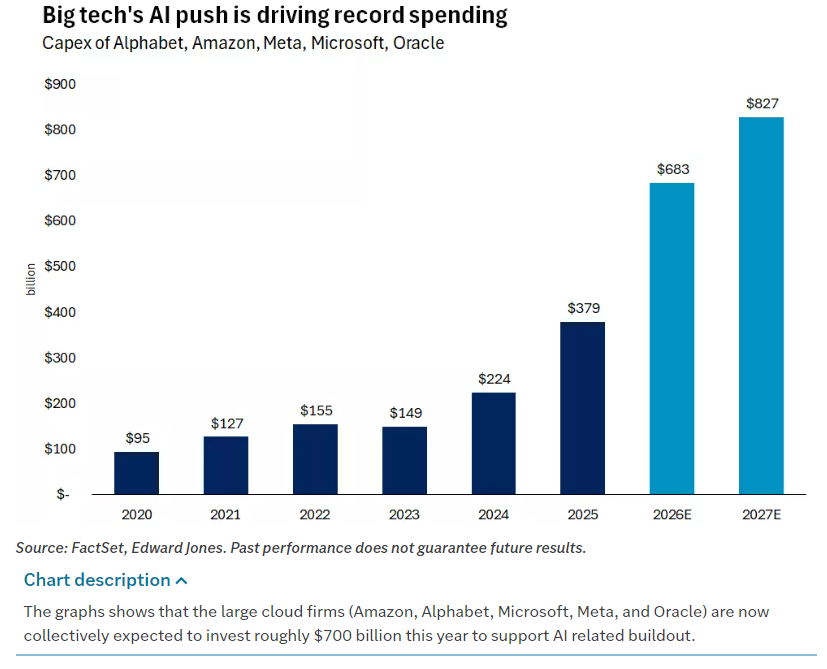
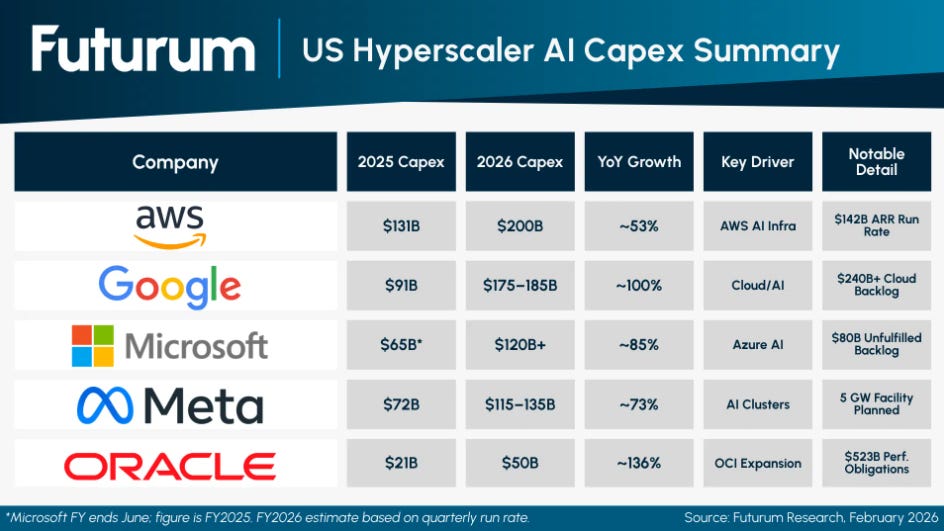
Quality growth and AI infrastructure. The mega‑caps have validated their earnings power, but the more interesting risk‑reward is in the ecosystem: the semis, storage, networking and software names that sit in the second ring around the big platforms. Flow and earnings both say that capex on AI data centers — estimated near $700 billion this year for the large cloud firms alone — is not slowing down.

Hard assets and real‑economy throughput. Energy equities, refiners, select E&Ps, and industrials tied to grid, machinery and infrastructure are obvious beneficiaries of higher oil and renewed capex. Precious metals and commodity baskets offer both inflation hedging and exposure to the same global capex and security themes driving policy in China and the Middle East.
Defensives and duration‑aware income. With central banks on hawkish hold and term premia inching higher, it still makes more sense to own the front and middle of the curve, plus inflation‑linked products, than to back up the truck on long duration. Utilities, selective Healthcare and dividend‑growth strategies provide ballast without walking away from equity risk.
The key is sizing. This is not a “bet the house” moment, but it is also not the time to dump everything because the headlines are noisy. Earnings remain the anchor; as long as that anchor holds, volatility around oil, tariffs, or Fed rhetoric is more likely to create tradable swings than a full regime change.
Over the next few weeks: respect the new highs, but do not worship them; respect the war‑and‑oil risk, but do not trade as if the world is ending; and, most importantly, listen to where the cash flows and capex budgets are actually going. Right now, they are still flowing into data centers, infrastructure, and real assets. Until that changes, the burden of proof rests with the bears.

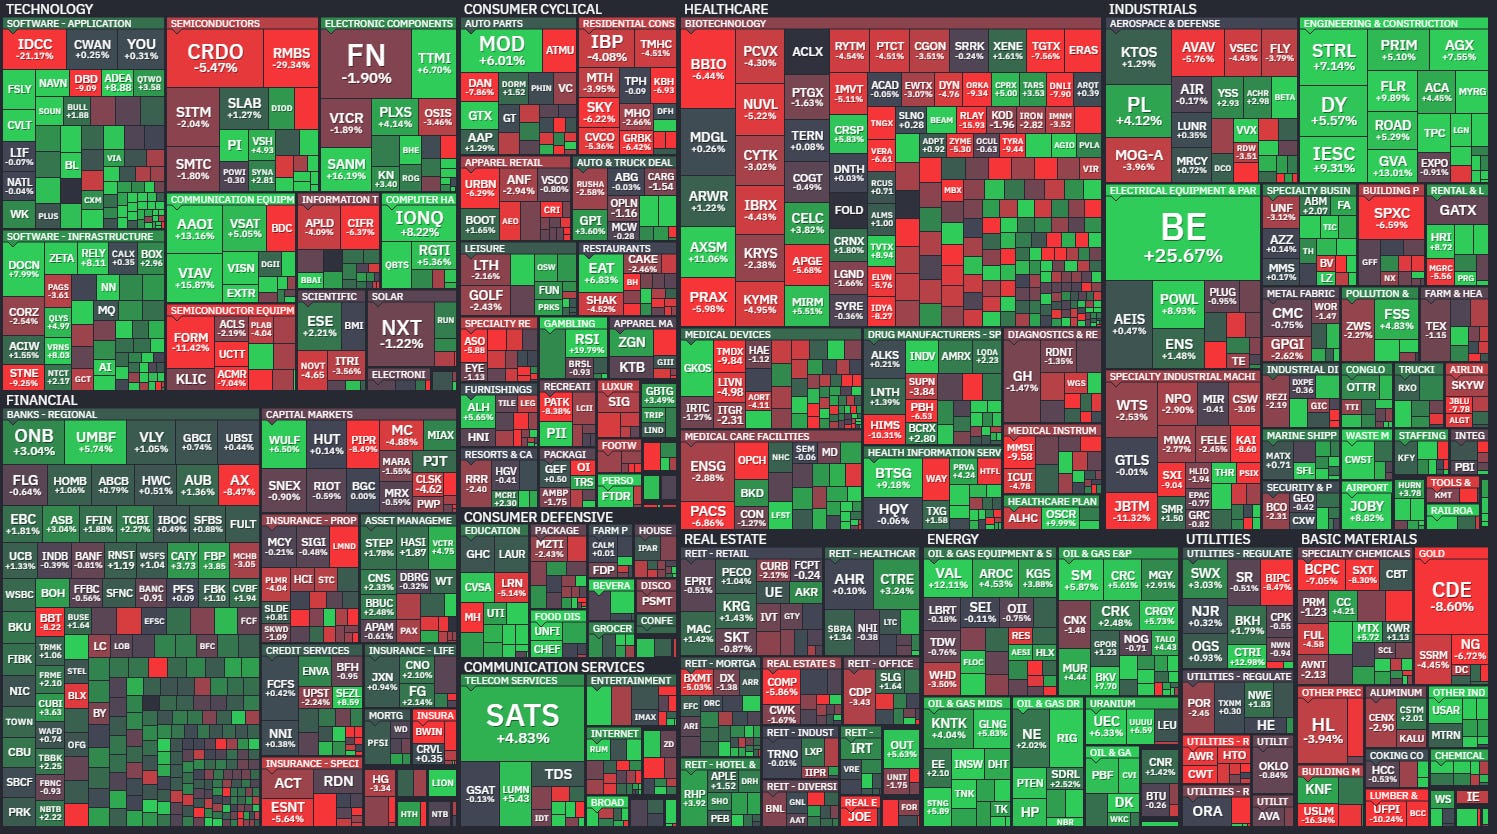
Weekly Benchmark Breakdown
Breadth Is Firming, But Leadership Is Still Uneven
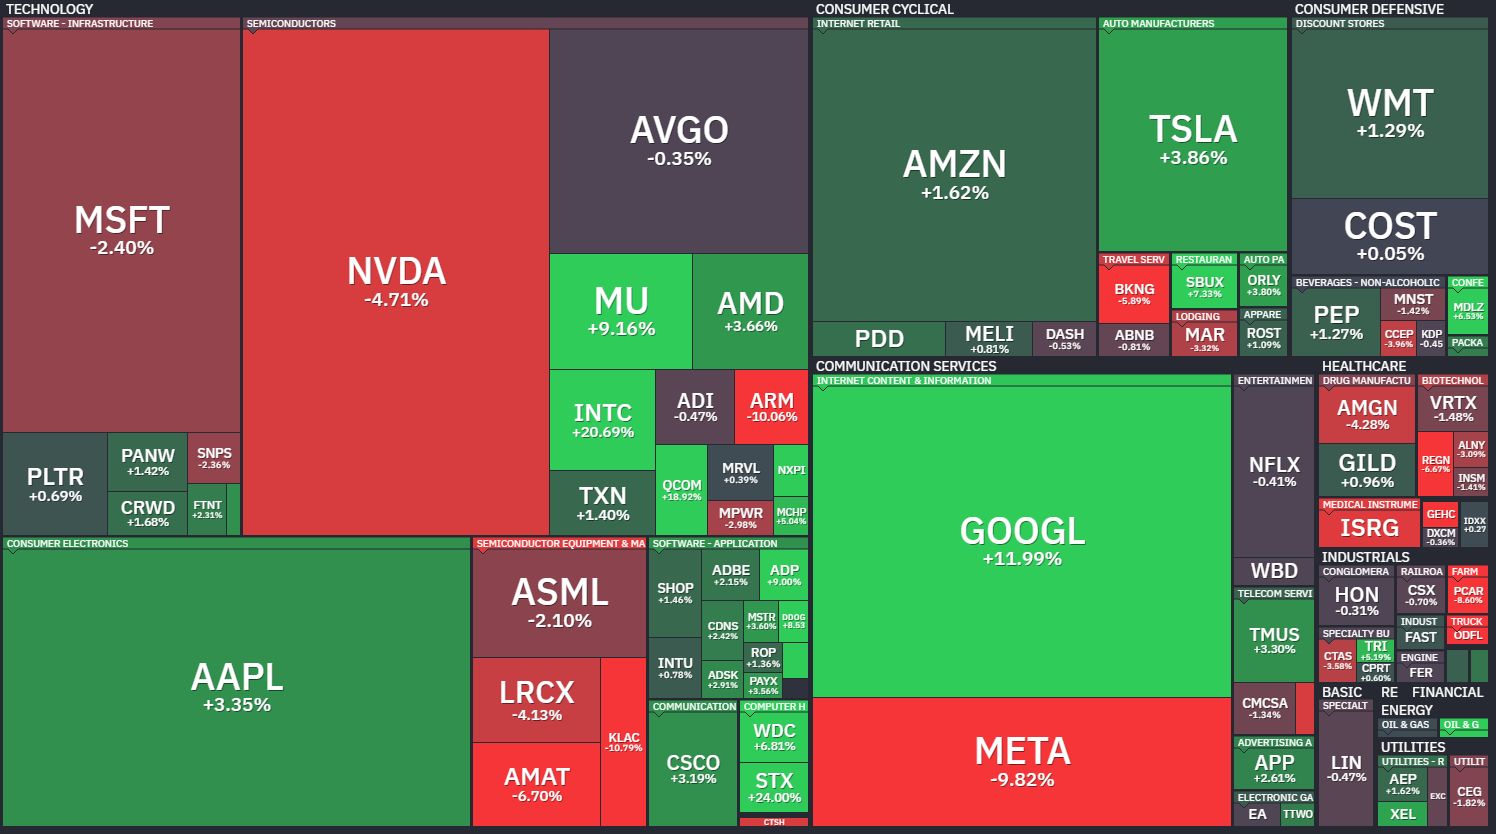
This was a constructive breadth week, but not a clean all-clear. The tape is showing participation across the major averages, with new highs beating new lows in every index shown. The better message is that the intermediate and long-term cohorts are mostly above 50%, which means the market is not being carried by a tiny handful of names. The more cautious message is that leadership remains uneven, with mega-cap tech still split between major winners and major drag from NVDA, MSFT, and META.
For the S&P 500, breadth is steady but not explosive. The index has 55.86% of stocks above the 5-day, 55.66% above the 20-day, 55.06% above the 50-day, 52.08% above the 100-day, 54.87% above the 150-day, and 56.85% above the 200-day. That is healthy, but not yet a thrust regime.
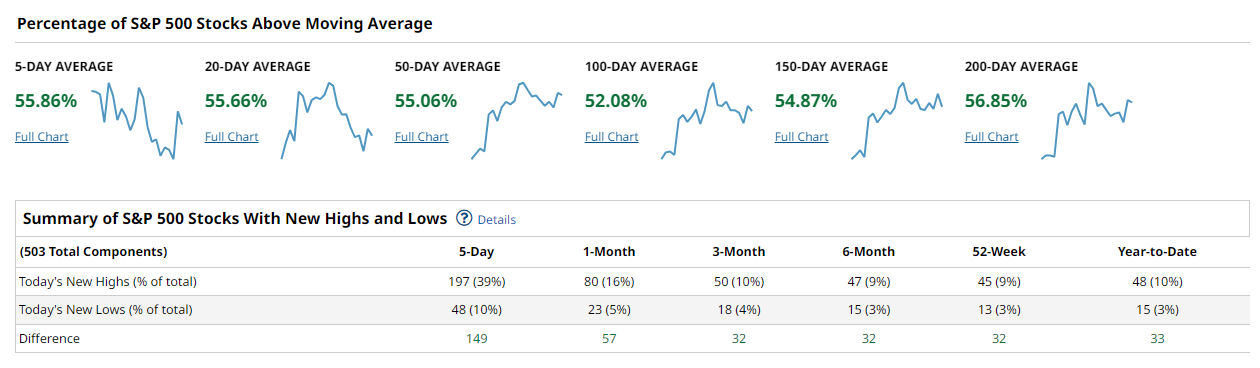
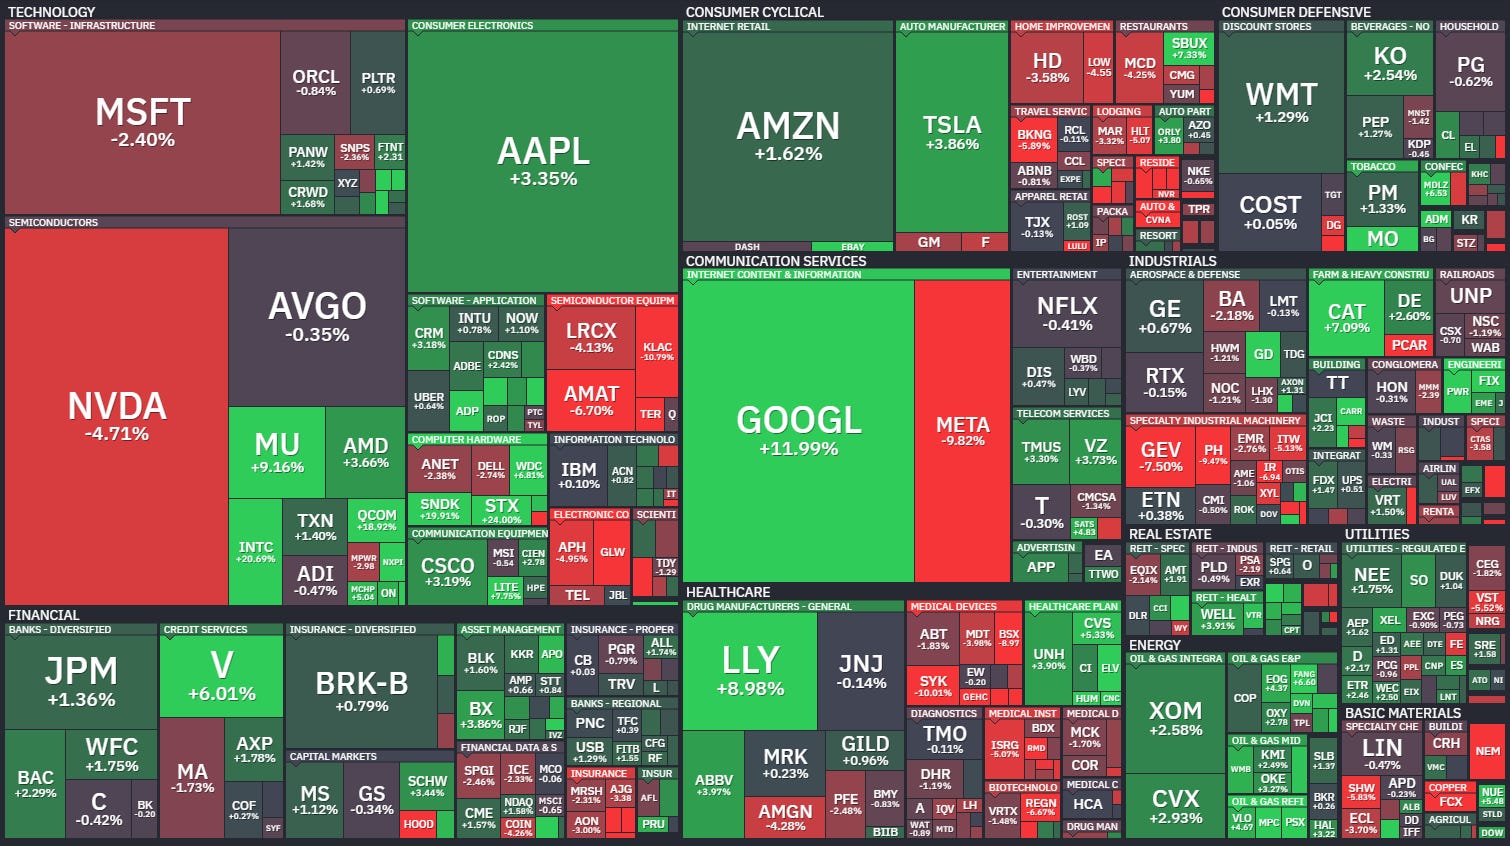
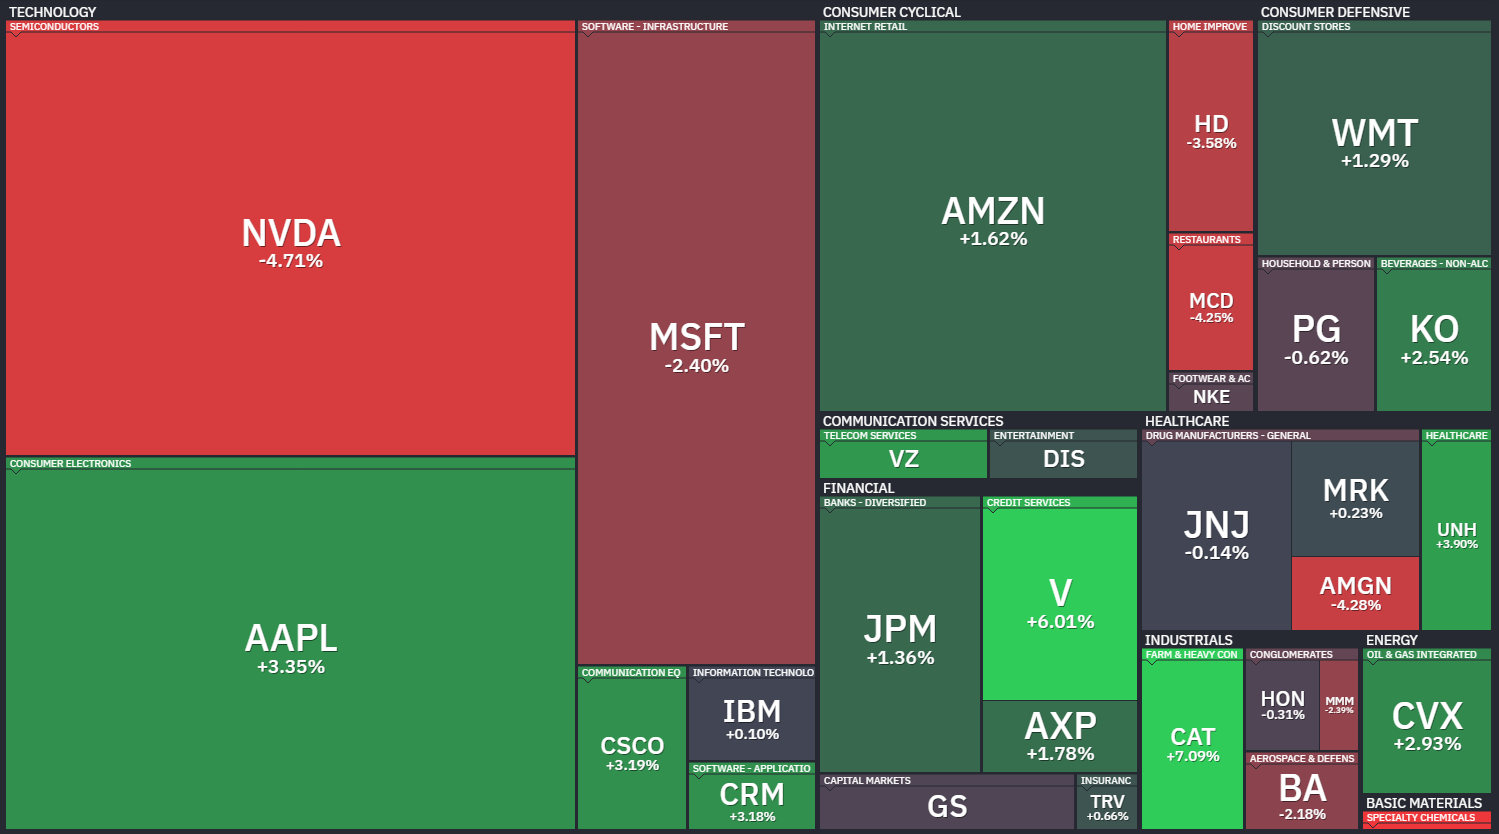
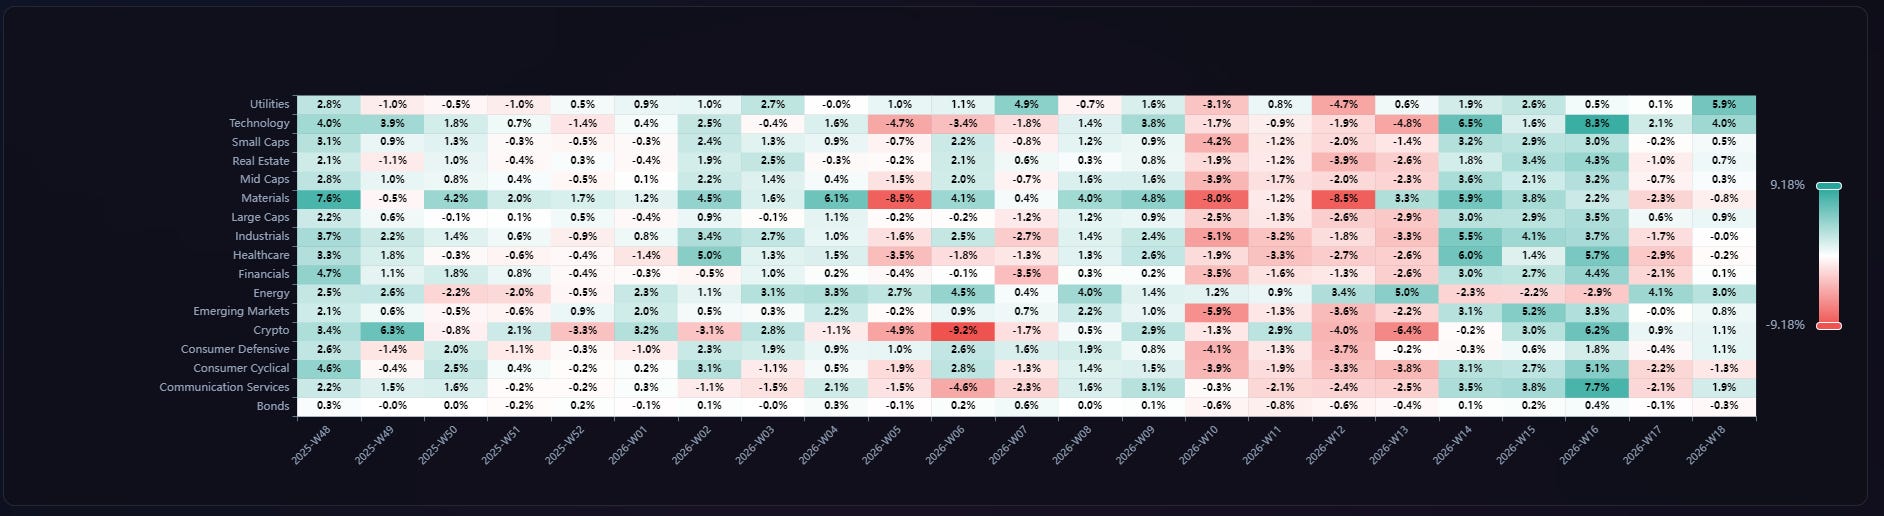
New highs are also leading new lows across all windows, with the 5-day spread at +149, 1-month at +57, 3-month at +32, 6-month at +32, 52-week at +32, and year-to-date at +33. The heatmap confirms the split: GOOGL, AAPL, AMZN, financials, energy, and parts of industrials helped offset weakness in NVDA, META, MSFT, and some semiconductor equipment.
Nasdaq 100 breadth is stronger near term. It has 73.26% above the 5-day, 66.33% above the 20-day, 65.34% above the 50-day, 53.46% above the 100-day, 54.45% above the 150-day, and 56.43% above the 200-day. That is the best short and intermediate participation profile of the group.
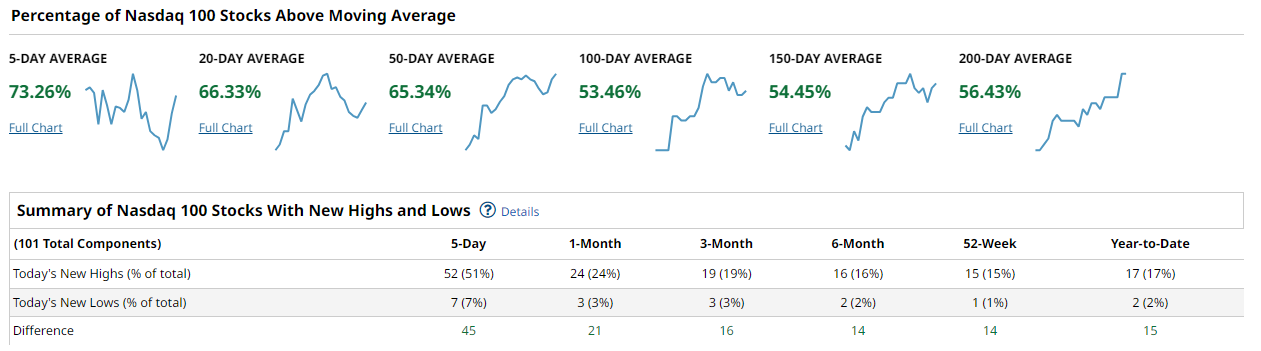
New highs beat new lows by +45 over 5 days, +21 over 1 month, +16 over 3 months, +14 over 6 months, +14 over 52 weeks, and +15 year-to-date. This is not just one stock, but the heatmap still shows a divided tape: GOOGL and AAPL were powerful, while META, NVDA, ARM, ASML, LRCX, and AMAT weighed on the complex.
The Dow/Industrials picture is respectable. The group shows 60.00% above the 5-day, 63.33% above the 20-day, 53.33% above the 50-day, 50.00% above the 100-day, 53.33% above the 150-day, and 60.00% above the 200-day.
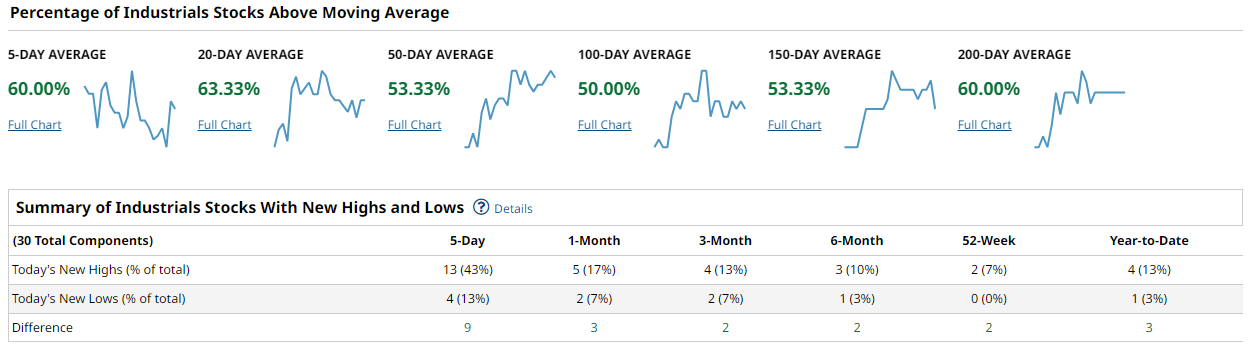
New highs beat new lows by +9 over 5 days, +3 over 1 month, +2 over 3 months, +2 over 6 months, +2 over 52 weeks, and +3 year-to-date. That is positive, but not broad dominance. CAT was the standout, while BA and some cyclical pockets lagged.
The Russell 2000 has the most encouraging broad-market profile. It shows 63.62% above the 5-day, 65.18% above the 20-day, 72.12% above the 50-day, 60.90% above the 100-day, 60.54% above the 150-day, and 61.69% above the 200-day.
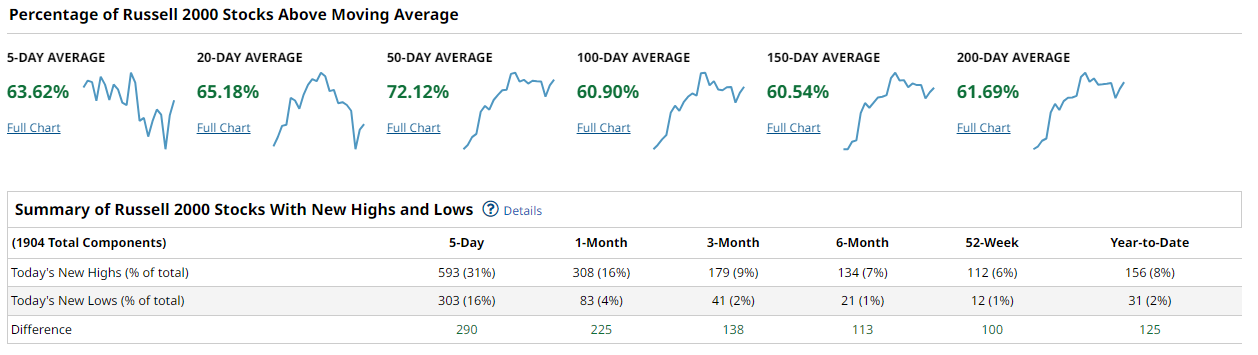
New highs beat new lows by +290 over 5 days, +225 over 1 month, +138 over 3 months, +113 over 6 months, +100 over 52 weeks, and +125 year-to-date. That is real participation, even if the heatmap remains noisy underneath the surface.
The synthesis is simple: breadth is improving beyond mega-cap leadership, but the market still needs confirmation. A durable advance would look like the S&P 500 50-day cohort pushing above 60%, Nasdaq holding its 50-day breadth above 60%, and new highs continuing to beat new lows across the 3-month and 52-week windows. Concern would rise if the 5-day and 20-day cohorts roll over quickly while semis and mega-cap tech stay heavy.
The playbook is to favor leadership with broad participation: select small caps, financials, energy, industrial strength, and large-cap tech that is still acting well. Avoid chasing the weakest semiconductor and crowded mega-cap names until they reclaim participation. Watch the 50-day breadth cohorts and new high/new low spreads for confirmation.
Bottom line: breadth is supportive enough to stay constructive, but not strong enough to abandon selectivity.

Investor Sentiment Report
AAII Investor Sentiment Survey
The AAII Investor Sentiment Survey tracks the percentage of individual investors who are bullish, neutral, or bearish on the stock market over the next six months. Published weekly every Thursday, it's a widely followed contrarian indicator — historically elevated bearish readings have preceded market recoveries, while extreme optimism has often foreshadowed pullbacks.
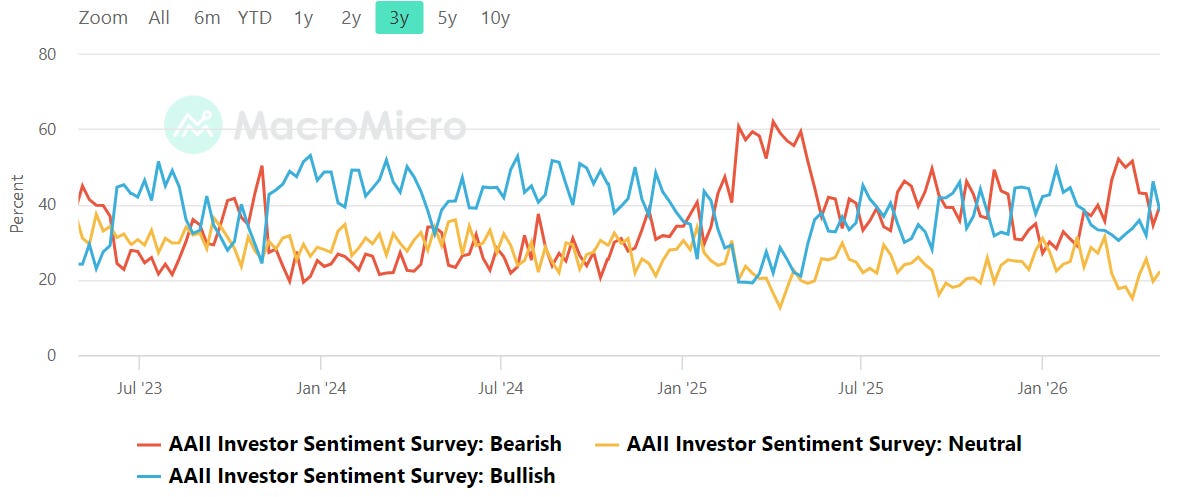
The AAII survey shows bulls and bears clustered close together, with bearish sentiment slightly outpacing bullish sentiment and neutral readings still sitting in the lower band. The bull-minus-bear is near flat to modestly negative, a long way from the crowded optimism zone above +20 and no longer in the deeply washed-out fear zone that marked prior rebound setups. That tells us individual investors are not euphoric, but they are also no longer aggressively pessimistic.
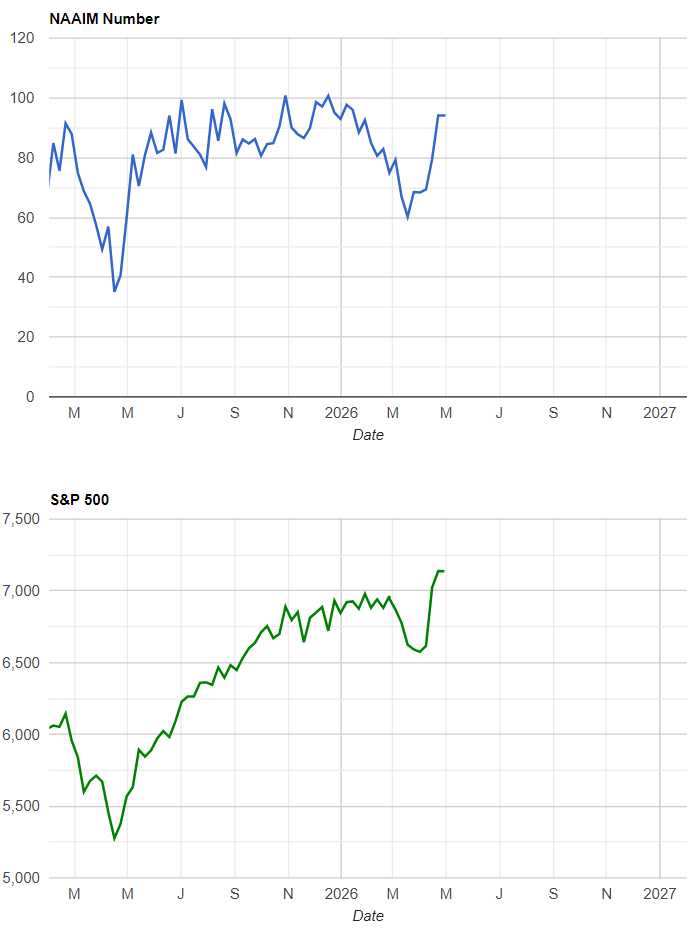
NAAIM Exposure Index
The NAAIM Exposure Index (National Association of Active Investment Managers Exposure Index) measures the average exposure to U.S. equity markets as reported by its member firms. These are typically active money managers who provide their equity exposure levels weekly. The index offers insight into how much these managers are investing in equities at any given time, ranging from being fully short (-100%) to leveraged long (up to +200%).
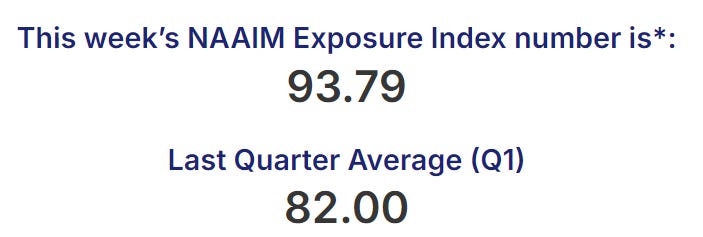
The institutional side is much more committed. NAAIM exposure sits at 93.79, with the prior readings clustered around 94.15 after rising from 79.49, 69.38, 68.36, and 68.52 earlier in April and late March. That is a meaningful drift toward full exposure. The interpretation is straightforward: retail sentiment is balanced, but active managers have already re-risked. The tripwire now is a drop in NAAIM into the 50s without major price damage, which would create dry powder, or another push deeper into the 90s while price stalls, which would raise vulnerability to forced de-risking.
CBOE Total Put/Call Ratio
CBOE's total put/call ratio includes index options and equity options. It's a popular indicator for market sentiment. A high put/call ratio suggests that the market is overly bearish and stocks might rebound. A low put/call ratio suggests that market exuberance could result in a sharp fall.
The put/call chart shows the 10-day average sitting near the lower end of its recent three-year range, roughly around the low 0.80s, while the equity index continues pushing higher. That is not panic. It is closer to complacency. In practical terms, a reading near 0.8 says traders are not heavily hedged and are leaning more toward upside exposure than downside protection. That does not automatically make the tape bearish, but it does affect drawdown behavior. When protection is light, the first pullback can travel faster because there are fewer hedges cushioning the tape. The tripwire is a move back toward 1.0, which would show fear rebuilding and could eventually support a better bounce setup. If the ratio stays pinned near 0.8 while price extends, the signal becomes more crowded and less forgiving.
Equity vs Bond Volatility
The Merrill Lynch Option Volatility Estimate [MOVE] Index from BofAML and the CBOE Volatility Index [VIX] respectively represent market volatility of U.S. Treasury futures and the S&P 500 index. They typically move in tandem but when they diverge, an opportunity can emerge from one having to “catch-up” to the other.
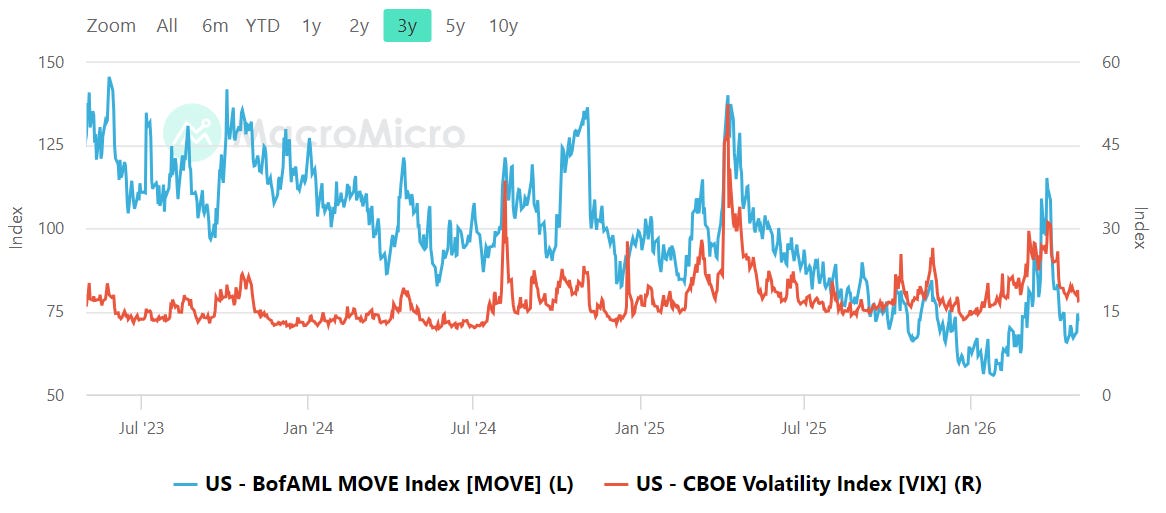
MOVE and VIX are both off their recent stress highs, but the more important message is the compression in equity volatility versus the still-active rate volatility backdrop. MOVE has retreated sharply from the March/April spike and is now back near the lower end of its recent range, while VIX has also cooled back toward the mid-teens. That combination says the market is not pricing immediate systemic stress. Risk-taking can continue when both bond vol and equity vol are contained. The danger is divergence. A MOVE spike above roughly 120 while VIX stays sleepy would be an early warning that rates are starting to pressure equities before equity traders fully adjust. A VIX move back into the high teens would be the cleaner confirmation that equity hedging demand is returning.
CNN Fear & Greed
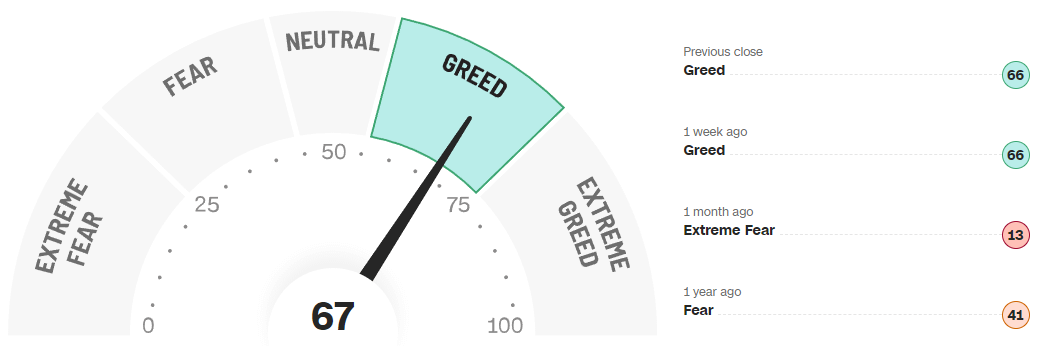
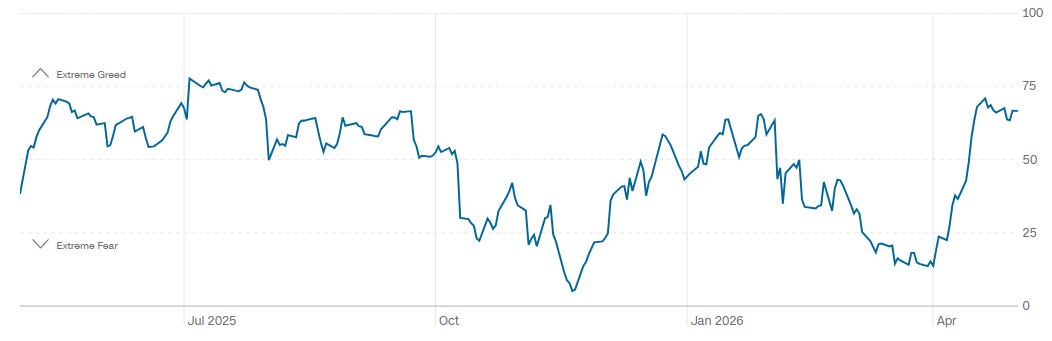
CNN Fear and Greed is at 67, firmly in greed. The gauge shows 66 at the previous close, 66 one week ago, 13 one month ago, and 41 one year ago. That is a major sentiment reset in a short period of time: from extreme fear one month ago to greed now. The one-year path shows a sharp rebound from the April fear trough, with the index now back into the upper half of its range but not yet in extreme greed. This is not the kind of washed-out backdrop that gives investors a fat emotional margin of safety, but it is also not a full-blown speculative blowoff. The tripwires are clear: a push above 75 would move the tape closer to exhaustion risk, while a pullback toward neutral would create a cleaner entry if price and breadth hold together.
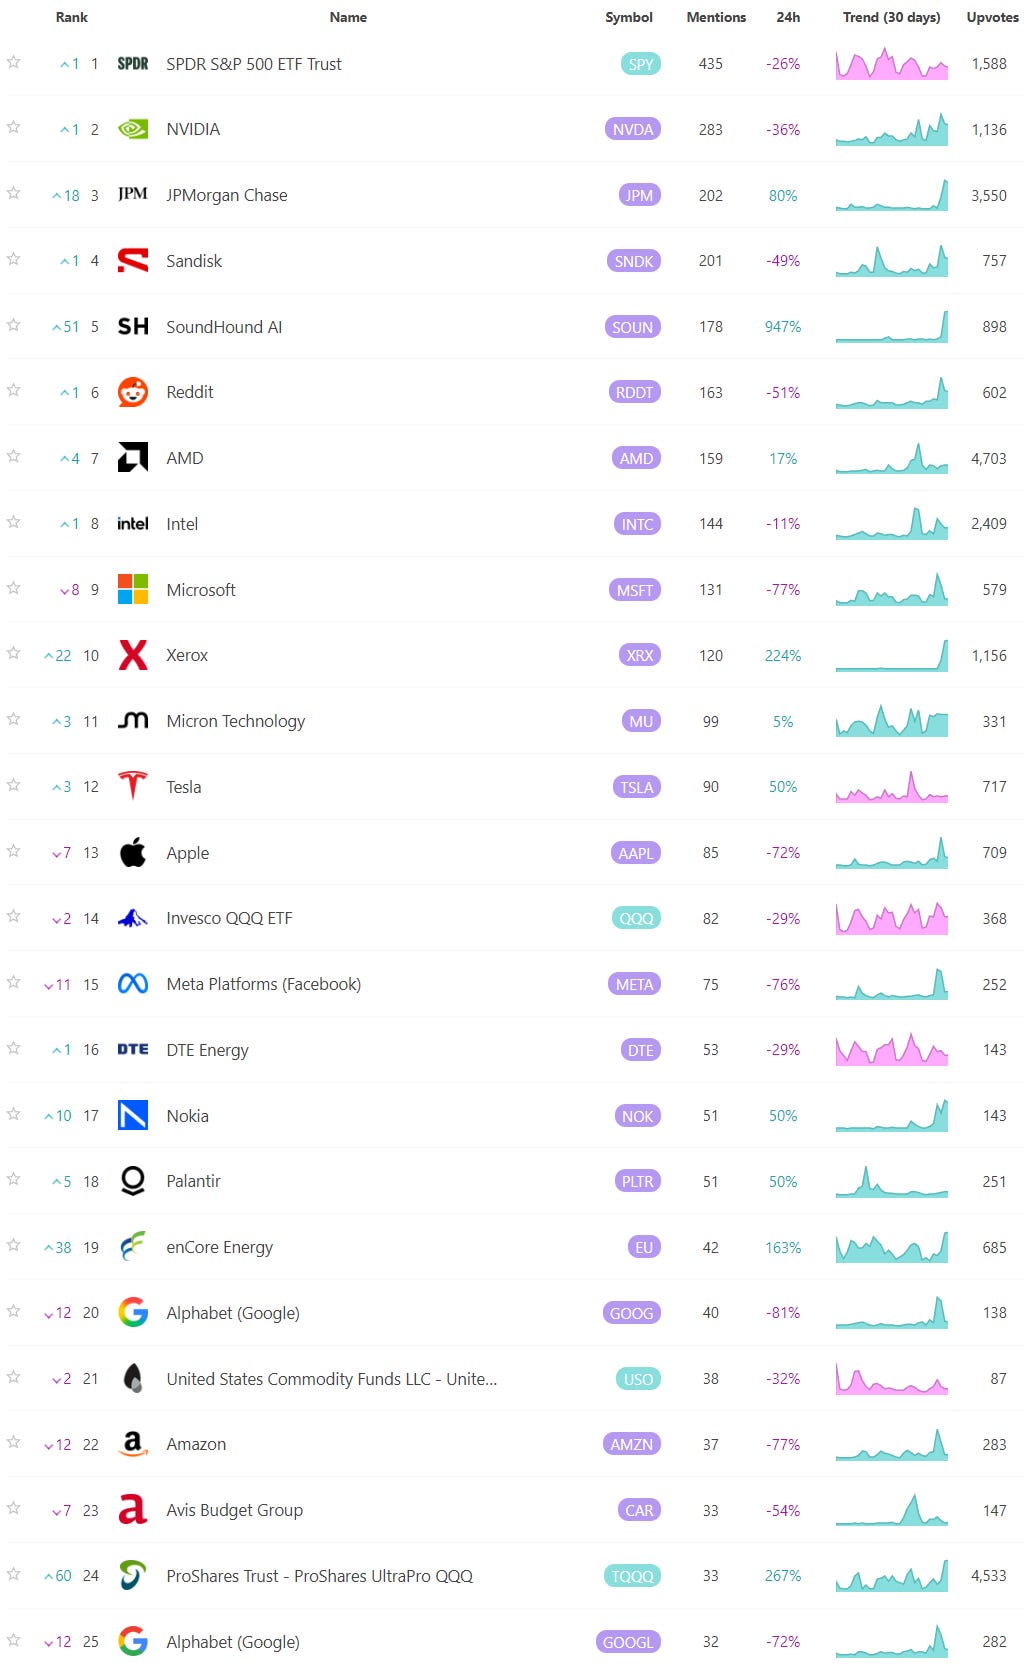
Social Media Favs
Social sentiment offers a real-time view of investor mood, often revealing market shifts before traditional indicators. It can signal momentum changes, spot emerging trends, and gauge retail investor impact—especially in high-volatility names. Tracking sentiment around events or earnings provides actionable insights, and when layered with quantitative models, can enhance predictive accuracy and risk management. Sustained sentiment trends often mirror broader market cycles, making this data a valuable tool for both short-term trades and long-term positioning.

Technician’s Playbook: Trading the Majors (SPY/QQQ/IWM/DIA)
When you’re a large institutional player, your primary goal is to find liquidity - places to do a ton of business with the least amount of slippage possible. VolumeLeaders.com automatically identifies and visually plots the exact spots where institutions are doing business and where they are likely to return for more. It’s one of the primary reasons “support” and “resistance” concepts work and truly one of the reasons “price has memory”.
Across all four index ETFs the current tape has a similar feel: a strong impulse leg up off late‑April lows, followed by a first meaningful pullback into fresh high‑volume shelves. The path is not one of exhaustion blow‑off; it is an impulsive markup that is finally testing whether new buyers are willing to absorb size at higher reference levels or if the first responsive sellers are going to push us back into the prior balance.
SPY
Start with SPY. After grinding higher in the 710–715 area, SPY pushed into a vertical expansion and printed a very large block just shy of 720, tagged in the high‑400s on the historical rank list. That print and the surrounding cluster carry heavy notional and sit right in the middle of a newly built volume band, marking 718–721 as the current line of scrimmage. The first pullback from that print has been relatively controlled, with price rotating down into a secondary shelf around 713–715 where another sizable recent cluster showed up. As long as SPY can hold acceptance above that mid‑teens shelf, the high‑700s block looks more like aggressive initiation than rejection; lose it with tempo and price has room to slide back toward the earlier 707–709 level that anchored the base of the rally.
QQQ
QQQ tells a similar story, but with even cleaner evidence of big money stepping in on the way up. Late April saw a sizable dark‑pool style print near 663, marked in the low‑400s historically, that effectively stopped a local downdraft and launched the current leg higher. That trade was followed by a strong impulse up through 665 and into the mid‑670s, where we now have a compact consolidation with a fresh large print in the upper part of the range. The key band here is roughly 668–672: that is where the recent high‑dollar cluster sits, and it is the first place to watch for either absorption of supply or a failed breakout. Acceptance above the upper 670s would open the door to a continuation trend, using that 668–670 area as a tactical pivot; a failure that breaks back through 665 would suggest that late‑April initiation is being challenged, putting 660 and then the original 663 block back in play as downside magnets.
IWM
IWM has transitioned from a choppy balance to a decisive upside run, and the tape shows how important the early heavy prints were. Up near 276–277 there is a large cluster of block trades, including a top‑100 tag in the mid‑40s, that initially capped price and carved out a mini‑range. Once that lid finally gave way, the ETF exploded higher, and the recent ramp into the high 278s/low 279s is now resting on that former ceiling. The biggest cluster by dollars in the cluster table sits around 273–276, but the real tactical band is 276–278: that is where prior resistance, large April prints, and a thick Level line all align. Hold above 278 and the market is signaling that prior sellers have been absorbed and that dips into 276–277 are likely to find responsive buyers; slip back under 276 with size and the door reopens to a move toward the lower volume shelf near 272, where another multi‑day cluster lives.
DIA
DIA is the most extended on the downside in the very short term, having just broken from a late‑month spike into the high 490s. A standout large print hit near 487–488 on the way up, followed by another big signature near 492–493 into the local highs. The subsequent selloff has driven price back into that 488–490 pocket, where both trade levels and recent clusters show meaningful notional. That band is now DIA’s immediate battleground. Acceptance back above roughly 492 would argue that the recent downtick was nothing more than a liquidation break and would put the late‑April high cluster back on the table as a magnet. Persistent trade below 488, especially if it chews through the large late‑April block that fired the last leg up, would expose the next lower shelf around 484–485.
For the next few sessions, a constructive bullish path across the complex would look like early weakness that holds those first pullback shelves (SPY 713–715, QQQ 668–670, IWM 276–278, DIA 488–490), followed by intraday higher lows and a push back through the most recent large‑print highs. Continuation would be confirmed by sustained trade above the top of those zones with expanding volume and an inability to rotate back inside by the close; in that case, the recent large‑print highs become first support, and the next measured magnets are the upper volume bands just beyond current highs. A bearish path would feature early attempts to stabilize that fail quickly, impulsive breaks back through the key shelves, and then heavy tape that cannot reclaim them on any bounce. That failure‑to‑reclaim behavior would signal distribution rather than mere backfilling and would shift focus to the lower Level bands and earlier high‑dollar clusters as downside magnets.
From an execution standpoint, a disciplined trader can treat these shelves as clearly defined risk boxes. On the long side, leaning into tests of those high‑volume bands with tight invalidation just beyond the far side of the shelf keeps the dollar risk small relative to the potential move back toward recent highs. Short setups are the mirror image: look for failed pushes back into the shelf from below, use the other side of the band as your invalidation, and target the next lower Level where size last did business. The key is to let the big‑ticket prints and clusters tell you where real money has already taken a stand, and then structure your trades so that you are either trading with that money on successful holds or quickly out of the way when the tape shows that their conviction is being unwound.

Summary Of Thematic Performance YTD
VolumeLeaders.com offers a robust set of pre-built thematic filters, allowing you to instantly explore specific market segments. These performance snapshots are provided purely for context and inspiration—think about zeroing in on the leaders and laggards within the strongest and weakest sectors, for example.
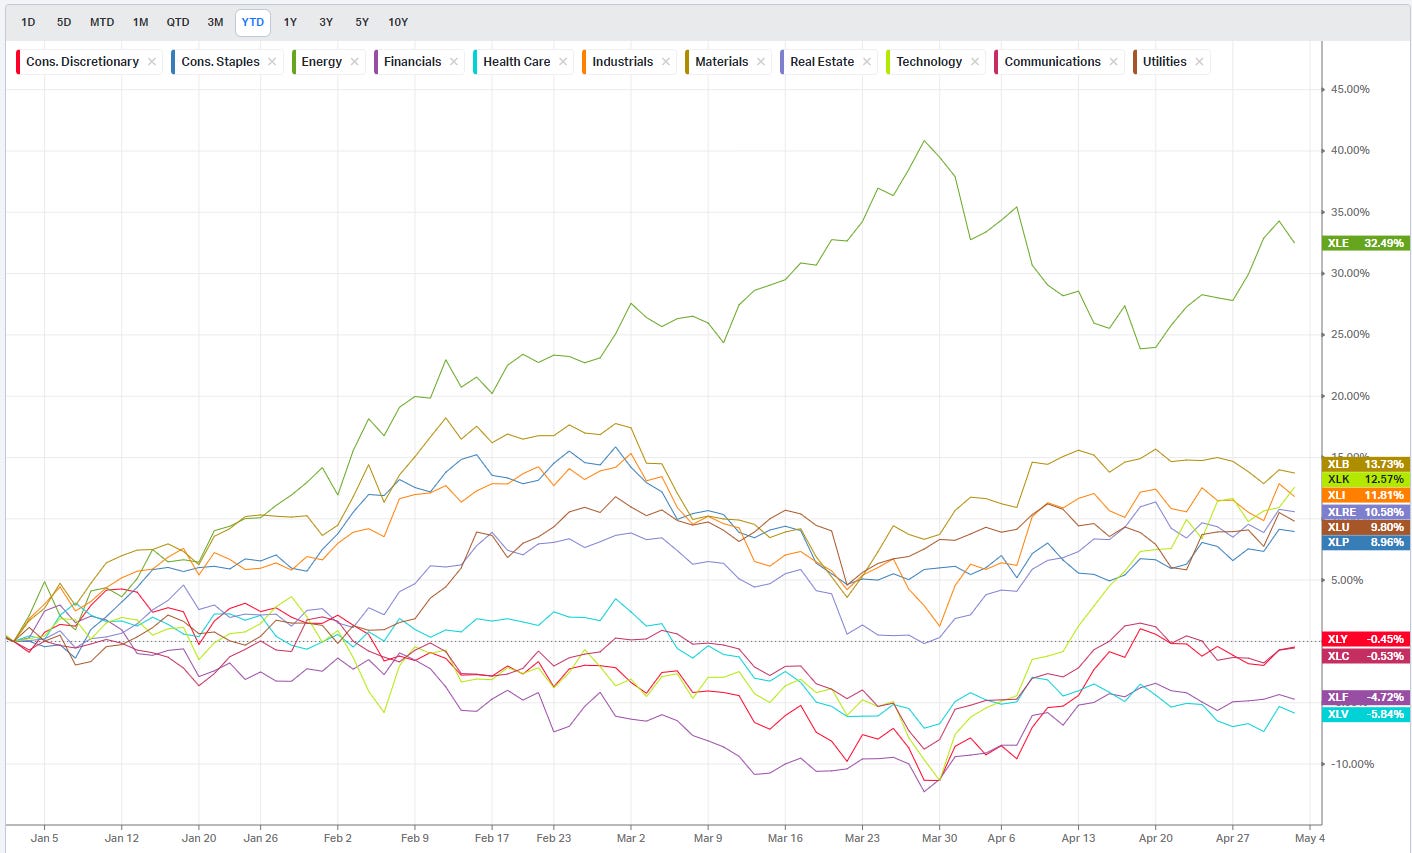
S&P By Sector
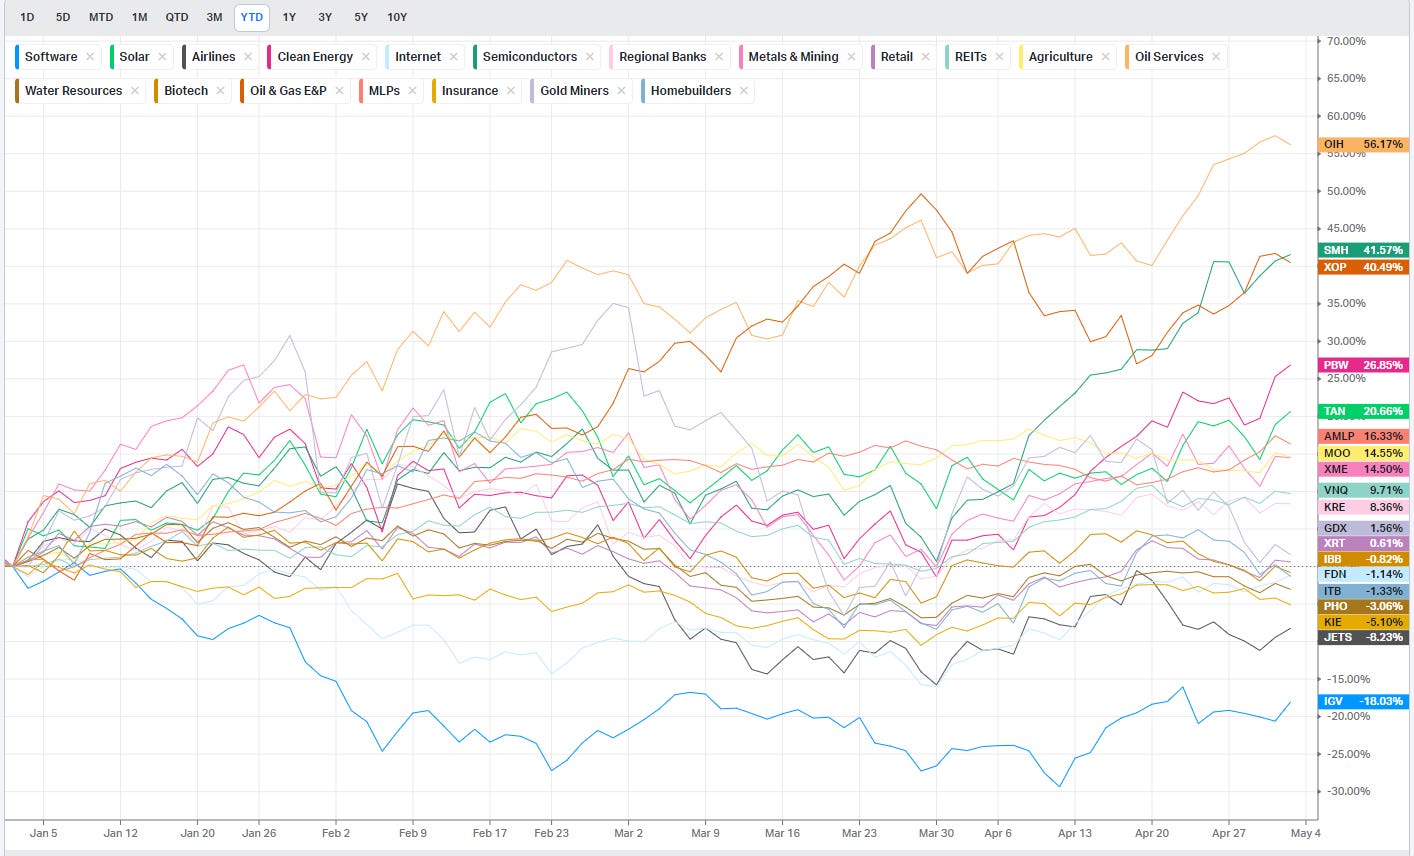
S&P By Industry
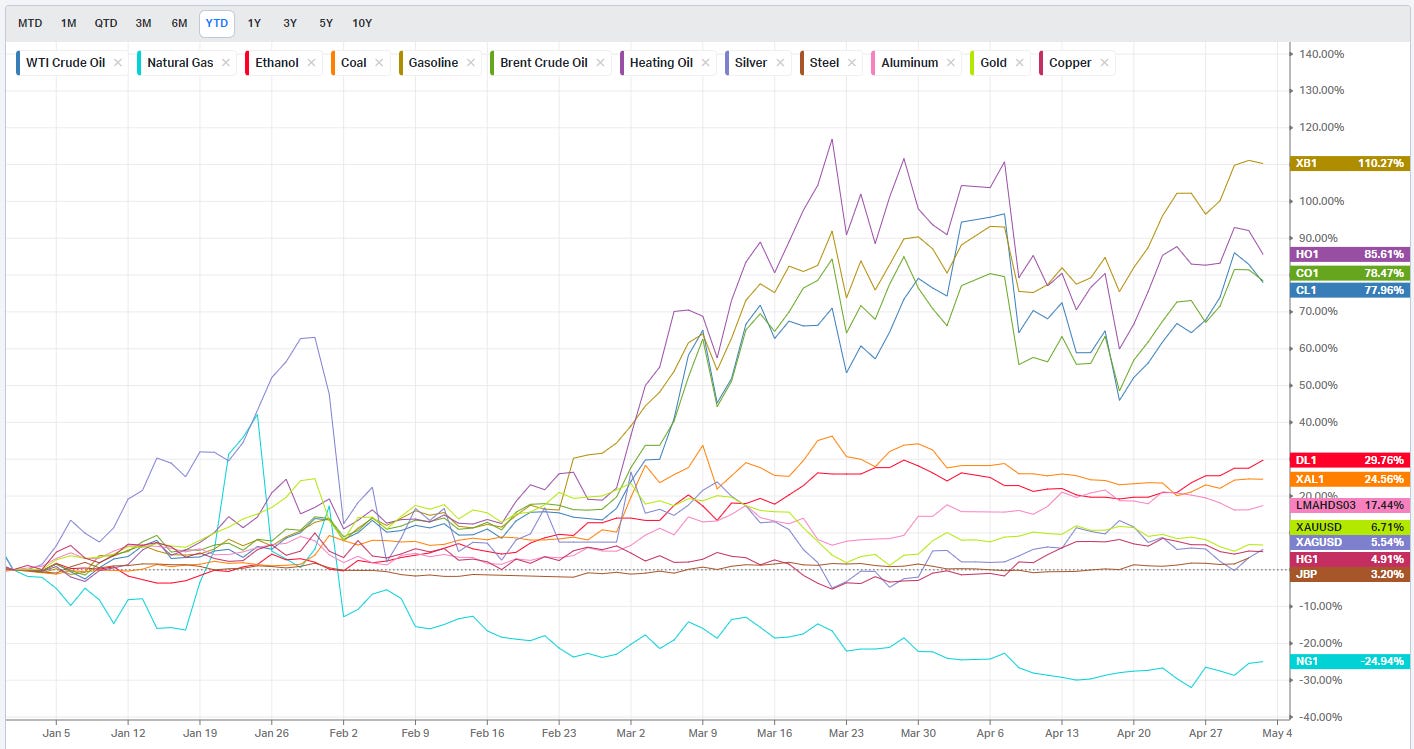
Commodities: Energy & Metals
Currencies/Major FX Crosses
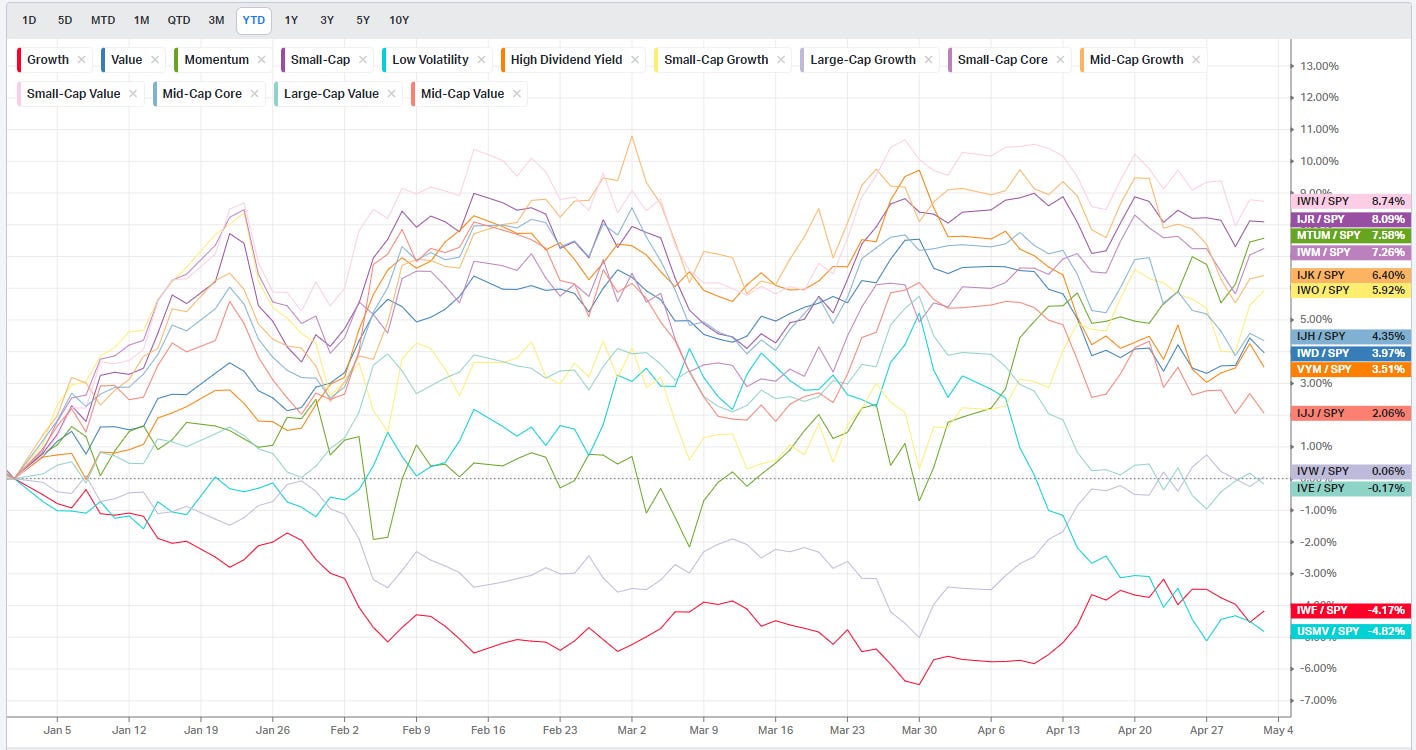
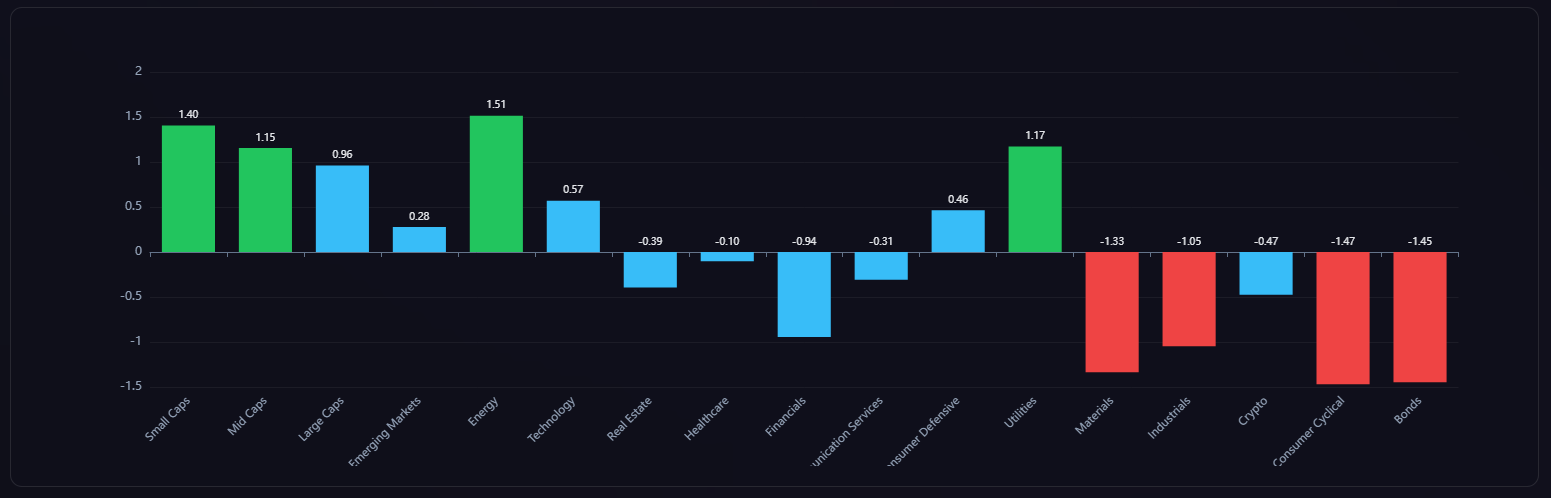
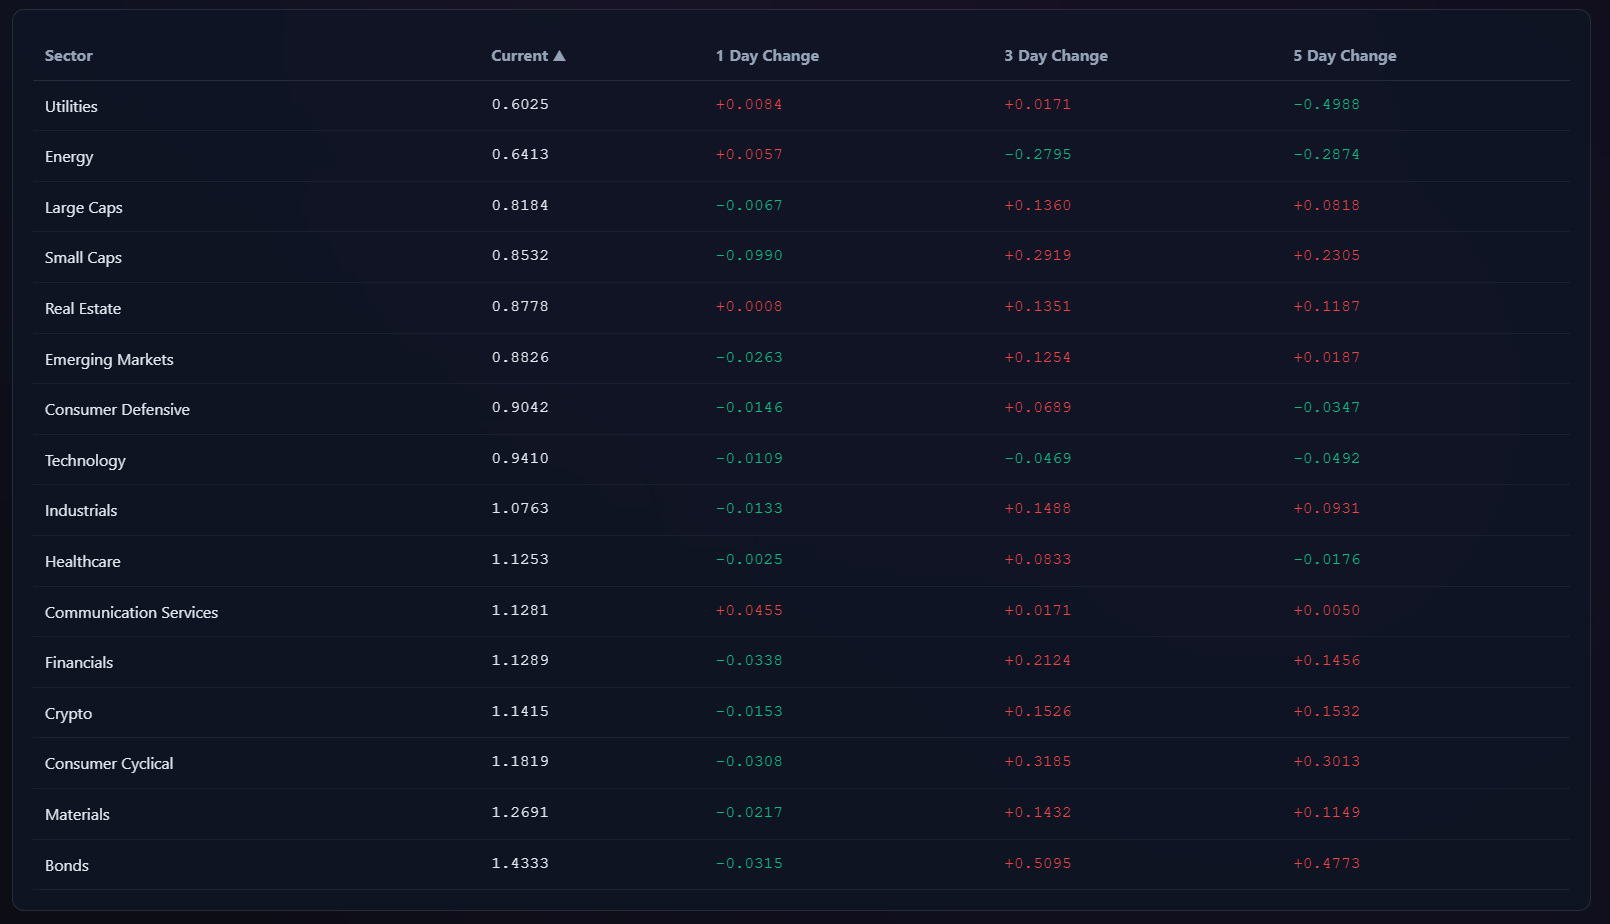
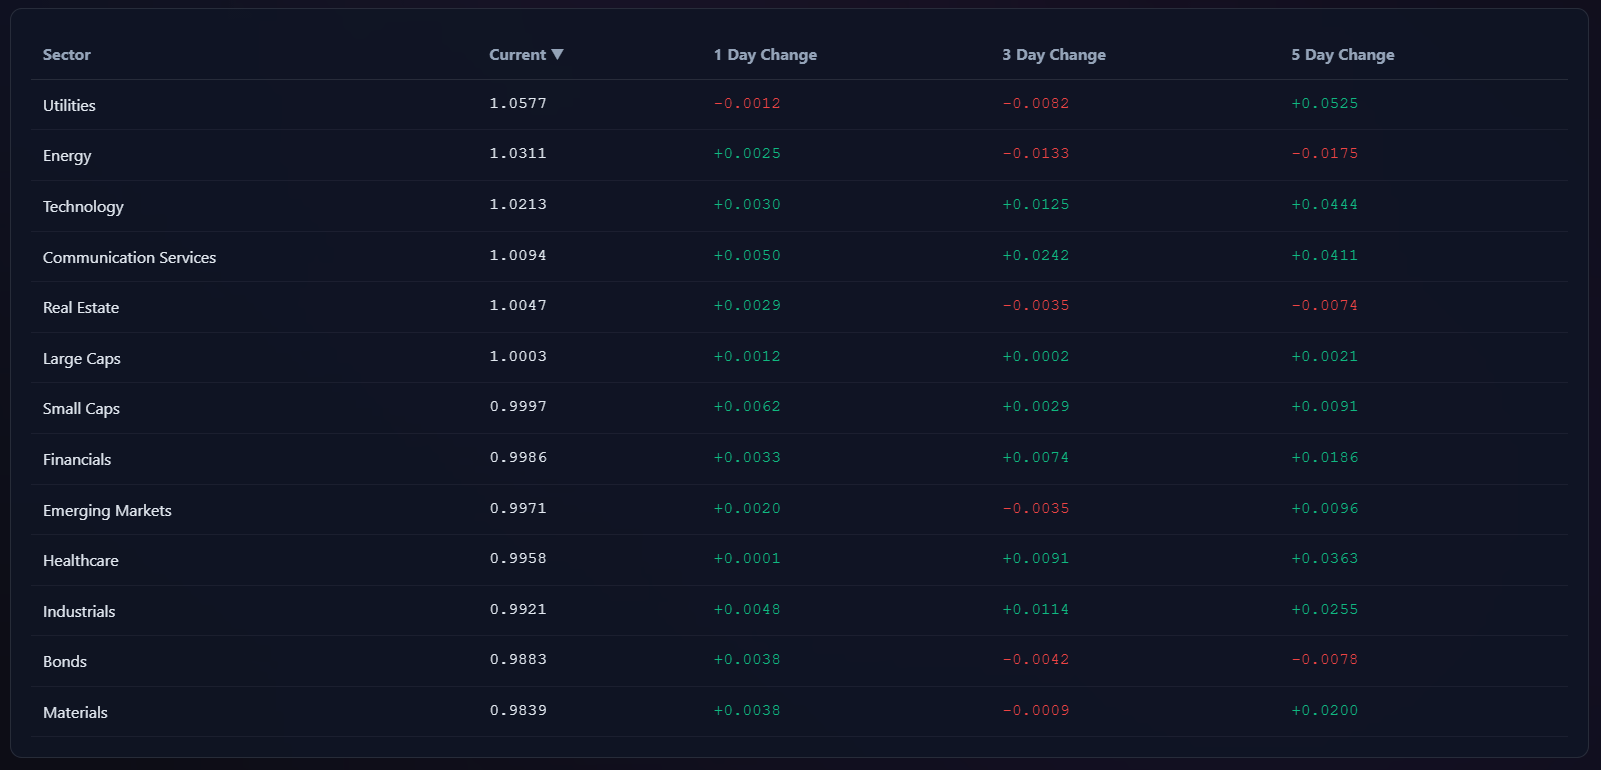
Factors: Style vs Size-vs-Value

Events On Deck This Week
Here are key events happening this week that have the potential to cause outsized moves in the market or heightened short-term volatility.
Payrolls, services, and chips: a tape that will have to keep earning it
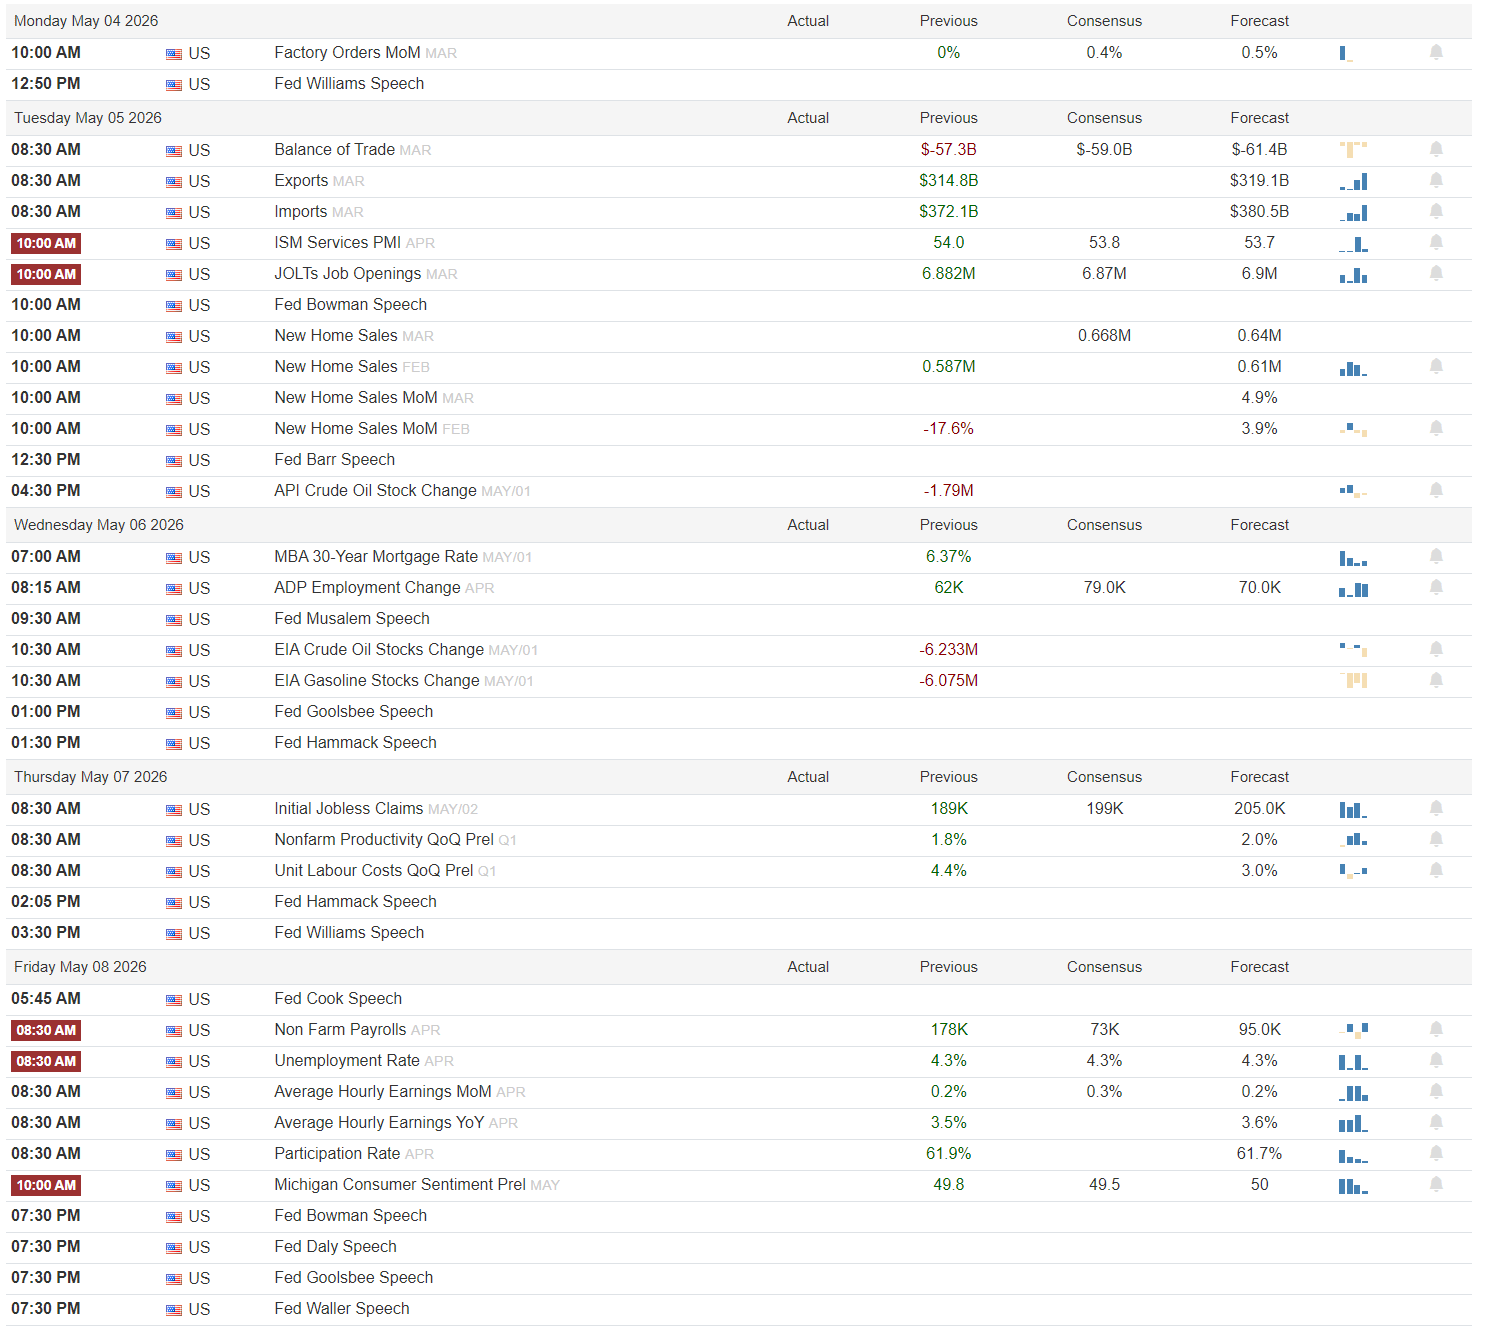
Monday opens light but not irrelevant. Factory Orders m/m for March show previous 0.4%, with consensus around 0.5%; a clean beat would lean risk‑on as it reinforces a manufacturing stabilization story, while a miss back toward zero or negative would keep cyclical beta on a short leash. The lone scheduled event is a Fed Williams speech; any emphasis on still‑uneasy inflation or reluctance to cut into firm activity would skew the read risk‑off for duration and long‑duration growth.
Tuesday is the first real macro test. The Balance of Trade shows a previous deficit of -57.3B with consensus -59.0B and forecast -61.4B; a narrower gap is modestly growth‑supportive, but a deeper deficit flags softer external demand and can bleed into risk‑off positioning at the margin. Exports (previous 314.8B, consensus 319.1B) and imports (previous 372.1B, consensus 380.5B) will tell you if global goods flow is re‑accelerating or not; better exports with contained imports is the cleanest equity‑friendly mix, while hot imports and weak exports lean toward growth‑down, dollar‑up. ISM Services PMI sits at 54.0 prior, with consensus 53.8 and forecast 53.7; anything materially above 54 keeps the services engine running and supports cyclicals, but an air‑pocket into the low 53s or below quickly becomes risk‑off for late‑cycle assets. JOLTS Job Openings (previous 6.882M, consensus 6.877M, forecast 6.9M) will be parsed for ongoing labor cooling; a downside surprise is bond‑friendly but starts to whisper harder‑landing risk if it is sharp. New Home Sales levels are partially unreadable, but directionally a beat supports housing and homebuilders while a miss reinforces rate‑bite. Bowman and Barr are both on the tape; any suggestion that services inflation is re‑accelerating or that further hikes remain on the table would tighten financial conditions into the close.
Wednesday shifts the focus to housing finance and crude. MBA 30‑Year Mortgage Rate and ADP Employment Change both print before the open; ADP’s previous 62K versus consensus 79K and forecast 70K make the trajectory important. A rebound back toward consensus argues for still‑solid private payrolls and is mildly risk‑on for equities but risk‑off for front‑end rates; a clear miss keeps the soft‑landing narrative intact but pressures cyclicals. EIA Crude and Gasoline Stocks Changes (previous -6.233M and -6.075M, respectively) are pure energy and inflation input. Another meaningful crude draw is bullish for energy equities but unhelpful for the Fed if accompanied by gasoline tightness; a surprise build softens the commodity‑inflation impulse. Multiple Fed speakers, including Goolsbee and Musalem, have room to frame how they trade off softer labor against sticky prices; any collective tone that downplays near‑term cuts would cap duration.
Thursday is about productivity, labor costs, and the weekly claims drip. Initial Jobless Claims have a previous 189K against consensus 199K and forecast 205K; risk‑on wants to see claims stay sub‑200K without a spike, while a sudden lurch higher would quickly revive slowdown hedging. Nonfarm Productivity q/q and Unit Labor Costs q/q (previous 1.8% and 4.4%) sharpen the margin story: stronger productivity with cooler labor costs is a Goldilocks mix that supports multiples, while weak productivity and hot labor costs would be toxic for both equities and long bonds. The Fed speakers slate is lighter but still includes Hammack and Williams; any explicit linkage between still‑firm labor costs and policy patience would keep the belly of the curve under pressure.
Friday is payrolls day and the true week‑defining print. Nonfarm Payrolls show a previous 178K with consensus 73K and forecast 95K; a number close to forecast with stable 4.3% unemployment keeps the soft‑landing base case alive and is modestly supportive for risk, while a sub‑50K or negative shock would hit cyclicals and credit quickly. Average Hourly Earnings m/m at 0.2% prior (consensus 0.3%, forecast 0.2%) and y/y 3.5% are the inflation fulcrum: cool wages are risk‑on for duration and growth, while a surprise acceleration would resurrect the higher‑for‑longer trade. Participation Rate (previous 61.9%, consensus 61.7%) and Michigan Consumer Sentiment prelim at 49.8 prior (consensus 49.5, forecast 50) will either confirm resilience or show consumer fatigue. A long roster of Fed speakers (Cook, Bowman, Daly, Goolsbee, Waller) means the market will get immediate policy color on however payrolls land; any chorus that leans either toward renewed tightening chatter or an earlier‑than‑priced cut will set the tone into the weekend.
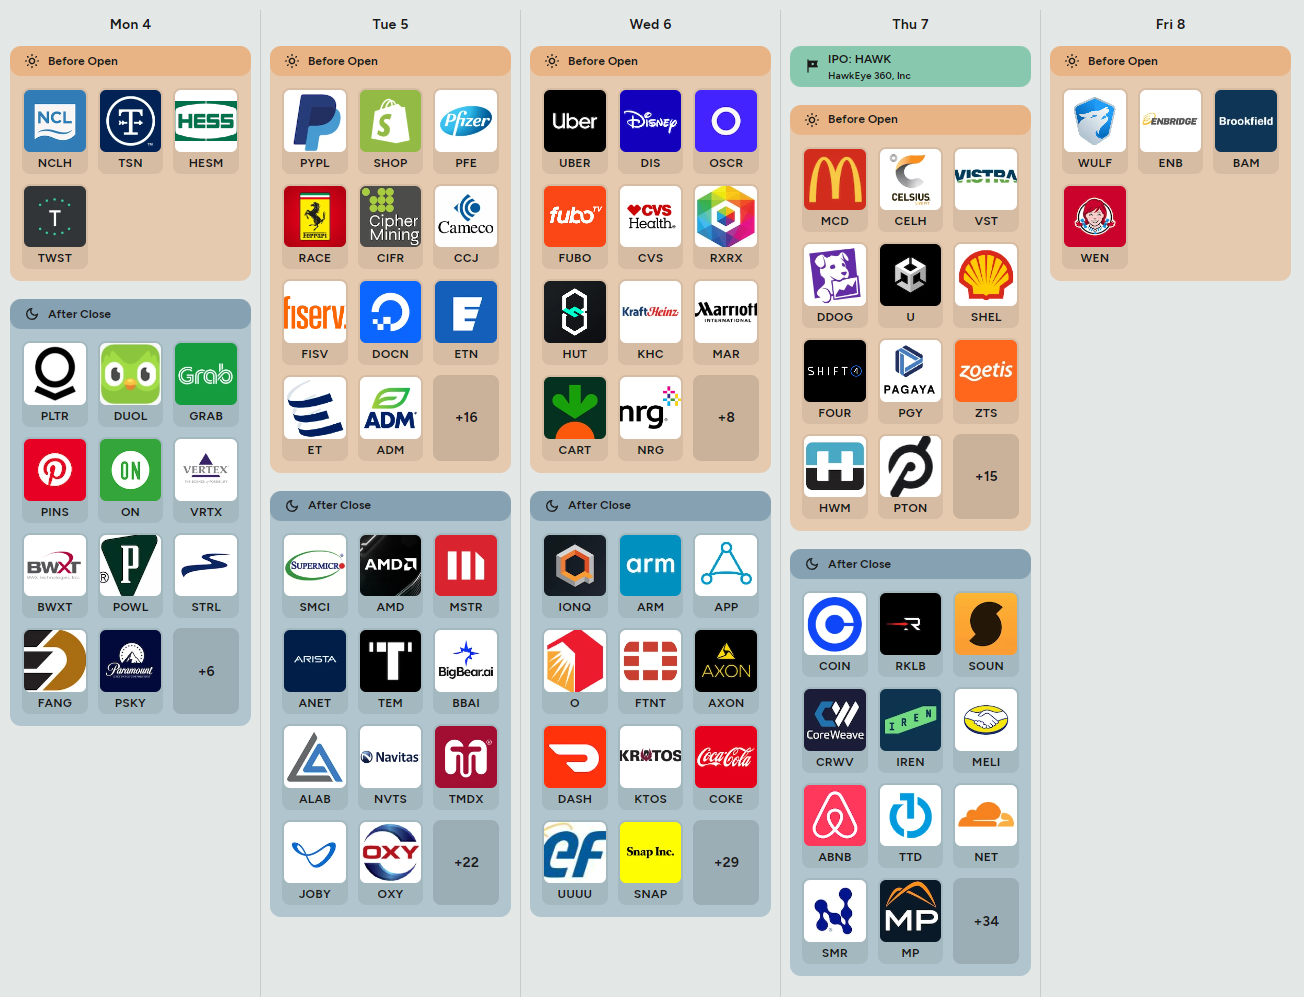
On the micro side, the earnings board is loaded with macro read‑through. Monday evening brings Palantir, Pinterest, and Paramount for a look at software, digital advertising, and media demand. Tuesday is the heaviest: PayPal, Shopify, and Fiserv before the open for payments and small‑biz health, with AMD, Supermicro, and MicroStrategy after the close as a direct check‑in on AI/semis and the crypto‑equity complex. Clean beats with constructive guides there would be risk‑on for growth and factor‑longs, while any soft guidance from AMD or SMCI in particular could pressure the entire AI complex. Wednesday features Uber, CVS, Marriott, and Coca‑Cola, giving a broad read on services consumption, healthcare, and consumer staples defensiveness. Thursday’s slate adds McDonald’s, Celsius, Shell, Unity, Pagaya, Zoetis, and a heavy after‑close board with Coinbase, CoreWeave, MercadoLibre, The Trade Desk, and Cloudflare; those prints will speak to discretionary demand, energy capex, and ad‑tech / cloud‑spend momentum. Friday is quieter, with Enbridge, Brookfield, and Wendy’s anchoring energy infrastructure and low‑ticket QSR. Line items to watch across the week are volume growth, pricing power, AI‑related capex, and margin guidance; beats on revenue and margins with steady 2024 outlooks keep the growth trade intact, while weaker top‑line or cautious guides would reinforce the idea that the macro is decelerating underneath the surface.
Sign‑posts for active traders:
ISM Services PMI holding meaningfully above 54 versus slipping toward 53
Nonfarm Payrolls in a tight 75K–125K band with wages at or below 0.3% m/m
AMD and SMCI both closing higher on strong guides versus a post‑print fade
Bottom line: this is a data‑heavy, earnings‑dense week where a modestly cooler labor/price mix and solid AI‑complex prints keep the soft‑landing, growth‑with‑disinflation narrative alive, while any combination of hot wages and weak earnings would flip the tape decisively back to defense.

Order Flow in Focus: Reading Smart Money Tells
Order Flow in Focus: Reading Smart Money Tells is a recurring segment that spotlights unique intraday opportunities revealed through institutional order flow. Each feature dissects a moment when the tape quietly shifted—when large, ranked prints clustered at key liquidity locations and informed players positioned ahead of the move. The goal isn’t hindsight; it’s pattern recognition—learning to spot the footprints of capital that knows before the crowd does.
META’s air‑pocket into value
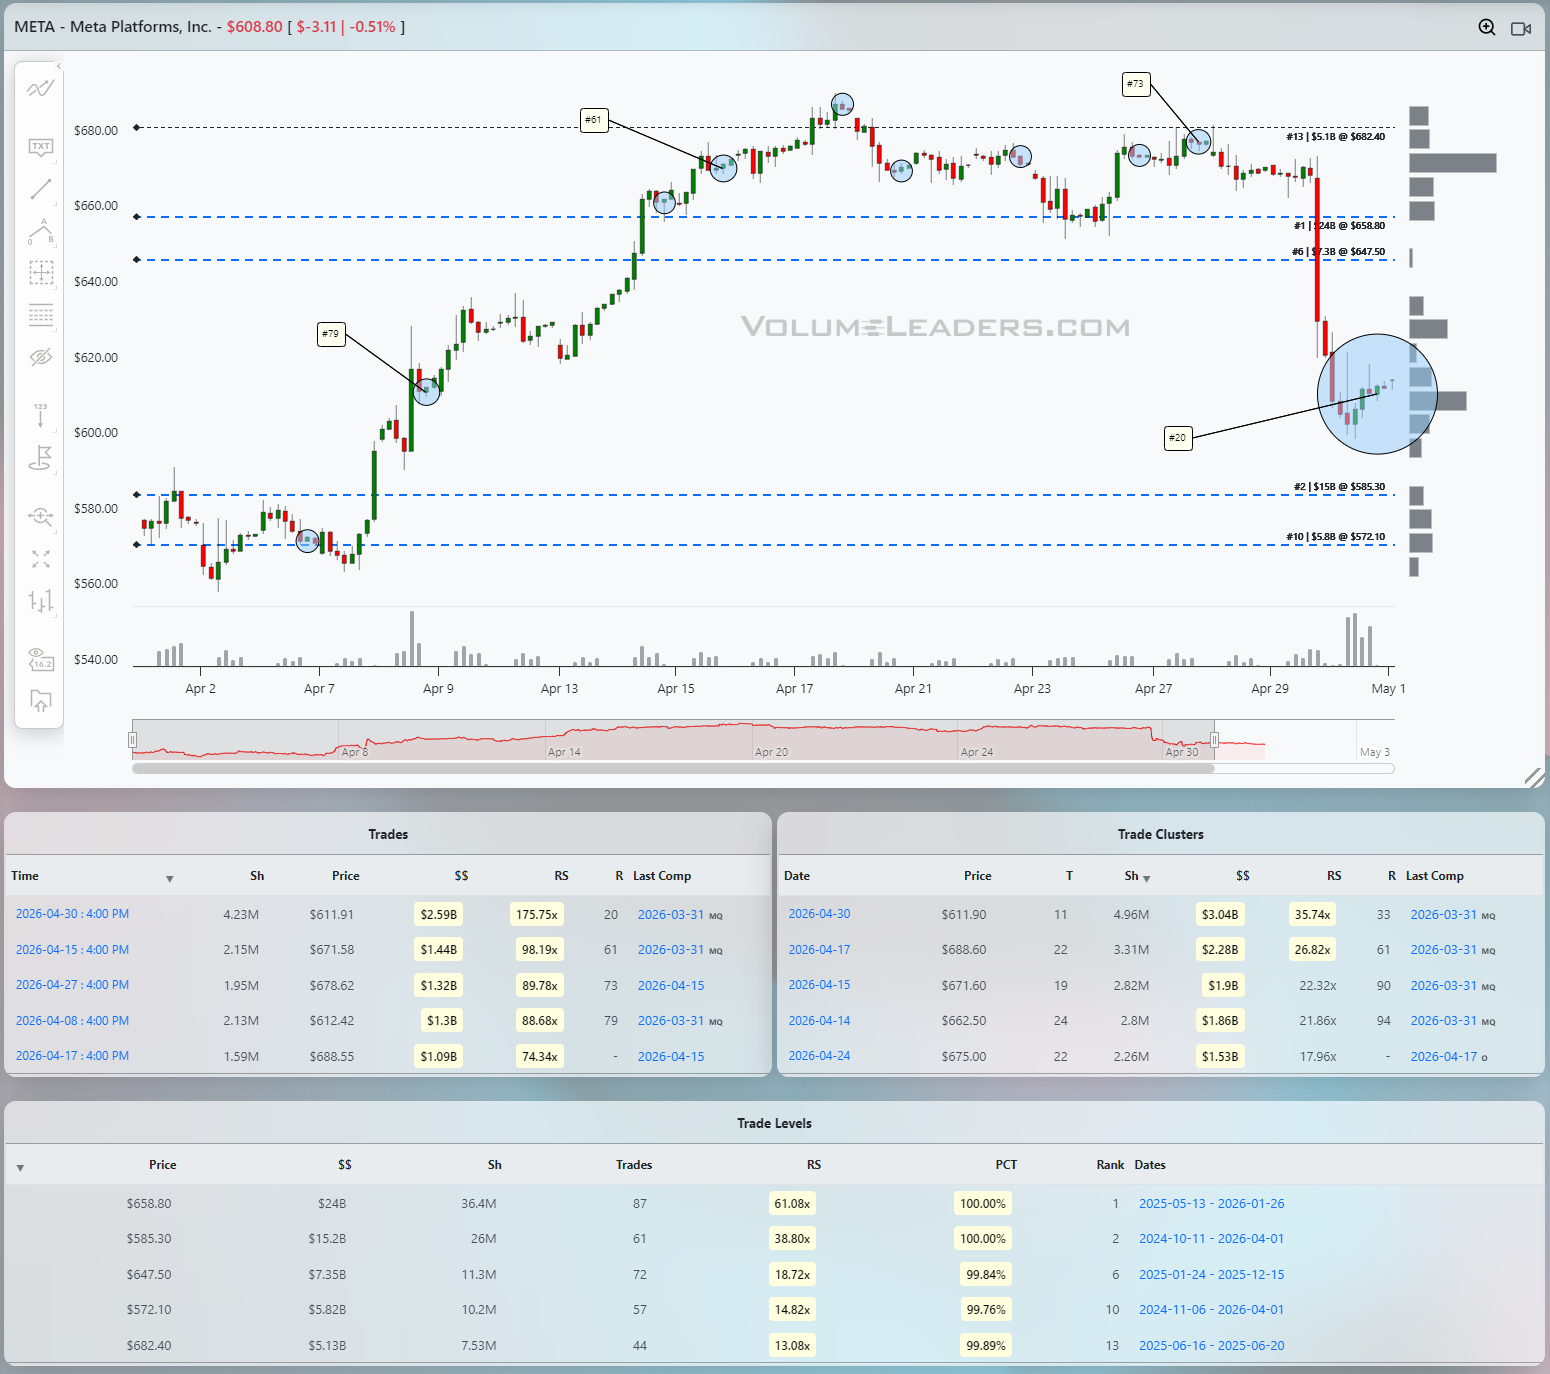
META has been dead money on the higher time frame, but the intraday tape still pays if you respect where the real volume has decided fair value lives. On this leg, the story starts well before the flush. Earlier in the month, META launched out of the lower blue value band in the mid‑570s, where a ranked institutional buy print fired just off that lower dashed line. When a top‑100 style buyer defends the lower edge of value and price immediately runs, you know bigger players are marking that area as their dip zone.
The markup leg that followed was clean and impulsive, stair‑stepping through the mid‑590s and then the 600s with little resistance until it began stalling under the upper blue band near 680. Up there, you can see a cluster of large bubbles, including a high‑ranked print tagged in the 40s, that fails to push price into a new distribution. Those big trades are not chasing breakouts; they are handing inventory to late longs right at the top of the value zone. The repeated failure to build acceptance above the top dashed line is your first tell that META is “sell the rip” at the upper band, at least until fresh, even larger buyers show up.
The trade we care about is the short that followed that distribution. Once the stock broke back below the upper blue band and could not reclaim it on a retest, the prior cluster of large prints up there flipped from support to overhead supply. That is your first tactical entry zone: you let the breakdown happen, then wait for a weak bounce back toward the underside of that line. When the bounce stalls under that prior cluster, with no new ranked buyers appearing, you lean short against the upper band with a tight stop just above the last big bubble in the 670s. Your target is the opposite side of the range where institutions are demonstrating a desire to transact down in the $575’s.
The beauty of this sequence is how the tape accelerates once that middle band finally gives way. On the day of the flush, META slices through the mid‑640s shelf and free‑falls toward the lower value area. That is not random panic; look at where the huge blue‑shaded bubble prints: a massive ranked trade goes off right on top of the lower blue band in the low‑600s. That is the same region that launched the prior leg higher, and once again real money is stepping in as others puke. For the active short, that monster print is your exit tell even if original targets suggest the lower blue-dashed lines are where we would prefer to land. When a historically large buyer is willing to absorb into the hole right at a long‑term volume node, you cover into that liquidity rather than wait for a bounce to force you out.
If you are nimble enough to flip, that lower band is also your speculative long entry. The structure says META is still range‑bound between these two blue “fair value” rails. You have just seen a vertical move from the top band to the bottom band in one session, capped by a giant absorption print. You can buy into that zone with a defined stop just below the lower dashed line, treating a sustained break under that value edge as the invalidation. First target is the mid‑640s shelf for a mean‑reversion trade; if price can reclaim and hold above that middle band, you then have room to trail for a possible full trip back toward the upper 670s–680s resistance where the last round of sellers showed their hand.
The lesson from this META tape is simple: in a sideways regime, the blue historical volume rails do the heavy lifting by showing exactly where institutions are expected to be active because it’s historically true. When ranked prints cluster at the top band and price refuses to trend, they are quietly telling you to fade strength. When a historic buyer materializes at the lower band after an air‑pocket, they are advertising the other side of the trade. Your job is not to predict the headline; it is to recognize when capital that knows better is trading the extremes of value and to ride on their backs to the next destination. When you have a massive amount of inventory to buy or sell, a perpetual problem you have to solve for is finding counter parties

Market Intelligence Report
A desk-grade synthesis of institutional positioning and market structure—unpacking the flows, levels, and emerging themes that shaped the week, and translating them into a model portfolio built the same way professional desks prepare for the week ahead.
MIR Part 1: The Backdrop
The tape this week had a very particular feel: risk is still being taken, but in a much more selective, institutional way. The broad backdrop is a neutral‑to‑cautious environment rather than a full‑throttle chase. Indices are holding up, but there is a subtle drift toward more defensive posture, with investors balancing resilient price action against a macro mix of sticky inflation, a Fed that just reaffirmed higher‑for‑longer, and a heavy run of mega‑cap earnings.
The April FOMC meeting left the policy rate unchanged at 3.50%–3.75%, with an unusually high number of dissents and a clear message that cuts are off the table for 2026 unless the data break hard. That keeps the cost of capital real and forces allocators to be choosey; they are still willing to pay for growth, but the bar is higher, especially with oil north of 100 and some renewed energy‑driven inflation pressure in the system.
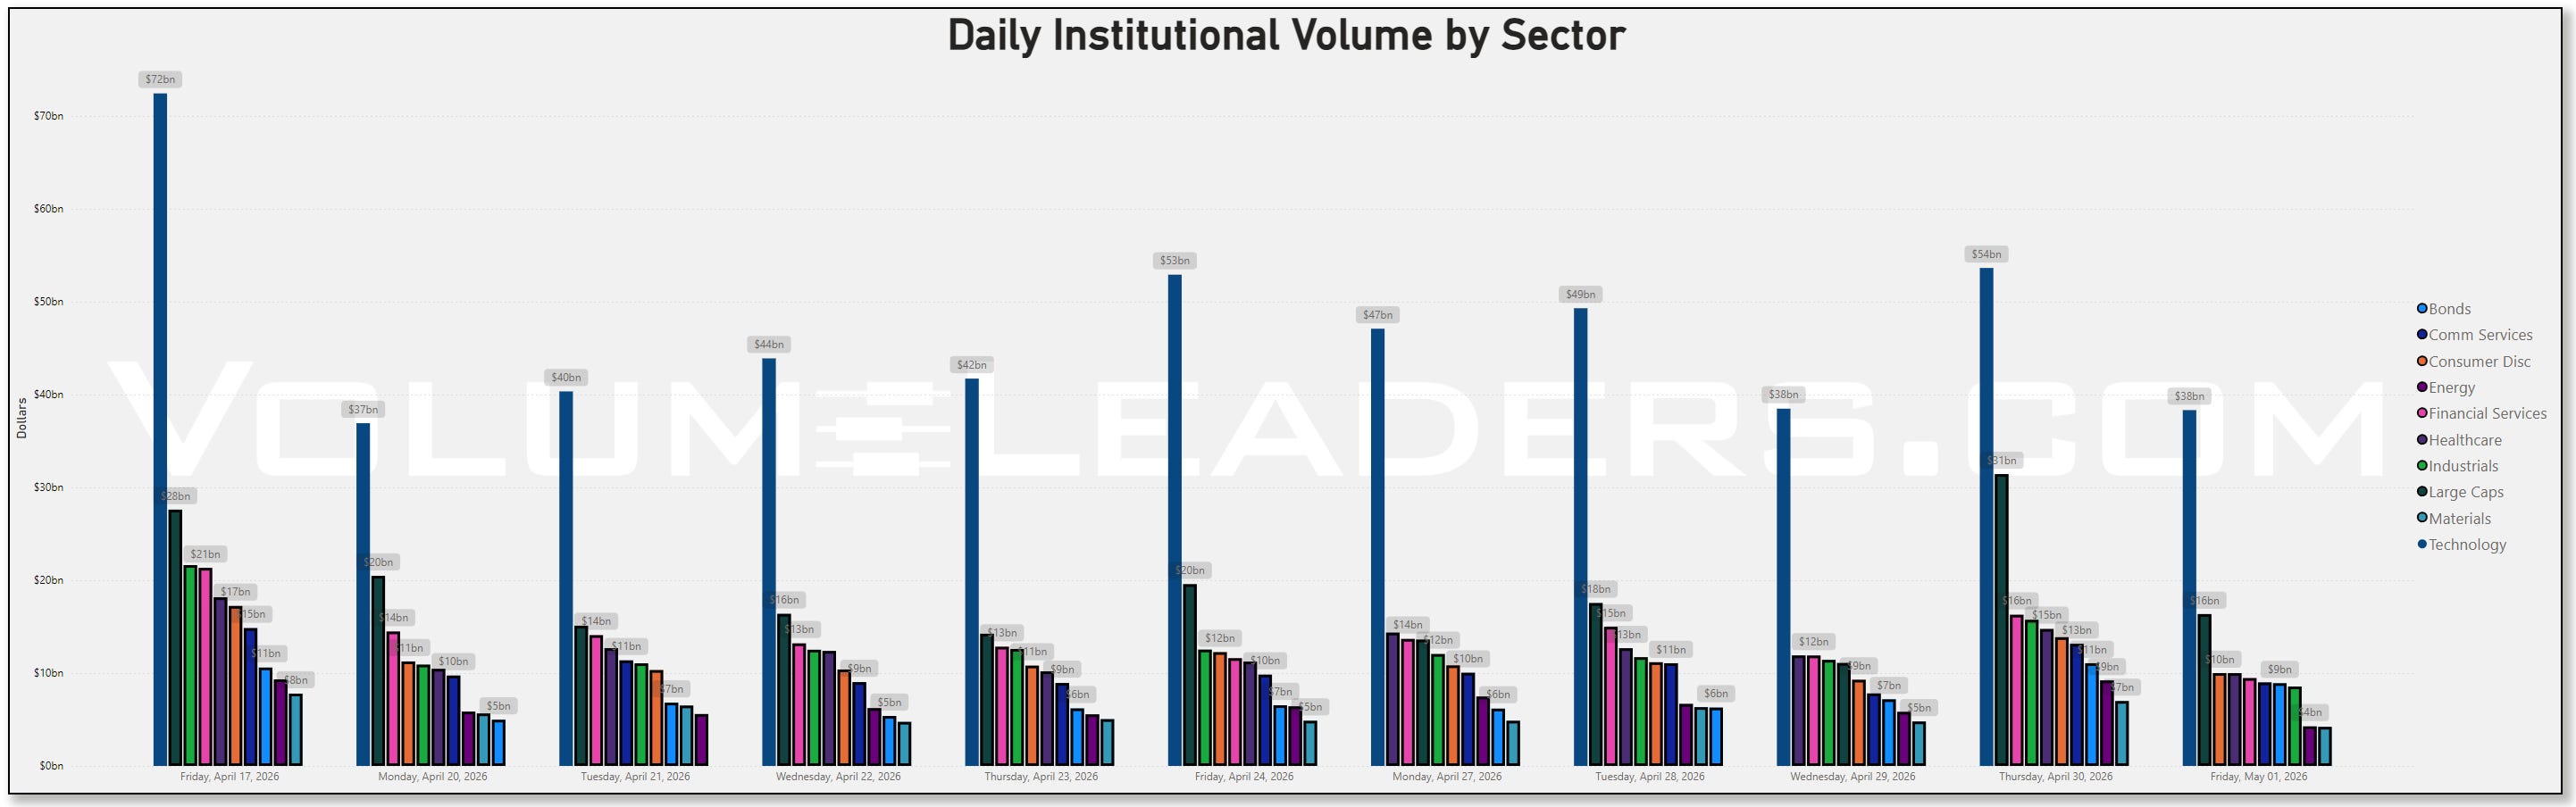
From that environment frame, participation tells you where capital actually showed up, and it was a week where Technology remained the dominant liquidity sink but not the only story. The sector volume table shows Technology still printing the highest institutional dollars by a wide margin, running in the high $30b range on Friday after a $54b spike the prior Thursday. Consumer Discretionary and Communication Services sat a tier below, hovering around the low‑ to mid‑teens, while Energy and Healthcare put in respectable but more moderate flows. Bonds and Financials, by contrast, saw a notable step‑down versus the prior week; bond flows fell from a $10.6b peak last Friday to under $9b this Friday, and Financial Services rolled from roughly $16.4b to about $10.3b over the same comparison. That fits the macro narrative: a Fed on hold with lingering inflation worries has pushed rate‑cut expectations out, which dulls the immediate appeal of duration while also raising questions about net‑interest margins and credit costs.
Within that participation backdrop, the top‑down flow picture is dominated by the classic liquidity vehicles. On the all‑venues bar chart, SPY is still king at roughly $38b of aggregate flow, with QQQ around $21b, and then a steep step down into the single‑digit billions for everything else. HYG and LQD feature prominently in the top‑30 scatter as well, with large bubbles at high volume, telling you that credit ETFs remain central tools for expressing macro risk and hedging around spreads.
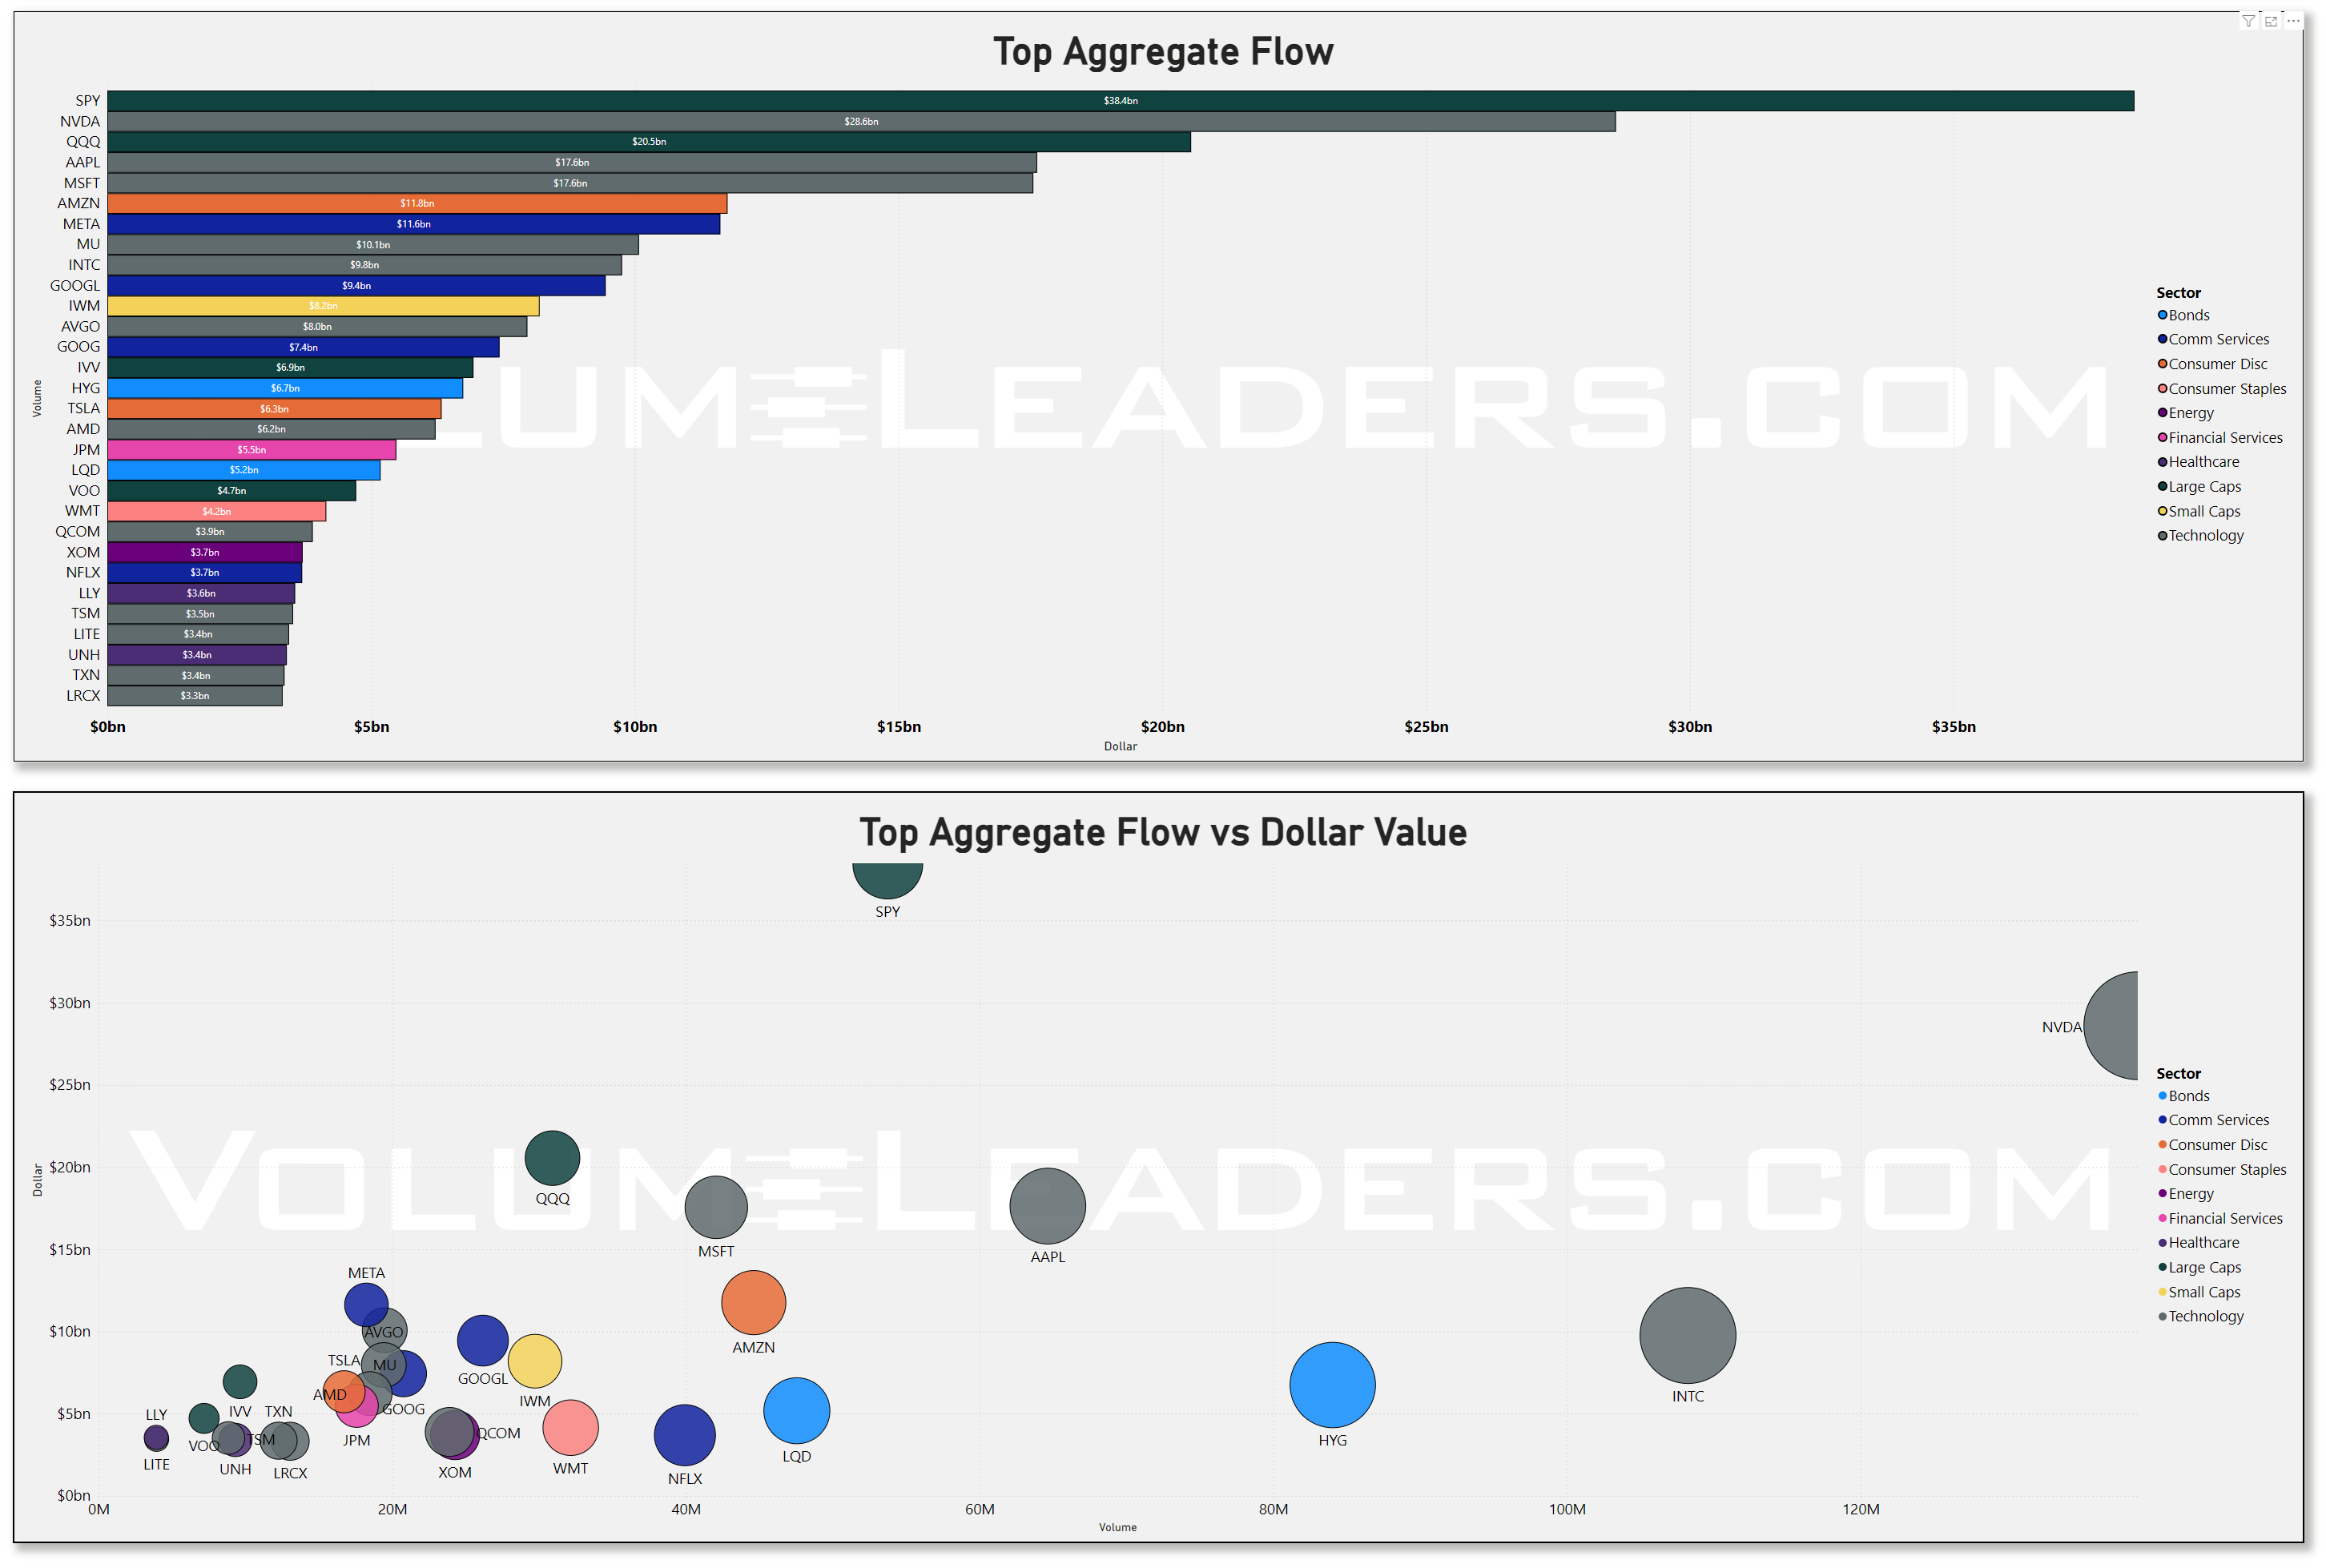
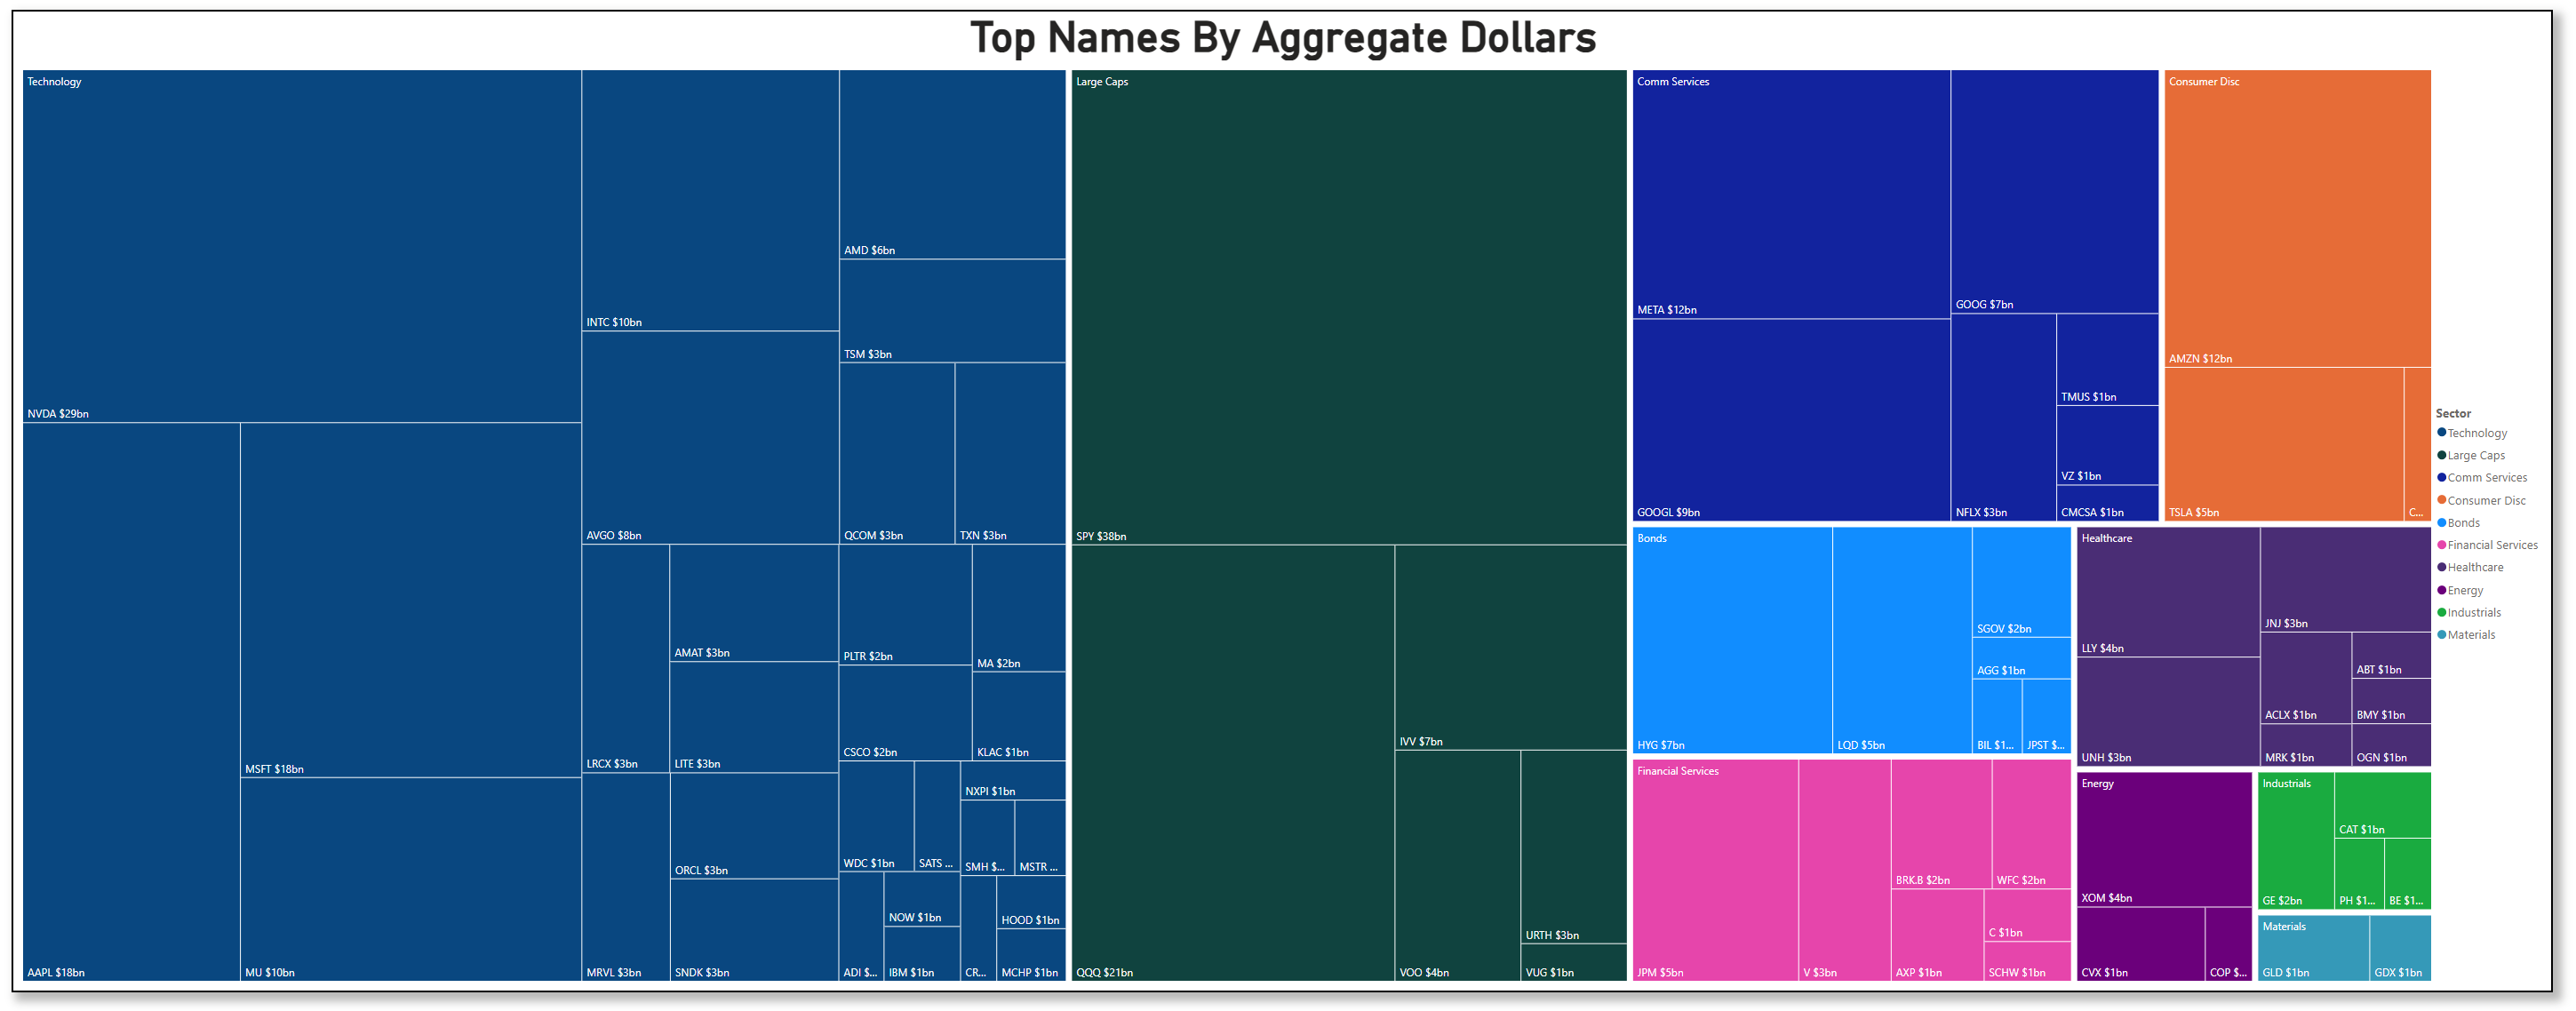
The treemap reinforces this concentration: SPY at ~$38b and QQQ at ~$21b anchor the Large Cap bucket, while Technology chip names like NVDA at ~$29b, AAPL and MSFT each around $18b, and INTC and MU at about $10b each dominate the individual‑stock blocks. META shows up with about $12b in Communications, and AMZN with ~$12b and TSLA at ~$5b headline Consumer Discretionary. This is not a “small‑cap rotation” week; this is a week where the marginal dollar stayed glued to the mega‑cap complex and the big beta ETFs, consistent with a tone of cautious optimism rather than speculative frenzy.
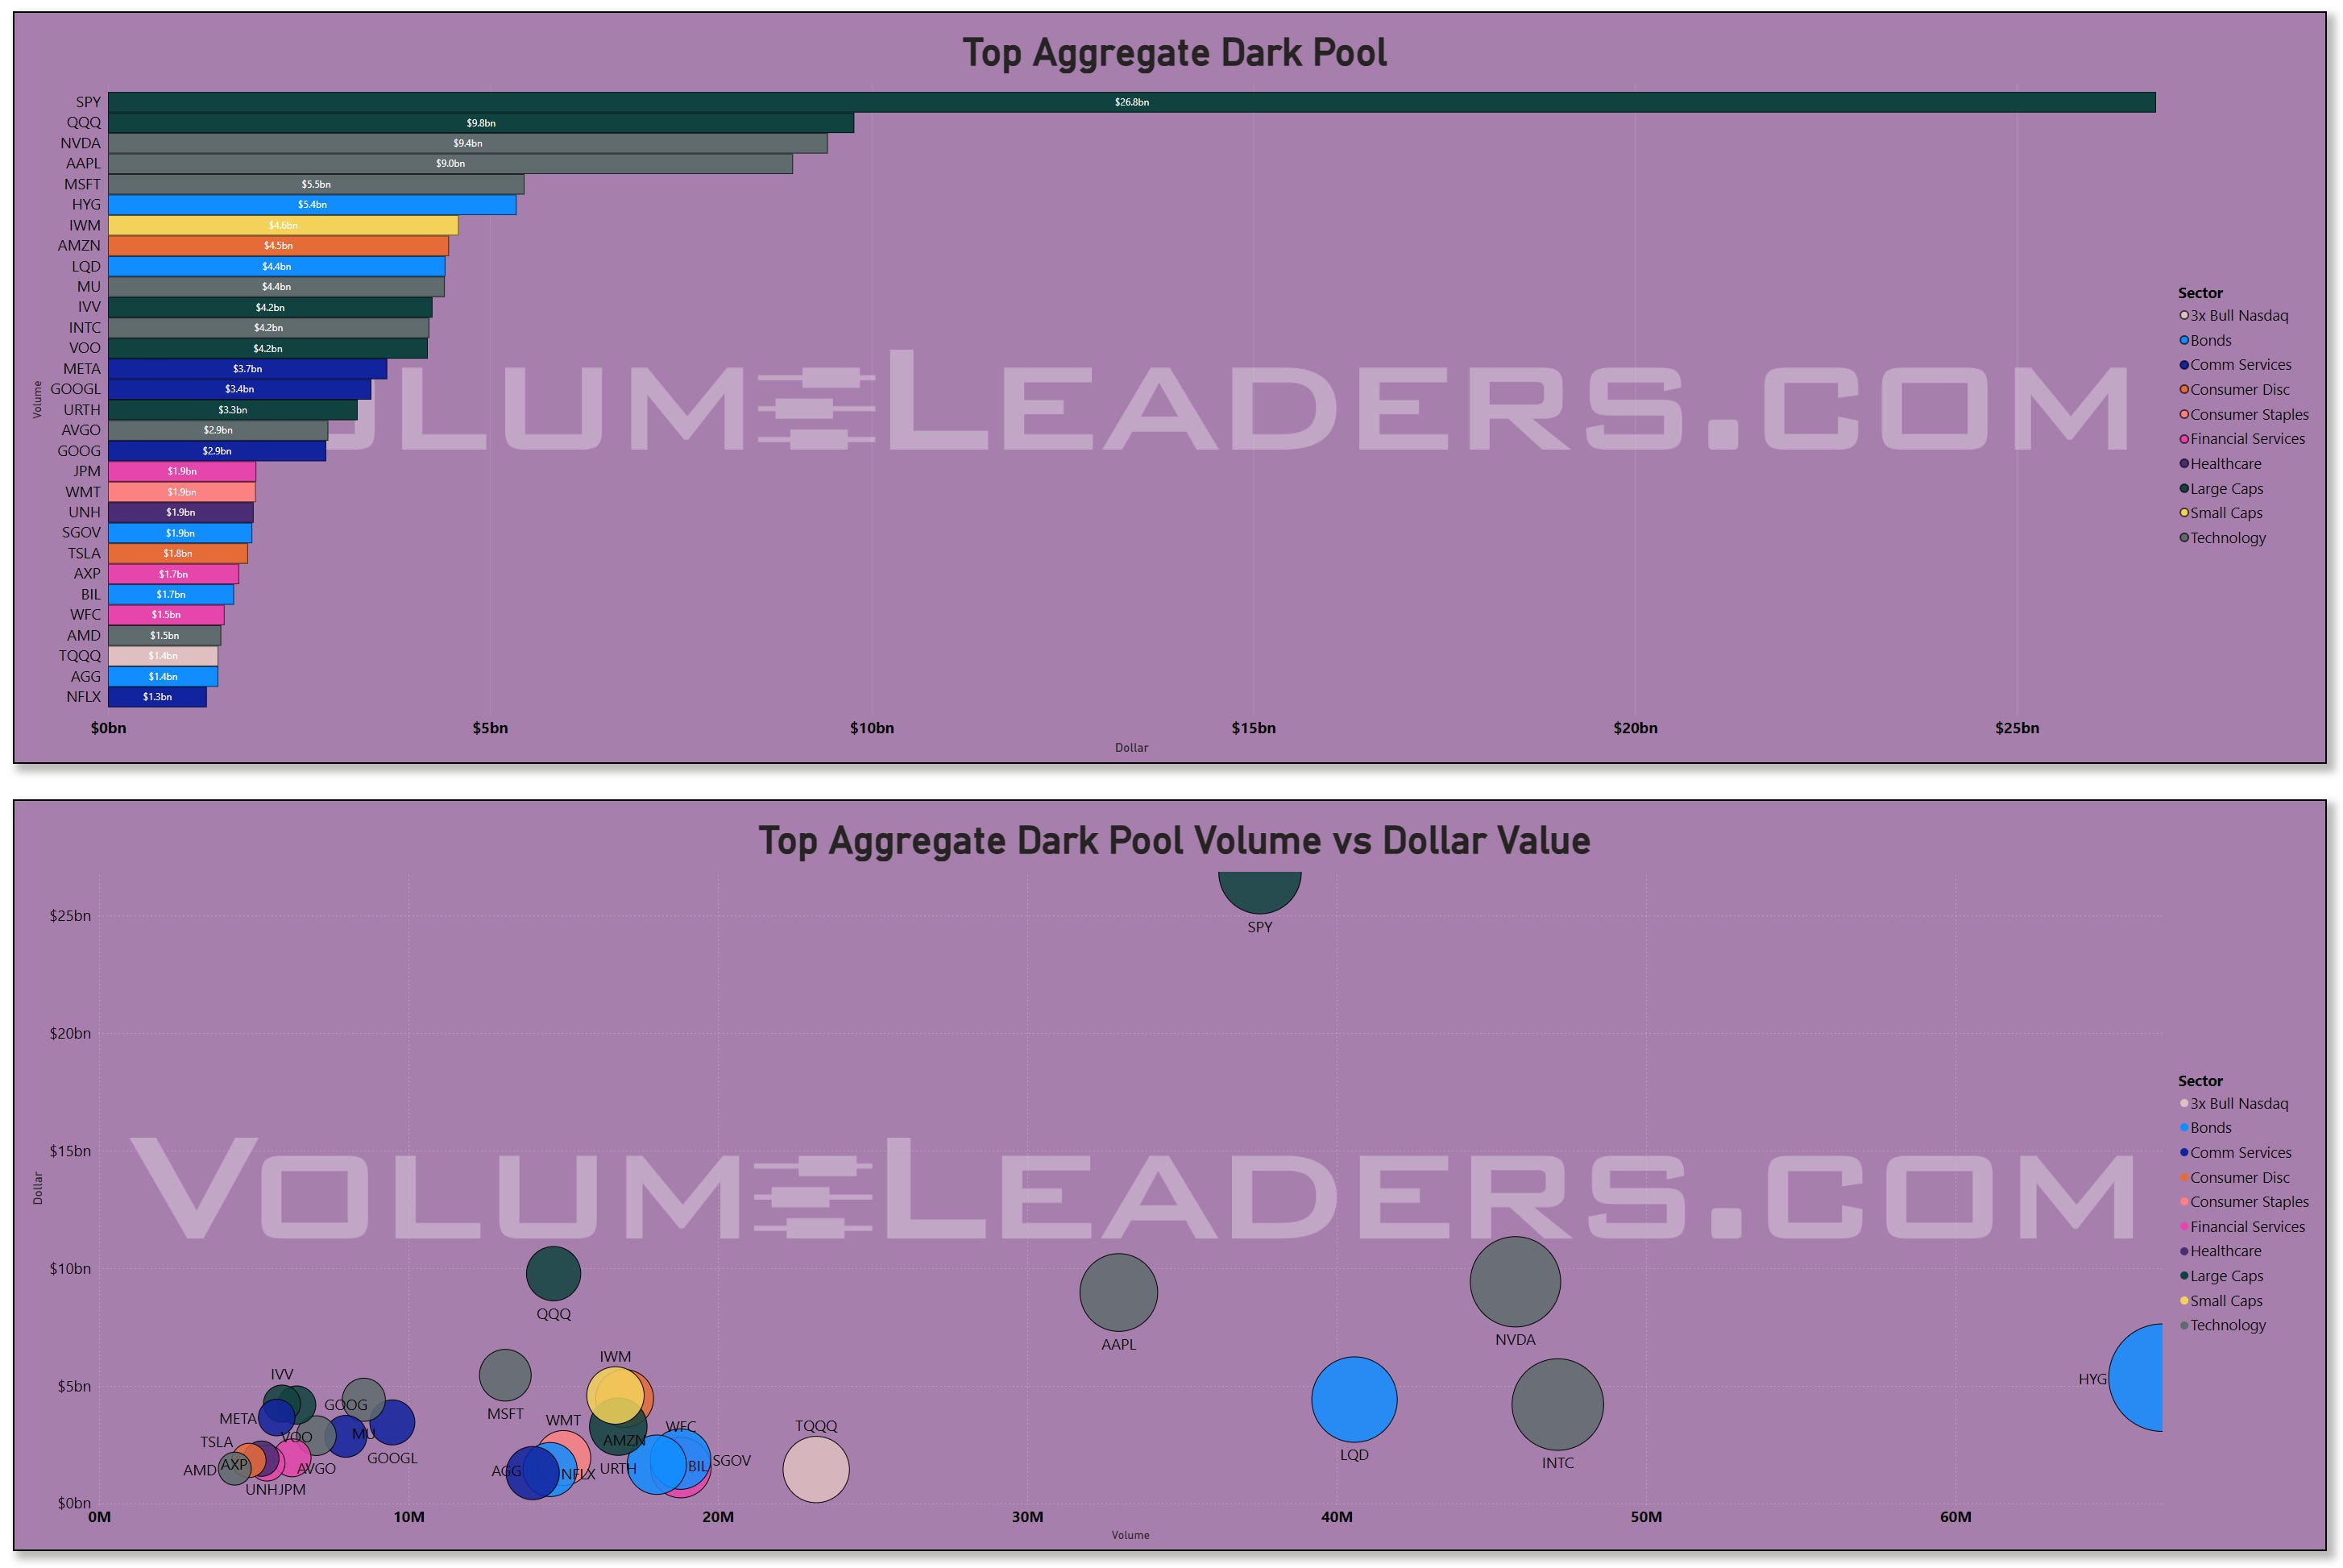
The dark‑pool view adds an important layer. In hidden venues, SPY again leads with roughly $27b of notional, followed by QQQ in the mid‑teens and then NVDA, AAPL, and MSFT all clustered around the high‑single‑digit billions. IWM prints about $5b of dark‑pool flow, which is meaningful but still dwarfed by the large‑cap indices. META, AMZN, and GOOG all sit in the $4b–$5b range. When you see that much dark activity in the index and the mega‑caps while spot price action is relatively contained, it typically signals redistribution rather than outright chase: real money is using the post‑earnings liquidity window to quietly adjust exposures without moving the tape. That makes sense given the macro catalyst mix. The Fed has just signaled a longer wait for cuts, and mega‑cap earnings were strong but laced with AI‑capex cost questions; Microsoft, Amazon, Alphabet, and Meta all delivered robust AI narratives, but investors spent just as much time worrying about growing investment budgets. Those are perfect conditions for portfolio‑level rebalancing: trim what ran hardest, add where risk‑reward still screens favorable, all executed off‑exchange to avoid telegraphing size.
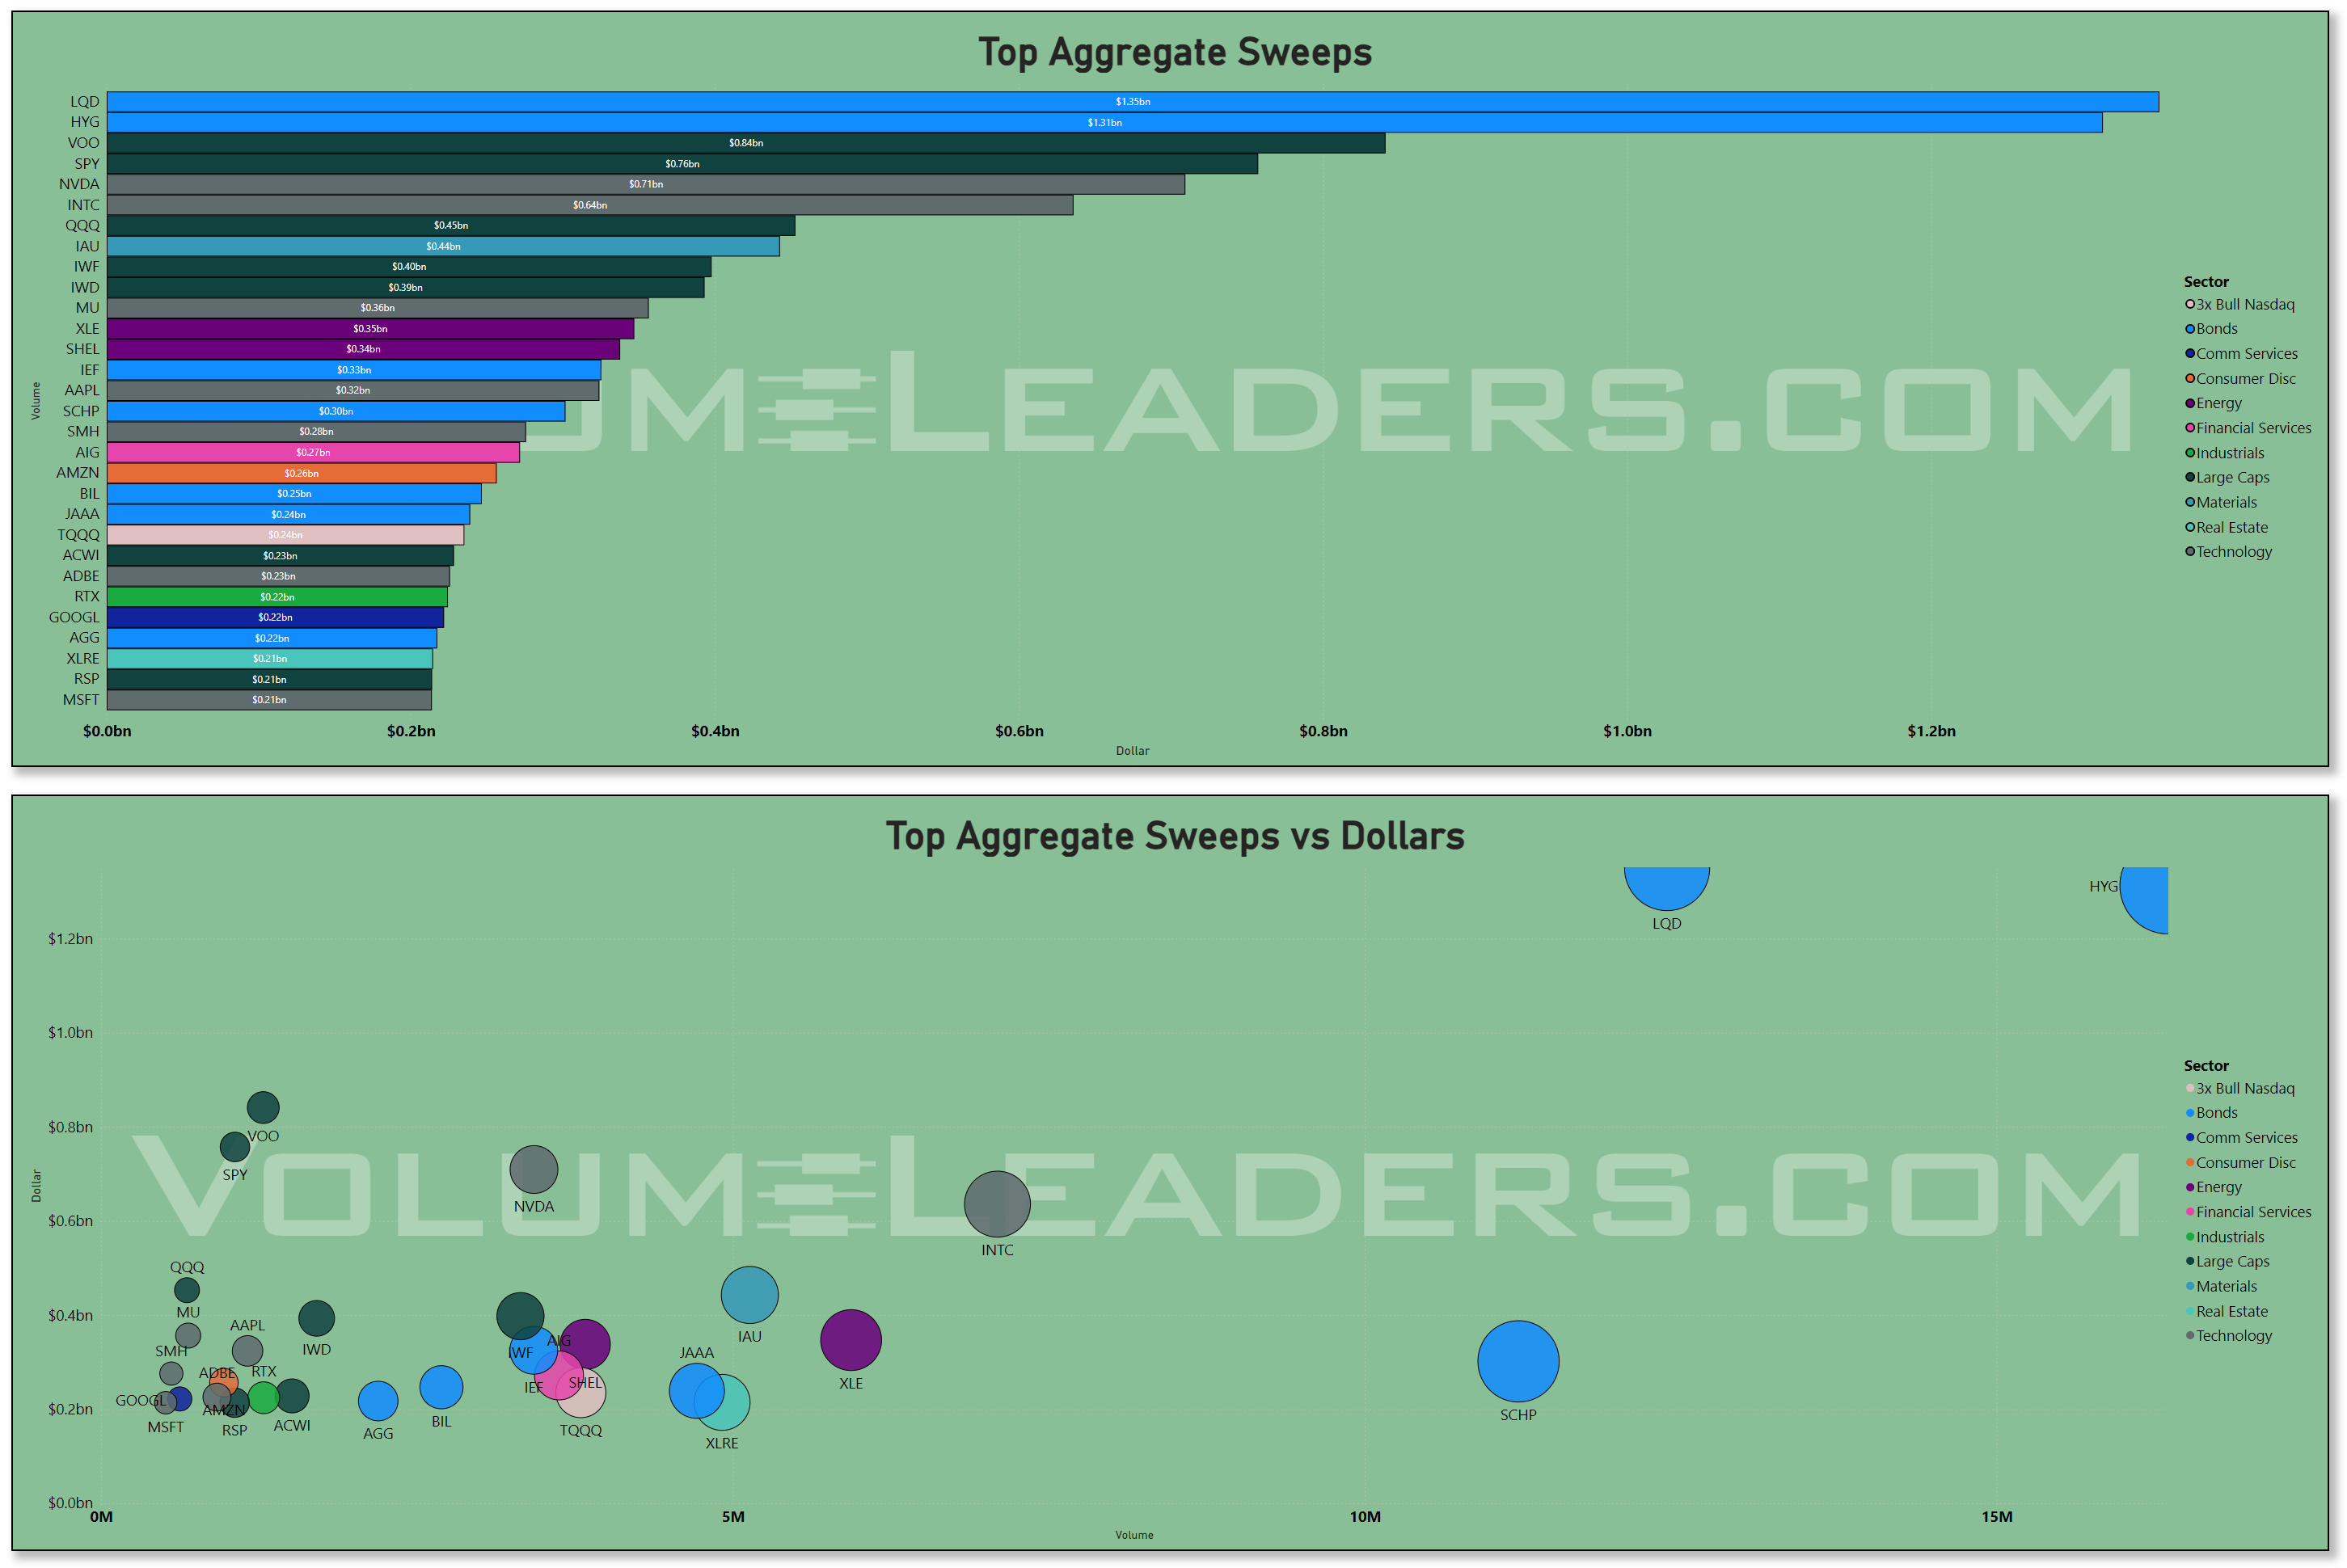
Sweeps tell you where the more tactical money was willing to hit bids or lift offers aggressively in lit markets, and that picture is subtly different. The top sweeps bar has LQD and HYG at the very top, both north of $1.1b in sweep dollars, followed by VOO and SPY around the $0.5b–$0.6b area. NVDA, INTC, QQQ, and IAU sit in a secondary cluster around $0.3b–$0.4b, and then you see XLE, IWF, SCHP, and a mix of factor and bond proxies. In the sweeps scatter, LQD and HYG stand out with very high dollars and volume, while SPY shows up with a balanced bubble and NVDA, INTC, and XLE each with meaningful but comparatively smaller dots. That combination says the real chase this week was less about piling into AI at any price and more about using credit ETFs and broad equity proxies as fast hedging and de‑risking tools. Given the backdrop of an 8‑4 FOMC vote with four doves wanting cuts and the market grudgingly pricing no cuts in 2026, it is not surprising to see tactical flows in LQD and HYG as traders calibrate exposure to tighter‑for‑longer policy and elevated high‑yield spreads.
When you pull it all together, the environment looks like this: the market is not in a panic, but it is noticeably more fragile under the surface. Broad participation remains decent, but it is skewed toward the same leadership pockets we have been leaning on for months: mega‑cap tech, AI semis, and the large‑cap indices. Energy and Healthcare are quietly improving, which lines up with the surge in crude and the renewed importance of defensive earnings streams as growth expectations cool. Real Estate and Utilities underperform, reflecting the drag from sticky policy rates and higher long yields. Technology and Financials register clear outflows on the day, consistent with profit‑taking in crowded winners and hesitation around the rate path. Risk validation metrics show that volatility has been picking up where outflows concentrate, especially in Tech and Consumer Cyclicals, while down‑vol has not fully overwhelmed up‑vol in the more defensive pockets. That cocktail argues for selective engagement: you can take risk, but you want to express it in places where realized volatility is compressing or stable and where flows are consistent, not spiky.
Allocation decisions from that framework naturally gravitate toward a barbell. On one side, synthetic sector and relative performance measures still favor Technology and parts of Communication Services; even with this week’s outflows, they maintain strong relative strength versus the broad market, helped by the fact that the S&P 500 just printed its best April since 2020 on the back of those very names. On the other side, Energy and Healthcare have been gaining traction with improving participation and more stable volatility signatures, making them attractive destinations for capital that wants to stay in equities but dial back idiosyncratic risk. Financials, Real Estate, and small caps look more like avoid zones for now, with weaker relative strength and less supportive risk profiles. The upshot is that the market still prefers to be involved in quality growth and cash‑flow‑rich defensives, funded in part by trimming more rate‑sensitive or economically marginal exposures.
Within that allocation context, the individual‑name flows mostly confirm the story rather than contradict it. NVDA’s ~$29b of aggregate dollars sits at the center of the Technology universe, and the combination of heavy dark‑pool prints and substantial lit sweeps suggests an active two‑sided battle: long‑only managers continuing to build or defend positions, and shorter‑term traders using the liquidity to manage gamma and event risk. AAPL and MSFT around $18b, AMZN at double‑digit billions, and META at ~$12b round out the usual suspects. META’s inclusion near the top of the Communications block, alongside GOOGL at ~$9b, underscores how much the street is still using these platforms as core macro proxies for global ad spend and AI infrastructure, even as regulatory and capex overhangs keep a lid on outright euphoria. On the ETF side, SPY’s $38b and QQQ’s $21b flows are textbook allocation traffic; paired with the dominant dark‑pool presence, they look more like the plumbing of asset‑allocation and overlay programs than outright speculative chase.
The more interesting tells are in the credit and factor corners. HYG shows up repeatedly across the dashboards: mid‑single‑digit billions in the treemap, heavy notional in both all‑venue and dark‑pool rankings, and outsized sweeps in the credit sleeve. LQD is similar, though skewed even more toward sweeps. That pattern, combined with rising oil prices and an FOMC that is clearly uneasy about inflation, hints at a market that is incrementally hedging credit risk and duration, not just reaching for yield. SCHP and other inflation‑linked products also make appearances in the sweeps list, suggesting that some players are quietly paying for inflation protection even as headline macro narratives talk about disinflation timelines.
By the time you reach the trade‑sourcing layer in this funnel, the message is pretty clean. The environment allows risk, but it is not forgiving; participation is robust in a handful of leadership groups, with breadth thinning out below the surface; risk metrics are flagging expansion in the crowded growth pockets and stability in select defensives; allocation flows are still rewarding mega‑cap quality and AI beneficiaries while warming to Energy and Healthcare; and execution context says not to chase breakouts in the leaders after big prints but instead to lean into well‑defined pullbacks or rotation days when the flows and volatility line up. Institutional behavior this week looks more like active, valuation‑aware positioning than blind chase: using dark pools to rebalance SPY, QQQ, and the megacaps around earnings; using sweeps in LQD, HYG, and XLE as tactical hedges or adjustments to macro views; and continuing to reward sectors where cash flows and pricing power can withstand a longer stretch of restrictive policy. For us, that means the opportunity set still skews toward patiently buying controlled weakness in the core growth and AI complex where volatility is being paid to mean‑revert, while respecting the rotational bid into Energy and Healthcare as legitimate, not just noise, as long as oil and policy stay on their current path.
MIR Part 2: Individual Names From The Institutional Tape
VolumeLeaders tracks several proprietary signals designed to spotlight names drawing significant institutional interest. Below, we’ve surfaced the latest results and analyzed them to highlight emergent themes. If any of the sectors, narratives, or positioning trends resonate, the names mentioned here offer a strong starting point for deeper research and watchlist consideration.
VL Trade Rank Velocity™ (TRV)
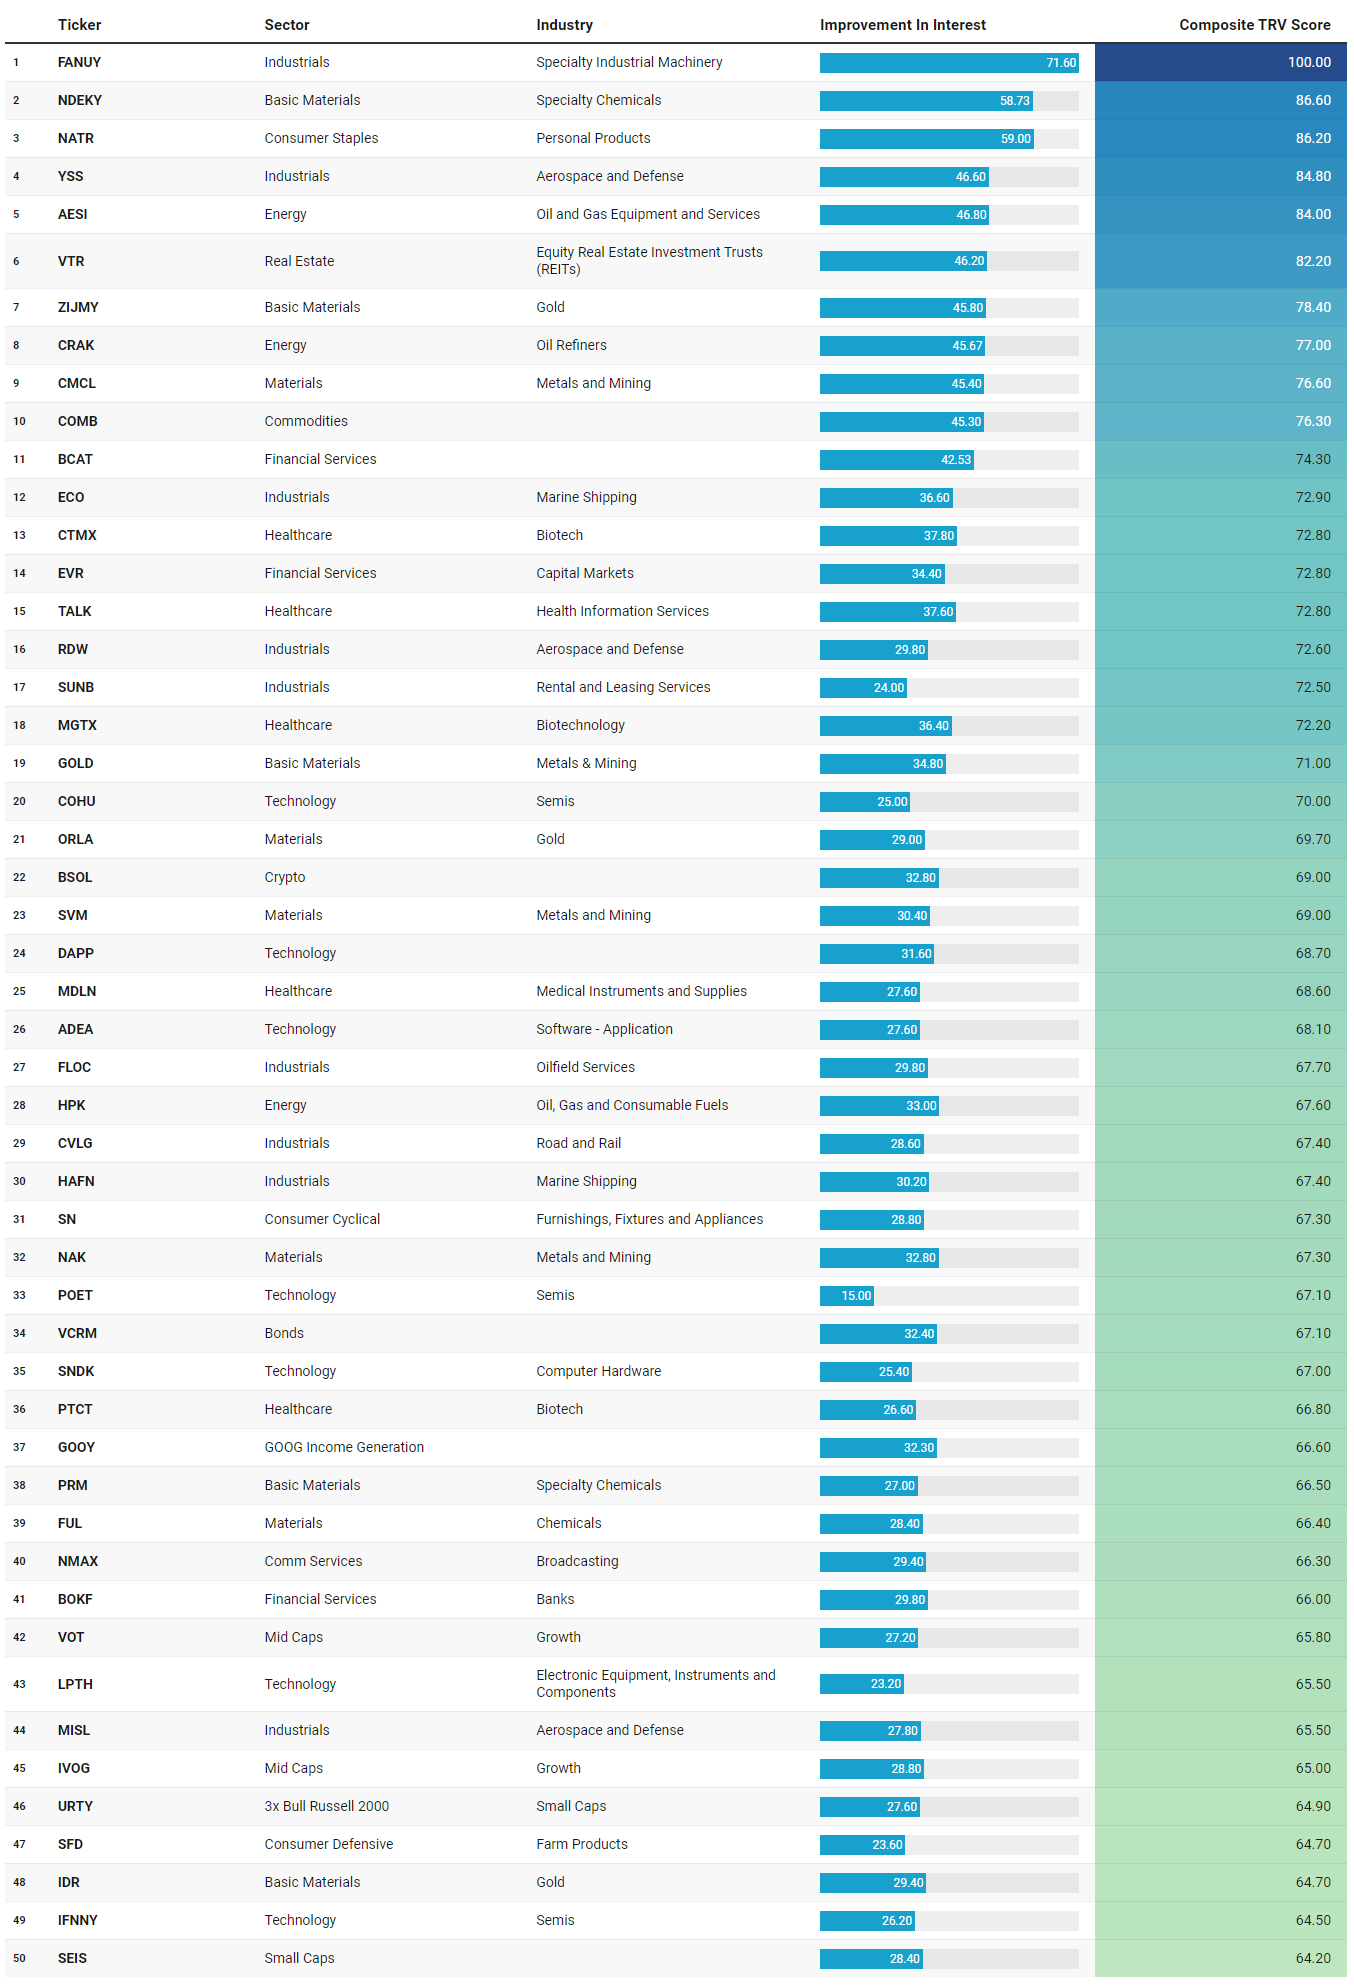
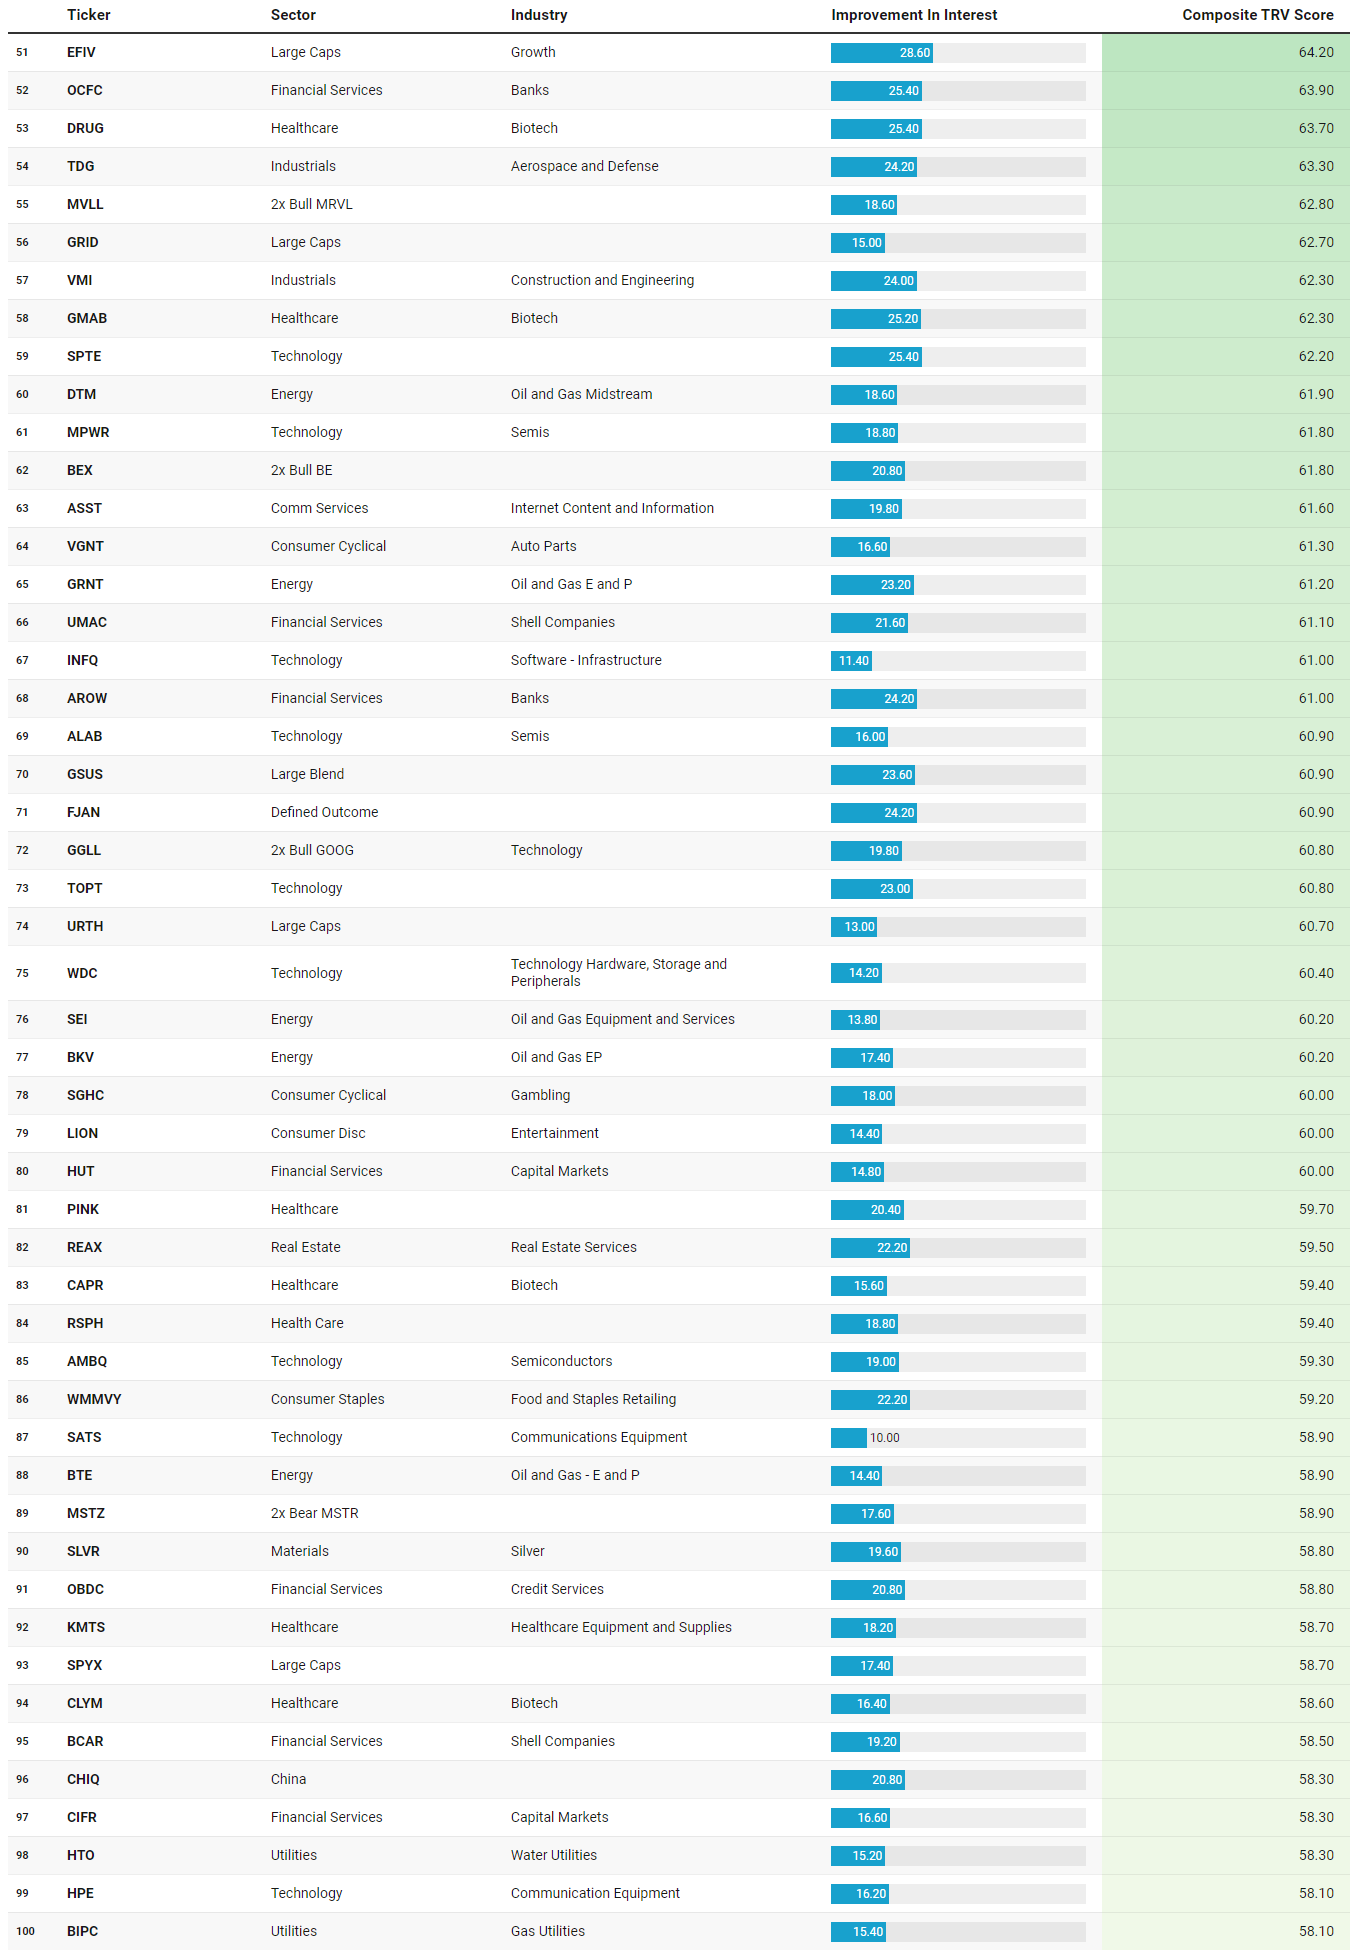
TRV is a proprietary metric that measures the recent acceleration or deceleration in institutional trading activity for a given stock by comparing its average trade rank over the past few days to its average in recent weeks. A sharp improvement in TRV typically reflects a notable shift in positioning, often accompanied by sustained trade activity, suggesting institutions are actively engaging with the name and that intensity of activity is rising. This often precludes meaningful price or narrative shifts. This isn’t a buy-list or sell-list; it’s meant to draw your eyes to names where institutions are putting money to work.
The TRV list this week slots neatly into the same regime we have been talking about: risk is allowed, but the market is demanding cash flows, real assets, and idiosyncratic edges rather than broad beta. What jumps out first is how heavy the list is in Industrials, Energy, and hard‑asset Materials, with a secondary cluster in specialized Tech and Healthcare. That is exactly what you would expect to see when the Fed has just reiterated higher‑for‑longer, oil has ripped back through triple‑digits, and investors are thinking as much about supply chains and capex cycles as they are about multiple expansion.
At the very top, FANUY, an industrial machinery name, posts the highest composite score at 100 with strong recent improvement in interest and a decent run of sustained activity. That is classic “picks and shovels” flow: rather than swinging at broad Industrials ETFs, smart money is drilling down into the specialist equipment suppliers that benefit if corporate spending on automation and re‑shoring keeps grinding higher. YSS, RDW, MISL, and TDG cluster around Aerospace and Defense, again with elevated sustained activity, which lines up with the ongoing geopolitical risk premium and the secular rebuild in defense budgets across the US and Europe. Layer in ECO and HAFN on the marine shipping side, CVLG on trucking, and VMI in construction and engineering, and you get a clear through‑line: the tape continues to reward logistics, infrastructure, and real‑economy throughput rather than just “asset light” stories.
Energy is the second major pillar. AESI and FLOC sit in oilfield services, DTM in midstream, and HPK, GRNT, BKV, BTE in exploration and production. These are not crowded megacap oils; they are more targeted ways to play a world where crude prices have firmed as supply disruptions and OPEC discipline tighten balances. The fact that these names are showing meaningful improvement in interest with respectable sustained activity suggests this is not just day‑trader chase; it looks like institutions incrementally adding torque on top of the larger, more liquid energy exposures we saw in the sector and sweep dashboards.
Materials and Basic Materials round out the hard‑asset side. ZIJMY, ORLA, GOLD, CMCL, SVM, NAK, IDR, SLVR and COMB point squarely at precious metals and broader commodity baskets. In an environment where the Fed is signaling little urgency to cut but inflation risk is being repriced higher thanks to energy and global supply frictions, a tilt into gold, silver, and diversified commodity exposure is a textbook portfolio response. The mix of individual miners and wrappers implies both tactical trading and longer‑horizon hedging flows.
On the growth and innovation side, the list is more selective, but the themes are clear. COHU, POET, IFNNY, MPWR, ALAB, AMBQ, WDC and SNDK give you a bench of semiconductor and memory‑hardware names that sit downstream from the mega‑cap AI capex boom we have been tracking in NVDA, AVGO, and the hyperscalers. These are not the headline darlings; they are the ecosystem beneficiaries where valuation and cyclicality still matter. ADEA and INFQ in software, along with satellite and communications plays like SATS and HPE, extend that idea: the street is poking around for second‑derivative winners in infrastructure and tooling rather than just piling into the largest platforms.
The presence of BSOL, DAPP, MVLL, MSTZ, HUT, and CIFR keeps crypto and blockchain squarely in the speculative mix. That basket includes both equity proxies and levered structures on marquee crypto names. With Bitcoin still elevated and volatility episodic, these flows look more like tactical positioning around halving‑cycle narratives and ETF inflows than structural allocation, but the sustained activity scores in a few of them say the tape has not fully moved on from the theme yet.
Healthcare and Consumer names on the list reinforce the “selective, not defensive” message from the broader flow work. CTMX, MGTX, PTCT, GMAB, DRUG, CAPR, CLYM, KMTS, and PINK suggest continued appetite for high‑beta biotech and specialty devices where idiosyncratic catalysts can trump macro. On the Consumer side, NATR and WMMVY in staples, SFD in farm products, SN in furnishings, VGNT in auto parts, SGHC in gambling, and LION in entertainment suggest investors are picking spots where pricing power and specific demand trends can offset rate and wage headwinds. That lines up with an earnings season in which consumer spending has held up but become more uneven across categories.
Finally, there is a subtle but important representation from Financials and structure products: EVR, BOKF, OCFC, HUT, CIFR, BCAT, OBDC, UMAC, BCAR, and specialty ETFs like VOT, IVOG, EFIV, GSUS, GRID, URTH, SPYX, SEIS, VCRM, FJAN. Taken together, that group looks like the plumbing of a market that is actively repositioning but not panicking: banks and capital‑markets names where the street can express views on deal activity and credit, plus growth‑tilted and ESG‑tilted wrappers to fine‑tune exposures around the core SPY/QQQ positions we saw in the aggregate‑flow dashboards.
So the emergent theme set is pretty clean. Under a neutral but fragile macro regime with a hawkish‑leaning Fed, expensive mega‑cap growth, and firming commodity prices, real money is leaning into hard‑asset cyclicals, infrastructure, and second‑tier AI and crypto plays, while using a mix of factor and outcome‑oriented vehicles to shape risk around the index. It is still a risk‑on tape, but it is one where the easiest beta has already been harvested; the TRV list is telling you that the next leg of opportunity is shifting toward cash‑flow‑linked, supply‑constrained, and idiosyncratically catalyst‑rich names rather than another straight line up in the same seven tickers.
VL Institutional Outliers™ (IO)
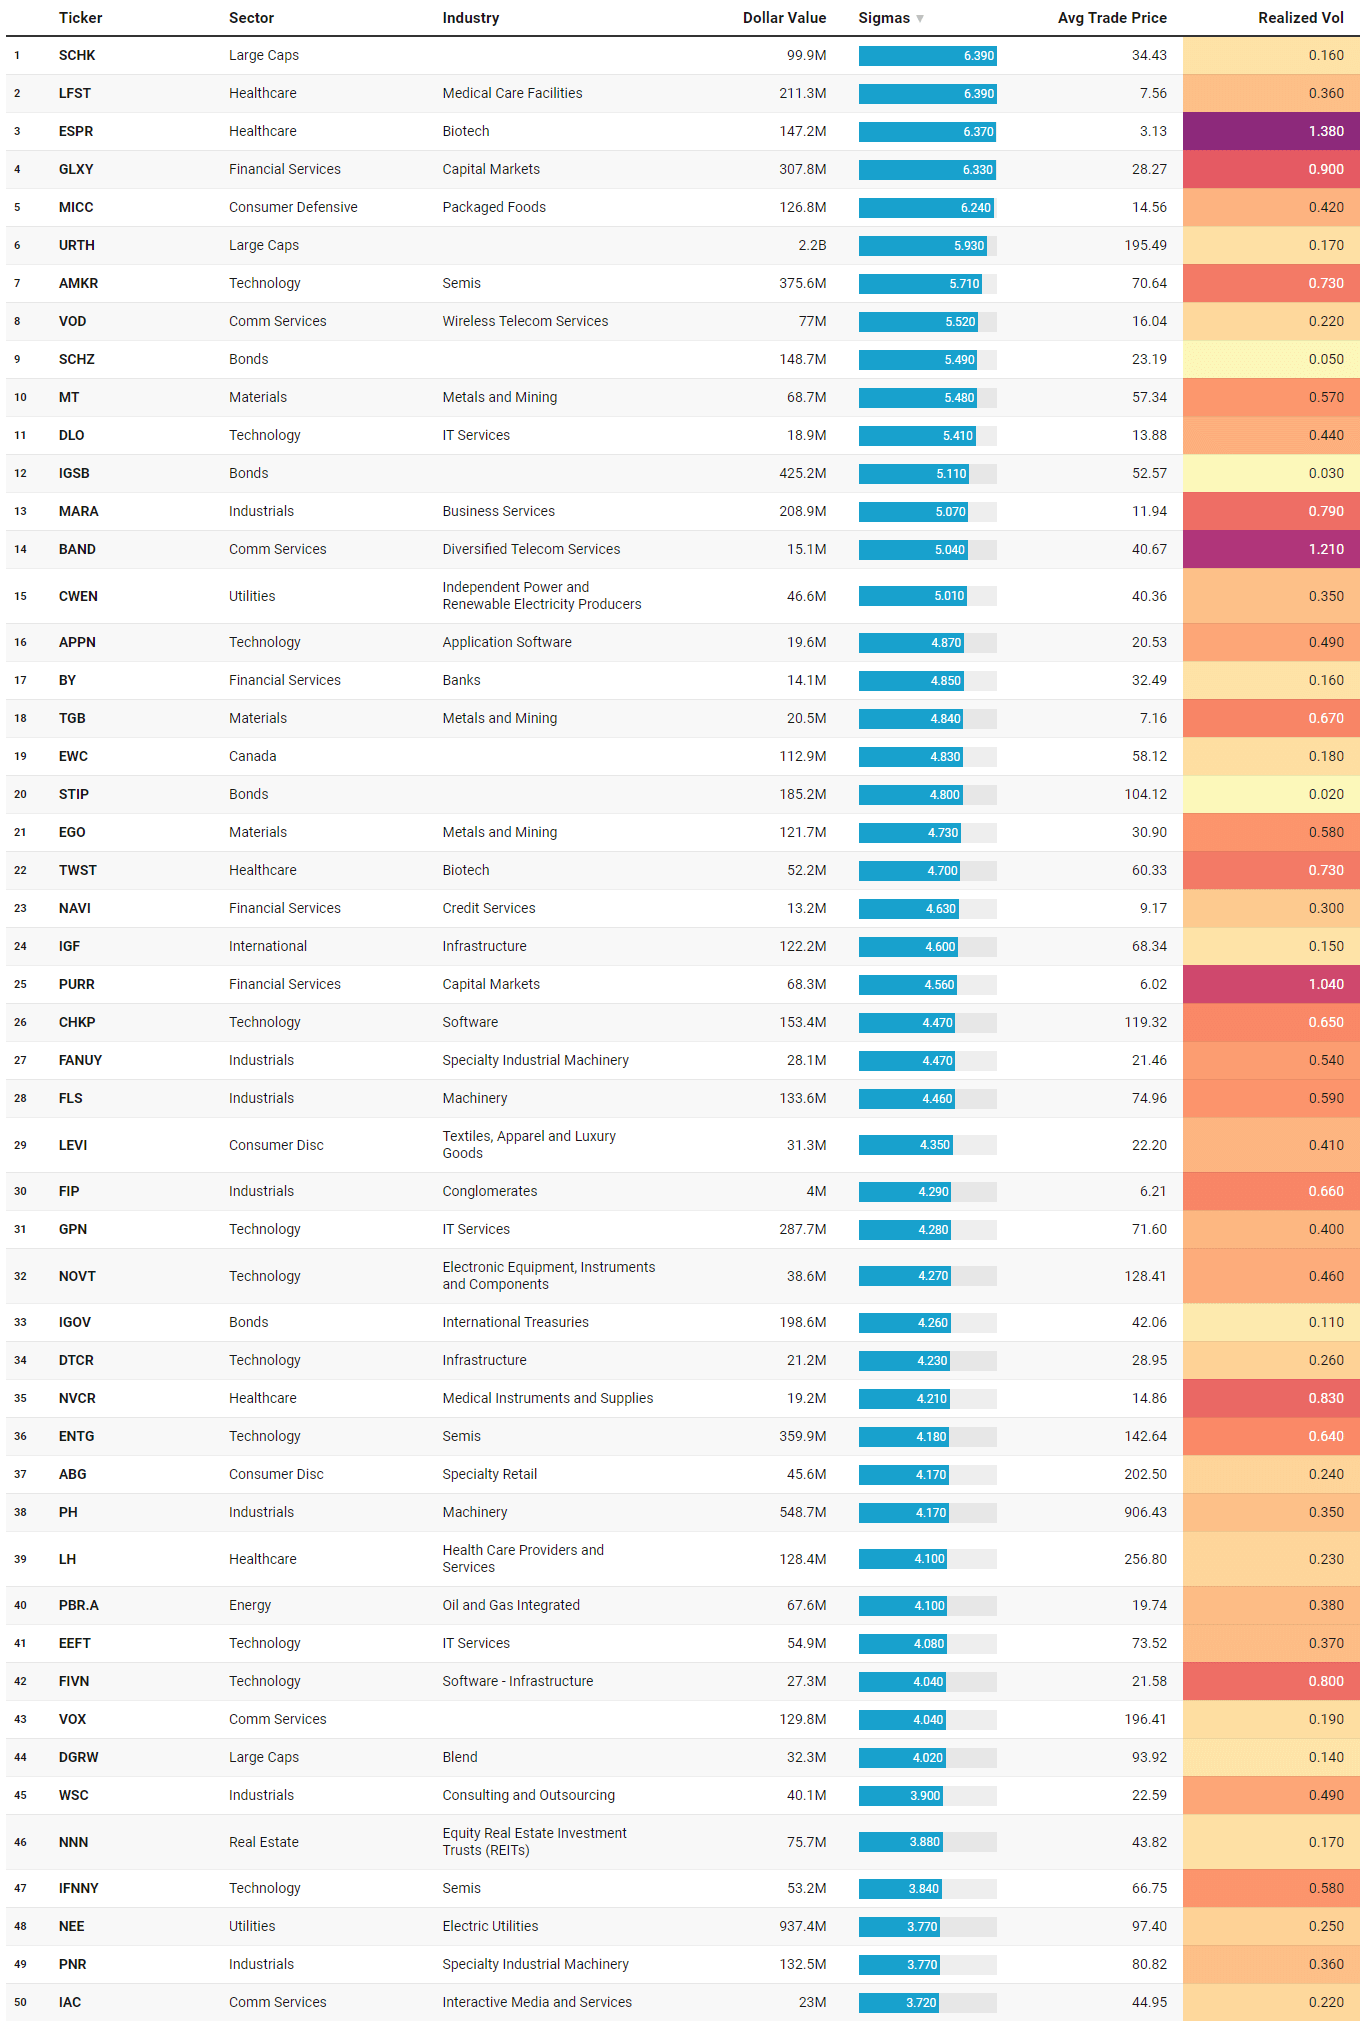
Institutional Outliers is a proprietary metric designed to spotlight trades that significantly exceed a stock’s recent institutional activity—specifically in terms of dollar volume. By comparing current trade size against each security's recent normalized history, the metric flags outlier events that may indicate sudden institutional interest but may be missed because the activity doesn’t raise any flags/alerts when comparing the activity against the ticker’s entire history. For example, it’s conceivable that a ticker today receives the largest trade it has had in the last 6 months but the trade is unranked and would therefore be missed by current alerts built off Trade Ranks. Day traders can use “Realized Vol” to identify tickers that are moving swiftly with large price displacement while others can use it to size your risk appropriately.
If the TRV list told us where smart money is quietly building risk, the IO tape is showing you where it is swinging hard, either to grab exposure or to get out of the way. The common thread this week is targeted aggression in very specific themes: restructuring stories in Healthcare and Financials, real‑asset and income proxies, and a dense cluster of semiconductor and infrastructure names tied into the same AI and capex regime we have been talking about. With the Fed holding rates steady and signaling no urgency to cut, but also acknowledging rising internal dissent, the market is in a “trade around the edges” environment rather than a broad de‑risk. Oil and commodities have firmed, high‑yield spreads are being watched more closely, and mega‑cap earnings are forcing investors to pick winners and losers instead of buying the whole complex.
Start with Healthcare, which is unusually prominent at the top of the outlier list. ESPR prints roughly $147m with a 6.37‑sigma surge in activity at an average price just above 3, and TWST, AXSM, PRAX, NVCR, MMSI, GKOS, THC, HSIC, LH, QGEN and others all show elevated sigma scores with respectable dollar values. That combination points to event‑driven repricing: binary biotech outcomes, reimbursement or clinical updates, and in THC and LH’s case, shifting expectations around procedure volumes and managed‑care dynamics. Realized vol across most of these names is elevated but not chaotic, which is exactly what you would expect when institutions are leaning into or away from fundamental catalysts rather than simply panic‑trading the tape.
Financials and income vehicles form the second large cluster. GLXY, a capital‑markets name with heavy crypto exposure, sees more than $300m at 6.33 sigmas, while NAVI, BY, BMA, BN, PDI and PURR all print above 2.2 sigmas. Layer in the big flows in value and dividend‑tilted large‑cap ETFs like DGRW, IUSV, VOOG and URTH, plus a run of bond products – IGOV, SCHI, SCHR, IGSB, STIP, USFR, XLY‑adjacent consumer baskets – and you get a picture of allocators actively recalibrating rate and credit risk. When the Fed pushes cuts further out and inflation risks re‑price higher, you tend to see this sort of barbell: some investors rotate toward quality value and dividend growth, others use IG and inflation‑linked ETFs to fine‑tune duration, and tactical desks trade around capital‑markets names that are sensitive to liquidity and spreads.
Semiconductors and broader tech infrastructure are another standout theme. AMKR and ENTG both post enormous dollar values – roughly $376m and $240m on May 1, and ~$360m on April 30 for ENTG – with sigmas north of 2.2 and realized vol that is elevated but still well‑behaved. AXTI, MXL, AOSL, ONTO, IFNNY and AAPU add to the list, alongside infrastructure and software names like DTCR, GPN, CHKP, DLO, APPN, TEAM, WK and FIVN. This is the “picks and shovels” companion to the mega‑cap AI flows we saw in the broader dashboards: as the street digests another round of AI‑heavy earnings from NVDA, Microsoft, Amazon and Alphabet, it is making outsized, idiosyncratic bets along the supply chain – packaging, specialty materials, test equipment, and the software rails that sit on top. The volatility profile here – meaningful but not explosive – suggests repositioning and accumulation, not liquidation.
Real assets and hard‑asset proxies show up again in the IO tape, but with a different flavor than the TRV list. On the metals and mining side, SIL, BAR, MT, TGB and EGO all register 2+ sigmas of activity, while PH, PNR, FLS, SITE and RYCEY in Industrials, plus IDU, FE, NEE, CWEN and BIPC in Utilities, speak to a renewed focus on infrastructure, grid reliability and industrial capacity. These flows line up cleanly with the macro backdrop of higher energy prices, elevated geopolitical risk, and continued government incentives for infrastructure and clean energy projects.
Then there is the idiosyncratic tape. CVNA trades a massive ~$625m at 3.47 sigmas with realized vol under 0.6, which is exactly what a high‑short‑interest, post‑turnaround story looks like when institutions are actively battling over the next leg. GME’s ~$93m at 2.07 sigmas and DOO, LEVI, ABG, RRR and XLY itself reinforce that the speculative corner of Consumer Discretionary is still alive, but in a far more selective way than the meme era; realized vol is elevated but not unhinged, suggesting real money is involved alongside retail. Regional and international tilts round things out: EPU and EWC in Peru and Canada, IGF in global infrastructure, VOX and VOD in Communications, TLK and ROKU in content and distribution. Those flows reflect investors leaning into markets and industries with direct leverage to commodities, infrastructure or specific regulatory regimes, again consistent with a world that is paying attention to supply and policy rather than just index beta.
Put together, the IO list says this: institutions are not de‑risking the whole book; they are dramatically re‑sizing very specific names and sleeves. Healthcare and biotech, semis and infrastructure, quality value and bond proxies, and hard‑asset plays are where the biggest deviations from “normal” activity are happening. That fits the broader narrative of a market that can support risk but is increasingly unforgiving: capital is willing to be bold, but only where the story, the flow regime and the macro backdrop line up.
VL Sector Leaders & Losers
VL Sector Leaders is a weekly snapshot of where true leadership is asserting itself inside the market, stripped of the distortions that come from broad, style-mixed indices. Rather than asking which stocks look strong in absolute terms, this list focuses on which names are outperforming within the environments they actually compete in.
Each week, we surface the ten stocks demonstrating the most persistent relative strength inside their respective sectors. These are not headline chasers or one-day wonders. They are names that continue to separate themselves from peers through real price behavior, often reflecting sustained demand rather than fleeting attention.
For day traders, this list is a powerful awareness tool. Sector Leaders tend to offer cleaner intraday structure, better follow-through, and more predictable reactions around key levels because they already sit on the right side of relative strength. Even on choppy tape, leadership names often remain tradeable while the rest of the market degrades.
For swing traders, VL Sector Leaders helps narrow the universe to stocks with the highest probability of staying relevant. Relative leaders are more likely to hold trends, survive pullbacks, and reassert themselves after consolidation. When markets rotate, these names are often among the first to resume leadership — or the last to break.
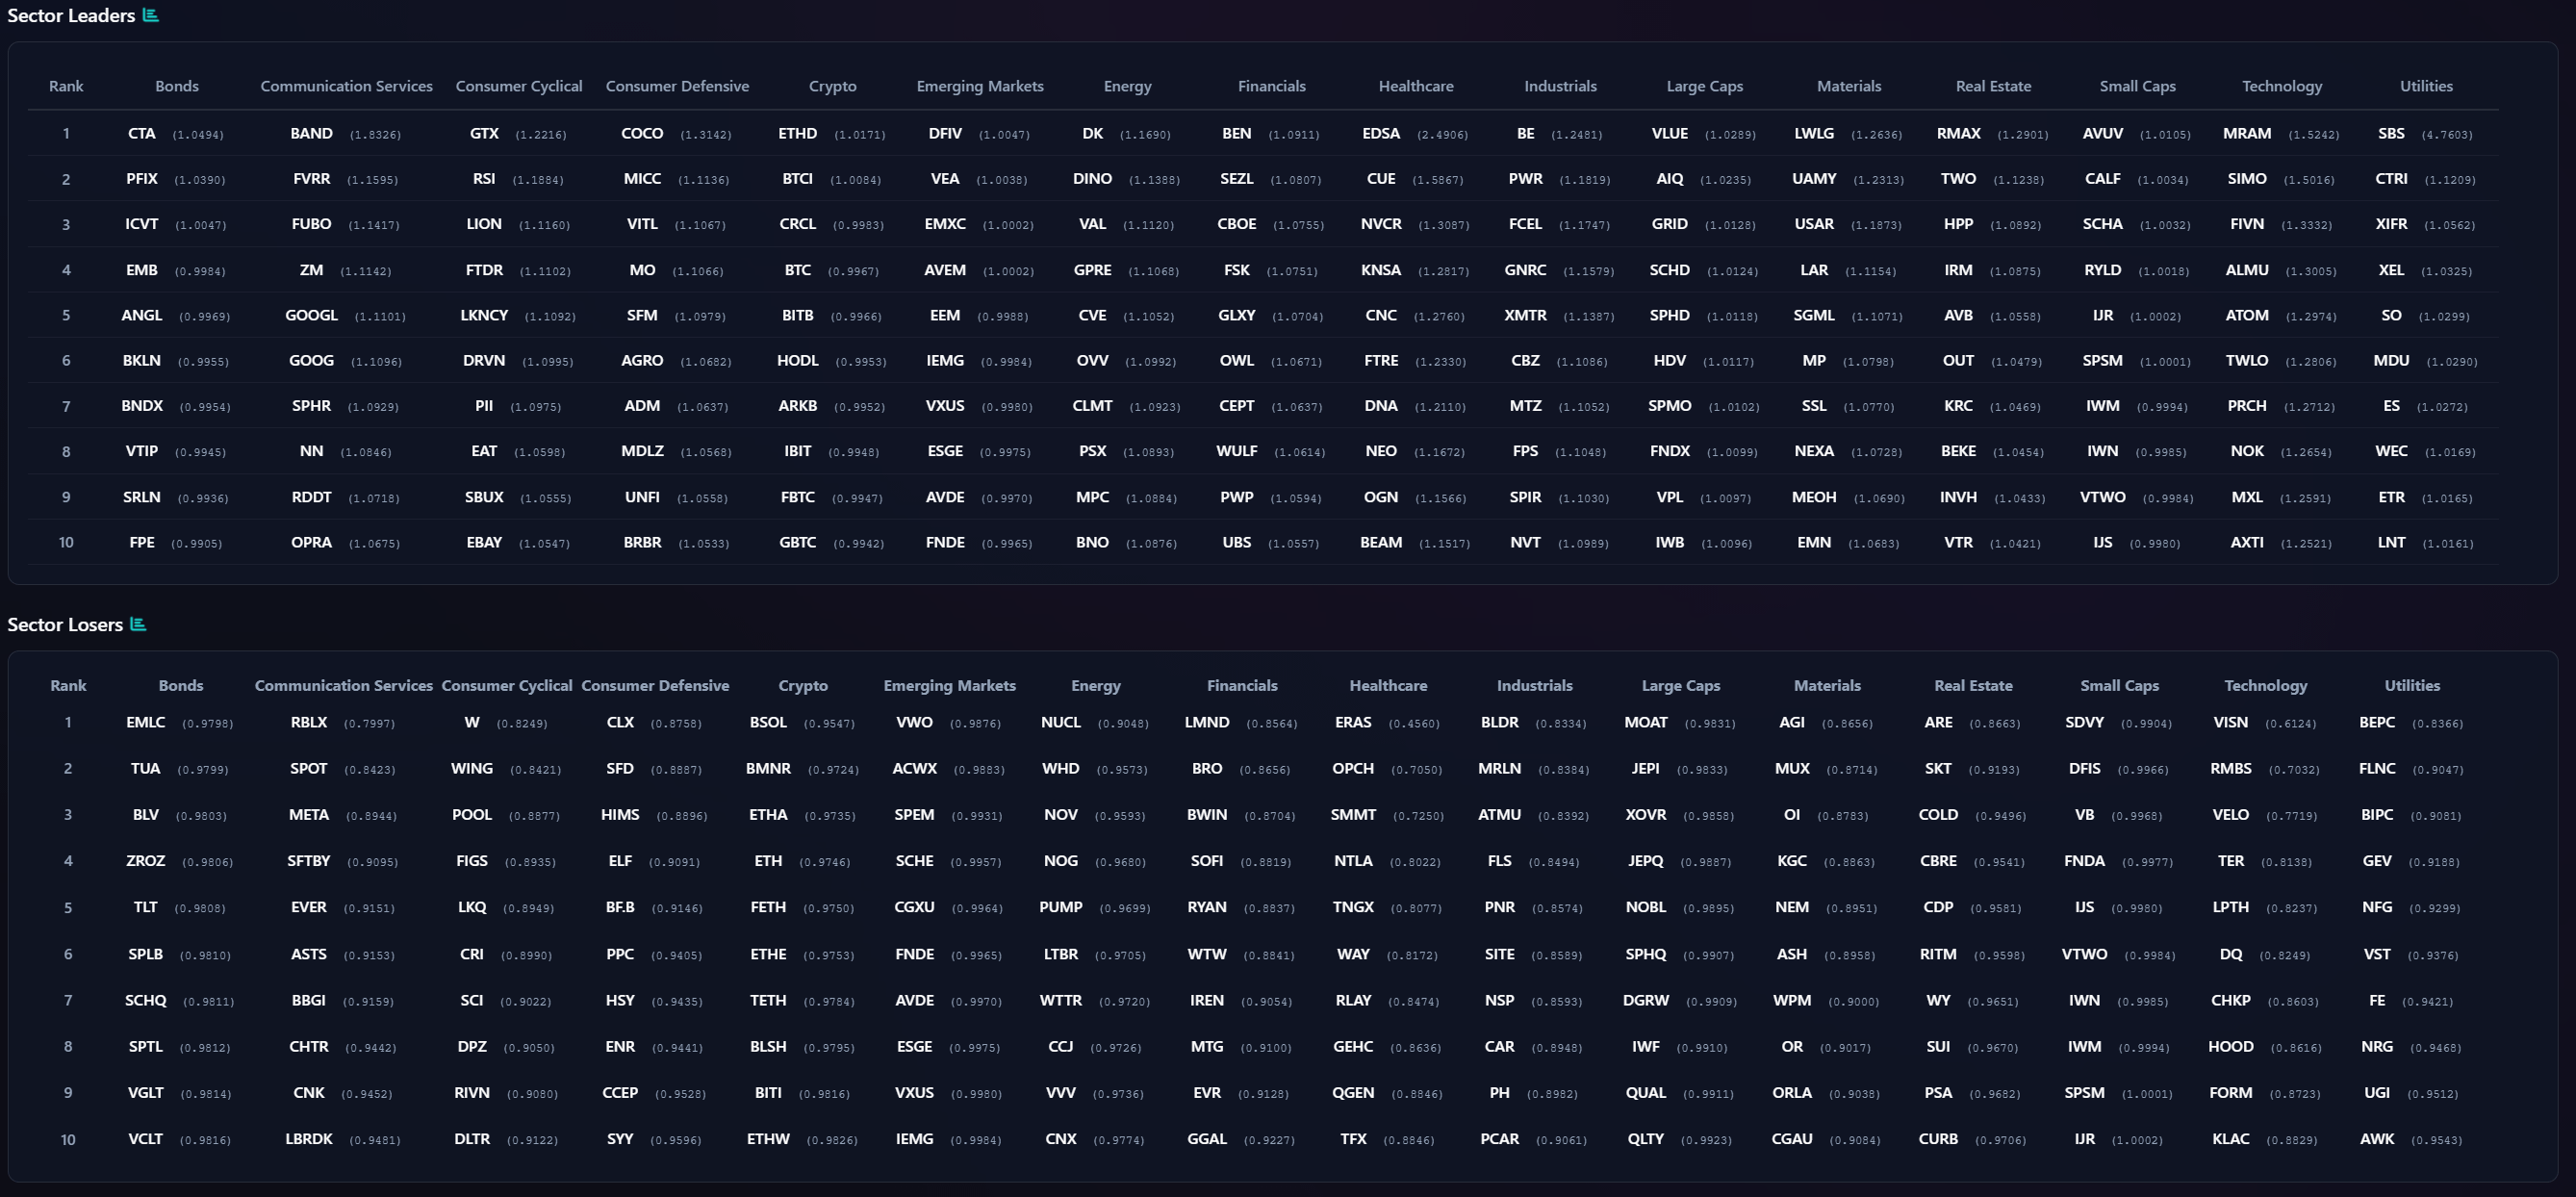
The leaders and losers grids line up almost perfectly with the regime we have been mapping out from the flow work and the TRV and IO lists. The tape is not arguing about the index direction so much as it is sorting winners and losers inside each sleeve, with capital rewarding real cash‑flow stories, hard‑asset leverage, and niche growth, while fading the expensive, crowded, or structurally challenged ends of the spectrum. This is what a neutral‑to‑fragile environment looks like when investors still want exposure but are no longer willing to own “the sector” uncritically after the Fed just made clear that cuts are a 2027 story at best and high‑frequency data keep inflation risk alive.
On the leadership side, a few patterns jump out. In Communication Services, BAND, FVRR, FUBO, ZM, GOOGL and GOOG sit in the leader column, while RBLX, SPOT, META, SFTBY and a handful of ad‑ and entertainment‑centric names populate the losers. That split says the market is rewarding selective exposure to communication infrastructure, niche platforms and profitable search while punishing the higher‑beta, engagement‑driven and ad‑cycle‑sensitive names. Against the backdrop of mega‑cap earnings where the street applauded disciplined AI and cloud spend but questioned ad‑centric volatility, that bifurcation makes sense.
Consumer Cyclical and Defensive tell a similar story of selectivity. On the cyclical side, GTX, RSI, LION, FTDR and LKQ are on the front foot, while W, WING, POOL, FIGS and CRI sit in the penalty box. That is effectively a tilt toward auto‑adjacent, services and value plays and away from high‑beta e‑comm, discretionary big‑ticket and fashion names. In Consumer Defensive, COCO, MICC, VITL, MO, SFM and AGRO lead, while CLX, SFD, HIMS, ELF, BFB and PPC lag. The winners are staples with either pricing power or structural demand, and in some cases agricultural exposure, which maps cleanly to an inflationary backdrop with food and energy re‑accelerating. Investors are saying they will still pay for defensiveness and cash generation, but not for every household name indiscriminately.
Crypto, Emerging Markets and Energy also show a clear two‑way tape. On the crypto side, ETHD, BTCI, CRCL, BITB and HODL sit in leaders while BSOL and BMNR show up as sector losers, a neat echo of what we saw on the TRV and IO lists: flows favor more institutionally palatable structures and diversified exposures over the pure‑beta, levered performers. In Emerging Markets, DFIV, VEA, IEMG and VXUS lead while VWO, ACWX and SPEM lag, which is basically a tilt toward developed‑ex‑US and quality‑tilted EM over generic beta. In Energy, DK, VEA’s refiners, DINO, AVEM‑linked names and CVE lead, while NUCL, WHD, NOV, NOG and CNX lag, an internal rotation from more speculative or long‑duration energy plays toward integrateds, refiners and names with clearer cash‑return frameworks. That matches a world where crude is firm but investors are more interested in free cash flow and discipline than pure volume growth.
Financials and Real Estate expose the market’s skepticism about rate‑sensitive balance sheets. On the Financials leader board you see BEN, CBOE, FSK, GLXY, OWL, CEPT, WULF and UBS – asset managers, exchanges, specialty finance and crypto‑adjacent players – while the loser side is packed with LMND, BRO, BWIN, SOFI, RYAN, WTW, IREN, MTG, EVR and GGAL. In other words, capital is gravitating to fee‑based, flow‑linked and structurally advantaged financials while punishing names that are more levered to credit quality, retail lending or speculative growth. That is entirely consistent with a higher‑for‑longer Fed, sticky core inflation and a market increasingly attentive to credit risk. Real Estate shows the same pattern: RMAX, HPP, IRM, AVB, KRC and INVH on the winner list, versus ARE, SKT, COLD, CBRE, RITM and PSA on the loser list. The winners skew toward niche operators and data‑or storage‑linked models; the losers are more exposed to office, rate‑sensitive cap rates, or secularly challenged formats.
Industrials and Materials round out the hard‑asset theme we saw in the TRV and IO sets. BE, PWR, FCEL, GNRC, XMTR, CBZ, MTZ and SPIR lead Industrials, while BLDR, MRLN, ATMU, FLS, PNR, SITE, NSP and PCAR lag. Leaders lean toward energy transition, grid, specialty engineering and mission‑critical equipment, while losers skew to more generic construction, building products and cyclical machinery. In Materials, LWLIG, UAMY, USAR, LAR, SGML, MP, SSL, NEXA and EMN lead, while AGI, MUX, OI, KGC, NEM, ASH, WPM, GORO and CAGU lag. That looks like a rotation toward specialty and niche materials and away from crowded, benchmark gold majors, which fits with the idea that gold and metals are being used as targeted hedges and carry trades, not simply chased in size.
Finally, Technology and Small Caps confirm the broader message of selectivity. On the Tech leader side, MRAM, SIMO, FIVN, ALMU, ATOM, TWLO, PRCH, NOK, MXL and AXTI show up – a mix of specialty semis, storage, infrastructure software and turnaround communications equipment. Losers, by contrast, include VISN, RMBS, VELO, TER, LPTH, DQ, CHKP, HOOD, FORM and KLAC – either richly valued leaders that ran hard into the AI narrative or structurally challenged platforms. Small‑cap leaders like AVUV, CALF, HPP, RYLD, UR, SPSM and IJS are value and quality tilts, while losers like SDVY, DFIS, VB, FNDA, IUS, VTWO, IWM and IJT are broad beta and higher‑beta factor products. In other words, even within the riskier parts of the market, the tape is rewarding diversification, cash flow and factor efficiency rather than pure small‑cap beta.
Taken together, the Sector Leaders and Losers lists reinforce the same through‑line we have been hammering: this is a market that still rewards risk, but only when it is backed by cash flows, real assets, or structural edges. Leadership is narrow, internally bifurcated and consistent with a higher‑for‑longer, commodity‑aware macro; weakness is concentrated in rate‑sensitive balance sheets, crowded growth winners and undifferentiated beta.
MIR Part 3: Framing-Up A Trade
This week’s institutional tape is giving you permission to take risk, but only if you are choosy about where and how. The macro backdrop is clear enough: the Fed just held rates steady and pushed back against near‑term cut expectations, with rising internal dissent but no sign of easing into 2026. At the same time, crude and other commodities have firmed, re‑injecting inflation risk into the conversation. Earnings out of mega‑cap tech were strong but nuanced, with investors cheering AI revenue and side‑eyeing capex budgets. Against that backdrop, our flow dashboards, TRV/IO watchlists, and sector leaders/losers all told the same story: capital still wants growth and AI, but it is steadily rotating toward hard assets, infrastructure and quality income, and punishing rate‑sensitive balance sheets and lazy, undifferentiated beta.
Framing up positioning for the coming week off that information set, as always, we need to think in sleeves rather than single trades. The goal is alignment: own what the tape is rewarding, avoid or underweight what it is fading, and use defensives and fixed income as buffers rather than hiding places. Here is what that looks like this week.
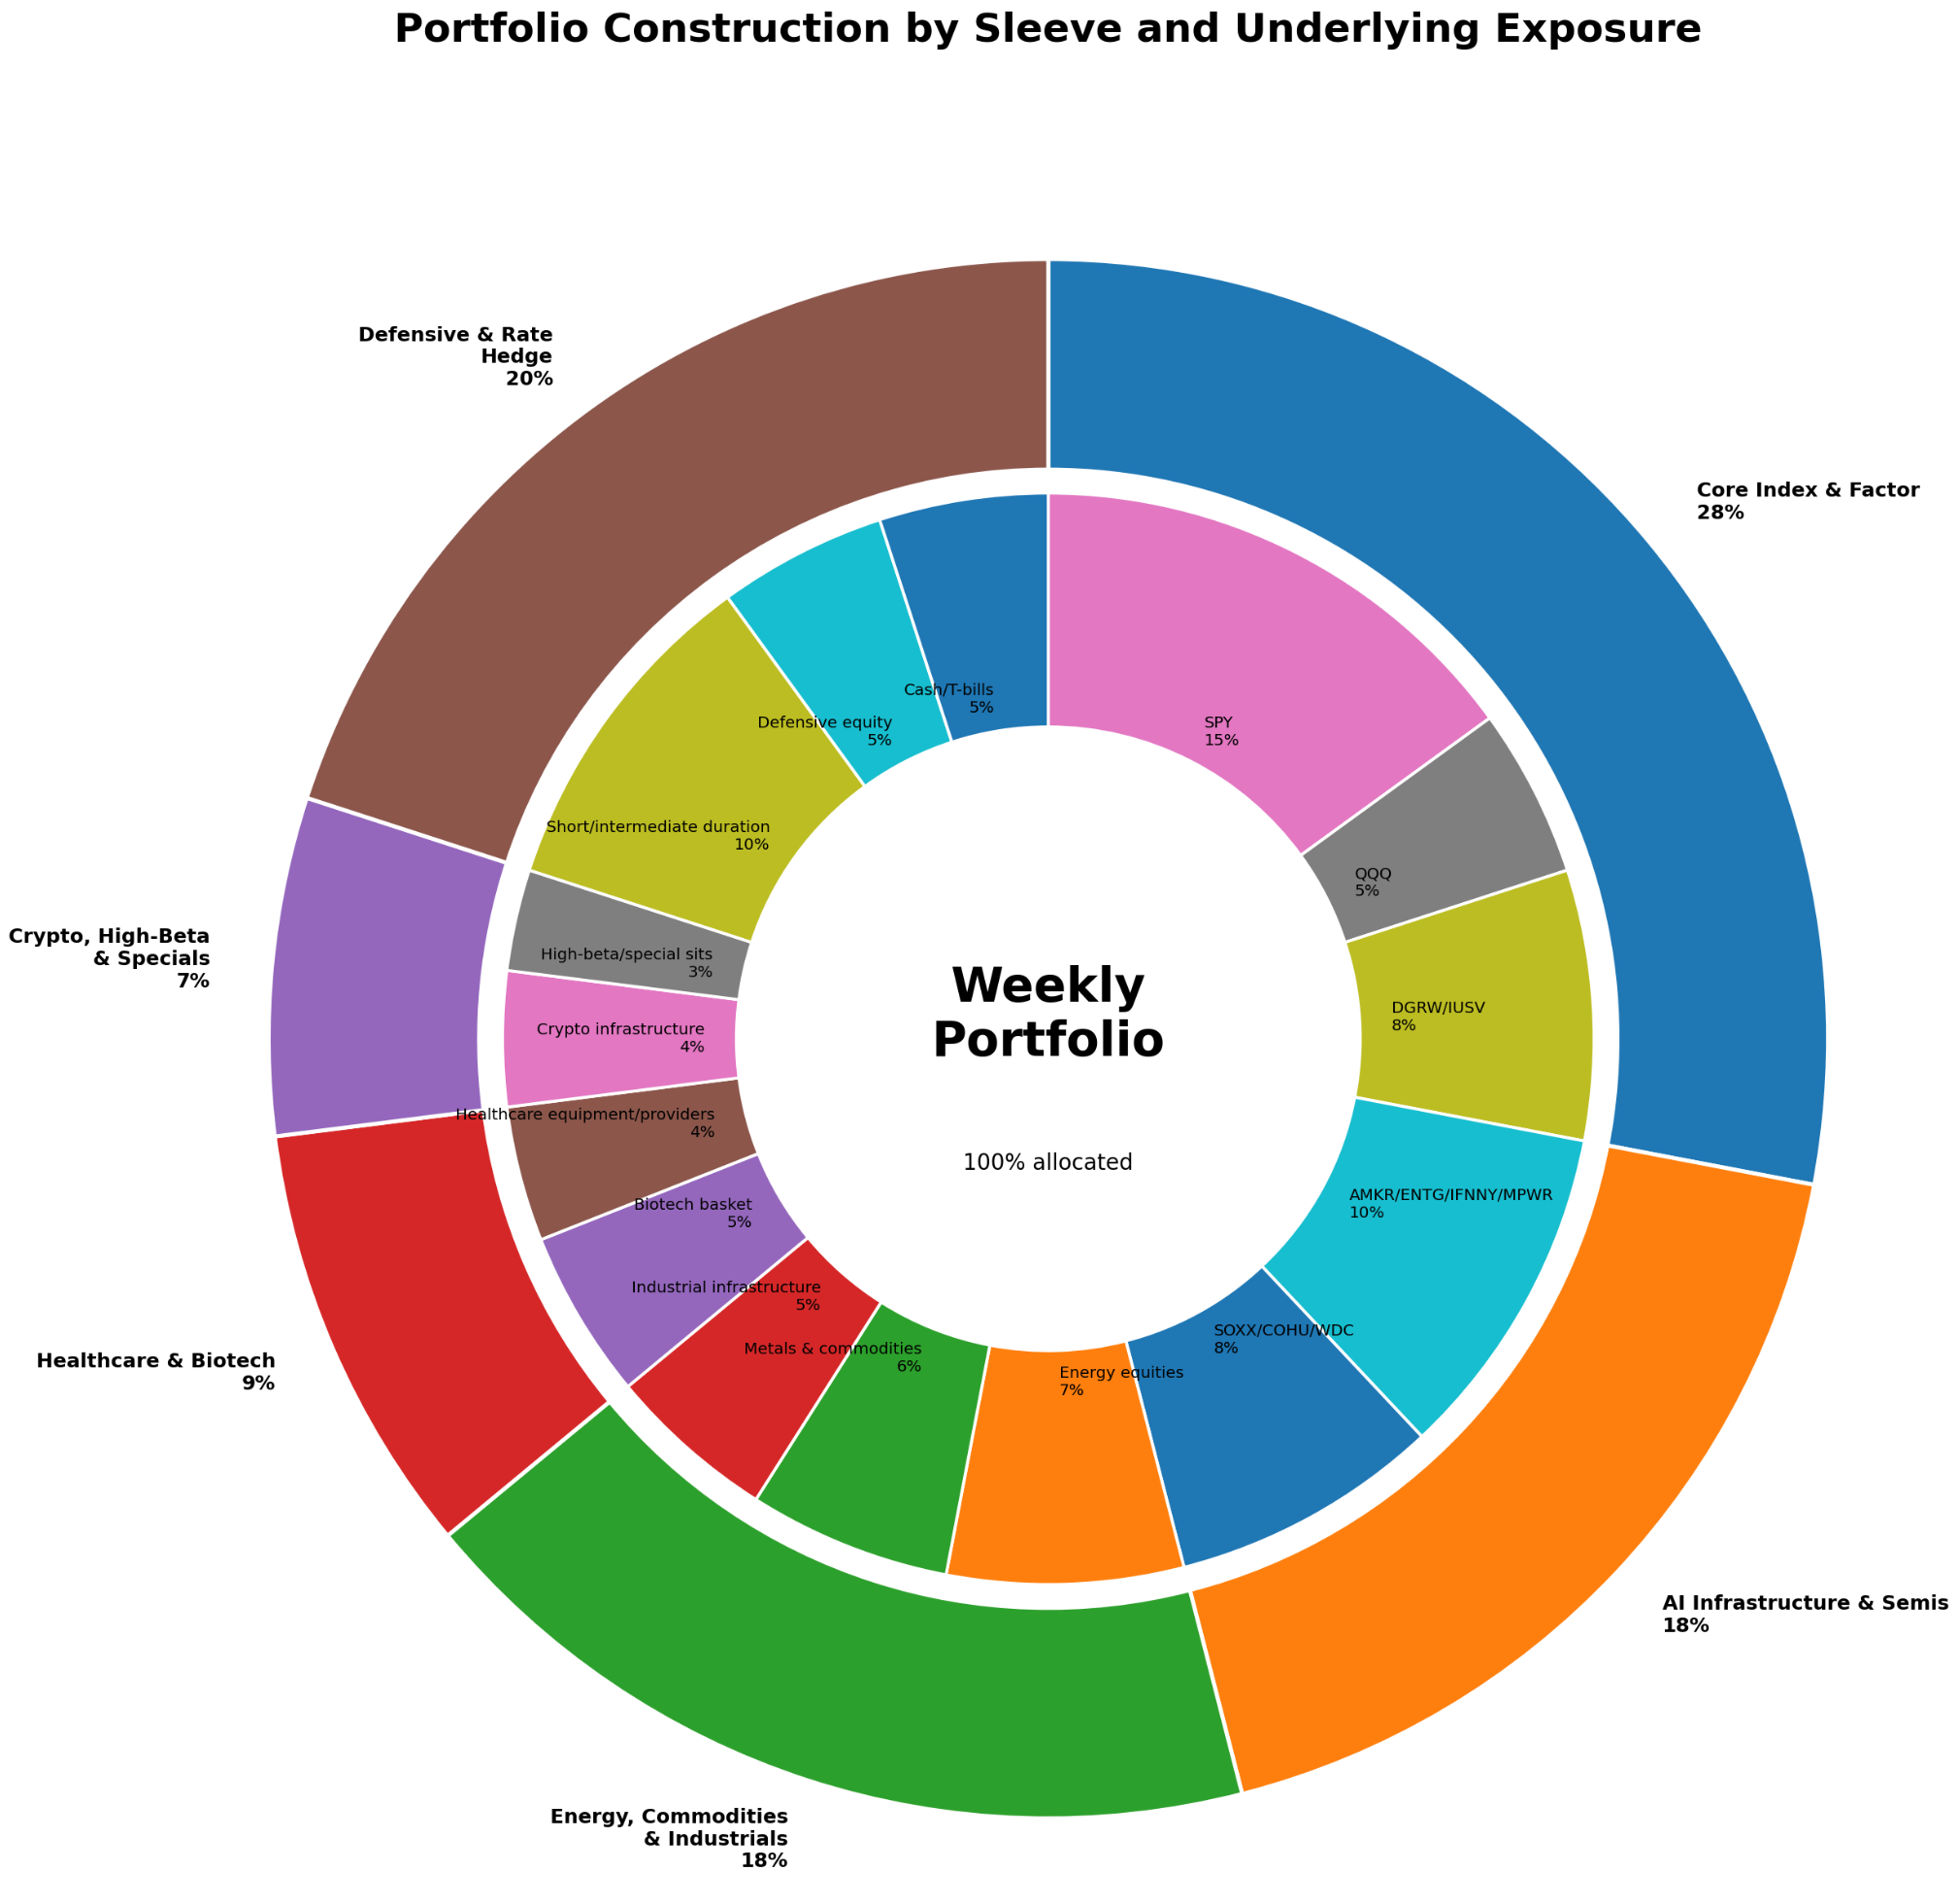
First, a core index and factor sleeve at 28%. This is the spine of the book. I want to stay involved in US risk via about 15% in SPY and 5% in QQQ, mirroring where the largest and most stable institutional flows are going in both lit and dark venues. These vehicles saw tens of billions of dollars in aggregate flow and dark‑pool activity this week, which tells you they remain the primary tools for asset‑allocation desks. Layer another 8% into factor tilts like DGRW and IUSV, which showed up as institutional outliers and give you a quality‑dividend and value bias that fits a higher‑for‑longer regime where cash flows and balance sheets matter more than pure duration.
Next, an 18% AI infrastructure and semis sleeve. The point here is not to chase NVDA’s headline tape; it is to own the plumbing underneath the AI capex boom that our IO and TRV lists highlighted. Names like AMKR, ENTG, IFNNY, MPWR, COHU, and WDC all saw outsized institutional activity with controlled realized vol, signaling accumulation and active positioning rather than liquidation. I would allocate roughly 10% across a basket of AMKR, ENTG, IFNNY, MPWR and one or two peers, and another 8% into broader semi and infrastructure exposure via SOXX plus select hardware names like COHU or WDC. That keeps you levered to the AI build‑out theme that mega‑cap earnings just reinforced, but distributes risk across the supply chain instead of stacking it all into one crowded ticker.
Then an 18% sleeve dedicated to Energy, commodities and industrials – effectively the “hard assets and real economy” expression. TRV and IO both surfaced oilfield services (AESI, FLOC, SEI), E&Ps (HPK, GRNT, BKV, BTE), and midstream (DTM), alongside gold and silver miners and commodity wrappers like GOLD, SIL, BAR and COMB. At the same time, sector leaders favored refiners and integrated oils over more speculative producers, and macro data showed oil and refined product prices pushing higher. I would run about 7% across energy equities – an XLE core with satellite positions in a couple of the better‑quality E&Ps or service names from the list – 6% across precious metals and broad commodities via GOLD, SIL, BAR and COMB, and 5% in industrial infrastructure and machinery plays like FANUY, PH, FLS and PNR, which all printed significant institutional outlier activity. This sleeve gives you both an inflation hedge and exposure to capital‑expenditure and reshoring themes that the tape is quietly rewarding.
Healthcare and biotech deserve their own sleeve at 9%. The IO list was stacked with Healthcare outliers – ESPR, TWST, AXSM, PRAX, CTMX, MGTX, PTCT, THC, MMSI, HSIC, GKOS, LH and others – and sector flows showed the group gaining traction as investors looked for idiosyncratic growth that is less tethered to the rate path. I would allocate about 5% to a diversified biotech basket using 6–8 of the more liquid, event‑rich names (for example ESPR, TWST, AXSM, PRAX, PTCT, CTMX), and 4% to steadier healthcare equipment and provider names like THC, MMSI, HSIC, GKOS and perhaps LH. The goal here is not to trade every headline, but to own a portfolio of names where institutional attention and catalysts align, sized so that a blow‑up does not define your week but a string of positive surprises can move the needle.
A 7% sleeve goes to crypto, high‑beta and special situations – the “torque bucket.” Crypto‑linked names such as GLXY, HUT, CIFR and ETF structures like DAPP and BSOL showed up across TRV, IO and sector grids, while high‑beta consumer names like CVNA and GME saw huge outlier prints with manageable realized vol. That tells you there is still real money playing in these corners, but with more discipline than in the meme era. I would commit about 4% to a basket of crypto and infrastructure exposures (GLXY, HUT or CIFR plus one liquid ETF), and 3% to a mix of CVNA, GME or a discretionary ETF with embedded torque. This sleeve is explicitly tactical: you expect to trade around these names, not marry them, and you are being paid in volatility and potential gap moves for the risk.
Finally, a 20% defensive and rate‑sensitive hedge sleeve holds the whole construct together. Outlier activity and sweeps in bond ETFs like IGOV, SCHZ, IGSB, SCHI, SCHR, STIP and USFR, plus Utilities and defensive sector funds like IDU and FE, tell you that institutions are actively managing duration and hedging inflation rather than going all‑in on long bonds. I would park about 10% in a mix of short‑ to intermediate‑duration and inflation‑linked ETFs such as USFR, SCHR and STIP, giving you ballast and some protection if inflation prints hot or the Fed leans more hawkish. Another 5% goes into defensive equity sectors that our sector leaders/losers grids show as relatively stable – a combination of Utilities and Healthcare ETFs or names like NEE, FE and IDU. The last 5% I would keep as cash or very short‑term bills. In a regime where macro data, policy headlines and single‑name events are all capable of moving markets quickly, dry powder is not a lack of conviction; it is optionality.
Net‑net, this construction keeps you long risk in the parts of the market that the institutional tape is clearly endorsing – AI infrastructure, hard assets, selective Healthcare, and quality factor tilts – while funding and hedging that risk with duration‑aware fixed income, defensives, and modest allocations to high‑beta and crypto where the upside justifies the noise. It respects the idea that we are in a neutral‑to‑fragile environment rather than a clean bull or bear: you are not betting on a Fed pivot or a collapse in growth, you are betting that thoughtful alignment with flows and fundamentals will matter more than ever as the easy beta phase of this cycle gives way to a more selective, idiosyncratic tape.
Good luck this week, VL Crew!
Thank you for being part of this community and for investing your time in this week’s edition. The quality of this readership — thoughtful, disciplined, engaged — is what makes this work meaningful. I’m grateful to build alongside you. Here’s to a week of clarity, conviction, and well-executed opportunities.
— VolumeLeaders