Market Momentum: Your Weekly Financial Forecast & Market Prep
Issue 88 / What to expect April 27, 2026 thru May 01, 2026


Weekly Market-On-Close Report
U.S. equities just printed another week of record closes, but the “why” behind the move is more interesting than the price action itself. We are watching a market that is juggling a historic oil shock, a hot AI‑driven capex cycle, and fragile Middle East diplomacy, and somehow still grinding higher on the back of earnings strength and persistent tech leadership. The surface looks like a textbook soft landing. The underlying drivers are anything but simple.
If you only glanced at the headline indices, you would assume we were in a clean, low‑drama expansion. The S&P 500 has pushed to fresh highs and the Nasdaq has strung together multiple winning weeks, powered mainly by technology and communication services, while the Dow has lagged a bit. The broad U.S. market has now notched several consecutive weeks of gains, helped by some easing in Middle East tensions, an earnings season that is coming in better than feared, and economic data that remain broadly supportive rather than recessionary. Some strategists are even pointing out that this has been one of the fastest rebounds back to new highs after an 8‑plus percent drawdown in the past half‑century. On the surface, that sounds like a classic “wall of worry” bull market. Underneath, though, there is a clear tension between the geopolitical tape and what companies are actually reporting.
At the macro level, the conflict involving Iran and the status of the Strait of Hormuz has become a kind of axis around which everything else rotates. Desk commentary has started using a tongue‑in‑cheek framework of “BI” and “AI” – Before Iran and After Iran – to describe how quickly the regime shifted once the crisis escalated. When bombardments were front‑page news and the Strait was effectively shut down, markets reverted to a very familiar playbook: equities sold off, Brent crude ripped higher, and safe‑haven flows rotated into the dollar and gold. Oil briefly flirted with triple‑digit prices and then spiked as high as the 120 area before reversing, while bond markets struggled to decide whether to treat Treasuries as an inflation hedge or a risk‑off asset. The underlying reality is that roughly a quarter or more of global petroleum liquids and a large share of LNG traffic normally flows through that waterway, along with crucial fertilizer inputs. That is not the sort of supply shock you shrug off, especially if you are an energy‑importing economy in Europe or Asia.
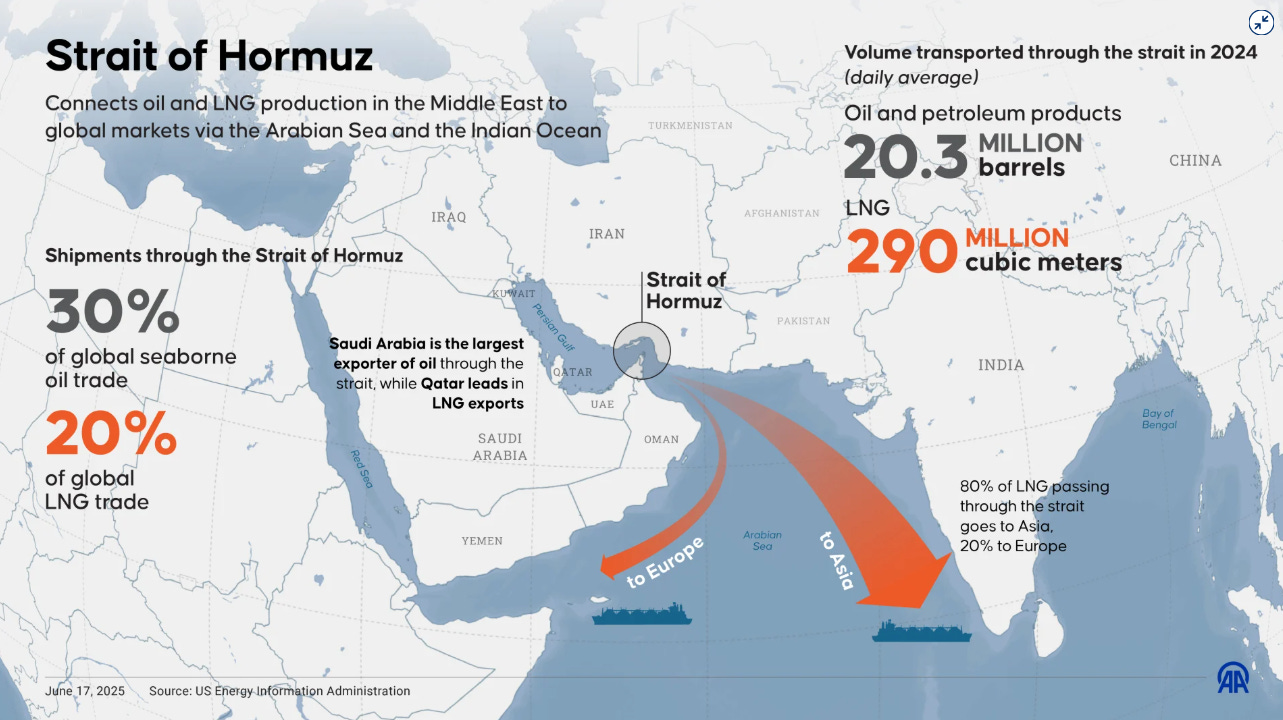
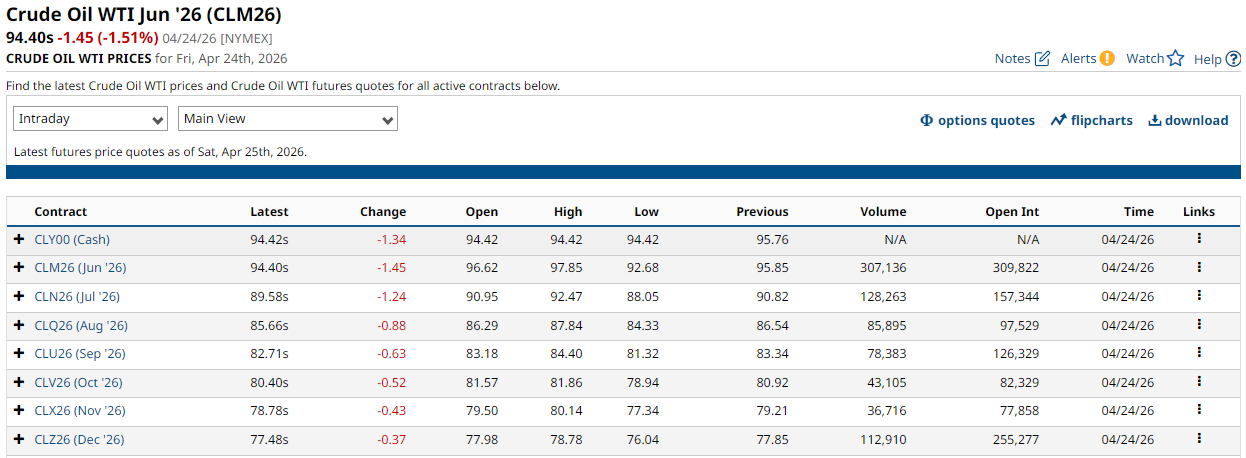
Fast‑forward to late April and the narrative has flipped. Iranian officials have declared the Strait “completely open” for commercial ships under a ceasefire umbrella that includes a U.S.‑brokered truce between Israel and Lebanon. That single development dramatically shifted market psychology. Oil prices rolled over, with benchmarks giving back a large chunk of their panic premium, and bond yields eased as investors marked down the odds of a truly entrenched energy‑driven inflation spike. Crude is still elevated, but futures curves now imply something closer to a mid‑70s trading range into year‑end rather than a prolonged stay in the 100 to 150 dollar zone that had briefly been feared. For now, the worst‑case scenario – a sustained shutdown of the Strait and a multi‑quarter oil shock – has been priced out. That repricing has been a key ingredient in the equity rebound.
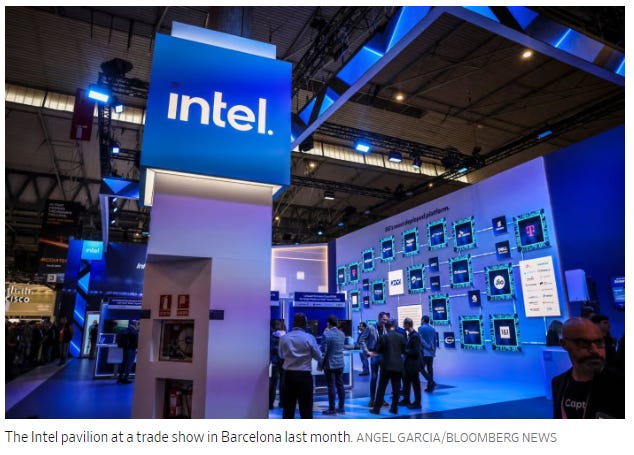
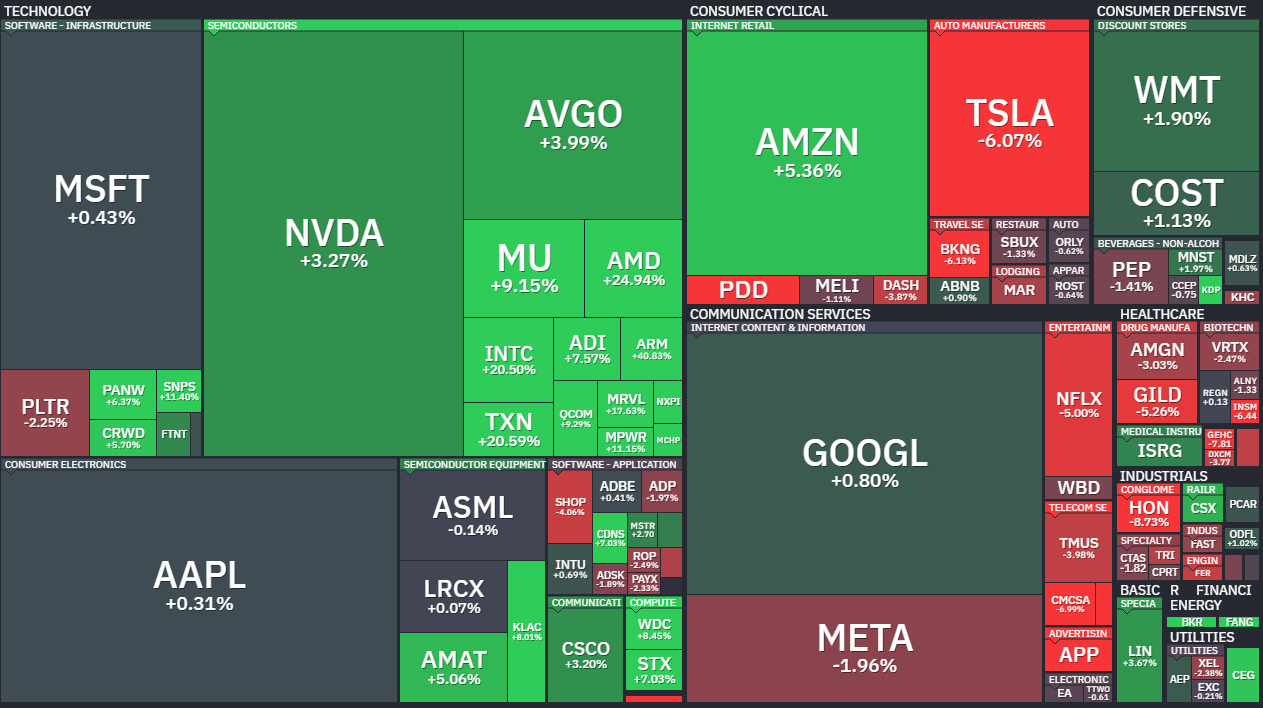
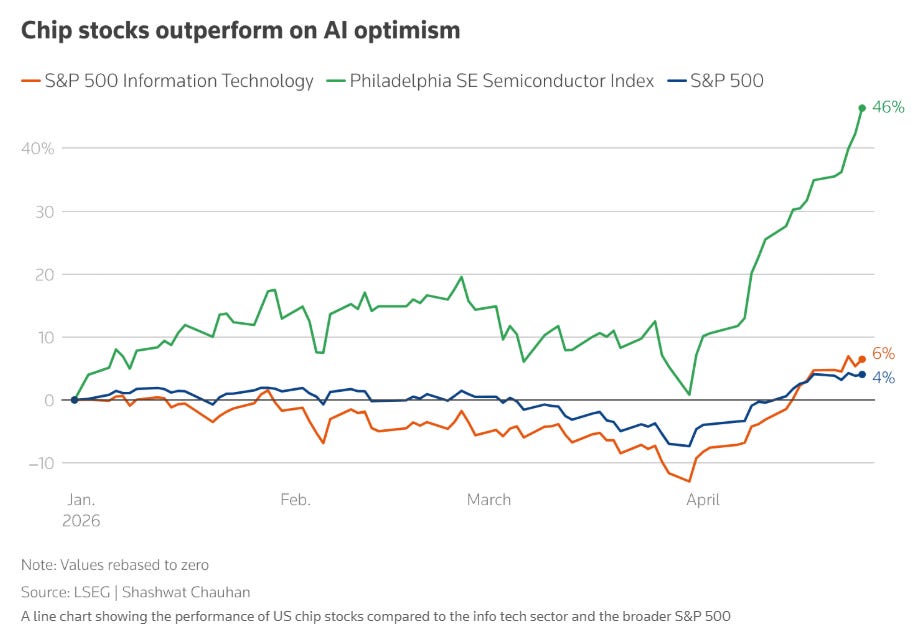
At the same time, the market continues to be pulled forward by one dominant structural theme: AI infrastructure and the semiconductor complex that underpins it. The latest leg higher in the indices was catalyzed by a single catalyst: a remarkably strong forecast from Intel. When Intel issued second‑quarter guidance well above consensus and the stock surged more than twenty percent in a day, it lit a fire under the entire semiconductor space. AMD and ARM both posted double‑digit gains, Qualcomm ripped higher, and equipment and memory names like KLA, Nvidia, Lam Research, Micron, Applied Materials, and ASML all joined the move. Software did not sit out either, with names tied to enterprise workflows and cloud infrastructure adding several percent in a single session.
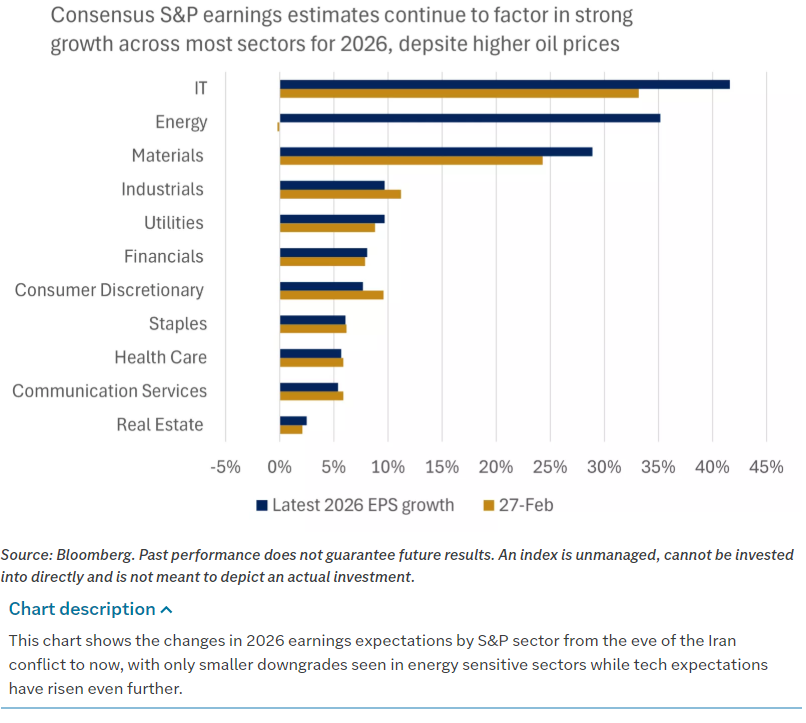
That one day was something like a microcosm of this cycle. Whenever the tape needs a hero, it reaches for semis and whatever is most levered to AI capex. Software rotates between being treated as a potential AI casualty and an AI beneficiary, but the bid has become increasingly selective, favoring companies with clear data‑center, automation, or workflow angles. Mega‑cap tech, for its part, often behaves like a quasi‑defensive: investors hide out in these names when macro headlines get scary because they see them as both growth stories and balance sheet safe havens. Importantly, this is no longer just a handful of mega‑caps carrying the market. Sector‑level earnings revisions have broadened out. Technology is still leading, with expectations for roughly mid‑40s percent earnings growth in the quarter, but energy, materials, and parts of the cyclical complex are also seeing upward revisions. There is mounting evidence that the “other 493” in the S&P 500 are finally starting to participate more meaningfully in the earnings story.
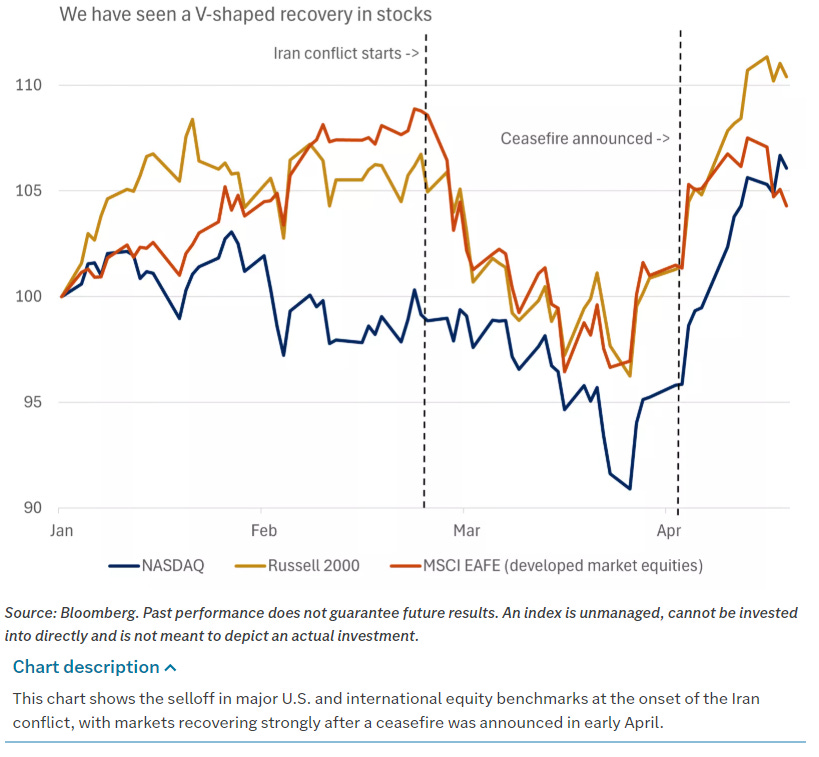
The speed of the rebound from the Iran‑driven selloff has been almost as noteworthy as its size. After an almost‑correction linked to the oil spike and geopolitical panic, the S&P 500 snapped back to new highs in just eleven trading sessions. The consensus explanation is a familiar mix of starting positioning, risk unwinds, and sentiment whiplash. Going into the crisis, portfolios were already tilted defensively. Many large managers had added exposure to staples, utilities, and energy and cut back on cyclicals and high‑beta growth. Hedging activity picked up in index options and macro products. When the worst fears around the Strait did not materialize and ceasefire headlines began to improve, the market was forced to unwind that posture. Hedges were monetized, underweights in tech and cyclicals were covered, and cash on the sidelines chased the rally. The result was a classic V‑shaped pattern that looks, in hindsight, more like a positioning squeeze than a pure macro repricing.
Technically, there are signs that the “easy” part of that squeeze is behind us. The S&P 500 is now starting to respect overhead resistance levels in the low‑7,000s, with multiple open gaps below in the 6,600 to 6,900 region. Momentum indicators, which had flashed deeply overbought during the snapback, are rolling over. Some technical analysts describe the recent advance as a short‑covering rally that is now losing steam. Their own portfolios tell a similar story: after shifting from a low‑volatility stance to fully risk‑on as the market ripped higher, they have started to layer in hedges again as the tape gets stretched. In other words, the big trend is still up, but the risk‑reward over the very near term is no longer as asymmetrically attractive.
All of this is happening against a macro backdrop that, while noisy, continues to look more like a mid‑cycle wobble than a late‑cycle crack. On inflation, the latest producer price data for March came in cooler than feared, especially given the earlier shock in oil. Headline PPI rose moderately month on month, and core PPI, which strips out food and energy, slowed to a minimal increase from the prior reading. Surveys of consumers show one‑year inflation expectations drifting slightly lower, even as longer‑term expectations edge up but remain anchored. That mix is not perfect, but it is very far from an environment where inflation expectations are unmoored.
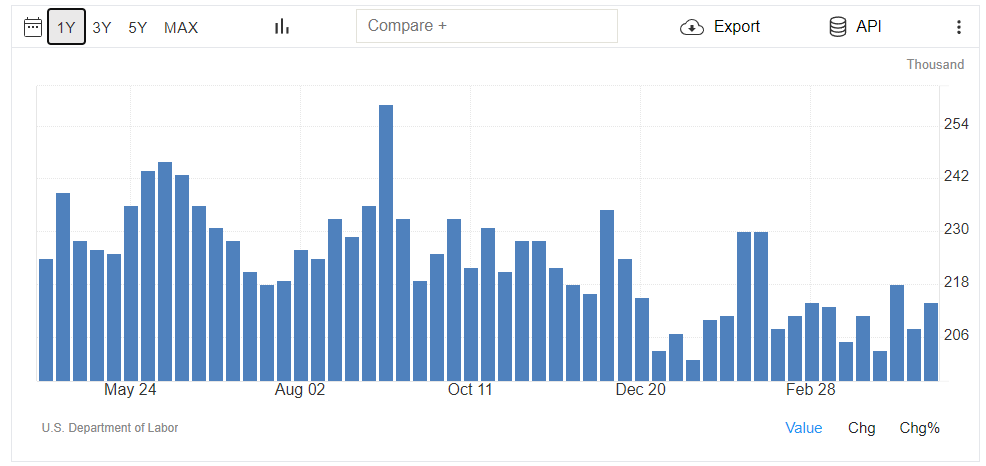
The labor market continues to “bend, not break.” Initial jobless claims are holding near historically low levels, consistent with a still‑tight jobs backdrop. Private payroll data remain steady, and while headline stories about AI‑related layoffs are proliferating, the aggregate numbers do not yet show broad‑based weakness. Growth indicators tell a similar story of uneven resilience. Some regional manufacturing surveys, such as the Philly Fed index, have bounced to their highest levels in well over a year, even though components related to input prices remind us that cost pressures have not disappeared. Housing is one of the more obvious soft spots: existing home sales have slipped and builder sentiment has cooled, pressured by affordability and rates. But again, this looks more like a slow grind than a sudden break.
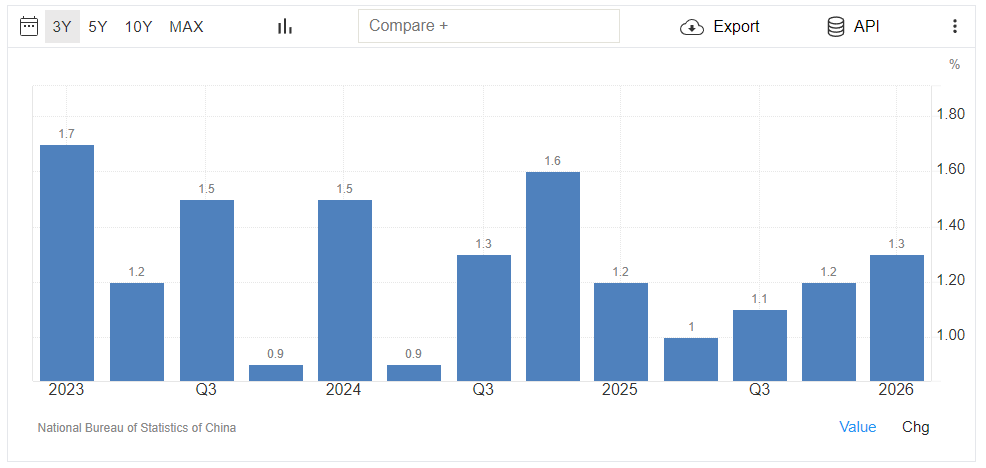
Zooming out globally, the pattern rhymes. European equities have benefitted from the easing in oil and Strait‑related anxiety, with major indices logging solid gains as energy prices eased back from their extremes. The European Central Bank is signaling that it is in no rush to tighten the screws further, even as the region remains exposed to higher imported energy and input costs. Japan’s market continues to hover near record territory, buoyed by corporate reforms and the same AI enthusiasm that is powering U.S. semis, though surveys show that manufacturers remain wary after the recent energy shock. China’s macro data present a more mixed picture: headline GDP growth has surprised to the upside on the back of exports and industrial output, but domestic demand – especially in consumption and property – remains subdued. Put together, it is not an obviously recessionary global picture. It is a patchwork of slowdowns and pockets of strength that leaves plenty of room for earnings to drive equity outcomes.
Earnings, in fact, are the main anchor holding this whole structure in place. A large majority of S&P 500 companies that have reported so far this quarter have beaten their estimates, and aggregate earnings for the index are on track to grow around the low‑teens percentage rate versus a year ago. If that holds, it would mark a sixth consecutive quarter of double‑digit earnings growth for the S&P 500. The contribution is broadening out across sectors, with not only tech but also energy, materials, and some cyclical corners beating expectations. Management commentary from major banks and consumer‑facing companies has been quietly constructive. One large institution noted that its internal data on spending, savings, and credit behavior look almost completely at odds with the extreme bearish tone of some sentiment surveys and media narratives. That gap between how people say they feel and how they are actually behaving with their money has been a recurring theme in this cycle.
None of that means the earnings backdrop is invulnerable. Higher energy costs, even if they do not stay at peak levels, will work their way through input prices with a lag. If oil flares again, or if geopolitical risk narrows transport routes in a more lasting way, margins would come under pressure later in the year. A more abrupt deceleration in global demand would put additional strain on cyclicals. But as of now, the earnings data line up better with a market that digested a shock and moved on than one teetering on the edge of a profit recession.
Looking ahead, there are three obvious fault lines to watch. The first is geopolitics and the Strait itself. The current ceasefire and Iran’s pledge to keep the Strait open have materially reduced near‑term tail risk, but no one believes this configuration is permanently stable. Any renewed closure, significant attack on energy infrastructure, or miscalculation between regional powers could quickly resurrect the “war‑flation” narrative and trigger another risk‑off episode. The second is rates. Treasury yields have retreated from their recent highs as oil cooled and some political overhang around the Federal Reserve’s leadership eased, but rate‑volatility gauges remain elevated. The forward market has scaled back expectations for near‑term cuts and now sees a relatively narrow range for the 10‑year, but that comfort could evaporate quickly if inflation data re‑accelerate or if term premium reprices higher. Equities can live with higher yields when they are tied to better growth; they struggle more when yields rise without a corresponding upgrade to the growth outlook. The third is positioning and technical structure. After such a sharp rebound, the market is no longer under‑owned in the way it was during the depths of the Iran scare, and the index now sits near technical resistance with visible air pockets below.
From a portfolio standpoint, the message from institutional commentary is broadly consistent. This does not look like an environment that justifies abandoning equities wholesale. The macro backdrop and earnings trend are too resilient for that. But it also does not look like a place to be complacent or all‑in on the highest‑beta slices of the market without any protection. If the de‑escalation trend in the Middle East holds and oil continues to behave, leadership is likely to rotate back toward cyclicals rather than defensive sectors. Smaller caps and more economically sensitive names could regain some footing relative to mega‑caps. International and emerging markets, which tend to benefit from a weaker dollar and more benign global trade conditions, could also see some catch‑up, although their own structural challenges remain.
The practical playbook that emerges is relatively straightforward. Keep core equity exposure intact, because the fundamental story still leans in favor of risk assets. Within that exposure, stay flexible. When oil and yields are moving in the right direction and the headlines are a little less toxic, it makes sense to lean modestly into cyclicals and high‑quality growth levered to real economic activity. When the Strait or inflation narrative turns darker, it is equally reasonable to rotate back toward defensives and to tighten up risk. Use spikes in volatility – whether provoked by another geopolitical headline, a surprise in inflation data, or a policy misstep – as a chance to add to the themes you actually want to own in a three‑ to five‑year window, such as AI infrastructure, onshoring and industrial capacity, or selected emerging markets, rather than as a reason to sell everything into weakness.
In the end, the last month has been a reminder of something most traders and investors already know intuitively: narratives move faster than fundamentals. In a few short weeks, markets swung from “war‑flation and near correction” to “ceasefire, open Strait, and record highs,” even though the underlying earnings trajectory barely budged. In a structurally AI‑ and capex‑led cycle, it takes more than scary headlines to truly break the tape. It takes a genuine hit to cash flows or to liquidity conditions. So far, we do not have that. What we have is a market that still wants to drift higher, a geopolitical backdrop that keeps injecting noise, and investors trying to decide how much of this regime they are willing to be long when the next shock inevitably arrives.

Weekly Benchmark Breakdown
Breadth Is Improving, But It Still Needs Confirmation
This week’s breadth tape says trend is intact, but thrust is only partial. The S&P 500 is basically sitting with about half its members above every major moving average from the 5-day through the 200-day, the Nasdaq 100 is stronger in the 20-day and 50-day buckets, the Dow still has solid long-term participation despite ugly near-term readings, and the Russell 2000 is showing much better breadth once you look past the shortest window. That is a constructive risk tone, but it is not the kind of all-clear, everybody-goes tape that usually marks the cleanest legs higher.
SPX
The S&P 500 looks steady, not explosive. The percentages above the 5, 20, 50, 100, 150, and 200 day averages are 52.08, 52.48, 51.68, 53.08, 56.46, and 55.66. In other words, the whole structure is hovering just above neutral, with the longer-term cohorts modestly better than the fast money cohort. The near-term new-high/new-low spread is still soft at -73 over five days, but it turns positive everywhere else at +20 over one month, +12 over three months, +18 over six months, +24 over 52 weeks, and +18 year to date. That is a market that is healing internally, but not yet broad enough to call it a true participation surge.

NDX100
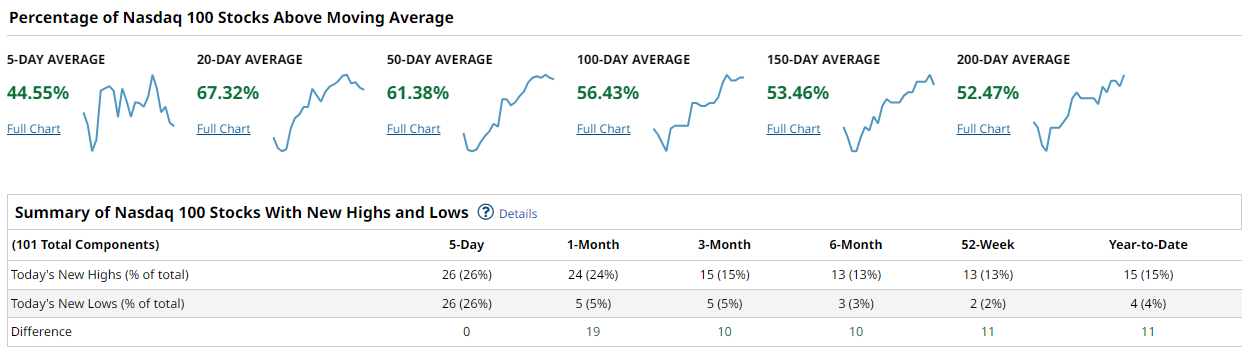
The Nasdaq 100 remains the leadership engine. The 5-day reading is only 47.52, but the 20-day and 50-day cohorts are both 61.38, with the 100-day, 150-day, and 200-day readings at 54.45, 55.44, and 53.46. That tells you the short-term shakeout has not broken the intermediate trend. The new-high/new-low spread is flat over five days at 0, then positive across every longer lookback at +19 over one month, +10 over three months, +10 over six months, +11 over 52 weeks, and +11 year to date. That is exactly what leadership looks like in a market that still leans on large-cap sponsorship.
DJIA
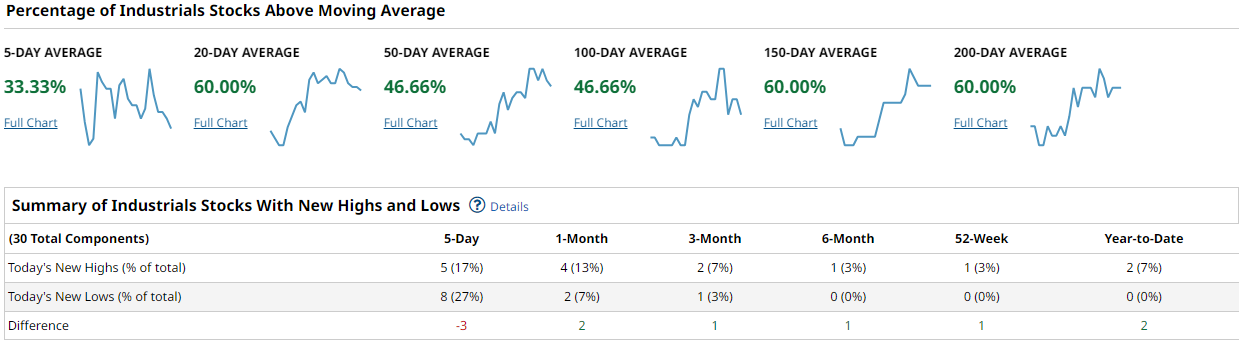
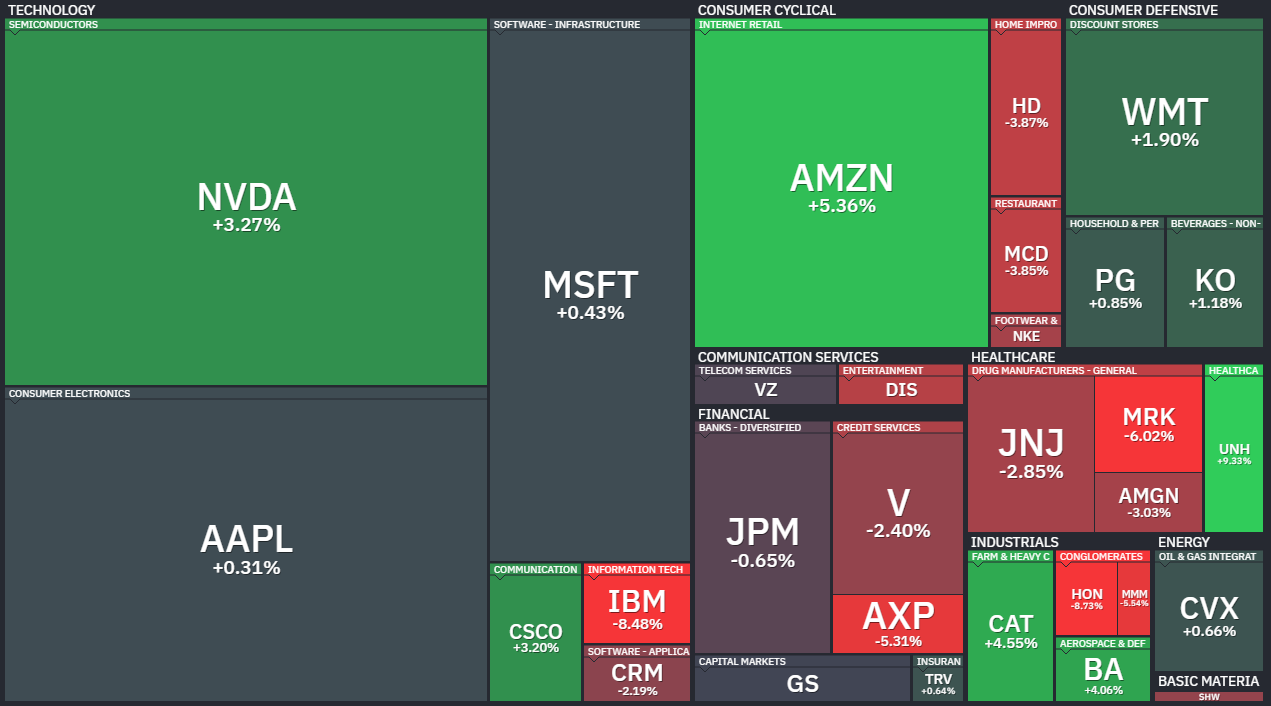
The Dow is a split personality tape. Only 33.33% of components are above the 5-day average and just 10.00% are above the 20-day, but the longer measures stay firm at 66.66% above the 50-day, 66.66% above the 100-day, 56.66% above the 150-day, and 73.33% above the 200-day. The new-high/new-low spread is just -2 over five days, then positive at every longer horizon at +3 over one month, +2 over three months, +1 over six months, +1 over 52 weeks, and +2 year to date. So the Dow is not breaking down structurally. It is taking a short-term hit inside a still-healthy long-term trend.
Russell 2000
Small caps are the most interesting part of the report. The 5-day reading is 50.57, the 20-day read is in the mid-80s at 84.81, the 50-day is 66.51, the 100-day is 60.12, the 150-day falls back to 45.06, and the 200-day is 59.12. That is not a clean sequence, but it does say participation has improved dramatically on the rebound while some intermediate-term damage still lingers. The new-high/new-low spread is ugly in the shortest window at -237 over five days, yet strongly positive after that at +198 over one month, +115 over three months, +102 over six months, +95 over 52 weeks, and +108 year to date. That is what early broadening often looks like: messy near term, much better underneath.

Synthesis
Put it together and the message is straightforward. Cap-weight still looks more dependable than the broad list because the Nasdaq’s intermediate breadth is cleaner, while the S&P is only modestly above neutral and the Dow’s short-term participation is still poor. But the broad market is no longer absent from the conversation, especially with Russell longer-horizon new highs beating new lows by a wide margin. Viewed qualitatively, the weekly return maps fit that reading: this still looks selective rather than uniformly risk-on. A durable advance gets confirmed if the S&P 500 and Russell 2000 can push their 50-day cohorts above 60 and if the short-term new-high/new-low spreads turn positive. Concern rises if the S&P 500 slips back under 50 on the 50-day measure, the Nasdaq loses its low-60s 20-day and 50-day posture, or the Dow cannot repair that 10.00% 20-day reading.
Playbook
The play this week is to stay constructive, but selective. Favor liquid leadership and cyclical areas where breadth is already above 50 and improving. Avoid chasing weak bounce candidates that still cannot reclaim the 150-day line, especially in the small-cap tail where the repair remains uneven. The best confirmation to watch for is simple: more stocks joining the move. If the S&P 500 and Russell 2000 can hold stronger 50-day participation, if short-term new highs start outnumbering new lows, and if the Dow’s near-term breadth stops looking washed out, then this rally has room to become more durable.
Bottom line
Breadth is good enough to respect the upside, but still selective enough that this rally needs broader confirmation before you call it a fully durable advance.

Investor Sentiment Report
%Bull-Bear Spread
The %Bull-Bear Spread measures the gap between bullish and bearish investor sentiment, often from surveys like AAII. It’s a contrarian indicator—extreme optimism may signal a coming pullback, while extreme pessimism can hint at a potential rally. Large positive or negative spreads often mark market turning points.
The American Association of Individual Investors bull-bear spread flipped to 11.63% for the week of April 23 from -11.06% a week earlier, and it was still -17.86% as recently as April 2. That is a real sentiment thrust, not noise. It tells you the crowd has moved out of the hole and is starting to lean back toward risk. Just as important, though, this is not yet the kind of optimism that usually marks a fully crowded tape. At 11.63%, the spread has exited the sub-zero zone that often supports reflex rebounds, but it is still short of the 20-plus area where enthusiasm starts to get a little too consensus for comfort. For this week, a push through 20 would tell you optimism is getting crowded, while a slide back below zero would say the improvement was only tactical, not durable.
NAAIM Exposure Index
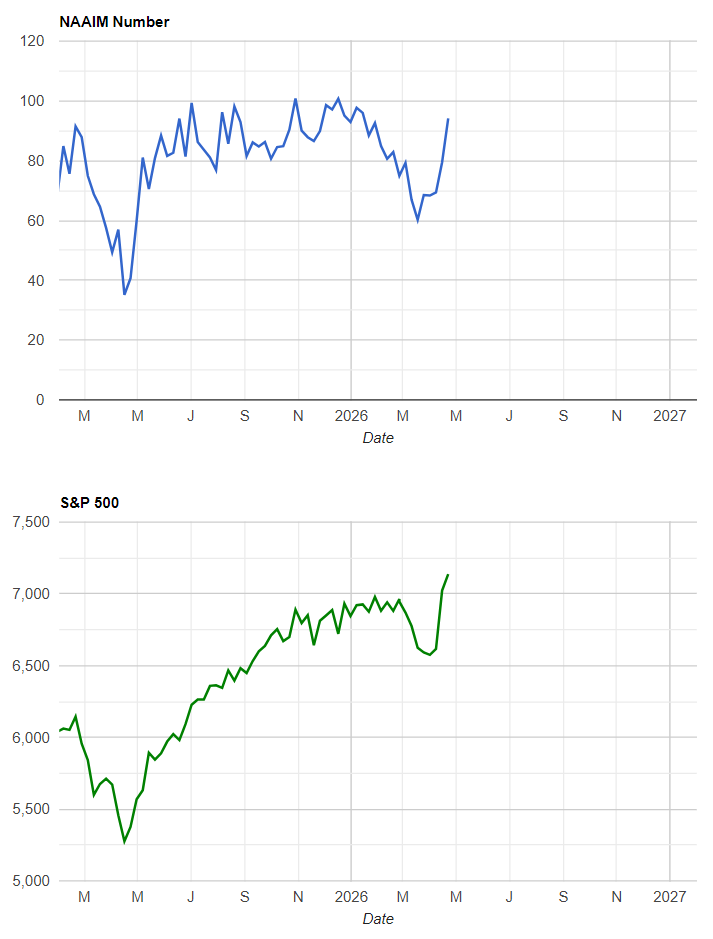
The NAAIM Exposure Index (National Association of Active Investment Managers Exposure Index) measures the average exposure to U.S. equity markets as reported by its member firms. These are typically active money managers who provide their equity exposure levels weekly. The index offers insight into how much these managers are investing in equities at any given time, ranging from being fully short (-100%) to leveraged long (up to +200%).
The National Association of Active Investment Managers exposure index printed 94.15 on April 22, up hard from 79.49 the prior week and 69.38 two weeks before, with the last quarter average still down at 82.00. Managers have chased the market higher in a visible way, and that matters because this gauge tracks what active risk managers have actually done with exposure, not what they say in surveys. The message this week is straightforward: there is less dry powder than there was a month ago, and that makes the tape more vulnerable to de-risking if price stumbles. I would read a clean drop into the 50s without major price damage as a healthy reset that reloads buying power. By contrast, staying pinned in the 90s tells you trend conviction is still strong, but it also means the market has less cushion if an adverse headline arrives.
CBOE Total Put/Call Ratio
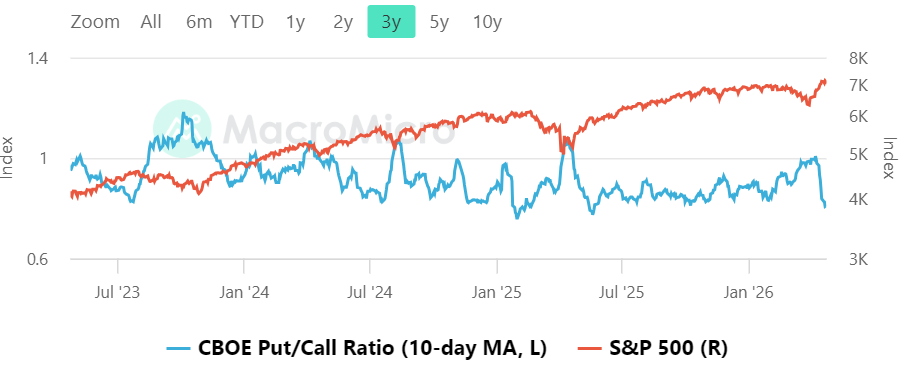
CBOE's total put/call ratio includes index options and equity options. It's a popular indicator for market sentiment. A high put/call ratio suggests that the market is overly bearish and stocks might rebound. A low put/call ratio suggests that market exuberance could result in a sharp fall.
The Cboe Global Markets total put/call ratio on the visible 10-day average sits at 0.84 for April 17, down from 0.88 on the prior print. That is not a fearful options tape. It is a market that has been leaning back toward calls and away from urgent downside protection. MacroMicro's own framing is useful here: low readings point to exuberance, while a 10-day average above 1.1 is the kind of zone where washout conditions start to look more like a trough than a trap. So 0.84 is constructive for momentum, but it also says the market is losing some of the hedge fuel that often cushions pullbacks and powers the best rebounds. A push back toward 1.0 would improve the texture of the tape, while a shove down toward 0.8 or lower would start to smell more frothy than healthy.
Equity vs Bond Volatility
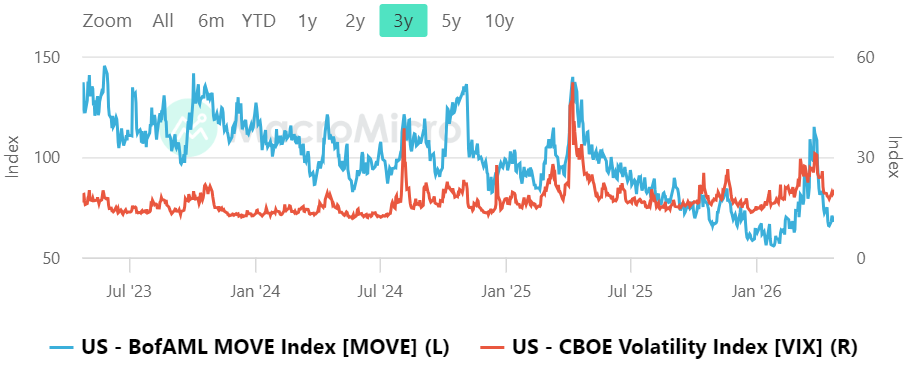
The Merrill Lynch Option Volatility Estimate [MOVE] Index from BofAML and the CBOE Volatility Index [VIX] respectively represent market volatility of U.S. Treasury futures and the S&P 500 index. They typically move in tandem but when they diverge, an opportunity can emerge from one having to “catch-up” to the other.
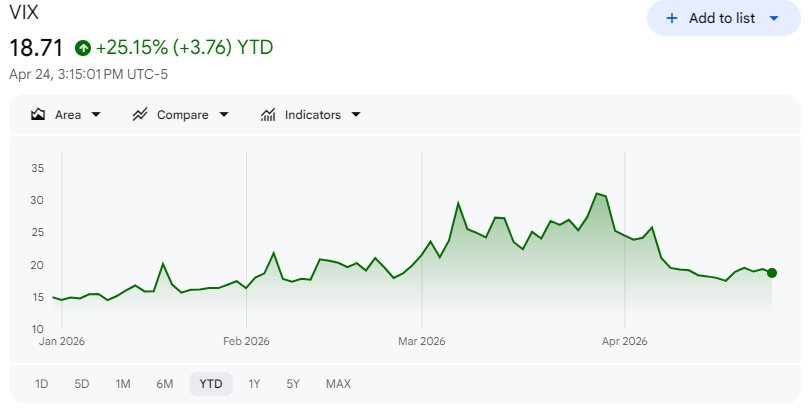
The visible vol pairing is not screaming stress, but it is no longer asleep either. MacroMicro shows the MOVE index at 67.90 on April 20 versus 65.70 on the prior visible print, while the VIX is 18.87 versus 17.48. In other words, both bond vol and equity vol have ticked higher together, which is a yellow light rather than a red one. We are nowhere near the kind of 120-plus MOVE event that would force a much more defensive posture, but the VIX is already sitting in the high teens, which means the equity market is no longer pricing a perfectly frictionless advance. If bond vol backs off while VIX stays contained, risk assets can keep grinding higher. If MOVE starts climbing again with VIX sleepy, that is the setup I would respect most.
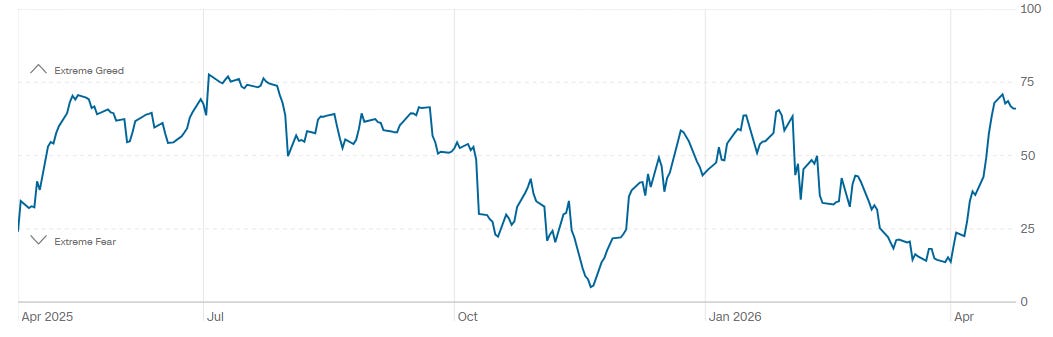
CNN Fear & Greed
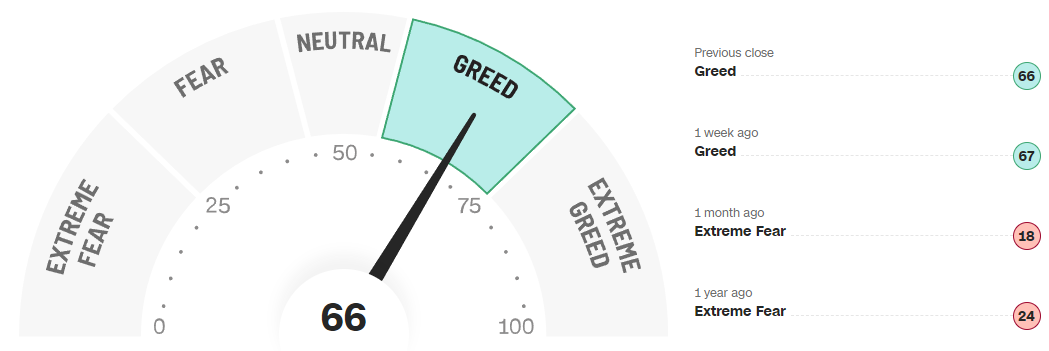
The CNN Fear and Greed composite is back in greed territory. The clean takeaway is that the gauge is sitting in the upper 60s rather than anywhere near panic. The one-year backdrop says this is warm, not manic: over the last year the average reading was 47.94, the median was 53, the minimum was 5, the maximum was 78, 40% of sessions fell in greed, and only 2% reached extreme greed. Recent headlines also confirm how sharp the swing has been. By April 14 the gauge was still in a fear zone, and by April 17 it had already flipped into greed. That kind of sentiment repair can support price in the near term, but it also means a lot of the easy re-rating has already happened. I would treat a move into the 80s as a more credible exhaustion signal, while a retreat toward the 40s would reopen a more attractive entry backdrop.
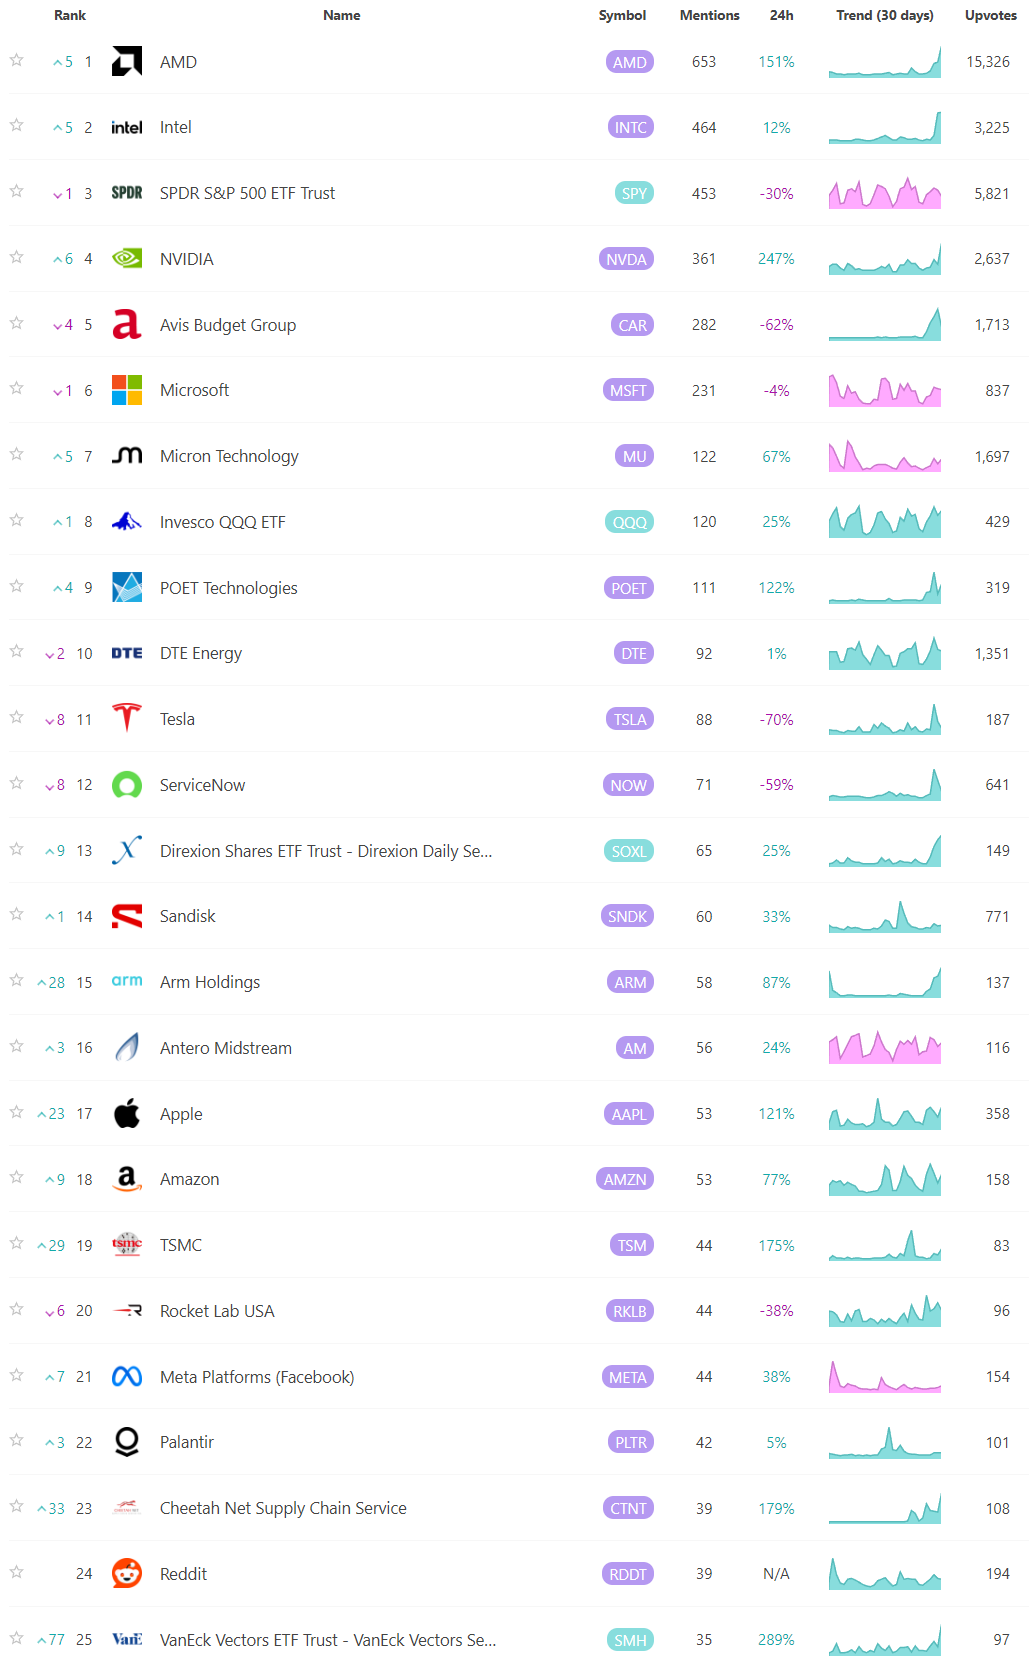
Social Media Favs
Social sentiment offers a real-time view of investor mood, often revealing market shifts before traditional indicators. It can signal momentum changes, spot emerging trends, and gauge retail investor impact—especially in high-volatility names. Tracking sentiment around events or earnings provides actionable insights, and when layered with quantitative models, can enhance predictive accuracy and risk management. Sustained sentiment trends often mirror broader market cycles, making this data a valuable tool for both short-term trades and long-term positioning.
Bottom line: the sentiment tape has improved from skeptical to clearly optimistic, which is still supportive for price, but with the bull-bear spread back above zero, NAAIM near 94, put/call complacent, and Fear and Greed in the upper 60s, this market now needs price confirmation more than it needs more cheerleading.

Technician’s Playbook: Trading the Majors (SPY/QQQ/IWM/DIA)
When you’re a large institutional player, your primary goal is to find liquidity - places to do a ton of business with the least amount of slippage possible. VolumeLeaders.com automatically identifies and visually plots the exact spots where institutions are doing business and where they are likely to return for more. It’s one of the primary reasons “support” and “resistance” concepts work and truly one of the reasons “price has memory”.
Sponsored Tech Leads While The Rest Of The Tape Negotiates
This is still a sponsored tape, but not an equal-opportunity one. QQQ has the cleanest impulse structure of the four, SPY looks constructive but less decisive, DIA is still balancing under overhead supply, and IWM is improving without yet proving broad risk appetite. The important distinction is that trend is alive, but participation is still selective. That matters because selective sponsorship usually keeps upside alive while making failed breakouts more common.
SPY
SPY still reads constructive, but the message is more about structure than one giant print. The tape looks like an orderly trend rather than distribution: buyers repeatedly defended the middle of the weekly range and kept nudging price back toward the upper shelf. The key read is that pullbacks stayed corrective instead of impulsive, which usually means institutions are still doing business on weakness rather than rushing to de-risk. The bullish scenario is continued acceptance above the middle shelf and eventual resolution through the upper band. The bearish path starts if SPY slips back through that central support and fails to reclaim it quickly, which would shift the tape from sponsored trend into churn.
QQQ
QQQ is the clearest long of the group. The path is classic impulse, shallow pullback, then continuation into 663.44. The dominant memory line is 648.80, where $5.28B traded across 33 prints with a 97.25th percentile score, and it also matches the largest visible cluster at $4.53B. Above that, 651.50 carries $2.07B, 655.10 carries $1.53B, and a fresh late-week shelf sits at 663.90 with $1.2B. The standout prints were 1.5M at 643.65 for $965M, 1.46M at 648.82 for $946M, and 1.4M at 648.59 for $908M, with top-100 tags #32, #39, and #49 visible in the move. That reads like absorption on weakness and then sponsorship on reclaim. Hold 651.50 and the path stays pointed at 655.10 first and then 663.90. Lose 648.80 with acceptance and the next magnets are 646.80 and 644.10.
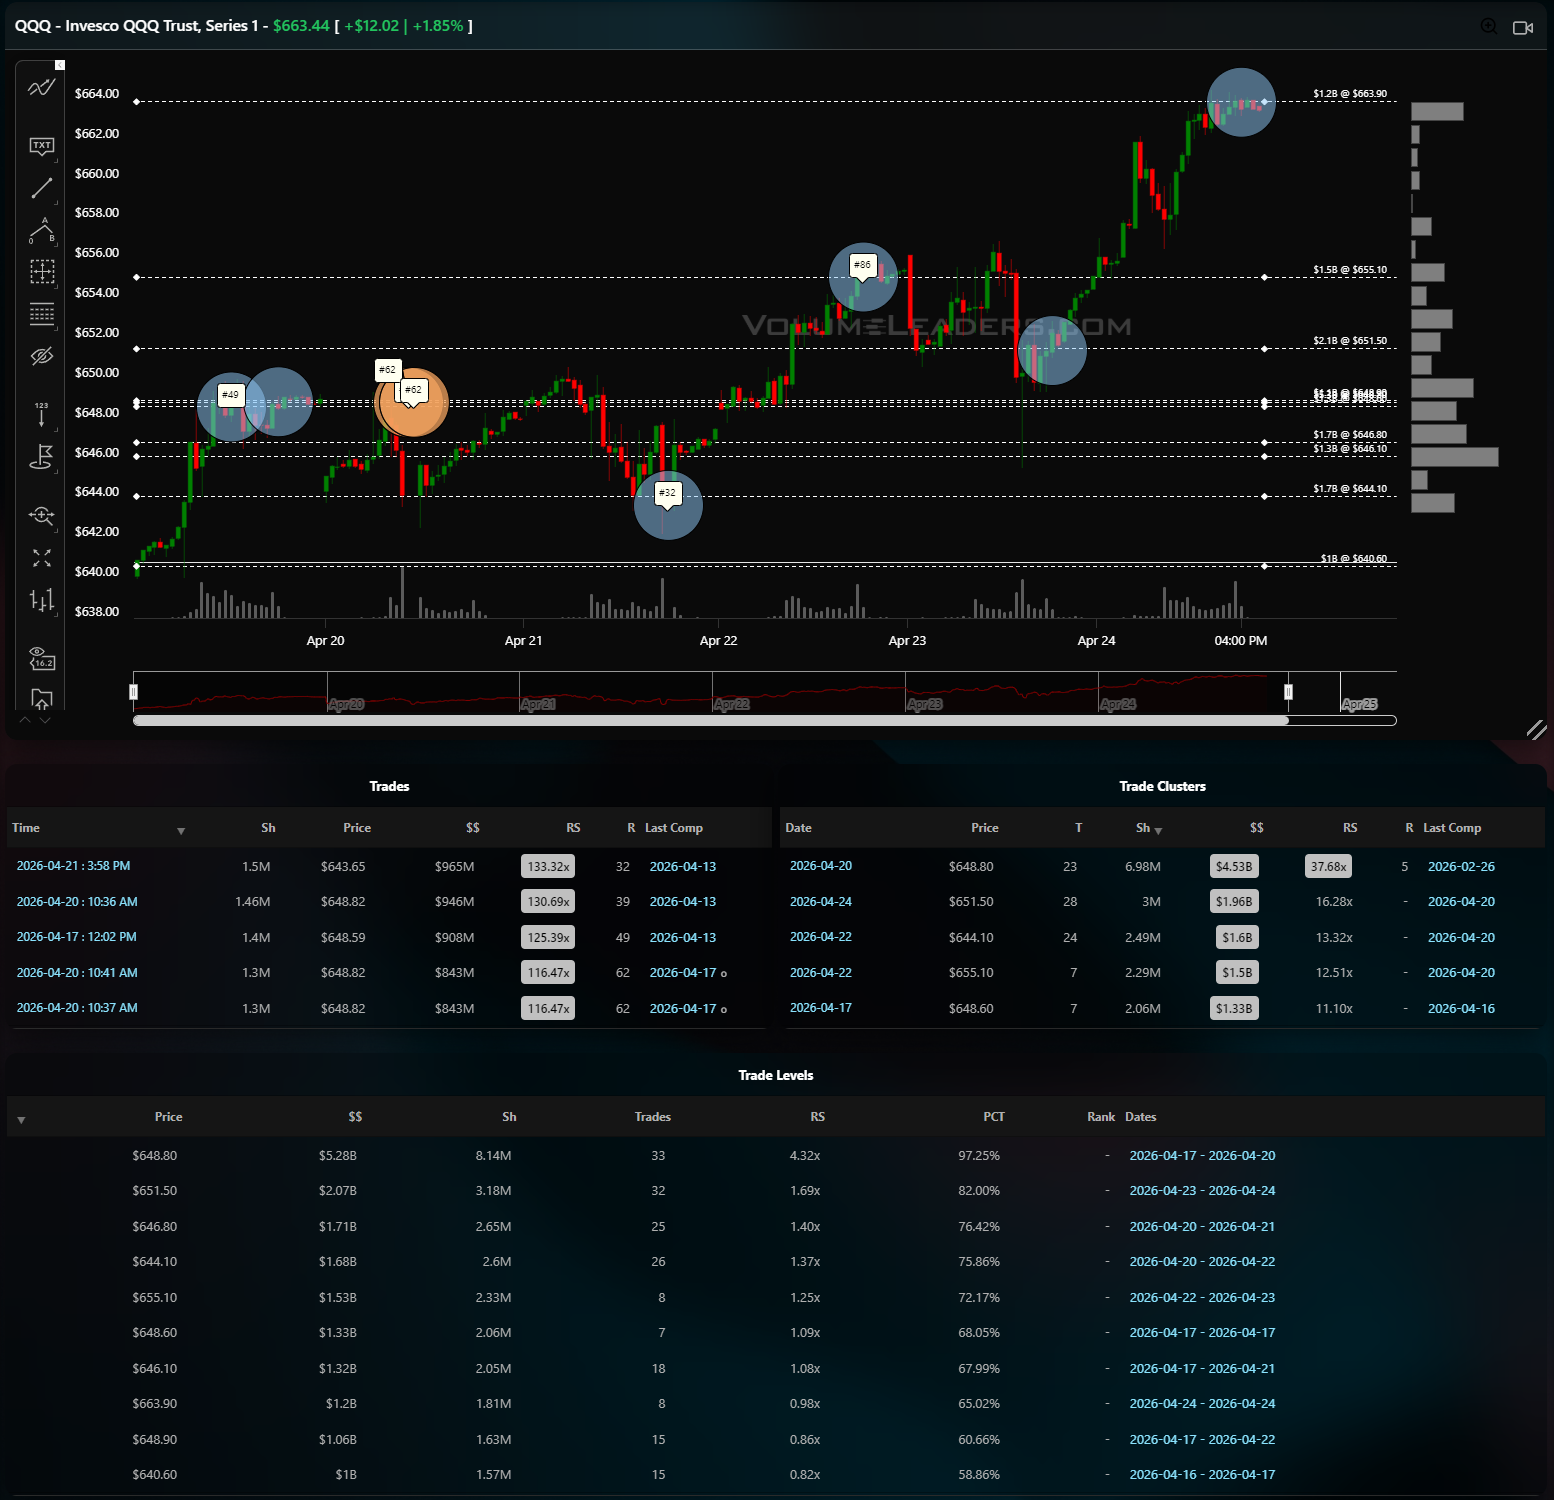
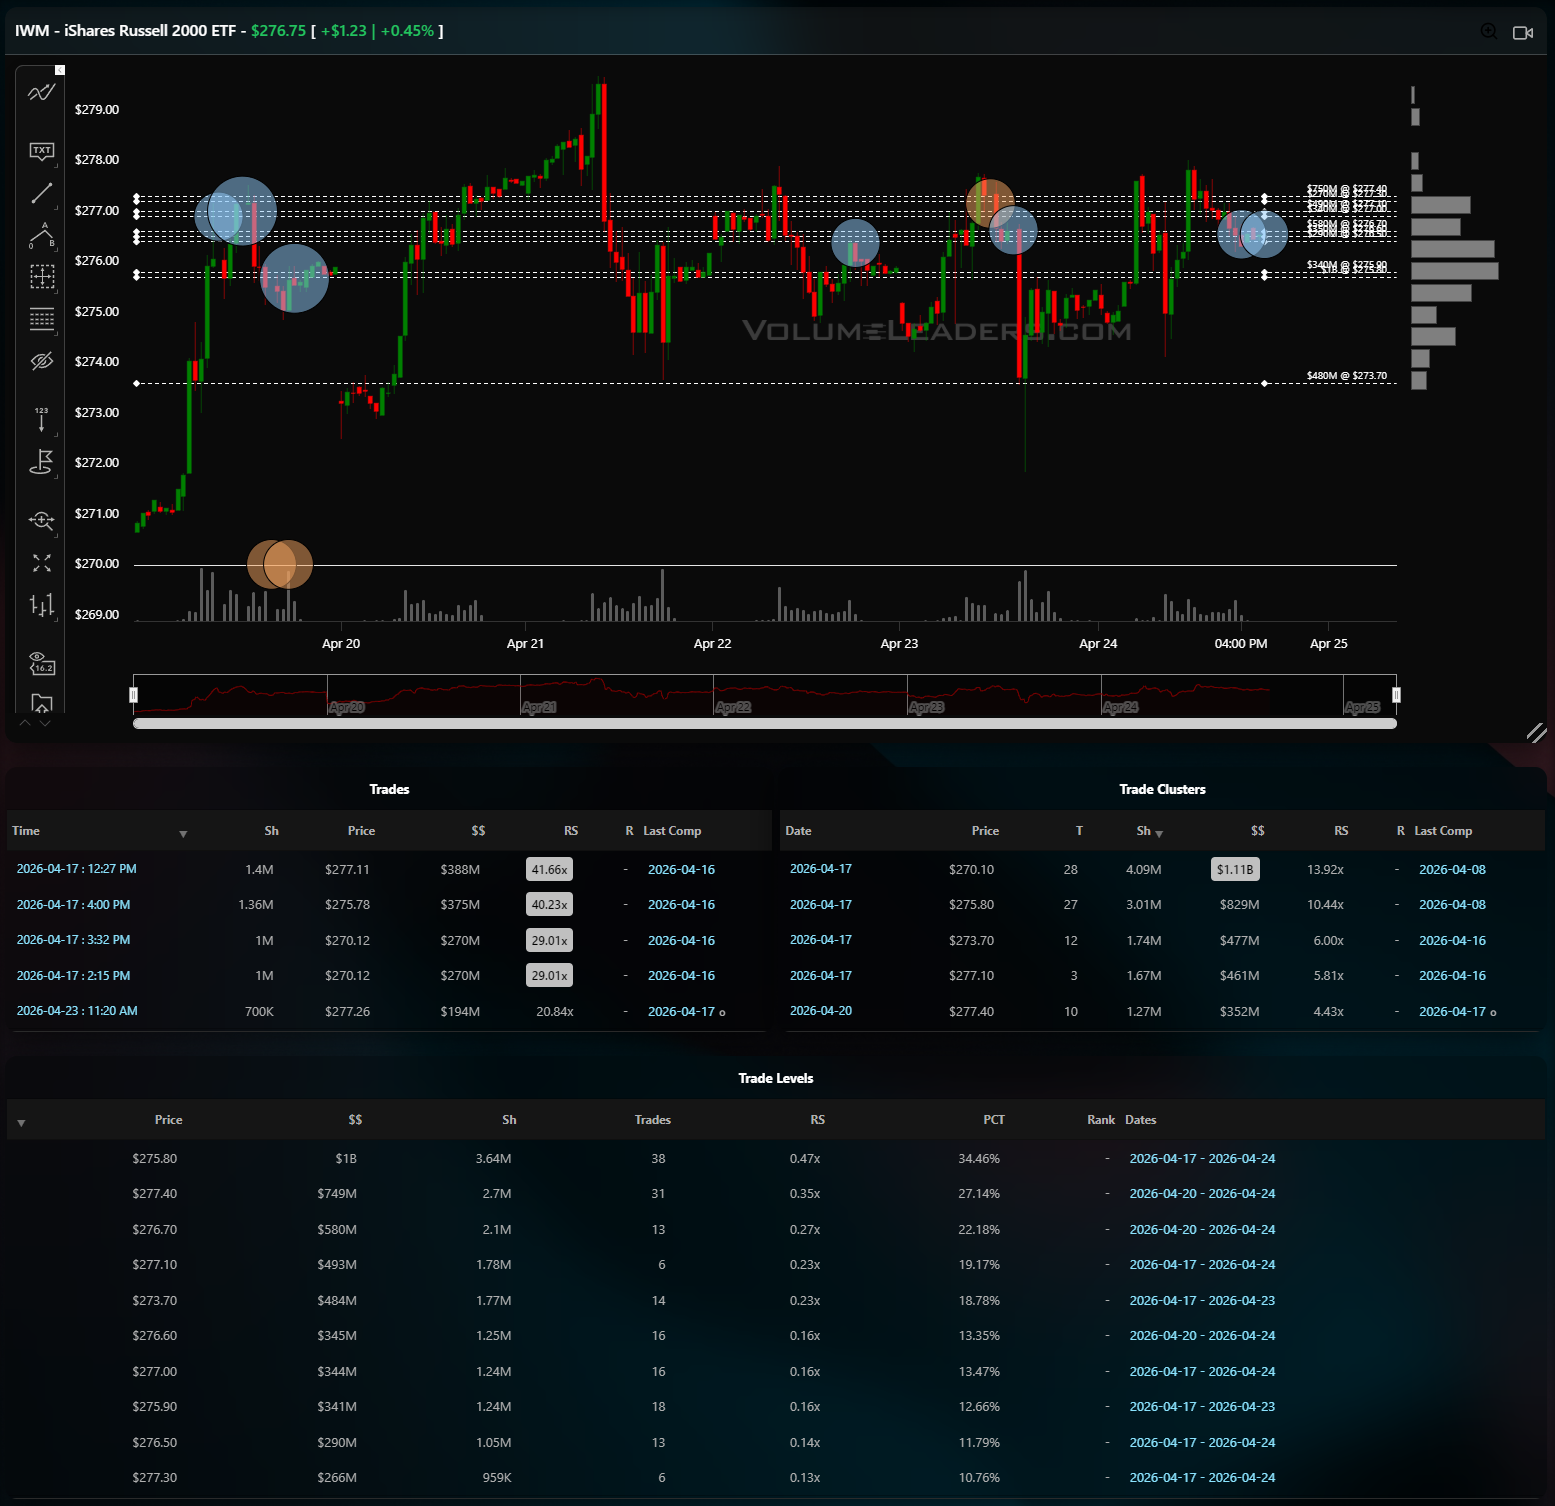
IWM
IWM is better, but it is not yet authoritative. The structure feels like a rebound trying to become a trend, not a trend already in force. That is an improvement, but it is still a lower-quality setup than QQQ. The bullish case is straightforward: small caps need to keep holding the mid-range cluster and then accept into the upper shelf. If that happens, it would be the first real sign that participation is broadening beyond the mega-cap complex. The bearish case is also clear: fail at the upper shelf or lose the central support band, and IWM likely rotates back toward its lower cluster quickly. This remains the chart that needs the most proof.
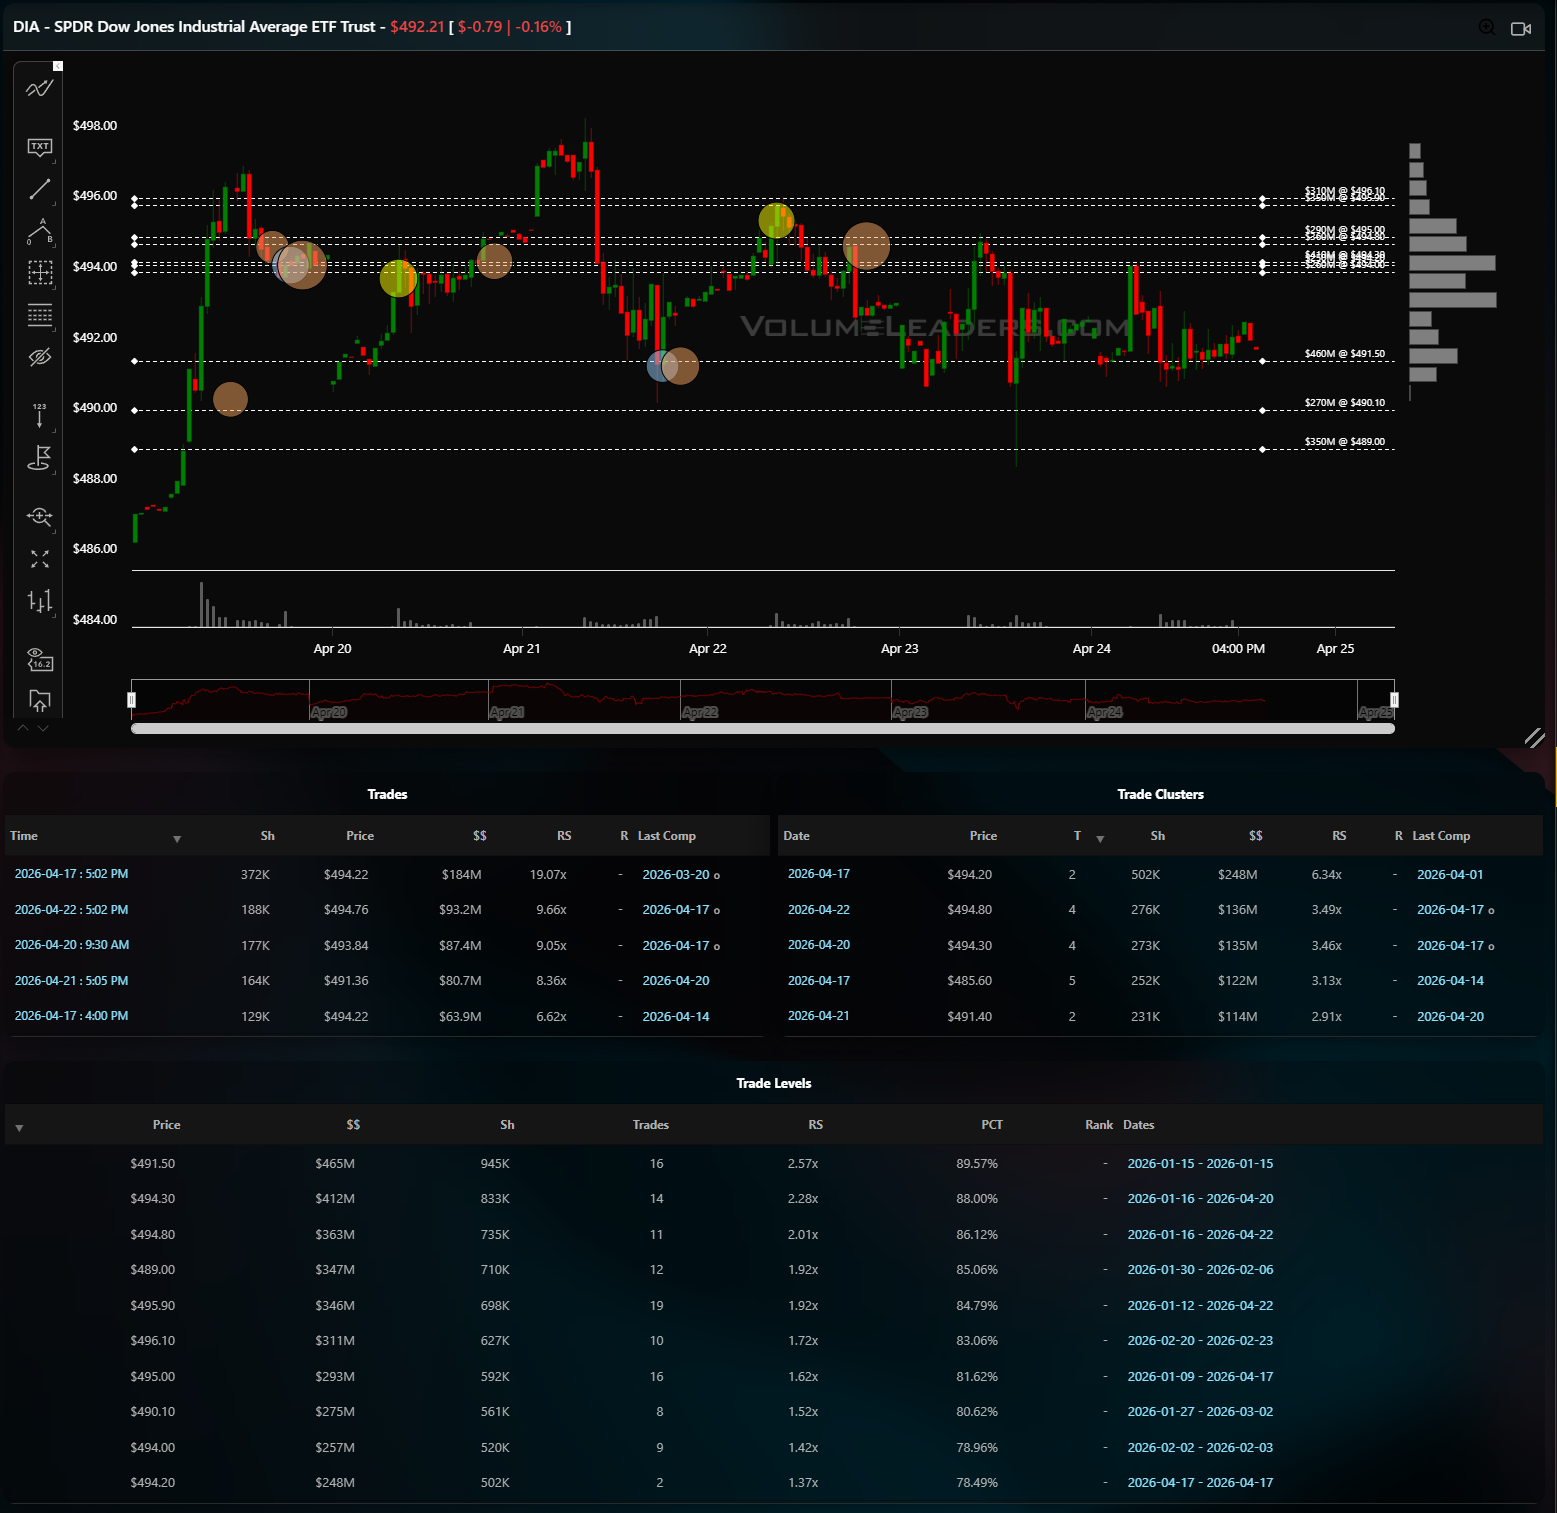
DIA
DIA is the most balanced of the four and still has real work to do overhead. The line of scrimmage is 491.50, where $465M traded. Above, supply is stacked at 494.30 for $412M, 494.80 for $363M, 495.00 for $293M, then 495.90 and 496.10 with $346M and $311M. The largest visible prints came at 494.22 for $184M, 494.76 for $93.2M, 493.84 for $87.4M, and 491.36 for $80.7M. Price is still sitting below the heavier 494 to 496 supply band, which argues for absorption more than clean breakout sponsorship. Above 494.80, DIA can squeeze into 495.90 to 496.10. Below 491.50, the next magnets are 490.10 and 489.00.
Playbook
The tactical lean this week is straightforward: favor the index with the clearest sponsorship and the cleanest invalidation. That is QQQ, using 651.50 and especially 648.80 as the pass-fail zone, with 655.10 and 663.90 as the first magnets. SPY is acceptable on holds of its middle shelf, but not a chase if it starts leaking back into range. DIA needs confirmation above 494.80 before it deserves momentum treatment, and IWM should still be treated as a confirmation vehicle rather than the lead dog. This is still a bullish tape, but it remains a selective one, so the best trade is to lean with the sponsored names and make the market prove breadth before you pay up for everything else.

Summary Of Thematic Performance YTD
VolumeLeaders.com offers a robust set of pre-built thematic filters, allowing you to instantly explore specific market segments. These performance snapshots are provided purely for context and inspiration—think about zeroing in on the leaders and laggards within the strongest and weakest sectors, for example.
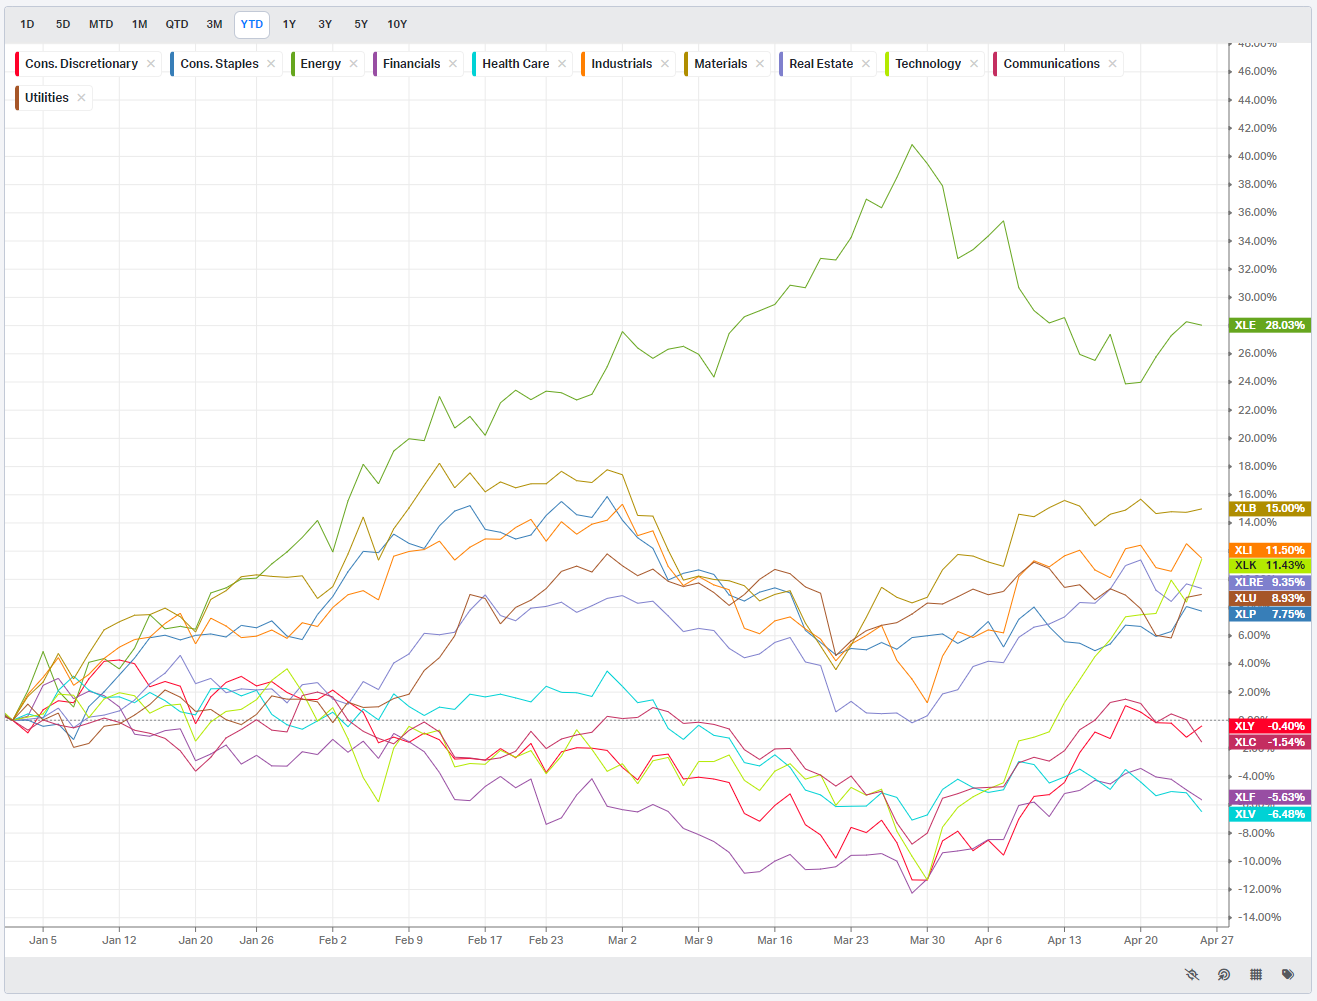
S&P By Sector
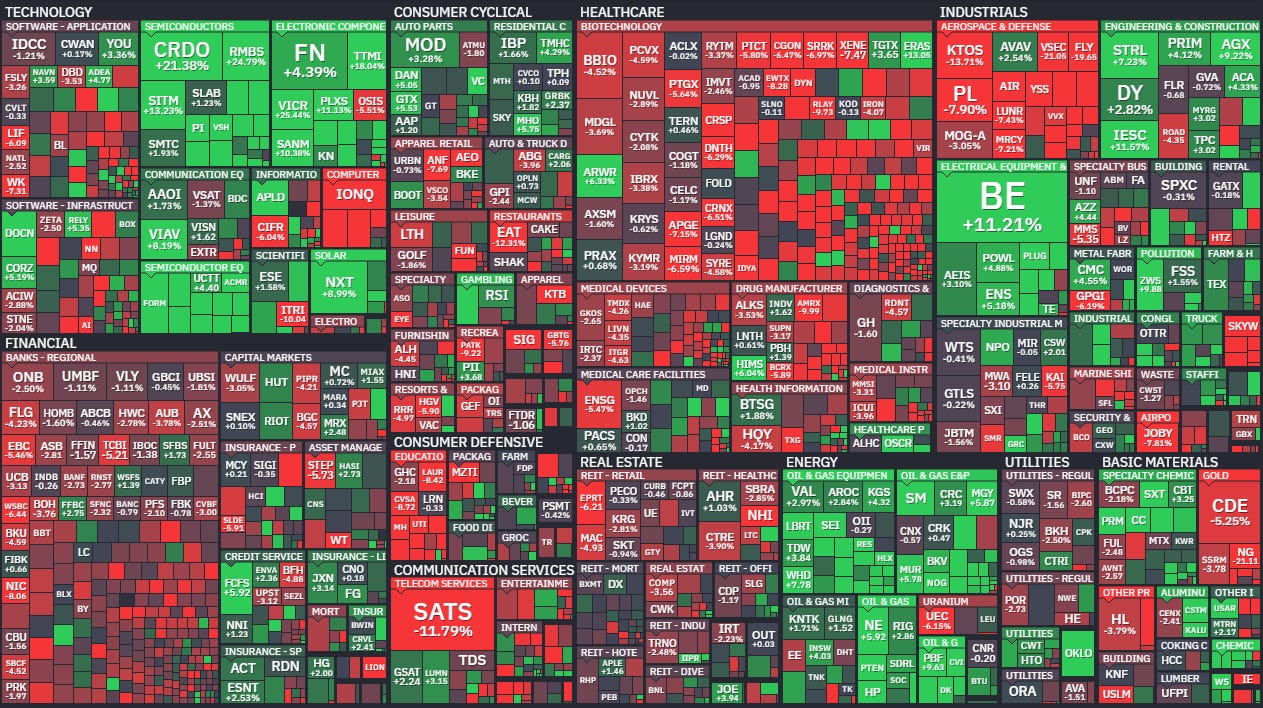
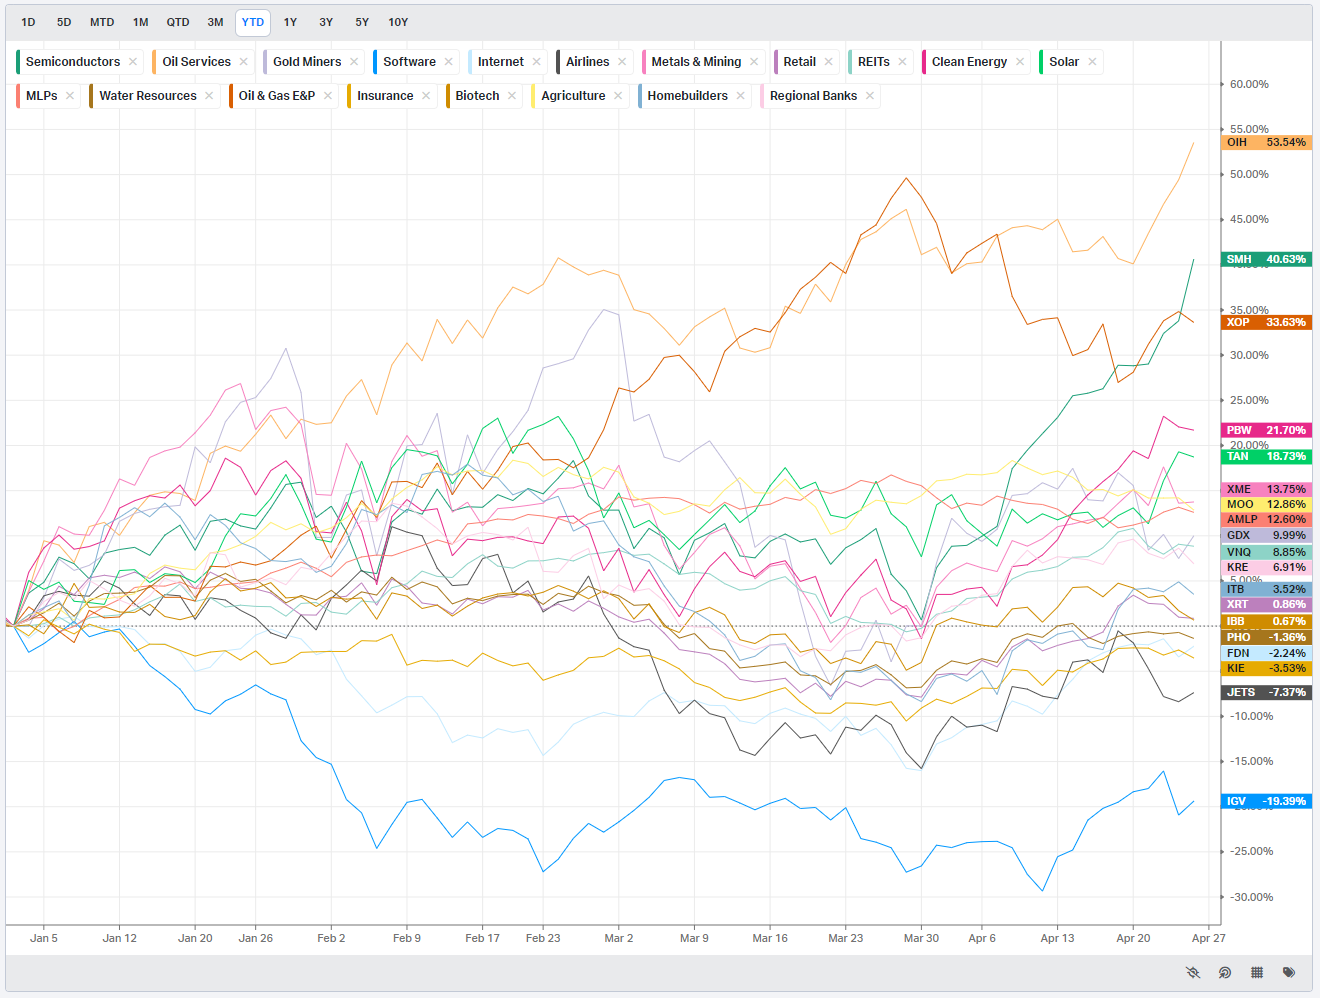
S&P By Industry
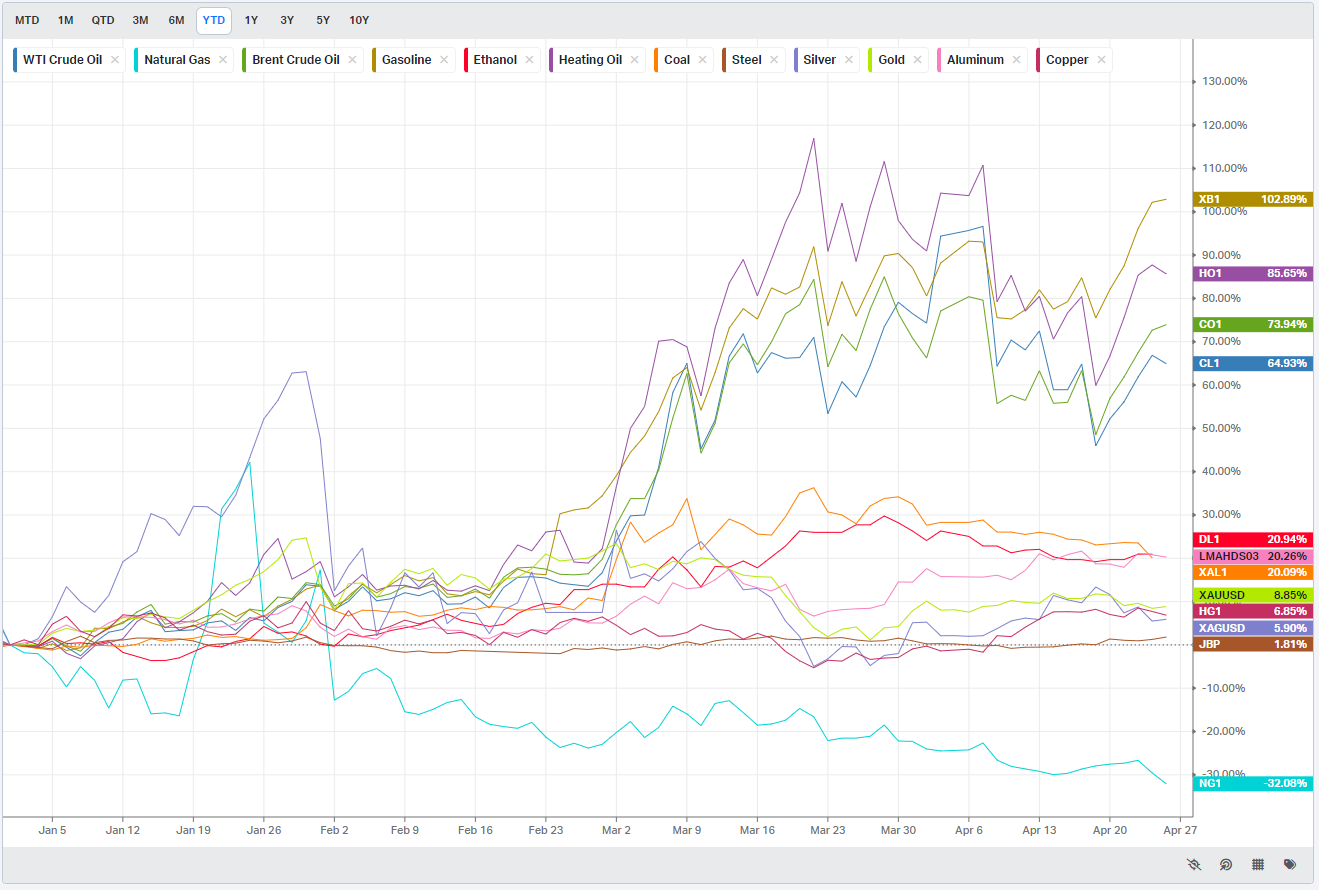
Commodities: Energy & Metals
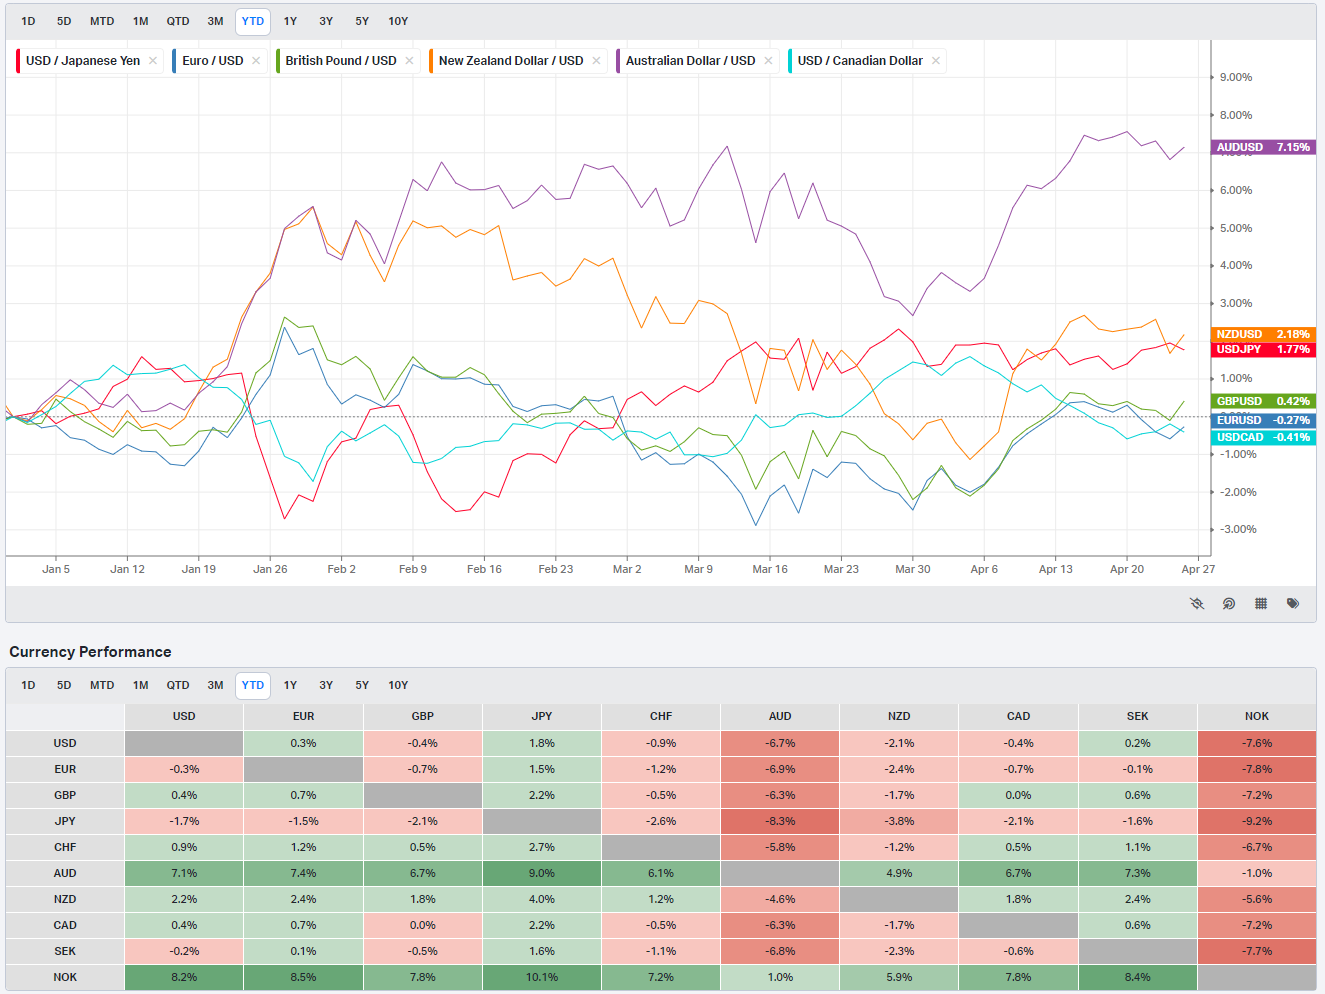
Currencies/Major FX Crosses
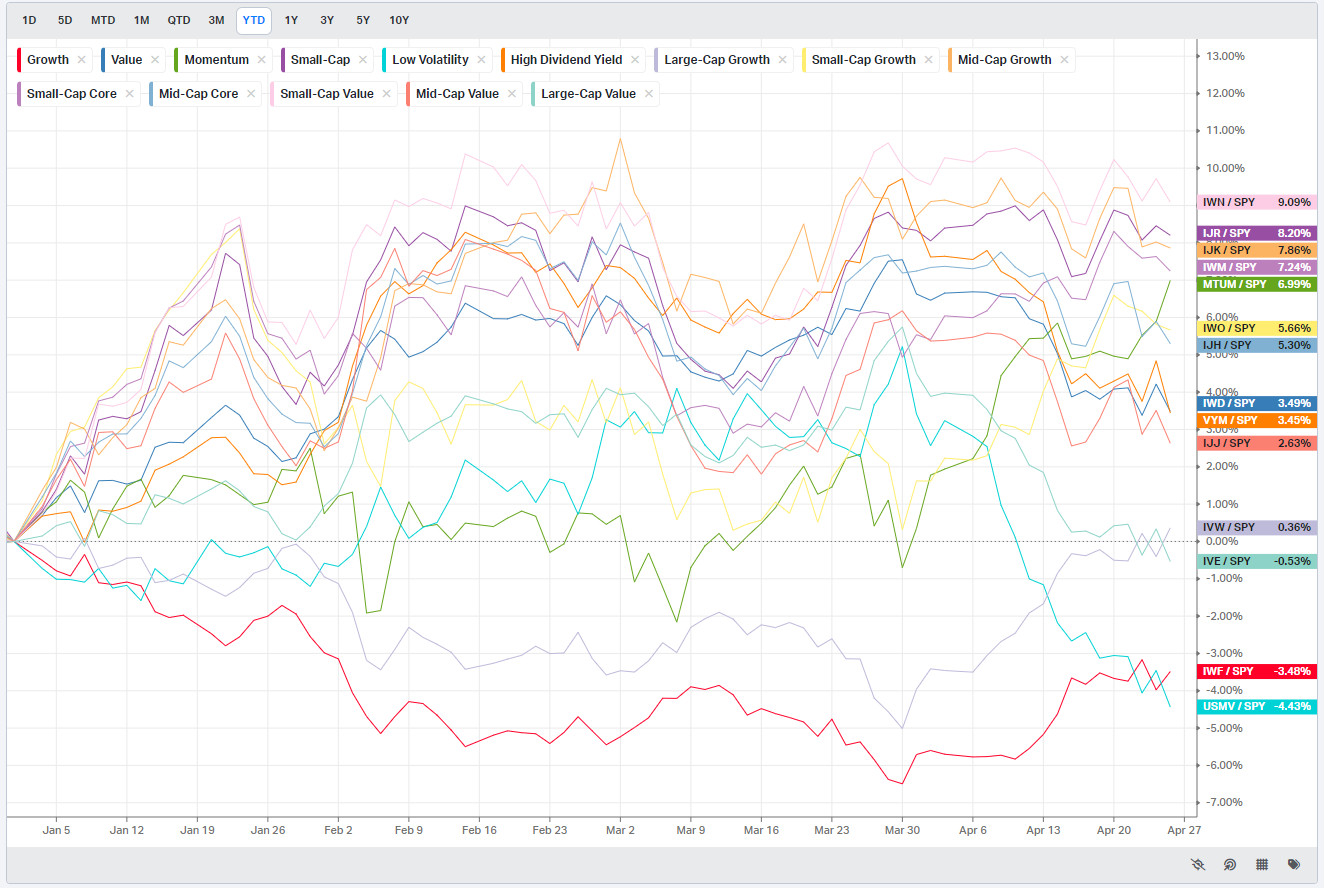
Factors: Style vs Size-vs-Value

Events On Deck This Week
Here are key events happening this week that have the potential to cause outsized moves in the market or heightened short-term volatility.
Fed Week Meets Megacap Earnings
Monday
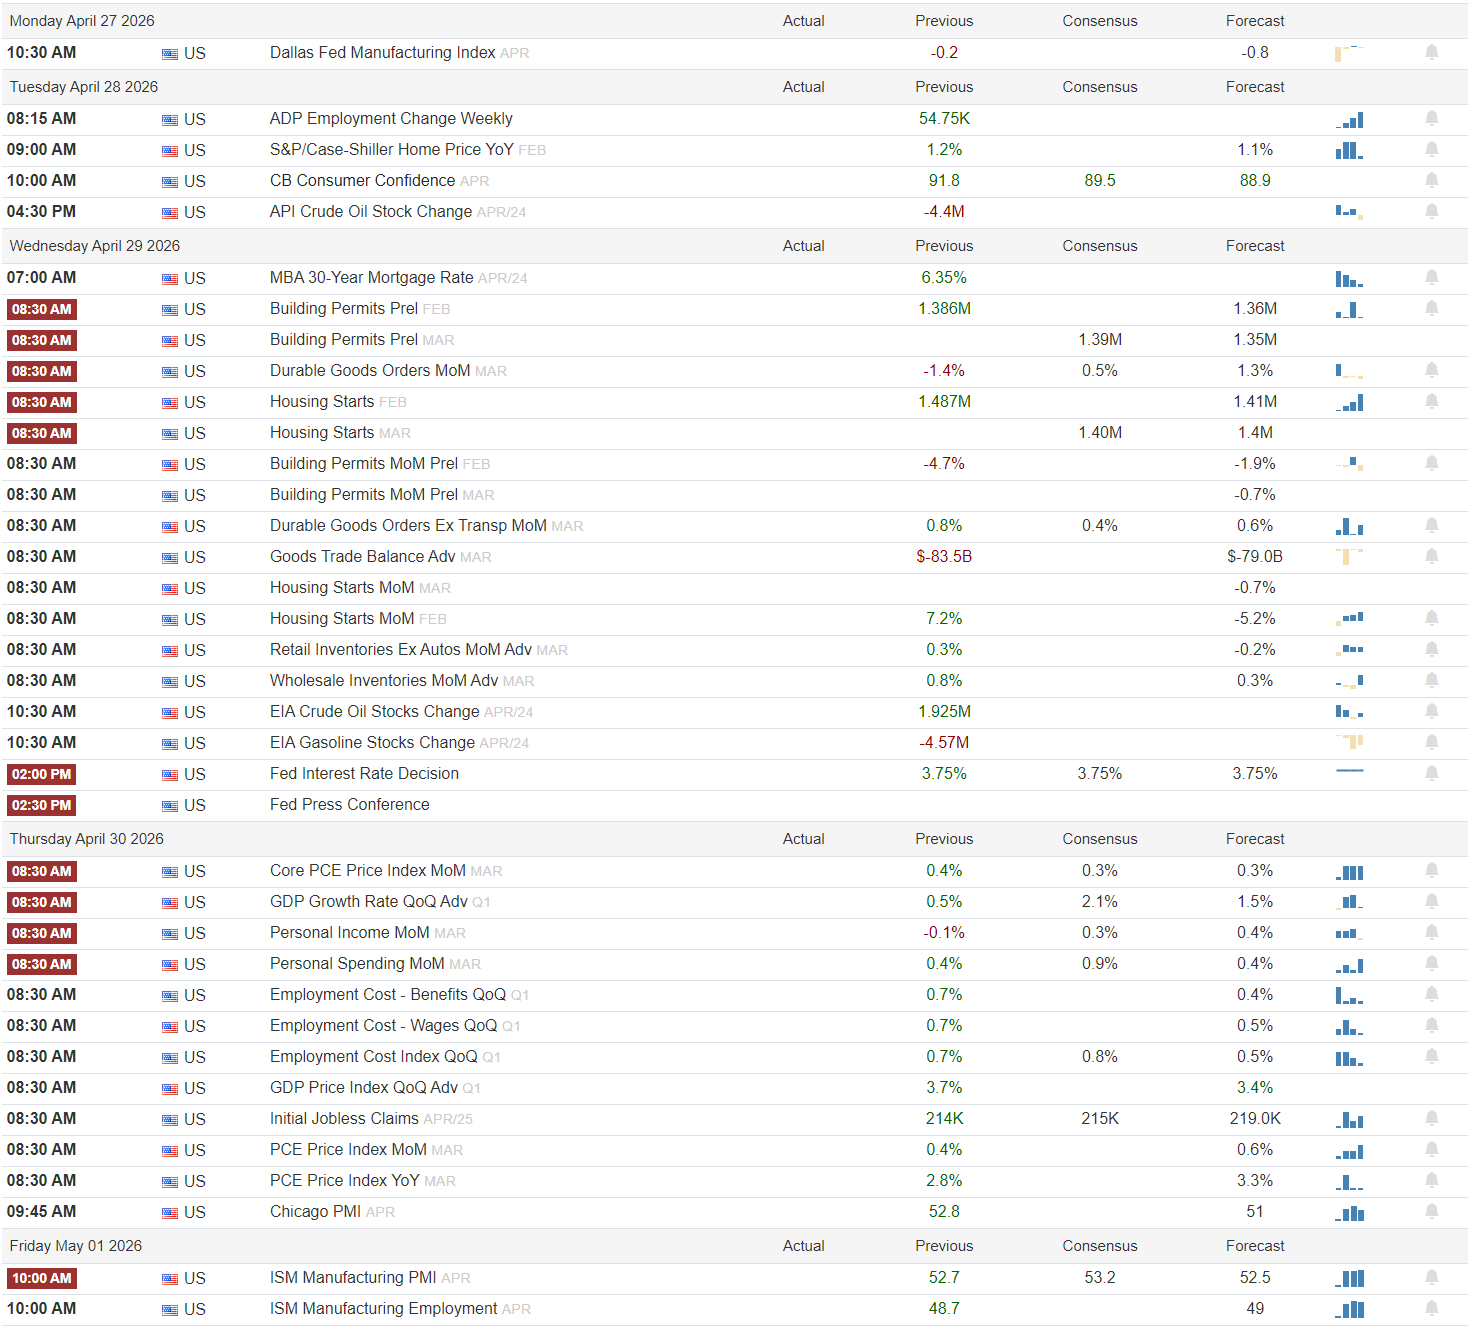
Monday is light, which means the market gets one clean macro tell before the week turns crowded. The Dallas Fed Manufacturing Index for April shows a previous reading of -0.2 and a forecast of -0.8. If that number comes in less negative than forecast, it argues the industrial slowdown is still manageable and gives cyclicals a steadier start. A weaker print would not break the tape by itself, but it would lean risk-off into a week already loaded with rates, growth, and inflation risk. No Fed speakers are visible.
Tuesday
Tuesday starts to sketch the consumer backdrop. ADP Employment Change Weekly shows 54.75K previous, while the forward fields are unreadable. Case-Shiller home prices for February show 1.2% previous and 1.1% forecast, which points to a slightly cooler housing inflation pulse. Consumer confidence is the bigger swing factor, with 91.8 previous, 89.5 consensus, and 88.9 forecast. A beat back toward 91 or better would help the consumer and credit complex. A miss would reinforce a softer demand story. API crude had a previous draw of -4.4M, with the forward read unreadable, so energy remains in play.
Wednesday
Wednesday is where the week starts to bite. The 30-year mortgage rate sits at 6.35%. Durable goods are set up for a rebound, with headline orders moving from -1.4% previous to 0.5% consensus and 1.3% forecast, while ex-transport goes from 0.8% previous to 0.4% consensus and 0.6% forecast. The advanced goods trade balance is seen improving from -$83.5B to -$79.0B. Housing and permits lean softer at the margin, with visible March estimates around 1.39M permits, 1.35M forecast permits, and 1.40M starts. Then the focus shifts entirely to the Federal Reserve. The rate decision is pinned at 3.75% across previous, consensus, and forecast, and the only visible Fed event beyond that is the press conference. The market does not need a surprise on rates. It needs a tone that does not harden the higher-for-longer message.
Thursday
Thursday is the hinge day. Core PCE for March shows 0.4% previous and 0.3% for both consensus and forecast. Q1 GDP shows 0.5% previous, 2.1% consensus, and 1.5% forecast, so the visible setup is for a firmer growth read without a boom. Personal income is seen rising from -0.1% to 0.3% consensus and 0.4% forecast, while spending is 0.4% previous, 0.9% consensus, and 0.4% forecast. The labor cost side also matters: ECI was 0.7% previous, 0.8% consensus, and 0.5% forecast, with wages at 0.7% previous and 0.5% forecast. Claims are 214K previous, 215K consensus, and 219.0K forecast. The catch is headline PCE, with 0.4% previous and 0.6% forecast on the monthly line, and 2.8% previous with 3.3% forecast on the yearly line. That is the session where the market decides whether cooler core can outweigh a hotter headline.
Friday
Friday closes the loop with manufacturing. ISM Manufacturing PMI for April shows 52.7 previous, 53.2 consensus, and 52.5 forecast. ISM Manufacturing Employment shows 48.7 previous and 49 forecast. That is still an expansionary headline with labor lagging underneath. If PMI can hold above 52.5 while employment firms, the cyclical tape should stay constructive. If headline momentum slips and Thursday leaves an inflation bruise, the market will likely rotate back toward defense. No additional Fed speakers are visible.
Earnings and IPOs
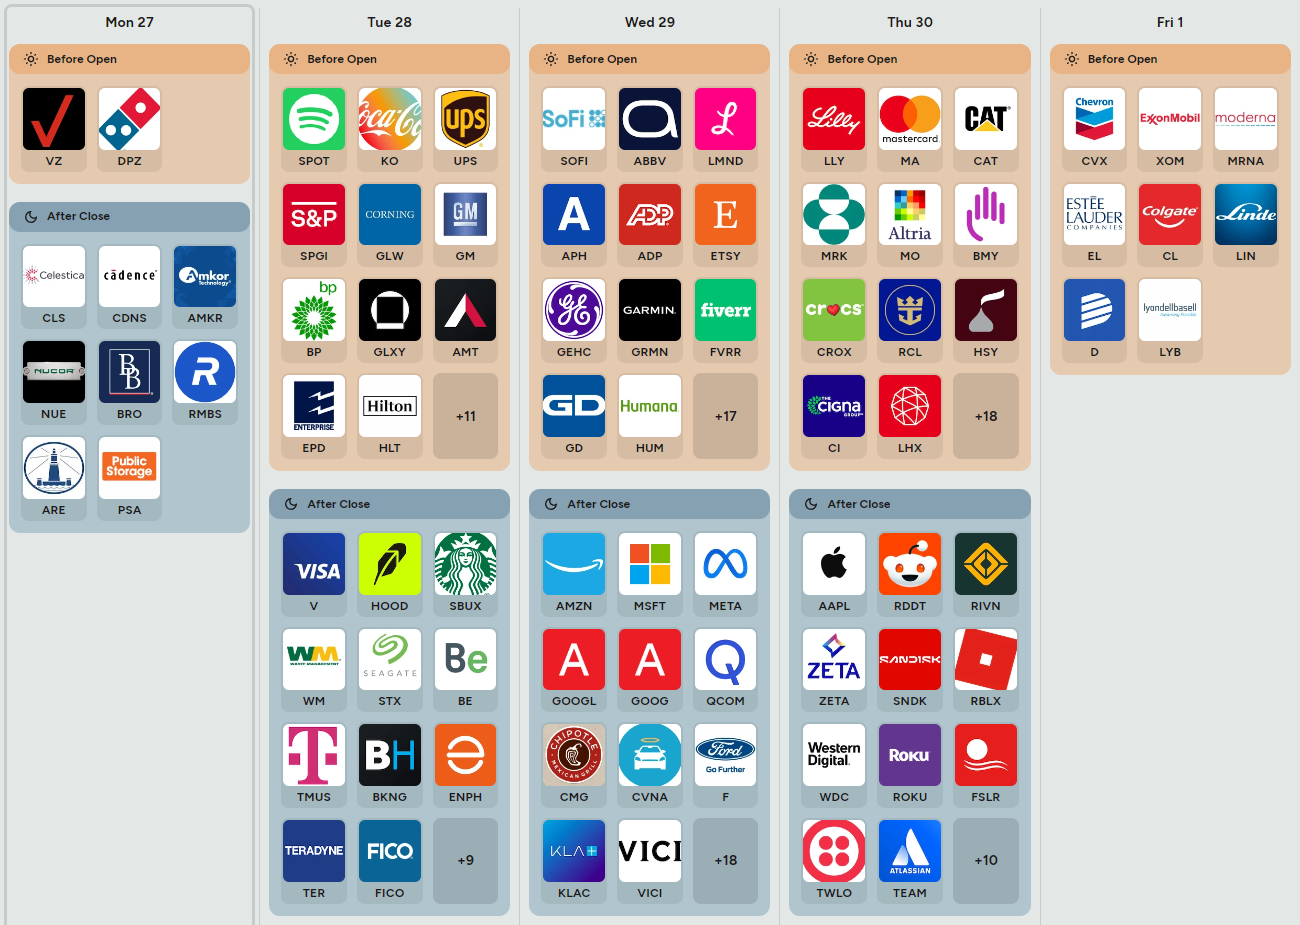
The board is dominated by earnings, and the read-through is broad. Early in the week, names like Spotify, Coca-Cola, UPS, Visa, and Starbucks can tell the market a lot about consumer demand, freight, and transaction volumes. Wednesday after the close is the real index pivot, with Amazon, Microsoft, Meta Platforms, and Alphabet all on deck. Watch cloud demand, AI spending, and ad trends because those spill straight into semis, software, and the cap-weighted tape. Thursday adds Eli Lilly, Mastercard, and Caterpillar before the bell, then Apple after the close. Friday brings the energy complex into focus with Chevron and ExxonMobil. If those reports confirm steady demand and controlled costs while the macro mix stays orderly, leadership can broaden. If the megacaps beat into hotter inflation, the market may still struggle to hold the upside.
Bottom line
Core PCE at 0.3% with ECI near 0.5% and GDP at 1.5% or better is the cleanest risk-on mix on the board.
A 3.75% hold is fully priced; the tripwire is a firmer press conference into a visible 0.6% monthly PCE and 3.3% yearly PCE.
ISM above 52.5, especially if confidence beats 89.5 and claims stay near 215K to 219.0K, keeps the cyclical bid intact.
This is a week where the tape has to prove it can absorb a fully priced Fed hold, mixed inflation, and megacap earnings all at once.

Order Flow in Focus: Reading Smart Money Tells
Order Flow in Focus: Reading Smart Money Tells is a recurring segment that spotlights unique intraday opportunities revealed through institutional order flow. Each feature dissects a moment when the tape quietly shifted—when large, ranked prints clustered at key liquidity locations and informed players positioned ahead of the move. The goal isn’t hindsight; it’s pattern recognition—learning to spot the footprints of capital that knows before the crowd does.
The move in CAR is a clean study in how distribution leaves footprints before price catches up.
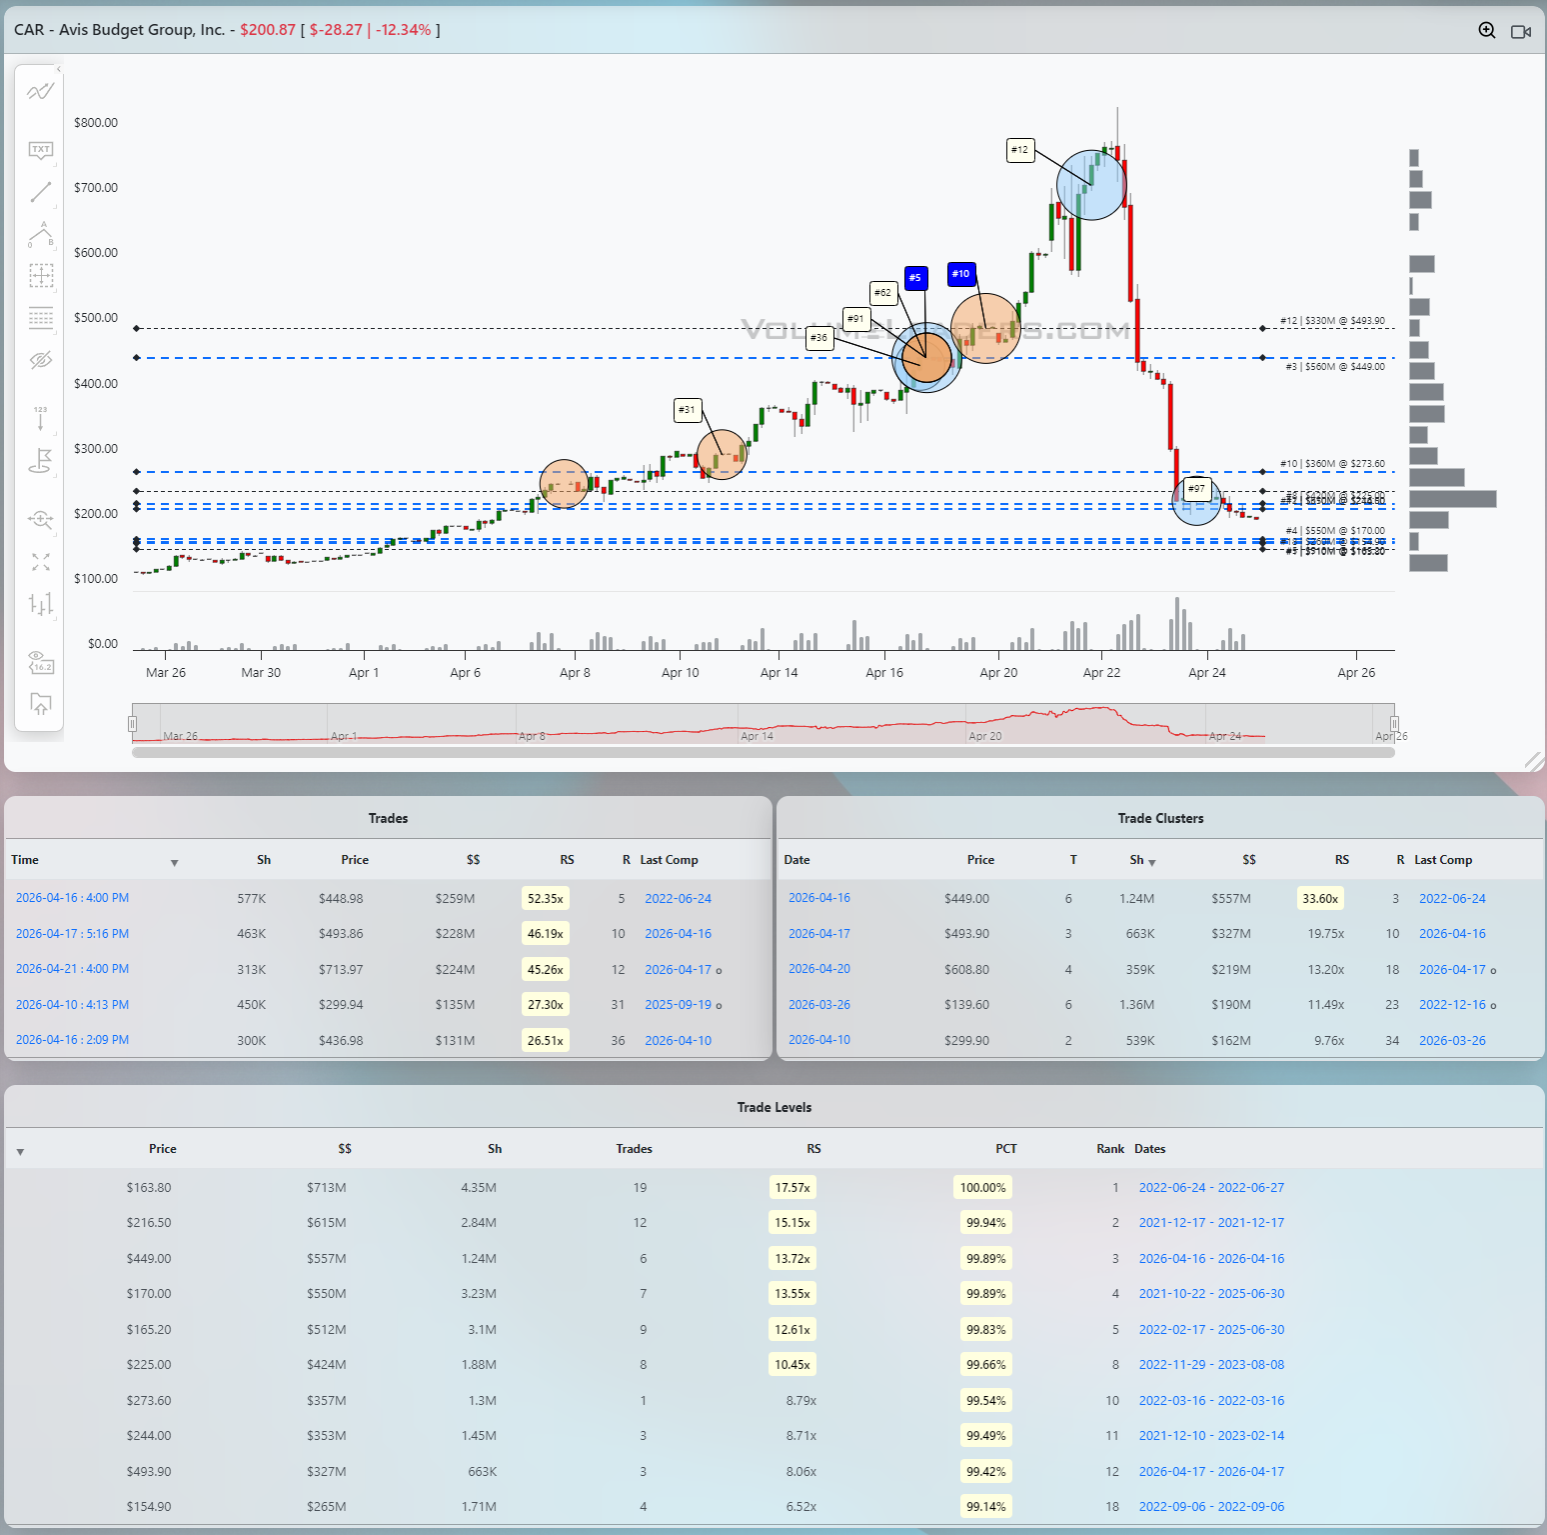
The uptrend into the high was orderly until it wasn’t. Price pushed into the 700s and then extended into the 800s, but what changed was not the candles, it was the tape. You start to see clustered, ranked prints appear into that upper zone, including a #12 tag near the peak. That is not random activity. That is large capital choosing to transact at elevated prices, and importantly, not chasing higher after the fact. The presence of multiple high-ranked prints into the same region tells you supply is being introduced into strength.
The first actionable moment comes a bit earlier, around the 430 to 450 zone. There is a dense pocket of activity there, with several ranked prints, including tags in the top 10 range and large notional blocks sitting right around the 440 handle. That area lines up with a major cumulative level, roughly $449 with about $557M behind it, showing up in the table as a near 99th percentile level. The $449 blue-dashed level ranks #3 and, in hindsight, is where most of the inventory from lower prices was let out. However, when price initially breaks above it, that is your first tell that the trend isn’t over. When price revisits it later from above and cannot hold this key level, that is a distinctive shift.
Everyone smelled squeeze and there is a front-side move that can be played on the break above the #3 level into the #12 print. The backside move is what a lot traders we were talking to were waiting for. The actual short setup emerges on the retest of that same zone. Price rolls over from the 800s, loses the #12-ranked print, and comes straight back into the mid 400s, where the prior high-dollar level sits. The collapse came so fast it wouldn’t be unreasonable to expect a small head-fake here - a small bounce up before continuation lower. All that came was a pause in the tape that dripped lower, clearly not support stepping in. When a prior support level fails to produce upward response and instead absorbs all buying liquidity, it flips and now the downside break of the #3 level becomes a momentum play that still had plenty of meat on the move to capture.
With no bid stepping in, that becomes your line of scrimmage. A disciplined entry sits on the break and inability to reclaim that level, with risk defined just back above it. The market has already told you that $449 is no longer being defended.
From there, the path is straightforward because the next meaningful liquidity sits far lower. The tables show heavy historical levels around $273.60 and then a much deeper pocket around $170, including a $550M level. Once the 440s give way, price moves quickly through open air, accelerating into the 200s and eventually testing that lower band. That is where you see another large print, tagged around the low 200s, suggesting the first real attempt at stabilization.
The exit is anywhere into that lower liquidity. As price approaches the 270s and then pushes toward the 200 to 220 zone where prior large levels cluster, the trade has done its job.
What makes this leg instructive is the sequence. Ranked prints into highs, failure to hold a high-dollar level on retest, and then air pocket to the next cluster. The tape told you the story before the candles did. The “Levels” feature in the VolumeLeaders platform is one of the most powerful tools retail can add to their arsenal because those levels tell you exactly where institutions like to do business and consistently behave like magnets for price. If you’ve ever wondered why price has memory and support & resistance levels exist, you’ll be incredibly surprised to find how often those dashed-levels show up at those magic spots.

Market Intelligence Report
A desk-grade synthesis of institutional positioning and market structure—unpacking the flows, levels, and emerging themes that shaped the week, and translating them into a model portfolio built the same way professional desks prepare for the week ahead.
MIR Part 1: The Backdrop
Selective Risk, Heavy Tech, Quiet Redistribution
The backdrop
The internal macro-to-micro read opens with a market that is calm enough to take risk, but not healthy enough to reward indiscriminate risk. Broad participation is only marginally tilted toward offense, realized volatility at the market level has cooled, and the sturdier pockets are still large caps, emerging-market exposure, and a few defensive or hard-asset groups, while healthcare, financials, and communication-heavy growth remain much less convincing. That is the important starting point. This is not a tape that is saying no to risk. It is saying yes, but only where sponsorship is obvious and the volatility profile is cooperative. That sits neatly beside what the outside world looked like this week: the S&P 500 and Nasdaq finished at record highs, the Dow lagged, and U.S. equity funds pulled in their largest inflow in four weeks, with tech funds doing most of the lifting. The mood is constructive, but it is still paying a premium for certainty.
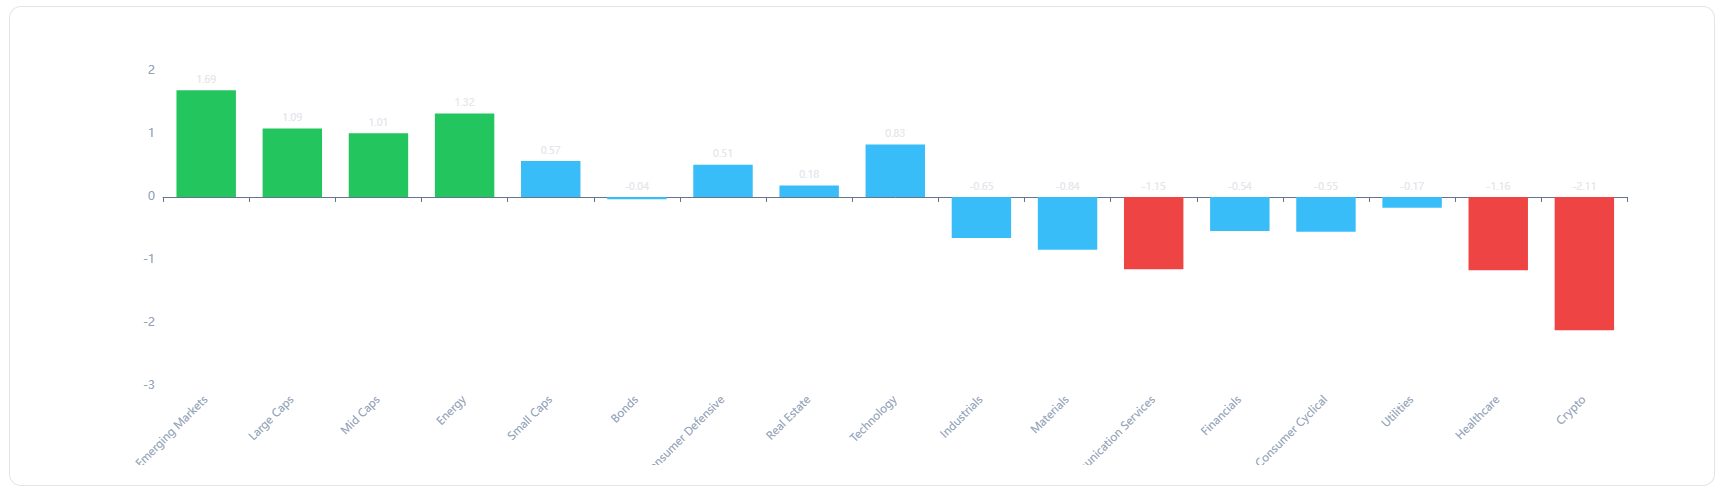
The sector tape
That is exactly how the sector-dollar breakdown reads. Technology is still the institutional center of gravity on a day-to-day basis, and the real week-over-week story is not that tech stayed large. It is that the supporting cast rotated in a very specific way. Energy and industrial exposure look firmer than they did last week, financials improved from a low base without yet earning leadership status, and healthcare never really took command. In other words, capital broadened a little, but it broadened toward sectors with either hard macro catalysts or cleaner earnings leverage, not toward a full cyclical handoff. That is consistent with the external tape.
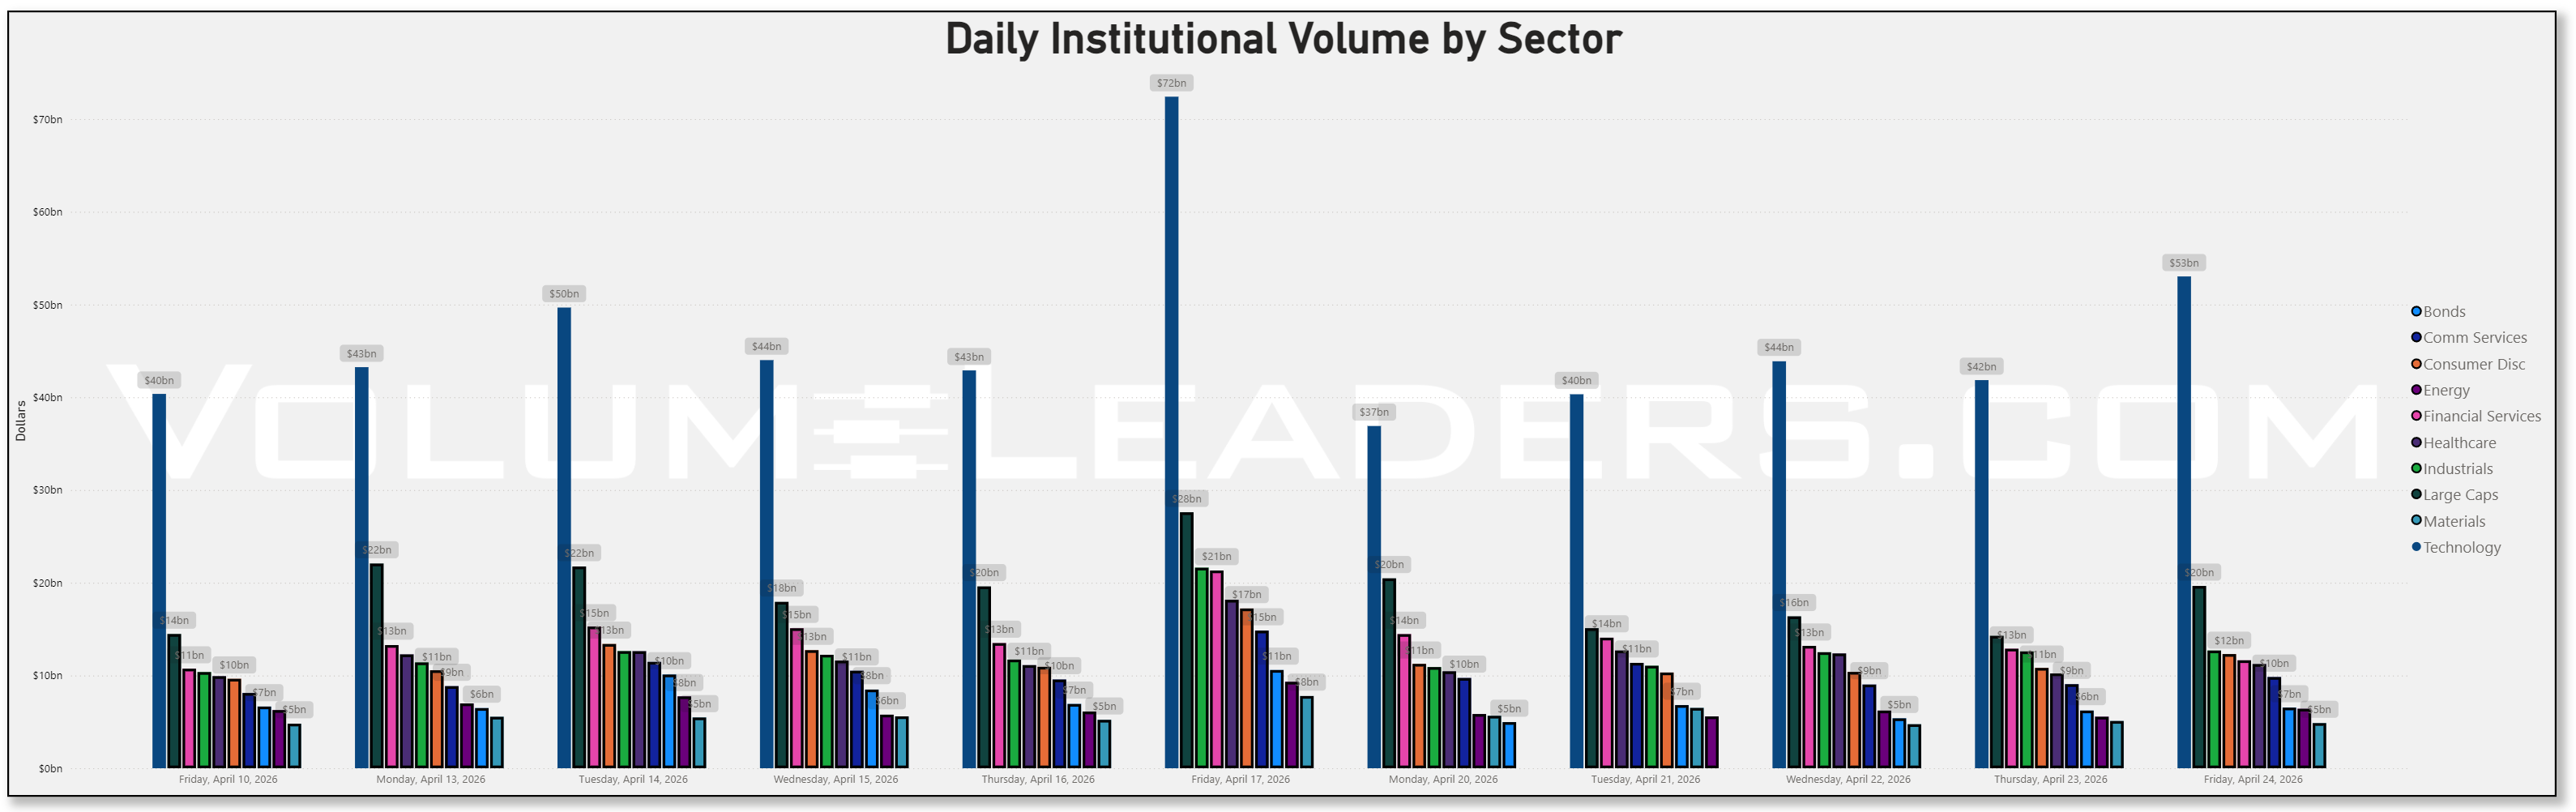
This earnings season’s upward revision pressure has been led by industrials, information technology, healthcare and materials, while energy has been a relative drag on estimate revisions. At the same time, oil-sensitive complex behavior stayed relevant because the Strait of Hormuz disruption kept a geopolitical bid under the energy tape even as Friday’s diplomacy headlines eased crude off the highs. So the week never became a pure growth chase. It became a selective allocation week with tech in front, energy and industrials as the unusual gainers, and the lower-quality cyclicals still struggling to earn trust.
The name tape
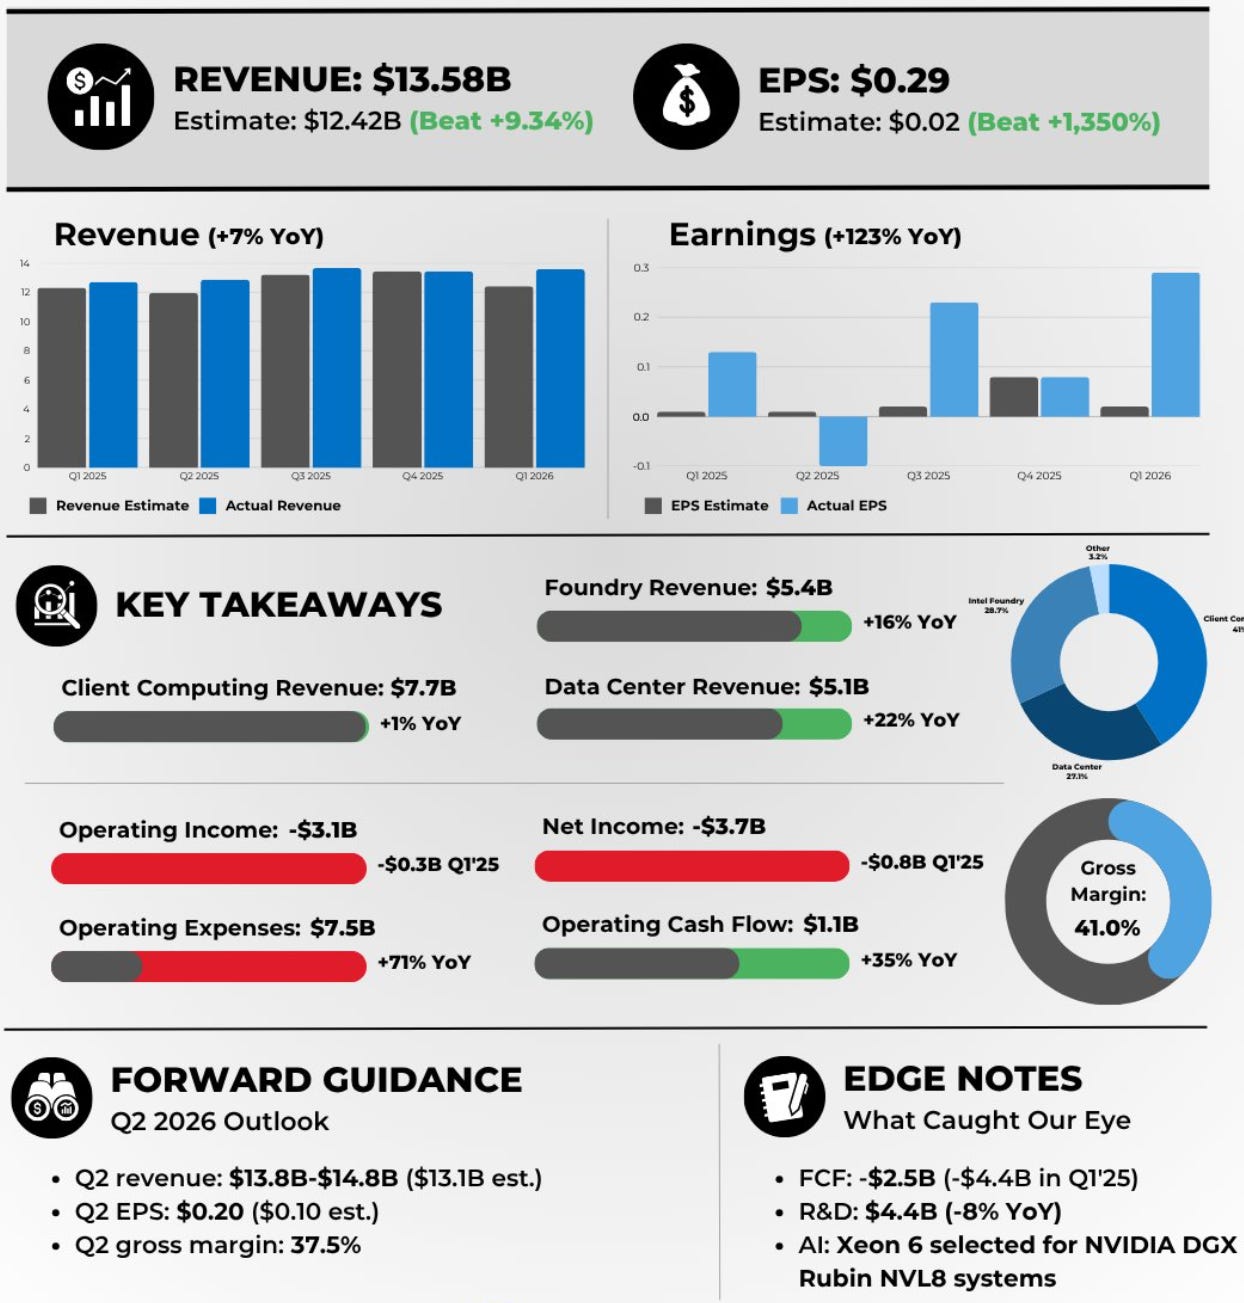
At the single-name level, the aggregate-dollars rankings tell a very familiar story for this kind of regime. Index wrappers dominate the board first, then the money narrows quickly into megacap AI, semis, and a handful of event-driven names. That is broad positioning on top and selective expression underneath. The most obvious single-name gravity this week is around Intel and the wider chip complex.
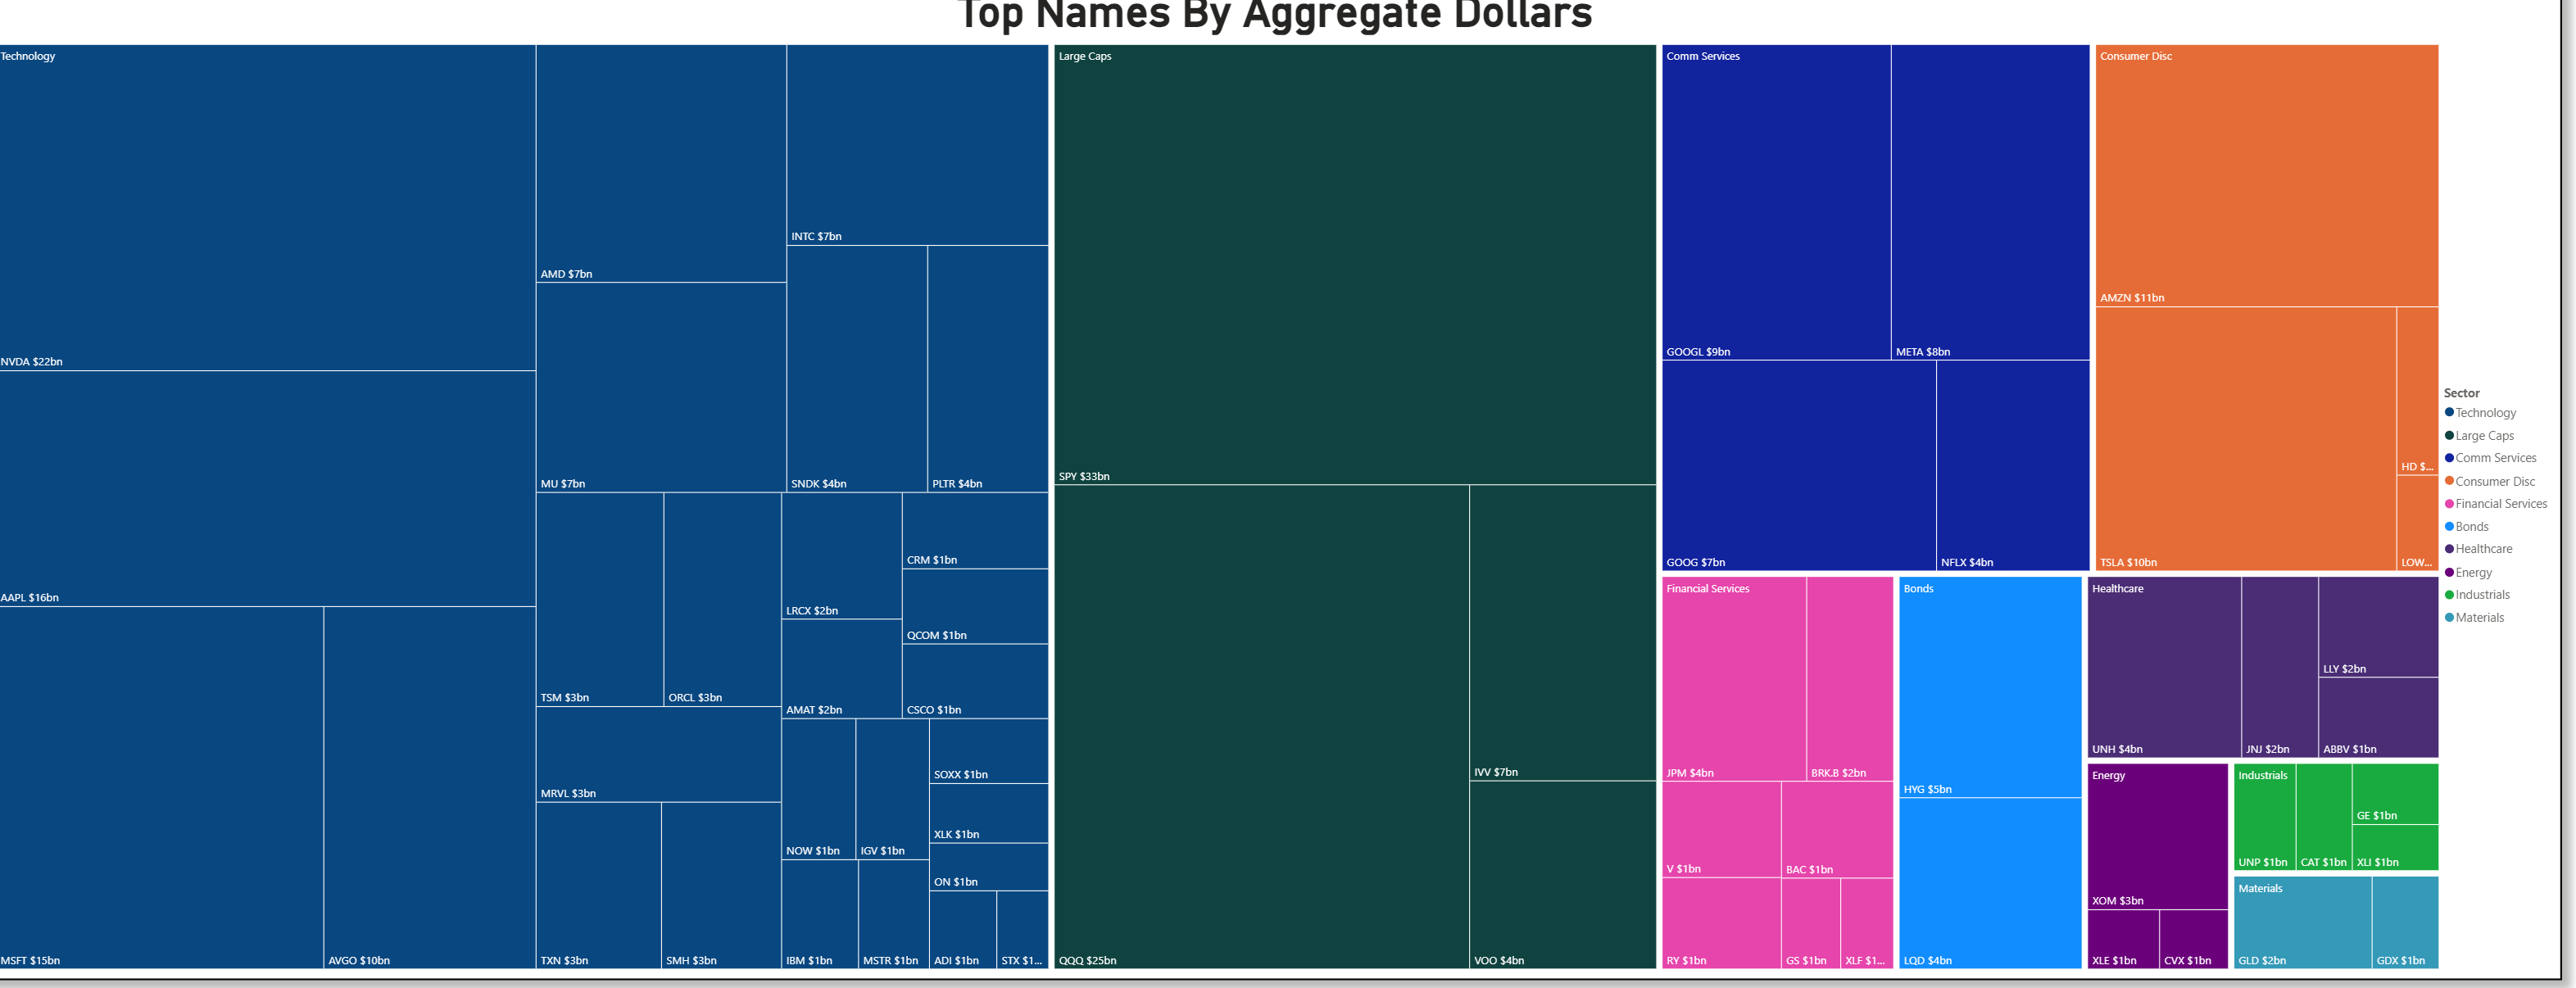
Intel surged more than 20% after a strong forecast tied to AI-driven CPU demand, helping push U.S. chipmakers to record highs and extend the semiconductor index’s winning streak, with Advanced Micro Devices and Nvidia also participating.
That matters because the aggregate-dollars bars and the dollar-versus-volume scatter together say the same thing: the biggest dollar risk still lives in benchmark vehicles and gigantic core holdings, but the highest urgency is concentrated in the names where earnings, AI capex, or valuation repricing can force immediate repositioning.
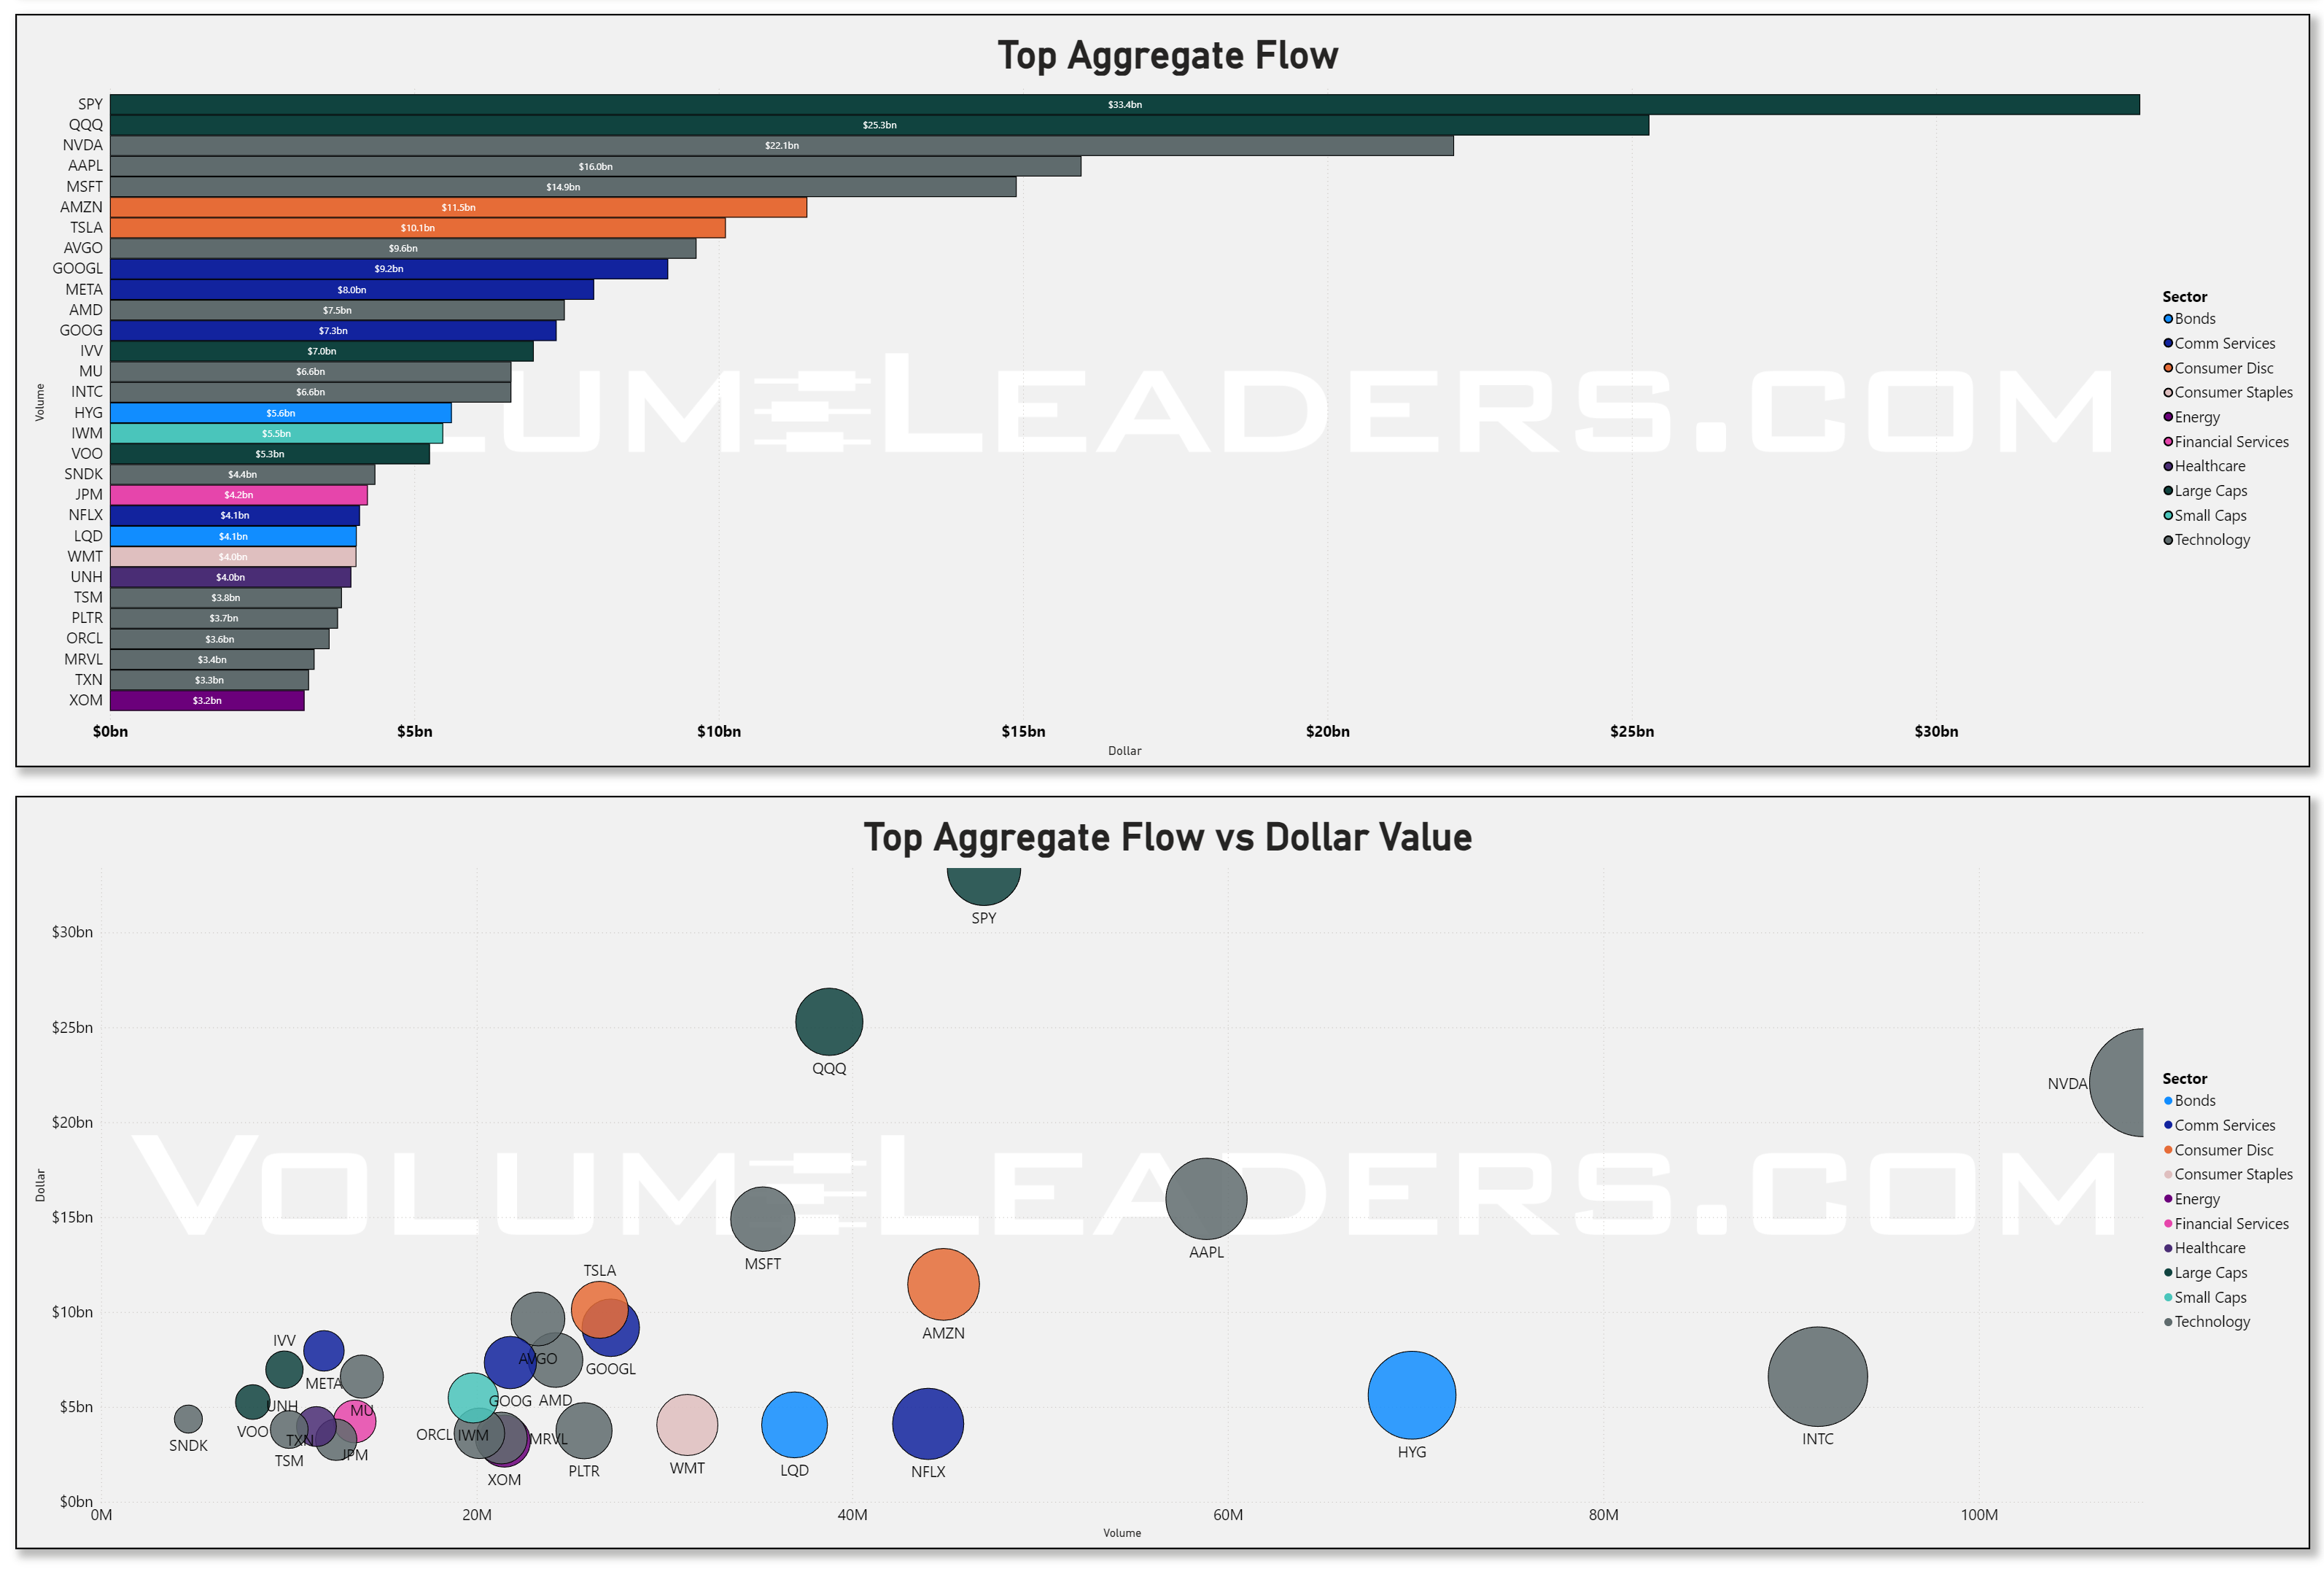
That also helps explain why money kept circling back to Alphabet and Amazon after their separate moves to deepen ties with Anthropic, and to Tesla after it raised 2026 spending plans by 25%. Those are not sleepy core-position stories. Those are catalyst-rich, capital-intensive stories, and they belong in the part of the tape where urgency and narrative meet.
Hidden flow and fast money
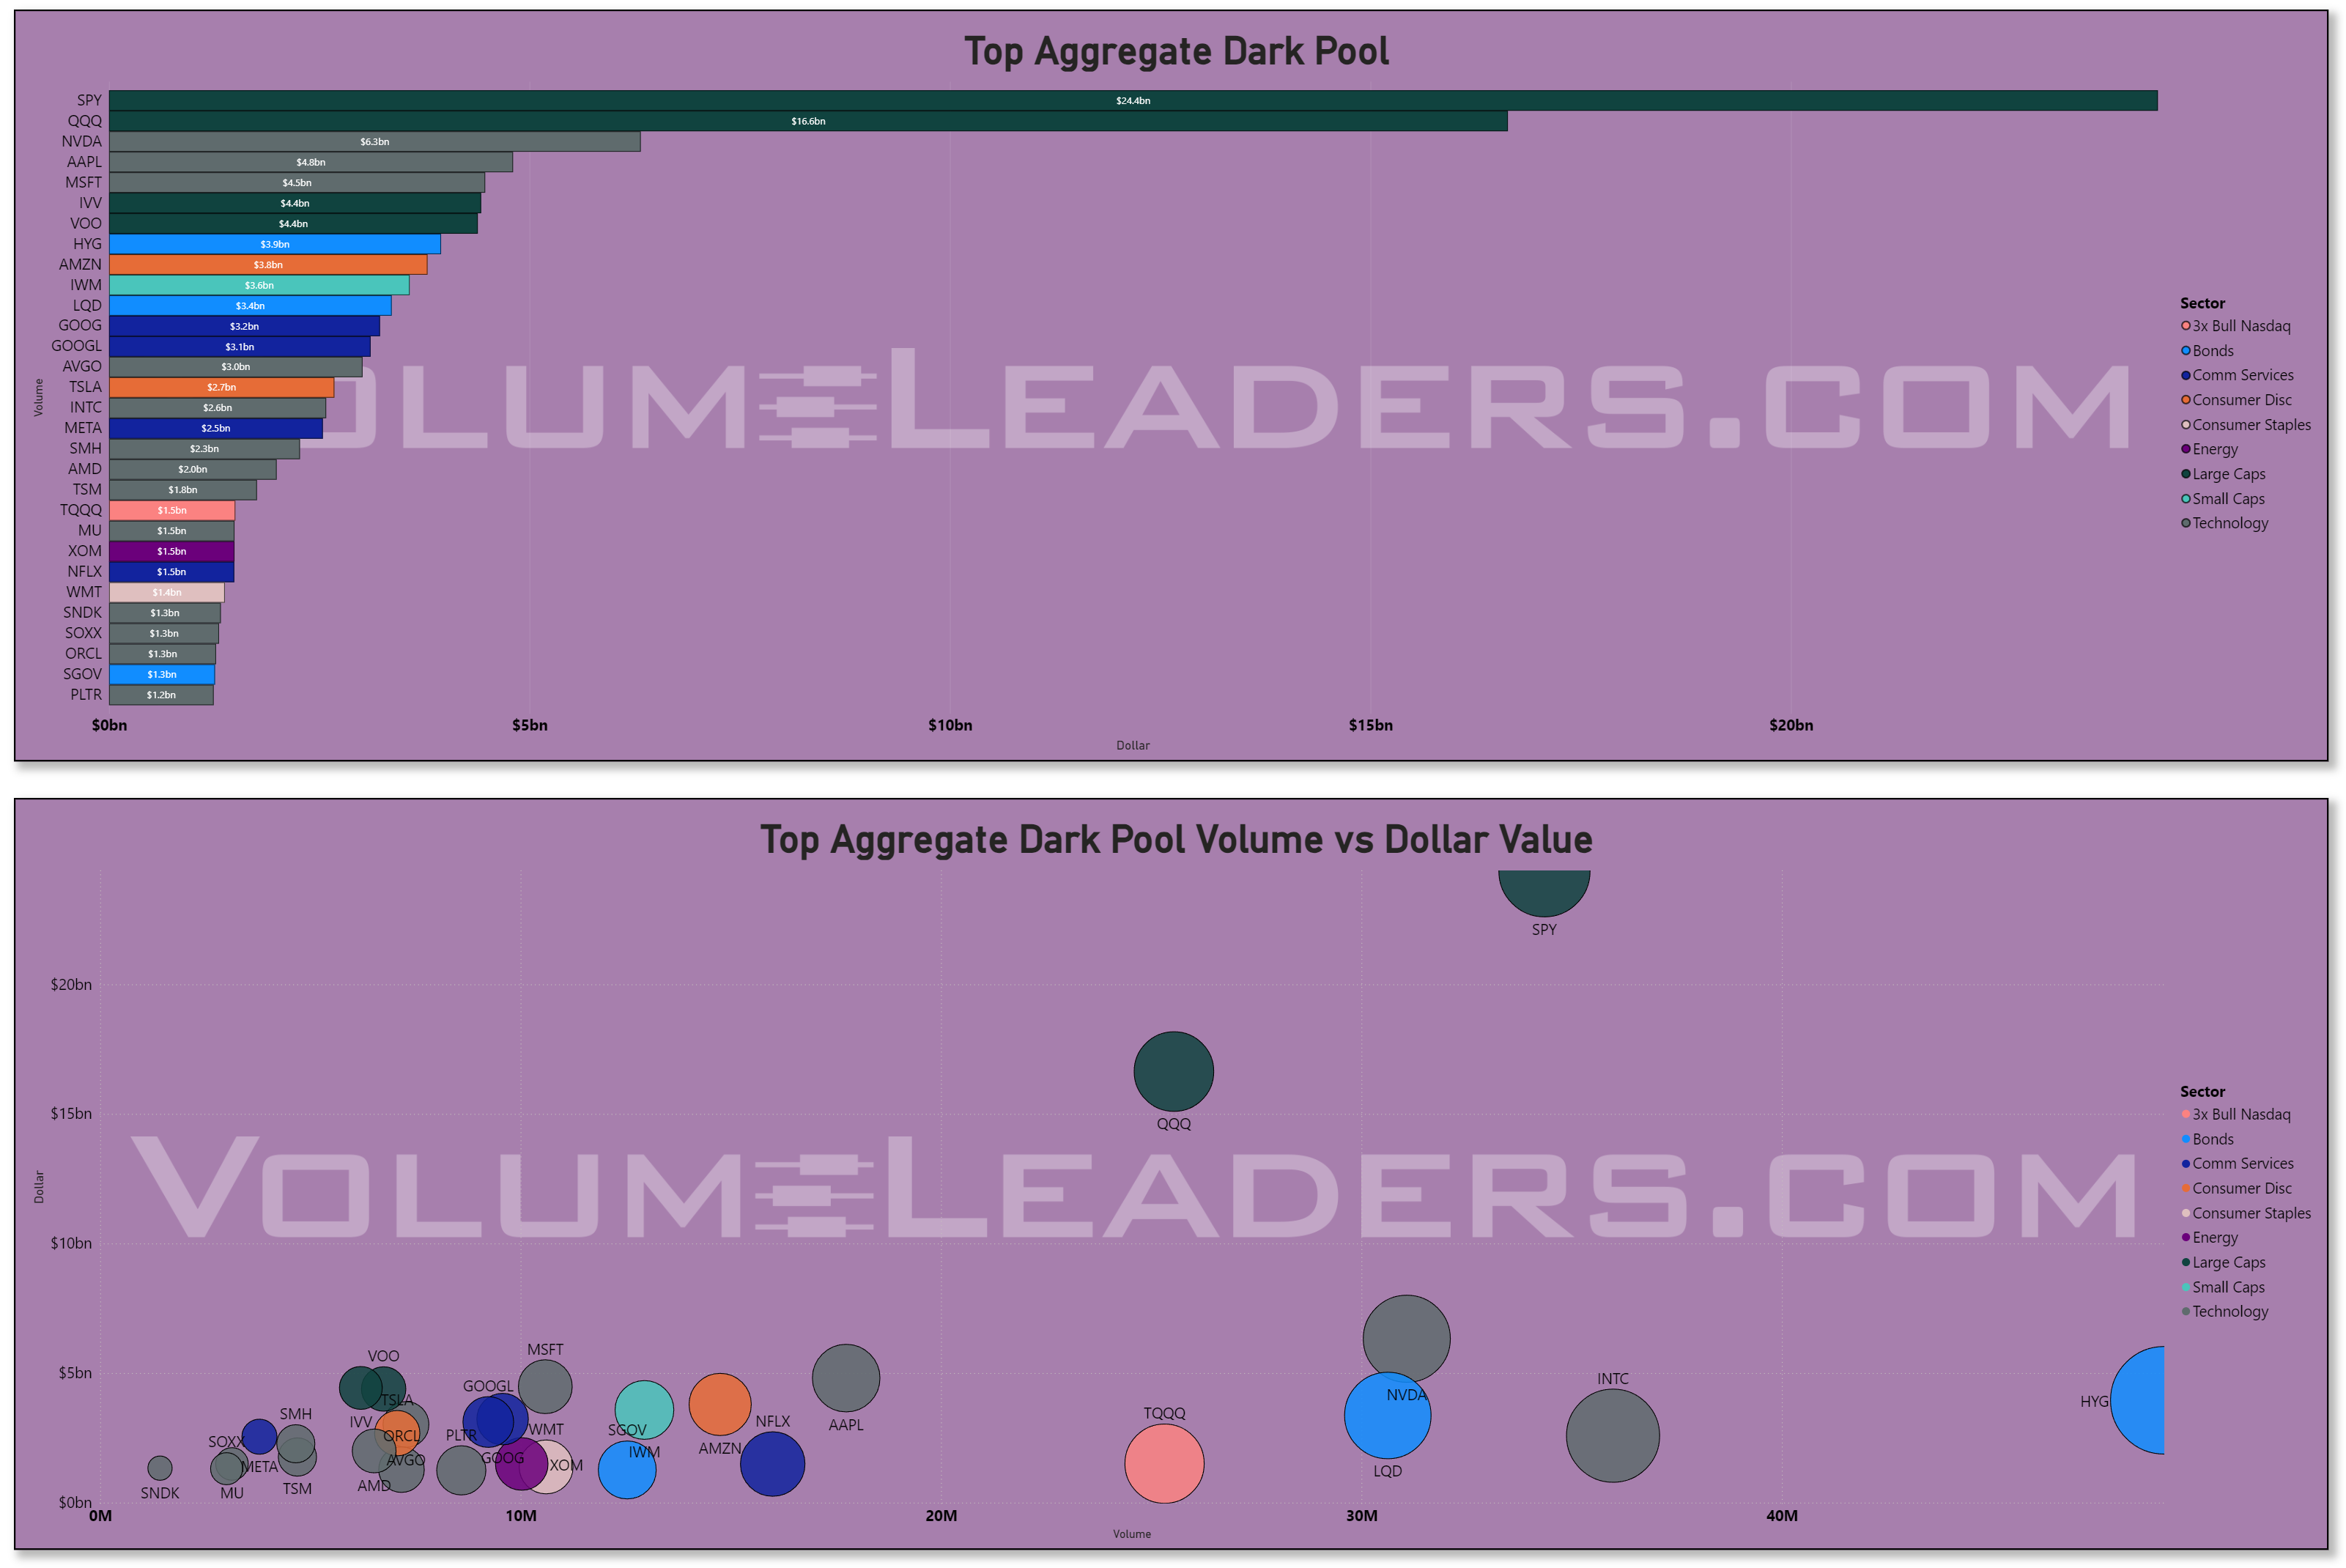
The dark-pool lens makes the read more interesting, because it is quieter and therefore more revealing. The hidden-dollar rankings remain concentrated in benchmark products and mega-cap anchors, which is usually what institutional rebalancing looks like when managers want exposure changed without advertising urgency. That does not have to be bullish. Dark flow is often redistribution as much as accumulation. But in this context, with market-wide realized volatility cooling and index-level leadership still intact, the concentration in those names looks more like serious sponsorship than exit panic.
The sweep tape is the personality shift. Sweeps are the impatient expression of the same market, and here the money leans toward the high-beta semis and major event names. That is classic tactical behavior ahead of a crowded catalyst window. The next week brings the April 28-29 meeting of the Federal Reserve, plus GDP and inflation data, and a heavy late-April earnings slate.
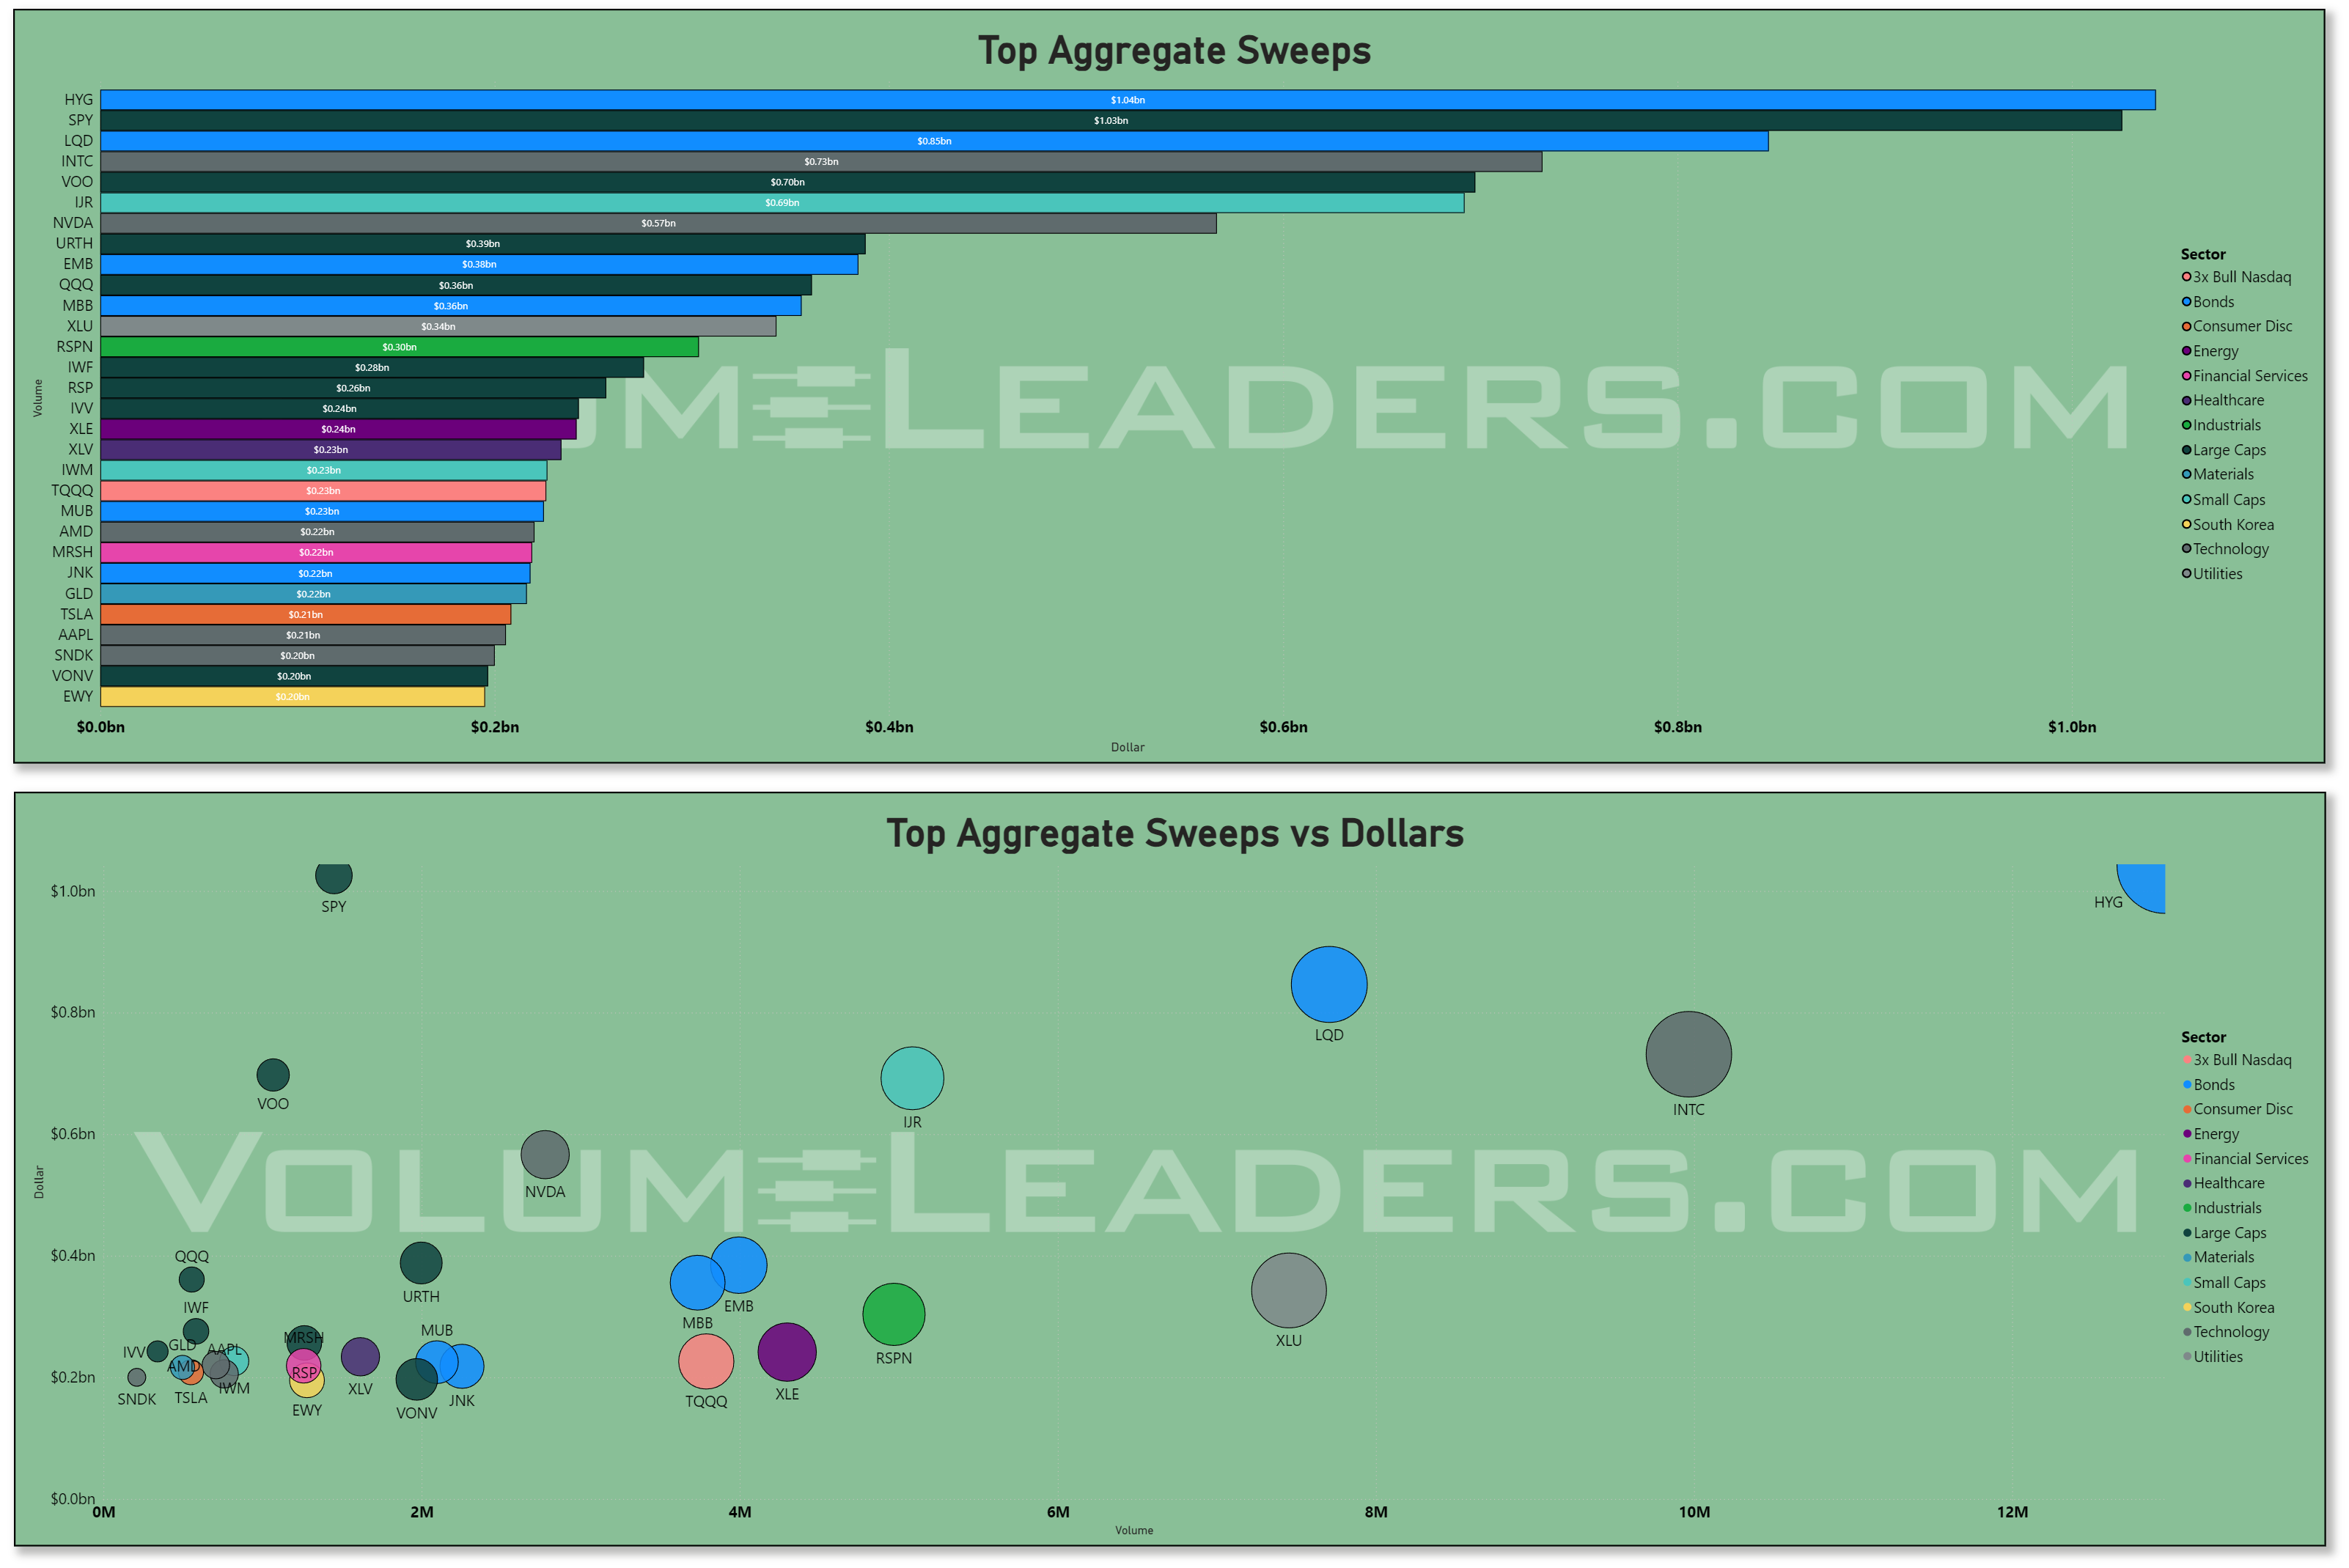
180 S&P 500 companies are set to report next week, including 11 Dow names, with results from Microsoft, Meta Platforms, and Apple alongside the large AI spenders and the energy majors Exxon Mobil and Chevron on-deck. That kind of late-April earnings concentration is one of the most reliable calendar periods for separating strategic positioning from tactical chasing, and the dark-pool versus sweep split is reading exactly that way.
What it means
Put the three lenses together and the message is coherent. Broad positioning is still constructive because the index products and mega-cap cores are absorbing real dollars. Hidden flow says institutions are still willing to move size under the surface rather than simply stand aside. Sweeps say traders are still prepared to press catalysts. But the internal structure keeps this from being a full-throated risk-on endorsement.
The market still prefers to be involved where participation, relative strength, and volatility all line up: large-cap growth with real earnings support, semis tied to the AI spend cycle, selected energy exposure where macro scarcity still matters, and a few defensive pockets that are quietly improving. The parts of the market that remain harder to trust are the same ones that keep failing to earn broad sponsorship underneath the index: healthcare, financials, and communication services. If the coming week’s macro prints cool the rate scare and the mega-cap reports validate the spending cycle, these flows can keep feeding a cap-weighted advance. If the data reprice rates higher, or the biggest platform names fail to justify their capex burden, then this week’s concentration will read less like healthy sponsorship and more like a narrowing market living off a handful of giant balance sheets. For now, the tape is still investable, but only in the places where the money has made its preferences obvious.
MIR Part 2: Individual Names From The Institutional Tape
VolumeLeaders tracks several proprietary signals designed to spotlight names drawing significant institutional interest. Below, we’ve surfaced the latest results and analyzed them to highlight emergent themes. If any of the sectors, narratives, or positioning trends resonate, the names mentioned here offer a strong starting point for deeper research and watchlist consideration.
VL Trade Rank Velocity™ (TRV)
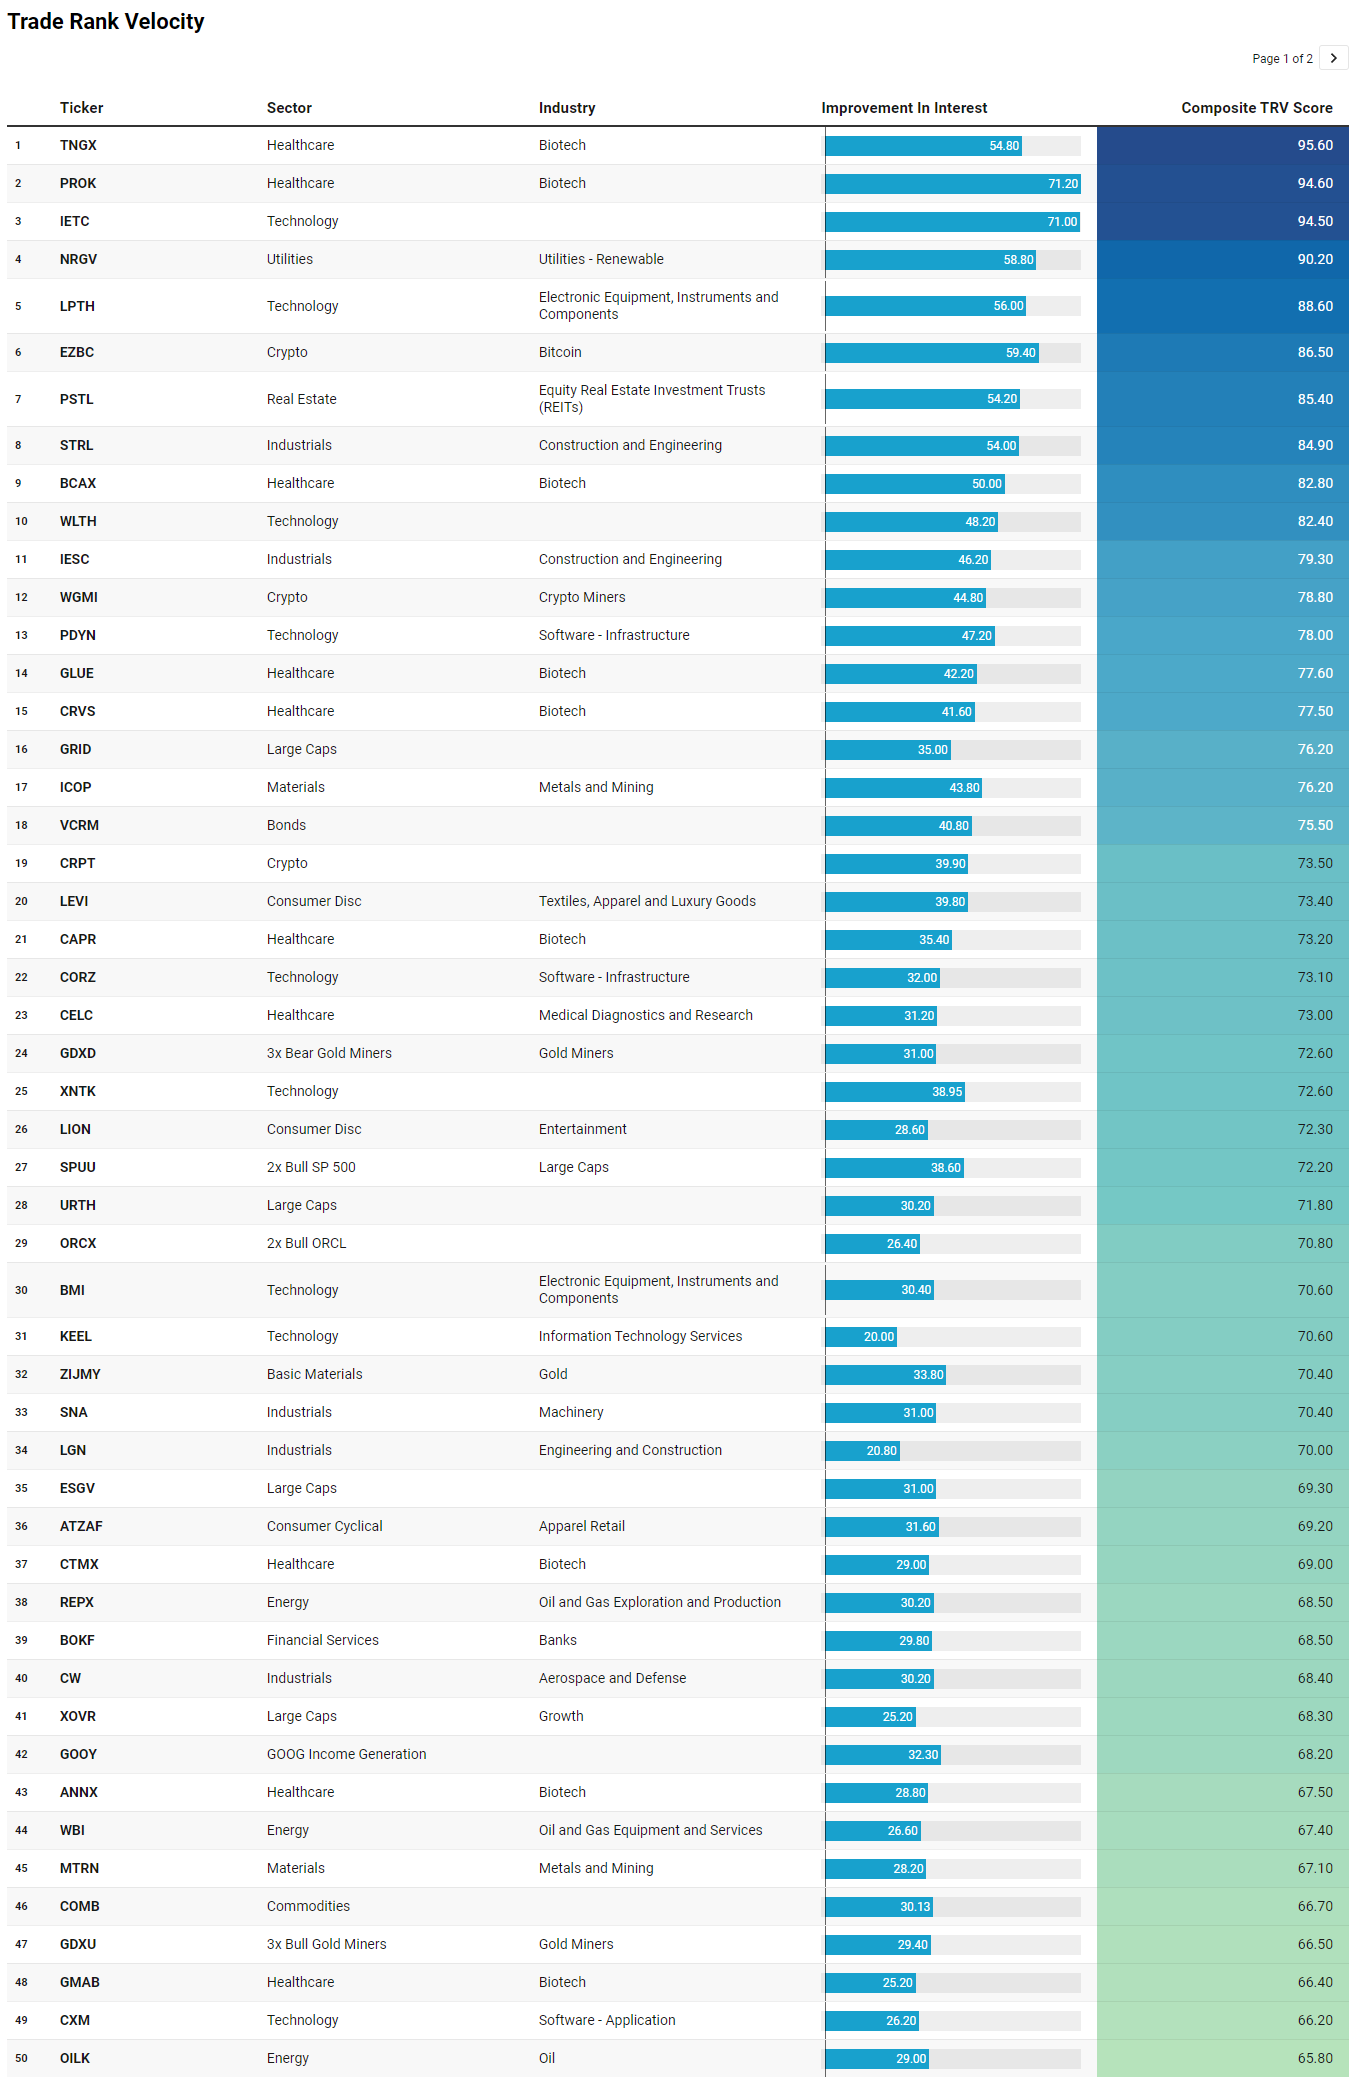
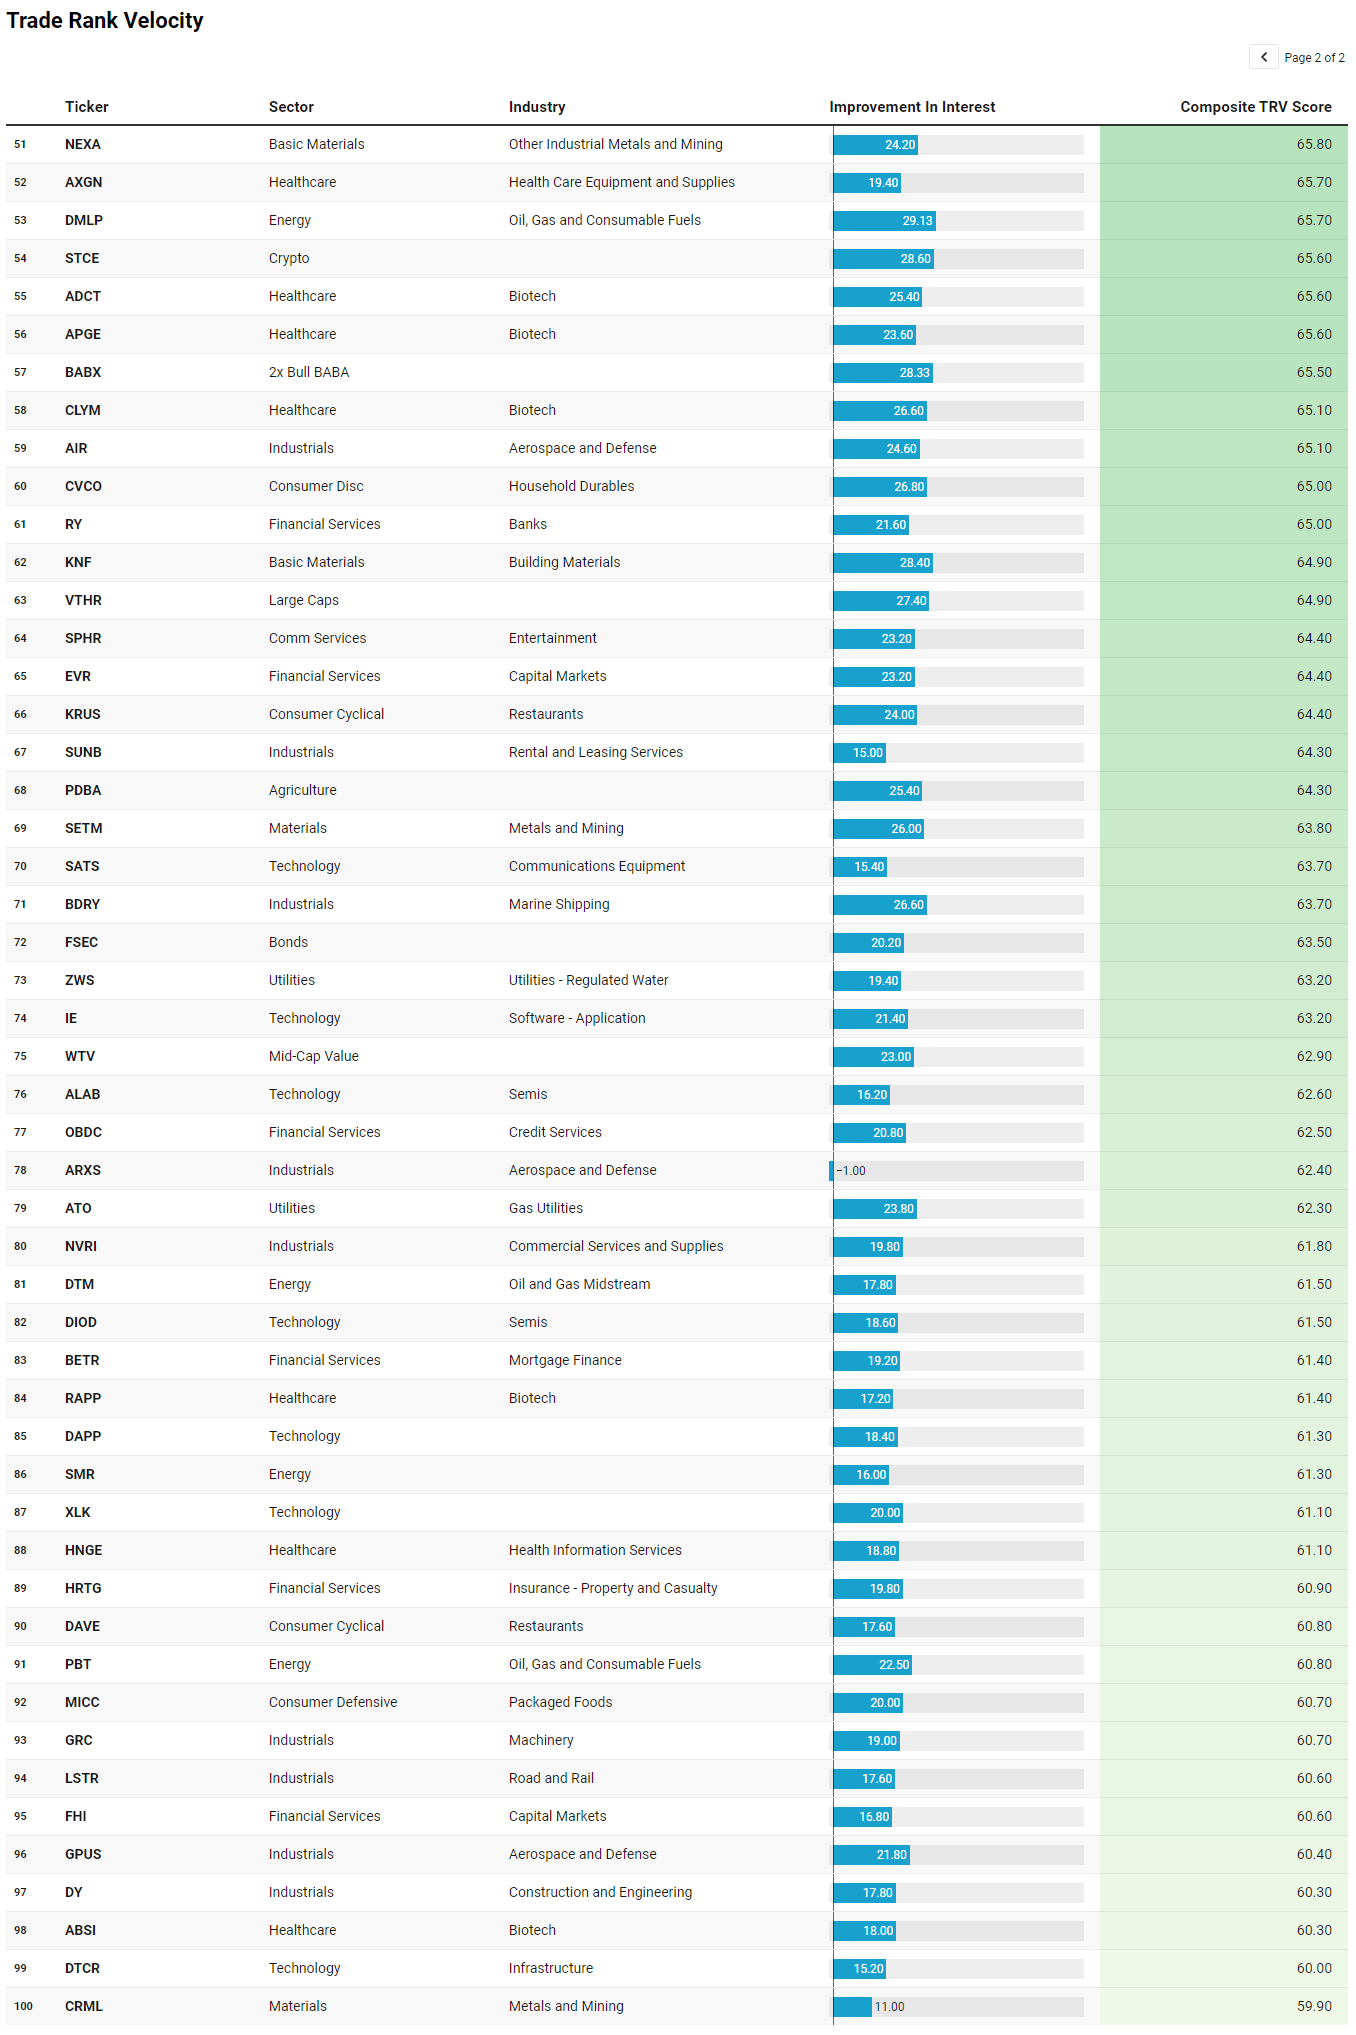
TRV is a proprietary metric that measures the recent acceleration or deceleration in institutional trading activity for a given stock by comparing its average trade rank over the past few days to its average in recent weeks. A sharp improvement in TRV typically reflects a notable shift in positioning, often accompanied by sustained trade activity, suggesting institutions are actively engaging with the name and that intensity of activity is rising. This often precludes meaningful price or narrative shifts. This isn’t a buy-list or sell-list; it’s meant to draw your eyes to names where institutions are putting money to work.
The TRV list adds a useful layer to the broader tape because it is not just showing where the biggest dollars went, but where interest is improving and persisting beneath the surface. On that basis, the first theme is healthcare speculation, especially biotech. TNGX sits at the top with a 95.6 composite score, followed by PROK at 94.6, with BCAX, GLUE, CRVS, CAPR, CTMX, ANNX, GMAB, ADCT, APGE, CLYM, RAPP, and ABSI all appearing deeper in the list. That is a clear cluster. It does not necessarily mean defensive healthcare leadership. It looks more like targeted risk appetite in high-idiosyncratic, event-driven biotech.
The second theme is infrastructure and real-economy buildout. STRL, IESC, LGN, DY, GRID, PAVE, SNA, GRC, LSTR, AIR, CW, ARXS, and GPUS all point in the same direction: construction, engineering, aerospace, defense, machinery, roads, rail, and grid-related exposure. This fits neatly with the prior narrative that institutions are not simply buying software dreams; they are also pressing into the physical picks-and-shovels side of growth. If the market is rewarding AI, electrification, power demand, reshoring, and infrastructure, this list suggests the sponsorship is migrating into the companies that build, connect, transport, and maintain the backbone.
Technology remains present, but the composition is more interesting than a plain mega-cap chase. LPTH, PDYN, CORZ, BMI, KEEL, CXM, SATS, IE, ALAB, DIOD, DAPP, XLK, and DTCR show a mix of electronic components, software infrastructure, semis, communications equipment, and infrastructure tech. That aligns with the broader flow narrative around semis and compute infrastructure, but it also says the market is hunting for second-derivative beneficiaries rather than only hiding in the largest index weights.
There is also a persistent hard-asset and hedge sleeve. ICOP, ZIJMY, MTRN, COMB, GDXU, NEXA, SETM, CRML, OILK, DMLP, WBI, DTM, PBT, SMR, and REPX suggest continued interest in metals, gold, commodities, energy, midstream, and nuclear-adjacent exposure. Paired with renewable utility NRGV and regulated water ZWS, the tape still carries that barbell character: growth leadership on one side, resource security and defensiveness on the other.
The takeaway is that this TRV list confirms a selective risk-on tape, not a broad everything rally. Institutions appear to be rewarding emerging momentum in biotech, infrastructure, semis, crypto-linked risk, energy, metals, and utility stability. The cleanest read is a market willing to take risk, but only where there is a strong thematic reason to do so.
VL Institutional Outliers™ (IO)
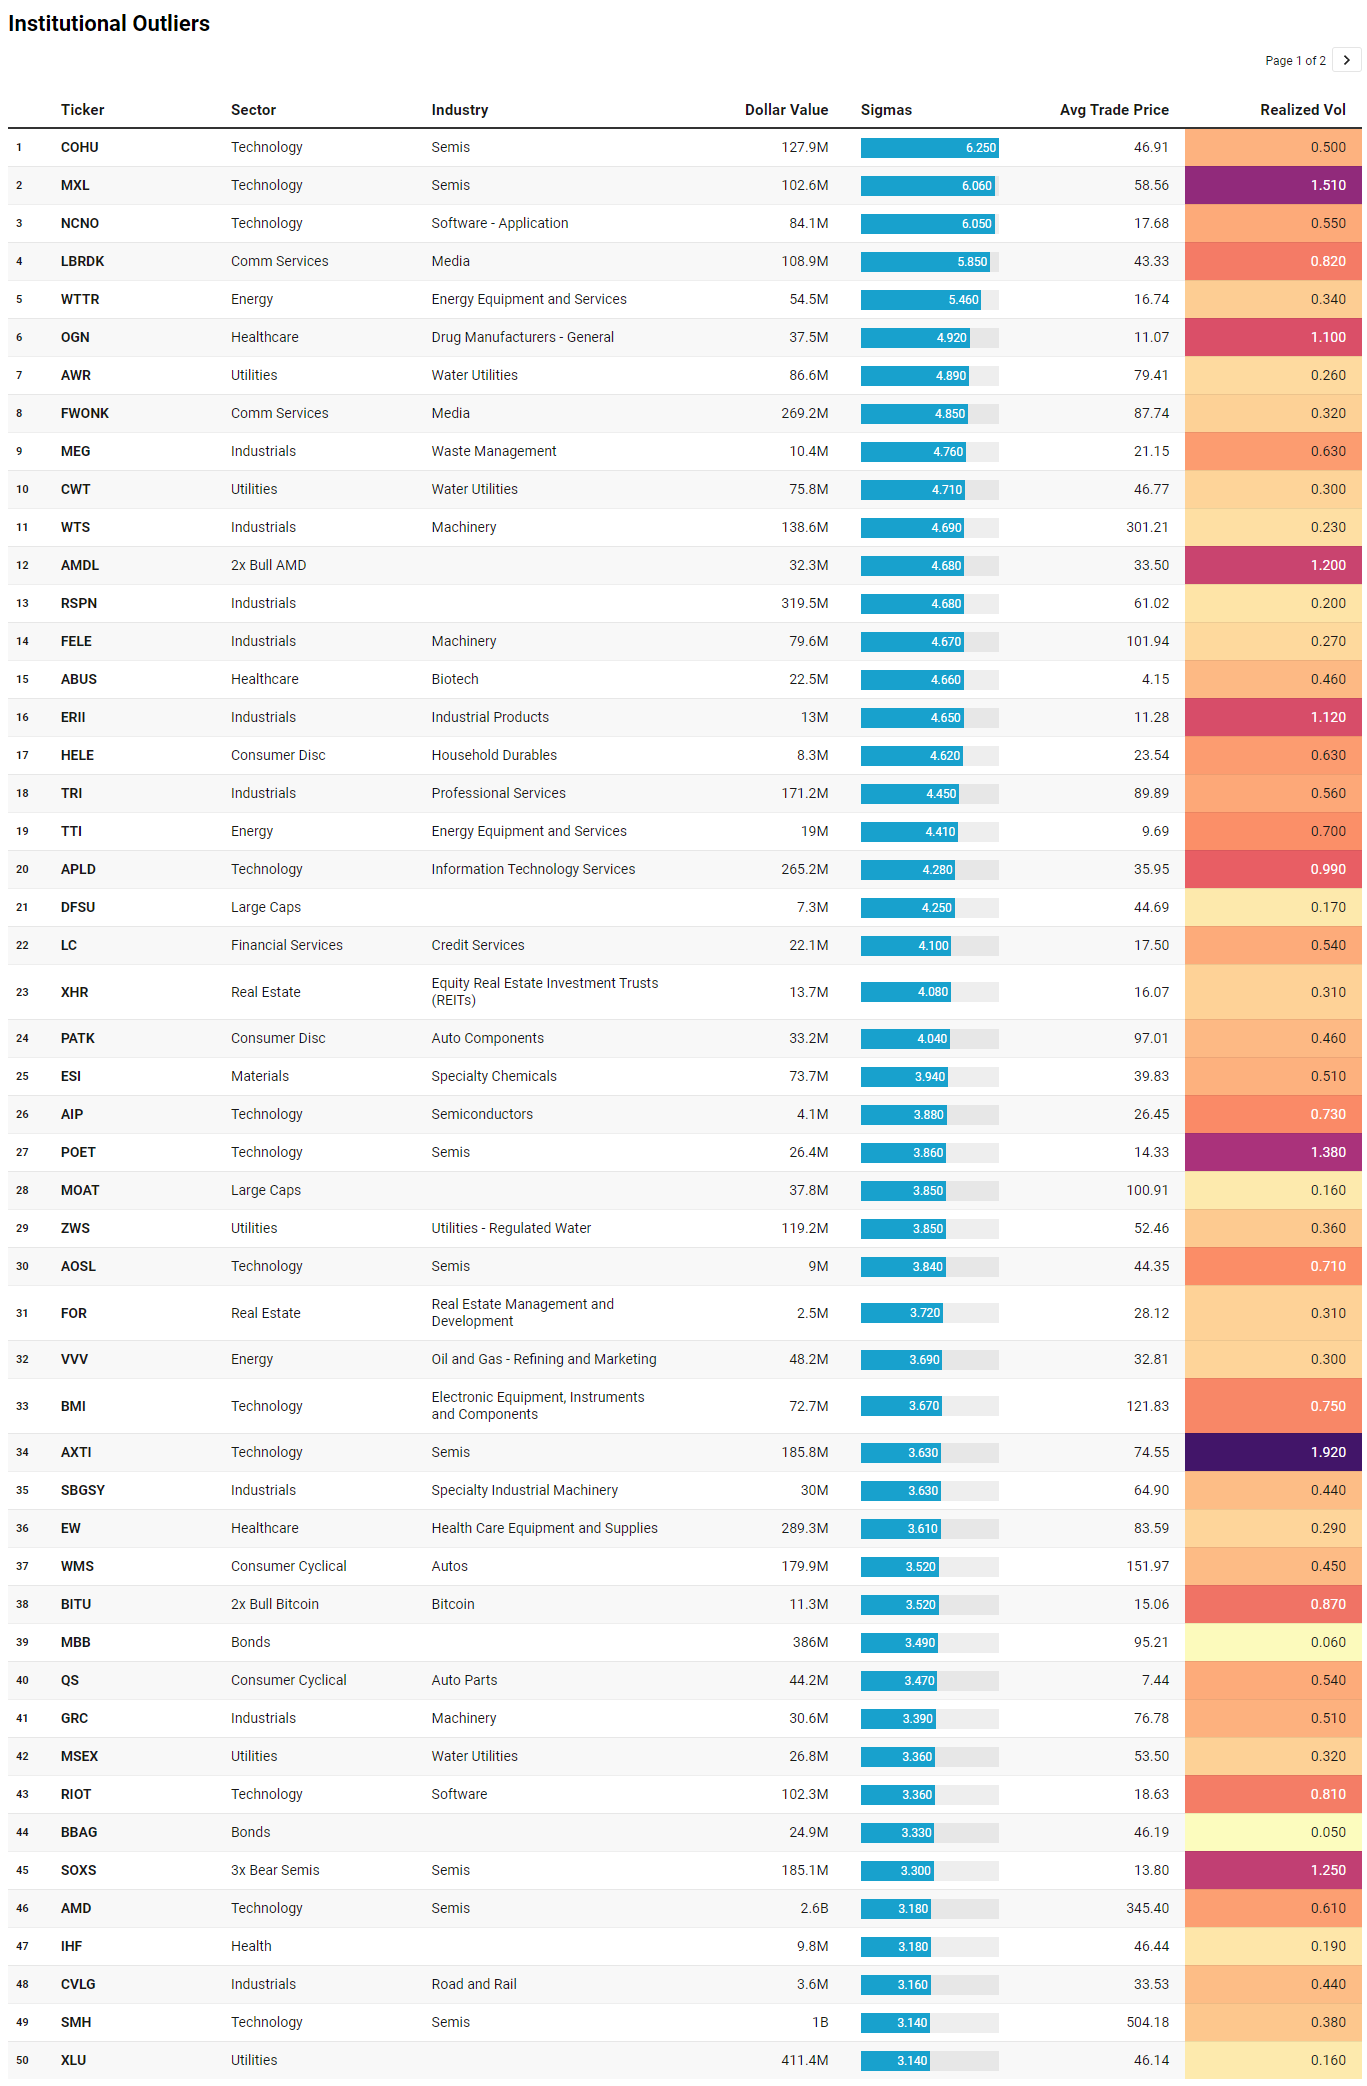
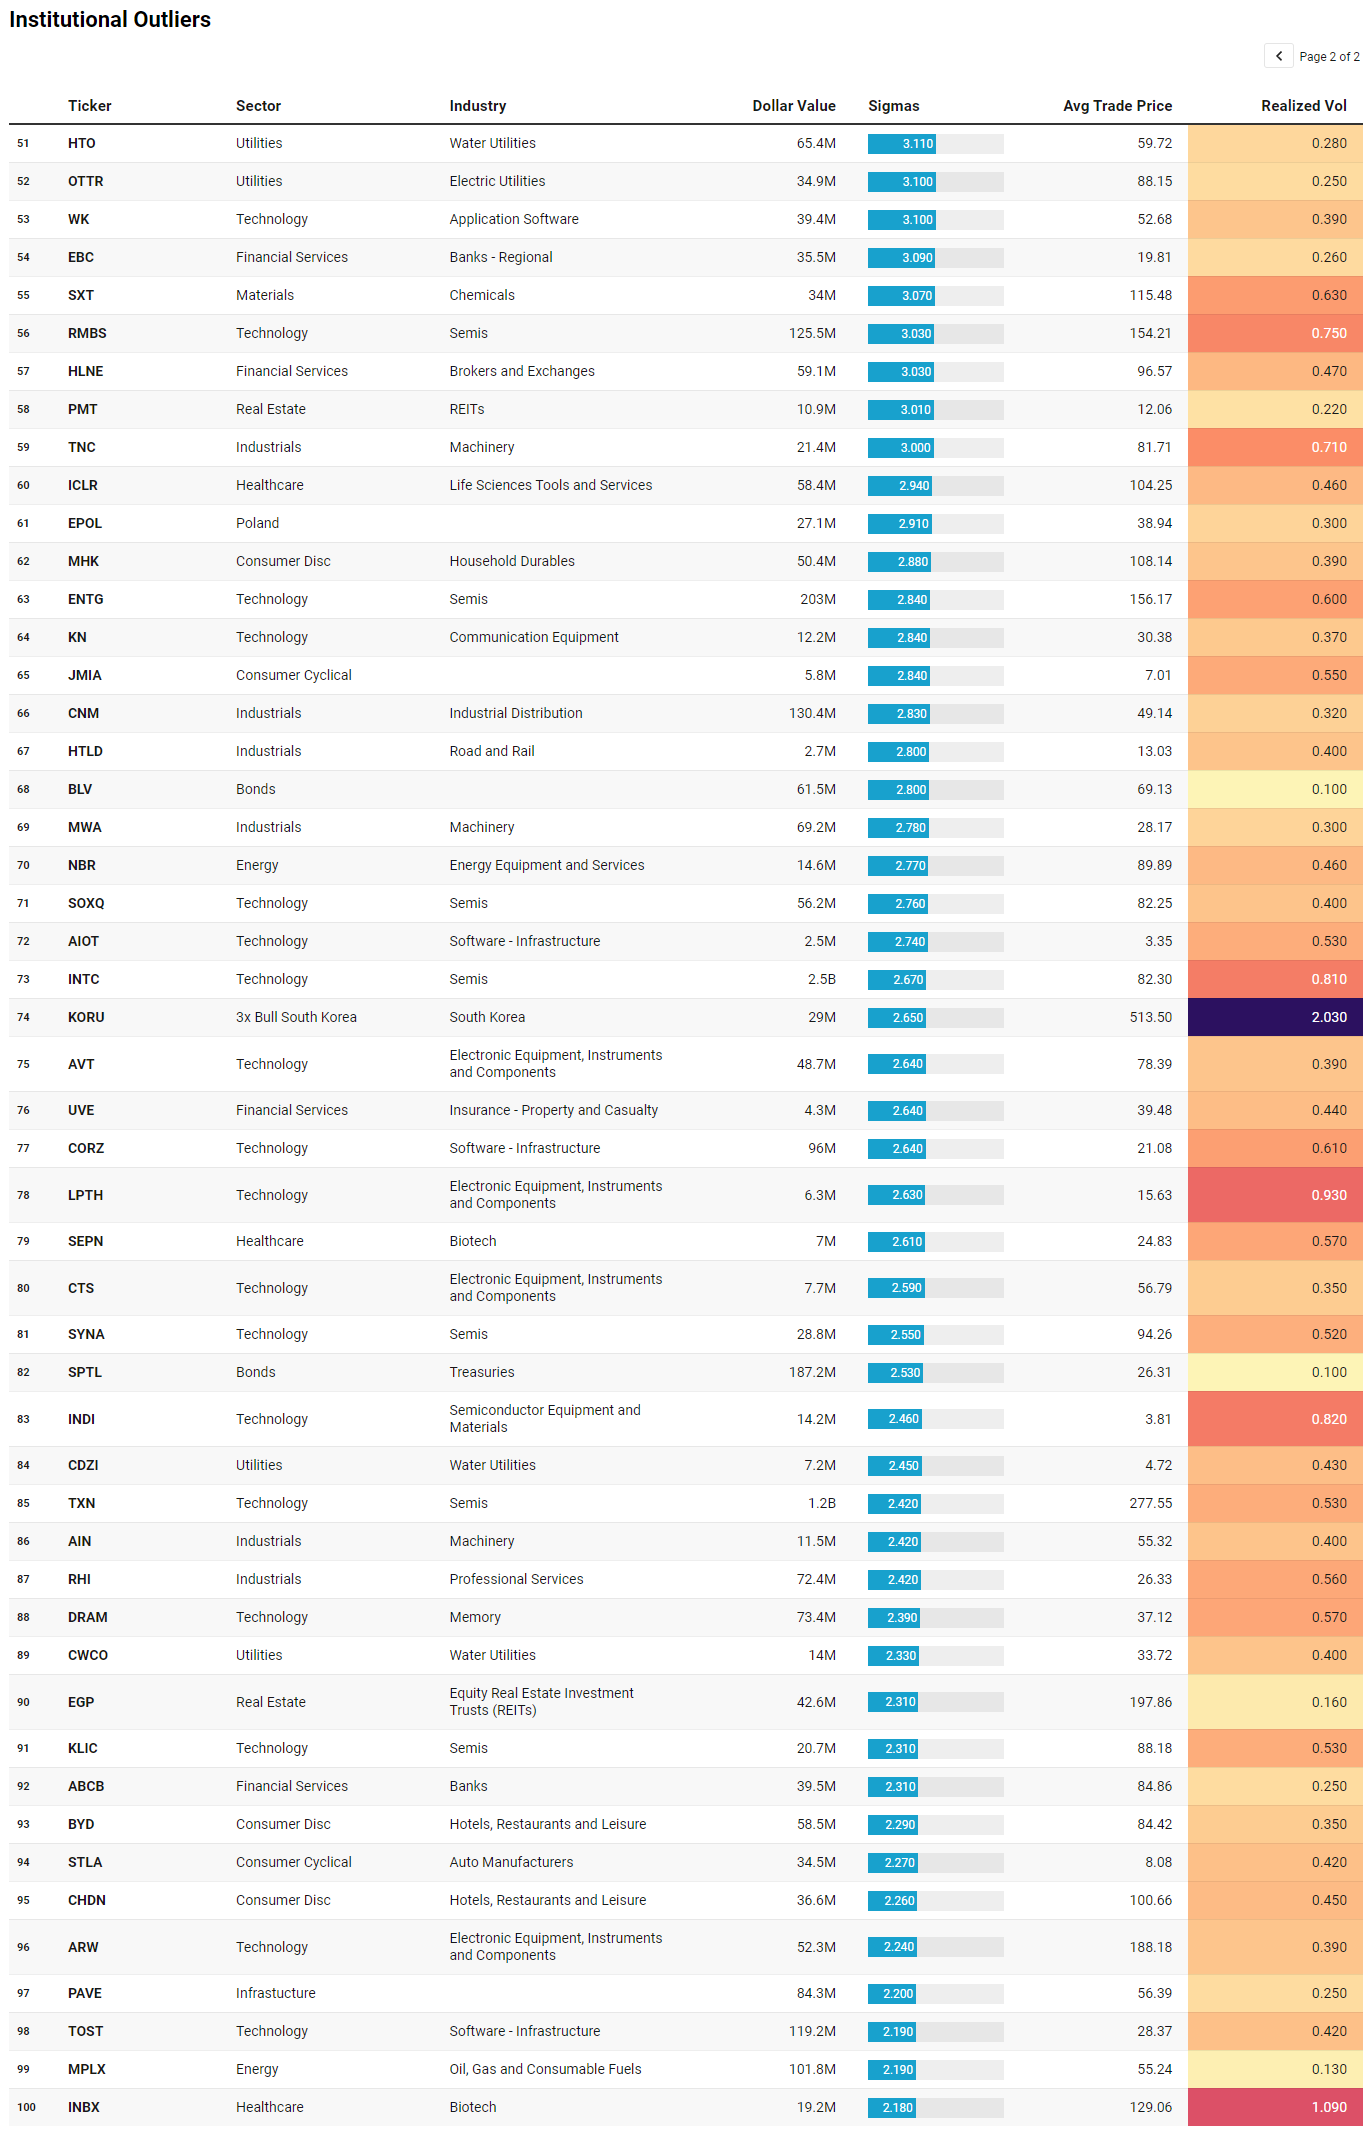
Institutional Outliers is a proprietary metric designed to spotlight trades that significantly exceed a stock’s recent institutional activity—specifically in terms of dollar volume. By comparing current trade size against each security's recent normalized history, the metric flags outlier events that may indicate sudden institutional interest but may be missed because the activity doesn’t raise any flags/alerts when comparing the activity against the ticker’s entire history. For example, it’s conceivable that a ticker today receives the largest trade it has had in the last 6 months but the trade is unranked and would therefore be missed by current alerts built off Trade Ranks. Day traders can use “Realized Vol” to identify tickers that are moving swiftly with large price displacement while others can use it to size your risk appropriately.
The Institutional Outliers list sharpens the picture in a different way than TRV. Where TRV highlighted improving and persistent interest, the outliers isolate where capital acted with urgency and size relative to history. And the first thing that stands out is just how concentrated that urgency is in semiconductors and their immediate ecosystem.
At the top of the list you have COHU and MXL printing at over 6 sigma events, followed by POET, AXTI, RMBS, ENTG, SYNA, INDI, KLIC, TXN, SMH, and AMD showing up across multiple magnitudes of activity. AMD alone printed over $2.6bn, with SMH over $1bn and INTC north of $2.5bn. That is not diffuse interest. That is concentrated positioning in the core of the compute stack. Even the presence of SOXS, a 3x bear semis vehicle, signals that the move is large enough to warrant active hedging around it rather than passive ownership. This aligns directly with the broader narrative of capital clustering in semis, but the outliers confirm it is not just steady allocation, it is episodic, aggressive positioning.
The second theme is infrastructure and industrial plumbing, and it is remarkably consistent with what showed up in TRV. WTS at $138M, FELE, CNM at $130M, TRI at $171M, PAVE at $84M, and RSPN at over $319M all point toward machinery, distribution, engineering, and infrastructure exposure. These are not speculative edges of the market. These are businesses tied to water systems, electrical components, construction supply chains, and industrial services. When those names show up as statistical outliers, it suggests institutions are not only leaning into growth narratives but funding the physical backbone required to support them.
Utilities, specifically water, form a third clear cluster. AWR at $86M, CWT at $75M, ZWS at $119M, MSEX, HTO, OTTR, and CWCO all appear with elevated sigma readings. These are low-volatility, regulated assets, and their realized vol readings in the list are correspondingly muted. The combination of high-dollar outlier prints and low realized volatility is telling. It implies accumulation rather than reaction. This is capital quietly parking in stability while still participating elsewhere in the tape.
There is also a meaningful presence of balance sheet and duration exposure through bonds. MBB prints nearly $386M, XLU over $411M, and SPTL at $187M. That, paired with lower realized volatility, reinforces the idea that institutions are layering protection rather than exiting risk outright. It is a hedge, not a liquidation signal.
Energy and materials show up, but more selectively. Names like WTTR, VVV, MPLX, and NBR indicate targeted positioning in services, refining, and midstream rather than a broad commodity chase. Similarly, metals and chemicals appear, but without the same intensity as semis or infrastructure.
Finally, there is a subtle but important presence of software and data infrastructure. NCNO, APLD, CORZ, WK, TOST, and AIOT reflect continued engagement in the application and infrastructure layer of tech, but again, it is not the dominant theme. It is secondary to the hardware and industrial buildout.
Taken together, the IO list reinforces the idea that this is a high-conviction, selectively aggressive tape. Semiconductors are the epicenter, infrastructure is the scaffolding, utilities are the hedge, and bonds are the ballast. Institutions are not broadly de-risking. They are expressing a very specific view of where growth, resilience, and protection should coexist.
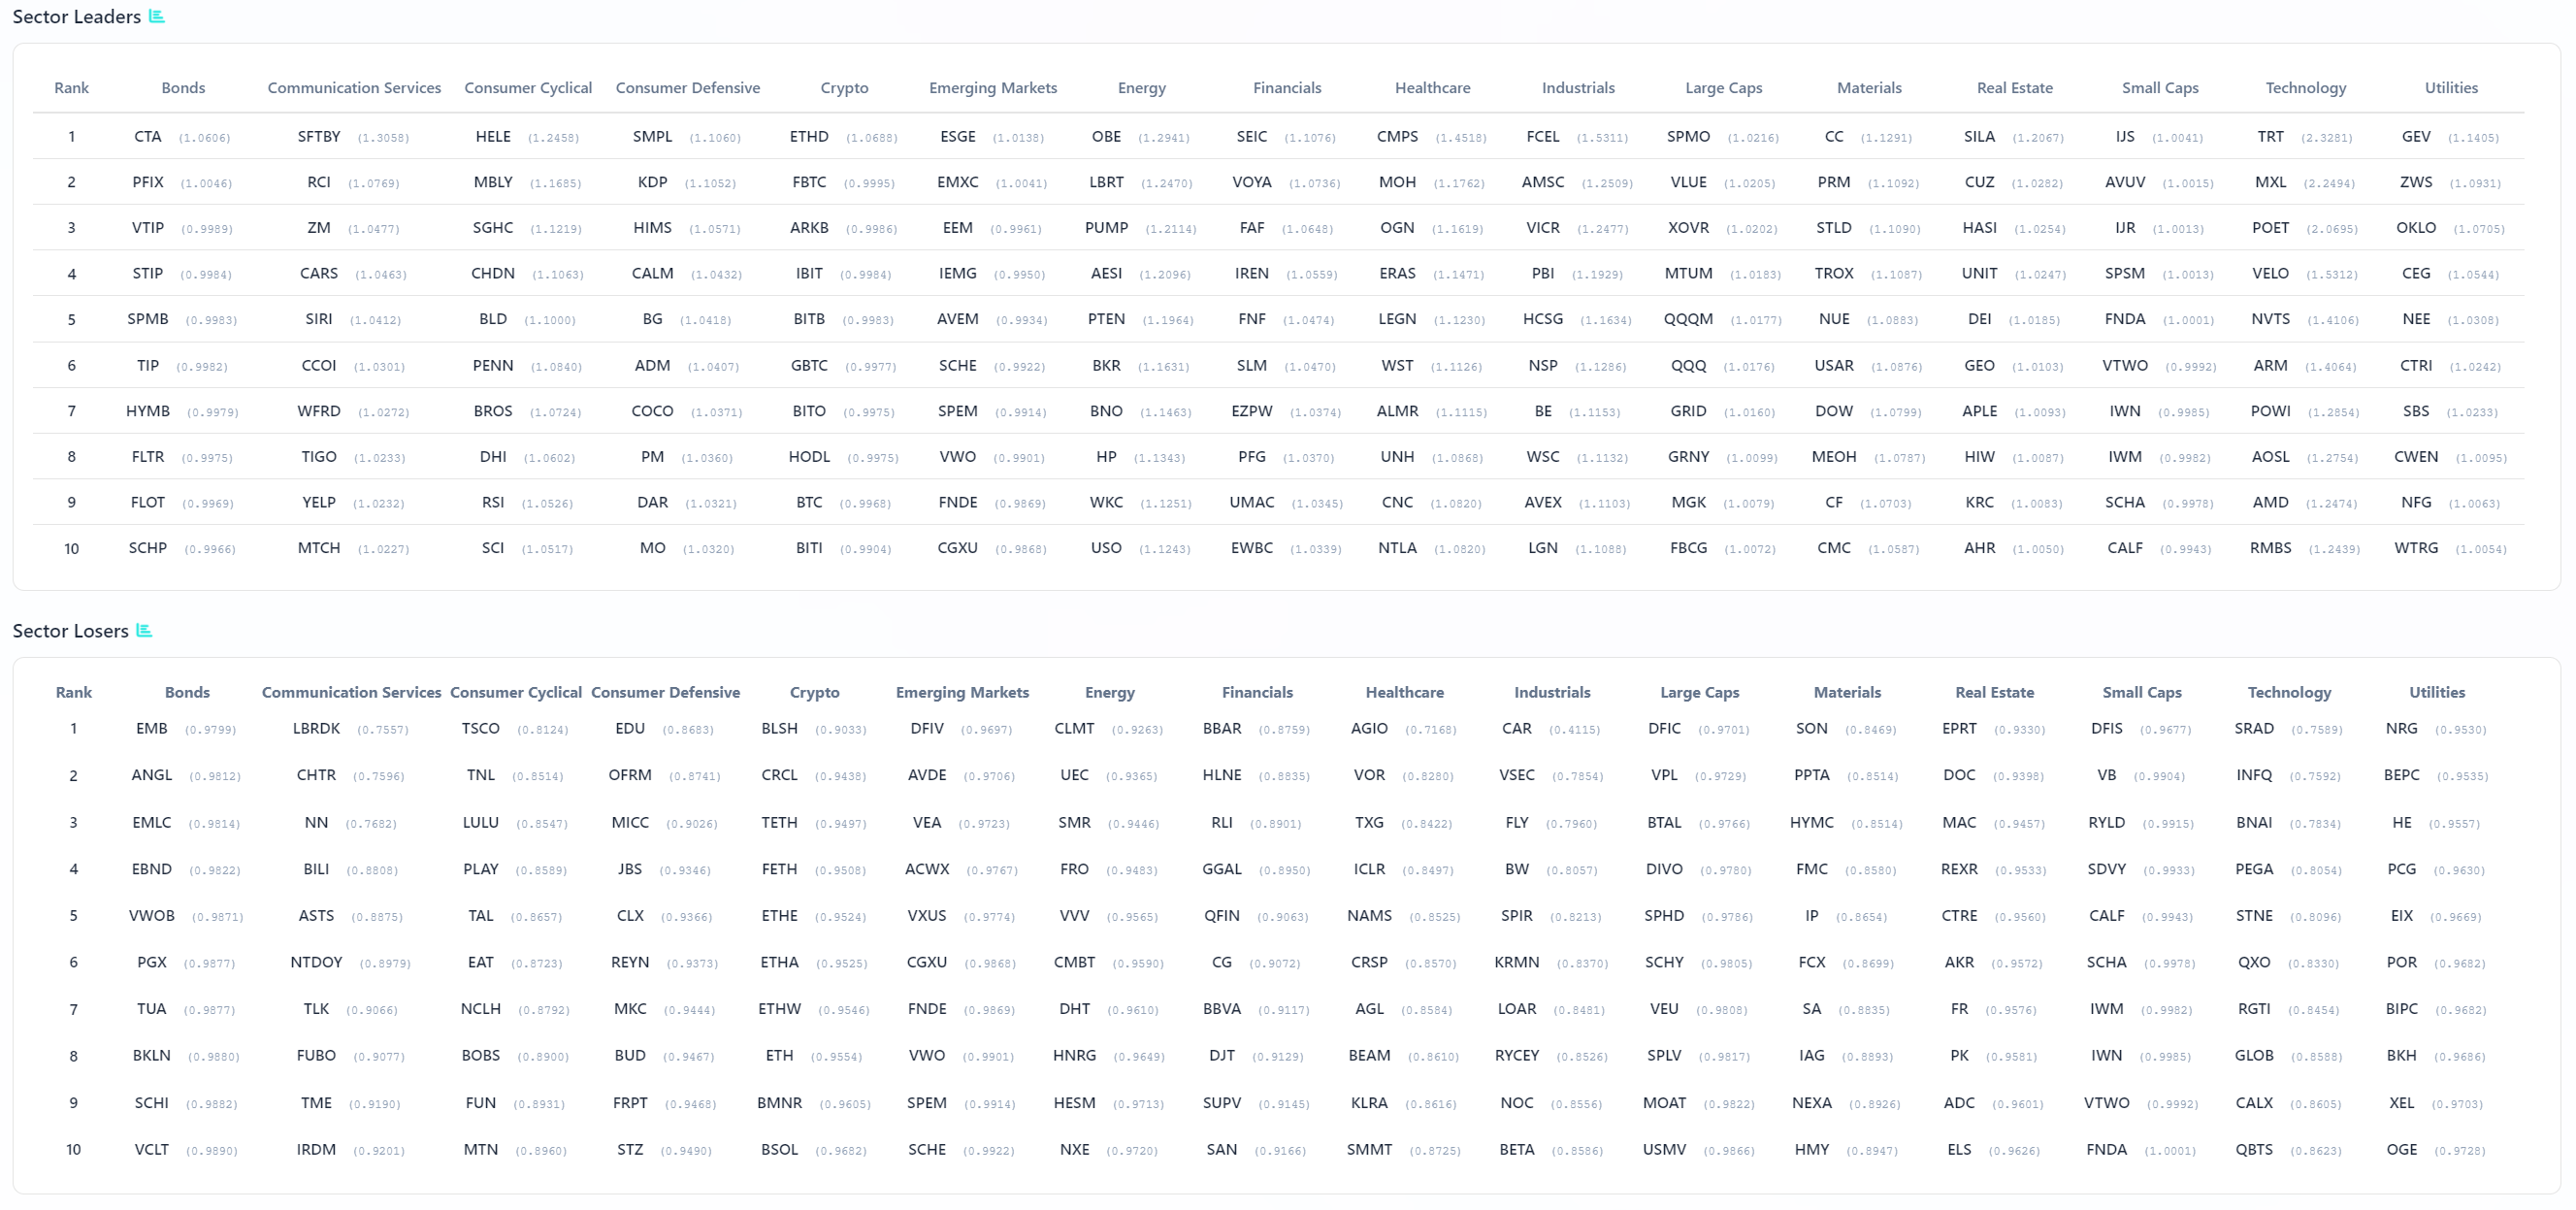
VL Sector Leaders
VL Sector Leaders is a weekly snapshot of where true leadership is asserting itself inside the market, stripped of the distortions that come from broad, style-mixed indices. Rather than asking which stocks look strong in absolute terms, this list focuses on which names are outperforming within the environments they actually compete in.
Each week, we surface the ten stocks demonstrating the most persistent relative strength inside their respective sectors. These are not headline chasers or one-day wonders. They are names that continue to separate themselves from peers through real price behavior, often reflecting sustained demand rather than fleeting attention.
For day traders, this list is a powerful awareness tool. Sector Leaders tend to offer cleaner intraday structure, better follow-through, and more predictable reactions around key levels because they already sit on the right side of relative strength. Even on choppy tape, leadership names often remain tradeable while the rest of the market degrades.
For swing traders, VL Sector Leaders helps narrow the universe to stocks with the highest probability of staying relevant. Relative leaders are more likely to hold trends, survive pullbacks, and reassert themselves after consolidation. When markets rotate, these names are often among the first to resume leadership — or the last to break.
The sector leaders table is doing something subtle but important this week. It is not just showing where performance is strongest, it is showing how tightly aligned that performance is with the underlying institutional positioning we have already mapped out. What emerges is a market that is both directional and deliberate, with leadership clustering around a handful of coherent themes rather than dispersing broadly.
Technology leadership is the most obvious continuation. Names like TRT, MXU, POET, Velo, ARM, NVTS, AMD, and RMBS are not just outperforming, they are doing so across multiple layers of the stack. This mirrors what we saw in both aggregate flow and outlier activity, where semiconductors and their ecosystem were the epicenter of capital deployment. What stands out here is the depth. Leadership is not confined to mega caps; it extends into mid-cap and niche semiconductor plays, suggesting conviction is broadening within the theme rather than narrowing.
Industrials reinforce that same message. FCEL, AMSC, VICR, PBI, HCSG, NSP, BE, WSC, AVEX, and LGN show consistent leadership across the sector. These are not speculative names. They are tied to power infrastructure, engineering, distribution, and industrial services. This aligns cleanly with the infrastructure buildout narrative that has been reinforced across TRV and IO. When semis and industrials lead together, it typically reflects a market that is pricing both demand and the systems required to support it.
Utilities are perhaps the most interesting layer of leadership. GEV, ZWS, OKLO, CEG, NEE, CTRI, SBS, and CWEN appearing at the top while the sector itself is traditionally defensive tells you this is not a simple risk-off rotation. Instead, it is a parallel allocation. Capital is simultaneously embracing growth while maintaining exposure to regulated, cash-flow-stable assets, particularly those tied to power and water. This fits perfectly with the outlier activity we saw in water utilities and reinforces the idea of a barbell approach.
Healthcare leadership is more mixed but still constructive, with CMPS, MOH, ERAS, LEGN, and UNH showing strength. This is not a broad defensive bid but rather selective positioning in managed care and biotech-adjacent names, consistent with the more speculative biotech activity observed in TRV.
On the other side, the laggards confirm where capital is not interested. Communication services weakness persists, with names like LBRDK, CHTR, ASTS, and TME appearing near the bottom. This is notable because media did show isolated outlier prints, but the lack of leadership suggests those were not part of a sustained accumulation trend. Financials also remain absent from leadership and show up among laggards, reinforcing that this is not a rate-driven or cyclical macro trade.
Bonds present a split picture, with inflation-sensitive and hedging instruments leading while credit-heavy exposures lag. That aligns with the broader posture of participation with protection rather than outright risk-taking.
The net result is a market that is highly selective. Leadership is concentrated in semiconductors, infrastructure, and power-related utilities, while capital avoids broad financials, media, and lower-quality cyclicals. It is a tape that rewards thematic alignment and punishes drift, and the sector leaders table is making that distinction very clear.
MIR Part 3: Framing-Up A Trade
At this point the tape is selective, intentional, and layered. Capital is not broadly chasing beta, it is expressing a very specific view of where growth, stability, and protection intersect. The through-line has been consistent across every lens: semiconductors and compute infrastructure at the center, industrial and power buildout as the enabling layer, utilities and duration as ballast, and only tactical engagement elsewhere.
That framing leads to a portfolio that is not fully risk-on and not defensive either. It is a barbell with a strong core bias toward structural growth, paired with deliberate hedges that allow participation without overexposure to macro shocks.
The core sleeve is semiconductors and compute infrastructure. This is where the largest and most aggressive positioning showed up, both in aggregate dollars and outlier activity. The presence of multi-billion dollar prints in AMD, INTC, and SMH, combined with depth in names like RMBS, POET, AXTI, and ENTG, tells you this is not a trade, it is an allocation. This sleeve should carry the highest weight.
The second sleeve is industrials and infrastructure. The consistency across TRV, IO, and sector leadership in names tied to machinery, engineering, grid, and distribution suggests that capital is funding the physical layer behind the growth narrative. This is not as explosive as semis, but it is persistent and durable.
The third sleeve is utilities and power. This is where the tape becomes more nuanced. Heavy, low-volatility accumulation in water utilities and regulated power names suggests institutions are actively hedging while staying engaged. This sleeve is not about upside, it is about stability and correlation control.
The fourth sleeve is a hybrid hedge consisting of duration and selective commodities. The presence of large flows into MBB, SPTL, and XLU alongside targeted energy and materials exposure suggests a desire to maintain protection against both rate volatility and supply-side shocks.
Finally, there is a small tactical sleeve for higher-beta expressions, including selective biotech and crypto-linked exposure. This is not core, but it reflects the market’s willingness to take risk in pockets where the payoff profile is asymmetric.
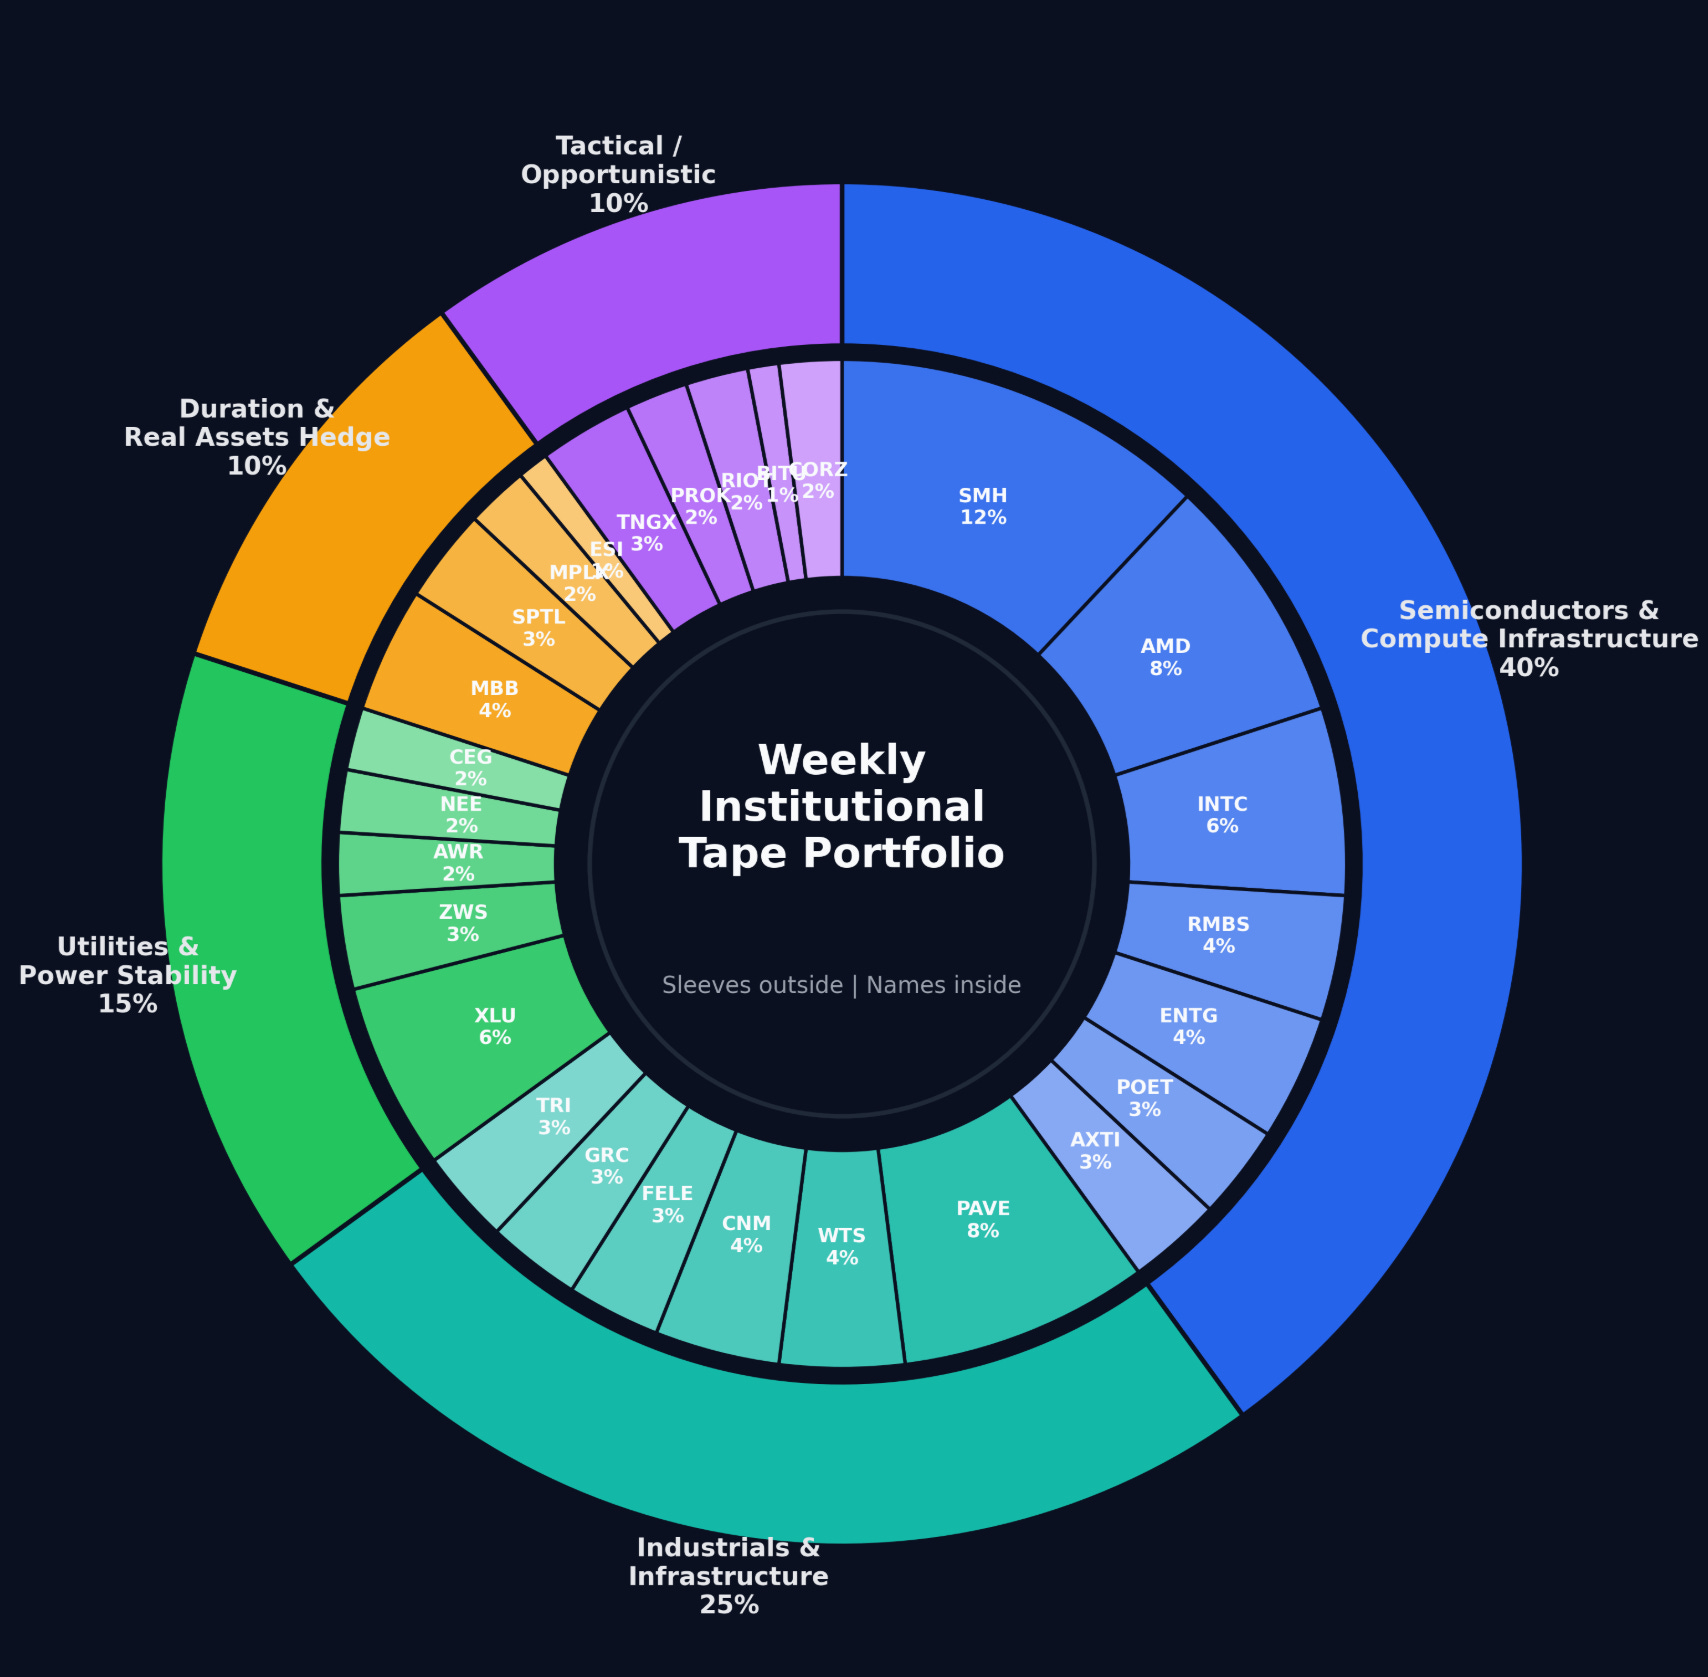
Putting that together into a desk-level portfolio:
Semiconductors and Compute Infrastructure (40%)
SMH 12% as the broad beta expression
AMD 8% as a primary beneficiary of compute demand
INTC 6% reflecting large institutional positioning and turnaround optionality
RMBS 4% as a memory and IP lever
ENTG 4% as a materials and supply chain enabler
POET 3% as a higher-beta optical/infra play
AXTI 3% as a substrate and niche semi exposure
Industrials and Infrastructure (25%)
PAVE 8% as the diversified infrastructure vehicle
WTS 4% tied to water systems and flow control
CNM 4% as a distribution backbone
FELE 3% for electrical and power infrastructure
GRC 3% as machinery exposure
TRI 3% as services tied to industrial and legal infrastructure
Utilities and Power Stability (15%)
XLU 6% as the core defensive anchor
ZWS 3% for water infrastructure
AWR 2% for regulated water exposure
NEE 2% for large-scale power generation
CEG 2% for nuclear and baseload optionality
Duration and Real Assets Hedge (10%)
MBB 4% for mortgage-backed duration exposure
SPTL 3% for long-duration Treasuries
MPLX 2% for midstream energy stability
ESI 1% for materials/chemicals exposure
Tactical / Opportunistic (10%)
TNGX 3% representing biotech momentum
PROK 2% as another biotech expression
RIOT 2% for crypto-linked beta
BITU 1% as leveraged crypto exposure
CORZ 2% for digital infrastructureThe way to trade this is not to chase strength blindly but to use pullbacks into known liquidity zones. The semis sleeve should be accumulated on dips, not breakouts, given how extended positioning already is. Industrials can be added more steadily given their smoother participation profile. Utilities and duration should be treated as holds rather than trades, stepping in more aggressively if volatility picks up.
The key is alignment. As long as semis continue to attract outsized capital and industrials confirm the real-economy linkage, the portfolio leans into growth. If that relationship breaks, particularly if semis lose sponsorship while defensives accelerate, the posture shifts quickly toward preservation.
Right now, though, the message is clear. Participate in the buildout, respect the hedges, and stay anchored to where capital is actually committing, not where it is narrating. Good luck this week, VL Crew!
Thank you for being part of this community and for investing your time in this week’s edition. The quality of this readership — thoughtful, disciplined, engaged — is what makes this work meaningful. I’m grateful to build alongside you. Here’s to a week of clarity, conviction, and well-executed opportunities.
— VolumeLeaders