Market Momentum: Your Weekly Financial Forecast & Market Prep
Issue 87 / What to expect April 20, 2026 thru April 24, 2026


Weekly Market-On-Close Report
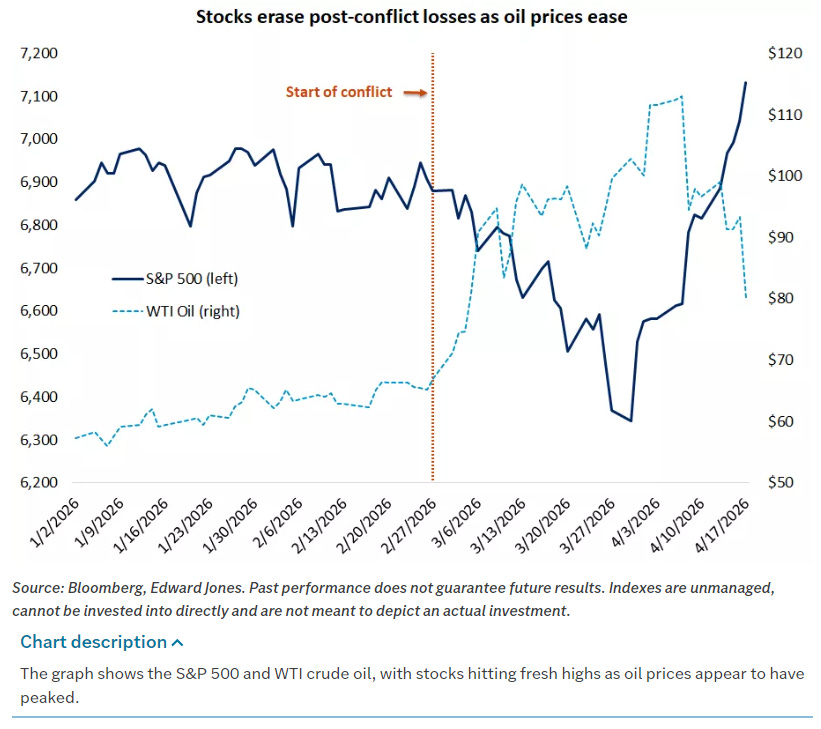
Equities came into April looking tired. Stagflation chatter was everywhere, oil had just delivered one of the largest supply shocks in history, and the S&P had flirted with a near‑correction as investors scrambled for hedges and cash. Then, in the space of a couple weeks, the narrative flipped. Headlines shifted from “energy shock” to “peace framework,” crude rolled over hard, and the same index futures that had been grinding lower suddenly ripped back to fresh highs. The result is a tape that looks strong on the surface, but is very much being steered by macro headlines, positioning swings, and a handful of dominant themes rather than broad, easy risk‑on.
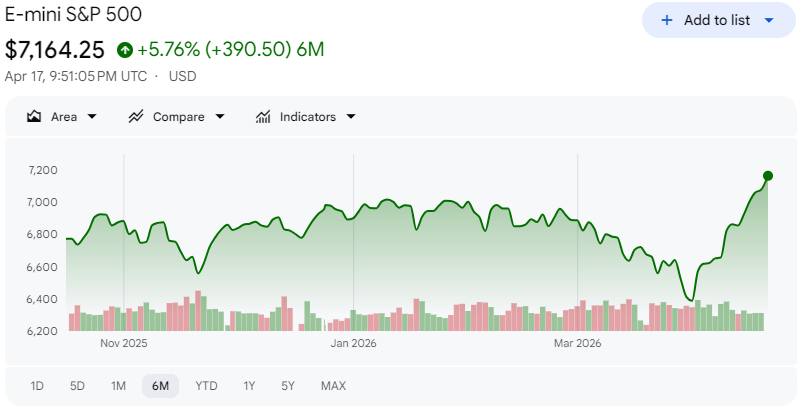
You can see that clearly in the S&P 500 E‑mini complex. June E‑mini S&P futures (ESM26) have climbed alongside spot, with a roughly 1.2% gain on Friday alone as peace optimism in the Middle East sparked a powerful bid across risk assets. Index futures were already firm into the week, but the move accelerated as reports of a potential U.S.–Iran deal and broader ceasefire framework surfaced. When you have record‑high spot indices, implied vol that refuses to really spike, and futures leading the charge on risk‑positive headlines, what you are really watching is positioning get dragged back in. Traders who spent March building protection against an escalating conflict and energy‑driven inflation shock are now being forced to cover, re‑risk, or both.
The macro context for that squeeze is nuanced. The week began on a cautious tone, with investors laser‑focused on Middle East tensions and the risk of a persistent energy shock. That caution was justified: oil had surged to levels not seen since the last major supply disruption, eurozone industrial data was soft, and services PMIs in France and Italy had slipped back into contraction territory as businesses pulled back ahead of local elections and amid geopolitical uncertainty. At the same time, U.S. fundamentals were not falling apart. Recent U.S. retail sales and manufacturing data have been consistent with “steady trend growth,” and their earlier weekly notes emphasized that the domestic economy has remained surprisingly resilient in the face of higher rates and energy volatility. When you put that together, you get a backdrop where growth fears are concentrated overseas, inflation risk has an oil‑centric flavor, and the U.S. still looks like the cleanest dirty shirt.
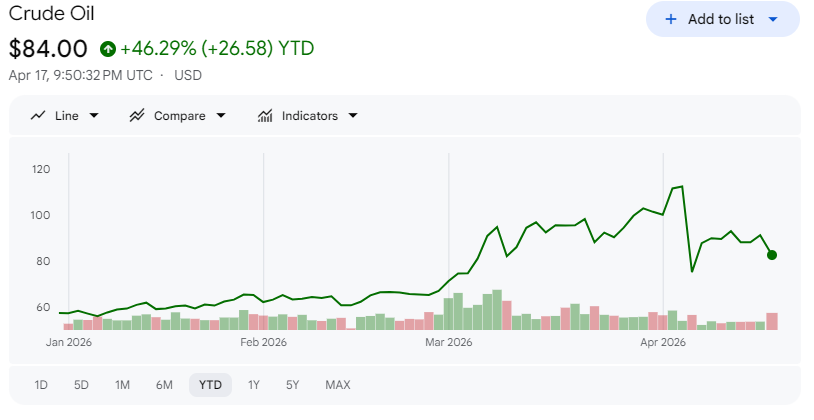
Then the narrative breaks. Mid‑week, reports of a two‑week ceasefire framework and ongoing negotiations involving the U.S., Iran, and regional players hit the tape, followed by additional color suggesting separate talks around Israel and Lebanon. Oil, which had been grinding higher on supply disruption fears, promptly posted its steepest one‑day decline since 2020. That is a critical pivot: a large chunk of the “stagflation” risk premium was built on the idea that the energy shock would be both large and durable. When the probability of a long, drawn‑out conflict drops, traders have to rip that premium back out of curves, and by extension, out of the macro narrative. Edward Jones framed it succinctly in an earlier piece: a short‑lived disruption likely results in oil easing, global growth staying intact, and equities delivering modest gains, while a prolonged closure risks sharply higher prices and rising recession probabilities, especially outside the U.S. As soon as it looks like we are shifting toward the short‑disruption scenario, equity markets do what they always do: repricing happens in a hurry.
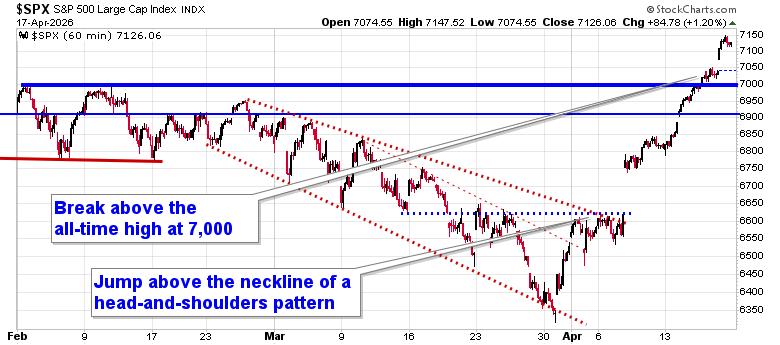
You see that snapback in the index statistics. Major U.S. equity benchmarks are back at fresh record highs, with the S&P 500 and Nasdaq hitting new peaks as defensive positioning unwinds. The Dow and Russell had both been under pressure while FANG‑style growth and large‑cap tech held up better, and crude and gold were doing most of the macro heavy lifting. The latest swing flips that dynamic on its head. With crude backing off and peace hopes rising, cyclicals and financials are suddenly allowed to participate again, and the Russell moves from “problem child” to “high‑beta expression of relief.”
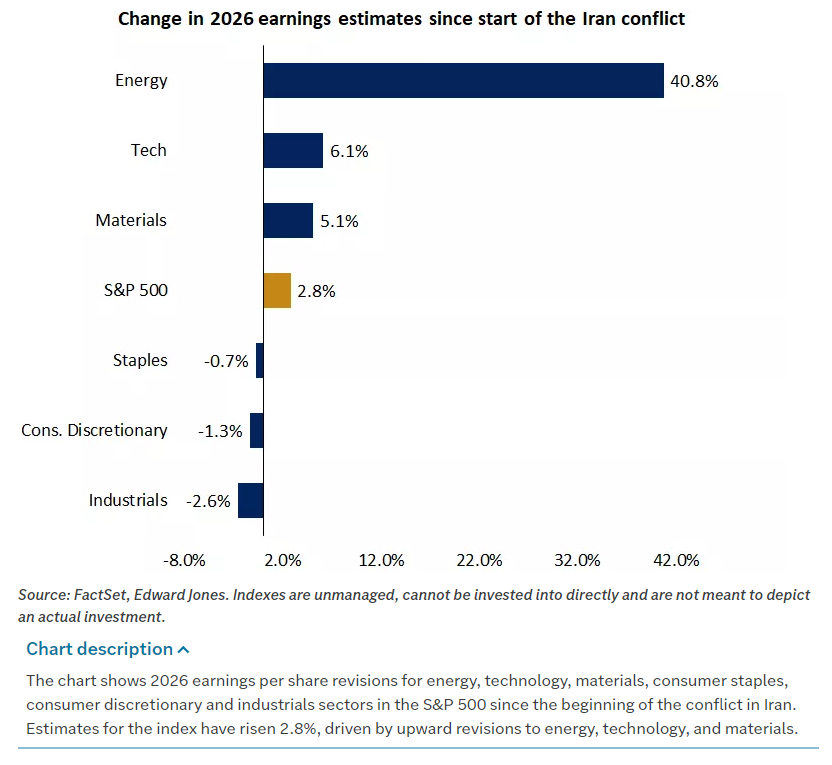
But we should be honest about what is driving this rebound. It is not a sudden improvement in global growth data. Eurozone forecasts are still being revised down – projected 2026 eurozone growth has been cut to roughly 1.1% from 1.3% earlier this year. Services in France and Italy remain in contraction, and business sentiment is fragile. The catalyst for the equity pop is primarily a risk‑premium adjustment around energy and geopolitics, bolstered by reasonably solid U.S. earnings and macro data. First‑quarter earnings season is off to a strong start and that full‑year profit estimates are still being revised higher, especially in sectors like technology and energy. Put differently: growth expectations have not improved dramatically, but they also have not broken, and that is enough when the biggest macro overhang suddenly looks less scary.
The other key ingredient is positioning. A “sentiment reset” and the unwinding of defensive allocation that had been built up in response to the energy shock has put the wind at the backs of indices for now. Before the ceasefire chatter, a lot of institutional capital had shifted into cash, short‑duration high‑quality bonds, and defensive equity sectors as protection against a worst‑case scenario in the Strait of Hormuz. At the same time, many players layered on index hedges via options and futures. Once the worst‑case begins to look less likely, those hedges become expensive ballast, and the market starts reflexively moving the other way.
You can see the mechanics in futures and options markets. The S&P rally is not happening in a vacuum; it is occurring alongside improved breadth in the underlying, even if leadership is still pretty concentrated. Flows have rotated back toward cyclical sectors, financials, and parts of industrials, while the usual megacap tech names continue to dominate in absolute dollar terms. That is exactly the mix you would expect if you combine “peace optimism” with “still‑solid U.S. earnings” and “everyone was hedged up and needs to chase.” The risk is that this becomes more of a positioning‑driven melt‑up than a fundamentally grounded new leg higher – but for now, the tape is rewarding anyone who stayed long into the reset.
So how should a thoughtful investor read this? First, recognize that this is not a clean, all‑clear signal. Uncertainty around the Middle East remains high, even with ceasefire headlines, and that European growth remains vulnerable to any renewed energy spike. Energy markets themselves are still volatile; a one‑day collapse in crude does not erase the structural tightness in supply, and future setbacks in negotiations could just as easily push prices back up. Moreover, central banks do not get to ignore the inflation impulse simply because oil cooled off for a week.
Second, the leadership profile of this rally matters. The biggest beneficiaries so far have been large‑cap U.S. growth and quality – tech, communication services, pieces of healthcare – along with some energy names that still enjoy strong earnings leverage even at slightly lower crude prices. Financials and industrials have joined the party, but in a more selective way. That mix lines up perfectly with a market that believes in “higher for longer, but not disastrous” monetary policy. If the Fed is going to stay cautious on cuts because headline inflation keeps getting nudged around by energy, you want companies that can grow earnings through a moderate rate environment, not those that need a rapid policy pivot.
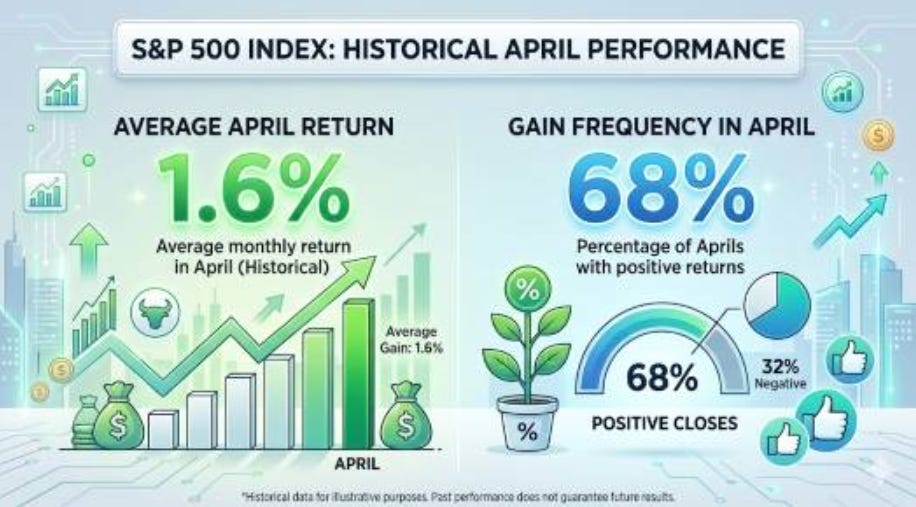
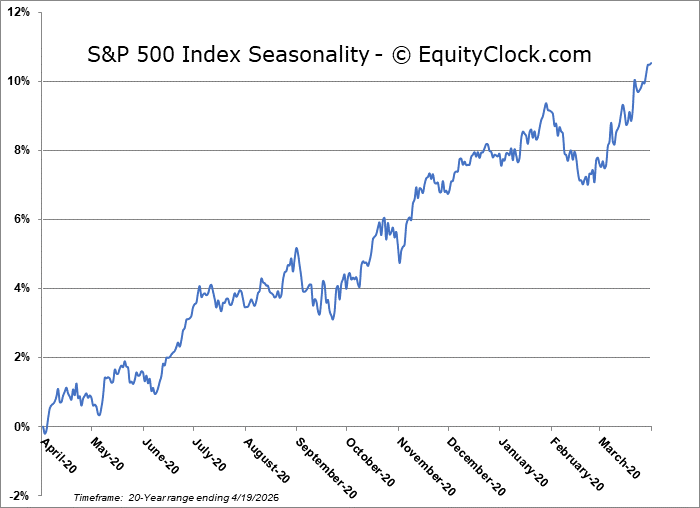
Third, April’s seasonal backdrop is adding fuel to the move. Historically, April has been one of the stronger months for U.S. equities, with the S&P 500 posting positive returns more often than not and averaging roughly mid‑single‑digit annualized gains during this part of the year over longer lookbacks. Seasonality is never a trade by itself, but when it lines up with a micro‑catalyst like an energy‑driven sentiment reset, it can amplify the follow‑through. Traders know this; systematic and discretionary trend‑followers alike tend to give more room to upside breakouts when they occur in historically favorable windows.
That leads to the practical takeaway. For long‑term allocators, the message from this week is not “panic buy,” but “respect the trend while understanding its drivers.” The U.S. remains the relative winner in a world where Europe is wrestling with weak services and industrial data, China is still dealing with structural baggage, and commodity volatility is the main macro transmission mechanism. Within U.S. markets, the strongest hand is still large‑cap growth tied to durable cash flows and secular themes – cloud, AI, energy infrastructure, high‑quality financials. Those are the areas where earnings revisions are holding up, where balance sheets can handle a higher‑for‑longer rate path, and where liquidity is deepest.
At the same time, the speed of the rebound after such a sharp energy‑driven scare should make you cautious about extrapolating in a straight line. A lot of this week’s move is the air coming out of hedges and worst‑case fears, not a brand‑new macro regime. That means drawdowns from here could be abrupt if peace negotiations falter, if energy markets tighten again, or if upcoming data – inflation, labor, earnings – push the Fed back into a more hawkish corner. The NYSE MAC commentary underscores that traders on the floor are acutely aware of this; positioning has shifted, but nobody believes the risk has disappeared.
For traders operating on shorter horizons, as long as /ES continues to hold above the breakout levels established during the peace‑headline surge, dip‑buying in the direction of the trend will remain the default playbook. The moment we start seeing failed breakouts – futures spiking on good news and then sinking back into prior ranges – you will know that the “unwind of defensive positioning” is largely complete and that the market needs new fuel. Watching how futures open relative to overnight news on the Middle East, energy, and the Fed will be crucial in gauging whether we are transitioning from a short‑covering thrust into a more sustainable, earnings‑driven trend.
In short, the current environment is a textbook example of markets doing what they always do: overshooting in both directions as they digest new information. A few weeks ago, the world looked on the verge of an energy‑induced stagflation scare; today, the same benchmarks are sitting at or near all‑time highs, with futures pricing in a more benign outcome. The truth, as usual, sits somewhere in between. For now, the path of least resistance is higher, but it is a path paved by geopolitics and positioning as much as by fundamentals. That calls for participation, not complacency – stay aligned with the leaders, respect the underlying economic resilience, but keep one eye on the energy tape and the Fed, because they still hold the keys to whether this spring surge blossoms into a more durable leg of the bull market or proves to be just another sharp detour on a choppy road.

Weekly Benchmark Breakdown
Market breadth stays constructive amid fresh highs
The tone this week is cautiously bullish. The S&P’s trend still shows strength (over two‑thirds of stocks remain above both their 50‑ and 200‑day MAs) and a flood of new highs outpaces new lows. Breadth suggests an extension of the rally rather than exhaustion. Volatility is low and market momentum is intact, implying the risk tone remains constructive, though the advance is far from “blow‐off.” We’d need, for example, the 50‑day cohorts to push beyond 60% and sustained NH≻NL readings to confirm a durable breakout.
On the S&P 500, participation is solid but not extreme. Roughly 64% of S&P stocks hit new 5‑day highs versus 13% new lows (net NH–NL ≈+260). That positive divergence holds at 1‑month (≈44% highs vs 6% lows, +192) and even at longer views (52‑week new highs roughly 48 vs near zero lows).

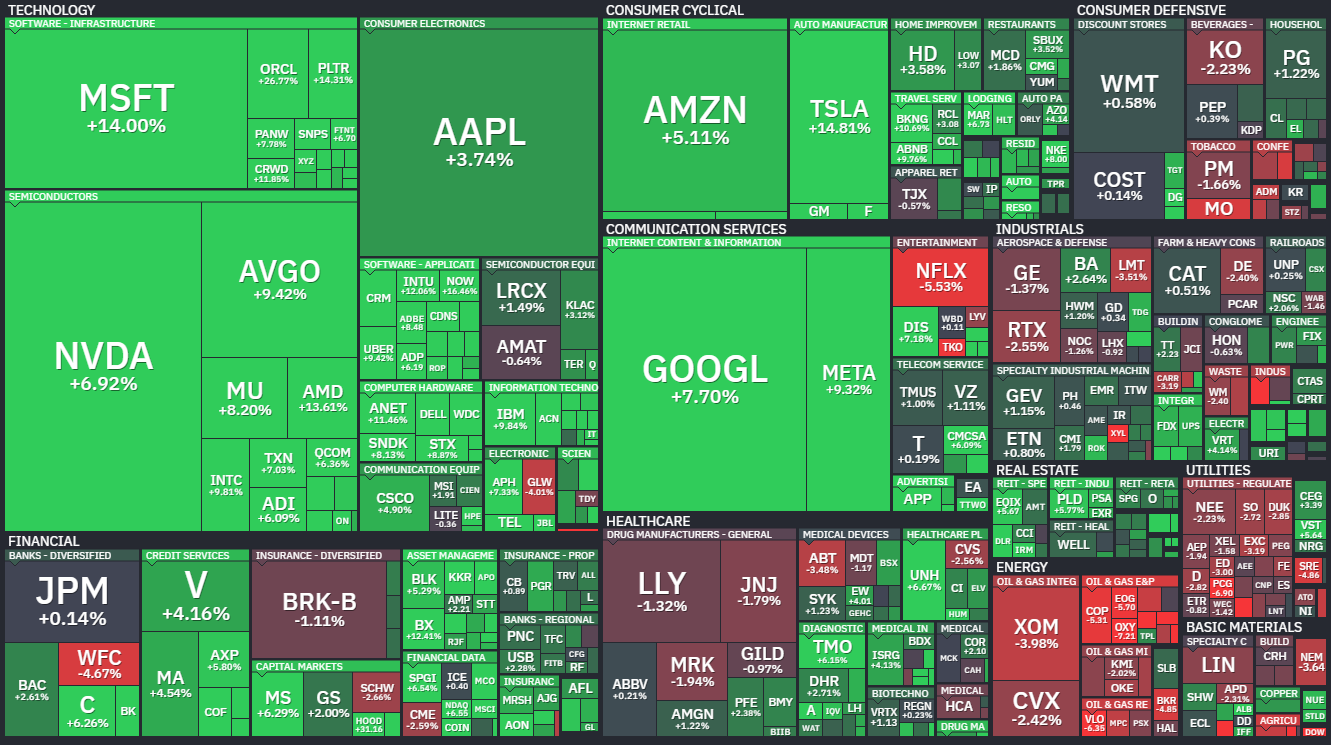
Short‑term MAs are well clustered. Nearly all 500+ components trade above their 5‑day and 20‑day lines, and perhaps 70–80% are above 50‑day, with a solid majority above 100‑ and 150‑day lines (Barchart’s trend widget implies a growing uptrend). In practical terms, broad participation is healthy, even if a handful of megacaps carry most weight. The Finviz weekly map shows tech and consumer cyclicals greener, with utilities and staples the weak spots – a bullish composition.
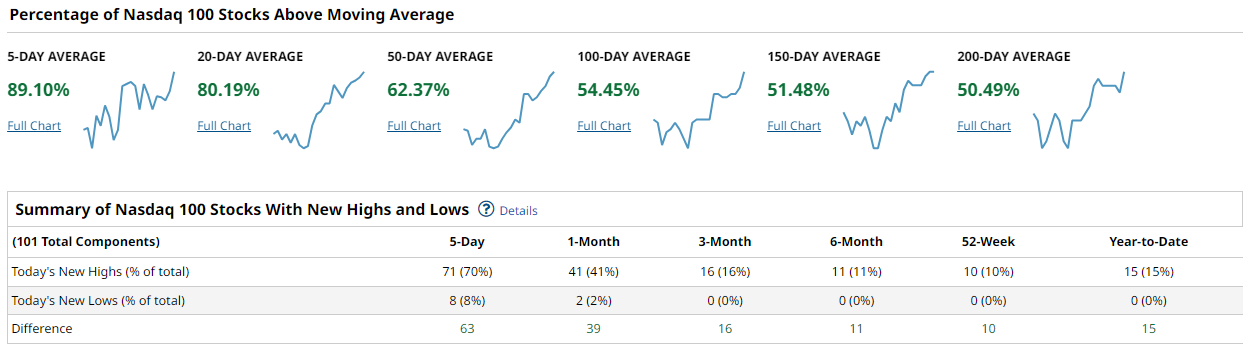
The Nasdaq-100 is even more robust. About 70% of its stocks are at fresh 5‑day highs vs only 8% at new lows (net +63). One‑month breadth shows 41% at highs vs 2% at lows (+39), and even 3‑ and 6‑month figures remain tilted positive. All but one of its 30–35 names sit above the 50‑day MA, and roughly 55–60% trade above 100‑day (only 10% above 52‑week by definition).
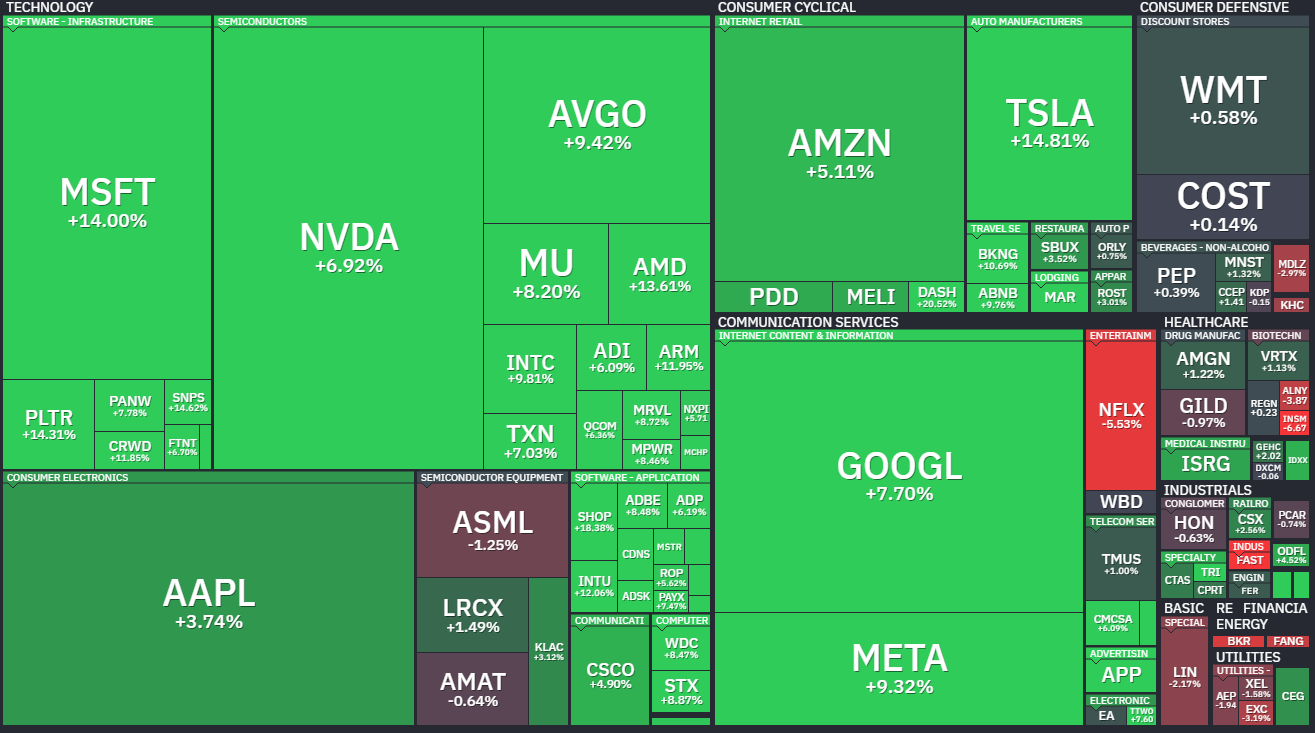
The cap‐weighted rally is clear – mega‑caps like NVDA, AAPL, and other Magnificent Seven names popped nicely last week – but unlike January’s narrow advance, plenty of smaller tech names are joining in. The Nasdaq’s heatmap is awash in green (even many mid‑caps) and only a few defensive names in red.
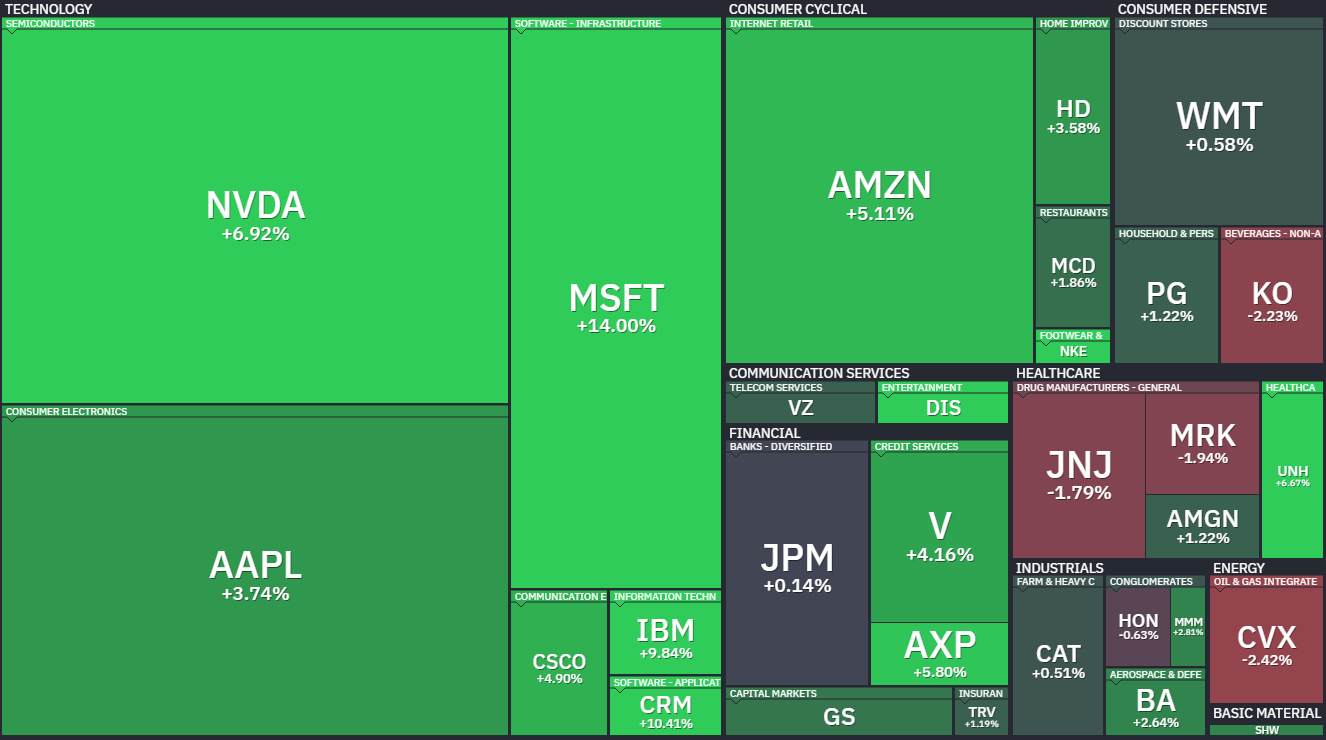
The Dow Industrials remain strong by their standards. Over 87% of its 30 stocks hit new 5‑day highs against 7% at new lows (net +24). The three largest movers (like Microsoft, Boeing, etc.) were up, while energy names underperformed. Short‐term breadth is high: essentially 100% are above the 5‑ and 20‑day lines, and well over half above the 50‑day MA (versus only ~13% above the 52‑week high mark).
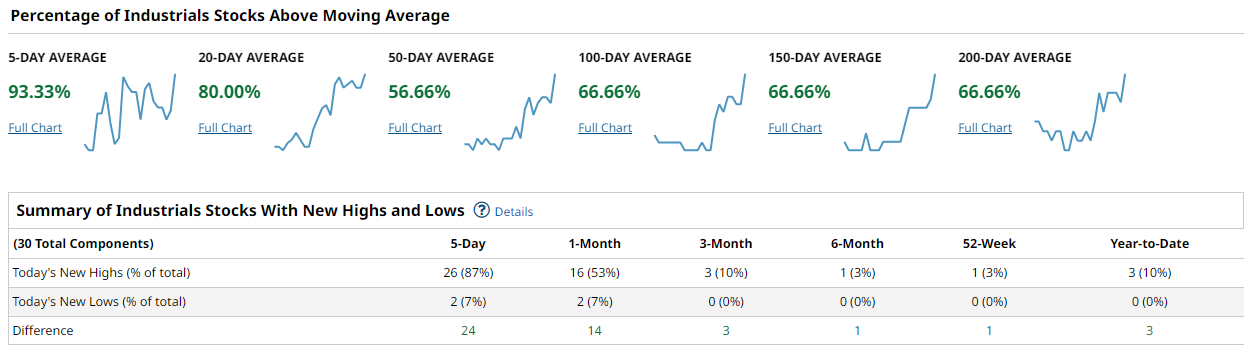
Year‑to‑date only 10% of Dow names have hit new highs (3 out of 30), reflecting its defensive bias, but that’s up from zero last month. On the weekly map, financials and industrials are mostly green, offset by the sole tech stumble of Intel (small red box) – overall a healthy mix given the narrowness of the Dow.
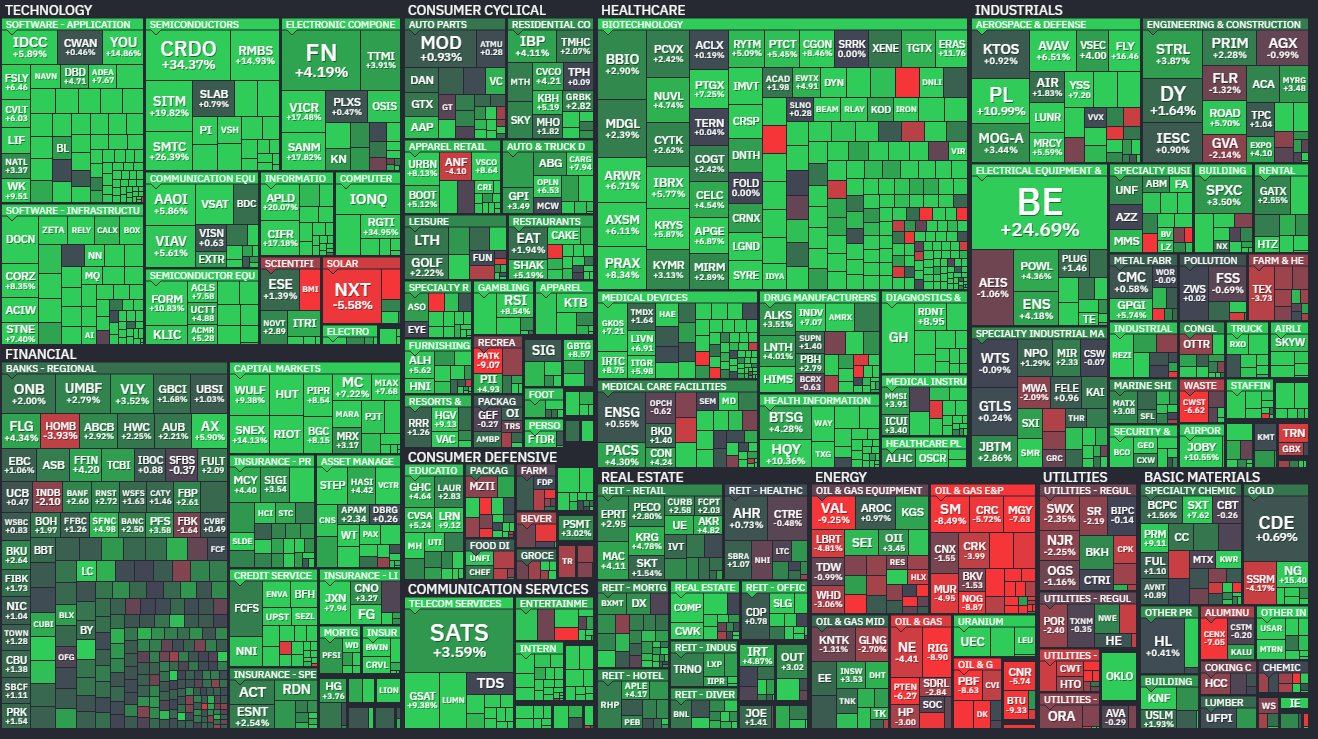
The Russell 2000 shows broad participation at full tilt. A remarkable 70% of its ~1,900 small‐caps are at 5‑day highs (1,348 issues) vs 7% at lows (net +1,217). Even at 1‑month, over half are fresh highs (55%) against 3% lows. This breadth advantage persists out to 6‑ and 12‑month measures. Short‐term, virtually every R2000 name is above its 20‑day MA and roughly two‑thirds above 50‑day, with a solid majority above 100‑ and 150‑day.

The Russell’s weekly heatmap is a sea of green, led by biotech, small tech, and regional banks, while only a few late‑cycle sectors (like insurance/REITs in red) lag. In sum, small‑cap breadth is actually the strongest of the big four, suggesting the rally is broadly supported in the market’s guts.
Synthesis: The advance is firmly supported by broad participation rather than just a few mega‑caps. S&P 500 and Nasdaq metrics show roughly 60–70% of stocks above key moving averages, with new‐highs well outnumbering lows on all lookbacks. The Russell’s astounding NH–NL spread underscores this. In fact, cap-weighted megacaps (e.g. NVDA, AAPL, MSFT) have run, but they’re joined by many mid/small names. This suggests a durable uptrend; in a narrow advance, we’d expect far fewer new highs. What would scare us? If the percent above 50‑day falls back toward 40–50% while indices hang in place, that divergence (fewer stocks supporting new highs) would flash an internal warning. But right now 50‑day cohorts are closer to 60–70% in the S&P and even higher in the small‑cap index. And NH≻NL remains strongly positive. That combination (broad cohorts above MAs and consistent NH>NL) would confirm a durable bull trend. Conversely, a collapse of breadth (NH→NL or 50d cohorts plunging under 50%) could justify turning cautious.
Playbook: With breadth looking favorable and risk tone constructive, lean into cyclical and momentum exposures. The Russell’s strength argues for small‑cap and cyclicals over pure defensives. Keep overweight technology and growth leaders (they’re driving the index gains) but hedge with diversified participation; after all, utilities and staples are lagging and provide hedge. We’d favor energy and financials on dips too – their recent strength in the Russell hint at rotation, and they screen cheap on breadth. Avoid complacency: watch the 50‑day breadth readings and the NH–NL numbers into next week. A failure to crack new record highs in price while breadth stalls would be a red flag. But as long as 60%+ of stocks stay above 50‑days and NHs exceed NLs, the path of least resistance is up.
Bottom Line: Broadening breadth underpins this week’s rally; risk remains skewed to the upside, provided these participation metrics hold.

Investor Sentiment Report
%Bull-Bear Spread
The %Bull-Bear Spread measures the gap between bullish and bearish investor sentiment, often from surveys like AAII. It’s a contrarian indicator—extreme optimism may signal a coming pullback, while extreme pessimism can hint at a potential rally. Large positive or negative spreads often mark market turning points.
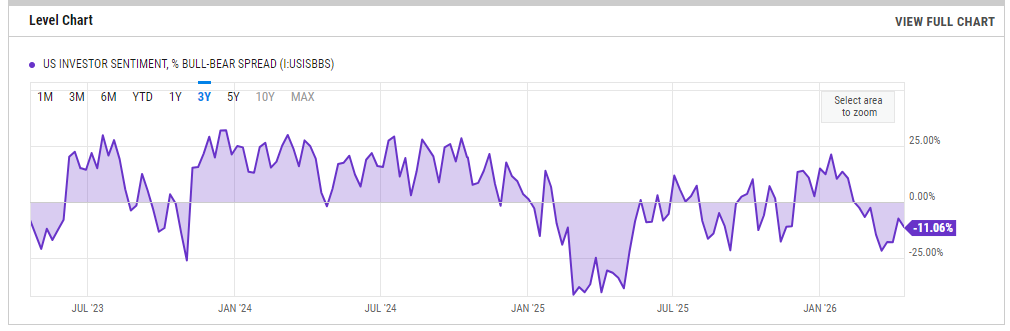
The AAII bull–bear spread is currently in slightly negative territory, having climbed up from deeper pessimism in prior weeks. This means more individual investors are still bearish than bullish, though the gap is narrowing. Historically, readings below zero are contrarian bullish signals—suggesting potential market support—whereas extreme positives (well above +20%) would warn of crowding. Right now the spread is just below neutral, so risk appetite is neither extreme fear nor over-exuberance. If the spread were to surge above +20%, it would mark an overbought panic and could signal a pullback. Conversely, a move significantly below 0% (e.g. into double-digit negatives) would indicate near-extreme fear, which could portend a strong bounce if the market steadies. In short, current modest negativity is a mildly bullish backdrop, but keep an eye on any spike to extreme levels to flip the signal.
NAAIM Exposure Index
The NAAIM Exposure Index (National Association of Active Investment Managers Exposure Index) measures the average exposure to U.S. equity markets as reported by its member firms. These are typically active money managers who provide their equity exposure levels weekly. The index offers insight into how much these managers are investing in equities at any given time, ranging from being fully short (-100%) to leveraged long (up to +200%).
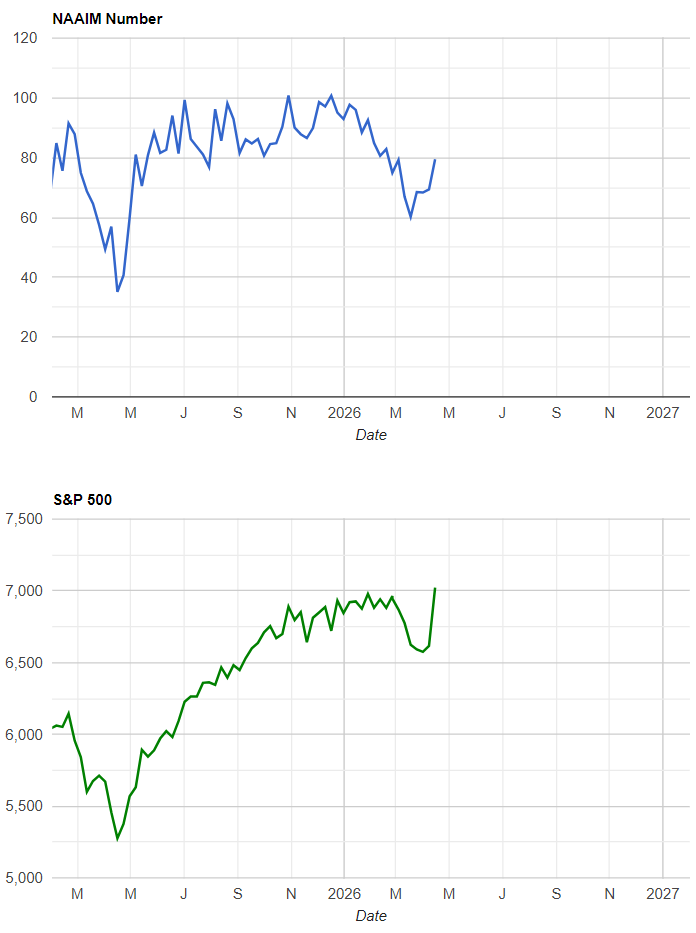
Active managers have been progressively increasing equity exposure. The NAAIM Index is now around 80, up from roughly 70 a week ago. This suggests professional traders are nearly fully invested, a notable rise in just one week. While not at extreme record highs, the index is near its quarterly average and indicates limited dry powder. A drop into the 50s without a major selloff would signal caution (managers de-risking on strength), whereas a rise above 90 would be an alarm for excessive optimism. Currently, managers’ exposure around 80% implies a fairly bullish positioning, though not yet at extreme “all-in” levels.
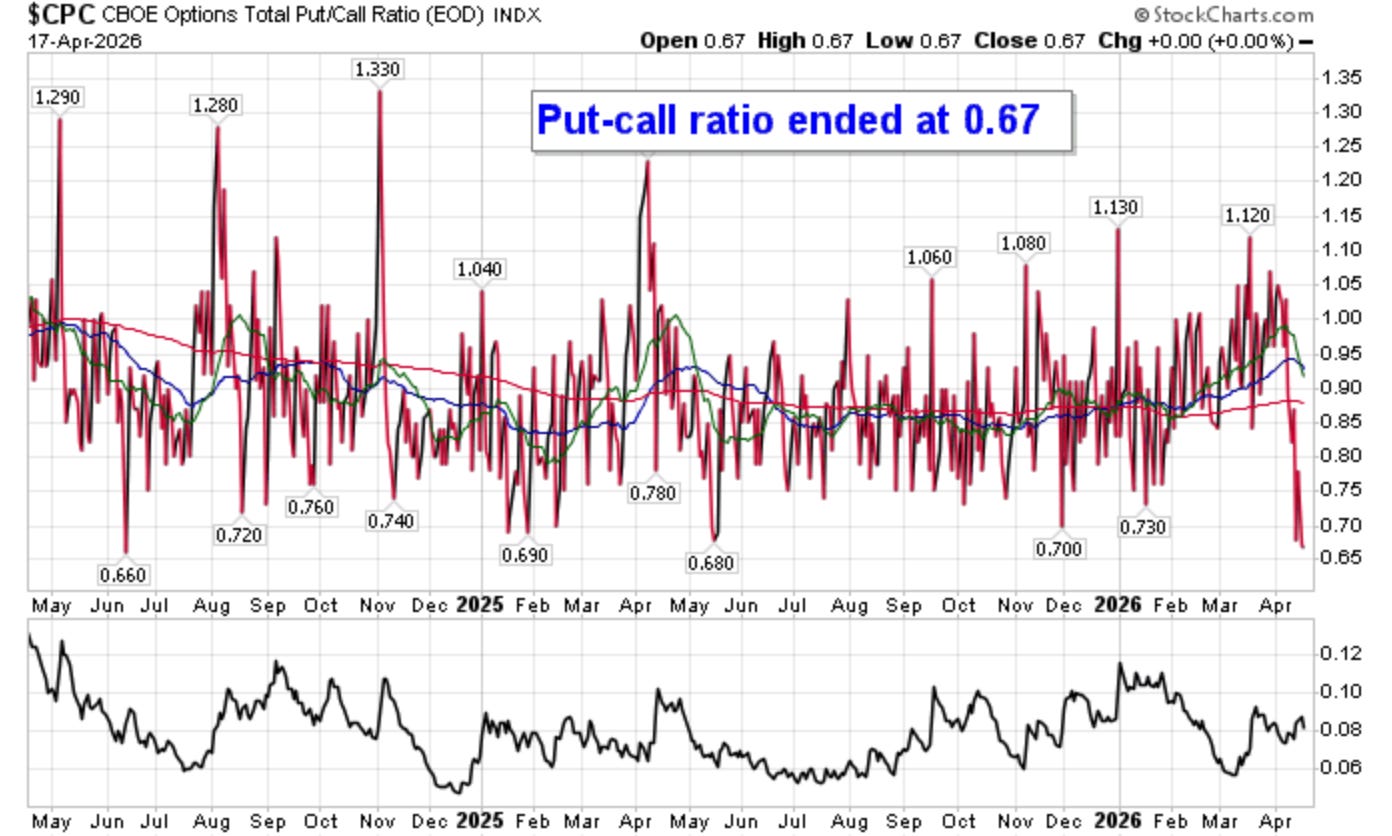
CBOE Total Put/Call Ratio
CBOE's total put/call ratio includes index options and equity options. It's a popular indicator for market sentiment. A high put/call ratio suggests that the market is overly bearish and stocks might rebound. A low put/call ratio suggests that market exuberance could result in a sharp fall.
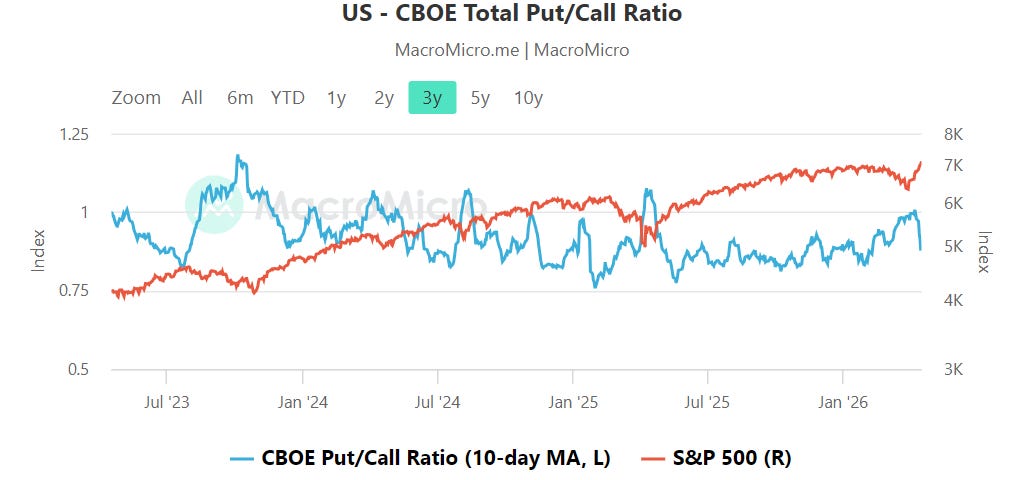
The options put/call ratio (10-day average) sits just below 1.0, roughly in the 0.9–0.95 range. At these levels, there are slightly more calls than puts, indicating a moderately bullish tilt but nothing extreme. By historical standards, a ratio below about 0.8 is often associated with overheated complacency, while above ~1.2 indicates panic or fear. Our current reading is closer to neutral/bullish, suggesting traders are not aggressively hedging against a sharp drop. In this environment, a further decline toward 0.8 would warrant concern of an overextended rally, whereas a jump above 1.0–1.1 would show a sudden scare and deeper risk aversion.
Equity vs Bond Volatility
The Merrill Lynch Option Volatility Estimate [MOVE] Index from BofAML and the CBOE Volatility Index [VIX] respectively represent market volatility of U.S. Treasury futures and the S&P 500 index. They typically move in tandem but when they diverge, an opportunity can emerge from one having to “catch-up” to the other.
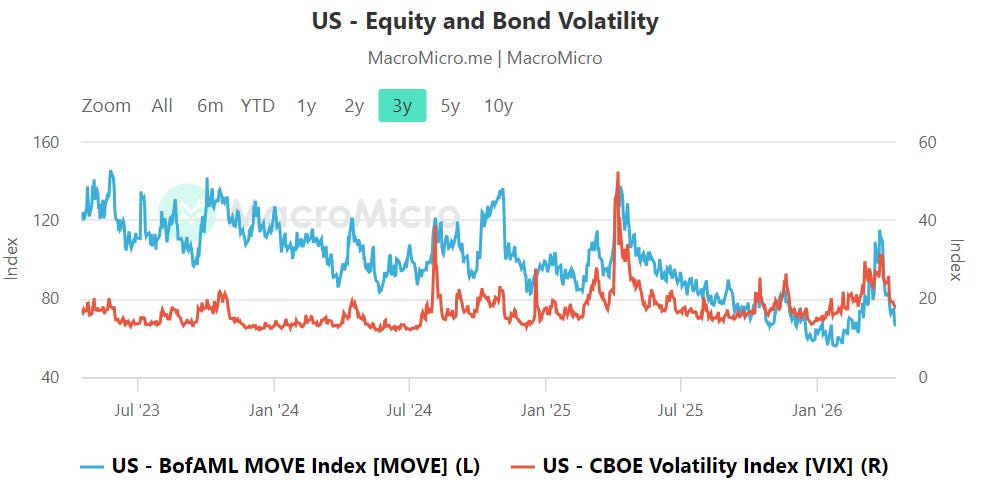
Equity and bond volatilities remain relatively calm. The MOVE Index (bond volatility) is around the mid-70s, while the VIX (equity volatility) is in the high teens (just under 20). Both are subdued after the recent rally – neither is flashing high stress. There is no unusual divergence: bond vol is somewhat elevated due to economic uncertainty, but equity vol has not spiked in kind. Key thresholds to watch would be a MOVE surge above roughly 120 while the VIX stays low, which has historically presaged equity turmoil, or a standalone jump in VIX into the mid-20s, which would break this complacency. For now, both readings suggest modest caution but not panic.
CNN Fear & Greed
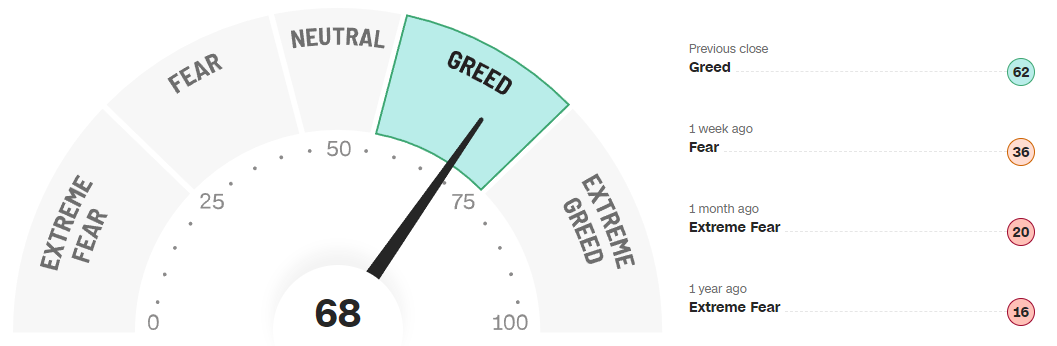
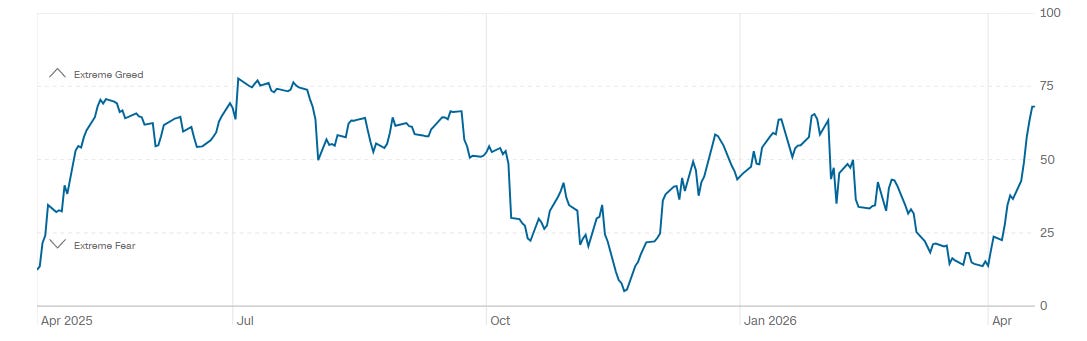
The CNN Fear & Greed Index stands at around 68, registering a “greed” tilt but not an extreme reading. Over the past year the index has mostly meandered between fear and greed, with an average in the mid-40s and only a few days above 70. At 68, sentiment is near the top of its recent range but still shy of the 80+ levels that would signal extreme euphoria. This suggests investors are leaning optimistic but have not become overly complacent. Should the gauge climb above 80–85, that would be a warning of froth and possible topping; if it falls back below 50 (neutral) or into the 20s (fear), it could mark a better buying opportunity. For now, the gauge implies greed is modest, aligning with the market’s steady advance.
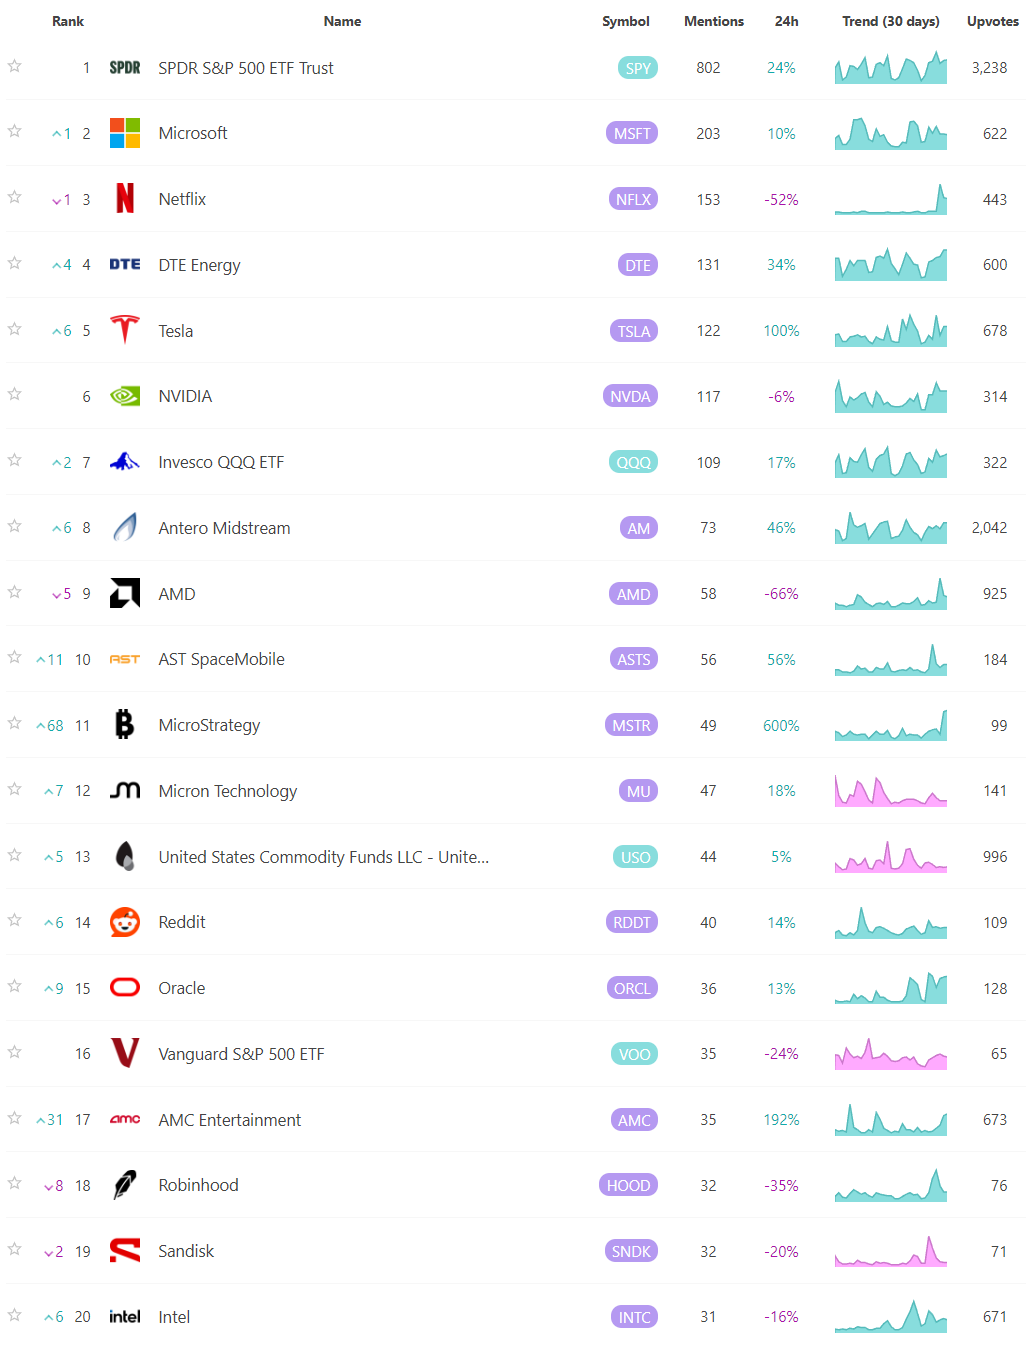
Social Media Favs
Social sentiment offers a real-time view of investor mood, often revealing market shifts before traditional indicators. It can signal momentum changes, spot emerging trends, and gauge retail investor impact—especially in high-volatility names. Tracking sentiment around events or earnings provides actionable insights, and when layered with quantitative models, can enhance predictive accuracy and risk management. Sustained sentiment trends often mirror broader market cycles, making this data a valuable tool for both short-term trades and long-term positioning.
Bottom line: Broadly bullish signals (above-50-day MA thrust, small caps leading, fear-to-greed shift) are in play, but breadth is only moderate and sentiment is just warming up – we need sustained 50-day MA breakouts (>60% of stocks) and more new highs than lows to call the move durable, otherwise pullbacks remain likely.

Technician’s Playbook: Trading the Majors (SPY/QQQ/IWM/DIA)
When you’re a large institutional player, your primary goal is to find liquidity - places to do a ton of business with the least amount of slippage possible. VolumeLeaders.com automatically identifies and visually plots the exact spots where institutions are doing business and where they are likely to return for more. It’s one of the primary reasons “support” and “resistance” concepts work and truly one of the reasons “price has memory”.
Across the index complex the tape is telling a consistent story: strong impulsive breaks to new highs followed by early signs of digestion right under freshly built liquidity bands. SPY, QQQ, IWM, and DIA all just absorbed sizable capital on the way up, and now the question is less “is this trend strong?” and more “where does it actually fail?”
SPY
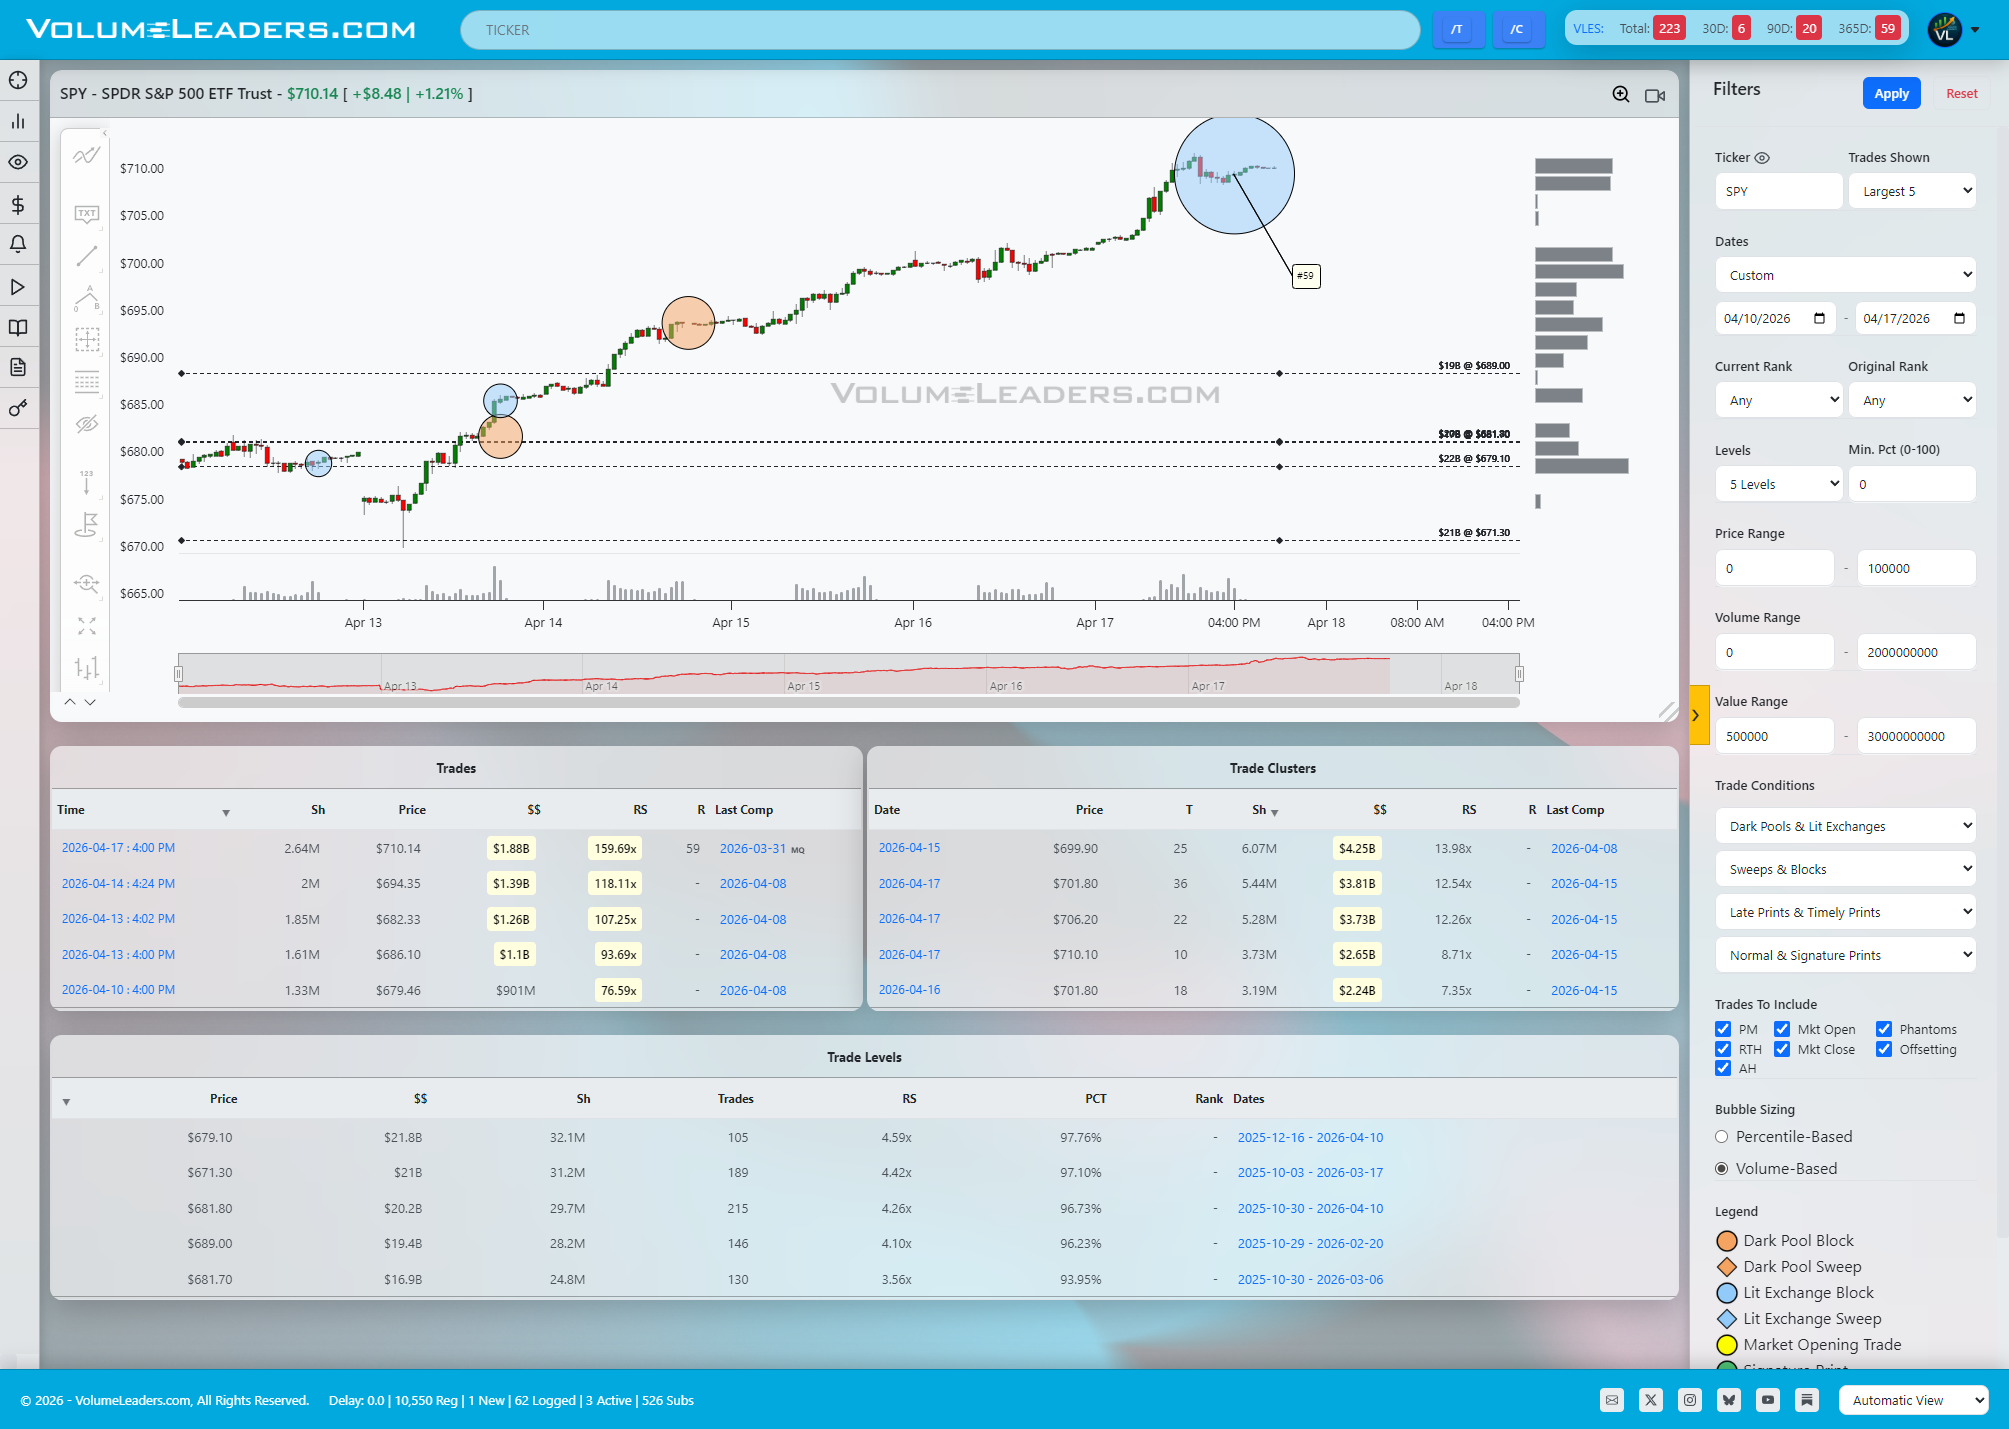
In SPY, the most important tell is the late-session top-100 print near 710, roughly 2.6M shares and north of 1.8B notional, one of the largest prints this symbol has ever seen. That kind of size does not chase; it either quietly absorbs upside supply or hands the baton off into a blow-off. The immediate reaction is a pause, not a sharp rejection, which tilts the read toward absorption and a shift of the value area higher. Below, the key structural shelves sit in the high 680s and around 670, where prior clustered prints and large trade levels anchored multi-billion dollar interest. If SPY holds above that 700–705 band and consolidates, the path of least resistance remains higher; a sustained break back through the 690s would be the market voting that the 710 print was distribution, not sponsorship.
QQQ
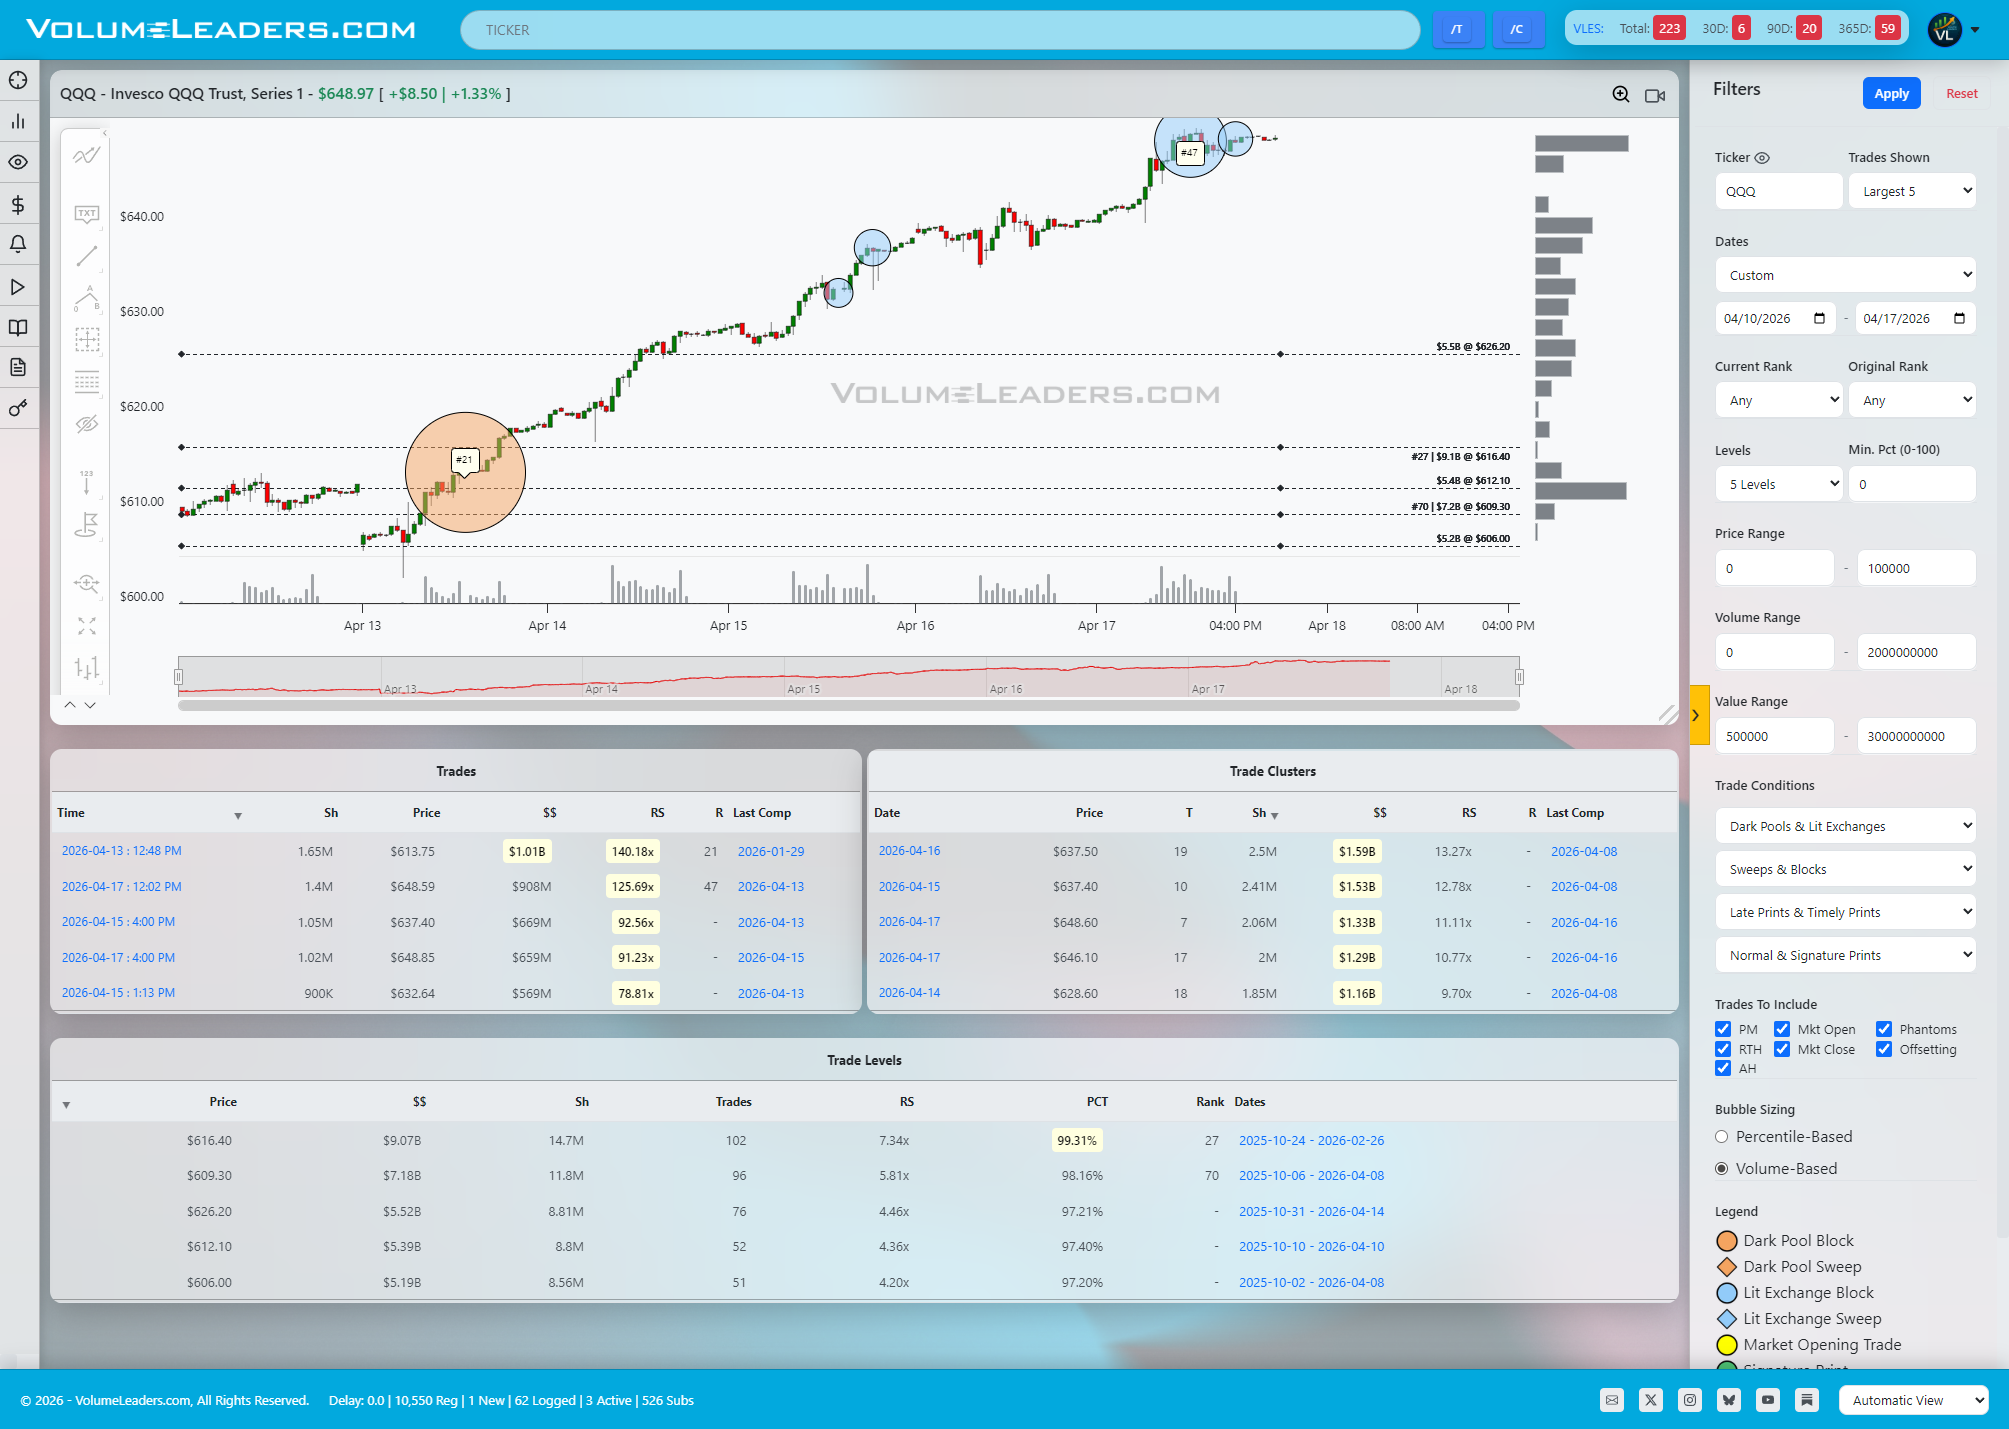
QQQ shows an even cleaner narrative of sponsored markup. The tape kicked off with a massive print around 613–614, over a billion notional and ranked in the top 25 historical trades for this ETF, effectively setting the base for the current leg. Since then, heavy clusters have stacked in the mid-630s and high 640s, each session building size with nine-figure prints in the 640–650 region. The latest action is a tight balance just under the recent high near 649, with multiple sizeable trades trading hands without meaningful downside follow-through. As long as buyers can defend that 643–645 intraday shelf, this looks like a high-and-tight flag after heavy sponsorship rather than exhaustion; lose that shelf with velocity and the door opens back into the 630–635 cluster where the next real liquidity magnet sits.
IWM
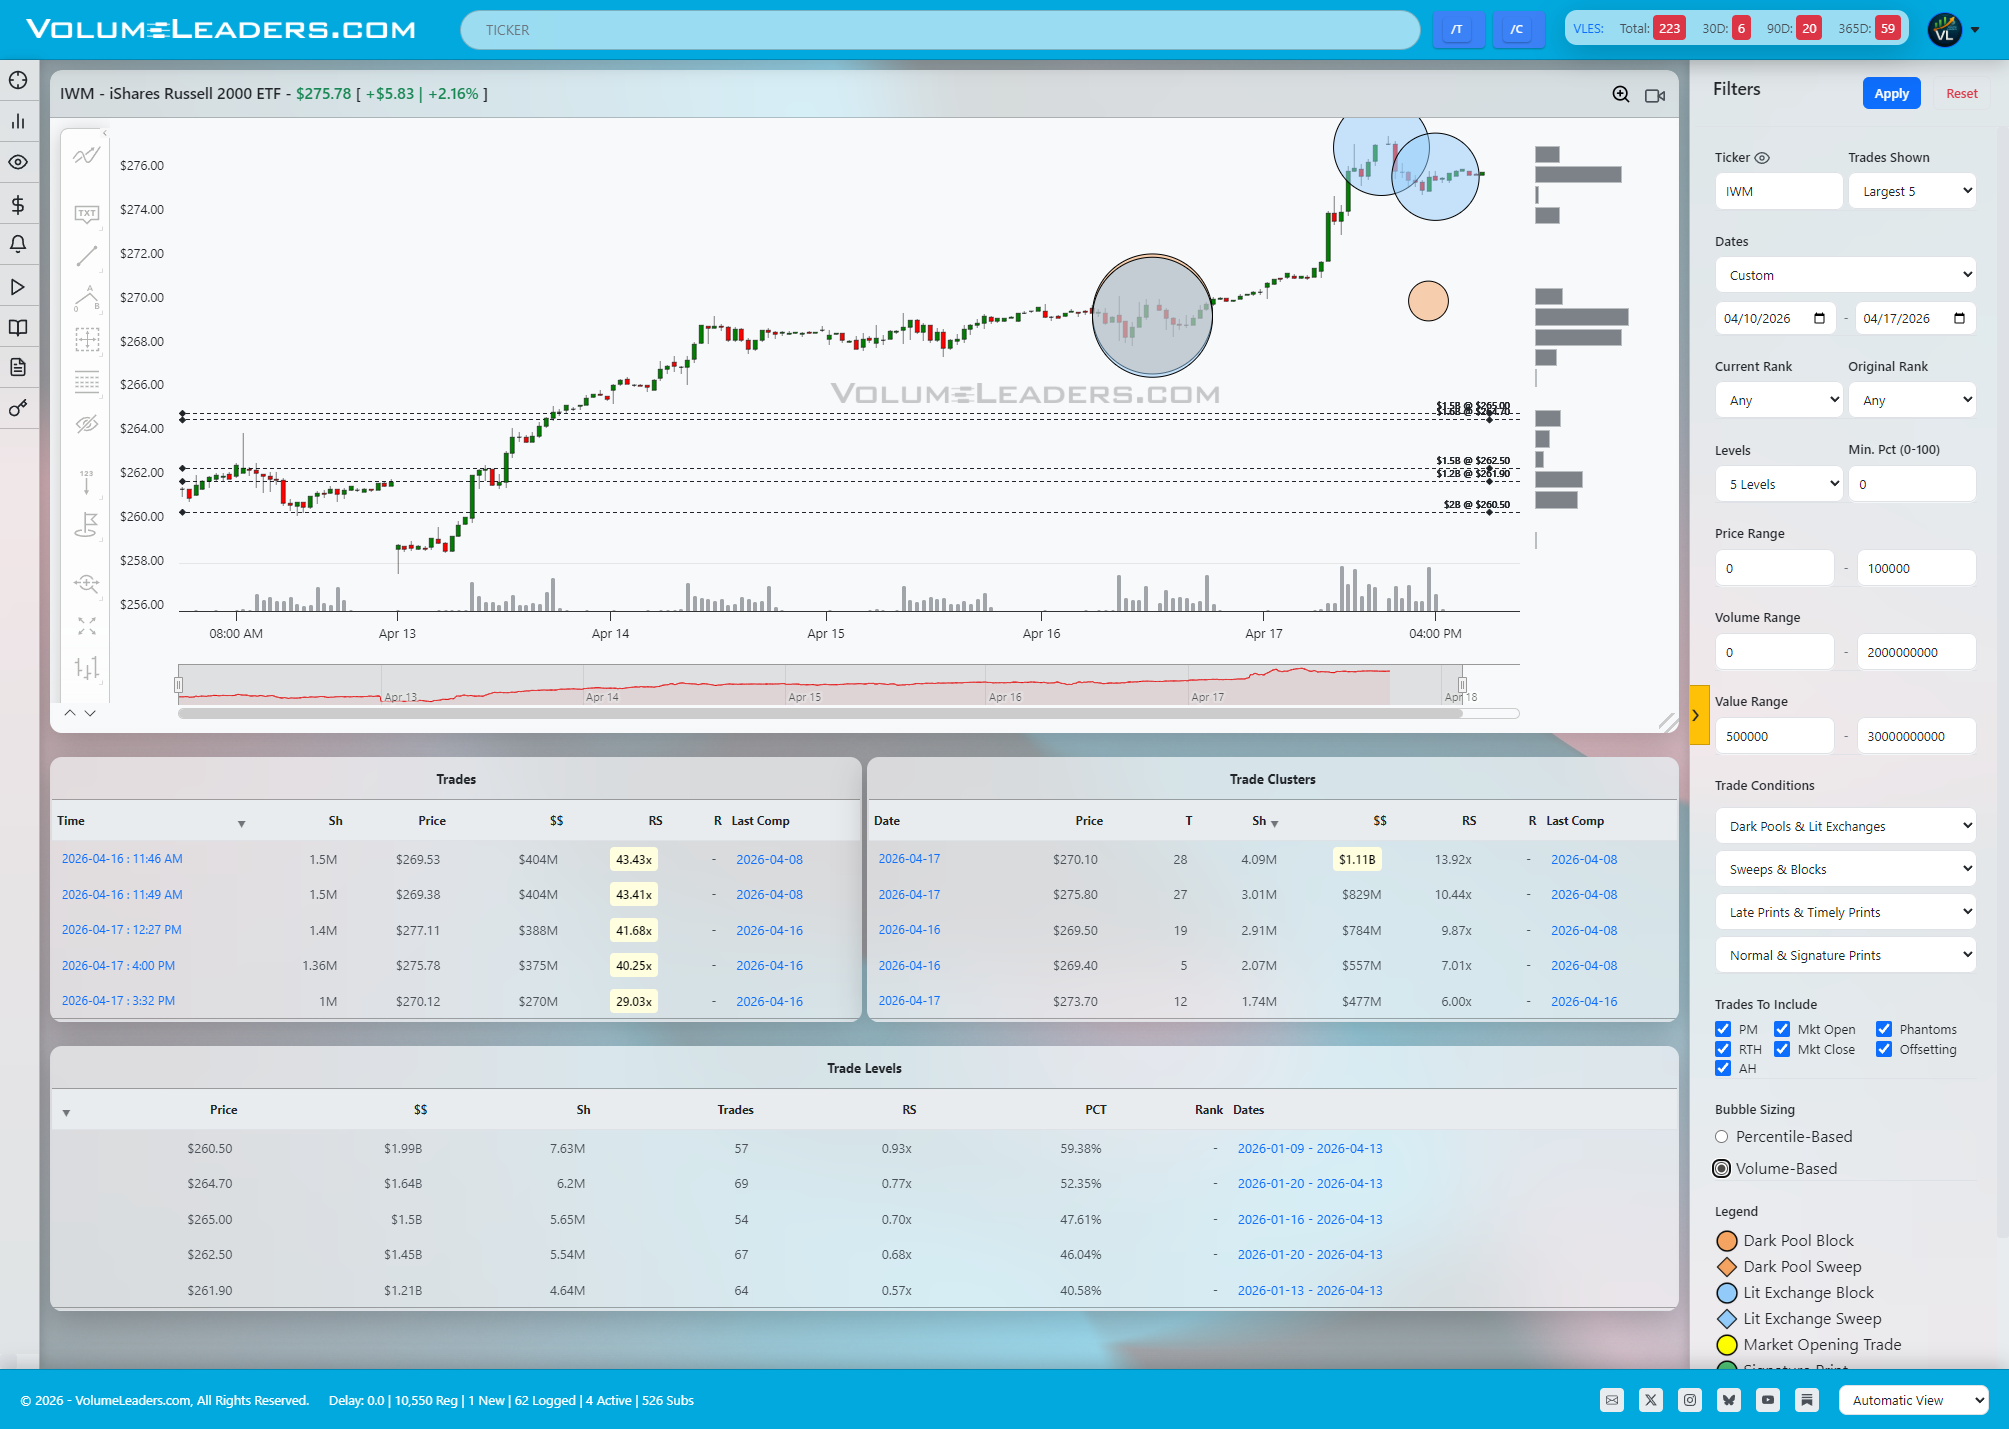
IWM is the higher beta expression of the same theme. It exploded from the low 260s into the mid-270s on a run of unusually large trades, including a 400M-type print near 270 that stands out relative to typical Russell ETF flow. The largest recent cluster sits right around 270–276, with over a billion notional trading in that area in a single session, effectively making it the new “line of scrimmage” for small caps. Acceptance above the 274–276 band converts that entire high-volume node into support and opens room toward a fresh extension higher, while a decisive break back through 268 would indicate that the big buyer up there was either completed or wrong, inviting a regression into the 262–264 cluster.
DIA
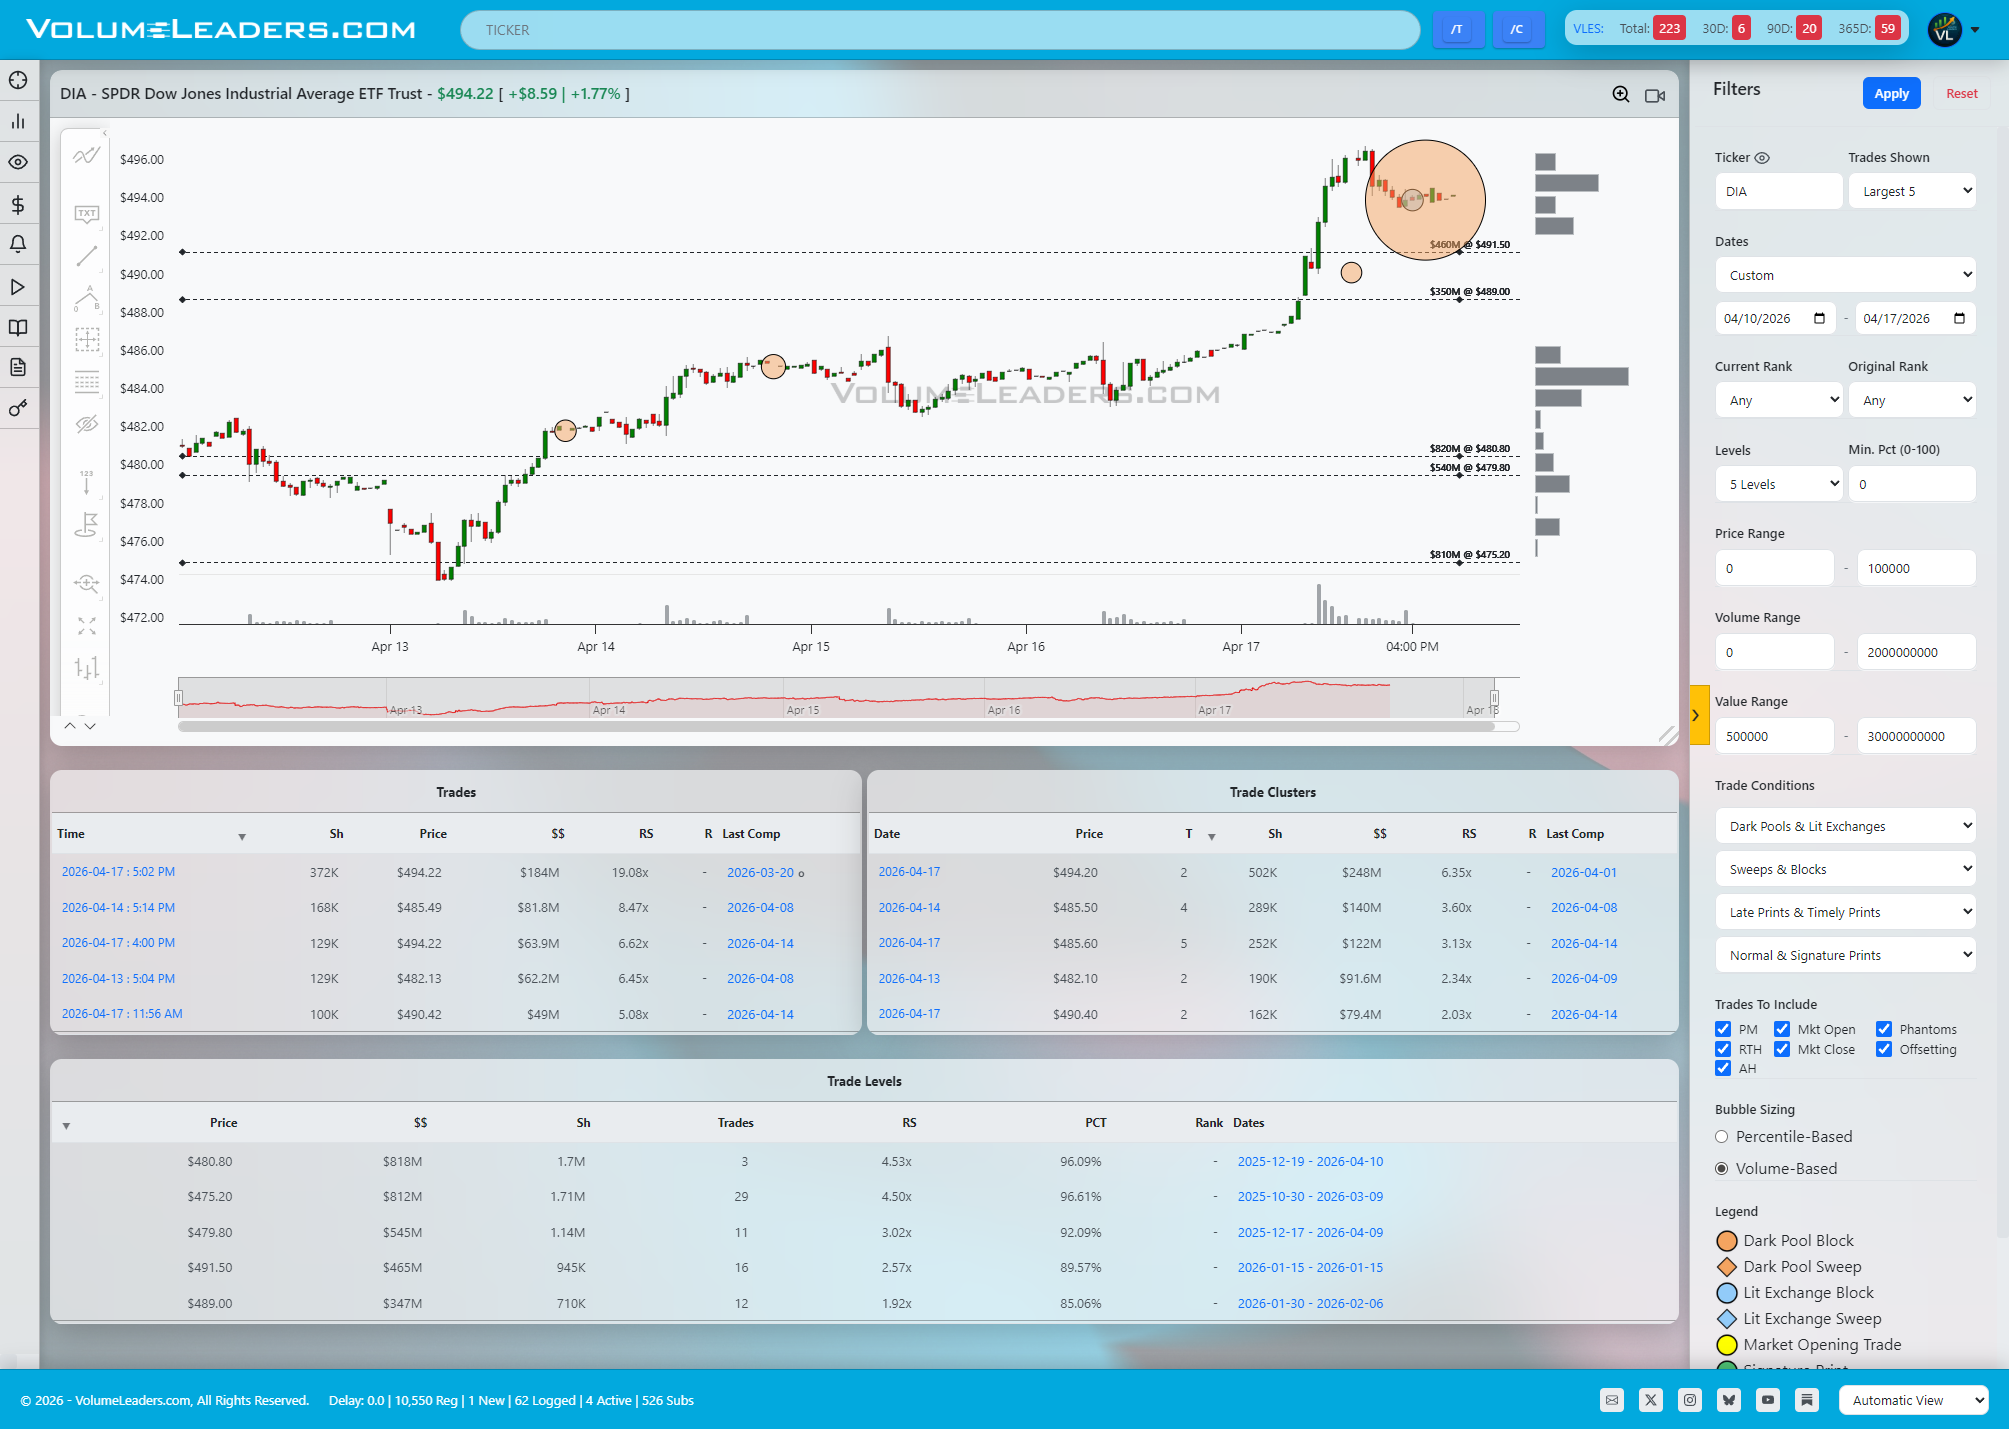
DIA rounds out the picture with a sharp vertical impulse from roughly 478 to just under 495, capped by a large end-of-day print slightly below the high. That trade, nearing 200M notional but with fewer shares than the tech-heavy products, has the look of an institution defending a breakout rather than unwinding risk, especially given the absence of immediate rejection. The main support band now sits in the 486–488 zone, where multiple prior sessions accumulated sizable levels in the 400–800M range; below that, the next serious demand shows up closer to 480. If price can base above 492–494, the upside continuation case is intact; if it starts living back under 488, the odds shift toward a mean reversion down into that lower band.
Tactically, a disciplined trader can frame the next sessions around these stacked shelves and the recent top-100 prints. On the bullish side, the setup is straightforward: look for early dips into the nearest high-volume shelf just below current price (for example, 700–705 SPY, 643–645 QQQ, 270–272 IWM, 486–488 DIA) that hold on reduced selling pressure and then show a clean reclaim of the prior session’s intraday balance. Entries there lean on the idea that the large late-session prints represent inventory transfer to stronger hands, with tight invalidation just under the shelf and first targets into or through the recent highs. Bullish continuation is confirmed when price not only tags the prior high but accepts above it for a chunk of the session, turning those highs into intraday support instead of a simple tag-and-reject.
The bearish scenario is less about calling a top and more about recognizing a failed auction. If price opens strong and then quickly knifes back through the prior session’s high-volume node associated with the big prints or if we gap-down on weekend news, that is your first tell that the large trade was informed distribution. For instance, SPY losing 700 after failing to hold above 710, or QQQ rejecting 649 and then breaking 643 with momentum, would indicate that the late buyers are underwater and that inventory needs to be cleaned up lower. In that case, the first downside magnets become the next lower cluster bands: SPY toward the high 680s, QQQ into 630–635, IWM back to 262–264, and DIA toward 480. Execution-wise, short entries make more sense on failed retests back into those broken shelves than on the initial flush, with invalidation just above the reclaimed level. Either way, the tape around those large prints and clusters over the next one to two sessions will tell you whether this was sponsored expansion or the start of a distribution top.

Summary Of Thematic Performance YTD
VolumeLeaders.com offers a robust set of pre-built thematic filters, allowing you to instantly explore specific market segments. These performance snapshots are provided purely for context and inspiration—think about zeroing in on the leaders and laggards within the strongest and weakest sectors, for example.
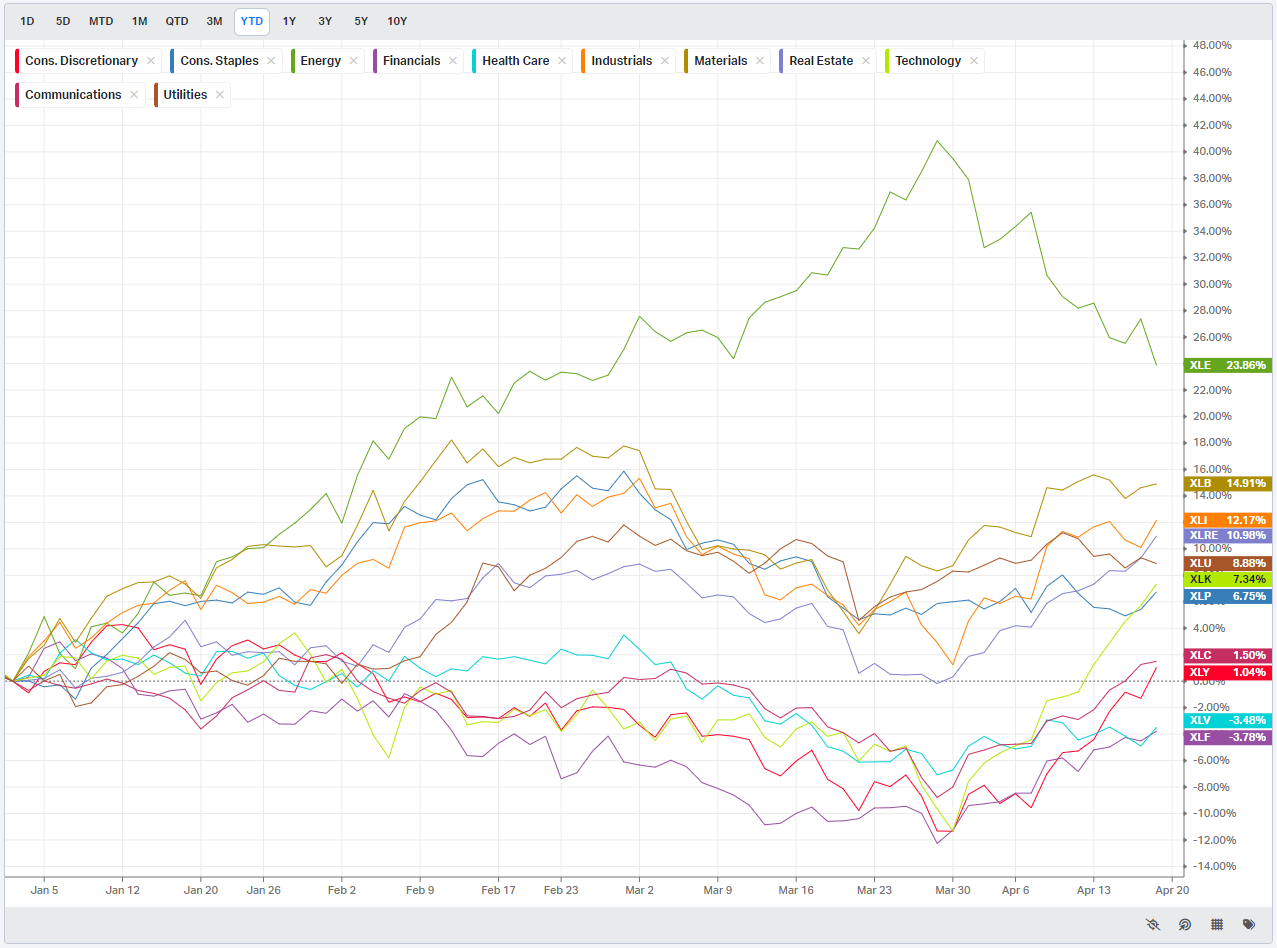
S&P By Sector
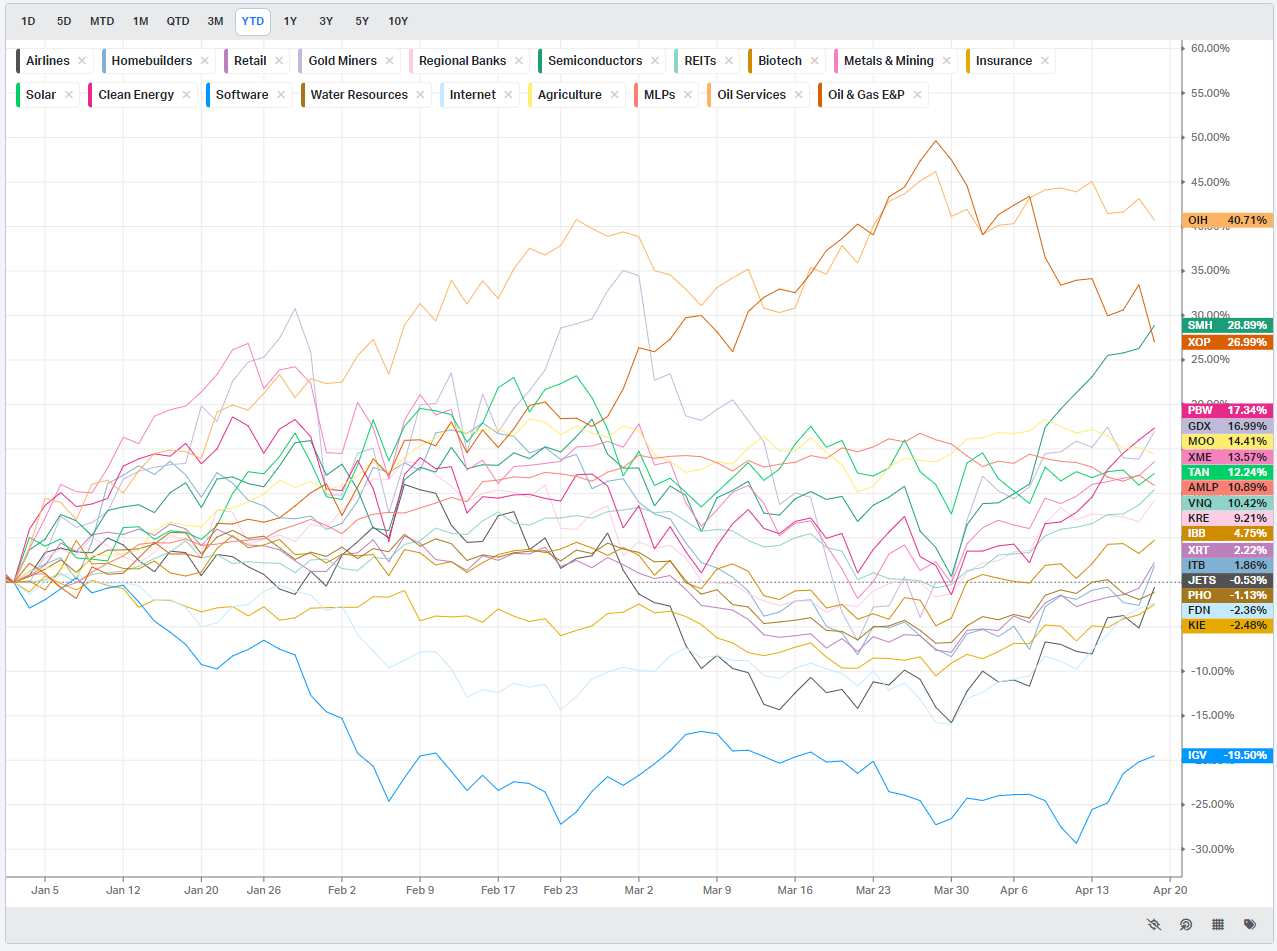
S&P By Industry
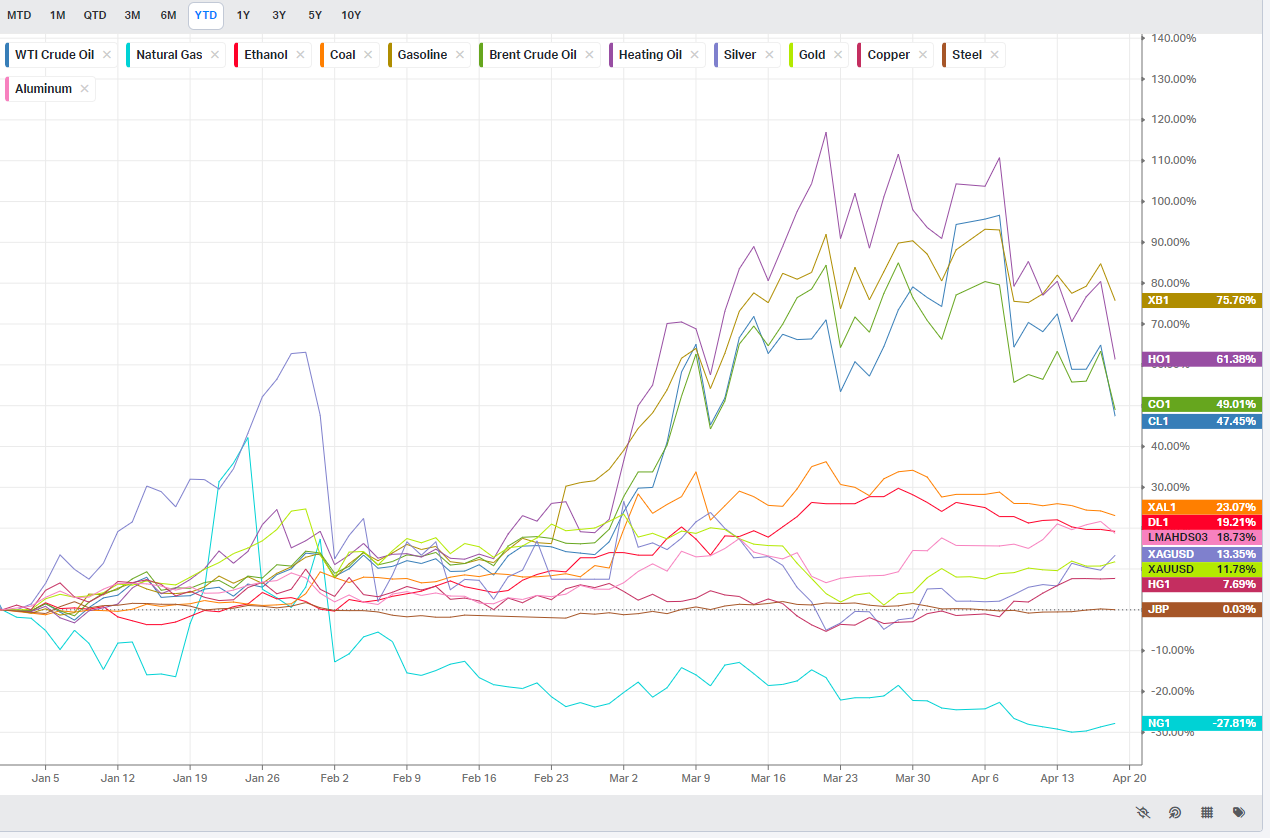
Commodities: Energy & Metals
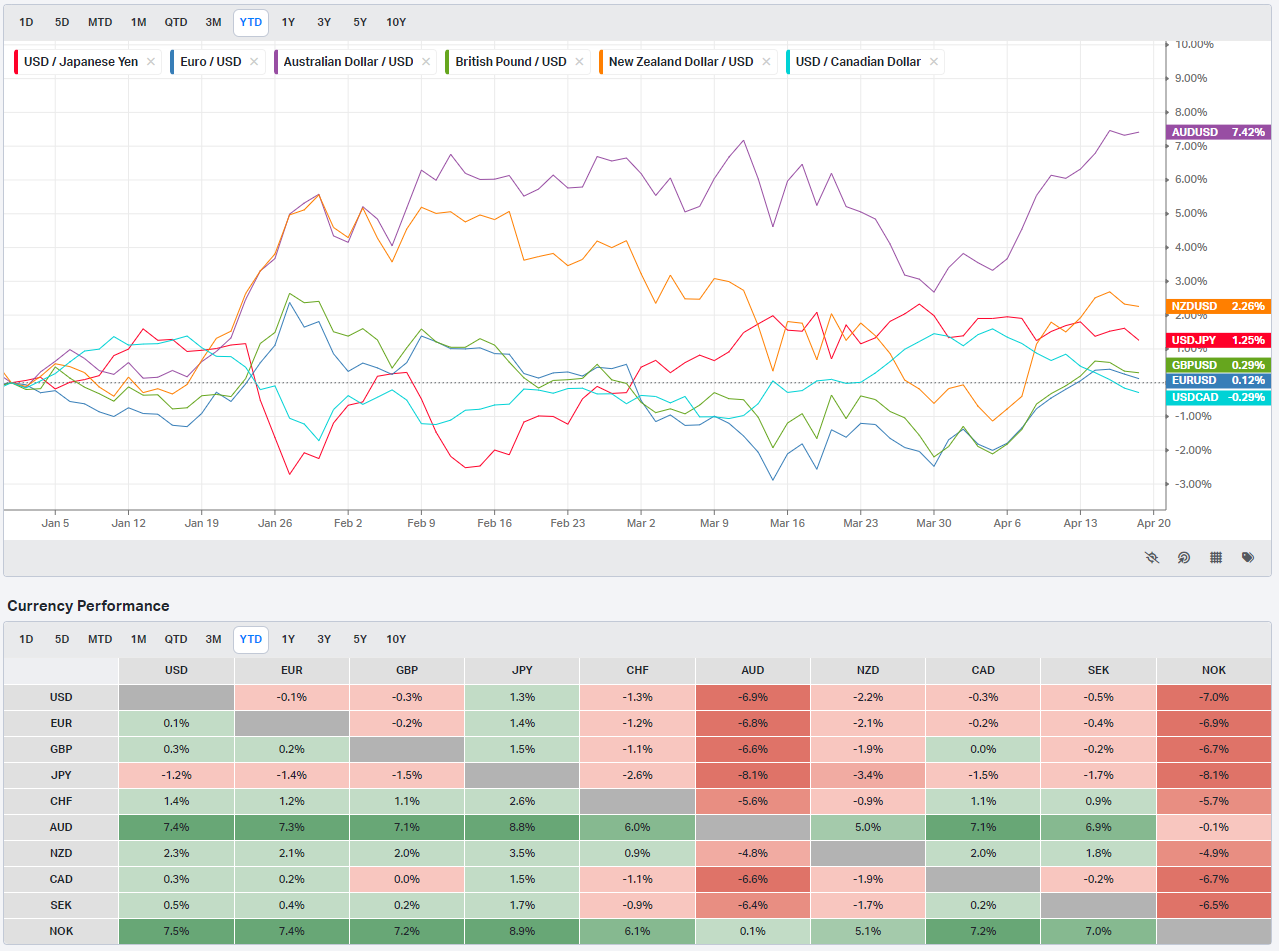
Currencies/Major FX Crosses
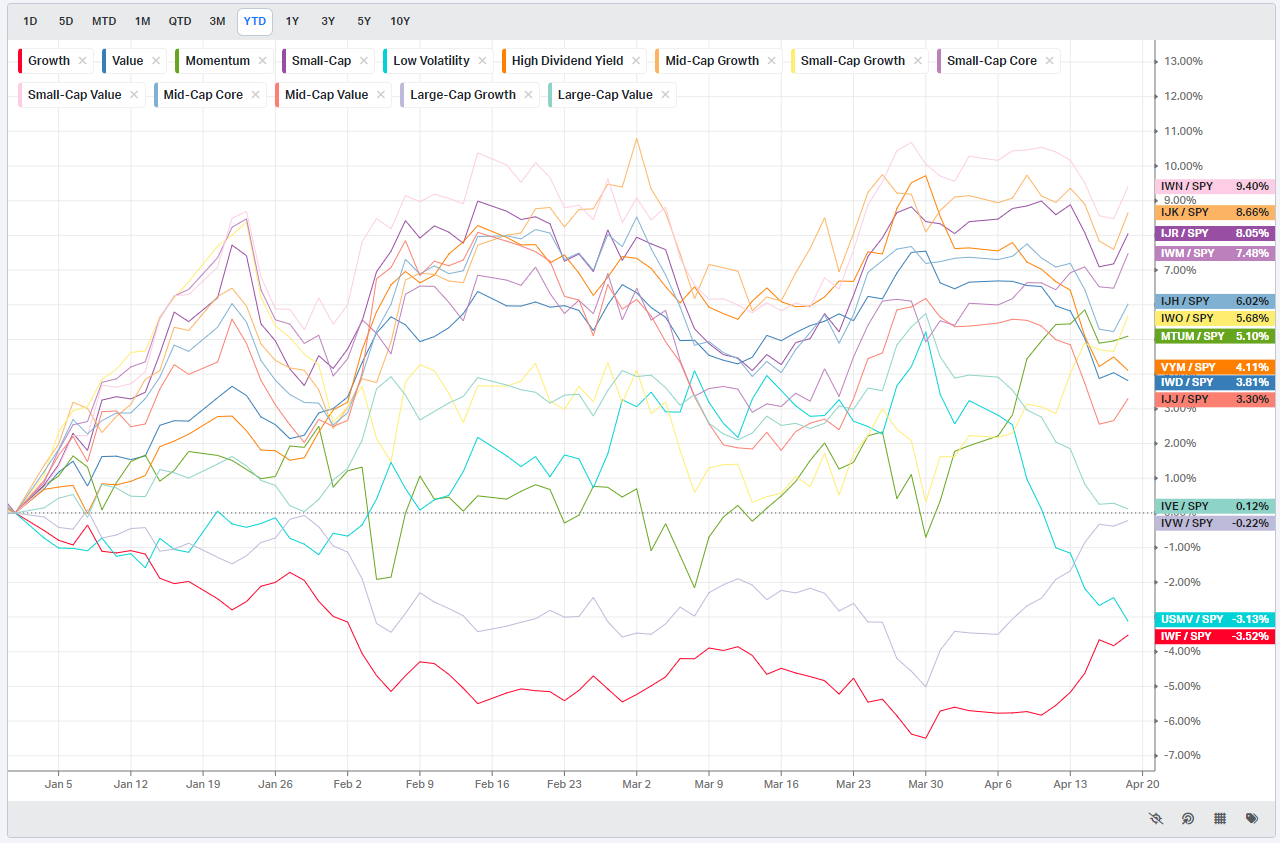
Factors: Style vs Size-vs-Value

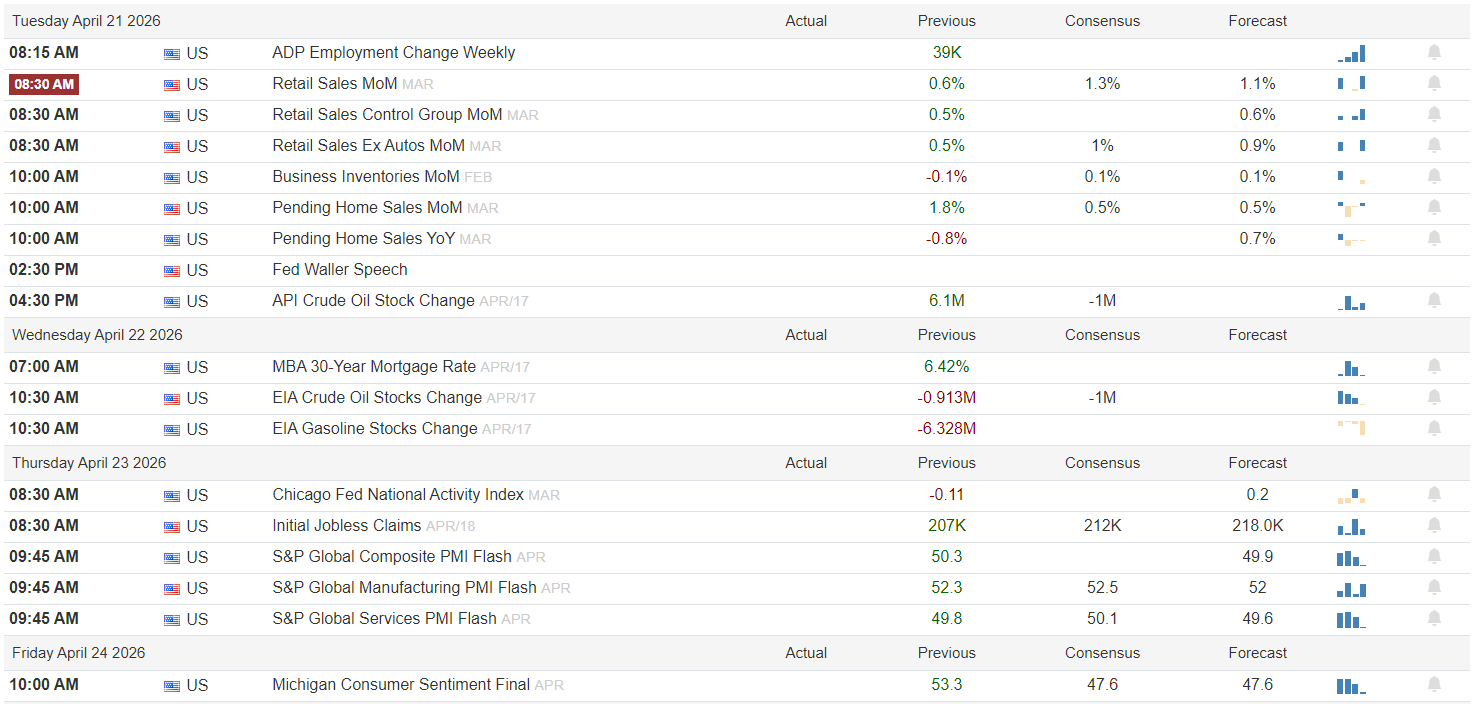
Events On Deck This Week
Here are key events happening this week that have the potential to cause outsized moves in the market or heightened short-term volatility.
Global Data Week: Inflation Eases but Growth Signals Beckon
Monday: China kept rates steady (1Y 3.0%, 5Y 3.5%). Europe saw disinflation – German PPI (Mar) -3.3% YoY (prev -1.8%) and Canada CPI +1.8% YoY (prev +2.5%). No major US releases; markets will watch these clues. ECB’s Lagarde speaks – a dovish tone could boost risk appetite.
Tuesday: UK unemployment 5.2%, wages +3.9% YoY. US Retail Sales (Mar, cons. +1.1% MoM) will test demand – a miss cools equities, a surprise beat fuels risk-on. Fed’s Waller speaks later; any hawkish tone would damp risk appetite.
Wednesday: Quiet day. UK inflation is likely easing (core CPI ~3.3% YoY), reducing BoE pressure. No Fed speakers until the next meeting, so markets stay balanced. Disinflation cues favor bulls, but the lack of new catalysts keeps risk in check.
Thursday: Flash PMIs roll out. US Composite ~50.3 – Services ~49.8, Mfg ~52.3. Europe is mixed (~50.7). A steady ~50 reading supports the rally; further softening (especially services) would curb risk appetite.
Friday: Michigan sentiment (final) is key. Consensus ~53.3 (prev 47.6) – above 50 suggests resilience, below 50 is cautionary. UK retail sales (Mar) fell -0.4% MoM. US consumer confidence will sway markets: a strong print bolsters bulls; a miss gives bears an edge.
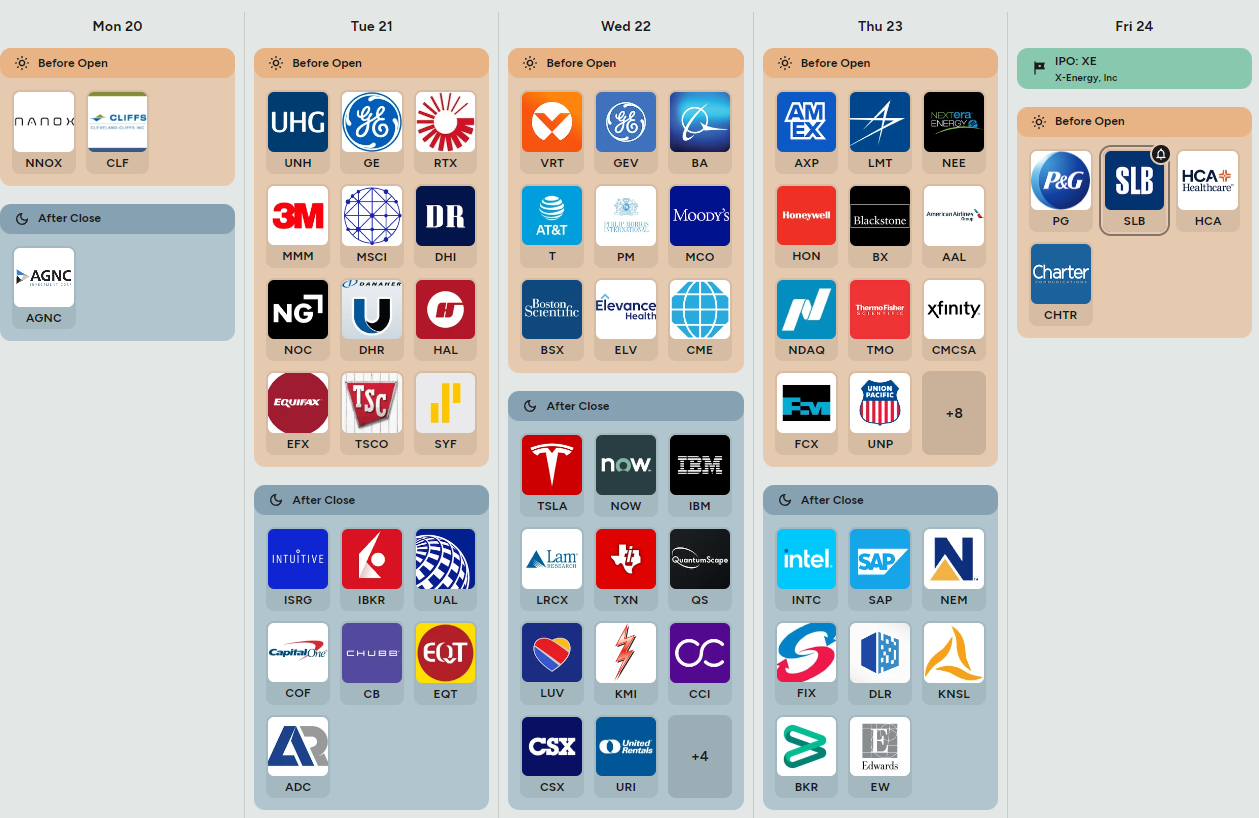
Earnings/IPO board: Tesla (Mon after-close) tests EV demand – strong deliveries or Autonomy revenue would boost tech; a miss cuts risk appetite. UnitedHealth (Tue pre-market) reveals insurance margins. Intel and ServiceNow (Wed after-close) highlight chip capex and enterprise IT demand. Boeing and AmEx (Thu pre-market) signal aerospace and consumer spending.
Sign-posts for the week:
US Retail Sales below +0.5% spooks markets; +1.0% or higher bolsters risk-taking.
Initial jobless claims above 220K signal labor cooling; sub-210K keeps the rally intact.
Michigan final sentiment below 50 indicates fading confidence; above 50 suggests resilience.
Bottom line: Bulls need low inflation and solid consumer data to hold ground; if key data disappoint, a pullback is likely.

Order Flow in Focus: Reading Smart Money Tells
Order Flow in Focus: Reading Smart Money Tells is a recurring segment that spotlights unique intraday opportunities revealed through institutional order flow. Each feature dissects a moment when the tape quietly shifted—when large, ranked prints clustered at key liquidity locations and informed players positioned ahead of the move. The goal isn’t hindsight; it’s pattern recognition—learning to spot the footprints of capital that knows before the crowd does.
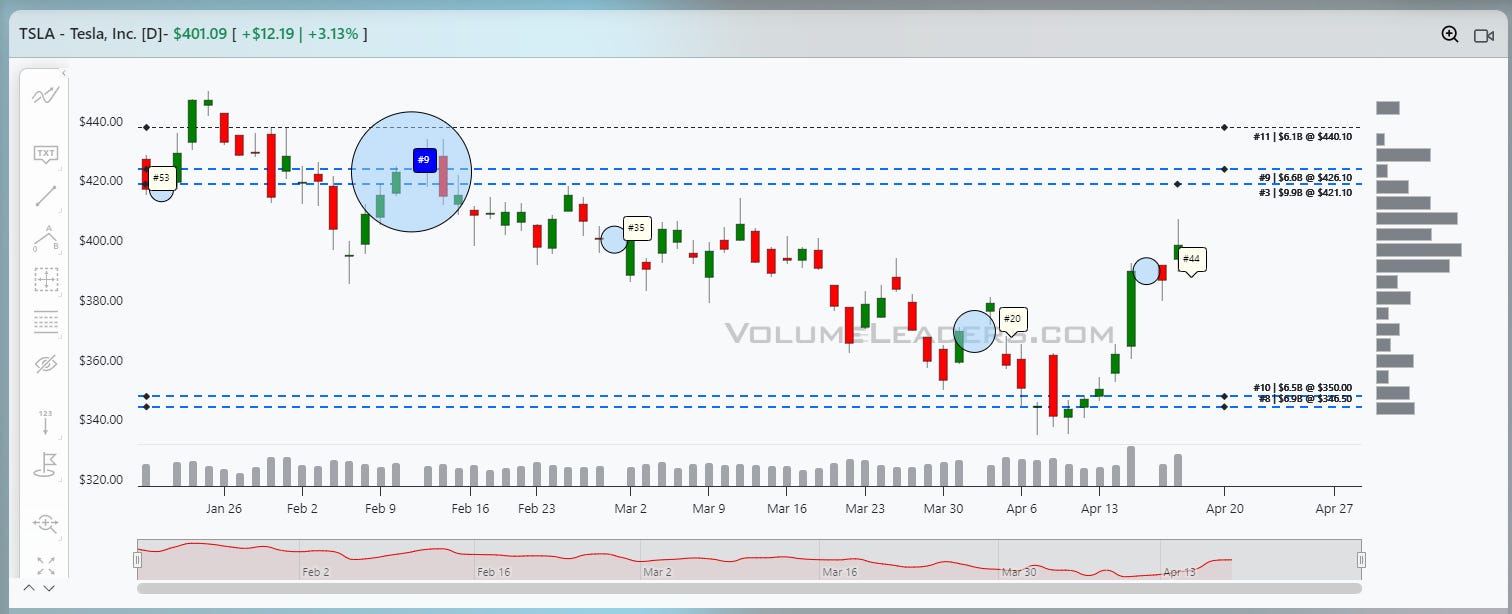
The chart of TSLA shows a classic ordered push higher in roughly $10 increments, punctuated by big block trades at key levels – the signatures of smart money at work. Price had been coiling near a heavy volume node (the lower blue-dashed lines) before the thrust. A massive trade (a top-100 print) came through just above that pivot, absorbing all the sellers and leaving the stock balanced on top of smaller support levels (black dashed line). Once this wall held, TSLA lifted off in another smooth impulse: every few dollars up it stalled briefly as bids and offers matched at minor resistance, but the buyers kept showing up.
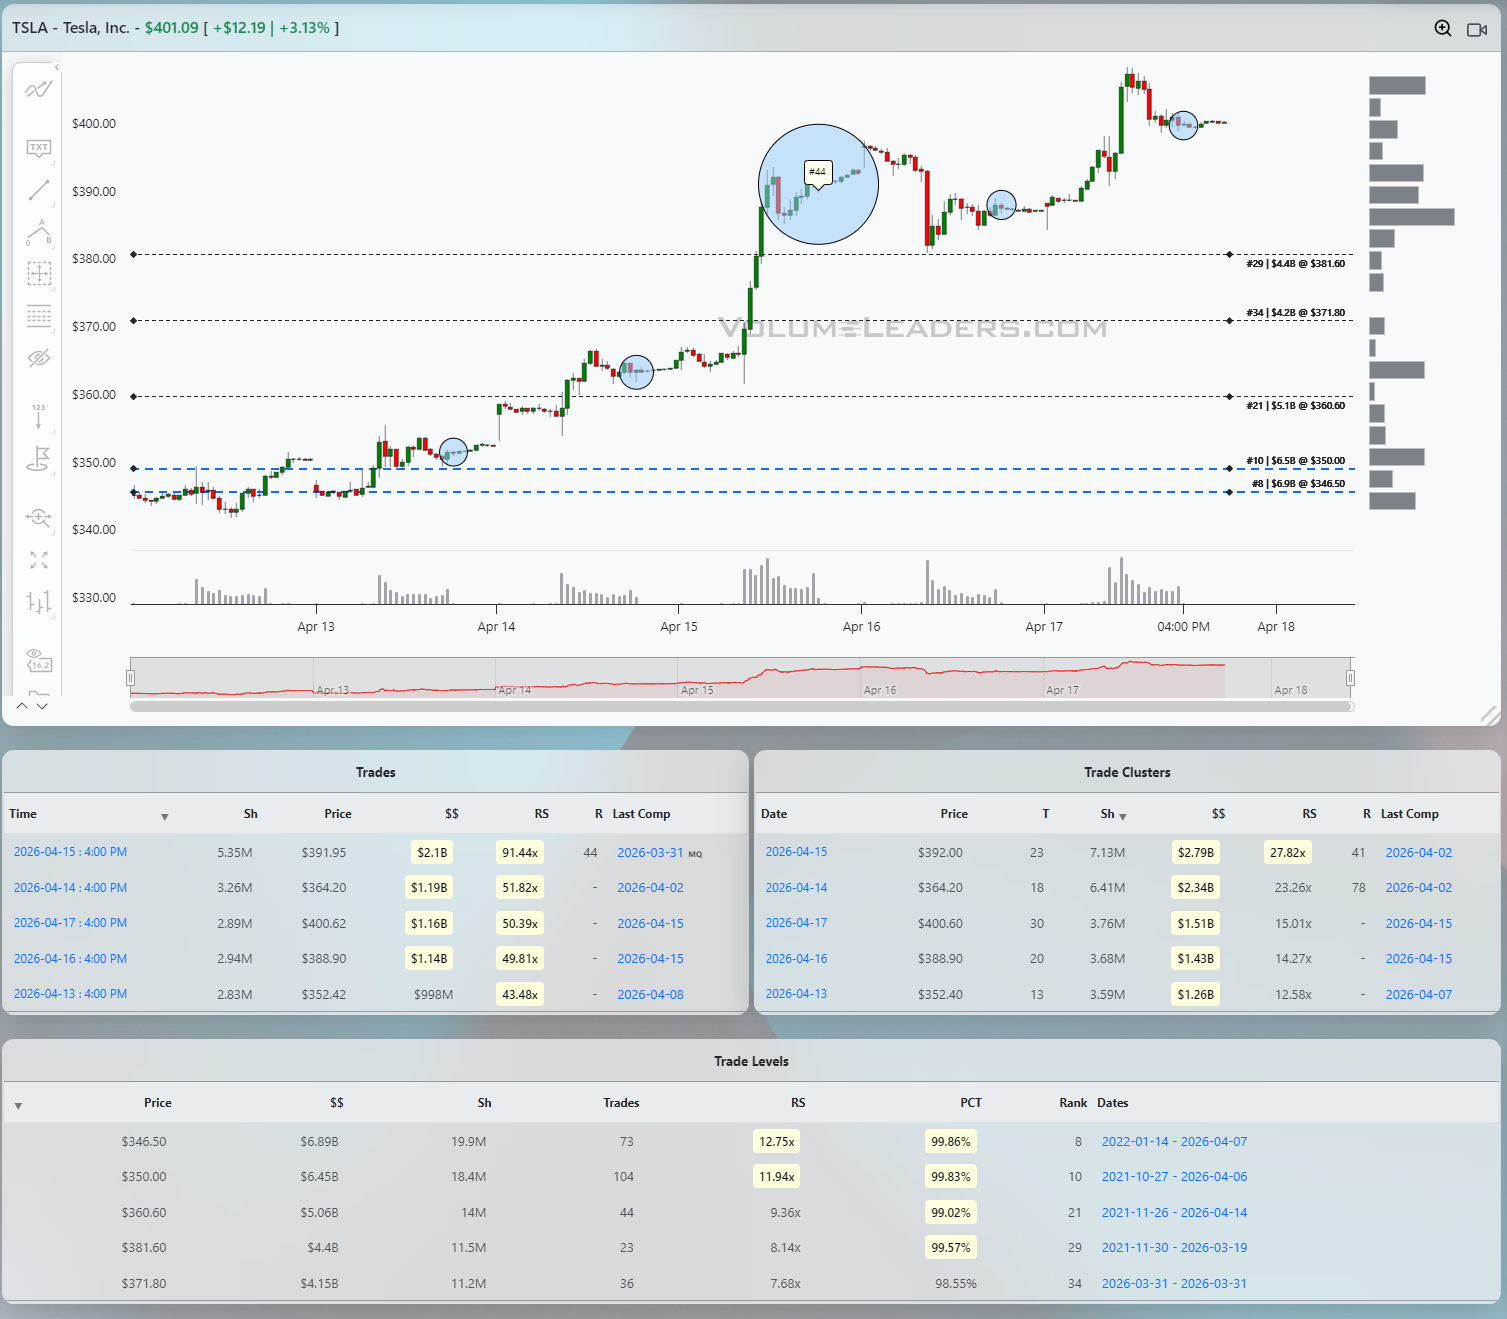
Within this move, we spotted the telltale prints. The first block at the pivot was effectively a bid absorption – it happened right around the lower blue line, which our tables show is one of the biggest historical volume anchors for TSLA. That block essentially footed out any sellers. As the rally continued, we saw another hefty trade come through near the prior swing high, each time helping the stock clear the next $10 handle. Those oversized trades were like breadcrumbs: the smart players quietly buying on dips. Each time the stock hesitated near a round number or a visible dashed level, it was quickly supported by institutional flow, not without hinting at exhaustion points.
Key support and resistance lines jump out in the data. The primary “scrimmage line” became that lower blue pivot. A failure back below it – especially if another large sell print came in – would have suggested the move failed and we'd look for fade back to the recent balance. But since TSLA held above and prints skewed buyers, the path was up. The target for the move are the blue lines above, the prior fair value area. TSLA is winning-back price structure and those upper blue dashed level appear to be the magnets. Conversely, losing that #44 print suggests a fade back into prior levels (black dashed lines and ultimately blue dashed line) to see if buyers are still committed to upper targets.
For execution, the clues were clear: enter around a break above heavy demand at the pivot, ride the measured move of roughly $10 to the next volume shelf, and adjust stops below each cleared line. The scenario failed only if TSLA slips back under its support blocks, at which point the rally leg would be negated. In short, watching the tape for those big clustered prints at the blue-dashed anchors gave the early signal; following through with the flow – stops just under the pivot, targets at the next institutional node – would have captured the move.

Market Intelligence Report
A desk-grade synthesis of institutional positioning and market structure—unpacking the flows, levels, and emerging themes that shaped the week, and translating them into a model portfolio built the same way professional desks prepare for the week ahead.
MIR Part 1: The Backdrop
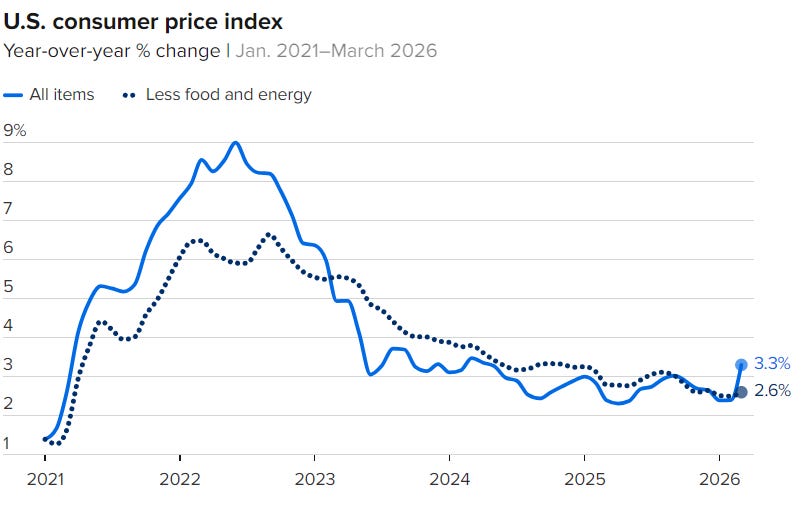
The tape ended the week with a much steadier internal feel than the headline macro backdrop would normally permit. Under the surface, participation looks broad enough to keep the advance alive, but not so broad that you can just buy anything and expect to be paid. The market is still behaving like it prefers quality, liquidity, and size first, with risk accepted selectively rather than indiscriminately. Volatility has been calming at the market-wide level after an earlier flare, which matters because it tells you the advance is being built on improving stability rather than pure panic-covering. At the same time, the more stable pockets are not always the ones with the best relative leadership, which is why the market keeps gravitating back toward the same familiar capital magnets: large caps, technology, financials, and the higher-quality cyclical complex. That is the real message of the week. Conditions improved enough to support risk, but the market still wants risk expressed through names and sectors that can absorb institutional size cleanly. Systematic hedge funds have just put roughly $86 billion of new equity exposure to work over the last five sessions, one of the largest five‑day buying waves on record, and they are doing it into a backdrop of re‑accelerating headline inflation and still‑accommodative financial conditions. March CPI came in hot at 0.9% month‑over‑month and 3.3% year‑over‑year, with a 10.9% jump in energy doing most of the lifting, which explains why energy‑linked products are suddenly back near the top of the institutional flow stack after being sleepy earlier in the quarter.
Against that macro, the dashboard is painting an environment that is not euphoric, but still willing to take risk: broad indices have rallied hard this week, participation has broadened, and volatility has not perked-up ahead of the weekend as markets wait and watch for the real give‑up to materialize.
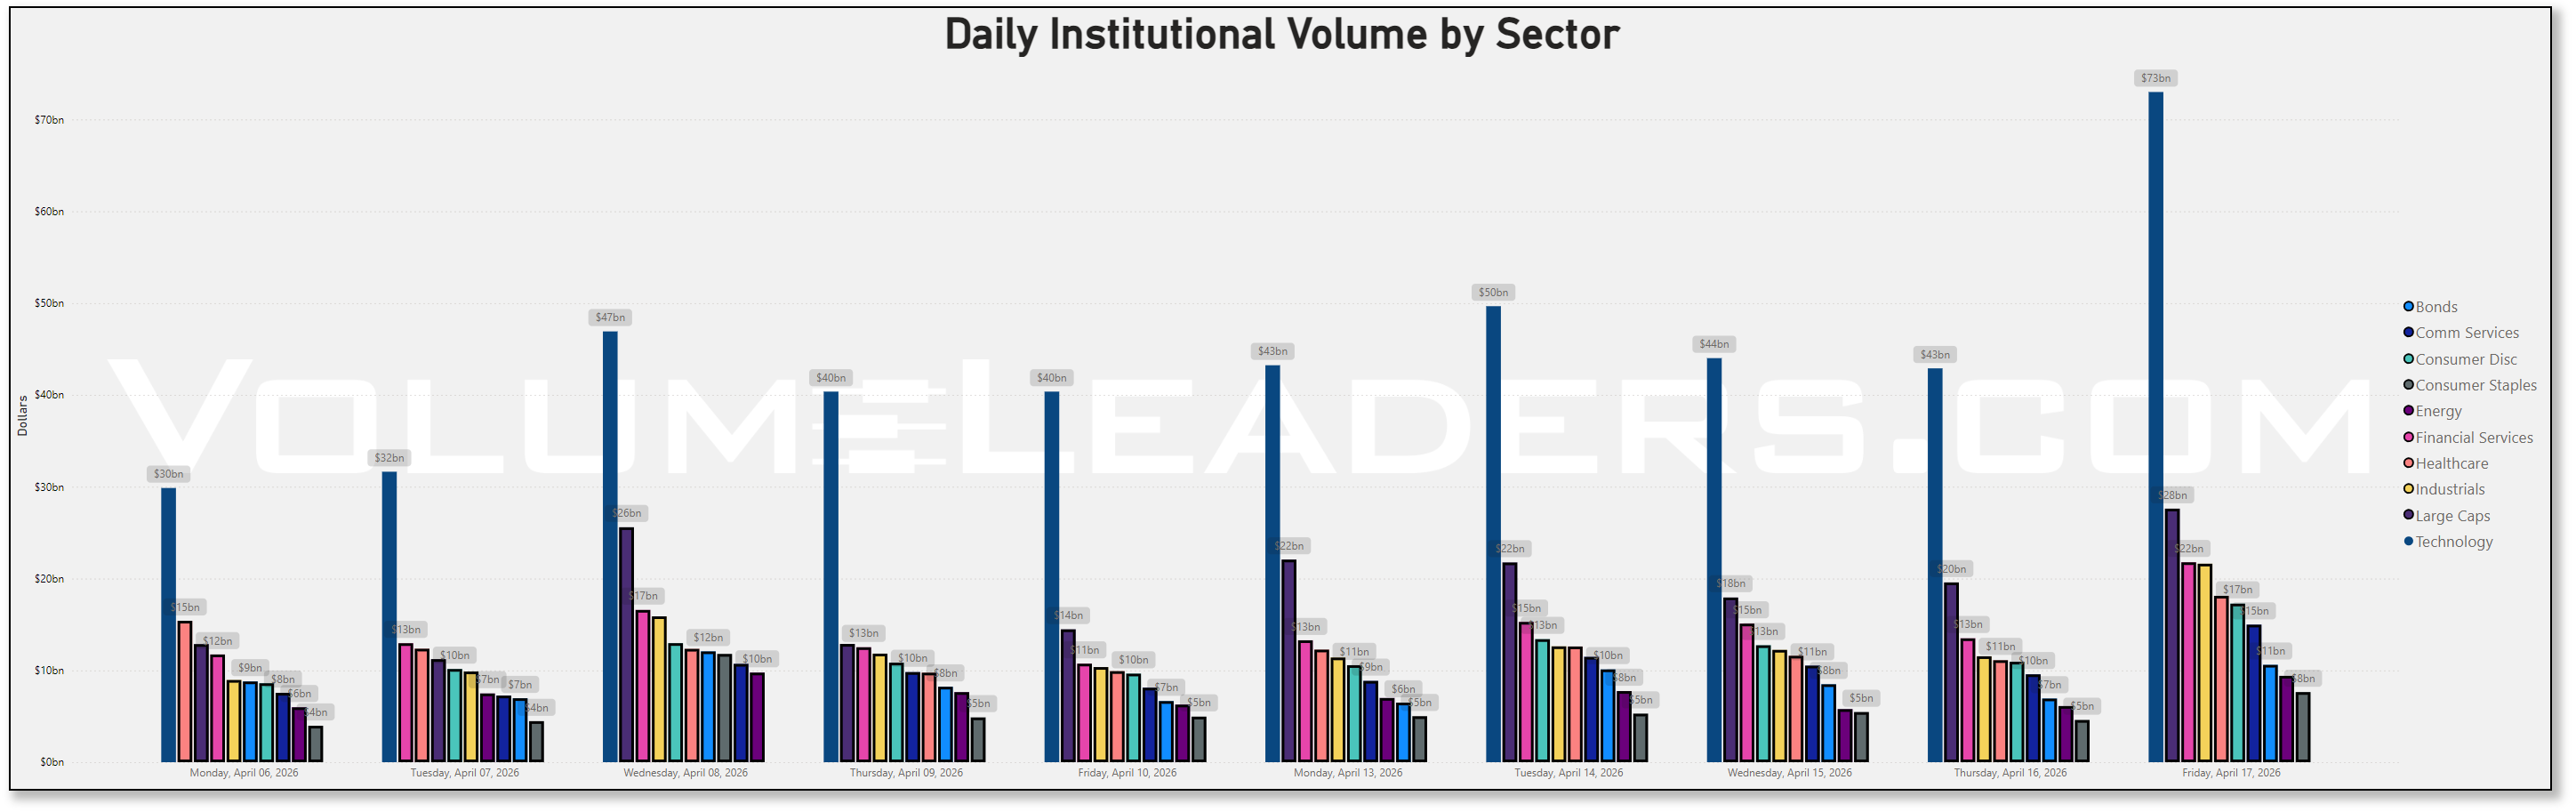
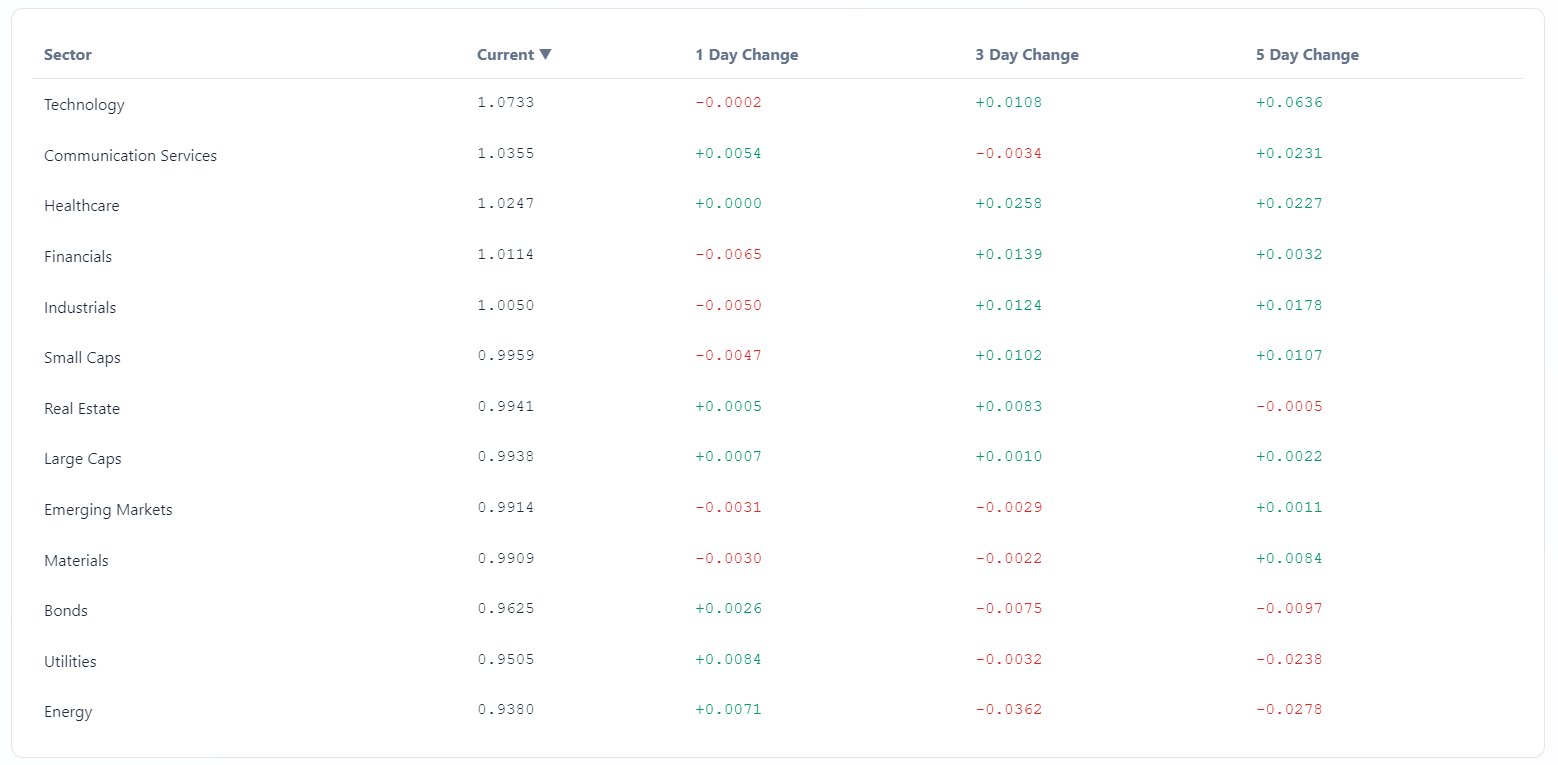
That broader backdrop lines up well with the raw flow totals. Technology was the clear center of gravity again, and not by a little. The sector printed roughly $252.7b for the week versus about $189.1b the prior week, a massive week-over-week acceleration thank to the OPEX push over the top. Large Caps also stepped up hard, rising to about $108.9b from roughly $77.0b the week before. Financial Services climbed to about $78.9b from $64.5b, Industrials to about $69.4b from $56.9b, Consumer Discretionary to about $64.9b from $52.2b, and Healthcare to about $65.7b from $59.8b. That is not a defensive, hiding-in-corners tape. It is a tape reallocating toward liquid leadership while still broadening at the edges. By contrast, Bonds were basically flat week over week, Energy eased slightly, and Consumer Staples actually slipped. In other words, the market did not abandon ballast, but the incremental dollar clearly went toward offense and cyclicality rather than pure shelter.
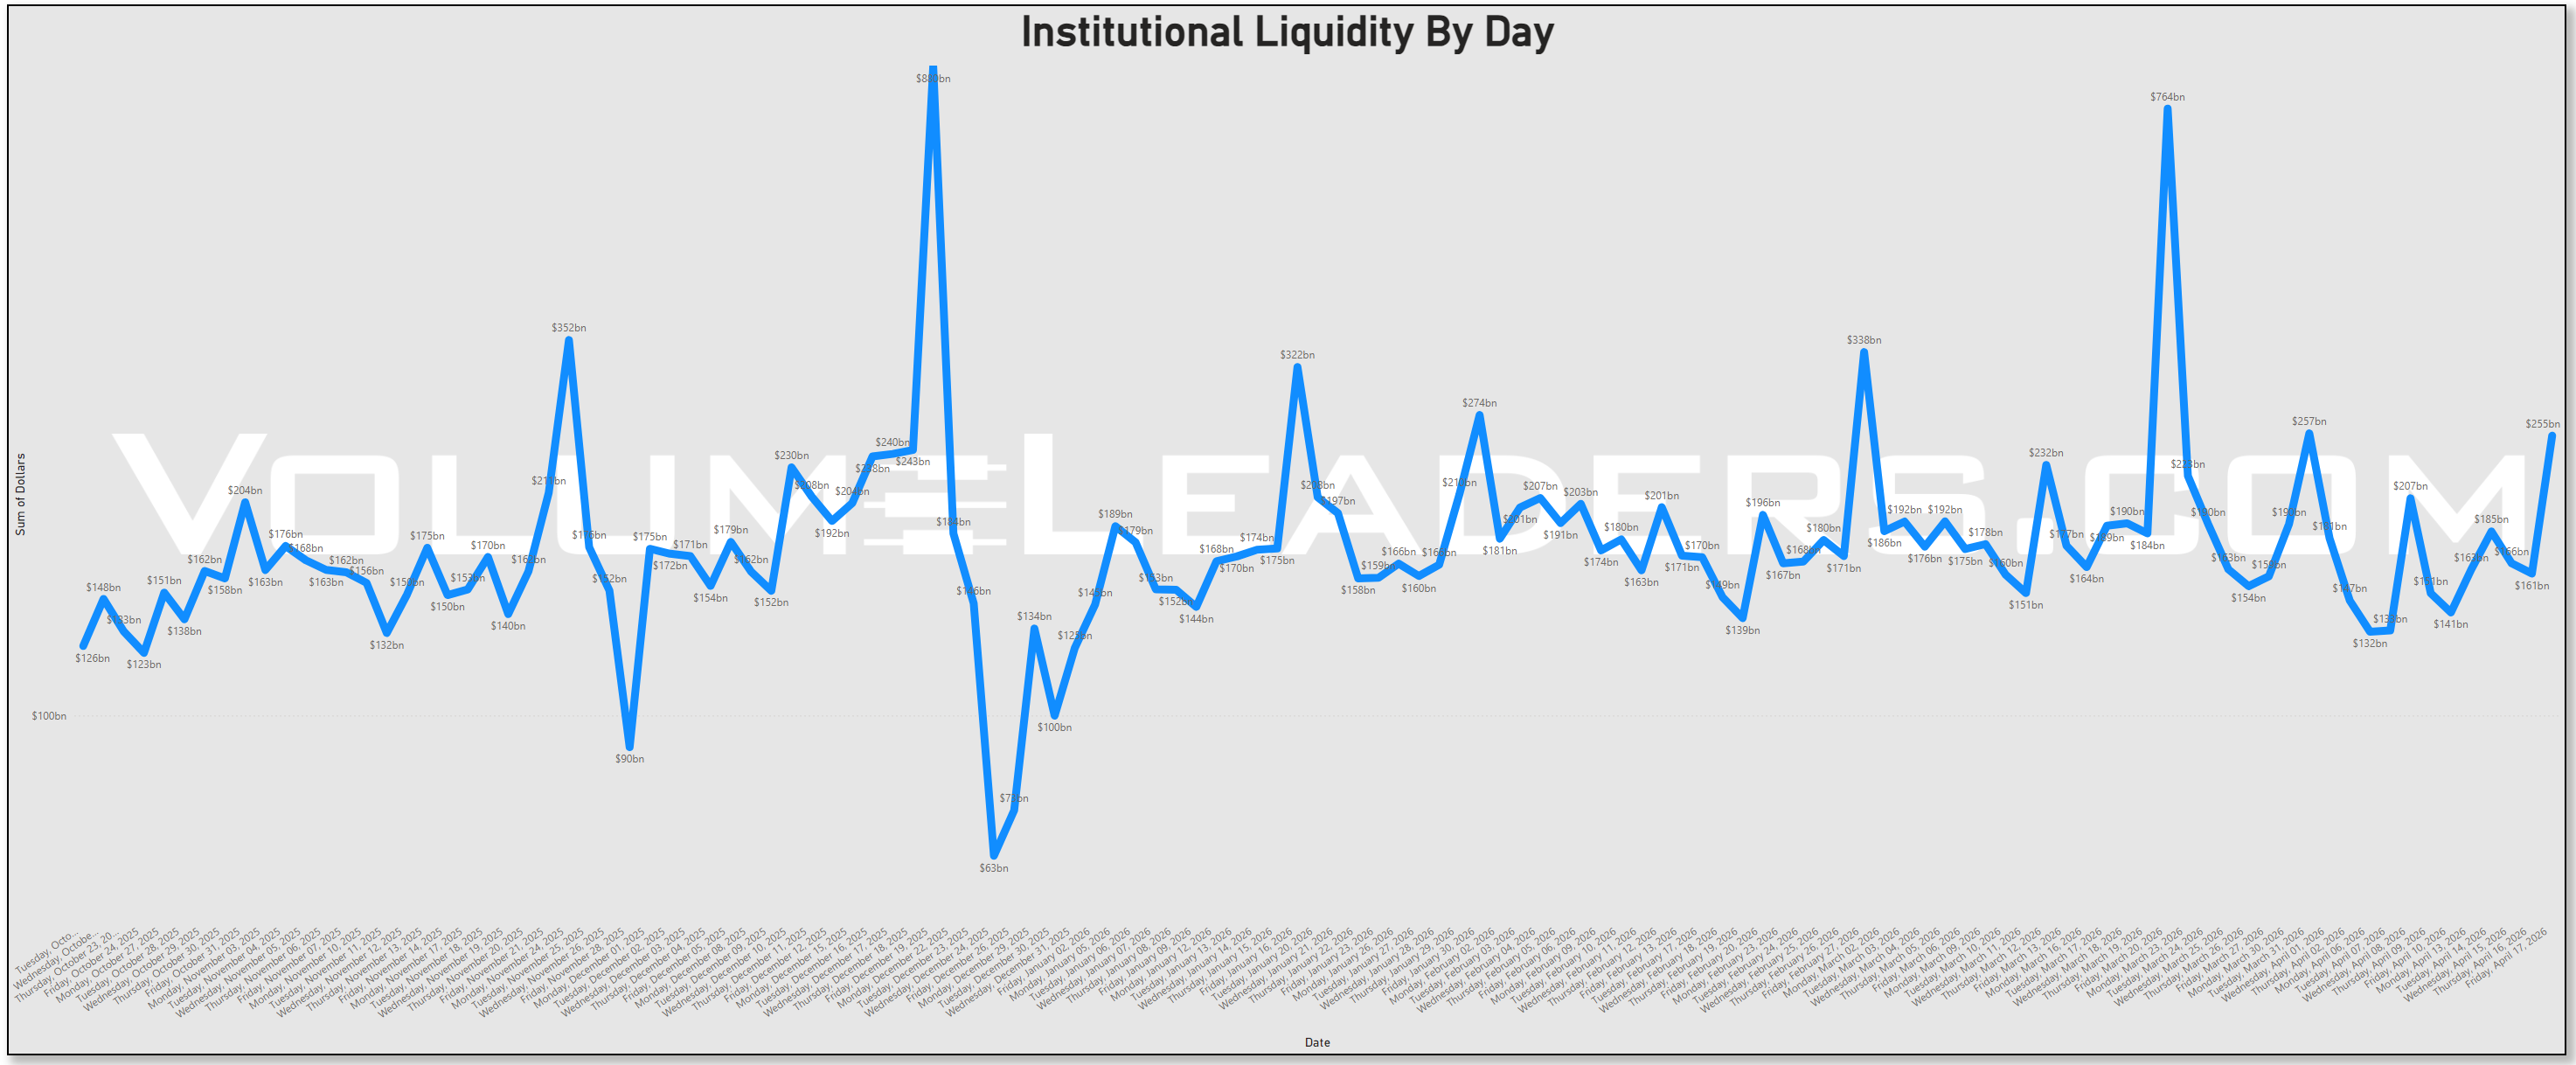
By the way of OPEX liquidity events, this one was tame, ringing the register for about $255bn.
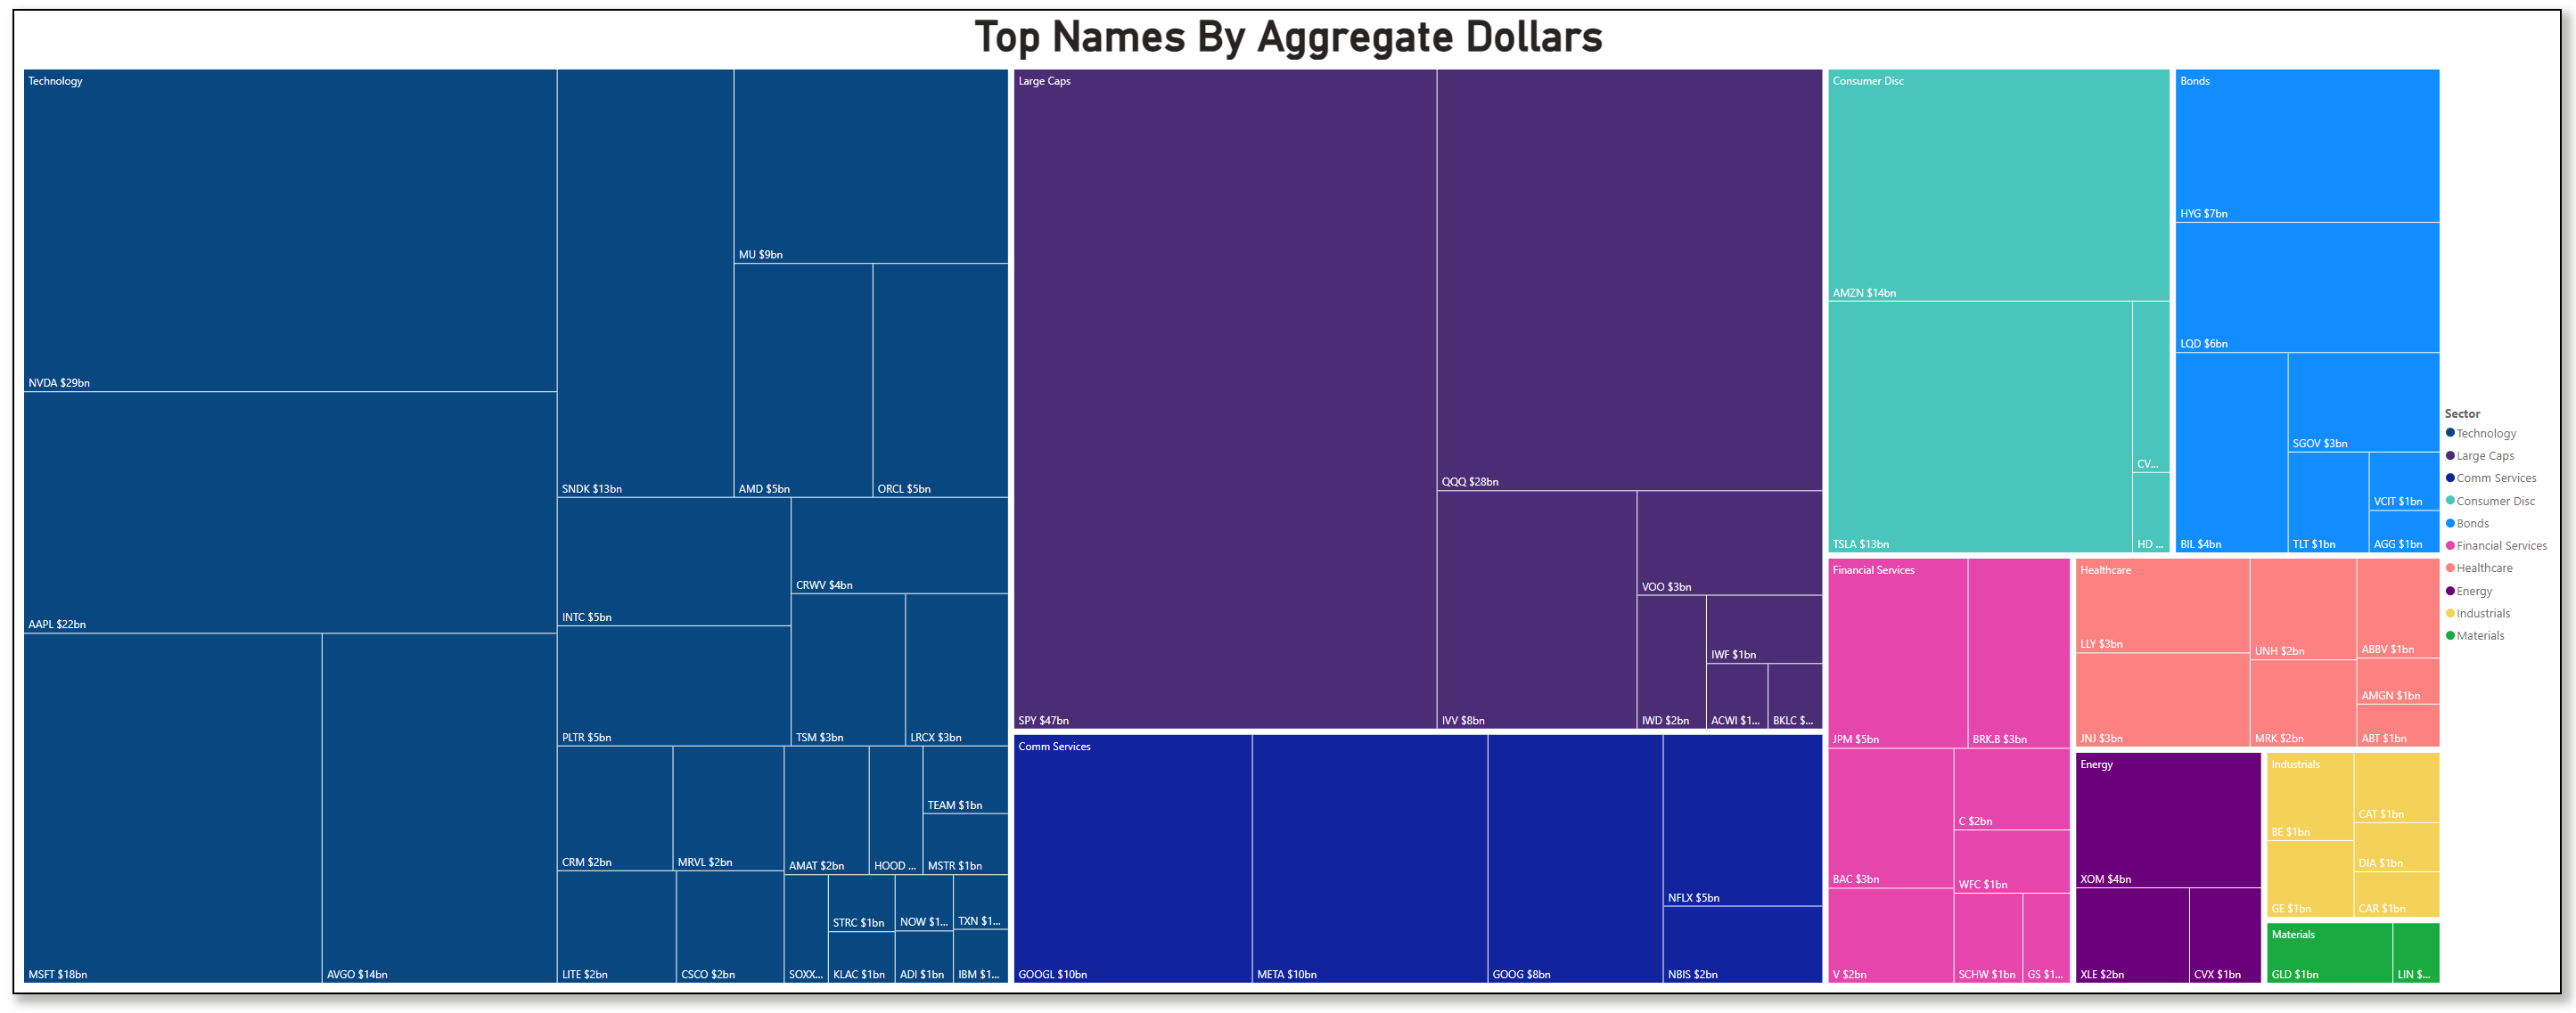
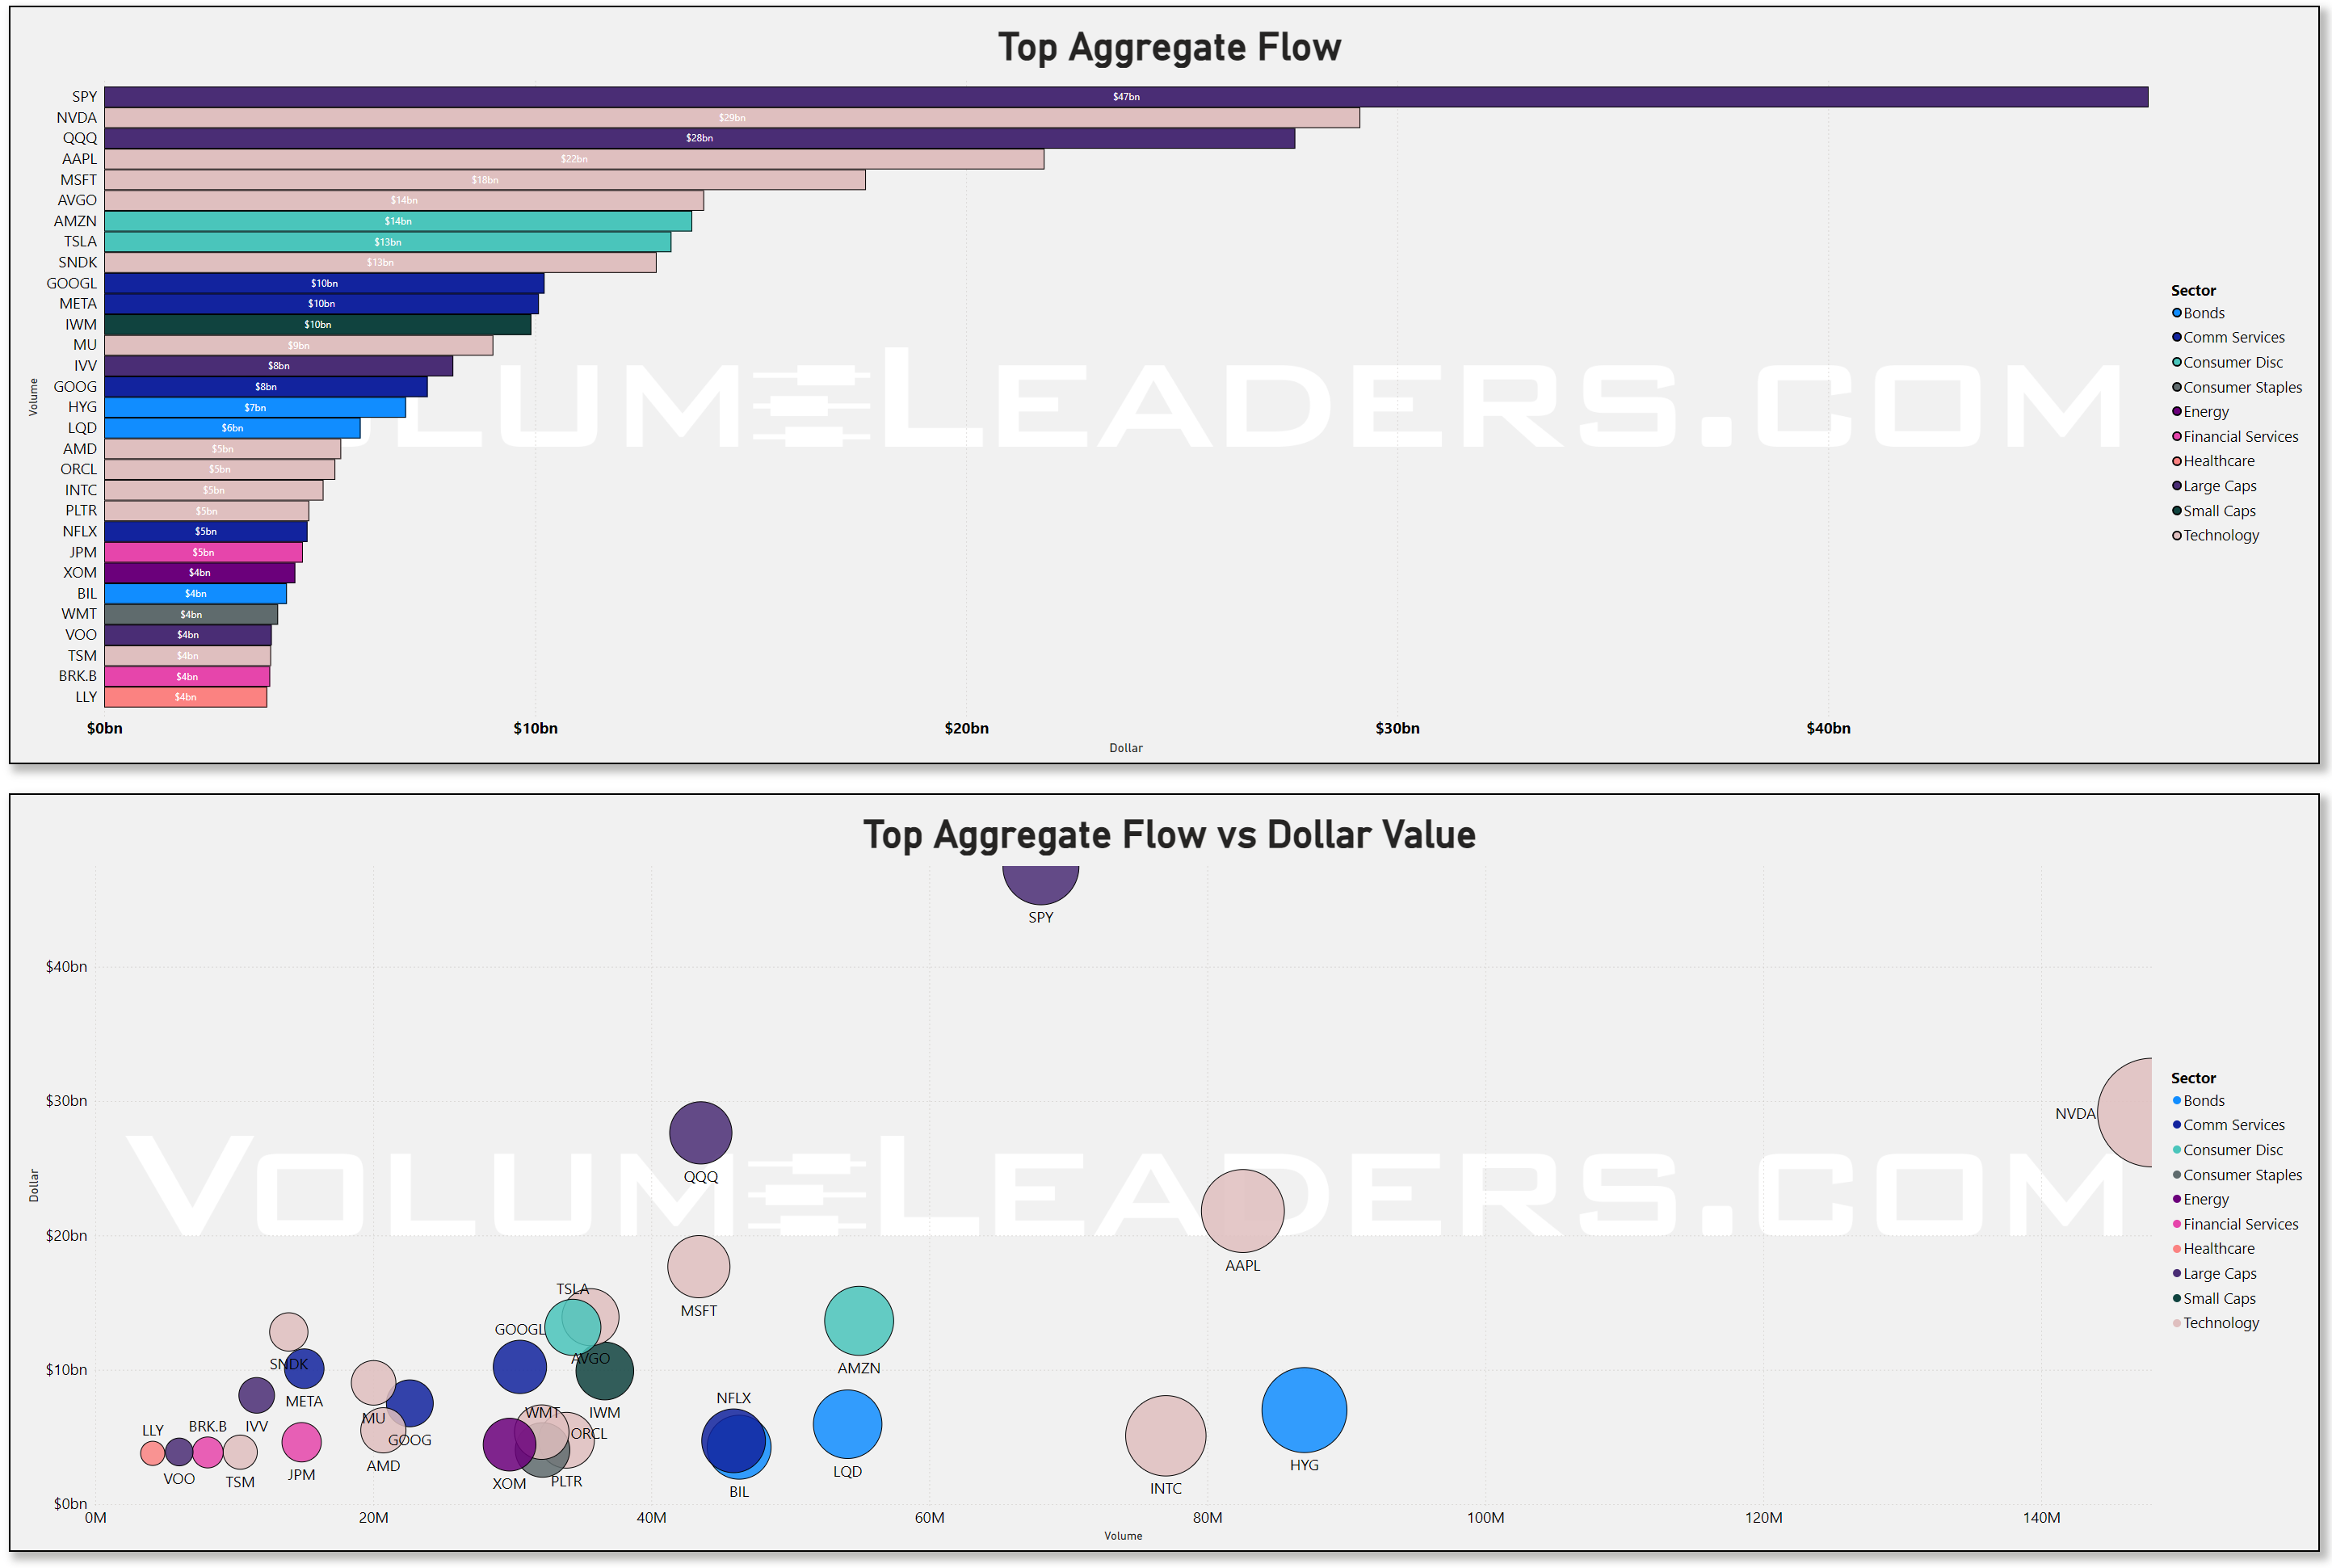
The aggregate leaderboard for this week makes that even clearer. SPY dominated all names at roughly $47b, which immediately frames this as a broad positioning week first and a stock-picking week second. After that came NVDA at about $29b, QQQ at roughly $28b, AAPL near $22b, MSFT around $18b, AVGO and AMZN near $14b each, TSLA and SNDK around $13b, then GOOGL, META, and IWM clustered near $10b. That lineup is revealing. It says institutions wanted index exposure, yes, but they also kept concentrating around the AI and mega-cap ecosystem, with semis, platform tech, and liquid index wrappers doing the heavy lifting. Even outside the absolute leaders, the next rung was filled with the same kind of names: AMD, ORCL, INTC, PLTR, TSM, CRWV, AMAT, and MU all showed meaningful presence. This was not random tech tourism. It looked more like a recommitment to the complex that still owns the market's growth narrative.
That recommitment had a credible macro and earnings foundation. U.S. March CPI came in hot at 3.3% year over year, with gasoline surging as Middle East tensions fed through energy markets, while March PPI was still firm at 4.0% year over year even though the monthly increase was lighter than expected. At the same time, the reopening of the Strait of Hormuz and the resulting drop in oil prices helped calm near-term inflation anxiety and pushed Wall Street back to record highs by Friday. Layer on top of that a strong start to bank earnings, with major firms reporting outsized trading revenues during the recent volatility, and you have exactly the kind of macro mix that supports heavy index flow, financial participation, and renewed appetite for big liquid growth names rather than a retreat from risk.
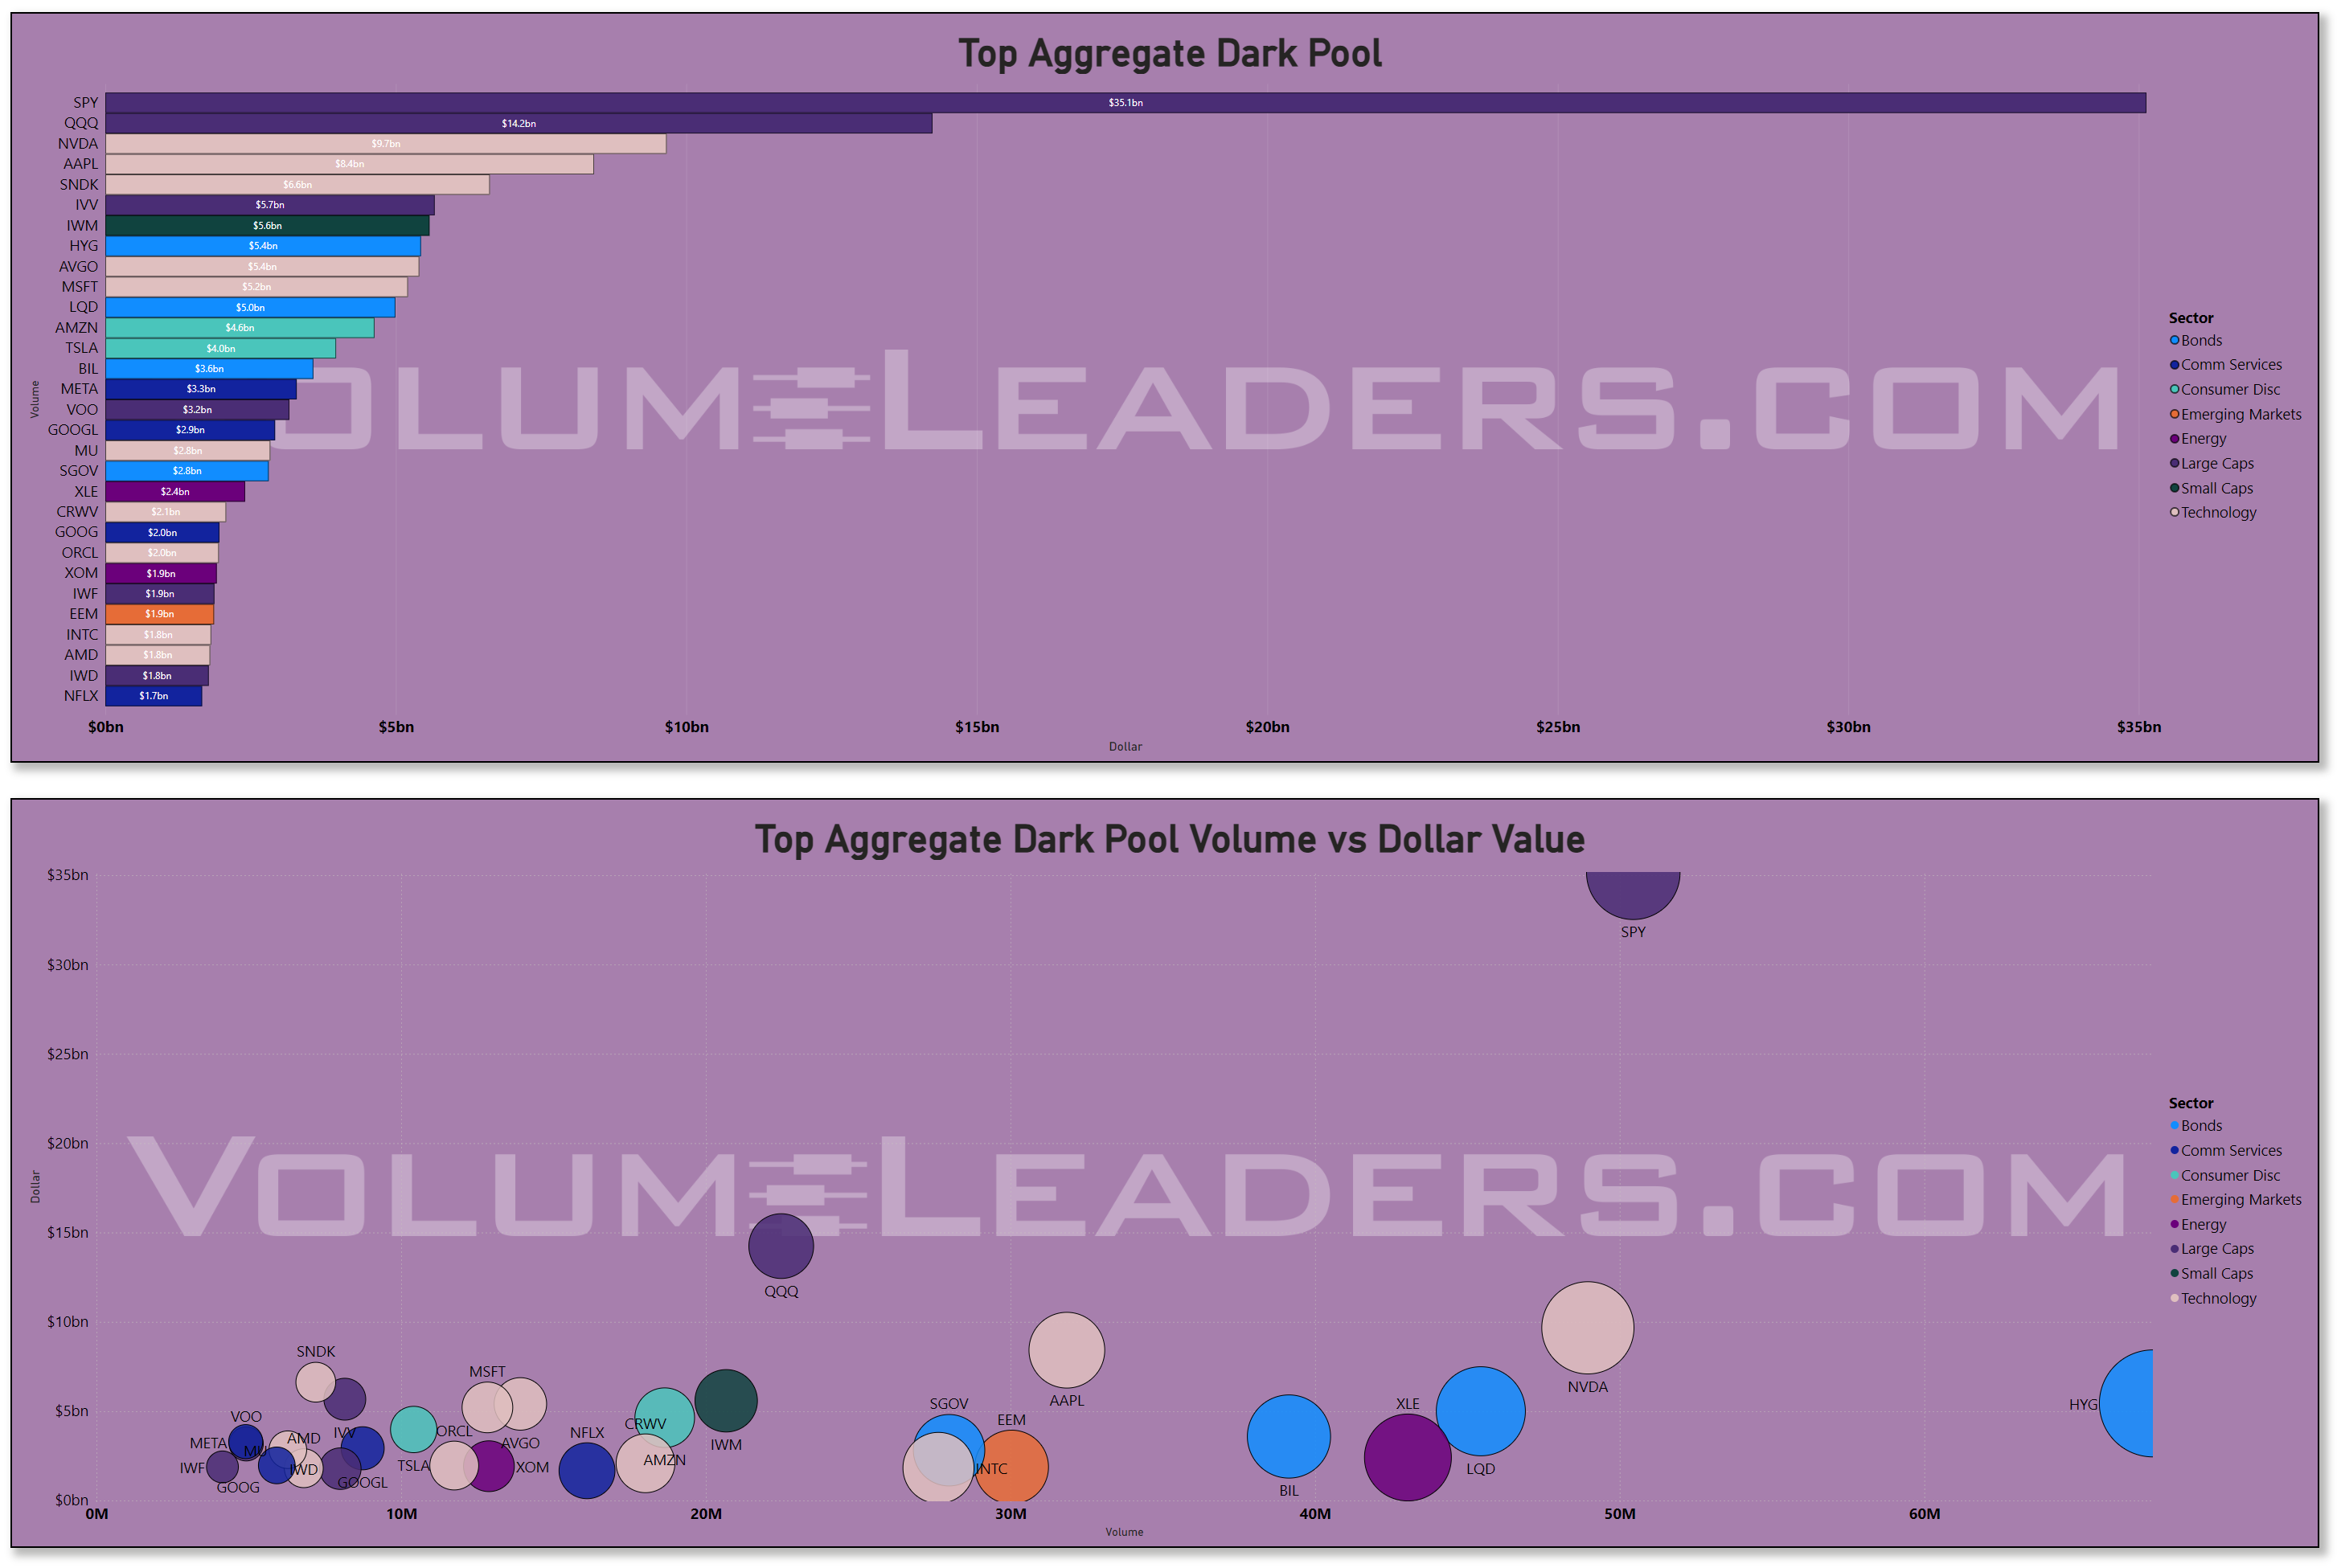
The dark-pool lens reinforces the idea that this was real size finding a home, not just fast-money speculation. SPY alone did about $35.1b in dark-pool dollars, with QQQ near $14.2b, NVDA around $9.7b, AAPL about $8.4b, SNDK roughly $6.6b, IVV near $5.7b, IWM around $5.6b, HYG about $5.4b, AVGO near $5.4b, MSFT about $5.2b, and LQD around $5.0b. That is an institutional footprint. The presence of both equity beta and credit wrappers in the dark-pool ranks matters because it suggests the week was not just about upside expression in equities. It was also about where large allocators were willing to warehouse risk more quietly. HYG and LQD showing up this prominently tells you credit was part of the conversation, which fits a market trying to price a softer energy shock and less immediate macro stress. When dark pools fill with SPY, QQQ, NVDA, AAPL, HYG, and LQD all at once, the cleaner read is portfolio construction and redistribution, not a bunch of disconnected stock calls.
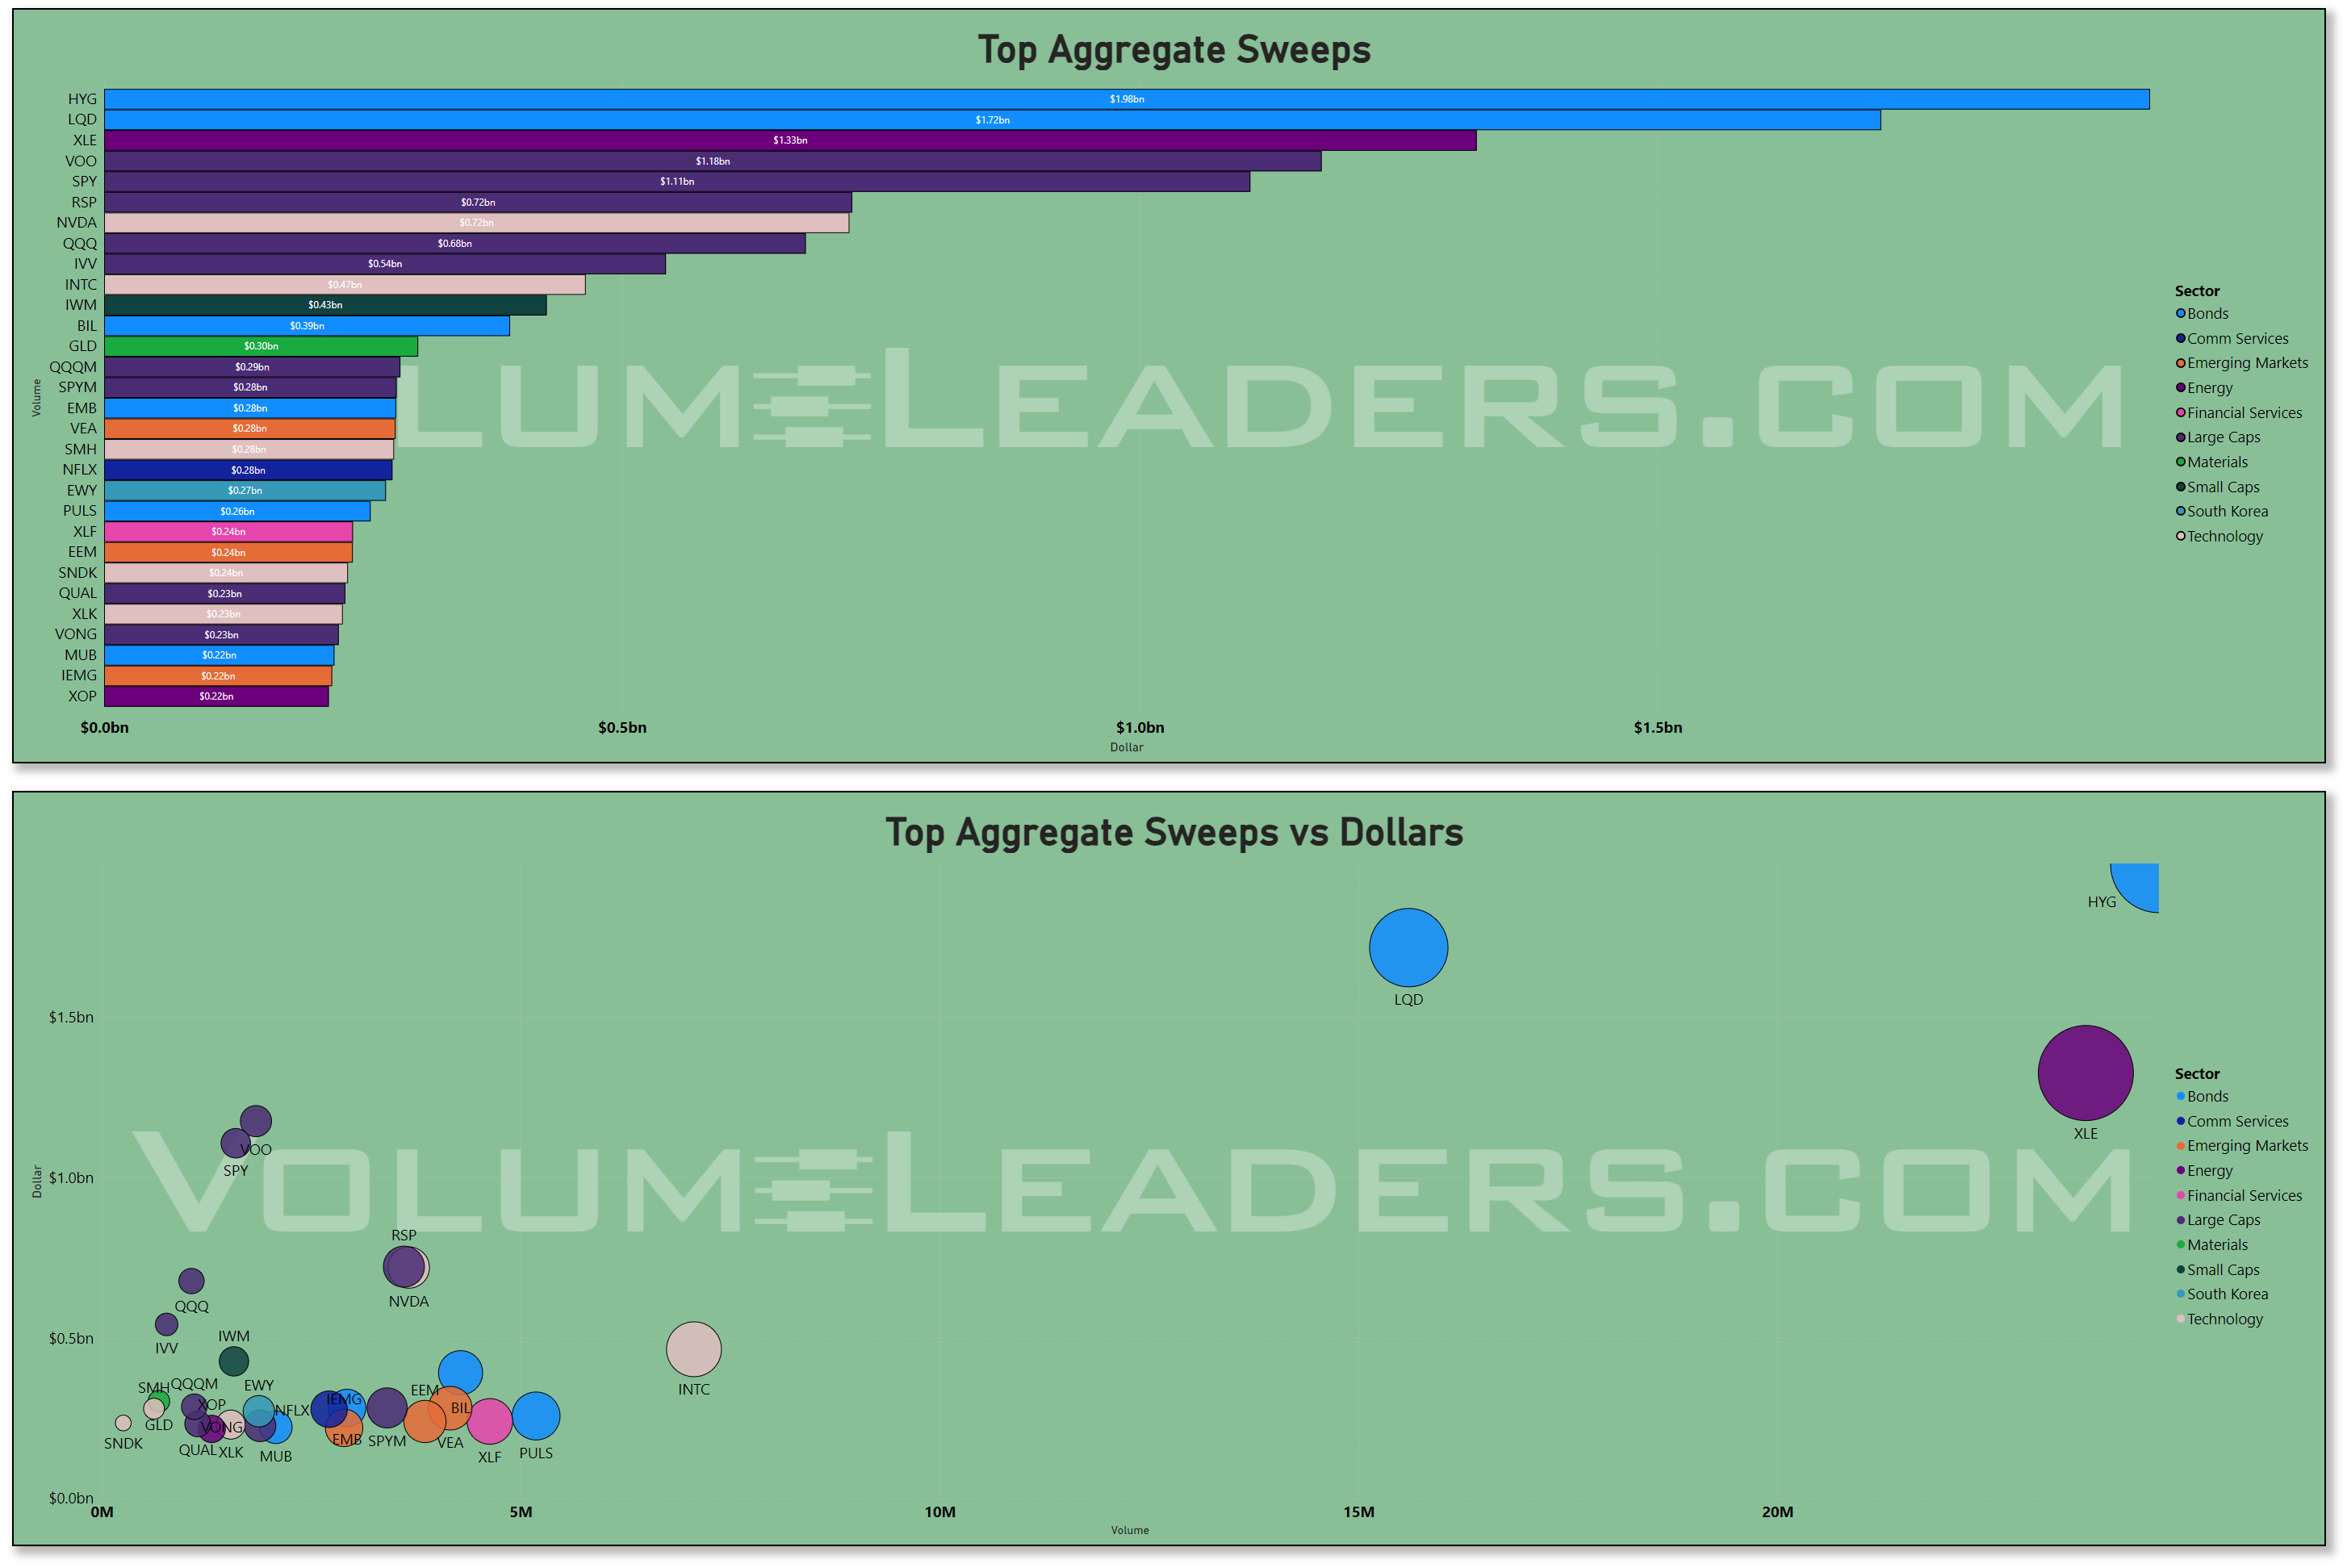
The sweep tape, meanwhile, had a different personality. Here the bond and credit complex was outright dominant. HYG led at about $1.9b, LQD followed near $1.7b, and XLE - a name not often seen here - came in around $1.33b, ahead of VOO near $1.18b and SPY around $1.11b. Then came RSP and NVDA near $0.72b, QQQ about $0.68b, IVV around $0.54b, INTC near $0.47b, and IWM roughly $0.43b. Sweeps are the tactical lens, and this mix reads like a market still actively hedging, rotating, and leaning into short-horizon expression rather than simply sitting on passive conviction. The prominence of HYG and LQD says traders were moving quickly through credit and duration-sensitive vehicles, while XLE's strong sweep presence tells you energy was still being actively traded as a macro headline instrument even though the weekly sector total itself did not lead.
What makes the whole picture coherent is how well the flow data rhymes with the broader internal landscape. Relative leadership has been strongest where the market can marry stability with scalability. The best areas are not just moving; they are doing so with better volatility behavior than the laggards.
Large caps and the major leadership groups still look like the market’s preferred home for capital, while small caps remain less trusted even when their volatility profile briefly improves.
Financials have been gaining internal traction, which now shows up in both the weekly totals and the single-name roster through JPM, BRK.B, BAC, WFC, C, GS, and SCHW. Industrials are improving too, and that matters because it hints that the rally is not trapped entirely inside one narrow software-and-semis corridor. But the corridor still matters most. Technology remains the market’s primary reservoir of institutional demand, and the sector’s weekly surge was too large to dismiss as noise.
There is also a seasonal texture here that fits the tape. April is deep earnings season, and this particular week carried the additional potential for options-related repositioning around expiration, which can concentrate activity in index products and the largest liquid leaders. That does not create the trend by itself, but it can amplify where institutions already want to be. This week, they clearly wanted to be in the deepest pools of liquidity, in benchmark wrappers, in the AI supply chain, and in financials benefiting from elevated trading activity, while still keeping a tactical hand in credit and energy-sensitive vehicles.
So the cleanest read is that this was a constructive week, but not a carefree one. The market is acting as if the worst of the immediate macro scare may be passing, yet it has not abandoned discipline. Broad risk appetite improved, market-wide volatility behavior improved, and capital flowed accordingly, but the dollars still clustered where institutions can get both exposure and flexibility. SPY at roughly $47b, NVDA at about $29b, QQQ near $28b, AAPL at about $22b, and the giant dark-pool footprint in both equity and credit wrappers say the same thing in different dialects: this was a week of serious repositioning into leadership, not a loose speculative free-for-all. Until that changes, the market still looks like it prefers to reward participation in liquid, institutional-grade leadership while treating the rest of the tape as secondary.
MIR Part 2: Individual Names From The Institutional Tape
VolumeLeaders tracks several proprietary signals designed to spotlight names drawing significant institutional interest. Below, we’ve surfaced the latest results and analyzed them to highlight emergent themes. If any of the sectors, narratives, or positioning trends resonate, the names mentioned here offer a strong starting point for deeper research and watchlist consideration.
VL Trade Rank Velocity™ (TRV)
TRV is a proprietary metric that measures the recent acceleration or deceleration in institutional trading activity for a given stock by comparing its average trade rank over the past few days to its average in recent weeks. A sharp improvement in TRV typically reflects a notable shift in positioning, often accompanied by sustained trade activity, suggesting institutions are actively engaging with the name and that intensity of activity is rising. This often precludes meaningful price or narrative shifts. This isn’t a buy-list or sell-list; it’s meant to draw your eyes to names where institutions are putting money to work.
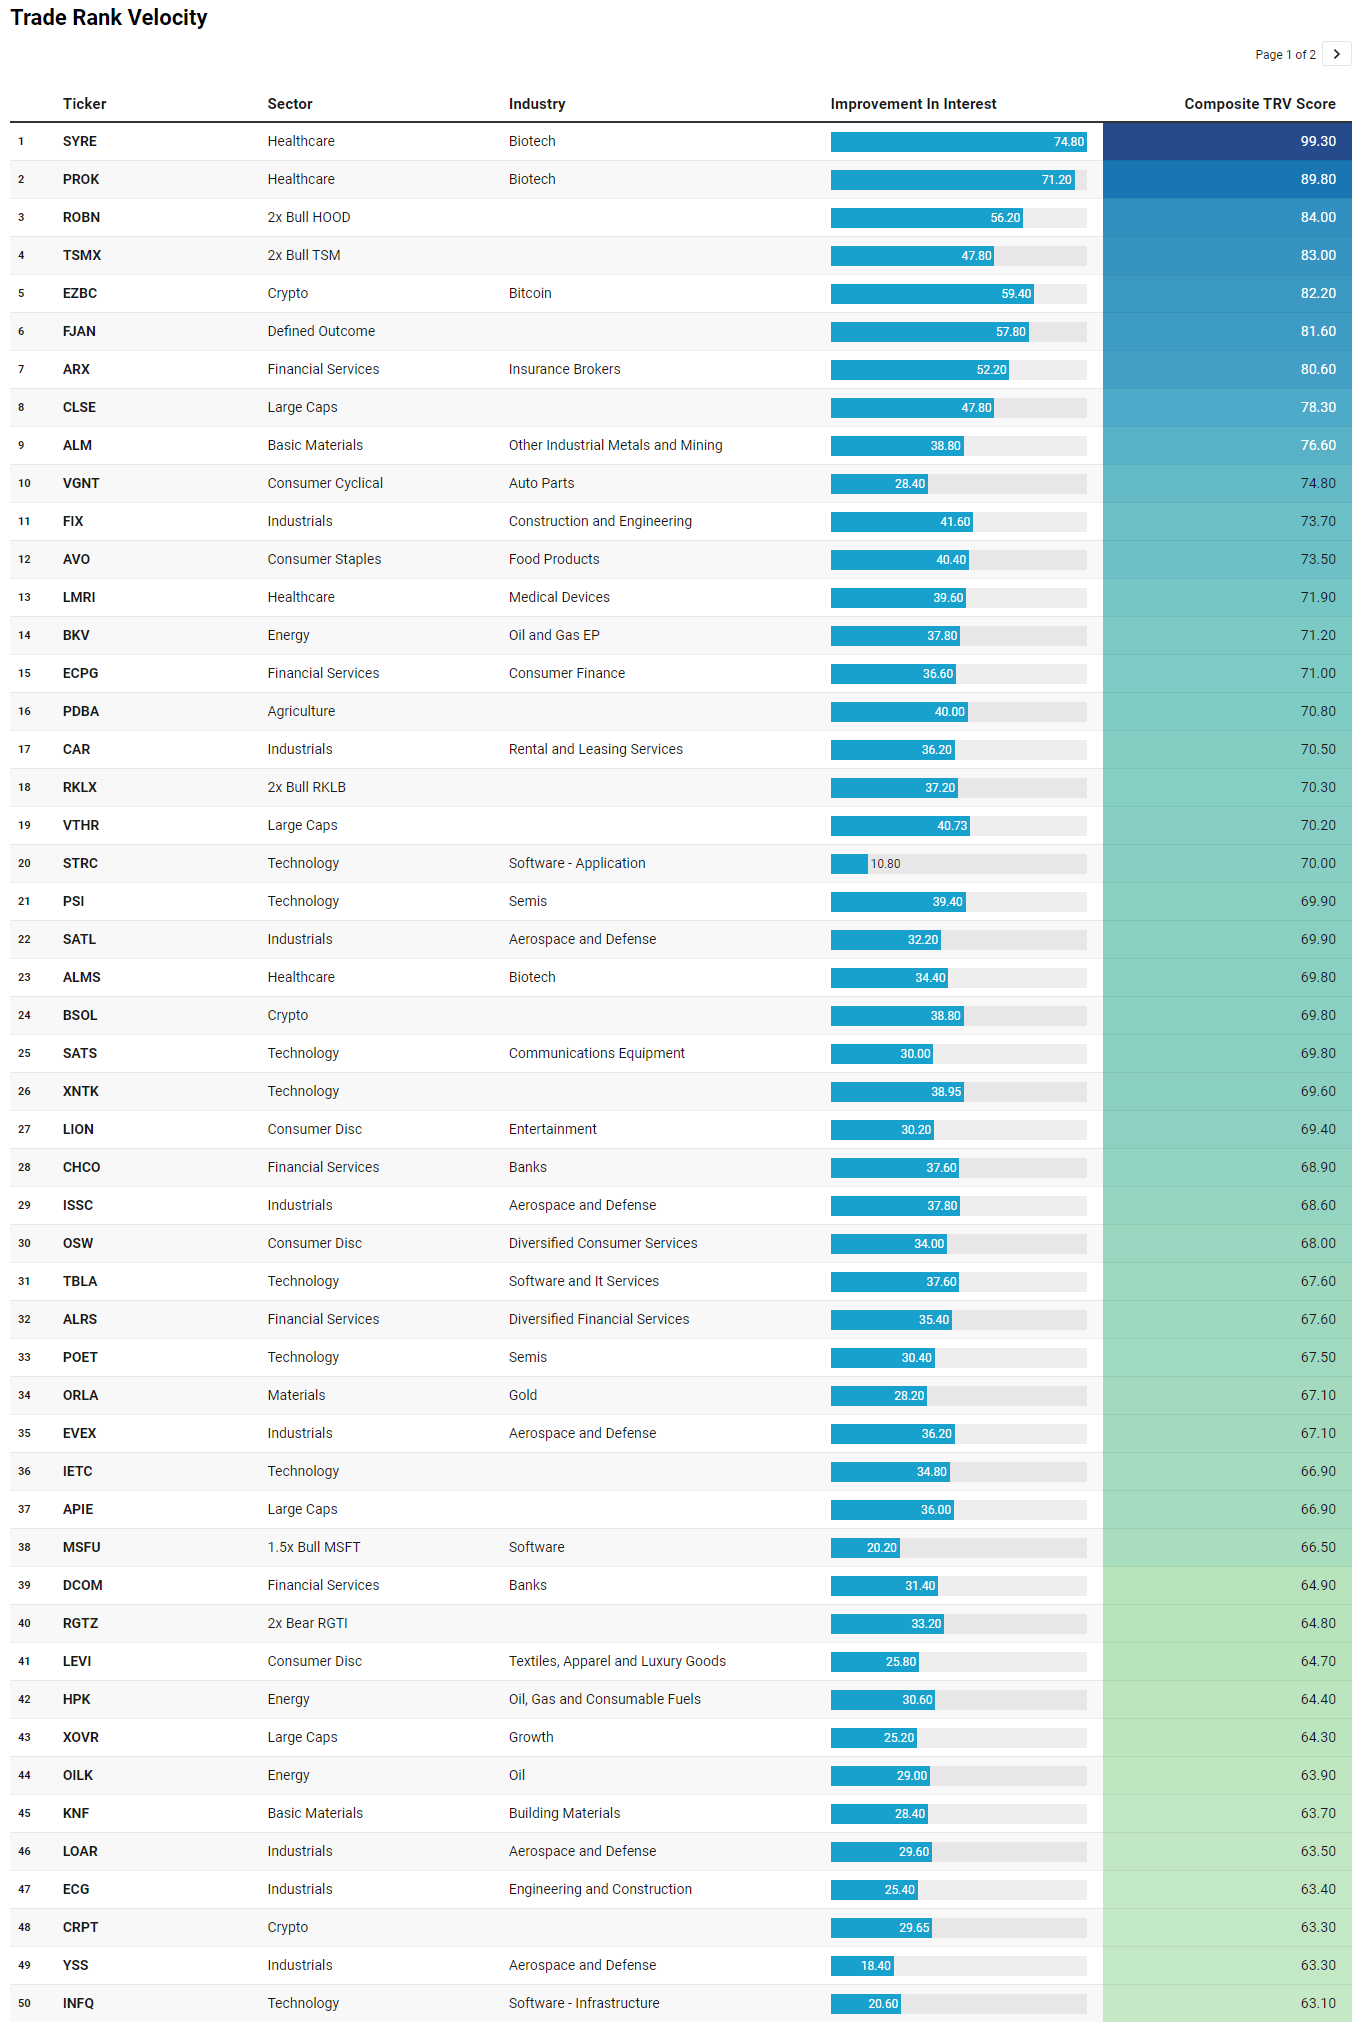
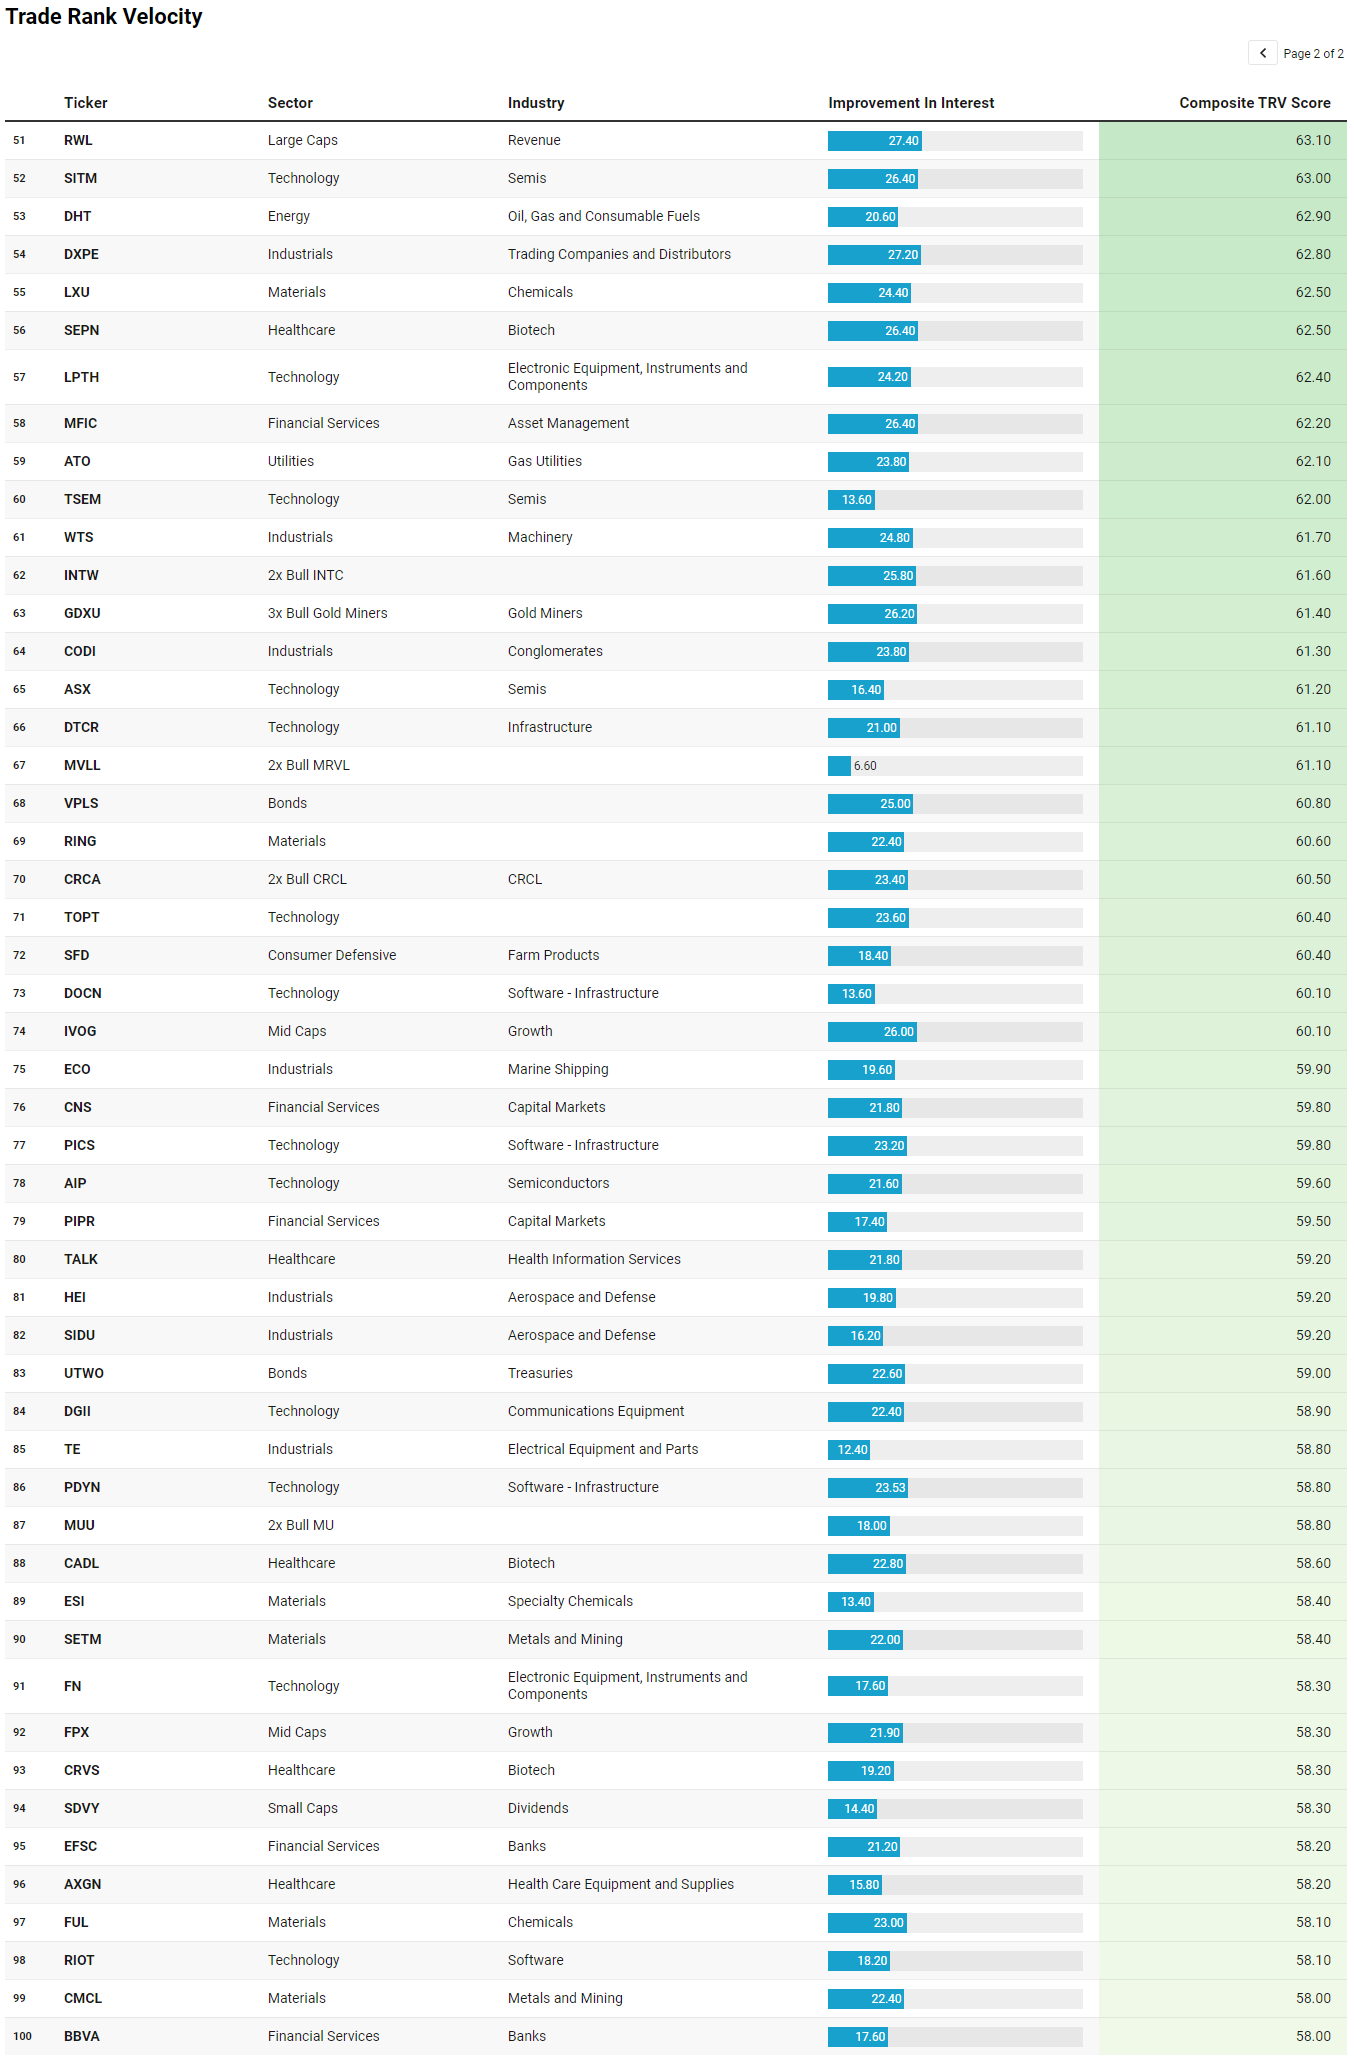
What stands out most from the TRV list is that the week was not just about institutions crowding into the obvious index and megacap leaders. Underneath that top-heavy flow, there was a second layer of emerging interest in areas that fit the same broad regime: capital is still favoring liquid leadership, but it is also beginning to probe for the next tier of participation in higher-beta satellites, cyclical infrastructure, and specialized growth pockets. That is an important confirmation, because it suggests the tape is not purely defensive index parking. It is starting to broaden selectively.
Technology remains the clearest thematic through-line. The list is full of semis, software, infrastructure, and communications equipment names, from PSI, POET, SITM, TSEM, ASX, AIP, and FN to STRC, INFQ, DOCN, PICS, PDYN, and SATS. Even the leveraged expressions reinforce that point, with TSMX, MSFU, MVLL, MUU, and INTW showing up as vehicles for amplified participation rather than passive exposure. That fits the broader narrative perfectly. In the aggregate flow, institutions were already concentrating in the large-cap AI and semiconductor complex. The TRV list says that interest is not staying confined to NVDA, MSFT, AVGO, and the index wrappers. It is bleeding outward into adjacent and second-derivative beneficiaries, which is often what a healthy institutional theme does once the core leadership is established.
The second major theme is a notable build in industrials, especially aerospace, defense, engineering, and machinery. FIX, SATL, ISSC, EVEX, LOAR, YSS, WTS, HEI, SIDU, TE, DXPE, and ECG all point in the same direction. That matters because it supports the idea that this market is not relying exclusively on software and semis to carry risk appetite. There is a parallel bid in real-economy execution names, the kinds of stocks that tend to attract sustained capital when institutions are thinking beyond a one-week trade and into longer-duration spending cycles.
Financials are another important confirming cluster. ARX, ECPG, CHCO, ALRS, DCOM, MFIC, CNS, PIPR, EFSC, and BBVA suggest that the sector’s improvement was not limited to the giant money centers showing up in weekly aggregate dollars. There is broader interest across brokers, banks, capital markets, and consumer finance, which strengthens the case that the financial bid is becoming more internally diverse.
There are also two more speculative pockets worth noting. One is biotech and healthcare, with SYRE, PROK, ALMS, SEPN, CADL, CRVS, LMRI, AXGN, and TALK. The other is crypto and related beta, with EZBC, BSOL, and CRPT. I would treat both as emergent rather than dominant themes. They look more like opportunistic expansions of risk appetite than the market’s primary home for capital.
So the clean read is that the TRV list extends the same story already visible in the weekly flow data: institutions still prefer quality, scale, and proven leadership, but they are now reaching into selective satellites around tech, industrial buildout, and financial participation. That is how a constructive tape broadens when it is doing so on purpose rather than by accident.
VL Institutional Outliers™ (IO)
Institutional Outliers is a proprietary metric designed to spotlight trades that significantly exceed a stock’s recent institutional activity—specifically in terms of dollar volume. By comparing current trade size against each security's recent normalized history, the metric flags outlier events that may indicate sudden institutional interest but may be missed because the activity doesn’t raise any flags/alerts when comparing the activity against the ticker’s entire history. For example, it’s conceivable that a ticker today receives the largest trade it has had in the last 6 months but the trade is unranked and would therefore be missed by current alerts built off Trade Ranks. Day traders can use “Realized Vol” to identify tickers that are moving swiftly with large price displacement while others can use it to size your risk appropriately.
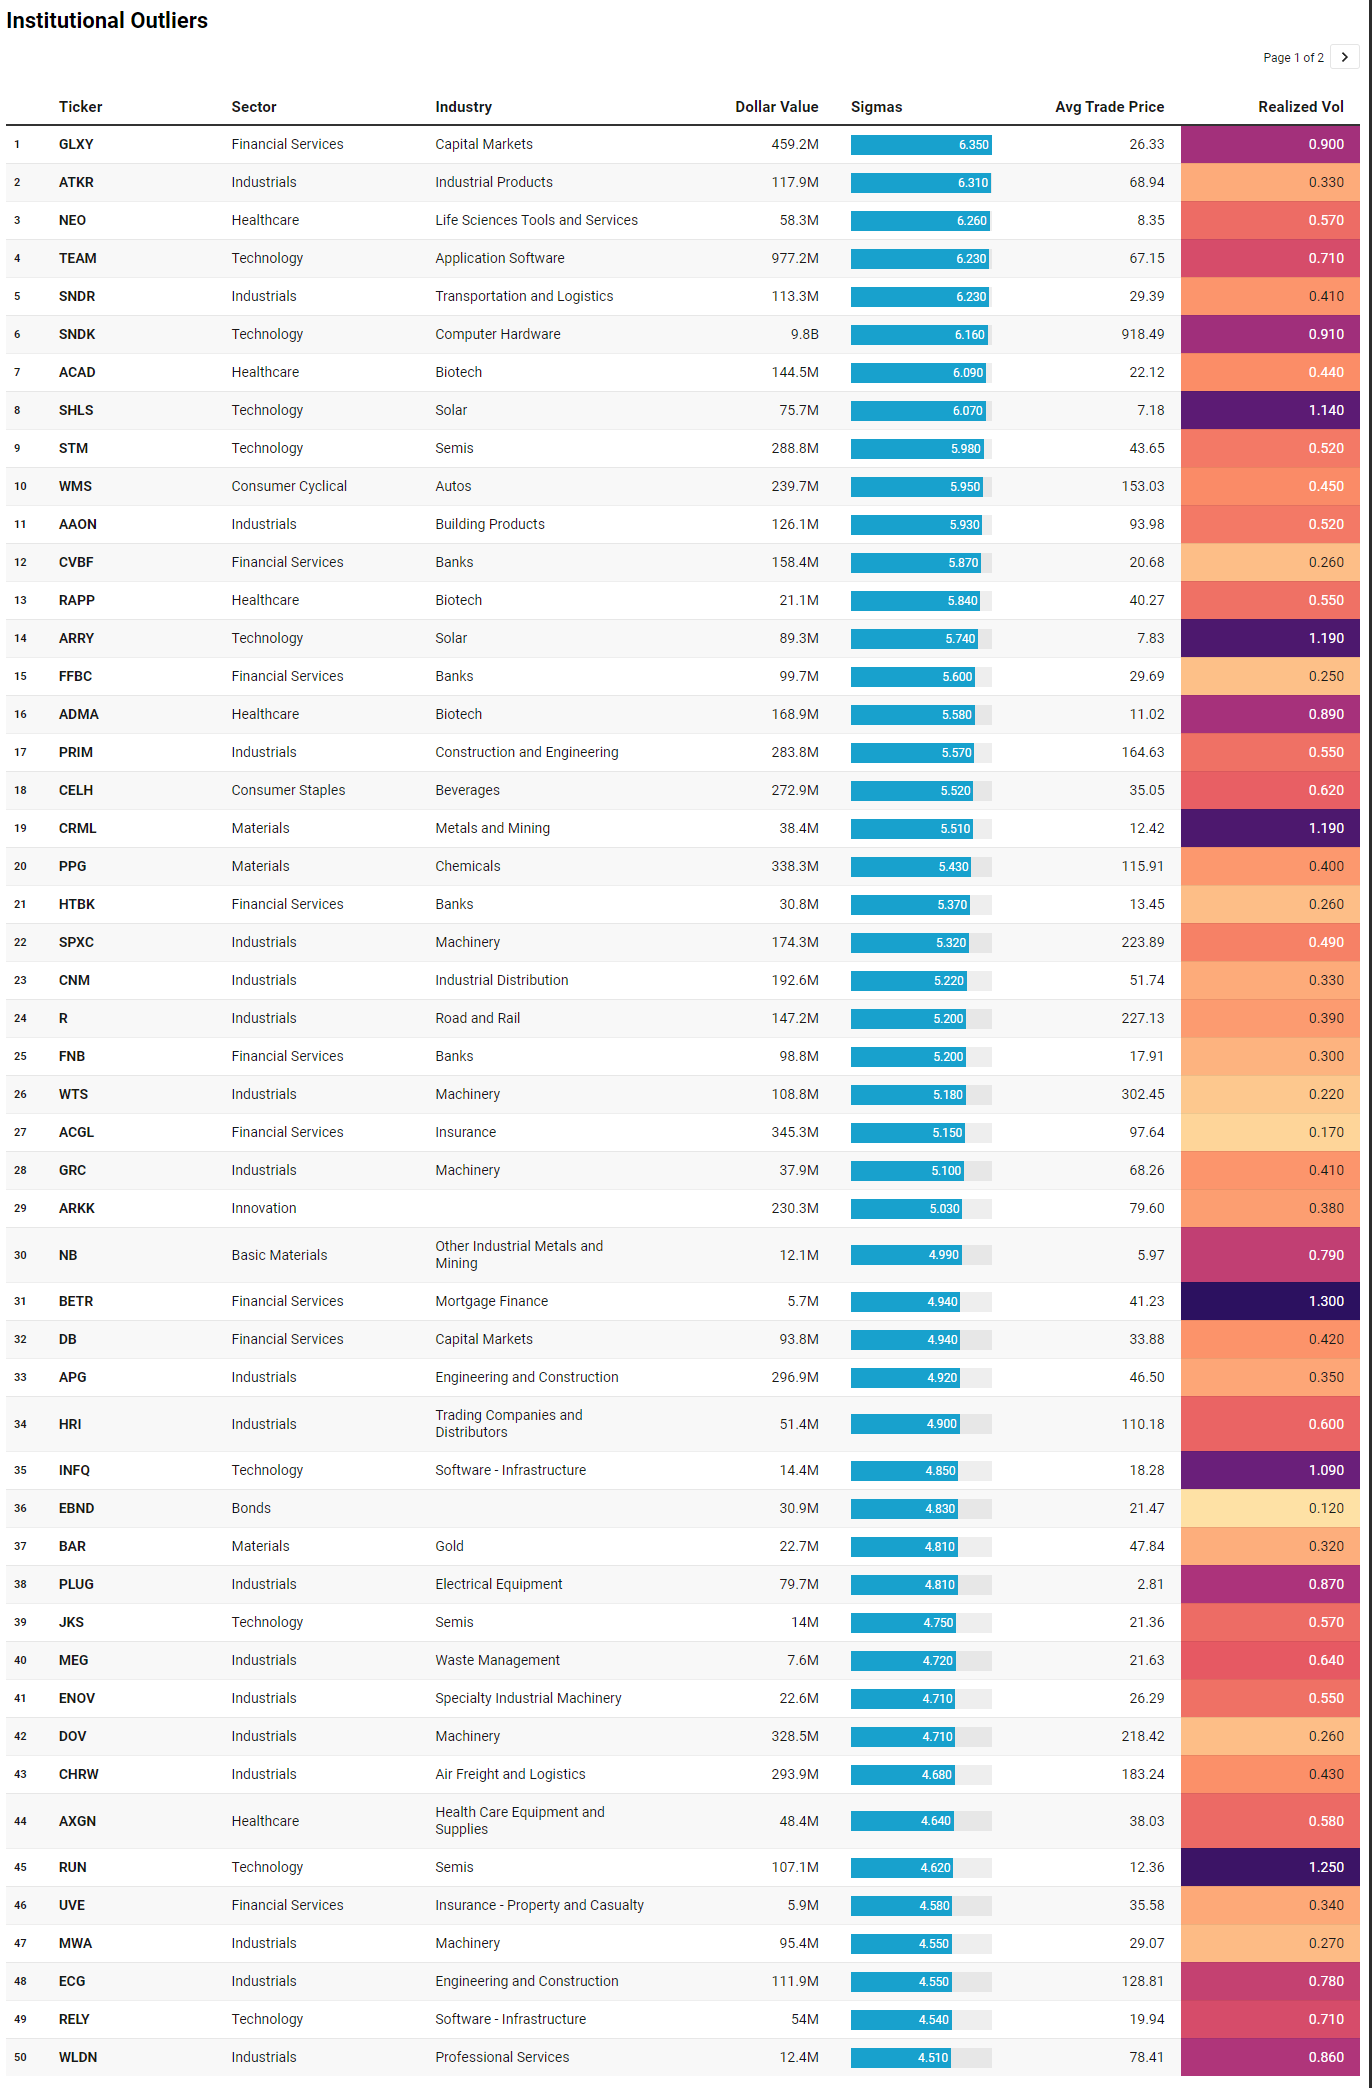
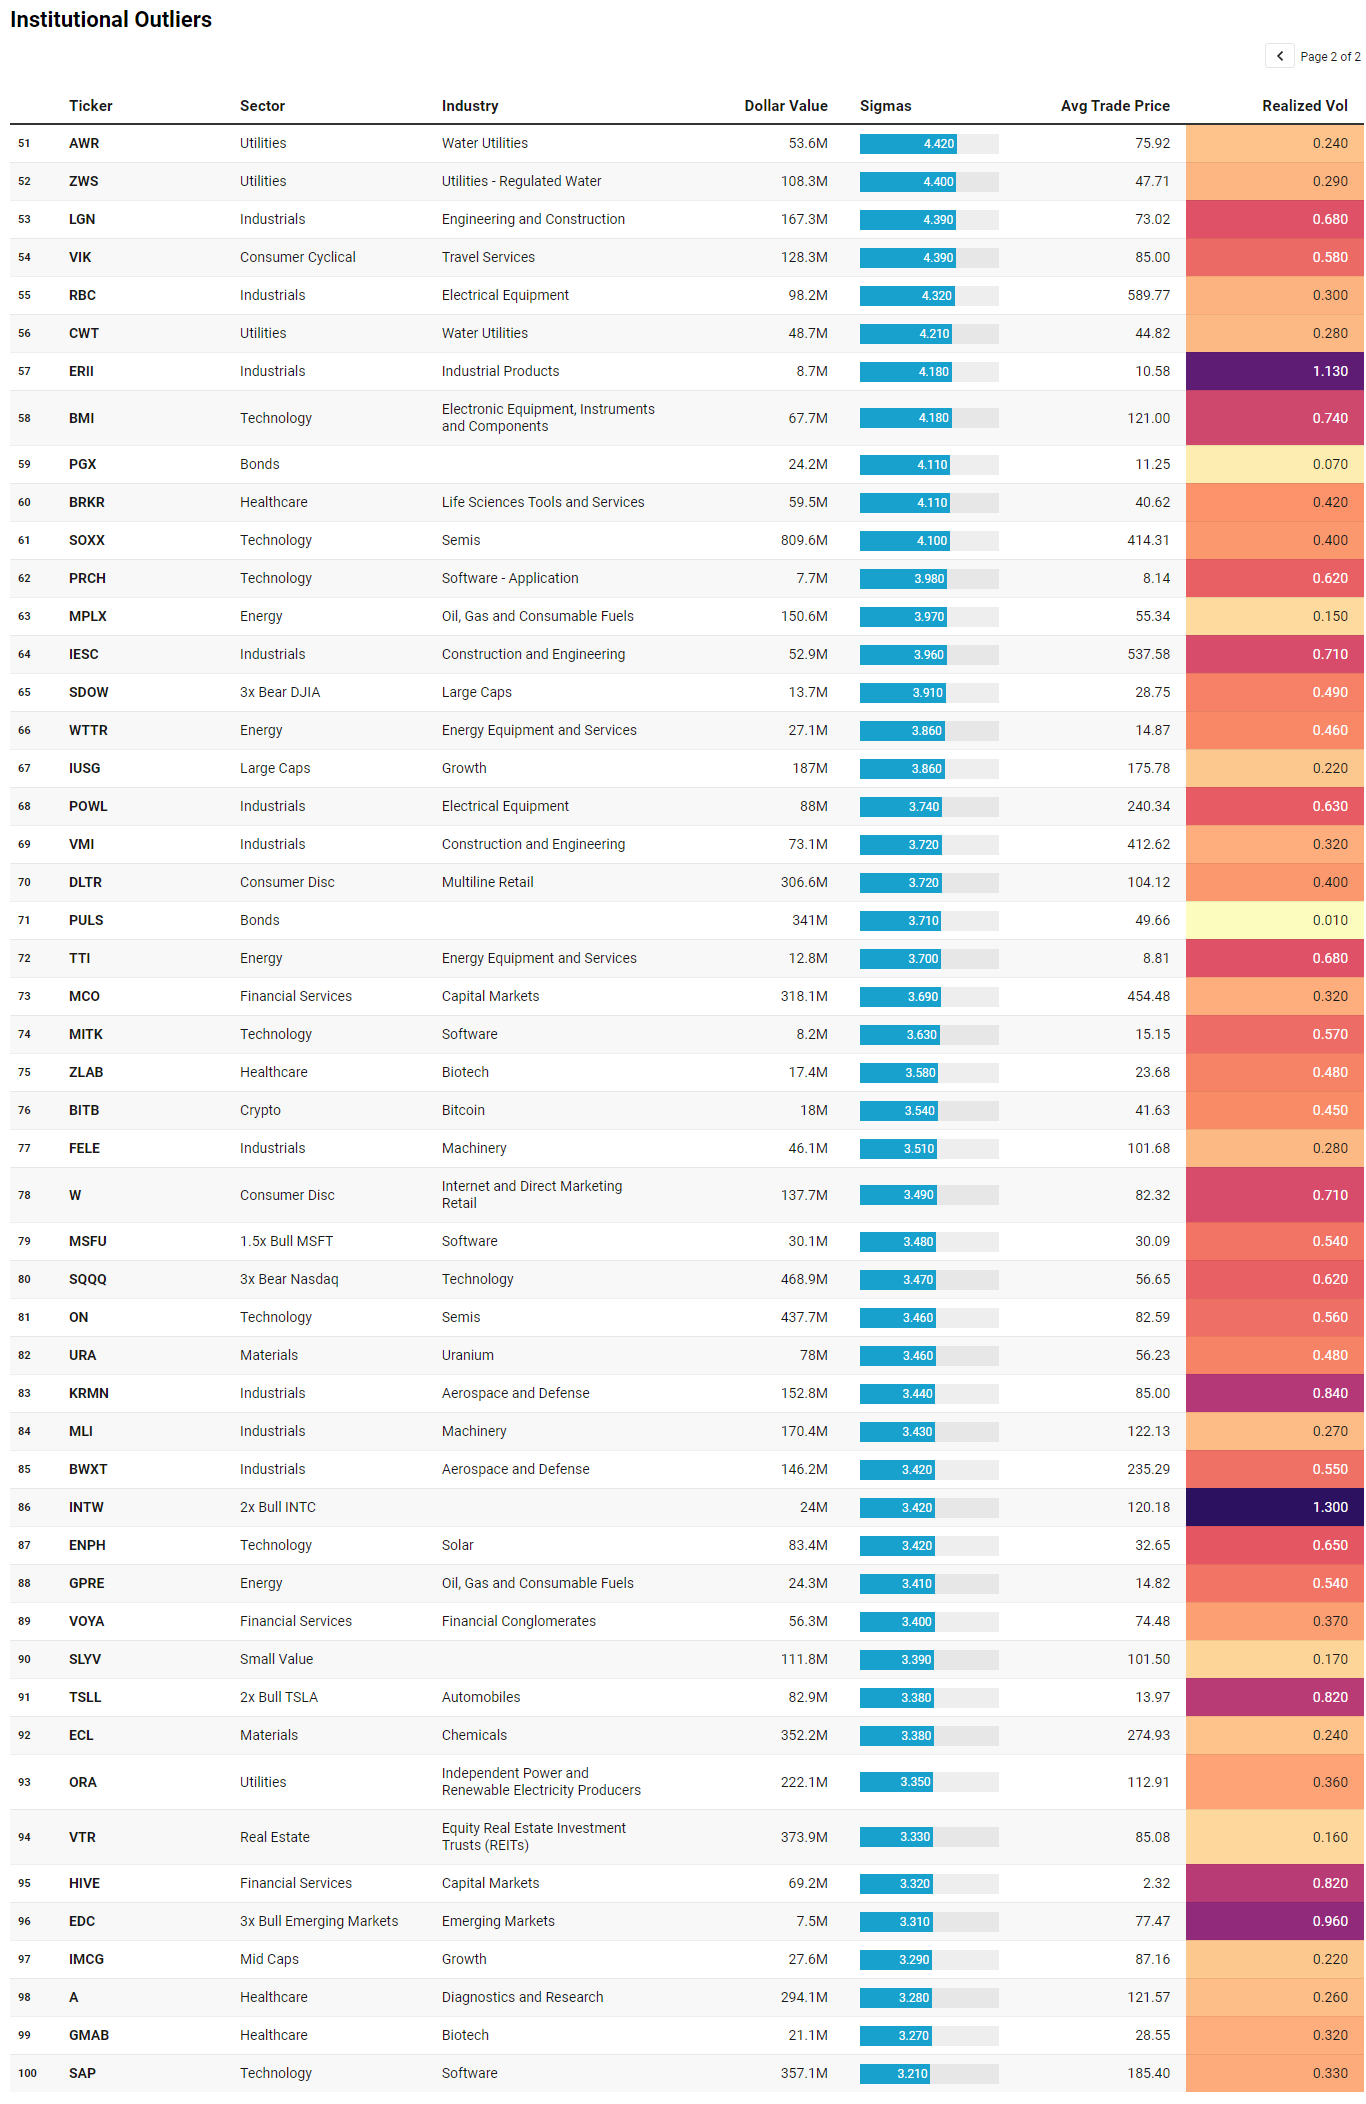
Where TRV showed the gradual build of interest across themes, IO isolates moments where institutions made unusually aggressive, non-routine decisions. This is where intent is loud, even if direction is not always obvious.
The first and most important theme is that the same core leadership complex dominating aggregate flows is also producing the largest outliers. SNDK stands out immediately at nearly $9.8b with a 6+ sigma print, alongside TEAM near $977m, SOXX around $810m, ON roughly $438m, SAP near $357m, and STM close to $289m. That is not a coincidence. When you see both persistent participation and extreme outliers in the same ecosystem, it reinforces that this is not just passive allocation drifting into tech. Institutions are actively engaging, pressing size, and in some cases likely repositioning meaningfully within the complex. The presence of both single names and semis ETFs tells you this is being expressed at multiple levels of abstraction, from stock-specific views to broader thematic exposure.
The second theme is the strength and breadth of industrial outliers, which is arguably the most important confirmation of the broader narrative. Names like ATKR, PRIM, SPXC, CNM, R, WTS, APG, DOV, CHRW, MWA, RBC, KRMN, BWXT, and MLI show up across machinery, construction, logistics, and defense. These are not small prints either. Many sit in the $100m to $300m range with high sigma readings. This aligns almost perfectly with the idea that the market is expanding participation into real-economy execution. It is one thing to see industrials improve in weekly sector totals; it is another to see concentrated, statistically significant trades across that entire supply chain. That suggests real capital commitment rather than exploratory rotation.
Financials show a similar pattern, though with a slightly different character. GLXY prints at roughly $459m with a 6.35 sigma event, MCO at about $318m, ACGL near $345m, DB around $94m, and multiple regional banks like CVBF, FFBC, and FNB appearing with elevated sigma. This is not just index exposure to financials. It looks more like targeted positioning across capital markets, insurance, and banking, which fits a backdrop where trading activity and rate uncertainty are still driving earnings power.
A more subtle but important layer is the presence of hedging and tactical expressions embedded within the outliers. SQQQ shows up near $469m, SDOW appears, and leveraged long expressions like TSLL and MSFU are also present. At the same time, bond vehicles like PULS and EBND appear with relatively low realized volatility. This mix reinforces the idea that institutions are not operating with a single directional view. They are building portfolios, balancing exposure, and actively managing risk while still committing capital to leadership.
Finally, there is a smaller but notable cluster in materials, energy, and utilities, including PPG, ECL, MPLX, ORA, and uranium exposure via URA. These are not dominant themes, but their presence as outliers suggests institutions are still sensitive to macro inputs like inflation, energy pricing, and infrastructure demand.
Taken together, the IO list sharpens the broader picture. The same areas attracting steady participation are also where institutions are making their most decisive moves, while industrial expansion and financial breadth confirm that the tape is widening beneath the surface. The addition of hedges and defensive instruments alongside those outliers underscores that this remains a controlled, risk-aware allocation environment rather than an unrestrained chase.
VL Sector Leaders
VL Sector Leaders is a weekly snapshot of where true leadership is asserting itself inside the market, stripped of the distortions that come from broad, style-mixed indices. Rather than asking which stocks look strong in absolute terms, this list focuses on which names are outperforming within the environments they actually compete in.
Each week, we surface the ten stocks demonstrating the most persistent relative strength inside their respective sectors. These are not headline chasers or one-day wonders. They are names that continue to separate themselves from peers through real price behavior, often reflecting sustained demand rather than fleeting attention.
For day traders, this list is a powerful awareness tool. Sector Leaders tend to offer cleaner intraday structure, better follow-through, and more predictable reactions around key levels because they already sit on the right side of relative strength. Even on choppy tape, leadership names often remain tradeable while the rest of the market degrades.
For swing traders, VL Sector Leaders helps narrow the universe to stocks with the highest probability of staying relevant. Relative leaders are more likely to hold trends, survive pullbacks, and reassert themselves after consolidation. When markets rotate, these names are often among the first to resume leadership — or the last to break.
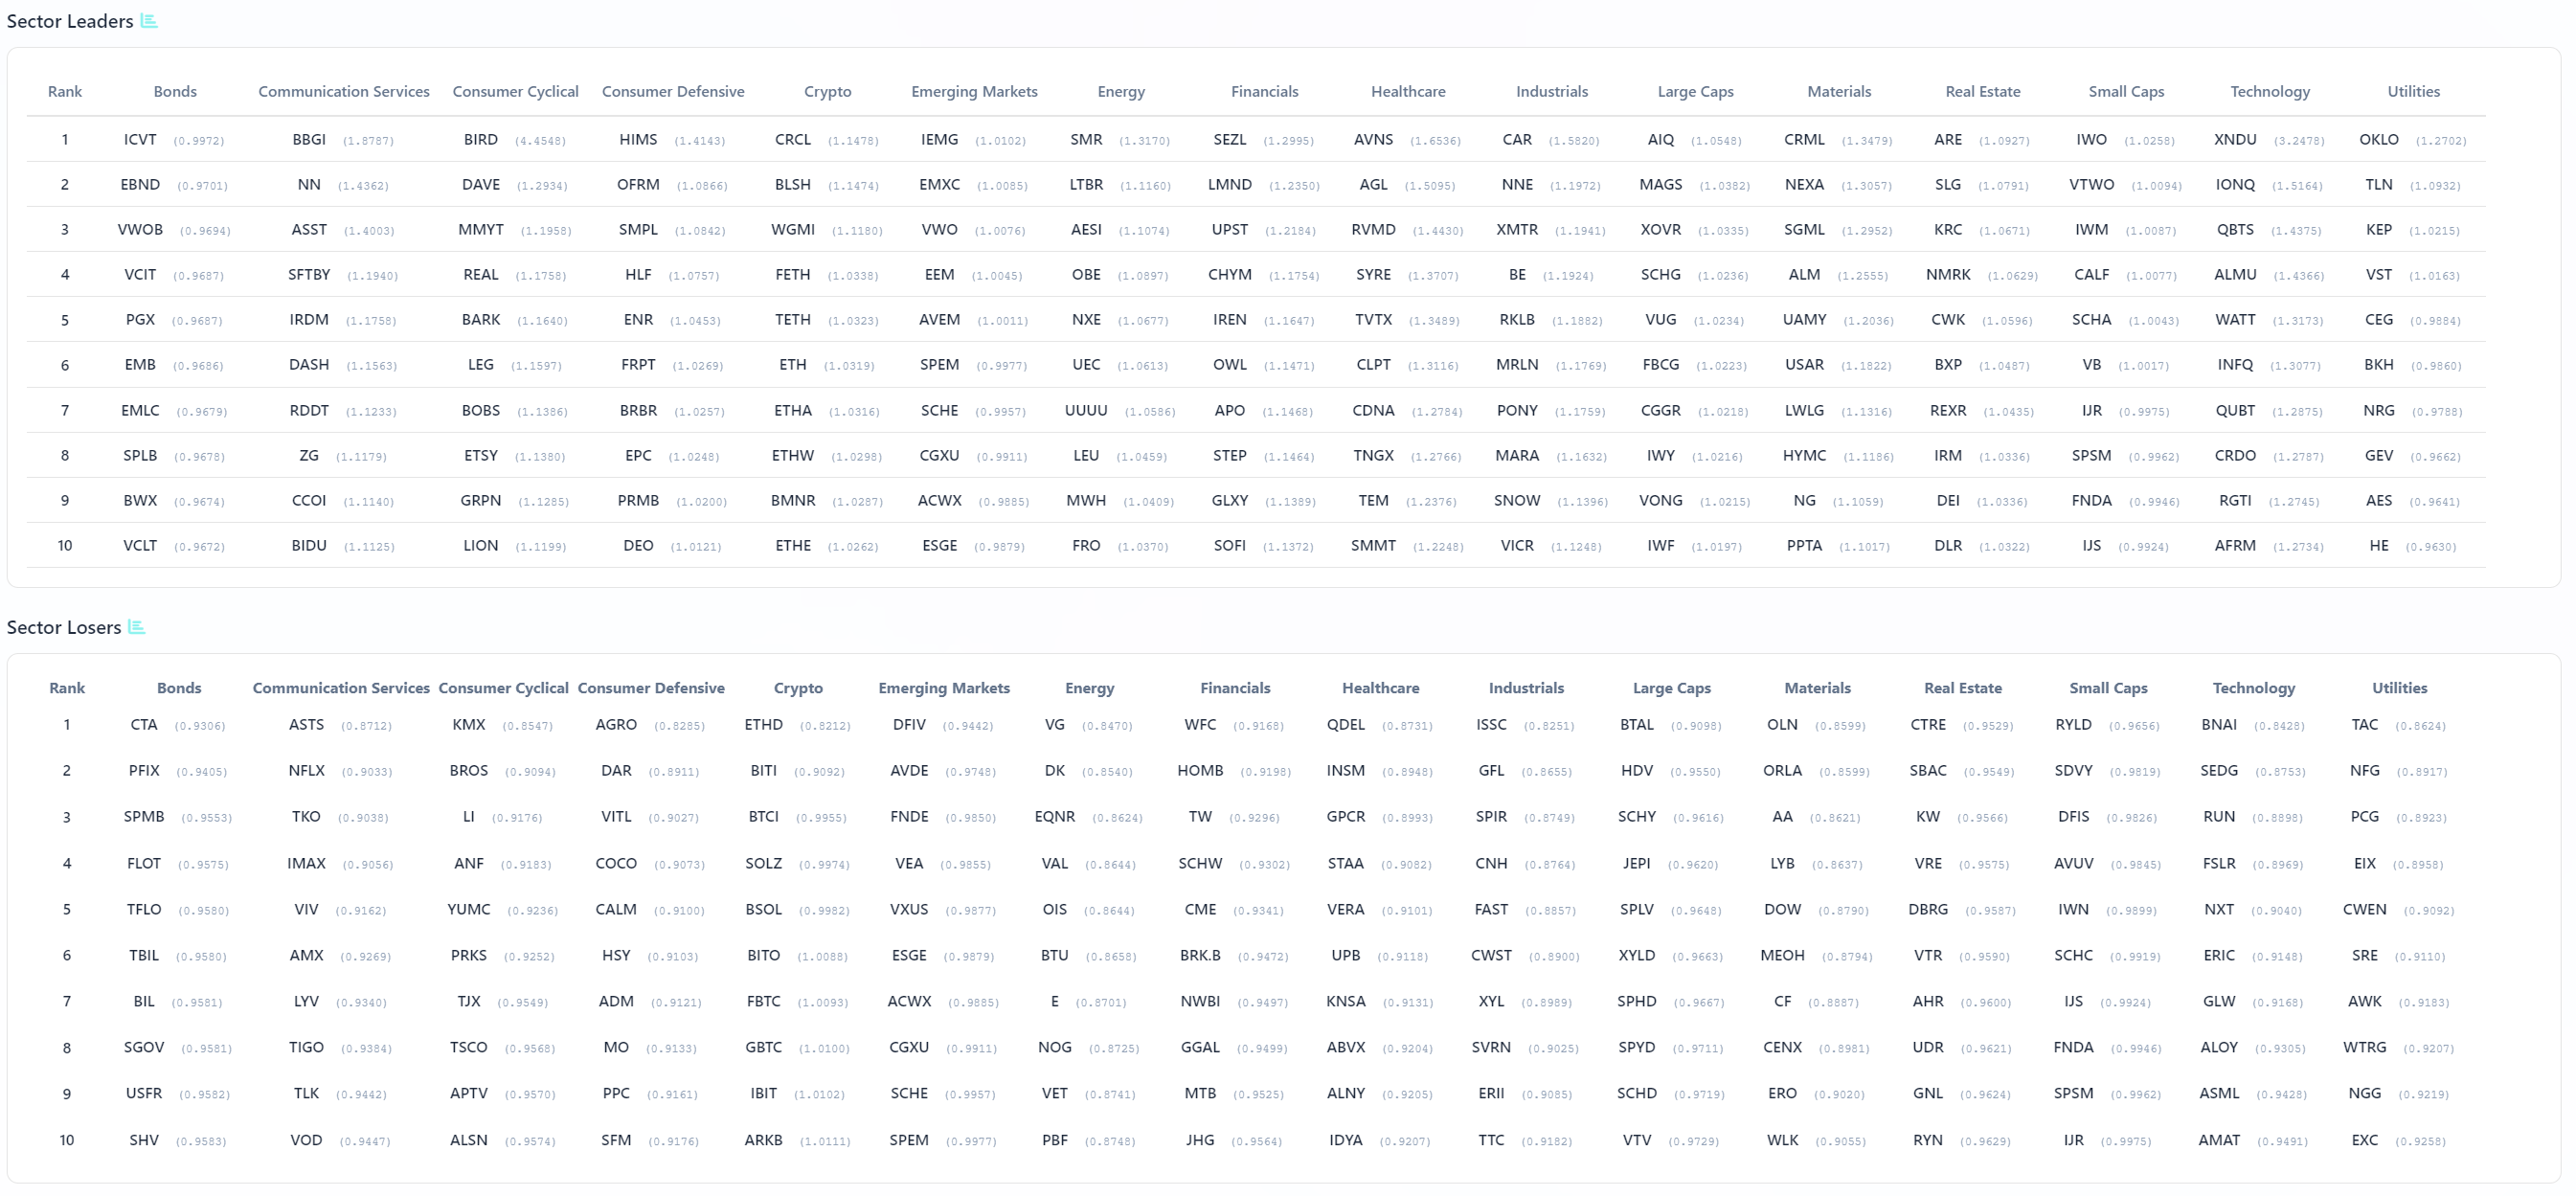
The Sector Leaders list tightens the narrative even further because it answers a slightly different question than both TRV and IO. It is not about where interest is accelerating or where prints are unusually large. It is about where performance is actually being sustained relative to the market. And what stands out immediately is how closely leadership aligns with the same areas that have been absorbing the bulk of institutional flow, but with a very specific twist: leadership is not just concentrated, it is selective within those concentrations.
Technology again sits at the center, but it is not a uniform story. Names like XNDU, IONQ, QBTS, ALMU, and WATT show up as leaders, which tilts the leadership profile toward more specialized, higher-beta and forward-looking subsectors such as quantum, alternative computing, and niche hardware rather than just the mega-cap incumbents. That matters because it suggests the core trade in NVDA, MSFT, and the large semis has matured enough that leadership is now rotating within the ecosystem rather than simply expanding it. The market is still committed to the theme, but it is starting to express that commitment through more differentiated exposures.
Large caps reinforce the idea of stability as a prerequisite for leadership. AIQ, MAGS, SCHG, VUG, FBCG, CGGR, and IWY dominate that column, all of which are growth-heavy, liquidity-rich vehicles. Leadership here is not about surprise. It is about consistency and scale. This matches the broader flow data where SPY, QQQ, and the mega-cap complex dominated aggregate dollars. When leadership and flow align this cleanly in large caps, it typically signals that institutions are still anchoring portfolios around reliability before reaching for incremental alpha elsewhere.
Industrials are arguably the most important confirming signal. CAR, NNE, XMTR, BE, RKLB, MRLN, PONY, MARA, SNOW, and VICR show up as leaders, spanning transportation, defense, infrastructure, and specialized manufacturing. This is not a narrow pocket. It is a broad expression of real-economy strength. Combined with the TRV and IO signals in the same sector, it suggests industrials are not just seeing episodic interest. They are potentially developing into a legitimate secondary pillar of leadership beneath technology right now.
Financials also show a healthy leadership profile, though slightly more mixed. SEZL, LMND, UPST, CHYM, IREN, OWL, APO, STEP, GLXY, and SOFI point to a blend of fintech, alternative asset managers, and capital markets exposure rather than just traditional banks. That nuance matters. It suggests the market is rewarding financials where there is growth optionality or leverage to capital markets activity, not just balance sheet stability.
There are also pockets of leadership in materials and crypto-adjacent exposures, with names like CRML, NEXA, SGML, ALIM, UAMY, USAR, and NG showing up, alongside crypto proxies like CRCL, BLSH, and WGMI. These are not dominant, but they reinforce the idea that the market is willing to entertain thematic extensions as long as they sit on top of a stable core.
What is notably absent is just as important. Small caps and defensive sectors show far less compelling leadership, and where they do appear, it tends to be more fragmented and less persistent. That aligns with the broader read that this is not a full risk-on environment in the traditional sense. It is a selective expansion of risk, anchored in liquidity and reinforced by sectors that can support sustained institutional participation.
Taken together, the leadership list confirms that the market is not searching for a new story. It is refining the one it already has. Technology remains the primary engine, industrials are emerging as a credible second leg, financials are contributing through capital markets leverage, and everything else is being evaluated through that lens rather than driving it.
MIR Part 3: Framing-Up A Trade
Framing this tape into an actionable posture starts with accepting what the market has already made clear. This is not a broad, indiscriminate risk-on environment, and it is not a defensive unwind either. It is a controlled expansion of risk, anchored in liquidity, expressed through leadership, and supplemented by selective probing into adjacent themes. Institutions are allocating, but they are doing so with precision. That dictates how we position. You do not chase breadth for its own sake. You build around what is already working, and you layer exposure outward in a way that respects both opportunity and fragility.
The core of the portfolio has to live where the market is most comfortable deploying size. That is the large-cap and index complex, with a heavy tilt toward technology and growth leadership. This is not just about performance. It is about reliability of execution, depth of liquidity, and the ability to scale exposure without friction. A realistic allocation starts with a Core Beta and Leadership sleeve at 40 percent. That sleeve is anchored in SPY at 15 percent and QQQ at 10 percent, providing broad participation and ensuring alignment with the dominant flow. From there, the exposure tightens into leadership names that have both flow confirmation and thematic dominance. NVDA at 5 percent, MSFT at 4 percent, and AVGO at 3 percent round out the core. These are not speculative inclusions. They are the center of gravity for institutional capital, and until that changes, they remain the foundation.
The next sleeve builds directly on top of that foundation by isolating the thematic engine driving incremental allocation. Technology and semiconductors are not just leading, they are expanding internally. That expansion is where alpha tends to develop once the primary trade matures. A Technology Expansion sleeve at 20 percent captures that dynamic. SOXX sits at 8 percent as a diversified expression of semiconductor strength. From there, exposure is allocated across second-derivative beneficiaries and infrastructure plays: AMD at 3 percent, ORCL at 3 percent, AMAT at 3 percent, and a higher-beta satellite like IONQ at 3 percent. This sleeve is where you accept a bit more volatility in exchange for participation in the next layer of institutional rotation within the dominant theme.
What makes this tape more interesting than a simple tech-led rally is the parallel strength in industrials. This is where the market is quietly broadening in a way that tends to be more durable than short-term rotations. The Industrial Expansion sleeve comes in at 15 percent and reflects a cross-section of that buildout. CAT at 4 percent provides exposure to large-scale infrastructure and machinery. FIX at 3 percent captures engineering and construction momentum. ETN at 3 percent adds electrification and industrial systems exposure. GE at 3 percent brings aerospace and defense leverage, while a more specialized name like WTS at 2 percent rounds out the sleeve. These are not trades chasing headlines. They are positions aligned with sustained capital flows into real-economy execution.
Financials deserve their own sleeve, but with a specific emphasis. The leadership is not purely in traditional banking. It is in capital markets, alternative asset managers, and institutions benefiting from elevated activity levels. A Financials and Capital Markets sleeve at 10 percent reflects that nuance. JPM at 4 percent anchors the sleeve with scale and liquidity. GS at 3 percent adds leverage to trading and deal flow. APO at 2 percent introduces alternative asset exposure, and IBKR at 1 percent captures the retail and institutional trading ecosystem. This sleeve is less about directional macro bets and more about monetizing the environment itself.
At this point, the portfolio is aligned with the dominant flows, but it still lacks tactical flexibility. The tape has made it clear that institutions are actively hedging and adjusting exposure, not simply accumulating. A Tactical and Hedge sleeve at 10 percent addresses that. HYG at 4 percent provides exposure to credit with an income component and sensitivity to risk appetite. LQD at 3 percent adds higher-quality duration exposure. SH at 2 percent introduces a modest equity hedge, and GLD at 1 percent offers a small allocation to a macro hedge that can respond to geopolitical or inflation shocks. This sleeve is not designed to drive returns. It is designed to stabilize them.
Finally, there is room for a small Opportunistic sleeve at 5 percent, where the market is probing but not fully committed. This is where you express exposure to emerging themes without overcommitting capital. CRCL at 2 percent captures crypto-adjacent momentum, RKLB at 2 percent provides exposure to aerospace growth and speculative innovation, and URA at 1 percent adds a thematic energy and nuclear component. These are not core positions. They are controlled expressions of optionality.
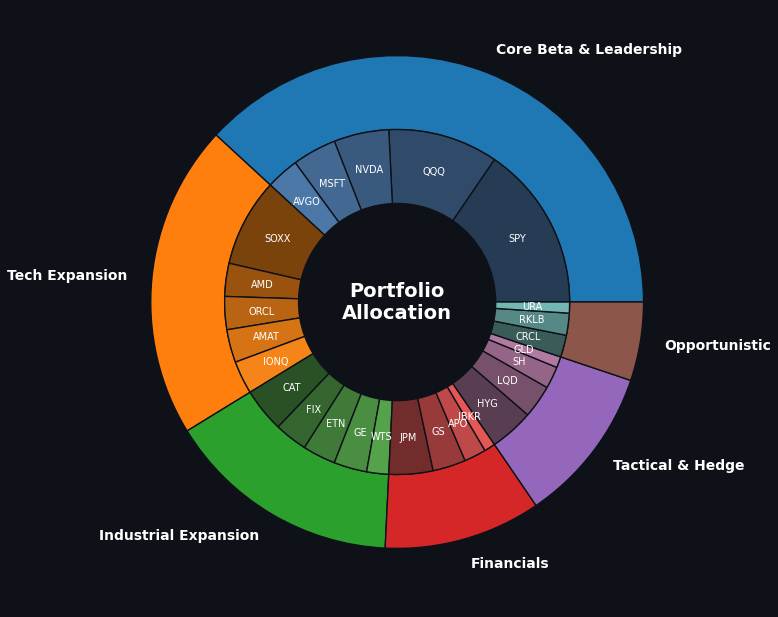
Core Beta and Leadership (40% total)
SPY – 15%
QQQ – 10%
NVDA – 5%
MSFT – 4%
AVGO – 3%
(3% of this sleeve is unallocated)
Technology Expansion (20% total)
SOXX – 8%
AMD – 3%
ORCL – 3%
AMAT – 3%
IONQ – 3%
Industrial Expansion (15% total)
CAT – 4%
FIX – 3%
ETN – 3%
GE – 3%
WTS – 2%
Financials and Capital Markets (10% total)
JPM – 4%
GS – 3%
APO – 2%
IBKR – 1%
Tactical and Hedge (10% total)
HYG – 4%
LQD – 3%
SH – 2%
GLD – 1%
Opportunistic (5% total)
CRCL – 2%
RKLB – 2%
URA – 1%What ties the entire structure together is coherence with the tape. The largest allocations sit in the areas with the deepest and most consistent institutional participation. Secondary sleeves extend that exposure into areas where interest is building but not yet dominant. Defensive and tactical components acknowledge that risk is still being actively managed rather than ignored. The portfolio leans into strength, respects liquidity, and builds flexibility around the edges rather than betting everything on a single outcome.
Good luck this week, VL Fam!
Thank you for being part of this community and for investing your time in this week’s edition. The quality of this readership — thoughtful, disciplined, engaged — is what makes this work meaningful. I’m grateful to build alongside you. Here’s to a week of clarity, conviction, and well-executed opportunities.
— VolumeLeaders