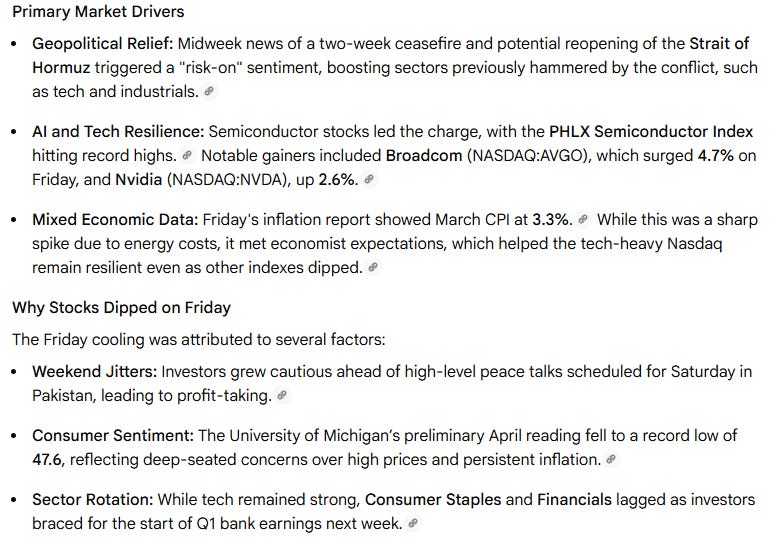
Market Momentum: Your Weekly Financial Forecast & Market Prep
Issue 86 / What to expect March 13, 2026 thru March 17, 2026


Weekly Market-On-Close Report
Ceasefire Rally, Hot Inflation, and a Market That Priced in the Best Case
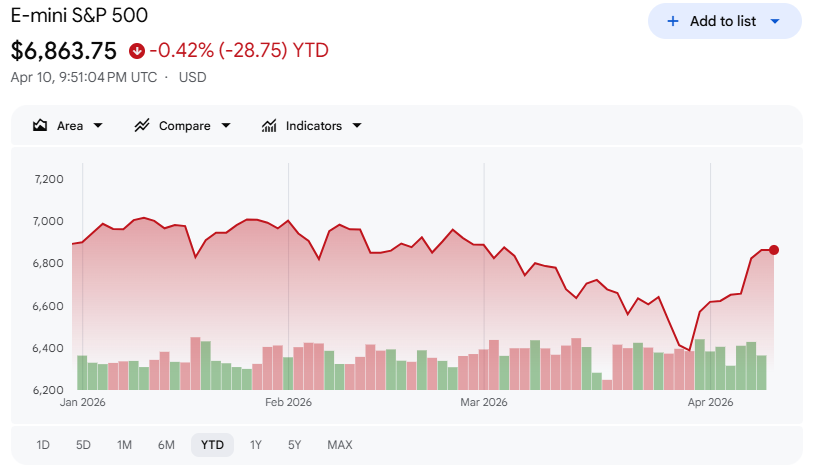
Th week delivered the kind of trading action that compresses months of narrative into five sessions: a geopolitical resolution that sent equities surging and oil cratering, an inflation print that confirmed the war’s economic cost, and a growing divergence between what markets are pricing and what the macro data is actually saying. The S&P 500 gained +3.56% for the week to close at 6,816.89, the Nasdaq Composite added +4.68% to 22,902.90, and the Dow Jones Industrial Average rose +3.03% to 47,916.57. It was the second consecutive week of solid gains, and for the first time since late January, the S&P 500 is within striking distance of breakeven on the year, sitting at -0.42% YTD. But the optimism layered into these prices deserves scrutiny, because the ceasefire that drove the week’s gains remains unverified on the ground, the inflation damage is only beginning to register in the data, and the consumer is in worse shape than the headline index levels suggest.
The Catalyst: Trump’s Tuesday Night Announcement
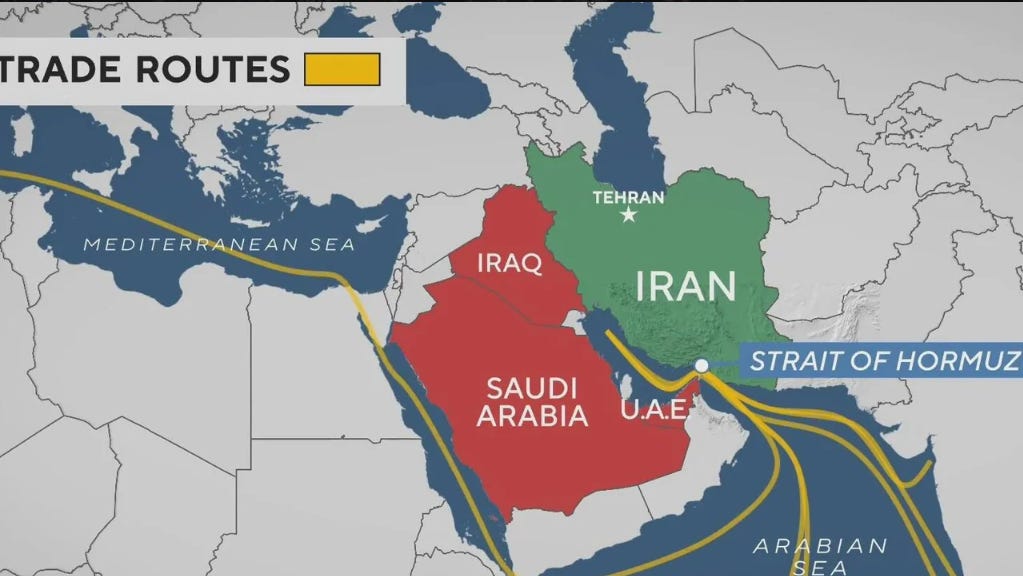
Just before midnight on Tuesday, April 7 -- less than two hours before a self-imposed deadline that markets had been watching with considerable anxiety -- President Trump posted on Truth Social that the United States and Iran had agreed to a two-week ceasefire, contingent on Iran reopening the Strait of Hormuz. The reaction was immediate and decisive. Futures ripped higher overnight. When cash markets opened Wednesday morning, the S&P 500 posted its best single-day gain in over a year, surging +2.5%, the Dow +2.9%, the Russell 2000 +3.0%, and international equities +3.5%.
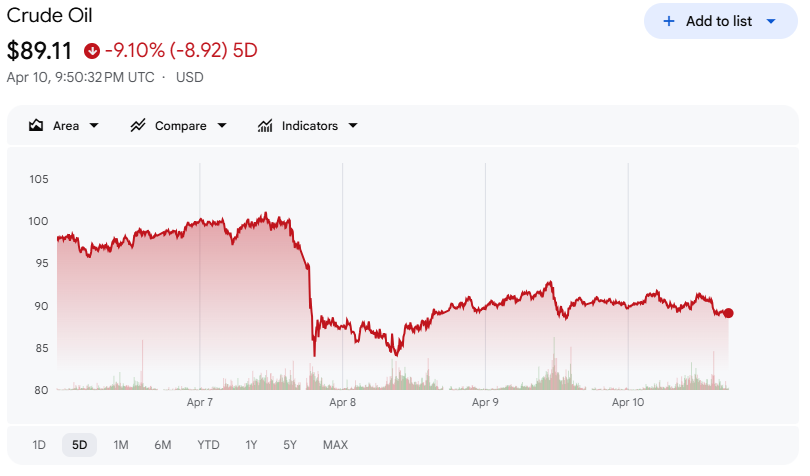
The oil move was even more dramatic. WTI crude, which had traded above $110 at the peak of the conflict and touched approximately $112 heading into Tuesday night, collapsed by 16% on Wednesday alone -- the largest single-session decline since April 2020 -- falling to approximately $94 (NYT). Brent crude, which had peaked near $118 per barrel during the conflict after starting the year near $70, fell in tandem. The VIX, which had been elevated well above 20 for weeks, dropped back below that threshold on the news. Credit spreads tightened sharply to levels last seen in late January. Treasury yields declined modestly through the week, generating positive total returns in US Treasuries for the period.
This was, in market terms, a clean geopolitical relief trade. Risk-on across the board, oil down hard, volatility crushed, credit tight. The template is familiar. What makes this week different -- and more complicated to interpret -- is everything that happened after Wednesday’s open.
The Complication: Nothing Has Actually Reopened
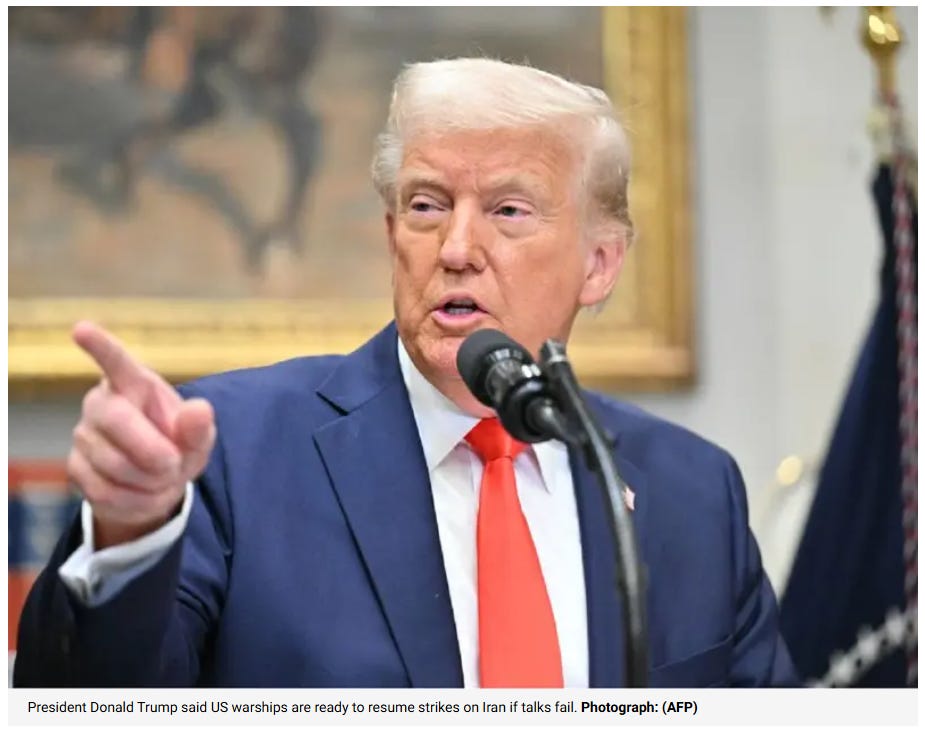
By Thursday and into Friday, physical flow through the Strait of Hormuz had not resumed. The Strait remained closed. Oil, which had sold off violently on the ceasefire announcement, began drifting back toward $100 per barrel, with Brent settling near $96 by week’s end. Iran’s parliamentary speaker publicly accused the United States of violating the terms of the ceasefire agreement. Trump, in turn, warned on Friday of renewed military strikes if talks collapse. The ceasefire is set to expire April 21 -- and that date now functions as the single most important near-term risk event for global markets.
To be precise about what markets priced this week: they priced the announcement of a ceasefire, not the cessation of the conflict. That is a meaningful distinction. The structural uncertainty -- whether the Strait reopens, whether Iranian exports resume, whether the tanker insurance and shipping markets normalize -- remains entirely unresolved. A two-week window is a short leash. The fact that oil rebounded from $94 back toward $100 before the week was out suggests the market’s initial reaction may have overshot the fundamental reality.
For institutional portfolio managers, the positioning data adds texture here. The Commitments of Traders report for ES futures as of March 31 showed leveraged funds holding 396,837 short contracts while covering aggressively -- reducing their short position by 83,084 contracts in the prior period. Asset managers were net long and adding, with 1,139,703 long contracts and an additional 34,394 added in the period. Dealers were adding to their short book, up 159,321 contracts to 950,231 short -- consistent with hedging for long clients rather than a directional view. The short-covering pressure from leveraged funds has been a meaningful mechanical tailwind for this rally. As that covering exhausts itself, the bid from that source diminishes.
Sector Leadership: Industrials, Tech, and the Glaring Exception
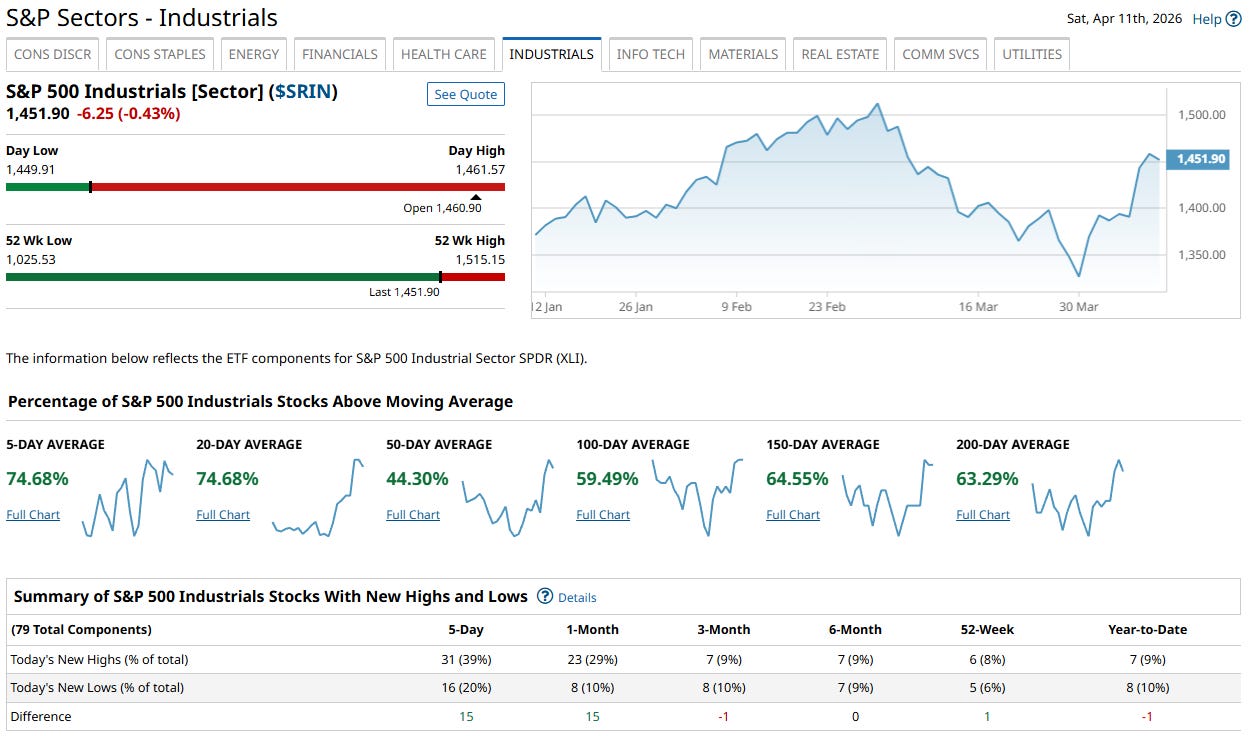
Sector performance for the week told a coherent story. Industrials led all S&P 500 sectors with a gain of approximately +5.3% to +5.6%, which makes sense: the sectors most punished by an oil shock -- airlines, transports, logistics, manufacturing -- are the most direct beneficiaries of an oil reversal. Consumer discretionary, communication services, and information technology followed, with the latter two benefiting from the combination of lower energy input costs and a VIX collapse that flattened the risk discount on long-duration growth assets.
The only sector in negative territory for the week was energy. This too is exactly what one would expect from a -16% oil move. The inversion is worth noting: the macro trade that saved the broad market hurt the one sector that had been an earnings bright spot during the conflict period. As corporate estimates get revised heading into Q1 earnings season -- with bank earnings beginning the week of April 14 -- energy will likely be a relative gainer on revisions while most other sectors face downward pressure from the oil-induced cost surge earlier in the quarter.
The Russell 2000 added 100.54 points on the week to close at 2,630.59, and sits at +5.99% YTD -- outperforming the S&P 500 meaningfully on the year. The S&P MidCap 400 is up +6.58% YTD. The consistent mid- and small-cap outperformance relative to large-cap this year is a structural signal worth tracking: it suggests the market’s underlying tone, when stripped of mega-cap noise, has been more resilient than the headline index levels imply.
The CPI Report: Confirmation of the Damage, With a Silver Lining
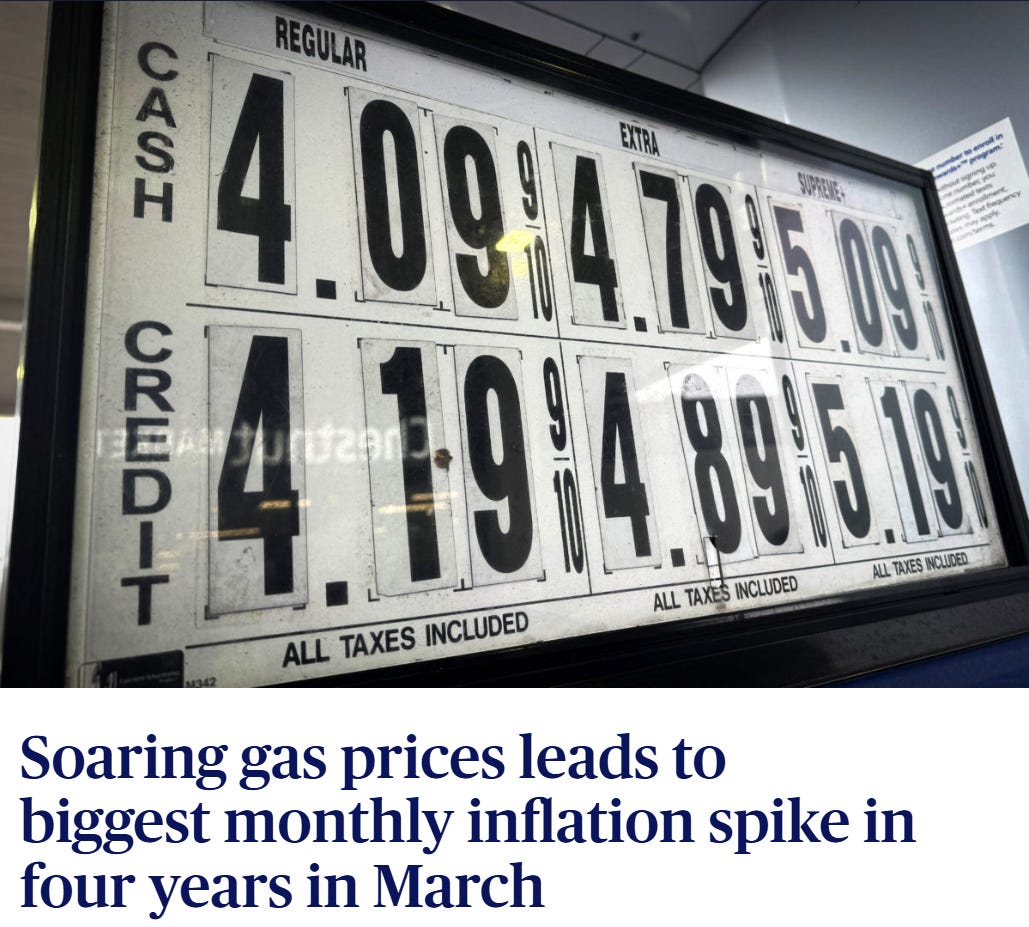
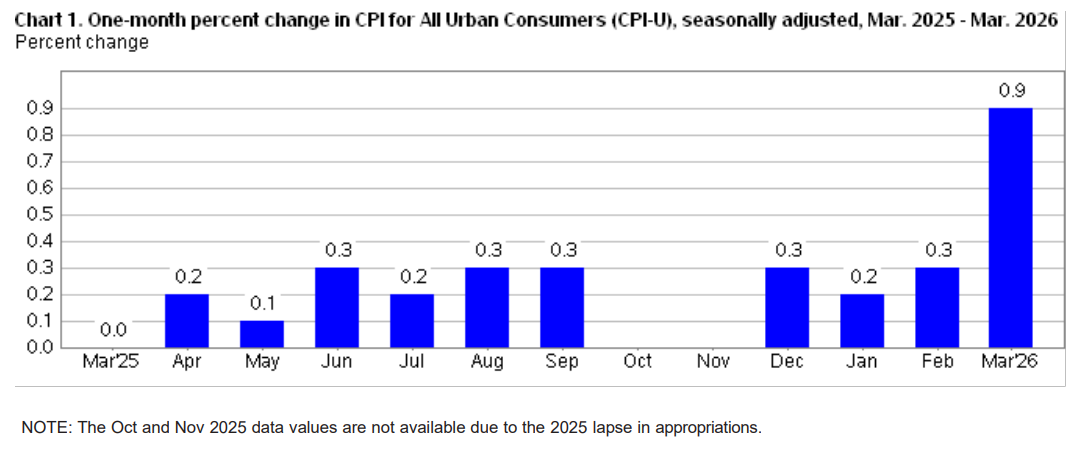
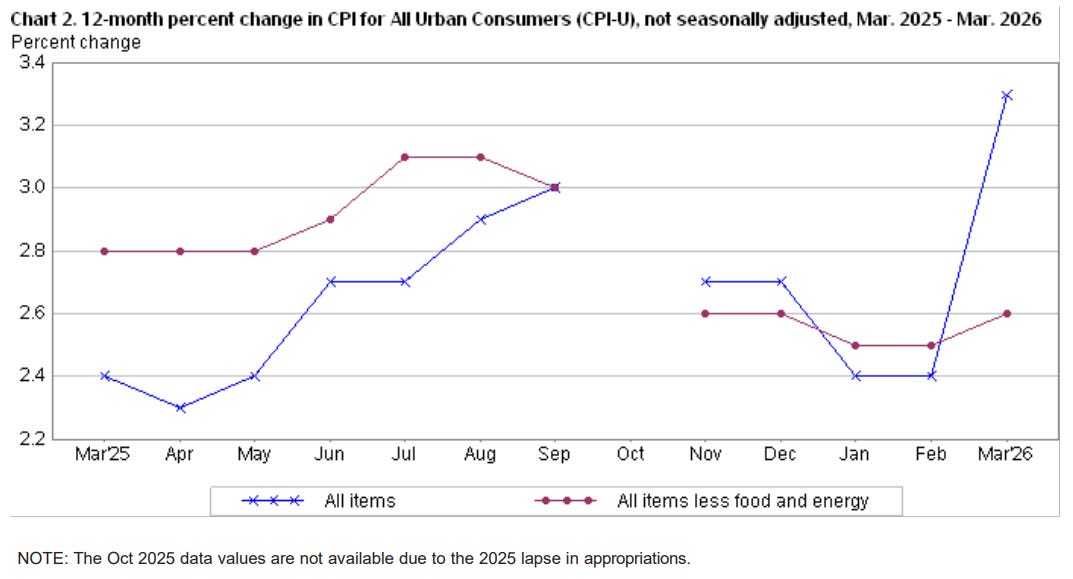
Friday’s March CPI report delivered what most sophisticated participants expected but hoped to avoid seeing in print. Headline CPI rose +0.9% month-over-month -- the largest monthly gain since June 2022 -- pushing the year-over-year rate to +3.3%, up sharply from 2.4% in February and the fastest pace since May 2024. The culprit was obvious: energy prices surged +10.9% for the month, retail gasoline climbed +18.9% year-over-year, and the national average gasoline price hit $4.12 per gallon -- the first time above $4 since 2022. Airfare jumped +14.9% year-over-year.
The market reaction was muted and largely rational. Participants understood that the March energy component reflected the conflict surge that is already partially reversing. If the ceasefire holds and oil stabilizes in the mid-to-upper $90s, the April and May prints should see meaningful energy deflation. CPI could peak near 4% before resuming a downward trajectory -- but “near 4%” is not a comfortable number for a Federal Reserve that has been trying to declare victory on inflation for the better part of two years.
The more constructive component was core CPI: +0.2% month-over-month and +2.6% year-over-year, coming in 0.1 percentage point below expectations. Shelter inflation fell to its lowest reading since August 2021. Grocery prices fell -0.2% for the month. These are real disinflationary signals in the underlying economy. But the cover has limits. Core PCE ran at 3.0% year-over-year as of February. The three-month annualized core PCE rate is running above 4%. Goods inflation is accelerating at nearly 5% on a three-month annualized basis, driven by tariff pass-through just beginning to work through supply chains. Real earnings fell -0.6% in March -- wages rose just +0.2% against a +0.9% CPI print. The Fed is not cutting rates into this data.
The Macro Backdrop: A Consumer Under Pressure
Beneath the relief rally, the underlying economic data is telling a sobering story. Real GDP growth for Q4 2025 was revised down to +0.5% annualized in the third estimate -- already weak before the conflict hit in force. ISM Services came in at 54 for March, still in expansion for the 21st consecutive month but decelerating at the margin. Personal income fell -0.1% in February. Personal spending on a January-February annualized basis ran at just +0.7% -- effectively flat in real terms.
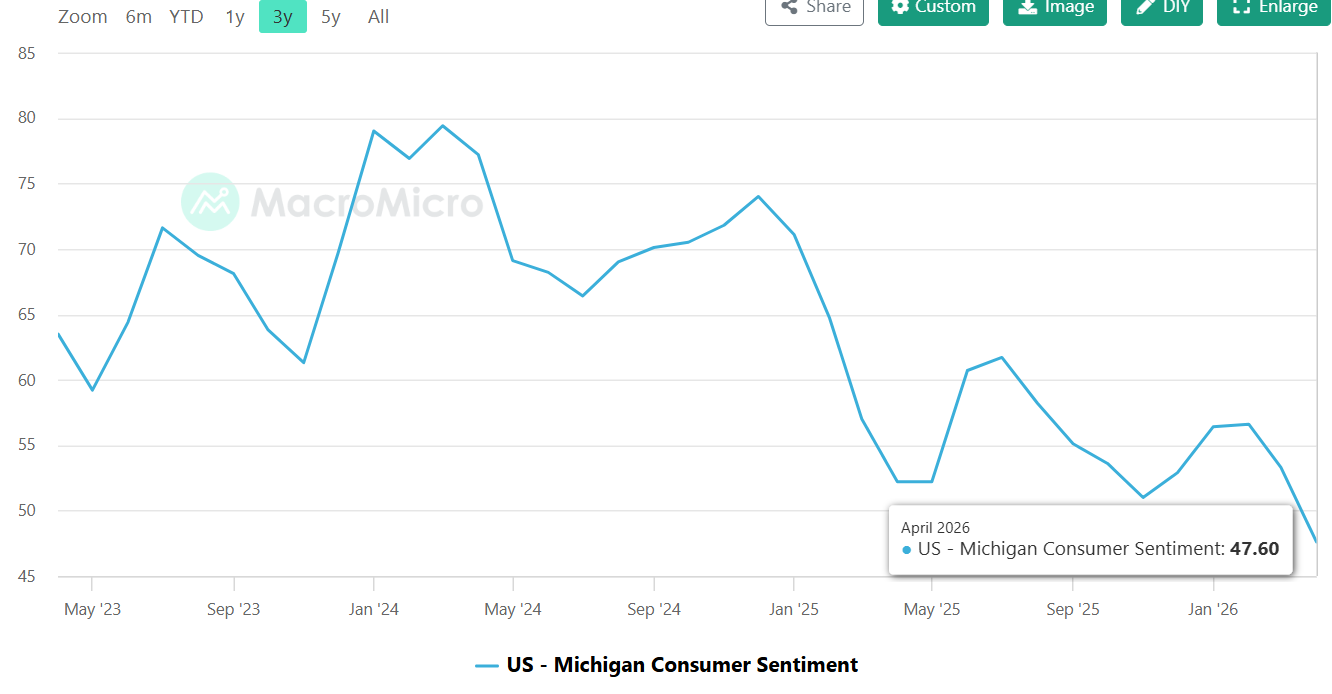
The most striking data point of the week may have been the University of Michigan preliminary consumer sentiment reading for April: 47.6, down 5.7 points from March and among the weakest readings in years. One-year inflation expectations jumped to 4.8%, up a full percentage point from March. When gasoline hits $4.12 at the pump, when real earnings are negative, sentiment does not recover in a week because the president posted a ceasefire announcement on social media. The Trump approval trajectory, in a midterm election year, is a political risk factor that institutional allocators are beginning to model -- deteriorating approval against a backdrop of high gasoline prices and declining real wages creates policy pressure that is not always market-friendly.
Global Markets: The Relief Trade Was Universal
The ceasefire’s impact was not confined to US equities. The Nikkei 225 surged +7.15% -- the standout performer among developed market indices -- while the TOPIX added +2.60%. European equities posted strong gains: FTSE MIB Italy +4.35%, CAC 40 +3.73%, STOXX Europe 600 +3.05%, DAX +2.74%, FTSE 100 +1.57%. Emerging markets had their best weekly gain in several years. The CSI 300 rose +4.41%, Hang Seng +3.09%, Shanghai Composite +2.74%. EM bonds strengthened, credit spreads tightened, the USD weakened, and EM currencies recovered -- a classic broad risk-on configuration.
Two global data points deserve mention beyond the headline moves. China’s PPI rose +0.5% year-over-year in March, the first positive reading in over three years after 41 consecutive months of deflation. Chinese factory deflation has been one of the disinflationary forces suppressing global goods prices; its reversal removes a tailwind Western central banks had been quietly relying on. Japan’s CGPI came in at +2.6% year-over-year for March, above consensus, while the 10-year JGB yield sits at 2.42%, near its highest level since 1997. The Bank of Japan’s policy path remains one of the more consequential macro variables running in parallel to the conflict narrative, particularly for carry trades and the dollar-yen complex.
The Setup Heading Into April 21
The S&P 500’s 52-week range runs from 5,026.75 -- the low struck on April 7, 2025 -- to 7,097.00, the high reached January 28, 2026. The index closed this week at 6,816.89, meaningful recovery from the March 31 low of 6,353.25 but still roughly 4% below the January highs. The YTD return of -0.42% understates the violence of the path: a sharp selloff, an oil-driven inflation shock, a geopolitical confrontation, and now a relief rally that has retraced a substantial portion of the damage in two weeks.
The bull case is straightforward: the ceasefire holds, the Strait reopens by April 21, oil retreats toward $80-85, the April CPI moderates sharply, Q1 earnings come in ahead of lowered estimates, and the Fed has cover to cut once before year-end. In that scenario, the S&P tests the January highs. The bear case is equally coherent: the ceasefire collapses, oil retests $110, CPI does not peak until Q2 near 4%, the Fed holds with a hawkish lean, consumer spending stalls, and the March lows near 6,353 are revisited.
What the market has done this week is price something closer to the bull case while the evidence on the ground -- a Strait still physically closed, a disputed ceasefire, a consumer sentiment reading of 47.6, real earnings negative, and three-month core inflation metrics running above 4% -- still looks like a coin flip at best. That is not a reason to be structurally short a market with intact earnings growth expectations and short-covering tailwinds. It is a reason to size positions with the April 21 expiration date in view, to watch the physical oil market rather than the political announcements for confirmation, and to treat the current level of the S&P as a range midpoint rather than a launching pad.
The week was extraordinary. The next two weeks will determine whether it was the beginning of a sustained recovery or a relief rally that priced the resolution before the resolution was real.

Weekly Benchmark Breakdown
Breadth Bifurcation: Cap-Weight Lifts, the Median Stock Stalls
Th week produced a sharp divergence between what the headline indices implied and what the underlying data confirmed. The short-term thrust figures look better than they have in weeks -- new highs are outpacing new lows on the 5- and 1-month lookbacks across every universe we track -- but the intermediate-term moving average cohorts tell a more cautious story. The 50-day participation rates are deeply sub-50% in the large-cap tech-heavy universes and only marginally above water in the broader indices. This is a thrust-without-trend environment: good enough to cover shorts, not yet good enough to press longs into size.
The S&P 500 breadth profile is internally inconsistent in a way that demands respect. On the 5- and 20-day readings, 58.76% and 66.13% of components, respectively, sit above those short-term averages -- a solid short-term recovery thrust. But the 50-day collapses to 43.42%, meaning the majority of SPX constituents have not yet repaired the damage done in March and early April.
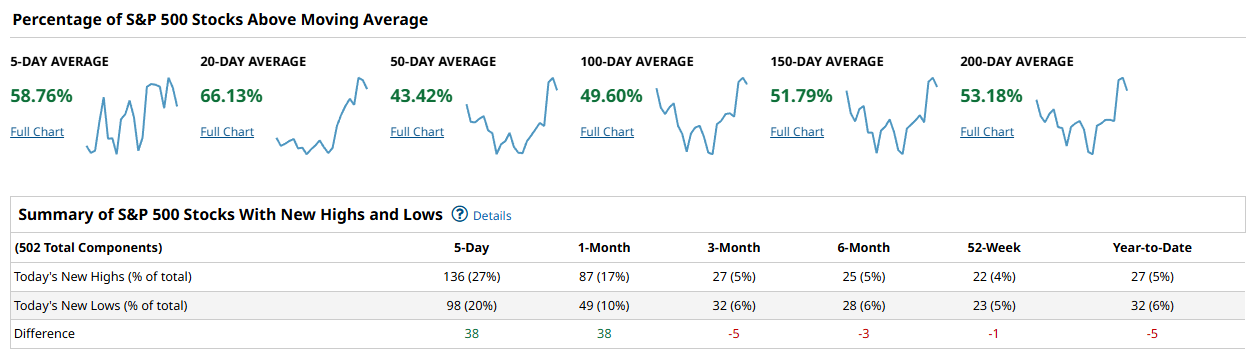
The 100- and 150-day numbers recover to 49.60% and 51.79%, and the 200-day lands at 53.18%, which tells you the long-term trend base is intact even as the intermediate structure is broken. New high/new low differentials are positive on the 5-day (+38) and 1-month (+38) windows, but flip negative at the 3-month (-5), 6-month (-3), 52-week (-1), and year-to-date (-5) lookbacks. The market is generating fresh 5-day highs but still running below water on almost every meaningful lookback. The weight of that negative NH-NL structure at longer horizons cannot be hand-waved away.
The Nasdaq 100 is the weakest large-cap breadth picture of the four. The 5-day reading of 52.47% and 20-day of 56.43% confirm participation in the bounce, but the 50-, 100-, 150-, and 200-day cohorts cluster tightly between 44.55% and 48.51% -- all sub-50%, all deteriorating relative to where they stood in January.
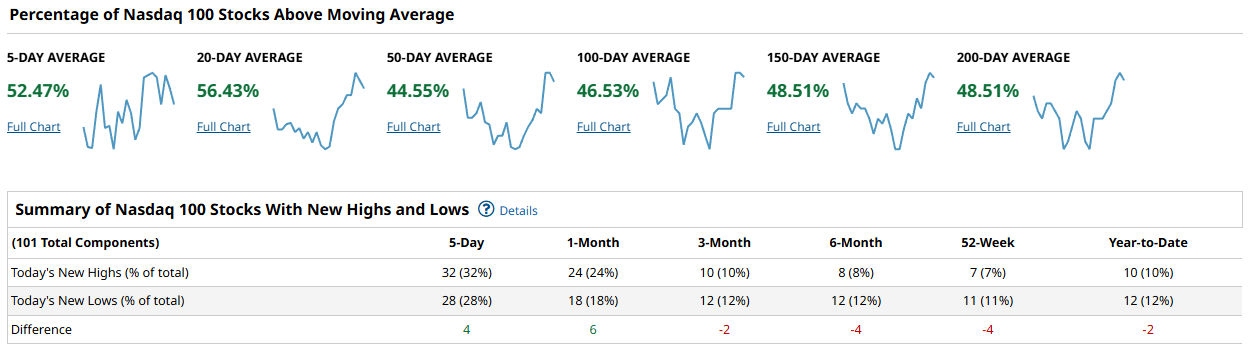
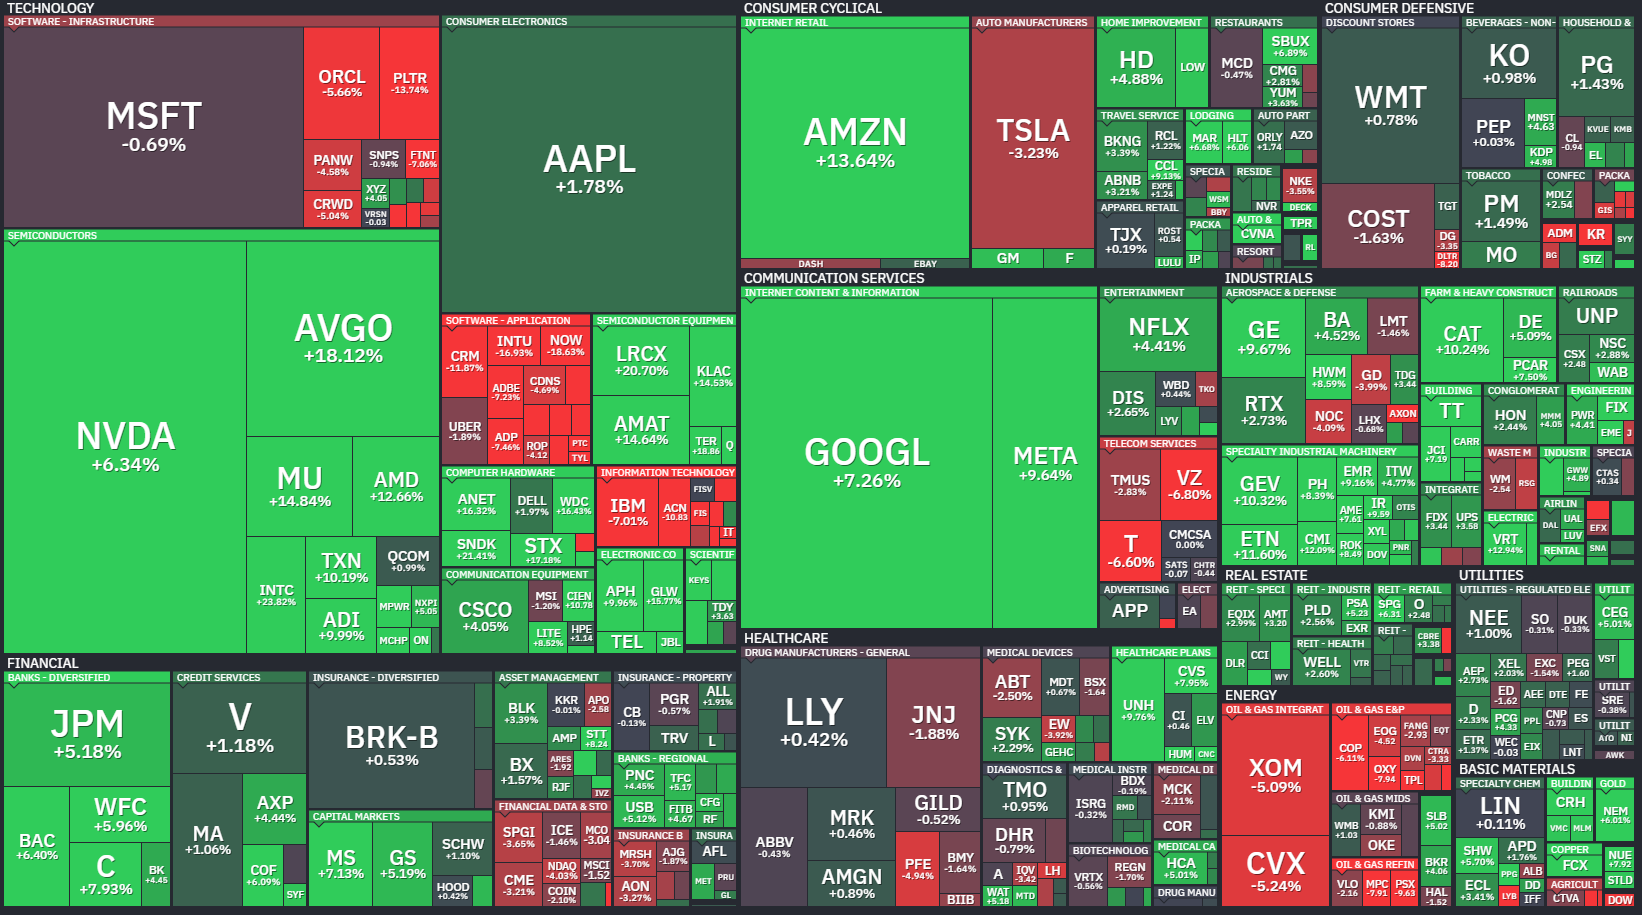
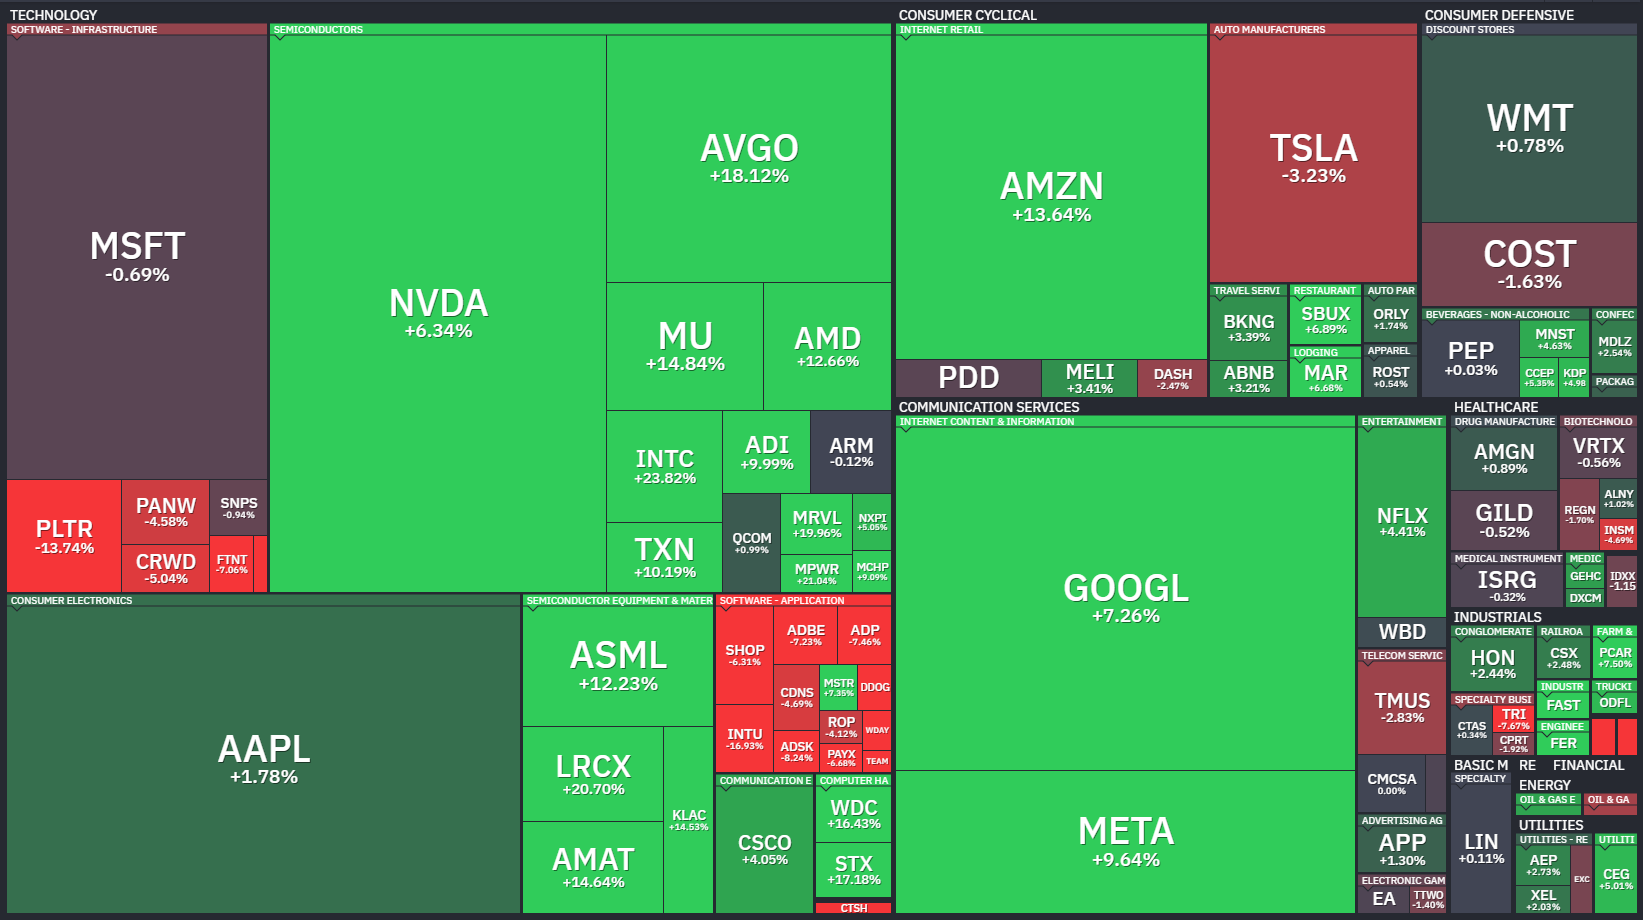
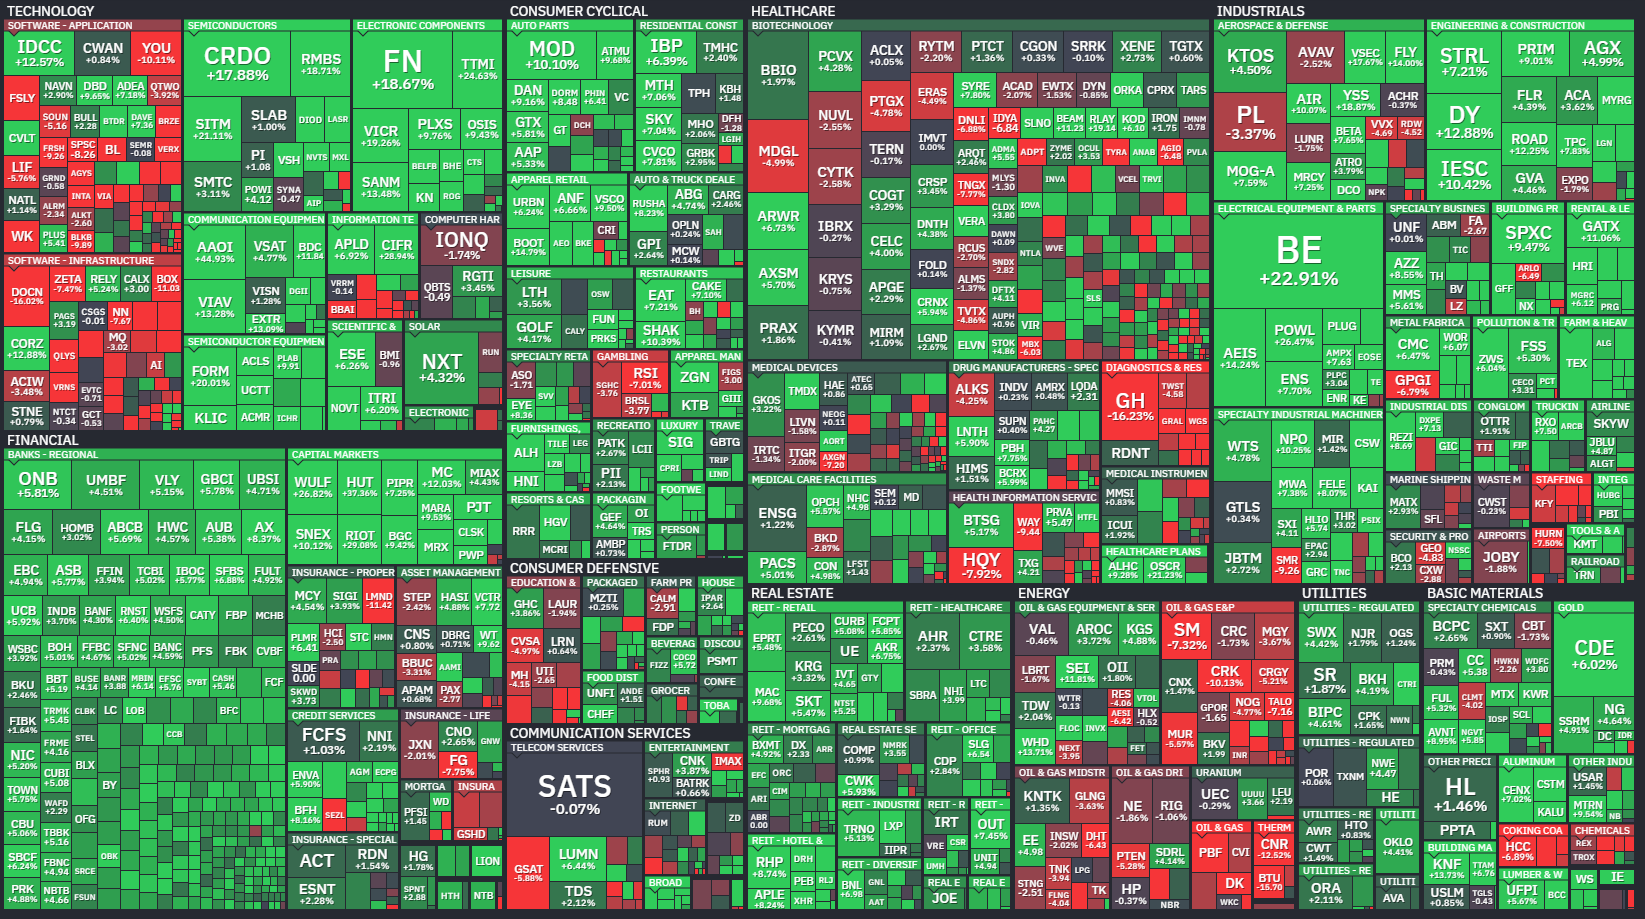
The NH-NL spread is barely positive on the 5-day (+4) and 1-month (+6) windows, and negative at every lookback from 3-months out. The heatmap partially masks this: AVGO’s +18.12% week, AMZN at +13.64%, MU at +14.84%, and GOOGL at +7.26% generated outsized cap-weight returns, but MSFT was essentially flat (-0.69%), AAPL contributed just +1.78%, and names like PLTR (-13.74%), PANW (-4.58%), and CRWD (-5.04%) dragged the software infrastructure cohort lower. The semis saved the NDX this week; software did not.
The Dow Industrials tell a simpler story, partly because the sample is only 30 names. The 5-day reading of 63.33% and 20-day of 66.66% look fine, but the 50-day is just 33.33% -- one in three Dow components above their 50-day moving average.
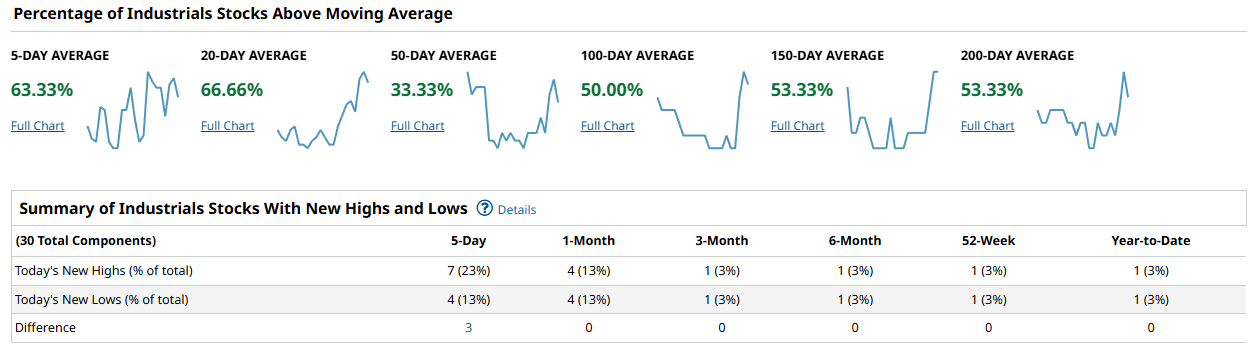
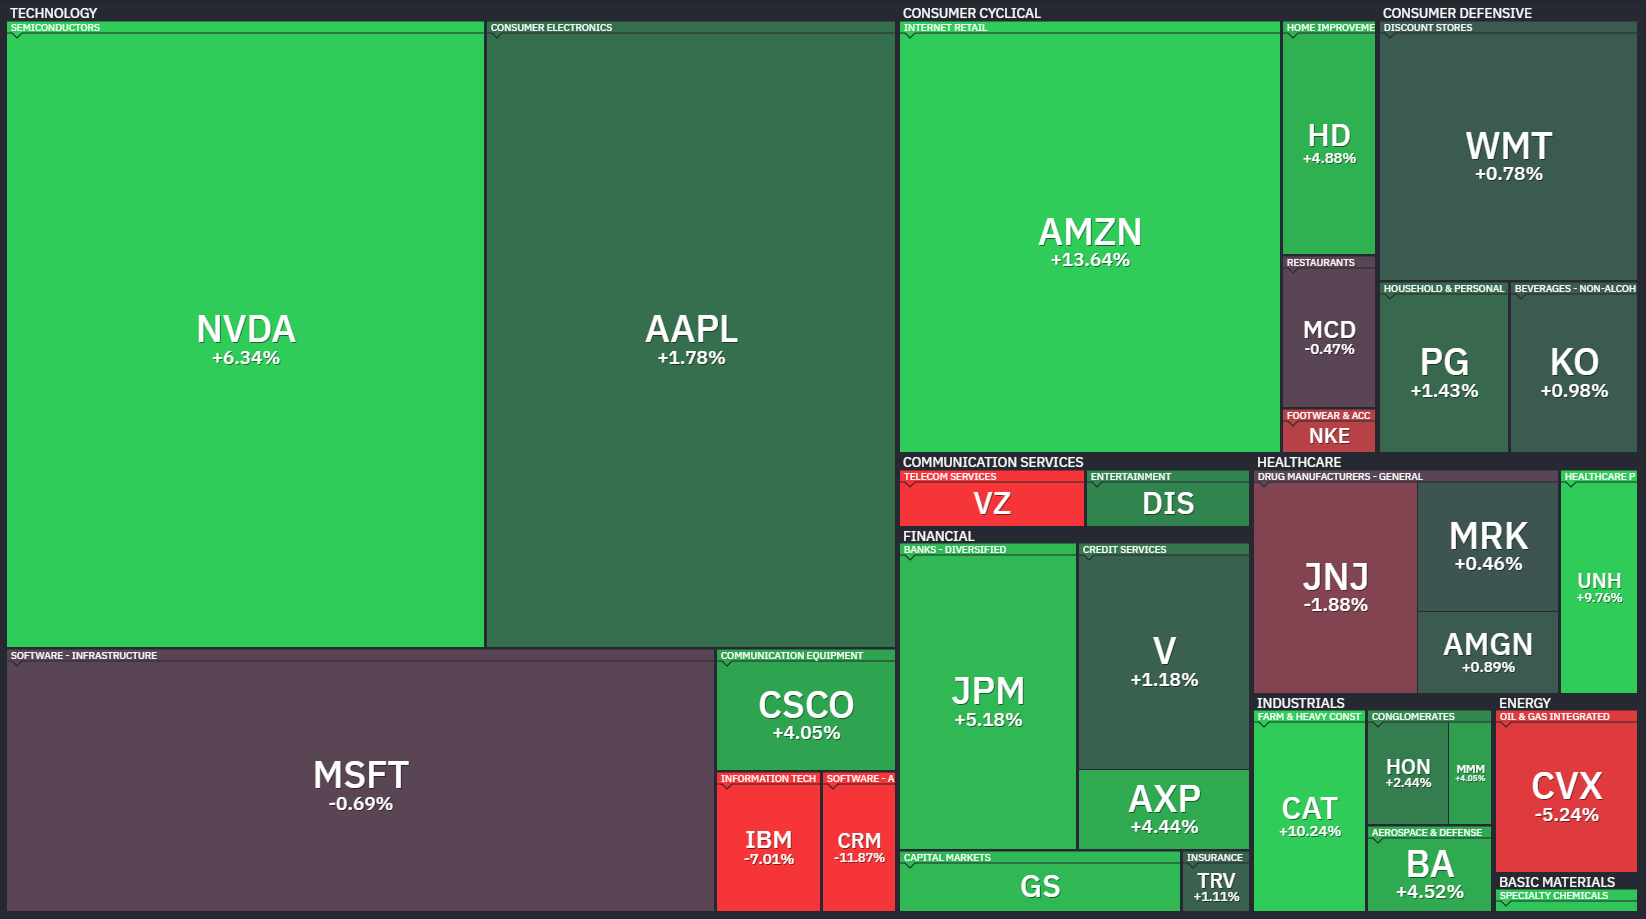
IBM’s -7.01% week was the headline casualty in the blue-chip heatmap, while AMZN (+13.64%) and JPM (+5.18%) carried the index. The NH-NL differential was +3 on the 5-day and flat (0) at every longer window. The Dow is neither confirming nor denying the rally; it is simply tagging along.
The Russell 2000 is, counterintuitively, the breadth bright spot this week. The 5-day reading of 63.85%, 20-day of 72.28%, and 50-day of 55.48% all outpace their large-cap counterparts. The 100-, 150-, and 200-day cohorts range from 53.92% to 56.47% -- above 50% across the board, which is more than either the S&P 500 or the NDX can say at any intermediate horizon.

New high/new low differentials are robustly positive on every lookback: +249 on 5-day, +261 on 1-month, +59 on 3-month, +49 on 6-month, +45 on 52-week, and +56 year-to-date. The RUT heatmap is a mess of green and red at the individual stock level -- the usual small-cap chaos -- but the aggregate signal is unambiguous: small-cap participation is broader and more durable than anything the mega-cap dominated indices are showing.
The synthesis here is uncomfortable for bulls building a conviction thesis. Cap-weight is doing the heavy lifting. AVGO, AMZN, MU, NVDA, GOOGL, and META accounted for a disproportionate share of the SPX and NDX point gains this week, while the median SPX constituent sits below its 50-day moving average. The Russell’s superior breadth is encouraging on its face, but small caps tend to underperform in risk-off regimes and outperform in genuine recovery regimes -- the question is which one this is. What would confirm a durable advance is the 50-day cohorts in the SPX and NDX pushing back above 55-60%, and the longer-horizon NH-NL differentials turning positive at the 3-month lookback. Right now, neither condition is met.
For the playbook this week, lean toward the areas that generated actual breadth, not just cap-weight returns. Semiconductors (AVGO, MU, AMAT, LRCX were all notably strong) and select consumer internet (AMZN, GOOGL) deserve staying power as long as the 20-day cohorts hold. Avoid chasing software infrastructure -- the PANW, PLTR, CRWD complex is still breaking down beneath the surface, and the NDX’s sub-45% 50-day reading reflects that damage. Energy is a clear avoid on shorter timeframes after XOM’s -5.09% and CVX’s -5.24% weeks, and the sector shows no breadth support on any horizon. Watch for the SPX 50-day participant rate to cross back above 50% as your first signal that the intermediate trend is repairing. Until that happens, treat this as a counter-trend thrust inside a damaged tape, not a new leg higher.
Bottom line: Short-term thrust is real but narrow -- mega-cap semis and consumer tech are doing the work while the median S&P 500 stock remains below its 50-day moving average, and the NH-NL picture turns negative at every lookback beyond one month, making this a trading bounce to respect but not yet a breadth-confirmed advance to trust.

Investor Sentiment Report
%Bull-Bear Spread
The %Bull-Bear Spread measures the gap between bullish and bearish investor sentiment, often from surveys like AAII. It’s a contrarian indicator—extreme optimism may signal a coming pullback, while extreme pessimism can hint at a potential rally. Large positive or negative spreads often mark market turning points.
The AAII bull-bear spread printed -7.24% for the week ending April 9, a sharp improvement from -17.86% the prior week and a considerable recovery from the -21.60% trough registered on March 19. Bears still outnumber bulls, but the velocity of the rebound -- roughly fourteen points in three weeks -- tells you capitulation selling is fading and some sidelined participants are beginning to re-engage.
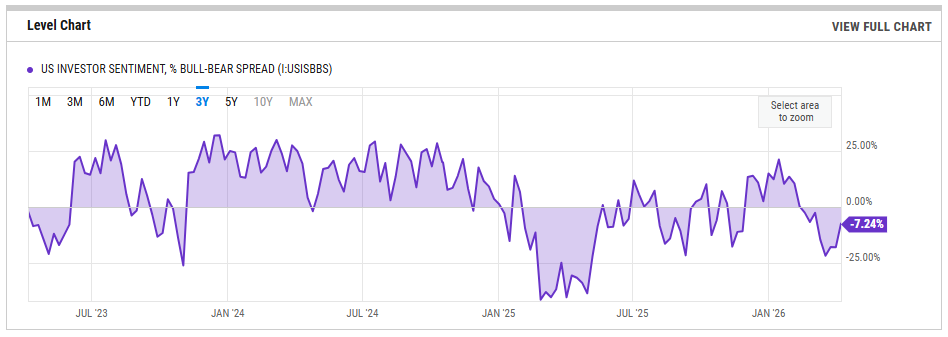
Context matters: the long-term average sits near +6.29%, and this reading stood at -40.16% one year ago during last spring's washout, so current pessimism is moderate rather than extreme. The sub-zero reading remains contrarian-supportive for equities; historically, sustained prints below zero have preceded tradeable rallies once price stabilizes. A continued march back toward zero and then into positive single digits would confirm the sentiment unwind is genuine. The tripwire to watch on the upside is a move above +20, the level hit in mid-January, which marked the crowded-optimism ceiling before this entire leg lower began. On the downside, any fresh deterioration back below -15 without an accompanying price catalyst would suggest the recovery in sentiment is fragile and vulnerable to another liquidation wave.
NAAIM Exposure Index
The NAAIM Exposure Index (National Association of Active Investment Managers Exposure Index) measures the average exposure to U.S. equity markets as reported by its member firms. These are typically active money managers who provide their equity exposure levels weekly. The index offers insight into how much these managers are investing in equities at any given time, ranging from being fully short (-100%) to leveraged long (up to +200%).
The NAAIM Exposure Index posted 69.38 for the week of April 8, a marginal uptick from 68.36 the prior week and essentially flat versus 68.52 on March 25. Active managers have been parked in the high-60s for three consecutive weeks after climbing off the 60.24 low registered on March 18. Compared to the Q1 average of 82.00, this represents a meaningful de-risking -- managers have shed more than twelve points of exposure since the start of the year.
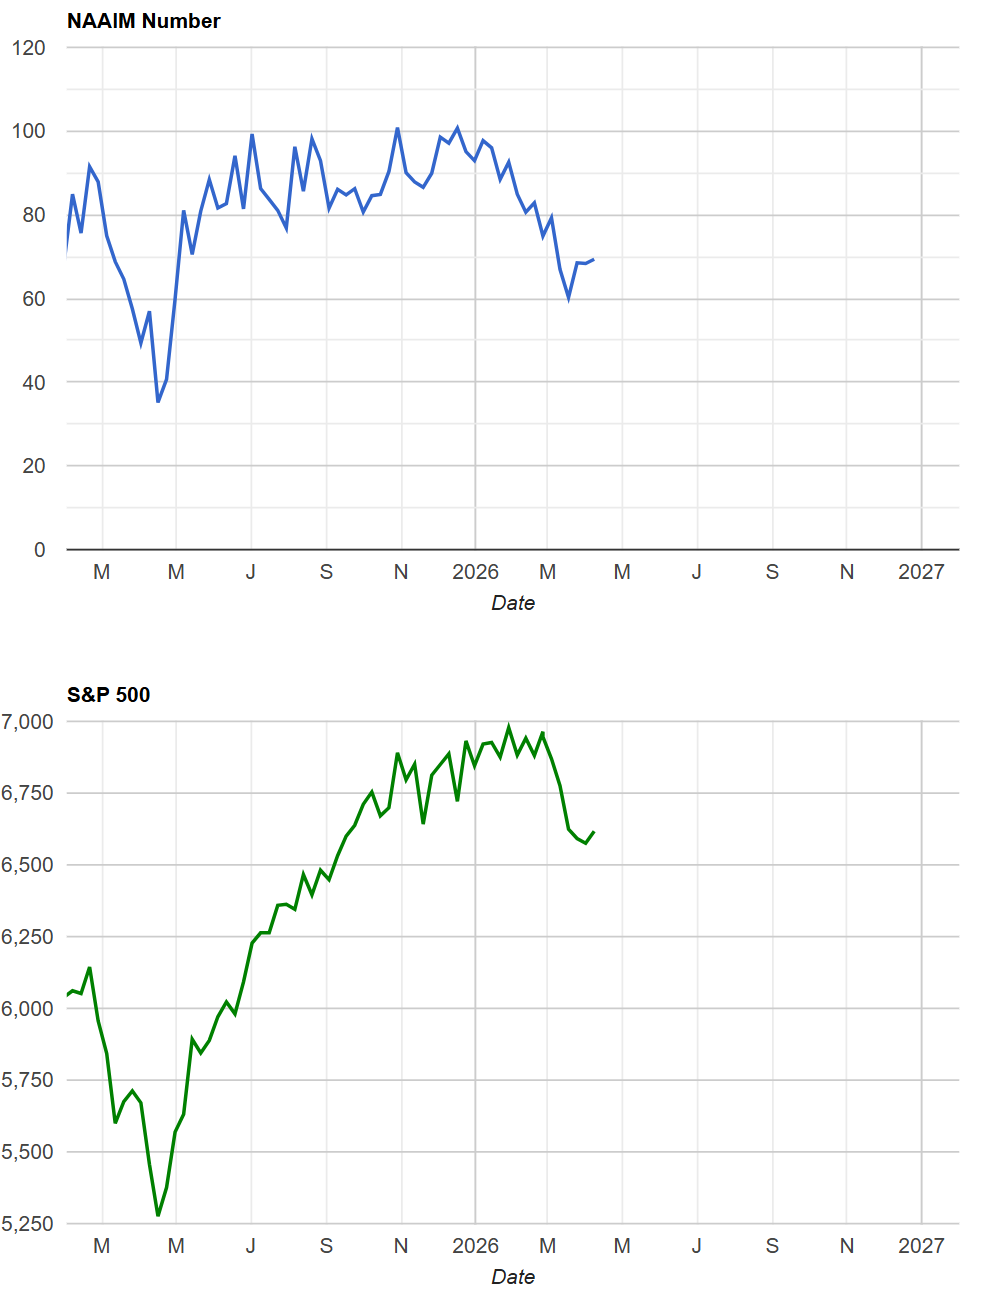
The current level implies roughly 30 percent dry powder among the surveyed managers, which is supportive on a contrarian basis: that capital becomes fuel for the next up-move once a catalyst appears. The risk, however, is that managers are stabilizing here rather than reloading aggressively, which suggests conviction remains low. A drop into the mid-50s without corresponding price damage would be a strong contrarian buy signal, indicating managers are hedged beyond what the tape warrants. Conversely, a push back above 90 would flash vulnerability -- at that point there is no one left to buy and any negative surprise triggers forced de-risking.
CBOE Total Put/Call Ratio
CBOE's total put/call ratio includes index options and equity options. It's a popular indicator for market sentiment. A high put/call ratio suggests that the market is overly bearish and stocks might rebound. A low put/call ratio suggests that market exuberance could result in a sharp fall.
The CBOE total put/call ratio 10-day moving average sits at 1.00 as of April 9, ticking down marginally from 1.01 the session prior. A reading at the 1.00 line means options traders are purchasing puts and calls in roughly equal proportion, which on a smoothed basis reflects persistent demand for downside protection. For context, the 10-day average below 0.80 characterizes complacent, risk-on tape conditions, while prints above 1.00 mark genuine fear-driven hedging.
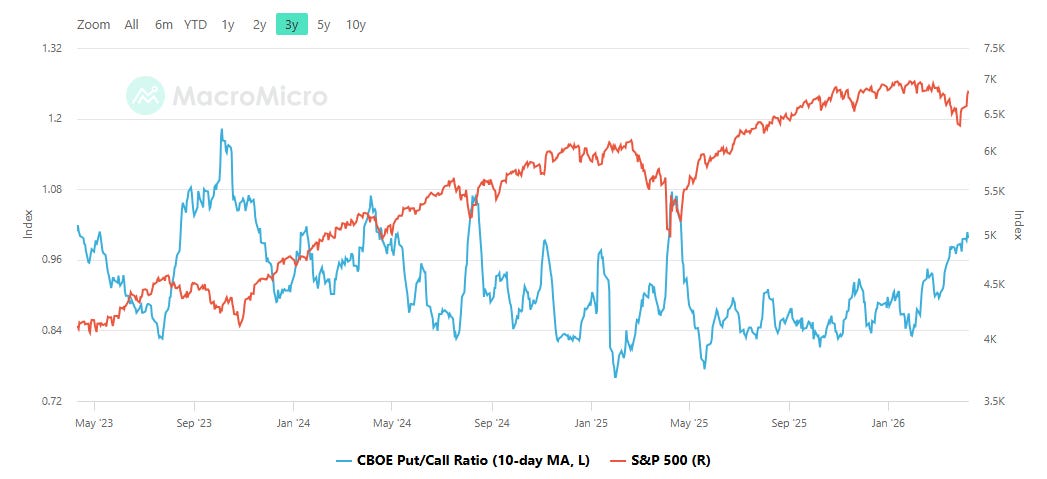
The current level is sitting right on the border of elevated anxiety. From a contrarian lens, sustained readings at or above 1.00 have historically coincided with the later stages of drawdowns rather than the beginning -- the hedging has already been done, which tends to limit further downside depth and improve the quality of the eventual bounce. The tripwire here is direction: if the 10-day average begins rolling below 0.95, it would indicate the hedging impulse is receding and risk appetite is returning, a constructive signal. A fresh push above 1.05 would suggest a new wave of fear is arriving and the drawdown has further to run.
Equity vs Bond Volatility
The Merrill Lynch Option Volatility Estimate [MOVE] Index from BofAML and the CBOE Volatility Index [VIX] respectively represent market volatility of U.S. Treasury futures and the S&P 500 index. They typically move in tandem but when they diverge, an opportunity can emerge from one having to “catch-up” to the other.
The MOVE index closed at 74.01 on April 9, while the VIX printed 19.23 on April 10. The divergence between these two readings is the most important signal on the tape this week. MOVE spiked violently to approximately 150-175 in late March through early April -- a severe Treasury market stress episode -- but has since collapsed back to 74, well below the 120 danger threshold and near the lower bound of its trailing-year range. The VIX, by contrast, ran into the low-to-mid 30s during the same episode but has only partially retreated, hovering near 19, which keeps it in the elevated zone above the high-teens threshold.
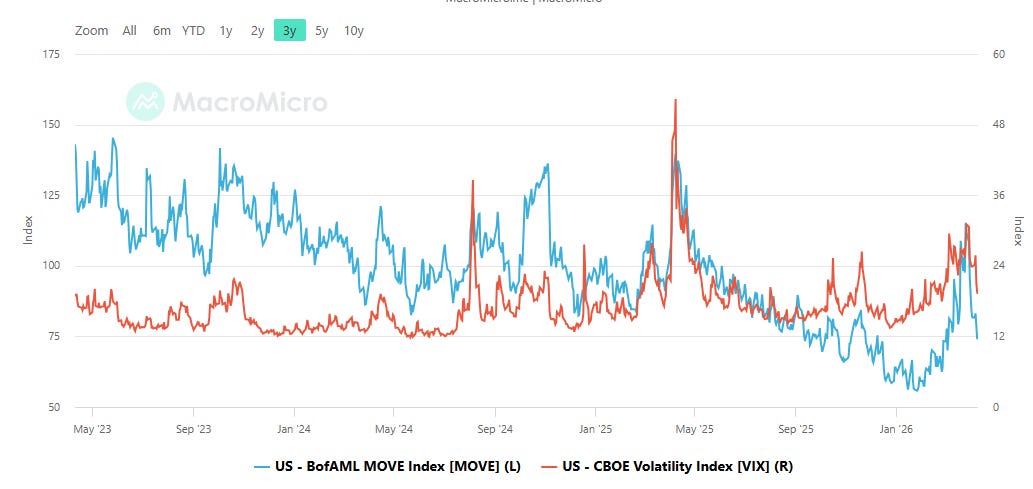
The pattern of MOVE normalizing rapidly while VIX remains sticky tells you bond-market stress has resolved -- likely via policy clarification or liquidity support -- but equity participants have not yet absorbed that message. Historically, when MOVE leads to the downside and VIX follows with a lag, equities tend to stabilize. The tripwire is a MOVE re-acceleration back above 120 with a sleepy VIX, which would signal a new Treasury dislocation the equity market has not priced. On the VIX side, a clean break below 17 would confirm the equity fear premium is draining and risk-on conditions are reasserting.
CNN Fear & Greed
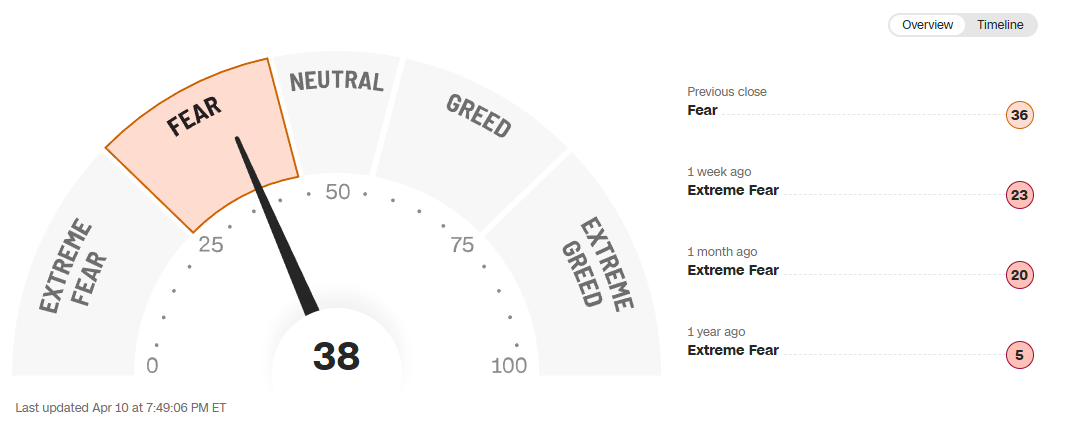
The CNN Fear and Greed Index posted a composite reading of 38 on April 10, labeled Fear, up from 36 at the previous close and a notable improvement from the Extreme Fear print of 23 just one week ago. One month ago the gauge sat at 20, also Extreme Fear, and the one-year-ago reading was a remarkable 5 -- near the absolute floor of the zero-to-100 scale -- marking the panic low from last spring's dislocation. The one-year trajectory is one of gradual regime repair: the index has crawled from deep capitulation toward low-end Fear, but has not yet approached Neutral at 50, let alone Greed territory.
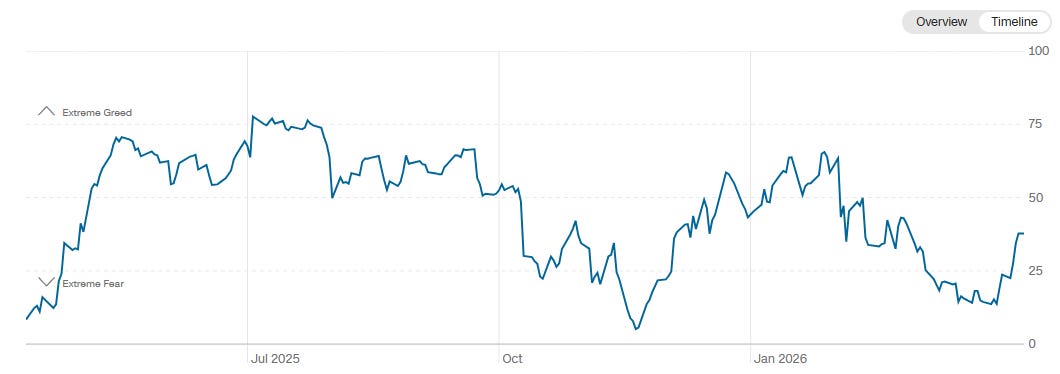
A reading of 38 keeps the index in contrarian-supportive territory -- there is enough pessimism baked into positioning that positive surprises get amplified, while negative surprises meet a market that has already de-risked. The tripwire on the upside is a push through 55 into Greed, which would indicate the easy contrarian edge has been spent and the market is no longer offering a fear discount. On the downside, a retreat back below 20 would signal the recovery attempt has failed and a deeper capitulation cycle is underway.
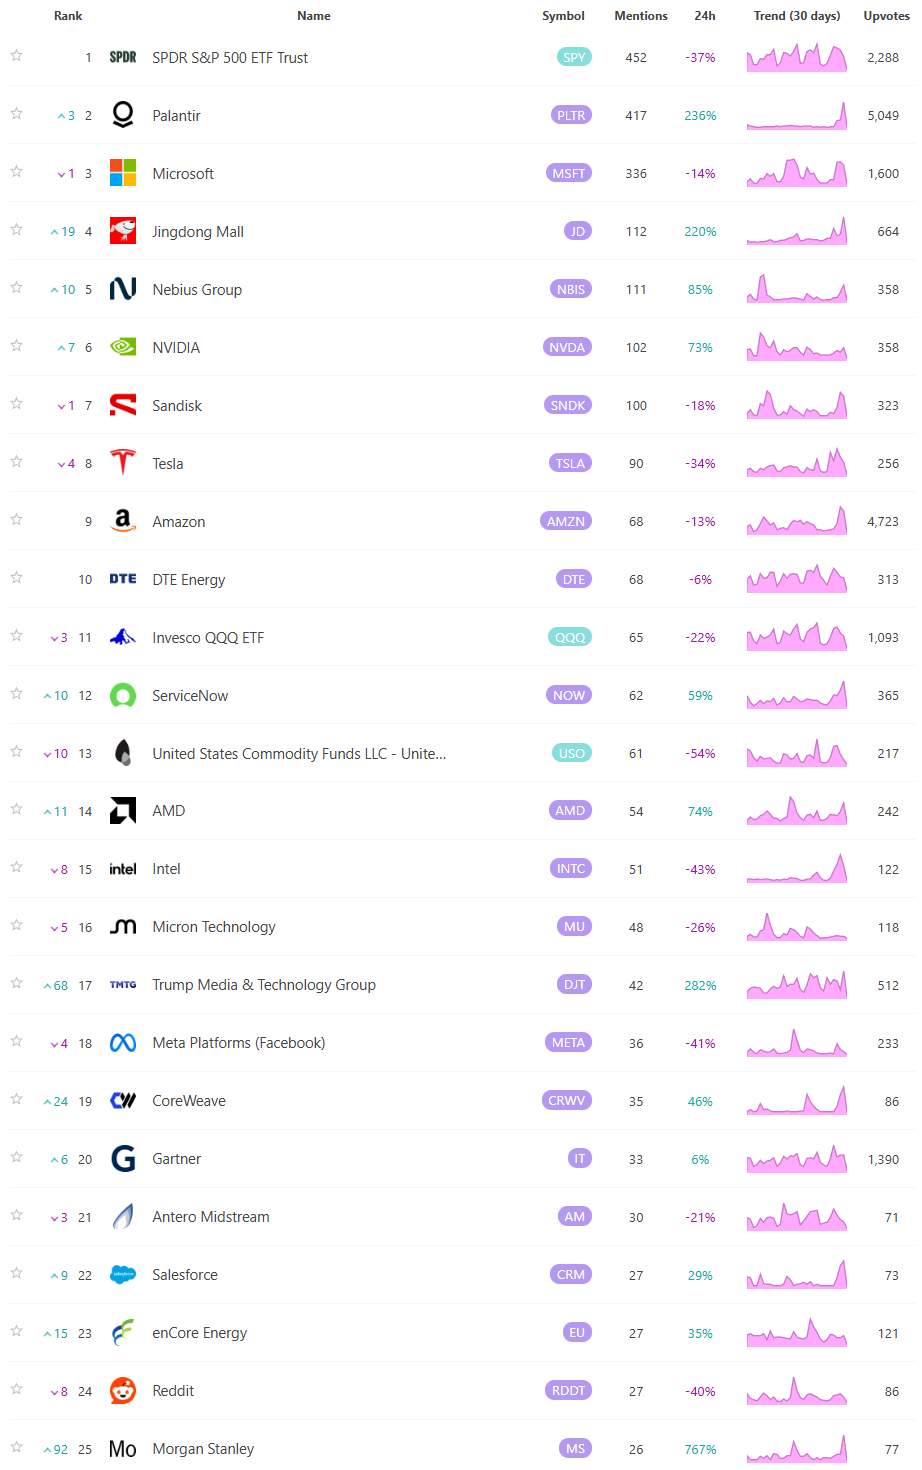
Social Media Favs
Social sentiment offers a real-time view of investor mood, often revealing market shifts before traditional indicators. It can signal momentum changes, spot emerging trends, and gauge retail investor impact—especially in high-volatility names. Tracking sentiment around events or earnings provides actionable insights, and when layered with quantitative models, can enhance predictive accuracy and risk management. Sustained sentiment trends often mirror broader market cycles, making this data a valuable tool for both short-term trades and long-term positioning.
Bottom line: the tape shows a market climbing out of a fear trough rather than sliding into one -- the bull-bear spread is recovering, NAAIM managers hold dry powder, put-call hedging is peaking, bond volatility has normalized ahead of equity volatility, and the Fear and Greed gauge is grinding higher from Extreme Fear -- all of which favor tactical risk-taking into weakness so long as MOVE stays below 120 and the Fear and Greed composite does not roll back below 20.

Technician’s Playbook: Trading the Majors (SPY/QQQ/IWM/DIA)
When you’re a large institutional player, your primary goal is to find liquidity - places to do a ton of business with the least amount of slippage possible. VolumeLeaders.com automatically identifies and visually plots the exact spots where institutions are doing business and where they are likely to return for more. It’s one of the primary reasons “support” and “resistance” concepts work and truly one of the reasons “price has memory”.
SPY
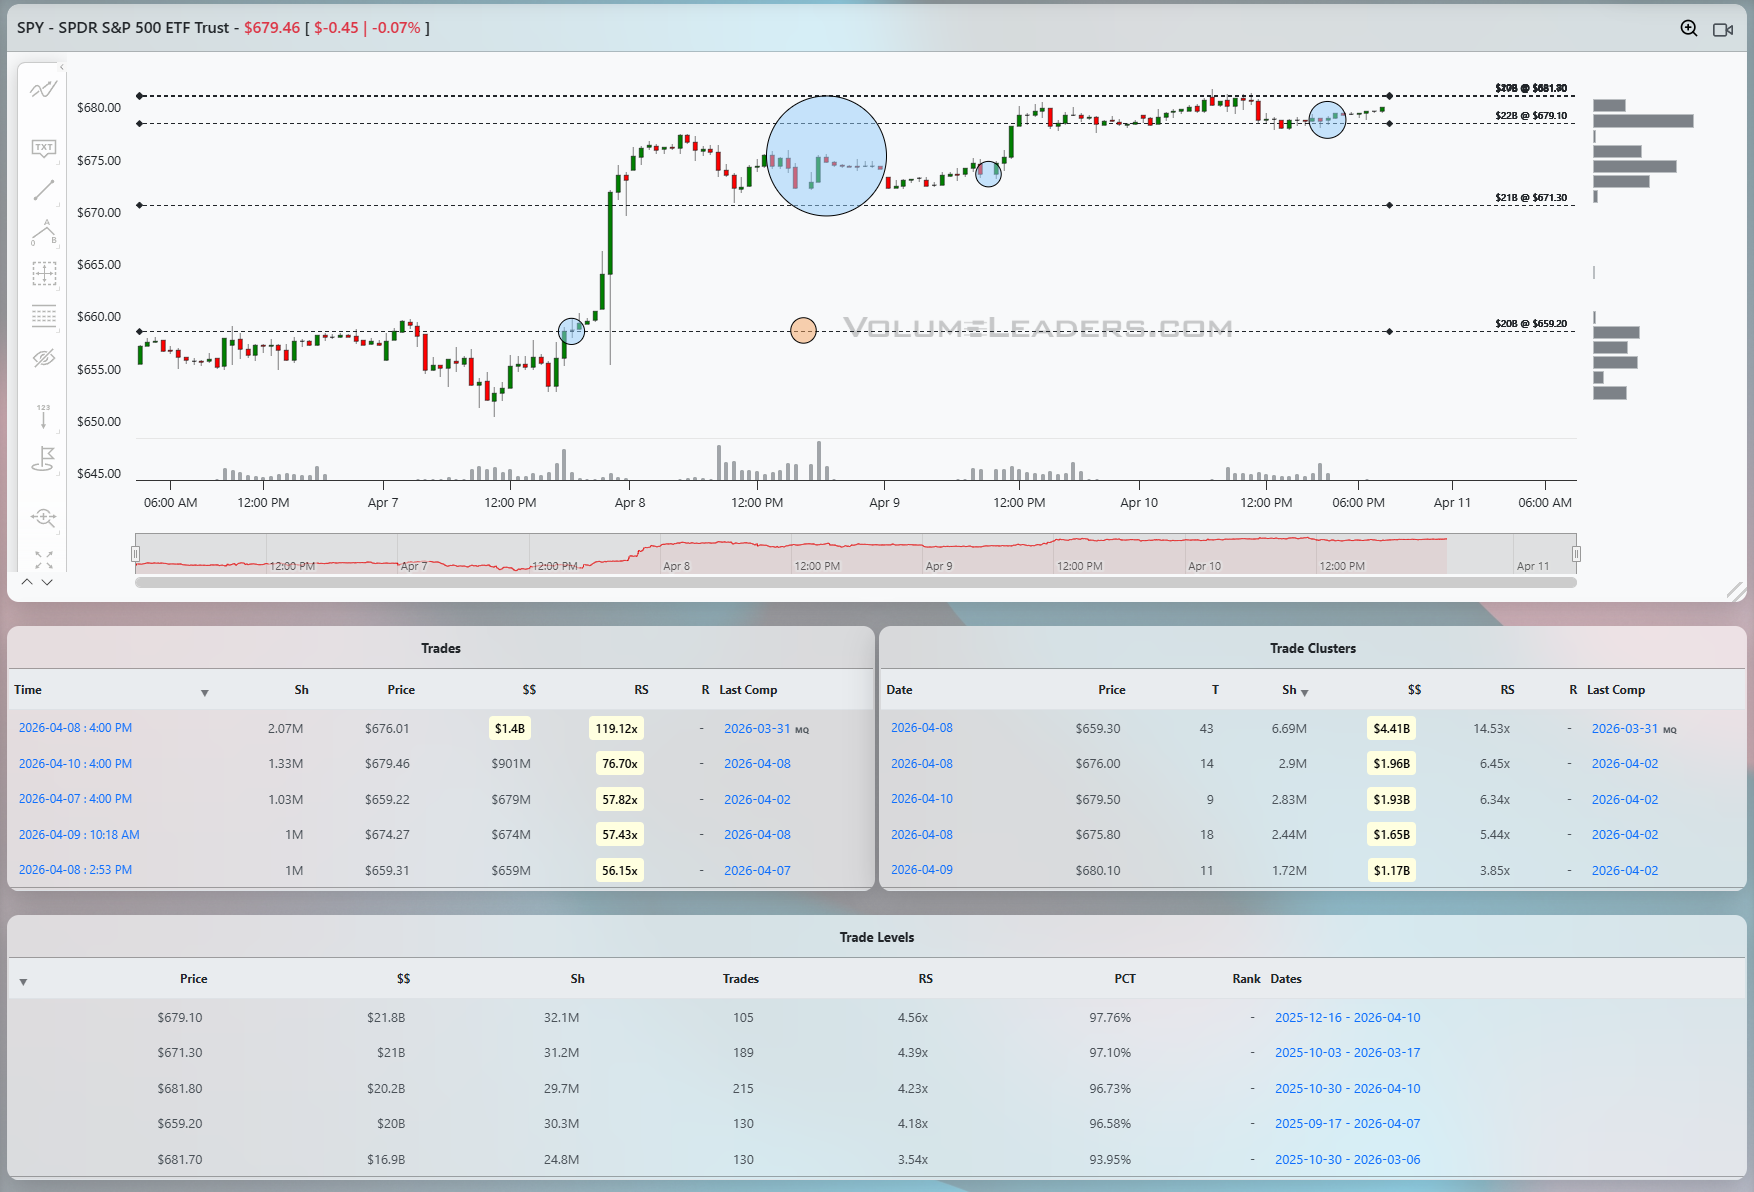
SPY delivered the week's cleanest institutional footprint. The April 8 ceasefire impulse drove price from the $659 area to the $680 region in a single vertical session, and the tape at the low end of that move was not subtle. A $1.4 billion print at $676.01 on April 8 at 4:00 PM with a relative size of 119.12x stands as the dominant institutional statement of the week -- one of the largest dollar prints in SPY's history on a day-to-day basis. That print landed at the close of the ceasefire surge session, and the cluster underneath it at $659.30 carrying $4.41 billion across 43 trades is the most important level on the entire chart. That cluster is the foundation. It is where the accumulation that preceded the impulse was built, and the $659.20 trade level at $20 billion notional with a 96.58% PCT confirms this area has been contested by serious capital over a long date range. Below $659, there is no comparable support within the visible structure. A return to that zone without a macro catalyst deterioration would be the most well-defined re-entry on the book.
The $679.10 level at $21.8 billion and 97.76% PCT is the ceiling that matters most. SPY closed the week at $679.46, sitting essentially on top of it. The cluster at $679.50 carrying $1.93 billion and the cluster at $680.10 at $1.17 billion confirm this as the contested zone. The $681.80 and $681.70 levels above, each carrying roughly $20 billion in notional, define the next shelf. Acceptance above $681.80 with volume behind it would open a run toward the upper boundary of the range; failure here, which is the base case given where price closed Friday, sets up a retest of the $675.80 cluster and then the $676 pivot from the April 8 close print.
QQQ
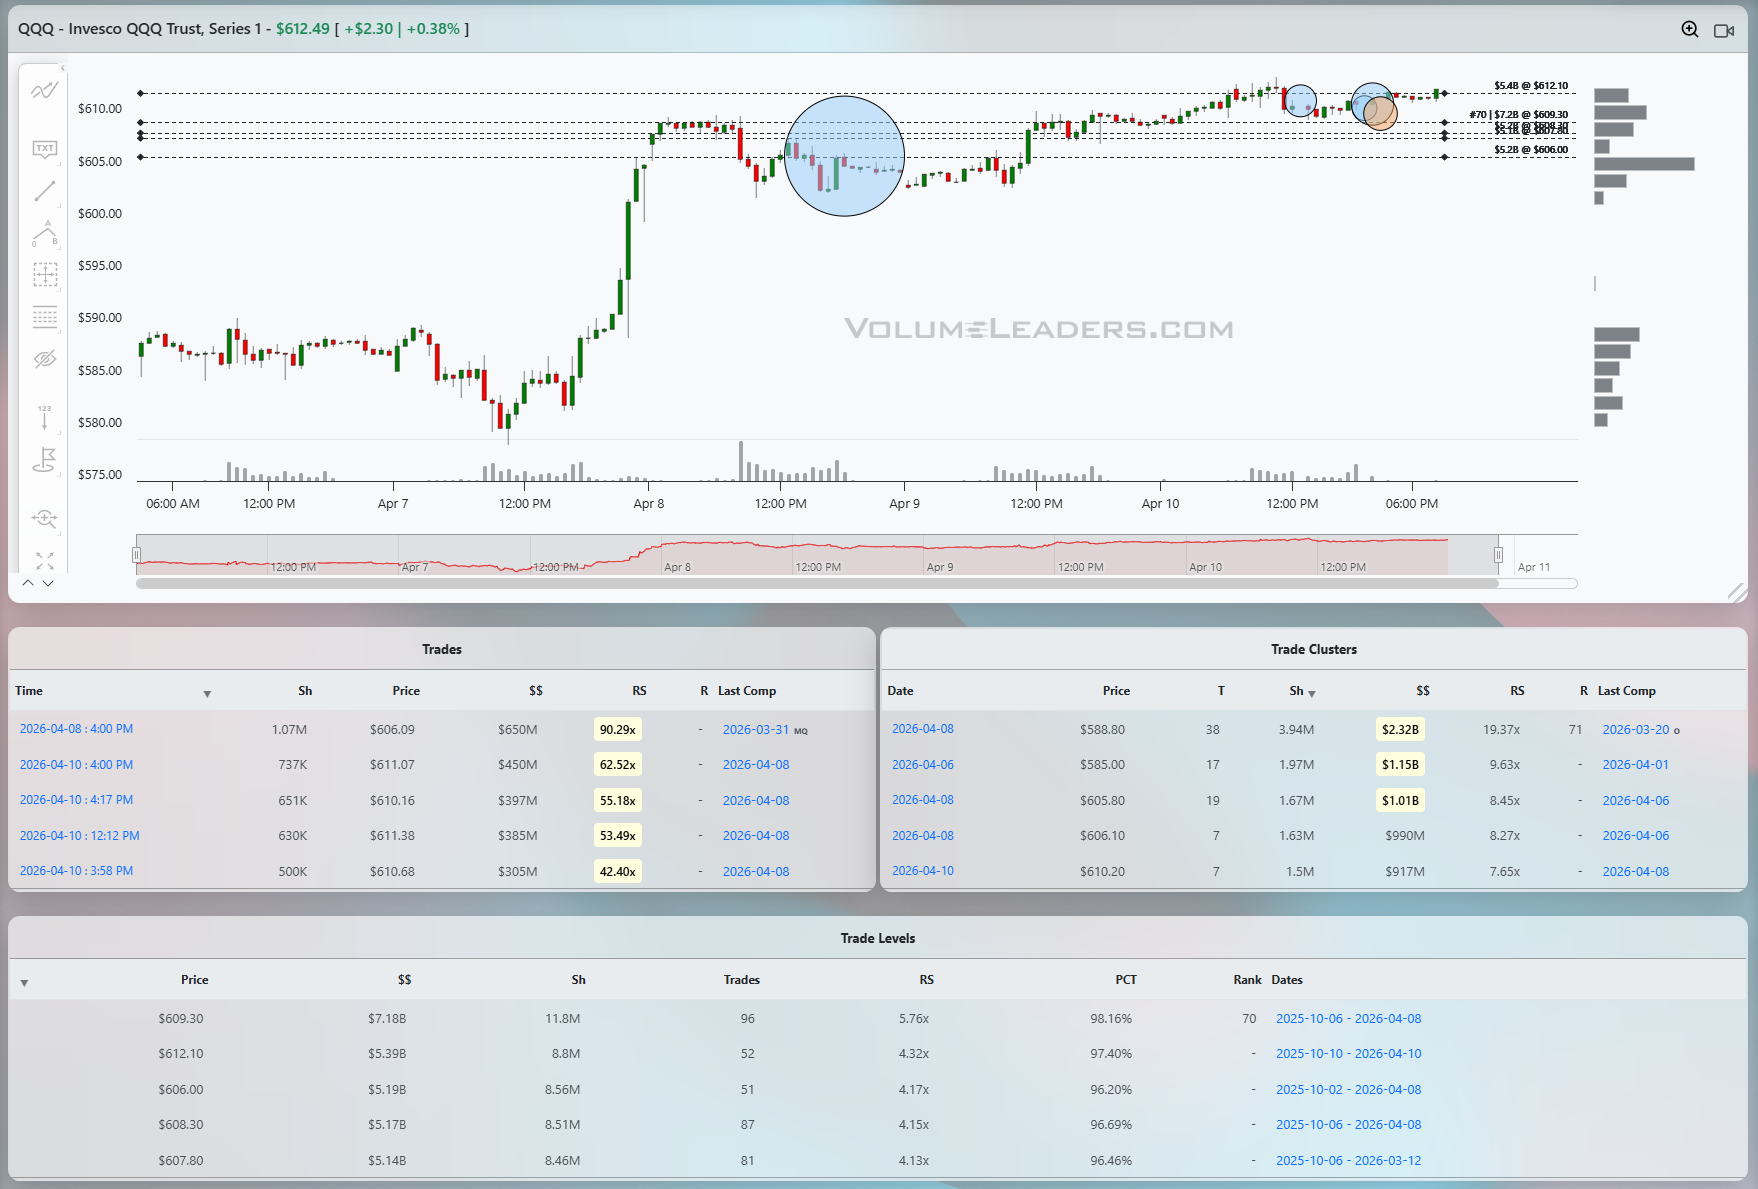
QQQ layered in its own complexity. The $609.30 level at $7.18 billion and rank 70 -- the 70th largest level in QQQ's history -- is the structural anchor. The $2.32 billion cluster at $588.80 with a rank of 71 is the floor of floors, dating back to March 20. The current price at $612.49 is hovering above the $612.10 level at $5.39 billion and 97.40% PCT, which is also rank 52 historically -- so QQQ is sitting right on top of a top-100 all-time level. That is the line of scrimmage. The April 8 close print of $650 million at $606.09 with a 90.29x relative size was the institutional anchor for the ceasefire move. The cluster accumulation at $605.80 and $606.10, each carrying approximately $1 billion, marks the first meaningful support below current price. A flush back through $609 without a macro catalyst would be concerning; rejection at $612.10 with diminishing volume would be the tell that the level is defending. Above $612.10, the $608.30 and $607.80 levels become support and the path opens toward $615 and beyond.
IWM
IWM carries the week's most significant historical print. The #14 ranked trade in IWM's entire history printed on April 8 at $252.76, carrying $898 million at a relative size of 96.62x. That print landed at the base of the ceasefire impulse, exactly at the $252.80 level that carries $2.39 billion notional and a 67.96% PCT. The $250.80 level at $2.42 billion and the $250.10 at $1.96 billion stack just below, creating a dense support shelf in the $250 to $253 zone that is now the most institutionally established area in IWM. The ceasefire impulse took price from that zone to $262, establishing the $260.50 level at $1.98 billion as the current ceiling -- visible on the chart as the dashed line price is hovering just above. IWM closed at $261.30, above the $260.50 level but below the $262 cluster region. The line is thinner here than in SPY or QQQ: acceptance above $262 with follow-through would signal small-cap leadership and confirm the risk-on recovery is broadening. A slide back through $260.50 and then $259.20 -- where the $389 million cluster print landed on April 8 -- would indicate the IWM move is stalling at resistance and the heavy base near $252 becomes the next magnet.
DIA
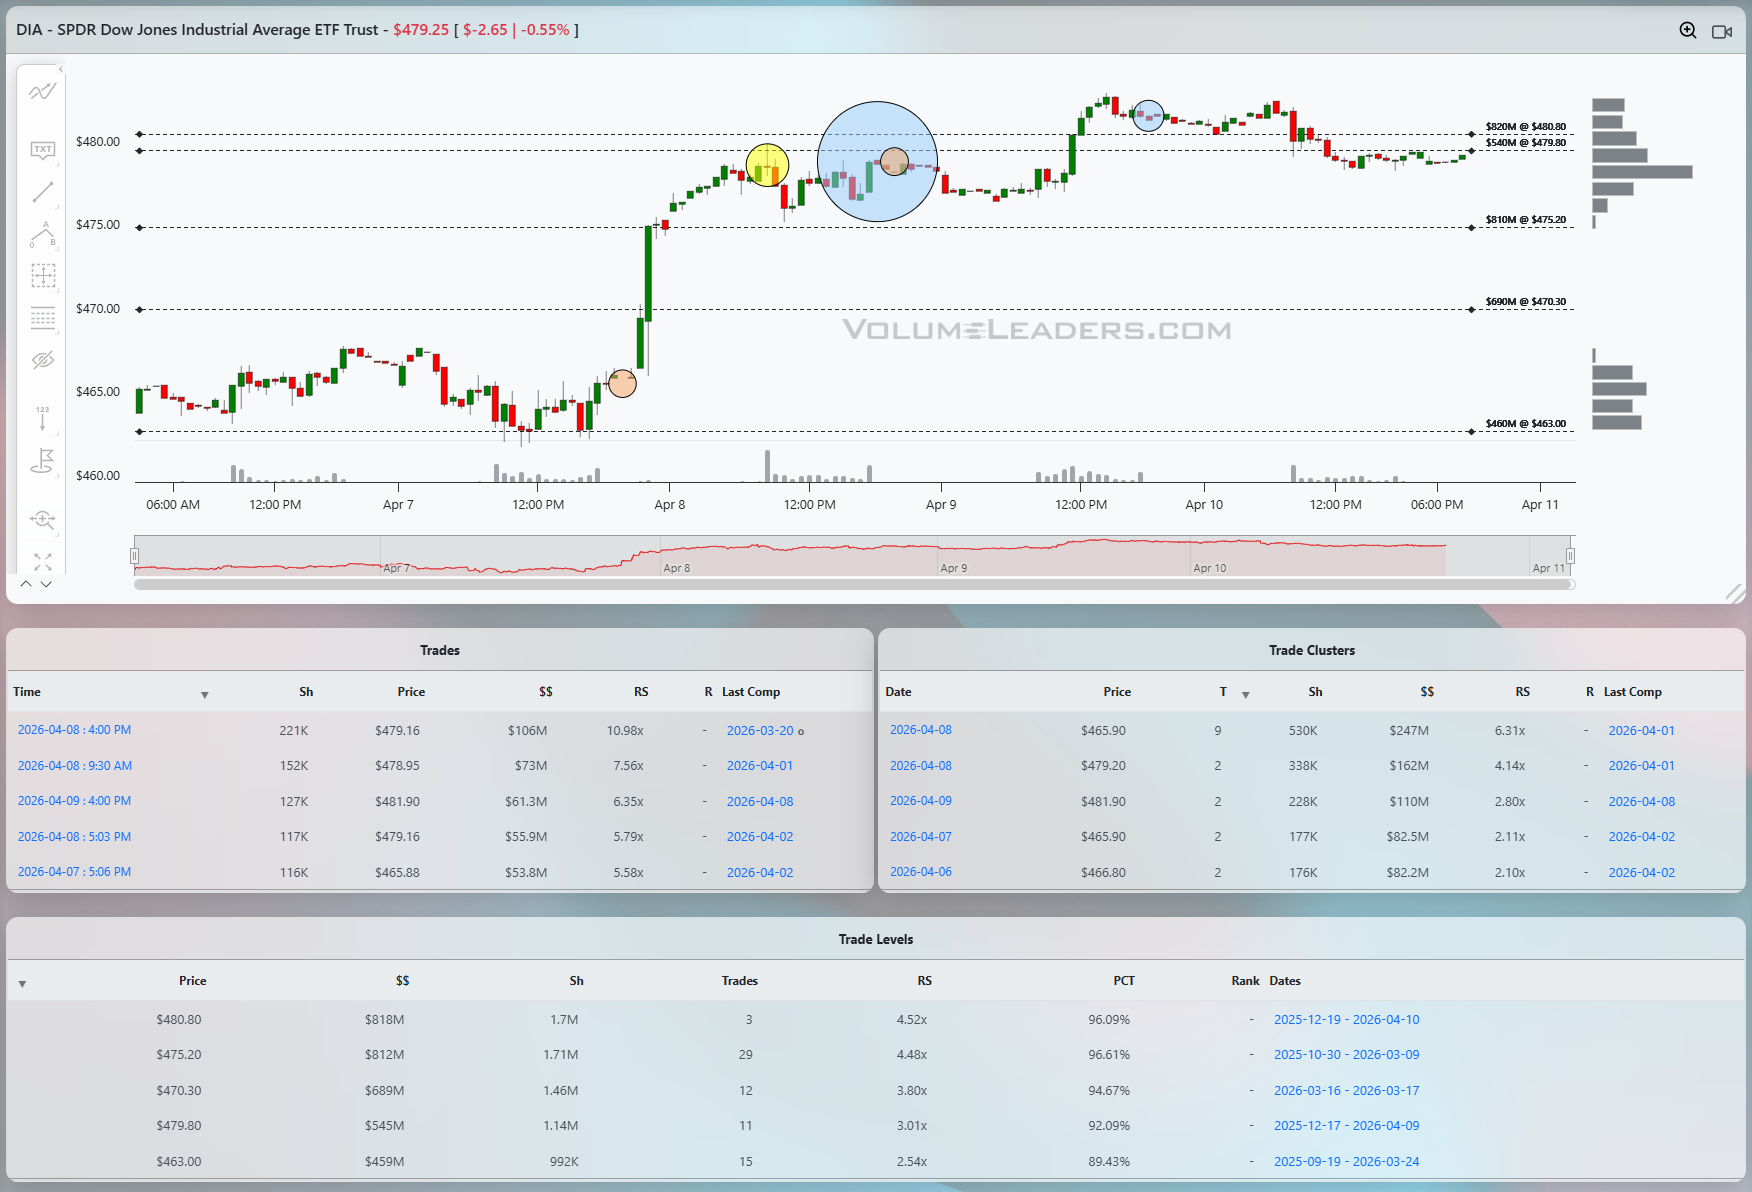
DIA is the quietest of the four. The $480.80 level at $818 million and the $475.20 level at $812 million are closely spaced and both sit at the 96% PCT range, defining a compression zone between $475 and $481. Price at $479.25 is right in the middle of it. The $106 million April 8 close print at $479.16 with a 10.98x relative size is meaningful for DIA but modest compared to the institutional activity in SPY and QQQ -- the Dow complex is not where the big money has been concentrating. The cluster at $465.90 carrying $247 million is the gap fill reference below. The $481.90 cluster and the $480.80 level define the immediate upside resistance; a clean close above $481 would be constructive, but DIA is a follower here, not a leader.
Taken together, the four charts describe a market that printed its institutional thesis on April 8, built a defensible base, and has now drifted into resistance going into the weekend. SPY at $679.10, QQQ at $612.10, and IWM at $260.50 are all sitting at or just above their respective line-of-scrimmage levels. The bullish path requires acceptance above all three simultaneously -- SPY through $681.80, QQQ through $615, IWM through $262 -- with volume that matches the April 8 cluster density. The bearish path only needs SPY to fail at $679.10 and close back inside the $675 to $676 cluster zone, which would confirm the resistance is holding and pull forward a retest of the $659 base. The most dangerous scenario for the tape is a slow grind into April 21 -- the ceasefire expiration date -- without either confirmation, leaving institutional players caught between two well-defined levels with no new catalyst to break the tie.

Summary Of Thematic Performance YTD
VolumeLeaders.com offers a robust set of pre-built thematic filters, allowing you to instantly explore specific market segments. These performance snapshots are provided purely for context and inspiration—think about zeroing in on the leaders and laggards within the strongest and weakest sectors, for example.
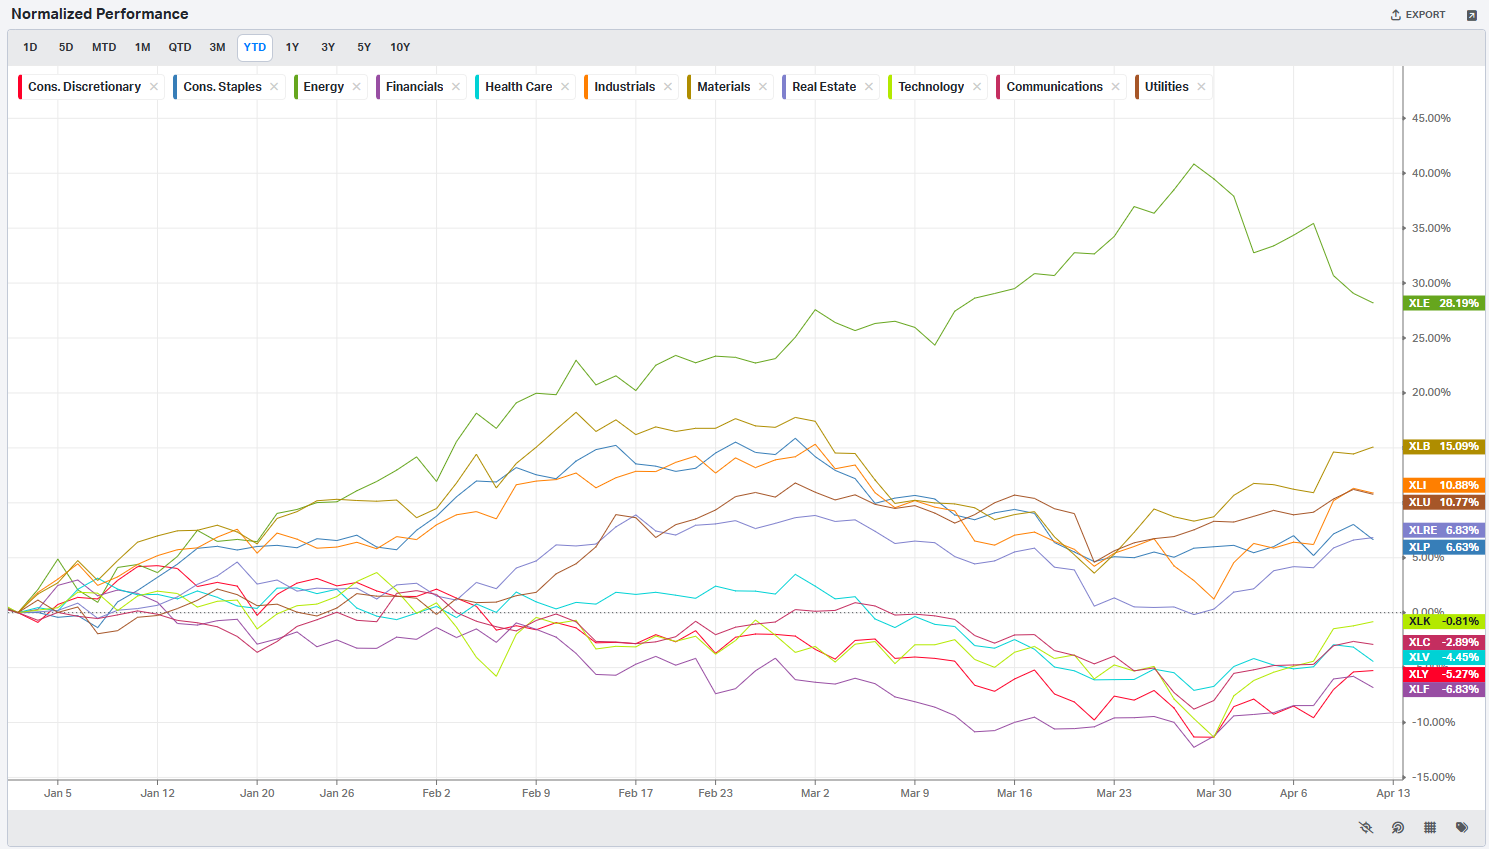
S&P By Sector
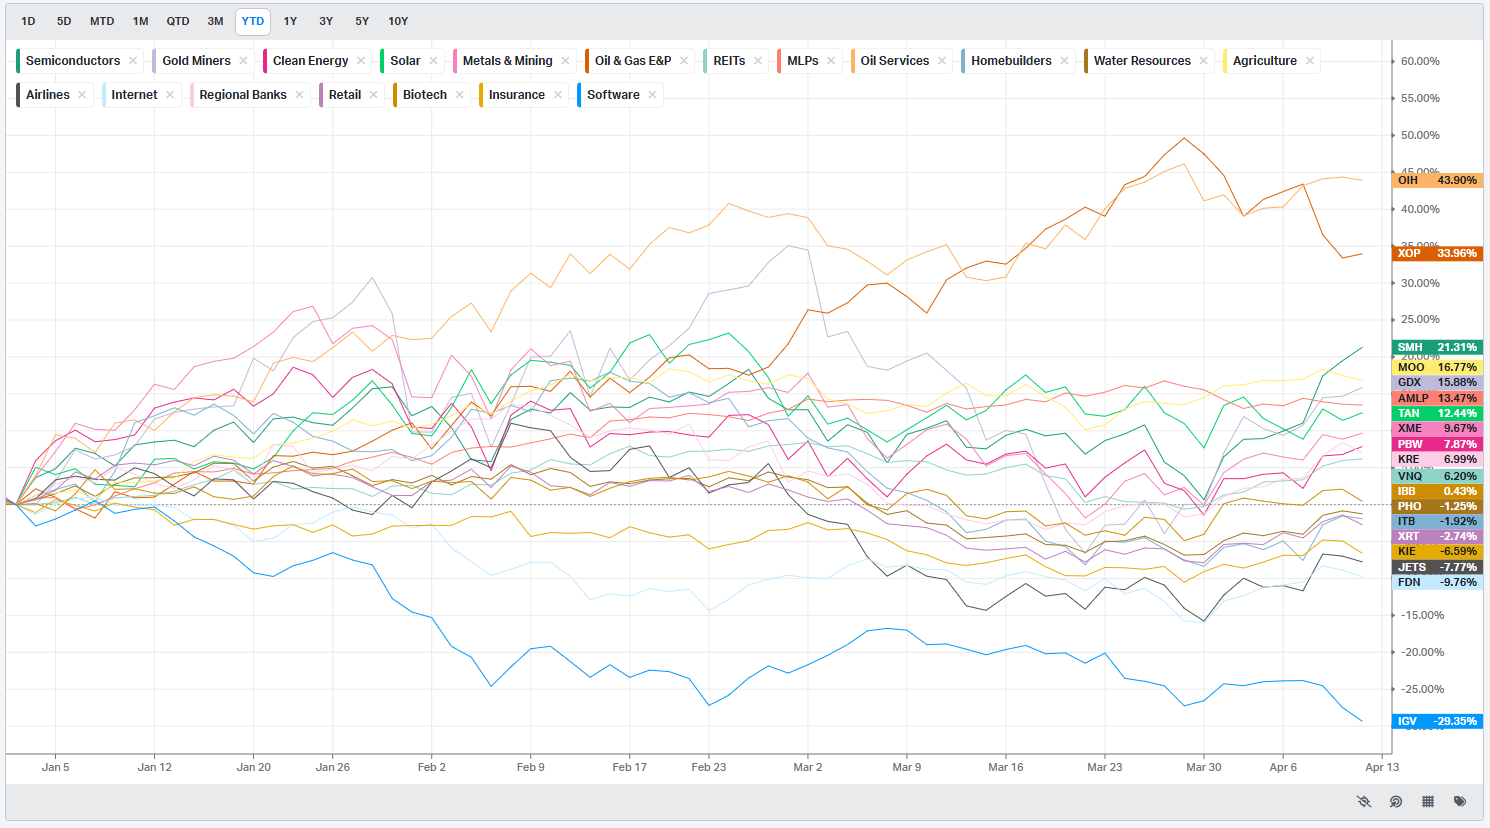
S&P By Industry
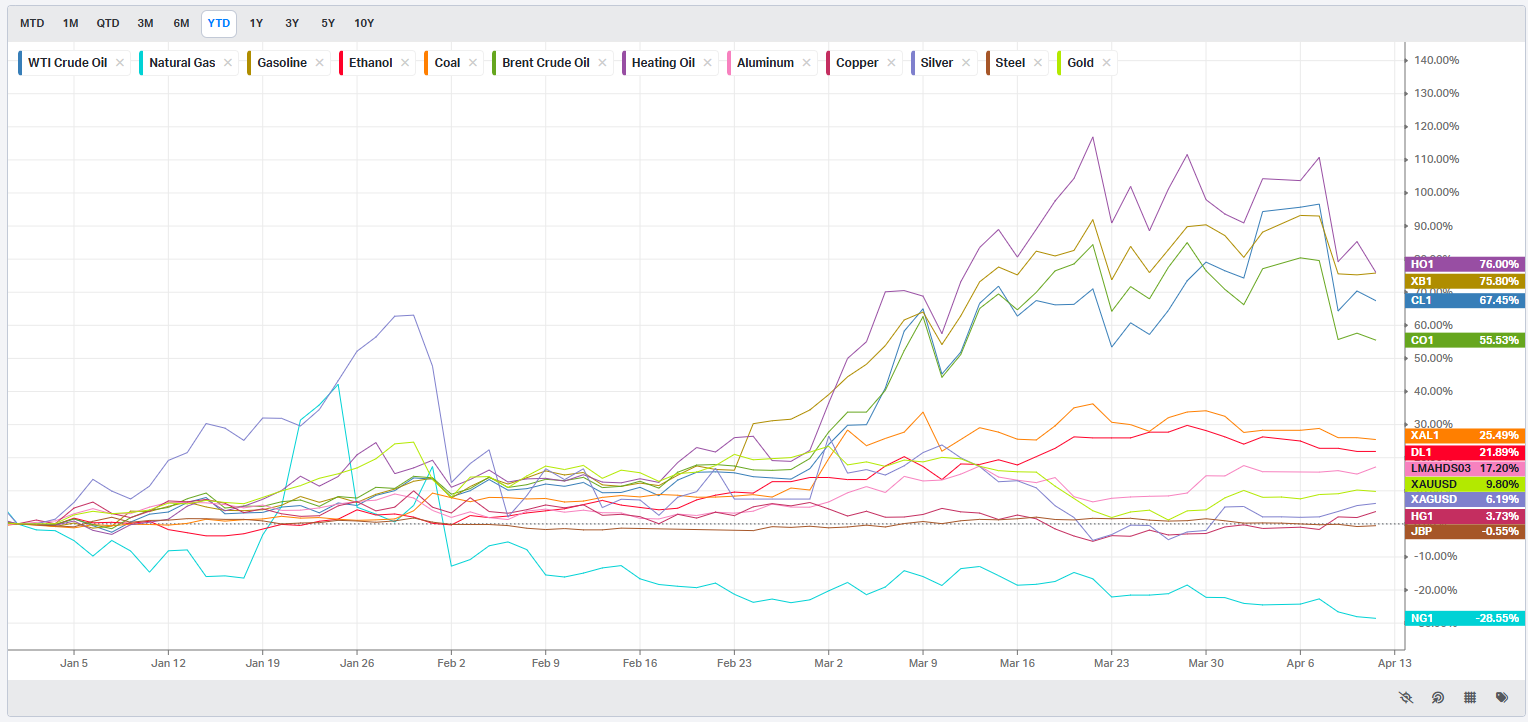
Commodities: Energy & Metals
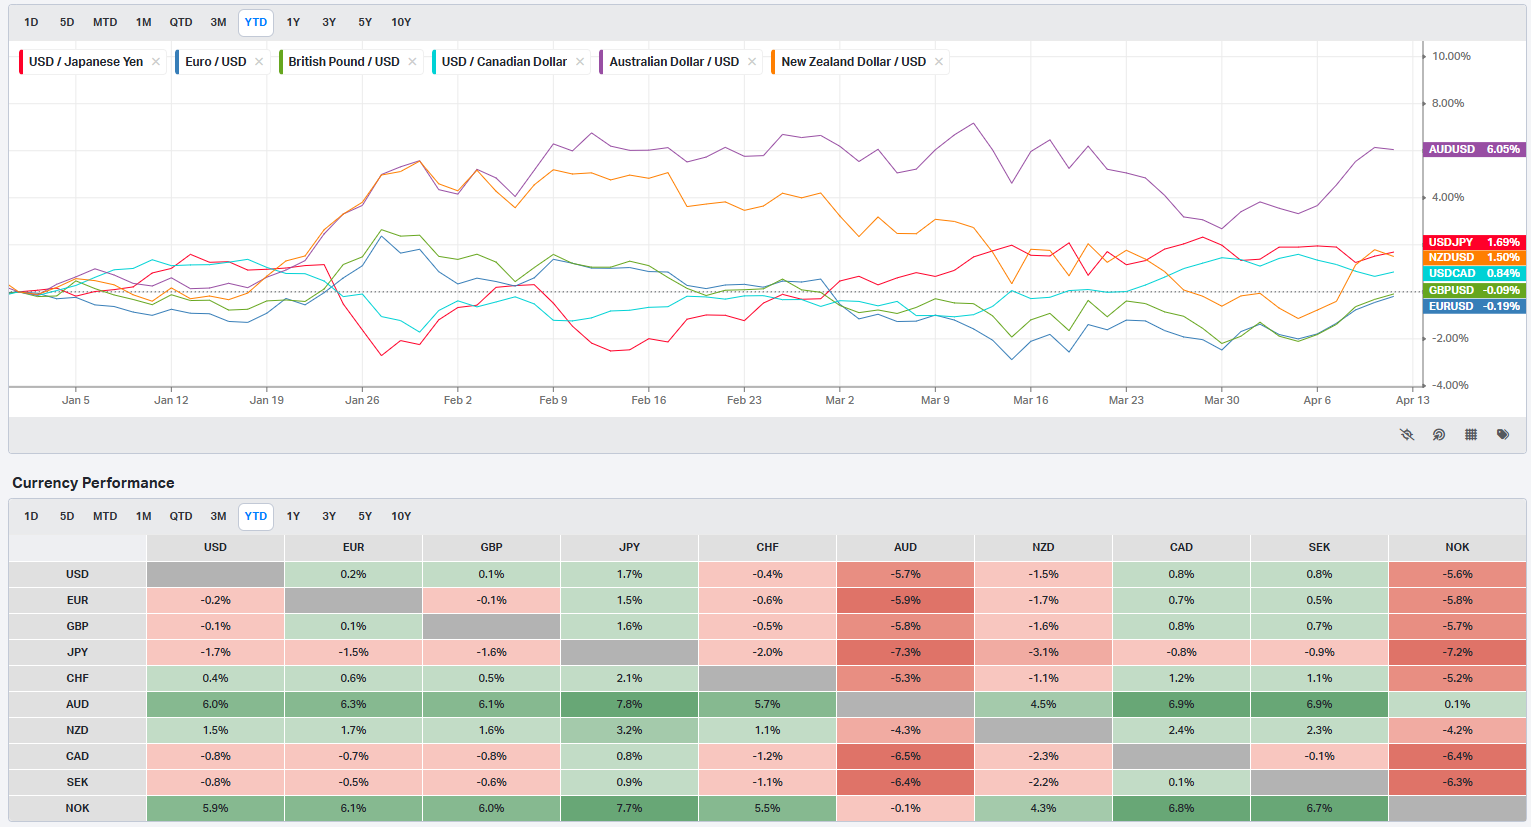
Currencies/Major FX Crosses
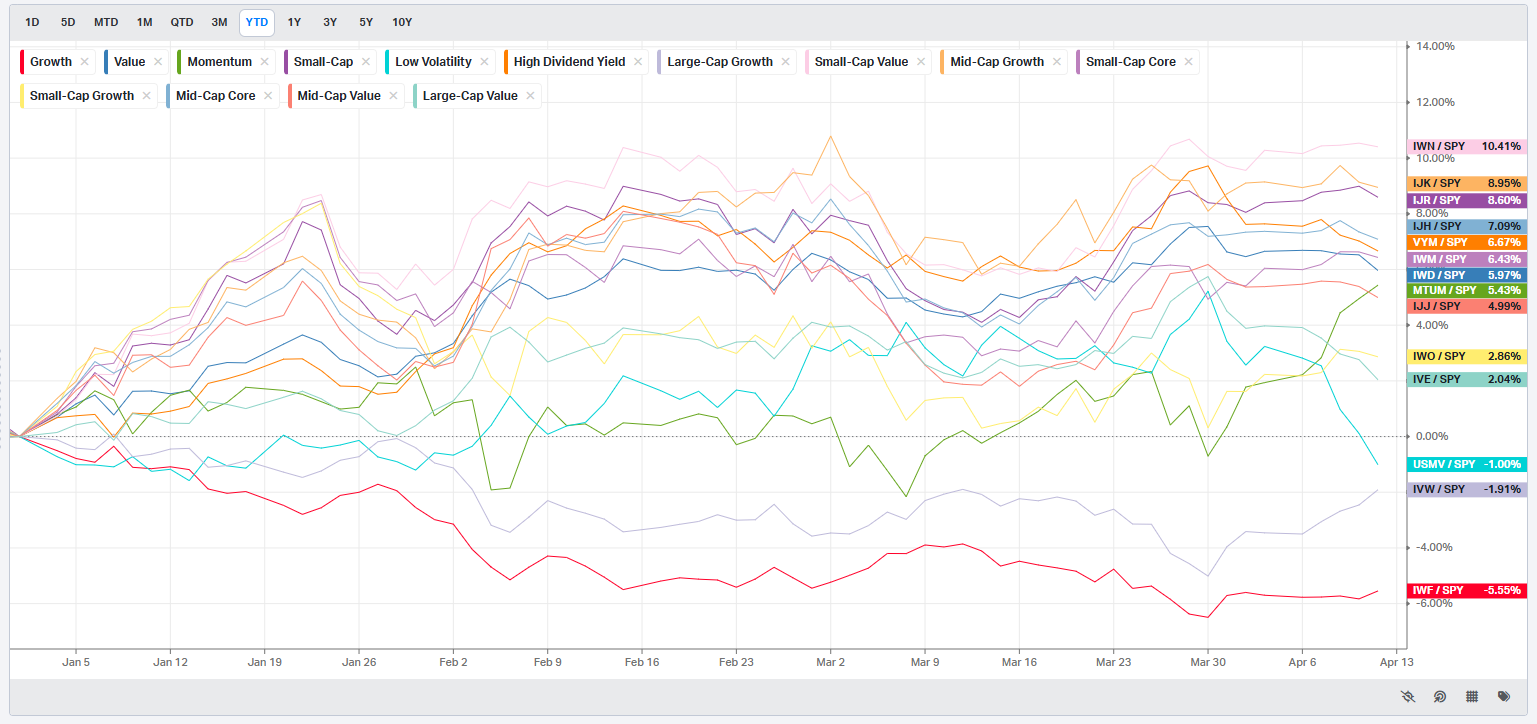
Factors: Style vs Size-vs-Value

Events On Deck This Week
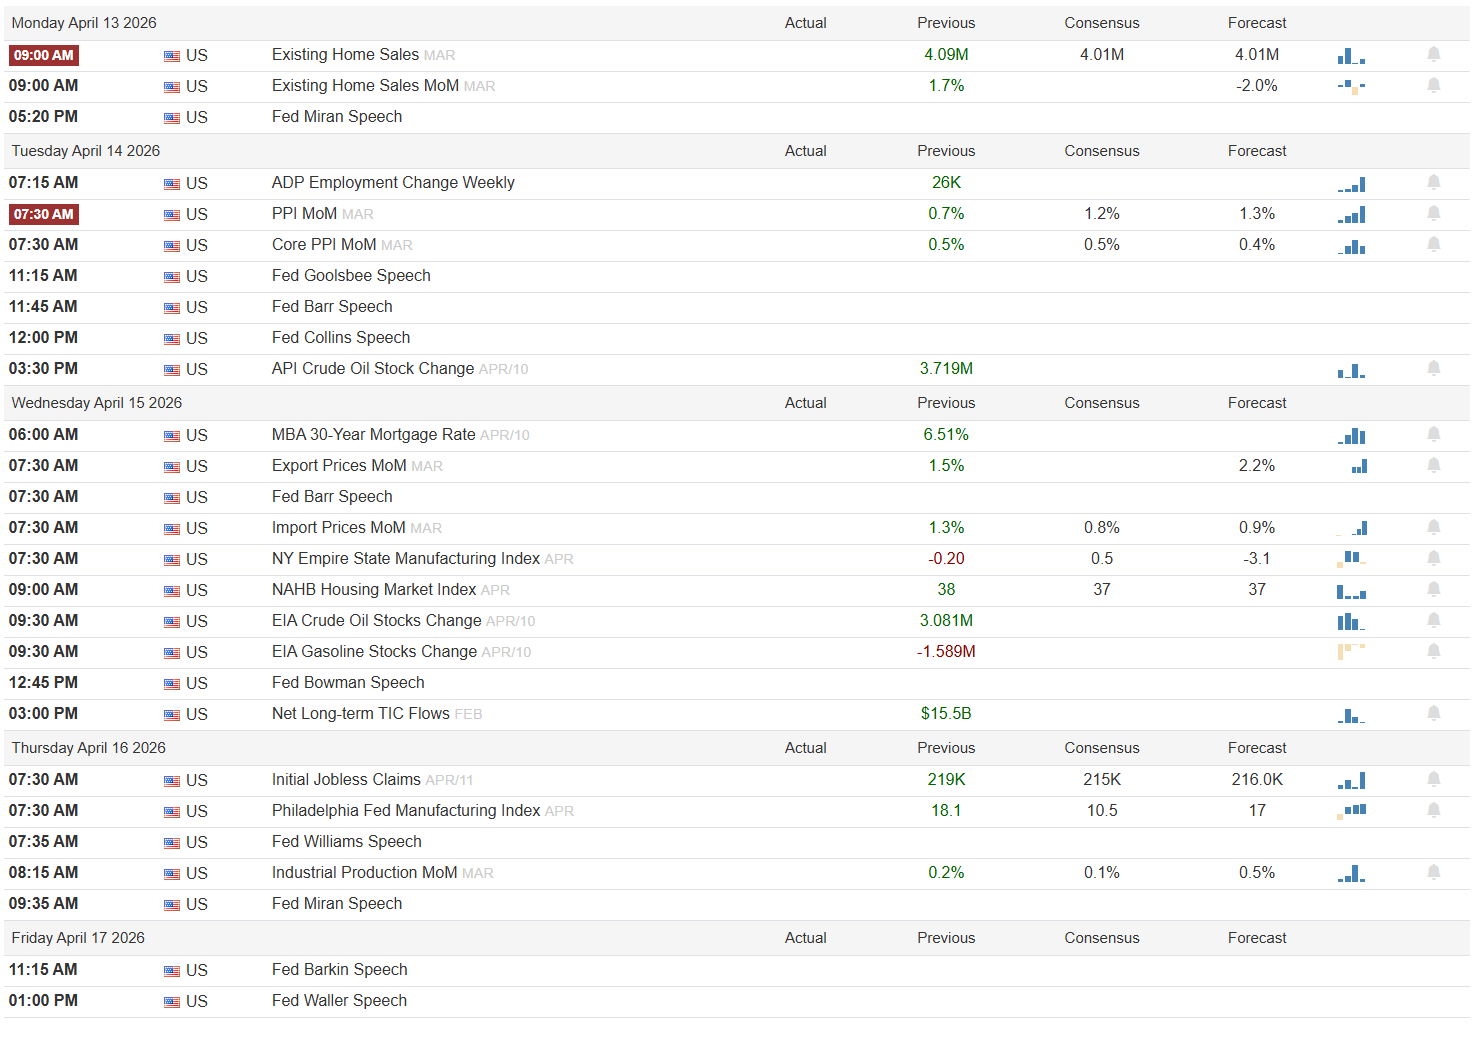
Here are key events happening this week that have the potential to cause outsized moves in the market or heightened short-term volatility.
Monday opens quietly on the data side, with Existing Home Sales for March carrying a previous print of 4.09 million and both consensus and forecast at 4.01 million. The street is already braced for a mild step-down in transaction volume, so a number that matches or beats consensus is largely neutral; a print notably below 4.01 million, however, would reinforce the narrative that the 6.51% mortgage rate environment visible on the Wednesday calendar is throttling demand. Fed Governor Miran speaks in the afternoon -- in the current tariff-inflected backdrop, any language connecting trade policy uncertainty to the growth outlook would be the real market mover, not the housing number.
Tuesday is the week’s first high-stakes session. PPI MoM for March carries a previous reading of 0.7%, consensus at 1.2%, and forecast at 1.3%. Core PPI MoM shows a previous of 0.5%, consensus of 0.5%, and forecast of 0.4%. The risk-off scenario is a headline PPI that meets or exceeds the 1.3% forecast while core softens toward 0.4%, a split that would suggest pipeline price pressure is building in goods while services moderate -- an uncomfortable combination for the Fed. Risk-on would be headline below 0.7% with core in line, opening the door to rate-cut repricing. Three Fed speakers -- Goolsbee, Barr, and Collins -- crowd the mid-day calendar, and with PPI fresh, any acknowledgment that goods inflation is re-accelerating on tariff pass-through would harden the higher-for-longer read. API Crude Oil Stock Change, previously 3.719 million barrels, closes the session; a large build would soften energy-sector momentum.
Wednesday shifts to the supply chain. Import Prices MoM for March previously printed 1.3%, consensus 0.8%, forecast 0.9%; Export Prices came in at 1.5% prior with a forecast of 2.2%. If export prices continue running hot, it signals domestic producers are passing costs outward -- a modest positive for industrial margins. The NY Empire State Manufacturing Index for April carries a deeply negative previous of -0.20, consensus of 0.5, and forecast of -3.1; a print at or below the -3.1 forecast would confirm that mid-Atlantic manufacturing contraction is deepening, which is unambiguously risk-off for industrials. NAHB Housing for April was 38 prior, with consensus and forecast both at 37 -- homebuilder sentiment appears to be grinding sideways at depressed levels rather than recovering. EIA crude and gasoline inventory data land at 9:30, with crude previously building 3.081 million barrels and gasoline drawing 1.589 million barrels. A continued crude build paired with a gasoline draw would keep the refining spread in focus. Fed Governor Bowman speaks at midday.
Thursday is the week’s labor and manufacturing fulcrum. Initial Jobless Claims for the week of April 11 carry a previous of 219K, consensus 215K, and forecast 216.0K. The street is not looking for deterioration, so a print above 230K would be genuinely jarring and would immediately reprice recession odds. The Philadelphia Fed Manufacturing Index for April carries a very strong previous of 18.1, consensus of 10.5, and forecast of 17 -- the consensus is calling for a meaningful deceleration, and a print that tracks closer to the prior 18.1 would be a convincing risk-on signal for the industrial complex. Industrial Production MoM for March shows previous 0.2%, consensus 0.1%, forecast 0.5%; a beat of 0.5% would confirm the manufacturing resilience narrative. Fed Williams speaks in the morning and Miran again in late morning -- Williams in particular carries weight on rate path guidance.
Friday is light on data, with Fed Governor Barkin and Governor Waller both speaking in the late morning and early afternoon. Waller’s remarks will receive outsized attention given his standing as one of the more data-reactive voices on the committee; any softening of his stance on inflation would be read constructively by equities heading into the close.
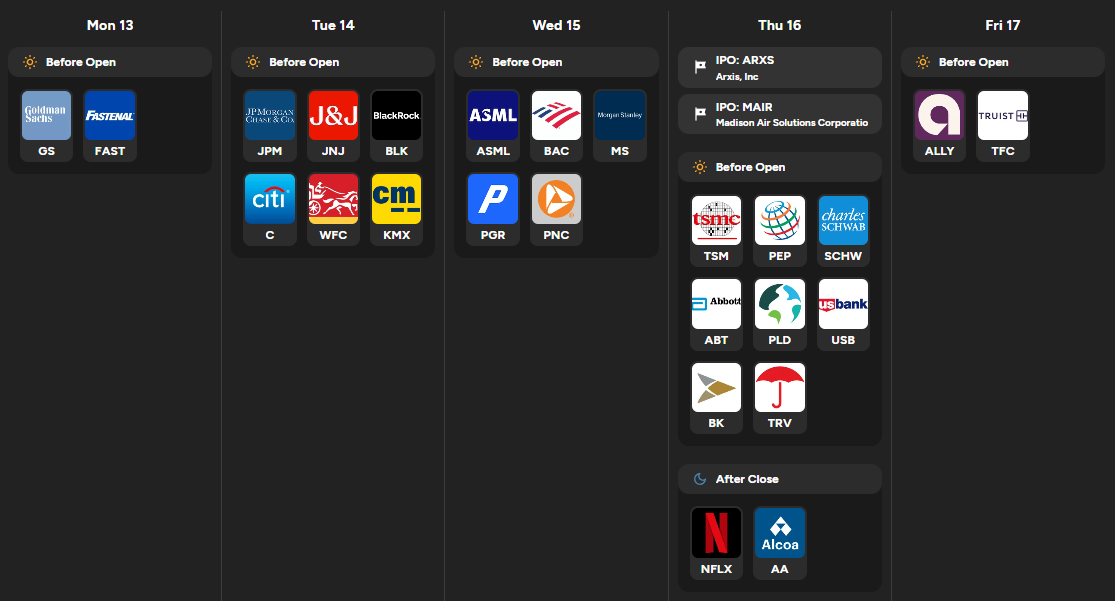
The earnings calendar is front-loaded with financials and carries a strong macro read-through for the entire week. Goldman Sachs and Fastenal open Monday; GS trading revenues and net interest margin guidance will set the tone for broker-dealer sentiment into a heavy slate. Tuesday brings JPMorgan, J&J, BlackRock, Citi, Wells Fargo, and CarMax -- the most consequential morning of the season. JPM's net interest income guidance and credit-card delinquency commentary will function as a consumer-health proxy; BlackRock's AUM flows will confirm or deny whether the institutional risk-off impulse that dominated March is reversing. Wednesday adds ASML, Bank of America, Morgan Stanley, Progressive, and PNC; ASML's order book is the key semiconductor demand signal, and any commentary around AI-driven equipment spending would ripple into the chip supply chain. Thursday is headlined by TSMC before the open -- its capacity utilization and leading-edge node revenue are the most important semiconductor data points of the quarter -- followed by Pepsi, Charles Schwab, Abbott, Prologis, US Bancorp, Bank of New York Mellon, and Travelers. Netflix and Alcoa report after Thursday's close; Netflix subscriber growth in a consumer stress environment and Alcoa's realized aluminum pricing under tariff pressure are both worth watching. Ally Financial and Truist round out Friday before the open. Two IPOs are slated for Thursday: Arxis Inc and Madison Air Solutions Corporation, both likely to gauge risk appetite for mid-market industrial names in a volatile tape.
Sign-posts
PPI headline above 1.3% Tuesday confirms tariff pass-through and resets the rate-cut timeline, risk-off for rate-sensitive sectors.
Philadelphia Fed Manufacturing above 17 Thursday alongside jobless claims holding below 220K would be a clean risk-on combination for industrials and small caps.
TSMC Thursday morning: order book commentary signaling slowing AI capex is the single largest sector-level risk to the technology tape this week.
The week ahead is a full-contact macro and earnings collision -- financials will set the tone on Tuesday, semiconductor demand answers on Wednesday night and Thursday morning, and a PPI surprise in either direction on Tuesday morning has the power to reprice the entire rate path before any of it matters.

Order Flow in Focus: Reading Smart Money Tells
Order Flow in Focus: Reading Smart Money Tells is a recurring segment that spotlights unique intraday opportunities revealed through institutional order flow. Each feature dissects a moment when the tape quietly shifted—when large, ranked prints clustered at key liquidity locations and informed players positioned ahead of the move. The goal isn’t hindsight; it’s pattern recognition—learning to spot the footprints of capital that knows before the crowd does.
On March 20, 2026, something happened in UNH (UnitedHealth Group) that the tape will not forget for a long time. Two ranked block prints -- the largest and second-largest in the stock’s recorded history -- landed within the same tight cluster at ~$275. The Trade Levels panel makes this explicit: $275.60 carries a Relative Strength score of 37.32x, a 100% PCT rank, and a date range running from November 2018 through March 23, 2026, meaning this level accumulated $7.9 billion across 28.7 million shares over years before being formally stamped on the tape. When the number-one all-time cluster in a ticker prints and the number-two cluster prints alongside it, that is not noise. That is a location decision. Institutions do not route nine-figure orders into the same zip code by accident.
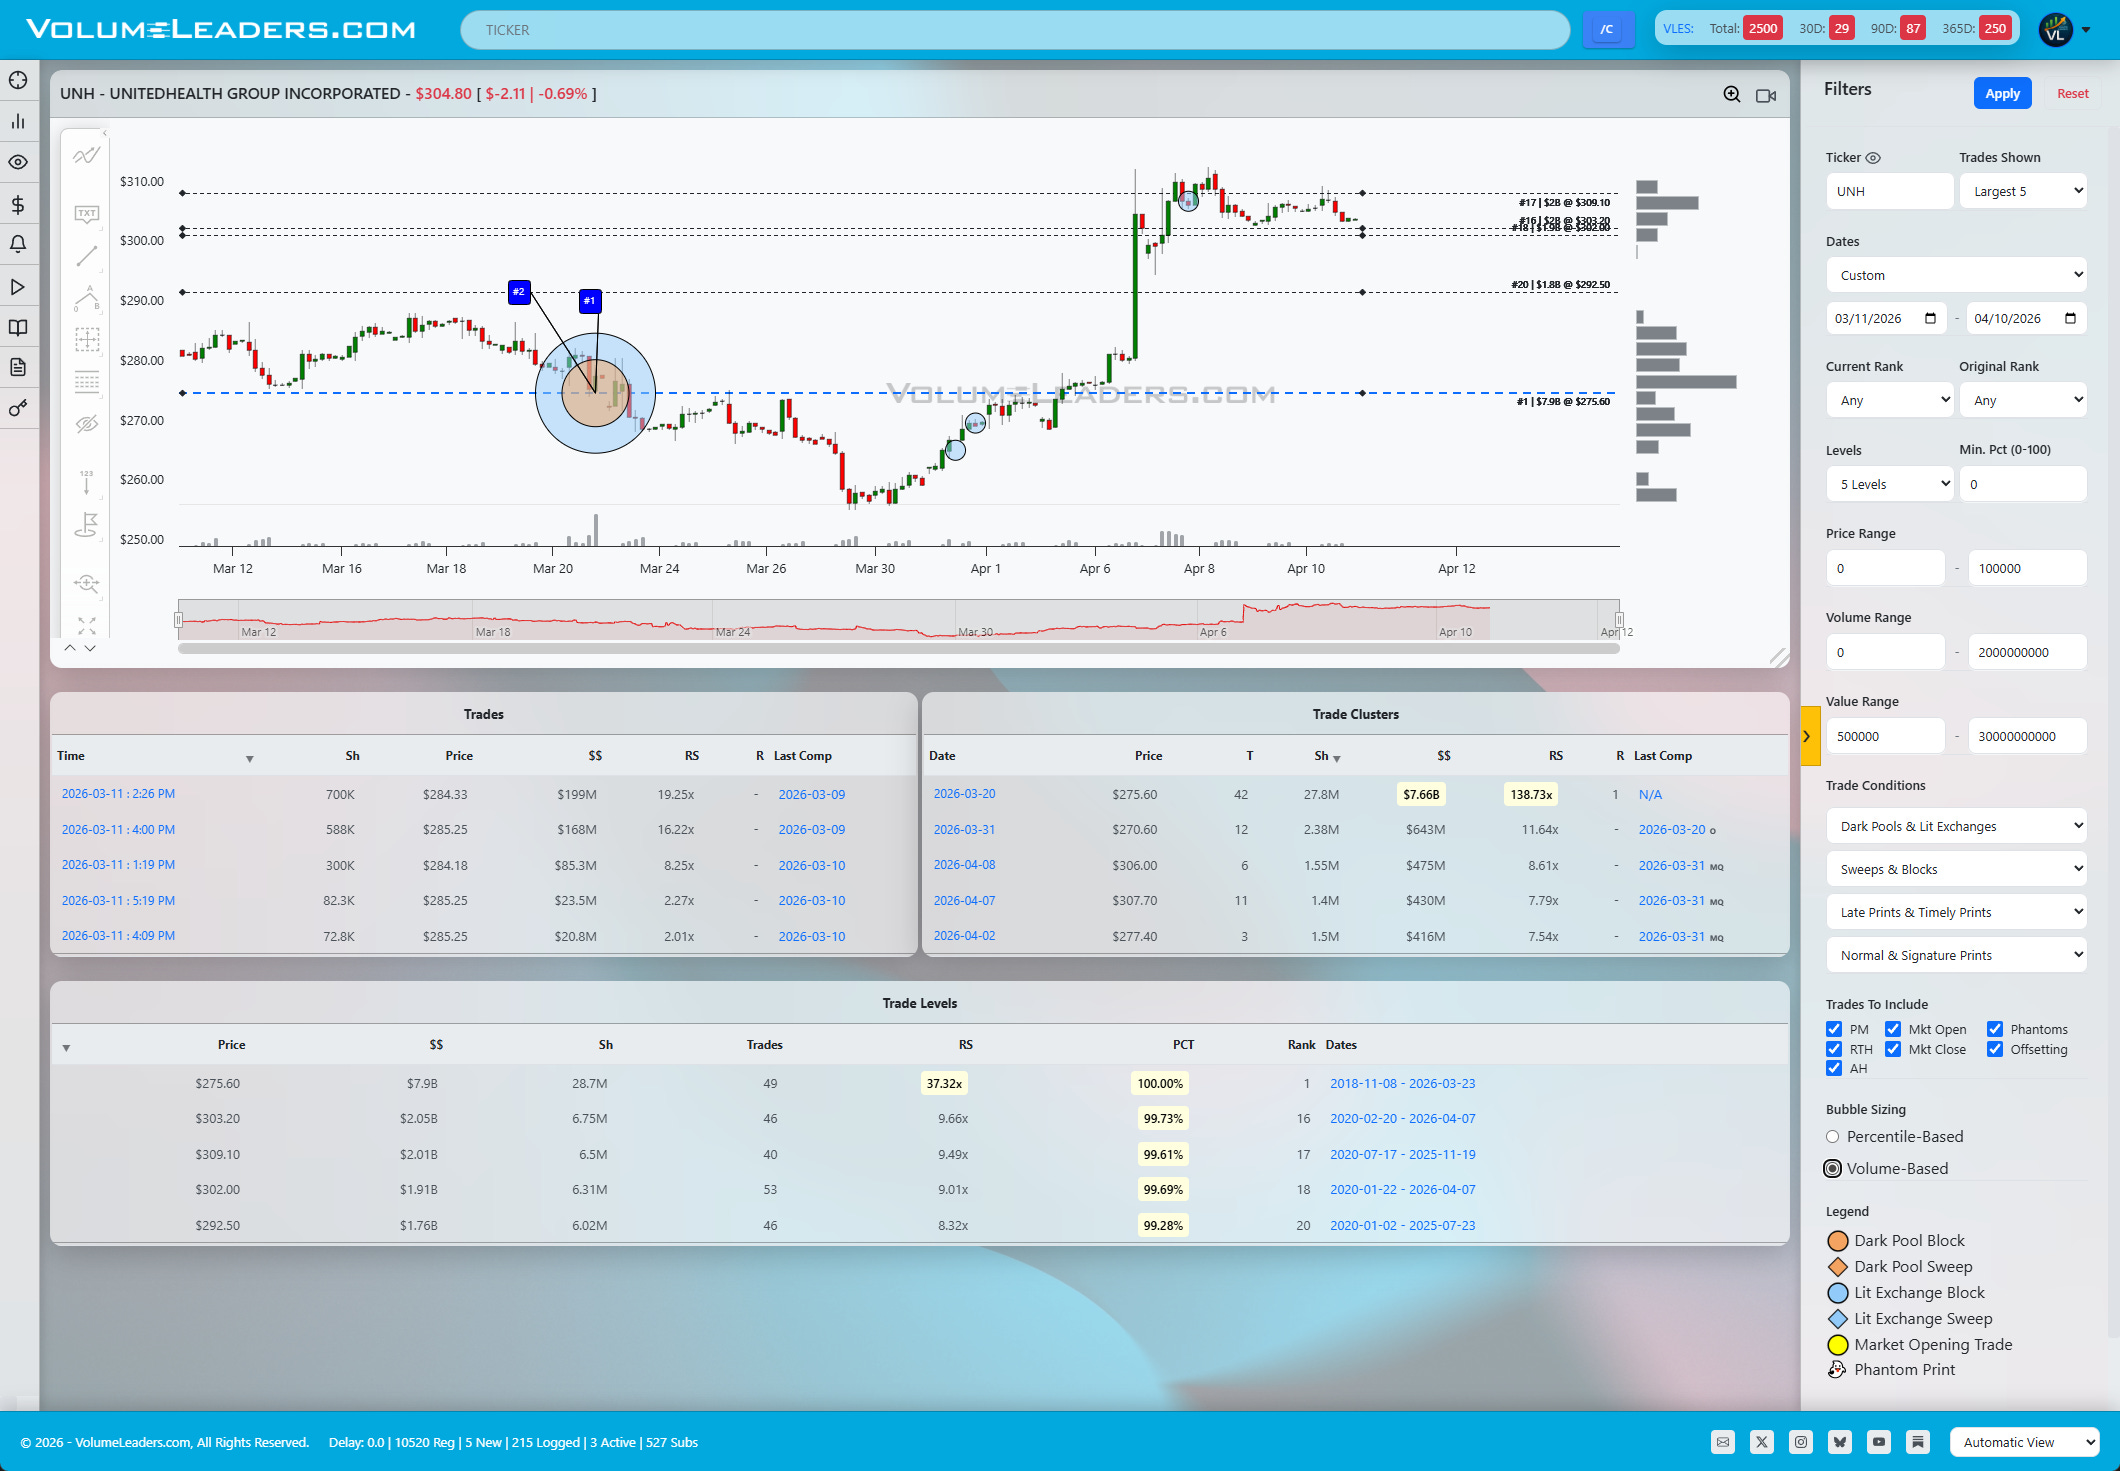
The chart tells the rest of the story in sequence. Price had already been declining through mid-March, slipping from the $285 range down into the $275 area where the blocks absorbed. The initial reaction was constructive -- a modest bounce off the cluster, which is the expected mechanical response when that much buying interest is concentrated at a single level. That bounce was the first test of the prints from above, and it held. Then came the more important test: a secondary leg lower that brought price back down to retest $275.60 from underneath. This is the footprint pattern that separates a real level from a coincidence. A genuine accumulation zone defends itself on retest. If the smart money that printed those blocks was truly committed, they would step in again at or just above their cost basis. The tape showed exactly that -- a second defense of the level before a larger rotational move to the upside eventually took price well above $300.
Now here is where pattern recognition demands intellectual honesty, and it is the lesson the setup is actually teaching. The bearish case at the time was not unreasonable. Price had been in a sustained downtrend, macro conditions were deteriorating, and a break of $275 would have opened a clear path toward $265 and lower. A trader positioned short through the initial cluster would not have been wrong in their analytical framework. But the presence of the number-one and number-two all-time prints at that exact level created an obligation that most traders ignore: it defined a line in the sand so specific and so historically significant that staying wrong through it was a choice, not a circumstance. The blocks were not ambiguous. They were ranked, dated, and sitting in the open. A short thesis that requires $275.60 to hold to preserve the short thesis was fine. Until the thesis popped.
The informed position at that point is not to press the short -- it is to cover, step aside, or consider that the larger institutional bid defines support and that the path of least resistance may be reversing. The exit was not a gift handed out by the tape; it was visible in plain sight, marked by two of the largest ranked prints in the stock’s history, sitting at a price the market had now tested and rejected twice. The trade was to respect the level and not stay wrong once it confirmed.
This is what order flow literacy actually means in practice. The blocks do not tell you what will happen. They tell you where the real players drew their line. Everything after that is about whether you are trading with that information or against it.
Only VolumeLeaders gives you the infrastructure to contextualize every print against the full history of a ticker -- so when the number-one and number-two all-time blocks land at the same level on the same day, you are not guessing at significance, you are reading rank. The built-in filters and alerts for ranked prints mean a setup like $275.60 in UNH never slips past you unnoticed. Like I always say: number ones rarely disappoint.

Market Intelligence Report
A desk-grade synthesis of institutional positioning and market structure—unpacking the flows, levels, and emerging themes that shaped the week, and translating them into a model portfolio built the same way professional desks prepare for the week ahead.
MIR Part 1: The Backdrop
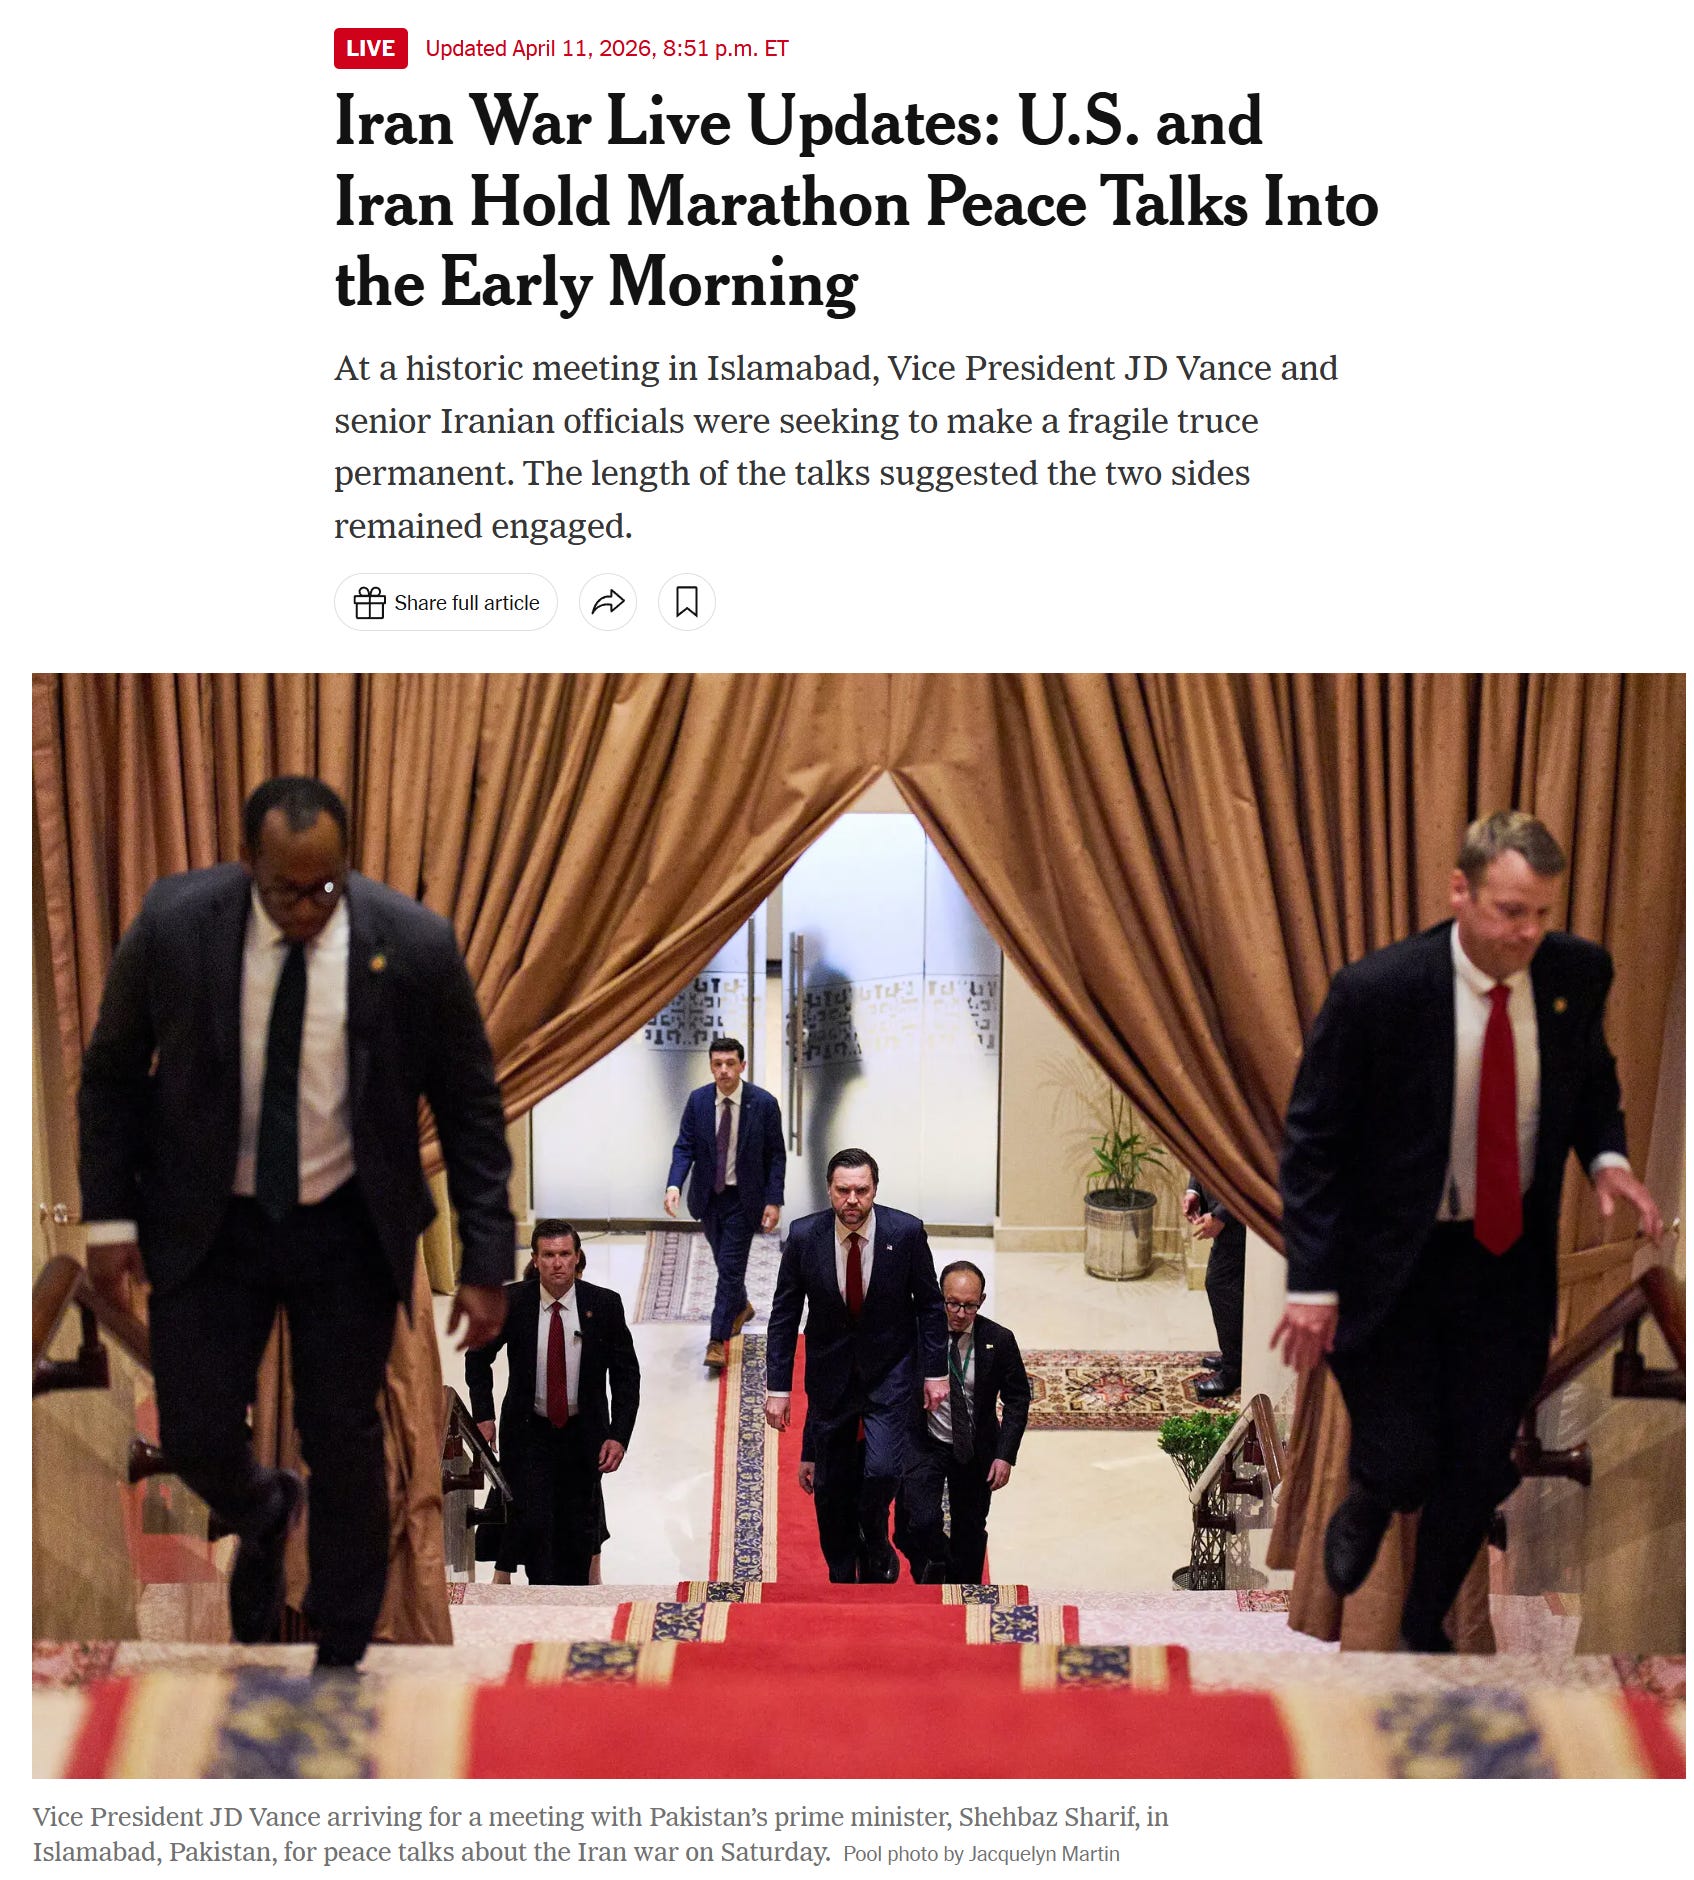
This week was not a normal week of institutional repositioning. It was a week in which the macro backdrop shifted mid-stride -- from geopolitical anxiety and oil at $100 to a fragile but market-moving Iran-U.S. ceasefire announced April 7th -- and institutions responded with conviction across multiple venues simultaneously. Understanding the flows this week means understanding that the tape was not expressing one clean directional thesis. It was expressing relief, repositioning, and selective accumulation all at once, and the structure of participation beneath the surface tells you more than the index move alone.
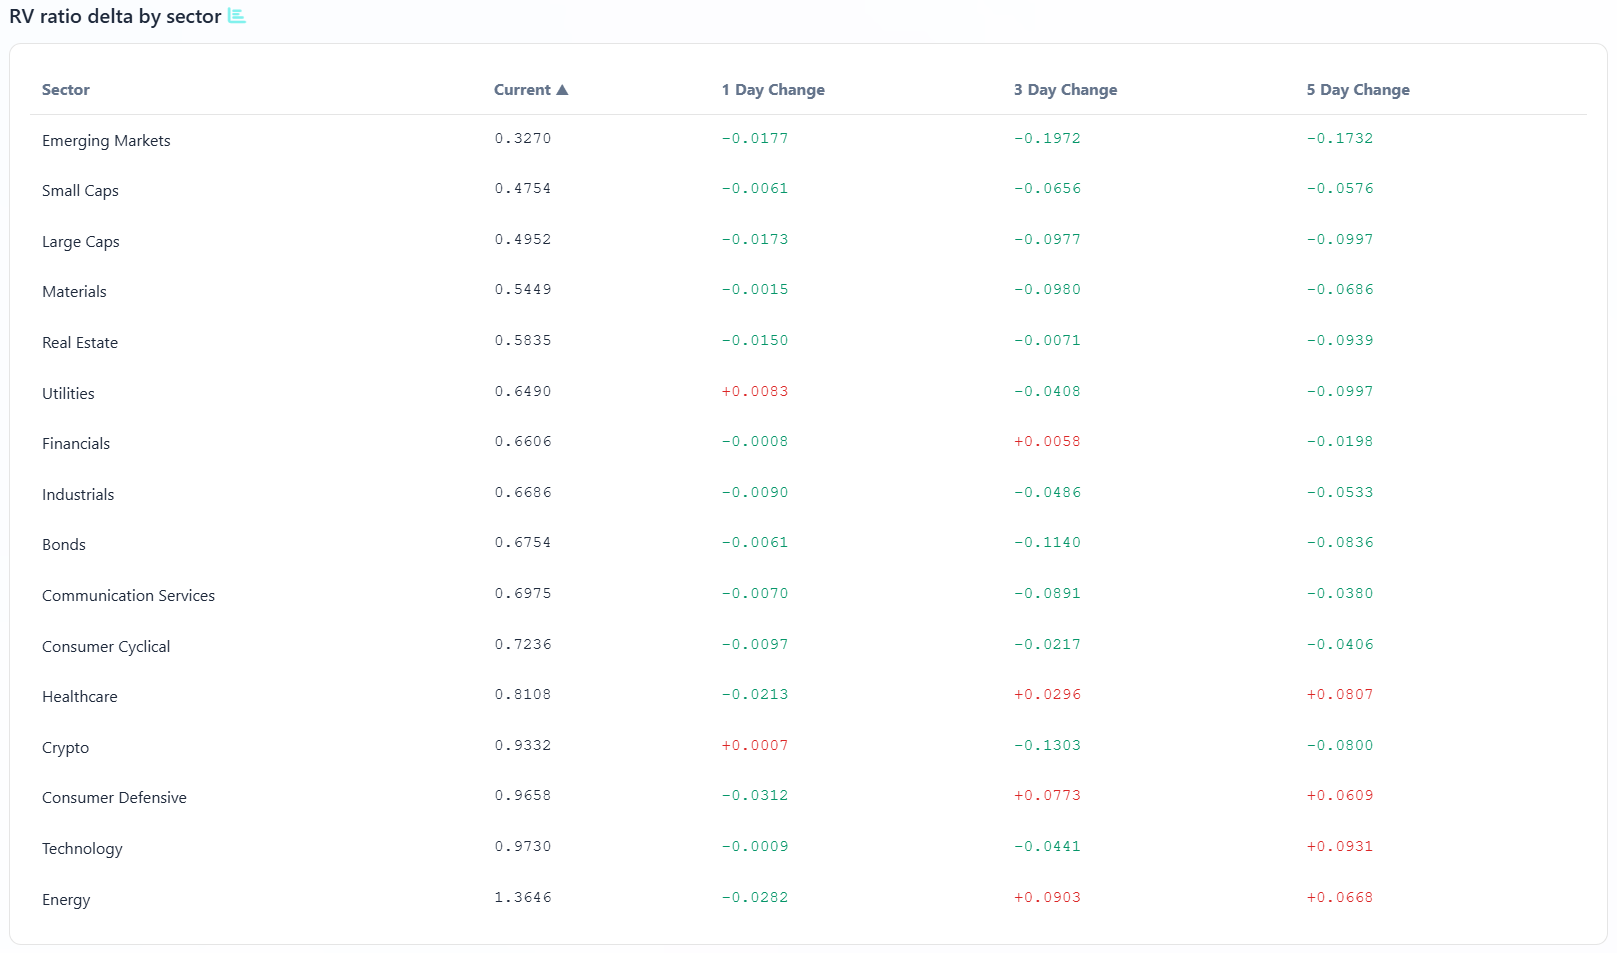
The broad market environment entering this week was already tilted constructively. More than 63% of the market was trading above key structural levels, a reading that places the regime firmly in trend-supportive territory rather than the fragile, narrowly-led conditions that often define bear market reflexes. Large caps, emerging markets, and small caps were all registering participation rates well into the 80s and 90s, which is the kind of breadth configuration that historically rewards measured risk-taking rather than defensive posturing. The market-wide volatility ratio sat below 1.0 and was contracting, meaning upside volatility was beginning to outpace downside volatility in the aggregate -- a constructive signal, though the slight deteriorating slope in the trend indicated that this was not yet a regime with a full green light. Industrials, materials, and real estate showed some of the most favorable volatility structures of any sector, with ratios well below equilibrium and improving trends, creating pockets where the tape was actively forgiving of participation. At the opposite end, energy carried an elevated and still-deteriorating volatility structure, effectively amplifying downside punishment for anyone positioned there as the ceasefire deflated oil from near $100 back toward more normalized levels following the April 7th ceasefire announcement.
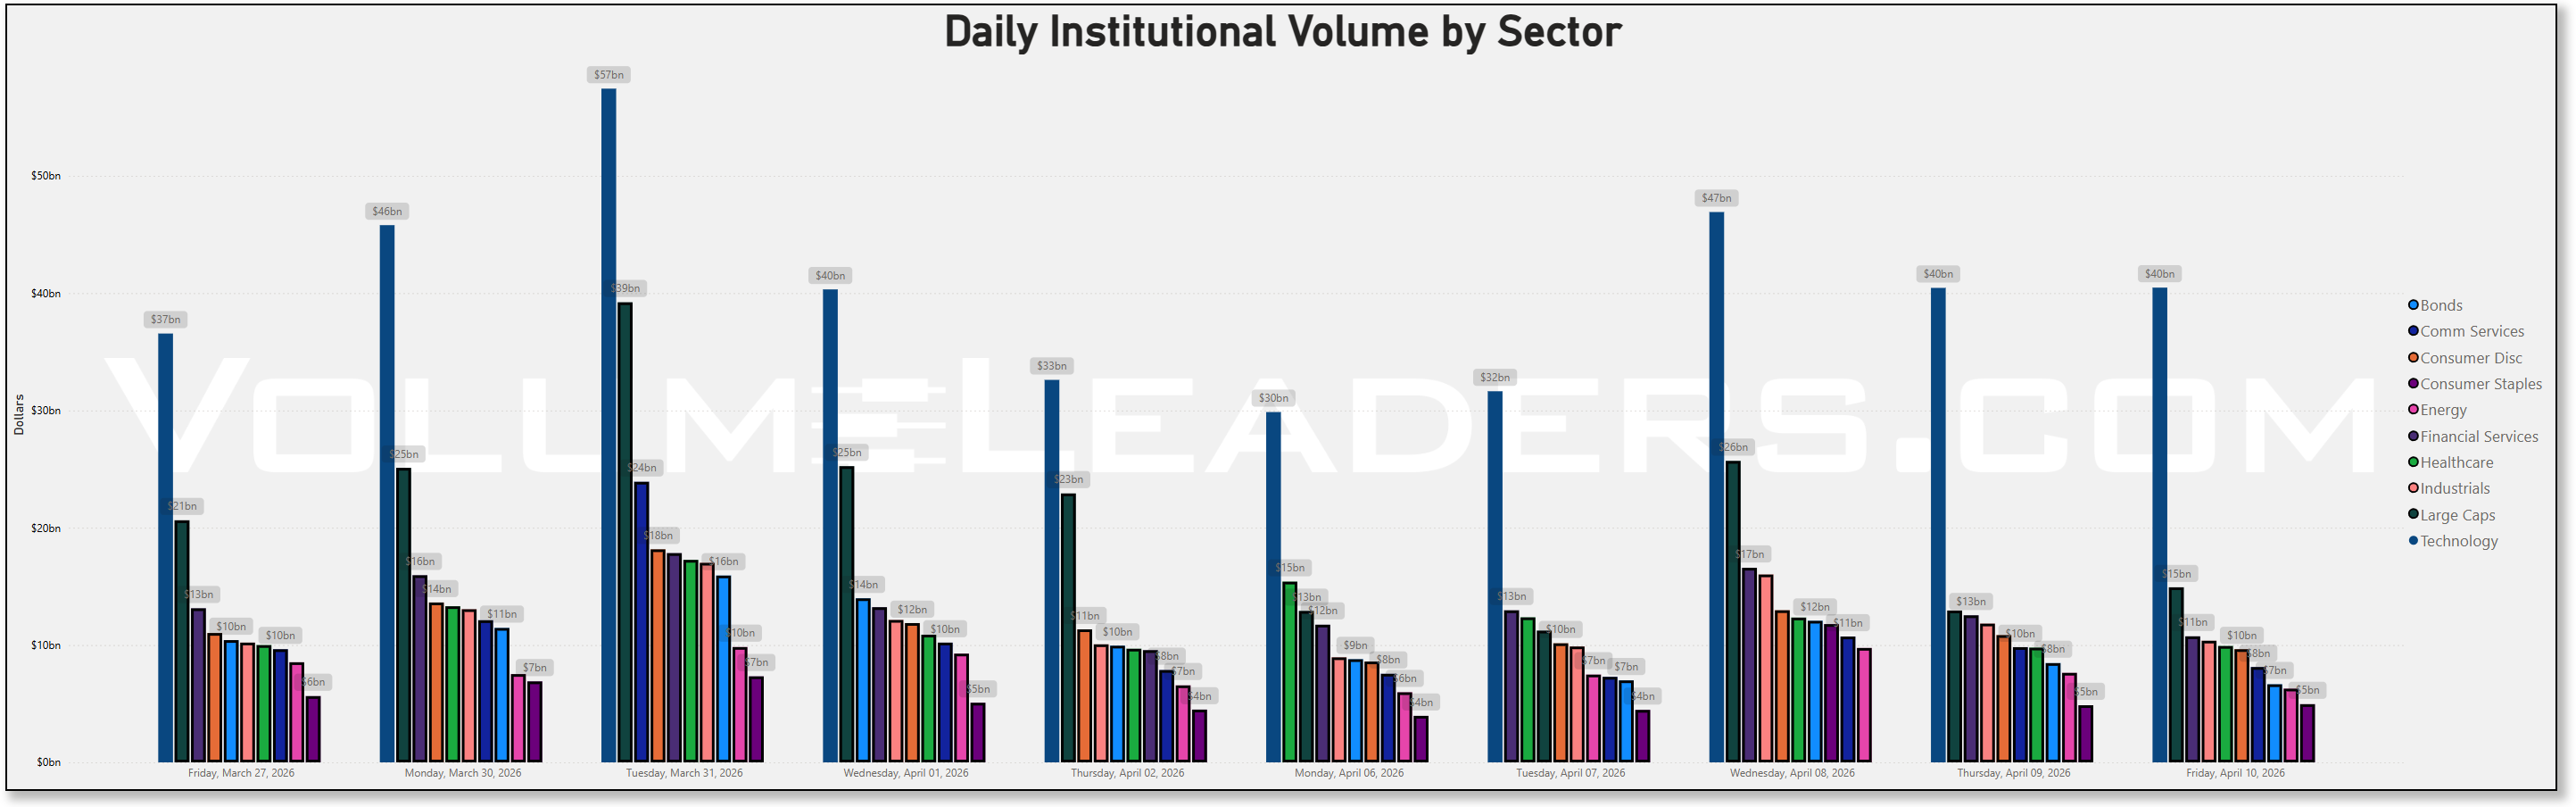
Against that backdrop, the daily institutional volume table tells the week’s story in chapters. The Monday through Wednesday window of March 30 through April 1 saw aggregate dollar volumes running hot across financials, technology, and large caps, with technology alone registering $57 billion on Tuesday March 31 and $45 billion Wednesday April 1. That pace was not maintained. By Thursday April 2 tech dropped to $32 billion, and the following Monday and Tuesday -- April 6 and 7 -- saw technology volumes pull back further to the high $20s and low $30s. Then the week that matters arrived. Wednesday April 8 saw technology reaccelerate to $46 billion, the second highest print of the entire two-week lookback. Thursday April 9 moderated slightly to $40 billion, and Friday April 10 settled in the low $40s. The April 8 and 9 surge in technology volume coincided precisely with a broader institutional response to the geopolitical relief trade and the ongoing earnings positioning cycle ahead of the TSMC report scheduled for April 16, where analysts at expect revenue of $35.47 billion and consensus EPS of $3.26 -- numbers already confirmed as likely beatable given TSMC’s March revenue data showing a 45.2% year-on-year gain. Financials followed a similar arc, running heavy in the $16 to $18 billion range midweek before moderating Friday, consistent with institutional pre-positioning ahead of the bank earnings week beginning April 14 with JPMorgan, Citi, Goldman, and Wells Fargo.
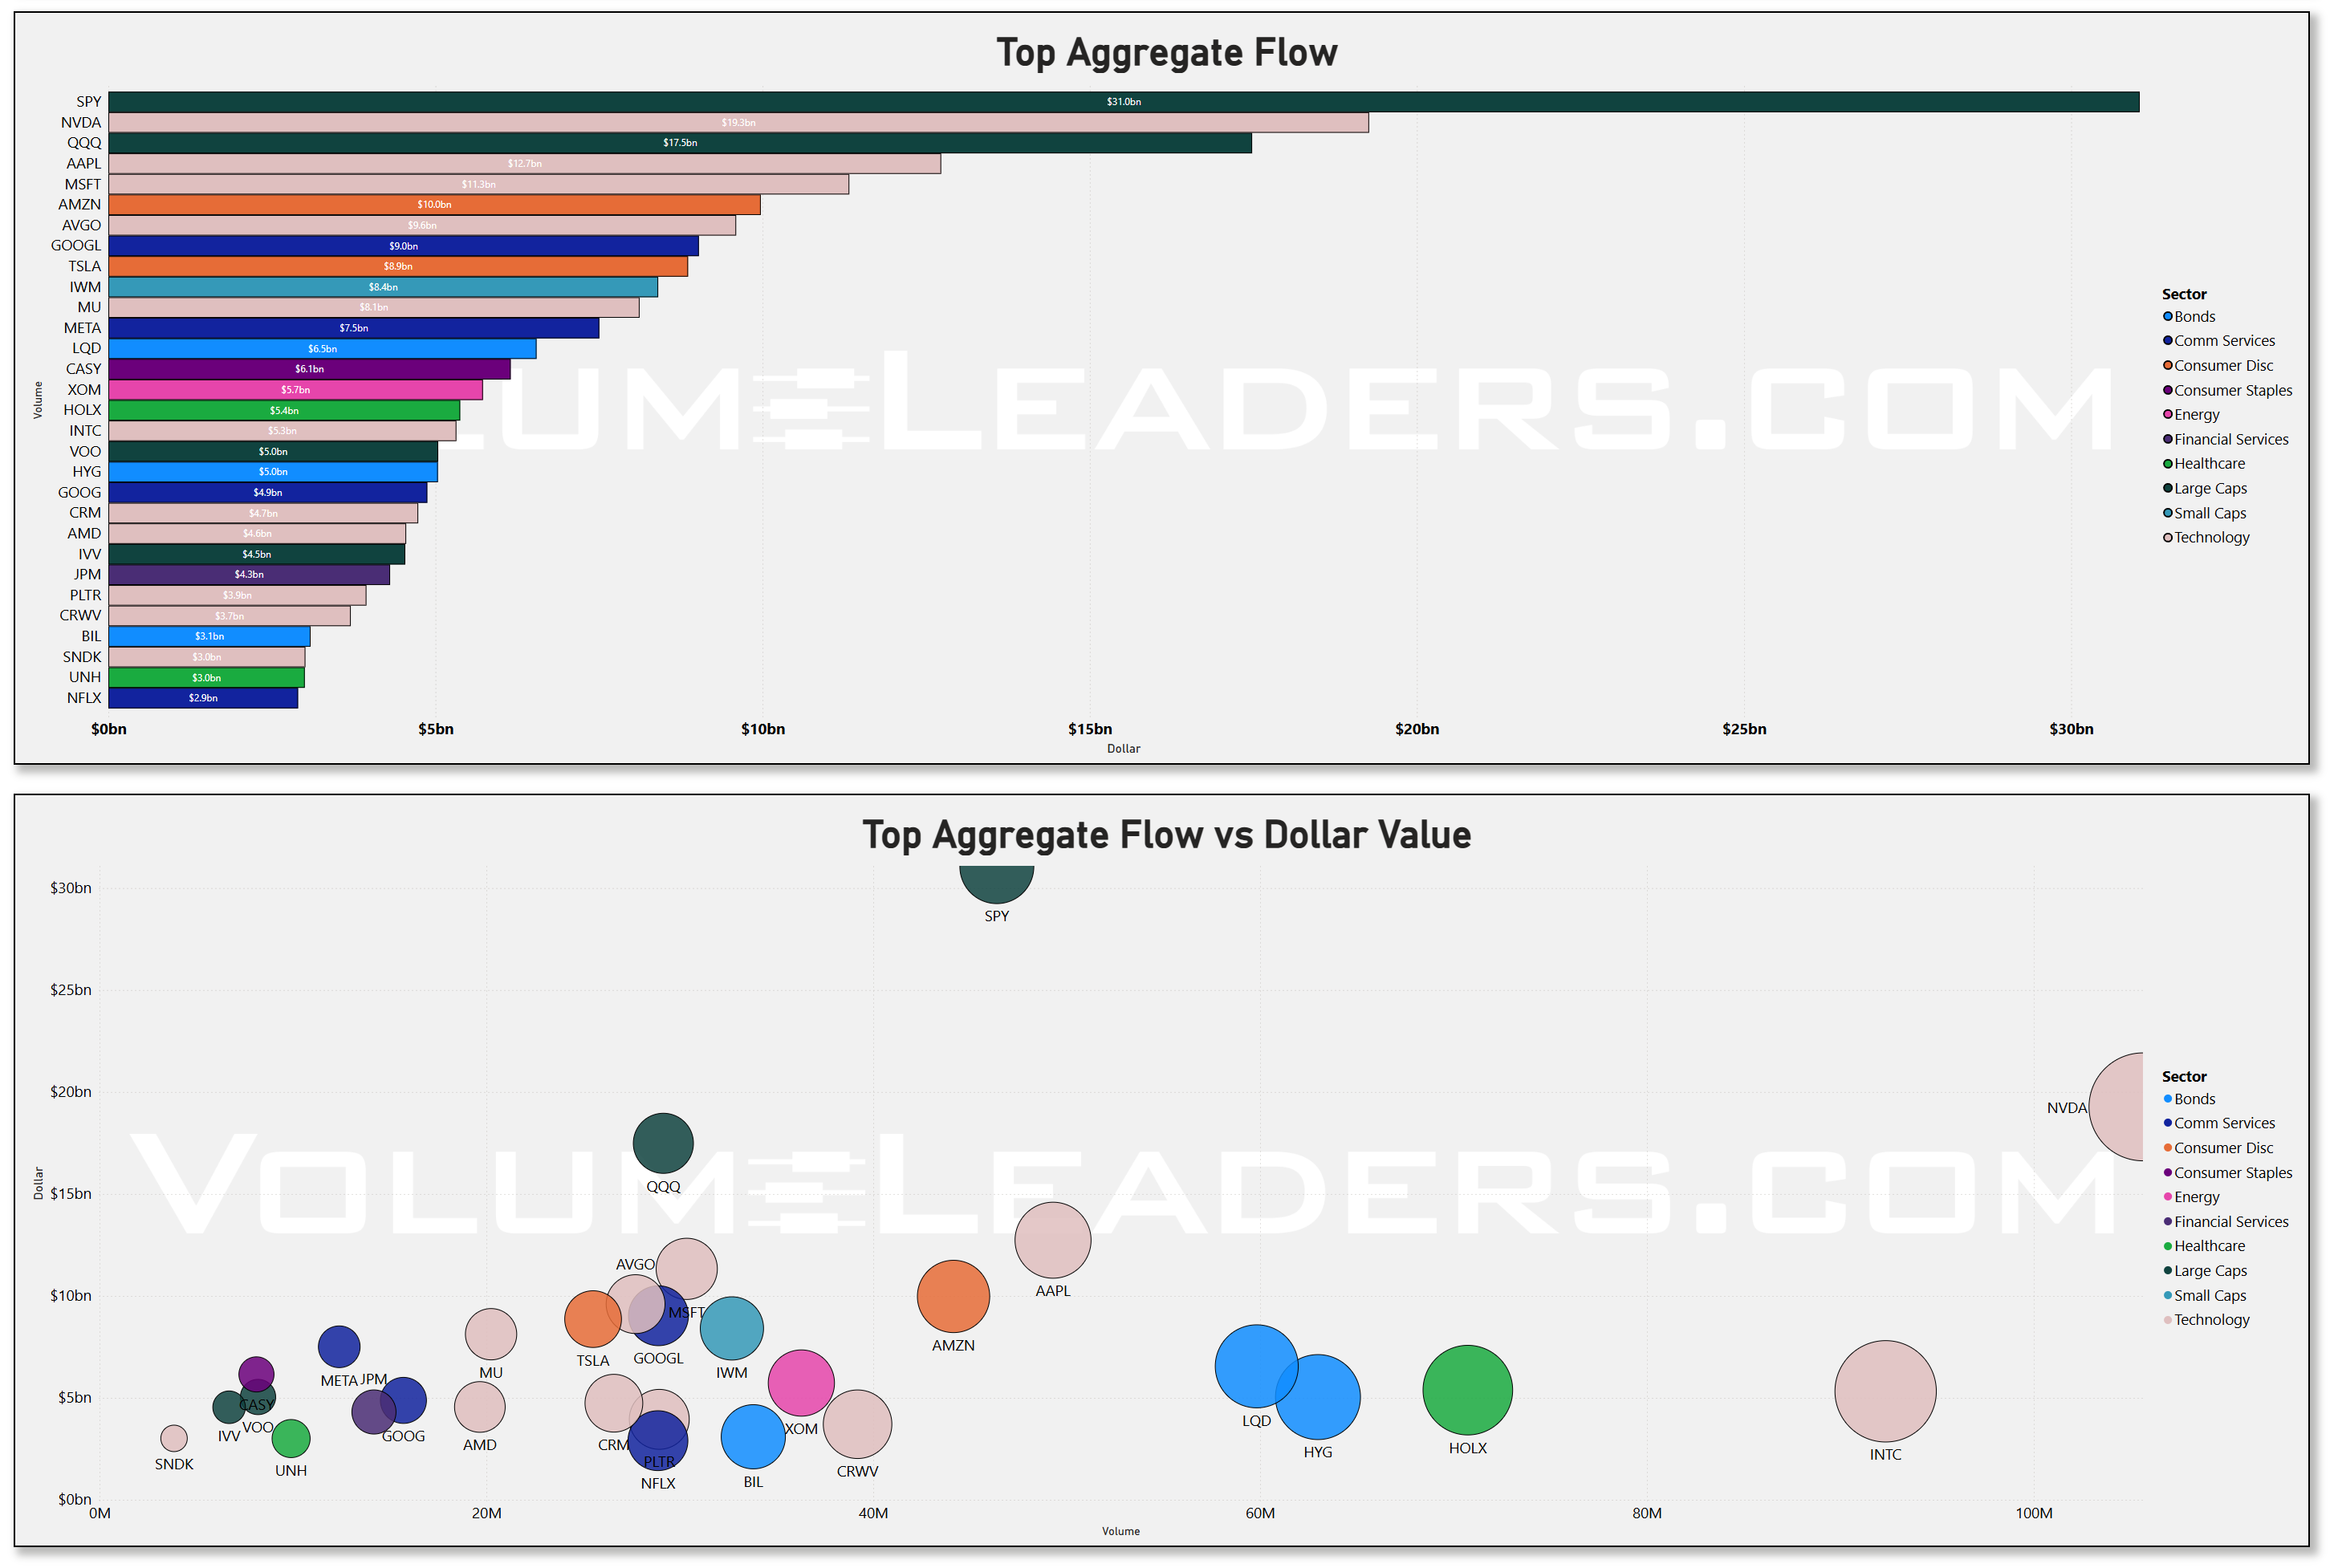
The aggregate flow rankings make the hierarchy explicit. SPY led all names at roughly $31 billion in total institutional dollars for the week, a figure that on its own reflects the index-level repositioning that comes with a macro regime shift. But the more interesting signal is the degree to which NVDA at approximately $19 billion and QQQ at $17 billion ran in tandem with SPY, clustering at the top in a configuration that speaks to broad program-driven repositioning and a lack of concentrated single-name conviction. AAPL at $13 billion, AVGO at $10 billion, AMZN at $10 billion, and MSFT at $11 billion filled out the megacap technology footprint, while the Comm Services complex showed up through GOOGL at $9 billion, GOOG at $5 billion, and META at $8 billion.
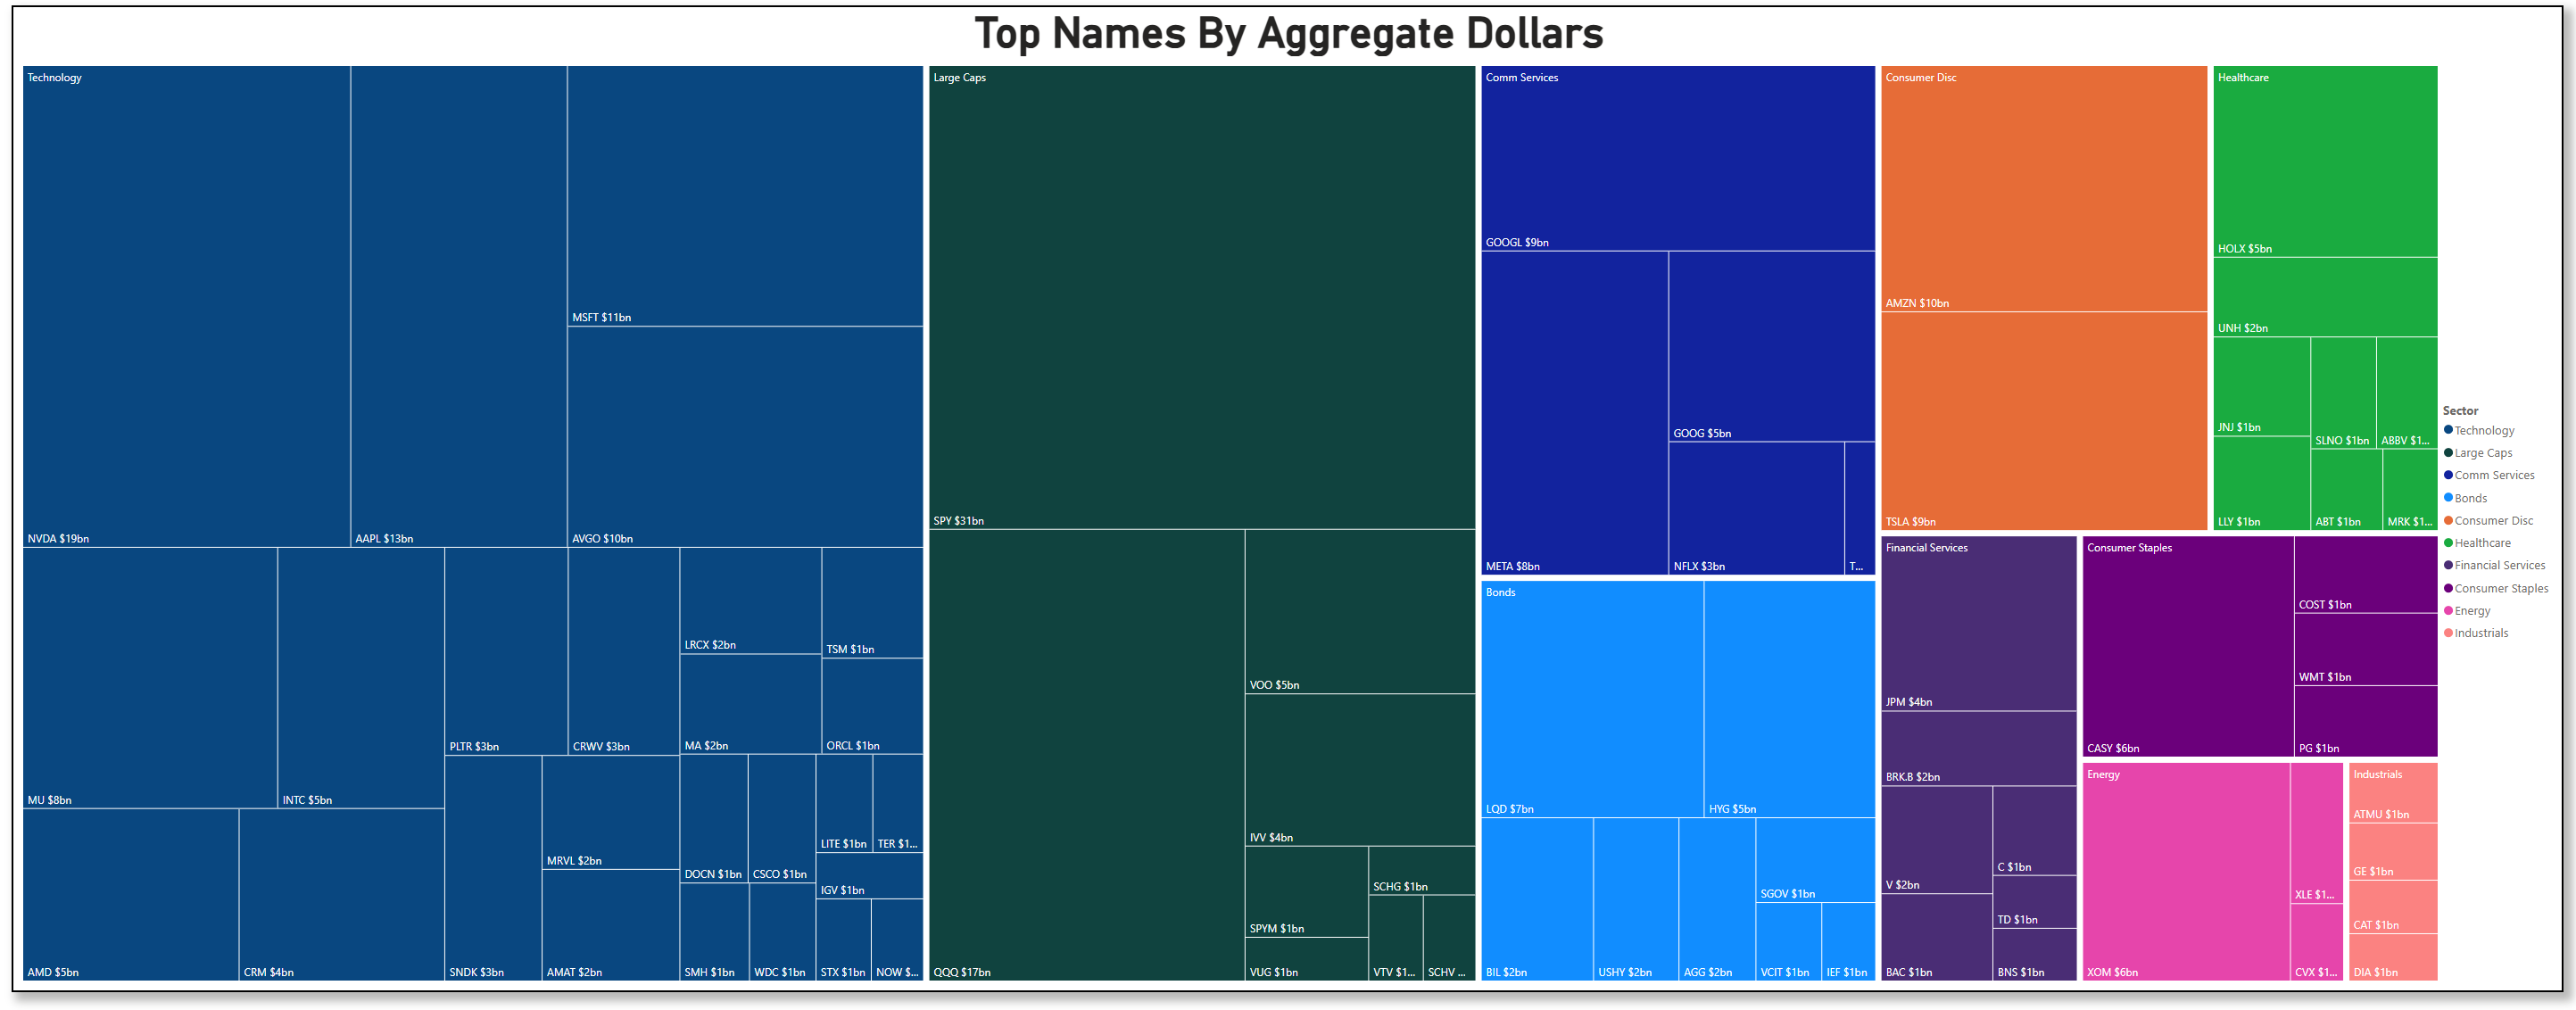
Together these names represent the institutional consensus trade of the week: technology and communication services were the primary destination for repositioned capital as the geopolitical risk premium in oil came off and macro confidence stabilized. On the volume-versus-dollar scatter, NVDA stood in a class by itself -- far to the right and elevated in dollar terms simultaneously, meaning institutions were moving large dollars through relatively concentrated share counts, which is characteristic of high-conviction allocation rather than index rebalancing. INTC appeared in a similar position on the volume axis with modest dollar totals, suggesting high-volume but low-average-price activity consistent with tactical speculation rather than meaningful capital commitment.
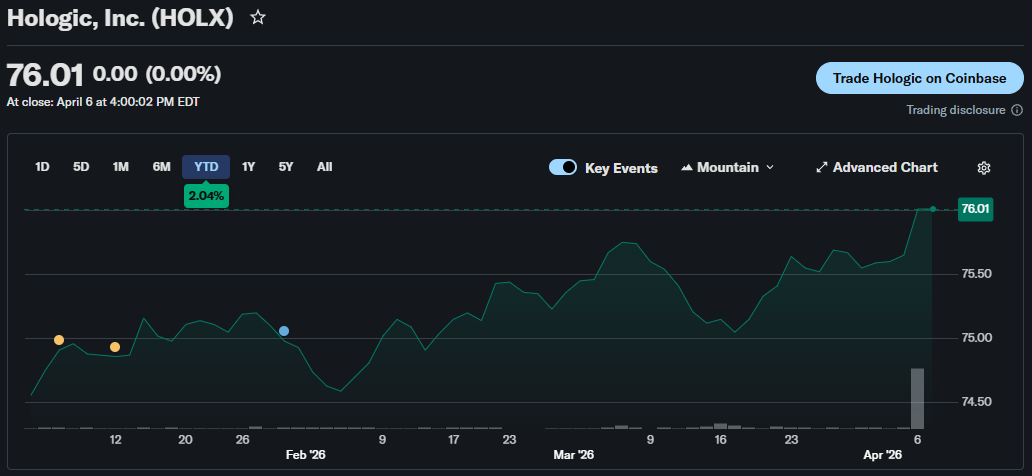
The dark pool lens adds texture to what was visible on the lit tape. SPY again dominated at approximately $16 billion, but the composition beneath it shifted. QQQ at $10 billion, IWM at $5 billion, and LQD at $5 billion appeared together in a way that tells you institutions were not just buying equity exposure -- they were also expressing views on credit and duration simultaneously. LQD and HYG both registering significant dark pool dollar flows, with HYG at roughly $3.8 billion and USHY appearing in the volume-versus-dollar scatter with high share volume relative to dollars, is consistent with the post-ceasefire credit relief trade: as geopolitical risk premia compressed in the bond market, institutional buyers quietly accumulated investment-grade and high-yield exposure in size through off-exchange venues where price impact is minimized. HOLX at $1.4 billion in dark pool dollars stood out as the lone healthcare name with meaningful hidden flow, which is notable given that healthcare remained one of the weaker sectors by participation metrics -- a divergence perhaps not worth watching since HOLX was taken private and stopped trading on the Nasdaq on April 6th.
CRM at roughly $3 billion in dark pool activity, combined with CRWV appearing on the scatter with relatively high volume, suggests the cybersecurity-adjacent software theme is attracting institutional attention in quiet venues even as the broader technology sector leadership stays concentrated in semiconductors.
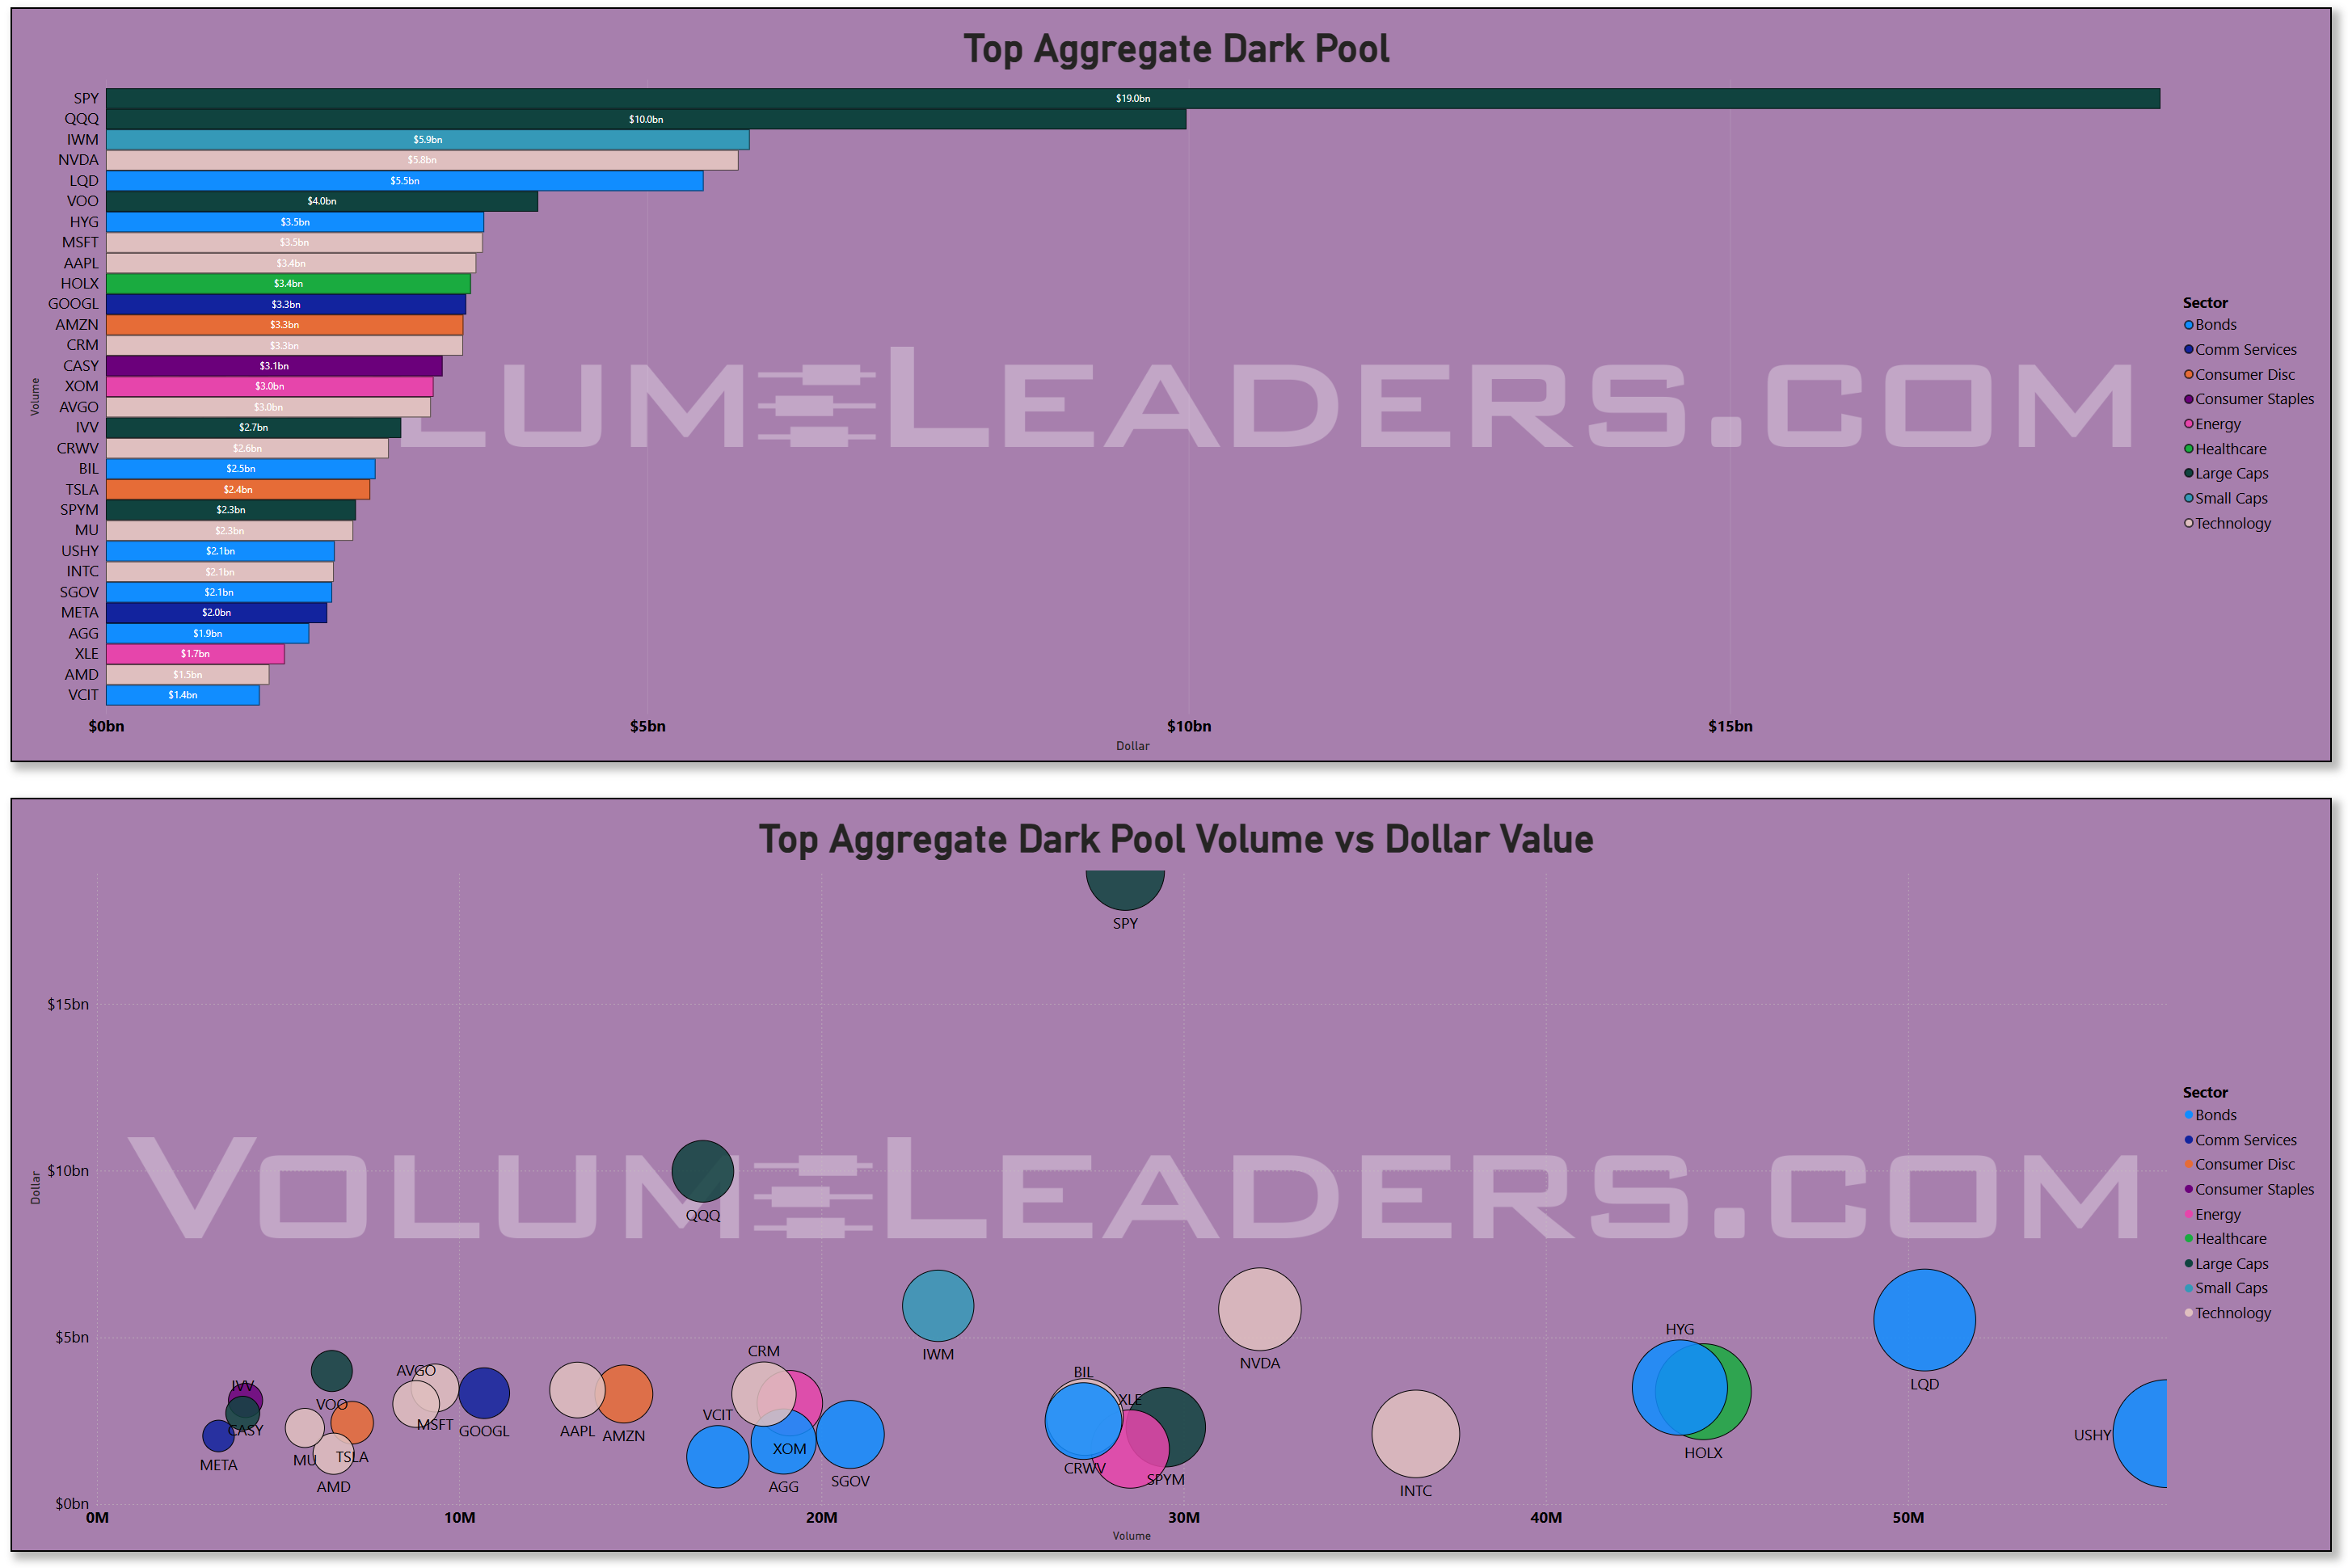
The sweep activity tells the most tactically direct story. LQD at $1.76 billion in sweeps was the largest single instrument swept this week by a significant margin, and HYG at $1.24 billion was second. The presence of credit ETFs at the very top of the sweep ladder -- above SPY at $1.1 billion -- is not a routine occurrence. Sweeps by definition reflect urgency: market participants who are willing to pay through multiple price levels to build a position immediately. When fixed income ETFs generate that kind of urgency, it almost always reflects either a rapid de-risking event or, as appears to be the case here, an aggressive positioning move driven by a macro catalyst -- in this case the ceasefire-driven credit spread compression and the simultaneous relief in the oil market on April 7th. The equity sweep activity was heavily concentrated in passive vehicles: VOO, IWM, VUG, VTV, IWB, and XLE all appearing in the top tier, with XLE’s $0.47 billion in sweeps representing a tactical energy positioning bet that should be monitored closely. SCHV and USHY showing up in the high-volume, moderate-dollar quadrant of the sweep scatter indicates that institutions were also chasing value and high-yield income exposure at speed, consistent with a risk-recovery playbook rather than defensive rotation.
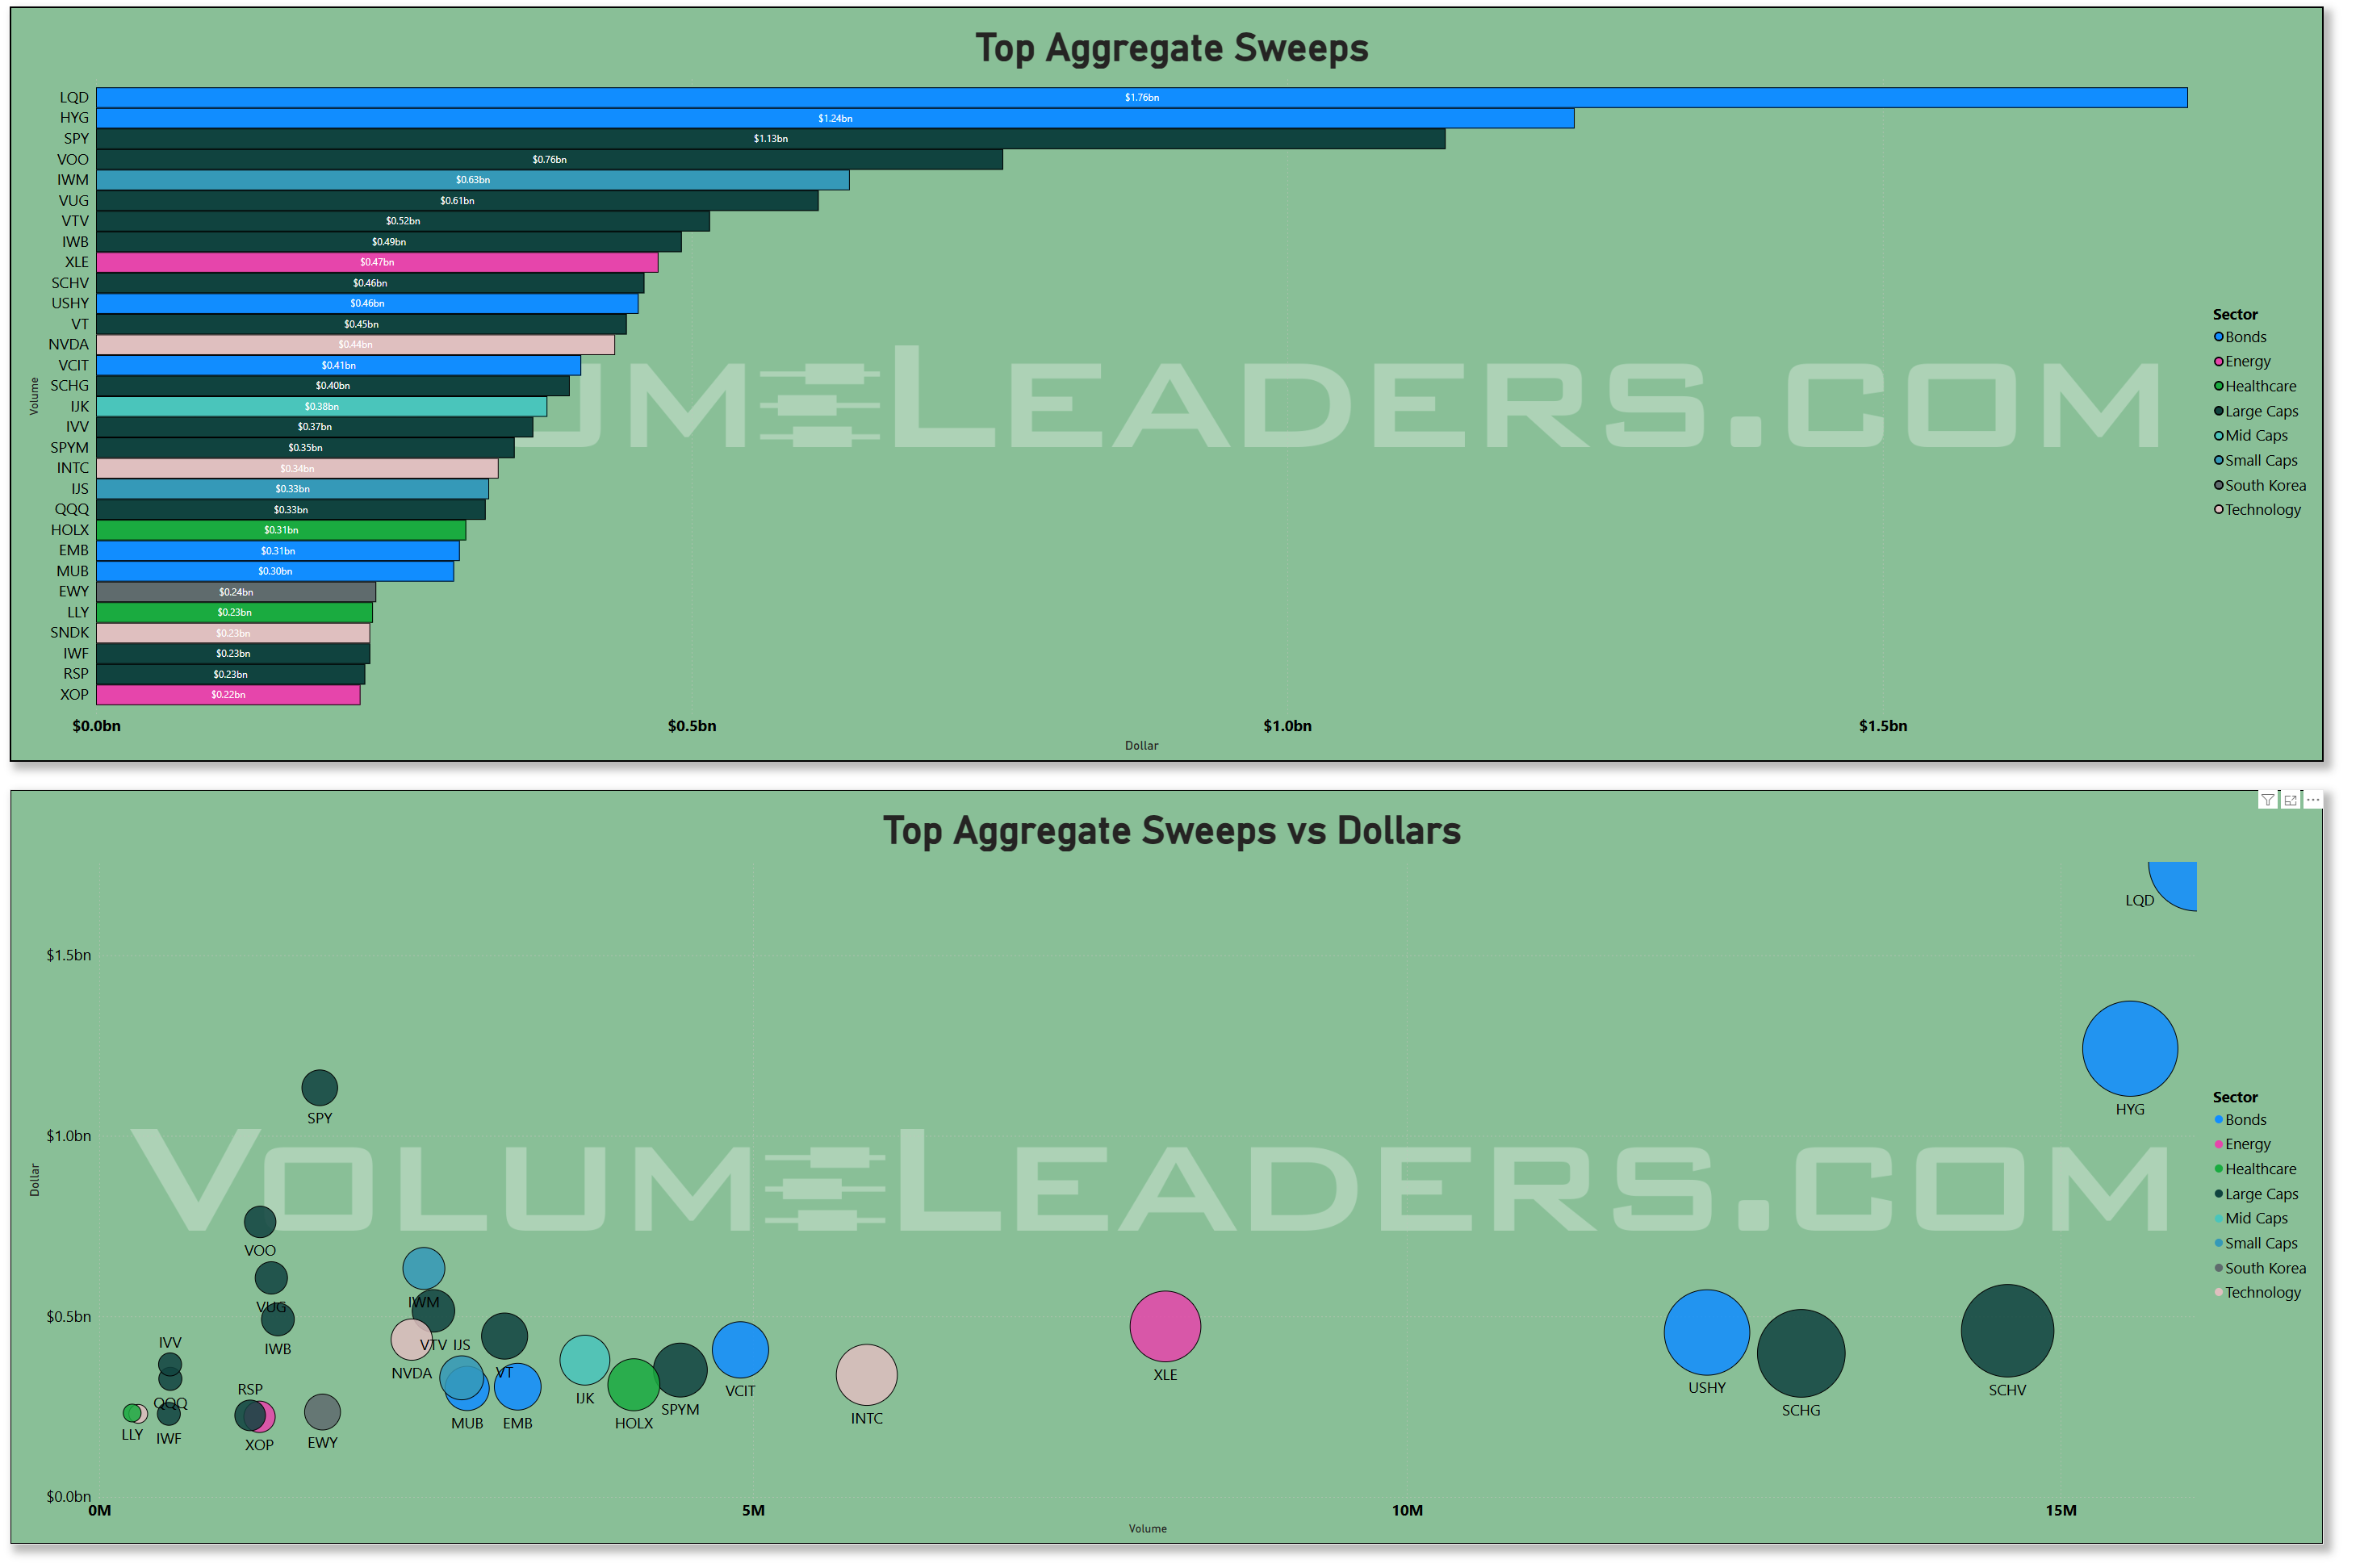
The relative strength picture across sectors at week’s end reinforced the hierarchy visible in the flows. Emerging markets, industrials, communication services, materials, and financials were all registering positive relative strength versus SPY, while technology -- despite receiving enormous absolute dollar flow -- was still underperforming SPY on a relative basis with a modestly deteriorating trend. This is the nuance the raw flow figures can obscure: technology attracted the most institutional dollars this week, but it was not leading the market. Capital was flowing in, but from a structural underperformance that has been building over weeks, and the five-day participation trend in technology remained in negative territory. The areas demonstrating the cleanest combination of improving participation, constructive volatility structure, and strengthening relative strength were industrials, materials, and emerging markets -- sectors that either benefit directly from the ceasefire normalization or carry the kind of physical-economy exposure that performs well when macro fear recedes and growth expectations stabilize.
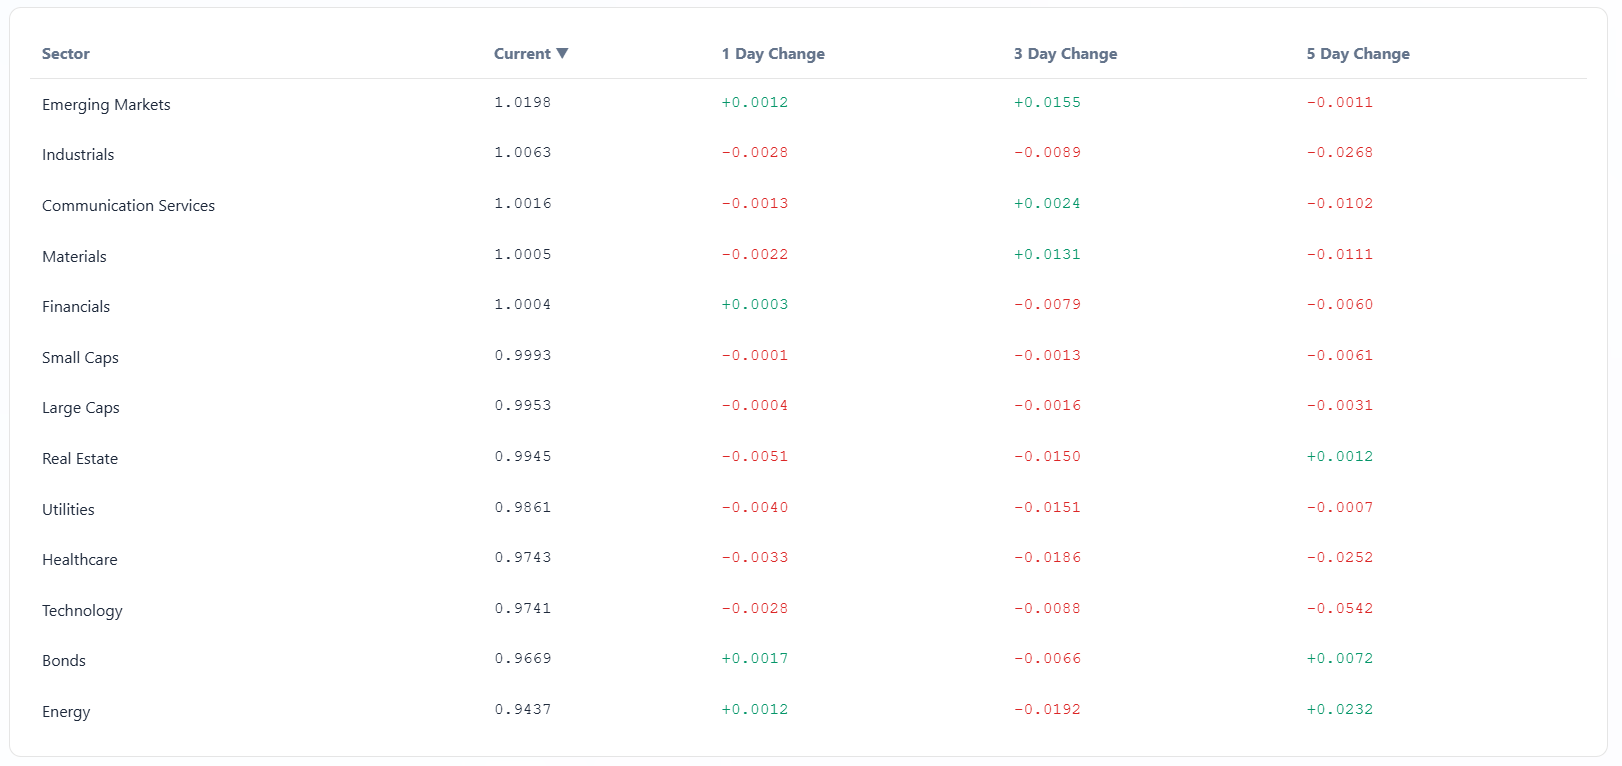
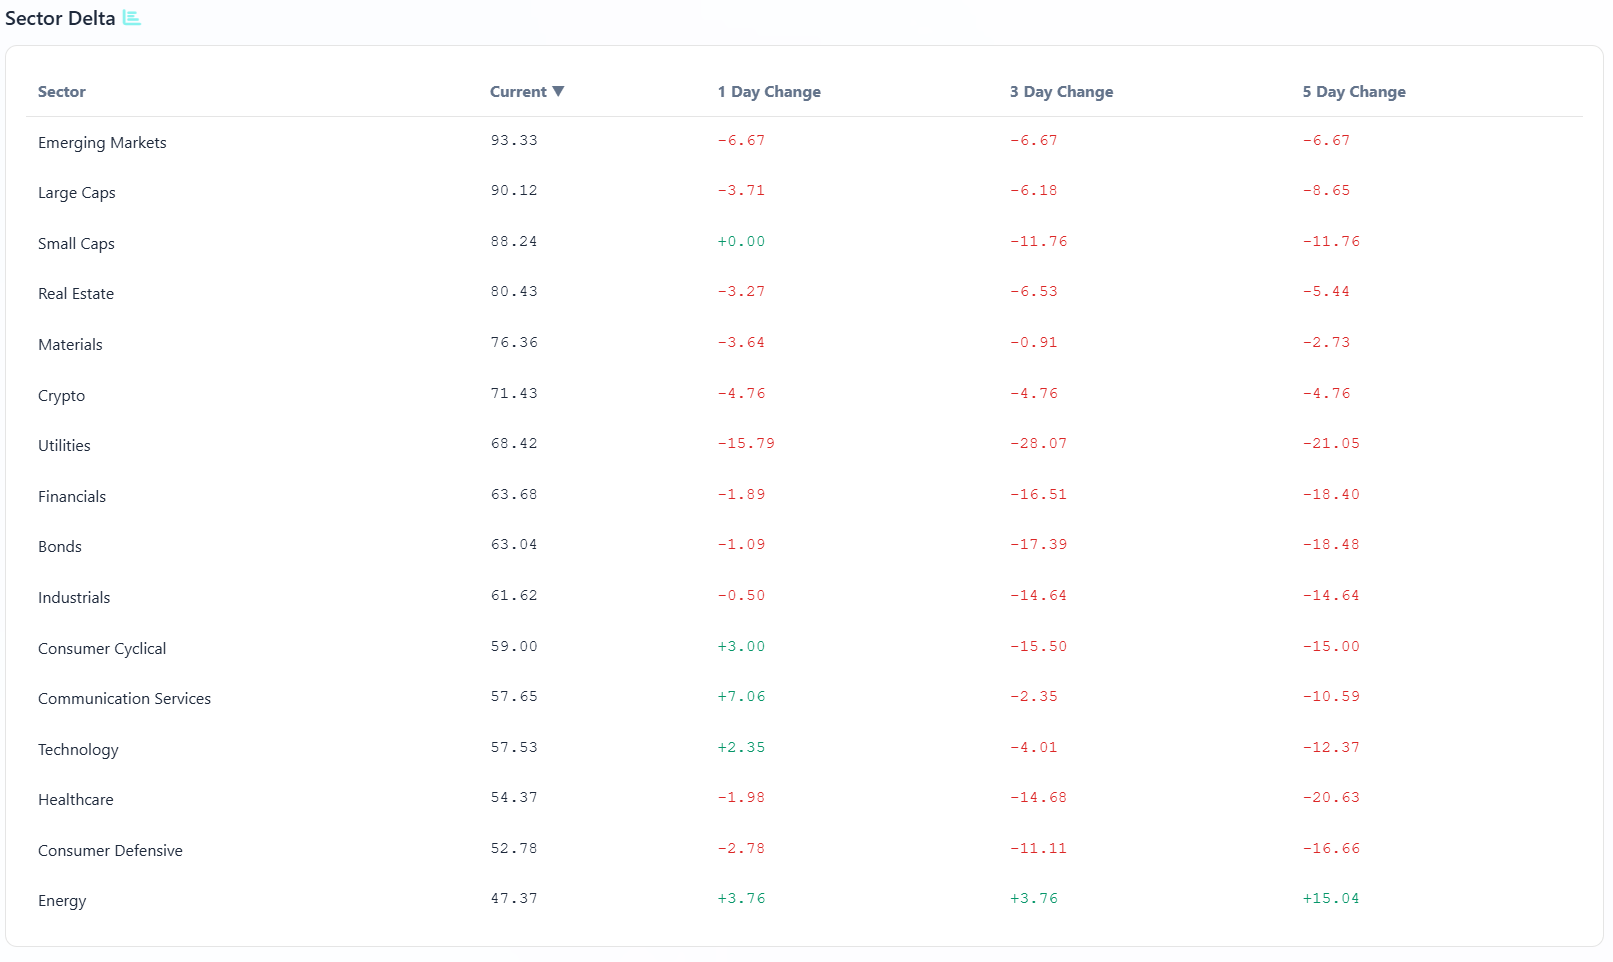
Energy deserves a separate mention precisely because of what did not happen. Despite the brief oil spike, energy’s participation rate remained below 50% -- the only sector below the structural midpoint -- and its volatility ratio at 1.36 remained the highest of any sector and was still deteriorating on a three- and five-day basis. The XOM flows visible in both aggregate and dark pool charts, and XLE’s sweep presence, reflect tactical positioning around oil price volatility rather than a genuine institutional conviction in the sector’s intermediate-term trajectory. Energy flows this week look like risk management and opportunistic hedging, not allocation.
The picture that assembles from all of this is one of a market in the early stages of absorbing a meaningful macro regime improvement, but doing so with selectivity rather than indiscriminate risk-on behavior. The institutions that drove the heavy SPY and QQQ flows were expressing broad equity relief. The dark pool buyers of LQD and the sweep buyers of HYG were aggressively repositioning credit exposure. The accumulation in AVGO, CRM, and CRWV was quiet and deliberate, the kind of footprint left by investors who believe the semiconductor and cybersecurity cycles have more duration than the recent volatility implied. What the week did not produce was a clean, unanimous sector rotation signal. Technology got the dollars but not the relative leadership. Energy got tactical flows but not structural conviction. The cleanest institutional theme -- supported by both the flow data and the broad participation picture -- remains a preference for large-cap, broad-market, and real-economy leadership in a regime where risk is cautiously on, volatility is compressing from elevated levels, and the primary macro catalyst for the next leg is still sitting in the earnings calendar for the week ahead.
MIR Part 2: Individual Names From The Institutional Tape
VolumeLeaders tracks several proprietary signals designed to spotlight names drawing significant institutional interest. Below, we’ve surfaced the latest results and analyzed them to highlight emergent themes. If any of the sectors, narratives, or positioning trends resonate, the names mentioned here offer a strong starting point for deeper research and watchlist consideration.
VL Trade Rank Velocity™ (TRV)
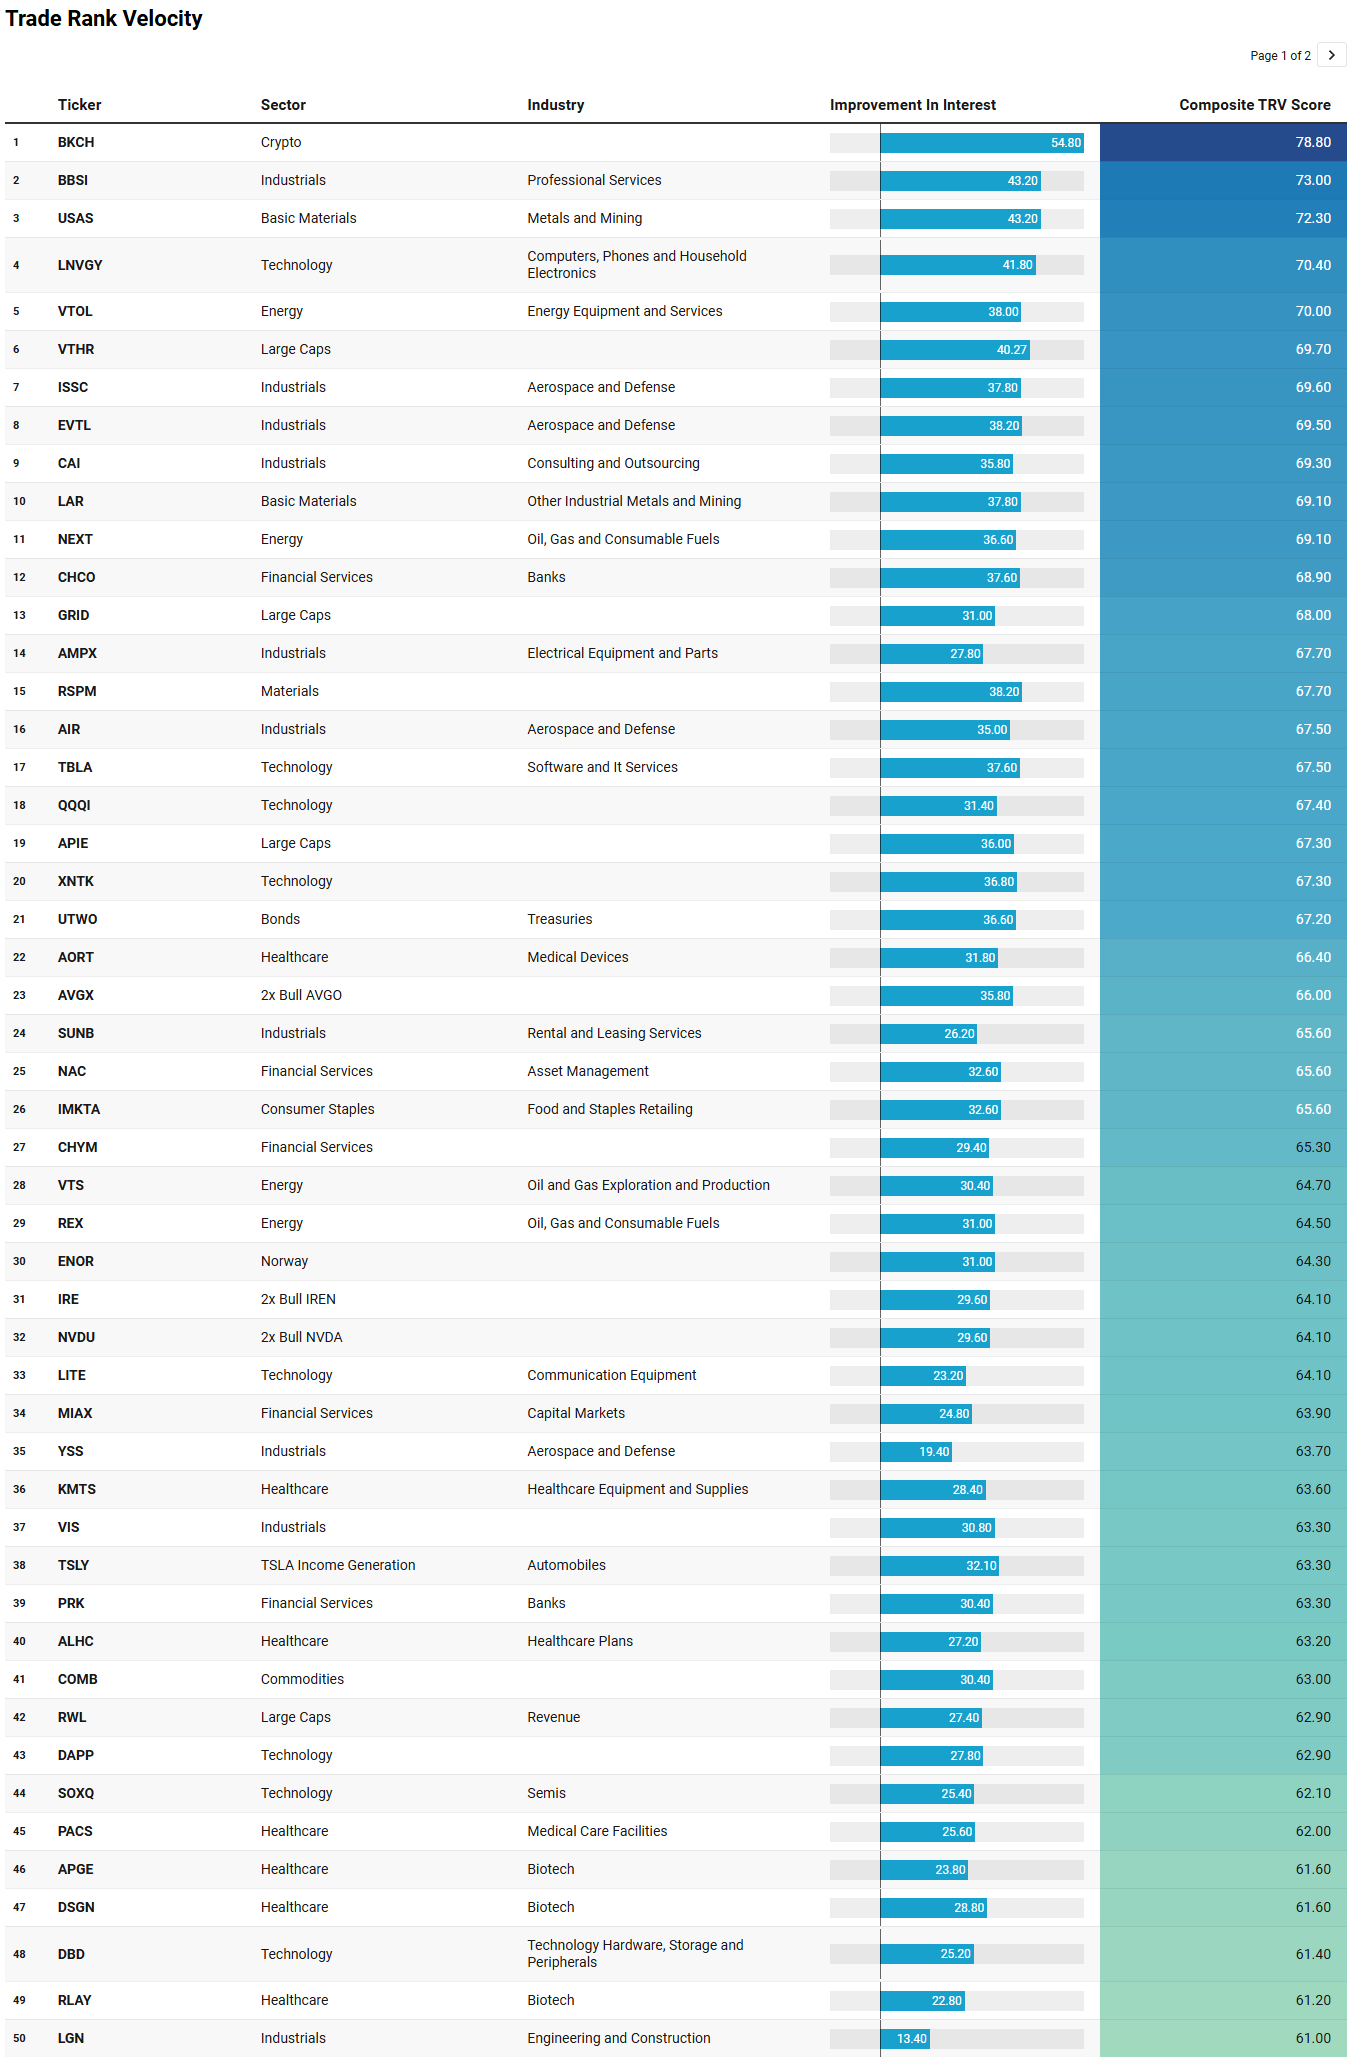
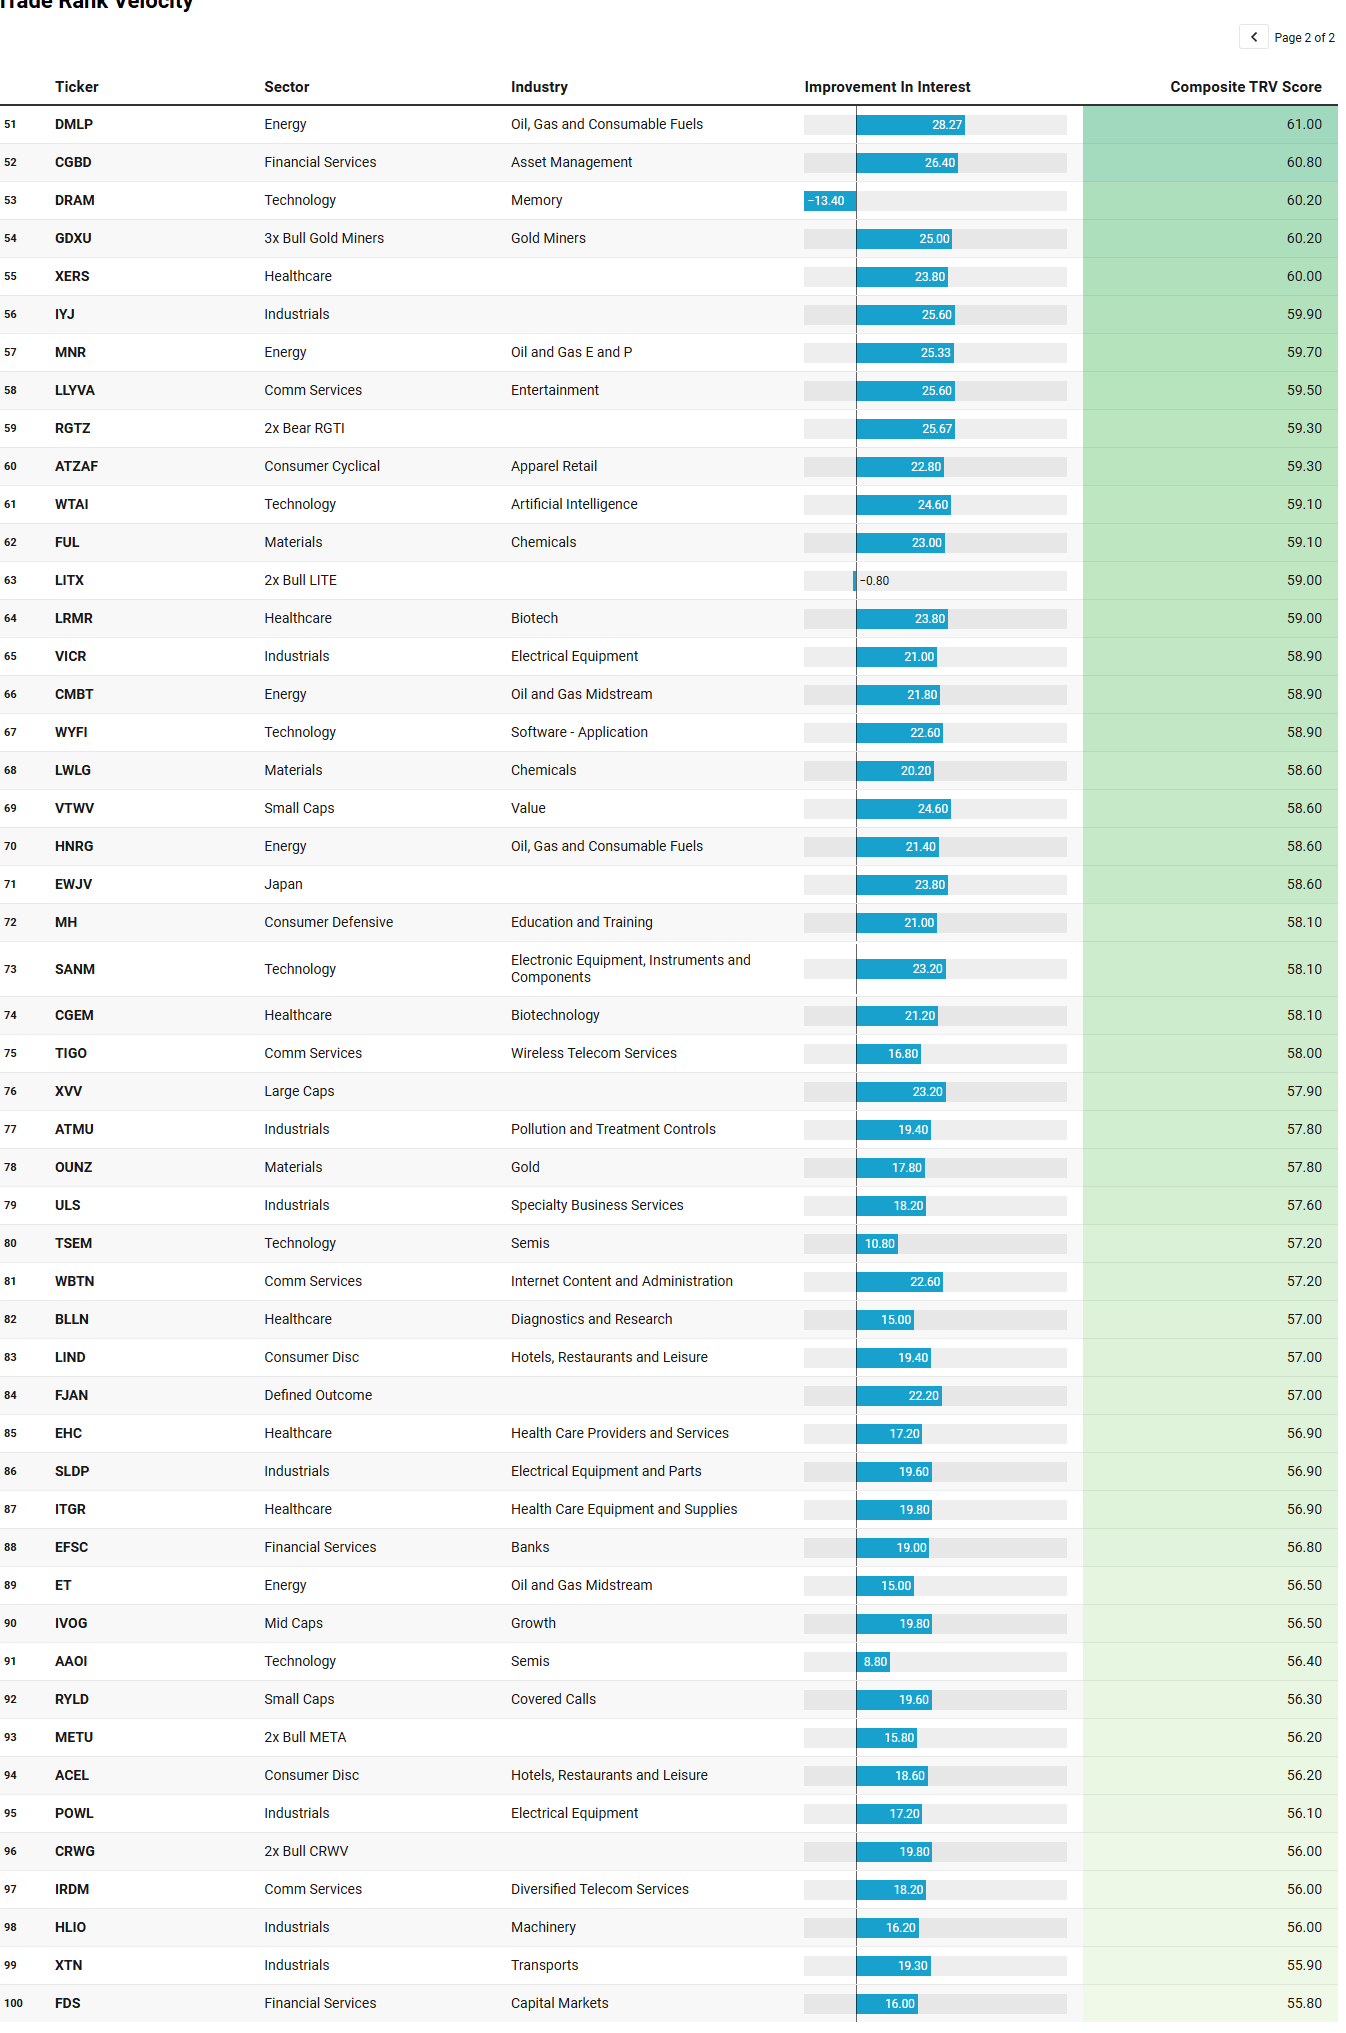
TRV is a proprietary metric that measures the recent acceleration or deceleration in institutional trading activity for a given stock by comparing its average trade rank over the past few days to its average in recent weeks. A sharp improvement in TRV typically reflects a notable shift in positioning, often accompanied by sustained trade activity, suggesting institutions are actively engaging with the name and that intensity of activity is rising. This often precludes meaningful price or narrative shifts. This isn’t a buy-list or sell-list; it’s meant to draw your eyes to names where institutions are putting money to work.
The TRV watchlist extends and sharpens it the institutional flow we saw above, and in a few places catches something the top-level dollar flows would have missed entirely.
The most immediately legible theme is the aerospace and defense cluster. ISSC, EVTL, AIR, and YSS all appear in the industrials-aerospace bucket with recent activity as fresh as April 10th and sustained interest scores ranging from 8 to 33 weeks. The breadth of that grouping -- spanning unmanned systems in EVTL, aircraft services in AIR, and defense electronics in ISSC -- combined with the duration of sustained interest suggests this is not a single-week rotational flush. The Iran conflict created a sustained bid under defense names that did not fully unwind when the ceasefire was announced; the institutional preference for real-economy, physical-asset industrials visible in the flow data finds its single-name expression here. XTN, the transportation ETF, and IYJ, the broad industrials ETF, appearing in the list alongside VIS reinforces the thesis that industrials as a sector theme has legs beyond any single catalyst.
The semiconductor and optical connectivity thread is also unmistakable. LITE with 25 weeks of sustained activity and LITX its leveraged counterpart both scoring well, alongside SOXQ, TSEM, and AAOI, creates a coherent picture: the institutional dollar flows into NVDA, AVGO, and the QQQ this week were the headline, but the real accumulation story is occurring one layer down in the component and connectivity names that supply the AI infrastructure buildout. LITE in particular -- a fiber and optical components company -- has been a consistent beneficiary of data center bandwidth demand, and 25 weeks of sustained interest with accelerating recent improvement is the kind of reading that preceded institutional scale-in in prior cycles. AVGX, the 2x leveraged AVGO product, appearing with a June 2024 through early April 2026 footprint, is a tell that some participants are expressing the same semiconductor thesis with amplified conviction.
The crypto and digital asset thread running through BKCH, DAPP, IRE, and NVDU is consistent with the ceasefire-driven risk recovery. BKCH -- the blockchain-focused ETF -- registered the highest improvement-in-interest score on the entire list at 54.8, with recent activity on April 9th. That reading arrived on the same day the market digested the ceasefire and equity volatility began to compress. Crypto has historically acted as a high-beta risk sentiment barometer, and a score of 78.8 composite with the strongest improvement reading on the list is not something to dismiss as noise. DAPP with 9 weeks of sustained interest reinforces that the digital asset theme has been quietly building even while broader market attention was absorbed by the geopolitical backdrop.
Two outlier signals deserve mention because they diverge from the risk-on consensus. DRAM, the memory ETF, carries a negative improvement score of -13.4 but a sustained activity reading of 102 weeks -- one of the longest on the list by a wide margin. That combination describes a name where interest has never gone away but momentum has recently reversed, consistent with the memory cycle narrative where inventory normalization is pressuring near-term pricing even as the secular AI demand story remains intact. GDXU, the 3x leveraged gold miners ETF, and OUNZ, the physical gold vehicle, both appearing with healthy composite scores and fresh April 10th activity, tells you that not everyone repositioned into equities this week. A segment of the institutional universe was still accumulating hard-money exposure even as the relief rally took hold -- a hedge against ceasefire fragility, elevated oil, and the residual macro uncertainty that the CNBC reporting on April 9th around the disputed ceasefire terms made explicit.
Taken together, the watchlist confirms that the week’s institutional preference for industrials, semiconductors, and risk-recovery assets was not limited to the large-cap headline names. It was being expressed simultaneously in the single-name mid- and small-cap layer with sustained conviction. The aerospace defense cluster, the optical connectivity thread, and the crypto reemergence all fit the same macro frame: a market pricing a world where the geopolitical risk premium is coming off, AI infrastructure spending is durable, and the participants who stayed disciplined through the volatility are now quietly building the positions they wanted.
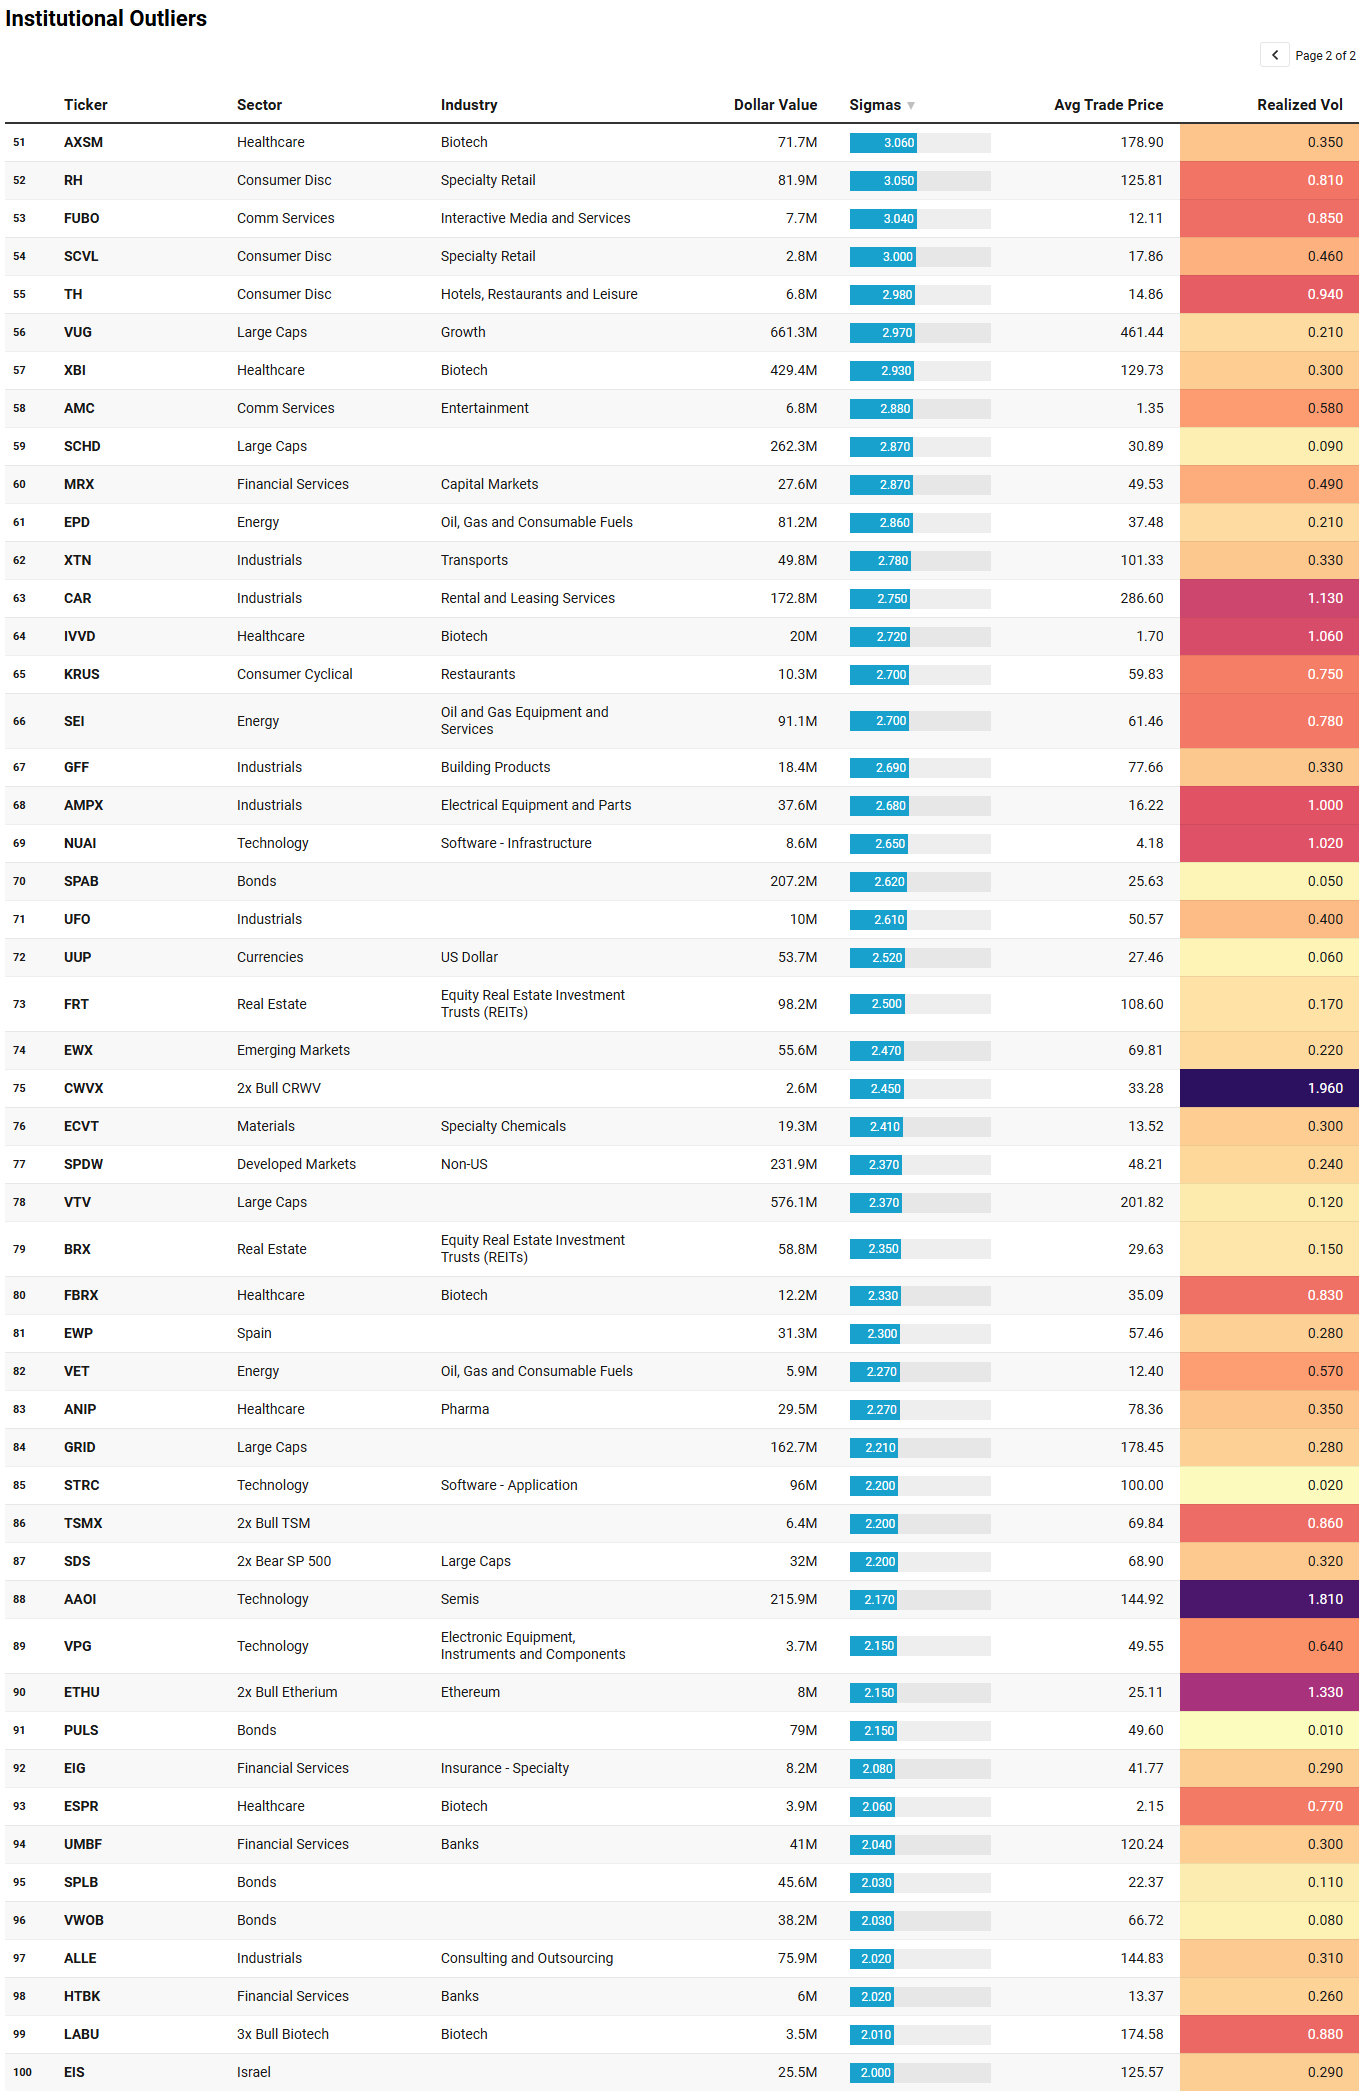
VL Institutional Outliers™ (IO)
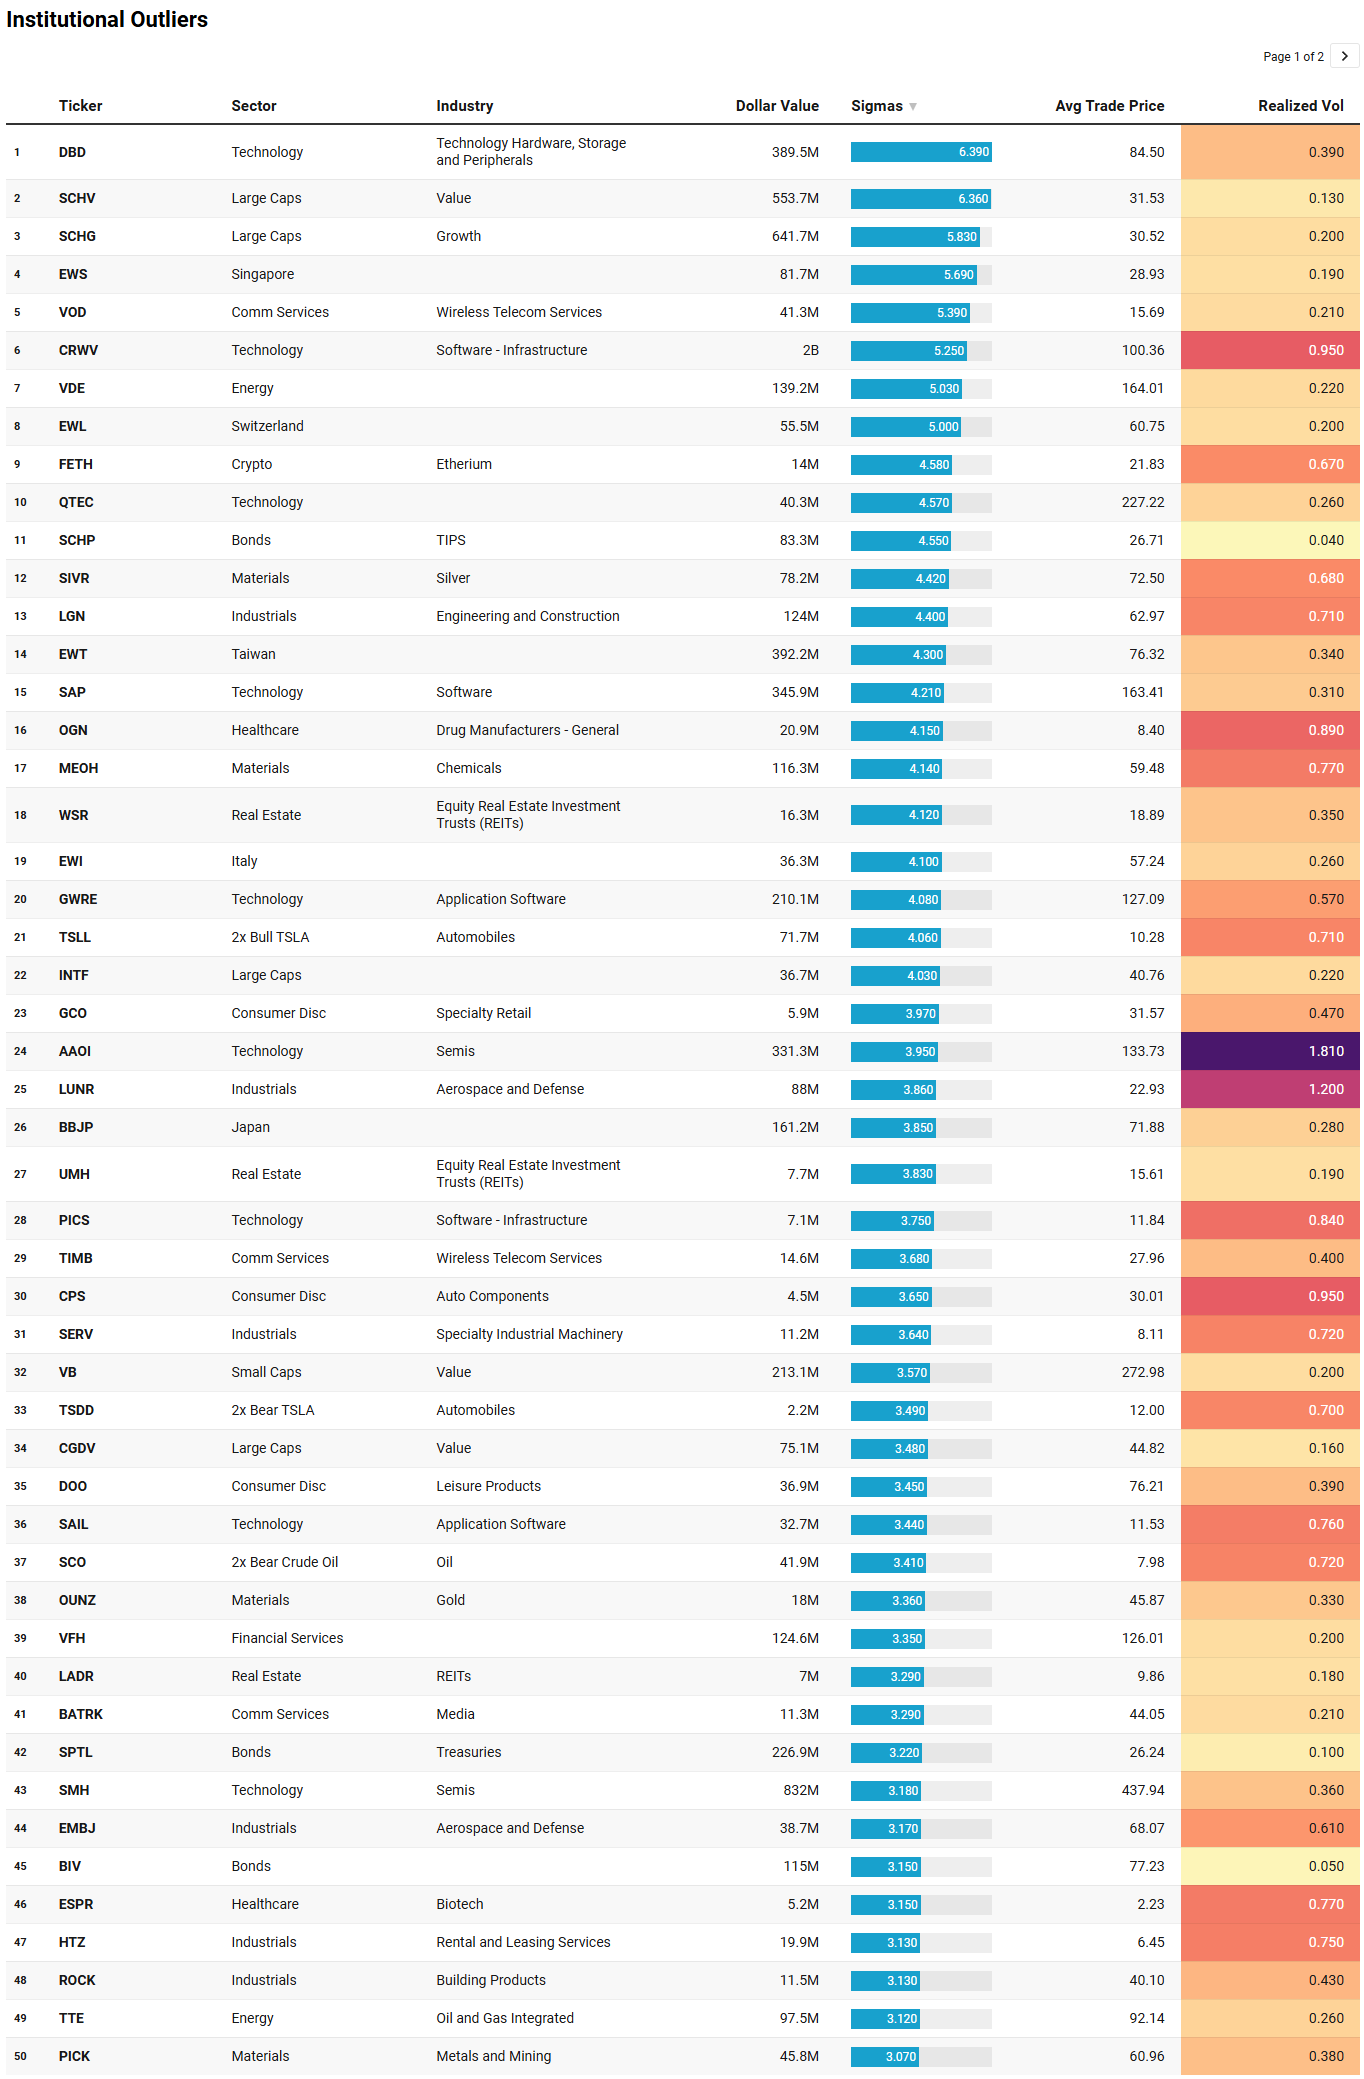
Institutional Outliers is a proprietary metric designed to spotlight trades that significantly exceed a stock’s recent institutional activity—specifically in terms of dollar volume. By comparing current trade size against each security's recent normalized history, the metric flags outlier events that may indicate sudden institutional interest but may be missed because the activity doesn’t raise any flags/alerts when comparing the activity against the ticker’s entire history. For example, it’s conceivable that a ticker today receives the largest trade it has had in the last 6 months but the trade is unranked and would therefore be missed by current alerts built off Trade Ranks. Day traders can use “Realized Vol” to identify tickers that are moving swiftly with large price displacement while others can use it to size your risk appropriately.
The institutional outlier list is dense with signals, and read alongside the flow narrative from earlier in the week it sharpens several themes considerably while introducing a few that were not visible in the aggregate dollar data at all.
The most striking single print on the entire list is CRWV on April 10th at $2.02 billion and 5.25 sigmas above its expected activity, with a realized volatility of 0.95. That is not repositioning noise. CoreWeave -- the AI-native GPU cloud infrastructure company that went public in early 2025 and has built its business renting Nvidia GPU clusters to hyperscalers and AI labs for training and inference workloads -- printed that size at roughly $100 average trade price in a way that places it among the largest outlier events on the list by raw dollar value, and the sigma reading confirms this was genuinely anomalous relative to the name's own history. The leveraged companion CWVX also appeared the same day at 2.45 sigmas, which is directionally consistent with broader institutional interest in the name rather than a single counterparty event. The realized vol of 0.95 tells you the institutions participating accepted meaningful price uncertainty to establish or extend exposure -- that is a conviction tell, not a passive flow. Read alongside the dark pool and sweep activity in the weekly narrative, the CoreWeave print anchors a coherent AI infrastructure thesis running from foundry capacity at TSMC down through GPU cloud at CoreWeave and into the fiber and optical delivery layer at LITE and AAOI -- all of which registered outlier or sustained TRV readings this week. Someone was building the full stack, quietly and in size, using the ceasefire relief window as cover.
AAOI printed outlier readings on both April 9th and April 10th, at 3.95 and 2.17 sigmas respectively, with realized volatility of 1.81 on both days. Two consecutive outlier prints in an optical semiconductor name at that vol level is a pattern worth isolating. AAOI makes high-speed optical transceivers that go directly into data center interconnect infrastructure, and its appearance alongside LITE in the TRV watchlist with 25 weeks of sustained interest creates a coherent picture: institutions are building exposure in the component layer of the AI infrastructure stack through names that have not yet received the headline attention that NVDA and AVGO absorb. The consecutive sigma readings and the high realized vol suggest these are not passive index flows -- they are targeted, and someone was willing to be visible doing it.
The international sovereign ETF cluster on April 10th -- EWS at 5.69 sigmas, EWL at 5.00, EWI at 4.10, EWP at 2.30, SPDW at 2.37, and EWX at 2.47 -- is the signal on this list that the aggregate flow data could not fully surface. Taken individually each is explicable as end-of-week rebalancing or a single counterparty block. Taken together on the same day, with Singapore, Switzerland, Italy, Spain, developed markets, and emerging markets all printing simultaneously above their expected activity levels, this reads as a coordinated international equity allocation. The ceasefire reduced the geopolitical risk premium not just for U.S. equities but for global markets, and these prints suggest institutional capital was being deployed into international developed and emerging exposure on the relief -- consistent with the emerging markets relative strength leadership visible in the MIR Backdrop data and the participation rates above 93% for EM noted in that section.
DBD’s April 9th print of $389 million at 6.39 sigmas -- the highest sigma reading in the two-day list -- is the most attention-grabbing single outlier. Diebold Nixdorf at roughly $84 average price with 0.39 realized vol suggests this was not a distressed or speculative print; the vol is contained and the price is mid-range, pointing toward a deliberate institutional position rather than a squeeze or event-driven spike. DBD also appeared in the TRV watchlist, which means this outlier print is landing into a name that was already registering sustained institutional interest. The two-day convergence of TRV score and outlier sigma is the kind of confirmation that warrants attention.
The bond side of the list deserves a unified read. SPTL at 3.22 sigmas, BIV at 3.15, SPAB at 2.62, PULS at 2.15, SPLB at 2.03, VWOB at 2.03, and SCHP from April 9th at 4.55 sigmas represent a broad-based outlier day across duration, credit, TIPS, and emerging market debt simultaneously. SCHP in particular -- TIPS at 4.55 sigmas -- is a pointed signal: institutions were buying inflation protection in size on April 9th, the same day the ceasefire was being processed by the market. That combination of relief-rally equity positioning on one hand and simultaneous TIPS accumulation on the other describes a sophisticated playbook: participate in the risk-on move while quietly hedging the scenario where the ceasefire collapses and energy prices re-accelerate. The VWOB print adds the EM debt dimension, consistent with the same international reallocation theme visible in the equity EW series.
SCO -- the 2x inverse crude oil product -- printing at 3.41 sigmas on April 10th with realized vol of 0.72 is the most explicitly directional trade on the list. Someone was aggressively positioning for lower oil over the weekend, either as a ceasefire conviction bet or as a hedge against long energy equity exposure accumulated earlier in the week when crude was still elevated…news as of late Saturday night appears to corroborating the bet Given that TTE also appeared on the same day’s outlier list, the picture is one of active rotation within energy: reducing crude beta while maintaining integrated oil exposure, which is a defensively sensible way to manage an energy book as the geopolitical premium deflates.
The biotech cluster -- XBI at 2.93 sigmas, AXSM at 3.06, LABU at 2.01, FBRX at 2.33, IVVD at 2.72, ESPR on both days -- is the one theme on this list that does not connect cleanly to the macro narrative driving everything else. Biotech outlier prints in a week dominated by geopolitics and semiconductor positioning suggest something more idiosyncratic: either pipeline-driven single-name activity creating sector-level spillover, or an early rotation signal into a sector that the the backdrop data flagged as near the participation balance point, sitting just above 54% breadth with a healthcare volatility ratio that was still elevated but beginning to improve at the margin. It is too early to call it a regime shift for healthcare, but the density of outlier prints across multiple biotech names on the same two days is not something to dismiss.
Taken as a whole, the IO list for April 9th and 10th tells a story of institutions doing several things at once on Friday: allocating internationally through sovereign ETFs, building semiconductor infrastructure exposure through CRWV and AAOI in size, covering crude beta through SCO, accumulating duration and inflation protection through the bond outlier cluster, and leaving a trail of biotech prints that may or may not be the early footprint of the next rotation. The through-line connecting it all is that these were not passive flows. Every name on this list printed above its own historical baseline in a statistically meaningful way, which means informed capital was making deliberate choices in a compressed window -- and nearly all of those choices point in the same direction the broader narrative has been building toward all week.
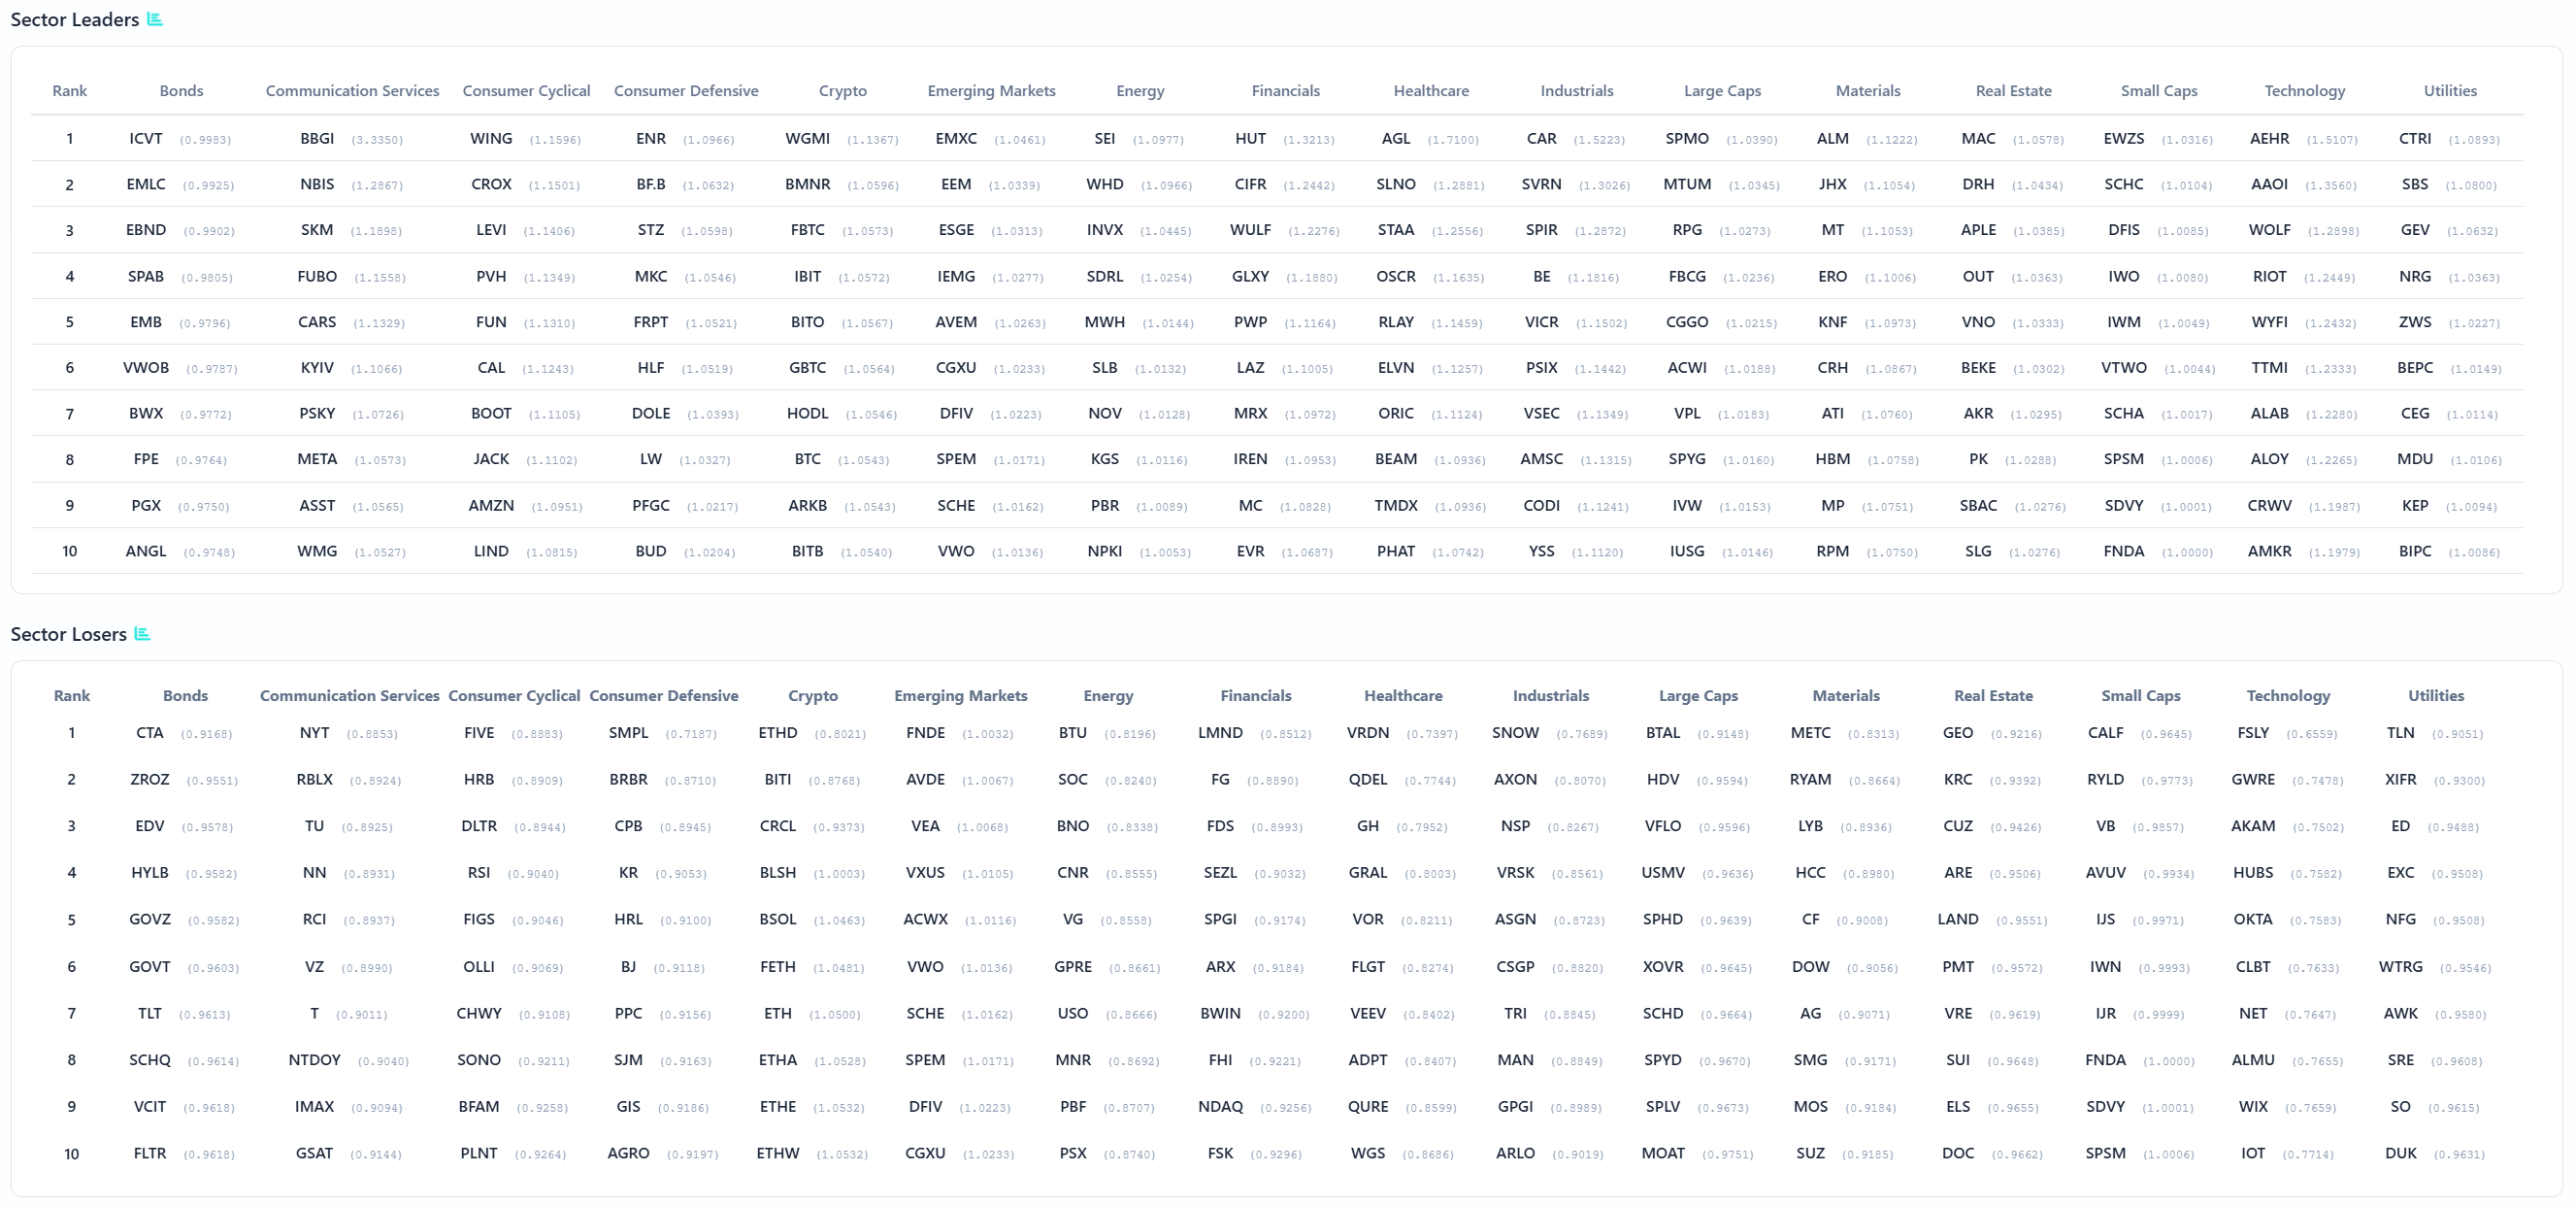
VL Sector Leaders
VL Sector Leaders is a weekly snapshot of where true leadership is asserting itself inside the market, stripped of the distortions that come from broad, style-mixed indices. Rather than asking which stocks look strong in absolute terms, this list focuses on which names are outperforming within the environments they actually compete in.
Each week, we surface the ten stocks demonstrating the most persistent relative strength inside their respective sectors. These are not headline chasers or one-day wonders. They are names that continue to separate themselves from peers through real price behavior, often reflecting sustained demand rather than fleeting attention.
For day traders, this list is a powerful awareness tool. Sector Leaders tend to offer cleaner intraday structure, better follow-through, and more predictable reactions around key levels because they already sit on the right side of relative strength. Even on choppy tape, leadership names often remain tradeable while the rest of the market degrades.
For swing traders, VL Sector Leaders helps narrow the universe to stocks with the highest probability of staying relevant. Relative leaders are more likely to hold trends, survive pullbacks, and reassert themselves after consolidation. When markets rotate, these names are often among the first to resume leadership — or the last to break.
The industrials column is where the narrative finds its most concentrated single-sector validation. CAR leading industrials at a ratio of 1.5225 is an attention-grabbing top slot for a car rental company, and it connects directly to the CAR outlier print visible in the IO list -- a name with realized vol above 1.0 that clearly attracted institutional attention in size. Below it, SVRN, SPIR, BE, VICR, VSEC, AMSC, CODI, YSS, and IUSG fill out a roster that spans defense electronics, power conversion, energy storage, and government services. This is not a homogeneous cyclical sector rallying on macro relief -- it is a defense and advanced industrial complex registering leadership simultaneously across multiple sub-industries, consistent with the aerospace and defense cluster that dominated the TRV watchlist and the EMBJ outlier print from the IO list. The breadth of leadership within industrials this week is the single clearest sector-level confirmation that the theme has structural rather than tactical roots.
Technology leaders tell a more interesting story than the raw flow dollars suggested. AEHR, AAOI, WOLF, RIOT, WYFI, TTMI, ALAB, ALOY, CRWV, and AMKR occupy the top ten slots. AAOI holding technology leadership rank after posting consecutive outlier sigma readings on both April 9th and April 10th confirms that the optical interconnect thesis is not just a dark pool whisper -- it is expressing itself in relative price performance as well. CRWV appearing at rank nine in technology leadership is the direct equity-price confirmation of the $2.02 billion outlier print, telling you that the institutional accumulation in CoreWeave was not fighting the tape. ALAB -- Astera Labs, another AI infrastructure connectivity name -- appearing alongside AAOI and CRWV creates a coherent sub-theme within the technology leadership column: the AI plumbing layer is outperforming the headline semiconductor names on a relative basis this week, even as the megacap dollars dominate the aggregate flow charts.
Emerging markets leadership through EMXC, EEM, ESGE, IEMG, AVEM, SPEM, CGXU, DFIV, SCHE, and VWO is essentially a who’s-who of international equity exposure vehicles, and every one of them registering leadership ratios above 1.02 on the same week that EWS, EWL, EWI, and SPDW printed outlier sigma readings creates a closed loop: the international allocation thesis visible in the IO list is confirmed by price leadership in the EM column. The participation rate above 93% for emerging markets in the backdrop data, the outlier ETF prints, and now sector leadership ratios all pointing the same direction is about as clean a multi-lens confirmation as the data can produce.
Materials leadership through SPMO, MTUM, RPG, FBCG, CGGO, ACWI, VPL, SPYG, IVW, and IUSG is top-heavy with factor and momentum ETFs, which is a tell in itself -- momentum factor leadership within materials suggests the move is being chased programmatically, meaning the initial accumulation has already occurred and the factor models are now amplifying it. ALM, JHX, MT, ERO, KNF, CRH, ATI, HBM, MP, and RPM in the individual name column add copper, steel, specialty metals, and rare earth exposure, reinforcing the real-economy infrastructure thesis that ran through the TRV and IO lists all week.
The sector losers column is equally informative as a risk management frame. SNOW leading technology losers at 0.7478 is a clean data point: despite the broad technology dollar flows, cloud software was not participating in the leadership. Energy losers -- BTU, SOC, BNO, CNR, USO, MNR, PBF, PSX -- are almost entirely commodity-price-linked rather than infrastructure names, consistent with the view that the ceasefire deflated the crude premium and punished names with the most direct oil price beta. The presence of FNDA and SPSM in both the real estate and small caps loser columns on the same week they appeared in the leader columns in other categories reflects the cross-sectional dispersion that a volatile, catalyst-driven week produces: the same vehicles can lead in one context and lag in another depending on factor exposure and timing.
The through-line from the leaders list is that the week’s winners were concentrated in three coherent clusters -- AI infrastructure within technology, defense and advanced industrials, and international equity via emerging markets -- and that each of those clusters is now confirmed across at minimum three independent lenses: aggregate dollar flow, outlier sigma prints, TRV sustained interest, and relative price leadership. That degree of convergence across independent data sources is what separates a durable institutional theme from a one-week tactical trade.
MIR Part 3: Framing-Up A Trade
The week’s institutional tape delivered a message that was consistent enough across five independent lenses -- aggregate flow, dark pool accumulation, sweep urgency, outlier sigma prints, TRV sustained interest, and relative price leadership -- that ignoring the through-line would require deliberate effort. The message is this: informed capital used the Iran ceasefire relief window as cover to build exposure in three structurally supported themes simultaneously, while quietly layering in international equity allocation and credit relief positioning that the headline index move obscured. The playbook for the week ahead is to align with that institutional footprint, not to chase the index recovery that already happened, but to position in the specific pockets where the institutional accumulation is freshest and the relative structure is most constructive.
The first and most important framing decision is what not to own. Energy with a participation rate below 50%, the highest volatility ratio of any sector at 1.36 and still deteriorating, and a loser column populated entirely by commodity-price-linked names is the clearest avoid in the book. The ceasefire deflated the crude premium and the sector leadership data confirmed it in real time. Any energy exposure in the portfolio below should be understood as a deliberate hedge or a very short leash tactical position, not a conviction allocation. Similarly, cloud software broadly -- SNOW leading the technology losers column at 0.7478 -- suggests that the technology dollar flows this week were not indiscriminate. They were targeted at infrastructure, not application layer SaaS, and the portfolio should reflect that distinction.
The second framing decision is time horizon. The institutional prints described across this week’s data -- particularly the sustained TRV readings in LITE, the consecutive outlier days in AAOI, and the $2 billion CoreWeave print -- are not day-trade setups. They are intermediate-term signals. The portfolio below is built for a two-to-six week hold horizon, with the understanding that the TSMC earnings on April 16th and the bank earnings beginning the same week function as near-term catalysts that could either accelerate or pressure the thesis depending on their outcome.
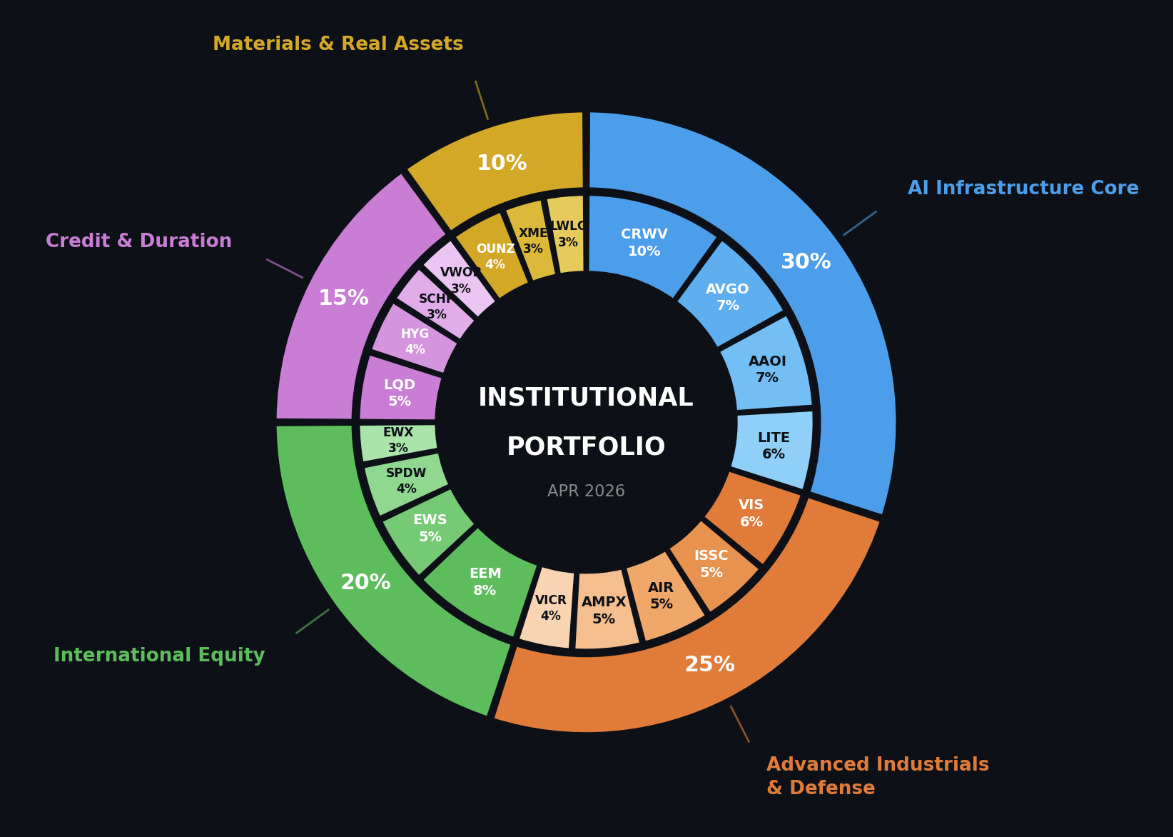
SLEEVE 1: AI INFRASTRUCTURE CORE -- 30%
This is the highest-conviction sleeve and the one with the most direct institutional backing across the most independent data sources. The CoreWeave ($2.02 billion, 5.25 sigmas), AAOI (consecutive outlier days at 3.95 and 2.17 sigmas), and LITE (25 weeks sustained TRV, sector leadership confirmation) prints represent the clearest institutional accumulation signal of the week. The sleeve owns the AI plumbing layer rather than the headline megacaps, because the relative leadership data showed AAOI, CRWV, and ALAB outperforming within technology even as NVDA and AAPL absorbed the largest raw dollar flows. AVGO provides the bridge between the megacap flow story and the infrastructure theme given its optical networking and custom silicon exposure.
CRWV -- 10%: The anchor of the sleeve and the single most significant institutional print of the week. CoreWeave is the only pure-play AI GPU cloud infrastructure name of scale, and the $2 billion print at 5.25 sigmas on a name with a realized vol of 0.95 is not a position being built casually. The thesis is that as hyperscalers and AI labs compete for GPU capacity, CoreWeave’s reserved infrastructure model commands premium pricing and durable margins. The risk is binary around any deterioration in Nvidia’s supply chain or a softening in enterprise AI capex guidance -- TSMC’s April 16th report is the first near-term catalyst to watch.
AAOI -- 7%: Consecutive outlier sigma readings on April 9th and 10th, sector leadership rank in technology, and 32 weeks of TRV sustained interest create a multi-lens confirmation that is rare in a single name. AAOI makes high-speed optical transceivers for data center interconnect, and the secular driver -- AI compute clusters requiring exponentially higher bandwidth between GPUs -- is not a one-quarter story. The realized vol of 1.81 on both days demands position sizing discipline; this is not a name to overweight.
LITE -- 6%: Twenty-five weeks of sustained TRV interest is one of the longest readings on the entire watchlist, and the name’s appearance in both the TRV leaders and the IO list creates the same multi-lens confirmation as AAOI. Lumentum’s fiber and optical components business feeds directly into the same data center bandwidth demand driving AAOI. The JPMorgan overweight reiteration with a $950 price target visible in the week’s news flow adds a sell-side catalyst layer to the institutional footprint.
AVGO -- 7%: The AVGX leveraged proxy in the TRV list and AVGO’s $10 billion aggregate flow rank confirm that the institutional thesis on Broadcom has not been abandoned despite the broader technology sector underperforming SPY on a relative basis. AVGO’s custom ASIC business for Google and Meta and its networking silicon exposure make it the most direct large-cap expression of AI infrastructure capex. It is the sleeve’s quality anchor.
TSM -- 0% in the sleeve directly, but TSMC earnings on April 16th are the catalyst that either validates or pressures the entire sleeve. The TSMX leveraged product appearing in the IO list at 2.20 sigmas tells you some participants are already positioned for the print. Given the March revenue data showing 45.2% year-on-year growth and the analyst consensus already calling for a likely beat, the asymmetry favors the bull case -- but initiating into the name ahead of earnings rather than in reaction to them is a sizing decision each will make differently.
SLEEVE 2: ADVANCED INDUSTRIALS AND DEFENSE -- 25%
The aerospace and defense cluster in the TRV watchlist -- ISSC, EVTL, AIR, YSS with sustained interest -- combined with the CAR outlier print in the IO list, EMBJ’s 3.17 sigma reading, and the breadth of industrials sector leadership from VICR through AMSC and YSS constructs a sleeve with both tactical and structural support. The ceasefire did not eliminate defense demand; it removed the acute geopolitical risk premium from energy while leaving the secular defense modernization cycle intact. Power conversion, unmanned systems, aerospace services, and defense electronics are all represented.
VIS -- 6%: The broad industrials ETF provides the sector sleeve anchor and reduces single-name idiosyncratic risk while capturing the leadership breadth visible across the sector leaders column. With a TRV composite score of 63.3 and recent activity on April 10th, VIS captures the VICR, AMSC, and YSS leadership without requiring individual position management in each.
ISSC -- 5%: Nine weeks of sustained TRV interest and April 10th activity in a defense electronics name with direct exposure to airborne systems and mission-critical hardware. The aerospace and defense sub-industry is registering the kind of multi-week sustained institutional accumulation that precedes a meaningful re-rating, and ISSC is one of the cleaner single-name expressions of that theme.
AIR -- 5%: AAR Corp’s aircraft maintenance, repair, and overhaul business benefits from both defense spending durability and the commercial aviation capacity constraints that have kept aftermarket services pricing elevated. Eight weeks of sustained TRV interest and April 10th activity confirm the institutional engagement is current.
VICR -- 4%: Vicor’s power conversion technology is embedded in both defense electronics and high-density AI compute applications, creating a dual-theme exposure that bridges the industrials and AI infrastructure sleeves. Eleven weeks of sustained TRV interest and April 10th activity with a sector leadership rank make this one of the more structurally supported names in the portfolio.
AMPX -- 5%: Twenty-seven weeks of sustained TRV interest is among the longest readings in the industrials column, and the April 9th IO outlier print at 2.68 sigmas with a realized vol of 1.00 confirms fresh institutional engagement. Amprius Technologies’ high-energy-density battery exposure connects to both defense (next-generation aircraft power systems) and the broader electrification industrial cycle.
SLEEVE 3: INTERNATIONAL EQUITY -- 20%
The simultaneous outlier prints in EWS, EWL, EWI, EWP, SPDW, and EWX on April 10th, combined with the emerging markets participation rate above 93% and the cleanest positive relative strength trend of any sector data, make the international allocation sleeve the most macro-driven component of the portfolio. The ceasefire removed a geopolitical overlay that had been suppressing international equity appetite, and the institutional response on Friday was rapid and broad-based. This sleeve is built with a tilt toward the specific geographies that printed outlier readings, balanced with the broad EM vehicle that confirmed the theme across the TRV and backdrop data.
EEM -- 8%: The broadest emerging markets vehicle and the top-ranked name in the EM sector leaders column at 1.0339. With a participation rate above 93% and improving relative strength versus SPY, EEM provides the sleeve anchor. The backdrop data showed EM with the lowest volatility ratio of any sector at 0.33 and still improving -- meaning upside volatility is dramatically outpacing downside volatility, the most favorable RV configuration in the entire dashboard.
EWS -- 5%: Singapore at 5.69 sigmas on April 10th is the highest-sigma international print on the IO list. Singapore functions as the institutional gateway to Southeast Asian growth and serves as a proxy for regional supply chain normalization post-conflict. The low realized vol of 0.19 on a 5.69 sigma print tells you this was a deliberate, low-urgency allocation rather than a panic buy or event-driven spike.
SPDW -- 4%: Developed markets ex-US at 2.37 sigmas provides the broadest international developed exposure and complements the country-specific prints. With Switzerland and Italy also printing outliers the same day, SPDW captures the developed market reallocation thesis in a single liquid vehicle.
EWX -- 3%: Emerging markets small caps at 2.47 sigmas adds a size tilt within the EM allocation, consistent with the broader small cap and mid cap participation breadth visible in the data where small caps registered above 88% breadth.
SLEEVE 4: CREDIT AND DURATION POSITIONING -- 15%
The sweep data placed LQD and HYG at the very top of the urgency ladder for the week, above SPY. That is an institutional signal that credit allocation was not an afterthought -- it was a primary expression of the ceasefire relief trade. The bond outlier cluster on April 10th spanning SPTL, BIV, SPAB, SPLB, VWOB, and PULS, combined with SCHP’s 4.55 sigma TIPS print on April 9th, builds a fixed income picture that is genuinely complex: institutions were simultaneously positioning in duration, credit spread compression, inflation protection, and emerging market debt. The sleeve below reflects that multi-dimensional positioning.
LQD -- 5%: Investment-grade corporate credit led the sweep table at $1.76 billion. With credit spreads compressing on the ceasefire relief and the market-wide volatility ratio below 1.0, investment-grade credit carries favorable risk-adjusted positioning for a two-to-six week hold. The duration exposure is a secondary consideration given that the rate path remains data-dependent into next week’s PPI print.
HYG -- 4%: High-yield at $1.24 billion in sweeps and a dark pool reading of roughly $3.8 billion tells you institutions were not just buying quality credit -- they were reaching for spread. The ceasefire relief trade is most powerful in high-yield given the energy sector’s heavy representation in HY indices; as the geopolitical risk premium compresses, HY credit spreads tighten disproportionately. The realized vol on HYG’s sweep prints was contained, suggesting this was allocation rather than distressed buying.
SCHP -- 3%: The TIPS print at 4.55 sigmas on April 9th was the most pointed signal in the entire bond outlier cluster. Buying inflation protection at the same time as participating in the risk-on relief trade is the hedge that a sophisticated desk runs when the ceasefire is fragile and energy prices retain the capacity to re-accelerate. Next week’s PPI print on Tuesday -- with consensus at 1.2% against a prior of 0.7% -- is the immediate catalyst that either validates or pressures this leg.
VWOB -- 3%: Emerging market bonds at 2.03 sigmas closes the loop between the international equity allocation and the credit sleeve. EM debt benefits from the same ceasefire relief dynamic as EM equity, with the added dimension of dollar sensitivity -- and UUP appearing in the IO list at 2.52 sigmas on April 10th is the one signal that cuts against this position, suggesting some institutional hedging of dollar weakness. Size this accordingly.
SLEEVE 5: MATERIALS AND REAL ASSETS -- 10%
Materials sector leadership across ALM, JHX, MT, ERO, and MP, combined with USAS in the TRV watchlist with 6 weeks of sustained interest and OUNZ appearing on both the TRV and IO lists in consecutive sessions, constructs a real assets sleeve that is supported by both the relative strength data -- materials registering positive RS versus SPY with an improving trend -- and the convergence of gold accumulation signals across two independent watchlists.
OUNZ -- 4%: Physical gold delivery ETF appearing in the TRV watchlist and registering outlier prints on both April 9th and April 10th. Gold accumulation alongside a risk-on relief rally is the clearest portfolio hedge signal in the dataset. The GDXU appearance in the TRV list adds a leveraged miners dimension that some participants are clearly expressing, but OUNZ provides the clean exposure without the vol amplification.
XME -- 3%: Metals and mining ETF captures the materials sector leadership breadth including the base metals exposure that benefits from infrastructure spending and EM demand recovery. USAS in the TRV list and PICK in the IO list both point toward institutional interest in the metals complex that goes beyond gold.
LWLG -- 3%: Lightwave Logic appearing in the TRV watchlist with 12 weeks of sustained interest and April 10th activity as a polymer photonics materials company creates a bridge between the materials sleeve and the AI infrastructure theme -- photonic integrated circuits are an emerging architecture for high-bandwidth, low-latency optical interconnects in data centers, connecting the real assets sleeve directly to the AI infrastructure thesis running through Sleeve 1.
PORTFOLIO SUMMARY
The portfolio is long the institutional consensus of the week -- AI infrastructure, defense industrials, international relief, and credit spread compression -- while maintaining the inflation hedge through SCHP and the hard money hedge through OUNZ that the smartest money on the tape was quietly building at the same time it was buying risk. The single largest risk to this book is a TSMC earnings miss or guidance cut on April 16th, which would pressure Sleeve 1 directly and likely create contagion into Sleeve 2 through the defense electronics names with semiconductor content. The second largest risk is a PPI print on Tuesday above 1.3% that reprices the rate path and pressures the duration leg of Sleeve 4. Size both risks accordingly and treat those two catalyst dates as the first decision points for adding or reducing exposure.
Thank you for being part of this community and for investing your time in this week’s edition. The quality of this readership — thoughtful, disciplined, engaged — is what makes this work meaningful. I’m grateful to build alongside you. Here’s to a week of clarity, conviction, and well-executed opportunities.
— VolumeLeaders