Market Momentum: Your Weekly Financial Forecast & Market Prep
Issue 85 / What to expect April 06, 2026 thru April 10, 2026


Weekly Market-On-Close Report
A Week Between War and Relief: Markets Navigate the Hormuz Endgame
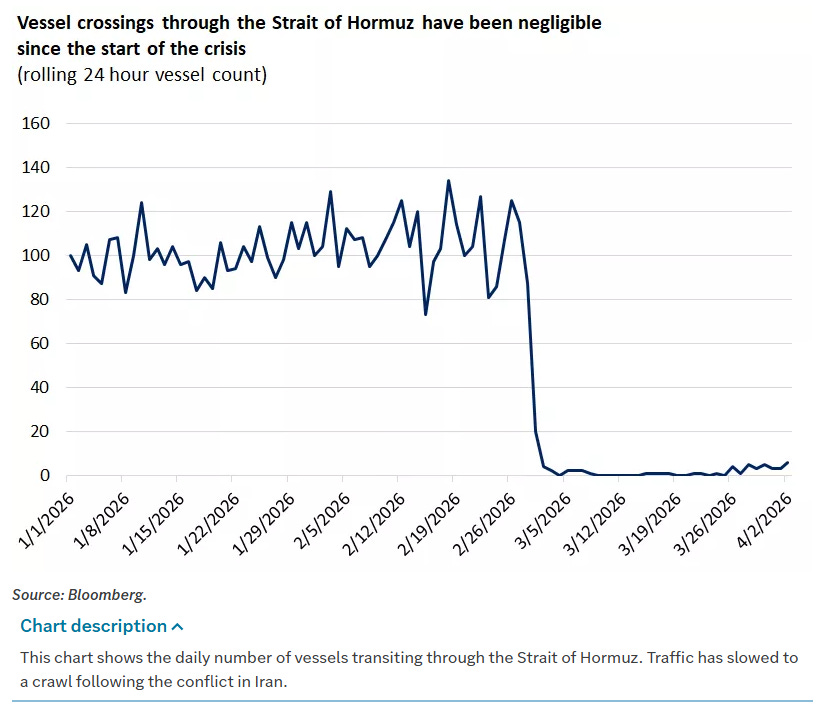
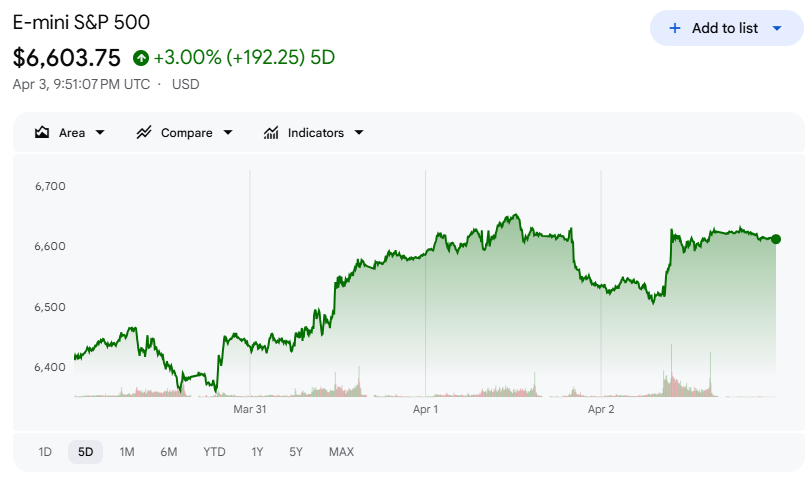
The week of March 30 through April 2 did not begin with clarity. It began with WTI crude sitting above $100 per barrel, the Strait of Hormuz effectively closed to normal vessel traffic, and a market that had been down five consecutive weeks wondering whether the geopolitical ceiling was finally cracking or about to fall harder. By Thursday’s close, the answer looked, at least tentatively, like the former. The S&P 500 gained 3.36% on the week, the Nasdaq Composite posted its best week since November, and the Dow Jones Industrial Average added 2.96% -- a genuine relief rally, built on a combination of de-escalation signals from the White House, a Federal Reserve chair who told the market exactly what it needed to hear, and economic data that held together better than the headlines suggested it should.
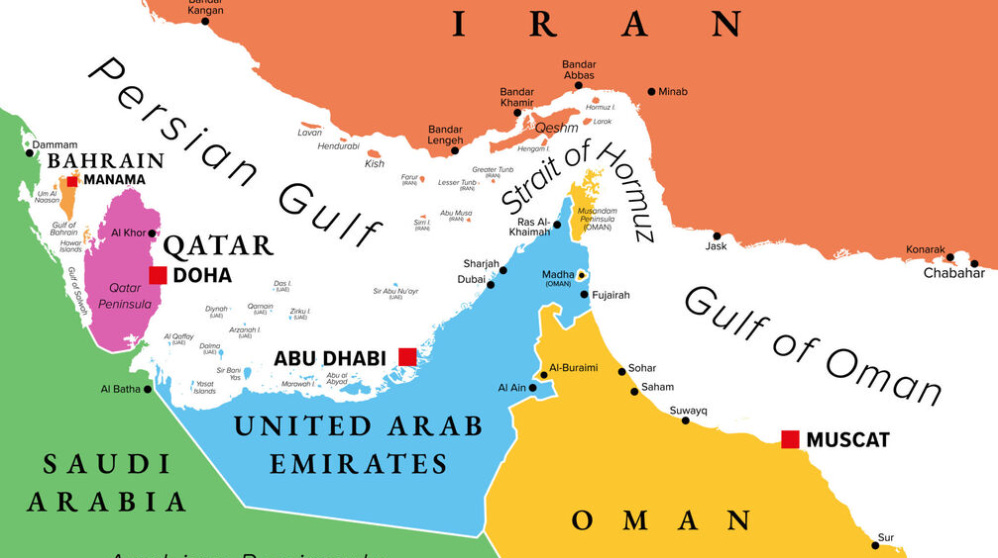
To understand why this week mattered, you have to understand what preceded it. The Strait of Hormuz crisis began in earnest in early March when Iran closed the strait in response to the U.S.-Israeli military campaign, sending Brent crude surging from approximately $85 per barrel to a peak above $126, and Dubai crude to an extraordinary $166.80. Approximately 20% of global oil supplies transit that waterway daily, and its closure represented the kind of supply shock that central bankers and portfolio managers had been running scenario analysis on for decades without ever expecting to actually live through. Barclays economists estimated that sustained prices at $100 per barrel could reduce global GDP growth by 0.2 percentage points while adding 0.7 points to global inflation, the classic stagflationary combination that gives every monetary policymaker nightmares.
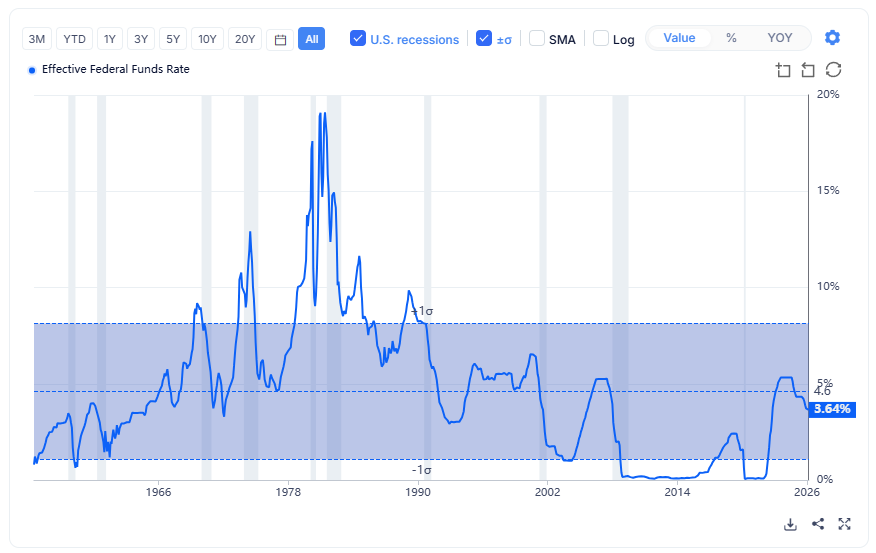
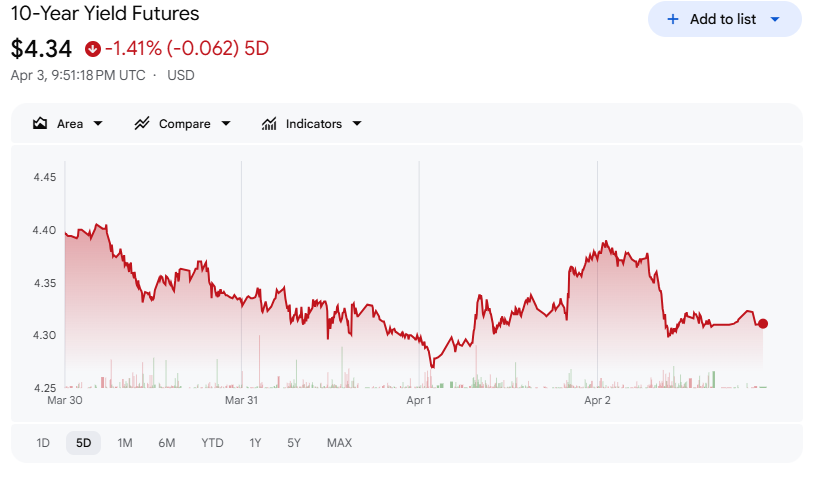
Against that backdrop, Monday March 30 opened with two critical inputs that began to shift the calculus. The first was Federal Reserve Chair Jerome Powell speaking at Harvard University, where he did something markets had not expected: he took the rate-hike scenario off the table. Just the prior Friday, market participants had priced greater than a 50% probability of a Fed rate increase driven by the energy price spike. Powell systematically unwound that expectation. He framed the oil price surge as a supply shock with historical parallels to the pandemic and prior trade disruptions -- likely transient, not structural. “By the time the repercussions of tightening monetary policy are felt, the oil price shock will likely have subsided, and we would be constraining the economy at an inappropriate moment,” he told the audience. The fed funds rate would stay in its current 3.5%-3.75% range. Inflation expectations, he said, “seem to be well anchored in the longer term.” Bond markets exhaled, and the 10-year Treasury yield began its descent from the week’s starting point of 4.44%.
The second input was geopolitical, and it was harder to read. The Trump administration had been calibrating its public messaging on Iran with what Fortune and others described as deliberate market-awareness, timing announcements of pauses and escalations relative to market open and close. On Monday, the signal that emerged was that the U.S. was prepared to hand off management of the Strait to allied naval forces and exit the direct military engagement window. “The USA won’t be there to help you anymore,” was the framing from the White House, and markets read it not as abandonment but as de-escalation -- removing the worst-case scenario of a prolonged U.S. ground campaign in theater. Equities rallied hard on Tuesday and Wednesday on that read.
Then Wednesday night, President Trump addressed the nation and failed to provide the clean de-escalation timeline markets had priced. Reports from Iran indicated a protocol was being drafted with Oman to monitor Hormuz vessel traffic and potentially set transit tolls -- a gradual reopening rather than a clean resolution. Oil prices moved higher again Thursday morning. Trump simultaneously threatened to escalate attacks on Iran over the next two to three weeks, a comment that temporarily weighed on equities before they recovered by the afternoon close. The week closed Thursday -- markets were shuttered Friday for Good Friday -- with the S&P 500 at 6,582.69, the Dow at 46,504.67, and the Nasdaq at 21,879.18. Still down 3.84%, 3.24%, and 5.86% year-to-date respectively, but the five-week losing streak was broken.
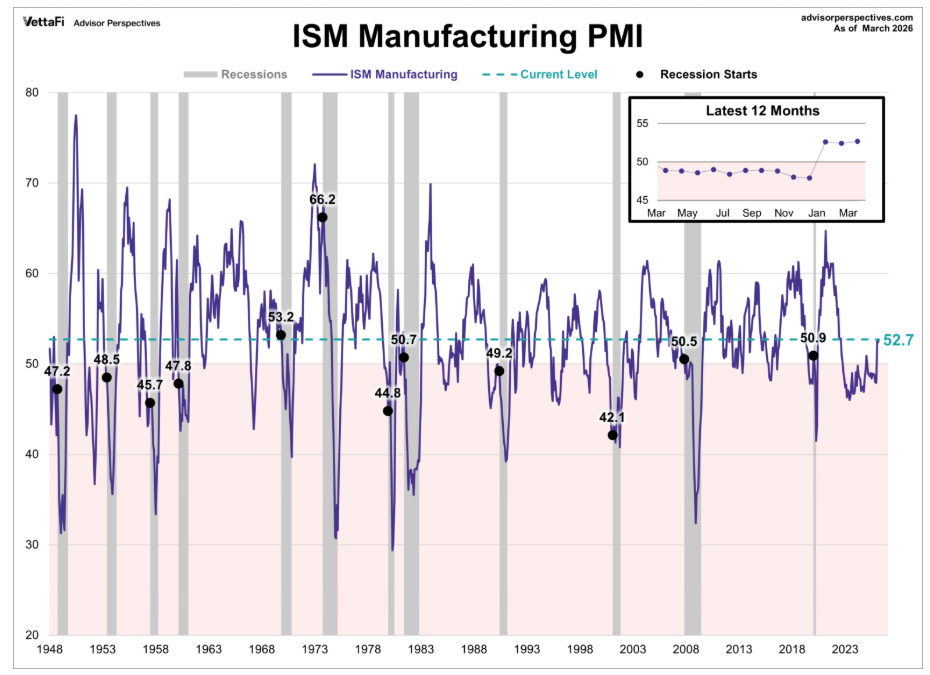
The economic data released during the week provided a modest but genuine source of comfort beneath the geopolitical noise. The ISM Manufacturing PMI for March printed 52.7, beating consensus expectations of a modest decline and marking three consecutive months of expansion in the manufacturing sector. New orders and production were growing. The employment subcomponent contracted for the 30th consecutive month, which continues to be a concern, but the price pressures component hit its highest reading since June 2022 -- a reminder that the inflation problem in manufacturing has not gone away even before you account for the energy shock.
On the labor front, the picture was mixed in the way that makes it genuinely ambiguous. ADP private payrolls for March came in at +62,000 -- above the 40,000 estimate, but down slightly from February’s revised +66,000. It is a number that says the economy is still creating jobs without saying it is creating them at a pace that would alarm the Fed. Initial jobless claims for the week ended March 28 fell 9,000 to 202,000, well below the 212,000 estimate -- the kind of number that says layoffs are not accelerating despite the uncertainty. But JOLTS data for February showed job openings at 6.9 million, down from 7.2 million in January, and hiring at its lowest level since 2020. Employers are neither firing people nor bringing new ones on at any pace. It is the labor market equivalent of a system running in neutral.
Consumer Confidence from the Conference Board offered a small but notable upside: the March reading came in at 91.8, up 0.8 points, the second consecutive monthly improvement. That improvement is coming from a low base -- confidence has been on a broadly downward trend since 2021 -- but any interruption of deterioration in an environment this uncertain is meaningful. The Atlanta Fed’s GDPNow model was estimating Q1 growth at 1.6%, a rebound from the prior quarter’s 0.7% and a number that, if it holds in the official data, argues against the recession narrative that parts of the market had begun pricing in.
The bond market was the week’s clearest beneficiary of the Powell commentary. The 10-year Treasury yield fell from 4.44% to 4.31% by Thursday afternoon. That 13-basis-point move in a single week is meaningful in a market that had been pricing in a possible rate hike as recently as the prior Friday. The message from fixed income was that once the market accepted Powell’s “look through the oil shock” framework, the growth concern became the dominant force pushing yields lower rather than inflation fear pushing them higher. It is a subtle but important distinction: duration was being bought not because inflation fears receded overnight, but because the market recalibrated the probability that the Fed would make the oil shock worse by tightening into a slowdown.
Internationally, European equities had a genuinely strong week, perhaps reflecting both the direct energy import benefit of any Hormuz de-escalation and the relative insulation of European markets from the domestic policy uncertainty that has weighed on U.S. assets. The STOXX Europe 600 rose 3.92%, Italy’s FTSE MIB led all major indexes at +5.18%, and the UK’s FTSE 100 added 4.70%. European markets were closed Friday for Good Friday as well, so these figures reflect four-day performance. Japan was the notable underperformer globally, with the Nikkei 225 falling 1.7% and the TOPIX down 1.0%, as markets there positioned for a Bank of Japan rate hike at the April meeting driven by oil-induced inflation pressures and as currency intervention signals from officials added to the uncertainty. The yen did strengthen modestly to 159.3 from 160.3 against the dollar. China’s official Manufacturing PMI for March printed 50.4, its fastest expansion rate in a year, and the non-manufacturing PMI recovered from contraction to 50.1 -- the first genuinely encouraging Chinese data point in several months, though the market response was muted given the global geopolitical overhang.
The ES June futures contract (ESM26) closed the week around 6,603.75, having carved out its month-to-date low at 6,353.25 on March 31 before recovering sharply. The 52-week range runs from a low of 5,026.75 to a high of 7,097.00, set on January 28 -- and the current level represents a meaningful pullback from those highs while remaining well above the prior year’s lows. The technical structure says the market found buyers at the 6,353 area with conviction, but the overhead supply between current levels and the January high is substantial.
The week ahead will test whether the relief rally has legs. ISM Services PMI and the March CPI report are the two most important data points on the calendar -- Services because any crack in the one part of the economy that has held together would change the growth narrative materially, and CPI because it will be the first full month of data that captures oil price shock pass-through at the consumer level. Edward Jones strategists advised clients to stay disciplined and resist emotionally charged decisions, emphasizing that U.S. economic fundamentals remain resilient and that excess cash should be deployed opportunistically into quality investments rather than held indefinitely in anticipation of a resolution that may not come cleanly.
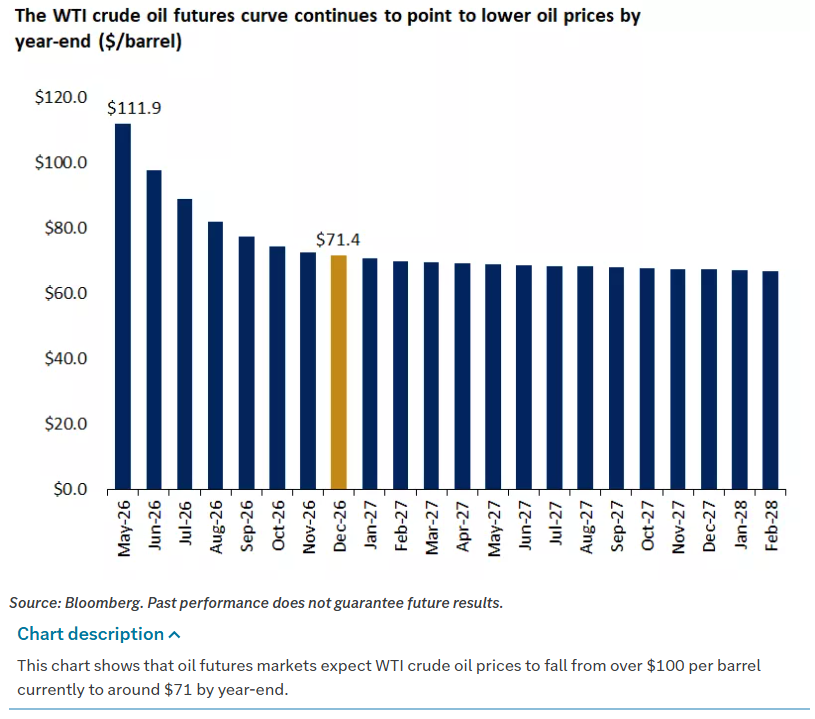
That is reasonable counsel. Theoretically, a three-to-four-week Hormuz closure duration with WTI oil gradually declining to the $70-$80 range by year-end and U.S. GDP growth remaining at trend levels of 1.5%-2.0% -- implies equity markets that deliver modestly positive returns and avoid recession. The tail risk -- a three-to-four-month closure with sharply higher oil prices, physical shortages, and rising recession probabilities in Asia and Europe -- has not gone away. Trump’s April 1 address leaned toward escalation rather than exit. The market chose to believe the former scenario this week. Whether that belief survives contact with next week’s data and whatever comes out of the White House over the weekend is the only question that matters right now.

Weekly Benchmark Breakdown
Breadth Bounces at the Surface, But the Foundation Has Not Been Repaired
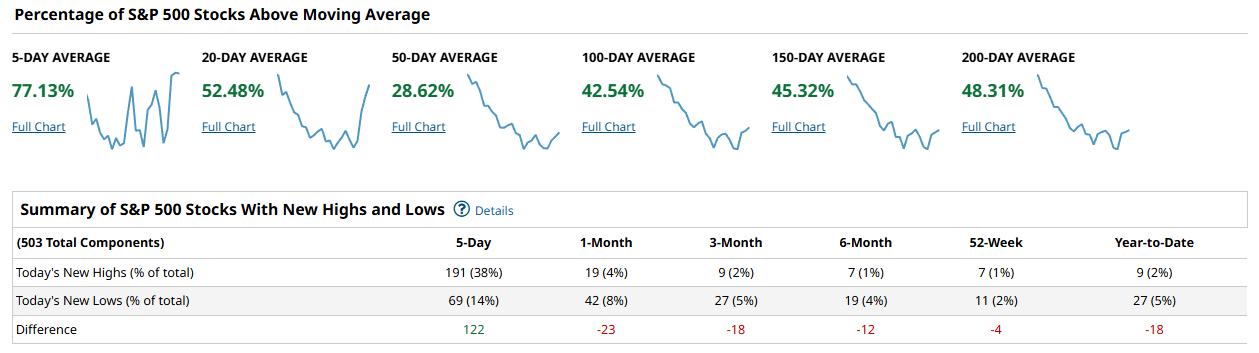
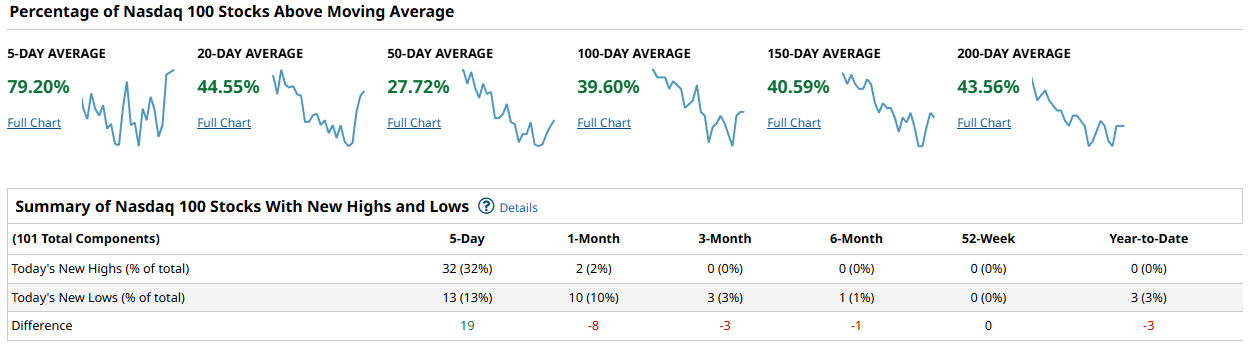
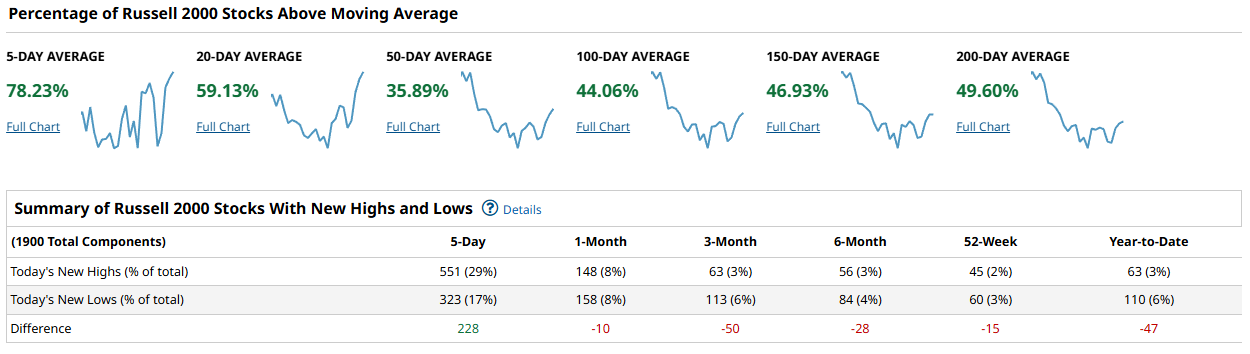
The week ended with a short-term thrust that looks better than it feels. Five-day participation readings spiked across every index -- S&P 500 at 77.13%, Nasdaq 100 at 79.20%, Russell 2000 at 78.23%, Industrials at 73.33% -- which tells you sellers stepped back for a session or two and a reflexive bid came in. But the moment you look even one step further out, the picture deteriorates sharply and does not recover. The intermediate-term trend structure is broken, new lows are overwhelming new highs on every lookback beyond five days, and breadth thrust is conspicuously absent. This is a bounce in a damaged market, not the early stage of a durable advance.
The S&P 500 cohort data is where that damage is most legible. The 50-day reading sits at 28.62%, meaning fewer than three in ten index members are above a measure that was broadly considered a bull-market floor just a few months ago. The 100-day is at 42.54%, the 150-day at 45.32%, and the 200-day at 48.31% -- all trending lower on their trailing sparklines. The new high/new low table confirms the story: on a one-month lookback the index produced 19 new highs against 42 new lows for a difference of -23, and that deficit compounds out to -18 on three-month, -12 on six-month, and -4 on a 52-week basis. The 5-day NH/NL spread of +122 is the only positive number in the table and it is entirely a function of where prices were exactly five sessions ago, not structural improvement.
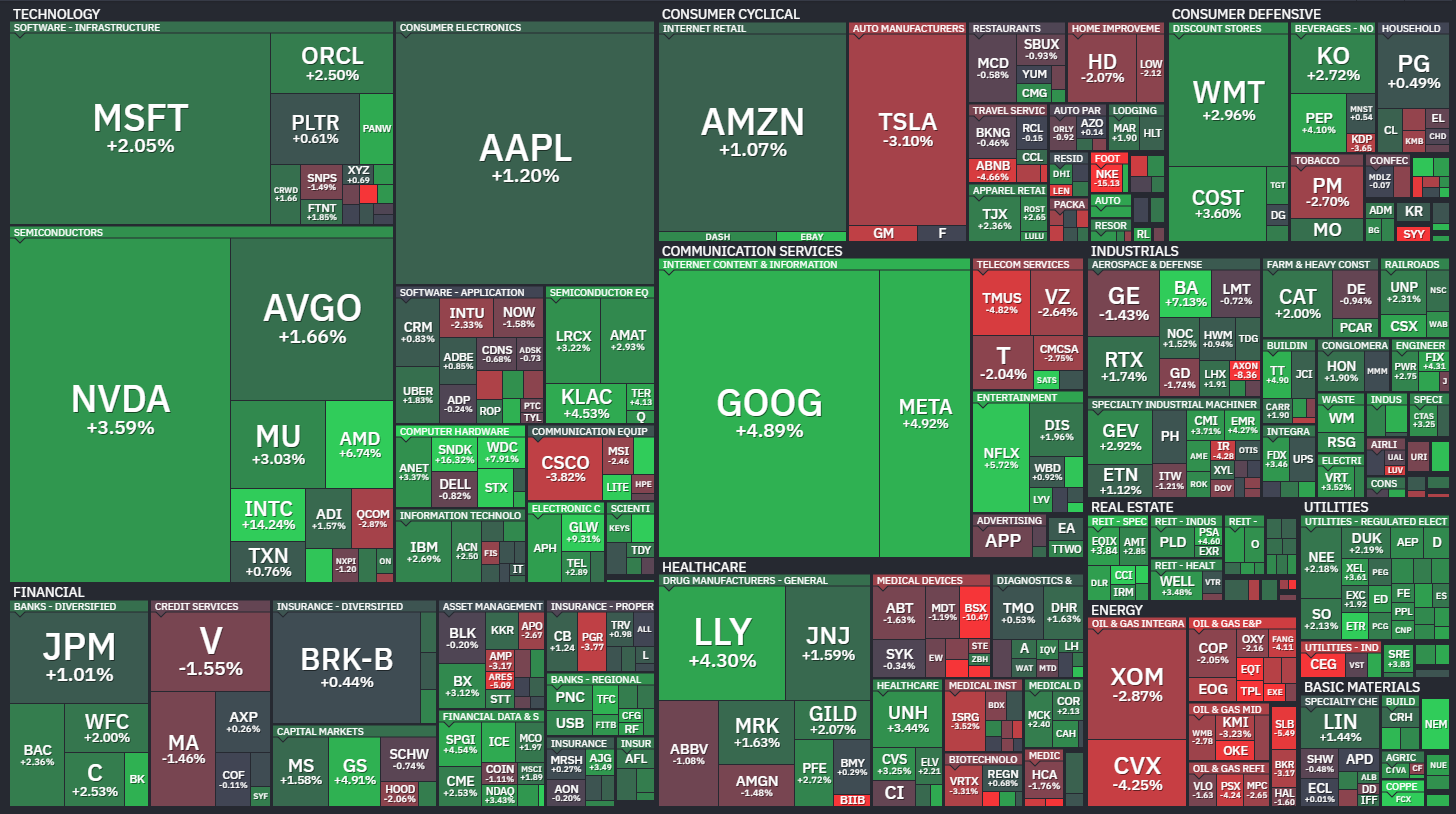
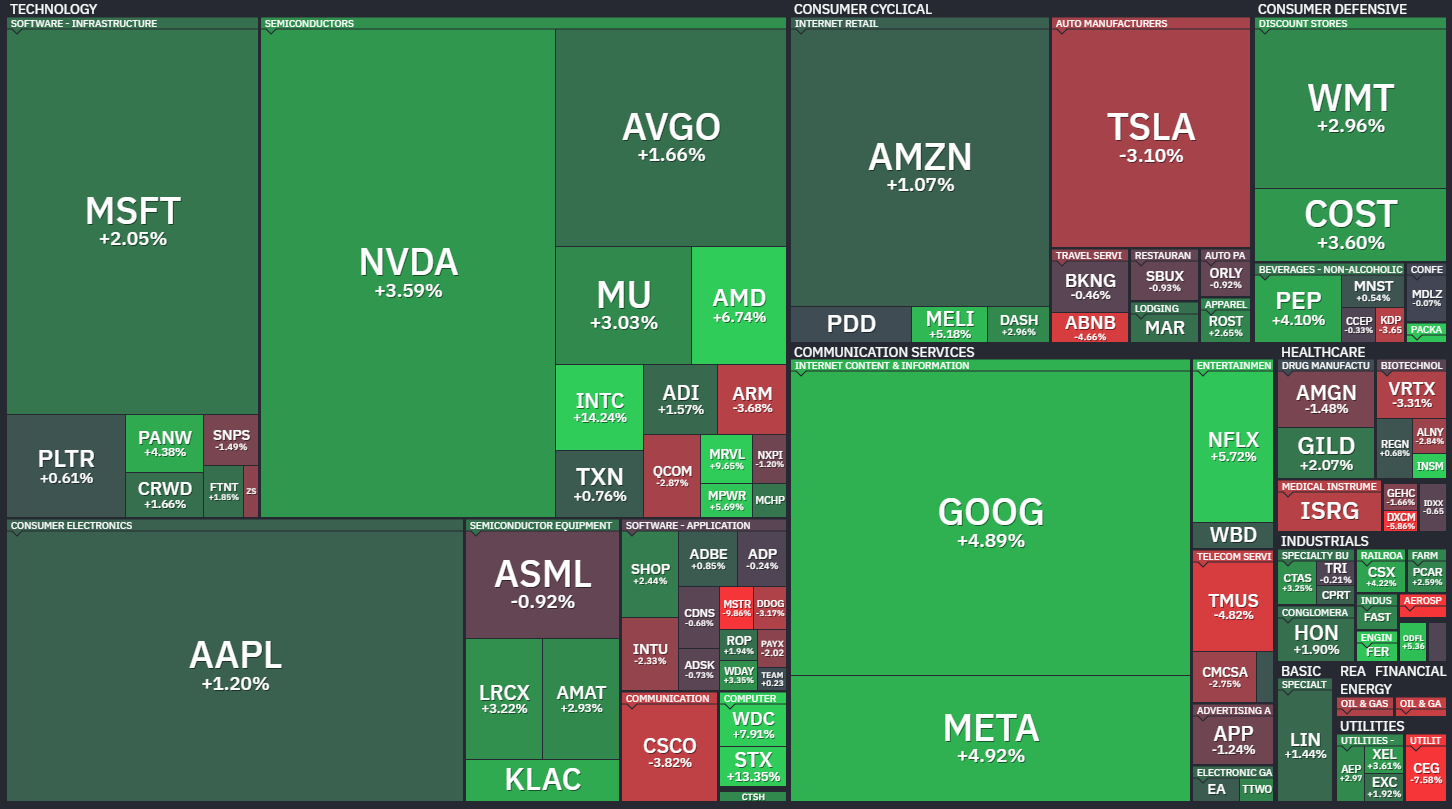
The weekly heatmap shows a two-tier market inside the SPX: mega-cap tech provided most of the green -- NVDA +3.59%, GOOG +4.89%, META +4.92%, AMD +6.74%, INTC +14.24% -- while energy (XOM -2.87%, CVX -4.25%), select consumer cyclicals (TSLA -3.10%, NKE deep red), and pockets of financials were clear drags. The index-level gain is a story of six or seven names carrying the week.
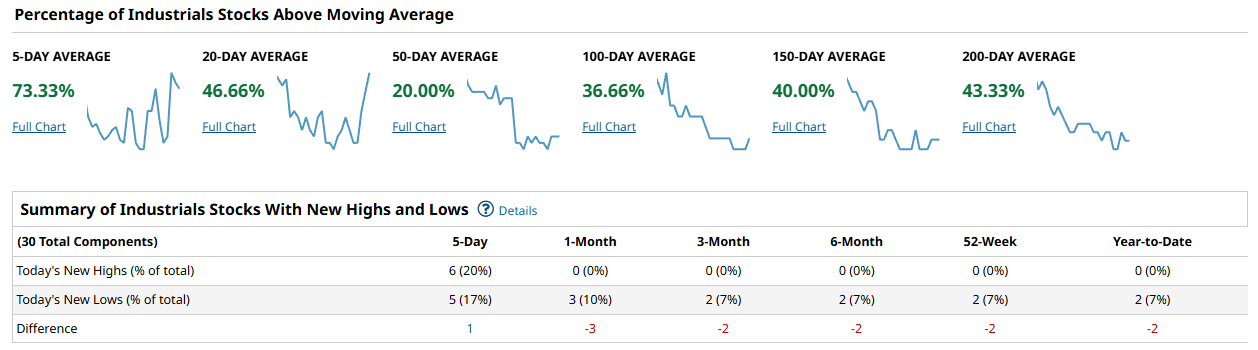
The Industrials read the worst of the four. Twenty percent of the 30 components are above their 50-day moving average. Read that again -- one in five Dow stocks is holding its 50-day. The 100-day comes in at 36.66%, the 150-day at 40.00%, and the 200-day at 43.33%. New highs on every lookback beyond five days are zero. New lows on a 52-week basis are 2 out of 30, or 7%. The five-day NH/NL difference is barely positive at +1.
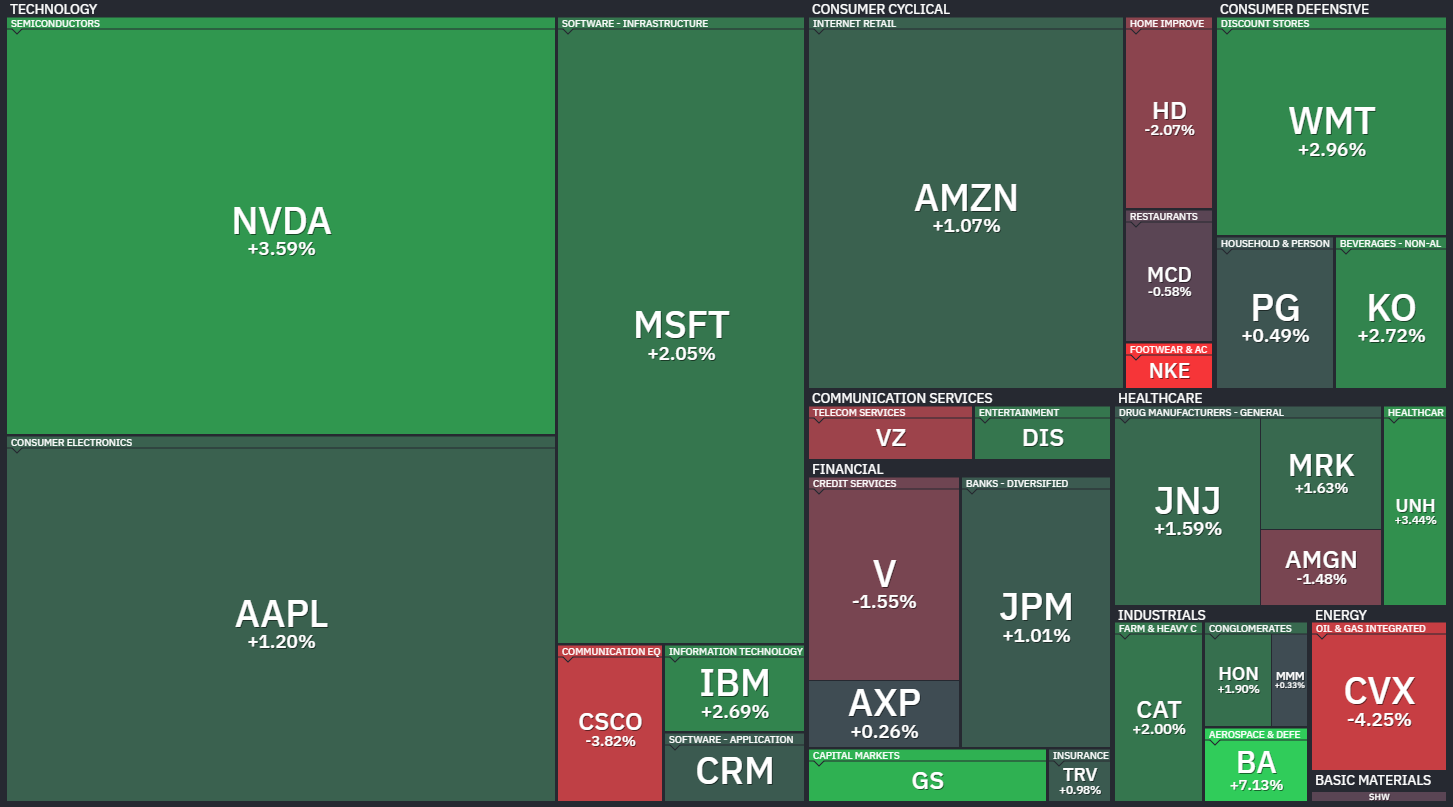
The heatmap for the Dow-30 shows BA +7.13% as the standout -- a name that has been technically wrecked for two years and whose weekly gain is more about positioning unwind than fundamental re-rating -- while GE -1.43%, CAT +2.00%, and most of the industrial complex was quiet to slightly negative. Industrials are a late-cycle tell and right now they are not offering a constructive signal.
The Nasdaq 100 mirrors that dynamic directly. The 50-day sits at 27.72%, the 100-day at 39.60%, the 150-day at 40.59%, and the 200-day at 43.56% -- all in long downtrends. The 52-week new high count is zero out of 101 components. Notably the 52-week NH/NL difference is flat at zero, which is slightly better than the SPX in absolute terms, but on a one-month basis the spread is -8 and on three months it is -3.
The heatmap captures the mega-cap dependence precisely: AVGO, NVDA, MU, AMD, MSFT, and GOOG were the tent poles. CSCO -3.82%, ARM -3.68%, MSTR and DDOG deep red, CDNS lower -- the secondary and growth layers of the index underperformed meaningfully. Breadth below the headline is not healthy.
The Russell 2000 deserves a separate look because it is simultaneously the most interesting and the most concerning. The 20-day reading at 59.13% is notably stronger than any other index at that time horizon, which suggests the small-cap bounce off recent lows had some real participation behind it. The 50-day is at 35.89%, the 100-day at 44.06%, the 150-day at 46.93%, and the 200-day at 49.60%. Those numbers are all better than the NDX and nearly in line with the SPX, but the new high/new low table is ugly beyond the five-day window: one-month difference is -10, three-month is -50, six-month is -28, and 52-week is -15. The 5-day NH/NL difference of +228 looks large in absolute terms across 1,900 names but on a percentage basis it is 29% new highs vs 17% new lows -- a positive spread, but not a thrust-level reading.
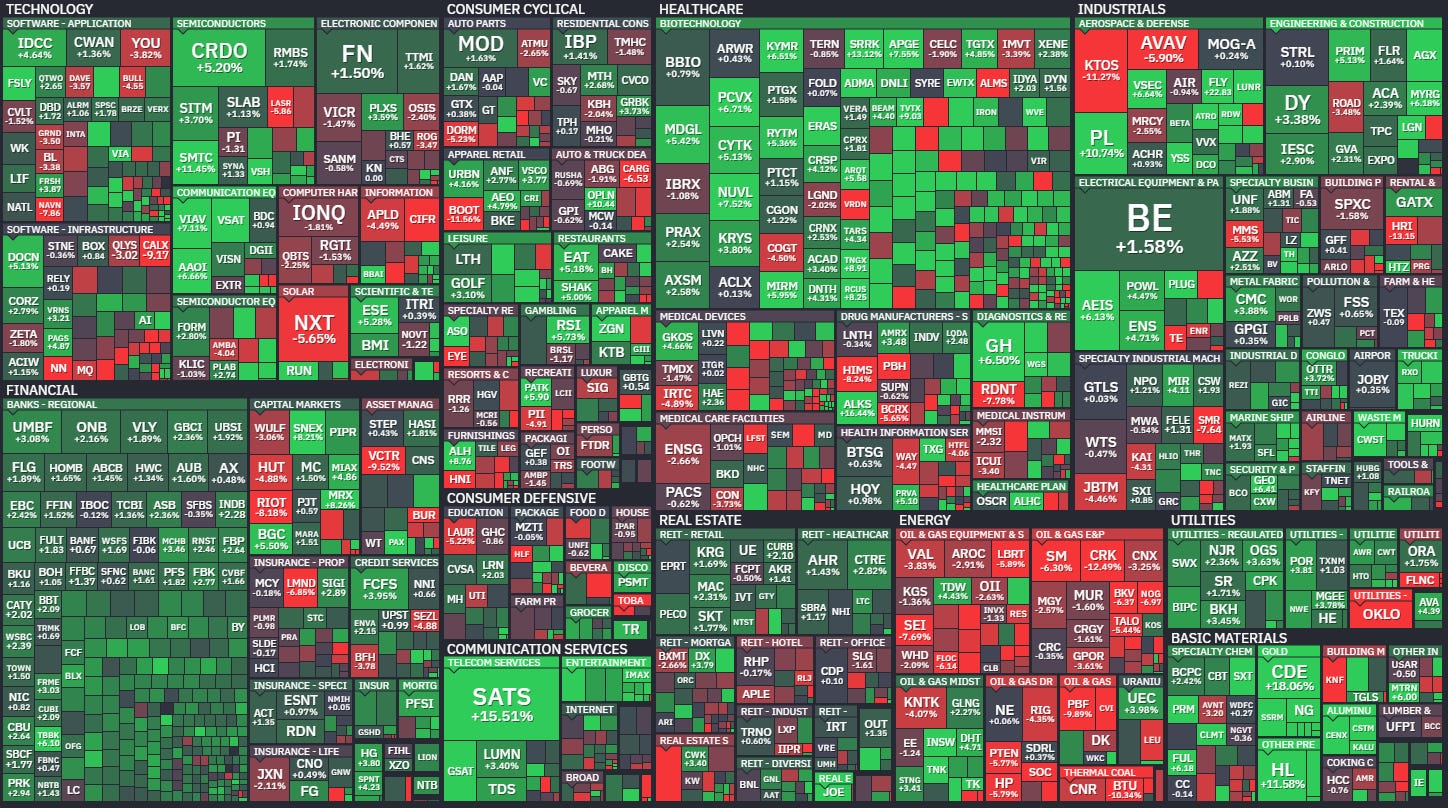
The small-cap heatmap is the most mixed of the four: energy, healthcare, and several industrial sub-groups were in the red while select financials, biotech, and a handful of cyclicals posted gains. There is no coherent sector leadership.
Putting the four together: the cap-weighted indices held up because a concentrated group of mega-cap tech names caught a bid, not because participation expanded. The equal-weight story is mediocre at best. The 50-day cohort across all four indices is well below the 60% threshold that would indicate the market’s trend-following population has flipped long. New lows are dominating new highs on every intermediate and long-term lookback without exception. The Russell’s relatively stronger 20-day reading is the one marginal positive -- if small-caps can hold their recent lows and begin pushing the 50-day cohort above 40% and then 50%, that would be the first breadth confirmation worth monitoring. Until the SPX 50-day cohort clears 40%, the one-month NH/NL spread goes positive, and the Industrials 50-day cohort climbs back toward 50%, any rally is a relief move in a downtrend.
The playbook for the coming week follows from that structure. Lean toward names and sectors that showed relative strength during the drawdown: Consumer Defensive (WMT, KO, COST) held the 200-day and their heatmaps were positive, which is what you want to see from defensives acting defensively. Within tech, focus on the mega-cap names that drove the week’s gains -- they are at least holding structural levels -- and be cautious about adding to the secondary growth layer that lagged. Avoid energy for now unless you have more strategic views on longer time horizons; CVX and XOM both printed notable weekly losses and the sector’s trend remains broken. Financials are mixed, with large-cap names (JPM, BAC) faring better than the broader group. Watch the Russell 2000’s 20-day cohort: if it fades back below 50% next week, the small-cap bounce is exhausted. Watch the SPX one-month NH/NL spread for any move toward zero -- that is the first meaningful signal that something is changing beneath the surface.
The bottom line: breadth bounced at the five-day level but every intermediate and structural measure remains in deterioration, new lows are running ahead of new highs beyond a one-week window, and the gains that did occur were too concentrated in mega-cap names to constitute the kind of broad participation that precedes a sustainable advance.

Investor Sentiment Report
%Bull-Bear Spread
The %Bull-Bear Spread measures the gap between bullish and bearish investor sentiment, often from surveys like AAII. It’s a contrarian indicator—extreme optimism may signal a coming pullback, while extreme pessimism can hint at a potential rally. Large positive or negative spreads often mark market turning points.
The AAII bull-bear spread printed -17.70% for the week ending March 26, a modest improvement from -21.60% the prior week but still deeply negative and well below the long-term average of +6.31%. The trajectory is what matters here: this spread sat at +21.26% in mid-January and has collapsed nearly 39 points in roughly ten weeks, one of the sharper sentiment reversals of the cycle. Readings in this range -- persistently below zero for multiple weeks -- have historically been contrarian supportive. The crowd is bearish enough that the fuel for a sustained selloff from sentiment alone is diminishing.
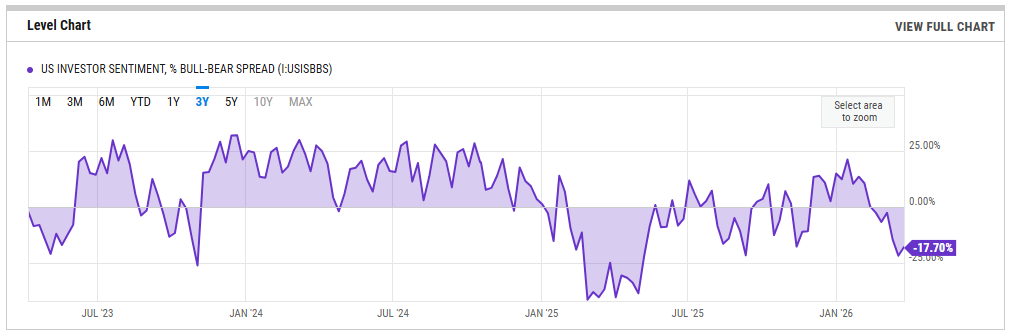
That said, the spread has not washed out to the -30 to -40 zone that typically marks durable bottoms. The week-over-week improvement from -21.60 to -17.70 is encouraging at the margin but does not yet constitute a trend reversal in mood. What would flip the signal: a second consecutive improvement back toward -10 would suggest fear is being worked off and the contrarian bid is building. A fresh plunge below -25 would warn that pessimism is deepening beyond a correction mindset and into something more structural.
NAAIM Exposure Index
The NAAIM Exposure Index (National Association of Active Investment Managers Exposure Index) measures the average exposure to U.S. equity markets as reported by its member firms. These are typically active money managers who provide their equity exposure levels weekly. The index offers insight into how much these managers are investing in equities at any given time, ranging from being fully short (-100%) to leveraged long (up to +200%).
The NAAIM Exposure Index came in at 68.36 for the week of April 1, essentially flat from 68.52 the prior week but meaningfully lower than the 82-85 range where active managers were positioned in early February. The median exposure of 82.50 tells you the central manager is still reasonably long, but the minimum reading of -100 -- meaning at least one respondent is fully net short -- and the widening standard deviation at 55.64 reveal growing disagreement in the advisory community.
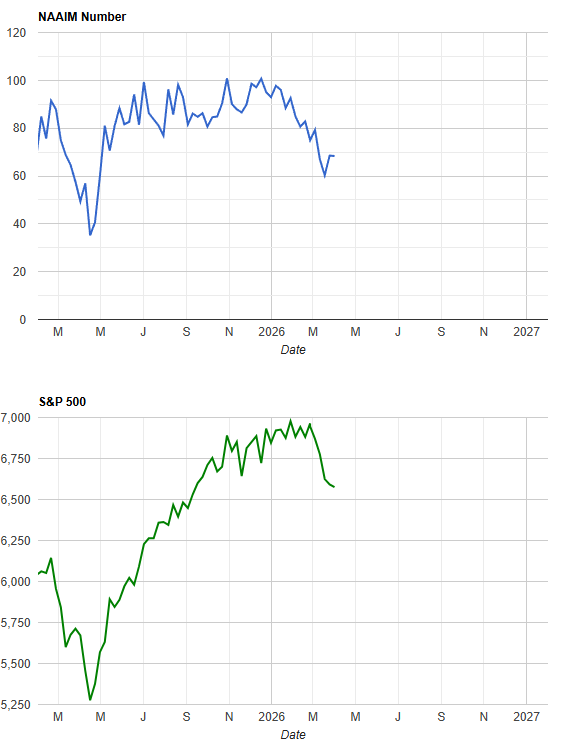
Managers have been de-risking steadily for eight weeks now. At 68, there is dry powder available for re-engagement, but exposure is not yet in the capitulation zone below 40-50 where managers have historically been forced back in by performance anxiety. The practical tripwires: a drop into the mid-50s without commensurate price damage would be a classic setup for a mechanical re-risking rally. Conversely, a push back into the low 80s from here without a breadth expansion would mean managers are chasing price rather than following participation, and that re-risking would be fragile.
CBOE Total Put/Call Ratio
CBOE's total put/call ratio includes index options and equity options. It's a popular indicator for market sentiment. A high put/call ratio suggests that the market is overly bearish and stocks might rebound. A low put/call ratio suggests that market exuberance could result in a sharp fall.
The CBOE total put/call ratio printed 1.05 on April 2, up from 1.03 the prior session and part of a broader spike visible over recent weeks. Readings above 1.0 indicate more puts being purchased than calls across the options market, which places the current level squarely in the fear zone. The chart shows a sharp recent surge from what had been a more complacent sub-0.90 range through most of the first quarter. When the ratio sits above 1.0 for several consecutive sessions, it typically means hedging activity is elevated and portfolio insurance is being actively purchased, which has two implications: drawdown depth tends to be cushioned because the hedging itself creates a floor of sorts, and the quality of any bounce improves because the unwind of that put positioning supplies mechanical buying pressure.
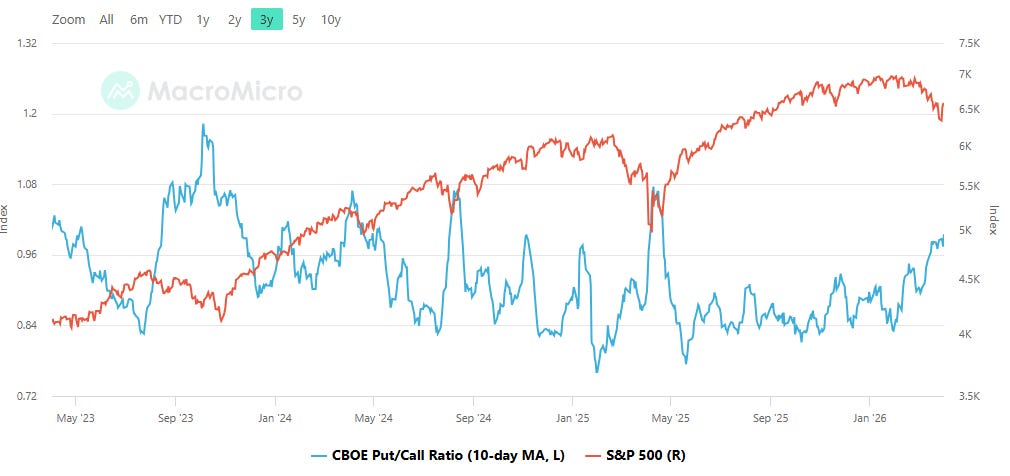
The contrarian read is that sustained readings above 1.0 have historically preceded tradeable lows within a few weeks. The tripwire on the upside: if this ratio pushes toward 1.15-1.20, that would mark a fear extreme consistent with washout conditions. On the other side, a retreat back below 0.90 without a meaningful price recovery would suggest complacency is returning prematurely.
Equity vs Bond Volatility
The Merrill Lynch Option Volatility Estimate [MOVE] Index from BofAML and the CBOE Volatility Index [VIX] respectively represent market volatility of U.S. Treasury futures and the S&P 500 index. They typically move in tandem but when they diverge, an opportunity can emerge from one having to “catch-up” to the other.
The MOVE Index sits at 81.78, down from 84.41 and now at a 12-month low, while the VIX has spiked to 23.87 after spending most of the first quarter in the 15-17 range. This is a notable divergence. Bond volatility has been normalizing steadily since its elevated readings above 160 in mid-2025, and the current sub-85 level says the rates market is relatively calm -- no disorderly repricing of duration, no liquidity stress in Treasuries.
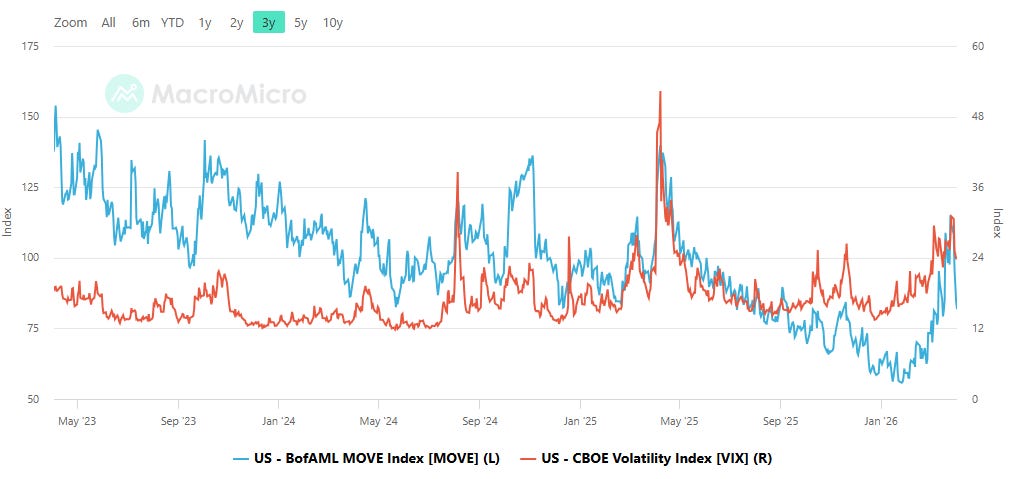
Meanwhile, equity volatility has surged, which means the stock market is pricing in near-term risk that the bond market is not yet confirming. Historically, when the MOVE leads the VIX higher, systemic stress tends to follow because bond dislocations eventually bleed into equities via funding and collateral channels. The current pattern is the reverse -- equity fear running ahead of rates fear -- which is more consistent with an event-driven repricing than a structural funding problem. The tripwire to watch: if MOVE reverses and spikes above 100-120 while VIX remains elevated, that convergence would signal the stress is migrating into the plumbing of the market. As long as MOVE stays subdued, the equity selloff is more likely to be containable.
CNN Fear & Greed
The CNN Fear and Greed Index registered 19 on April 2, firmly in Extreme Fear territory. That is up slightly from a previous close of 15 and a one-week-ago reading of 14, so the gauge has ticked higher at the margin but remains anchored near its lows. One month ago the composite read 31, which was already in the Fear zone, and the descent from there has been steady. The one-year-ago reading of 12 provides useful context: the market was in Extreme Fear at this time last year as well, and what followed was a multi-month rally through mid-2025 that pushed the gauge well into Greed territory.
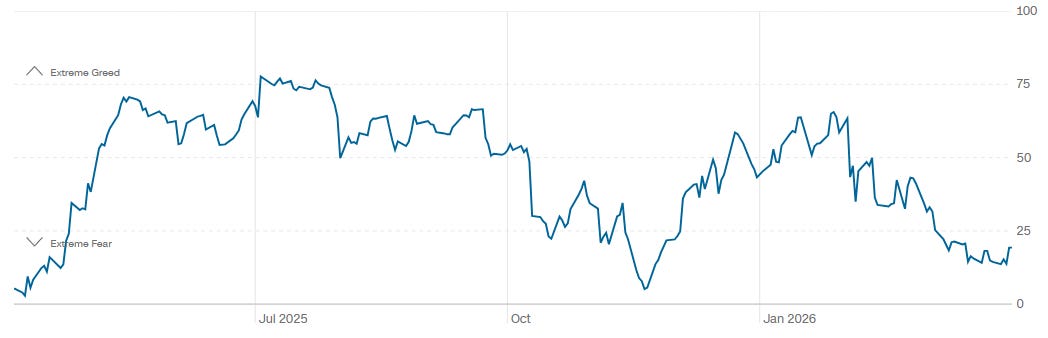
The one-year timeline shows a clear regime shift -- the index spent much of mid-to-late 2025 in the Greed and Neutral bands before rolling over sharply in late Q1 2026. At 19, the composite is deep enough into Extreme Fear that the contrarian setup is building, but it is not yet at the single-digit washout levels that have historically marked the best entry points. A move below 10 would signal true capitulation. A recovery back above 25-30 that holds for more than a few sessions would be the first sign that the fear regime is breaking.
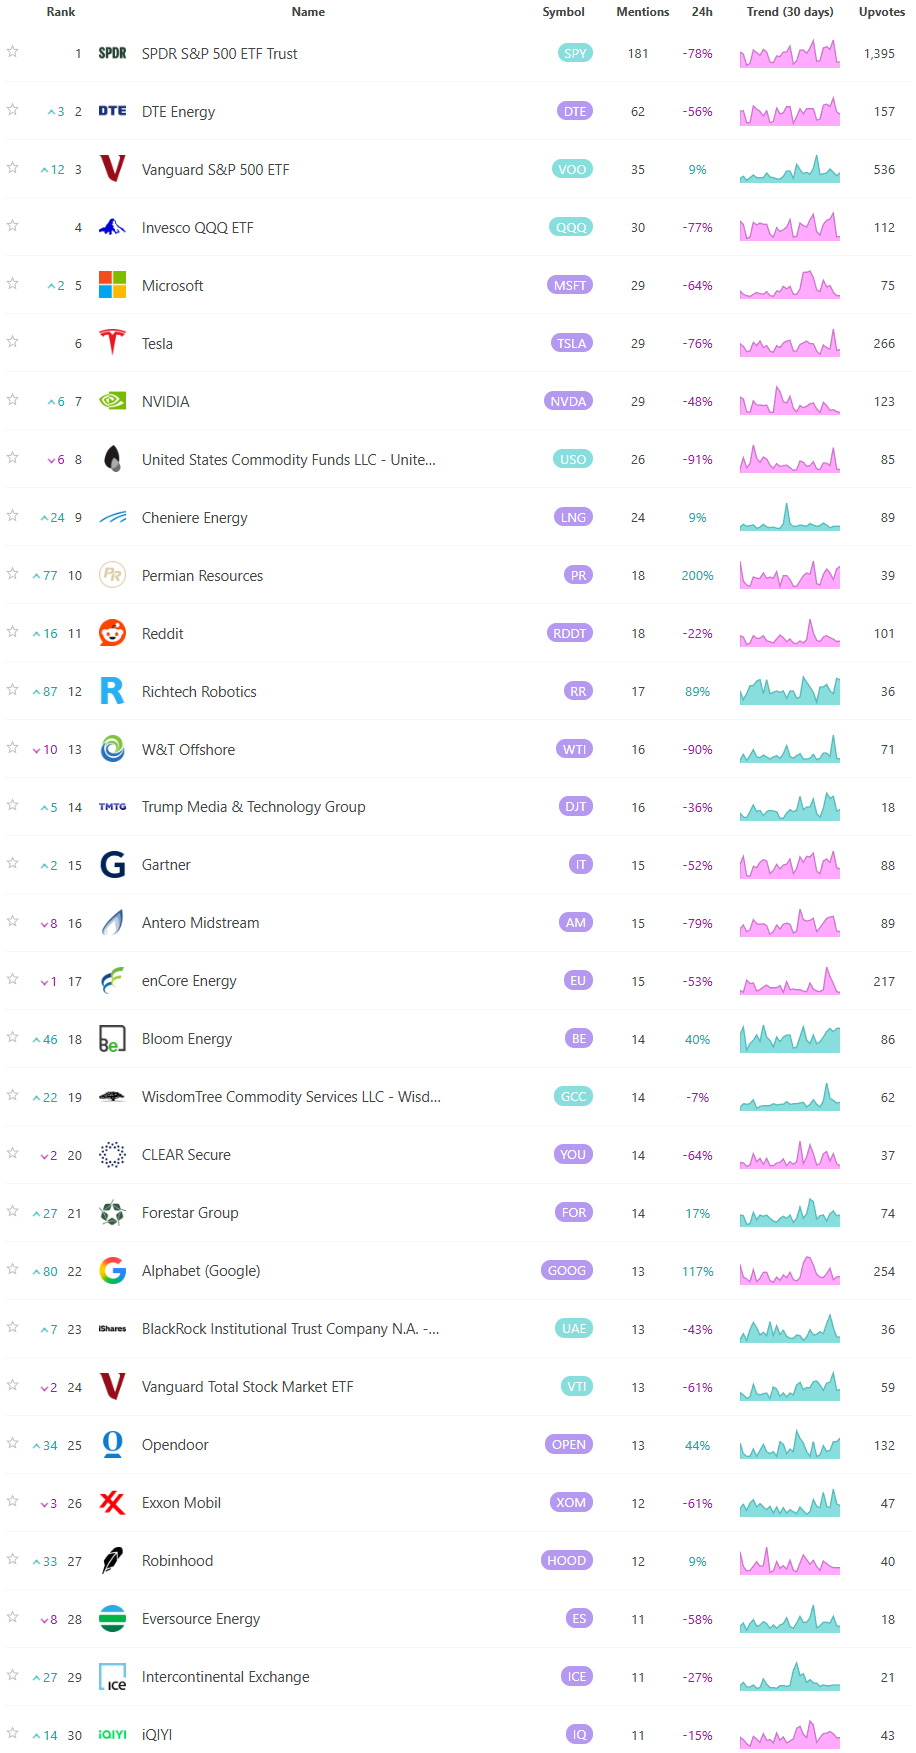
Social Media Favs
Social sentiment offers a real-time view of investor mood, often revealing market shifts before traditional indicators. It can signal momentum changes, spot emerging trends, and gauge retail investor impact—especially in high-volatility names. Tracking sentiment around events or earnings provides actionable insights, and when layered with quantitative models, can enhance predictive accuracy and risk management. Sustained sentiment trends often mirror broader market cycles, making this data a valuable tool for both short-term trades and long-term positioning.
The bottom line: retail sentiment is deeply bearish, active managers are de-risking but not yet capitulating, the put/call ratio confirms elevated hedging demand, bond volatility is calm while equity volatility runs hot, and Fear and Greed sits in Extreme Fear -- a constellation that historically favors contrarian longs on a multi-week horizon, but one that still lacks the final washout in positioning and sentiment that would make the entry high-conviction.

Technician’s Playbook: Trading the Majors (SPY/QQQ/IWM/DIA)
When you’re a large institutional player, your primary goal is to find liquidity - places to do a ton of business with the least amount of slippage possible. VolumeLeaders.com automatically identifies and visually plots the exact spots where institutions are doing business and where they are likely to return for more. It’s one of the primary reasons “support” and “resistance” concepts work and truly one of the reasons “price has memory”.
SPY
Start with SPY. The chart covers roughly March 4 through early April 3, and the price structure tells a clean story: a topping process in the 670s, a sharp impulsive leg down to the low 620s, and now a tepid bounce back toward the mid-650s. The top-line price as of the last bar is $655.92. Three top-100 historical prints anchor this chart. The #13 print hit around the $666 area on March 12 at $2.95B and 251x relative size -- that was right at the beginning of the breakdown leg and its character, sitting at resistance, reads more like distribution than absorption. The paired #29 and #2 prints clustered around the $670 zone on March 17-18 at $2.97B (252x) and an unranked but large companion print, collectively representing some of the heaviest notional activity ever recorded in SPY at a price that subsequently failed -- that is textbook rejection by big money. The #4 print at $652.75 on March 20 at $3.26B and 278x is the most important single trade on the chart. It printed right into the initial leg of the selling, at a price that has since been recovered. That level, $652-653, is where the largest single trade in the visible window transacted, and it now acts as the line of scrimmage. The Levels table reinforces the structure: $679.10 carries $21.6B at 97.76th percentile, $671.30 carries $21B at 97.10%, and $659.20 carries $19.2B at 95.56% -- all above current price. The $659.20 Level is the first meaningful supply shelf overhead. The cluster on March 17 at $670.70 aggregated $12.5B at 41x, the heaviest cluster in the table, which was the distribution zone. The #23 print near $648-650 on March 31 at $2.46B and 209x is the second anchor of the demand thesis -- two historically significant buys in the low 650s separated by ten days.
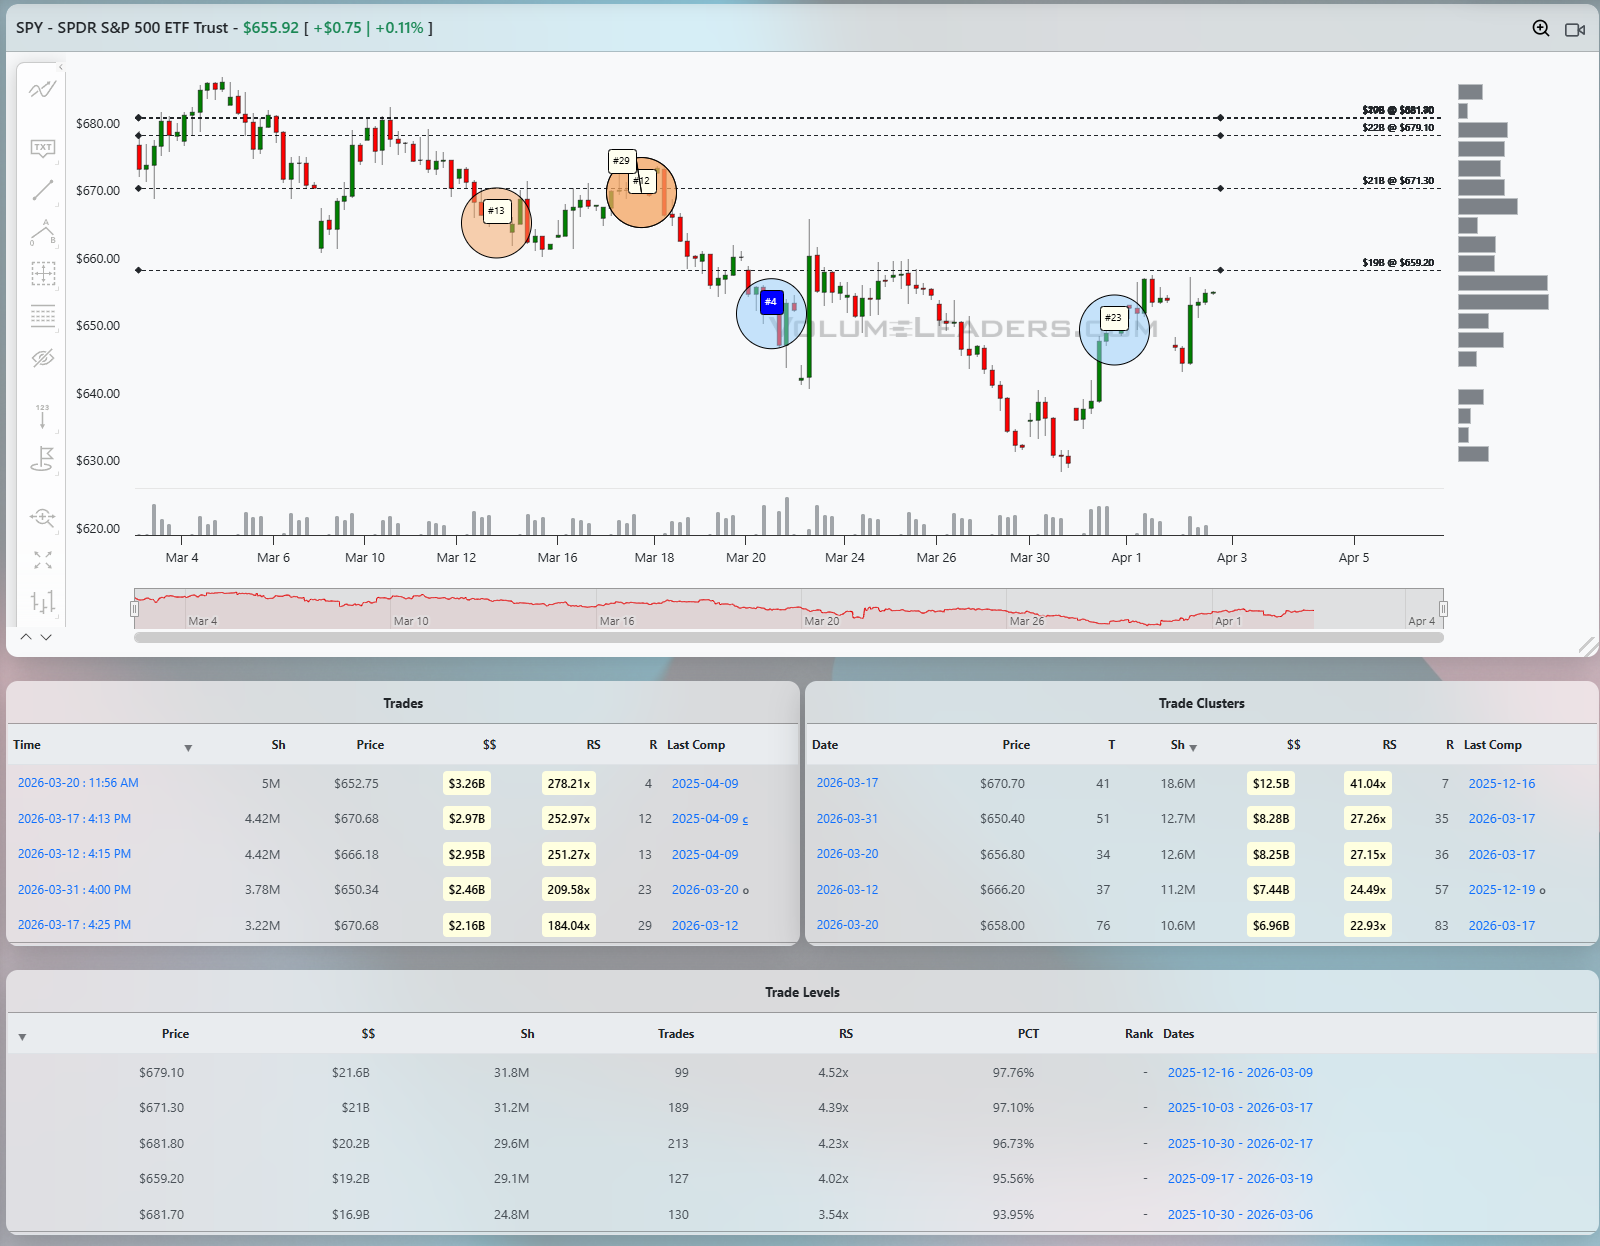
The bull case is straightforward: if SPY can hold above the $652-653 zone where the #4 print transacted and build acceptance above $659.20, the next magnet is $671.30, which carries $21B and is where the original distribution cluster peaked. The bear case is that this bounce is a dead-cat from a damaged tape, that the $659.20 Level acts as a ceiling, and a failure back below $650 opens the door to the lower 630s where there is comparatively little Level support visible in the table. A disciplined trader would use $653 as the hard invalidation on any long, target $659 as the first exit, and wait for a confirmed close above $659 before sizing toward $671.
QQQ
QQQ tells a nearly identical story but with somewhat smaller relative prints given the index's tech concentration. The chart shows price at $584.80 after a breakdown from the $605-612 range in early March. The #76 print around $588 on March 23 at $796M and 110x was the first significant institutional re-engagement after the breakdown -- it was right at the mid-range of the decline and has not held as support. The #94 print around $577-578 on March 31 at $749M and 104x is the more significant accumulation signal, coming at the lower end of the selloff range. The Levels table shows $609.30 with $6.88B at 98.16% and ranked #83 all-time, $612.10 at $5.37B, $608.30 at $5.15B -- there is a dense cluster of major supply at $608-612. The cluster table confirms $593 on March 20 at $3.82B and 31x was the heaviest accumulation period, followed by the March 23 cluster at $588 for $2.02B. Current price of $584.80 is below both of those cluster prices, meaning those buyers are underwater.
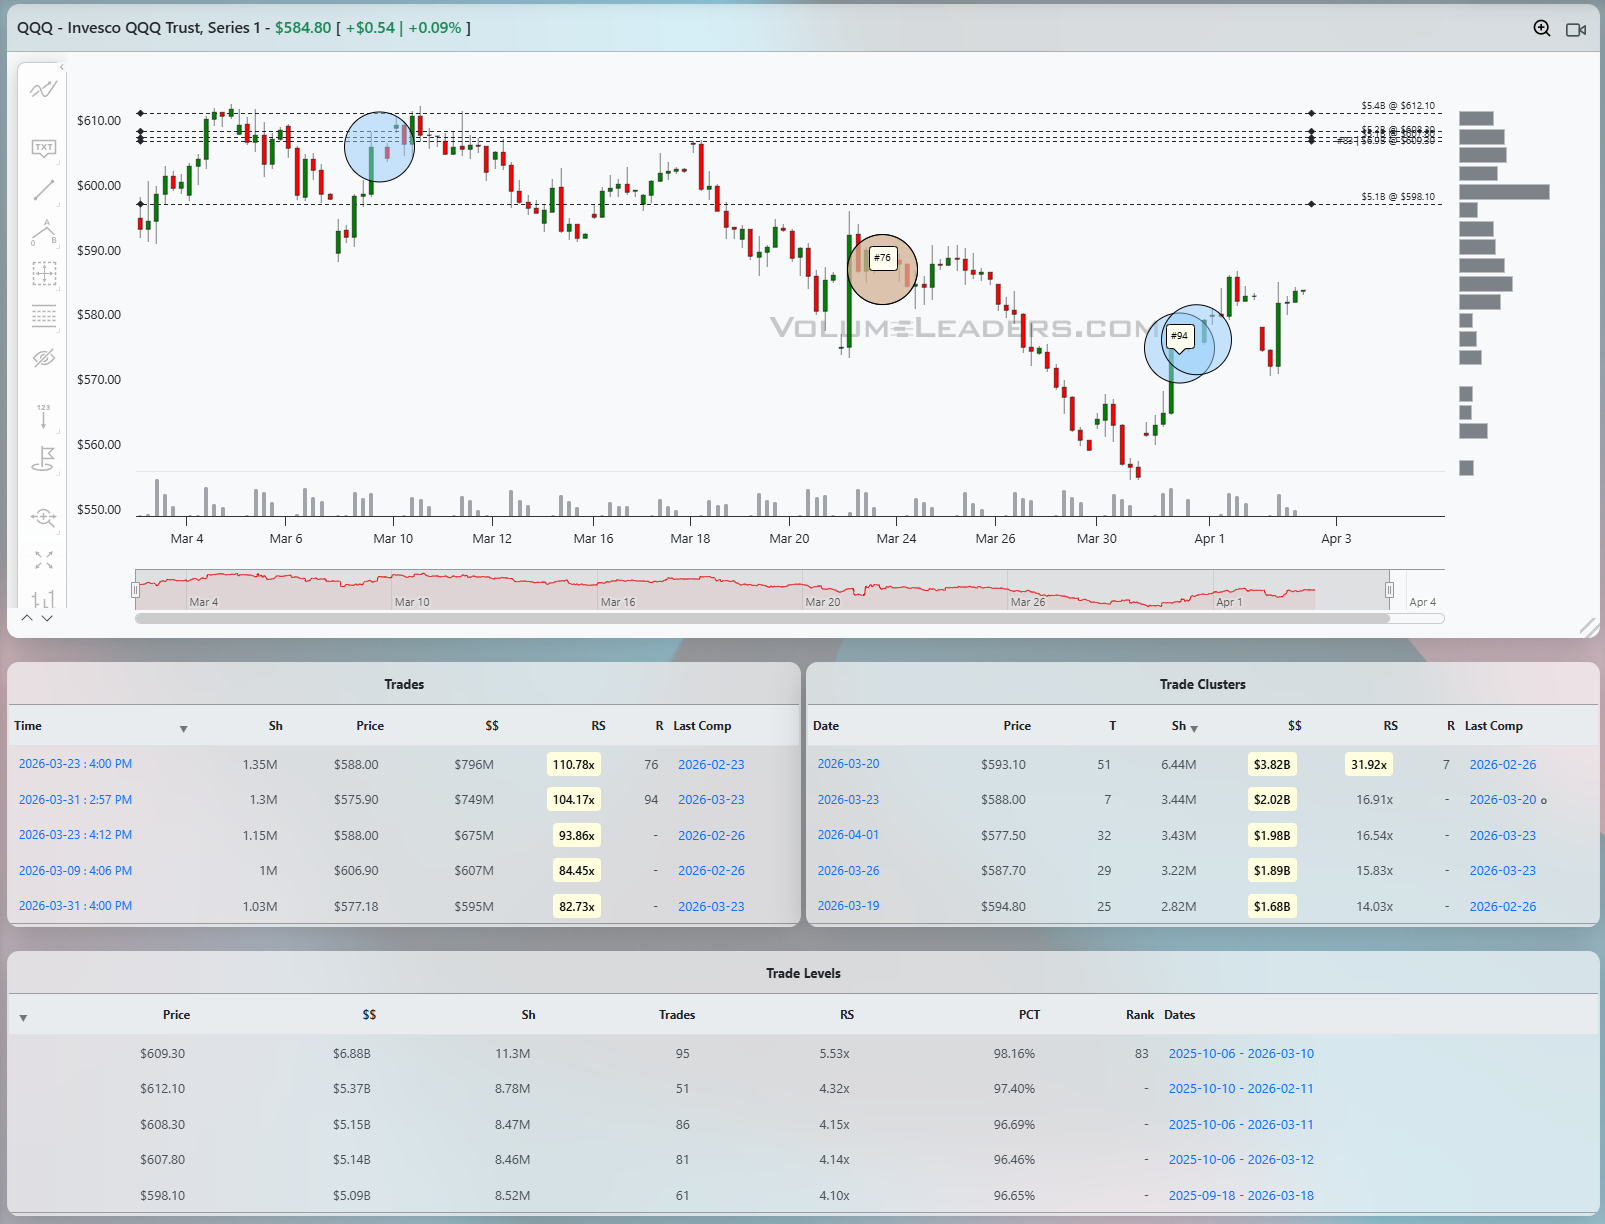
The line of scrimmage for QQQ is $588, where the #76 print and March 23 cluster intersect. A reclaim of $588 and then $593 would be the minimum requirement for a constructive read. Failure to reclaim $588 keeps QQQ in distribution mode with the next meaningful Level support only visible at $598.10 on the Level table -- paradoxically above current price -- meaning price has sliced through most of the Level structure and is trading in relatively thinner air. The bear path targets the $570-575 range and the gap at $560’ish where there is no high-$$ Level visible.
IWM
IWM closed at $251.19 and is the one chart where the bounce has had some texture. The Level table shows $242.90 with $6.04B at 93.14% and $238.60 with $4.61B at 89.70% -- those are the two deepest support Levels and both were tested in late March. The cluster on March 16 at $246.60 aggregated $1.67B at 21x, the largest cluster in the table. Two significant prints near that $246-248 zone -- one on March 16 at $496M and 53x and one on April 1 at $393M and 42x -- represent the clearest accumulation thesis in the small-cap space. The April 1 print at $249.56 is particularly interesting because it occurred at end-of-day on quarter-turn and at a historically elevated RS. The Level table does not show a dense wall of supply until price approaches $260-265, meaning there is more open air above IWM in percentage terms than in any of the other three majors.
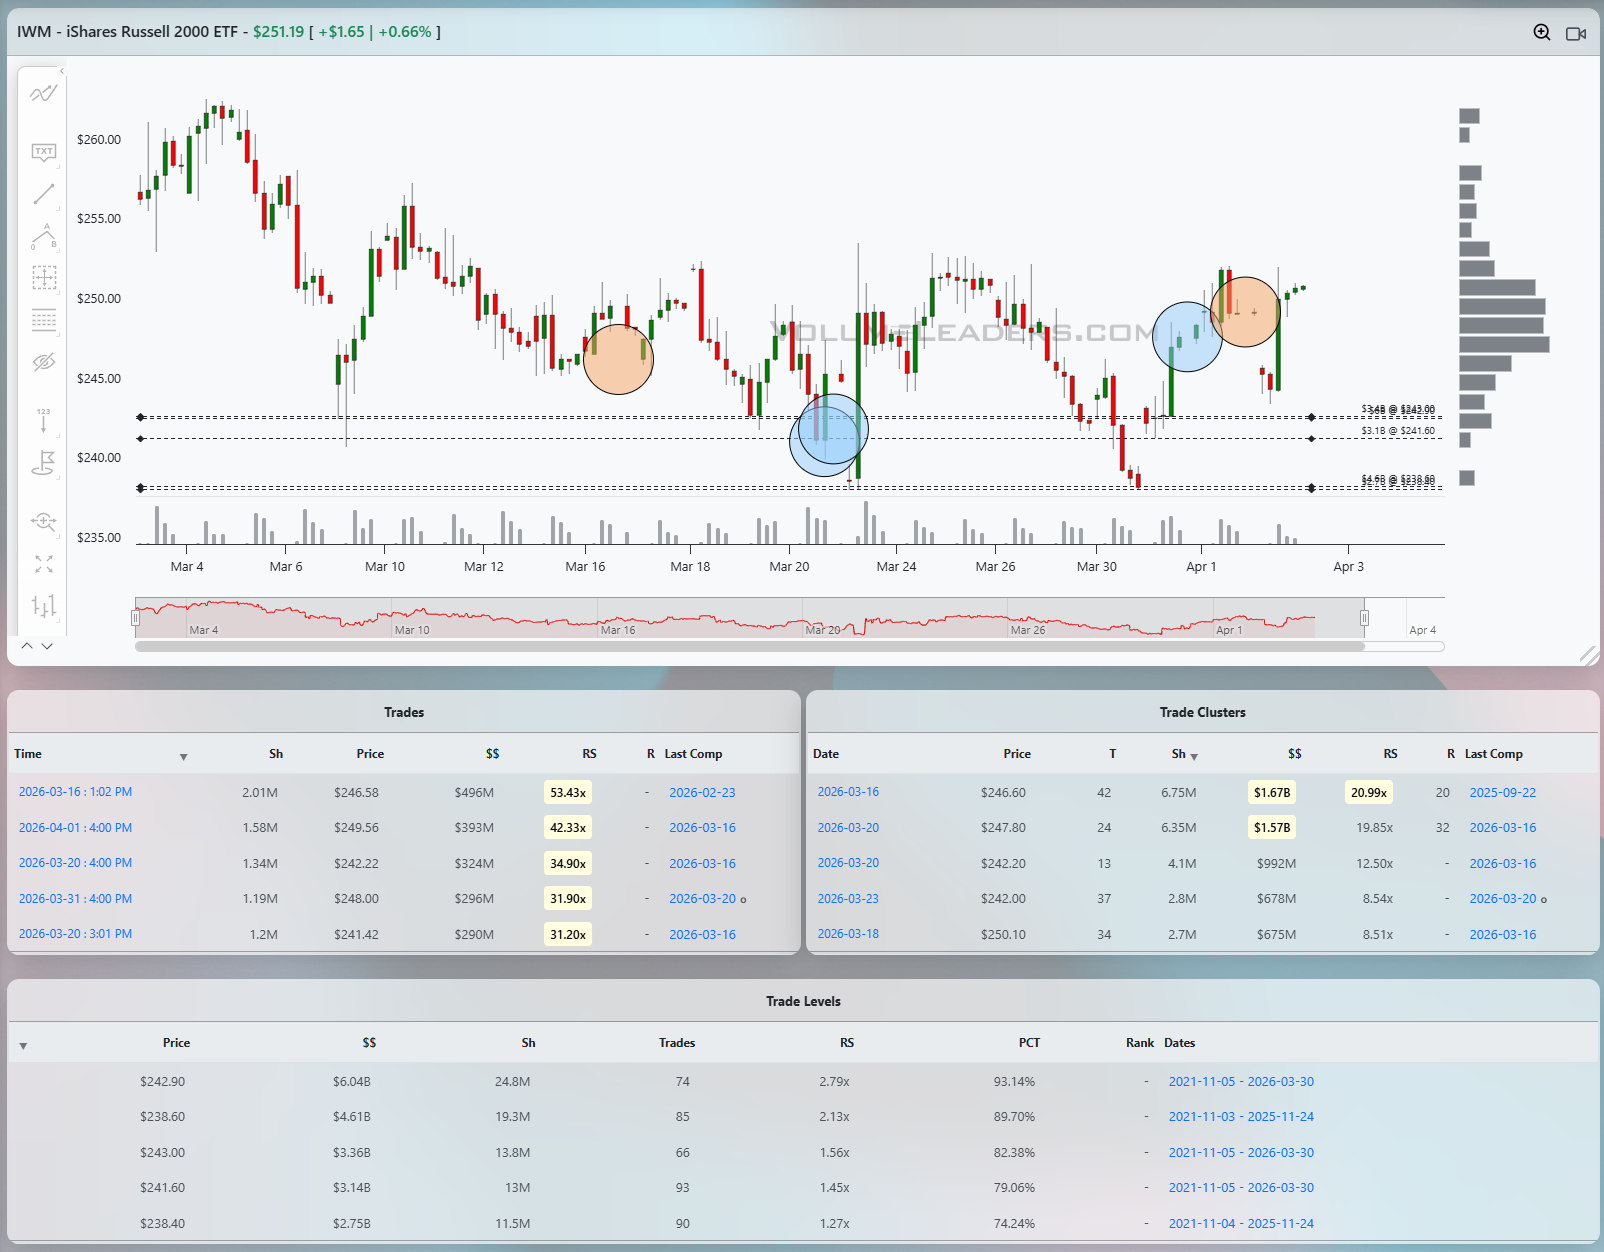
The line of scrimmage is $248-249, where the two top prints and the largest cluster are concentrated. Holding above that price and building a base there is the bull confirmation. Failure back into $242-243, where the $6.04B Level sits, would be the retest that determines whether small caps can find a higher low or revisit the late-March lows below $240.
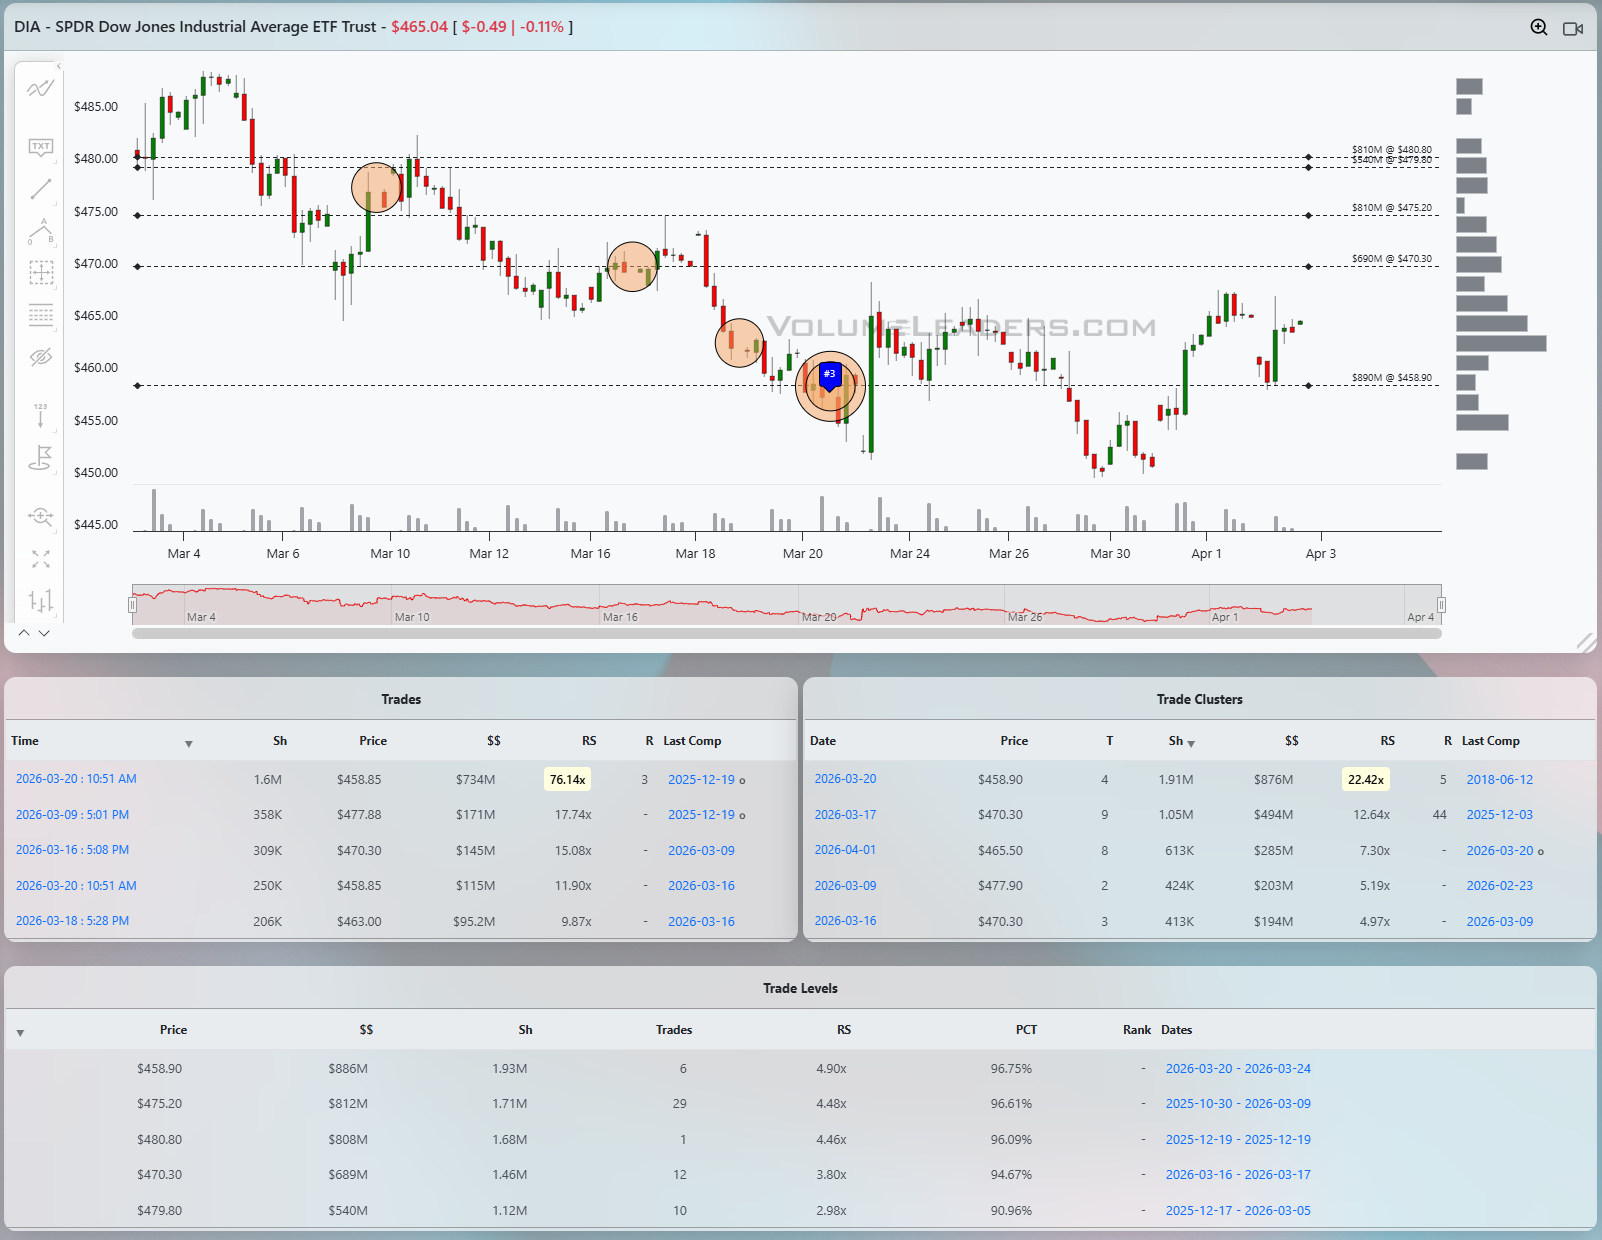
DIA
DIA is the most structurally damaged of the four. Price sits at $465.04 after a clean impulse down from the $480-485 area. The most consequential print on the board is the #3 label at $458.85 on March 20 at $734M and 76x -- the third-largest trade ever recorded in DIA. A print of that magnitude at what was the low of the initial leg is a strong absorption signal. The Level table backs this up: $458.90 carries $886M at 96.75% percentile, which is the top Level in the table and corresponds almost exactly to where the #3 print transacted. That price, $458-459, is the primary support for DIA. The cluster at $458.90 on March 20 aggregated $876M at 22x, rank 5 all-time -- the heaviest cluster in the visible DIA window and concentrated at the same price. Overhead, $470.30 carries $689M at 94.67%, $475.20 carries $812M at 96.61%, and $480.80 carries $808M at 96.09% -- three stacked supply levels within a $10 range. DIA is stuck in a box between $458-459 support and $470 resistance. A clean close above $470.30 opens $475.20. A daily close below $458 puts the #3 print supply in jeopardy and accelerates the selloff toward the mid-440s where the chart shows no visible Level density.
Across all four instruments the tape reads the same: historically significant absorption in the lower half of the March drawdown range, heavy supply overhead in the upper half, and a bounce that has reclaimed maybe a third of the selloff. The common theme is that the largest prints -- SPY's #4 at $652, DIA's #3 at $458, IWM's cluster at $246-249 -- are all sitting near or just below current price. That positioning argues against panic and in favor of methodical re-accumulation, but none of these instruments have yet traded back through the rejection zones where distribution was heaviest. Until SPY clears $659, QQQ reclaims $588-593, DIA closes above $470, and IWM holds $248-249 on a pullback, the path of least resistance remains corrective and any position sizing should reflect that the bounce has not yet been confirmed by the tape.

Summary Of Thematic Performance YTD
VolumeLeaders.com offers a robust set of pre-built thematic filters, allowing you to instantly explore specific market segments. These performance snapshots are provided purely for context and inspiration—think about zeroing in on the leaders and laggards within the strongest and weakest sectors, for example.
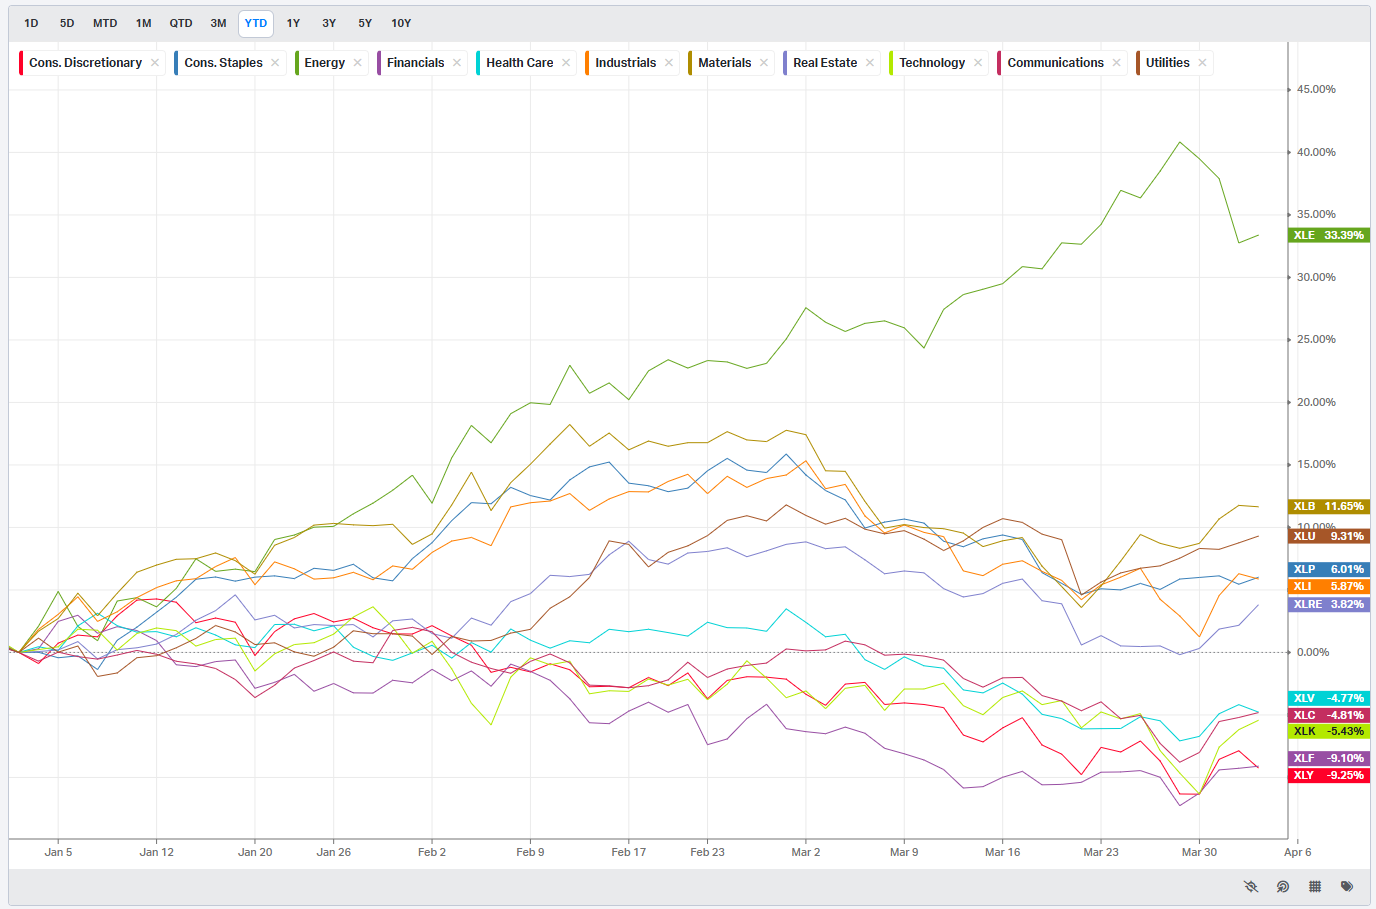
S&P By Sector
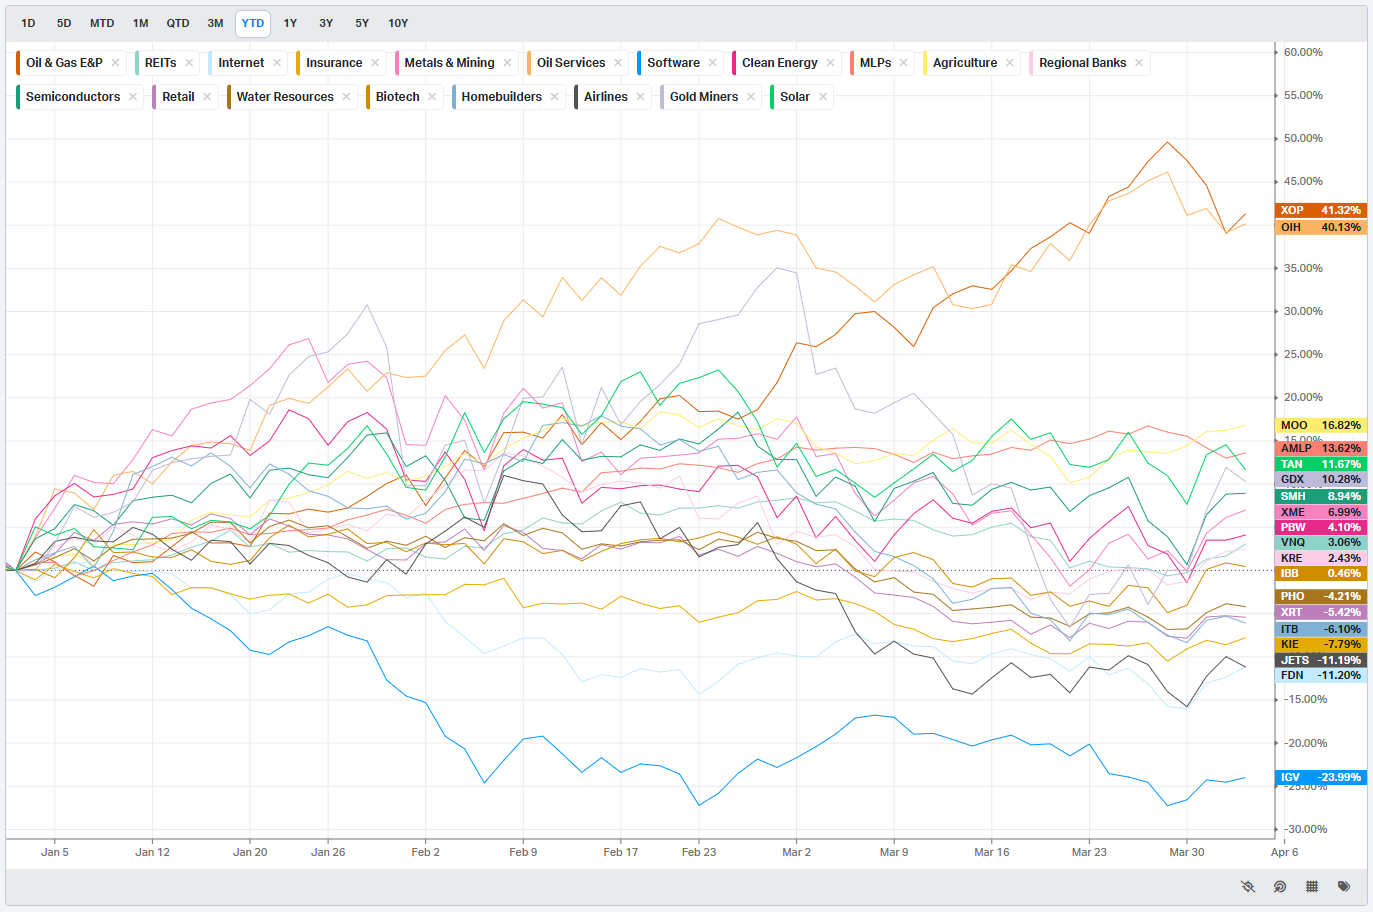
S&P By Industry
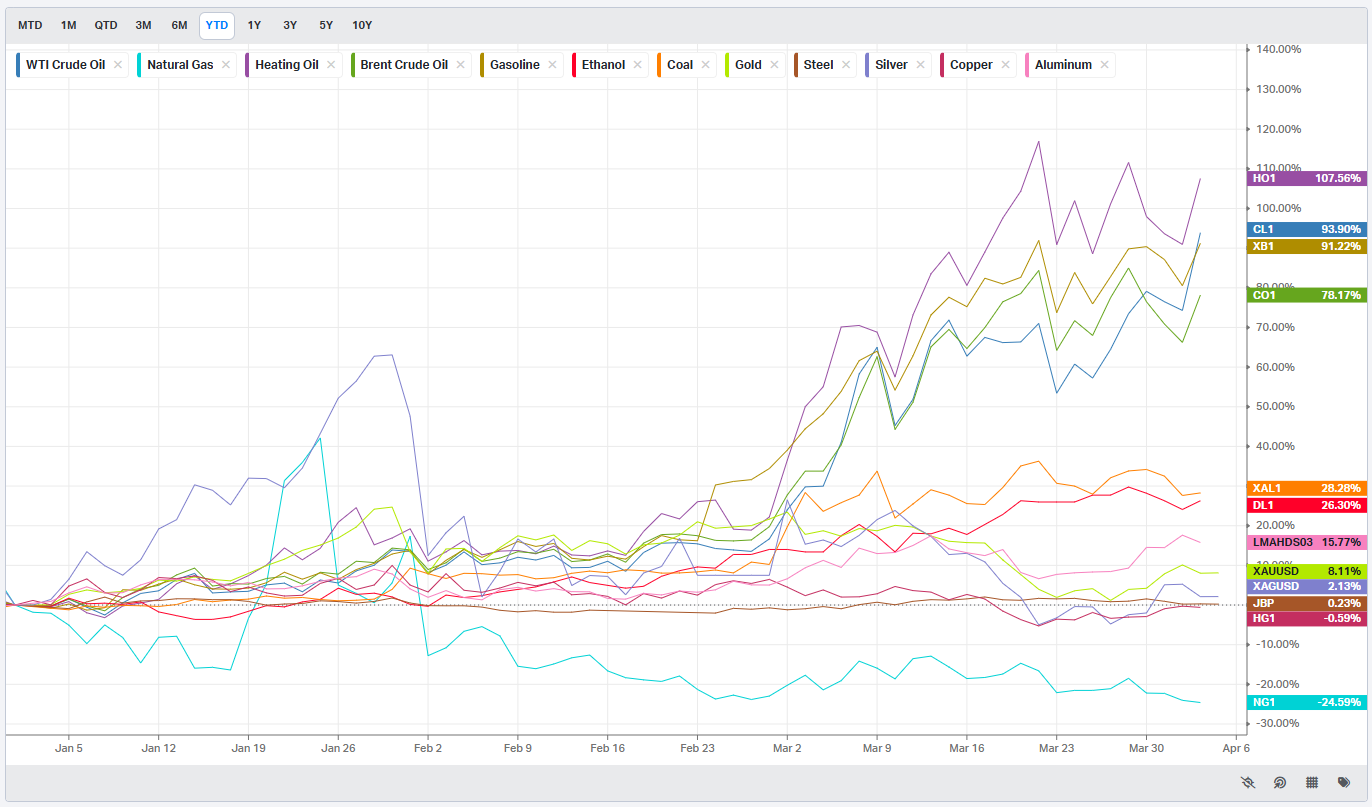
Commodities: Energy & Metals
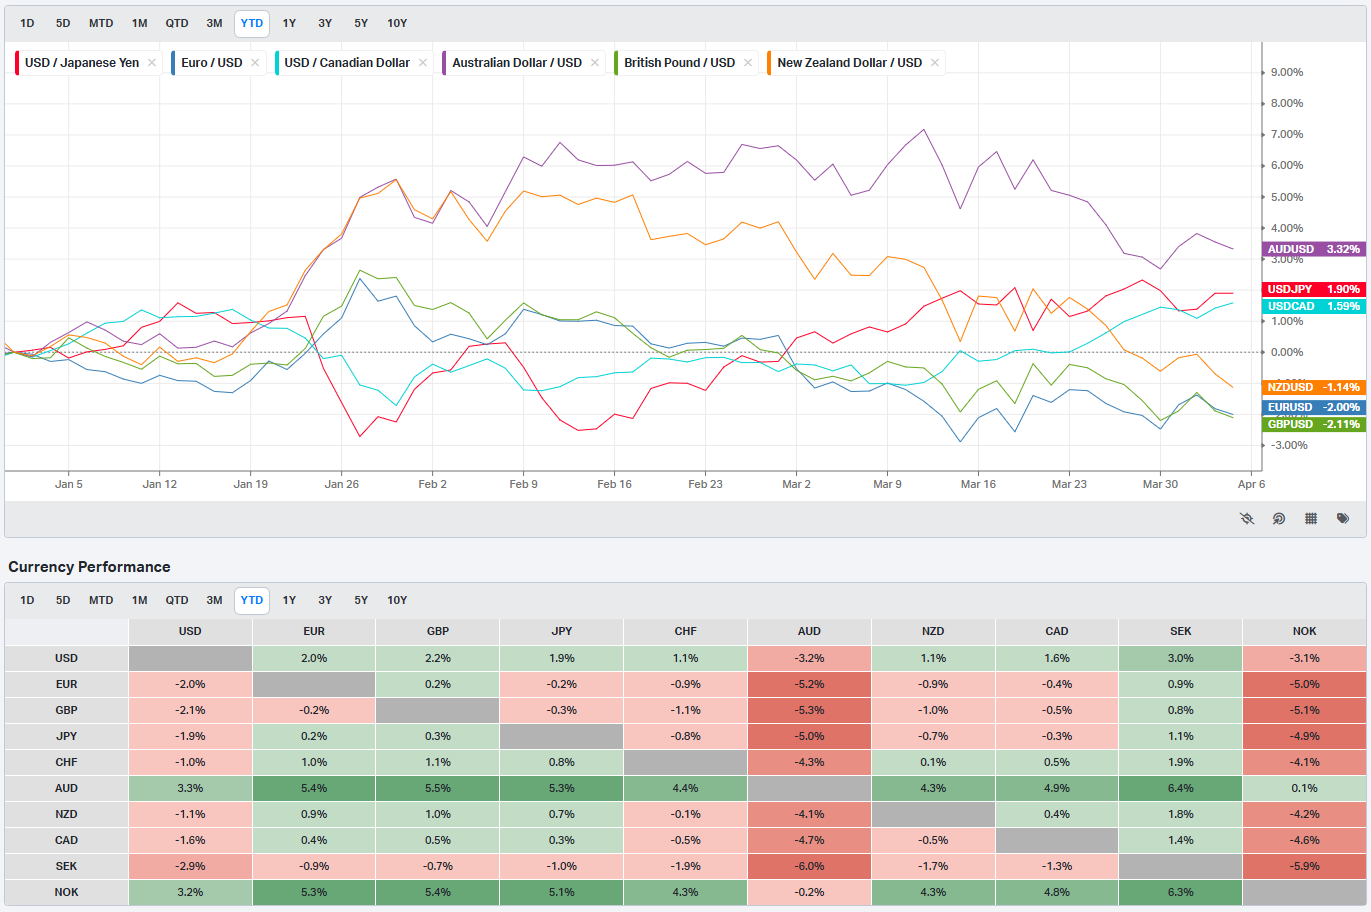
Currencies/Major FX Crosses
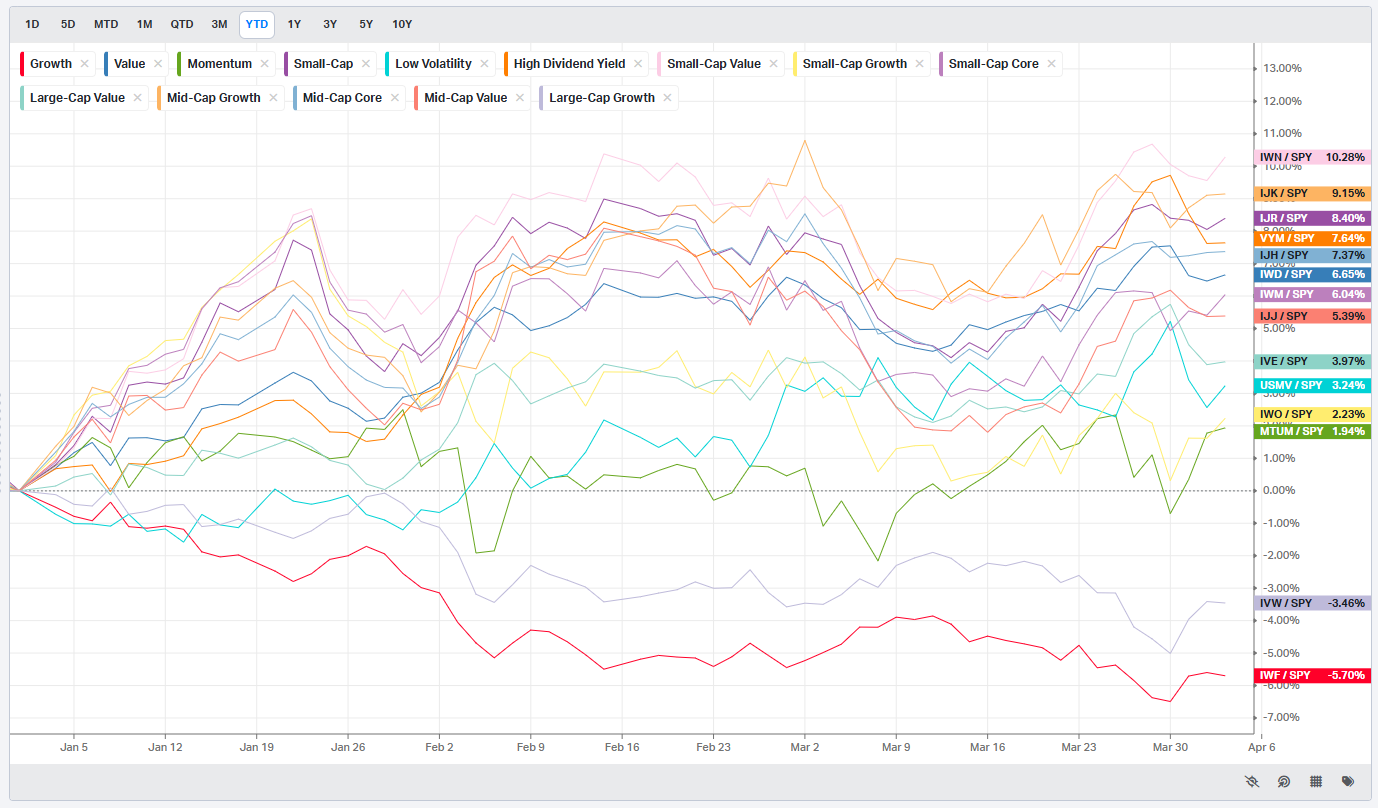
Factors: Style vs Size-vs-Value

Events On Deck This Week
Here are key events happening this week that have the potential to cause outsized moves in the market or heightened short-term volatility.
A Week That Could Reprice the Damage or Confirm It
The week opens Monday with ISM Services PMI for March, where the previous print was 56.1 against a consensus of 55 and a forecast of 54. That is a meaningful setup: the consensus is already below the prior read, and the forecast is a full two points lower. A print that holds above 55 would be genuinely constructive because it would signal that the services economy, the one part of the data that has held together through the first quarter, has not yet cracked under policy and tariff uncertainty. A miss to 54 or below would confirm the deterioration the leading surveys have been telegraphing and would be risk-off for cyclicals.
Tuesday loads up with Durable Goods Orders for February, where the headline previous was 0% and consensus is 0.4% with a forecast of 0.6%, while the ex-transportation strip carried 0.4% previously against a consensus and forecast of 0.7%. Both series need to clear their consensus numbers to avoid a negative narrative. ADP Employment Change is also on the board with a previous of 10K and no consensus shown, which makes it a binary read: anything well above 10K would be bullish for the labor picture; anything at or below would accelerate the slowdown thesis. Two Fed speakers matter here -- Goolsbee at 12:35 PM and Jefferson at 5:50 PM. Goolsbee’s tone on growth risks versus patience will be read closely; any acknowledgment that downside risks to growth are rising without matching urgency on cuts would be a subtle negative for rate-sensitive sectors.
Wednesday is structurally the quietest session for hard data but the most consequential for rate-market positioning. FOMC Minutes at 2:00 PM will be the only thing traders watch. The debate around the March meeting -- how seriously the committee discussed cutting, what their pain threshold for labor weakness is, and how they are framing the tariff shock -- will move the front end if it reads more dovish or more hawkish than the statement implied. MBA 30-Year Mortgage Rate previously printed 6.57%; EIA Crude Oil Stocks Change previously showed 5.451M and Gasoline Stocks Change -0.585M. A crude draw would firm energy names, but the Minutes will dominate.
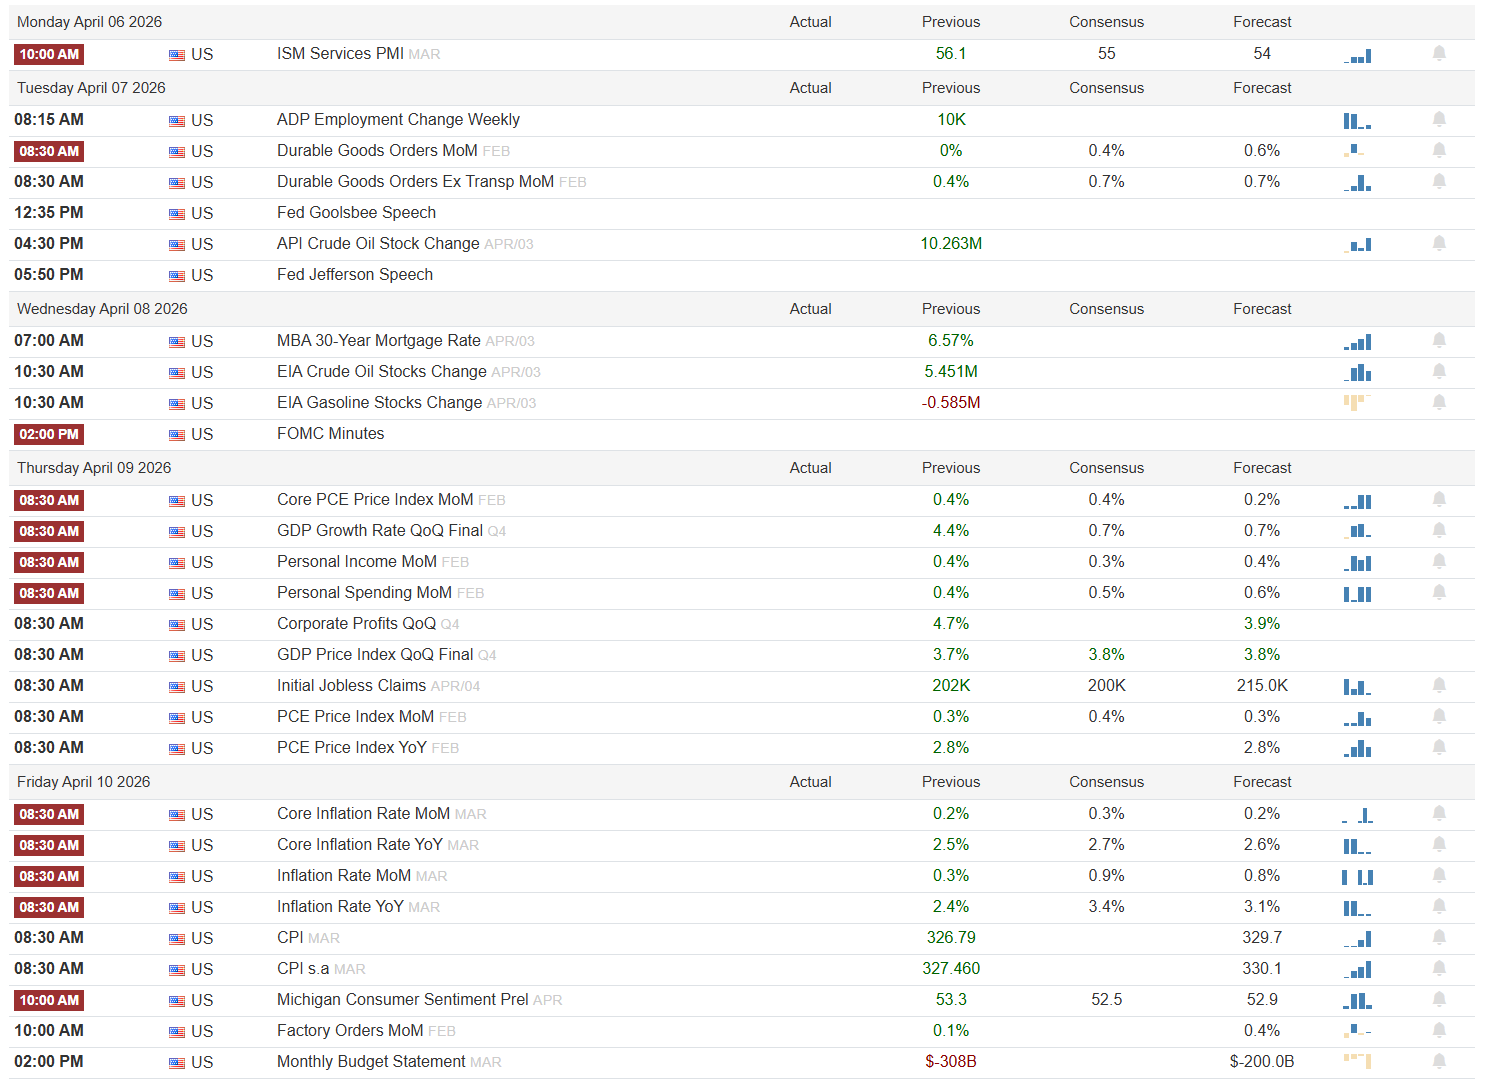
Thursday is the week’s data heavyweight. Core PCE MoM for February comes in with a previous of 0.4%, consensus at 0.4%, and forecast at 0.2% -- a downside surprise relative to trend. If it prints 0.2%, the disinflation narrative gets a meaningful data point. PCE MoM was previously 0.3%, consensus 0.4%, forecast 0.3%, and PCE YoY was 2.8% with a forecast of 2.8% -- no change expected there. GDP Growth Rate QoQ Final for Q4 was previously 4.4%, with both consensus and forecast at 0.7% -- a stark deceleration, though it is a backward-looking revision. GDP Price Index Final was 3.7% previously, consensus and forecast at 3.8% -- stagflation framing at its cleanest. Initial Jobless Claims had a previous of 202K against a consensus of 200K and forecast of 215K; a print near or above 215K would be the first real warning signal on labor. Personal Income was 0.4% previously, consensus 0.3%, forecast 0.4%. Personal Spending was 0.4% previously, consensus 0.5%, forecast 0.6%.
Friday is CPI day. Core Inflation Rate MoM for March carries a previous of 0.2%, consensus of 0.3%, and forecast of 0.2%. Core YoY was 2.5%, consensus 2.7%, forecast 2.6% -- the market is braced for a modest reacceleration. Headline Inflation Rate MoM was 0.3% previously with consensus at 0.9% and forecast at 0.8% -- a potentially jarring step-up. Headline YoY was 2.4%, consensus 3.4%, forecast 3.1%. If those headline numbers print anywhere near consensus, the tariff pass-through story gets confirmed in live data. Michigan Consumer Sentiment Prel for April was 53.3 previously against a consensus of 52.5 and forecast of 52.9 -- still deteriorating, and any fresh drop below 50 would be a sentiment shock.
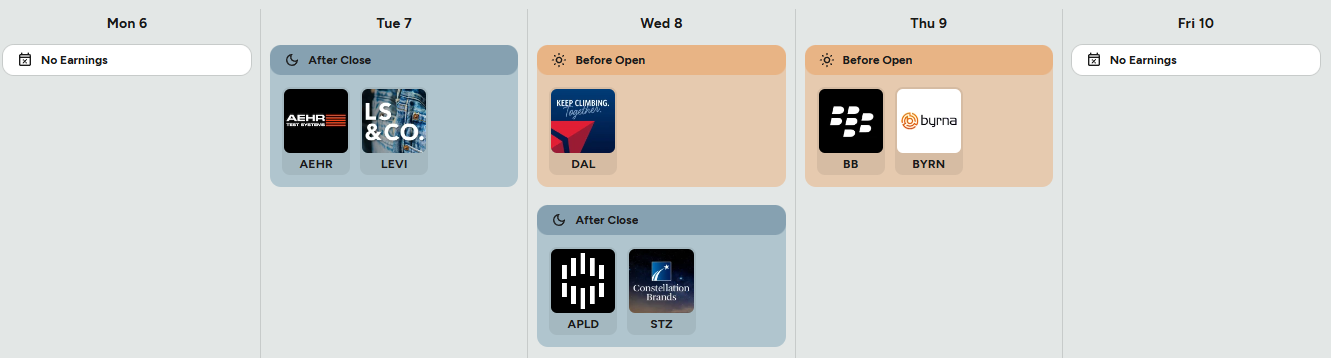
On the earnings side, Delta Air Lines (DAL) reports Wednesday before the open and is the single most important macro read-through of the week. Forward booking commentary, yield trends, and any language about demand softness or tariff-related travel impacts will ripple into the entire airline and travel sector. Levi Strauss (LEVI) reports Tuesday after the close; watch gross margins and consumer demand signals from the mid-market consumer. BlackBerry (BB) and Byrna Technologies (BYRN) report Thursday before the open -- niche reads with limited broad market spillover. Applied Digital (APLD) and Constellation Brands (STZ) both report Wednesday after the close; STZ in particular is a consumer staples bellwether with significant exposure to import costs, and any commentary on tariff headwinds to their Mexican production base will be watched for consumer defensive sector implications.
The three sign-posts to watch:
ISM Services Monday: a print at or below 54 confirms services deterioration and is the first risk-off trigger of the week.
Core PCE Thursday: a 0.2% print would support the Fed cutting case and be the week’s most bond-bullish data point; a 0.4% repeat kills that thesis.
CPI Friday: headline MoM near or above 0.9% is the stagflation print that pressures both stocks and bonds simultaneously.
A week where services data softens, CPI runs hotter than expected, and Jobless Claims creep toward 215K would be the worst combination the market could absorb right now, and nothing in the current breadth structure suggests there is enough underlying support to shrug it off.

Order Flow in Focus: Reading Smart Money Tells
Order Flow in Focus: Reading Smart Money Tells is a recurring segment that spotlights unique intraday opportunities revealed through institutional order flow. Each feature dissects a moment when the tape quietly shifted—when large, ranked prints clustered at key liquidity locations and informed players positioned ahead of the move. The goal isn’t hindsight; it’s pattern recognition—learning to spot the footprints of capital that knows before the crowd does.
SCO -- ProShares UltraShort Bloomberg Crude Oil -- closed at $8.23, down 6.26% on the session, and the chart spanning late March through April 3 is one of the cleaner examples you will see of institutional positioning leaving a legible footprint before a multi-day move. Understanding what you are looking at starts with understanding what SCO is: a -2x leveraged vehicle on crude, structurally decaying through daily reset, roll yield, and fees at every moment it is held. Nobody puts real size into this name for a buy-and-hold-long thesis. When you see a ranked print cluster here, the message is not about SCO as a vehicle -- it is a signal about where a well-capitalized participant expects crude to go in the next 24 to 72 hours. The instrument is the tell, not the destination.
The story starts on March 27 at 9:30 AM. The first trade in the print table shows 310K shares at $7.87 for $2.44M, 2.06x the ticker’s average. The price context matters: SCO had been grinding along in the $7.80-$8.00 range for most of the week, and the Level table shows $7.80 carrying $10.7M at 94.75% -- a structurally important liquidity location. That 9:30 AM print on March 27 was buying right into the open at a Level-adjacent price, which in a leveraged crude instrument reads as a bet that crude was about to start rolling over. It was not yet a conviction signal on its own, but it was a flag.
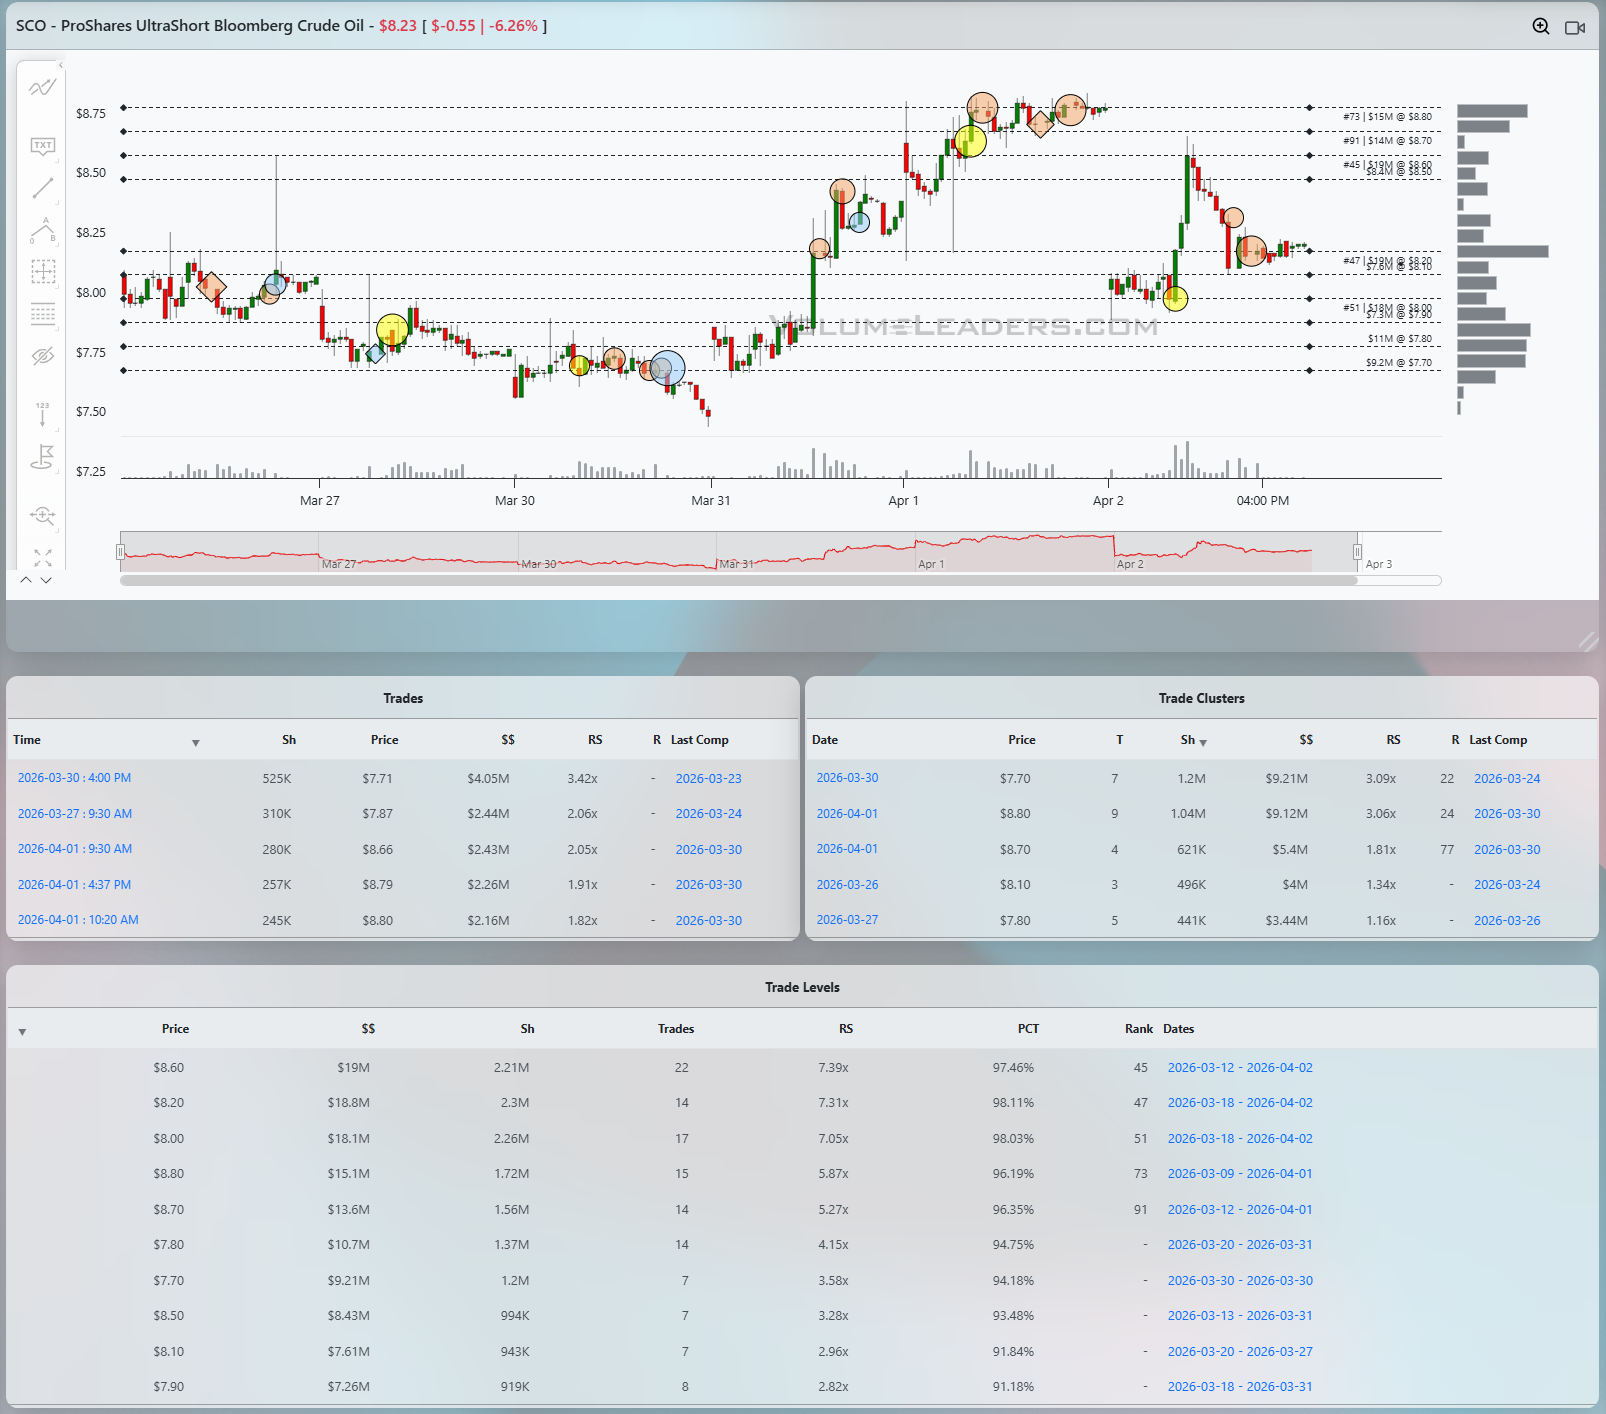
What made it actionable and sharpened the read was what came next on March 30. The largest single trade in the visible window printed at the 4:00 PM close: 525K shares at $7.71, $4.05M, 3.42x average. The cluster table shows the March 30 grouping at $7.70 aggregated $9.21M across 7 trades, 3.09x the average, ranked 22nd in the history of this date’s cluster structure. Seven trades totaling over $9 million at the $7.70 Level in a single session, closing at $7.71, right at the $7.70 Level that carries $9.21M of all-time notional. That kind of precision -- money arriving at exactly the price where the Level already existed -- is not noise. It is absorption of the offer at a price they had already established as meaningful.
The Level at $7.70 and $7.80 were your staging area. A disciplined trader watching SCO on March 30 closing with that cluster would have had a simple setup going into March 31: if crude fails to recover and SCO holds above $7.70, the next leg higher is the trade. Invalidation was a close back below $7.70. The risk was defined, the logic was clean, and the structural drag arguments -- daily compounding, roll -- actually worked in favor of urgency, not against entry. The thesis was explicitly short-duration: you are not holding SCO for a month, you are taking a 24-48 hour crude breakdown trade.
What happened next was textbook. From the March 30 close at $7.71, SCO launched. By April 1 it had pushed through $8.20, $8.60, and ultimately tagged the $8.80 Level -- where the Level table shows $15.1M of historical notional at 96.19% and rank 73, and where the cluster table shows April 1 aggregating $9.12M at 3.06x, ranked 24th. Multiple top-100 ranked prints appeared on the chart around $8.70-$8.80 on April 1 and April 2, tagged #73, #91, and #45 on the Level table’s right-side annotations -- $15M, $14M, and $13B respectively at those prices. Those were not buyers pressing the momentum. Those were sellers arriving at pre-established supply Levels in a -2x product that anyone rational knows decays. When the $8.80 cluster printed $9.12M and the #45-ranked Level at $8.60 showed up in the same 48-hour window, that was the exit signal.
The trade was: enter near $7.70-$7.80 on March 30 using the cluster as confirmation, stop below $7.70, target the $8.60-$8.80 Level band where historical supply was known to exist and ranked prints were statistically likely to appear as crude broke down. The move from $7.70 to $8.80 represented roughly 14% in a leveraged instrument over two sessions. By April 2 the ranked prints were clustering at the top of the range and the instrument was on its way back to $8.23 and falling -- evidence that whoever bought the March 30 cluster was right on crude, right on timing, and, critically, right on the exit. The Level at $8.00 and $8.20 -- $18.1M and $18.8M respectively, both above 97th percentile -- are now overhead resistance on any bounce. The tape said crude was going to fall. The tape then said it had fallen enough. Both messages were there for anyone reading the right language.

Market Intelligence Report
A desk-grade synthesis of institutional positioning and market structure—unpacking the flows, levels, and emerging themes that shaped the week, and translating them into a model portfolio built the same way professional desks prepare for the week ahead.
MIR Part 1: The Backdrop
The week ending April 2, 2026 was not a week characterized by easy-reads. Macro cross-currents and Whitehouse jawboning at market opens and closes kept participants on edge. Against that backdrop, the macro decision framework that should be guiding every capital allocation decision this week points clearly in one direction before you look at a single name: the environment is not broadly supportive of risk, breadth and participation have narrowed, realized volatility across the market is elevated and expanding, and only a small number of sectors have managed to generate any durable relative strength versus the benchmark. Asking where to deploy capital aggressively in this environment is the wrong question. The right question is where the positioning is going, regardless of the directional intent, and what the flow of large institutional dollars says about who is doing what beneath the surface.
Start with the Volume by Sector chart, because it sets the stage more clearly than any individual name can. Technology printed roughly $214.9 billion on a super heavy OPEX (Friday, March 20), a figure that dwarfed every other sector and established tech as the unchallenged gravitational center of institutional attention during that liquidity event. Healthcare and Financials were also running elevated, with Healthcare touching $72.4 billion on that same Friday and Financials at $68.6 billion. The contrast with all periods thereafter including the current week is meaningful. Technology came down hard: the heaviest tech print this week was Tuesday’s $57.4 billion, followed by Wednesday’s $40.5 billion and Thursday’s $32.7 billion -- a step-down in participation that mirrors the deterioration in tech’s relative strength that the broader market framework has been flagging for several weeks. The sector is not being abandoned, but the intensity of institutional engagement has clearly moderated. Large Caps, which are effectively a separate classification dominated by index products, followed a similar pattern: $58.2 billion on March 20 collapsing to $23.8 billion by Thursday this week. This prior week we traded back up to test overhead OPEX action from underneath and closed the week neither convincingly above nor below so this week is sure to shed some light on whether bears still control price.
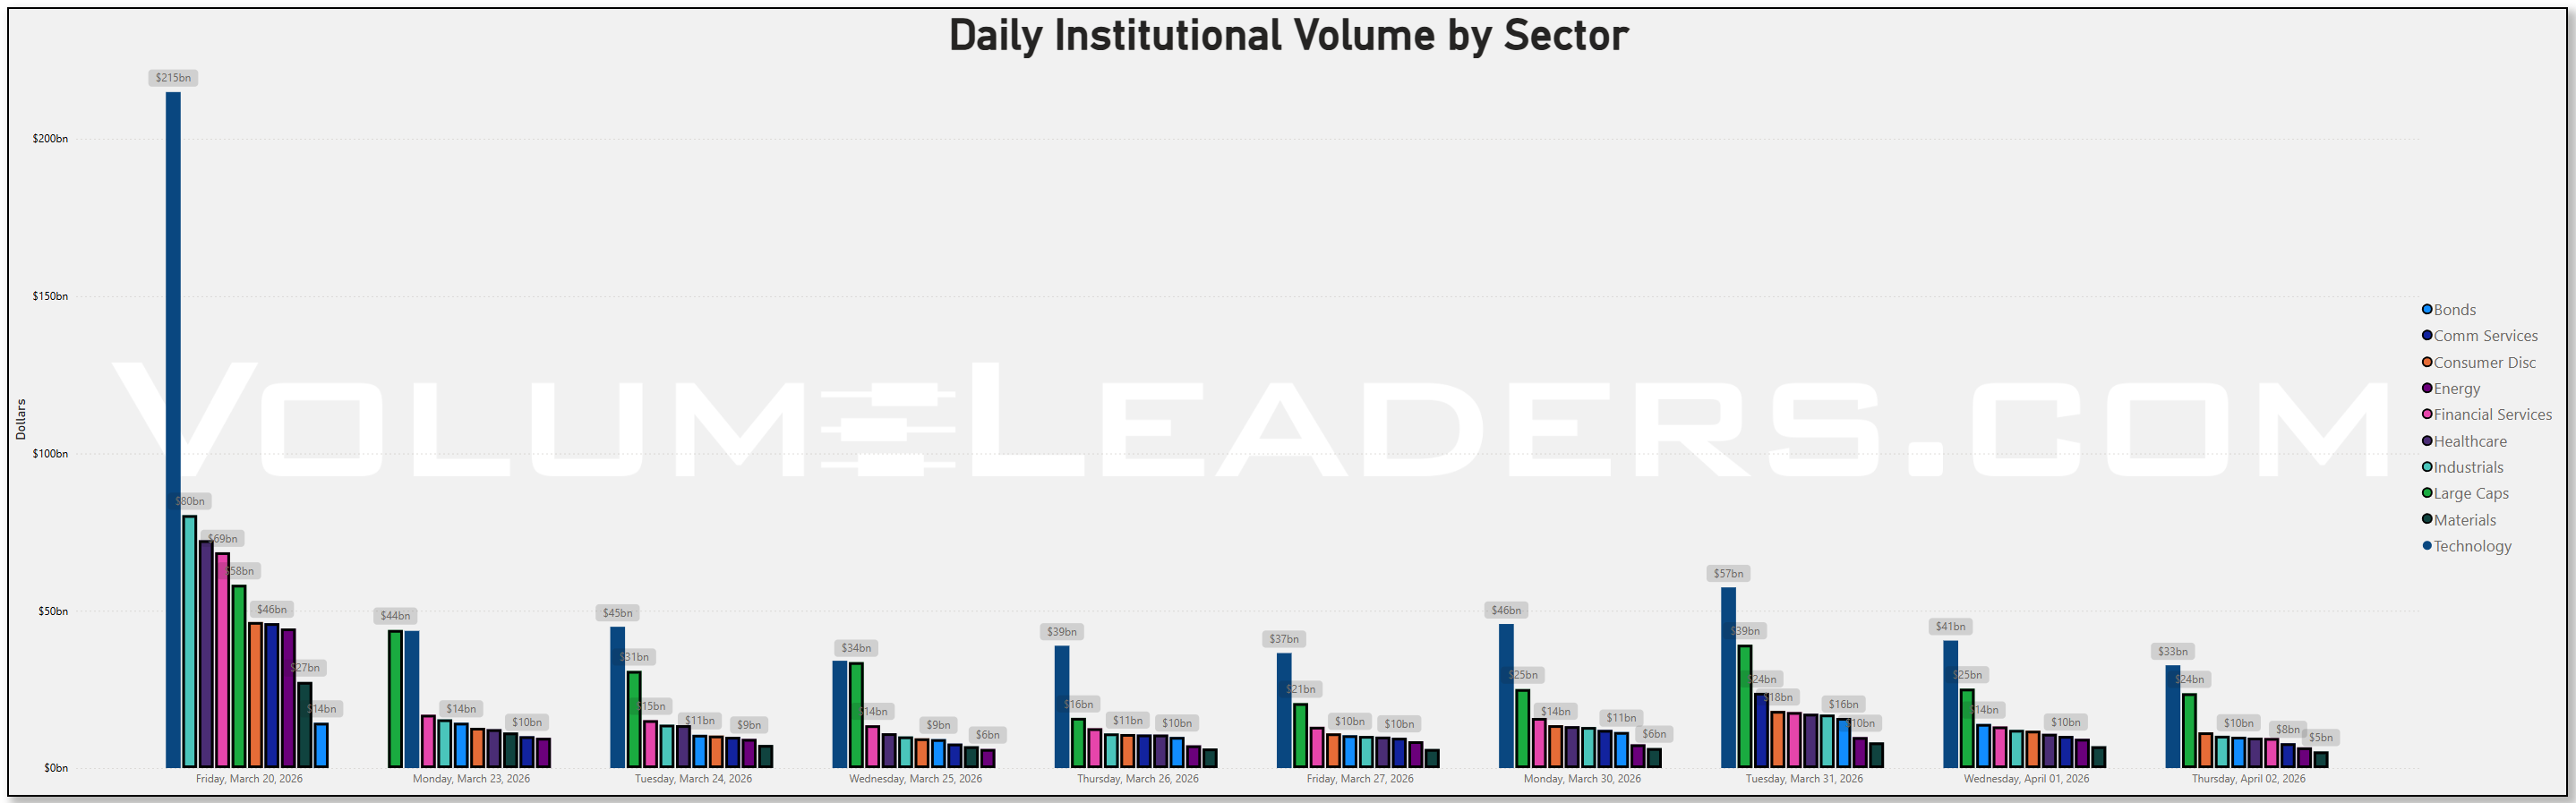
There are some other nuances to chew on in the meantime however. What is unusual -- and worth flagging specifically -- is the behavior of Financials and Healthcare week-over-week. Financials ran $68.6 billion on March 20 and remained elevated through much of the prior week, but this week dropped significantly: Monday at $15.9 billion, sliding to $9.6 billion by Thursday. That is a notable pullback in a sector that had been one of the three largest institutional volume categories, and it aligns with the relative strength deterioration in financials that the macro framework has been tracking. Healthcare showed a similar pattern, stepping from $72.4 billion on March 20 down to $9.7 billion by Thursday. The market is not rotating aggressively into defensives -- it is simply having a quieter week in most sectors as volume concentrates into a smaller number of names and instruments.
Energy is the most interesting week-over-week comparison. The prior week saw $44.4 billion flow through energy on March 20 alone -- an outsized number driven in part by crude oil repricing around the tariff demand-destruction narrative. This week energy ran $9.3 billion on Monday and compressed to $6.6 billion by Thursday. The deceleration is consistent with what the macro framework shows: energy’s relative strength versus SPY is deteriorating and its volatility ratio is elevated, meaning the sector is experiencing more downside than upside across sector peers -- not a place where disciplined capital wants to be positioned for short-term trend-following purposes.
The treemap of top names by aggregate dollars confirms that positioning is overwhelmingly index-centric this week. SPY dominates the entire chart at approximately $48 billion in aggregate notional, an enormous figure that immediately signals this week’s institutional activity was primarily about macro positioning and risk management rather than single-name conviction.
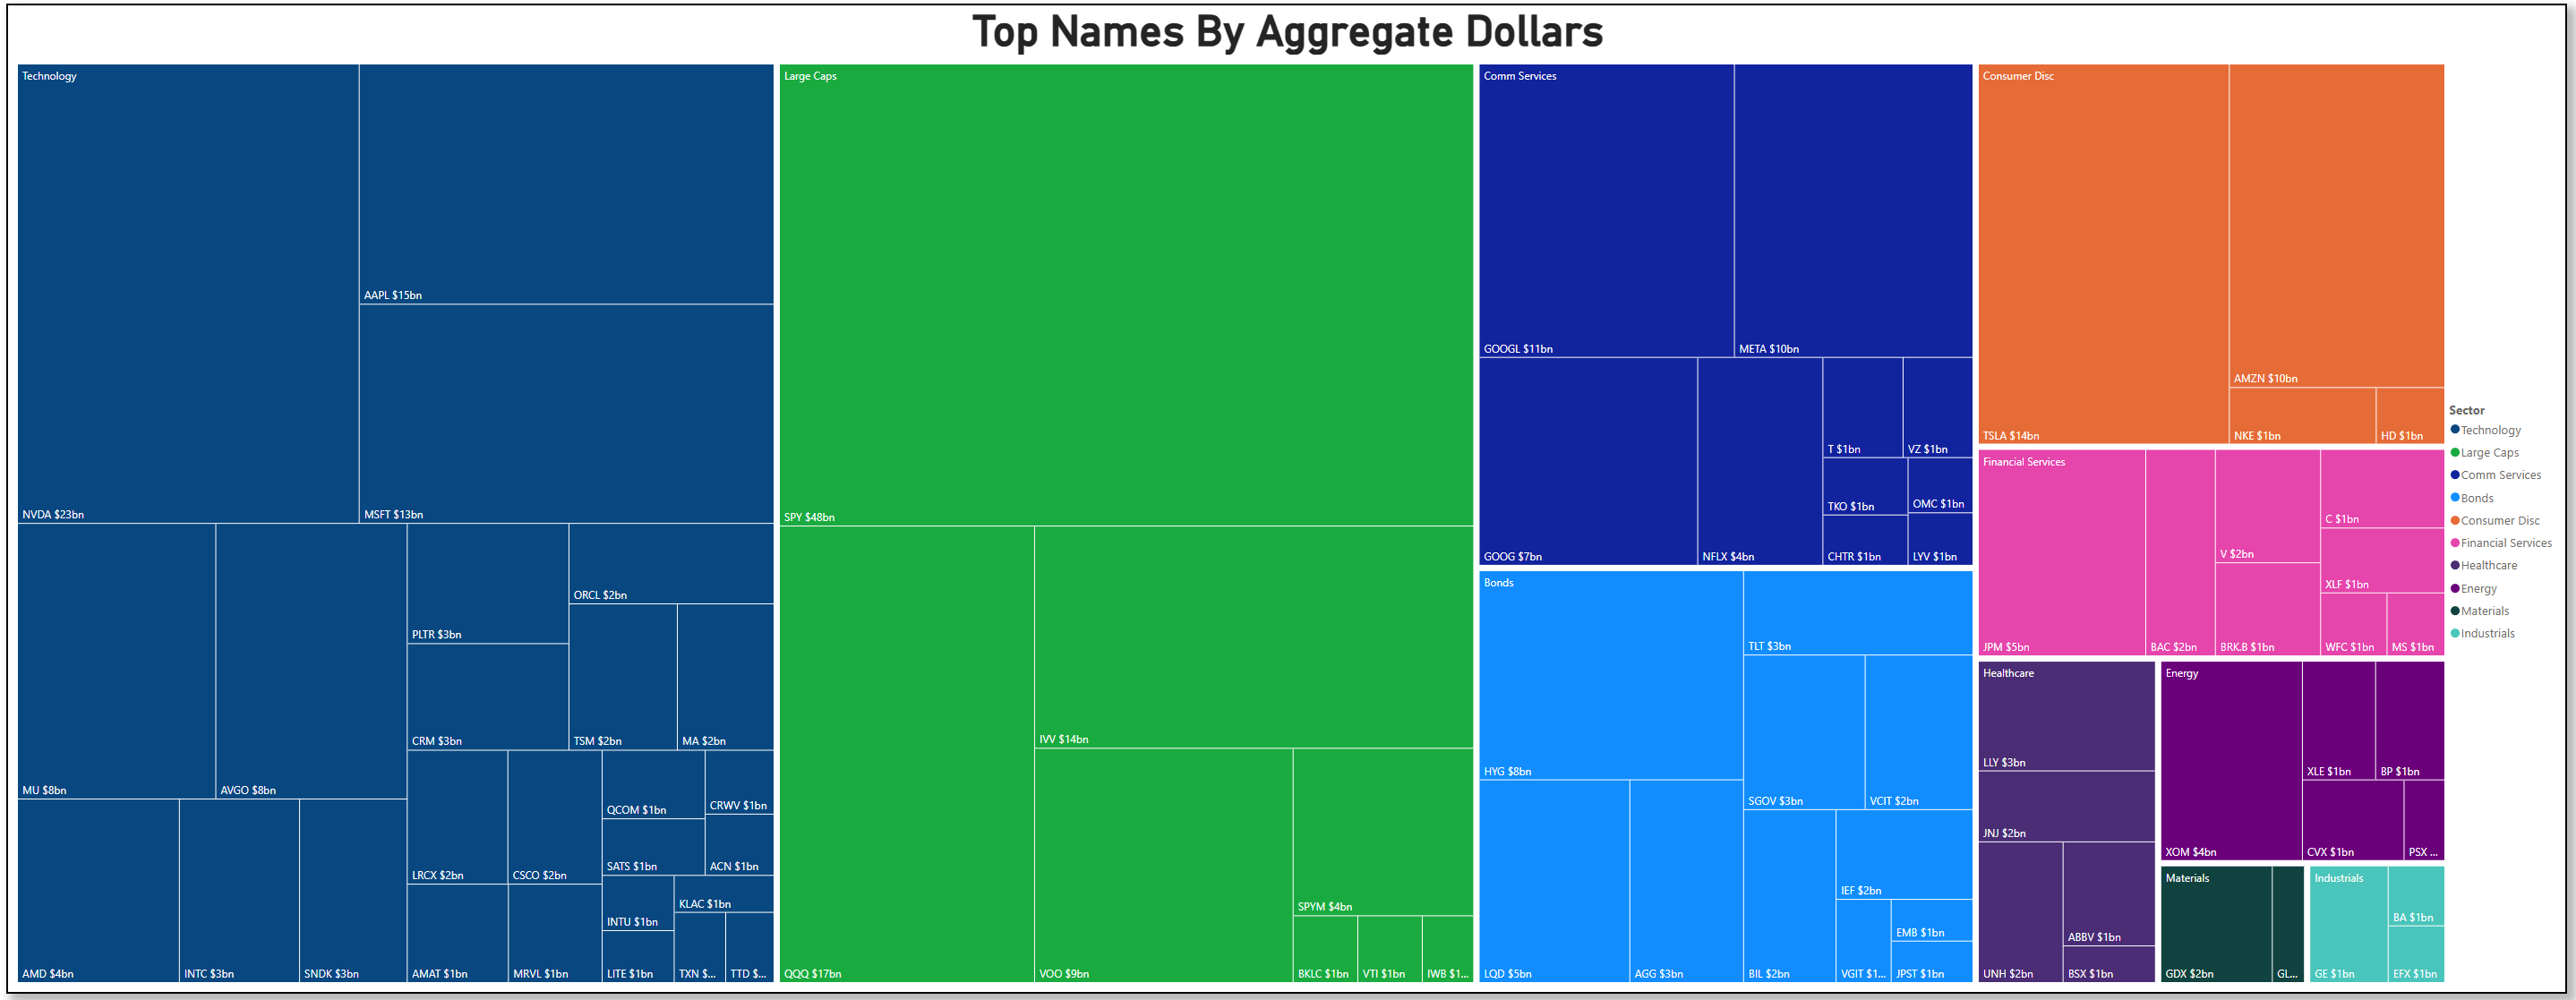
QQQ at roughly $17 billion and IVV at approximately $14 billion reinforce that read. When SPY, QQQ, and IVV collectively absorb the three largest notional positions in the market, institutions are expressing views at the index level, not rotating into individual sector stories. The mega-cap tech names are still present -- NVDA at approximately $23 billion, AAPL at $15 billion, MSFT at $13 billion -- but their relative position in the treemap is smaller than their historical norms for a constructive week. TSLA at roughly $14 billion is outsized relative to its earnings contribution, consistent with its role as a high-beta sentiment proxy. On the fixed income and credit side, IVV’s bond exposure and HYG at approximately $8 billion are notable presences, which makes sense: when the macro framework is signaling caution about the growth environment and rates markets are active, institutions use bond ETFs for both hedging and tactical duration positioning.
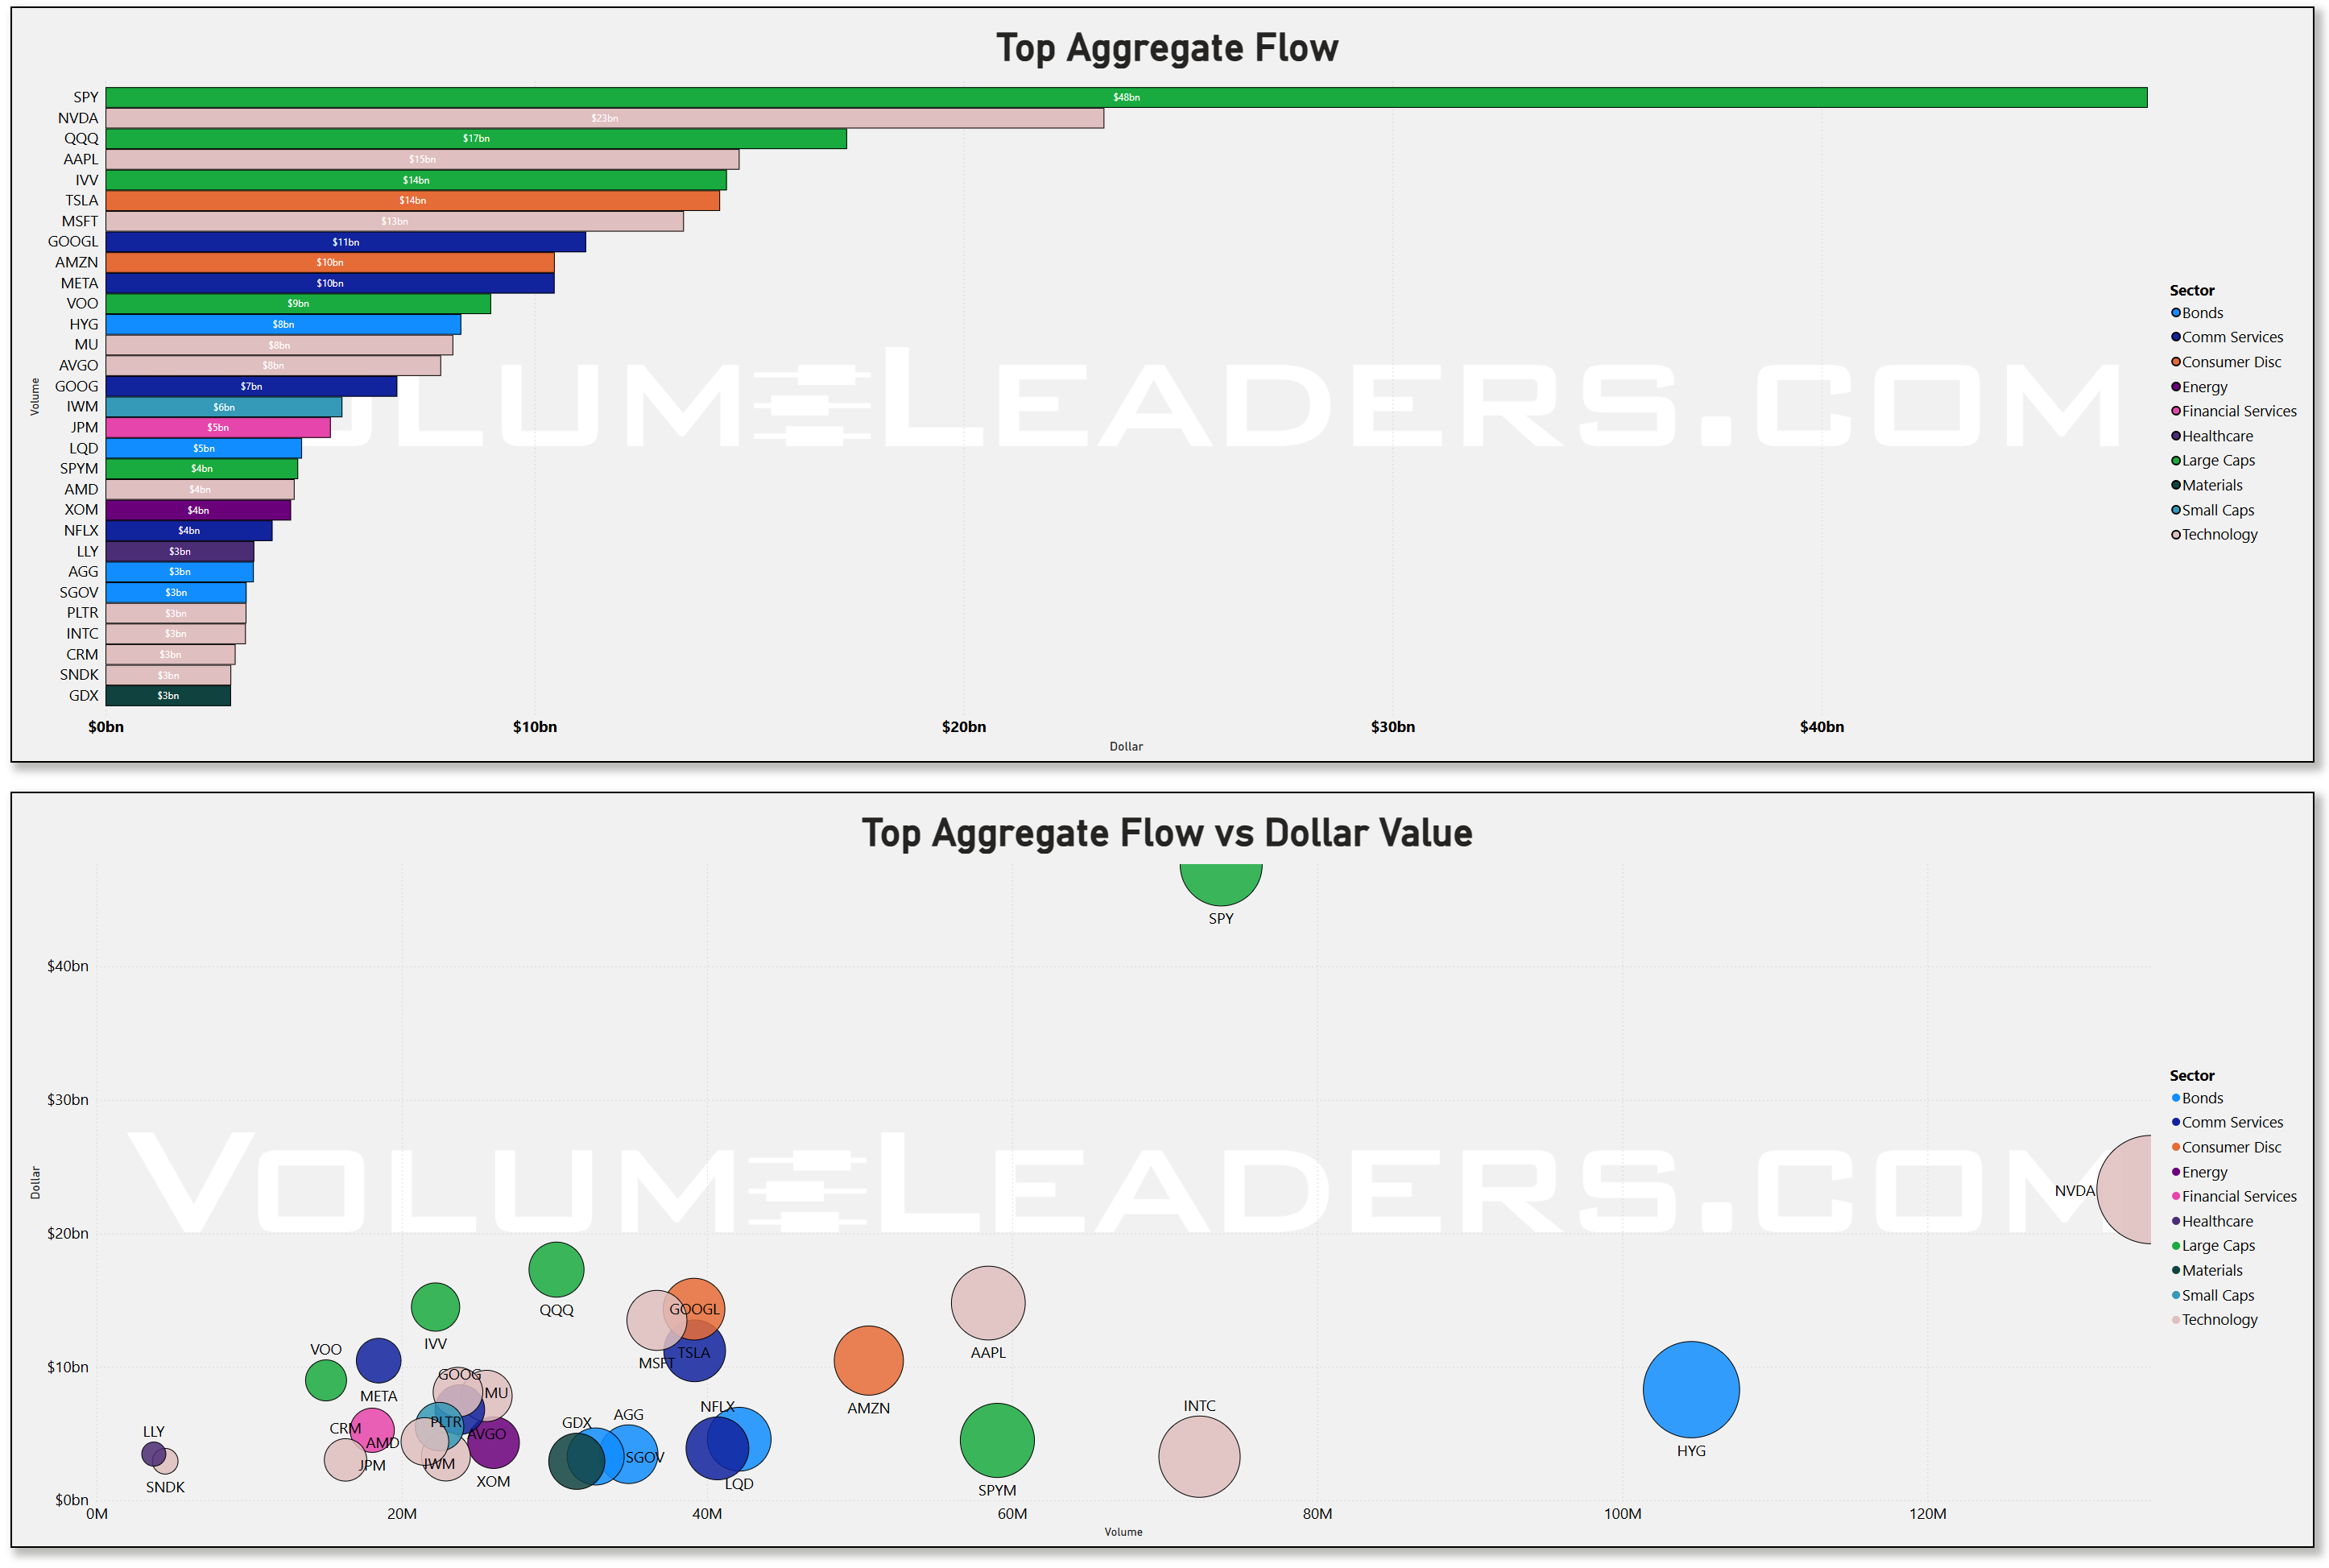
The aggregate flow bar chart tells you the same story in rank order. SPY’s $48 billion aggregate is so dominant it almost renders the next names invisible. NVDA at $23 billion is the standout single-stock story, with the volume-vs-dollar scatter placing it in the upper-right quadrant -- high dollar value but not proportionally high share volume, which implies elevated per-share price action and concentrated positioning rather than algorithmic share accumulation. AAPL at $15 billion and TSLA at $14 billion come next, followed by MSFT’s $13 billion. The credit instruments -- HYG at $8 billion and LQD visible in the scatter -- tell you institutions were actively managing credit exposure alongside equity exposure, which fits the tariff-driven growth concern narrative perfectly.
The dark pool picture is where the narrative gets more interesting. SPY pulled approximately $32.7 billion through dark venues -- a remarkably high dark pool share of its total aggregate flow, suggesting that a meaningful portion of the index positioning this week was deliberately executed away from lit markets to minimize information leakage. QQQ followed at approximately $11.5 billion dark, IVV at roughly $11 billion. NVDA pulled about $9 billion through dark pool, and VOO at $7.1 billion. TSLA at $5.8 billion and HYG at $5.7 billion round out the top of the dark pool chart. The dark pool scatter is revealing: HYG appears at approximately 70 million shares with a bubble size consistent with its $5.7 billion, making it one of the most volume-efficient dark pool names of the week on a per-dollar basis.
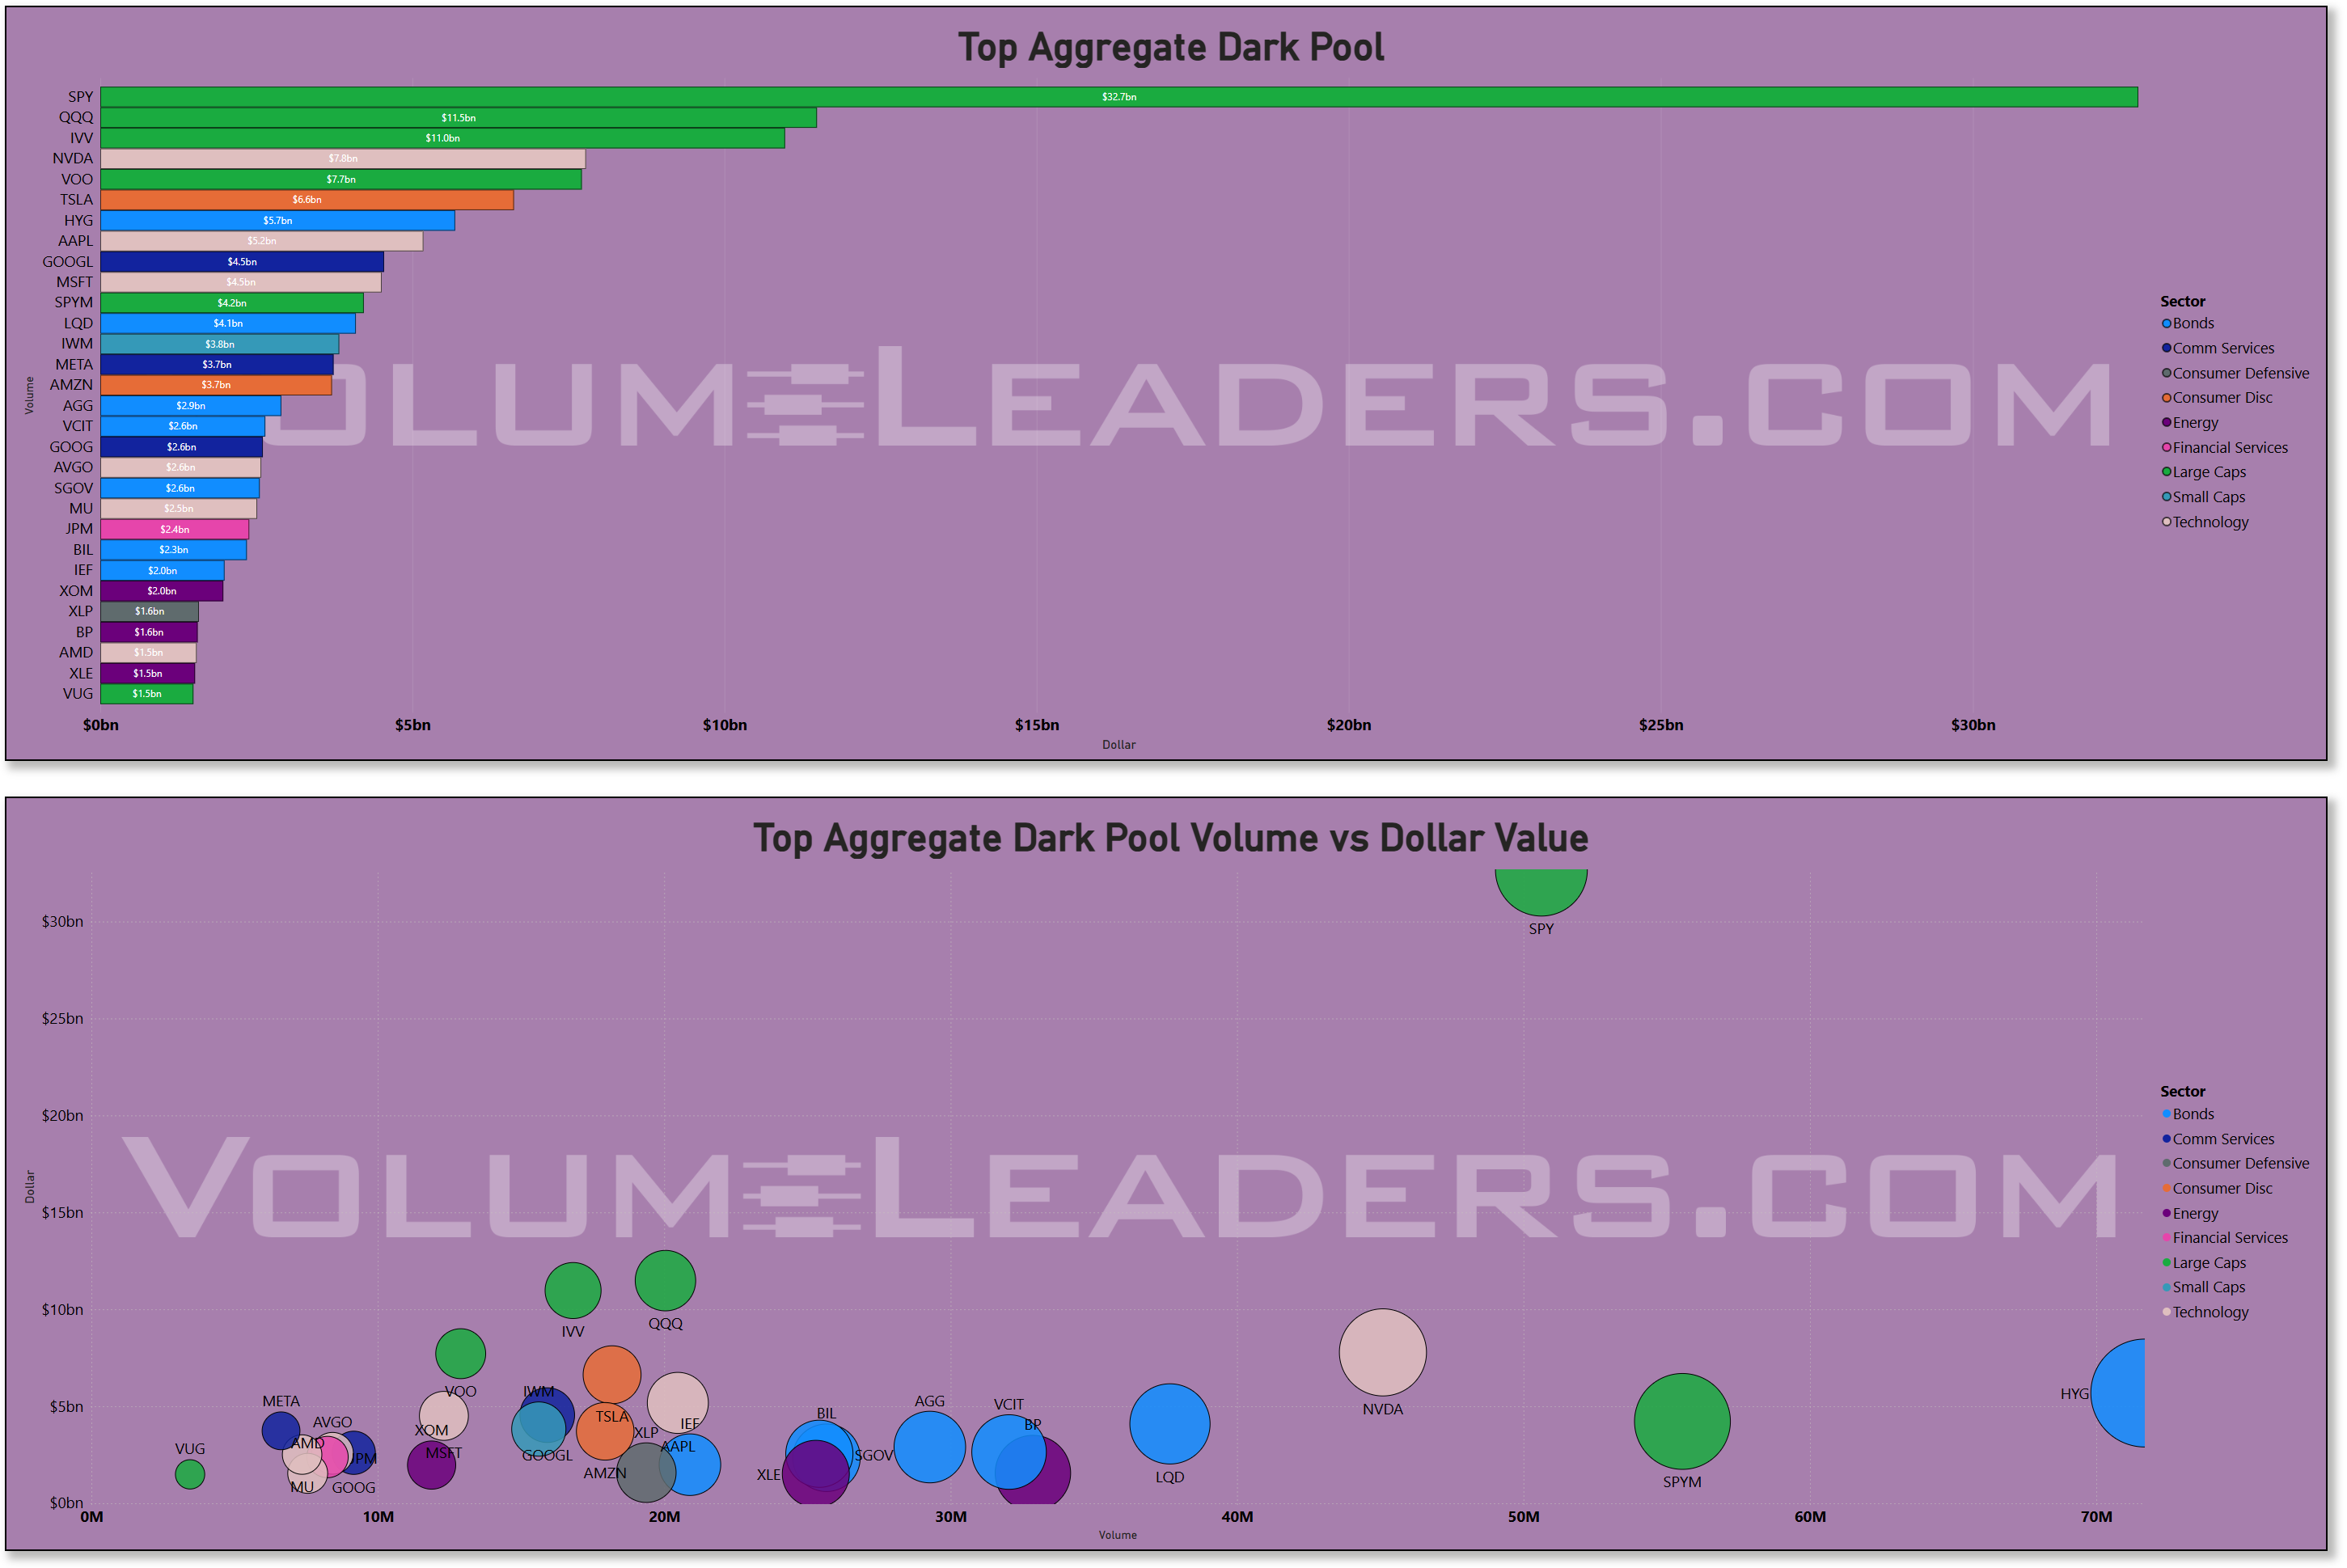
Large share volume in HYG transacted quietly in dark venues is a classic institutional credit portfolio hedge or reallocation signature -- not the behavior of a portfolio manager adding high-yield risk, more consistent with someone adjusting duration and credit exposure in size without moving the market. Similarly, the presence of BIL, AGG, SGOV, VCIT, and BP in the dark pool top names confirms that fixed income and defensive instruments are being quietly accumulated through non-displayed venues, which the macro framework’s cautious tone on the overall environment would predict.
The sweep activity tells a distinctly different story and is the most directionally interesting piece of data this week. SPYM -- the 2x levered S&P 500 ETF -- printed approximately $2.6 billion in sweeps, by far the largest sweep total on the board. That is not a passive allocation signal. Sweeps in a 2x levered product are tactical, urgent, and directionally intentional. Whoever was sweeping SPYM this week wanted exposure immediately, at the market, without the luxury of patience. Given that sweeps peaked during the week’s most volatile sessions, the most plausible read is that this was tactical hedging combined with speculative long positioning by participants who believed the selloff was overdone on a short-term basis. HYG at approximately $1.5 billion in sweeps is the second largest, again confirming that credit hedging was being executed urgently at various points during the week.
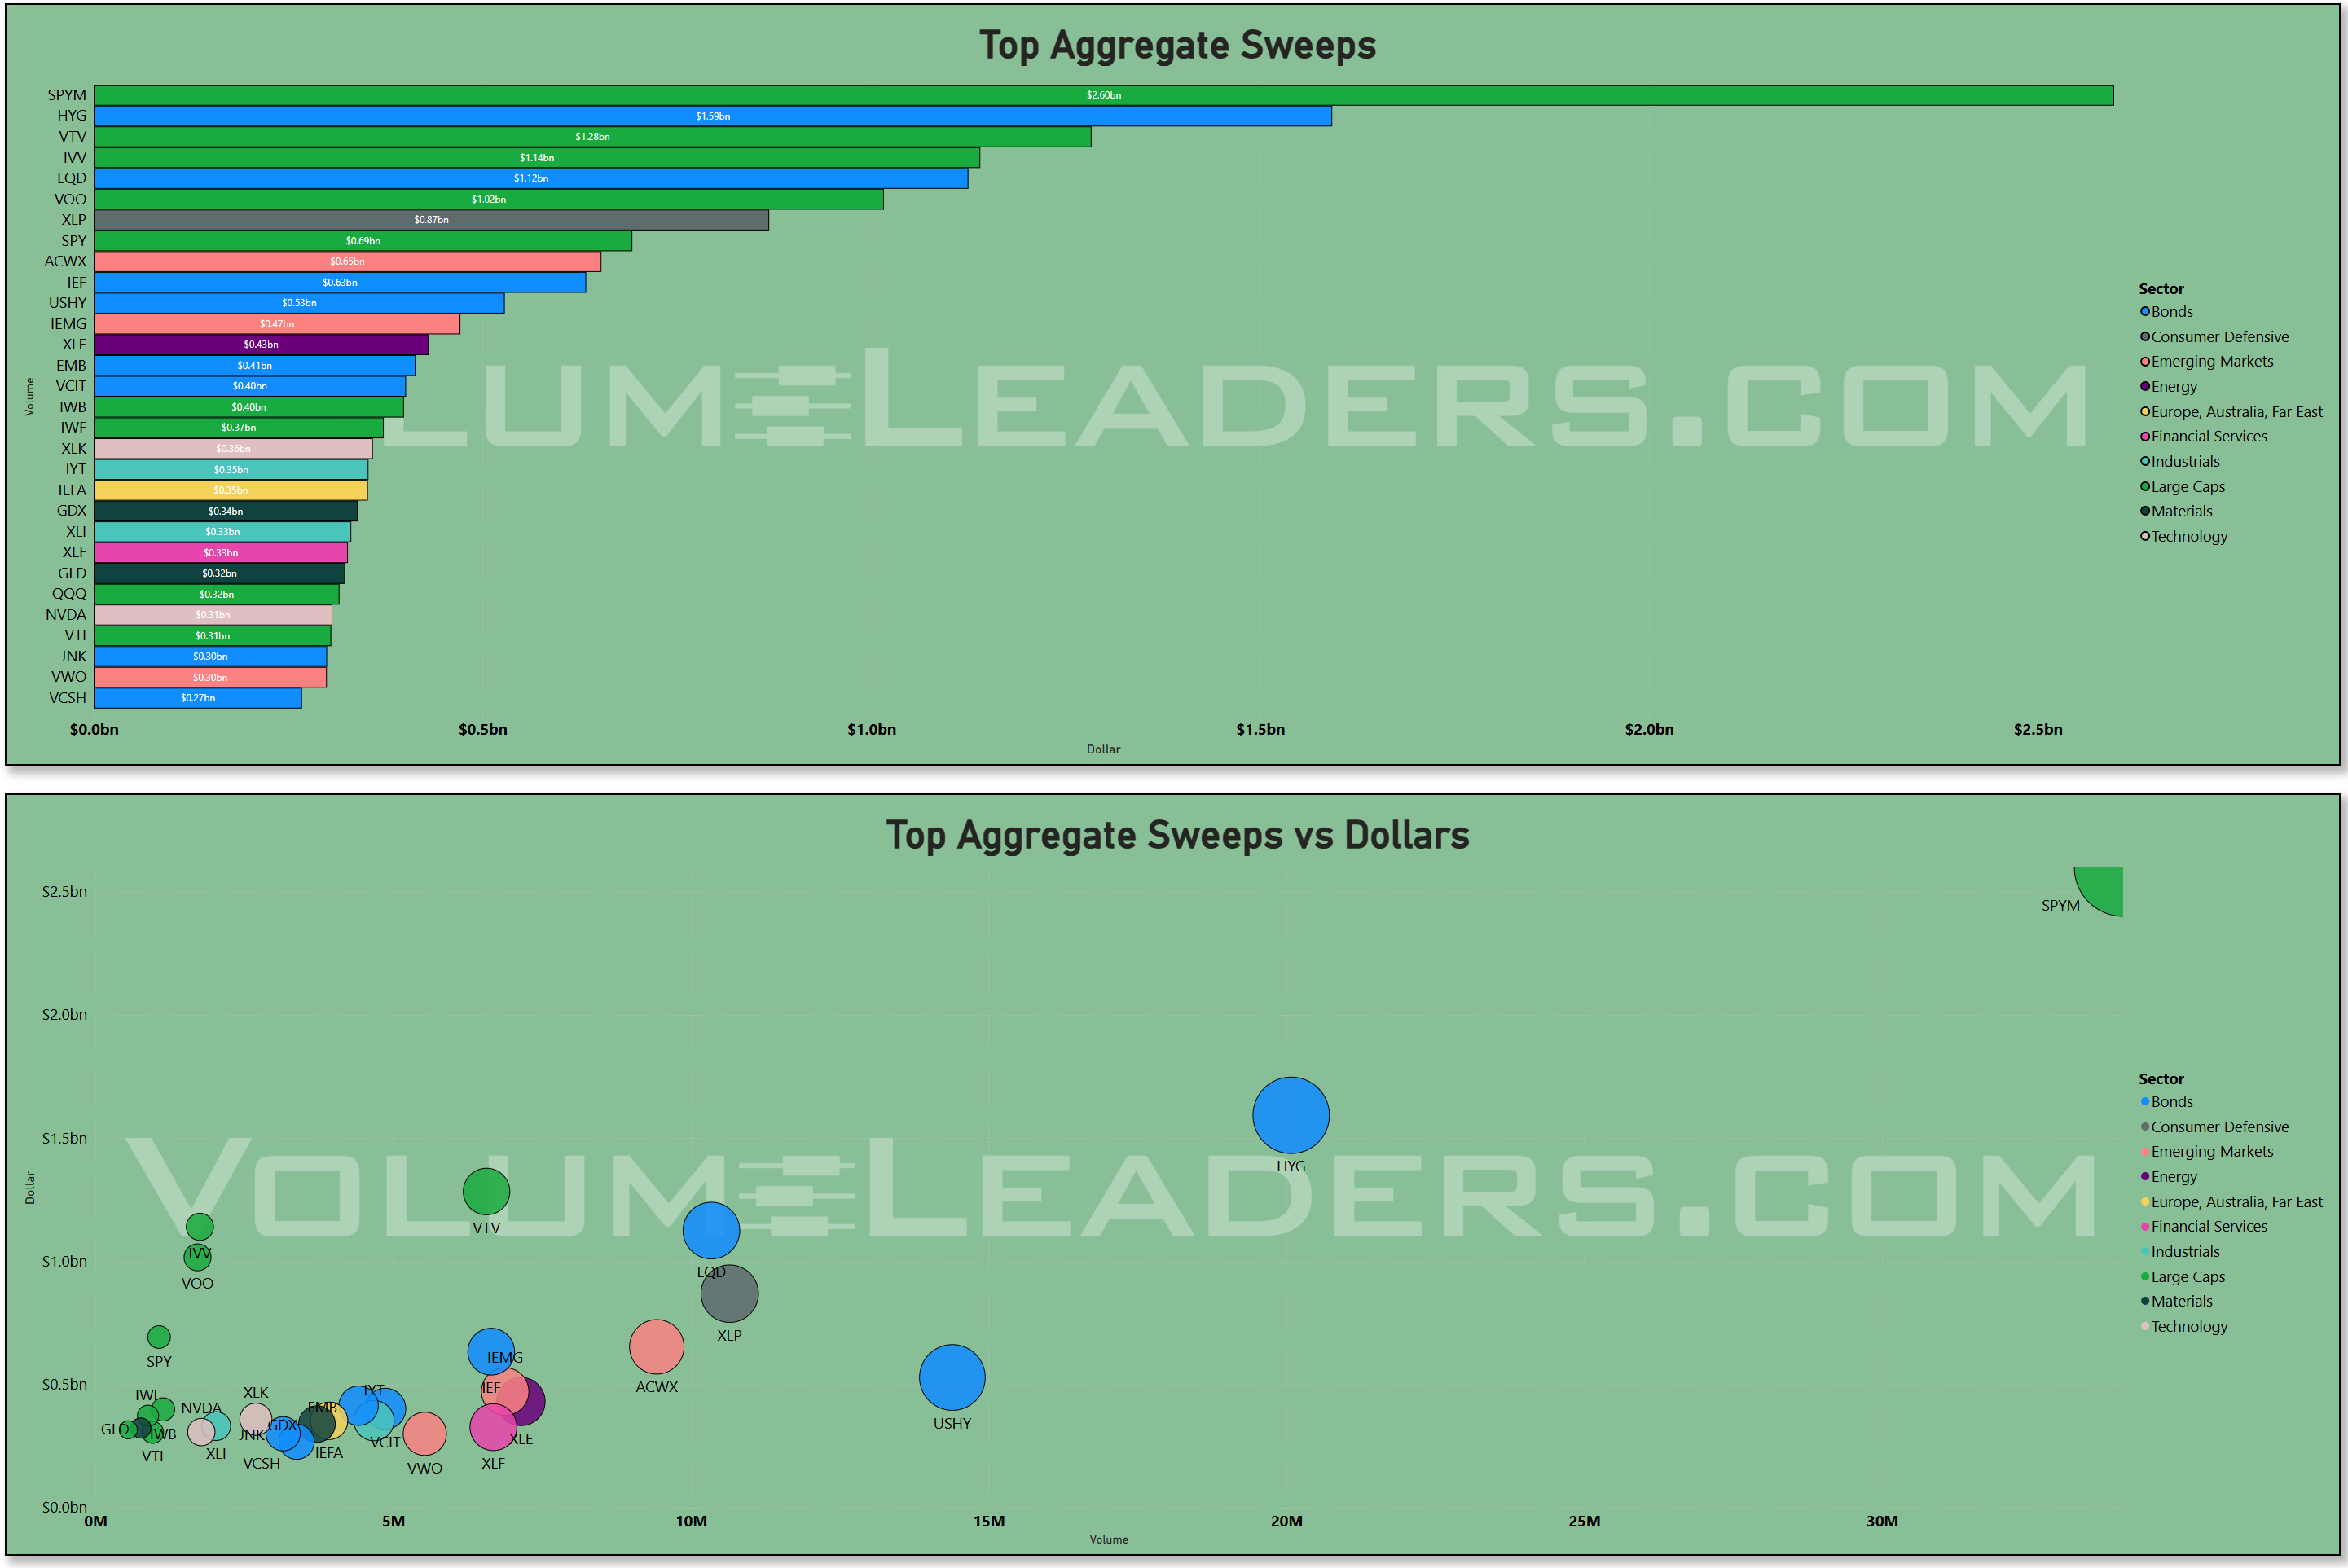
VTV at roughly $1.1 billion -- the Vanguard Value ETF -- is a notable sweep presence. Large cap value sweeps of that magnitude are usually defensive rotation, and they fit with the macro framework’s observation that areas with lower relative volatility and more stable characteristics are where the market’s participation is finding some footing. IVV at approximately $1.1 billion and LQD at $1.2 billion continue the bonds-and-index theme through the sweep channel. The international sweep names -- ACWX at $0.61 billion, IEMG at $0.47 billion, IEF -- suggest some participants are actively rotating exposure away from pure U.S. equity risk and toward non-dollar diversification, a pattern that has been building since the CNBC and CFR analyses of the one-year anniversary of the original Liberation Day showed sustained underperformance of U.S. assets relative to global benchmarks. The “Anywhere But the USA” dynamic has not fully resolved, and the sweep flow into ACWX and IEMG is its institutional expression.
Putting it all together through the lens of where participation is actually healthy versus deteriorating: the macro framework says the overall market environment does not favor broad risk-taking, participation is narrowing rather than expanding, and the sectors showing the most stable volatility profiles are primarily defensive and quality-oriented. The flow data confirms exactly that. Institutions spent this week positioning in index products (mostly through dark pools to avoid market impact), managing credit and duration exposure through both dark and sweep channels, and making very selective single-stock commitments concentrated in the mega-cap names that have the liquidity to absorb institutional size without structural damage. The absence of aggressive single-stock sweep activity in growth or small-cap names is not subtle -- it says the conviction layer of the market is not yet present. NVDA’s $23 billion aggregate is the one exception where a single name is genuinely absorbing institutional attention at a level that implies strategic positioning rather than tactical hedging, and even there the dark pool component is substantial, consistent with accumulation rather than momentum chasing.
The week was, in its deepest read, a portfolio restructuring event dressed up as normal trading: index hedging, credit duration management, levered tactical bets on a bounce, and quiet accumulation of defensive tilts through dark venues. The market framework says conditions have to improve materially before broad participation returns. The flow data says institutions are waiting for exactly that.
MIR Part 2: Individual Names From The Institutional Tape
VolumeLeaders tracks several proprietary signals designed to spotlight names drawing significant institutional interest. Below, we’ve surfaced the latest results and analyzed them to highlight emergent themes. If any of the sectors, narratives, or positioning trends resonate, the names mentioned here offer a strong starting point for deeper research and watchlist consideration.
VL Trade Rank Velocity™ (TRV)
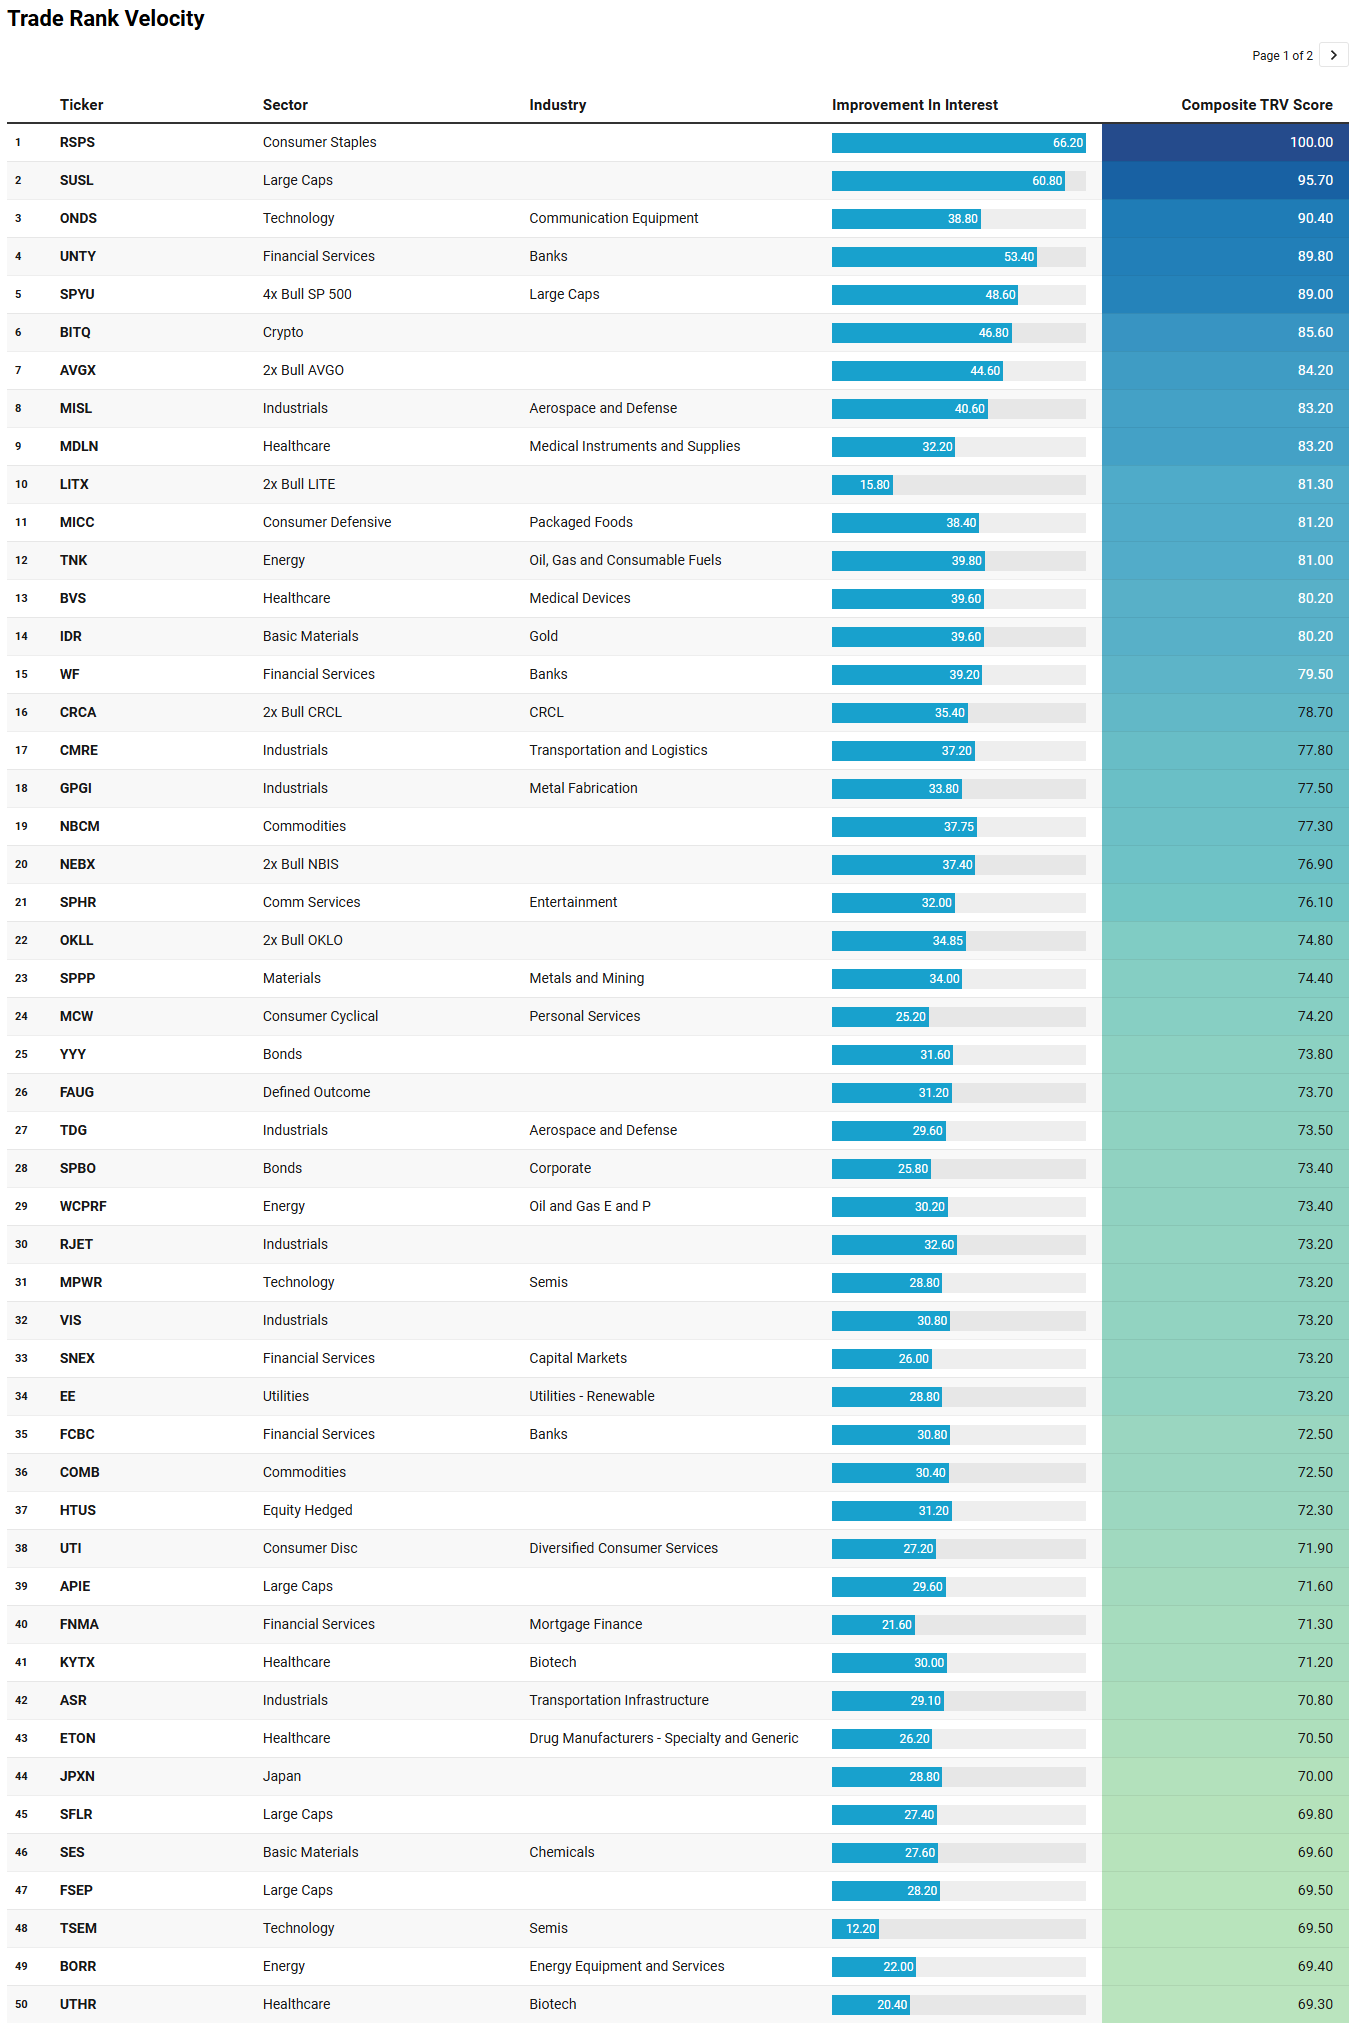
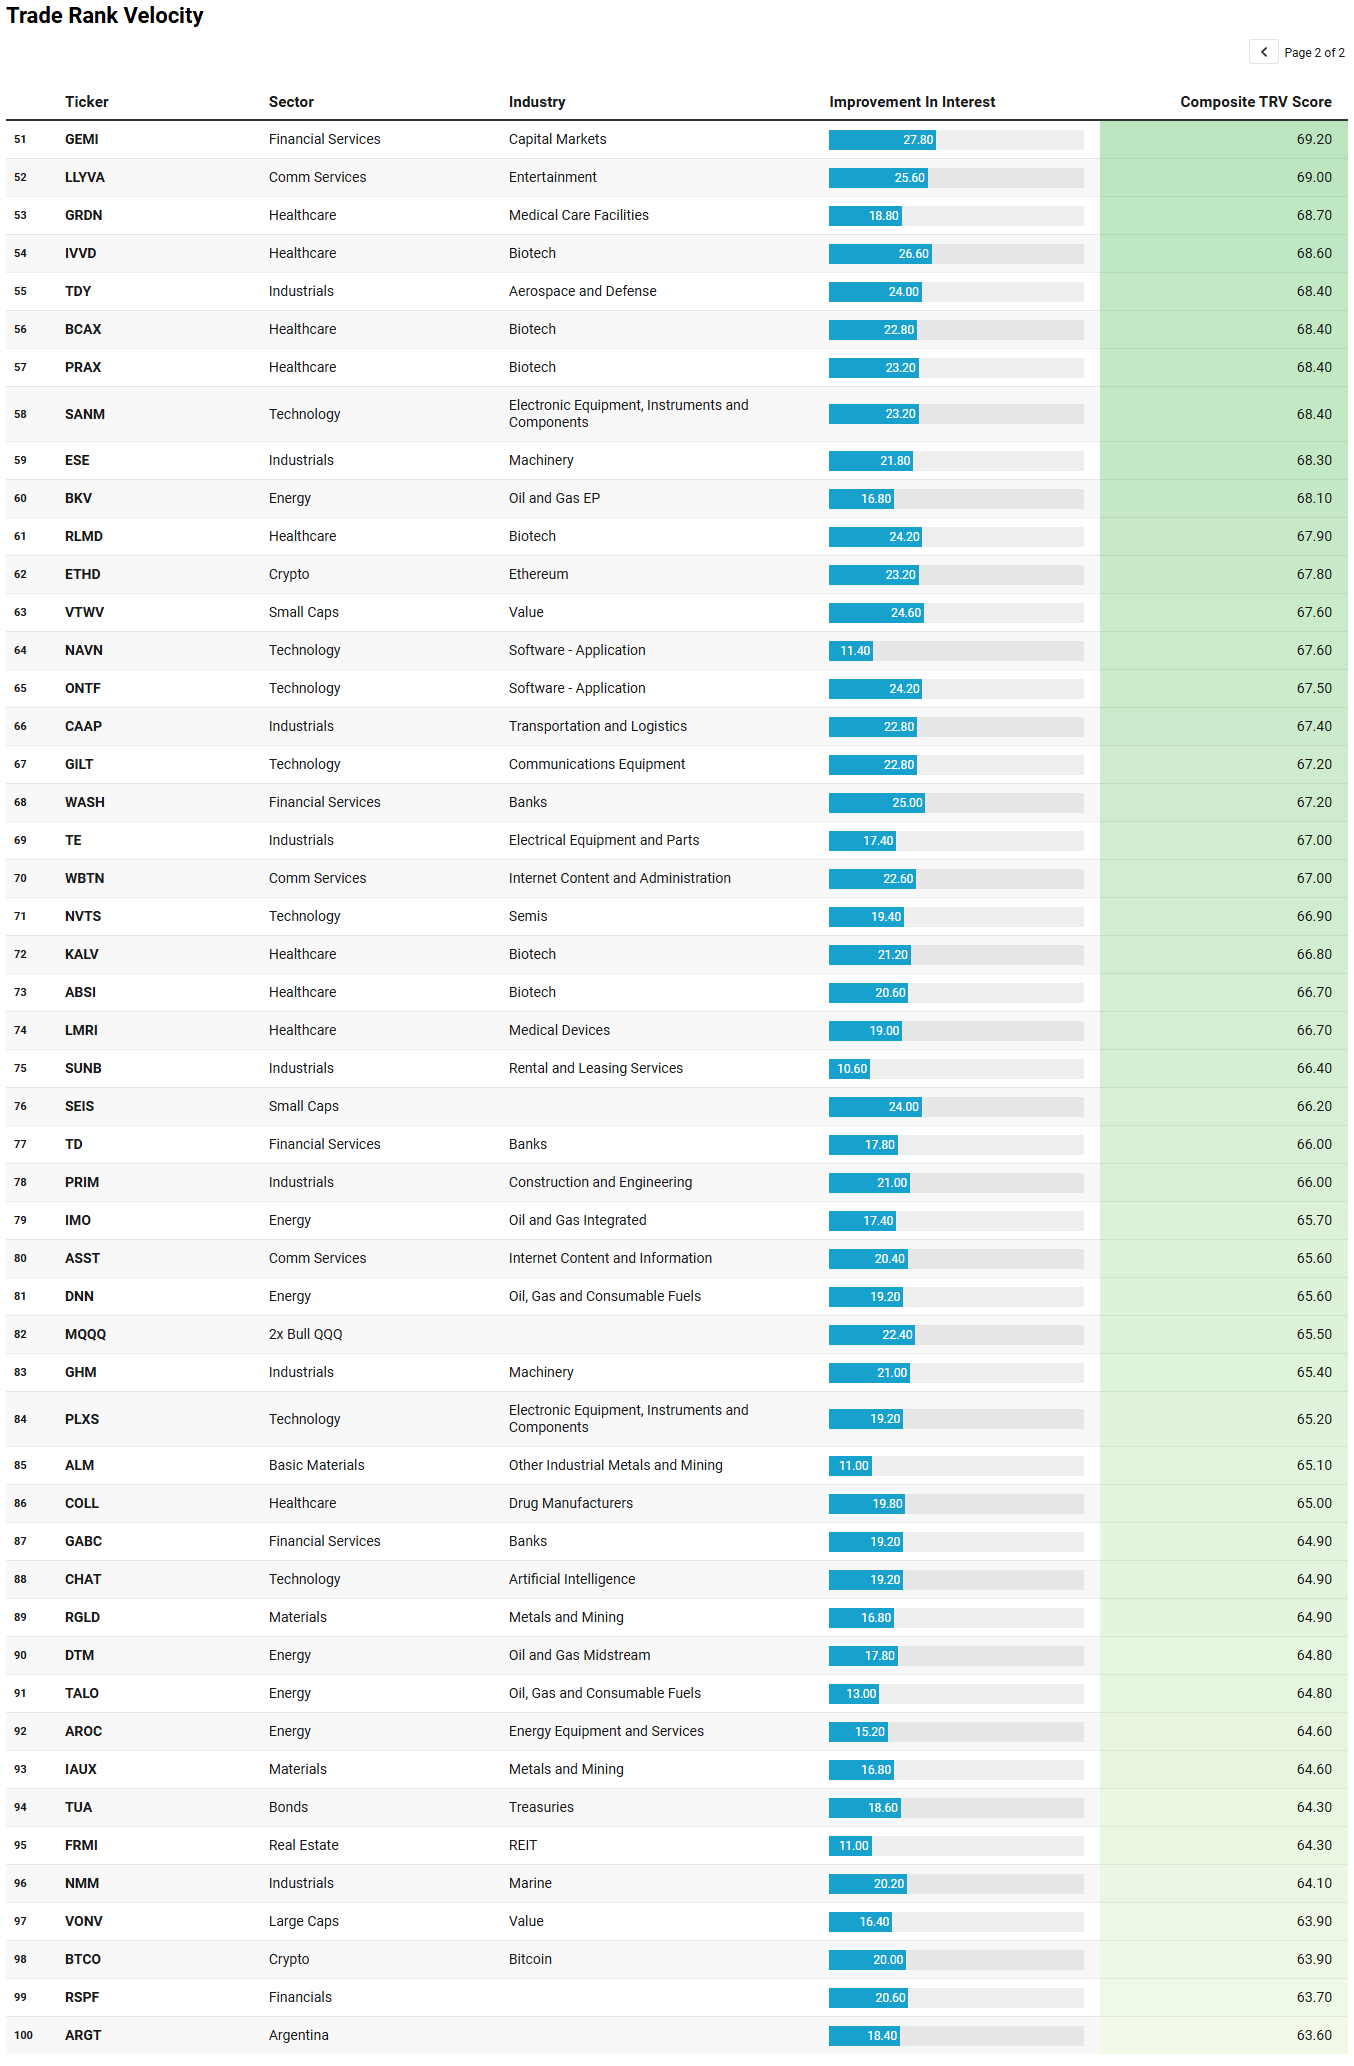
TRV is a proprietary metric that measures the recent acceleration or deceleration in institutional trading activity for a given stock by comparing its average trade rank over the past few days to its average in recent weeks. A sharp improvement in TRV typically reflects a notable shift in positioning, often accompanied by sustained trade activity, suggesting institutions are actively engaging with the name and that intensity of activity is rising. This often precludes meaningful price or narrative shifts. This isn’t a buy-list or sell-list; it’s meant to draw your eyes to names where institutions are putting money to work.
The TRV watchlist lands this week with a character that maps almost perfectly onto the cautious, environment-first tone the flow data and market structure have been telegraphing. Read the top names as a collective signal rather than a shopping list and a coherent picture emerges: this is not a market generating broad risk appetite. It is a market where participants are hedging, rotating into hard assets and defensives, and making very selective tactical bets in levered instruments while the broader environment remains hostile to conviction.
The most prominent theme at the top of the composite score rankings is defensive repositioning wrapped in ESG and factor packaging. RSPS and SUSL -- both scoring in the high 90s -- are equal-weight consumer staples and ESG-screened large cap instruments respectively. Their appearance at the very top of the list, with the most recent activity as of March 30, is consistent with the rotation the flow data showed: institutions quietly accumulating defensive tilts through non-displayed venues while single-stock growth positioning faded. SUSL in particular sitting second overall tells you that ESG-screened quality large caps are seeing genuine interest improvement, not just passive drift.
Immediately beneath that, the levered long positioning in index products surfaces as the watchlist’s second dominant theme. SPYU -- the 4x levered S&P 500 product -- carries a composite score of 89 with the most recent activity on April 2 and 10 sessions of sustained interest. That is exactly the instrument and timing signature that fits the SPYM sweep data from the institutional flow charts: someone was buying levered upside urgently on April 2 as the tariff-repricing selloff extended, making a tactical bet that the move was overdone. MQQQ, the 2x QQQ instrument, appears later in the list with a score of 65.5 and recent activity April 1. The sustained interest in levered long products even as the macro environment deteriorates is a contrarian positioning tell, not a trend-following one.
The hard asset and commodity cluster is the third clear theme and arguably the most strategically significant given the macro backdrop. IDR in gold, SPPP in metals and mining, RGLD and IAUX also in metals and mining, COMB and NBCM in broad commodities, and ALM in industrial metals all appear across the watchlist with activity concentrated heavily in the April 1 to April 2 window. This is the tariff-inflation hedge playing out in real time. When trade frictions raise the effective cost of imported goods and dollar weakness compounds the repricing, hard assets become the natural destination for capital that cannot find conviction in equities. The breadth of metals and mining representation across both materials and energy-adjacent names -- including DNN in uranium and BKV, TALO, and AROC in oil and gas -- says this is not a single-name story. It is a regime-level rotation into real assets.
Healthcare biotech is the fourth cluster and it deserves a separate sentence because the names appearing -- KYTX, UTHR, BCAX, PRAX, RLMD, ABSI, KALV, IVVD, GRDN -- are almost entirely small and mid-cap with sustained activity in the 5-to-21 session range. This is patient accumulation, not tactical chasing, in names that are domestically oriented and therefore largely insulated from tariff-driven revenue compression. Biotech as a tariff-immune domestic growth pocket is a thesis that fits the current environment cleanly.
The final theme is the Japan and international diversification signal: JPXN for Japan and ARGT for Argentina both appearing with recent activity, alongside the ACWX and IEMG sweep presence from the institutional flow data, says the “Anywhere But the USA” diversification impulse is still actively working its way through positioning. The watchlist and the flow data are saying the same thing from two different altitudes.
VL Institutional Outliers™ (IO)
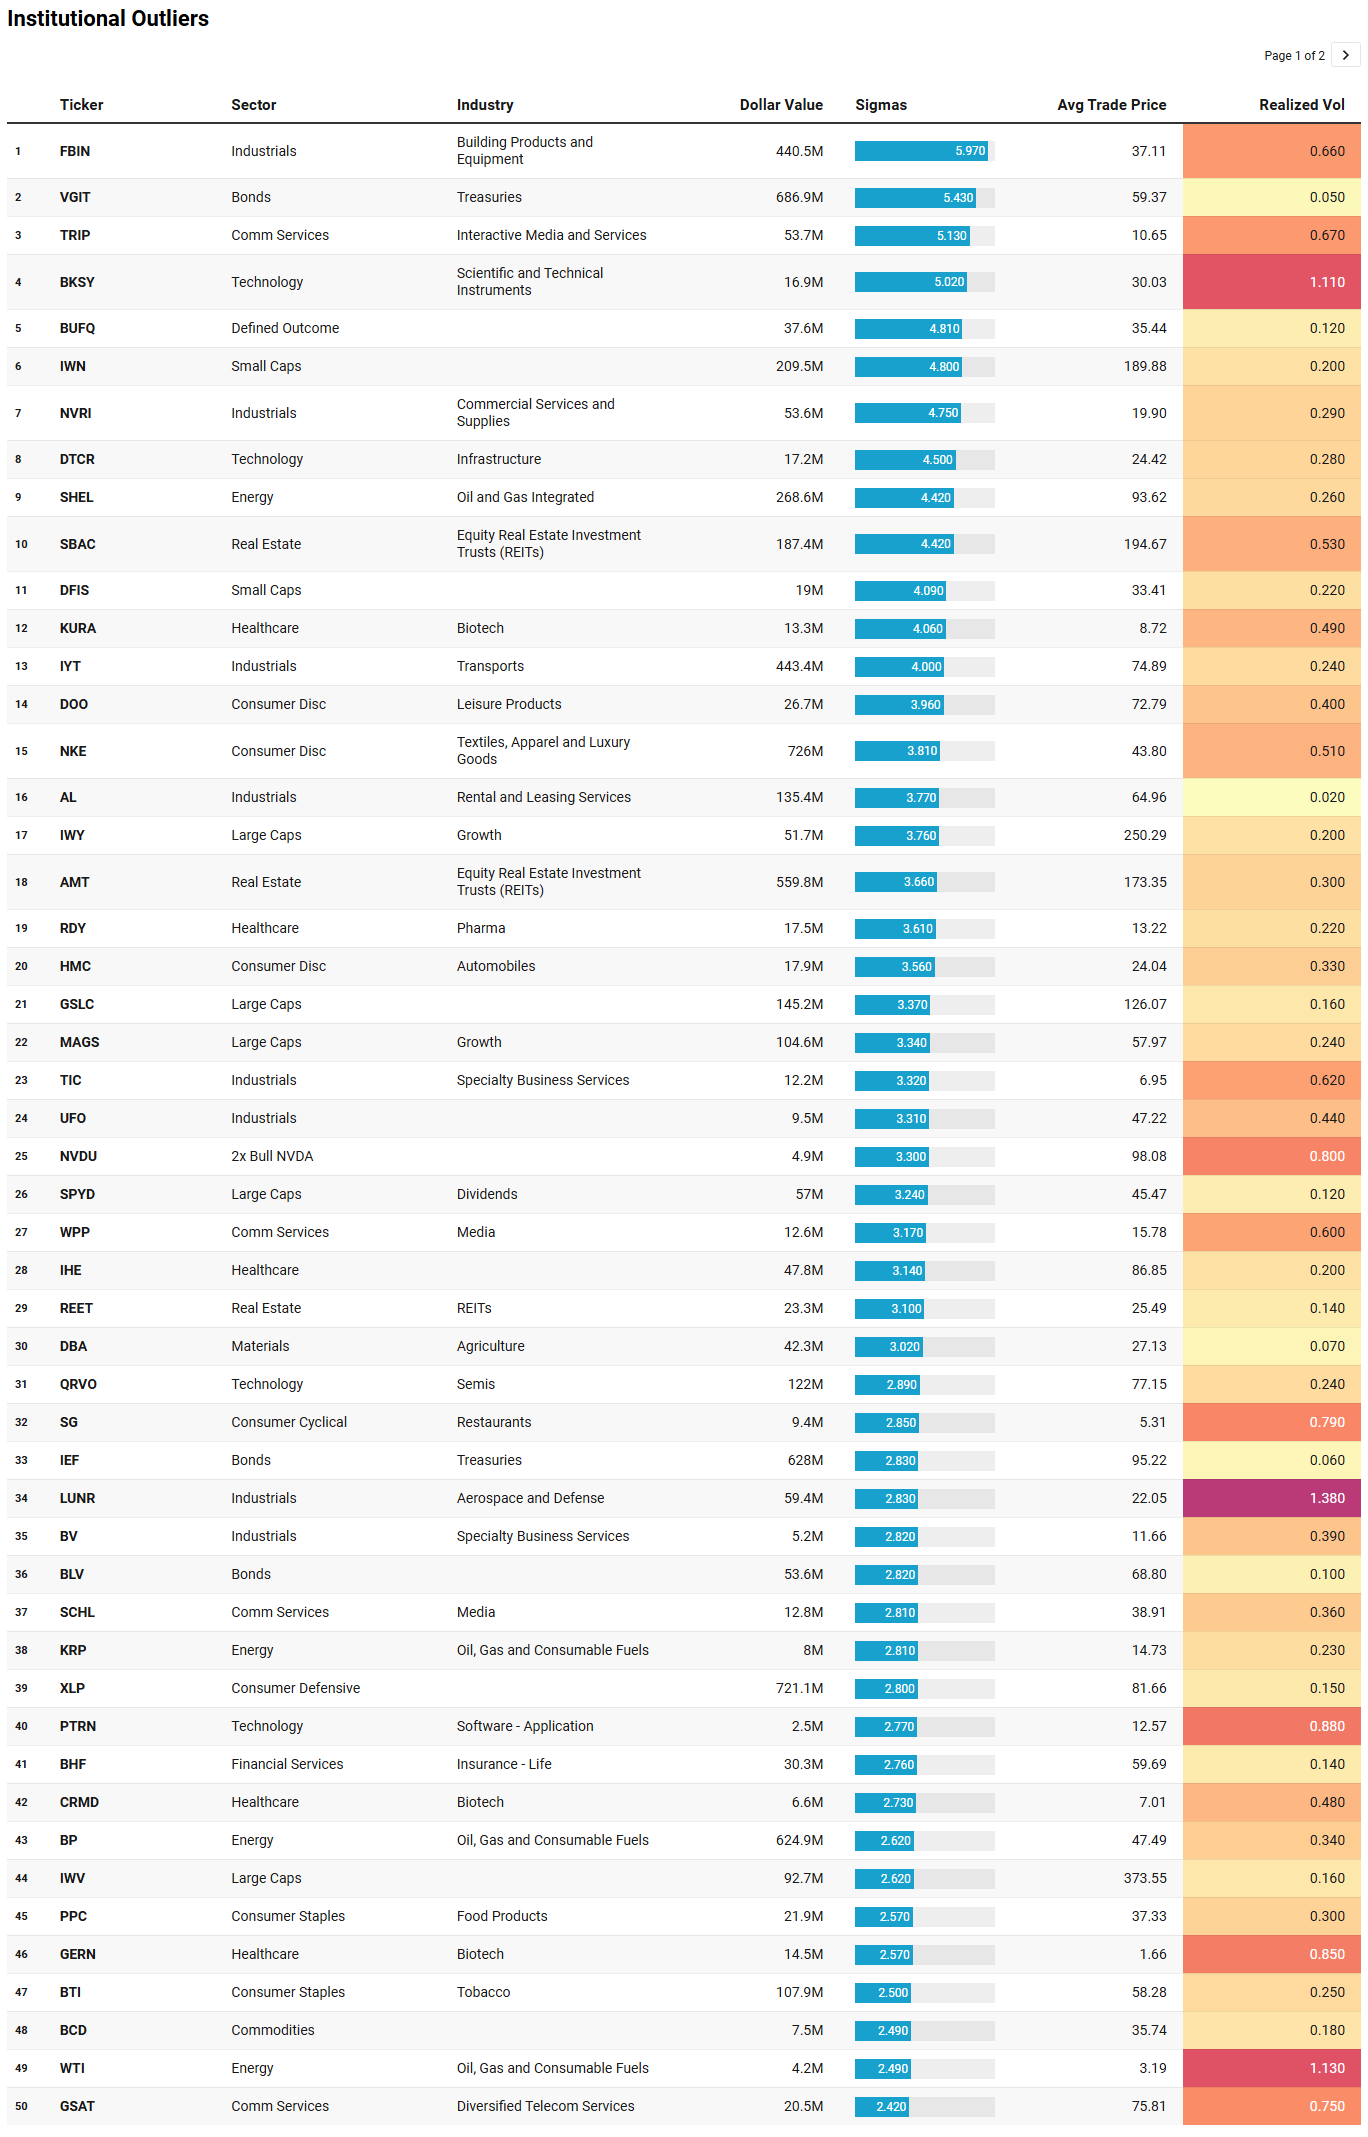
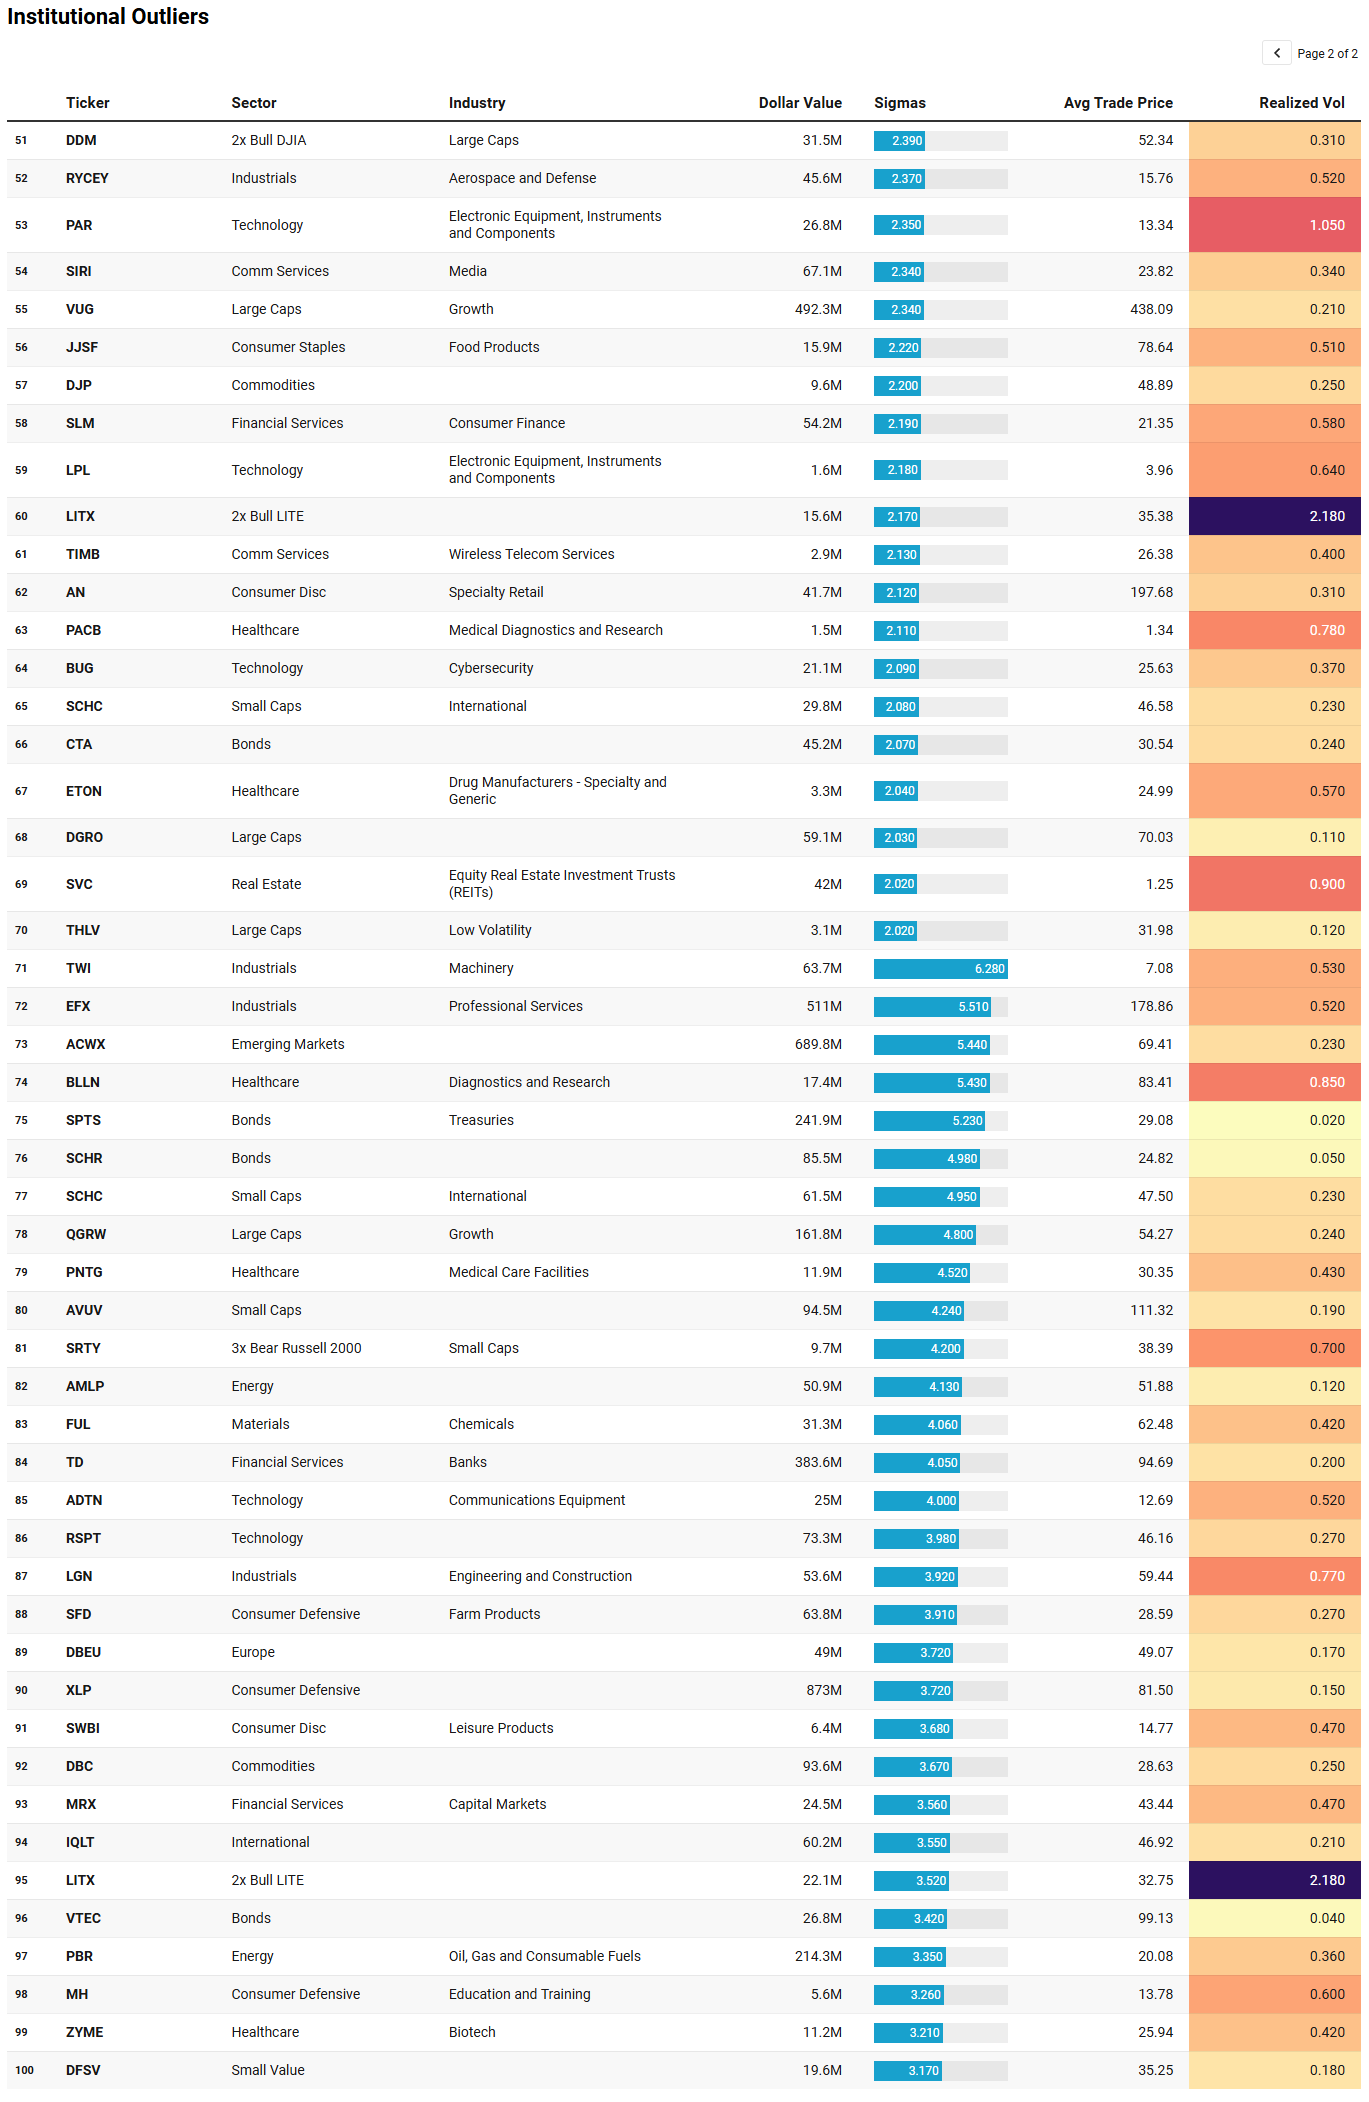
Institutional Outliers is a proprietary metric designed to spotlight trades that significantly exceed a stock’s recent institutional activity—specifically in terms of dollar volume. By comparing current trade size against each security's recent normalized history, the metric flags outlier events that may indicate sudden institutional interest but may be missed because the activity doesn’t raise any flags/alerts when comparing the activity against the ticker’s entire history. For example, it’s conceivable that a ticker today receives the largest trade it has had in the last 6 months but the trade is unranked and would therefore be missed by current alerts built off Trade Ranks. Day traders can use “Realized Vol” to identify tickers that are moving swiftly with large price displacement while others can use it to size your risk appropriately.
The IO list for the week is one of the cleaner institutional outlier sets you will see in a stressed tape, and the signal-to-noise ratio is high precisely because the outlier methodology strips out the normal day-to-day volume and flags what is genuinely anomalous. What emerges is not a collection of random large prints. It is a coherent institutional response to a macro event, and virtually every major cluster in the list supports a consistent interpretation.
The single most important read in the entire table is the fixed income complex. VGIT -- intermediate Treasuries -- printed $686.9 million at 5.43 sigmas above its expected level on April 2, with a realized vol of just 0.05. IEF -- the 7-to-10 year Treasury ETF -- added $628 million at 2.83 sigmas on the same day. SPTS, the short-term Treasury product, ran $241.9 million at 5.23 sigmas on April 1. SCHR printed $85.5 million at 4.98 sigmas also on April 1. BLV and CTA and TUA from the TRV watchlist add to the fixed income constellation. The pattern is unambiguous: institutional participants were moving duration capital with urgency across multiple maturity points simultaneously. Short-term, intermediate, and long-duration Treasuries all registered outlier prints within 48 hours of each other. This is not passive rebalancing. This is a coordinated shift toward safety driven by the growth-shock repricing that the tariff backdrop accelerated. The realized vol on every one of these instruments is in the low single digits -- 0.02, 0.05, 0.06 -- meaning these are not speculative positions. They are institutional hiding spots, and the sigmas tell you the hiding was happening at an unusual pace.
The second dominant cluster is Consumer Defensive. XLP printed $872.9 million at 3.72 sigmas on April 1 and then $721.1 million at 2.80 sigmas on April 2 -- back-to-back outlier sessions in the same instrument totaling nearly $1.6 billion in two days. That is not a coincidence. XLP with a realized vol of 0.15 is exactly the kind of low-volatility, domestically oriented, tariff-insulated exposure that institutions reach for when the growth environment deteriorates. BTI at $107.9 million and 2.50 sigmas, PPC at $21.9 million, and JJSF and SFD all appearing in the same two-day window deepen the defensive consumer rotation signal. The TRV list already flagged RSPS and MICC in this theme; the IO list confirms it with dollar magnitude and sigma significance.
The international diversification theme from the TRV watchlist sharpens considerably in the IO data. ACWX -- which appeared prominently in the sweep data from the institutional flow charts as a tactical instrument -- printed $689.8 million at 5.44 sigmas on April 1, one of the highest sigma readings in the entire two-day table. SCHC (international small caps) was an outlier on both April 1 at 4.95 sigmas and again on April 2 at 2.08 sigmas -- two consecutive sessions of anomalous positioning in the same name is a deliberate rotation signal, not noise. DBEU (European equities) at $49 million and 3.72 sigmas on April 1 and IQLT (international quality) at $60.2 million and 3.55 sigmas add texture. This cluster maps directly onto the “Anywhere But the USA” dynamic that has been a feature of global institutional positioning since the original Liberation Day shock a year ago. The ACWX sigma reading alone -- 5.44 on nearly $700 million of notional -- is the kind of print that reflects a mandate-level allocation decision, not a tactical punt.
The consumer cyclical stress readings are just as telling. NKE printed $726 million at 3.81 sigmas on April 2. Nike is the canonical tariff-exposed consumer name -- its supply chain runs through Vietnam and China, both of which faced the highest reciprocal tariff rates in the original Liberation Day framework. A $726 million print at nearly 4 sigmas is either a large institution reducing exposure ahead of continued tariff pain, or a highly convictional buyer who believes the damage is fully priced. Given the realized vol of 0.51 and the price of $43.80, the print is in a name that has already experienced significant drawdown from its highs, which tilts the interpretation modestly toward accumulation by a long-term holder rather than pure liquidation. HMC -- Honda -- appeared at $17.9 million and 3.56 sigmas, consistent with auto sector repricing around tariff exposure for Japanese manufacturers. DOO (BRP) and AN (AutoNation) round out the auto-adjacent stress in the cyclical space.
FBIN -- Fortune Brands Innovations -- is the most unusual outlier in the entire table and deserves a standalone moment. $440.5 million at 5.97 sigmas in a building products name on April 2 -- that is the highest sigma reading of the two-day window. FBIN makes plumbing fixtures, doors, and cabinetry, many of which depend on imported materials or components subject to the new tariff structure. A nearly 6-sigma outlier print in a mid-cap building products manufacturer on the same day that Treasury and defensive ETF prints were also outlier-level is a genuinely unusual conjunction. It reads either as a large institution repositioning its entire industrial housing-exposed book in a single session, or as an options-related delta hedge of unusual size. The realized vol of 0.66 says the name has been moving meaningfully, and the $37.11 average price puts it well off highs.
EFX -- Equifax -- at $511 million and 5.51 sigmas on April 1 is the other high-sigma outlier that warrants attention. Equifax is a professional services and data name with significant exposure to the mortgage and employment data cycle. A print of that magnitude in a week when both Treasury flows and defensive rotation were anomalous suggests someone was repositioning exposure to economic cycle sensitivity in the professional services space with conviction. IYT -- the transportation ETF -- added $443 million at 4.00 sigmas on April 2, consistent with the industrials-transportation theme visible in the TRV list with ASR and CAAP and NMM, all of which represent infrastructure and logistics names that become either beneficiaries or victims of tariff-driven trade flow rerouting.
The real estate tower -- AMT at $559.8 million and 3.66 sigmas, SBAC at $187.4 million and 4.42 sigmas, and REET and FRMI from the TRV list -- represents cell tower and broad REIT positioning that aligns with the duration trade. When institutions buy long-duration Treasuries they often pair it with rate-sensitive equity exposure like tower REITs, which behave like long-duration bonds in a falling-rate environment. The simultaneous outlier prints in VGIT, IEF, AMT, and SBAC on the same two-day window is that pairing in live data.
The commodity hedge runs through DBA -- agricultural commodities at $42.3 million and 3.02 sigmas -- alongside DBC at $93.6 million and 3.67 sigmas and BCD at $7.5 million and 2.49 sigmas on April 1, mirroring the TRV list’s metals and agriculture cluster. When tariffs threaten supply chains for agricultural goods, real asset commodity instruments absorb institutional hedging flows almost reflexively, and that is exactly what the IO data shows.
The full two-day picture is of an institutional community executing a textbook macro shock playbook simultaneously across multiple asset classes: move into Treasuries across the curve, rotate to consumer defensive, reduce tariff-exposed cyclical exposure, hedge with commodities, and diversify internationally away from U.S. equity risk. Every cluster in the IO list fits that framework, the sigmas confirm it was done with unusual urgency, and the alignment between the IO outliers, the TRV themes, and the institutional flow data is about as coherent a narrative as this kind of cross-sectional data can produce.
VL Sector Leaders
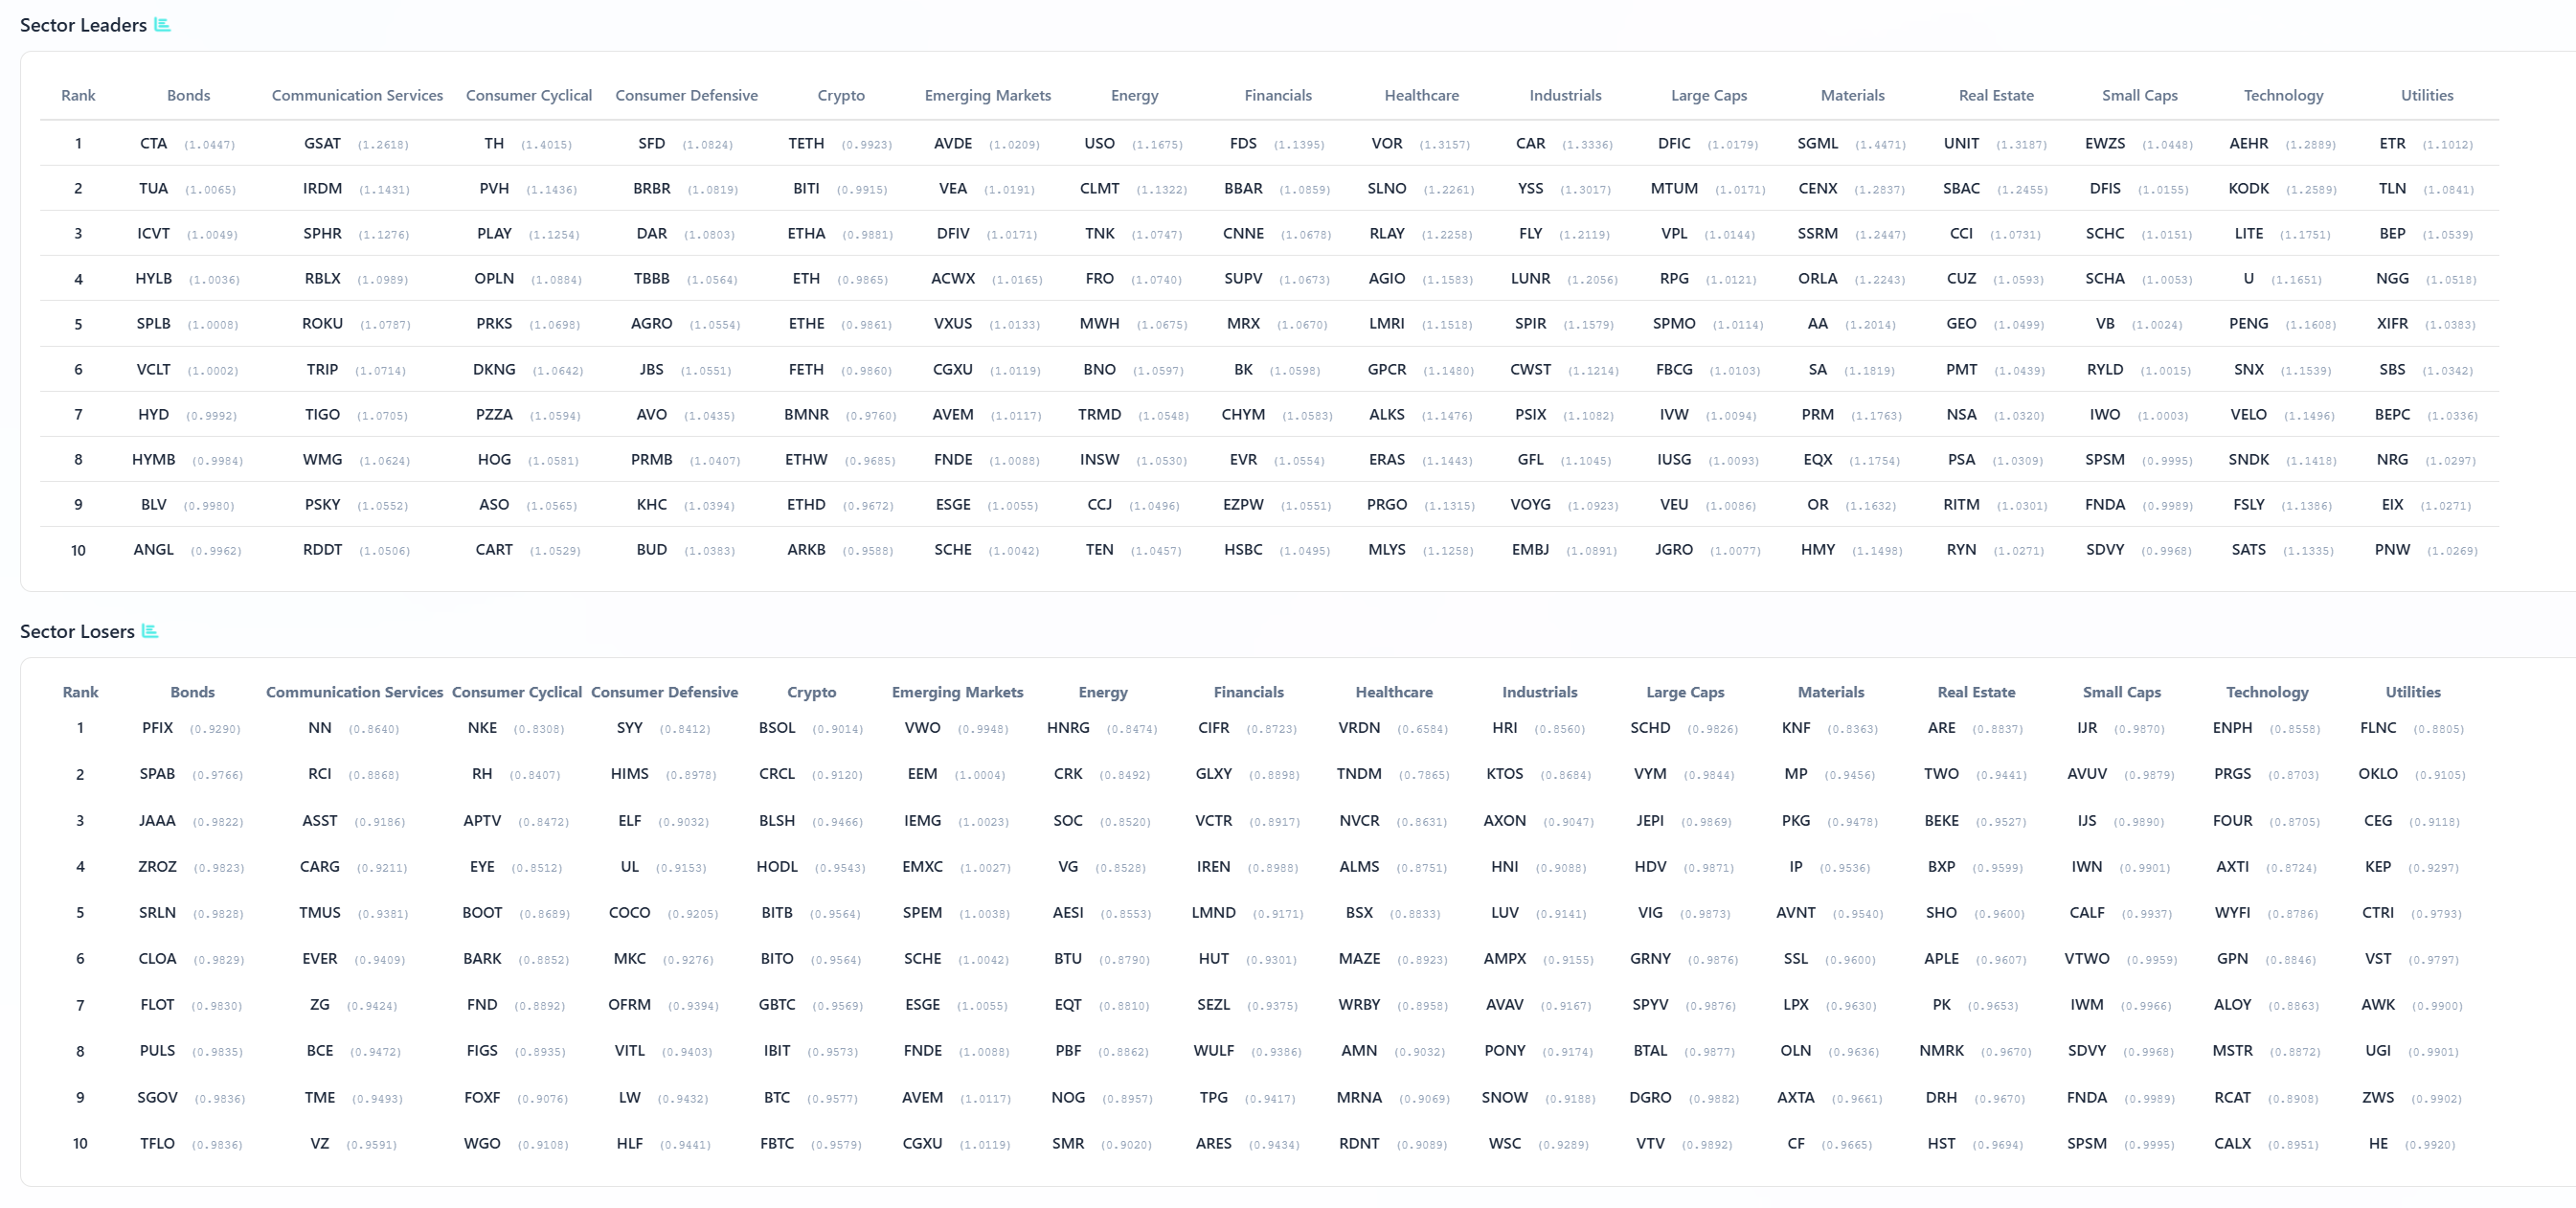
VL Sector Leaders is a weekly snapshot of where true leadership is asserting itself inside the market, stripped of the distortions that come from broad, style-mixed indices. Rather than asking which stocks look strong in absolute terms, this list focuses on which names are outperforming within the environments they actually compete in.
Each week, we surface the ten stocks demonstrating the most persistent relative strength inside their respective sectors. These are not headline chasers or one-day wonders. They are names that continue to separate themselves from peers through real price behavior, often reflecting sustained demand rather than fleeting attention.
For day traders, this list is a powerful awareness tool. Sector Leaders tend to offer cleaner intraday structure, better follow-through, and more predictable reactions around key levels because they already sit on the right side of relative strength. Even on choppy tape, leadership names often remain tradeable while the rest of the market degrades.
For swing traders, VL Sector Leaders helps narrow the universe to stocks with the highest probability of staying relevant. Relative leaders are more likely to hold trends, survive pullbacks, and reassert themselves after consolidation. When markets rotate, these names are often among the first to resume leadership — or the last to break.
The sector leadership table is the final filter through which everything above passes, and what it confirms is both useful and sobering. Starting with the leaders column and reading across sectors, the names that are printing above their recent norms are concentrated in exactly the pockets the TRV watchlist and IO outlier data identified: defensives, hard assets, select fixed income-adjacent instruments, and a handful of idiosyncratic names that are insulated from the tariff shock by virtue of their business model geography or demand structure.
In Bonds, CTA leads followed by TUA and ICVT -- a mix of trend-following bond instruments and convertibles, suggesting the fixed income rotation that showed up at 5-plus sigmas in the IO table is sustaining leadership in the rate-sensitive complex. The HYLB and SPLB entries in the lower ranks of the bond leaders tell you even credit is seeing some relative stability, though with more caution implied by their lower ratios. In Consumer Defensive, SFD leads -- the same farm products name that appeared in the IO outlier data at 3.91 sigmas on April 1 -- followed by BRBR, DAR, TBBB, and PRKS. The consistency between IO outlier prints, TRV scores, and sector leadership rank for these names is about as clean a confirmation signal as the data can generate. SFD showing up in all three lenses simultaneously -- unusual institutional activity, elevated TRV composite, and sector leadership rank -- is the definition of aligned conviction.
In Energy, USO leads, which given crude’s volatility around the tariff-driven demand-destruction narrative is a nuanced signal. USO leading while XOM and CVX appeared as laggards in the breadth heatmap last week says participation in energy is rotating toward the commodity vehicle itself rather than the integrated majors -- a trade structure consistent with macro hedging rather than sector bullishness. TNK and MWH and FRO in the energy leaders are all tanker and shipping-adjacent names, which ties directly back to the TRV list’s appearance of TNK, NMM, and CMRE -- a marine and tanker sub-theme that reflects tariff-driven rerouting of global trade flows as a potential catalyst for shipping demand.
In Healthcare, VOR leads followed by SLNO, CNNE, SUPV, and LMRI. The biotech cluster dominating Healthcare leadership -- with LMRI also appearing in the TRV watchlist with sustained 14-session activity -- reinforces the thesis that domestically oriented, tariff-immune biotech is the single-stock hunting ground for healthcare exposure right now. In Industrials, CAR leads -- a rental name with domestic pricing power -- followed by YSS, FLY, LUNR, and SPIR. LUNR appeared in the IO table at 2.83 sigmas on April 2, making it another name visible across multiple lenses simultaneously. The aerospace and defense tilt in the industrials leaders (LUNR, TDG from TRV, TDY from TRV) is consistent with the observation that defense spending is one of the few government expenditure categories that tariff uncertainty does not diminish.
In Materials, SGML leads, a lithium name, followed by CENX (aluminum), SSRM, ORLA, and AA. Metals are leading materials, and specifically the names most directly tied to the commodity cycle rather than processed goods -- consistent with the hard asset rotation visible throughout the IO and TRV data. RGLD and IAUX from the TRV list sit in the same thematic family. In Large Caps, DFIC leads with MTUM second -- a factor rotation toward low-correlation large caps and momentum that is consistent with environments where participation is narrowing and only the strongest relative-strength names retain institutional support.
The Sector Losers table is equally instructive for what to avoid. NKE leads the Consumer Cyclical losers -- consistent with its 3.81-sigma IO print suggesting repositioning rather than accumulation unless and until that giant print can be reclaimed. In Utilities, FLNC, OKLO, and CEG lead the losers, which matters given that OKLL (2x Bull OKLO) appeared in the TRV list; the leadership data says the underlying is deteriorating even as the levered instrument shows TRV interest, a combination that warrants caution on that specific name. In Technology, ENPH, PRGS, and FOUR lead the losers, confirming that non-mega-cap tech is not where leadership resides. The Financials losers column -- CIFR, GLXY, VCTR -- is dominated by crypto-adjacent financial names, consistent with BITQ’s TRV presence being a trading vehicle rather than a fundamental sector-rotation story.
MIR Part 3: Framing-Up A Trade
Everything the tape told us this week points toward the same portfolio architecture: defense first, hard assets second, selective long-duration rate sensitivity third, and tactical levered upside only in small size as an asymmetric option on a macro resolution. The macro environment is hostile to broad risk, participation is narrow, volatility is elevated and expanding across most sectors, and the institutional community spent the holiday-shortened-week executing a textbook shock-response playbook in fixed income, defensives, international diversification, and commodity hedges. The portfolio below reflects our safest read on current flows and how to build out a weekly rebalanced port going into the week.
The framework has five sleeves: a fixed income and rate-sensitivity sleeve, a defensive equity sleeve, a hard asset and commodity sleeve, a select equity growth sleeve for names with tariff immunity and domestic revenue, and a small tactical sleeve for asymmetric beta positioning. Cash is held at a meaningful level because the macro framework says the environment does not yet justify full deployment, and the IO data showed institutions buying protection as urgently as they were buying anything else.

Fixed Income and Rate Sensitivity -- 25% of portfolio
VGIT at 10%: The highest-sigma Treasury print in the entire IO table at 5.43 sigmas on $687 million of notional. Intermediate duration Treasuries are the institutional hiding spot of choice when the growth outlook deteriorates, and the Fed’s 25bp cut trajectory through June and September remains the base case unless labor data breaks sharply. This is the core duration anchor.
IEF at 8%: The 7-to-10 year complement to VGIT, which also appeared as a 2.83-sigma outlier on $628 million. Running both instruments adds curve exposure across the intermediate belly where the growth-shock repricing has been most acute.
AMT at 7%: Tower REITs are the equity expression of the duration trade. AMT printed $559.8 million at 3.66 sigmas and SBAC at $187.4 million at 4.42 sigmas within the same 48-hour window. Both are domestically revenue-driven, tariff-insulated, and behave like long-duration bonds in a rate-falling environment. AMT is the primary position given its size and liquidity; SBAC can be treated as a complement for accounts with more capacity.
Defensive Equity -- 30% of portfolio
XLP at 12%: The single most consistently anomalous institutional print across both days -- $872.9 million at 3.72 sigmas on April 1 and $721.1 million at 2.80 sigmas on April 2, nearly $1.6 billion in two sessions. XLP is the cleanest expression of the defensive rotation theme and the breadth of its notional dwarfs any other defensive instrument in the IO table. It leads sector rankings, it appeared in the TRV list via RSPS (its equal-weight equivalent), and its realized vol of 0.15 says it is exactly the kind of stable, low-noise instrument institutions use to park equity exposure when they cannot find conviction elsewhere. RSPS at 3% as a complement for equal-weight diversification within the staples sleeve.
WMT at 5%: WMT appeared positively in the breadth heatmap with a +2.96% weekly return and sector leadership context in Consumer Defensive. As the largest domestic retailer with significant private-label capability and pricing power, WMT is the single-stock expression of the XLP thesis. Its tariff exposure through imported goods is real but manageable relative to peers, and its size allows institutional accumulation without market impact.
BTI at 5%: British American Tobacco appeared in the IO table at 2.50 sigmas and $107.9 million on April 2. Tobacco is one of the purest defensive income stories available -- inelastic demand, high free cash flow yield, domestically consumed product. BTI specifically offers non-U.S. revenue diversification that aligns with the international repositioning theme.
COST at 5%: Costco appeared with a +3.60% weekly gain in the breadth heatmap, confirmed sector leadership, and represents the premium membership model that has historically proven resilient through inflationary and tariff-driven cost pressures as members trade down to bulk purchasing behavior.
Hard Assets and Commodities -- 20% of portfolio
GDX or SGML at 7%: Gold miners lead the Materials sector leaders table (SGML rank 1, followed by CENX, ORLA, AA), and gold itself is a classic tariff-shock hedge as it benefits from dollar weakness, inflation repricing, and safe-haven demand simultaneously. GDX provides diversified senior miner exposure; SGML provides more targeted lithium beta for accounts that want commodity specificity. IDR and IAUX from the TRV list are smaller-cap complements with higher beta to the metals cycle.
DBC at 7%: Broad commodity ETF that appeared in the IO table at 3.67 sigmas on $93.6 million on April 1. DBC covers energy, metals, and agriculture in a single vehicle, which makes it the most efficient expression of the commodity hedge theme without requiring single-commodity concentration. DBA at 3% as an agriculture-specific complement -- DBA appeared at 3.02 sigmas in the IO table and agricultural commodity repricing from tariff-driven supply disruption is one of the most direct pass-through effects identified in the post-Liberation Day analysis.
TNK or NMM at 3%: The tanker and marine shipping sub-theme that appeared in TRV (TNK, NMM, CMRE) and sector leaders (TNK rank 3 in Energy, FRO present) is the trade-rerouting thesis in single-stock form. When tariffs restructure global trade flows, shipping names that can redeploy capacity to new routes benefit. Small position given the event-driven nature of the thesis and the leverage embedded in these names.
Domestic Growth with Tariff Immunity -- 15% of portfolio
Healthcare Biotech sleeve at 10%: UTHR at 4%, PRAX at 3%, GRDN at 3%. All three appeared in the TRV watchlist with sustained activity of 19, 9, and 21 sessions respectively -- the sustained activity scores indicate patient accumulation rather than event-driven positioning. All three are domestically revenue-driven with no meaningful tariff exposure to their cost structure or revenue base. UTHR is the largest and most liquid of the three, making it the anchor. PRAX and GRDN add pipeline and care-facility diversification within the sleeve. UTHR also appeared in the sector leaders Healthcare column as a rank-2 name. The IO table’s KURA and BLLN appearances reinforce that biotech is seeing anomalous institutional attention.
TDG at 3%: TransDigm appeared in the TRV watchlist (composite 73.5, sustained 9 sessions, most recent April 2) and is an aerospace and defense parts manufacturer with significant aftermarket revenue that is contractually priced and largely insulated from tariff-driven cost disruption. Defense and commercial aviation aftermarket parts pricing is a domestic dollar-denominated revenue stream that fits the tariff-immunity criterion.
NVDA at 2%: The only mega-cap tech name in the portfolio, and sized deliberately small. NVDA’s $23 billion aggregate flow from the institutional data and its sector leadership position in Technology are undeniable, but its semiconductor supply chain retains meaningful tariff risk from potential sector-specific duties that the administration has flagged as forthcoming (J.P. Morgan Asset Management). The position is sized as a tactical acknowledgment of institutional support rather than a full-conviction allocation.
Tactical Asymmetric Sleeve -- 5% of portfolio
SPYU at 3%: The 4x levered S&P 500 product that appeared in the TRV list at composite 89 with 10 sessions of sustained activity and most recent activity April 2, matching the SPYM sweep data from the aggregate flow charts. This is an explicitly tactical, short-duration position. The thesis is that at current levels of Fear and Greed (19), AAII spread (-17.70%), and put/call ratio above 1.0, the market is oversold enough on a multi-week horizon to reward a small leveraged long. The invalidation is a daily close in SPY below $650. The target is $659 (first resistance Level from the VolumeLeaders data). This position is sized to lose without damaging the portfolio and to add 150-200 basis points on a 5-7% SPY bounce.
ACWX at 2%: The international ex-U.S. diversification position that appeared as the third-highest sigma reading in the entire IO table at 5.44 sigmas on $689.8 million on April 1. ACWX is sized modestly here because the defensive and hard asset sleeves are doing the heavy lifting, but the institutional signal in this name was too large to ignore entirely. It is the portfolio’s expression of the “Anywhere But the USA” structural diversification theme that the macro and sentiment data support.
Cash -- 5%
Held as dry powder. The macro framework says the environment is hostile to broad risk and the breadth data confirms that new high/new low dynamics are deteriorating across all four major indices beyond the five-day window. Cash is not a position of weakness here -- it is the acknowledgment that the best entries may come after the CPI print on Friday or after the FOMC Minutes on Wednesday clarify the Fed’s reaction function to the growth shock. Deploy on confirmation, not anticipation.
The through-line of this entire week’s data -- from breadth to sentiment to institutional flow to TRV scores to IO outliers to sector leadership -- is that capital is repositioning defensively with urgency, hard assets are receiving macro hedge flows at anomalous sigma levels, and the only equity risk worth taking is domestically oriented, tariff-insulated, and already showing sustained institutional accumulation. The portfolio above is built to survive a further leg lower without catastrophic drawdown, participate in a recovery through both the tactical levered sleeve and the quality growth names, and generate income and stability through the defensive and fixed income sleeves while the macro picture resolves. Good luck this week, traders!
Thank you for being part of this community and for investing your time in this week’s edition. The quality of this readership — thoughtful, disciplined, engaged — is what makes this work meaningful. I’m grateful to build alongside you. Here’s to a week of clarity, conviction, and well-executed opportunities.
— VolumeLeaders