Market Momentum: Your Weekly Financial Forecast & Market Prep
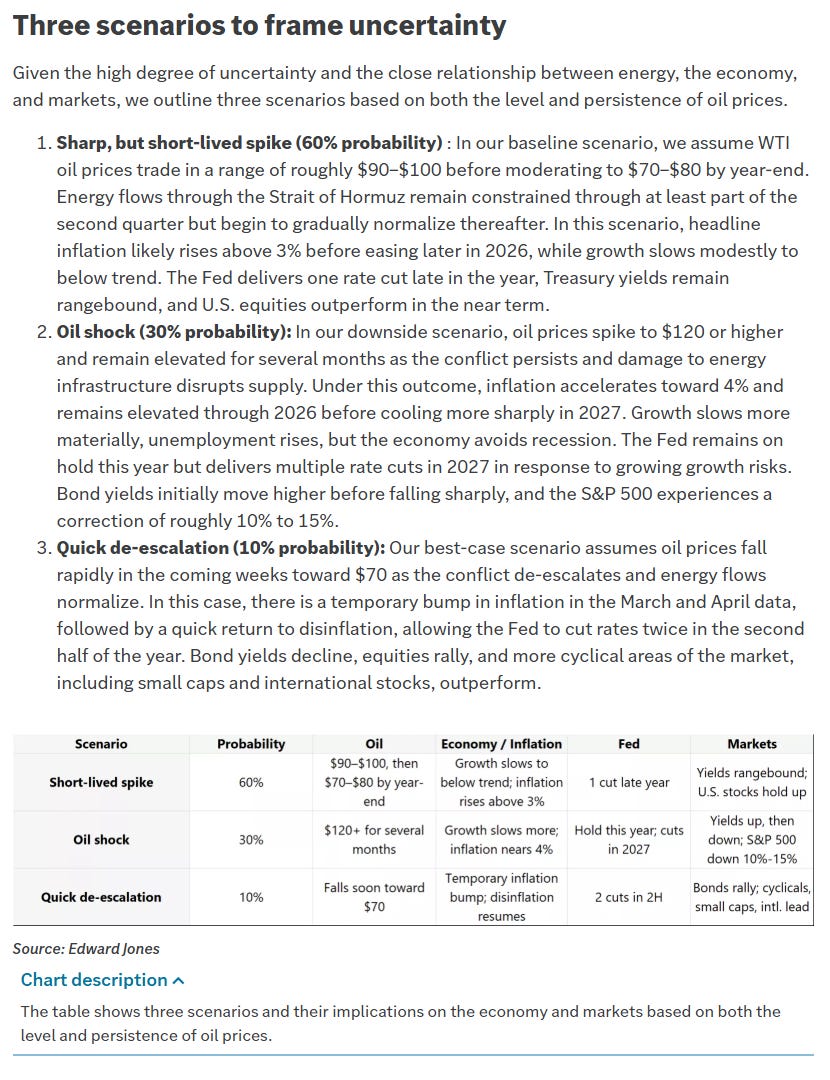
Issue 84 / What to expect March 23, 2026 thru March 27, 2026


Weekly Market-On-Close Report
The market did not unravel this week. It revealed itself.
At a glance, the headline damage looks severe. Major indices pushed to multi-month lows, volatility expanded, and Friday’s close had the feel of forced positioning rather than orderly price discovery. Beneath that surface, however, something more nuanced is taking place. This is not a market in freefall. It is a market recalibrating under pressure, with capital reallocating deliberately rather than exiting indiscriminately.
Two forces are driving that recalibration: escalation and uncertainty.
The geopolitical backdrop has shifted meaningfully. The conflict in the Middle East has moved beyond contained tension into something that now directly threatens energy infrastructure and global supply routes. Disruptions to production, attacks on shipping lanes, and the growing possibility of broader military involvement have all combined to elevate the probability of a sustained energy shock. Oil is no longer reacting to headlines, it is being repriced as a constraint.
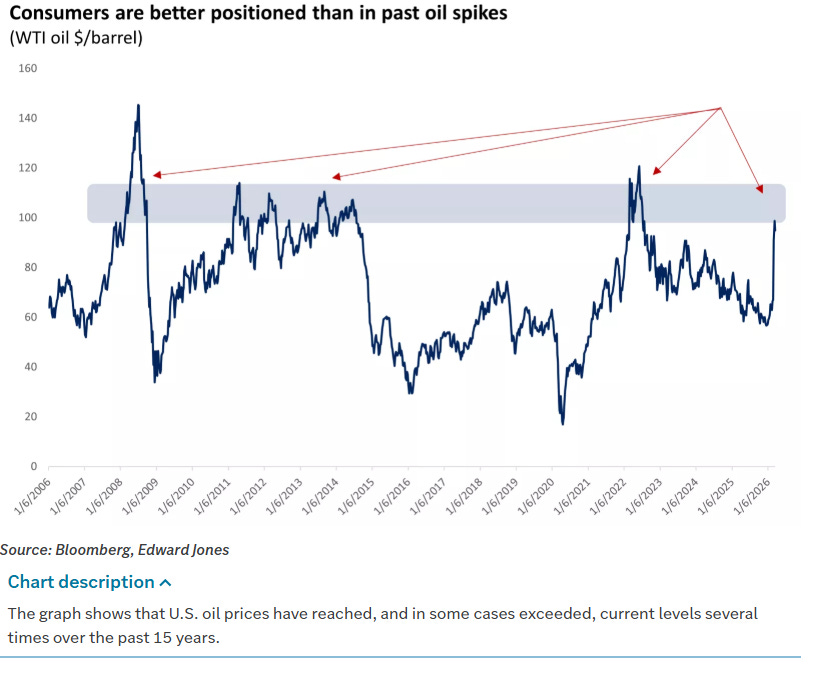
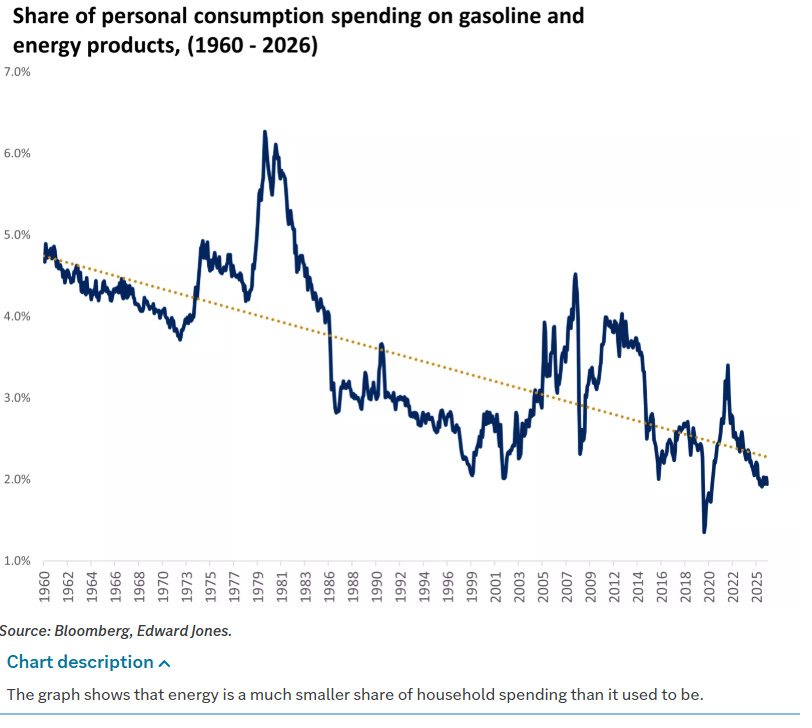
That matters because energy sits at the intersection of growth and inflation. Higher oil prices act as a tax on consumption, diverting spending away from discretionary areas while simultaneously lifting headline inflation. Markets understand this instinctively. The result is a tightening of financial conditions that does not come from central banks alone, but from the cost structure of the economy itself.
This is where the second force, uncertainty, takes hold.
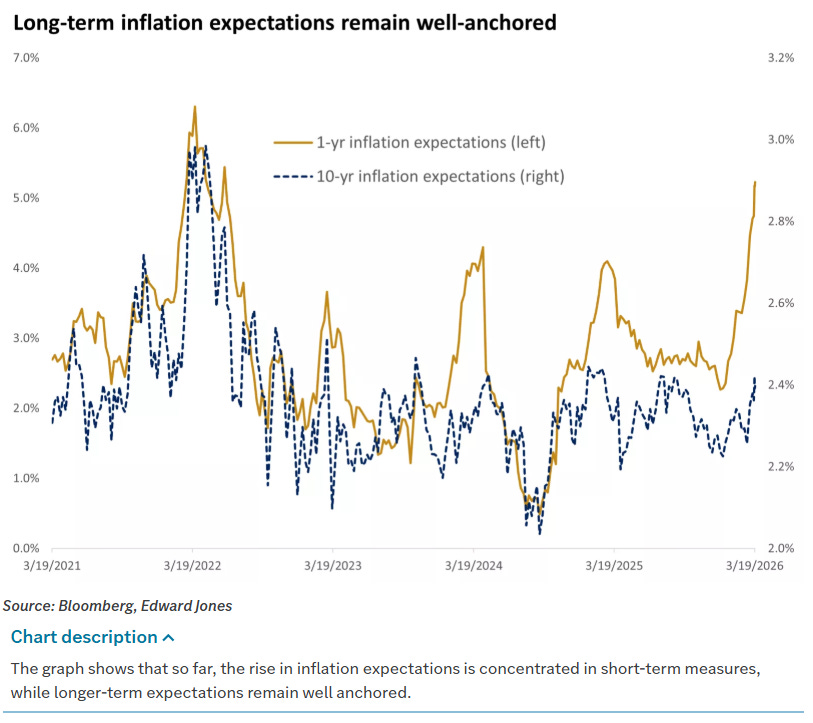
Central banks are now navigating a more complex landscape. Inflation risks are rising again at the same time that growth risks are beginning to surface. Policy, which had been slowly transitioning toward accommodation, is now back in a holding pattern. The most recent signals suggest that policymakers are willing to tolerate a temporary rise in inflation if it is driven by energy, but they are far less willing to respond preemptively while the trajectory remains unclear.
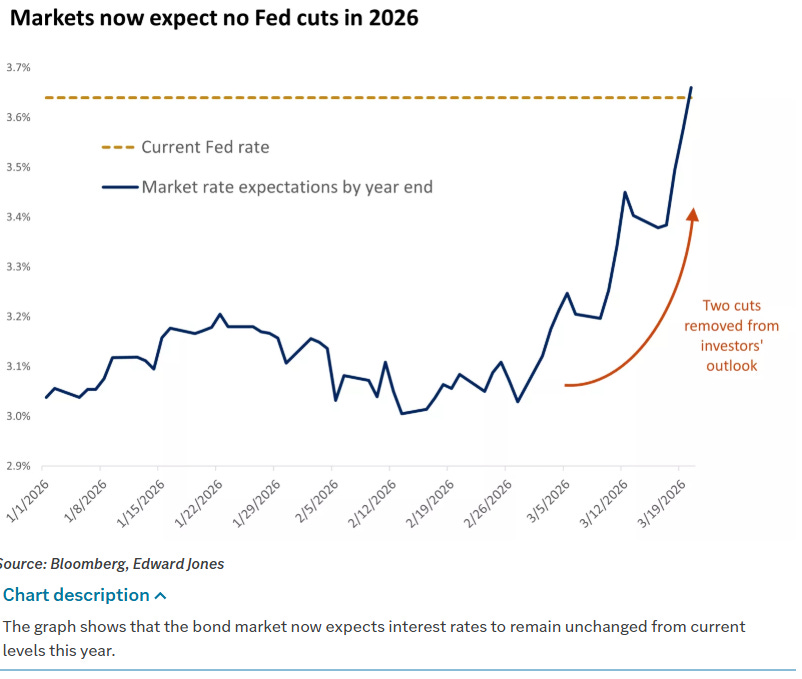
Bond markets have responded accordingly. Yields have moved higher, not necessarily because growth expectations are improving, but because inflation risk has re-entered the equation. That shift alone is enough to pressure equity valuations, particularly in the parts of the market that had benefited most from lower discount rates.
And yet, despite all of this, the equity market has not collapsed. Instead, it has narrowed.
The broad index flows tell the story first. Capital continues to anchor itself in the most liquid, scalable expressions of risk. Index exposure remains dominant, and within that, large-cap leadership continues to absorb the majority of allocation. This is not the behavior of a market exiting risk. It is the behavior of a market concentrating it.
Technology remains at the center of that concentration, but even there, the tone is evolving. The largest names continue to see meaningful flow, yet the marginal dollar is becoming more selective. Investors are no longer rewarding every strong narrative equally. The hurdle for continued outperformance has risen, and capital is beginning to differentiate between structural winners and crowded trades. That differentiation is showing up in second-order leadership.
Across semiconductors, connectivity, and infrastructure, there is evidence of capital moving into the layers that support the dominant themes rather than simply chasing the themes themselves. This is a subtle but important shift. It suggests that investors are still committed to the broader direction of innovation and investment, but are seeking more durable and less crowded entry points. At the same time, a different kind of expansion is taking place.
Industrials have quietly emerged as a credible secondary area of interest. Not in a speculative sense, but in a practical one. Companies tied to power systems, logistics, engineering, and defense are beginning to attract consistent attention. These are businesses that sit closer to physical demand than financial abstraction. In an environment where supply chains, infrastructure, and energy all matter more, that shift makes sense.
This is not a rotation away from technology. It is a layering of exposure around it. Financials are also participating, though in a more measured way. The breadth of activity across banks, asset managers, and insurers suggests that the system itself remains stable. There is no sign of stress-driven de-risking. Instead, capital is probing the group, testing whether improved regulatory conditions and steady credit markets can support a broader role in the next phase of the cycle.
What is equally important is what is not happening. There is no evidence of a wholesale move into lower-quality, high-beta risk. The parts of the market that tend to lead in the early stages of aggressive risk-on behavior remain relatively subdued. That absence reinforces the idea that this is not a market transitioning into expansion, but one navigating through uncertainty. Defensive exposure remains present, and in some cases, persistent.
Staples, utilities, and segments of real estate continue to attract capital, not as primary drivers of return, but as stabilizers within portfolios. Credit markets tell a similar story. Tactical activity in corporate bond ETFs reflects an ongoing demand for hedging and yield, even as equity exposure remains intact.
Taken together, these crosscurrents define the current regime. Participation is selective. Leadership is concentrated. Expansion is tentative. Risk is being expressed, but it is being expressed carefully. This brings us to the question that matters most: how to position within this environment.
The answer is not to predict the next headline or to anchor on a single macro outcome. It is to align with the behavior of capital itself.
At the core of any portfolio right now should be the same foundation that institutions are using. Broad index exposure remains essential, not because it offers the highest return, but because it reflects the primary channel through which capital is flowing. Maintaining that alignment ensures that the portfolio participates in the market’s baseline movement without overcommitting to any single narrative.
Layered on top of that should be concentrated exposure to validated leadership. The technology complex, particularly in areas tied to infrastructure and scalability, continues to justify allocation. This is where the market has demonstrated both conviction and persistence. The goal is not to chase momentum, but to remain aligned with the segments that continue to attract reinforcement.
Beyond that, selective expansion into emerging areas of interest becomes appropriate.
Industrials represent one of the clearest opportunities in this regard. The combination of structural demand, tangible business models, and increasing institutional attention makes them a logical extension of existing exposure. This is not a call for broad cyclical risk, but for targeted allocation to areas where participation is already visible.
Financials occupy a middle ground. They warrant inclusion, but not emphasis. Their role is to reflect stability and potential upside without assuming that they will lead.
Defensive exposure should not be abandoned. In a market defined by uncertainty, having a stabilizing component is not a concession, it is a necessity. Whether through staples, utilities, or credit, this portion of the portfolio provides balance against the more concentrated risk elsewhere.
Finally, a small allocation to tactical or higher-beta expressions can be justified, but it should remain controlled. The market has not yet signaled that it is ready to reward aggressive positioning across the board.
What emerges from this structure is not a binary stance, but a layered one. It is a portfolio that participates without overextending, that concentrates where the market is concentrating, and that remains flexible enough to adapt as conditions evolve. The broader takeaway is straightforward, even if the environment is not. This is not a market that rewards conviction in isolation. It rewards alignment. Alignment with liquidity, alignment with leadership, and alignment with the reality that uncertainty, for now, remains the defining feature of the landscape.
Until that changes, the most effective positioning is not to anticipate the next regime, but to operate within the current one with discipline. Exact sleeve allocations and individual names we’ve isolated from the tape as being best aligned with institutional conviction for this week can be found in the Market Intelligence Report at the end of this newsletter.

Weekly Benchmark Breakdown
Sub-20% Across the Board: Breadth Continues to Deteriorate
The short-term moving average cohorts tell the whole story this week, and it is not a pleasant one. Across the S&P 500, Nasdaq 100, Dow, and Russell 2000, fewer than one in five stocks are trading above their 5-day moving average. The 20-day readings are worse in most cases, meaning this is not a sharp one-day washout but a sustained, grinding decline that has dragged participation lower for weeks. New-low lists overwhelm new-high lists at every lookback window, from 5-day through year-to-date. This is broad, persistent distribution, and it has not yet produced the kind of oversold thrust that typically marks a tradeable low.
On the S&P 500, just 18.29% of constituents are above their 5-day average. That figure collapses to 12.72% at the 20-day and 19.08% at the 50-day, confirming the trend damage extends well beyond a bad week.
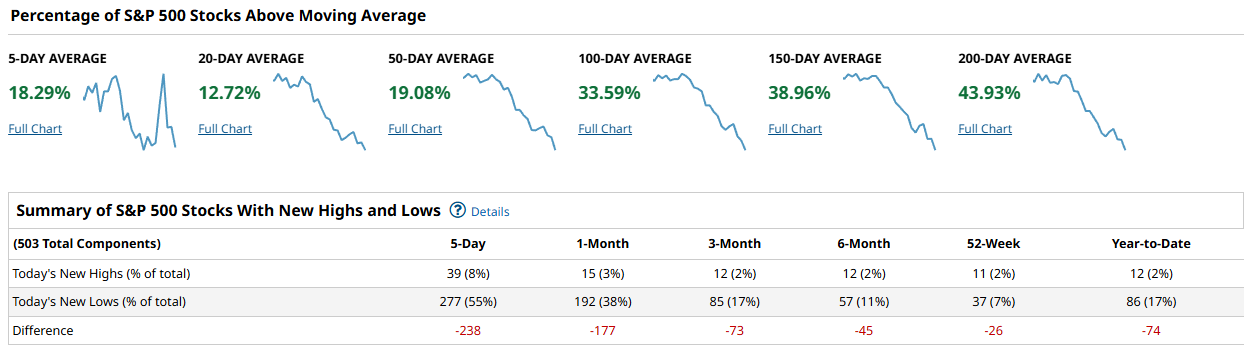
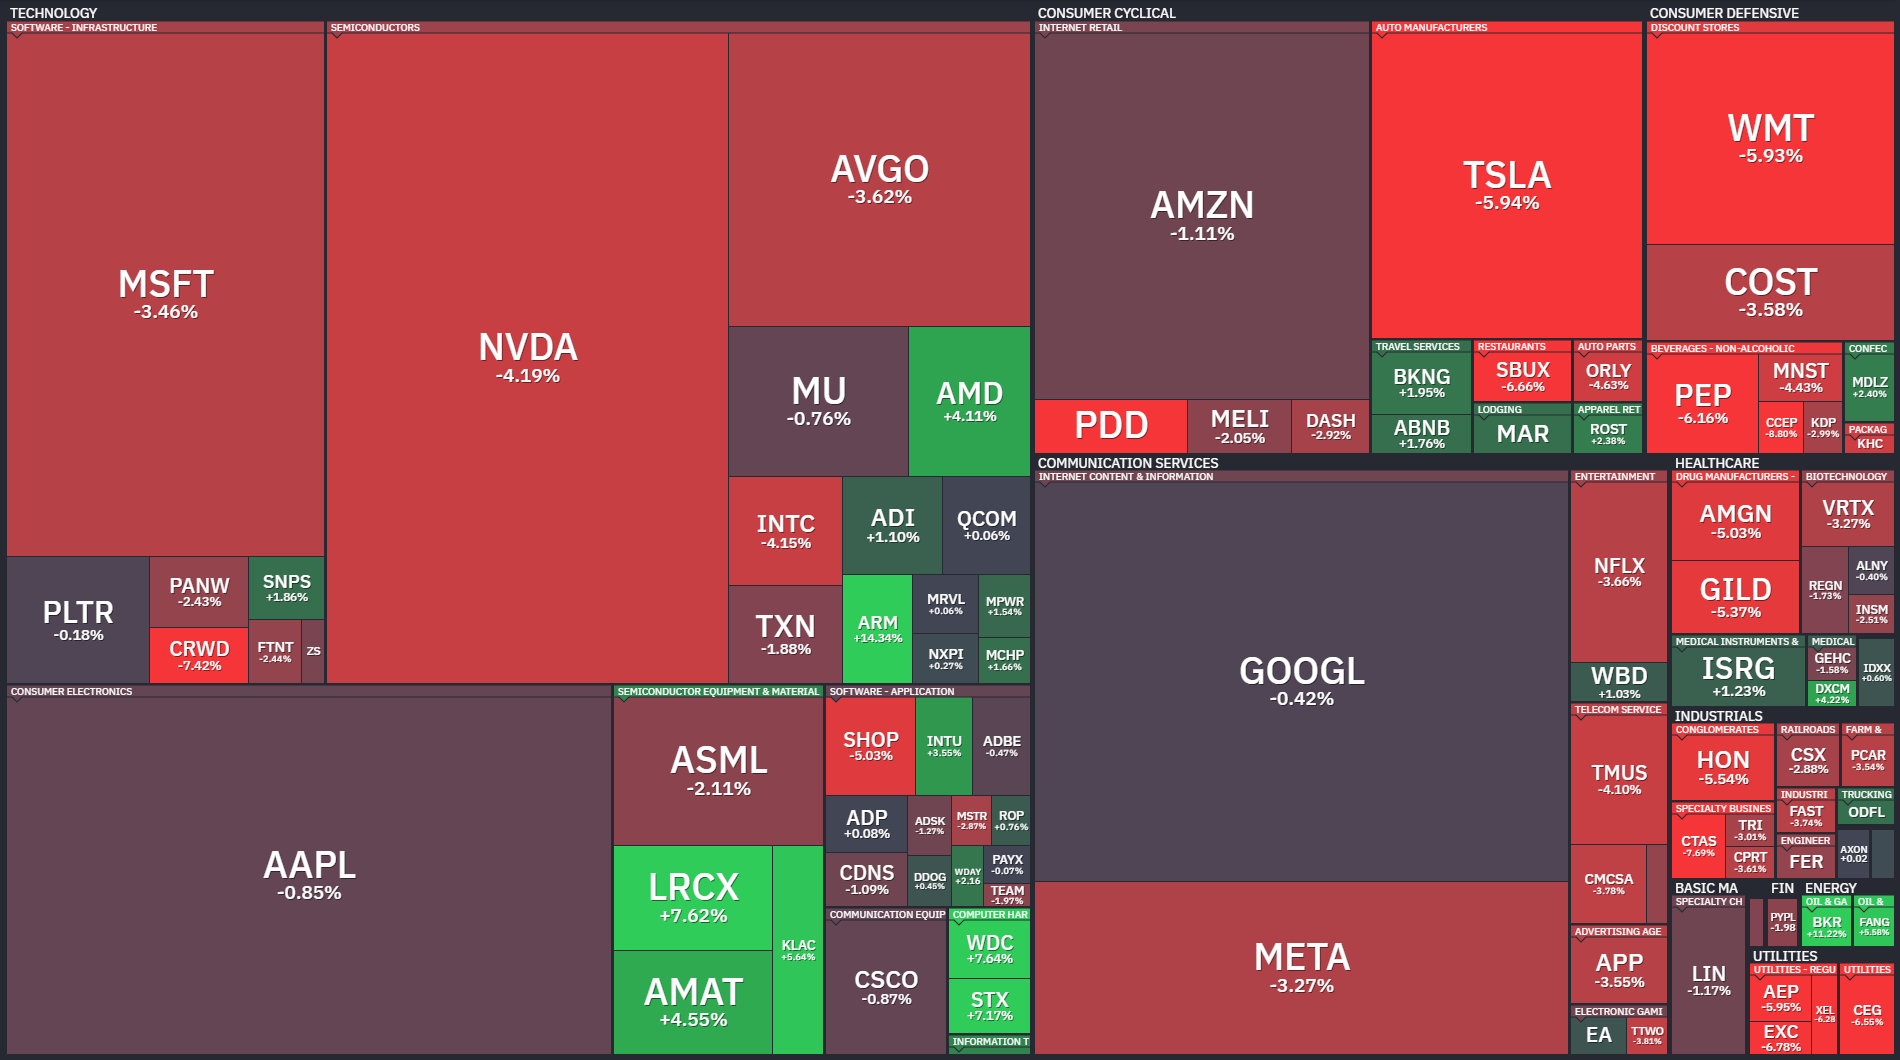
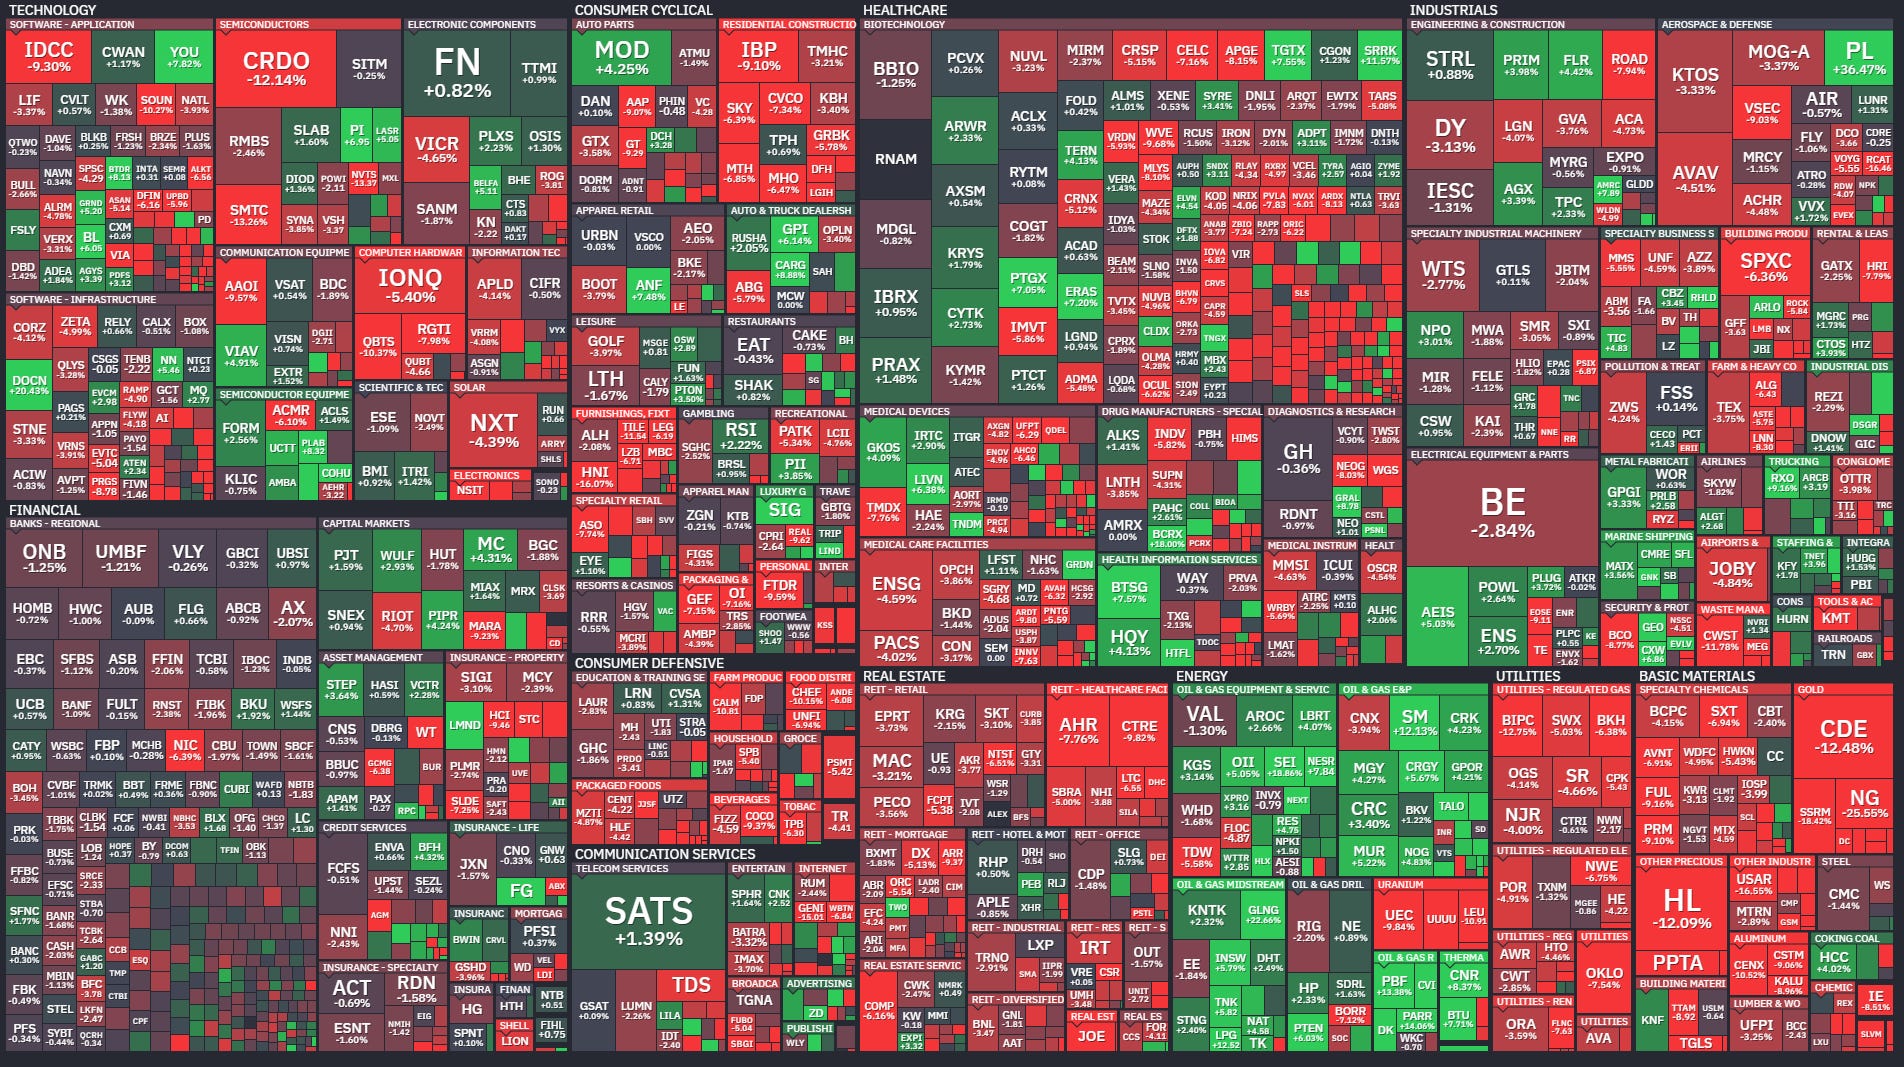
Even the longer-term 100-day and 150-day cohorts, at 33.59% and 38.96%, remain comfortably below majority participation. The 200-day sits at 43.93%, meaning more than half the index has already broken below its long-term trend. Five-day new highs minus new lows printed -238, and the year-to-date figure reads -74. The heatmap is a sea of red led by the mega-caps: MSFT -3.46%, NVDA -4.19%, AAPL -0.85%, AMZN -1.11%, TSLA -5.94%, and META -3.27%. The lone pockets of green were semiconductor equipment names like LRCX +7.62% and KLAC +5.64%, along with a few financials such as WFC +4.72% and GS +4.00%.
The Nasdaq 100 shows a similar profile but with one wrinkle: the 20-day reading of 18.81% actually sits above the 5-day at 14.85%, which is unusual and signals the short-term selloff is accelerating rather than stabilizing.
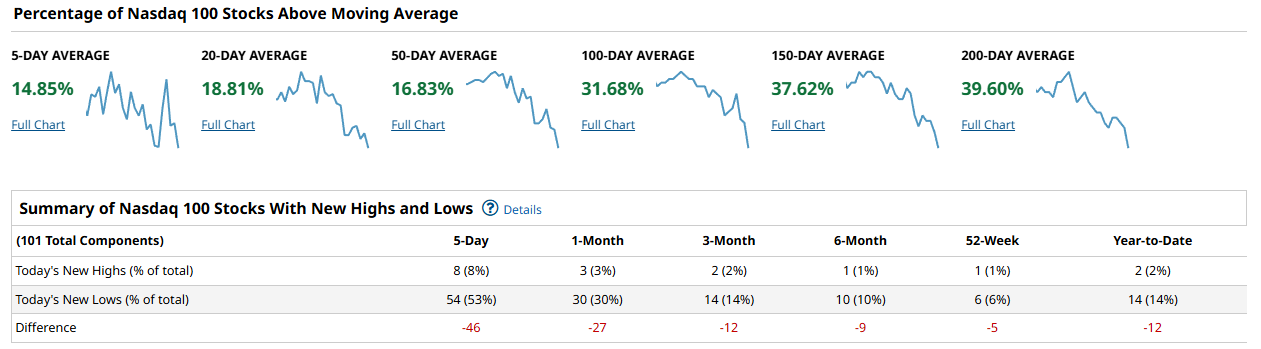
The 50-day at 16.83% and 100-day at 31.68% are both worse than the S&P equivalents, and the 5-day high-low difference of -46 out of just 101 names means nearly half the index printed a fresh short-term low. The heatmap confirms the damage is top-heavy: MSFT -3.46%, NVDA -4.19%, AVGO -3.62%, TSLA -5.94%, and WMT -5.93% all dragged heavily, while a handful of semis bucked the trend with AMD +4.11%, ARM +14.34%, and AMAT +4.55%.
The Dow Industrials are the weakest index on a breadth basis this week. Only 10.00% of the 30 components sit above their 5-day average and a meager 6.66% above the 20-day.
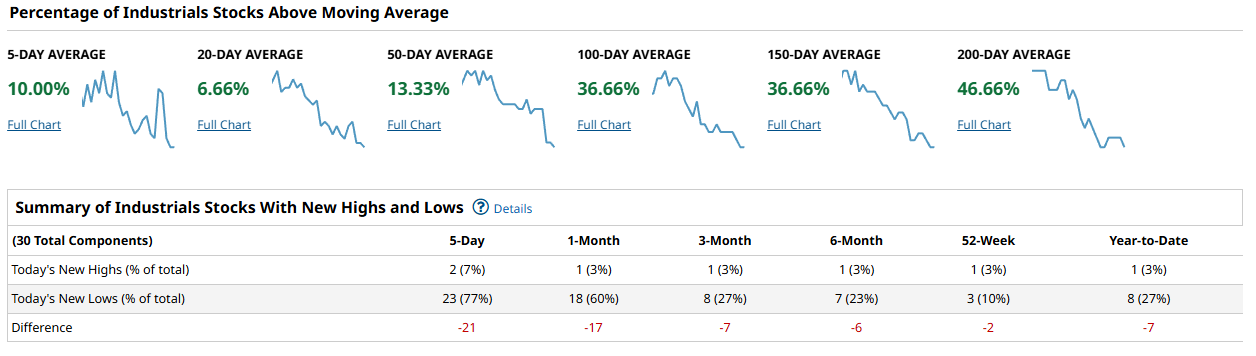
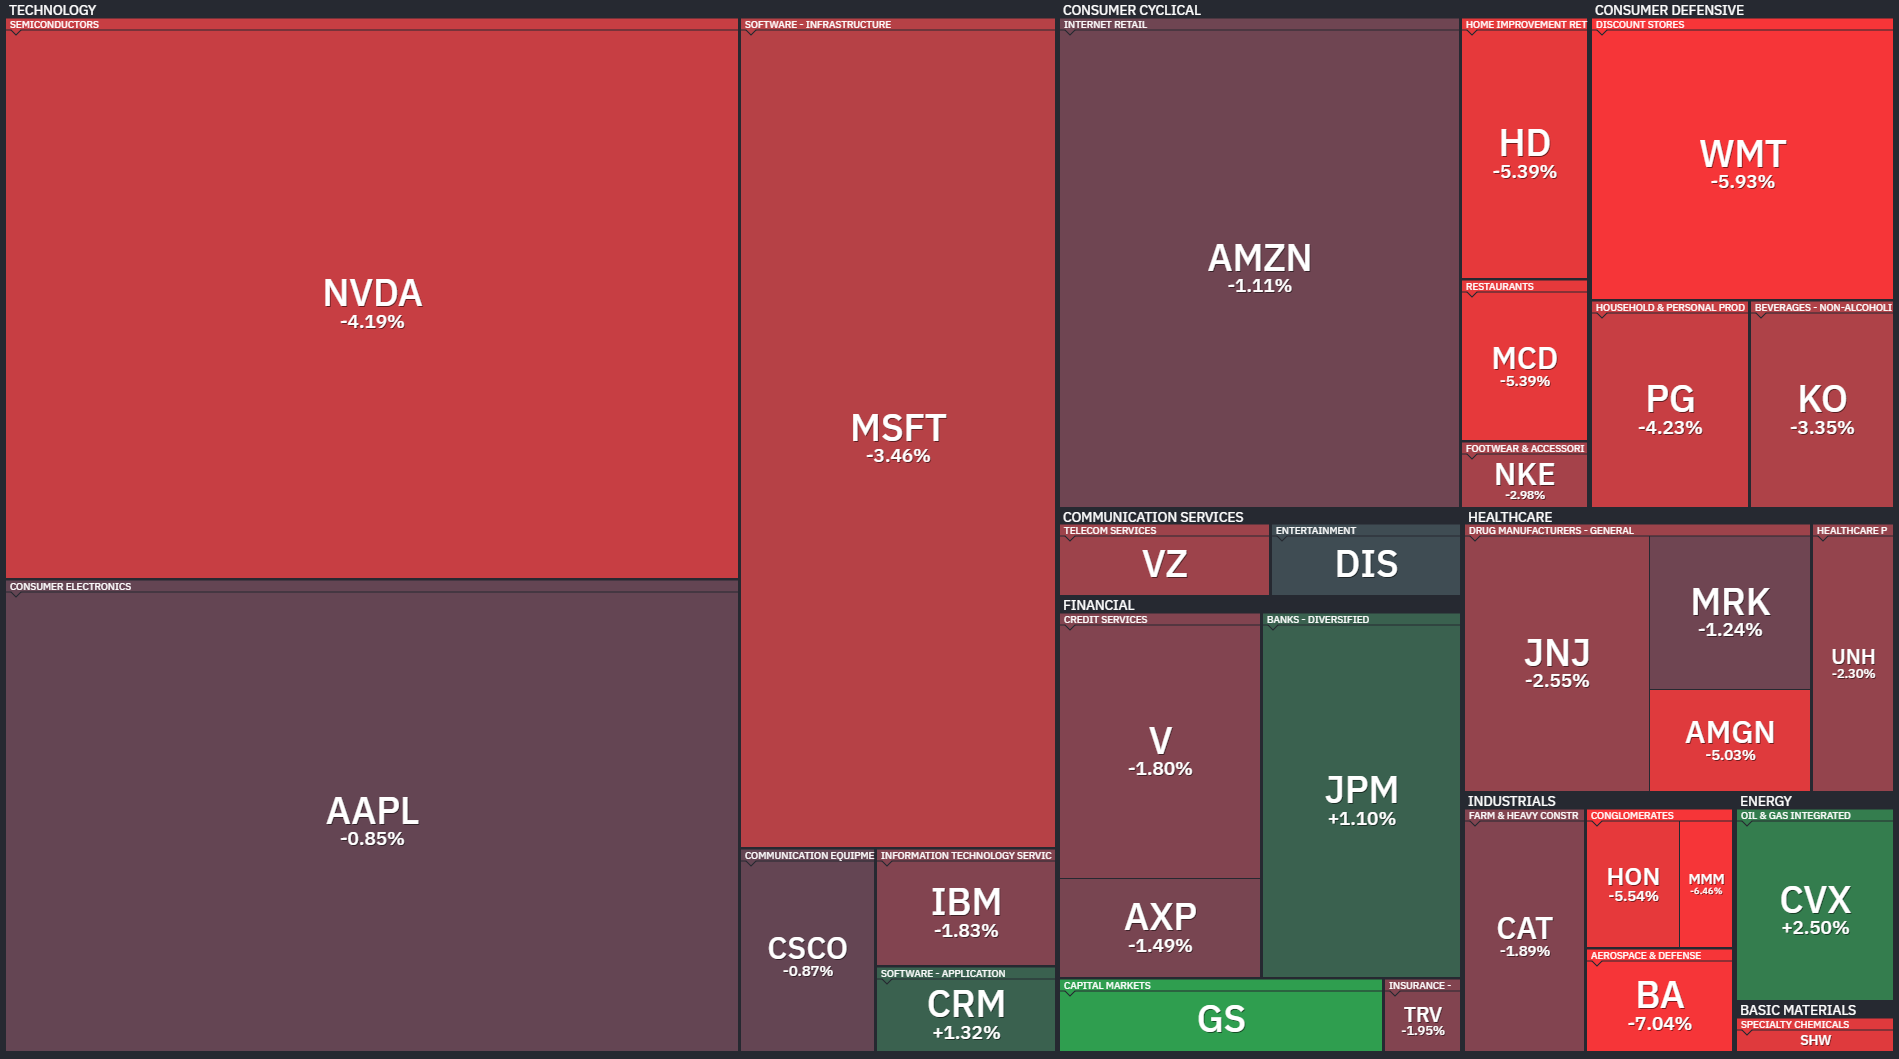
The 50-day reading of 13.33% means just 4 of 30 names hold that intermediate trend. New lows on a 5-day basis hit 77% of the index, with the high-low difference at -21 out of 30 names. The heatmap is nearly uniformly red: NVDA -4.19%, MSFT -3.46%, HD -5.39%, WMT -5.93%, MCD -5.39%, BA -7.04%, HON -5.54%, PG -4.23%, and KO -3.35%. JPM +1.10%, CVX +2.50%, CRM +1.32%, and GS were among the rare names in the green.
The Russell 2000 rounds out the picture with 19.88% above the 5-day, 15.39% above the 20-day, and 20.14% above the 50-day. Those numbers look marginally better than the Dow but the absolute new-low counts are staggering: 892 names, or 47% of the index, printed a new 5-day low, and the differential of -694 is the worst of any index in raw terms.
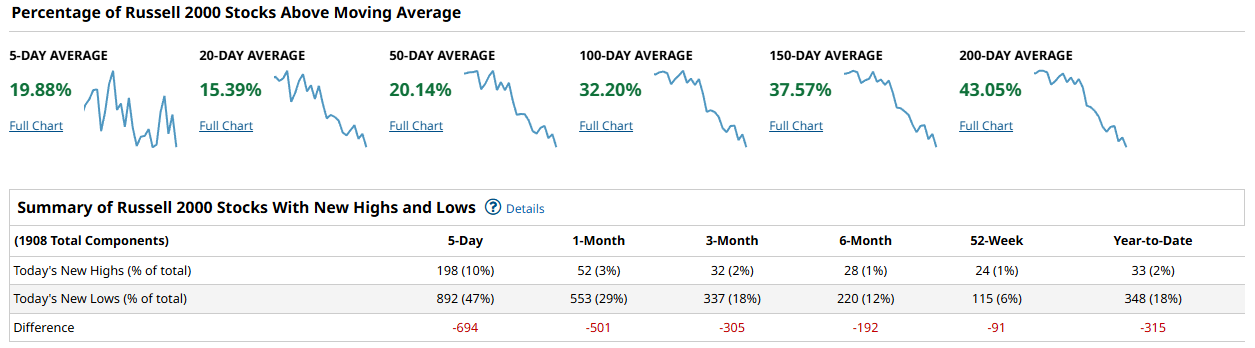
The 1-month high-low gap of -501 and the year-to-date figure of -315 confirm that small caps have been ground down steadily with no meaningful bid underneath. The heatmap is a chaotic mix of red and green at the individual stock level, but sector-wide, technology, healthcare, and industrials all lean heavily negative.
Pulling these threads together, the message is consistent: cap-weighted indices and the equal-weight broad market are deteriorating in lockstep. This is not a case of mega-cap strength masking weakness underneath; the largest names in the S&P and Nasdaq are leading the decline. Participation is narrowing into a handful of semiconductor equipment stocks and select financials, which is not the kind of rotation that builds a sustainable floor. Until the 50-day cohorts push convincingly above 60% and new highs begin outpacing new lows on at least the 1-month lookback, any bounce should be treated as a selling opportunity rather than the start of a new leg higher.
From a positioning standpoint, this is an environment that favors capital preservation over aggressive deployment. Reducing net long exposure into strength, leaning toward the relative outperformers in semis and select banks, and avoiding the consumer-facing names getting hit hardest -- WMT, HD, MCD, TSLA, PG -- is the playbook. Watch for a day where 5-day new highs on the S&P flip positive and the 20-day moving average cohort snaps back above 40%; that would be the first mechanical signal that sellers are exhausted. We are not there yet.
Breadth is broken and getting worse, not better -- stay defensive until the tape proves otherwise.

Investor Sentiment Report
%Bull-Bear Spread
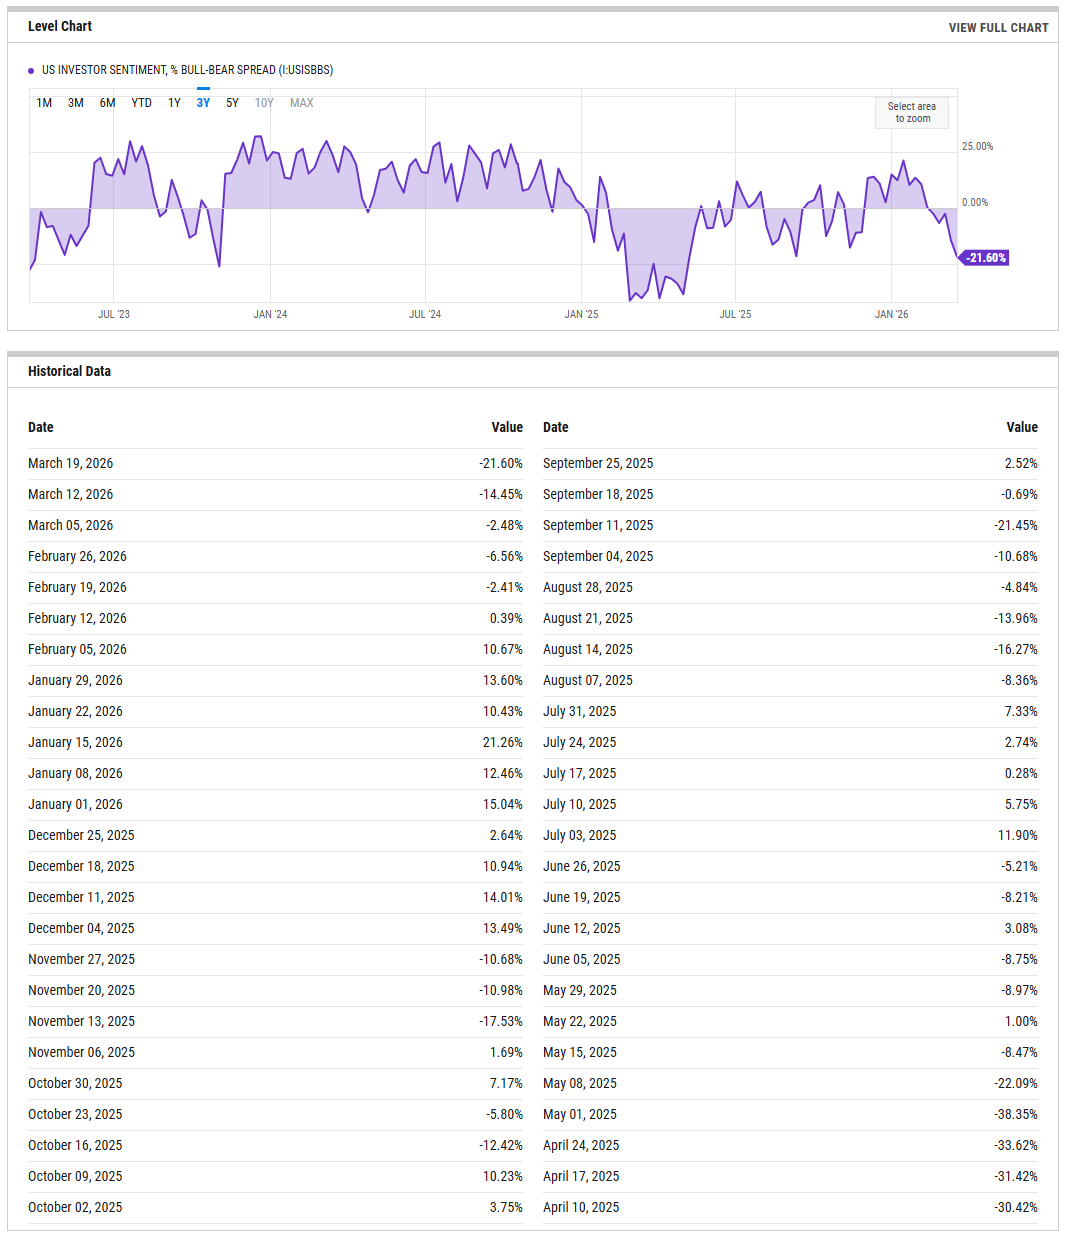
The %Bull-Bear Spread measures the gap between bullish and bearish investor sentiment, often from surveys like AAII. It’s a contrarian indicator—extreme optimism may signal a coming pullback, while extreme pessimism can hint at a potential rally. Large positive or negative spreads often mark market turning points.
The AAII bull-bear spread plunged to -21.60% for the week ending March 19, down sharply from -14.45% the prior week and -2.48% just two weeks before that. That is a nearly 19-point collapse in a fortnight, and the reading now sits firmly in contrarian-supportive territory. Historically, spreads below -20% have coincided with periods where the crowd has already done most of its selling, and forward returns over the next 4 to 12 weeks tend to skew positive from these levels. The speed of the deterioration matters as much as the level itself -- this was not a slow grind into pessimism but a panicked lurch, which often marks the kind of sentiment washout that precedes a tradeable low rather than a sustained downtrend. For this signal to flip from “supportive backdrop” to “outright buy,” you would want to see the spread stabilize near these levels for a second consecutive week while price holds support, rather than watch it fall further toward -30%, which would suggest genuine capitulation still underway. On the other side, any snapback above -10% without a corresponding price rally would suggest the fear was shallow and the next leg lower may not be finished.
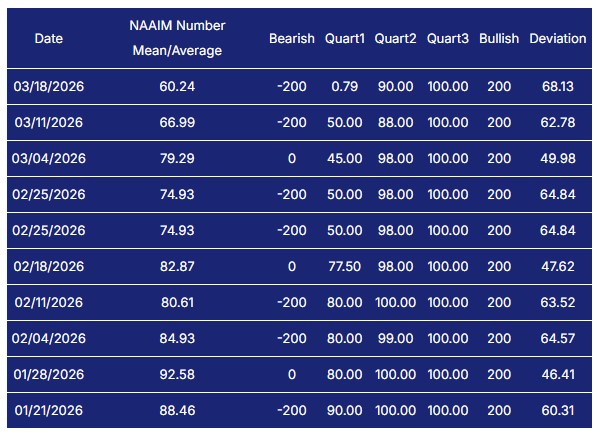
NAAIM Exposure Index
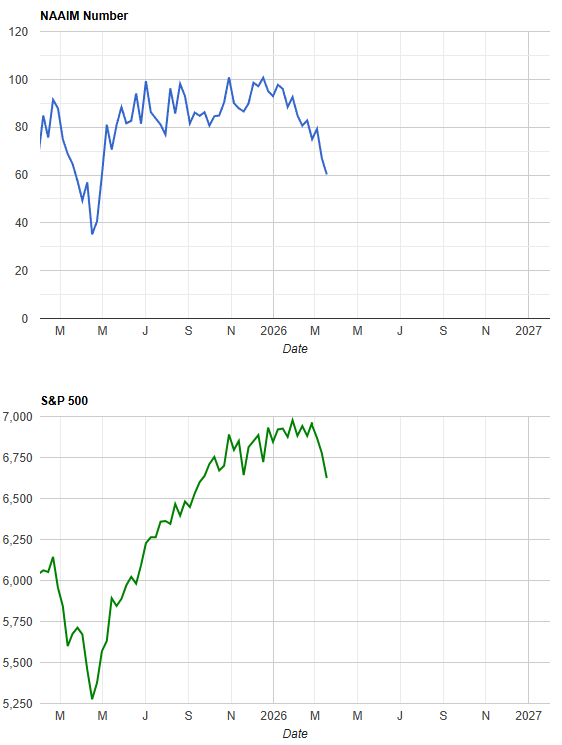
The NAAIM Exposure Index (National Association of Active Investment Managers Exposure Index) measures the average exposure to U.S. equity markets as reported by its member firms. These are typically active money managers who provide their equity exposure levels weekly. The index offers insight into how much these managers are investing in equities at any given time, ranging from being fully short (-100%) to leveraged long (up to +200%).
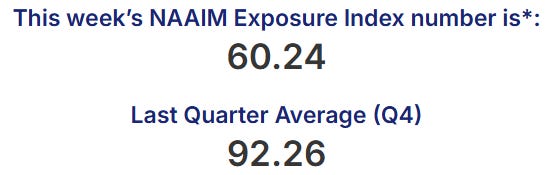
The NAAIM Exposure Index dropped to 60.24 on March 18, continuing a steep slide from 82.87 just four weeks earlier. The week-over-week move from 66.99 to 60.24 represents an accelerating de-risking trend among active managers, and the current level sits well below the Q4 average of 92.26. At 60, managers still hold meaningful long exposure but have clearly pulled in their horns, which creates a two-sided setup. On one hand, there is dry powder available to re-deploy if conditions stabilize, and history shows that readings in the low 60s often precede multi-week rallies once a catalyst appears. On the other hand, a drop into the 50s without corresponding price damage would signal that professional money is bracing for something worse than what has already been priced. The tripwire to the upside is a reversal back through 75 on consecutive weeks, which would confirm managers are re-engaging rather than just covering shorts. For now, the message is that the smart money is cautious but not yet panicking, which keeps the door open for a tactical bounce but does not guarantee one.
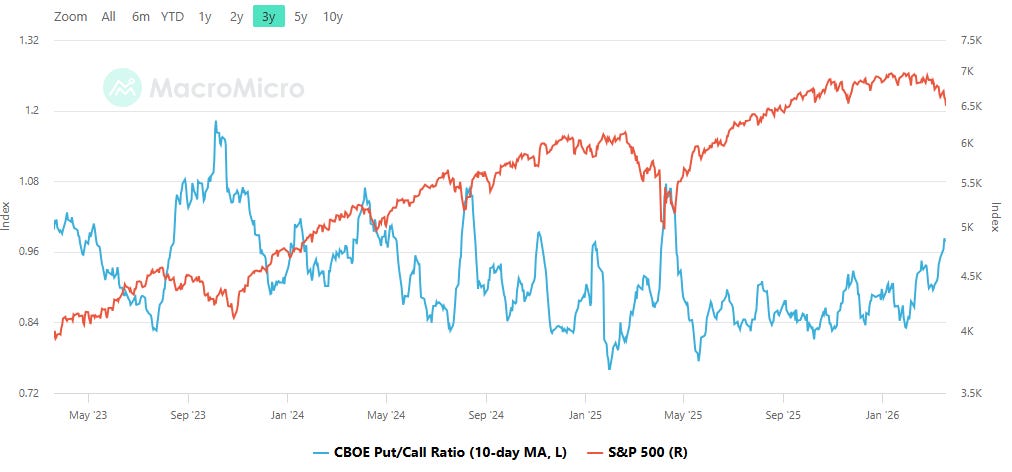
CBOE Total Put/Call Ratio
CBOE's total put/call ratio includes index options and equity options. It's a popular indicator for market sentiment. A high put/call ratio suggests that the market is overly bearish and stocks might rebound. A low put/call ratio suggests that market exuberance could result in a sharp fall.
The 10-day moving average of the CBOE total put/call ratio sits at 0.98, holding steady near that level for the most recent readings. This is elevated by any historical standard -- the ratio has been trending higher in recent weeks from a lower trough and is now pressing against the psychologically important 1.0 threshold. Readings in this neighborhood indicate that hedging demand is running well above normal, with put buying dominating call activity across the board. From a contrarian standpoint, a sustained print at or above 1.0 on the 10-day average has historically marked zones where downside protection is already heavily in place, and the incremental seller is largely spent. That is the mechanical backdrop for a sharp short-covering rally if any positive catalyst materializes. The tripwire here is a move above 1.05 on the 10-day average, which would signal outright panic hedging and typically marks a durable low within one to two weeks. A retreat back below 0.85 without a meaningful bounce in equities would be the bearish tell, suggesting the puts were unwound via rolling rather than profit-taking.
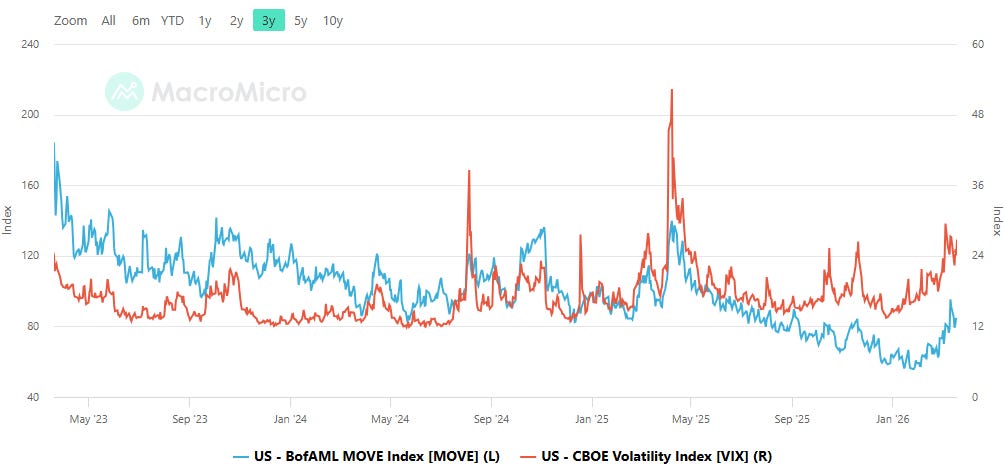
Equity vs Bond Volatility
The Merrill Lynch Option Volatility Estimate [MOVE] Index from BofAML and the CBOE Volatility Index [VIX] respectively represent market volatility of U.S. Treasury futures and the S&P 500 index. They typically move in tandem but when they diverge, an opportunity can emerge from one having to “catch-up” to the other.
The VIX closed at 26.76 on March 20, up from 24.06 the prior session, while the MOVE Index rose to 84.88 from 81.25. Both measures are trending higher in tandem, which is the more straightforward regime -- equity and bond stress are rising together, suggesting a shared macro driver rather than an isolated dislocation in one asset class. The good news, if you can call it that, is that MOVE at 84.88 remains well below the alarm-bell zone above 120 where bond volatility historically spills over into forced equity liquidation. The VIX in the mid-to-high 20s reflects genuine nervousness but not the kind of blow-off spike above 35 that typically accompanies a full washout. The key divergence to watch is whether MOVE begins to accelerate while VIX stays anchored in the 20s -- that setup, with MOVE above 100 and VIX still sub-30, has been a reliable leading indicator of equity stress arriving with a lag. For now the synchronized grind higher keeps the risk tone negative but orderly.
CNN Fear & Greed
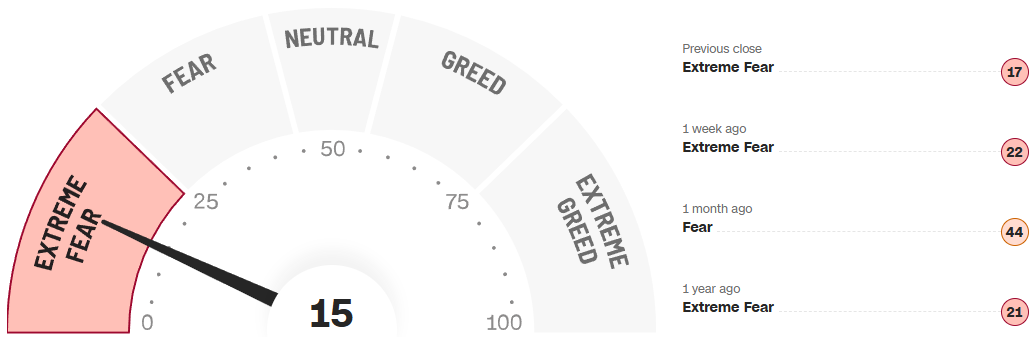
The CNN Fear and Greed Index printed 15 this week, deep in Extreme Fear territory and down from 22 a week ago and 44 a month ago. This is the lowest reading on the 1-year chart, which peaked near 75-80 in the Greed/Extreme Greed zone during the summer of 2025 and has been sliding almost continuously since. The trajectory from 44 (Fear) a month ago to 15 (Extreme Fear) today represents a swift collapse in composite sentiment that encompasses market momentum, put/call ratios, safe haven demand, junk bond demand, and stock price breadth all pointing the same direction.
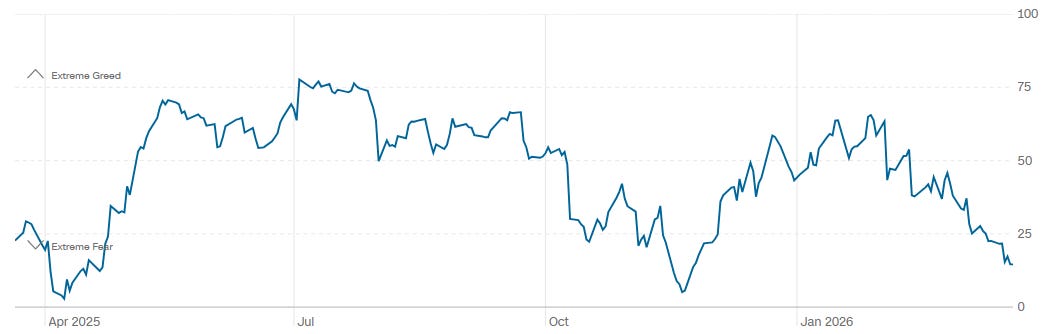
Readings at 15 are rare and historically mark zones where the risk-reward for initiating new longs begins to improve meaningfully, though they do not guarantee an immediate reversal -- the index spent extended stretches near 20 in early April 2025 before the eventual rally. The tripwire for a durable turn is a move back above 25 that holds for more than a few days, signaling the composite indicators are starting to stabilize. A further plunge below 10 would be genuine capitulation and would represent one of the strongest contrarian buy signals this gauge can produce.
The bottom line: with the bull-bear spread at -21.60%, NAAIM down to 60.24, the put/call ratio pressing 1.0, the VIX in the upper 20s, and Fear and Greed at 15, the sentiment tape is deeply washed out and approaching the kind of extreme that has historically rewarded patient buyers -- but the absence of a stabilization signal in any single indicator means the turn has not yet arrived.
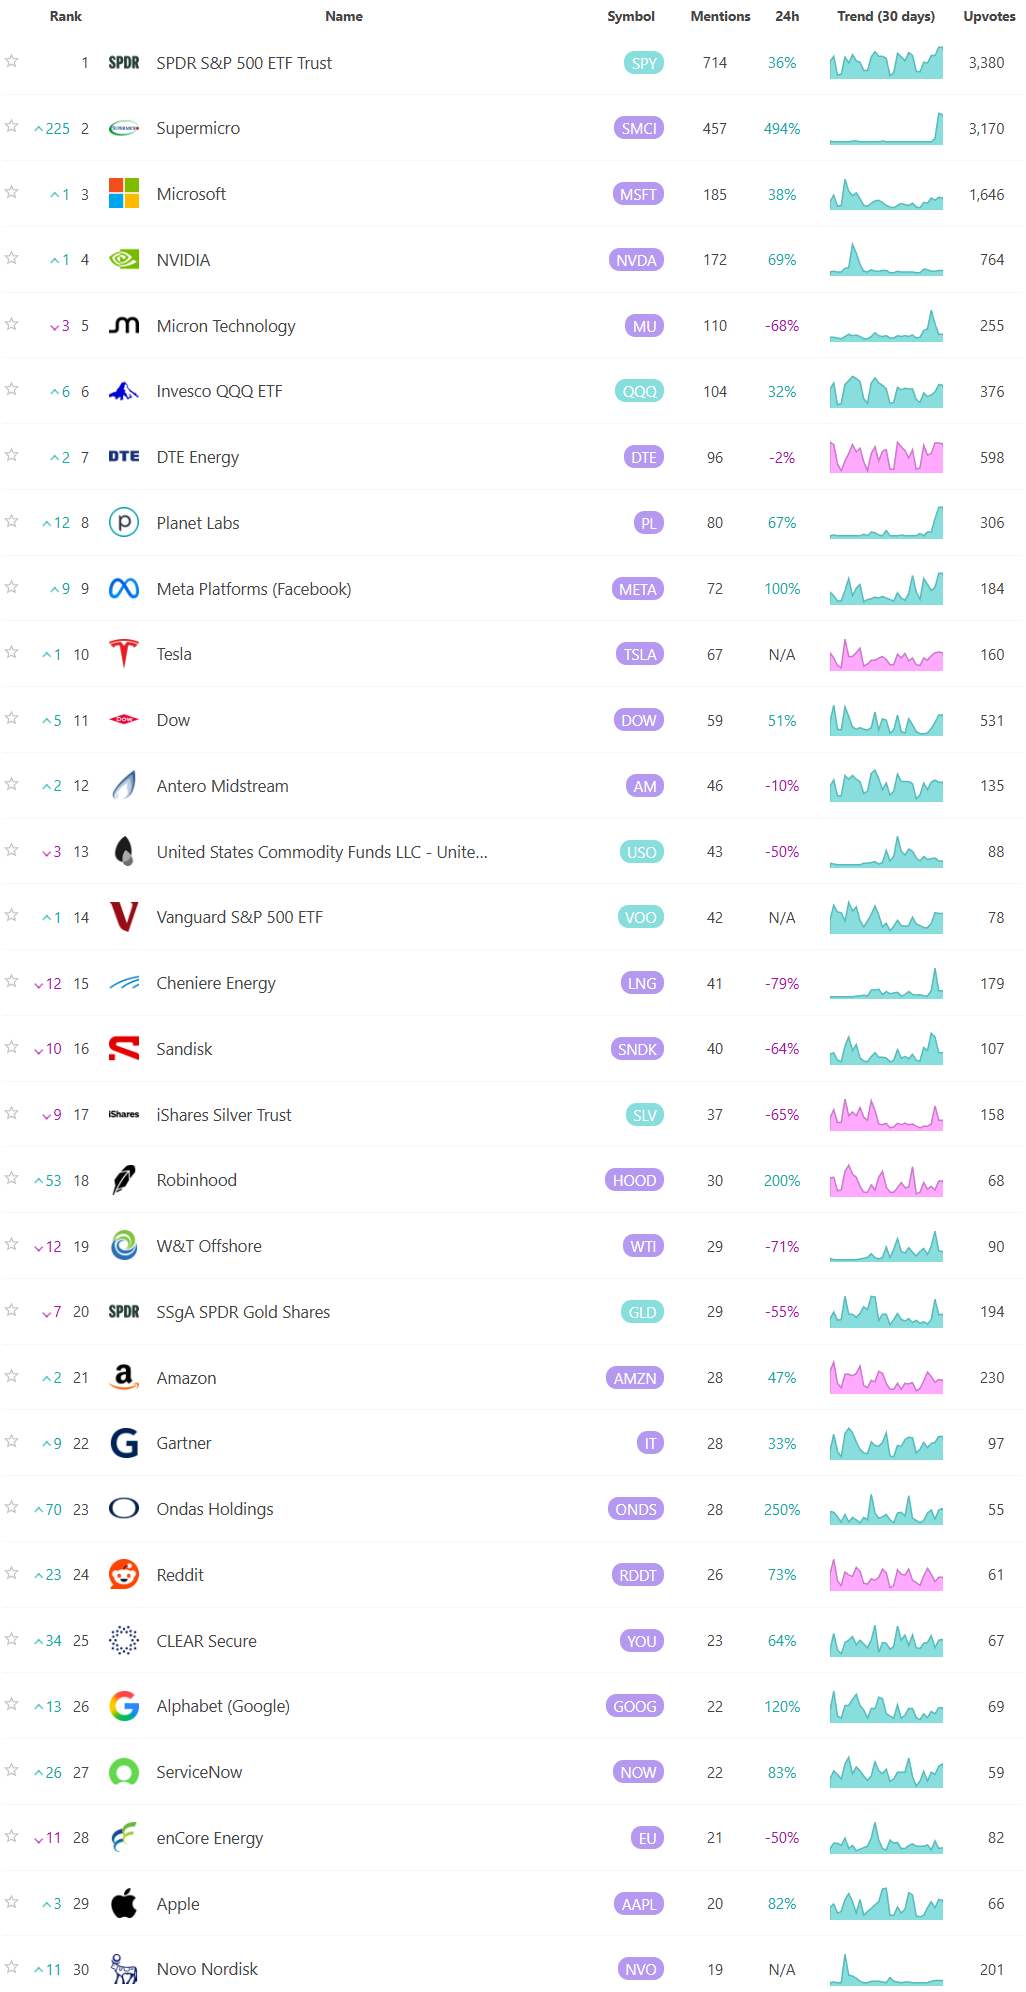
Social Media Favs
Social sentiment offers a real-time view of investor mood, often revealing market shifts before traditional indicators. It can signal momentum changes, spot emerging trends, and gauge retail investor impact—especially in high-volatility names. Tracking sentiment around events or earnings provides actionable insights, and when layered with quantitative models, can enhance predictive accuracy and risk management. Sustained sentiment trends often mirror broader market cycles, making this data a valuable tool for both short-term trades and long-term positioning.

Technician’s Playbook: Trading the Majors (SPY/QQQ/IWM/DIA)
When you’re a large institutional player, your primary goal is to find liquidity - places to do a ton of business with the least amount of slippage possible. VolumeLeaders.com automatically identifies and visually plots the exact spots where institutions are doing business and where they are likely to return for more. It’s one of the primary reasons “support” and “resistance” concepts work and truly one of the reasons “price has memory”.
SPY
SPY closed at 648.57, down 11.23 on the day and sitting roughly 22 handles below Monday's high near 670. The weekly structure is a clean impulse lower: the tape opened in the upper 660s, carved a series of lower highs and lower lows through Wednesday, caught a brief bounce Thursday into the low 650s, then rolled over hard into Friday's close. The damage is real. Two prints near 670.68 on March 17 landed in the top-100 history -- ranked #12 and #28 -- at $2.97B and $2.16B respectively, both carrying relative sizes above 180x. Those were not bids; they hit during the distribution phase at the highs and have so far marked the ceiling. On the downside, Friday produced a cluster of heavy prints in the 648-652 zone, including a 5M-share, $3.26B trade at 652.75 ranked #4 all-time at 278.98x relative size, plus a 3.3M-share, $2.14B print at 648.57.
That #4 print is the kind of ticket that either marks a capitulation low or confirms a new seller in control -- context next week will tell. The all-time volume level table shows $21B stacked at 671.30 (97th percentile, 4.39x RS) and $19B at 659.20 (95th percentile), with the 660.70 shelf holding $11.1B. The line of scrimmage is the 659-660 zone: acceptance back above it reopens 666-670 where the volume profile is thickest, while failure to reclaim it targets the 648 print and then 640 clean air. The bullish path requires Monday to hold above 648 and push through 652 with volume, targeting the 659 level as a first magnet. The bearish path is a gap below 648 into the low 640s where there is no visible institutional support. A disciplined long would use a 648 close as invalidation with a first target of 659; shorts would fade any rally into 659-660 with a stop above 662.
QQQ
QQQ at 587.12 tells a similar story with worse internals. The week's high came on a sharp thrust to 607 on March 17 before a waterfall selloff took it below 582 by Thursday. Friday saw a bounce back through 587, but the tape is capped by a wall of resistance. The top visible trade was 950K shares at 585.99, $557M, with a 77.76x relative size, followed by a nearly identical 900K-share print at the same price for $527M at 73.67x. Both hit Friday morning and read as re-engagement rather than capitulation given the bounce that followed.
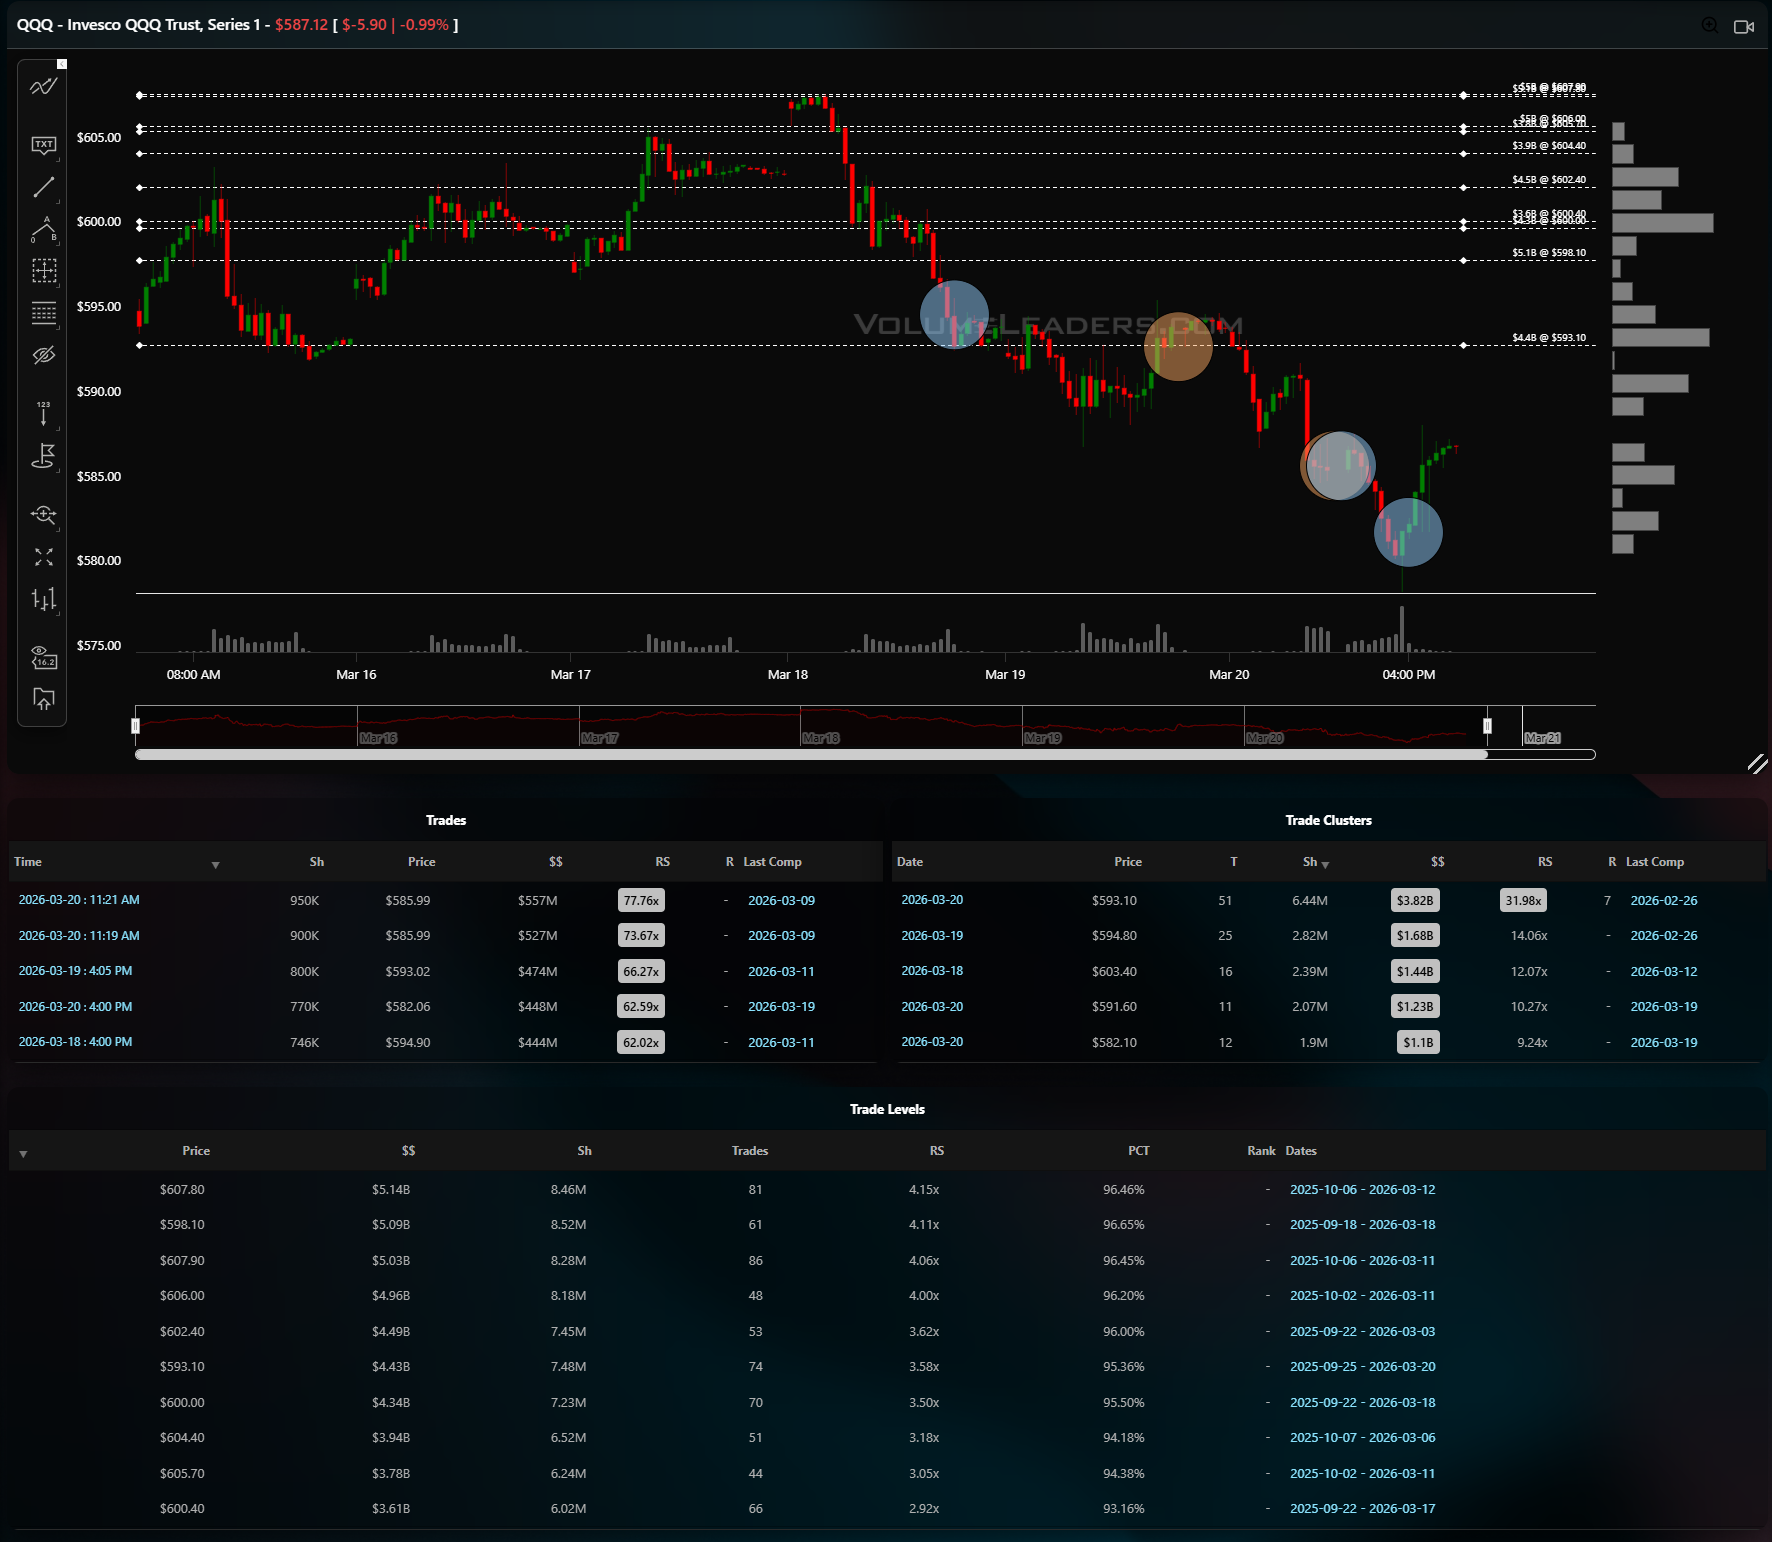
The level table reveals massive overhead: $5.14B at 607.80 (96th percentile), $5.09B at 598.10, and $5.03B at 607.90. The 593.10 level at $4.43B is the nearest meaningful shelf above, and the March 20 cluster at 593.10 aggregated $3.82B at a 31.98x RS with a rank of #7. Below, the 582 area where Thursday's low printed is thin by comparison. The pass/fail line here is 593: a close above it would suggest the Friday bounce has legs toward the 598-600 zone where $5B+ of cumulative volume sits. Failure to hold 585, where those two big prints landed, opens 580 and then 575 quickly. The bullish setup leans on 585 as support with a first target of 593; the bear case is a rejection at 593 that sends the tape back to retest Thursday's low.
IWM
IWM at 242.22 is the weakest chart in the group and it is not close. Price peaked near 252 early in the week, collapsed through the 246-248 balance area by Wednesday, and spent Thursday and Friday carving new lows into 241. The top trade on the board is a 2.01M-share, $499M print at 246.58 on March 16 with a 53.48x RS, which now sits overhead as failed support turned resistance. Friday produced three notable prints in the 241-242 zone: 1.34M shares at 242.22 for $324M, 1.2M shares at 241.42 for $290M, and 893K shares at 241.80 for $216M. None carry a top-100 tag, which means institutional urgency has not yet reached historic levels on the bid side.
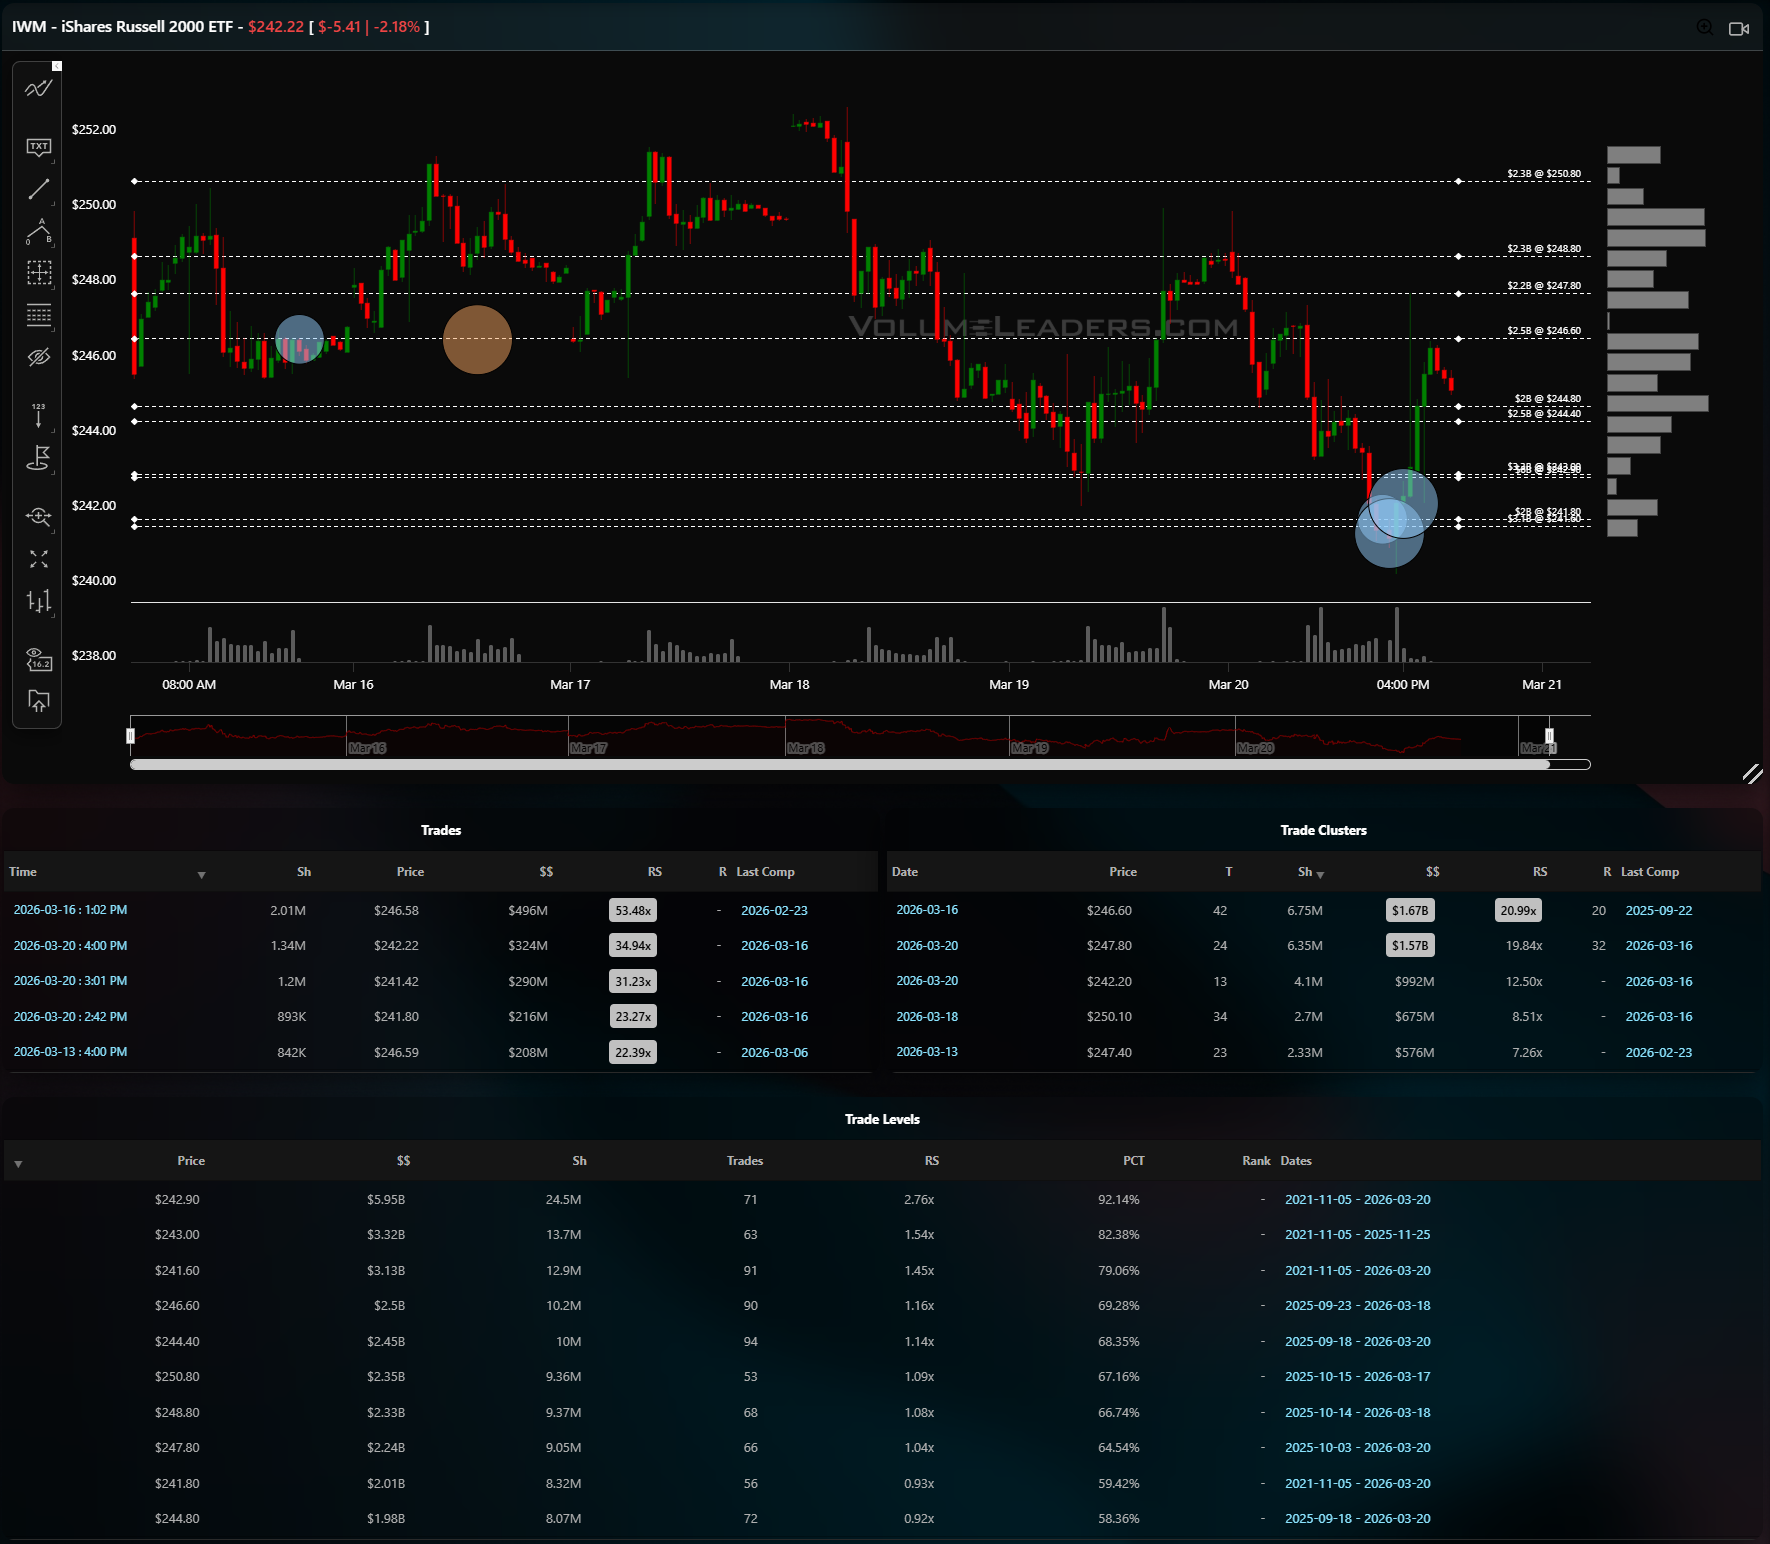
The level table is revealing: $5.95B at 242.90 sits at the 92nd percentile, and below that the next shelf is 243.00 at $3.32B (82nd percentile) and 241.60 at $3.13B (79th percentile). The date range on these levels stretches back to November 2021, so this is deep structural support built over years. The line of scrimmage is 242.90 -- IWM closed just below it. Acceptance back above 243 would allow a squeeze toward the 246-247 band where last week's breakdown originated. The bear case is straightforward: a daily close below 241 opens the door to 238 and potentially 235, and there is very little volume-based support in that zone to arrest the fall. Longs need to see Monday hold 241.60 with a push back through 243; shorts have the easier trade, fading any rally into 246 with a stop above 247.
DIA
DIA at 455.89 printed a #3 all-time trade on its tape Friday -- a 1.6M-share, $734M ticket at 458.85 with a 76.15x RS, last comparable trade dating to December 2019. That is the single most important print across all four charts this week. It landed during a bounce attempt midday Friday and the tape subsequently failed to hold above it, closing at 455.89. The week's high was above 473 on March 17, and the selloff carved over 17 handles of range.
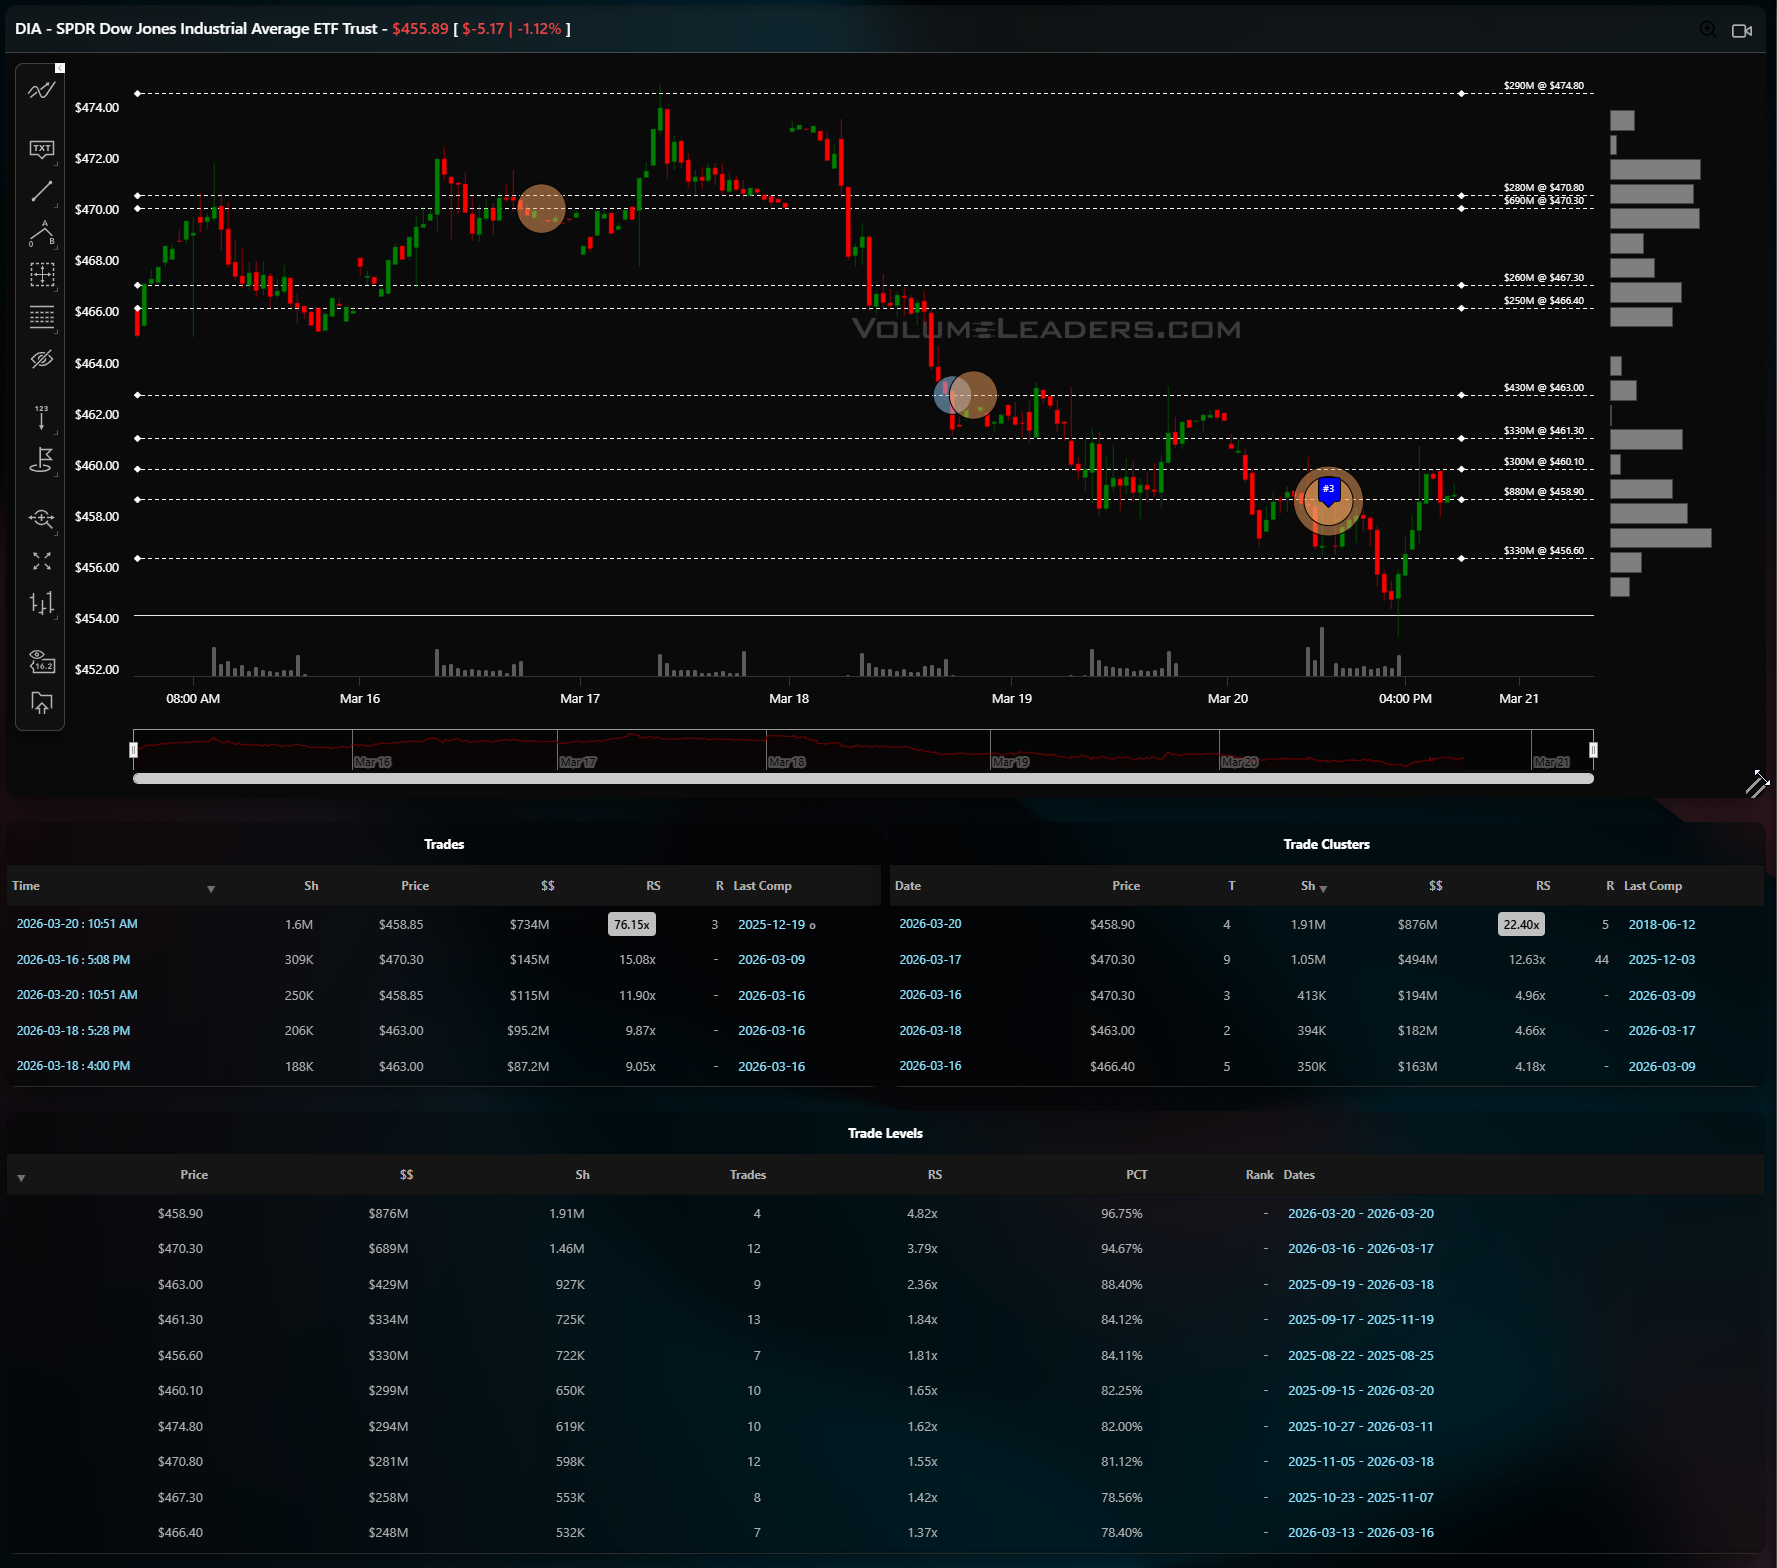
The level table shows the 458.90 price concentrating $876M at a 4.82x RS, 96th percentile, with the date range of March 20 alone -- meaning nearly all of that notional is fresh. Above, 470.30 holds $689M at the 94th percentile, and 463.00 holds $429M. The cluster table shows March 20 aggregating $876M at a 22.40x RS, also ranked #5. The line of scrimmage is that 458.90 level: a reclaim would confirm the #3 print was absorption and opens a fast move to 461-463 where the next volume shelf sits. Failure to get back above it means the print was distribution, and the next downside target is 456.60 ($330M, 84th percentile) and then 454 where the chart goes thin. For a long, buying a retest of 456 with a stop below 455 and targeting 459 is the cleanest setup; the short play is to sell a failure at 459 targeting a retest of 456 and lower.
Across all four names, the pattern is the same: heavy institutional paper hitting during the selloff with no sign yet that it has been absorbed. SPY's #4 print, DIA's #3 print, and the twin 77x/73x QQQ prints are the week's signature. Until price can reclaim the zones where these prints were placed and hold above them for a full session, the tape remains in distribution mode. The first thing to watch Monday is whether 648 SPY, 585 QQQ, 241.60 IWM, and 456 DIA hold as floors. If they do, the bounce could carry back toward the mid-week volume shelves. If any one of them gives way on volume, the next leg lower will be swift and poorly cushioned.

Summary Of Thematic Performance YTD
VolumeLeaders.com offers a robust set of pre-built thematic filters, allowing you to instantly explore specific market segments. These performance snapshots are provided purely for context and inspiration—think about zeroing in on the leaders and laggards within the strongest and weakest sectors, for example.
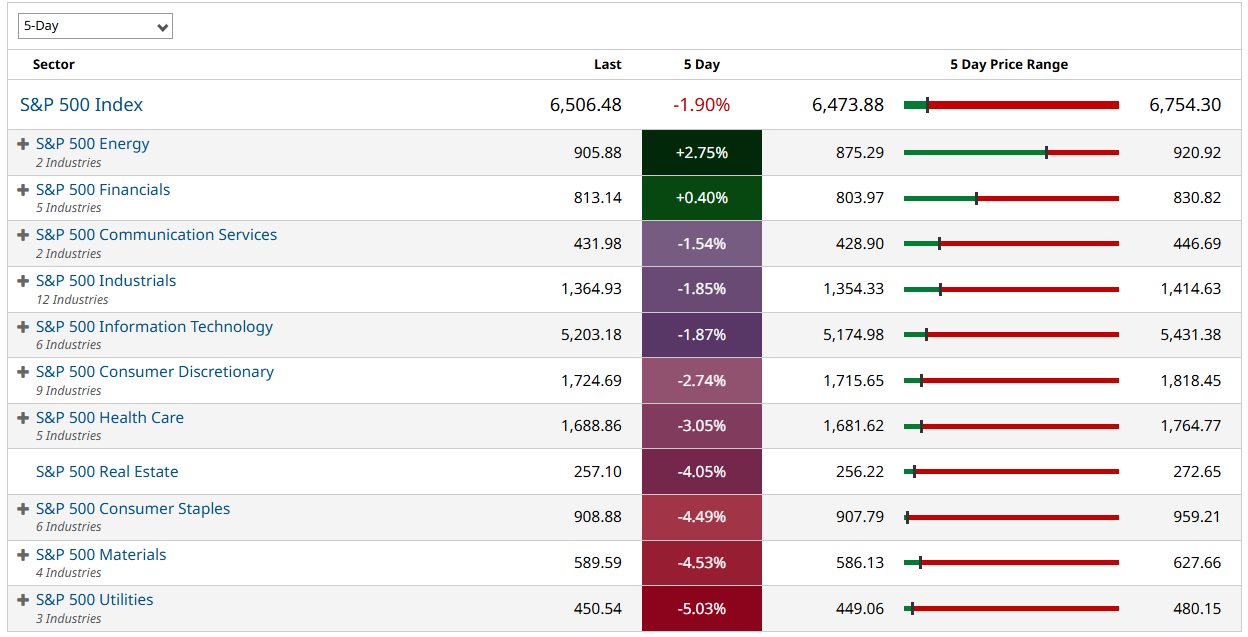
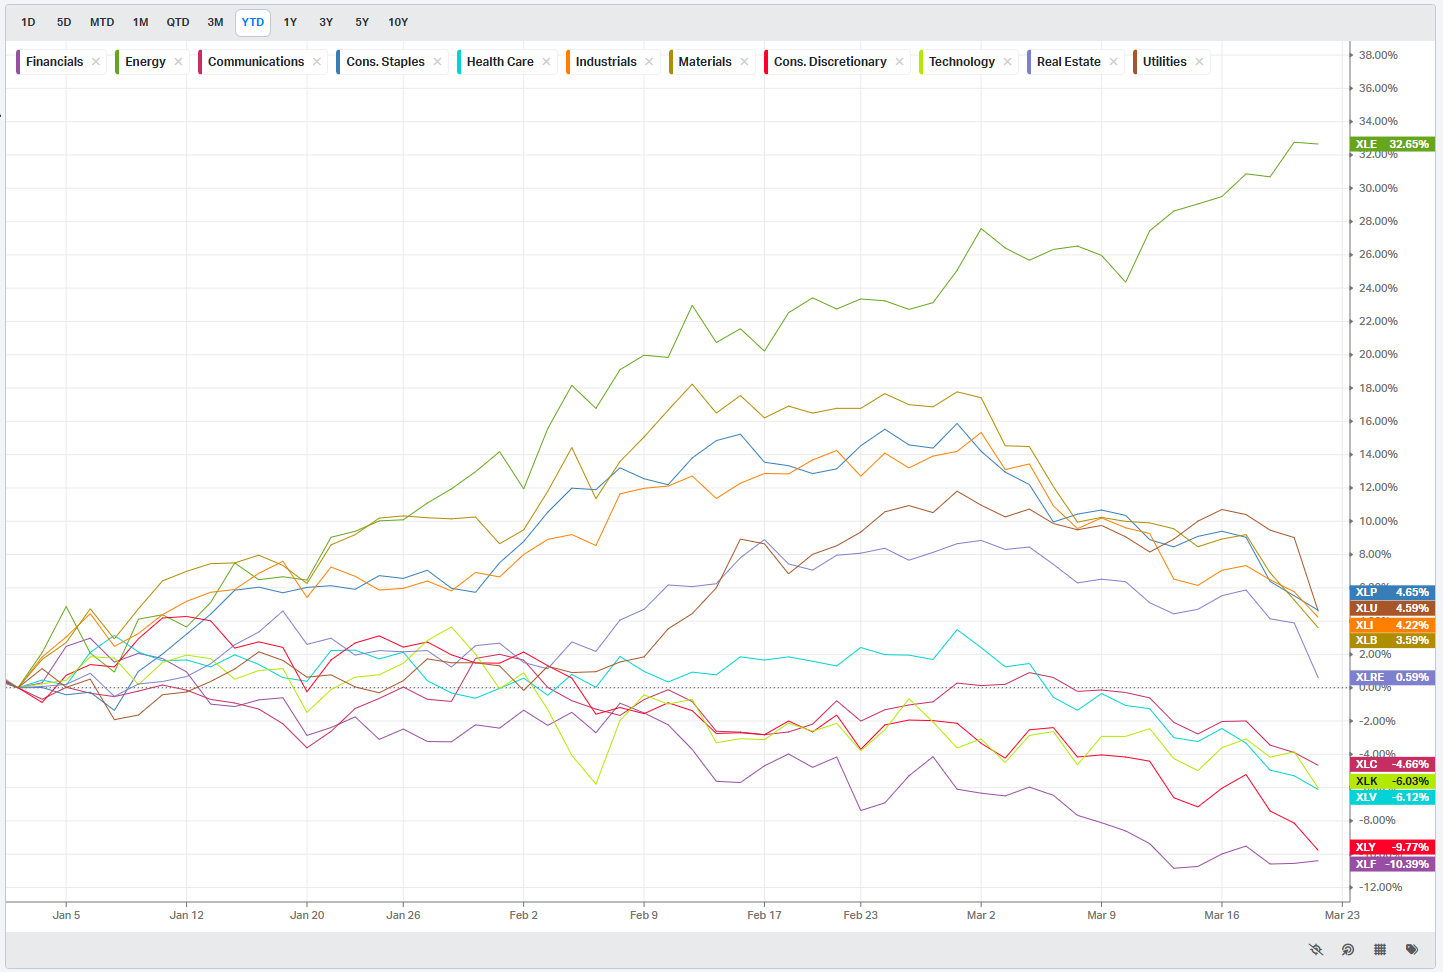
S&P By Sector
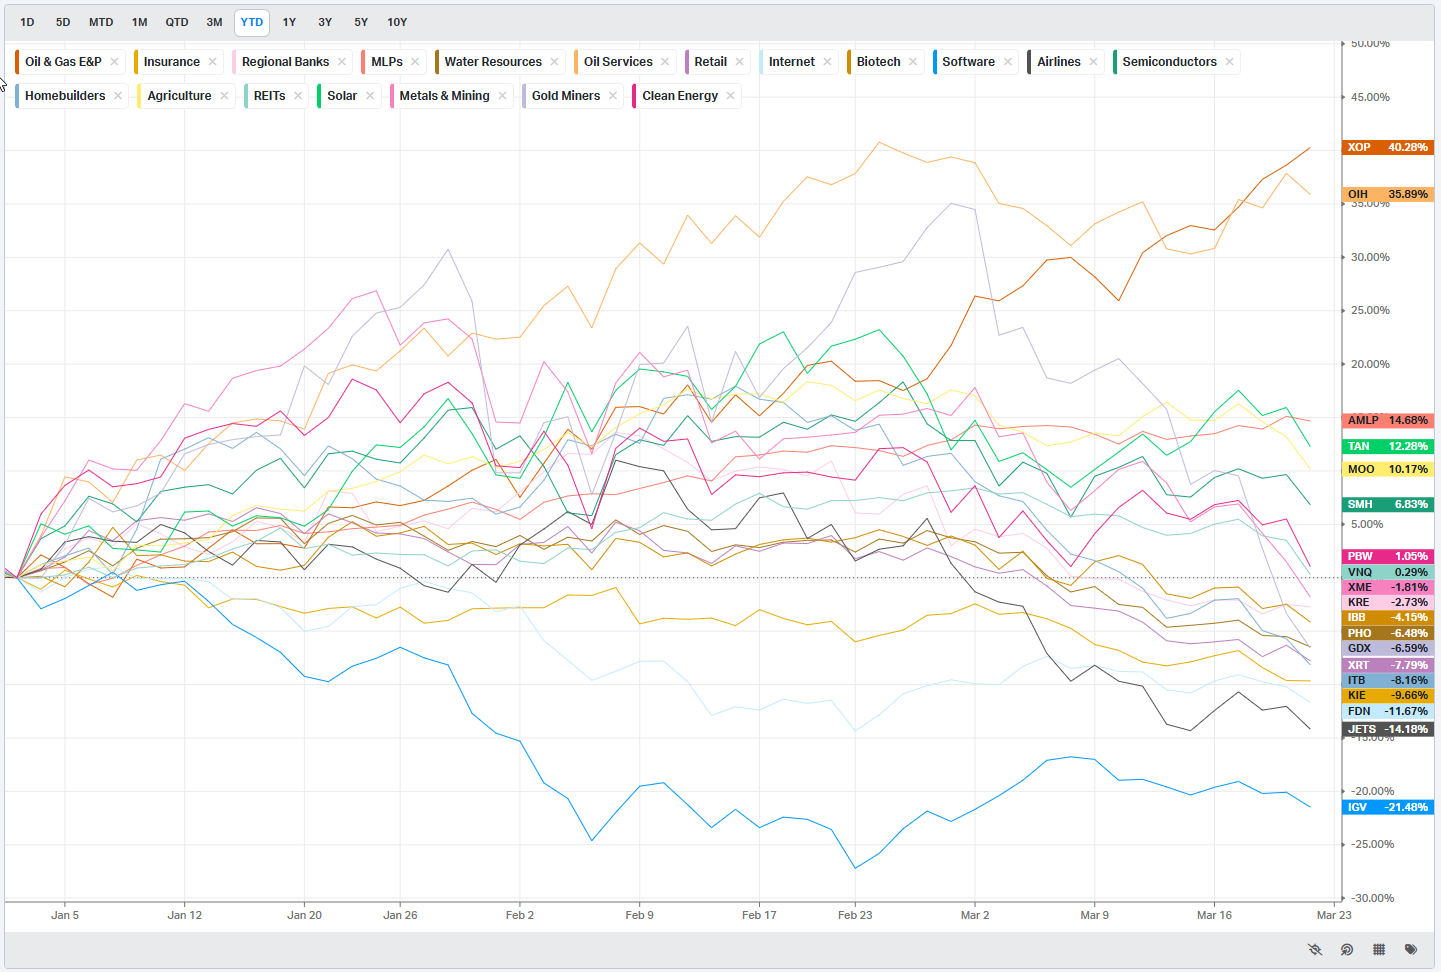
S&P By Industry
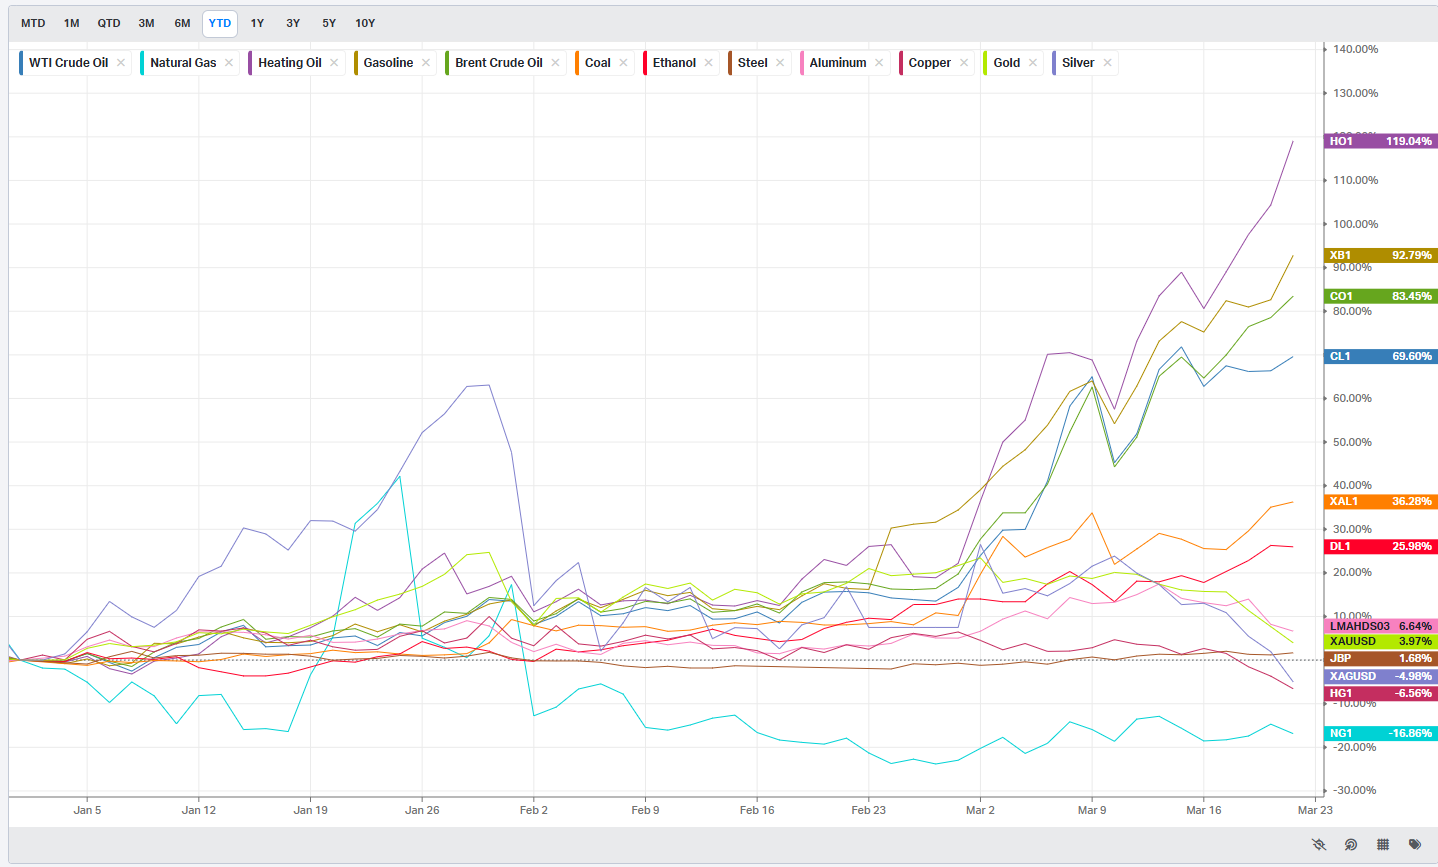
Commodities: Energy & Metals
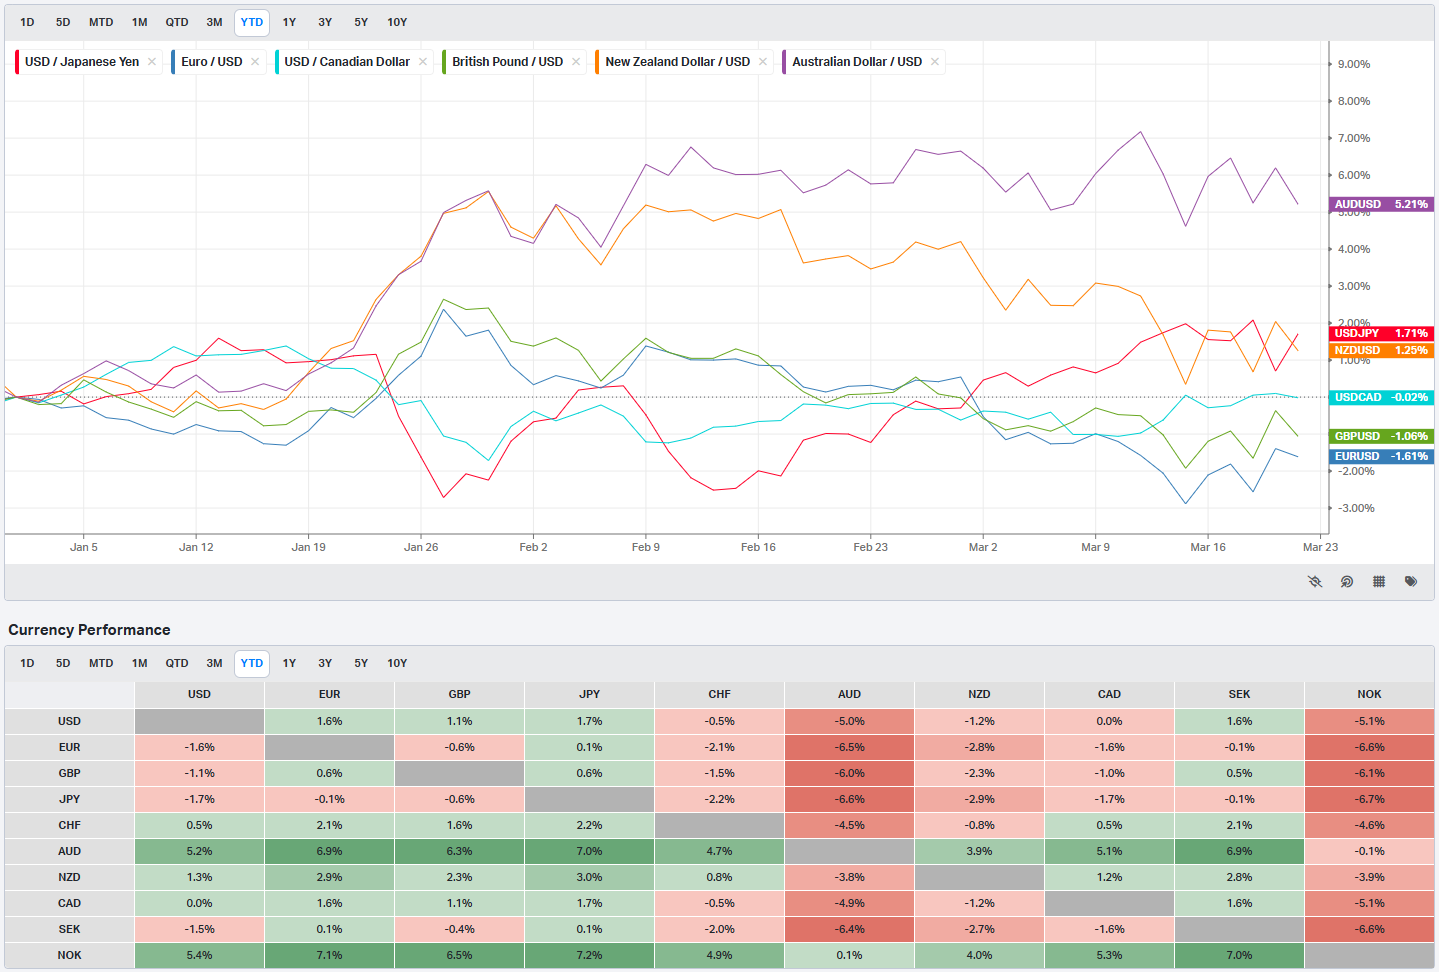
Currencies/Major FX Crosses
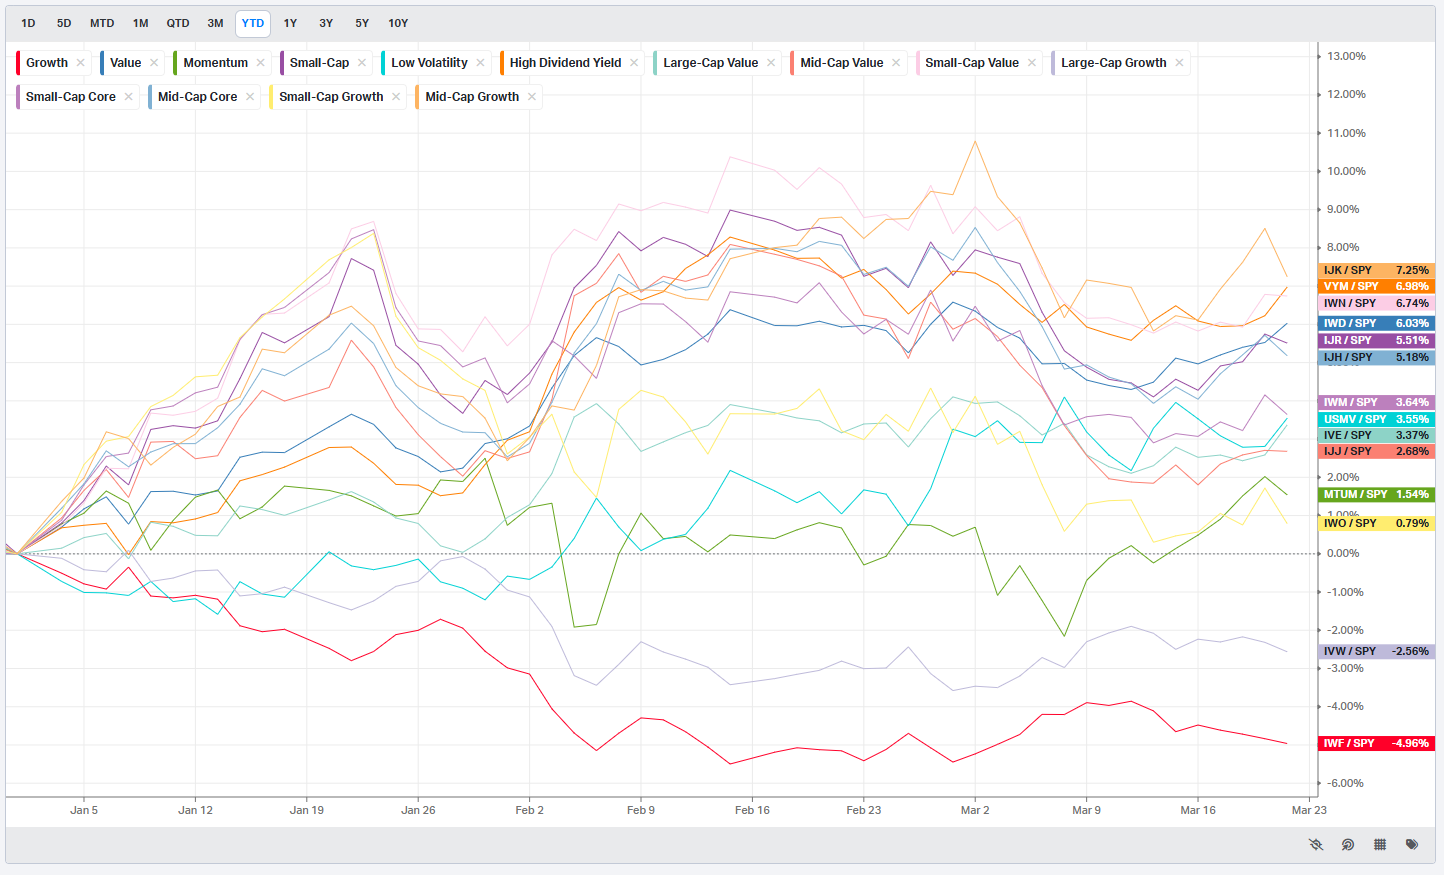
Factors: Style vs Size-vs-Value

Events On Deck This Week
Here are key events happening this week that have the potential to cause outsized moves in the market or heightened short-term volatility.
PMIs, Claims, and a Wall of Fed Speakers: The Week Ahead
Monday is light. The Chicago Fed National Activity Index for February prints at 8:30 AM with a previous of 0.18 and a forecast of 0.27. A miss here would confirm the deceleration theme that breadth has been telegraphing for weeks; a beat would be noise in this context. Nothing else moves the tape until Tuesday.
Tuesday is the first real session of the week. ADP Employment Change drops at 8:15 AM with a previous of just 9K -- any meaningful upside surprise would challenge the soft-landing narrative, while another weak print emboldens the rate-cut camp. The bigger event is the trio of S&P Global Flash PMIs for March at 9:45 AM. Composite previously came in at 51.9 with a forecast of 50.5, Manufacturing at 51.6 versus 50.2 forecast, and Services at 51.7 versus 50.4. All three forecasts point toward the expansion-contraction line. A sub-50 manufacturing print would be risk-off; services holding above 51 would be risk-on. The API Crude Oil report follows at 4:30 PM (previous build of 6.6M), and Fed Barr speaks at 6:30 PM.
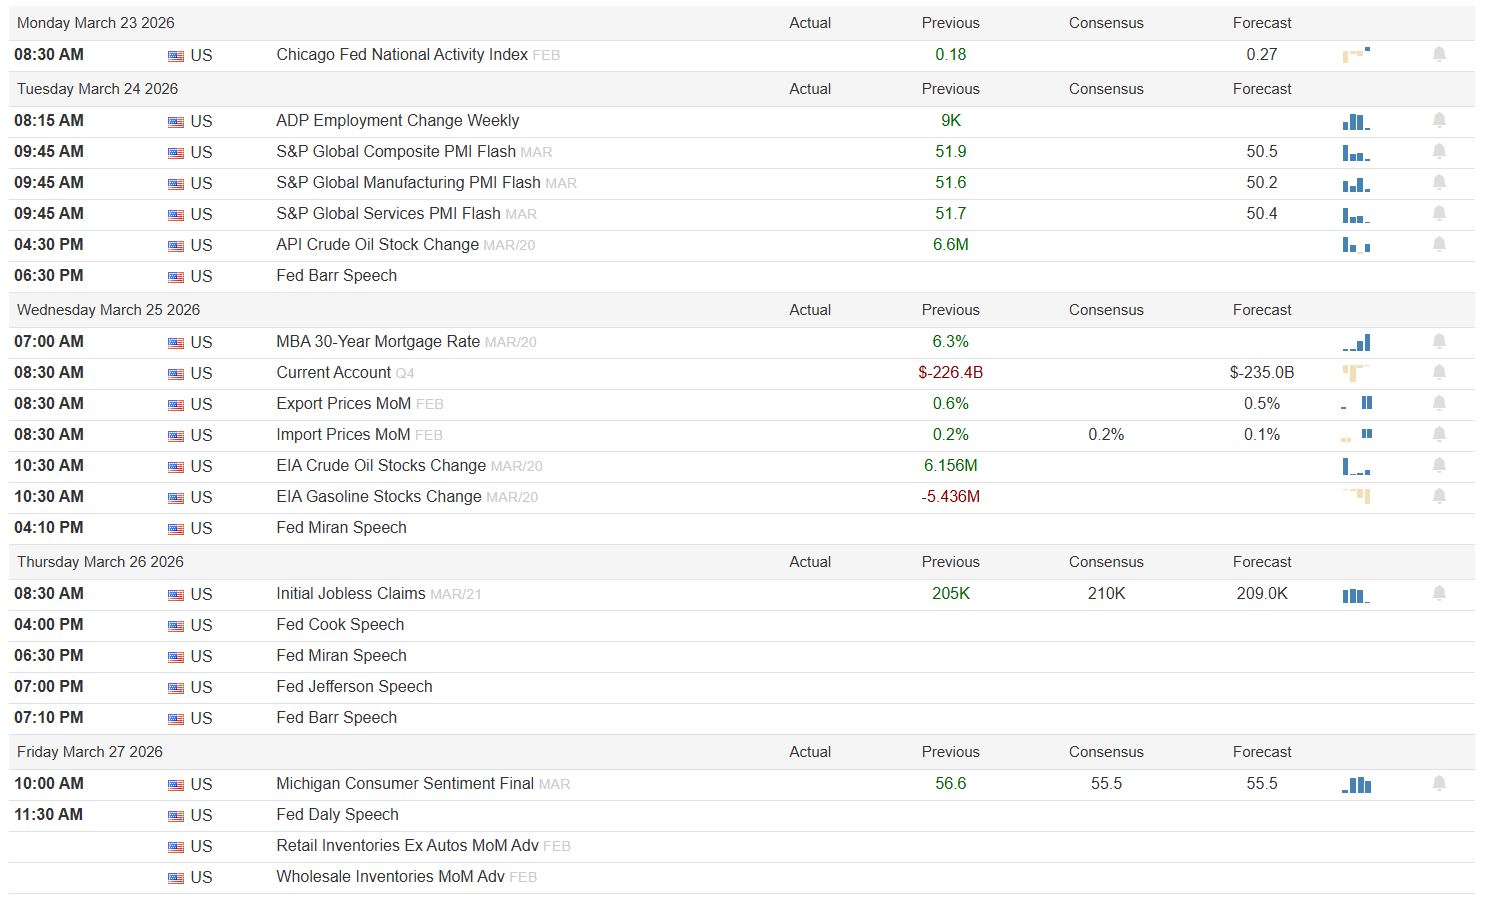
Wednesday layers on trade prices and energy. Export Prices MoM for February show a previous of 0.6% with a 0.5% forecast, and Import Prices at 0.2% previous with a 0.2% consensus and 0.1% forecast -- cooling on both sides would be equity-friendly. The Current Account for Q4 prints at 8:30 AM with a previous of -$226.4B and a forecast of -$235.0B, which is worth watching for dollar implications. EIA Crude Oil Stocks (previous build of 6.156M) and Gasoline Stocks (previous draw of -5.436M) hit at 10:30 AM. A second consecutive large crude build would weigh on energy. Fed Miran speaks at 4:10 PM.
Thursday is claims day and Fed speaker overload. Initial Jobless Claims for March 21 arrive at 8:30 AM with a previous of 205K, consensus of 210K, and forecast of 209K. A print above 220K would be the first real crack in the labor wall and would likely trigger a bid in duration. After the close, four Fed speakers line up in sequence: Cook at 4:00 PM, Miran at 6:30 PM, Jefferson at 7:00 PM, and Barr at 7:10 PM. Any coordinated hawkish messaging across that lineup would pressure the front end overnight.
Friday closes with the final Michigan Consumer Sentiment for March at 10:00 AM -- previous of 56.6 with both consensus and forecast at 55.5. A reading below 55 would confirm sentiment is cracking in line with what the AAII and Fear and Greed gauges already show, and any uptick in the embedded inflation expectations would be the worst of both worlds. Fed Daly speaks at 11:30 AM. Retail and Wholesale Inventories round out the day.
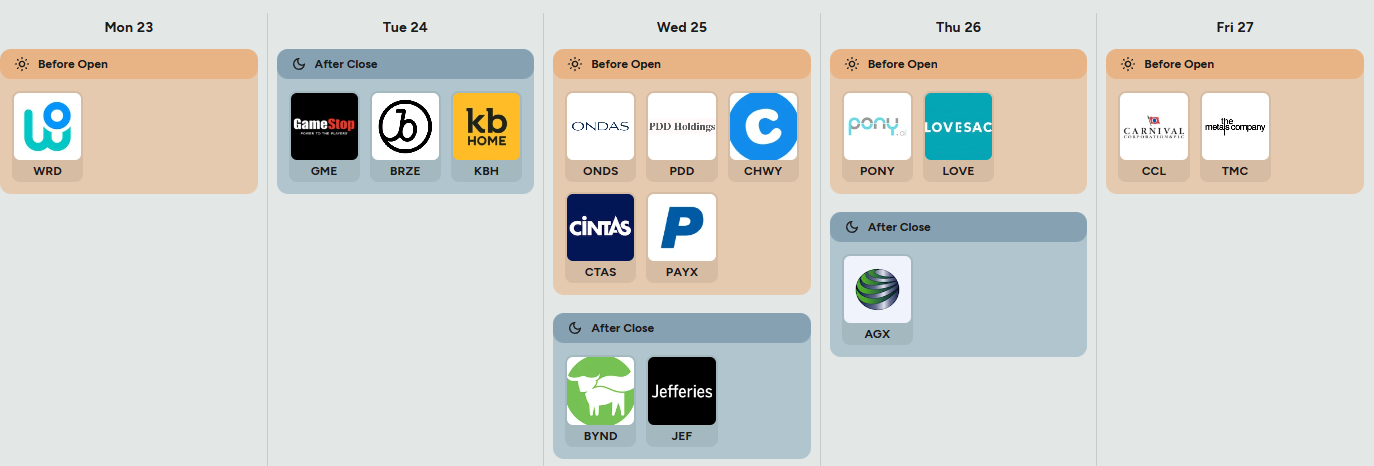
On the earnings side, the calendar is thin but pointed. KBH after the close Tuesday gives a direct read on housing demand, new orders, and cancellation rates in a rising-mortgage-rate environment -- a miss would hit the homebuilder complex hard. Wednesday is the marquee day: PDD before the open offers a window into Chinese consumer spending, CHWY speaks to the U.S. consumer wallet, and CTAS and PAYX before the open are the best real-time proxies for labor market conditions through their payroll processing and staffing data. After the close Wednesday, JEF reports -- their fixed income and advisory revenue lines are a leading indicator for capital markets activity and credit appetite. GME and BRZE after the close Tuesday are headline-grabbers but carry minimal macro signal. CCL before the open Friday is worth watching for discretionary spending and forward booking trends.
Flash PMIs sub-50 on manufacturing with services below 51 would confirm contraction broadening -- watch for the 9:45 AM tape reaction Tuesday.
Initial claims above 220K Thursday would be the first hard data confirming what sentiment gauges have been warning -- duration bid, equity fragile.
Michigan Sentiment below 55 with rising inflation expectations Friday would be the stagflation print that removes the last pillar of support.
The macro calendar leans toward confirming what the tape already suspects: growth is decelerating, sentiment is fragile, and the Fed is talking more than acting.

Order Flow in Focus: Reading Smart Money Tells
Order Flow in Focus: Reading Smart Money Tells is a recurring segment that spotlights unique intraday opportunities revealed through institutional order flow. Each feature dissects a moment when the tape quietly shifted—when large, ranked prints clustered at key liquidity locations and informed players positioned ahead of the move. The goal isn’t hindsight; it’s pattern recognition—learning to spot the footprints of capital that knows before the crowd does.
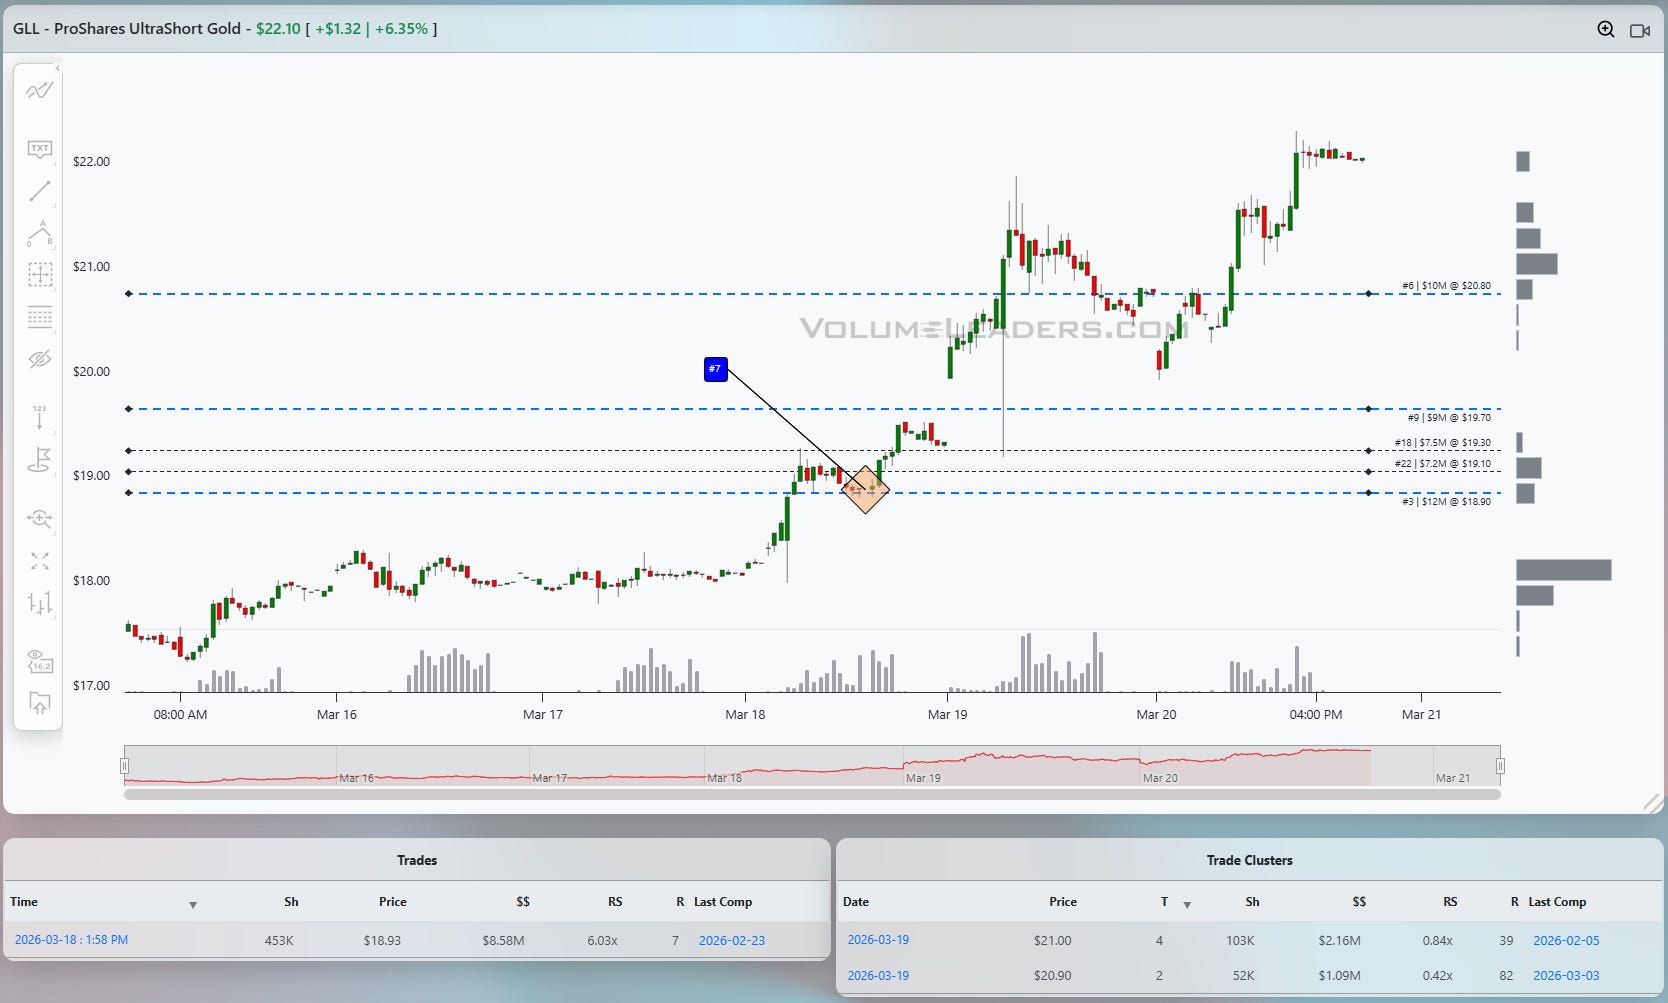
GLL Whispered Before Gold Screamed
On Wednesday March 18 at 1:58 PM, someone bought 453,000 shares of GLL -- the ProShares UltraShort Gold ETF -- at $18.93 for $8.58 million. The print ranked #7 all-time for the ticker and carried a relative size of 6.03x. GLL had spent the prior three days grinding sideways between 17.00 and 18.40, a slow crawl that attracted no attention while gold futures and IAU made new highs overhead. The #7 print landed right at the 18.90 level, which the Trade Levels table shows as the single most concentrated price on GLL’s entire book: $12.3M notional, 649K shares, a 4.68x RS, and a 99.48th percentile ranking -- the #3 all-time level. Whoever placed that order was not speculating into thin air. They were stacking capital at the deepest institutional shelf the instrument has ever built, and they were doing it while gold was still pressing new highs. That is the kind of positioning that does not show up in price. It shows up in the tape.
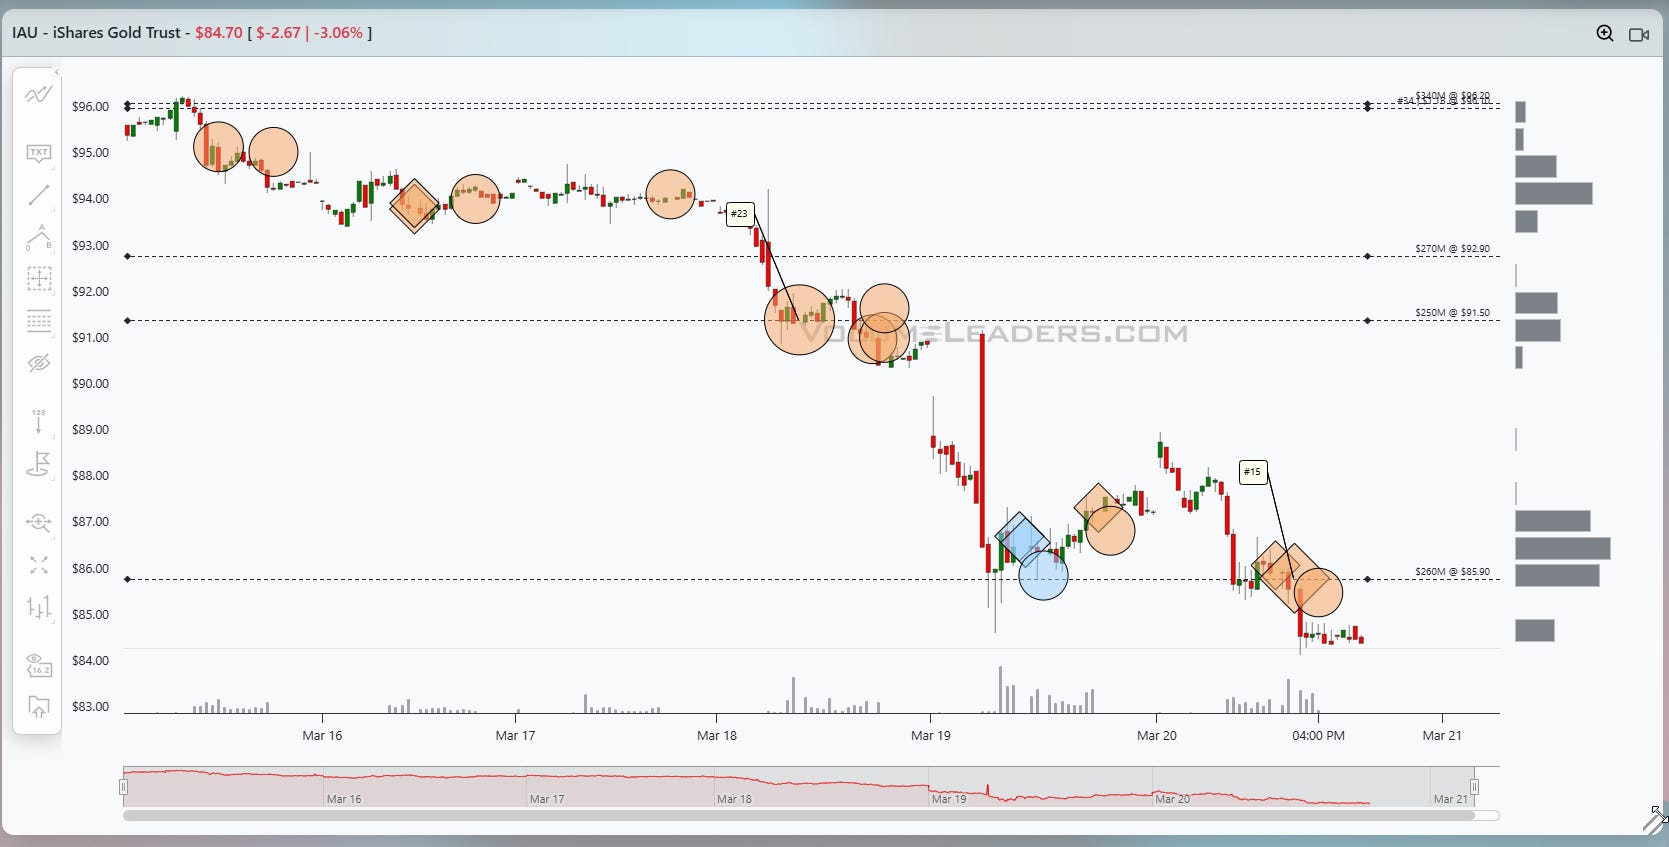
The context matters. IAU closed March 18 near $91.50 after a week of relentless buying that had pushed the gold trust from the low $93s on March 16 to an intraday high above $95 on March 17. The IAU trade table confirms the crowding: a 2.18M-share, $199M print at $91.52 on March 18 at 10:24 AM with a 127.85x RS ranked #23 all-time, followed by a 900K-share, $82M print at $91.14 later that afternoon at 52.57x. The cluster table shows March 18 alone accumulated $222M at $91.50 across 6 trades and 2.42M shares, with a 12.43x RS and a rank of #36. The gold crowd was piling in with both hands.
But the GLL print at 1:58 PM was the tell. A 2x leveraged short-gold vehicle absorbing $8.58M at its all-time #3 volume level, while the long-gold trade was printing top-25 historical tickets on IAU -- that is a divergence you cannot ignore. The message was not ambiguous: someone with deep pockets was betting the gold rally was exhausted, and they were using the leveraged instrument to maximize the payoff on the sell.
By Thursday March 19, GLL had already ripped from that 18.93 entry through the 19.70 level ($9.05M, #9 ranked) and the 20.80 level ($10.5M, #6 ranked), closing the session above 21.00. The cluster table confirms the follow-through: March 19 printed two clusters at $21.00 ($2.16M, 103K shares, RS 0.84x, rank #39) and $20.90 ($1.09M, 52K shares). Meanwhile, IAU was in freefall. The trust gapped lower from its $91+ closing price on March 18 and spent Thursday carving through the $86-87 zone. The IAU cluster at $86.70 on March 19 shows $60.4M across 7 trades and 697K shares and appeared to be putting in local low. The buying that had built the $91.50 shelf just 24 hours earlier was being unwound at fire-sale prices five dollars lower.
Friday completed the move. GLL surged to $22.10, up $1.32 or 6.35% on the day, extending the run from that #7 print at 18.93 to a gain of roughly 16.7% in two sessions. IAU collapsed to $84.70, down $2.67 or 3.06%, with a 3M-share, $258M print at $85.92 carrying a 165.14x RS and a rank of #15 all-time. That is the largest print IAU has seen since March 12, and it landed not at a support shelf but in the middle of a gap -- the kind of ticket that reads as forced selling rather than informed buying. The IAU level table confirms the damage: the $85.90 level holds $261M at a 1.24x RS and 78.95th percentile, dated from January 16 through March 20. Price sliced through it and kept going, which means the level was not absorbed but overwhelmed.
The pattern recognition here is straightforward. When a leveraged inverse product prints a top-10 all-time trade at its highest-conviction volume level while the underlying long instrument is making new highs on heavy flow, the smart money is positioning for a reversal before the crowd knows one is coming. The GLL #7 print at 18.93 was the signal. The IAU #23 print at $91.52 on the same day was the crowd leaning the other way. Within 48 hours, the leveraged short had gained nearly 17% and the long was down over 7% from its highs. The entry was the GLL print itself -- 18.93, with invalidation below the 18.90 level where $12.3M of structural support sat. The first target was the 20.80 level, the #6 ranked shelf at $10.5M. The exit signal was Friday’s IAU #15 print at 85.92, which confirmed the liquidation phase was in full force and the easy money on the short had been made.
This is what informed capital looks like when it moves ahead of a turn. It does not announce itself. It places a single, oversized ticket at a price that matters, in an instrument the crowd is not watching, and waits.

Market Intelligence Report
A desk-grade synthesis of institutional positioning and market structure—unpacking the flows, levels, and emerging themes that shaped the week, and translating them into a model portfolio built the same way professional desks prepare for the week ahead.
MIR Part 1: The Backdrop
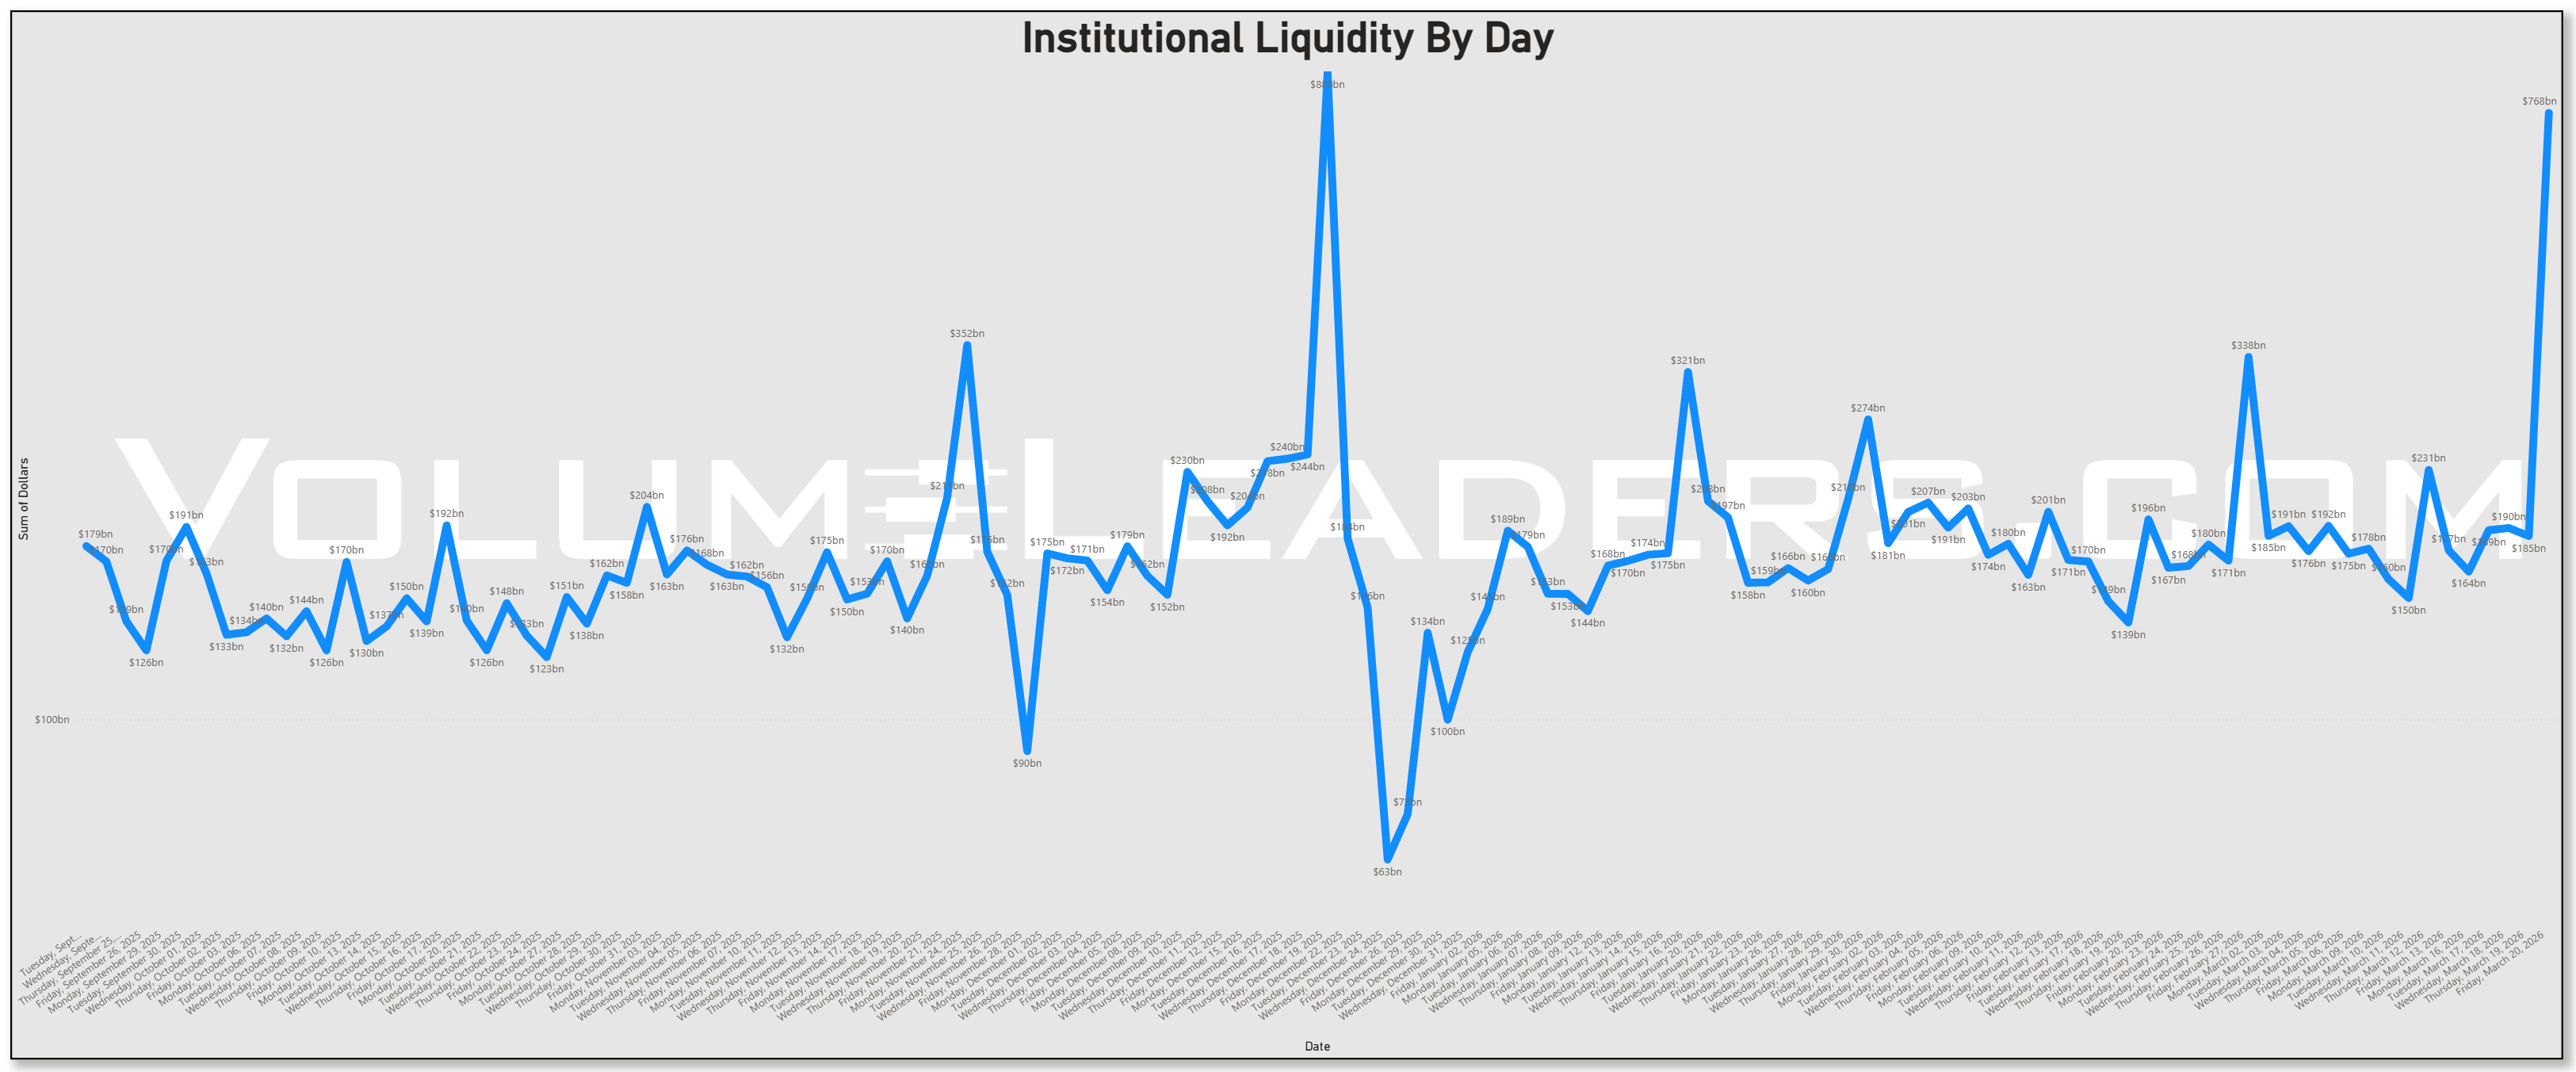
The tape this week has the feel of a market that is still willing to participate, but only selectively, and with far less tolerance for disorder beneath the surface. The broad backdrop is not outright hostile to risk, but it is no longer uniformly cooperative either. Participation is narrowing, volatility is no longer compressing in a way that invites aggressive expression, and the burden of proof has shifted back onto individual areas rather than the index itself. That subtle change in tone matters, because it reframes everything that follows. The flows you are seeing are not indiscriminate buying, they are increasingly deliberate positioning and institutions finally showed up big after 3 months.
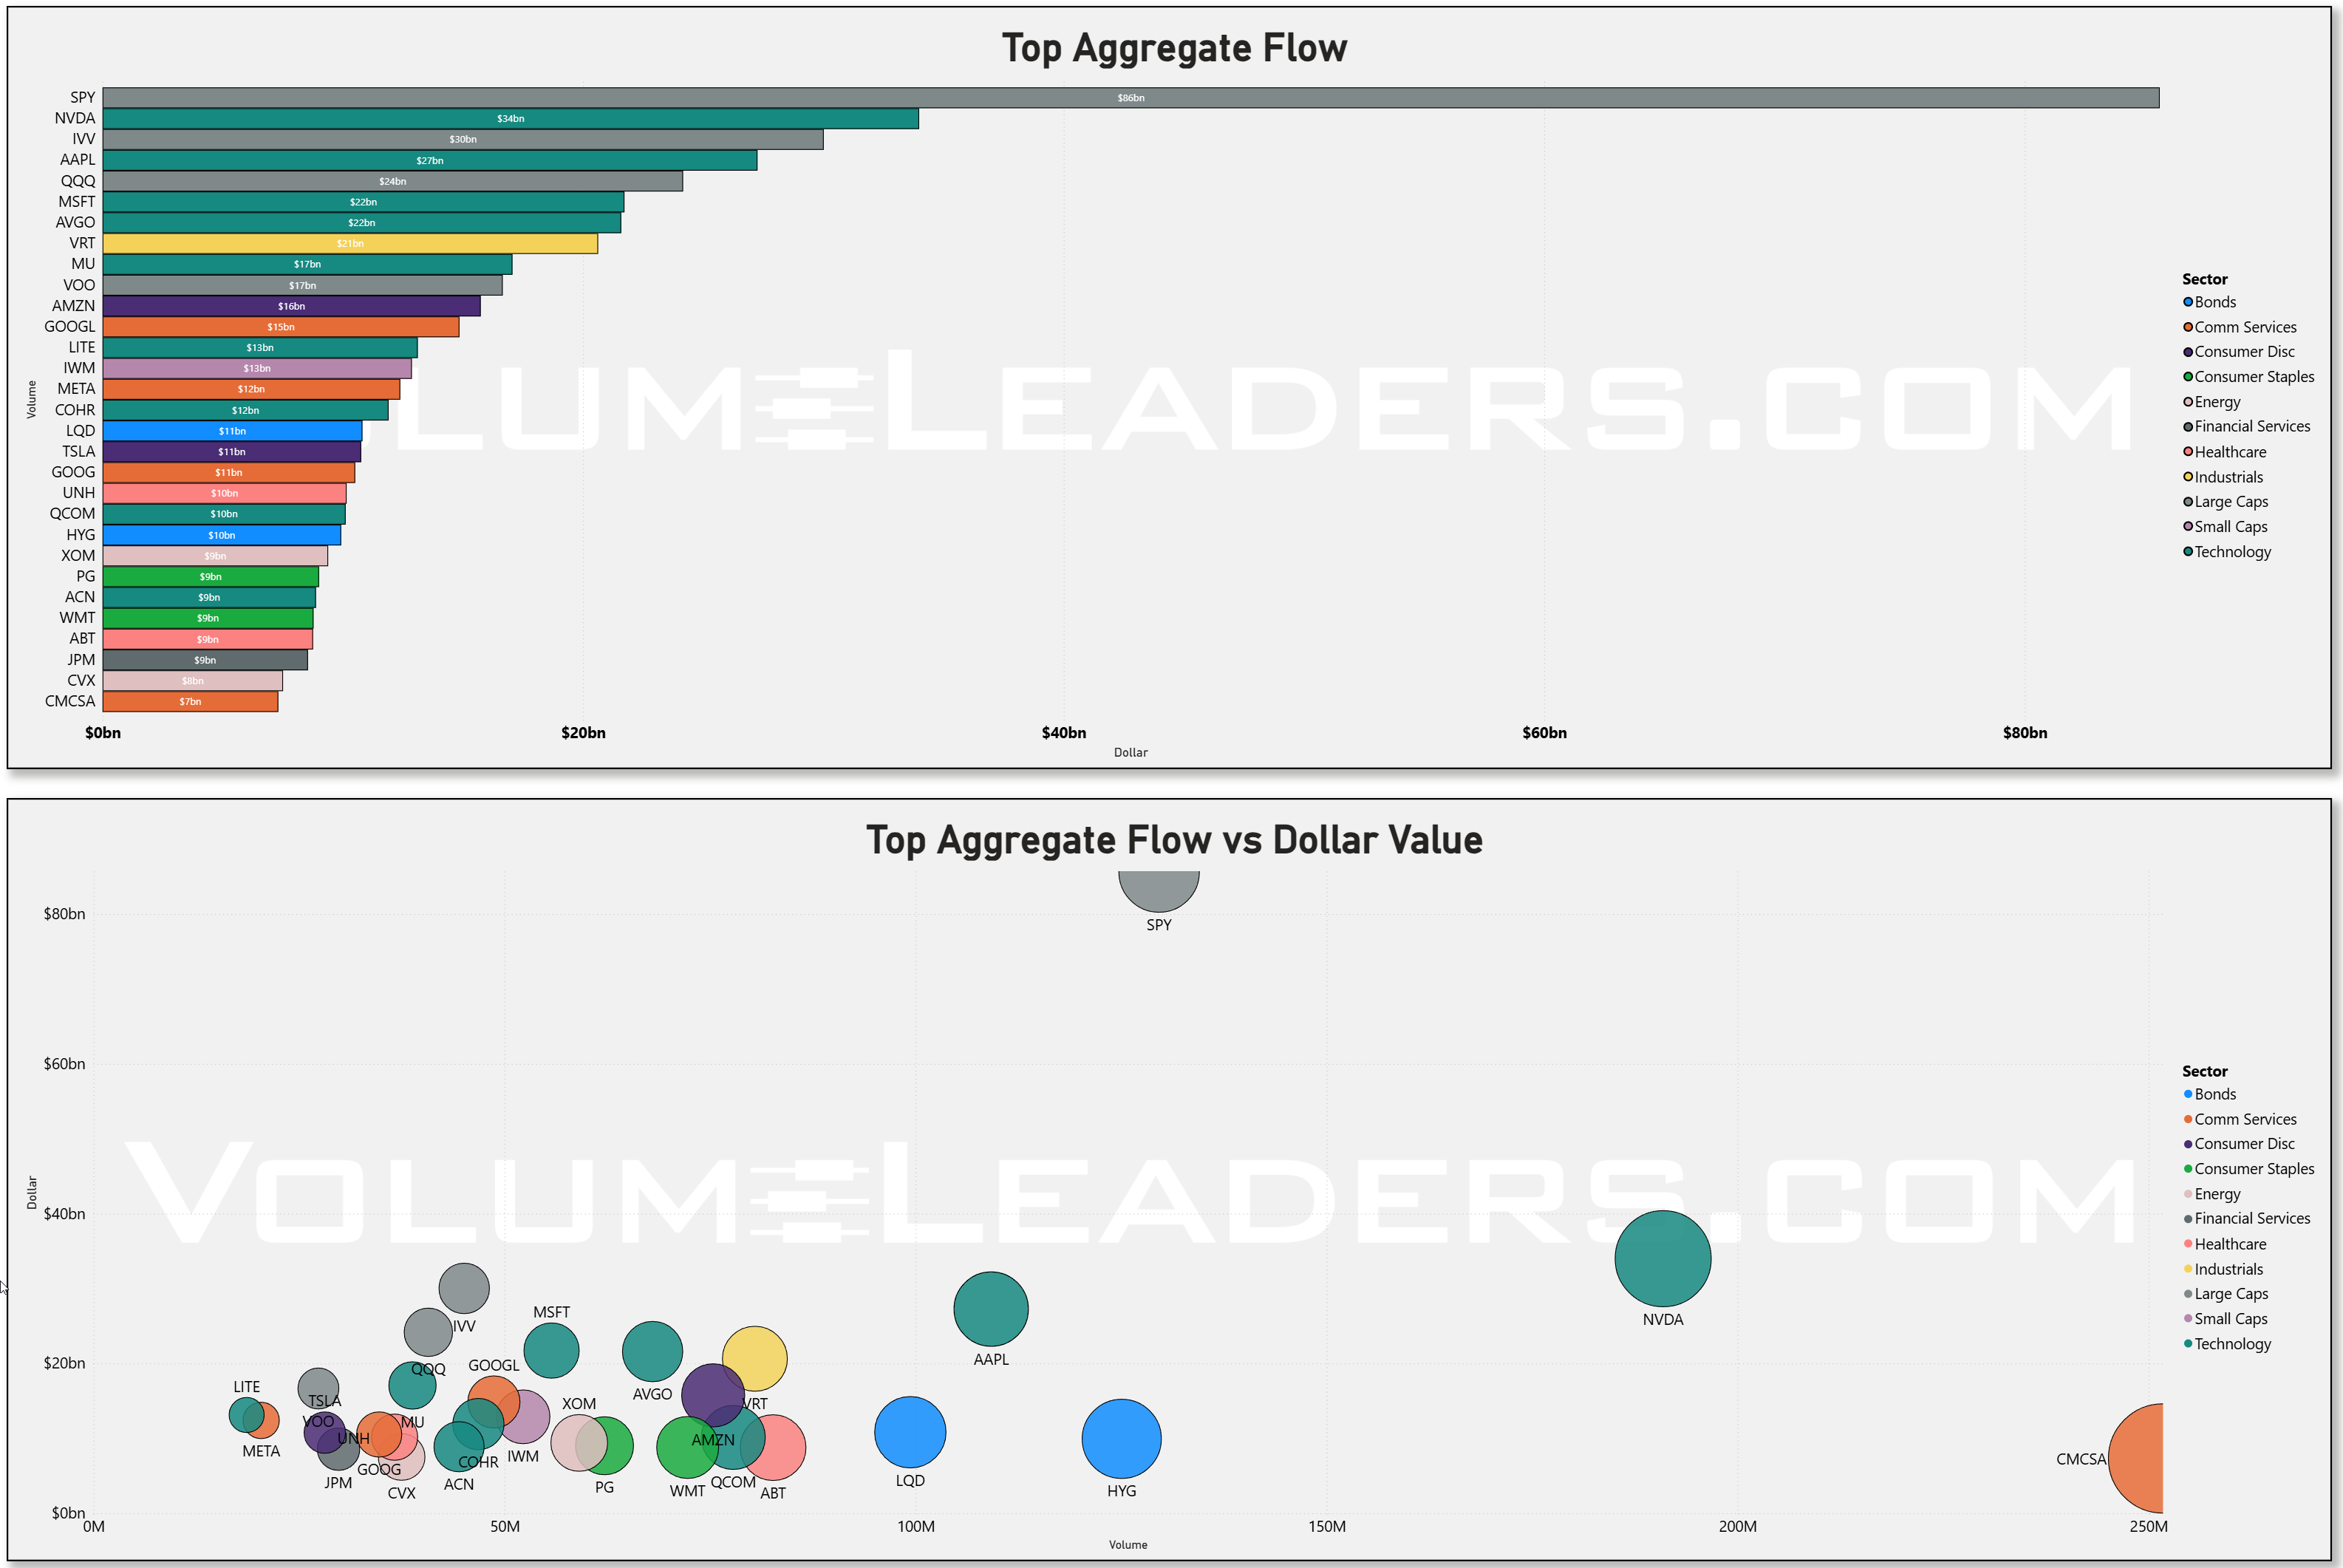
Start with the index layer, because that is where institutions declare intent most cleanly. SPY at roughly $86bn sits well above everything else, and it is not particularly close. QQQ and IVV follow in the $20bn to $30bn range, with VOO not far behind. That cluster tells you two things at once. First, the market is still being expressed through the index as the primary vehicle, which is consistent with a regime that is not yet confident enough to fully decentralize into single-name risk. Second, the dispersion beneath that index layer is widening, which is why the rest of the flows matter more than usual.
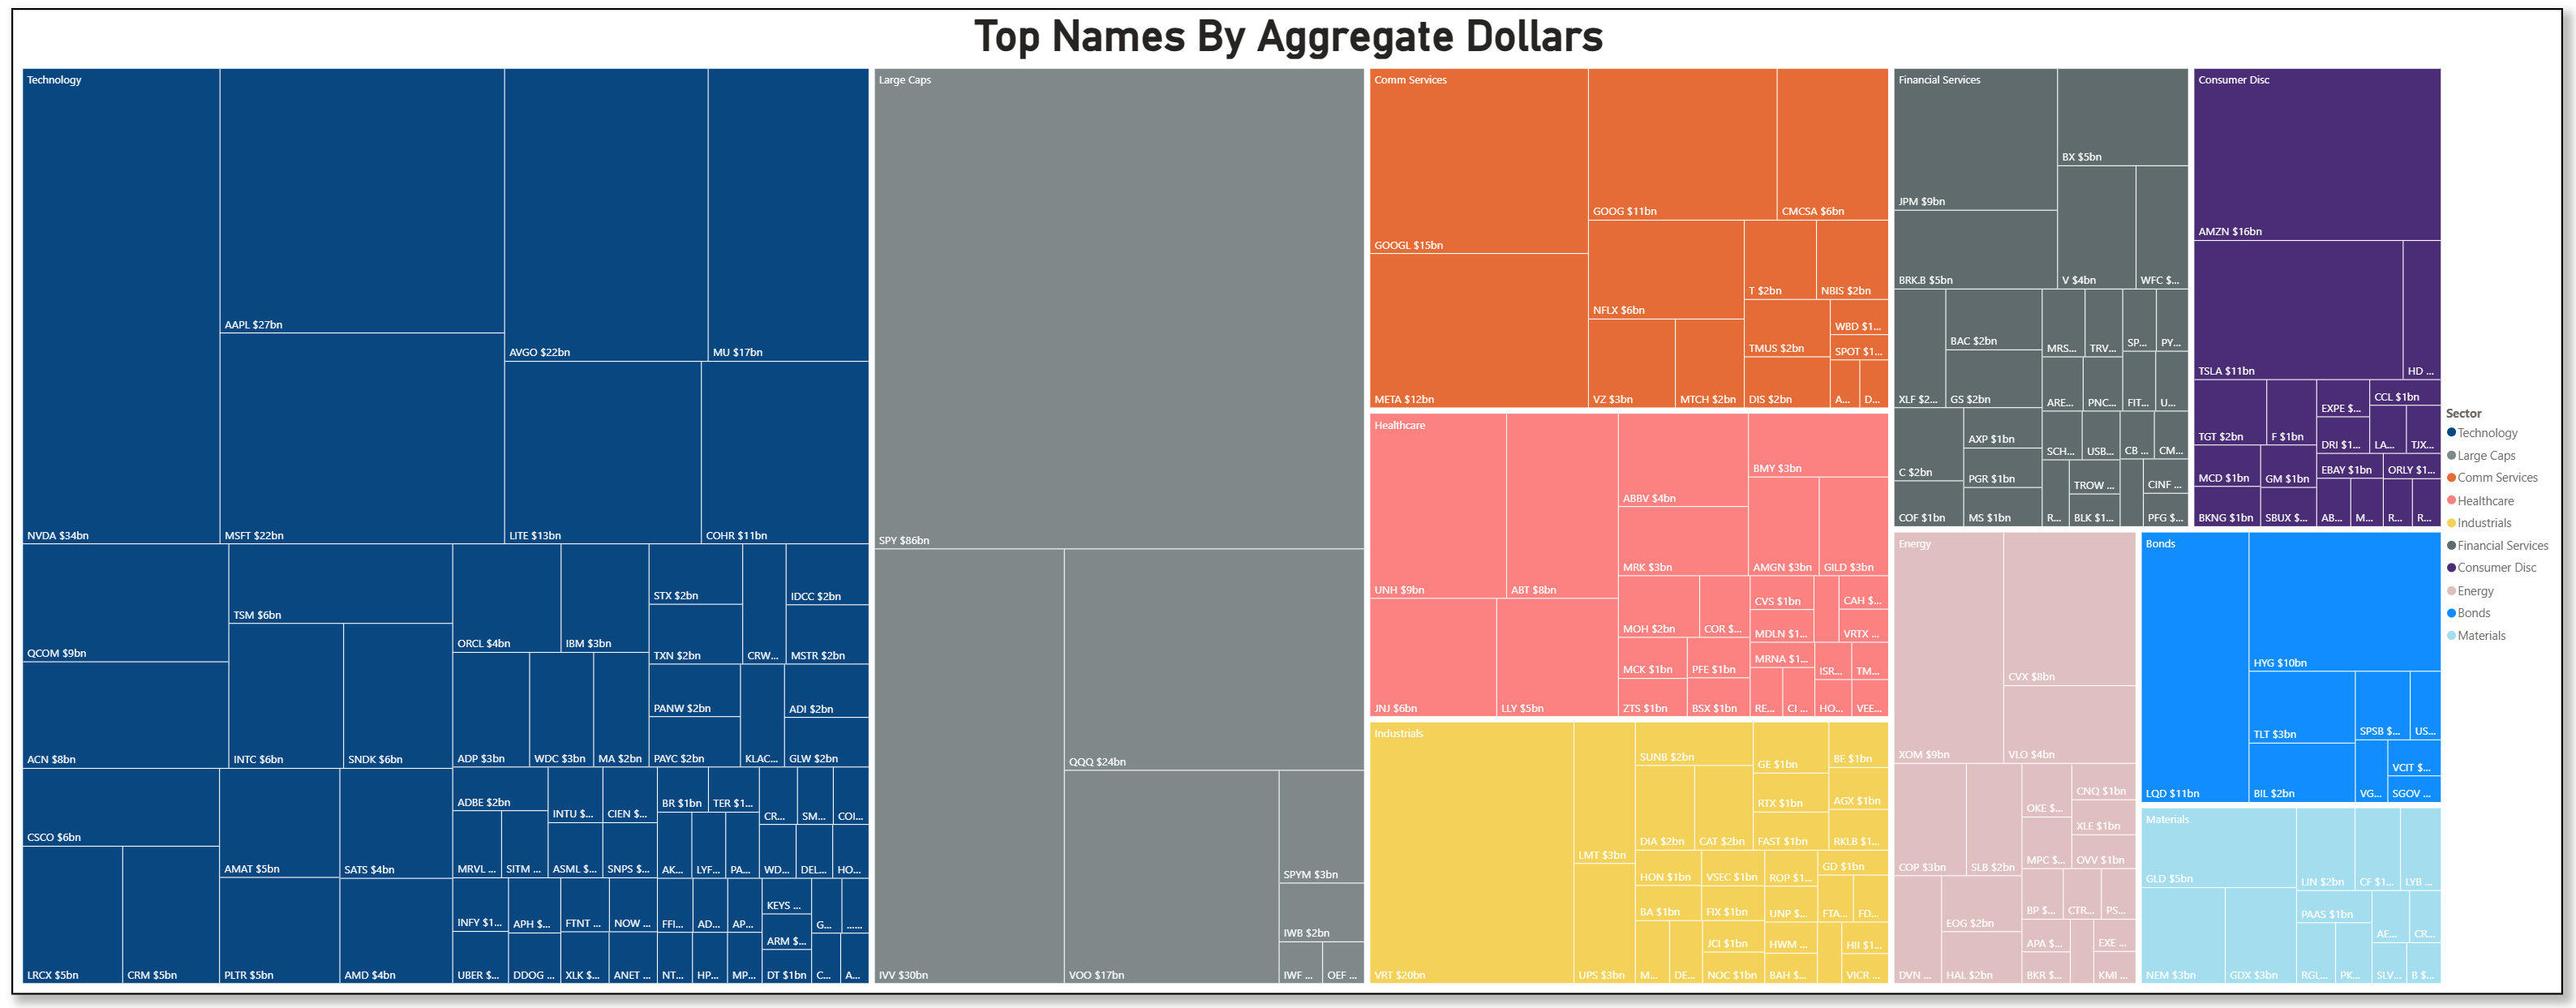
Technology remains the gravitational center of capital. NVDA around $34bn, AAPL near $27bn, MSFT and AVGO both in the low $20bn range, and then a long tail of semis and infrastructure names filling in behind them. The treemap reinforces this dominance. Technology is not just leading, it is absorbing a disproportionate share of incremental dollars. But the character of that flow is evolving. Earlier phases of leadership tend to be broad and forgiving. This week feels more like maintenance of leadership than expansion of it. You still see size going through the leaders, but you do not see the same degree of new participation cascading down the cap spectrum.
That aligns with the underlying participation picture. Leadership is still intact, but it is not accelerating. The momentum layer is flattening rather than expanding. When that happens, capital tends to consolidate into what it already trusts. NVDA, AAPL, MSFT, AVGO, those flows read less like discovery and more like reinforcement. The market is choosing to stay involved, but it is doing so through familiarity rather than exploration.
Large caps as a category also stand out, with SPY dominating that bucket and other broad exposures like QQQ and VOO reinforcing it. The implication is that capital is still comfortable expressing risk at the top of the capitalization spectrum, but it is not yet rotating meaningfully into smaller or more idiosyncratic exposures. That is consistent with a regime where volatility is not low enough to invite aggressive expansion, but not high enough to force de-risking either. It is a middle state, and middle states tend to favor concentration.
Where things get more interesting is when you step away from the index and megacap layer and look at sector distribution week over week. The data shows a clear step function higher into the end of the week. Friday’s prints are materially larger across almost every sector, with Technology pushing above $200bn, Industrials above $80bn, Healthcare above $70bn, and Financials close behind. That is not random. That is OPEX-driven repositioning layered on top of an already selective environment. Options expiration tends to force rebalancing, hedging adjustments, and roll activity, and you are seeing that expressed in size.
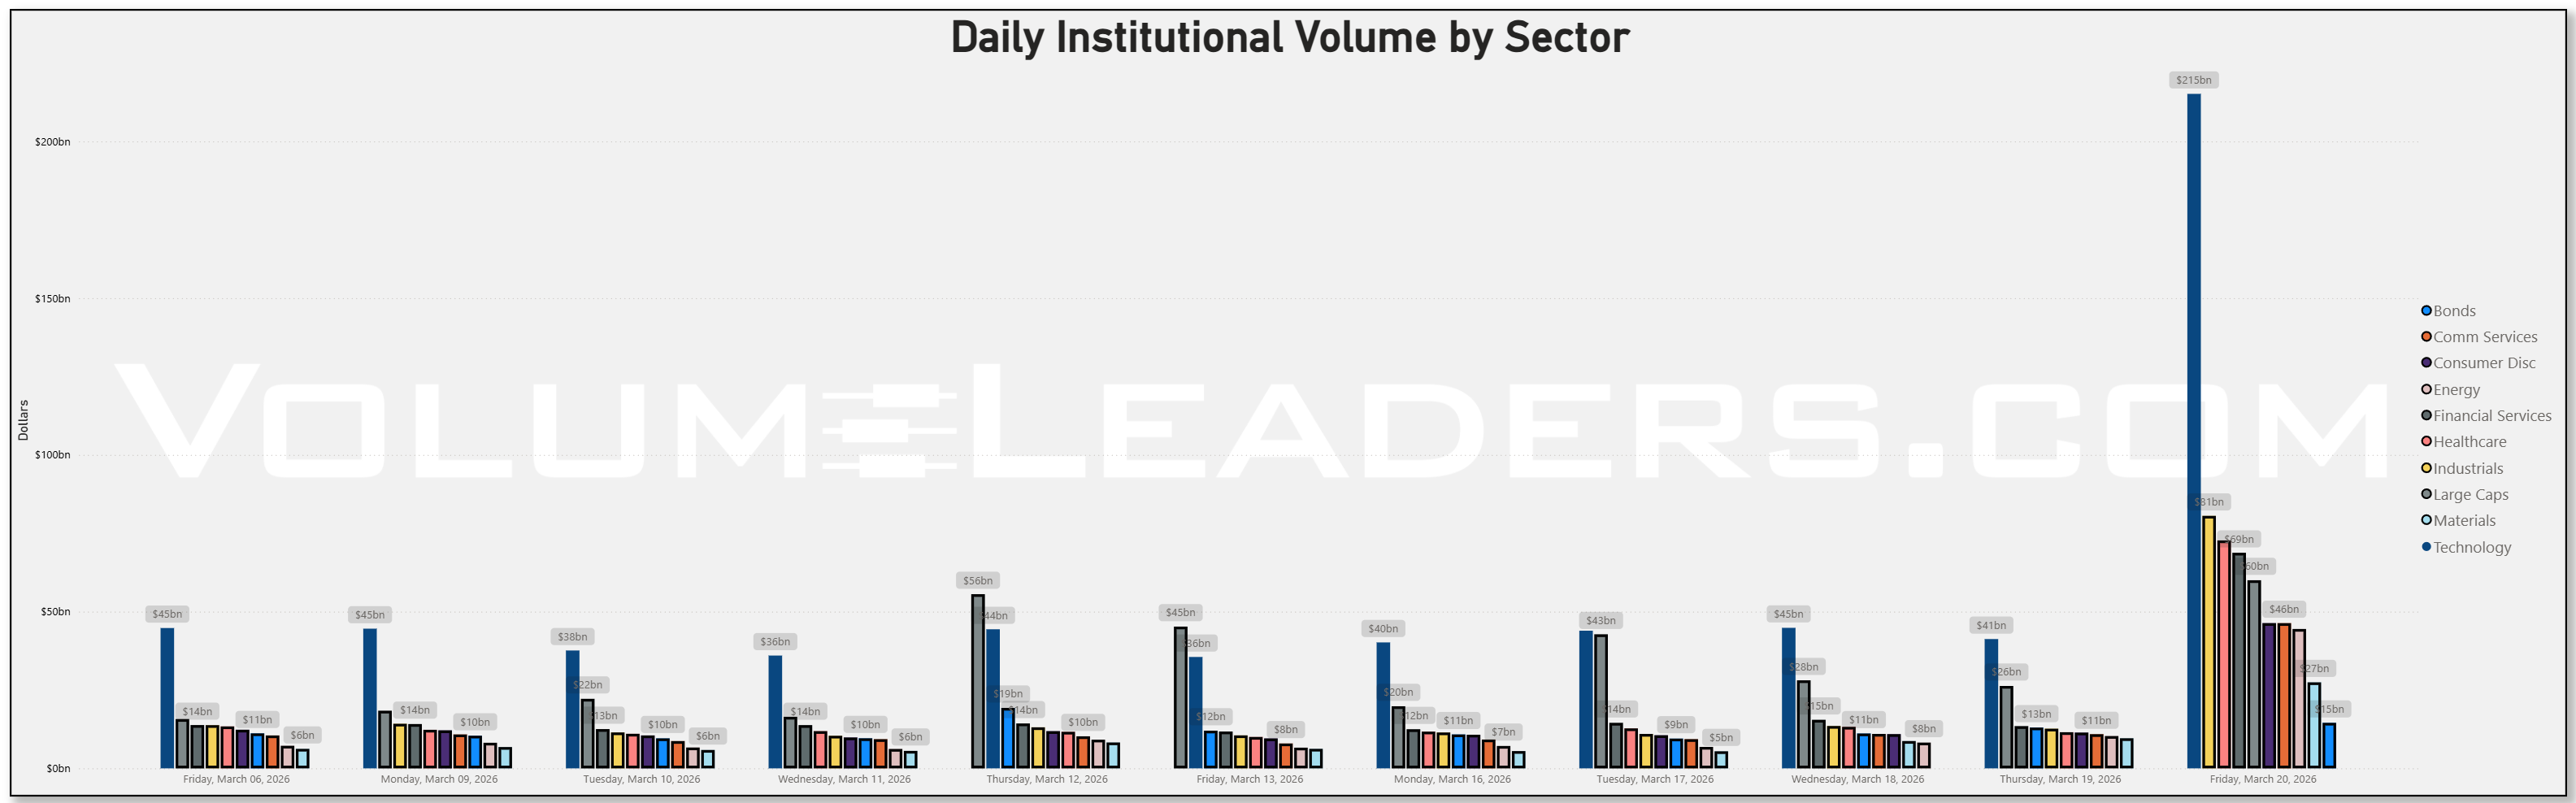
But the relative changes matter more than the absolute spike. Communication Services and Consumer Discretionary both show meaningful expansion into the back half of the week, with names like GOOGL, META, AMZN, and TSLA showing up prominently. That suggests a willingness to lean back into growth-adjacent exposure, but again, through established leaders rather than new entrants. Financials also firm up, with JPM, BAC, and BX appearing consistently in the top flows. That is notable because Financials had been lagging participation earlier. The re-emergence of flow there points to a market that is at least probing for broader confirmation, even if it has not fully committed to it yet.
Energy, by contrast, looks more like maintenance than expansion. XOM and CVX show up, but the flows are comparatively smaller and less dynamic. Materials are similar, present but not driving the conversation. That bifurcation is important. It tells you where capital is choosing not to go with urgency, which is often as informative as where it is going.
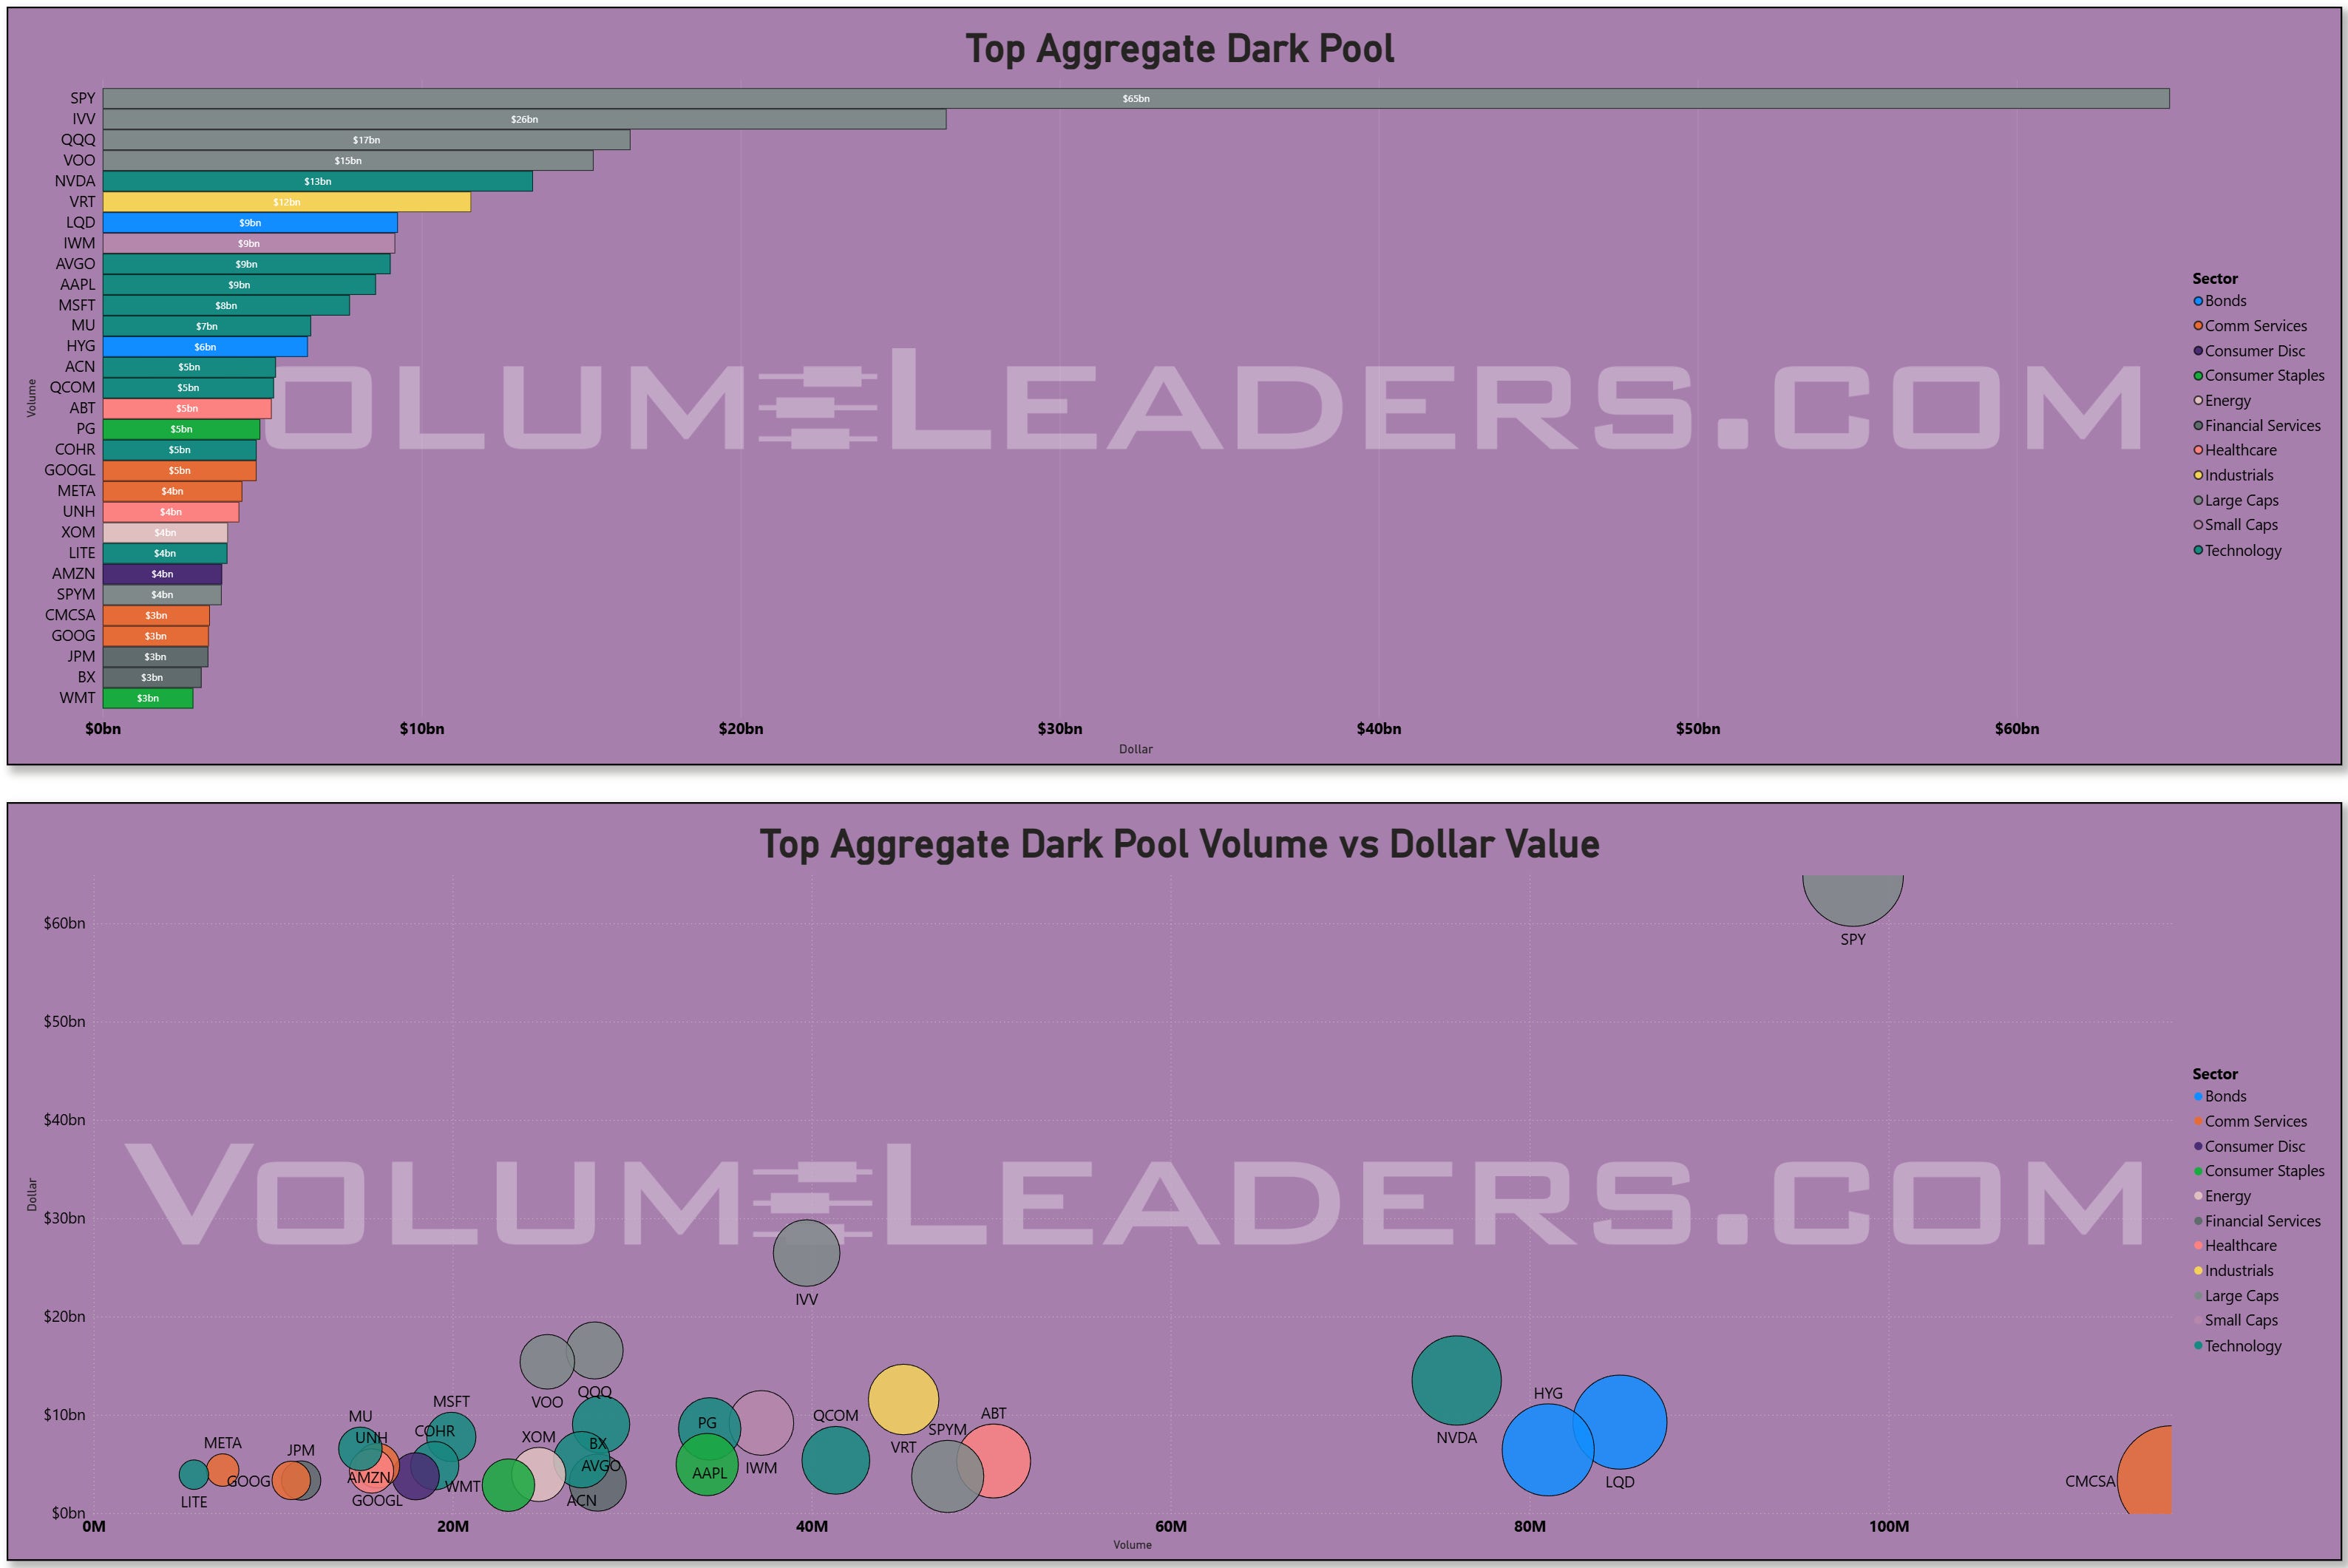
The dark pool layer adds another dimension to this. SPY again dominates at roughly $65bn, followed by IVV, QQQ, and VOO. That is classic institutional positioning. When you see that kind of size in the dark pool, it is less about immediacy and more about intent. It is accumulation and redistribution over time, not tactical expression. NVDA, AAPL, MSFT, and AVGO all appear here as well, reinforcing the idea that the leadership complex is still being supported beneath the surface.
What stands out is that the dark pool flows are heavily skewed toward the same names and structures that dominate the lit tape. There is not a hidden rotation occurring out of sight. The visible leadership is being confirmed, not contradicted. That alignment between lit and unlit flow is a sign of coherence in positioning. When those diverge, you worry about distribution. When they align, you are more likely looking at continuation or at least stabilization.
The sweep activity, however, tells a slightly different story. LQD and HYG sit at the top, with LQD around $2.7bn and HYG not far behind. That is not equity risk, that is credit expression. Sweeps are the most tactical of the three lenses, and seeing that kind of activity in corporate bond ETFs suggests active hedging and short-term positioning around rates and spreads. It fits with the broader macro backdrop, where uncertainty around policy path and growth expectations remains elevated. The presence of IAU and other defensive or alternative exposures in the sweep data reinforces that there is still a demand for protection, even as equity indices hold up.
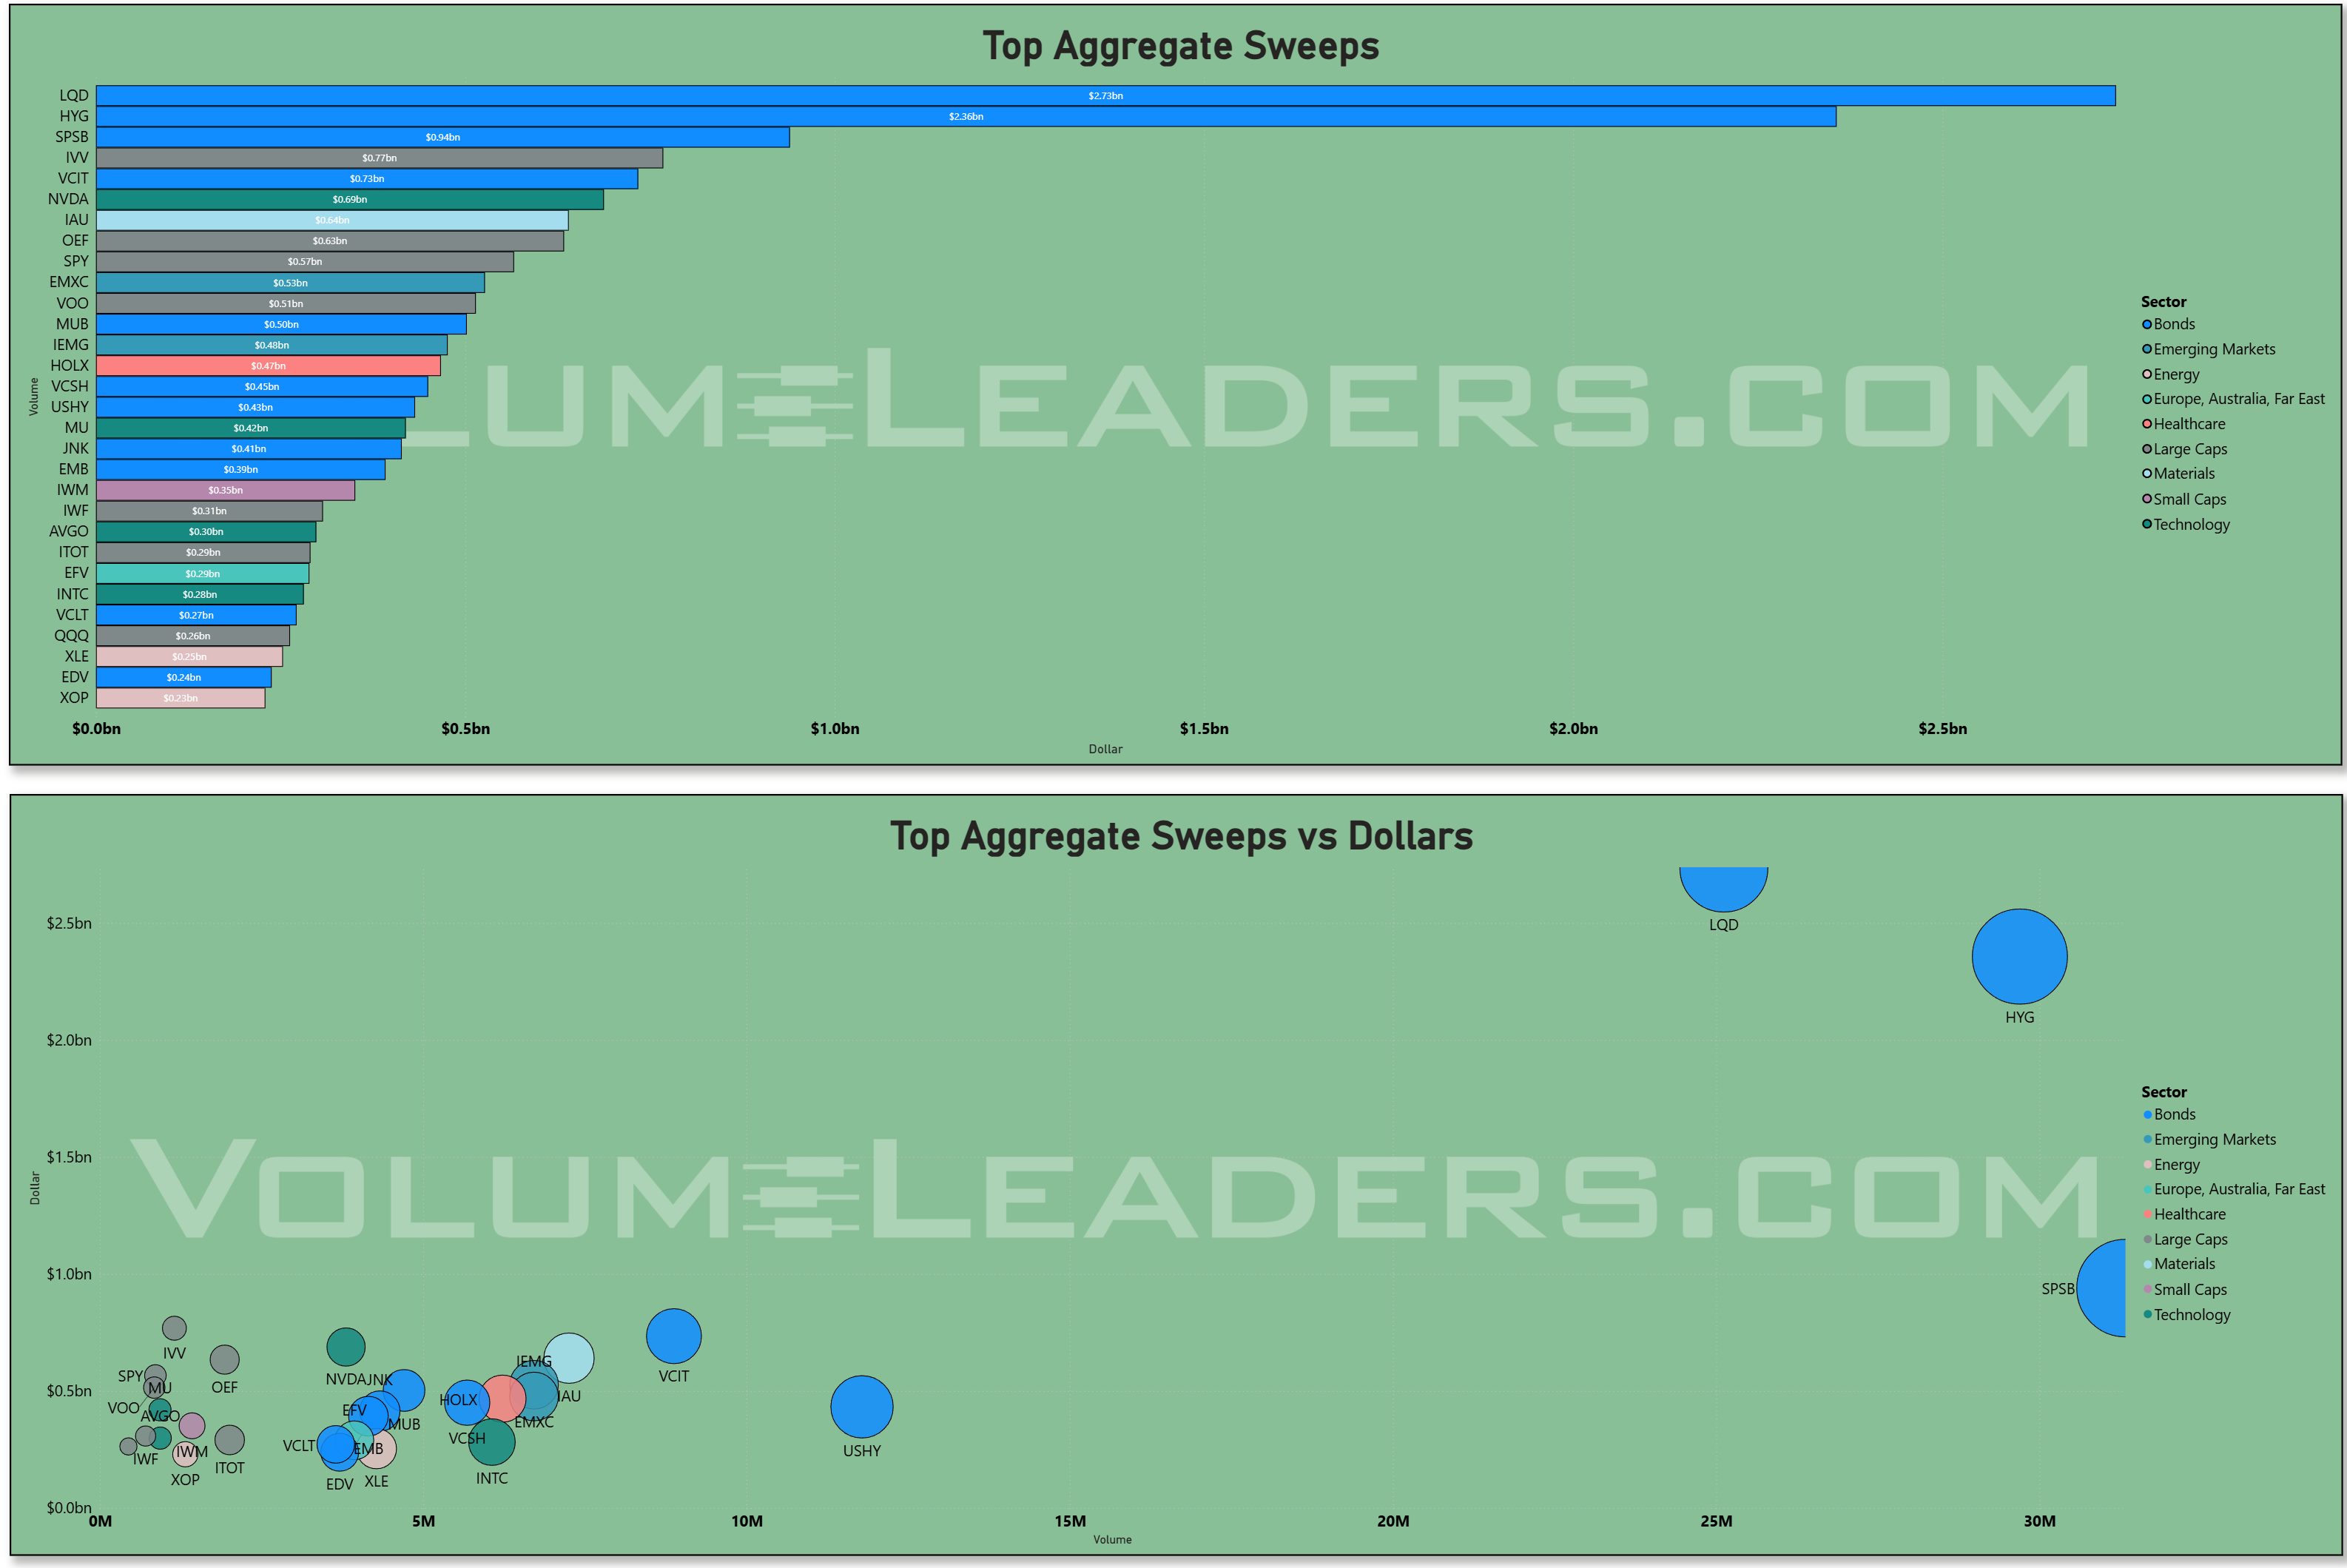
That duality is the key to understanding this tape. On one hand, equity flows into SPY, QQQ, and the megacap leaders suggest that capital is not fleeing risk. On the other hand, sweep activity in credit and defensive proxies suggests that capital is not fully comfortable either. It is expressing risk, but with a hedge.
The volume versus dollar scatter plots help clarify this further. SPY sits alone in the upper right, massive dollar value with massive volume. NVDA is the next most prominent, high dollar value but with a different volume profile, reflecting the price level. Names like CMCSA show large volume relative to dollar value, which can indicate more tactical trading rather than outright conviction. Meanwhile, bond ETFs like LQD and HYG show high volume with meaningful but smaller dollar values, consistent with their role as hedging instruments.
All of this feeds back into the broader condition of the market. Participation is present but not expanding aggressively. Volatility is not fully cooperative, acting more as a constraint than a tailwind. Relative strength is concentrated in Technology and select growth-adjacent areas, with tentative re-engagement in Financials and Communication Services. Defensive and rate-sensitive instruments are seeing tactical flows, suggesting underlying caution.
In that context, the flows this week read less like a directional bet and more like a recalibration. OPEX has forced positioning adjustments, and institutions are using that liquidity to reinforce what they already own, probe areas of potential expansion, and hedge the parts of the tape that remain uncertain. The result is a market that is still functioning, still liquid, still supported, but increasingly selective.
That selectivity is the message. When capital has to choose, it tells you what it trusts. Right now, it trusts the index, it trusts the megacap leadership, and it is cautiously exploring beyond that, but not yet committing. Until participation broadens and volatility becomes more cooperative, that is likely to remain the defining characteristic of this tape.
MIR Part 2: Individual Names From The Institutional Tape
VolumeLeaders tracks several proprietary signals designed to spotlight names drawing significant institutional interest. Below, we’ve surfaced the latest results and analyzed them to highlight emergent themes. If any of the sectors, narratives, or positioning trends resonate, the names mentioned here offer a strong starting point for deeper research and watchlist consideration.
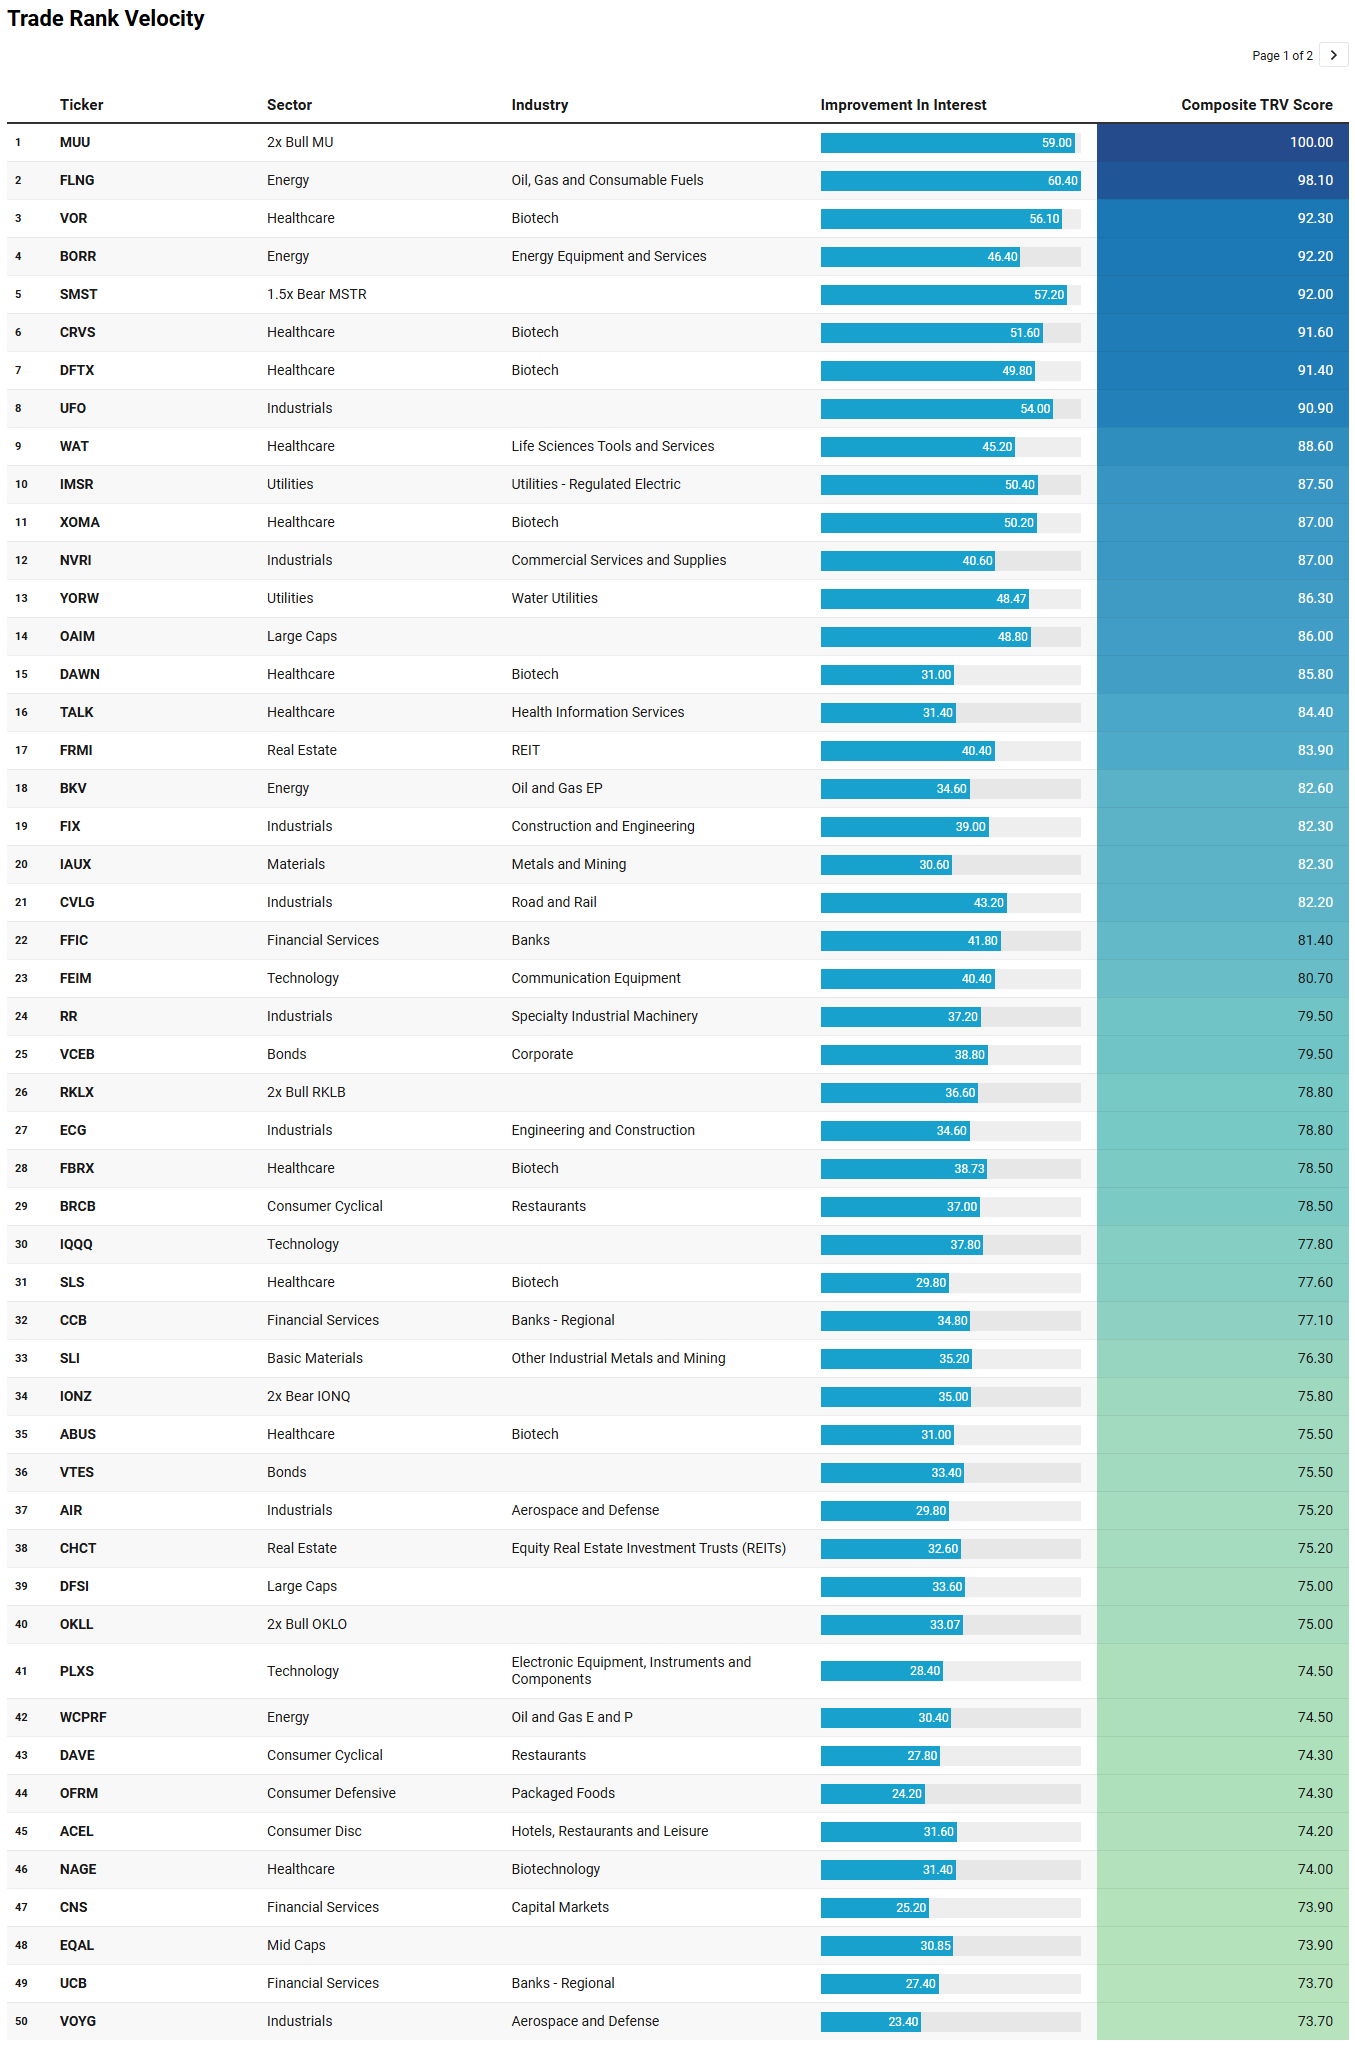
VL Trade Rank Velocity™ (TRV)
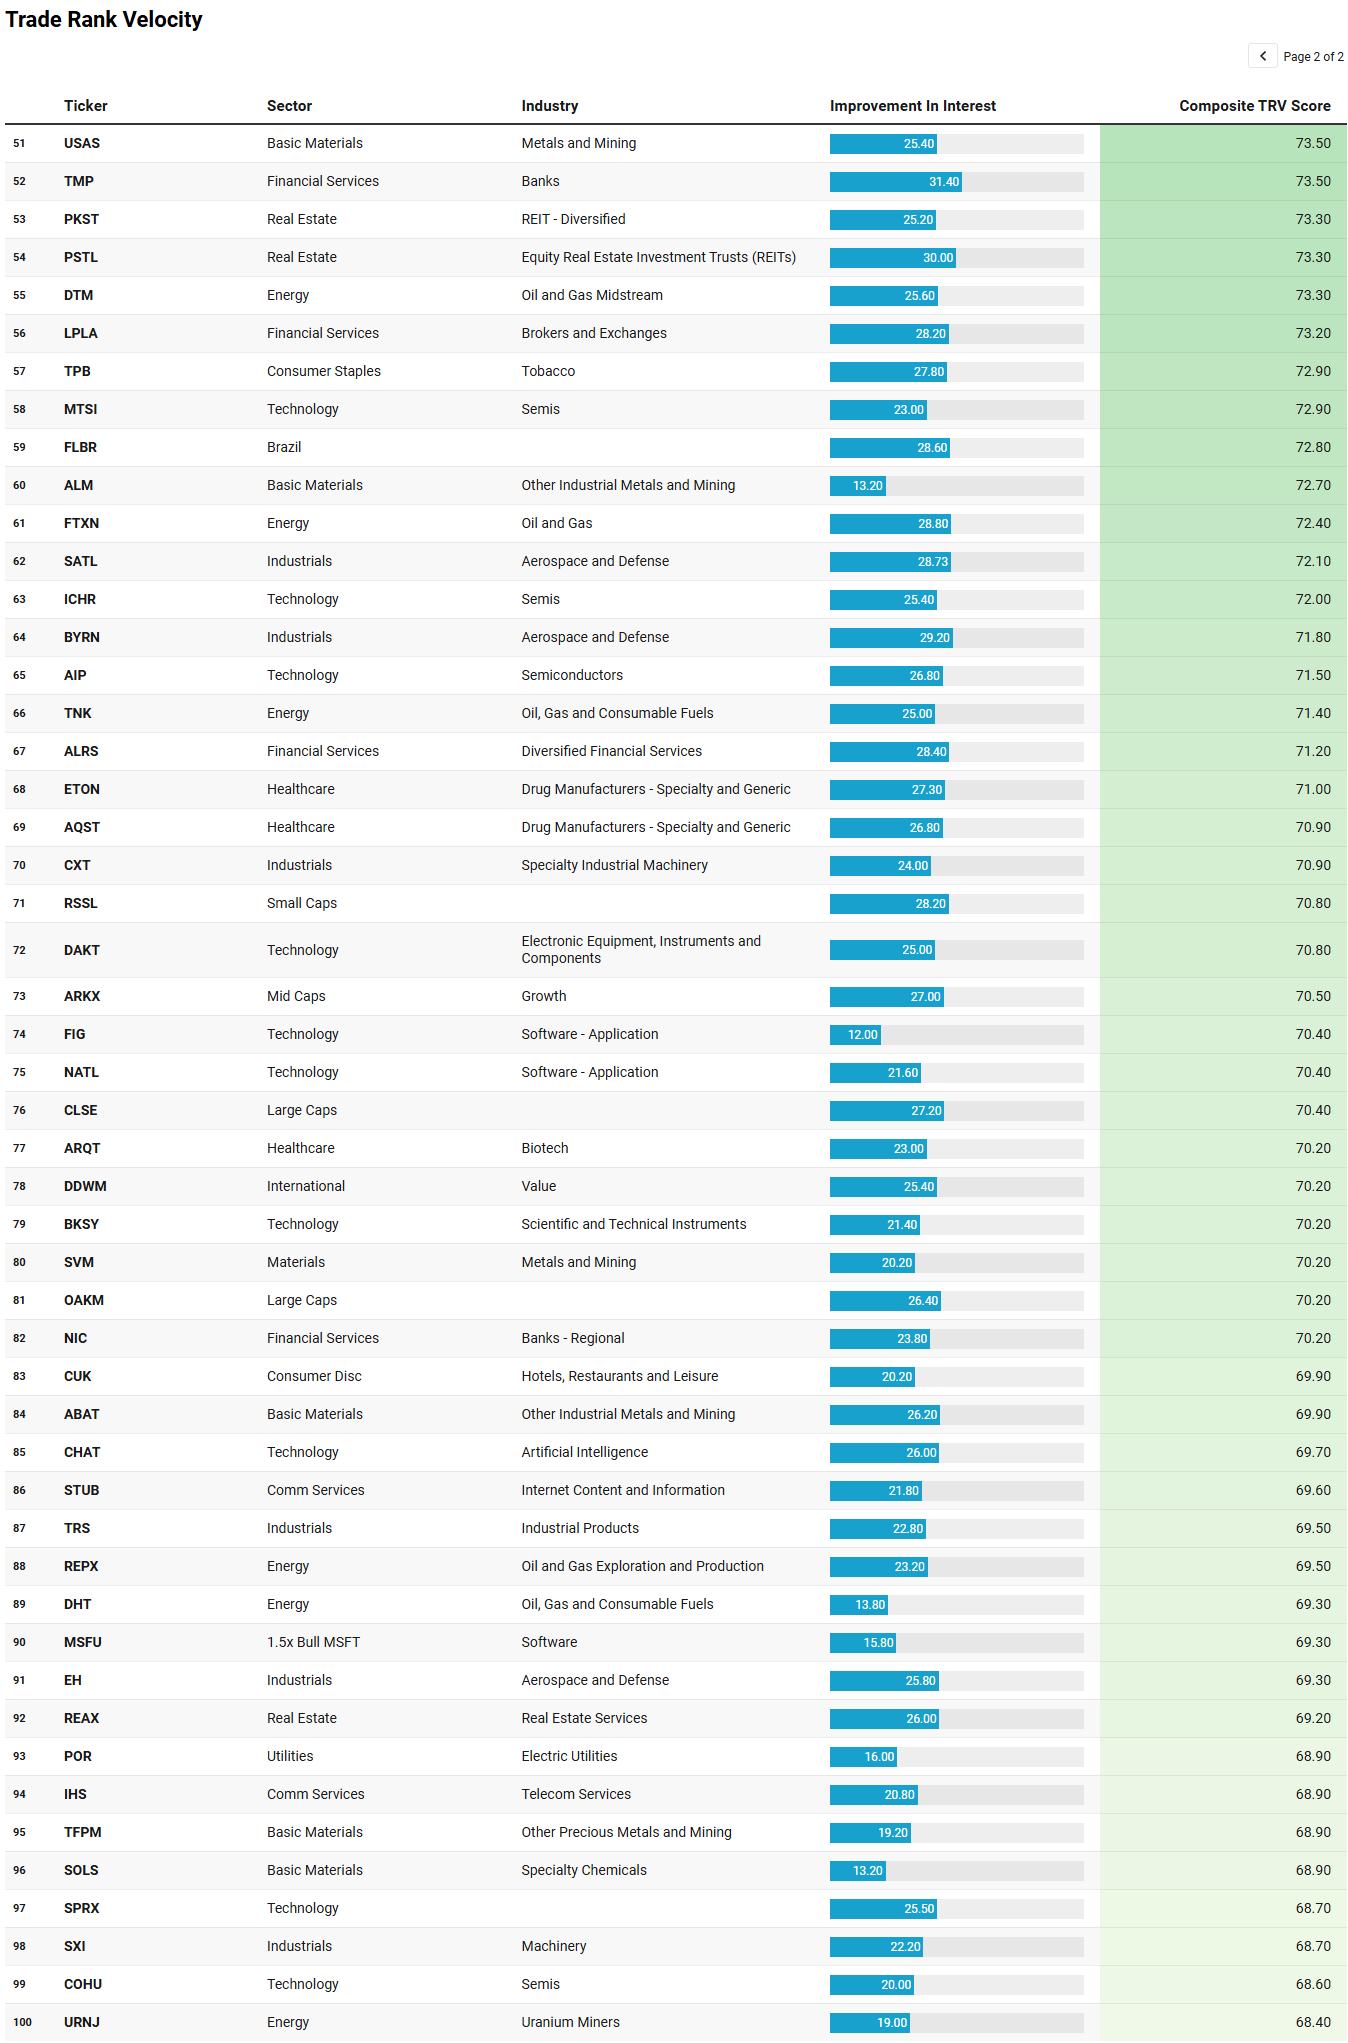
TRV is a proprietary metric that measures the recent acceleration or deceleration in institutional trading activity for a given stock by comparing its average trade rank over the past few days to its average in recent weeks. A sharp improvement in TRV typically reflects a notable shift in positioning, often accompanied by sustained trade activity, suggesting institutions are actively engaging with the name and that intensity of activity is rising. This often precludes meaningful price or narrative shifts. This isn’t a buy-list or sell-list; it’s meant to draw your eyes to names where institutions are putting money to work.
What jumps out immediately is that the watchlist is not contradicting the broader flow story from the week, it is sharpening it. The big tape told us institutions still prefer liquid index exposure, megacap technology, and selective re-engagement rather than a full risk-on broadening. This TRV list shows where that selective curiosity is beginning to leak beneath the surface.
The first theme is that participation is widening at the edges of leadership, but in a very particular way. Technology is still here, though not just through the usual megacap proxies. You can see it spilling into semis and adjacent infrastructure with MTSI, ICHR, AIP, COHU, PLXS, DAKT, FEIM, and even leveraged expressions like MUU and MSFU. That fits the earlier read that capital still trusts the technology complex, but is starting to explore second-order beneficiaries rather than only hiding in NVDA, AAPL, and MSFT. This is not yet broad speculative excess, but it is a clear sign that leadership capital is testing depth.
The second theme is a surprisingly strong industrial and aerospace cluster. UFO, AIR, VOYG, SATL, BYRN, EH, TRS, SXI, FIX, ECG, CVLG, and RR suggest that capital is probing physical economy, infrastructure, logistics, and defense-adjacent names. That fits well with the prior narrative that the market is cautiously exploring beyond the core leadership without fully abandoning quality. Industrials did show up as a meaningful secondary area in the weekly aggregate flow, and this list suggests that beneath the headline index activity there is real stock-level sponsorship developing.
Healthcare is the third major theme, but it is clearly a stock picker’s healthcare tape, not a broad defensive stampede. The concentration in biotech and specialty pharma names like VOR, CRVS, DFTX, XOMA, DAWN, SLS, ABUS, ARQT, ETON, and AQST says institutions are looking for idiosyncratic payoff rather than hiding in the sector generally. That reads more like selective alpha hunting than classic safety.
Energy remains present as well, but the composition matters. FLNG, BORR, BKV, WCPRF, DTM, TNK, REPX, DHT, and URNJ suggest a mix of shipping, services, exploration, midstream, and uranium rather than a clean broad-beta oil trade. That supports the earlier point that energy is being maintained, not aggressively embraced. Capital is still willing to engage there, but it is being choosy.
Finally, the bond and utility presence is important. VCEB, VTES, YORW, IMSR, and POR echo the sweep and credit activity we already discussed. Even while institutions are exploring selective growth and industrial expansion, they are still keeping one hand near stability, yield, and defensiveness. That is probably the cleanest takeaway from this list. The tape is not fully risk-off, but neither is it carefree. It is a market rotating with curiosity, not abandon.
VL Institutional Outliers™ (IO)
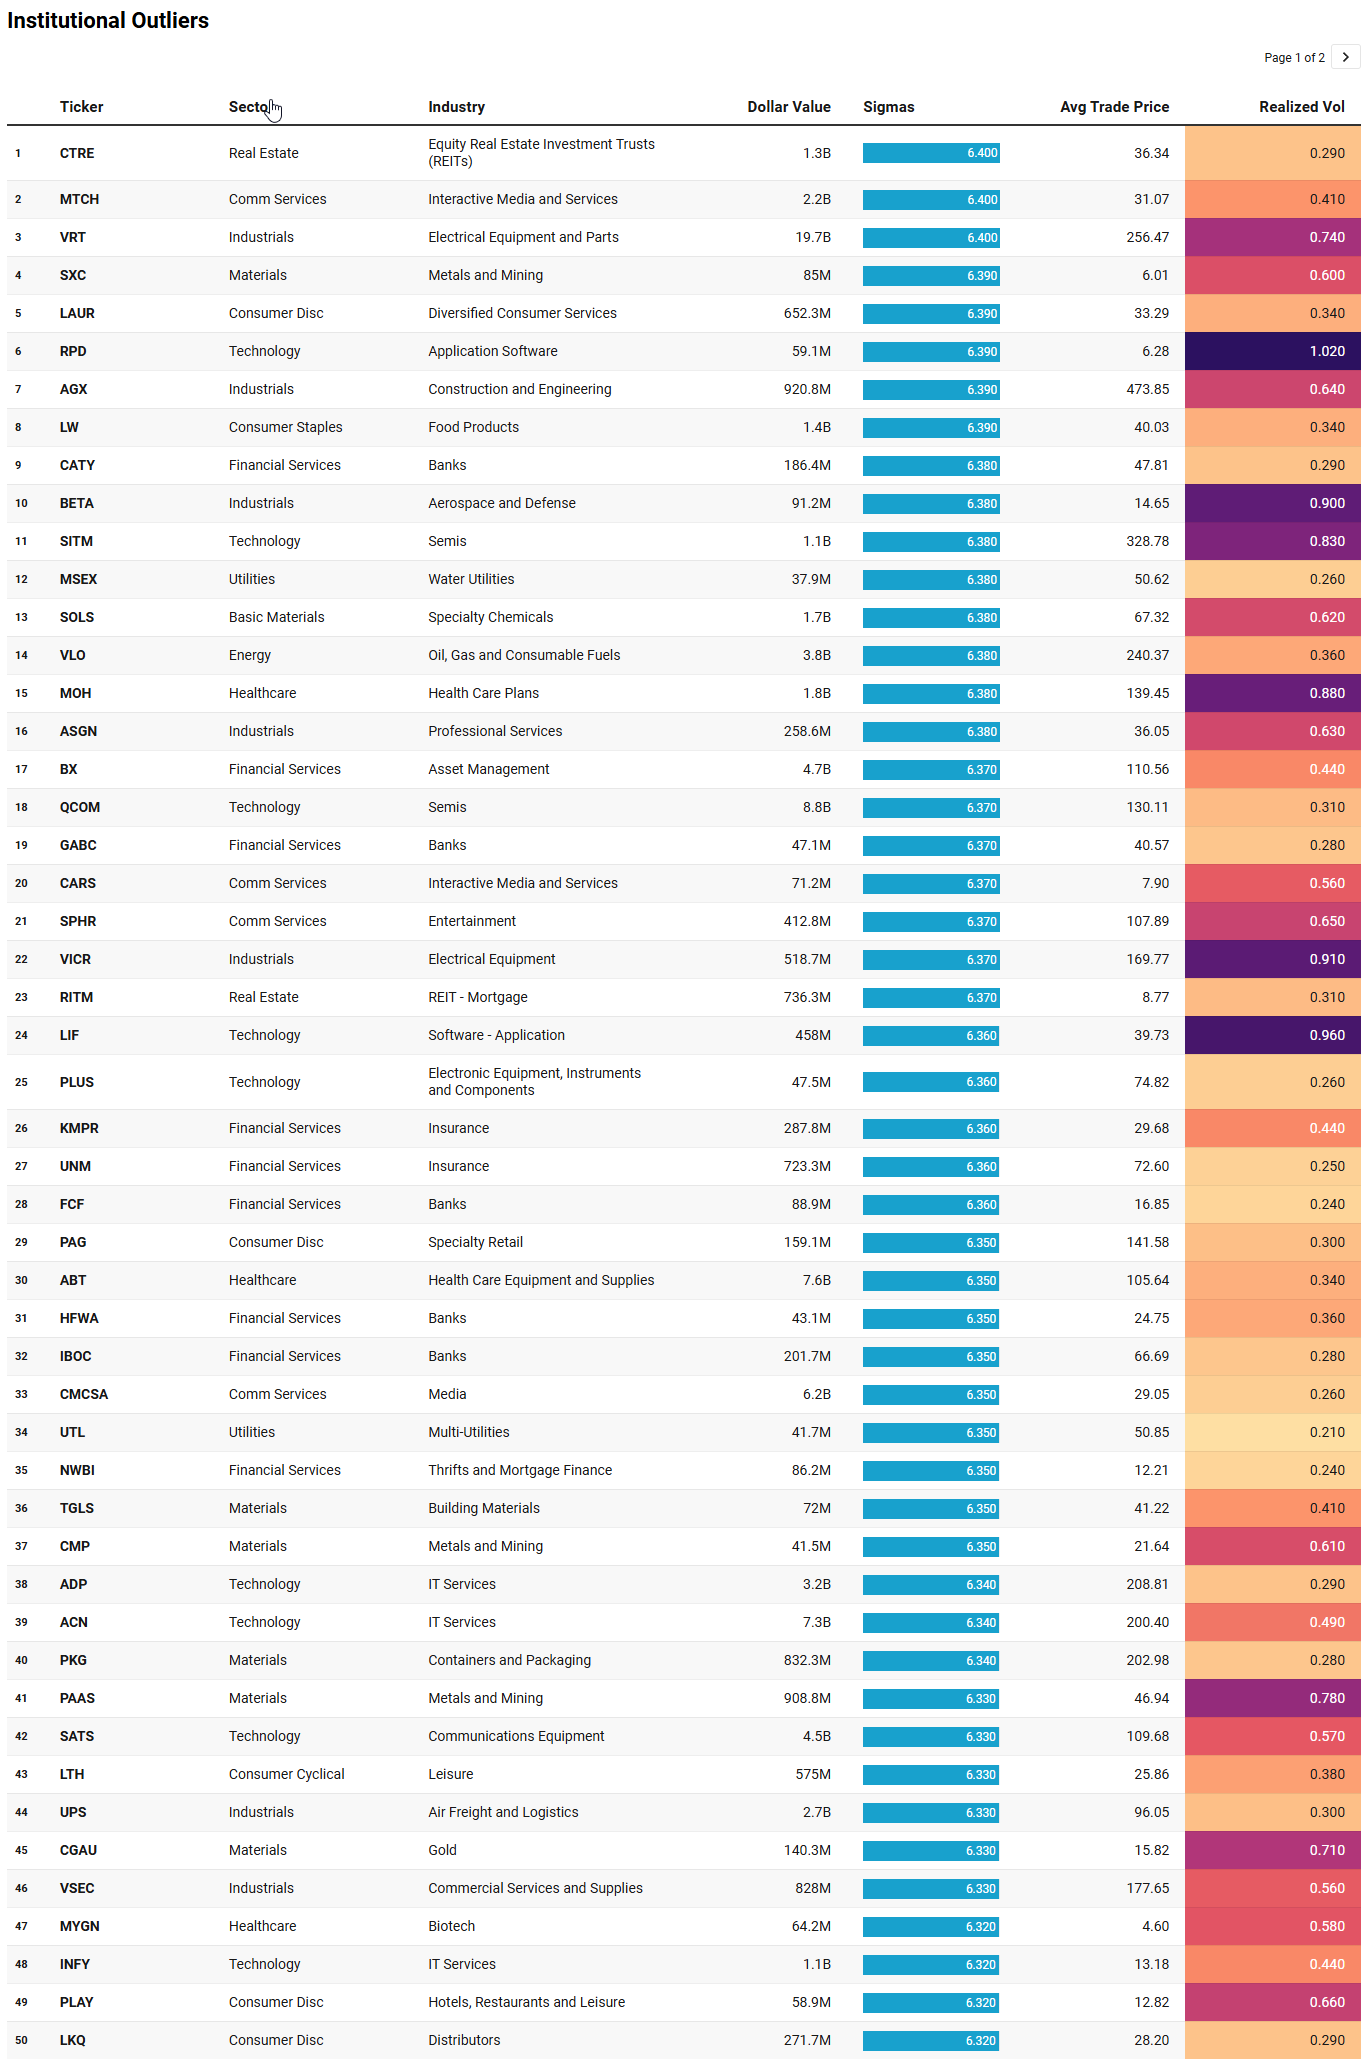
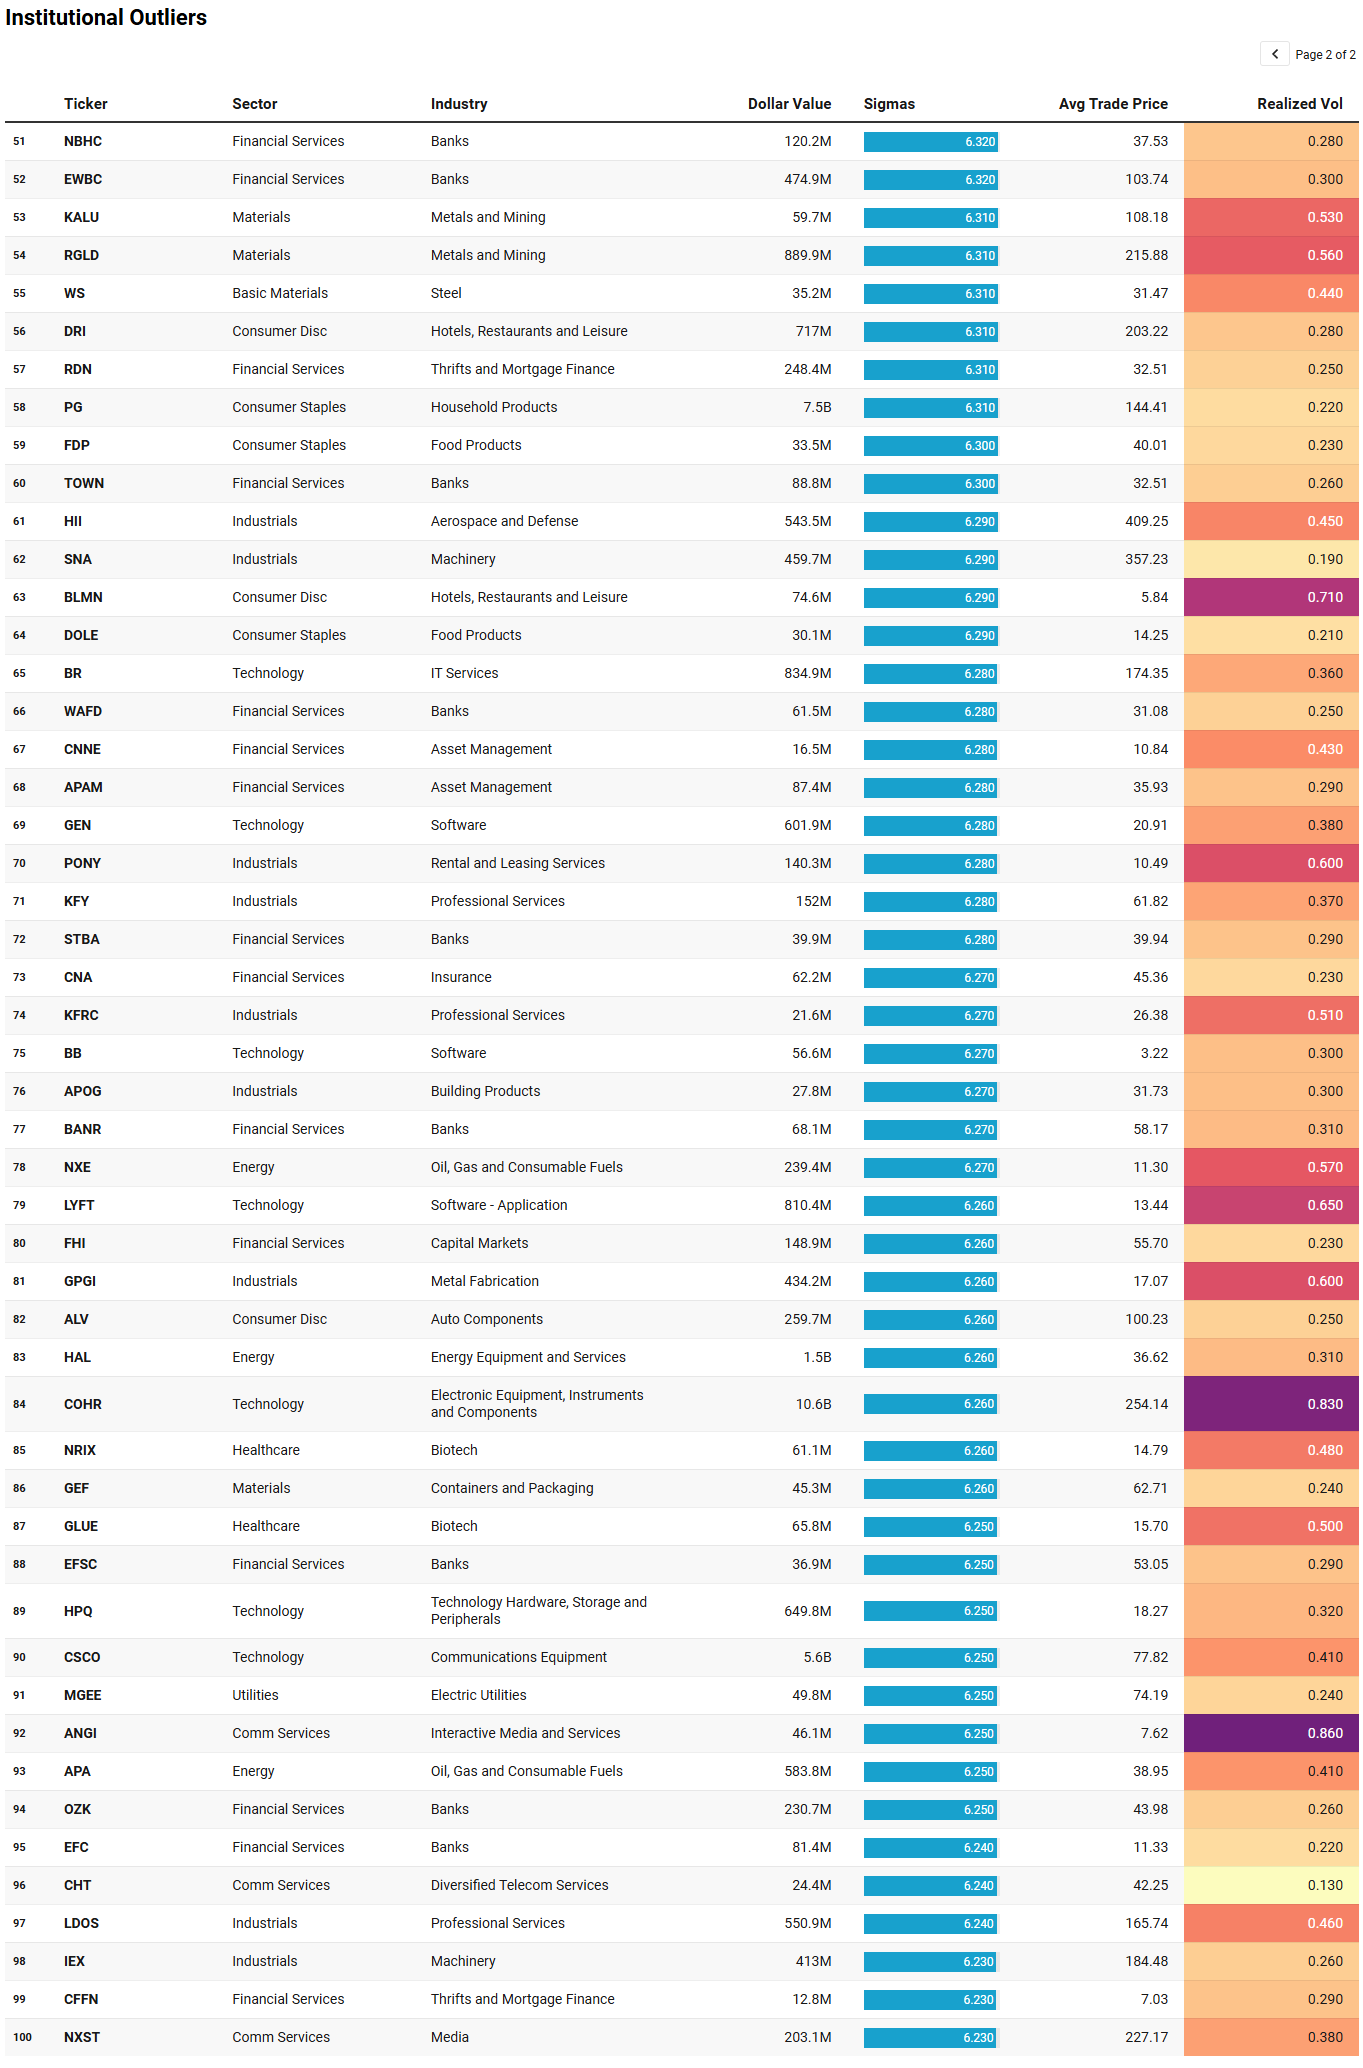
Institutional Outliers is a proprietary metric designed to spotlight trades that significantly exceed a stock’s recent institutional activity—specifically in terms of dollar volume. By comparing current trade size against each security's recent normalized history, the metric flags outlier events that may indicate sudden institutional interest but may be missed because the activity doesn’t raise any flags/alerts when comparing the activity against the ticker’s entire history. For example, it’s conceivable that a ticker today receives the largest trade it has had in the last 6 months but the trade is unranked and would therefore be missed by current alerts built off Trade Ranks. Day traders can use “Realized Vol” to identify tickers that are moving swiftly with large price displacement while others can use it to size your risk appropriately.
The outliers list reinforces the same central idea from the broader tape and the TRV watchlist: institutions are not behaving as though this is a carefree, fully diffused risk-on market. They are expressing conviction, but in concentrated bursts, and often through mature, liquid, operationally legible businesses rather than pure speculation.
The first thing that stands out is how many of these outliers are not obscure story stocks at all, but durable operators in technology, industrials, financials, and staples. QCOM at roughly $8.8bn, COHR above $10bn, ACN above $7bn, CSCO above $5.5bn, ADP above $3bn, and SATS above $4bn tell you the tape is still rewarding institutional-grade technology, but with a noticeably different flavor than the usual headline-heavy megacap complex. This is less about glamour and more about infrastructure, connectivity, enterprise spend, and execution. That fits perfectly with the earlier read that leadership is broadening only at the edges, and mostly into second-order beneficiaries rather than full speculative expansion.
Industrials are arguably the clearest emergent theme here. VRT at nearly $20bn towers over almost everything, and it is joined by AGX, UPS, VICR, VSEC, HII, LDOS, IEX, SNA, and several professional-services names. That is a serious cluster. It suggests institutions are leaning into physical buildout, power, logistics, defense, and real-economy execution. In other words, the market is still willing to fund operational leverage and tangible demand, even if it is not yet embracing lower-quality cyclicality indiscriminately. That strengthens the earlier narrative that industrials are one of the more credible secondary areas of sponsorship beneath the index-heavy surface.
Financials also deserve attention, not because of one giant print, but because of the sheer density of names. BX is near $4.7bn, but then you have a long list of banks, insurers, mortgage lenders, and asset managers stacked behind it: CATY, UNM, EWBC, OZK, IBOC, KMPR, RDN, APAM, and many others. That kind of breadth matters. It suggests institutions are not just trading one money-center expression; they are probing the group more broadly. This is exactly the kind of subtle broadening you want to see if the market is trying to move beyond a narrow technology monoculture.
Consumer staples and utilities showing up with names like PG, LW, MSEX, UTL, and MGEE are equally important. They tell you there is still a meaningful demand for stability, cash flow, and defensiveness. So while there is real institutional appetite for technology and industrial execution stories, there is also no evidence of a wholesale abandonment of caution.
That is probably the cleanest summary of the outliers list. Institutions are putting real money to work, but they are doing it with discernment. The market is expanding, but selectively. The winners are not random; they are the places where scale, durability, and operational relevance still justify concentration.
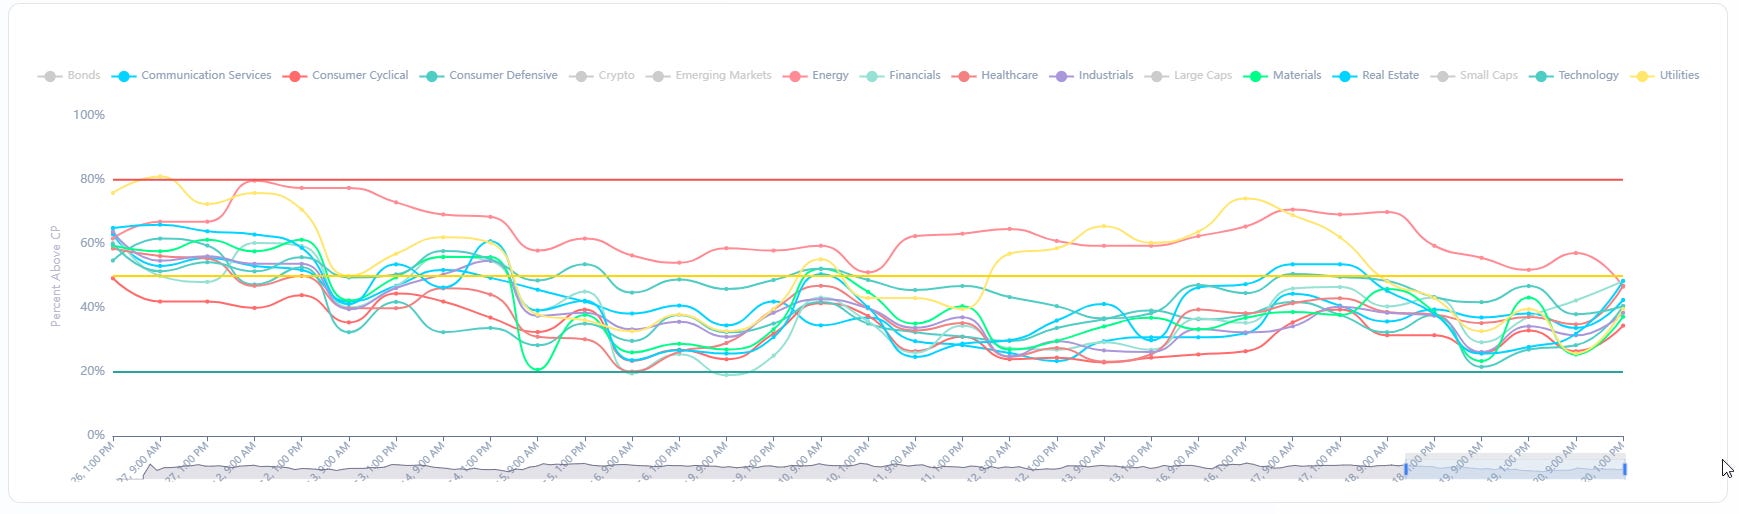
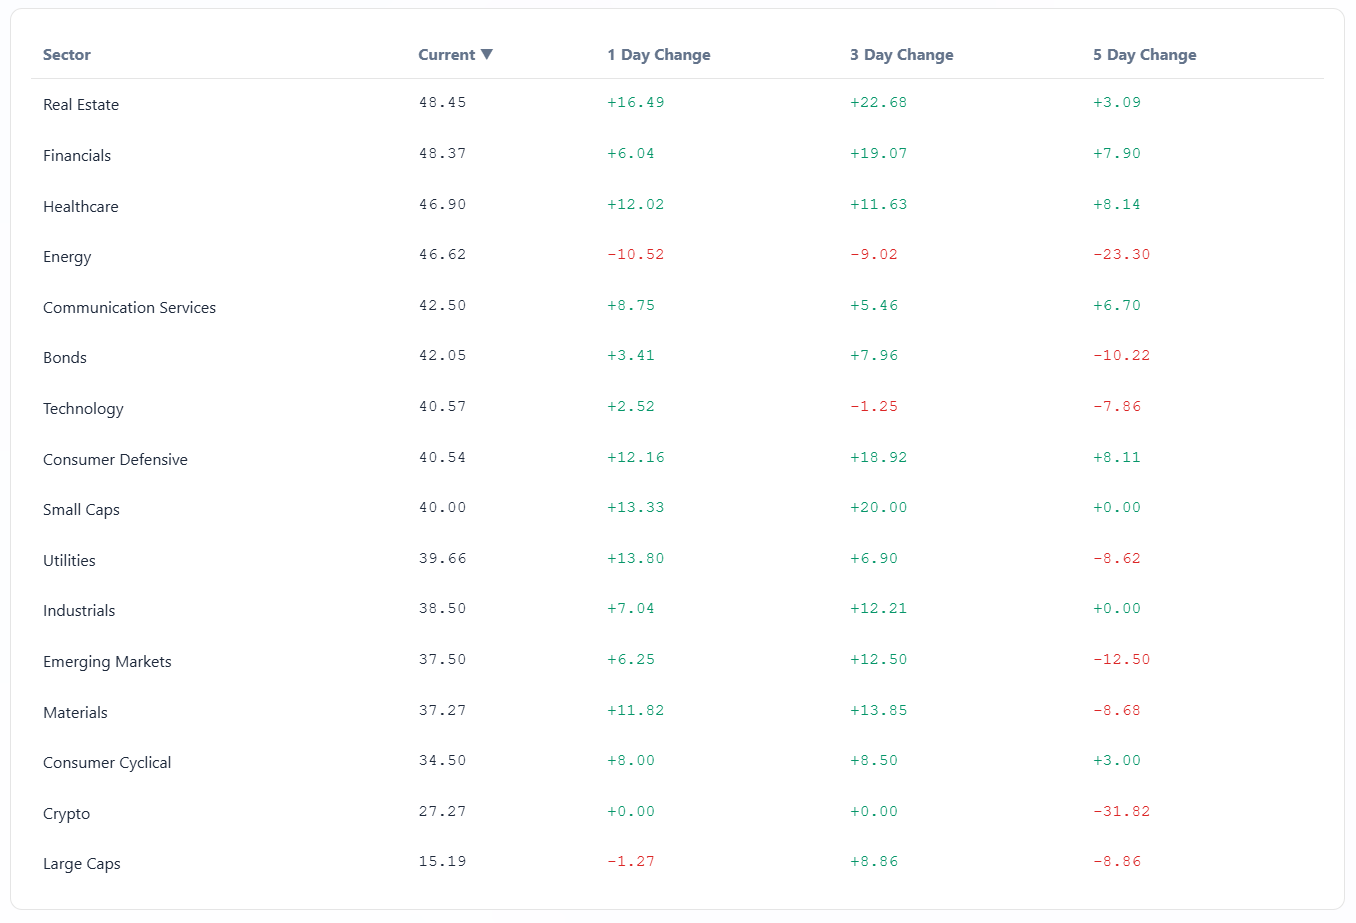
VL Sector Leaders
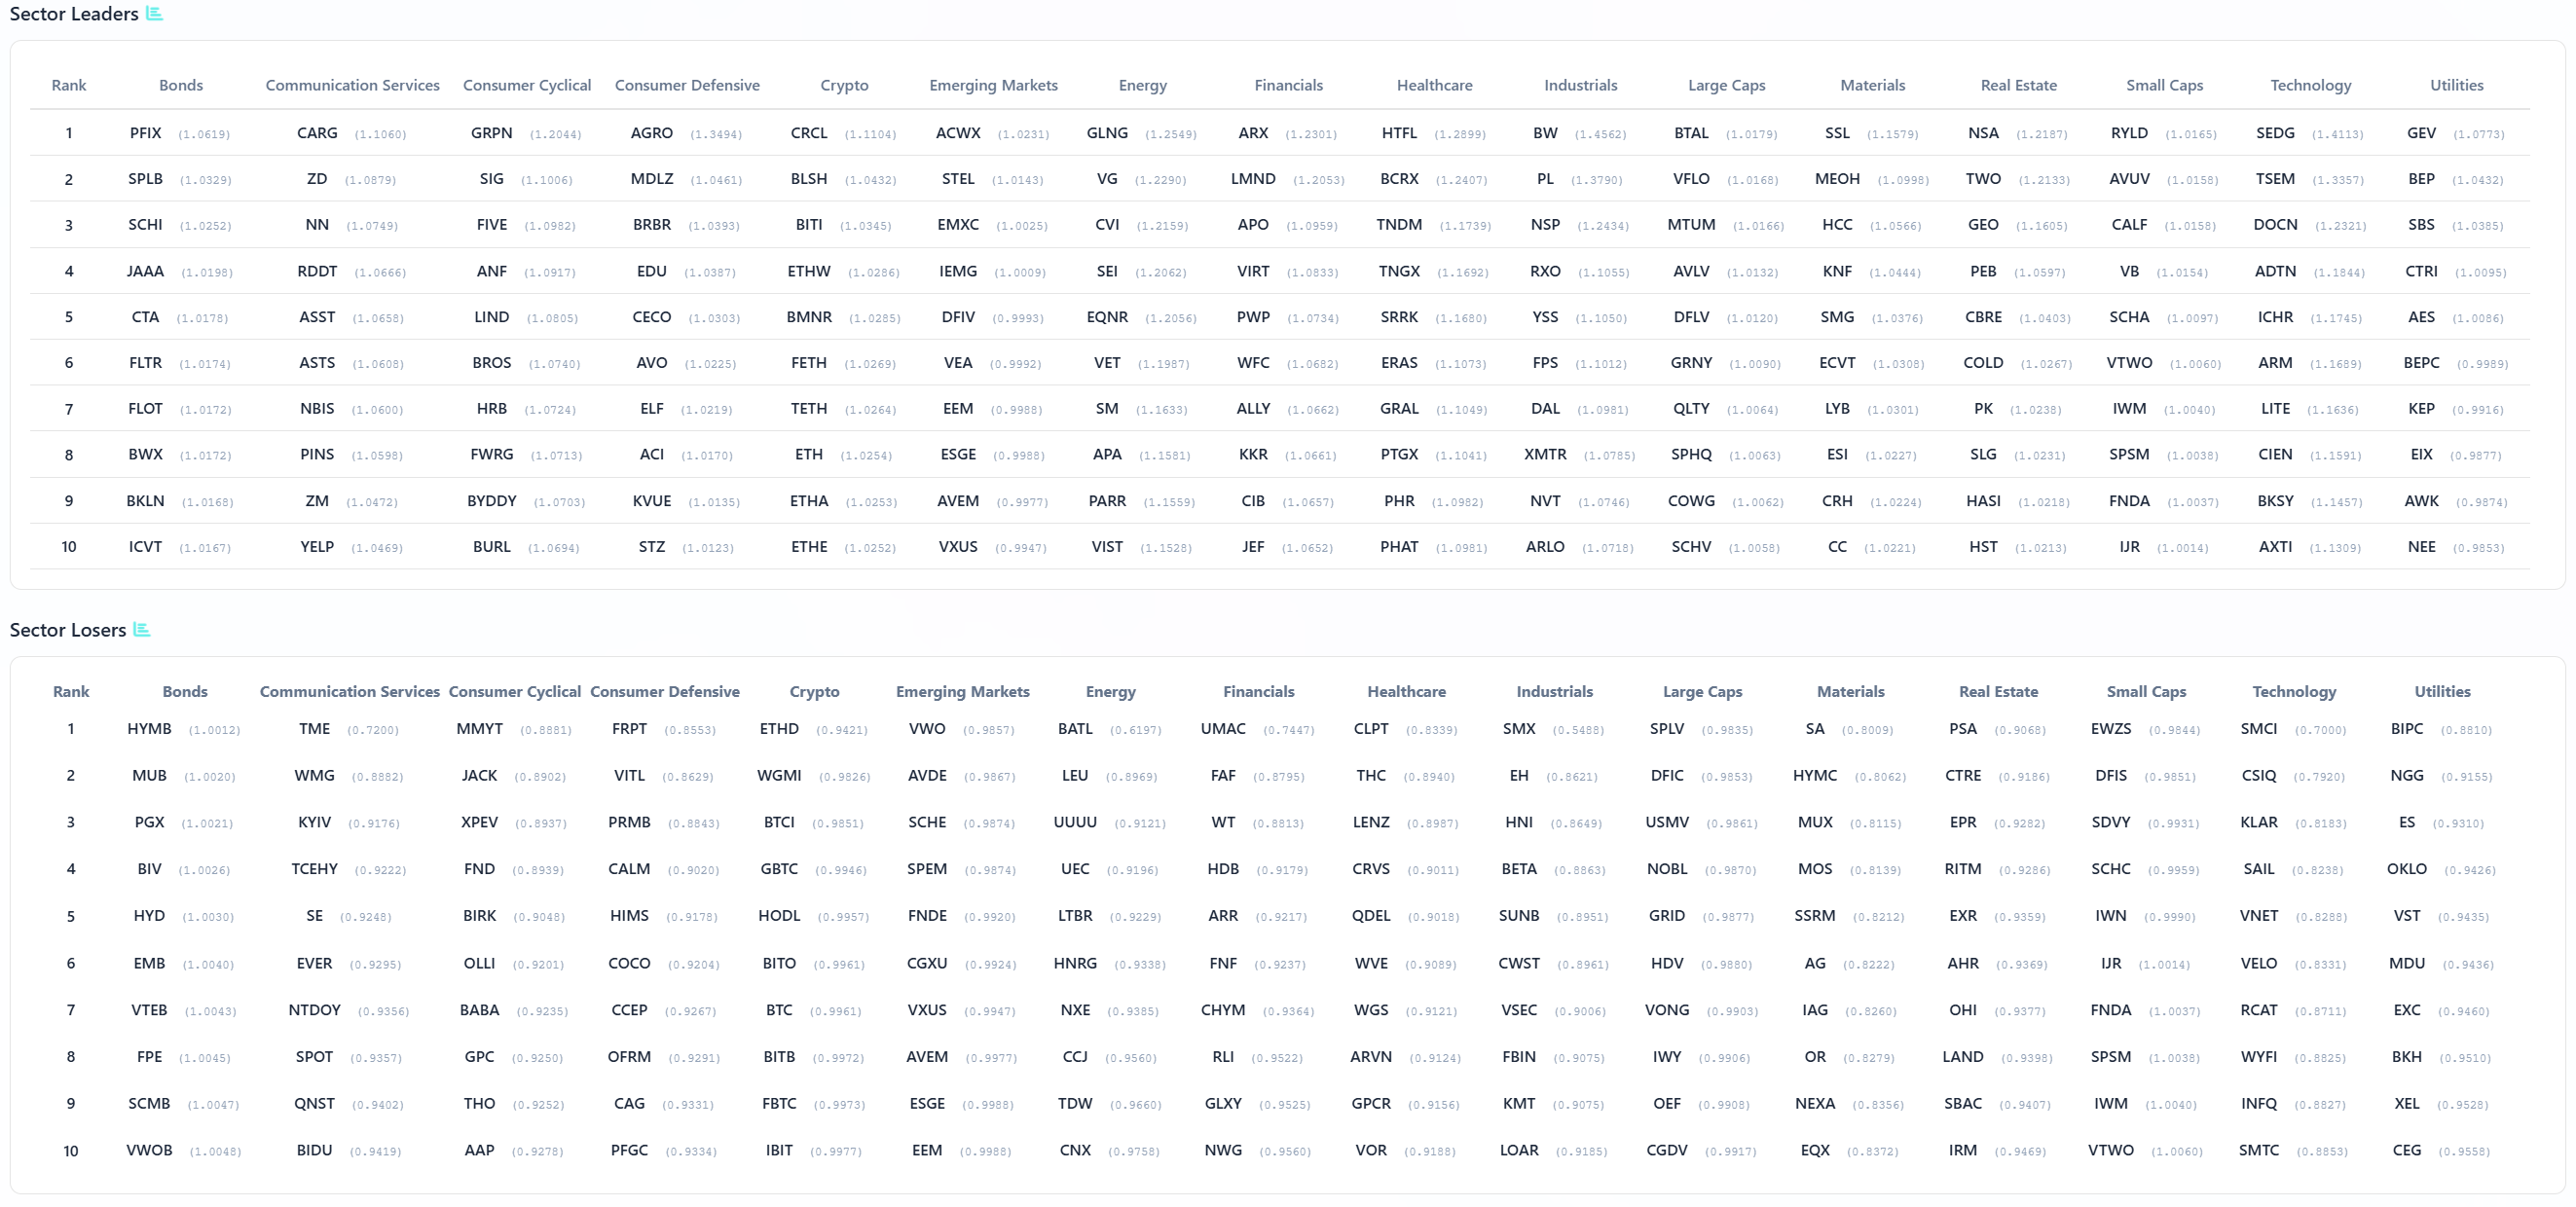
VL Sector Leaders is a weekly snapshot of where true leadership is asserting itself inside the market, stripped of the distortions that come from broad, style-mixed indices. Rather than asking which stocks look strong in absolute terms, this list focuses on which names are outperforming within the environments they actually compete in.
Each week, we surface the ten stocks demonstrating the most persistent relative strength inside their respective sectors. These are not headline chasers or one-day wonders. They are names that continue to separate themselves from peers through real price behavior, often reflecting sustained demand rather than fleeting attention.
For day traders, this list is a powerful awareness tool. Sector Leaders tend to offer cleaner intraday structure, better follow-through, and more predictable reactions around key levels because they already sit on the right side of relative strength. Even on choppy tape, leadership names often remain tradeable while the rest of the market degrades.
For swing traders, VL Sector Leaders helps narrow the universe to stocks with the highest probability of staying relevant. Relative leaders are more likely to hold trends, survive pullbacks, and reassert themselves after consolidation. When markets rotate, these names are often among the first to resume leadership — or the last to break.
What this leadership table makes clear is that the market is not rotating in a chaotic or indiscriminate way. It is rotating with structure, and more importantly, with hierarchy. The same underlying tone we have been building throughout still holds: participation exists, but it is selective, and leadership is being earned rather than broadly granted.
Start with Technology, because that remains the anchor. The leaders are not speculative fringe names, they are still tied to infrastructure and scalability. TSM, ARM, ADTN, ICHR, LITE, CIEN, and Ciena-adjacent optical and semiconductor ecosystem names point to a continuation of the same theme we saw in both aggregate flow and TRV: capital is still allocating to the buildout layer of technology. This is not just AI as a concept, it is the plumbing that supports it. That is a healthy form of leadership because it tends to be more durable and less sentiment-driven.
Industrials continue to confirm as a legitimate secondary pillar. BW, PL, NSP, RXO, DAL, XNTR, and NVT show up across transportation, logistics, aerospace, and engineered products. This aligns almost perfectly with the institutional outliers list, where industrial prints were some of the largest and most concentrated. What you are seeing is not a one-off curiosity but a developing layer of leadership beneath the surface. The market is rewarding execution tied to real-world demand, not just financial engineering.
Financials are quietly constructive. HTLF, LMND, APO, WFC, ALLY, KKR, and CIB show a mix of traditional banking, alternative asset managers, and fintech-adjacent exposure. It is not explosive leadership, but it is consistent and broad. That matters. When financials participate without dominating, it tends to signal a market that is stable enough to function but not overheated. This is exactly the kind of participation you want in a selective environment.
Energy and Materials are more nuanced. Names like GLNG, VG, CVI, SM, APA, and VIST on the energy side, and SSL, HCC, KNF, SMG, and ECVT on the materials side, suggest there is still engagement, but it is not uniform. Leadership here is fragmented and often tied to specific sub-themes like shipping, refining, or specialty chemicals. That reinforces the earlier observation that these sectors are being maintained rather than aggressively accumulated.
The defensive complex is still present, and that is important context. Consumer defensive leaders like AGRO, MDLZ, BRBR, and ELF, along with utilities like GEV, BEP, and SBS, indicate that stability and cash flow are still being rewarded. Real estate names such as NSA, TWO, GEO, and CBRE also appear, which ties back to the outlier activity we saw in REITs and mortgage exposure. This is not a market that has abandoned safety.
What ties all of this together is the absence of low-quality, purely speculative leadership. Even in consumer discretionary, names like CARG, SIG, FIVE, and ANF lean toward operational execution rather than narrative excess. The market is still advancing, but it is doing so through businesses that can justify capital allocation.
That is the defining characteristic of this leadership set. It confirms a market that is rotating, but with discipline. Capital is spreading, but only into areas where it can find both participation and validation.
MIR Part 3: Framing-Up A Trade
Framing this tape into a trade is less about making a bold directional call and more about aligning with how capital is actually behaving. The message across every layer has been consistent. Institutions are still involved, but they are concentrating risk into what they trust, probing selectively beyond that, and hedging the parts of the market that remain uncertain. That implies a portfolio that is not fully defensive, but also not broadly exposed. It should be concentrated, tiered, and intentional.
At the top of the stack sits the core expression of market participation. This is the sleeve that aligns with the index dominance and megacap reinforcement we saw all week. Roughly 35 percent of capital belongs here. SPY at 20 percent is the anchor, reflecting the continued preference for broad exposure and liquidity. QQQ at 10 percent expresses the same idea but tilts toward the leadership complex. A smaller 5 percent allocation to IVV or VOO rounds this out, not for alpha, but for stability and execution efficiency. This sleeve is not meant to outperform, it is meant to keep you aligned with the primary flow of capital.
The second sleeve is where you press into validated leadership. This is the 25 percent allocation to technology infrastructure and semis, where both aggregate flow and stock-level sponsorship have been strongest. NVDA at 8 percent remains the centerpiece, not because it is early, but because it continues to attract reinforcement-level flow. AVGO at 5 percent and QCOM at 4 percent provide exposure to different parts of the semiconductor stack, while MSFT at 4 percent anchors the software layer. The remaining 4 percent is split between names like ICHR or LITE, which reflect the second-order expansion we are beginning to see. This sleeve is where you accept concentration, because that is where the market is concentrating.
The third sleeve is the emerging participation layer, where capital is beginning to broaden but has not yet fully committed. This is a 15 percent allocation to industrials and real-economy execution. VRT at 5 percent is the clearest expression of this theme given the scale of institutional outliers. UPS at 3 percent brings in logistics and global flow, while a combination of FIX, NSP, or RXO at a combined 4 percent captures construction, engineering, and transportation. The remaining 3 percent can be allocated to aerospace and defense exposure such as HII or LDOS. This sleeve is where you are early, but not speculative. You are aligning with emerging sponsorship that is already visible.
The fourth sleeve is financials, at 10 percent. This is not a conviction overweight, but it is a necessary participation sleeve given the breadth of outlier activity. BX at 3 percent captures alternative asset flow, while JPM or a diversified bank ETF sits at 3 percent to express stability. The remaining 4 percent can be spread across regionals or insurance names like UNM or EWBC. This sleeve reflects a market that is stable enough to support financial participation, but not yet rewarding it aggressively.
The fifth sleeve is a barbell between defensiveness and yield, at 10 percent. PG at 3 percent and a staple like MDLZ at 2 percent anchor the defensive equity side. Utilities such as NEE or BEP at 2 percent provide stability, while a 3 percent allocation to LQD or VCEB reflects the clear sweep activity in credit. This sleeve is not about return, it is about respecting the persistent demand for safety that continues to show up in the tape.
The final 5 percent is reserved for tactical expression and optionality. This is where you can express higher beta or thematic ideas without distorting the portfolio. A small allocation to something like MUU or a targeted biotech basket can live here, alongside a modest hedge via HYG or even a volatility proxy. This sleeve should be flexible and actively managed.
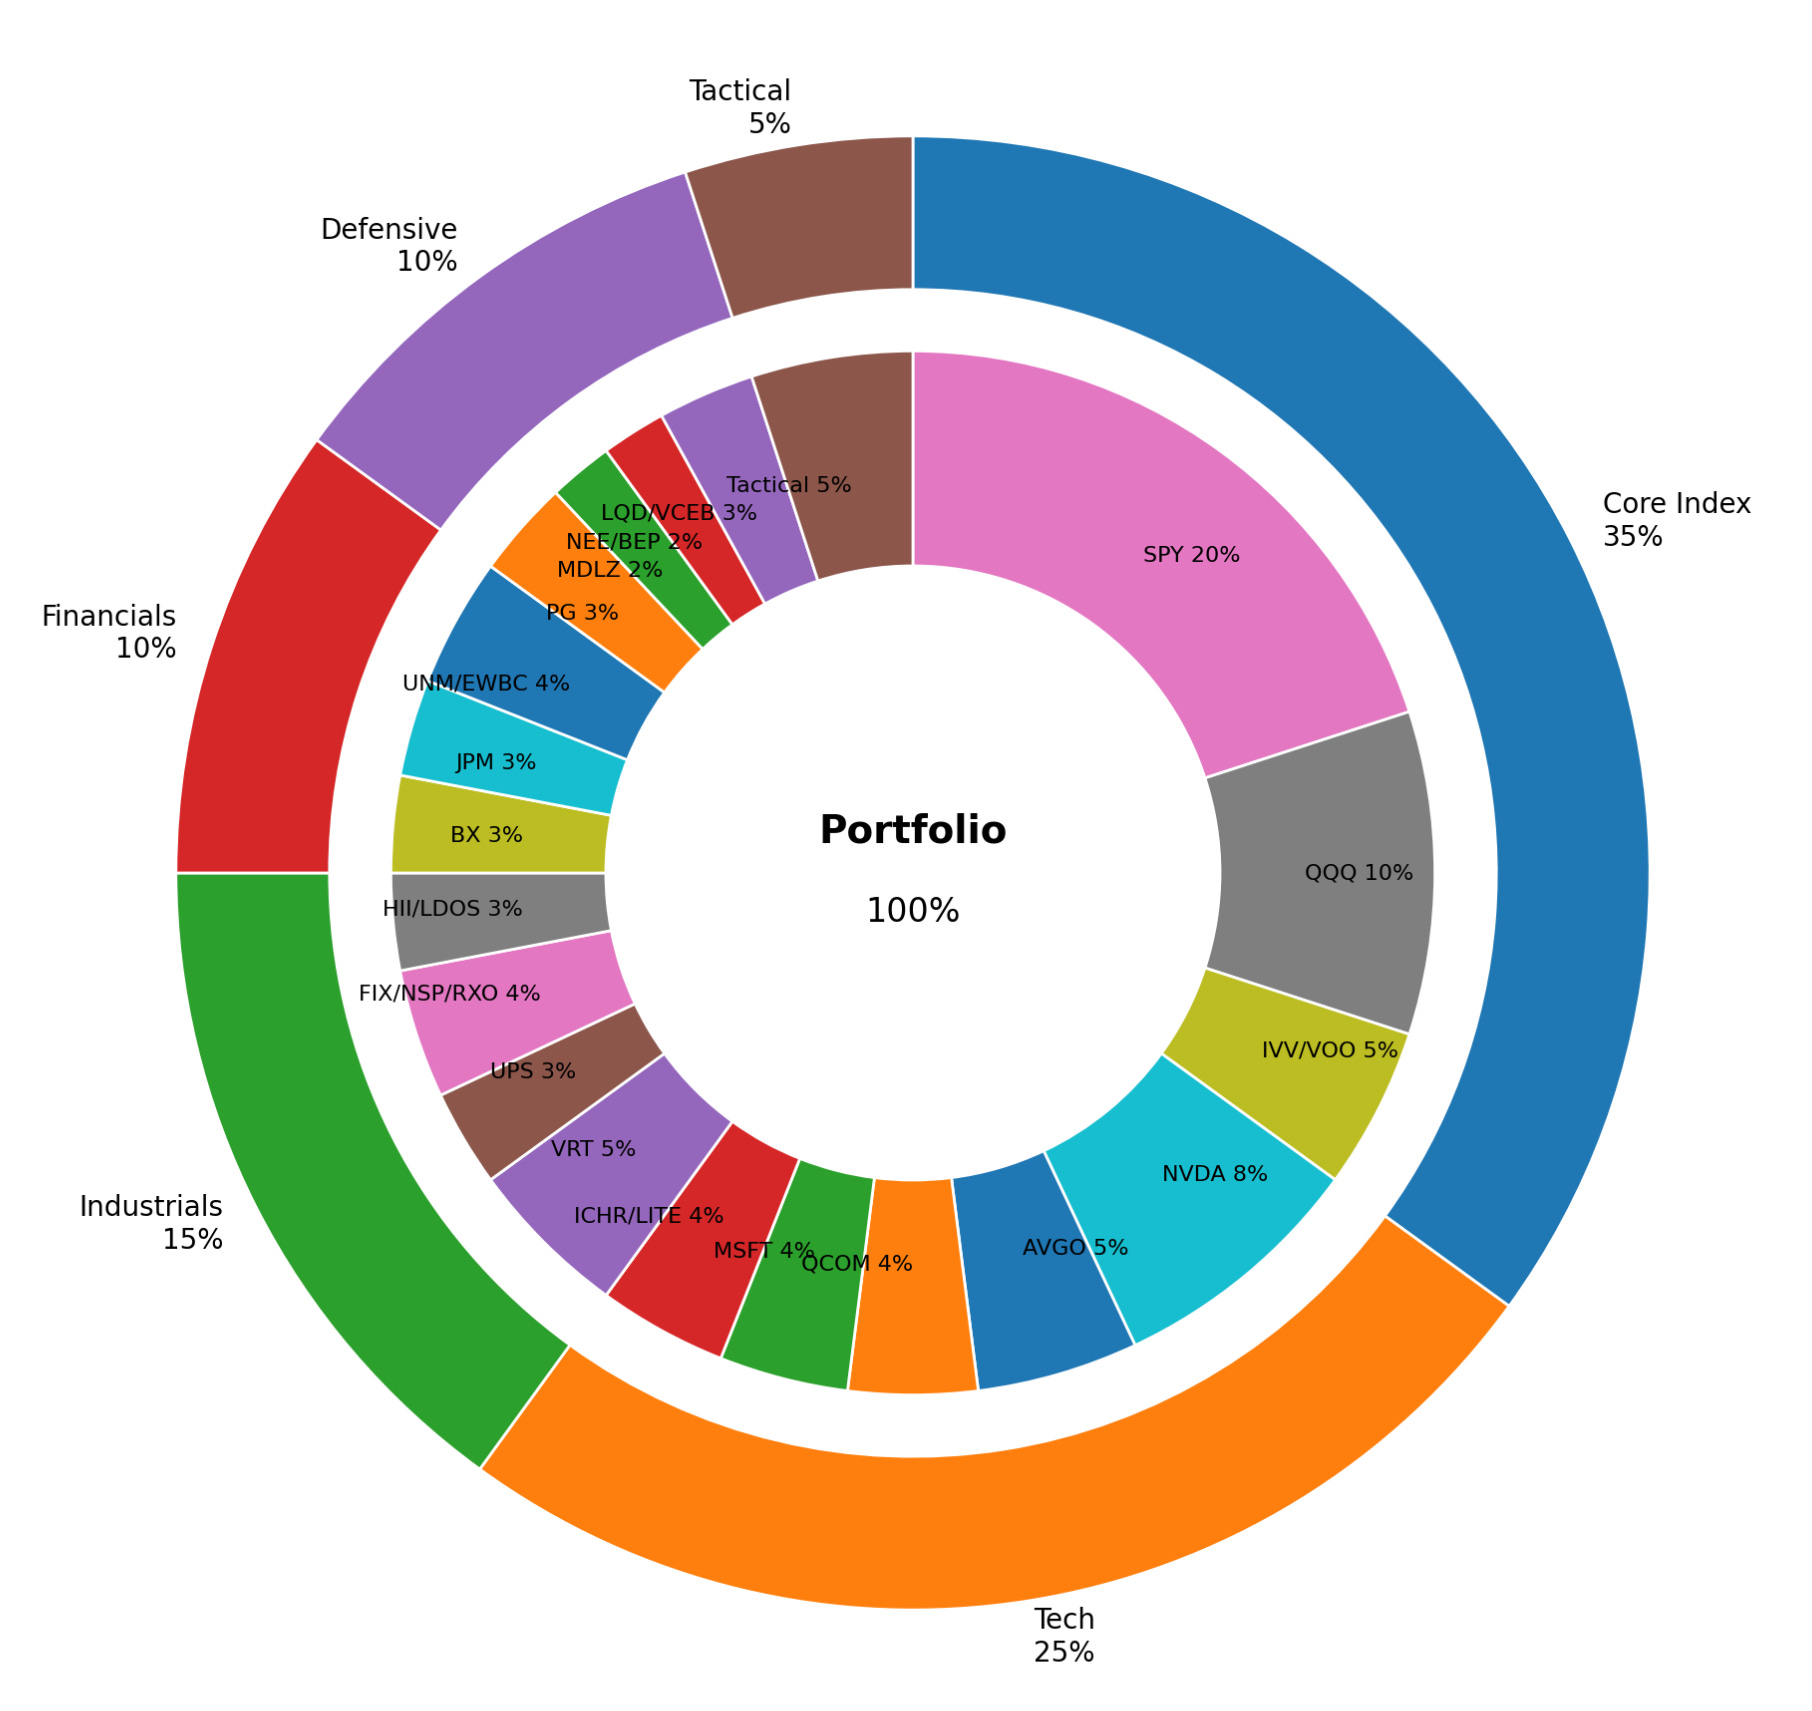
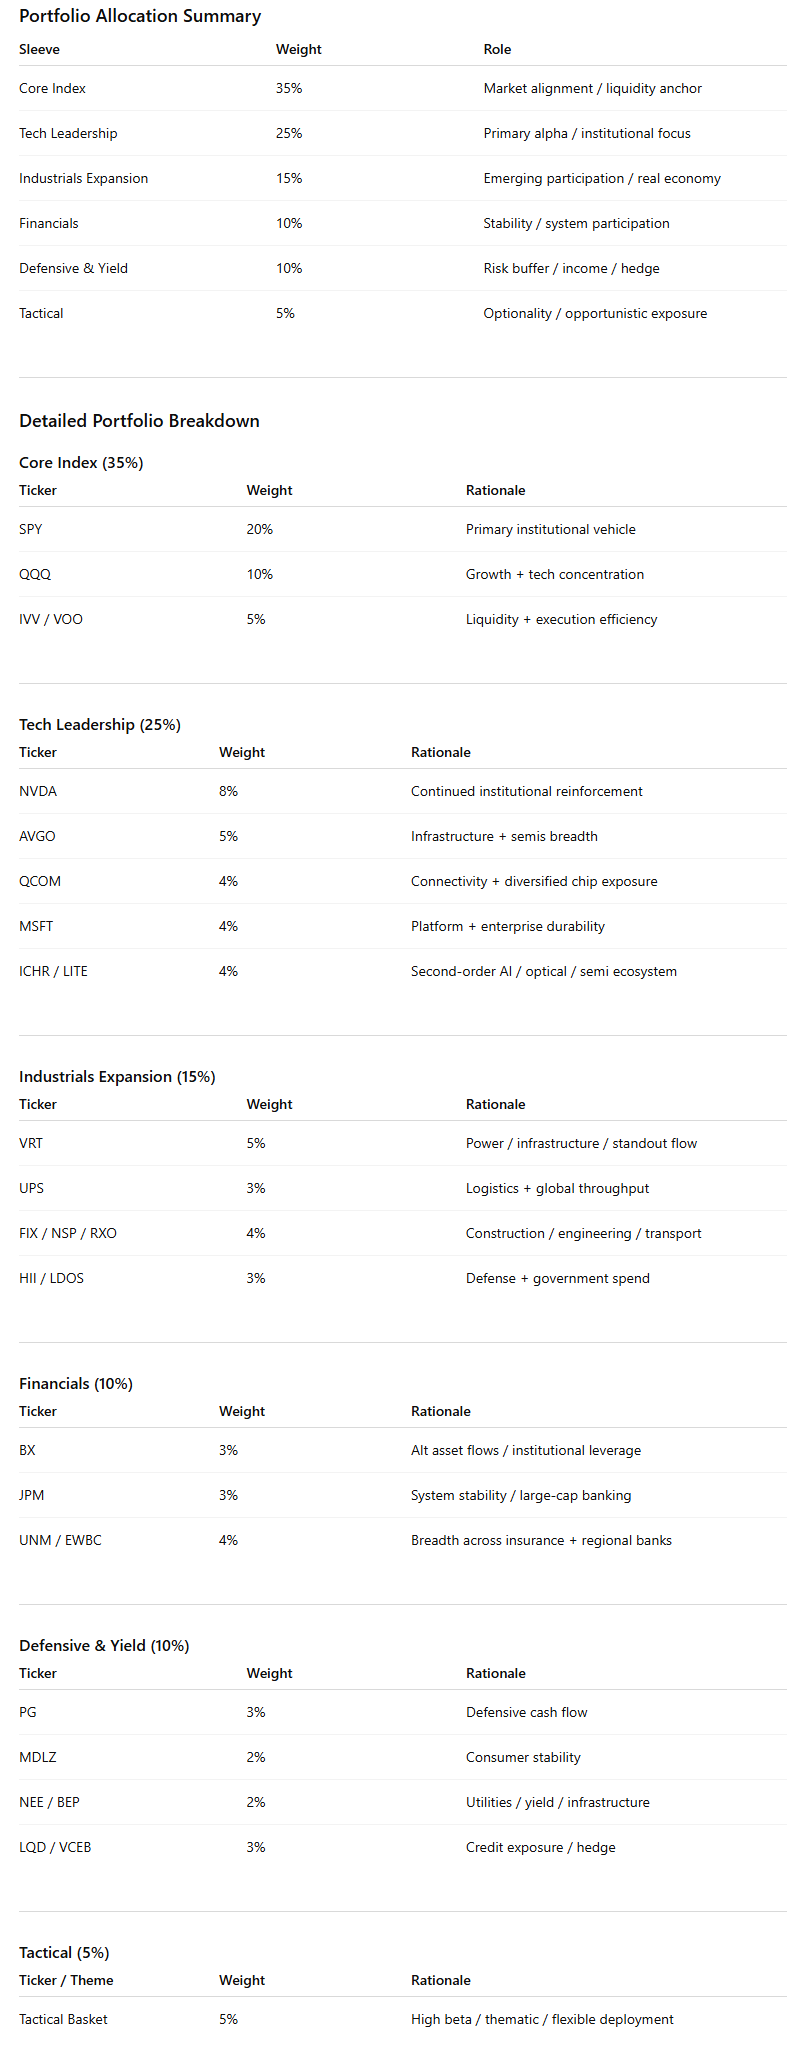
What this portfolio does, in totality, is mirror the market’s current personality. It is long the index because institutions are. It is overweight leadership because that is where capital is being reinforced. It is selectively long industrial expansion because that is where new participation is forming. It respects financials without overcommitting. And it carries a defensive ballast because the tape continues to demand it.
Most importantly, it avoids the temptation to over-rotate into lower-quality risk. The market has not given permission for that yet. Until participation broadens and volatility compresses more meaningfully, the right posture is one of aligned conviction, not aggressive expansion. Good luck this week, VL Crew!
Thank you for being part of this community and for investing your time in this week’s edition. The quality of this readership — thoughtful, disciplined, engaged — is what makes this work meaningful. I’m grateful to build alongside you. Here’s to a week of clarity, conviction, and well-executed opportunities.
— VolumeLeaders