Market Momentum: Your Weekly Financial Forecast & Market Prep
Issue 83 / What to expect Mar 16, 2026 thru Mar 20, 2026


Weekly Market-On-Close Report
War, Oil, and the Weight of Uncertainty
The S&P 500 fell for the third consecutive week, closing Friday at 6,632 after shedding 107 points over five sessions that felt considerably more violent than the 1.6% headline decline suggests. The Dow dropped 2.0% to 46,558, the Nasdaq Composite lost 1.3%, and the S&P MidCap 400 led all major indices lower with a 2.0% decline. But the weekly scorecards obscure the real story, which was the intraday chaos driven by a war that is now two weeks old and a commodity market that has become the primary transmission mechanism for global stress.
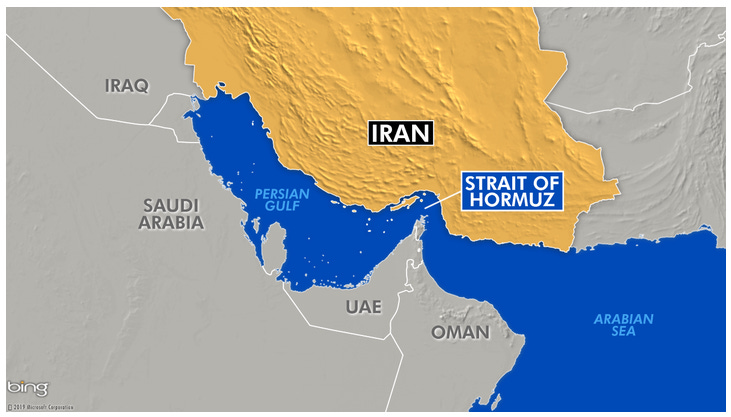
The conflict with Iran -- Operation Epic Fury, as the administration has termed it -- has evolved from an air campaign into a grinding contest over the Strait of Hormuz, the narrow passage off Iran’s southwestern coast through which roughly 20 million barrels of oil transit daily.

Since hostilities began on February 28, that chokepoint has been effectively closed to commercial traffic. Iran has deployed mines, targeted tankers, and made clear through both military action and rhetoric that it intends to keep the strait shut as long as strikes on its territory continue. The Wall Street Journal reported Friday that the US is deploying a Marine expeditionary unit to the region and that Iran has begun laying additional mines even as the US Navy has destroyed most of the larger vessels used for mining operations. Smaller Iranian boats have taken over the work, complicating clearance efforts.
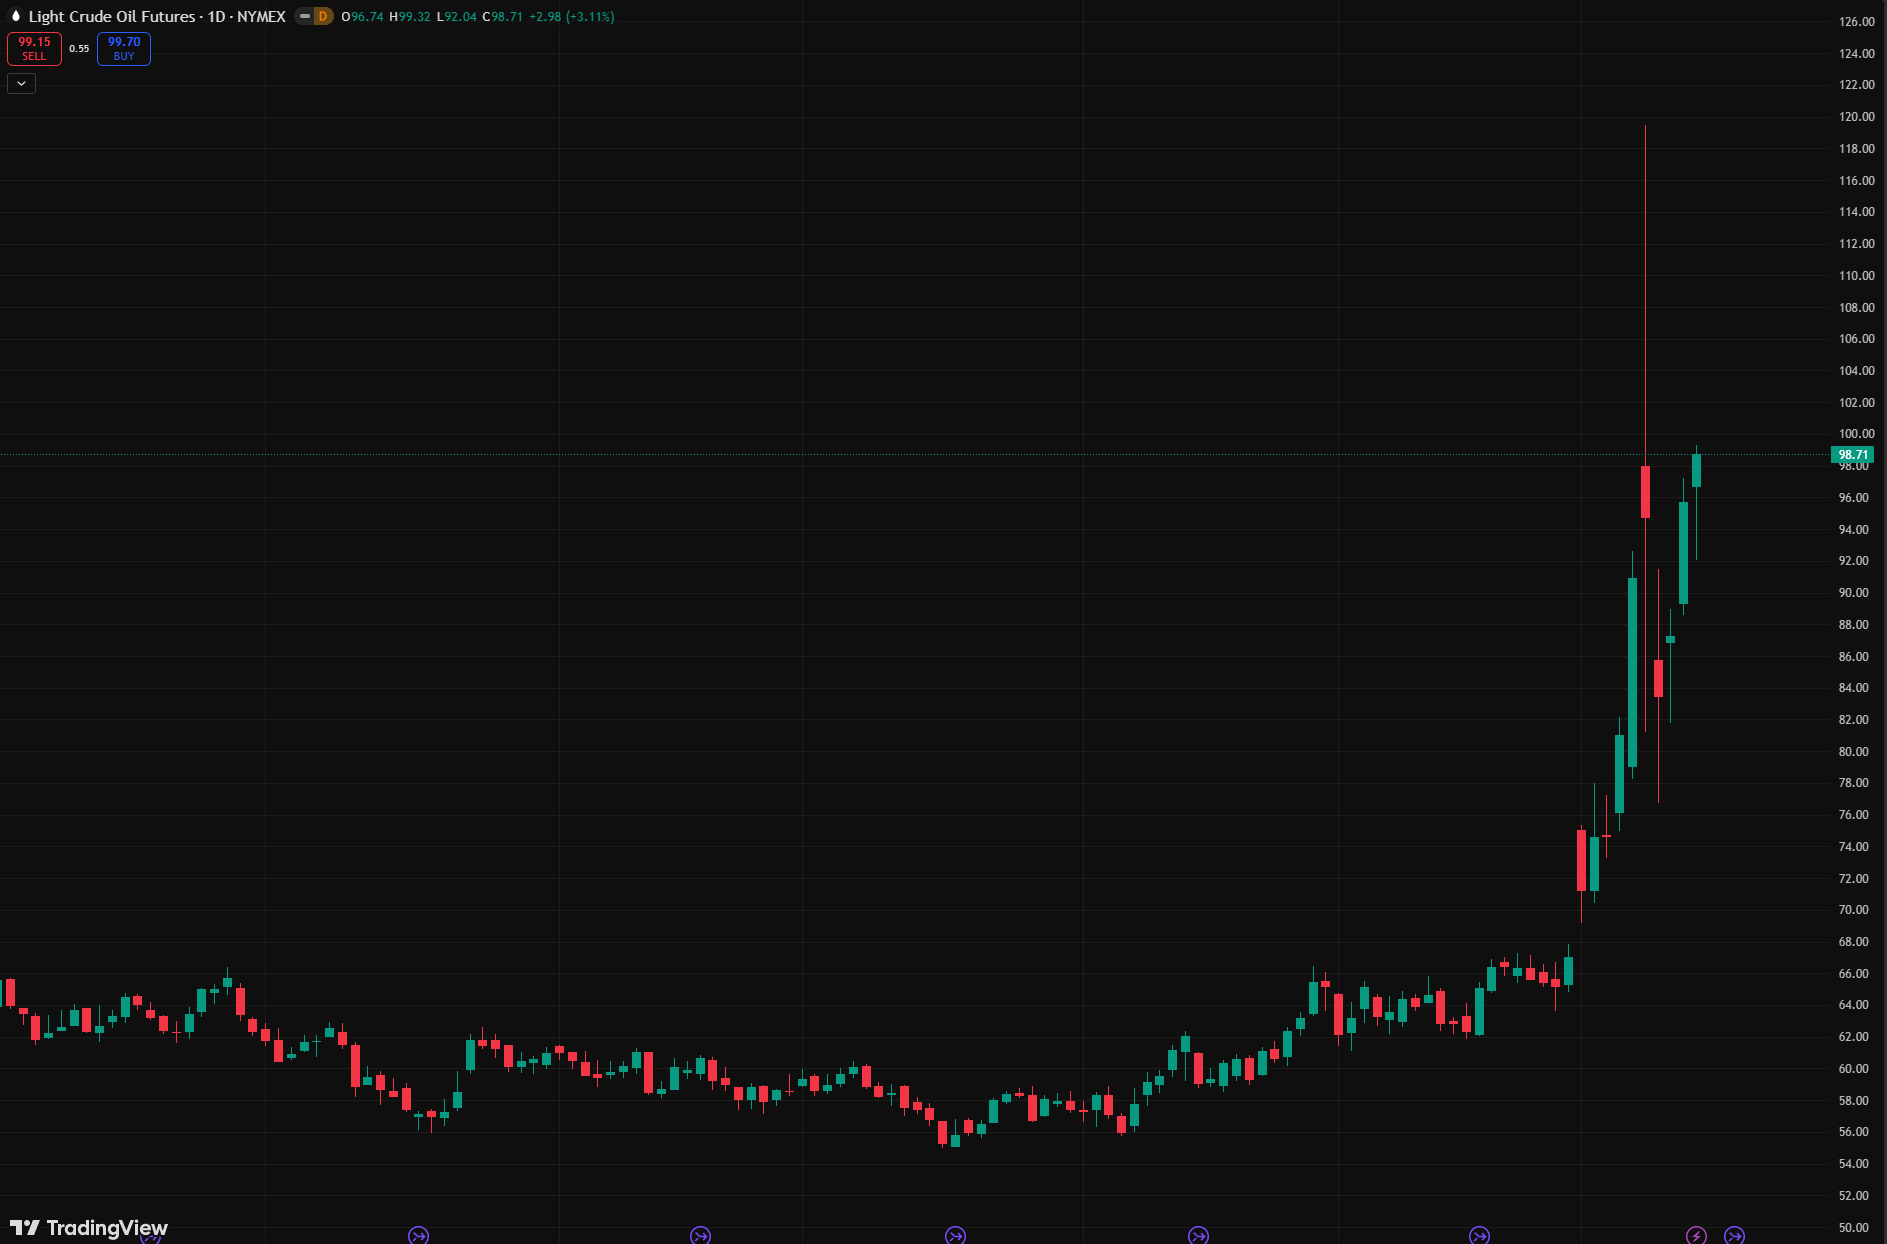
The oil market reflected this chaos with a precision that equity markets could not match. Brent crude surged to $120 per barrel on Monday as the war intensified, cratered below $85 on Tuesday after President Trump suggested the conflict could end soon, then ripped back above $100 by Thursday as Iran targeted tankers in the Persian Gulf. WTI settled around $98.65 on Friday, up 8.5% for the week and a staggering 71.8% year-to-date. Goldman Sachs hiked its oil price forecast for the second time in barely a week, now projecting Brent at $98 per barrel through March and April and warning that prices could approach the 2008 peak near $150 if flows through the strait remain depressed through the end of the month.
The policy response has been enormous in scale and modest in effect. The International Energy Agency announced a coordinated release of 400 million barrels from member nations’ strategic reserves -- the largest in the organization’s history, dwarfing the 182 million barrels released after Russia’s 2022 invasion of Ukraine. The US will contribute 172 million barrels, with deliveries expected to begin next week and take approximately 120 days to complete. Japan said it would begin releasing from its own reserves as early as March 16. Germany, South Korea, and the UK are also expected to participate. But energy analysts have been blunt about the math: the strait carries over 20 million barrels per day, and the IEA’s full drawdown capacity cannot compensate for a disruption of that magnitude. Helima Croft of RBC Capital Markets noted that the market impact may be limited given the rate at which oil can physically be extracted from reserves and transported to where it is needed most -- Asia, where refineries may not see deliveries until mid-May. The US Treasury also issued a temporary waiver allowing buyers to take Russian oil cargoes already en route -- roughly 100 million barrels across some 30 tankers -- as a stopgap measure.
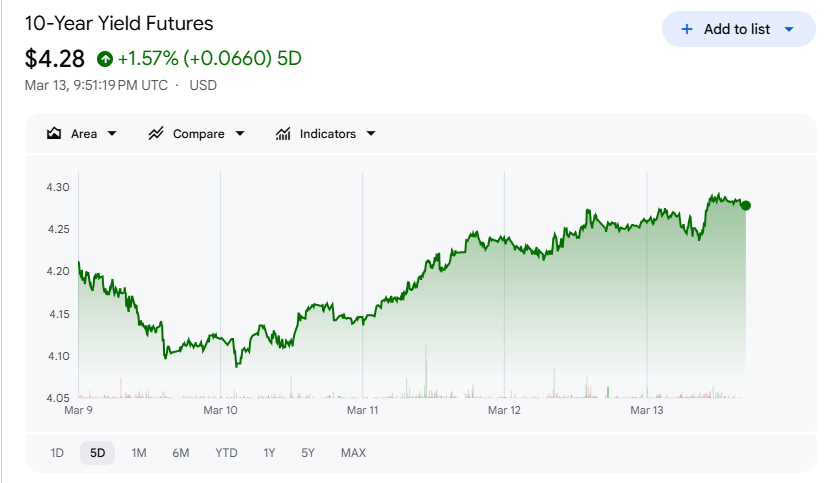
The equity market’s reaction to this backdrop has been less about panic and more about a slow, grinding repricing of risk. The typical conflict playbook emerged initially -- equities down, oil up, precious metals bid, dollar strengthening -- but Treasuries refused to follow the script. Instead of a safe-haven bid, yields rose sharply as “war-flation” fears took hold. The 10-year Treasury yield climbed to 4.28%, up about 10 basis points on the week, and the German 10-year bund touched 2.99%, its highest in over two years. In the UK, gilt yields spiked 20-30 basis points across the curve as the Bank of England repriced March rate-cut probabilities from 80% before the conflict to 20% after. This is the core tension in the current tape: an oil shock that simultaneously threatens growth and reignites inflation, leaving central banks with no clean path forward.
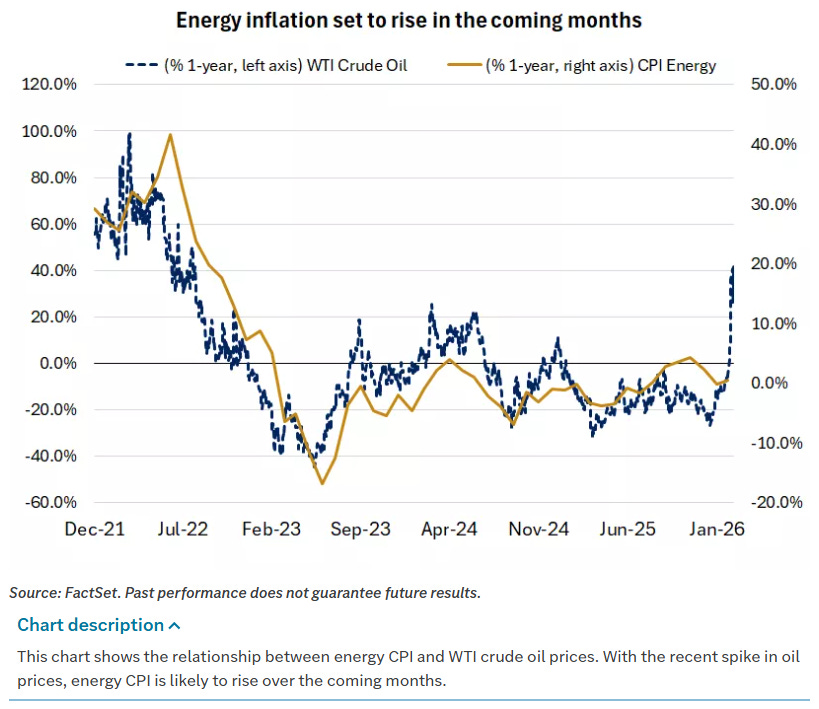
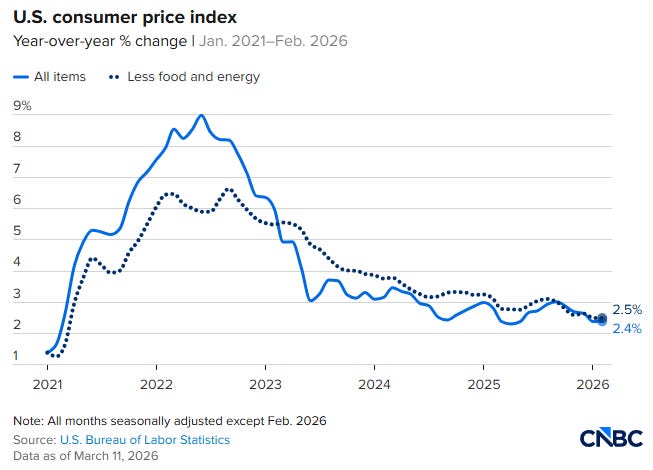
The economic data that arrived alongside the geopolitical storm reinforced that tension. The BEA’s second estimate of Q4 GDP was revised sharply lower to an annualized 0.7% from the initial 1.4% print, with the downward revision driven by lower exports, consumer spending, government spending, and investment. Meanwhile, the Fed’s preferred inflation gauge -- the core PCE price index -- rose to 3.1% year-over-year in January, its highest reading since early 2024. February CPI offered a sliver of encouragement with core coming in at 0.2% month-over-month and 2.5% year-over-year, but that data predates the oil shock. Headline CPI could very well move back above 3% as higher energy costs pass through, with WTI futures implying a retreat toward $75 by year-end -- still 30% above the 2025 close near $60.
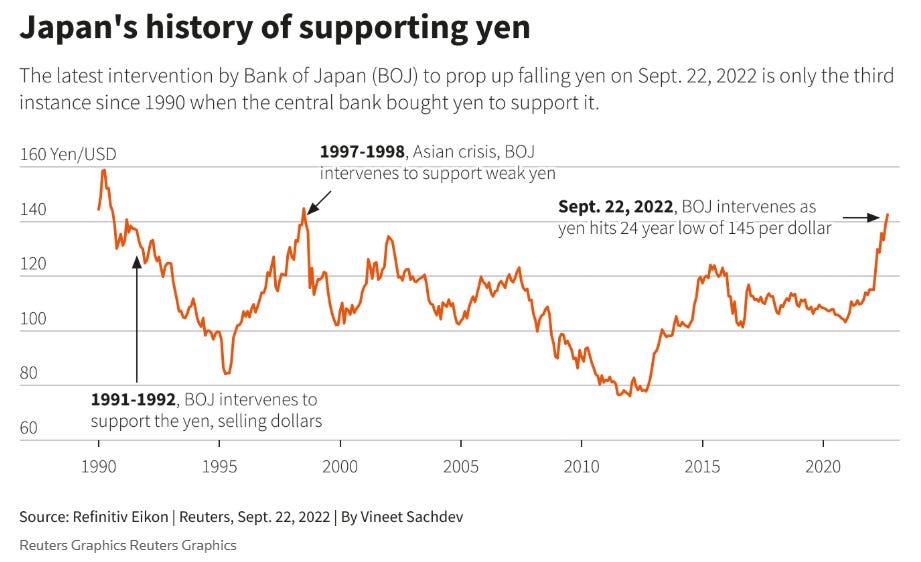
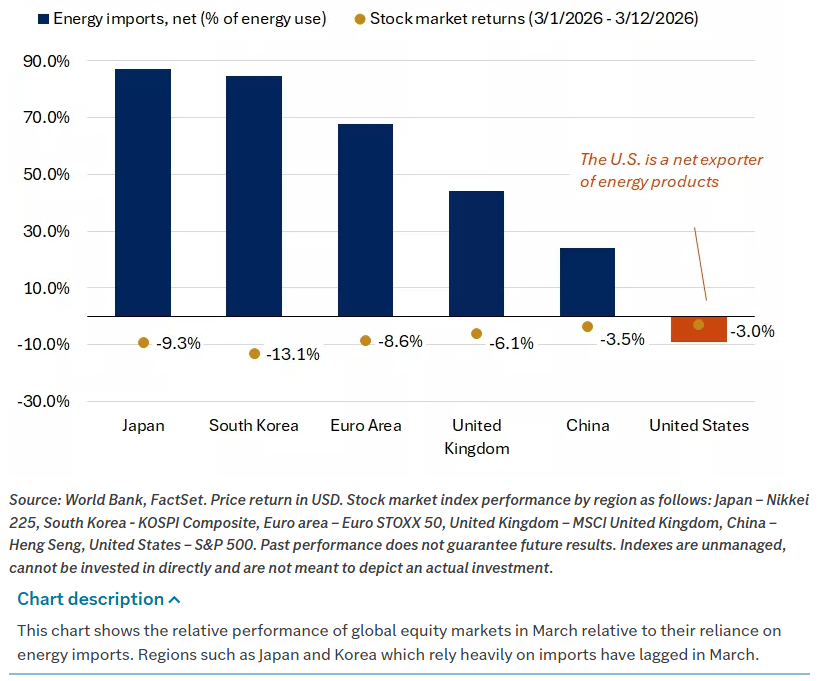
The picture outside the US was equally strained. Europe saw industrial production slide 1.5% month-over-month in January, the largest decline since April 2025, while German factory orders collapsed 11.1% on the month -- more than double the expected decline. UK GDP was flat in January, missing expectations for 0.2% growth. European equities bore the heaviest burden: the STOXX Europe 600 fell 0.47%, but the damage was far worse in energy-import-dependent markets. Japan’s Nikkei dropped 3.24%, South Korea’s KOSPI experienced single-day declines of 7% and 12% before a 10% Thursday rally, and the euro area fell 8% or more from pre-conflict levels. The relationship was nearly linear: the more a region depends on imported energy, the worse its equity market performed in March. Japan, which imports 80-90% of its energy supply with the majority transiting the Hormuz strait, announced strategic reserve releases and gasoline subsidies as the yen weakened to 159.5 against the dollar, approaching levels that triggered direct intervention in July 2024.
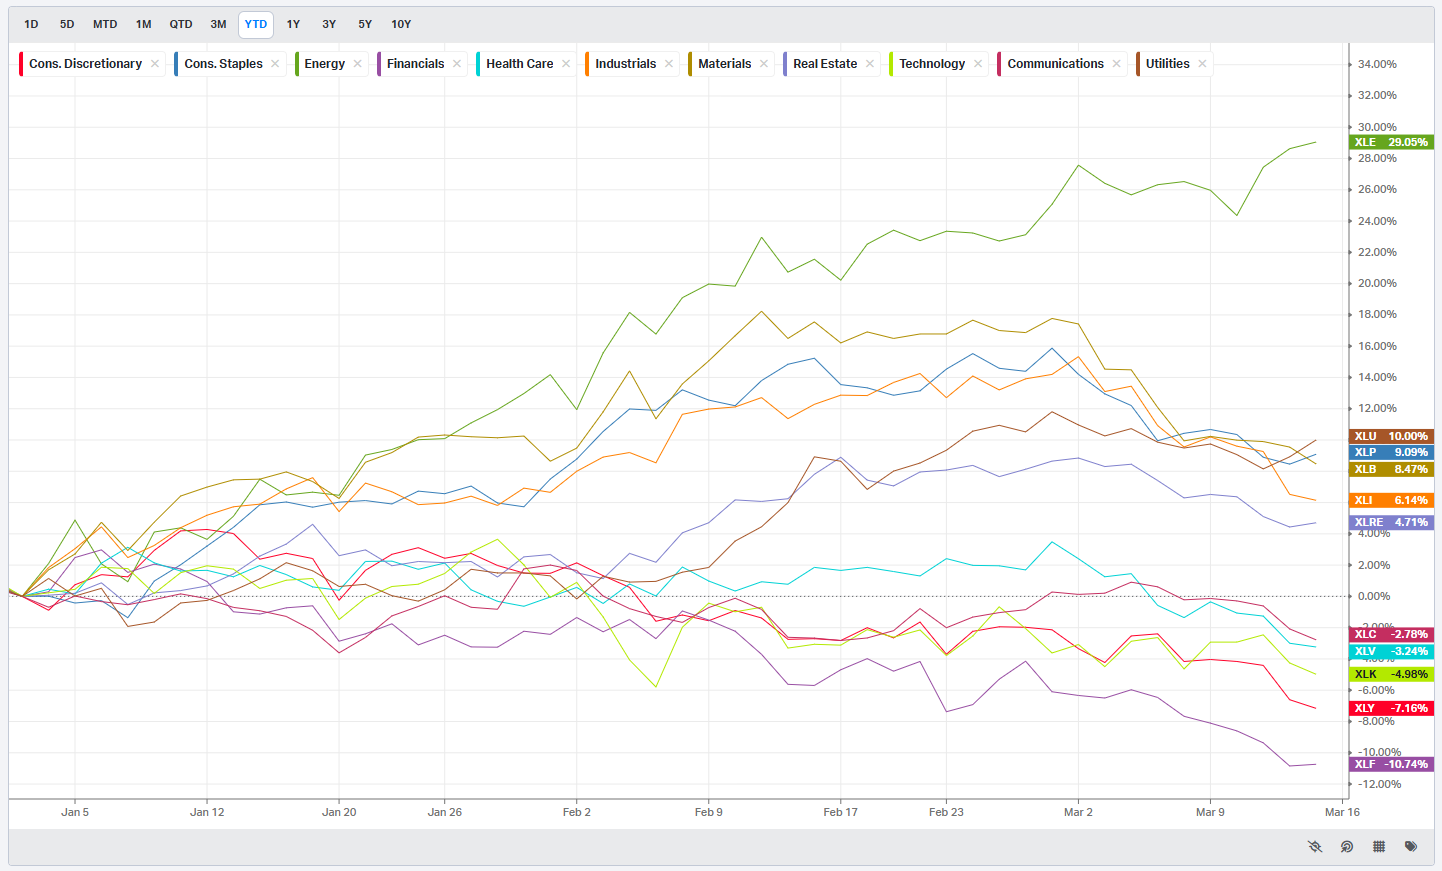
Beneath the macro headlines, sector rotation told its own story. Systematic de-risking drove crowded trade unwinds, with the NYSE Semis index falling 8% while the IGV Software ETF rose 8% in a mirror-image reversal. Energy was the best-performing sector while Consumer Staples and Materials -- two of the best-performing sectors year-to-date -- led to the downside with losses exceeding 5%. Defense contractors outperformed as expected but could not offset the broader industrial weakness. Mega-cap tech showed some of the defensive qualities it has exhibited in recent years, with the NYSE FANG+ Index rising 3%, though that masked sharp dispersion: Meta fell more than 3% after reports that its latest AI model missed expectations, while semiconductor and storage names like Sandisk, Micron, and Western Digital surged between 2% and 6% on Friday.
The bond market’s behavior deserves particular attention. Investment-grade corporate issuance logged its second-largest week on record, suggesting issuers are rushing to raise capital before conditions deteriorate further. High yield was volatile, whipped by shifting macro headlines and energy price moves. The absence of a Treasury safe-haven bid -- the defining feature of this particular geopolitical shock -- tells you the market’s primary fear is not recession but stagflation: the toxic combination of slowing growth and reaccelerating inflation that leaves portfolios with nowhere to hide.
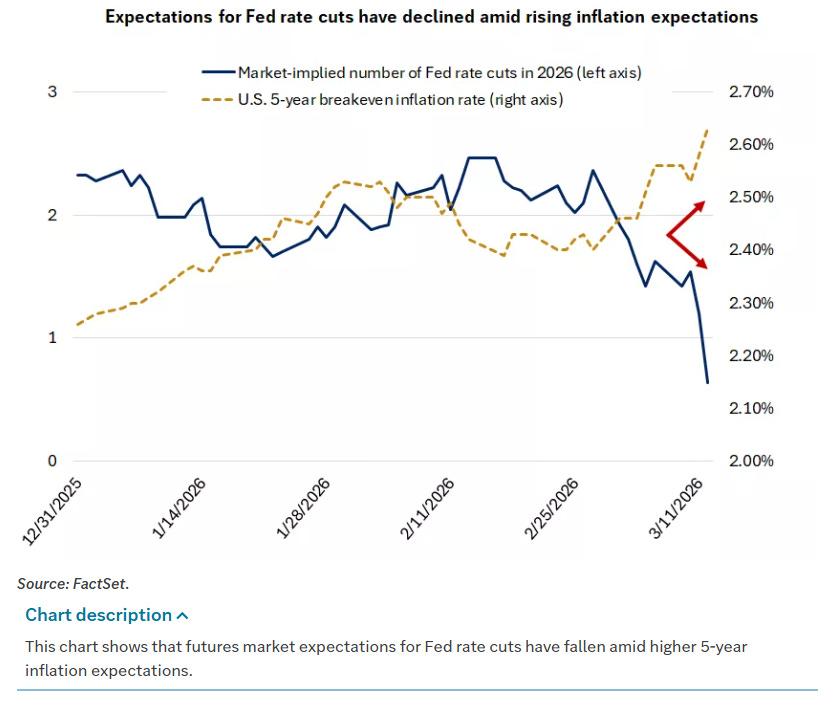
Looking ahead, the Fed meets Wednesday with markets pricing essentially zero chance of a rate cut and all attention focused on the updated dot plot and economic projections. Expectations are set for policymakers to hold at 3.50-3.75% and it should be noted that while the Fed typically looks through supply-driven oil shocks, it cannot afford to appear complacent with core PCE already at 3.1%. Futures that had been pricing roughly 50 basis points of easing for 2026 now barely imply a single 25 basis-point reduction. The language around the dots and the inflation forecast revision will determine whether markets interpret the Fed as patient or paralyzed.
There are reasons for measured optimism buried beneath the wreckage. S&P 500 earnings are expected to grow about 15% in 2026. Tax refunds are running 9% above last year’s pace. Initial jobless claims have averaged 213,000 this year, well below the 30-year average of 300,000-plus.
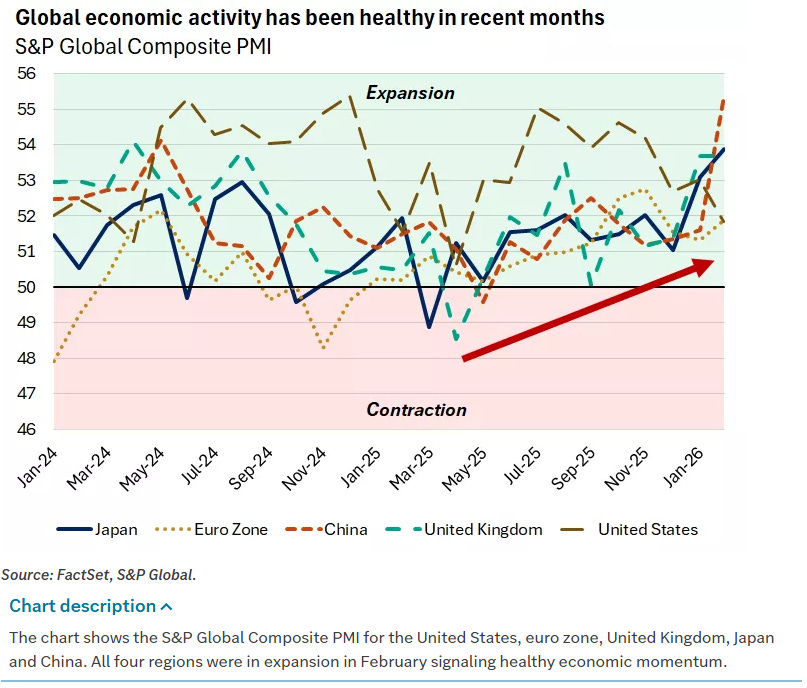
The US has been a net energy exporter since 2019, which structurally reduces its vulnerability to oil shocks compared to prior decades. Global PMI readings were in expansion territory across the US, Europe, and Asia heading into the conflict. And China’s exports surged 21.8% in the January-February period, driven by strong global demand for technology products.
But optimism and positioning are different things. The administration has suggested the campaign could last up to eight weeks. Goldman sees risks skewed to the upside for oil prices. And the bond market is telling you, in the clearest possible terms, that the old playbook of buying the geopolitical dip may not apply when the geopolitical event threatens the global inflation trajectory at a moment when central banks have not yet finished the job of restoring price stability. The length of the conflict, the path of energy prices, and the Fed’s willingness to look through the noise versus react to the data -- those three variables will determine whether the next chapter is a relief rally or something considerably more painful.

Weekly Benchmark Breakdown
Weak Hands On The Wheel
This was a deterioration week for breadth rather than a new thrust. Across the major indexes, only a small minority of stocks are holding above even short-term moving averages, new lows are running ahead of new highs on most lookbacks, and the weekly heatmaps skew red outside a few standout names. The tape still says risk is on the defensive, with more evidence of distribution than accumulation under the surface.
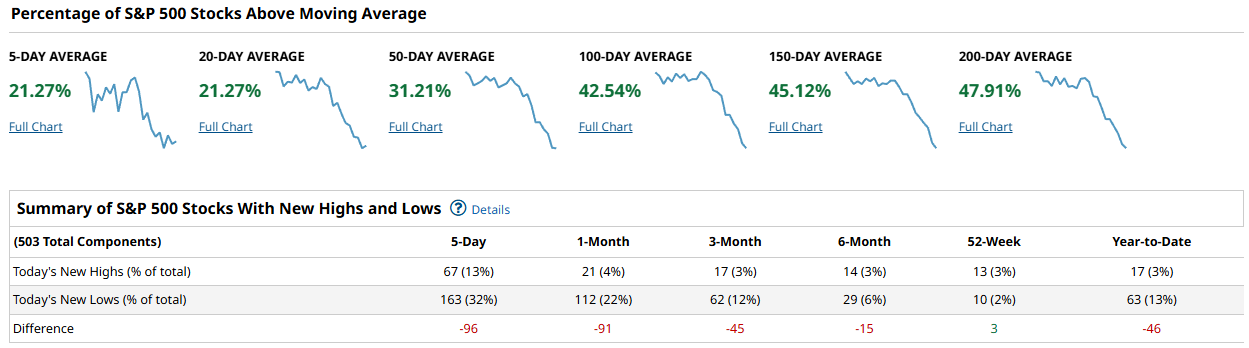
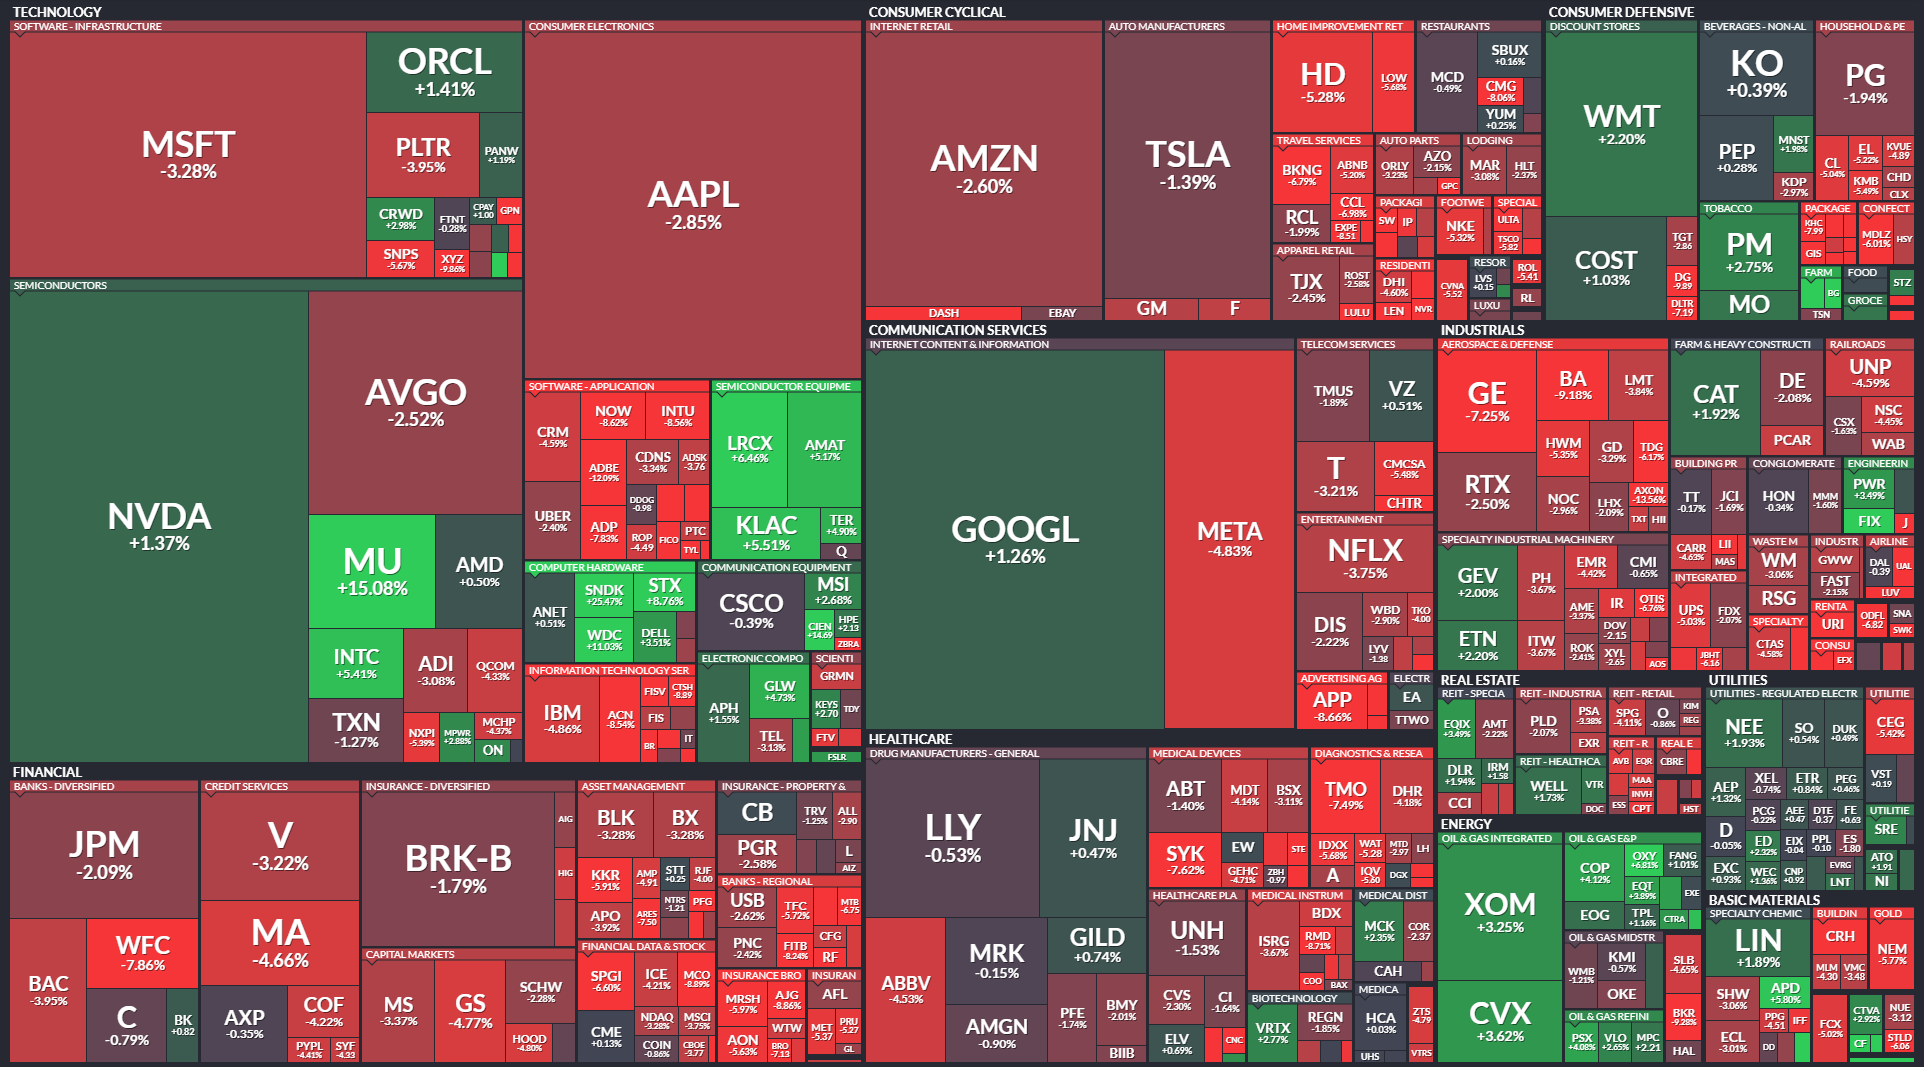
For the S&P 500, roughly one fifth of the index is above the 5-day and 20-day averages, about 21 percent in both cases, and only about 31 percent are still above the 50-day. As you move out the curve, participation improves but is slipping, with around 43 percent above the 100-day, 45 percent above the 150-day, and just under half, about 48 percent, still above the 200-day. New lows dominate new highs: over the past 5 days there were 67 new highs versus 163 new lows, a net negative of about 100, and the 1-month and 3-month windows also show more lows than highs. The weekly heatmap shows most large SPX names in the red, with only a handful of big tech and defensives green, underscoring that the recent pullback is broad and not just a small-cap or sector-specific issue.
The Dow is a bit less extreme but still soft. Only the mid-range averages have decent participation: the 50-day sits near 40 percent of components above it, with the 100-day slightly better in the low 40s, and similar levels around the 150-day and 200-day. The very short-term metrics, 5-day and 20-day, have slipped into the mid-teens, indicating that most Dow names have broken their near-term trends in the recent selloff. The new high–new low table is roughly balanced to slightly negative across the 5-day and 1-month windows, which is better than the other indexes but far from a leadership profile. The Dow heatmap for the week shows large red blocks in financials, cyclicals, and some industrials, with only a few green names in energy and select defensives.
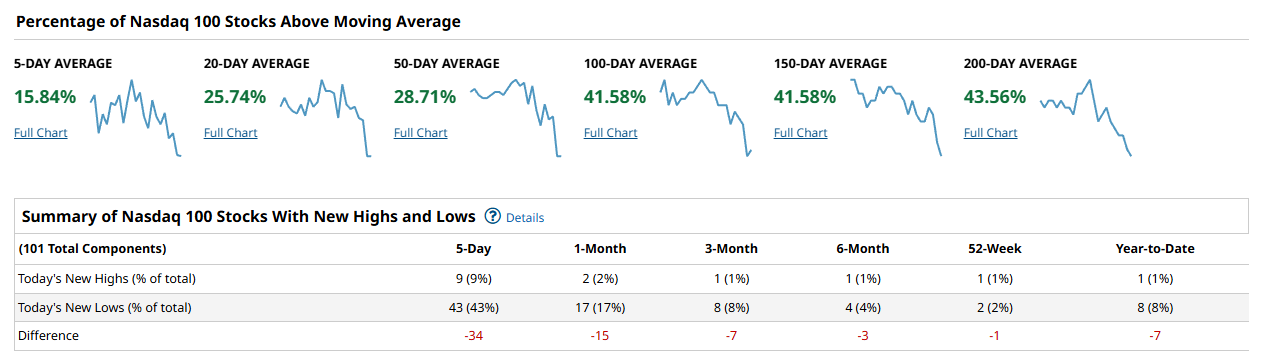
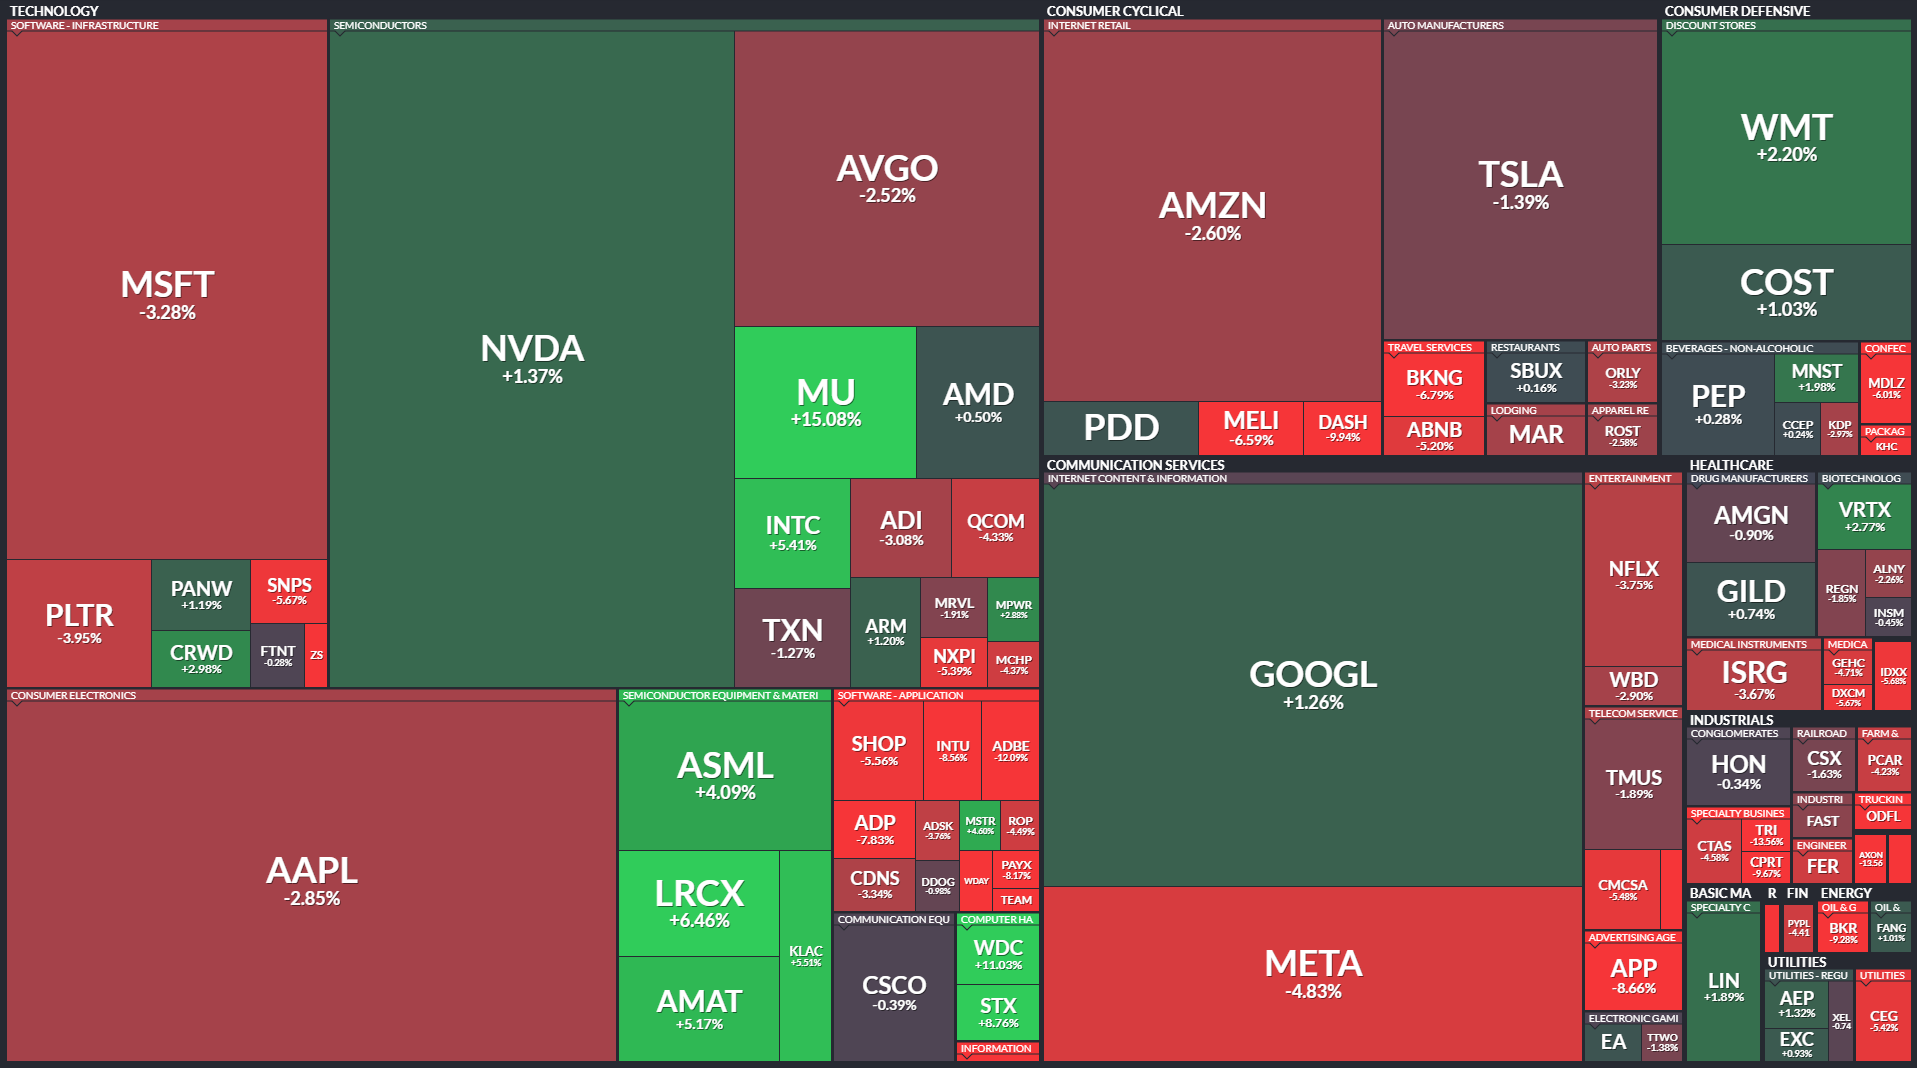
The Nasdaq 100 shows a similar pattern but with even weaker short-term participation. Only about 16 percent of components are above the 5-day, around 26 percent above the 20-day, and roughly 29 percent above the 50-day. The longer-term gauges look healthier but are rolling over: just over 41 percent are above the 100-day and 150-day, and about 44 percent remain above the 200-day. New highs are scarce while new lows stack up: over the past week, single-digit highs are swamped by several dozen new lows, leaving a solidly negative net reading. The weekly NDX heatmap is dominated by red in software, internet, and semis, with only a couple of big winners standing out, which keeps the growth and momentum complex on its back foot.
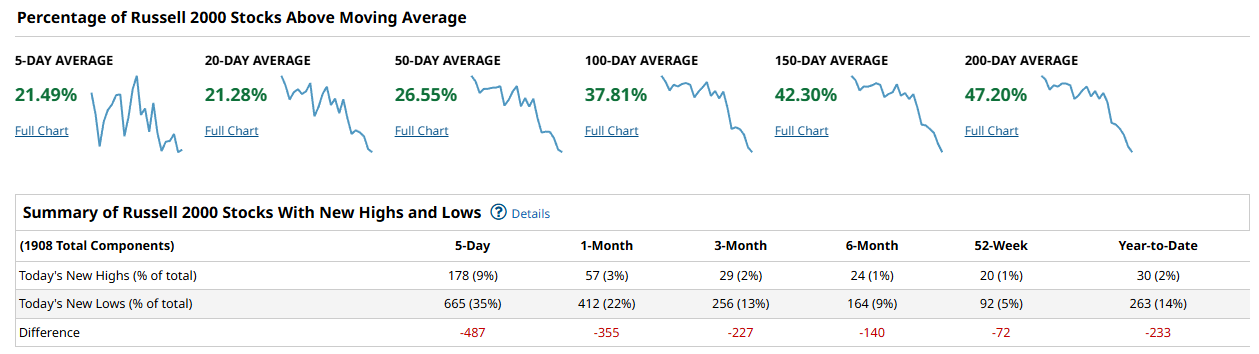
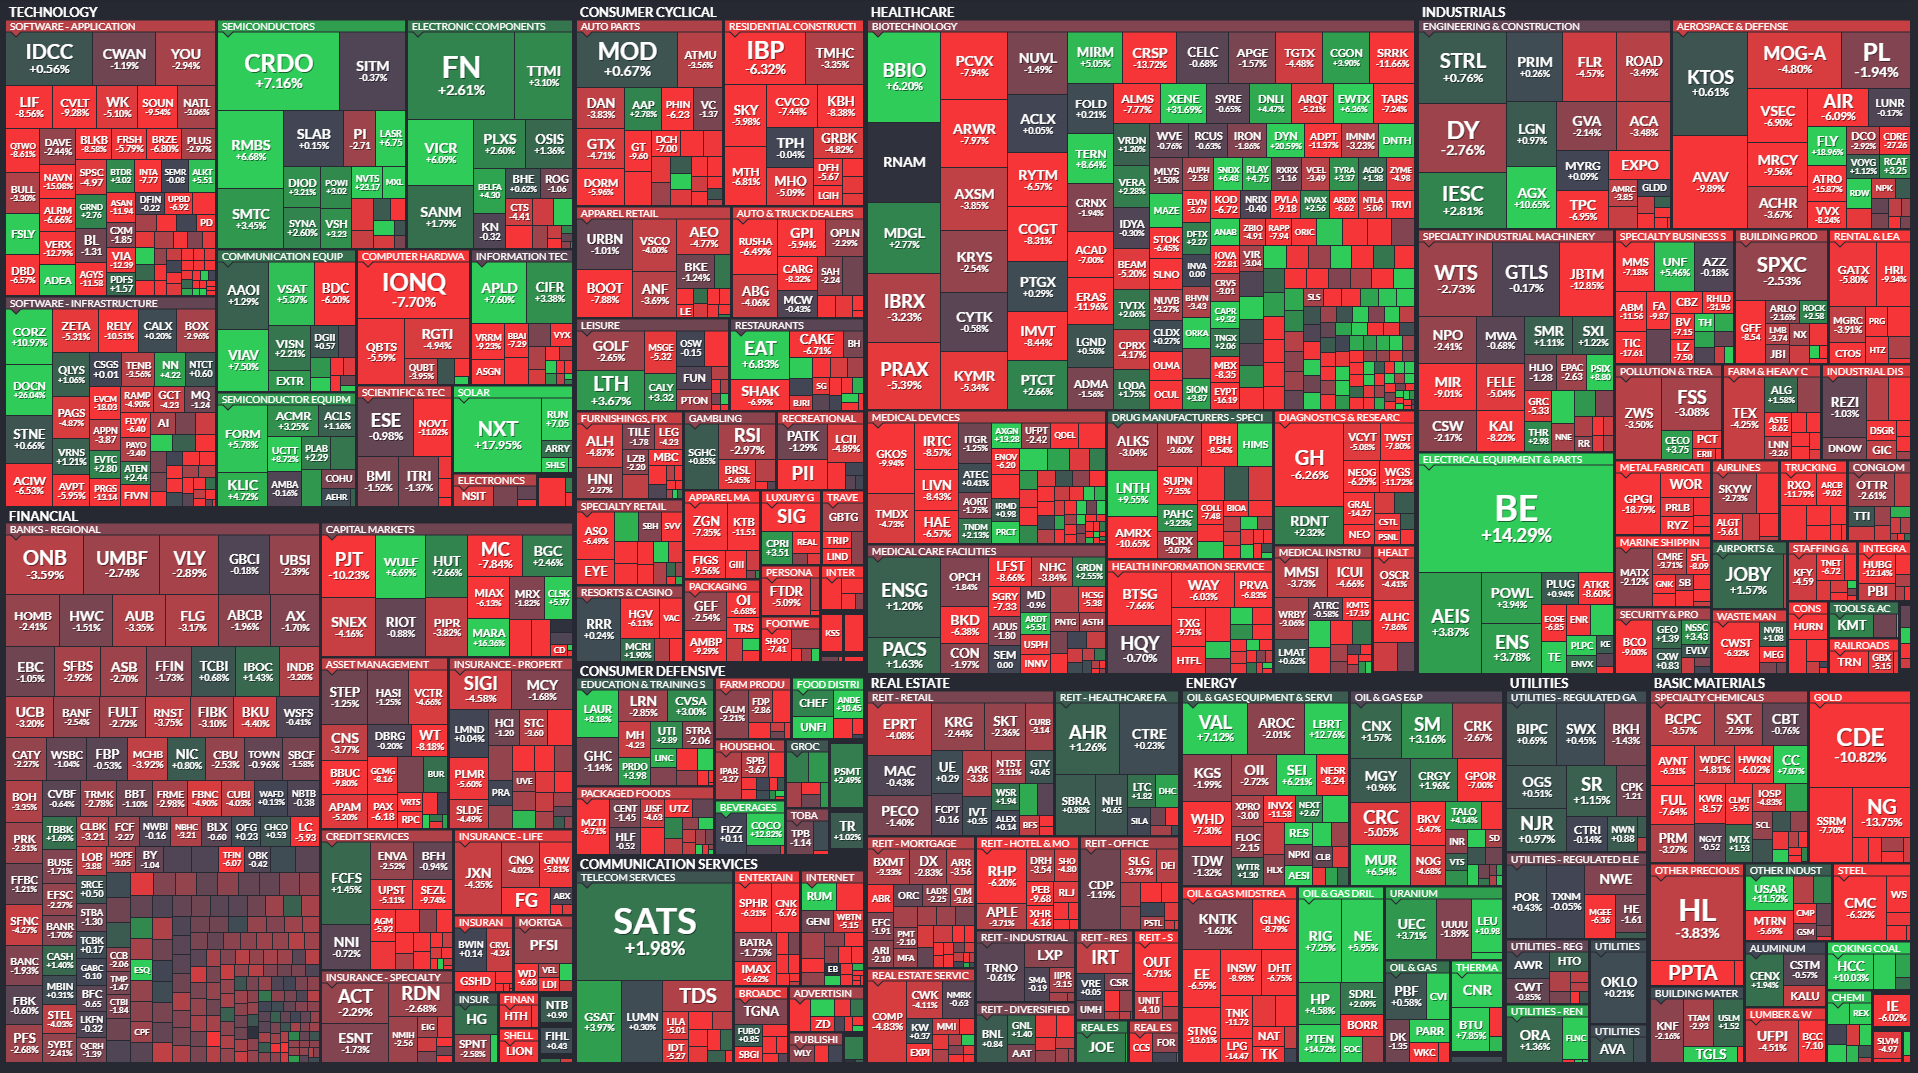
The Russell 2000 remains the weakest of the four. Only about 21 percent of components are above the 5-day and 20-day averages, about 27 percent above the 50-day, and under 40 percent above the 100-day. Even at the long end, the 150-day sits a bit above 42 percent and the 200-day around 47 percent, so more than half of small caps are now trading below their key long-term trend lines. New lows overwhelm new highs across time frames: over the past week there were roughly 178 new highs versus 665 new lows, a net deficit approaching 500, and the 1-month and 3-month windows also show several hundred more lows than highs. The weekly Russell heatmap is a sea of red across financials, cyclicals, healthcare, and real estate, highlighting persistent stress in economically sensitive areas.
Putting it together, cap-weighted indexes are still being held up by a narrow group of mega caps, while the broad market continues to erode. Participation in long-term averages is now under 50 percent in all four indexes, and short-term averages are in the teens to low 20s, which is what you expect in a corrective phase, not the early innings of a durable advance. To flip the script, we would need to see the percentage of stocks above the 50-day climb back through 60 percent on the S&P, Nasdaq 100, and Russell, coupled with sustained stretches where new highs outnumber new lows rather than the other way around.
For the playbook, this backdrop argues for keeping risk skewed toward quality and liquidity, favoring larger caps with stable trends and avoiding broad exposure to small caps and speculative growth until their breadth stabilizes. Defensive sectors and the relative winners on the weekly heatmaps can still work on a selective basis, but this is not a tape to be aggressively buying breakdowns or chasing every bounce. The key tell in the week ahead will be whether short-term breadth, especially the 5-day and 20-day cohorts, can rebound meaningfully without making even lower lows in the new lows lists.
Bottom line: breadth says we are in a correction with weak participation, so it pays to stay selective and patient rather than declare the all-clear.

Investor Sentiment Report
%Bull-Bear Spread
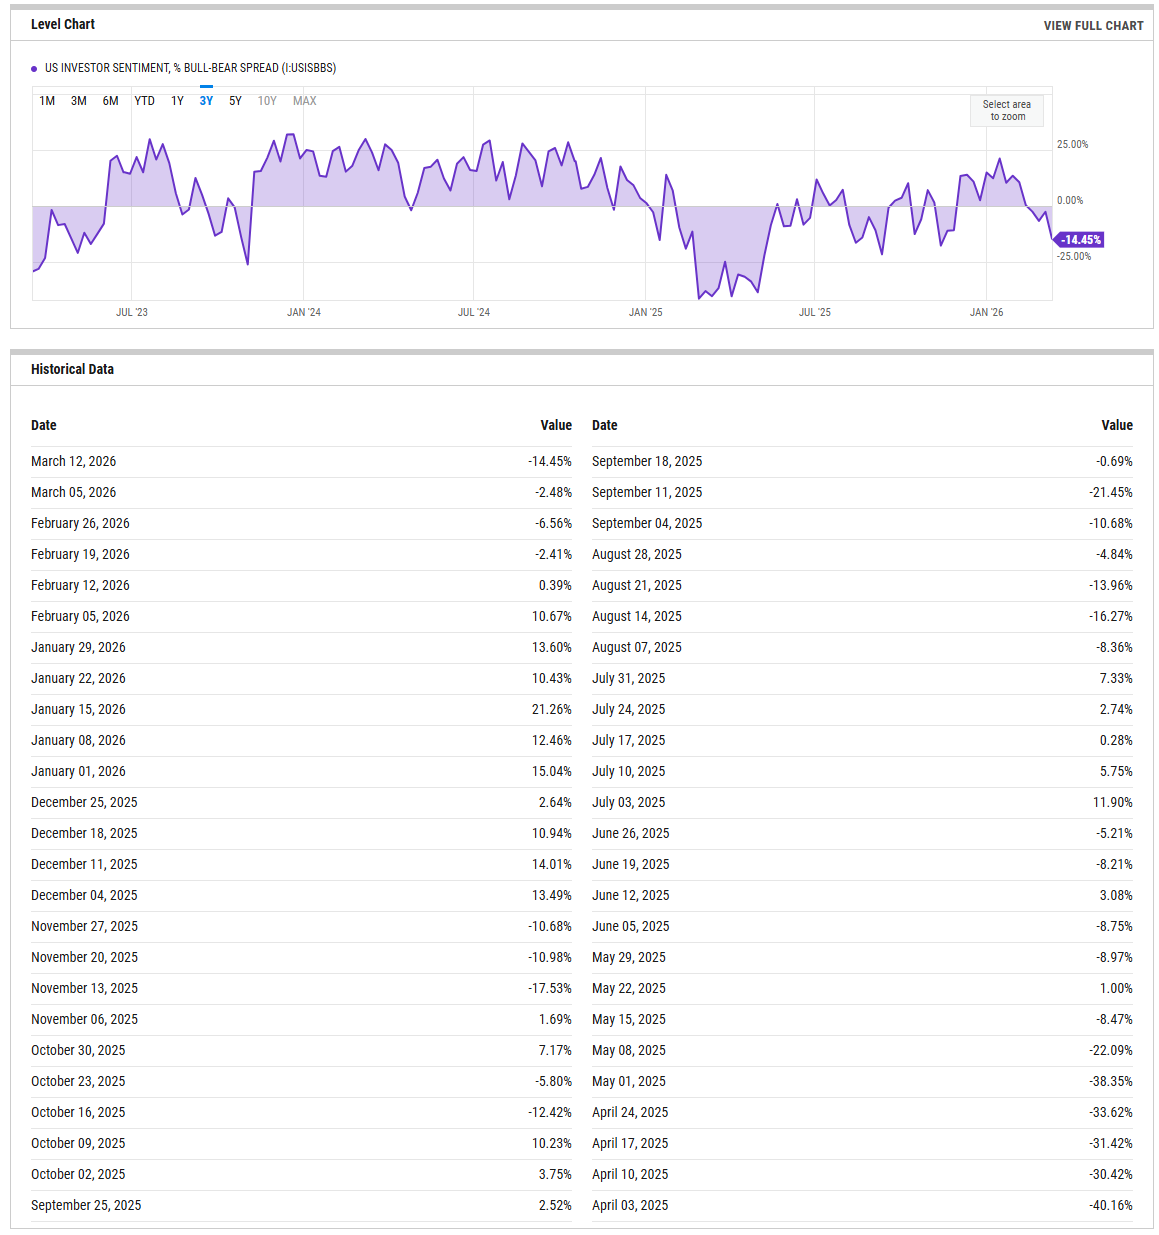
The %Bull-Bear Spread measures the gap between bullish and bearish investor sentiment, often from surveys like AAII. It’s a contrarian indicator—extreme optimism may signal a coming pullback, while extreme pessimism can hint at a potential rally. Large positive or negative spreads often mark market turning points.
The AAII bull-bear spread cratered to -14.45 percent for the week ending March 12, down nearly twelve points from -2.48 the prior week. This is the deepest negative print since the spread sat comfortably above +21 in mid-January, and it marks the fifth consecutive week of deterioration from that January peak. A spread this far below zero puts retail sentiment squarely in contrarian-supportive territory: historically, readings worse than -10 have tended to precede tradeable bounces within two to four weeks, because the crowd has already repositioned defensively and incremental sellers thin out. That said, the velocity of the drop matters. A one-week plunge of this magnitude suggests the sentiment reset is not yet mature; we need to see the spread stabilize in the negative teens for at least one more print before treating it as a reliable washout signal. A push back above zero on improving breadth would confirm the pessimism was overdone. The tripwire to watch on the downside is a slide below -20, which would mark a level associated with capitulatory sentiment and a higher-probability mean-reversion setup.
NAAIM Exposure Index
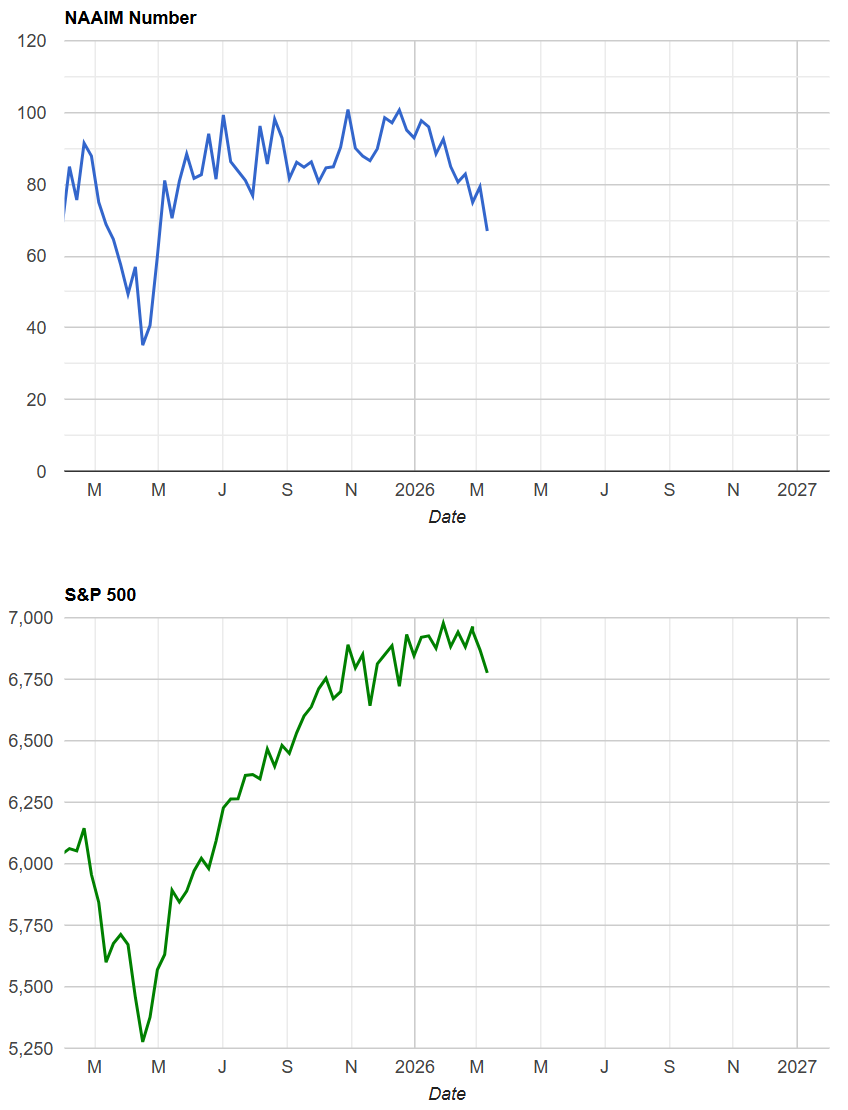
The NAAIM Exposure Index (National Association of Active Investment Managers Exposure Index) measures the average exposure to U.S. equity markets as reported by its member firms. These are typically active money managers who provide their equity exposure levels weekly. The index offers insight into how much these managers are investing in equities at any given time, ranging from being fully short (-100%) to leveraged long (up to +200%).
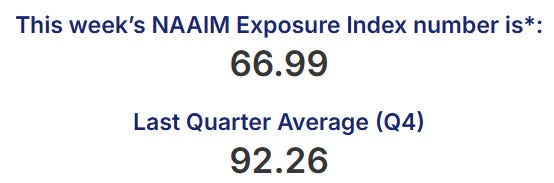
The NAAIM Exposure Index fell to 66.99 for the survey week ending March 11, down from 79.29 the prior week and continuing a steady unwind from the 96.01 reading posted in mid-January. Active managers have shed nearly thirty points of equity exposure in two months while the S&P 500 has only recently begun to show strain, which means this is proactive de-risking rather than forced liquidation. At 67, the index sits well below the Q4 2025 average of 92.26, implying meaningful dry powder that could fuel a re-risking rally if a catalyst emerges. A drop into the mid-50s without commensurate price damage would be a strong contrarian buy signal, as it would indicate managers are defensively positioned far beyond what the tape warrants. Conversely, a snap-back above 90 would signal that the herd has re-levered too quickly and would leave the market vulnerable to a crowded unwind on the next downdraft.
CBOE Total Put/Call Ratio
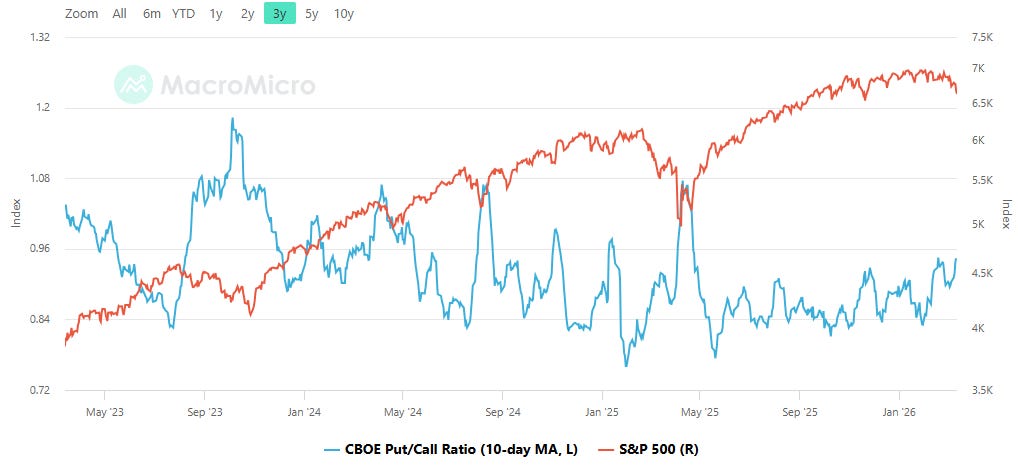
CBOE's total put/call ratio includes index options and equity options. It's a popular indicator for market sentiment. A high put/call ratio suggests that the market is overly bearish and stocks might rebound. A low put/call ratio suggests that market exuberance could result in a sharp fall.
The CBOE total put/call ratio printed 0.91 on March 12, with the 10-day moving average holding steady at 0.94. That 10-day average sitting in the low-to-mid 0.90s reflects a market that is hedged but not panicking -- above the complacency zone near 0.80 where protection demand dries up and corrections tend to bite hardest, yet still short of the 1.10-plus readings that historically mark durable washout lows. At current levels, any drawdown is likely to be cushioned by existing put hedges unwinding on the way down, but the protection is not extreme enough to fuel the kind of violent short-covering snap-back that follows true capitulation. A drift of the 10-day average above 1.05 would signal genuine fear entering the tape and would mark the zone where bottoms tend to form with higher reliability. On the other hand, a fade back below 0.85 would strip the market of its hedge cushion and leave it exposed to deeper downside if a macro shock arrives.
Equity vs Bond Volatility
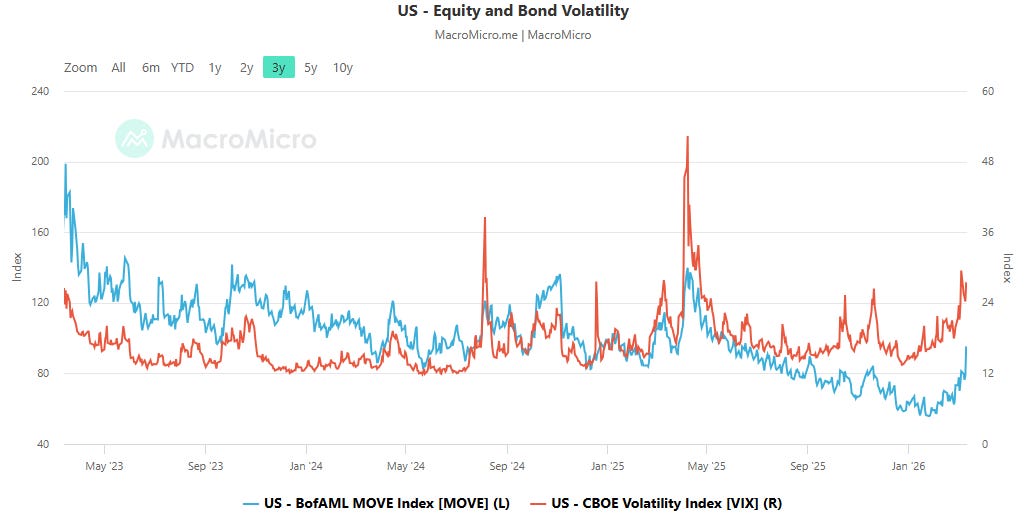
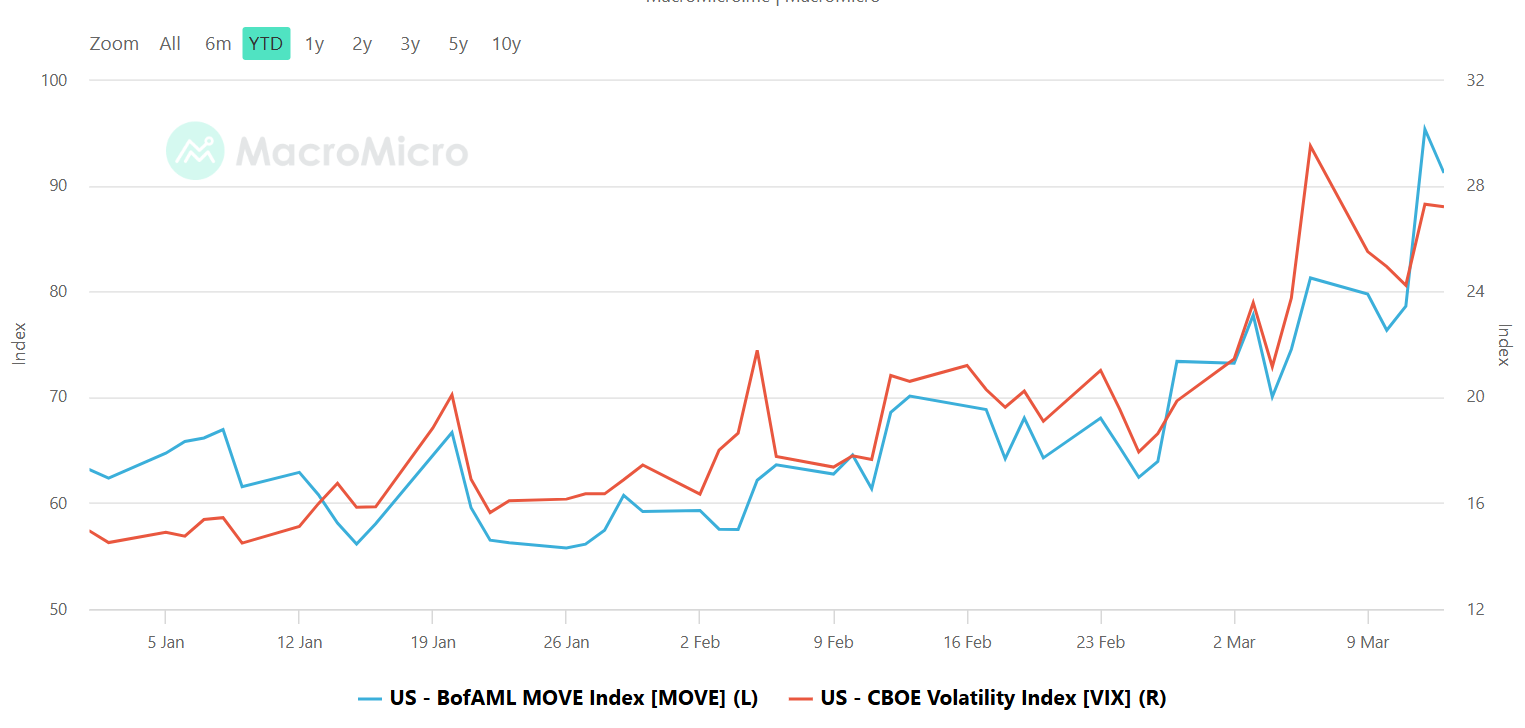
The Merrill Lynch Option Volatility Estimate [MOVE] Index from BofAML and the CBOE Volatility Index [VIX] respectively represent market volatility of U.S. Treasury futures and the S&P 500 index. They typically move in tandem but when they diverge, an opportunity can emerge from one having to “catch-up” to the other.
The MOVE Index jumped to 95.30 on March 12, up from 78.59, while the VIX rose in tandem to 27.27 from 24.23. Both volatility gauges are rising together, which means the stress is broad-based across asset classes rather than isolated in one corner of the market. MOVE at 95 is elevated but still below the 120 threshold that has historically preceded the most acute equity dislocations; when bond volatility breaks above that level while the VIX remains in the mid-20s, it tends to foreshadow a lagged equity vol spike as funding conditions tighten and correlation regimes shift. With VIX already in the upper 20s, the equity market is pricing in meaningful uncertainty, but the real danger signal would be MOVE accelerating past 110-120 while VIX plateaus, creating the divergence pattern that preceded several of the sharper drawdowns in recent years. For now, the synchronized move suggests markets are repricing risk coherently rather than exhibiting the kind of complacent disconnect that precedes ugly surprises.
CNN Fear & Greed
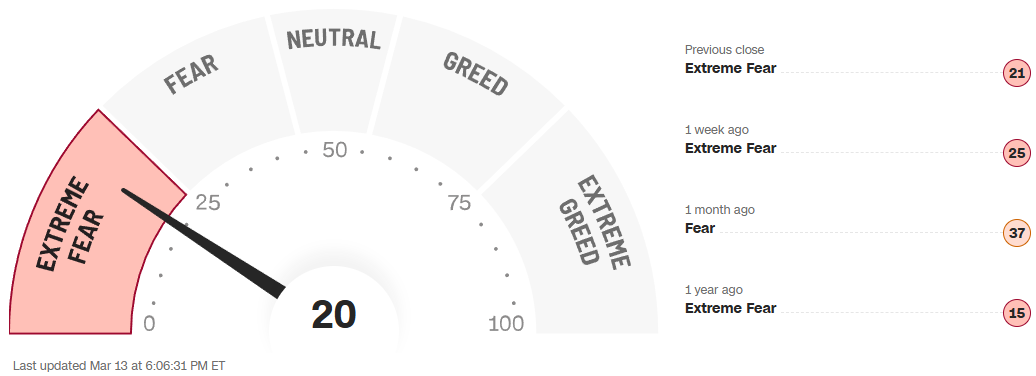
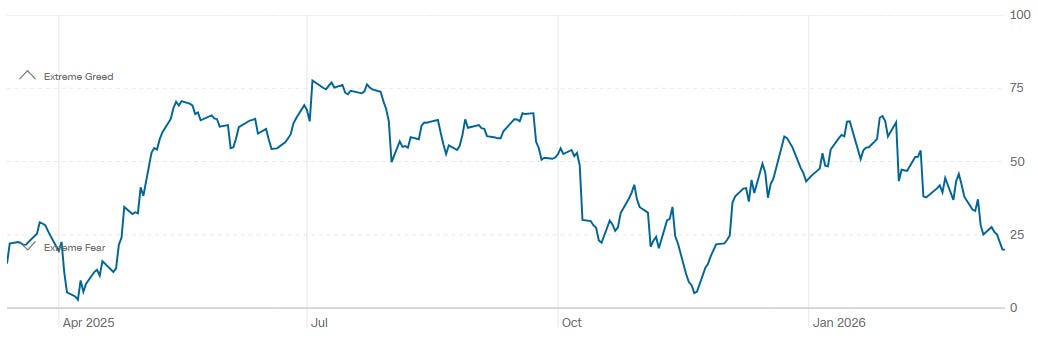
The CNN Fear and Greed Index sits at 20, deep in Extreme Fear territory, down from 25 a week ago and 37 a month ago. Six of the seven sub-indicators read Extreme Fear or Fear, with safe haven demand and junk bond demand both flashing their most defensive signals. The one-year chart tells a story of deteriorating confidence: the index peaked near 75 during the summer 2025 greed phase, churned through a series of lower highs into autumn, and has now plunged to a level last seen almost exactly a year ago during the March 2025 selloff. That prior Extreme Fear reading of 15 ultimately marked a tradeable low, and the current print at 20 is approaching the same zone. A sustained reading below 15 would signal the kind of capitulatory exhaustion that tends to produce the best risk-reward entries. The brief spike to 60 earlier this month followed by a collapse back to 20 is a failed-rally pattern that suggests the fear regime is not yet spent and that the next durable turn will require either a macro catalyst or a deeper flush into the single digits to fully clear positioning.
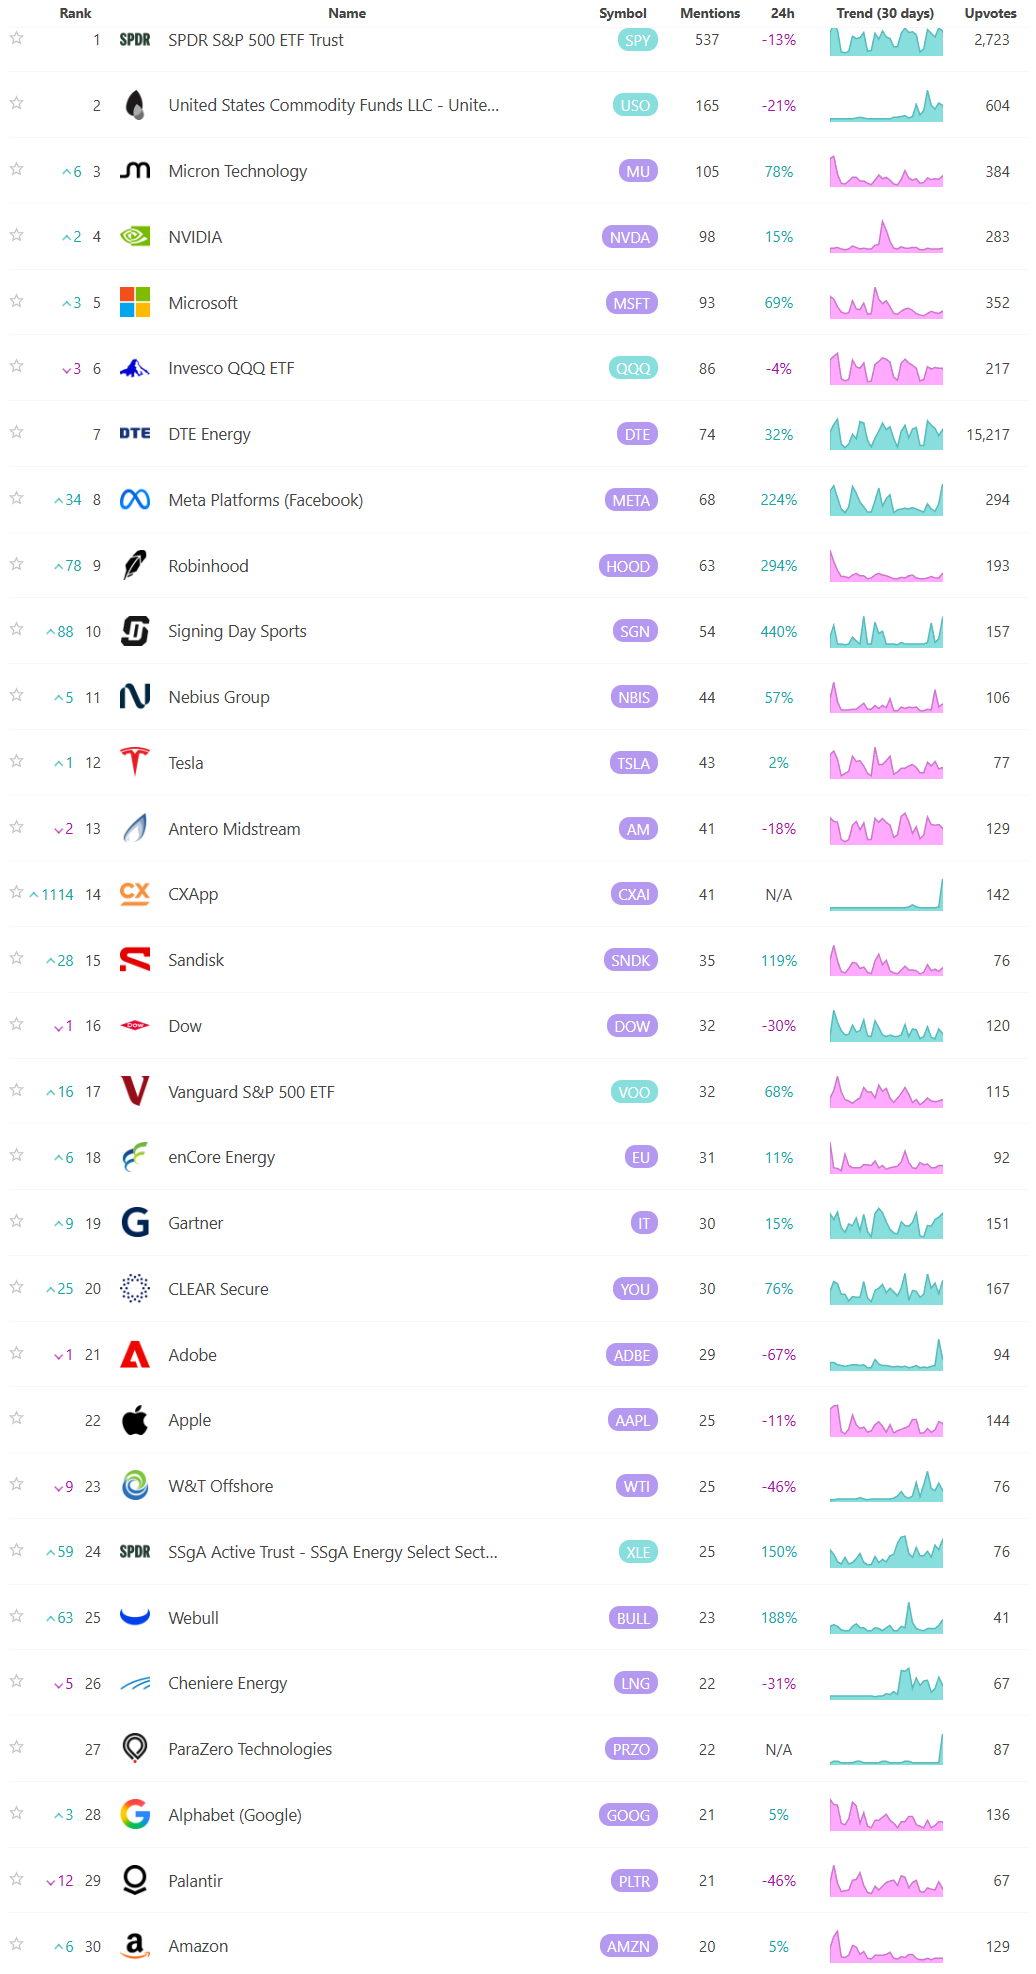
Social Media Favs
Social sentiment offers a real-time view of investor mood, often revealing market shifts before traditional indicators. It can signal momentum changes, spot emerging trends, and gauge retail investor impact—especially in high-volatility names. Tracking sentiment around events or earnings provides actionable insights, and when layered with quantitative models, can enhance predictive accuracy and risk management. Sustained sentiment trends often mirror broader market cycles, making this data a valuable tool for both short-term trades and long-term positioning.
Bottom line: sentiment surveys, active manager exposure, options positioning, cross-asset volatility, and the fear-greed composite are all leaning in the same direction -- defensive but not yet capitulatory -- which sets up a tape where the next leg is more likely a washout low than a sustained breakdown, provided MOVE stays below 120 and the bull-bear spread stabilizes in the negative teens.

Technician’s Playbook: Trading the Majors (SPY/QQQ/IWM/DIA)
When you’re a large institutional player, your primary goal is to find liquidity - places to do a ton of business with the least amount of slippage possible. VolumeLeaders.com automatically identifies and visually plots the exact spots where institutions are doing business and where they are likely to return for more. It’s one of the primary reasons “support” and “resistance” concepts work and truly one of the reasons “price has memory”.
SPY -- SPDR S&P 500 ETF Trust
SPY closed at $662.48, down 54 basis points, and the tape is sitting right on the doorstep of the most consequential volume shelf on the chart. The dominant feature here is the massive cluster that printed on March 12 at $666.20, absorbing $7.44 billion across 11.2 million shares -- the fourth-largest cluster in the visible window. That print landed right into the teeth of the $666-$671 zone where two chunky trade levels reside: $679.10 carrying $21.68 billion at 4.54x relative size and 97.76 percentile, and $671.30 at $20.98 billion. Price has now slipped below both, which reframes them as overhead resistance rather than support. The trade ranked #11 printed in the upper $650s area in mid-March and its positioning near the current price suggests institutional activity is testing the waters at these levels rather than fleeing.
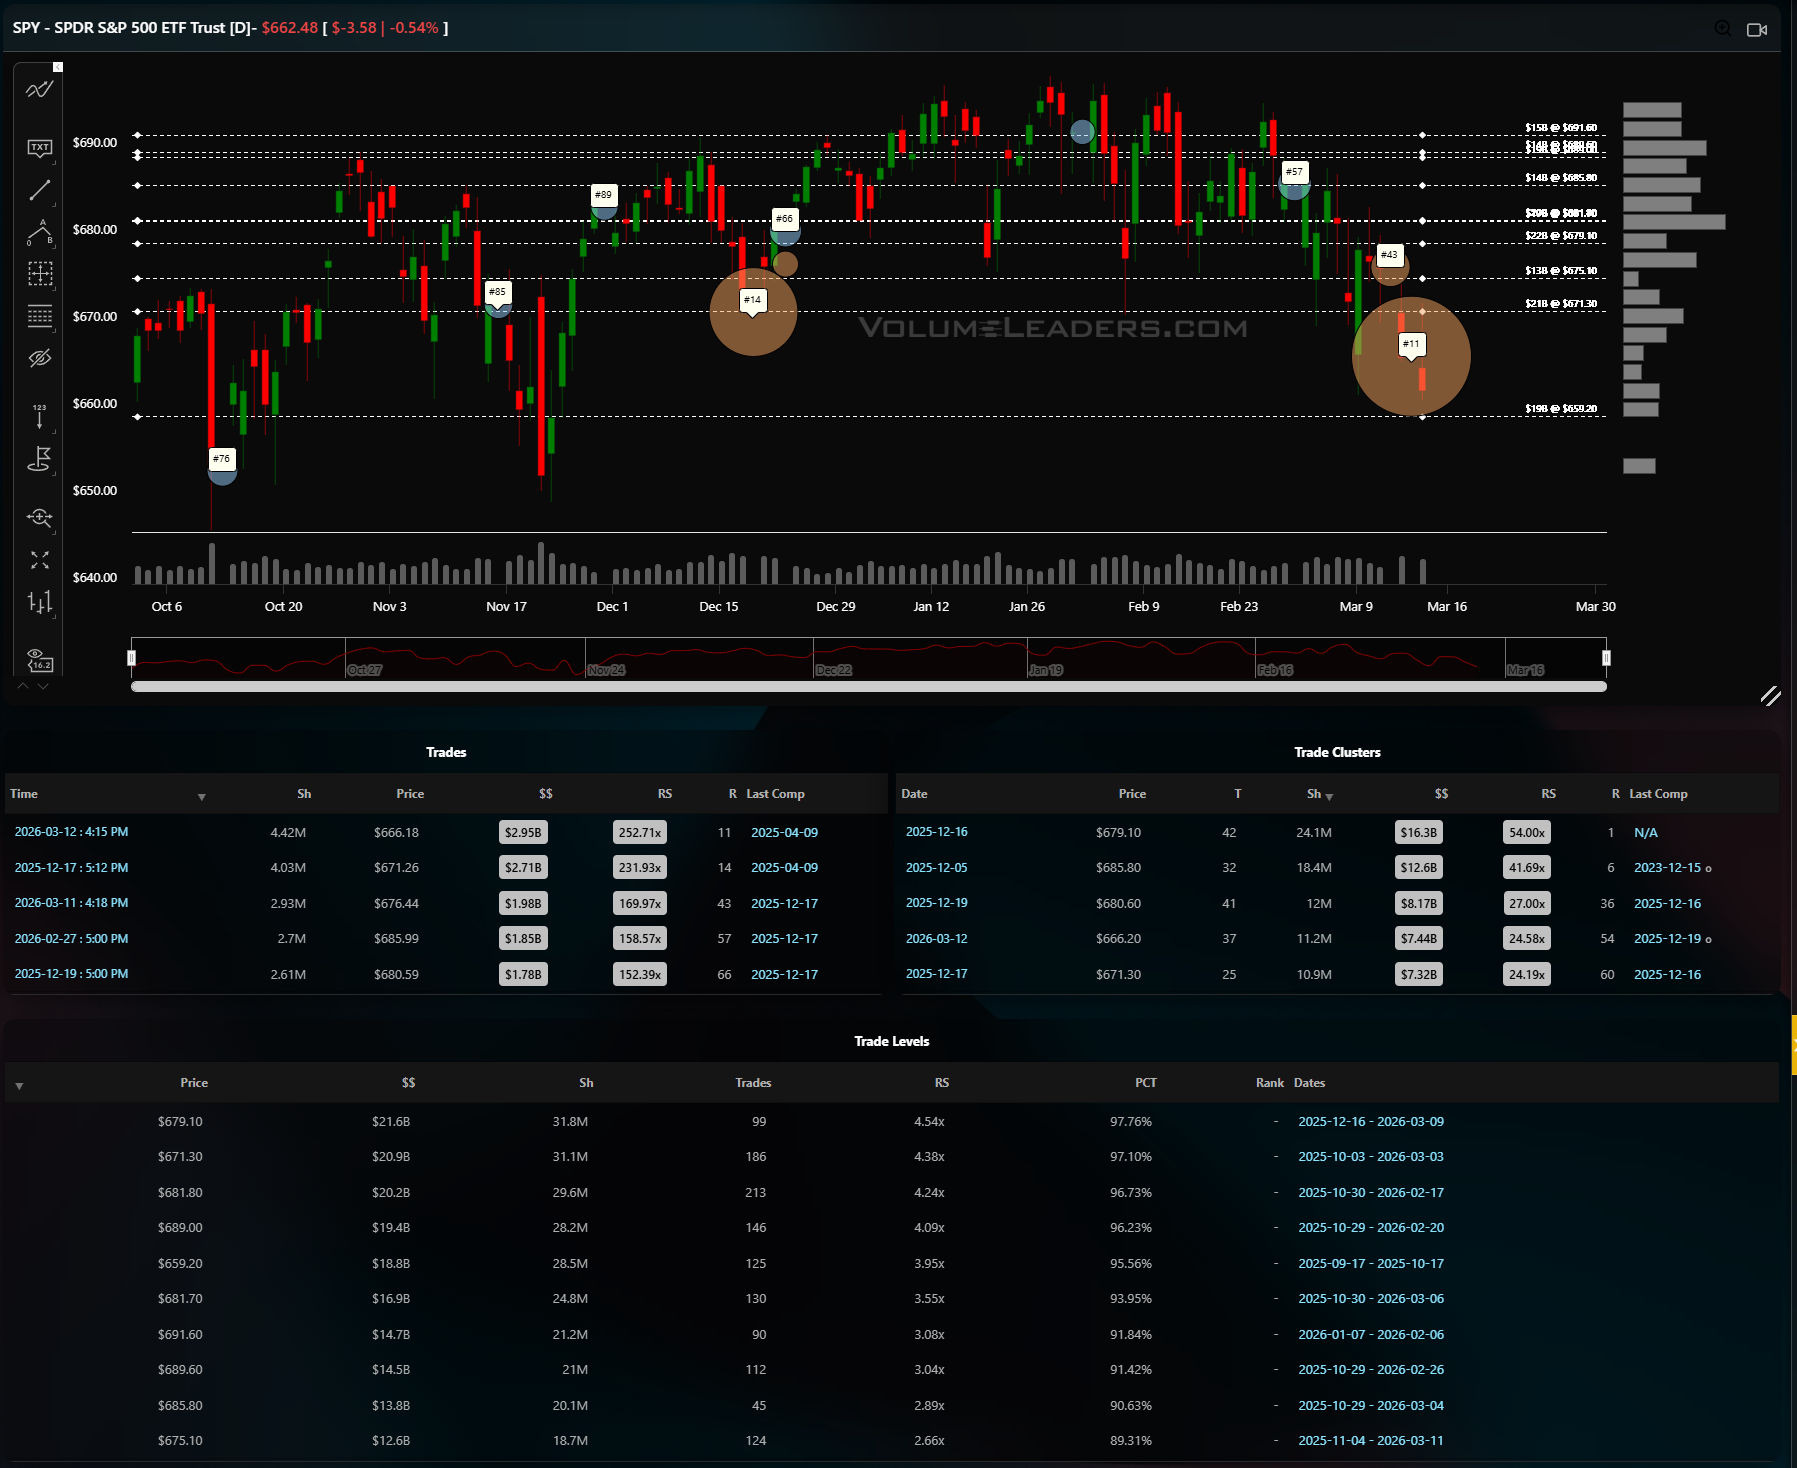
Below, the December cluster at $675.20 with $16.38 billion and the mid-November print #85 near $668 marked the last meaningful demand zone on the way up. The line of scrimmage sits at $659-$662 -- the lower boundary of the late-February and early-March balance area. Acceptance below $659 opens a fast move toward the $650 shelf where trade #76 printed back in October, a level that has not been revisited since. On the bullish side, reclaiming $671 with conviction and holding it through a session close would suggest the March 12 cluster was genuine absorption rather than distribution, and the next magnet becomes the $679-$681 zone where large levels sit. A disciplined approach here is to watch for a reclaim of $666 on expanding volume as a first signal, with invalidation on a close below $659. First upside target would be the $671 level; first downside target if $659 fails is the $650 pocket.
QQQ-- Invesco QQQ Trust
QQQ at $593.00, off 71 basis points, is trading well below the massive volume footprint that dominates the $606-$616 band. The largest cluster on the chart sits at $616.40 with $5.43 billion, 8.81 million shares, and a relative size of 45.57x -- ranked number one with a 99.31 percentile reading. That is the gravitational center of this name, and price is now nearly four percent below it. The October trade #9 near $610 was a historically significant print that anchored a multi-week base, and the January print #11 near $621 marked the high-water mark before the February unraveling. The late-February cluster at $606.00 absorbed $3.57 billion at 29.92x relative size, and price has now broken below that as well. The trade levels table confirms the damage: the $609.30 level holds $6.88 billion at 5.56x and the $608.30 level holds $5.15 billion, both now overhead.
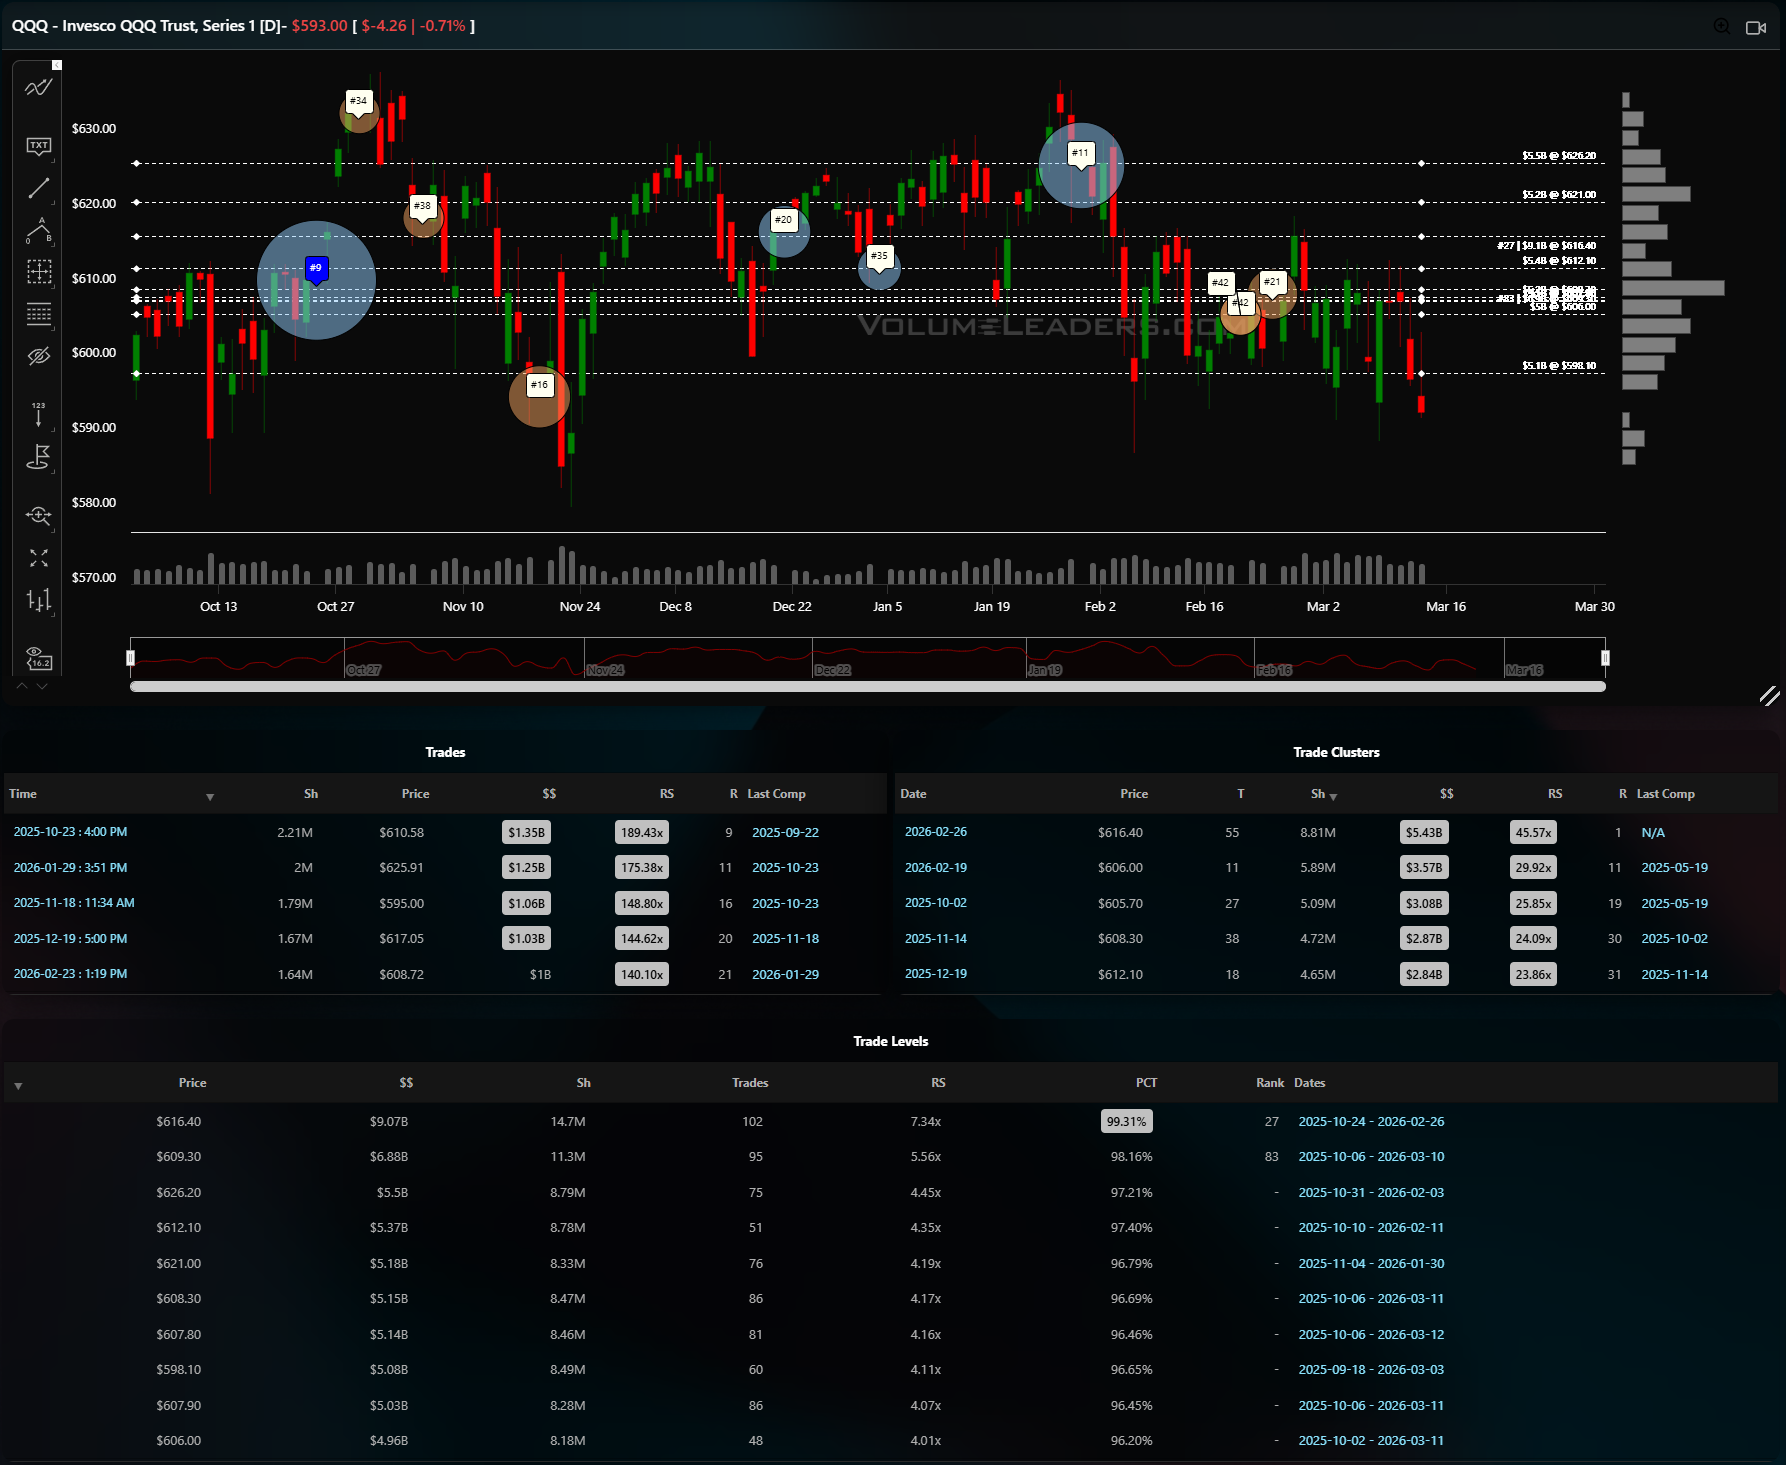
The line of scrimmage is $598-$600, where the November print #16 landed near $595 on $1.07 billion. If that zone fails, the next shelf with meaningful volume memory is $589-$591 where the volume profile on the right edge of the chart thins considerably. The bullish recovery case requires a push back above $606, the broken cluster, on heavy participation. That would suggest the selloff was a shakeout rather than the start of a trend change, and the $616 cluster becomes the magnet. Until $606 is reclaimed, rallies are sells and the path of least resistance is lower. A tactical short below $598 targets the $589 area with a stop above $606.
IWM -- iShares Russell 2000 ETF
IWM at $246.55, down 35 basis points, tells a cleaner structural story than the large-cap indices. The dominant volume cluster printed on December 12 at $257.70 with $1.55 billion across 6.02 million shares at 19.57x relative size. That cluster coincides almost exactly with the February high near $260 where trade #59 printed as a large circle -- classic distribution at a volume-defined ceiling. Below current price, the $242.90 level is the highest-dollar trade level on the chart at $5.83 billion with a 2.71x relative size and 92.14 percentile, making it the structural floor for this entire October-to-present range. The December prints #40 and #23 clustered in the $248-$253 zone, and the large gray circle #47 near $245 marked the December low before the January rally.
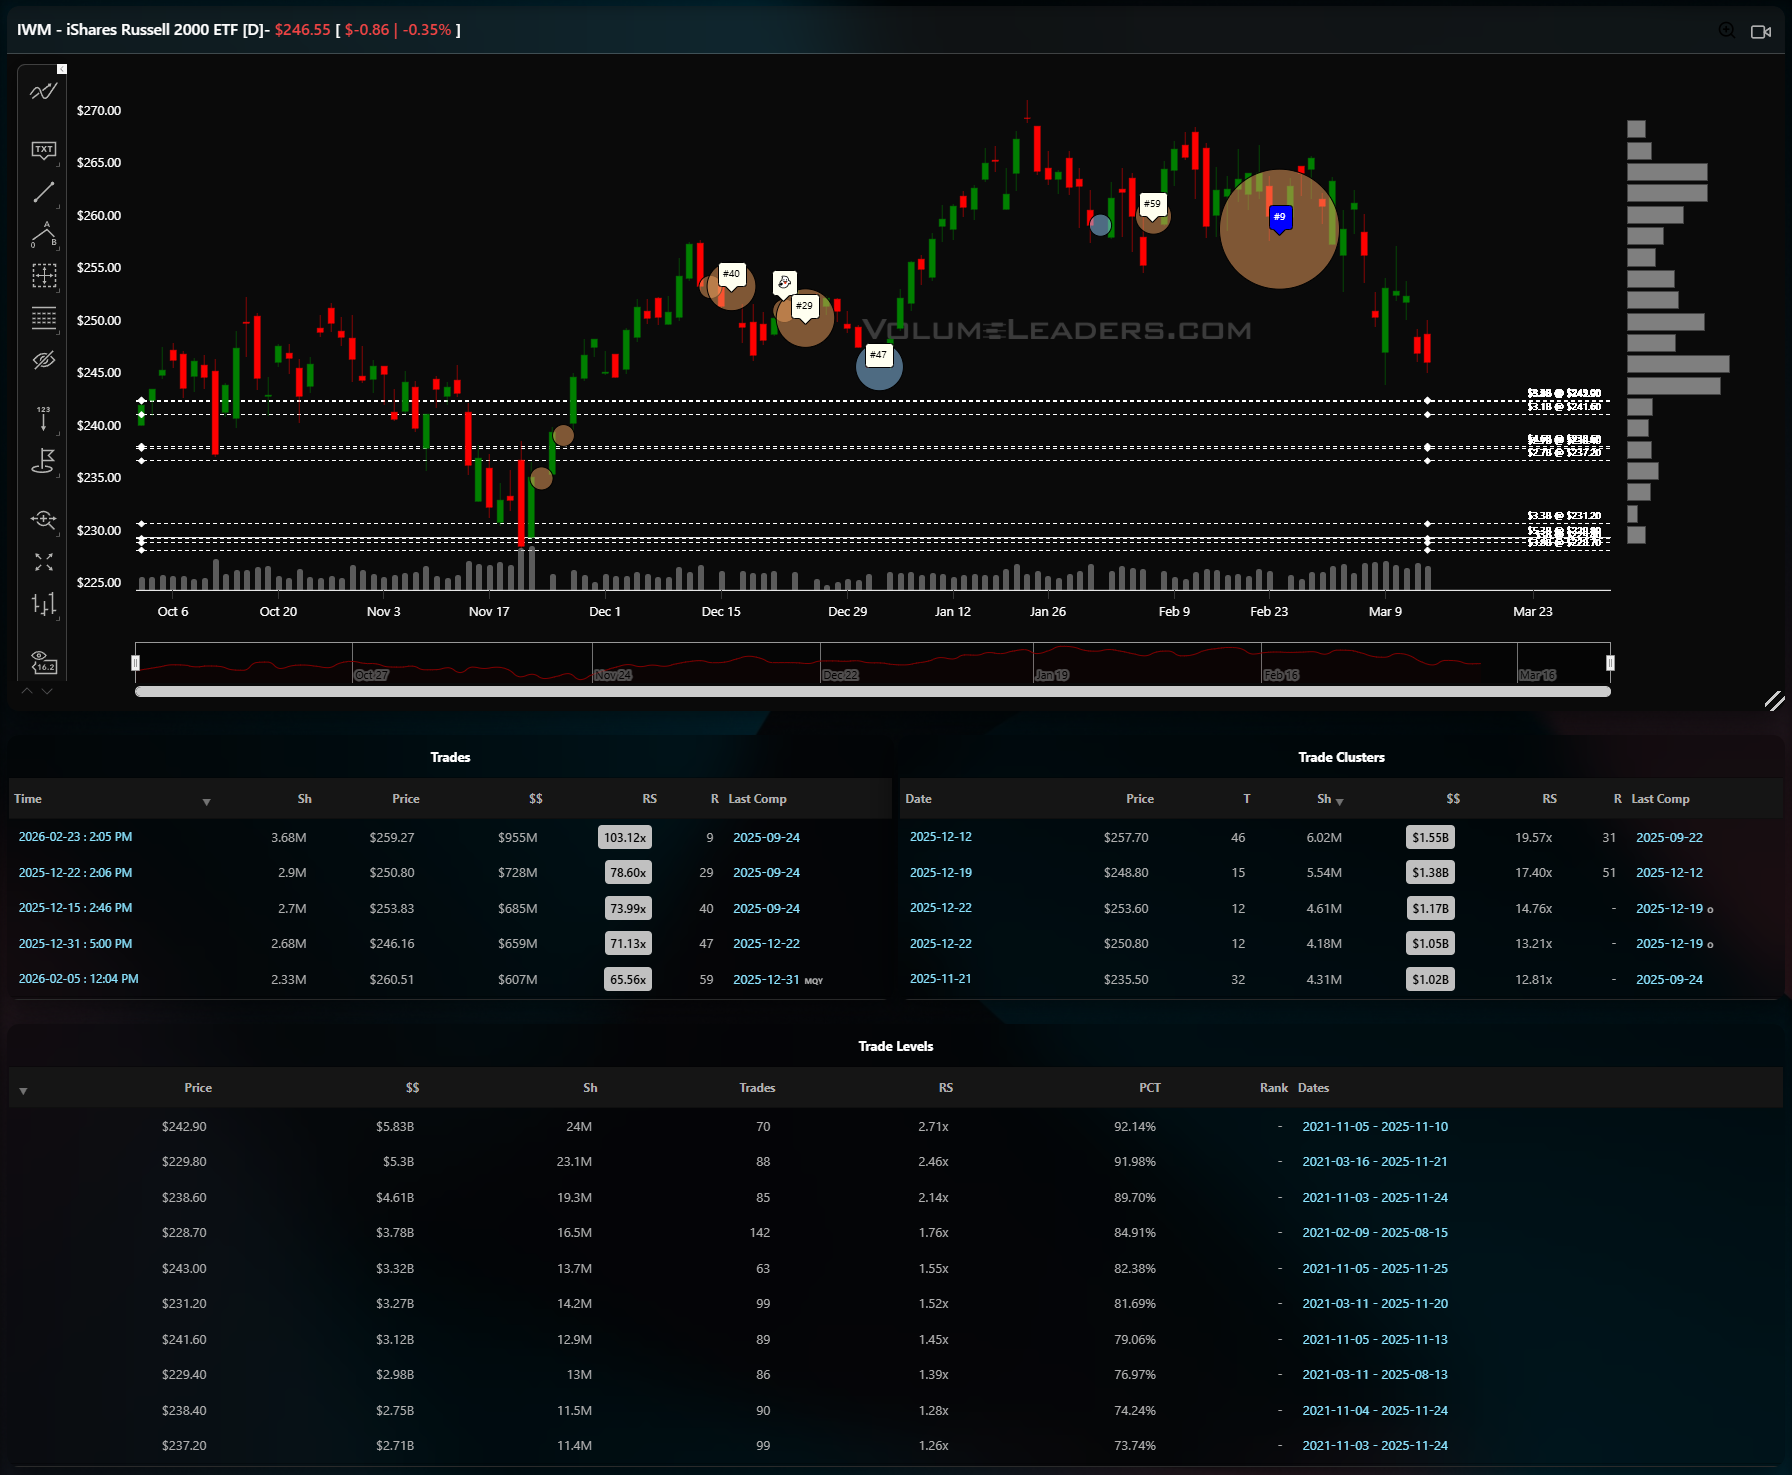
Price is now back in that same pocket, essentially retesting the base of the Q4 consolidation. The $237-$238 shelf below holds $4.61 billion and represents the October launch point. The line of scrimmage is $243-$245, right where price sits. A close below $242 would crack the highest-dollar level on the chart and likely trigger a flush toward $237, where the next volume shelf resides. The bullish case requires holding $243 and reclaiming $250 -- the midpoint of the December-February range -- which would reestablish the $257 cluster as the upside target. Small caps are the most honest expression of risk appetite in this market, and IWM holding its Q4 base while large caps break their own structures would be a notable divergence worth monitoring.
DIA -- SPDR Dow Jones Industrial Average ETF
DIA at $466.80, down 15 basis points, has undergone the sharpest structural breakdown of the four indices. The massive December cluster near $480 is the defining feature -- prints #69, #59, and #1 all landed within a tight $479-$481 band, with the single-trade at $480.78 carrying $808 million at 84.04x relative size, ranked number one on the chart. That is an extraordinary concentration of institutional flow at a single price, and the fact that DIA is now trading sixteen dollars below it tells you the market has decisively rejected that level. The $475.20 level holds $812 million at 4.47x relative size and 96.61 percentile, making it the top trade level by dollar value, and it too is well overhead. The February cluster at $501.50 with $391 million marked the cycle high before the violent reversal, and the January cluster at $491.50 with $465 million is another shelf that price blew through on the way down.
The current resting spot near $466-$467 sits in a relative volume void -- the next meaningful level below is $461.30 at $330 million, and below that $456.60 at $330 million. The line of scrimmage is the $466-$468 zone where the March 9 print of $171 million at 17.80x landed. A failure here opens $461 quickly, and if that gives way, $455 is the next shelf with any structural memory. The bullish case requires a reclaim of $475, the top trade level, which is a significant distance from here and would likely require a macro catalyst. Until then, DIA is in a distribution-to-markdown phase and bounces into the $475 shelf are fade opportunities with stops above $480.
Bottom line: all four indices are pressing against or have already broken their highest-dollar volume shelves, with QQQ and DIA showing the most structural damage and IWM hanging by a thread at its Q4 base -- the tape is asking for either a swift reclaim of broken levels or a deeper flush into the next volume pockets below.

Summary Of Thematic Performance YTD
VolumeLeaders.com offers a robust set of pre-built thematic filters, allowing you to instantly explore specific market segments. These performance snapshots are provided purely for context and inspiration—think about zeroing in on the leaders and laggards within the strongest and weakest sectors, for example.
S&P By Sector
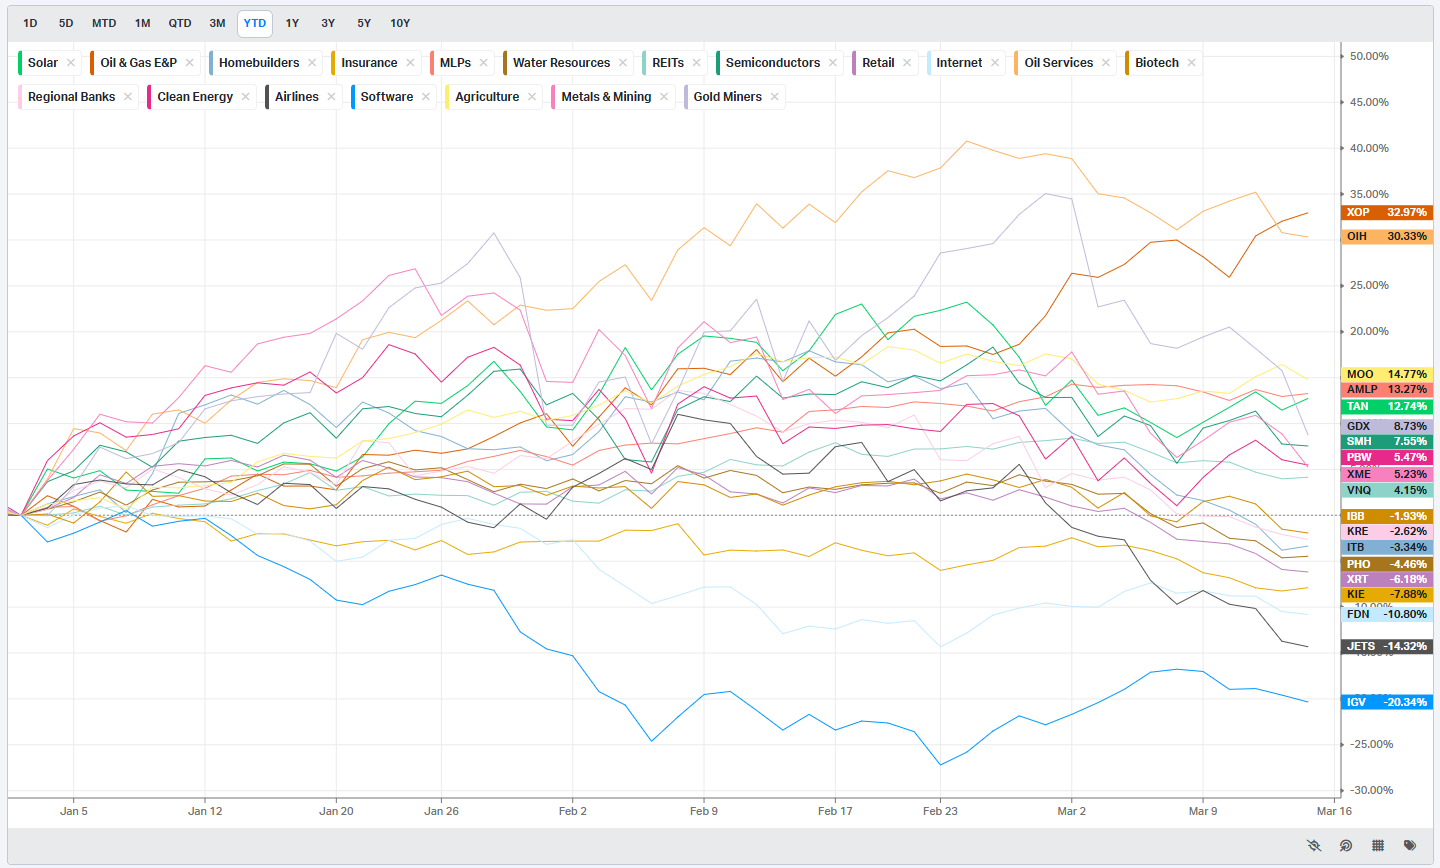
S&P By Industry
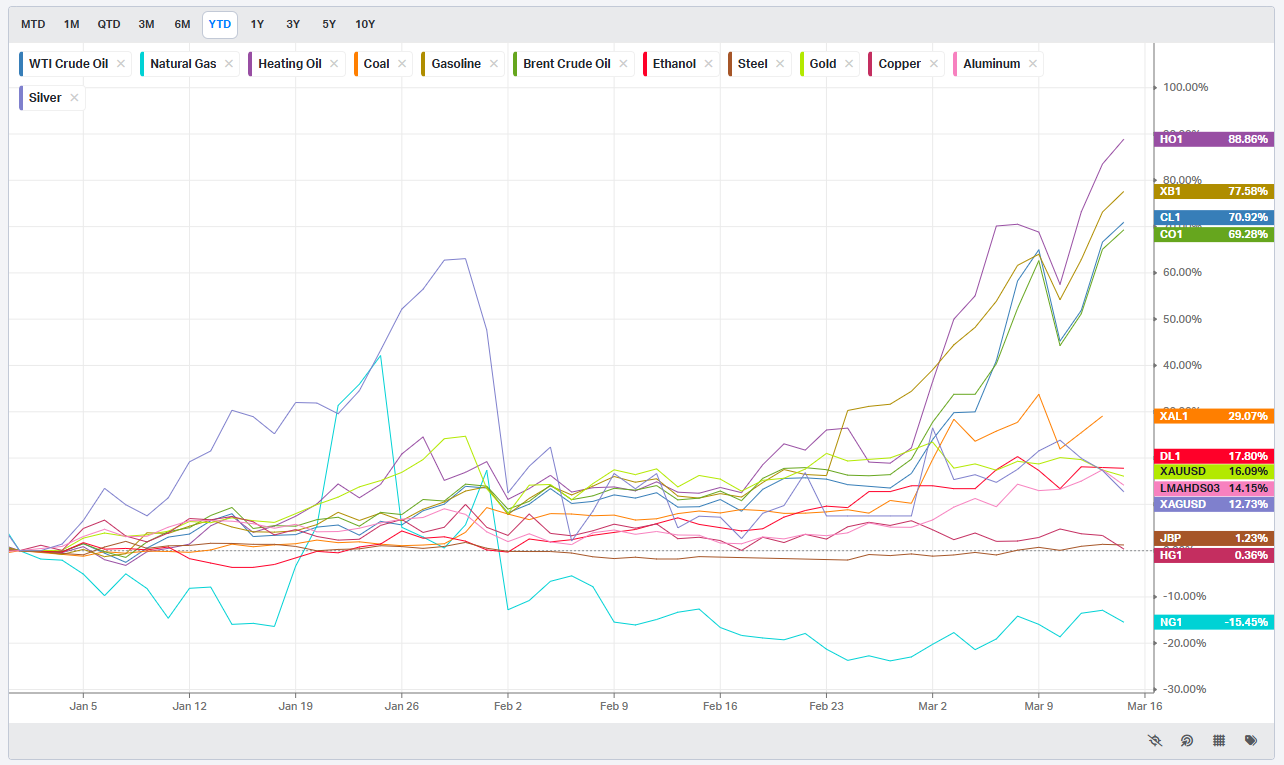
Commodities: Energy & Metals
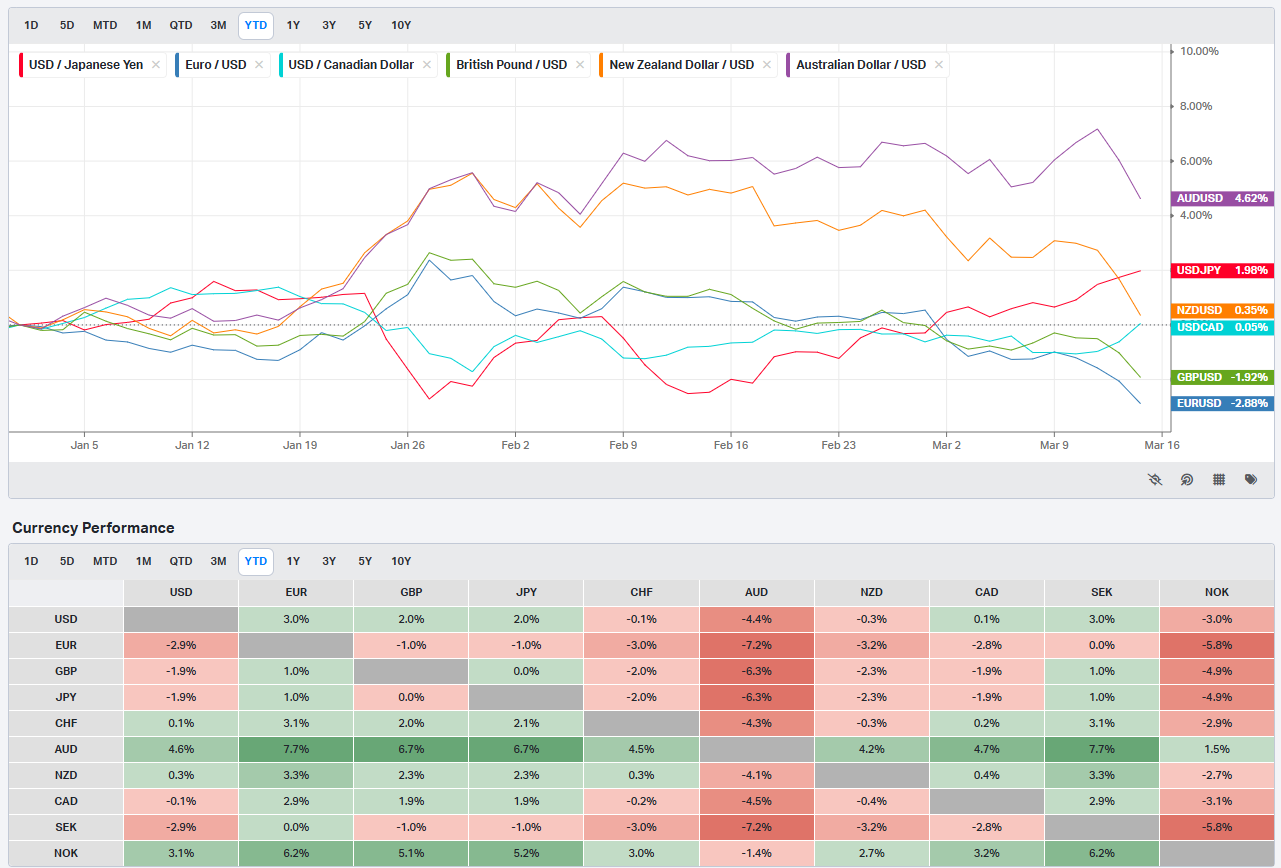
Currencies/Major FX Crosses
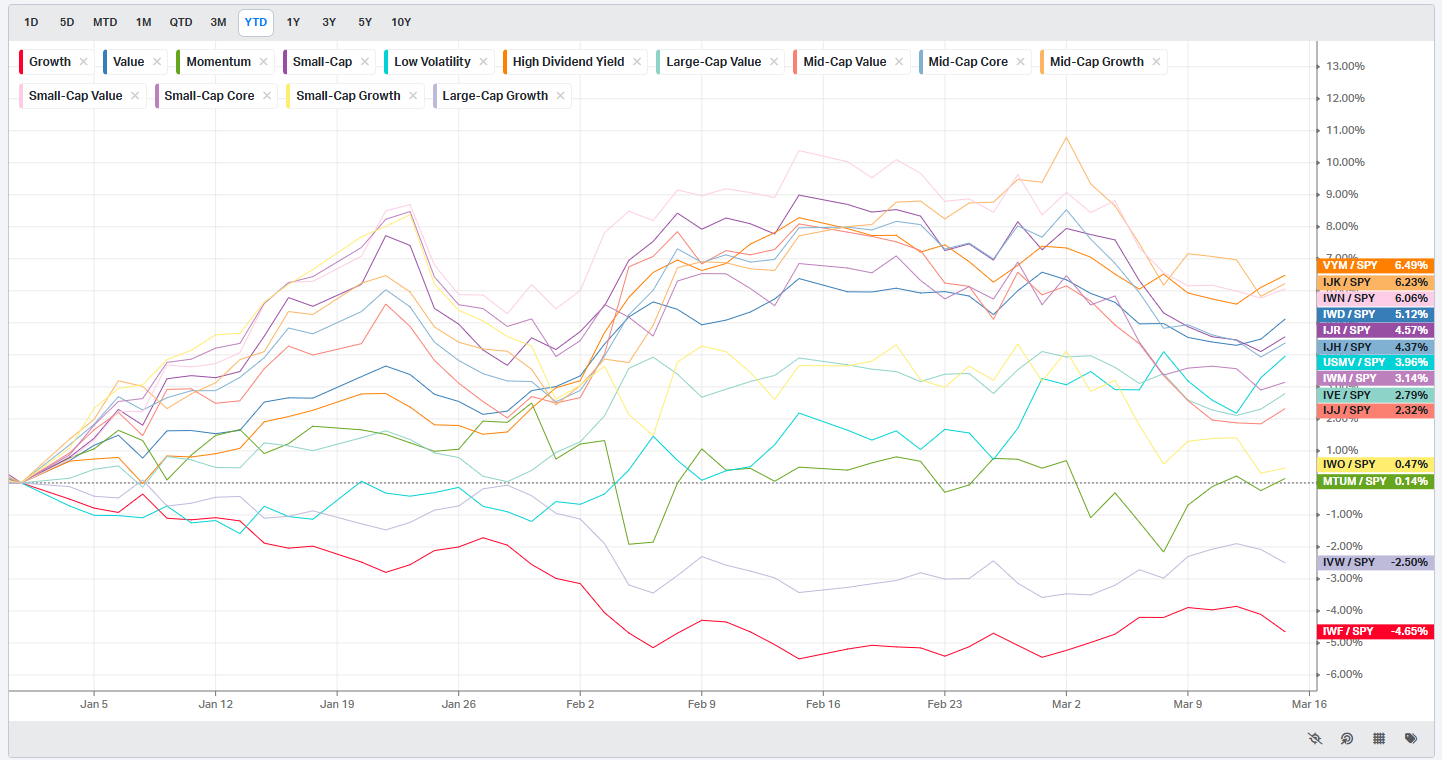
Factors: Style vs Size-vs-Value

Events On Deck This Week
Here are key events happening this week that have the potential to cause outsized moves in the market or heightened short-term volatility.
Monday opens with NY Empire State Manufacturing (previous 7.10, consensus 3.8, forecast 3), Industrial Production MoM (previous 0.7%, consensus 0.2%, forecast 0.3%), and NAHB Housing Market Index (previous 36, consensus 37, forecast 32). A miss on Empire and a soft NAHB print would reinforce the growth-scare narrative already priced into sentiment gauges, while an upside surprise on Industrial Production could offer a brief reprieve. The API crude draw of -1.7M barrels sets the energy table for Tuesday.
Tuesday brings ADP Weekly Employment Change (previous 15.5K), Pending Home Sales MoM (previous -0.8%, consensus -1%, forecast -0.7%), and Pending Home Sales YoY (previous -0.4%, forecast -1.8%). Housing data deteriorating further against a backdrop of 6.19% mortgage rates -- visible as Wednesday’s MBA print -- would tighten the vise on rate-sensitive sectors.
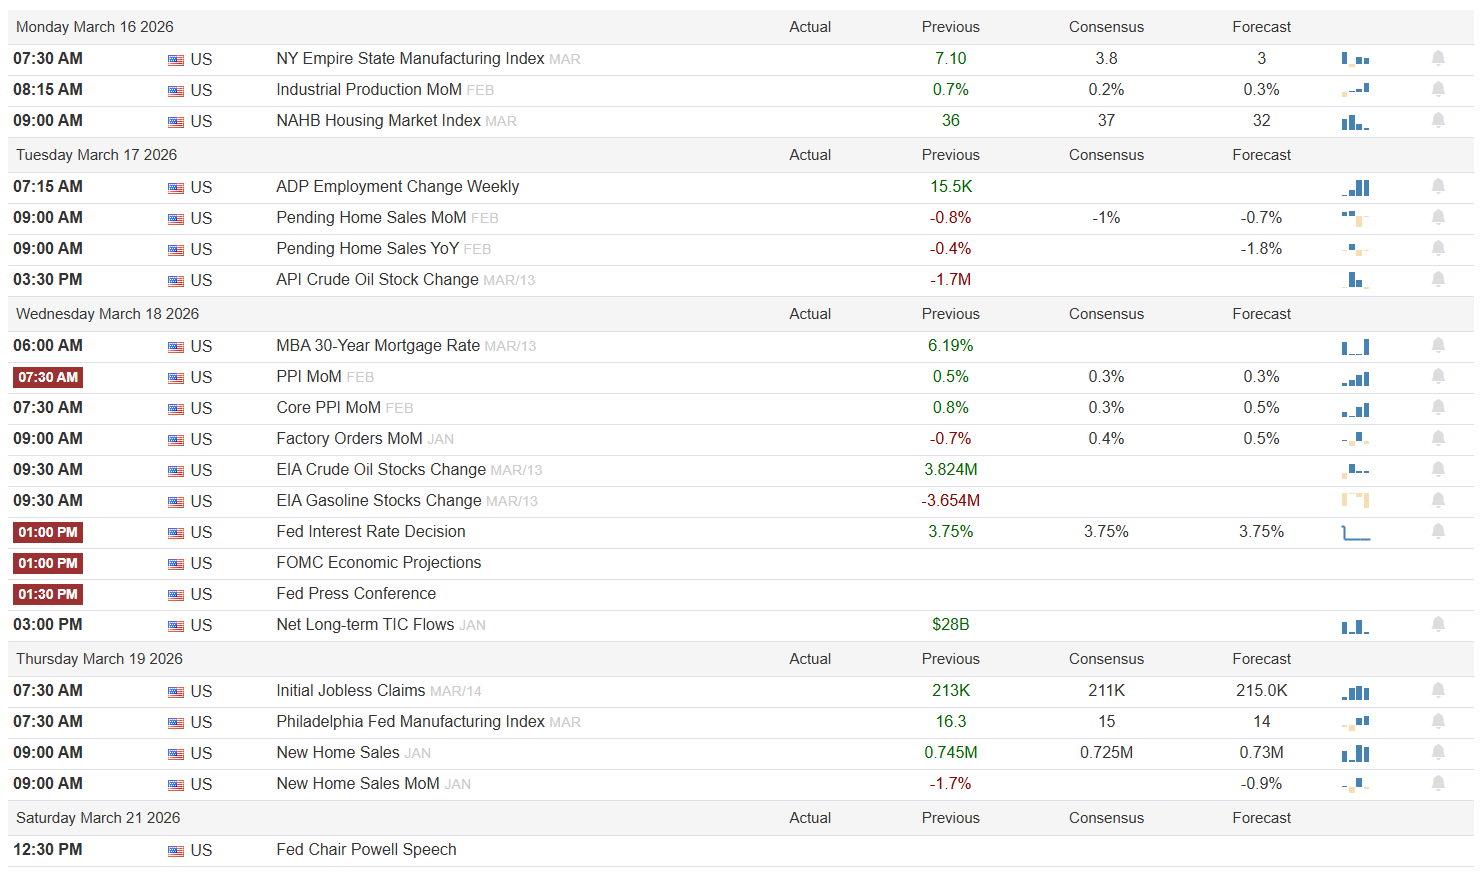
Wednesday is the main event. PPI MoM (previous 0.5%, consensus 0.3%, forecast 0.3%) and Core PPI MoM (previous 0.8%, consensus 0.3%, forecast 0.5%) land at 7:30 AM. Hot prints here, after January’s 0.8% core reading, would complicate the Fed’s path. Factory Orders (previous -0.7%, consensus 0.4%, forecast 0.5%) add a demand read. Then at 1:00 PM, the Fed rate decision (previous 3.75%, consensus 3.75%, forecast 3.75%) arrives alongside the updated dot plot and economic projections, followed by Powell’s press conference at 1:30 PM. The hold is priced in -- the action is in the SEP dots, the inflation forecast revision, and any language around the pace of future cuts. A hawkish hold with dots shifting up would accelerate the equity selloff; dovish language acknowledging growth risks would be the catalyst bulls need to reclaim broken volume shelves.
Thursday delivers Initial Jobless Claims (previous 213K, consensus 211K, forecast 215K), Philly Fed Manufacturing (previous 16.3, consensus 15, forecast 14), and New Home Sales (previous 0.745M, consensus 0.725M, forecast 0.73M). Claims drifting toward 220K-plus would mark the first real deterioration in the labor read. Powell speaks again Saturday at 12:30 PM, offering a final word on the week’s data.
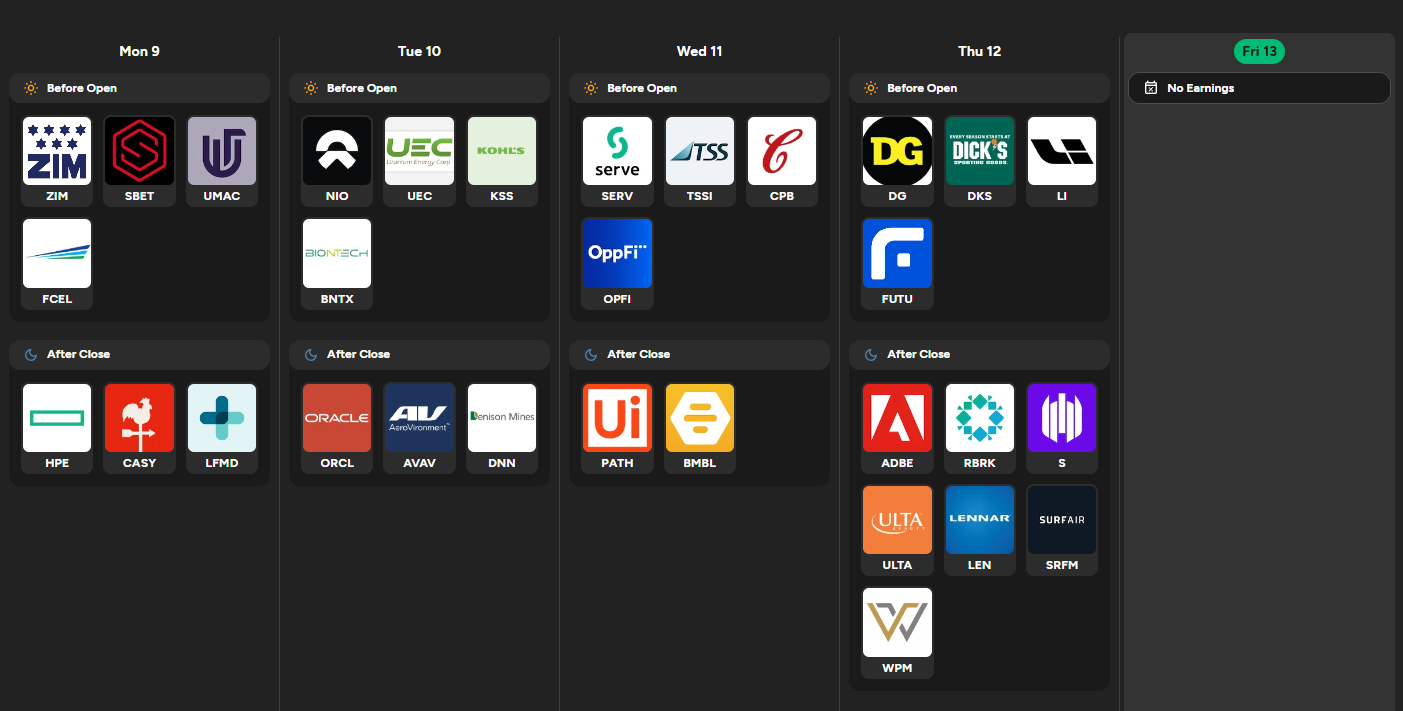
On the earnings board, the macro-sensitive names cluster toward the back half of the week. Oracle reports Tuesday after close -- cloud guidance and enterprise spending commentary set the tone for tech. Wednesday after close brings UiPath and Bumble, neither a macro mover but both sentiment proxies for AI software and consumer discretionary spend. Thursday is the heaviest day: Dollar General and Dick's Sporting Goods before the bell offer a direct read on the lower-income consumer and discretionary resilience. After Thursday's close, Adobe is the marquee print -- creative cloud ARR and AI monetization commentary will either validate or undercut the premium baked into large-cap software. SentinelOne, Lennar, and Ulta round out the evening, providing reads on cybersecurity budgets, homebuilder margins against elevated rates, and consumer beauty spend. Any guidance cuts from DG or LEN would deepen the growth-fear trade.
Three sign-posts for the week:
PPI Core MoM at or above 0.5% on Wednesday morning would signal the January heat was not a one-off and likely sends VIX above 30 before the Fed decision.
If the dot plot median shifts higher by even 25 basis points, treat it as a regime signal: the Fed is done cutting for now and broken equity levels become valid resistance.
Claims printing above 220K on Thursday would be the first hard labor crack, turning the narrative from inflation-fear to growth-fear and shifting the playbook from fade-rallies to watch-for-capitulation.
The week hinges entirely on whether Powell validates the growth scare or dismisses it -- everything else is prologue.

Order Flow in Focus: Reading Smart Money Tells
Order Flow in Focus: Reading Smart Money Tells is a recurring segment that spotlights unique intraday opportunities revealed through institutional order flow. Each feature dissects a moment when the tape quietly shifted—when large, ranked prints clustered at key liquidity locations and informed players positioned ahead of the move. The goal isn’t hindsight; it’s pattern recognition—learning to spot the footprints of capital that knows before the crowd does.
BMNU and BMNR -- When Leverage Confirms the Underlying
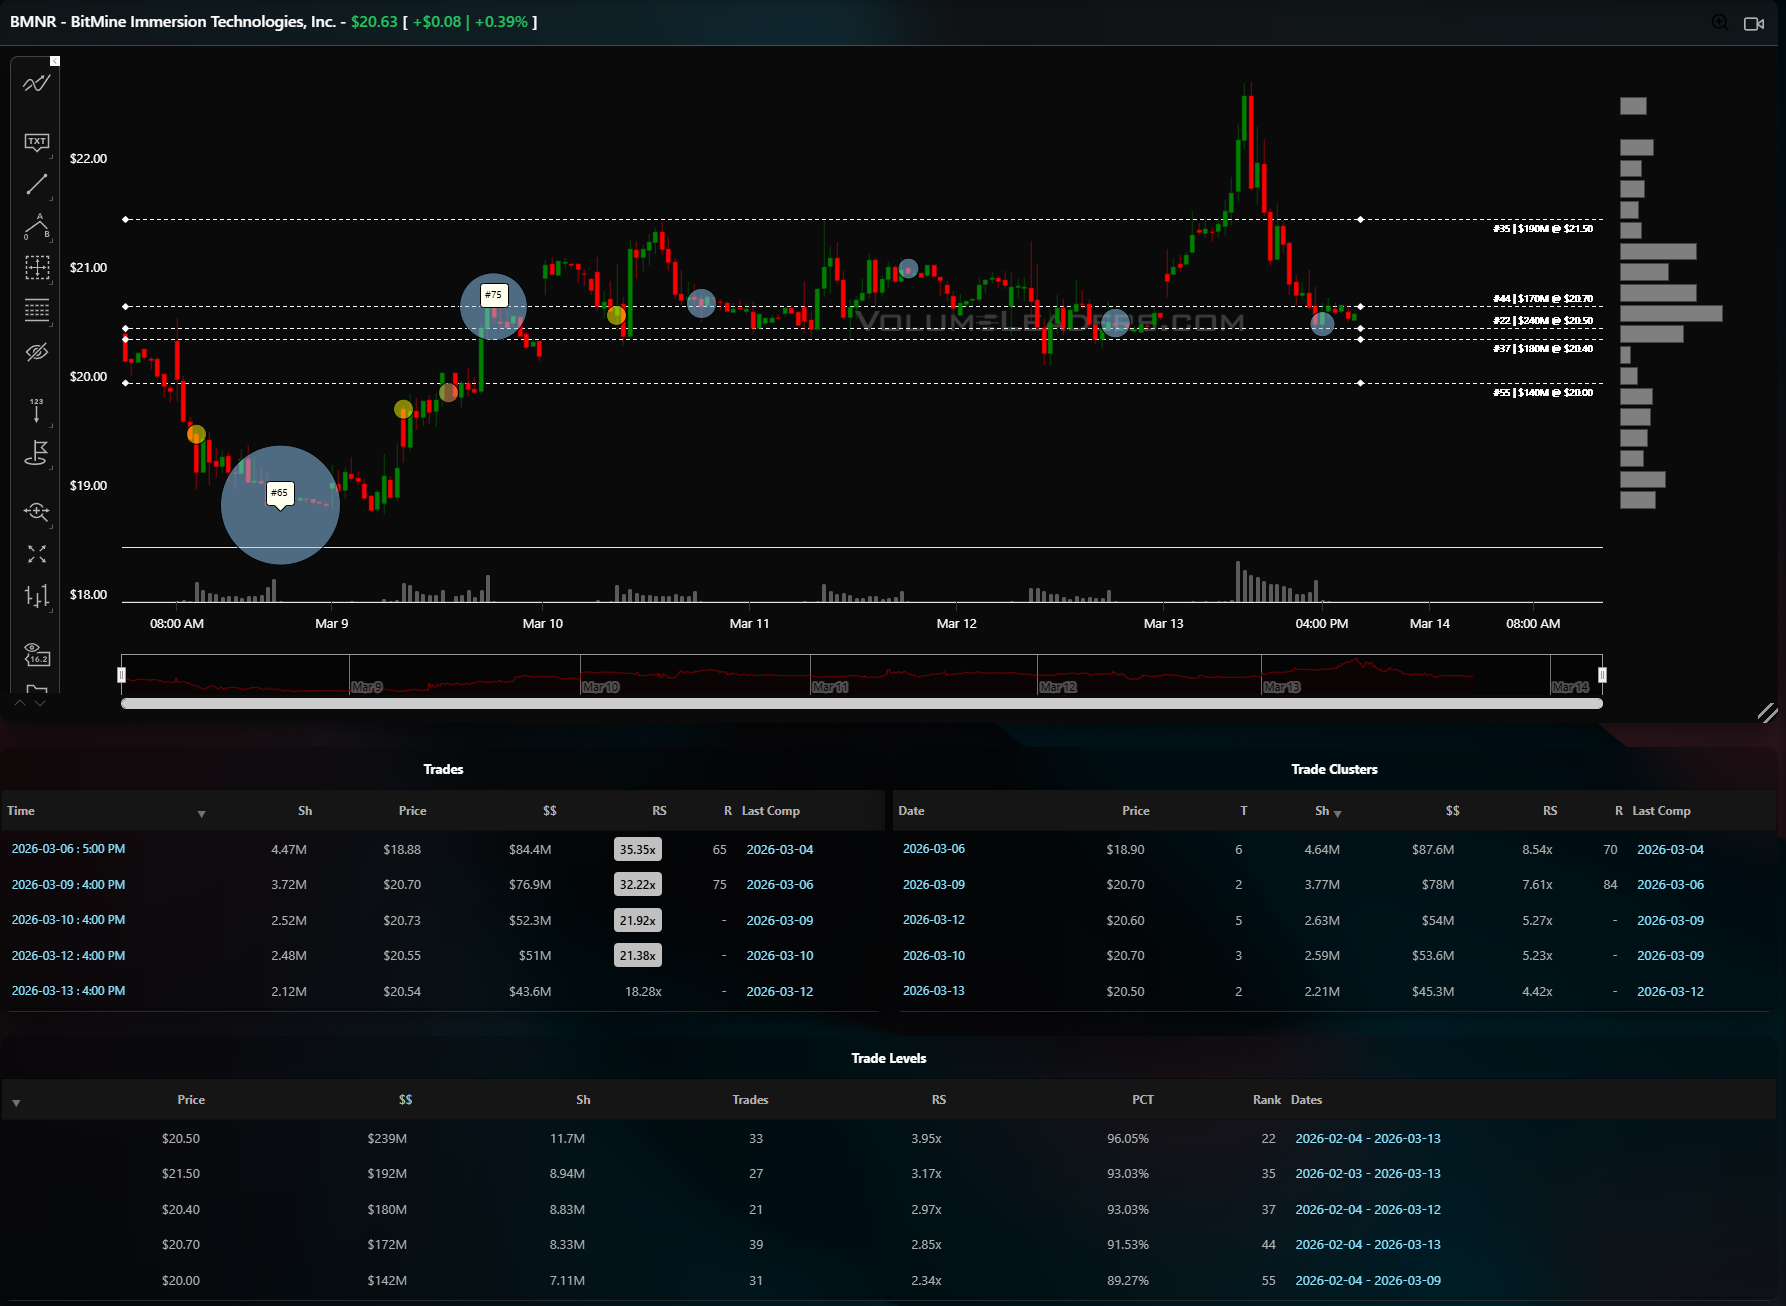
The setup began on March 6 when BMNR, the underlying BitMine Immersion Technologies equity, printed its largest trade of the visible window: 4.47 million shares at $18.88 for $84.4 million, carrying a 35.35x relative size and ranked #65 all-time. That print landed near the absolute low of the chart, a capitulatory flush into the $18.50-$19.00 zone that immediately reversed. The same session produced a cluster at $18.90 worth $87.6 million across 4.64 million shares at 8.54x relative size -- the heaviest cluster on the entire board. When a top-100 print and the largest dollar cluster converge at the same price on the same day, the tape is telling you someone with size wanted that inventory.
Over on BMNU, the 2x leveraged BitMine ETF, the confirmation was unmistakable. March 6 saw prints #98 and #93 land in the $1.78-$1.85 range, followed on March 9 by prints #91 at $1.82 and another 500K-share block at $1.92. Four ranked trades in three sessions, all within a twenty-cent band at the base of the structure. The trade levels table shows why this zone mattered: the $1.80 level holds $8.96 million at 5.34x relative size and 98.94 percentile, while $1.90 carries $8.02 million at 4.78x. These are the third and fourth ranked levels for the entire instrument -- the floor was not accidental.
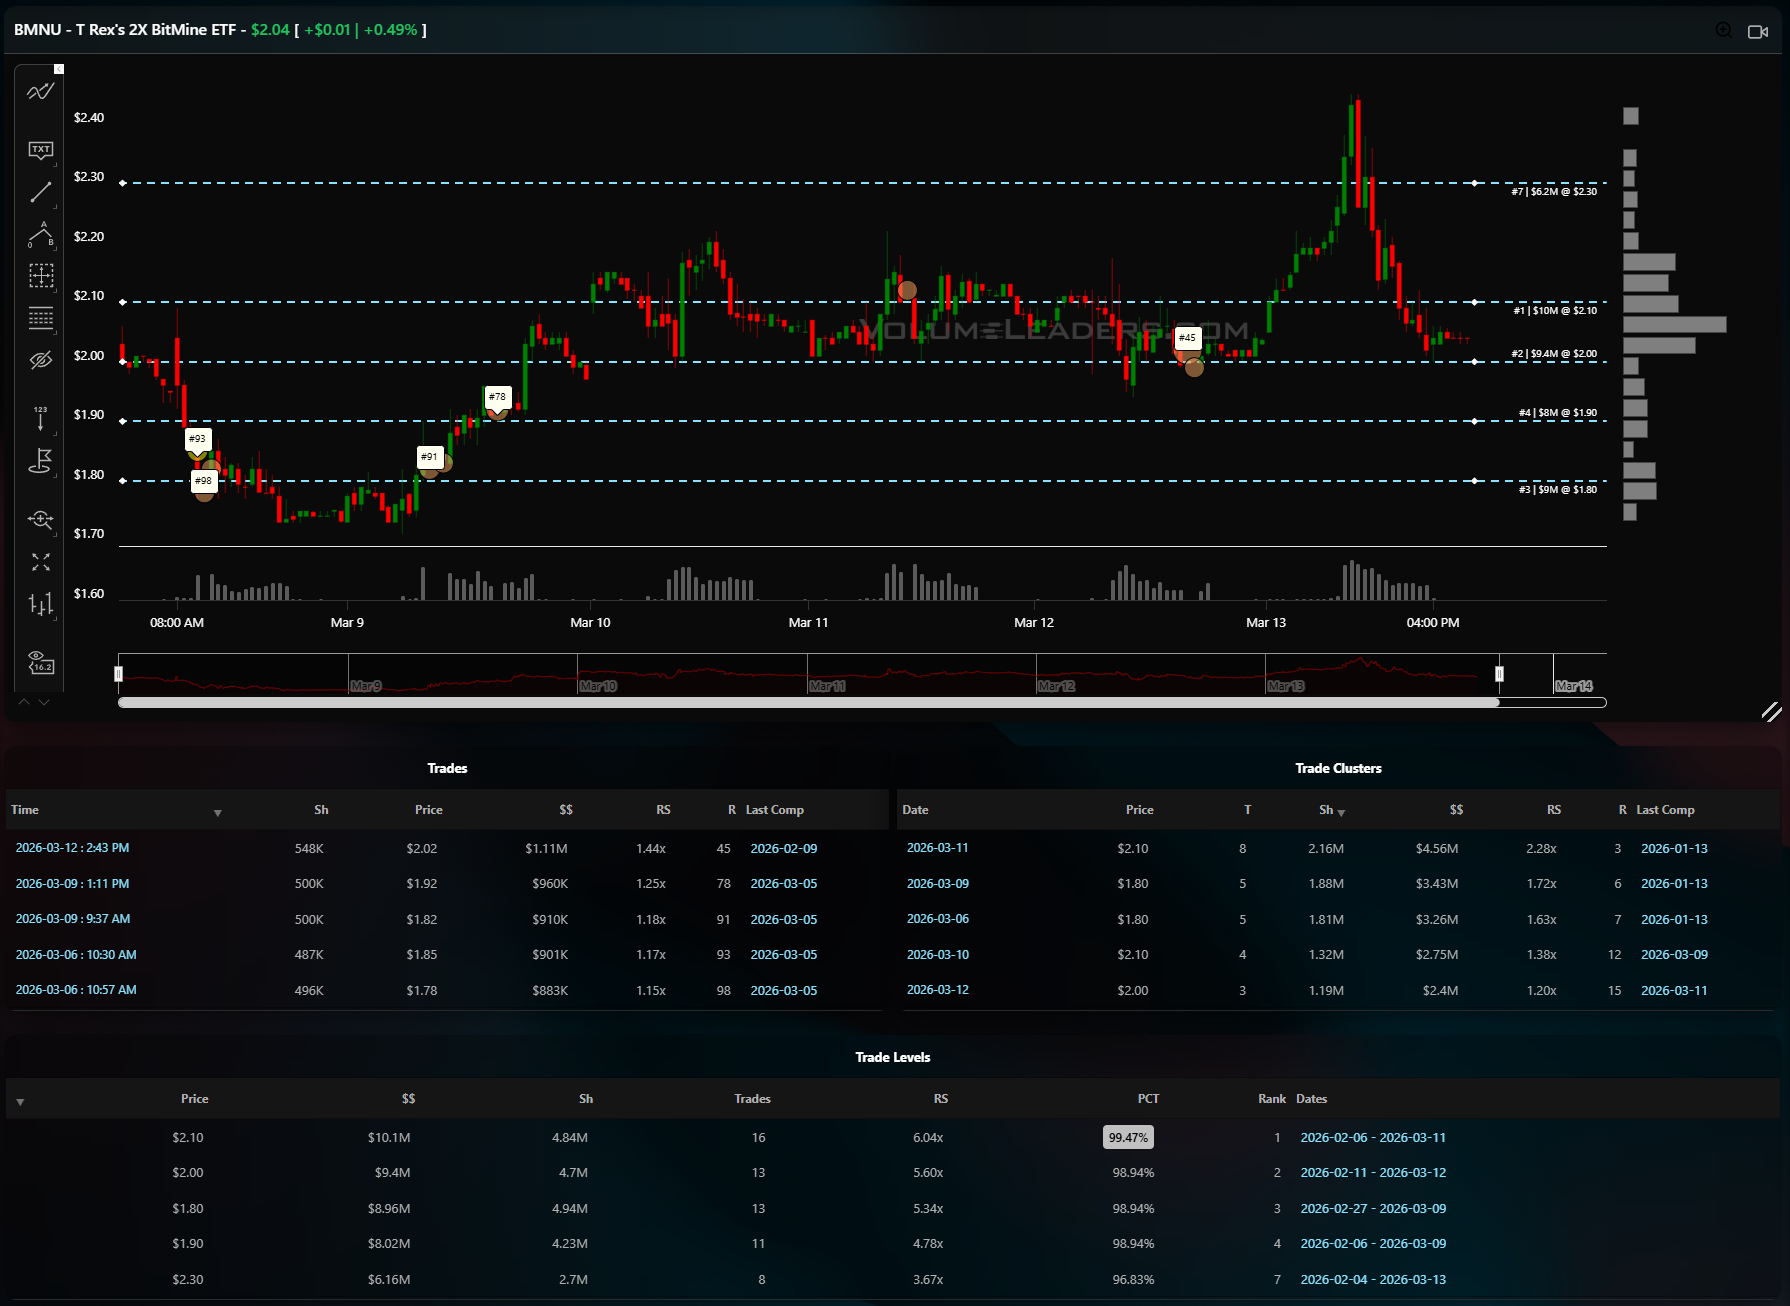
The entry framework was straightforward. BMNR’s March 9 session saw a 3.72 million share print at $20.70 for $76.9 million at 32.22x relative size, confirming that the low-$19 base had held and the bid was moving higher. On BMNU, trade #78 printed near $1.93 the same day. With the underlying confirming above its cluster and the leveraged product stacking ranked prints at its volume floor, the pass/fail was clean: long BMNU above $1.90 with invalidation below $1.78, the low of the ranked print zone.
The exit signals were equally legible. BMNU’s $2.10 level is the number-one ranked level on the chart -- $10.1 million at 6.04x relative size and 99.47 percentile. The March 11 cluster at $2.10 absorbed $4.56 million, and when price tagged that level on March 12 the tape printed 548K shares at $2.02 for $1.11 million, the highest-dollar individual trade of the week. That was the first logical trim -- the top volume level acting as a ceiling. What happened next rewarded patience: the March 13 session spiked BMNU above $2.40 before reversing hard back to $2.04 by the close, a classic blowoff rejection at the $2.30 level where $6.2 million sits at 3.67x relative size.
On BMNR, the symmetry held. Price consolidated in the $20.40-$20.70 band where $180 million and $172 million in trade levels sit at ranks 37 and 44 respectively, then spiked above $22 on March 13 before reversing to close at $20.63. The $21.50 level at $192 million and rank 35 acted as the resistance shelf, and the March 13 cluster at $20.50 worth $45.3 million was the final absorption print -- capital taking profit into the spike.
The trade, whether you took the levered or underlying, delivered roughly 20 percent in under a week. The pattern recognition lesson is this: when a leveraged product and its underlying simultaneously print their largest-dollar clusters and multiple top-100 ranked trades at the same structural low, and both instruments confirm acceptance above those levels in the following session, the smart money is not hedging -- it is building a position. The pass/fail was $1.78 on BMNU and $18.90 on BMNR. Neither was tested after the base formed. That is what conviction looks like on the tape.

Market Intelligence Report
A desk-grade synthesis of institutional positioning and market structure—unpacking the flows, levels, and emerging themes that shaped the week, and translating them into a model portfolio built the same way professional desks prepare for the week ahead.
MIR Part 1: The Backdrop
The broad market is operating in a bearish, narrow-breadth regime where sellers hold the initiative and participation is fragmenting into isolated defensive pockets rather than building constructively. Only about a third of the tracked universe sits above key structural levels, and the bias runs roughly two-to-one bearish, with just two of sixteen sectors showing what qualifies as genuine leadership. Conviction is low, dispersion is high, and the environment punishes aggressive risk-taking while rewarding patience in the handful of areas where rotation aligns with actual capital commitment. That is the macro frame, and everything in the flow data this week confirms it.
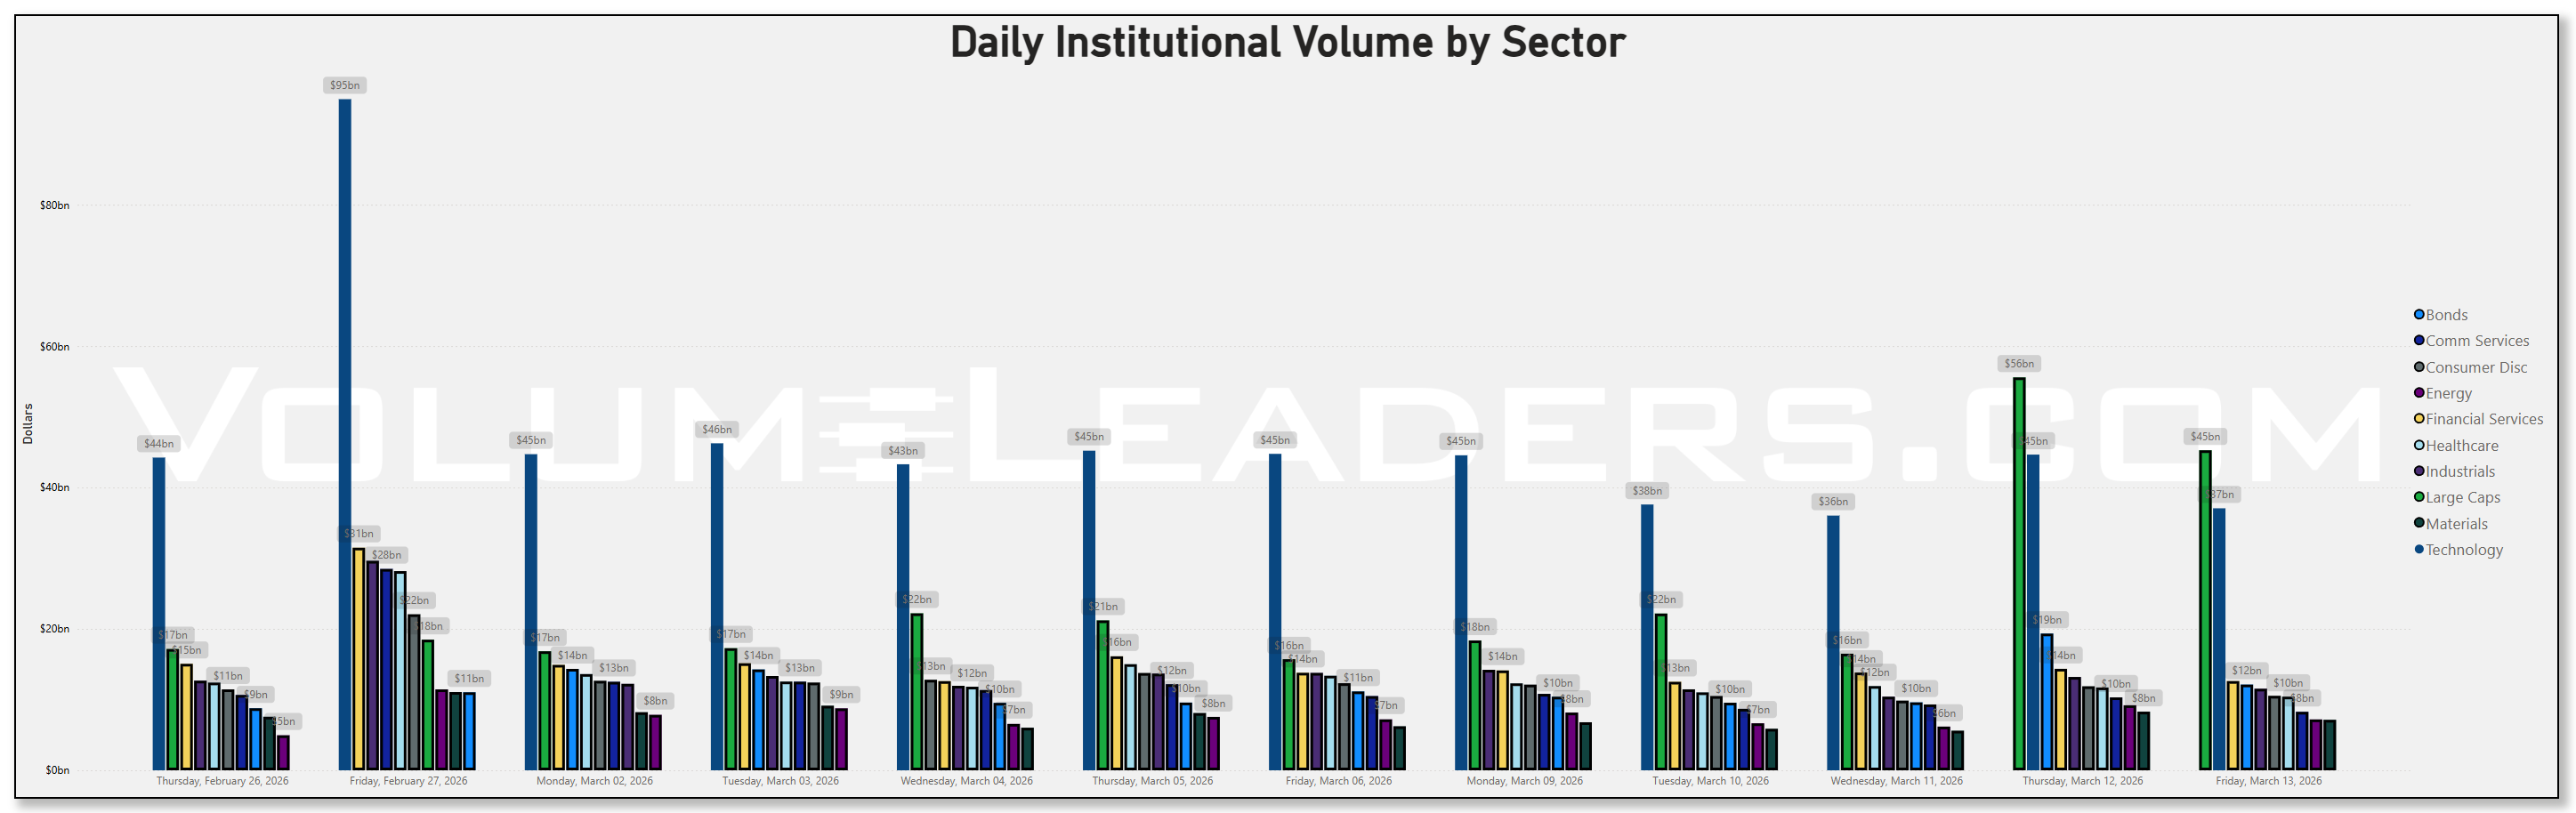
Start with the headline numbers. Technology led all sectors in raw institutional dollars this week at $35.57 billion on Friday alone and nearly $95 billion across the past two weeks, but the trajectory tells a different story than the total. The sector printed $94.9 billion on February 27 OPEX, then bled steadily to $44.6 billion on March 9 and $37 billion on Tuesday before bouncing to $44.7 billion and $35.6 billion to close the week. That is not accumulation; that is a controlled drawdown in notional as price deteriorated.
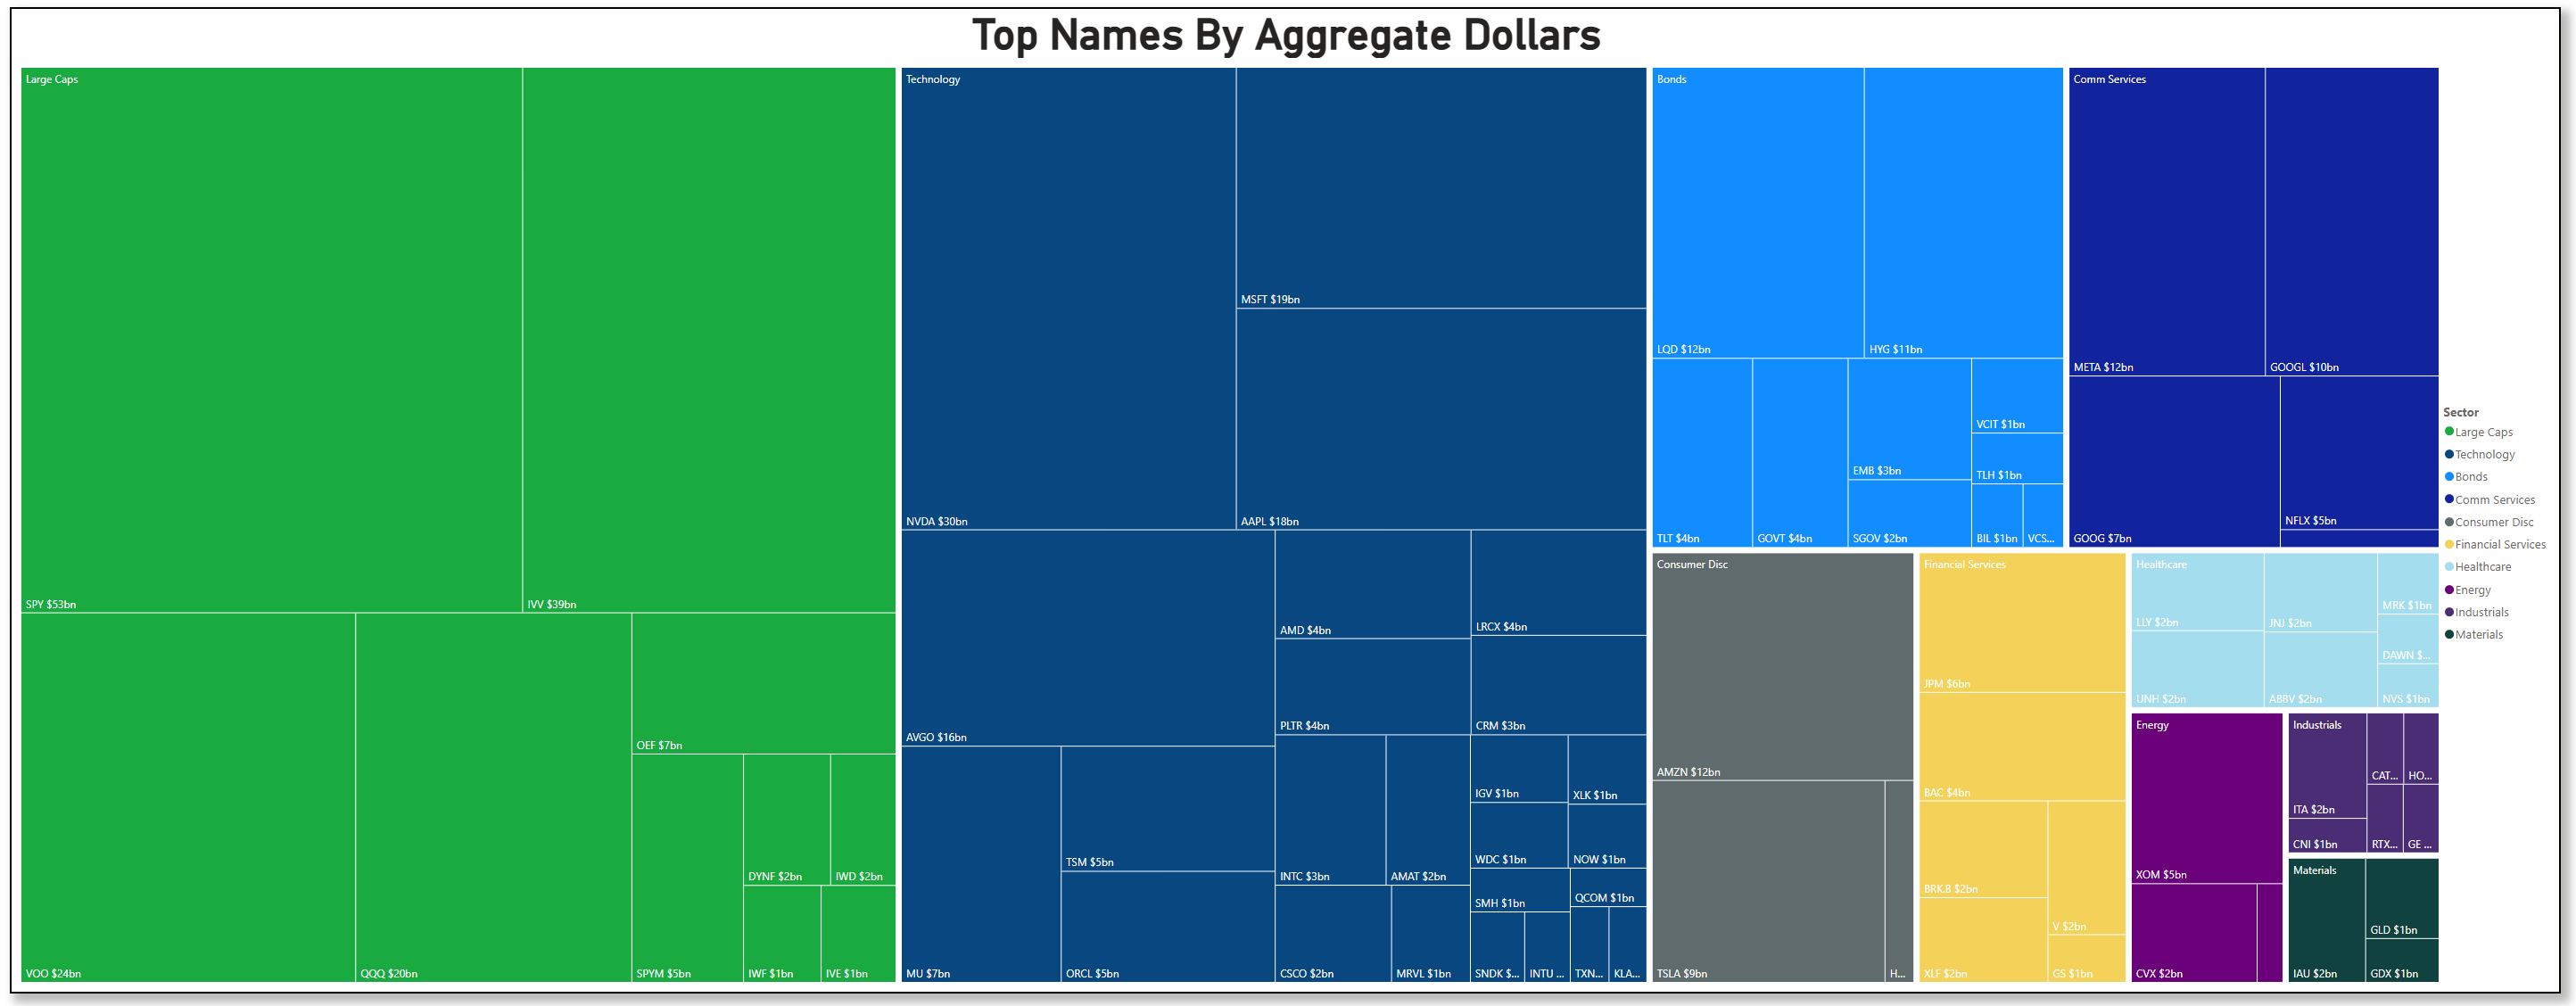
On the aggregate flow bar chart for this week, NVDA led all single names at roughly $30 billion, followed by MSFT at $19 billion and AAPL at $18 billion, with AVGO at $16 billion and a long tail of semiconductor and software names filling out the $3-$7 billion range. But the relative strength data paints Technology as essentially flat versus the benchmark over one and three days while marginally negative over five, meaning the enormous dollar flow is running in place rather than generating alpha. Volatility in the sector remains relatively well-contained -- among the lowest readings in the risk-validation layer -- which keeps it from being an outright avoid, but the lack of participation breadth underneath those mega-cap flows makes it a name-by-name tape rather than a sector bet.
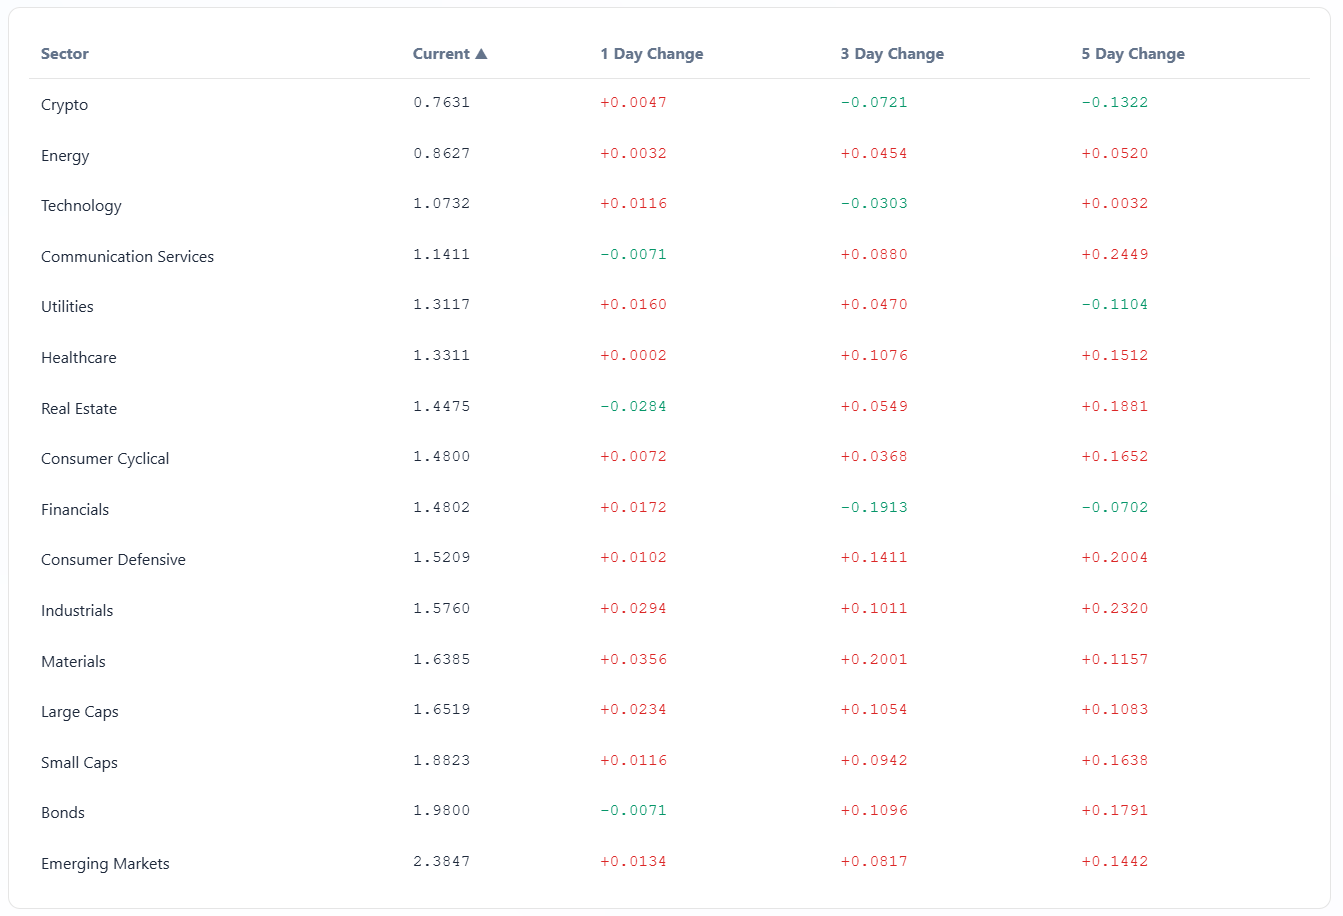
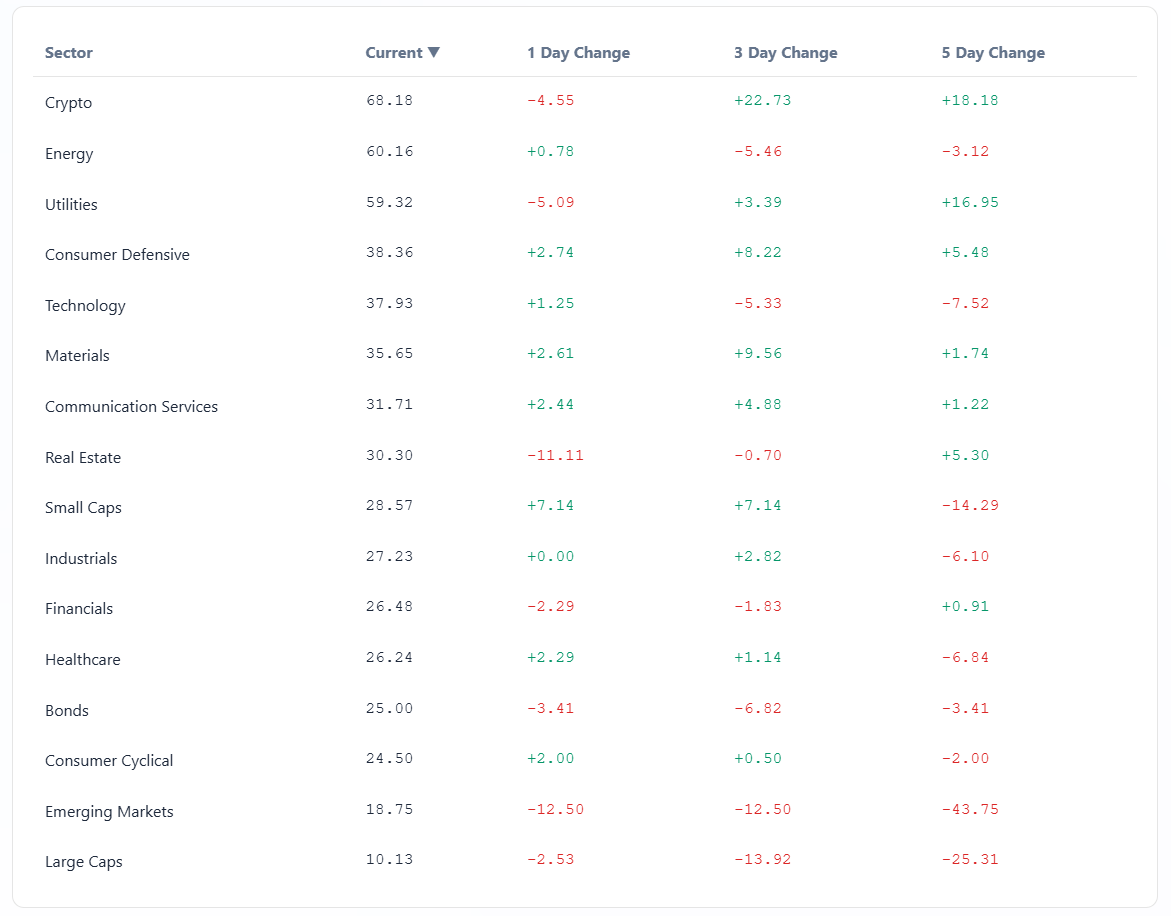
The more interesting story is where the market actually wants to be involved. Crypto, Energy, and Utilities are the three sectors showing the strongest participation above structural levels and the most constructive rotation patterns. The composite scoring framework ranks Crypto highest, followed by Energy and Utilities, with all three carrying positive sector-level readings while the rest of the board sits in negative territory.
Energy in particular stands out in the flow data: the sector pulled $6.65 billion on Friday, up from $6.56 billion on Wednesday, and has held remarkably steady in the $6-$9 billion daily range throughout the two weeks. XOM shows up at roughly $5 billion on the aggregate bar chart, with CVX at $2 billion, and Energy’s volatility profile is among the most stable on the board -- sub-1.0 on the risk ratio, meaning upside moves are outpacing downside moves. That is rare in the current environment and speaks to genuine defensive positioning flowing into commodity-linked equities as the macro picture clouds, consistent with crude markets absorbing the API draw of -1.7 million barrels reported this week and EIA showing a 3.82 million barrel build that complicates the near-term supply picture.
Bonds deserve serious attention this week, and the sweep data makes the case loudly. LQD leads all names in aggregate sweep dollars at approximately $2.79 billion, followed by HYG at $2.07 billion. Those are not passive flows -- sweeps represent urgent, price-taking execution where someone needs to get filled now. The fact that investment-grade and high-yield credit ETFs are the top two sweep recipients in the entire market, ahead of every equity name and every index product, tells you that fixed-income desks are aggressively repositioning ahead of next week’s Fed decision.
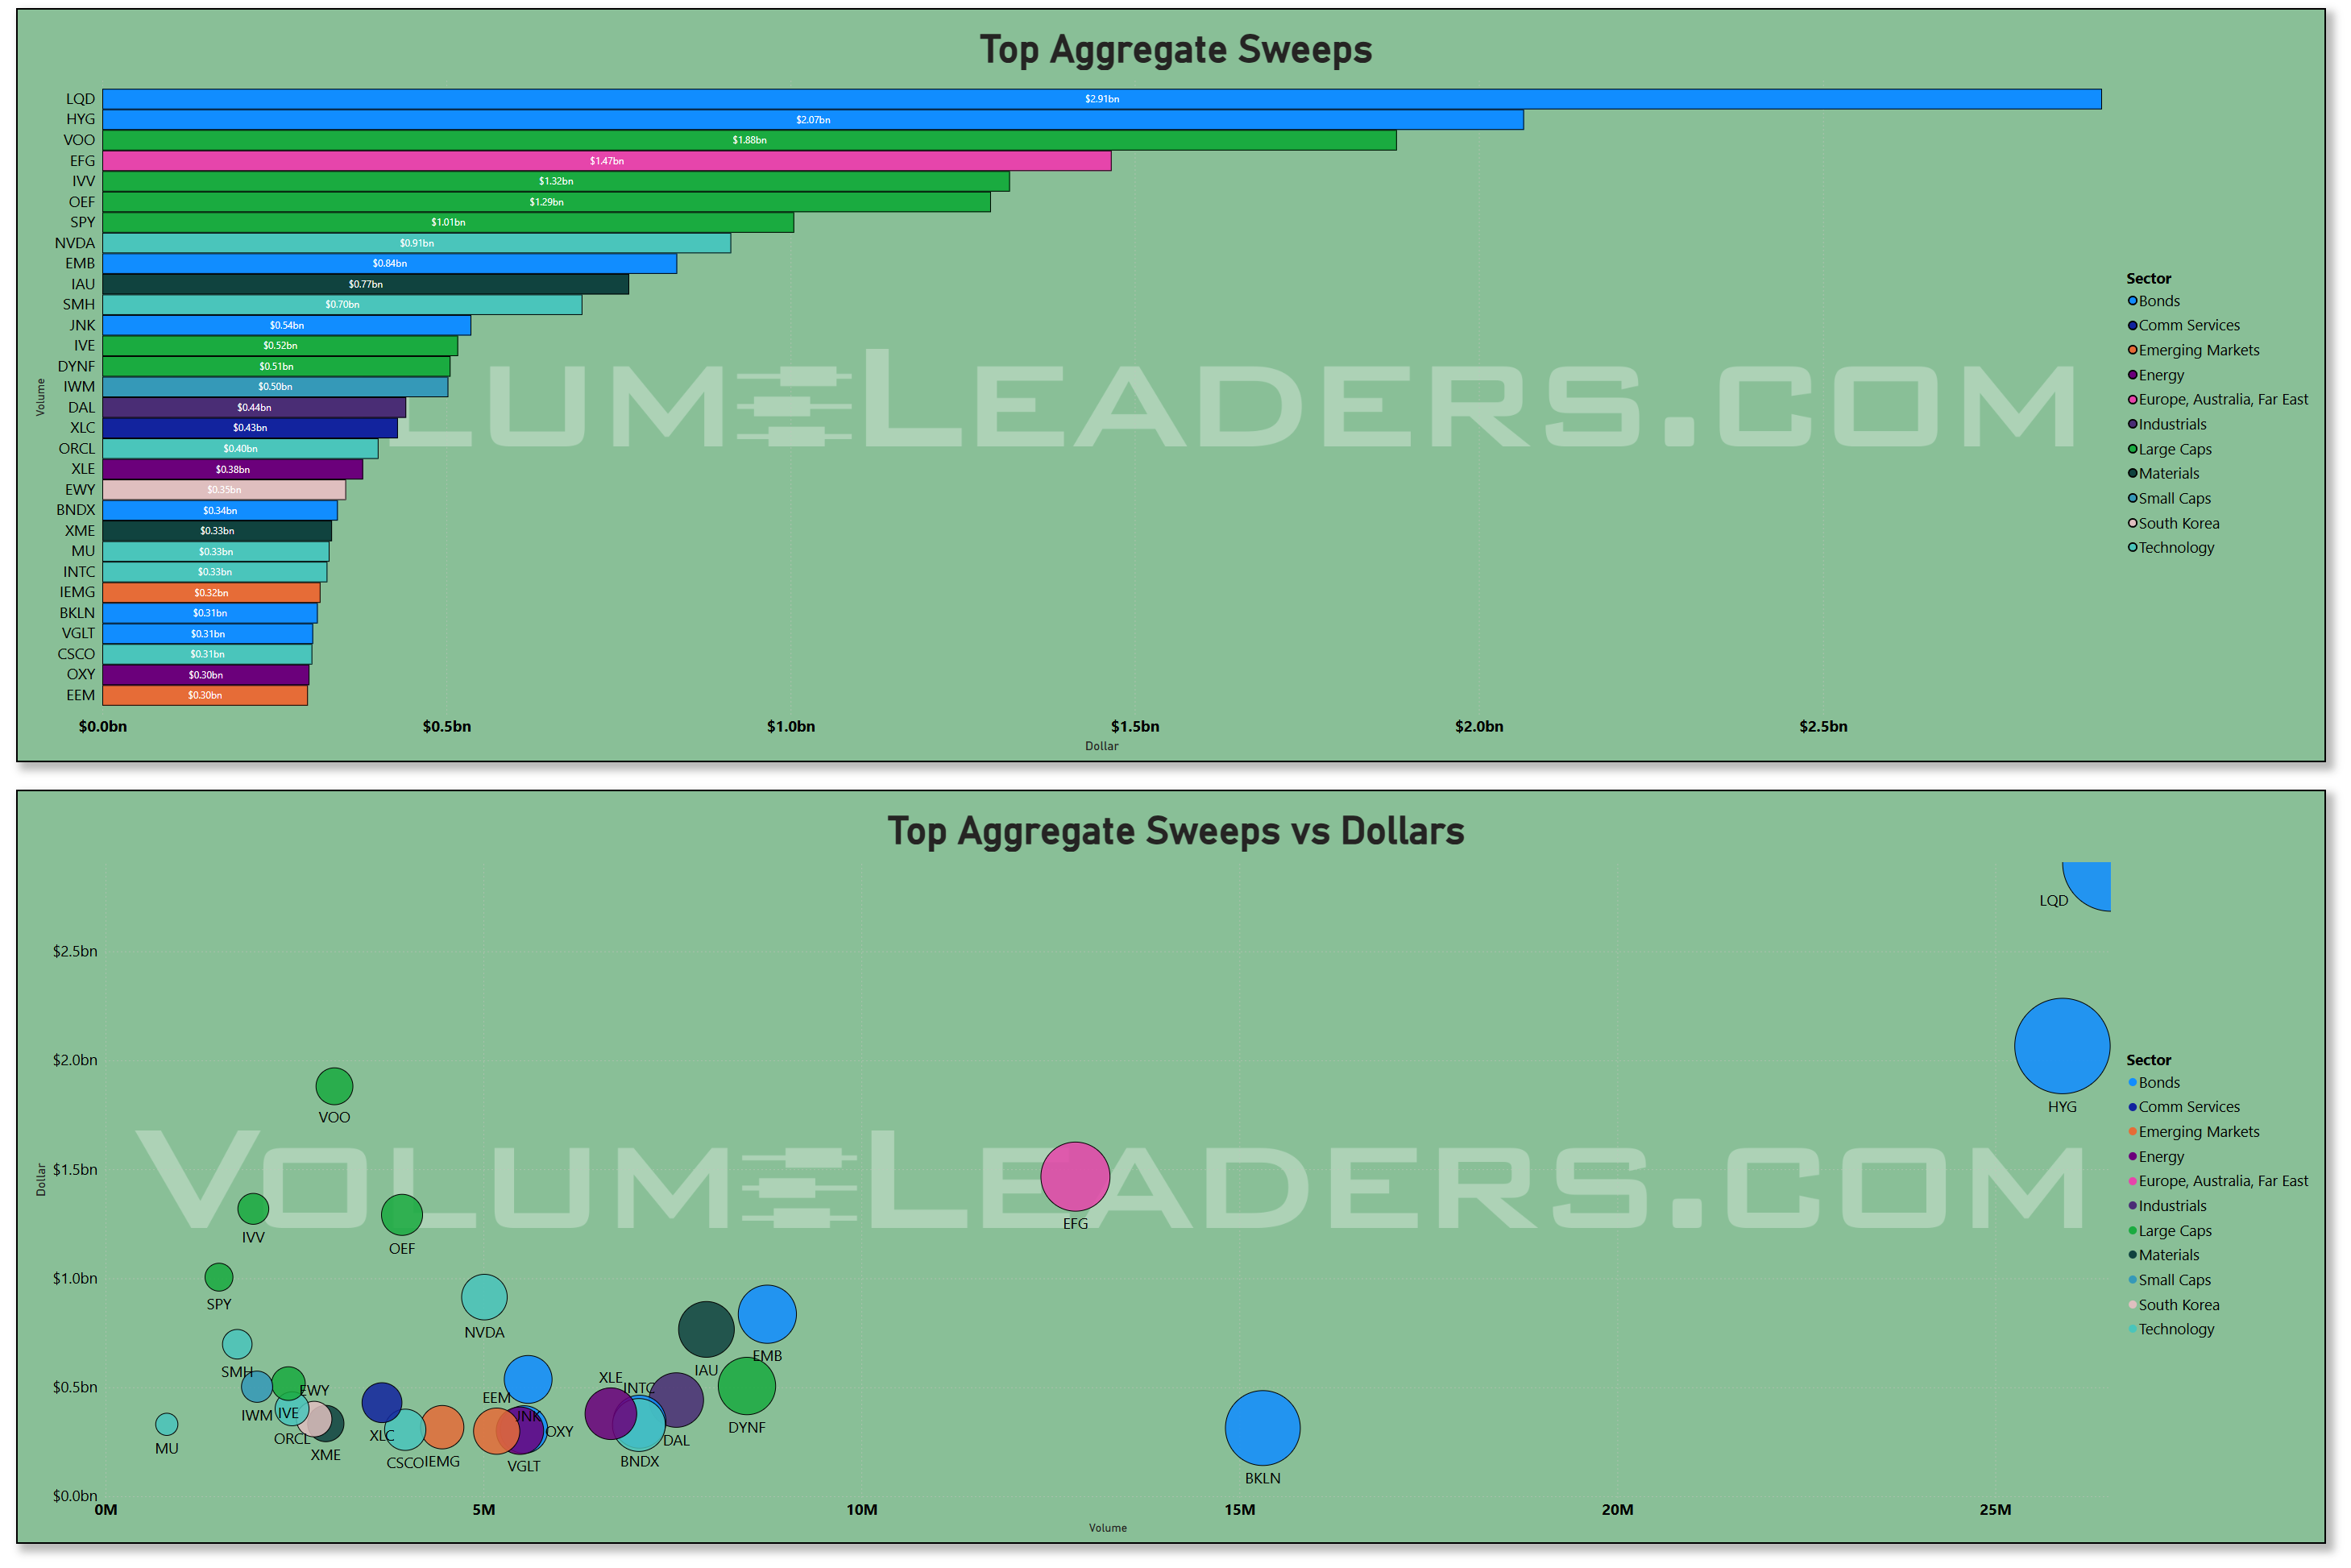
The dark pool data reinforces this: LQD carried roughly $11 billion in dark-pool volume, HYG roughly $10 billion, and GOVT at $4 billion, all commanding outsized positions in the hidden liquidity channel. Meanwhile, the daily sector table shows Bonds oscillating between $9.5 billion and $19.3 billion across the two weeks, with the Thursday print of $19.3 billion representing the highest single-day bond flow in the window -- likely front-running the March 18-19 FOMC meeting where the committee is expected to hold at 3.75%. The bond volatility profile is elevated, carrying one of the higher risk readings on the sector board, which means these flows are happening into a moving market rather than a calm one.
That combination -- heavy sweeps, heavy dark pool, rising volatility -- is consistent with institutional rebalancing and hedging rather than directional conviction.
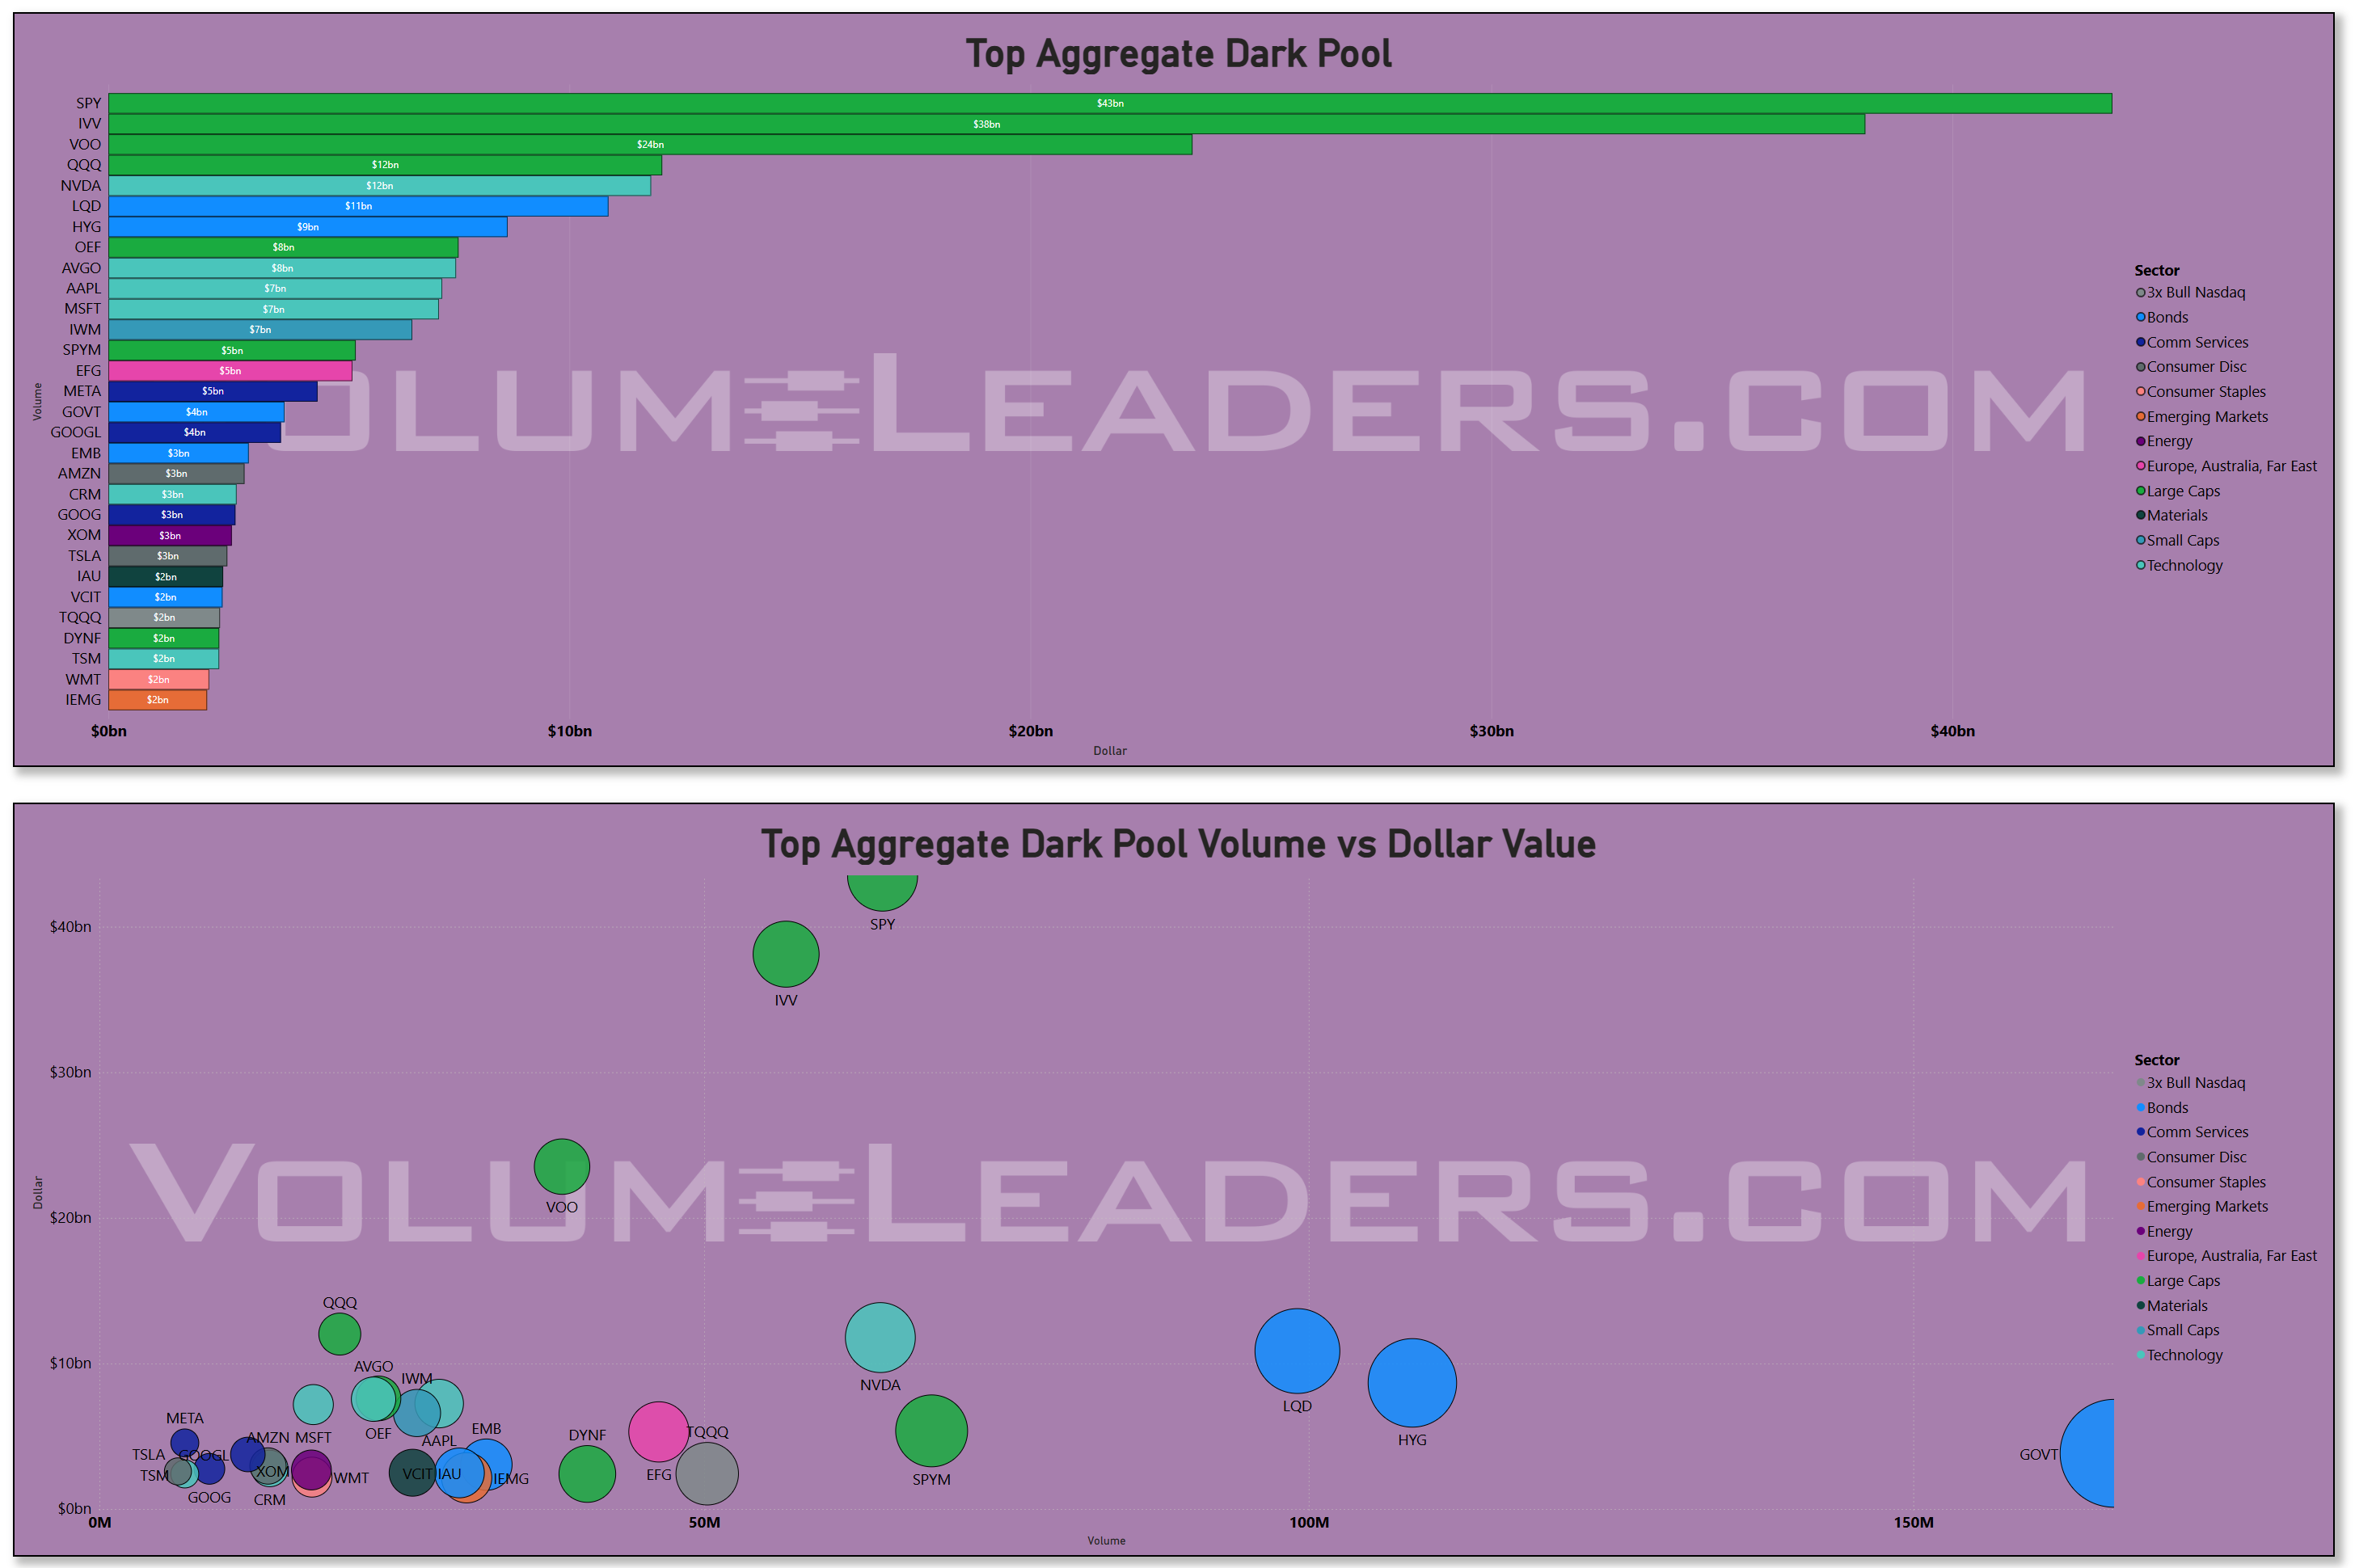
Large Caps dominate the treemap and the aggregate flow charts as expected, with SPY at roughly $53 billion, IVV at $39 billion, VOO at $24 billion, and QQQ at $20 billion on the aggregate bar. On the dark pool side, SPY leads at approximately $42 billion and IVV at $38 billion, with VOO at $20 billion. But the sweep channel tells a subtler story: SPY only carried about $1.01 billion in sweeps while VOO absorbed $1.88 billion and IVV $1.30 billion. The index complex is seeing heavy passive and dark-pool flow but relatively muted urgency on the sweep side, which suggests the big rebalancing is happening methodically through dark pools rather than through panicked tape-clearing. The participation data confirms that Large Caps as a group are among the weakest sectors structurally, with one of the lowest readings above key levels and a five-day relative strength trajectory that has deteriorated sharply. That is the index drag: the biggest flows are landing in the most damaged structural environment.
Financial Services pulled $14.1 billion on Monday and $12.5 billion on Tuesday before fading to $11.8 billion midweek and closing Friday at $11.8 billion -- steady but unspectacular. The sector’s relative strength versus the benchmark has been weakening over five days, and its volatility profile is middling. BAC shows up on the aggregate scatter plot at roughly $8 billion with extremely high volume above 100 million shares, suggesting heavy turnover without clear directional commitment. JPM carried around $6 billion. The sector reads as neutral to slightly negative -- not a hide, not a chase.
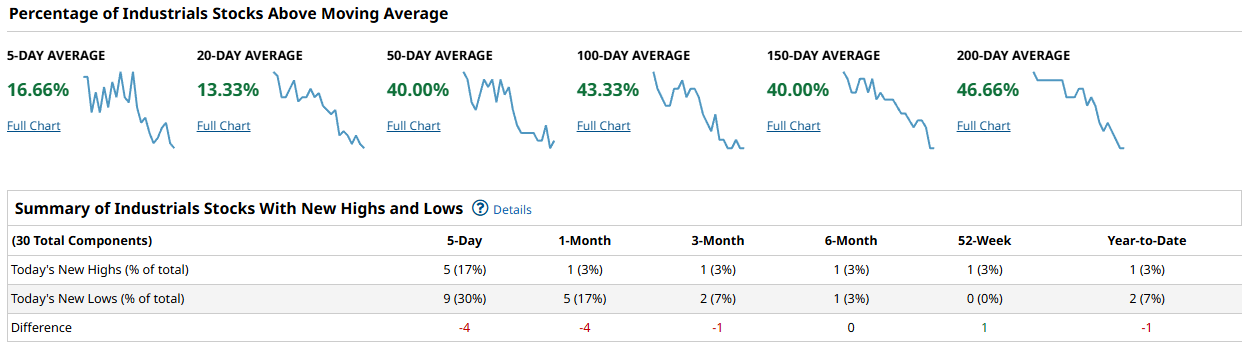
Consumer Discretionary is one of the weaker spots. The sector dropped from $22.1 billion on February 27 to $9.5 billion by Friday, a persistent bleed that mirrors the price damage across cyclicals. AMZN at $12 billion and TSLA at $9 billion dominate the name-level flows, but both are showing deteriorating relative strength and the sector carries one of the more elevated volatility readings. Industrials tell a similar story, with the participation framework flagging the sector as finding no support and the volatility profile worsening over one, three, and five days. Healthcare sits in an uncomfortable middle ground -- sub-30% participation above structural levels, edging lower, with a volatility ratio that has been rising over three and five days.
The through-line is clear: this is a defensive, rotation-driven tape where the largest dollar flows are landing in index products and mega-cap tech through dark pools and passive channels, while the urgent, sweep-driven capital is racing into credit markets ahead of the Fed. The pockets of genuine structural strength are narrow -- Energy, Utilities, and Crypto -- and the sectors that typically lead risk-on rallies, including Large Caps, Consumer Cyclicals, and Industrials, are showing deteriorating participation and rising downside volatility. The environment favors tactical dips in structural leaders over broad exposure, and it demands tight risk management everywhere else. Capital is not leaving the market, but it is very clearly choosing where it wants to sit, and right now that preference tilts defensive.
MIR Part 2: Individual Names From The Institutional Tape
VolumeLeaders tracks several proprietary signals designed to spotlight names drawing significant institutional interest. Below, we’ve surfaced the latest results and analyzed them to highlight emergent themes. If any of the sectors, narratives, or positioning trends resonate, the names mentioned here offer a strong starting point for deeper research and watchlist consideration.
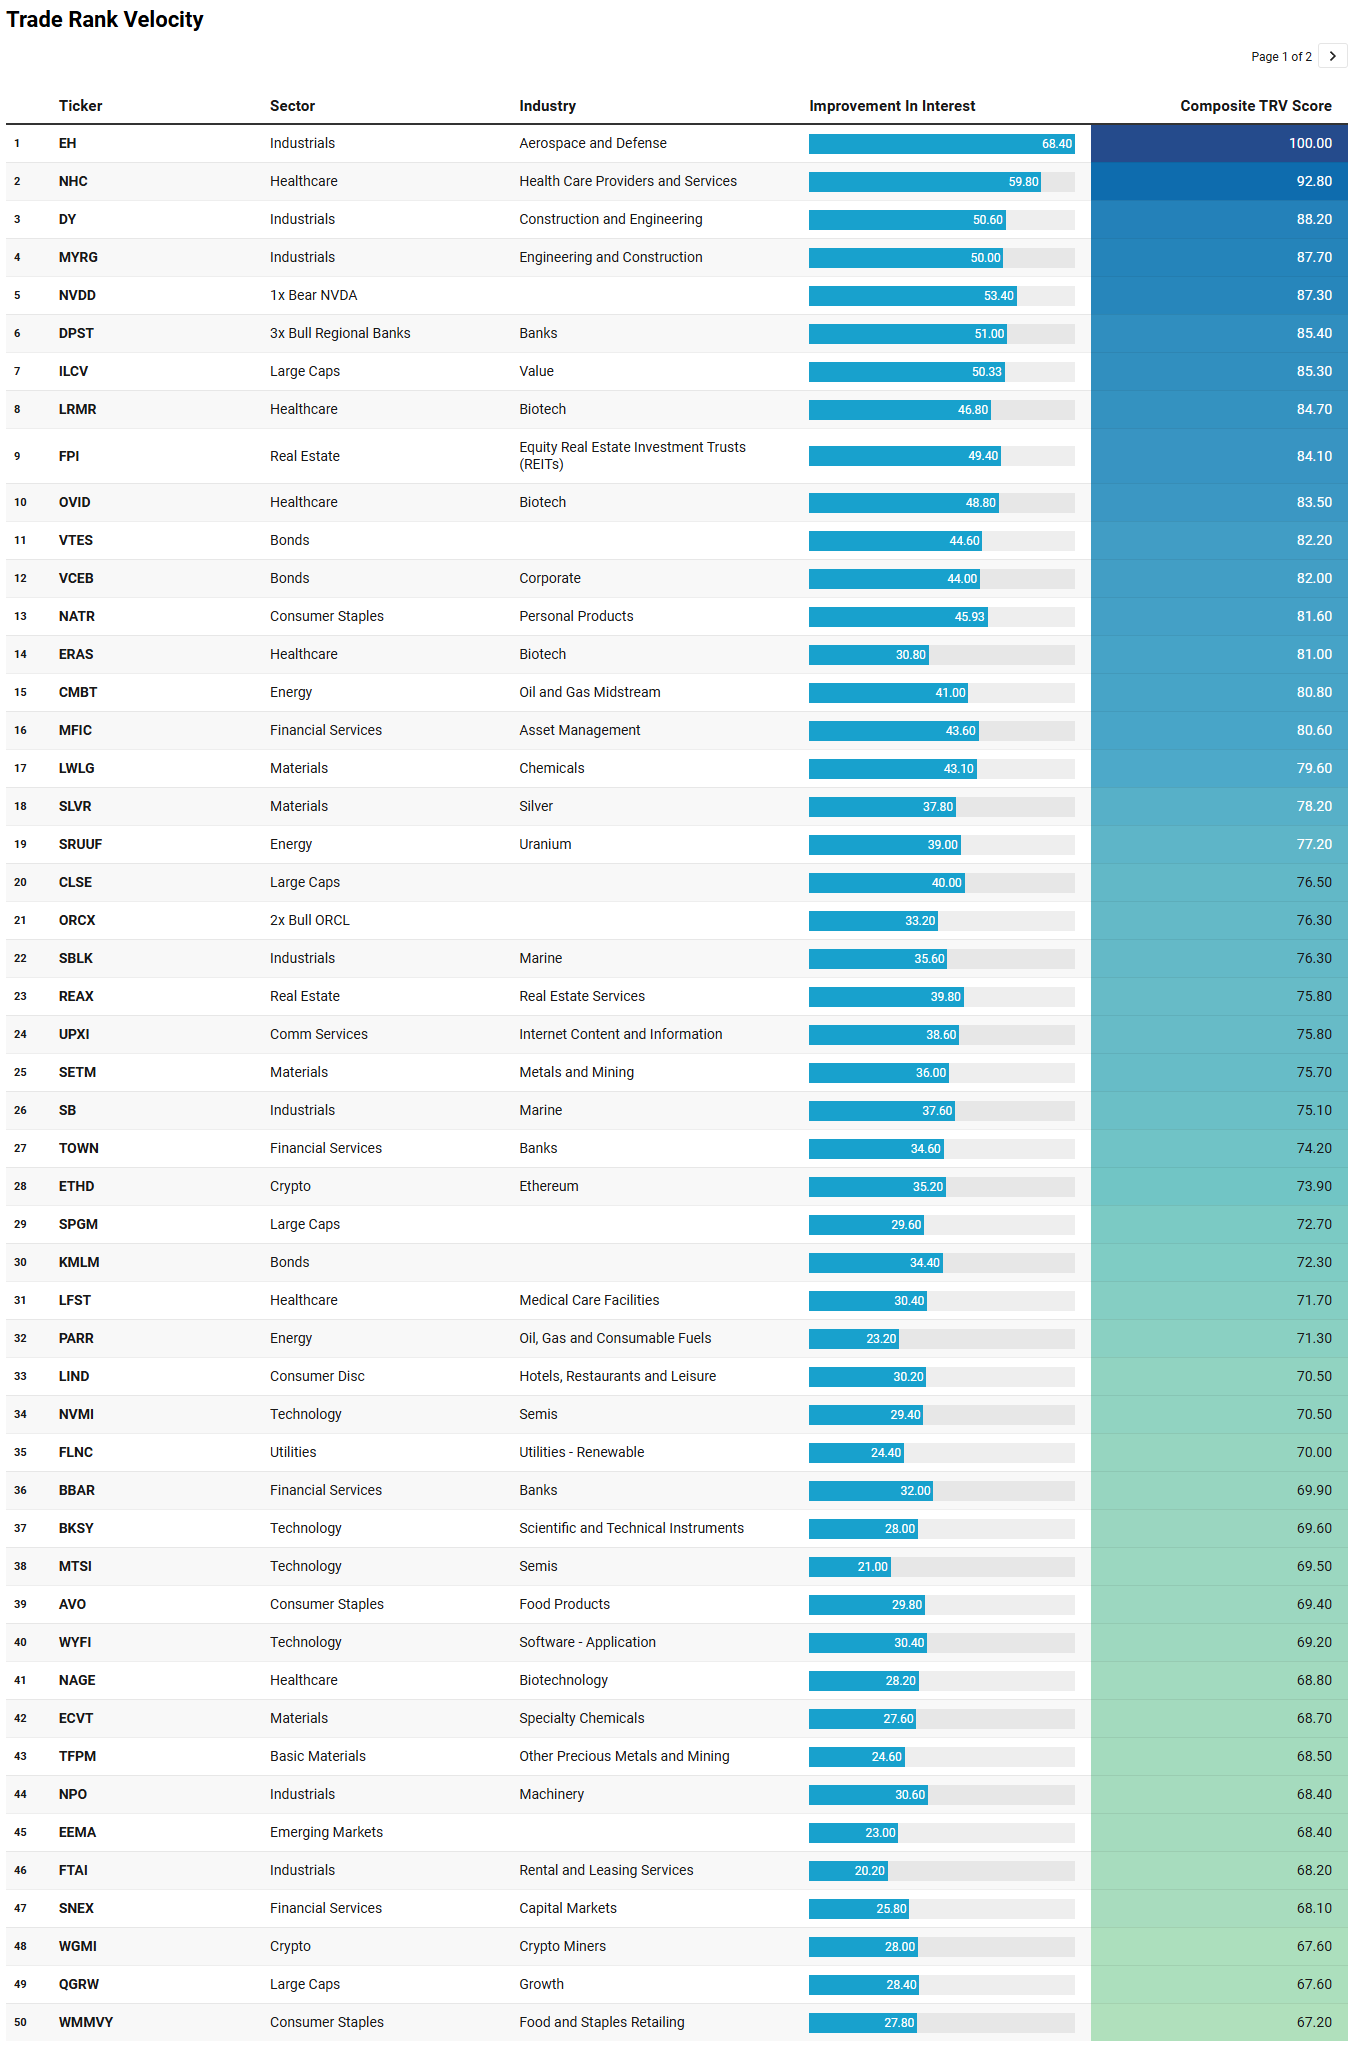
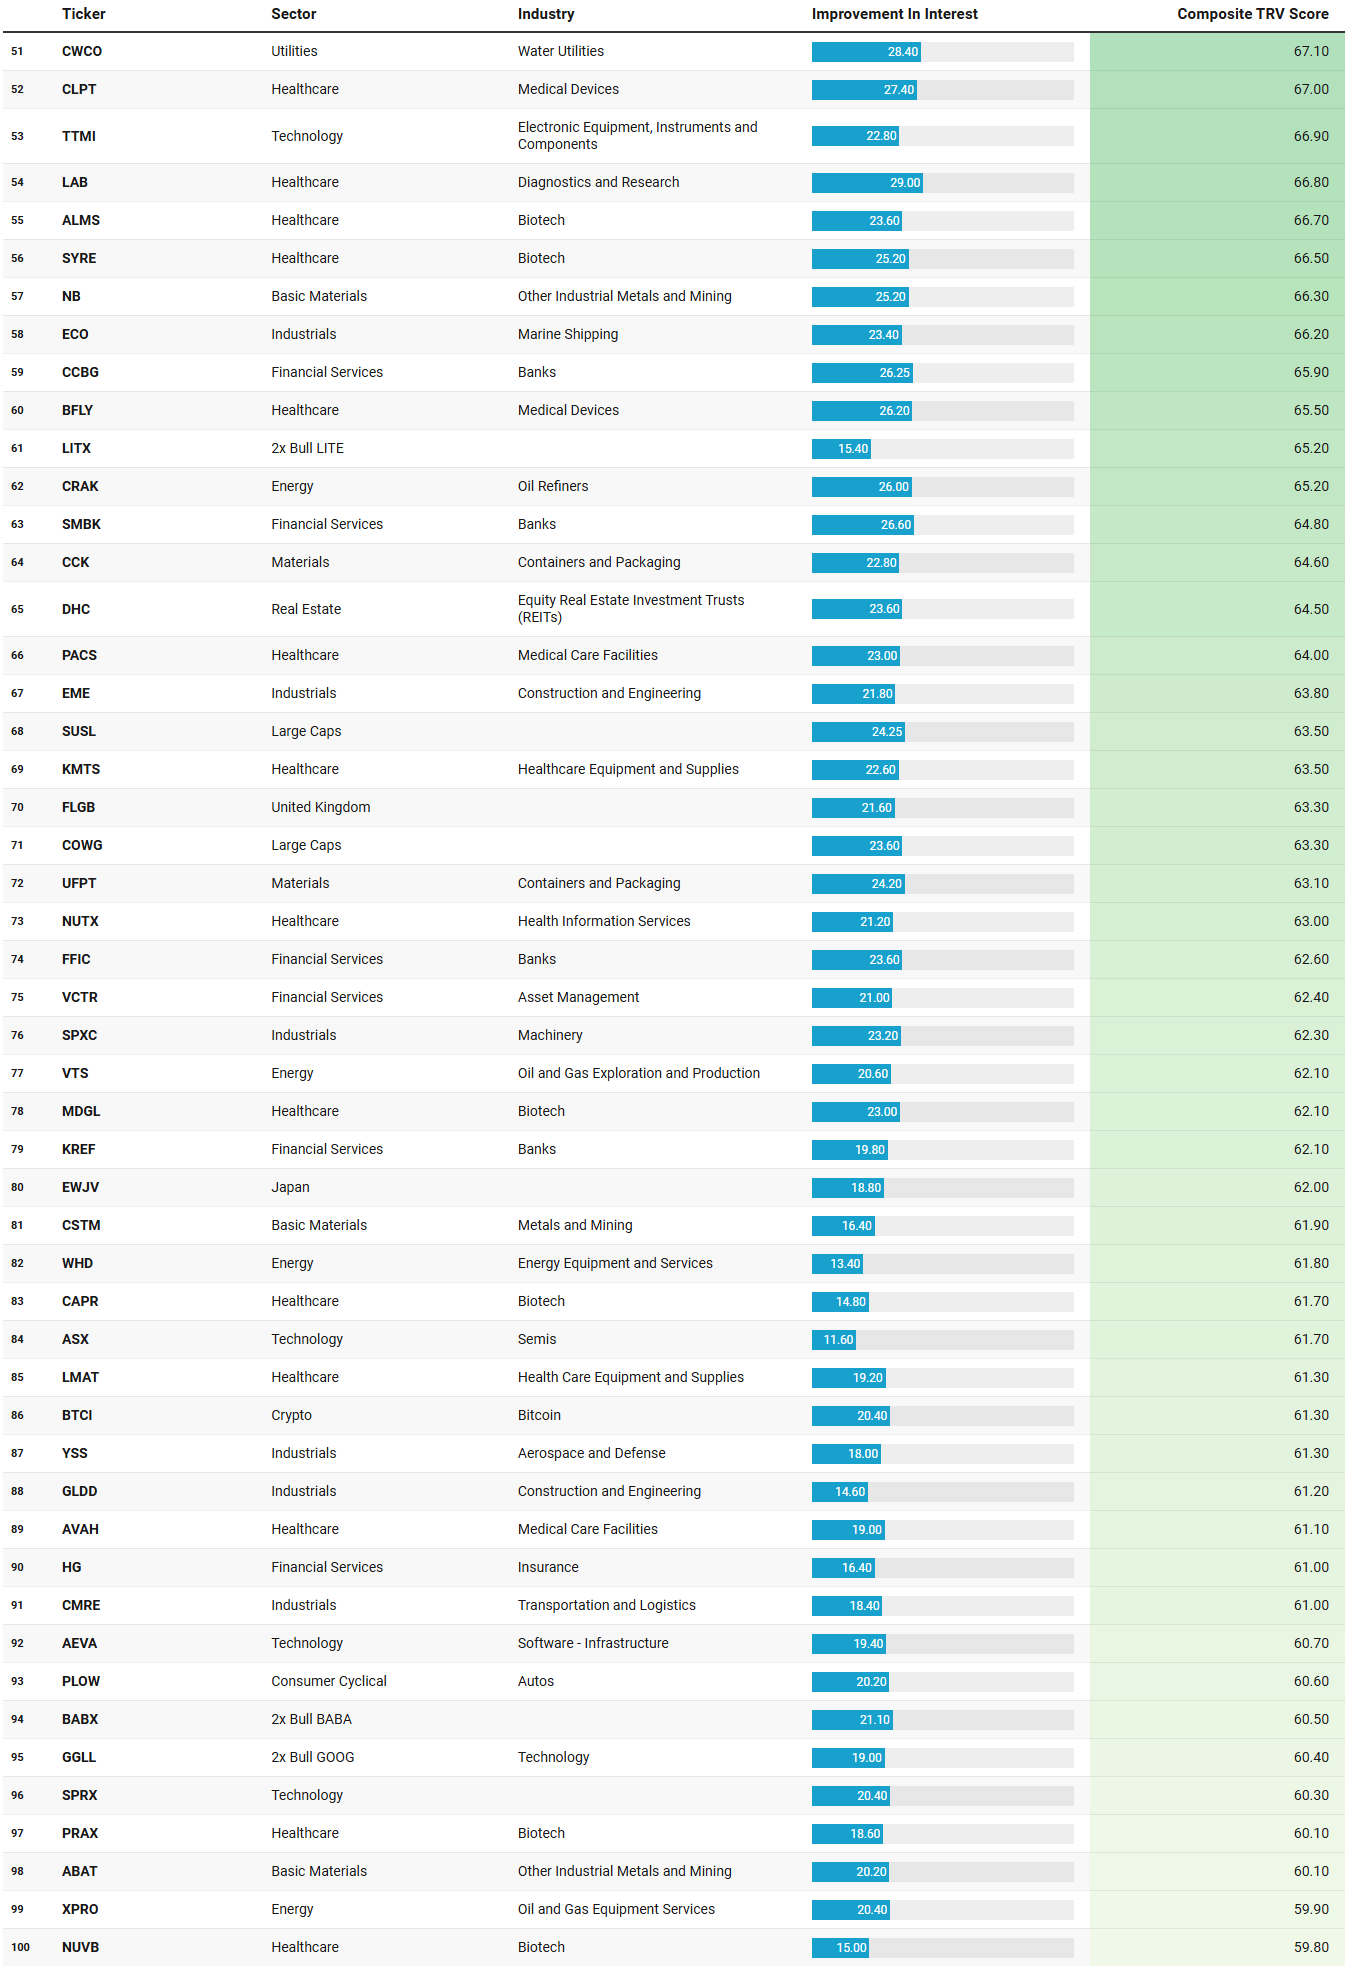
VL Trade Rank Velocity™ (TRV)
TRV is a proprietary metric that measures the recent acceleration or deceleration in institutional trading activity for a given stock by comparing its average trade rank over the past few days to its average in recent weeks. A sharp improvement in TRV typically reflects a notable shift in positioning, often accompanied by sustained trade activity, suggesting institutions are actively engaging with the name and that intensity of activity is rising. This often precludes meaningful price or narrative shifts. This isn’t a buy-list or sell-list; it’s meant to draw your eyes to names where institutions are putting money to work.
The TRV watchlist this week reinforces the defensive, rotation-driven narrative with striking clarity, and it surfaces a few emergent threads worth tracking.
The most conspicuous cluster is Industrials, and specifically the infrastructure and construction pocket within it. DY and MYRG -- both construction and engineering names -- sit near the top of the list with composite scores of 88.2 and 87.7 respectively, each carrying sustained activity readings of 10, meaning this is not a one-day blip but persistent, building interest. EME and GLDD round out the group further down. These are the companies that actually build grid infrastructure, lay fiber, and pour concrete for data centers and reshoring projects. The fact that they are surfacing alongside elevated Energy flows and Utilities leadership in the broader framework suggests the market is sniffing out a durable capex theme even as cyclicals broadly deteriorate. EH, the top-ranked name at a perfect 100 composite, is an aerospace and defense industrial -- another pocket of government-adjacent spending that tends to hold up in defensive regimes.
The second theme is hard assets and real assets. SLVR (silver), SETM (metals and mining), TFPM (precious metals), NB (industrial metals), CSTM (metals and mining), and LWLG (chemicals) form a materials cluster that is unusually dense for a list dominated by healthcare and industrials. Add CMBT (oil and gas midstream), SRUUF (uranium), PARR (oil and gas), CRAK (oil refiners), WHD and VTS (energy services and E&P), and you have a commodity complex that spans the entire energy and materials value chain. This dovetails perfectly with Energy’s sub-1.0 volatility ratio and persistent relative strength versus SPY noted in the broader flow data -- the institutional tape and the emerging-interest tape are pointing at the same sectors.
Third, bonds and rate-sensitive plays are quietly building. VTES and VCEB, both bond ETFs, show sustained activity of 7 and 8 respectively with fresh prints this week, consistent with the massive sweep and dark-pool flows into LQD and HYG documented in the institutional data. DPST, the 3x bull regional banks ETF, scoring 85.4 is a bold bet that the rate cycle is turning -- someone is positioning for regional bank outperformance ahead of the FOMC hold, and multiple community bank names like TOWN, CCBG, SMBK, FFIC, and KREF scattered throughout the list confirm that this is not a single leveraged punt but a distributed theme.
Finally, the inverse and leveraged names tell their own story. NVDD, the 1x bear NVDA ETF, sits at 87.3 -- fifth on the entire list. That is explicit hedging or directional shorting against the largest single-name dollar flow in the market. Alongside ORCX (2x bull ORCL), LITX (2x bull LITEOIN), BABX (2x bull BABA), and GGLL (2x bull GOOG), the leveraged product interest suggests a bifurcated positioning environment where traders are using levered instruments to express high-conviction single-name views in both directions rather than taking broad market bets.
The healthcare cluster -- heavily biotech -- is wide but lacks a unifying macro thread; it reads more as idiosyncratic pipeline positioning across LRMR, OVID, ERAS, NAGE, and others than a sector rotation signal.
The bottom line from the watchlist: the smart money emerging-interest radar is aligned with the institutional flow picture. Capital is gravitating toward infrastructure buildout, hard assets, and rate-sensitive financials while actively hedging mega-cap tech exposure -- a defensive posture with selective offense in the sectors where participation and structural strength already reside.
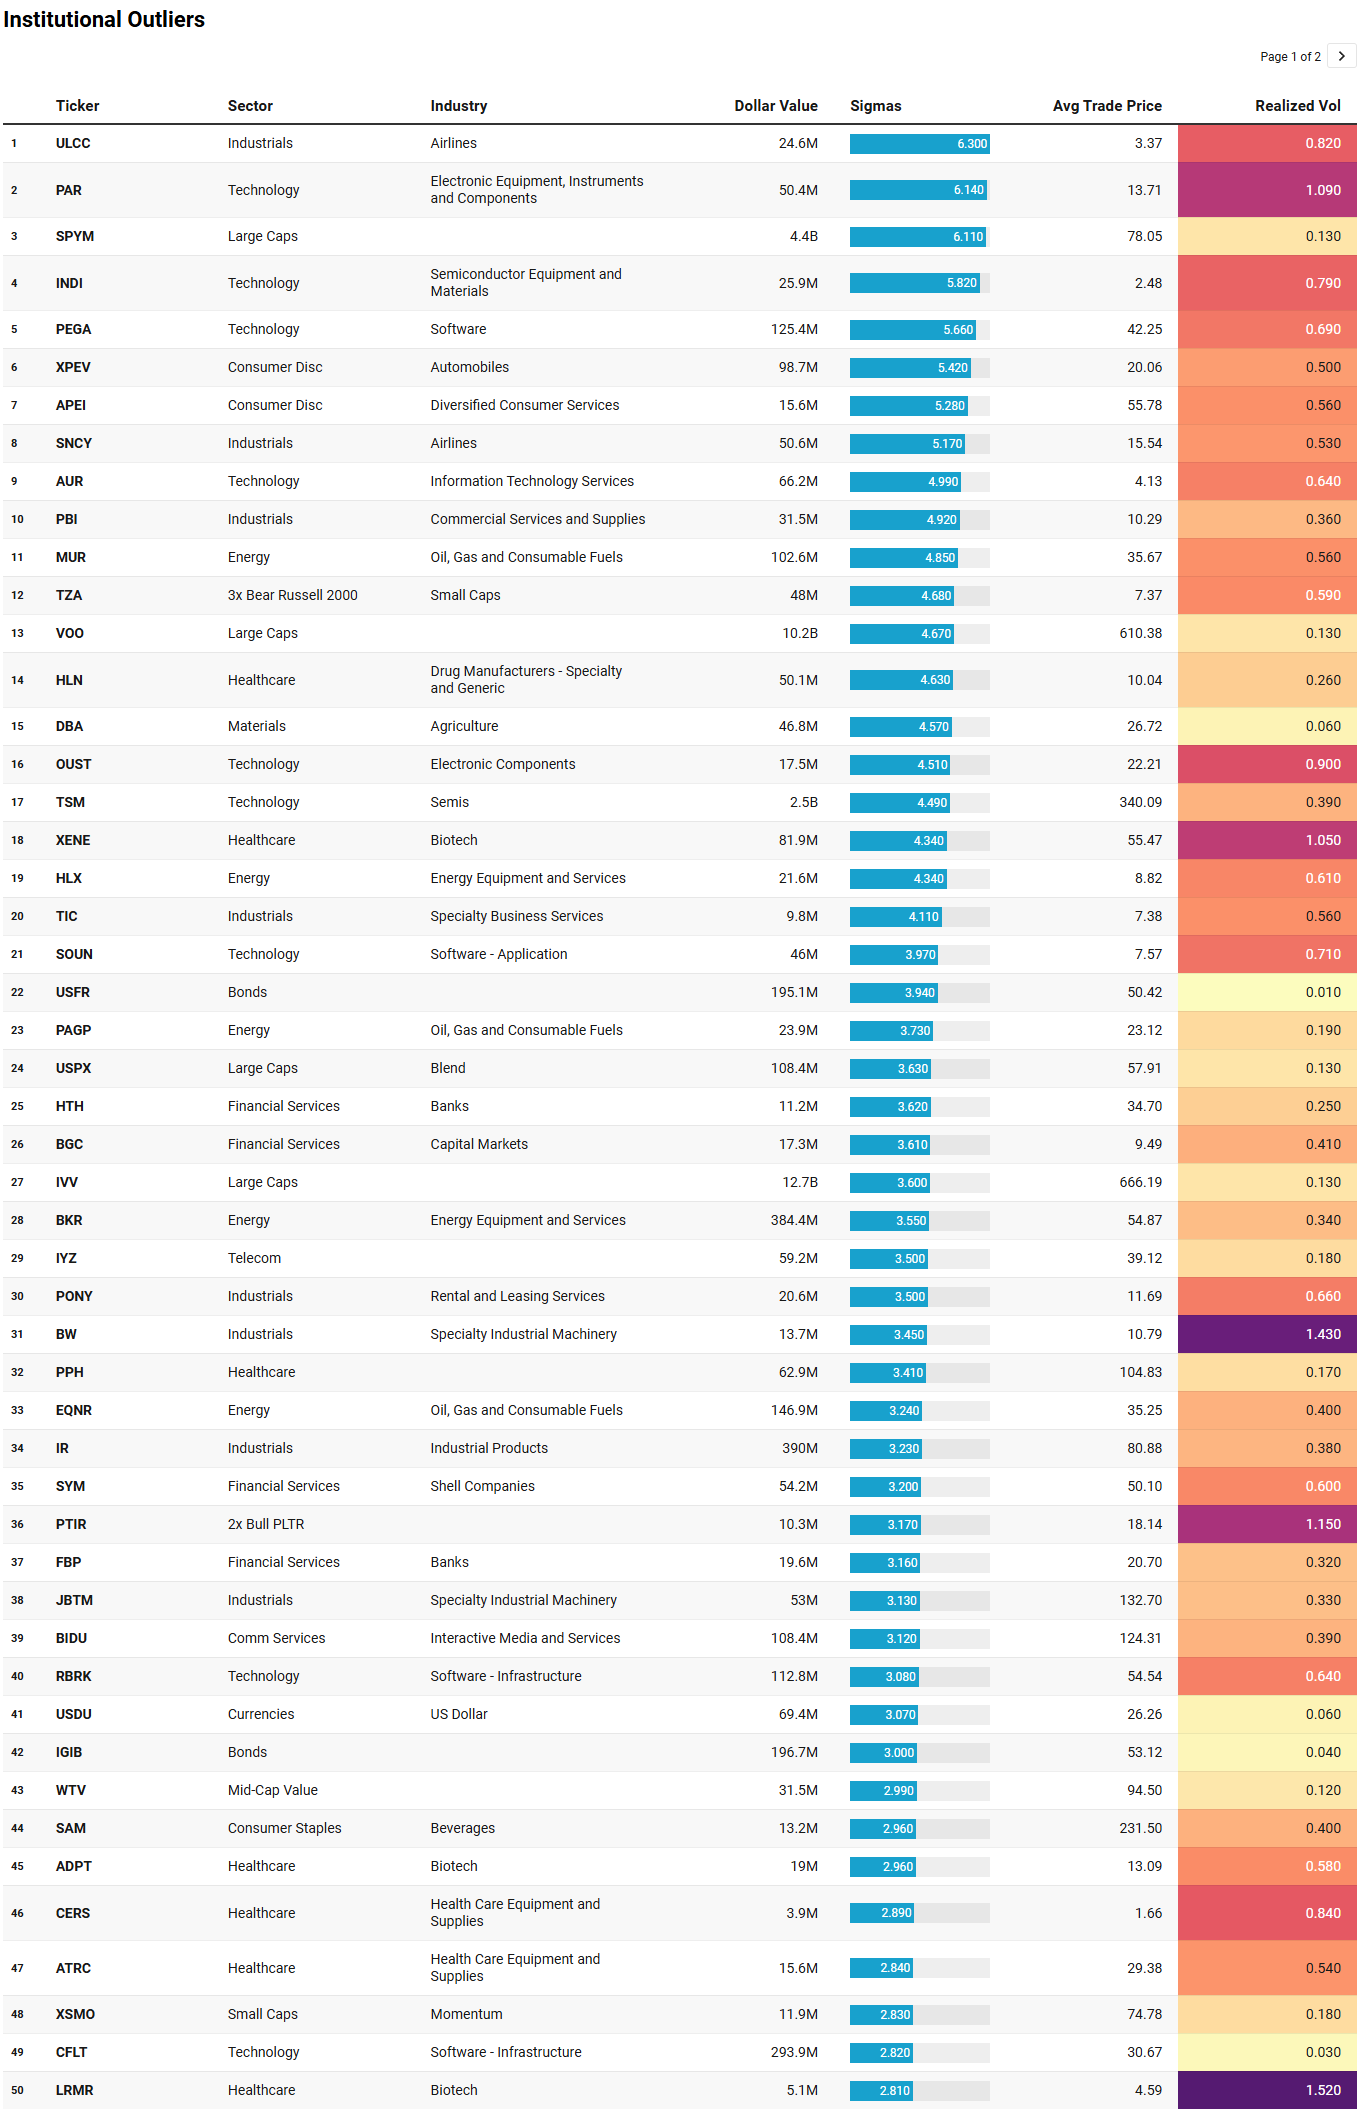
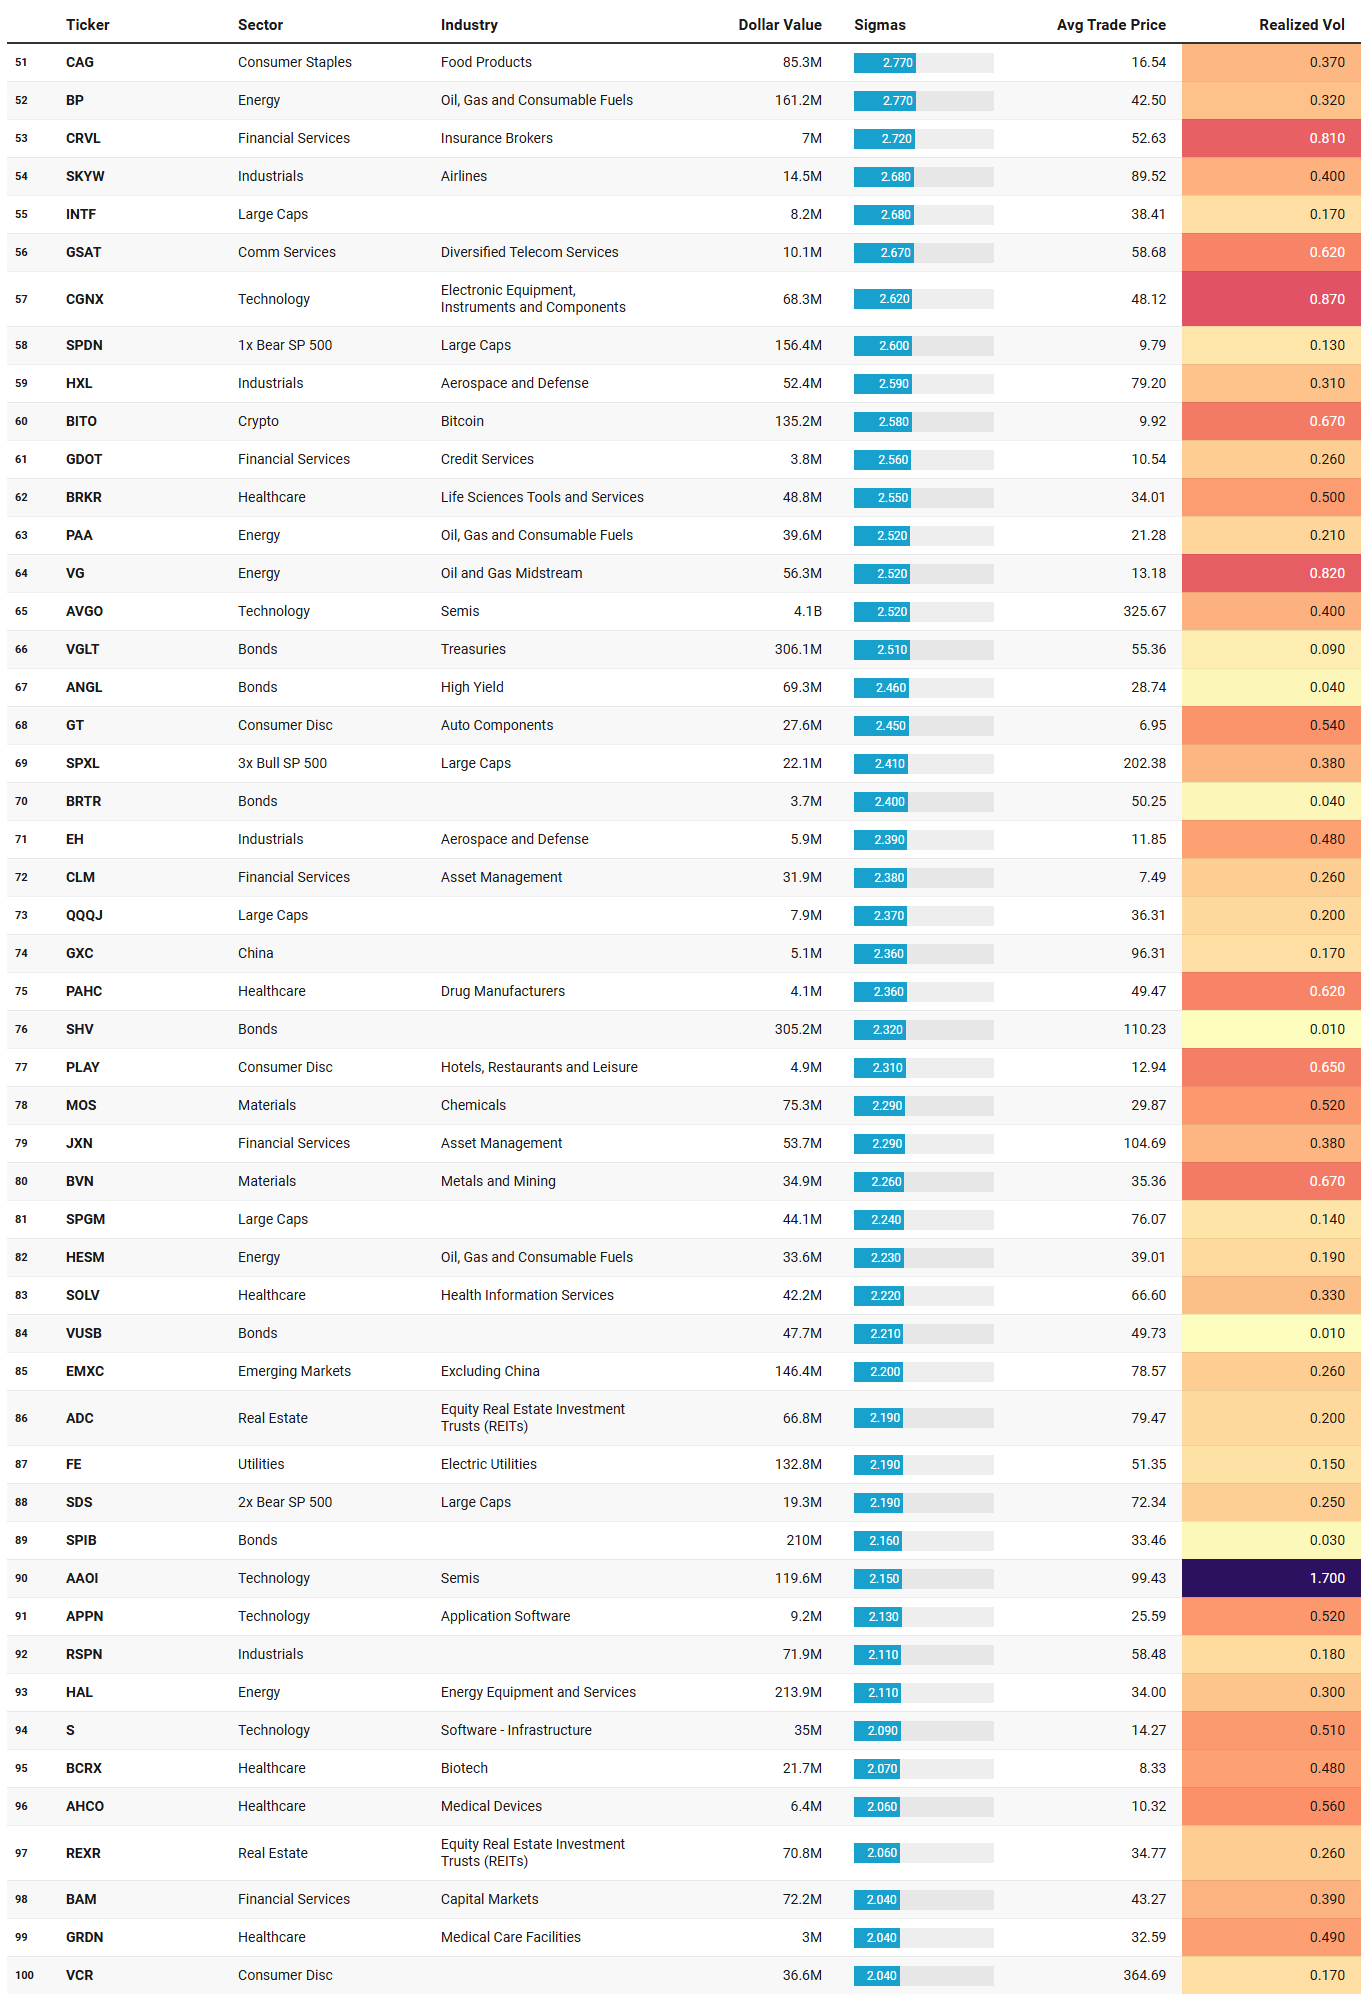
VL Institutional Outliers™ (IO)
Institutional Outliers is a proprietary metric designed to spotlight trades that significantly exceed a stock’s recent institutional activity—specifically in terms of dollar volume. By comparing current trade size against each security's recent normalized history, the metric flags outlier events that may indicate sudden institutional interest but may be missed because the activity doesn’t raise any flags/alerts when comparing the activity against the ticker’s entire history. For example, it’s conceivable that a ticker today receives the largest trade it has had in the last 6 months but the trade is unranked and would therefore be missed by current alerts built off Trade Ranks. Day traders can use “Realized Vol” to identify tickers that are moving swiftly with large price displacement while others can use it to size your risk appropriately.
The institutional outlier list from Friday reads like a positioning map for a market caught between hedging the present and building exposure to the next cycle, and the themes it surfaces fit hand-in-glove with the broader narrative.
The most striking feature is the depth of energy involvement. MUR at $102.6 million and 4.85 sigmas, EQNR at $146.9 million and 3.24 sigmas, BP at $161.2 million and 2.77 sigmas, BKR at $384.4 million and 3.55 sigmas, HAL at $213.9 million and 2.11 sigmas, plus midstream names like PAGP, PAA, VG, and HESM scattered through the middle of the list -- this is not a single fund making a bet, it is broad institutional involvement across the entire energy value chain this week. The upstream, services, and midstream exposure together totals well over a billion dollars in outlier activity. Combined with Energy’s persistent relative strength, sub-1.0 volatility ratio, and steady daily flows in the $6-$9 billion range documented in the broader data, the IO list confirms that the sector is attracting real allocation, not just passive rebalancing. BKR and HAL in particular are energy services names that benefit from sustained capex cycles regardless of commodity direction, which aligns with the infrastructure buildout theme surfacing in the TRV list through DY, MYRG, and EME.
The fixed-income positioning is equally loud. USFR at $195.1 million (floating rate), IGIB at $196.7 million (intermediate corporate), VGLT at $306.1 million (long treasuries), SHV at $305.2 million (short-term treasuries), SPIB at $210 million (intermediate), ANGL at $69.3 million (fallen angels), and BRTR and VUSB adding to the pile. The spread across the curve is notable -- institutions are not making a single duration bet but are building diversified fixed-income exposure across short, intermediate, and long maturities simultaneously. This is classic pre-FOMC positioning: constructing a bond book that benefits from multiple rate scenarios while the sweep data we documented earlier shows the urgency flowing into LQD and HYG. The USFR print at 3.94 sigmas with near-zero realized volatility is a pure cash-parking trade, suggesting someone is raising dry powder.
The hedging complex confirms the defensive posture. TZA, the 3x bear Russell 2000 ETF, printed $48 million at 4.68 sigmas -- someone is aggressively shorting small caps even as IWM clings to its Q4 base near $243. SPDN, the 1x bear S&P 500, pulled $156.4 million at 2.6 sigmas, and SDS, the 2x bear S&P, added another $19.3 million. That is a layered hedge across both indices and leverage factors, consistent with the two-to-one bearish bias and narrow breadth regime identified in the macro framework.
The single-stock tech outliers offer nuance rather than a unified theme. TSM at $2.46 billion and 4.49 sigmas and AVGO at $4.11 billion and 2.52 sigmas are mega-cap semiconductor repositioning -- massive notional but moderate sigma readings, meaning the flow is large in absolute terms but not wildly unusual relative to their typical activity. PEGA at $125.4 million and 5.66 sigmas, RBRK at $112.8 million and 3.08 sigmas, CFLT at $293.9 million and 2.82 sigmas, and SOUN at $46 million are the software names drawing attention, but realized vol across these names runs 0.6-0.7, indicating choppy price action accompanying the flow rather than clean directional moves. PAR at $50.4 million and 6.14 sigmas with 1.09 realized vol is the highest-sigma single stock on the board -- that level of statistical unusualness in a mid-cap tech name warrants monitoring for follow-through next week.
ULCC at $24.6 million and 6.3 sigmas sits at the very top of the list by statistical rarity, and alongside SNCY at $50.6 million and 5.17 sigmas and SKYW at $14.5 million, airlines form a small but notable cluster. Three airline names printing institutional outliers in the same week, with ULCC’s realized vol at just 0.82 suggesting relatively orderly execution, hints at sector-level repositioning -- possibly ahead of spring travel data or fuel cost repricing given the concurrent energy flows.
The IO list, taken together, shows institutions simultaneously building energy exposure across the full value chain, constructing diversified bond portfolios ahead of the Fed, layering explicit hedges against equity downside, and selectively engaging with individual tech and industrial names where idiosyncratic catalysts justify the risk in a hostile macro frame. It is a positioning map for a market that expects volatility, favors real assets, and is not yet ready to re-risk broadly.
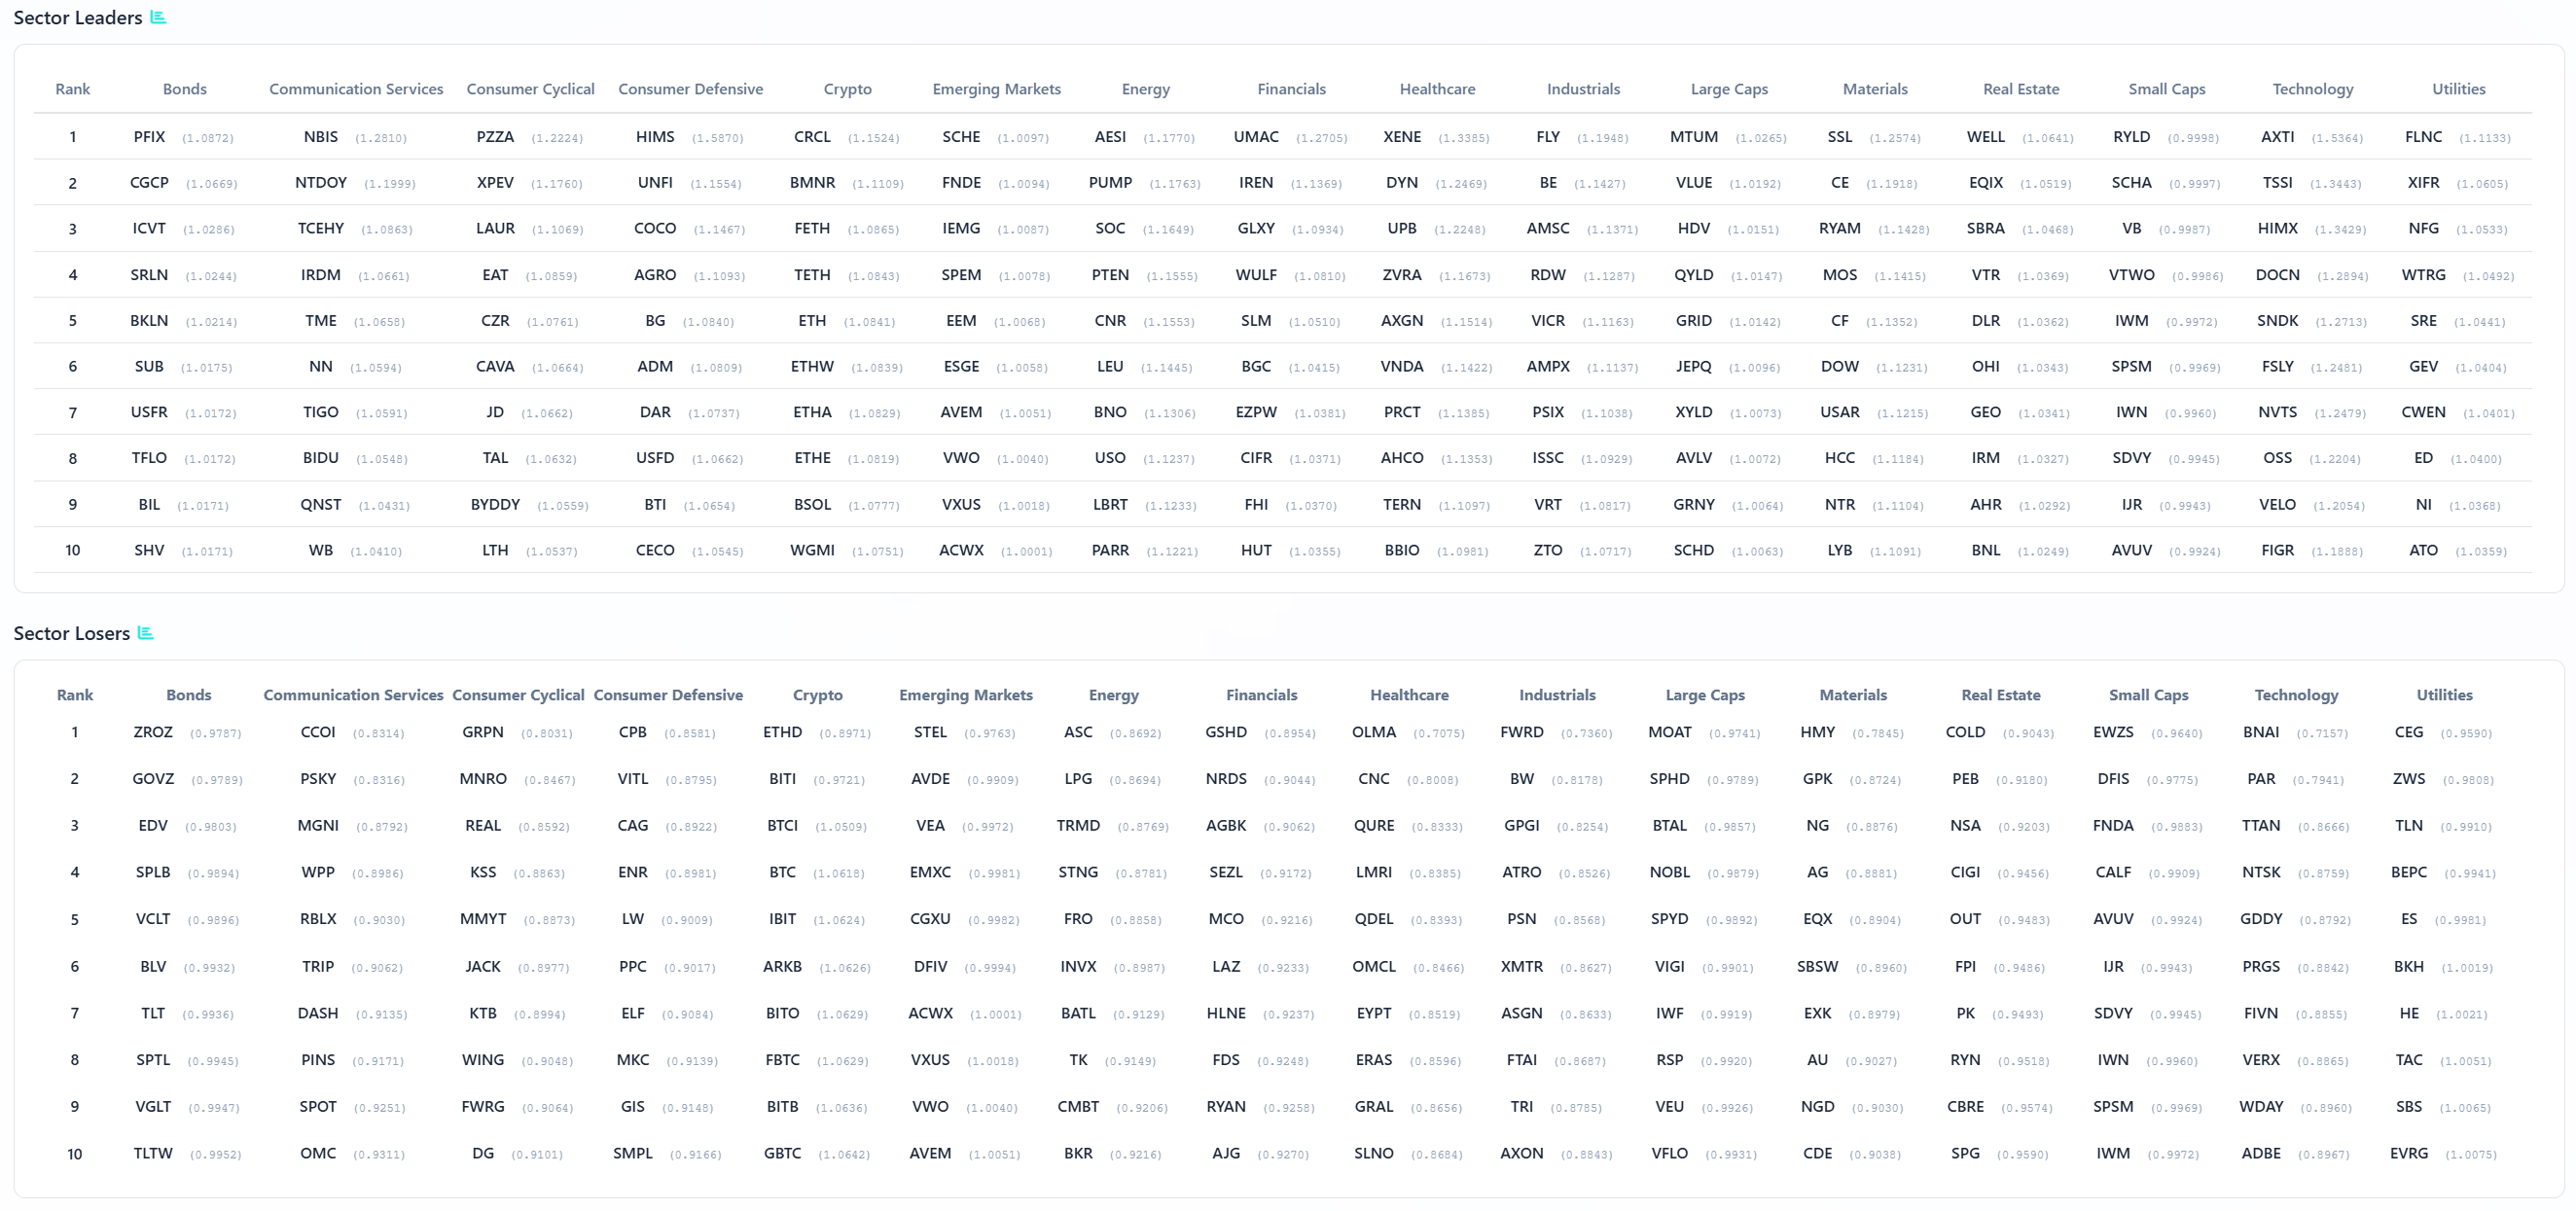
VL Sector Leaders
VL Sector Leaders is a weekly snapshot of where true leadership is asserting itself inside the market, stripped of the distortions that come from broad, style-mixed indices. Rather than asking which stocks look strong in absolute terms, this list focuses on which names are outperforming within the environments they actually compete in.
Each week, we surface the ten stocks demonstrating the most persistent relative strength inside their respective sectors. These are not headline chasers or one-day wonders. They are names that continue to separate themselves from peers through real price behavior, often reflecting sustained demand rather than fleeting attention.
For day traders, this list is a powerful awareness tool. Sector Leaders tend to offer cleaner intraday structure, better follow-through, and more predictable reactions around key levels because they already sit on the right side of relative strength. Even on choppy tape, leadership names often remain tradeable while the rest of the market degrades.
For swing traders, VL Sector Leaders helps narrow the universe to stocks with the highest probability of staying relevant. Relative leaders are more likely to hold trends, survive pullbacks, and reassert themselves after consolidation. When markets rotate, these names are often among the first to resume leadership — or the last to break.
The sector leaders and losers tables confirm every rotation theme we have been tracking and sharpen the edges considerably.
The leaders table’s most immediately striking column is Energy. AESI, PUMP, SOC, PTEN, CNR, LEU, BNO, USO, LBRT, and PARR -- the top ten Energy leaders are dominated by oilfield services and E&P names, with scores ranging from 1.1770 down to 1.0221. PUMP and PTEN are pressure pumping and completions companies, LBRT is Liberty Energy, and AESI leads the entire sector. This is the capex-intensive, activity-driven pocket of energy, not the passive royalty or midstream names. It aligns precisely with BKR and HAL showing up as institutional outliers and WHD surfacing on the TRV list -- the market is not just buying the commodity, it is buying the picks-and-shovels layer that benefits from sustained drilling activity regardless of short-term crude price swings.
Consumer Cyclical is where the international story emerges. PZZA leads at 1.2224, but the next three names -- XPEV, LAUR, and EAT -- mix Chinese EV exposure with domestic restaurants and education. CAVA and CZR fill out the middle ranks. XPEV also printed as an institutional outlier at $98.7 million and 5.42 sigmas, so the leadership score and the outsized institutional flow are converging on the same name. The Consumer Cyclical leaders board is telling you that within a broadly weak sector, pockets of growth tied to international demand and experiential spending are outperforming.
Healthcare leadership runs through XENE, DYN, UPB, ZVRA, AXGN, VNDA, PRCT, AHCO, TERN, and BBIO -- almost entirely biotech and specialty pharma. XENE also appeared on the IO list at $81.9 million and 4.34 sigmas with 1.05 realized vol, making it the highest-conviction healthcare name across both frameworks. The losers side is equally telling: OLMA, CNC, QURE, LMRI, QDEL, OMCL, EYPT, ERAS, GRAL, and SLNO populate the bottom, with managed care name CNC sitting at 0.9509. The bifurcation is stark -- biotech catalysts are being rewarded while services and managed care are being punished.
The Utilities column reinforces the structural leadership case. FLNC leads at 1.1330, a renewable utilities name that also carries a TRV score of 70 with 21 days of sustained activity. XIFR, NFG, WTRG, SRE, GEV, CWEN, ED, NI, and ATO fill out the rest -- a mix of renewables, gas utilities, and regulated electrics. The losers side features CEG, ZWS, and BEPC, meaning the market is differentiating within utilities rather than treating the sector as a monolith.
The Industrials leaders column -- FLY, BE, AMSC, RDW, VICR, AMPX, PSIX, ISSC, VRT, and ZTO -- leans heavily into aerospace, defense electronics, and power infrastructure. BE (Bloom Energy) and AMSC (American Superconductor) are grid modernization plays that tie directly into the Utilities leadership and the construction-engineering cluster from the TRV list. The convergence across all three watchlists on the electrification and grid buildout theme is now too dense to dismiss as coincidence.
On the losers side, the damage is concentrated where the broader narrative predicts it. Large Caps losers -- MOAT, SPHD, BTAL, NOBL, SPYD, VIGI, IWF, RSP, VEU, VFLO -- are almost entirely factor and smart-beta ETFs, confirming that passive strategies and broad index products are underperforming as the market rewards selectivity over exposure. Technology losers include BNAI, PAR, TTAN, NTSK, GDDY, PRGS, FIVN, VERX, WDAY, and ADBE -- enterprise software and AI-adjacent names that are bleeding relative strength even as the mega-cap semiconductor complex absorbs billions in flow. The Technology leaders, by contrast, feature RYLD, AXTI, SCHA, HIMX, DOCN, SNDK, FSLY, NVTS, OSS, and VELO -- a mix of income strategies, small-cap semis, and edge infrastructure. The message is clear: within tech, the market is rotating away from premium-multiple software toward hardware, income, and smaller specialty names.
The sector leaders table, read alongside the TRV and IO data, resolves into a single coherent picture: energy services, grid infrastructure, selective biotech catalysts, and regulated utilities are where structural leadership resides, while broad index products, enterprise software, and managed care sit on the wrong side of the rotation.
MIR Part 3: Framing-Up A Trade
The institutional tape this week painted a remarkably coherent picture: a bearish, narrow-breadth regime where only a third of the market holds above structural levels, volatility is elevated and skewing to the downside, and capital is fragmenting into a handful of defensive pockets rather than distributing broadly. Energy, Utilities, and Crypto carried the strongest participation and relative strength readings. Fixed income absorbed the most urgent institutional flow, with bond sweeps dominating the entire market. Mega-cap tech drew enormous notional but generated no alpha versus the benchmark, and cyclicals, industrials, and large-cap index products sat on the wrong side of every rotation signal. The TRV watchlist surfaced infrastructure buildout and hard assets as emergent themes. The IO list confirmed energy allocation across the full value chain, layered bond positioning ahead of the FOMC, and explicit hedging against equity downside. The sector leaders table sharpened the edges further, revealing that oilfield services, grid modernization, selective biotech, and regulated utilities are where genuine leadership resides.
The positioning framework that follows from this is defensive in posture but selective in offense. The environment punishes broad exposure and rewards concentrated bets in sectors where participation, relative strength, and volatility all align constructively. It demands hedging -- the tape is telling you to carry protection, not to hope the floor holds. And it demands duration awareness ahead of a Fed meeting where the dots and the language matter more than the rate decision itself.
The portfolio I would build for next week reflects that framework. It is organized into five sleeves, each sized to the conviction level the data supports, and each grounded in specific signals from the tape.
ENERGY SERVICES AND INFRASTRUCTURE -- 25%
This is the highest-conviction sleeve. Energy carries the lowest volatility ratio on the sector board, persistent relative strength versus SPY, steady daily institutional flows in the $6-9 billion range, and the deepest cluster of IO outliers on Friday -- BKR, HAL, MUR, EQNR, and BP all printing multi-sigma readings. The TRV list surfaced CMBT, SRUUF, PARR, WHD, and CRAK. The sector leaders table confirmed that oilfield services names like AESI, PUMP, PTEN, and LBRT are outperforming. The thesis is not a commodity bet -- it is a capex-cycle bet on sustained drilling activity and energy infrastructure spending.
BKR (Baker Hughes) at 7% -- largest energy IO print at $384 million and 3.55 sigmas, diversified across equipment and services, benefits from international drilling acceleration.
HAL (Halliburton) at 5% -- $214 million IO print at 2.11 sigmas, pure-play completions and pressure pumping exposure, directly tied to the PUMP/PTEN/LBRT leadership cluster.
EQNR (Equinor) at 5% -- $147 million IO print, European integrated with growing offshore wind exposure, provides geographic diversification away from pure US shale.
MUR (Murphy Oil) at 4% -- $103 million at 4.85 sigmas, mid-cap E&P with Gulf of Mexico leverage, higher beta to oil prices if the supply picture tightens.
PAGP (Plains GP) at 4% -- midstream exposure at 3.73 sigmas, low realized vol of 0.19 indicating orderly institutional accumulation, and CMBT on the TRV list confirms midstream interest is broad-based.
GRID AND ELECTRIFICATION INFRASTRUCTURE -- 15%
The convergence across all three watchlists on this theme is too dense to ignore. DY and MYRG topped the TRV list with sustained activity readings of 10. The sector leaders table placed BE and AMSC in the Industrials leadership column. FLNC led Utilities leaders with 21 days of sustained TRV activity. The macro catalyst is straightforward: data center buildouts, grid modernization mandates, and reshoring capital expenditure are structural tailwinds that persist regardless of the business cycle, and these names are demonstrating relative strength in a market where almost nothing else is.
DY (Dycom Industries) at 4% -- TRV composite 88.2, specialty contractor for fiber and electrical infrastructure, direct beneficiary of utility capex cycles.
MYRG (MYR Group) at 4% -- TRV composite 87.7, electrical construction for transmission and distribution, pairs with DY as a pure-play grid buildout expression.
BE (Bloom Energy) at 4% -- sector leader in Industrials, fuel cell and distributed power generation, positioned at the intersection of grid reliability and data center backup power demand.
FLNC (Fluence Energy) at 3% -- leads Utilities sector leaders at 1.1330, 21 days sustained TRV activity, energy storage systems that are essential to grid balancing as renewable penetration increases.
FIXED INCOME AND RATE POSITIONING -- 25%
The bond tape was the loudest signal of the week. LQD and HYG led all names in aggregate sweeps at $2.79 billion and $2.07 billion respectively. Dark pool flows into LQD hit $11 billion and HYG $10 billion. The IO list showed IGIB at $197 million, VGLT at $306 million, SHV at $305 million, SPIB at $210 million, and USFR at $195 million. The TRV list surfaced VTES and VCEB with sustained activity. This sleeve is sized at 25% to reflect both the conviction level and the defensive function it serves ahead of Wednesday’s FOMC decision where the dot plot revision and Powell’s press conference will determine whether the rate path reprices higher.
IGIB (iShares Intermediate Investment Grade) at 7% -- $197 million IO print at 3.0 sigmas, intermediate duration captures carry without excessive rate sensitivity, sweet spot if the Fed signals patience.
VGLT (Vanguard Long-Term Treasury) at 5% -- $306 million IO print, the duration bet that pays if growth fears dominate the FOMC language and the long end rallies.
SHV (iShares Short Treasury) at 5% -- $305 million IO print with near-zero realized vol, pure dry powder and capital preservation, the parking lot for cash that needs to stay liquid through the decision.
ANGL (VanEck Fallen Angel High Yield) at 4% -- $69.3 million IO print, captures the credit spread compression trade if the Fed acknowledges growth risks, higher quality than broad HY.
USFR (WisdomTree Floating Rate) at 4% -- $195 million IO print at 3.94 sigmas, floating rate neutralizes duration risk entirely, the hedge within the bond sleeve.
SELECTIVE EQUITY ALPHA -- 20%
This sleeve targets the individual names where institutional outlier activity, TRV emerging interest, and sector leadership scores converge. The sizing is moderate because the environment demands selectivity -- each position must justify itself across multiple frameworks, and the broad market hostility means any long equity exposure needs to be in names demonstrating genuine structural strength.
XENE (Xenon Pharmaceuticals) at 4% -- $81.9 million IO print at 4.34 sigmas, leads Healthcare sector leaders at 1.3355, biotech with clinical catalysts in a sector where the tape is sharply bifurcated between winners and losers.
PEGA (Pegasystems) at 3% -- $125.4 million at 5.66 sigmas, enterprise workflow automation, one of the highest-sigma software names on the IO list in a sector where most software is bleeding relative strength.
TSM (Taiwan Semiconductor) at 4% -- $2.46 billion IO print at 4.49 sigmas, the foundry backbone of the semiconductor cycle, carries a lower realized vol (0.39) than most tech names and benefits from structural demand regardless of near-term AI narrative shifts.
BIDU (Baidu) at 3% -- $108.4 million at 3.12 sigmas, Chinese internet exposure that pairs with XPEV’s appearance on both the IO list and Consumer Cyclical sector leaders, expressing the international demand theme.
IR (Ingersoll Rand) at 3% -- $390 million IO print at 3.23 sigmas, industrial compressors and flow control, the infrastructure-adjacent industrial that benefits from the same capex cycle driving the grid sleeve.
EH (EHang) at 3% -- perfect 100 composite TRV score, 2.39 sigma IO print, aerospace and defense industrial at the top of the emerging interest radar, sized smaller due to higher idiosyncratic risk.
HEDGES AND TAIL PROTECTION -- 15%
The tape demands hedging. The two-to-one bearish breadth ratio, the VIX in the upper 20s, the MOVE at 95 and rising, the CNN Fear and Greed Index at 20 in Extreme Fear, and the explicit institutional outlier prints in TZA, SPDN, and SDS all tell you that professional desks are carrying protection and so should we. This sleeve is not a directional bet against the market -- it is insurance that allows the rest of the portfolio to function without forced selling if the floor breaks.
SHV (cross-referenced above in bond sleeve, combined weight reflects dual purpose) -- already allocated above, the short treasury position doubles as both yield capture and crash buffer.
SPDN (ProShares Short S&P 500) at 5% -- $156.4 million IO print at 2.6 sigmas, 1x inverse provides linear hedge against broad market decline without the decay risk of leveraged products, sized to offset roughly half the gross equity exposure.
TZA (Direxion 3x Bear Russell 2000) at 3% -- $48 million at 4.68 sigmas, explicit small-cap hedge that directly addresses IWM sitting on its Q4 base at $243, leveraged sizing kept small because the 3x structure amplifies quickly.
USDU (WisdomTree Strong Dollar) at 3% -- $69.4 million IO print at 3.07 sigmas, dollar strength hedge that benefits if the FOMC dots shift hawkish and rate differentials widen, also provides portfolio-level diversification against the international equity names in the alpha sleeve.
DBA (Invesco Agriculture) at 4% -- $46.8 million at 4.57 sigmas with just 0.06 realized vol, agriculture commodities as a non-correlated real asset sleeve that hedges food inflation risk and provides diversification away from both equity and fixed income beta.
The portfolio nets out to roughly 60% defensive positioning (bonds, hedges, and dollar/commodity diversification) and 40% offensive positioning (energy, grid infrastructure, and selective alpha), which reflects the regime the tape is describing: a market where capital preservation is the first priority and risk-taking is reserved for the narrow pockets where every layer of the framework -- participation, volatility, relative strength, and institutional flow -- aligns constructively. The energy and infrastructure sleeves carry the highest conviction because they are confirmed across the broadest set of signals. The bond sleeve is sized for the event risk of FOMC week. The hedges are sized to allow the equity longs to breathe without forcing panic exits if SPY loses the $659 line of scrimmage identified in the volume profile. If the Fed delivers a dovish hold and the dots stay flat, the playbook shifts toward reducing hedges and adding to the alpha sleeve. If PPI runs hot and the dots shift higher, the hedges earn their keep and the bond sleeve’s duration exposure via VGLT becomes the primary adjustment lever. Good luck this week, VL!
Thank you for being part of this community and for investing your time in this week’s edition. The quality of this readership — thoughtful, disciplined, engaged — is what makes this work meaningful. I’m grateful to build alongside you. Here’s to a week of clarity, conviction, and well-executed opportunities.
— VolumeLeaders