Market Momentum: Your Weekly Financial Forecast & Market Prep
Issue 82 / What to expect March 02, 2026 thru March 06, 2026


Weekly Market-On-Close Report
The Market After Nvidia: Positioning For An AI World That Still Has To Live With Inflation
If you only glanced at the screens this week, you might think not much happened. The S&P 500 finished modestly lower, the Dow lagged a bit more, and the Nasdaq slipped but did not break. March E‑mini S&P futures (ESH26) gave back roughly half a percent on Friday, tracking a 0.43% dip in the cash S&P as the Dow fell about 1% and the Nasdaq 100 eased 0.3%. On the surface, that is just noise inside a broader range indices have been trading in for several weeks now.
Underneath, the tape told a more interesting story: investors just digested a historic AI earnings print, a hotter U.S. producer price number, and a steady drip of data that point to slower but still positive growth. The result is a market that still wants to be long risk, but is finally starting to think harder about price, path, and which parts of the AI narrative are investable versus already embedded in expectations.
Let’s unpack how the week looked through the lens of futures, macro, and institutional behavior – and what it implies for positioning now that the Nvidia fireworks are behind us.
E‑mini Futures: A Calm Surface Above Busy Hands
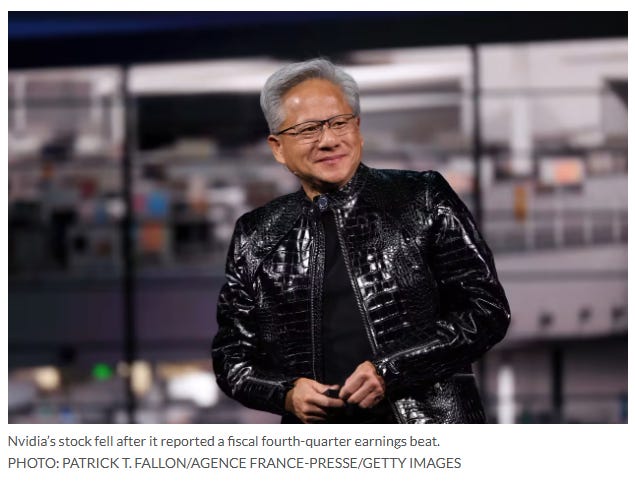
Start with the futures curve. March E‑mini S&P (ESH26) trades just above 6,880, within striking distance of recent highs but no longer racing ahead. Daily ranges have expanded slightly from the sleepy early‑year action, yet realized volatility remains modest by historical standards. That is exactly what you expect after a one‑way run fueled by AI enthusiasm: the market needs to pass the baton from “multiple expansion on hopes” to “earnings delivering on those hopes.” Nvidia largely did its part, beating lofty expectations and again surprising on data center demand and AI accelerator sales. But the fact that the index complex could not break meaningfully higher afterward tells you a lot of good news was already priced in.
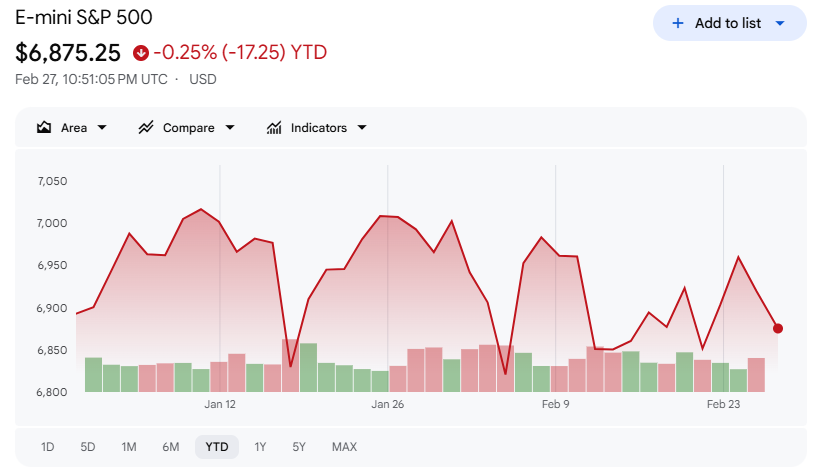
February closes as only the second down month in the last ten for the S&P, and even that mild setback came in a tight range.
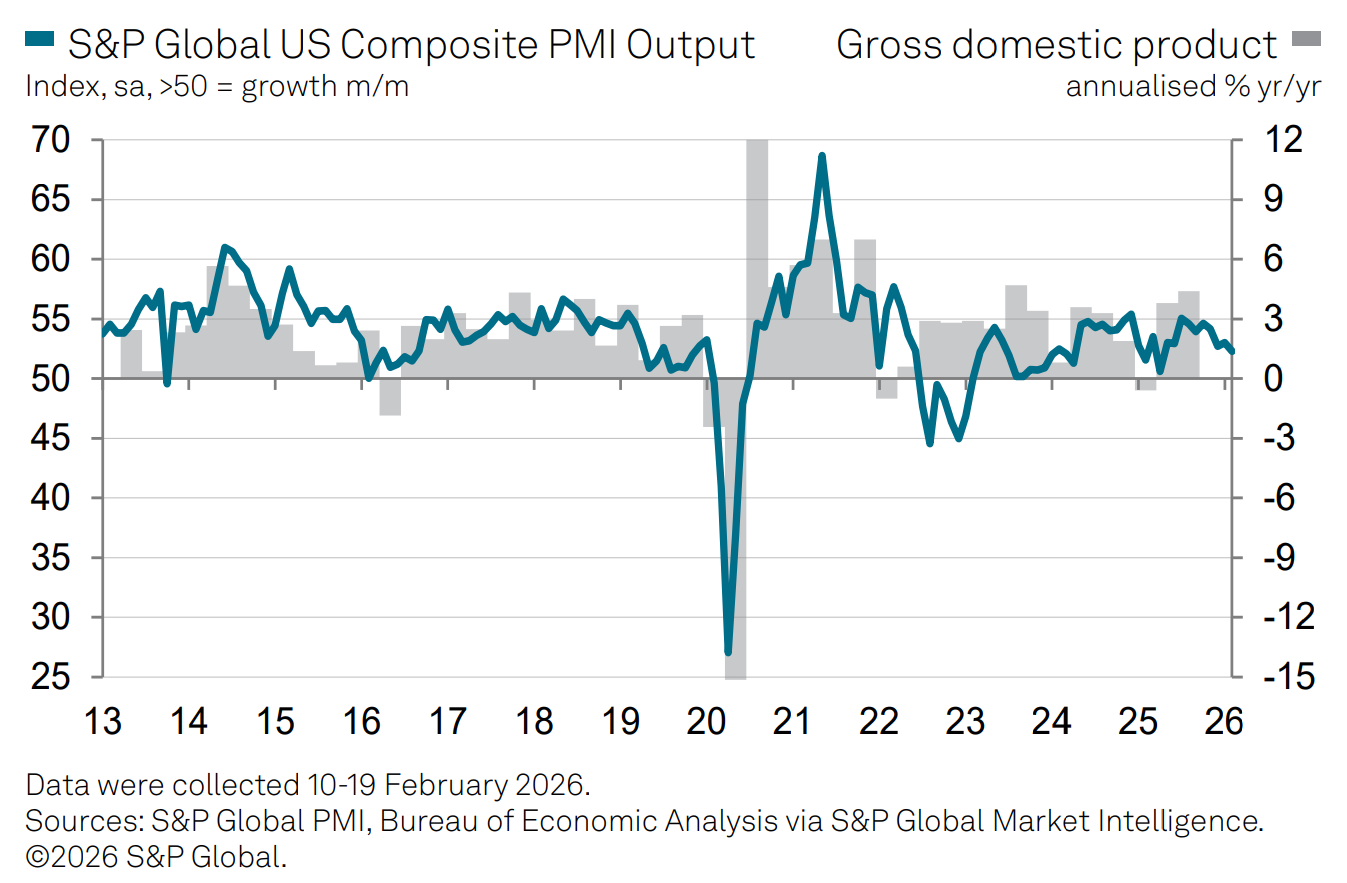
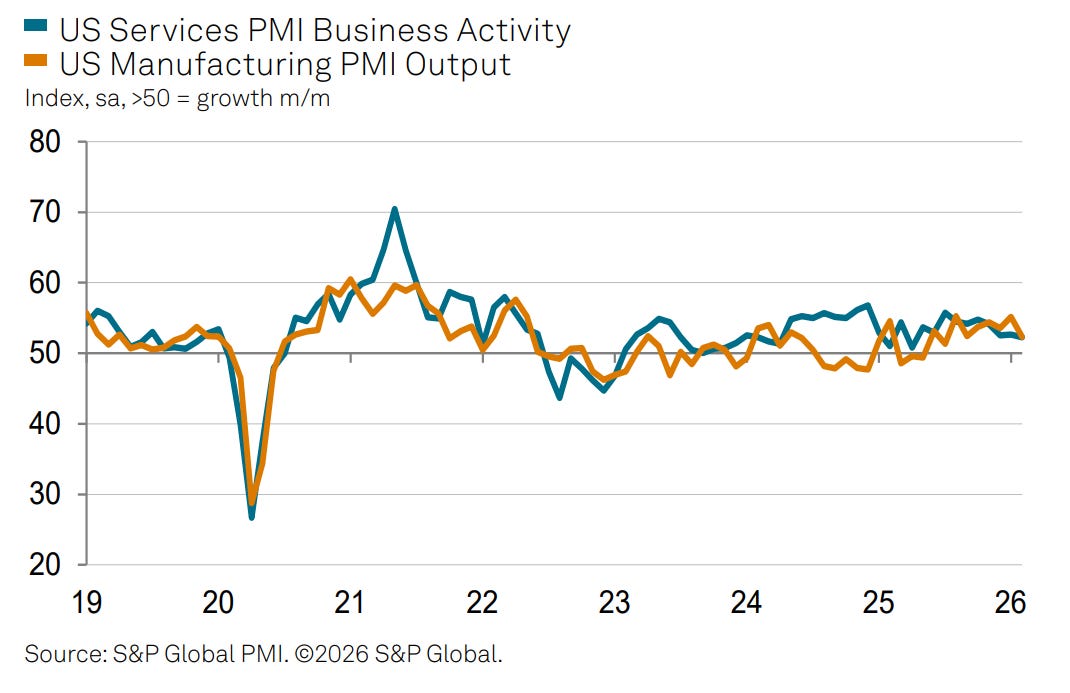
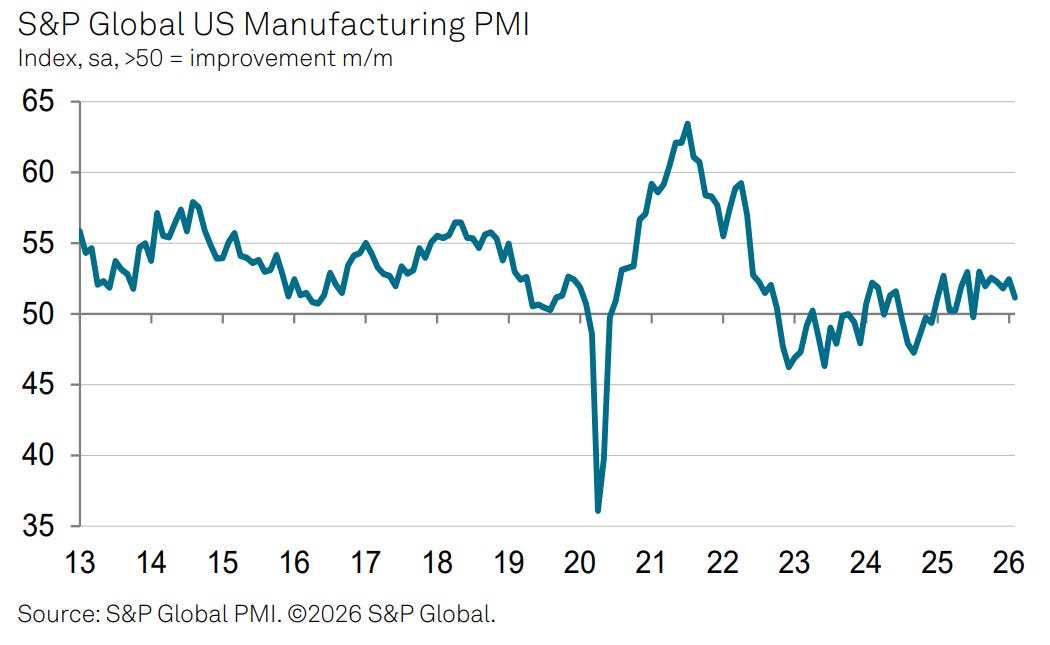
Industrial production and capital goods orders surprised to the upside, suggesting business spending is still healthy, while flash PMIs for February suggested manufacturing and services are slowing but still expanding. The manufacturing PMI slipped to roughly 51.2 from 52.4, a touch below consensus but comfortably above the 50 line that separates expansion from contraction. Services cooled a bit as well. Put differently: no boom, no bust – a soft‑landing backdrop with pockets of overheating.
In that context, E‑mini futures are doing what they should: consolidating gains, absorbing event risk, and letting leadership rotate without breaking the broader uptrend. The important tells this week were not in the headline index level, but in who took the punches and who kept attracting flows.
AI, Earnings, And A Market That Finally Wants Proof
Nvidia’s quarter was the main event. The company once again smashed Wall Street’s expectations, with data center revenues surging and management leaning into language about an “agentic AI inflection point” and sovereign AI demand. In prior quarters, that kind of print would have been enough to pull the entire tech complex higher. This time, investors cheered but also used the liquidity to rebalance. Semiconductor and AI infrastructure names saw huge dark‑pool and lit volumes, while index futures and options had a more mixed reaction: some desks added exposure, others quietly took down gross.
Global research houses have been warning for weeks that tech leadership needed earnings to catch up to price. S&P 500 earnings growth expectations for 2026 have climbed into the mid‑teens, led by technology with projected growth north of 30%, and argued that continued profit expansion is essential for further upside given elevated valuations. At the same time, they have been nudging investors toward a more cyclical tilt – industrials, consumer discretionary, health care – and a more balanced view of tech after last year’s AI melt‑up.
This week’s price action supports that message. AI is not “over;” it just graduated from a simple beta trade in a handful of megacaps to a more nuanced theme that runs through semis, optics, cloud, and even select software and industrial names. Nvidia is still the spine, but the story is broadening down the stack.
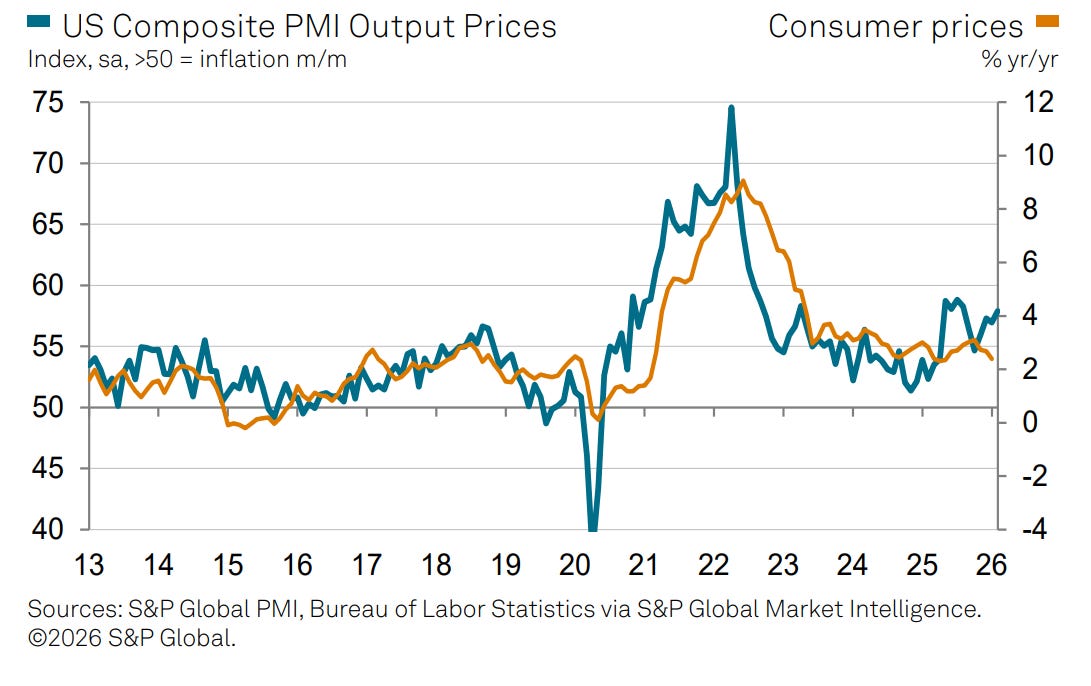
Macro: Inflation Bumps, But No Panic
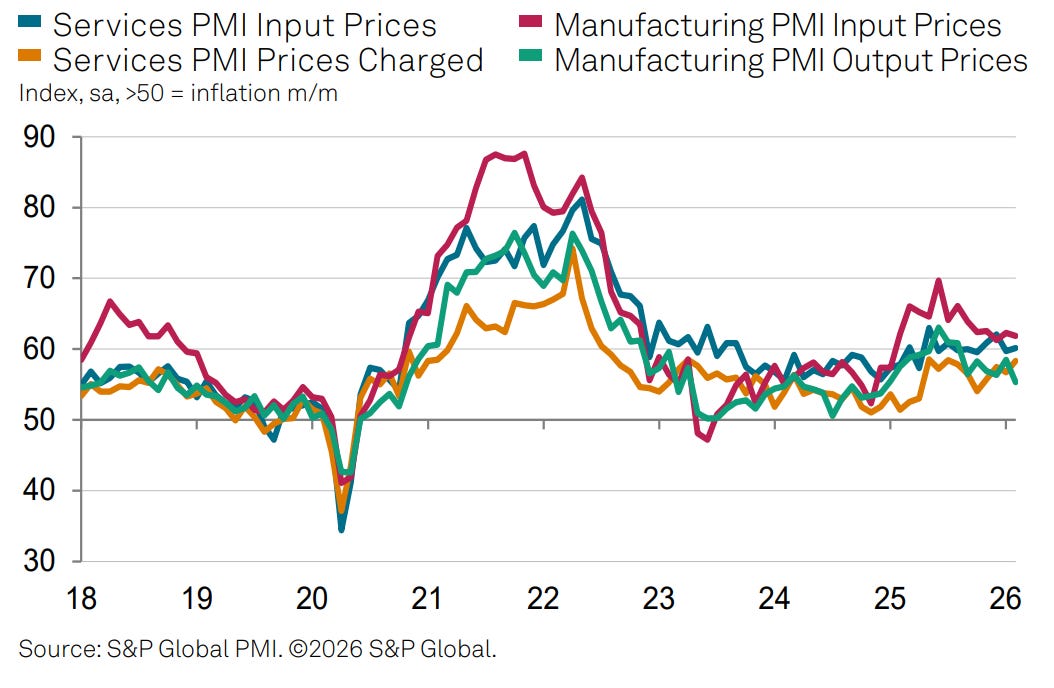
On the macro front, the key U.S. data point was a hotter‑than‑expected producer price print for January. U.S. producer prices rose at their fastest pace in several months, complicating the narrative that inflation will glide back to target in a straight line. Services prices, in particular, remain sticky, even as goods disinflation largely played out. Manufacturing prices paid rose at the slowest rate in over a year, while services prices charged hit a seven‑month high. That split matters for margins.
Outside the U.S., the picture looks like a classic late‑cycle expansion. In Europe, wholesale prices in Germany ticked up 1.2% year on year in January, while policymakers in some emerging markets are beginning to cut rates cautiously after front‑loading tightening over the last two years. Inflation in some EM economies could re‑accelerate later in the year, potentially ending 2026 in a 3.5%–4.0% range as governments unwind energy price caps. Markets took those moves in stride; local curves and FX barely flinched, suggesting most of this path was already in the price.
For equities and equity futures, the upshot is straightforward: the macro regime is still “slow‑disinflation with growth,” but the clean one‑way path is gone. That argues for less leverage, more selectivity, and a bigger role for quality and balance sheet strength in stock selection.
Rotation Beneath The Surface
So how did investors actually position into this macro and earnings mix?
First, there is clear evidence of renewed interest in the real economy. Capital goods orders (non‑defense ex‑aircraft), a proxy for business investment, rose 0.6% and beat expectations, while industrial production rebounded. Those data points lined up with strong flows and relative strength in industrials, machinery, and transportation: names tied to reshoring, infrastructure, and capex all outperformed index futures on the week. That dovetails with multiple research houses pointing to industrials and select consumer names as attractive beneficiaries of a still‑resilient U.S. economy.
Second, defensives and bond proxies quietly caught a bid. Utilities, water companies, and high‑quality REITs saw outsized institutional flows with modest intraday volatility. That is exactly how long‑only and asset‑allocation desks usually express “respect the risk, but don’t de‑risk” – they don’t dump futures; they tilt toward cash‑flow stability and duration while leaving the core equity allocation in place. The fact that long‑duration Treasuries and investment‑grade credit also attracted interest fits the same pattern: a soft‑landing baseline with some concern about the path of inflation and policy.
Third, there is evidence of a slow broadening of participation. Small‑cap value ETFs, equal‑weight benchmarks, and mid‑cap growth funds all showed better behavior this week, catching up a bit after lagging the AI‑driven mega‑cap run. Opportunities in developed international small‑ and mid‑caps and emerging markets still abound, where one can find valuations are more reasonable and earnings growth is more broadly distributed. While U.S. traders still anchor on the S&P and Nasdaq futures, the quiet rotation into smaller and overseas names is one of the more constructive medium‑term signals in the tape we’ve been watching over the past year or more and still believe has runway.
Putting It Together: What The Tape Is Really Saying
When you stitch these threads together – futures behavior, macro data, institutional flows, and leadership patterns – a coherent picture emerges.
The market still believes in the AI and productivity story. Nvidia’s blowout numbers, combined with strong results from other cloud and software leaders, reaffirm that AI is not just a narrative; it is driving real capex and revenue growth in key parts of the index. But the bar is higher now. Investors are no longer willing to pay any price for anything with “AI” in the slide deck. They are rewarding companies that deliver, rotating along the supply chain, and using event windows to trim excesses.
At the same time, the macro backdrop is supportive but less forgiving. Inflation progress is real but uneven; services and wages remain sticky, and producer prices remind us that we are not completely out of the woods yet. Central banks can afford to talk about eventual cuts, but they are in no rush, especially after being burned by premature optimism earlier in the cycle. That keeps real rates positive and makes quality balance sheets and cash flows more valuable.
Global growth is slowing but not collapsing. Europe is muddling through, Japan is benefiting from a weaker yen and corporate reforms, and parts of emerging markets are poised for a cyclical recovery as monetary policy slowly shifts toward easing. That creates opportunities beyond the U.S. mega‑cap complex for investors willing to do the work.
What does all of that mean for for traders and asset allocators?
First, the path of least resistance is still sideways‑to‑up, but with more chop. E‑mini S&P futures are likely to respect prior support zones rather than melt straight higher. Technical levels around recent ranges should matter more now that the trend is mature and participation has broadened. Dips into lower ends of the range on non‑recessionary headlines are more likely to be bought than sold aggressively, at least until the macro data or earnings picture change meaningfully.
Second, sector and factor dispersion will matter more than index direction. With valuations rich and the AI narrative well‑known, future upside is more likely to come from stock and sector selection than from multiple expansion across the board. It’s not unreasonable right now to call for equal weight in tech but overweight industrials, consumer discretionary, and health care; cyclicals and services can carry more of the growth load if AI enthusiasm cools a bit.
Third, risk management needs to respect both tails. On one side, a genuine growth scare – a sharp downturn in PMIs, a negative payrolls surprise, or evidence that capital spending is rolling over – would hit cyclicals hard and finally challenge the “soft landing” narrative that has cushioned every dip. On the other, a renewed inflation flare‑up or a more hawkish turn by the Fed could pressure long‑duration assets, including the very growth and AI names that have led the charge. Inflation could easily re‑accelerate in some regions if energy price caps are removed which is a reminder that the 2021–22 playbook is not gone forever; it is just dormant for now.
How To Be Positioned Now
In practical terms, this environment favors a barbell. On one end, maintain exposure to the AI and digital infrastructure spine – the names and sectors that have proven they can convert capex into earnings – but size them with the understanding that expectations are high and event risk is real. On the other, own the cash‑flow engines of the real economy: industrials leveraged to capex and reshoring, financials and credit that benefit from a still‑normal cycle, and carefully chosen defensives and bond proxies that can cushion volatility without forcing you out of the equity market altogether.
A core long bias in major indices/E‑mini S&P and Nasdaq futes, scaled down from early‑cycle levels, with willingness to add on pullbacks into well‑defined support zones.
Active use of sector and style overlays – whether via sector futures, options, or correlated ETFs – to overweight industrials, selected consumer names, and health care while maintaining a more modest overweight in tech.
Risk hedges expressed through index and rate options rather than blunt de‑risking. With volatility still moderate, using options to protect against downside tails while staying invested in the base case remains attractive.
For longer‑horizon investors, the message is similar but slower: stay overweight equities relative to bonds, as many strategists still recommend, but make sure your equity exposure is not just a leveraged bet on a handful of AI names. Diversify across the full chain of beneficiaries – chips, optics, cloud, software, industrial automation, and select consumer platforms – and pair that with exposures that do well if AI enthusiasm temporarily outruns reality.
The bottom line is that the post‑Nvidia market is not an “end of AI” story; it is the beginning of a more grown‑up phase in which earnings, valuation, and macro all have a say. Futures are telling you that investors are willing to live with that complexity. The opportunity now is to be as selective as they are – to use the calm surface of the index tape to quietly upgrade what you own, how you hedge, and where you look for the next leg of leadership.
Subscribers can access our complete portfolio recommendations — including sleeve-by-sleeve allocations, individual position breakdowns, and the full investment rationale for each name — in the Market Intelligence Report at the end of this article.

Weekly Benchmark Breakdown
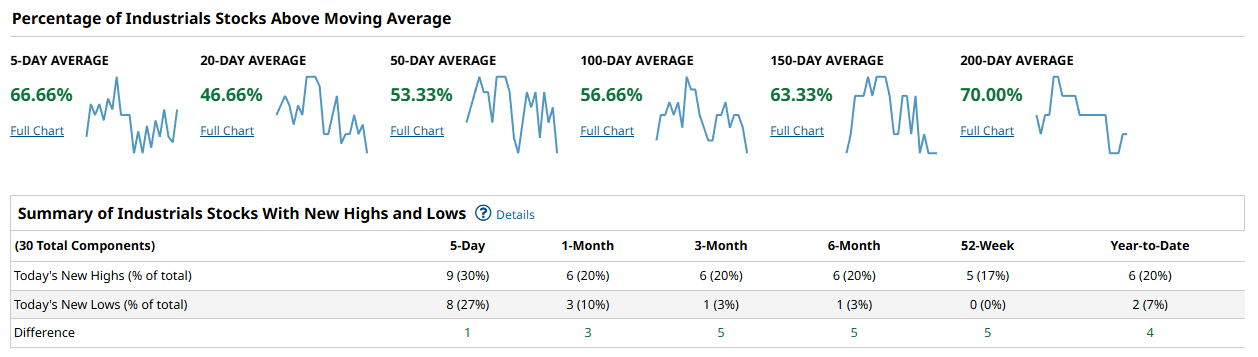
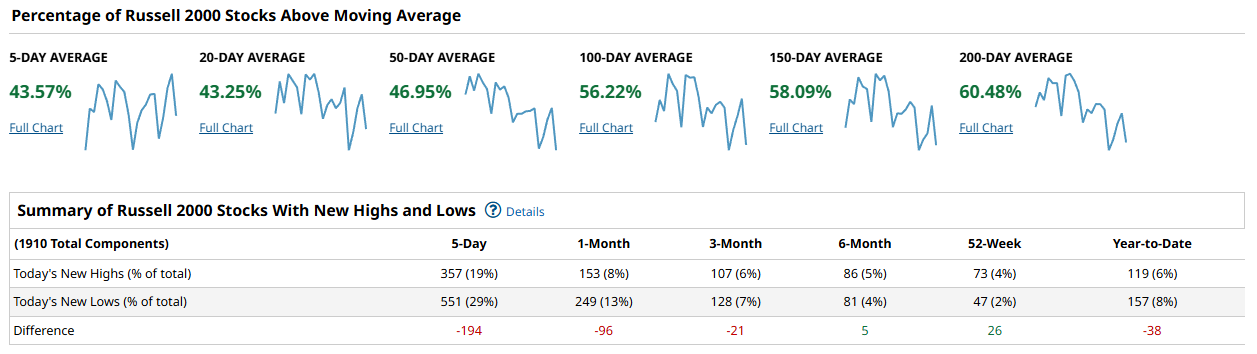
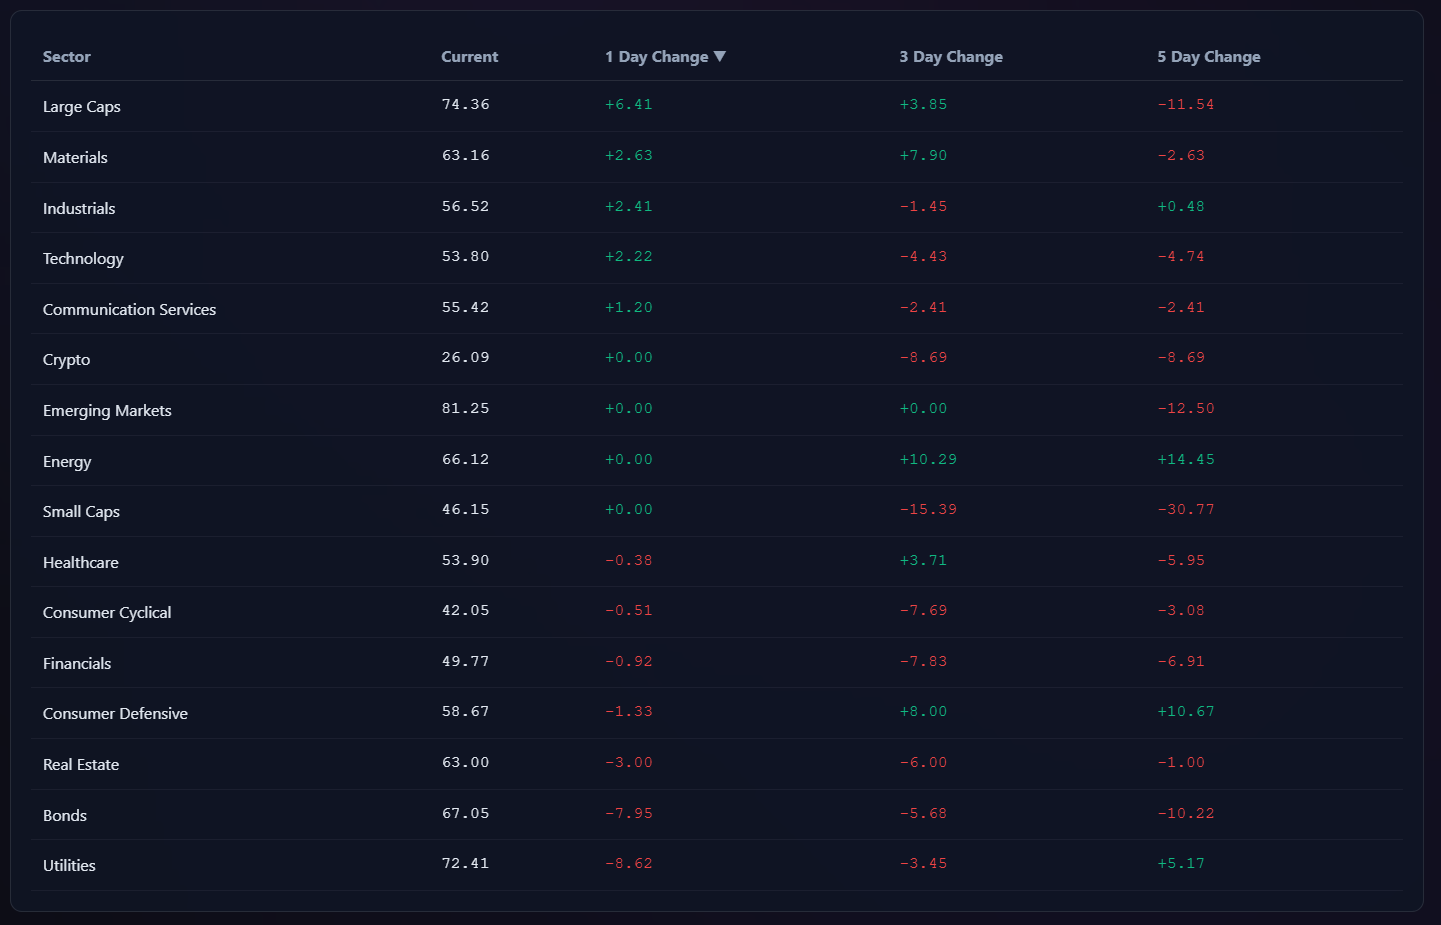
Breadth Check: Bulls Lean In, Small Caps Still Need To Prove It
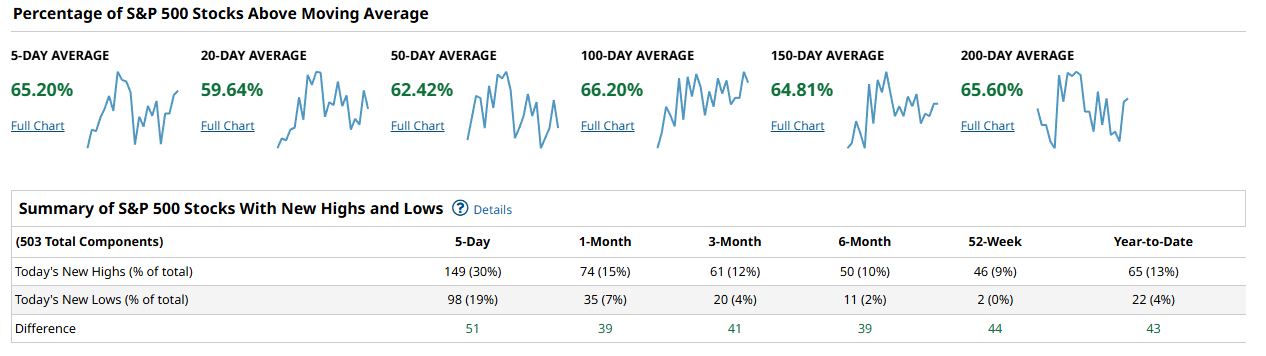
This week’s breadth read says “trend, not thrust.” Participation is good enough to support the advance in the big benchmarks, but not yet strong enough to call it a runaway risk-on stampede. New highs are finally outpacing new lows in the large caps, while small caps are still wobbling around the flat line. The bias is constructive, but the tape is still asking for confirmation from the broader market rather than just the mega caps.
On the S&P 500, roughly two‑thirds of the index is back above its key moving averages, with about 65 percent above the 5‑day, just under 60 percent above the 20‑day, around 62 percent above the 50‑day, and about 66 percent above the 100‑day. The 150‑ and 200‑day cohorts sit in the mid‑60s, which is exactly what you want to see in an ongoing uptrend: most stocks in established rising trends, with short‑term pullbacks being bought. New highs finally exceeded new lows by about 50 issues over the last 5 days, and the edge persists across 1‑month and 3‑month windows as well, where new highs beat new lows by roughly 40 names. The weekly return heatmap backs that up: gains are broad across sectors, not just in one or two pockets, even with a few large‑cap tech laggards dragging on the cap‑weighted index.
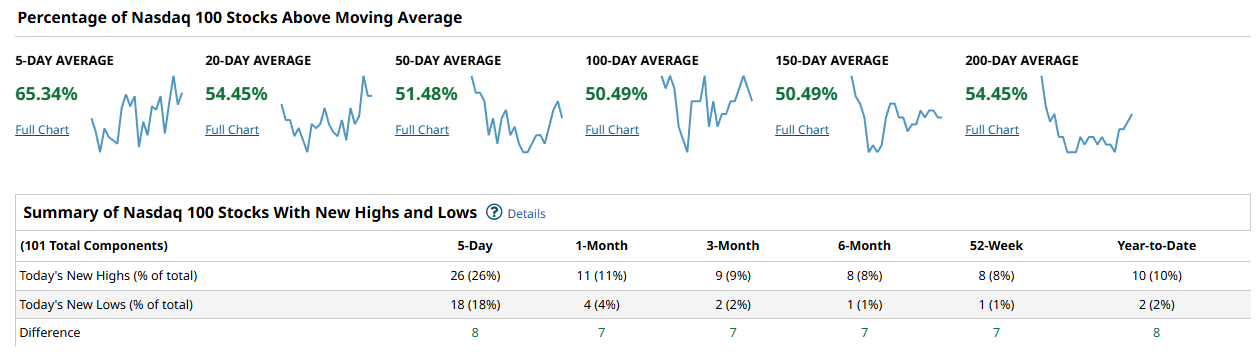
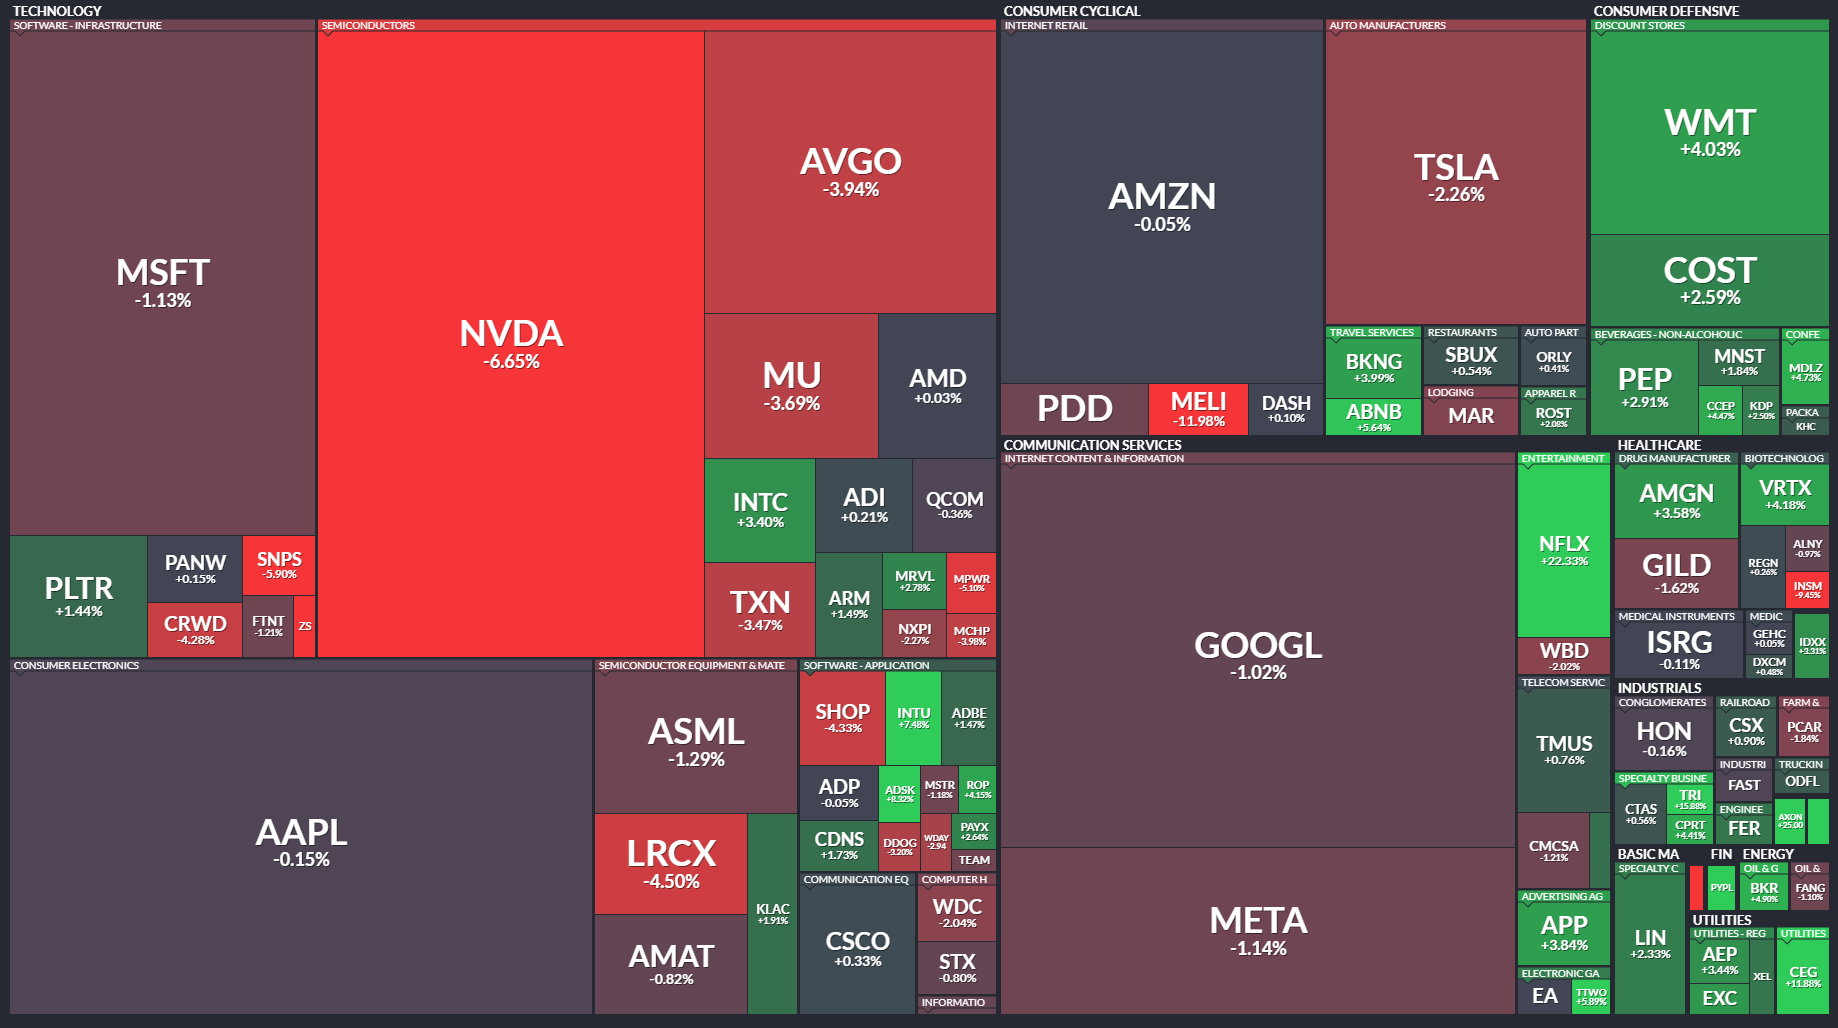
The Nasdaq 100 shows similar but slightly less mature breadth. About 65 percent of components are above the 5‑day, but that drops into the low‑50s for the 20‑ and 50‑day, and hovers near 50 percent on the 100‑ and 150‑day before recovering into the mid‑50s at the 200‑day. That mix says short‑term momentum is firm, but the intermediate trend is more mixed than the S&P’s. New highs are beating new lows by a single‑digit count across the 5‑day to 6‑month windows, which is an improvement from earlier in the year but still more “acceptable” than “impressive.” The weekly heatmap shows heavy red in a few mega‑cap tech names while many mid‑sized growth and chip names quietly post gains, a classic case of index optics masking improving under‑the‑surface participation.
The Dow’s industrial cohort is quietly one of the healthier groups. Roughly two‑thirds of the components are above the 5‑day, just under half above the 20‑day, and a bit over half above the 50‑day, with the 100‑, 150‑, and 200‑day cohorts climbing from the mid‑50s into roughly 70 percent at the longest lookback. That upward progression across timeframes is what you want in a trend: more and more stocks traveling above rising longer‑term averages. New highs are running modestly ahead of new lows at every horizon, with a very slim positive spread over 5 days and a slightly wider edge as you move out to 3‑month and 6‑month windows. The heatmap shows that while the price‑weighted index still responds heavily to a handful of names, the median Dow component had a decent week, especially on the defensive and industrial side
The Russell 2000 is still the problem child. Only about 44 percent of members are above their 5‑day and 20‑day averages, and fewer than half sit above the 50‑day. The longer‑term picture is better, with roughly 56 percent above the 100‑day, 58 percent above the 150‑day, and about 60 percent above the 200‑day, but that mix tells you we have not transitioned from repair to robust advance yet. New highs are still lagging new lows over the last 5 days by nearly 200 issues, and even on a 1‑month basis new lows outnumber highs by almost 100. That gap only flips positive at the 6‑month and 52‑week horizons, and even there the edge is small. The weekly heatmap is a sea of red with just a few bright green standouts, confirming that weakness is broad rather than isolated inside small caps.
Putting it all together, cap‑weighted indices look better than the “average stock,” but the good news is that participation is no longer narrowing; it is slowly improving from the top down. Large‑cap breadth is already in the “uptrend, but not overbought” zone, while the Nasdaq is still working off prior leadership concentration and the Russell remains in a choppy basing process. A durable next leg higher would be confirmed by two things: 50‑day breadth pushing and holding north of 60 percent in the Nasdaq 100 and Russell, and a clean flip where new highs consistently outnumber new lows in the small caps on 5‑day and 1‑month windows.
From a playbook standpoint, this argues for staying tilted toward quality large caps and secular growth, but starting to lean into selective cyclicals and industrials where the Dow and parts of the S&P already show improving participation. I would remain underweight the lowest‑quality small caps until the Russell’s short‑term breadth and new‑high lists turn decisively positive, but it is time to keep a close watch list there rather than ignoring the space altogether. For confirmation, watch whether SPX and NDX 50‑day cohorts can stay above 60 percent on pullbacks, and whether Russell new lows dry up materially over the next couple of weeks.
Bottom line: this is a constructive but not yet euphoric breadth backdrop where you want to ride the existing uptrends in large caps while demanding better proof from small caps before going all‑in on a full‑market risk‑on bet.

Investor Sentiment Report
%Bull-Bear Spread
The %Bull-Bear Spread measures the gap between bullish and bearish investor sentiment, often from surveys like AAII. It’s a contrarian indicator—extreme optimism may signal a coming pullback, while extreme pessimism can hint at a potential rally. Large positive or negative spreads often mark market turning points.
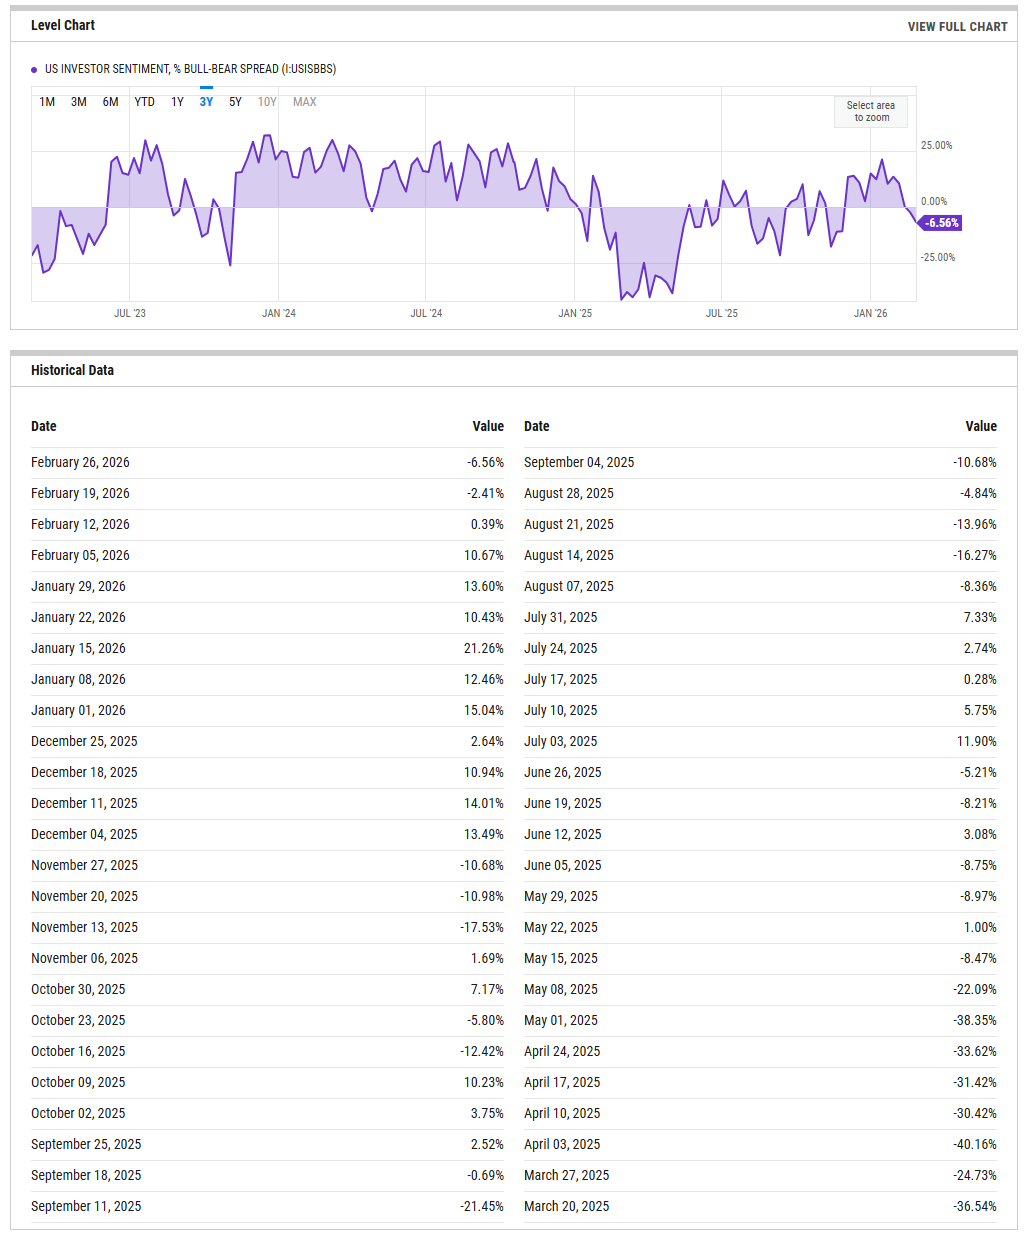
The AAII bull-bear spread has slipped modestly back into negative territory, sitting at about -6.6% this week after being slightly negative last week and moderately positive through most of January. That marks a clear retreat from the double‑digit positive readings seen around mid-January and early February, and it is a sharp contrast to the deeply negative prints of late 2023. Historically, anything below zero reflects more bears than bulls and tends to be supportive for rebounds rather than a place to press shorts, while readings above +20 begin to flag crowding and vulnerability to air pockets. With the spread only mildly negative, sentiment is cautious but not washed out, implying investors are hedging enthusiasm rather than panicking. A sustained move below -10 without price damage would upgrade this to a contrarian tailwind, while a quick snap back above +15 from here would say dip-buying confidence is back in control and raise the odds of a shakeout if prices stall.
NAAIM Exposure Index
The NAAIM Exposure Index (National Association of Active Investment Managers Exposure Index) measures the average exposure to U.S. equity markets as reported by its member firms. These are typically active money managers who provide their equity exposure levels weekly. The index offers insight into how much these managers are investing in equities at any given time, ranging from being fully short (-100%) to leveraged long (up to +200%).
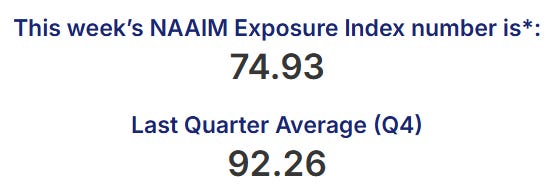
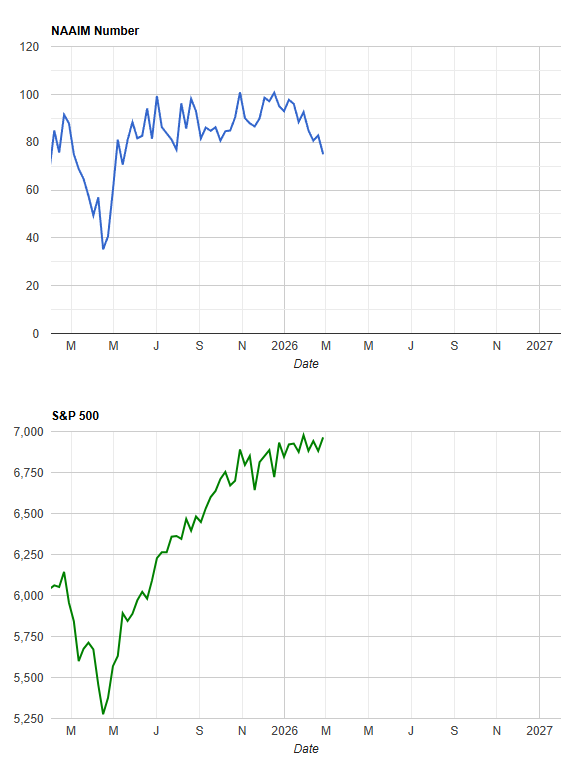
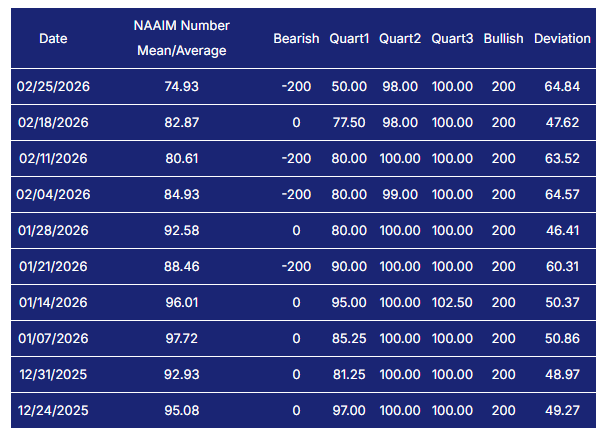
NAAIM’s active manager exposure has eased off the highs but remains firmly in the risk-on camp, with the latest reading around 75 after spending most of January and early February in the low- to mid-80s and even touching the mid-90s around year-end. That tells us managers are still meaningfully long, but some have taken a bit of risk off the table as markets have chopped sideways. The long-only crowd does not have a lot of dry powder at these levels, yet exposure is not so extreme that any pullback would automatically trigger forced de-risking. If the index were to roll down into the 50s while the major averages hold up, that would signal significant cash building and a stronger upside cushion. Conversely, any push back into the 90s would indicate that positioning has become crowded again and that even a routine volatility shock could produce an outsized de-risking wave.
CBOE Total Put/Call Ratio
CBOE's total put/call ratio includes index options and equity options. It's a popular indicator for market sentiment. A high put/call ratio suggests that the market is overly bearish and stocks might rebound. A low put/call ratio suggests that market exuberance could result in a sharp fall.
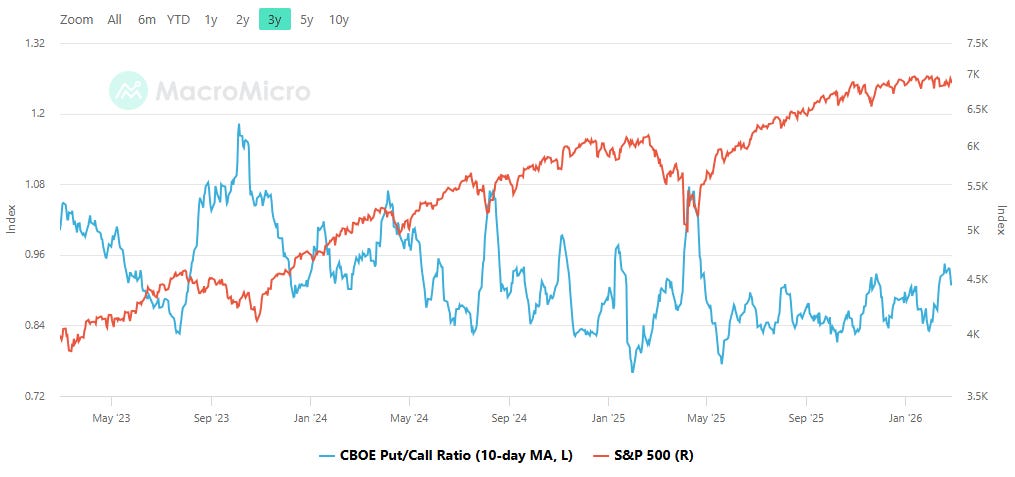
The 10-day moving average of the total put/call ratio has lifted off the extreme-complacency lows seen late last year and now sits roughly in the mid-range of the past three years, around the 0.9 area rather than the 0.8 “frothy” band or the 1.0-plus “fear” territory. That configuration suggests traders are buying a reasonable amount of downside protection but not scrambling for hedges. With options activity neither stretched toward speculative calls nor dominated by panic puts, short-term positioning argues for more ordinary, mean-reverting pullbacks rather than deep air pockets or crash risk. If the 10-day average were to compress back toward 0.80 while prices grind higher, that would signal renewed call-chasing and raise the odds of a sharper shakeout on the next negative catalyst. A spike above roughly 1.05 on the average, especially if it occurs on modest price damage, would instead set up a better-quality rally as shorts and hedgers eventually unwind.
Equity vs Bond Volatility
The Merrill Lynch Option Volatility Estimate [MOVE] Index from BofAML and the CBOE Volatility Index [VIX] respectively represent market volatility of U.S. Treasury futures and the S&P 500 index. They typically move in tandem but when they diverge, an opportunity can emerge from one having to “catch-up” to the other.
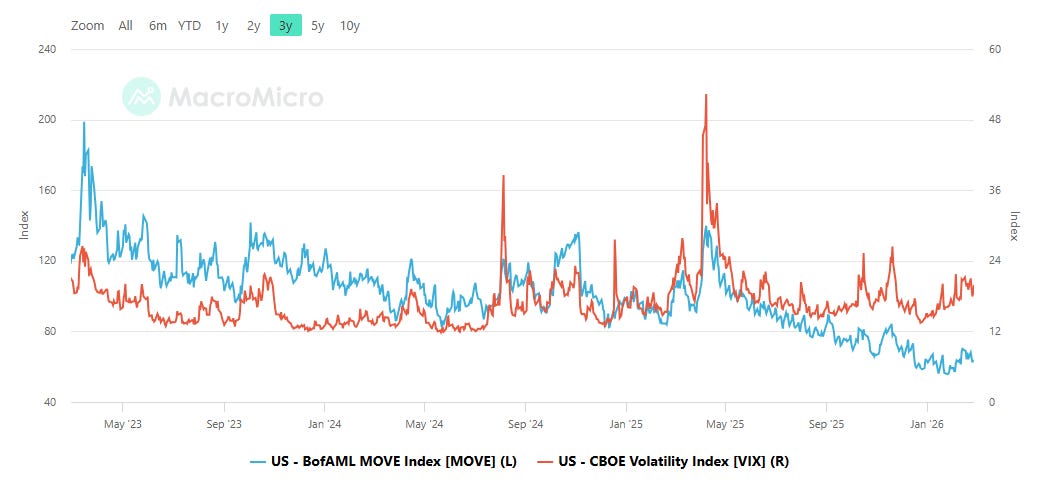
On the volatility front, both sides of the capital structure look relatively calm. The MOVE index, which spiked above 200 during the rate scares of early 2023, has since trended steadily lower and now sits in the double digits near its three-year lows, while the VIX hovers in the low to mid-teens after episodic bursts toward the mid-20s last year. That alignment – subdued bond vol and modest equity vol – says markets currently see little immediate macro or policy shock risk. It also means that any surprise in rates or growth could have an outsized psychological impact because few participants are braced for it. A notable tripwire would be a MOVE surge back above roughly 120 while the VIX remains sleepy in the low teens; that pattern has historically preceded stress for equities. Alternatively, a VIX break into the high teens or low 20s without a parallel MOVE spike would point to more tactical equity nerves rather than systemic fear.
CNN Fear & Greed
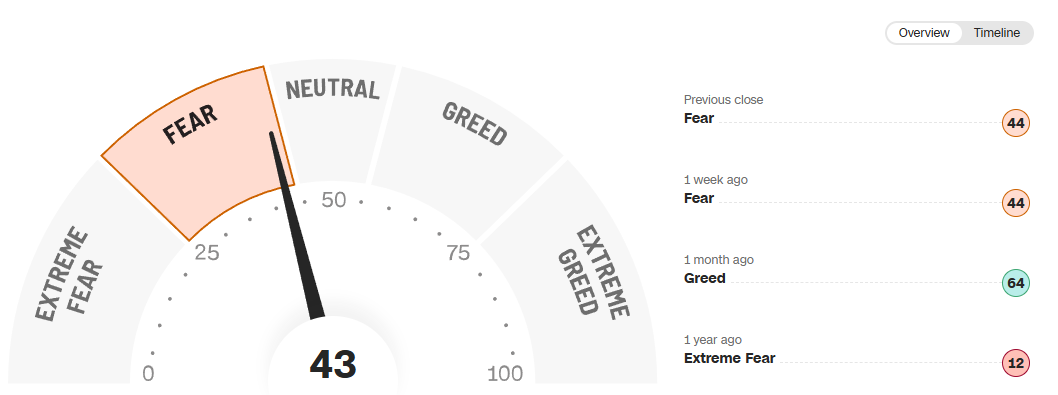
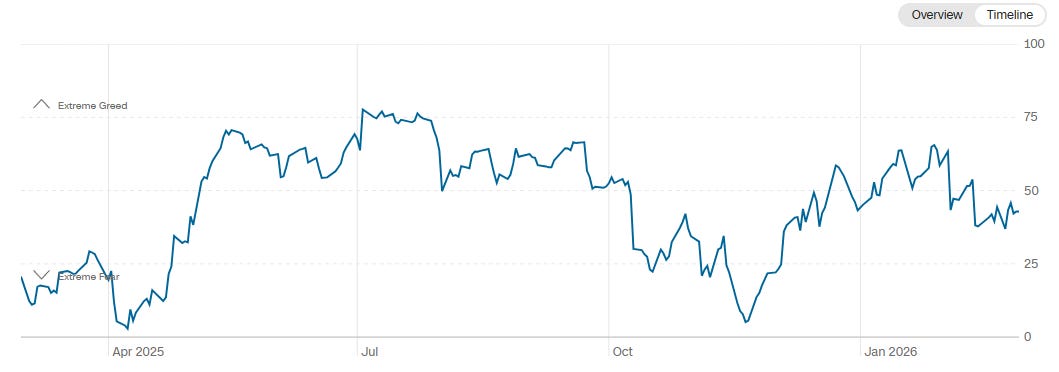
CNN’s composite Fear & Greed gauge prints at 43 this week, labeled “Fear,” down slightly from 44 both one week ago and at the prior close, and well below the “Greed” reading of 64 one month ago. Over the past year, the gauge has oscillated between extreme fear near 10–15 and greed in the 60s and 70s, and the current backdrop sits right in the middle of that range – cautious, but far from capitulation. The one-year timeline shows that prior trips into the low teens tended to coincide with attractive entry points, while forays above about 75 marked exhaustion zones that preceded consolidation or pullbacks. Sitting just under neutral today, the signal is more about cooling enthusiasm than outright fear, suggesting there is room for either side to gain control. A slide back into the low 30s or below, especially if prices hold near highs, would create a more supportive wall of worry, while a quick jump back above 65 would warn that optimism is getting crowded again.
Social Media Favs
Social sentiment offers a real-time view of investor mood, often revealing market shifts before traditional indicators. It can signal momentum changes, spot emerging trends, and gauge retail investor impact—especially in high-volatility names. Tracking sentiment around events or earnings provides actionable insights, and when layered with quantitative models, can enhance predictive accuracy and risk management. Sustained sentiment trends often mirror broader market cycles, making this data a valuable tool for both short-term trades and long-term positioning.

Technician’s Playbook: Trading the Majors (SPY/QQQ/IWM/DIA)
When you’re a large institutional player, your primary goal is to find liquidity - places to do a ton of business with the least amount of slippage possible. VolumeLeaders.com automatically identifies and visually plots the exact spots where institutions are doing business and where they are likely to return for more. It’s one of the primary reasons “support” and “resistance” concepts work and truly one of the reasons “price has memory”.
The tape the last few sessions has been a classic post-swing digestion: a sharp pop early in the week, failure at overhead supply, and then a controlled bleed back into well-defined volume shelves. SPY, QQQ, IWM and DIA are all sitting back inside prior balance zones rather than in free fall, and the heaviest prints are clustering near the lower half of the recent ranges. That tells us big money is still willing to do business on weakness, but they are not chasing strength the way they were earlier in February. From here, the next move will be decided by how price reacts around those high-dollar levels that just absorbed size into the Friday close.
SPY
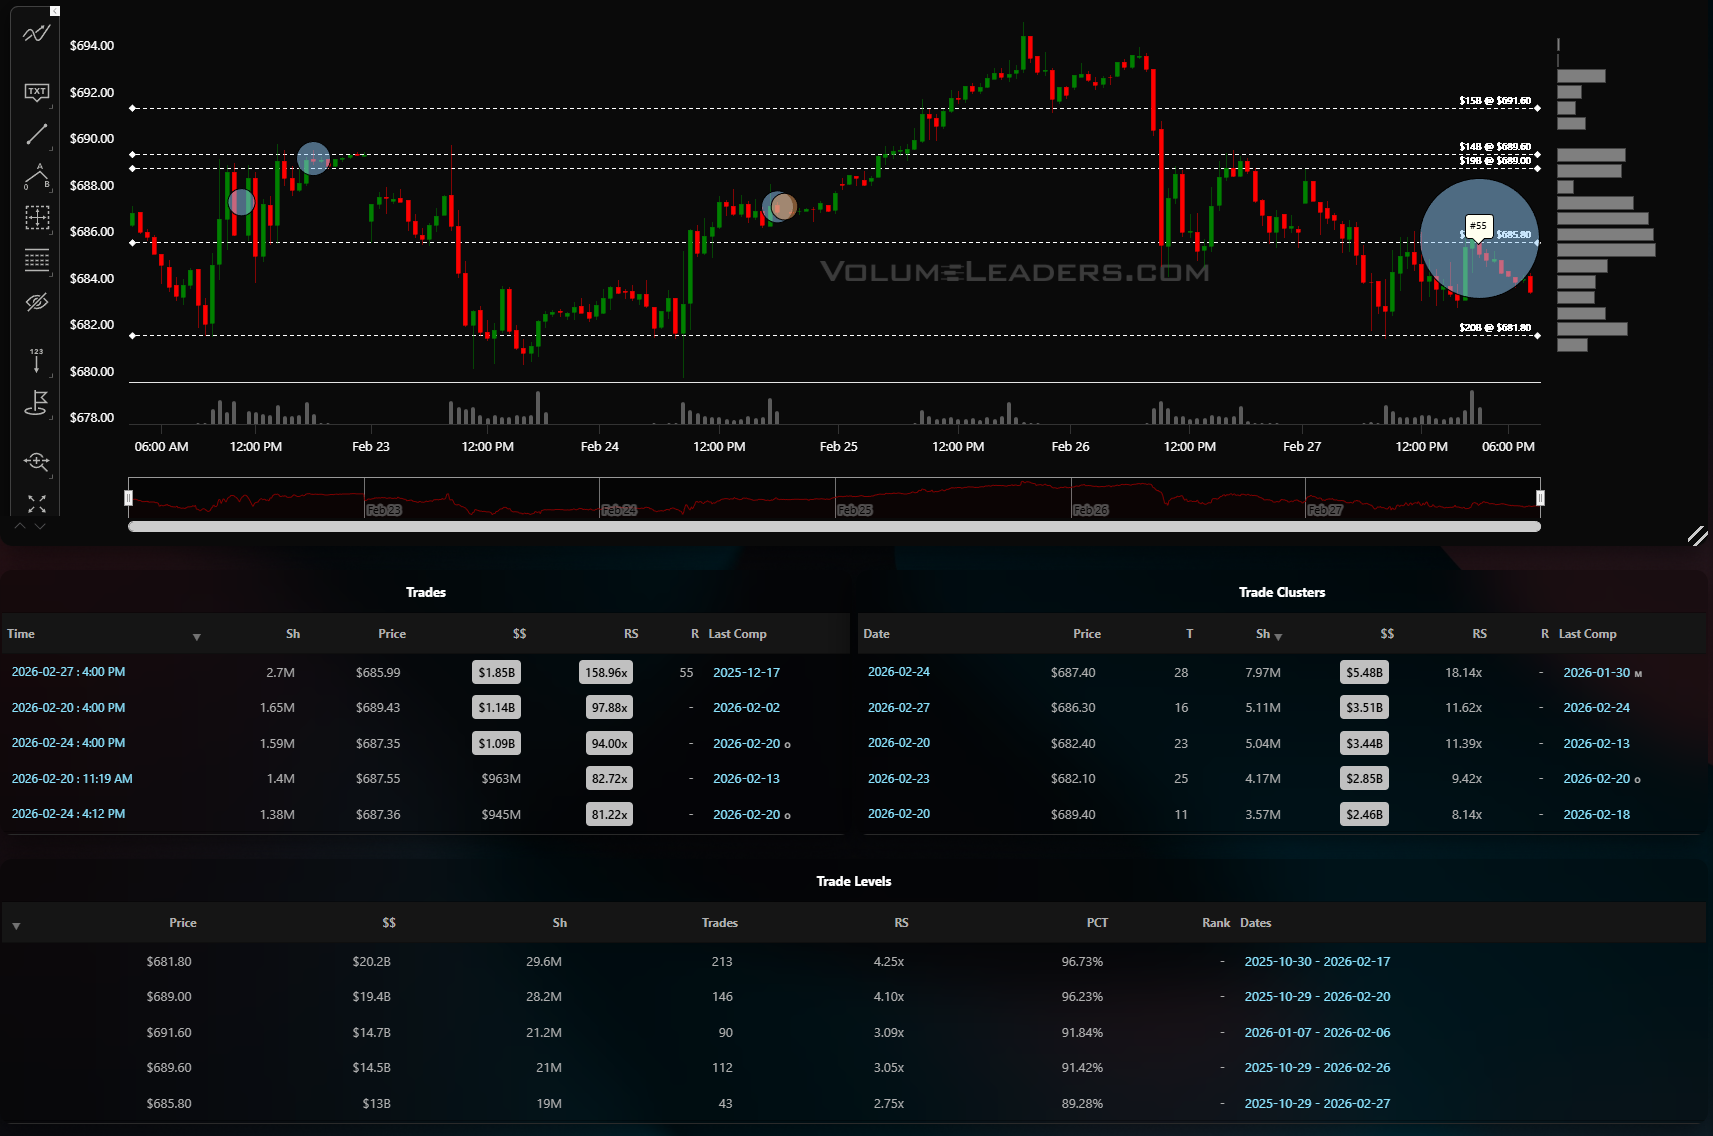
On SPY, the action is centered around the mid-680s. You have multiple billion-dollar prints between roughly 682 and 688, with Friday’s standout buy near 685.99 tagging more than 2.7M shares and north of 1.8B notional, ranked in the very high percentile of all-time levels. That sits right on top of a hefty cumulative Level around 681–682 that has over 20B traded historically and ranks in the mid-90s by percentile. The way price bounced off that area intraday says buyers defended the shelf on first touch, but the close back below 690 keeps it a range, not a breakout. For the next sessions, that 20B-level at $681’ish is your line of scrimmage. Acceptance below 681 would open a path toward the lower volume trough in the high 670s and open the door to new yearly lows, while sustained trade back above 690 would tell you the big prints were accumulation and that puts 695–700 back in play. Tactically, dip buyers can lean against 681 with tight invalidation, while late shorts need acceptance back under 681 to press.
QQQ
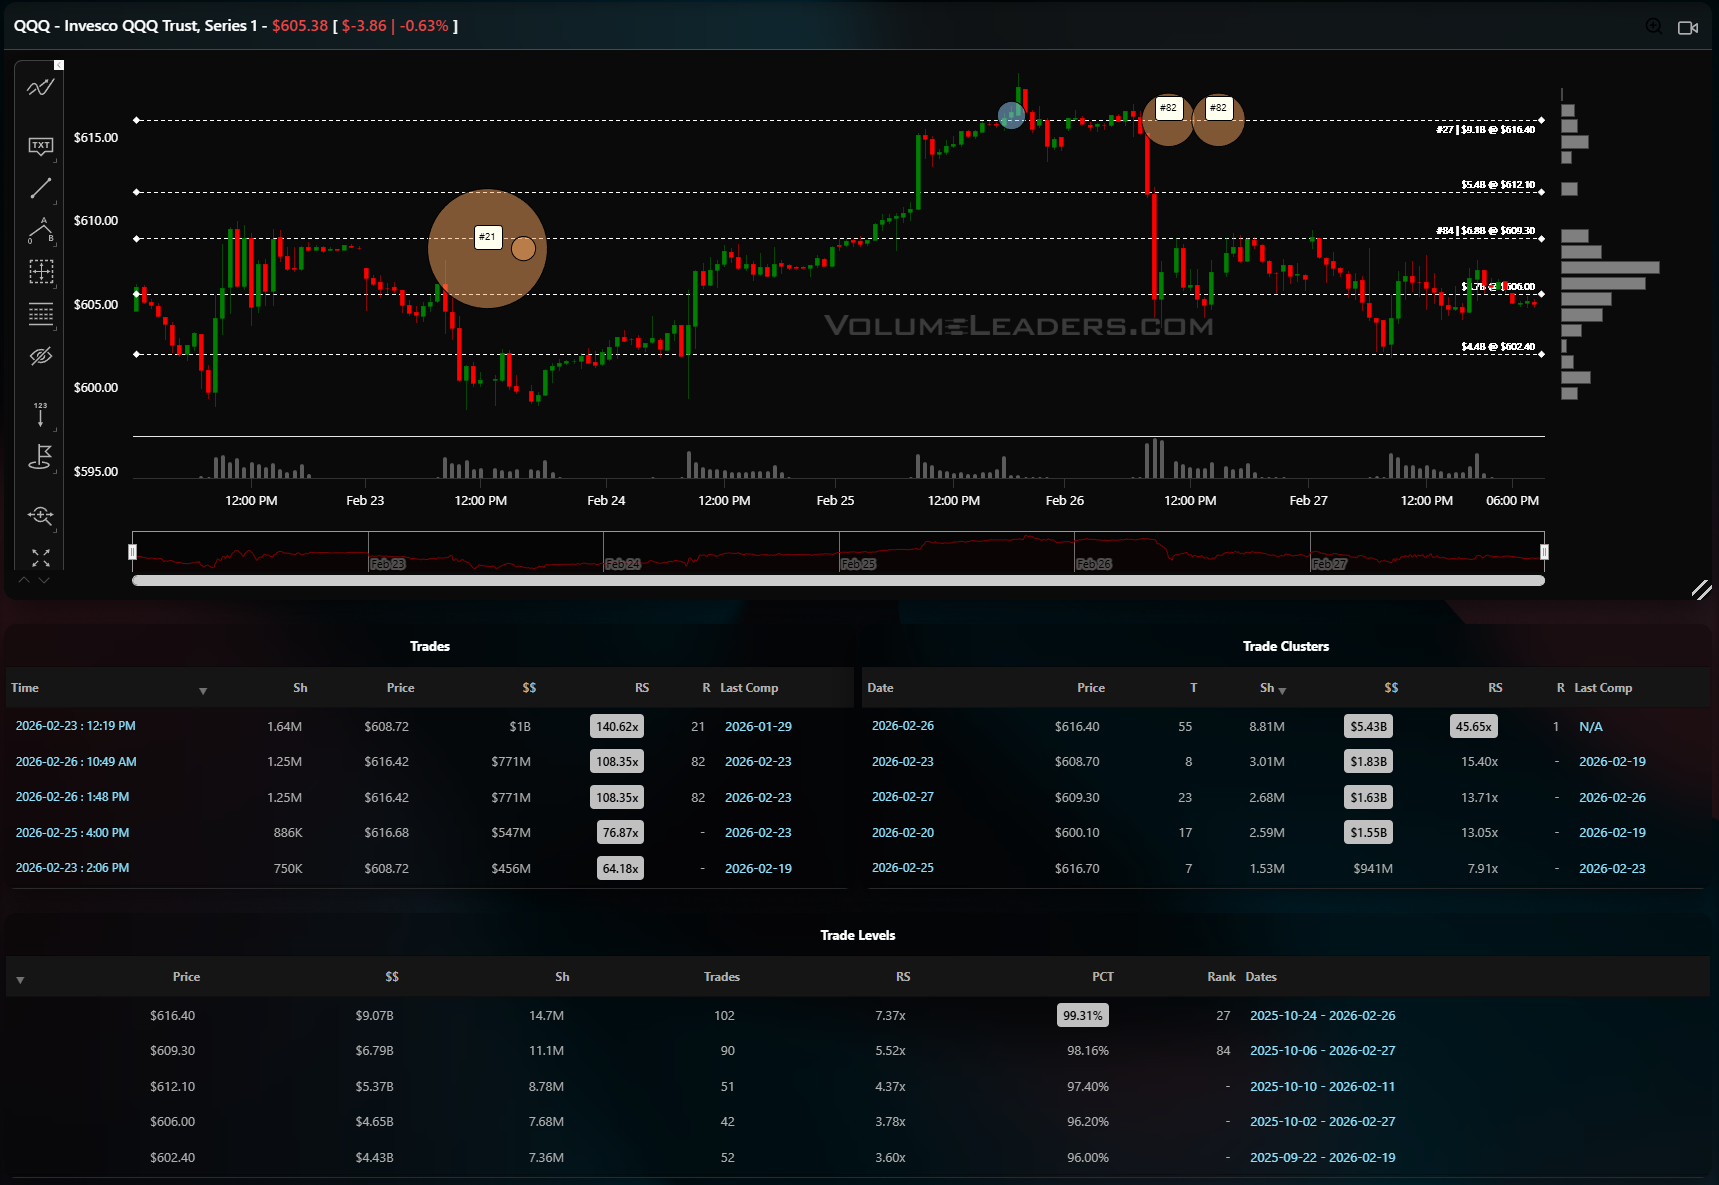
QQQ shows a similar story but with even more eye-popping prints. There is a billion-dollar block at 608.72 flagged as a top-50 trade historically and backed up by several 700–800M prints in the 608–616 zone. That zone coincides with a dominant Level at 616.40 where roughly 9B has changed hands, ranking in the high-90s percentile with nearly 15M cumulative shares traded. Price ripped through that band, failed above 615, and then slid back to test the lower edge around 602–605 into week’s end. For bulls, the constructive script is simple: hold 602 on a closing basis and rotate back through 610, turning that prior supply into a volume shelf that supports a push toward the recent highs near 620. Bears want to see 602 decisively lost, which would convert that Level into trapped longs and open a magnet toward the sub-600 pocket where historical volume thins out. A disciplined trader can fade spikes into 612–615 with stops just above the week’s high, or look to buy responsive selling near 602 with an eye on 610 as a first target.
IWM
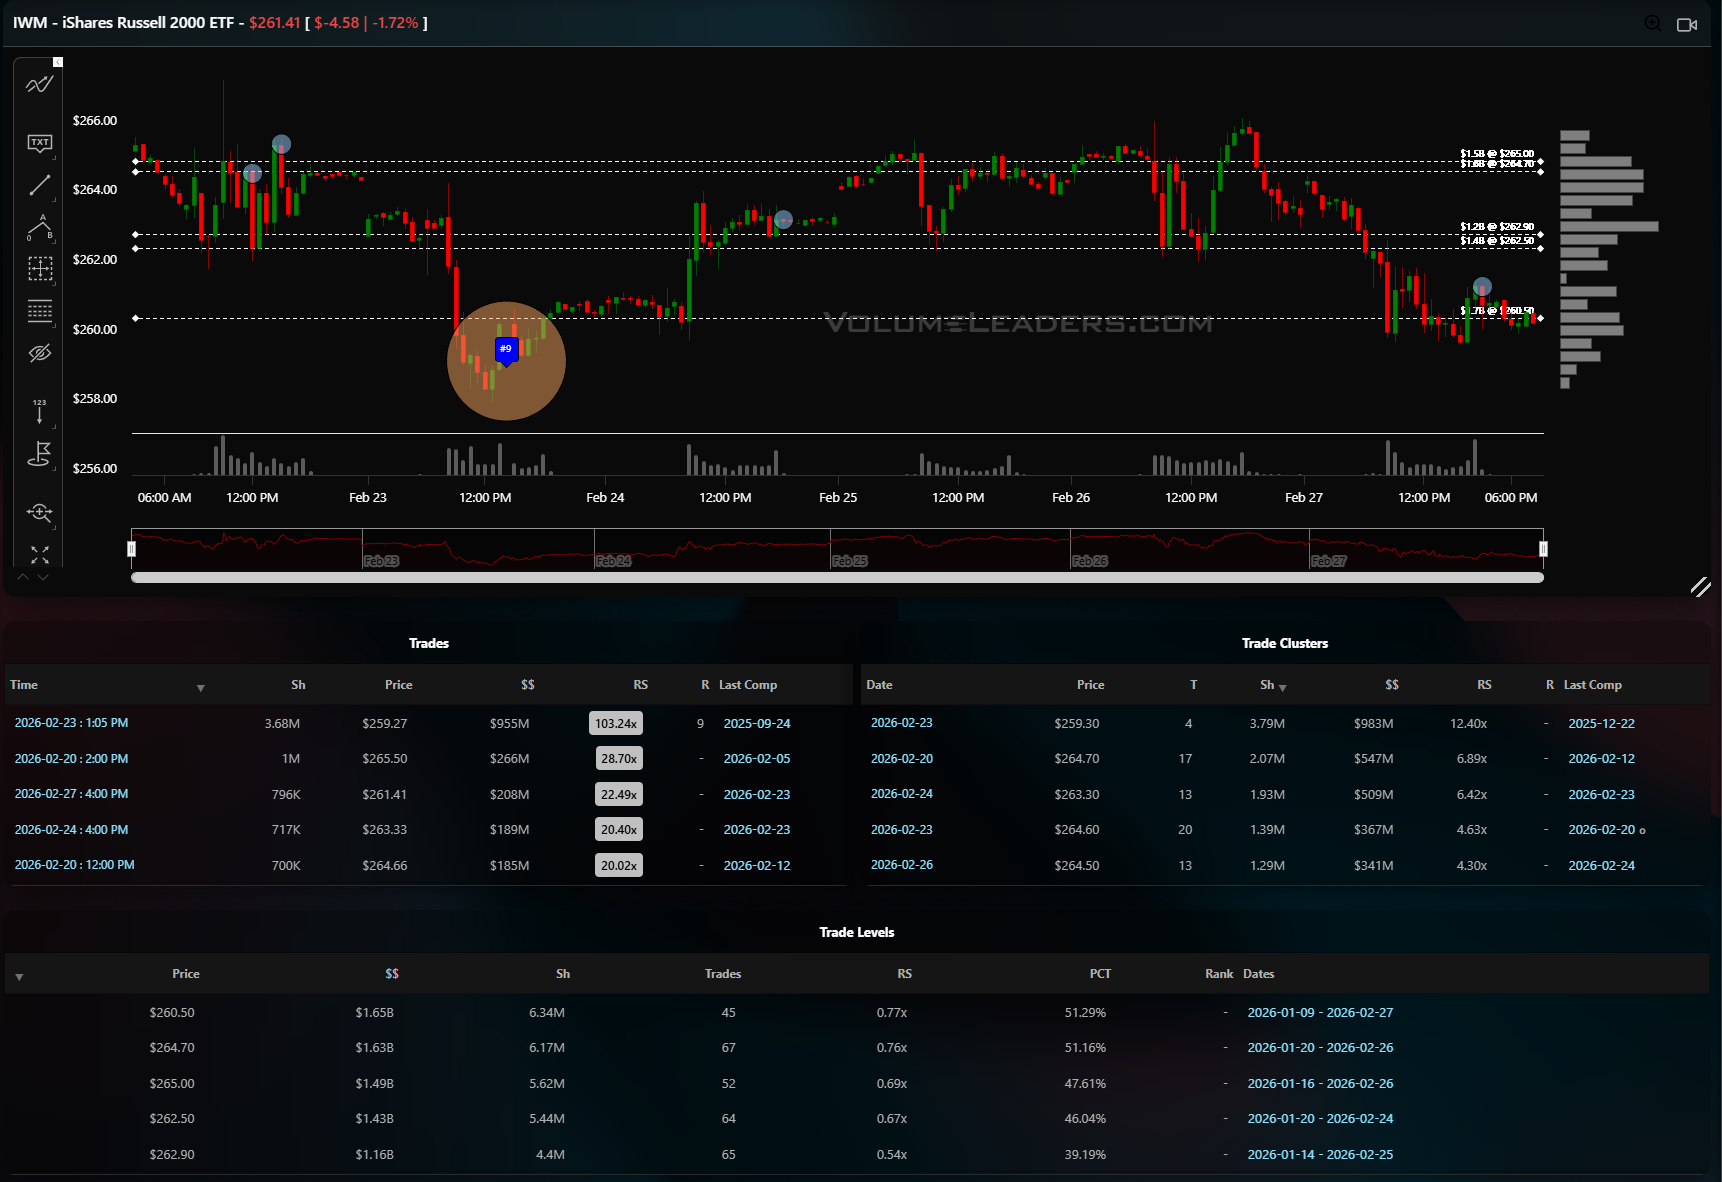
IWM’s tape is the sloppiest. The largest print on the page is a roughly 3.6M-share, 955M notional sale around 259.25–259.50, with relative size above 100x its average Level. That sits just below a heavy historical Level near 260 where cumulative volume is in the mid single-digit billions and percentile sits around the low-50s, indicating lots of prior back-and-forth. Price tried to rally back into that region and was rejected, finishing the week grinding just under 260 with the visible volume profile bulging between about 259 and 262. That makes 259–262 the key battleground. Acceptance above 262 would say that big sale was absorbed and flips the tape toward 265–266, where the next cluster of large historical Levels live. Lose 259 on volume and there is air down down below; that #9 trade will be the near term sign-post for traders to watch for execution.
DIA
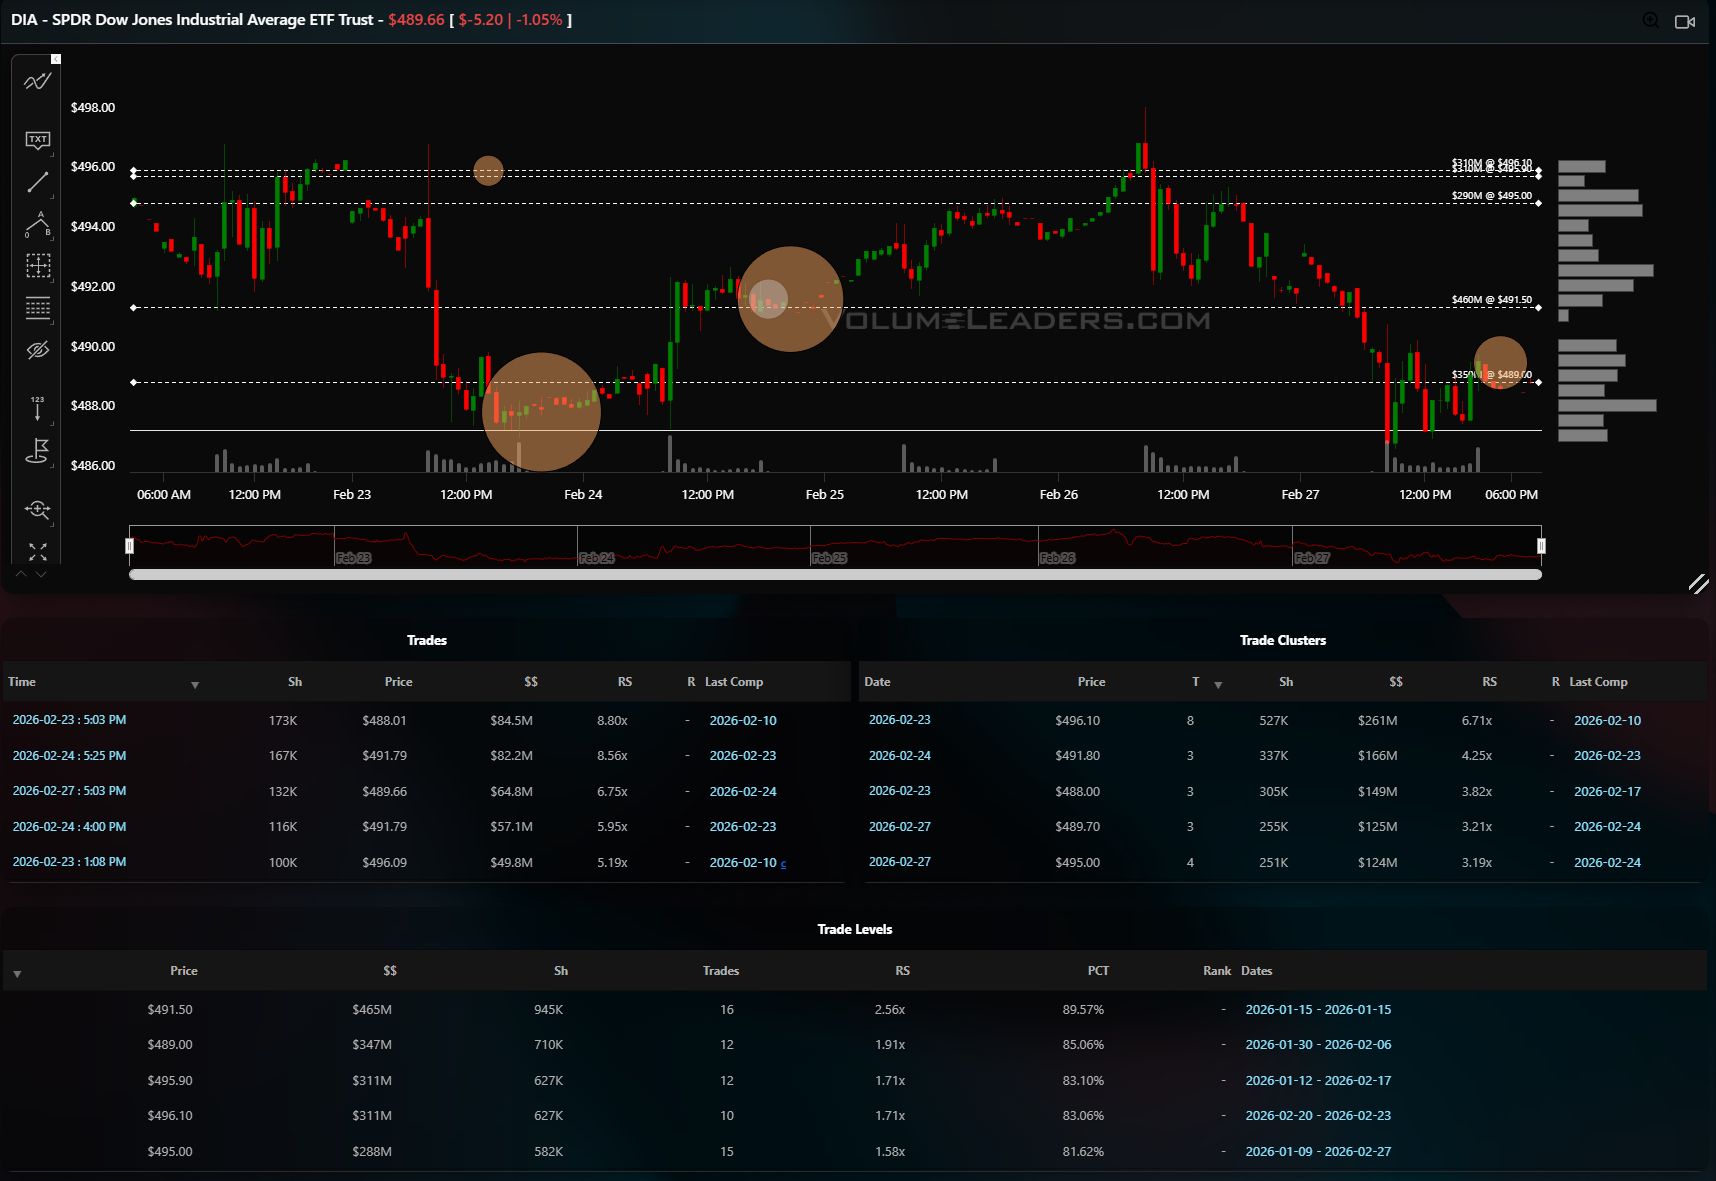
DIA sits somewhere between SPY and IWM. Big blocks went off just under 491 and again closer to 488–489, including an 84M and 82M notional pair on Feb 23 that line up with a sizeable historical Level around 491.50 where approximately 465M has traded and ranks around the high-80s percentile. The ETF bounced cleanly after those blocks, climbed into the 496–498 zone, and then rolled over to finish the week back near 489–490, hugging a chunky volume node. For the Dow, that 489–492 range is the immediate decision area. Holding above it and reclaiming 495 would tell us those earlier blocks were accumulation and should pull price back toward 498–500. A break and hold under 488, especially on fresh large prints, would shift the bias to distribution and invite a test lower. Traders can work a mean-reversion framework: buy against 488–489 with tight risk and 495–497 as the first objective, or sell failed pushes into 495 with 500 as the line that forces you to cover.
In all four indices, the story is similar: big money showed up on the recent dip, but none of the key shelves has yet been cleanly converted into support, so the next few sessions around these volume bands will tell us whether these blocks were smart buying or the opening salvo of a larger distribution.

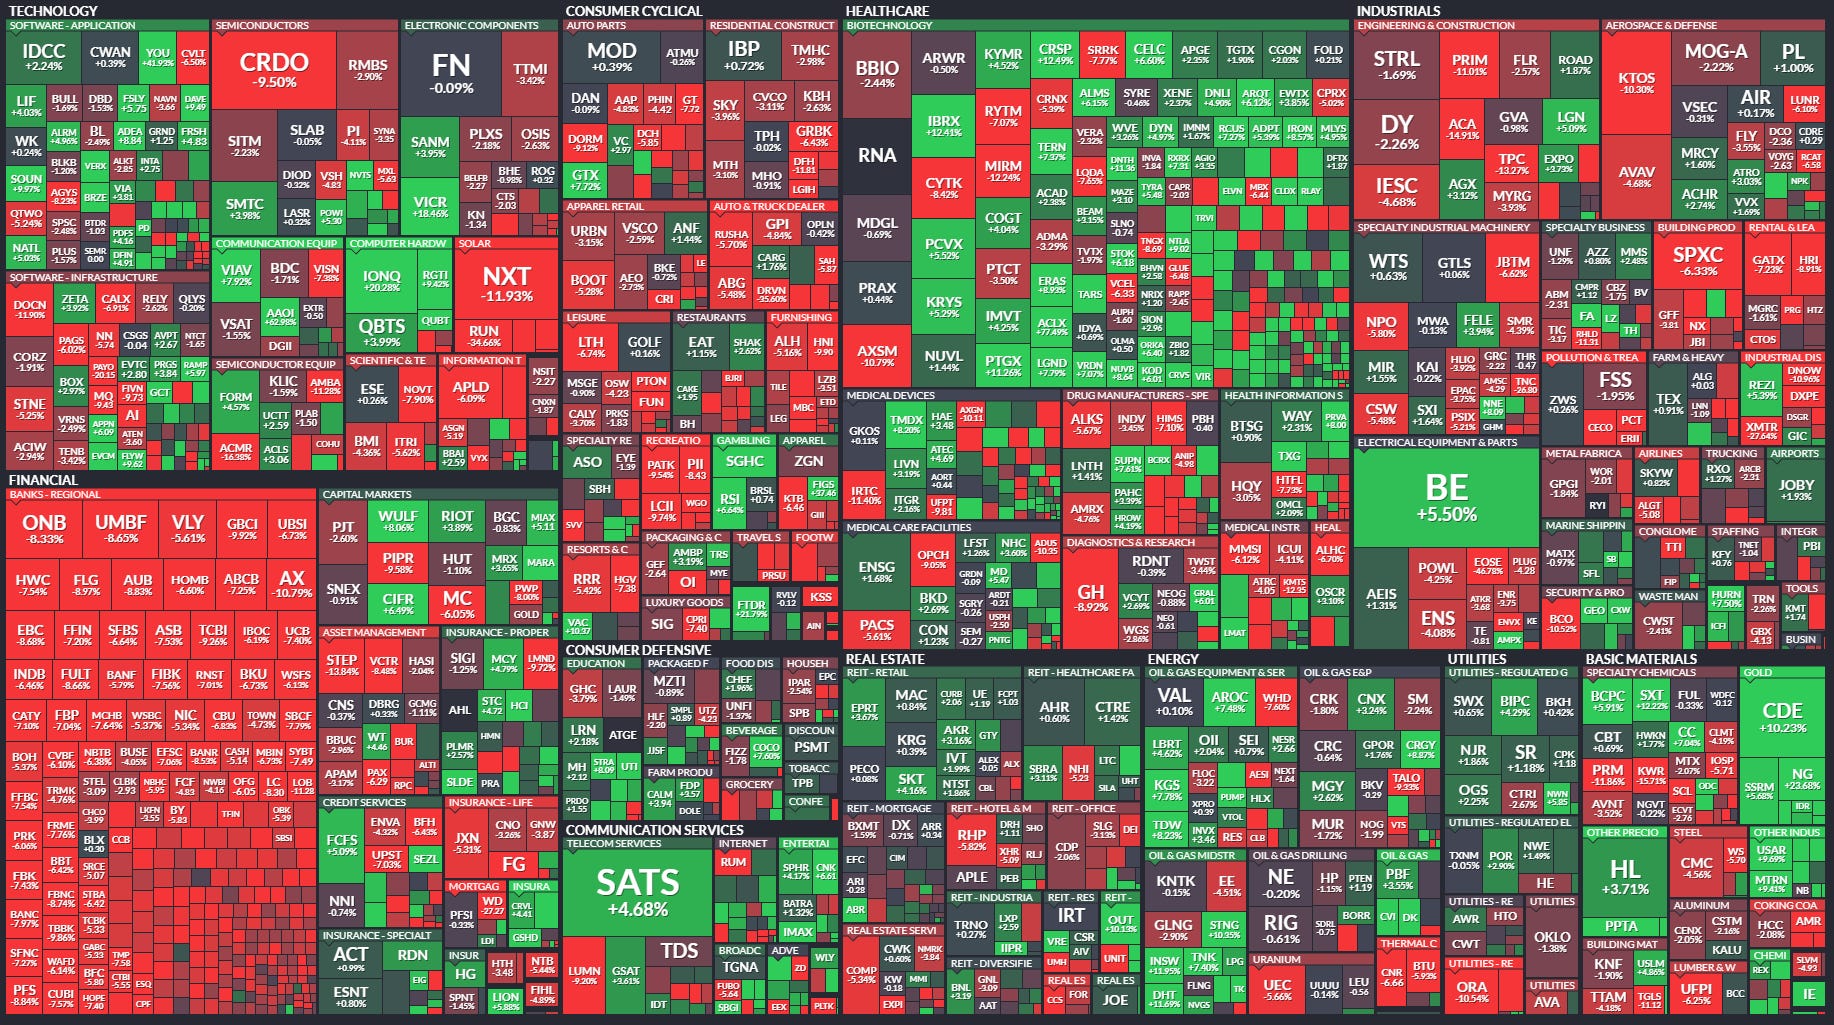
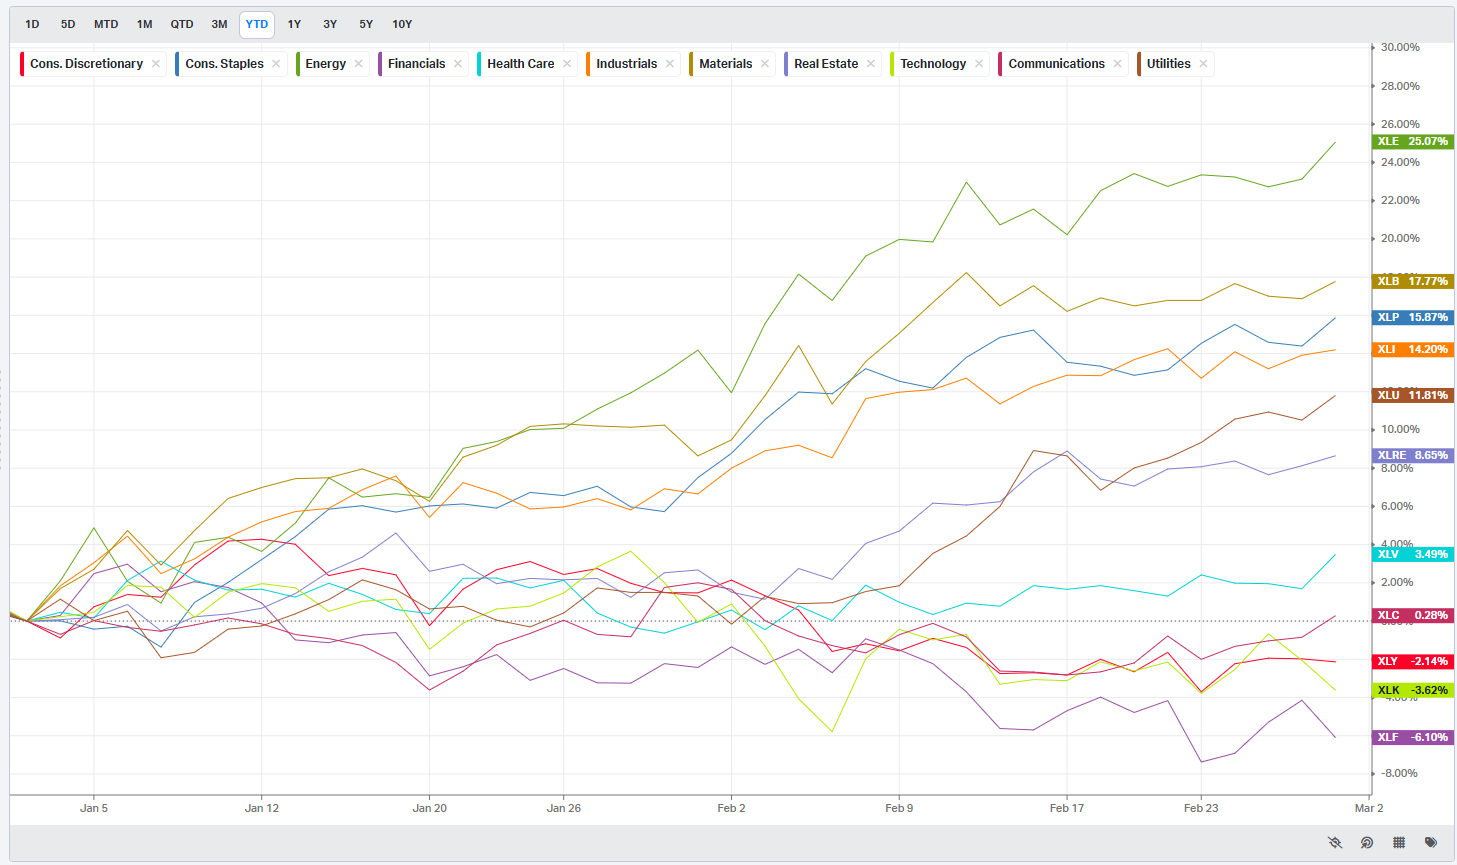
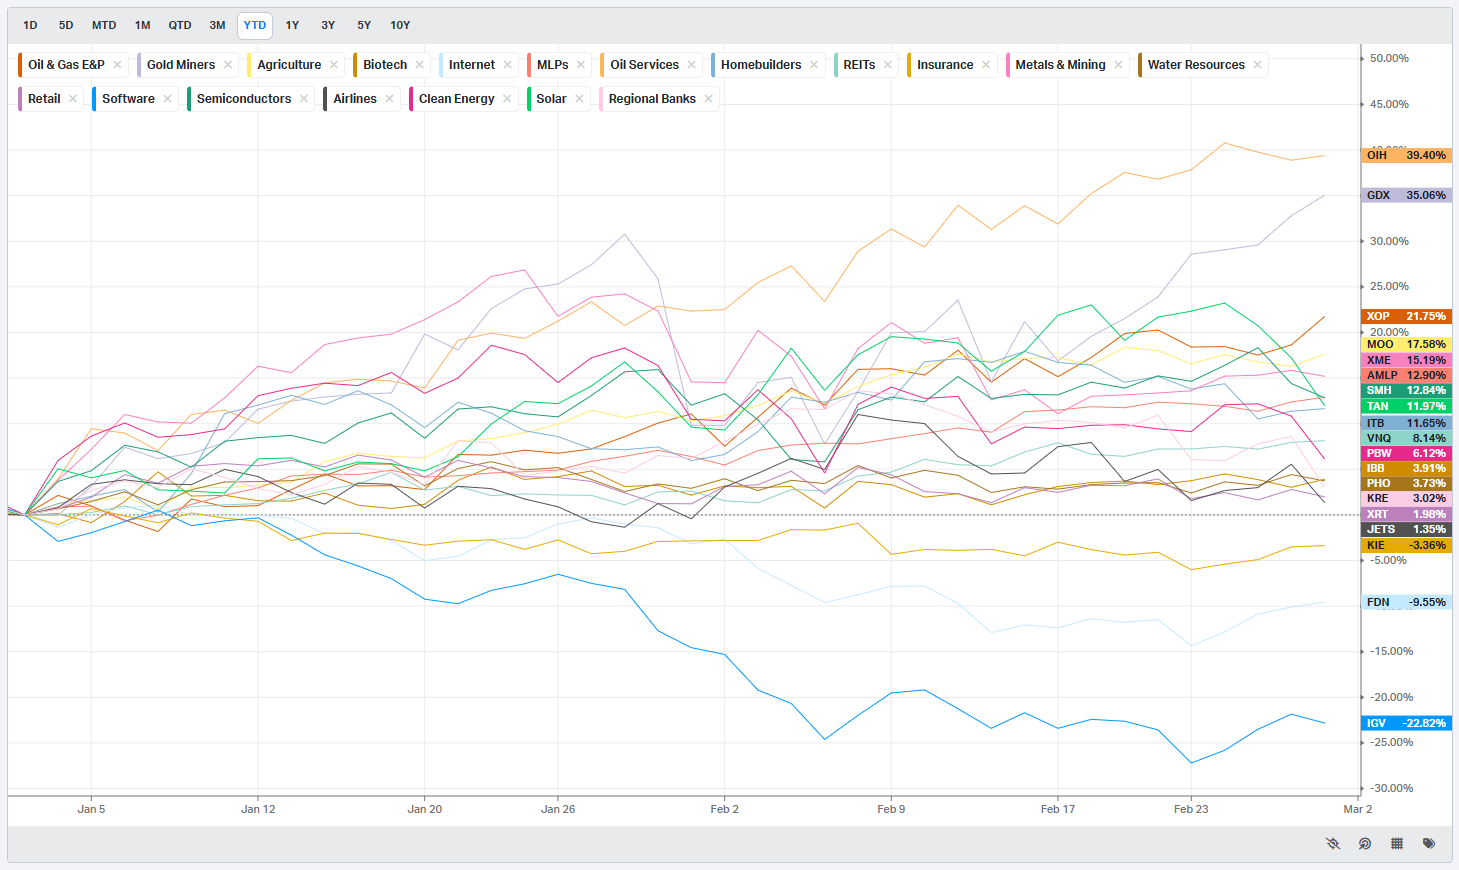
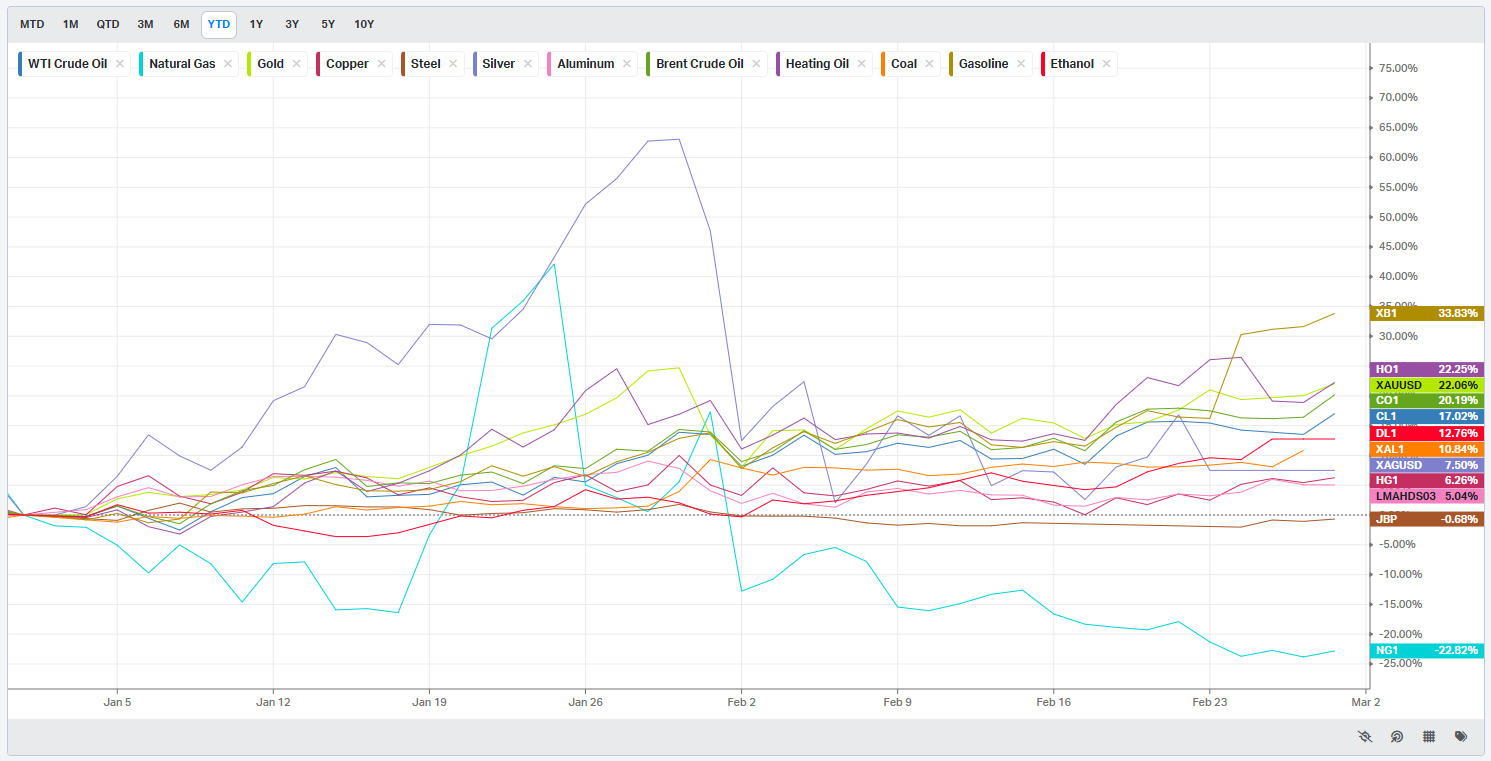
Summary Of Thematic Performance YTD
VolumeLeaders.com offers a robust set of pre-built thematic filters, allowing you to instantly explore specific market segments. These performance snapshots are provided purely for context and inspiration—think about zeroing in on the leaders and laggards within the strongest and weakest sectors, for example.
S&P By Sector
S&P By Industry
Commodities: Energy & Metals
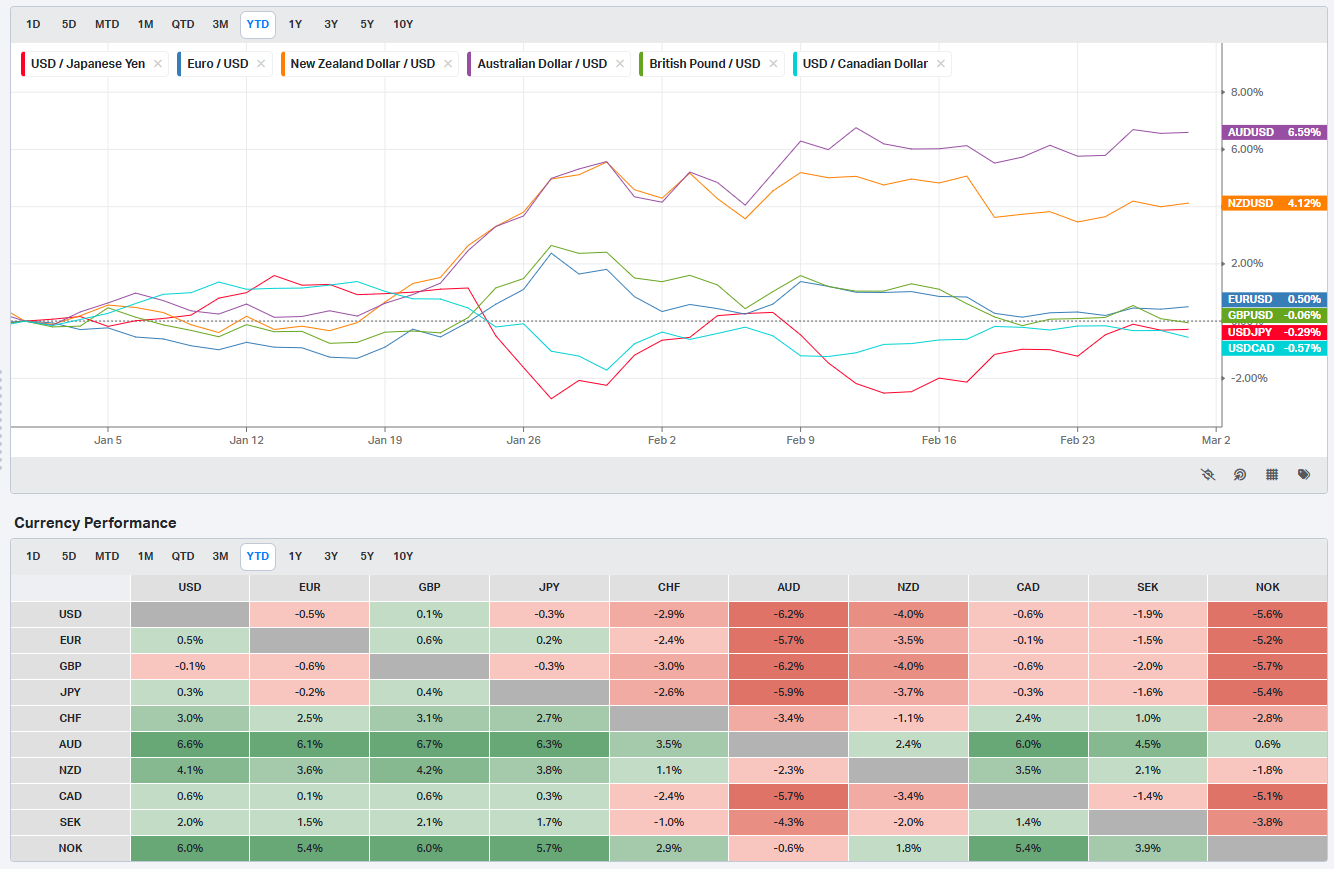
Currencies/Major FX Crosses
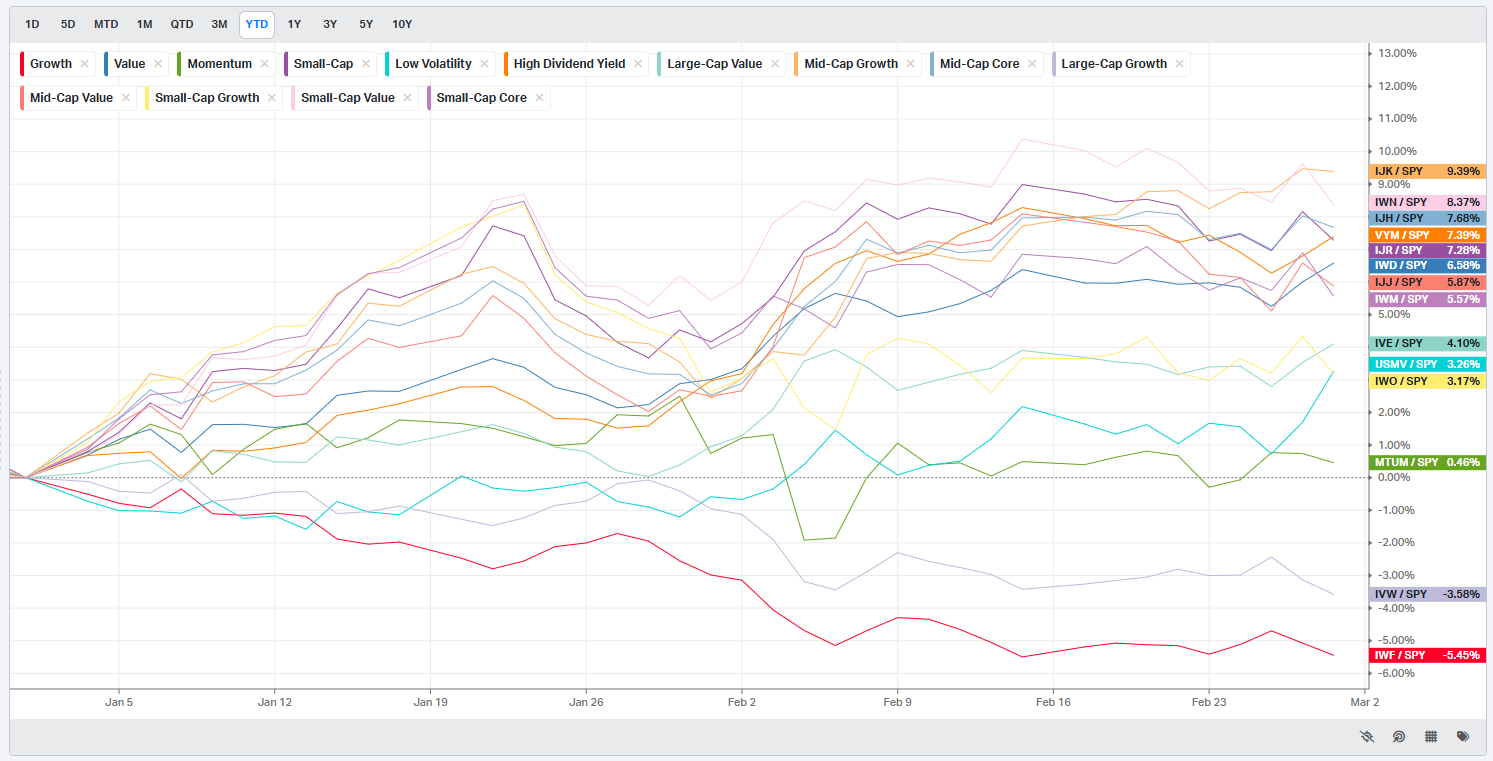
Factors: Style vs Size-vs-Value

Events On Deck This Week
Here are key events happening this week that have the potential to cause outsized moves in the market or heightened short-term volatility.
Data-heavy week with growth, labor, and the consumer all in play
Monday starts with ISM Manufacturing PMI for February, with the prior print at 52.6 and consensus at 52.3 versus a softer 51.3 forecast. A headline that stays above 52 with employment holding near the prior 48.1 would reinforce a soft-landing narrative and favor cyclicals and yields grinding higher; a downside surprise that slips back toward the high 40s would be risk-off for industrials and value, especially if markets read it as the first crack in activity rather than a one-off wobble.
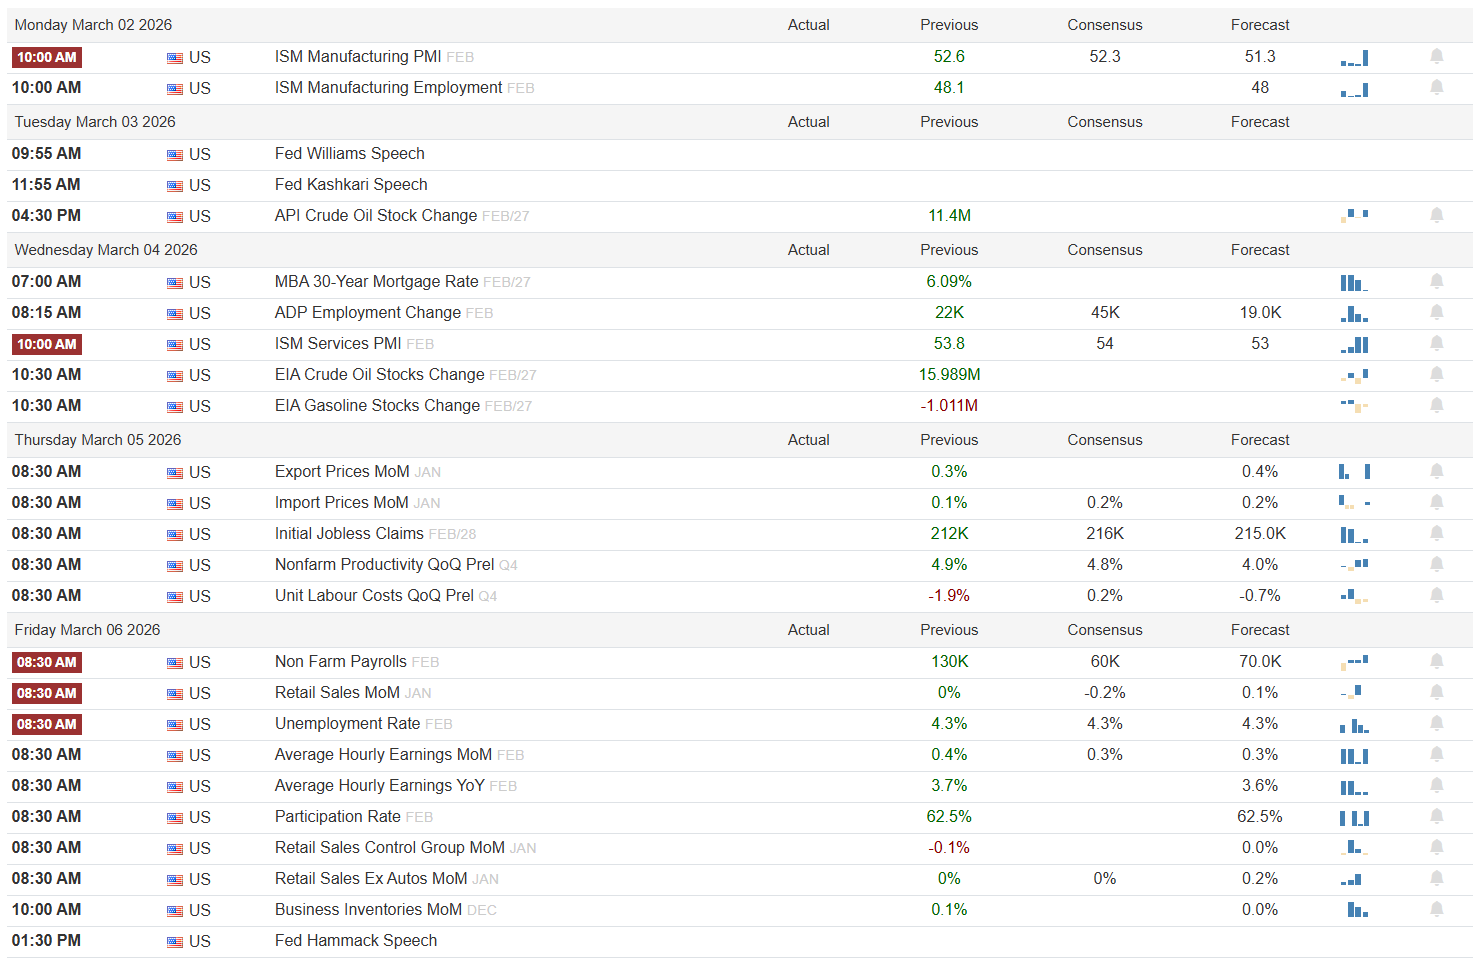
Tuesday is light on hard data but brings Williams and Kashkari on the tape. Markets will focus less on prepared remarks and more on any improvised pushback against current rate-cut timelines; a hawkish lean that stresses sticky inflation or overheating labor would pressure duration and the long-growth complex, while any openness to earlier easing would keep the risk-on bid alive.
Wednesday is services day, with ISM Services PMI coming off a 53.8 prior, consensus 54, and forecast 53, plus ADP employment after a 22K reading last month. A firm services print with stronger private payrolls would reinforce resilience and could steepen the curve, while a downside miss on both would cool the growth narrative and support defensives. Energy traders will be watching the EIA crude and gasoline stock changes, with prior levels at 15.989M for crude and -1.011M for gasoline; another large crude build and gasoline draw would keep the focus on refined product tightness rather than crude scarcity.
Thursday’s focus is on prices and productivity. Export prices and import prices both posted 0.3 percent and 0.1 percent previously, with consensus looking for a mild pickup to 0.4 and 0.2 respectively. A hotter pair would revive inflation worries and could reprice the front end higher, while cooler prints keep the disinflation story intact. Nonfarm productivity was 4.9 percent last quarter with unit labor costs at -1.9 percent; anything that preserves that mix of strong productivity and subdued labor costs is equity-friendly, while a reversal (weak productivity, rising unit labor costs) would stoke margin concerns.
Friday is the main event with Nonfarm Payrolls after a 130K prior and consensus at 60K with a 70K forecast, wrapped in a full labor-market package: unemployment rate steady at 4.3 percent, average hourly earnings MoM at 0.4 percent and YoY at 3.7 percent previously, and participation at 62.5 percent. A Goldilocks combo would be job growth modestly above 70K, unemployment flat, and wages cooling a touch from 0.4/3.7; that keeps the soft-landing and gradual-cut narrative intact. A hot report with payrolls well above 100K and wages reaccelerating would be risk-off for duration and long-duration equities, while a clear downside miss with rising unemployment would raise growth-scare chatter.
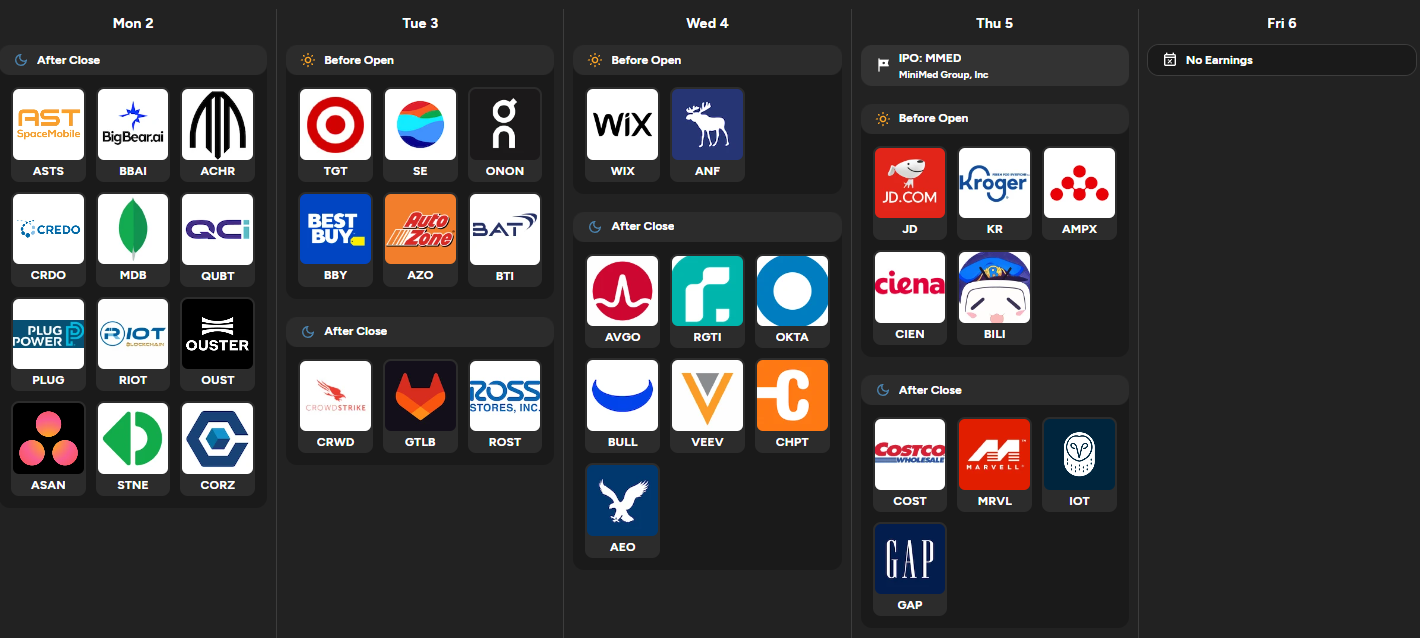
On the micro side, earnings are still rich with macro tells. Early in the week, Target, Sea, Best Buy, and AutoZone give a clean cross-section of the consumer, from big-box discretionary to online, electronics, and auto parts; comps, traffic, and margin commentary will shape the read-through on real-world consumption and trade-down behavior. Midweek, AVGO and Marvell at the close on Wednesday and Thursday are key for the semiconductor and AI infrastructure trade, where data-center growth, networking demand, and forward capex signals can swing the broader chip complex. Costco and Kroger speak to grocery inflation, membership health, and consumer mix, while crowd favorites like CrowdStrike, Okta, and other software names will color sentiment around enterprise IT spend and security budgets. The lone IPO on Thursday is more micro, but the level of demand and first-day price action will still say something about appetite for risk capital.
Sign-posts for traders this week:
ISM Manufacturing PMI holding above 52 versus the 52.3 consensus
Friday payrolls clearing or missing the 70K mark with wages above or below 0.4 percent MoM
AVGO and MRVL data-center commentary aligning or diverging on AI-related demand
Bottom line: this is a data- and earnings-heavy week where the default remains constructive, but any combo of hot inflation, overly strong labor, or weak consumer signals could quickly flip the tone from soft landing to growth or policy scare.

Order Flow in Focus: Reading Smart Money Tells
Order Flow in Focus: Reading Smart Money Tells is a recurring segment that spotlights unique intraday opportunities revealed through institutional order flow. Each feature dissects a moment when the tape quietly shifted—when large, ranked prints clustered at key liquidity locations and informed players positioned ahead of the move. The goal isn’t hindsight; it’s pattern recognition—learning to spot the footprints of capital that knows before the crowd does.
On this VOO segment, smart money left a very clean set of footprints around a failed breakdown that turned into a high-odds long.
The day opens with VOO trading in the low 630s, chopping sideways just above a heavy historical volume band centered around 627–628. Down in that area you can see one of the largest ranked prints of the session: about 2.2M shares at 626.64, roughly 1.388B notional, with relative size north of 40x a typical Level. Right behind it sits another 1.9M share print at 637.53 worth 1.21B, also carrying a 30–40x relative size tag. Both trades live inside a cluster where the Level table shows 627.90 and 627.60 carrying billions of cumulative notional, 70x and 20x RS, and 99.7–99.9th percentile rankings. In other words, this isn’t casual flow; this is real money getting busy at a price where institutions have agreed to do business time and again.
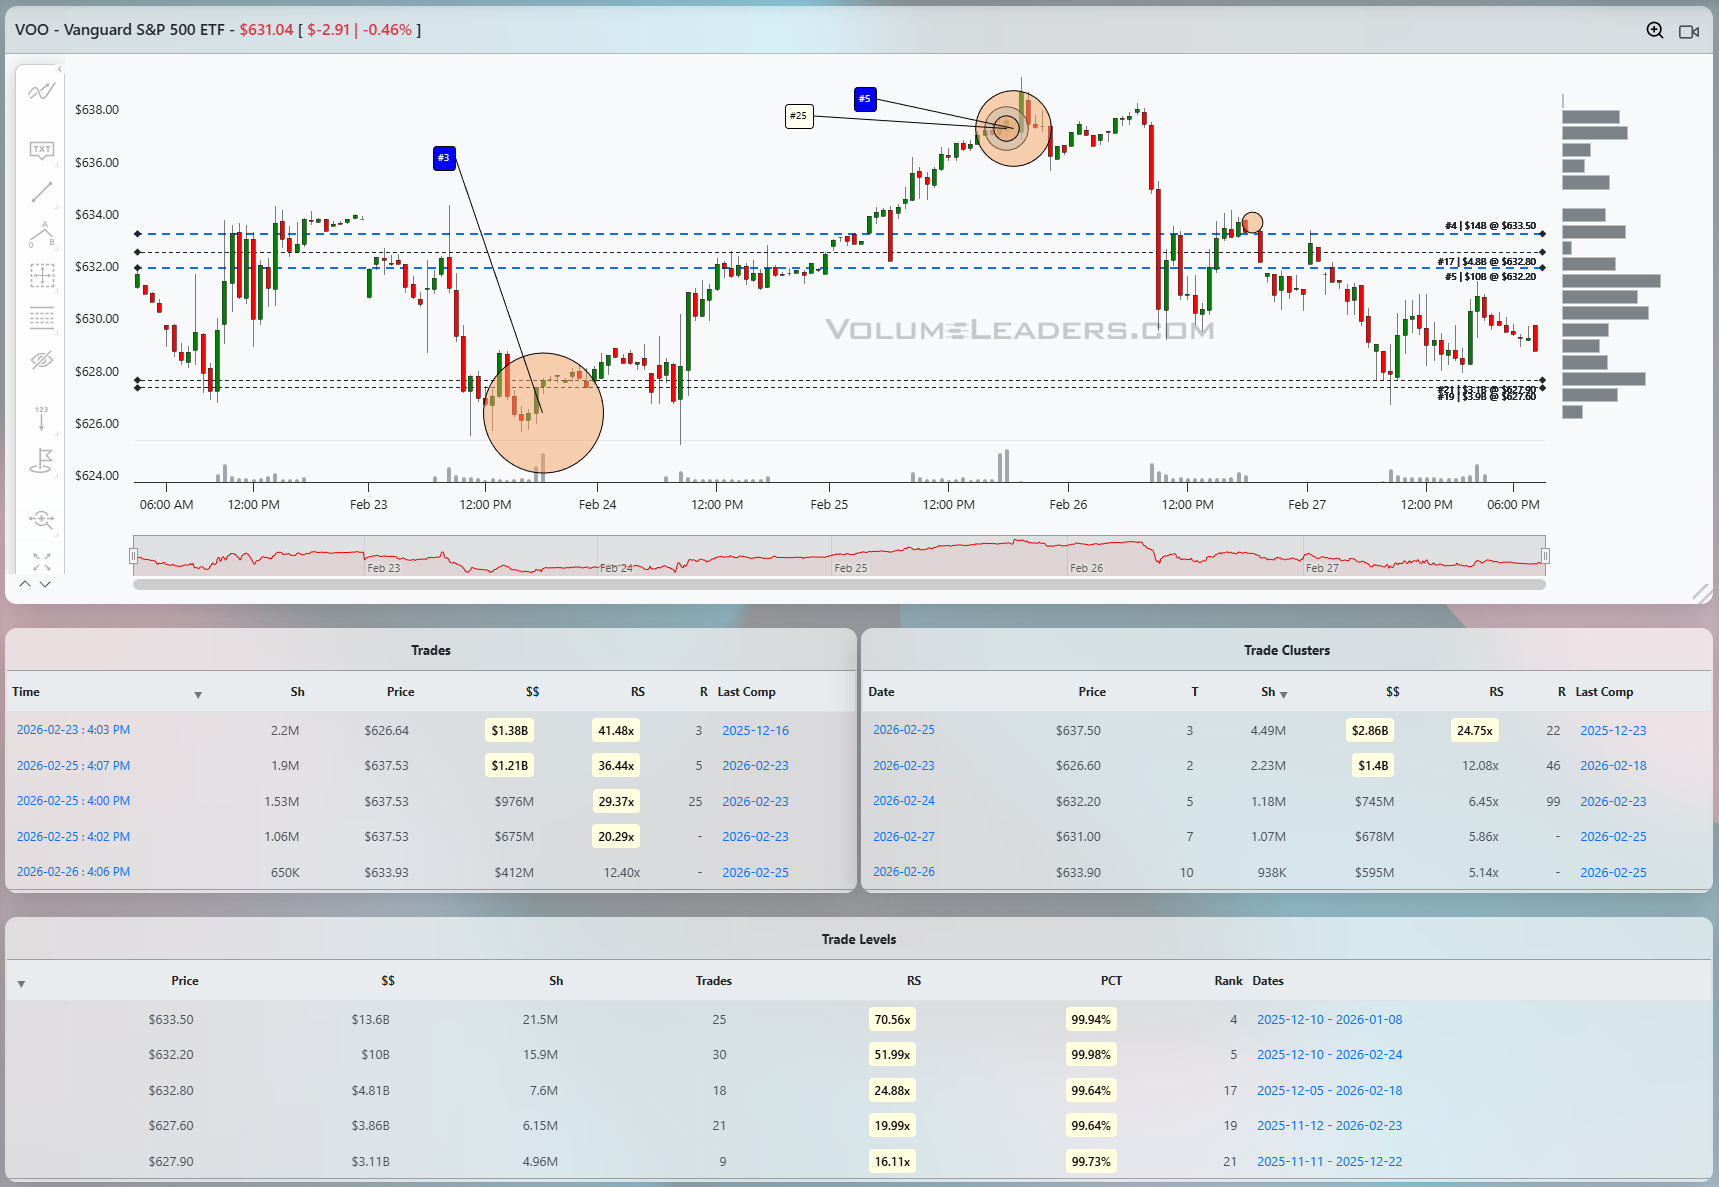
The tape gave us a print to lean on, now we just need to infer intent. The following session provides that critical context when price wicks into the #3 print and price rebounds with fervor followed by impulsivity up in the form of a giant green bar. Price grinds into huge Levels (blue dashed lines mean they’re in the top 5 all time for this name!) before we get our first warnings that the move may be over for now: #25 and #5 ranked trades fire at the highs followed by consolidation that gave retail and logical place to scale out. Price rolls over hard, giving us a look above some large levels and subsequent failure before settling into a ping-pong pattern between known liquidity locations.
The lesson from this sequence is that when a ranked, billion‑dollar block fires and the market promptly rejects the break lower, you are looking at a location where informed capital is stepping in. Your job is not to predict the block; it is to recognize that once it prints and price behaves, you have a defined line of scrimmage, a clear invalidation, and a path to the next volume magnet – the exact the ingredients you need to turn someone else’s size into your asymmetric trade.

Market Intelligence Report
A desk-grade synthesis of institutional positioning and market structure—unpacking the flows, levels, and emerging themes that shaped the week, and translating them into a model portfolio built the same way professional desks prepare for the week ahead.
MIR Part 1: The Backdrop
Institutional flow this week looked like a market that still wants to be in risk, but is getting a little more selective about how it expresses that appetite. At the top of the funnel, broad participation is still healthy: the cyclical and growth-heavy sectors retain the strongest relative strength versus the tape, downside volatility remains contained, and the lowest realized volatility cohorts are still dominated by large-cap growth, quality tech, and bond proxies. At the same time, our risk dashboard has shifted from unambiguous green to more of a “pro-risk, but not blind chase” posture. Index-level volatility is moderate rather than compressed, leadership remains concentrated, and a few higher-beta corners are starting to show more two-way trade. In plain English, the environment still supports taking risk, but you want to be aligned with where the real capital is rotating, not fighting it.
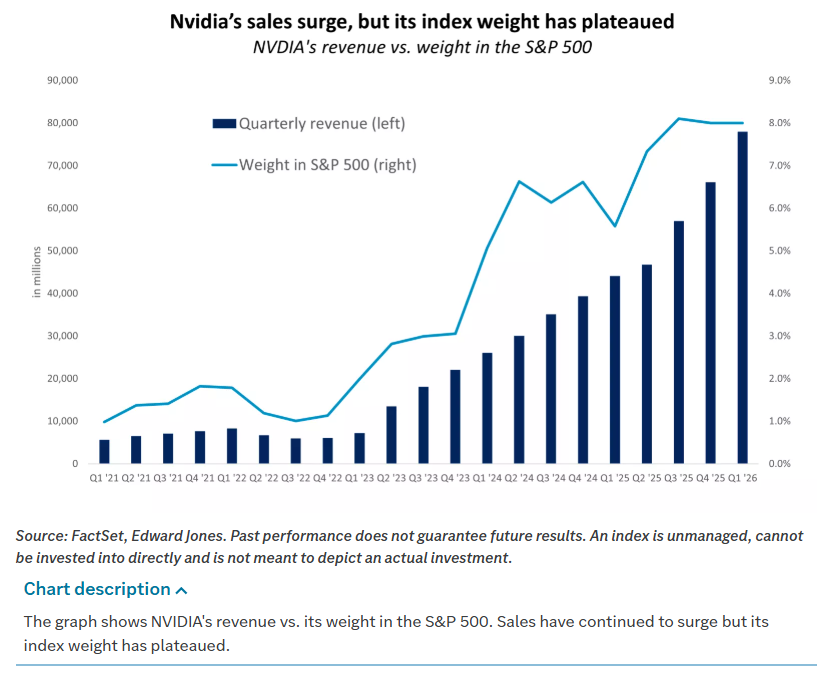
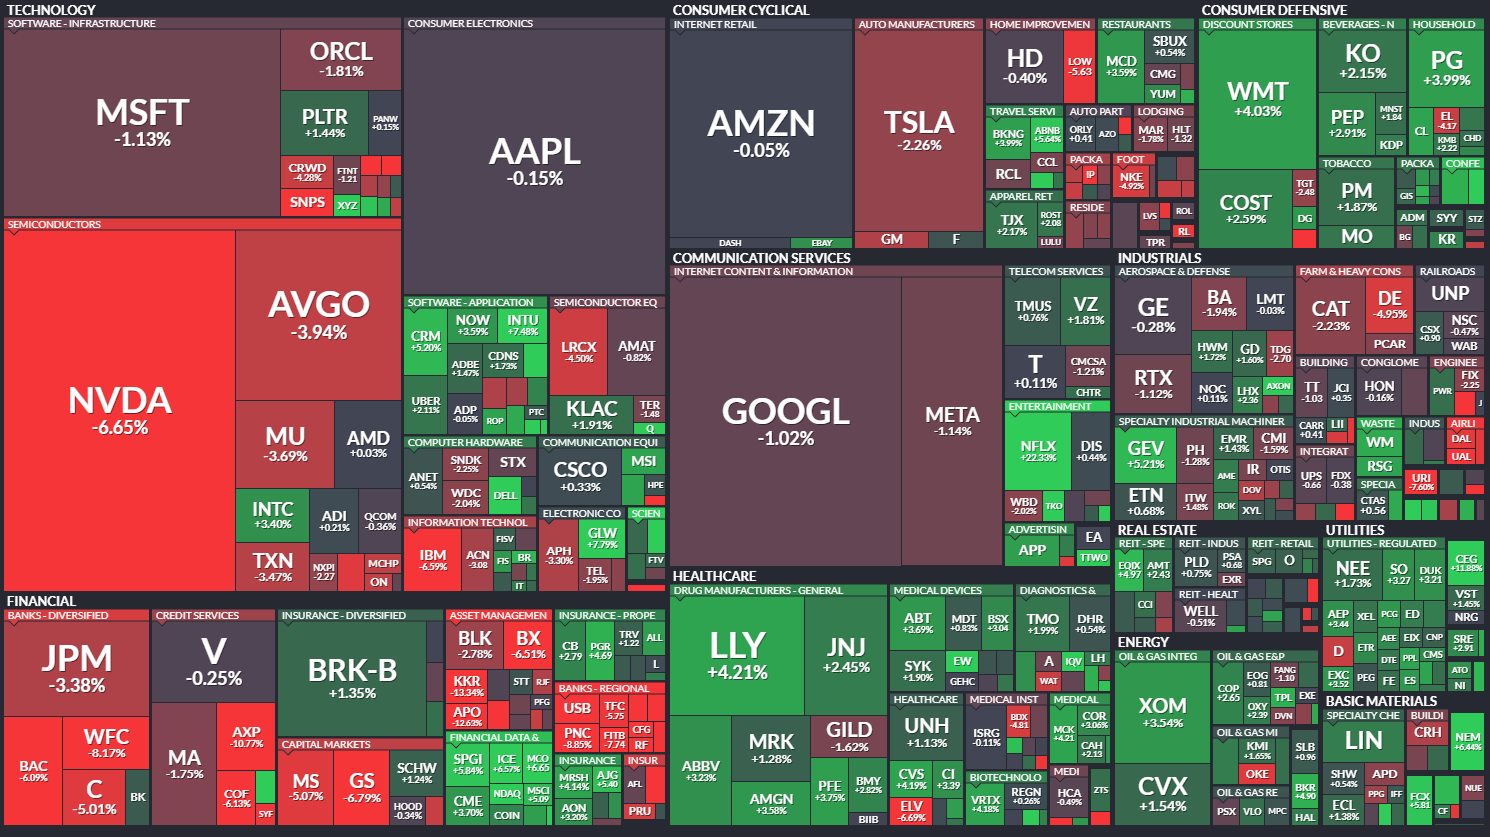
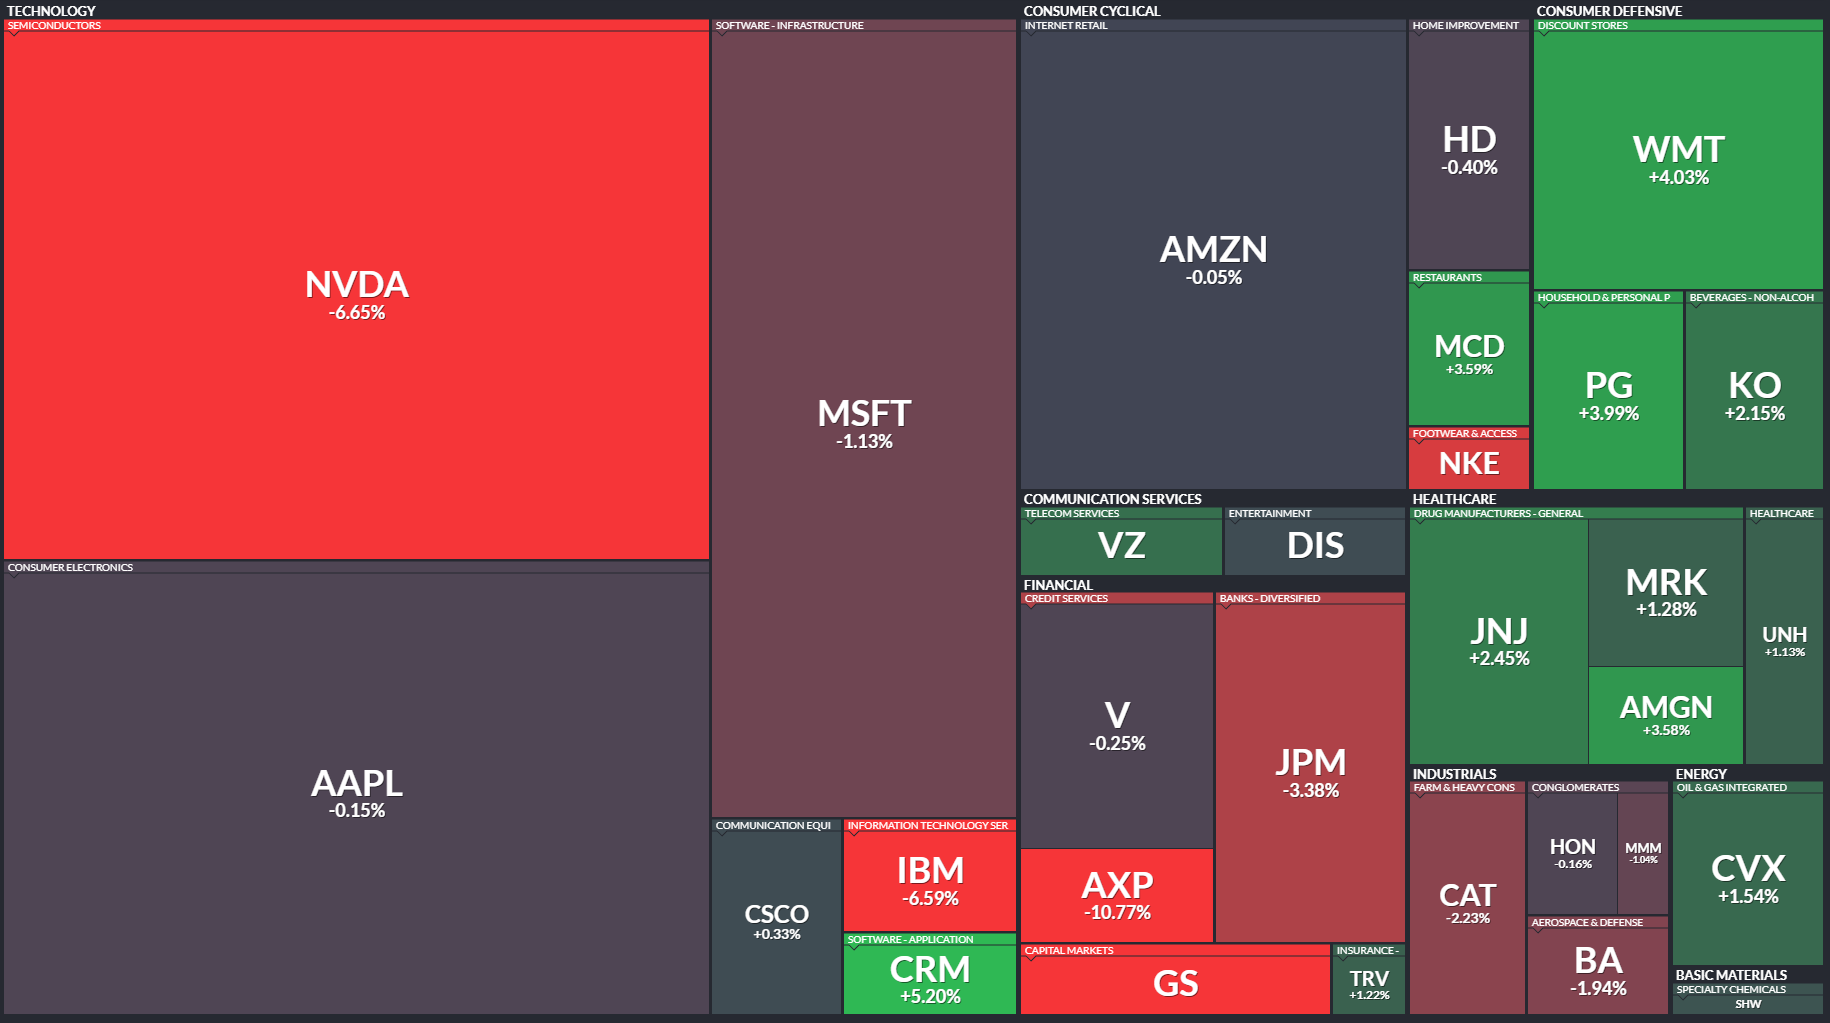
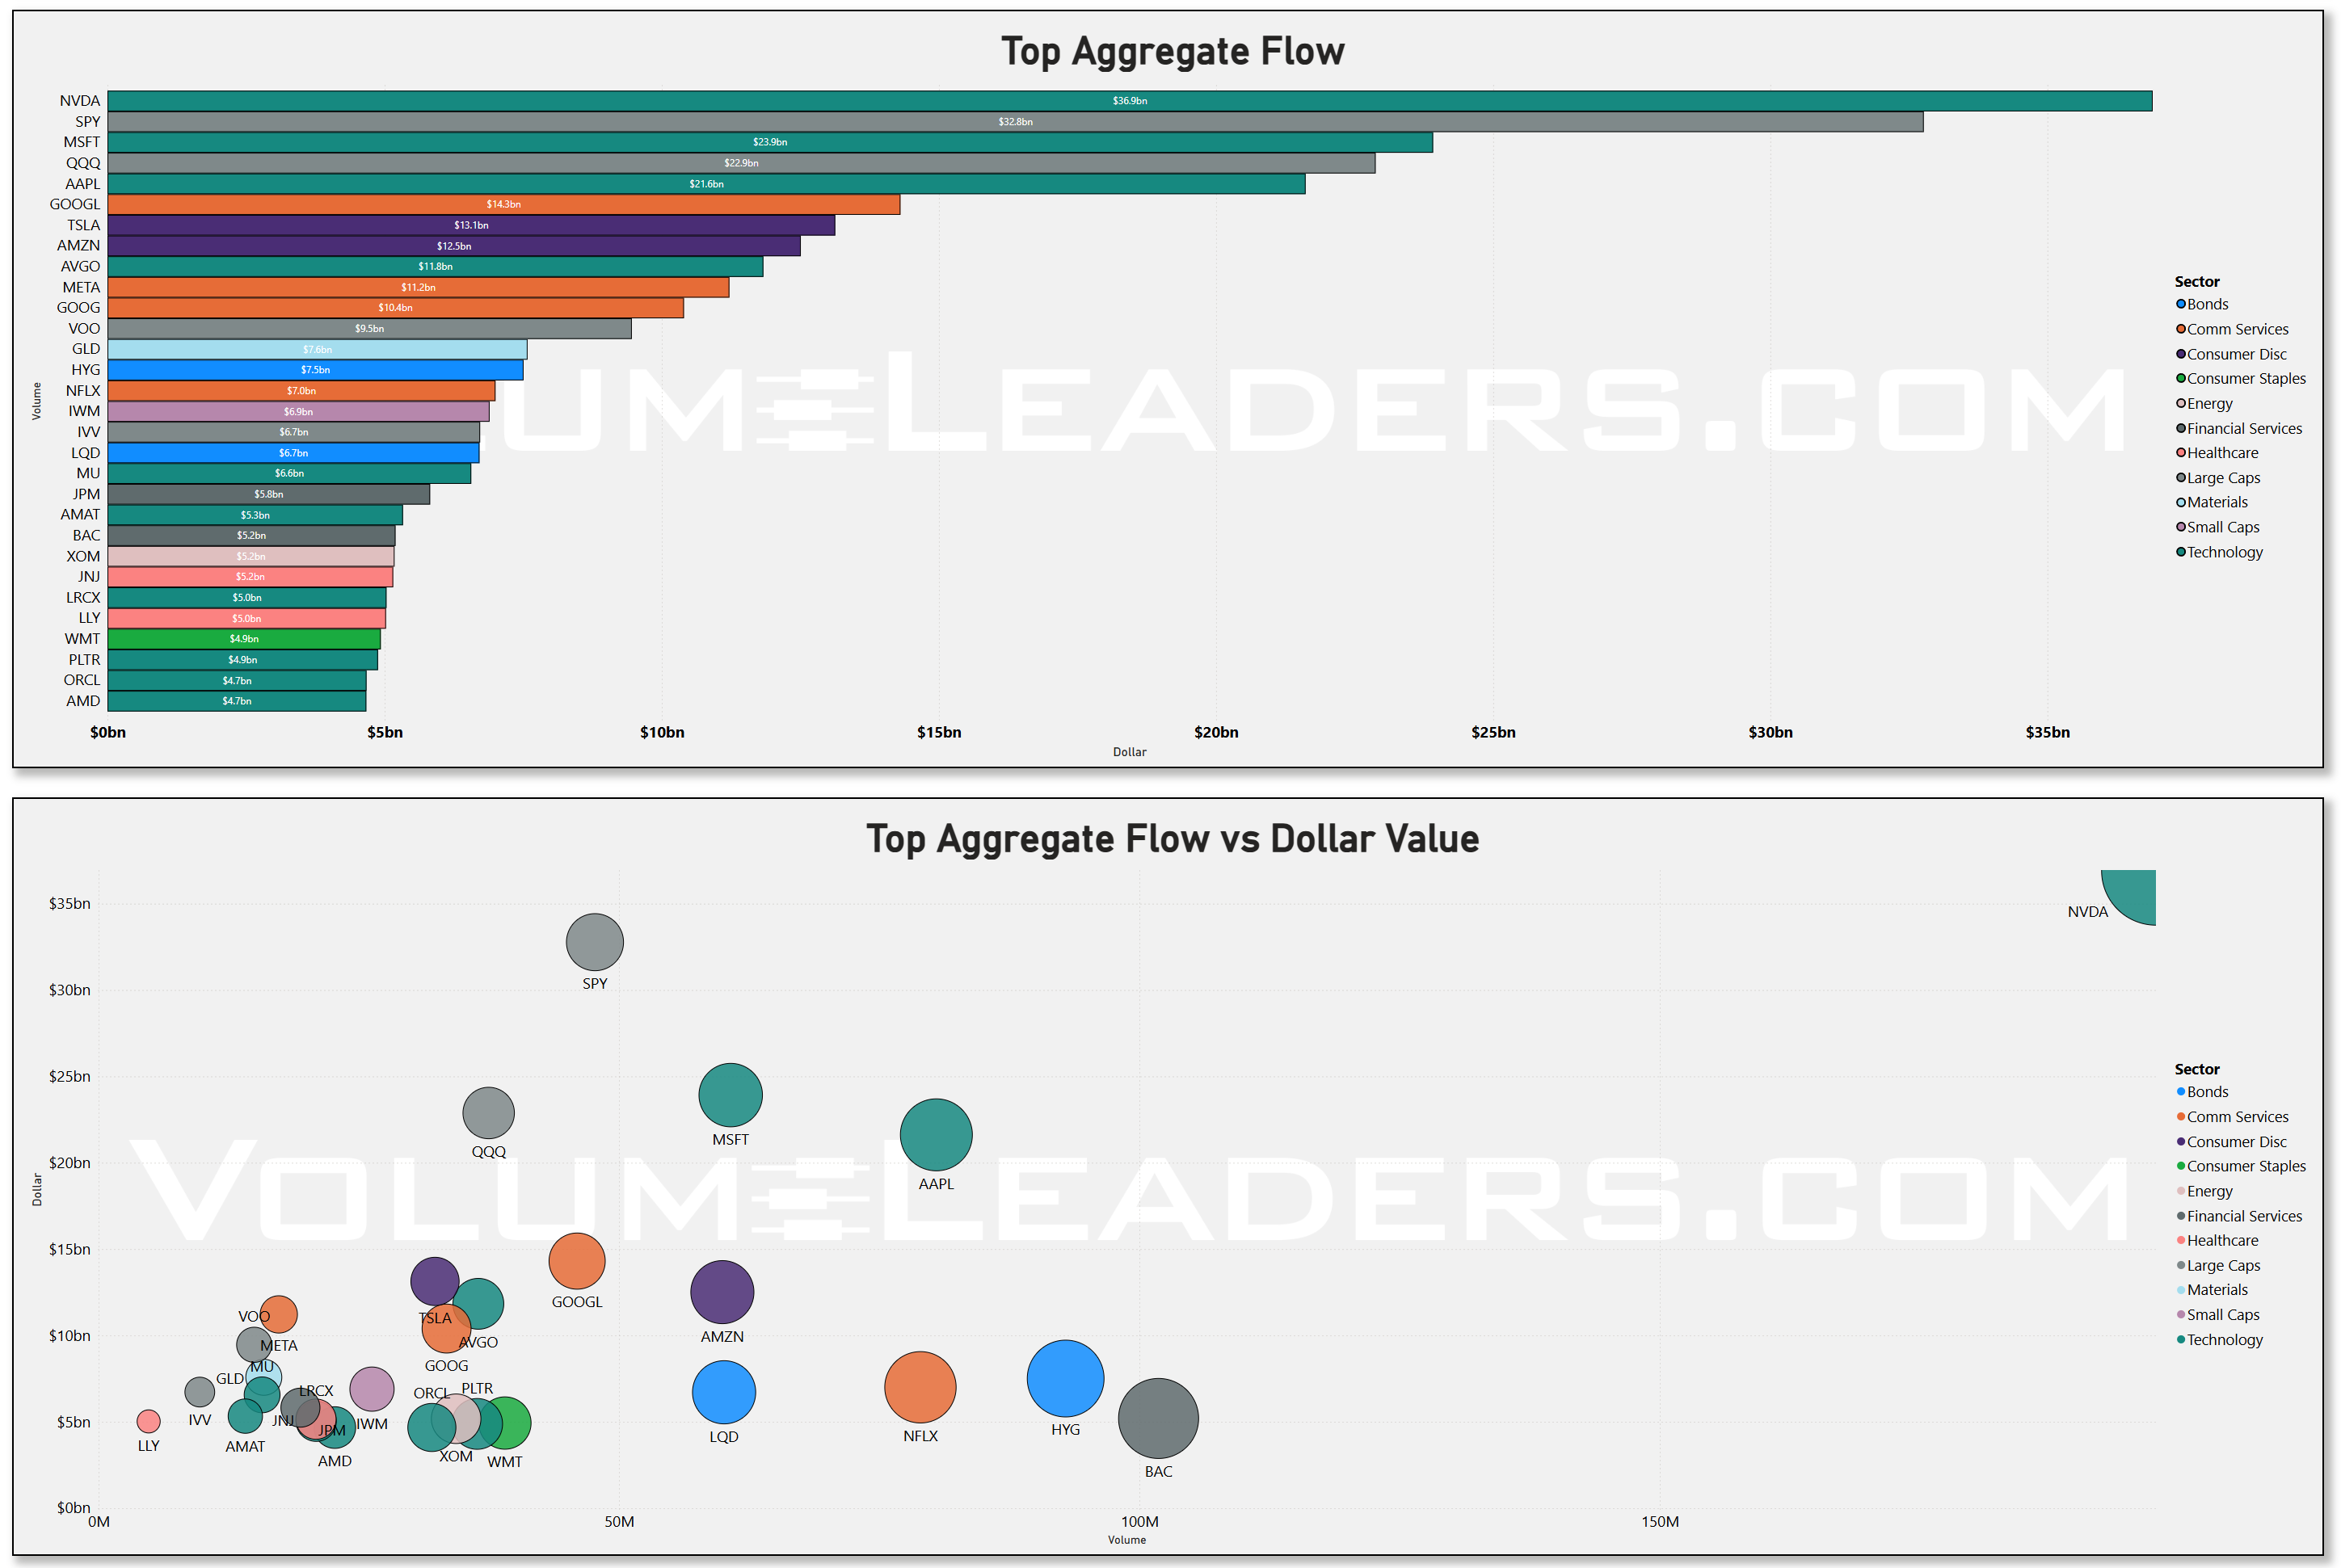
Technology’s profile looks more like an air pocket followed by a surge. For most of the lookback window, daily tech volume sat in the low-to-mid $40bn range, then exploded to roughly $95bn on the final trading day of the month, up from about $43bn the prior Friday. That is not a gentle build; it is a discrete shock. Given the timing, it lines up with two forces: Nvidia’s blowout earnings and guidance, which again beat already-high expectations on the back of another surge in data center revenue and AI demand, and the usual month-end rebalancing and benchmark-tracking adjustments after a period where tech outperformed. In other words, tech was not trading “hot” all week; it caught a firehose of institutional interest and risk transfer into month-end.
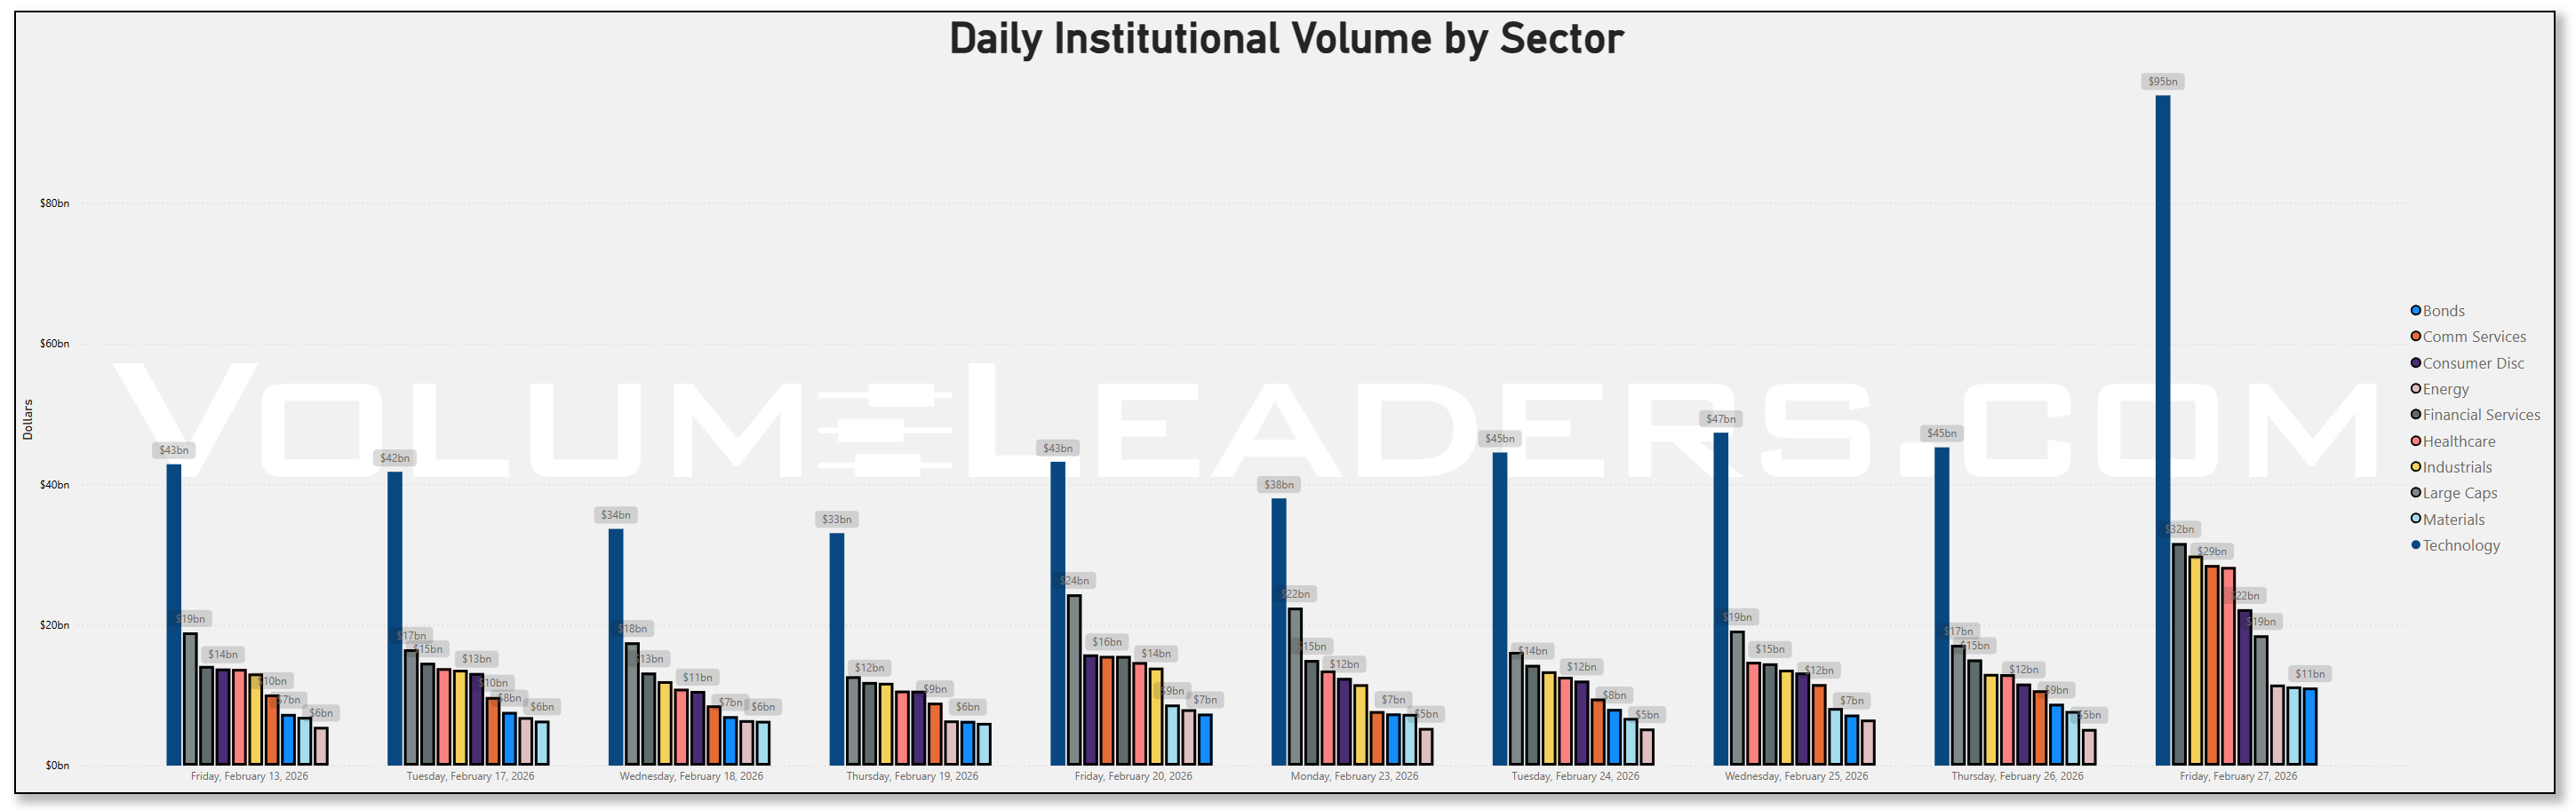
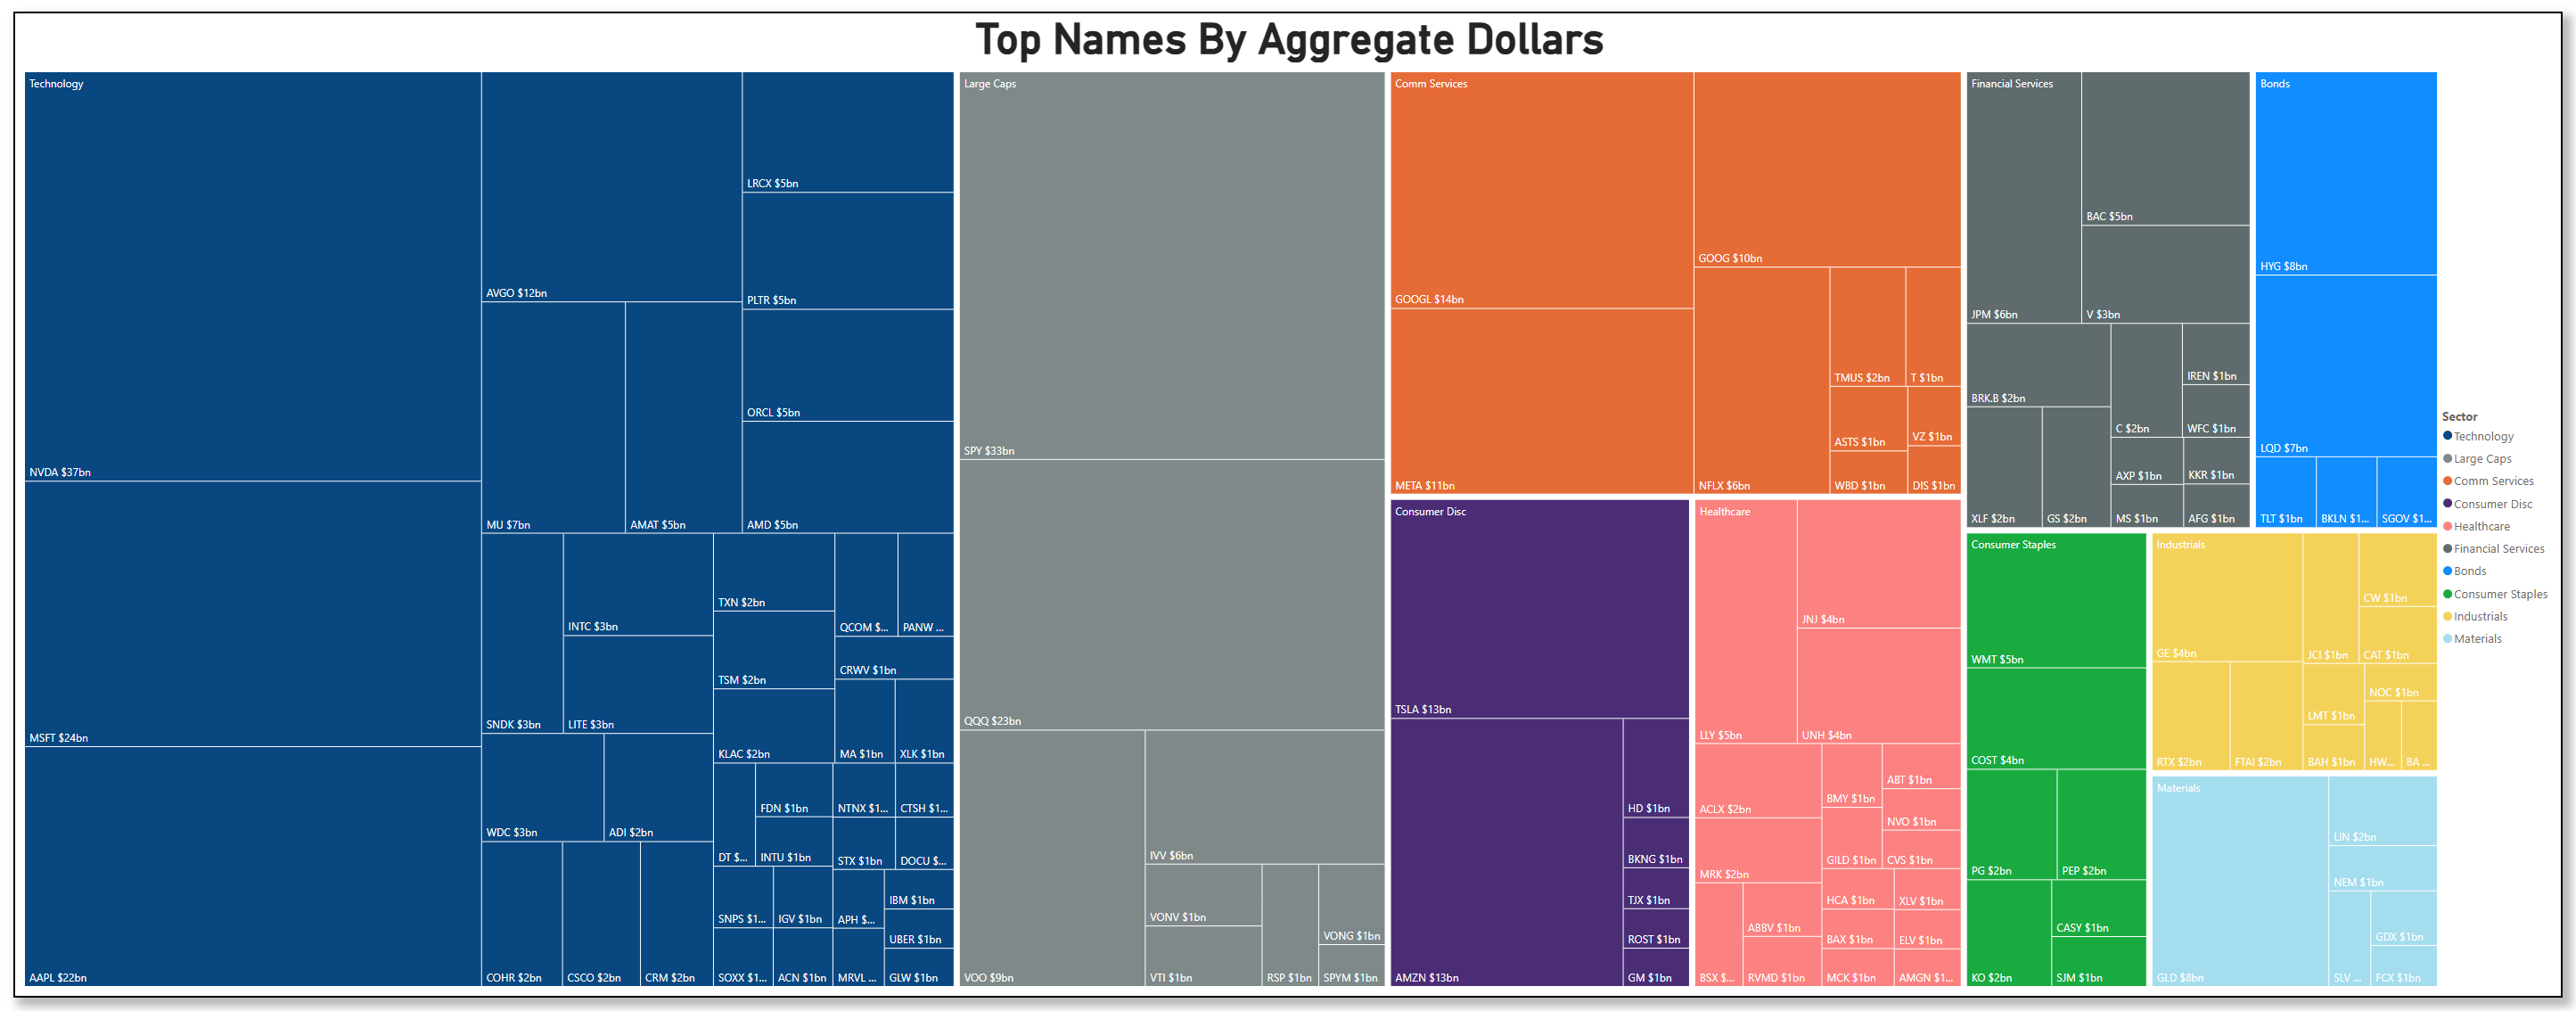
The treemap still shows NVDA with roughly $37bn in aggregate dollars, MSFT around $24bn, and AAPL near $22bn, with AVGO, MU, LRCX, PLTR, ORCL, AMD and other AI-adjacent names filling out the upper tier. That composition reinforces the idea that the 95bn spike is not just passive rebalance; it is also active repricing of the AI infrastructure complex after Nvidia’s results confirmed that AI server and accelerator demand remains in an early innings build-out. The fact that the rest of the week sat near $40bn and then doubled into month-end suggests that many desks waited for the catalyst and the calendar to move size, rather than chasing ahead of the print.
Large Caps as a style bucket still look like the core expression vehicle. Weekly data shows Large Caps around $18.5bn this Friday, a touch lower than the prior Friday’s roughly $19.5bn, but within a tight band. Inside that bucket, SPY (~$33bn), QQQ (~$23bn) and VOO (~$9bn) are the main pipes, joined by growth-tilted funds like VONG, VTI and IVV. The difference now is that, relative to their own history, these flows look more steady than Tech’s spike. That is characteristic of strategic allocation rather than a single event-driven surge. Month-end and quarter-to-date rebalances tend to create outsized flow in the sectors that moved the most, and Technology fits that bill; broad large-cap index flow looks more like the steady hum of capital staying invested as macro data keeps the soft-landing narrative intact.
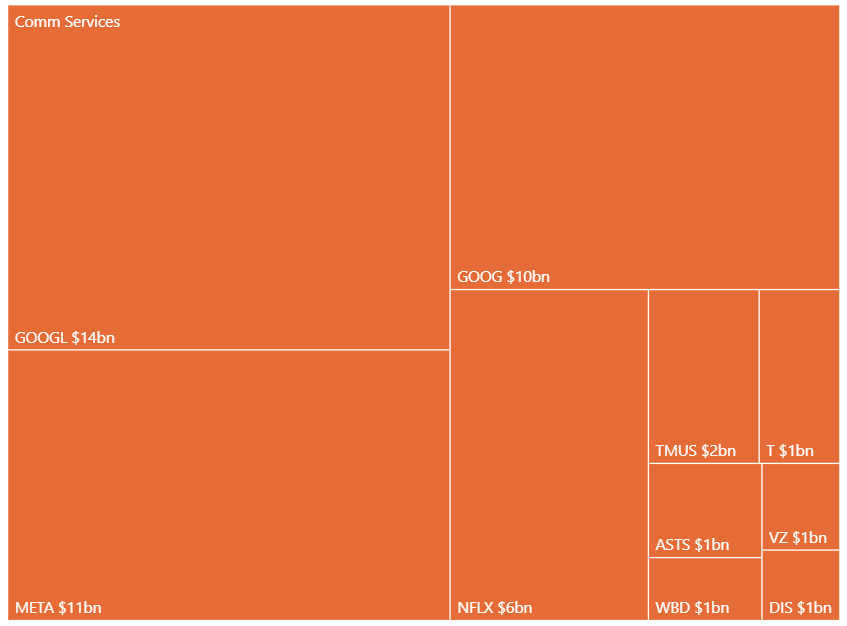
Communication Services remains a clear second-tier winner. GOOG/GOOGL together show about $24bn, META about $11bn, NFLX around $6bn, and then a tail of telecom and media. Those flows pair naturally with Technology’s; the AI and cloud platforms, digital advertising, and streaming franchises are where relative strength and lower realized downside volatility are still most apparent. Consumer Discretionary is narrower, with TSLA (~$13bn) and AMZN (~$12bn) dominating; the rest of the discretionary space attracts far less institutional attention. That concentration supports the idea that institutions are leaning into specific growth platforms rather than broad consumer beta.
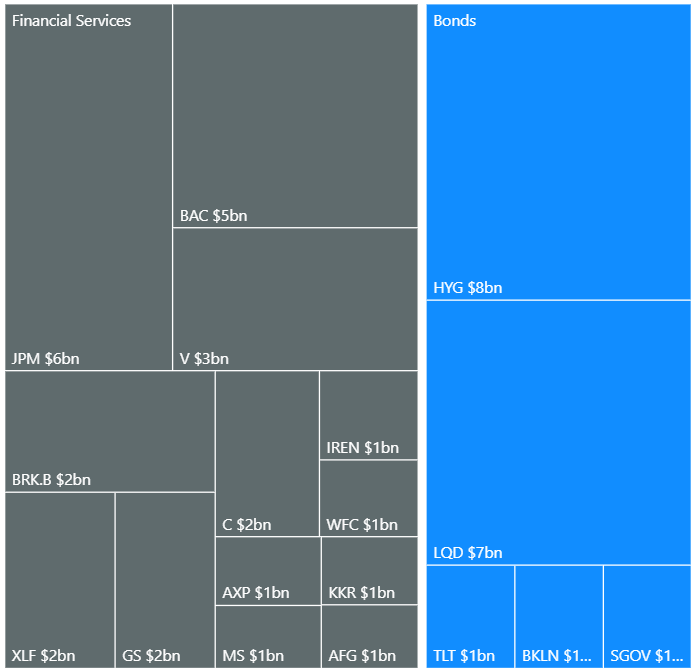
Financials and Bonds still show a quiet but important bid. Financial Services ticked up to around $31.6bn from roughly $30.0bn the prior Friday, while Bonds jumped to about $11.1bn from just under $8.8bn. That sits well with macro data that show inflation cooling but not collapsing and labor still relatively firm, a mix that allows banks to enjoy healthy net interest margins without immediate credit stress and keeps credit spreads in check. In the single-name and ETF lists, BAC, JPM and XLF show multi‑billion footprints, and on the bond side LQD and HYG have large bubbles in both the sweep and dark-pool scatter plots. It looks like investors pairing their tech and growth exposure with carry trades in credit and financials rather than hiding from risk.
Energy and Materials continue to look like afterthoughts in comparison. Weekly Energy dollars sit in the low $11bn range, up slightly from the prior week’s low-$10bns, and Materials also hover in the low $11bns. Crude has been range-bound, and while geopolitics creates episodic bursts of volatility, there is no persistent macro impulse forcing institutions to make big directional bets there. That shows up in the flow breakdown: GLD, GDX, a handful of industrial metals and integrated oils have presence, but nothing remotely close to the gravitational pull of NVDA, MSFT, SPY or QQQ.
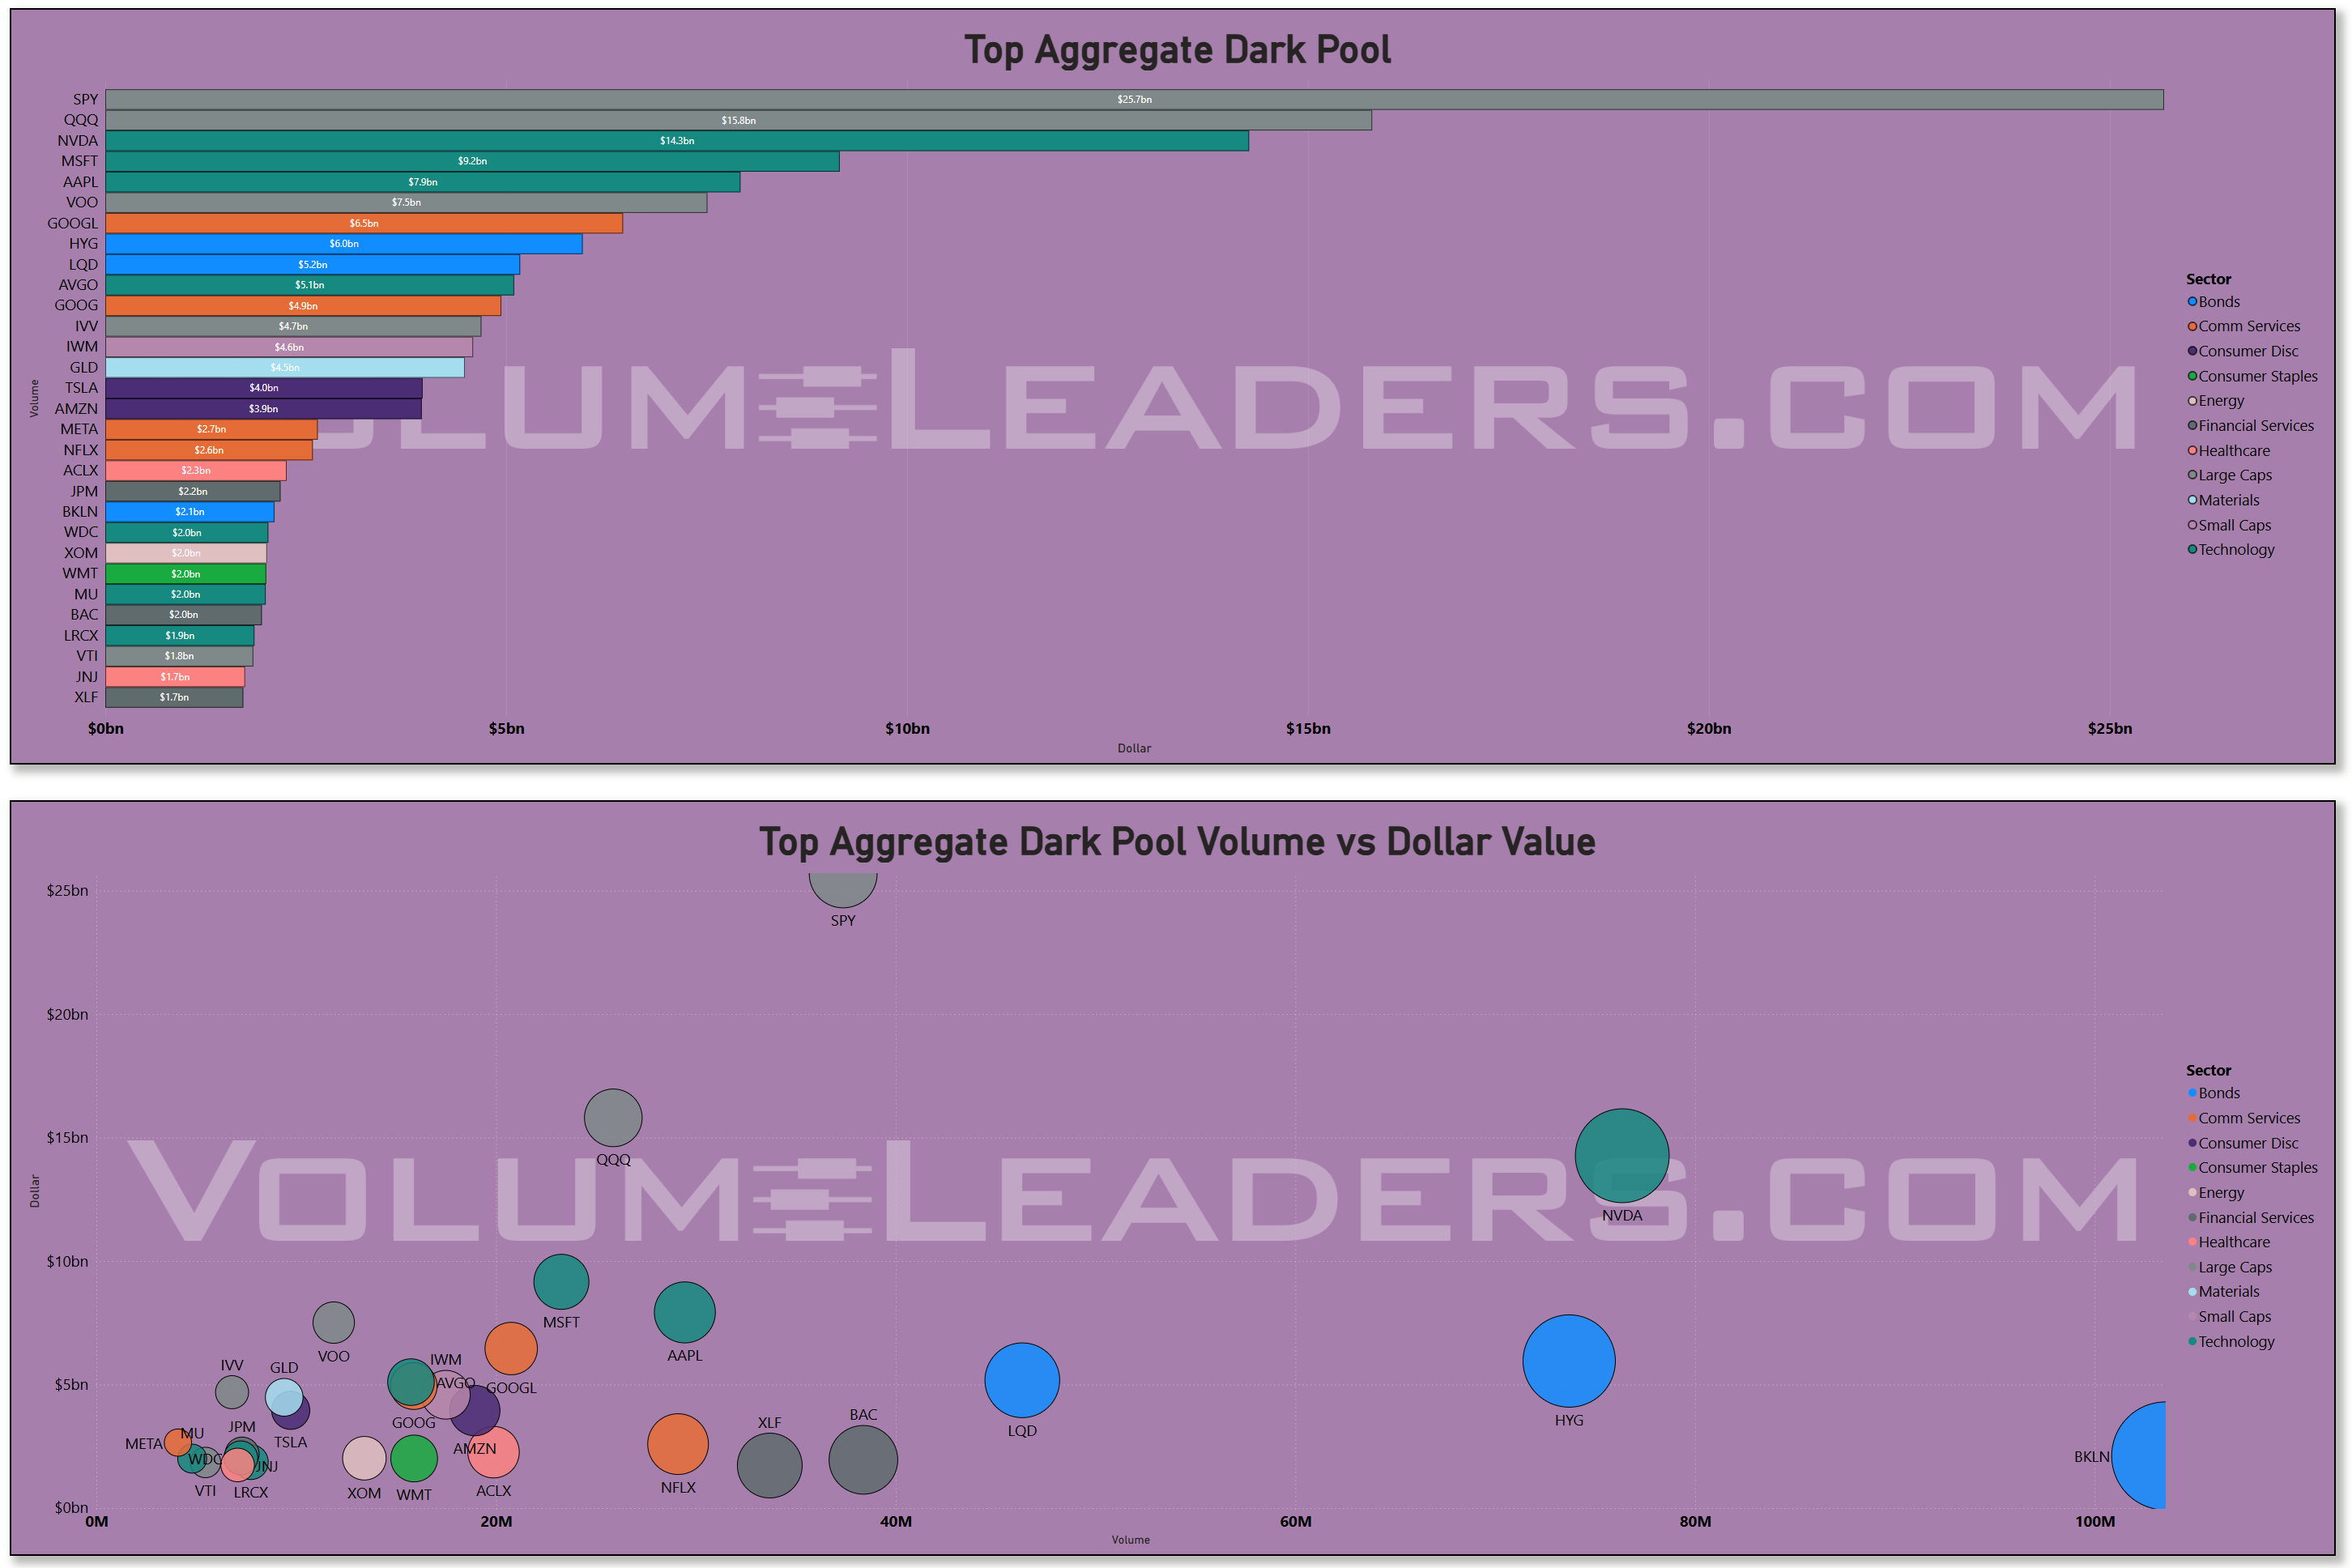
The lit versus dark versus sweep lenses confirm the character of the week. In dark pools, SPY (~$25bn) and QQQ (~$18bn) remain dominant, with NVDA, MSFT, AAPL and AMZN making up the next tier in the mid-to-high single-digit billions. NVDA’s dark-pool bubble in the volume-versus-dollars chart is especially notable: huge dollar value and very high volume, consistent with a post-earnings tug-of-war between funds increasing exposure to the AI leader and others taking profits or hedging concentrated gains. The fact that Tech’s sector volume only spikes on Friday, yet NVDA sits atop the weekly dark-pool and aggregate-flow lists, argues that the smartest money timed their size around the event window, not in a constant drip throughout the week.
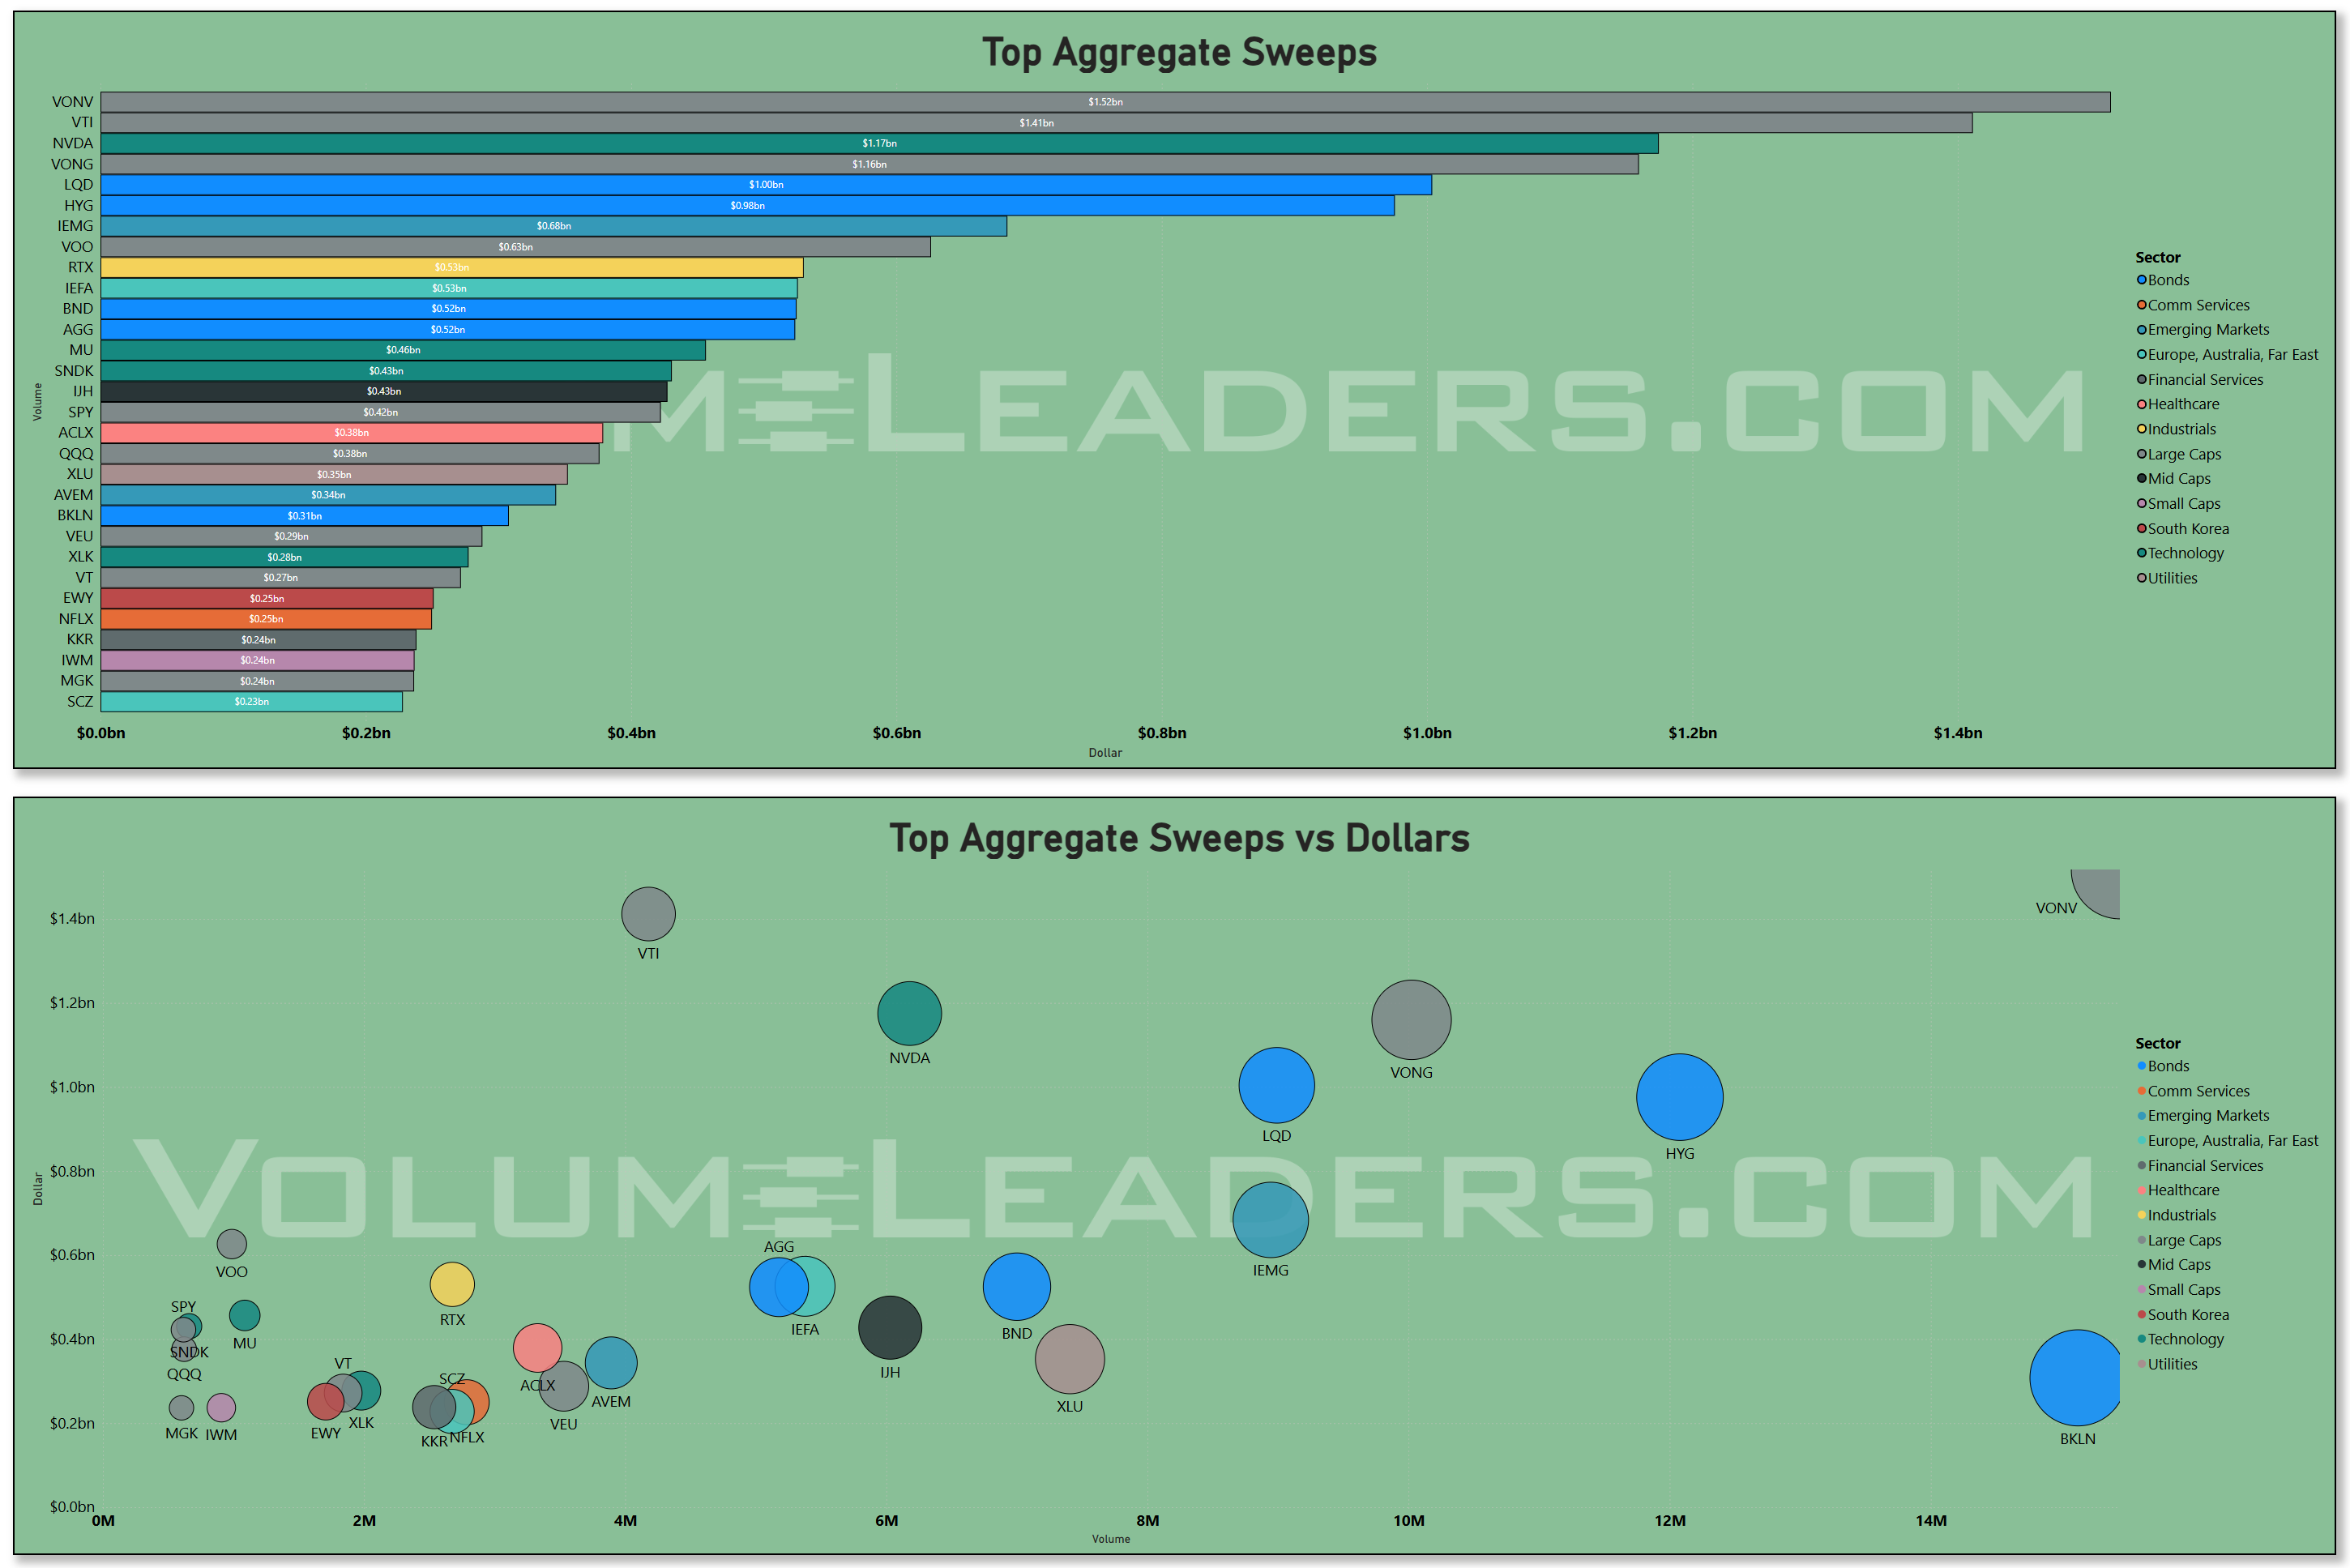
Sweeps tell the story of tactical overlay. VONV, VTI, and VONG lead the sweep dollar bars with roughly $1.4bn, $1.3bn, and $1.1bn, followed by LQD, HYG, and single names like NVDA and MU in the high hundreds of millions. Those are the instruments options desks and macro books use for quick directional and hedging moves. Combine that with the fact that broad realized volatility remains moderate, and you have a picture where hedging and chase behavior is happening at the index and factor level while single-name AI leaders absorb the bulk of the fundamental repricing.
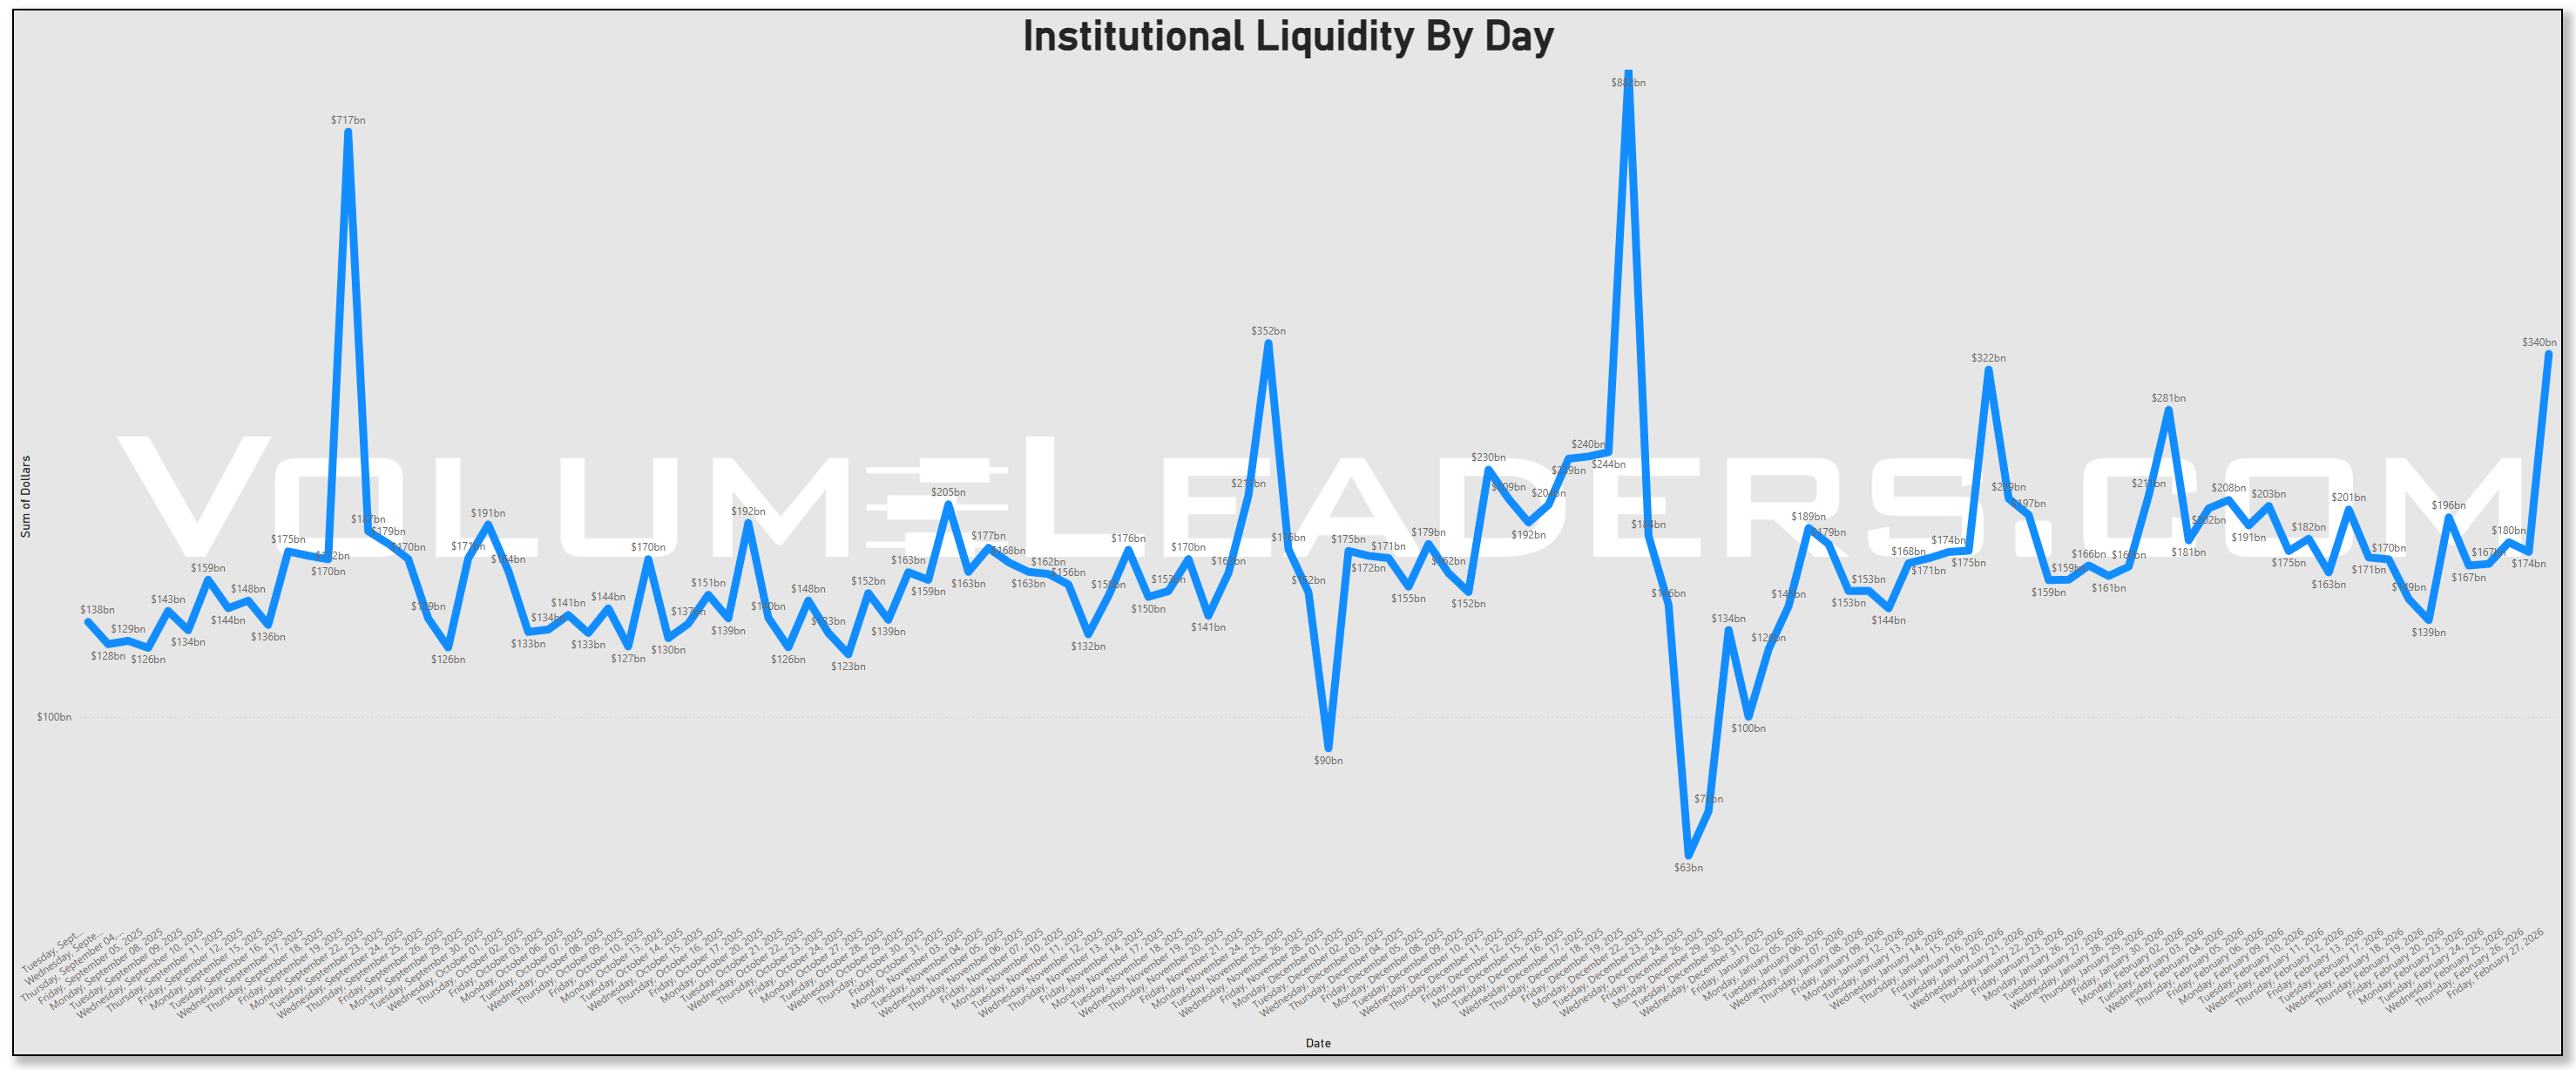
Institutional liquidity by day shows that Friday’s Tech surge corresponded with one of the higher participation days of the last few months, in the low-to-mid $300bn range, but still below the extreme $700–800bn spikes seen around major quarterly events. So this was a big, but not historic, liquidity day. That is consistent with a market handling heavy post-earnings and month-end flows smoothly, rather than one in which liquidity is being overwhelmed.
This appears to be an environment where growth and large-cap leadership are intact, risk appetite is positive, and credit is being accumulated rather than sold. The practical takeaway is that institutions took advantage of a high-liquidity window to make big adjustments in the AI and tech complex, while continuing to express core risk through SPY, QQQ, and quality growth, and pairing that with increased credit and financials exposure.
Net-net, the week looks less like a slow-building melt-up in Technology and more like a sharp, catalyst- and calendar-driven repositioning into an existing leadership theme. That supports staying aligned with the AI and large-cap growth trade, but with an added emphasis on respecting event-driven air pockets: after a 95bn day, the next leg will likely be more two-way, with dark pools and sweeps giving the best early read on whether that flow resolved as net accumulation or distribution.
MIR Part 2: Individual Names From The Institutional Tape
VolumeLeaders tracks several proprietary signals designed to spotlight names drawing significant institutional interest. Below, we’ve surfaced the latest results and analyzed them to highlight emergent themes. If any of the sectors, narratives, or positioning trends resonate, the names mentioned here offer a strong starting point for deeper research and watchlist consideration.
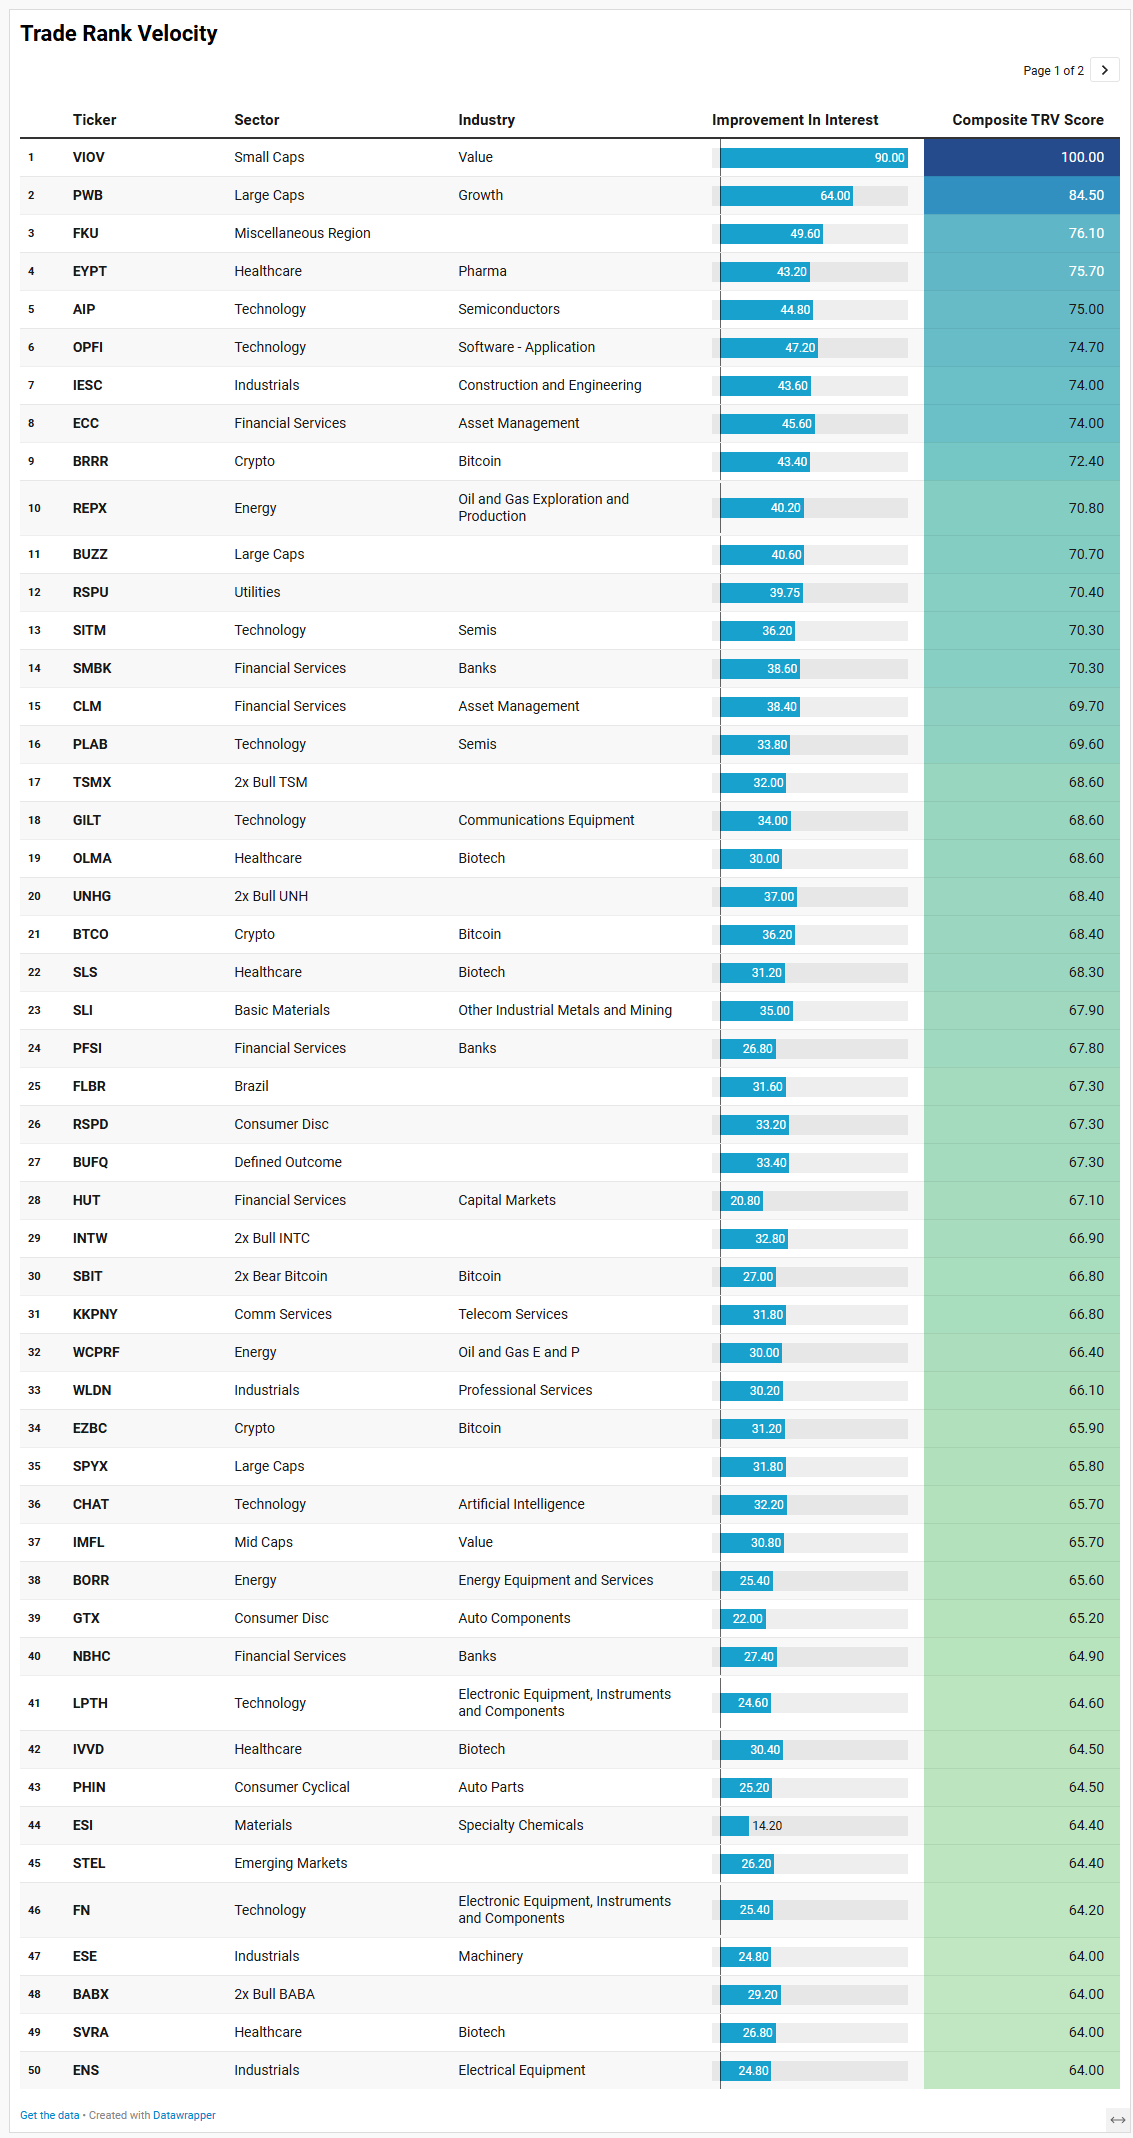
VL Trade Rank Velocity™ (TRV)
TRV is a proprietary metric that measures the recent acceleration or deceleration in institutional trading activity for a given stock by comparing its average trade rank over the past few days to its average in recent weeks. A sharp improvement in TRV typically reflects a notable shift in positioning, often accompanied by sustained trade activity, suggesting institutions are actively engaging with the name and that intensity of activity is rising. This often precludes meaningful price or narrative shifts. This isn’t a buy-list or sell-list; it’s meant to draw your eyes to names where institutions are putting money to work.
Two big themes jump off this week’s TRV list: the market is rotating down the cap spectrum into idiosyncratic growth and value pockets, and it is simultaneously leaning harder into the AI and semiconductor complex with both directional and hedged expressions.
At the very top, VIOV and PWB set the tone: small-cap value and large-cap growth. That pairing mirrors the broader flow picture we have been seeing – core capital anchored in quality growth, with a willingness to nibble in higher-beta value when liquidity and sentiment allow. VIOV’s top composite score, driven by a very sharp improvement in interest, says institutions are finally paying attention to the forgotten corners of small-cap value. PWB’s strong showing keeps the long-standing message intact: large-cap growth is still the benchmark that everything else is measured against.
Under the surface, the semiconductor and AI strip is clearly the most coherent single theme. AIP, SITM, PLAB, FORM, MTSI, AMKR, and the 2x vehicles tied to TSM and SNDK, plus the inverse SSG, all show up with high composite scores and a mix of fresh and sustained interest. You do not get that many mid-cap and small-cap chip names lighting up at the same time unless institutions are actively repositioning along the supply chain rather than just trading NVDA at the top of the stack. The presence of both levered bull products like TSMX and SNXX and the bear-side SSG suggests this is not one-way exuberance; it is active risk-taking and hedging around a sector that has become the macro hinge for the equity market. That fits neatly with the broader story of post‑earnings AI repricing and the enormous dollar flows we just saw in semis and related hardware.
Crypto-linked exposure is another clear cluster. BRRR, BTCO, EZBC and HUT all screen highly, with a mix of spot-adjacent products and capital markets plays. Alongside SBIT, the 2x bear Bitcoin vehicle, the list reads like a market that is leaning into crypto volatility rather than ignoring it. The combination of both bull and bear leverage suggests more of a trading environment than a simple beta grab, which makes sense given how sensitive digital assets remain to liquidity expectations and policy headlines.
Financials and real-economy cyclicals round out the picture. Asset managers (ECC, CLM, SLRC, VCTR), regional and specialty banks (SMBK, PFSI, NBHC), and life insurance (FG) all show high composite scores, echoing the sector-level flows that have been quietly building in financials. That is exactly the kind of positioning you would expect if investors are leaning into carry and normalized credit risk rather than bracing for an imminent recession. On the industrial side, IESC, WLDN, ESE, ENS, ISSC, KAI, SXI, PH, GWW, EPAC, ATS, CSW, AMPX and other machinery and electrical equipment names reinforce the idea that capital is rotating into real-world capex and infrastructure beneficiaries, not just software and chips. The presence of uranium (URA), specialty chemicals (ESI, SOLS), and metals/mining (SLI, USAS, ORLA) adds a commodity and energy-transition angle to that cyclical bid.
Healthcare and biotech are a quiet but persistent undercurrent. EYPT, OLMA, SLS, IVVD, SVRA, CAPR, RAPP, ABUS, ALMS, TECX, BIOA, GRAL, PACS and EHAB span everything from early-stage biotech to medical facilities and diagnostics. That breadth, combined with decent sustained-activity scores, suggests a broad stock-picking tape where capital is hunting for asymmetric outcomes rather than making a top-down sector call. It matches a volatility regime where downside has been contained enough to support single-name risk-taking in more speculative areas.
Finally, there is a noticeable presence of defined-outcome and income-oriented products – BUFQ, TSLY, SPYX, GRNJ, BFEB, EAGL, PDBA, BRTR. That is consistent with an environment where investors want equity and thematic exposure but are increasingly thoughtful about path and drawdown, using structure and options overlays rather than just raw beta.
Taken together, the TRV list says the same thing the bigger flow work has been saying, but with more granularity: institutions are still anchored in large-cap growth and AI, are pushing further out the risk curve into smaller semis, crypto, and selective cyclicals, and are funding that by rotating within sectors rather than abandoning risk. It is a market that rewards alignment with the AI and quality-growth spine, but increasingly offers interesting satellite opportunities in small-cap value, industrial capex plays, and idiosyncratic biotech – provided you respect the fact that much of this activity reflects active, two-sided risk-taking rather than passive trend-following.
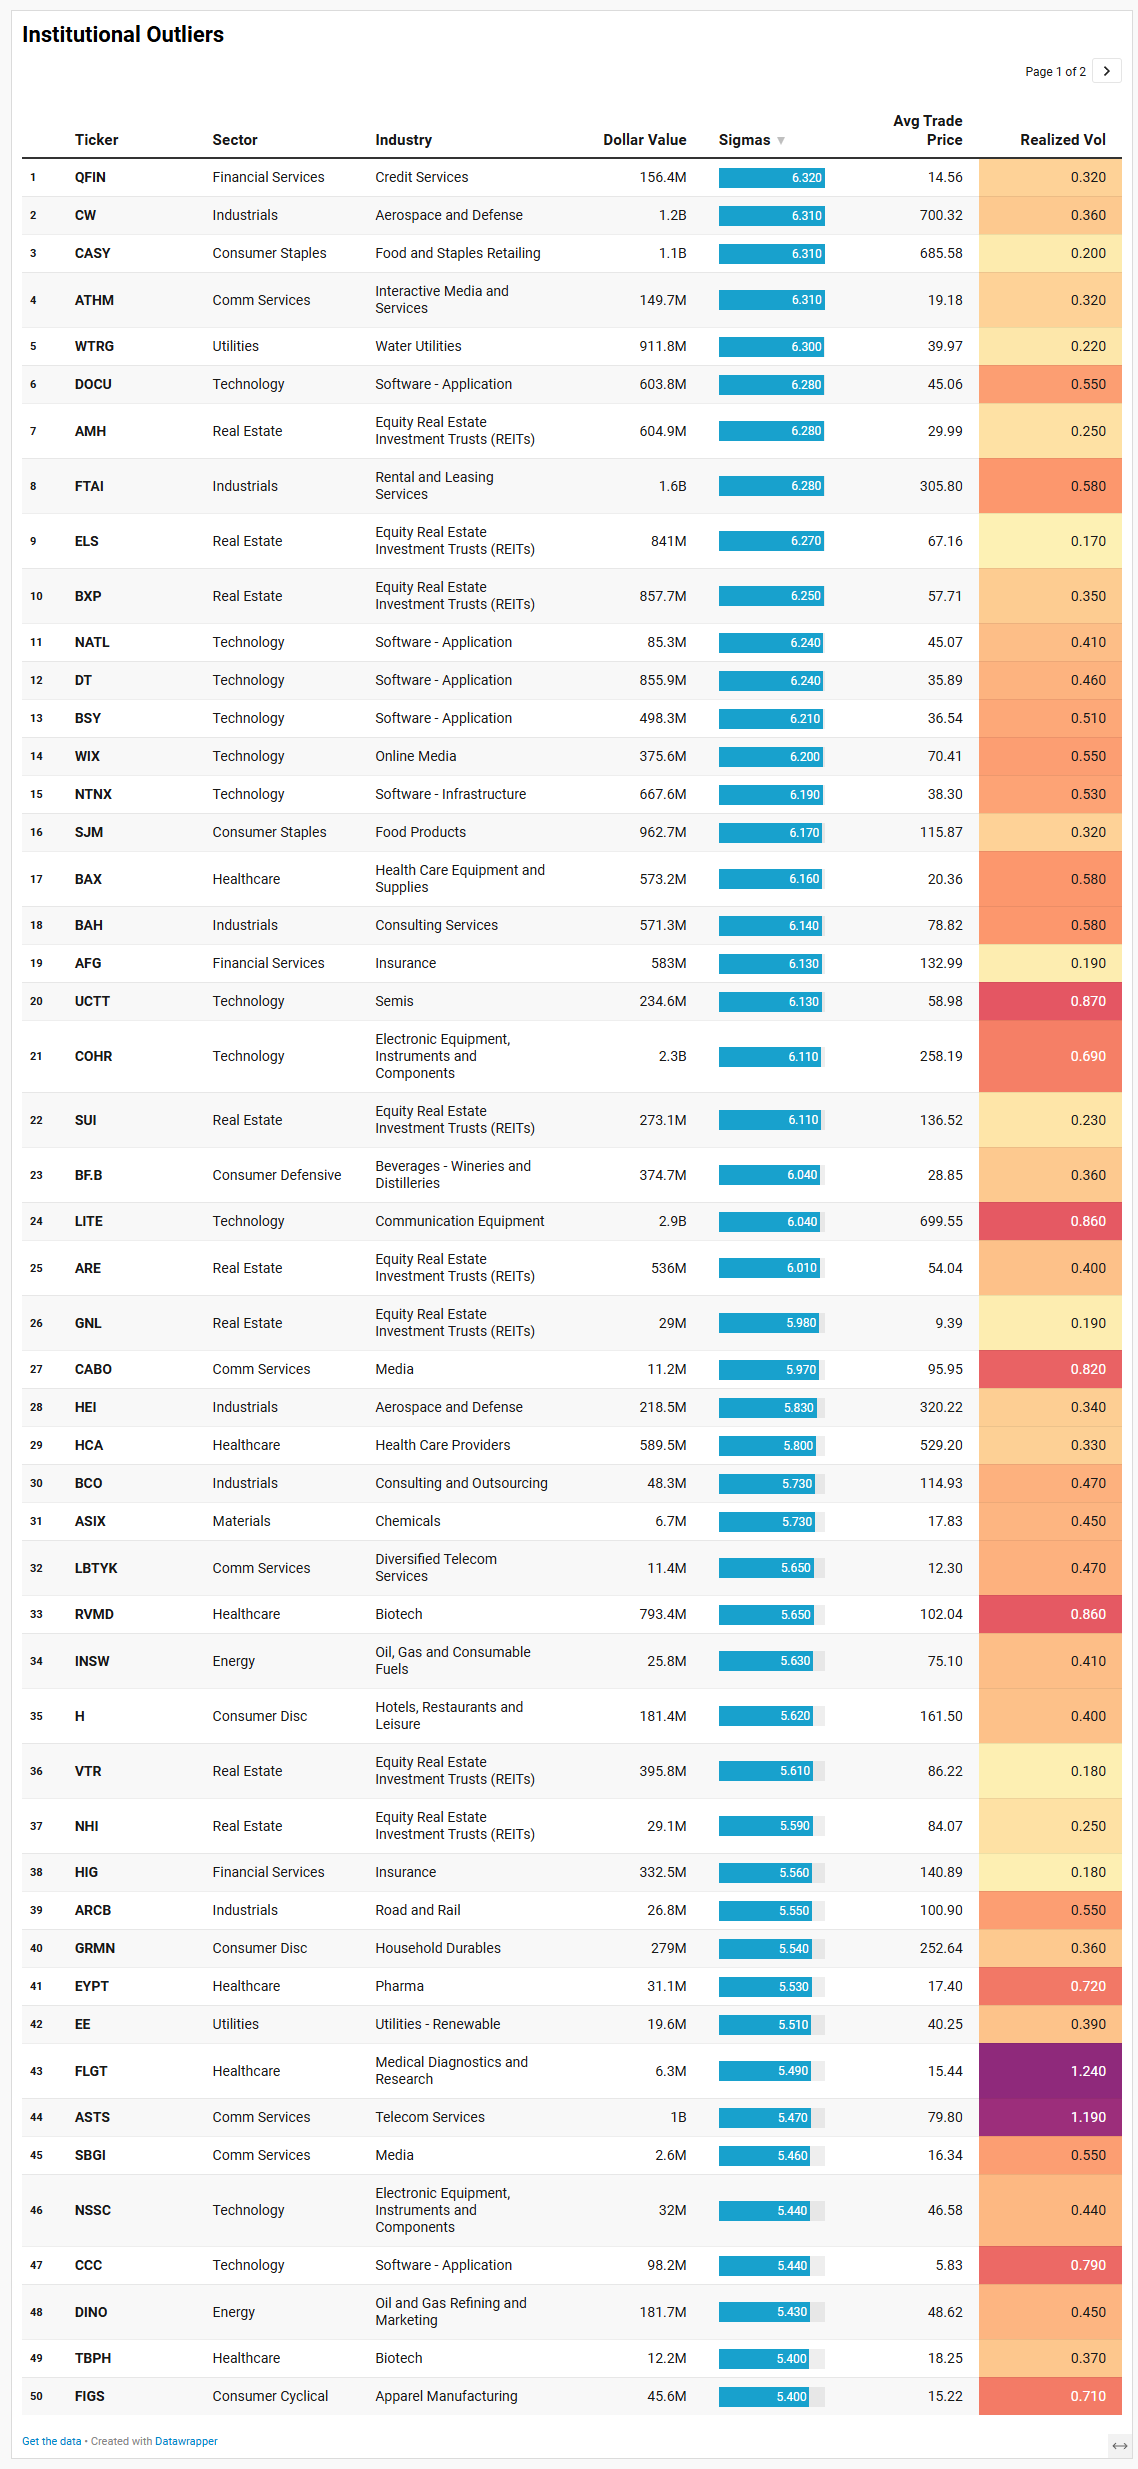
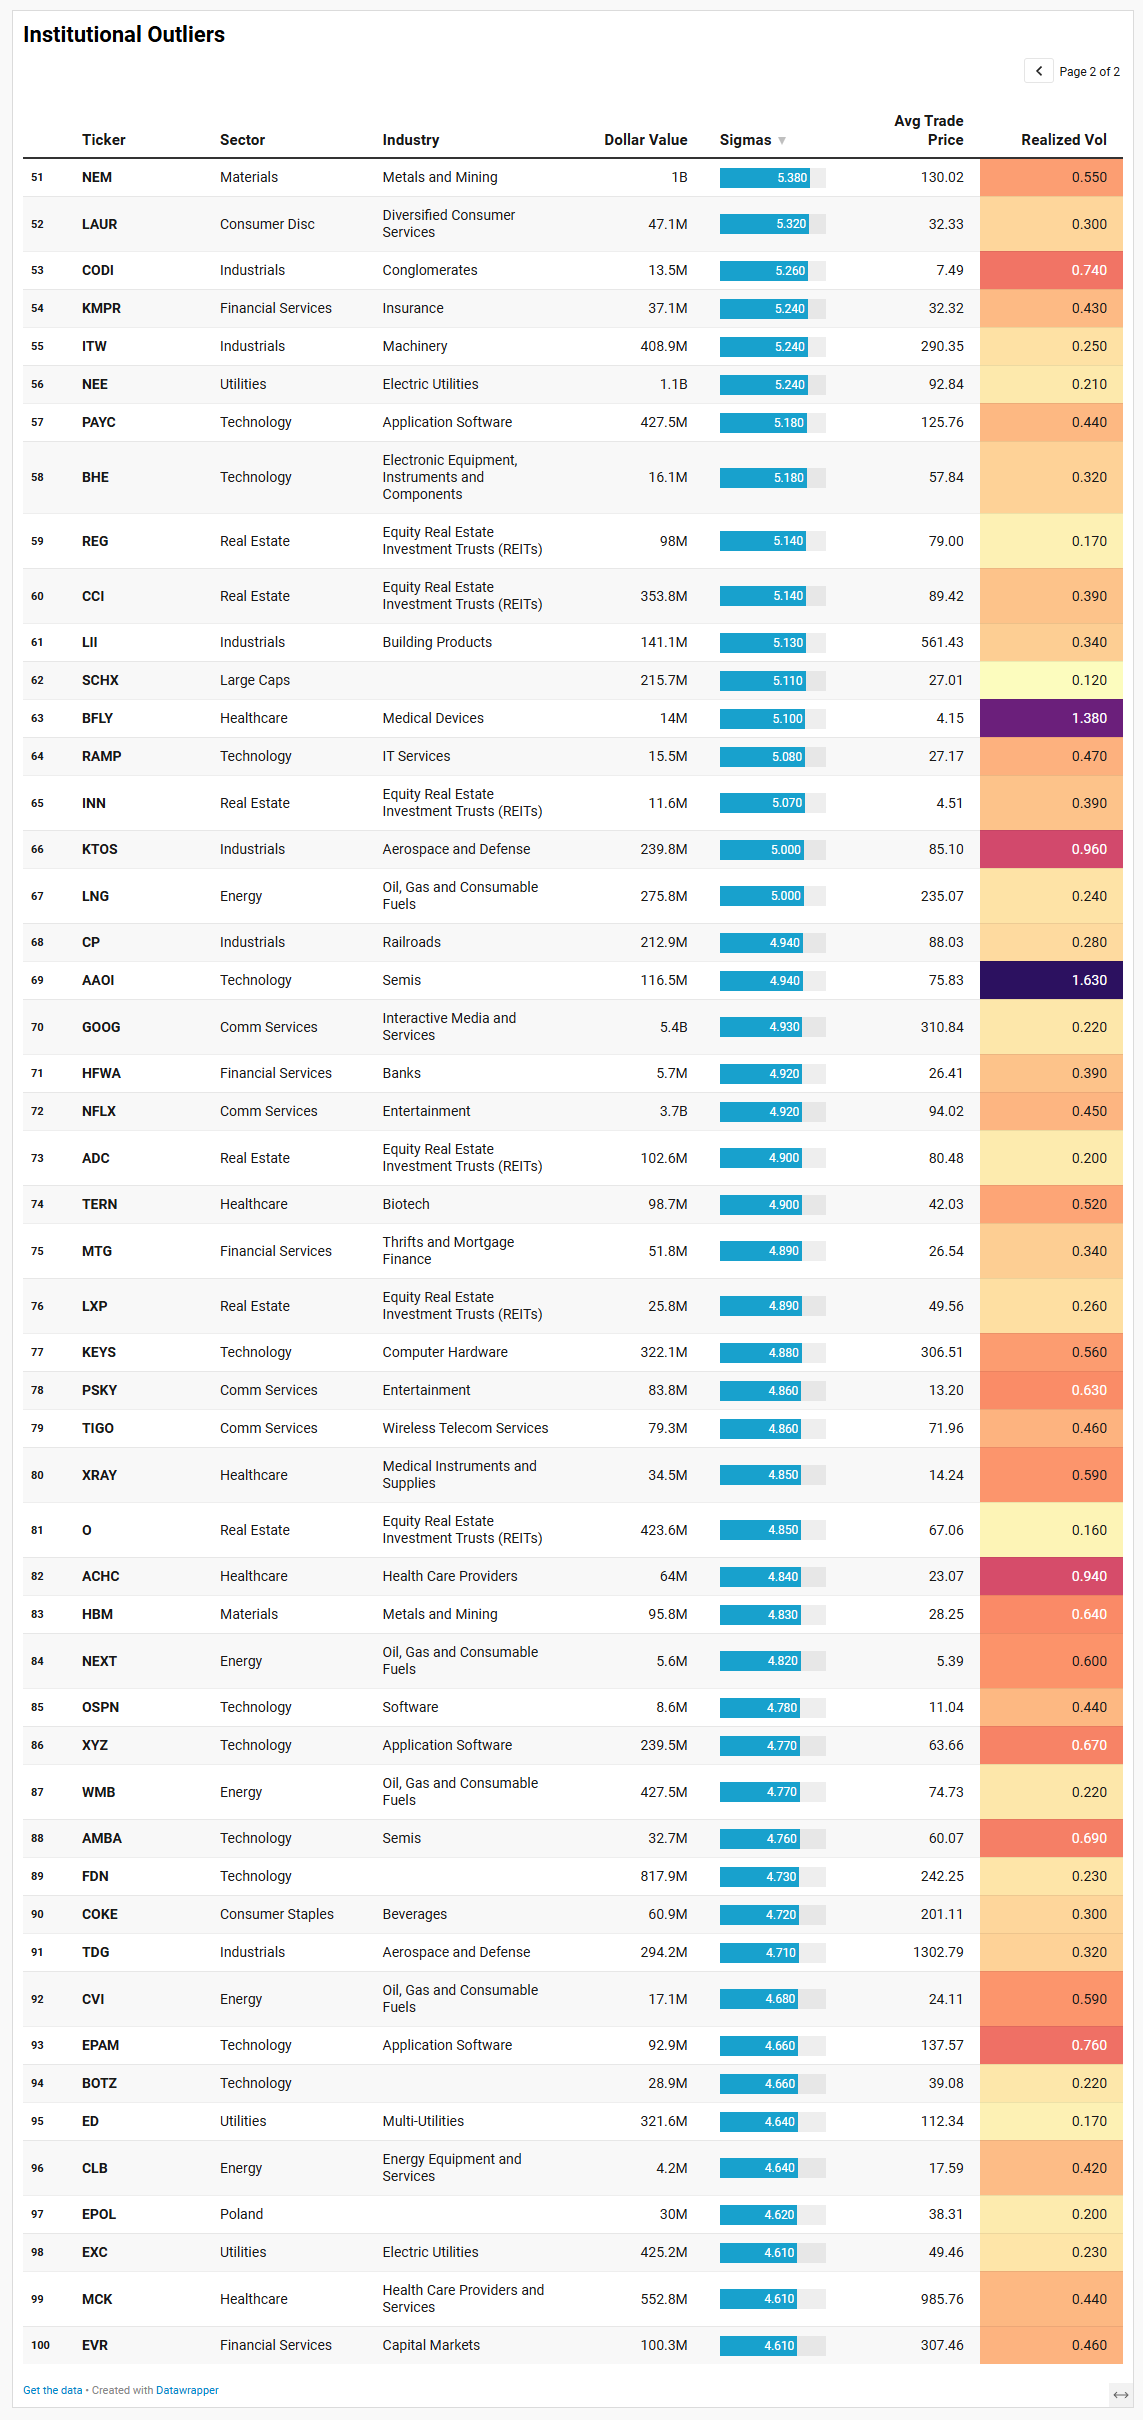
VL Institutional Outliers™ (IO)
Institutional Outliers is a proprietary metric designed to spotlight trades that significantly exceed a stock’s recent institutional activity—specifically in terms of dollar volume. By comparing current trade size against each security's recent normalized history, the metric flags outlier events that may indicate sudden institutional interest but may be missed because the activity doesn’t raise any flags/alerts when comparing the activity against the ticker’s entire history. For example, it’s conceivable that a ticker today receives the largest trade it has had in the last 6 months but the trade is unranked and would therefore be missed by current alerts built off Trade Ranks. Day traders can use “Realized Vol” to identify tickers that are moving swiftly with large price displacement while others can use it to size your risk appropriately.
The IO list paints a different, but complementary, picture to the TRV ranks. Instead of emergent interest building in smaller, idiosyncratic names, this is where capital came in unusually hard and fast on a single day – the kind of tape where you ask whether this was structural repositioning, event-driven repricing, or just big hands taking advantage of Friday’s month-end liquidity.
A major theme is an institutional reach into “real economy” cash-flow franchises with surprisingly tame realized volatility. Look at CASEY’s General Stores (CASY) at about 1.1B dollars with realized vol around 0.20, Smucker (SJM) at roughly 963M with 0.32 vol, and Brown-Forman (BF.B) near 375M at 0.36. These are sleepy consumer staples that typically live far from the spotlight, yet they sit near the top of the sigma rankings. That smells like long-only and asset-allocation money adjusting defensives in size, not short-term spec. On the industrial side, names like CW (~1.17B), FTAI (~1.61B), HEI (~218M), ITW (~409M), TDG (~294M), and CP (~213M) all print 5–6 sigma days on modest volatility. Together with machinery and logistics names, that is a strong nod toward aerospace, transportation, and industrial capex beneficiaries – very much in line with the broader flows into industrials and capex plays we saw in the TRV list.
Real estate is another cluster that stands out. AMH, ELS, BXP, SUI, ARE, GNL, VTR, NHI, REG, CCI, LXP, INN and O all show five-sigma or better outlier activity, with dollar values ranging from tens of millions to almost 900M and realized vol mostly sub‑0.4. That is not panic in property; it looks like institutions re‑underwriting REIT exposure—possibly rotating between residential, healthcare, and specialty REITs as the rate path and growth outlook evolve. The presence of water and utility names like WTRG (~912M), NEE (~1.11B), EE, ED, and EXC adds to that defensive, yield-sensitive theme. It dovetails nicely with the sector data showing a quiet bid in bonds and bond-proxy equities.
Tech shows up here too, but in a different guise than the high-flying AI megacaps. DOCU, NTNX, DT, BSY, WIX, FDN, PAYC, EPAM, and a host of hardware and component names—LITE (~2.90B), COHR (~2.31B), KEYS (~322M), AAOI, AMBA, UCTT, NSSC, BHE—are all printing multi-sigma days. Realized vol in this group ranges from the low 0.4s to around 1.6, so this is where the tape is more two-way. Taken together with the TRV semis and AI hardware cohort, you get the sense of a full-stack rotation: from the flagship data-center names at the top of the market to opticals, specialty components, and second-tier software. Some of that is likely follow-through from Nvidia’s earnings and guidance reinforcing AI infrastructure demand all the way down the supply chain.
Healthcare and biotech are another strong motif, but here the emphasis tilts toward event risk and stock-specific repricing. RVMD (~793M), HCA (~589M), MCK (~553M), BAX (~573M), and a long tail of smaller biotech and medtech names (TERN, TBPH, FLGT, BFLY, XRAY, ACHC, EYPT again) all see outlier flow. Volatility is noticeably higher for some of the smaller names—FLGT at 1.24, BFLY at 1.38, AAOI at 1.63—suggesting these are “something happened” tapes rather than quiet accumulation. That contrasts nicely with the lower-vol, more “utility-like” flows in staples and REITs.
Communications and media show a mix of structural and tactical activity. GOOG itself prints over 5.4B dollars at nearly 5 sigma with very low realized vol around 0.22, while NFLX logs roughly 3.7B at 4.9 sigma. Around them sit lower-cap telecom and media plays like ASTS (~1.0B with 1.19 vol), CABO, LBTYK, SBGI, PSKY, TIGO and ATHM – all with elevated sigma scores and moderate to high vol. That combination looks like a bit like a barbell to me: big, steady index-constituent flow in GOOG and NFLX consistent with their leadership roles, and high-beta satellites being traded more aggressively as satellites around that core possibly.
Energy and materials round out the IO theme with a commodity flavor: NEM (~1.00B), LNG (~276M), WMB (~427M), DINO, INSW, CVI, CLB, HBM and NEXT all show up with 4.6–5.4 sigma days. None of them has extreme realized volatility by recent standards, implying that this is more about sector rebalancing around commodity price shifts than forced liquidation or manic chase.
In aggregate, the IO list says that Friday’s month-end was a “big rotation” day: large, low-vol blocks in defensives, REITs, utilities, and industrial champions; more volatile, event-driven risk in second-tier tech and healthcare; and continued core flow into GOOG and NFLX. Layered on top of the TRV and sector data, it reinforces the idea of a market that is still pro‑risk at the index and AI core, but is actively re‑shaping exposures under the surface—adding quality cash-flow names, upgrading defensives, and trading around the more speculative edges rather than abandoning risk altogether.
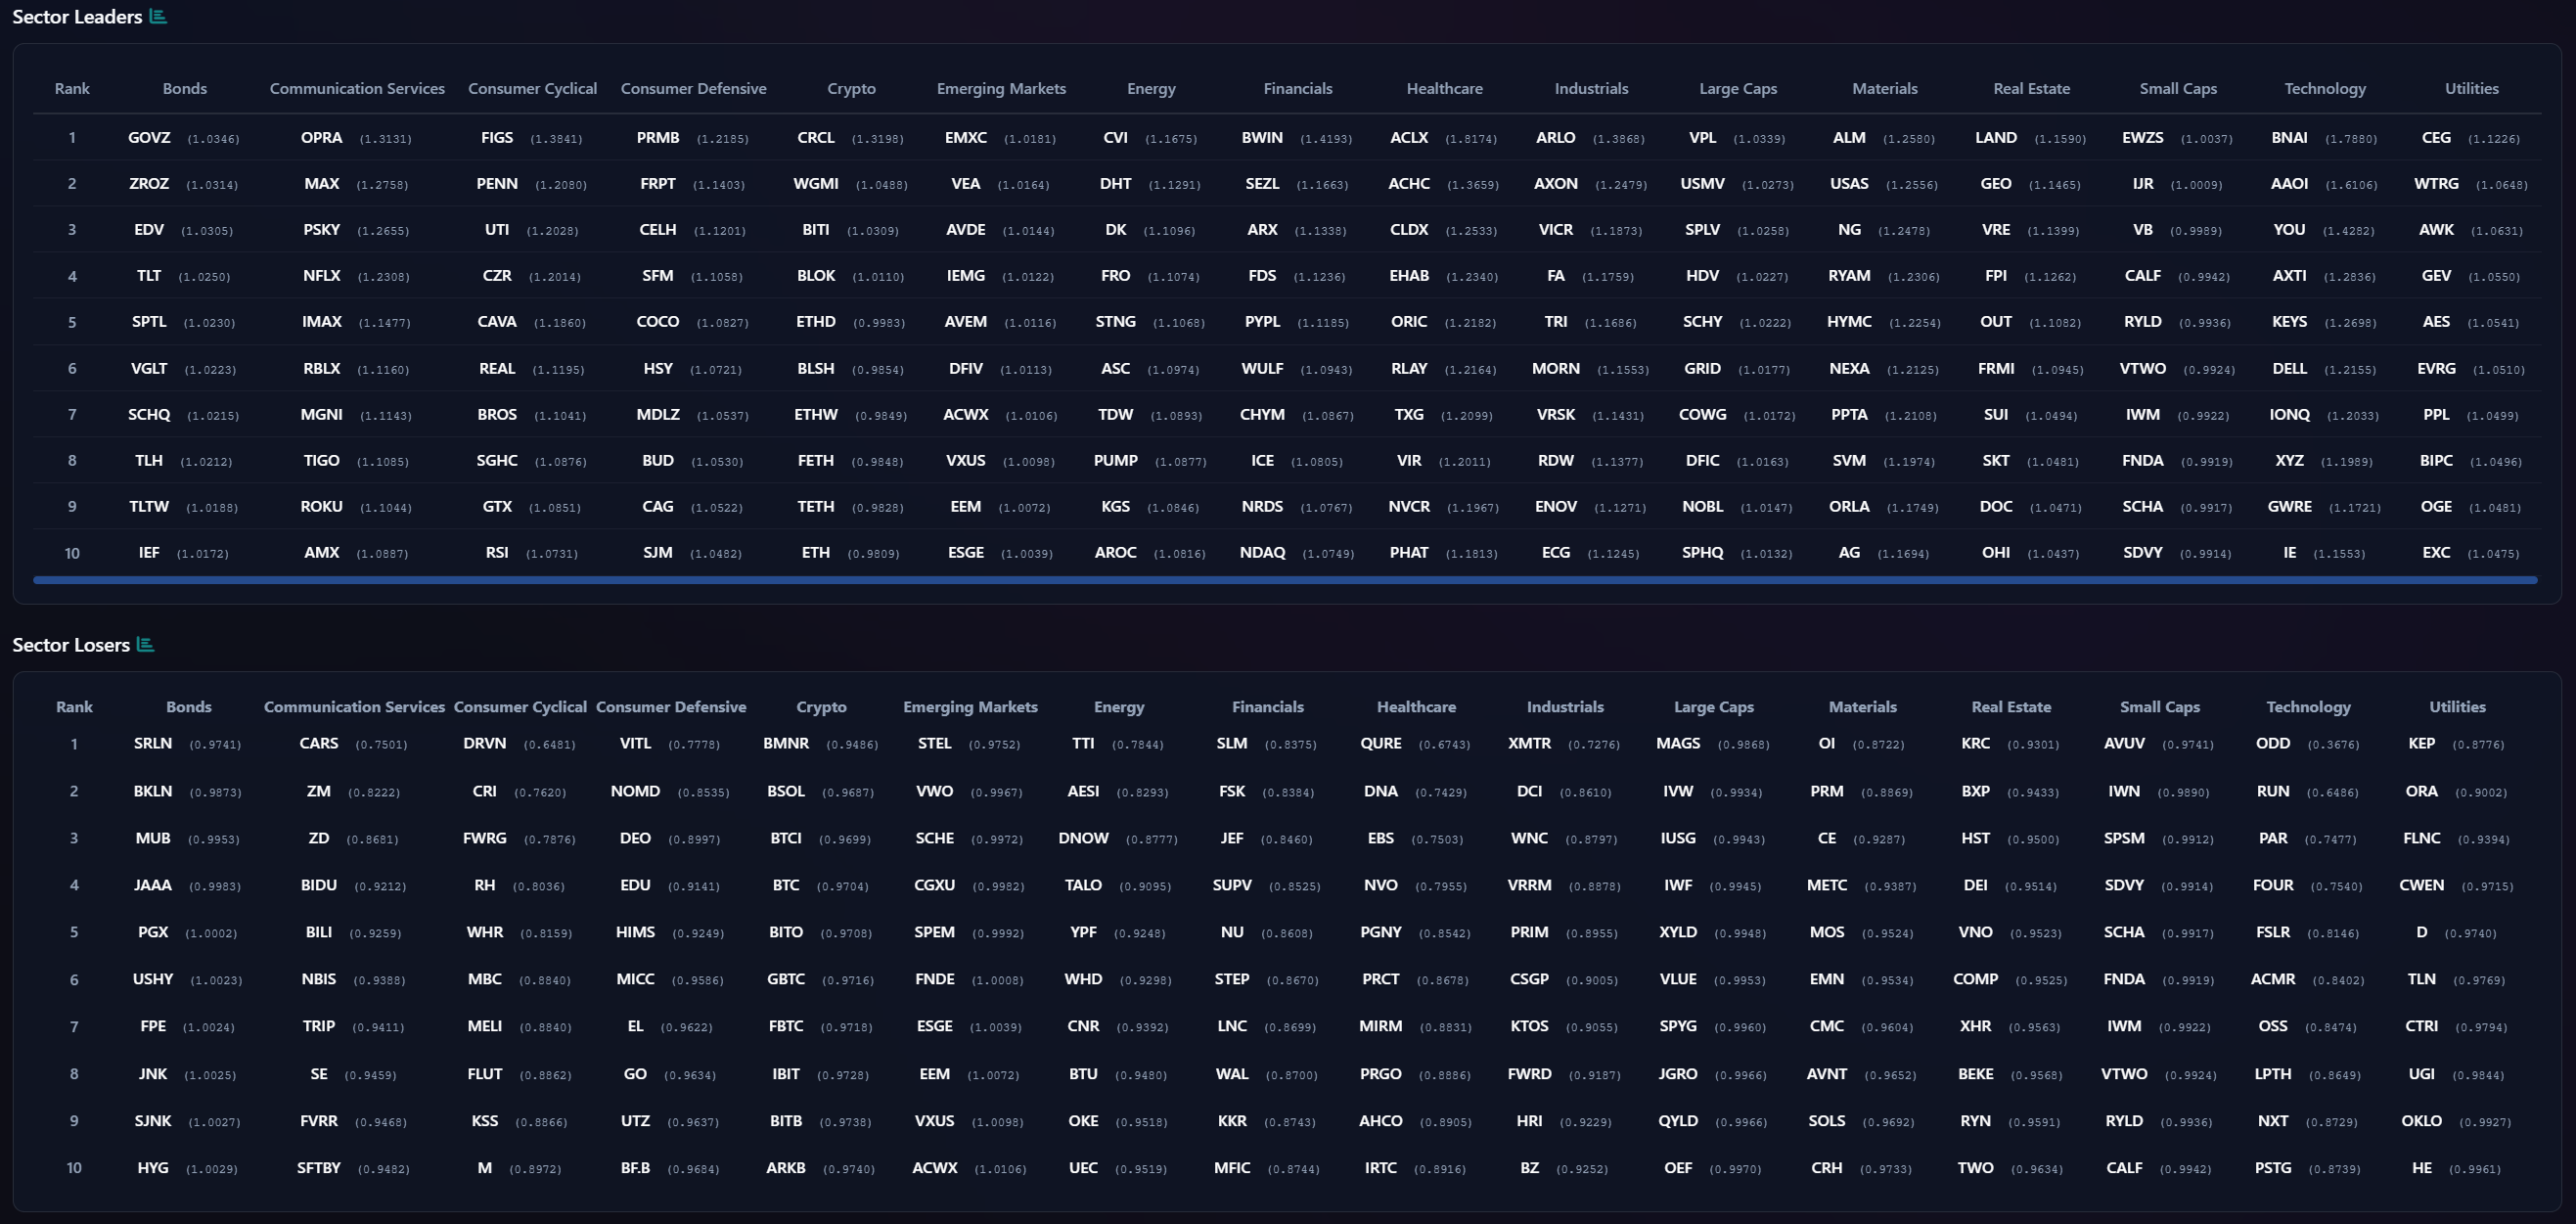
VL Sector Leaders
VL Sector Leaders is a weekly snapshot of where true leadership is asserting itself inside the market, stripped of the distortions that come from broad, style-mixed indices. Rather than asking which stocks look strong in absolute terms, this list focuses on which names are outperforming within the environments they actually compete in.
Each week, we surface the ten stocks demonstrating the most persistent relative strength inside their respective sectors. These are not headline chasers or one-day wonders. They are names that continue to separate themselves from peers through real price behavior, often reflecting sustained demand rather than fleeting attention.
For day traders, this list is a powerful awareness tool. Sector Leaders tend to offer cleaner intraday structure, better follow-through, and more predictable reactions around key levels because they already sit on the right side of relative strength. Even on choppy tape, leadership names often remain tradeable while the rest of the market degrades.
For swing traders, VL Sector Leaders helps narrow the universe to stocks with the highest probability of staying relevant. Relative leaders are more likely to hold trends, survive pullbacks, and reassert themselves after consolidation. When markets rotate, these names are often among the first to resume leadership — or the last to break.
The Sector Leaders board confirms that this market still wants quality growth and structural cash flows, but it has broadened enough that you no longer have to live exclusively in the mega-cap AI complex to find leadership.
Across bonds and bond-proxies, the leadership list is full of high-grade government and duration sleeves rather than junk beta. GOVZ, ZROZ, EDV, TLT and SPTL sit at the top of the bonds column, while utilities leaders include CEG, WTRG, AWK, AES, EVRG and EXC. That is exactly the mix you would expect in an environment where inflation is cooling, the front end is repricing a slower pace of cuts, and investors are happy to own duration and stable cash flows as ballast. It lines up cleanly with the institutional outlier flows we saw into bond ETFs and defensives, and with the broader decision framework that has been flagging lower realized downside volatility in these areas.
In Communication Services, the leadership list is stacked with quality growth and network effects. OPRA and MAX set the tone at the top, followed by names like PSKY, NFLX, IMAX, RBLX, MGNI, TIGO and ROKU. That mix – digital advertising, streaming, gaming, niche media and telecom – sits right on top of the aggregate dollar flows where GOOG, META and NFLX were dominant. It tells us leadership is not just in the mega-cap platforms; it is also filtering into mid-cap plays that ride the same secular demand for attention and bandwidth. The presence of multiple streaming and creator-economy names reinforces the idea that this is a “time spent online” trade as much as a pure AI trade.
Consumer-facing leadership is bifurcated between higher-beta cyclicals and surprisingly resilient staples. On the cyclical side, Figs, Penn, UTI, CAVA, CAVA, REAL and HSY appear among the leaders, alongside auto and specialty retail like GTX and CAG. These are not the classic big-box bellwethers; they are targeted exposure to specific themes such as athleisure, gaming, experiential dining and niche retail. That speaks to a consumer tape where wallet share is fragmenting, but still being spent. On the defensive side, PRMB, FRPT, CELH, SFM, CAVA, COCO and MDLZ show that the market still rewards staples with a growth angle – pet, health-oriented beverages, natural foods and “affordable premium” categories.
Within Energy, leadership tilts toward names with leverage to infrastructure and midstream dynamics rather than pure wildcat beta: CVI, DHT, DK, FRO, STNG, ASC, TDW, PUMP and KGS. This dovetails with the flows we saw in the outlier list toward LNG, WMB and refined-product plays and with a macro backdrop where crude is range-bound but transport, shipping and refined-product margins matter. Financials leaders such as BWIN, SEZL, ARX, FDS, PYPL, WULF, CHYM and ICE skew toward asset managers, exchanges, specialty finance and select digital-payments names – a tilt toward fee-based, flow-sensitive franchises rather than pure credit spread bets.
The Industrials and Materials columns are full of companies tied to capex, reshoring and infrastructure: ARLO, AXON, VICR, FA, TRI, MORN, VRSK, ENOV and NOBL on the industrial side, and ALM, USAS, NG, RYAM, HYMC, NEXA, PPTA, SVM and ORLA on the materials side. This is precisely the capex and “picks and shovels” theme that has been popping up in the TRV and IO lists – optical components, process-control equipment, specialty chemicals and metals that benefit from both industrial demand and energy transition spending.
On the equity-style side, large-cap leaders like VPL, USMV, SPLV, HDV, SCHY, GRID, COWG and DFIC point to a preference for low-volatility and quality tilts within the large-cap universe, which squares with a realized volatility backdrop that rewards stable factor exposures. Small-cap leaders such as EWZS, IJR, IWM, CALF, RYLD, VTWO, FNDA and SCHA show that participation has broadened into small caps, but with a bias toward value, quality and covered-call income strategies rather than raw small-cap beta.
Technology leadership is strikingly consistent with everything else we have seen. BNAI, AAOI, YOU, AXTI, KEYS, DELL, IONQ, XYZ and GWRG dominate the column – a mix of AI infrastructure, opticals, cloud data, testing and niche hardware. These are exactly the types of names that have been lighting up TRV and IO screens and absorbing substantial institutional liquidity. The message is that while the megacap AI names still anchor the narrative, the leadership baton is steadily being passed down the stack to the enablers and component suppliers.
Taken together, the Sector Leaders board confirms a regime where leadership clusters around three poles: AI and digital infrastructure, quality cash-flow franchises in defensives and bond proxies, and real-economy capex beneficiaries. The losers list, by contrast, is dotted with more speculative small caps, weaker financials and laggard tech, underscoring that the market is not indiscriminately risk-on. It is rewarding quality and structural growth while gently but firmly pushing capital out of lower-quality, late-cycle and overcrowded corners of the tape.
MIR Part 3: Framing-Up A Trade
This week’s tape says “stay risk-on, but refine the expression.” The combination of breadth, sentiment, sector leadership, and flow argues for leaning into the AI and large‑cap growth spine, pairing it with capex and industrial plays, and wrapping the whole thing with duration and quality income. The key is to respect how much capital just moved around Nvidia, semis, REITs, and defensives into month‑end and to let that guide both sizing and where to demand a margin of safety.
Here is how I would frame the book for the week, expressed as sleeves. Percentages are portfolio weights, not conviction scores.
Core Index and Growth Spine – 35 percent
This is the anchor. I want broad large‑cap exposure plus explicit overweights to the AI and platform leaders that sit at the center of every flow and leadership board.
15 percent SPY or VOO: core S&P 500 beta, capturing the continued institutional preference for large caps and the healthy breadth we saw in the S&P. This is the ballast that benefits from the general pro‑risk regime and institutional liquidity without overfitting to any one theme.
10 percent QQQ: concentrated in the secular growth and communication platforms that led both aggregate and dark‑pool flows. This aligns with the leadership in Communication Services and Technology and keeps you tied to the AI and cloud complex without going all single‑name.
10 percent equal-weight AI/megacap basket: NVDA, MSFT, AAPL, AVGO, GOOGL, META in roughly equal slices. This sleeve is the deliberate tilt toward the high‑dollar, high‑liquidity names that institutions keep using as their primary expression vehicles. Nvidia’s earnings and the follow‑through in semis and cloud justify staying overweight, but I would size it so that a sharp post‑event shakeout is a drawdown, not a portfolio event.
AI Infrastructure and Semis Down the Stack – 20 percent
Flows and TRV/IO lists say the baton is moving into the supply chain: opticals, test, power, and second‑tier chip names. This is where the alpha lives if the AI build‑out remains in acceleration mode.
8 percent broad semis via SOXX or SMH: captures the structural demand without over‑concentrating in a single vendor, and reflects the continued sector‑level leadership.
8 percent hand‑picked hardware/optical/component names: think LITE, COHR, KEYS, MTSI, AMKR, PLAB, SITM in modest individual sizes. These showed up across leadership, TRV, and IO as places where smart money is moving size, suggesting a transition from “concept” to “line item” in institutional models.
4 percent tactical leverage/hedge sleeve: a mix of small positions in TSMX (2x TSM), another liquid bull or bear semi ETF (like SSG on the short side), and perhaps a small BOTZ allocation. This is not a leverage fetish; it is a recognition that the options and sweep tape is very active here. I would keep gross leverage low but use these as tools to lean into or fade short‑term dislocations without touching the core.
Capex, Industrials, and Energy Infrastructure – 15 percent
The leadership and outlier lists are full of aerospace, machinery, logistics, and midstream/transport names. That is where real‑economy cash flows meet the AI and reshoring story.
10 percent diversified industrial/capex basket: ITW, TDG, HEI, CW, FTAI, KAI, ATS, GWW, and a rail like CP. Each would be small (1–1.5 percent) but together they give exposure to aerospace, process equipment, leasing, and logistics. These names showed unusually strong institutional interest with moderate volatility, which is exactly what you want in a cyclical sleeve.
5 percent energy/midstream and materials: LNG, WMB, DINO, NEM, plus a uranium or specialty-metal play like URA or SLI. This sleeve balances the capex theme with commodity leverage that has seen notable outlier flow but remains under-owned relative to tech.
Financials, Credit, and Income – 15 percent
Flows into banks, insurance, credit ETFs, and bond proxies say investors are pairing growth risk with carry rather than hiding in cash.
6 percent financials: XLF plus selected names like BAC, JPM, AFG, HIG, and a high‑quality asset manager. This targets the mix of fee and spread income that benefits from a stable, non-recessionary backdrop.
6 percent investment‑grade and high‑yield credit: a split between LQD and HYG. Both showed large dollar sweeps and dark‑pool interest, indicating that they are core building blocks in institutional portfolios. They also improve the portfolio’s income profile and help cushion equity volatility if the AI complex wobbles.
3 percent income/defined‑outcome wrappers: something like TSLY for TSLA income exposure, a buffered equity ETF (BUFQ), or an ESG‑tilted low‑carbon index such as SPYX. This acknowledges the demand for path‑controlled equity exposure and makes the overall risk profile more palatable without abandoning upside.
Defensives, REITs, and Bond Proxies – 10 percent
The IO list screams “big quiet flows” into REITs, utilities, water, and high‑quality staples. I want this sleeve as both ballast and optionality if growth wobbles.
5 percent REIT mix: AMH, ELS, BXP, VTR, REG, O and perhaps a broad REIT ETF. The idea is to lean into where outlier flows are repricing the space, especially in residential and healthcare where fundamentals are most resilient.
3 percent utilities and infrastructure: NEE, WTRG, ED, EXC, plus a utility ETF. These names offer yield, low realized volatility, and a structural role in energy transition and grid spending.
2 percent quality staples and consumer defensives: CASY, SJM, BF.B, maybe COST or WMT via an ETF if you prefer. These showed up as outlier buys with low vol, suggesting institutions are quietly building positions as a counterweight to growth risk.
Tactical/Idiosyncratic Risk Sleeve – 0-5 percent
This is where the small‑cap, crypto‑adjacent, and biotech TRV names live – the stuff that can move the needle but also needs tight risk management.
3 percent basket of high‑conviction TRV names: a mix drawn from VIOV, AIP and one or two of the better‑behaved biotech or industrial names (EYPT, OLMA, IESC). The idea is to express the broadening participation into smaller idiosyncratic stories without letting any single ticker dominate risk.
2 percent crypto and satellite trades: BRRR or BTCO on the long side balanced with a small SBIT position, plus one or two outlier comms/space plays like ASTS that saw heavy flows. This reflects the fact that institutional money is clearly trading these themes, but it keeps exposure in “optionality” size.
Cash/Short‑Term Bills – 0–5 percent
I would keep residual cash low, around 2–3 percent at most, primarily as dry powder rather than a defensive stance. The tape is still supportive, and the better hedge here is thoughtful construction—duration, defensives, and credit—rather than sitting out.
If major indices started to slip below large levels and markets started to sour, the first things I would tighten up are the extensions and the weakest links, not the core.
Here is how I would sequence it.
High‑octane AI and leverage
The very first trims would be the tactical and levered expressions around AI and semis: 2x vehicles (TSMX, SNXX, SBIT), satellite AI ETFs (BOTZ, narrower AI baskets), and any short‑dated options overlays that effectively give you turbo exposure. Those are great when the tape is cooperative, but they turn a normal pullback into a drawdown. If the indices start to sour, you want your AI exposure to live in liquid, unlevered names and broad funds, not gear.Speculative satellites and story stocks
Next would be the idiosyncratic, higher‑volatility satellites that sit far from the core index: small‑cap biotech, pre‑profit software, crypto‑linked equities, and thematic wrappers with thin liquidity. These are the names that gap first and come back last. I would cut position sizes there aggressively and concentrate risk in the higher‑quality part of the same themes (for example, move from small chip designers into the better‑capitalized semis and equipment).Cyclical beta without balance‑sheet strength
If the weakness starts to look more macro than just “AI hangover,” I would then trim lower‑quality cyclicals: second‑tier consumer discretionary, marginal industrials and materials, anything heavily dependent on cheap financing or a flawless growth path. Keeping the industrial/capex sleeve but upgrading it toward companies with strong cash flows and pricing power is the idea – you want the real‑economy exposure, but not the names that go illiquid on you when PMIs roll over.Tighten the core, keep the ballast
Only after cutting the edges would I touch the core: modestly reducing QQQ and single‑name megacap overweights, while keeping SPY/VOO and the quality factor intact. I would be slowest to touch the ballast sleeves – Treasuries, investment‑grade credit, utilities, and high‑quality staples/REITs – because those are what let you stay in the game while the indices work through a correction.
The overarching principle: shrink leverage and tail risk first, shrink speculative risk second, and only then resize the core growth bet – while keeping or even adding to the parts of the book that naturally benefit from a risk‑off or slower‑growth tape.
Otherwise, when framed this way, the portfolio stays aligned with the market’s perceived behavior right now: core exposure in large‑cap growth and AI, expanded down the stack into semis and capex, balanced by financials, credit, and income, and buffered with REITs, utilities, and staples. The tactical sleeve lets you participate in the more speculative edges the tape has highlighted, while the ballast sleeves make sure a sharp AI or small‑cap air pocket does not force you out of the trade just as the institutional flows are leaning your way. Good luck this week, VL-Squad!
Thank you for being part of this community and for investing your time in this week’s edition. The quality of this readership — thoughtful, disciplined, engaged — is what makes this work meaningful. I’m grateful to build alongside you. Here’s to a week of clarity, conviction, and well-executed opportunities.
— VolumeLeaders