Market Momentum: Your Weekly Financial Forecast & Market Prep
Issue 81 / What to expect Feb 23, 2026 thru Feb 27, 2026


Weekly Market-On-Close Report
U.S. Equities: Grinding Higher Through the Noise
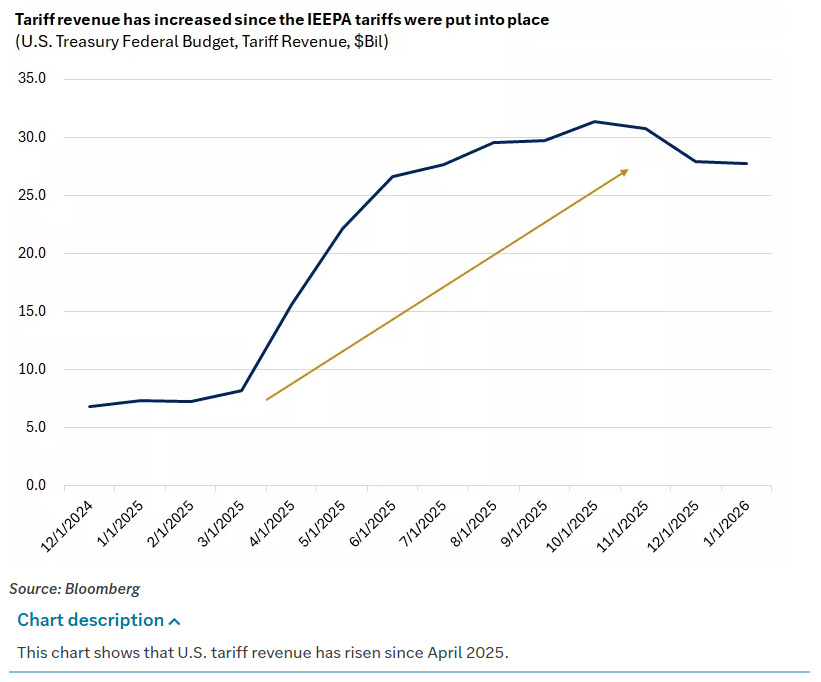
The past week gave us a pretty good snapshot of what this cycle has become: a market that wants to go up, but has to fight through a wall of macro headlines, policy uncertainty, and intermittent growth scares to get there. The headline event was the U.S. Supreme Court’s decision to strike down President Trump’s wide‑ranging IEEPA‑based tariffs, followed almost immediately by the administration’s move to re‑impose a 10% across‑the‑board tariff using Section 122. On paper that sounds dramatic. In practice, the equity market treated it as a modest clearing event rather than a shock. The S&P 500 finished the holiday‑shortened week around 6,910, up a little over 1%. The Dow ended near 49,626, up about 0.3%. The Nasdaq Composite did best, gaining about 1.5% and finally snapping a losing streak that had been in place since early January. Under the surface, sector rotation, factor chop, and macro nuance mattered a lot more than the headline tariff story.
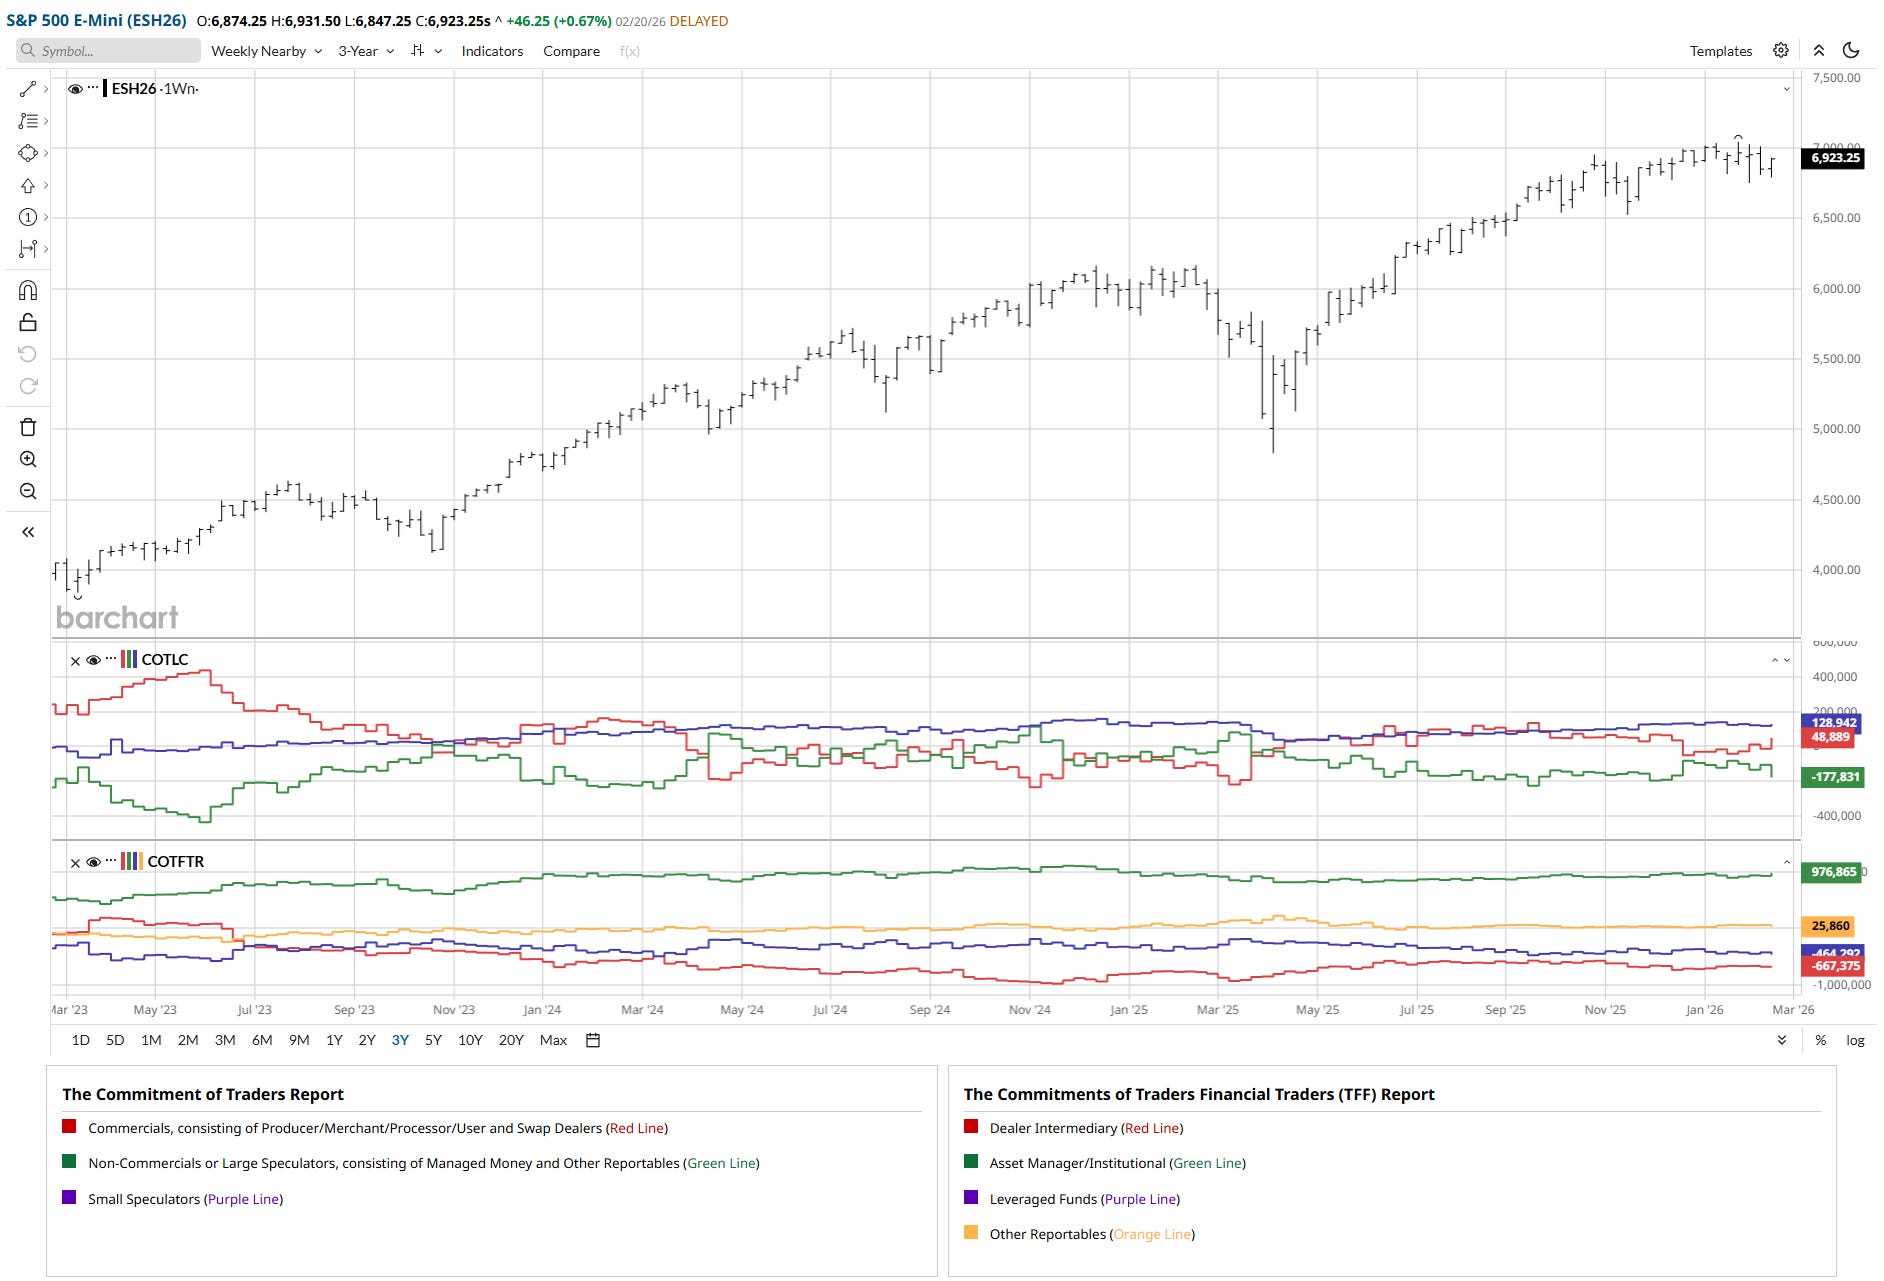
The E‑mini S&P 500 March 2026 contract (ESH26) told the same story in slightly different language. The contract settled near 6,923, up roughly 0.7% on the day, and its performance tables show a market that has been quietly grinding for months. Over the past three months, ESH26 is up about 4.7%, with a 52‑week gain north of 8% and a 1‑year low down in the 4,900s.
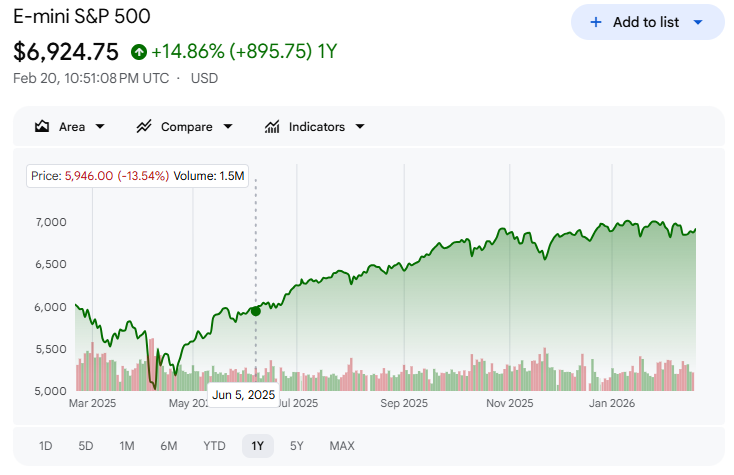
That is not the profile of an overstretched, late‑cycle tape; it is the profile of a market that has already absorbed a big move off the 2025 lows and is now consolidating those gains in a higher range. The 1‑month performance is more muted, up around 1.4%, reflecting the back‑and‑forth between growth scares and soft‑landing optimism that has characterized the early weeks of 2026.
What makes the futures picture especially interesting is how positioning has shifted. Commitment of Traders data as of February 17 show commercials running very large gross positions on both sides, with over 1.44 million contracts long and 1.40 million short. Asset managers, a subset of that commercial bucket, have leaned net long with more than 1.16 million longs against about 183,000 shorts, adding over 50,000 long contracts week‑over‑week. Non‑commercial traders, by contrast, are significantly net short, with around 196,000 longs against 374,000 shorts. In plain English, real‑money institutions are still using equity futures as their primary way to express bullish exposure, while speculators have been fading the rally. That kind of split is exactly what you want to see if you’re looking for a market that can climb a wall of worry: the people who matter for trend are adding, while fast money is giving you fuel for squeezes on every upside surprise.
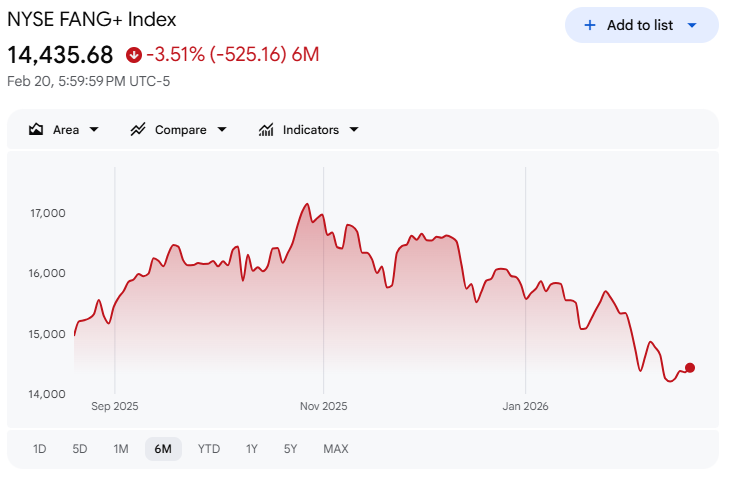
Color from the trenches backs up this view. Early in the week, the S&P 500 broke below its 100‑day moving average and retested the late‑January and early‑February lows around 6,780, only to reverse roughly 1.5% intraday and close flat. That kind of undercut‑and‑reclaim pattern showed up more than once over the week as the index ping‑ponged between its 50‑ and 100‑day moving averages. The two lines are only about 1.5% apart and now converging, which is exactly what you see in a consolidation phase: volatility inside a defined band, pressure building for a directional break. Financials, which had fallen about 5% the prior week, helped lead the first bounce; later in the week, mega‑cap tech joined in, with the NYSE FANG+ index avoiding a full 20% drawdown from its Halloween peak.
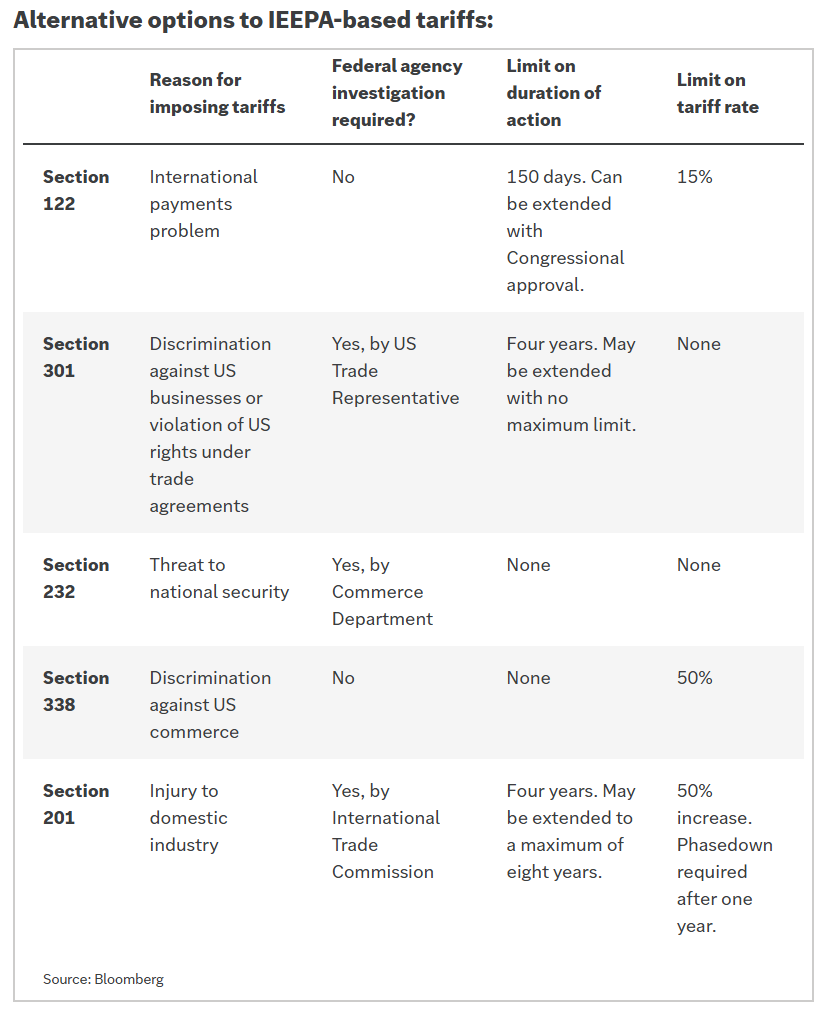
The tariff decision slotted into that technical backdrop more as a catalyst for short covering than as a driver of a new macro regime. The Supreme Court’s 6‑3 ruling essentially said the administration overstepped with the emergency powers law. Equity traders had been handicapping this outcome as likely for months, and derivatives pricing reflected that. The initial reaction was a rally in equities, a modestly weaker dollar, and slightly higher Treasury yields. Within hours, the administration responded with plans to impose a 10% global tariff under Section 122 and to use the next 150 days to build new cases under Sections 301 and 232. Credit markets, equity indexes, and even commodity curves took that in stride because the effective tariff rate under the new plan is broadly similar to what was already embedded in prices.

Where the tariff saga matters more is at the margin, in sectors like apparel, footwear, parts of food, and certain tech hardware lines that had been absorbing the bulk of the IEEPA‑based tariffs. For those groups, the repeal of the old tariffs plus the imposition of a simpler 10% baseline is a small net positive. It clears the legal overhang and should make planning slightly easier, even if the eventual 301 and 232 investigations re‑target certain industries. The more important point is that the decision reduced uncertainty rather than added to it; markets dislike surprises more than they dislike modestly higher trade frictions.
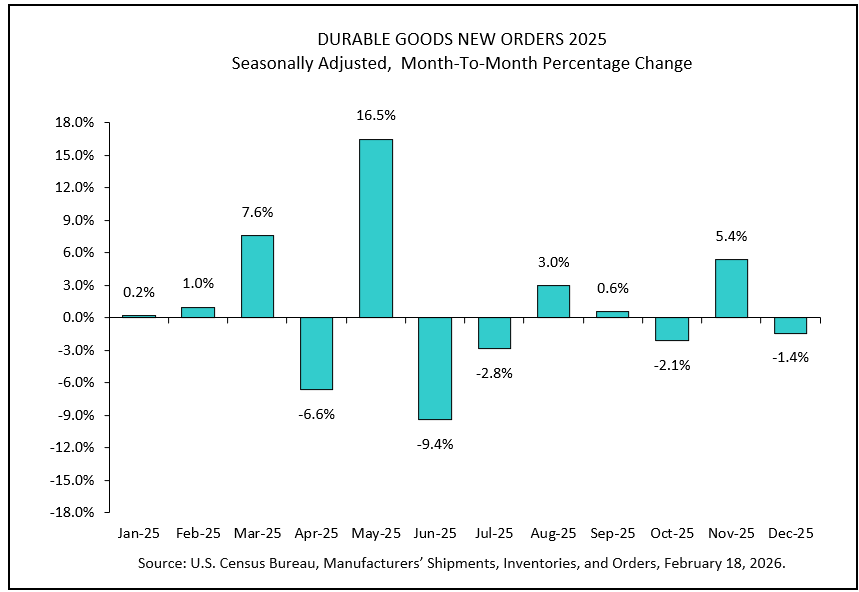
On the macro front, last week’s data confirmed what most of us already suspected: the U.S. economy has downshifted from the blistering 4.4% annualized growth of the third quarter to a more sustainable pace, but it has not fallen off a cliff. Fourth‑quarter GDP printed at 1.4% annualized, with most of the drag coming from government spending and exports. Consumer spending contributed about 1.6 percentage points of growth, down from Q3 but still solid. Business investment added roughly 0.7 points, helped by an uptick in residential spending. Industrial production and capacity utilization improved, and while durable goods orders for December fell 1.4% month‑over‑month, that came after a huge 5.4% gain the prior month. Core capital goods orders—which better capture business equipment spending—actually rose 0.6%, beating expectations.
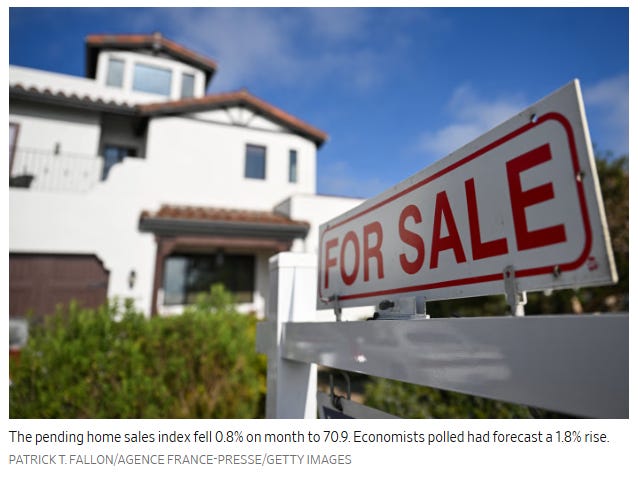
Inflation, however, reminded markets that the disinflationary glide path is not perfectly smooth. December core PCE, the Fed’s preferred measure, rose 0.4% month‑over‑month and 3.0% year‑over‑year, up from 0.2% and 2.8% in November. Headline PCE came in at 2.9% year‑over‑year, the highest since March 2024. Goods inflation was the main culprit, which fits with the tariff narrative and with lingering supply bottlenecks in some categories. At the same time, January housing data offered a mixed picture of that crucial sector. The NAHB homebuilder sentiment index slipped to 36, pending home sales fell 0.8% in January, but housing starts and permits beat expectations in both November and December after being delayed by the government shutdown. That combination says affordability constraints are still real, but builders are quietly preparing for better conditions later this year as mortgage rates grind lower from their peaks.
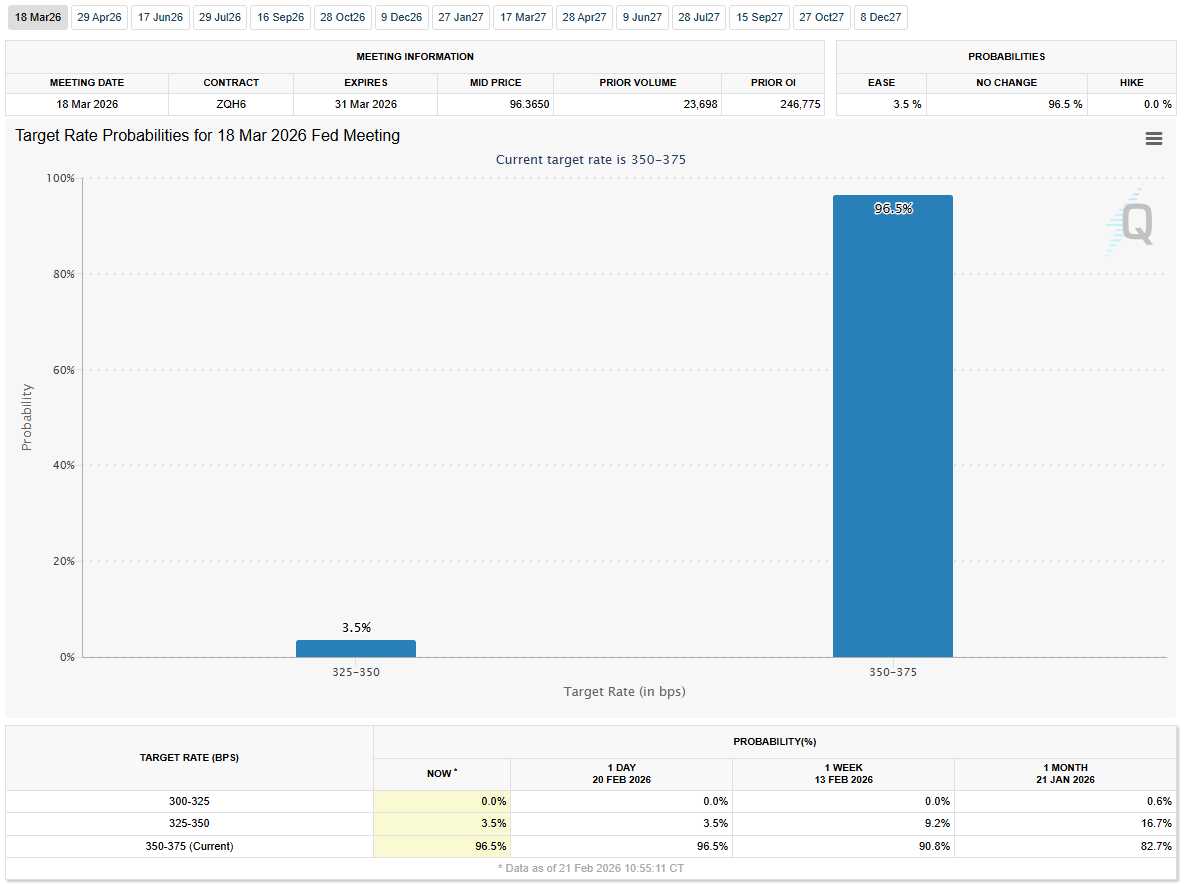
The Fed’s January minutes layered nuance on top of that data. Policymakers are nowhere near declaring victory on inflation. While they acknowledged reduced downside risks to employment, they emphasized that the risk of more persistent inflation remains. Some participants are now openly discussing the “possibility that upward adjustments” to rates could be appropriate if inflation re‑accelerates, even as others argue that further easing may be warranted if the data cooperates. Futures markets have responded by pulling forward the odds of “no change” in mid‑year meetings; the probability of a June hold is now approaching 50%, up meaningfully from last week. The message for equity investors is straightforward: rate cuts are coming later and more slowly than the market hoped back in December, but cuts are still on the table.
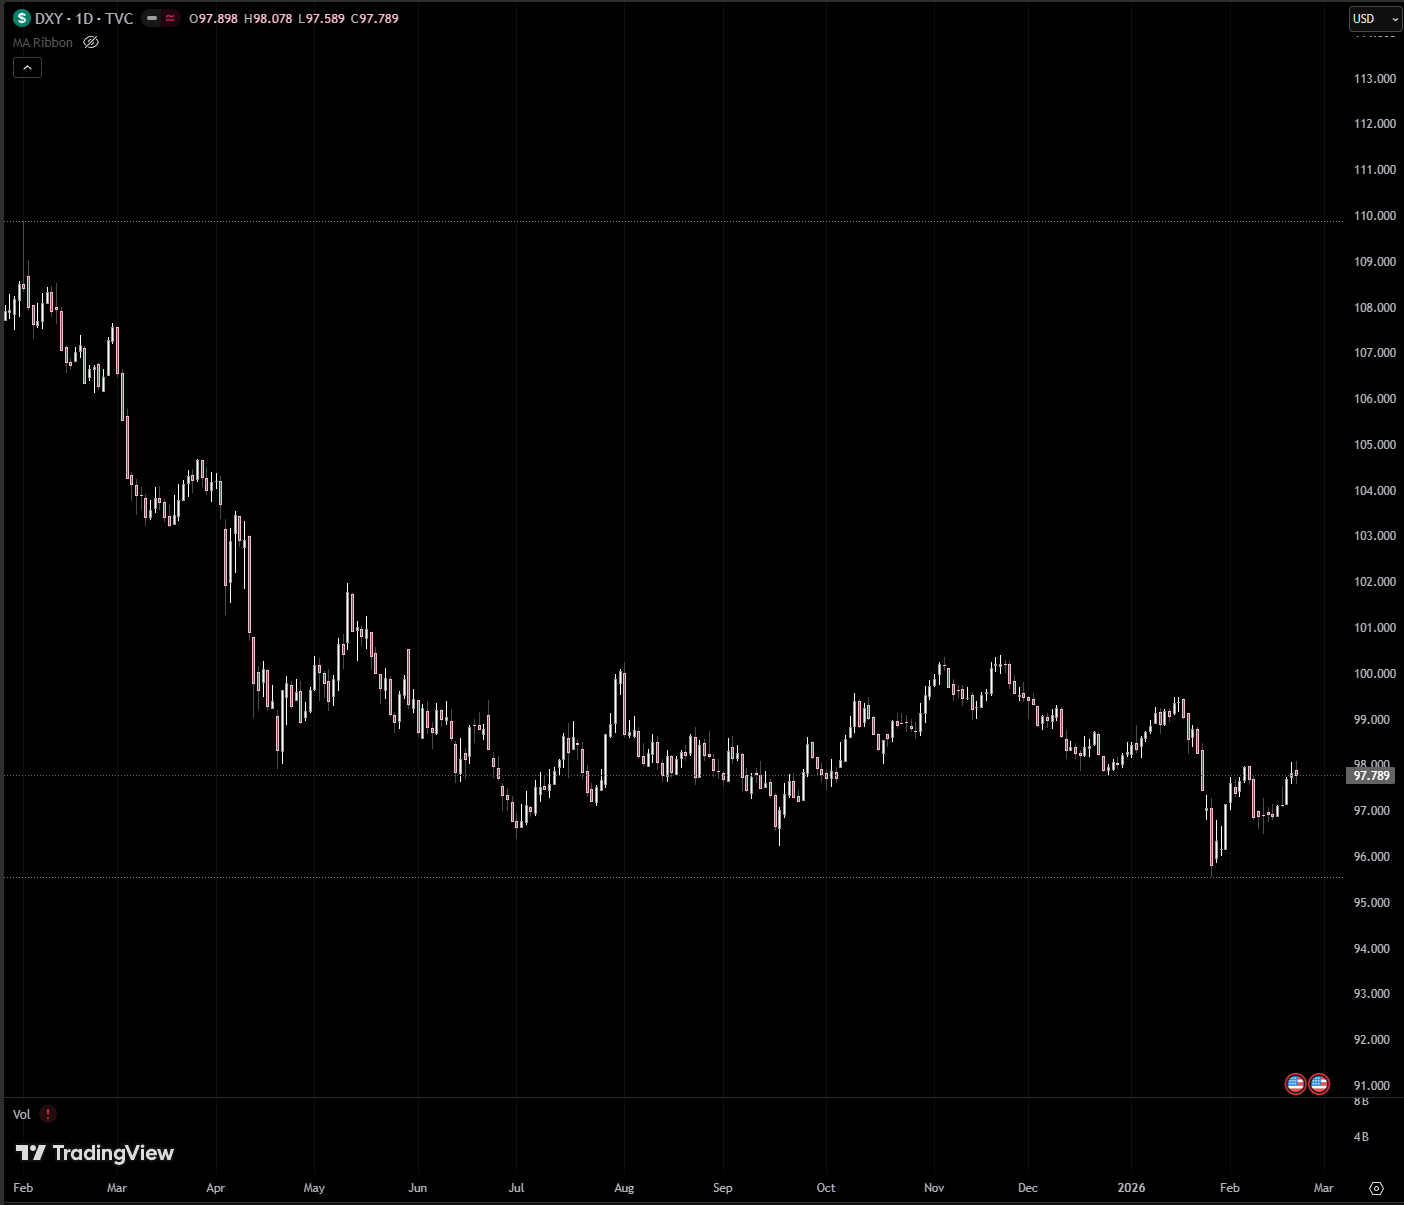
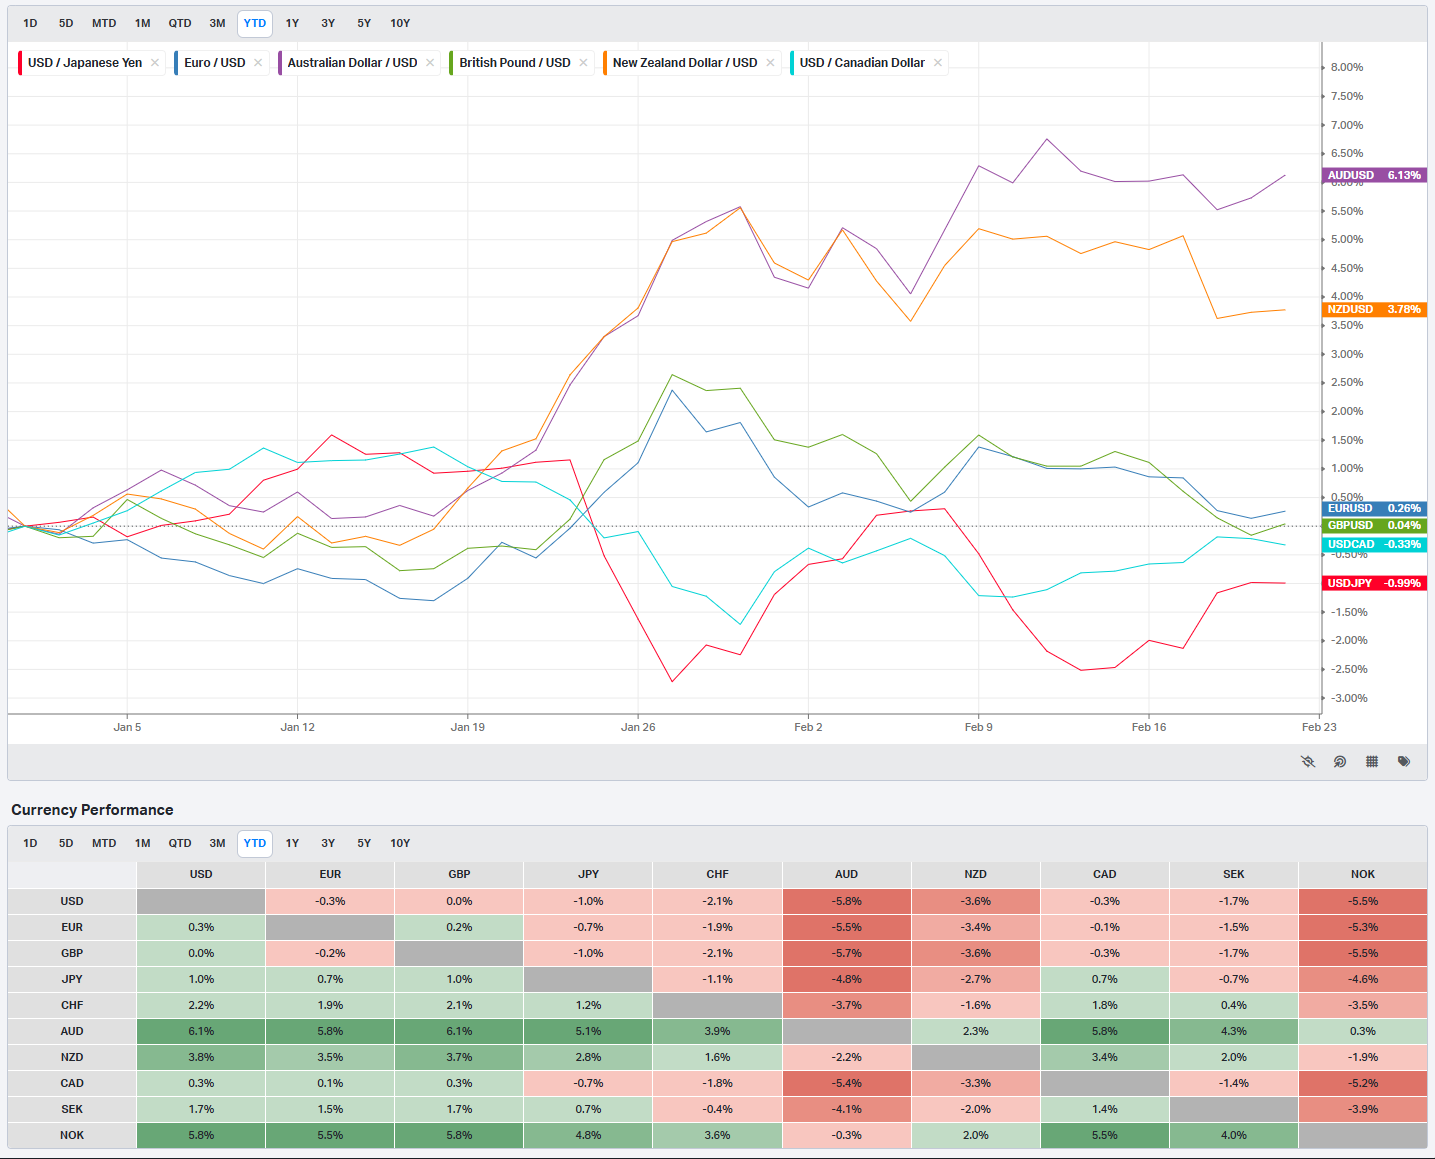
Credit and rates markets have been remarkably well‑behaved in that environment. High yield bonds outperformed Treasuries last week, riding the equity market’s modest strength. Investment‑grade spreads stayed tight, and new issuance came at healthy concessions and was generally oversubscribed. On the sovereign side, the 2‑year yield rose about 7 basis points on the week, while the 10‑ and 30‑year finished only 2–3 basis points higher. That small bear‑flattening mirrors the story in Fed expectations: slightly more hawkish at the front end, but no sense that the entire curve needs to reprice dramatically higher. The U.S. dollar index gained about 1% for the week, driven largely by strength versus the pound and yen.
Outside the U.S., the tone was surprisingly constructive. European equities staged another solid week, with the STOXX Europe 600 up just over 2% and several major country indexes printing fresh highs. Banks led, helped by a steeper yield curve and reduced anxiety around AI‑driven disruption in data‑heavy financials. Manufacturing PMIs in the eurozone, Germany, and the UK all improved from January and beat expectations, even as eurozone industrial production for December disappointed. UK inflation eased to 3.0% year‑over‑year in January, its lowest in nearly a year, while unemployment rose to 5.2% and wage growth slowed. That combination has markets pricing a decent chance of a Bank of England rate cut as soon as March.
Japan was one of the few soft spots, with the Nikkei and TOPIX slipping modestly. Fourth‑quarter GDP grew at an annualized 0.2% quarter‑over‑quarter, well below consensus expectations around 1.6%. Private consumption cooled, but exports held up better than feared despite U.S. tariffs. Inflation continued to decelerate, with nationwide core CPI at 2.0% year‑over‑year, the slowest in two years. Interestingly, 10‑year Japanese government bond yields fell to around 2.10% from 2.23%, reflecting fading concerns about aggressive fiscal expansion under the new government and reinforcing the idea that the Bank of Japan can stay gradual as it normalizes policy.
In emerging markets, activity was quiet in Asia because mainland China remained closed for the Lunar New Year, though the IMF used the lull to nudge its medium‑term China growth forecast up to 4.5% for 2026. The more interesting stories were idiosyncratic. Romania’s central bank kept its key rate at 6.50% while inflation remained near 9.6%, but the constitutional court’s approval of pension reforms was taken as a credit‑positive step. Peru’s Congress ousted yet another president but installed an interim leader who pledged continuity in macro policy until elections in April, and markets mostly shrugged. Those episodes underscore a broader theme: political noise in EM is high, but as long as macro policy stays orthodox and external balances don’t blow out, global investors are willing to look through a lot.
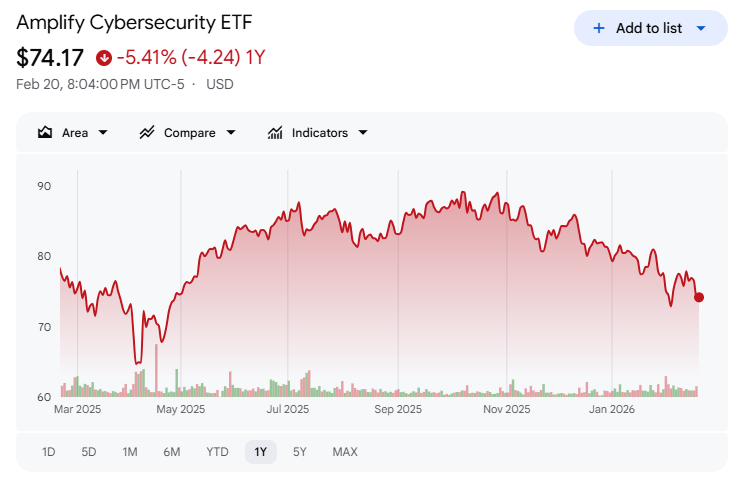
Back at the sector level in the U.S., the “AI winter” theme that had been hammering software and related areas started to show cracks. Some of the most heavily shorted names in software, analytics, staffing, and logistics bounced on better‑than‑feared earnings and dip‑buying. But the thaw is uneven. Cybersecurity stocks, which many had argued were insulated from AI disruption, sold off sharply after a major AI player launched an automated code‑scanning and security product. The cyber ETF HACK dropped roughly 3% on the day and nearly 5% on the week. That kind of dispersion is typical when a new technology narrative moves from pure hope to actual revenue and cost‑pressure realities: some business models get validated, others get challenged, and the blanket “own anything AI‑adjacent” trade stops working.
Another under‑the‑radar theme is what the NYSE desk called the “private credit chill.” Private credit has been a quiet backbone of the cycle, especially in software, data centers, and other capital‑intensive growth areas. Recent bankruptcies in sectors like auto finance and branded consumer products had already raised eyebrows. Now, with software valuations under pressure and questions emerging around liquidity and redemption mismatches, investors are starting to pay closer attention to who financed what and under what terms. That does not necessarily mean we’re staring at a systemic risk event, but it does mean that part of the “shadow banking” world is losing some of its halo, and that can tighten financial conditions at the margin for small and mid‑cap businesses.
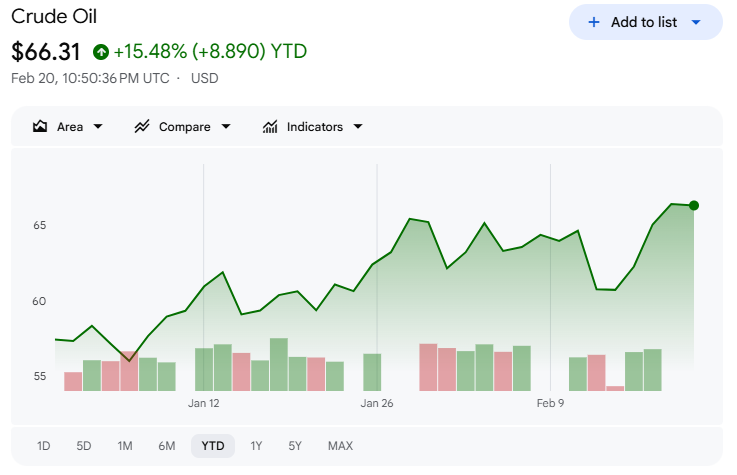
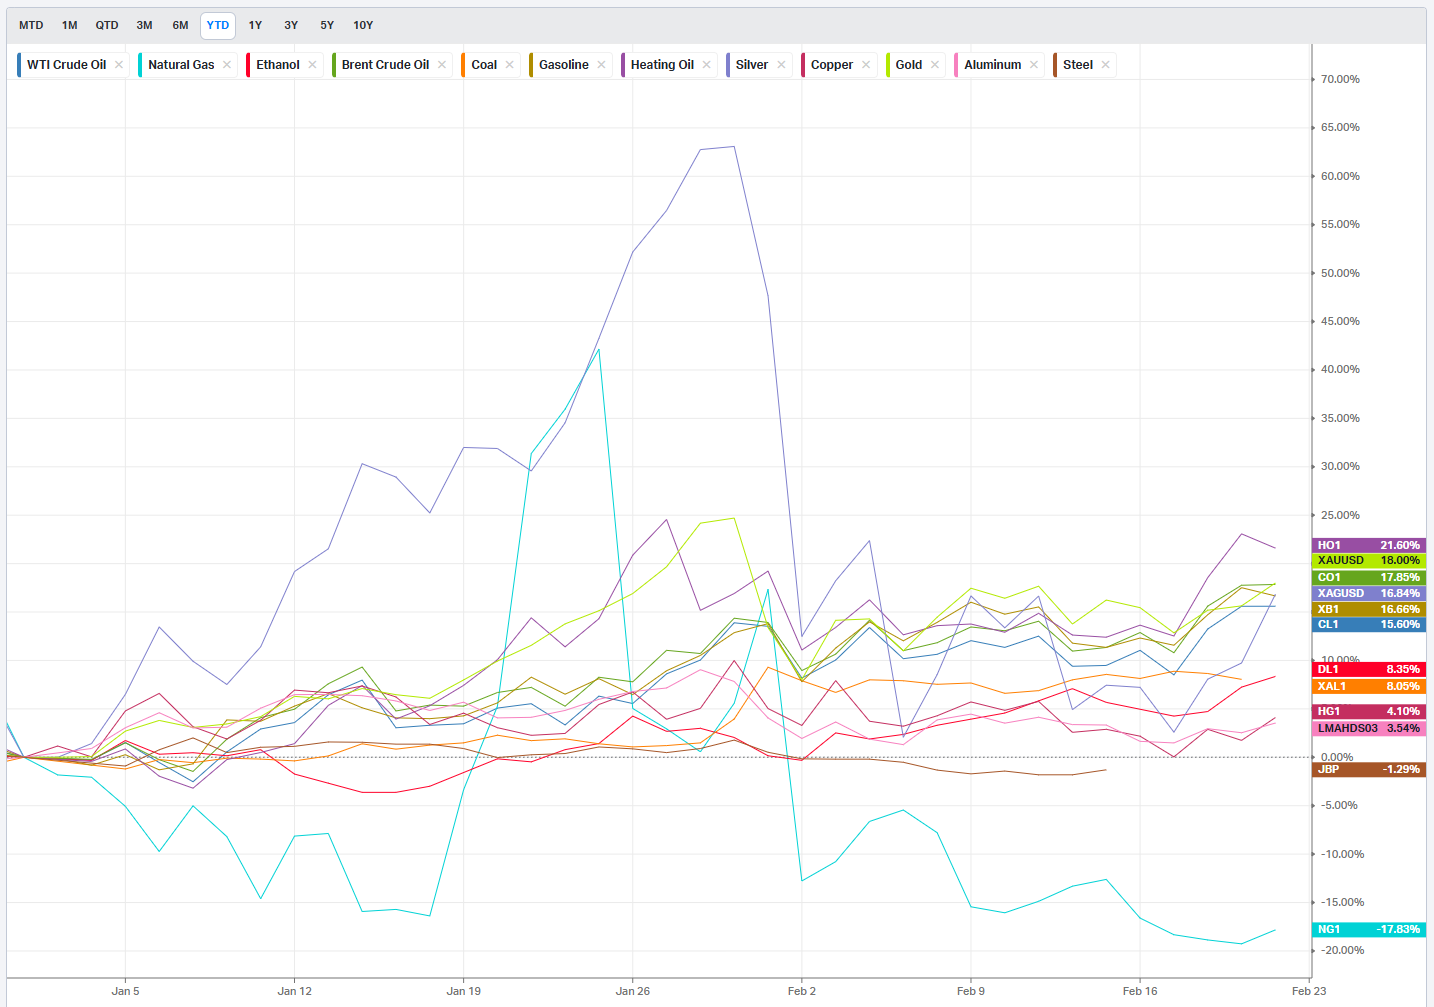
Commodities wrapped the week with a distinctly risk‑on flavor. Brent crude finished around $71–72 a barrel, up roughly 6% on the week, helped by rising tensions between the U.S. and Iran and a surprisingly large 9‑million‑barrel crude inventory draw. Natural gas, by contrast, gave back more of its winter‑storm spike as weather patterns turned milder. Precious metals were quiet until the back half of the week, then rallied; gold is trying to hold above the $5,100 level, while silver and copper both reclaimed their 50‑day moving averages. Agriculture caught a bid after the USDA raised price outlooks on lower planted acreage, with wheat leading on expectations of reduced production. Crypto quietly drifted lower, with Bitcoin stuck in a tightening range below the highs, capped repeatedly by an 8‑day moving average that traders have clearly been watching.
So where does that leave us heading into the next stretch? The big picture looks like this. The S&P 500 has digested a soft patch in growth and a hotter‑than‑hoped inflation print without breaking its uptrend. Positioning is supportive, with institutions net long and speculators still skeptical. Tariff risk, while not gone, is more bounded and more predictable than it was a week ago. Global growth outside the U.S. is not roaring, but Europe is stabilizing, Japan is muddling through, and EM pockets are holding up. Credit markets are calm. Volatility is contained.
That is not the setup for a blow‑off top, but it is the setup for a continuation of the grinding bull market we’ve been in since 2025, punctuated by periodic growth scares and policy shocks. The near‑term tripwires are clear enough: another upside surprise in PCE or PPI that forces the Fed to lean harder into the hawkish side of its reaction function; a meaningful escalation in Middle East tensions that pushes oil and breakevens sharply higher; or a genuine accident in private credit or regional banks that revives systemic risk fears. On the other side of the ledger, any sequence of inflation prints closer to 0.2% month‑over‑month, combined with steady labor data and a Fed that starts talking about the timing of its first cut rather than the risk of hikes, would extend the runway for equities and support a broader participation phase beyond the megacaps.
For now, the message from the tape and the macro is similar: this is still a trend‑friendly environment, but it is no longer a “set it and forget it” market. Rotations are faster, winners and losers inside themes like AI and reshoring are more differentiated, and policy—whether from the Fed, the Supreme Court, or the White House—can nudge sentiment in either direction on short notice. The investors who will navigate this best are the ones who stay anchored to the underlying trend in growth and earnings, respect the level‑by‑level risk markers in futures and cash indexes, and resist the temptation to overreact to every headline.

Weekly Benchmark Breakdown
Broad Market Breadth Tilts from Trend to Thrust
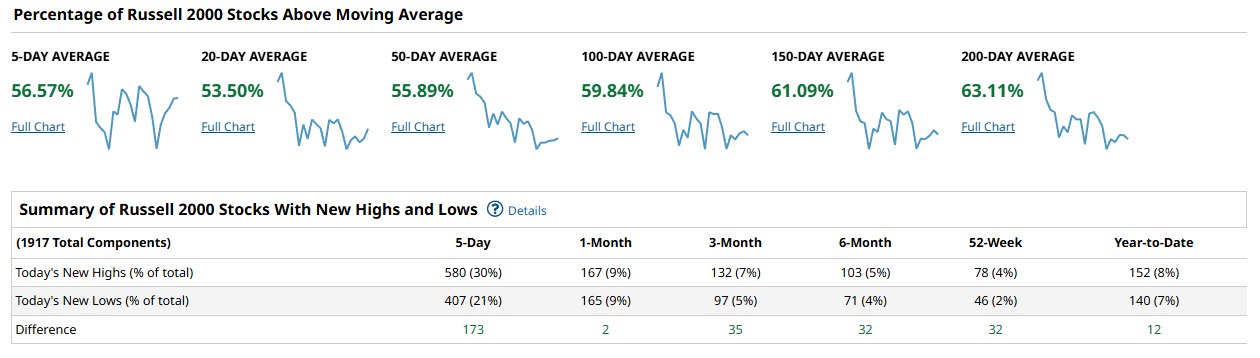
This week finally looks more like a genuine breadth thrust than a narrow grind. Across the major indices, a clear majority of stocks are back above their key moving averages, and new highs outnumber new lows on every lookback that matters. The risk tone is no longer “just OK” – it is outright constructive, with only the usual small‑cap caveats keeping things from a full‑blown all‑clear.
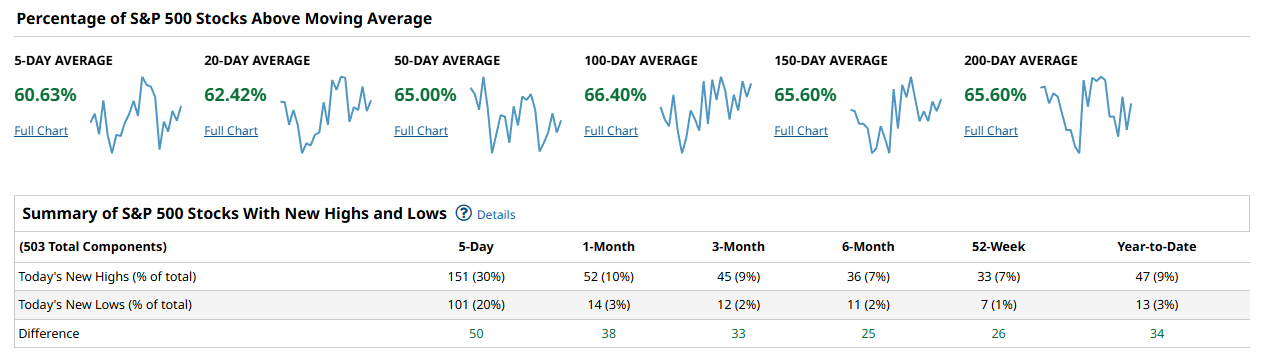
In the S&P 500, participation is impressively broad. About 60.6% of names are above the 5‑day, 62.4% above the 20‑day, 65.0% above the 50‑day, 66.4% above the 100‑day, and 65.6% above both the 150‑ and 200‑day moving averages. Today’s new highs tally 151 stocks, or 30% of the index, versus 101 new lows, or 20%, for a 5‑day net of +50. On a 1‑month basis, new highs beat new lows 52 to 14, for a net of +38; at 3 months the spread is 45 to 12, net +33; and at 6 months 36 to 11, net +25. Even over the 52‑week window, new highs are 33 versus just 7 new lows, a net of +26, and year‑to‑date stands at 47 highs against 13 lows, net +34. That is the profile of an index where the uptrend is not only intact but engaging most of the roster.
The Nasdaq 100 is less explosive than the S&P, but it still shows healthy, improving participation. Roughly 63.4% of constituents are above the 5‑day, 51.5% above the 20‑day, 49.5% above the 50‑day, 50.5% above the 100‑day, 51.5% above the 150‑day, and 50.5% above the 200‑day. New highs over the last 5 days total 37 names, or 37%, against 22 new lows, or 22%, for a net of +15. The 1‑month spread is 8 highs versus 5 lows, net +3; at 3 months 6 versus 5, net +1; 6 months 6 versus 5, net +1; 52‑weeks 6 versus 5, net +1; and year‑to‑date 6 versus 5, again net +1. That is an index where about half the members are in uptrends and new highs are in control, but the dominance is still modest rather than runaway.

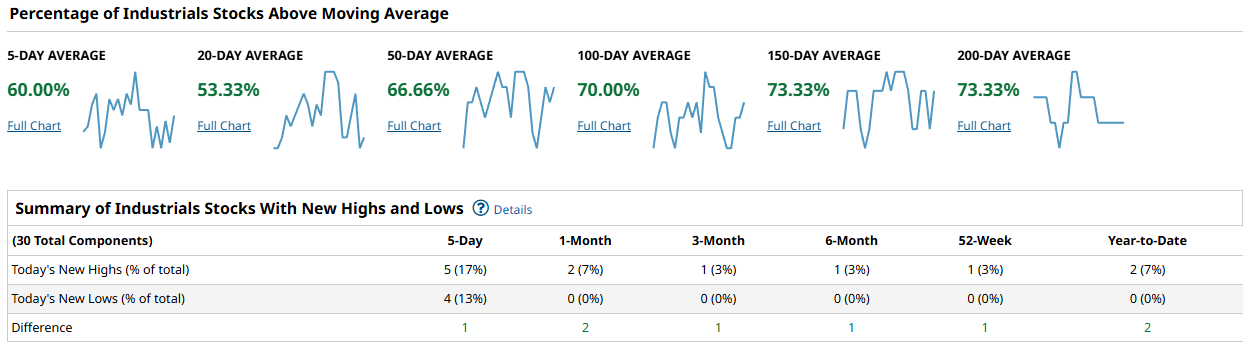
The Dow Industrials quietly sport one of the cleanest internal tapes of the group. Sixty percent of components are above the 5‑day, 53.3% above the 20‑day, 66.7% above the 50‑day, and a stout 70.0%, 73.3%, and 73.3% above the 100‑, 150‑, and 200‑day moving averages, respectively. On a 5‑day view, there are 5 new highs (17%) against 4 new lows (13%), for a net of +1. The 1‑month period shows 2 highs and 0 lows, net +2; 3 months 1 and 0, net +1; 6 months 1 and 0, net +1; 52‑weeks 1 and 0, net +1; and year‑to‑date 2 and 0, net +2. That pattern – more than two‑thirds of components above the intermediate and long‑term averages and almost no new lows on any horizon – is classic strong‑trend behavior.
The Russell 2000 finally looks like it wants to join the party instead of fighting it. Here, 56.6% of components are above the 5‑day, 53.5% above the 20‑day, 55.9% above the 50‑day, 59.8% above the 100‑day, 61.1% above the 150‑day, and 63.1% above the 200‑day moving averages. On the 5‑day new‑highs list, 580 stocks, or 30%, made new highs versus 407, or 21%, making new lows, for a net of +173. At one month, 167 highs (9%) versus 165 lows (9%) produce a slim net of +2, but by 3 months the spread widens to 132 versus 97, net +35; at 6 months 103 versus 71, net +32; over 52 weeks 78 versus 46, net +32; and year‑to‑date 152 versus 140, net +12. That marks a meaningful shift from a muddling small‑cap tape toward one where the balance of power is tilting to the upside.
Taken together, this is no longer just a cap‑weighted story. The S&P now has roughly two‑thirds of its members above the 50‑, 100‑, and 200‑day averages, the Dow is even stronger on those same measures, and the Russell has finally pushed its longer‑term cohorts over the 60% line. The Nasdaq 100 lags a bit on the 50‑day, with just under half its members above that bar, but even there the majority are above longer‑term measures and new highs are ahead of new lows across all lookbacks. A durable advance from here would be validated if the Nasdaq 100’s 50‑day cohort can push decisively above 60% and if the Russell’s 5‑ and 20‑day cohorts stay north of 55% while the strong net new‑highs readings persist. Concern would creep back in if those 50‑day cohorts in the growth and small‑cap complexes slip back below 50% and the sizable positive NH minus NL gaps start to close.
For the playbook, this backdrop still argues for staying net long and leaning into strength rather than fading it. Large‑cap exposure via the S&P and Dow can remain core, with pullbacks toward the 50‑day in sectors where more than 60% of constituents are in uptrends treated as opportunities rather than threats. The improving readings in the Russell open the door to a measured increase in small‑cap exposure, but with a focus on quality and liquidity until the one‑month and year‑to‑date new‑highs nets expand further. In the Nasdaq 100, it makes sense to keep riding the leaders while watching carefully for any deterioration in that roughly 50% cohort above the 50‑day, which would be the first tell that the growth engine is stalling.
Bottom line: breadth has shifted from merely supportive to genuinely bullish, and unless these newfound majority‑above‑trend readings roll over quickly, the path of least resistance for equities remains higher.

Investor Sentiment Report
%Bull-Bear Spread
The %Bull-Bear Spread measures the gap between bullish and bearish investor sentiment, often from surveys like AAII. It’s a contrarian indicator—extreme optimism may signal a coming pullback, while extreme pessimism can hint at a potential rally. Large positive or negative spreads often mark market turning points.
The AAII-style percent bull minus bear spread is not shown numerically here, but the one-year line tracks a move from deep negative territory last spring into the 40–70 zone by mid-2025, followed by a choppy drift lower into the mid-range over the past several months. The current reading sits around the middle of the band, well off last year’s extremes of pessimism and also shy of the peak optimism seen in mid-2025. That leaves sentiment neither a clear contrarian tailwind nor a major headwind; it says investors are optimistic, but not wildly so. From a tactical standpoint, a push back above roughly +30 on the spread would start to feel crowded and raise the odds of disappointments biting harder, while any slide back toward zero or negative territory without a major price break would set up a higher-probability rebound window.
NAAIM Exposure Index
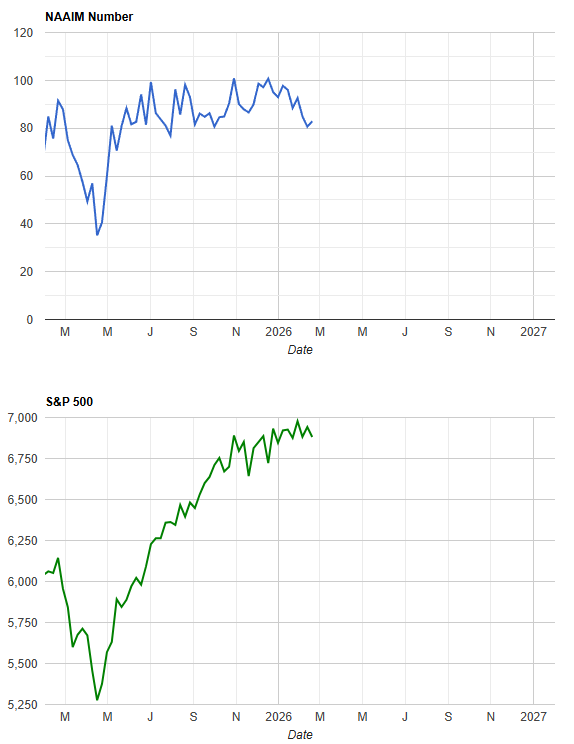
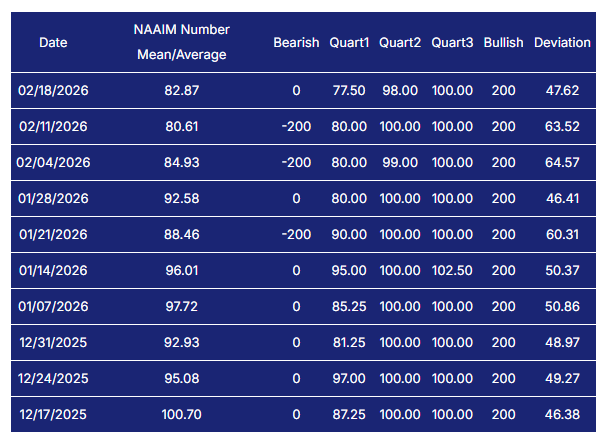
The NAAIM Exposure Index (National Association of Active Investment Managers Exposure Index) measures the average exposure to U.S. equity markets as reported by its member firms. These are typically active money managers who provide their equity exposure levels weekly. The index offers insight into how much these managers are investing in equities at any given time, ranging from being fully short (-100%) to leveraged long (up to +200%).
Active managers remain heavily invested. The latest NAAIM Exposure Index prints 82.87, following 80.61 and 84.93 in the two prior weeks, after sitting in the 90–100 zone for much of December and early January. There are effectively no bearish outliers on the panel, with the bearish column at 0 or -200 in recent weeks, and the upper quartiles still clustered near 100, which confirms that most managers entered February close to fully invested rather than holding much dry powder. That means the tape has less “new buying” fuel available if prices rip higher, but also that any real risk-off episode could turn into forced de-risking because there is plenty of exposure to cut. A decisive roll of the NAAIM index down into the 50s or below, especially if the S&P is still near highs, would be an early warning that professionals are quietly heading for the exits; a renewed push back into the 90s would say they are embracing risk again and leaving very little cushion if volatility returns.

CBOE Total Put/Call Ratio
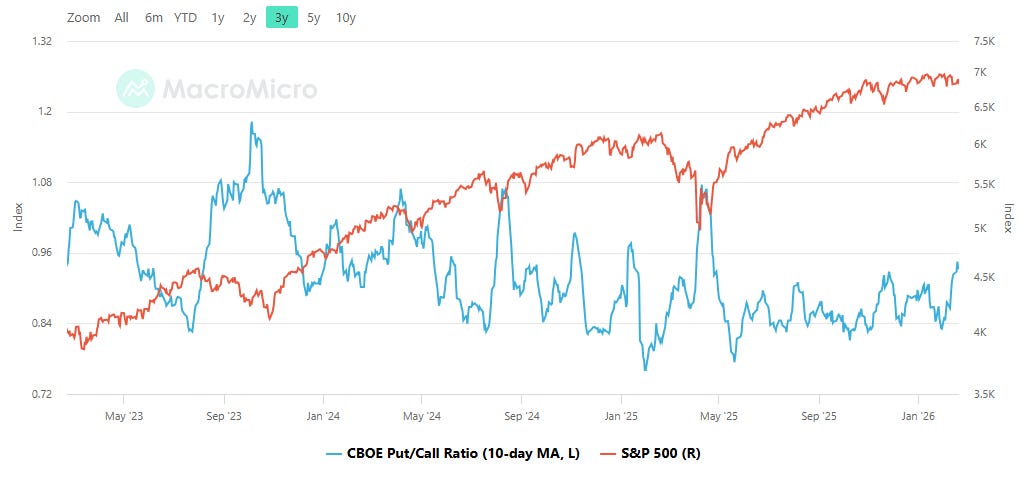
CBOE's total put/call ratio includes index options and equity options. It's a popular indicator for market sentiment. A high put/call ratio suggests that the market is overly bearish and stocks might rebound. A low put/call ratio suggests that market exuberance could result in a sharp fall.
The 10-day moving average of the CBOE total put/call ratio is hovering close to the middle of its three-year range, oscillating around the 0.90–0.95 area after having dipped toward 0.80 at prior points of optimism and spiked above 1.10 during stress episodes. Right now it is neither signaling outright complacency nor panic, which fits a market that has pulled back modestly but not yet forced traders into capitulation. In practice, that means options positioning is not providing a big contrarian edge this week: there is enough put buying to limit the odds of an air-pocket drop, but not enough fear to guarantee a powerful squeeze higher. If this 10-day average rolls back toward 0.80 while prices grind up, that would mark a frothier setup where pullbacks tend to be sharper. Conversely, a push above 1.05–1.10 on a market wobble would signal more durable downside protection has been bought, often laying the groundwork for a better-quality rally.
Equity vs Bond Volatility
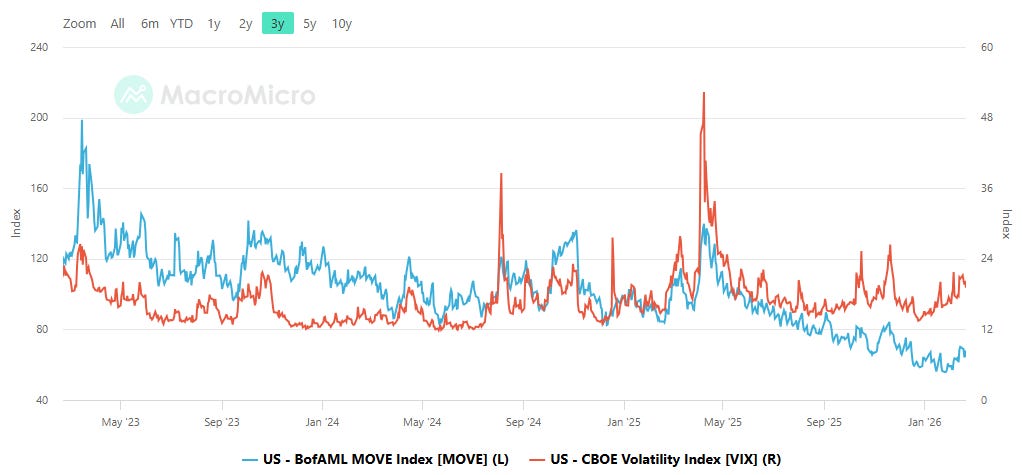
The Merrill Lynch Option Volatility Estimate [MOVE] Index from BofAML and the CBOE Volatility Index [VIX] respectively represent market volatility of U.S. Treasury futures and the S&P 500 index. They typically move in tandem but when they diverge, an opportunity can emerge from one having to “catch-up” to the other.
Across the MOVE and VIX pair, the picture is of gradually calming bond markets and still-contained but jumpy equity volatility. Over the past three years the MOVE index has bled steadily lower from the 150–200 zone into the high double digits, while the VIX has oscillated mostly between the low teens and low 20s with a few sharp spikes toward 30–40 during shock events. Recently, MOVE has drifted down toward the lower end of its range while VIX trades in the mid-teens to high-teens area, suggesting rates volatility is no longer the primary source of systemic stress and that equity vol is responding more to idiosyncratic and earnings-related noise. For risk-taking, that mix is supportive: when both vol complexes are subdued, carry and dip-buying strategies tend to work. The tripwires would be a renewed MOVE surge back above roughly 120 while VIX is still sleepy, which often front-runs equity trouble, or a VIX breakout into the low 20s or higher even with a tame MOVE, which would flag equity-specific risk aversion that deserves respect.
CNN Fear & Greed
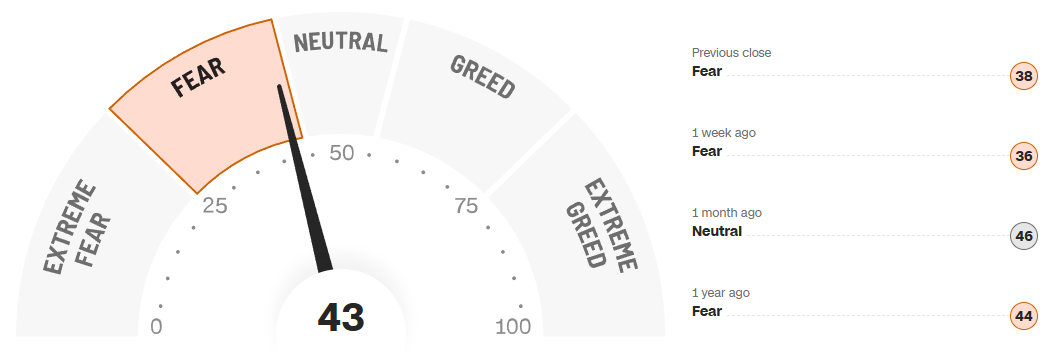
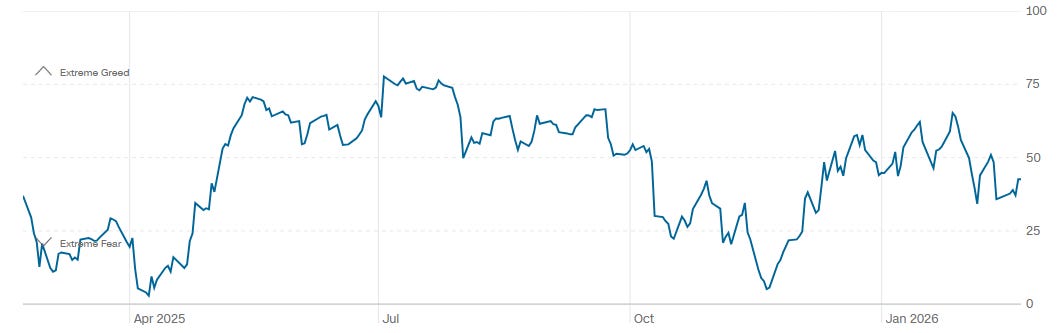
The CNN Fear & Greed index sits at 43 today, labeled “Fear,” up from 38 at the prior close and 36 one week ago, but below the 46 “Neutral” reading one month ago and roughly in line with the 44 print a year ago. The one-year history shows oscillations between fear and greed without spending much time at the extreme ends of the dial; recent months have seen repeated pushes into the upper half of the range fade back toward neutral-to-fear rather than translate into runaway euphoria. Put together, that says the mood is cautious but not panicked: investors are uneasy enough to leave some room for positive surprise, yet not so depressed that we can talk about an obvious capitulation low. A drop of this gauge into the 20s, especially if accompanied by widening credit spreads or a VIX push over the high teens, would mark a better contrarian entry zone. Conversely, another run into the 75+ “Extreme Greed” band would signal exhaustion risk, where incremental good news is more likely to be sold than chased.
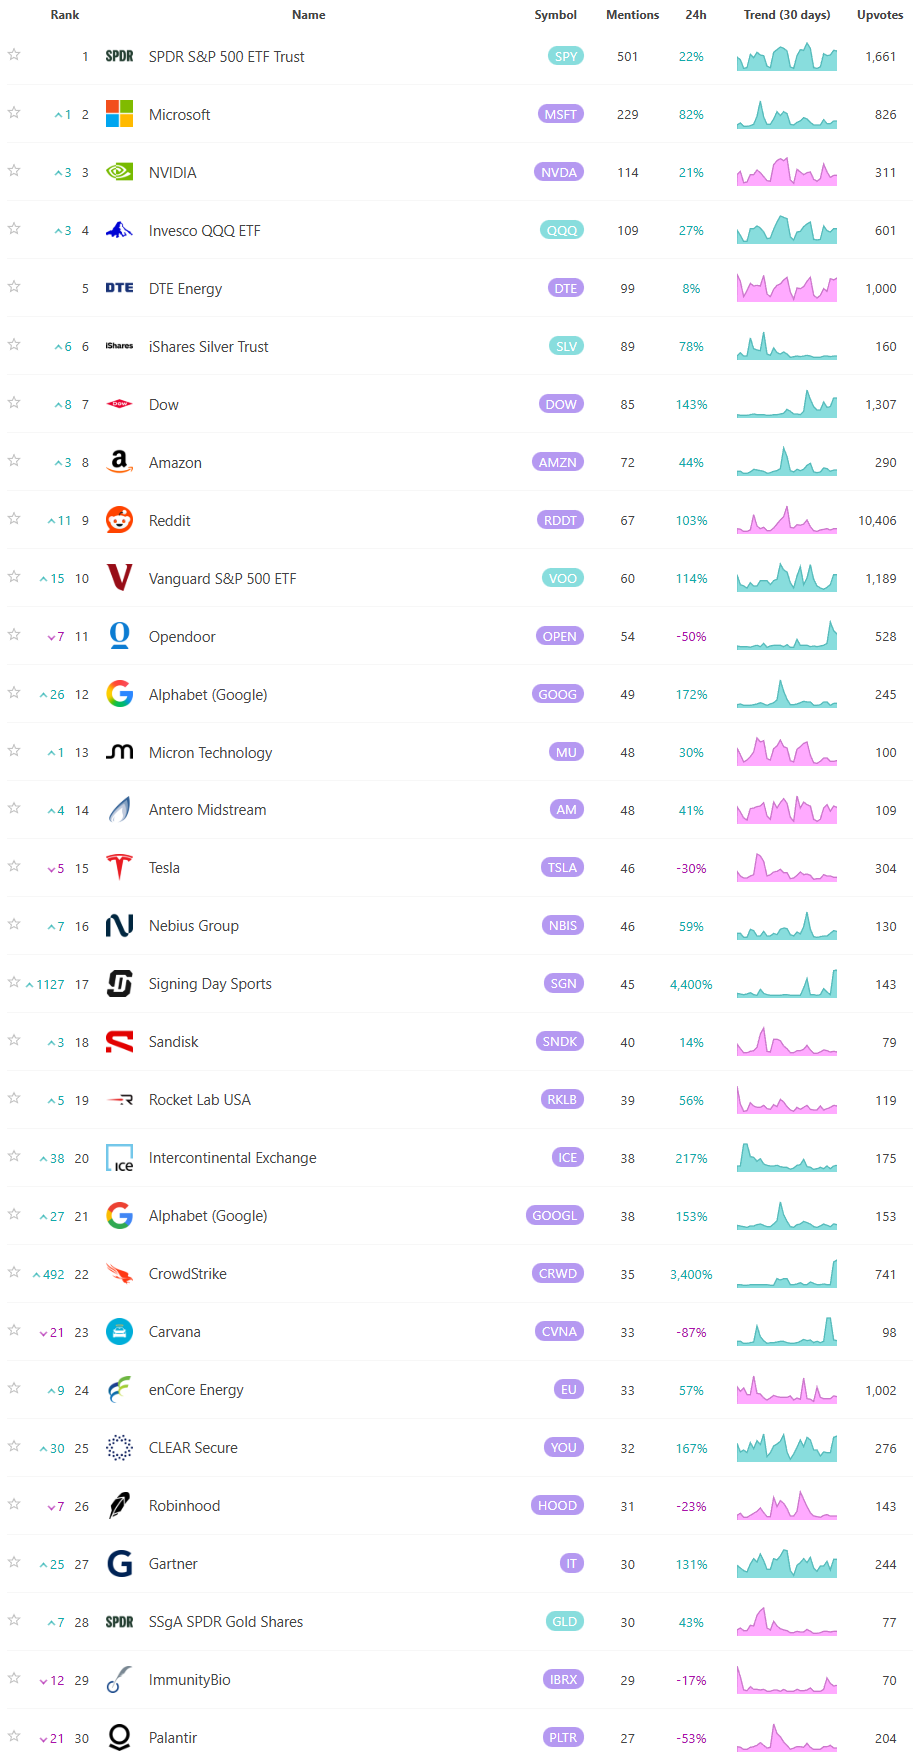
Social Media Favs
Social sentiment offers a real-time view of investor mood, often revealing market shifts before traditional indicators. It can signal momentum changes, spot emerging trends, and gauge retail investor impact—especially in high-volatility names. Tracking sentiment around events or earnings provides actionable insights, and when layered with quantitative models, can enhance predictive accuracy and risk management. Sustained sentiment trends often mirror broader market cycles, making this data a valuable tool for both short-term trades and long-term positioning.

Technician’s Playbook: Trading the Majors (SPY/QQQ/IWM/DIA)
When you’re a large institutional player, your primary goal is to find liquidity - places to do a ton of business with the least amount of slippage possible. VolumeLeaders.com automatically identifies and visually plots the exact spots where institutions are doing business and where they are likely to return for more. It’s one of the primary reasons “support” and “resistance” concepts work and truly one of the reasons “price has memory”.
The index ETFs are all working through the same basic script: a push off last week’s lows, a test of overhead volume bands built earlier in the week, and a lot of size trading right at those shelves. This is the spot on the field where strong hands either absorb the late sellers and turn the tape higher, or fail and open the door to a more meaningful back‑fill into last week’s range. The VolumeLeaders data says real money is very active at these inflection zones, which gives us clean levels to trade against in the next couple of sessions.
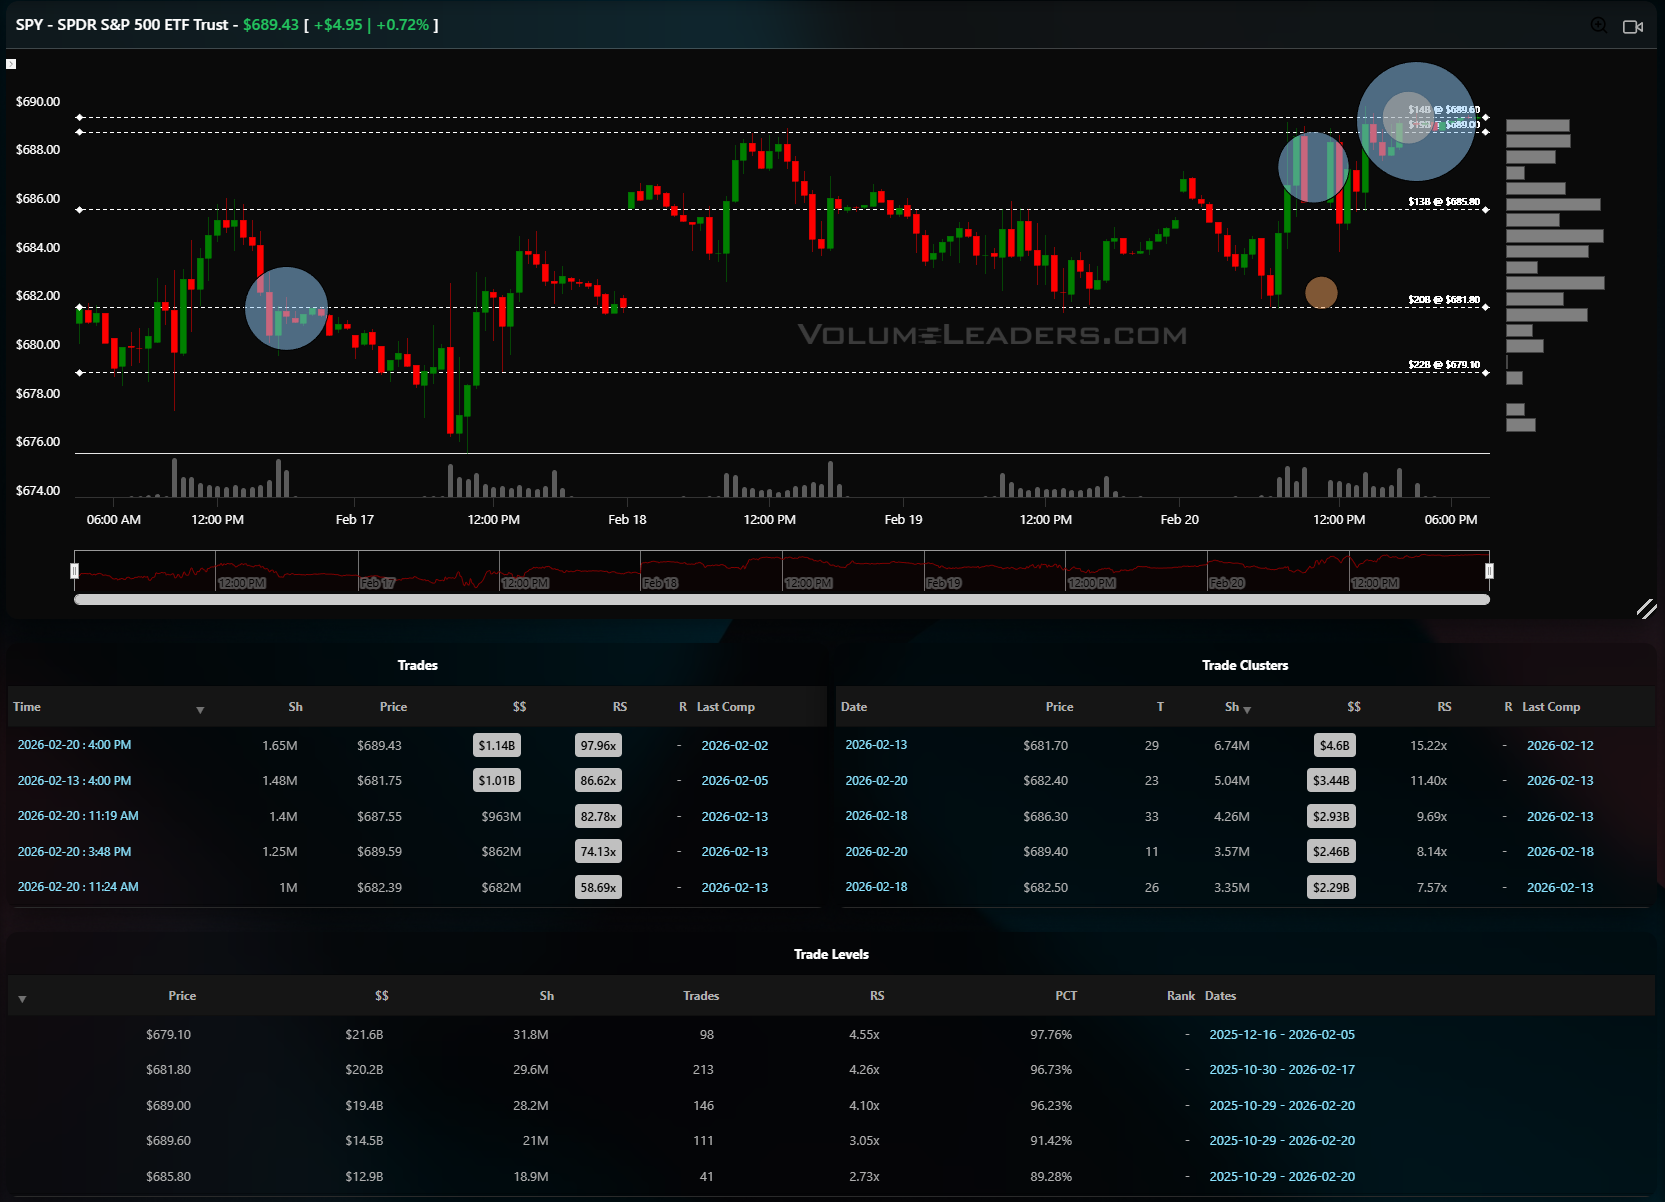
SPY
In SPY, the path has been an early-week selloff, a sharp reversal, and now a balance just under the upper dashed band in the high 680s to low 690s. Several of the largest trades in this window printed between roughly 681 and 689, with notional in the $1.0–1.1B area and RS readings in the high 80s to high 90s, placing them in the 95–98% notional percentile. Those are “decision” trades. If price can hold above the 681–682 cluster that did about $3.4–4.6B of business with RS above 11x and PCT north of 90%, it argues that big buyers are defending their cost basis and the next magnet is the upper Level band near 689–690 where cumulative $$ is heaviest. Lose that 681–682 shelf on volume and the door opens for a quick slide back into the mid‑670s, where the next meaningful Level support sits. Tactically, buyers want to lean into dips holding 681–682 with clear invalidation just below, targeting a retest and potential breakout above the 689–690 band; sellers are waiting for either a failed breakout above 690 or a clean break under 681 to press toward those lower Levels.
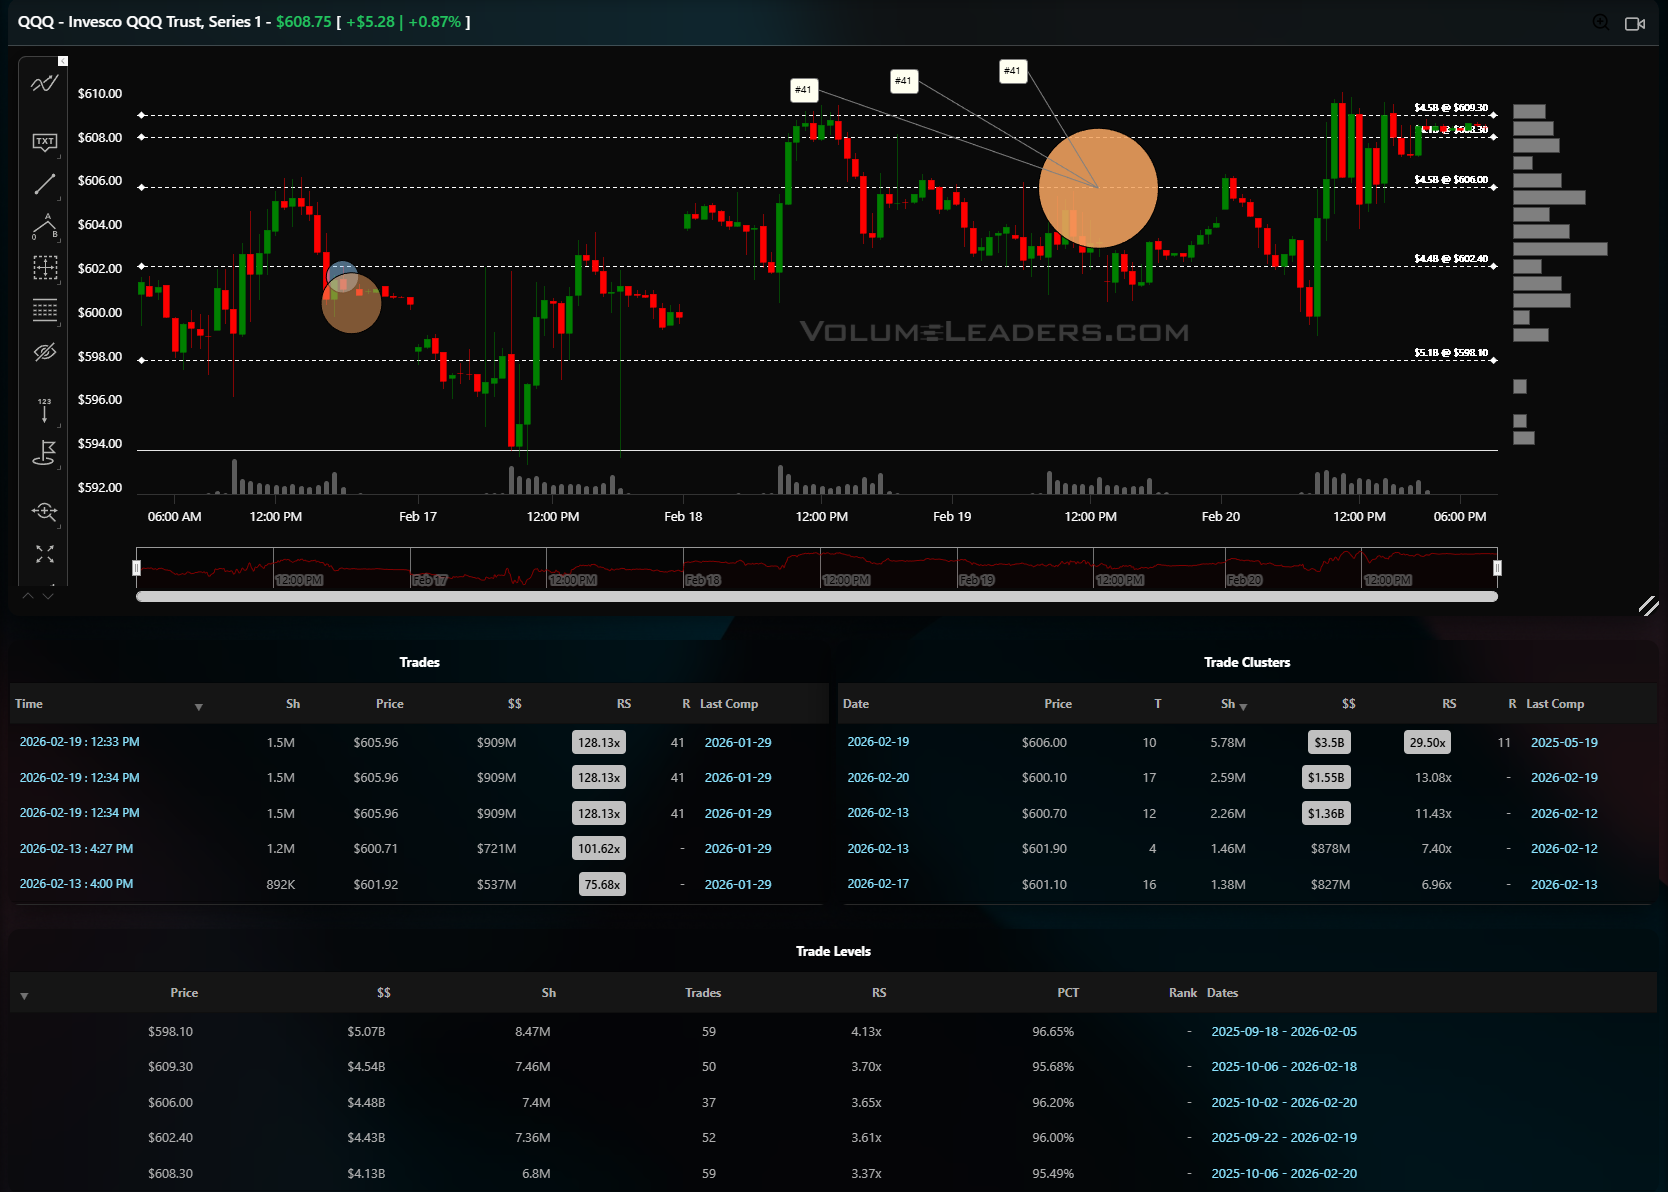
QQQ
QQQ shows a similar pattern but with even more concentrated size near the highs. The standout sequence is a run of prints around 605–606 that each traded about 1.5M shares and roughly $900M notional, with RS metrics in the 100–128x area, tagged as top‑100 historical trades. That kind of clustering after a push off the lows almost always marks a battleground between funds re‑loading long and others taking liquidity. The trade Levels table shows massive all‑time volume around 606–609, with $$ north of $4–5B, RS above 3.5x and PCT in the mid‑90s. Acceptance above that 606–609 band turns it into a launchpad with a natural magnet toward the prior high zone just above, while rejection and repeated failure there would confirm it as supply. For execution, the clean long is buying pullbacks that hold above roughly 598–600, where another thick Level lives, with first targets back into 606–609; the clean short is fading spikes into that same 606–609 band with stops just above and eyes on a rotation back to 598 and then the low 590s if the floor gives way.
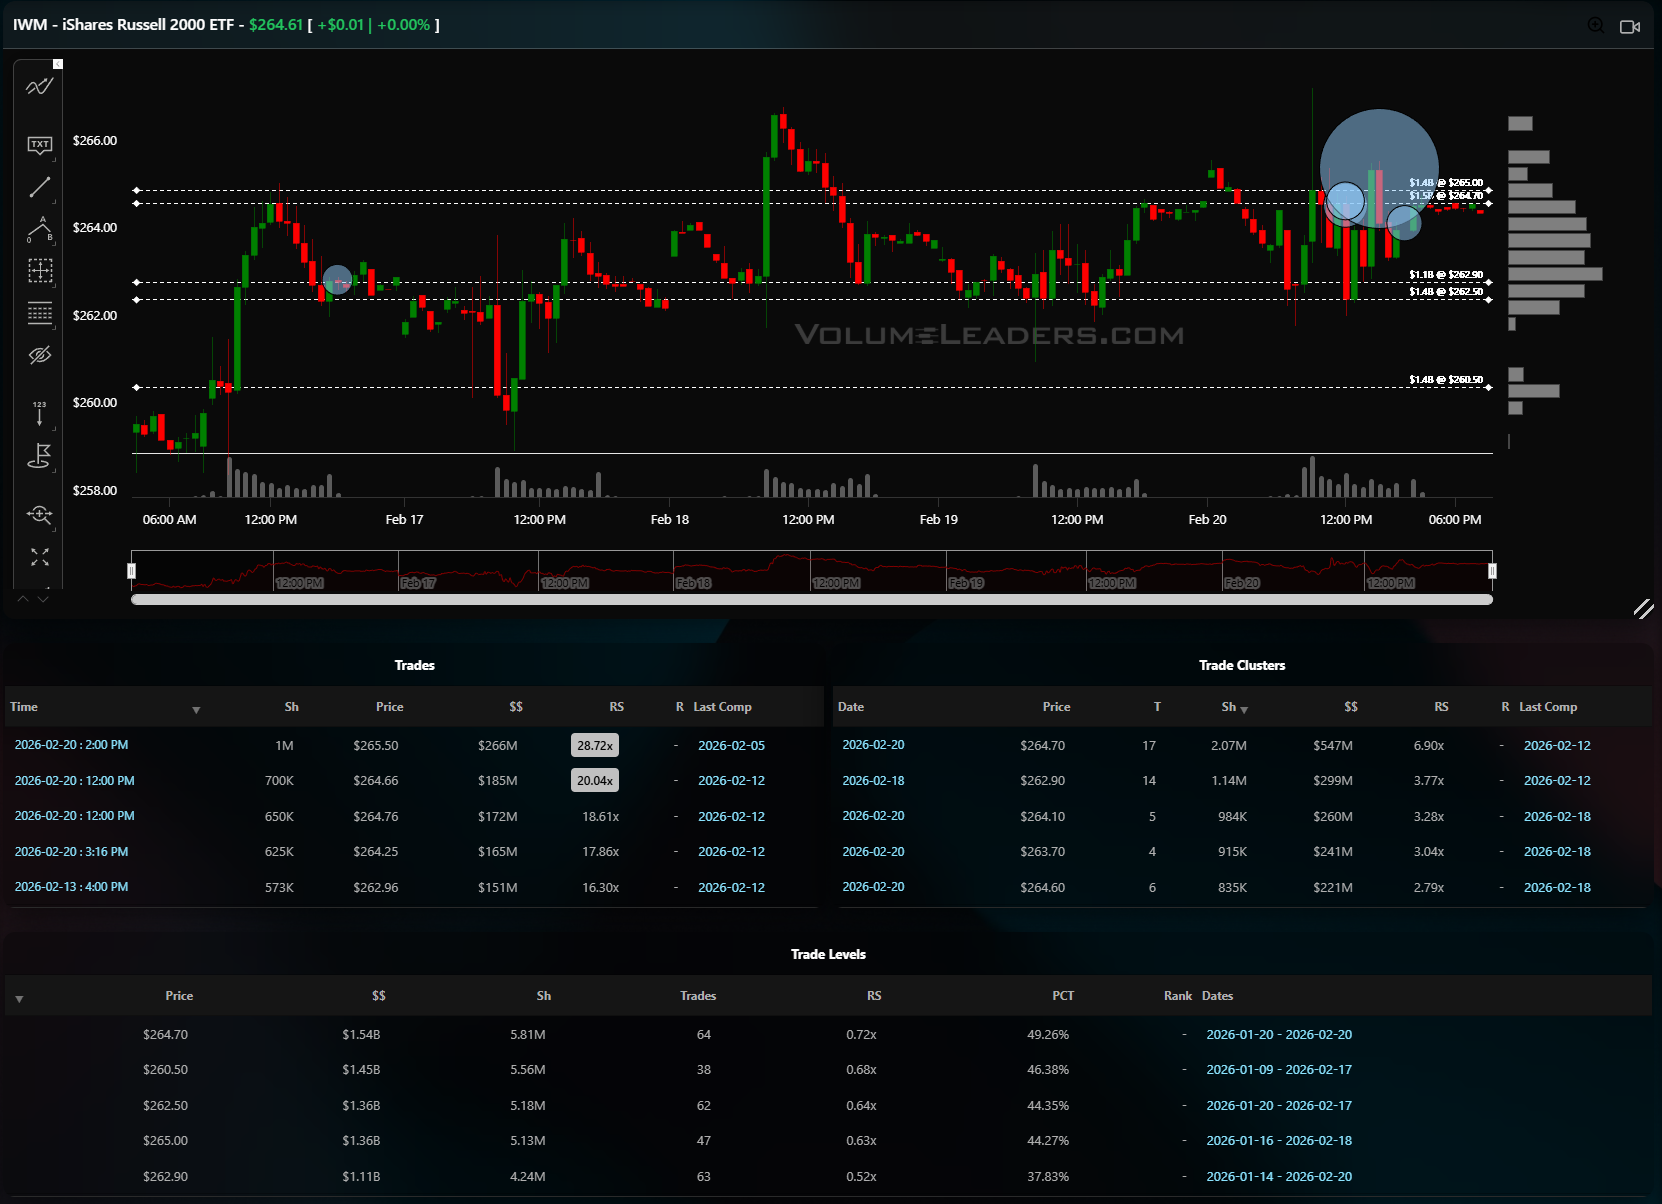
IWM
IWM’s tape is more range‑bound but the tape shows meaningful accumulation in the mid‑260s. On February 20, a 1M‑share block went off at about 264.70 for $266M, RS nearly 29x, followed by a 700k block at 264.65 for $185M with RS over 20x. Both sit right in a band where cumulative Levels show more than $1.1–1.5B traded between roughly 260.5 and 264.7, but with RS only around 0.5–0.7x and PCT in the 40–50% zone. That mix says historic Level volume is moderate, but recent “who done it” size is aggressive, suggesting fresh positioning rather than just churn. The pass/fail area is essentially 262–265. Hold above that and you can argue small caps are being quietly accumulated with a magnet back toward the recent spike high; break below 262 with those big prints trapped and the risk shifts to a fast move back into the high 250s where the next trade Levels sit. Traders can anchor risk to that 262–265 band, buying higher lows above it with tight invalidation or selling breakdowns through it for a quick mean‑reversion move.
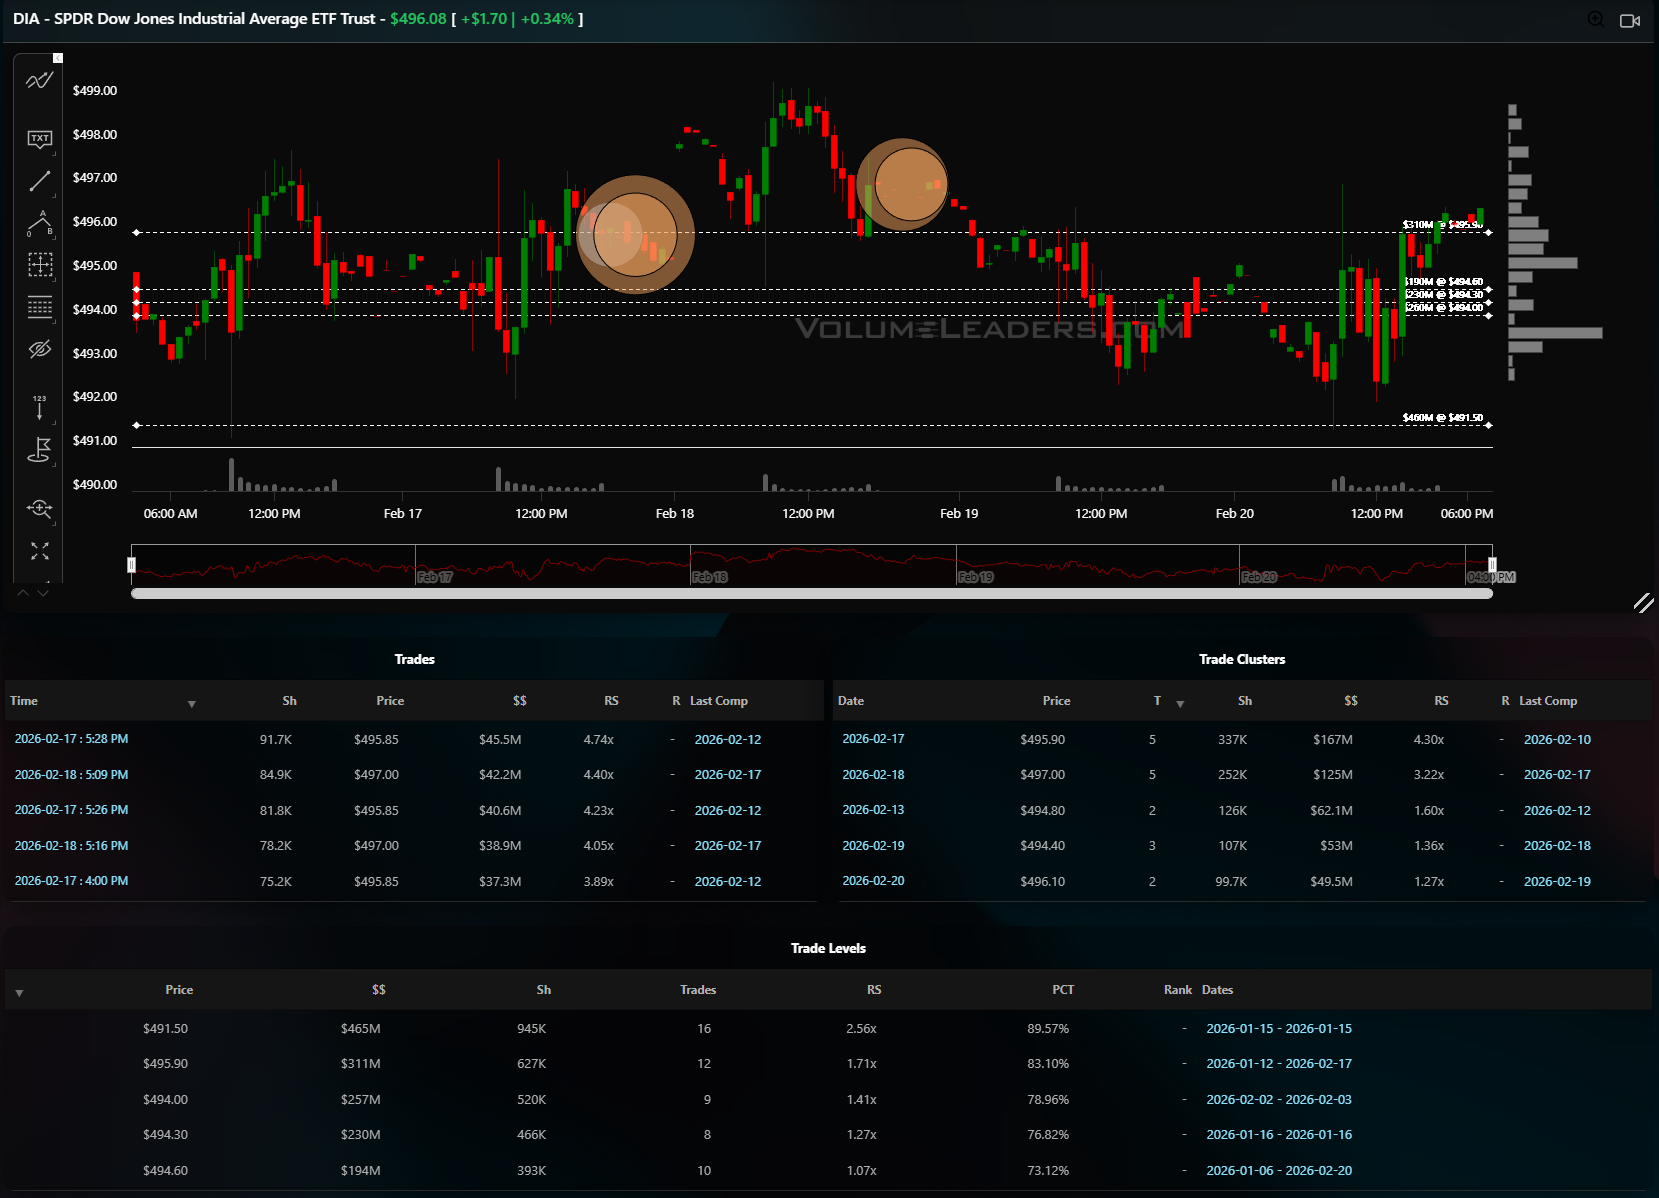
DIA
DIA has put in a broad sideways range with attempts to push higher repeatedly meeting size near the mid‑495s. The recent trade list shows blocks around 495–497 with 75–90k shares each and notional in the high $30–45M range, while the trade Levels table highlights a major Level near 491.5 that has done about $465M in volume, RS 2.56x and PCT close to 90%. That 491–492 shelf is the anchor for buyers; as long as price respects it, the path of least resistance is a grind back toward the upper band in the high 495s, where another $300M+ Level sits with RS north of 1.7x and PCT in the 80s. A decisive daily close below 491 would say that support finally failed and open room toward the lower 480s where older volume pockets lurk. A disciplined trader in DIA can frame longs against 491–492 with first targets into 495–497, while shorts look to fade stalling price action in that upper band with risk just above and an eye on a rotation back into the 491 shelf.
Overall, across all four ETFs, the tape says we are at important decision zones where large prints have defined clear, tradeable lines in the sand for the next leg.

Summary Of Thematic Performance YTD
VolumeLeaders.com offers a robust set of pre-built thematic filters, allowing you to instantly explore specific market segments. These performance snapshots are provided purely for context and inspiration—think about zeroing in on the leaders and laggards within the strongest and weakest sectors, for example.
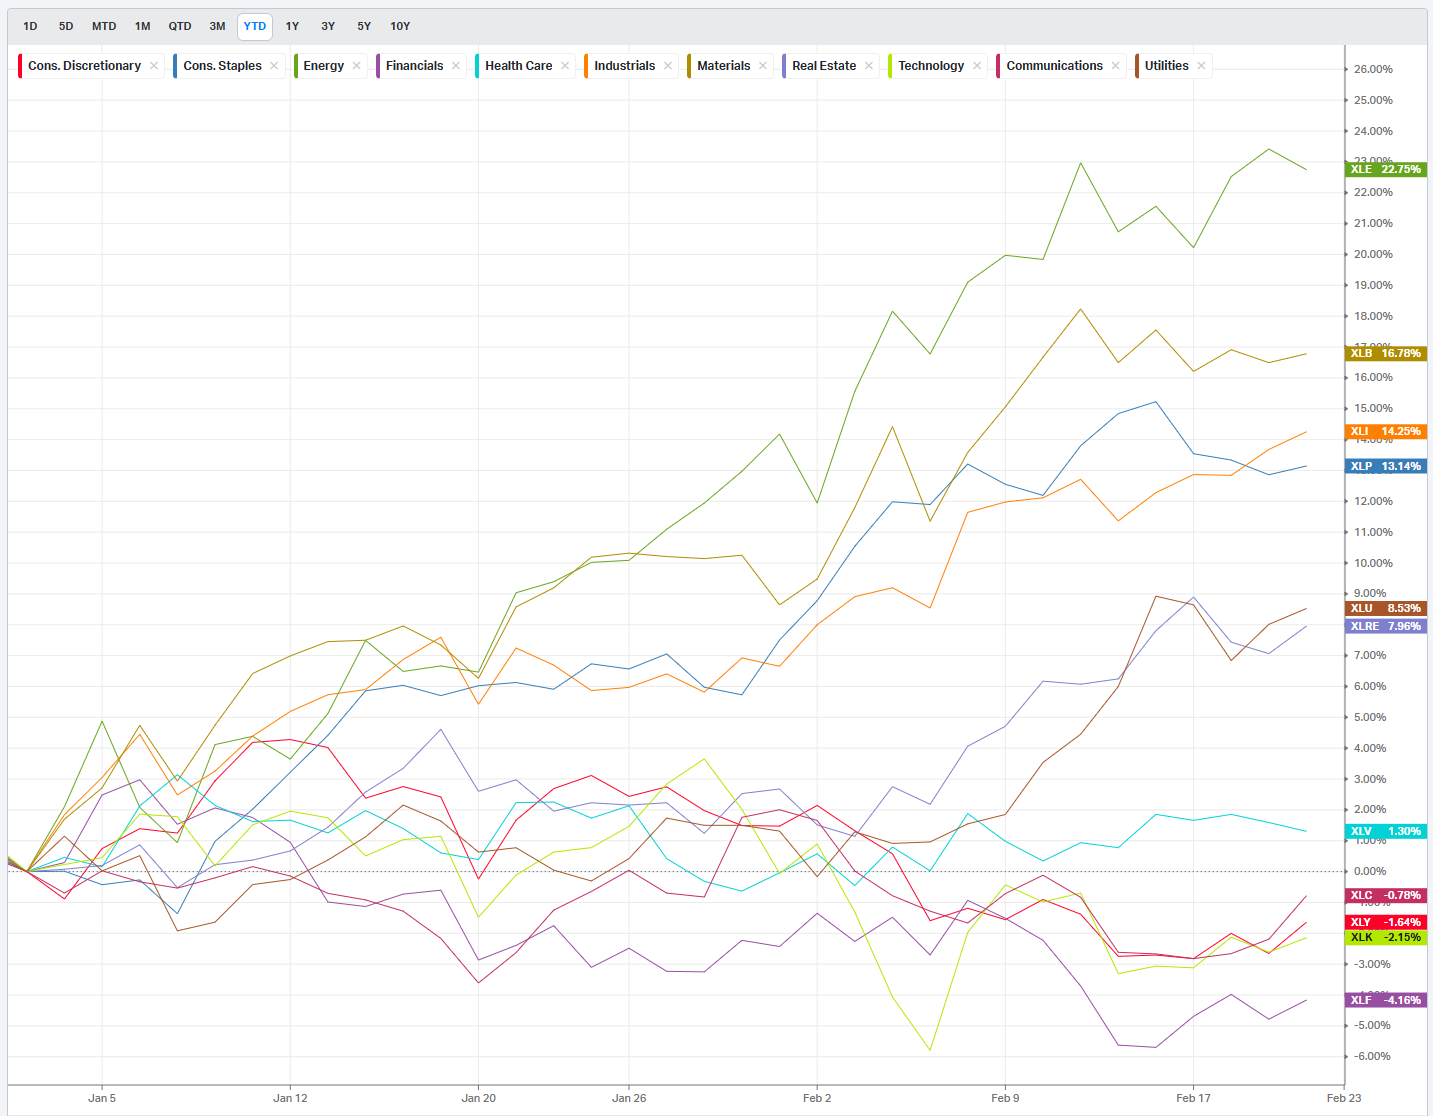
S&P By Sector
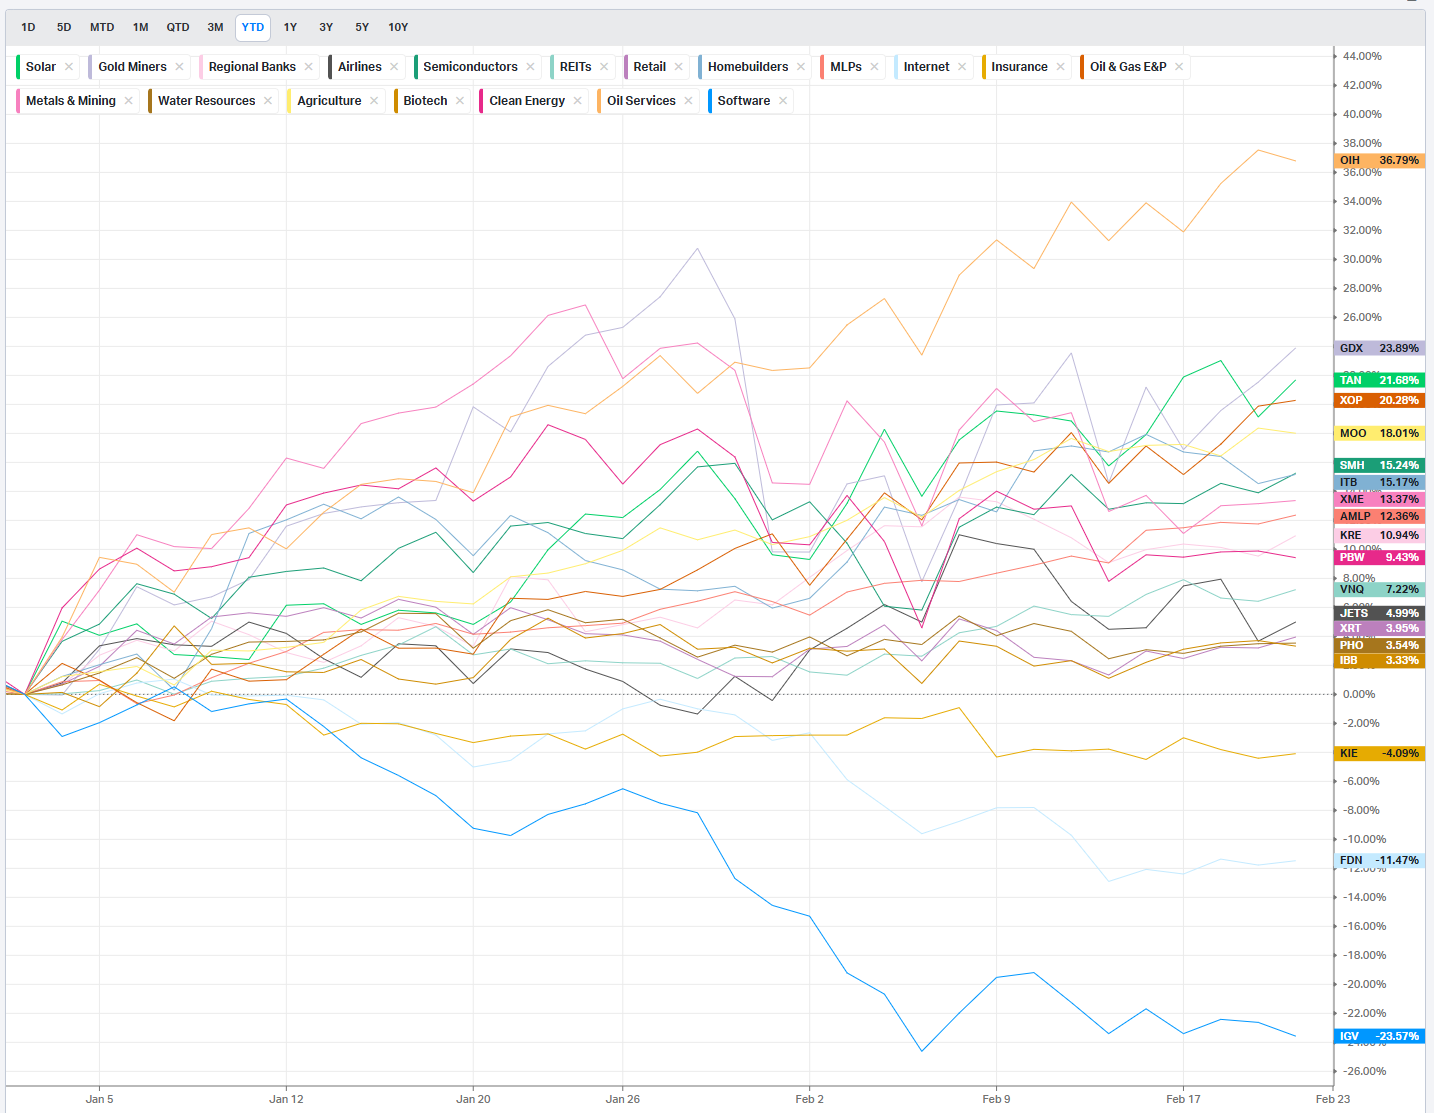
S&P By Industry
Commodities: Energy & Metals
Currencies/Major FX Crosses
Factors: Style vs Size-vs-Value

Events On Deck This Week
Here are key events happening this week that have the potential to cause outsized moves in the market or heightened short-term volatility.
Macro Week Ahead: Data Drip, Fed Talk, and a Heavy Midweek Tape
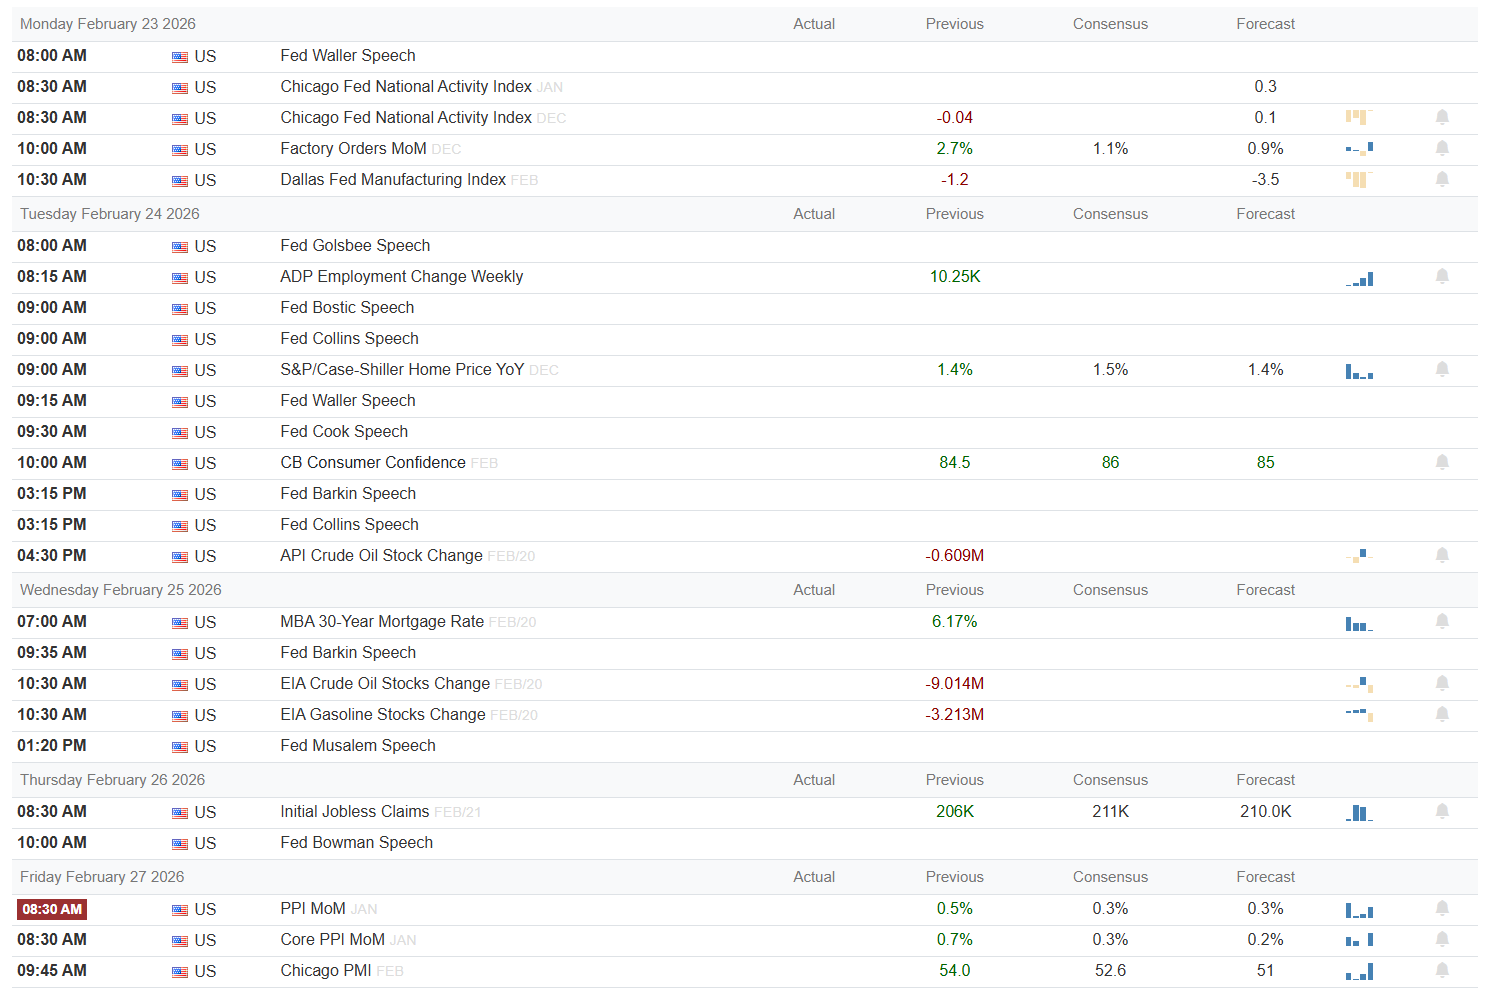
Monday is light on hard data but heavy on Fed tone-setting. We get the Chicago Fed National Activity Index with a previous reading of -0.04, followed by Factory Orders for December at a prior 2.7 percent and a consensus around 1.1 percent versus a 0.9 percent forecast. A print closer to that prior 2.7 percent would scream resilient demand and likely torque yields higher, a mild risk-off outcome for long-duration growth. A softer number toward forecast would keep the “soft landing” narrative alive and support risk. Dallas Fed Manufacturing wraps the morning; any move further into contraction would be a yellow flag for cyclical earnings.
Tuesday is the busiest macro day. ADP weekly employment change shows a previous 10.25K, with traders watching whether hiring cools or reaccelerates into March. Case-Shiller Home Price YoY carries a 1.4 percent previous and the same 1.4 percent consensus, so any upside surprise would reinforce sticky shelter inflation. The key sentiment tell is Conference Board Consumer Confidence, with a prior 84.5 versus 86 consensus and 85 forecast; a beat says households are still willing to spend, while a miss would feed slowdown chatter. The day is littered with Fed speakers; if they lean on “higher for longer” in reaction to firm confidence or housing, that tilts the day risk-off via rates and dollar.
Wednesday brings housing finance and energy. MBA 30-year mortgage rates previously printed 6.17 percent; a move higher crimps housing turnover, while any drift lower is a quiet positive for homebuilders and consumer durables. The EIA crude and gasoline stock changes (previous -9.014M and -3.213M barrels) will steer the oil complex: another big draw tightens the market and supports energy equities, while a rebuild would take some heat out of the inflation narrative. Fed commentary that leans dovish against stable inventories would be the cleanest risk-on mix.
Thursday’s focus is on labor with Initial Jobless Claims, where the previous read is 206K versus a 211K consensus and a 210K forecast. Another sub-210K print keeps the labor market “too tight” and nudges the Fed reaction function in a hawkish direction, a short-term headwind for richly valued growth but supportive for cyclicals if growth optimism dominates. A surprise jump in claims would flip the script, pressuring cyclicals and credit but likely helping duration. A mid-morning Fed Bowman appearance will matter mostly if she pushes back on easing expectations or hints at tolerance for weaker labor.
Friday is inflation and activity in one burst. Headline PPI MoM for January shows a previous 0.5 percent with both consensus and forecast at 0.3 percent; any upside surprise back toward 0.5 percent or higher would be classic risk-off via rates, with financials and value holding up better than long-duration tech. Core PPI has a prior 0.7 percent with 0.3 percent consensus and 0.2 percent forecast; a cooler print here would be the cleaner risk-on cue. Chicago PMI rounds out the week with a prior 54.0, consensus 52.6, and forecast 51; holding north of 50 keeps the “expansion but cooling” story intact, while a break toward or below 50 would resurrect growth-scare volatility.
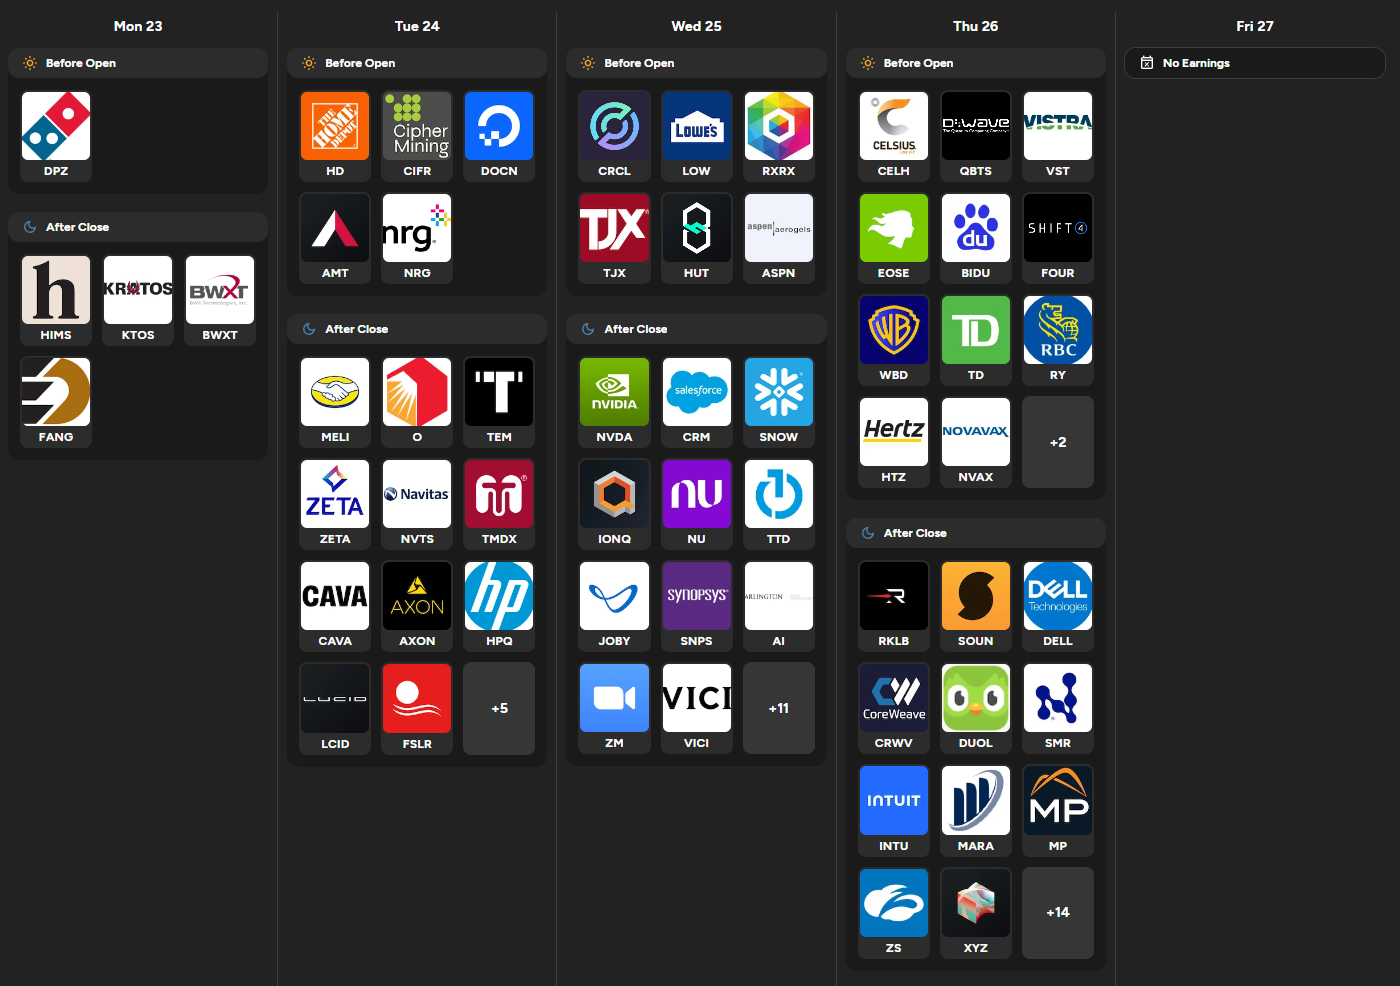
On earnings, the action is front-loaded and tech-heavy. Tuesday night features Home Depot, HP, and a cluster of high-beta names like CAVA, AXON, and several small-cap growth stories; for macro read-through, watch HD’s comps and guidance as a proxy for goods spending and home improvement, and HP’s PC/printer commentary as a cyclical demand gauge. Wednesday after the close is the main event with NVIDIA, Salesforce, Snowflake, IonQ, and others stacked together; NVIDIA’s data center and gaming lines will set the tone for semis and AI, while Salesforce and Snowflake guide the broader enterprise software and cloud complex. Thursday brings Warner Bros. Discovery plus Canadian banks TD and RBC before the open, and Dell, Intuit, and Zscaler after the close; streaming engagement, capital markets commentary, tax and small-business demand, and security spend all feed into how durable this earnings cycle really is. There are no marquee names on Friday, so any late-week gap will come from PPI and Chicago PMI, not micro headlines.
Three sign-posts for active traders:
Conference Board Confidence holding above 84.5 with PPI at or below 0.3 percent keeps the “Goldilocks” trade alive.
Initial Claims staying near 206K while PPI or Core PPI surprise higher would be a classic rates-led risk-off cocktail.
NVIDIA’s read on data center demand and capex is the swing factor for whether AI-led leadership extends or finally needs a breather.
Bottom line: this is a data-and-earnings convergence week where modest beats on growth and cooler inflation keep the tape risk-on, but any combination of hot PPI and strong labor will quickly shift the focus back to rates and test the market’s appetite for chasing highs.

Order Flow in Focus: Reading Smart Money Tells
Order Flow in Focus: Reading Smart Money Tells is a recurring segment that spotlights unique intraday opportunities revealed through institutional order flow. Each feature dissects a moment when the tape quietly shifted—when large, ranked prints clustered at key liquidity locations and informed players positioned ahead of the move. The goal isn’t hindsight; it’s pattern recognition—learning to spot the footprints of capital that knows before the crowd does.
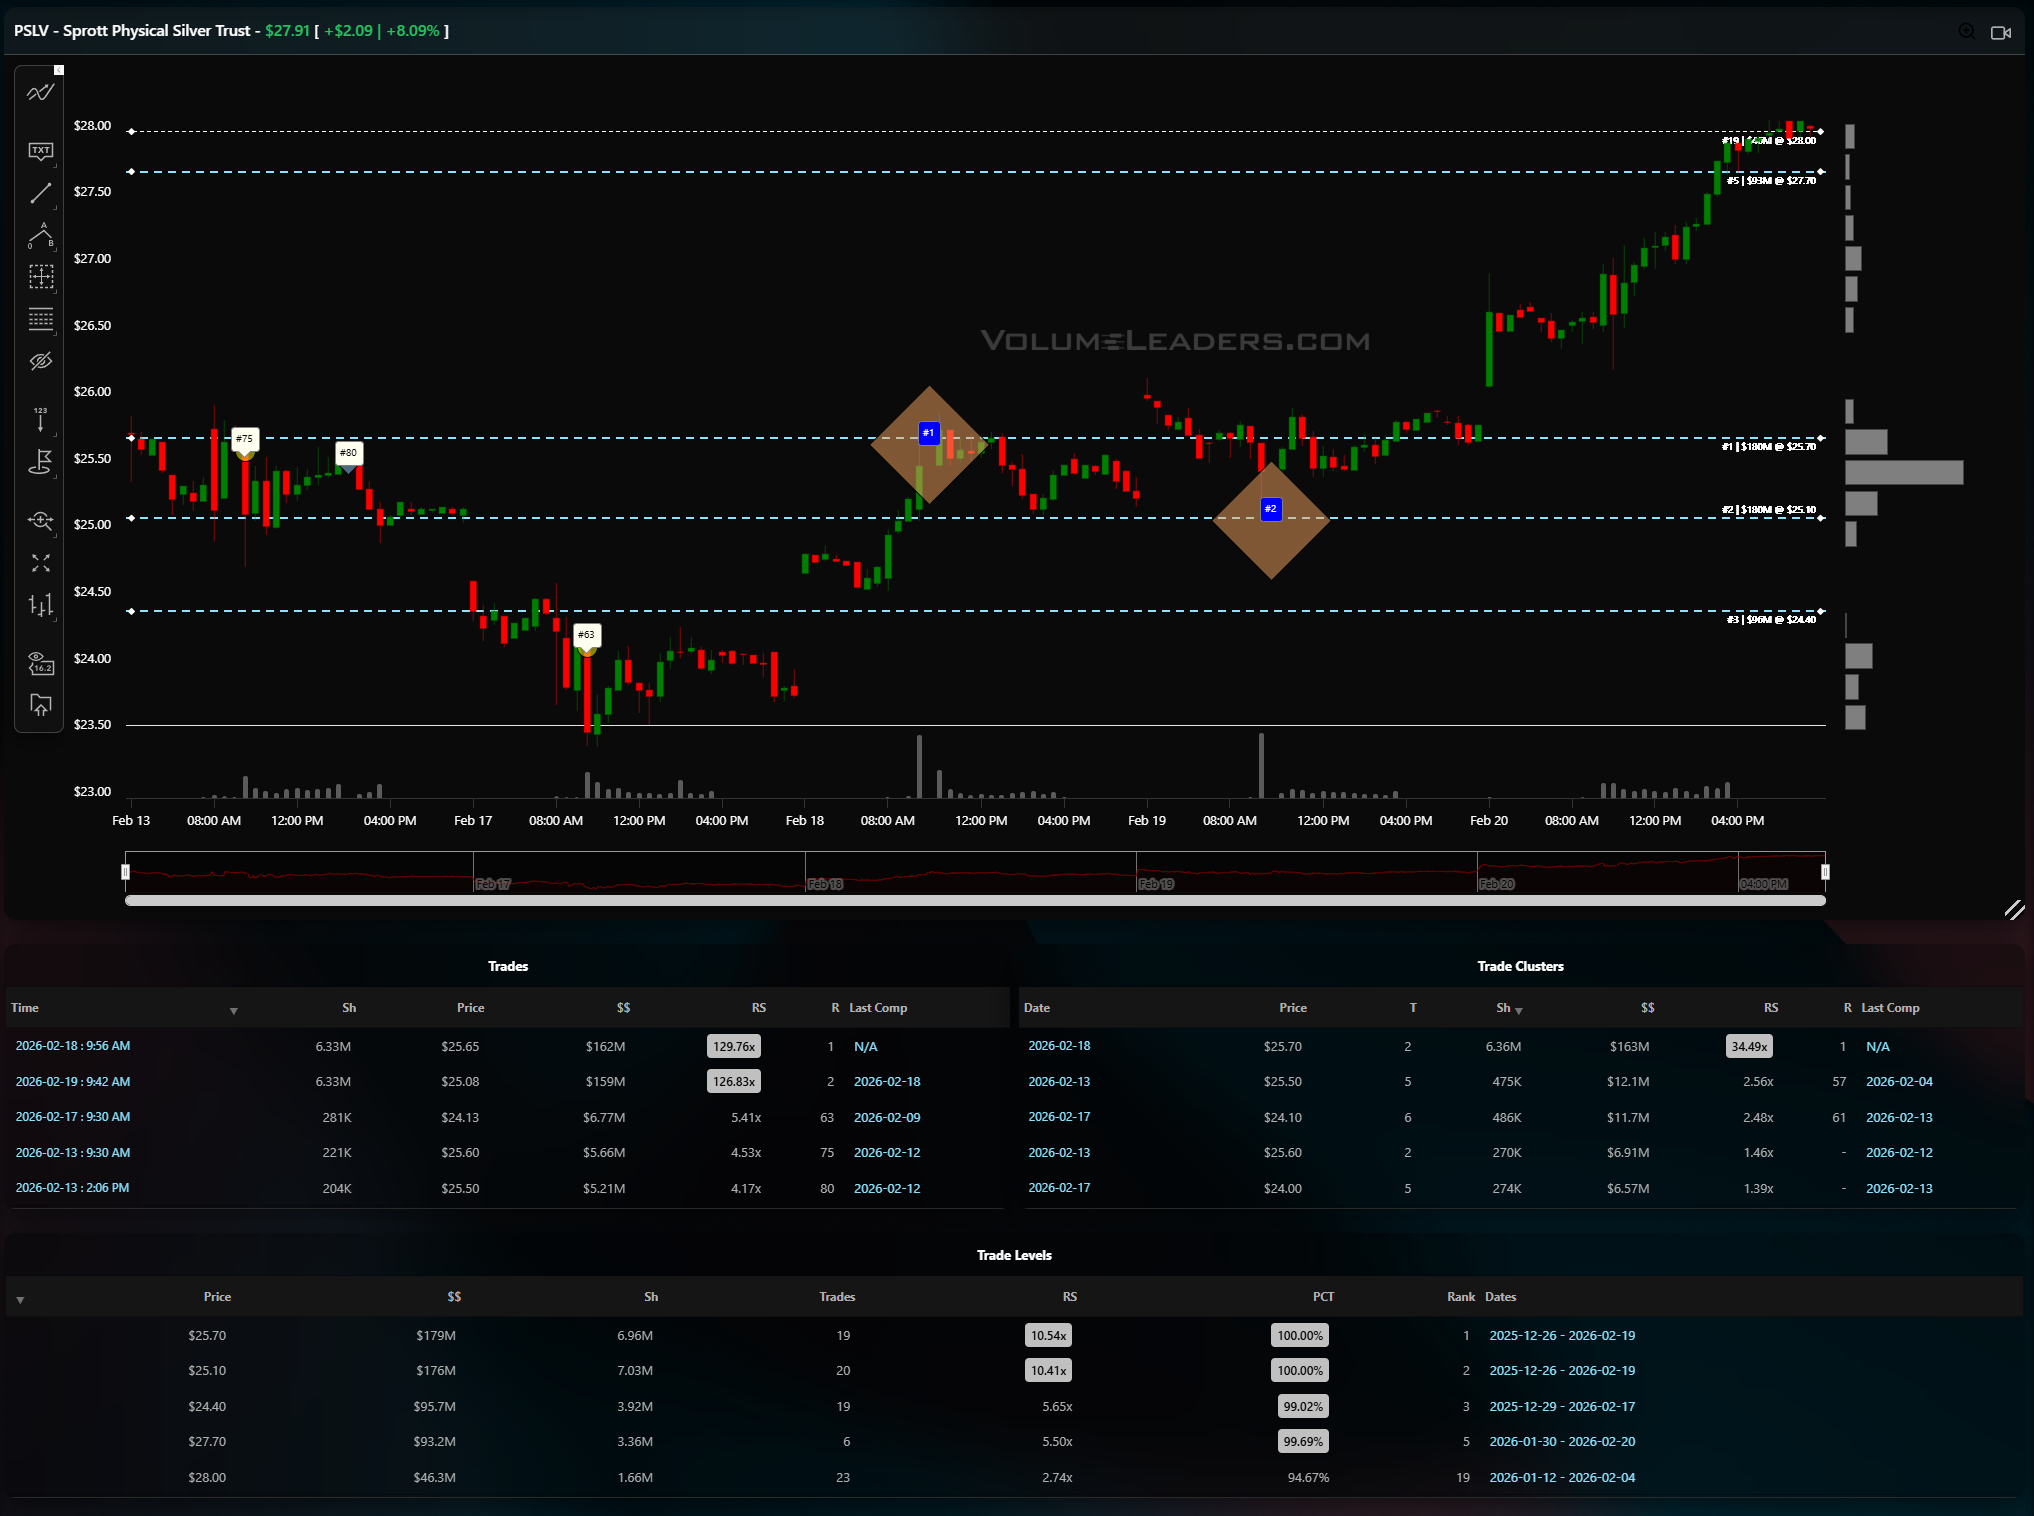
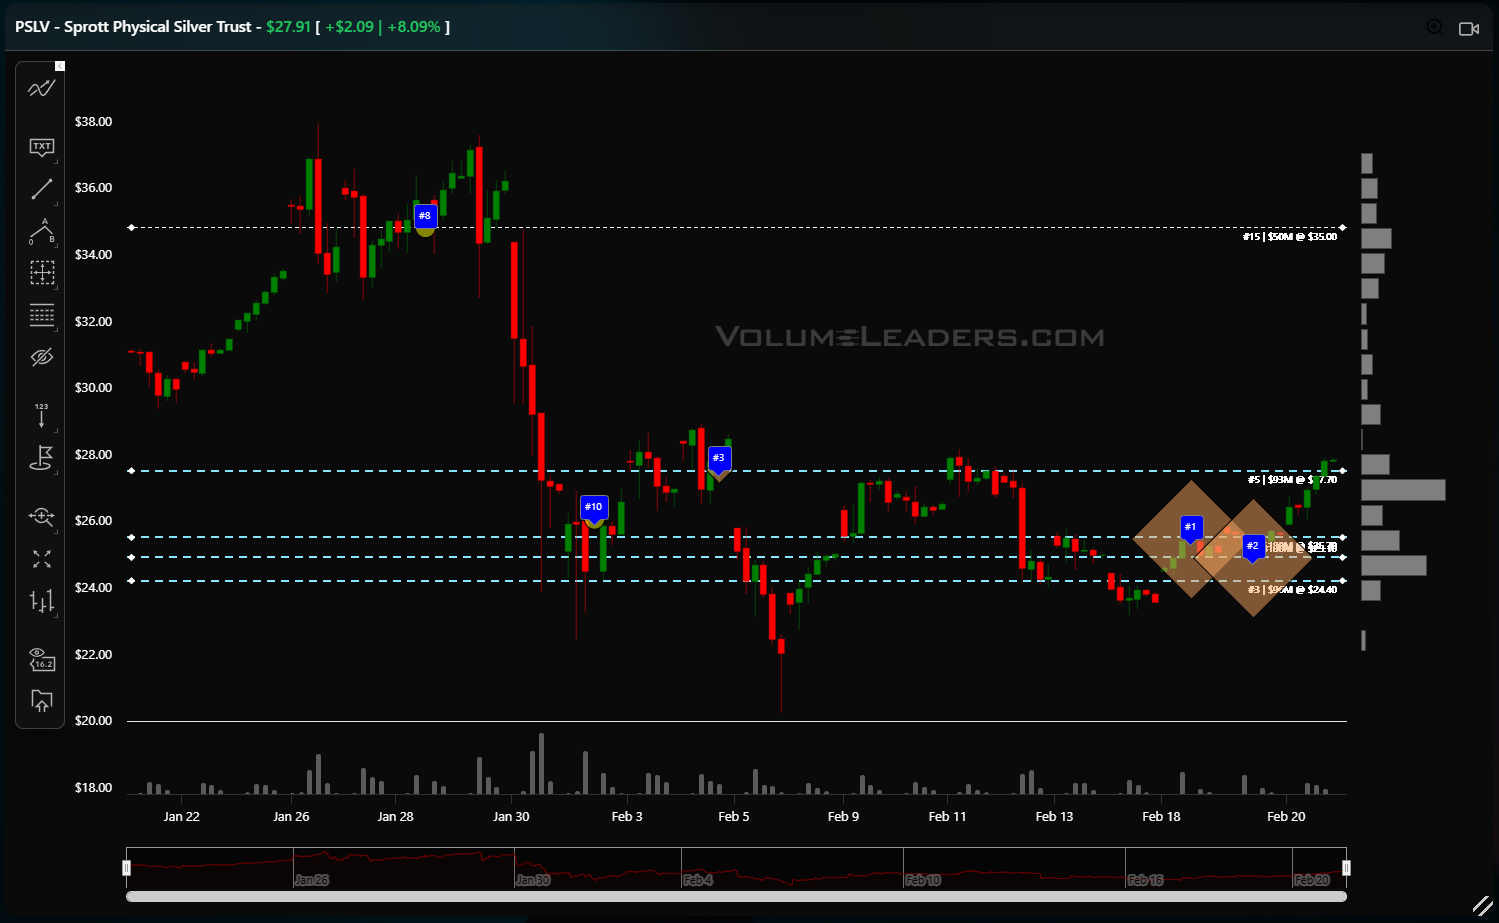
The most interesting thing about this PSLV sequence is that the long was telegraphed well before the obvious breakout candle. The tells were sitting in the levels.
Start with the backdrop. After the late‑January flush from the mid‑$34s into the low‑$20s, price spent several sessions grinding sideways between roughly $24 and $26, building out a fat, horizontal volume profile. The Trade Levels table shows three dominant liquidity shelves in that zone: the largest at $25.70 with about $179M traded and an RS north of 10x, a second at $25.10 with around $174M and similar RS, and a third at $24.40 with just under $96M. All three are ranked at or near the 100th percentile of historical dollar volume. What that tells you is simple: this is where big money did business on the way down and then again during the basing process. If PSLV is going to turn, it almost has to turn from this band.
The first smart‑money footprint shows up after the initial plunge stabilizes. As price retests the $24.50–25.00 area in early February, you get a large, ranked print around $25.08–25.10 for roughly 3.2M shares and about $89M notional, with RS in the 70x range. That is not a tourist trade; that is someone absorbing size exactly on top of the third‑rank liquidity shelf. Price wobbles, tests below, but does not stay there. The next day or two, another block goes up closer to $25.70, again multi‑million shares and over $160M notional with RS around 120x, this time right on top of the number‑one level. Now you have two separate days where serious money steps in at the two biggest historical levels, and the tape refuses to make new lows. That is your early warning that the selling program is either finished or being met one‑for‑one by responsive buyers.
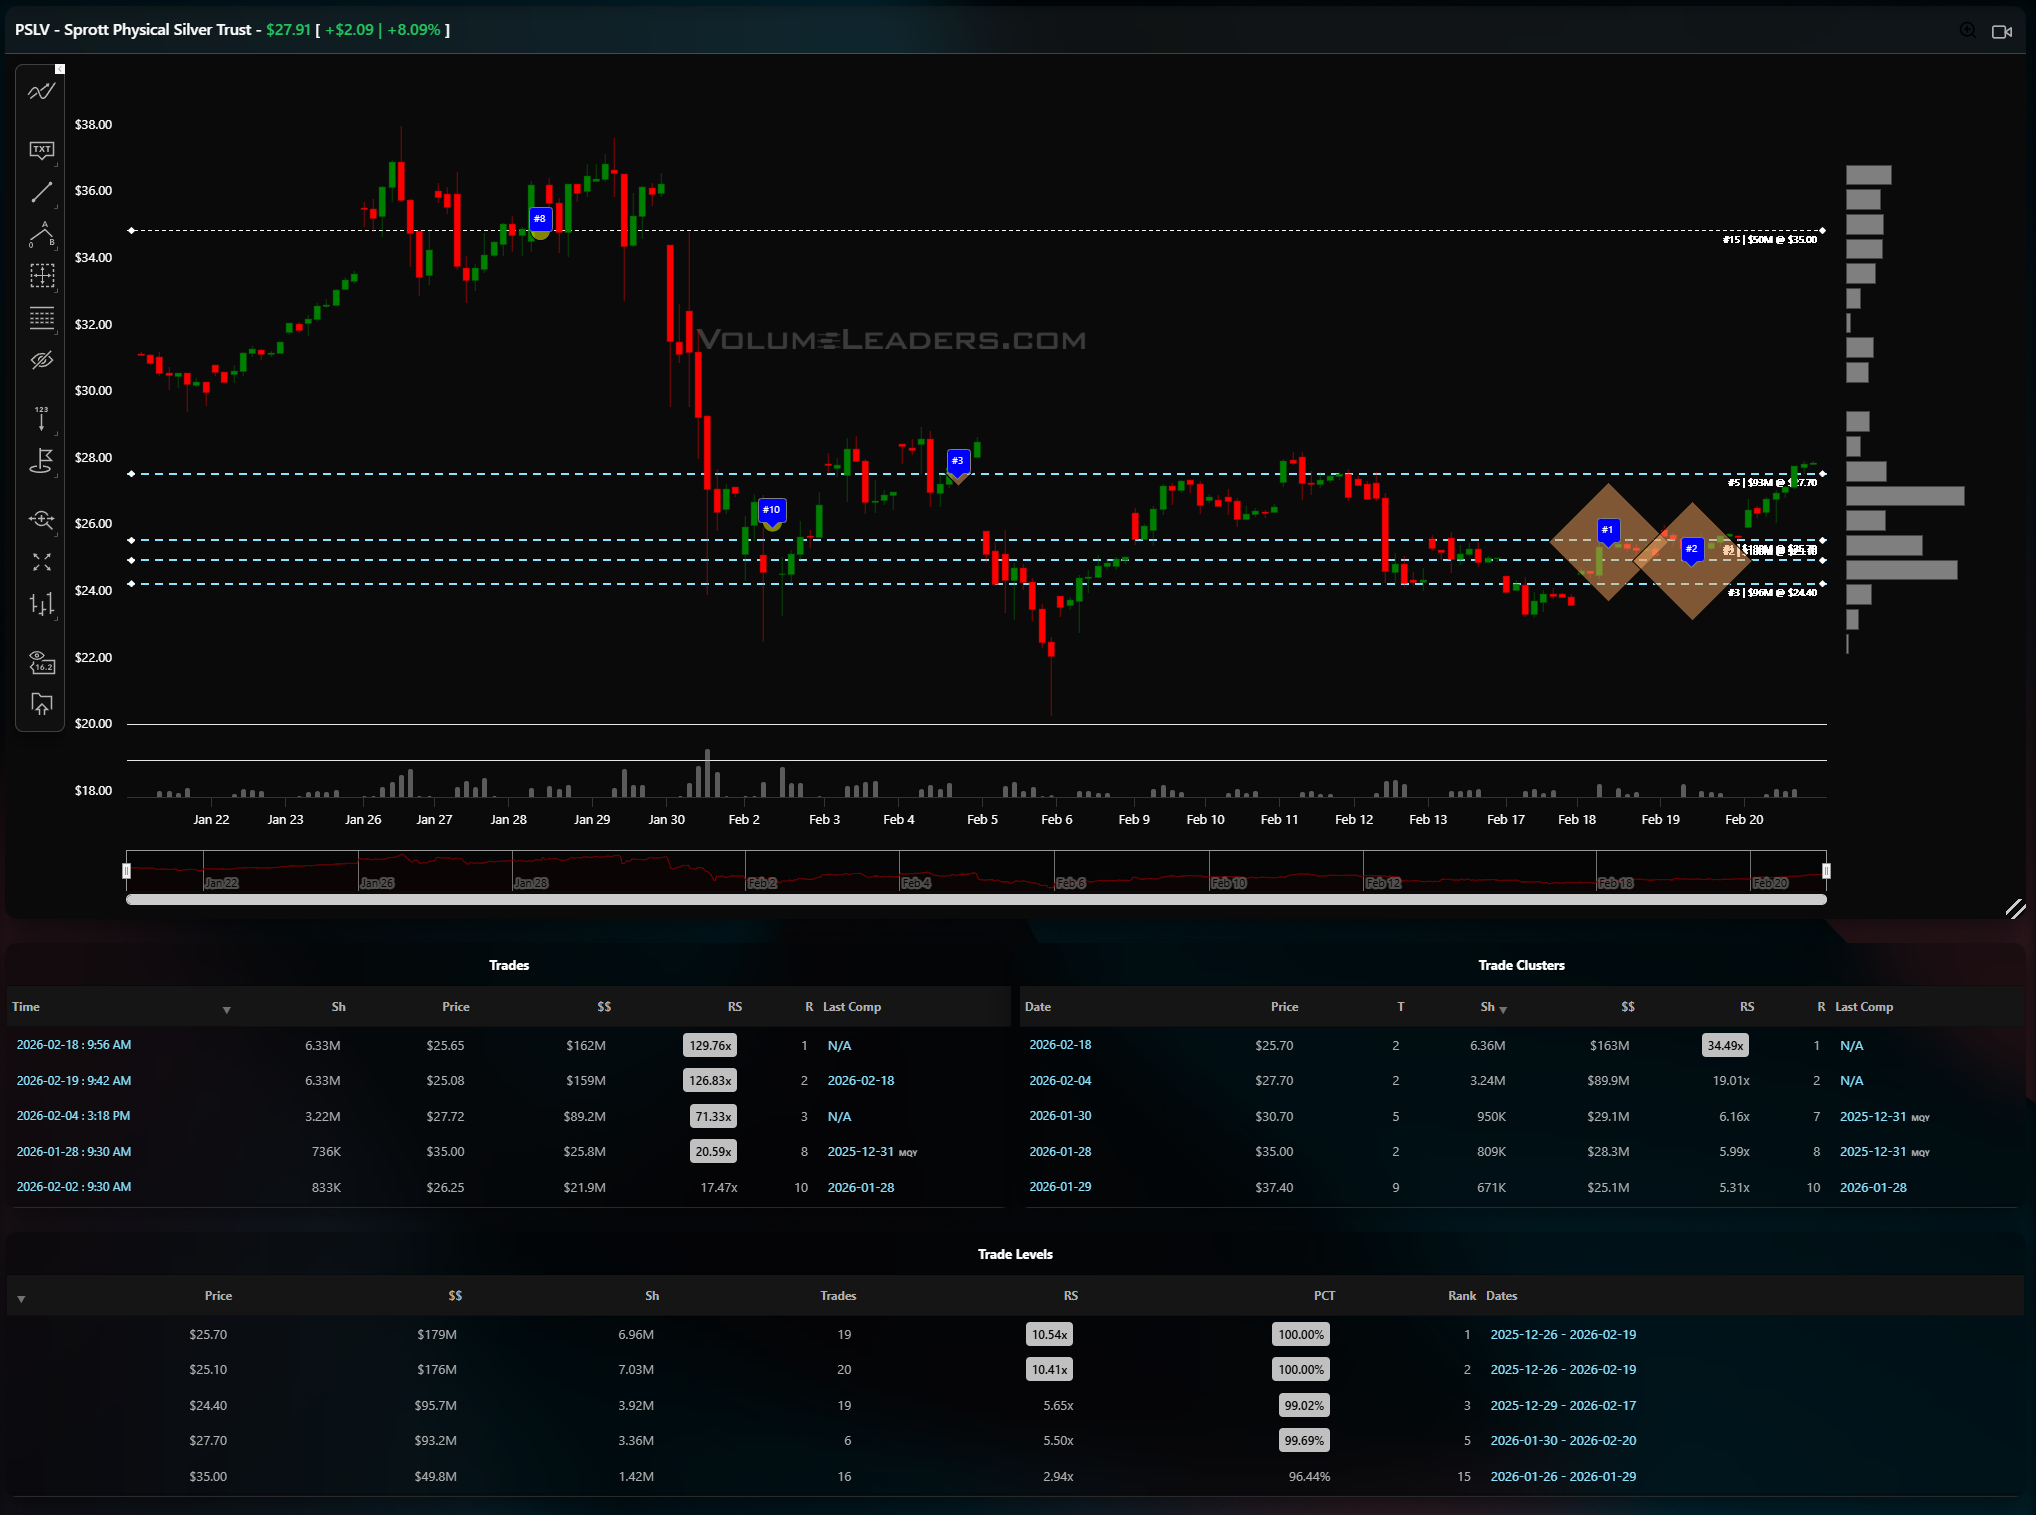
The real opportunity comes when those levels stop acting like passive support and become a springboard. On the morning of February 18, PSLV dips into the $25.10–25.70 pocket again. Instead of slipping lower, it prints a cluster of aggressive sweeps: one around $25.85–26.00 for over 6.3M shares and roughly $162M notional, and another a day later near $25.80–25.90 for a similar 6.3M shares and about $159M. Both carry RS well north of 120x, and they stack right on top of the prior liquidity shelves. That combination—heavy historical volume below, repeated large blocks that never break the shelf, and then two outsized sweeps that launch away from the band—is your tell that the real long leg is underway.
In real time, the trade sets up cleanly. Once you see the second big sweep fire off above $25.70, with price holding the $25.10–25.70 zone on every probe, you have a logical long entry on a retest of that band: buy in the $25.70–25.90 area with a stop tucked just below the lowest major level around $24.40. The initial target is the prior congestion and failed auction area up near $27.70–28.00, where the earlier February bounce died and where the volume profile thins out. In this case, PSLV moves from roughly $25.80 into the high $27s, eventually tagging just under $28.00. That gives you better than 4:1 reward‑to‑risk if you are risking about $1.40 under the shelves for a $2.00–2.20 upside move.
The beauty of this sequence is that nothing about it required predicting a macro catalyst or guessing where silver was headed next. The tape itself laid out the path: identify the ranked liquidity levels where real money cares (VL has a purpose-built screener, one of many, for this), watch how price behaves around them, then wait for the moment when big blocks stop just defending the floor and start attacking higher with back‑to‑back sweeps. At that point the market has already answered the only question that matters: someone with size has decided this is the spot to own, and your job is simply to structure an entry against their footprints and let the trade work toward the next obvious liquidity pocket above.

Market Intelligence Report
A desk-grade synthesis of institutional positioning and market structure—unpacking the flows, levels, and emerging themes that shaped the week, and translating them into a model portfolio built the same way professional desks prepare for the week ahead.
MIR Part 1: The Backdrop
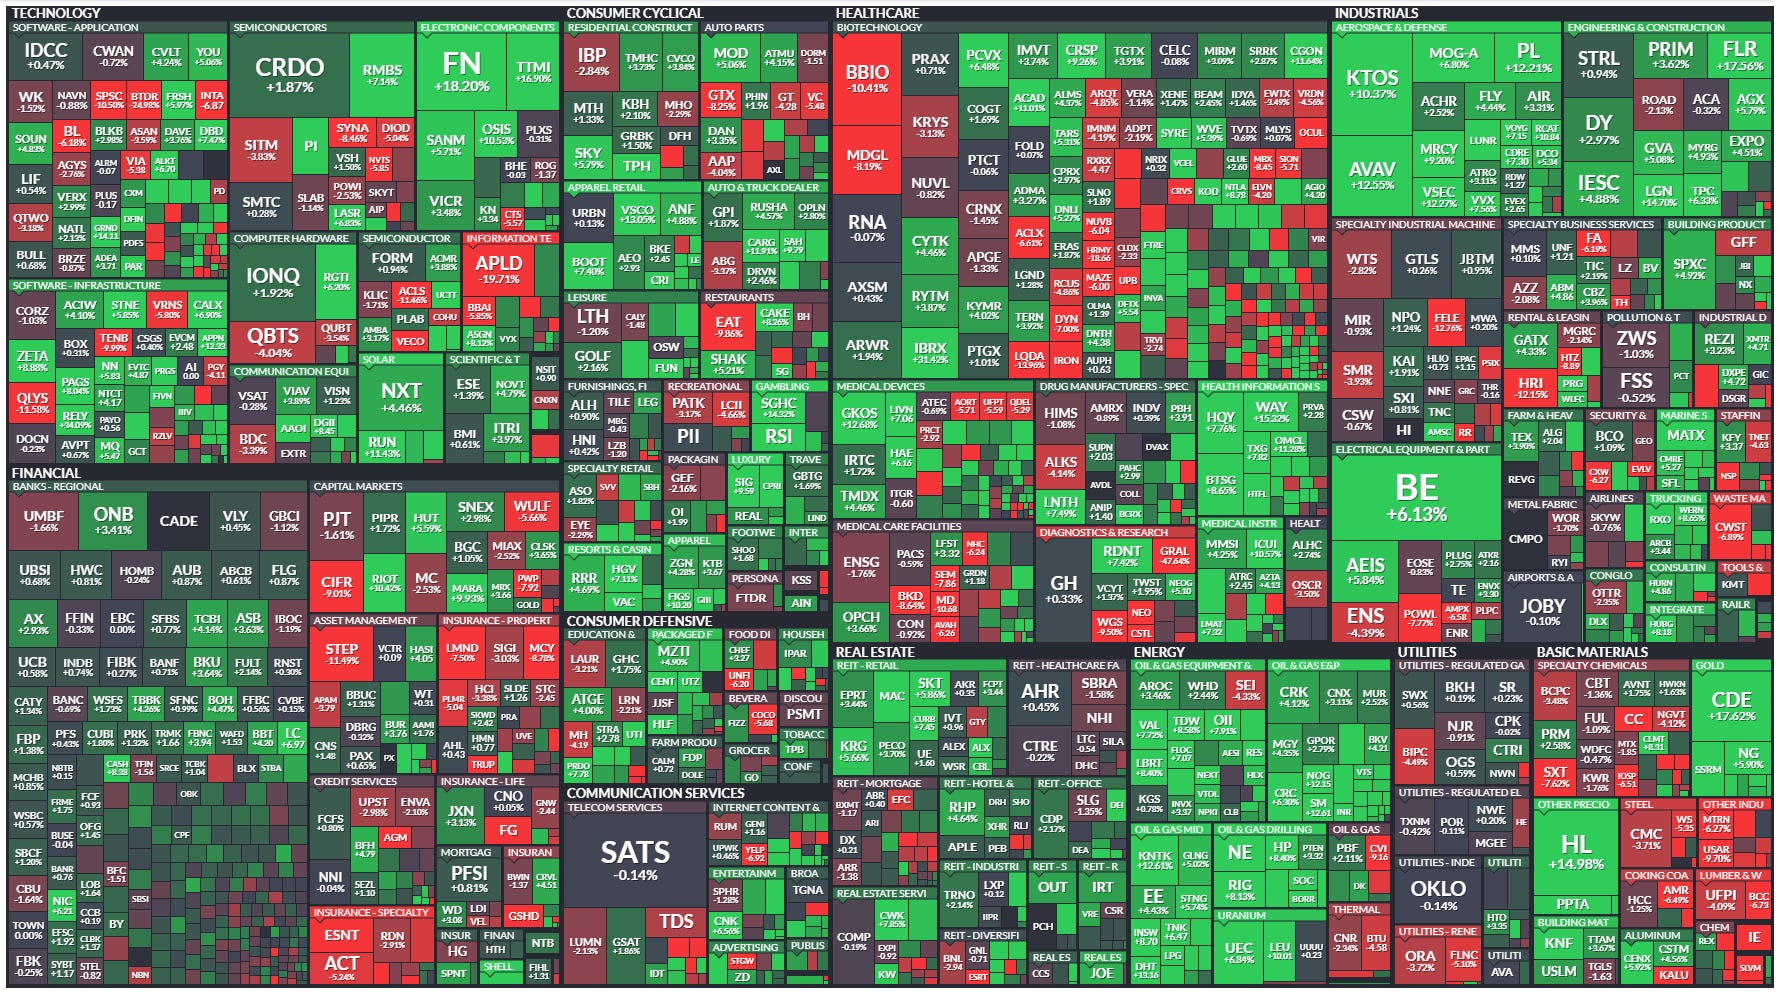
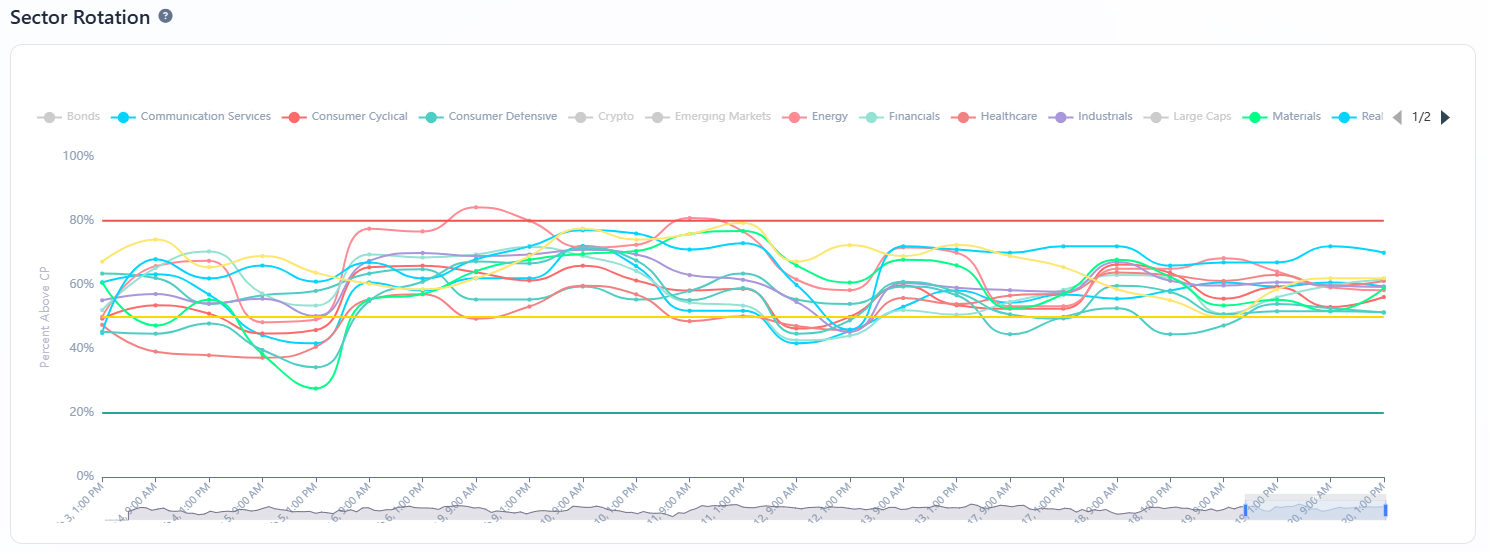
You can think of this week’s tape as “selective risk‑on”: the composite read is bullish, but the market is choosy about where it wants to express that optimism. Overall sentiment is running about 62% bullish versus 38% bearish, and a number of sectors are sitting comfortably north of the 60 line, while several others are hovering close to 50 rather than deeply negative. That is not a risk‑off regime; it is a market that still wants exposure, but increasingly prefers size, quality, and certain macro narratives over blanket beta.
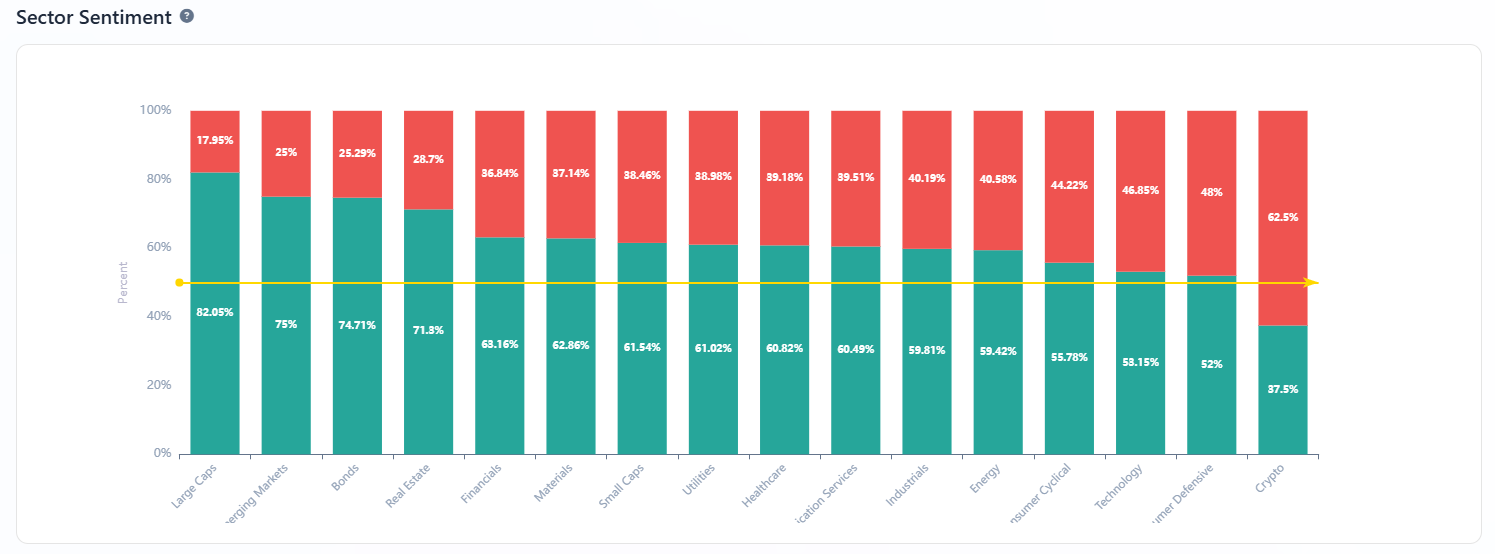
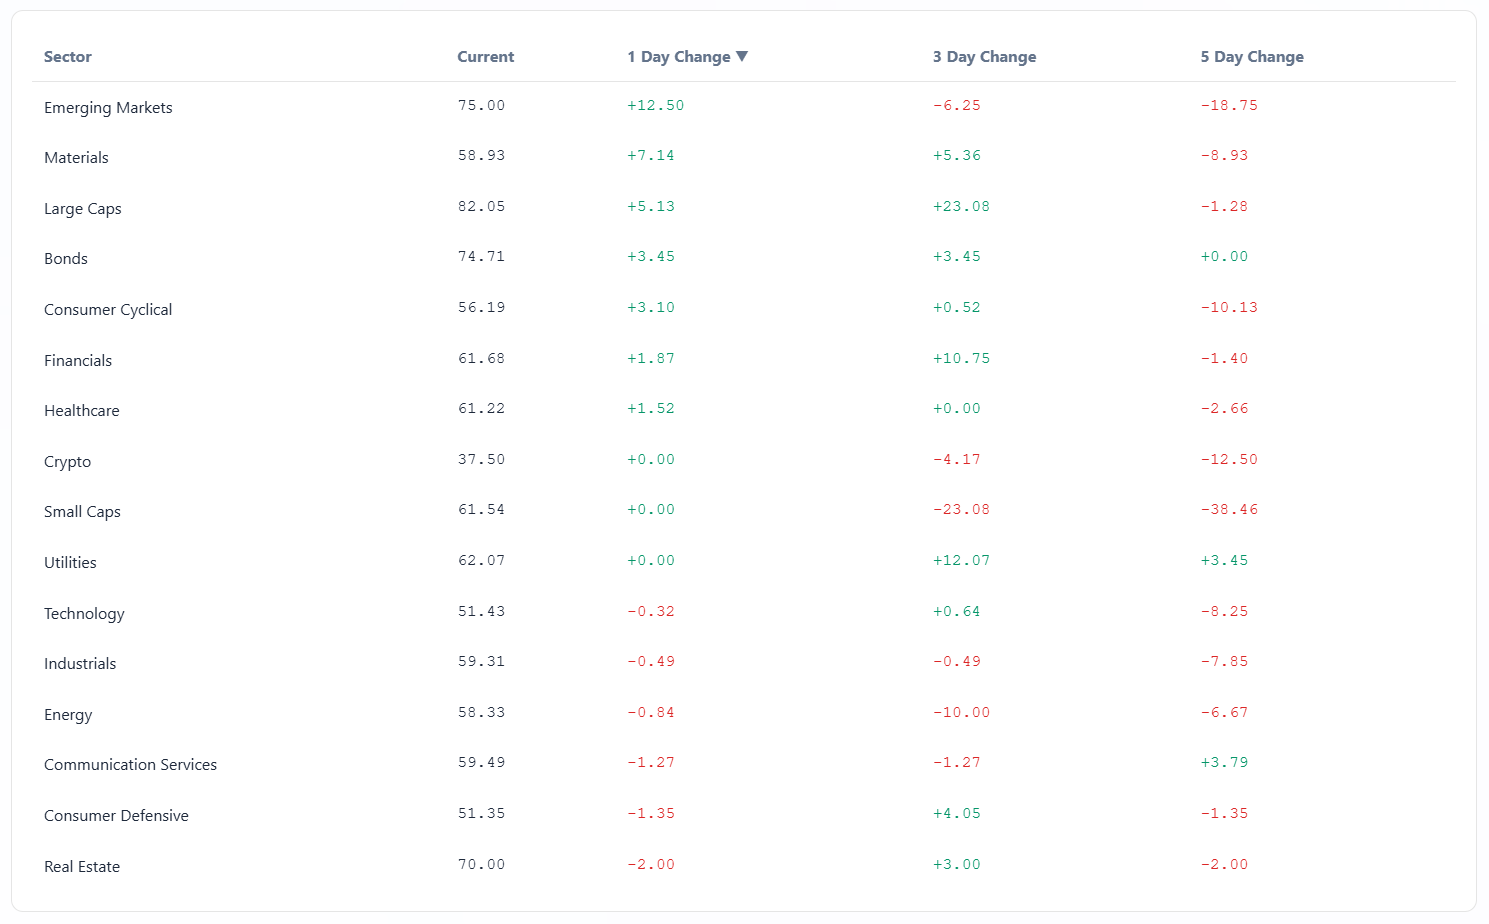
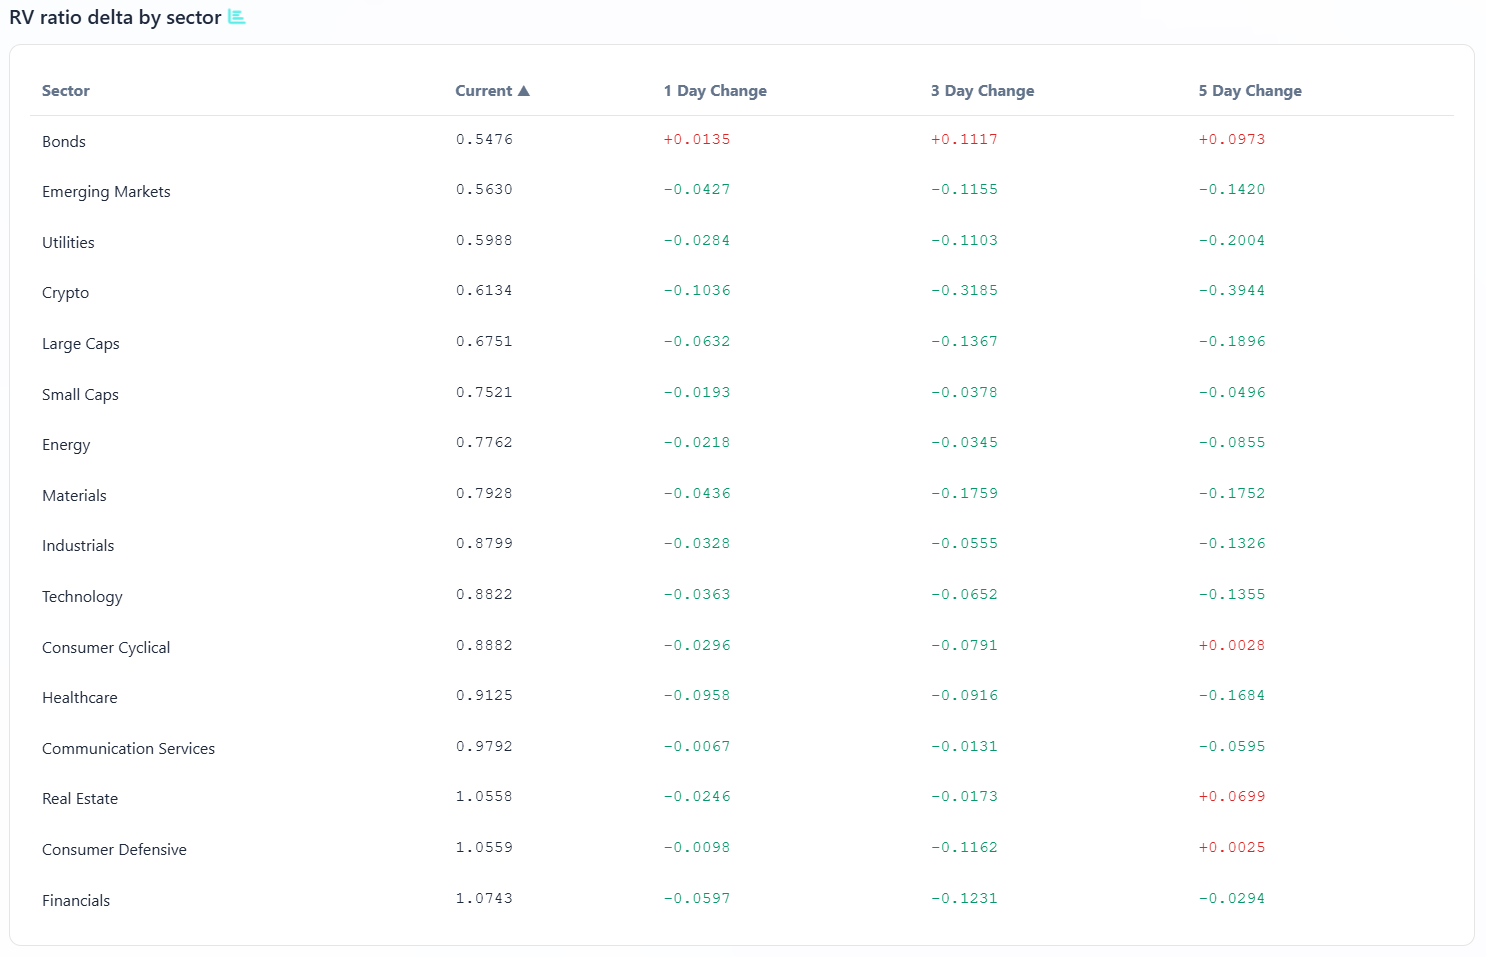
The sector sentiment panel makes that distribution clear. Large caps, emerging markets, bonds, real estate, utilities, financials, and small caps are all above the 60 mark on their current readings, with large caps north of 82 and emerging markets right around 75. That is a wide base of constructive signals across styles and geographies. Lower down the stack, healthcare, communication services, industrials, materials, energy, consumer cyclicals, technology, consumer defensives, and crypto cluster between the high 30s and upper 50s. None of those are washed‑out; they are more “debated” than “abandoned.” When you zoom into the sector‑delta table, you see big 5‑day drops in small caps, consumer cyclicals, technology, and crypto, while materials, utilities, and communication services are either flat or modestly lower over the same window. Taken together, the message is that the market hasn’t flipped bearish, but it has been rotating away from the high‑beta growth complex into more stable, cash‑flow‑heavy areas.
The rotation chart reinforces that this is an ongoing process rather than a one‑day event. Sector lines oscillate around the 50 band, with several defensive groups pressing toward the upper boundary and the more cyclical sectors curling down from prior highs. Bonds and large caps have pushed higher on the rotation scale, emerging markets have backed off from a recent peak, and consumer cyclicals have rolled over meaningfully in the last week or so. That kind of slow, overlapping rotation is classic of a maturing advance: money is not leaving the field, it is migrating toward places that can live with a slower growth and stickier inflation backdrop. Given recent upside surprises in core PCE and some hotter‑than‑hoped goods inflation, that behavior fits the macro tape.
Under the hood, realized volatility and relative strength help explain why certain pockets are getting the nod. On the volatility side, most sectors are sitting near or a bit above “1” on the risk ratio, which means upside and downside swings are roughly balanced, but the direction of travel matters. Materials, emerging markets, real estate, and communication services show improving volatility profiles over the last five days, with up moves starting to outpace down moves, while technology, small caps, energy, and healthcare show deteriorating profiles as downside swings pick up. That tilt makes materials, real estate, and comms feel more “stable to trade,” while growthier areas feel jumpier and less forgiving.
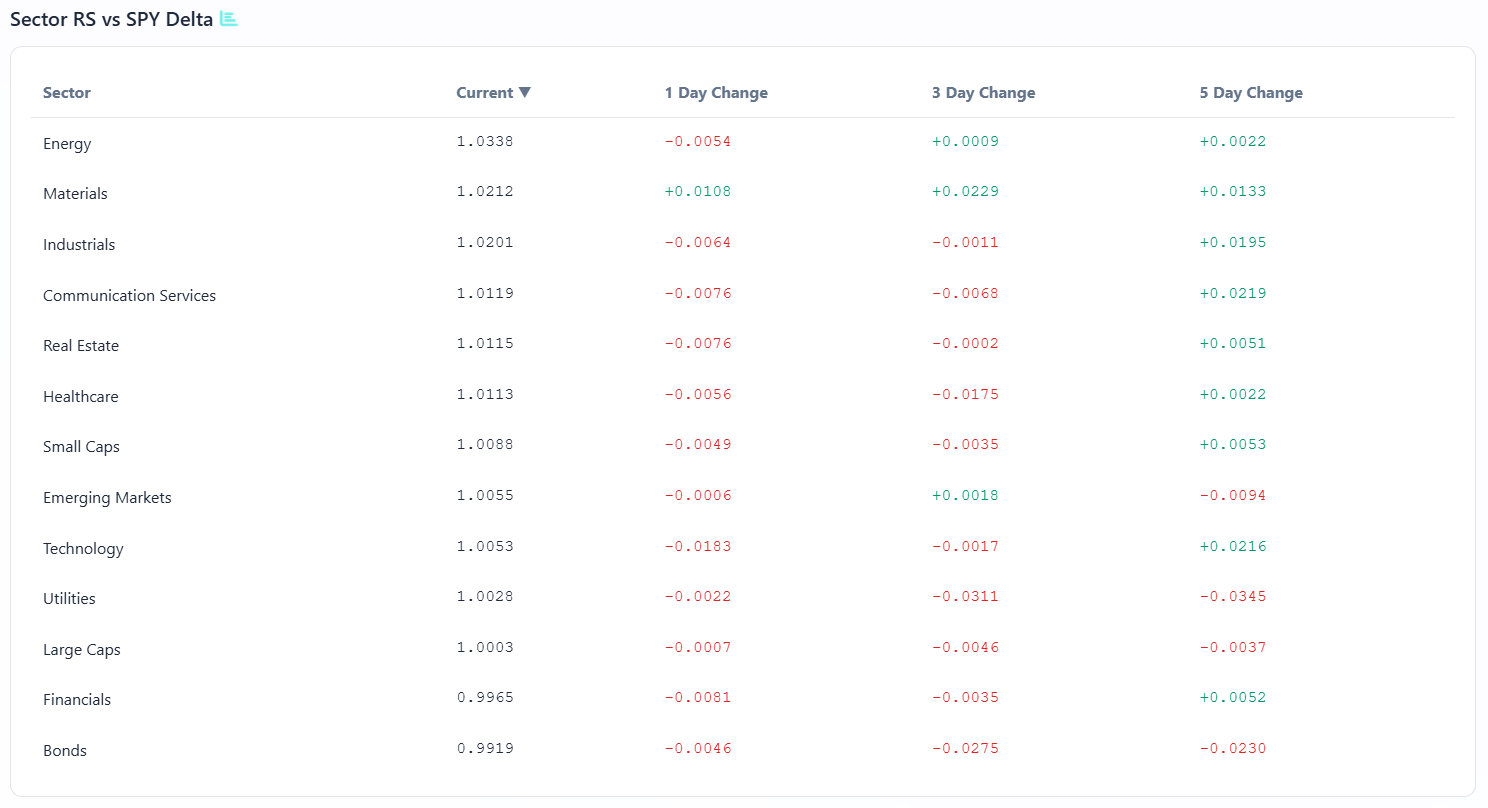
Relative strength versus SPY paints a similar picture: bonds, large caps, financials, and real estate have been quietly gaining ground, while small caps, energy, and crypto have slipped. In terms of where the market is comfortable being involved right now, the intersection of improving volatility and relative strength is squarely in large caps, bonds, and select defensives, while the adventurous money is still probing emerging markets but with tighter risk.
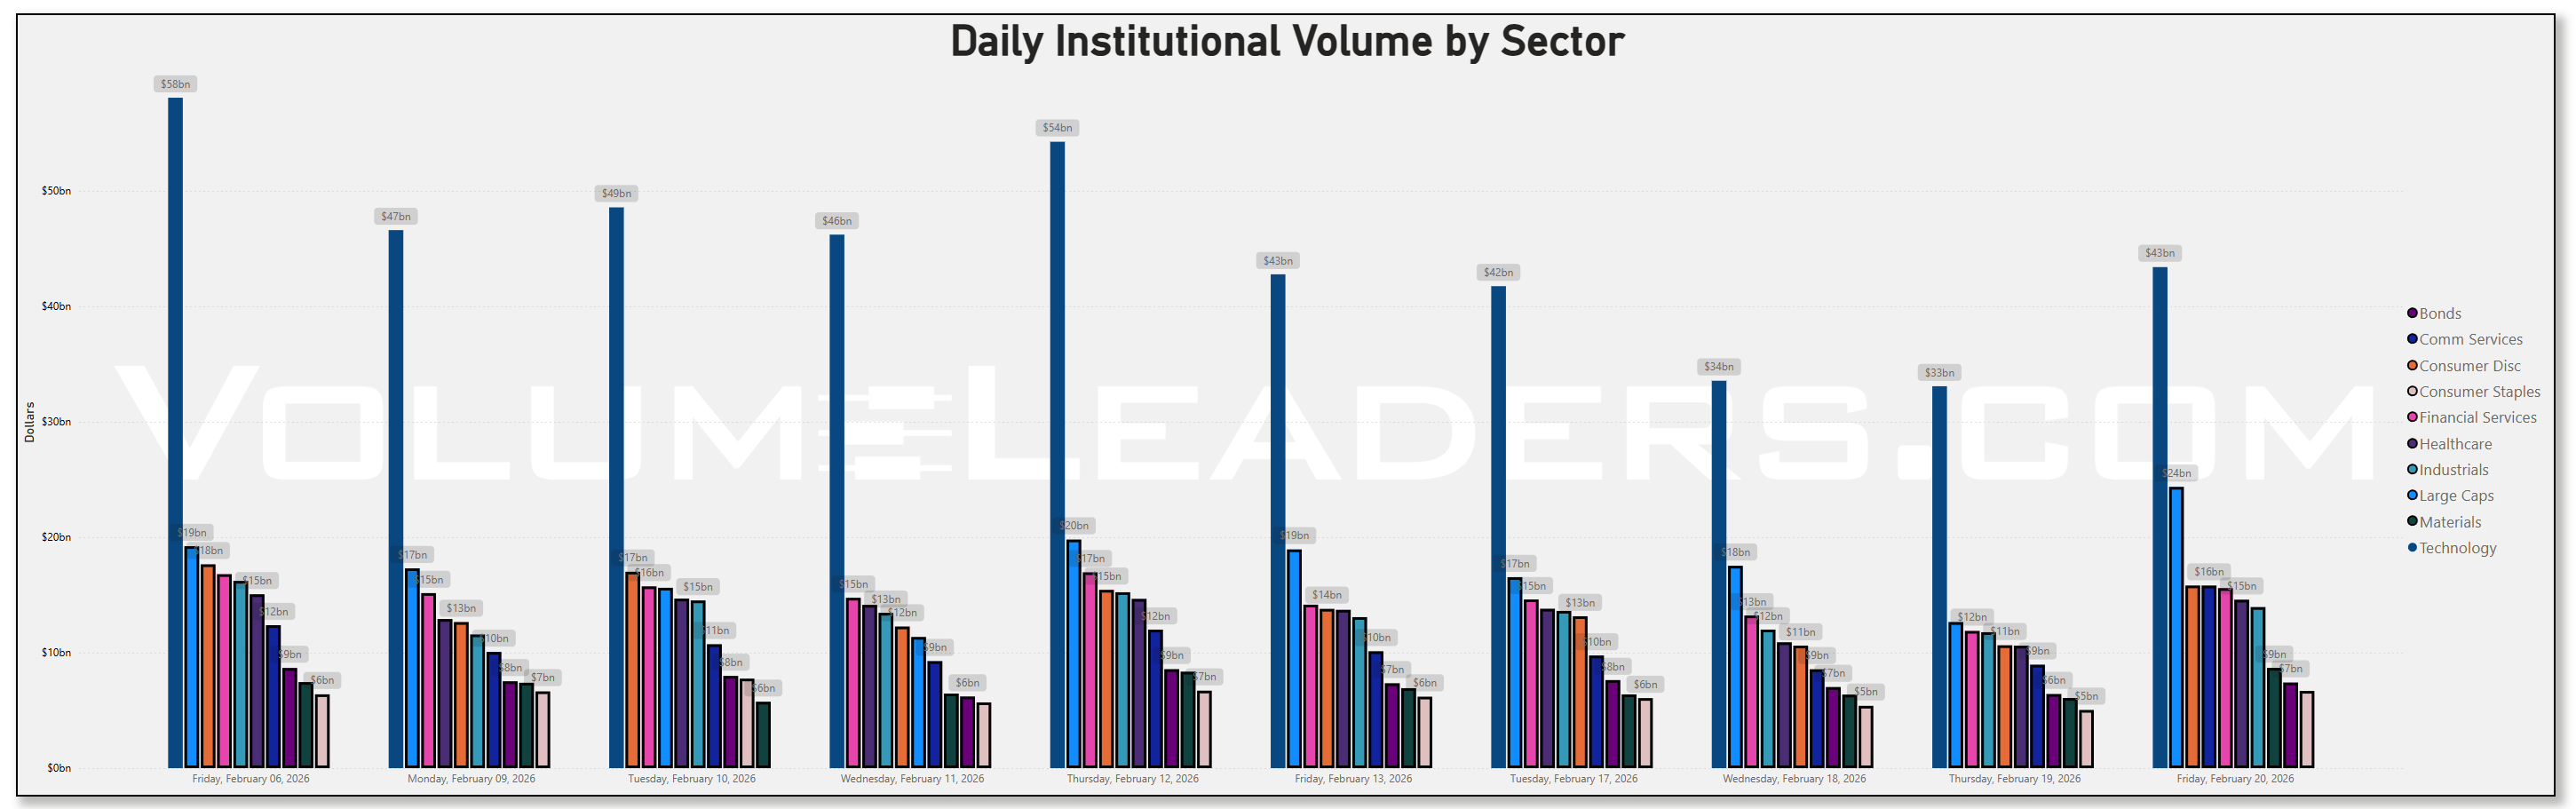
Institutional flow is consistent with that story. By sector, technology still commands the largest absolute dollars, with about $43.4 billion traded on Friday, February 20, up from roughly $37.1 billion a week earlier. Large caps as a style bucket saw a particularly sharp step‑up, from about $12.6 billion last Friday to $24.4 billion this Friday, more than an 90% jump for OPEX. Financial services climbed to about $15.6 billion from $11.9 billion, and bonds moved from roughly $6.4 to $7.4 billion. Healthcare and industrials held steady in the mid‑teens and low‑teens, respectively. Materials, energy, and consumer staples remained smaller in dollar terms, but they, too, ticked higher week‑over‑week. The only clear soft spots over five days were small caps and crypto, where the sector‑delta table shows double‑digit negative 5‑day changes, and energy and consumer cyclicals, which are down mid‑single‑digits. This is exactly what a defensive tilt looks like when the top‑down sentiment is still net bullish: flows rise almost everywhere, but they rise the most in big, liquid, quality‑tilted segments.
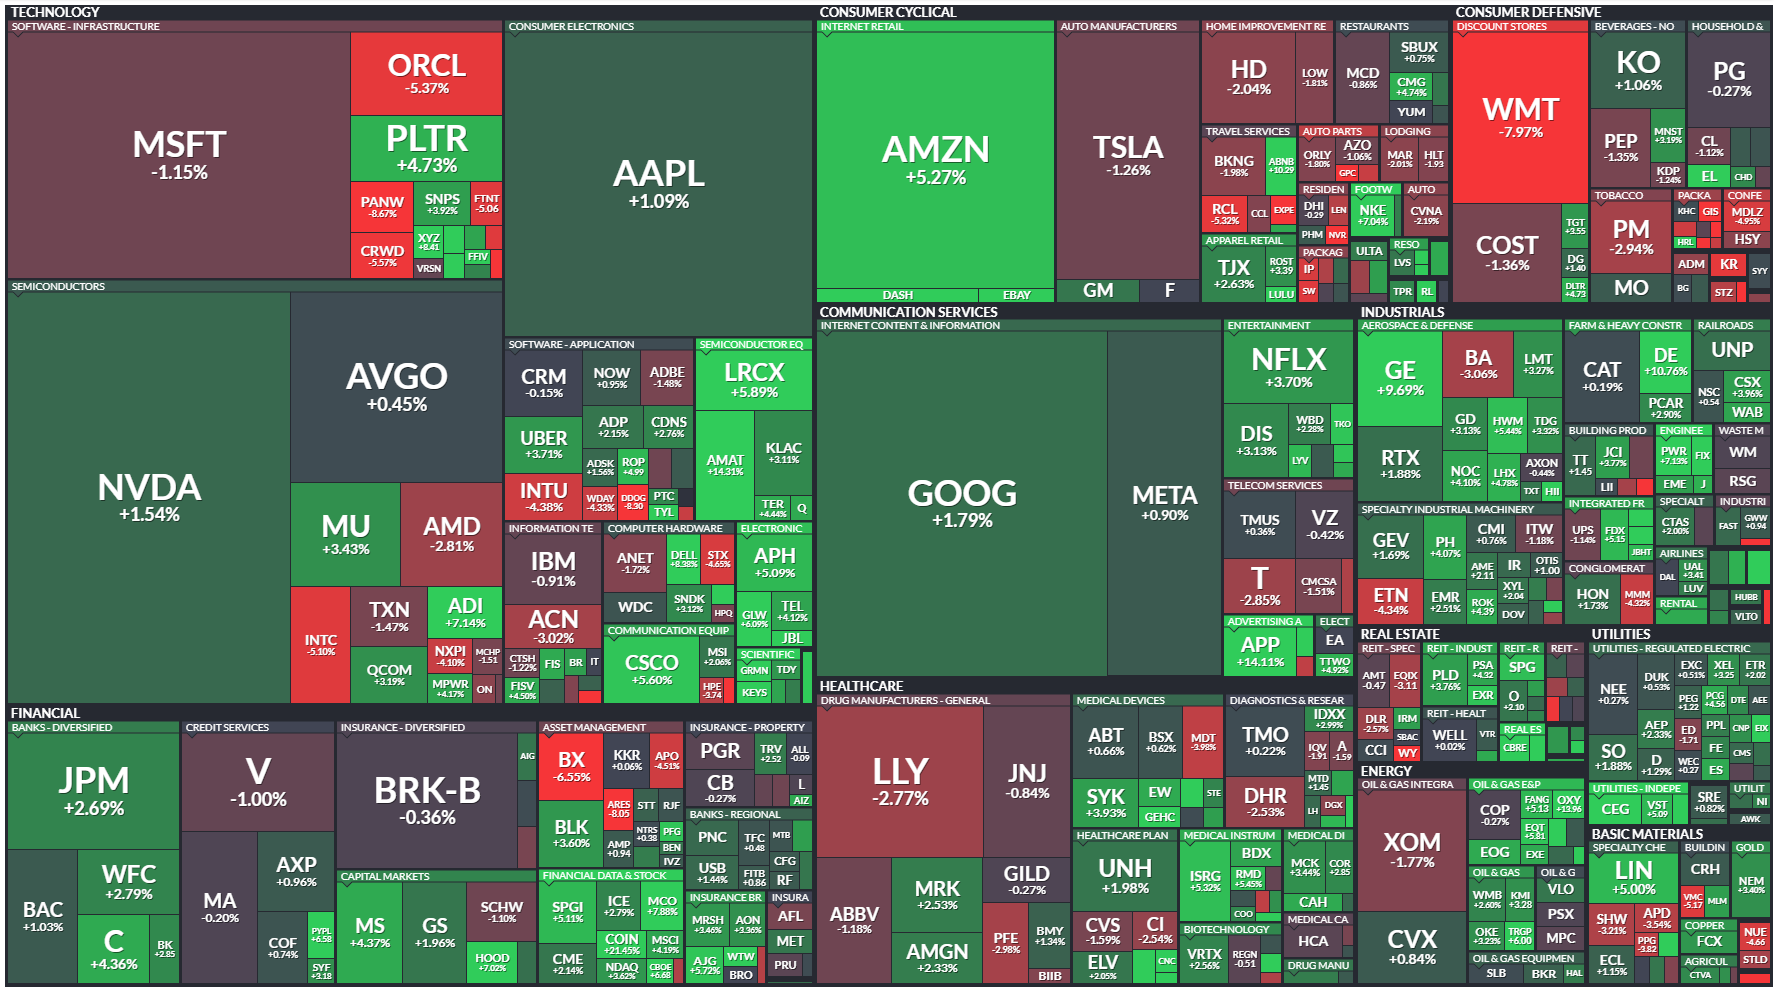
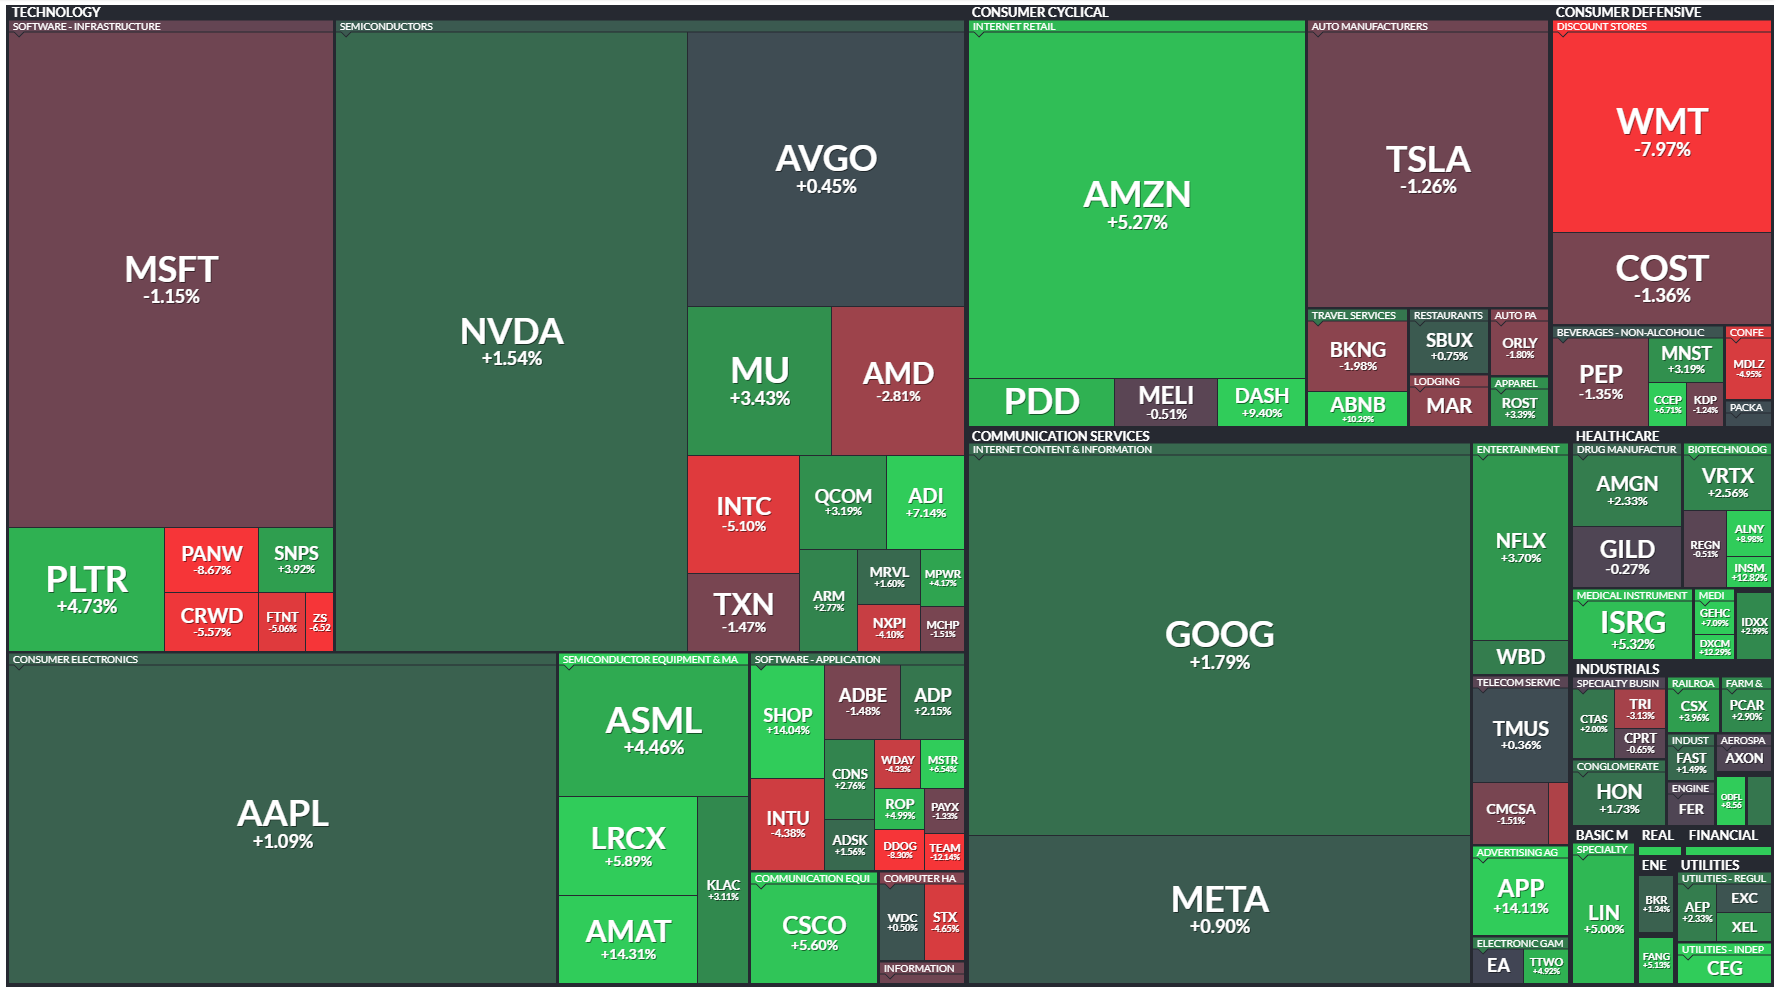
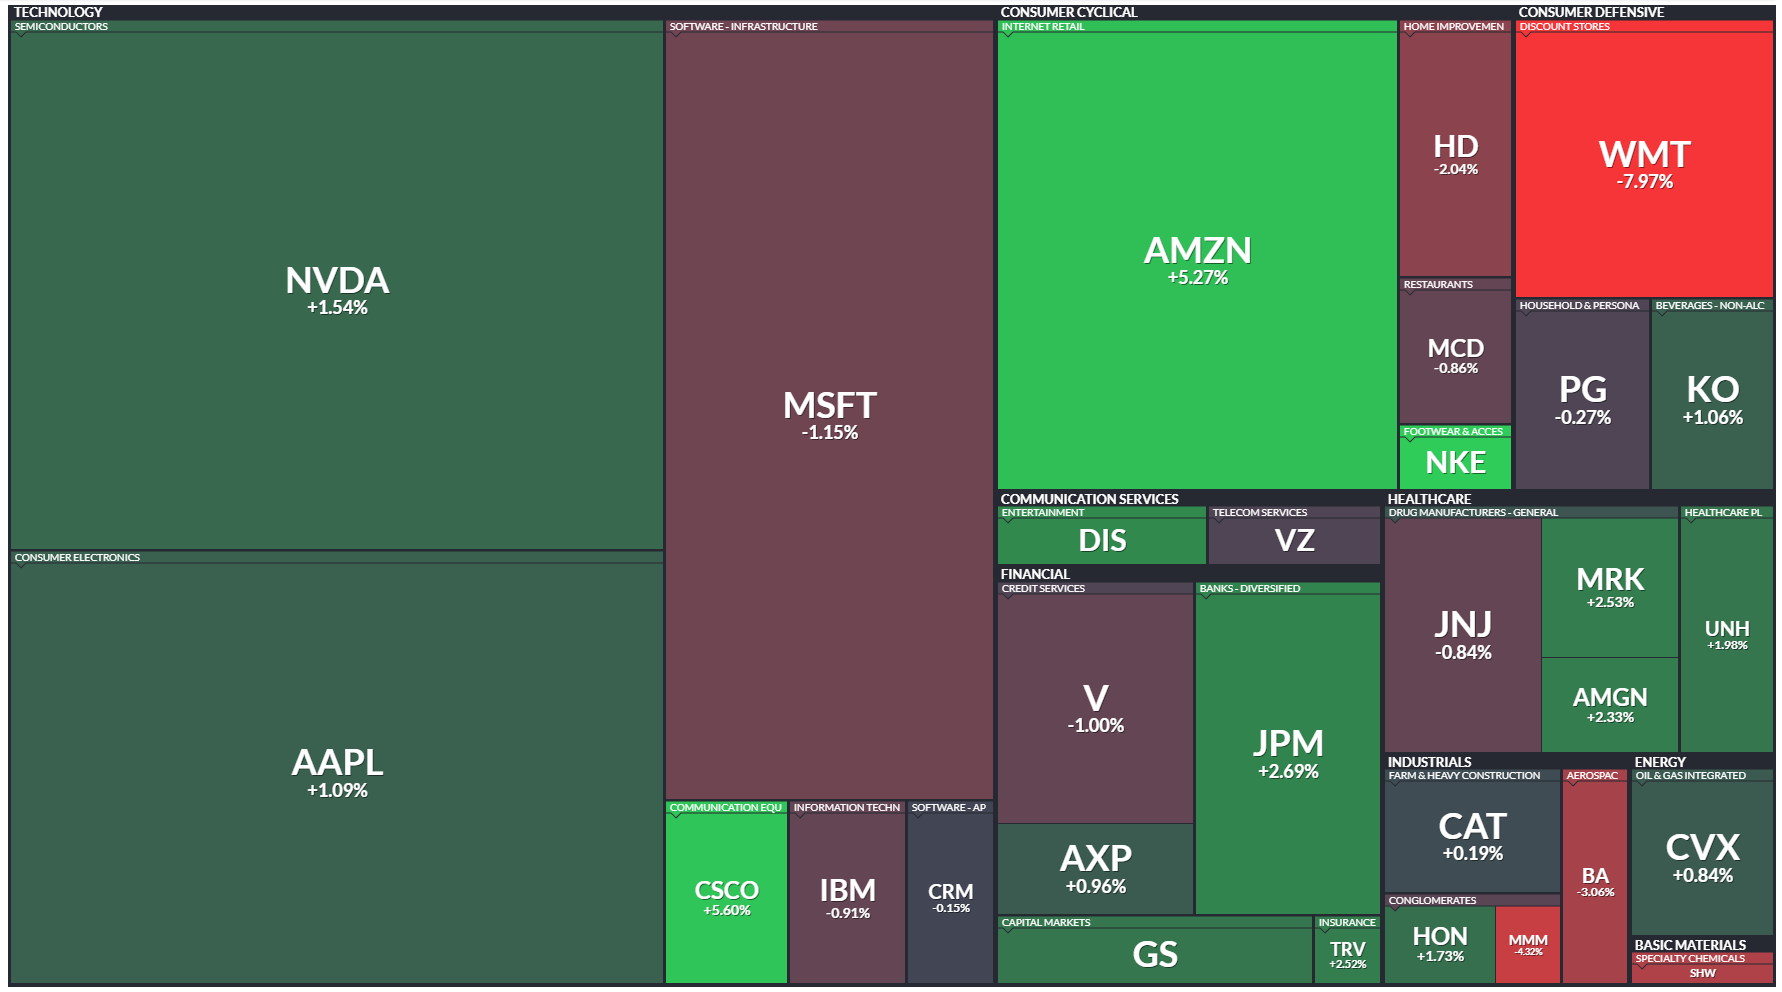
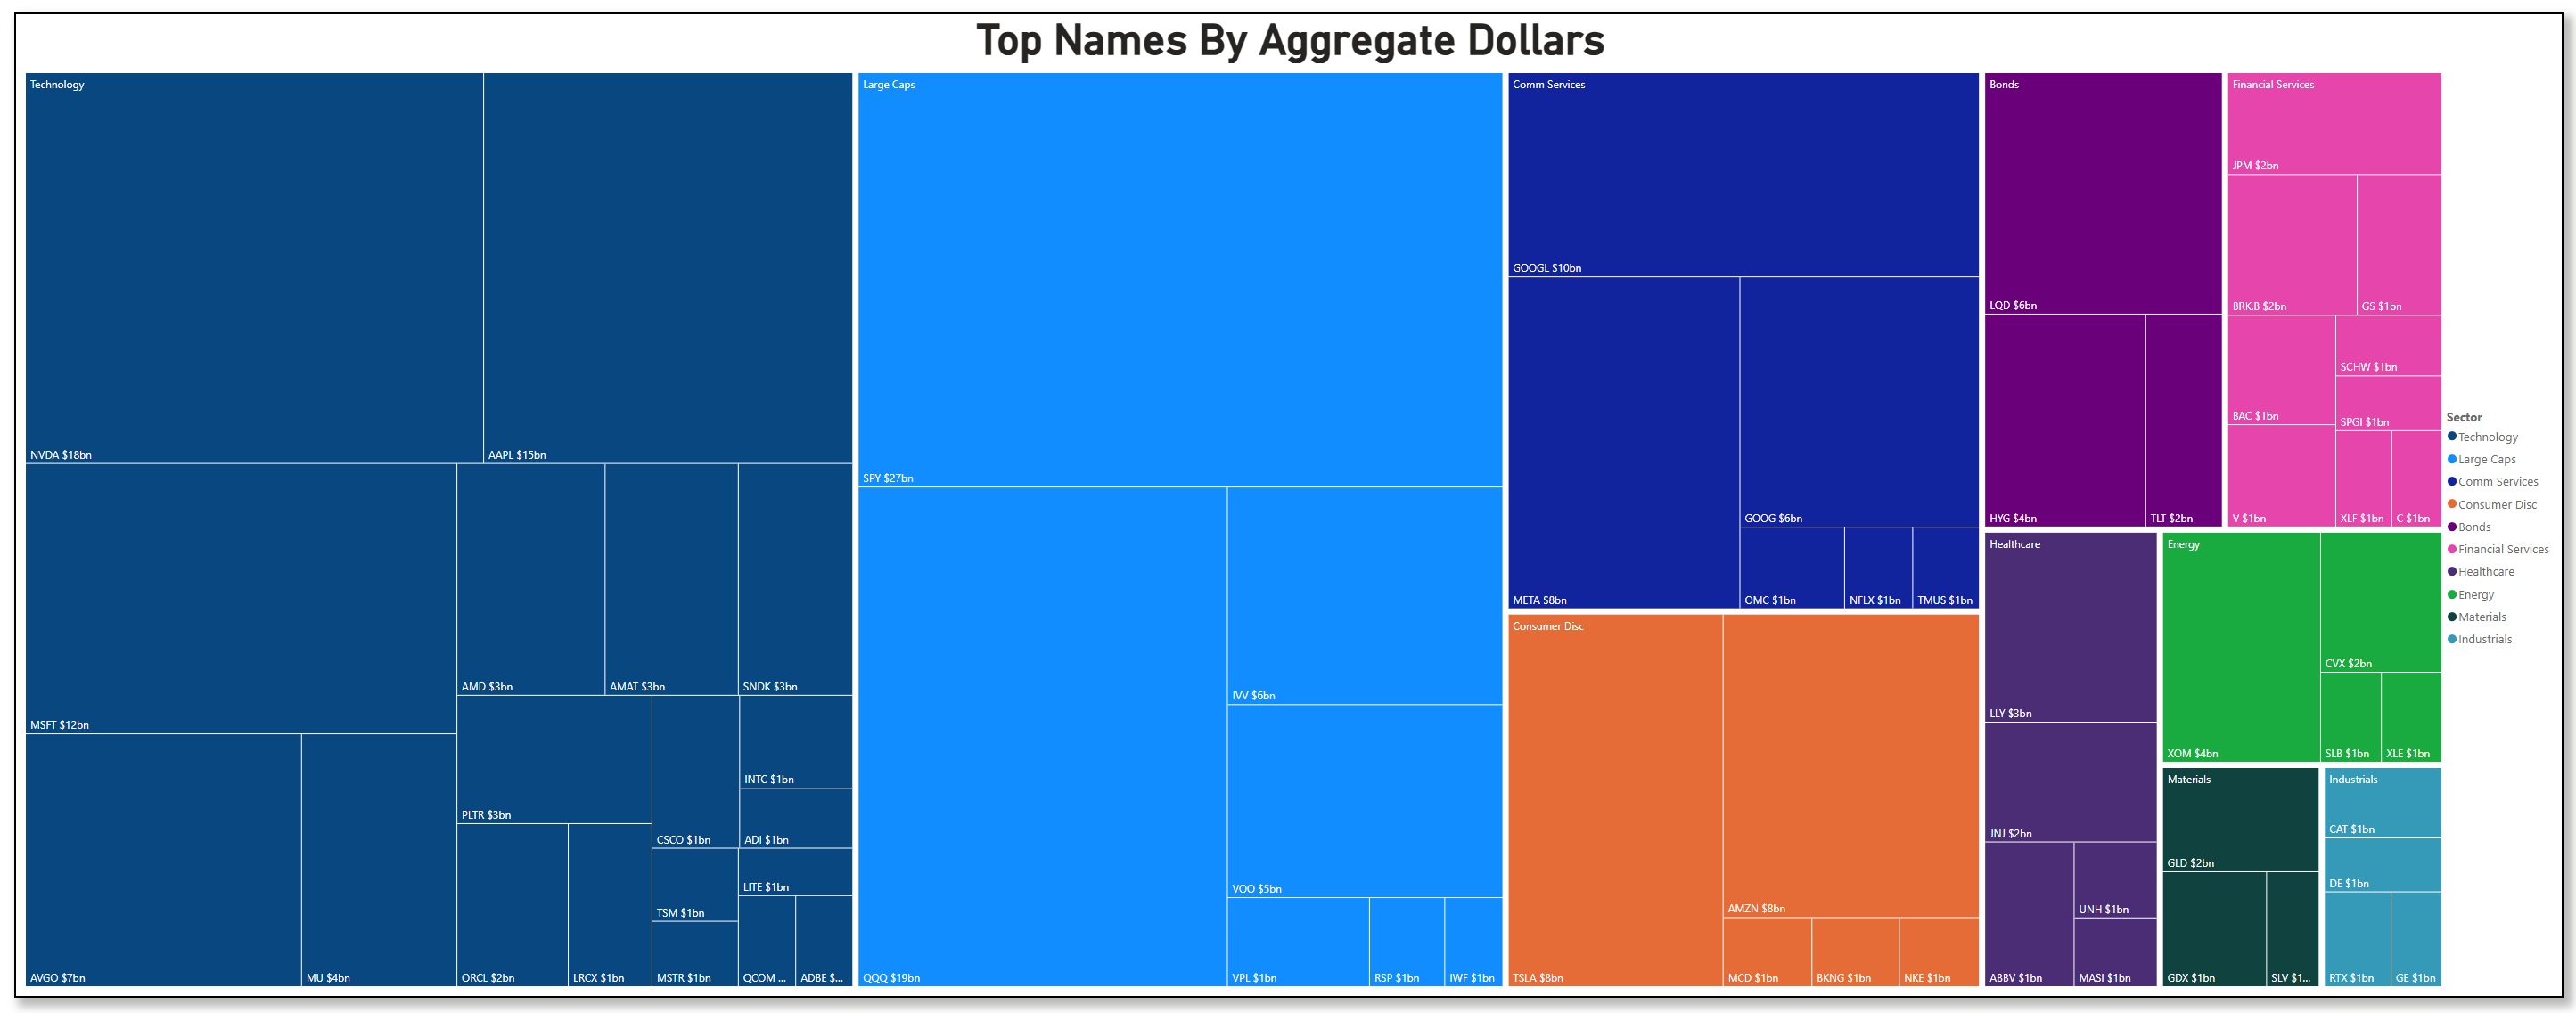
Drilling into names, the treemap of “Top Names by Aggregate Dollars” is dominated by technology and large caps. NVIDIA sits near $18 billion, Apple around $15 billion, Microsoft roughly $12 billion, and AVGO near $7 billion. A long tail of semis and platform names—AMD, AMAT, MU, ORCL, PLTR, QCOM, and others—cluster in the $1–4 billion zone. On the large‑cap side, SPY carries about $27 billion, IVV and VOO each sit around $5–6 billion, and QQQ near $9 billion. Communication services contributes GOOG at $10 billion and GOOGL at $6 billion, plus META at $8 billion and streaming names like NFLX and TMUS around $1 billion apiece. In bonds and credit, LQD and HYG both show roughly $6 billion, matched by TLT at about $2 billion. Financials feature JPM and BRK.B around $2 billion, BAC and GS near $1 billion, and XLF itself at $1 billion. Energy is led by CVX at $2 billion, with services and integrated names like SLB and XLE at about $1 billion each. The picture is not one of retreat; it is one of deliberate concentration in the names and products that dominate index weightings and drive factor exposures.
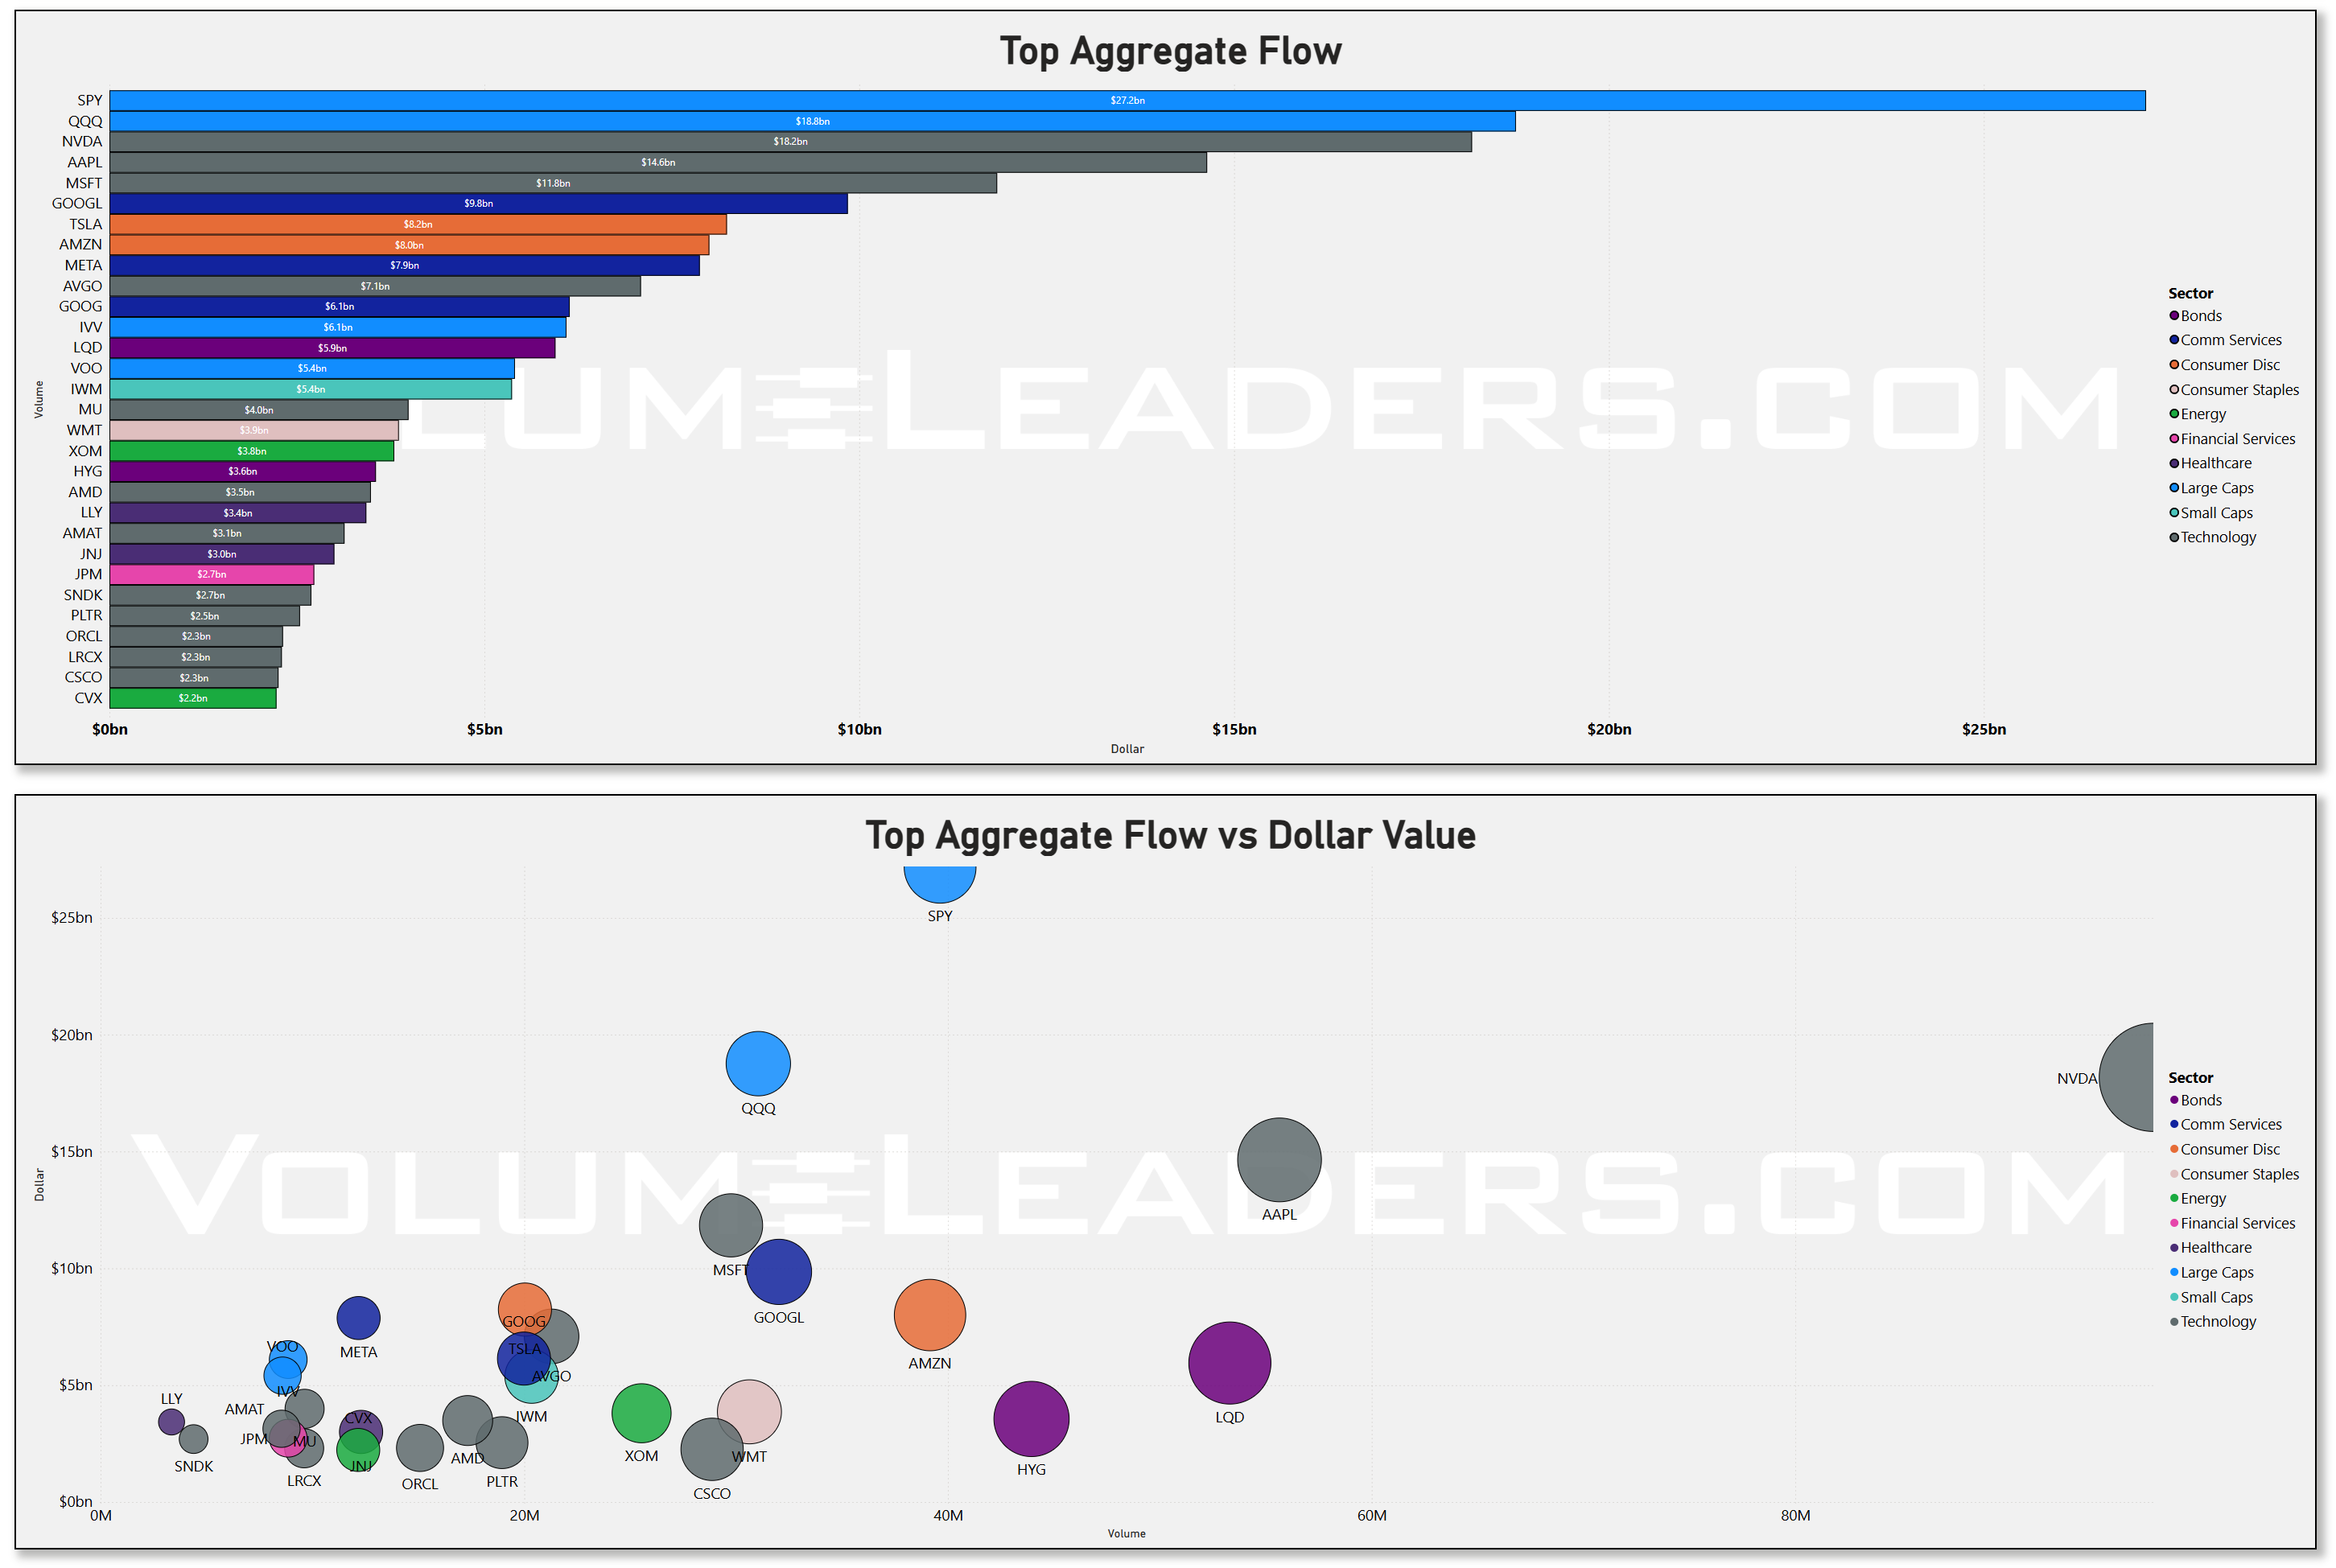
When you aggregate all trade types across lit and dark venues, the hierarchy tightens. SPY tops the list at roughly $27 billion in weekly flow, followed by QQQ in the low‑teens, then NVIDIA, Apple, and Microsoft in the $10–13 billion area. Tesla, Amazon, and META run in the $7–9 billion range, while GOOG, TSLA, AMZN, and sector ETFs like XLV, IWM, and XOM sit a tier lower at $3–6 billion. On the scatter of volume versus dollars, SPY stands alone as both the highest‑volume and highest‑notional print, QQQ and NVIDIA cluster beneath it, and Apple appears as a giant notional bubble with somewhat less share turnover, reflecting its higher price. This is broad positioning, not just tactical punts: institutions are using the deepest, most liquid vehicles to express a view that is still net long but more balanced between growth and defense than it was a few months ago.
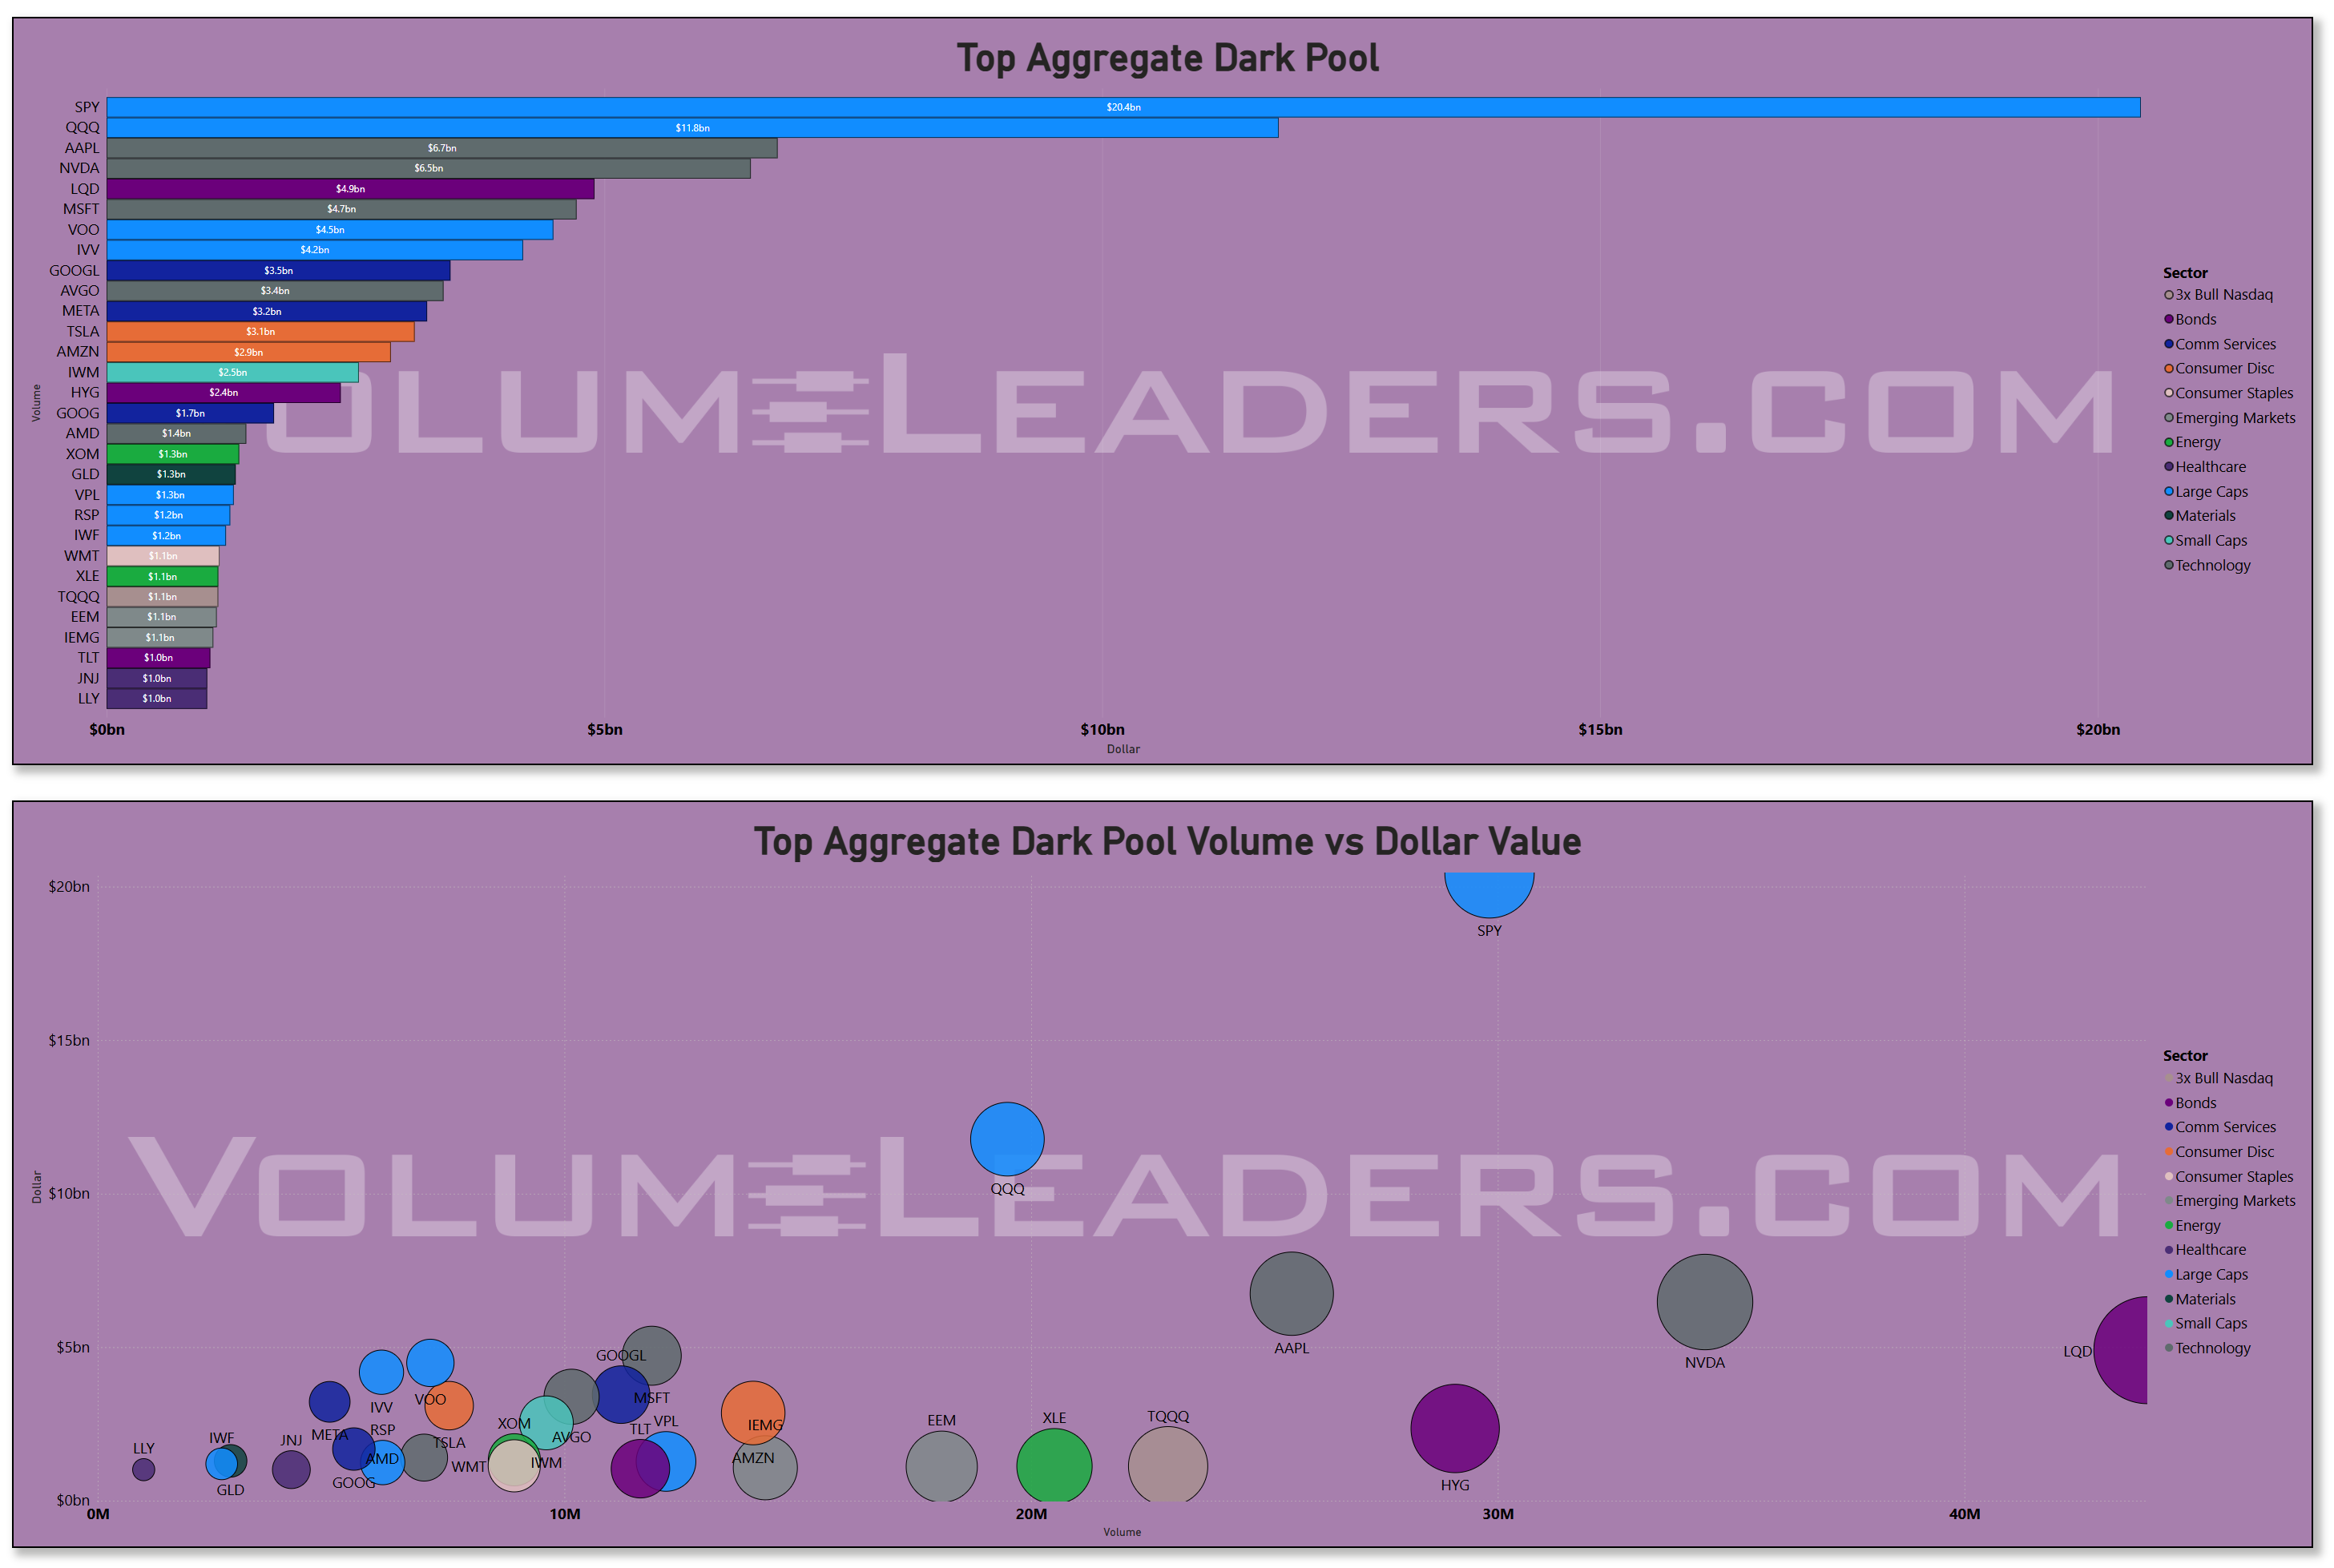
Dark‑pool flows add a layer of nuance. SPY again dominates in hidden venues, followed by QQQ, AAPL, and NVIDIA at substantial but smaller totals. Mega‑caps like MSFT, TSLA, AMZN, META, and GOOG are well represented, as are sector and style ETFs such as XLF, XLV, HYG, LQD, EEM, and TLT. The volume‑versus‑dollars scatter in the dark pools shows SPY and QQQ as huge bubbles, but Apple, NVIDIA, and HYG also stand out as large‑notional points. That mix is typical of quiet accumulation and redistribution rather than panic: desks are moving size in the background in the same names that dominate the lit tape, suggesting they are fine‑tuning exposures rather than running for the exits. In a world where the Fed is signaling patience on rate cuts and inflation is proving sticky, it makes sense to see credit ETFs and bond proxies feature prominently here; those are the instruments you adjust when you are hedging or leaning into duration.
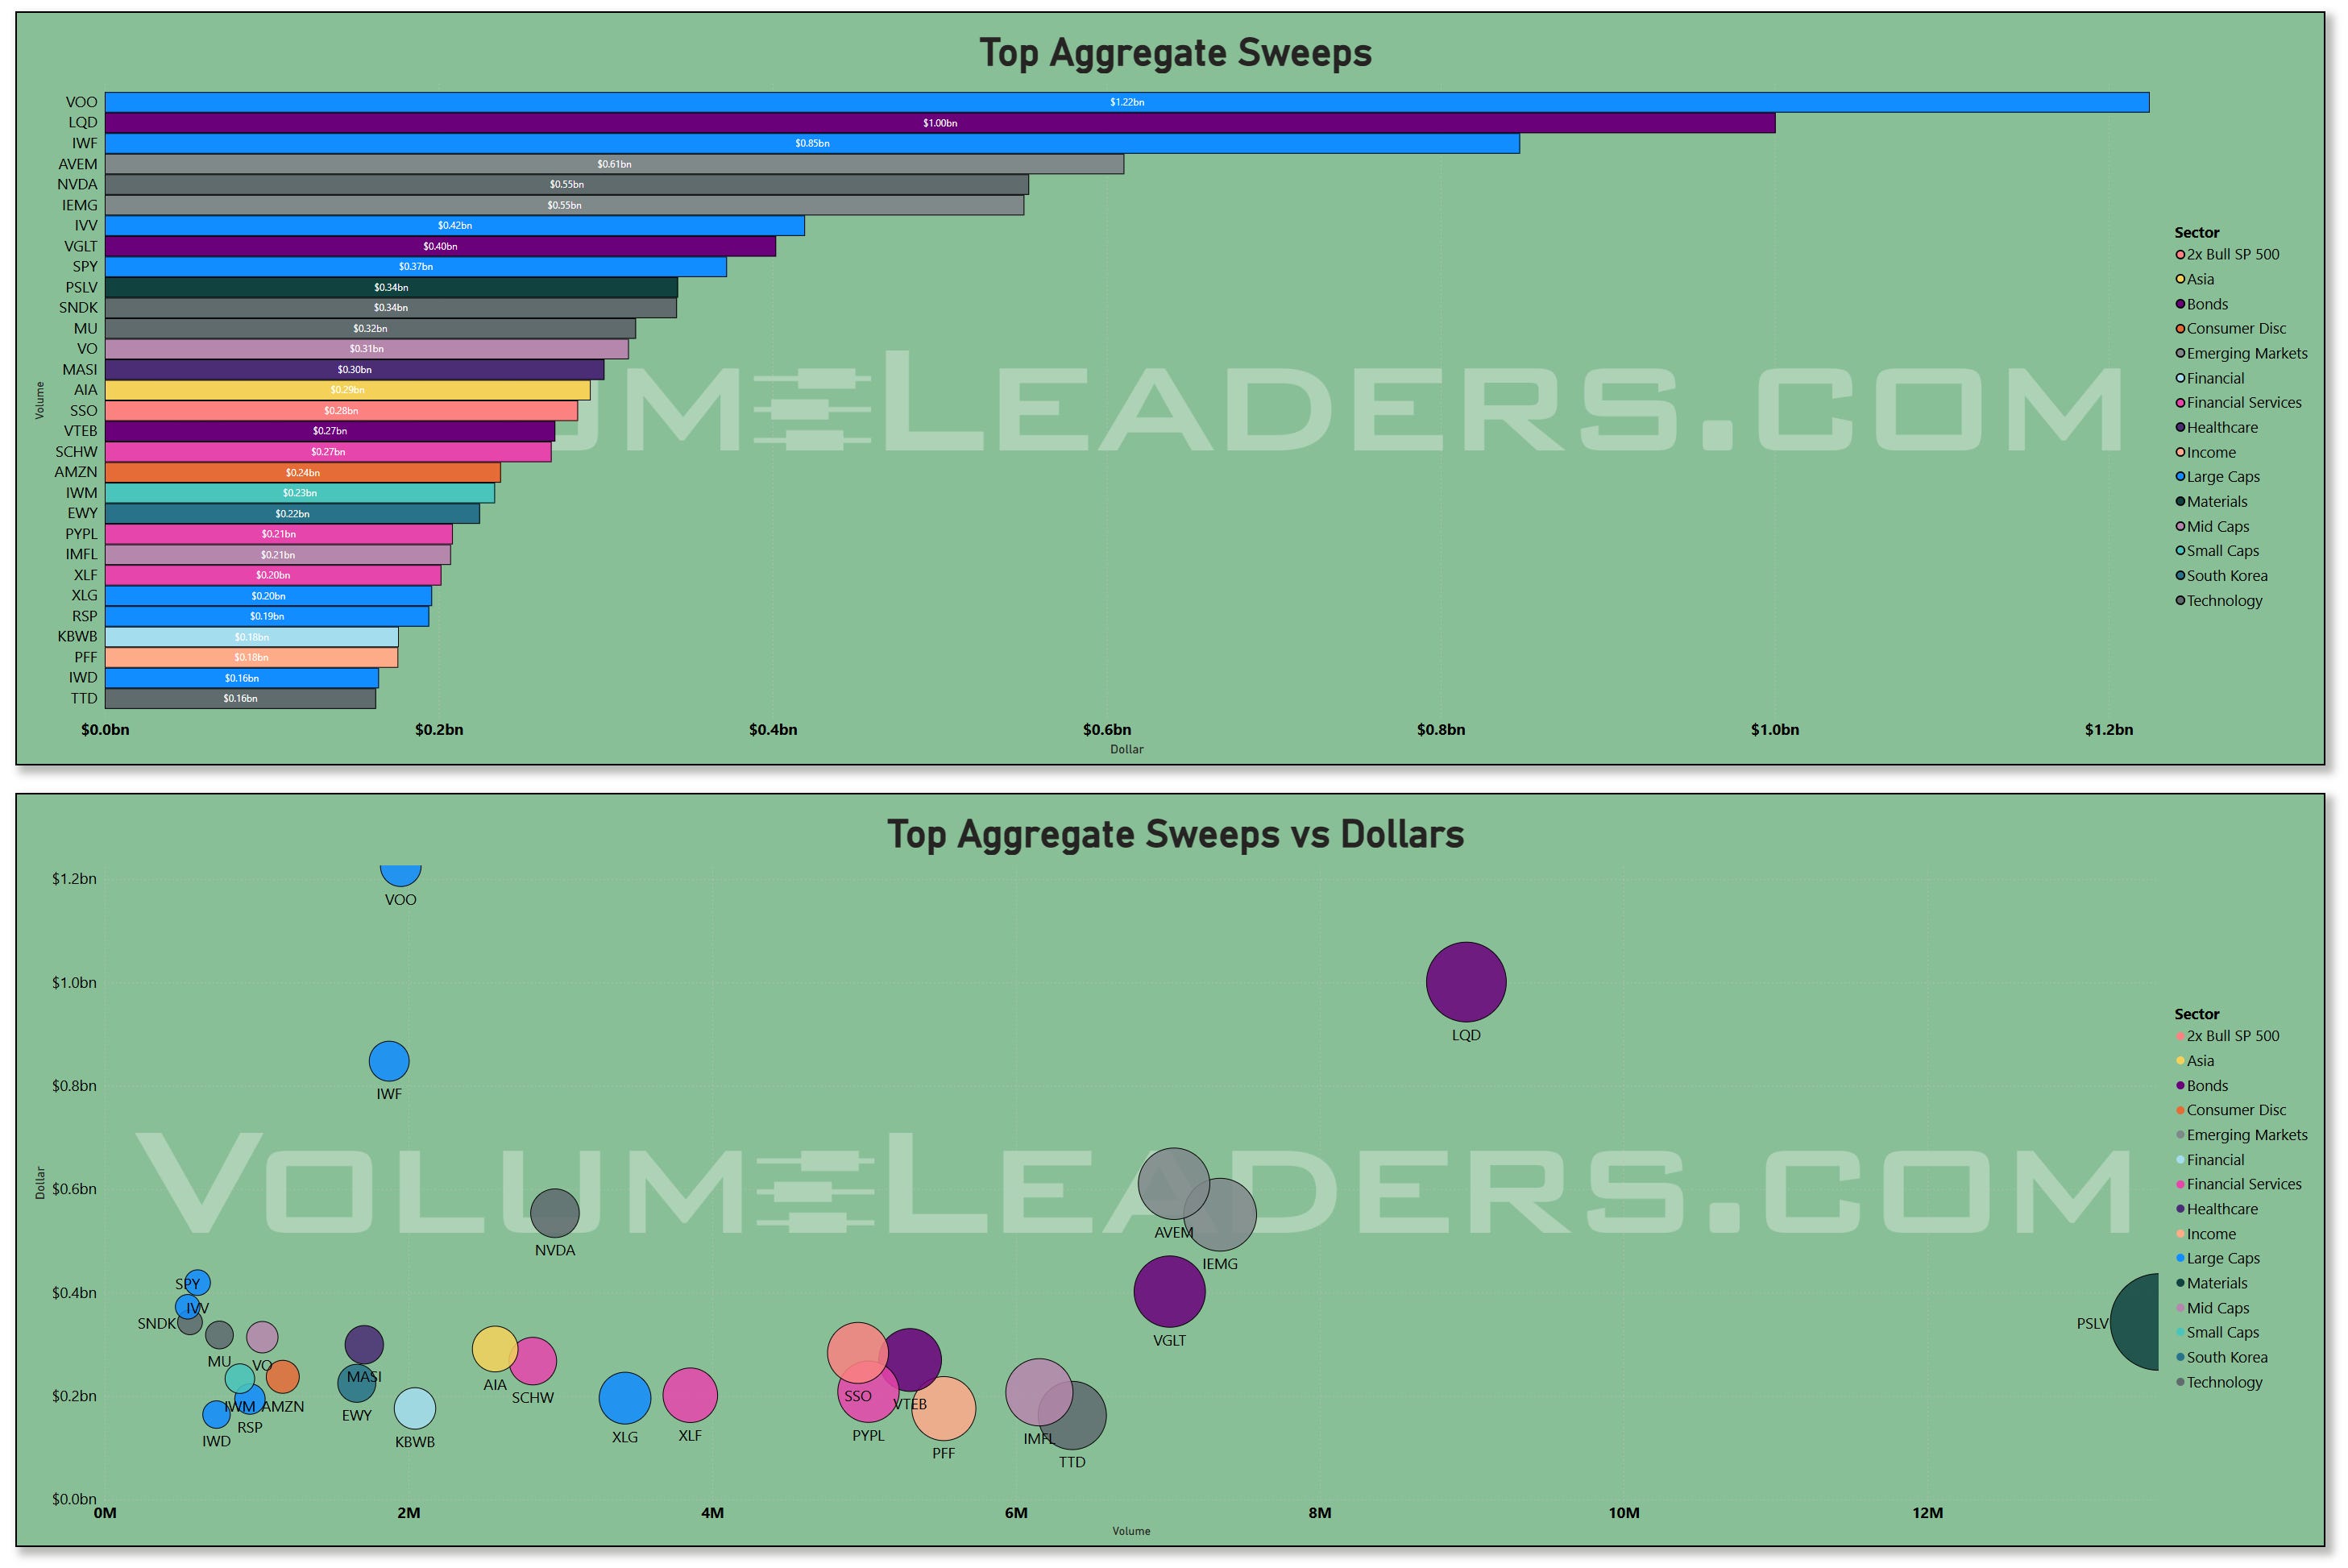
Sweep activity tells you where urgency is highest. The top‑sweeps bar chart shows VOO with well over $1.1 billion of sweeps, LQD and a leveraged S&P product in the $800–900 million zone, and AVEM, IEMG, and VGLT between $400 and $700 million. Individual tech names like NVIDIA, MU, and SNDK appear further down with $200–300 million. On the volume‑versus‑dollars scatter, LQD stands out as a high‑volume, high‑notional bubble, while VOO, SSO, and other broad beta products sit just behind it. That pattern says the fastest money is actively toggling index beta and credit exposure rather than frantically chasing or shorting single‑name growth. Given that recent data have pushed back the expected timing of Fed easing and kept two‑way risk alive in rates, it is logical to see sweeps concentrated in bond and index wrappers that let you adjust macro exposure quickly.
PSLV makes a rare appearance this week and the reaction in the charts has been obvious after two huge ranked sweeps took advantage of liquidity levels at the lows:
Overlaying it all is the institutional‑liquidity‑by‑day series. Over the past several months, daily notional has oscillated mostly between about $120 and $190 billion, with occasional spikes. The most recent cluster of days sits toward the high end of the normal band, in the mid‑$170s to high‑$190s, before an extremely quiet Thursday before the SCOTUS ruling on tariffs, ringing the register to the tune of a pathetic $139bn. Institutions came back to the table on Friday’s OPEX with a very modest $200bn in business. That tells you participation is steady-state amidst the macro confusion: big accounts did not step away when volatility and macro noise increased, and actually leaned-in a tad on OPEX. Seasonally, late February often sees an uptick in volumes as funds adjust post‑January positioning and start to think about quarter‑end rebalancing, and the current pattern fits that seasonal rhythm and broader narratives right now.
Putting all of this together, the cleanest way to characterize the tape is: constructive but discriminating. The composite sentiment and sector reads are net bullish, with many sectors in the “confidently positive” zone and others at least neutral. But the preference within that bullish bias is clear. Institutions are concentrating flows in large caps, core technology franchises, and broad index and bond products, while trimming or at least cooling their enthusiasm for small caps, cyclicals, and speculative growth. Volatility and relative strength trends reward that behavior, and the macro backdrop—slower but still positive growth, sticky inflation, and a patient Fed—does not yet argue for a wholesale shift back into high‑beta risk. Until those macro inputs change, this selective risk‑on regime, anchored by SPY, QQQ, and the bond complex with megacaps at the center, is likely to remain the defining character of the institutional tape.
MIR Part 2: Individual Names From The Institutional Tape
VolumeLeaders tracks several proprietary signals designed to spotlight names drawing significant institutional interest. Below, we’ve surfaced the latest results and analyzed them to highlight emergent themes. If any of the sectors, narratives, or positioning trends resonate, the names mentioned here offer a strong starting point for deeper research and watchlist consideration.
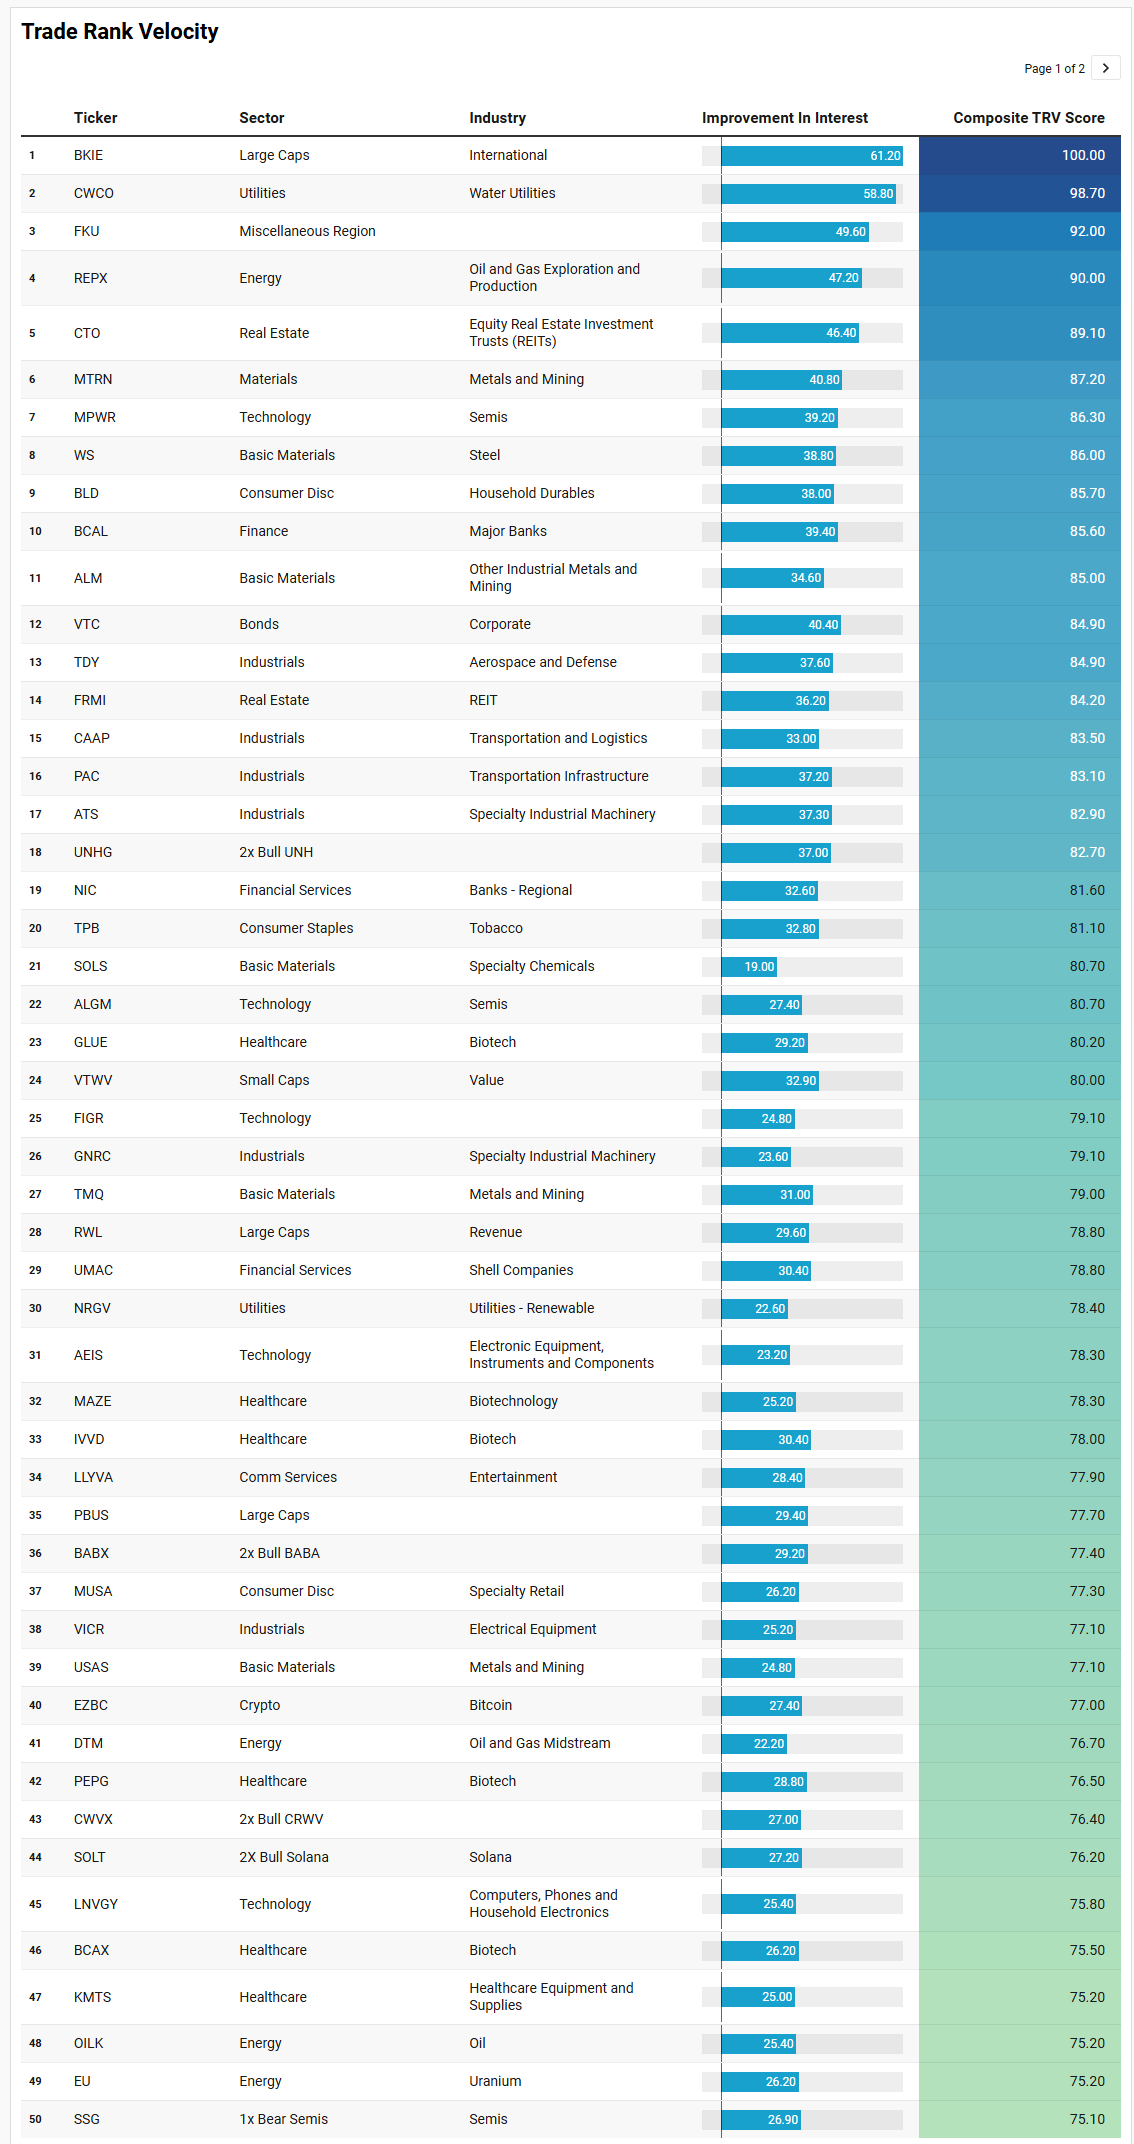
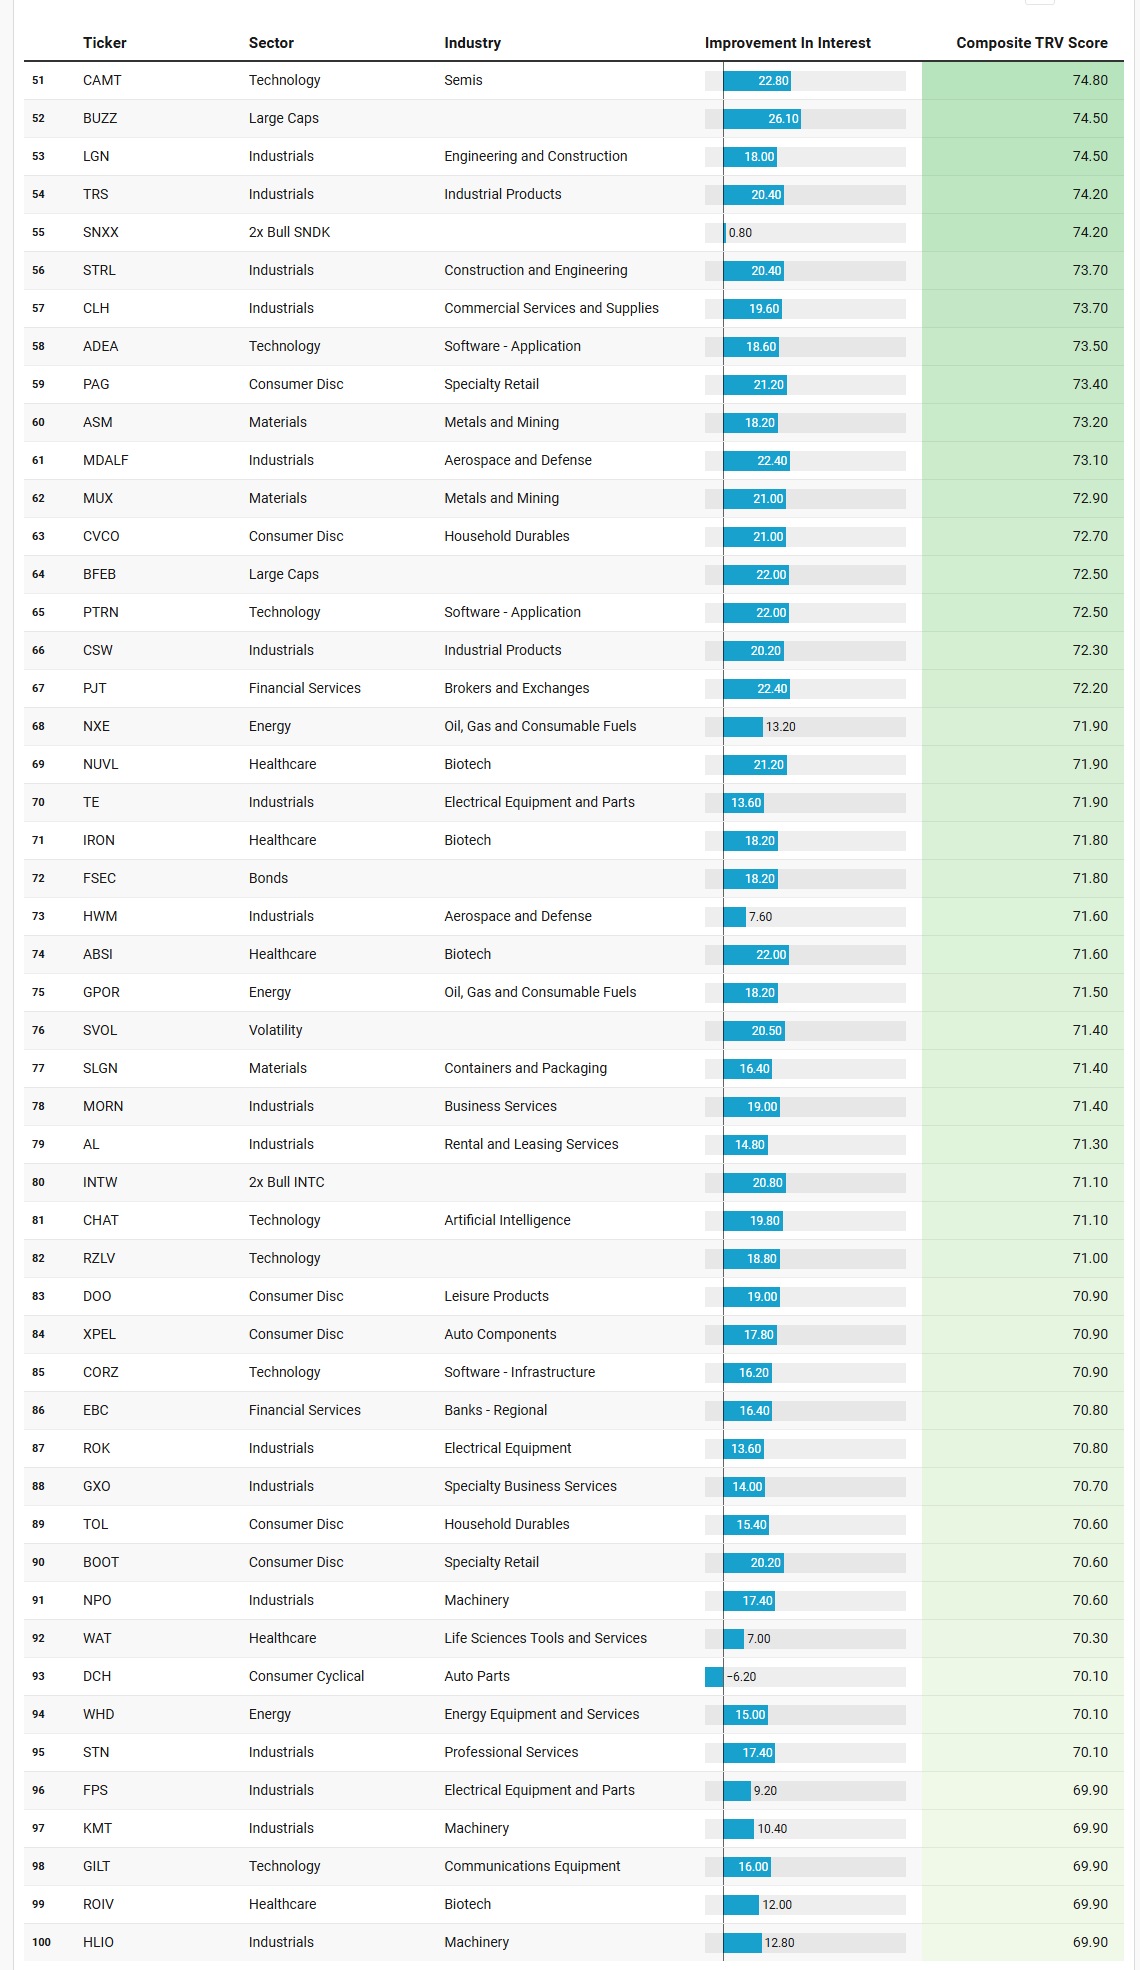
VL Trade Rank Velocity™ (TRV)
TRV is a proprietary metric that measures the recent acceleration or deceleration in institutional trading activity for a given stock by comparing its average trade rank over the past few days to its average in recent weeks. A sharp improvement in TRV typically reflects a notable shift in positioning, often accompanied by sustained trade activity, suggesting institutions are actively engaging with the name and that intensity of activity is rising. This often precludes meaningful price or narrative shifts. This isn’t a buy-list or sell-list; it’s meant to draw your eyes to names where institutions are putting money to work.
Two big themes jump off this TRV list, and both line up neatly with the “selective risk‑on” narrative we have been seeing in the flows.
The first is a very clear lean into real‑world cash flow and hard assets. You have a meaningful cluster in metals and mining and related materials: MTRN, WS, ALM, TMQ, USAS, ASM, MUX, plus uranium via EU and a containers/packaging name like SLGN. Energy shows up not as broad beta but as targeted upstream and infrastructure plays – REPX and NXE on the exploration and fuels side, OILK and WHD in equipment and services, and DTM in midstream. Layer on the transportation and infrastructure complex – CAAP and PAC in airports and infrastructure, ATS, GNRC, TRS, CSW, HWM, MDALF, NPO and other industrial machinery and aerospace names – and you can see institutions leaning into the tangible side of the cycle: stuff that benefits from steady nominal growth, capex, and onshoring. Household durables and specialty retail – BLD, CVCO, TOL, MUSA, PAG, DOO, BOOT, XPEL – sit on the same spectrum: plays that are sensitive to housing, autos, and middle‑class spending, but where the underlying businesses have reasonably defendable economics. Even utilities are skewed toward defensiveness with a twist, via CWCO in water and NRGV in renewables.
The second theme is “barbell around quality growth”: targeted semis, selective software, and a very deliberate mix of bull and bear products. On the semiconductor and electronics side you have MPWR, ALGM, CAMT, VICR, AEIS, LNVGY, and the inverse SSG plus the levered INTW, which together say traders are active in the chip complex but want tools on both sides of the trade. Software and AI are represented by ADEA, PTRN, FIGR, CORZ, CHAT, and RZLV – not the megacap platforms, but second‑tier growth where dispersion is highest and TRV tends to matter most. Crypto shows up via EZBC and SOLT, again in leveraged form, which fits with the idea that crypto is a tactical trading vehicle here rather than a core allocation. Volatility itself is on the radar through SVOL, and there are multiple 2x bull products (UNHG, BABX, CWVX, SNXX) tied to large, liquid underlyings. That cocktail says the street wants upside participation in quality growth and AI, but it is buying that exposure with optionality and leverage rather than simply adding cash equity.
Around those two poles you can see the defensive scaffolding. There is real estate via CTO and FRMI, corporate and short‑duration bond exposure via VTC and FSEC, a tobacco name (TPB), and a handful of regional and niche financials – BCAL, NIC, UMAC, PJT, EBC – plus the volatility‑selling SVOL. International and factor wrappers like BKIE, FKU, VTWV, PBUS, RWL, BUZZ and BFEB round it out: ways to stay invested while tilting toward value, revenue weighting, sentiment factors, or ex‑US exposure without taking idiosyncratic single‑name risk.
Net‑net, this watchlist is exactly what you would expect to see in a market that is still broadly bullish but increasingly discriminating. Capital is gravitating toward hard‑asset cyclicals, infrastructure, and quality industrials on one side; targeted semis, AI and software on the other; and it is being wrapped in real estate, bonds, and volatility products for risk control. High‑beta, story‑only growth is conspicuously absent.
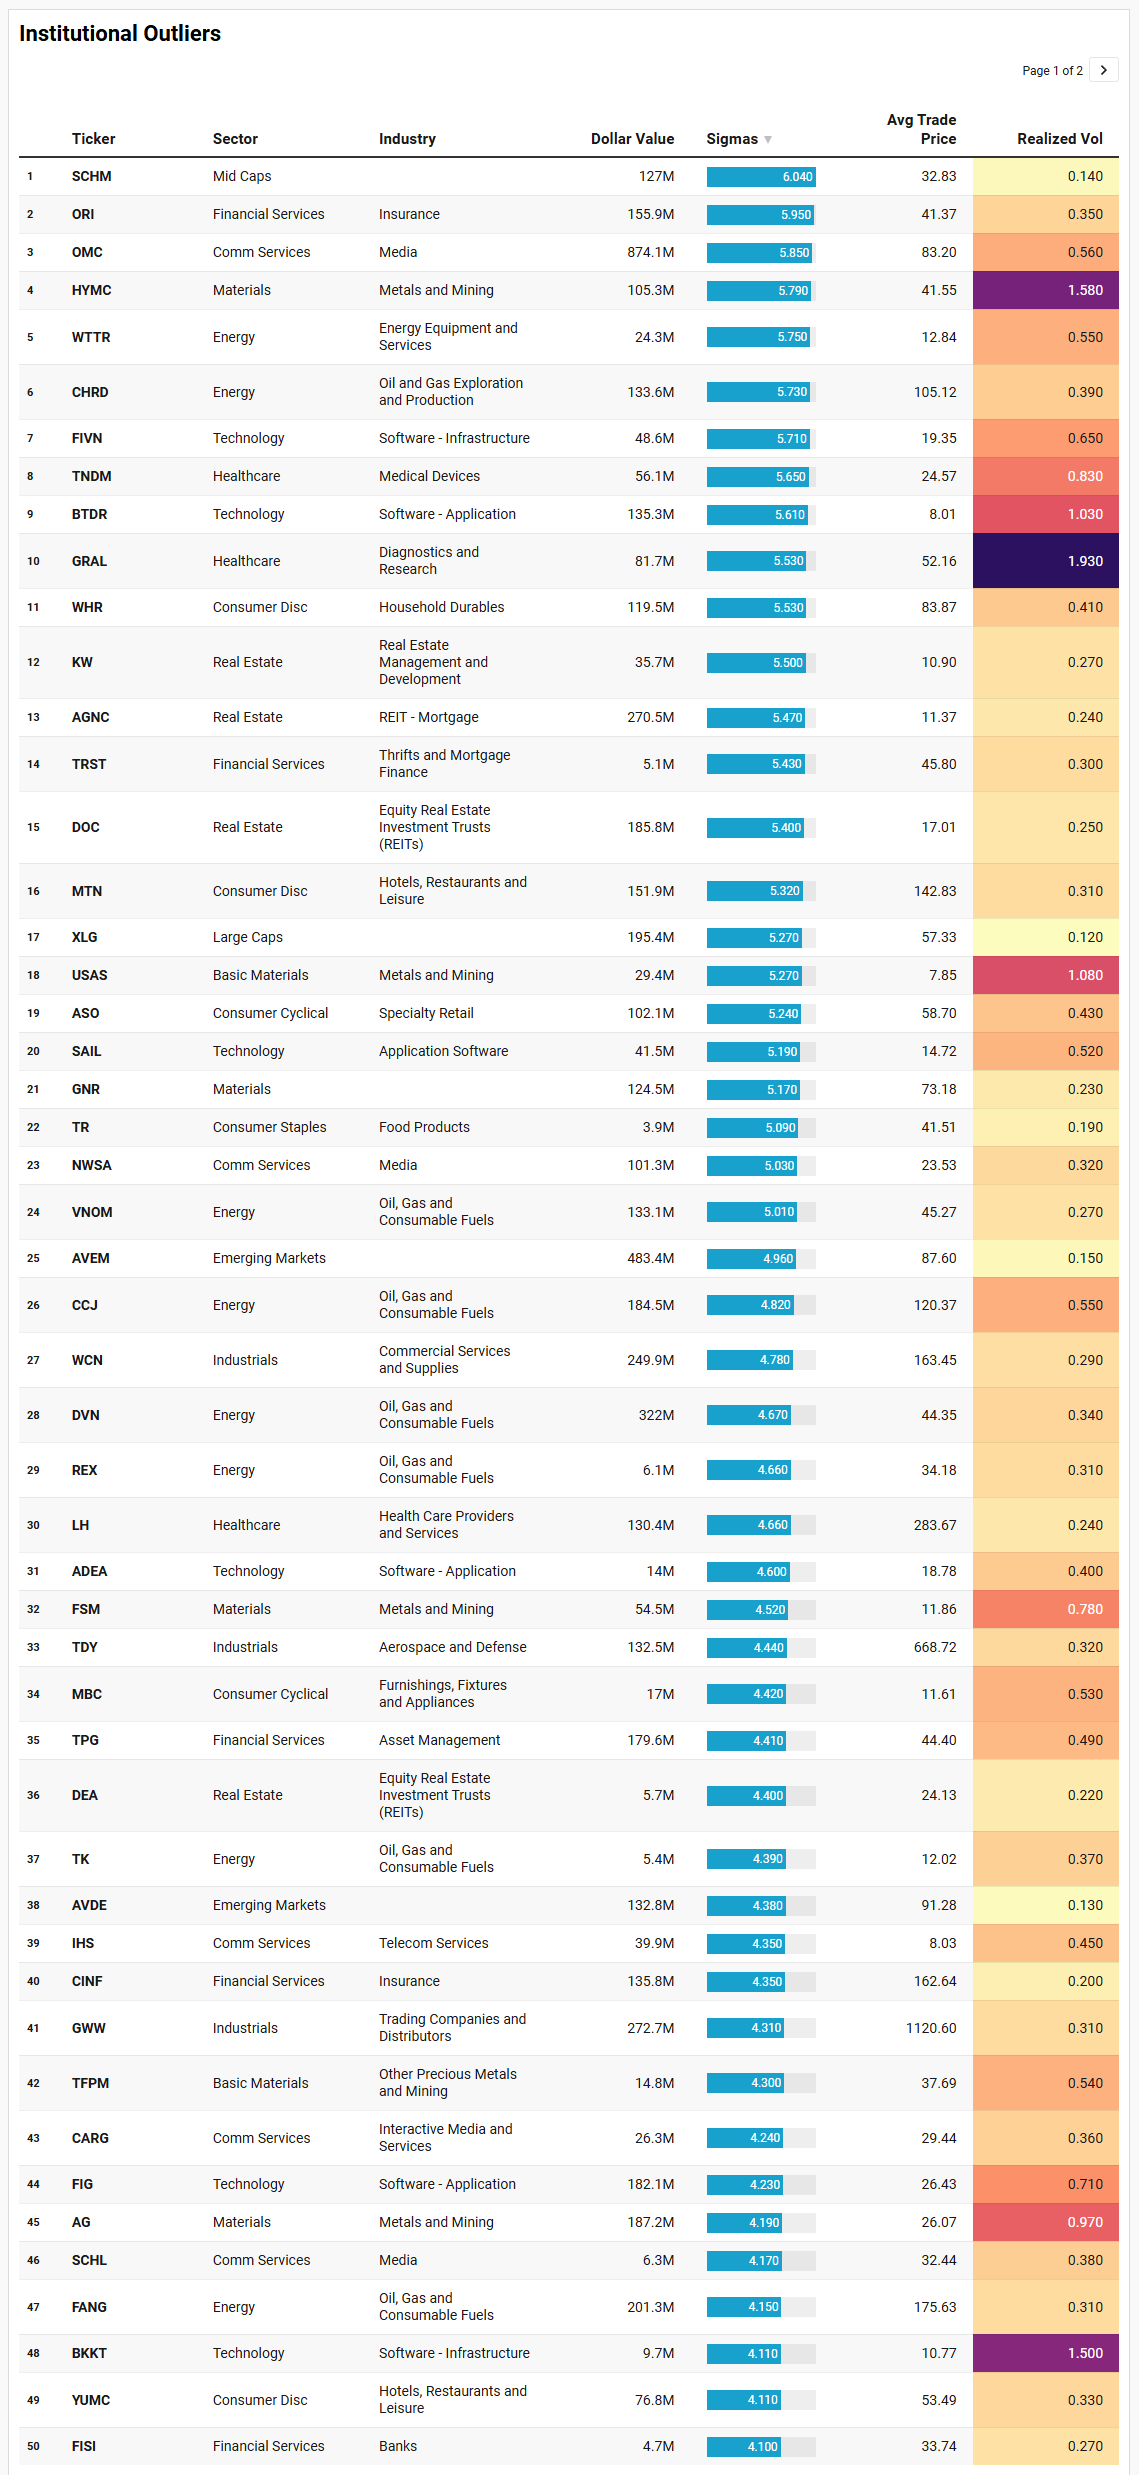
VL Institutional Outliers™ (IO)
Institutional Outliers is a proprietary metric designed to spotlight trades that significantly exceed a stock’s recent institutional activity—specifically in terms of dollar volume. By comparing current trade size against each security's recent normalized history, the metric flags outlier events that may indicate sudden institutional interest but may be missed because the activity doesn’t raise any flags/alerts when comparing the activity against the ticker’s entire history. For example, it’s conceivable that a ticker today receives the largest trade it has had in the last 6 months but the trade is unranked and would therefore be missed by current alerts built off Trade Ranks. Day traders can use “Realized Vol” to identify tickers that are moving swiftly with large price displacement while others can use it to size your risk appropriately.
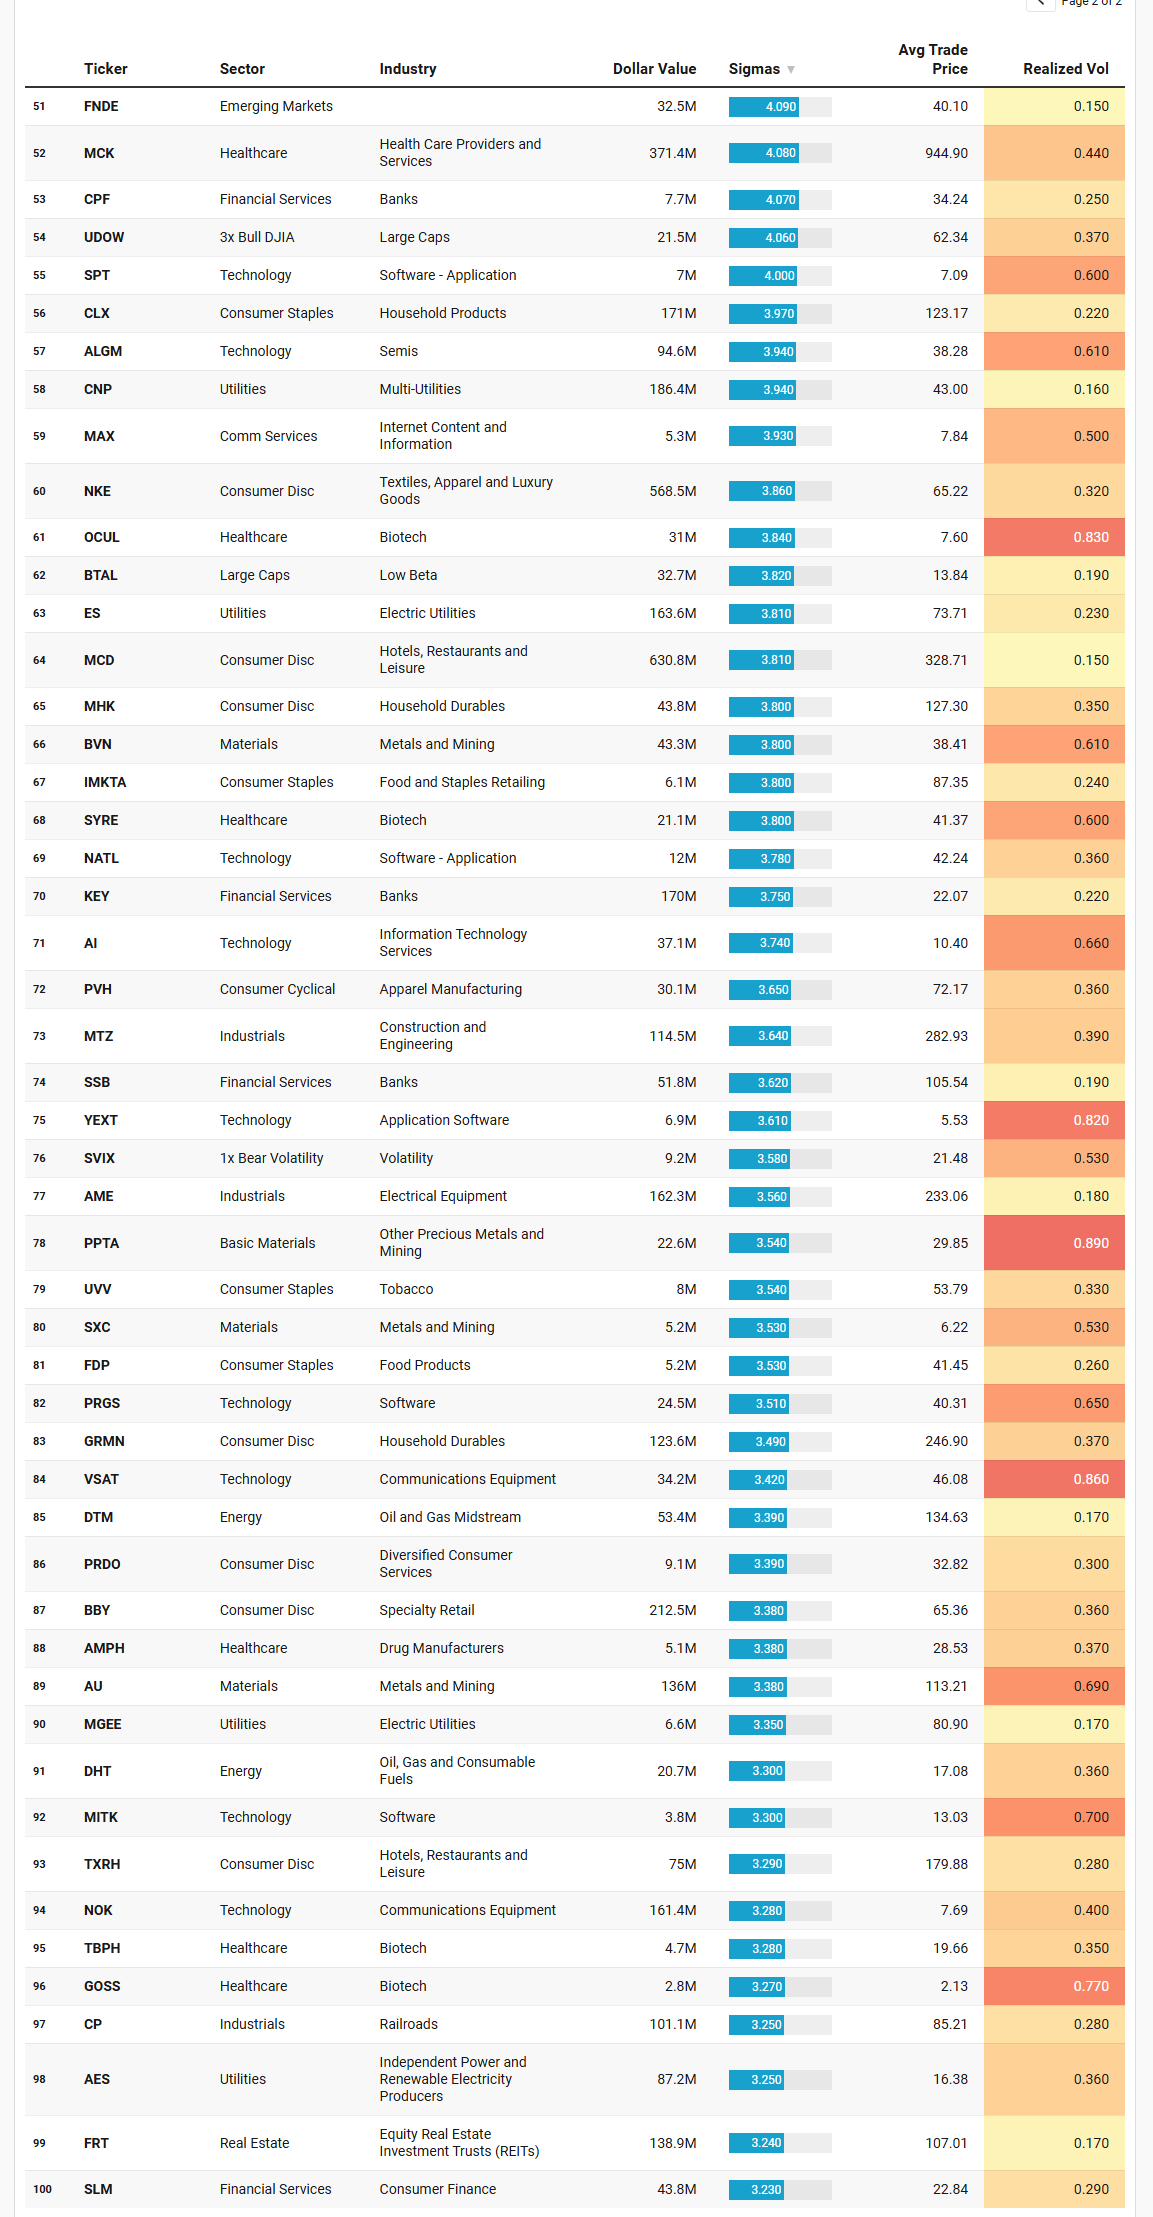
The IO list this week is basically a snapshot of where real institutional money decided to step hard on the gas pedal for a day: big dollar prints, multi‑sigma outliers, but mostly in surprisingly low‑drama parts of the tape. That alone tells you a lot about the regime we are in.
The most obvious theme is “boring balance‑sheet quality with cash flow.” Look at the insurance cluster: ORI prints about $156m at nearly 6 sigmas, and CINF shows another $136m at 4.35 sigmas. Thrifts and mortgage finance (TRST) and consumer finance via SLM round out that financial‑safety sleeve. Midstream and energy royalty names like VNOM, DVN, FANG, TK, DHT and DTM, plus uranium proxy CCJ, also sit high on the list, but most of them carry realized vol well under 0.6. That is not “swing for the fences” behavior; it is big money leaning into yield and cash‑rich energy exposures that can live with a stickier‑inflation, higher‑for‑longer policy path.
Real estate is telling a similar story. AGNC and DOC both show nine‑figure dollar prints with five‑plus sigma readings, joined by KW, DEA, and FRT. Mortgage REITs and high‑quality shopping‑center REITs do not get that kind of attention unless institutions are explicitly reallocating into income and rate‑sensitive vehicles. With the curve still elevated and the Fed in no rush to cut, that looks like a “get paid while we wait” trade rather than a speculative flip.
Another clear thread is “quality cyclicals and staples at scale.” On the consumer side you have WHR and MHK in household durables, NKE, PVH and BBY in apparel and electronics retail, MCD, YUMC, MTN and TXRH in leisure, plus ASO and PRDO in specialty retail and services. Realized vol on most of these sits in the 0.3–0.4 zone despite large notional prints – for example, NKE trades roughly $568m at only 3.86 sigmas and 0.32 vol, while MCD sees about $631m at 3.81 sigmas and just 0.15 vol. That looks like accumulation into brands with durable demand rather than speculative chase.
Materials and metals are an echo of the TRV list, but here the focus is on scale: HYMC, FSM, AG, AU, BVN, TFPM, PPTA, SXC and AU each put up high‑sigma days across gold, silver and diversified miners. USAS actually shows up on both lists – a sign that precious‑metals beta is one of the few truly “hot” themes right now. Pair that with GNR, a broad natural‑resources ETF outlier at $125m, and you have a pretty coherent “hard‑asset hedge” stream running under the surface.
Technology in the IO basket is there, but notice where: FIVN and BKKT on the software‑infrastructure side, FIG, SAIL, SPT, NATL, MITK and PRGS in application and IT services, ALGM in semis, NOK and VSAT in communications. These are mostly mid‑cap, cash‑flow‑generative franchises, not the frothiest corners of AI. AI itself does show up via the ticker AI, but at a modest $37m and 3.74 sigmas. Combined with low realized vol on most of these names, that speaks more to measured re‑engagement in beaten‑up software than to a fresh speculative mania.
Finally, there is a subtle but important volatility tell. You have both BTAL (low‑beta large‑cap ETF) and SVIX (short volatility) showing outlier activity, alongside UDOW, a 3x bull Dow product. That trio says institutions are expressing a view that index‑level drawdowns can be managed and that low‑beta equity plus short vol remains a viable overlay – but they are doing it through large, liquid wrappers tied to the Dow and broad large caps, not via leveraged growth or meme‑beta.
When you line this outlier tape up against the broader flows and TRV themes, the message rhymes perfectly: institutions are not exiting risk, they are reshaping it. Big money is crowding into cash‑flow, income and quality‑cyclical franchises, building hard‑asset and materials hedges, and nibbling selectively at mid‑cap software, all while keeping one hand on low‑beta and vol tools. It is a mature, valuation‑sensitive phase of the cycle, not an early‑stage chase.
VL Sector Leaders
VL Sector Leaders is a weekly snapshot of where true leadership is asserting itself inside the market, stripped of the distortions that come from broad, style-mixed indices. Rather than asking which stocks look strong in absolute terms, this list focuses on which names are outperforming within the environments they actually compete in.
Each week, we surface the ten stocks demonstrating the most persistent relative strength inside their respective sectors. These are not headline chasers or one-day wonders. They are names that continue to separate themselves from peers through real price behavior, often reflecting sustained demand rather than fleeting attention.
For day traders, this list is a powerful awareness tool. Sector Leaders tend to offer cleaner intraday structure, better follow-through, and more predictable reactions around key levels because they already sit on the right side of relative strength. Even on choppy tape, leadership names often remain tradeable while the rest of the market degrades.
For swing traders, VL Sector Leaders helps narrow the universe to stocks with the highest probability of staying relevant. Relative leaders are more likely to hold trends, survive pullbacks, and reassert themselves after consolidation. When markets rotate, these names are often among the first to resume leadership — or the last to break.
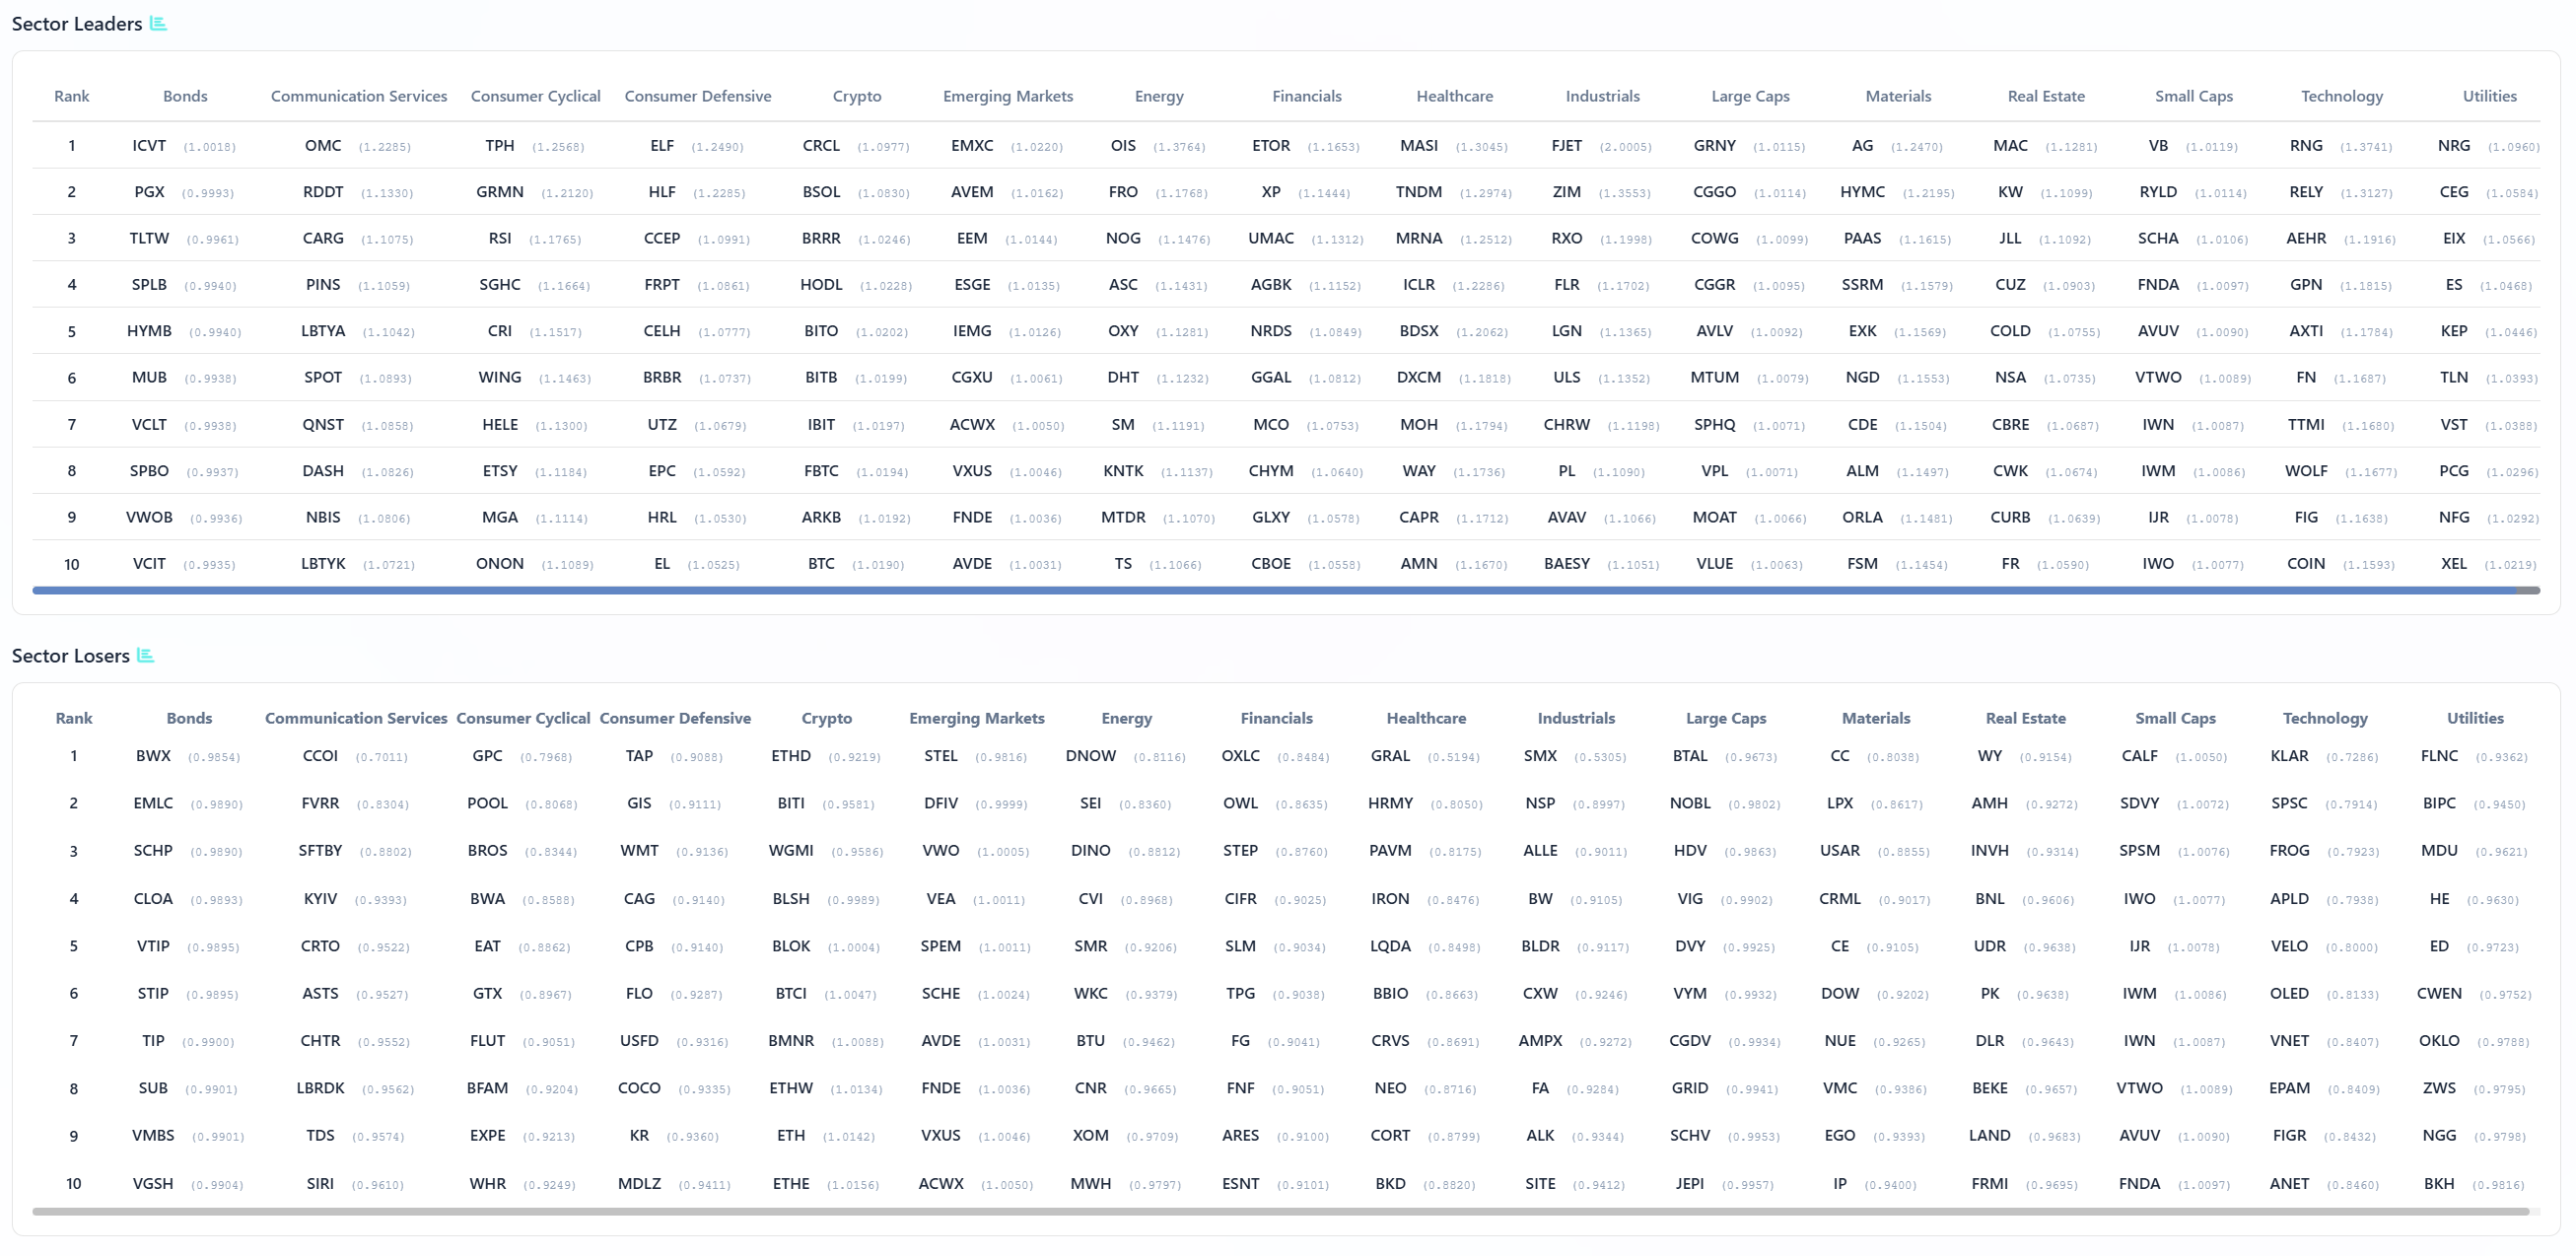
The sector leaders and losers board adds some nice texture to what we have already seen in the flows and TRV lists. At a high level, leadership is coming from quality within each group rather than from speculative edges, and the laggards are disproportionately the story‑heavy, balance‑sheet‑lighter names.
On the leaders side, the bond column is topped by ICVT, PGX, TLTW, SPLB, HYMB and MUB – convertibles, preferreds, long corporates, and tax‑advantaged munis. That is classic institutional positioning for a world where you still want income and duration but do not want the full volatility of common equity. In communication services, you see large platforms and monetization stories like OMC, RDNT, CARG, PINS and SPOT leading, while the losers list is full of high‑beta internet and ad‑tech names such as CCOI, FVRR, SFTBY and KYIV. That split is very much “own the franchises, sell the fragile.”
Consumer cyclicals tell the same story. Leaders are TPH, GRMN, RSI, SGHC and CRI – homebuilders, branded hardware, and specialty retailers with real products – while the losers column highlights GPC, POOL, WMT, BWA and CAG, plus a swarm of restaurant and discretionary names that are more sensitive to a squeeze on mid‑income spending. In consumer defensives, ELF, HLF, CCEP, FRPT and CELH are on top, pushing a mix of health, beverages and niche brands; the losers are dominated by big packaged‑goods incumbents and grocery chains. The market is rewarding unit growth and brand momentum, not sheer scale.
In growthier corners, the pattern is even sharper. In crypto, tickers like CRCL, BSOL, BRRR and HODL are on the leader board, while ETHD, BITI and other hedging and short products sit in the losers. That fits with the idea that crypto is being traded tactically long‑biased for now. In emerging markets, EMXC, AVEM, EEM, ESGE and IEMG lead, which are broad, diversified vehicles; the losers list features narrower, single‑country and factor slices like STEL, DFIV and VWO that have more idiosyncratic risk. Energy leaders include OIS, FRO, NOG, ASC and OXY, skewing toward service and higher‑quality E&P, while the losers column shows DNOW, SEI, DINO and CVI – more inventory‑sensitive refiners and distributors.
Financials and healthcare continue the quality theme. The leaders list is full of diversified managers and service names – ETOR, XP, UMAC, AGBK, NRDS, GGAL and MCO on the financial side, MASI, TNDM, MRNA, ICLR and DXCM in healthcare – while the losers tilt toward higher‑beta regional lenders and early‑stage biotech. In industrials, FJET, ZIM, RXO, FLR, LGN, ULS and CHRW are leading, pointing to logistics, engineering and shipping strength; laggards include SMX, NSP, ALLE and BW, a collection of more cyclical manufacturing and staffing names.
Large‑cap leadership is dominated by growth and quality factor wrappers – GRNY, CCGO, COWG, CGGR, AVLV and MTUM – while the laggard side shows BTAL, NOBL, HDV and VIG, which are low‑vol and dividend‑tilted products. That is an important nuance: at the index level, institutions are still willing to pay up for large‑cap growth and momentum, even as they hide inside defensives elsewhere. Materials leaders like AG, HYMC, PAAS, SSRM and EXK line up with the IO hard‑asset theme, and the losers – CC, LPX, USAR, CRML and DOW – are more traditional chemicals and building materials.
Real estate leaders such as MAC, KW, JLL, CUZ and COLD mirror the IO tilt into REITs with specific demand stories, while losers like WY, AMH, INVN and BNL skew toward more generic property exposure. Small‑cap leaders – VB, RYLD, SCHA, FNDA and AVUV – are diversified and value‑tilted; losers like CALF, SDVY, SPSM and IWO are more growth‑ and dividend‑factor slices that have been fading. And in technology, RNG, RELY, AERH, GPN, AXTl and FN lead with payments, comms and niche hardware, while KLAR, SPSC, FROG, APLD, VELO and OLED show up as losers – exactly the kind of higher‑multiple software and specialty hardware names that de‑rate first when rates stay sticky.
Taken together, the sector leaders/losers grid is a one‑page summary of the tape we have been describing: own quality, scale, and real cash flows inside each group; lean into hard assets and selective growth; and fund that by selling the more speculative, rate‑sensitive names within the same sectors rather than abandoning the sectors outright.
MIR Part 3: Framing-Up A Trade
This tape is telling us to respect the trend but stop treating it like a free lunch. Institutions are still net long, still pouring dollars into SPY, QQQ, core megacap tech and large‑cap wrappers, but the real action is a slow migration toward quality, cash flow, hard assets, and income, funded by trimming the more speculative corners of growth. The fact that flows in bonds, REITs, quality cyclicals, and large‑cap value have picked up while small caps, high‑beta software, and crypto ETFs wobble says a lot about how real money wants to be exposed right now.
Framing up a trade for the week, I’m building a barbell around three pillars: liquid core beta in the U.S. majors, income and defensives that can live with sticky inflation and a patient Fed, and a targeted growth sleeve focused on semis, AI, and quality software rather than anything that just says “tech.” I would finance that barbell by staying light in small caps, deep‑cyclical energy beta, and story‑only software, and by using volatility and factor tools to keep the overall profile closer to low‑beta than full‑throttle risk‑on.
Core equity beta – 35%
The core needs to sit where liquidity and institutional flow are deepest. I would allocate 20% to SPY and 10% to QQQ as the main engines, and 5% to a revenue‑weighted large‑cap fund like RWL. SPY and QQQ reflect exactly where dark‑pool and lit flow are concentrated, and they keep you in the megacaps that continue to dominate both returns and capital flows. RWL tilts that core toward companies with actual top‑line strength instead of pure market‑cap momentum, which lines up with the rotation we are seeing into more fundamental quality inside the large‑cap complex.
Income and defensives – 30%
This sleeve is about getting paid while you ride out macro noise. I would put 8% into LQD and 5% into HYG to mirror the heavy bond and credit ETF flows, 5% into a broad muni or tax‑advantaged fund like MUB, and 4% into a convert‑tilted product such as ICVT or TLTW, which showed up as sector leaders. On the equity side, I would add 4% in high‑quality REITs via a blend like a DOC/FRT/AGNC basket and 4% into defensive utilities and infrastructure via something like ES and CWCO/NRGV. This mix reflects the institutional outliers: mortgage REITs, shopping‑center REITs, utilities, and bond proxies all had outsized, multi‑sigma prints, which looks more like structural allocation to me than a trade.
Hard assets and real‑world cyclicals – 20%
Flows and watchlists both point to renewed interest in metals, miners, energy infrastructure, and quality industrials. I would allocate 8% to a diversified metals/miners stack built around GNR or a similar natural‑resources ETF, overlaid with select names like AG, AU, HYMC, MTRN, and USAS. Another 7% would go to energy income and infrastructure: midstream and royalty names such as DTM, VNOM, FANG, and DVN, plus an oil proxy like OILK. The remaining 5% would sit in industrials and infrastructure – names like GNRC, TDY or HWM, and a logistics or rail position such as WCN and CP. This sleeve is where you get leverage to capex, reshoring, and nominal growth without betting the farm on high‑beta cyclicals; it is exactly where both TRV and IO lists are lighting up and has been a persistent theme across the last several newsletters.
Targeted growth and AI – 10%
Rather than spray at anything with an AI label, I would build a focused basket around semis and durable platforms: 4% in NVIDIA (warning: earnings this week and Mag7-names haven’t exactly been a homerun post-earnings so far), 2% in Apple or Microsoft, and 2% split among MPWR, ALGM, and CAMT. The remaining 2% I would allocate to a curated mid‑cap software/AI basket – FIG, ADEA, PTRN, and one or two infrastructure names like FIVN or CORZ – and I would size that basket with the understanding that it is the first sleeve to cut if volatility flares. This tracks the flows: semis and megacap tech still dominate dollar volume and dark‑pool activity, and the TRV list shows sustained institutional interest in high‑quality mid‑cap enablers rather than meme names.
Risk management and overlays – 5%
Given the outlier activity in BTAL, SVIX, UDOW, and the low‑beta factor products, I would round out the portfolio with 3% in a low‑beta equity ETF such as BTAL or a similar long‑low‑beta/short‑high‑beta construct, and 2% in a small short‑volatility or carry product like SVOL, sized modestly. The idea is not to get cute with vol, but to lean slightly into the regime the tape is already rewarding: owning stable names and selling insurance in a controlled way while the crowd pays up for protection. If volatility spikes or the macro tape turns, this is the sleeve you flatten first.
In practice, this portfolio keeps you long the U.S. equity trend and the AI‑plus‑megacap leadership that still drives most of the index, but wraps that exposure in bonds, REITs, utilities, and hard assets that institutions are clearly embracing as ballast. It mirrors what the institutional tape is actually doing: upgrading quality, adding income and real assets, staying engaged in core growth where earnings are real, and using factors and derivatives to keep the overall risk profile controlled rather than euphoric. Good luck this week, VL! See you in the Discord!
Thank you for being part of this community and for investing your time in this week’s edition. The quality of this readership — thoughtful, disciplined, engaged — is what makes this work meaningful. I’m grateful to build alongside you. Here’s to a week of clarity, conviction, and well-executed opportunities.
— VolumeLeaders