

Market Momentum: Your Weekly Financial Forecast & Market Prep
Issue 80 / What to expect Feb 16, 2026 thru Feb 20, 2026


Weekly Market-On-Close Report
The bull market is catching its breath, not losing its way.
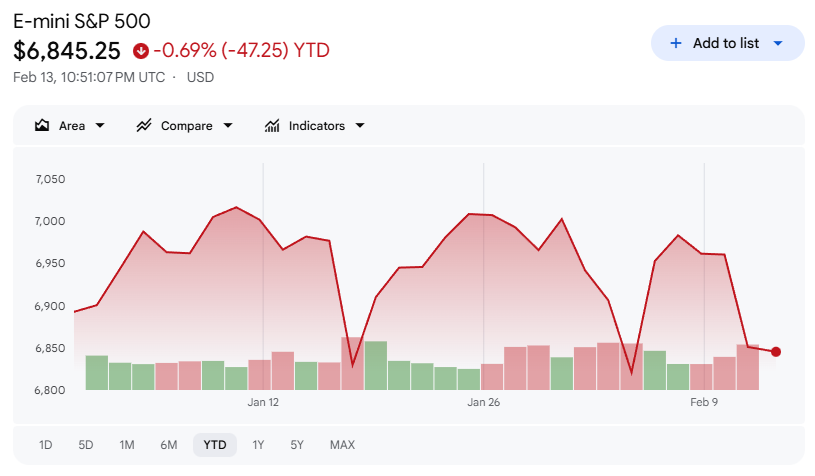
You can see it right in the E‑mini tape. The March ’26 S&P contract, ESH26, is chopping the same range since the beginning of the year, effectively flat year‑to‑date, but still sitting near all‑time highs after a huge run through 2024 and into January.
Under the surface, though, leadership is shifting. The mega‑cap growth engines that dragged the index higher last year are wobbling, while real assets, cyclicals, and international markets quietly take the baton. The question for the next leg is not “bull or bear?” so much as “who leads from here?”
Futures say digestion, not damage
Start with the futures curve. ESH26 last traded around 6,836 with a weekly change of roughly ‑0.5 percent, right in line with the cash index. Price found buyers in the 6,750–6,780 zone finding buyers and rallies into the 6,880–6,900 area drew out sellers/supply. That kind of profile is textbook consolidation after a strong trend: volatility is higher than it was last summer, but the path of least resistance is still sideways‑to‑up unless and until 6,800 gives way in earnest.
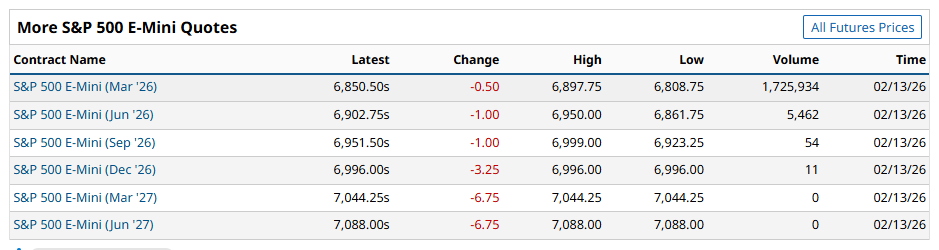
Term structure backs that up. Out along the curve, later‑dated S&P minis trade at small premiums to March, consistent with normal carry rather than panic hedging.
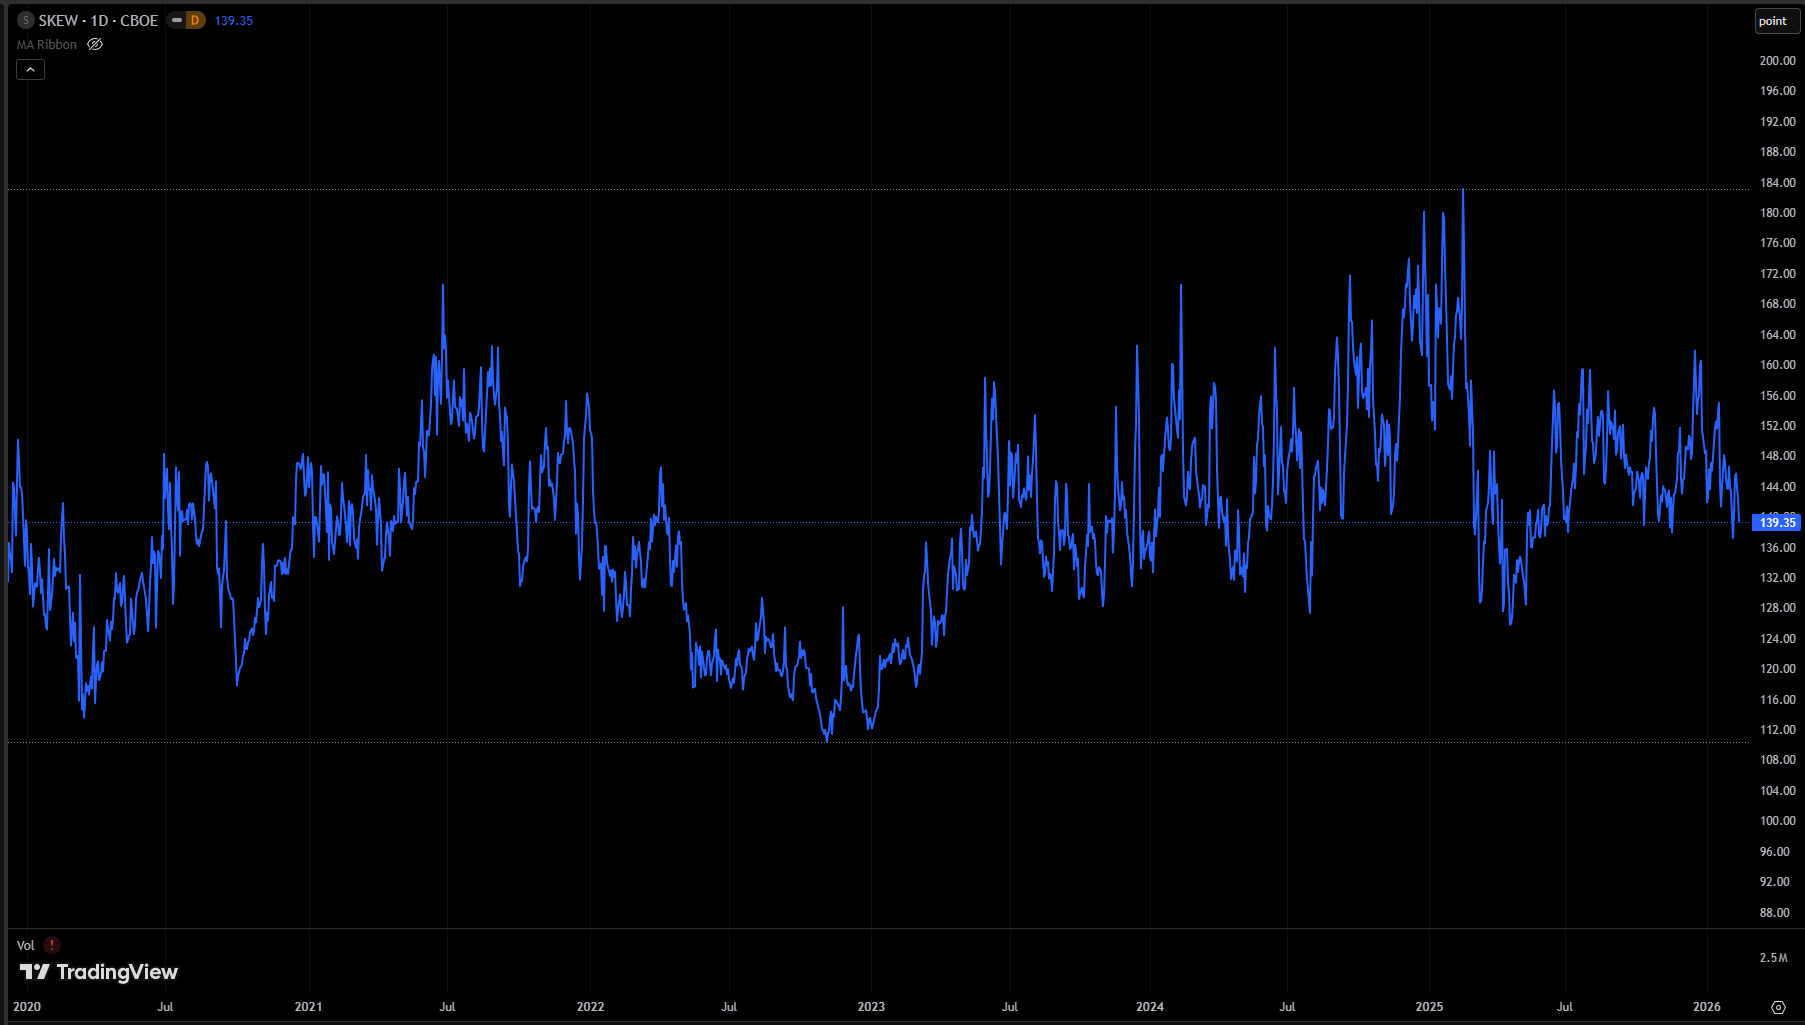
Options markets agree: skew is elevated but not extreme, and implied vol has drifted up from last year’s troughs without anywhere near the kind of spike that marked the 2022 bear market.
If this were the start of a major top, you would expect to see more stress: the front contract breaking decisively below prior breakout levels, term structure flipping, credit cracking. Instead, you have a market that is tired after a torrid run but still well‑supported by macro.
Macro: slower inflation, still‑resilient growth
The reason markets can churn near highs while leadership reshuffles is simple: the macro backdrop is presenting as pretty good.
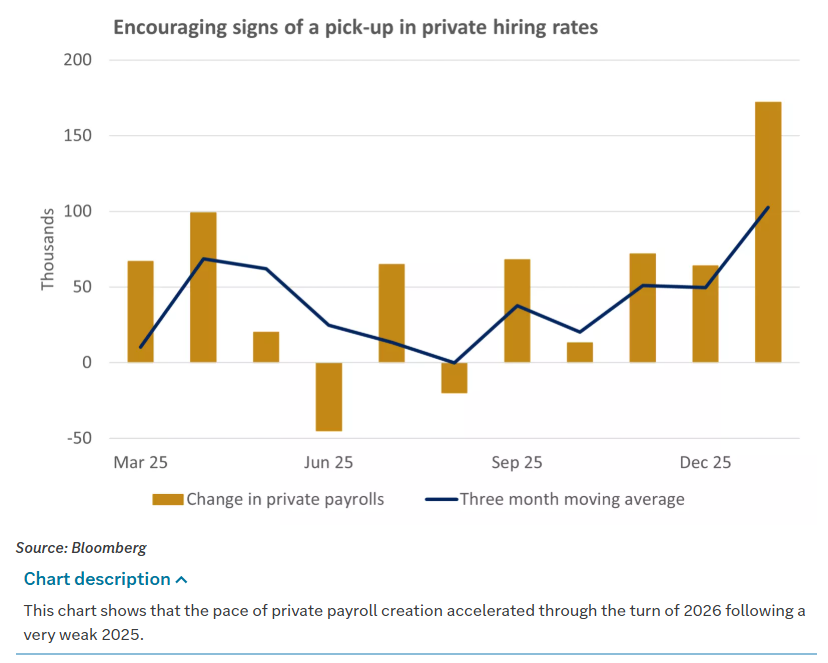
U.S. economic data have softened at the edges but remain consistent with above‑trend growth. Payroll gains have moderated, wage growth has cooled, and the unemployment rate has drifted a bit higher, but not in a way that suggests the labor market is rolling over. Manufacturing surveys have perked up from contraction into expansion territory, helped by a rebound in new orders.
On inflation, January’s U.S. CPI report showed headline prices up about 2.4 percent year‑over‑year, with core measures continuing their slow drift back toward the Fed’s 2 percent target.
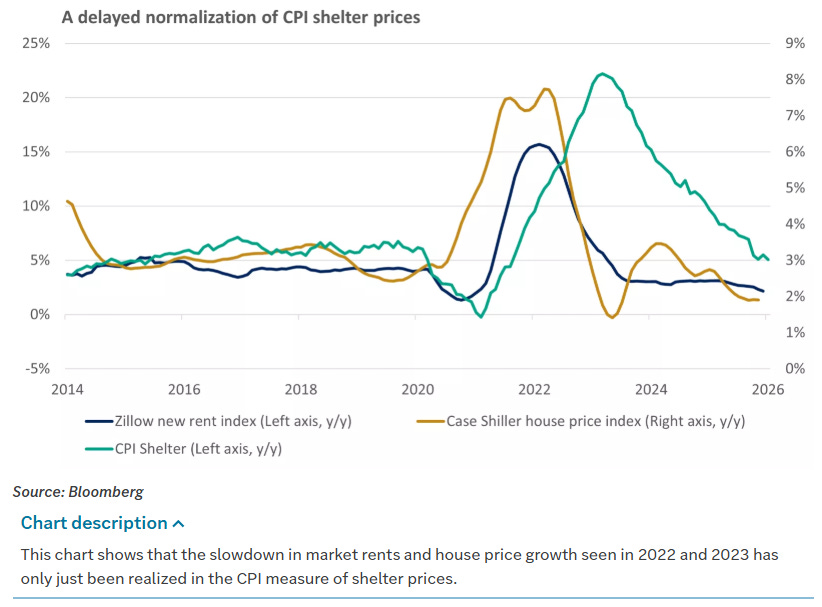
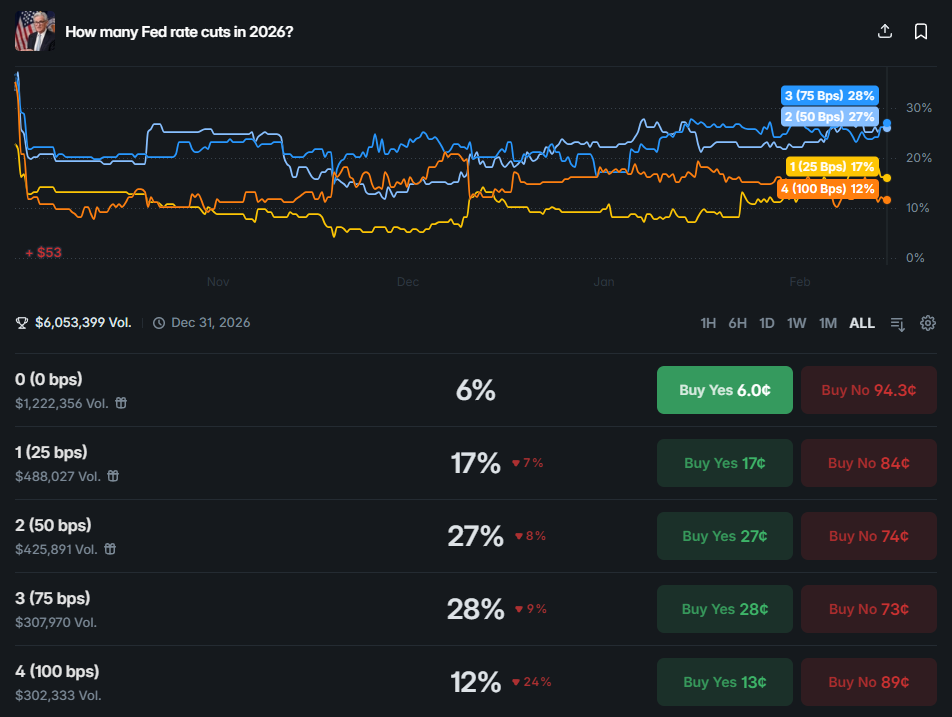
Inflation’s “slow grind lower” is intact despite occasional upside surprises, and that markets still expect the Fed to begin cutting rates later this year, even if the exact timing remains a bit of a moving target. The Fed left policy unchanged at its recent meeting and reiterated that the next move is likely down; futures now discount something like two cuts by year‑end, rather than the three or four optimists were hoping for back in December.
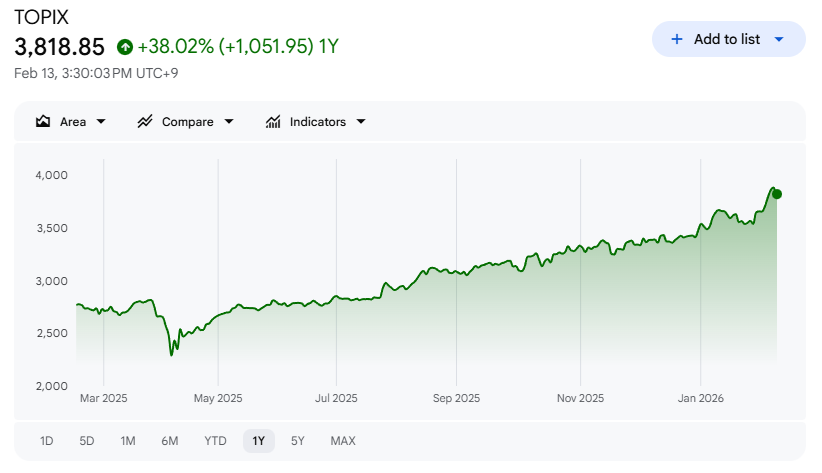
Outside the U.S., the picture is one of gradual healing. The eurozone and UK are finally seeing inflation fall decisively, giving the ECB and Bank of England room to start thinking about easing. Business surveys across Europe are still soft but no longer deteriorating, and fiscal policy in countries like Germany has turned more supportive as governments relax budget rules. Japan remains a bright spot thanks to fiscal stimulus and corporate reforms, with the TOPIX and Nikkei notching new highs even as the Bank of Japan inches gingerly away from negative rates.
Emerging markets are a mixed bag. Latin American central banks have already started cutting after front‑loading hikes earlier in the cycle, which has supported local bonds and equities. China, by contrast, continues to struggle with property‑sector weakness and fragile confidence; Beijing has eased policy via reserve‑requirement cuts and targeted lending, but investors remain skeptical that these measures can fully offset structural drags.
Taken together, the global macro picture looks like this: growth is decelerating from “hot” to “warm,” inflation is grinding lower, and central banks are inching toward easier policy while trying not to over‑promise. That is not a recipe for an imminent recession. It is a recipe for a slow, messy rotation within risk assets.
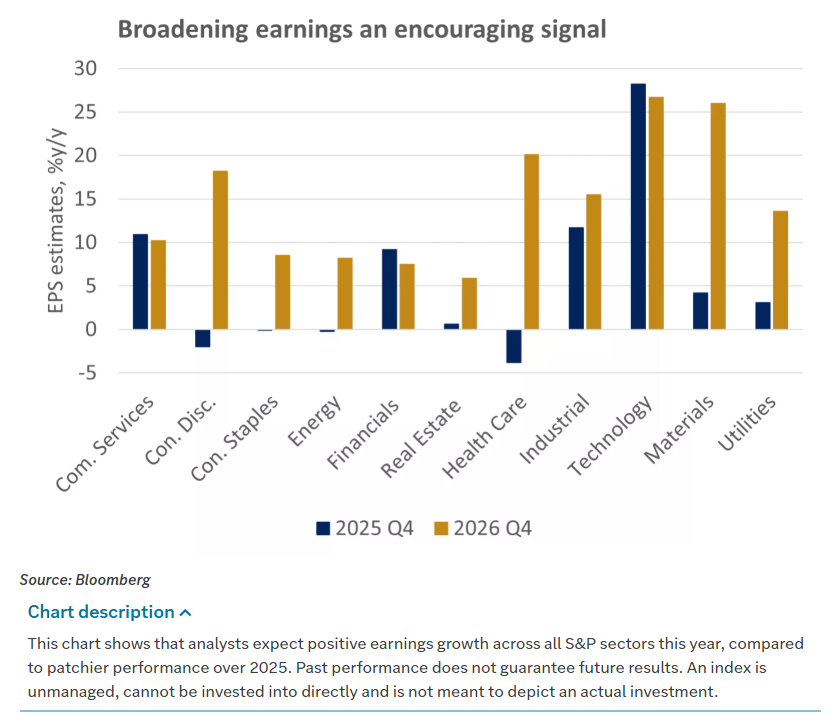
Earnings season: AI matures, breadth improves
On the micro side, earnings have mostly cooperated. With the bulk of S&P 500 companies having reported, the beat rate is comfortably positive and 2026 profit growth is tracking in the mid‑single digits. One could Characterize this season as “solid,” with particular strength in financials, industrials, and select technology and healthcare names.
The tone around AI has shifted from breathless to businesslike. Mega‑cap platforms tied to AI – think Microsoft, Meta, Nvidia – have continued to post strong top‑line growth and expand margins, but investors are no longer willing to pay any price for that exposure. While AI remains a powerful long‑term productivity driver, markets have already priced in a lot of that story for the largest names, and the better opportunities may lie in “the plumbing” – semiconductors, equipment, cloud infrastructure, and niche software that actually implements AI at the customer level.
You can see that in the way earnings reactions have shifted. Some marquee AI names have beaten and then sold off on guidance that was merely “good” rather than extraordinary. Meanwhile, second‑tier semis, industrial automation plays, and cybersecurity names have started to outperform on positive revisions and improved order books.
Financials have been a quiet winner. Banks and insurers in both the U.S. and Europe have, on the whole, reported stable credit quality and decent net‑interest margins despite the plateau in short‑term rates. With yield curves likely to steepen once cuts actually begin, and with defaults still running below long‑run averages, the setup for high‑quality financials looks better than it has in years.
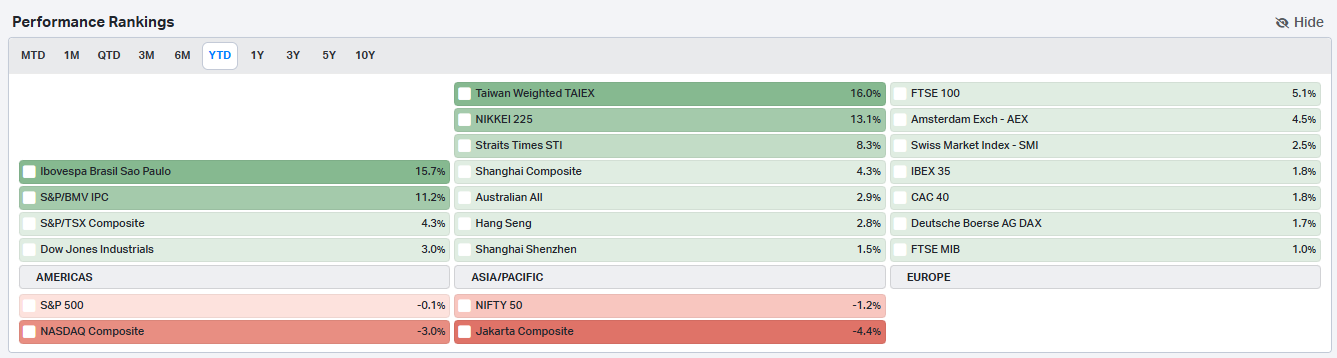
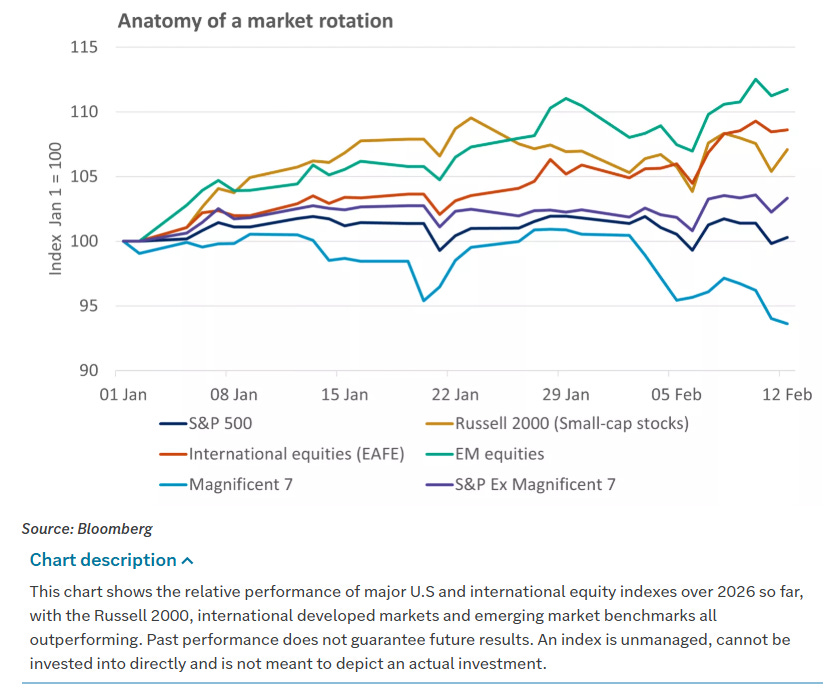
All of this has nudged market breadth in the right direction. Instead of a handful of mega‑caps driving all the performance, more sectors and more regions are contributing. International developed equities, as proxied by MSCI EAFE, are up meaningfully year‑to‑date and have outpaced the S&P over the last month. Within the U.S., value and equal‑weight indices have narrowed the gap vs. cap‑weighted growth benchmarks as cyclicals and financials wake up.
Rotation under the hood
A futures chart alone only tells you where the index is; you need to know who is carrying it. The leadership rotation of the last few weeks can be summed up in three moves.
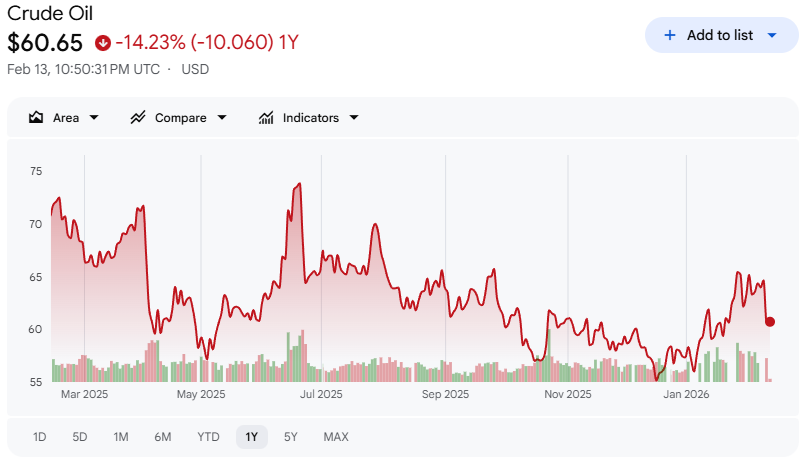
First, real assets and cyclicals are taking on more of the load. Commodity markets have been firm: crude has stabilized on the back of supply discipline and geopolitical risk, while industrial metals and gold trade near multi‑year highs thanks to a combination of energy transition demand, supply constraints, and lower real rates. Energy equities, particularly integrated majors and midstream operators, have outperformed as free‑cash‑flow yields stay elevated and capital discipline holds. Materials tied to infrastructure and construction – think steel, copper, cement, industrial gases – have also gained ground as U.S. and Japanese fiscal programs roll out and European governments pivot from austerity to investment.
Second, international and value factors are finally earning their keep. Non‑U.S. developed markets outperformed the U.S. this week, helped by better‑than‑expected data in the eurozone and UK and by ongoing strength in Japan. Valuations abroad remain meaningfully cheaper than U.S. large‑cap growth, and earnings revisions have turned positive in regions where central banks are likely to cut sooner. That cocktail has attracted both active allocations and passive flows into EAFE, Japan, and international value funds.
Third, within the U.S. growth complex, leadership has broadened beneath the mega‑caps. Instead of buying anything with “AI” in the slide deck, institutional money is discriminating between business models. Companies that can show clear AI‑driven productivity gains or durable recurring revenue are still being rewarded; those whose AI stories require heavy upfront capex with uncertain payback are not. That distinction has boosted quality growth, mid‑cap tech, and parts of healthcare (especially life‑science tools and profitable biotech) while leaving some of the more speculative corners behind.
Against that backdrop, the S&P can drift sideways near highs even as the names that led the last leg take a breather. The index is a blend of all these forces. Index traders are effectively betting that rotation can keep the whole boat afloat while the froth comes out of the most over‑owned stories.
What this means for traders and allocators
The message is straightforward: respect the range and trade the rotation. For the current /ES contract, it makes sense to think in terms of a 6,750–6,950 band until proven otherwise; in SPY that’s roughly 680-694. A convincing break above on strong breadth and volume would argue that the consolidation is over and the index is ready to leg higher. A sustained move below accompanied by widening credit spreads and weaker macro surprises would be your signal that the correction is getting teeth.
Inside that band, the edge comes from understanding which sectors are leading each move. Rallies driven by energy, financials, industrials, and non‑U.S. markets are more likely to be durable right now, because they line up with the macro tailwinds discussed above. Pops led by the most crowded AI and consumer‑internet names, without support from broader cyclicals, are more suspect and better candidates to fade.
For longer‑term allocators, the exercise is more about tilt than timing. The combination of cooling inflation, credible prospects for a gentle Fed easing cycle, resilient global growth, and broadening earnings leadership points to staying constructive on equities overall rather than de‑risking into cash. But it also argues for a more diversified approach than the 2023 “own the Magnificent Seven and call it a day” playbook.
None of this requires a heroic macro call. It is simply following the bread‑crumbs that the institutional tape has been leaving so far.
The risk to the thesis
Of course, every positioning story has a fail state. For this one, there are three.
First, inflation could re‑accelerate, forcing the Fed and its peers to push back hard on rate‑cut expectations. A couple of hot CPI or PCE prints that move core measures decisively higher would challenge the “gentle easing” narrative and likely push Treasury yields back toward last autumn’s highs. In that scenario, existing floors in indices would be at risk, and duration‑sensitive parts of the equity market – long‑duration growth and leveraged real estate – would come under pressure.
Second, growth could roll over more sharply than expected. If labor‑market data deteriorate quickly, credit spreads widen, or global PMIs slip back into contraction, the current rotation into cyclicals and financials would be vulnerable. Investors would likely seek safety in defensives, high‑quality growth, and long‑duration government bonds, and the indices would trade lower on earnings downgrades rather than multiple compression.
Third, something could break in the plumbing: a geopolitical shock, a policy mistake, or an unexpected default that rattles confidence. Those are, by definition, hard to forecast, but you can monitor for them via liquidity metrics, vol spikes, and cross‑asset correlations.
Until one of those fail states shows up in the data, the more probable path is the one we are living in now: a high‑altitude consolidation where the S&P 500 digests a huge prior run while leadership broadens out.
The bottom line is simple. The market has come to rest while it works through a set of cross‑currents that are, on net, still bullish for risk assets but no longer one‑dimensional. Futures pricing, global macro updates, and sector‑level performance all point in the same direction: stay in the game, but trade and allocate as if this is a rotation phase, not a melt‑up.
That means respecting the range, leaning into real assets, financials, and international exposure, and being more selective in growth than you had to be last year. The bull market may be tired, but it is still on its feet – and for investors willing to look beyond the usual suspects, that is an opportunity, not a problem.

Weekly Benchmark Breakdown
Breadth check: constructive but not convincing
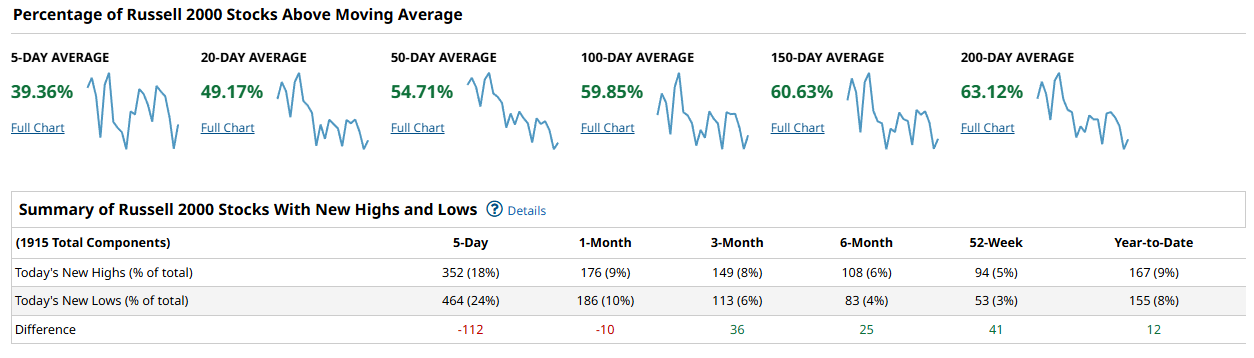
Across the major indices this week, breadth leans risk‑on but not in a decisive thrust. The S&P 500, Nasdaq 100, and Industrials all show a slim majority of members above their intermediate moving averages, while the Russell 2000 lags with less than half of its components above even the shortest lookback. New highs and new lows are roughly balanced in the S&P and Nasdaq, mildly negative in Industrials, and more clearly negative in the Russell. That combination says the uptrend is intact in the large caps, but participation is only middling and the small caps continue to act like a drag rather than a leadership cohort.
On the S&P 500, about 54 percent of stocks sit above the 5‑day moving average, climbing to roughly 61 percent above the 20‑day, 62 percent above the 50‑day, about 65 percent above the 100‑day, near 65 percent above the 150‑day, and just under 65 percent above the 200‑day. New highs and new lows are essentially a wash on the day, with 94 new highs and 97 new lows over the last five days, leaving a small negative differential of 3 issues.
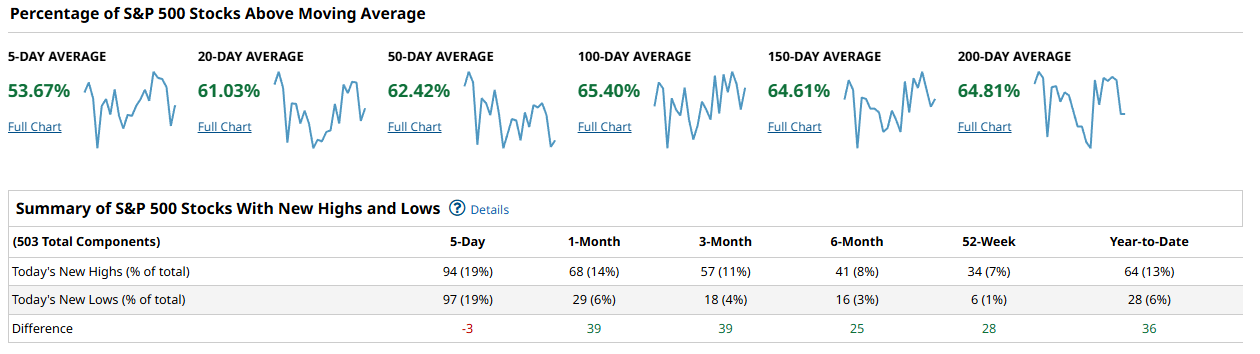
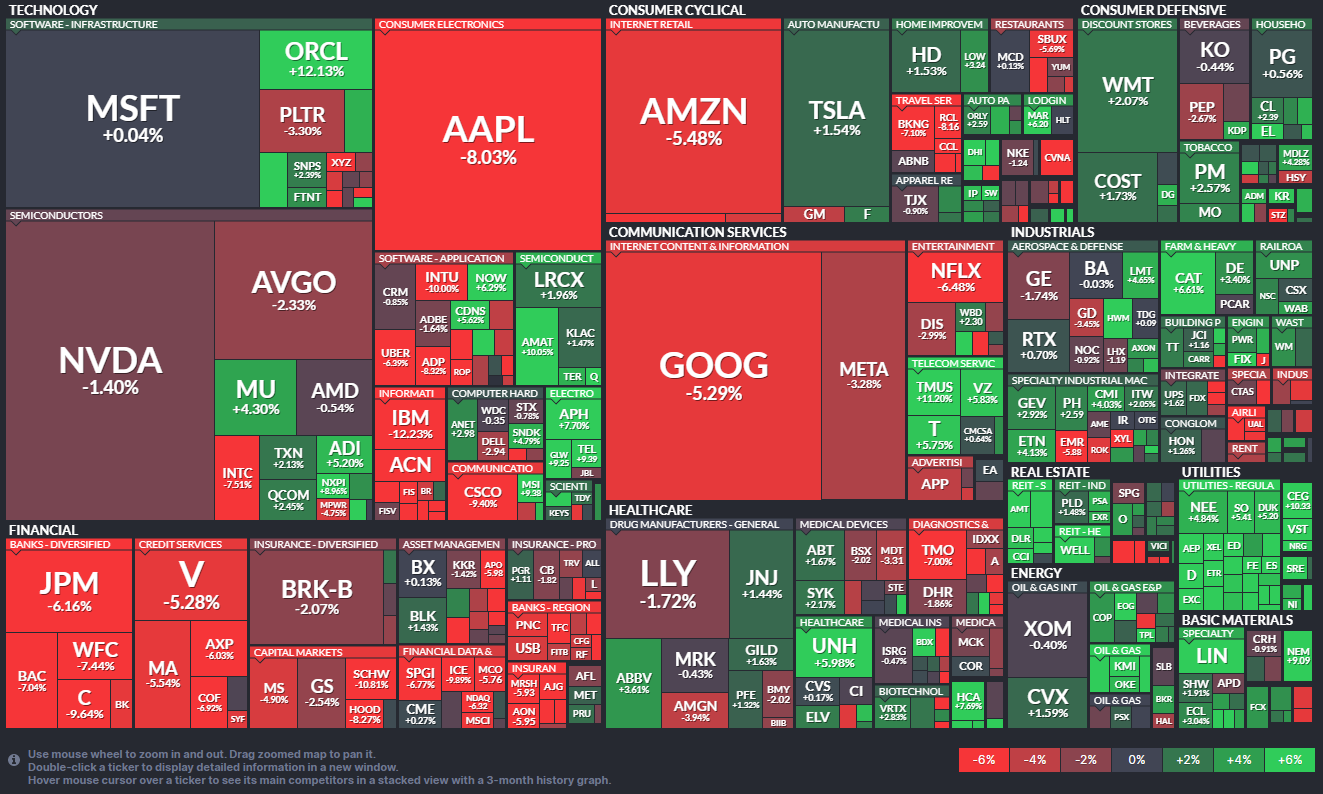
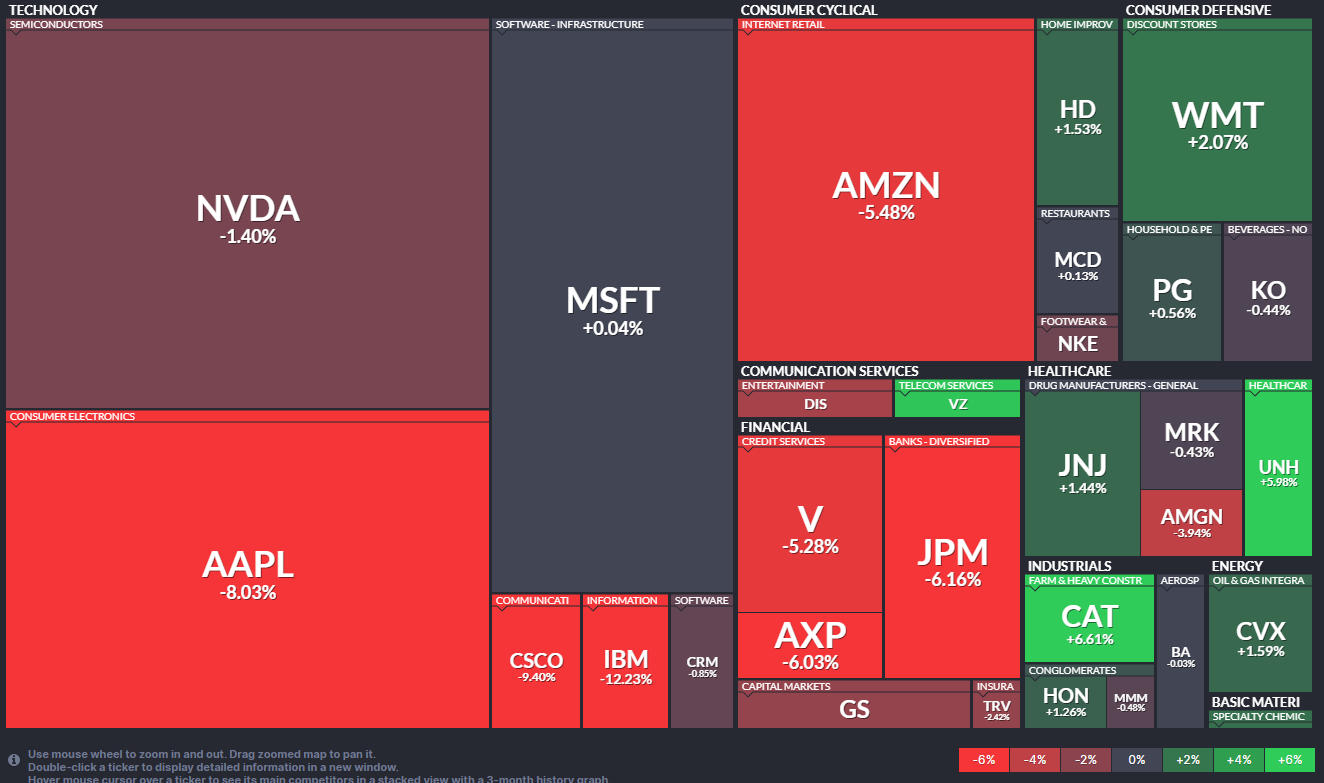
Over the one‑month and three‑month windows that flips positive, with NH‑NL both running around +39, and the 52‑week and year‑to‑date windows show a still‑healthy edge to new highs in the 25 to 36 issue range. The weekly S&P heatmap is dominated by red in the mega‑cap growth complex, with Apple off about 8 percent, Alphabet down more than 5 percent, and Amazon lower by more than 5 percent as well, while pockets of green show up in defensive areas like staples, health care, and parts of energy. Net‑net, the S&P advance is still broad enough under the surface, but the fact that the heaviest index weights are red while breadth is only modestly positive argues for rotation rather than an outright risk‑off break.
The Nasdaq 100 tells a similar story, but with even more index dependence on a few large losers. Roughly 49 percent of Nasdaq 100 stocks are above their 5‑day moving average, about 46 percent above the 20‑day, 48 percent above the 50‑day, about 50 percent above the 100‑day, roughly 50 percent above the 150‑day, and about 51 percent above the 200‑day. New highs and new lows over the last five days are almost perfectly balanced, with 23 new highs and 24 new lows, leaving a tiny negative differential of 1, while the longer lookbacks run close to flat with small positive differentials at three months and six months and a small negative for the year‑to‑date.

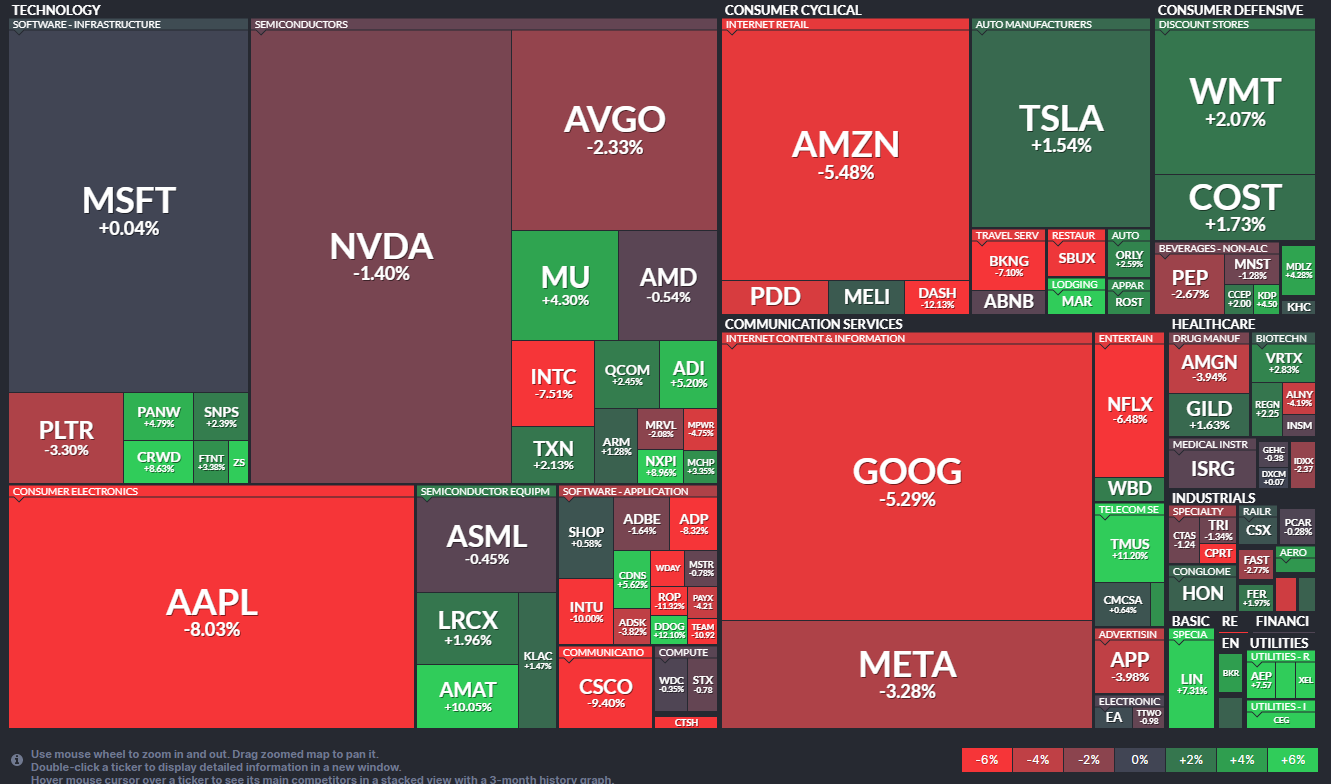
On the weekly heatmap, the index‑level damage is concentrated in the biggest names: Apple down more than 8 percent and Alphabet off more than 5 percent, with other mega‑cap tech and communication stocks under pressure, while some semiconductor names and a handful of software and infrastructure names print solid gains. That mix keeps the Nasdaq in a trend, but it is not the sort of all‑boats‑rising thrust you associate with the start of a powerful leg higher.
Within the Dow and the broader Industrials space, breadth is actually somewhat firmer, though still not explosive. Roughly 53 percent of the Industrials components are above their 5‑day moving average, about 53 percent above the 20‑day, 53 percent above the 50‑day, 60 percent above the 100‑day, roughly 67 percent above the 150‑day, and about 73 percent above the 200‑day, so the longer‑term trend profile is clearly stronger here than in the tech‑heavy indices. Over the last five days there are 5 new highs against 9 new lows, for a negative differential of 4, but over the three‑month, six‑month, and 52‑week windows the NH‑NL figures swing back to a small positive.
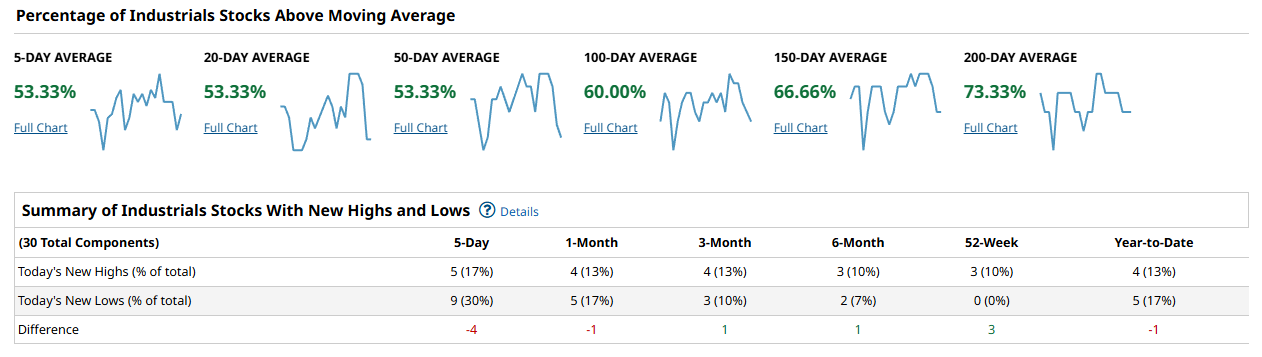
On the weekly heatmap, there is material weakness in the major Dow financials and some of the large industrials and multinationals, but also notable strength in select machinery, heavy equipment, and energy names, underscoring that cyclicals are not rolling over in unison.
The Russell 2000 is still the trouble child. Only about 39 percent of its members are above the 5‑day moving average, roughly 49 percent above the 20‑day, about 55 percent above the 50‑day, just under 60 percent above the 100‑day, about 61 percent above the 150‑day, and around 63 percent above the 200‑day. That structure says the long‑term damage has healed, but short‑term participation is weak. New highs and new lows over the last five days skew negative, with 352 new highs versus 464 new lows, for a differential of -112. The one‑month window is only modestly negative at -10, but the three‑month, six‑month, and 52‑week windows finally turn positive, with NH‑NL differentials of +36, +25, and +41 respectively, and year‑to‑date sitting at +12.
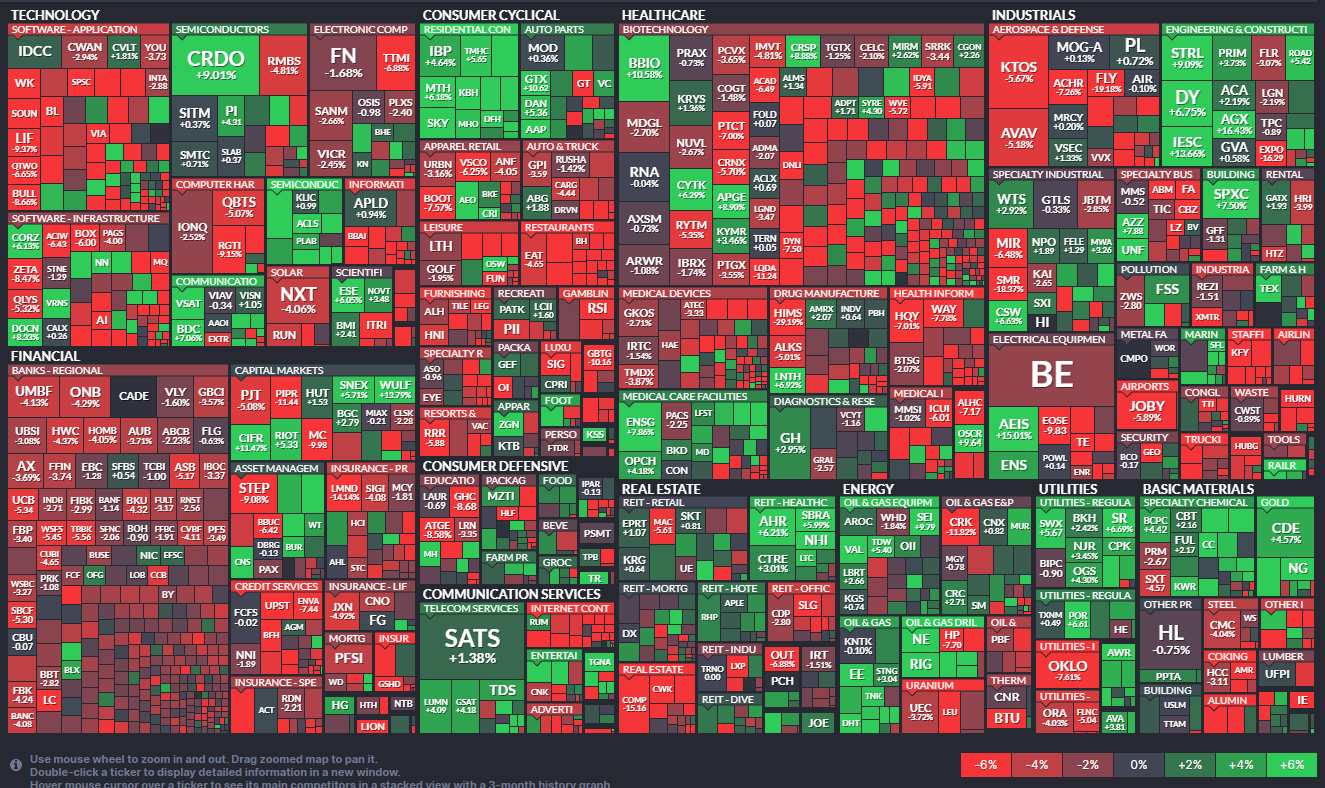
On the weekly heatmap, small caps are a noisy mix of red and green, with no clear leadership pocket strong enough to offset the broad selling pressure, which matches the weak short‑term breadth readings.
Putting it all together, the cap‑weighted indices are masking a quiet handoff beneath the surface. Mega‑cap growth, especially the big tech and internet bellwethers, took a hit this week even as a majority of S&P names hold above their intermediate moving averages and defensive and cyclical areas show relative strength. The Nasdaq 100 is more dependent than ever on a shrinking leadership group, while the Russell 2000 continues to lag on short‑term breadth and prints the most negative new‑low profile. A durable, high‑confidence advance from here would be confirmed if the percentage of stocks above their 50‑day moving averages in all four indices can push and hold north of roughly 60 percent while new highs outnumber new lows by a comfortable margin, especially in the small caps and Nasdaq. By contrast, if mega‑caps continue to slide and the S&P 500 and Nasdaq 100 cohorts above the 20‑ and 50‑day slip back into the 40s with new lows expanding, that would argue the market is transitioning from rotation to something more corrective.
For this week’s playbook, I would lean toward a balanced but selective risk posture. Favor areas where breadth and trend both line up: quality large caps outside the most crowded mega‑cap growth names, defensive sectors like staples and parts of health care that are showing positive weekly returns, and select cyclicals and industrials that sit above their intermediate moving averages. Be more cautious with the high‑beta tech and internet leaders that just printed sharp weekly losses, and avoid the weakest corners of the small‑cap universe until the Russell’s five‑day NH‑NL profile turns back decisively positive and its percentage above the 20‑day and 50‑day improves. Watch closely for an expansion in S&P and Nasdaq 100 members above the 50‑day moving average along with a clear positive NH‑NL spread as the signal that this pullback in the leaders is being absorbed rather than broadening into a more serious correction.
Bottom line: breadth is good enough to support the uptrend, but not strong enough yet to rule out a deeper shakeout if the recent mega‑cap weakness spreads.

Investor Sentiment Report
%Bull-Bear Spread
The %Bull-Bear Spread measures the gap between bullish and bearish investor sentiment, often from surveys like AAII. It’s a contrarian indicator—extreme optimism may signal a coming pullback, while extreme pessimism can hint at a potential rally. Large positive or negative spreads often mark market turning points.
The percent bulls minus bears spread is sitting around the low single digits this week, hugging the zero line after having been mildly positive in prior weeks. The one‑year trace shows that readings below zero have tended to coincide with exhaustion on the downside, while pushes north of about +20 have lined up with crowded optimism and subsequent chop or pullbacks. Right now the spread is neither deeply negative nor extended on the upside, which tells us the crowd is unsettled rather than outright fearful or euphoric. That backdrop usually argues for two‑sided volatility rather than a clean runaway trend. A decisive break below zero, especially if it digs into the -10 to -20 zone, would set up a better contrarian backdrop for buying dips; a sustained drive above +20, without a pause, would instead warn that upside is getting crowded and that any shock could trigger a sharper air‑pocket lower.
NAAIM Exposure Index
The NAAIM Exposure Index (National Association of Active Investment Managers Exposure Index) measures the average exposure to U.S. equity markets as reported by its member firms. These are typically active money managers who provide their equity exposure levels weekly. The index offers insight into how much these managers are investing in equities at any given time, ranging from being fully short (-100%) to leveraged long (up to +200%).
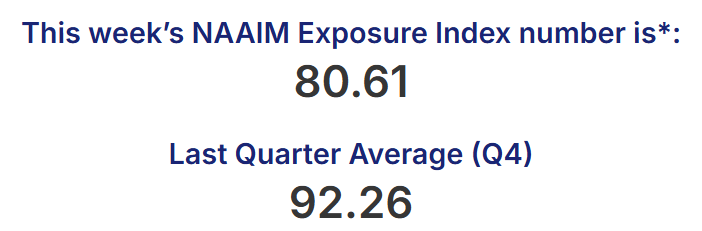
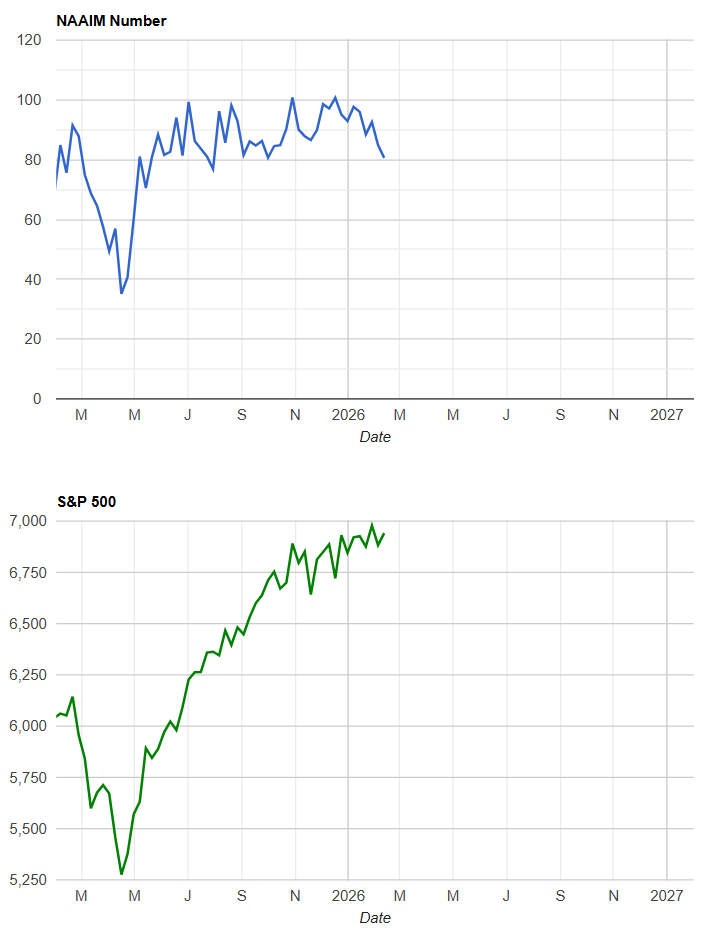
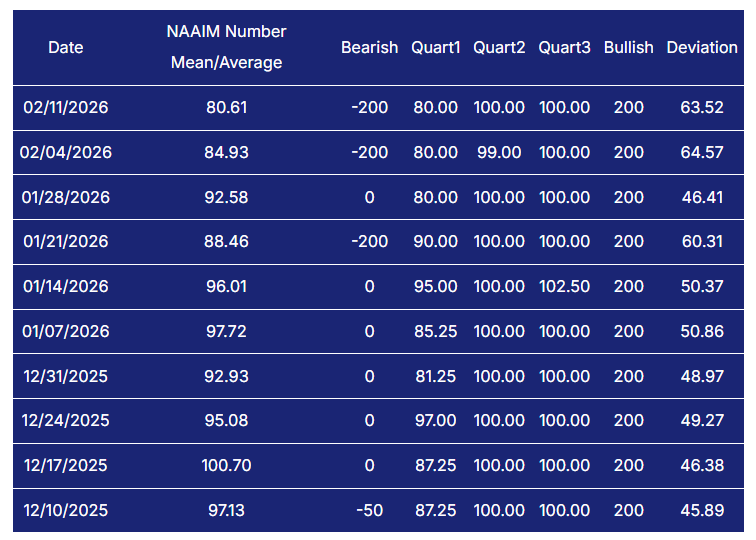
The NAAIM Exposure Index has eased back to roughly 81 this week after printing in the low to mid‑90s through most of January. That is still a high‑beta stance: active managers are meaningfully net long, but they have taken a modest step back from maximum throttle. The index has oscillated between about 80 and a bit over 100 since December, with only brief dips toward the 70s, which means there is not much dry powder waiting on the sidelines but there is real vulnerability if price suddenly stumbles. This positioning profile favors shallow, buy‑the‑dip type pullbacks as long as prices do not crack key support, but it also raises the risk of a fast de‑risking cascade if a negative catalyst appears. A drop in NAAIM into the 50s without major price damage would actually be constructive, signaling renewed firepower; a push back into the 90s or higher on the next rally would say managers are once again pressing their luck and that downside gap risk is building.
CBOE Total Put/Call Ratio
CBOE's total put/call ratio includes index options and equity options. It's a popular indicator for market sentiment. A high put/call ratio suggests that the market is overly bearish and stocks might rebound. A low put/call ratio suggests that market exuberance could result in a sharp fall.
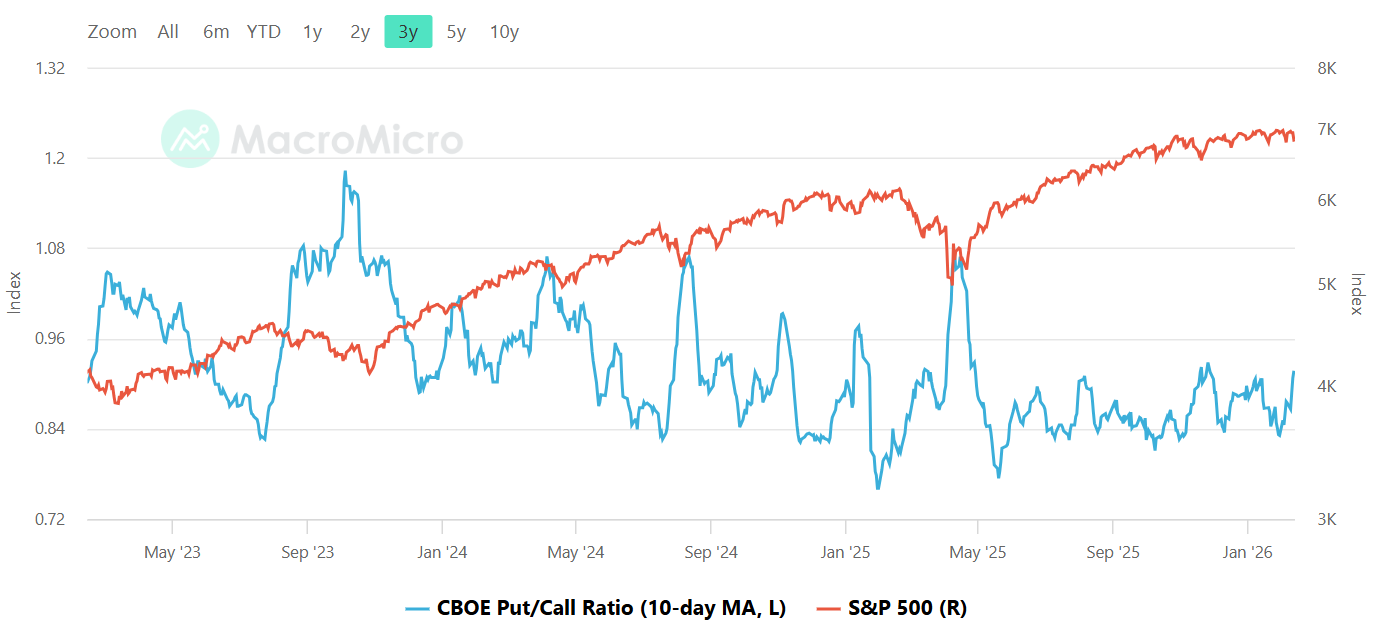
The 10‑day moving average of the CBOE total put/call ratio is currently sitting just under 1.0, after spending much of the past few months oscillating between roughly 0.8 on the complacent side and 1.1 on the more fearful side. The latest bounce off the recent lows suggests traders have been adding some protection and speculative downside bets as the index has wobbled, but we are not yet at a level that screams capitulation. In practice, readings near 1.0 reflect a more balanced options tape, where downside hedges can help limit the depth of any pullback but are not so extreme as to fuel a violent squeeze higher. If the 10‑day average were to sink back toward 0.8 while prices grind up, that would flag froth and thin downside protection, raising the odds of a sharper shakeout; a spike north of about 1.1, especially if it happens on weakness, would instead mark the kind of fear that tends to support robust, tradable rebounds.
Equity vs Bond Volatility
The Merrill Lynch Option Volatility Estimate [MOVE] Index from BofAML and the CBOE Volatility Index [VIX] respectively represent market volatility of U.S. Treasury futures and the S&P 500 index. They typically move in tandem but when they diverge, an opportunity can emerge from one having to “catch-up” to the other.
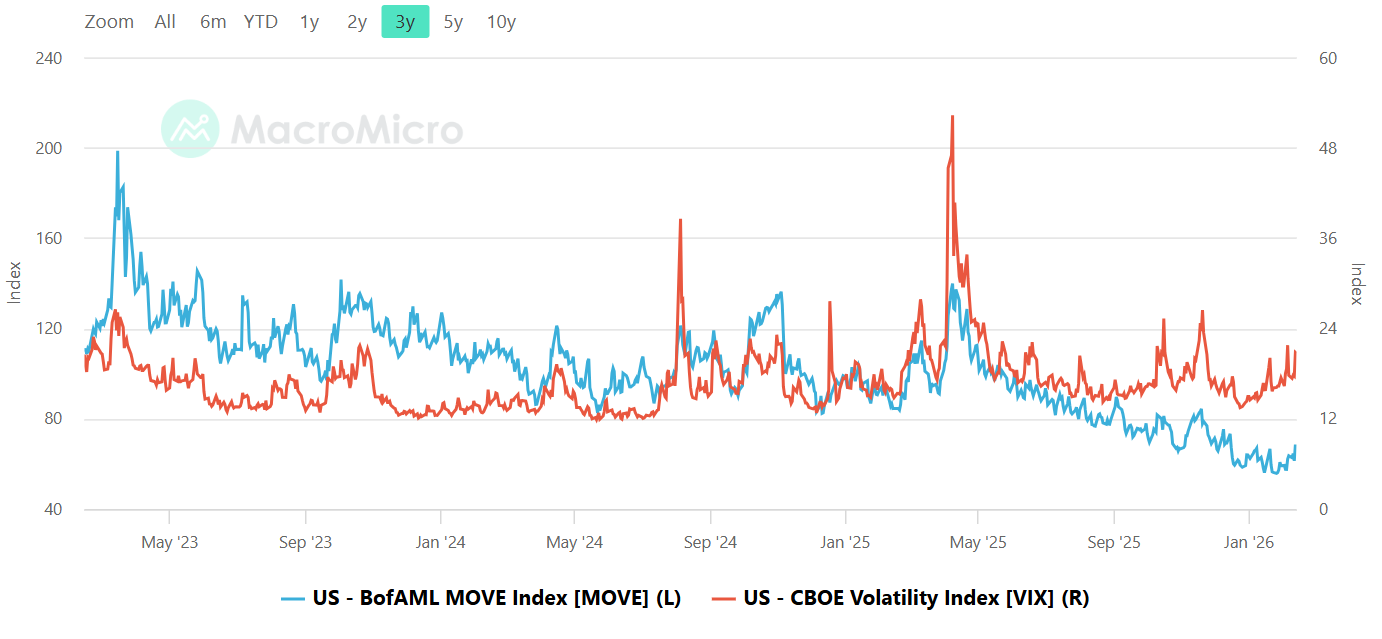
On the volatility front, the MOVE index has drifted down toward its lower range over the past year, while the VIX is sitting in the low to mid‑teens after having spiked into the mid‑20s during last year’s more acute equity scares. Both curves are well off their 2023 extremes: bond volatility has cooled from the 160–200 area into a far more benign zone, and equity volatility has likewise retraced from crisis‑type spikes back into a relatively calm regime. That alignment tells us there is no current signal of systemic stress coming from rates, and that equities are still trading in a low‑volatility environment where pullbacks can feel sharp locally but are not yet being driven by macro panic. The key tripwire to watch is a renewed MOVE surge back above roughly 120 while VIX remains sleepy; that kind of divergence has often preceded equity air‑pockets. Alternatively, a VIX push into the high teens or low 20s, especially if accompanied by an uptick in MOVE, would be a clear message that the tape is transitioning from benign chop into a more serious risk‑off phase.
CNN Fear & Greed
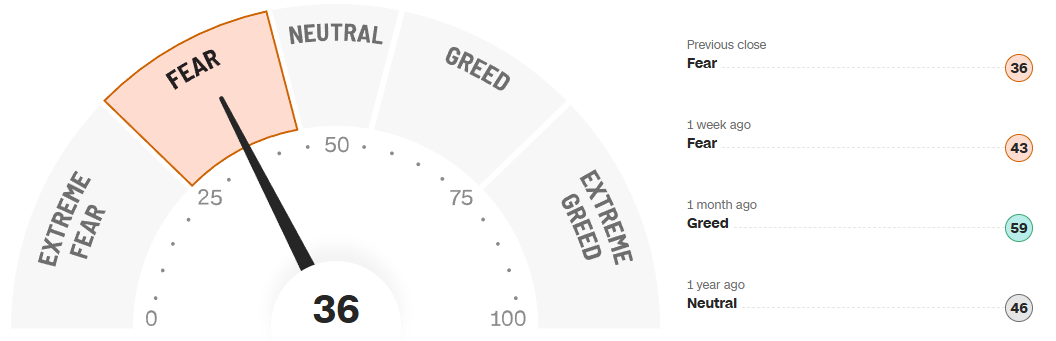
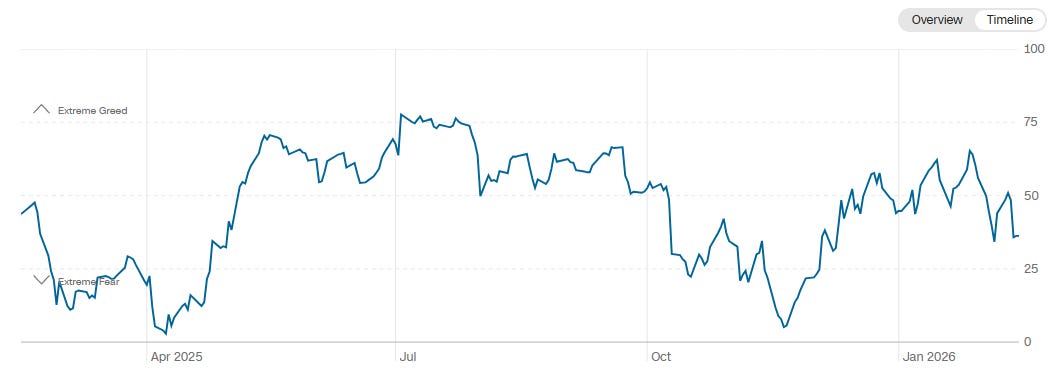
The CNN composite Fear & Greed gauge sits at 36 this week, squarely in the Fear bucket, down from 43 a week ago and well below the 59 print from a month ago that registered as Greed. The one‑year path shows a series of swings between the 20s (fear) and the 70s (greed), with the latest roll lower coming off a mid‑range, not from the kind of extreme euphoria that typically marks cyclical tops. In other words, sentiment has cooled appreciably without yet flushing into full capitulation. That backdrop often supports choppy consolidation with a mild upside bias, as marginal sellers express their nervousness but strong hands are not forced to liquidate. A slide in the gauge into the low 20s or below would move us into an outright fear regime that tends to set up better risk‑reward for new longs; a sharp snap back above 70 in coming weeks, particularly if price only grinds higher, would instead flag a late‑stage, exhaustion‑type optimism that should make traders tighten risk.
Bottom line: sentiment has backed off the greedy extremes and is drifting toward cautious, but with positioning still elevated enough that a genuine volatility shock could bite before the tape resets into a cleaner, high‑reward entry zone.
Social Media Favs
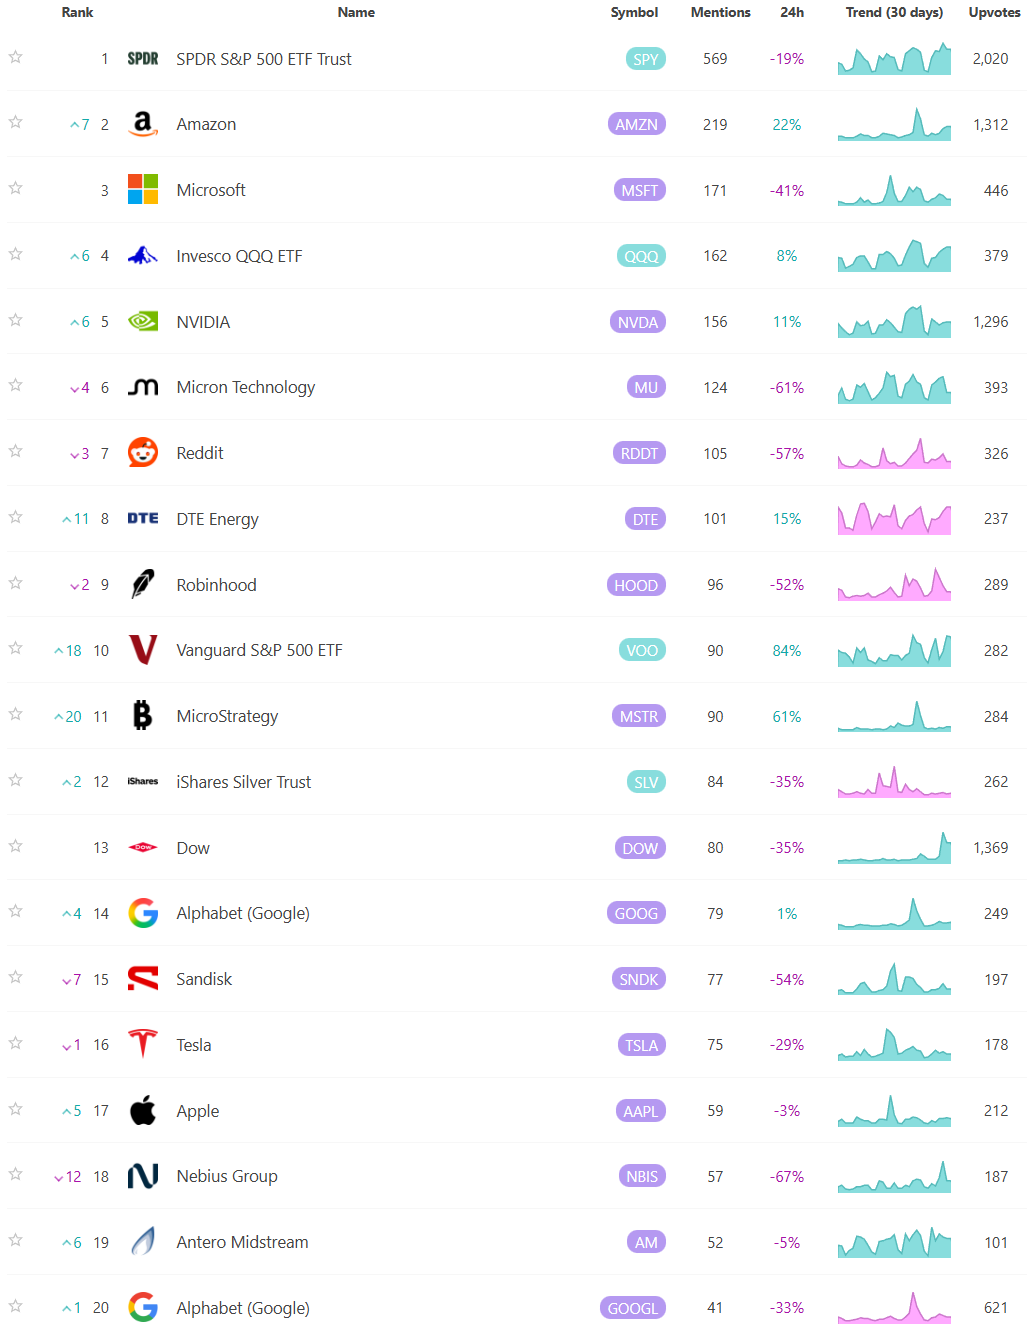
Social sentiment offers a real-time view of investor mood, often revealing market shifts before traditional indicators. It can signal momentum changes, spot emerging trends, and gauge retail investor impact—especially in high-volatility names. Tracking sentiment around events or earnings provides actionable insights, and when layered with quantitative models, can enhance predictive accuracy and risk management. Sustained sentiment trends often mirror broader market cycles, making this data a valuable tool for both short-term trades and long-term positioning.

Technician’s Playbook: Trading the Majors (SPY/QQQ/IWM/DIA)
When you’re a large institutional player, your primary goal is to find liquidity - places to do a ton of business with the least amount of slippage possible. VolumeLeaders.com automatically identifies and visually plots the exact spots where institutions are doing business and where they are likely to return for more. It’s one of the primary reasons “support” and “resistance” concepts work and truly one of the reasons “price has memory”.
SPY
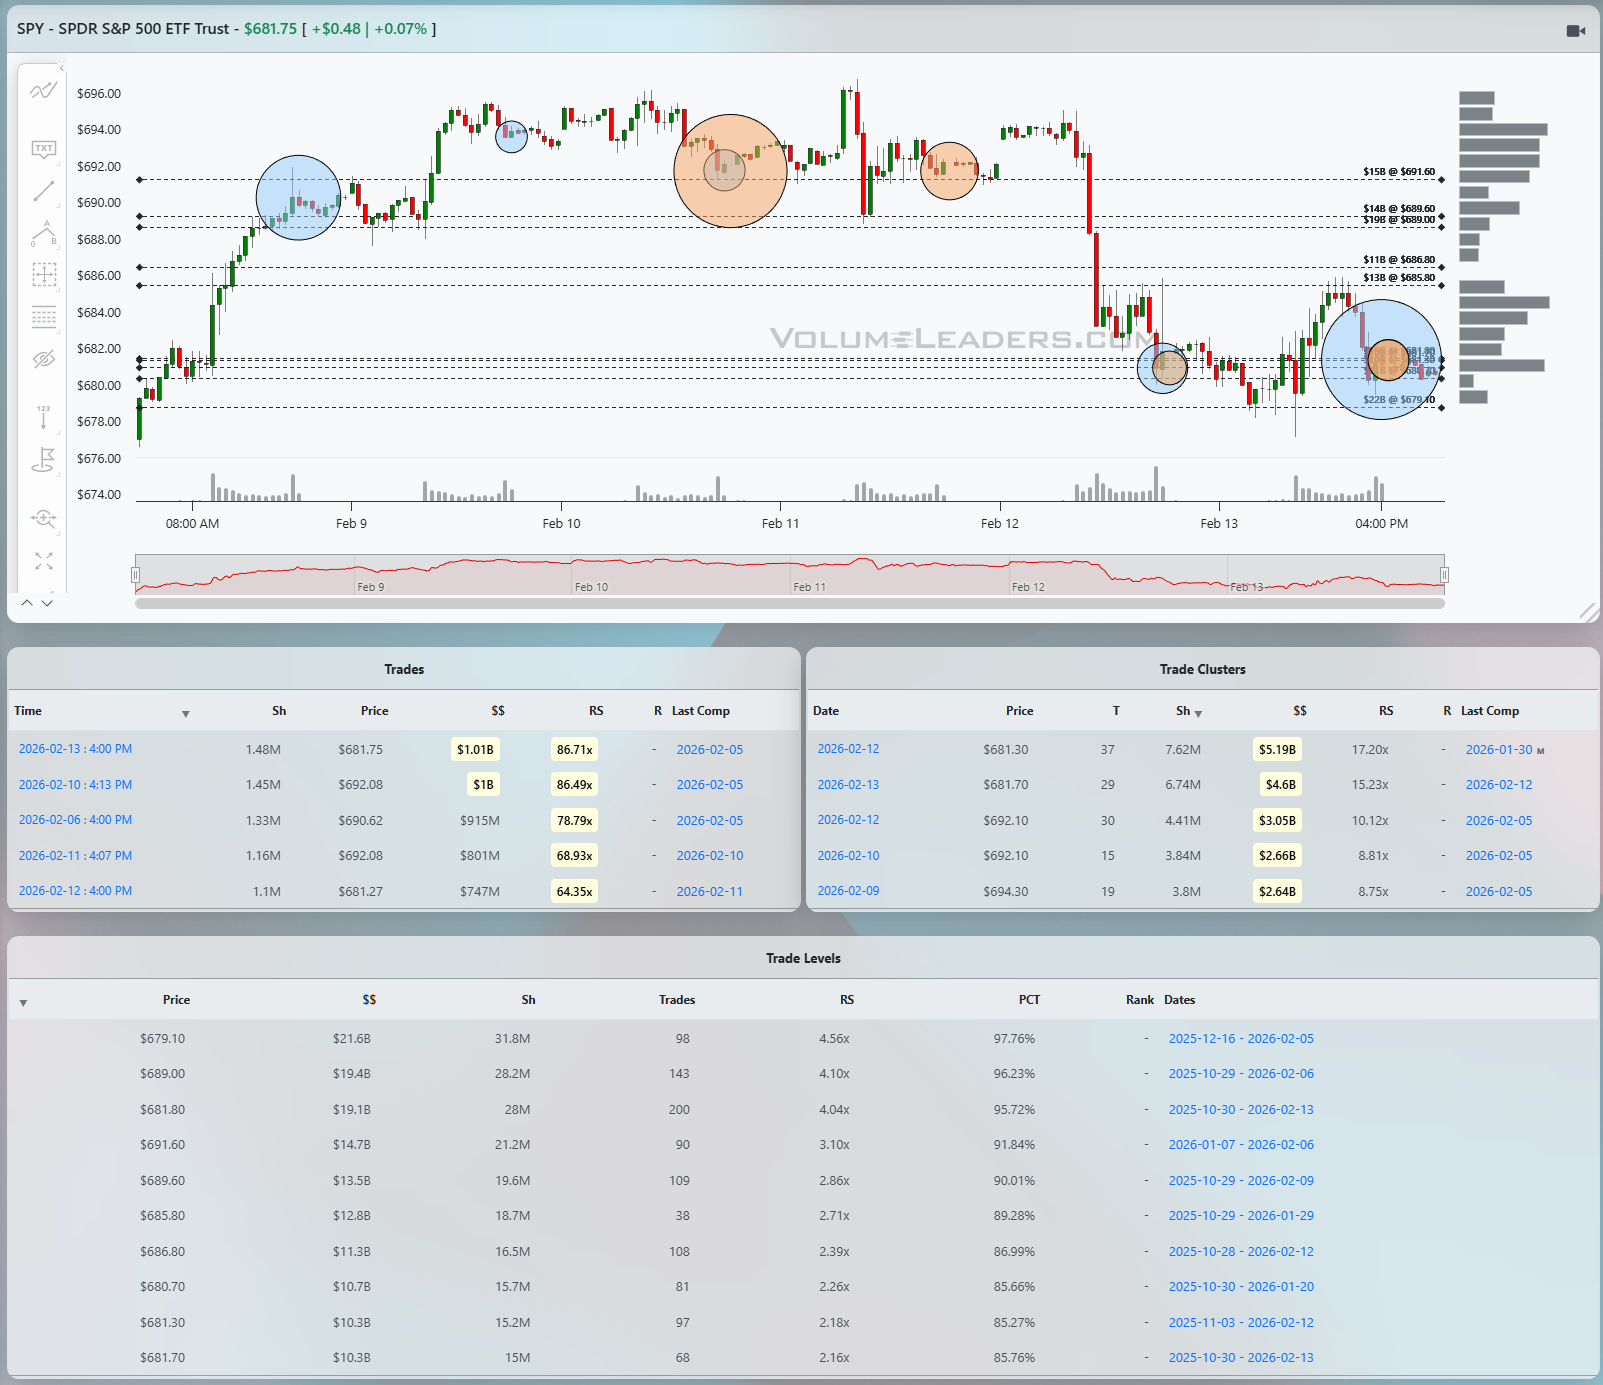
SPY spent the week transitioning from impulsive strength into a sharp flush and early-stage balance. Price ripped higher into the mid to high 690s before sellers finally showed up, and the break lower drove a fast test into the upper 670s where buyers stepped back in. Down here, the tape is trying to build a new acceptance area. The most important footprints are the recent large prints clustered around 681 to 682, where multiple trades over 1.1M to 1.5M shares changed hands with notional sizes from roughly $747M to just over $1B and RS readings north of 64x to 86x. That is serious risk transfer. The Level table backs this up with very heavy cumulative volume between roughly 679 and 682, with notional in the tens of billions and PCT readings in the mid- to high-90s, making this band the primary line of scrimmage. As long as SPY holds above the 679 shelf where another thick Level sits, dips are likely to get absorbed and the upside magnet remains that 685 zone and then the imbalance-sell zone into 690. A decisive break back below 679, especially if it happens on fresh large prints rather than just stop-outs, would flip the script and open the door for a drive toward the next heavy Level lower in the low 670s. For execution, a disciplined trader can use tests into 678–680 as the first decision point: responsive buying with tight invalidation just under targets a move back toward 685 and 690, while rejection and failure through that lower shelf argues for switching bias and pressing shorts toward the next volume node down.
QQQ
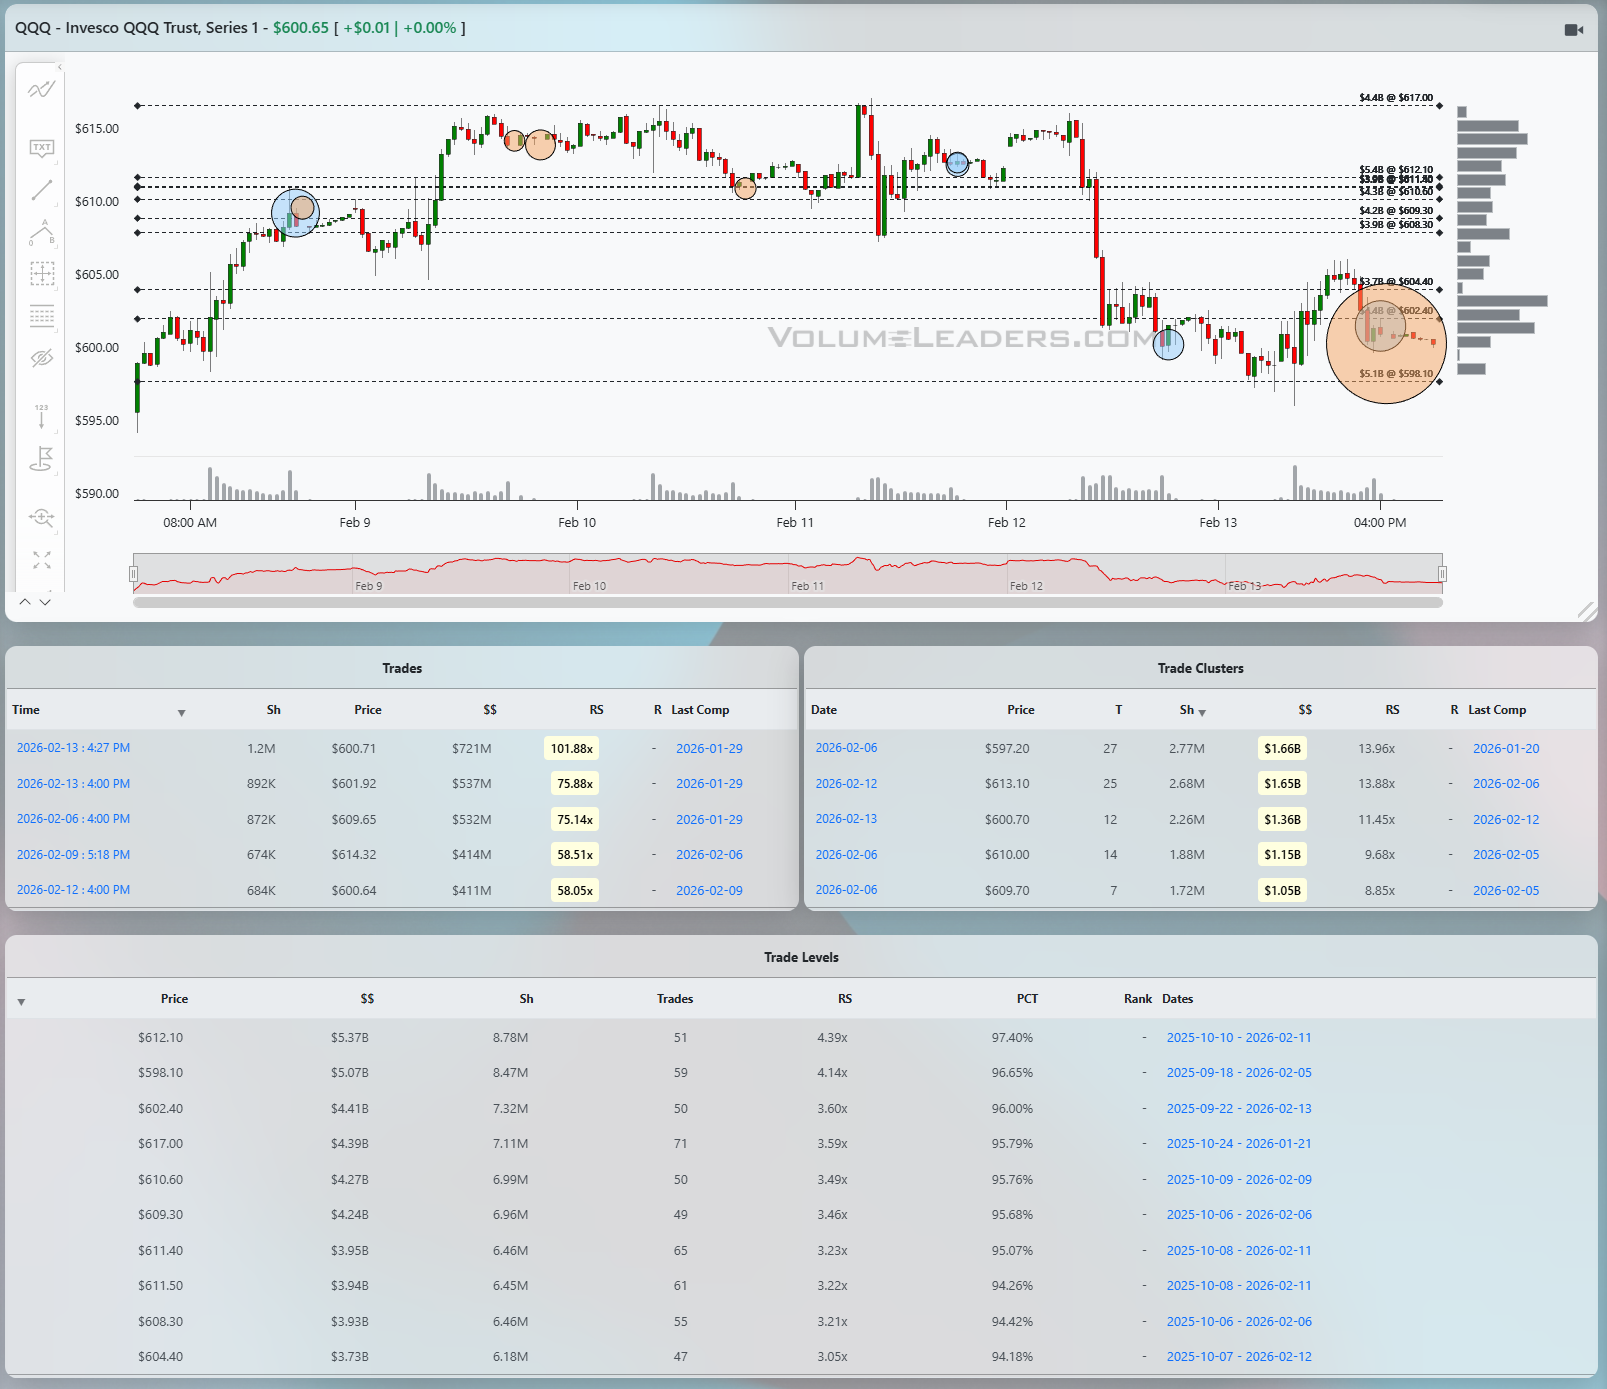
QQQ shows a similar pattern but with a slightly heavier feel after the recent tech weakness. Price rallied into the low 610s and then unwound hard before stabilizing just below 600. The most recent action is dominated by a set of very large trades around 600 to 601, including a print of about 1.2M shares for $721M at roughly 600.7 and several others in the 870K–890K share range with notional north of $520M and RS readings from roughly 58x up to a triple-digit 101x. Those are some of the largest trades in the dataset, and they are now anchoring a new balance area just under the big round 600 handle. The trade-level table shows this price band carrying notional in the $4–5B neighborhood with PCTs well above 95 percent, so it is fair to call 598–602 the immediate battleground. A bullish path from here would see QQQ continue to hold this 598–600 floor, convert it into support, and then rotate back toward the prior congestion in the low 610s and eventually the recent high near 617, with follow-through confirmed by fresh large buys above 605 rather than more churn at 600. The bearish scenario is a clean failure back through 598, turning these giant prints into trapped longs with all of the levels overhead presenting as supply; if that happens, the next likely magnet is the thicker volume shelf in the mid-590s, where a disciplined short can lean against 600 with clearly defined risk.
IWM
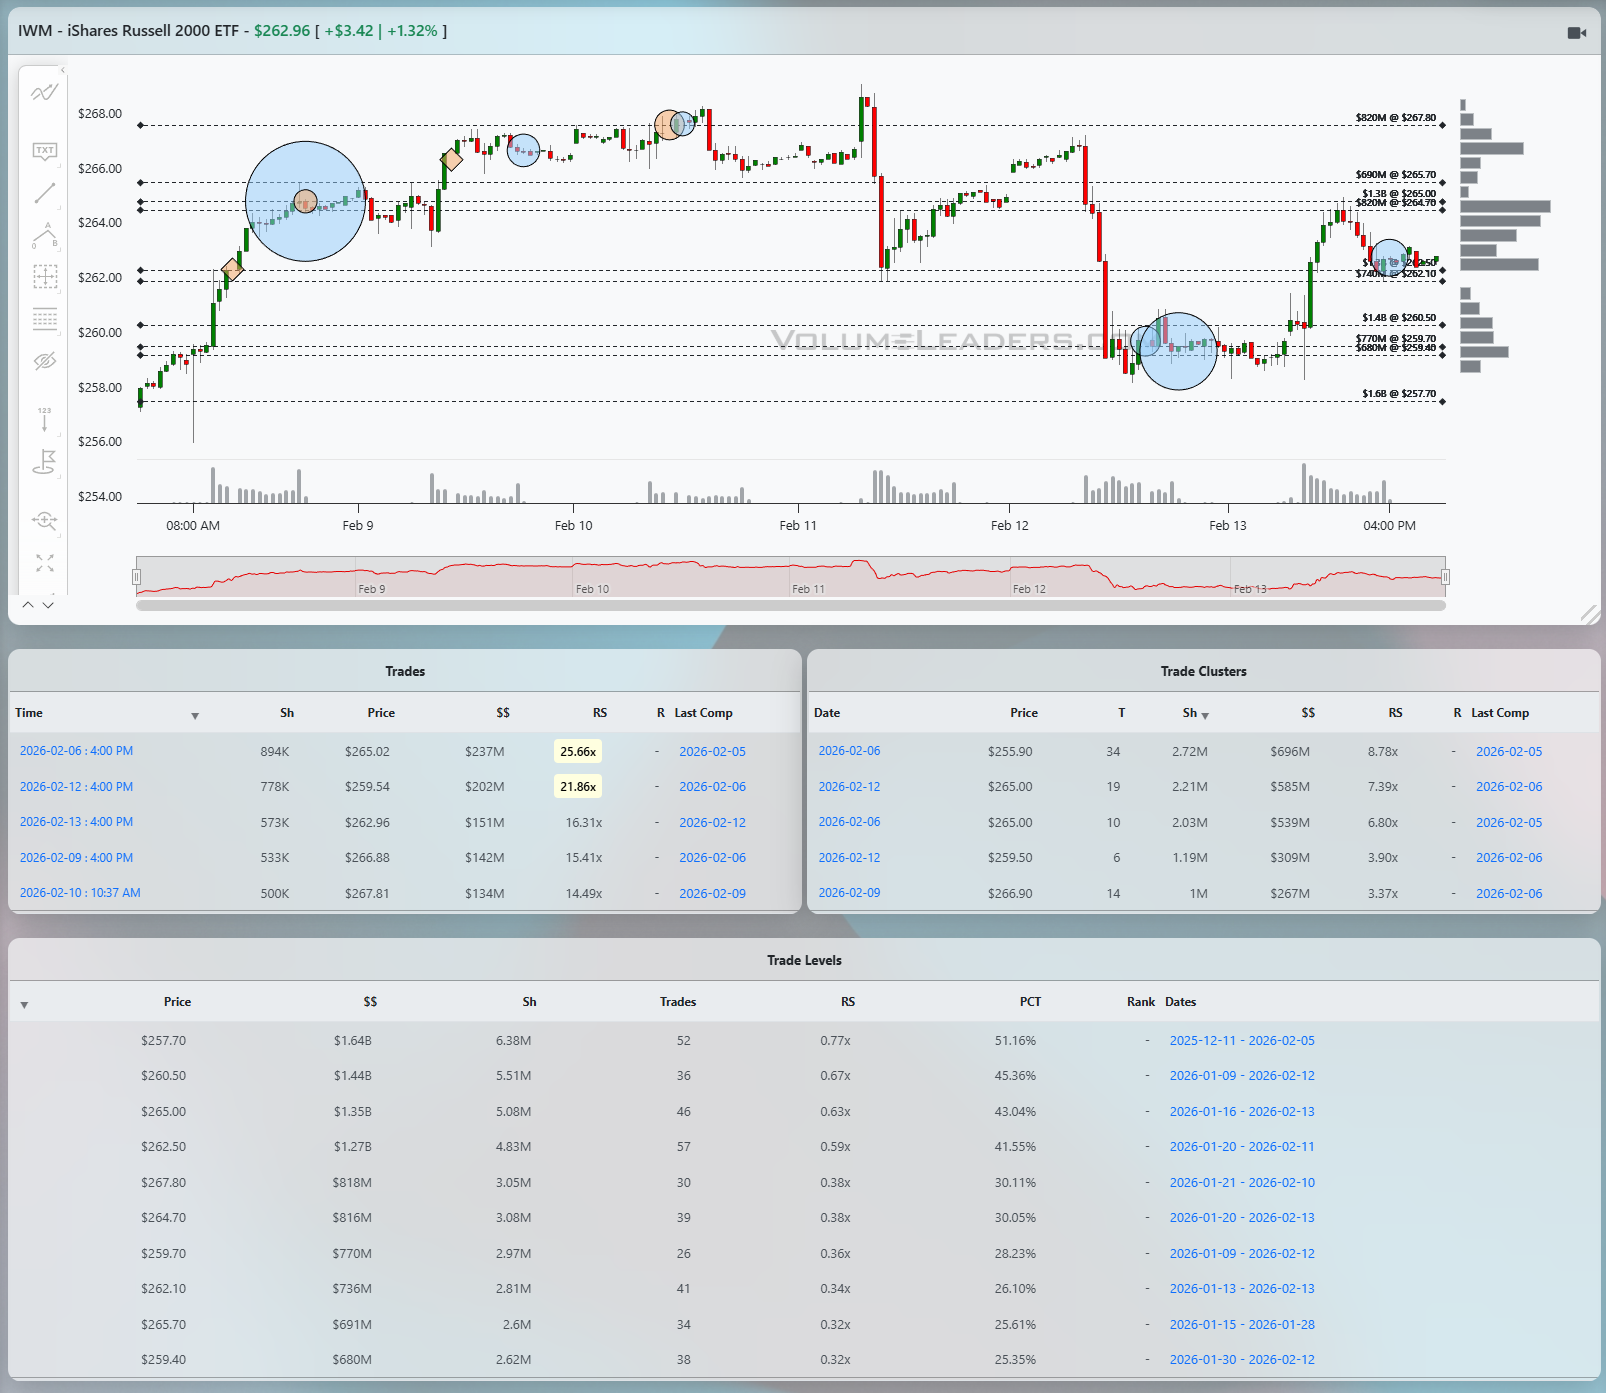
IWM has actually held up best on this tape, pushing into the mid-260s and then giving back some ground but still trading comfortably above earlier lows. The biggest footprints are the aggressive prints in the 265 and then 262 zone, including prints of roughly 804K shares at about 265.02 for $237M and 778K shares near 259.54 for $202M, with RS readings over 21x to 25x. That kind of concentrated positioning, combined with trade clusters that put multiple billions of notional between 259 and 265, builds a thick volume shelf that should now act as first support. The Level table shows strong cumulative notional from roughly 259.5 up through 267, with PCTs running from the low 40s up into the 50s, suggesting a broad acceptance band rather than a razor-thin ledge. If IWM can continue to defend 259–260 on any intraday wobble, the path of least resistance is a retest of the recent highs near 267–268, and a break and hold above that band would put the next magnet closer to the low 270s where prior trade density sits. Conversely, a decisive break below 259 with fresh large sells rather than just a lack of bids would signal that the strong hands who bought the breakout are stepping aside, opening room for a rotation back toward the mid-250s. Tactically, IWM offers cleaner dip buys than the big tech ETFs: bids near 260 with invalidation under 258 can look for 266–268 as first targets, while failed bounces into 264–265 can be shorted back toward that same 260 shelf.
DIA
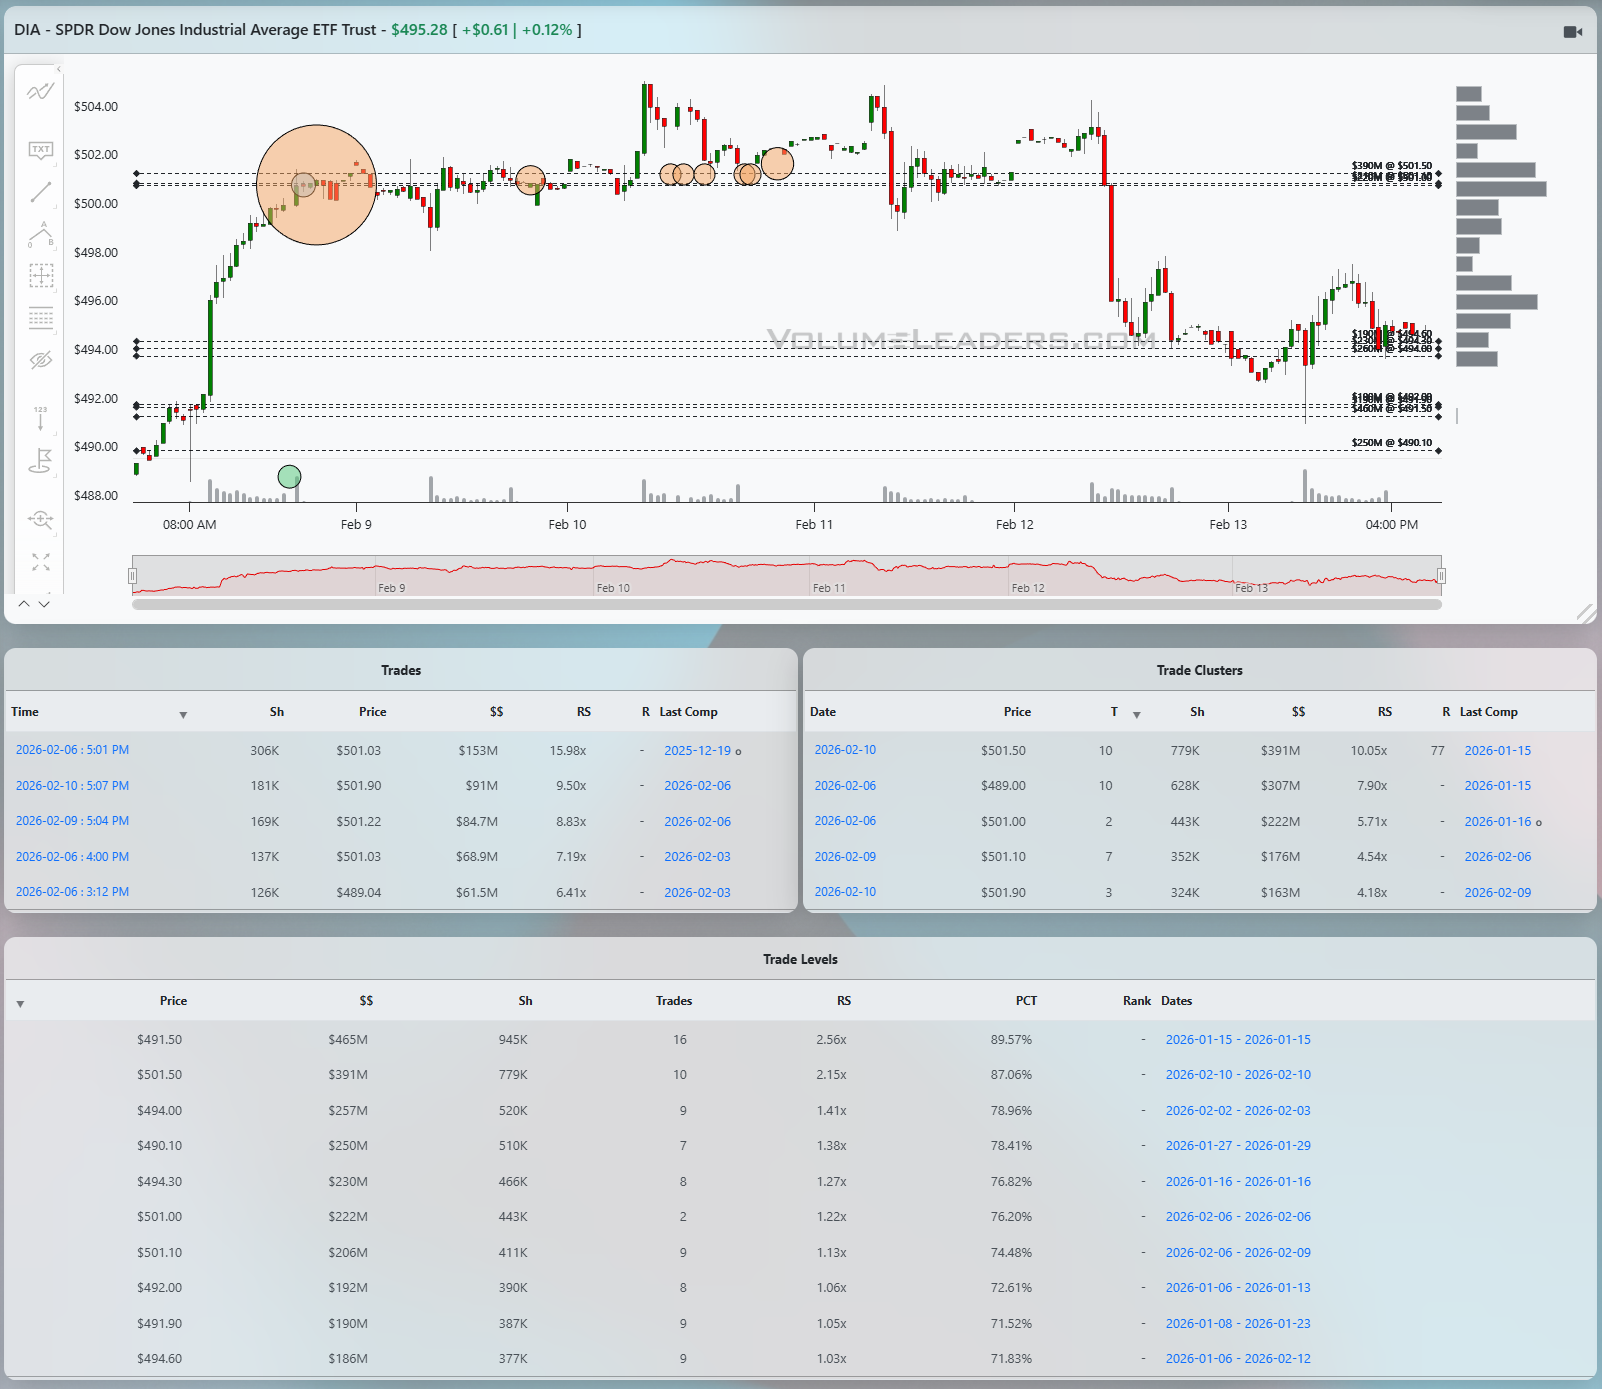
DIA has shifted from a powerful impulse leg into a more vulnerable-looking balance after a sharp spike and reversal. Price pushed up toward the low 502s before rolling over, and the subsequent selling drove the ETF down into the high 490s, where it is now chopping sideways. The trade tables show several notable prints near 501 with 169K–181K share blocks and notional in the $84M–91M range, alongside a large early-week buy in the low 490s. The Level summary places very heavy cumulative notional at 491.5, with about $645M traded, 258K shares, RS of 2.56x, and PCT just under 90 percent, making that price a key reference. Additional stacked Levels around 501.5 with $391M notional and PCT north of 89 percent draw a clear picture of a wide range between roughly 491 and 502 that currently houses the bulk of recent risk transfer. A bullish path would see DIA continue to hold above 491–492, base in the mid 490s, and then rotate back through 498 toward the 501–502 supply zone, with confirmation coming from new large buys lifting above 500 rather than just short-covering. Bearish continuation would be confirmed by a break and daily close below 491, which would turn the heaviest Level on the board into overhead supply and target a fast move into the high 480s where earlier demand first showed up. For traders, the structure favors fading moves at the edges of the 491–502 range until one side clearly wins: long against 491 with tight stops and targets near 499–501, or short into 501–502 with invalidation above the recent spike and eyes on 493–494 as the initial downside magnet.

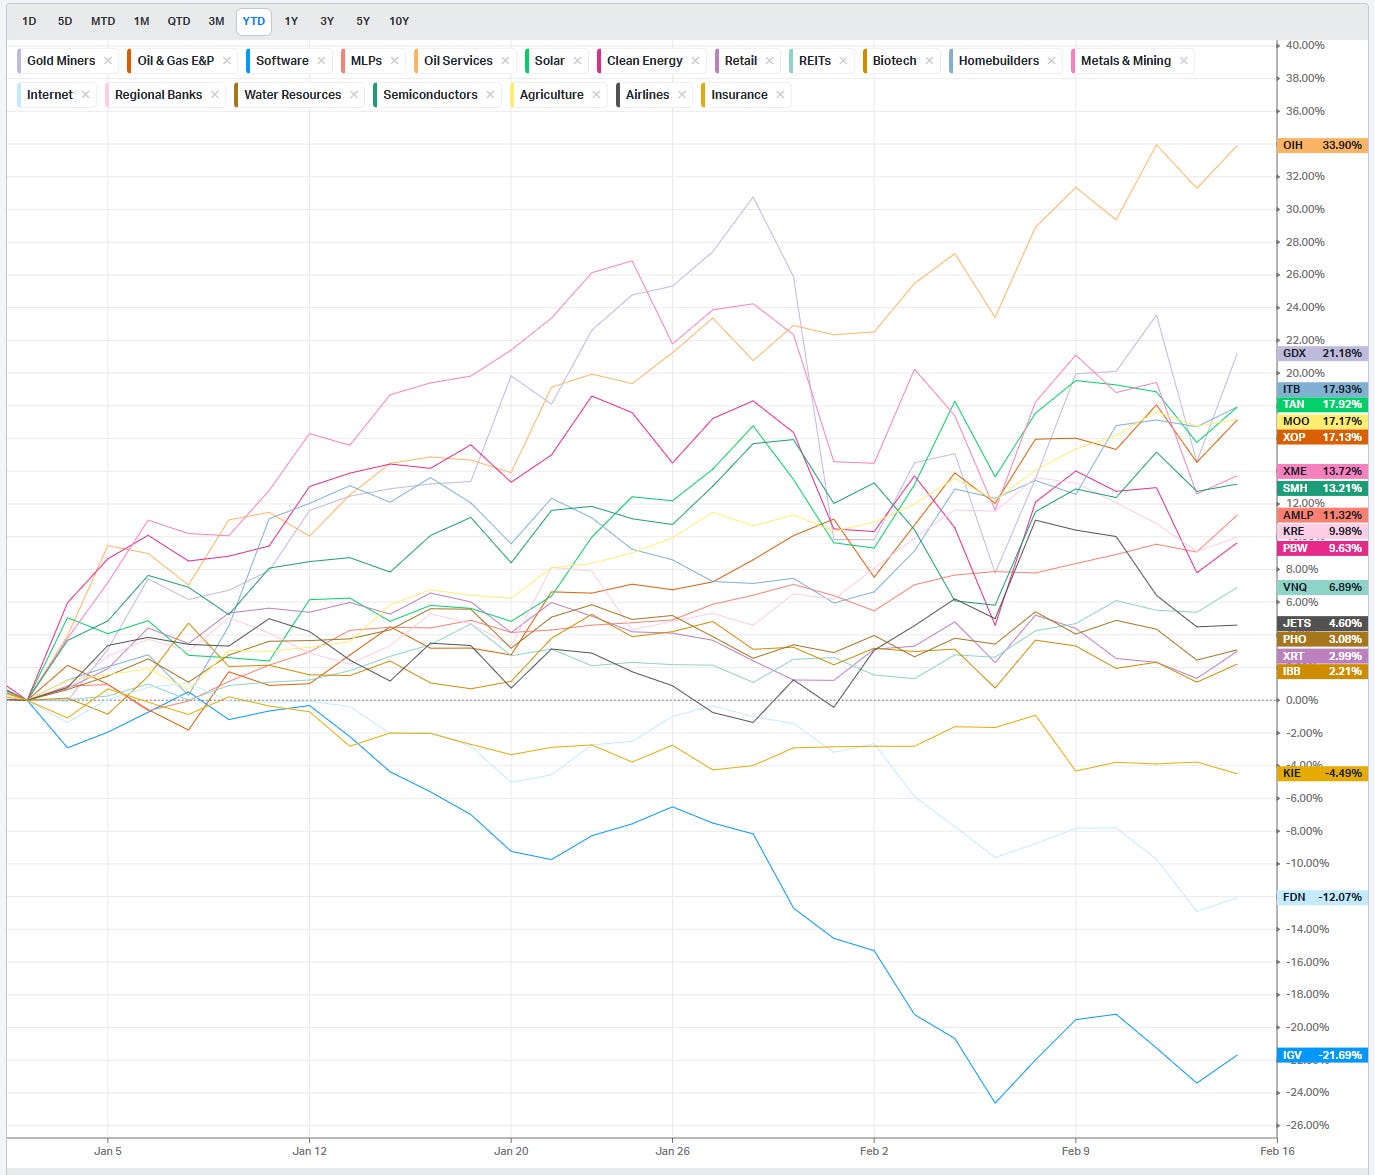
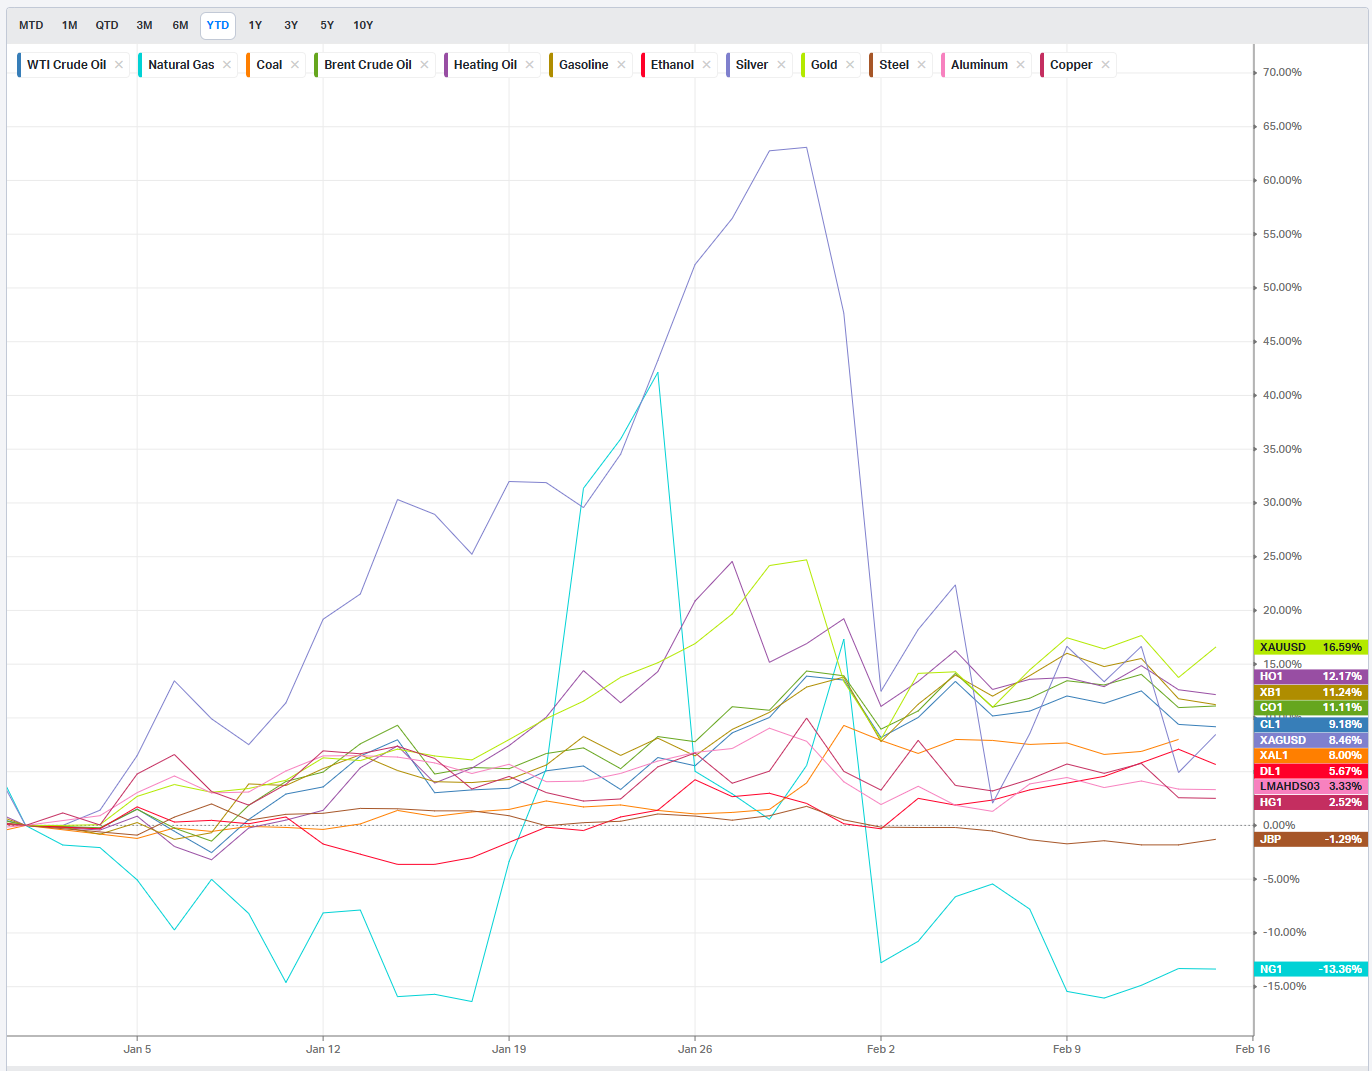
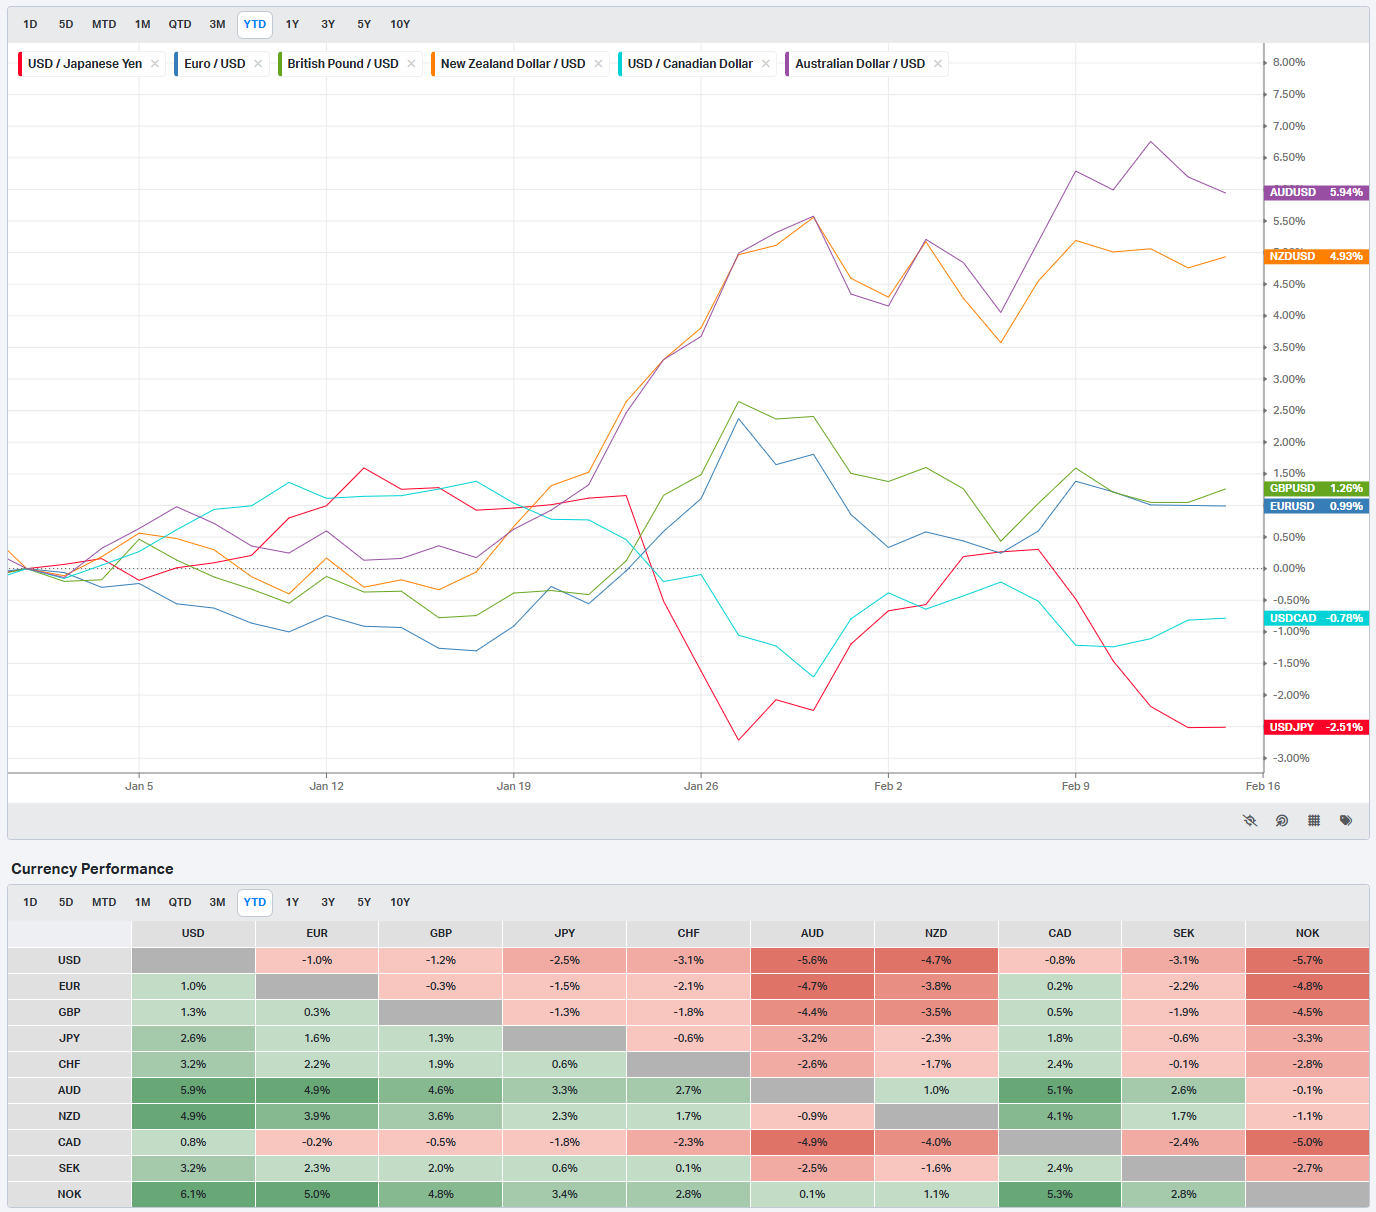
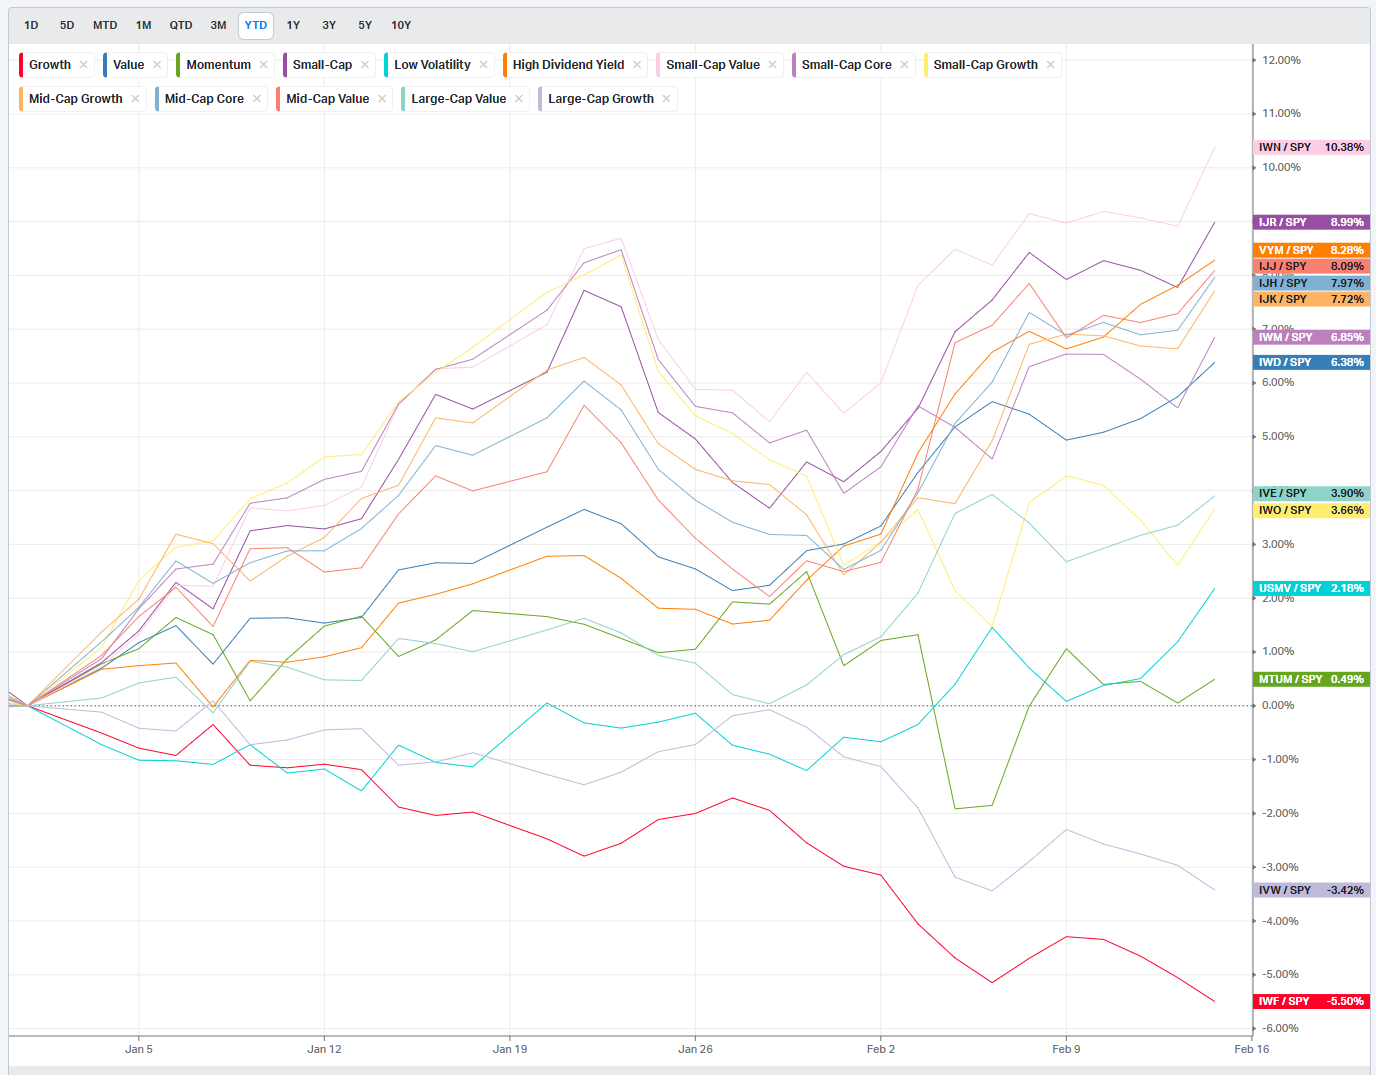
Summary Of Thematic Performance YTD
VolumeLeaders.com offers a robust set of pre-built thematic filters, allowing you to instantly explore specific market segments. These performance snapshots are provided purely for context and inspiration—think about zeroing in on the leaders and laggards within the strongest and weakest sectors, for example.
S&P By Sector
S&P By Industry
Commodities: Energy & Metals
Currencies/Major FX Crosses
Factors: Style vs Size-vs-Value

Events On Deck This Week
Here are key events happening this week that have the potential to cause outsized moves in the market or heightened short-term volatility.
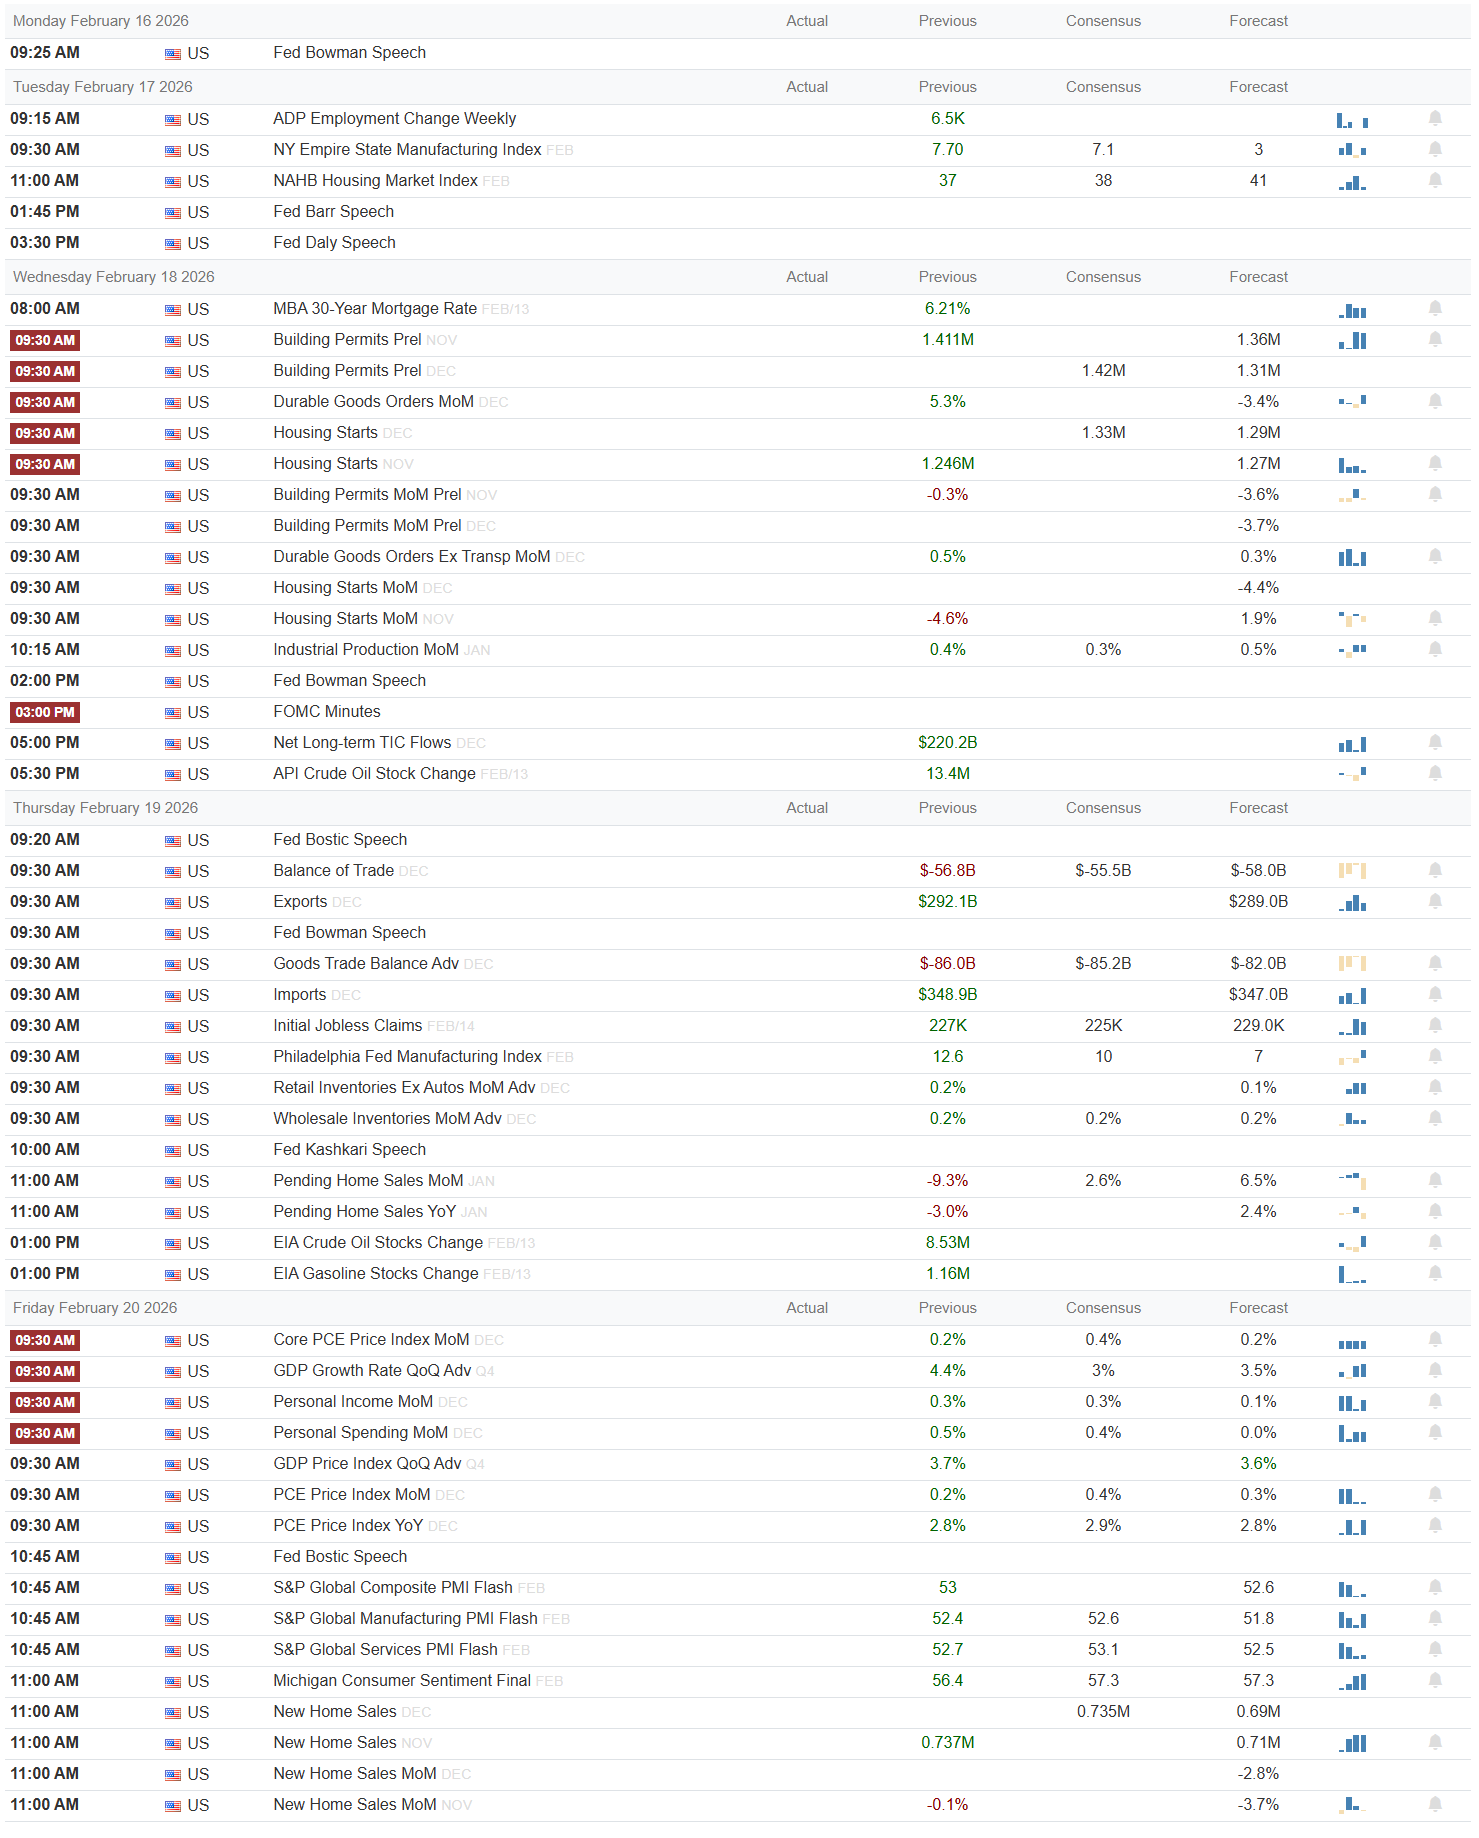
Monday is quiet on the data front, which is probably a blessing after the recent volatility. Washington’s Birthday keeps markets closed, so any weekend headlines will have to express through futures and overseas risk rather than cash trading. With no scheduled numbers, the tone into Tuesday will be set by how traders want to lean ahead of a dense midweek calendar.
Tuesday gets the ball rolling with ADP Employment Change Weekly at 09:15, where the previous reading shows 6.5K jobs. A materially hotter print would reinforce the idea that the labor market remains tight, which would be modestly risk-off through higher terminal-rate odds; a softer, low-single-thousands or negative print would ease those concerns and support duration and higher-beta equities. At 09:30 we see the NY Empire State Manufacturing Index, with a previous reading of 7.70, consensus 7.1, and a separate “forecast” column at 3. A result closer to that 7 handle says activity is holding up, while something nearer 3 or below would say the factory side is cooling. The NAHB Housing Market Index follows with a previous 37, consensus 38, and forecast 41; upside toward 40s would frame housing as a stabilizing force, while a miss back toward the low 30s would hit cyclicals and homebuilders. Fed’s Barr speaks at 01:45 PM and Bowman at 04:30 PM. Markets will be listening for any pushback on the timing and pace of cuts; a hawkish lean (emphasis on data dependence, upside inflation risk) would be risk-off at the margin, while openness to mid-year cuts would help underpin risk.
Wednesday is the real macro pivot. The MBA 30-Year Mortgage Rate print shows 6.21 percent, down from prior local peaks, and lower mortgage rates are a quiet positive for housing-sensitive equities. At 08:30 AM, housing and construction dominate: Building Permits, Housing Starts, and multiple month-over-month breakdowns are listed with “Actual,” “Previous,” “Consensus,” and “Forecast” columns. Previous Building Permits are 1.411M with consensus at 1.42M and forecast at 1.36M; a print closer to the higher side keeps the soft-landing narrative intact, while something down by the forecast would argue that higher rates are still biting. Housing Starts show a previous 1.246M with consensus 1.27M; again, anything near or above that is constructive, while sub-1.2M would be taken poorly by cyclicals. Durable Goods Orders ex-transports, with previous 0.5 percent and a negative consensus around -3 percent, is another swing factor: a less-bad number would be very risk-on for industrials and semis, while confirming a drop of that magnitude would feed slowdown fears. Industrial Production, at 09:15 or 09:30, carries a previous 0.4 percent, consensus 0.3 percent, and forecast 0.5 percent; upside would help the reflation camp. The FOMC Minutes at 02:00 PM are the marquee event: if the text shows broad comfort with disinflation and only a minority worried about reacceleration, that is supportive for equities and duration; any hint that cuts could be pushed further out would tighten financial conditions and weigh on growth stocks. Bowman speaks again at 05:30 PM, and any repetition of a hawkish stance could hit the close.
Thursday keeps the firehose running. The 09:30 AM block includes Balance of Trade (previous -56.8B), Exports (previous 292.1B), and Goods Trade Balance, plus Initial Jobless Claims with consensus around 227K. A claims print well below that level keeps the labor market tight and pressures the “cuts now” narrative; a surprise jump into the 250K area would be risk-on for bonds, trickier for stocks. The Philadelphia Fed Manufacturing Index, with previous 12.6 and consensus 10, will color the regional growth picture: beats are good for cyclicals but could revive inflation worries if they pile up. Retail Inventories, Wholesale Inventories, and Pending Home Sales (previous -9.3 percent month-on-month) will steer micro read-throughs; better housing turnover and inventory discipline help the soft-landing theme. Kashkari and Bostic speak during the session, and both are influential: markets will key off any explicit discussion of how many cuts they see this year. Late-day energy numbers, including the EIA Crude and Gasoline Stock Changes, will be watched by energy traders; big draws support crude, while large builds would pressure the complex.
Friday is the inflation and growth double-header. Core PCE Price Index month-on-month prints at 0.2 percent with previous 0.1 percent and consensus 0.4 percent; staying at or below 0.2 percent would be a clear risk-on signal for both bonds and long-duration equities, while any upside surprise back toward 0.4 percent reopens the “second wave” inflation discussion. GDP growth quarter-on-quarter comes in at 4.4 percent, above the 3 percent consensus and 3.5 percent forecast, a very strong backdrop that can be spun both ways: great for earnings resilience, but if it stays that hot the Fed will be in no rush to ease. Personal Income at 0.7 percent and Personal Spending at 0.5 percent round out the demand picture; healthy but not runaway numbers are ideal. The University of Michigan Sentiment Final reading sits at 56.4 versus a previous 57.3; a slide into low 50s would warn about consumer fatigue, while a recovery toward 60 would be reassuring. Multiple Fed speakers crowd the late-morning slot, and any coordinated messaging around “not far from cuts” would be a powerful tailwind into the weekend.
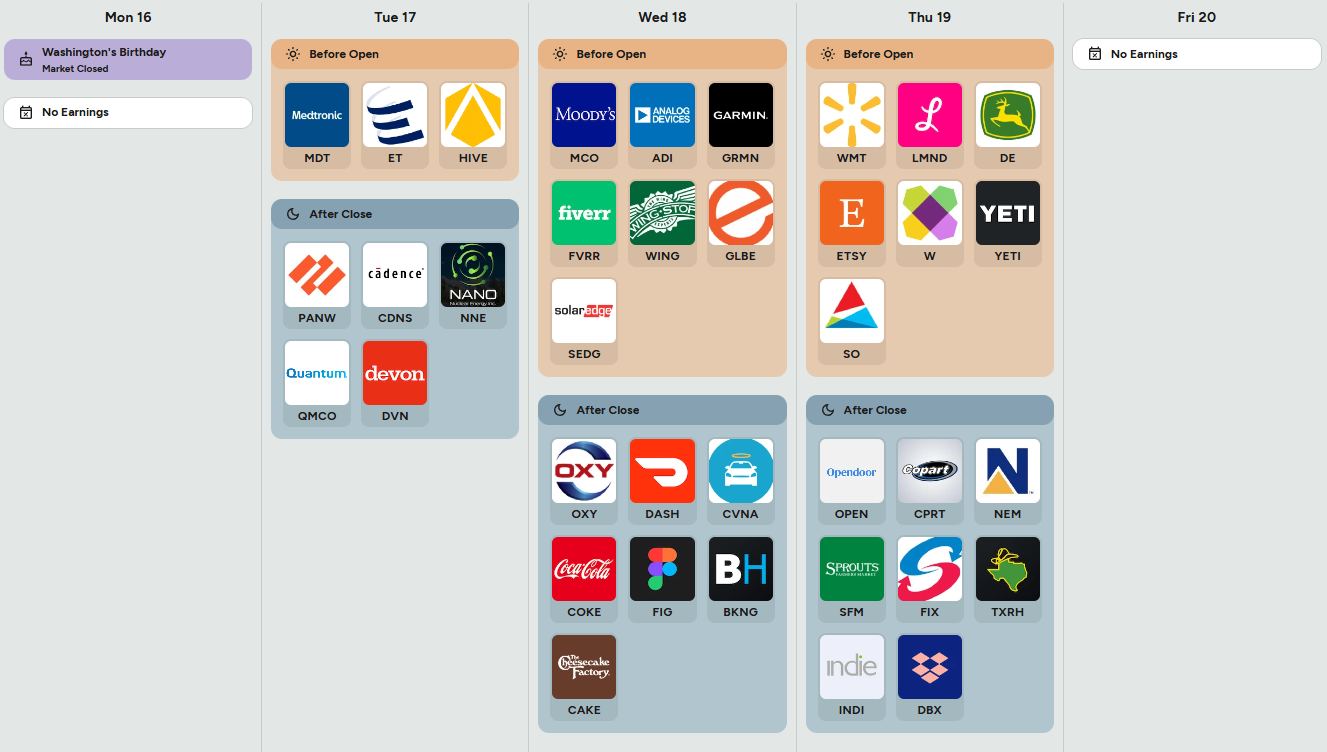
On the earnings side, the board is lighter but still loaded with single-name land mines. Tuesday after the close features Palo Alto Networks, Cadence, and Devon Energy; cyber and semi-cap commentary will feed into broader tech sentiment, while Devon’s capital discipline and capex plans will echo across the energy patch. Wednesday brings Analog Devices, Garmin, Fiverr, Wingstop, and SolarEdge before the open, then Occidental, DoorDash, Carvana, Coca-Cola, FIG, and Burger King’s parent after the close. ADI’s orders and backlog will color semi demand, while OXY and COKE give direct macro reads on energy and the global consumer. Thursday morning’s lineup includes Walmart, Lemonade, and Deere, plus Etsy, Wayfair, and Yeti; Walmart’s traffic, ticket, and guidance will be the biggest macro microprint of the week, and Deere’s order book is a key lens on industrial and ag capex. After the close, Copart, Newmont, Sprouts, and others will refine the read on used autos, gold, and grocery pricing. Beats with stable or better guidance from Walmart, Deere, and Coke would validate the soft-landing narrative; broad misses or cautious guides would undermine it.
Sign-posts for traders:
Core PCE month-on-month at 0.2 percent or lower on Friday should be treated as a green light for duration and high-multiple growth.
Walmart’s earnings and guidance tone relative to recent traffic trends will be the single most important consumer read-through.
FOMC Minutes language around the timing and conditionality of cuts will likely set the tone for the week’s second half.
Bottom line: this is a macro and mega-retail heavy week where benign inflation plus resilient growth and steady guidance would extend the soft-landing bid, while any upside surprise in PCE or cautious tone from Walmart and the Fed would quickly flip the tape back toward risk-off.

Order Flow in Focus: Reading Smart Money Tells
Order Flow in Focus: Reading Smart Money Tells is a recurring segment that spotlights unique intraday opportunities revealed through institutional order flow. Each feature dissects a moment when the tape quietly shifted—when large, ranked prints clustered at key liquidity locations and informed players positioned ahead of the move. The goal isn’t hindsight; it’s pattern recognition—learning to spot the footprints of capital that knows before the crowd does.
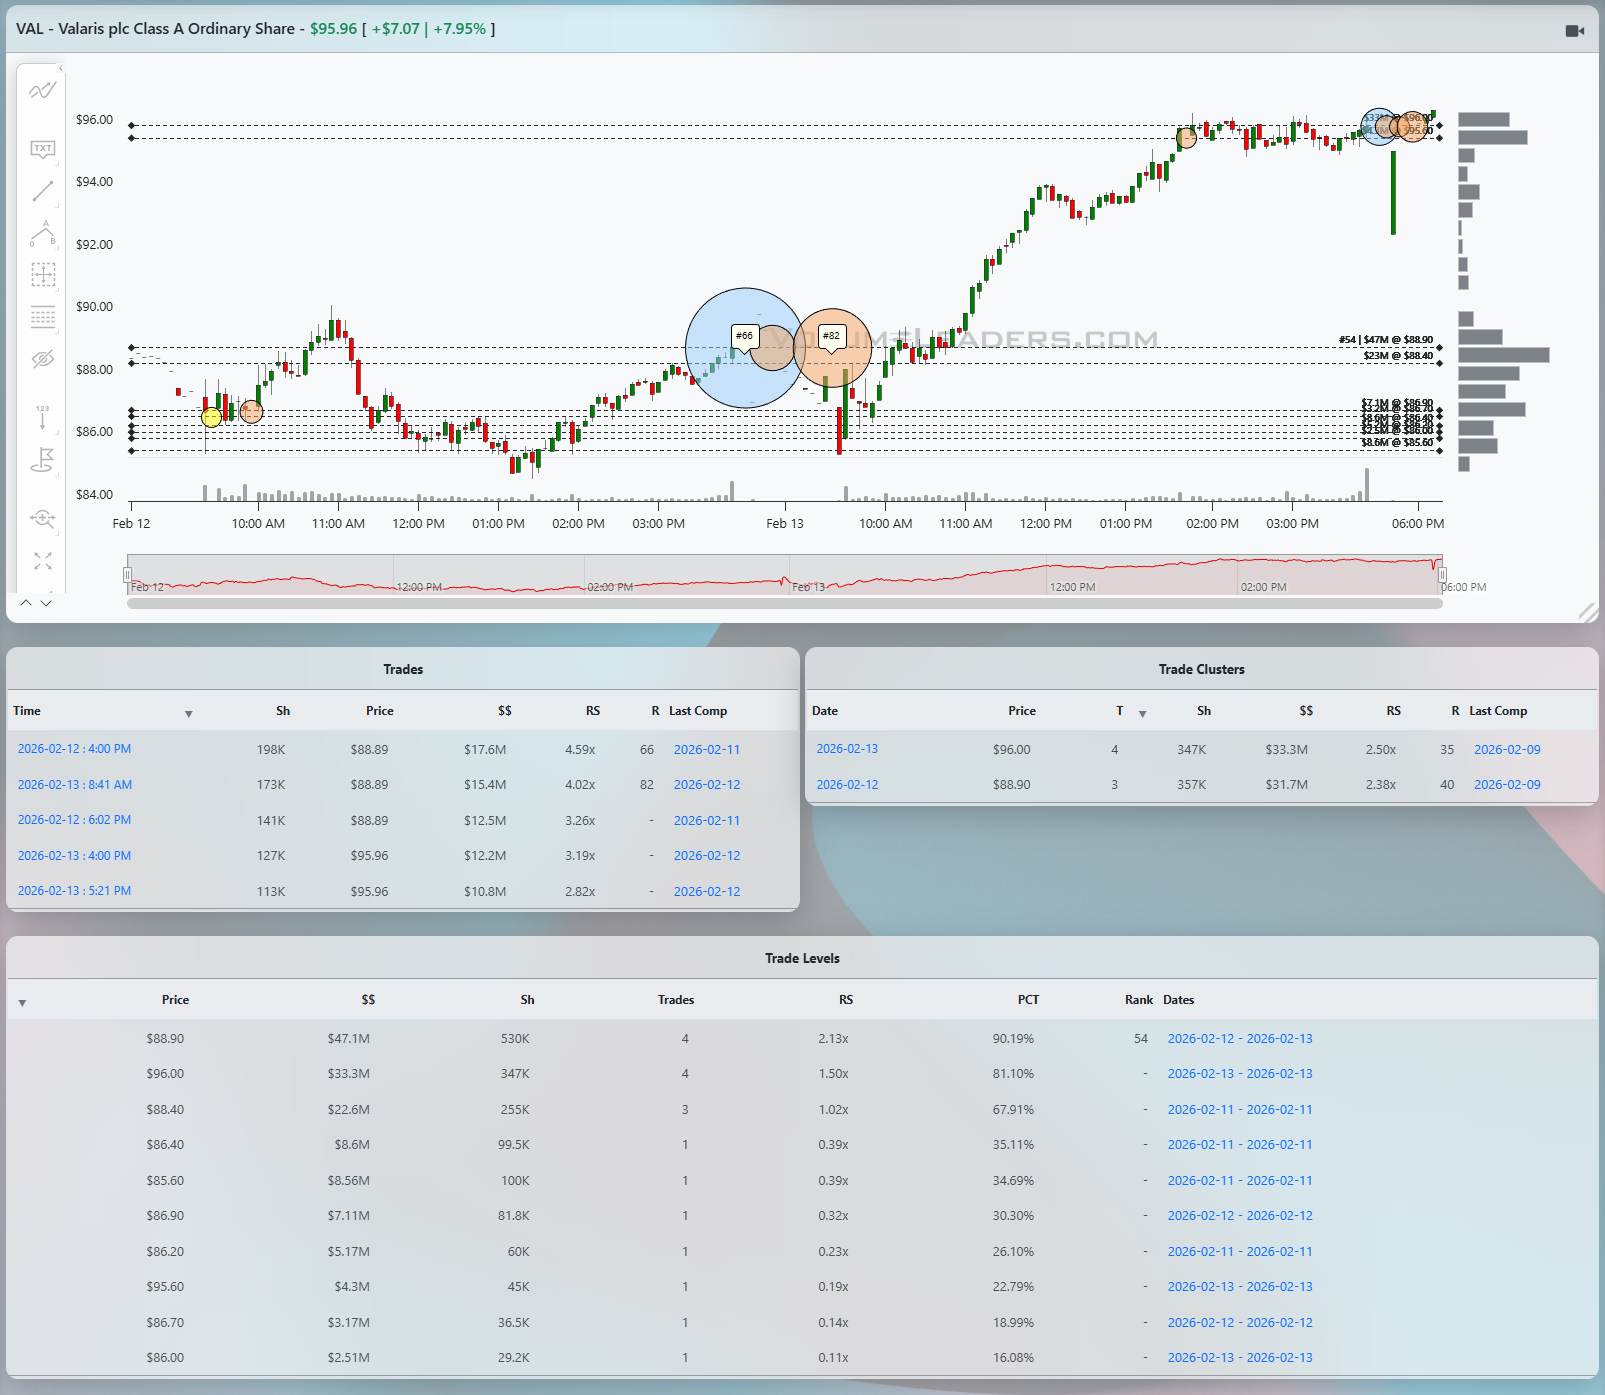
VAL is a good reminder that in a strong group, you do not need to overcomplicate things: when the tape telegraphs that real money is stepping up, you listen.
The move starts the prior day with a steady grind higher off the mid‑80s into the high 80s where many levels are developing in a cluster, illustrating smart money going to work. That is your first context clue: you are dealing with a name that has already proven buyers are in control. The real tell, though, shows up late on February 12 and early on the 13th as VAL builds a base just below 89. The trade tape prints a series of outsized blocks in that area: 198K shares at 88.89 for $17.6M with RS around 4.59x, 173K at 87.92 for $15.4M with RS about 4.02x, and 141K at 88.89 for $12.5M with RS near 3.25x. Those are not casual day‑trader clips. They are ranked, abnormal prints hitting right into a cluster of dashed Levels that already show significant historical volume between roughly 87.5 and 89.
The Level table under the chart confirms that this neighborhood matters. Around 88.90 there is roughly $47.1M notional traded on 551K shares with RS printed just over 2x and a PCT north of 90 percent. Just below, 86–87 handles show multi‑million notional but lower RS and PCT, telling you that the freshest and most aggressive capital is now congregating higher up the ladder. When a strong stock in a strong sector pulls back toward a high‑RS Level, attracts big, patient buyers and then refuses to break down, that is the kind of footprint you want to pay attention to.
From a trading standpoint, the long sets up cleanly on the morning of the 13th. VAL dips, tags that same 88–89 shelf where the large prints have been firing, and then snaps back above it. The candles tighten and turn higher, telling you that supply at that Level has been chewed through. A disciplined trader can frame an entry on the first push back through 89 with a stop tucked just below the prior low – roughly 87.5–88 depending on how tight you want to run it. You are risking a couple of points in a name that has already shown it can swing multiple dollars in a session and is now being defended by institutions.
Once the break clears 89, the character of the tape changes. VAL transitions from a grind to a trend, marching higher in a relatively straight line through 90, 92, and then 94. There is very little overlap on the way up, which is exactly what you expect when shorts are caught and longs are chasing. The trade clusters on the right confirm that big money is now active on the offer as well: the cluster table shows a notable grouping around 96.00 with 347K shares totaling about $33.3M and RS north of 2.5x. That is the first spot where you see comparable size to the earlier buys, but this time up at the highs rather than at the base. It is your first hint that some of the same players who bought the dip may now be unloading inventory into strength.
Price action up there reinforces the message. After the initial spike into the mid‑90s, VAL stalls and chops sideways against the upper dashed Levels. Multiple medium‑sized circles appear, signifying repeated large trades in a tight range rather than clean continuation. That is how distribution looks in a strong tape: not an air‑pocket reversal yet, just heavy hands selling into every attempt to push higher. For anyone long from the 89 breakout, this is the time to start paying yourself. A pragmatic exit plan would scale out into that 95–96 area as soon as the first failed push pulls back into the range, using a trailing stop just under the intraday low of the consolidation. If the stock can punch and hold over 96.5 with fresh large buys, you keep a runner; if it slips back under 95 on rising volume, you assume the first leg is done and step aside.
The beauty of this VAL sequence is how well the pieces line up: strong sector tailwind, a prior uptrend, high‑RS prints defending a clear Level in the high 80s, a clean breakout over 89 that offers tight risk, and then a vertical squeeze into 95–96 where abnormal size starts showing up on the other side of the tape. Reading those tells in real time would have set you up to buy strength where institutions were clearly active and then hand the stock back to them when they started ringing the register near the highs.

Market Intelligence Report
A desk-grade synthesis of institutional positioning and market structure—unpacking the flows, levels, and emerging themes that shaped the week, and translating them into a model portfolio built the same way professional desks prepare for the week ahead.
MIR Part 1: The Backdrop
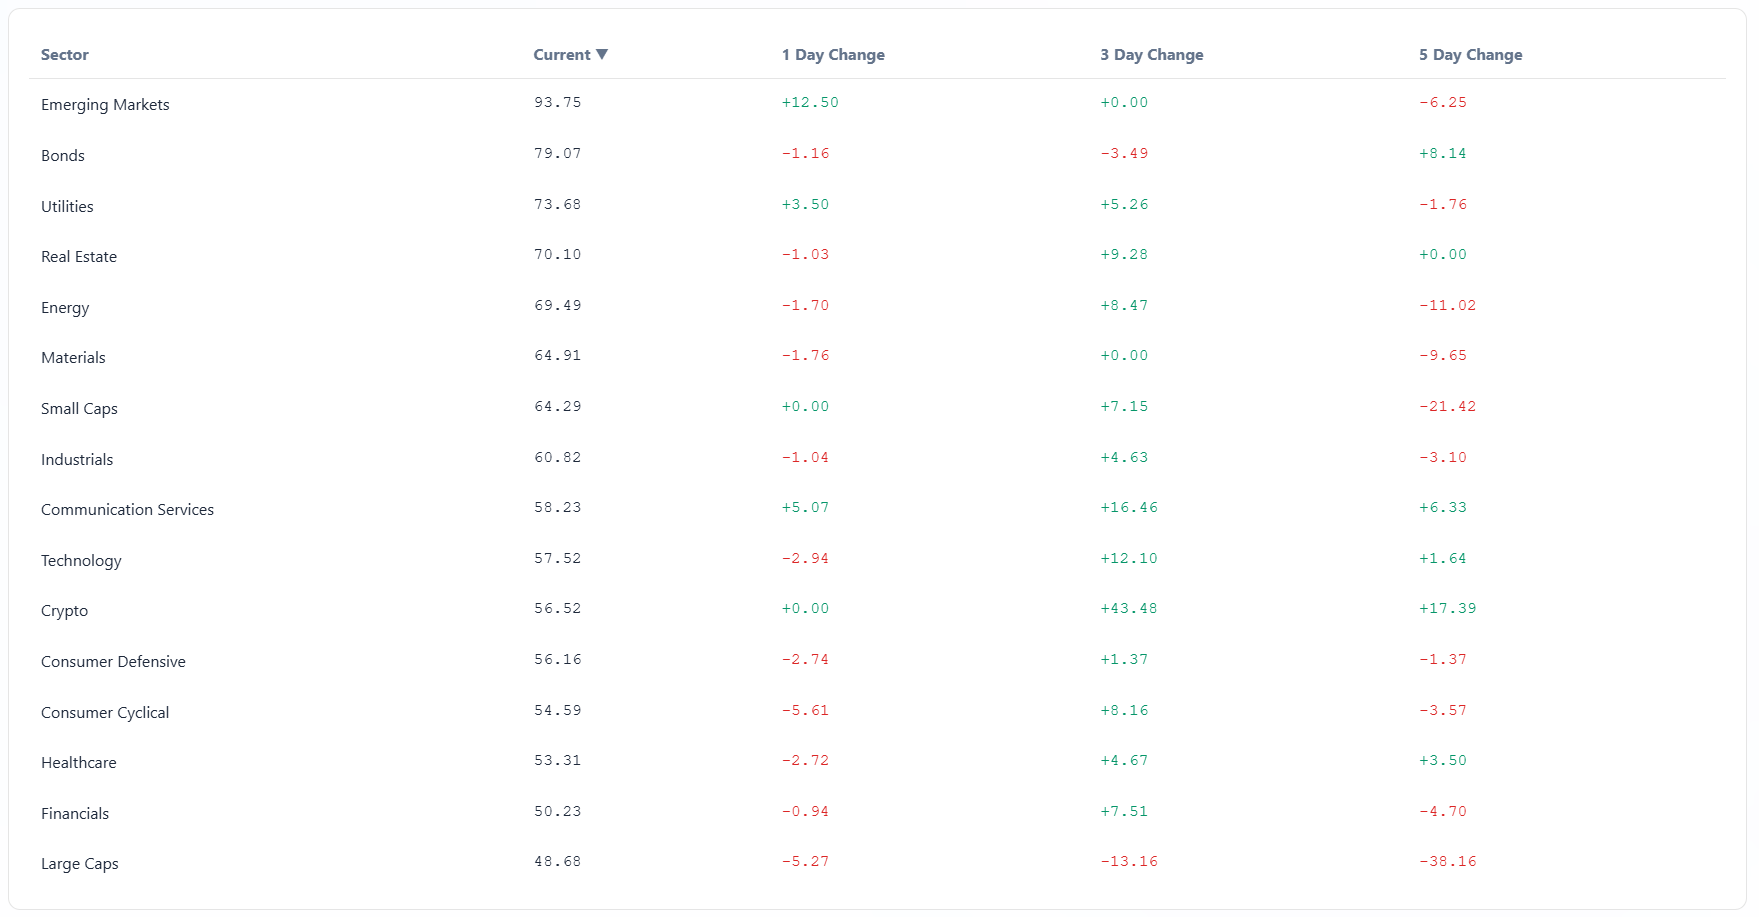
Institutional money came into this week tired of chasing mega‑cap tech and much more interested in owning real cash flow in the cyclical complex. Under the surface, the tape is still trending higher on a multi‑month view, but breadth and risk appetite have rotated: energy, materials, and industrials sit at the top of the relative‑strength stack, while technology, consumer discretionary, and communication services have slipped into the laggard bucket. The big takeaway from the dashboard is that investors have not abandoned risk; they have simply shifted it away from crowded growth toward real‑economy exposure, with small caps holding up better than the large‑cap indices. Volatility is elevated in the growth complex and more stable in value‑leaning groups, a pattern you tend to see when the market is digesting a leadership handoff rather than exiting the equity asset class.
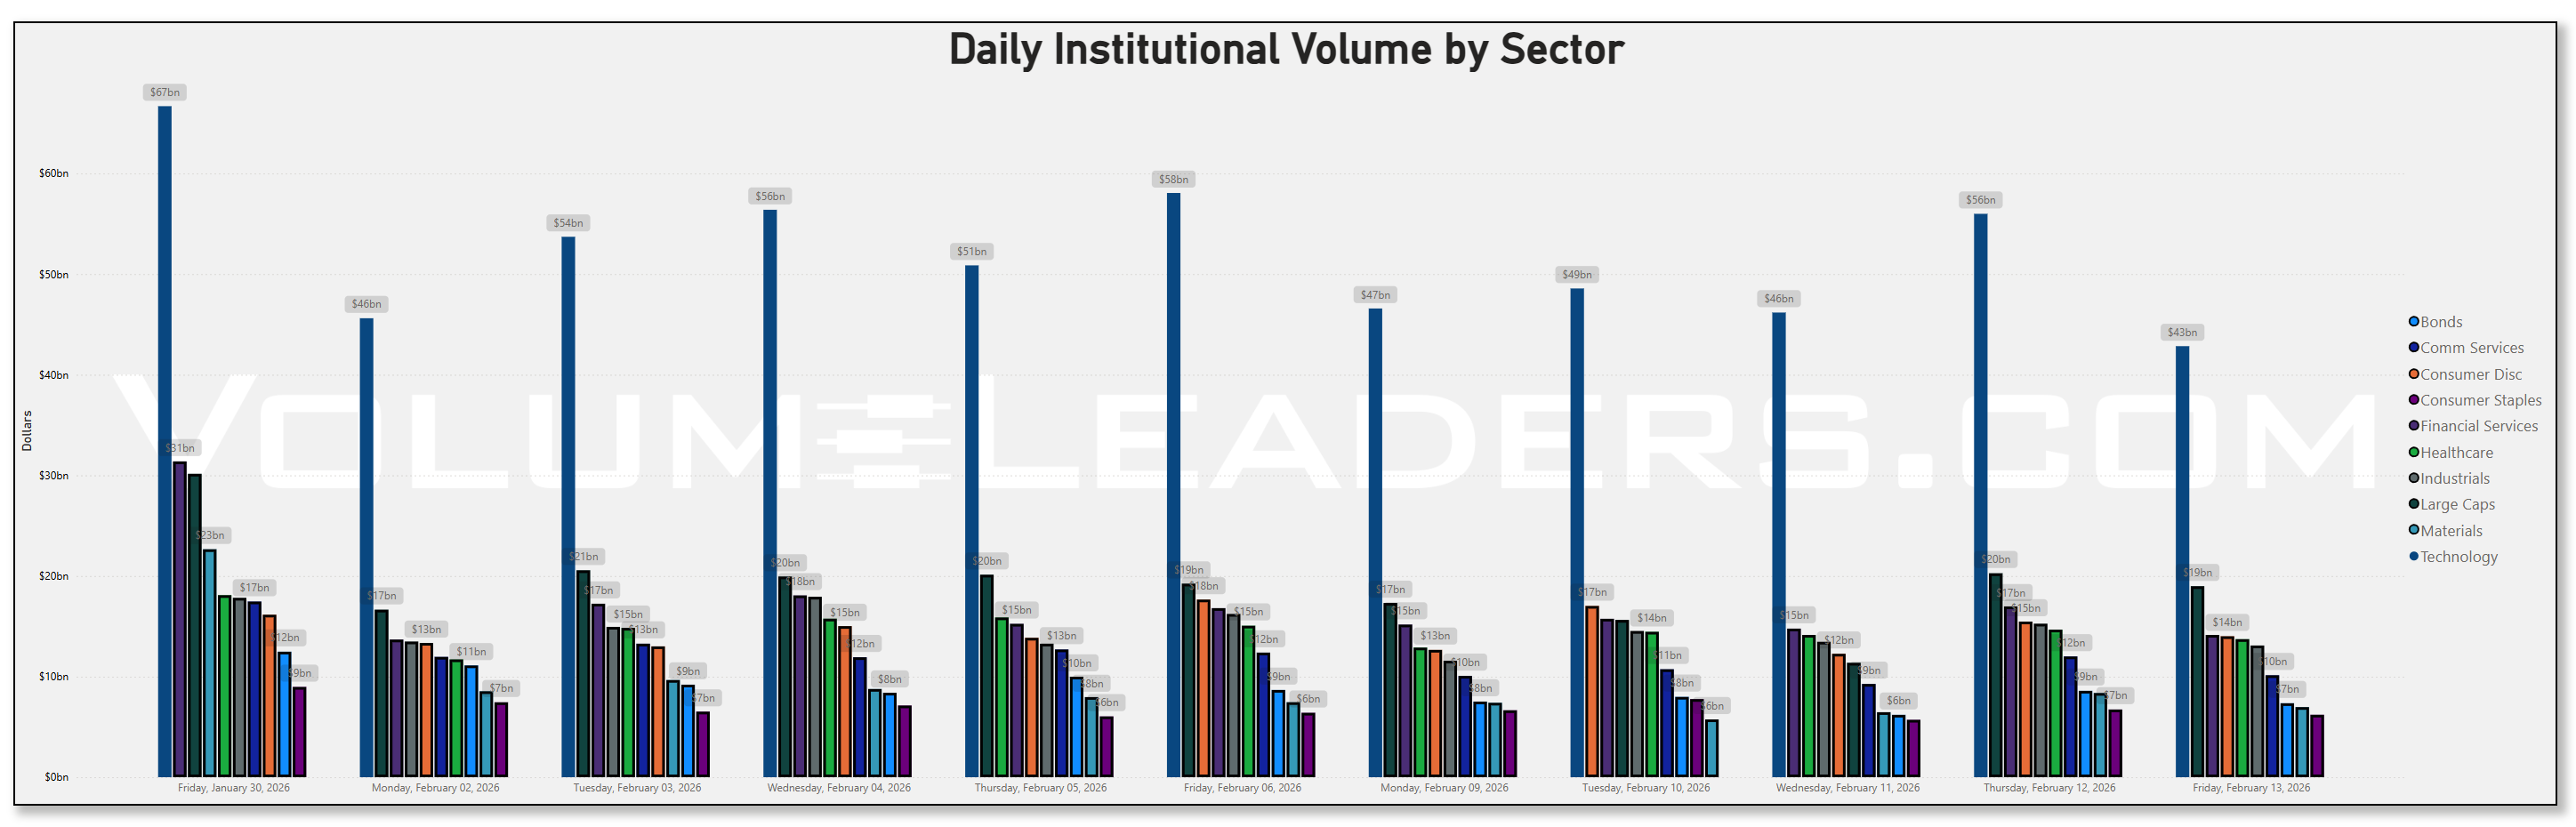
That backdrop shows up cleanly in the sector volume table. Technology is still the single largest dollar bucket, but it bled meaningful liquidity versus last week, dropping from about $56.4b on Friday, January 30 to roughly $45.6b on Monday, February 2 and finishing this week closer to $42.8b on Friday, February 13. Bonds, by contrast, saw a steady downshift in volume from roughly $12.5b at the end of January to about $7.3b by this Friday, which fits a world where inflation data are cooling and the urgency to hedge duration has eased. Year‑on‑year core CPI is running about 2.5 percent, the lowest since 2021, and January’s monthly core print came in at 0.3 percent, only a touch above December’s 0.2 percent, reinforcing the soft‑landing narrative rather than a second inflation wave. Sector money did not retreat; it rotated. Consumer discretionary and communication services logged lower week‑over‑week institutional volume, while financials, energy, and materials held in the low‑to‑mid‑teens billions per day and finished the week roughly flat to higher versus last week. That is classic early‑cycle positioning: lighten up on long‑duration growth after a big run, add to cyclicals that benefit from stable inflation, firm activity, and the prospect of eventual rate cuts.
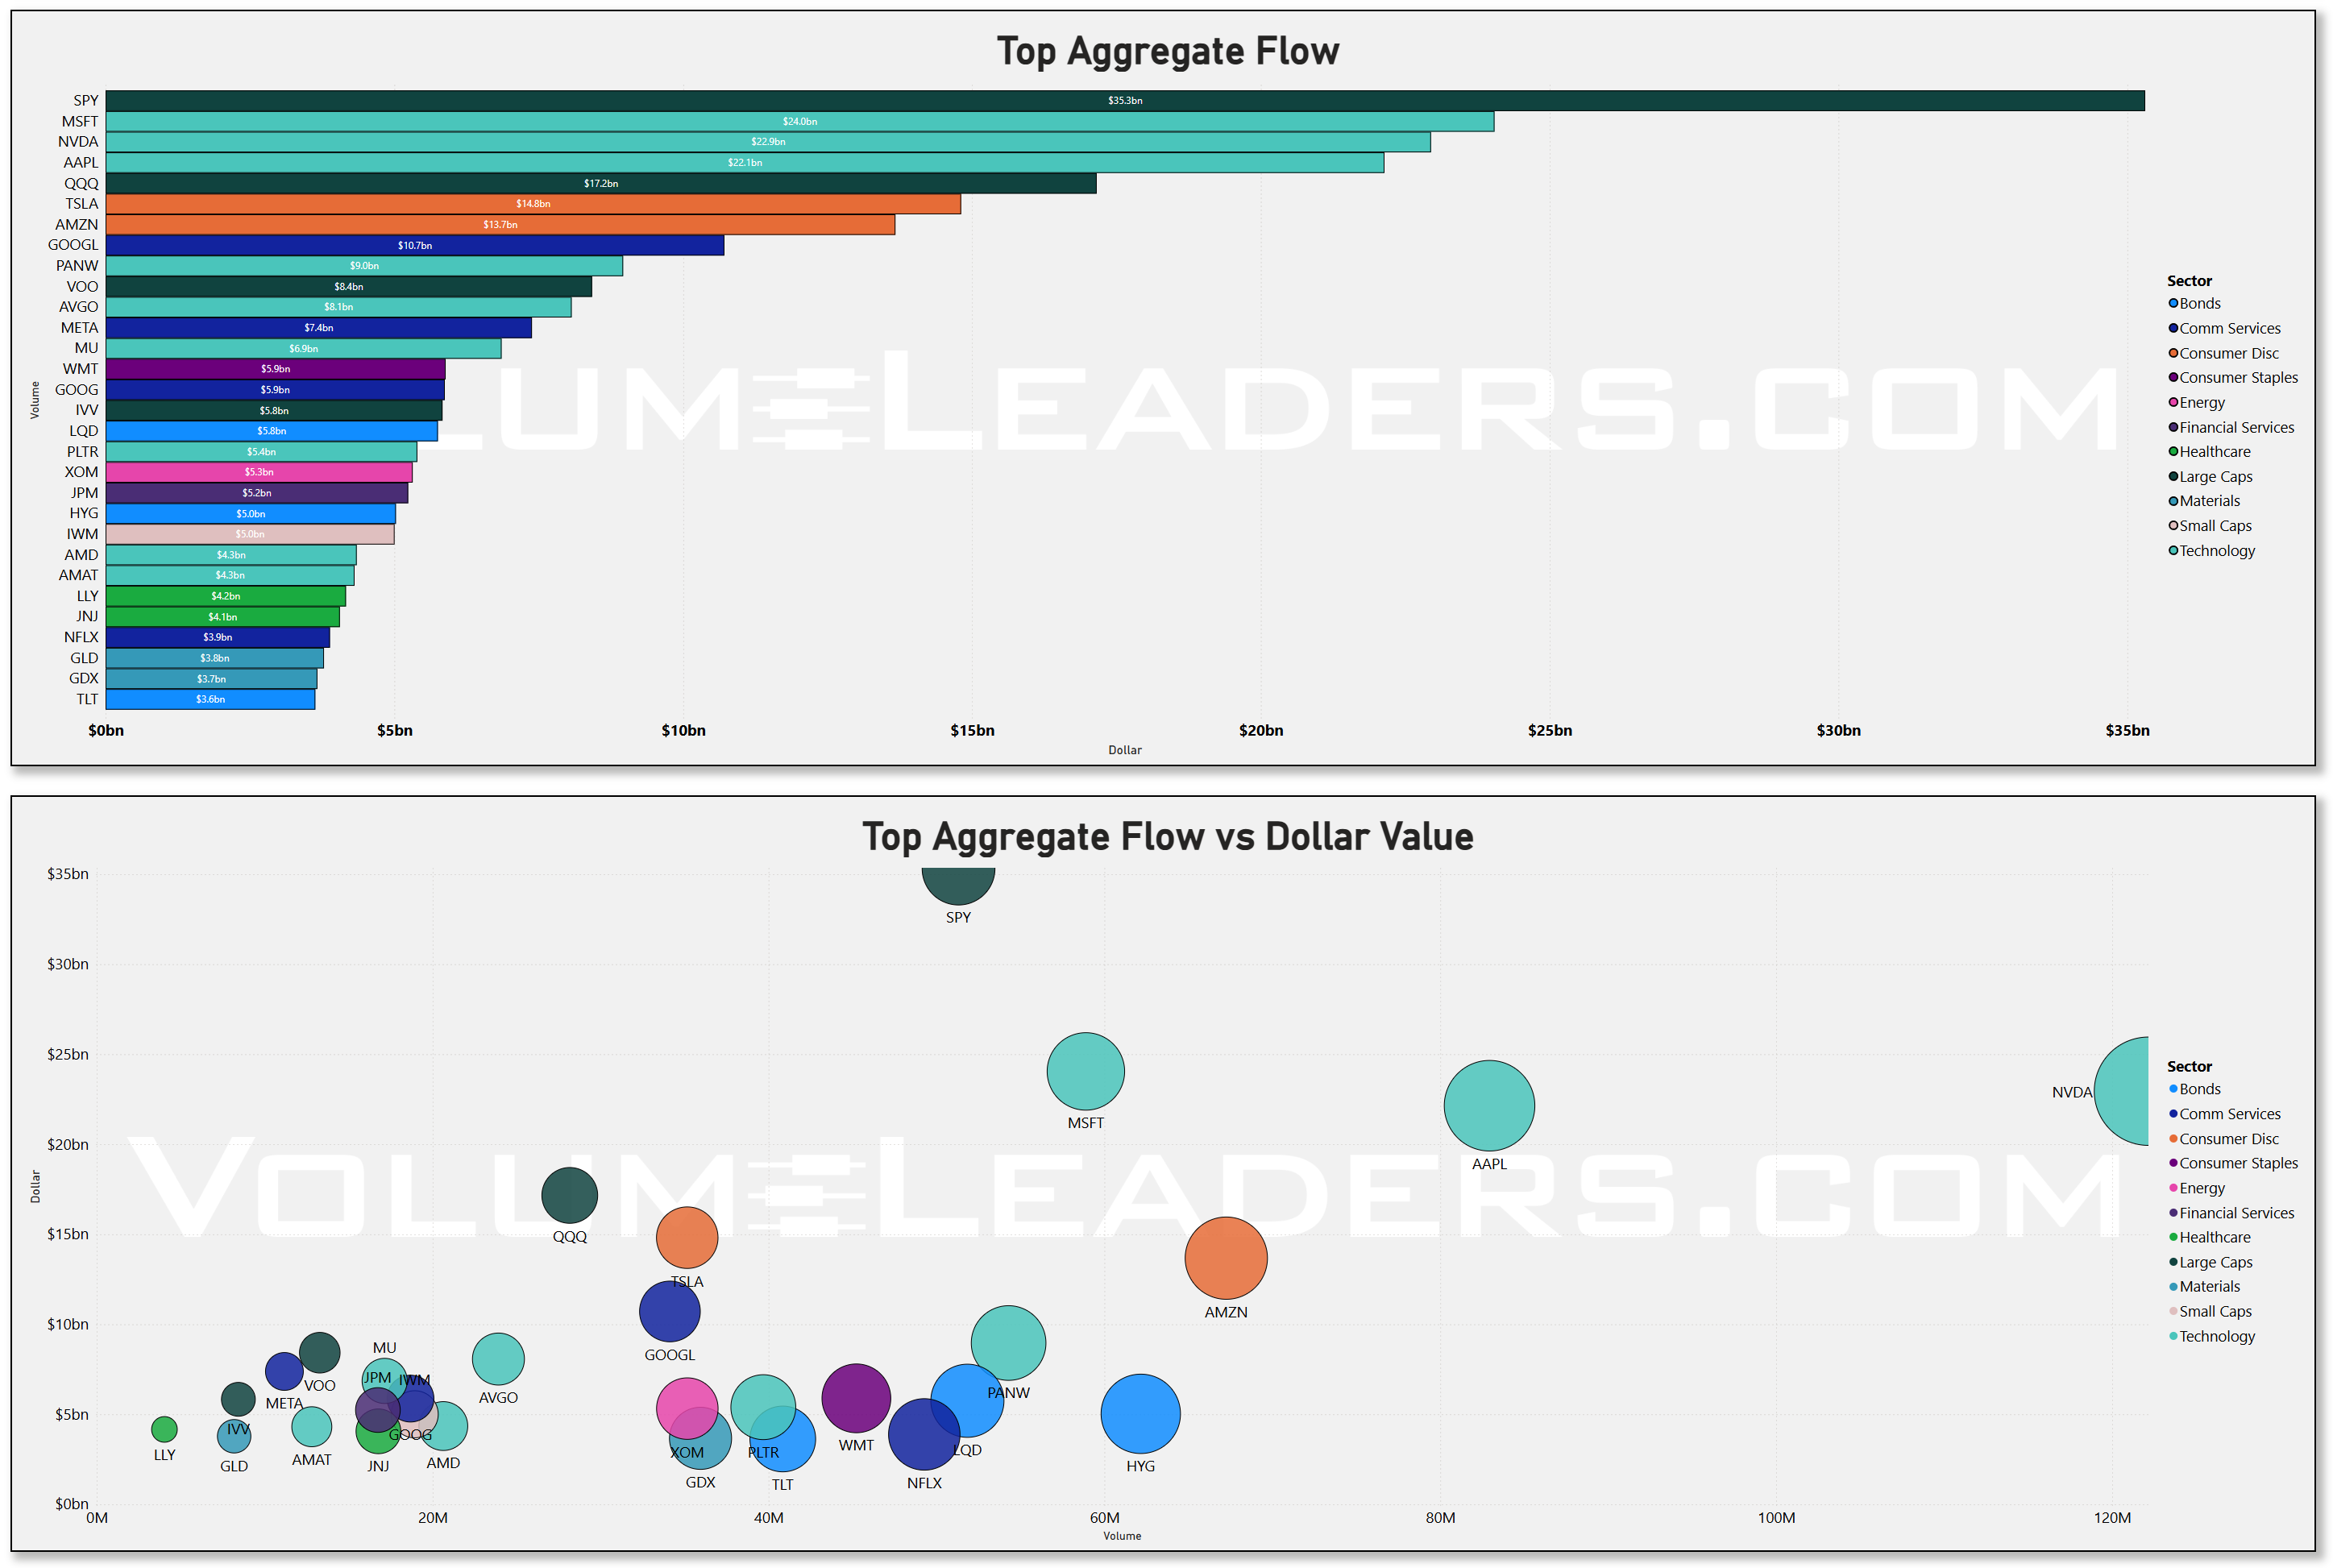
The aggregate flow charts reinforce that story. SPY is the liquidity backbone again, with roughly $35b in aggregate dollars and sitting atop both the bar and scatter rankings. QQQ and TSLA follow in the low‑teens billions, with MSFT, NVDA, and AAPL each in the high‑teens to low‑20s billions. That mix says asset allocators are still using the index complex as their primary exposure tool and then fine‑tuning with the usual megacaps.
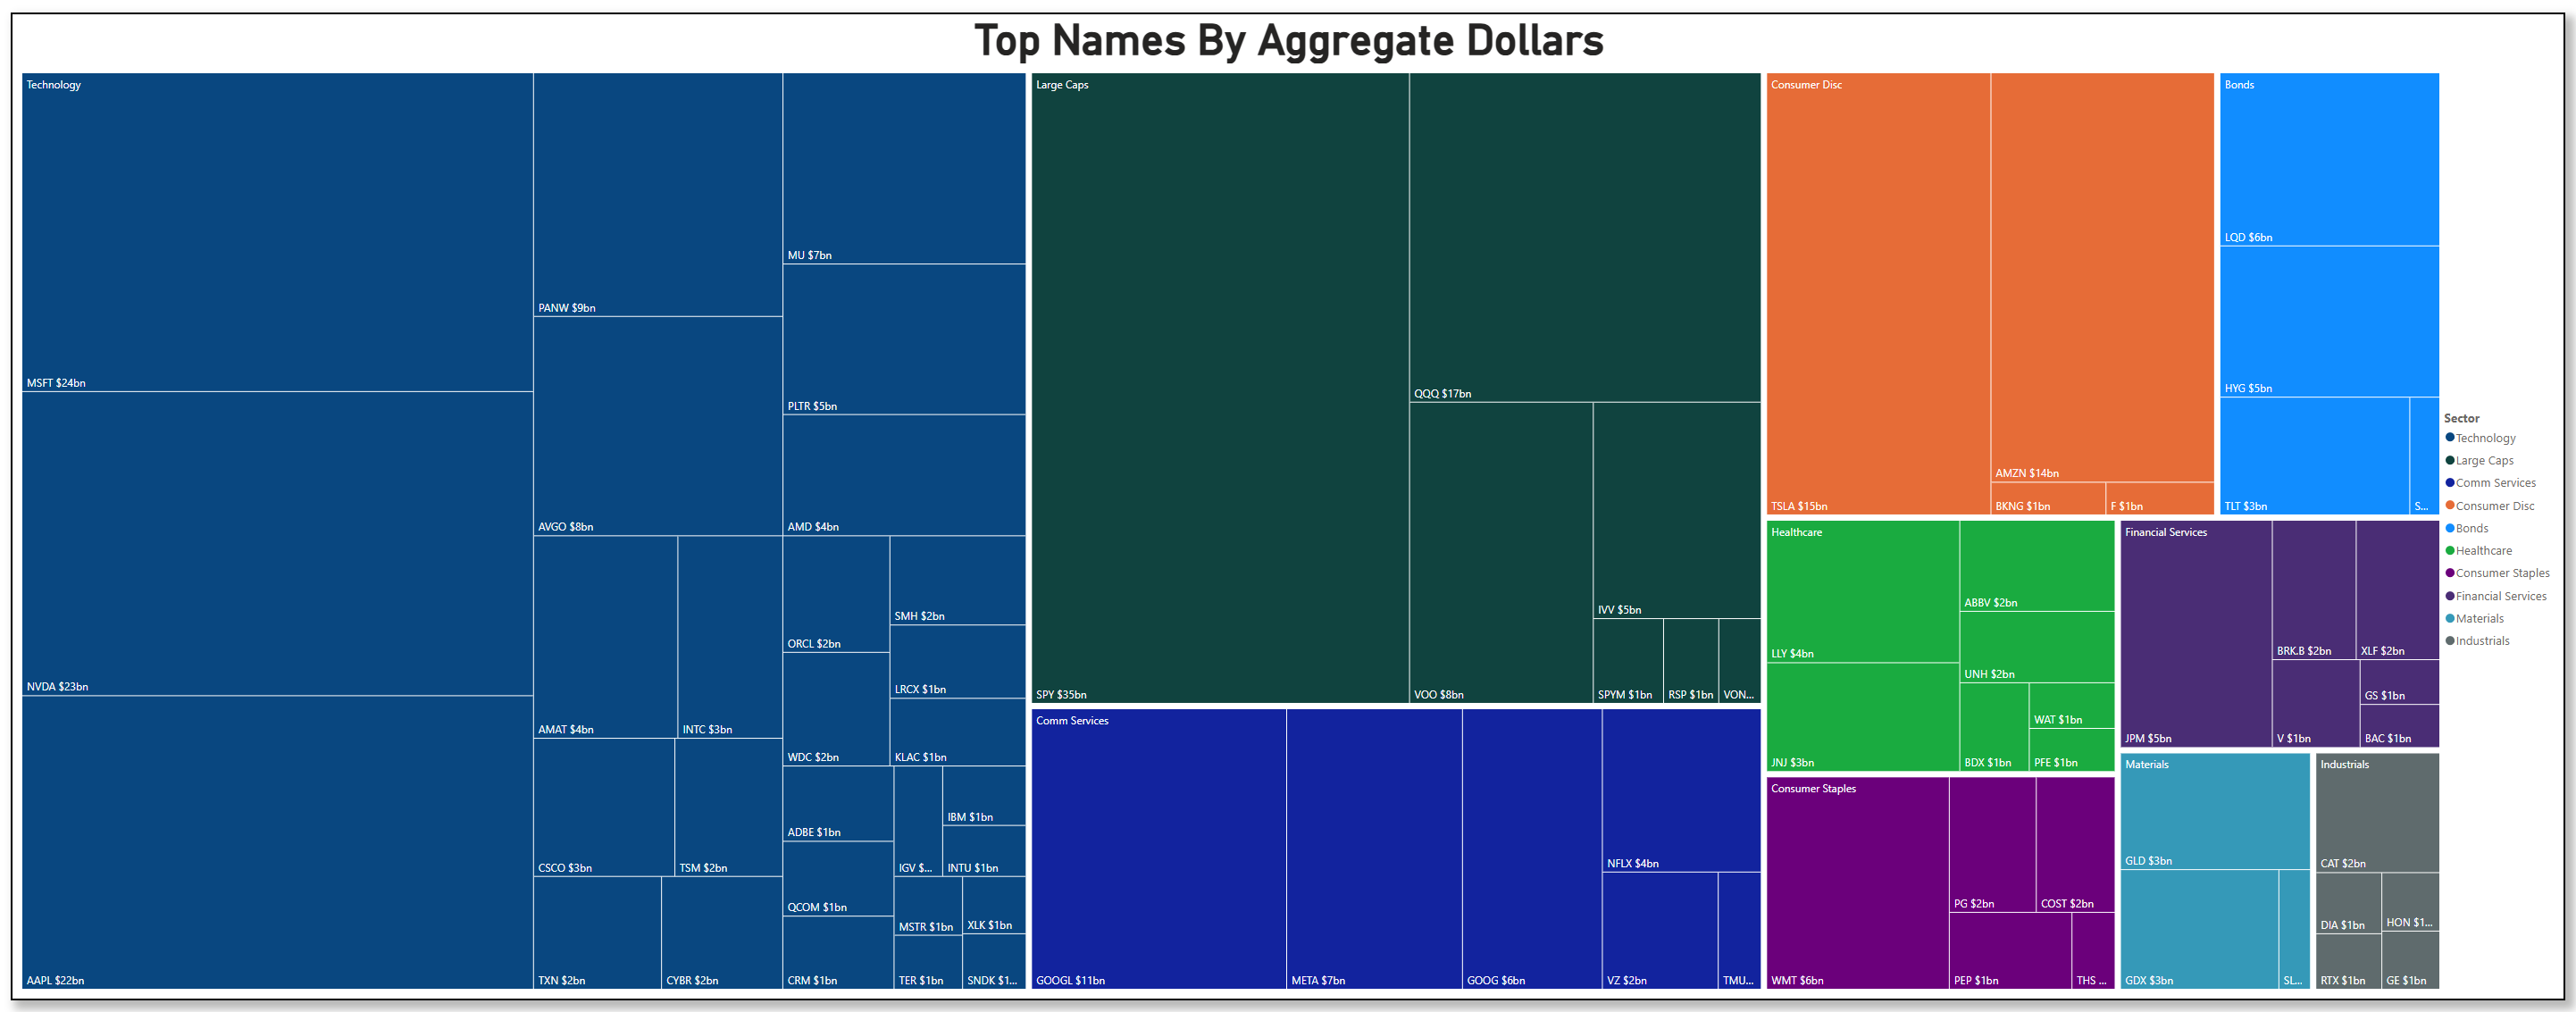
But look at the treemap of “Top Names by Aggregate Dollars” and the sector mix is different from last year’s playbook. Technology still dominates the left side of the map, but MSFT at ~$24b, NVDA at ~$23b, and AAPL at ~$22b share real estate with PANW around $9b, MU at $7b, PLTR at $5b, AMD at $4b, and AVGO at $8b. That is not just FAANG; it is a full‑spectrum bet on semis, security, and AI infrastructure. On the right, consumer discretionary is led by TSLA at roughly $15b and AMZN at $14b, but booking plays like BKNG and travel‑adjacent names show smaller, single‑digit billions. Healthcare and financials have smaller tiles but solid representation: LLY around $4b, UNH and ABVV near $2b, and banks such as JPM and BRK.B in the $3–5b range. Bonds are not absent either: LQD at ~$6b, HYG at ~$5b, and TLT at ~$3b suggest multi‑asset allocators are still pairing their equity risk with spread and duration exposure rather than abandoning fixed income.
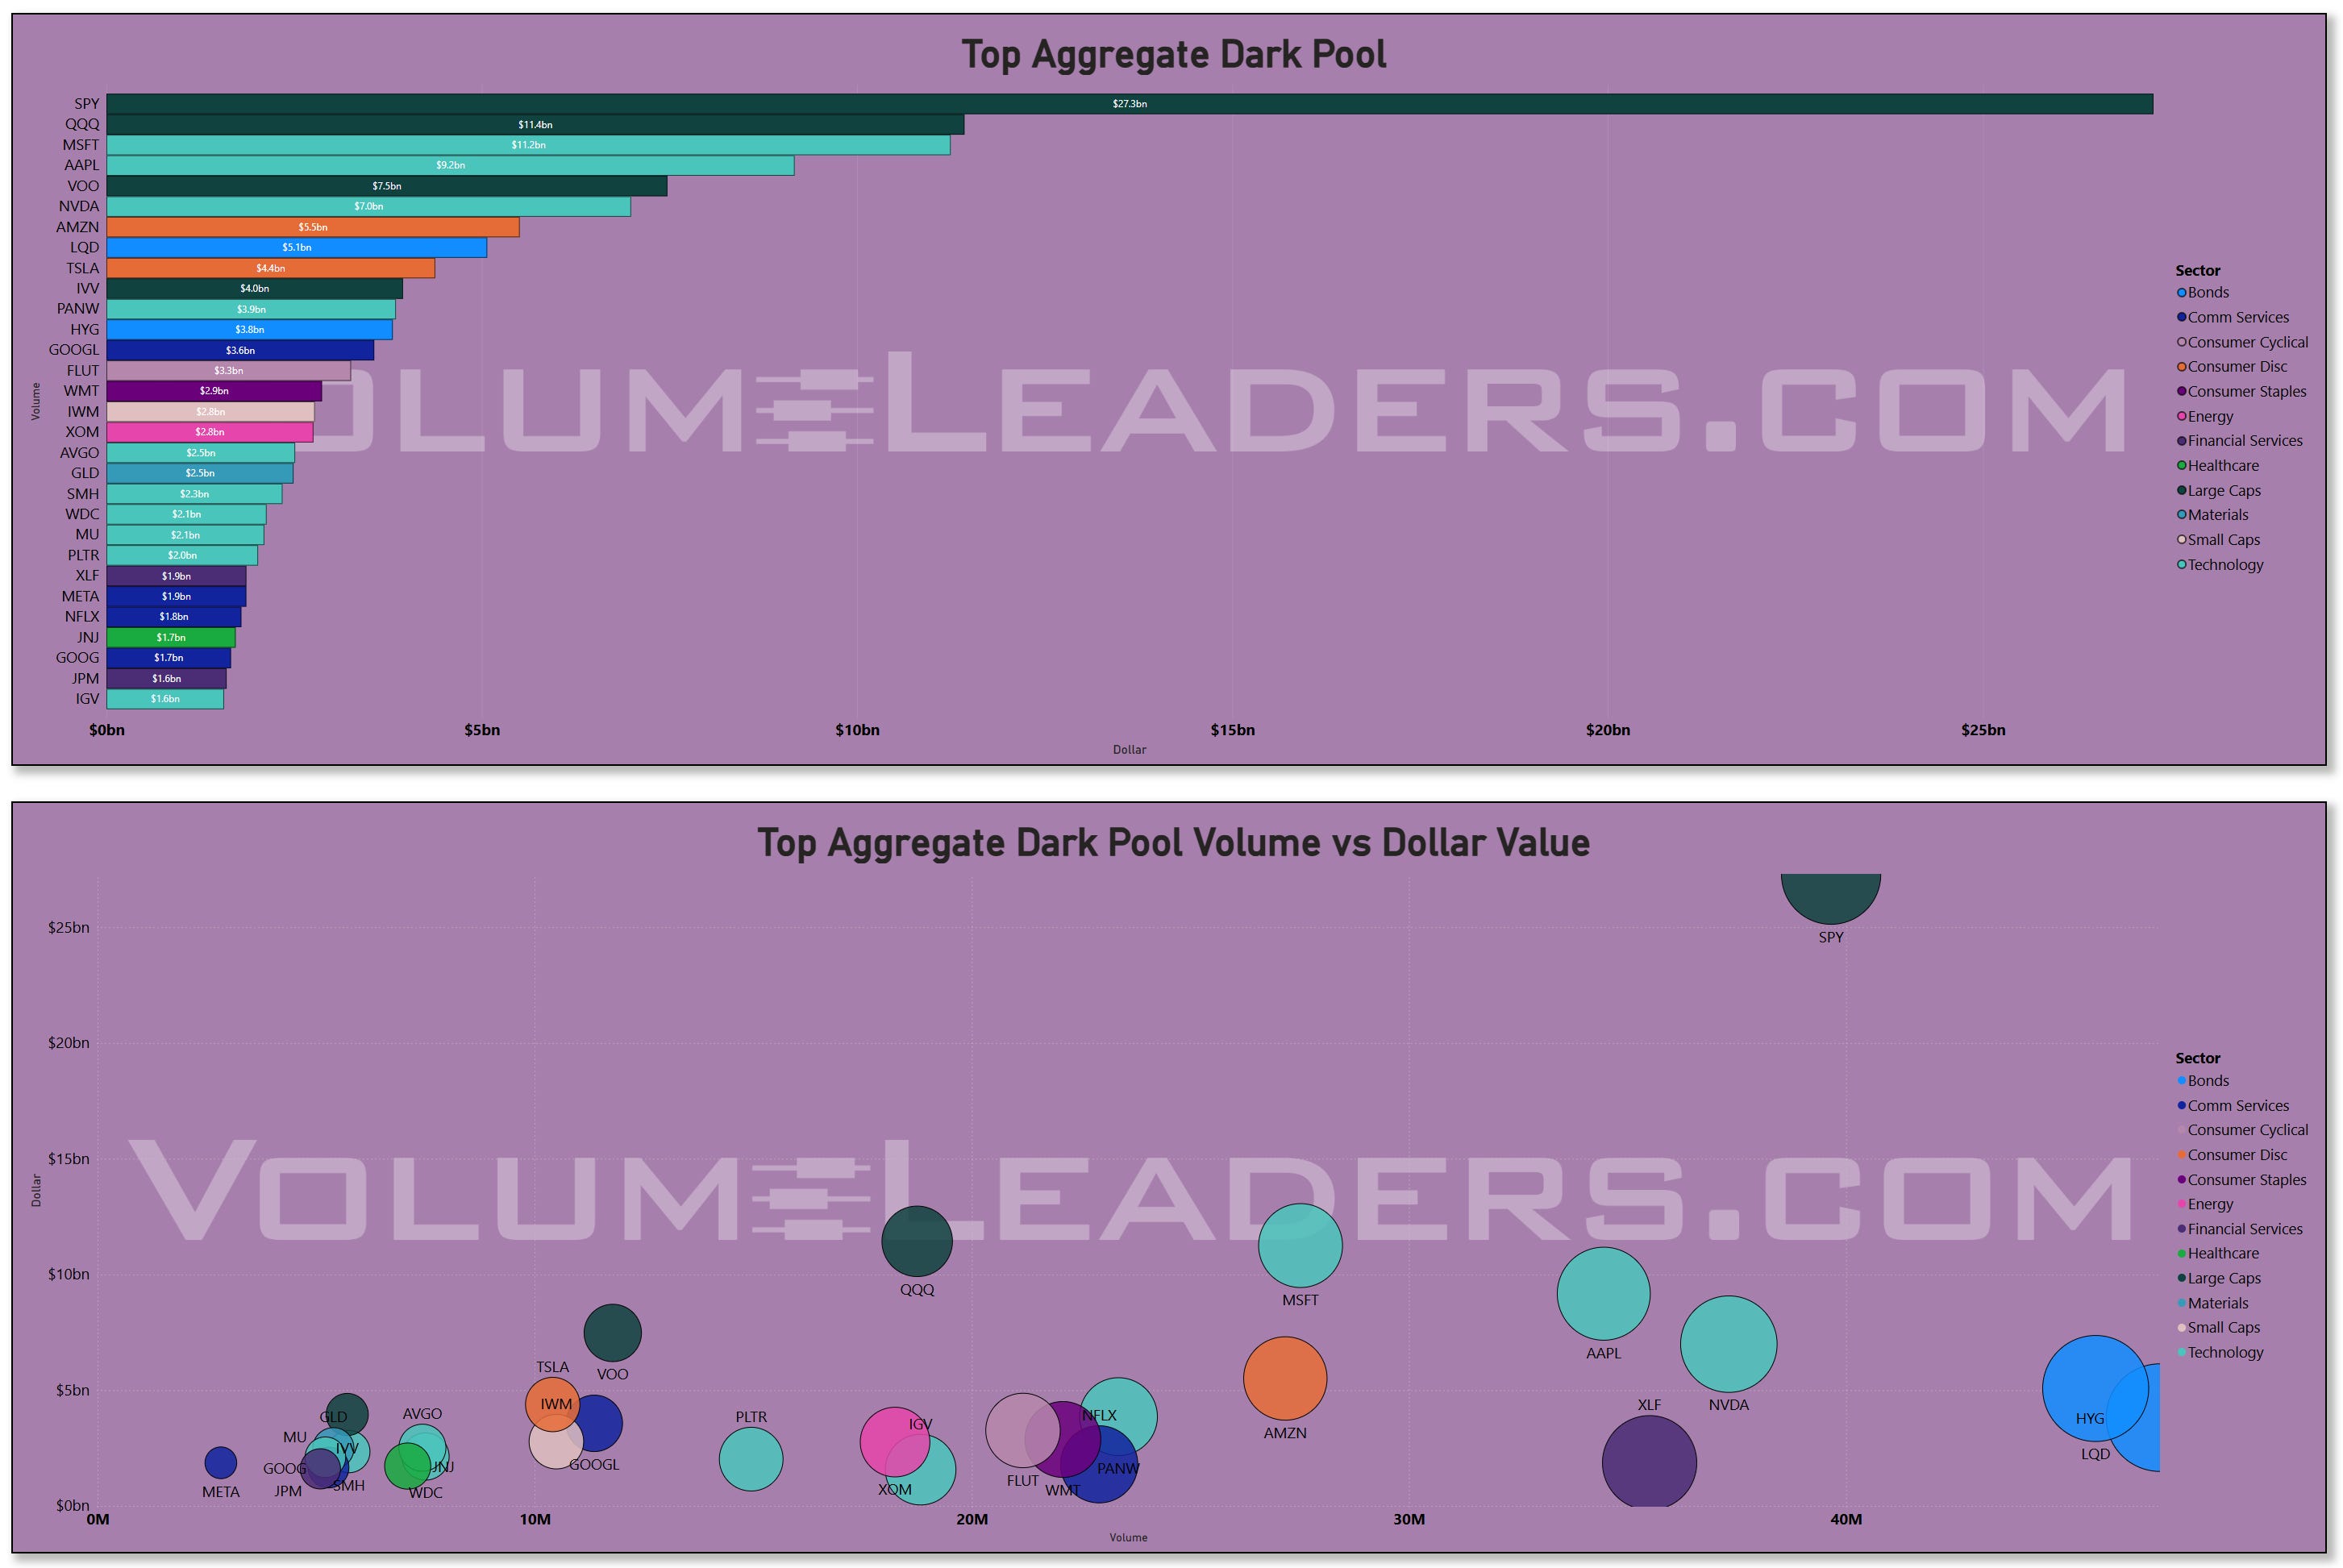
Dark‑pool activity tells you where the more patient hands are making decisions away from the screens. SPY once again dominates the dark tape with roughly $27b in hidden dollars, far outstripping the next cluster of QQQ, MSFT, and AAPL, each somewhere in the low‑teens billions. That kind of size in SPY dark pools is usually rebalancing and asset allocation rather than hot money; think pensions, insurers, and overlay managers quietly adjusting beta. AMZN, NVDA, GOOG, and TSLA all show up with meaningful dark‑pool dollars as well, but their bubble positions on the volume‑versus‑dollars scatter suggest more balance between accumulation and distribution; we are not seeing the skewed, one‑way footprints that screamed stealth hoovering in 2023. The more interesting tell is in the second tier: sector ETFs like XLF, HYG, and LQD print mid‑single‑digit billions in dark pools, with volume that lines up with a steady, rather than frantic, rhythm. That is what it looks like when real money is rotating allocations rather than de‑risking outright.
Sweeps are your chase and hedge lens, and they are sending a different message than the slow‑hand dark pools. On the sweeps bar chart, LQD and VONG sit near the top with roughly $1.0b each, followed by IEMG, XLK, and VTEB in the mid‑hundreds of millions. Underneath that, a long tail of ETFs and single names—NVDA, SPY, MU, IWM, AAPL, and KWEB among them—cluster in the $200–$400m range. The volume‑versus‑dollars scatter shows VONG and VTEB plotted far to the right with high volume and high dollars, while LQD sits high on the dollar axis with more modest volume. That combination tells me index and factor products are being used aggressively for tactical exposure and hedging—growth factor, municipal bonds, and investment‑grade credit—rather than single‑stock lottery tickets. The presence of KWEB with decent sweep dollars stands out too, especially in a week where China macro headlines remain noisy and policy support remains episodic; I personally don’t have a tremendous appetite for China-names given the current policy backdrop so I tend look at it more like opportunistic swing trading than strategic allocation.
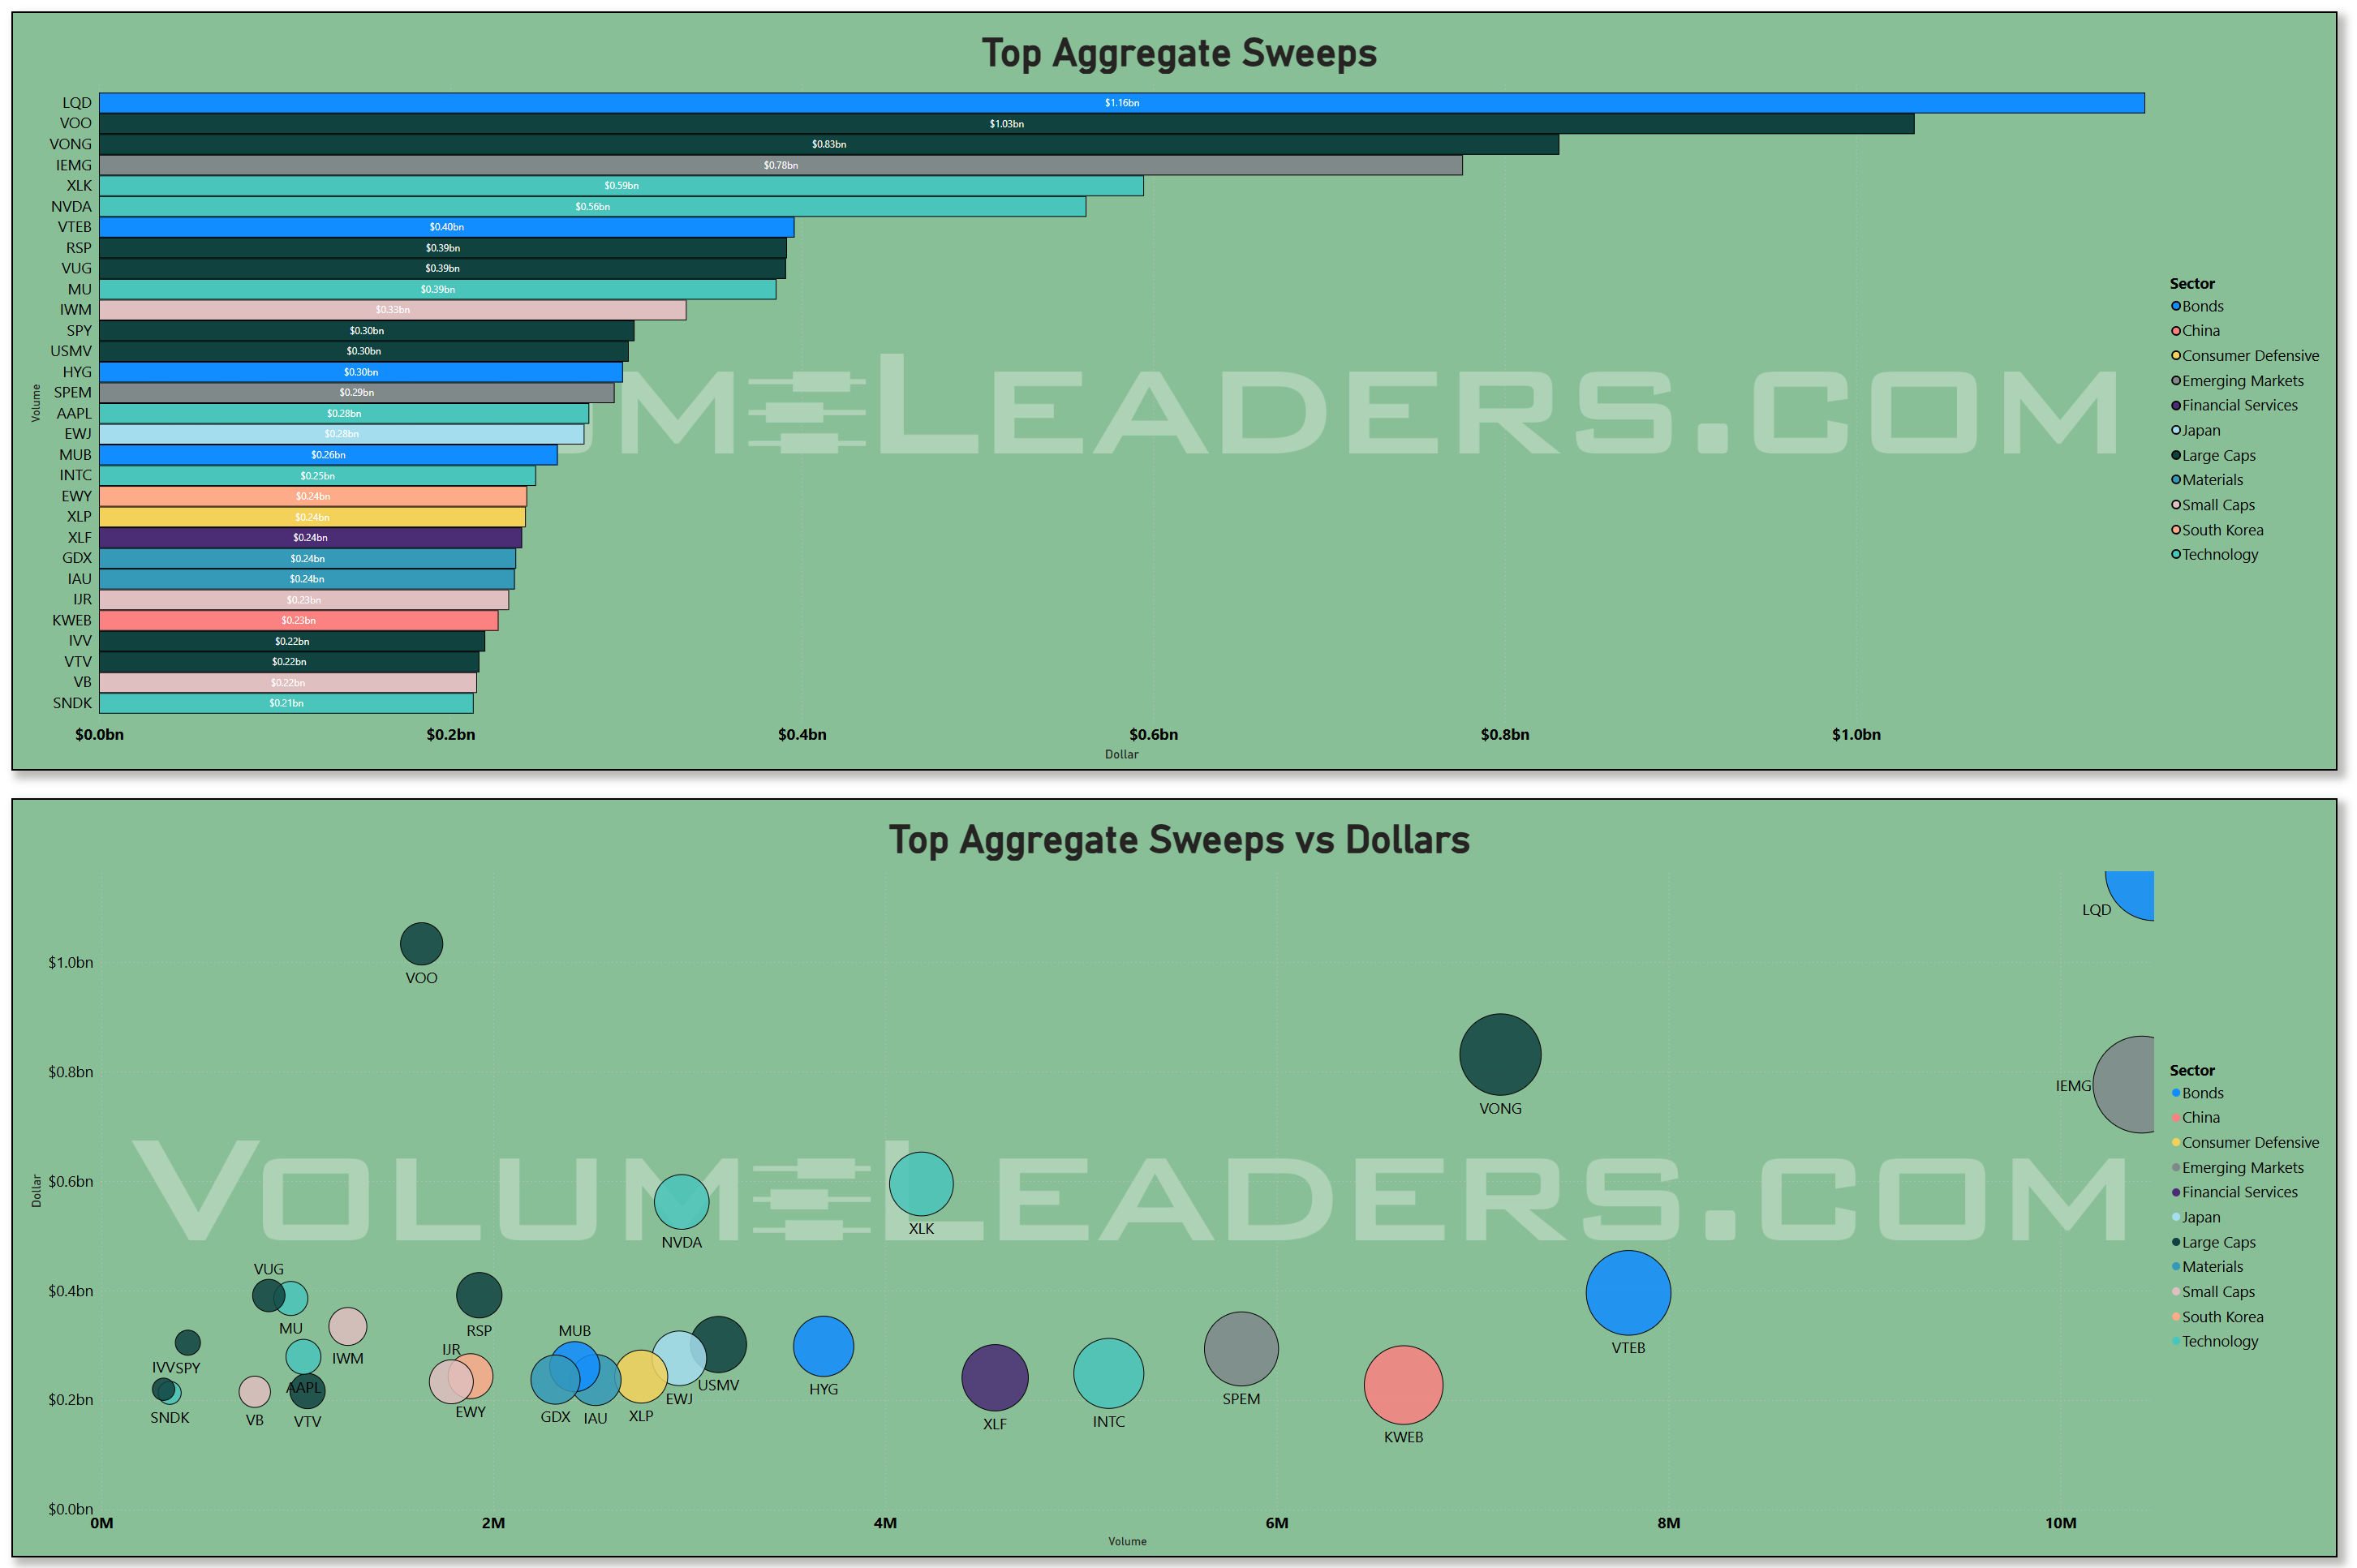
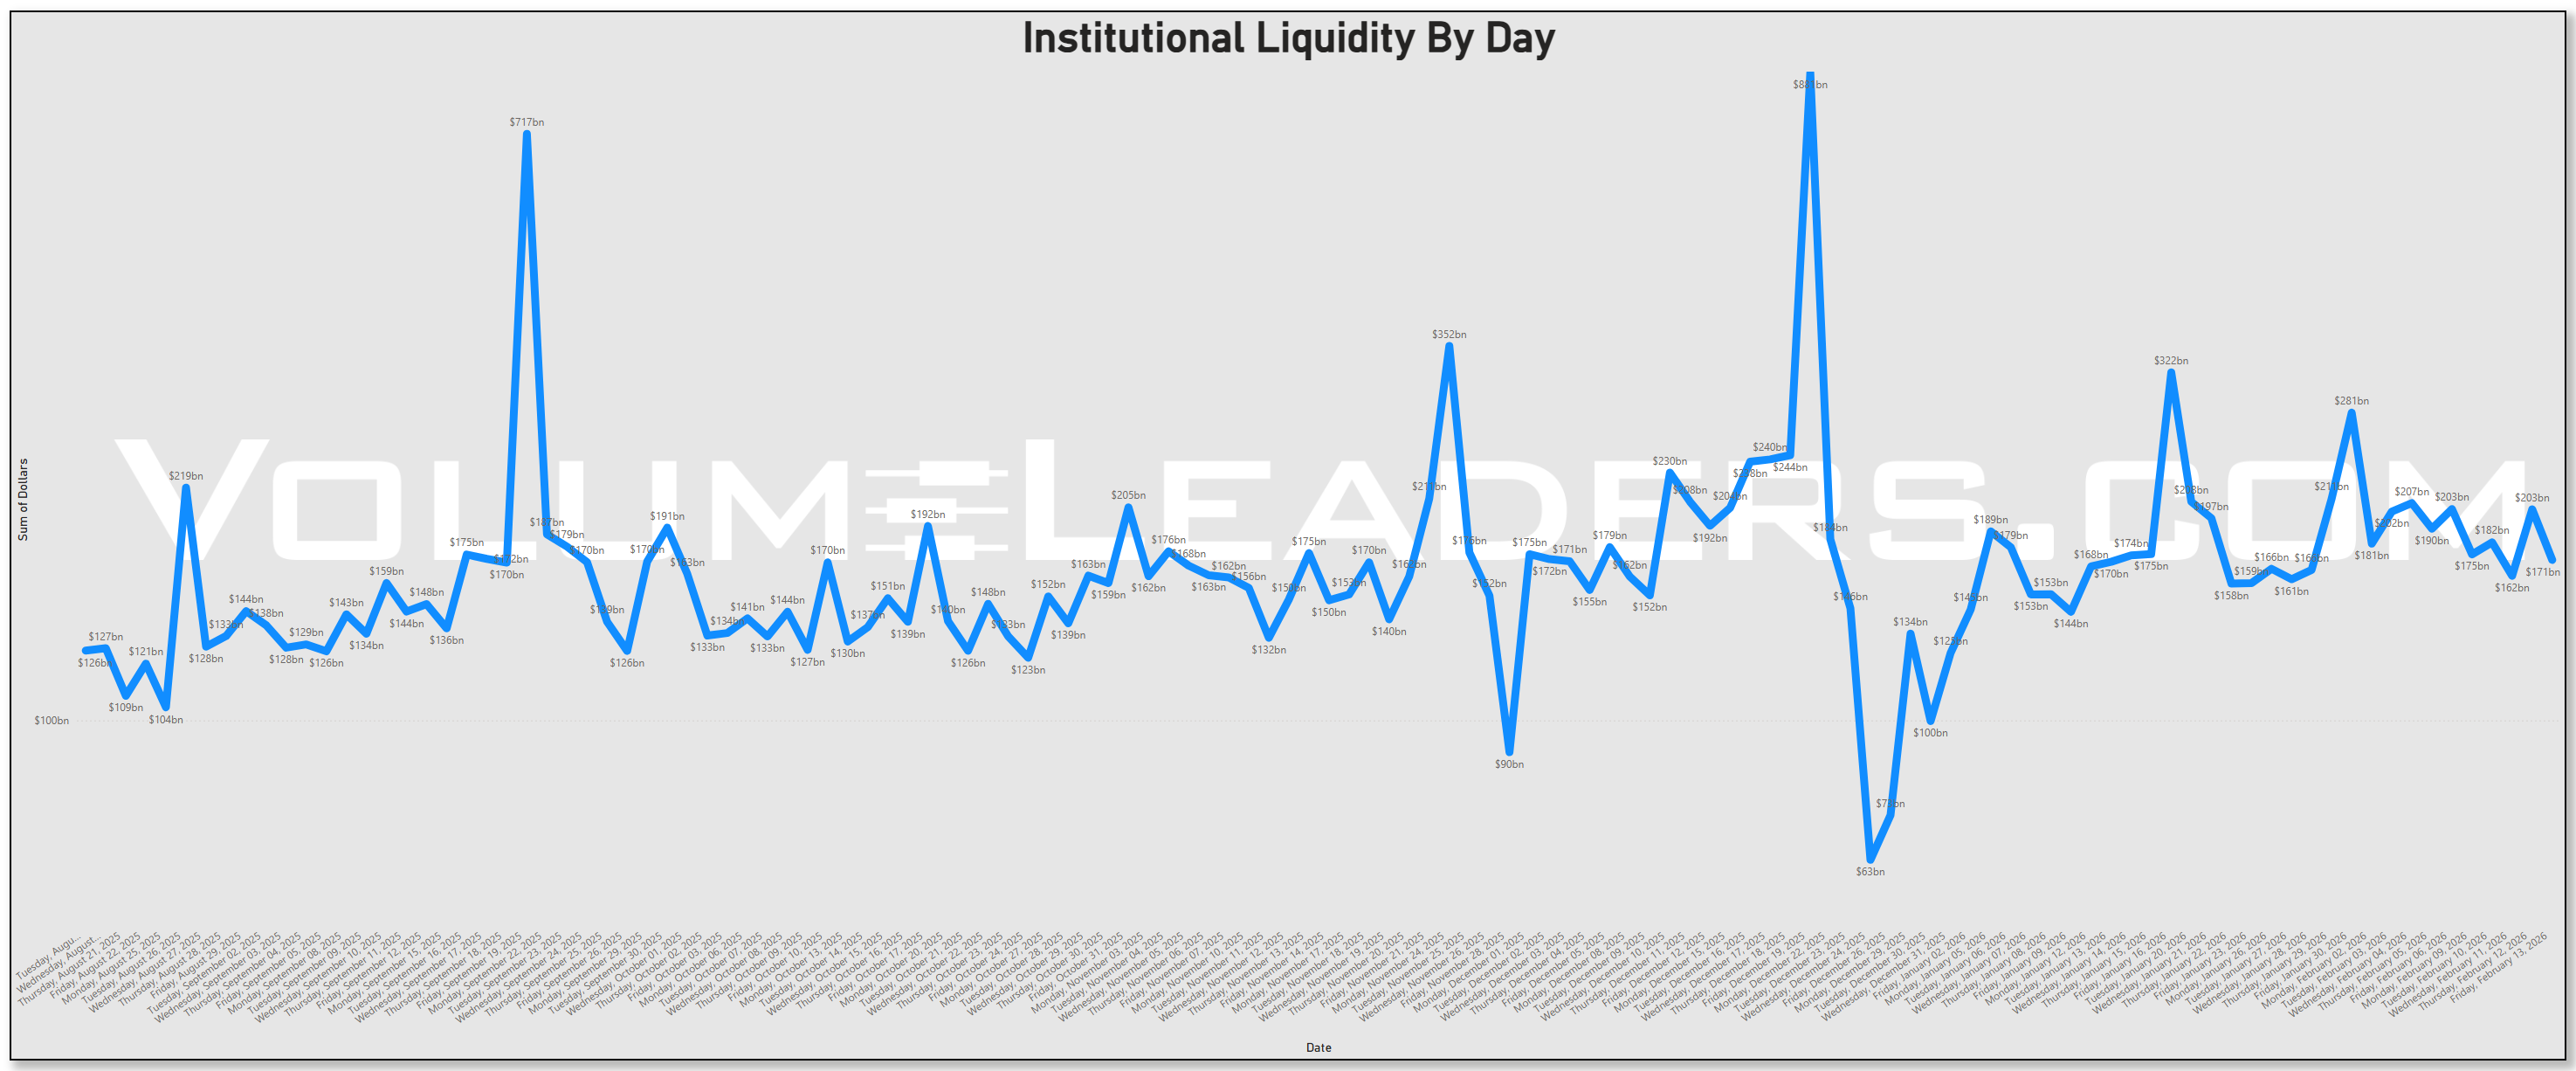
If you step back to the “Institutional Liquidity by Day” time series, this past week sits in the middle of the recent regime. We are nowhere near the $717b and $868b spikes from large prior liquidity events, but we are also well above the $63b to $90b troughs that showed up during holiday trade. Daily liquidity is mostly in the $150b to $240b band, with one day tagging just above $280b. That is comfortable, two‑way participation, not panic. Seasonally, February tends to be a digestion month: January’s positioning and tax‑driven flows fade, but you do not yet have the earnings hangover or summer liquidity drain. What we are seeing in the liquidity line fits that pattern—a market that is actively redistributing risk but not yet in a “sell first, ask questions later” mode.
Putting all of this together, the message from the flows is rotation, not retreat. The dashboard shows breadth and relative strength improving in energy, materials, and industrials, with financials trying to join the party and defensives like staples and utilities lagging. The sector dollar table confirms that money has not left the field; it has simply migrated away from the most crowded corners of tech and consumer internet. Lit‑tape aggregate flow tells you allocators are still anchoring around SPY, QQQ, and the big three tech names, but the treemap and dark‑pool charts say real money is also building and maintaining sizeable positions in second‑tier semis, security software, select industrials, and a handful of healthcare bellwethers. Sweep activity is concentrated in factor and sector products, which looks more like traders adjusting beta and yield exposure around macro catalysts—January CPI and the coming PCE print—than outright speculation.
For a practitioner, the implication is straightforward. The tape is telling you that the path of least resistance is to lean into strength in energy, materials, industrials, and quality financials, while being more selective in high‑multiple tech and discretionary where both relative strength and capital flows have rolled over. Index products remain the primary liquidity vehicle, but the real edge is increasingly in watching how the second‑tier names trade against those indices: when a MU, PLTR, or PANW attracts disproportionate dollars relative to the rest of tech, that is where incremental alpha is likely to sit. At the same time, keep an eye out for economic surprises; something like a hot PCE print or renewed Fed hawkishness and it’s quite reasonable to expect those tactical sweeps in growth products to flip from chase to hedge very quickly.
MIR Part 2: Individual Names From The Institutional Tape
VolumeLeaders tracks several proprietary signals designed to spotlight names drawing significant institutional interest. Below, we’ve surfaced the latest results and analyzed them to highlight emergent themes. If any of the sectors, narratives, or positioning trends resonate, the names mentioned here offer a strong starting point for deeper research and watchlist consideration.
VL Trade Rank Velocity™ (TRV)
TRV is a proprietary metric that measures the recent acceleration or deceleration in institutional trading activity for a given stock by comparing its average trade rank over the past few days to its average in recent weeks. A sharp improvement in TRV typically reflects a notable shift in positioning, often accompanied by sustained trade activity, suggesting institutions are actively engaging with the name and that intensity of activity is rising. This often precludes meaningful price or narrative shifts. This isn’t a buy-list or sell-list; it’s meant to draw your eyes to names where institutions are putting money to work.
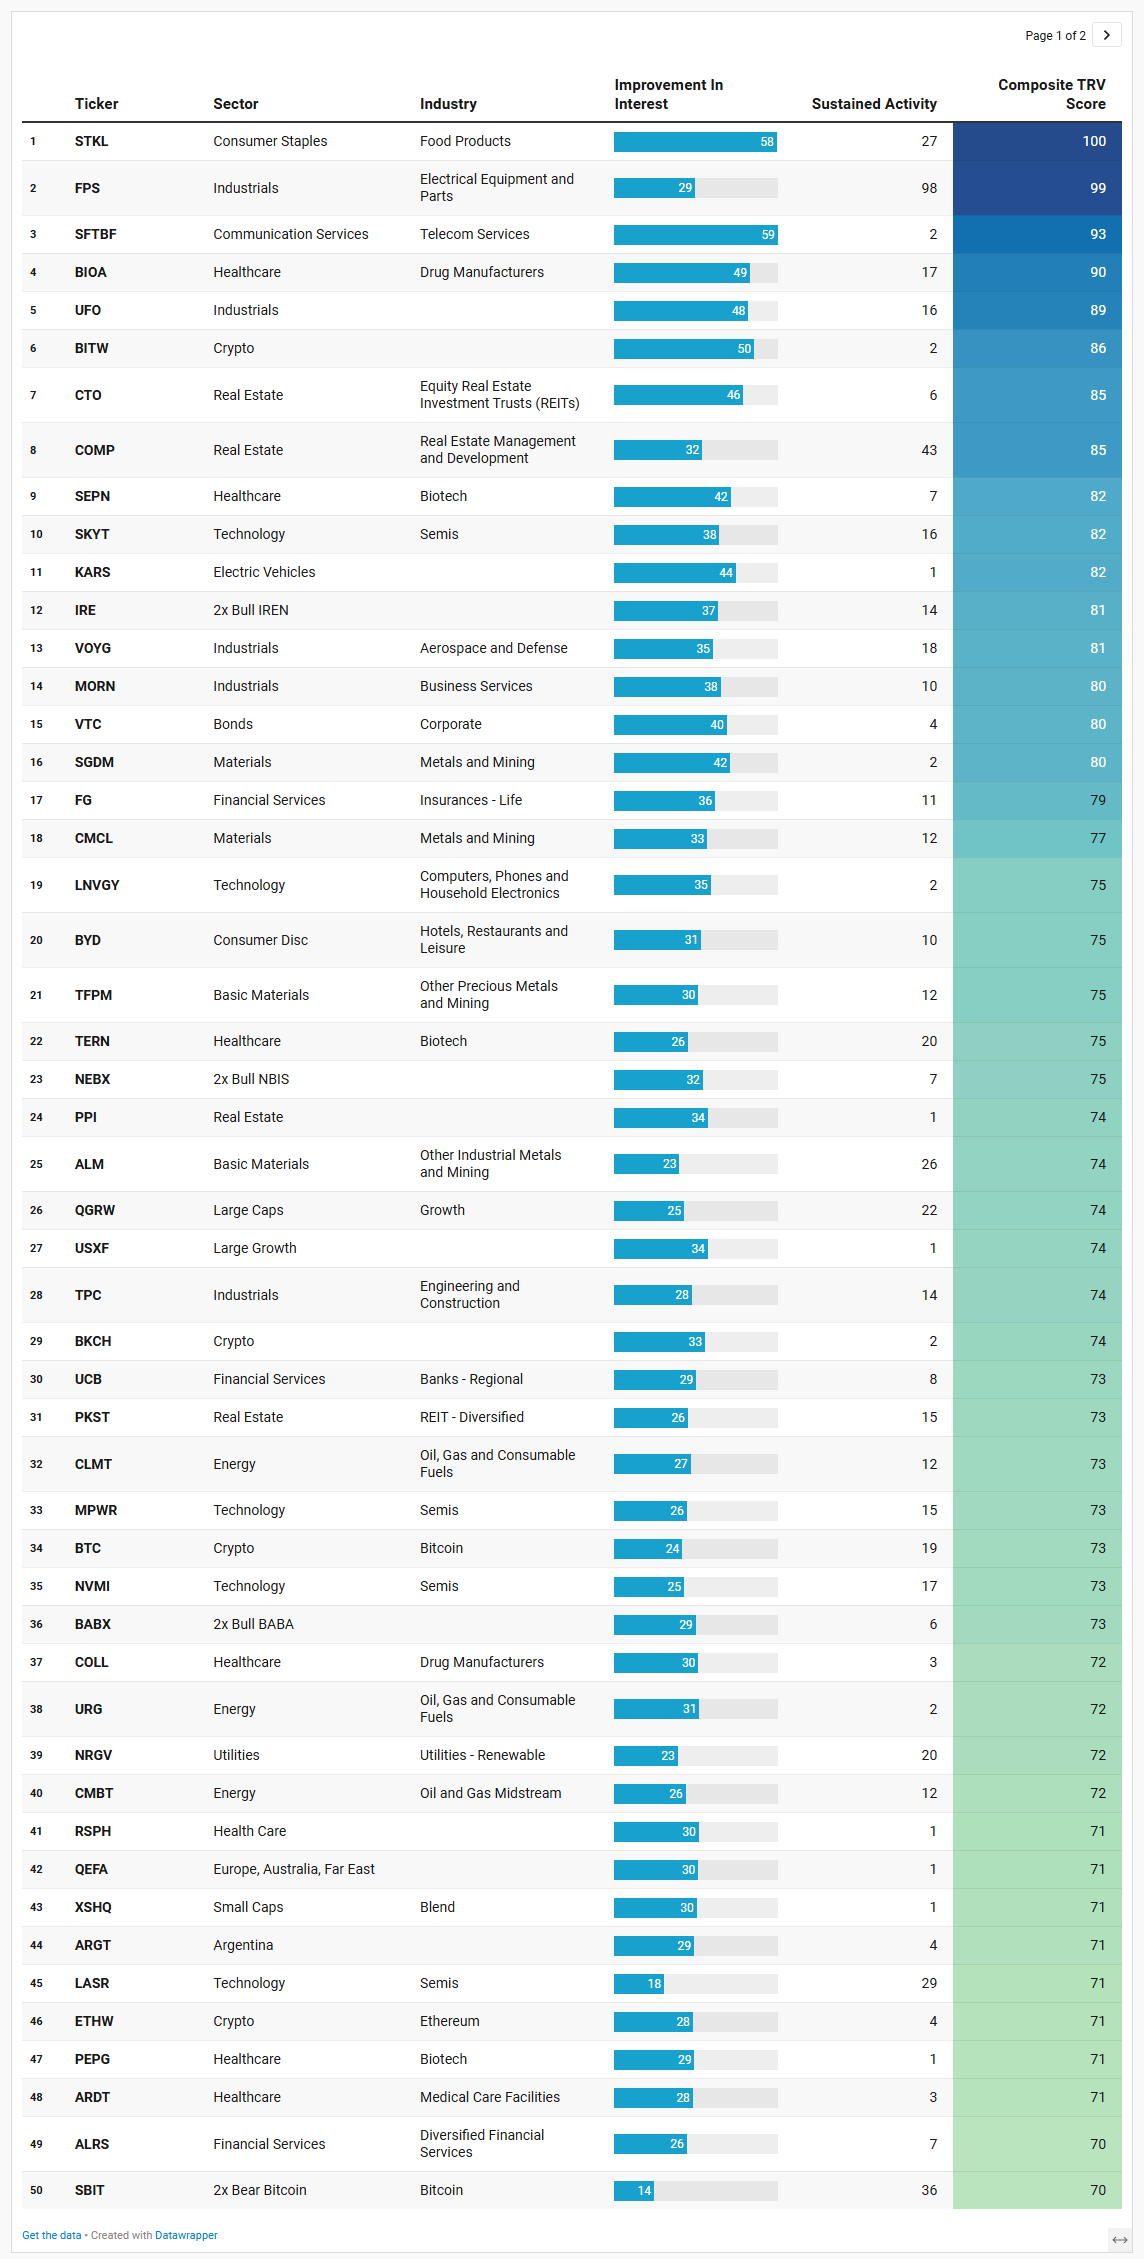
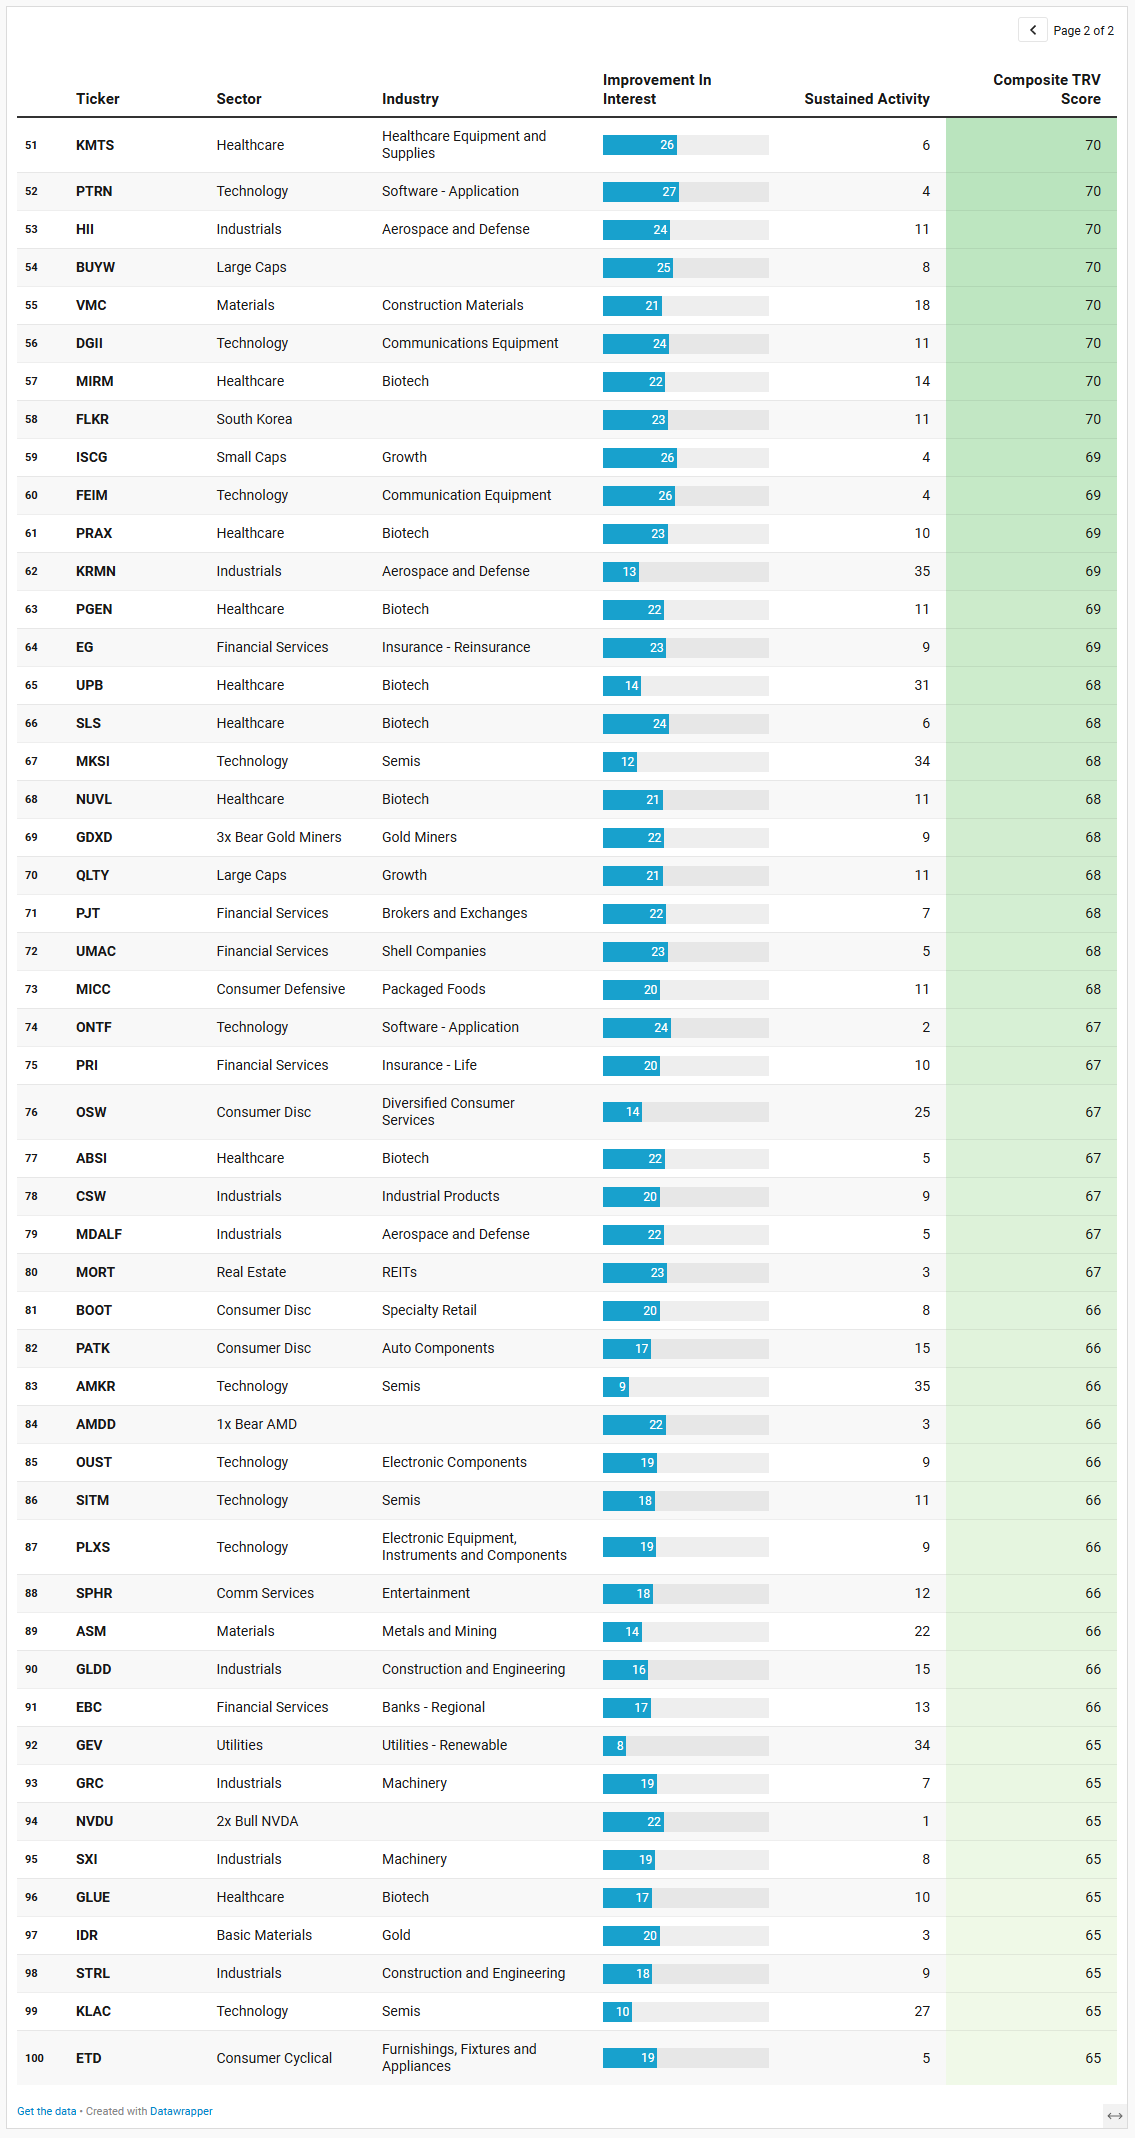
Three themes jump off this TRV list, and they line up cleanly with the flow story we have been tracking: a rotation into real assets and cyclicals, a broadening of the growth book beyond megacaps, and a still‑active but secondary speculative sleeve in crypto and leverage.
The real‑asset tilt is the strongest tell. Precious‑metals and miners show up everywhere: SGDM, CMCL, TFPM, ALM, ASM, IDR, plus inverse beta via GDXD. Add in energy and related plays like CLMT, URG, and CMBT, and you get a cluster of oil, gas, uranium, and midstream exposure. That is not defensive hiding; it is a bet on real‑asset beta in a world where inflation has cooled but remains close enough to target that nominal growth still matters. It matches the broader leadership we have seen from energy and materials and the steady institutional volume those sectors have carried while tech volumes have bled lower.
The second theme is a deliberate reach for “next‑tier” growth. The list is packed with semis and hardware names that sit just outside the index heavyweights: SKYT, MPWR, NVMI, LASR, MKSI, AMKR, SITM, PLXS, KLAC, DGII, FEIM, OUST. These are the plumbing behind AI, autos, and industrial automation. Seeing so many of them scoring high on both improvement and sustained activity says the growth trade is broadening into the supply chain, not just circling around NVDA and AVGO. Factor and wrapper products reinforce that: QGRW, USXF, QLTY, BUYW, XSHQ, and ISCG all lean toward quality and growth in large and small caps. That fits with flows we have seen into growth and quality ETFs even as direct megacap buying has cooled.
A third, quieter theme is tactical speculation. Crypto and levered expressions are well represented with BITW, BKCH, BTC, ETHW, and geared products like SBIT, IRE, NEBX, BABX, AMDD, GDXD, and NVDU. They have healthy composite scores but, in aggregate, sit a notch below the real‑asset and quality‑growth cohorts. That is exactly what you would expect in a market that still has risk appetite but is no longer being driven by pure liquidity or meme behavior: traders keep a speculative sleeve alive while the bulk of capital migrates toward more durable theses.
Within sectors, the watchlist reinforces cyclicals over defensives. Industrials are everywhere: FPS near the top with a 99‑handle score, plus VOYG, UFO, MORN, TPC, GLDD, STRL, CSW, GRC, SXI, HII, and KRMN. Those names cluster in aerospace, defense, engineering, and machinery—the parts of the market levered to capex, reshoring, and infrastructure spend. Real estate exposure via CTO, COMP, PPI, PKST, and MORT looks opportunistic rather than wholesale, consistent with a view that rates have peaked but refinancing risk still matters. Financials show up in insurers, regionals, and brokers—FG, UCB, PRI, PJT, ALRS, EG, UMAC—again pointing to selective earnings stories instead of broad bank beta.
Healthcare is a meaningful side pocket: BIOA, SEPN, TERN, PEPG, MIRM, PGEN, UPB, SLS, NUVL, GLUE, RSPH, KMTS, ARDT. This mix of biotech, specialty drugs, and equipment offers uncorrelated growth just as rate fears fade, echoing the improving relative strength we have seen in that sector. Geographically, products like KARS, ARGT, QEFA, and FLKR suggest investors are complementing US risk with targeted EM and cyclical foreign exposure.
On the consumer side, staples and value stand out. STKL and MICC sit in food and packaged goods, while BYD, BOOT, PATK, OSW, and ETD tilt toward travel, specialty retail, and services—areas that do fine in a “strained but not broken” consumer backdrop. Put together, this watchlist says institutions are rotating toward hard assets and cyclicals, broadening into second‑tier growth, and keeping a modest speculative sleeve alive, with far less emphasis on crowded megacap internet and high‑multiple SaaS than in prior phases of the cycle.
VL Institutional Outliers™ (IO)
Institutional Outliers is a proprietary metric designed to spotlight trades that significantly exceed a stock’s recent institutional activity—specifically in terms of dollar volume. By comparing current trade size against each security's recent normalized history, the metric flags outlier events that may indicate sudden institutional interest but may be missed because the activity doesn’t raise any flags/alerts when comparing the activity against the ticker’s entire history. For example, it’s conceivable that a ticker today receives the largest trade it has had in the last 6 months but the trade is unranked and would therefore be missed by current alerts built off Trade Ranks. Day traders can use “Realized Vol” to identify tickers that are moving swiftly with large price displacement while others can use it to size your risk appropriately.
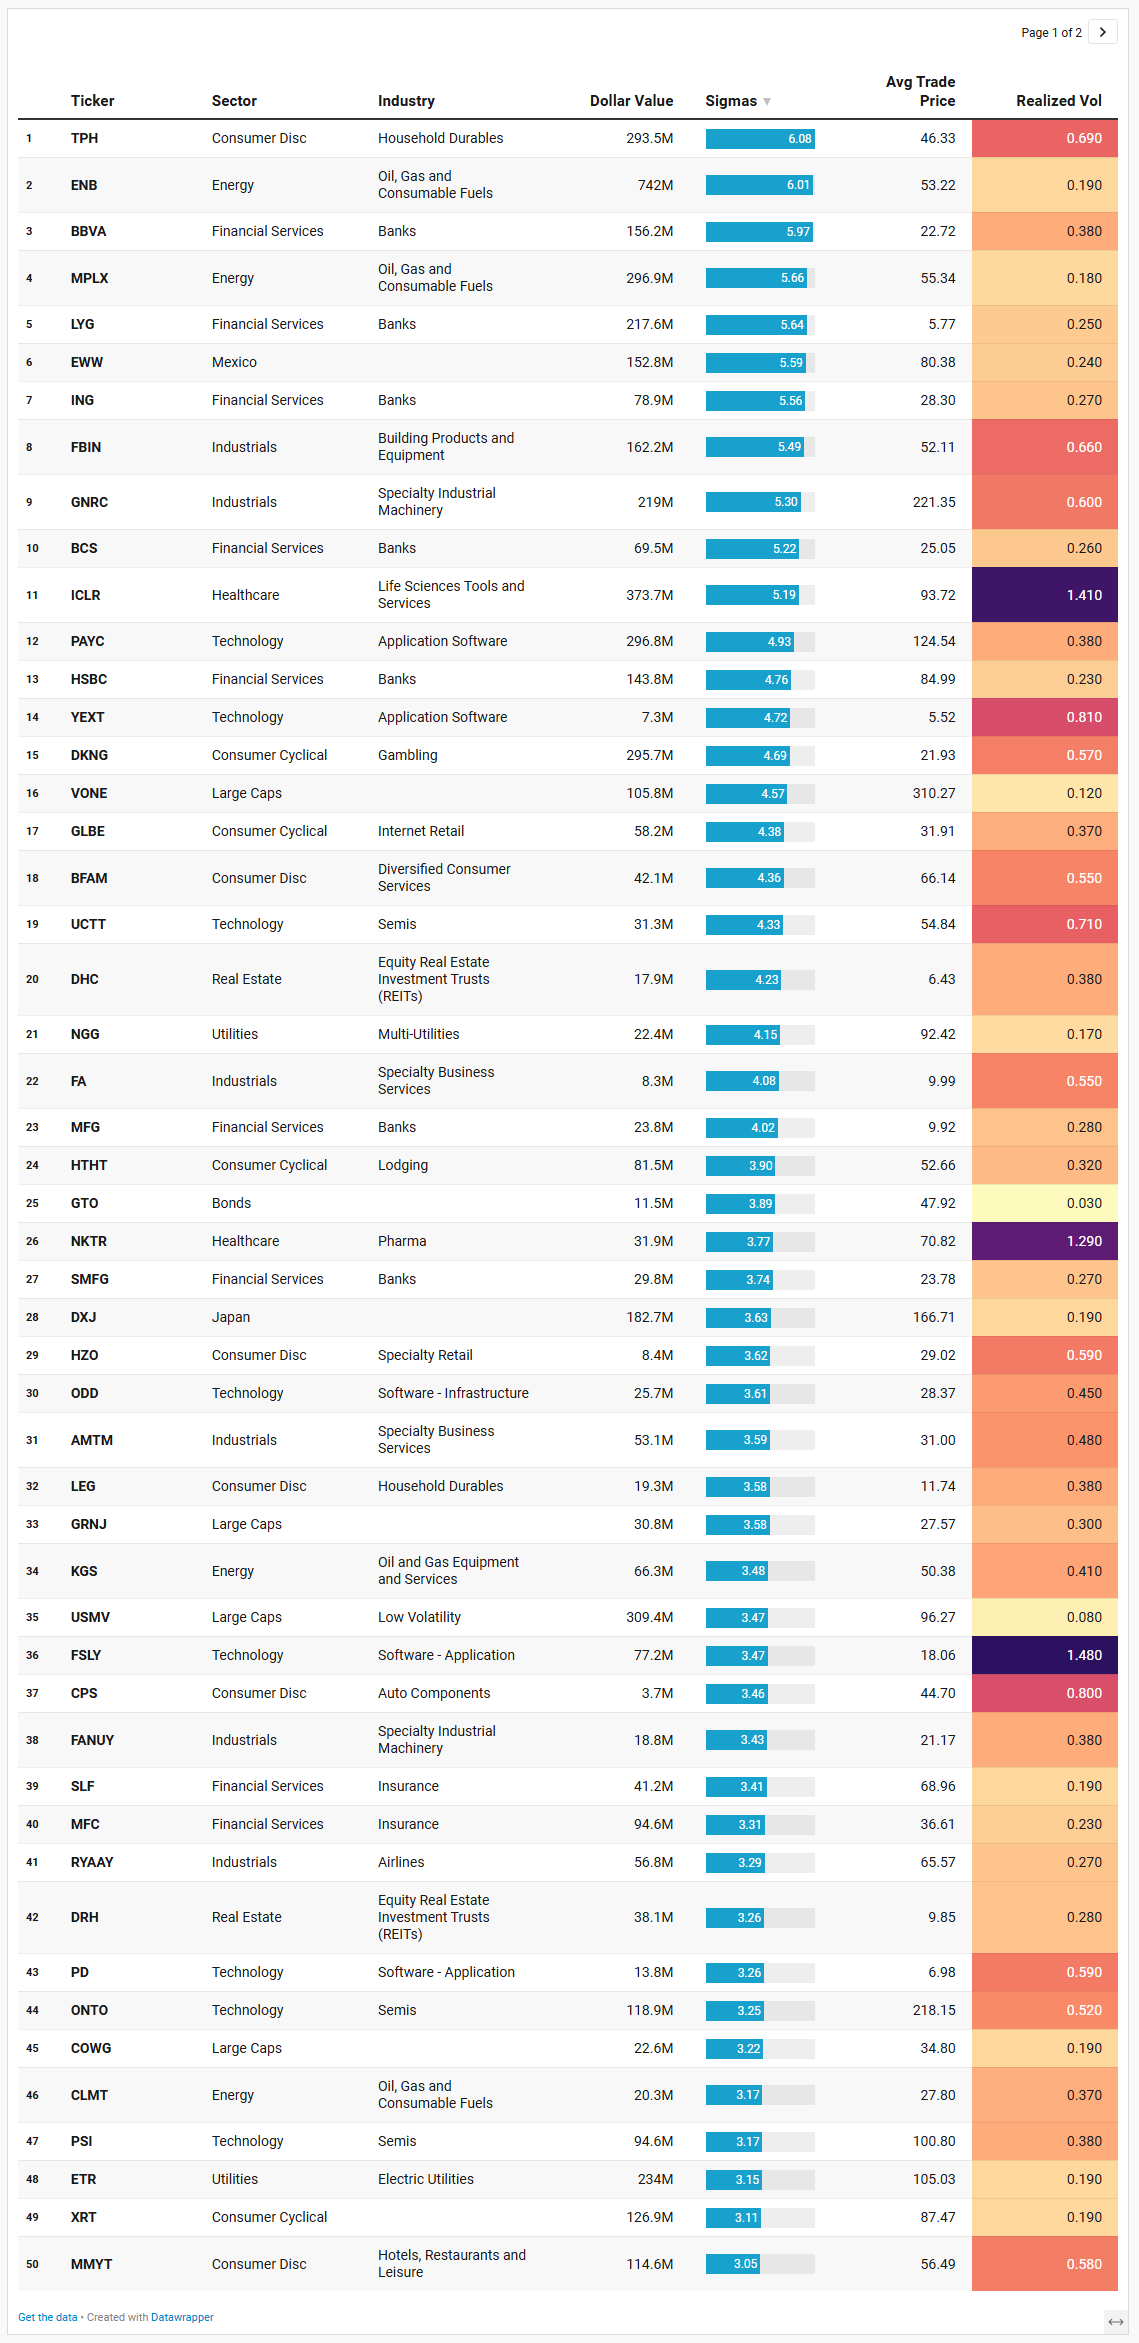
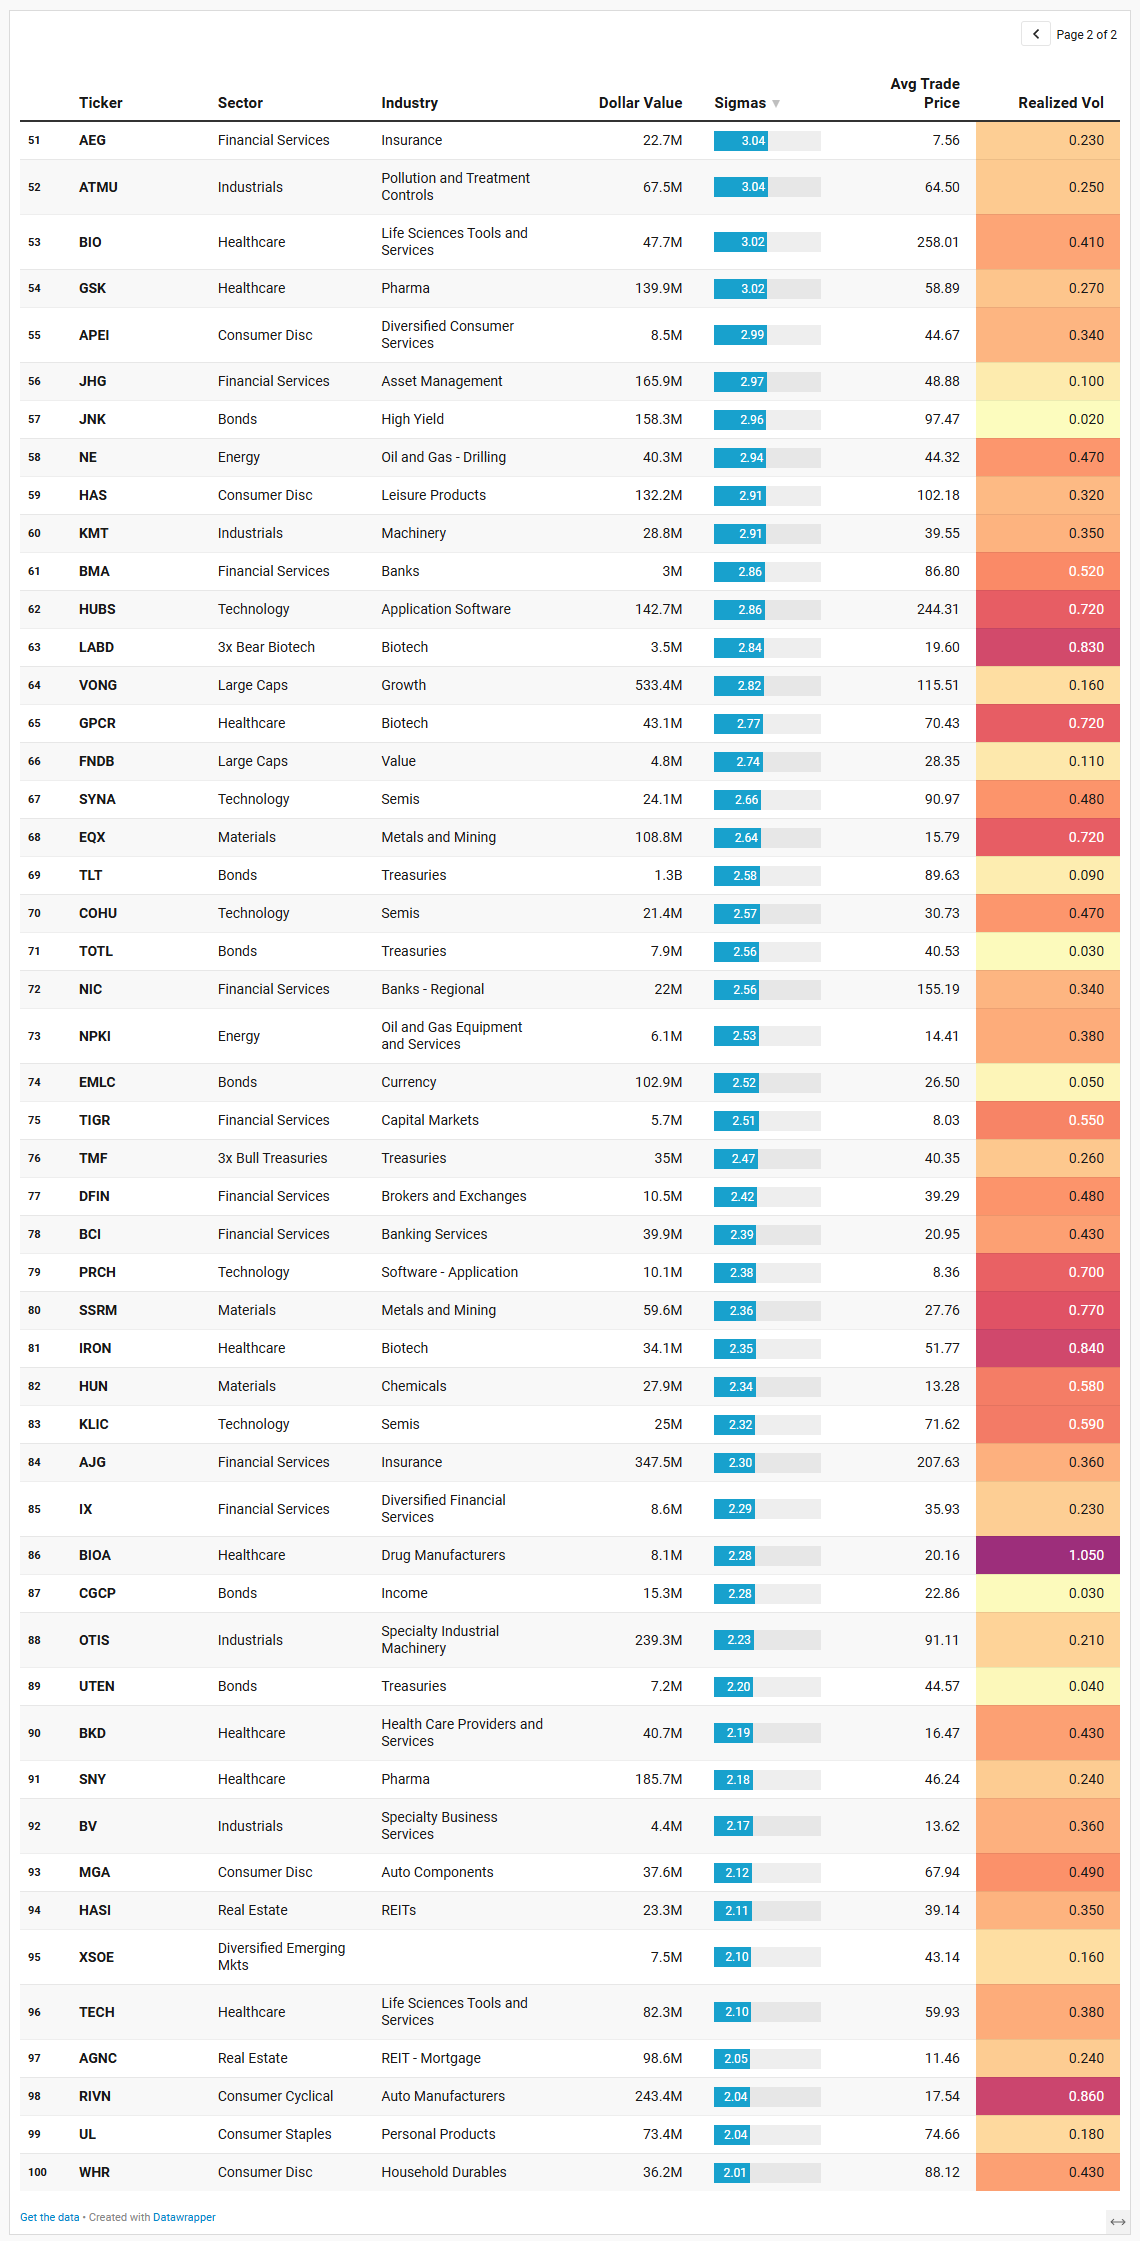
The IO list is basically a heat map of where institutions stepped outside their usual playbook, and it lines up neatly with the broader rotation we have been tracking: real assets and cyclicals are where the abnormal flow lived, with a secondary axis in global financials and a scattering of high‑beta growth and biotech.
At the very top, you have TPH in household durables printing roughly $294m at more than 6 sigmas, and MPLX and ENB in oil and gas with $297m and $742m at 5.7 and 6.0 sigmas respectively. That combination tells you real money was doing something deliberate in housing‑adjacent cyclicals and income‑heavy energy infrastructure, not just adding a little incremental beta. Realized intraday vol on ENB and MPLX is low—around 0.2—so these look more like allocation or yield‑grab moves than speculative punts. CLMT, NE, KGS, NPKI and MPLX round out the energy side with smaller but still anomalous prints, reinforcing the idea that the market continues to rebuild exposure across the oil and gas value chain rather than just trading front‑month futures.
Financials are the next obvious cluster. BBVA, ING, BCS, HSBC, MFG, SMFG, NIC, JHG, SLF, MFC, AEG, IX, TIGR, DFIN, BCI and AJG all screen as multi‑sigma outliers, with BBVA and ENB‑scale prints in the mid‑hundreds of millions and realized vol mostly sitting in the 0.2–0.4 range. Add in LYG from the prior day at 5.6 sigmas and you have a clear message: global banks and insurers were active risk‑transfer hubs this week. That fits the macro backdrop of cooling inflation, stable credit conditions, and markets leaning toward rate cuts later this year, a mix that helps steepen curves at the margin and improves the earnings outlook for financials. The presence of JNK, GTO, TLT, TOTL, EMLC, TMF and other bond ETFs on the list shows the fixed‑income side of the house participating as well, with multi‑sigma flows in high yield, core aggregates, Treasuries and EM currency debt. The realized vol on those is microscopic—0.02 to 0.09—so again, this is positioning, not panic.
Cyclicals and global beta form the third pillar. DXJ (Japan hedged), EWW (Mexico), XSOE (EM ex‑SOEs), VONE, USMV, VONG, GRNJ, COWG and FNDB all show up with multi‑sigma prints. Together they paint a picture of allocators tilting toward international and factor exposures—Japan, Mexico, EM, growth, low vol, value—rather than just leaning harder into SPY and QQQ. On the discretionary side, DKNG, HAS, RIVN, MMYT, HTHT, WHR, MGA, XRT, BFAM, APEI and HZO suggest strong activity around consumer beta: gambling, leisure, travel, EVs, and retailers. Realized vols here are higher, mostly in the 0.5–0.9 band, which is what you would expect if institutions were using liquidity pockets to reposition around idiosyncratic stories as well as the macro soft‑landing theme.
Tech and growth are present but more selective. PAYC, HUBS, FSLY, PD, PRCH, ODD and YEXT all show abnormal software flow; UCTT, ONTO, PSI, SYNA, COHU, KLIC and UCTT highlight activity in second‑line semis and equipment. None of these are megacap leaders, which matches our broader narrative that institutions are broadening their growth book into the plumbing of AI and cloud rather than doubling down on the same few index names. Realized vol on these names runs hotter—0.5 to 1.5—so these prints likely reflect a mix of earnings‑driven repricing and tactical chase rather than quiet long‑term accumulation.
Healthcare and materials round out the picture. ICLR, BIO, TECH, GSK, SNY, NKTR, GPCR, IRON, BIOA and BKD all flag in biotech, pharma and life‑science tools, joined by metals and mining names EQX, SSRM and HUN. The pattern here is familiar: uncorrelated growth and real‑asset inflation hedges getting fresh attention as rate and inflation volatility cool. Taken as a whole, this IO sheet says institutions used Friday’s tape to meaningfully adjust exposures in energy infrastructure, global banks and credit, international and factor ETFs, and selective growth and healthcare, with a noticeable tilt toward high‑quality cash‑flow and real‑asset sensitivity rather than pure duration or speculative meme risk.
VL Sector Leaders
VL Sector Leaders is a weekly snapshot of where true leadership is asserting itself inside the market, stripped of the distortions that come from broad, style-mixed indices. Rather than asking which stocks look strong in absolute terms, this list focuses on which names are outperforming within the environments they actually compete in.
Each week, we surface the ten stocks demonstrating the most persistent relative strength inside their respective sectors. These are not headline chasers or one-day wonders. They are names that continue to separate themselves from peers through real price behavior, often reflecting sustained demand rather than fleeting attention.
For day traders, this list is a powerful awareness tool. Sector Leaders tend to offer cleaner intraday structure, better follow-through, and more predictable reactions around key levels because they already sit on the right side of relative strength. Even on choppy tape, leadership names often remain tradeable while the rest of the market degrades.
For swing traders, VL Sector Leaders helps narrow the universe to stocks with the highest probability of staying relevant. Relative leaders are more likely to hold trends, survive pullbacks, and reassert themselves after consolidation. When markets rotate, these names are often among the first to resume leadership — or the last to break.
The VL sector leaders list is basically a who’s‑who of where the market wants to be right now, and it reinforces the same rotation story we have been seeing in breadth and flows: real‑economy cyclicals and real assets are carrying the ball, while tech leadership has broadened beneath the mega‑caps into more specialized names.
Start with the obvious: energy and materials leadership is deep, not just a single‑name story. In energy you have VAL, NE, CLMT, SFL, AM, SEI, WMB, SDRL, PUMP, ENB and others populating the top rows. That mix spans offshore drillers, pipelines, midstream, and services, which is exactly what you would expect if investors are betting on a sustained upcycle rather than a short‑term pop in crude. Materials show a similarly broad bench: EGO, GRID, SOLS, NG, SUZ, SSRM, IAG, SA, AGI and more. Gold miners, specialty chemicals, and clean‑energy‑adjacent plays are all represented. Put those together with construction names like EGO and VMC from the broader watchlists and you get a clear message: capital continues to migrate toward hard‑asset and commodity leverage, in line with the institutional flow data that showed steady or rising volumes in energy and materials while tech cooled.
Industrials and financials are the other big winners. On the industrials side you see GNRC, AMSC, GRID (overlapping materials/industrials), VRT, TRN, HWM, HCSG, GXO, TEX, GLDD, AGI, MUX, and a long tail of machinery, logistics, and specialty equipment. This is exactly the cohort tied into reshoring, grid and data‑center build‑out, and public infrastructure projects. Financial leadership leans toward more idiosyncratic names—SF, CCCC, WULF, CLFR, GLXY, BAM, BN, BUR, NMR, BX, BBDX and others—rather than just the big US money‑center banks. That lines up with the IO sheet that highlighted outsized flows in global banks and insurers: investors are clearly comfortable owning credit and balance‑sheet risk again, but they are picking their spots rather than buying the whole XLF complex indiscriminately.
On the growth side, leadership has broadened but tilted away from pure consumer internet. Technology leaders include FSLY, ICHR, CGNX, MNTN, VNET, TDC, QXO, AKAM, VSAT, TLN and AEIS. This is a very different profile from last year’s “only the megacaps matter” regime. You have edge computing and CDNs, chip‑equipment and inspection, industrial vision, network infrastructure and security, niche cloud data platforms, and Chinese datacenter hosting in the mix. Communication‑services leadership is similarly off the beaten path: SPHR and AMX on the winners side, with the big social and streaming platforms notably absent. That rhymes with the aggregate‑flow and dark‑pool charts, where semis, security, and second‑tier tech were heavy, while mega‑cap internet looked more like redistribution than fresh accumulation.
Small caps and international risk round out the leadership side. Under “Small Caps” you see SCHC, RYLD, IWN, SDVY, VB, VTWO, FNDA, IWM and SPSM—value‑tilted and dividend‑oriented small‑cap funds rather than high‑beta story stocks. In emerging markets, ESGB, EMXC, IEMG, VEA, AVEM, FNDE, AVDE, EEM and VXUS populate the top of the list, along with country and regional plays in the IO sheet like DXJ and EWW. That combination suggests allocators are redistributing risk globally, emphasizing diversified and factor‑tilted exposure over narrow, single‑country bets.
On the defensive side, you still have leadership pockets, but they look more like high‑quality stock‑pickers’ names than broad factor trades. Consumer defensive includes USFD, CRCL, BMNR, CLX, ETH, FNDE’s staples exposure and others. Real estate leaders like FRMI, IRM, CIM, AMT, CCI, SBAC, HASI, WELL, AHR, HR and UR lean heavily toward data centers, towers, and high‑quality income REITs, not levered office or speculative development. Utilities leadership is similarly selective: VST, NRG, EIX, PCG, CEG, XEL, EXC, DTE, TLN and SRE cluster around deregulated power, grid transition and nuclear exposure. These are the defensives that also benefit from energy transition and policy tailwinds, which is consistent with the idea that the market wants real assets and cash‑flow visibility, not bond‑like duration alone.
Finally, the losers list is just as important. In each sector, many of the laggards are the classic high‑beta or lower‑quality expressions: high‑yield bond ETFs, levered crypto and tech plays, weaker consumer discretionary brands, and rate‑sensitive real estate. That contrast underscores the broader narrative: leadership is coming from real‑asset cyclicals, quality balance sheets, and neglected but fundamentally sound growth, while capital quietly exits crowded, speculative and rate‑fragile corners of the tape. In other words, the VL sector leaders screen is fully aligned with the week’s institutional flow pattern: rotation and refinement of risk, not a wholesale abandonment of equities.
MIR Part 3: Framing-Up A Trade
This week’s tape says “stay in the game, but change your lineup.” Big picture, I want to stay constructive on risk, dial back pure growth beta, and lean harder into real assets, cyclicals, and second‑tier quality growth where institutional sponsorship is building rather than fading.
I would frame the book around four main sleeves: Core Equity Beta, Real Assets and Cyclicals, Quality Growth and Second‑Tier Tech, and Diversifiers and Hedges. Think of it as staying long the soft‑landing, but with more attention to cash flow, capex, and balance sheets than multiple expansion.
Core Equity Beta – 35%
This sleeve keeps us attached to the major indices and the liquidity complex while allowing the other sleeves to express the tilts.
SPY – 15%
Plain‑vanilla S&P exposure remains the backbone of institutional flow and dark‑pool activity. It keeps tracking error under control and lets the rest of the book lean into relative‑value views rather than calling the market top or bottom.QQQ – 10%
Tech and communication services are no longer the only game in town, but they are not broken. QQQ still carries heavy aggregate flow and dark‑pool sponsorship; we just do not want it to be the entire story. A 10 percent weight keeps us long AI and software, but leaves room to express rotation elsewhere.IWM – 5%
Small caps are starting to show better breadth and pop up across multiple leadership and TRV lists. A modest IWM allocation gives us exposure to the domestic cyclical side of the soft‑landing thesis without betting the farm.USMV or similar low‑vol large‑cap ETF – 5%
Institutional outlier flow into low‑vol products like USMV tells you allocators are willing to own equity, but with more attention to drawdown. This sleeve smooths the ride and pairs well with the more volatile commodity and single‑name exposure elsewhere.
Real Assets and Cyclicals – 30%
This is where the flows were loudest: energy, metals, industrials, and select real estate.
Energy infrastructure and services – 14%
ENB / MPLX / CLMT / NE / VAL / SDRL (roughly equal‑weighted)
Pipelines, midstream, and offshore drillers all screened as institutional outliers and sector leaders. They give us yield, inflation sensitivity, and leverage to capex and offshore spending rather than just spot crude. An actual desk would keep position sizes modest in the more volatile drillers (VAL, SDRL) and heavier in the pipelines (ENB, MPLX).Metals and miners – 8%
SGDM / EQX / CMCL / TFPM / SSRM
Flows into metals ETFs and single‑name miners, plus leadership in materials, argue for a real‑asset sleeve. This basket gives us gold and precious‑metals beta with both producers and royalty/streaming names that institutional money tends to favor when they want duration in the theme, not just a quick trade.Industrials and infrastructure – 8%
GNRC / OTIS / TPC / STRL / HWM / AM
These names sit right at the intersection of grid, data‑center, and infrastructure build‑out, and they appeared repeatedly on leadership and TRV lists. They also match the broader sector‑strength picture in industrials. A desk would scale sizes by liquidity, with larger weights in GNRC, OTIS, and HWM and smaller tactical allocations in the niche contractors.
Quality Growth and Second‑Tier Tech – 25%
Here we are deliberately getting away from just owning the megacaps and into the “plumbing” names institutions are quietly accumulating.
Semis and hardware – 12%
SKYT / MPWR / NVMI / ONTO / PSI / KLAC / AMKR / SITM / COHU
This basket reflects the watchlists: second‑tier semis, test, and specialty chip names that power AI, autos, and industrial automation. They lined up across TRV, IO, and sector‑leader screens. I would size the larger, more liquid names (MPWR, KLAC, ONTO) at the top of the sleeve and use the smaller‑caps as higher‑octane satellites.Software and infrastructure – 8%
PAYC / HUBS / FSLY / PD / ODD / YEXT / PRCH / TDC
These are not the crowded mega‑cap SaaS names; they are the infrastructure and vertical‑software stories that showed up in both outlier flow and leadership. They offer upside if enterprise spending remains healthy, but are small enough to move when the tape rewards idiosyncratic growth. Tight risk management is key here; an actual book would run smaller individual position sizes and actively trade around earnings and big prints.Healthcare growth – 5%
BIOA / ICLR / TECH / select biotech basket (for example, equal‑weight several of SEPN / TERN / PEPG / MIRM / NUVL)
Healthcare sits in that sweet spot of uncorrelated growth with improving relative strength. ICLR and TECH showed anomalous institutional interest, while a handful of biotech names populated the TRV and sector‑leader lists. This sleeve gives us optionality if the market continues to reward pipelines and life‑science tools now that rate volatility has cooled.
Diversifiers and Hedges – 10%
This sleeve is about shaping the distribution of outcomes rather than calling the next 5 percent move.
Rates and credit – 6%
TLT / JNK / GTO / EMLC / TMF (small)
Multi‑sigma flows in Treasuries and high yield tell you big money is still actively managing duration and credit. A core TLT position paired with some high yield (JNK) and EM local currency (EMLC) gives us ballast if growth disappoints and rates drop faster than expected. A small TMF position is optional leverage that can be quickly cut if the Fed turns more hawkish than the market expects.Defensive equity and staples – 4%
UL / STKL / MICC / USMV (incremental)
Personal products and food names showed up on the TRV list and are classic hiding places when volatility spikes. Bolting a few of these onto the low‑vol ETF creates a modest defensive barbell against the higher‑beta growth and commodity exposure.
If I were actually running this book, I would watch two things closely through the week. First, whether the breadth metrics we have been tracking (percent of components above their 50‑day plus new‑high/new‑low spreads) continue to improve in small caps, industrials, and financials. Second, whether the dark‑pool dollar share in megacap tech stabilizes or continues to look like redistribution. As long as breadth in cyclicals holds and megacap tech is digesting rather than cracking, this portfolio should participate in the upside while being better aligned with where real money is actually moving than a simple SPY/QQQ barbell.
If those three tripwires start to go the wrong way, I would treat it as a rotation inside the same framework, not an automatic “sell everything and go to cash.”
If breadth rolls over first – especially if small caps, industrials, and financials see their 50‑day cohorts slip back under the mid‑40s with new lows expanding – I would trim the highest‑beta cyclicals and real‑asset singles before touching the cores. Concretely, I would cut back or flatten the offshore drillers (VAL, SDRL, NE), the smaller energy and metals plays (CLMT, CMCL, ALM, some of the thinner miners), and the more levered industrial contractors (TPC, STRL, PUMP). Proceeds would move up the quality curve into more SPY and USMV, plus a bit more TLT and JNK to recognize a higher probability of a growth scare. The idea is to keep sector tilts modestly pro‑cyclical, but let the book’s beta drift down toward the indices rather than fight a breadth deterioration with the same high‑octane names.
If dark‑pool and flow data in megacap tech start to look like outright liquidation – big hidden sells in MSFT, AAPL, NVDA, QQQ with no corresponding second‑tier tech sponsorship – I would take down the entire Quality Growth and Second‑Tier Tech sleeve by a third to a half. The first cuts would be the most volatile software and small‑cap semis (FSLY, PD, PRCH, ODD, YEXT, some of the thinner chip names like AMKR, SITM, COHU), while keeping a reduced core in the sturdier compounders (MPWR, KLAC, ONTO, PAYC, HUBS, TECH, ICLR). Redeployment would go into defensives and real cash flow: staples (UL, STKL), quality utilities and power transition (VST, NRG, CEG), and a bit more value and low‑vol factor (FNDB, USMV). That way, if the de‑rating extends, you are tilted toward earnings stability rather than multiple risk.
In other words, the fail‑state playbook is: first take down the sharpest edges in cyclicals and speculative growth, then tilt toward quality and defensives, and only if stress really ramps do you pull down index beta and let cash and duration carry more of the load.
Good luck this week, VL. See you in the Discord chat.
Thank you for being part of this community and for investing your time in this week’s edition. The quality of this readership — thoughtful, disciplined, engaged — is what makes this work meaningful. I’m grateful to build alongside you. Here’s to a week of clarity, conviction, and well-executed opportunities.
— VolumeLeaders