Market Momentum: Your Weekly Financial Forecast & Market Prep
Issue 79 / What to expect Feb 09, 2026 thru Feb 13, 2026


In This Issue
Weekly Market-On-Close Report: All the macro moves, market drivers, and must-know narratives—covered in less than five minutes.
Weekly Benchmark Breakdown: Our weekly intelligence report on major indices cuts through the index-level noise to uncover participation, momentum, and structural integrity and tell you whether markets are rising on solid ground or skating on thin breadth. This is where bull markets prove themselves—or quietly start to unravel.
The Latest Investor Sentiment Readings: Track the emotional pulse of the market with our curated dashboard of sentiment indicators. From fear-fueled flight to euphoric overreach, this week's readings reveal whether investors are cautiously creeping in—or stampeding toward the exits.
Institutional Support & Resistance Levels For Major Indices: Exactly where to look for support and resistance this coming week in SPY, QQQ, IWM & DIA
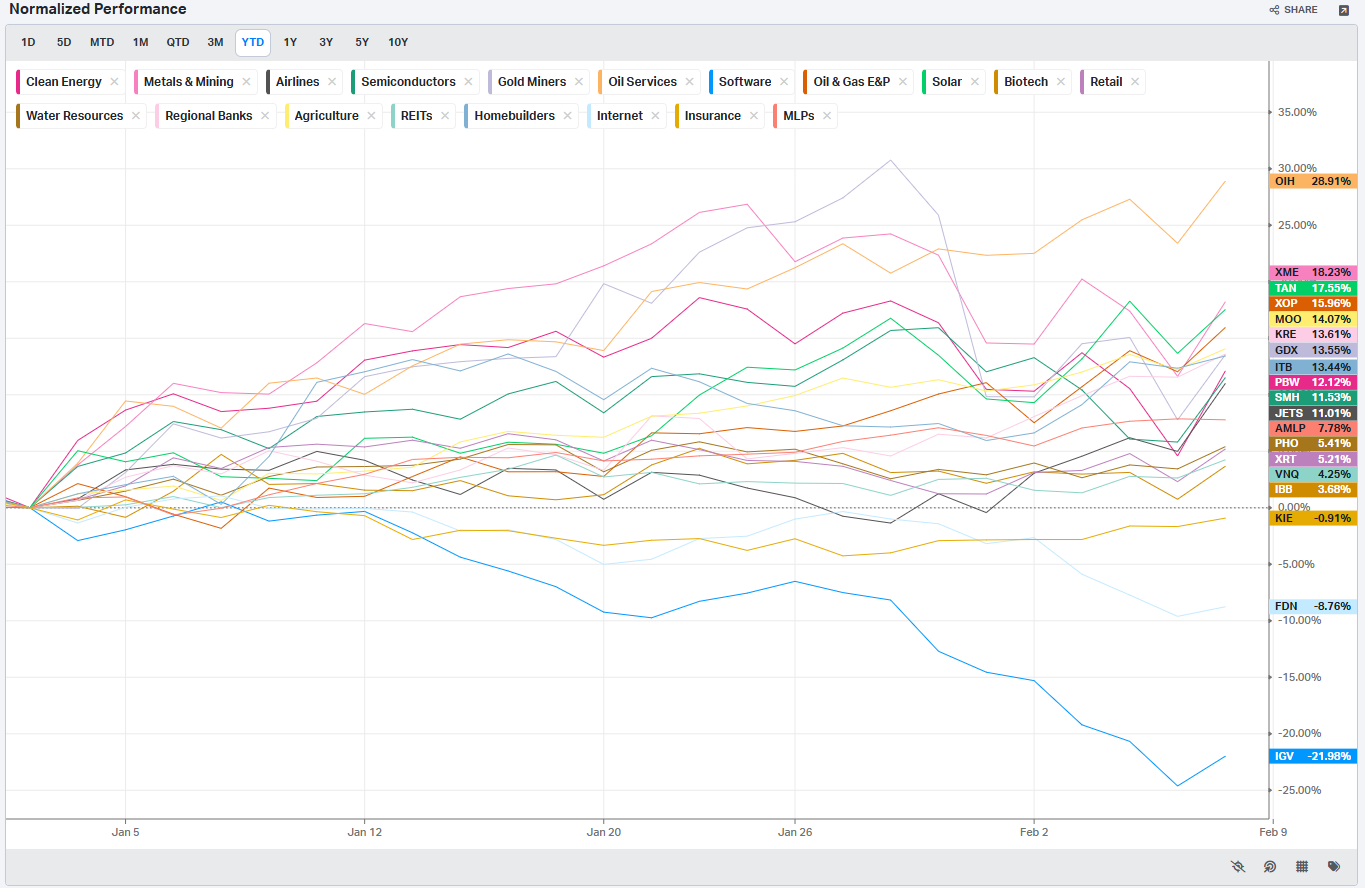
Normalized Performance By Thematics YTD: Which corners of the markets are beating benchmarks, which are overlooked and which ones are over-crowded!
Key Econ Events & Earnings On-Deck For This Coming Week
Market Intelligence Report: Track the real money. This section dissects where institutions are actively putting capital to work—and where they are quietly stepping aside. We start with a sector-by-sector view of flows, identifying which areas are commanding attention and which are losing sponsorship. From there, we move into the tape itself, highlighting the week’s most meaningful block trades and sweep activity across both lit exchanges and dark pools to distinguish durable allocation from short-term positioning.
Each week, we synthesize those signals into a cohesive, realistic portfolio that reflects how a professional allocator might express the dominant themes. The goal is not prediction, but alignment—showing how institutional conviction, optionality, and risk management come together in practice. Whether you’re leaning into momentum or staying selective around crowded trades, this report offers a grounded framework for understanding where size is moving, how it is being expressed, and why it matters.

Weekly Market-On-Close Report
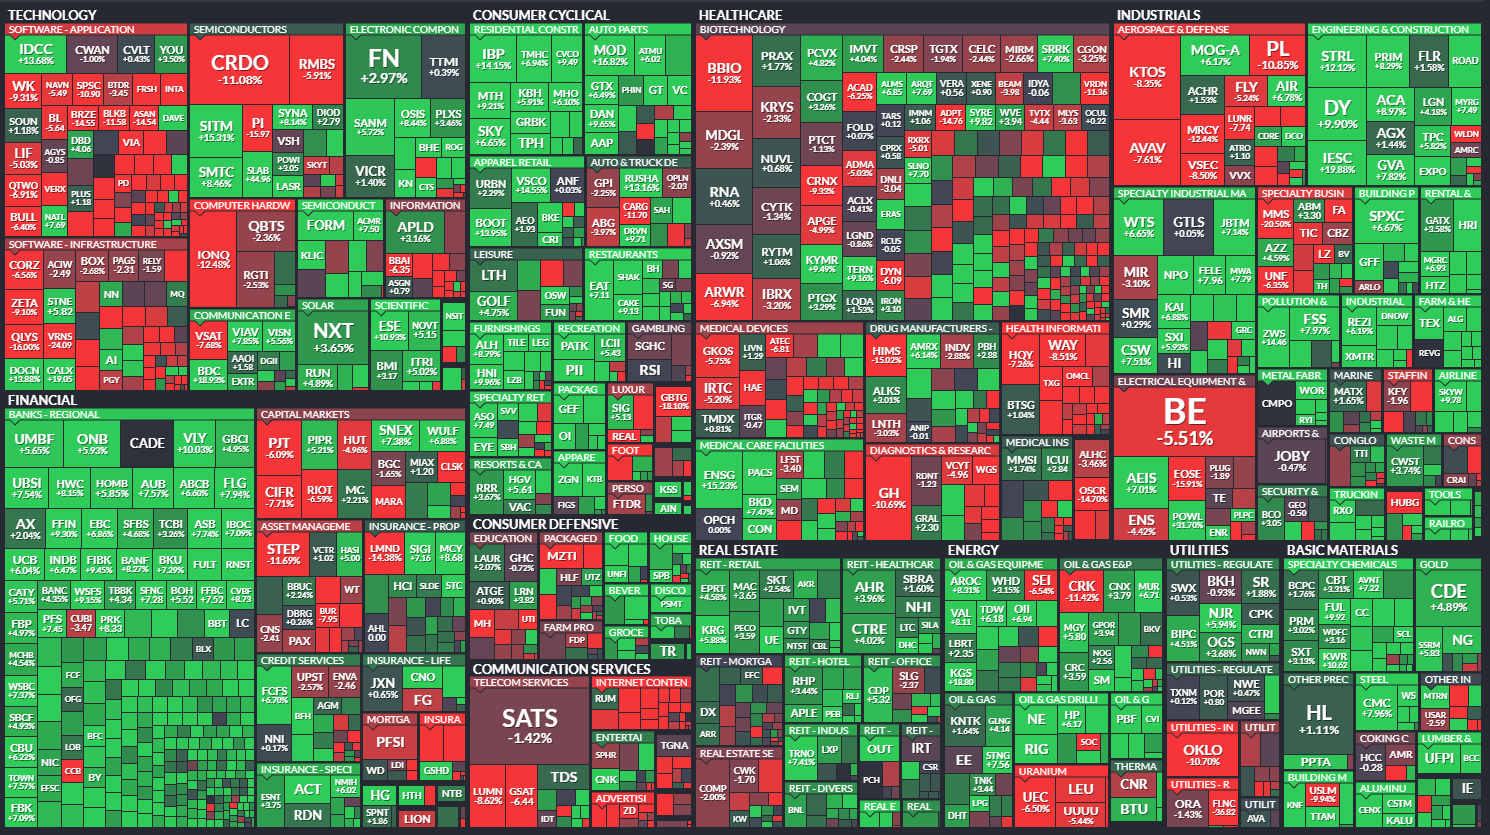
If you felt like markets spent the last week lurching from one “oh wow” headline to the next, you’re not alone. We just watched the Dow trade through 50,000 for the first time, tech suffer a “SaaS‑pocalypse,” crypto and metals whipsaw, and yet… the major equity indices finished the week looking more like a rotation than a rout.
Think of it as the market’s version of spring cleaning: shaking out excesses in the hottest trades, repricing the AI dream, and quietly moving capital back into the parts of the economy that still make, move, and dig real things.
The great rotation: old economy back in style
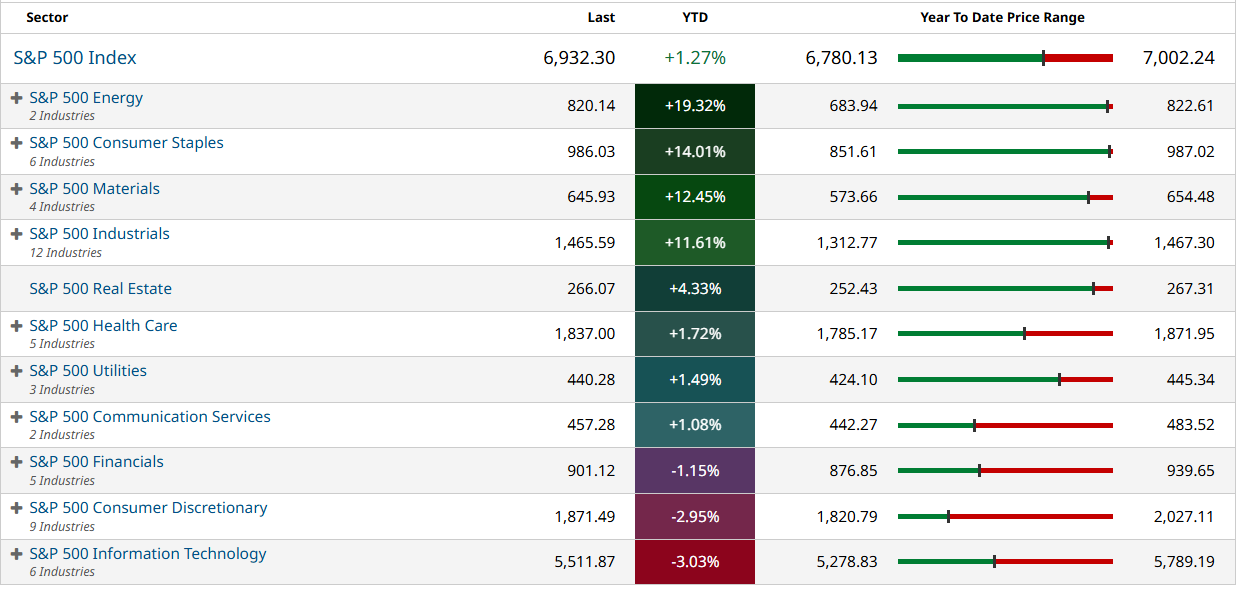
For years, “own the index” really meant “own megacap tech.” This year’s opening act is different. Traditional old‑economy sectors—energy, industrials, transportation, chemicals, staples, and regional banks—are suddenly the ones stealing the spotlight.
Several forces are pushing in the same direction:
Valuations outside tech look compelling after years of neglect.
Earnings expectations are firming as the industrial cycle finally shows signs of turning up.
Investors are actively trying to diversify away from very crowded megacap growth exposure.
The S&P 500 gave back its year‑to‑date gains last week, driven largely by a sharp drawdown in software, even as the Dow notched fresh records. In other words, this is not a broad risk‑off. It’s a repricing of what we pay for growth, and a rotation into sectors tied to real assets and physical activity.
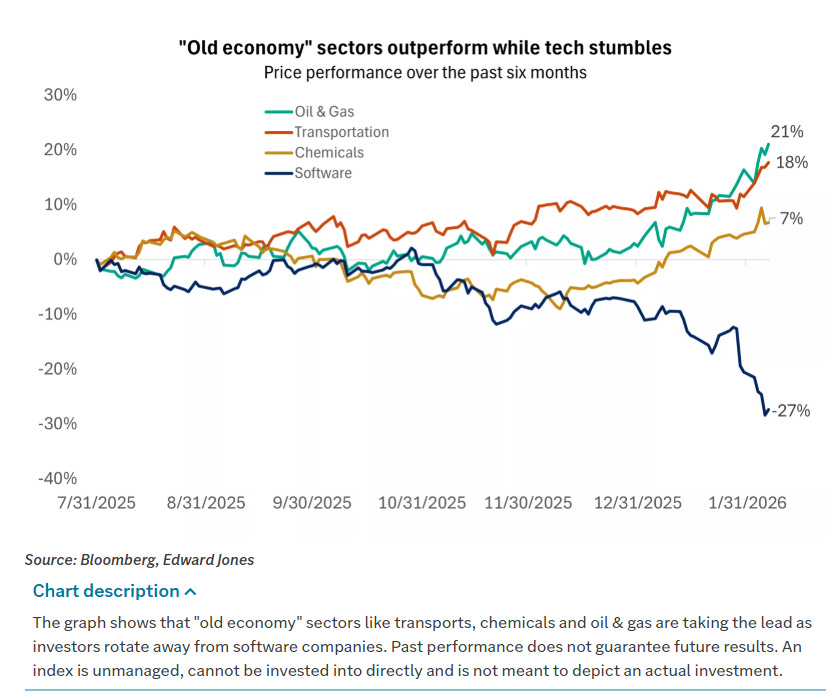
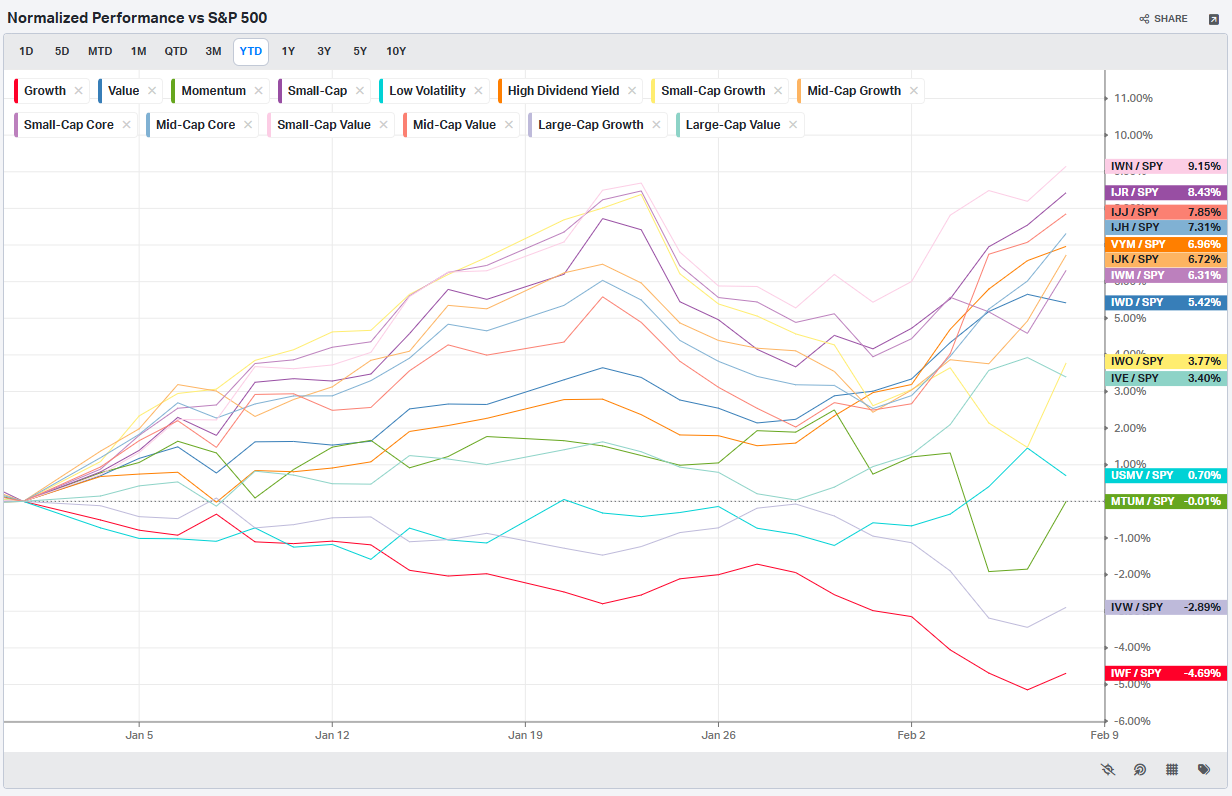
You can literally see the rotation in sector and factor charts: value has been steadily outperforming growth since Halloween, and cyclicals have been adding to gains even on days when software and speculative tech were getting hit.
This is happening against a macro backdrop that’s quietly supportive of cyclicals:
U.S. GDP expectations for 2026 have been revised higher to roughly 2.5%.
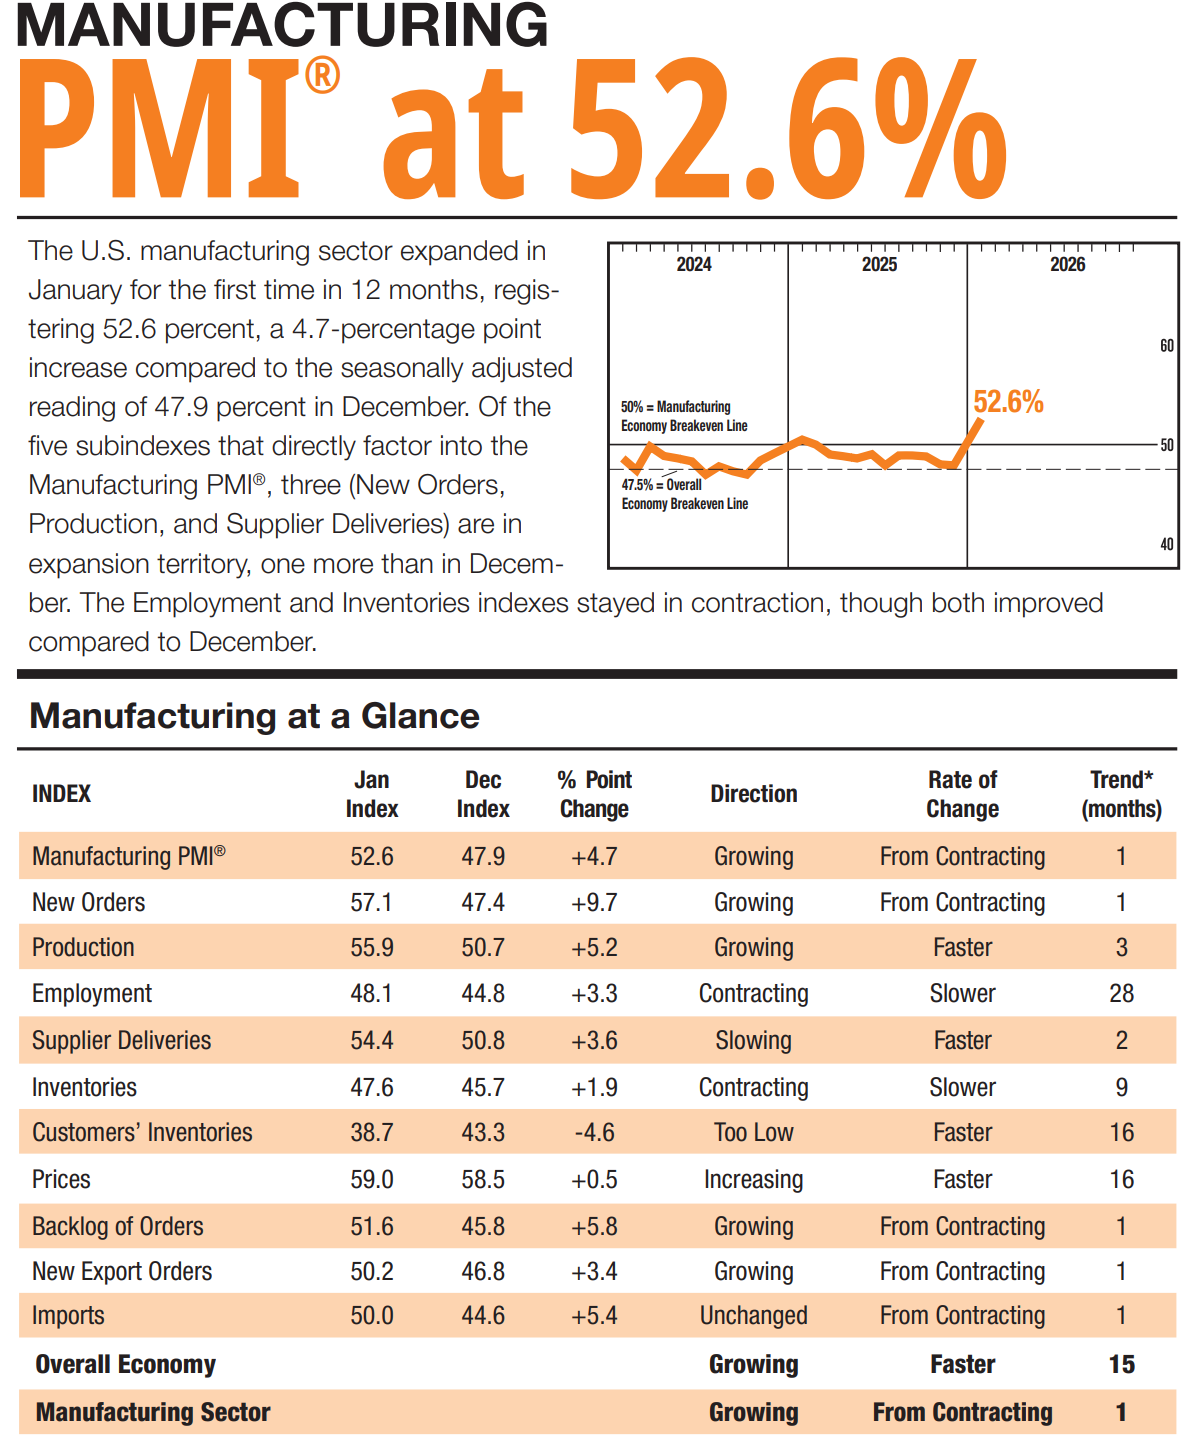
Manufacturing data (ISM) just printed the strongest expansion since 2022, with broad‑based gains in new orders, production, and backlogs.
Capital spending—especially AI‑linked capex—is surging, creating demand for chips, power, data centers, and the physical infrastructure behind them.
That mix—better growth, still‑contained inflation expectations, and a Fed that looks more “higher for longer but not crazy” than “panicked”—is the textbook environment where industrials, select financials, and energy can claw back leadership.
SaaS‑pocalypse, AI “invest‑digestion,” and the tech repricing
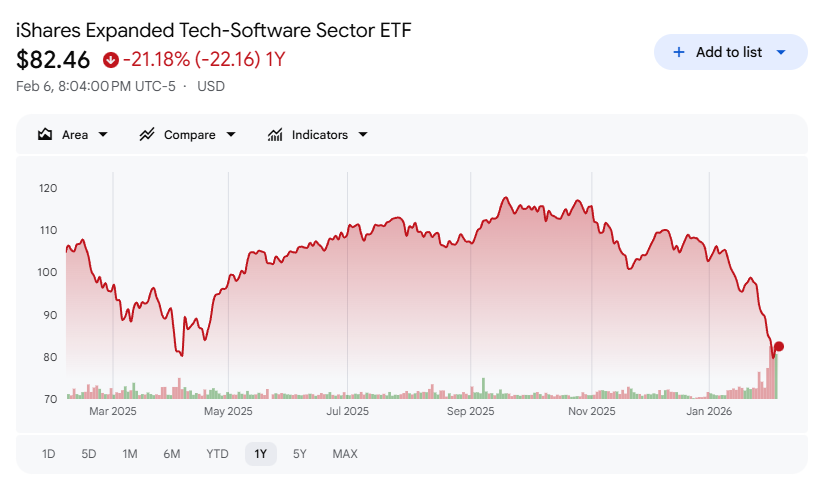
On the other side of that rotation is tech, and especially software. The NYSE MAC Desk coined the term “SaaS‑pocalypse” to capture what happened after an upgrade to Anthropic’s Claude “Cowork” AI suite added plug‑ins for legal and finance workflows.
The concern isn’t just “AI is scary.” It’s much more specific:
If AI agents can absorb more of the work done by white‑collar professionals, the number of paid software seats per company may shrink.
If low‑code/no‑code morphs into what the NYSE desk calls “VIBE coding”—firms building in‑house tools via AI instead of renting SaaS—then pricing power for traditional subscription software comes under question.
Once that narrative caught fire, it spread fast. Software, data analytics, and staffing names sold off sharply; Software has fallen nearly 25% over the last three months, despite sector‑wide earnings still growing at a roughly 30% clip year‑over‑year. The damage is almost entirely valuation compression, not a sudden collapse in profits.
Layered on top of that is the “AI invest‑digestion”—a market trying to swallow the sheer scale of AI capex. Highlights:
Alphabet guided 2026 capex up to around 180 billion dollars, nearly double 2025 levels and roughly 65 billion above where consensus had been.
Amazon is talking about 200 billion dollars in 2026 capex, about 50% higher than last year’s spending.
Across the hyperscalers, NYSE estimates around 655 billion dollars in AI‑related capital expenditures this year alone.
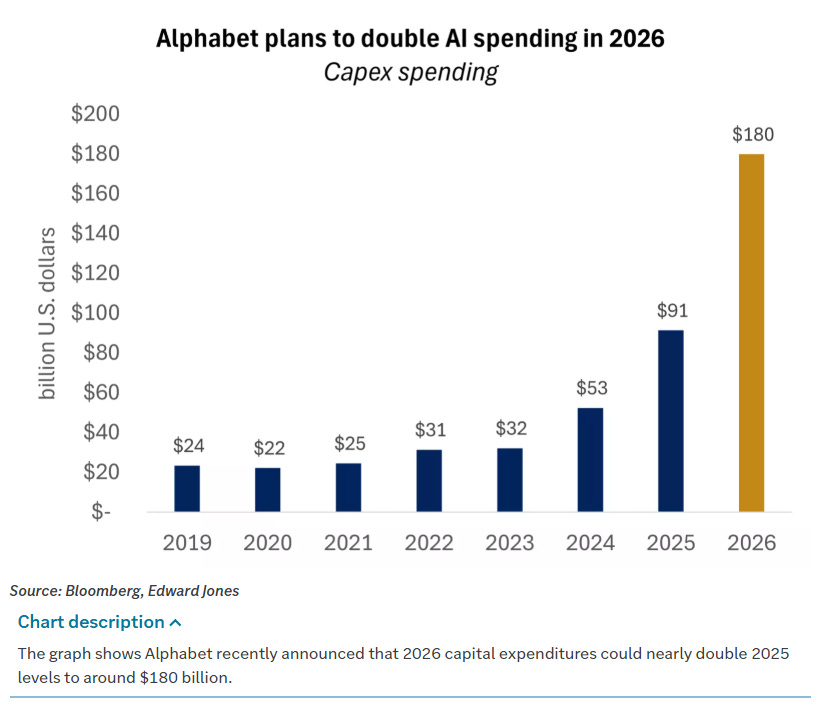
Those numbers are great news if you sell chips, build data centers, or produce the power these systems will consume. They’re less obviously great if you’re a shareholder trying to handicap the eventual return on that spending. Even with much of it funded from internal cash flow, the business models of these once capital‑light giants are moving into “heavy industry” territory, complete with rising debt usage.
The market reaction so far:
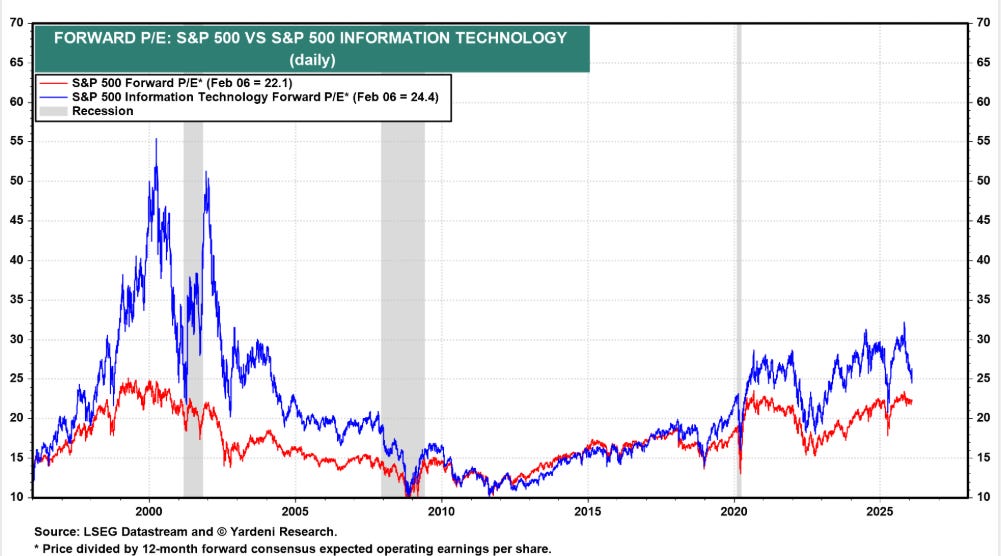
Tech earnings are still strong, but multiples are coming back to earth.
The S&P tech sector’s forward P/E has fallen from around 32x to 24x, now below its five‑year average and roughly in line with its 10‑year range.
Megacap names like Alphabet and Amazon that beat on fundamentals but talked up huge capex have traded lower on the week.
The takeaway is not “avoid tech.” It’s that the easy, multiple‑driven part of the AI trade is giving way to a more nuanced phase: picking between enablers (chips, infrastructure, power) and targets (software, staffing, some business services) while accepting more volatility as the market reprices risk and time horizons.
Commod‑atility, crypto chaos, and softer speculation
While all this was unfolding in equities, the real fireworks were in metals and crypto—an event referred to by some as “Commod‑atility.”
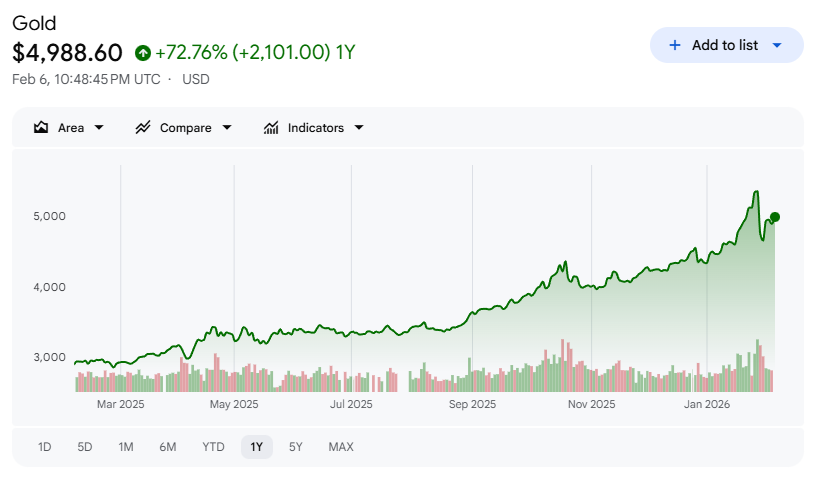
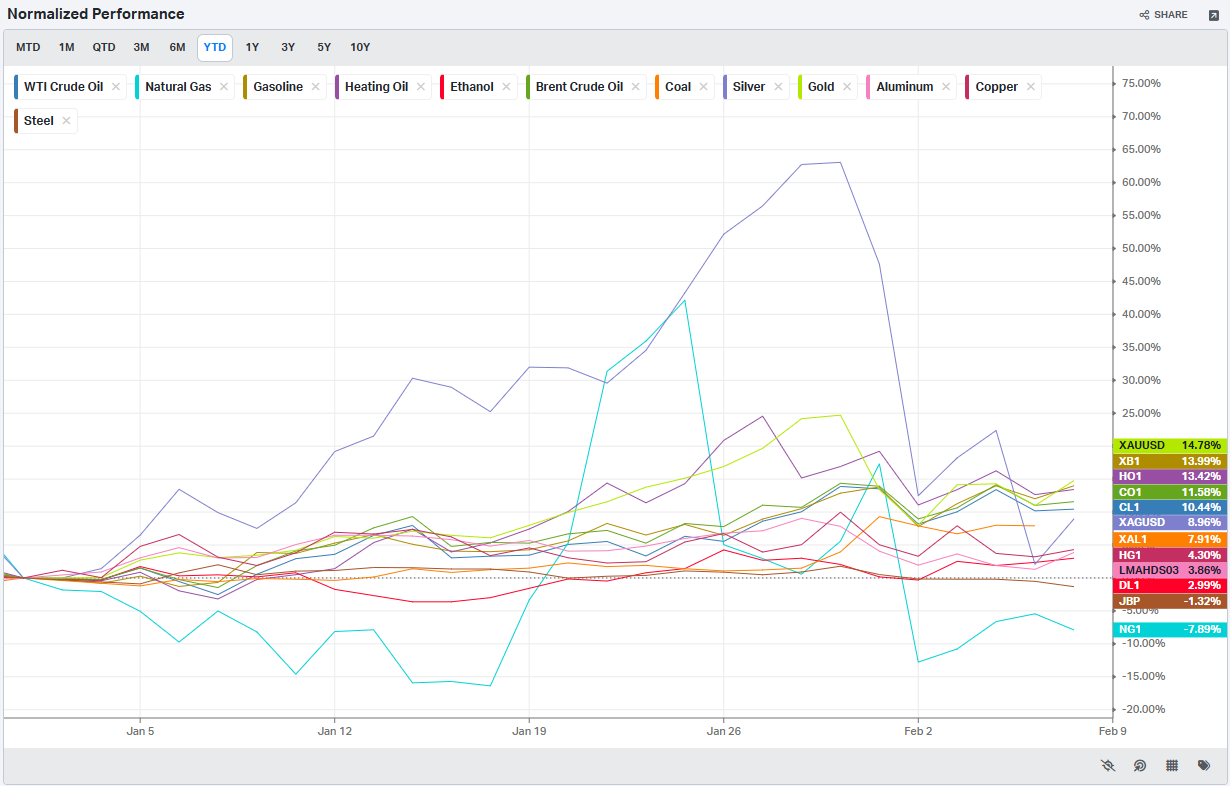
A few weeks of parabolic gains set the stage. By mid‑January, gold was up roughly 25% year‑to‑date and silver about 65%, buoyed by:
Aggressive central bank buying.
A familiar “de‑dollarization” narrative tied to fiscal deficits and geopolitics.
Retail and speculative flows treating metals as momentum trades.
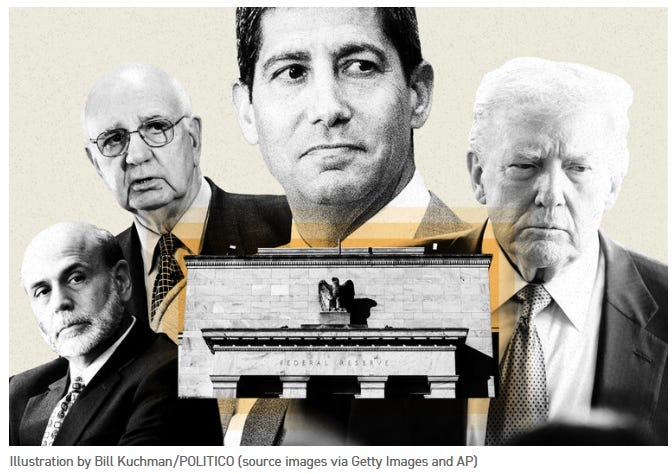
Then came the spark: President Trump’s nomination of Kevin Warsh to replace Fed Chair Powell. The direct reaction in Treasuries and the dollar was mild—a bit of yield‑curve steepening, a bounce in the dollar—but metals reacted violently. Gold fell more than 10% intraday in a half‑hour window before bouncing; silver dropped over 30% in short order.
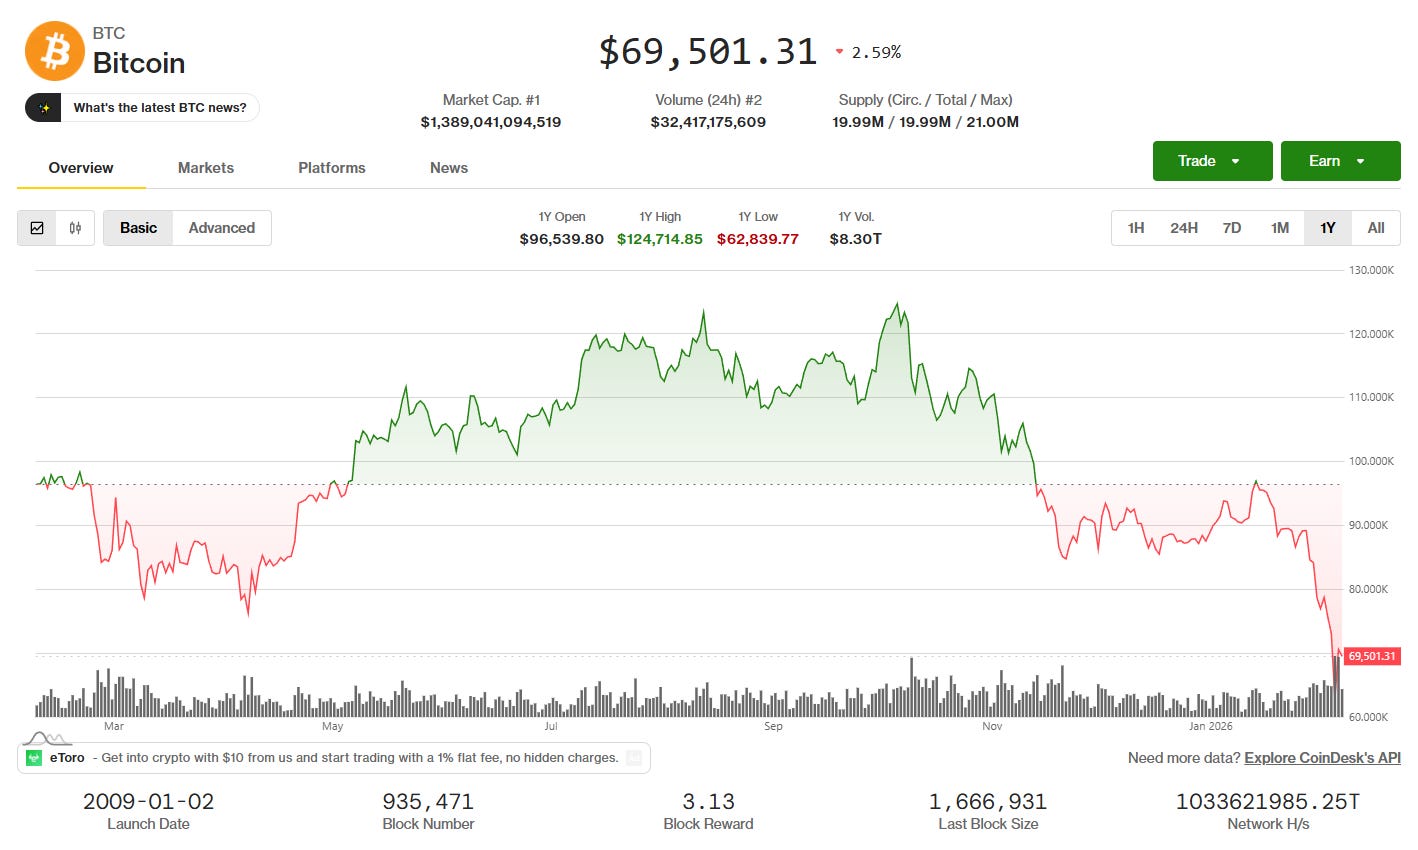
The volatility rolled into crypto over the weekend. Bitcoin broke below 80,000 dollars and the November lows ahead of a White House meeting between banks and crypto trade groups, then accelerated lower through the week, briefly testing 60,000 dollars before snapping back toward 70,000. NYSE points out that Bitcoin’s whipsaw coincided with deeply oversold technical readings and a high‑profile corporate earnings call, underscoring how sentiment‑driven this space remains.
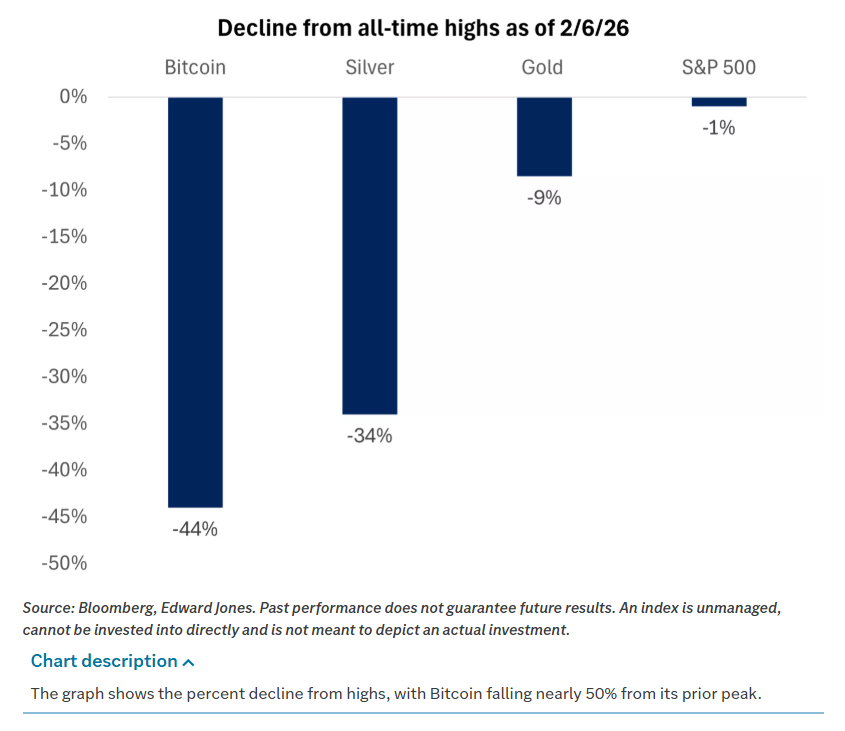
Many view this as part of a broader cooling in speculative risk appetite:
Bitcoin is down nearly 50% from its recent peak over the last four months.
Gold and silver have both corrected sharply from overextended levels, though they remain well above year‑ago prices.
The Fed’s messaging around a longer pause on rate cuts is likely reinforcing the idea that “free money” is not coming back to bail out levered risk trades anytime soon.
Their stance is fairly clear‑eyed:
They remain skeptical of Bitcoin’s long‑term utility and intrinsic value.
They still see a role for a modest gold allocation as “portfolio insurance,” given its diversification properties and uncorrelated behavior during certain stress regimes.
The catch is that over long periods, gold tends to deliver higher volatility and lower returns than equities, often spending years going sideways. So if you’re going to own it, you should probably think of it as a hedge rather than a core growth engine.
On the broader commodity tape:
Brent crude ended the week down about 2%, whipsawed by shifting sentiment around Iranian negotiations and Ukraine‑Russia dynamics.
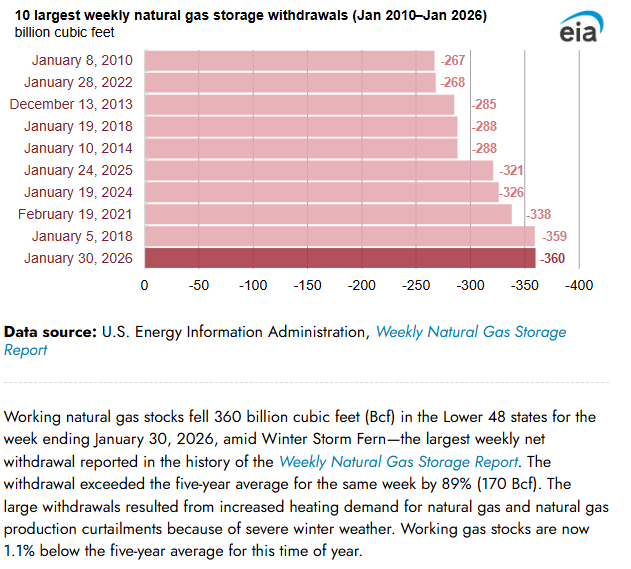
Natural gas, after spiking on winter storms, reversed sharply lower even as storage data showed the largest weekly draw on record.
Precious metals were mixed—gold up around 5% on the week while silver, platinum, and palladium slipped modestly.
This is what late‑cycle cross‑asset repricing looks like: correlation spikes in short bursts, narratives roll from one asset to the next, and under the surface the market quietly reassigns risk premia.
Labor, the Fed, and why recession still isn’t the base case
Against that backdrop, you might expect the macro data to look ugly. It doesn’t. It looks… mixed, in a way that actually fits the “rotation without recession” story.
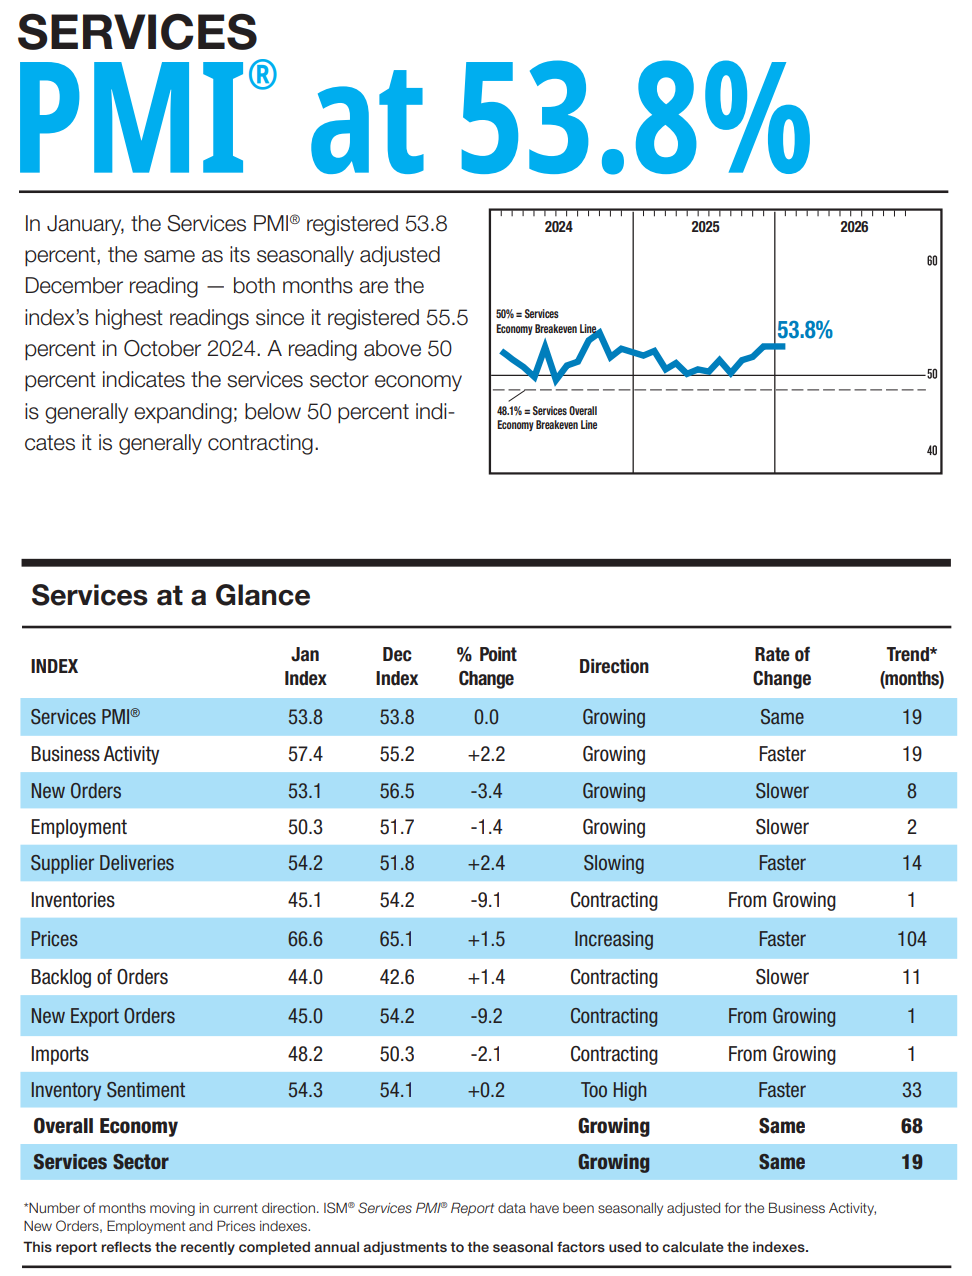
The manufacturing side is finally perking up. January’s ISM Manufacturing PMI jumped back into expansion territory at 52.6, up from 47.9 in December and well ahead of expectations. New orders and production both leapt, while employment, though still in contraction, improved. ISM Services, meanwhile, held steady in the low‑50s, with solid business activity and new orders and only modest price pressure.
The anecdotal commentary paints the nuance:
Manufacturing respondents complain about geopolitical tensions, “anti‑American” buyer sentiment, and confusing tariff policy that makes long‑term planning difficult.
Services respondents sound more optimistic, citing pending capex surges in data centers, combined cycle power, and nuclear capacity, and describing things as a “slow but more optimistic” start to the year.
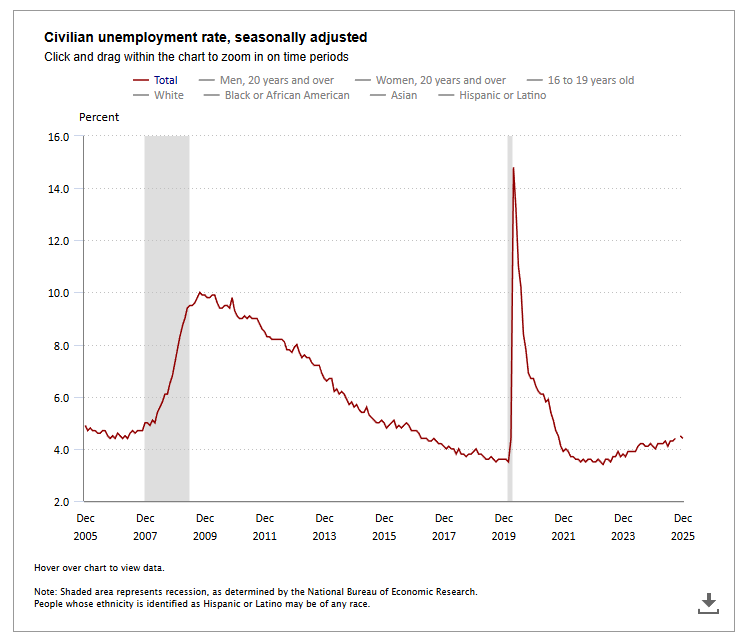
Labor data, partially delayed by a brief government shutdown, skewed softer:
ADP private payrolls added only about 22,000 jobs, well below prior months and consensus.
Challenger job cuts jumped to 180,000, the highest January print since 2009, with large layoffs at UPS, Amazon, and Dow and notable cuts in healthcare.
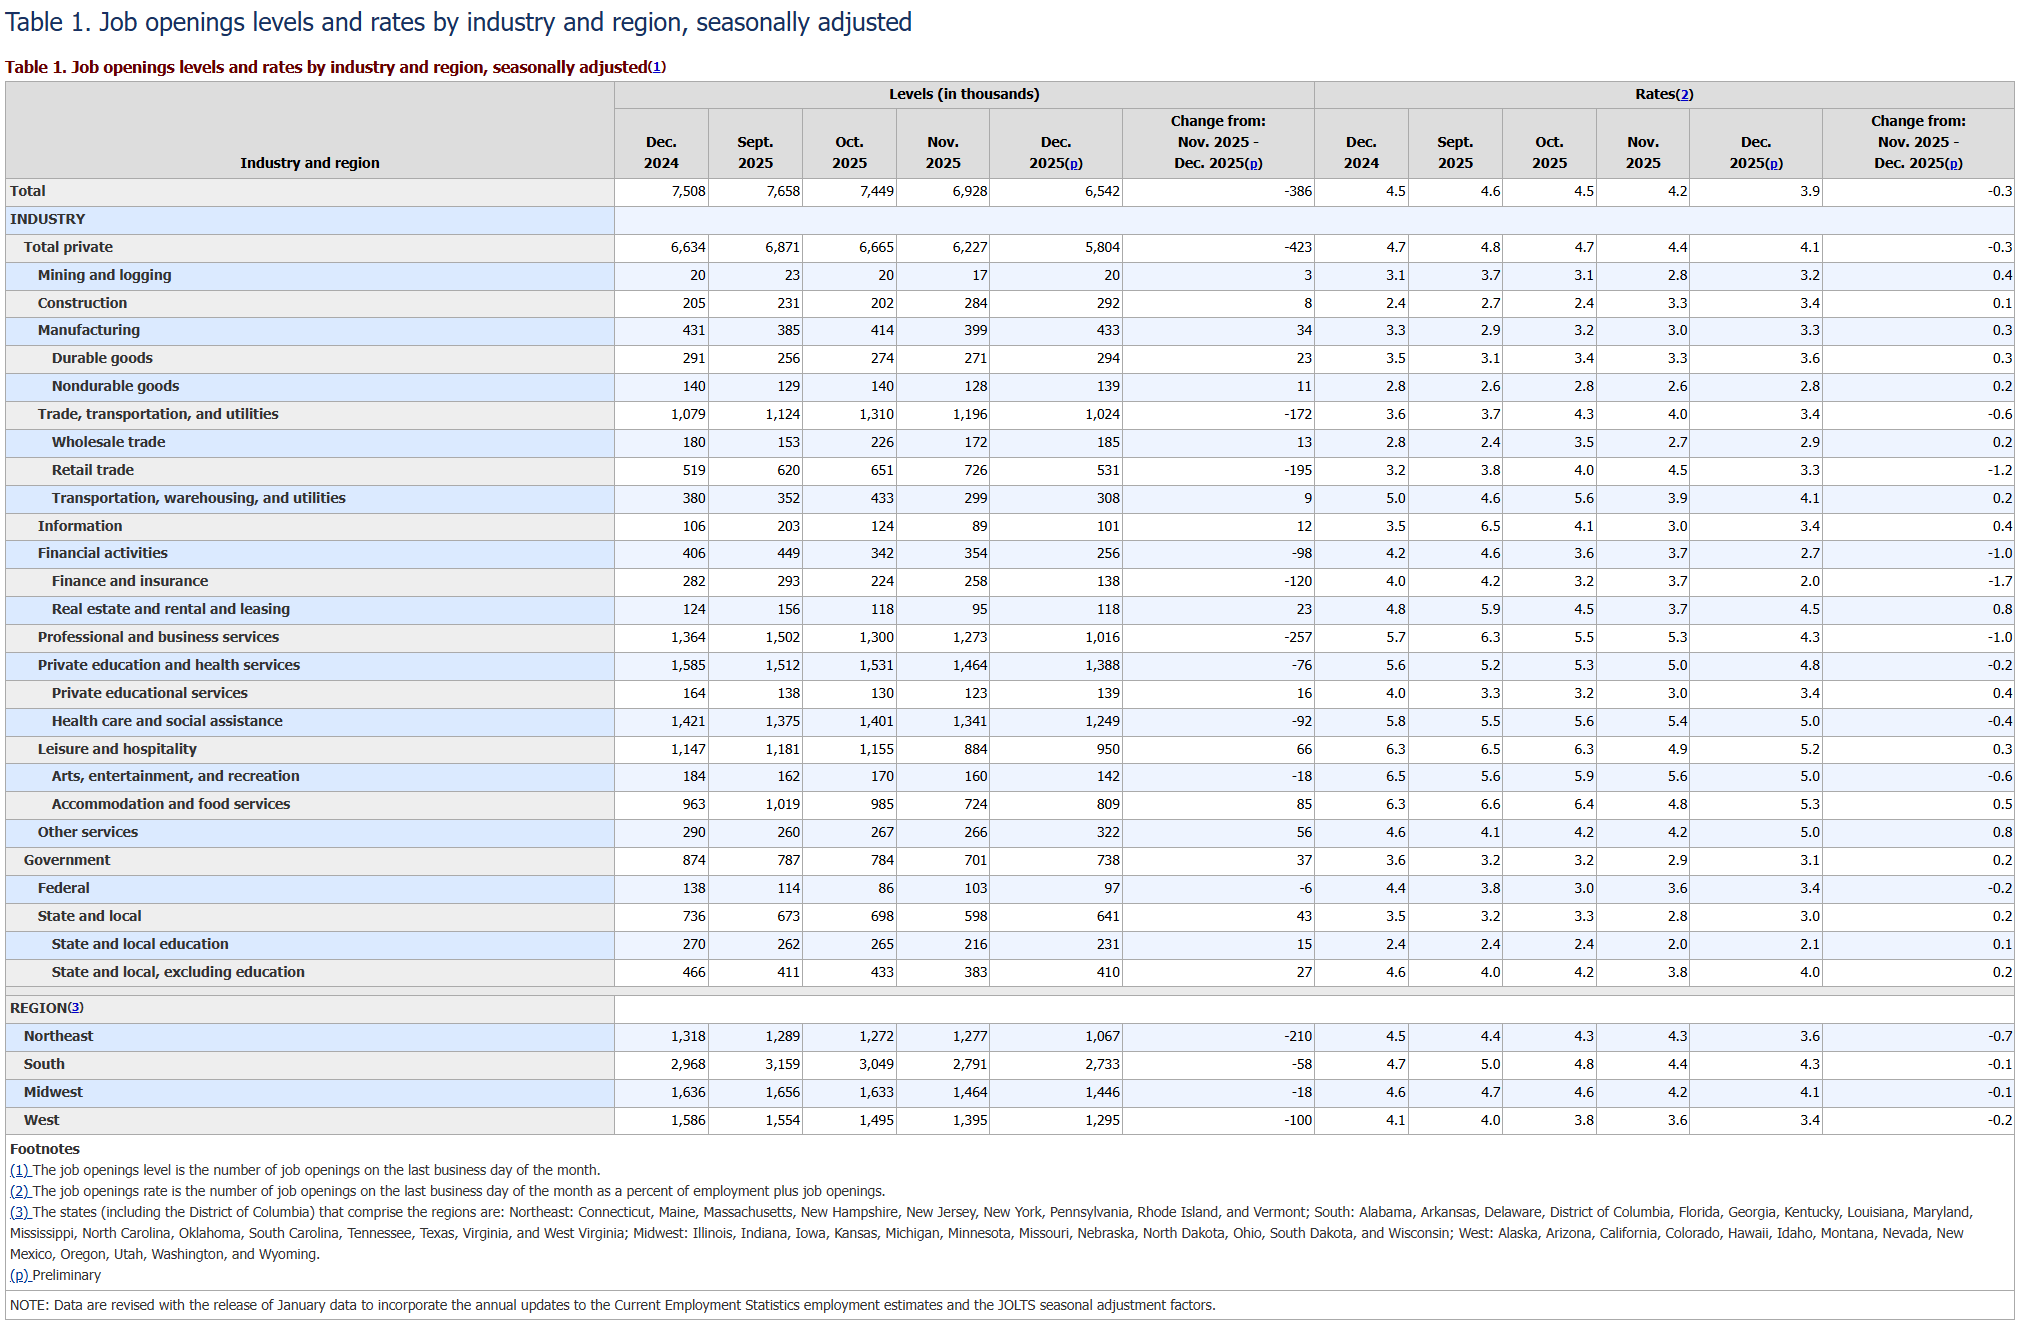
Initial jobless claims rose to 231,000, above expectations, and job openings (JOLTS) ticked lower while layoffs and discharges edged up, though both remain near pre‑COVID norms.
For markets, that cocktail—stronger manufacturing, steady services, softening labor—means:
The Fed has room to stay patient on cuts without needing to slam on the brakes.
Inflation risk isn’t screaming, but neither is growth rolling over in a way that screams “recession now.”
Rotation, Repricing, and waning Risk appetite may keep volatility elevated, but Recession is not a 2026 base case for most and that’s a big deal. As long as the default scenario is “slow‑to‑solid expansion with pockets of stress,” the bull market can survive even fairly violent sector‑level shakeouts.
For rates and FX, the message is consistent:
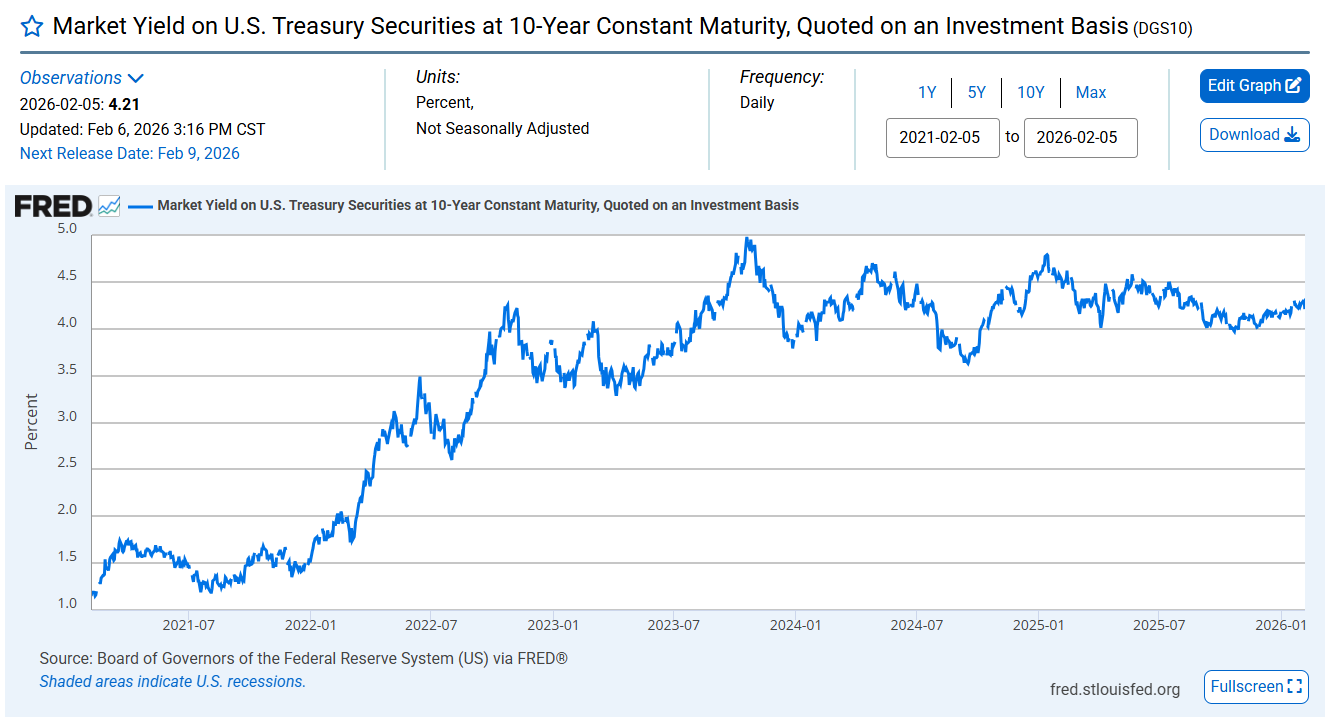
Treasury yields drifted lower by 2–4 basis points across the curve on the week, with the initial ISM‑driven backup more than offset by the softer labor prints.
Treasury volatility remains subdued near three‑year lows despite cross‑asset fireworks.
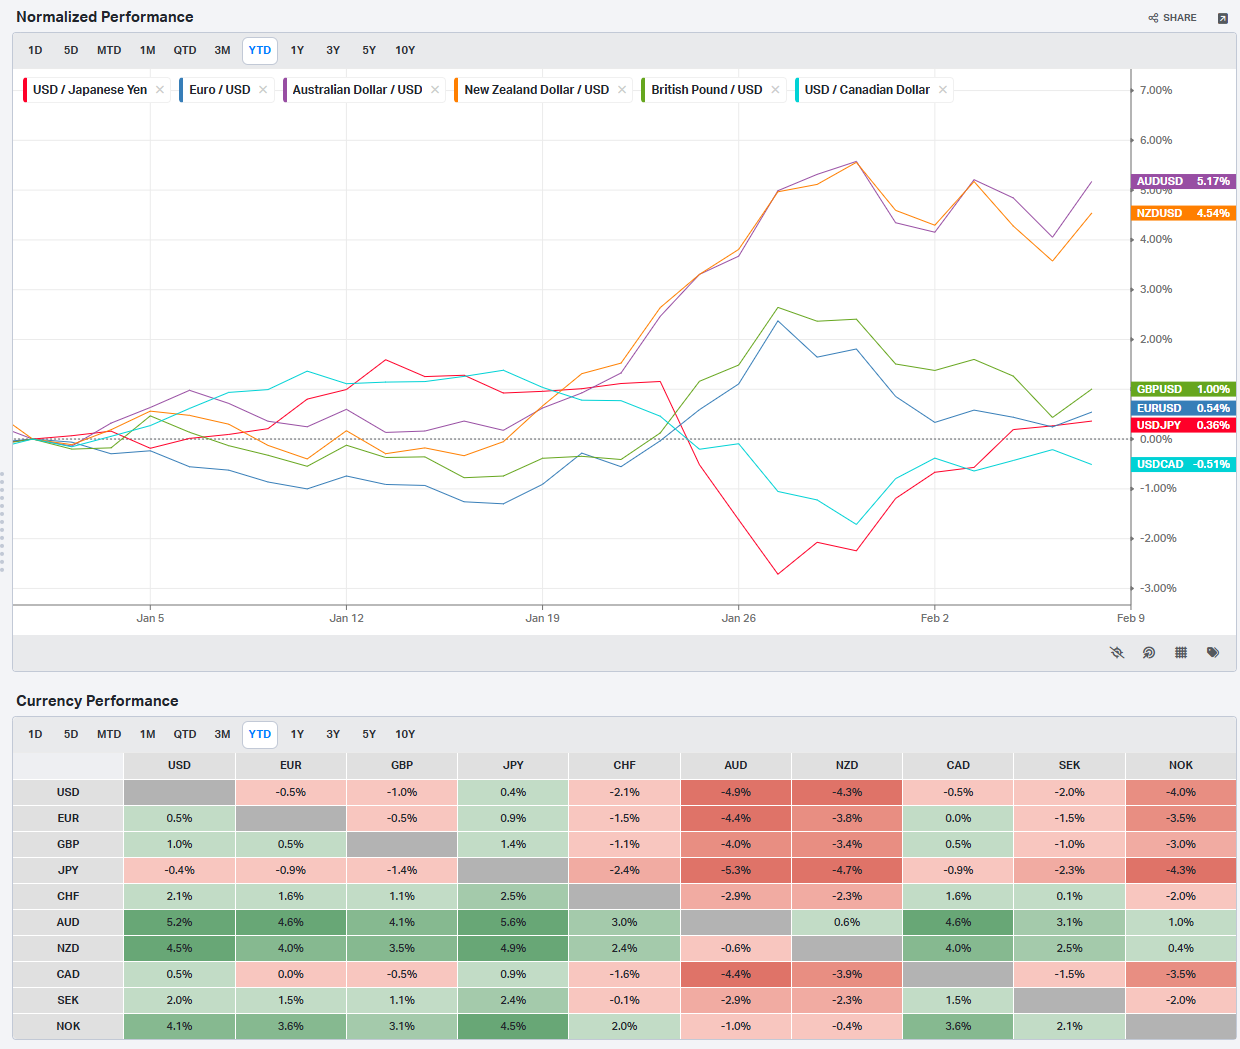
The dollar index gained roughly 1%, especially against the yen ahead of Japan’s elections, before easing with the late‑week equity rally.
So what do you do with this?
If you’re running money or just trying to keep your own portfolio out of trouble, this week’s chaos actually delivers some fairly actionable themes.
1. Embrace the rotation, don’t fight it.
The fact that the S&P 500 is only marginally off highs while software and speculative growth are in correction territory tells you that breadth is improving, not collapsing. That’s generally constructive for the durability of the cycle. It argues for:
Leaning into cyclicals and value where fundamentals are improving and valuations are still reasonable (industrials, select financials, some energy, and quality regional banks).
Gradually trimming over‑sized megacap growth weights if you haven’t already, especially where your risk budget was tied to multiple expansion.
2. Separate AI enablers from AI targets.
The “AI eats software” narrative is probably over‑broad, but the market is going to keep punishing business models that look exposed until we see clearer evidence of who can adapt. In practice:
Hardware, infrastructure, and power providers stand to benefit from the 600‑plus billion dollars in AI capex; that spending is real and already budgeted.
Some software names will successfully integrate AI and expand their TAM; others will see pricing and seat counts pressured. Building diversified baskets or using options around catalysts can make more sense than single‑name heroics here.
3. Treat gold as a hedge, not a hero.
If this week showed anything, it’s that gold can behave like a momentum asset on the way up and a risk asset on the way down. The diversification benefit is still there, especially versus equities and credit, but sizing matters. Frame gold as “insurance” rather than a growth engine to maintain perspective and avoid FOMO.
4. Respect, but don’t over‑weight, softening labor data.
The labor prints are clearly cooling at the margin, with job openings drifting down and layoffs creeping up from ultra‑low levels. That’s consistent with a late‑cycle softening, not yet a recessionary rollover. It’s a reason to:
Stay up‑in‑quality in credit.
Be selective in cyclicals, favoring stronger balance sheets and real pricing power.
Keep some dry powder to deploy into future volatility spikes rather than chasing every dip.
5. Remember the big picture: this is a re‑balancing, not an obituary.
Dow 50,000 is a headline, not a thesis. What matters more is the underlying message: leadership is broadening, excesses are being worked off, and the macro backdrop is still “good enough” for earnings growth outside a narrow slice of megacap tech.
If anything, this is the kind of market where a boring, diversified playbook suddenly looks smart again:
Core exposure to U.S. large‑caps, with a tilt toward quality.
Incremental allocation to U.S. mid‑caps, international small/mid caps, and select emerging markets where valuations are friendlier.
Modest, thoughtfully sized exposures to gold and other diversifiers for tail risk.
A more opportunistic stance on tech: buying when earnings outrun prices, being honest about where AI is a tailwind vs a threat.
Some weeks feel like a stress test for your conviction. This one was more like a stress test for your allocation discipline. If your portfolio can survive a SaaS‑pocalypse, Commod‑atility, and crypto chaos while still leaving you exposed to the old economy’s quiet comeback, you’re probably closer to the right mix than you think.

Weekly Benchmark Breakdown
Breadth check: early-stage thrust, not a blow-off. Across the major indices, participation is generally expanding rather than contracting, with small caps and industrials flashing the strongest momentum and the Nasdaq 100 still lagging on both moving-average cohorts and new highs versus new lows.
SPX: constructive, broadening under the hood
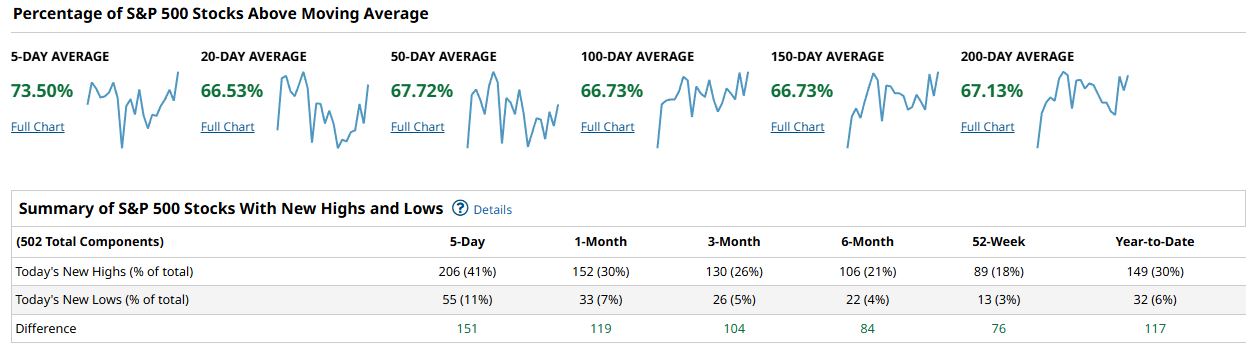
For the S&P 500, roughly 73.5% of constituents are above their 5-day moving average and about 66%–67% are above the 20-, 50-, 100-, 150-, and 200-day averages. That is what a healthy, trending tape looks like: short-term strength is backed up by medium- and longer-term support, not just a one- or two-day pop. New highs outnumber new lows by 151 over the last 5 days and by 119 over the last month, with the 3‑month and 6‑month windows also running positive (104 and 84 respectively). Even on a 52‑week look, the S&P shows a positive NH minus NL spread of 76, and year-to-date the difference is 117. Put simply, SPX breadth is not screaming exhaustion; it looks like an ongoing advance with solid internal sponsorship.
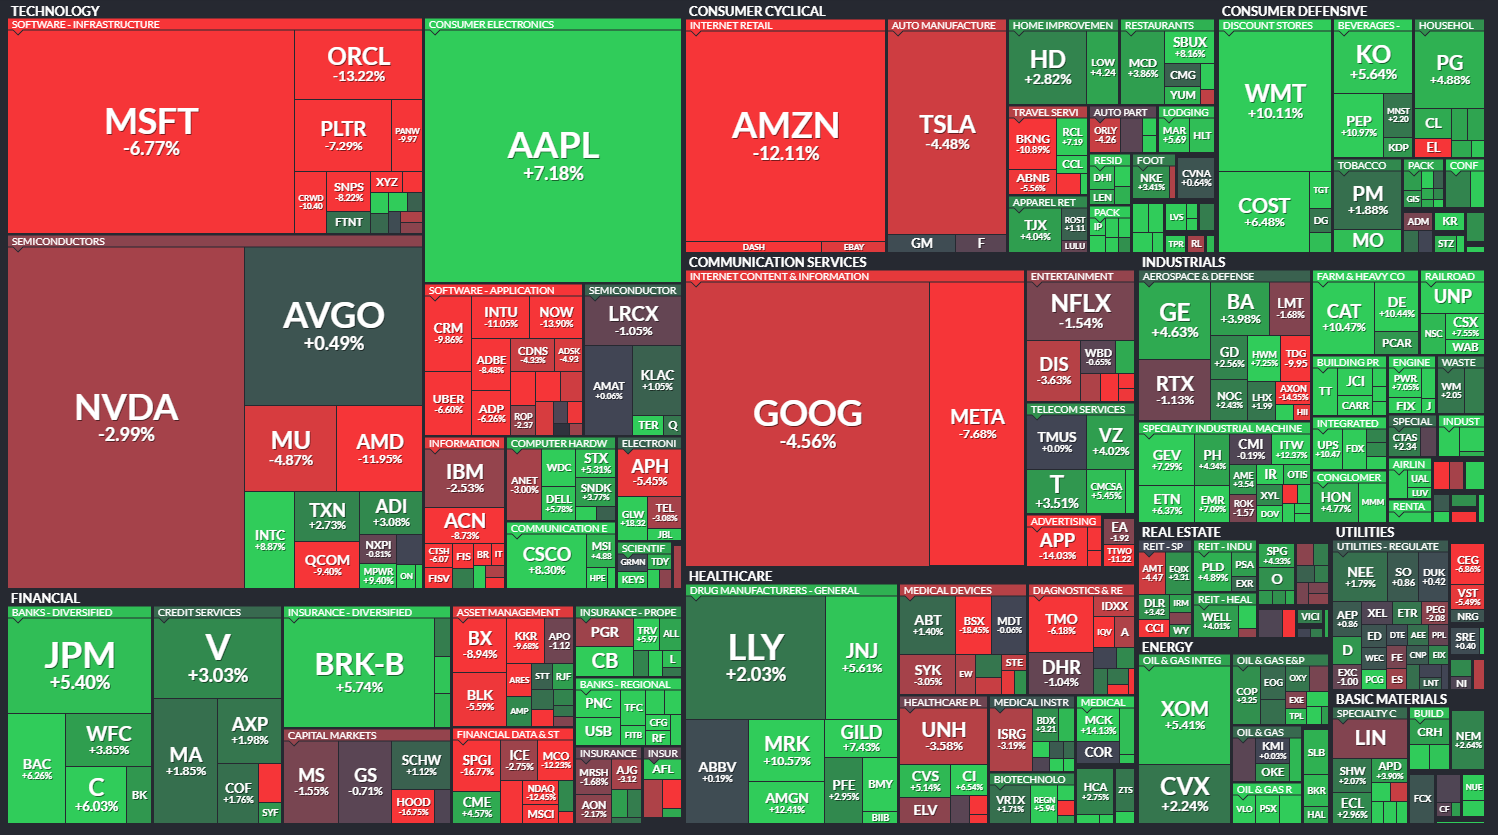
NDX 100: still the problem child
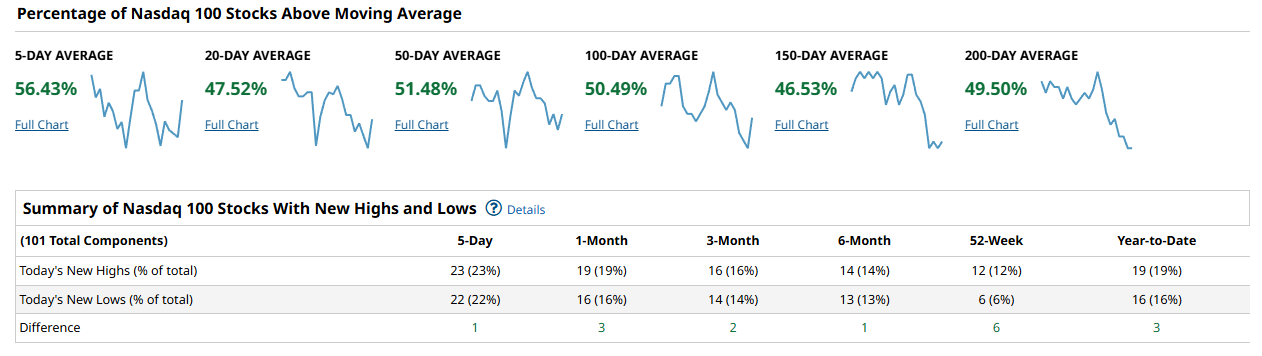
The Nasdaq 100 tells a very different story. Only about 56% of its members are above the 5-day average, and the share above the 20-, 50-, 100-, 150-, and 200-day measures is stuck in the high 40s to just over 50%. That is not disastrous, but for an index that drove leadership for years, it is clear underperformance. New highs and new lows are basically in a stalemate: over the last 5 days, 23 stocks hit new highs and 22 hit new lows, leaving a net of just +1. The 1‑month, 3‑month, and 6‑month windows all show NH minus NL in the low single digits, and even on a 52‑week and year‑to‑date basis, the net new highs barely get into the mid‑single digits. That is classic late‑cycle behavior for a prior leadership group: plenty of names above their long-term trends, but few making fresh highs and just as many leaking to new lows.
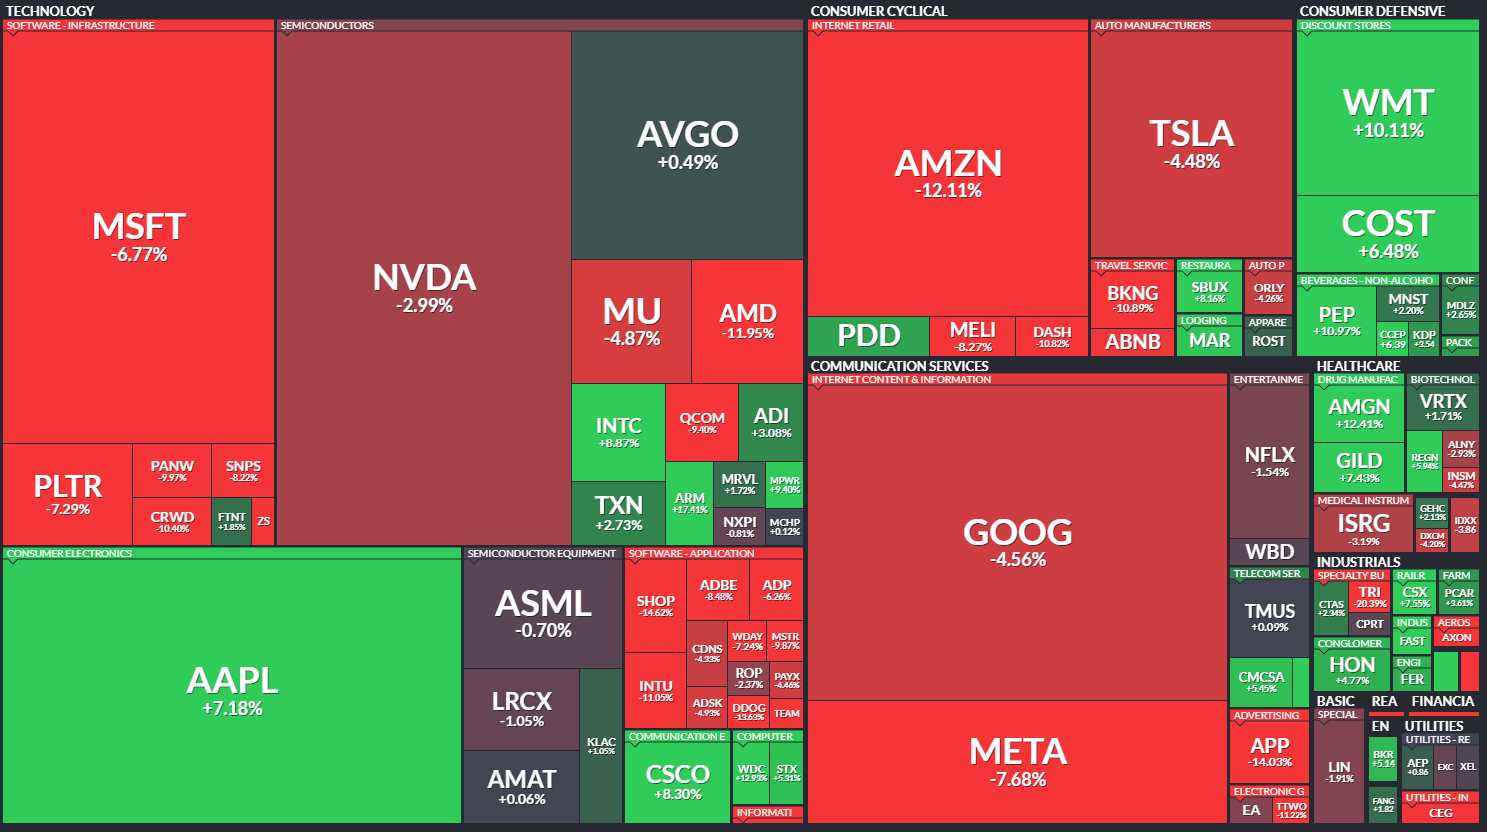
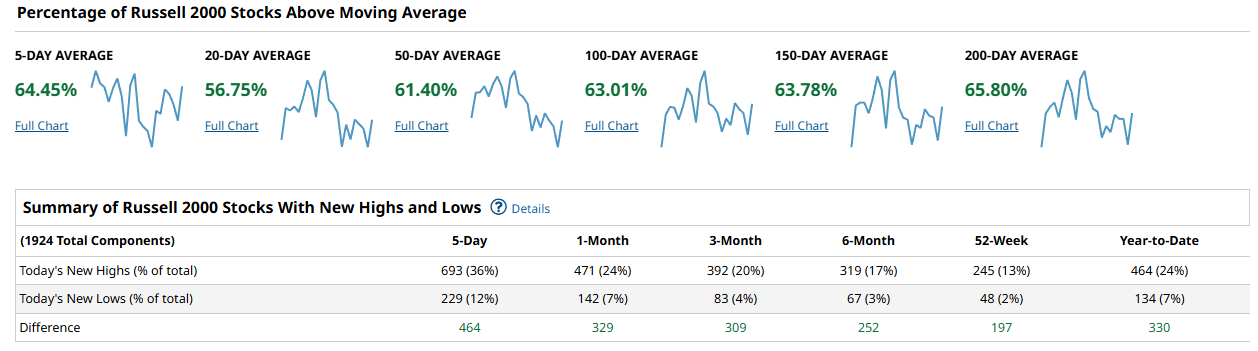
Russell 2000: real improvement, finally
The most encouraging story is in small caps. Around 64.45% of Russell 2000 members sit above their 5-day moving average, and between roughly 56% and 65% are above their 20-, 50-, 100-, 150-, and 200-day moving averages. That is a meaningful broadening after years of underperformance. On the new-high/new-low front, the shift is even clearer: over the last 5 days, 693 stocks (36% of the index) printed new highs versus 229 new lows (12%), for a net of +464. The 1‑month window shows a net of +329, 3‑month +309, 6‑month +252, 52‑week +197, and year‑to‑date +330. When you see positive NH minus NL across every timeframe like that, you are looking at a genuine thrust, not just a squeeze in a few heavily shorted names.
Industrials: a stealth leadership tell
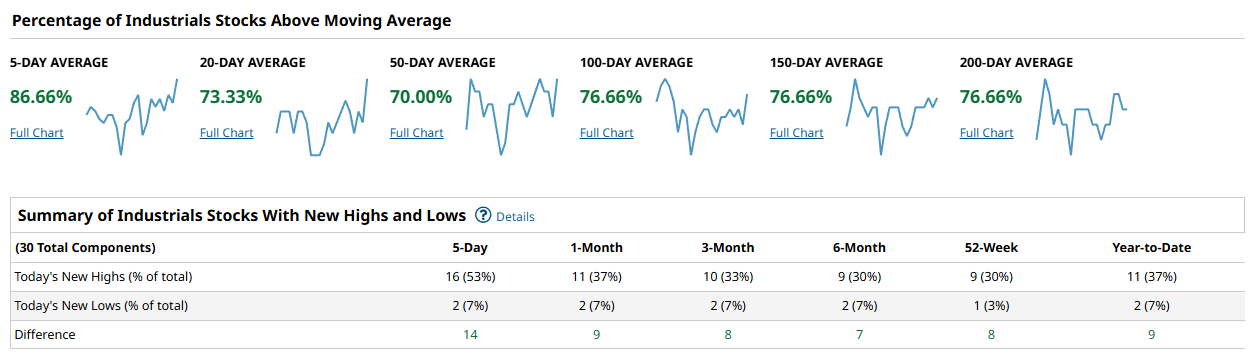
The industrials slice is where the trend looks most like a textbook internal bull. Roughly 86.66% of industrials are above the 5‑day average, and between about 70% and 76.66% are above the 20-, 50-, 100-, 150-, and 200-day measures. That is strong across every time horizon. New highs dominate: over the last 5 days, 16 industrials (about 53%) have made new highs versus just 2 new lows, for a net of +14. The 1‑month, 3‑month, 6‑month, 52‑week, and year‑to‑date NH minus NL spreads are all positive as well, ranging from +7 to +9. This is exactly what you want to see if you are looking for confirmation that the rally is spreading beyond megacap growth.
Synthesis: broad market winning over cap-weight
Putting it together, the message is that breadth is better in the broad market than in the cap-weighted glamour indices. The S&P 500 and industrials have more than two-thirds of constituents above their 50-day moving averages and strong, positive new-high-minus-new-low readings across multiple timeframes. The Russell 2000 is finally joining the party, with 60%+ of components above key moving averages and a very robust run of new highs swamping new lows from 5 days out to year-to-date. The weak link is the Nasdaq 100, where only about half the index is above key trend measures and NH vs NL is basically flat. A durable advance from here would be confirmed if SPX and RUT can keep their 50-day cohorts north of 60% while the Nasdaq 100 pushes its own 50-day participation and net new highs materially higher; concern would grow if the NDX weakness begins to bleed into SPX and small caps, driving 50-day cohorts back below 50% and flipping NH minus NL negative.
Playbook: lean into strength, fade narrow tech-only bets
From a positioning standpoint, this is a tape where you want to lean into the areas showing both trend and thrust and be more selective in prior leadership. The combination of solid SPX breadth, very strong industrials participation, and a genuine new-high thrust in the Russell 2000 argues for maintaining or even adding to exposure in cyclicals, industrials, and quality small caps rather than chasing the usual mega-cap tech complex. On the flip side, the Nasdaq 100s mixed internals suggest avoiding concentrated, index-level NDX exposure as your only risk proxy; if you want tech, focus on names that are actually making or approaching new highs rather than fighting the broad stall in the group. For confirmation, watch whether Russell and industrials can keep their 50- and 200-day cohorts above roughly 60% and whether SPX continues to print more new highs than new lows on rolling 5- and 20-day counts.
Bottom line: this remains a buy-the-dips market in the broad indices and cyclicals, but not a blanket green light to blindly load up on every big-cap tech name in the Nasdaq 100.

Investor Sentiment Report
%Bull-Bear Spread
The %Bull-Bear Spread measures the gap between bullish and bearish investor sentiment, often from surveys like AAII. It’s a contrarian indicator—extreme optimism may signal a coming pullback, while extreme pessimism can hint at a potential rally. Large positive or negative spreads often mark market turning points.
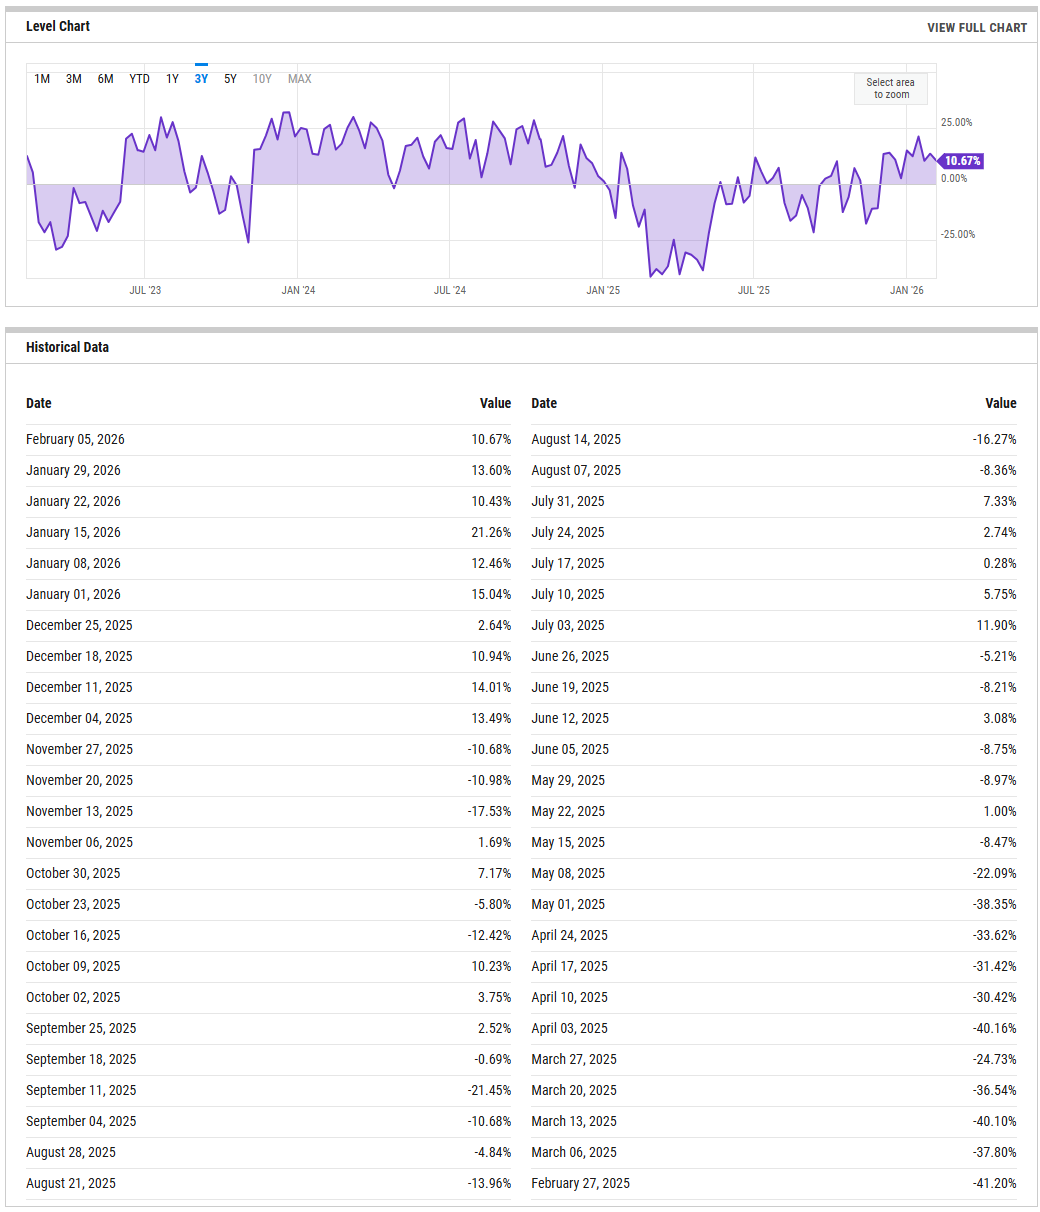
The AAII-style bull minus bear spread is sitting in mildly positive territory, not at an extreme and down from the greedier levels seen a few weeks back. The equity sentiment line over the last year ran from deep fear in early 2025 to extreme greed in midyear, then bled back toward neutral as the autumn correction hit, and has since recovered into the middle of the range again. That pattern says optimism has rebuilt, but not to the runaway, late-stage euphoria that typically precedes major tops. From a contrarian lens, sub-zero readings tend to be fuel for rebounds because pessimism is already priced in, while spreads above roughly +20 start to signal a crowded long and a market vulnerable to air pockets. Here, the current mid-teens spread implies room for risk-taking without outright complacency. The tripwire to watch is a push back toward that +20 zone without further price progress; that would tell you positioning has run ahead of the tape and the next 5% move is more likely down than up.
NAAIM Exposure Index
The NAAIM Exposure Index (National Association of Active Investment Managers Exposure Index) measures the average exposure to U.S. equity markets as reported by its member firms. These are typically active money managers who provide their equity exposure levels weekly. The index offers insight into how much these managers are investing in equities at any given time, ranging from being fully short (-100%) to leveraged long (up to +200%).
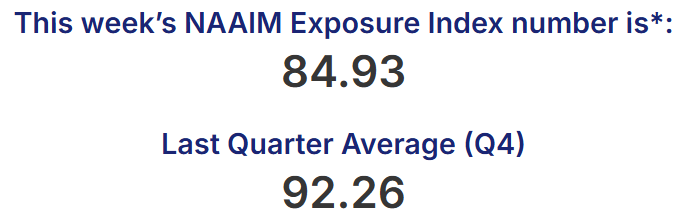
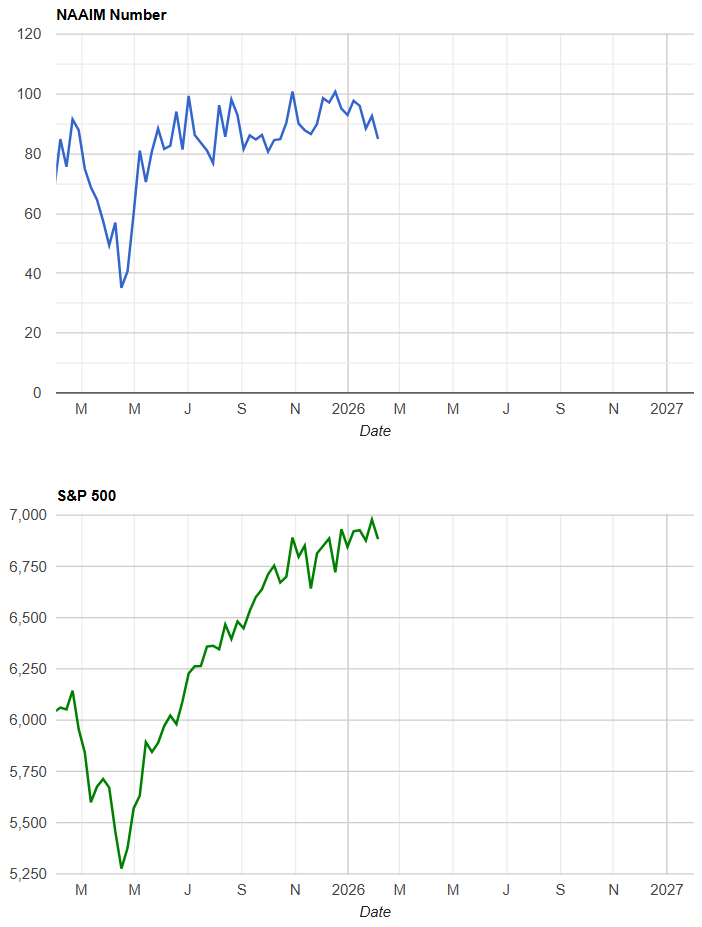
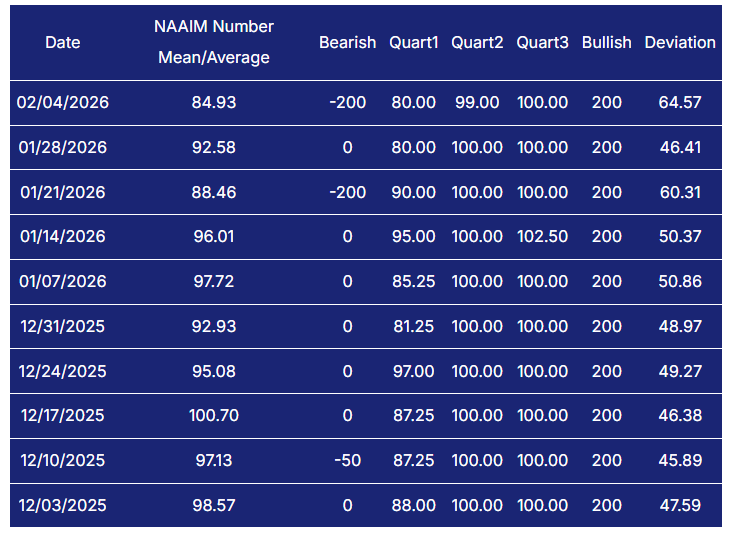
Active managers remain heavily invested. The latest NAAIM exposure print is 84.93, down modestly from 92.58 the prior week and from low-to-mid 90s levels throughout January, but still very much on the high side of its historical range. Over the past two months, readings have hugged the 90 handle with only brief dips, even as the market has chopped and corrected beneath the surface. That tells us two things: there is not a lot of institutional dry powder left to chase a breakout, and any air pocket in prices could force de-risking from already-elevated exposure. In practice, drops into the 50s with prices still holding up tend to mark healthy resets and often set up a better next leg higher. Conversely, a push back into the 90s from here, especially if price gains are narrowing, would increase the odds of a sharp shakeout as fast money trims risk. For now, NAAIM says managers are confident but exposed
CBOE Total Put/Call Ratio
CBOE's total put/call ratio includes index options and equity options. It's a popular indicator for market sentiment. A high put/call ratio suggests that the market is overly bearish and stocks might rebound. A low put/call ratio suggests that market exuberance could result in a sharp fall.
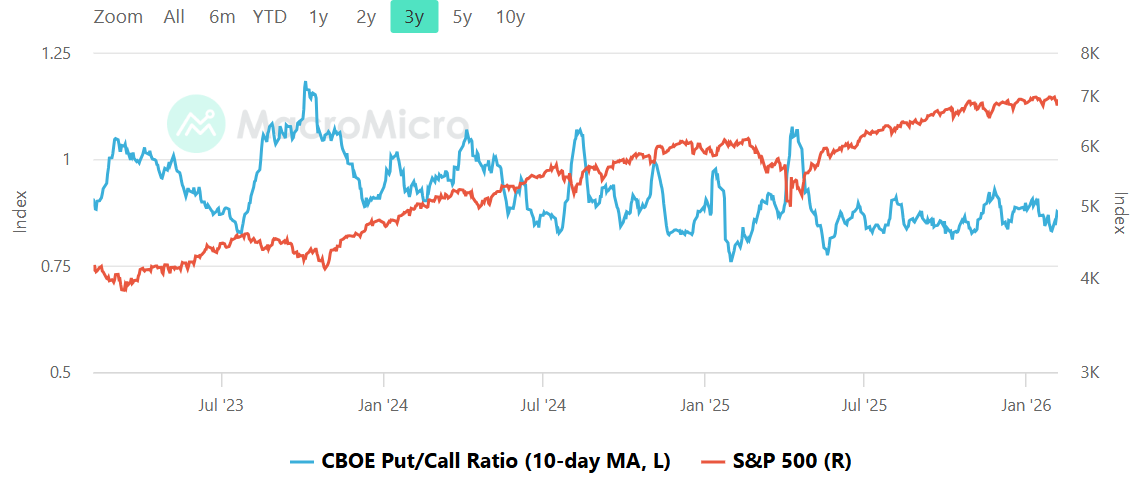
The 10-day moving average of the CBOE total put/call ratio is hovering just under the 1.0 line, oscillating in a band that has defined this entire cyclical bull run. Over the last three years, spikes toward 1.1–1.2 have lined up with panicky equity air pockets that soon reversed, while dips toward 0.7–0.8 have tended to coincide with short-term overbought conditions and shallow corrections rather than outright tops. Right now, the ratio is neither screaming fear nor froth; it is signaling a market where traders are buying some protection but not in a way that would supercharge a squeeze. This nuance matters: a low put/call backdrop amplifies drawdown depth because there are fewer shorts and hedges to cover, while a high ratio cushions declines and supports stronger bounces as hedges get unwound. The tripwires are clear: a decisive break below roughly 0.8 on the 10-day would warn that short-term complacency is taking hold, while a jump back above 1.05–1.10 without a matching price flush would hint that investors are hedging more aggressively than price action alone suggests.
Equity vs Bond Volatility
The Merrill Lynch Option Volatility Estimate [MOVE] Index from BofAML and the CBOE Volatility Index [VIX] respectively represent market volatility of U.S. Treasury futures and the S&P 500 index. They typically move in tandem but when they diverge, an opportunity can emerge from one having to “catch-up” to the other.
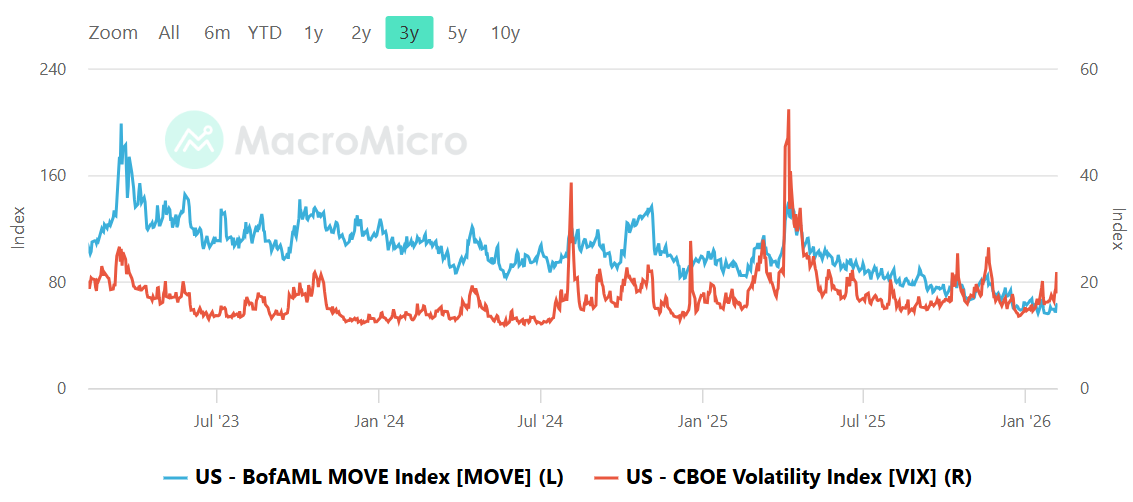
On the volatility side, both bond and equity markets are relatively calm. The MOVE index, tracking Treasury volatility, has dribbled lower from the 2023 spikes and is now sitting in a midrange band, nowhere near last cycle’s crisis highs. The VIX has also settled into a low double-digit zone, with occasional pops that fade quickly, reflecting a market that has learned to lean into dips rather than panic. The key dynamic to watch is divergence: historically, a MOVE spike above roughly 120 while the VIX stays asleep can be an early tell that equity stress is coming, as the rates market sniffs trouble first. Conversely, a sudden VIX surge into the high teens or low 20s with MOVE still anchored would usually reflect an equity-specific scare rather than a macro shock. Today we have neither; both curves say cross-asset risk is being absorbed smoothly. The tripwire is simple: if MOVE jumps sharply while the VIX remains below the mid-teens, start shortening your risk leash, because that setup rarely resolves with equities staying this quiet.
CNN Fear & Greed
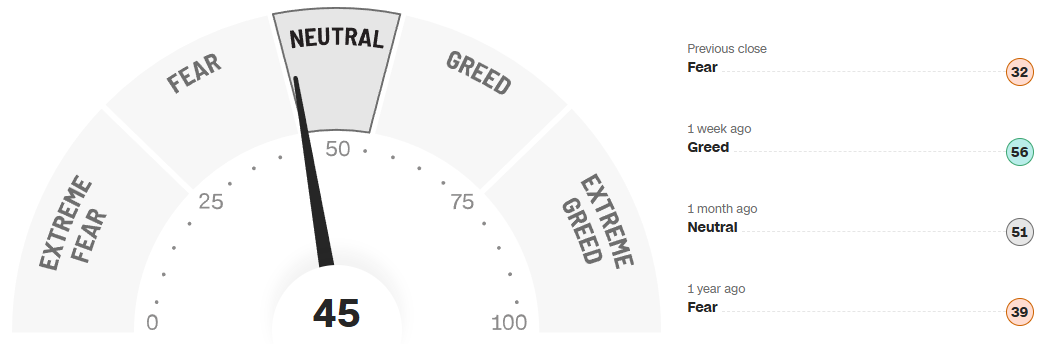
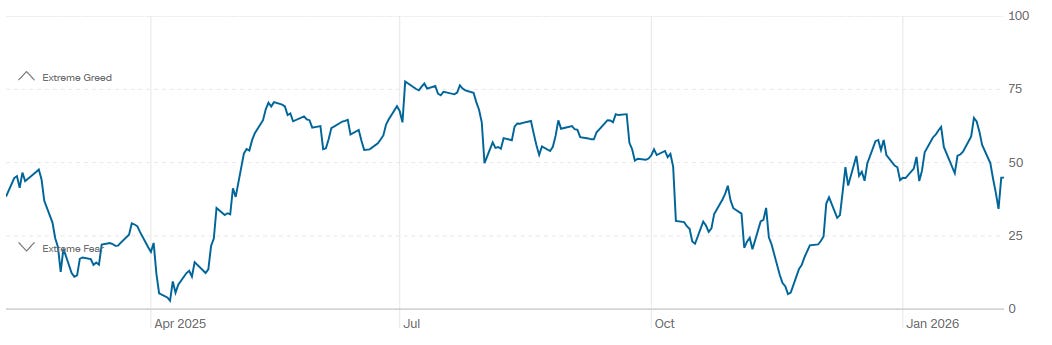
The CNN Fear & Greed composite sits at 45, labeled neutral, down from 56 a week ago when the gauge registered greed, and up from a prior close of 32 that flashed fear. Versus one month ago, when the reading was 51 (also neutral), and one year ago, when it printed 39 (fear), the tape has come a long way from the 2025 panic but has not yet tipped into runaway optimism. The one-year history of the indicator shows a full cycle: extreme fear in early 2025, a run into greed and then extreme greed as the rally matured, a sharp pullback alongside last year’s correction, and a grind back into the middle of the dial. In practical terms, this is a mid-range regime where sentiment is not a strong standalone signal; it neither demands you fade the crowd nor offers the fat pitch contrarians love. If the composite pushes north of 70 with price still grinding higher, that would start to look like exhaustion and argue for tightening stops. On the downside, a slide back below 30 on a modest pullback would likely mark a better entry for adding risk.
Bottom line: sentiment is warm but not hot, positioning is heavy but not yet forced, and unless we see either NAAIM sprint back into the 90s or Fear & Greed lurch toward extremes, the tape favors a choppy grind higher rather than an imminent sentiment-driven air pocket.
Social Media Favs
Social sentiment offers a real-time view of investor mood, often revealing market shifts before traditional indicators. It can signal momentum changes, spot emerging trends, and gauge retail investor impact—especially in high-volatility names. Tracking sentiment around events or earnings provides actionable insights, and when layered with quantitative models, can enhance predictive accuracy and risk management. Sustained sentiment trends often mirror broader market cycles, making this data a valuable tool for both short-term trades and long-term positioning.

Technician’s Playbook: Trading the Majors (SPY/QQQ/IWM/DIA)
When you’re a large institutional player, your primary goal is to find liquidity - places to do a ton of business with the least amount of slippage possible. VolumeLeaders.com automatically identifies and visually plots the exact spots where institutions are doing business and where they are likely to return for more. It’s one of the primary reasons “support” and “resistance” concepts work and truly one of the reasons “price has memory”.
SPY
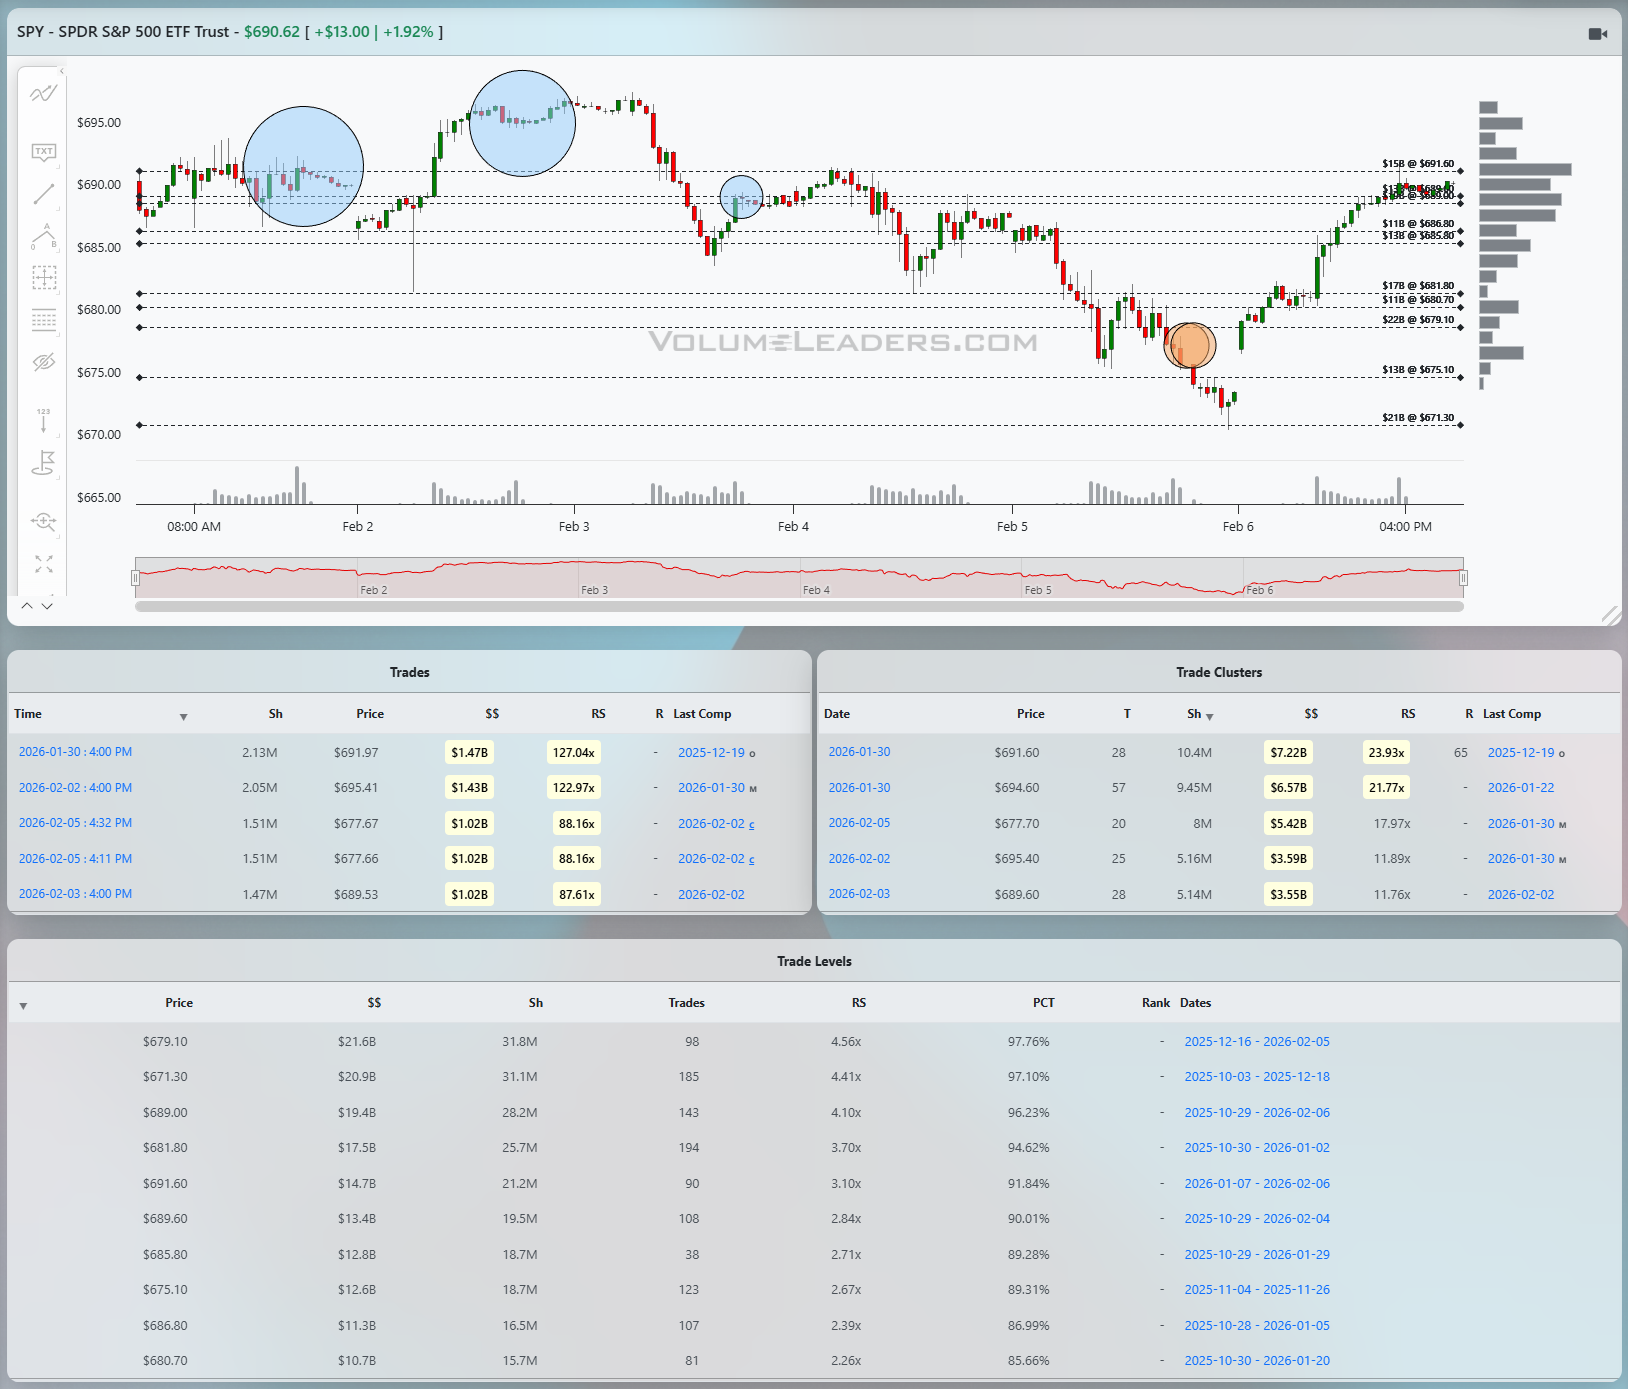
SPY has just transitioned from a messy pullback into a clean upside impulse, and the tape now has a very clear band where the bulls need to prove they can hold progress. The recent low carved out near 670 created a springboard, and the subsequent ramp has driven price back into a heavy overhead band with multiple high-dollar Levels stacked in the high 680s up through roughly 691. Across those Levels, notional volume runs into the low tens of billions with RS readings above 3x and PCTs in the mid-to-high 90s, marking this zone as a serious decision area rather than casual noise. The cluster table reinforces the idea: the largest recent cluster shows about 10 million shares and over 7.2 billion dollars traded around 690–691, with RS near 2.9x and PCT above 97 percent, which is about as serious as it gets for SPY in a short window. That concentration tells us larger hands have been very active in this neighborhood, and what happens on the next visit is going to define whether this turns into a full trend leg or just another range extension.
For SPY, the line of scrimmage is that 688–691 band. Acceptance above it, with price holding closes over the densest Levels and not immediately rejecting, would confirm that the big cluster was accumulation rather than distribution and open up upside into the low 700s where the next lighter resistance shelves sit. A bearish scenario would be a quick push into that band followed by sharp rejection on rising relative size, sending price back under 683 and eventually retesting the 676–679 shelf where several billion dollars traded with respectable RS and PCT but much less than the overhead supply. A disciplined trader will frame entries around those shelves: buying pullbacks that hold above 683 with a stop under the 679 cluster low, first target back into 691, and then trailing risk only if the tape can build time over that heavy cluster without giving it back. If SPY instead loses 679 on strong relative size, the smarter play is to step aside or flip short against that level, looking for the low 670s as the next magnet.
QQQ
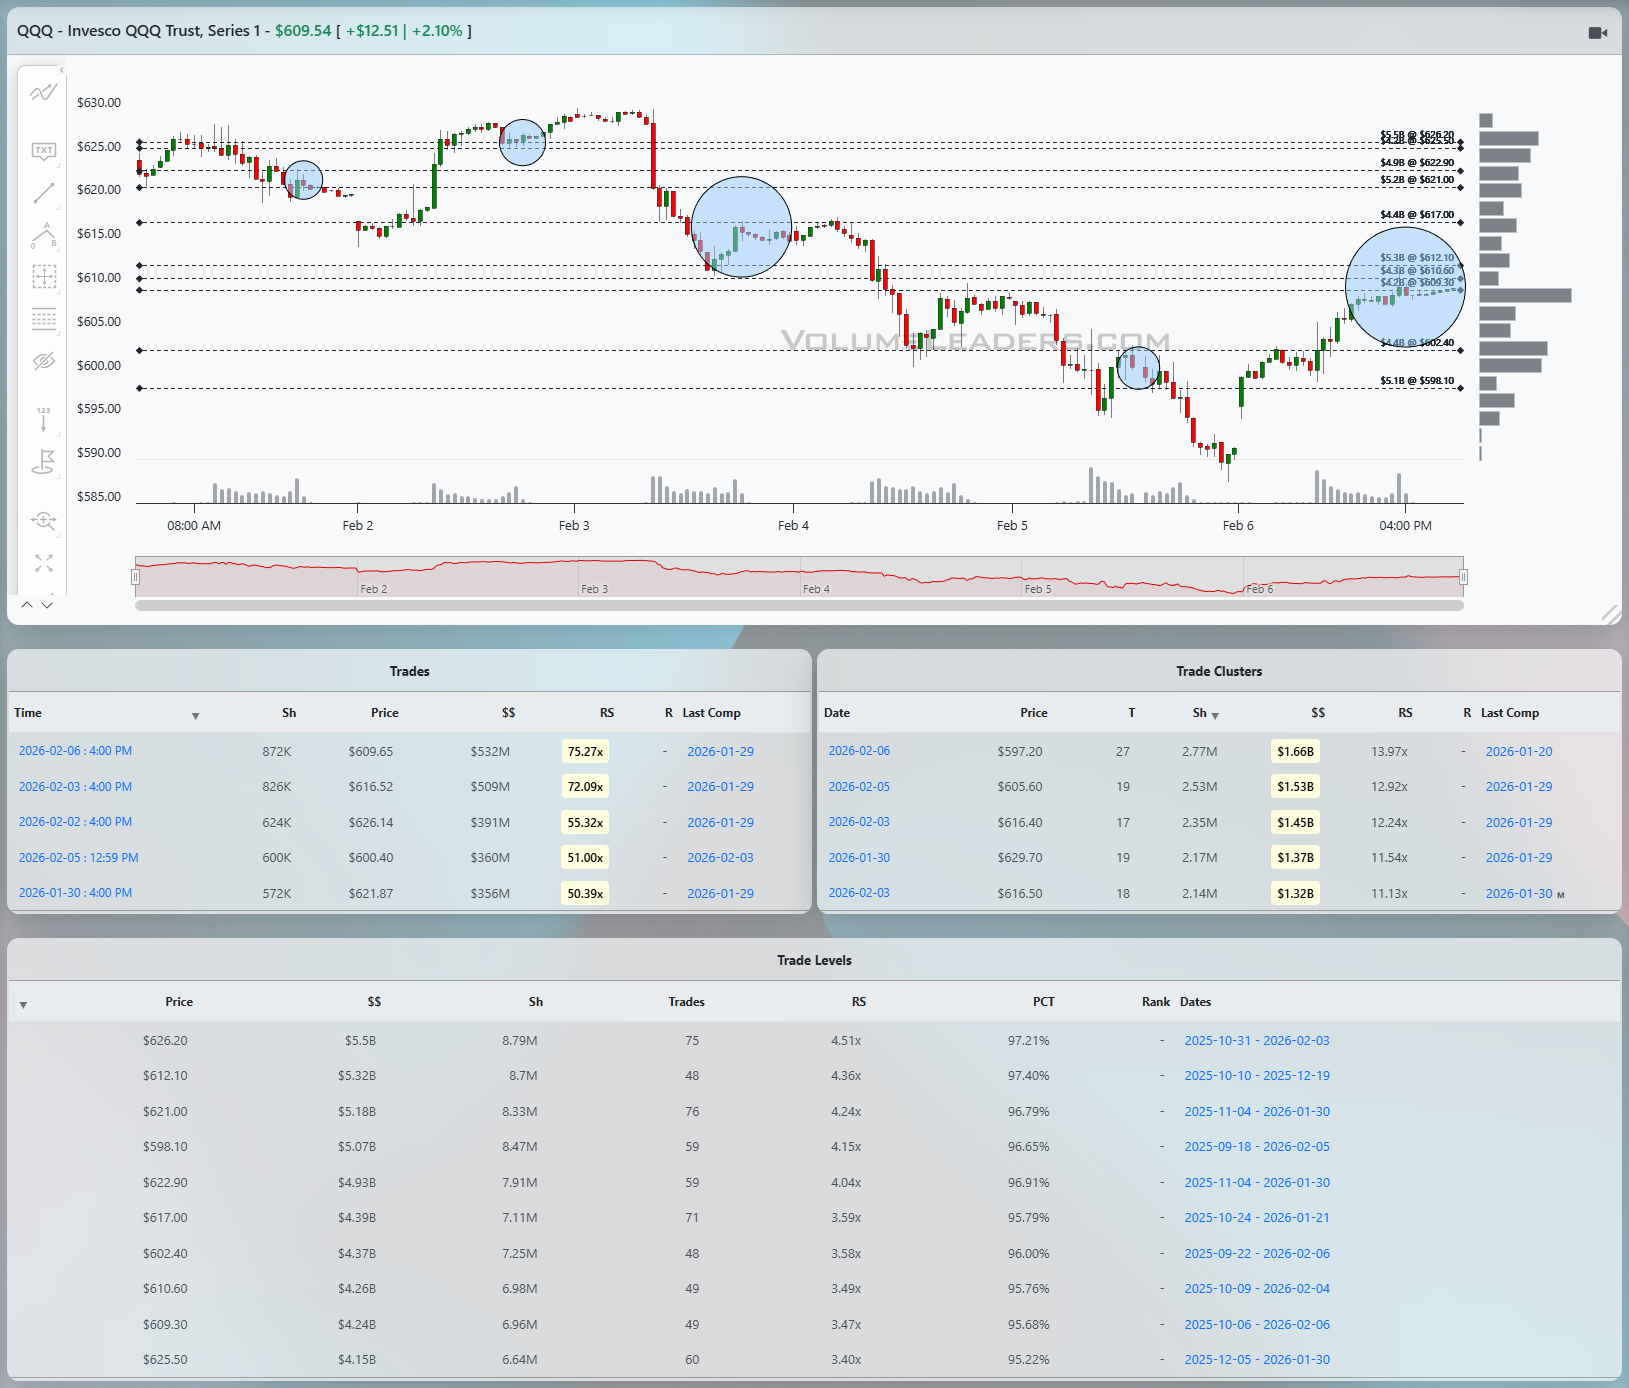
QQQ is in a different posture: it is bouncing from a clear downdraft rather than breaking out of a sideways range. The prior slide saw heavy selling into the low 600s, and the current rally is carrying price back into another band of large historical prints and big-dollar clusters between roughly 610 and 622. The trade table highlights several recent blocks in the 610–616 area with relative size north of 50x, 70x, and even over 75x versus average, representing some of the most intense single-print interest on the screen. Those are not casual day-trader clicks; they are institutional-level stakes, and their behavior now will tell us whether that stretch marked meaningful absorption or the start of longer-term distribution. The Level table backs that up with multiple prices in the low 620s showing RS in the 4x range and PCTs pushing above 96 percent, so we know that the 617–622 band is structurally important.
For QQQ, the pass/fail zone is 617–622. A bullish path is straightforward: the ETF spends a session or two digesting under that band, then takes it out on rising volume, holds over 617 on closing basis, and uses the heavy cluster as a springboard toward the mid-620s and then the prior breakdown zone near 630. That would tell us the earlier huge prints were buyers absorbing supply. A bearish path would see the current rally stall right into that 617–622 region, with renewed large prints appearing on the tape but price unable to sustain progress, followed by a roll back under 610 that reopens air toward the 600 shelf. A tactical trader will lean on those same numbers: long attempts belong either on early pullbacks that hold the 608–610 floor with risk defined just below, or on a clean breakout retest of 617 from above. If the tape violates 608 with relative size spiking again, the long case is invalidated and the next realistic magnet becomes the prior low zone.
IWM
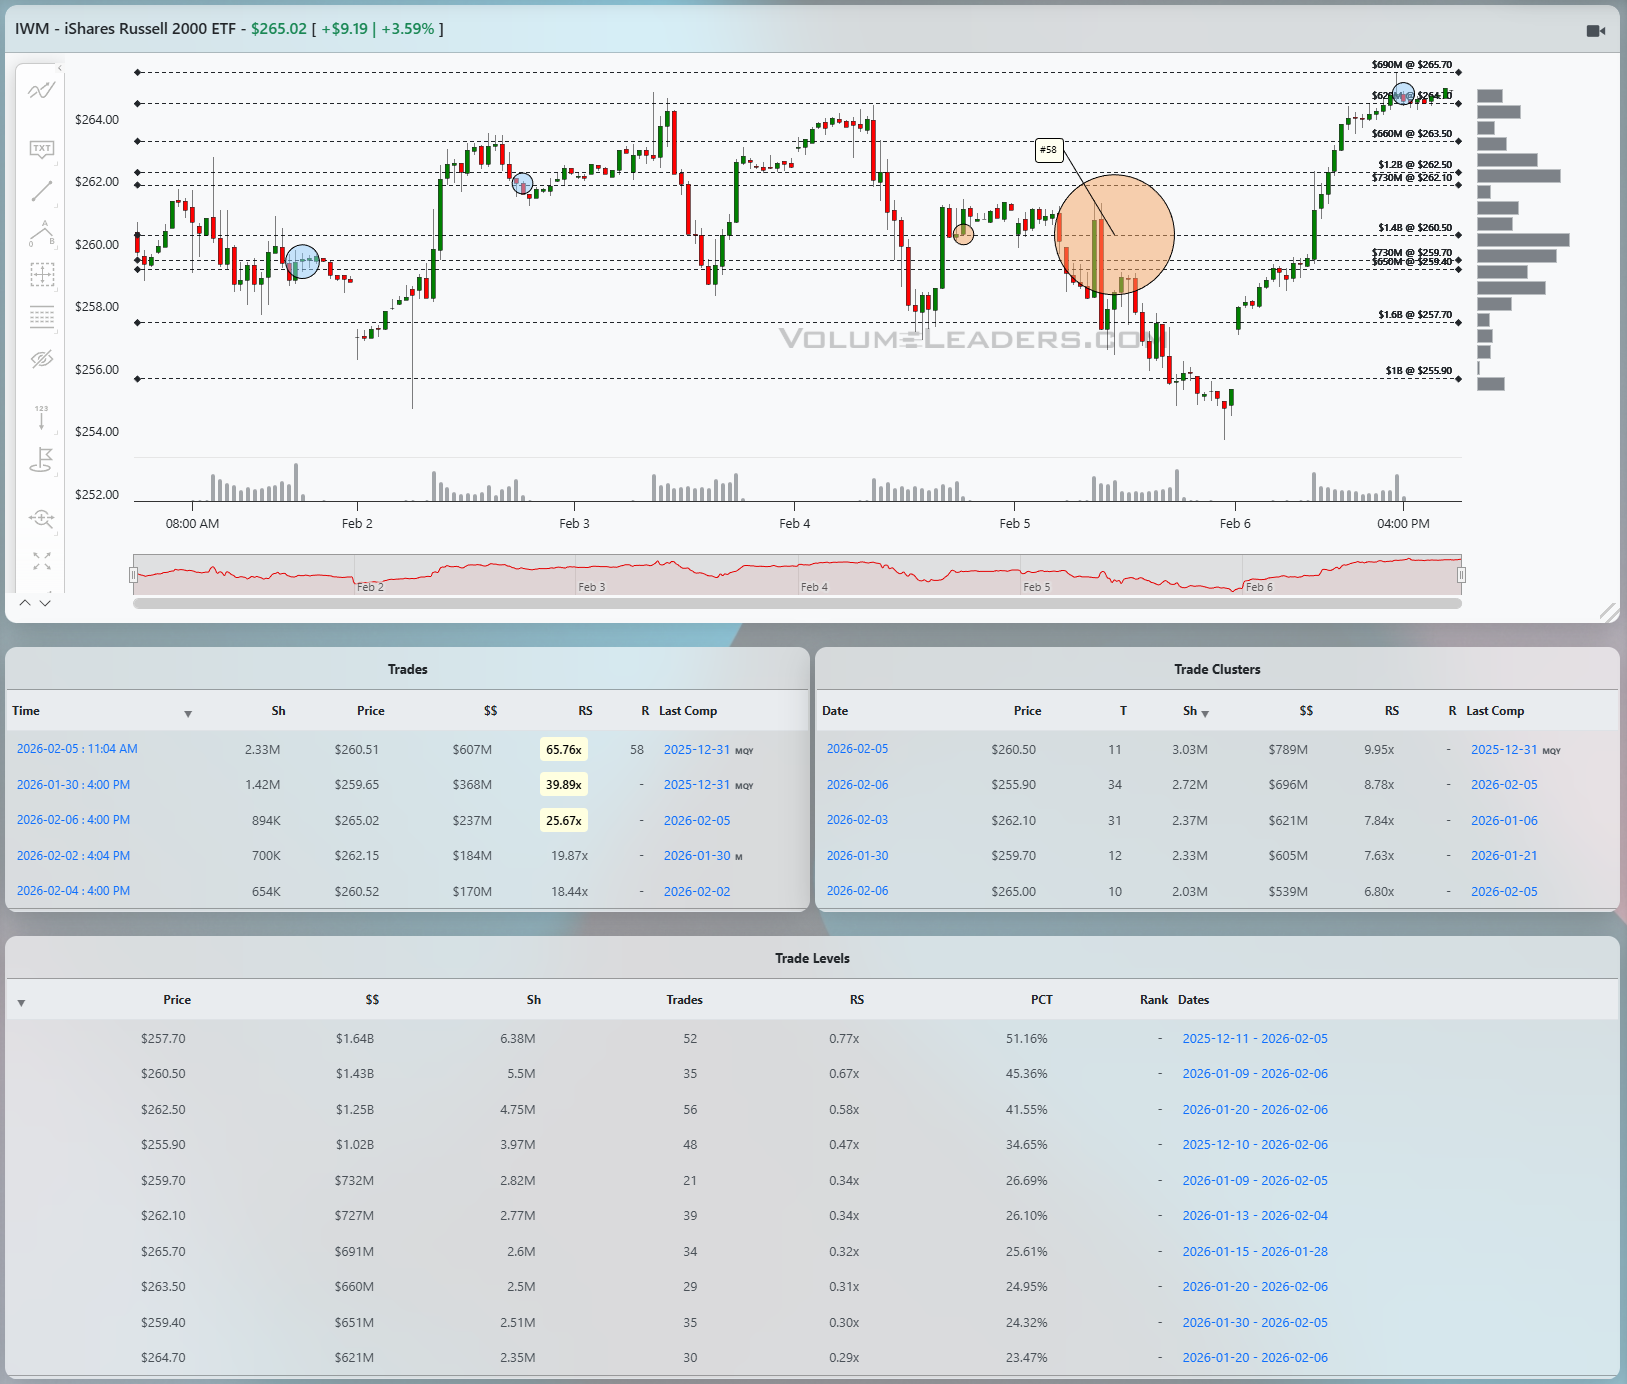
IWM, by contrast, is showing the most impulsive upside structure of the group. After a hard flush into the mid-250s, price has ripped back to test and slightly exceed the prior resistance band in the low-to-mid 260s. The recent trade table shows multiple large blocks printed into this rally, including one north of 2.3 million shares in the 265 area and others over a million shares around 259–261, with relative size readings in the 20–60x range. That kind of dollar flow into strength suggests active accumulation rather than just short-covering, particularly given the way price has marched steadily higher intraday. The Level table reinforces the idea that 260–262 hosted meaningful business, with several Levels showing high notional volume and solid RS, while the very top near 265 is still relatively new territory with fewer historical Levels but outsized recent flow.
For IWM, the key battleground is 260–262 as the first meaningful support band and 265 as immediate resistance. A bullish continuation would see pullbacks hold that 260–262 shelf, where prior big prints and strong Levels can act as support, followed by a fresh push through 265 that sticks, turning that price from a spike high into a proper shelf. That would open room toward the high 260s and potentially the 270 handle as the next upside magnet. A bearish scenario would be a failure to hold 260 on any backtest, especially if that breakdown coincides with new large prints that hit the tape on the bid, signaling distribution. In that case, the path of least resistance is back into the mid-250s where the last big liquidation low was set. Execution-wise, the most favorable R/R for longs is buying controlled pullbacks into 261–262 with tight stops under 259, while bears have cleaner shots fading spikes that fail near 265 with clear invalidation on any closing strength above that level.
DIA
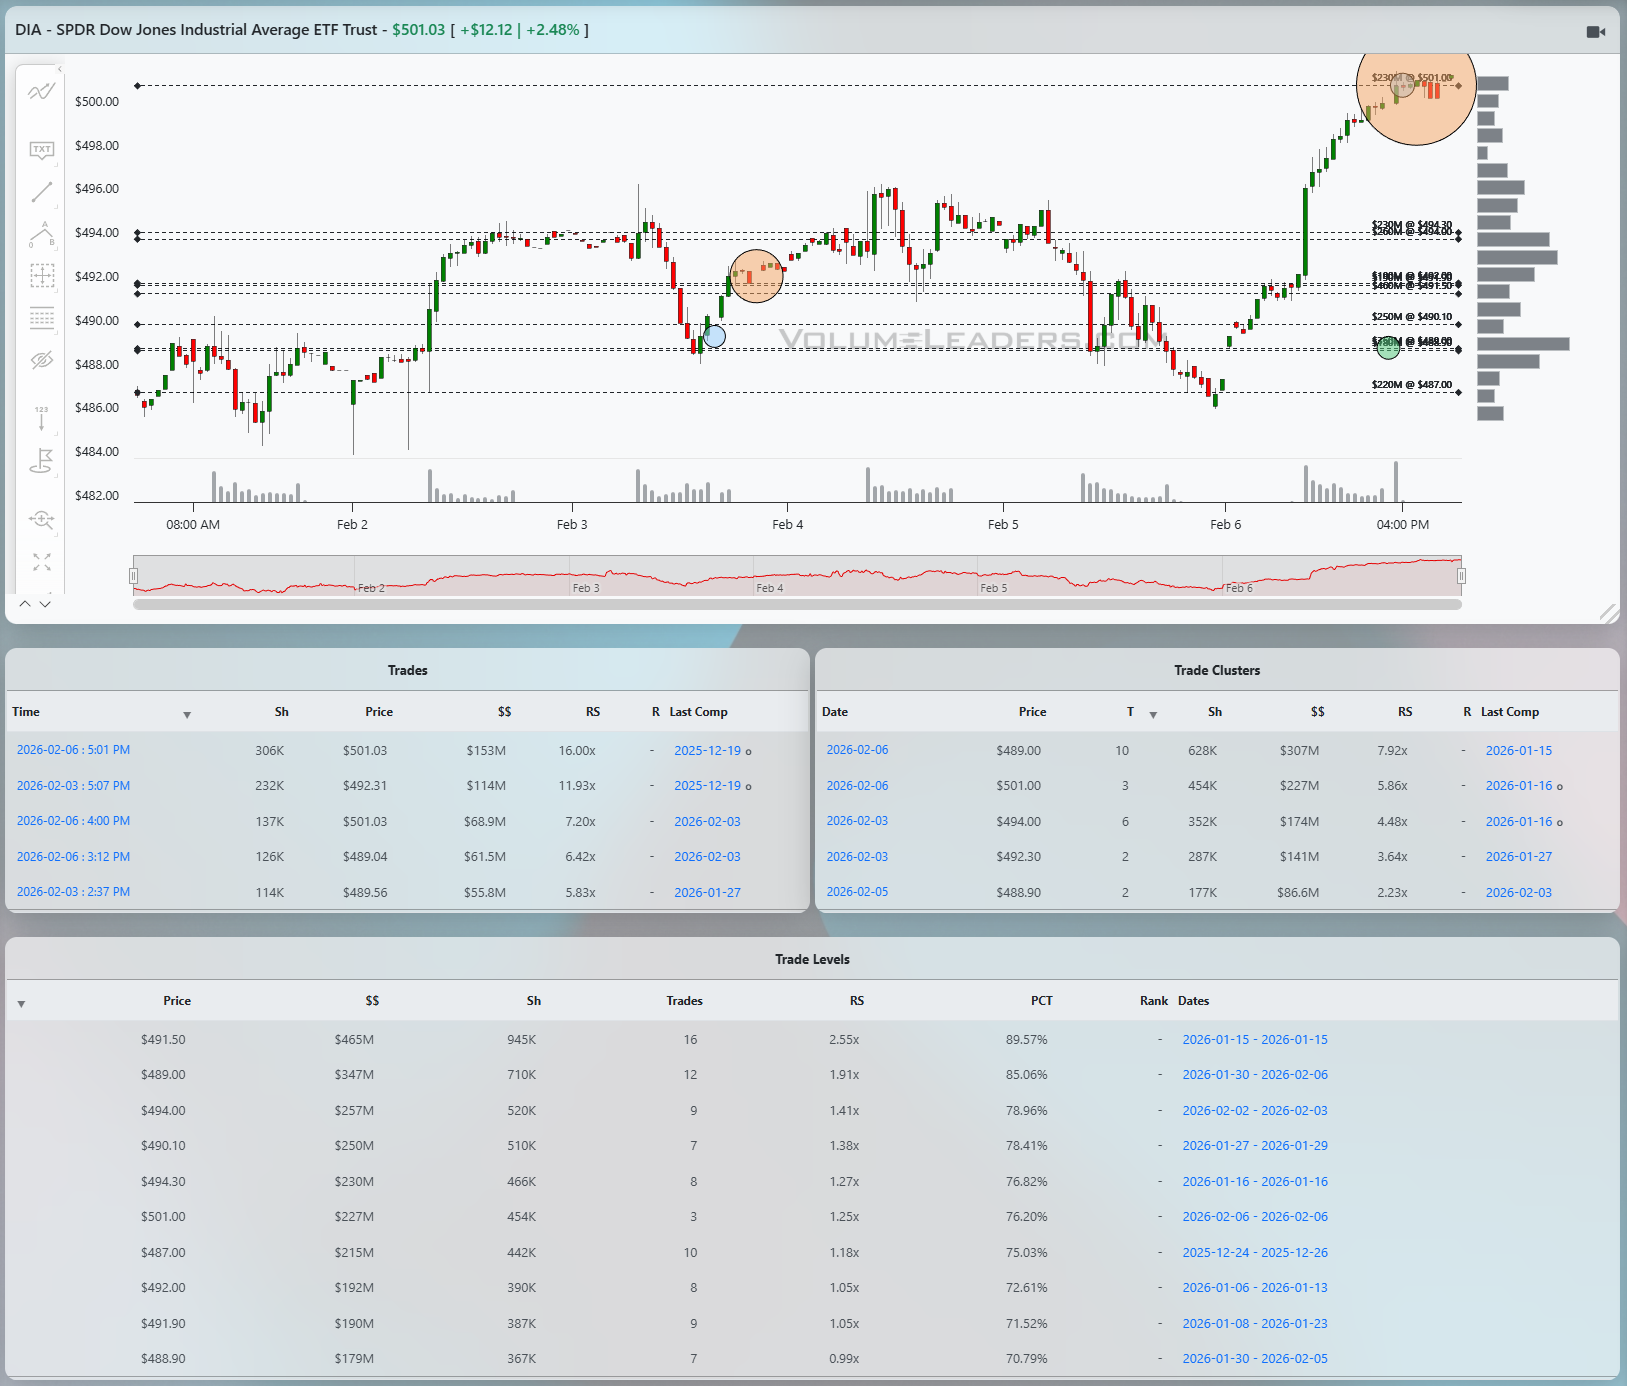
DIA rounds out the picture with a sharp V-shaped recovery and a strong push into fresh highs for this window. The last two sessions have attracted several notable blocks, including prints north of 300,000 shares around 501 and 503, with relative size readings over 10x and notional value in the mid-nine-figure range. The Level table shows a staircase of high-dollar Levels from roughly 489 up through 501, with RS metrics between about 1.9x and 2.5x and PCTs over 80 percent in many cases, confirming that big money has been building positions throughout the entire climb rather than simply chasing at the latest highs. The heaviest cluster sits near 489–491, with close to half a billion dollars traded and RS well above 2x, which now serves as the primary downside reference if this spike ever gives back ground.
For DIA, the immediate line of scrimmage is the 499–503 zone where the latest big blocks printed and where multiple Levels overlap. If price can hold above 499 on any pullback, that will read as constructive digestion at the highs and keeps the path open toward a run into the mid-500s where resistance is thinner. A bearish alternative would be a failure back inside 495, turning the recent spike into a blow-off and putting the 489–491 cluster back in play as the next magnet. From a tactical standpoint, longs will want to stalk entries on intraday dips that respect 499–500 with stops tucked below 495, while shorts only get an edge if DIA breaks under 495 on real size, opening room down into the low 490s.
Bottom line: SPY 683/691, QQQ 608/622, IWM 260/265, DIA 495/503.

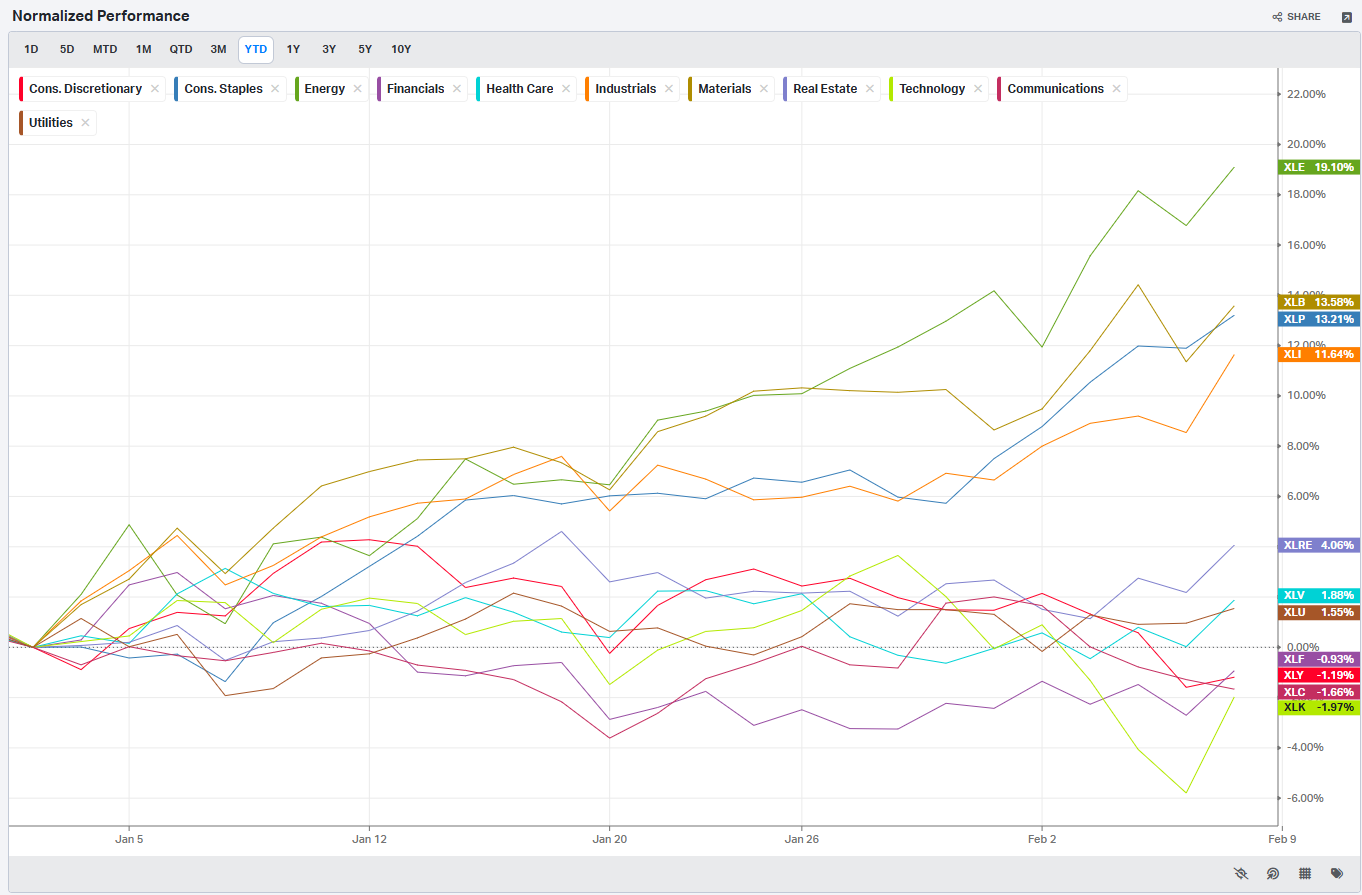
Summary Of Thematic Performance YTD
VolumeLeaders.com offers a robust set of pre-built thematic filters, allowing you to instantly explore specific market segments. These performance snapshots are provided purely for context and inspiration—think about zeroing in on the leaders and laggards within the strongest and weakest sectors, for example.
S&P By Sector
S&P By Industry
Commodities: Energy & Metals
Currencies/Major FX Crosses
Factors: Style vs Size-vs-Value

Events On Deck This Week
Here are key events happening this week that have the potential to cause outsized moves in the market or heightened short-term volatility.
Growth Data In The Crosshairs, Earnings Doing The Talking
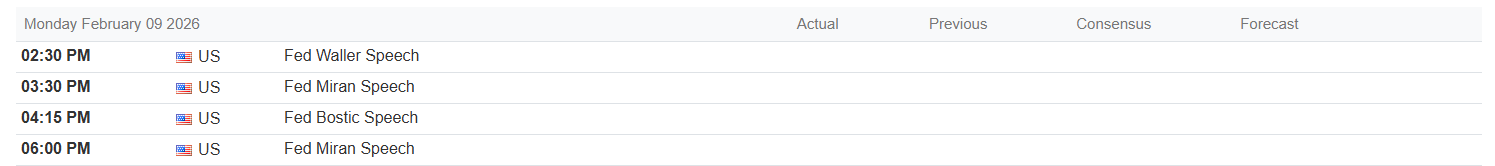
Monday is light on hard data but heavy on Fed color. Waller, Miran, and Bostic are all on the docket through the afternoon, so the tone from that trio will set the starting bid for risk. With no major releases to anchor them, any hint that the Committee is inching closer to rate cuts, or at least comfortable with current progress on inflation, would tilt the day risk-on. A more hawkish lean, especially from Waller, would matter because markets have already walked back the most aggressive easing bets; blunt talk about “higher for longer” would keep a lid on multiples into the rest of the week.
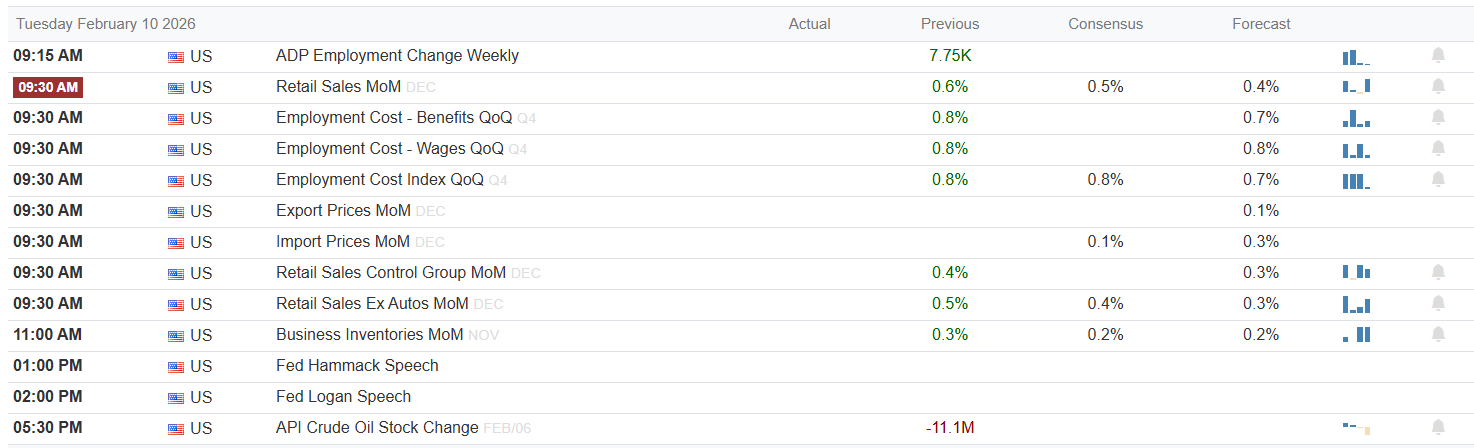
Tuesday is the first true data gauntlet. At 9:15 a.m. we get ADP Employment Change for the week, with an actual reading of 7.75K against a prior print that was visibly higher; directionally, that says hiring momentum has cooled at the margin. Retail Sales for December are clustered around 0.6 percent prior, 0.5 percent consensus, and 0.4 percent forecast, with the core ex-autos line showing 0.4 percent prior, 0.4 percent consensus, and 0.3 percent forecast. Retail Sales Control shows 0.3 percent prior, 0.2 percent consensus, and 0.2 percent forecast. Inflation-adjacent pieces like Export Prices, Import Prices, and the Employment Cost indexes are all sitting in low single digits with consensus and forecasts clustered just below the previous readings. A risk-on mix would be modestly soft ADP, retail volumes that hit or slightly beat the 0.4–0.6 percent range, and cost data that tick down versus prior without rolling over. Risk-off is either a hot combination of firm sales and firmer cost/inflation prints, which would revive “no cuts this year” chatter, or a miss across sales alongside very weak ADP, which would stoke growth scare narratives. Fed speeches from Hammack and Logan later in the day will be read through that lens: are they leaning into resilience or starting to acknowledge downside risks.
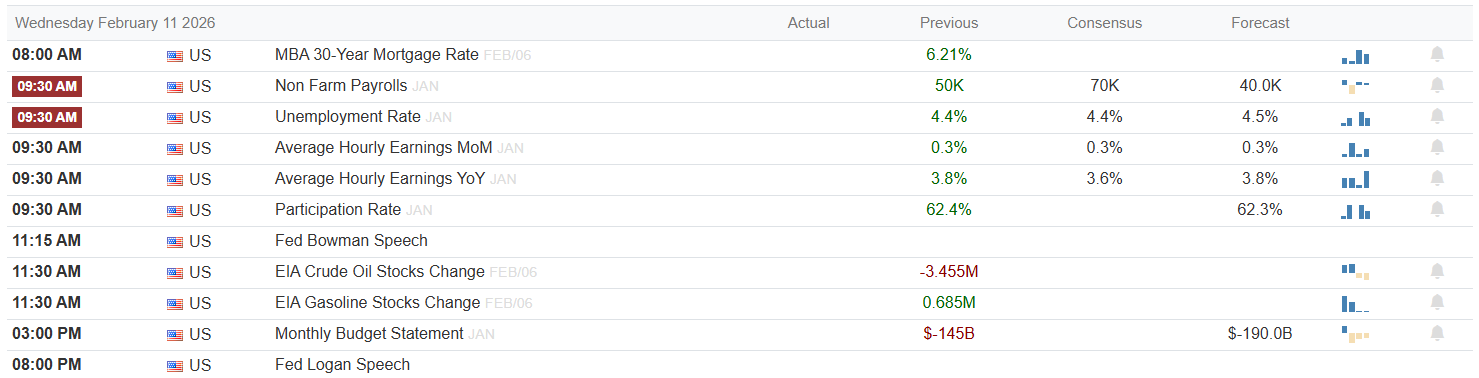
Wednesday shifts the focus to housing and the labor detail. The MBA 30-year mortgage rate sits at 6.21 percent after a long slide from last year’s peaks, which has started to stabilize housing activity. The marquee event is Non-Farm Payrolls at 9:30 a.m., with an actual of 50K versus a previous 70K and visible consensus and forecast near 40K. Average Hourly Earnings month-on-month are unchanged at 0.3 percent, with year-on-year wages at 3.8 percent against a 3.6 percent consensus and 3.8 percent forecast. The participation rate is 62.4 percent versus 62.3 percent prior. Taken together, that is slower hiring but still-firm wage pressure. Risk-on would be payrolls landing close to the 40K–50K zone with wages drifting down toward 3.6 percent year-on-year; that combination says soft landing. Risk-off would be either a sharp downside payroll surprise or another upside wage surprise that keeps real rates in focus. Later, EIA oil and gasoline stock changes will matter for energy and inflation expectations, and Bowman plus Logan have speaking slots that traders will parse for how much weight the Fed is putting on the wage side of the mandate.
Thursday’s tape is about claims and housing. Initial Jobless Claims show a previous reading of 231K against a 235K consensus and 225K forecast. That corridor is still consistent with a cooling but not collapsing labor market. Existing Home Sales for January show 4.35M prior, with consensus at 4.25M and a negative month-on-month forecast of around minus 3.4 percent. A risk-on setup would be claims tracking the 220K–230K area while existing home sales modestly beat the 4.25M handle, which would frame housing as stabilizing rather than double-dipping. A risk-off read would be a sudden jump in claims well above the 235K consensus or a big miss on sales, reinforcing the idea that the rate shock is still biting. Any Fed remarks that day would be weighed against how much stress shows up in the claims data.
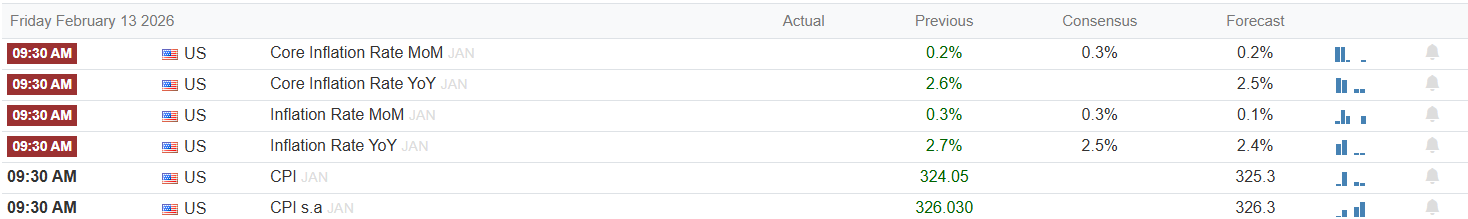
Friday is the inflation stress test. Core Inflation Rate month-on-month for January prints 0.2 percent prior, 0.3 percent consensus, and 0.2 percent forecast; the year-on-year core sits at 2.6 percent prior, 2.5 percent consensus, and 2.5 percent forecast. The headline Inflation Rate is 0.3 percent prior, 0.3 percent consensus, and 0.2 percent forecast with year-on-year at 2.7 percent prior, 2.4 percent consensus, and 2.4 percent forecast. CPI ex seasonal adjustment is in the 326 handle, with consensus and forecast very close. Risk-on is straightforward: inflation that meets or undershoots those 0.2–0.3 percent month-on-month and 2.4–2.6 percent year-on-year marks would validate the disinflation story and give the Fed cover to talk about cuts later in the year. Risk-off is a re-acceleration, especially if core lands above 0.3 percent on the month or kicks back above 2.6 percent year-on-year; that would reprice the entire front-end curve. Multiple Fed speakers on Friday will either lean into “mission accomplished” or emphasize patience, and the market will react accordingly.
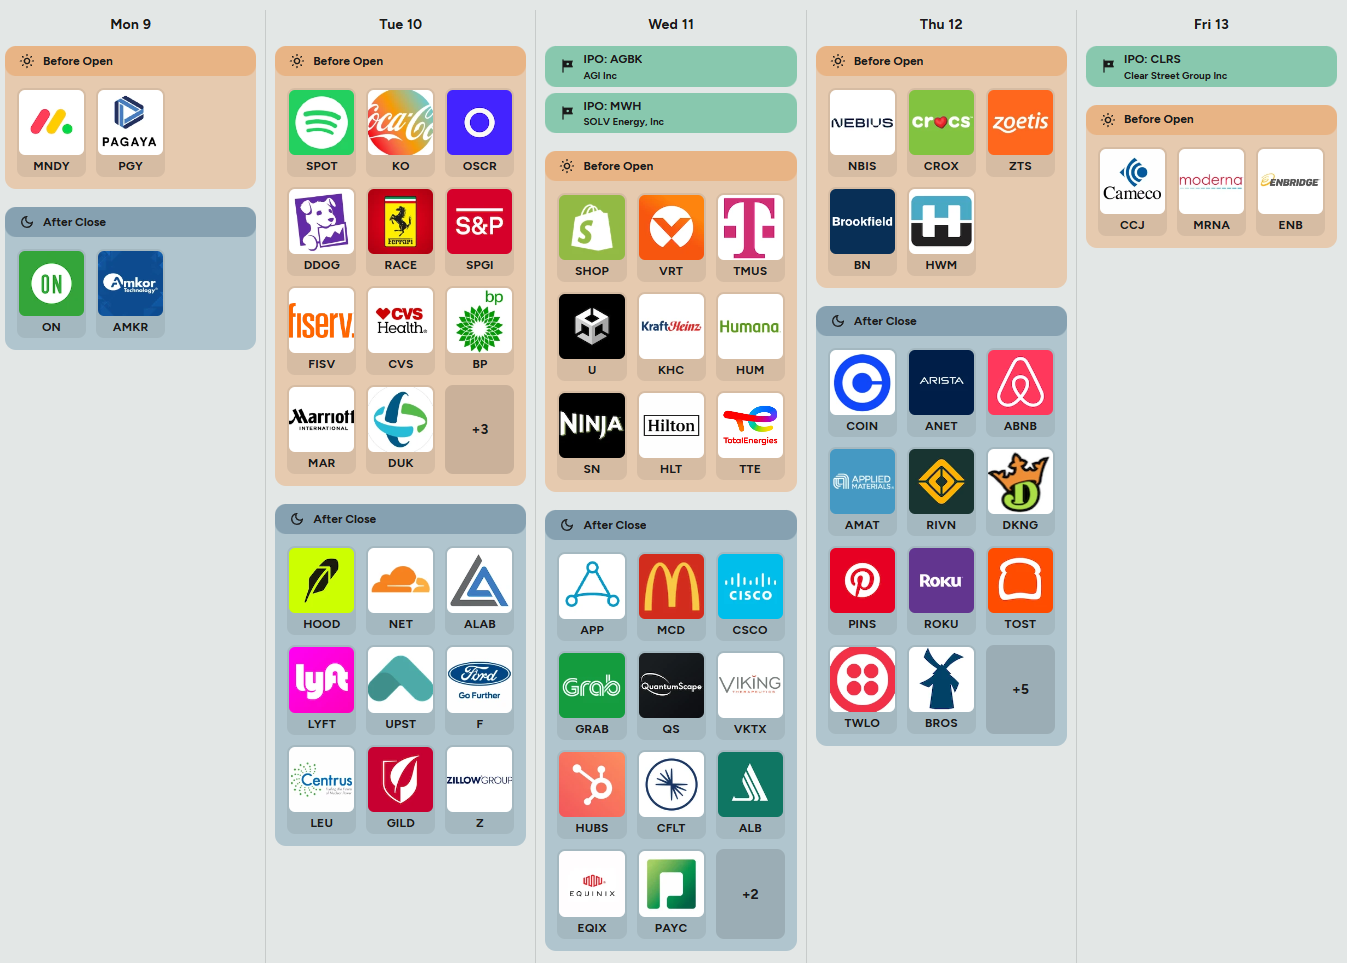
On the micro side, the earnings and IPO board is busy enough to move sectors. Early in the week, names like Coca-Cola and BP speak to the health of the consumer and energy complex; margins and forward commentary on volumes will be the tells. On Wednesday, Shopify, Hilton, and major health-care players like Humana line up before the open, while Apple, McDonalds, Cisco, and a broader mix of tech and consumer names report after the close. Here, traders should watch cloud spend, ad trends, and any commentary on AI-driven capex from the large platforms as a read-through into both software and semis. Thursday’s slate features high-beta tech and growth like Coinbase, Arista, Airbnb, Applied Materials, Rivian, DraftKings, and a cluster of internet names, which will drive factor swings in growth, semis, EVs, and crypto-adjacent risk. Friday’s focus narrows to macro-adjacent stories like Cameco, Moderna, and Enbridge. Cameco’s uranium demand outlook feeds into the energy transition trade; Moderna’s vaccine and pipeline commentary shapes the post-pandemic narrative in biotech; Enbridge is a proxy for North American energy infrastructure and cash flow duration. New IPOs such as CLRS will be watched less for the specific story and more for whether demand for fresh paper remains healthy; strong aftermarket performance is another soft confirmation that risk appetite is intact.
Sign-posts for active traders:
Retail Sales Control on Tuesday holding 0.2–0.3 percent or better keeps the soft-landing growth narrative alive; a zero or negative print would be a shot across the bow.
Friday’s core CPI year-on-year at or below 2.5 percent is the line between “cuts in play” and “higher for longer” chatter.
Non-Farm Payrolls in the 40K–60K band with wages no higher than 3.8 percent year-on-year is the sweet spot; any combination of sub-20K jobs or wage growth well north of 3.8 percent flips the week’s tone risk-off.
Bottom line: this is a data-heavy week where inflation and labor need to come in just cool enough to keep the soft-landing story alive, but any upside surprise in wages or CPI will quickly shift the narrative back toward sticky inflation and tighter-for-longer policy.

Order Flow in Focus: Reading Smart Money Tells
Order Flow in Focus: Reading Smart Money Tells is a recurring segment that spotlights unique intraday opportunities revealed through institutional order flow. Each feature dissects a moment when the tape quietly shifted—when large, ranked prints clustered at key liquidity locations and informed players positioned ahead of the move. The goal isn’t hindsight; it’s pattern recognition—learning to spot the footprints of capital that knows before the crowd does.
Every now and then the tape hands you a clean tell. PSQ did that on February 3rd. This is the inverse QQQ product, so buying PSQ is effectively getting short large-cap growth. Late that day, someone did exactly that in size, right as SPY and QQQ were pressing into balance highs.
For context, PSQ had been oscillating between support in the 29.70–29.80 area and resistance around 30.20–30.30. That 30.20 band was not just a random shelf; Level data had it as one of the largest volume nodes on the chart, with roughly 1.8B+ notional size. In other words, that is where real money had done business before. At the same time, SPY and QQQ were grinding into prior highs with sentiment leaning optimistic and no fresh breakout character.
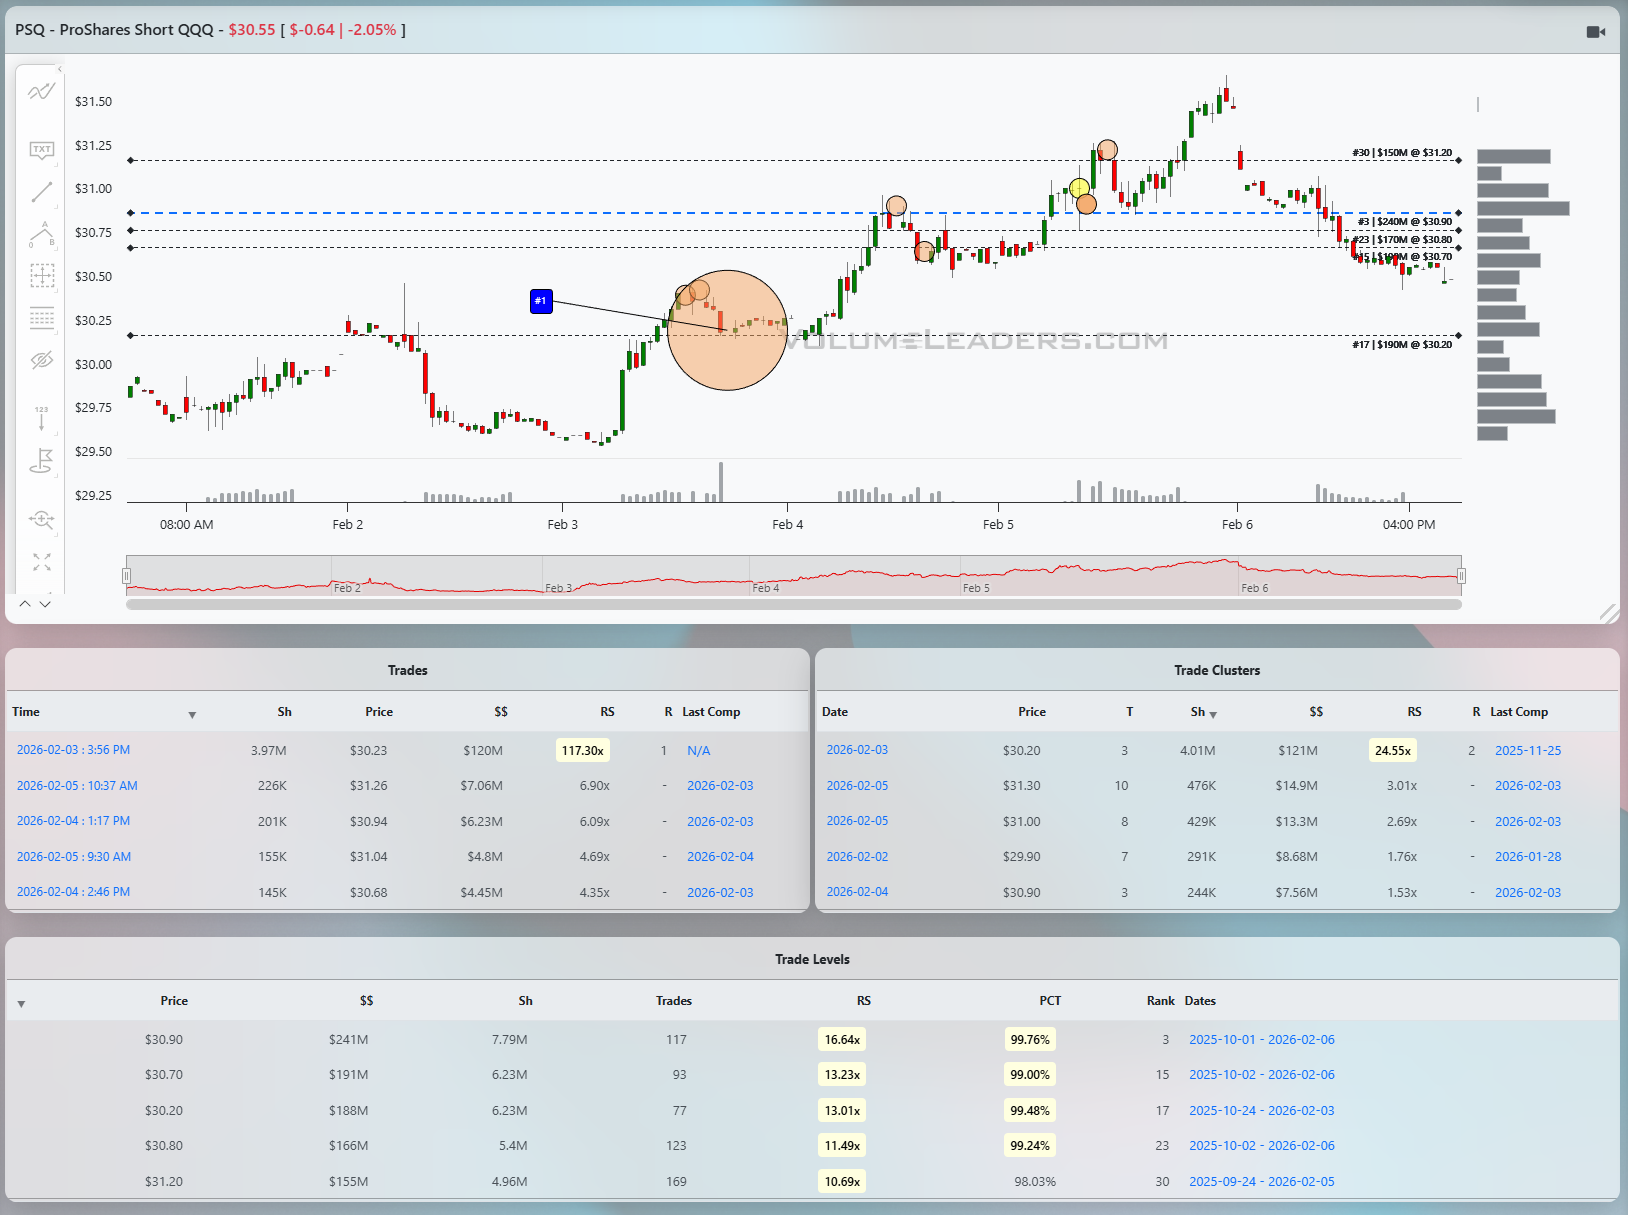
Four minutes before the close, PSQ printed a single 3.97M‑share block at 30.23, about 120M dollars in notional and 117x normal size, tagged as the number one ranked print. All things taken together, it certainly read as someone deliberately putting on short‑QQQ exposure, at size, into a deep liquidity pocket, exactly when the indices were extended into resistance. Those three elements – location (major Level), timing (end of day), and size (ranked block) – are the signposts.
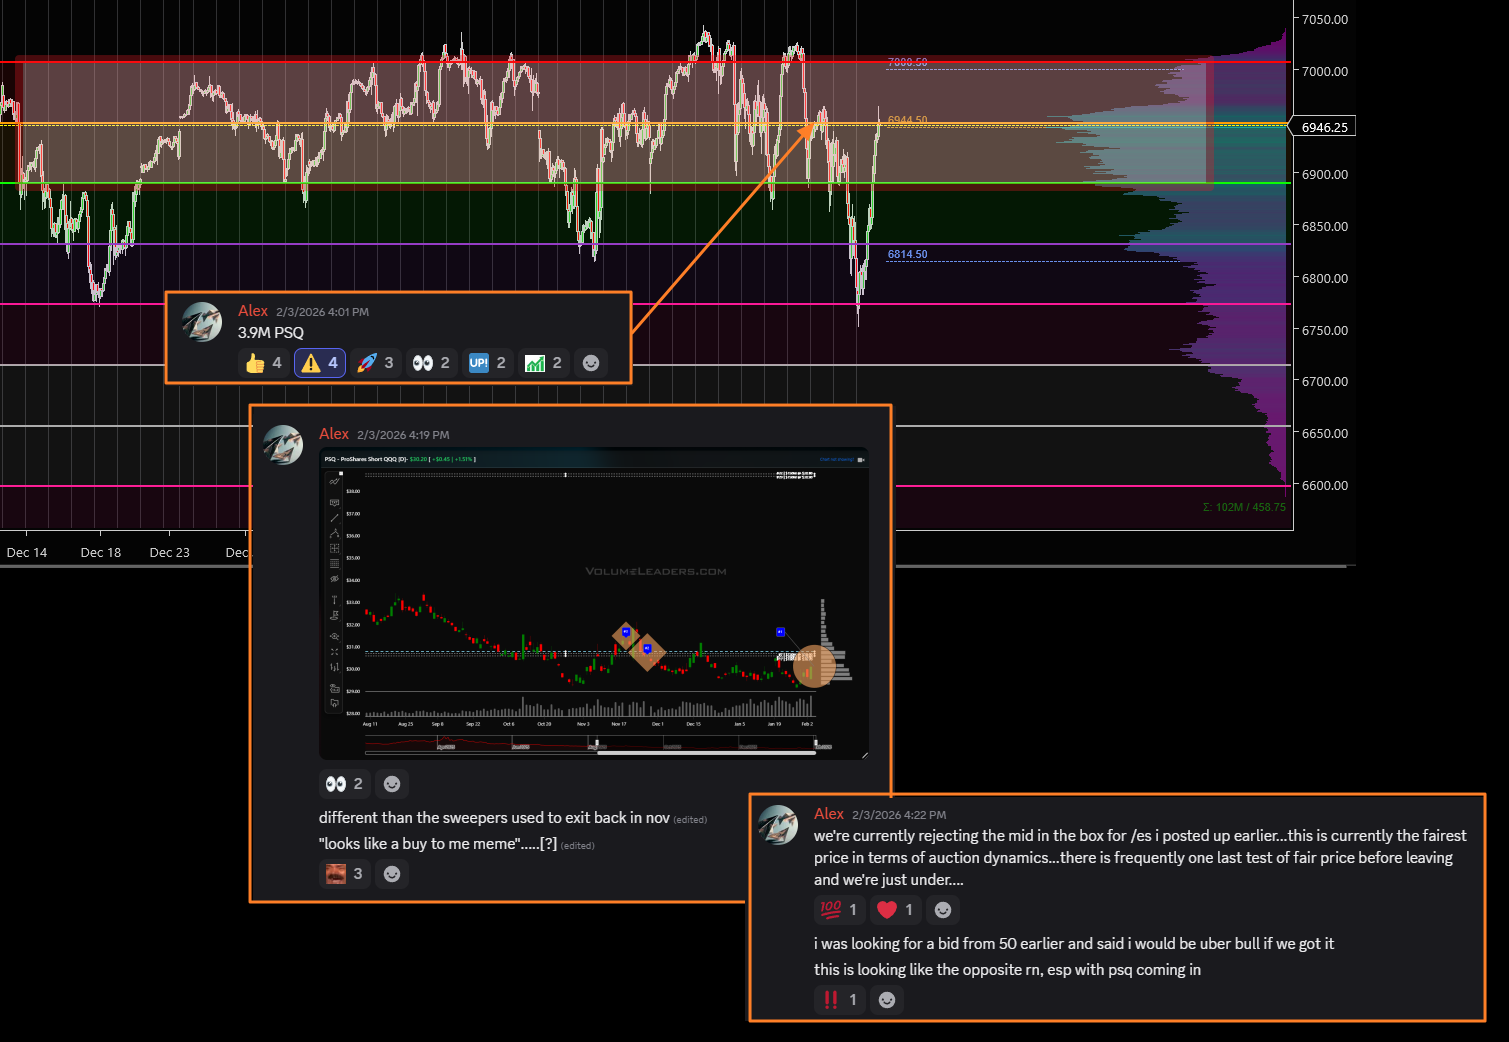
From a trading standpoint, that gave you a straightforward plan for the next session. Treat 30.20 as your pivot. If PSQ opened and immediately broke down through that level, the block was likely late protection getting unwound. If PSQ held above 30.20 and started to firm while QQQ struggled to make new highs, the bias shifted to “smart money long PSQ.” The actual follow‑through fit the second case: QQQ rolled, PSQ pushed higher, and price worked up into the heavier overhead bands around 30.70–30.90 and eventually the low 31s where prior volume was also elevated.
Net result: someone with a read on the narrative used PSQ to get short tech for 2-days of hard selling while the software-breakdown narrative permeated the media. The edge was not foresight about the news; it was recognizing that combination of size, price, location and timing as it hit.

Market Intelligence Report
A desk-grade synthesis of institutional positioning and market structure—unpacking the flows, levels, and emerging themes that shaped the week, and translating them into a model portfolio built the same way professional desks prepare for the week ahead.
MIR Part 1: The Backdrop
Institutional liquidity this week stayed elevated but orderly, with a couple of clear bulges that look more like re‑allocation and event response than panic. The multi‑month liquidity series shows this week’s prints sit well below prior extremes but comfortably above the 100–150B dollar baseline that defined quieter stretches earlier in the period.
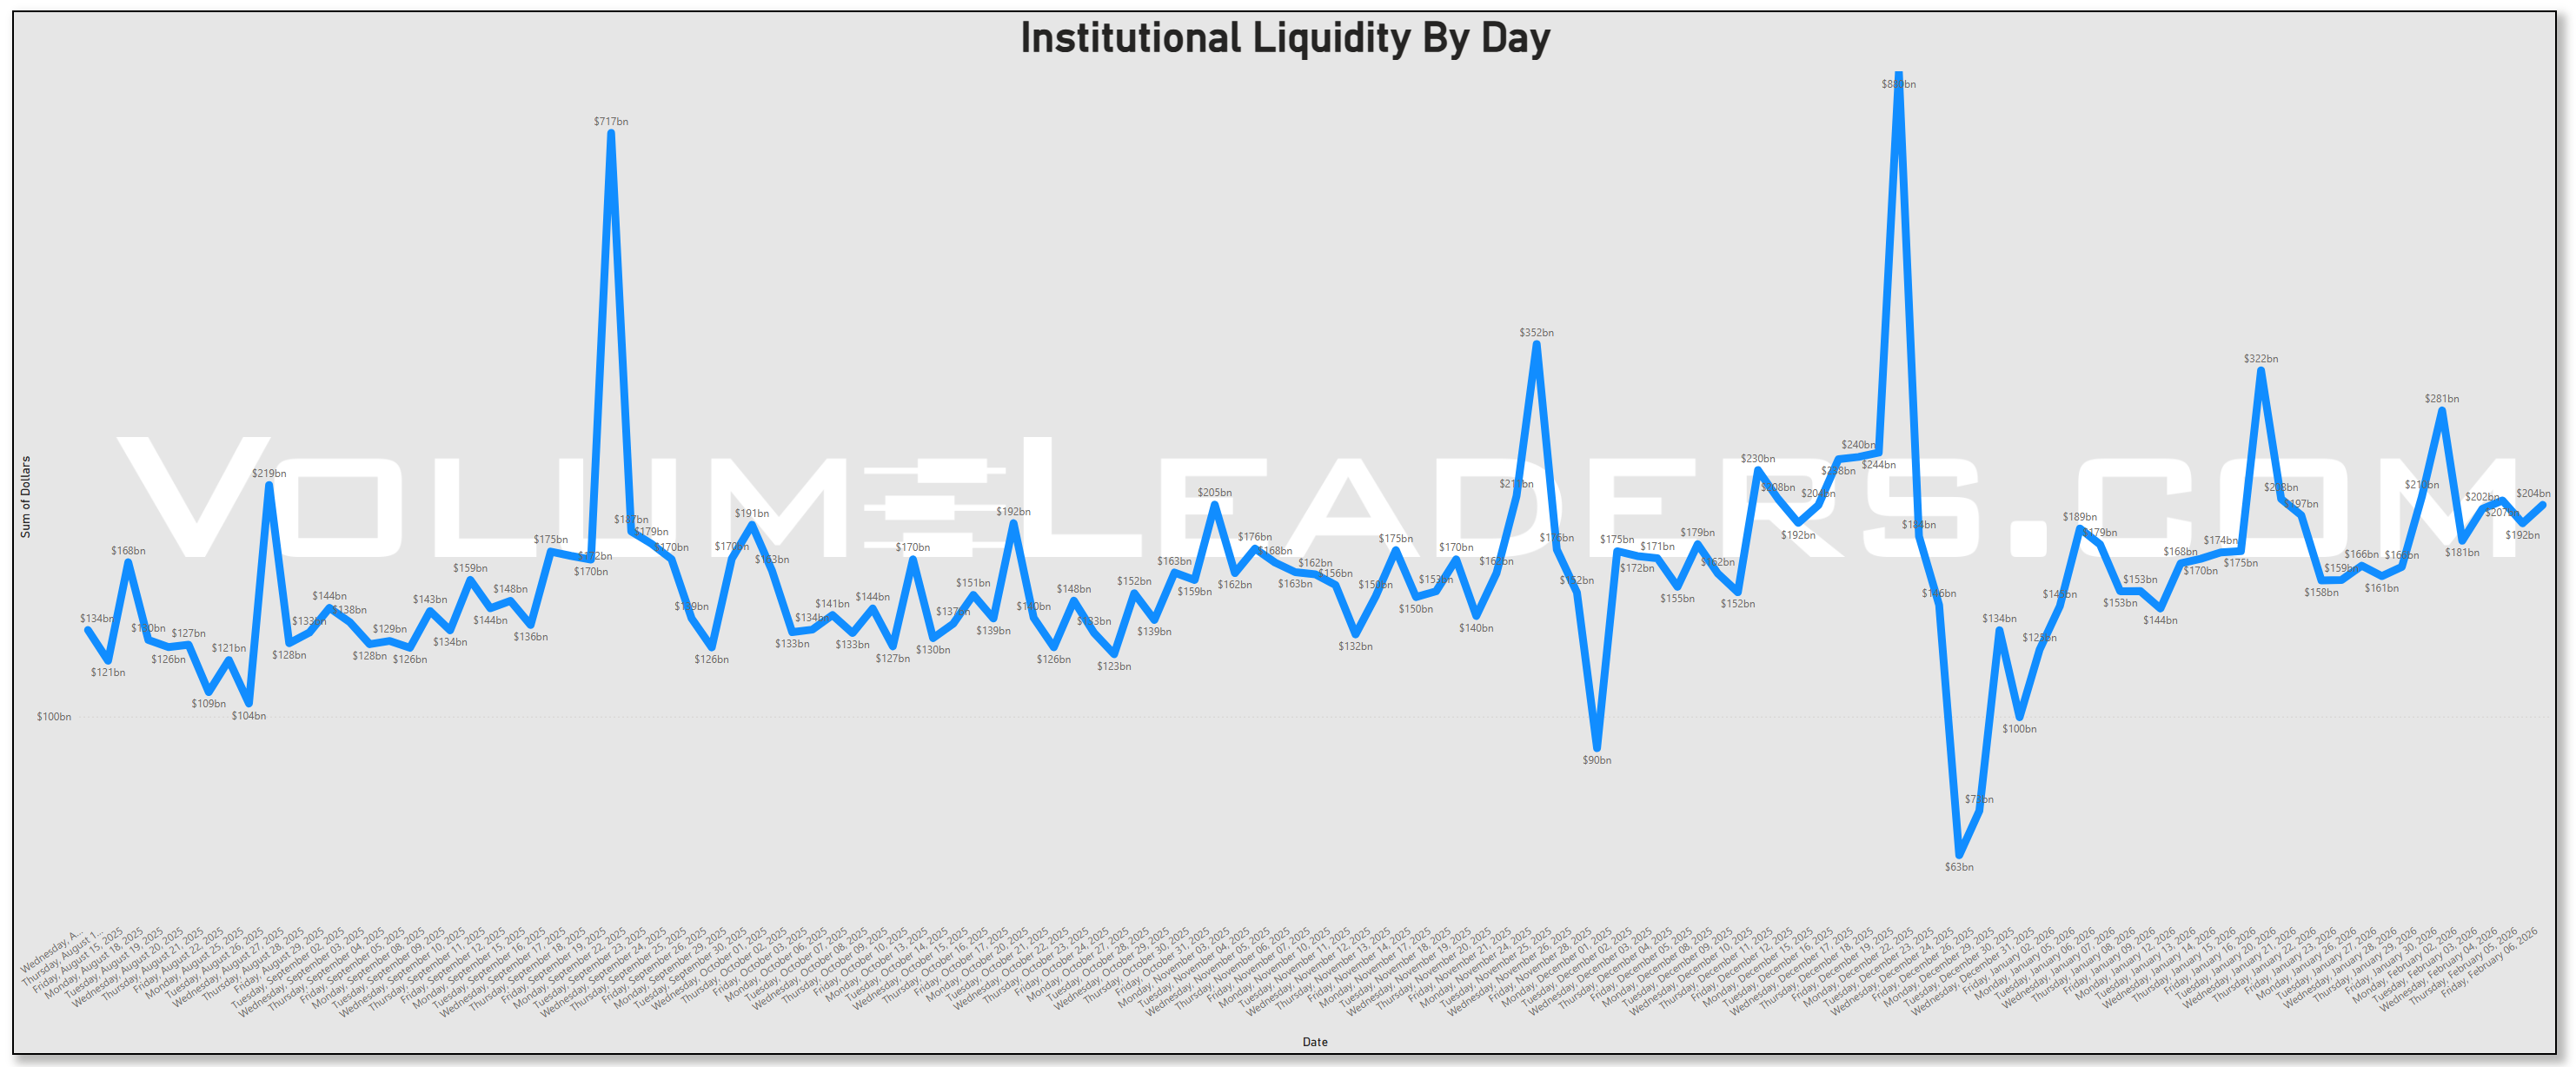
We are in that mode where real money is active every day, but only stepping on the gas around known catalysts rather than spraying liquidity indiscriminately. That fits the backdrop: a softer January ADP print at just 22K private jobs added, which keeps growth worries alive, and a market now fixated on the scale of 2026 AI capex, with estimates for big tech spending running around 600–650B dollars and headlines framing it as both opportunity and risk.
Looking at the daily sector dollar table, Technology still commands a large share of the tape, with flows between roughly 41.7B and 58.3B dollars across the two weeks in view, but the interesting part is the rotation underneath. Last week’s peak tech day sits near 66.7B dollars; this week’s top tech day is lower, closer to the high 50s, even as Industrials and Financials notch steadier readings in the mid‑teens to low‑20B range.
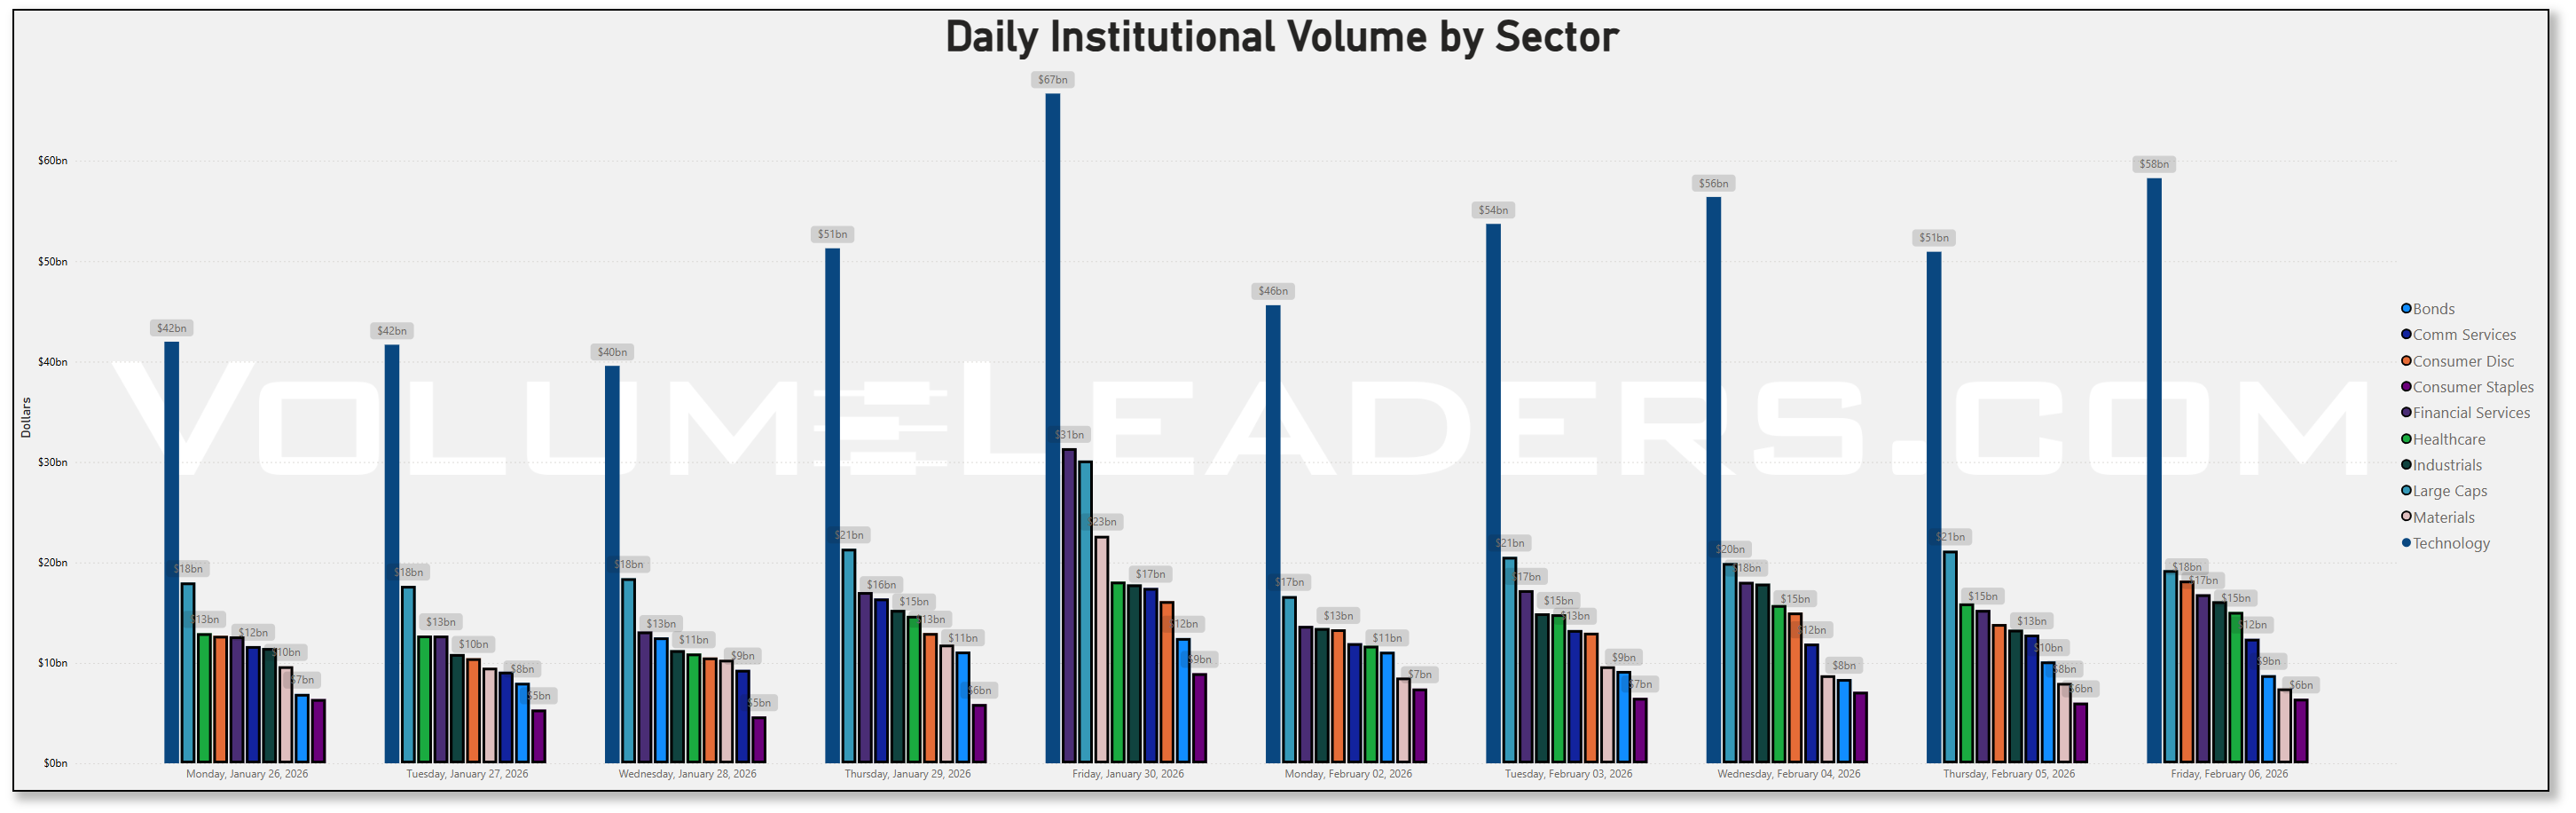
Industrials show dollars stepping up from around 11.3B early last week to over 16.1B by Friday, while Large Caps as a basket climb from roughly 18.0B to more than 19.2B over the same span. That is classic de‑crowding: less “all‑in” on pure tech beta, more consistent allocation to broad large‑cap and old‑economy sectors as investors digest what a 600B‑plus AI capex wave actually means for margins and balance sheets. Energy dollars, by contrast, fade out a bit, sitting in the low‑to‑mid single‑digit billions and not building the way they did around prior crude shocks, which makes sense with oil stuck in a range and attention shifting to capex and rates rather than supply scares.
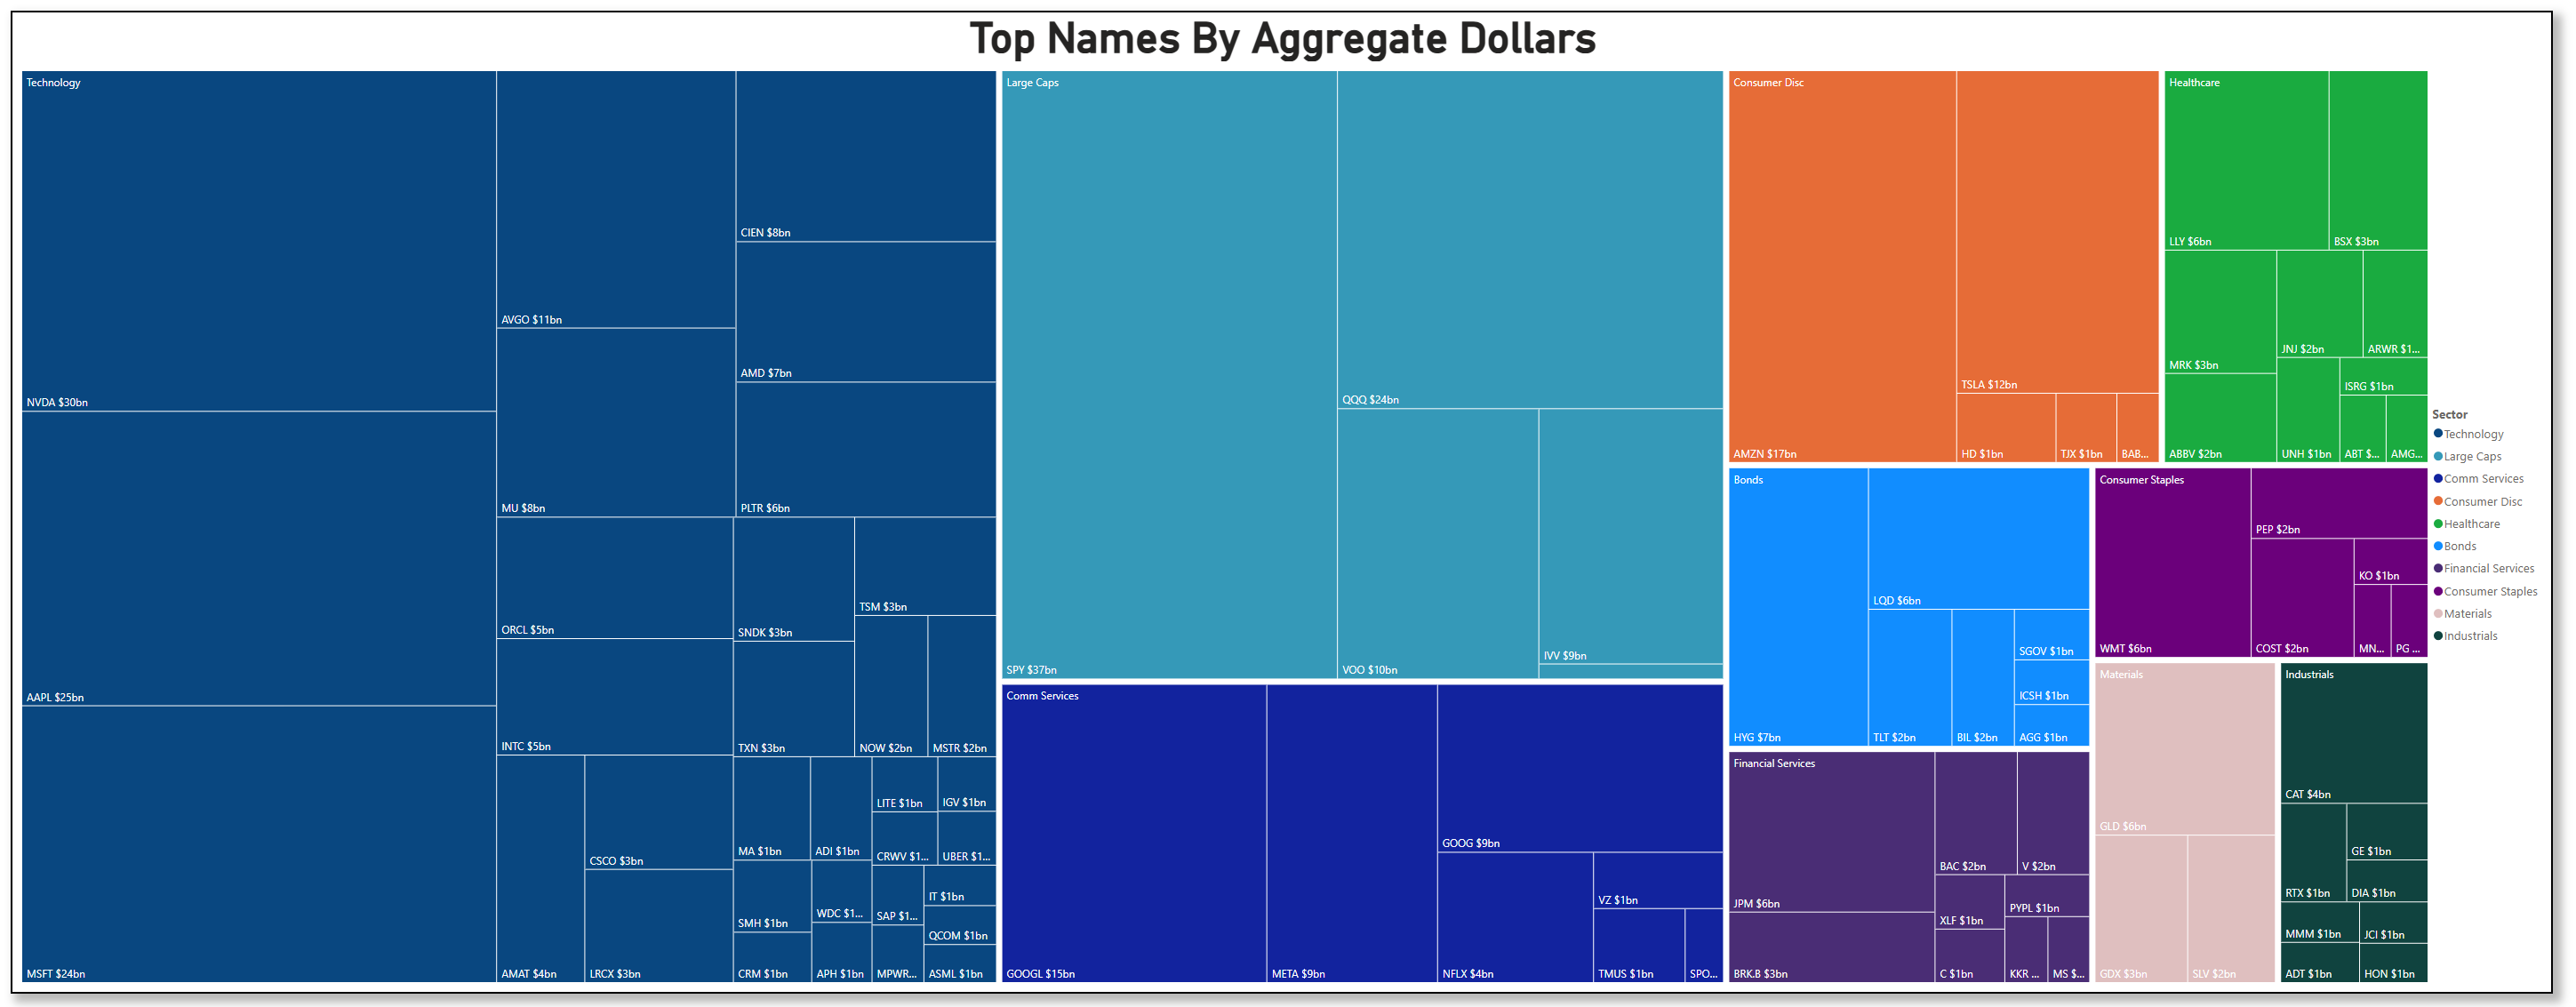
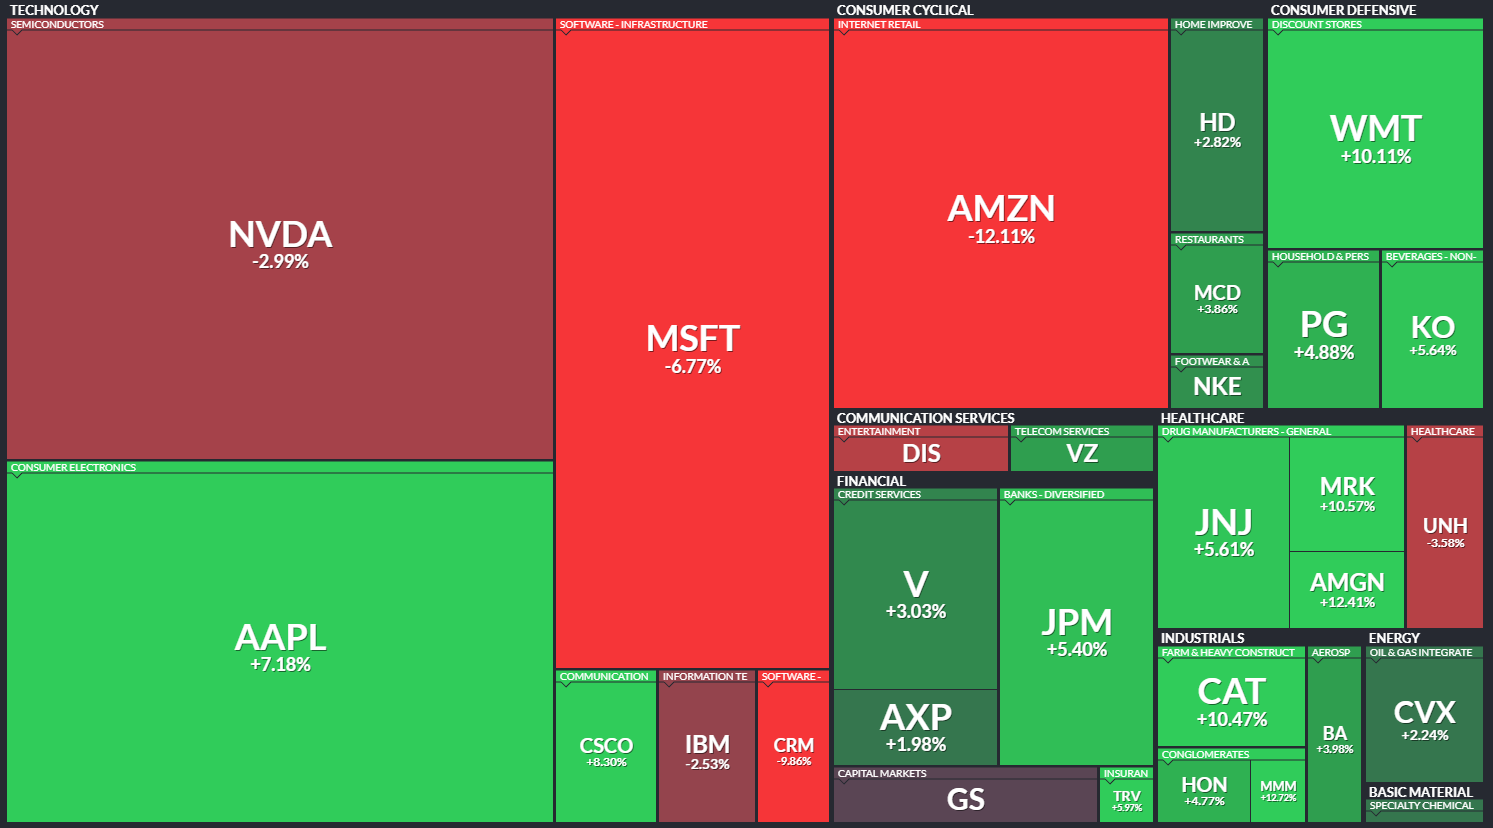
The treemap of “Top Names by Aggregate Dollars” confirms that concentration is still very real. Technology tiles dominate the left side: Nvidia at about 30B dollars, Apple around 25B, Microsoft near 24B, and a long tail of semis and platform names (AVGO around 11B, AMD 7B, PLTR 6B, MU 8B, ORCL 5B, TSM 3B, plus a cluster of 1–3B mid‑caps). On the index side, SPY towers over the large‑cap cluster at roughly 37B dollars, QQQ around 24B, VOO about 10B, and IWM roughly 9B. Bonds are visible but smaller, with LQD at 6B, HYG 7B, TLT 5B, and a mix of AGG and SGOV in the 1–3B band. That mix says most of the real money is still toggling between S&P beta and the AI complex, not abandoning tech but being more selective within it. Nvidia, Apple, and Microsoft are clearly still the magnets, with the breadth inside tech decent: names like AMD, MU, ORCL, and PLTR are each pulling multiple billions rather than being afterthoughts, which lines up with the narrative that the AI build‑out is moving into networking, memory, and software tooling, not just GPUs.
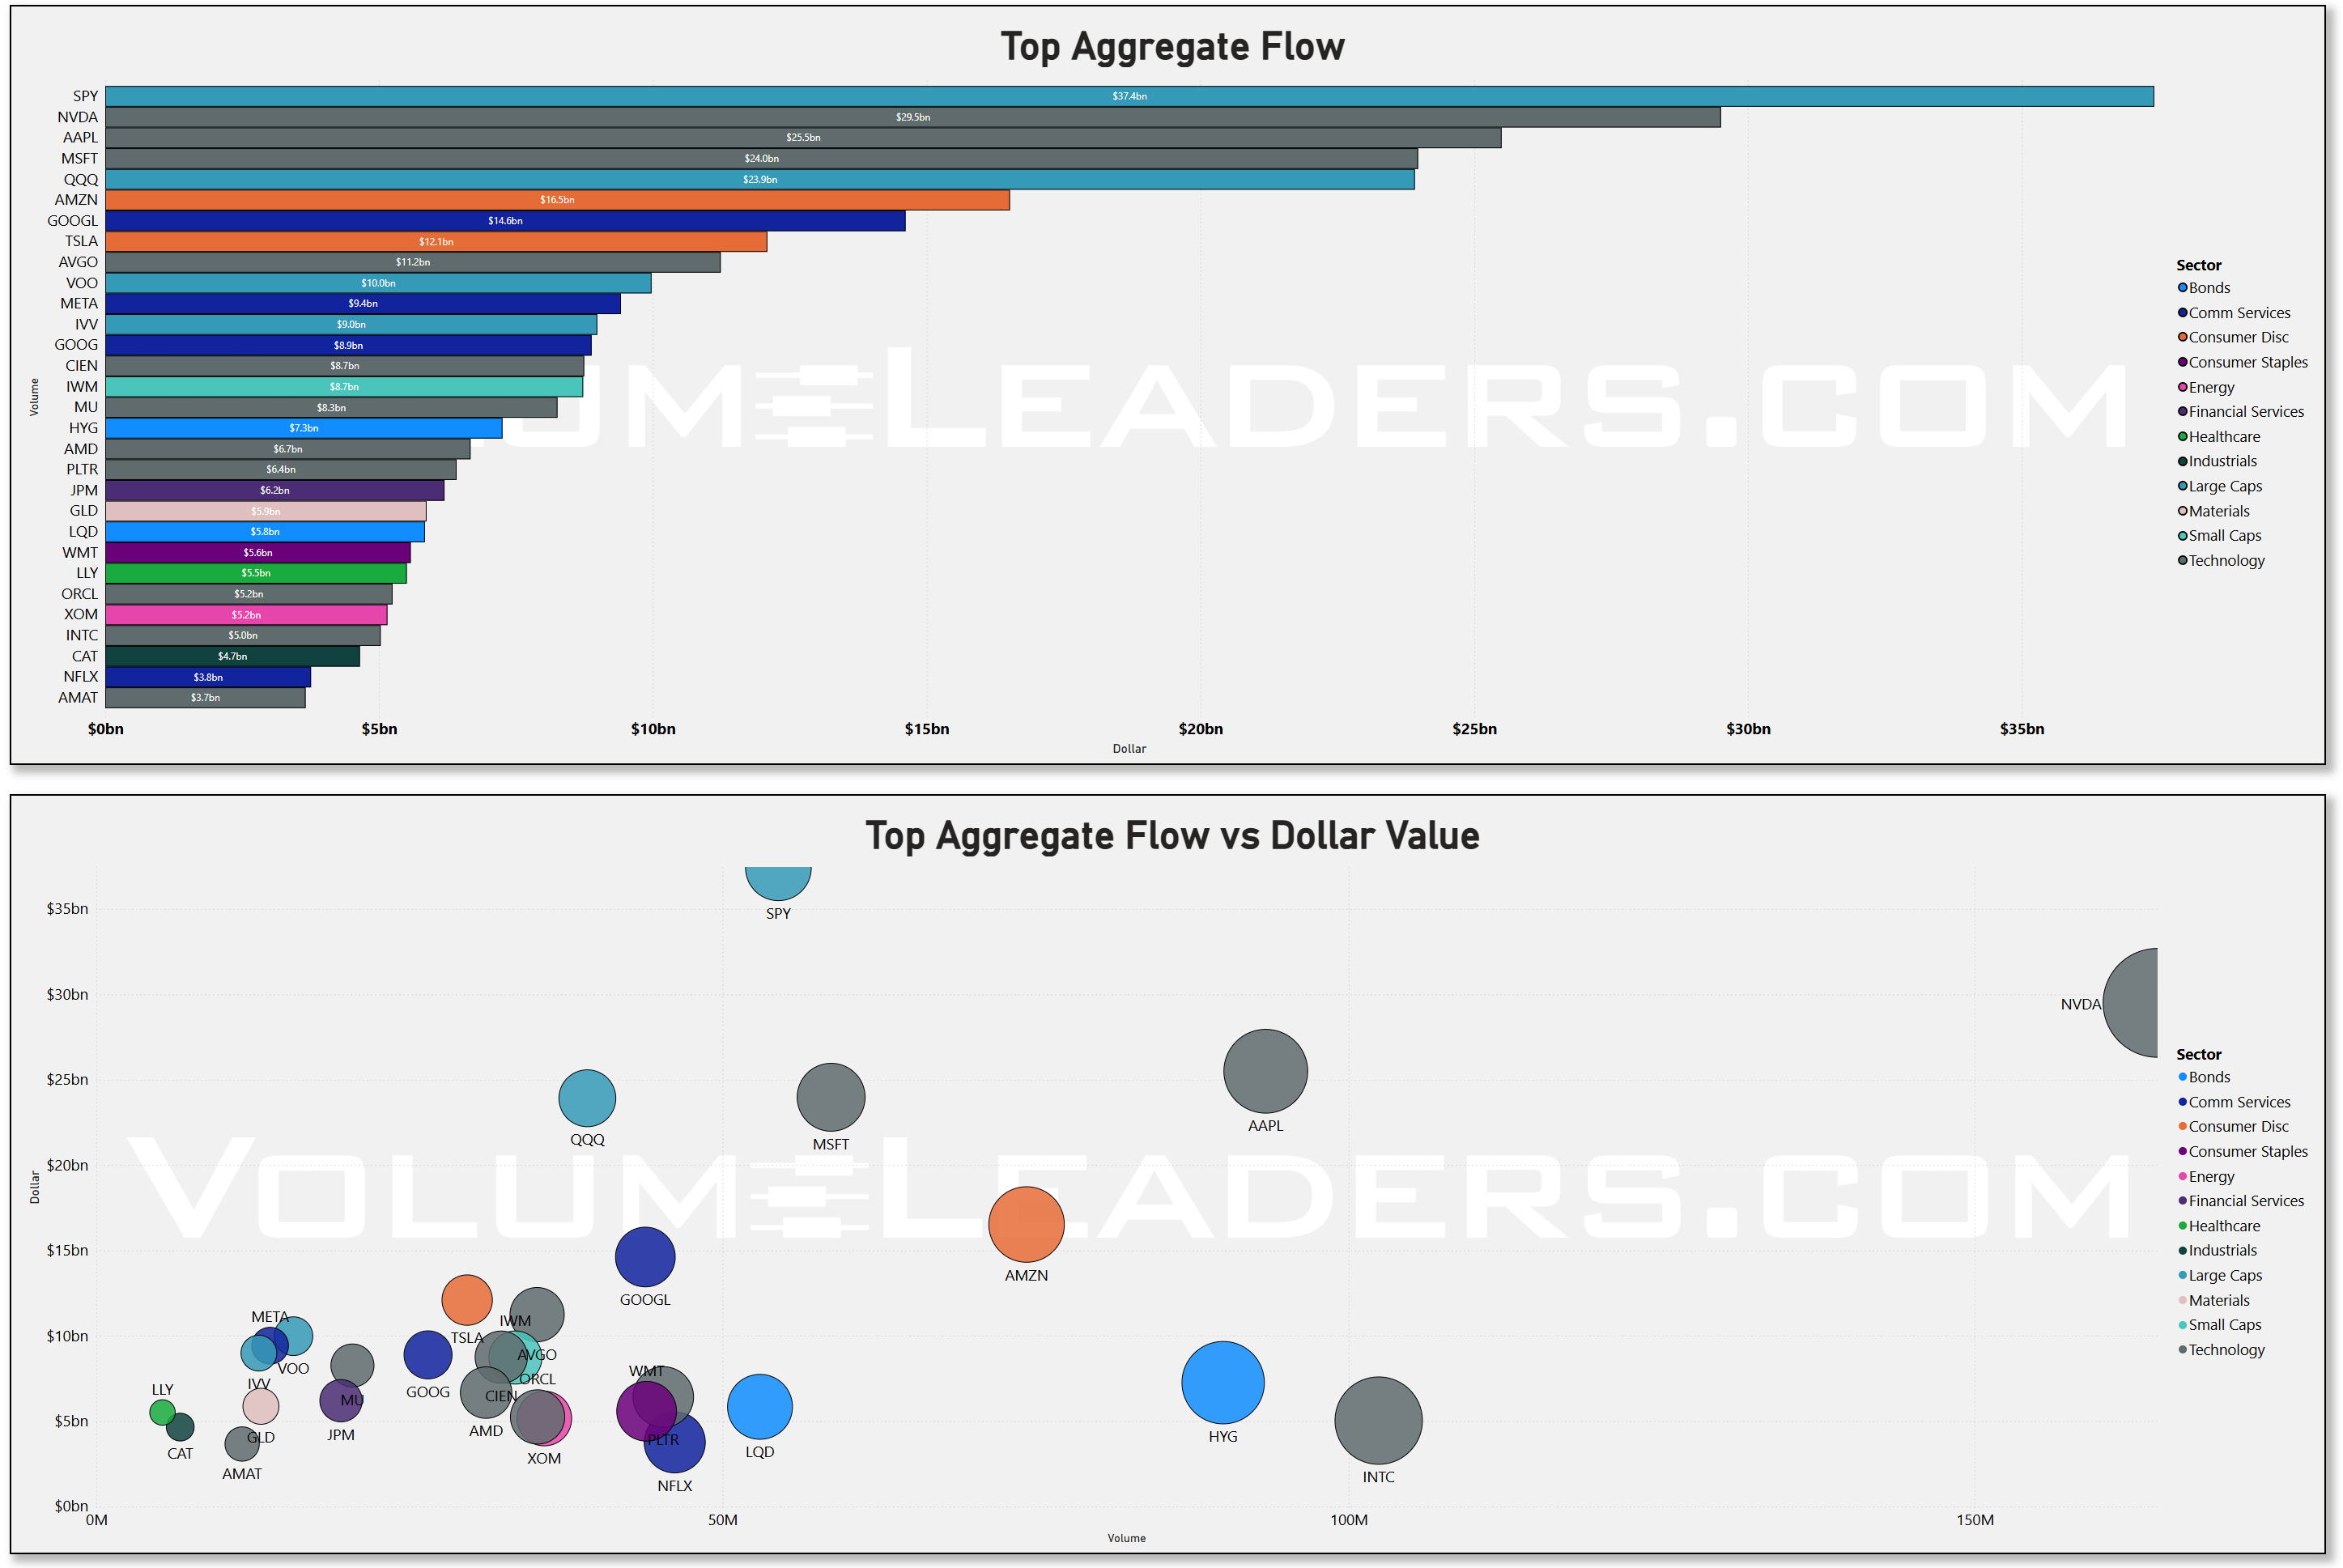
The aggregate flow bar and scatter reinforce that point. SPY sits on top at around 37B dollars of total flow, followed by Nvidia, Apple, and Microsoft in the 20–30B zone. QQQ, Amazon, and Google are not far behind in the low‑to‑mid teens. In the scatter view, SPY shows very high dollar value with correspondingly high volume, which is what you expect when asset allocators rebalance risk around an evolving Fed path; Fed funds futures now price a high probability of meaningful cuts by March, even as FOMC communication stays cautious, so there is constant tweaking of equity duration exposure. Nvidia’s bubble is notable: dollar value close to the top of the field with huge share turnover, consistent with investors reacting to the latest AI capex headlines and the company’s role as the primary beneficiary of the 600B+ 2026 build‑out. QQQ, HYG, and LQD form another cluster in the scatter: high‑volume, high‑dollar vehicles that suggest portfolio‑level adjustments in growth equity and credit rather than single‑name stock picking.
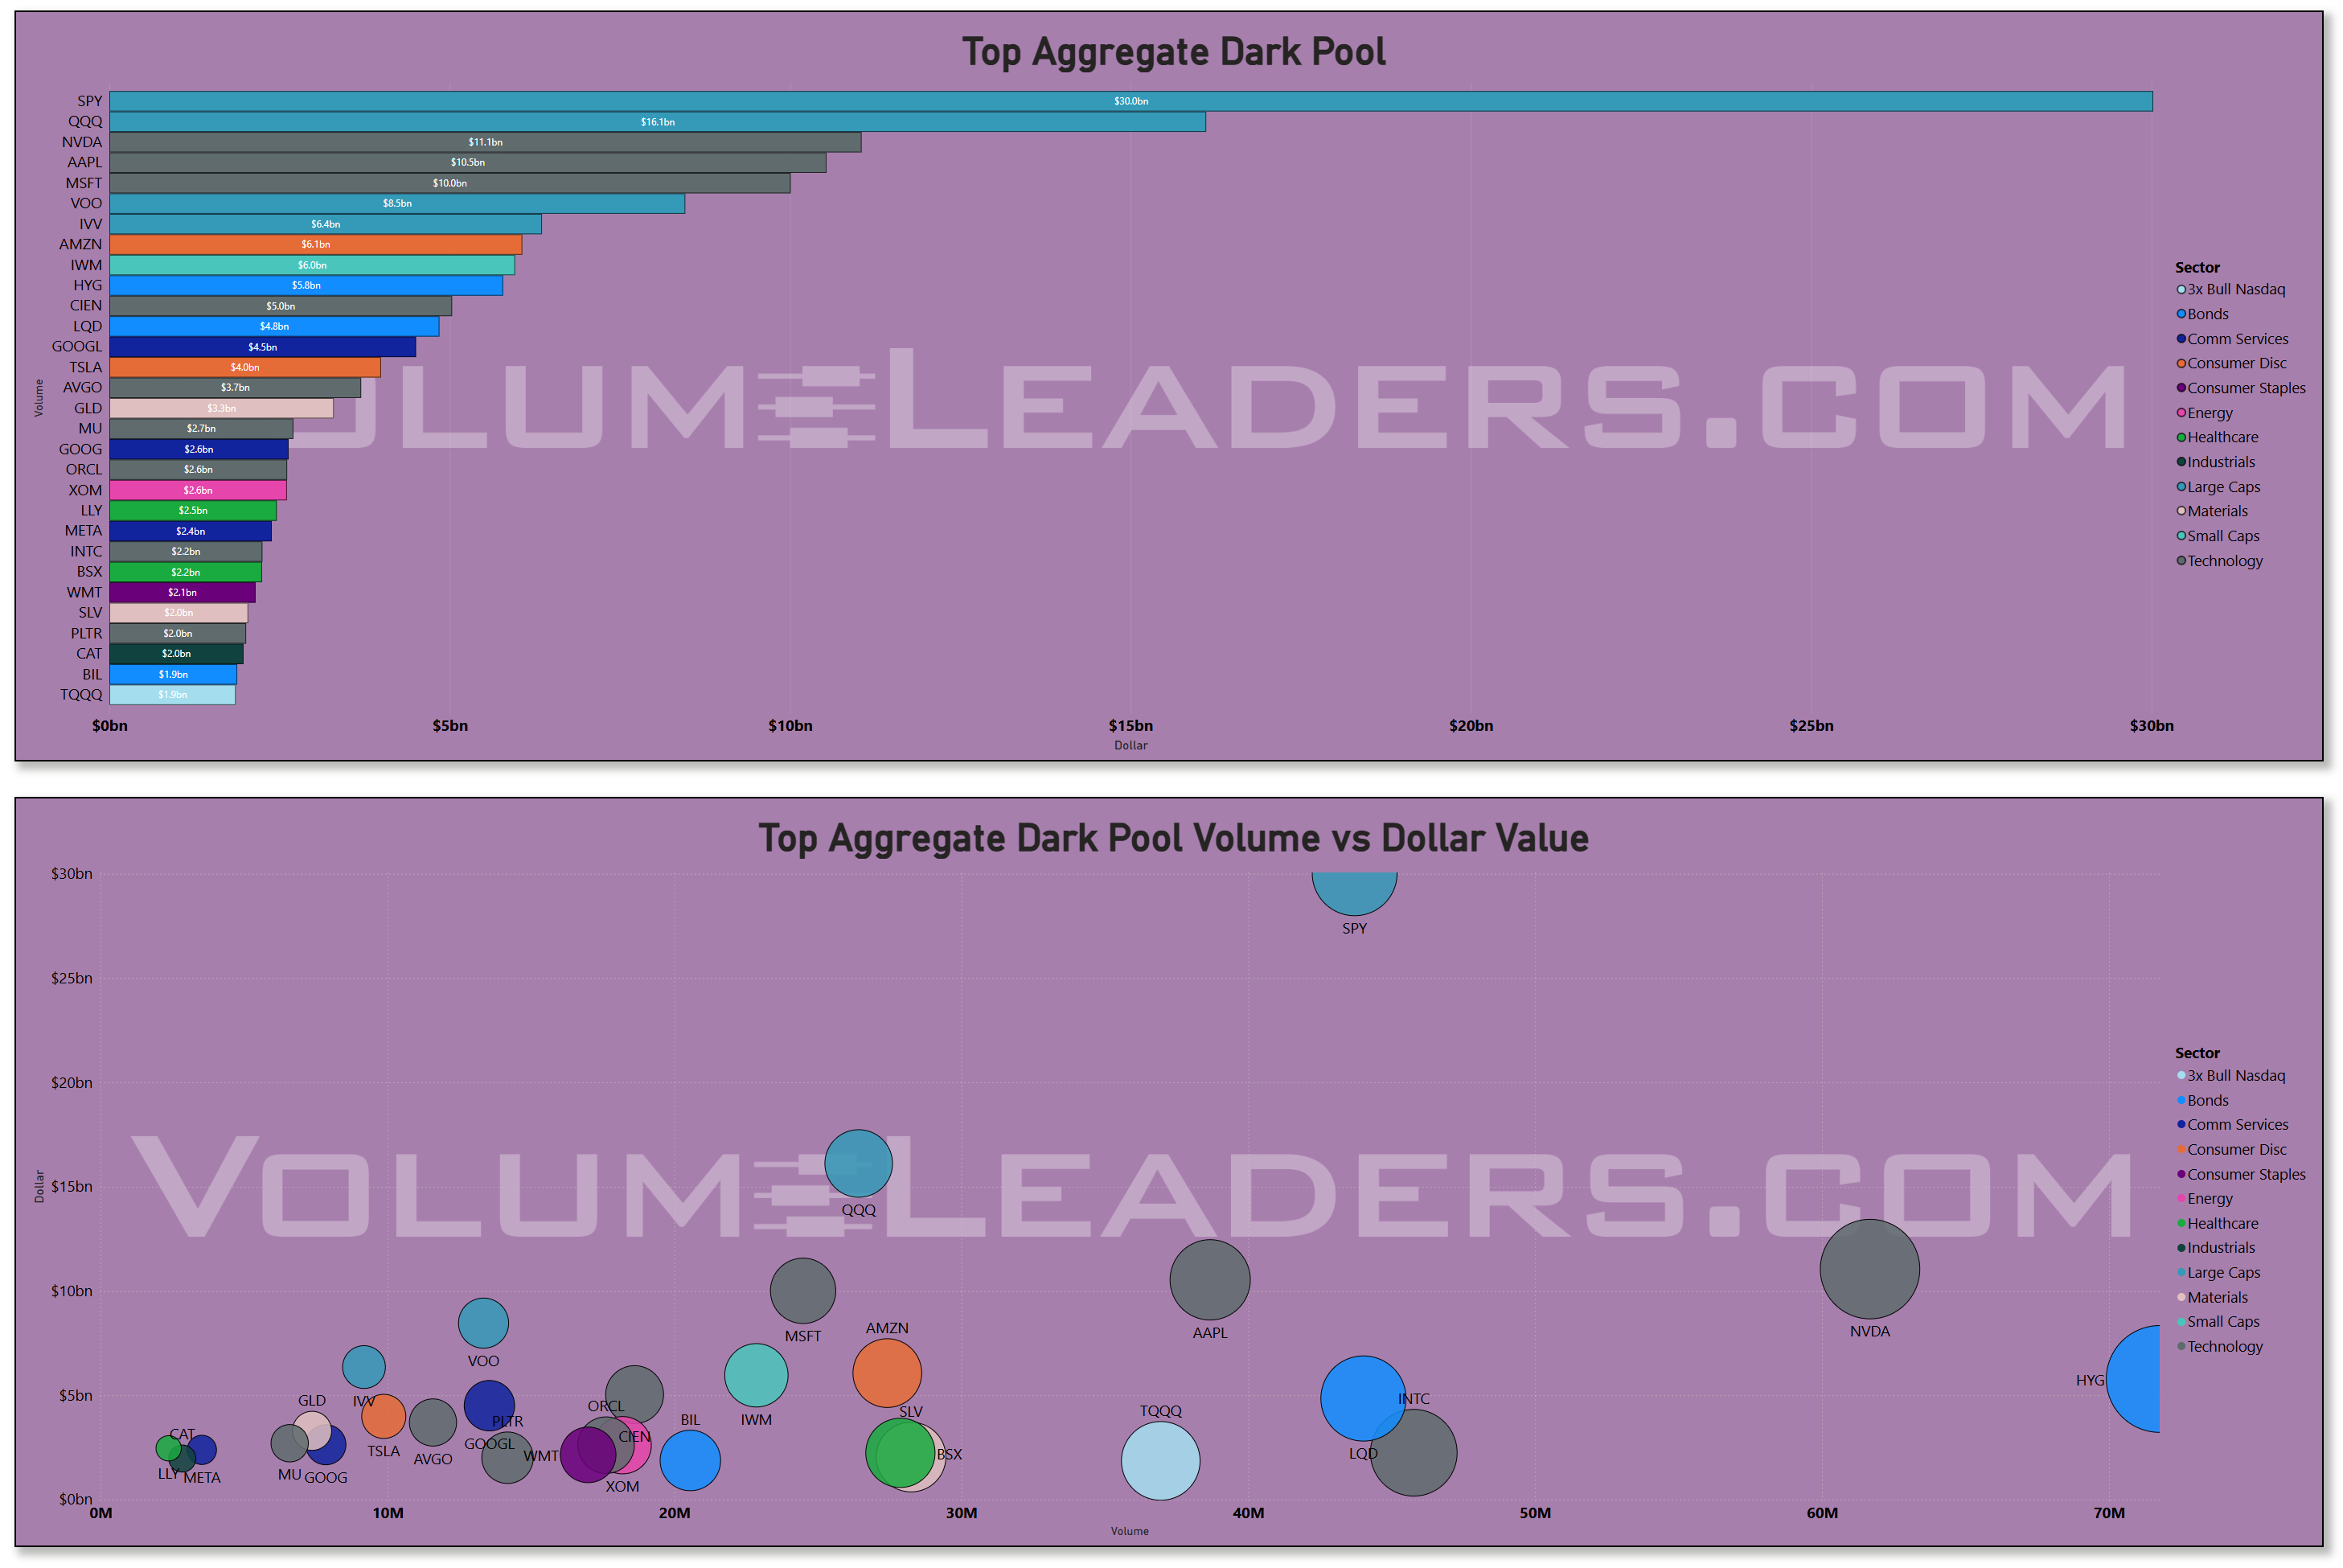
Dark‑pool activity tilts even more toward the index and megacap complex. SPY again dominates, with dark‑pool dollars approaching the low‑30B range. QQQ sits next with something in the high‑teens to around 20B, while Nvidia, Apple, and Amazon each carry well over 10B dollars off‑exchange. Below them is a layer of Tesla, Google, Meta, and some sector ETFs like IWM, GLD, and HYG in the low‑to‑mid single‑digit billions. When off‑exchange volume is this concentrated in SPY and QQQ, the base case is allocation and inventory management rather than directional punting: dealers, quant funds, and big long‑onlys quietly shifting size without lighting up the tape. The fact that Nvidia, Apple, and Amazon also have heavy dark‑pool prints suggests ongoing redistribution inside the AI and megacap cohort – more two‑way flow than one‑direction accumulation – which matches the recent price action where strong earnings and AI headlines have been met with both sharp rallies and equally sharp reversals.
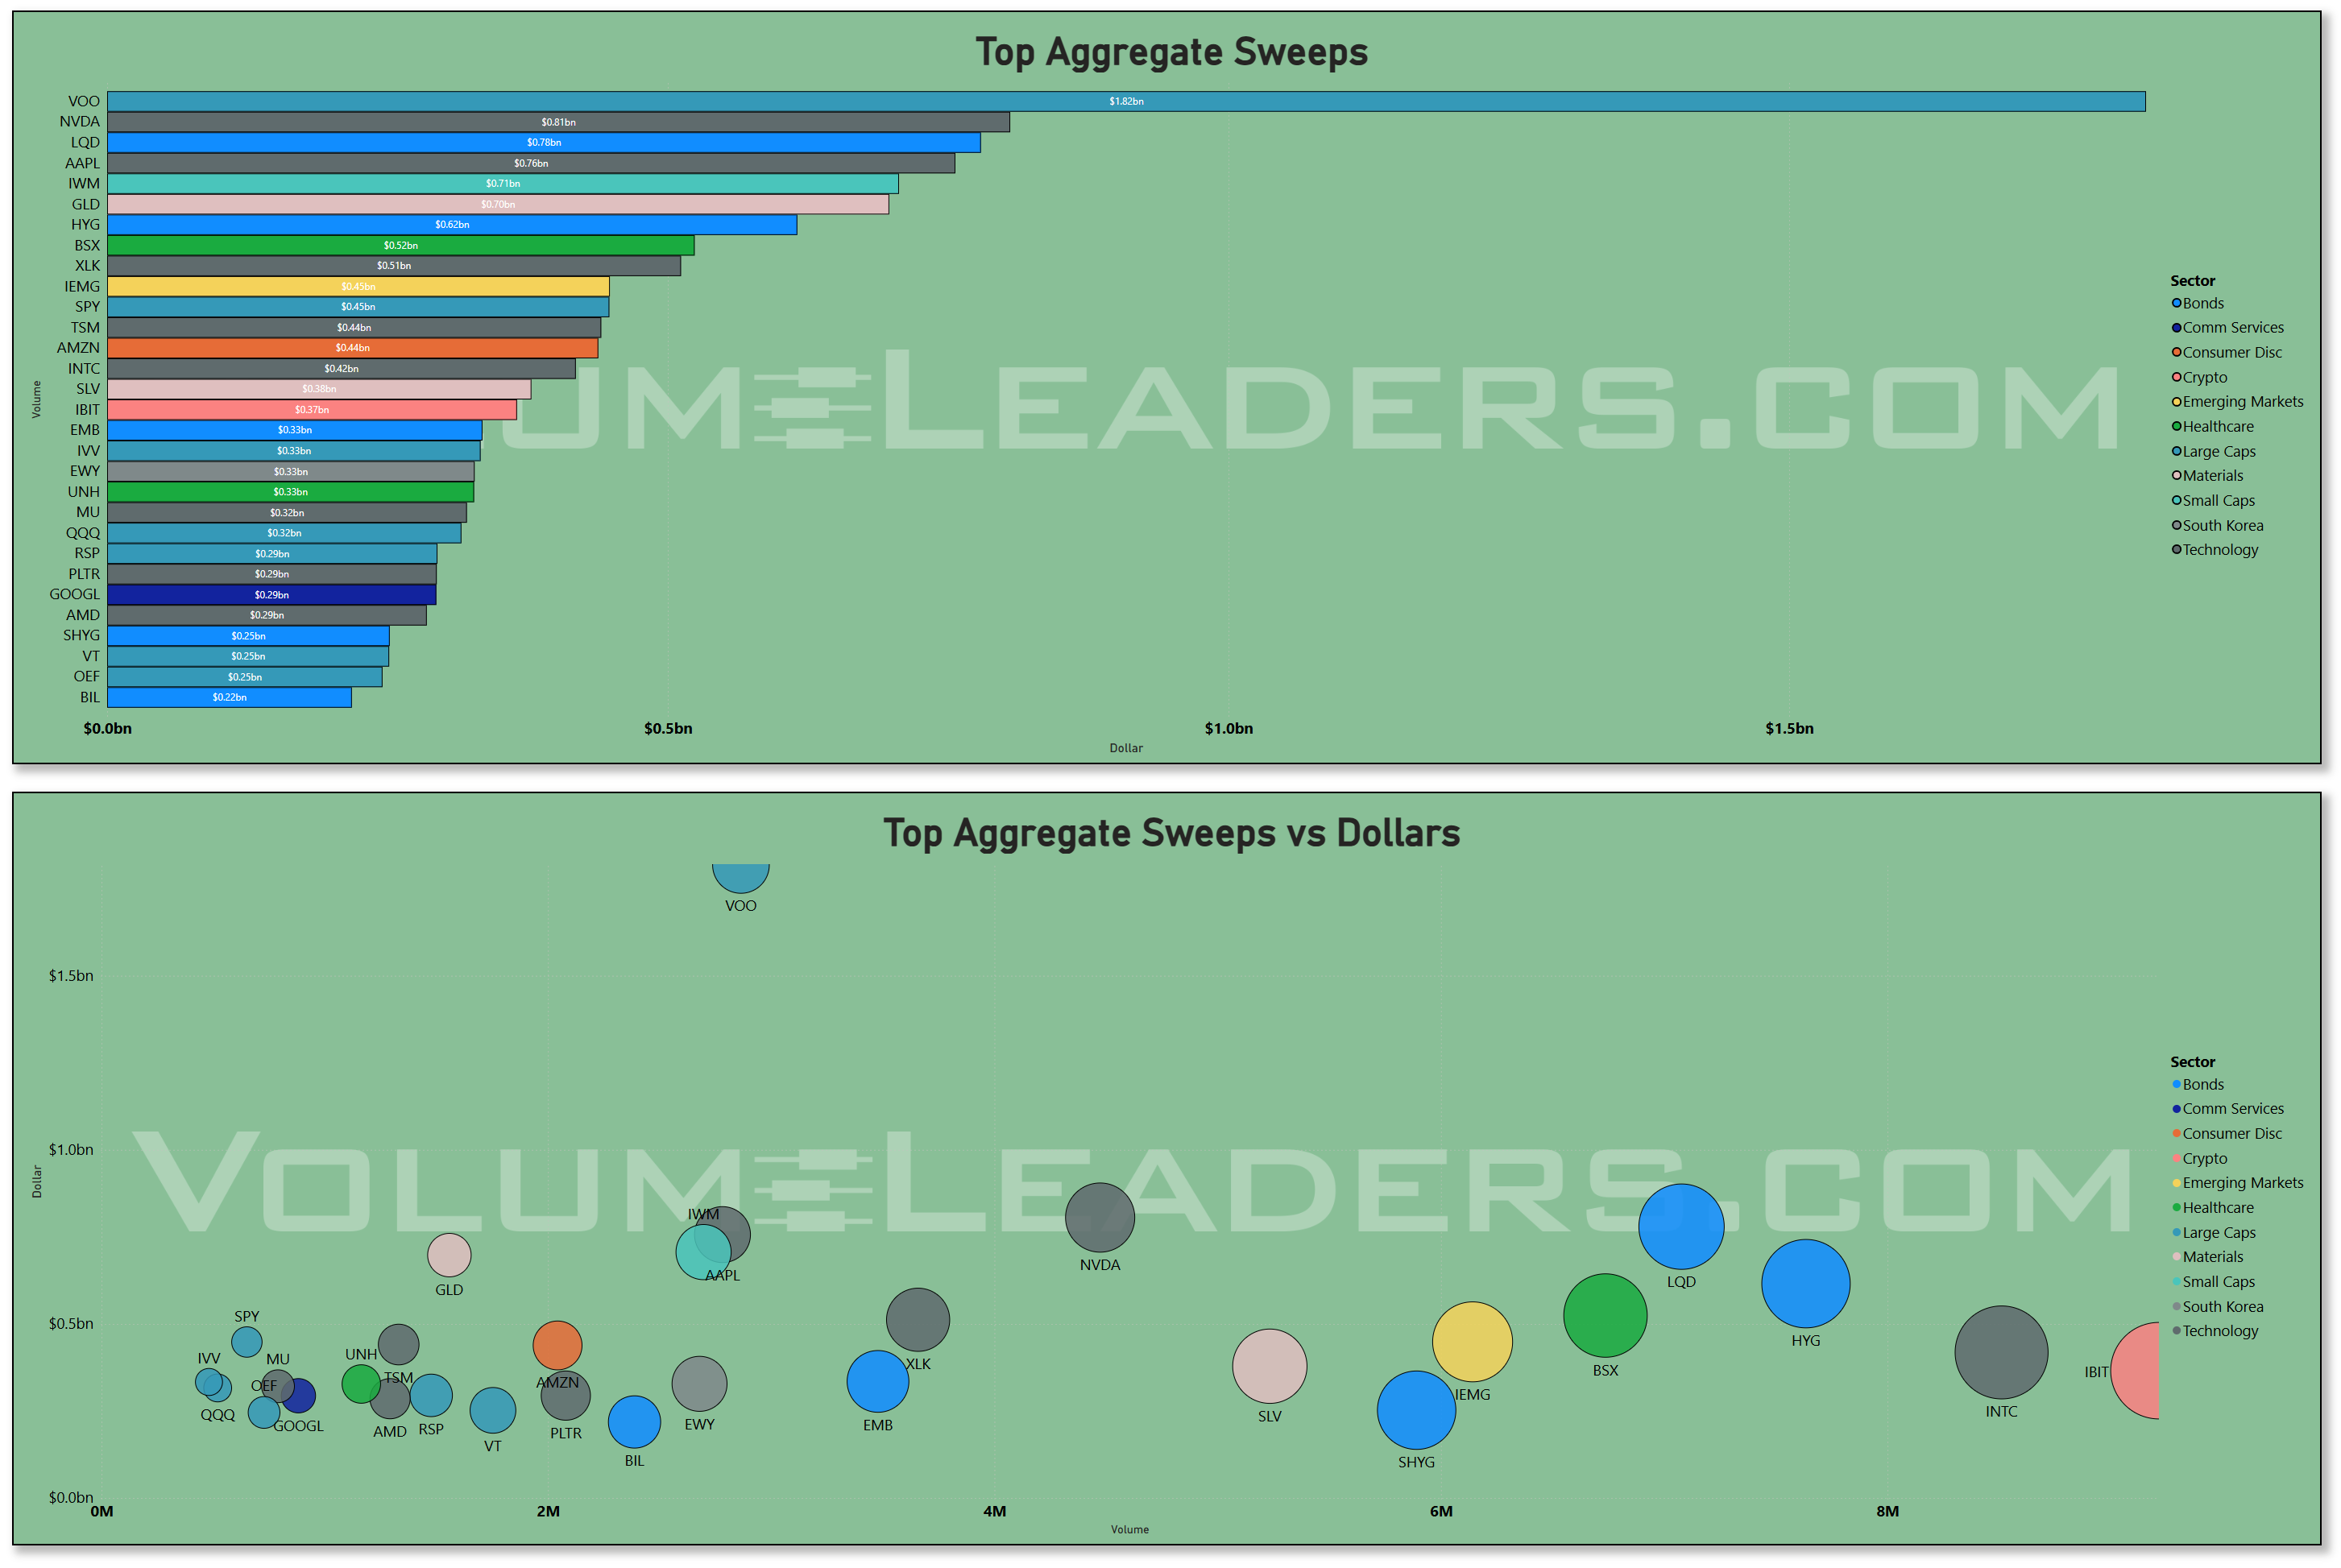
The sweeps lens shows where the faster money pressed. In the sweeps bar chart, VOO sits on top at around 1.5B dollars, followed by Nvidia, LQD, AAPL, IWM, GLD, and a suite of credit and EM products like SHYG, EMB, and RSX in the 0.3–0.8B band. The scatter of sweeps versus dollars shows VOO again as an outlier: high dollar volume but relatively modest share count, suggesting large, decisive notional trades rather than constant scalping. Nvidia and Apple appear with both big dollars and solid volume, indicating that short‑dated options and lit sweeps are being used to express views on the AI build‑out and megacap earnings. The presence of LQD, HYG, and SHYG in the upper half of the sweeps plot hints at tactical positioning in credit – likely traders leaning into the idea that an eventual Fed easing cycle will keep spreads supported even if growth softens, particularly after the weak ADP data. On balance, sweeps point to a “barbell” posture: index beta and high‑quality credit on one side, plus targeted aggression in the AI and growth bellwethers.
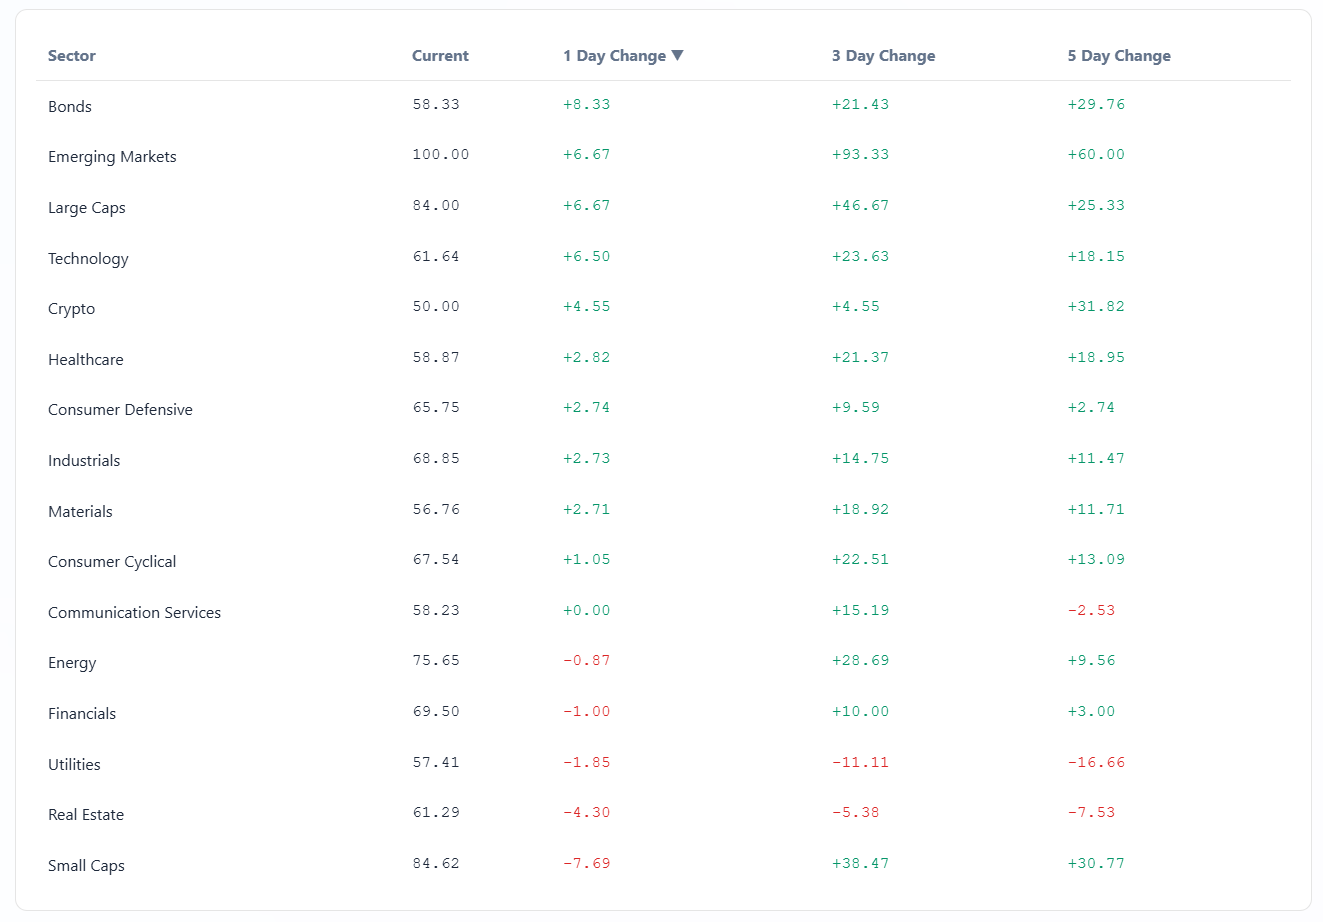
The sector rotation board backs up that interpretation. Leadership has shifted toward Materials, Industrials, Energy, and Small Caps on a multi‑day relative basis, with those groups improving over the last three sessions while some of the pure tech and communication cohorts cool off. Defensive areas like Utilities and Real Estate are soft, with Utilities losing ground over both one‑ and five‑day windows, and Real Estate lagging as higher‑for‑longer talk keeps a lid on duration‑sensitive sectors. Large‑Cap growth is still positive but no longer the runaway leader; the baton is being partially handed to cyclicals and smaller names, which is exactly what you would expect if investors think the AI capex wave is real but increasingly priced into the obvious winners and are now hunting for second‑derivative beneficiaries in machinery, materials, and industrial infrastructure.
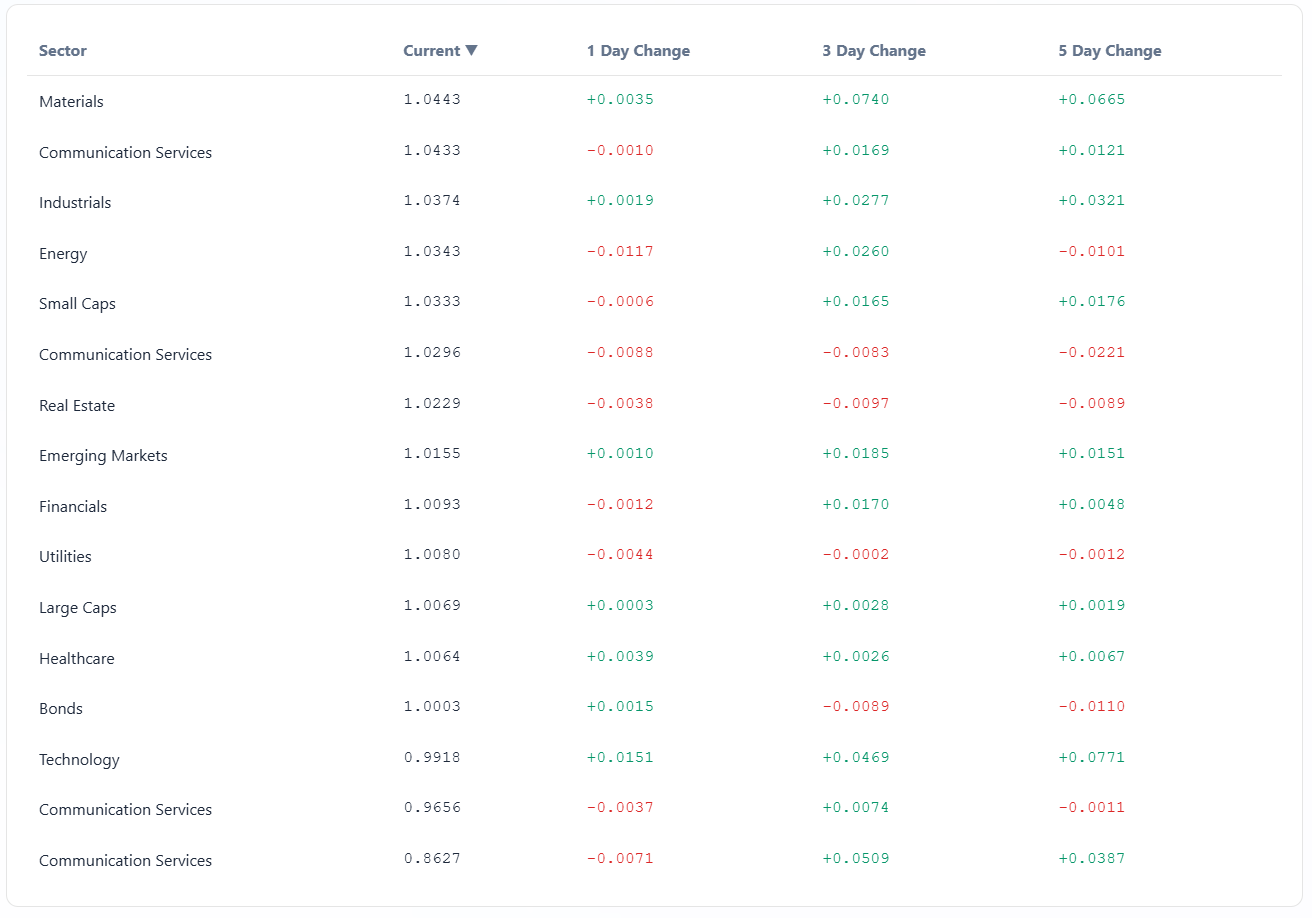
The relative strength board versus SPY shows a similar pattern. Technology is still near the top of the list but no longer alone; Industrials, Materials, and Energy are all punching above their weight, and Emerging Markets have perked up, likely helped by weaker jobs data, a softer dollar, and the prospect that a slower US labor market will give the Fed room to ease more aggressively into mid‑year. On the other side, Utilities and some communication services sleeves are losing RS as the market pays less for bond‑like cash flows and more for cyclical recovery and AI‑adjacent growth. Bonds themselves are interesting: Treasuries and IG credit show improving near‑term RS even as they remain middling over longer windows, consistent with a market that believes cuts are coming but is still debating the ultimate terminal rate.
Macro and seasonals tie this together. We just came through a stretch with a weak ADP jobs print, ongoing delays in the official payrolls report due to government funding noise, and a drumbeat of AI‑spending headlines that put a 600–650B 2026 capex figure in every investor’s notebook. At the same time, Fed officials have stuck to a cautious script, even as futures markets price in a high probability of material easing by March. Seasonally, early February often sees allocation flows as funds reposition after January’s performance numbers and ahead of the next options expiry; the elevated but not extreme daily liquidity fits that pattern. The structural message is that institutions are not yanking risk out of the system; they are reshaping it around the AI theme and a slower‑but‑still‑positive growth outlook.
Bottom line: flows this week point to ongoing institutional engagement, with capital rotating out of a narrow tech‑only trade into a broader mix of large‑cap beta, AI bellwethers, cyclicals, and credit, all under the umbrella of a market that expects big AI spending and eventual Fed easing but is no longer willing to pay anything for pure growth stories.
MIR Part 2: Individual Names From The Institutional Tape
VolumeLeaders tracks several proprietary signals designed to spotlight names drawing significant institutional interest. Below, we’ve surfaced the latest results and analyzed them to highlight emergent themes. If any of the sectors, narratives, or positioning trends resonate, the names mentioned here offer a strong starting point for deeper research and watchlist consideration.
VL Trade Rank Velocity™ (TRV)
TRV is a proprietary metric that measures the recent acceleration or deceleration in institutional trading activity for a given stock by comparing its average trade rank over the past few days to its average in recent weeks. A sharp improvement in TRV typically reflects a notable shift in positioning, often accompanied by sustained trade activity, suggesting institutions are actively engaging with the name and that intensity of activity is rising. This often precludes meaningful price or narrative shifts. This isn’t a buy-list or sell-list; it’s meant to draw your eyes to names where institutions are putting money to work.
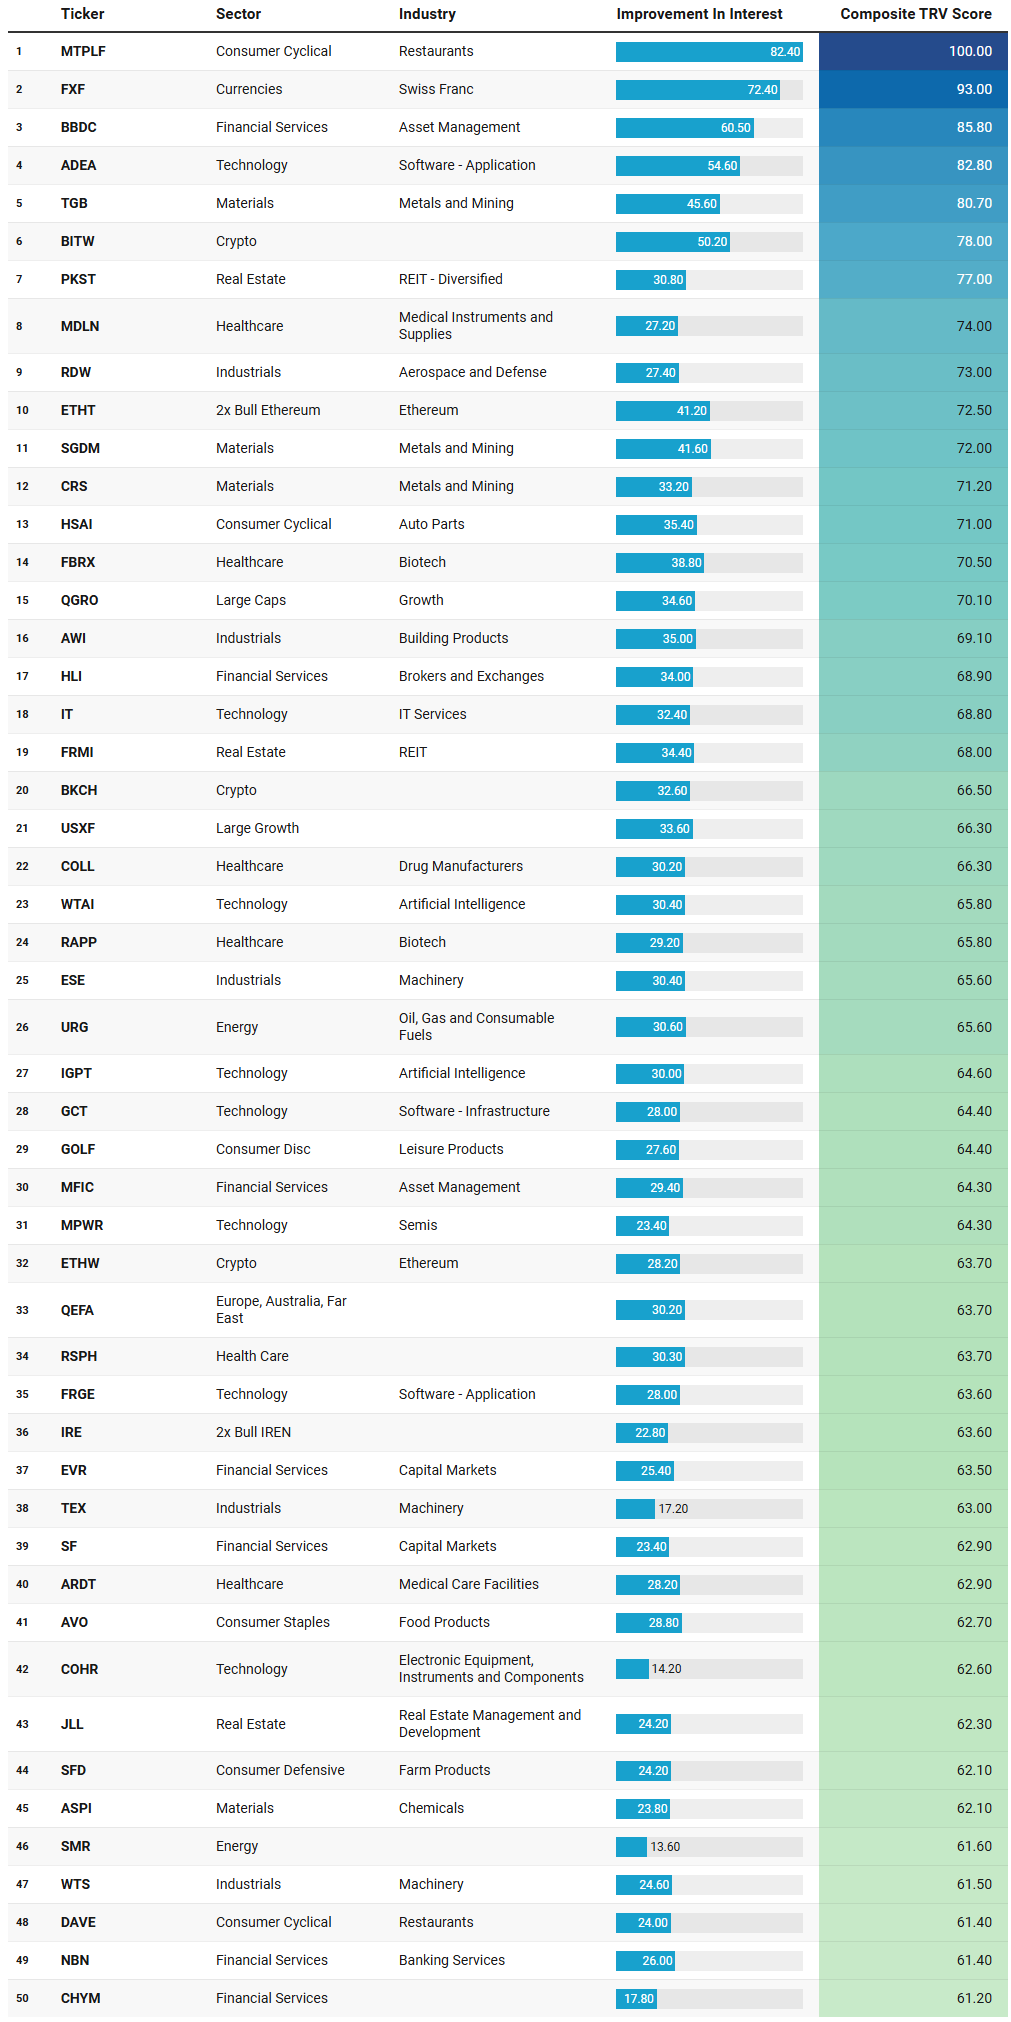
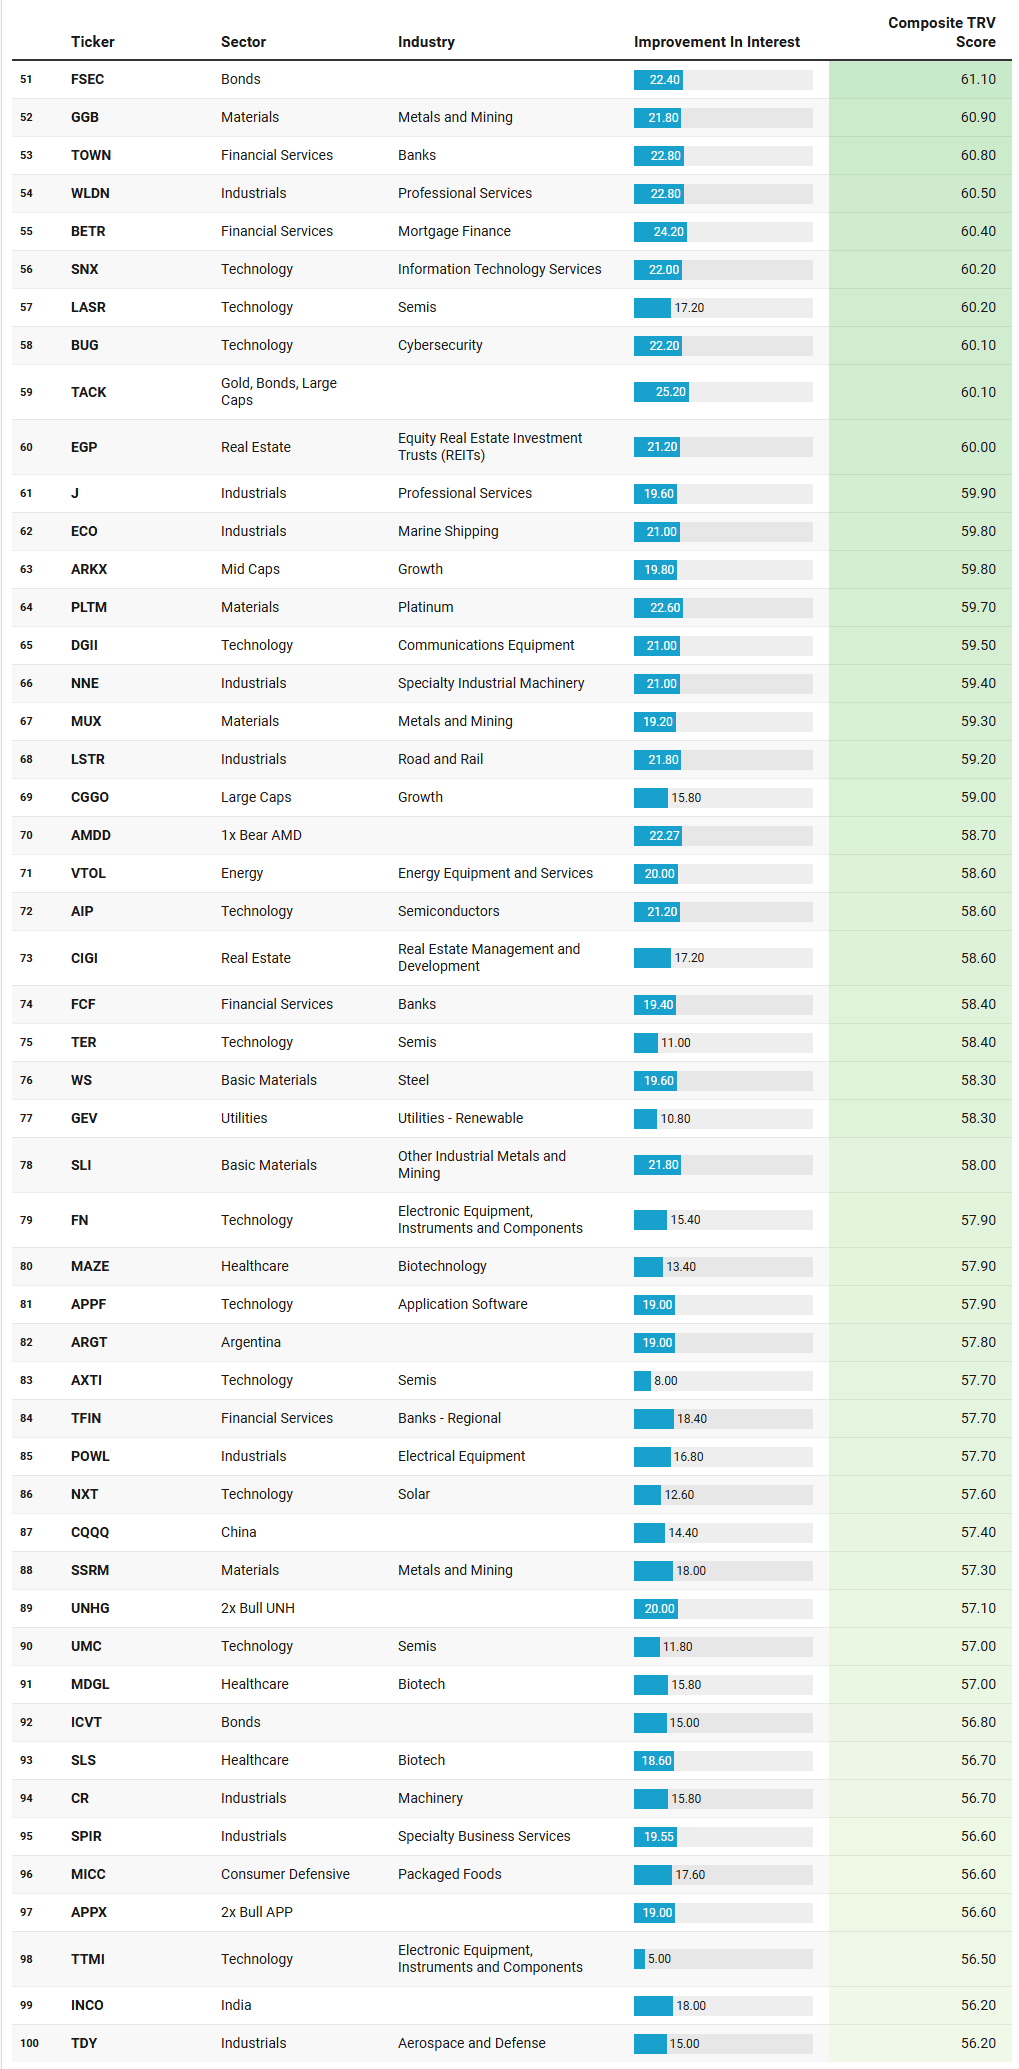
Two themes jump off this TRV list: speculative beta on the edges of the market, and “picks-and-shovels” exposure around metals, machinery, and AI infrastructure. That lines up neatly with the broader flow story we just walked through: capital rotating out the center of crowded megacap tech into more tactical, higher‑beta expressions and into the stuff that feeds the AI and capex build‑out.
At the very top, the list is dominated by niche or leveraged vehicles rather than household large caps. MTPLF, a restaurant name, and FXF, the Swiss franc ETF, sit in the first two slots with very high improvement scores, which tells you this week’s fresh attention skewed toward idiosyncratic and FX hedging plays rather than plain vanilla SPY or QQQ. BBDC and MFIC on the asset‑management side, plus EVR, SF, HLI, and several bank tickers like NBN, TOWN, FCF, and TFIN, speak to renewed interest in financials as a way to express views on deal activity, balance‑sheet leverage, and a shifting rate path. That fits a world where Fed cuts are now seen as likely but not guaranteed, and where the shape of the curve and capital‑markets activity will matter as much as pure earnings beta.
The speculative sleeve is hard to miss. You have BITW, BKCH, ETHW, and ETHT (2x bull Ethereum), plus 1x bear AMD (AMDD) and leveraged single‑stock expressions like IRE (2x bull IREN), APPX (2x bull APP), and UNHG (2x bull UNH). That cluster says traders are actively using leverage around crypto and single‑name stories rather than simply buying or shorting the index. It dovetails with the volatility we have seen in Bitcoin and Ethereum as policy uncertainty and regulation headlines ping around, and with the idea that a weaker labor tape plus eventual Fed easing keeps the door open for periodic speculative bursts in crypto and high beta. The presence of TACK, which blends gold, bonds, and large caps, alongside FSEC and ICVT on the bond side, also hints at a subset of investors looking for more balanced or convex exposures rather than one‑sided equity bets.
On the “picks‑and‑shovels” side, metals, mining, and related machinery are heavily represented. TGB, SGDM, CRS, GGB, MUX, PLTM, SSRM, SLI, and WS all sit in Materials, with a bias toward industrial metals and mining rather than just gold. Overlay that with machinery and industrial names like TEX, WTS, CR, ESE, POWL, TDY, J, NNE, LSTR, ECO, and VTOL, and you get a pretty coherent picture: the list is flagging upstream and midstream beneficiaries of a capex cycle. That is exactly what you would expect in a tape where big tech is guiding to hundreds of billions in AI infrastructure spending – money that ultimately flows into power, cooling, chips, networking, and the physical kit around it. Interest in SMR (nuclear‑adjacent), URG (uranium), and GEV (renewable utilities) supports the same idea on the power side: traders are sniffing around future baseload and green capacity as part of the AI and electrification story.
AI and software exposure appears, but in a way that extends the narrative beyond the obvious megacaps. ADEA and FRGE in software‑application, GCT in software‑infrastructure, WTAI and IGPT as AI‑themed ETFs, BUG in cybersecurity, APPF and SNX in IT services, and MPWR, LASR, AXTI, TER, AIP, UMC, and FN across semis and related hardware all point toward a second‑tier AI build‑out trade. The focus is not just on Nvidia or the hyperscalers; it is on enablers up and down the stack – power management (MPWR), specialty and analog semis (TER, AXTI), optical and RF (COHR, TTMI), and the software wrappers and tools around them. That is consistent with recent commentary that AI capex is broadening into networking, memory, and supporting software, not just GPUs and data‑center shells.
There is also a noticeable footprint in healthcare and biotech, but again skewed toward higher beta: FBRX, RAPP, MAZE, MDGL, SLS, UNHG, MDLN, ARDT, RSPH, and COLL. That mix lines up with an environment where speculative capital is being put to work in pipelines and turnaround stories, likely helped by a backdrop of moderating inflation and a Fed that is no longer actively tightening, which traditionally supports long‑duration cash‑flow sectors like biotech. It also meshes with the options and dark‑pool data showing steady interest in healthcare and large managed‑care names as part of the “quality growth” basket alongside tech.
Regional and thematic equity ETFs like QGRO, USXF, CGGO, ARKX, ARG T (Argentina), QEFA (developed ex‑US), INCO (India), CQQQ (China tech), and TACK round out the picture. These point to a rotation in geographic and factor exposures: growth tilts in U.S. large/mid‑caps, satellites in India and Argentina where macro stories are evolving quickly, and select interest in China tech after a long period of under‑ownership. That is exactly what you would expect if allocators are re‑balancing away from a pure S&P‑plus‑Nvidia posture into a more barbelled mix of U.S. growth, EM alpha, and idiosyncratic macro stories.
Finally, there is a quieter but important presence in real estate and rate‑sensitive cyclicals: PKST, FRMI, JLL, CIGI, EGP in REITs and real‑estate management, plus SMR, VTOL, ECO, and LSTR touching energy logistics and transportation. In a week where bond and credit flows showed a decent bid and expectations for 2026 rate cuts firmed, that makes sense: investors are not blindly buying duration, but they are re‑engaging selectively in areas that benefit from a friendlier cost of capital without needing a roaring growth backdrop.
Netting it out, the TRV list is telling the same story the sector and flow dashboards were telling: the market is moving away from a narrow “own the mega‑cap index and call it a day” regime into a more nuanced mix of speculative edges (crypto, leveraged single‑stock, small biotech), AI infrastructure and enablers (metals, machinery, semis, power), and selective rate‑sensitive plays (financials, REITs, credit sleeves). That is exactly the kind of pattern you want to see if you believe the AI capex wave is real, the Fed is closer to easing than tightening, and the next leg of returns will depend more on picking the right parts of the ecosystem than simply owning the headline winners.
VL Institutional Outliers™ (IO)
Institutional Outliers is a proprietary metric designed to spotlight trades that significantly exceed a stock’s recent institutional activity—specifically in terms of dollar volume. By comparing current trade size against each security's recent normalized history, the metric flags outlier events that may indicate sudden institutional interest but may be missed because the activity doesn’t raise any flags/alerts when comparing the activity against the ticker’s entire history. For example, it’s conceivable that a ticker today receives the largest trade it has had in the last 6 months but the trade is unranked and would therefore be missed by current alerts built off Trade Ranks. Day traders can use “Realized Vol” to identify tickers that are moving swiftly with large price displacement while others can use it to size your risk appropriately.
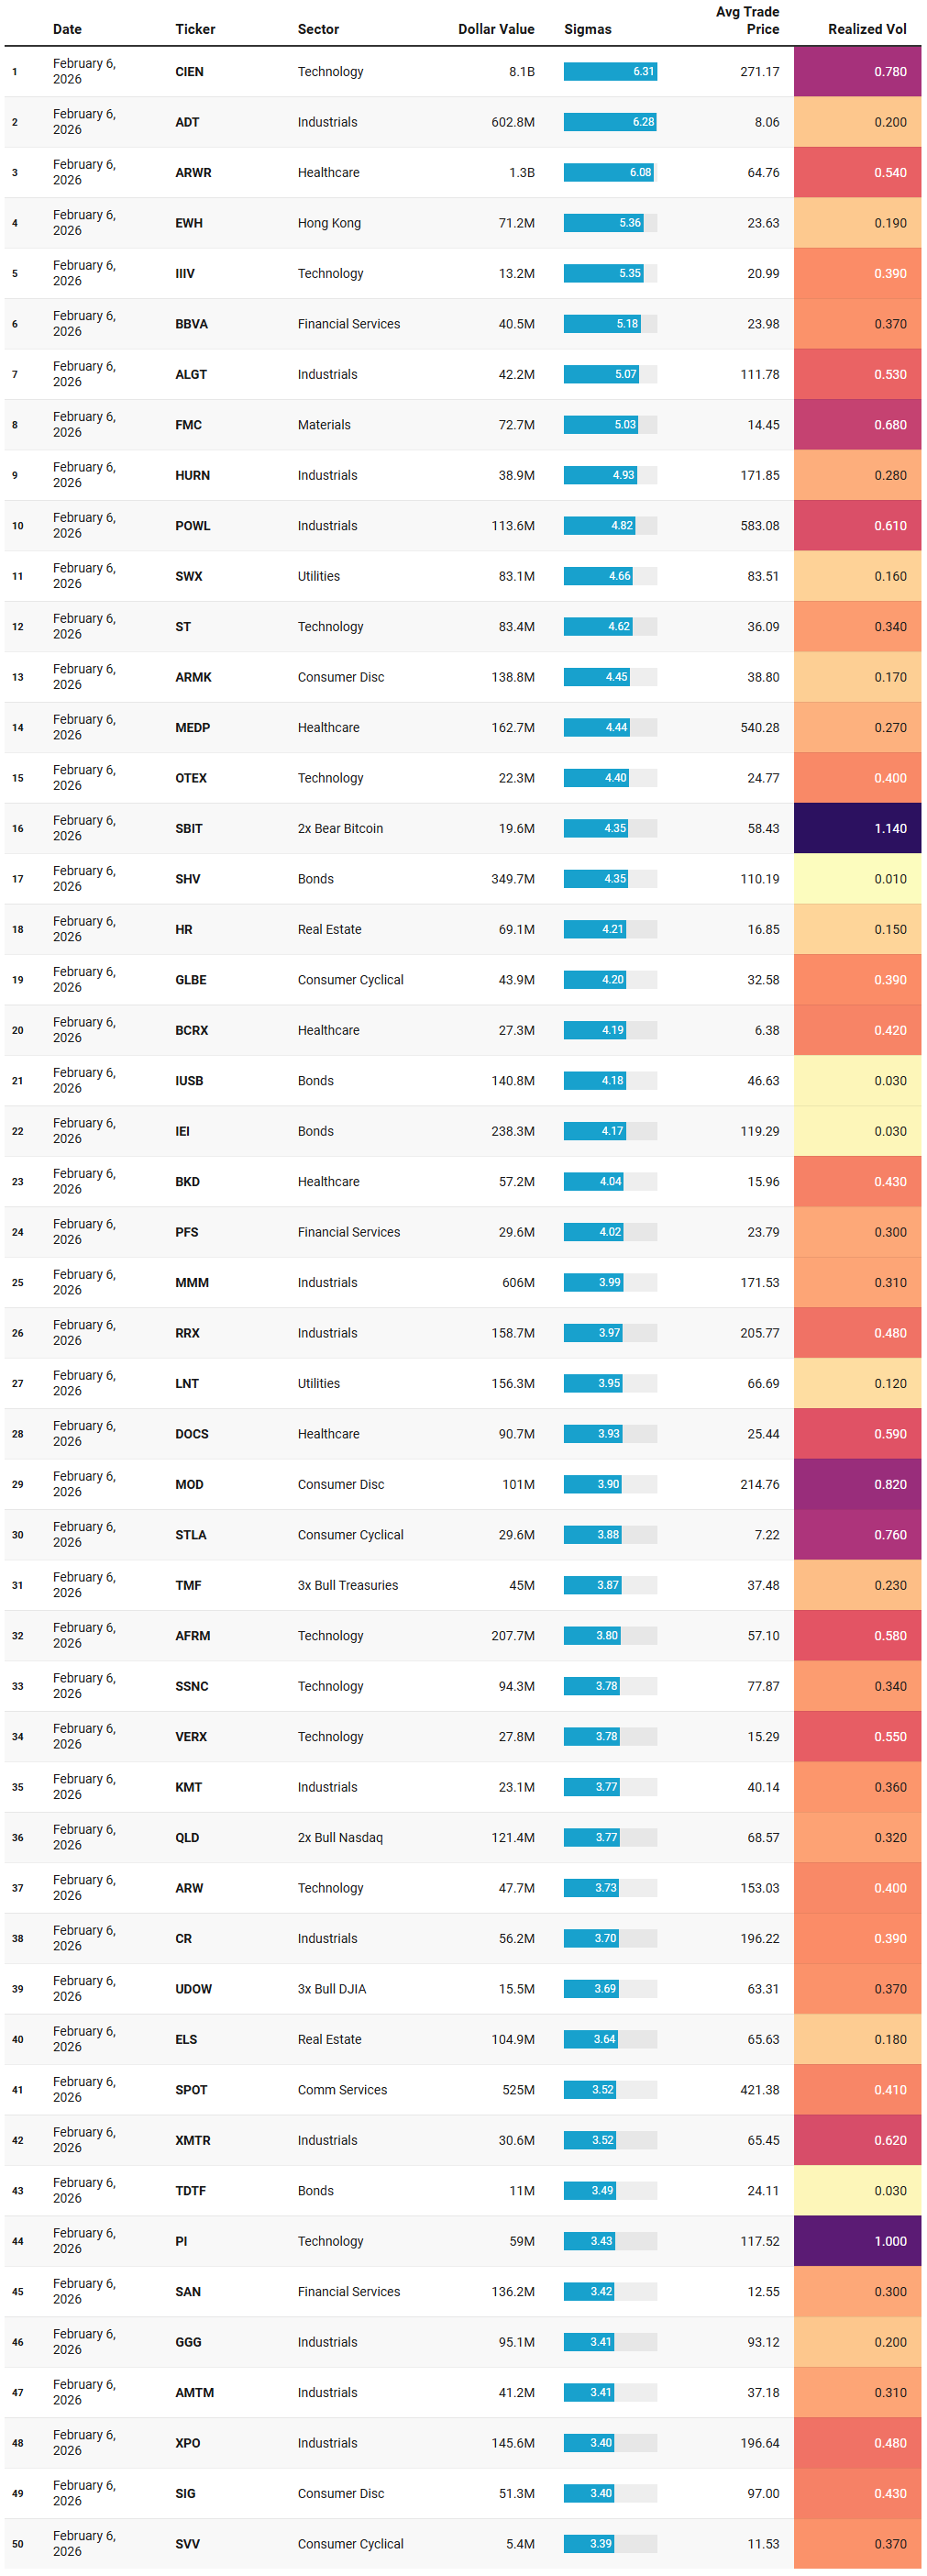
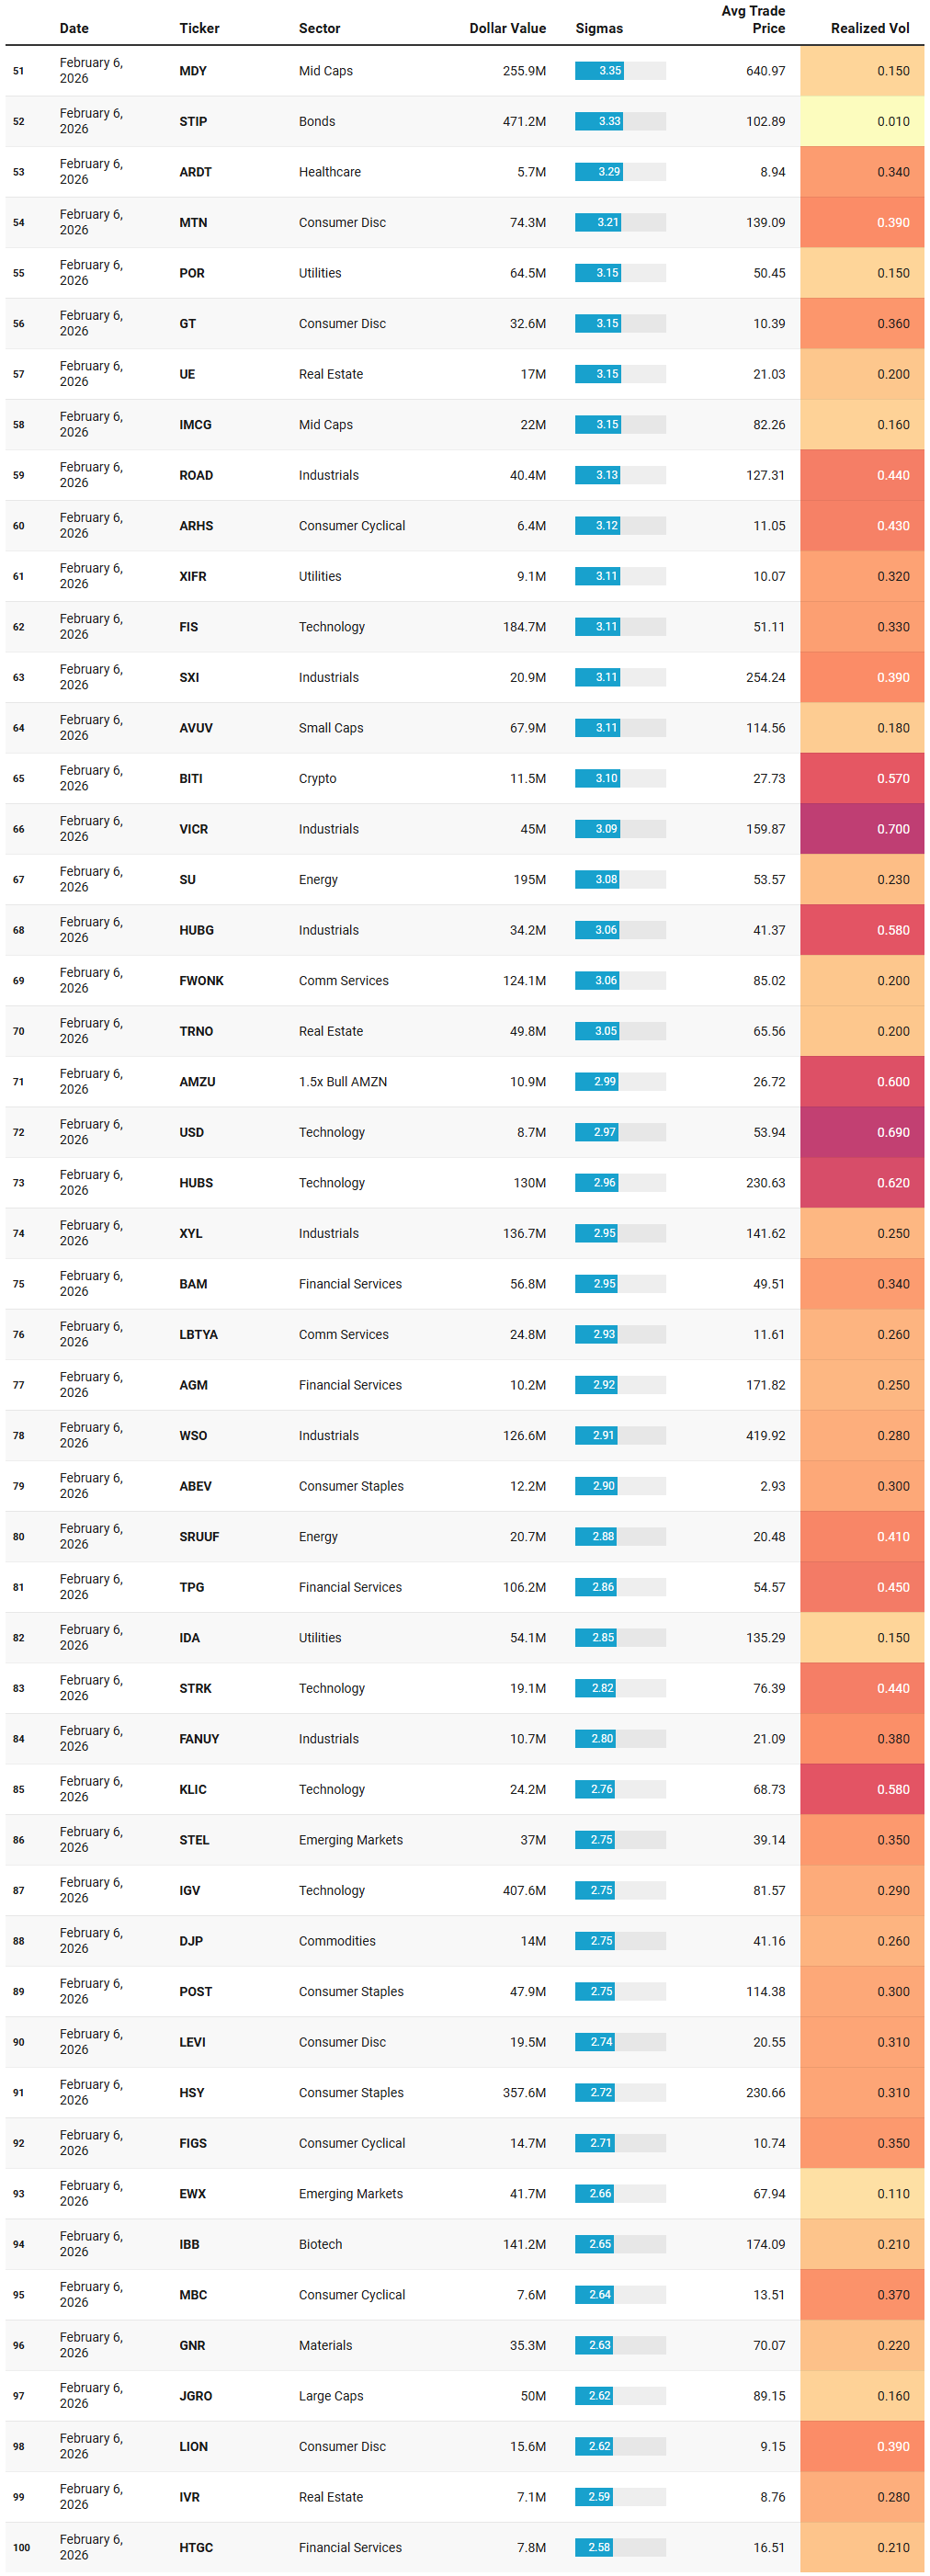
The IO list this week says “selective, surgical risk,” not “all‑clear” or “get me out.” What stands out is how many of these outliers are seeing large, statistically unusual dollar flows (3–6 sigmas) in otherwise contained tape – realized vol is mostly well under 1.0. That combination usually means institutions are quietly re‑positioning size in names and sleeves that fit the bigger narratives we have been tracking: AI and digital infrastructure, capex and industrial build‑out, balance‑sheet sensitivity to rates, and high‑beta expressions on the edges like crypto and leveraged index products.
Start with the true standouts. CIEN tops the list with roughly 8.1B dollars traded at 6.31 sigmas, average price around 271 and realized vol under 0.8. That is a massive notional number in a communications‑equipment name and slots neatly into the AI plumbing story: if big tech is committing 600–650B dollars to AI capex over the next couple of years, the optical, routing, and transport vendors have to move that data. Seeing CIEN spike in flow without chaotic intraday behavior reads more like institutions actively building or re‑sizing positions than a one‑off panic. A similar pattern shows up in POWL at about 113.6M dollars and 4.82 sigmas with realized vol around 0.61, and in VICR near 44.9M and 3.09 sigmas with vol 0.7. Both sit in electrical equipment, power management, and high‑end industrial kit – the exact real‑economy beneficiaries of a sustained data‑center and infrastructure spend cycle.
Next layer down, the list is stacked with industrial and machinery names seeing 3–4 sigma flows: RRX, CR, GGG, KMT, SXI, XMTR, ROAD, FANUY, XYL, WSO, SBGSY, plus logistics and transport like XPO and HUBG. Dollar values range from a few tens of millions up toward 150–160M, with realized vols mostly below 0.7. That is consistent with the sector leadership we saw in broader flows, where Industrials and Materials have been steadily gaining relative strength versus SPY and attracting more dollars week over week. Institutions appear to be legging into the physical side of the AI and reshoring trade – specialty machinery, engineering and construction, industrial products, distributors – rather than just loading more QQQ.
Financials and rate‑sensitive exposures are clearly in play as well. BBVA and SAN both print 3.4–5.2 sigmas with decent dollar values (roughly 40–136M), while PFS, BAM, TPG, PFS, and AGM show 3–4 sigma flows in thrifts, mortgage finance, and capital‑markets names. On the ETF side, SHV, IUSB, IEI, TDTF, STIP, and JGRO/MDY/AVUV all show elevated activity in short Treasuries, core bonds, and factor‑tilted equity sleeves. SHV alone shows about 349.7M dollars at 4.35 sigmas with essentially zero realized vol, and STIP about 471.2M at 3.33 sigmas, again in a very calm tape. That fits the macro backdrop: a soft January ADP print and lingering growth concerns have pushed Fed‑cut expectations forward, prompting real money to rotate along the curve and tweak equity duration via growth and mid‑cap baskets rather than yank risk entirely.
Crypto and high‑beta hedges show up too, but as tactical accents rather than the main story. SBIT (2x bear Bitcoin) prints around 19.6M dollars at 4.35 sigmas with realized vol over 1.1, while BITI (short BTC), AMZU (1.5x bull AMZN), QLD (2x bull Nasdaq), TMF (3x bull Treasuries), UDOW (3x bull Dow), and AMZU all see 3‑plus sigma flows. Those products tend to be used as short‑term expressions or hedges around event risk. Given the recent choppiness in crypto and the broader focus on AI capex headlines and rates, this looks more like fast money managing tails than systematic de‑risking.
On the growth and software side, there is a cluster of names seeing outsized flows but manageable vol: AFRM (~207.7M, 3.8 sigmas, vol 0.58), HUBS (~130M, 2.96 sigmas, vol 0.62), IGV (~408M, 2.75 sigmas, vol 0.29), OTEX, SSNC, VERX, IIIV, FIS, and PI. Many of these sit in software‑infrastructure, application software, or IT services – exactly where the market has been trying to re‑price who wins and who loses as AI agents creep into workflows. The 3–4 sigma prints in these names, without blow‑out realized vol, suggest institutions are actively redistributing exposure within the software complex rather than abandoning it wholesale. They line up with the broader narrative of “AI invest‑digestion,” where capex headlines are forcing a re‑think of business models and margins but not yet breaking the theme entirely.
The list also shows a measured bid in healthcare and biotech: ARWR (~1.3B, 6.08 sigmas, vol 0.54), MEDP (~162.7M, 4.44 sigmas), BCRX, BKD, DOCS, ARDT, IBB, MAZE, and FIGS. ARWR is particularly notable: over a billion dollars of flow at more than six sigmas in under‑1 vol suggests serious institutional repositioning in a single biotech name, likely around trial or pipeline news. Combined with 2.65‑sigma activity in the IBB ETF, this points to targeted risk‑taking in high‑duration healthcare alongside the broader equity and credit reshuffle, consistent with a world where inflation is cooling and the Fed is not in active hiking mode.
Real estate and utilities make a quieter but clear appearance. HR, ELS, UE, TRNO, IVR, and IDA all show 3–4 sigma flows, with dollar values from around 7–105M and realized vol clustered below 0.3. Add in XIFR and EWX/EWH/STEL for EM and renewables, plus SRUUF (uranium), and you see a storyboard of rate‑sensitive and power‑adjacent assets getting turned over as investors calibrate how lower eventual policy rates and AI‑driven power demand will filter through to REIT cash flows and generation. None of this looks like distressed dumping; it looks like planned rotation.
Consumer and discretionary flows round out the picture: SPOT (~525M, 3.52 sigmas), MTN, ARMK, SIG, GT, LEVI, LION, FigS, POST, HSY, ABEV, and a scattering of discretionary and staples names. SPOT is the clear outlier – a half‑billion dollars at 3.5 sigmas, moderate vol – likely tied to earnings and streaming‑economics headlines. The rest cluster around 2.7–3.4 sigmas with manageable vol, suggesting stock‑specific positioning rather than a sector‑wide de‑ or re‑rating.
All in, the IO watchlist lines up with the broader institutional‑flow message you are seeing elsewhere. Real money is not blasting out of equities. Instead, it is using size and rotational tape to make bets on the physical enablers of the AI and infrastructure cycle (CIEN, POWL, VICR, industrial machinery), fine‑tune rate and credit exposure through bonds and bank/capital‑markets names, and selectively lean into or hedge around high‑beta edges (crypto, leveraged index products, single‑name growth and biotech). If these outlier flows persist in the same directions – continued multi‑sigma dollar prints in AI plumbing, industrials, and bond sleeves, without a parallel blow‑out in realized vol – that could very well be your confirmation that this is structural repositioning around the new capex and rate regime, not a transient de‑risking spike.
VL Sector Leaders
VL Sector Leaders is a weekly snapshot of where true leadership is asserting itself inside the market, stripped of the distortions that come from broad, style-mixed indices. Rather than asking which stocks look strong in absolute terms, this list focuses on which names are outperforming within the environments they actually compete in.
Each week, we surface the ten stocks demonstrating the most persistent relative strength inside their respective sectors. These are not headline chasers or one-day wonders. They are names that continue to separate themselves from peers through real price behavior, often reflecting sustained demand rather than fleeting attention.
For day traders, this list is a powerful awareness tool. Sector Leaders tend to offer cleaner intraday structure, better follow-through, and more predictable reactions around key levels because they already sit on the right side of relative strength. Even on choppy tape, leadership names often remain tradeable while the rest of the market degrades.
For swing traders, VL Sector Leaders helps narrow the universe to stocks with the highest probability of staying relevant. Relative leaders are more likely to hold trends, survive pullbacks, and reassert themselves after consolidation. When markets rotate, these names are often among the first to resume leadership — or the last to break.
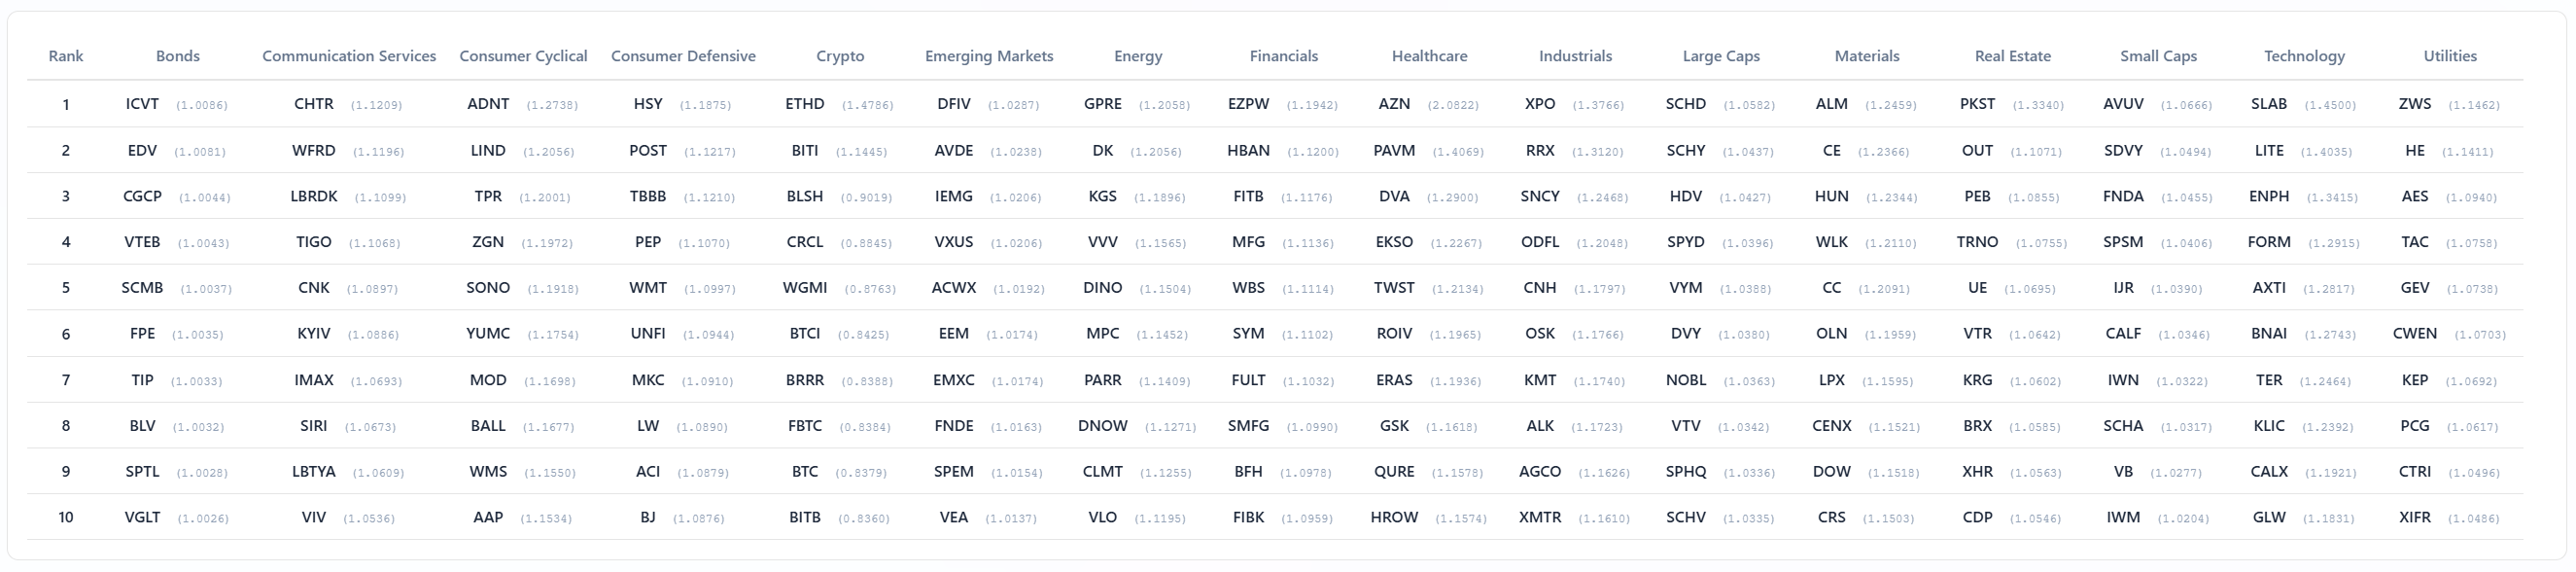
The sector‑leader board is basically a who’s‑who of where capital wants to hide or press right now, and it lines up cleanly with everything we have been seeing in the breadth, flow, and TRV work.
On the bond side, leadership is all in the long‑duration sleeves: ICVT, EDV, CGGP, VTEB, SCMB, FPE, TIP, BLV, SPTL, VGLT. That is a full run of convertibles, long Treasuries, and duration‑heavy tax‑exempt paper at the top of the bond column. It matches the IO and sector‑flow message that institutions are quietly re‑risking along the curve rather than dumping credit – adding interest‑rate sensitivity into portfolios as Fed‑cut expectations firm up and growth data cools around the edges.
Across equities, the pattern is clear: cyclicals and real‑economy enablers are leading within almost every sector column. In Industrials, XPO, RRX, SNCY, ODFL, CNH, OSK, KMT, ALK, AGCO, SPHQ, and XMTR all show up – a mix of trucking, machinery, industrial distributors, and logistics. Materials are led by names like ALM, CE, HUN, WLK, CC, OLN, LPX, CENX, DOW, CRS, and GNR, which skews heavily toward chemicals, commodity plastics, and basic materials rather than gold miners or precious‑metal proxies. Energy leadership centers on GPRE, DK, KGS, VVV, DINO, MPC, PARR, DNOW, CLMT, VLO and SU: refiners, midstream, and fuel distributors, not just the mega‑integrateds. That is exactly what you want to see in a tape that is leaning into the capex and AI build‑out narrative; the market is rewarding the companies that move molecules, materials, and freight, not just the software layer.
Technology leadership is equally telling. You have SLAB, LITE, ENPH, FORM, AXTI, BNAI, TER, KLIC, CALX, CTRI, GLW and others at the top – a set dominated by semis, components, opticals, solar, and high‑end networking rather than pure consumer internet. These are the plumbing and power names that feed the AI and cloud stack, and they fit neatly with the CIEN/POWL/VICR outlier flows and the treemap concentration in Nvidia, Apple, and Microsoft we saw earlier. It reinforces the idea that leadership inside tech has moved down the stack into infrastructure and enablers.
Large‑cap and small‑cap leaders tell the same story in different wrappers. On the big side you see SCHD, SCHY, HDV, SPYD, VYM, DVY, NOBL, VTV, SPHQ, SCHV – quality, dividend, and value‑tilted ETFs rather than high‑octane growth. On the small‑cap side, AVUV, SDVY, FNDA, SPSM, UR, CALF, IWM, SCHA, VB, IWM again – factor‑tilted small‑cap value and broad small‑cap beta. That combination fits the breadth work: participation is broadening beyond megacap growth, and leadership is tilting toward value, dividends, and cyclicals in both large and small universes.
Crypto and EM slots on the leader board are consistent with the speculative sleeves in the TRV and IO lists. ETHE, BITI, BLSH, CRCL, WGMI, BTCI, BRRR, FBTC, BTC and BITB mark out the crypto column, while DFIV, AVDE, IEMG, VXUS, ACWX, EEM, EMXC, FNDE, SPEM and VEA populate Emerging Markets. That is not a defensive posture; it is a barbelled risk stance where investors are willing to hold some EM beta and take tactical shots in crypto, but anchor it with quality factor products, long bonds, and cash‑flow heavy cyclicals.
Real Estate and Utilities leadership is narrower and skewed toward quality. PKST, OUT, PEB, TRNO, UE, VTR, KRG, BRX, XHR, CDP show up on the property side, leaning into industrial, logistics, and higher‑quality diversified REITs rather than levered office. In Utilities, ZWS, HE, AES, TAC, GEV, CWEN, KEP, PCG, CTRI, XIFR and names like POR, IDA, XIFR show up – a mix of regulated electric and renewables. That dovetails with the uranium, SMR, and renewables flags in the TRV list and with the notion that power and grid capacity are the constraining resource in the AI expansion.
Consumer and healthcare leadership are more selective but fit the same “real‑economy plus cash‑flow” theme. In Consumer Cyclical and Defensive you see ADNT, LIND, TPR, ZGN, SONO, YUMC, MOD, BALL, WMS, AAP on one side and HSY, POST, PEP and other staples on the other – brands, autos, home improvement, and discretionary tied to actual spending rather than pure digital stories. Healthcare leaders like AZN, PAVM, DVA, EKSO, TWST, ROIV, ERAS, GSK, QURE, and HROW mirror the biotech and med‑tech names popping in the IO and TRV screens: selective risk in pipelines and tools, not a blanket bet on the entire sector.
When you put it together, the sector‑leaders board is broadly aligned with the narrative you have been seeing all week. Leadership is concentrated in: duration‑sensitive bonds and quality dividend/value sleeves as the market leans into a slower‑growth, eventual‑cuts path; industrials, materials, and energy names that benefit from higher capex and infrastructure spend; second‑ and third‑derivative AI infrastructure in semis, components, power, and networking; and selective small‑cap value, EM, and crypto as higher‑beta expressions around the edges. Laggards, by implication, are the crowded corners of pure growth and defensives that do not offer either clear capex upside or yield.
In other words, the leader board is not screaming “all clear, buy anything.” It is pointing to a market that is rewarding cash‑flow, capex leverage, and real‑asset adjacency while still keeping a barbelled toe in EM and crypto – exactly the kind of structure you would expect in an AI‑driven, late‑cycle environment with a cautious but slowly easing Fed.
MIR Part 3: Framing-Up A Trade
This week’s tape says the same thing no matter how you slice it: institutions are still putting money to work, but they are rotating away from a narrow megacap‑only bet and into a barbell of quality large‑cap beta, AI infrastructure, cyclicals, and selective duration/credit, with tactical risk in EM and crypto on the edges. Framing up a trade around that means leaning into the new leadership without abandoning the core bull case, and making sure the portfolio is built to survive another round of AI “invest‑digestion” or a wobble in the jobs data.
Here is how I would translate the institutional tape into an actual book for the week, using realistic sleeves and liquid tickers, with weights that sum to 100%.
Core equity beta – 28%
The message from SPY, QQQ, VOO and the dark‑pool bars is that allocators are still rebalancing around index beta rather than exiting. I want that working for me, but I do not want to be overexposed to pure growth. I would allocate about 18% to SPY and 10% to a quality/value tilt like SCHD or VTV. SPY keeps me plugged into the broad U.S. market that still has positive breadth and strong earnings power, while the value sleeve reflects leadership in dividend and quality factor ETFs that have been climbing the sector‑leader board as rates peak and cyclicals improve.
AI infrastructure and enablers – 18%
Flows into Nvidia, Apple, Microsoft, CIEN, POWL, VICR, and a host of semis and components tell you the institutional bet is shifting from just “own NVDA” to “own the stack that builds and powers AI.” Here I would dedicate roughly 10% to a diversified semi/infrastructure ETF like SOXX or IGV plus 8% in a basket of names that sit closer to the plumbing: CIEN, POWL, ENPH, TER, AXTI, and GLW sized around 1–1.5% each. The justification is straightforward: big tech’s 600B–650B 2026 AI capex plans are structural, but single‑name risk is high, so owning suppliers and power/networking enablers spreads the theme risk while aligning with the outlier and leader lists that have been lighting up those tickers.
Cyclicals and industrial capex – 18%
Industrial and machinery outliers (XPO, RRX, CR, GGG, TEX, SXI, XMTR, ROAD, WSO, SBGSY) plus sector‑level leadership in Industrials and Materials argue for a real allocation to the physical build‑out. I would put around 10% into a broad industrial/cyclical ETF such as XLI plus, if you want more factor tilt, pairing it with AVUV over time. The remaining 8% I would spread across 1–2% single‑name stakes in XPO, RRX, POWL and a refiner like DINO or VLO. This sleeve is my expression of “AI and reshoring need trucks, transformers, and chemicals,” and it is backed by both TRV and IO outliers as well as sector relative‑strength work.
Selective growth and software – 8%
The software complex is being repriced, not abandoned. Elevated but orderly flows in AFRM, HUBS, IGV, OTEX, SSNC, and others tell me institutions are rotating within the space rather than walking away. I still want some exposure, but it should be smaller and more selective. I would park 5% in IGV as a diversified software basket and 3% split between HUBS and one of the application/infrastructure names like ADEA or GCT that are climbing the TRV list. The idea is to participate in any rebound as the AI‑transition winners emerge, without having this sleeve drive portfolio drawdowns if the SaaS de‑rating continues.
Duration and credit ballast – 14%
Outlier flows into SHV, STIP, IUSB, IEI, TDTF, and the long‑duration leaders (ICVT, EDV, BLV, SPTL, VGLT) say real money is quietly adding rate sensitivity and IG credit as the Fed shifts from hiking to an eventual easing stance. I would allocate about 7% to a core bond mix – for example 7% in IUSB or a similar total‑bond fund – and another 7% to a duration‑tilted sleeve split between IEI/STIP and a long‑duration vehicle such as EDV or BLV. This ballast is there to benefit if softer labor data and disinflation push yields lower, and to dampen equity volatility; the flows tell us institutions are comfortable owning more duration in this regime.
Real assets and power – 6%
AI capex plus energy transition is pushing attention toward uranium, nuclear, and renewables (SMR, URG, SRUUF, GEV, XIFR) alongside traditional refiners and fuel names. I would allocate 4% to a diversified commodities or natural‑resources ETF such as GNR or a focused uranium/nuclear basket, and 2% to an energy ETF like XLE or a single name such as SU or DINO. The goal is to have some exposure to the power bottleneck the tape is starting to price in, without making a pure oil‑beta bet.
Idiosyncratic growth and EM/crypto satellites – 6%
The TRV list and IO outliers both show targeted interest in EM (INCO, ARG T, QEFA, CQQQ), crypto wrappers (BITW, BKCH, BITI/SBIT), and high‑beta biotech. I would keep this a true satellite: 3% into an EM growth ETF like INCO or IEMG, 2% into a diversified biotech ETF such as IBB, and 1% into a conservative crypto proxy like BITW or a 0.5%/0.5% BITW–BITI mix to keep net exposure modest. The role of this sleeve is optionality: if risk‑on squeezes in EM or crypto, it contributes meaningfully; if not, it is small enough not to hurt.
Cash / short bills – 2%
Given the size of single‑name and leveraged ETF activity, it is clear that a portion of the street is actively trading around this regime with QLD, TMF, UDOW, and similar products. Rather than embed that leverage in the core book, I would hold about 2% in cash or very short‑term bills (SHV) and be willing to deploy tactically against predefined triggers: further breadth improvement in small caps and Industrials, or a clean reset in software valuations confirmed by renewed institutional buying. This aligns with the tape’s message that we are in an allocation environment with episodic air pockets, not a one‑way melt‑up.
Tactically, the playbook for the week is straightforward. I want to be buying dips in the core beta and industrial/AI‑plumbing sleeves while respecting the idea that megacap tech and software can still mean‑revert as the market digests the capex shock. If breadth in small caps and Industrials holds up and SPY continues to see heavy dark‑pool support, I would lean into the cyclical and AI‑infra exposure; if we start to see outlier selling in those same names alongside a reversal in bond‑market duration flows, I would rotate some capital back into the bond ballast and trim the higher‑beta satellites. 2% cash might sound light but we have 14% in high‑quality bonds and duration, plus another 6% in real‑assets/power and 6% in diversified EM/biotech/crypto satellites. Those fixed‑income holdings (IUSB, IEI/STIP, EDV/BLV) function as part of your defensive capital; they are not cash, but they do cushion equity drawdowns and can be tapped or rotated quickly. If you still feel like you need more psychological comfort, you can bump-up cash to 5-7% and trim proportionally from the higher beta sleeves to set aside a little more dry powder.
Bottom line: the institutional tape is telling you to own the bull market, but own it through quality index beta, AI infrastructure, cyclicals, and duration/credit ballast, with only measured exposure to pure growth and speculative edges while the market works through the AI capex and softer‑labor narrative.
Thank you for being part of our community and for dedicating your time to this edition. Your insights and engagement drive everything we do, and we’re honored to share this space with such committed, thoughtful readers. Here’s to a week filled with clear opportunities and strong performance 💰💰💰
— VolumeLeaders