

Market Momentum: Your Weekly Financial Forecast & Market Prep
Issue 78 / What to expect Feb 02, 2026 thru Feb 06, 2026


In This Issue
Weekly Market-On-Close Report: All the macro moves, market drivers, and must-know narratives—covered in less than five minutes.
Weekly Benchmark Breakdown: Our weekly intelligence report on major indices cuts through the index-level noise to uncover participation, momentum, and structural integrity and tell you whether markets are rising on solid ground or skating on thin breadth. This is where bull markets prove themselves—or quietly start to unravel.
The Latest Investor Sentiment Readings: Track the emotional pulse of the market with our curated dashboard of sentiment indicators. From fear-fueled flight to euphoric overreach, this week's readings reveal whether investors are cautiously creeping in—or stampeding toward the exits.
Institutional Support & Resistance Levels For Major Indices: Exactly where to look for support and resistance this coming week in SPY, QQQ, IWM & DIA
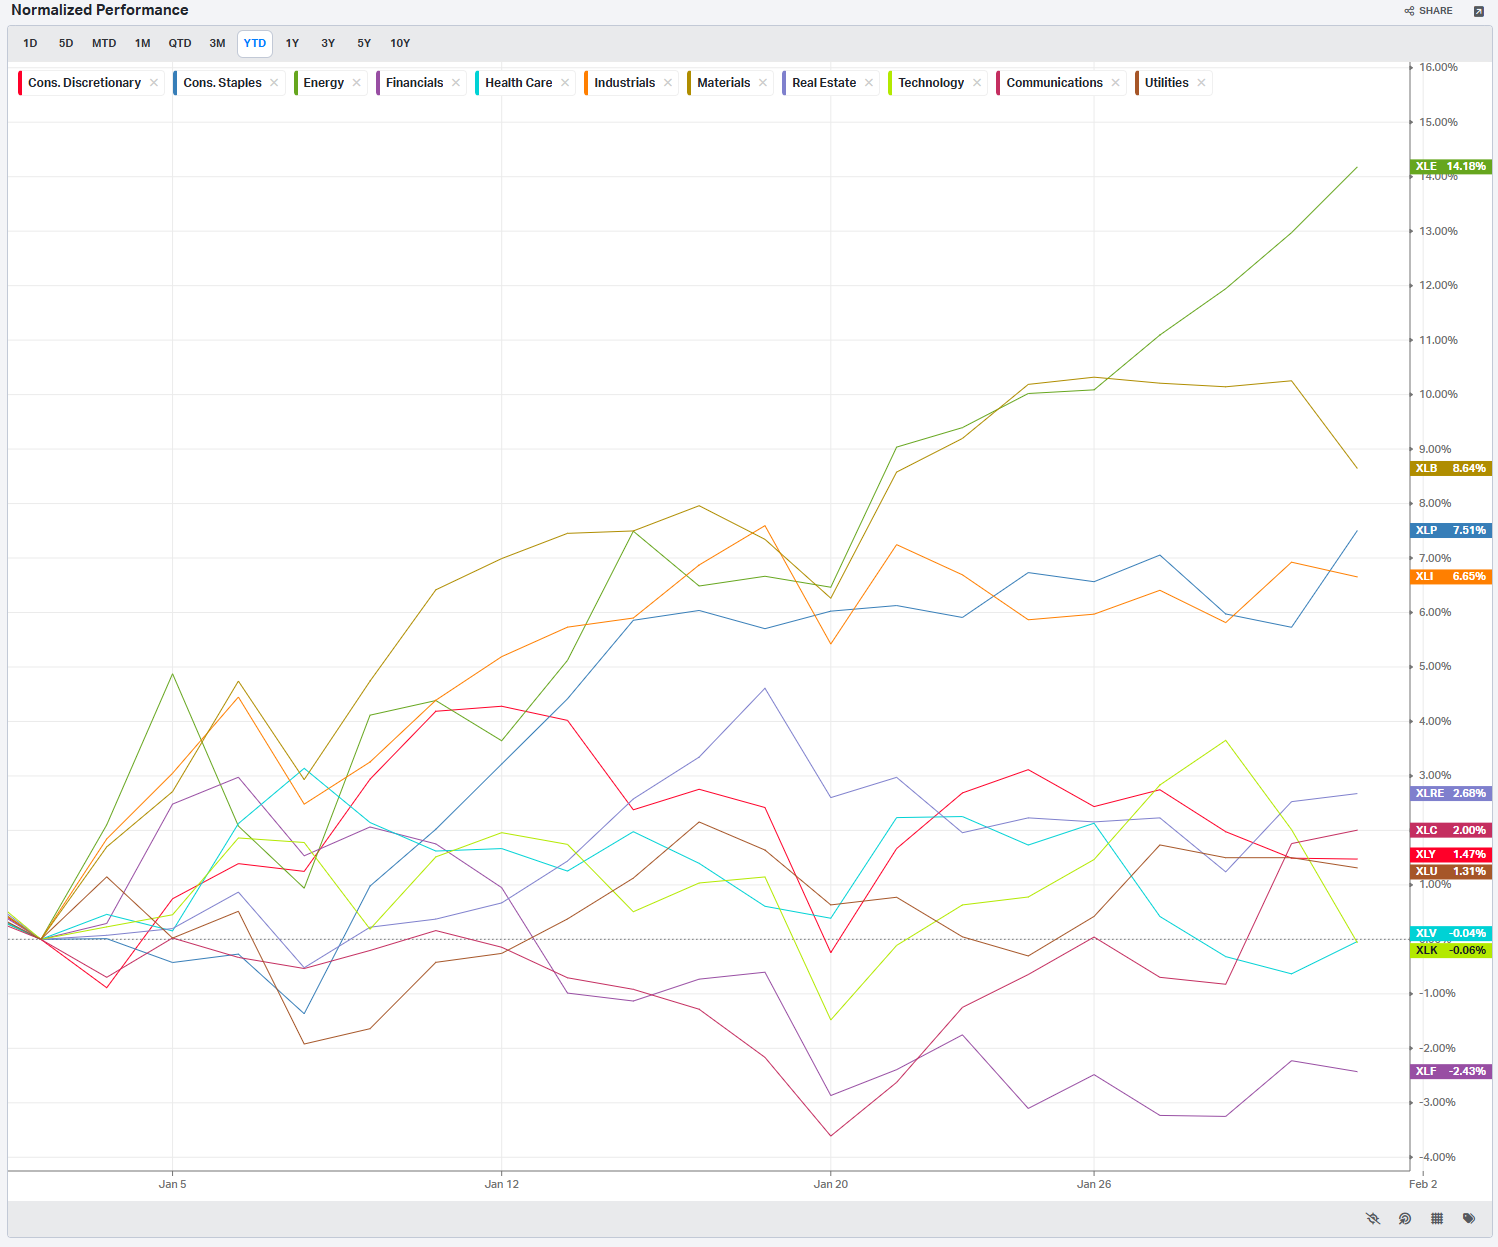
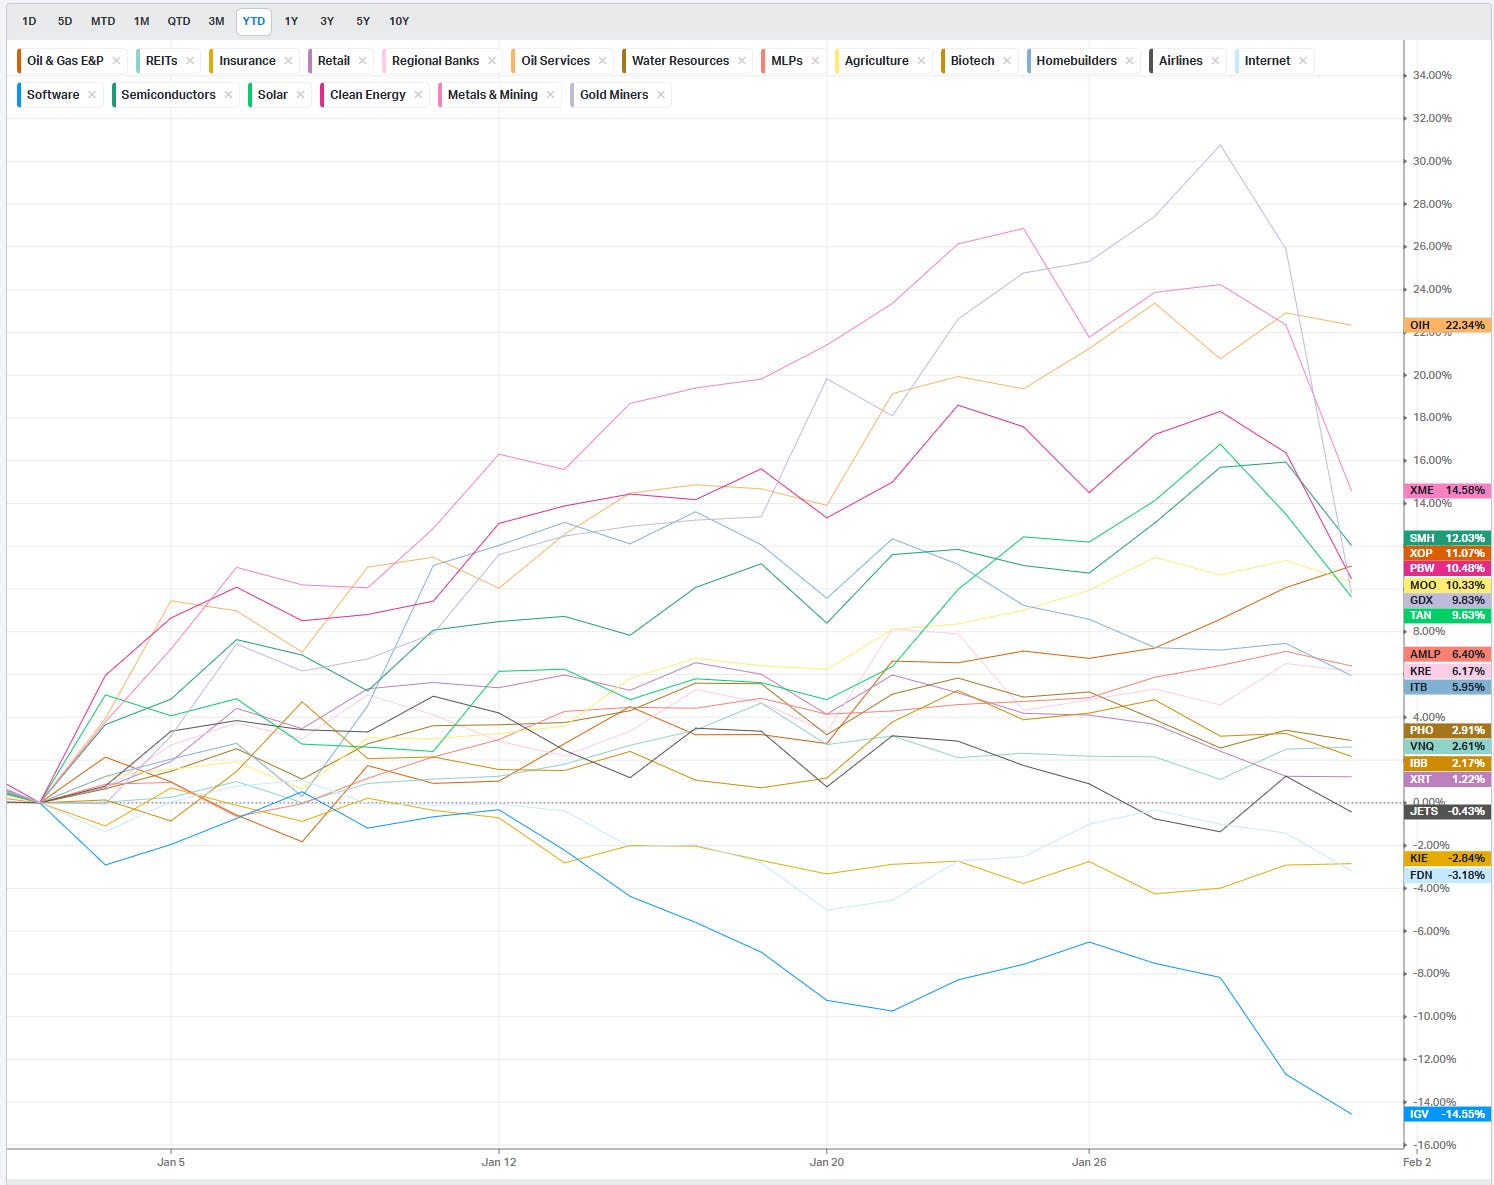
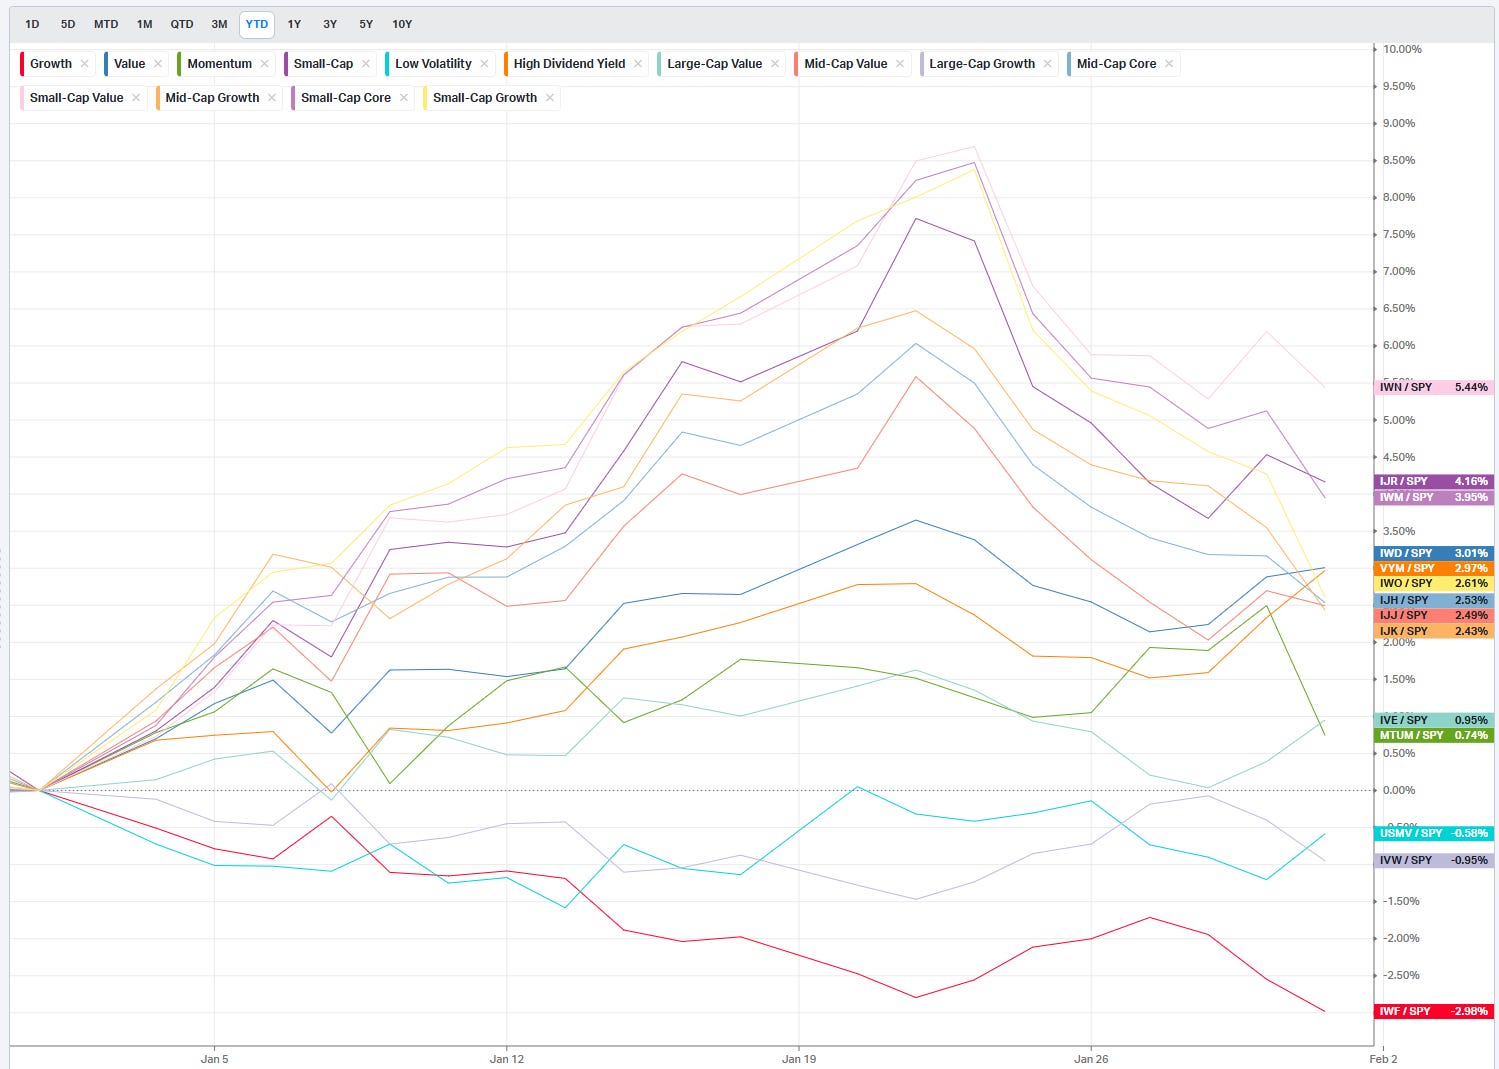
Normalized Performance By Thematics YTD: Which corners of the markets are beating benchmarks, which are overlooked and which ones are over-crowded!
Key Econ Events & Earnings On-Deck For This Coming Week
Market Intelligence Report: Track the real money. This section dissects where institutions are actively putting capital to work—and where they are quietly stepping aside. We start with a sector-by-sector view of flows, identifying which areas are commanding attention and which are losing sponsorship. From there, we move into the tape itself, highlighting the week’s most meaningful block trades and sweep activity across both lit exchanges and dark pools to distinguish durable allocation from short-term positioning.
Each week, we synthesize those signals into a cohesive, realistic portfolio that reflects how a professional allocator might express the dominant themes. The goal is not prediction, but alignment—showing how institutional conviction, optionality, and risk management come together in practice. Whether you’re leaning into momentum or staying selective around crowded trades, this report offers a grounded framework for understanding where size is moving, how it is being expressed, and why it matters.

Weekly Market-On-Close Report
S&P futures blink, but the expansion keeps grinding
If you just watched the E‑mini S&P futures for clues this week, you might be tempted to say “nothing to see here.” March E‑mini S&P has been chopping just below recent highs, with quotes hovering in the high‑6,900s and daily moves mostly in the plus‑or‑minus half‑percent range. Under the surface, though, the story is more interesting: global growth data have come in firmer than feared, inflation has eased but not disappeared, and leadership has begun to broaden away from the narrow, mega‑cap tech cohort that dominated the last few years. That is a much healthier backdrop than the headlines would have you believe, and it helps explain why every dip in futures so far in 2026 has attracted buyers instead of panic sellers.
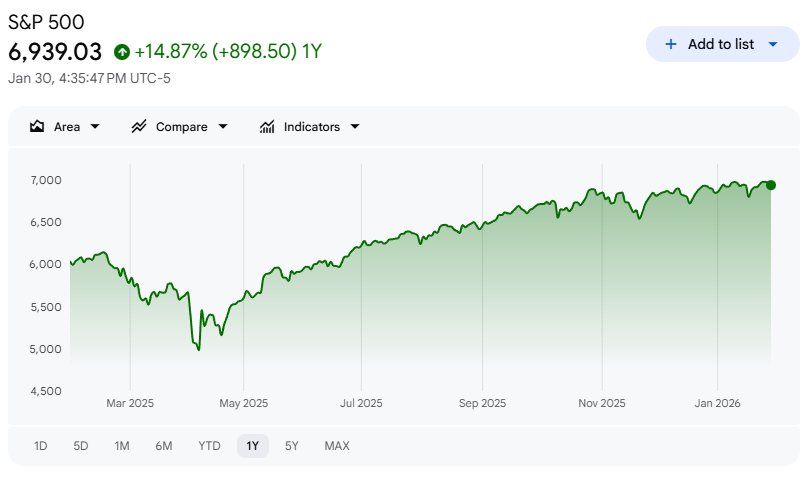
E‑mini S&P: consolidation at high altitude
Start with the futures themselves. March E‑mini S&P contracts recently traded in the 6900 zone, up modestly on the week and only a short distance below their contract highs. On a day when the cash S&P 500 slipped about 0.4 percent and the Nasdaq 100 gave back more than 1 percent, March E‑mini S&P futures declined just 0.43 percent and March E‑mini Nasdaq futures fell 1.35 percent, signaling a garden‑variety consolidation rather than a regime change. Technically, that is exactly the sort of pause you want to see after a strong run: new highs, then some sideways trade as earnings and macro data catch up to the price.

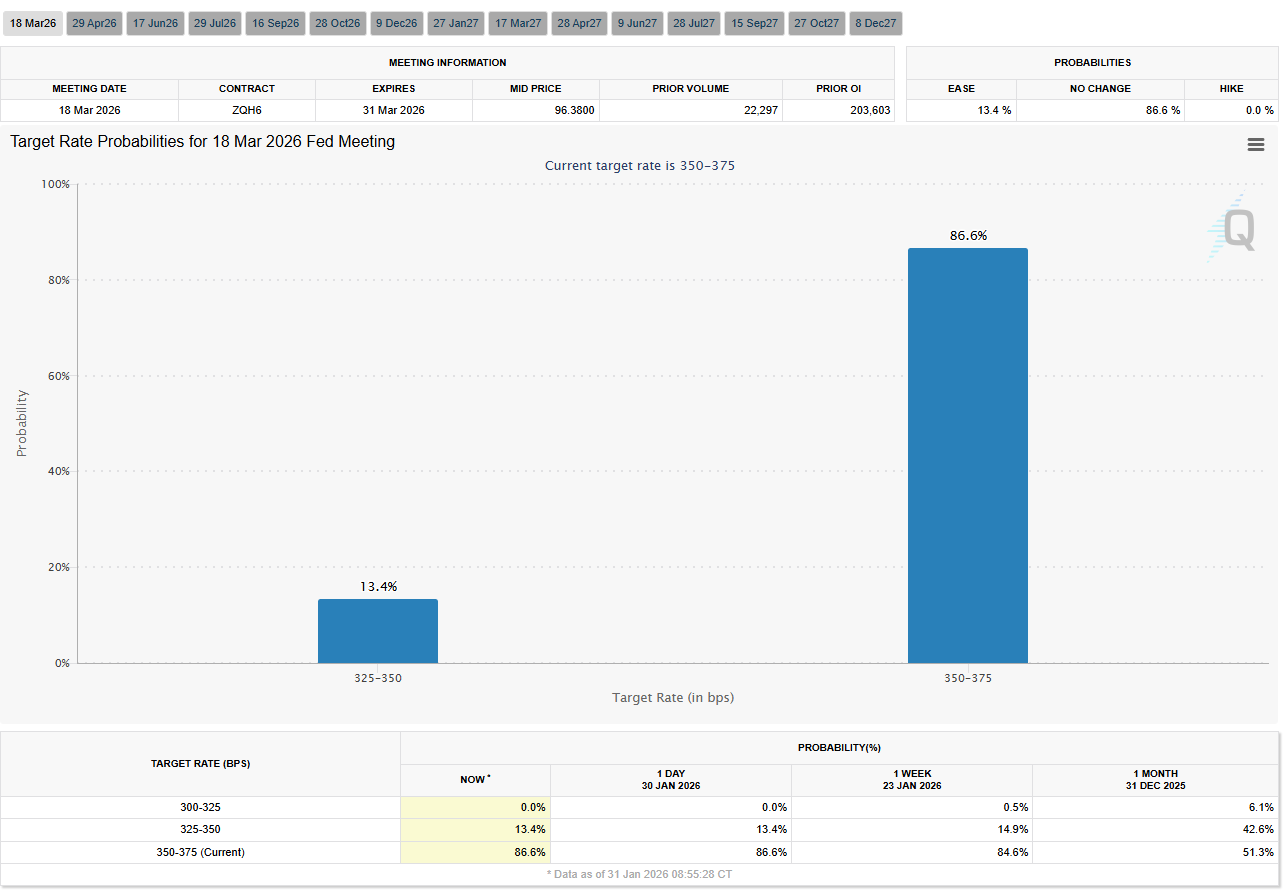
Importantly, futures positioning is happening against a macro backdrop that is less binary than last year. Fed funds sit in the mid‑3s after a string of cuts in late 2025, but policymakers and futures markets alike now see only limited room for further easing in 2026. That keeps real yields from collapsing, discourages the most speculative behavior, and supports the idea that equity gains from here will need to ride real earnings growth and productivity more than just multiple expansion. Futures at 6900 with that policy mix say the market is willing to pay for that story, but not blindly.
Growth data: better than the vibes
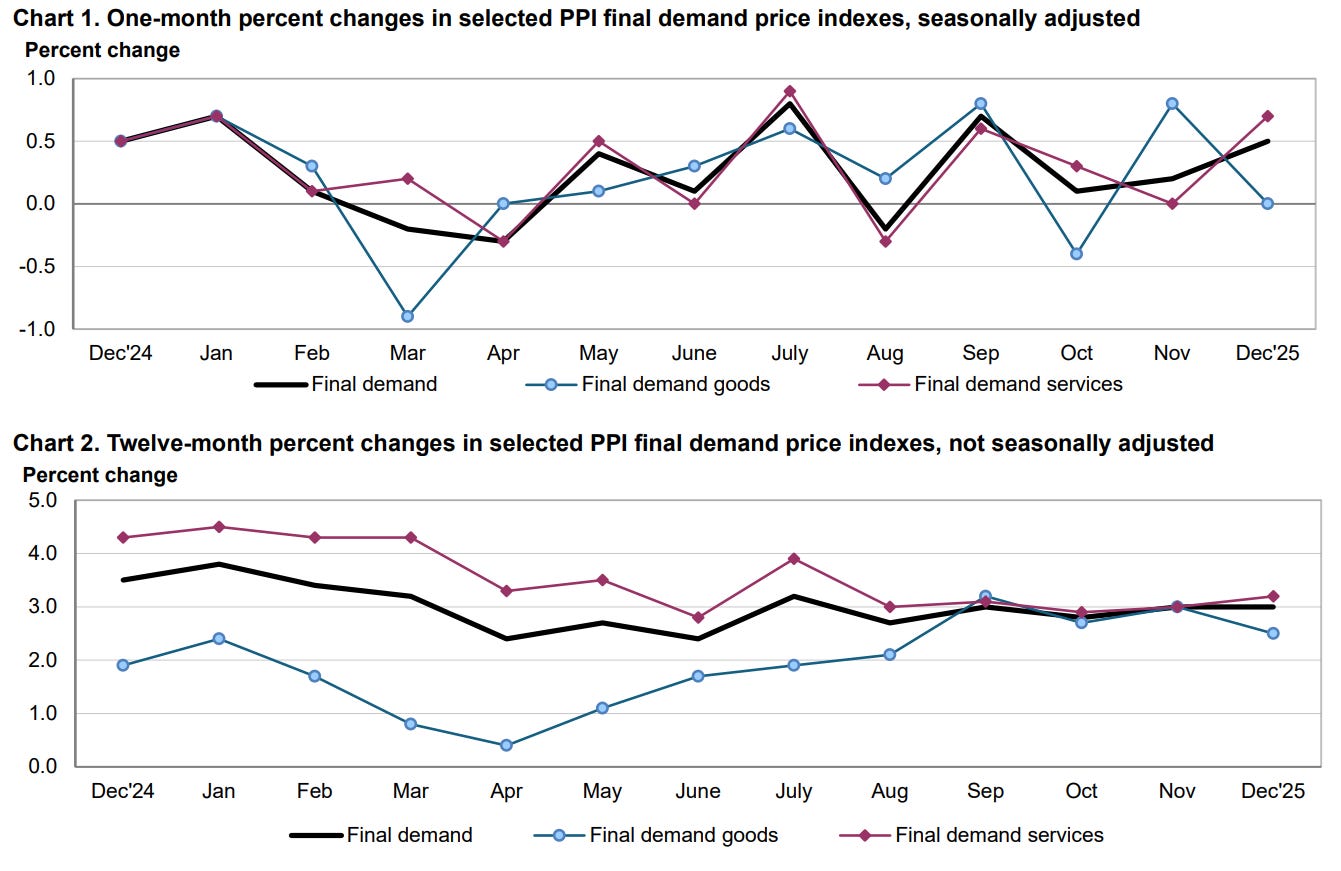
Weekly macro updates from global managers tell a consistent tale: growth data have surprised to the upside, even as inflation inches lower. In the U.S., a delayed Commerce Department report showed November durable goods orders jumping 5.3 percent after a 2.1 percent drop in October, with core capital goods orders up 0.7 percent — a solid sign that business investment has not rolled over. At the same time, producer prices rose 0.5 percent month over month in December, driven by a 0.7 percent increase in services; that is hotter than the 0.2 percent consensus, but still consistent with a grinding disinflation rather than a re‑acceleration.
Zoom out to Europe and sentiment is slowly mending. The European Commission’s confidence indicator climbed to 98.2 in January, just shy of its long‑term average, with improvements across most sectors and a notable rebound in France as political noise around the 2026 budget faded. In Japan, Tokyo’s core CPI cooled to 2.0 percent year over year in January from 2.3 percent in December, undershooting expectations and reinforcing the idea that the Bank of Japan can normalize policy at a measured pace without choking off growth.
Taken together, those data points support the “soft landing, not no landing” narrative that has been gaining traction since late 2025. The global economy is not booming, but it is expanding, and the weakest spots — manufacturing and housing — are starting to see some relief as policy shifts from aggressive tightening to cautious easing.
Earnings, productivity, and the “jobless profit boom”
The other side of the equation is earnings. Consensus expects S&P 500 earnings to grow nearly 15 percent in 2026 versus 2025, with all 11 sectors contributing to the advance — a notable contrast to the profit concentration in mega‑cap tech that characterized 2023–2024. Over the past six months, forward estimates have been revised higher, not lower, which is unusual this late in a cycle and supports the argument that the current expansion is being driven as much by productivity gains as by pure demand growth.
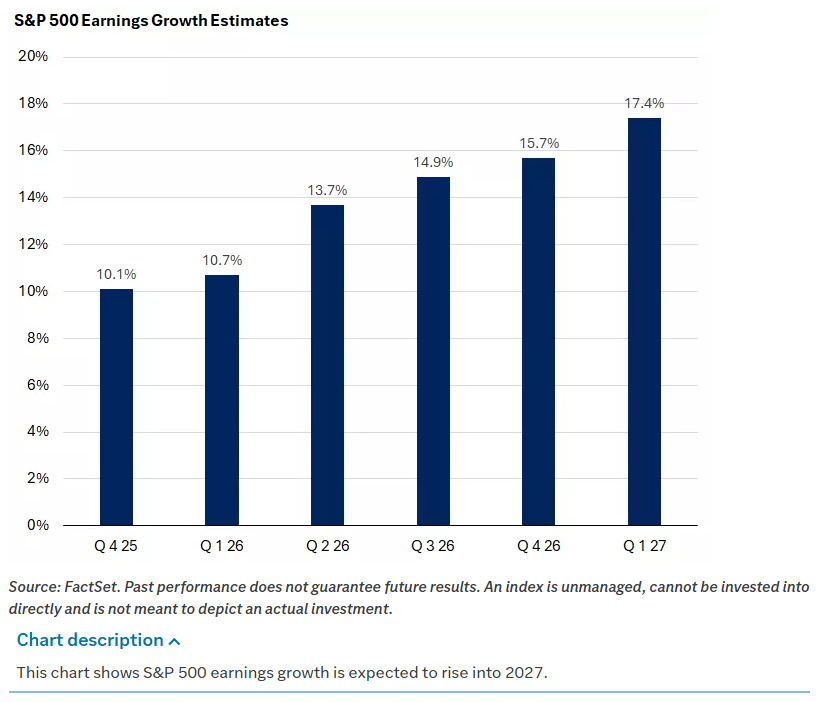
Edward Jones goes so far as to call this a “jobless profit boom,” noting that profits have accelerated without a major increase in headcount — a sign that technological adoption, particularly in AI and automation, is lifting output per worker. That framework matters for futures traders because it means margins can stay elevated even if wage growth remains firm and employment only inches higher. In other words, you do not need a hiring binge to justify higher index levels; you need steady demand and continuous efficiency improvements.
Rotation beneath the surface
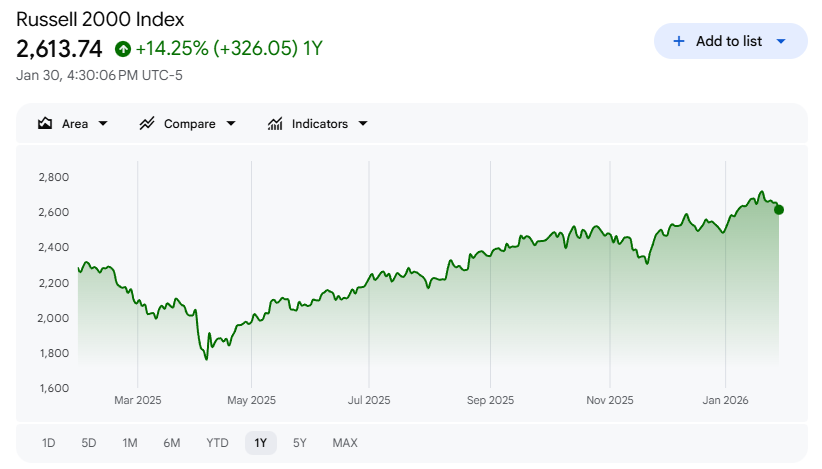
Perhaps the most constructive development in early 2026 is the broadening of leadership. Since November, small‑ and mid‑caps, value stocks, international equities, and cyclical sectors — materials, industrials, and consumer discretionary — have outperformed, reversing years of narrow, mega‑cap‑only advances. That is visible both in sector returns and in style indices: the Russell 2000 and various value benchmarks have outpaced the S&P 500 year to date, even as the big tech names remain healthy.
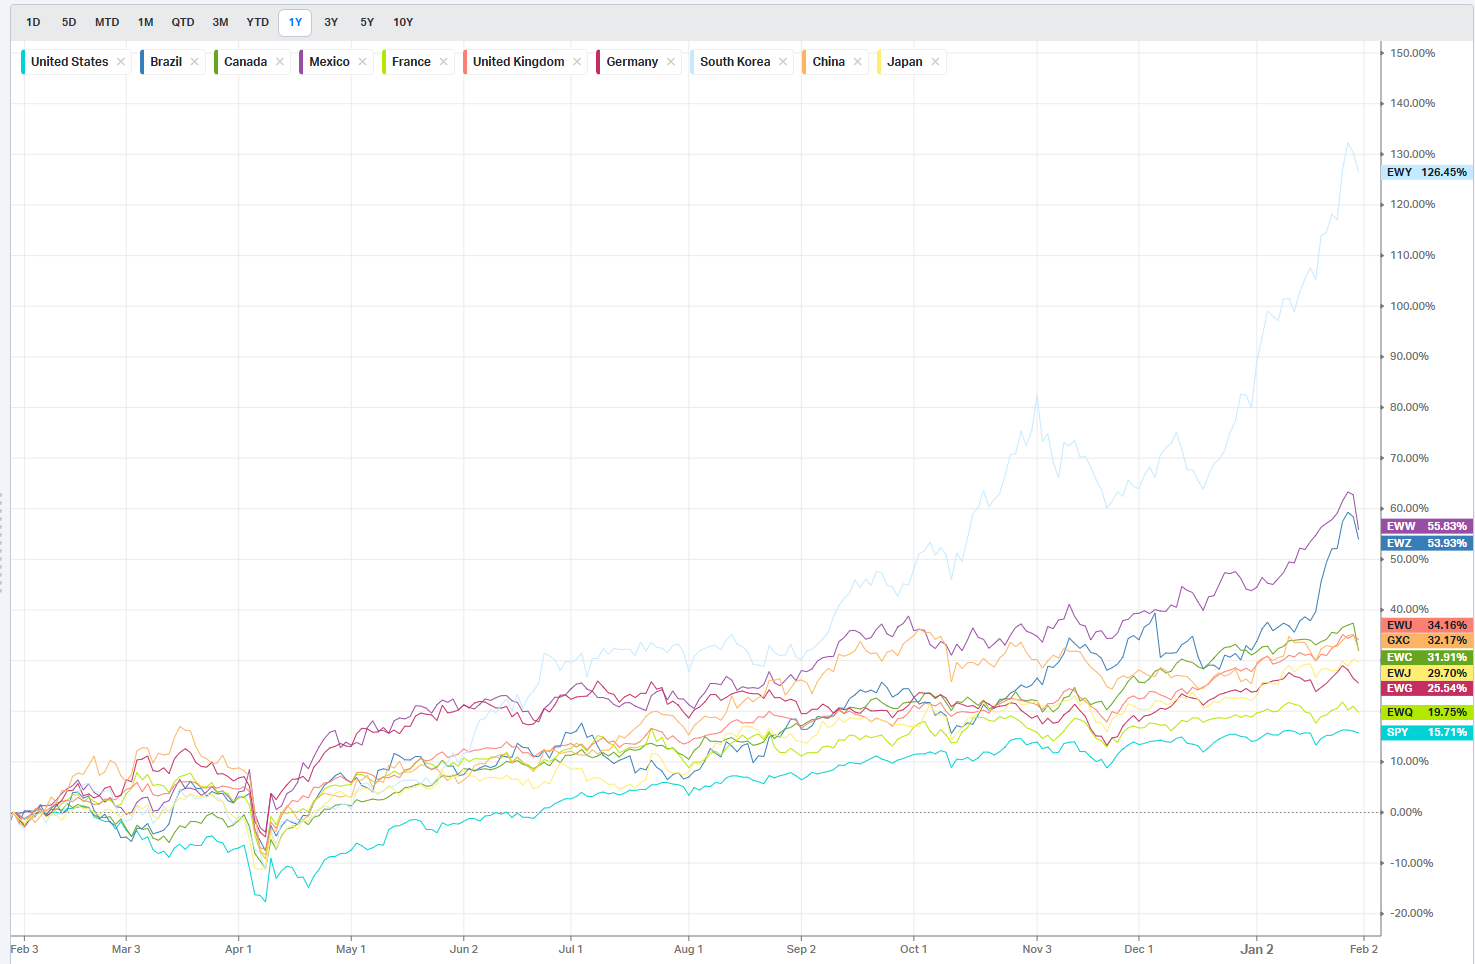
EAFE indices are modestly positive on the week and up 3.6 percent year to date, with Europe, the U.K., and Spain posting gains while Japan, after a strong start, took a breather. This is not the one‑way “buy U.S. large growth, ignore everything else” regime of the past few years. It is more nuanced, with pockets of strength across regions and sectors that historically benefit from early‑cycle or mid‑cycle reflation — exactly what you would expect if markets are pricing a longer, broader expansion rather than a late‑cycle blow‑off.
Policy: from emergency to calibration
On the policy front, the story has shifted from “how high will they go?” to “how fast will they come down?” After cutting rates at each of the final three meetings of 2025 to counter emerging labor softness, the Fed has now moved into a more cautious stance, with officials split on how many additional cuts are appropriate in 2026. Futures markets currently price only limited odds of another move at the very next meeting and roughly even odds of a quarter‑point cut by March, leaving the policy rate in the 3.5–3.75 percent range for now.
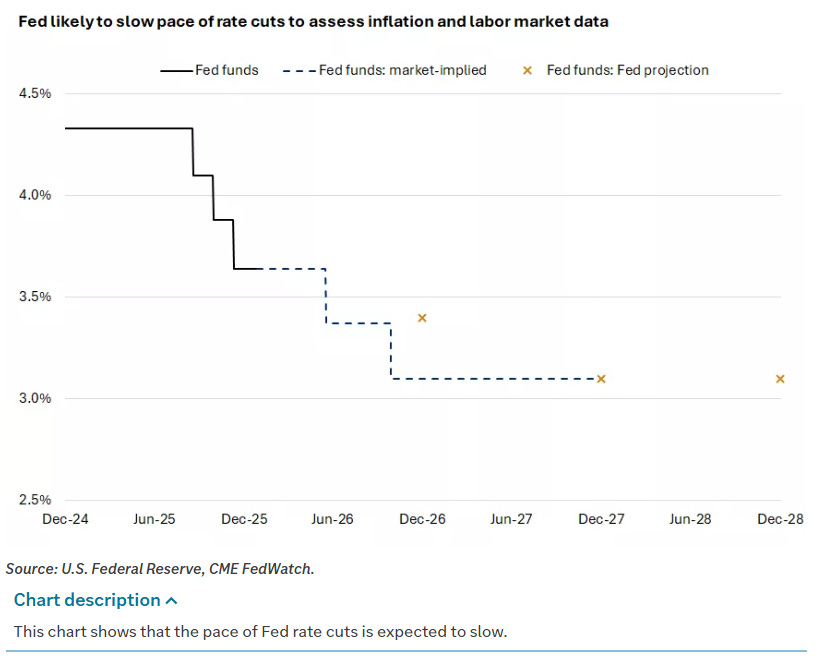
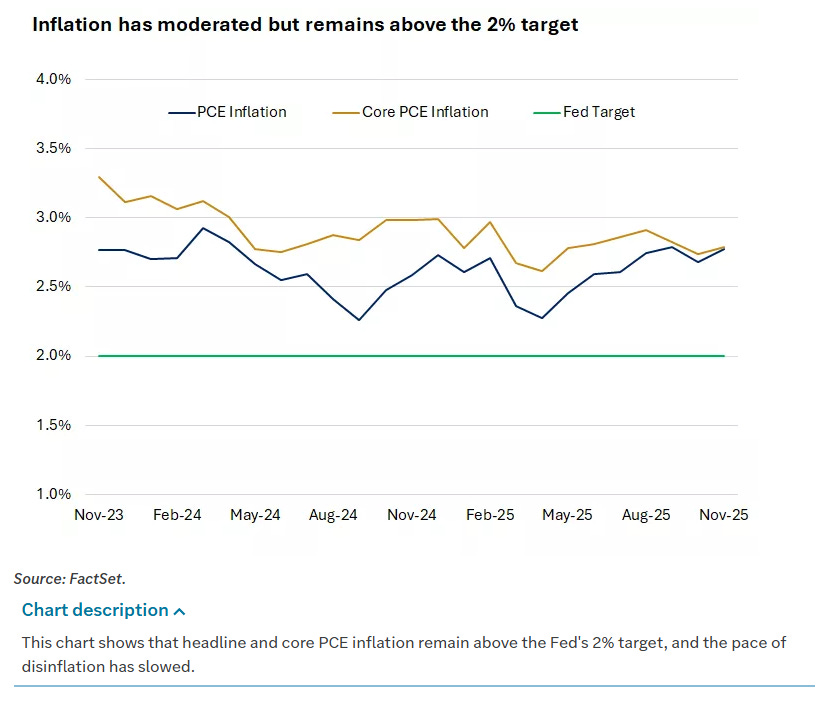
Commentary from asset managers echoes that cautious optimism. UBS and others argue that a slower pace of cuts is actually constructive if it reflects underlying growth resilience rather than inflation trouble. Strategists note that while inflation has fallen back toward central bank targets — headline CPI around 3.3 percent in some regions, core around 3.8 percent — policymakers expect it may briefly dip below 3 percent before drifting higher again, suggesting little appetite for an aggressive easing cycle.
For traders, that means the big risk is not so much an immediate policy mistake but a gradual repricing of the terminal rate if growth or inflation materially surprise in either direction. In practice, it keeps the curve relatively anchored and encourages investors to express views through sector and style rotation rather than big directional bets on the index.
So what does all of this mean for the next leg in indices?
Put it together and the message is straightforward: as long as growth data stay in the “firm but not overheating” zone and inflation continues to glide lower, the path of least resistance for E‑mini S&P futures remains higher, but through a choppy, rotational grind rather than a melt‑up. Pullbacks triggered by hot PPI prints or noisy payrolls are more likely to be used to add exposure to lagging cyclicals and quality growth than to spark a wholesale de‑risking.
Three dynamics in particular are worth watching:
Breadth and sector follow‑through. If materials, industrials, and small caps continue to outpace the S&P while mega‑caps hold or gently consolidate, that confirms the pro‑cyclical, broadening thesis. A relapse into narrow leadership — futures rising only when one or two mega‑caps rip — would be a warning that the expansion narrative is weakening.
Earnings revisions. Consensus is calling for roughly 15 percent S&P EPS growth in 2026, with upgrades across all sectors. If we keep seeing positive revisions in cyclicals and steady numbers in tech, futures have room to grind higher without multiple expansion. If revisions roll over, especially in economically sensitive groups, ES at 6,100 starts to look rich.
Policy and labor data. Markets are currently comfortable with the idea of one or two more cuts this year at most. A material downside surprise in employment could quickly push pricing toward a more aggressive easing path — bullish for duration, but potentially unsettling for equity risk premia if it smells like recession rather than soft landing. On the flip side, a re‑acceleration in wages and services inflation would resurrect “higher for longer” fears and could pressure high‑duration growth even if cyclicals hold up.
How to think about positioning
Major indices at these levels make the most sense if you believe three things:
The U.S. and global economies can grow modestly faster in 2026 than in 2025, helped by capex and a fading drag from housing and manufacturing.
Productivity and earnings remain supported by AI and tech adoption, allowing margins to hold up even without a hiring boom.
Central banks, led by the Fed, can normalize policy without choking off that growth — a slow, data‑dependent easing path rather than a lurch.
If that is your base case, dips look more like opportunities to add length with tight risk than the start of a major top. At the same time, the rotation data argues for looking beyond and making sure your equity sleeve is not just a leveraged bet on the same handful of mega‑caps that have already run hard. Equal‑weight S&P, small‑mid caps, and international developed markets all have a role to play if this truly is a broadening expansion. The simplest way to describe this tape is “high‑altitude consolidation with improving internals.” Nothing looks cheap here, but names are broadly being supported by a combination of better‑than‑expected macro data, steady disinflation, broadening earnings growth, and a healthier pattern of leadership that finally includes cyclicals, small caps, and non‑U.S. markets.
That does not mean the path will be straight. The next big employment report and each new inflation print will matter, and the Fed’s reaction function is still being calibrated in real time. There are some warnings covered in the Market Intelligence Report but for traders, things broadly right now call for a mindset of “trend with a helmet on”: respect the uptrend and the improving breadth, but keep an eye on the macro tripwires and be ready to adjust if revisions or policy expectations swing sharply.

Weekly Benchmark Breakdown
Breadth still supports the uptrend, but this week looks more like an aging advance than a fresh thrust, with large-cap benchmarks holding decent participation while small caps slip back into correction-type internals. Risk tone is still constructive for big liquid leaders, but the broad market is wobbling and new highs are not yet expanding in a way that would confirm a durable, low-risk leg higher.
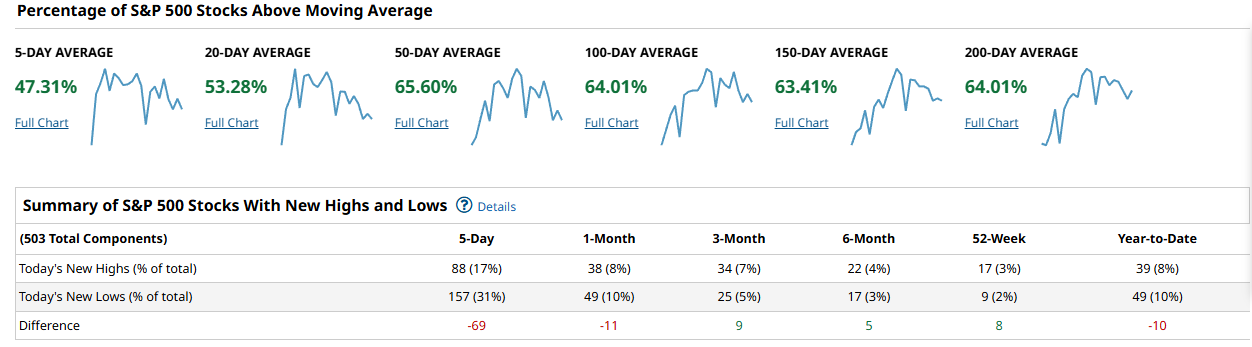
S&P 500
The S&P 500 remains in good shape under the surface, with a majority of constituents still above their key moving averages from 20 days out to 200 days, even after some recent cooling. The 5- and 20-day cohorts have slipped from very elevated levels, but readings around the low- to mid-60s for the 20- and 50-day groups, and mid-50s plus for the 200-day, tell you this is a consolidation within an uptrend, not a broad rollover. New highs have backed off from prior peaks, but new lows remain contained, so the net new highs-minus-lows profile is more “losing momentum” than “flashing danger,” consistent with digestion after a strong advance.
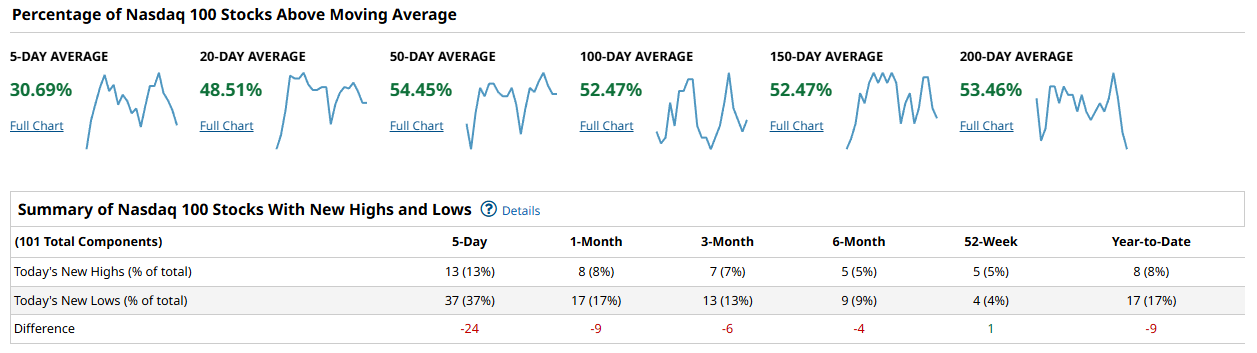
Nasdaq 100
The Nasdaq 100 shows a similar pattern: shorter-term breadth has cooled, but medium- and longer-term participation remains broadly supportive. The percent of NDX names above their 20- and 50-day averages has pulled back from overbought territory but still sits in the 50–60 percent neighborhood, while 200-day participation remains clearly above the halfway mark, confirming an ongoing uptrend in the growth and mega-cap space. New highs have narrowed versus a few weeks ago and the new lows list has picked up a bit, so the net new high/low profile is no longer screaming strength, but it is not yet outright deteriorating; it is what you tend to see in a maturing but intact uptrend.
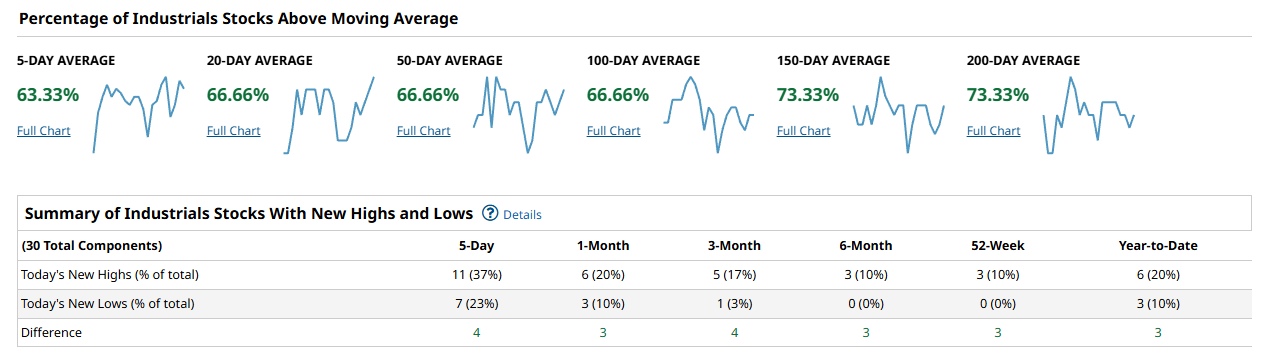
Dow Jones Industrial Average
For the Dow, breadth is respectable but not explosive, which fits with the idea that the index is grinding higher rather than surging. A solid majority of components remain above their 50- and 200-day moving averages, while the 5- and 20-day cohorts have faded from earlier highs, pointing to short-term fatigue without real structural damage. New highs among Dow names have eased and new lows have crept in, but the overall balance still leans modestly positive, implying pullbacks are more likely to be bought than to morph into something more sinister so long as 50-day participation holds above roughly the 60 percent area.
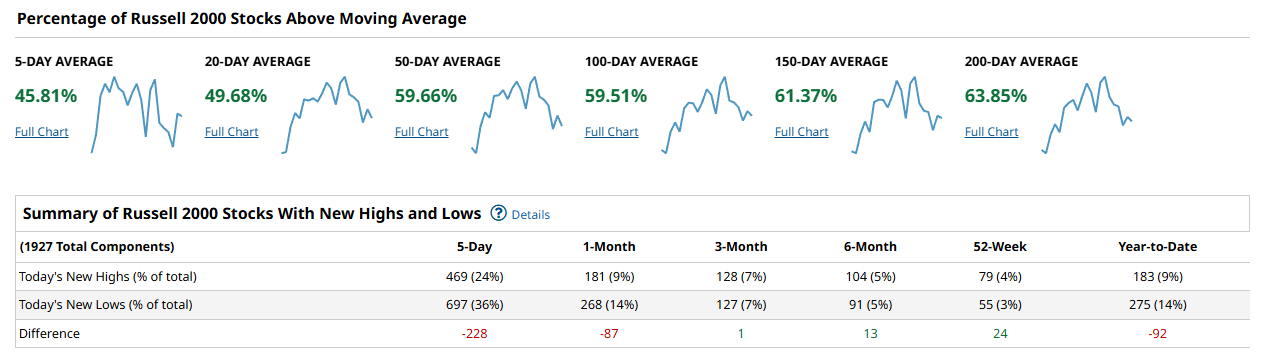
Russell 2000
The Russell 2000 is where the stress shows up. The percentage of small-cap constituents above their 200-day average has retreated into the mid-60s and is slipping, and the shorter-term cohorts (5-, 20-, and 50-day) have weakened more sharply, signaling that many small caps are losing their grip on recent breakouts. New lows have picked up across multiple lookback windows and new highs have thinned out, so the net highs-minus-lows profile is deteriorating rather than consolidating, which is more typical of a corrective phase inside or against the longer-term trend. That divergence between small caps and large caps is the main caution flag this week.
Synthesis
Across the tape, cap-weighted benchmarks look better than the broad market: the S&P 500 and Nasdaq 100 still have clear majorities of their members above 50- and 200-day averages, while the Russell 2000 is slipping and its new lows are expanding. Participation is therefore narrowing back toward large, liquid leaders, which is fine for price indices in the short term but not what you want to see if you are looking for a long-lasting advance with lower risk. The tell that we are transitioning from digestion to a durable next leg higher would be 50-day cohorts in all four indices pushing and holding above about 60 percent, alongside a clear expansion in net new highs (new highs consistently outnumbering new lows across time frames); the opposite – 50-day participation sinking decisively under 50 percent and new lows taking the upper hand – would justify much greater concern.
Playbook
This week, the playbook favors sticking with quality large caps and growth/tech leaders while being more selective and tactical in small caps and lower-quality cyclicals. As long as S&P and NDX 50- and 200-day breadth hold above roughly the 55–60 percent zone and net new lows stay contained, pullbacks in those groups look more like opportunities to add on weakness than signals to exit. In contrast, the Russell’s weakening 20- and 50-day cohorts and rising new lows argue for avoiding broad small-cap beta until you see those shorter-term lines stabilize and turn up, and the new lows list shrink. Confirmation to lean more aggressively long across the board would be a synchronized push higher in 20- and 50-day breadth in all four indices plus a visible pickup in new highs; absent that, it pays to respect the maturing character of this advance and keep some risk powder dry.
Bottom line
Trend still beats thrust: large-cap breadth says the uptrend is intact, but fading short-term participation and small-cap weakness mean this is a time to stay constructive but more selective rather than all-in.

Investor Sentiment Report
%Bull-Bear Spread
The %Bull-Bear Spread measures the gap between bullish and bearish investor sentiment, often from surveys like AAII. It’s a contrarian indicator—extreme optimism may signal a coming pullback, while extreme pessimism can hint at a potential rally. Large positive or negative spreads often mark market turning points.
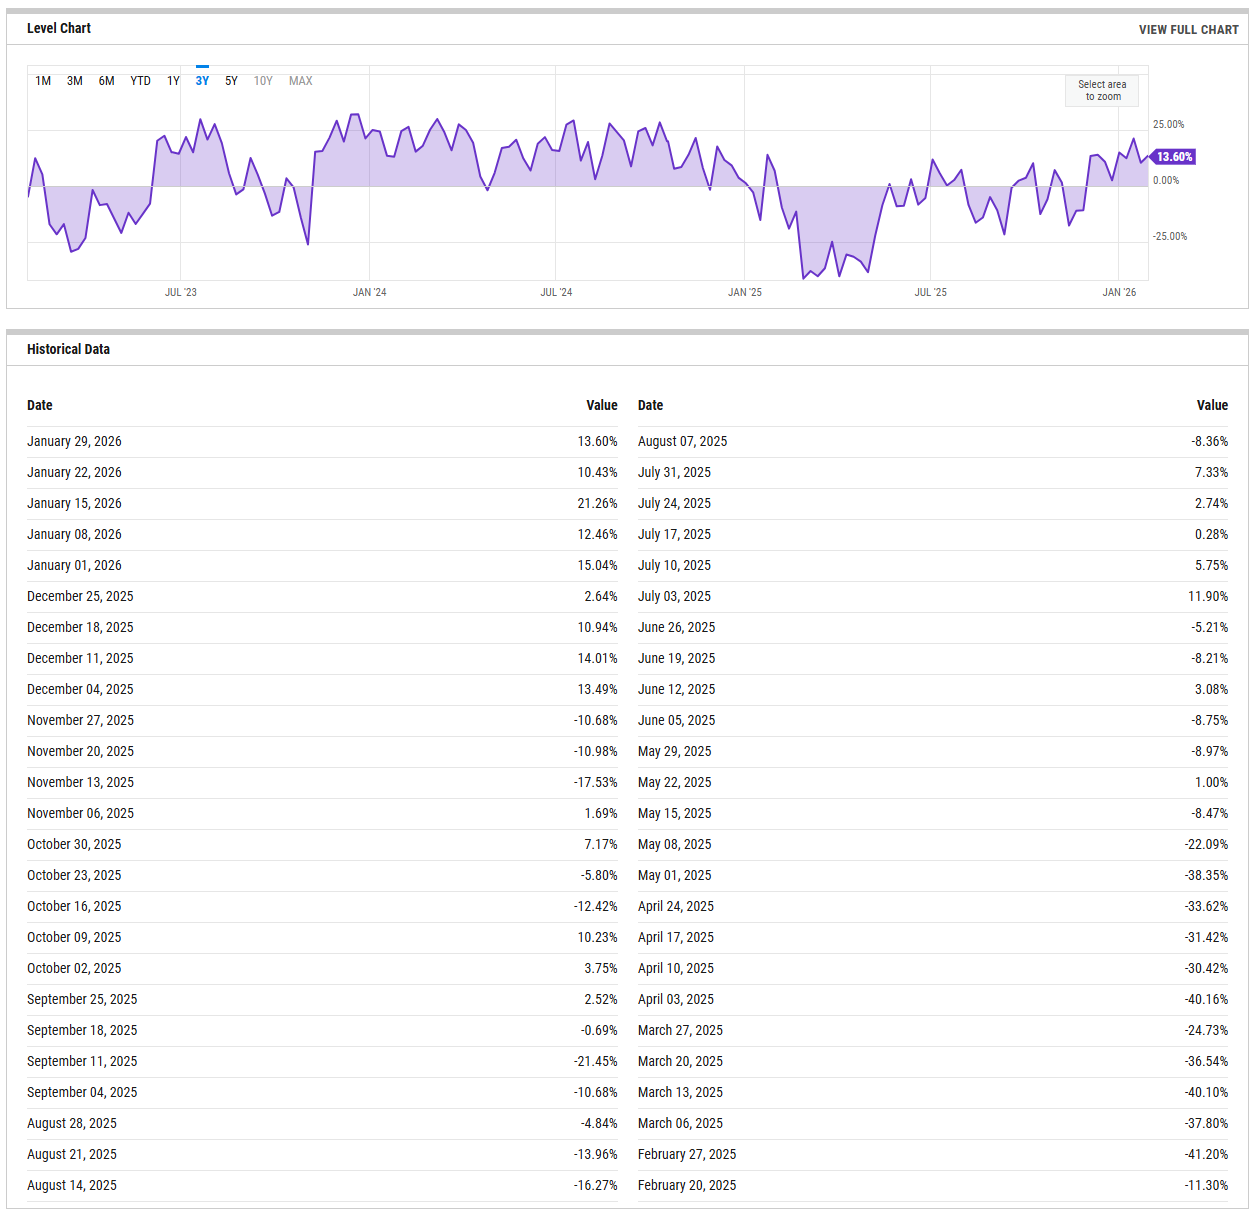
The AAII bull‑bear spread is sitting at 13.60 this week, up from 10.43 last week but well below the brief early‑January spike above 20 percent. That puts sentiment in a constructive, mildly optimistic zone rather than at a crowded extreme, with bulls clearly outnumbering bears but not yet in a runaway euphoric condition. Over the past year the spread has swung from deep negative readings below minus 20 to peaks in the mid‑20s, and the recent path shows a steady grind higher from negative territory in the fall to today’s modestly positive skew. From a risk‑taking standpoint, that means the easy contrarian fuel from outright pessimism is largely gone, but we are not yet in the “everyone on one side of the boat” setup that typically precedes more violent shakeouts. A push through the low‑20s and persistence at those levels would flag a more dangerous, crowded long side where even small disappointments can trigger sharper pullbacks; a roll back toward or below zero, especially if prices hold up, would refresh the contrarian backdrop and improve the odds of a more durable next leg higher.
NAAIM Exposure Index
The NAAIM Exposure Index (National Association of Active Investment Managers Exposure Index) measures the average exposure to U.S. equity markets as reported by its member firms. These are typically active money managers who provide their equity exposure levels weekly. The index offers insight into how much these managers are investing in equities at any given time, ranging from being fully short (-100%) to leveraged long (up to +200%).
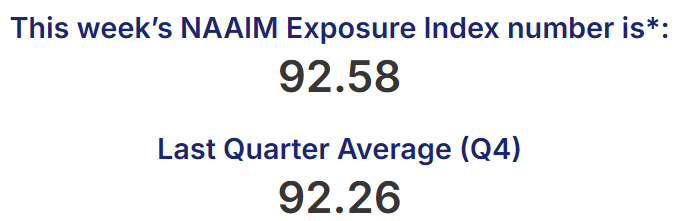
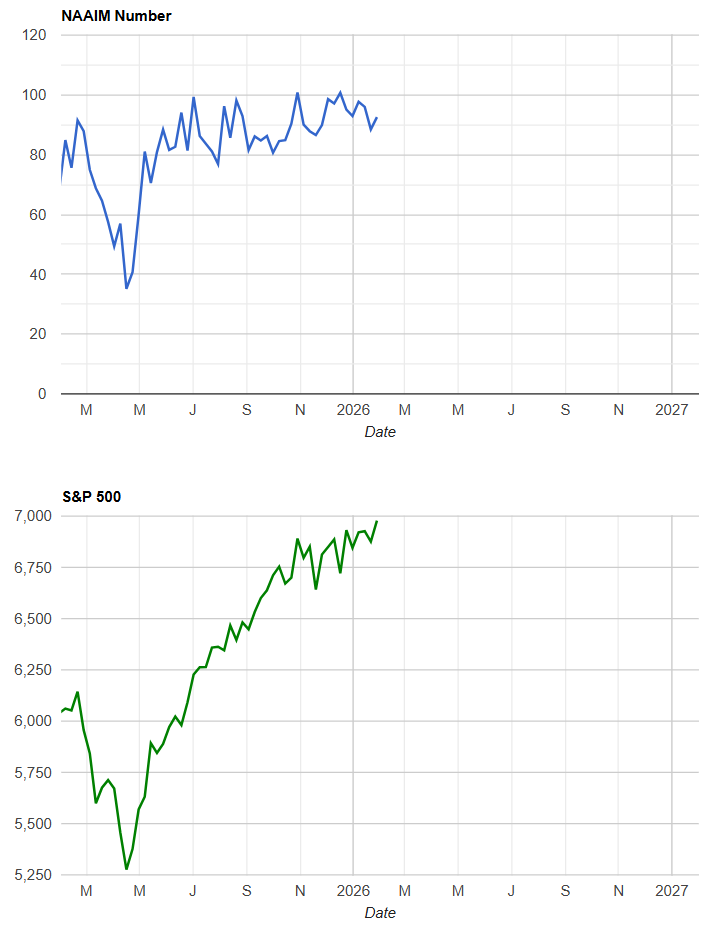
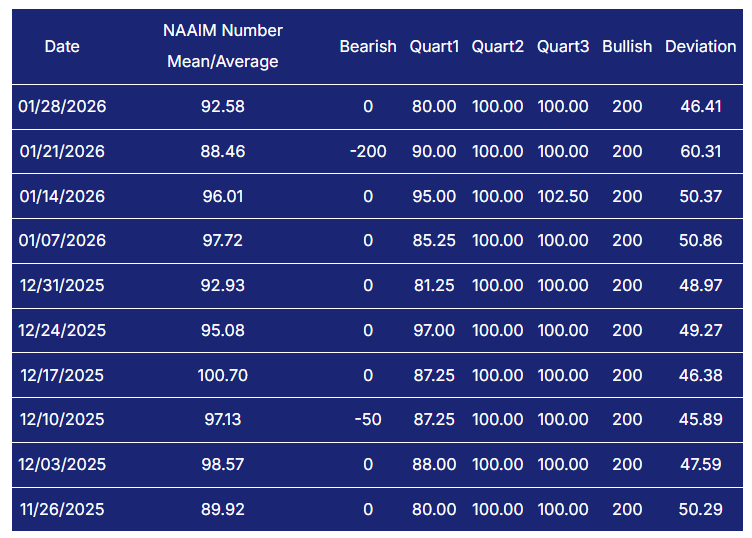
The latest NAAIM Exposure Index print comes in at 92.58, up from 88.46 the prior week and roughly in line with the mid‑90s readings we saw through much of December and early January. That is unequivocally aggressive positioning: active managers, on average, are essentially fully invested, with bearish outliers largely absent and the bullish quartiles still clustered near 100 percent exposure. The pattern over the last two months is one of persistently high risk-on stance rather than a brief spike, which tells you the professional crowd has been leaning into this advance for some time and does not have much dry powder left. In this state, the market can still grind higher, but any negative surprise runs the risk of forcing synchronized de-risking because there is little room to add and plenty of exposure that can be cut. From here, a renewed push of the NAAIM number into the high 90s or above 100 would be a clear sign of crowding and would raise the odds that even a modest pullback turns sharp; conversely, a retreat into the 50s without major price damage would quietly reset the tape in the bulls favor by rebuilding cash and hedging capacity.
CBOE Total Put/Call Ratio
CBOE's total put/call ratio includes index options and equity options. It's a popular indicator for market sentiment. A high put/call ratio suggests that the market is overly bearish and stocks might rebound. A low put/call ratio suggests that market exuberance could result in a sharp fall.
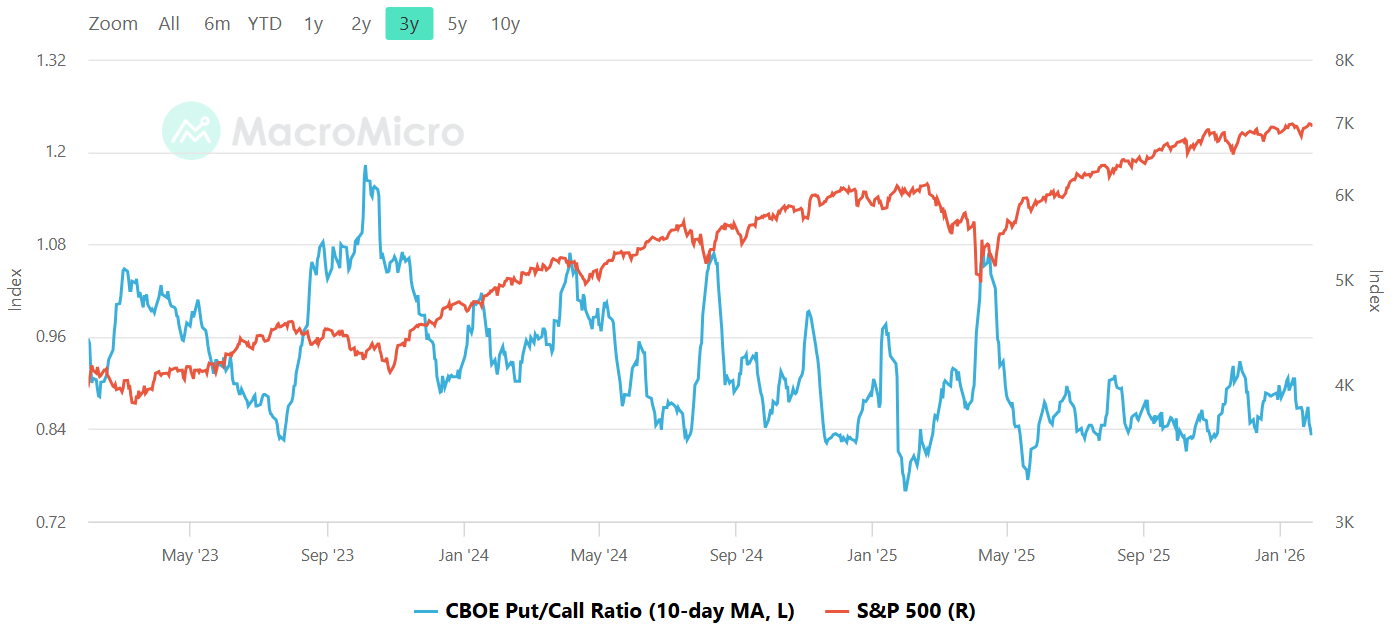
The CBOE total put/call ratio has been oscillating around the mid-0.8s lately, with the latest daily reading near 0.84 and the 10-day average sitting in a balanced, neither-panicked-nor-frothy zone. That is well off the extreme fear territory above roughly 1.1 that has historically lined up with durable lows, but it is also not down in the 0.6–0.7 exuberance band that tends to precede sharp air pockets. Options users are carrying a normal amount of downside protection against longs, which points to a market that can still suffer routine pullbacks but is less vulnerable to the kind of air-pocket flush you get when everyone is leaning the same way. In practical terms, this backdrop favors more “grindy” consolidations and orderly dips rather than waterfall declines, with the quality of bounces still supported by a decent cushion of hedges that can be monetized. A sustained 10-day average below about 0.8 would be a tripwire for complacency; a surge above 1.1 would indicate fear has reached levels that often precede stronger, more durable rebounds. It’s worth noting that the 10-day MA is roughly in a place we’ve seen vol mean-revert temporarily over the past year-or-so.
Equity vs Bond Volatility
The Merrill Lynch Option Volatility Estimate [MOVE] Index from BofAML and the CBOE Volatility Index [VIX] respectively represent market volatility of U.S. Treasury futures and the S&P 500 index. They typically move in tandem but when they diverge, an opportunity can emerge from one having to “catch-up” to the other.
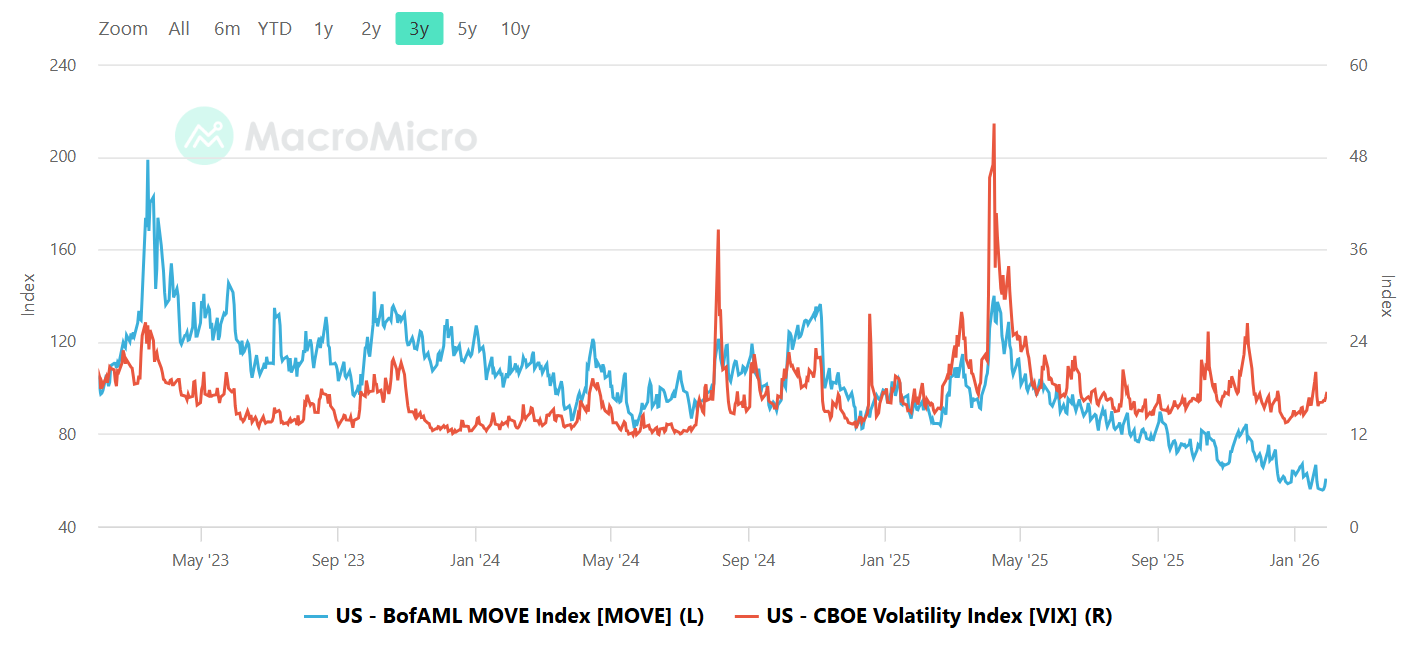
On the volatility side, the MOVE index is sitting in the high 50s while the VIX hovers in the mid-teens, leaving both bond and equity vol relatively subdued by recent standards and, importantly, not flashing a major divergence. Bond volatility has cooled significantly from last year’s episodes north of 120, suggesting the rates backdrop is no longer the acute stress point it was, while equity vol remains low but not at the extreme single-digit complacency you sometimes see at late-cycle peaks. This pairing points to an environment where macro shocks from the bond market are less likely to blindside stocks in the very near term, and where equity traders are still willing to sell volatility on dips but have not completely abandoned hedging. The key tripwires here are a renewed MOVE spike back above about 120 with VIX still dozing in the low teens, which would warn that bond stress is outpacing equity awareness, or a decisive VIX move into the high teens and above that would confirm a shift from benign chop to more meaningful equity risk-off.
CNN Fear & Greed
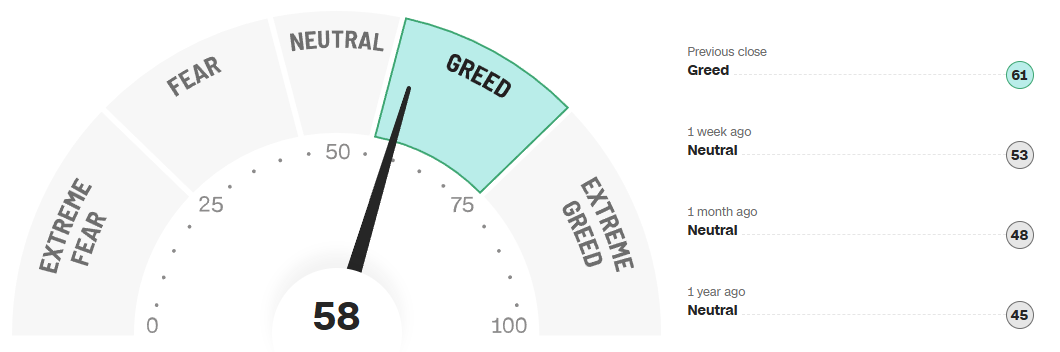
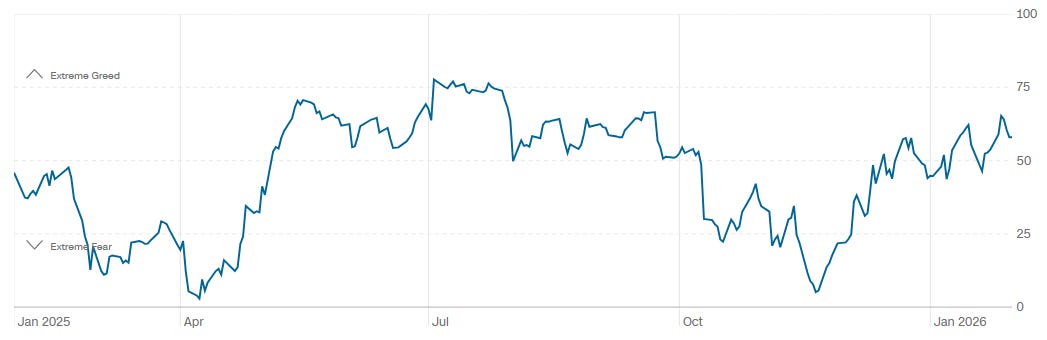
The CNN Fear & Greed Index is printing in the high-50s, firmly in “greed” but not yet “extreme greed,” after moving up a few points from last week’s high-50s reading. Over the past year, the gauge has averaged in the mid-40s with only brief forays into extreme fear below 10 and no readings above 90, so this latest move looks like a transition from neutral to constructive rather than the kind of blow-off enthusiasm that usually caps a run. The one-year path shows a series of swings but with a gentle upward tilt, consistent with a regime of mid-range greed where optimism tends to be rewarded but crowded sentiment does occasionally spill into sharp, sentiment-driven pullbacks. For risk-taking this week, that means the sentiment wind is still at the bulls’ back, but the contrarian edge is fading as the index climbs further above its long-run average near the mid-40s. A push into the mid-70s and above would signal exhaustion risk and a higher probability of a shakeout; a retreat back toward the 30–35 zone would mark out a better entry point, especially if prices hold up while the gauge cools.
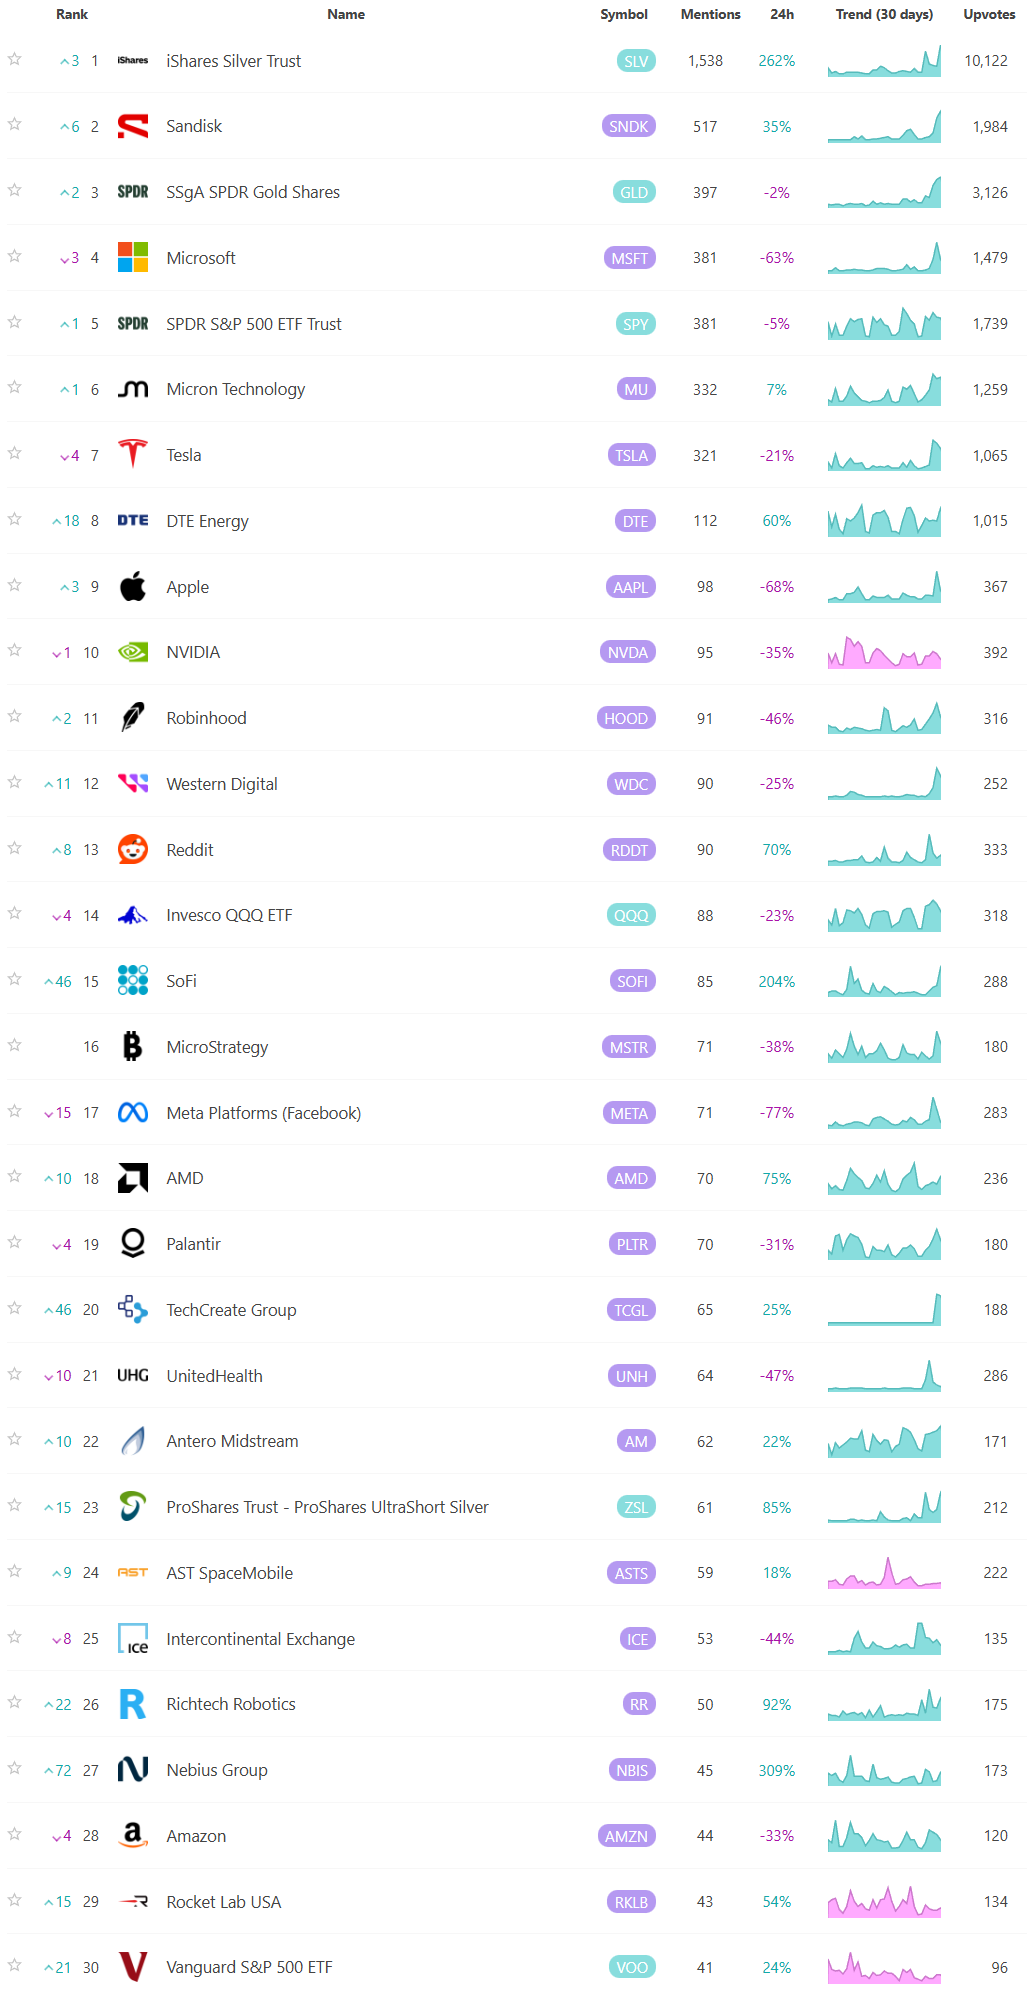
Social Media Favs
Social sentiment offers a real-time view of investor mood, often revealing market shifts before traditional indicators. It can signal momentum changes, spot emerging trends, and gauge retail investor impact—especially in high-volatility names. Tracking sentiment around events or earnings provides actionable insights, and when layered with quantitative models, can enhance predictive accuracy and risk management. Sustained sentiment trends often mirror broader market cycles, making this data a valuable tool for both short-term trades and long-term positioning.

Technician’s Playbook: Trading the Majors (SPY/QQQ/IWM/DIA)
When you’re a large institutional player, your primary goal is to find liquidity - places to do a ton of business with the least amount of slippage possible. VolumeLeaders.com automatically identifies and visually plots the exact spots where institutions are doing business and where they are likely to return for more. It’s one of the primary reasons “support” and “resistance” concepts work and truly one of the reasons “price has memory”.
SPY
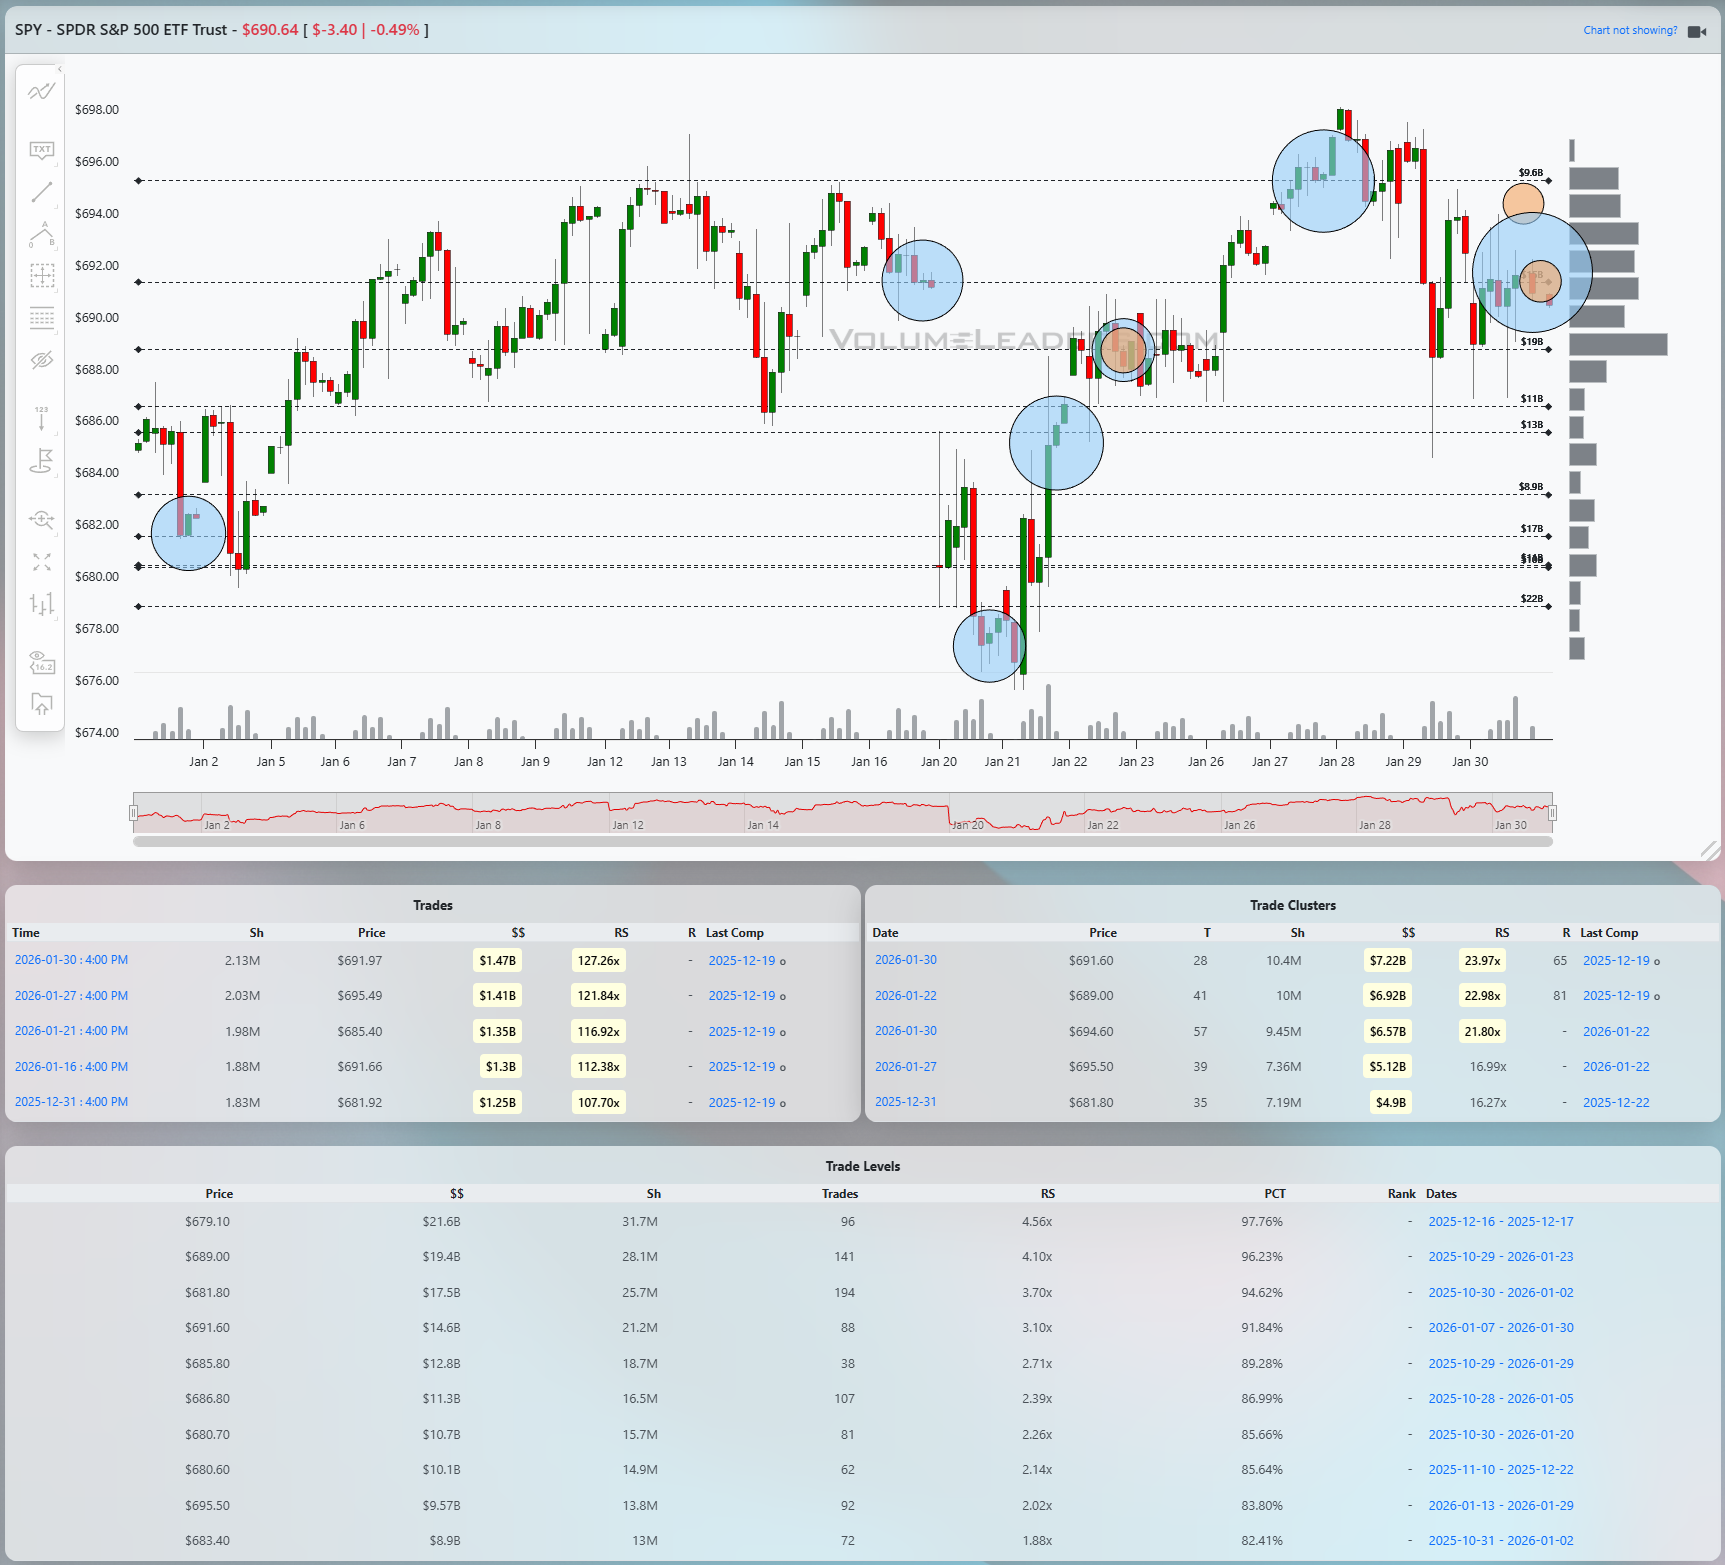
SPY has been in a choppy, rangebound tape this month, with a push to the highs above 695 fading back toward the mid‑680s and then a rebound attempt that stalled just under the prior peak. Along the way there were several outsized prints clustered in the high‑680s to low‑690s that stand out both on size and relative scale, including multiple trades around 691–692 with RS readings north of 4x and PCT in the mid‑ to high‑90s, signaling serious two‑sided engagement near the upper half of the range. The Level table shows a thick band of volume between roughly 681 and 689, with notional stacking up and RS mostly above 1.0, which defines the current line of scrimmage: acceptance in this band keeps SPY in balance, while a decisive move away likely fuels the next directional leg. On the upside, clearance and hold above the upper Levels near 692–694, where PCT pushes into the 90s, would say the larger buyers have absorbed supply and could open a run back toward and through the recent high just shy of 700; on the downside, a break under the lower Levels in the high‑670s, where RS and PCT still run elevated, would confirm sellers taking control and put the early‑January lows back in play. A disciplined trader can lean against the 681–689 band with tight invalidation either below the lower shelf or above the recent high cluster, targeting the opposite side of the range first and then the extensions beyond if order flow confirms
QQQ
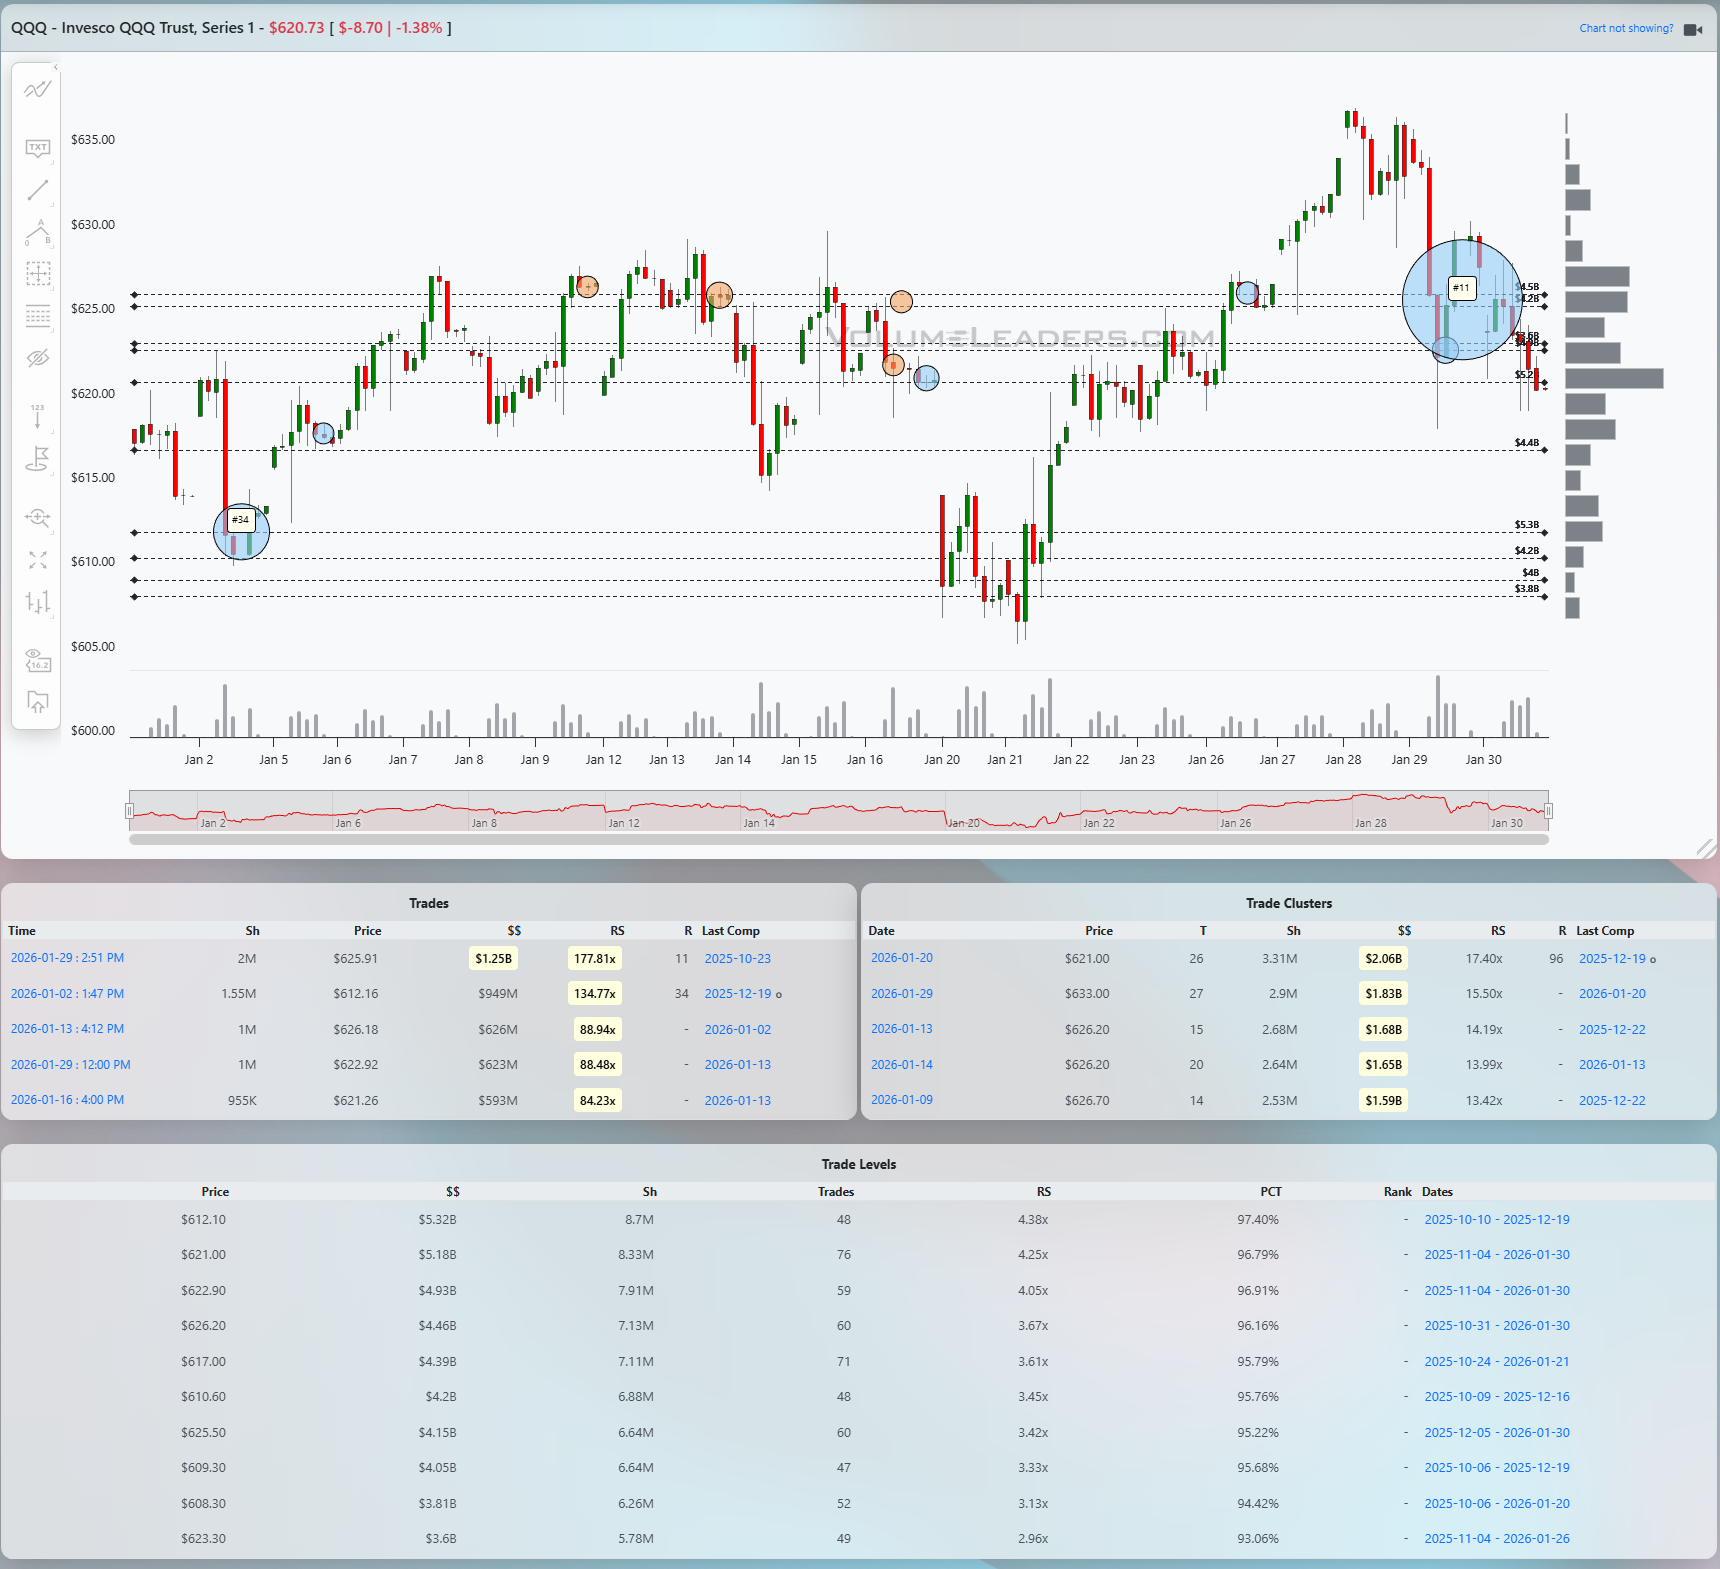
QQQ shows a more classic impulse‑then‑pullback structure: a strong run to new highs above 640 followed by a sharp check‑back that has found initial footing near the mid‑620s. The standout feature is the enormous recent sell‑side activity in the low‑630s to mid‑620s, including top‑100 style prints around 631–632 and a very large cluster near 625–626 with RS readings in the high teens and PCT north of 95 percent, which tells you big money was highly active during the first flush off the highs. If that supply turns into absorption, the band from roughly 625 to 632 becomes a launchpad; if not, it is the start of a distribution zone. The Level table reinforces that idea, with some of the largest $$ and RS values concentrated in that same 625–632 pocket, making it the primary battleground for the next leg. Bullish continuation now needs QQQ to hold that zone on retests and then push back above where the last upside prints occurred; that would signal the pullback is complete and the prior uptrend resuming, with the next magnet near the prior high and then round‑number extensions. Failure would show up as acceptance below about 625, opening air down toward earlier Levels in the high‑610s and possibly the 600 handle; traders can frame longs against 625–626 with tight stops just below, or fade failed bounces into 635 if the heavy cluster flow begins to resolve lower.
IWM
IWM has a different tone: it shows a powerful early‑January impulse off the low‑240s into the high‑260s, followed by a steady slide lower that has now retraced a good chunk of that move. The largest historical activity on the chart sits down near 244–246 from late December, with massive prints and a Level there carrying extremely high PCT and RS numbers, which effectively marks the base of the prior leg and a major demand zone should price revisit it. More recently, trade has been building in the mid‑250s, with multiple prints around 259–260 and clusters near 258–259 showing elevated RS but not yet the kind of extreme that screams capitulation, hinting at ongoing distribution rather than firm, patient accumulation. The Level table shows a band of volume stacking up between roughly 255 and 261, which now serves as the immediate line of scrimmage: staying below the upper edge of that band keeps the path of least resistance lower, while reclaiming and holding above 261–262 would be the first sign that sellers are losing their grip. A bullish path for the next sessions would be a hold of the recent lows in the mid‑250s, followed by a push back through 261 and then a grind toward the 266–268 supply shelf; a bearish path is continued failure near 259–261 that resolves down toward the heavier legacy support in the low-250s through mid‑240s. Tactically, traders can sell failed rallies into 259–261 with stops just above 262 and cover into the low‑250s, or begin stalking reversals if price flushes into the 244–246 demand pocket with evidence of absorption.
DIA
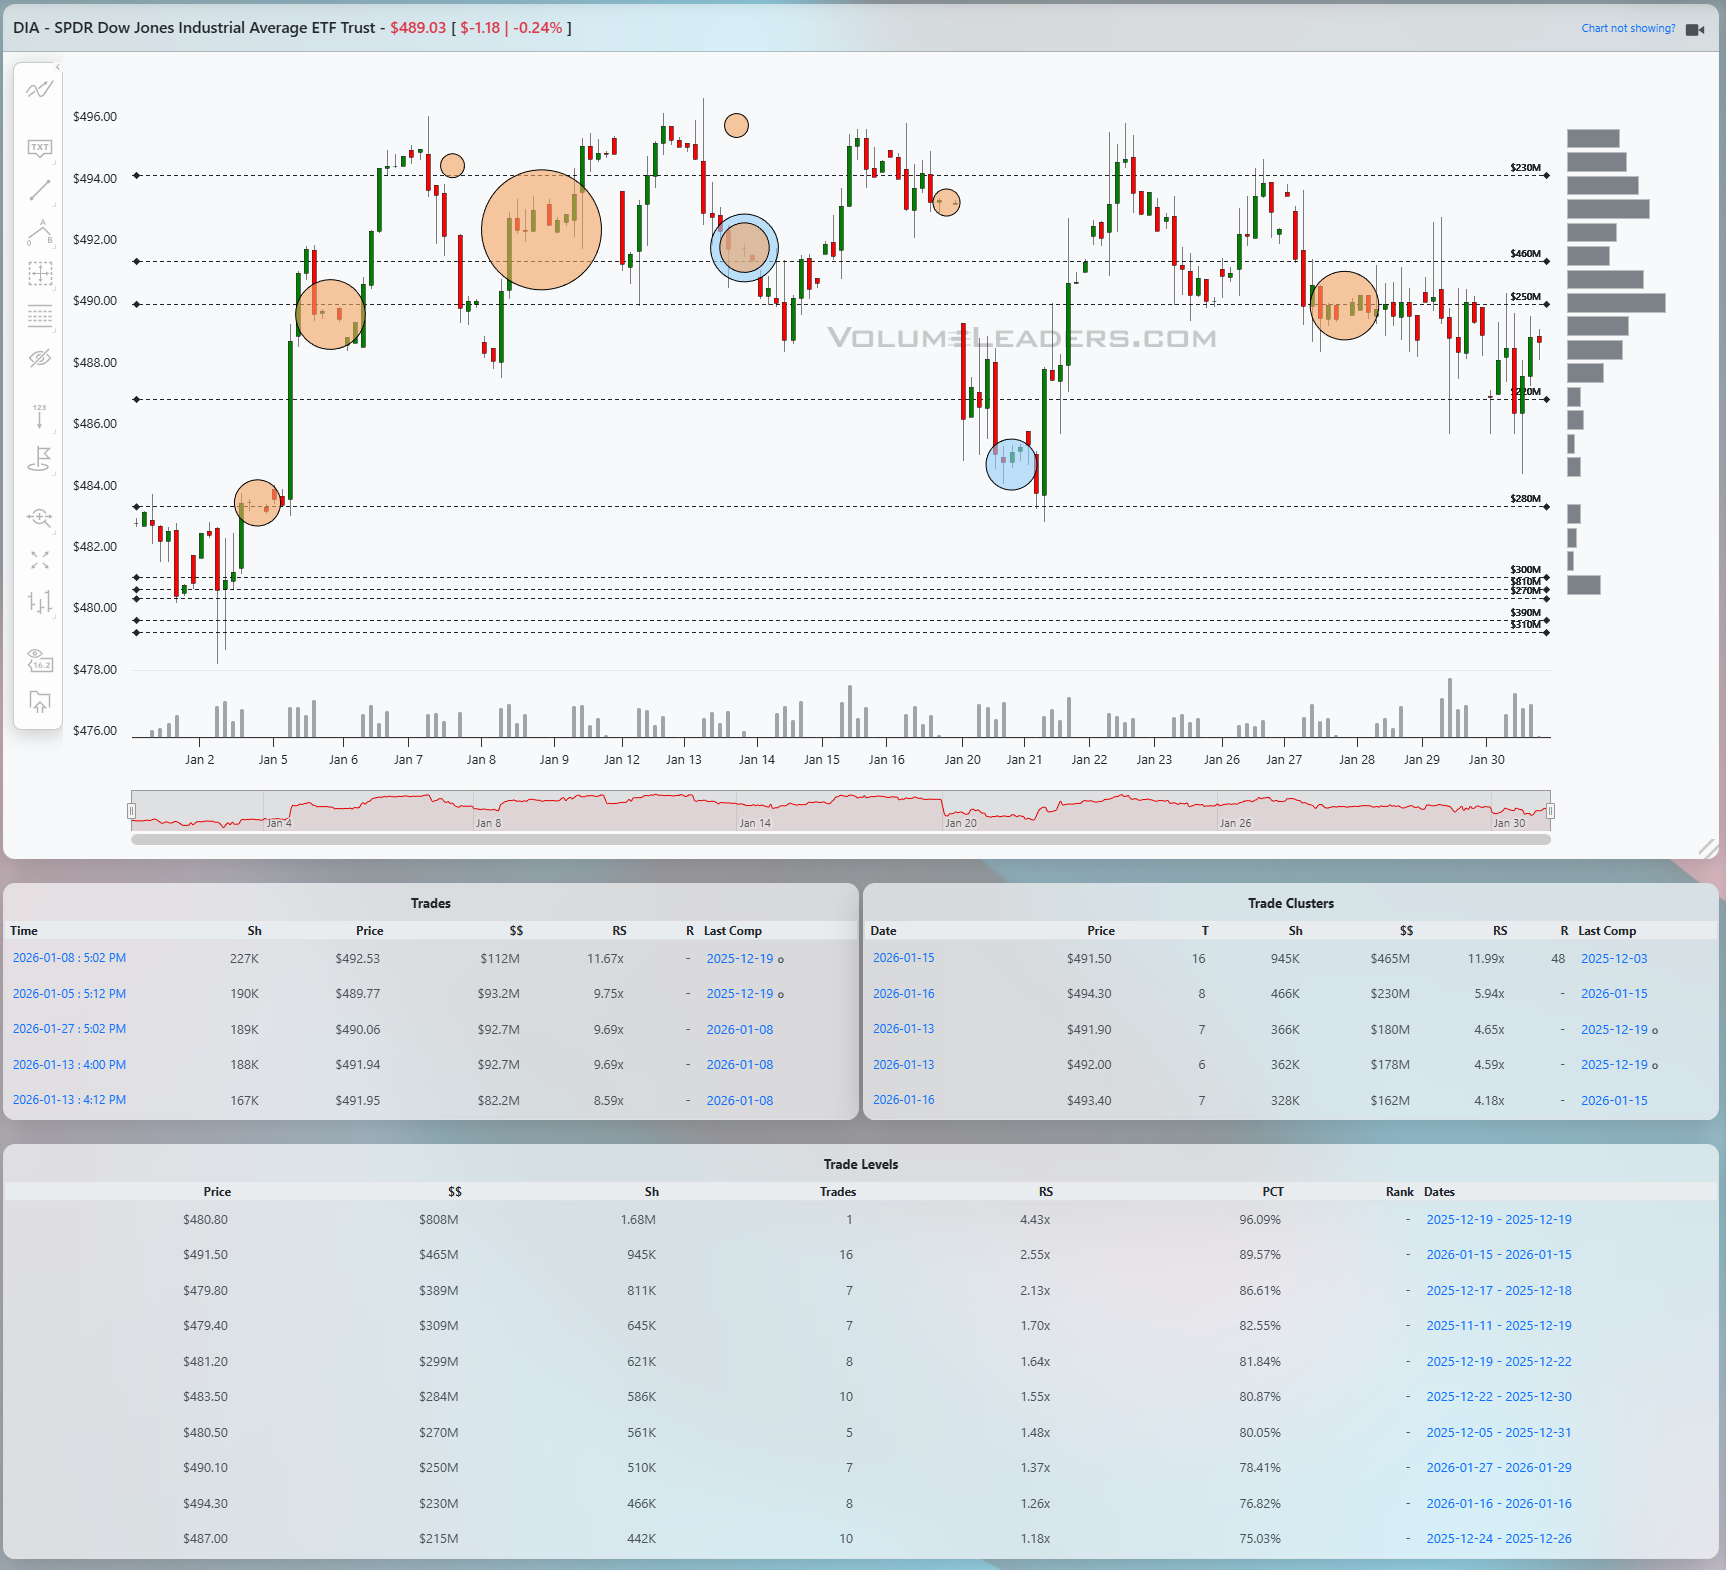
DIA has been range‑trading as well, with swings between roughly 480 and just above 495 and no clean breakout in either direction yet. Several large prints mark the early‑January push through the low‑480s, suggesting strong buying interest kicked off the month, but the more recent notable activity has clustered in the high‑480s to low‑490s, including sizeable trades around 491–492 and clusters with elevated RS and PCT in that same band. That pattern points to heavy two‑way trade near the top half of the range, where stronger hands are either absorbing supply for another leg higher or quietly distributing into strength. The Level table shows thick volume between about 485 and 492, which defines the main battleground; above that, there are lighter shelves closer to 495–497, and below, a series of levels stepping down toward 480 and then the high‑470s. A bullish scenario from here would be DIA holding above roughly 485 and then pushing through 492–493, turning that heavy band into support and targeting the upper band near 497 and then potentially 500; a bearish scenario would be a decisive break back below 485 that opens a slide into 480 and, if that gives way, toward the prior demand in the high‑470s. From an execution lens, traders can fade rejections at 492–493 with stops just above the recent highs, or look to buy confirmed reclaim and hold of that same band after a shakeout, using 485 as the key invalidation pivot and targeting the edges of the established range.
Bottom line: SPY 681–689 and ~694, QQQ 625–632 and ~640, IWM 255–261 and 244–246, DIA 485–492 and ~497.

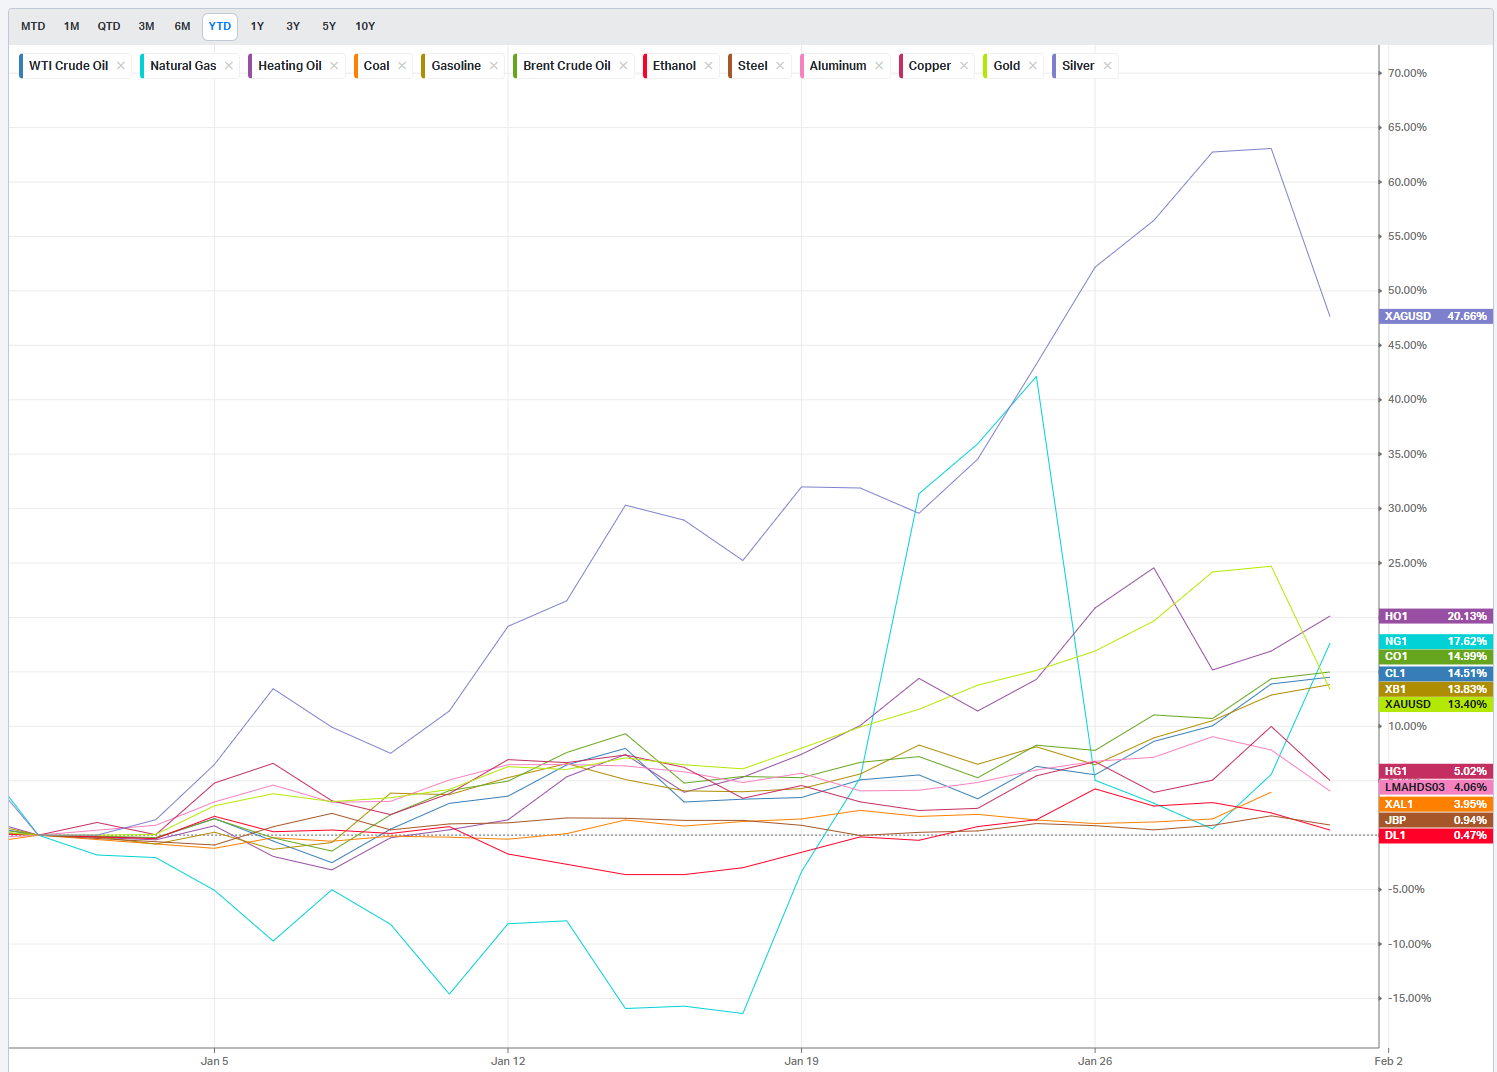
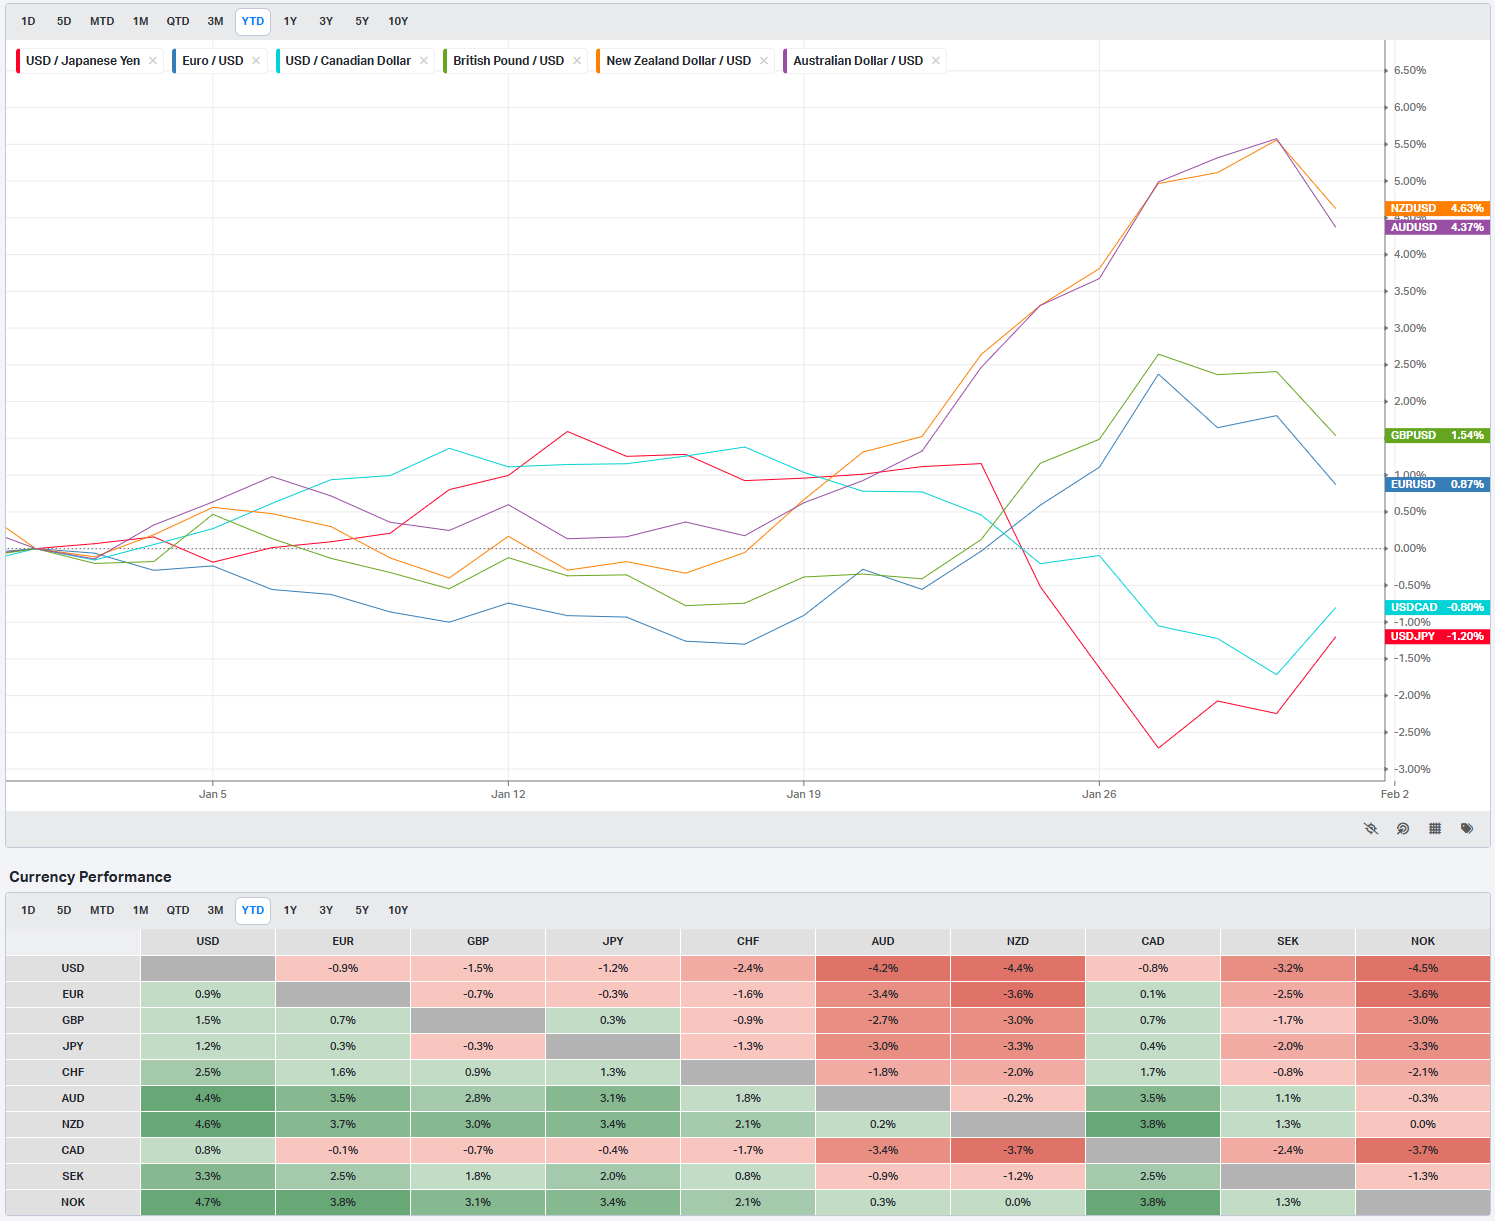
Summary Of Thematic Performance YTD
VolumeLeaders.com offers a robust set of pre-built thematic filters, allowing you to instantly explore specific market segments. These performance snapshots are provided purely for context and inspiration—think about zeroing in on the leaders and laggards within the strongest and weakest sectors, for example.
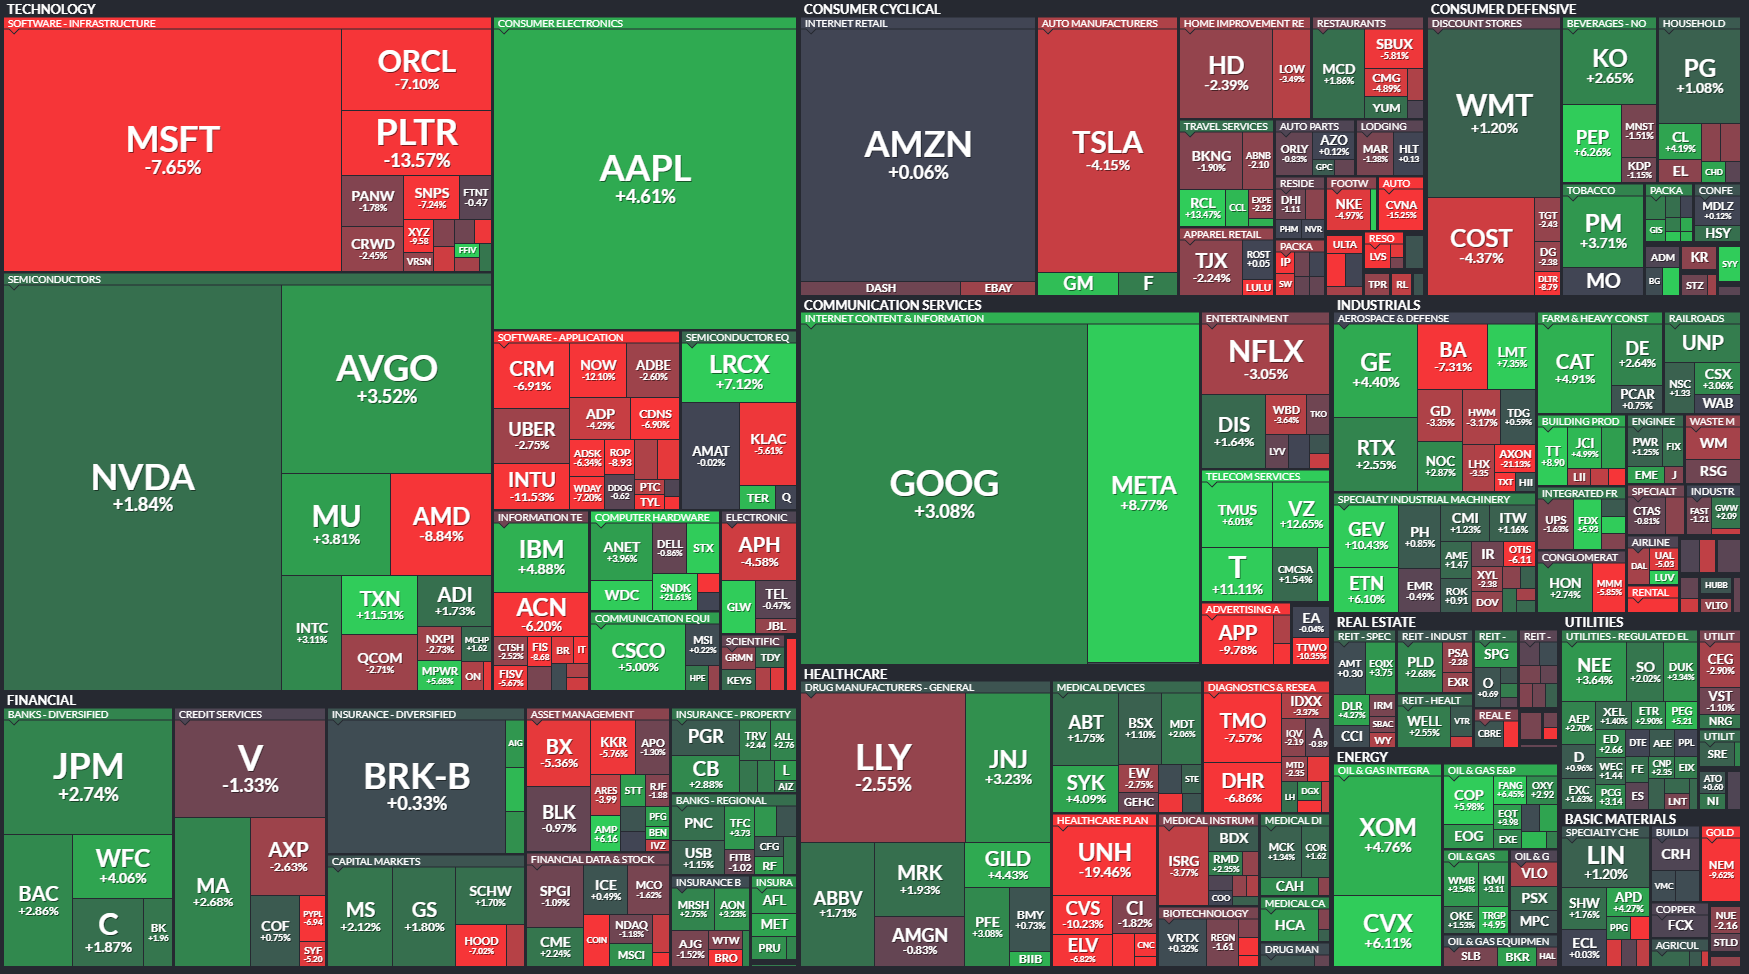
S&P By Sector
S&P By Industry
Commodities: Energy & Metals
Currencies/Major FX Crosses
Factors: Style vs Size-vs-Value

Events On Deck This Week
Here are key events happening this week that have the potential to cause outsized moves in the market or heightened short-term volatility.
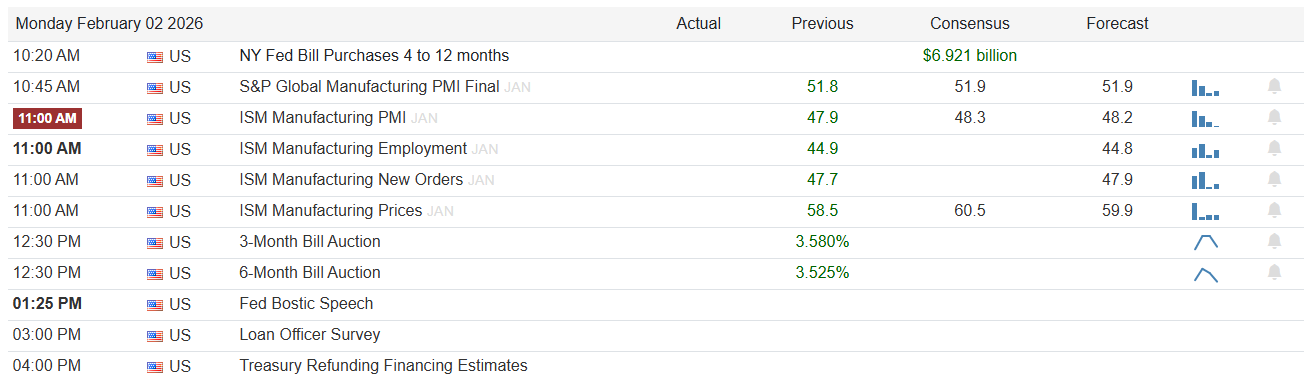
Monday is light on data but not irrelevant. The focus is the ISM Manufacturing PMI at 11:00 AM, with the previous reading at 47.9, consensus at 48.3, and forecast at 48.2, alongside the ISM Manufacturing Employment sub-index which previously printed 44.9 with consensus at 44.9 and forecast at 44.8. A move back above the 50 line in either headline or employment would be a clear growth-positive surprise that likely lifts cyclicals, industrials, and the value factor while pushing yields and the dollar higher. Conversely, a downside miss that drags PMI deeper into contraction and keeps employment soft would revive slowdown rhetoric and favor duration, defensives, and quality. Fed Bostic speaks at 1:25 PM; traders will listen for any shift in tone on the timing and pace of cuts, with a hawkish emphasis on sticky inflation a risk-off cue and a greater openness to mid-year cuts a green light for beta.
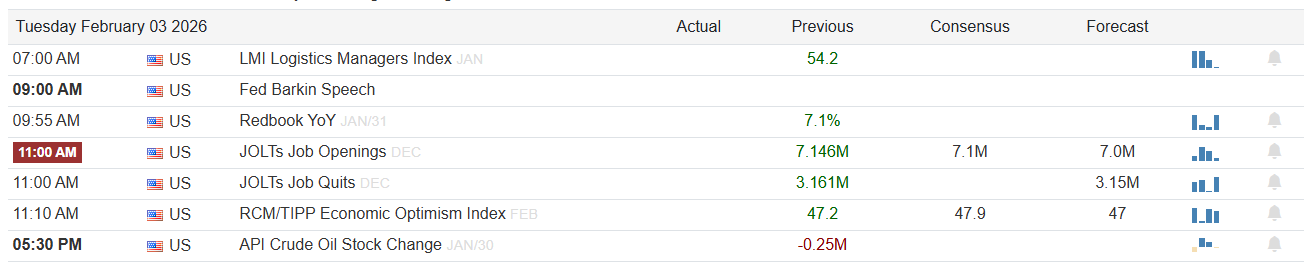
Tuesday brings less-tier-one data but more Fed speak. Fed Barkin is up at 9:00 AM, and his color on labor tightness and demand will help shape expectations into the rest of the week’s jobs data. The JOLTs Job Openings print at 11:00 AM carries a previous level of 7.146M, with consensus at 7.1M and forecast at 7.0M. A drop toward or below 7.0M would signal cooling demand for labor and should be bond-friendly, particularly if accompanied by less hawkish rhetoric from Barkin. A surprise rebound above the prior 7.146M would keep the “hot labor market” narrative alive, likely nudging rate-cut expectations back and weighing on long-duration growth. After the close, focus will quickly pivot to the heavier earnings slate later in the week.
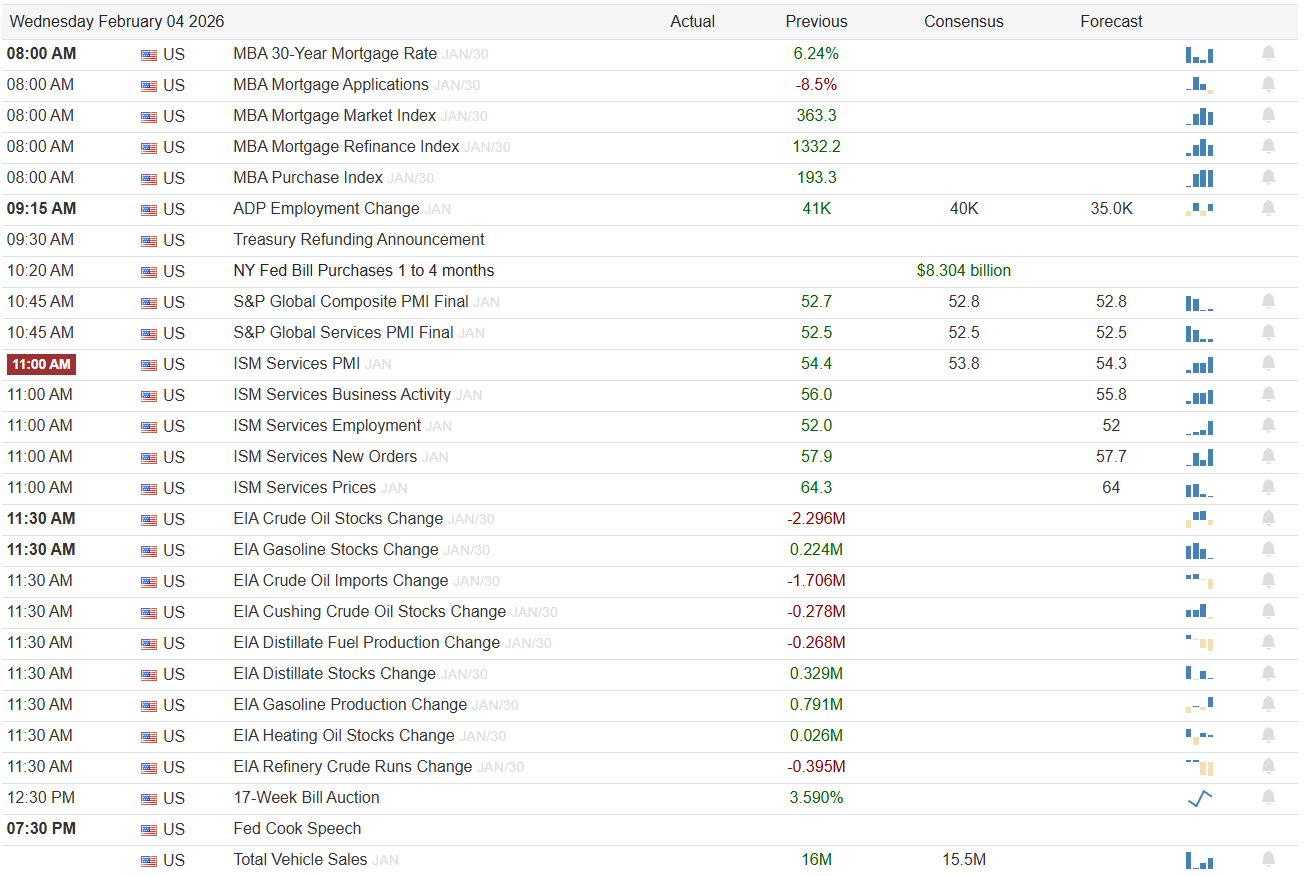
Wednesday is the first real macro cluster. At 8:00 AM the MBA 30-Year Mortgage Rate is reported with a previous reading of 6.24 percent; any move meaningfully lower helps the housing and homebuilder complex, while a backup in rates would reinforce higher-for-longer anxiety. At 9:15 AM, ADP Employment Change hits with a previous reading of 41K, consensus at 40K, and forecast at 35.0K; a number closer to 35K would underscore a gentle cooling in private payrolls, whereas a print north of 41K would argue the labor engine is still humming. The marquee print is ISM Services PMI at 11:00 AM, with a previous value of 54.4, consensus at 53.8, and forecast at 54.3. A beat north of the prior 54.4 would confirm resilient services demand and could pressure yields; a slip toward or below 53 would feed growth-scare chatter and probably help secular growth and bond proxies. Energy traders will be tuned to the EIA Crude Oil Stocks Change and Gasoline Stocks Change at 11:30 AM, with crude previously at -2.296M and gasoline at 0.224M; another crude draw with gasoline builds would point to firm demand but still-elevated product inventories, influencing the energy complex’s leadership. Fed Cook speaks at 7:30 PM, and any comment on financial conditions or the balance of risks could set the tone for Thursday’s trade.
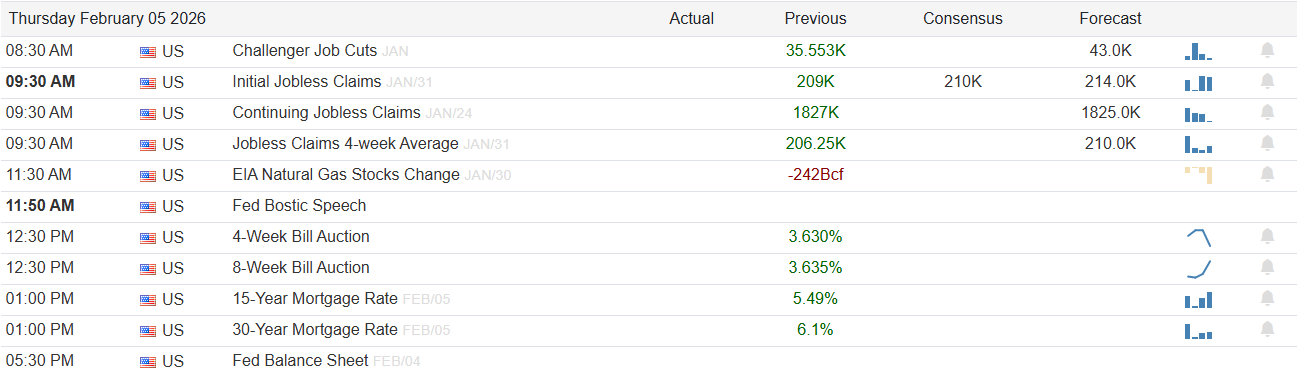
Thursday cools down on data but not on policy color. Initial Jobless Claims at 9:30 AM show a previous reading of 209K, with consensus at 210K and forecast at 214.0K, so the bar for surprise is low. A print that jumps clearly above the 214K zone would be the first sign of emerging stress and should support bonds and defensive sectors; a renewed run in the low-200Ks or below would confirm ongoing labor resilience and lean hawkish at the margin. Fed Bostic is on the tape again at 11:50 AM, and after a week of mixed data, markets will be especially sensitive to any explicit guidance on whether the first cut is more likely in mid-year or pushed toward year-end.
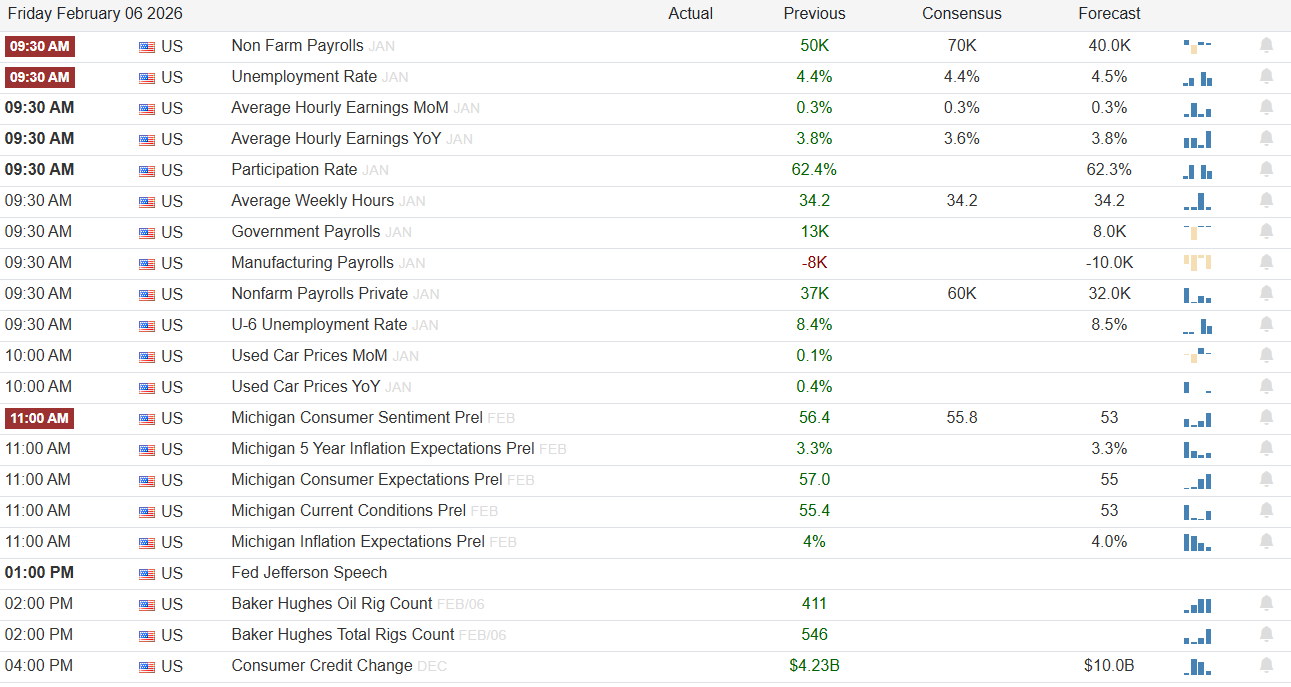
Friday is payrolls day, and that is where the rubber meets the road. At 9:30 AM, Non Farm Payrolls print with a previous reading of 50K, consensus at 70K, and forecast at 40.0K. An upside surprise well north of 70K, especially if paired with stable or lower unemployment from its previous 4.4 percent, would strengthen the “soft landing” story but might delay cuts and hit duration-sensitive growth. A marked downside miss near or below 40K, or an unemployment uptick from 4.4 percent, would reprice recession odds higher and favor Treasuries, defensives, and low-volatility factor baskets. Average Hourly Earnings MoM (previous 0.3 percent, consensus 0.3 percent, forecast 0.3 percent) and YoY (previous 3.8 percent, consensus 3.6 percent, forecast 3.8 percent) are the inflation flywheel: higher wages support spending but risk reigniting inflation fears. The Participation Rate, previously 62.4 percent, and the Michigan Consumer Sentiment prelim reading, previously 56.4, round out the growth-sentiment cross-check; sustained participation strength with improving sentiment is the cleanest risk-on mix. Fed Jefferson speaks at 1:00 PM, and any reaction to the payrolls mix could either soothe or amplify the morning’s volatility.
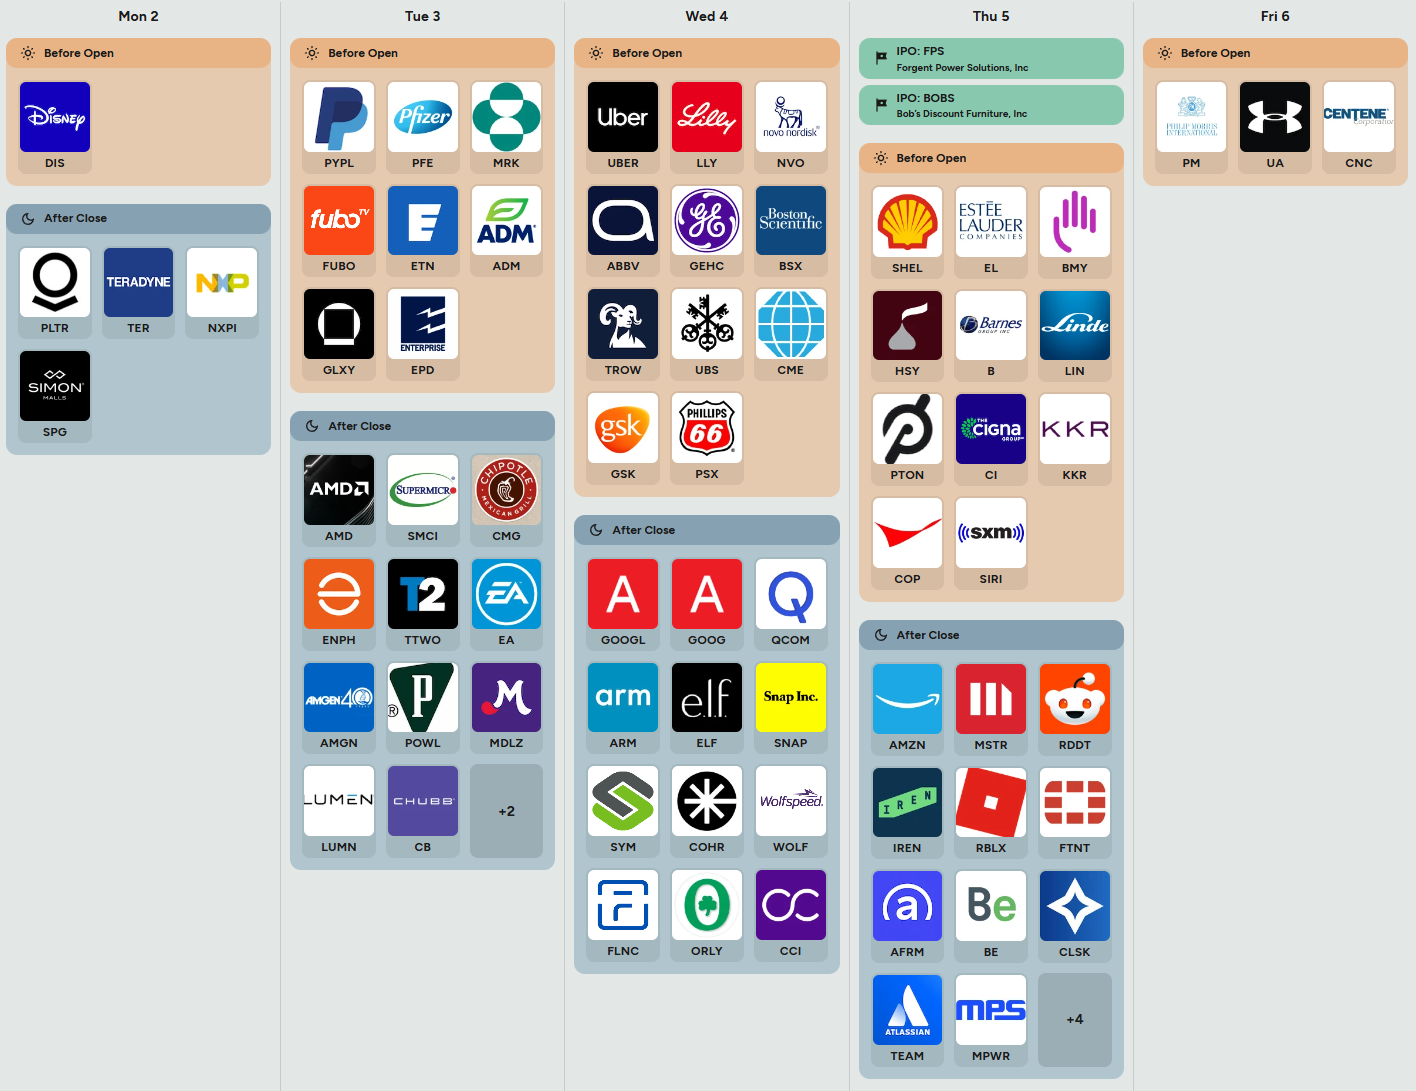
On the earnings and IPO front, the board is busy. Early in the week, Disney, Palantir, and key semis like Teradyne and NXP will offer color on consumer media, defense/AI infrastructure, and chip demand. Later, a heavy run of mega-cap and growth names hits: PayPal and major pharma like Pfizer and Merck on Tuesday morning for payments and healthcare, Uber, AbbVie, and big biotech on Wednesday, and then the main event with Amazon and other large-cap growth franchises reporting after the close on Thursday alongside Reddit, Roblox, and key cybersecurity names. For macro read-through, focus on revenue growth versus guide, margin trajectory, and any commentary on consumer spending, cloud/AI capex, and ad budgets; beats and upbeat guides from the large platforms tend to reinforce risk-on appetite and support indices, while cautious language on spending or hiring freezes would spill into broader growth multiples. Two IPOs Thursday, Fargent Power Solutions and Bobs Discount Furniture, will quietly test risk appetite in industrial and retail niches: strong books and first-day trading would confirm there is still plenty of liquidity for new paper.
Three sign-posts for active traders this week:
ISM Manufacturing PMI on Monday versus 48.3 consensus.
ISM Services PMI on Wednesday versus 53.8 consensus.
Friday Non Farm Payrolls versus 70K consensus and 4.4 percent unemployment.
Bottom line: this is a data-heavy, earnings-loaded week where modestly cooler growth with contained wages is the sweet spot for risk-on, while any combination of hot services, firm payrolls, and hawkish Fed tone will test the market’s willingness to keep paying up for beta.

Market Intelligence Report
A desk-grade synthesis of institutional positioning and market structure—unpacking the flows, levels, and emerging themes that shaped the week, and translating them into a model portfolio built the same way professional desks prepare for the week ahead.
MIR Part 1: The Backdrop
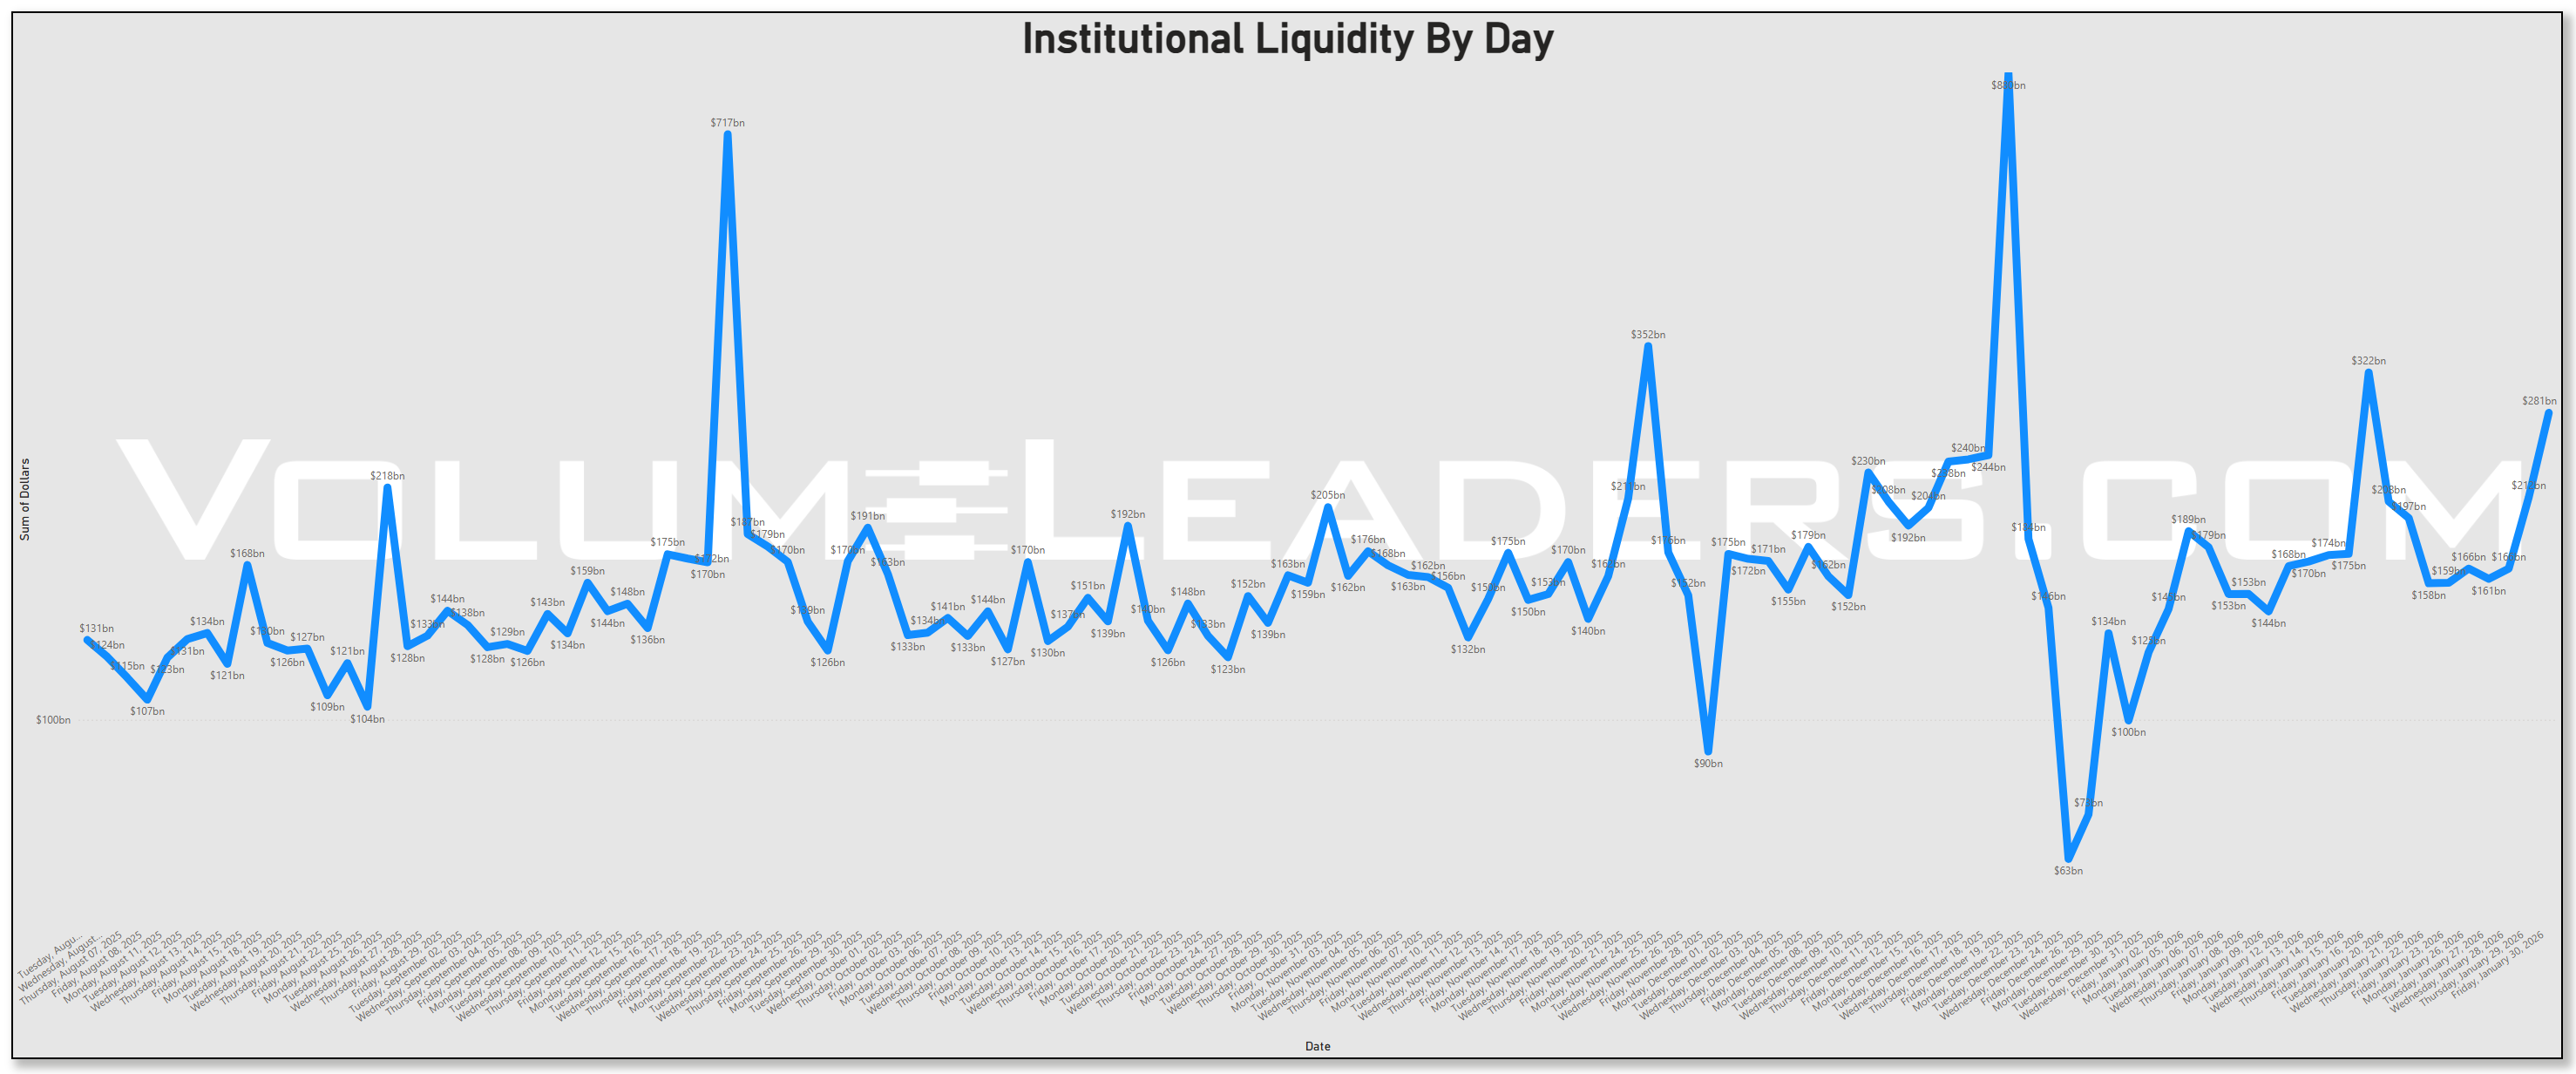
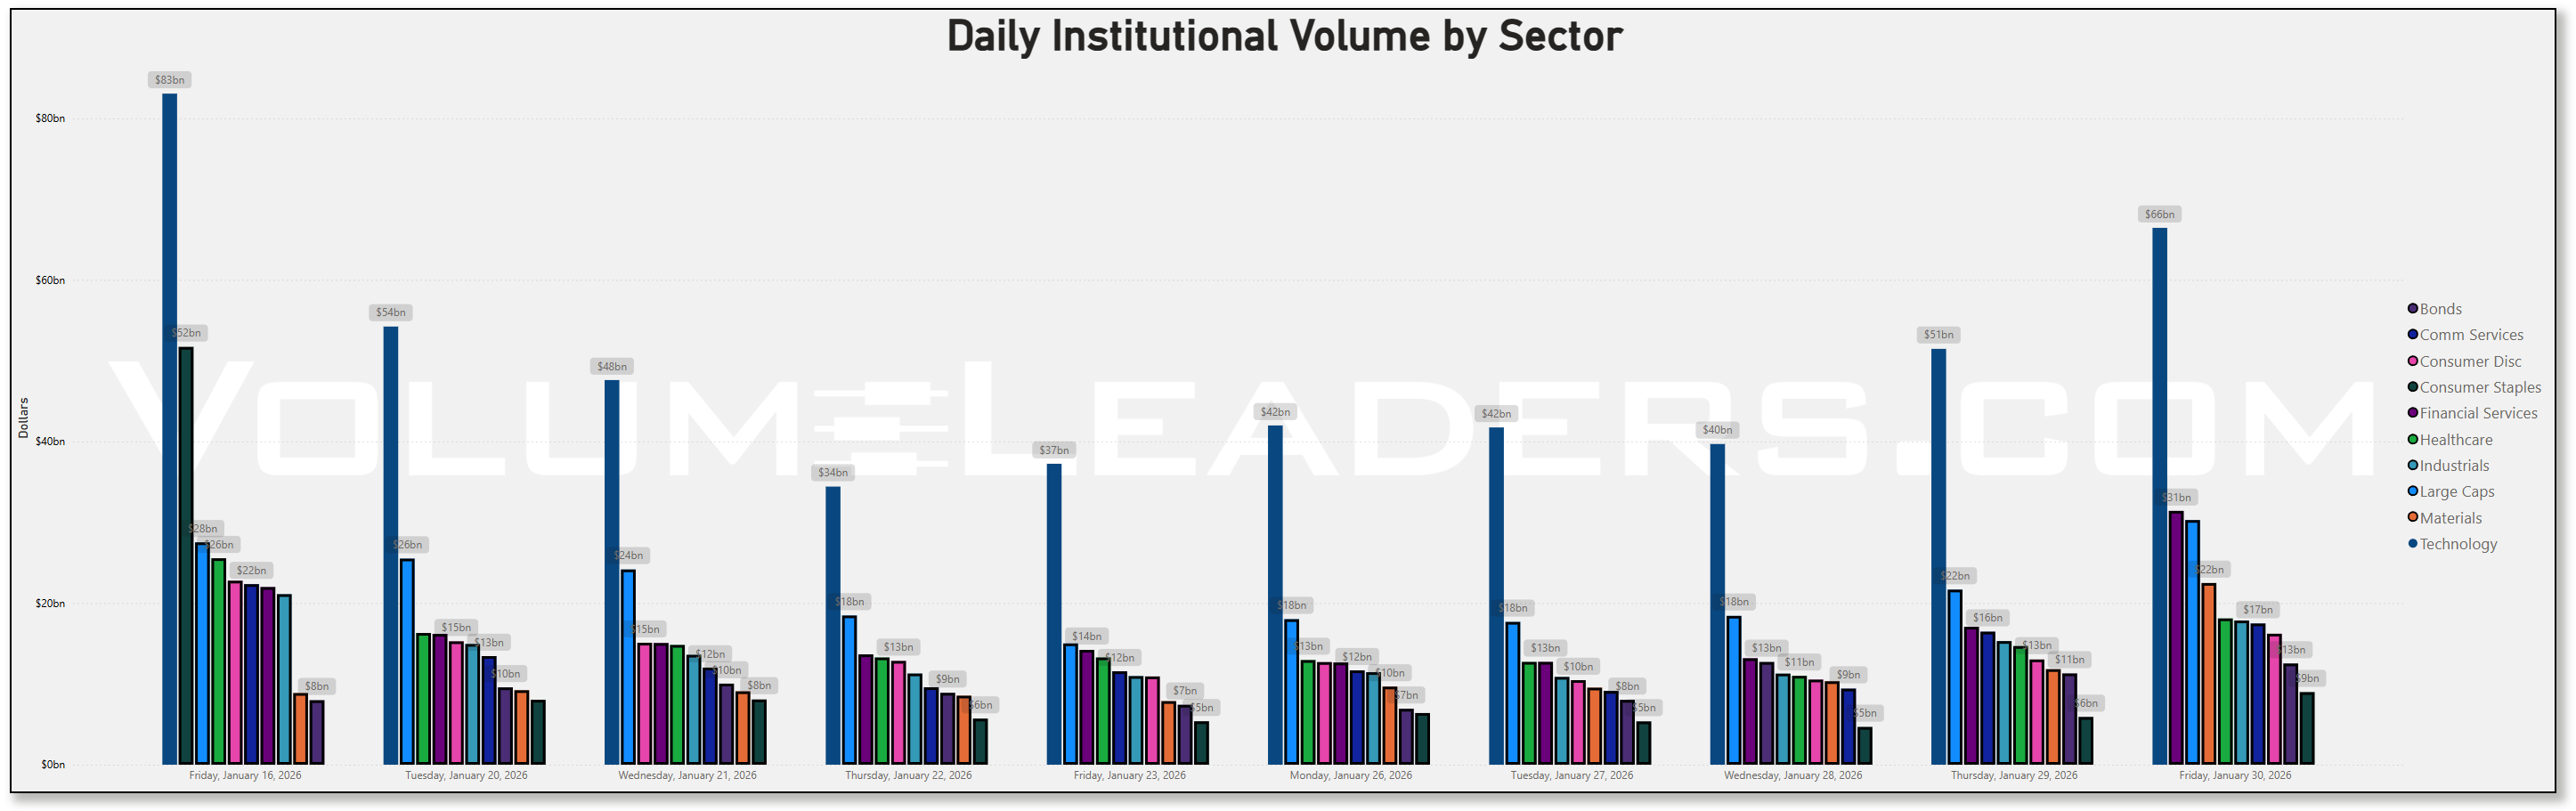
Liquidity stepped back up this week, but it did so in a way that looks more like an allocation and positioning refresh than a panic chase. Institutional Liquidity by Day shows a series of prints clustered in the mid $100bn range for most sessions and a recent push toward roughly $280bn right into the EOM, the heart of earnings season and right on top of a key Fed meeting where policymakers held rates and signaled only limited cuts ahead. The latest upswing in dollars looks broad and structural, not just a one-day headline chase, so we know real money is active again rather than sitting on its hands.
The daily sector dollar table reinforces that idea: technology remains the 800‑pound gorilla, with flows running from about $34bn early last week to $66bn on January 30, a clear step-up versus most of the prior days. Large Caps also saw a steady build from around the mid‑$18bn area late last week to $30bn on Friday, which is exactly what you expect when allocators are leaning back into broad beta rather than hiding in cash. Bonds put up respectable numbers, moving from roughly $6.9bn on January 26 to $12bn on January 30, suggesting that even with the Fed on hold and only one more cut penciled in for 2026, fixed income sleeves are still attracting capital as a carry and ballast play. Materials and Financial Services both printed north of $22bn and $31bn respectively on Friday, noticeably above some mid-month readings, hinting that investors are starting to rotate into real-economy and rate-sensitive sectors as growth data stays decent and earnings in banks and industrials come through. That mix — bigger dollars in Tech and Large Caps, but with improved participation from cyclicals and credit — is classic late-January behavior as new-year allocations settle and portfolio managers respond to early earnings signals.
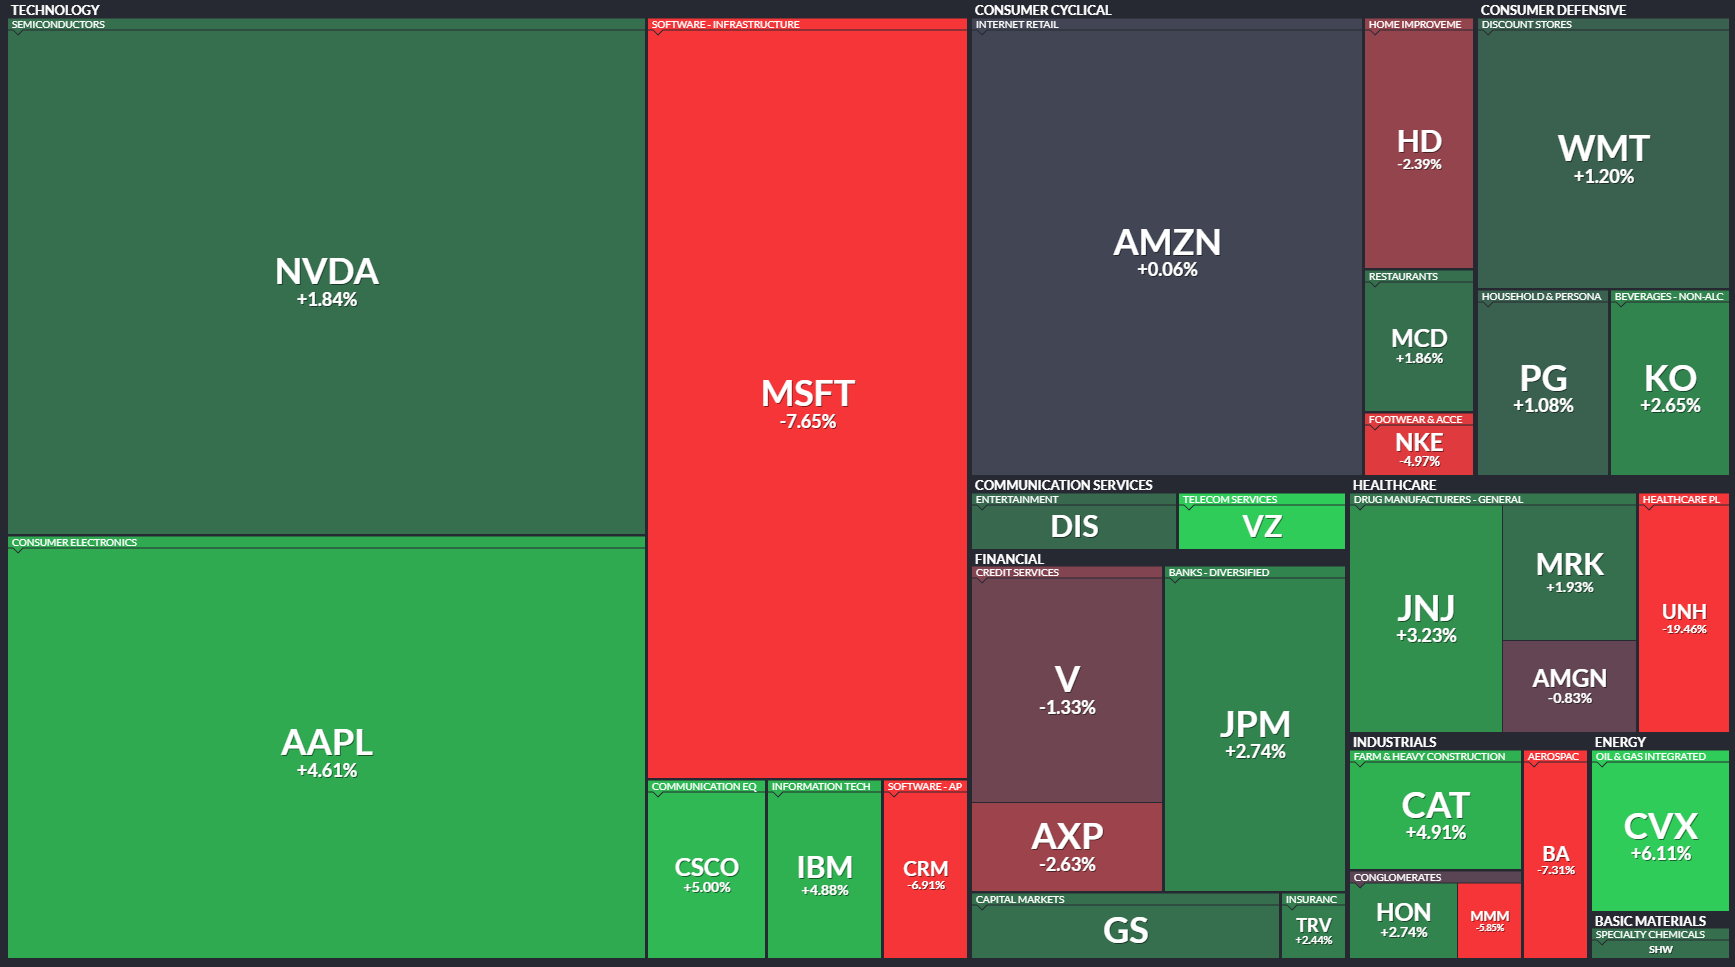
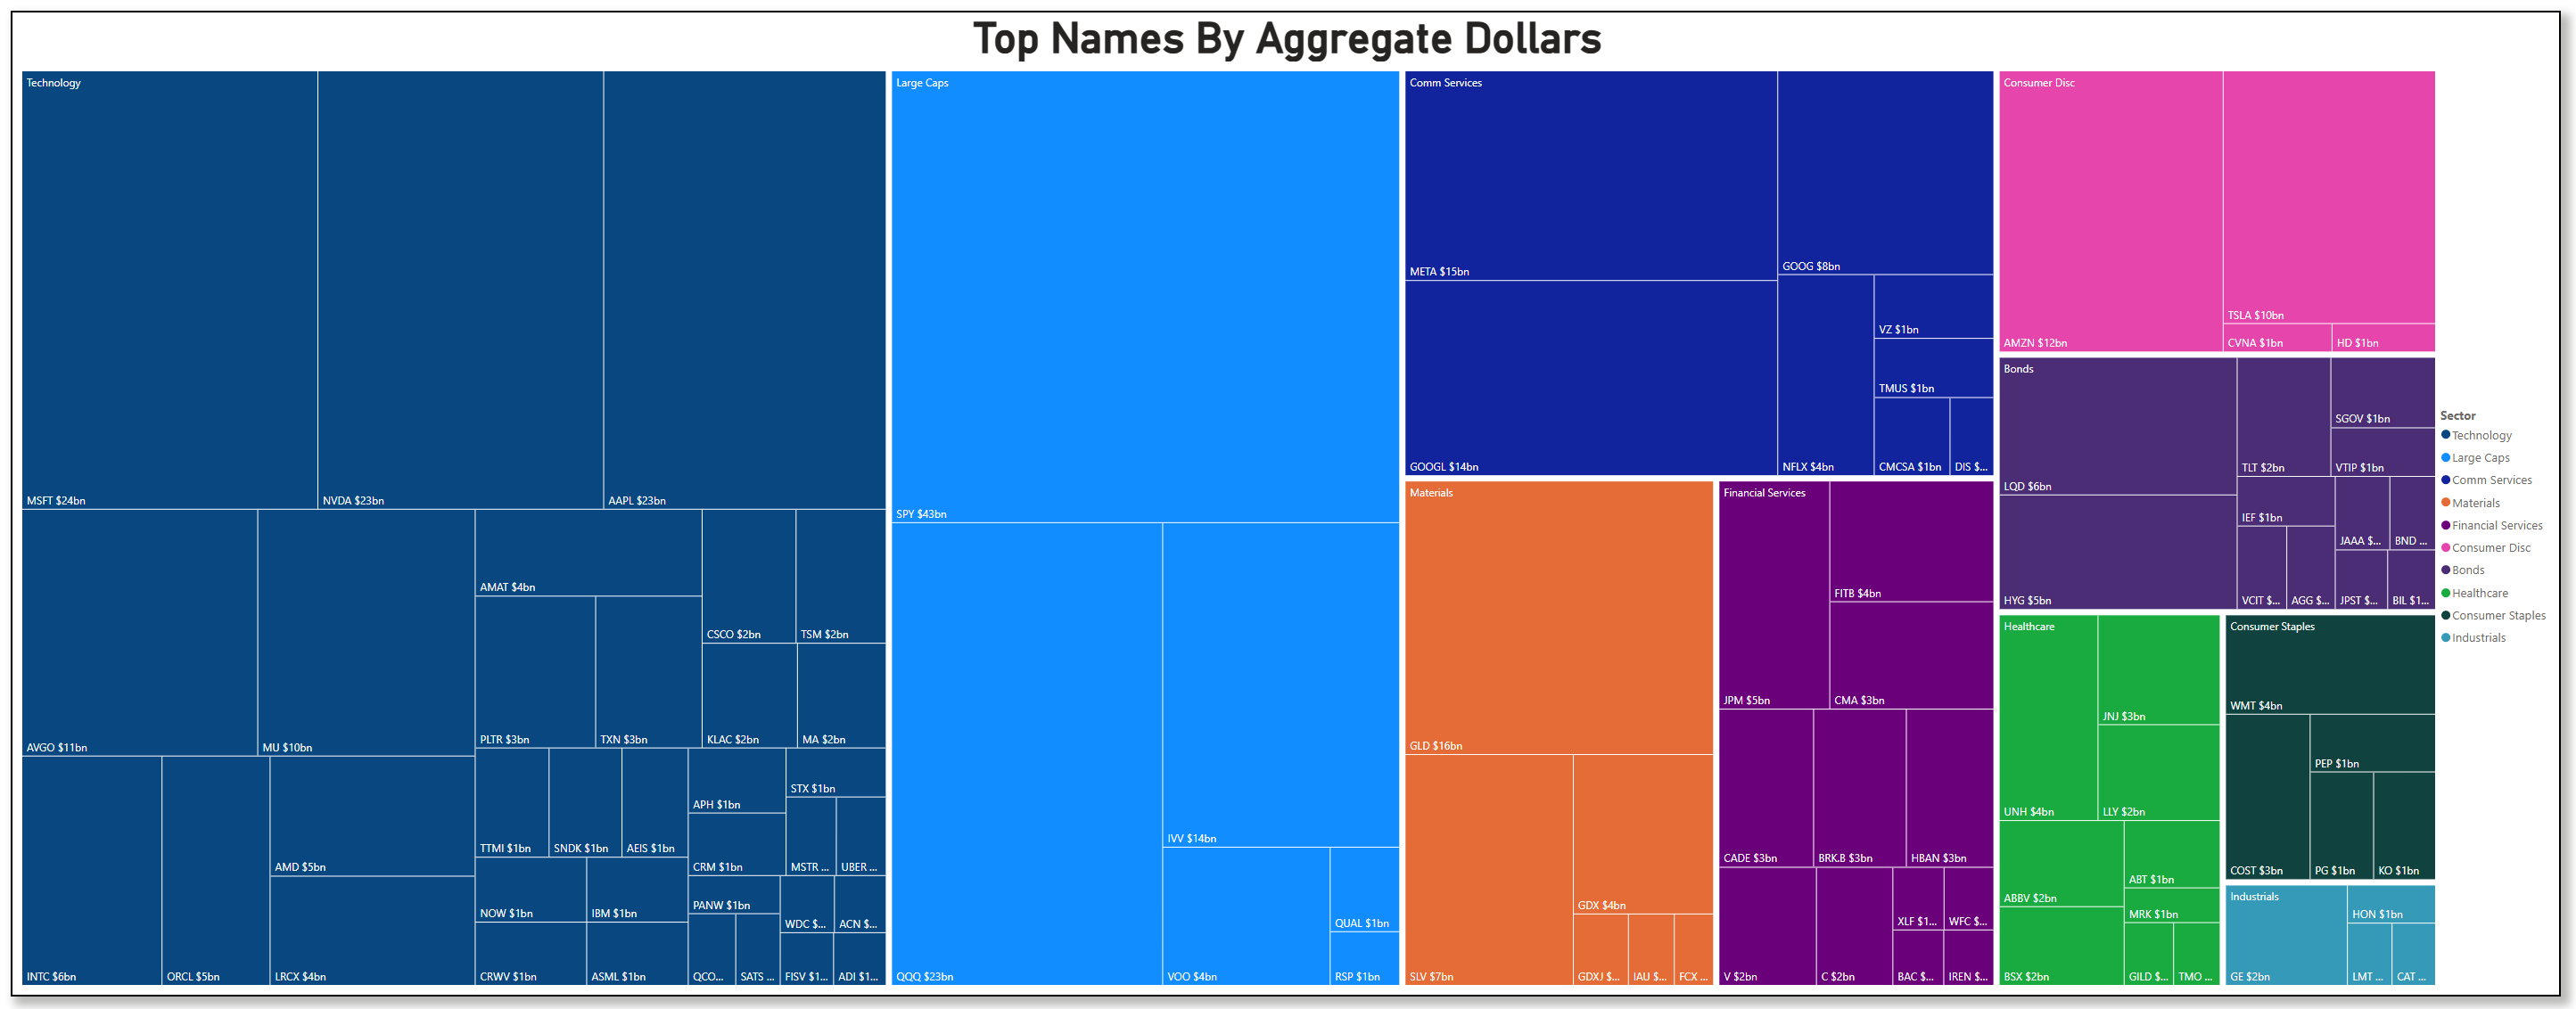
The treemap of Top Names by Aggregate Dollars makes it clear where the real attention is: technology dominates the canvas, with Microsoft around $24bn, Nvidia and Apple each near $23bn, and a deep bench of semis and software — AVGO at $11bn, MU at $10bn, AMD at $5bn, AMAT at $4bn, plus names like TSM, CSCO, and ORCL in the $2–5bn zone. On the index side, SPY towers at roughly $43bn, QQQ at about $23bn, and VOO at $4bn, while IVV and RSP add another layer of index exposure, confirming that a big chunk of this week’s activity is pure allocation and risk calibration. Communication Services is anchored by META at $15bn and GOOG/GOOGL around $14–8bn, aligning with the macro narrative that megacap platforms and AI leaders are doing the heavy lifting for S&P 500 earnings growth this season. The breadth inside Tech is notable: this is not just one or two chips; it is a full complex of hardware, foundries, semi-cap equipment, and software all seeing multi-billion dollar flow, which speaks to a durable theme around AI and digital infrastructure rather than a one-name story.
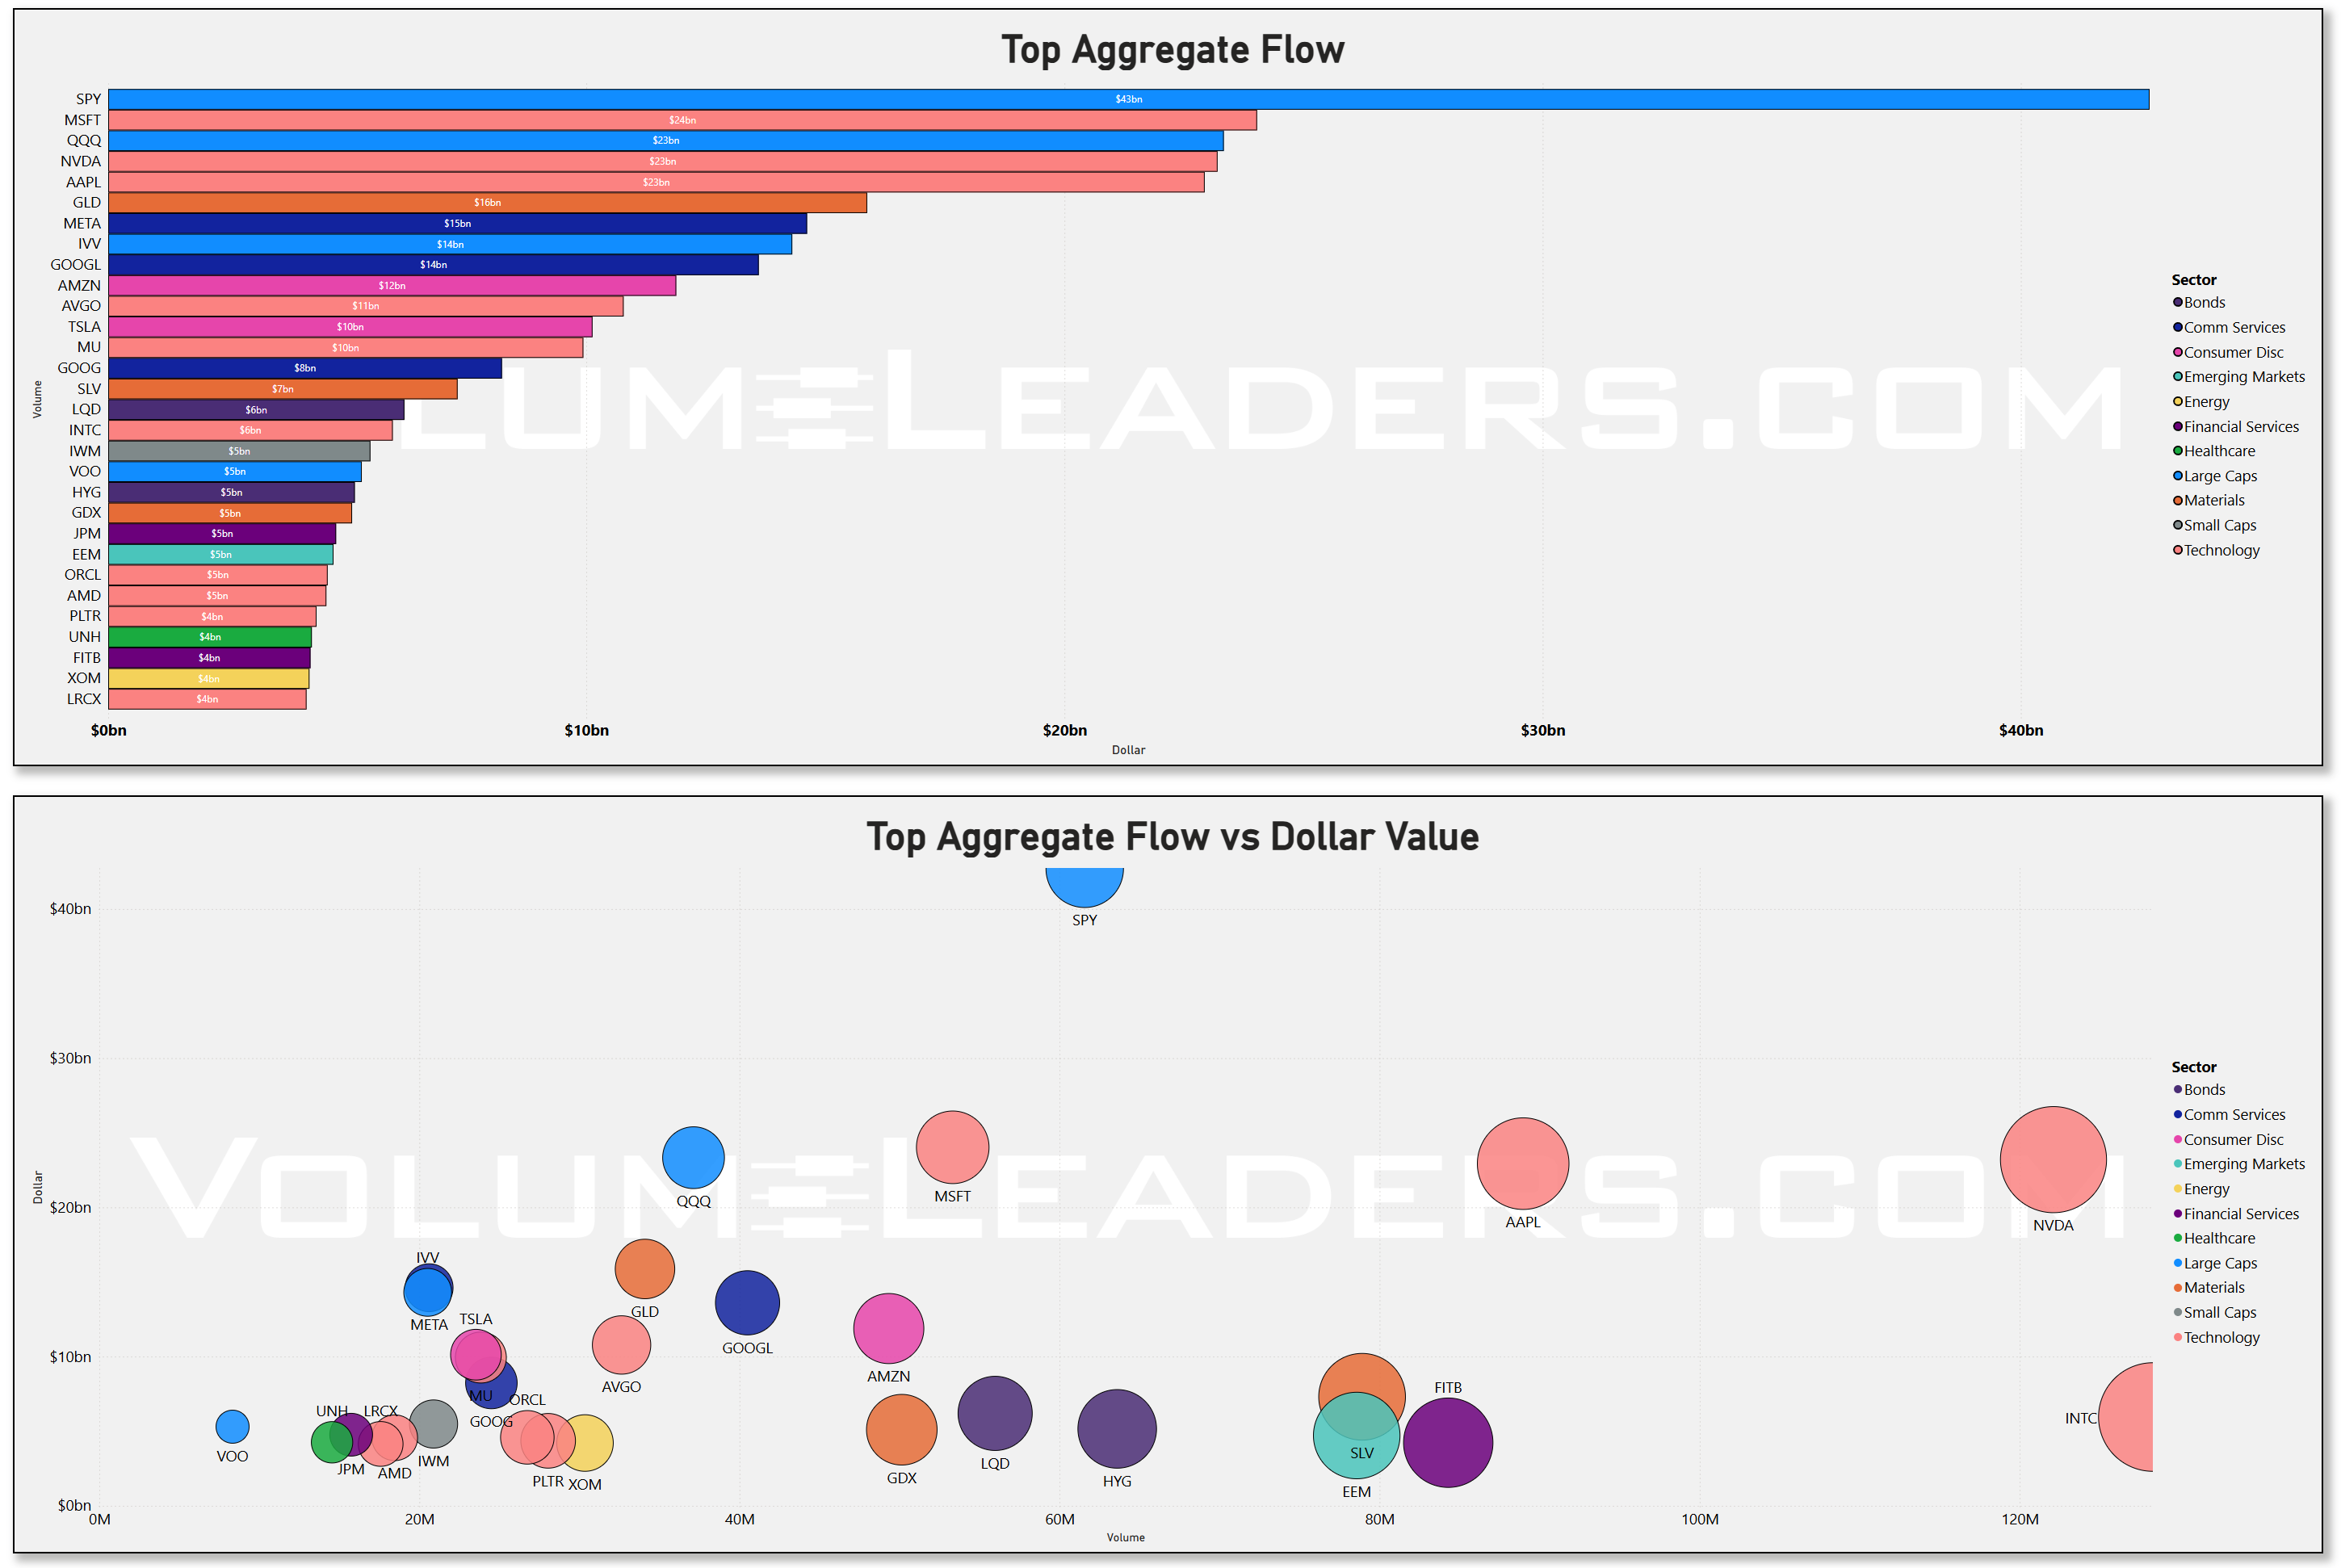
Looking at the aggregate flow bars and scatter, SPY again sits on top with about $44bn of total flow, followed by MSFT around $24bn, QQQ near $22bn, NVDA about $21bn, and AAPL near $18bn. VOO and IWM appear with more modest but still meaningful dollars, while SLV, GLD, LQD, and HYG all feature in the mid-single-digit billions, showing that metals and credit ETFs continue to serve as macro hedging and carry vehicles. The volume-vs-dollars scatter places SPY and QQQ high on both axes, while names like NVDA, INTC, and SLV skew toward higher volume for the dollars traded, indicating more active trading and swing positioning rather than sleepy buy-and-hold. That barbell — heavy, steady dollars in broad equity indices and megacaps, plus lively trading in semis, metals, and credit — fits an environment where investors are expressing macro and AI views simultaneously: anchoring risk in the benchmarks while using single names and sector ETFs for tactical tilts.
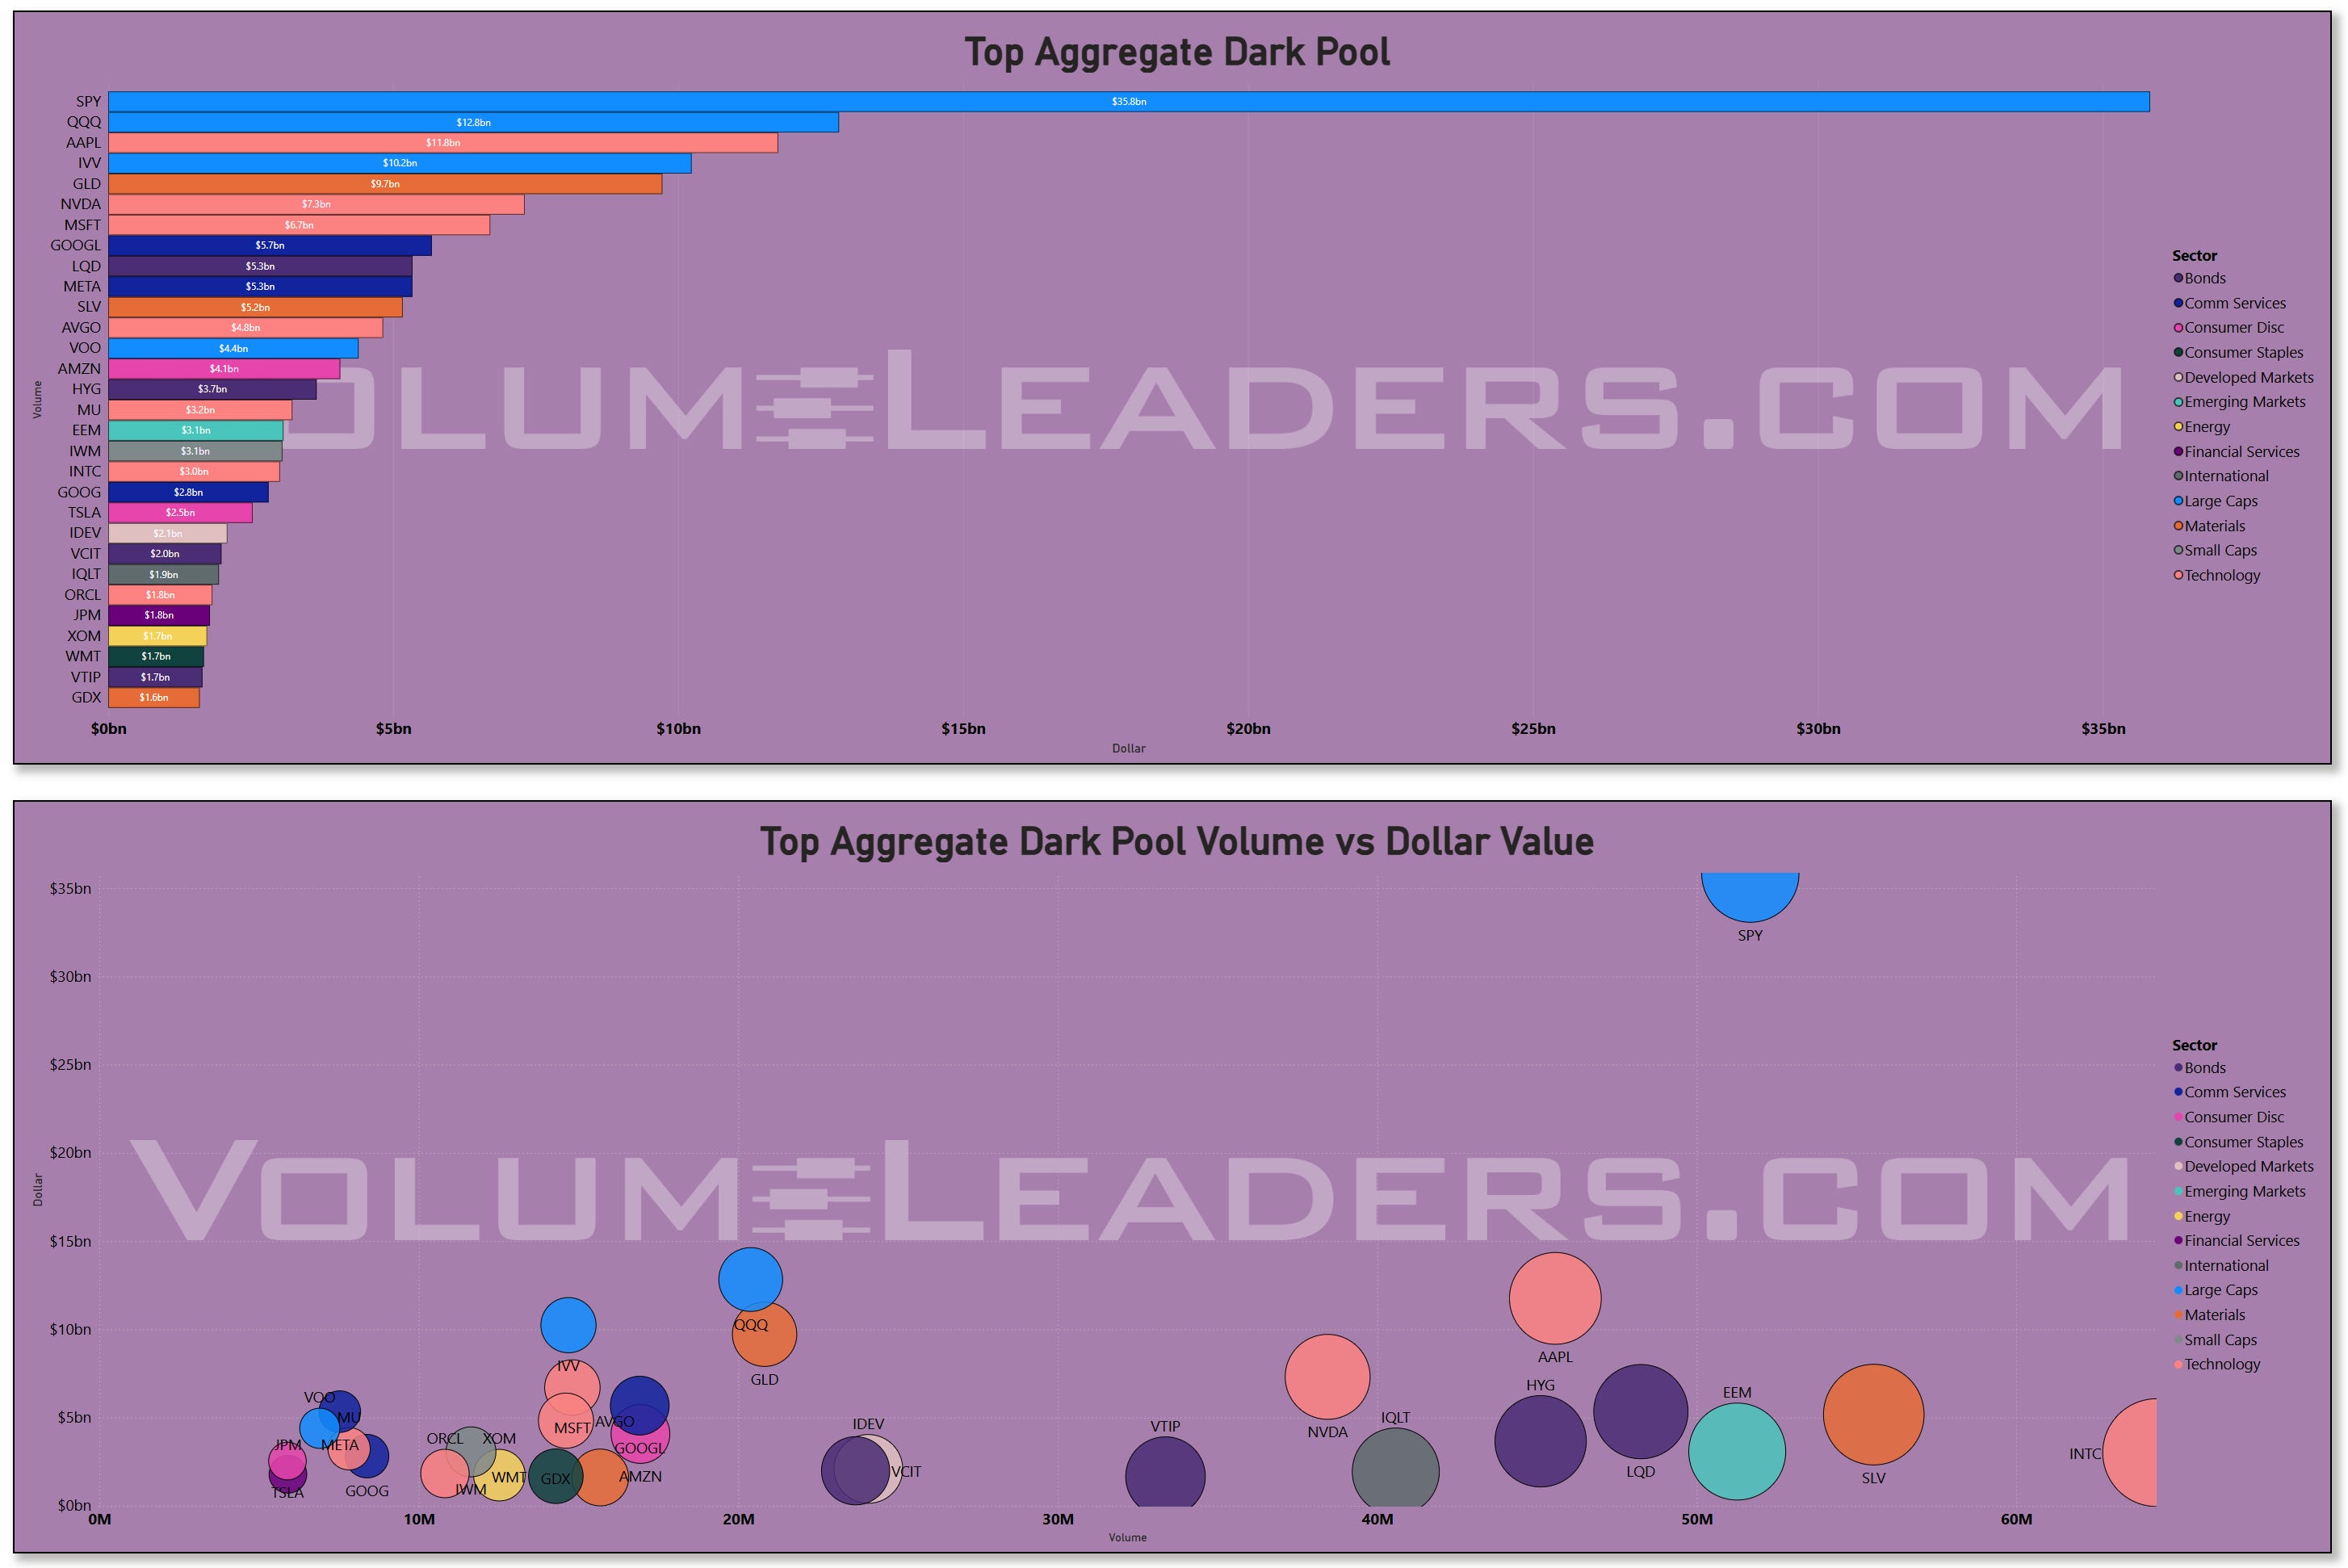
The dark-pool picture is where you see the real-scale inventory moves. SPY absolutely dominates the dark tape at roughly $35bn, with QQQ, AAPL, NVDA, and GLD all showing multi-billion dollar off-exchange prints beneath it. The scatter of dark-pool volume vs dollars shows SPY with enormous size on both dimensions, while QQQ, GLD, SLV, IEM, and LQD cluster in the mid-range, implying that institutions are quietly rolling sizable index and macro hedges in the dark, likely to minimize footprint while they adjust exposure around the Fed and earnings. Names like AAPL, NVDA, and MSFT appear with solid dark-pool presence but not quite the same dominance as SPY, which reads as ongoing two-way institutional interest rather than one-sided accumulation or distribution. Put differently, big money is still turning over inventory in the core megacaps, but the primary venue for changing the market’s overall risk posture remains the index ETFs.
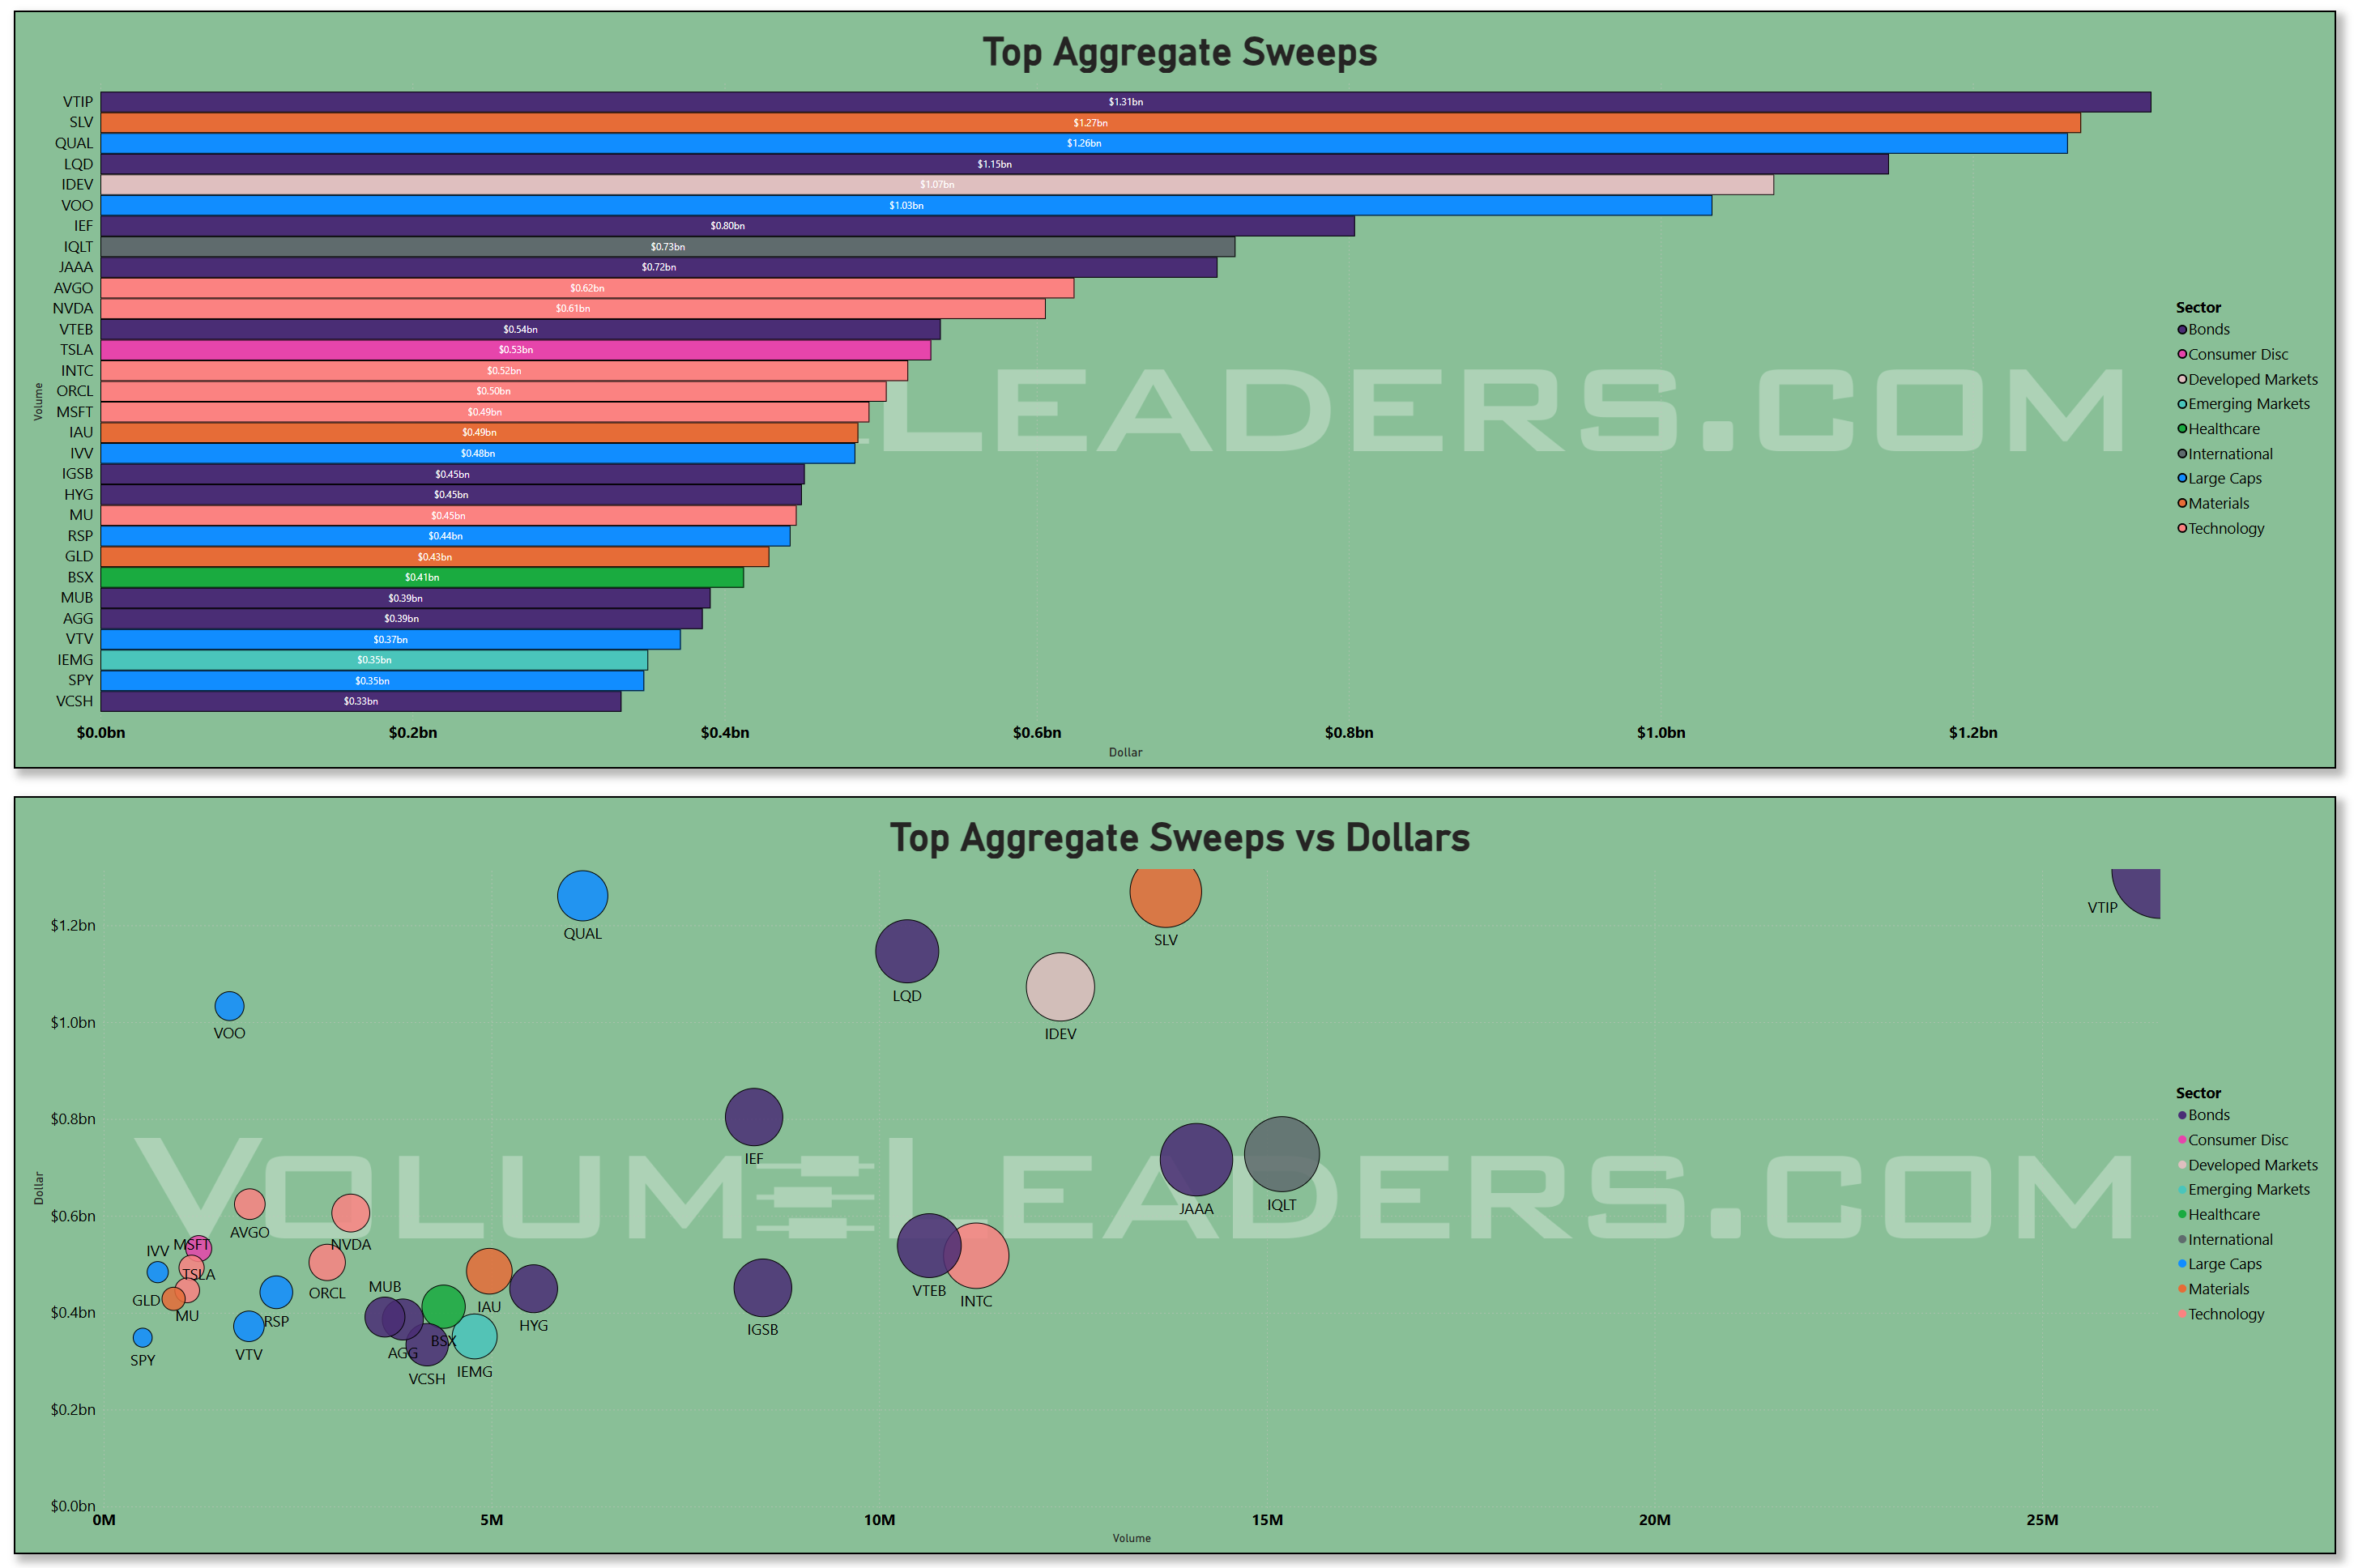
On the sweep side, the fastest money leaned heavily into rate- and quality-related ETFs. VTIP, SLV, QUAL, LQD, and IDEV top the aggregate sweep dollars list, each running in the neighborhood of $0.8–1.3bn. That is a clear tell that shorter-duration TIPS, silver, quality-factor equities, and investment-grade credit were the preferred vehicles for tactical leverage and hedging as the Fed held rates steady and reiterated a slow-cut path. Semis and key growth names like NVDA, TSLA, and INTC also show up with sizable sweep dollars, but they sit below the bond and quality ETFs, suggesting traders were adding or trimming risk around earnings rather than staging an outright speculative blow-off. The scatter reinforces this: VTIP and SLV stand out with high dollar values for their volume, while names like QUAL, IEF, and LQD cluster with significant volume and respectable dollars, painting a barbell of safe-income plays on one side and selective growth aggression on the other.
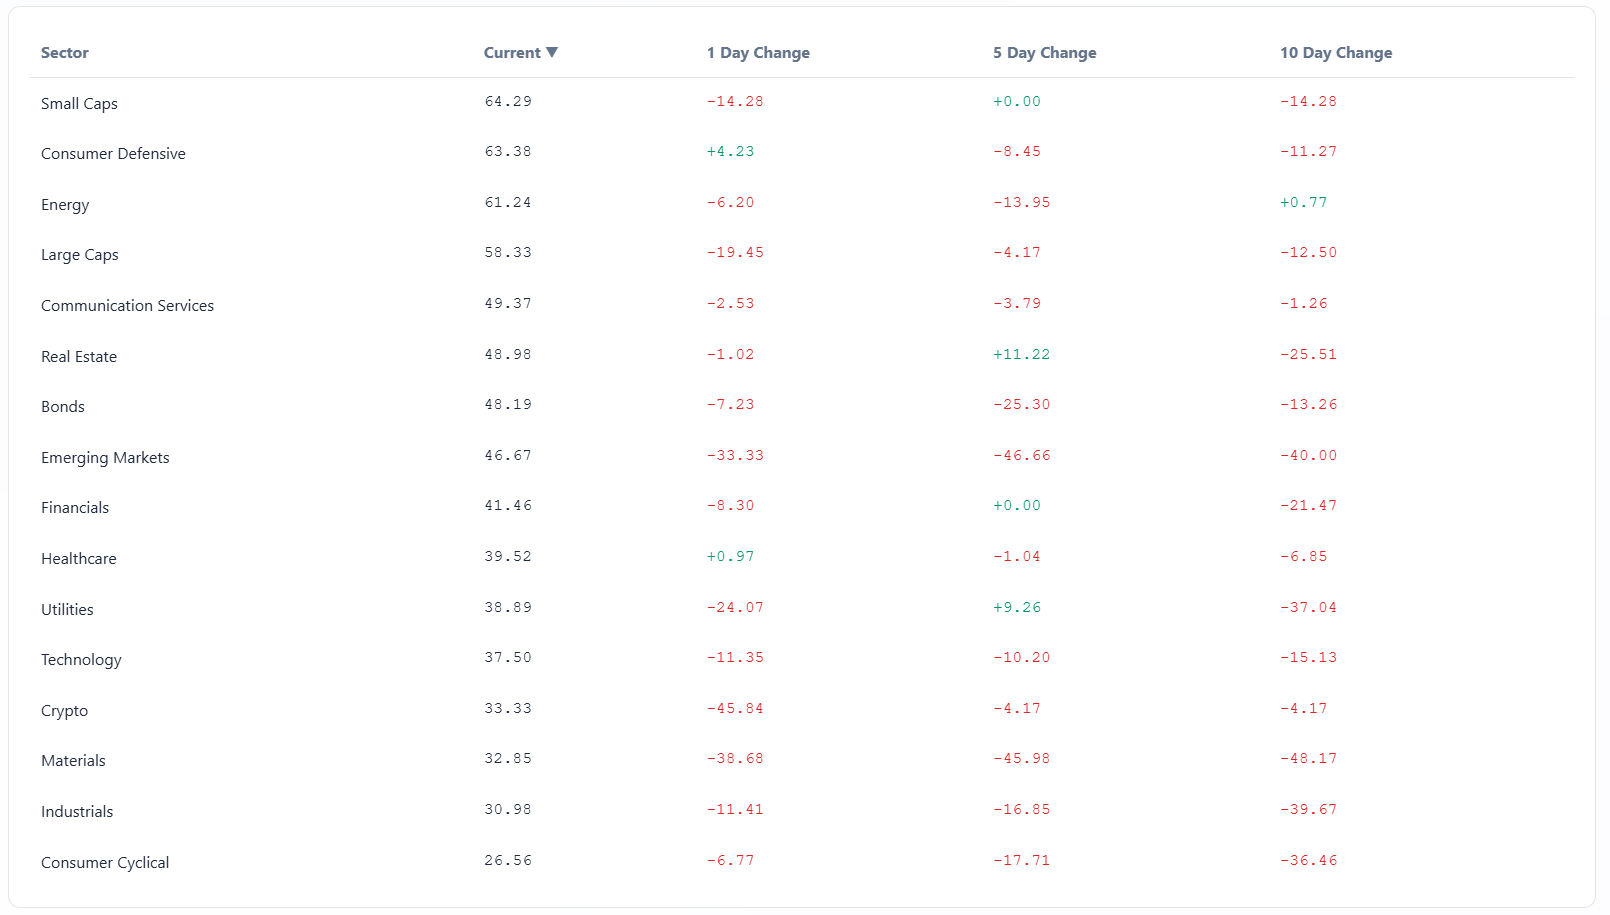
The sector rotation dashboard shows defensives quietly firming while classic growth and cyclicals have cooled on a short-term basis. Consumer Defensive, Energy, and Healthcare are inching higher on recent relative performance, while Technology, Industrials, Consumer Cyclical, and Materials have slipped over the last five to ten days. That lines up neatly with the flows we just walked through: Tech and Large Caps still command the biggest absolute dollars, but some of the incremental momentum has rotated toward staples, energy, and bond proxies as investors digest dense macro and earnings risk. Real Estate and Utilities remain laggards overall, though Utilities are trying to stabilize, consistent with a backdrop where rates are still restrictive but no longer rising aggressively and the Fed is signaling a cautious, data-dependent easing path.
Overlaying macro and seasonals, the story makes sense. The Fed just reaffirmed a “higher for longer, but maybe one more cut” stance, keeping the funds rate in the mid-3s and emphasizing lingering inflation uncertainty and a still-resilient labor market. At the same time, this particular week sits in the heart of megacap earnings, with Microsoft, Apple, Meta, and Tesla front and center, and consensus expecting tech to deliver outsized earnings growth for both the quarter and 2026 as AI capex turns into revenue. Historically, January and early February see stronger-than-average fund inflows as new money hits accounts and investors re-risk after tax-loss harvesting, especially into equities and bond funds. Put together, it is no surprise that we are seeing robust institutional dollars into SPY, QQQ, and the tech complex alongside meaningful allocations to LQD, HYG, and metals like GLD and SLV: investors are positioning for a soft-landing base case with central-bank support, but they are doing it with both growth exposure and macro hedges.
From here, the tells are straightforward. If SPY, QQQ, and the tech leaders like MSFT, NVDA, and AAPL continue to attract double-digit billions in total and dark-pool flow, especially on dips, it will confirm that institutions are still in accumulate-and-rotate mode rather than distributing into strength. If sweep activity remains concentrated in VTIP, LQD, and other rate-sensitive ETFs while dark-pool interest in GLD and SLV stays firm, that says the market is still hedging policy and inflation risk carefully rather than chasing a melt-up. Conversely, a visible roll-off in index and tech dollars coupled with rising sweeps in downside hedges or high-yield credit would be your early warning that this allocation phase is giving way to de-risking.
Bottom line: this was a high-liquidity, benchmark- and megacap-led week with notable support from credit and metals, signaling that institutions are leaning into a soft-landing and AI earnings story but doing so with one hand on the macro-hedge door rather than both hands on the throttle.
MIR Part 2: Individual Names From The Institutional Tape
VolumeLeaders tracks several proprietary signals designed to spotlight names drawing significant institutional interest. Below, we’ve surfaced the latest results and analyzed them to highlight emergent themes. If any of the sectors, narratives, or positioning trends resonate, the names mentioned here offer a strong starting point for deeper research and watchlist consideration.
VL Trade Rank Velocity™ (TRV)
TRV is a proprietary metric that measures the recent acceleration or deceleration in institutional trading activity for a given stock by comparing its average trade rank over the past few days to its average in recent weeks. A sharp improvement in TRV typically reflects a notable shift in positioning, often accompanied by sustained trade activity, suggesting institutions are actively engaging with the name and that intensity of activity is rising. This often precludes meaningful price or narrative shifts. This isn’t a buy-list or sell-list; it’s meant to draw your eyes to names where institutions are putting money to work.
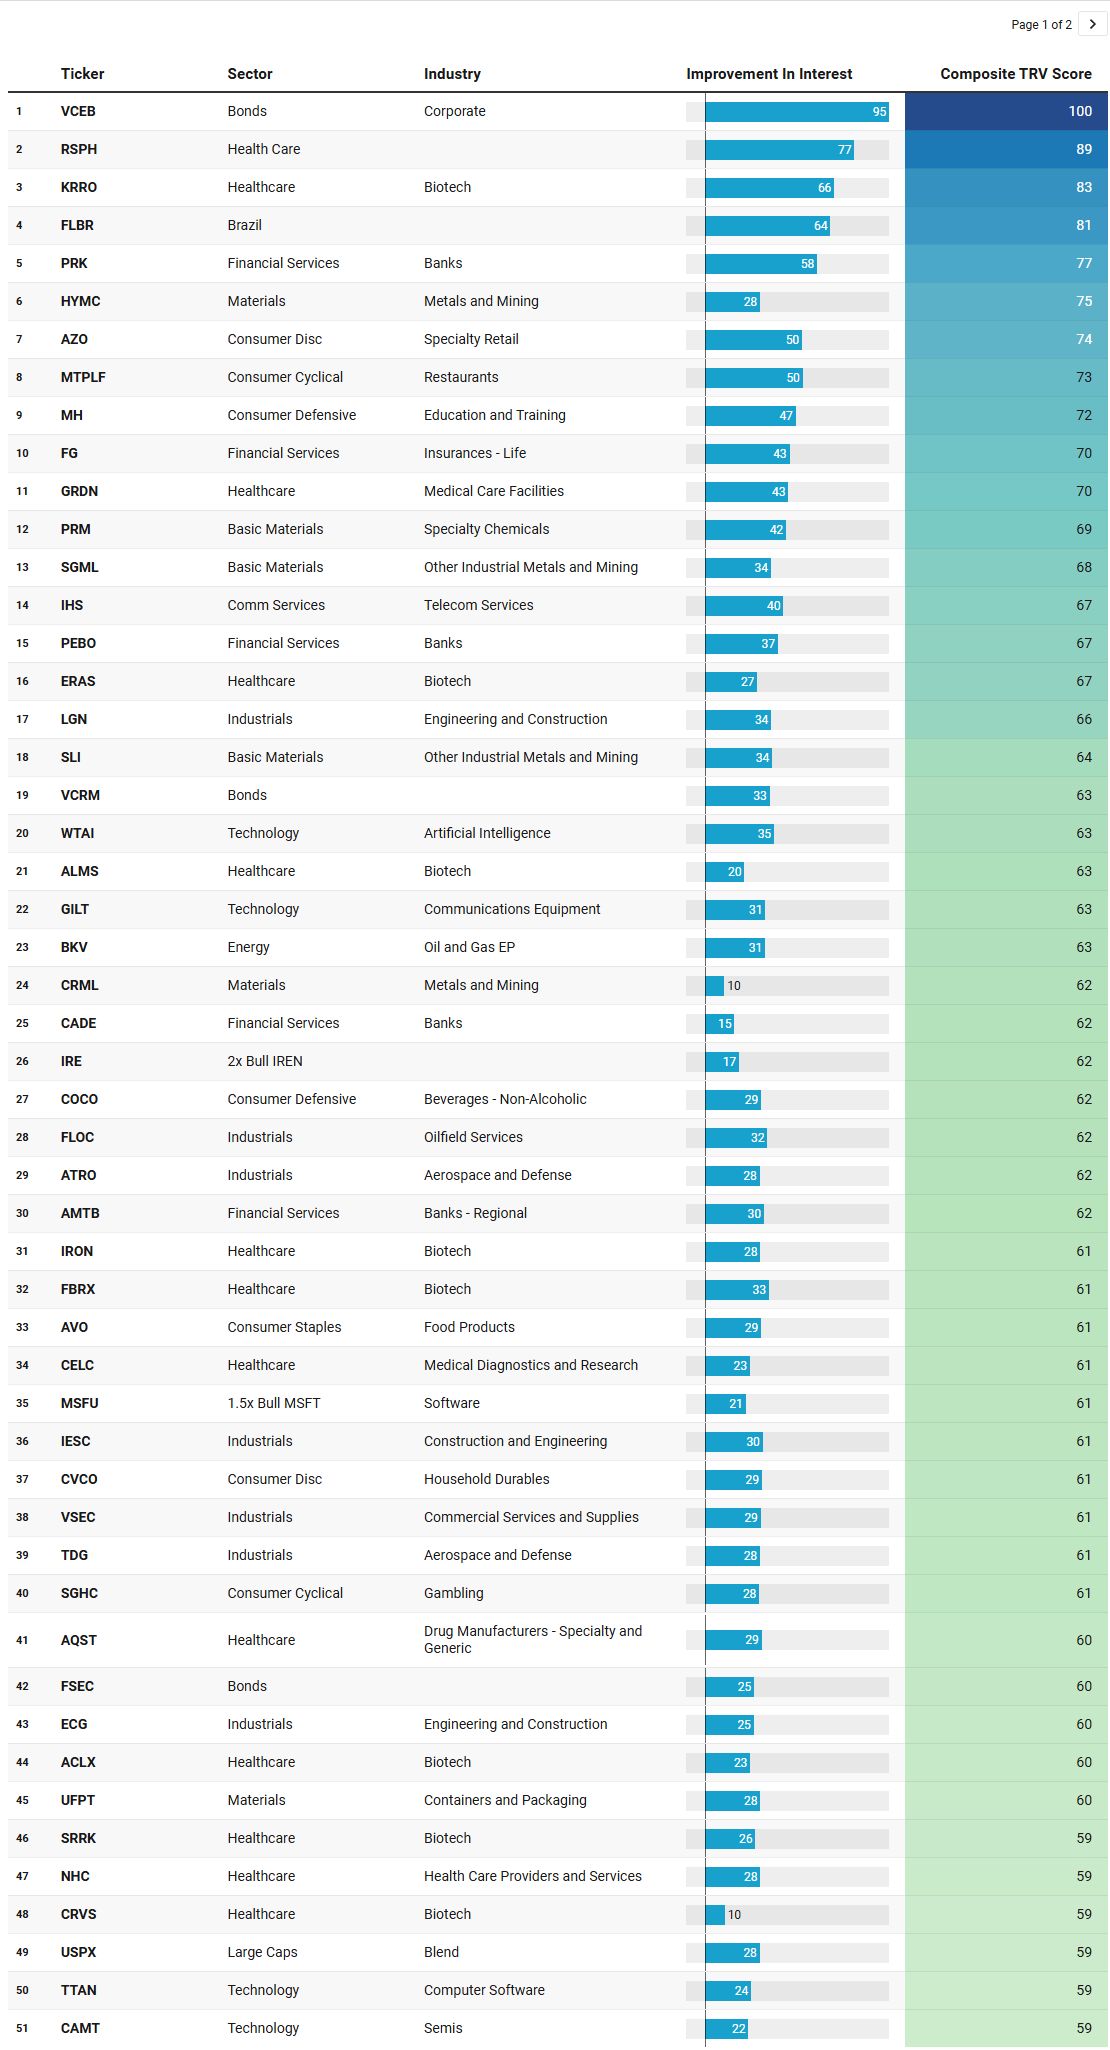
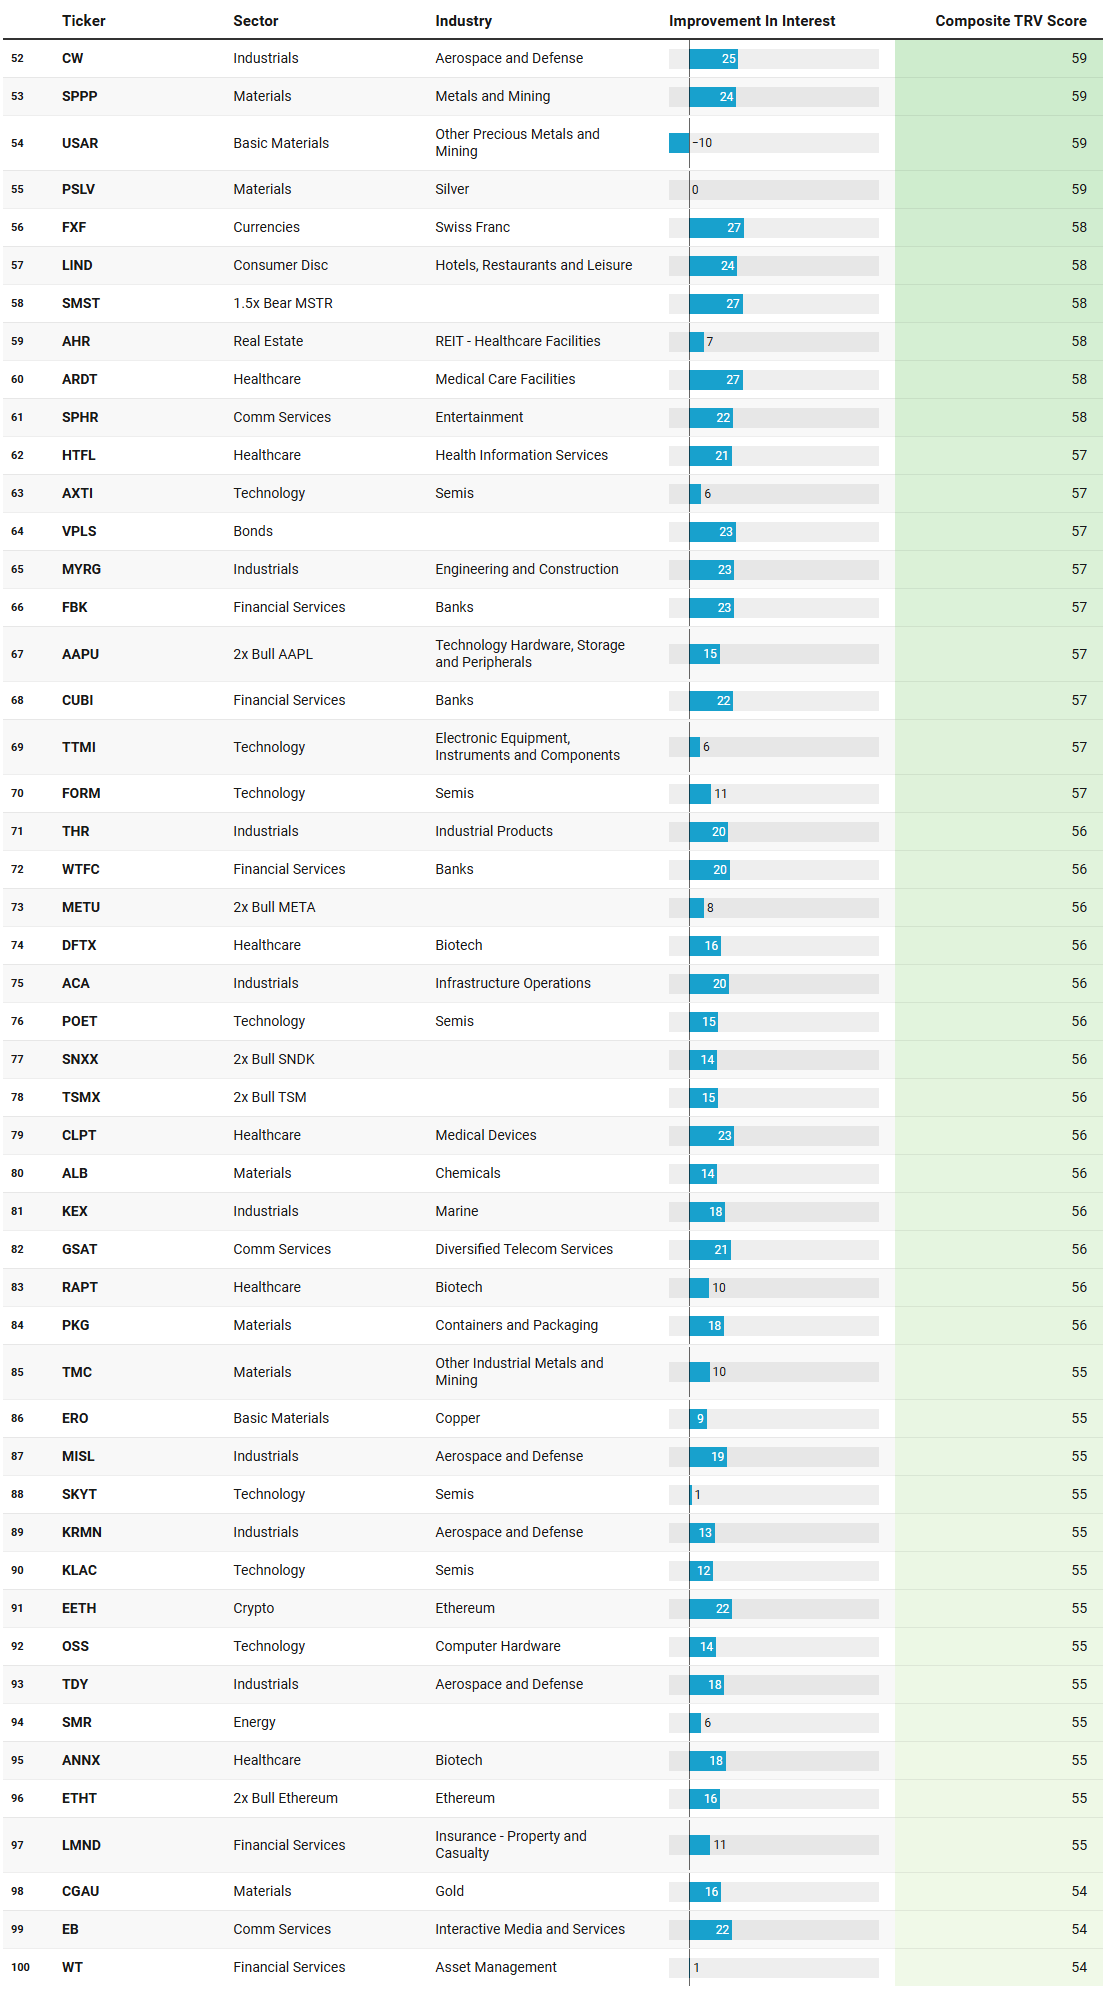
Three themes jump out of this week’s TRV list, and they line up cleanly with the institutional flow and macro backdrop in play.
First, you are seeing a clear bid for yield and credit quality. VCEB sits at the very top of the table with a composite score of 100, backed by a huge 94.6 improvement in interest and sustained activity. That is joined by VCRM and FSEC later in the list, plus VPLS a bit further down, all reflecting steady demand for corporate and other bond exposures rather than one-off spikes. In the context of a Fed that has paused but is still signaling only a gradual path toward lower rates, credit has become a sweet spot: investors can lock in higher coupons while taking less equity risk, and the TRV list says that trade is gaining sponsorship rather than fading. The presence of FXF, tied to the Swiss franc, fits that same risk-parity mindset, where allocators look for ballast and diversification alongside their growth bets.
Second, there is a strong “hard assets plus macro hedges” thread running through the materials and metals complex. HYMC, CRML, SPPP, TMC, SGML, SLI, USAR, UFPT, PKG, and ERO are all metals, mining, or packaging names that score well, and PSLV and CGAU add direct silver and gold exposure to the mix. That is a lot of real-asset and commodity-linked interest for one list. It fits with the broader tape where GLD and SLV were among the more active ETFs in both aggregate flow and sweeps, and where investors are clearly willing to pay for inflation and tail-risk insurance even as headline inflation cools. The mix of precious metals (gold, silver, copper) and more speculative deep-sea or specialty miners suggests a reach into second and third order beneficiaries: some investors are simply hedging policy and currency risk, while others are reaching for torque on any renewed commodity up-cycle.
Third, the list is loaded with growth, innovation, and AI-adjacent exposure, but with a noticeable tilt toward tactical leverage and second-tier beneficiaries rather than just the obvious mega-cap leaders. On the structured side you have MSFU, AAPU, METU, SNXX, TSMX, SMST, IRE, ETHT, and ETHT, all leveraged or inverse plays tied to Microsoft, Apple, Meta, Sandisk, TSMC, MicroStrategy, IREN, and Ethereum. That is a lot of appetite for amplified exposure to both big-tech earnings catalysts and crypto-related volatility in the same week that megacap earnings and a big Fed meeting are front and center. Underneath, there is a deep bench of pure-play growth: WTAI in artificial intelligence, CAMT, AXTI, FORM, SKYT, KLAC, and OSS across semis and hardware, TTAN and TTMI in software and electronics, plus EETH and ETHT in crypto. Taken together, that says traders are still very much engaged with the AI and digital infrastructure theme, but they are increasingly expressing that view through higher-beta satellites and leveraged wrappers rather than solely through the core FAAMG complex.
Within equities, the sector mix also mirrors the rotation seen in the flows. Financials are well represented: PRK, PEBO, CADE, AMTB, FBK, CUBI, WT, LMND, and WTFC all make the cut, spanning regional banks, specialty lenders, and insurers. That lines up with the solid institutional dollars into financials this week and with a macro narrative where a soft-landing, higher-for-longer rate path supports net interest margins without yet crushing credit quality. Industrials and infrastructure show up via LGN, IESC, FLOC, ACA, THR, MYRG, KEX, and multiple aerospace and defense names like ATRO, TDG, CW, MISL, KRMN, and TDY. That is consistent with investors leaning into fiscal-spending, reshoring, and defense tailwinds as Washington keeps the taps open and geopolitical risk remains elevated.
Healthcare and biotech are another major cluster. KRRO, ERAS, ALMS, IRON, FBRX, ACLX, SRRK, CRVS, DFTX, RAPT, ANNX, ARDT, GRDN, NHC, CELC, CLPT, HTFL, and RSPH highlight sustained, diversified interest across biotech, diagnostics, devices, providers, and health information services. This breadth matches the broader tape where healthcare has been stabilizing as a defensive growth sector, particularly appealing when cyclical leadership wobbles but investors still want long-duration innovation exposure. Some of these names show very high “Sustained Activity” scores — ERAS at 36, ALMS at 38, CRVS at 48 — which tells you this is not just one-day event trading; it is persistent attention.
At the consumer level, the list leans toward resilient and higher-quality demand rather than highly discretionary experiments. AZO, MTPLF, CVCO, LIND, SGHC, MH, AVO, COCO, and SPHR paint a picture of spending that is skewing toward auto parts, restaurants, housing-related durables, leisure, beverages, and entertainment with some gambling exposure on the side. That mix fits the “soft-landing, still-employed consumer” story emerging from recent data, where wage growth is cooling but remains positive in real terms and unemployment is still near the mid‑4s. It is supportive of a market that expects consumption to bend but not break.
There are a few outliers worth noting. Brazil’s FLBR hints at selective EM risk-taking, likely tied to a global rate environment that is less hostile and to commodity leverage in that market. EETH and ETHT, alongside crypto-related SMST and USPX as a large-cap blend wrapper, show that digital assets and high-beta equity are still very much in the institutional conversation, even as regulatory and macro uncertainty remain elevated. And SMR — tied to nuclear-related energy — plus BKV in oil and gas exploration and FLOC in oilfield services extend the hard-asset theme into the energy patch, consistent with the flows seen in energy ETFs and the ongoing narrative around supply security and transition.
Putting it all together, this week’s TRV watchlist reinforces the same three-legged stool that the broader flow data has been pointing to: real money is rotating toward quality credit and hard assets as macro ballast, staying aggressively engaged with AI, semis, and digital growth via both cash equities and leveraged products, and selectively adding to financials, industrials, and healthcare as core soft-landing beneficiaries rather than hiding in pure defensives.
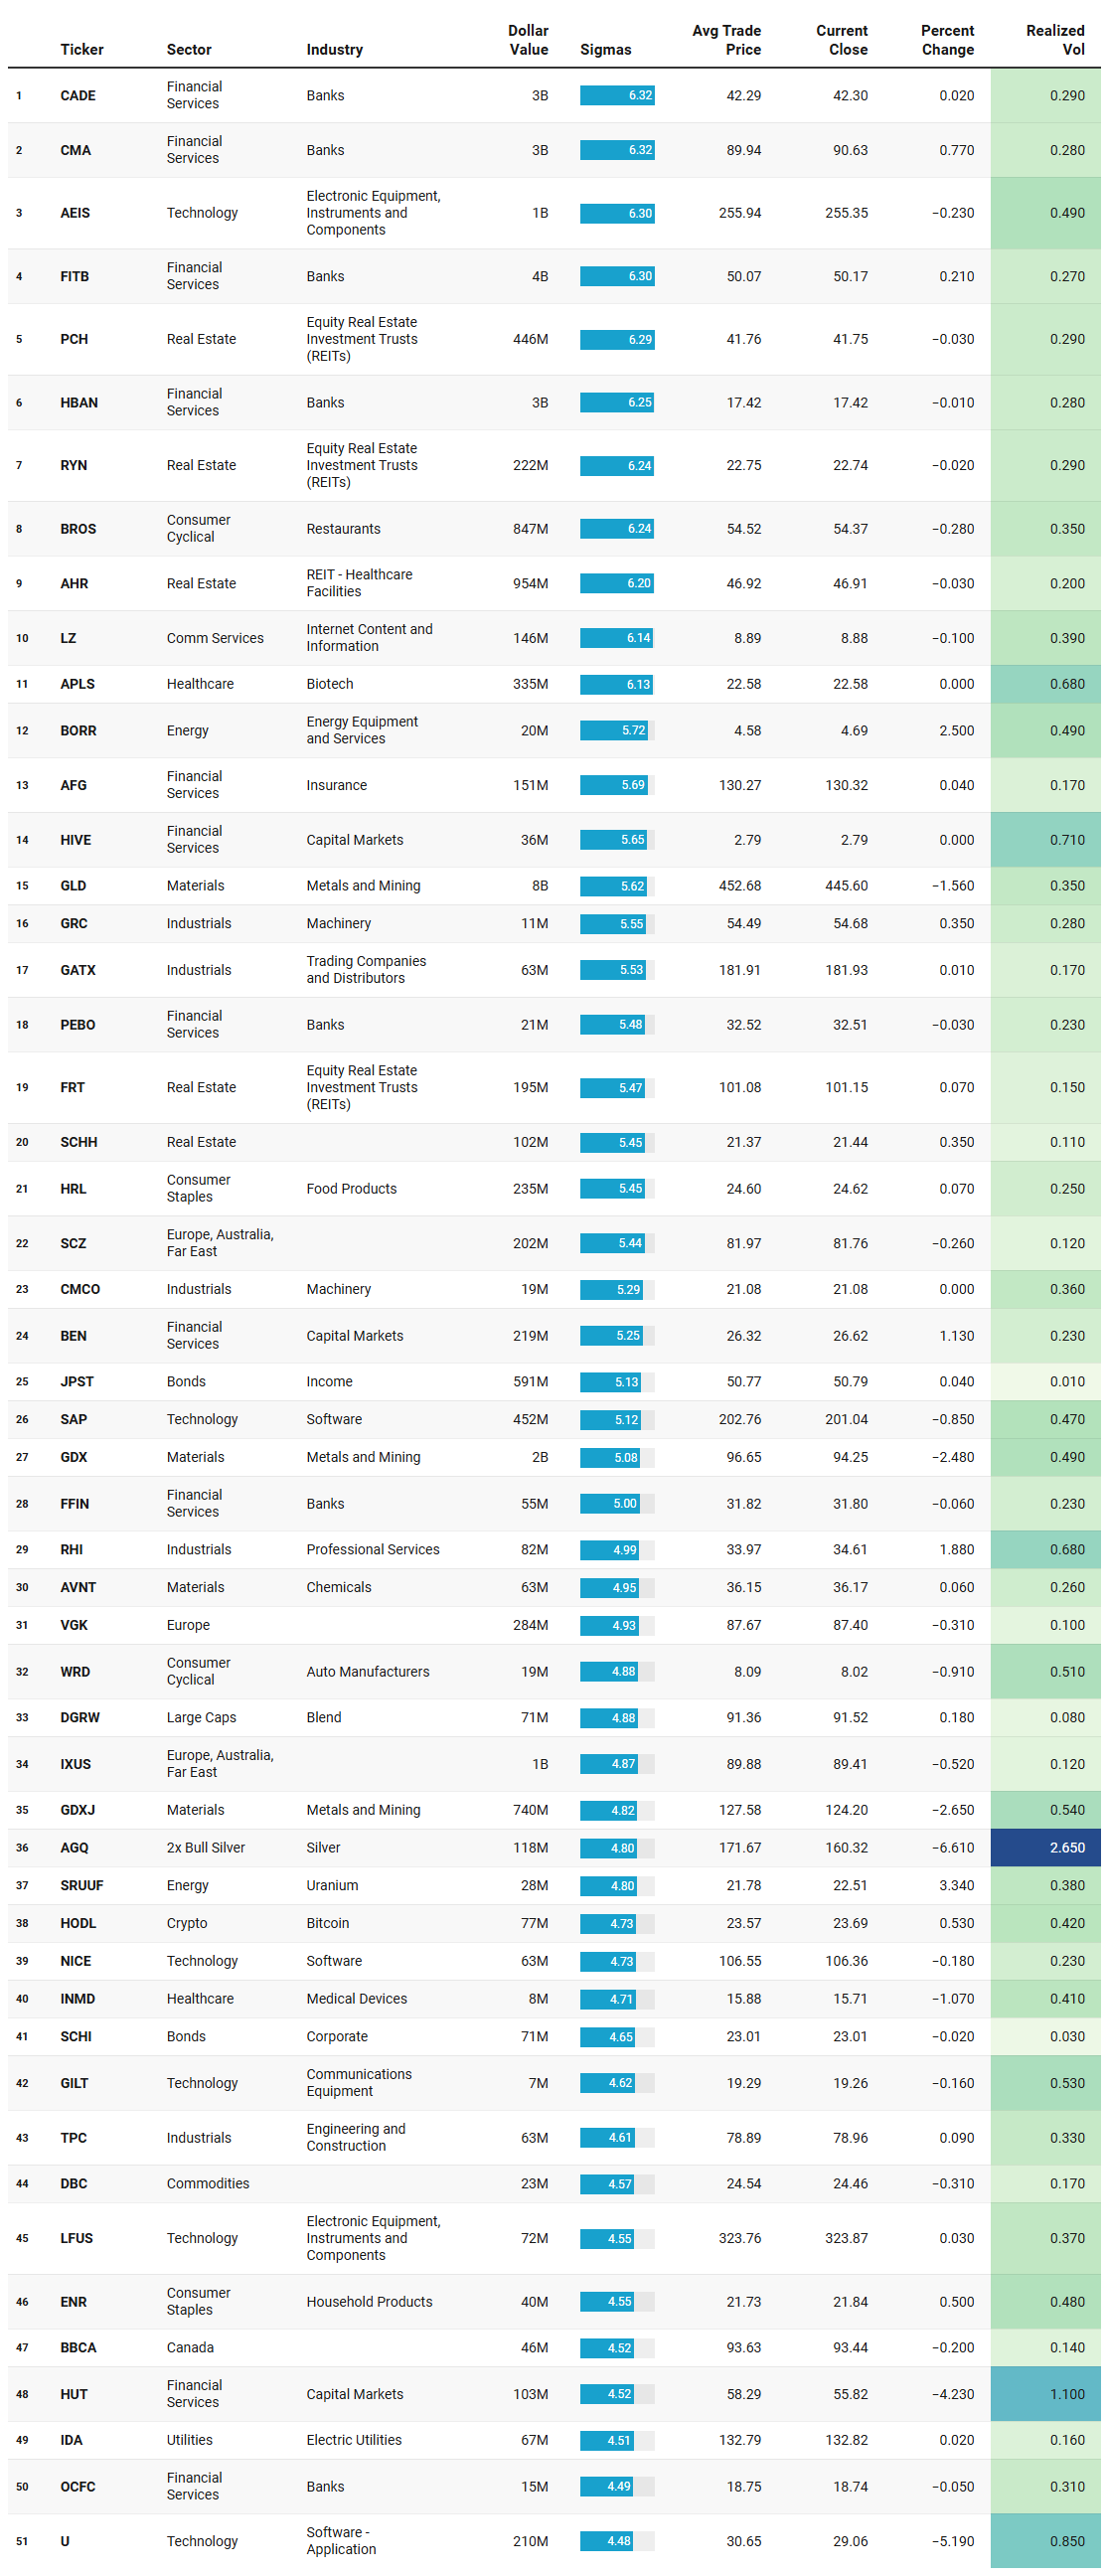
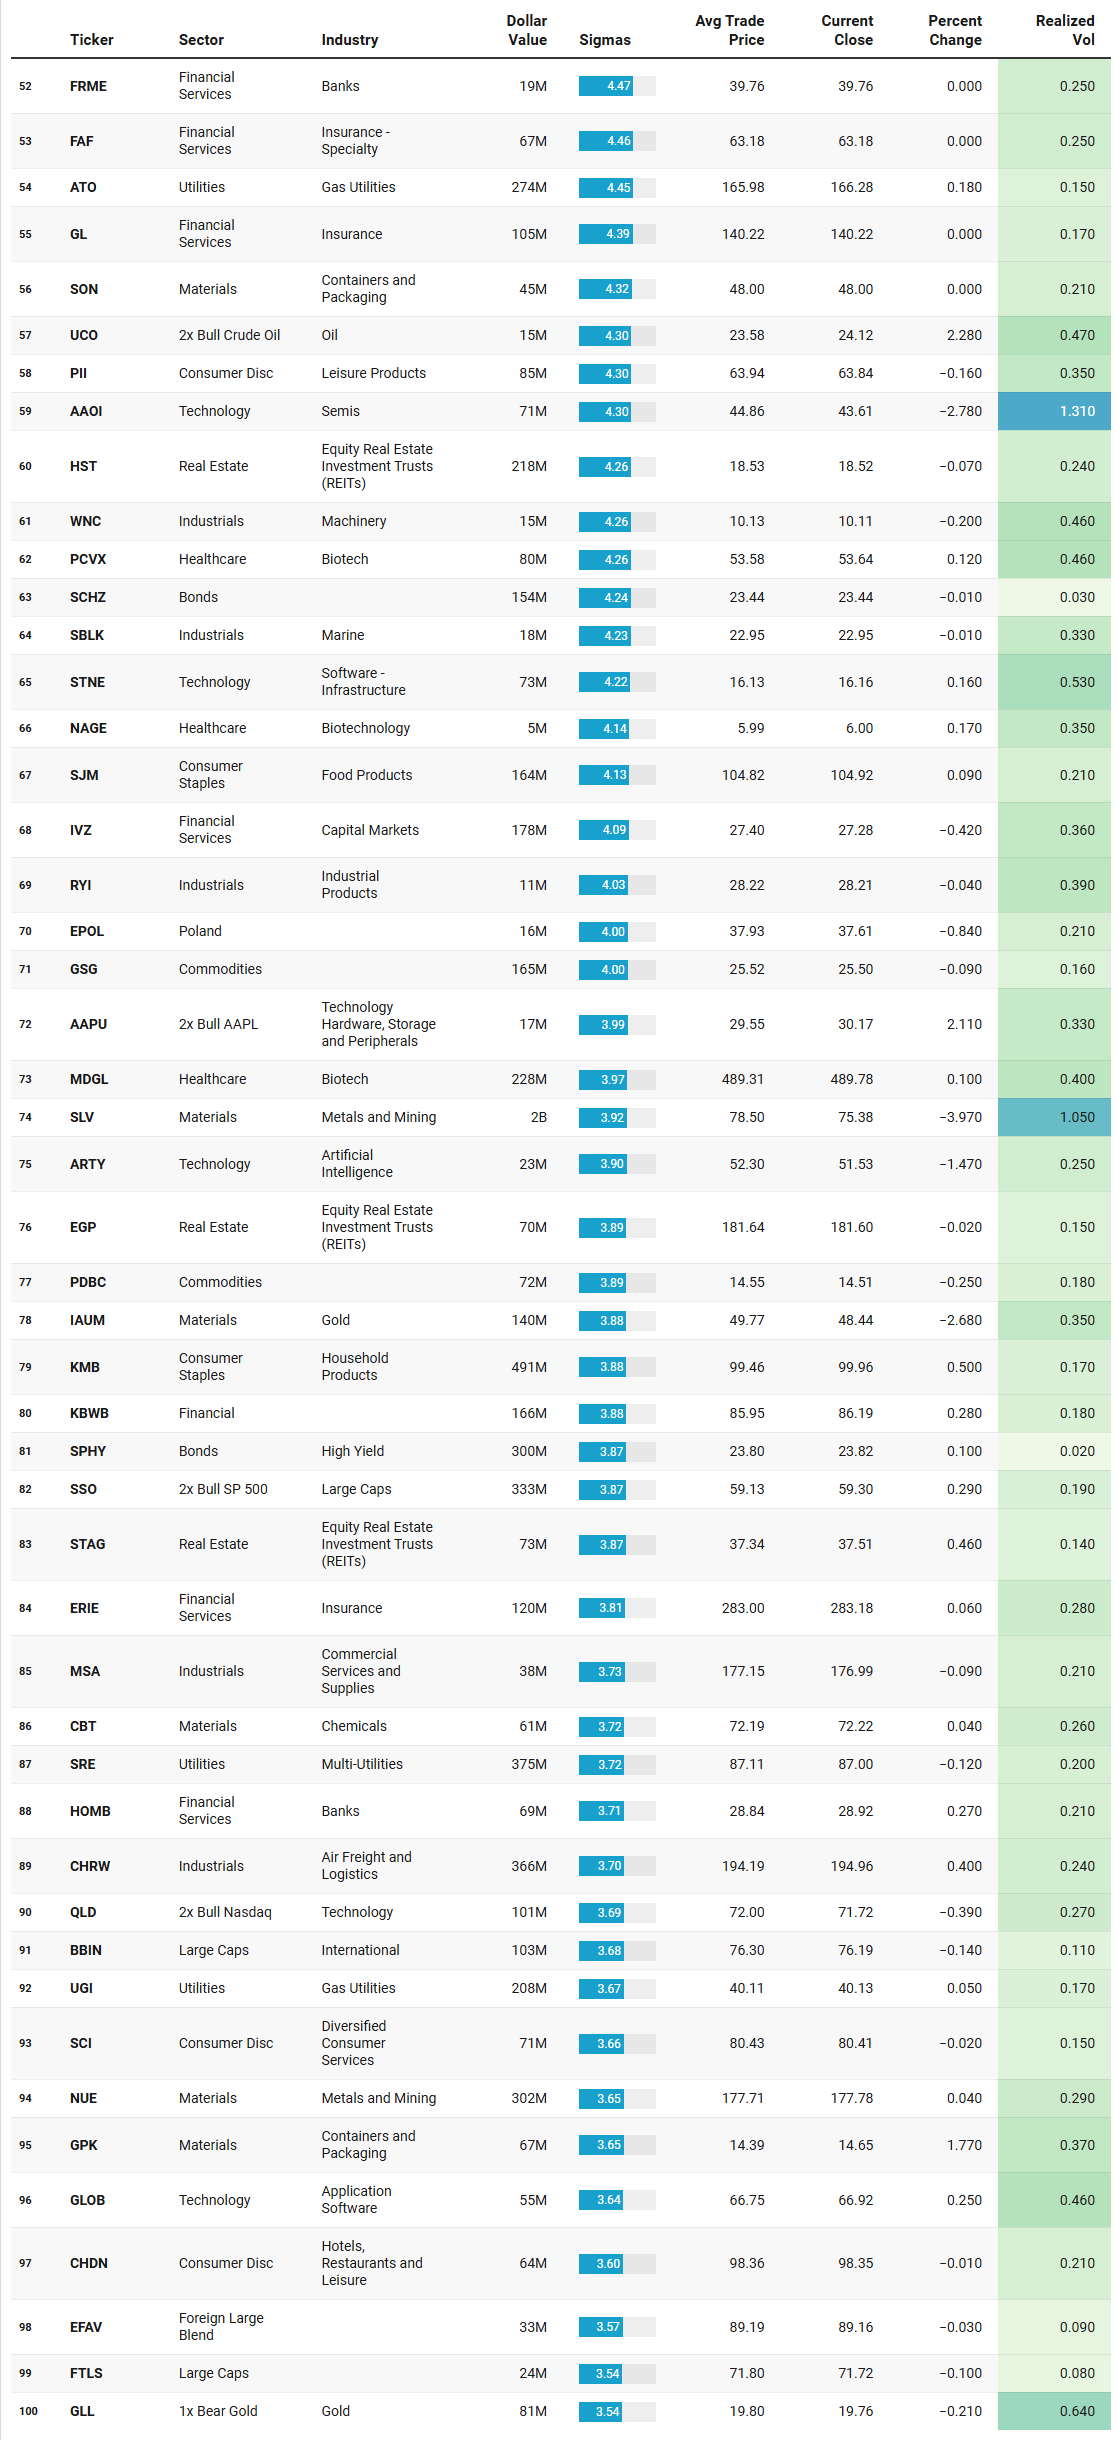
VL Institutional Outliers™ (IO)
Institutional Outliers is a proprietary metric designed to spotlight trades that significantly exceed a stock’s recent institutional activity—specifically in terms of dollar volume. By comparing current trade size against each security's recent normalized history, the metric flags outlier events that may indicate sudden institutional interest but may be missed because the activity doesn’t raise any flags/alerts when comparing the activity against the ticker’s entire history. For example, it’s conceivable that a ticker today receives the largest trade it has had in the last 6 months but the trade is unranked and would therefore be missed by current alerts built off Trade Ranks. Day traders can use “Realized Vol” to identify tickers that are moving swiftly with large price displacement while others can use it to size your risk appropriately.
The IO watchlist for this week doubles down on the financials rotation that has been building in the broader flow tape, but it also adds some fresh color to the real estate and metals narratives that have been simmering.
Financial Services completely owns the top of the list. CADE, CMA, FITB, HBAN, PEBO, FFIN, FRME, OCFC, HOMB, BEN, KBWB, and IVZ all register as outliers with sigma scores from 5.0 up to 6.3, and dollar values running from $2.8bn to $3.7bn on names like CADE, CMA, and FITB. Those are big‑ticket, multi‑sigma prints in regional banks and capital markets names, most of which are up modestly on the day (FITB +0.21 percent, CMA +0.77 percent) with tight realized vol in the low‑20s to low‑30s. This is not a one‑off; it ties directly back to the steady dollars into financials in the sector table and the TRV list, where names like PRK, PEBO, and CADE were already lighting up. With the Fed signaling a higher‑for‑longer path that supports net interest margins while growth stays decent, regional banks are looking like a classic catch‑up play: cheap valuations, resilient credit, and a macro tailwind from slower rate cuts. The fact that these are concentrated on January 30 tells you the print likely came in reaction to late‑week earnings or a sector rotation that picked up steam as the tape digested the Fed.
Real estate is the other standout, with a cluster of REITs and property‑related ETFs showing extreme interest. PCH, RYN, AHR, FRT, SCHH, and HST all hit sigma readings from 5.45 to 6.29, with dollars from $445m to $953m. AHR and PCH are barely changed on the day, while SCHH is up a touch at +0.35 percent, all in low‑vol environments. This extends the defensive quality bid seen in VCEB and corporate bonds on TRV, but with a yield‑sensitive twist: REITs benefit from stable rates and a soft landing where occupancy stays firm but cap rates do not compress aggressively. The presence of SCHH as a broad REIT ETF outlier alongside single‑name healthcare REITs like AHR suggests institutions are scaling into the sector systematically, likely as a hedge against any equity pullback while collecting dividends.
Metals and commodities round out the macro theme, with GLD at $7.98bn and 5.62 sigma, GDX and GDXJ at $2.4bn and $739m respectively, SLV at $2.38bn, IAUM, and even GLL as a gold short. GLD is down 1.56 percent on the day but with solid volume, while silver and miners are off more sharply (GDXJ -2.65 percent). That multi‑sigma flow across long and short gold/silver proxies confirms the hard‑assets hedge that has been a constant across TRV, dark pools, and sweeps: investors are positioning for inflation surprises, currency volatility, or just plain tail risk around the Fed and geopolitics, regardless of the day‑to‑day price action.
There are a few growth and cyclical outliers that fit the tactical rotation story. BROS in restaurants at 6.24 sigma and $846m echoes the consumer discretionary resilience on TRV, even as it is down 0.28 percent. AEIS, GILT, SAP, and NICE in tech show up with 5.12 to 6.3 sigma, but they are not dominating the way financials are — more like opportunistic adds in semis, software, and equipment amid the broader AI flow. Energy has BORR and SRUUF as outliers, plus UCO as 2x oil, aligning with the oilfield and uranium interest on TRV and the commodity ETF flow. Crypto and leveraged plays like HODL, AAPU, SSO, and QLD make cameo appearances, confirming that high‑beta tactical trading is alive but secondary to the sector rotations.
What ties this all together is the risk profile: most of these outliers are low‑vol names with multi‑billion dollar prints that scream conviction positioning rather than momentum chase. Banks and REITs are getting scaled in as the market prices a “higher for longer but stable” macro regime, metals are the evergreen hedge, and the rest are flavor for the soft‑landing bulls. This list does not change the narrative — it sharpens it, showing where the smart money is putting its biggest bets right now.
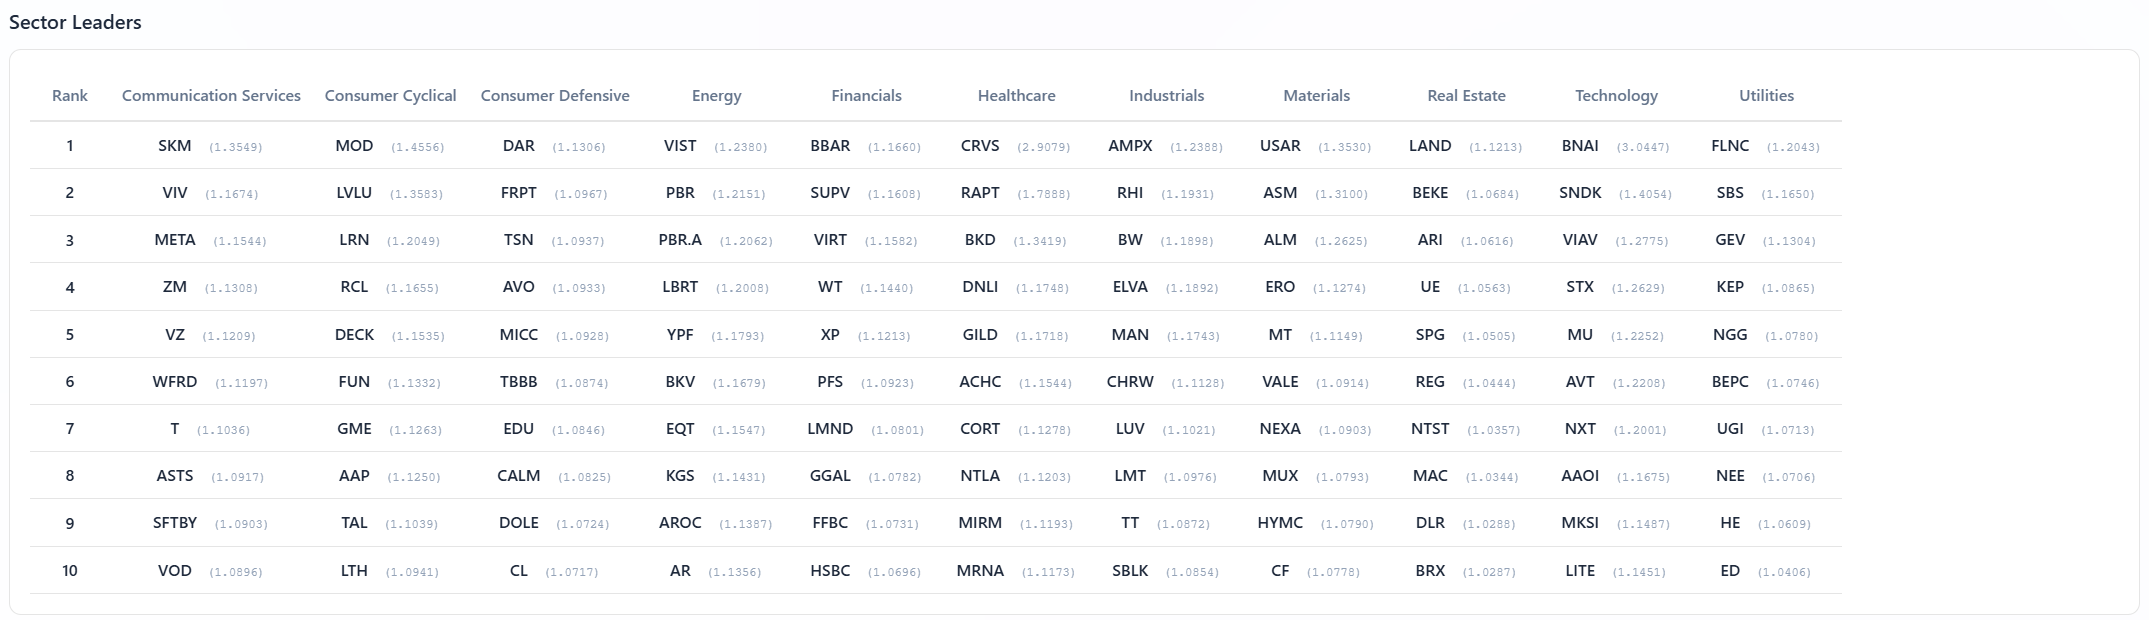
VL Sector Leaders
VL Sector Leaders is a weekly snapshot of where true leadership is asserting itself inside the market, stripped of the distortions that come from broad, style-mixed indices. Rather than asking which stocks look strong in absolute terms, this list focuses on which names are outperforming within the environments they actually compete in.
Each week, we surface the ten stocks demonstrating the most persistent relative strength inside their respective sectors. These are not headline chasers or one-day wonders. They are names that continue to separate themselves from peers through real price behavior, often reflecting sustained demand rather than fleeting attention.
For day traders, this list is a powerful awareness tool. Sector Leaders tend to offer cleaner intraday structure, better follow-through, and more predictable reactions around key levels because they already sit on the right side of relative strength. Even on choppy tape, leadership names often remain tradeable while the rest of the market degrades.
For swing traders, VL Sector Leaders helps narrow the universe to stocks with the highest probability of staying relevant. Relative leaders are more likely to hold trends, survive pullbacks, and reassert themselves after consolidation. When markets rotate, these names are often among the first to resume leadership — or the last to break.
The VL Sector Leaders list is basically a who’s‑who of where relative strength is quietly living beneath the index surface, and it dovetails nicely with the flows and TRV/IO themes being tracked.
Across Communication Services, you have SKM, VIV, META, ZM, VZ, and T all sitting in the top ranks, which says the leadership in this bucket is barbelled between global telcos and the big platforms. SKM and VIV at the top speak to non‑US defensiveness and yield, while META and ZM anchor the growth side as still‑dominant franchises in social and collaboration. That echoes the heavy aggregate dollars into META and the persistent dark interest in the mega‑cap comms complex: institutions are using this group both for income and for AI‑adjacent, ad‑driven growth.
Consumer Cyclical leaders like MOD, LVLU, LRN, RCL, DECK, and various specialty names tell you that discretionary strength is not just about the mega retailers; it is distributed across auto components, apparel, cruise lines, and experiential spend. That lines up with the macro tone of a still‑healthy US consumer and with the TRV list, where restaurants, leisure, and housing‑linked names keep popping up. Consumer Defensive leaders such as DAR, FRPT, TSN, AVO, and CL point to stable bid underneath staple protein, pet food, and packaged brands, consistent with investors wanting some ballast even while they lean into cyclicals.
Energy leadership is anchored in VIST, PBR, PBR.A, and LBRT, along with YPF and EQT, so you have Latin American upstream, US shale, and oilfield services all on the front foot. That fits neatly with the outlier interest in uranium, crude, and commodity ETFs in the IO and flow dashboards, and with a macro backdrop where energy supply risk and disciplined capex still support the space. On the Financials side, BBAR, SUPV, VIRT, WT, XP, and LMND show a blend of LatAm banks, electronic market‑makers, US regionals, and even an insurtech, which meshes almost perfectly with the institutional outlier list you just saw for CADE, CMA, FITB, HBAN, and the financial ETFs. The tape is clearly rewarding both core banking and capital‑markets plumbing.
Healthcare leaders like CRVS, RAPT, BKD, DNLI, GILD, NTLA, and MRNA reveal a wide spread of biotech, gene editing, big pharma, and care facilities. That breadth matches the TRV watchlist’s heavy tilt toward biotech and med‑tech, and it confirms that healthcare remains a favored way to own secular growth and innovation with some defensive characteristics. Industrials leadership is equally diversified: AMPX, RHI, BW, ELVA, MAN, CHRW, LUV, LMT, TT, and SBLK give you energy transition, staffing, industrial fabrication, defense, airlines, logistics, and shipping. Pair that with the recent surge in industrial dollars in the sector flow table and you get a clear message that investors are leaning into global trade normalization, defense spend, and operating leverage to a soft landing.
Materials leaders such as USAR, ASM, ALM, ERO, MT, VALE, NEXA, MUX, HYMC, and CF strongly reinforce the metals and mining theme that has been running through the institutional flow, TRV, and IO lists. You have precious metals, copper, steel, and fertilizers all showing up as top‑ranked, which is exactly what you would expect if the street is positioning for persistent demand, supply constraints, and a reflation‑friendly policy mix. Real Estate leadership, with names like LAND, BEKE, ARI, UE, SPG, REG, NST, MAC, DLR, and BRX, shows strength in farmland, Chinese platforms, commercial, and high‑quality retail/industrial REITs. That dovetails with the REIT outliers and suggests the bid in property is not limited to one niche; it is broadening as rates stabilize.
Finally, Technology leadership is stocked with BNAI, SNDK, VIAV, STX, MU, AVT, NXT, AAOI, MKSI, and LITE — a who’s‑who of storage, optical, memory, and test equipment, with a sprinkling of distribution. This is very consistent with the semis and AI hardware names at the top of of the aggregate dollar, sweep, and TRV lists, and it tells you that the current tech leg remains driven by the plumbing of AI and cloud rather than just front‑end software. Utilities leaders like FLNC, SBS, GEV, KEP, NGG, BEPC, UGI, NEE, HE, and ED round out the picture with a clear focus on grids, renewables, and regulated incumbents, which fits the quiet defensive and yield bid you are seeing in bond ETFs and credit outliers.
MIR Part 3: Framing-Up A Trade
The tape has been consistent all week: institutions are positioning for a soft landing where growth holds up but rates stay higher for longer, with AI and semis as the growth engine, hard assets as the inflation hedge, financials and industrials as the catch‑up rotation, and credit/REITs as the yield ballast. There is no panic distribution, no crowded euphoria — just methodical allocation with hedges. That sets up a straightforward, barbelled portfolio for the coming week: overweight the themes that got the biggest, sustained dollars (Tech semis, financials, metals), underweight pure defensives and EM, and keep hedges live but light. With payrolls, ISM Services, and a slew of megacap earnings looming, the setup favors dips as opportunities rather than traps, but with tight risk controls around any macro surprise that forces de‑risking.
Here is how I would frame it up on the VL desk:
Core Growth Sleeve (40 percent): this is where the flow and leadership are densest — AI hardware, storage, and semis that have dominated aggregate dollars, sweeps, and VL leaders. The biggest institutional conviction is here.
NVDA (15 percent): the anchor, with $21bn aggregate flow and persistent TRV/IO interest.
MU (10 percent): VL leader in semis, $10bn flow, and TRV standout; memory cycle turning up.
AVGO (10 percent): semis distribution and AI networking exposure, consistent across lists.
TSM (5 percent): foundry leverage, 2x bull on TRV, VL semis leader.
Financials Rotation Sleeve (25 percent): multi‑sigma IO outliers in CADE, CMA, FITB, HBAN, plus TRV and flow dollars say banks are the go‑to for NIM expansion and catch‑up. Regional and mid‑cap focus to capture the spread.
FITB (10 percent): $3.7bn IO outlier at 6.3 sigma, regional NIM tailwind.
CMA (8 percent): 6.32 sigma IO print, capital markets tie‑in.
CADE (7 percent): $2.8bn IO leader, TRV standout in banks.
Hard Assets & Hedges Sleeve (20 percent): metals/mining and commodities have been a constant across flow, TRV, IO, and VL — inflation hedge and tail risk without chasing crypto volatility.
GLD (8 percent): $8bn IO outlier, dark pool staple.
GDXJ (7 percent): junior miners VL leaders, TRV torque.
SLV (5 percent): silver leverage, IO and flow active.
Yield & Defensive Sleeve (15 percent): credit and REITs for carry, matching VCEB TRV topper, REIT IO outliers, and VL real estate leaders. Low vol, stable in risk‑off.
VCEB (7 percent): TRV #1 at 100 score, corporate yield play.
SCHH (4 percent): REIT ETF IO outlier at 5.45 sigma.
AHR (4 percent): healthcare REIT, 6.2 sigma IO and VL.
This is about 75 percent long equity bias with the rest in hedges/yield, sized for a 2–3 percent drawdown tolerance. Add on weakness in the core if payrolls print soft (under 40K) and ISM Services holds 54; trim semis and banks if unemployment ticks above 4.5 percent or yields spike through 4.25 percent. The tape says stay long the themes, but respect the tripwires.
NOTE: There are a few early‑warning strands running through the institutional tape, even though the dominant message is still constructive. TRV is heavy in higher‑beta, leveraged exposures and speculative corners rather than in boring compounders: 1.5x/2x wrappers tied to the big AI/crypto complex, a long roster of small‑ and mid‑cap biotechs, thinly traded miners, and other “all‑or‑nothing” metals names. That is classic late‑phase behavior inside an uptrend, where the core themes are still working but marginal dollars are chasing more torque because the obvious leaders have already re‑rated.
The IO list and sector work add a second, more subtle caution. Alongside strong, multi‑sigma buying in regional banks and REITs, you have outsized, two‑sided flow in gold, silver, and miners (plus the inverse gold ETF), and notable prints in low‑vol bond and corporate sleeves. Institutions are not going all‑in; they are actively calibrating commodity and rate hedges while they rotate into financials and property. Sector Leaders and the rotation dashboards round this out: leadership has broadened into Brazilian and LatAm financials, resource‑heavy materials, shipping, airlines, and travel — areas that tend to shine in the back half of a move — while short‑term relative strength has tilted toward defensives and away from classic high‑beta sectors and small caps. Taken together, nothing here screams that a top is imminent, but it does flag a tape that is becoming more fragile at the edges: the trend can keep grinding higher, yet the next negative surprise is more likely to trigger an air pocket than a gentle, orderly dip because so much incremental risk now lives in levered and speculative corners of the market. This is easy to bring into this week’s port if you want to err on the side of caution: dial back the highest-beta growth by shaving points from NVDA & MU and rotating a slice into a broader vehicle like QQQ/SMH; increase ballast and optionality by bumping up yield/defensives a few points and adding more high-quality credit as well. This add some cushion for the first sharp downdraft if it pops-up this week.
Thank you for being part of our community and for dedicating your time to this edition. Your insights and engagement drive everything we do, and we’re honored to share this space with such committed, thoughtful readers. Here’s to a week filled with clear opportunities and strong performance 💰💰💰
— VolumeLeaders