Market Momentum: Your Weekly Financial Forecast & Market Prep
Issue 77 / What to expect Jan 26, 2026 thru Jan 30, 2026


In This Issue
Weekly Market-On-Close Report: All the macro moves, market drivers, and must-know narratives—covered in less than five minutes.
Weekly Benchmark Breakdown: Our weekly intelligence report on major indices cuts through the index-level noise to uncover participation, momentum, and structural integrity and tell you whether markets are rising on solid ground or skating on thin breadth. This is where bull markets prove themselves—or quietly start to unravel.
The Latest Investor Sentiment Readings: Track the emotional pulse of the market with our curated dashboard of sentiment indicators. From fear-fueled flight to euphoric overreach, this week's readings reveal whether investors are cautiously creeping in—or stampeding toward the exits.
Institutional Support & Resistance Levels For Major Indices: Exactly where to look for support and resistance this coming week in SPY, QQQ, IWM & DIA
Normalized Performance By Thematics YTD: Which corners of the markets are beating benchmarks, which are overlooked and which ones are over-crowded!
Key Econ Events & Earnings On-Deck For This Coming Week
Market Intelligence Report: Track the real money. This section dissects where institutions are actively putting capital to work—and where they are quietly stepping aside. We start with a sector-by-sector view of flows, identifying which areas are commanding attention and which are losing sponsorship. From there, we move into the tape itself, highlighting the week’s most meaningful block trades and sweep activity across both lit exchanges and dark pools to distinguish durable allocation from short-term positioning.
Each week, we synthesize those signals into a cohesive, realistic portfolio that reflects how a professional allocator might express the dominant themes. The goal is not prediction, but alignment—showing how institutional conviction, optionality, and risk management come together in practice. Whether you’re leaning into momentum or staying selective around crowded trades, this report offers a grounded framework for understanding where size is moving, how it is being expressed, and why it matters.

Weekly Market-On-Close Report
Friday closed with a familiar signature: the tape looked heavy early, headlines did their damage, and then the market remembered what it usually remembers when liquidity is thinner and positioning is more visible than conviction. The S&P 500 Index finished up +0.03%, the Dow Jones Industrials Index closed down -0.58%, and the Nasdaq 100 Index closed up +0.34%. In futures, March E-mini S&P (ESH26) rose +0.02% and March E-mini Nasdaq (NQH26) rose +0.29%.
It was not a broad, uniform bid. It was a market that stabilized and turned higher through the same axis that has rescued countless weak opens: megacap technology. When the index is flat-to-up, the Dow is down, and the Nasdaq 100 is stronger, you are looking at a leadership story and a rates story, not a clean, all-clear risk-on story.
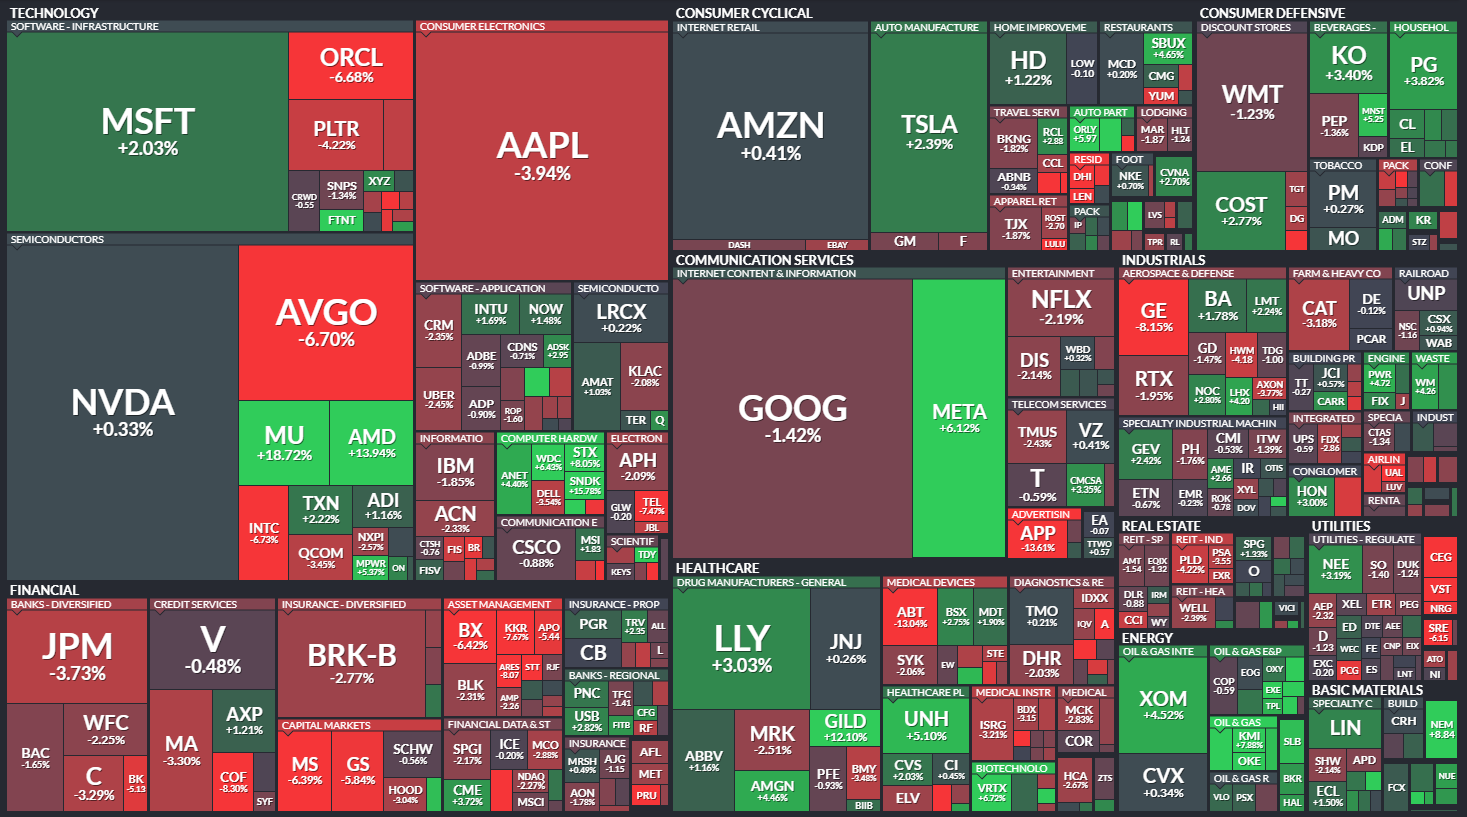
The early pressure had a clear catalyst. Intel (INTC) plunged more than -17% after a lackluster forecast from CEO Lip-Bu Tan, who warned the company was struggling with manufacturing problems. One stock does not equal one market, but INTC is a particular kind of tell because it sits right on top of the semiconductor narrative at the same moment investors are asking whether heavy AI investment is translating into durable revenue growth and profits.

But the more important pivot on Friday was not INTC itself. It was the market deciding that the day’s macro updates were a mild release valve rather than a new stressor. The University of Michigan US Jan consumer sentiment index was revised upward, inflation expectations were revised lower, bond yields turned lower, and stocks found their footing. That sequence is the entire playbook in one sentence: ease inflation fear at the margin, let yields relax, and duration-sensitive leadership gets permission to lift the indices.
The Macro Tape: Solid Growth, Sticky Inflation, and a Fed Expected to Hold
There were two macro layers operating simultaneously: the near-term data that influences day-to-day rate pricing, and the larger narrative around growth resilience versus inflation persistence.
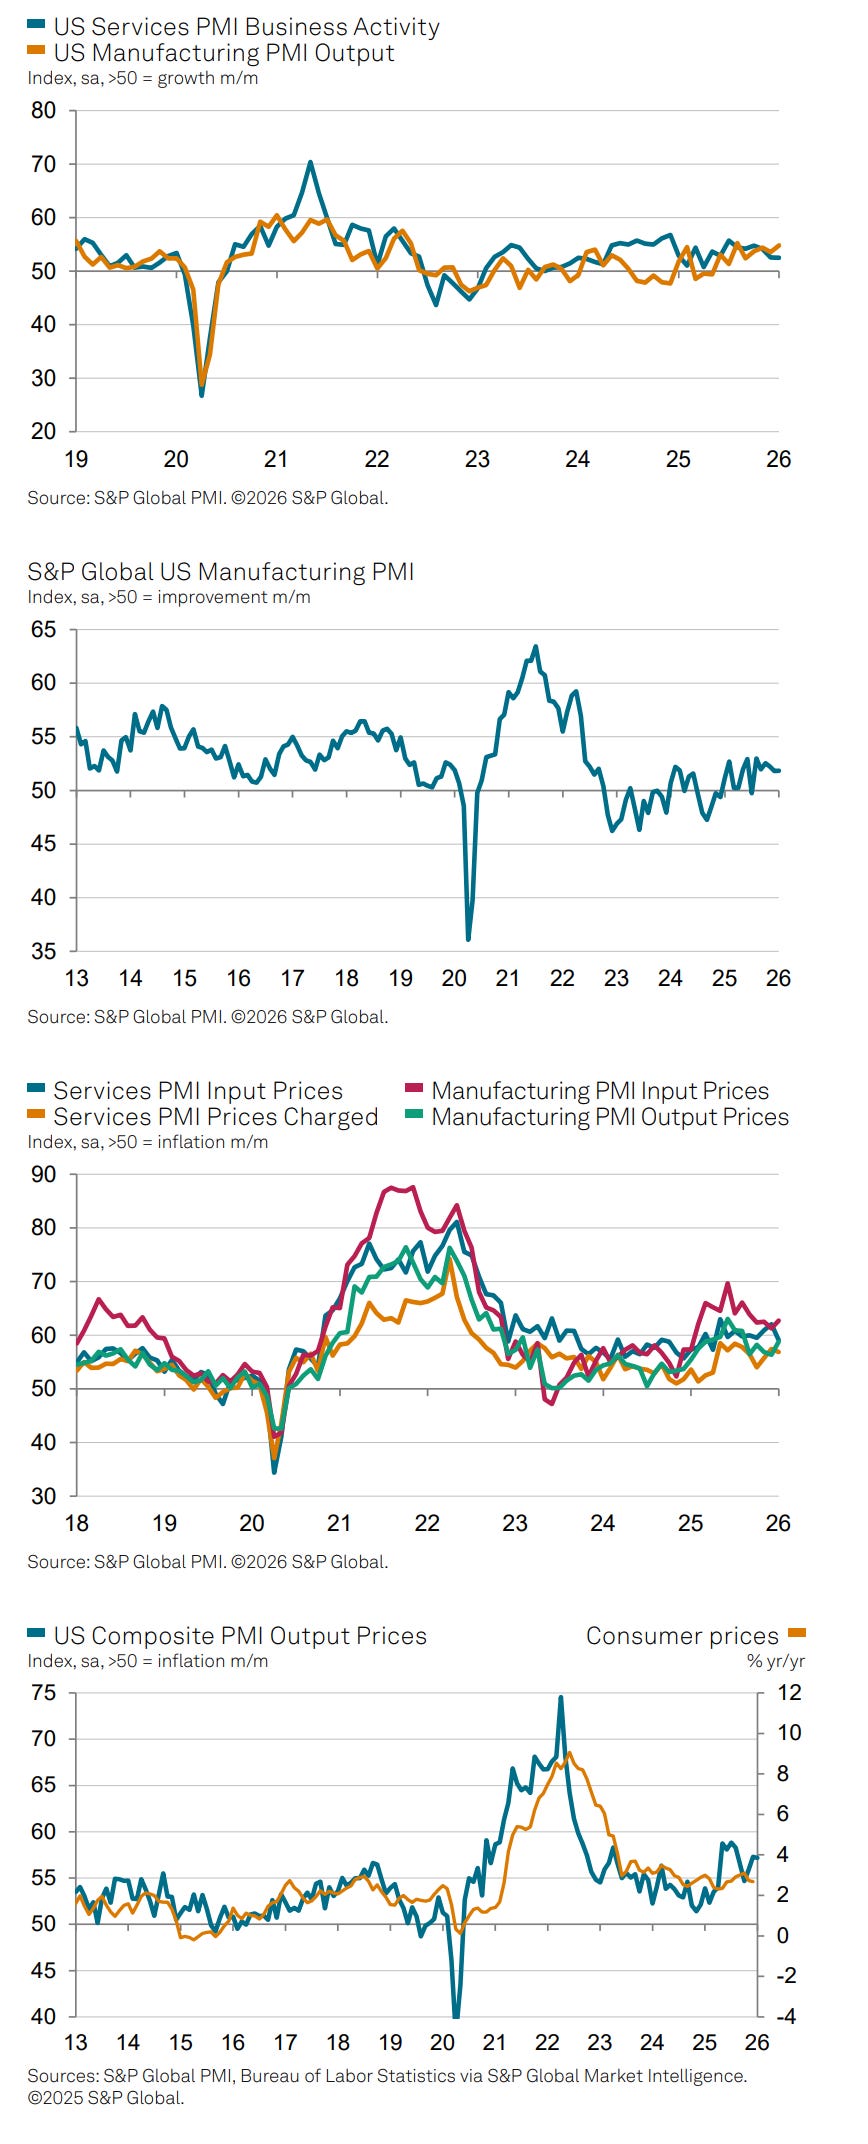
On the day, the US Jan S&P manufacturing PMI rose +0.1 to 51.9, slightly weaker than expectations of 52.0. That is not a recession print. It is modest expansion that came in just shy of consensus. In isolation, it is “fine.” In combination with eased inflation expectations, it fit the market’s desire to see growth hold while price pressure stops re-accelerating.
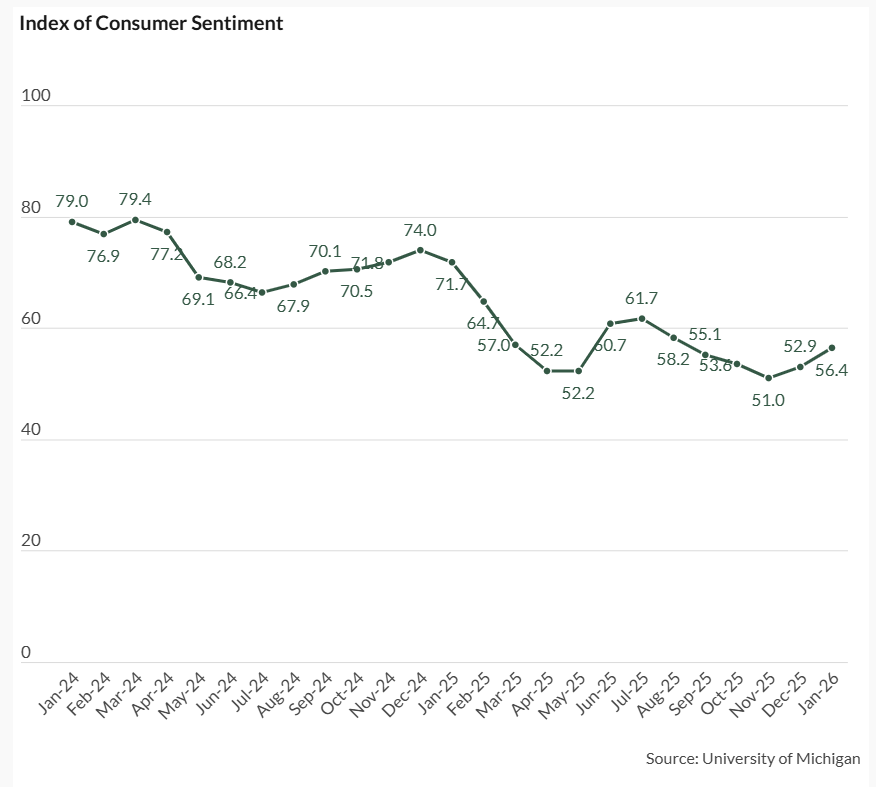
The University of Michigan revision did the heavy lifting. The consumer sentiment index was revised upward by +2.4 to a 5-month high of 56.4, stronger than expectations of no change at 54.0. More important for rates, the University of Michigan US Jan 1-year inflation expectations were revised lower to a 1-year low of 4.0% from the previously reported 4.2%, and Jan 5-10 year inflation expectations were revised lower to 3.3% from the previously reported 3.4%. Those are still elevated levels relative to a 2% target, but the direction of revision was what mattered for the intraday posture.
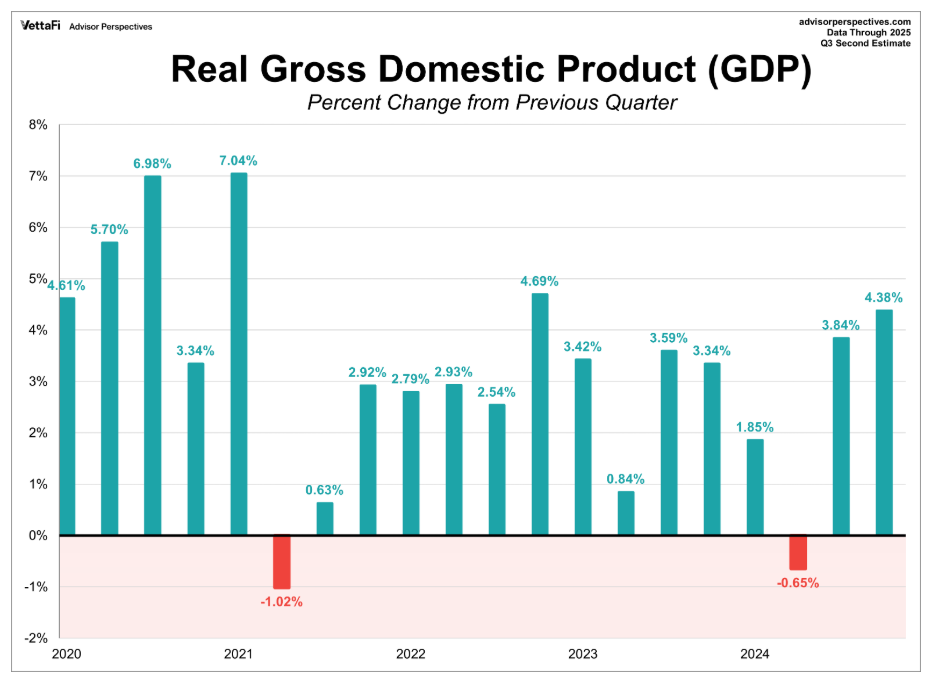
Zooming out to the week’s broader data, the Bureau of Economic Analysis revised U.S. third-quarter economic growth higher. Real GDP increased at an annual rate of 4.4%, up from a previous estimate of 4.3% and ahead of the second quarter’s 3.8% pace. The upward revision was largely driven by higher exports and investment. That is the kind of growth backdrop that makes “imminent recession” hard to sell and supports the idea that corporate profitability can remain resilient even with restrictive policy.
Inflation remains the counterweight. The BEA’s November core personal consumption expenditures (PCE) price index rose 0.2% month over month, in line with October. On a year-over-year basis, core PCE rose 2.8%, still well above the Fed’s 2% target. Put simply, the economy looks strong enough to keep going, and inflation looks sticky enough to keep the Fed cautious. That is why the market is not leaning into a near-term cut.
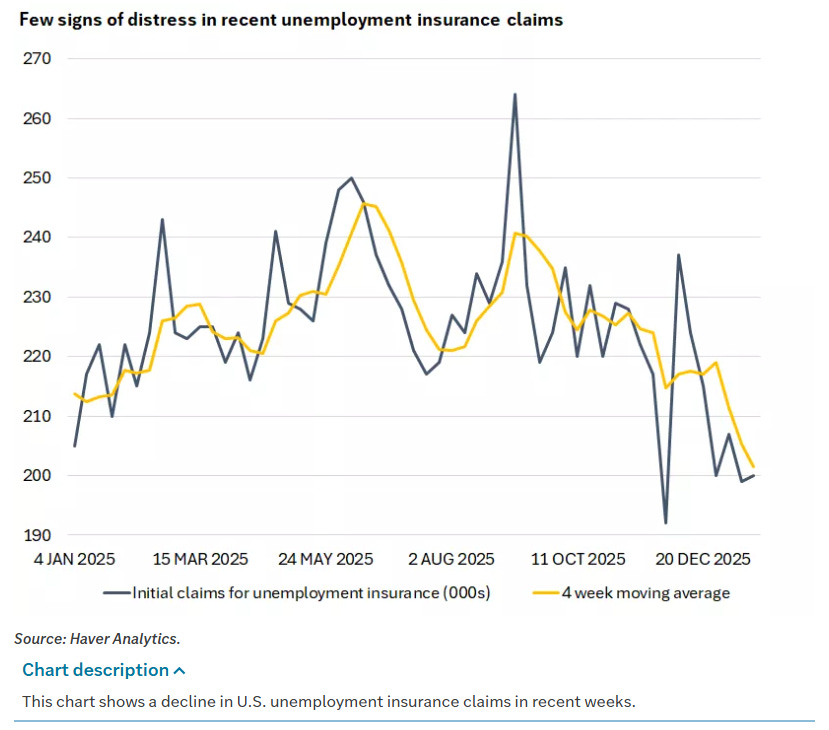
Labor data reinforced the “still firm” read. Initial jobless claims for the week ended January 17 came in at 200,000, a slight increase from the previous week’s revised 199,000 and below estimates for around 207,000. The four-week moving average fell to 201,500, the lowest level in two years. Continuing unemployment claims were 1.849 million in the week ended January 10, down from the prior week’s downwardly revised 1.875 million. Layoffs remain relatively subdued. You can talk about softening and pressure on purchasing power, but the claims data is not telling you that the labor market is breaking.
The sentiment report also carried an important nuance: January’s 56.4 reading is over 20% lower year over year, “as consumers continue to report pressures on their purchasing power stemming from high prices and the prospect of weakening labor markets.” That is a useful reminder of the regime we are in. Growth can be resilient while consumers still feel squeezed. That is not a contradiction. It is the environment.
S&P Global’s Flash U.S. Composite PMI added another layer. U.S. business activity growth inched higher in January, manufacturing outpaced services, and business confidence “remained positive but dipped slightly,” as “ongoing worries over the political environment and higher prices” offset optimism around economic growth prospects and demand conditions. This continues to describe a market that wants to believe in a soft landing but does not want to pretend policy risk has disappeared.
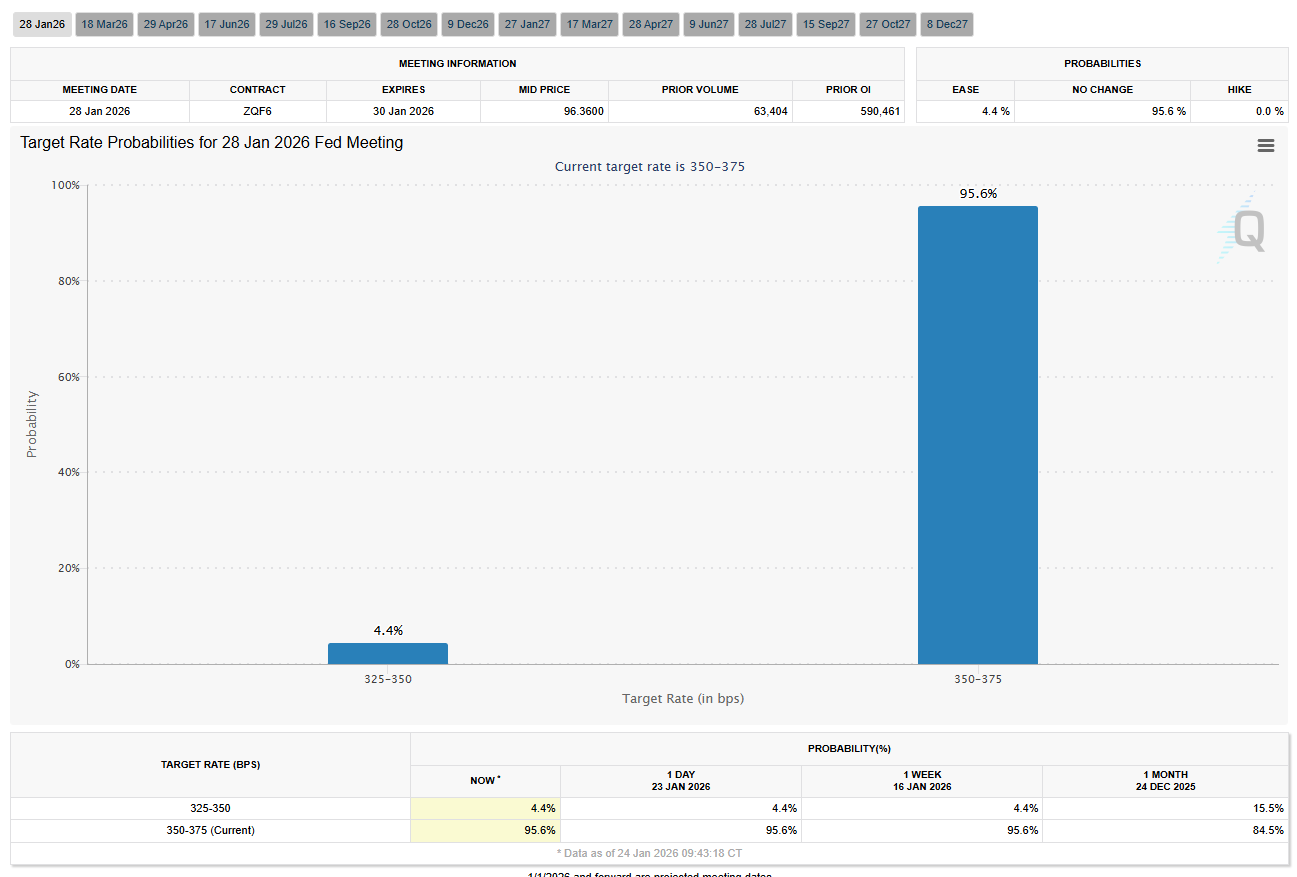
All of that lands directly on the Fed question. The markets are discounting the odds to 3% for a -25 bp rate cut at the FOMC’s next meeting on January 27-28. That is essentially a “no cut” baseline. If the Fed does what is expected, you do not get a huge “surprise rally” from the decision itself. The market will care far more about tone and the implied path.
There is also a separate, less comfortable issue embedded in rates: uncertainty around Fed leadership. T-notes are under pressure after President Trump expressed reluctance to name Kevin Hassett as the next Fed Chair and said he would prefer to keep him as National Economic Council director. The market saw Hassett as the most dovish candidate and the top contender. The notes add the key implication: nominating someone like Kevin Warsh, described here as a known hawk and the second-most-likely candidate, would be bearish for T-note prices. That is not a daily catalyst, but it is the kind of story that can add a risk premium to duration.
Rates: A Small Ease in Yields Helped Stabilize the Tape
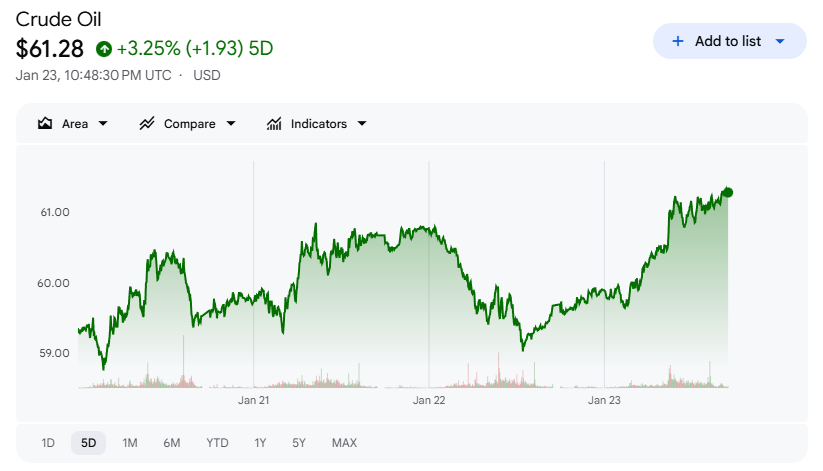
On Friday, rates were the stabilizer, not the obstacle. March 10-year T-notes (ZNH6) closed up by +2.5 ticks, and the 10-year T-note yield fell by -1.2 bp to 4.233%. The intraday path was clean: T-notes initially moved lower after WTI crude jumped more than +2% to a 1-week high, which is a negative factor for inflation expectations. Then the University of Michigan inflation expectations revisions came in softer and the market allowed yields to ease.
In Europe, yields moved higher. The 10-year German bund yield jumped to a 3-week high of 2.908% and finished up +1.9 bp to 2.906%. The 10-year UK gilt yield climbed to a 2.5-week high of 4.517% and finished up +3.8 bp to 4.512%. This coincided with stronger data: the Eurozone Jan S&P manufacturing PMI rose +0.6 to 49.4 versus expectations of 49.2. The UK Jan S&P manufacturing PMI rose +1.0 to 51.6, above expectations of 50.6, and the fastest pace of expansion in 17 months. UK Dec retail sales ex-autos rose +0.3% m/m, stronger than expectations of no change. In that context, the note that swaps are discounting a 0% chance of a +25 bp hike by the ECB at its next policy meeting on February 5 is important. It is not a hike story. It is a “growth is not collapsing” story, which can keep yields firm.
Equities: Headline Volatility, Leadership Concentration
This was a volatile, holiday-shortened week, with U.S. markets closed Monday for Martin Luther King Jr. Day. The defining feature was a whipsaw between trade-war fear and policy de-escalation, followed by a return to fundamentals and earnings.
The Tuesday selloff had a clear narrative. Stocks traded sharply lower to start the week, with the S&P 500 posting its largest daily decline since October amid renewed fears of a global trade war after President Trump announced he would impose new tariffs on European nations that opposed the U.S. purchasing or otherwise taking control of Greenland. The market treated it as a growth-and-inflation shock at once.
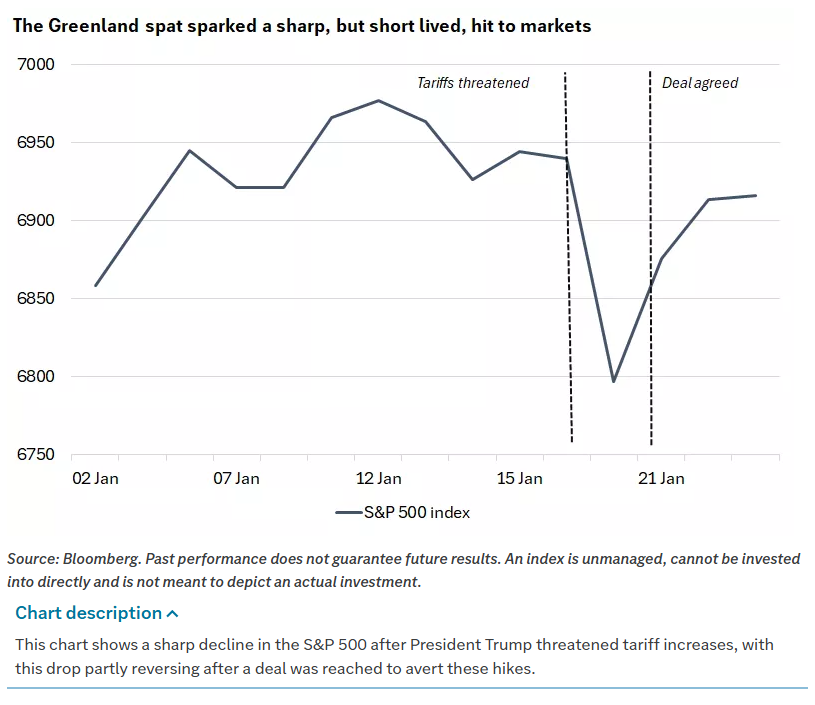
Then came the reversal. On Wednesday, Trump appeared to soften his stance. In a social media post, he said he and NATO Secretary General Mark Rutte had “formed the framework of a future deal with respect to Greenland” and that he would no longer “be imposing the Tariffs that were scheduled to go into effect on February 1st.” Stocks rallied on the news, ultimately finishing the week above their worst levels.
The notes provide extra specificity that explains why Tuesday was so violent: Trump threatened to raise tariffs on eight European trading partners by 10% on February 1 unless a deal was in place to buy the island, with the penalty increasing to 25% by June. That is not vague. That is a schedule. Markets hate schedules when they introduce a near-term policy shock.
This episode also had a notable wrinkle: during the initial tariff shock, assets that would typically benefit from a risk-off move, U.S. government bonds and the dollar, also sold off. That is described as a brief return to the “sell-U.S.” narrative that appeared at times in 2025. The quick emergence of a deal to address U.S. security interests in Greenland, while seemingly not impacting local sovereignty, helped equities rebound.
Friday then brought the focus back to the standard drivers. The market recovered from early losses and turned higher after the Magnificent Seven rallied, even after INTC’s -17% shock. That is a reminder that when stress appears, leadership concentration still matters. The market can feel weak at the surface and still get carried by the same few names.
Commodities and Geopolitics: Two Different Risk Signals
Two commodity moves told two different stories.
Energy moved on geopolitics. WTI crude oil jumped more than +2% on Friday to a 1-week high. It lifted energy producers after President Trump revived threats to use military force against Iran’s senior leadership for its violent crackdown on protests. Crude also rose after the Financial Times reported that the U.S. is threatening to curb the supply of dollars for Iraqi oil sales as it pressures Iraq’s leading politicians to form a government that excludes Iran-backed militia groups. That is risk premium oil, not demand-driven oil, and risk premium oil matters because it can push inflation expectations higher and complicate rates.
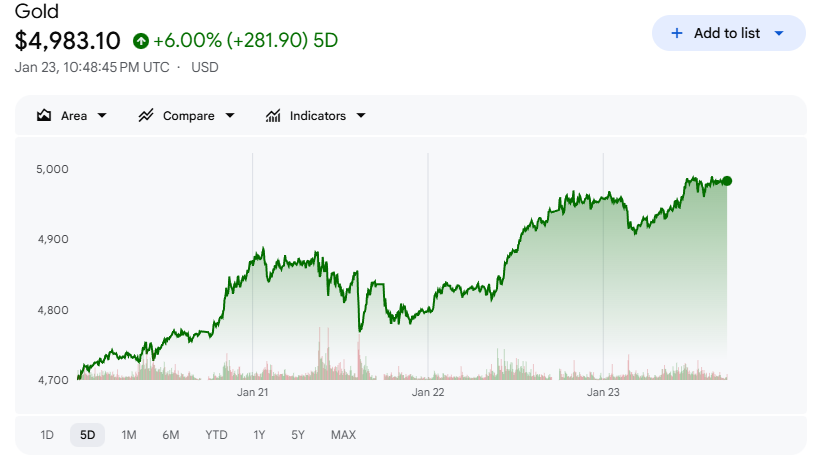
Precious metals moved on a different fear. Gold, silver, and platinum prices rose to fresh record highs on Friday, boosting mining stocks. The drivers listed were a weaker dollar, geopolitical risks, and renewed threats to the Fed’s independence, increasing demand for precious metals as a store of value. The notes quantify gold’s move: up 15% year-to-date after a 65% gain last year. That is not a casual drift. It is a sustained repricing that aligns with the idea that investors are still paying for insurance.
Earnings Season: Early Read Good, Real Test Now
Earnings are the next gating item for this tape. Q4 earnings season is beginning in earnest this week and has been positive so far: 81% of the 40 S&P 500 companies that have reported have beaten expectations. According to Bloomberg Intelligence, S&P earnings growth is expected to climb by +8.4% in Q4. Excluding the Magnificent Seven, Q4 earnings are expected to increase by +4.6%.
Those figures matter because they set the hurdle. +8.4% is a supportive earnings backdrop. +4.6% ex-Magnificent Seven is the breadth test. If that ex-megacap figure holds and the market sees improving profitability across broader segments, then the “broadening leadership” narrative has real footing. If it softens, the market is more likely to revert to narrow leadership because it has to.
This week’s calendar intensifies with Meta (META), Apple (AAPL), Tesla (TSLA), and Microsoft (MSFT) due to report. The notes frame the key question: do we see translation of heavy AI investment into revenue growth and profits? Markets have shown signs of rotation away from some of these names this year, with the Magnificent 7 broadly flat on the year so far, in contrast to better performance from other large-cap companies and significantly lagging small-cap stocks. Still, the technology sector is expected to deliver the strongest earnings growth across the S&P 500 this year, even if the gap with other sectors is seen narrowing. That combination is the tension: leadership may broaden, but tech still holds the earnings crown.
Policy: Tariffs in the Courts, Tariffs in the Headlines
Tariff uncertainty is not going away quickly. The Supreme Court did not issue a ruling on challenges to President Trump’s reciprocal tariffs and did not say when it will issue its next opinions, meaning it will likely be at least another month before ruling as the court begins a four-week recess. So the market is stuck pricing uncertainty rather than pricing resolution.
At the same time, the Greenland tariff episode showed how quickly headline policy can drive violent repricing and then reverse. On Wednesday, Trump said he would refrain from imposing tariffs on goods from European nations that oppose his effort to acquire Greenland. NATO Secretary General Rutte said a breakthrough was secured without discussing the territory’s sovereignty, instead focusing on broader security in the Arctic region. Whether you view that as de-escalation or a reframing, the market treated it as removal of an immediate shock.
Credit and the Risk Pulse
The notes highlight a relationship worth respecting: corporate bonds outperformed Treasuries. U.S. Treasuries posted modest losses heading into Friday, with short-term yields edging higher and longer-term yields declining slightly. Municipal bonds also lost ground amid rate volatility, though new issuance was relatively well absorbed. Meanwhile, corporate bonds posted gains, outperforming U.S. Treasuries amid improving macroeconomic sentiment and resilient investor demand. That is consistent with the idea that this was more of a headline-volatility week than a systemic stress week.
What the Week Was Really About
This was not a week of clean trend. It was a week of policy volatility that ultimately failed to break the broader structure because fundamentals remained sturdy enough to reassert themselves.
Growth was revised higher to 4.4% GDP. Inflation remained elevated with core PCE at 2.8% year over year. Claims stayed low with 200,000 initial claims and a four-week average of 201,500, the lowest in two years. Sentiment improved to 56.4, and inflation expectations eased at the margin, with 1-year expectations revised to 4.0% and 5-10 year expectations revised to 3.3%. The 10-year yield eased to 4.233%. The market is pricing only 3% odds of a -25 bp cut at the January 27-28 FOMC meeting, which keeps the bar high for a dovish surprise.
The risks are not “the economy is collapsing.” The risks are policy volatility, tariff uncertainty, geopolitics that can reprice energy and inflation expectations abruptly, and the ongoing question of whether earnings breadth can catch up to earnings concentration.
At the same time, the tape is sending a diversification message. The dollar’s sell-off persisted even after the Greenland de-escalation, with the greenback finishing the week 1.2% lower against a trade-weighted basket of currencies, its worst week since last June. Precious metals rose to fresh record highs, with gold up 15% year-to-date after a 65% gain last year. Those moves are not incompatible with a constructive equity view, but they are consistent with a market paying for insurance against policy and geopolitical uncertainty.

Weekly Benchmark Breakdown
Uptrend Intact, Short-Term Participation Slips
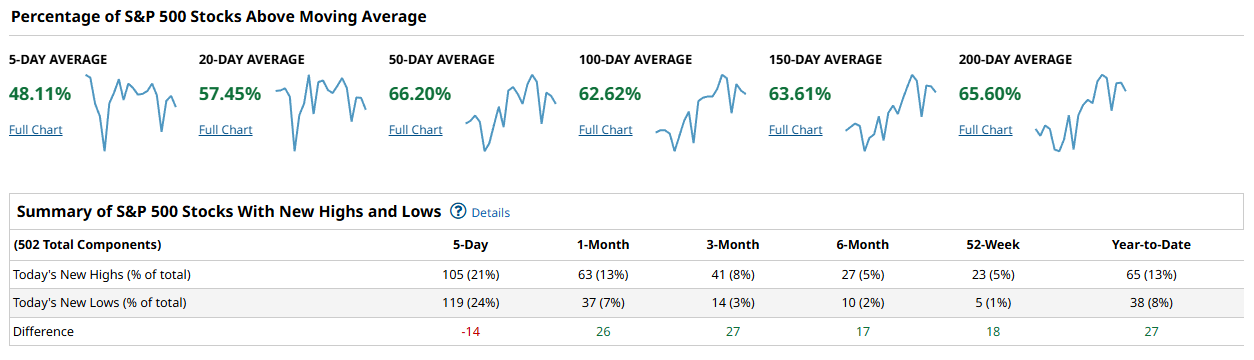
Breadth still reads like an uptrend that is losing some near-term thrust. The intermediate cohorts are generally healthy, but the very short-term measures are where the cracks show up. You can see it in the 5-day moving-average participation and, more importantly, in the 5-day new highs vs new lows: the market is still broadly above its key trend lines, yet fewer names are pressing fresh highs right now, especially outside the largest, steadiest leadership.
For the S&P 500, the backbone remains solid. About 66.20% of constituents are above the 50-day, 62.62% above the 100-day, 63.61% above the 150-day, and 65.60% above the 200-day. That is a market with a lot of stocks still in constructive trends. But the short-term is softer: only 48.11% are above the 5-day, with 57.45% above the 20-day. The new highs/new lows table reinforces that same message. Over the past 5 days, new lows (119, or 24%) exceeded new highs (105, or 21%) for a -14 spread. Zoom out and the picture improves: 1-month is +26, 3-month is +27, 6-month is +17, 52-week is +18, and year-to-date is +27. Translation: the intermediate trend is still supportive, but the tape is choppier and more rotational in the near-term.
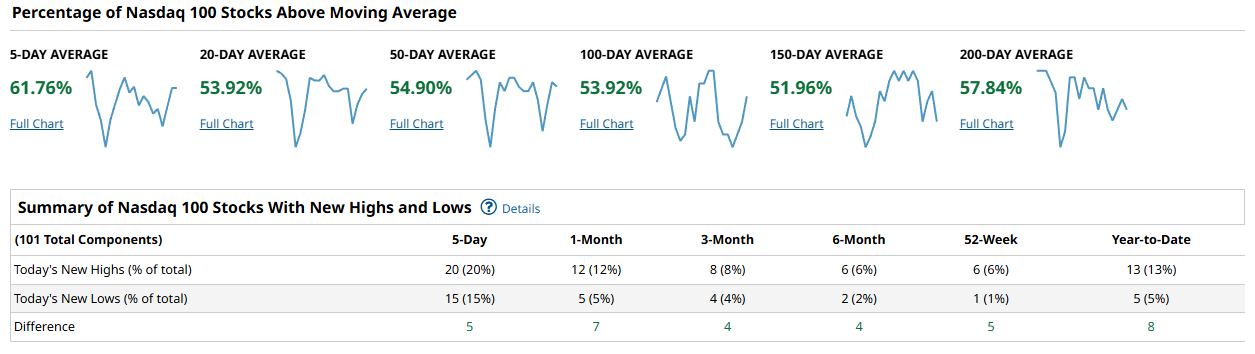
The Nasdaq 100 looks more balanced and a touch more stable in the short run, even if its intermediate breadth is not as strong as the S&P. Participation is 61.76% above the 5-day, 53.92% above the 20-day, 54.90% above the 50-day, 53.92% above the 100-day, 51.96% above the 150-day, and 57.84% above the 200-day. That is not a roaring breadth thrust, but it is not breaking down either. The new highs/new lows data is consistently positive across horizons: +5 over 5 days (20 highs vs 15 lows), +7 over 1 month, +4 over 3 months, +4 over 6 months, +5 over 52-week, and +8 year-to-date. In plain terms, mega-cap growth is not immune to noise, but it is still generating more winners than losers.
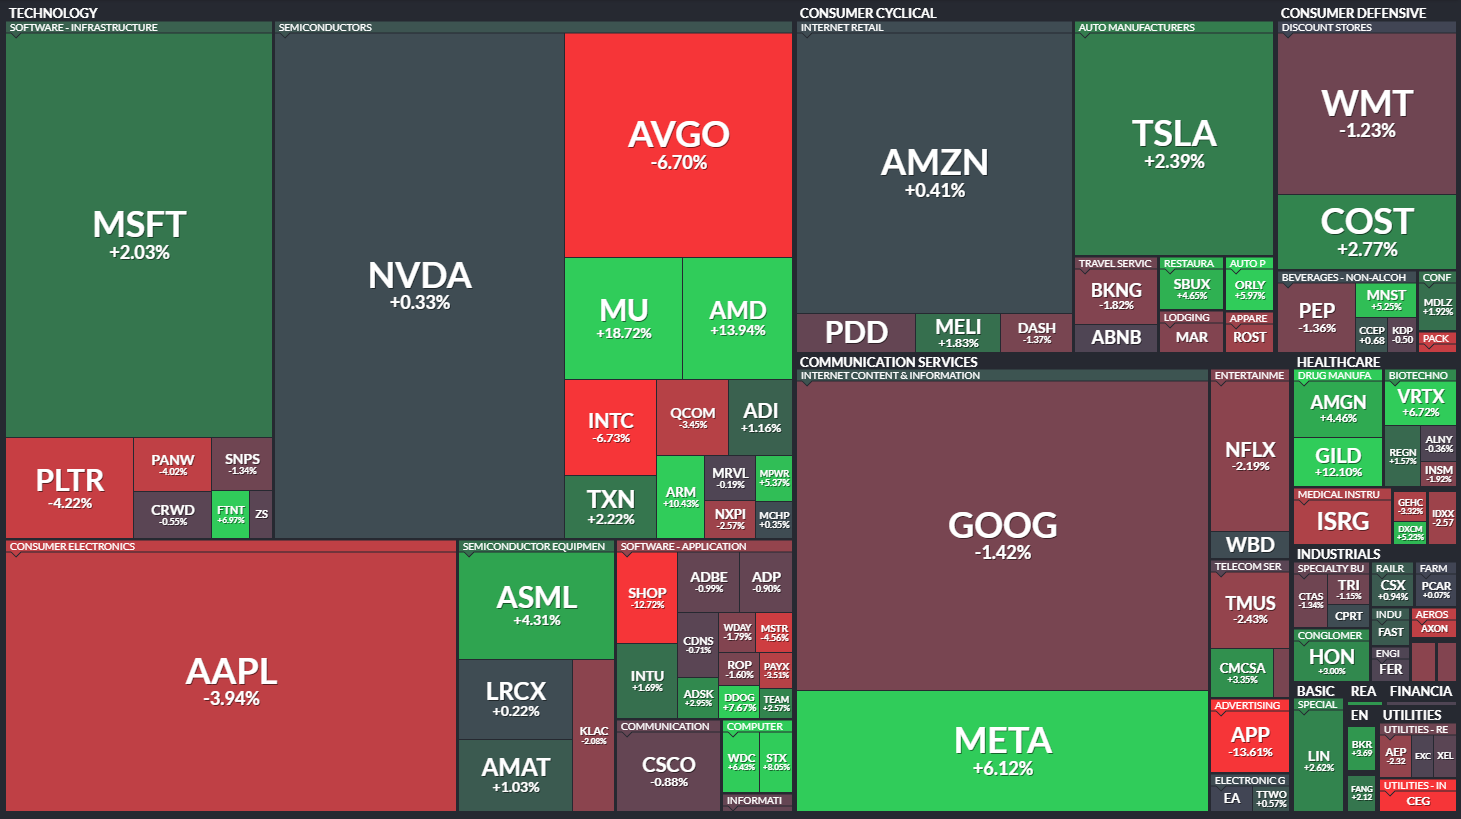
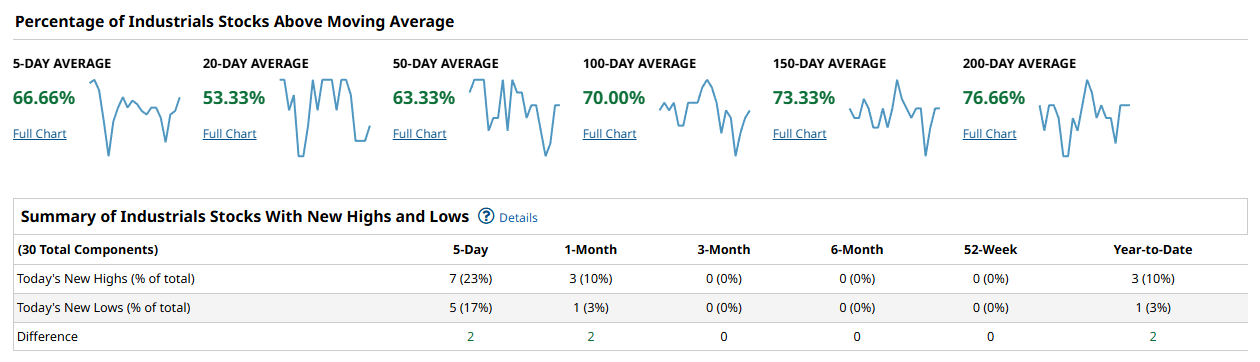
The Dow (Industrials in your table) is the cleanest breadth profile of the four. Long-term participation is outright strong: 70.00% above the 100-day, 73.33% above the 150-day, and 76.66% above the 200-day. Even the 50-day sits at 63.33%. The only mild wrinkle is the 20-day at 53.33%, while the 5-day is a firm 66.66%. New highs exceed new lows over the short lookbacks: +2 over 5 days (7 highs vs 5 lows) and +2 over 1 month (3 highs vs 1 low). The longer lookbacks are flat (0 highs and 0 lows on the 3-month, 6-month, and 52-week columns), which mostly reflects a narrow, mature index rather than a warning sign. This is steady leadership, not a speculative thrust.
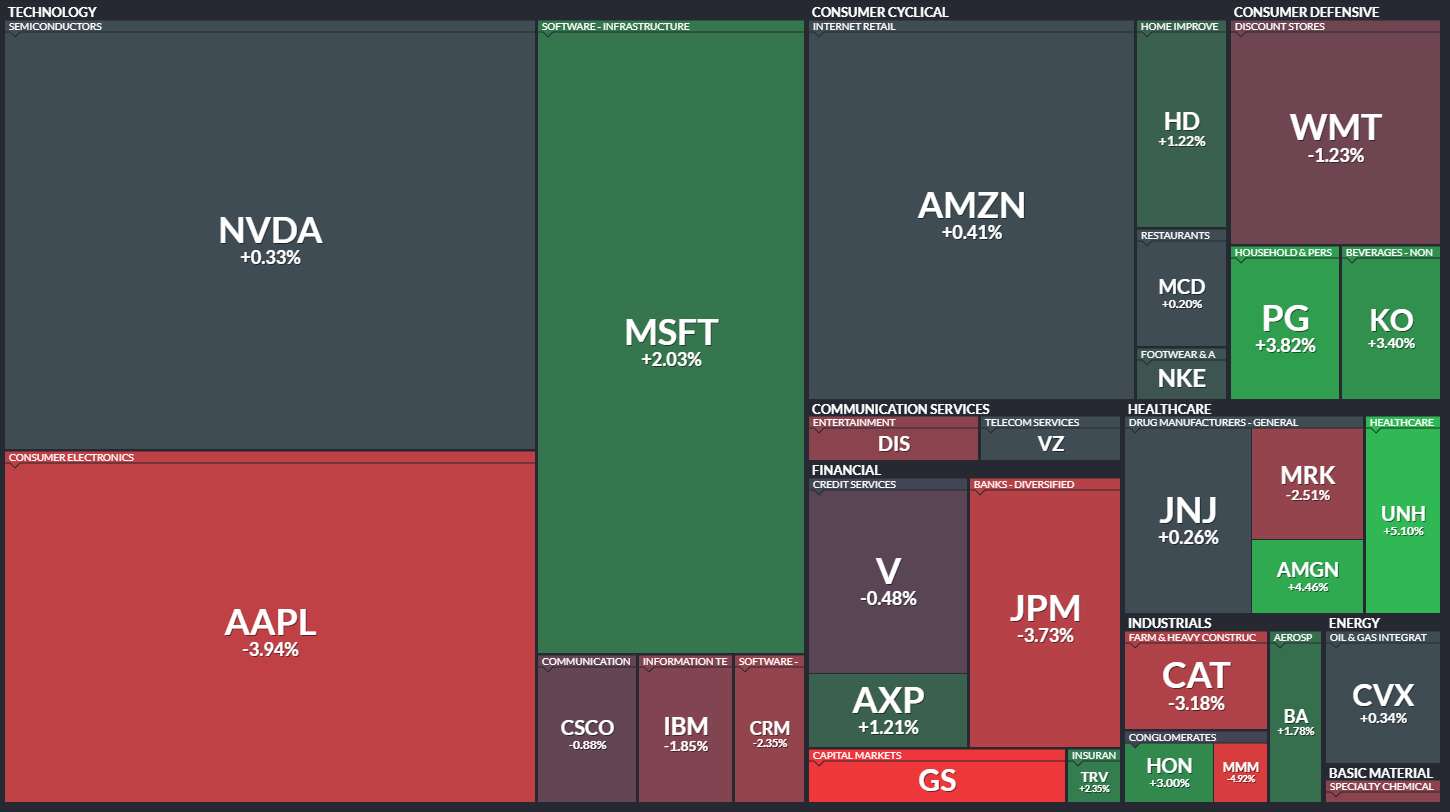
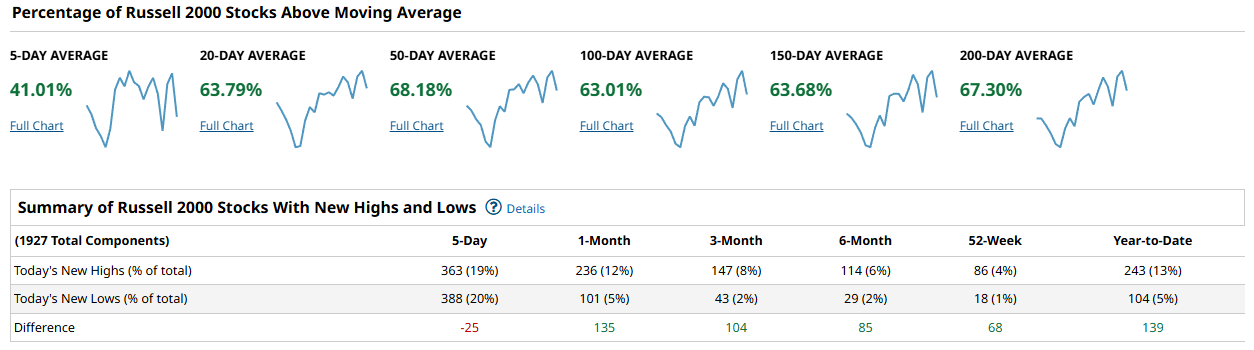
The Russell 2000 is where the message gets the most interesting. Intermediate breadth is strong: 68.18% above the 50-day, 63.01% above the 100-day, 63.68% above the 150-day, and 67.30% above the 200-day. Even the 20-day is 63.79%. But the 5-day drops to 41.01%, and the 5-day highs/lows spread is negative: -25 (363 highs vs 388 lows). That combination usually means small caps have been hit with fast profit-taking and dispersion, even though the broader trend structure still looks constructive. Step back from the last week and the Russell breadth actually looks excellent: +135 over 1 month, +104 over 3 months, +85 over 6 months, +68 over 52-week, and +139 year-to-date. So the issue is not that the uptrend is gone. The issue is that the short-term tape has gotten more two-sided.
Putting it together, cap-weighted leadership is doing its job, but the broad market is at a near-term decision point. The S&P and Russell both show the same pattern: strong 50/100/150/200-day participation, but weak 5-day participation and negative 5-day highs/lows. The Nasdaq 100 stays net-positive on highs/lows across all horizons, and the Dow looks like the defensive-growth blend of steady trend continuation. For a durable advance from here, you want confirmation that participation is re-widening, not just holding. Concretely, you want the S&P 500 to repair the 5-day cohort (48.11% is light) and for the 5-day highs/lows spread to flip back positive. For the Russell, the tell is whether that 41.01% above the 5-day rebounds while the 5-day -25 spread turns back into net new highs.
The playbook this week is to respect the intermediate uptrend while treating the short-term as “guilty until proven innocent”. Favor the areas and styles that are still producing net new highs consistently (the Nasdaq 100 profile) and the steady trend complex (the Dow profile). Be more selective in small caps until you see the 5-day participation recover and the 5-day new highs regain control over new lows. If the short-term breadth repairs quickly, that is your green light to add risk more aggressively. If it does not, expect more chop, more rotation, and more punishment for chasing extended moves.
Bottom line: the trend is still up, but short-term breadth is flashing caution, so stay constructive with a tighter leash until 5-day participation and new highs reassert themselves.

Investor Sentiment Report
%Bull-Bear Spread
The %Bull-Bear Spread measures the gap between bullish and bearish investor sentiment, often from surveys like AAII. It’s a contrarian indicator—extreme optimism may signal a coming pullback, while extreme pessimism can hint at a potential rally. Large positive or negative spreads often mark market turning points.
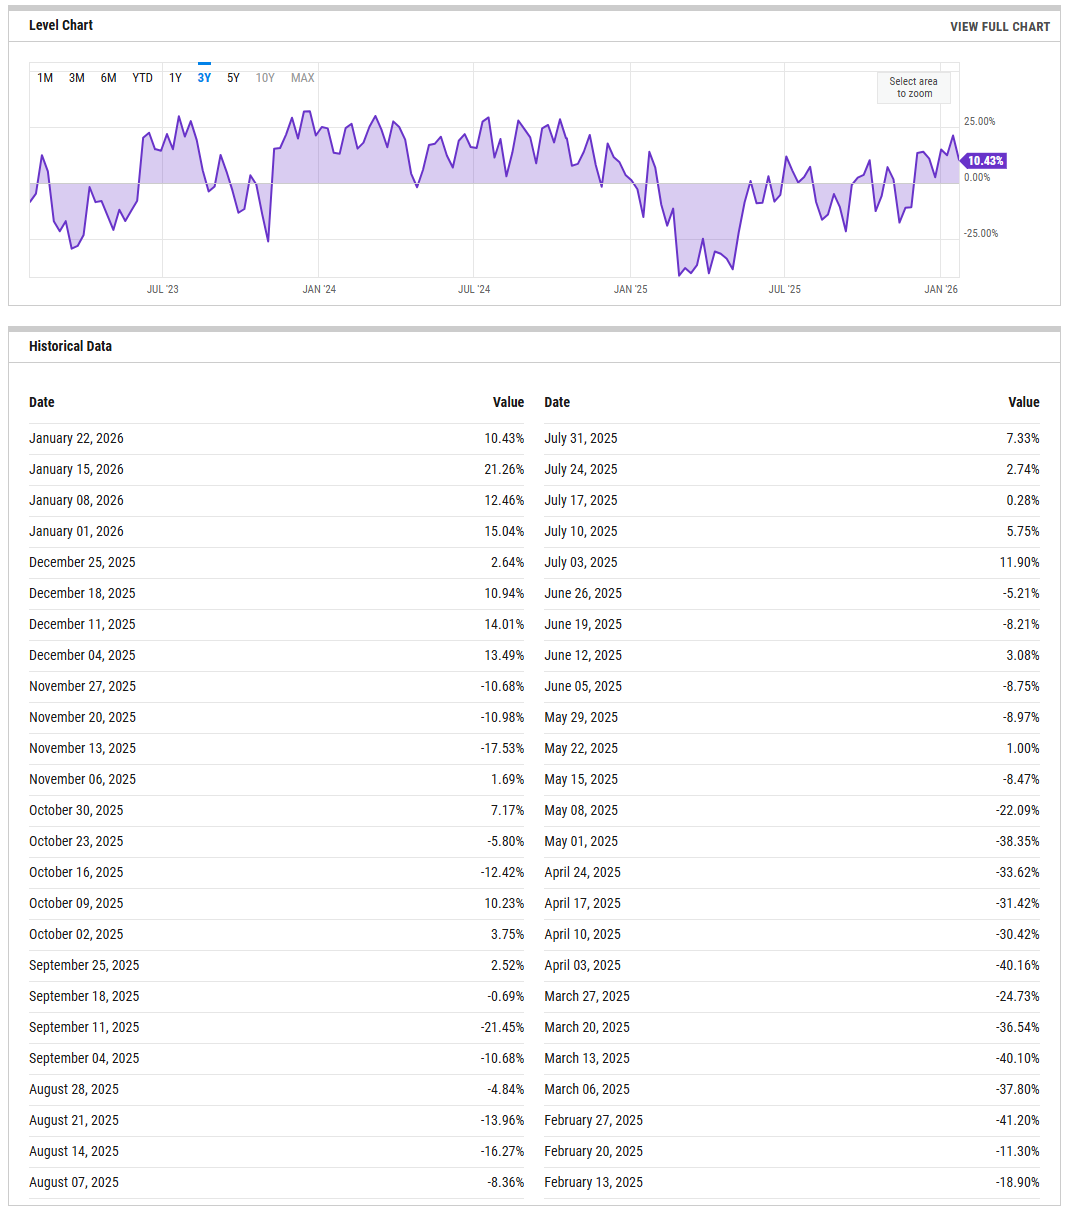
The percent bull minus bear spread is currently modestly positive, sitting at 10.43% on the latest reading. That is down meaningfully from mid-January highs north of 20%, and well off the more exuberant prints seen late last year. In practical terms, sentiment has cooled without flipping pessimistic. This is no longer a crowded long, but it is not a washout either. From a contrarian lens, sub-zero readings would be supportive for a sharper rebound, while a push back above 20% would signal sentiment getting stretched again. For now, the spread says optimism is present but no longer extreme, which tends to limit near-term upside velocity while also reducing downside risk.
NAAIM Exposure Index
The NAAIM Exposure Index (National Association of Active Investment Managers Exposure Index) measures the average exposure to U.S. equity markets as reported by its member firms. These are typically active money managers who provide their equity exposure levels weekly. The index offers insight into how much these managers are investing in equities at any given time, ranging from being fully short (-100%) to leveraged long (up to +200%).
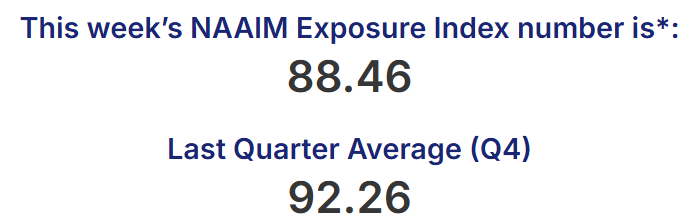
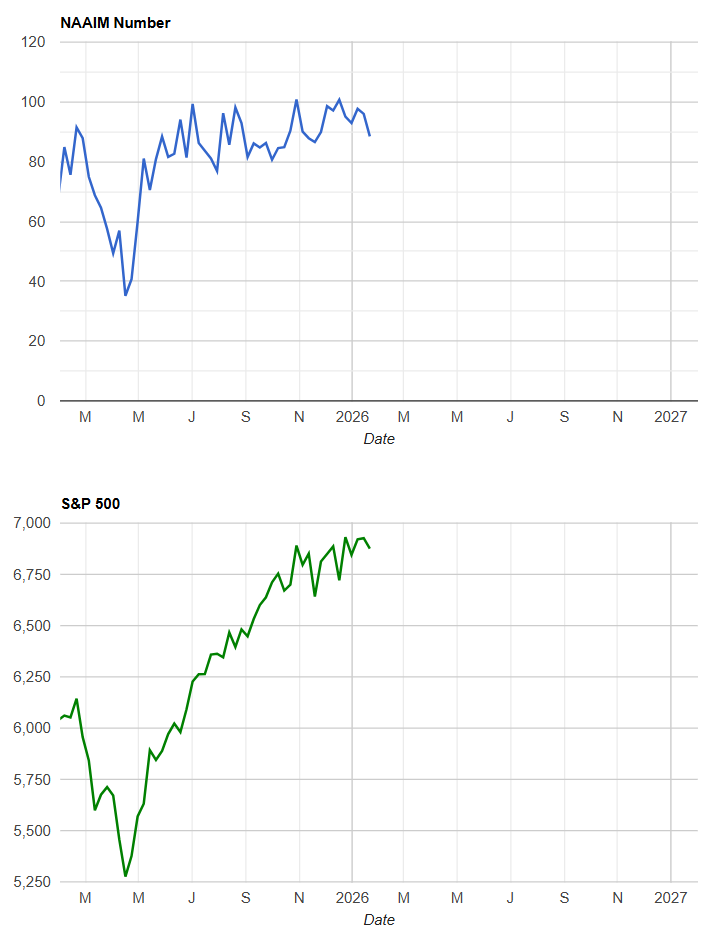
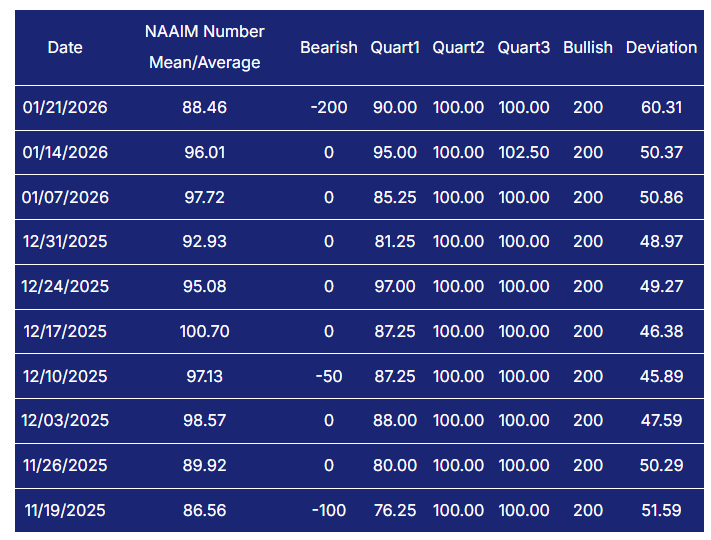
Overlaying that with the NAAIM Exposure Index adds texture. Active managers are still heavily invested, with the most recent average exposure at 88.46. That is down from the high 90s and occasional 100+ readings seen through December and early January, but it remains elevated by historical standards. This tells you there is not a lot of dry powder on the sidelines, and the market is still vulnerable to bouts of de-risking if price stumbles. At the same time, the gentle drift lower in exposure suggests some risk has already been trimmed. The key tripwires are straightforward. A clean drop into the 50s without meaningful price damage would be constructive, signaling reset without stress. A renewed push back into the 90s and above would imply crowding risk is rebuilding.
CBOE Total Put/Call Ratio
CBOE's total put/call ratio includes index options and equity options. It's a popular indicator for market sentiment. A high put/call ratio suggests that the market is overly bearish and stocks might rebound. A low put/call ratio suggests that market exuberance could result in a sharp fall.
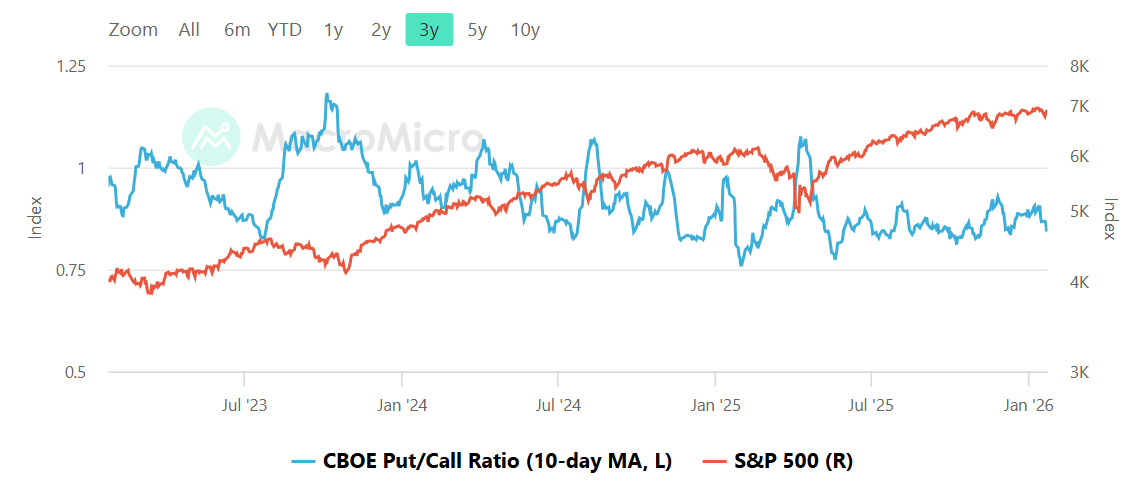
The CBOE total put/call ratio, shown with a 10-day moving average, remains subdued and clearly below the fear zone. While the exact reading is not labeled numerically, the line is well under the 1.0 area that typically marks defensive positioning, and it does not appear pressed down toward the frothier 0.7-0.8 extremes either. This places options positioning in a neutral-to-optimistic regime. Traders are not aggressively hedged, but they are also not leaning so hard into calls that the market is fragile to even minor shocks. In this environment, pullbacks tend to be shallower and more rotational than panicky, and rebounds are more likely to be grinding than explosive. The tripwires here are familiar. A sustained move toward 1.0 would indicate rising caution and set the stage for better risk-reward on the long side. A slide toward the low 0.8s or below would suggest complacency returning and would raise the odds that any volatility shock has teeth.
Equity vs Bond Volatility
The Merrill Lynch Option Volatility Estimate [MOVE] Index from BofAML and the CBOE Volatility Index [VIX] respectively represent market volatility of U.S. Treasury futures and the S&P 500 index. They typically move in tandem but when they diverge, an opportunity can emerge from one having to “catch-up” to the other.
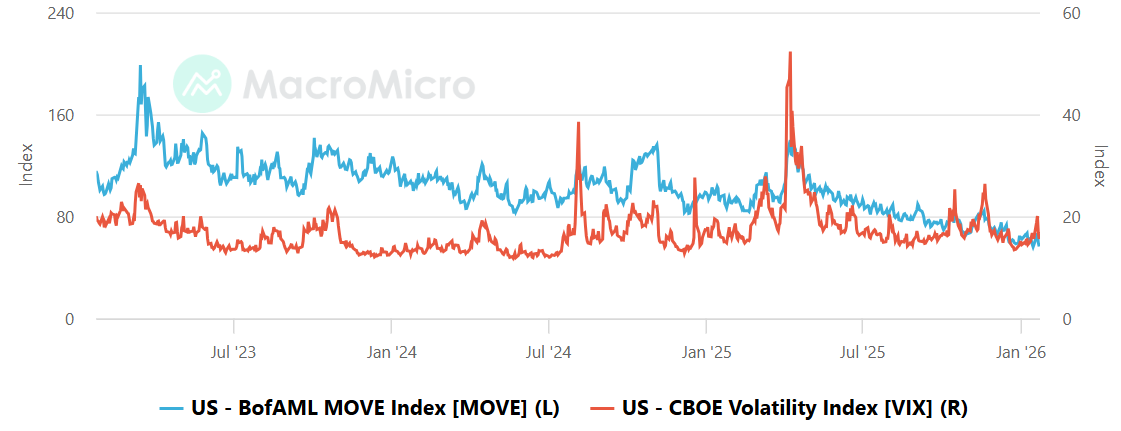
Looking at bond volatility versus equity volatility, both measures remain contained. The MOVE index is trending lower over the multi-year window and sits well off its prior spikes, while the VIX is likewise subdued and far from stress levels. There is no visible divergence where bond volatility is screaming higher ahead of equities. That matters, because sustained MOVE spikes often lead equity volatility rather than follow it. Right now, the message is one of macro calm and stable liquidity conditions. Markets are not pricing a rates shock, and equities are not being forced to reprice risk rapidly. The practical implication is that trend-following behavior can persist, but with less urgency. The tripwires are clear. A MOVE push above roughly 120 while VIX stays sleepy would be an early warning that something is brewing under the surface. Alternatively, a VIX move into the high teens would signal equities themselves are starting to feel stress, regardless of what bonds are doing.
CNN Fear & Greed
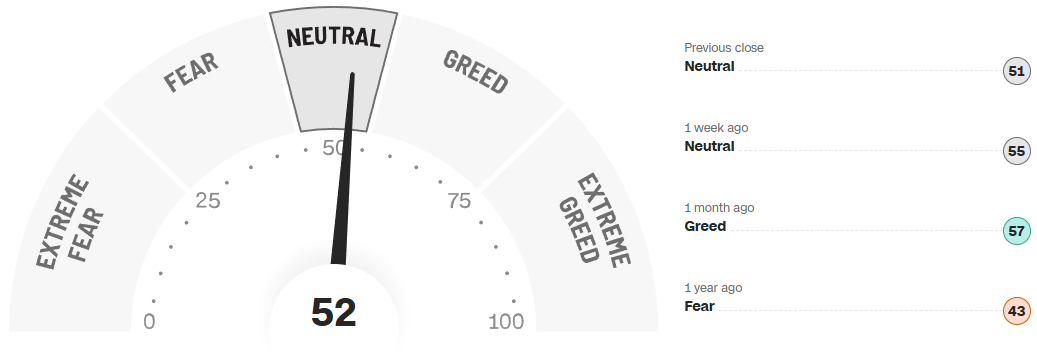
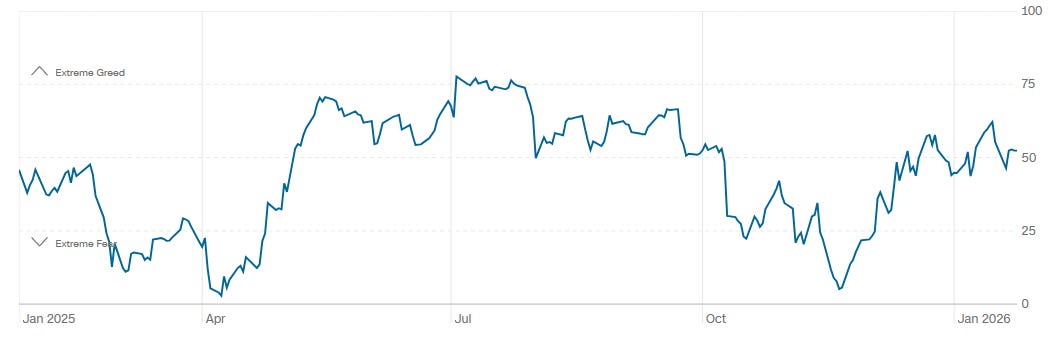
The CNN Fear and Greed composite currently reads 52, squarely in Neutral. One week ago it was 55, also Neutral, and one month ago it registered 57 in Greed. A year ago, the gauge sat at 43, firmly in Fear. The one-year path shows a market that washed out into fear earlier in 2025, then steadily recovered back toward the middle of the range. This is classic mid-cycle sentiment behavior rather than a late-stage blowoff. Investors are engaged, but they are not euphoric, and fear is not driving decision-making. From a tactical standpoint, neutral readings tend to support continuation with more two-sided trade. The tripwires are useful here. A push into the mid-60s or higher would raise the risk of sentiment exhaustion. A drop back toward the low-30s would likely coincide with better entry opportunities, assuming price damage remains contained.
Social Media Favs
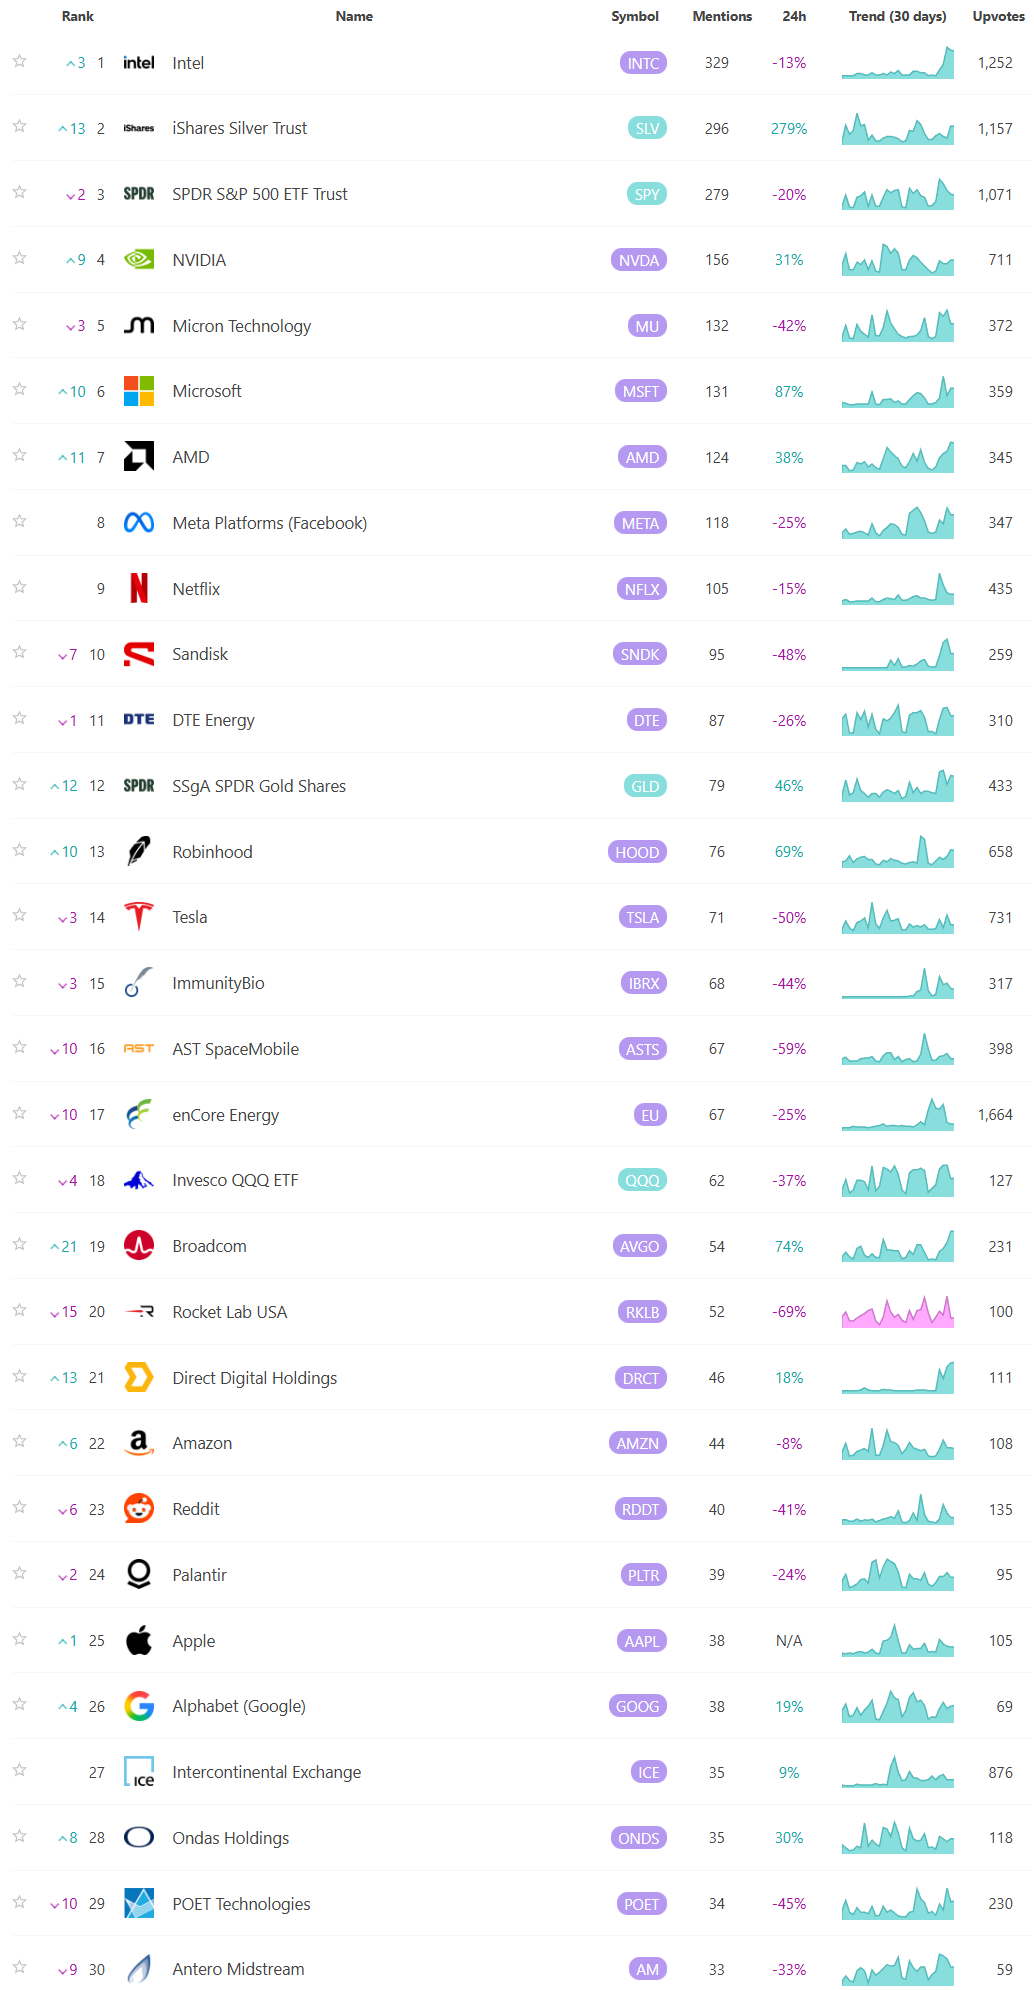
Social sentiment offers a real-time view of investor mood, often revealing market shifts before traditional indicators. It can signal momentum changes, spot emerging trends, and gauge retail investor impact—especially in high-volatility names. Tracking sentiment around events or earnings provides actionable insights, and when layered with quantitative models, can enhance predictive accuracy and risk management. Sustained sentiment trends often mirror broader market cycles, making this data a valuable tool for both short-term trades and long-term positioning.

Technician’s Playbook: Trading the Majors (SPY/QQQ/IWM/DIA)
When you’re a large institutional player, your primary goal is to find liquidity - places to do a ton of business with the least amount of slippage possible. VolumeLeaders.com automatically identifies and visually plots the exact spots where institutions are doing business and where they are likely to return for more. It’s one of the primary reasons “support” and “resistance” concepts work and truly one of the reasons “price has memory”.
The tape over the past month has been defined by strong impulses, sharp but contained pullbacks, and repeated tests of well-advertised volume shelves. Across indices, the common thread is acceptance above heavy support after fast downside probes, followed by more selective upside follow-through rather than runaway momentum.
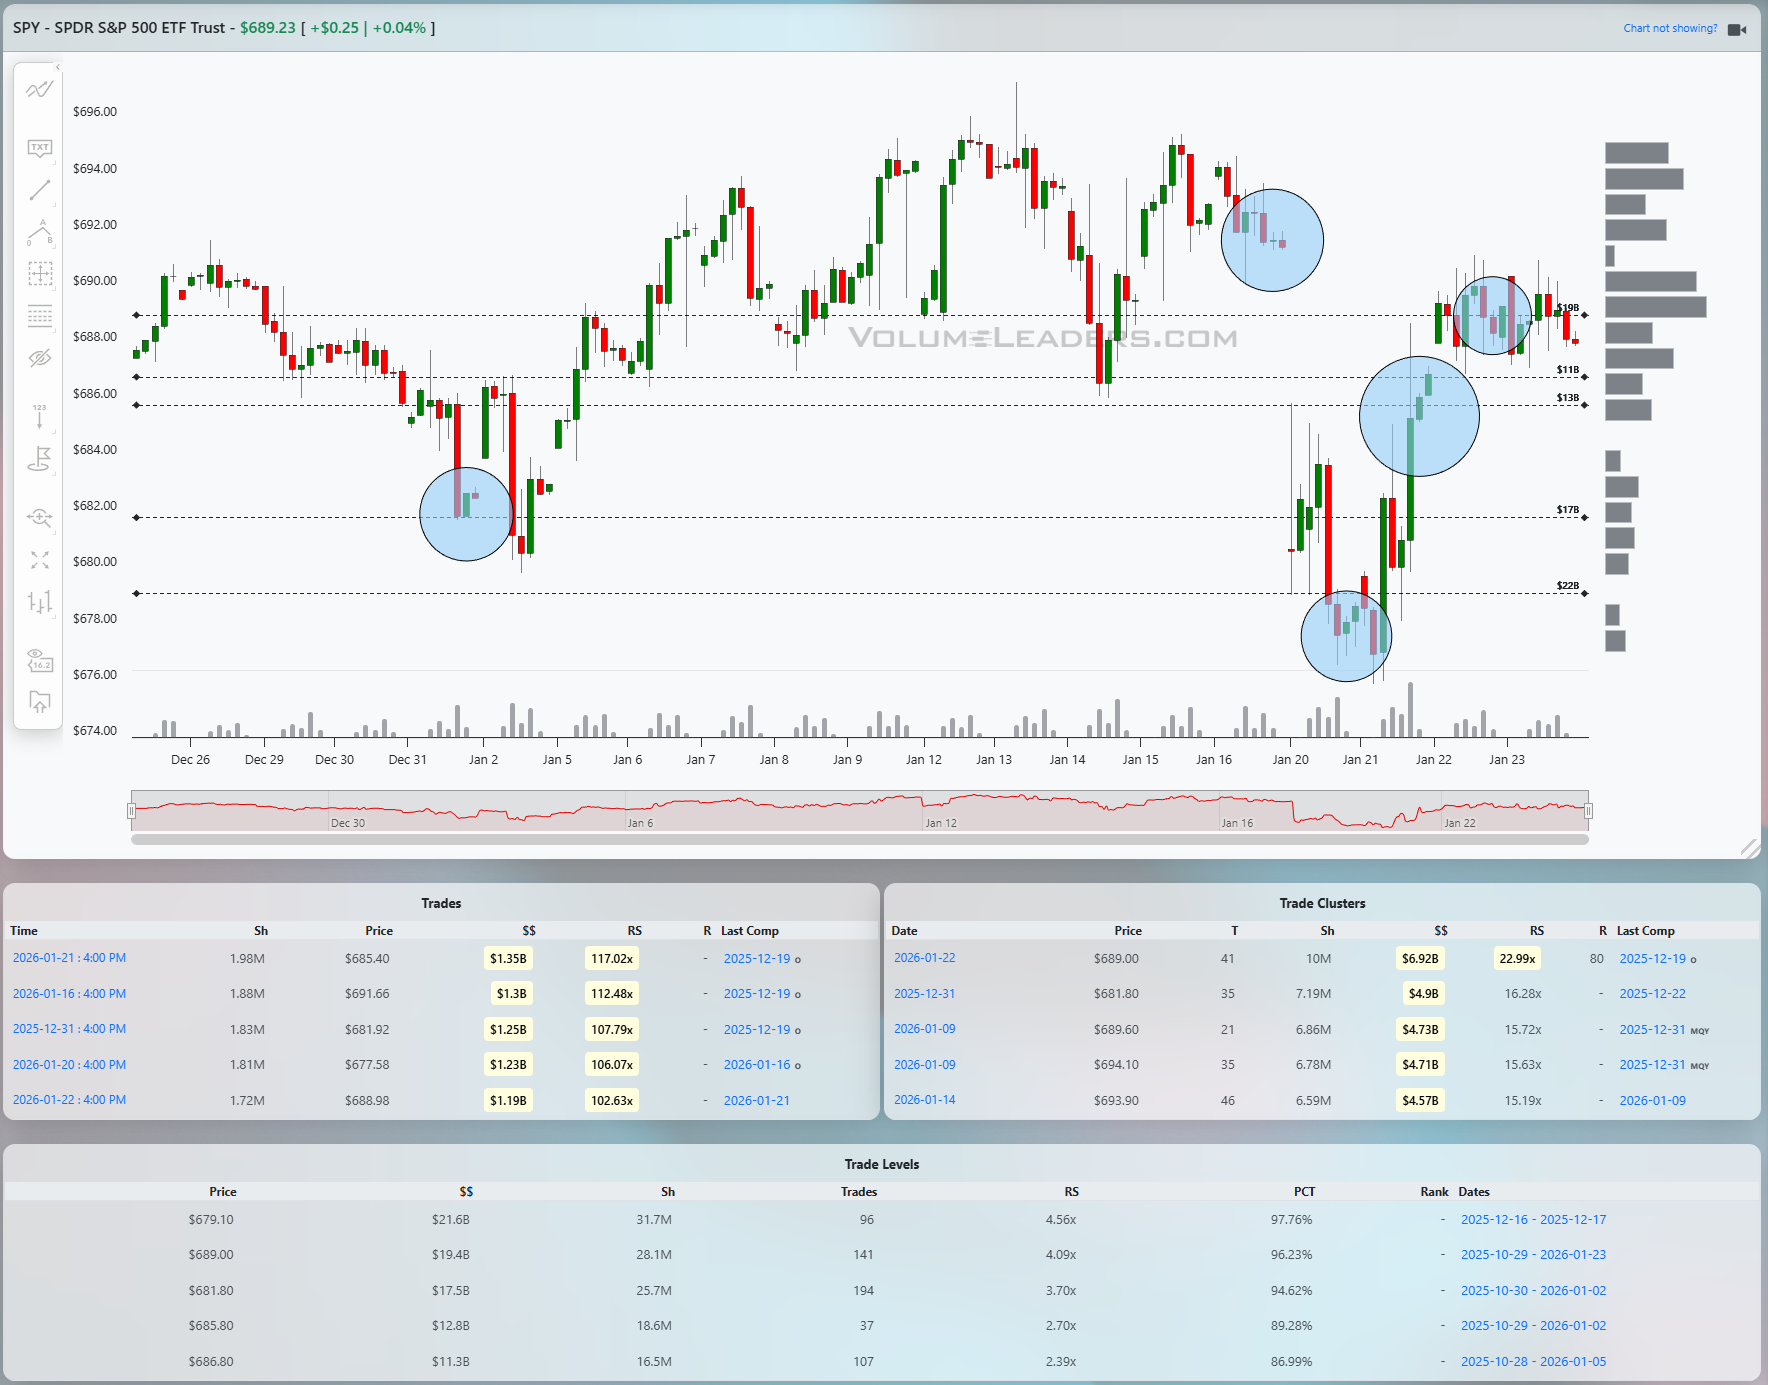
SPY has spent most of the period oscillating around a well-defined balance zone rather than trending cleanly. The early-January selloff into the low 680s was met with clear absorption, highlighted by a cluster of large prints near roughly 681 to 685, including multiple billion-dollar level interactions. That zone shows up in the Levels table with very high notional and RS readings north of 4x, marking it as a true institutional shelf rather than incidental trade. Price rebounded sharply from there, pushed back toward the mid-690s, and stalled again just under prior highs. More recently, another heavy interaction near the high 680s to low 690s suggests this band has become the line of scrimmage. Acceptance above roughly 690 opens the door back to the 694 to 696 area where prior supply showed up. Failure back below the mid-680s would signal that the buyers who defended that shelf are no longer active, with the next downside magnet sitting closer to the upper 670s.
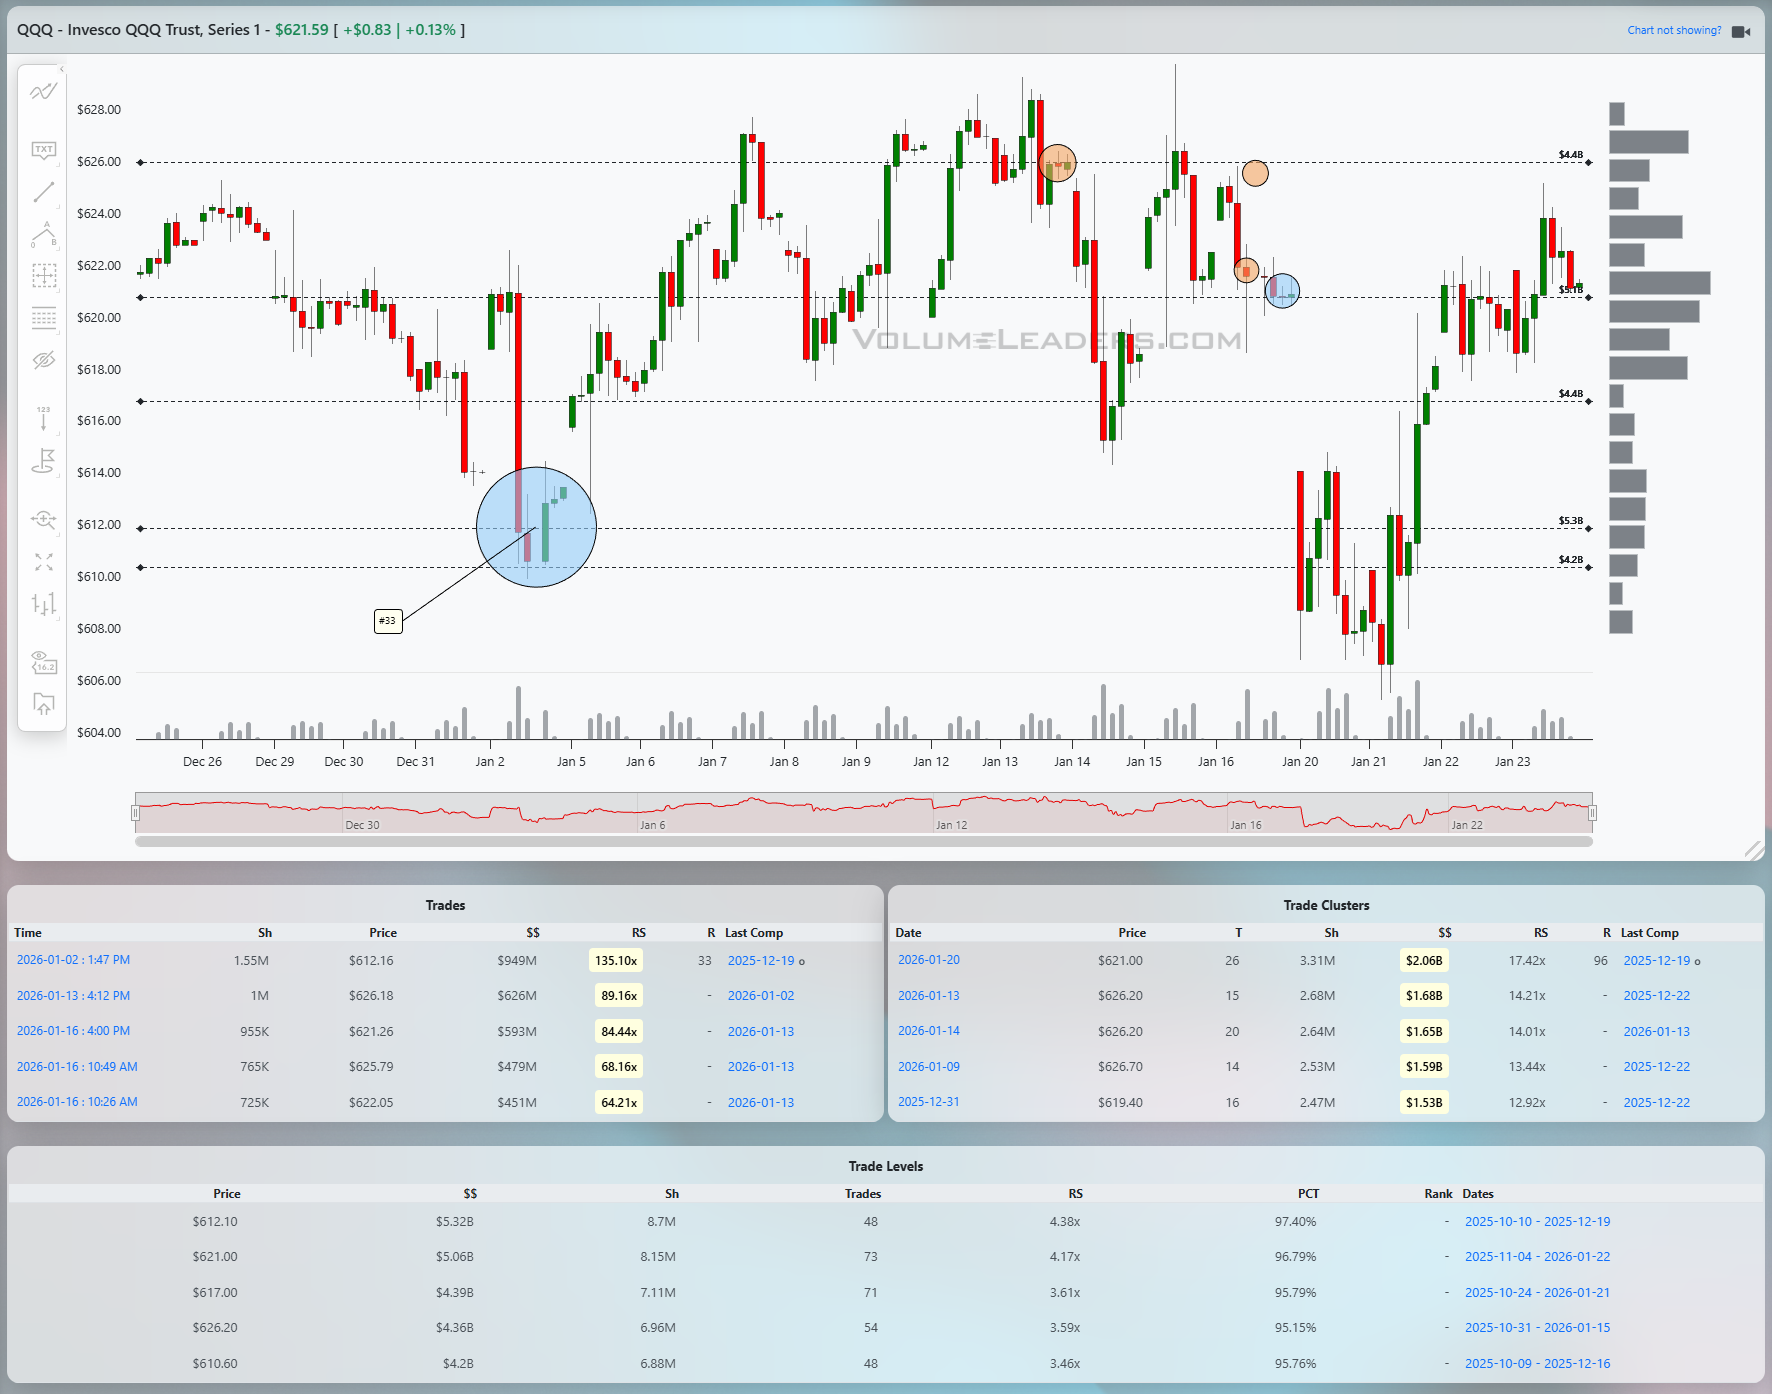
QQQ has traced a similar but slightly cleaner structure, with a stronger impulse off its early-January lows. The sharp drop into the low 610s was met with a very notable large trade cluster, including a labeled top-100 print near approximately 612, which strongly implies absorption rather than panic liquidation. From there, price rotated higher and reclaimed the 620 handle quickly. The Levels table highlights heavy concentration between roughly 619 and 621, with multi-billion dollar notional and RS above 4x, confirming that area as the primary support band. Above it, repeated interactions in the mid-620s have capped upside, suggesting supply is still present. A decisive hold above 621 keeps the tape constructive and points to a retest of 626 to 628. Losing 619 with acceptance would shift the focus back to the low-610s shelf, where the prior absorption would be tested for durability.
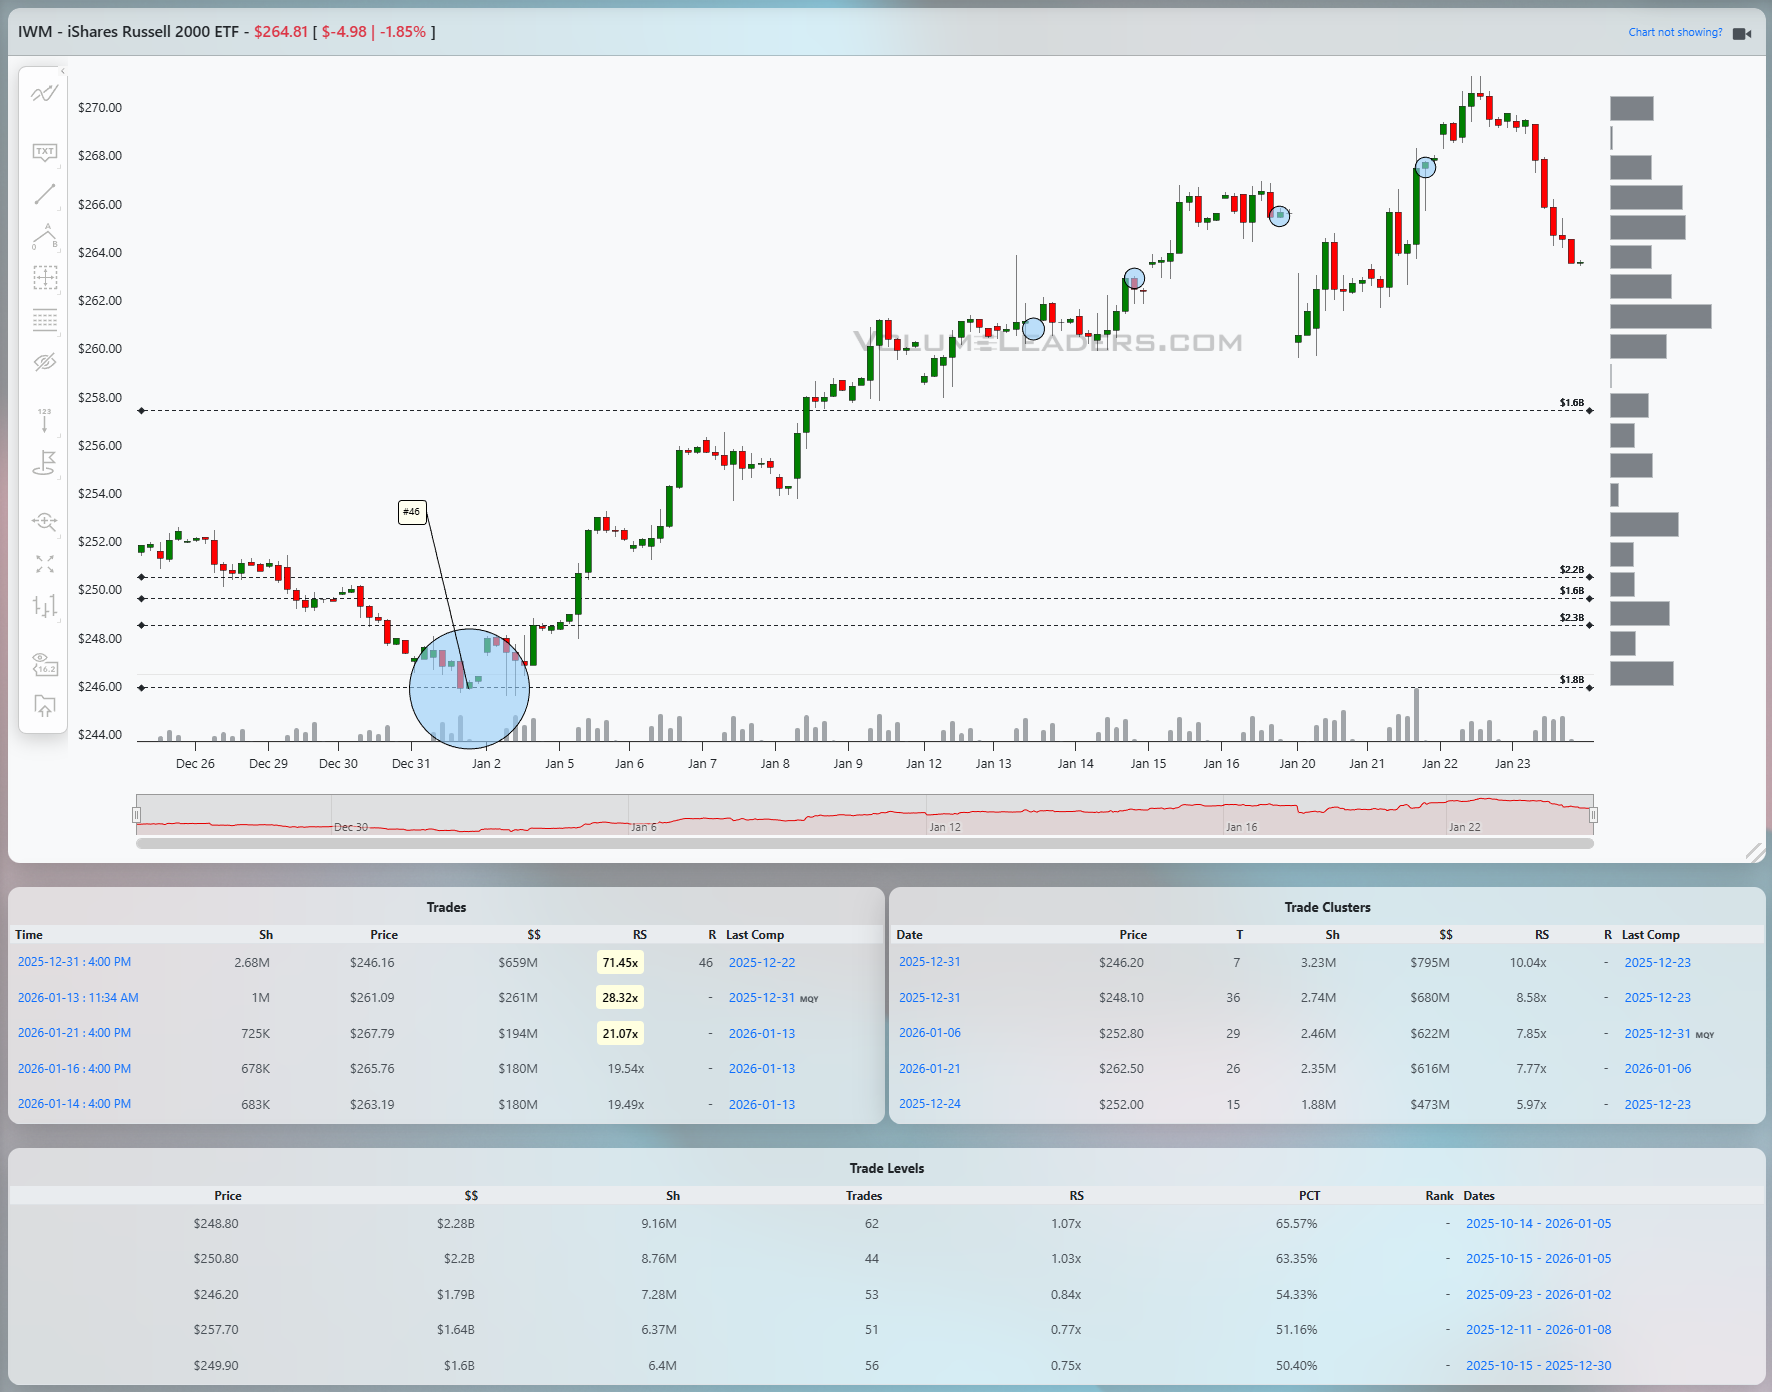
IWM stands out as the most extended and also the most vulnerable to mean reversion. The path has been a strong, persistent impulse from the mid-240s into the high 260s, with only shallow pauses along the way. Early in the period, a large, labeled print near roughly 246 marked an important inflection, coinciding with the largest cluster in the visible window. That level carries high percentile readings and clearly acted as a springboard. Since then, price has stair-stepped higher, but recent trade shows rejection near the upper 260s, followed by a pullback toward the mid-260s. The key support band now sits around 248 to 250, where cumulative volume and RS readings remain dominant. As long as IWM holds above the low-260s, the trend remains intact, but upside continuation requires acceptance back above the recent highs. A failure that slips below the mid-250s would be the first meaningful sign that the month-long impulse is transitioning into a deeper balance.
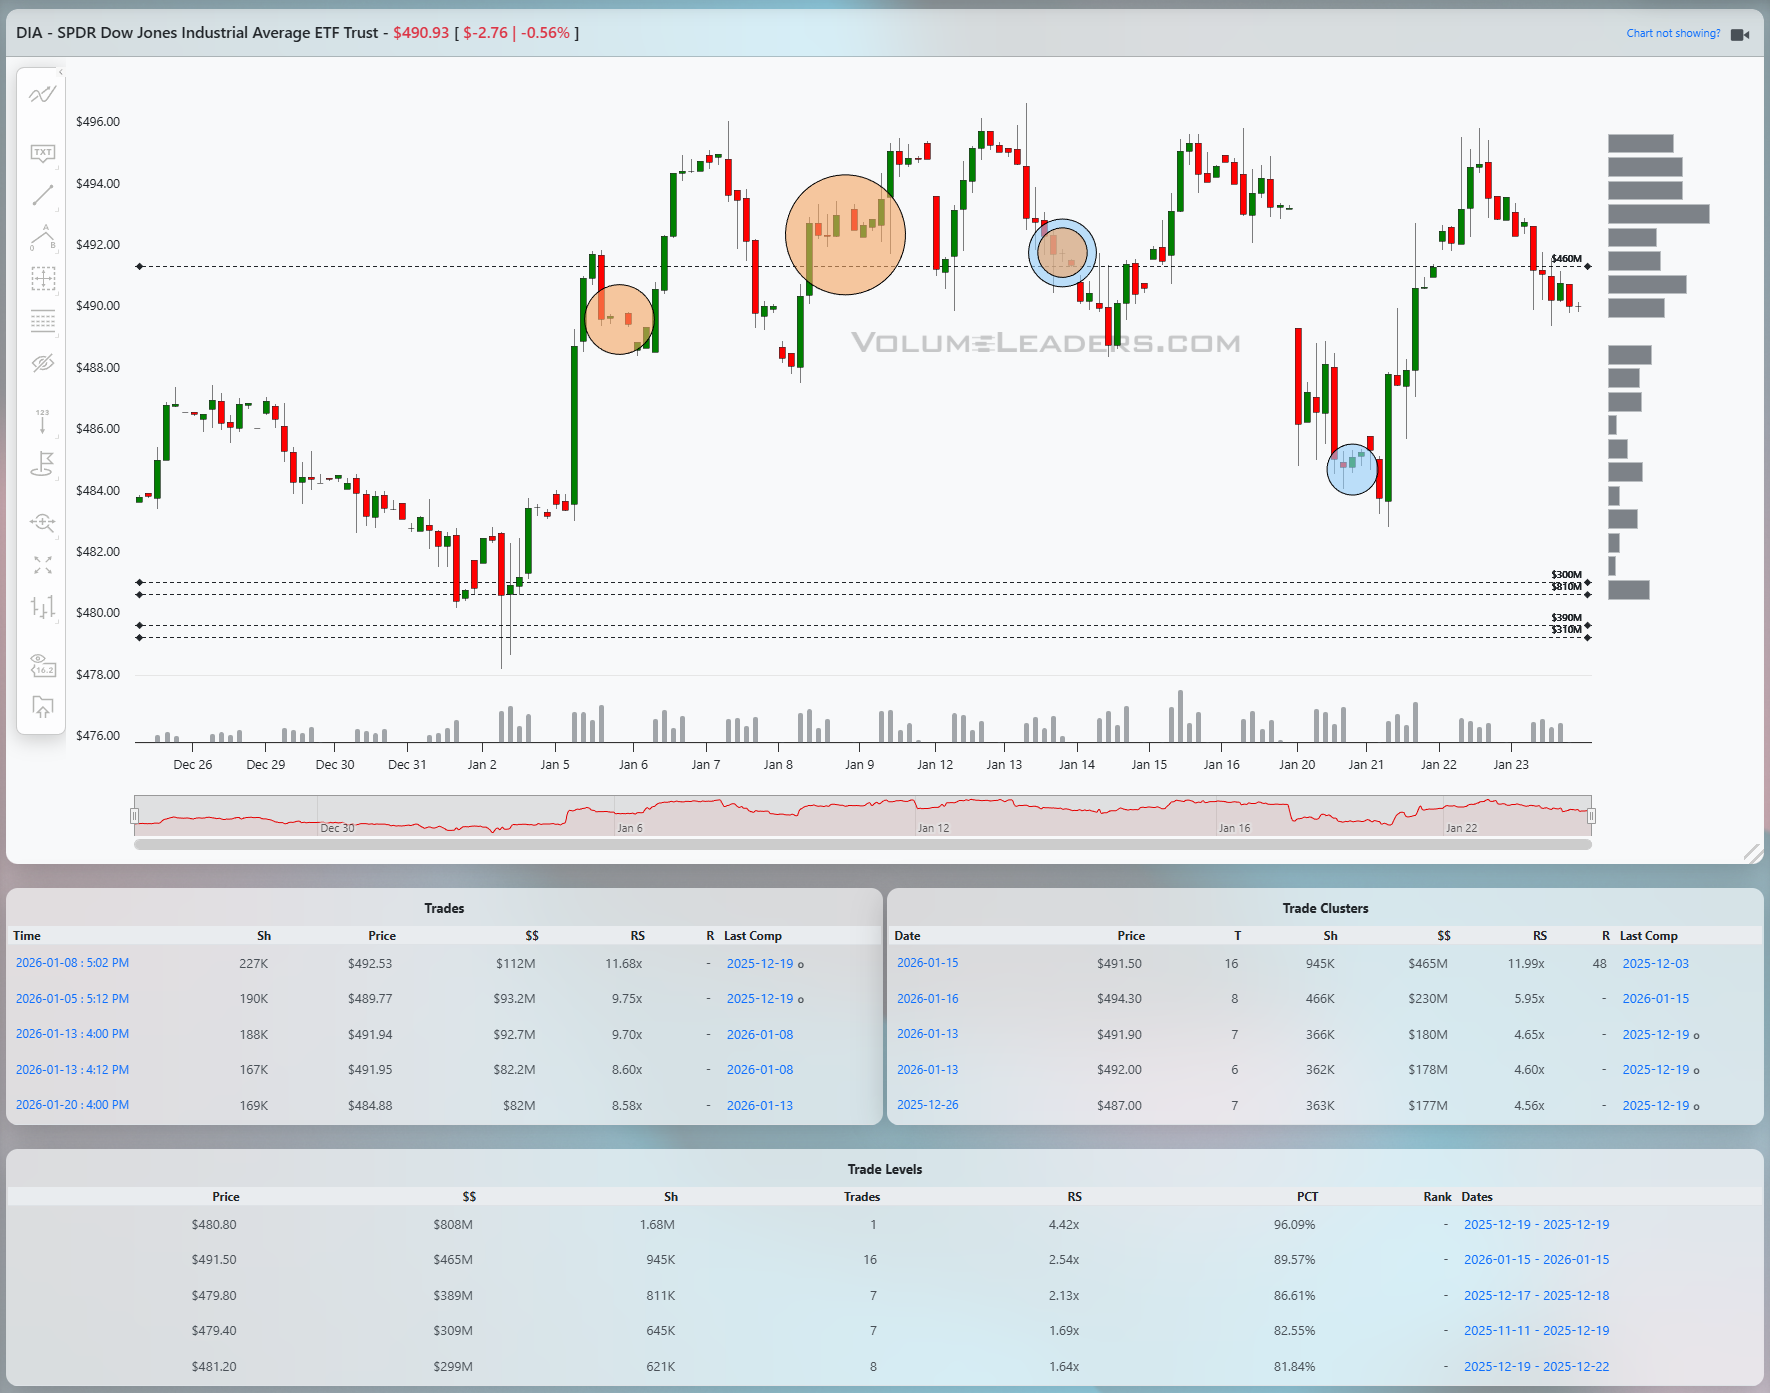
DIA has been the steadiest of the group, rotating within a tighter range while repeatedly respecting its volume-defined shelves. A sharp early-January push higher stalled near the mid-490s, where several large orange-circled prints suggest distribution rather than aggressive continuation buying. Price then pulled back into the low 480s, where absorption was visible again, and rebounded into the same upper band. The Levels table shows the most significant support clustered between roughly 479 and 481, with RS readings above 4x and very high percentile ranks, making that zone critical. The current line of scrimmage sits near 490. Acceptance above that level would imply the market has worked through overhead supply and could target the mid-490s again. Failure back through 485 would put the low-480s shelf back in play quickly.
From an execution standpoint, the tape favors patience and respect for these shelves rather than chasing strength. Entries framed near high-RS support levels offer defined invalidation if acceptance fails, while upside trades require confirmation through acceptance above the most recent supply zones rather than single-bar pokes.
Bottom line: the indices are holding above their highest-conviction volume shelves, favoring continuation unless those levels fail, with SPY 685 and 690, QQQ 619 and 626, IWM 250 and 268, and DIA 480 and 490 as the key prices to watch.

Summary Of Thematic Performance YTD
VolumeLeaders.com offers a robust set of pre-built thematic filters, allowing you to instantly explore specific market segments. These performance snapshots are provided purely for context and inspiration—think about zeroing in on the leaders and laggards within the strongest and weakest sectors, for example.
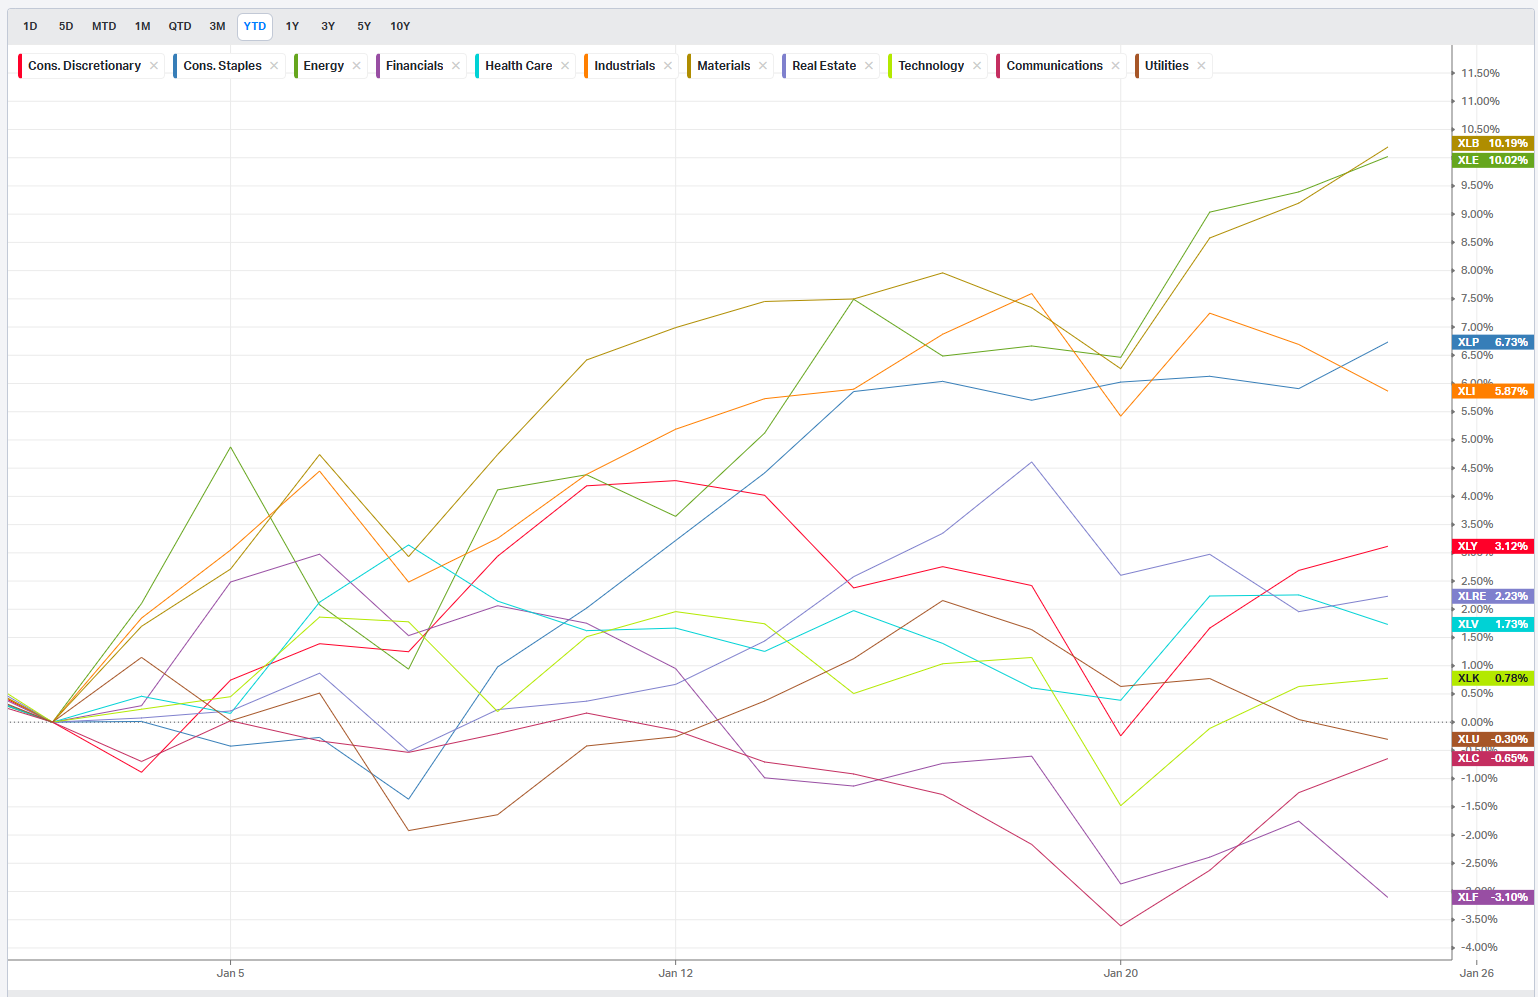
S&P By Sector
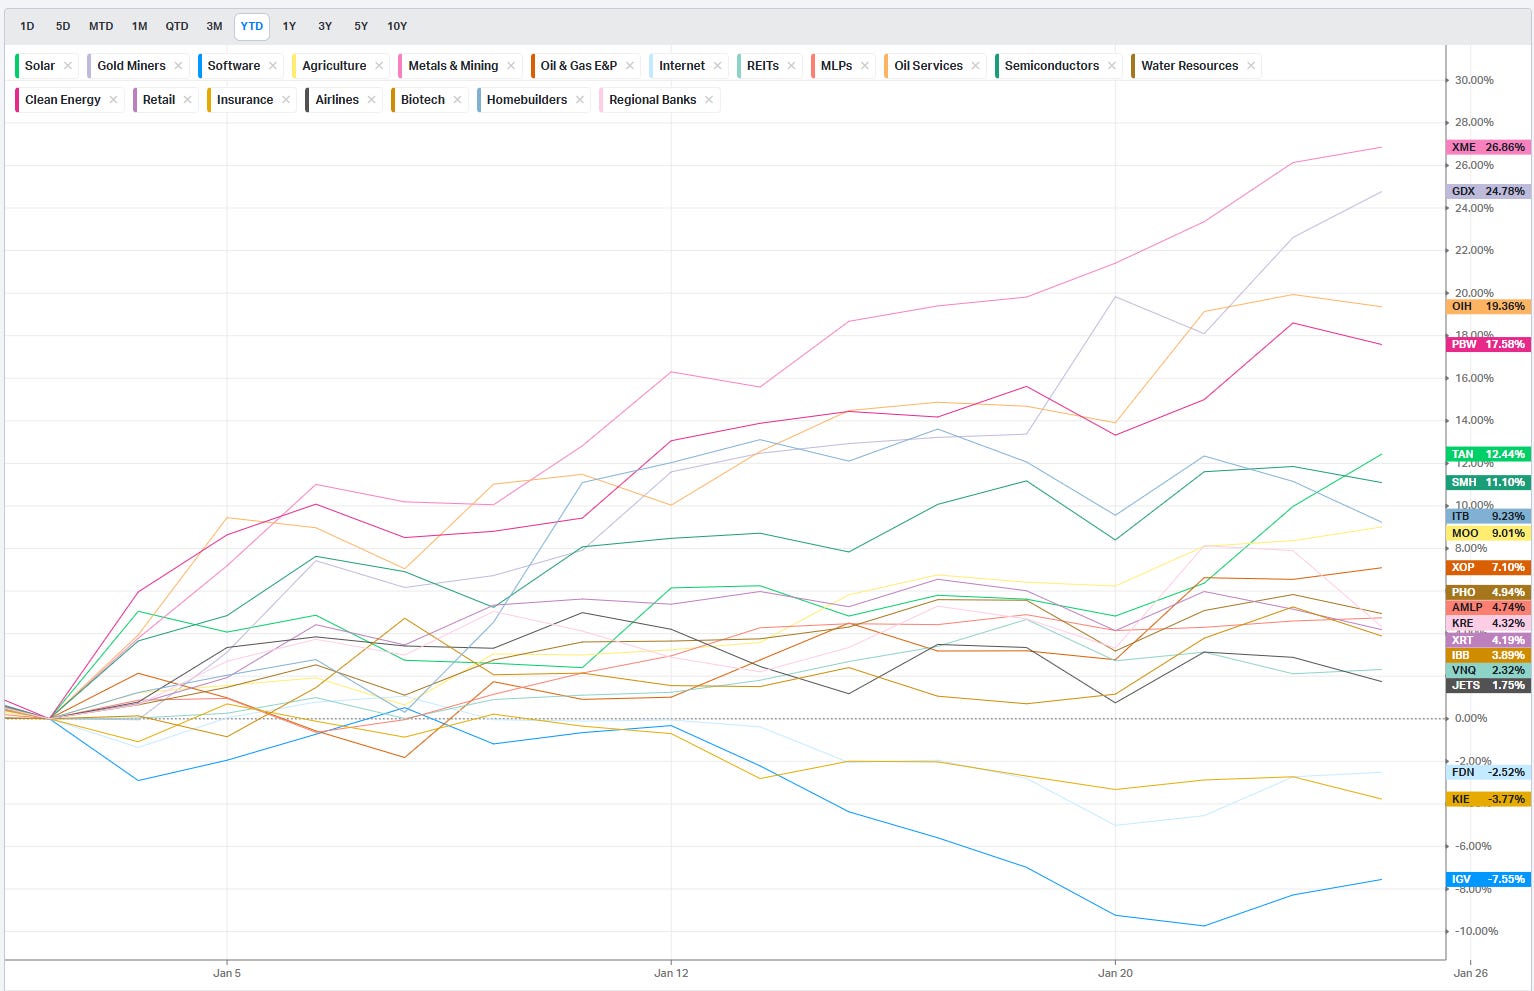
S&P By Industry
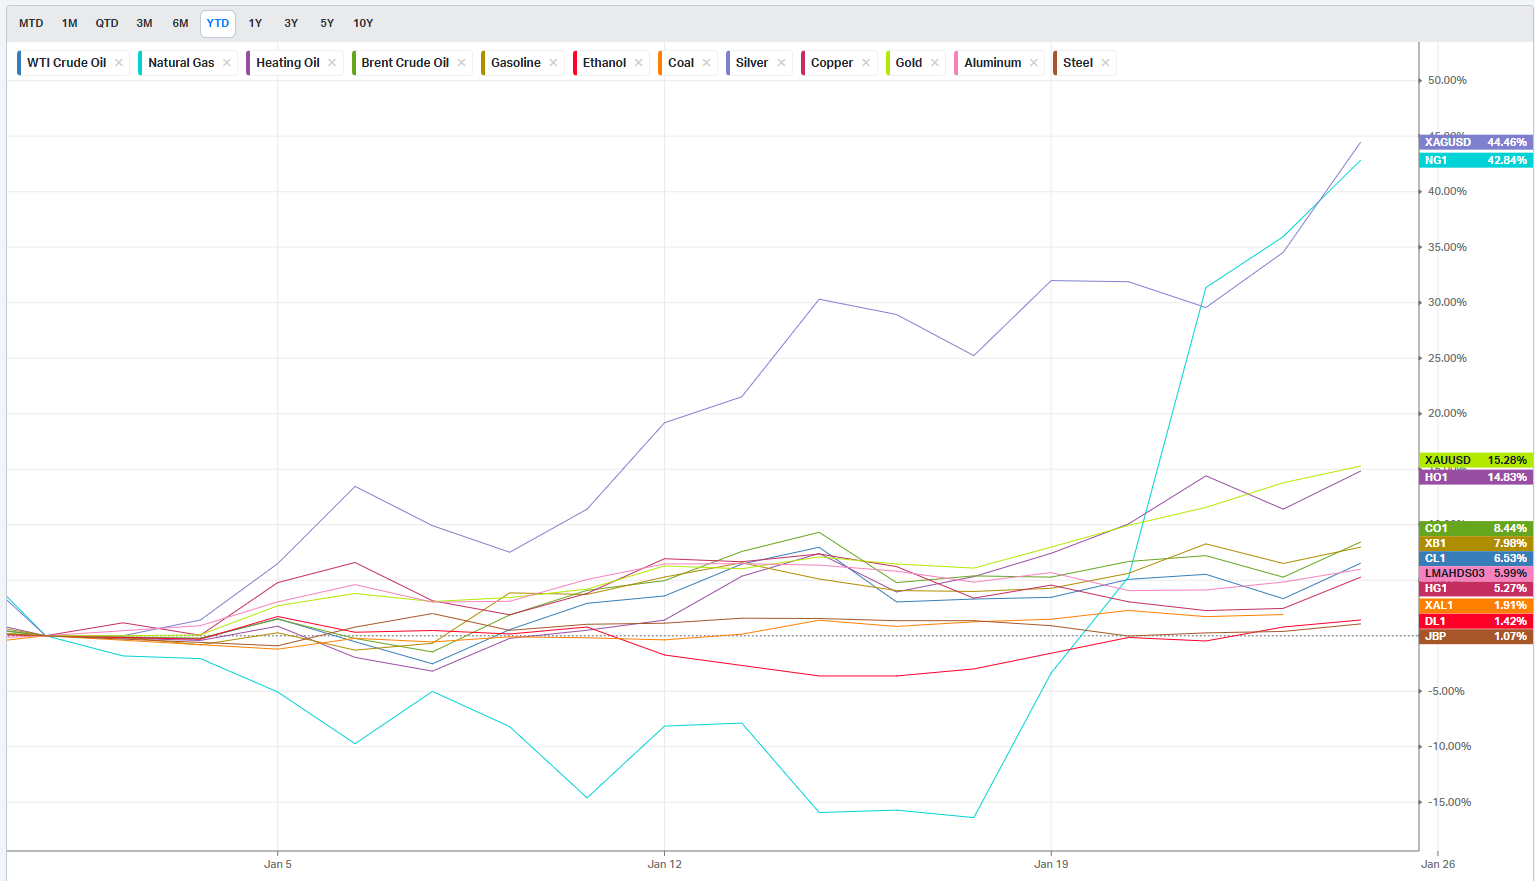
Commodities: Energy & Metals
Currencies/Major FX Crosses
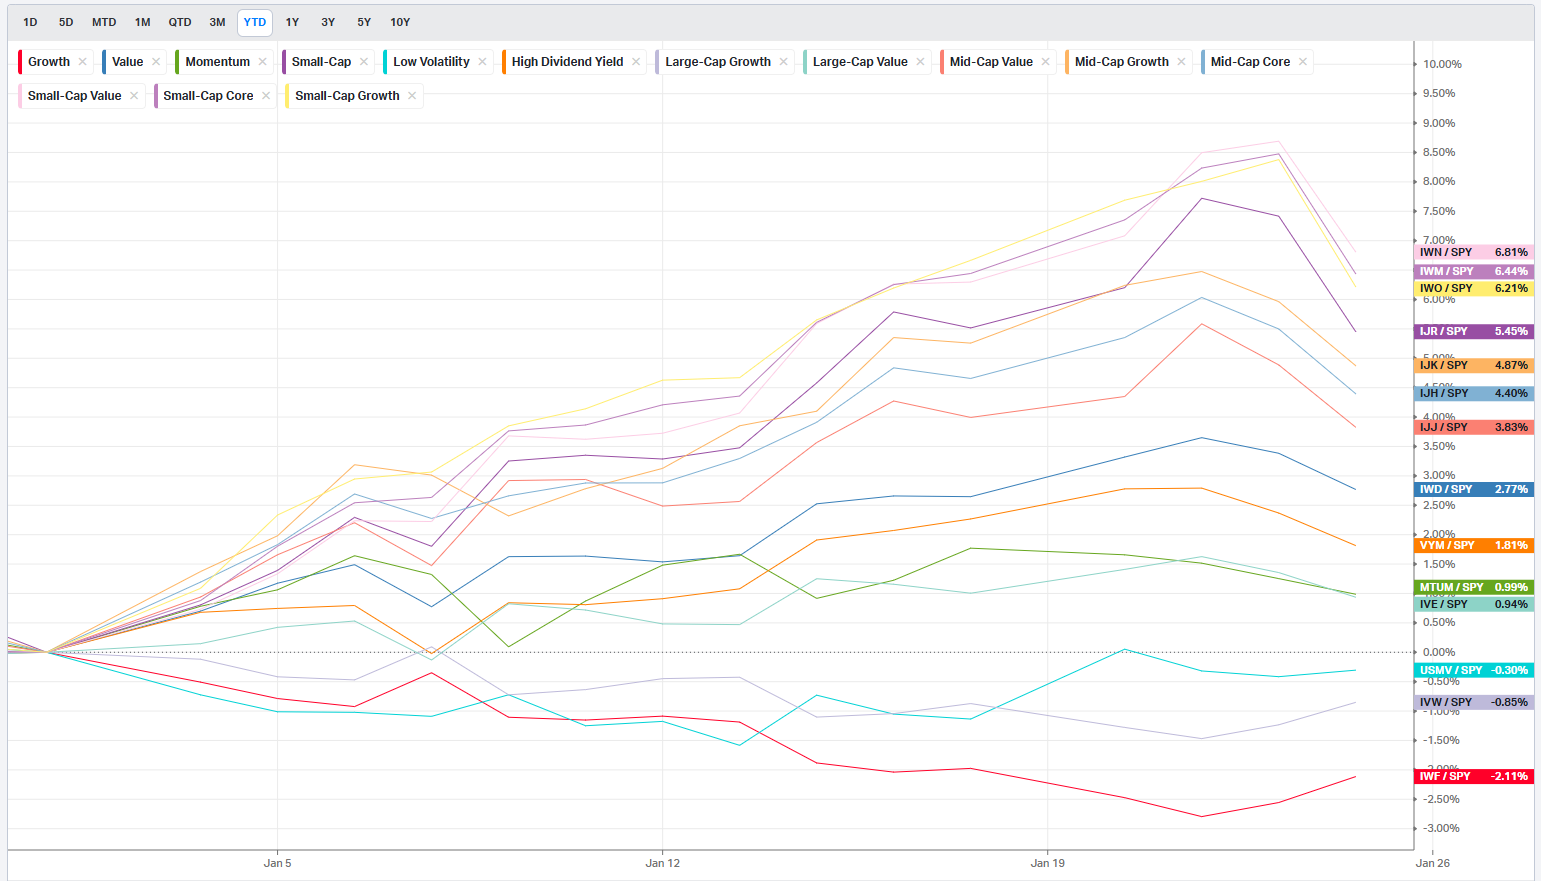
Factors: Style vs Size-vs-Value

Events On Deck This Week
Here are key events happening this week that have the potential to cause outsized moves in the market or heightened short-term volatility.
A Fed Hold, A Growth Gut-Check, And A Heavy Earnings Tape
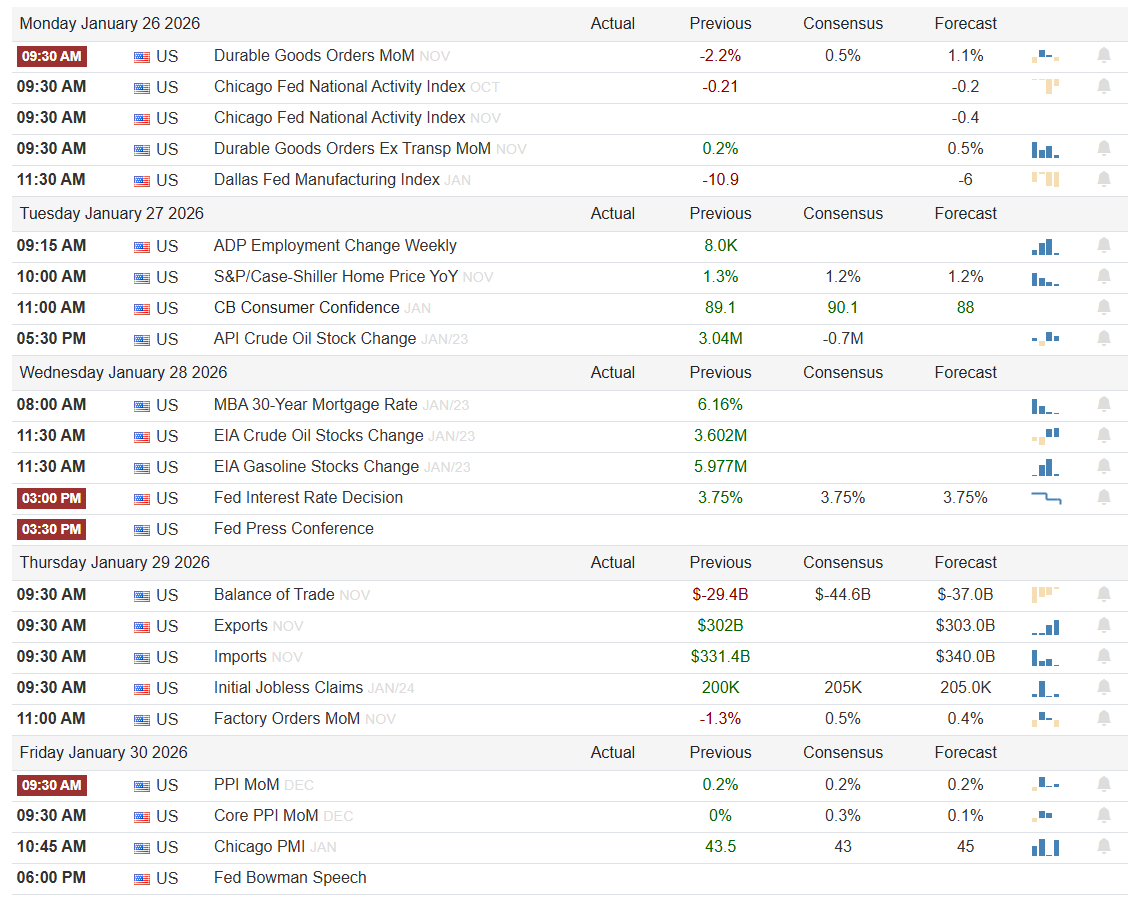
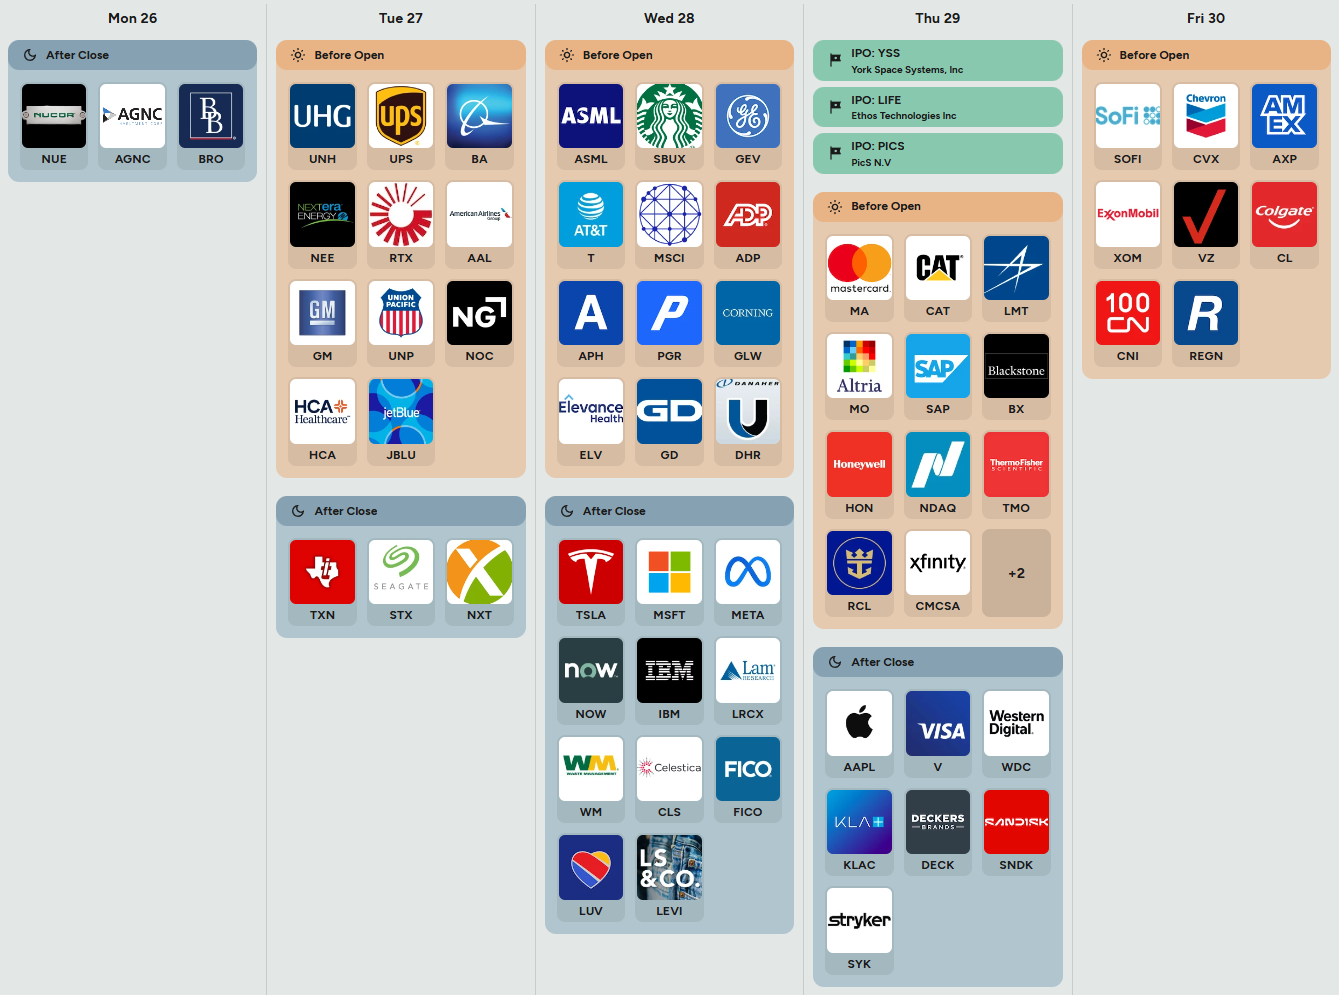
Monday sets the tone with a batch of manufacturing and activity reads that lean more growth-sensitive than inflation-sensitive. Durable Goods Orders MoM printed -2.2% versus a prior 0.5% and a 1.1% forecast, while Durable Goods Orders ex-Transport MoM came in 0.2% versus a 0.5% forecast. The Chicago Fed National Activity Index shows -0.21 for OCT versus a -0.2 forecast, and the NOV line item has the actual unreadable but the forecast is -0.4. Add the Dallas Fed Manufacturing Index at -10.9 versus a -6 forecast and you have a clear message: the data pulse is soft in the industrial complex. Risk-on for Monday would look like downside misses being framed as disinflationary and rate-supportive rather than recessionary. Risk-off is the opposite: markets start pricing that weakness as an earnings headwind instead of a rates tailwind. After the close, watch NUE, AGNC, and BRO for read-through into cyclicals, rate-sensitives, and insurance/financials.
Tuesday pivots to labor, housing, confidence, and energy. ADP Employment Change shows 8.0K, which is visibly small and would typically read as cooler labor momentum. Case-Shiller Home Price YoY is 1.3% versus 1.2% previously and a 1.2% forecast, while Consumer Confidence is 89.1 versus 90.1 previously and an 88 forecast. API Crude Oil Stock Change is 3.04M versus -0.7M previously, a build that leans demand-cooler at the margin and can weigh on crude if confirmed later in the week. Risk-on here is a mix of softer labor with stable confidence and contained housing inflation. Risk-off is labor rolling over in a way that hits growth expectations while housing stays sticky. Before the open, the tape is busy with UNH, UPS, BA, NEE, RTX, AAL, GM, UNP, NOC, HCA, and JBLU, which means health care, industrials, defense, and transports will have an outsized say in index tone. After the close, TXN, STX, and NXT will steer semis and storage sentiment.
Wednesday is the main event: rates and energy. MBA 30-year Mortgage Rate prints 6.16%. EIA Crude Oil Stocks Change is 3.602M and EIA Gasoline Stocks Change is 5.977M, both builds that reinforce the idea of comfortable supply. The Fed Interest Rate Decision is 3.75% with 3.75% previous, 3.75% consensus, and 3.75% forecast, so the decision itself is not the catalyst; the press conference is. Risk-on is the Fed holding 3.75% while sounding comfortable that inflation is not re-accelerating and that policy can stay restrictive without needing to tighten further. Risk-off is any tone that hints at renewed inflation concern or a willingness to lean tighter if activity re-firms. Before the open, ASML, SBUX, GEV, T, MSCI, ADP, APH, PGR, GLW, ELV, GD, and DHR hit a wide cross-section of global tech supply chain, consumer, industrials, health care, and defense. After the close, TSLA, MSFT, META, NOW, IBM, LRCX, WM, CLS, FICO, LUV, and LEVI can swing both index leadership and the risk appetite narrative.
Thursday brings the macro cleanup and a dense corporate slate. Balance of Trade is -$29.4B versus -$44.6B previously and a -$37.0B forecast, with Exports at $302B versus a $303.0B forecast and Imports at $331.4B versus a $340.0B forecast. Initial Jobless Claims are 200K versus 205K previously and a 205.0K forecast, still very low. Factory Orders MoM are -1.3% versus 0.5% previously and a 0.4% forecast, another soft manufacturing datapoint. Risk-on is a trade balance improvement paired with still-resilient labor, allowing equities to tolerate industrial softness as a rates-positive development. Risk-off is the combination of weak orders and a labor market that stays tight enough to keep policy restrictive. IPOs listed are YSS (York Space Systems, Inc), LIFE (Ethos Technologies Inc), and PICS (Pics N.V). Before the open, MA, CAT, LMT, MO, SAP, BX, HON, NDAQ, TMO, RCL, CMCSA, and two additional unreadable names set up a broad sector cross-current. After the close, AAPL, V, WDC, KLAC, DECK, SNDK, and SYK is a major tech, payments, and hardware checkpoint that can move both QQQ and the broader market.
Friday closes with inflation at the producer level and a final growth check. PPI MoM is 0.2% versus 0.2% previous and a 0.2% forecast, while Core PPI MoM is 0% versus 0.3% previous and a 0.1% forecast, a cooler core print on its face. Chicago PMI is 43.5 versus 43 previously and a 45 forecast, still contractionary. A Fed Bowman speech is scheduled at 06:00 PM, and what matters is whether she leans hawkish despite cooler core PPI or acknowledges disinflation progress. Before the open, SOFI, CVX, AXP, XOM, VZ, CL, CNI, and REGN round out the week with a mix of consumer finance, energy, telecom, staples, rails, and biotech.
Earnings and IPOs are doing the heavy lifting this week because the macro calendar is not about surprises in the policy rate, it is about how the Fed frames the next step and whether corporate guidance validates soft-landing expectations. The industrial and transport cluster early in the week (UPS, BA, RTX, UNP, CAT, HON) will influence the growth tone, while semis and tech infrastructure (ASML, LRCX, KLAC) will control the durability of the AI-led bid. Financial plumbing and payments (MA, V, NDAQ) will tell you whether activity is accelerating or just repricing risk, and energy (CVX, XOM) has an immediate read-through to inflation and the commodity complex given the visible inventory builds. Health care shows up repeatedly (UNH, HCA, ELV, TMO, SYK, REGN), which matters because defensive leadership can hide weakening breadth.
Durable Goods -2.2% versus a 1.1% forecast is the growth tripwire: any further downside surprise tone risks flipping cyclicals risk-off.
Fed at 3.75% is expected; the press conference is the catalyst: a dovish hold keeps risk bid, a hawkish hold raises the bar for multiples.
Core PPI MoM at 0% versus a 0.1% forecast is the inflation tripwire: a hotter-than-expected outcome would quickly reprice rates-sensitive leadership.
Bottom line: the week is a tug-of-war between soft manufacturing data, a steady 3.75% Fed decision, and earnings-driven leadership, with the tape likely to follow whichever narrative wins the press conference and big-tech guidance.

Order Flow in Focus: Reading Smart Money Tells
Order Flow in Focus: Reading Smart Money Tells is a recurring segment that spotlights unique intraday opportunities revealed through institutional order flow. Each feature dissects a moment when the tape quietly shifted—when large, ranked prints clustered at key liquidity locations and informed players positioned ahead of the move. The goal isn’t hindsight; it’s pattern recognition—learning to spot the footprints of capital that knows before the crowd does.
Silver & Avoiding the “Greater Fool” Theory
Silver has spent the past month doing exactly what makes most traders uncomfortable: it has gone up too far, too fast, and it has refused to give anyone the kind of pullback that feels safe. That discomfort is the story. The opportunity was never about chasing strength, it was about watching how price behaved when it briefly stopped going up and how size reacted in those moments.
Early in the window, SLV was still working through the mid to high 60s. You can see a cluster of large, ranked prints coming through around 64 to 65, including multiple top-100 style trades. That zone did not mark a breakout; it marked absorption. Price stalled, dipped, and instead of accelerating lower, volume expanded and the tape tightened. Sellers showed up, but they were met immediately. That is the first tell. Strong trends do not advertise themselves with clean bases. They reveal themselves when downside attempts fail despite real size pressing into the bid.
From there, the advance unfolded in legs. Each leg higher was followed by a shallow pullback, and each pullback attracted ranked prints. Around 69 to 70, another dense pocket of activity appeared, with cumulative levels showing roughly $400M notional and RS readings above 2x. Again, price paused, dipped slightly, and then resumed higher. That is not breakout buying. That is inventory being accumulated in places where weak hands are most likely to panic out after a fast run.
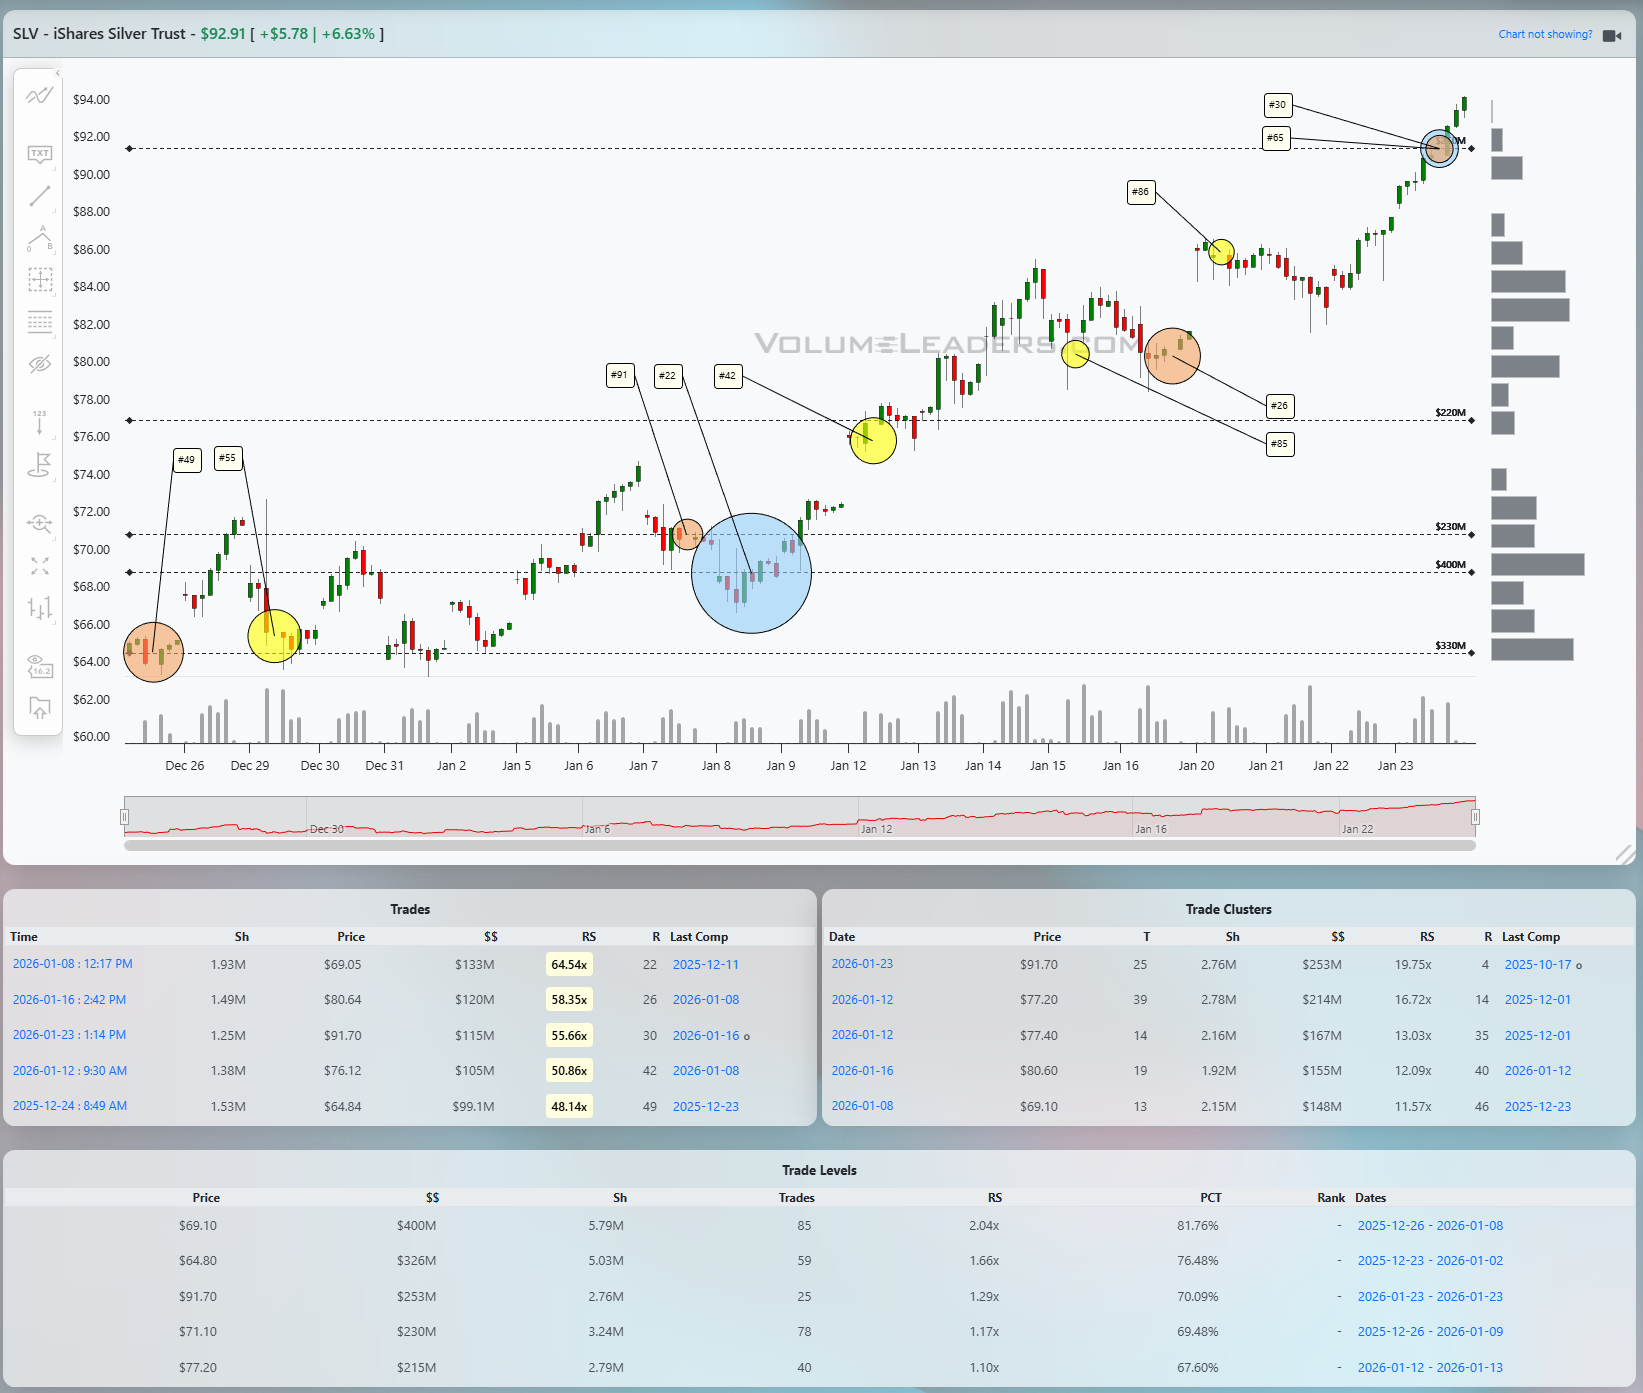
The most instructive sequence came in the mid to high 70s. SLV pushed into the upper 70s, pulled back toward 77, and this is where the trade leg became obvious. Multiple large trades printed in quick succession near 77.20 to 77.40, with cluster totals north of $200M and RS in the low teens. That is not random participation. That is size stepping in precisely where momentum traders are locking profits and late longs are questioning the move. Price respected that area cleanly. The market told you, in real time, that the dip was being bought aggressively, not tolerated reluctantly.
From a trade construction standpoint, this was yet another entry window in a sequence of potential entries, none of which felt safe unless you had the benefit of knowing where institutions were stepping in. As with other entries, the risk was definable. Acceptance below 77 would have invalidated the idea quickly. Instead, price turned higher almost immediately, confirming that supply was being absorbed rather than distributed. The next impulse carried SLV through the low 80s, where another pause developed. Once again, ranked prints appeared on the pullback near roughly 80.60, reinforcing the same behavior. Buyers were not chasing highs. They were waiting for fear.
As the move extended into the high 80s and low 90s, the psychology shifted. This is where most participants start worrying about tops. The tape, however, stayed consistent. A pullback into the mid to high 80s drew another set of large, ranked trades, including one marked in the mid-80s range. That told you the trend had not changed character. The same players were still active, still defending dips, still willing to absorb size when price backed off.
The lesson in this trade is simple and repeatable. In strong trends, the edge is not predicting tops. It is recognizing when large players consistently absorb fear-driven selling at higher and higher prices. Silver never offered comfort. It offered confirmation, again and again, in the form of ranked trades stepping in exactly where doubt was highest.

Market Intelligence Report
A desk-grade synthesis of institutional positioning and market structure—unpacking the flows, levels, and emerging themes that shaped the week, and translating them into a model portfolio built the same way professional desks prepare for the week ahead.
MIR Part 1: The Backdrop
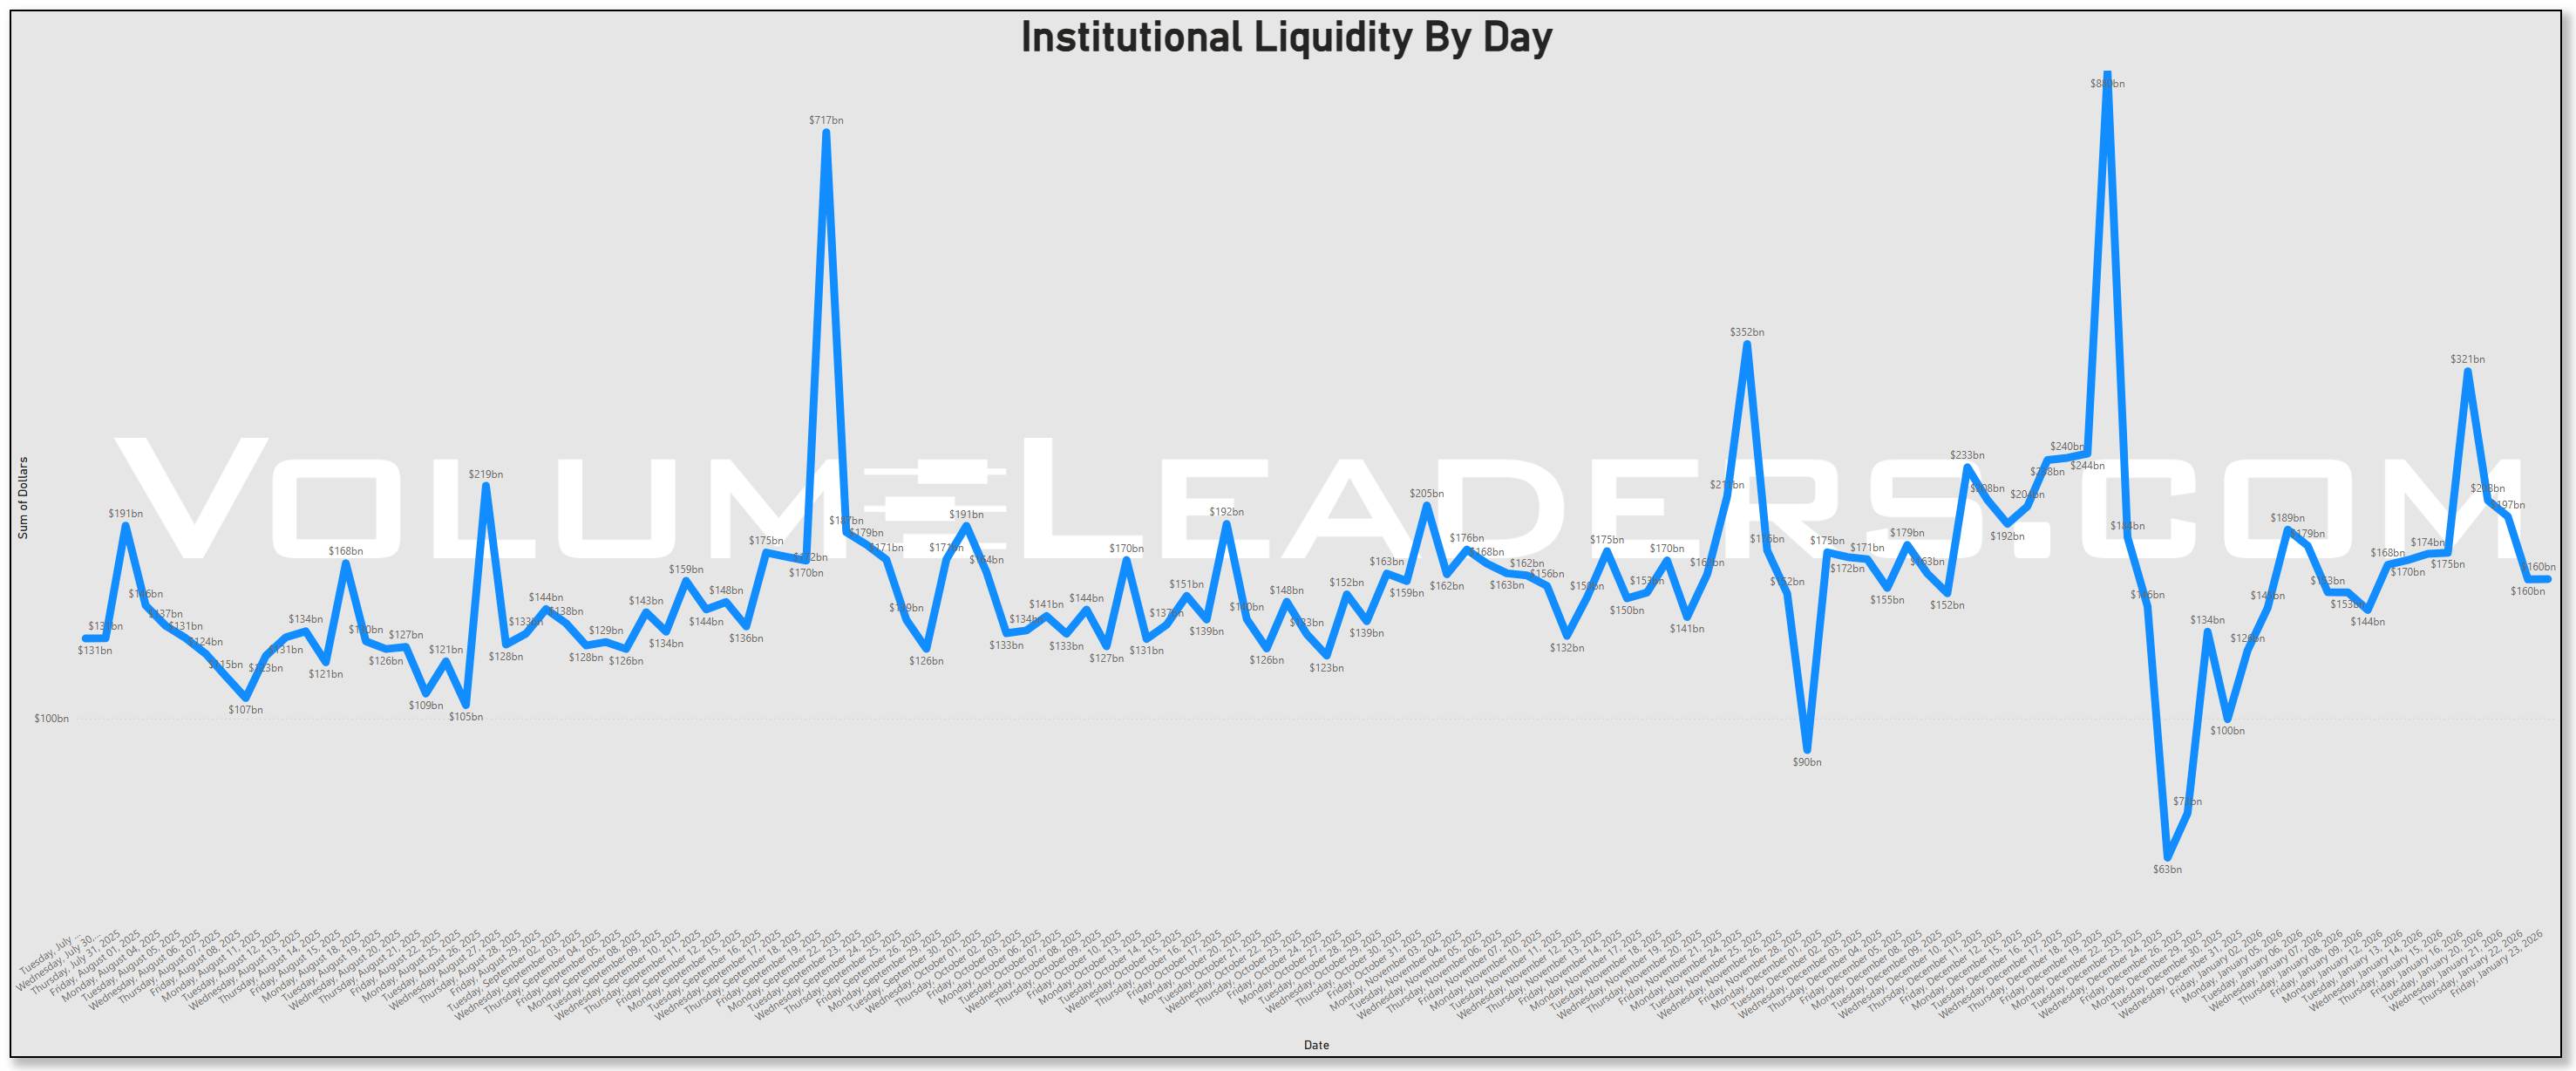
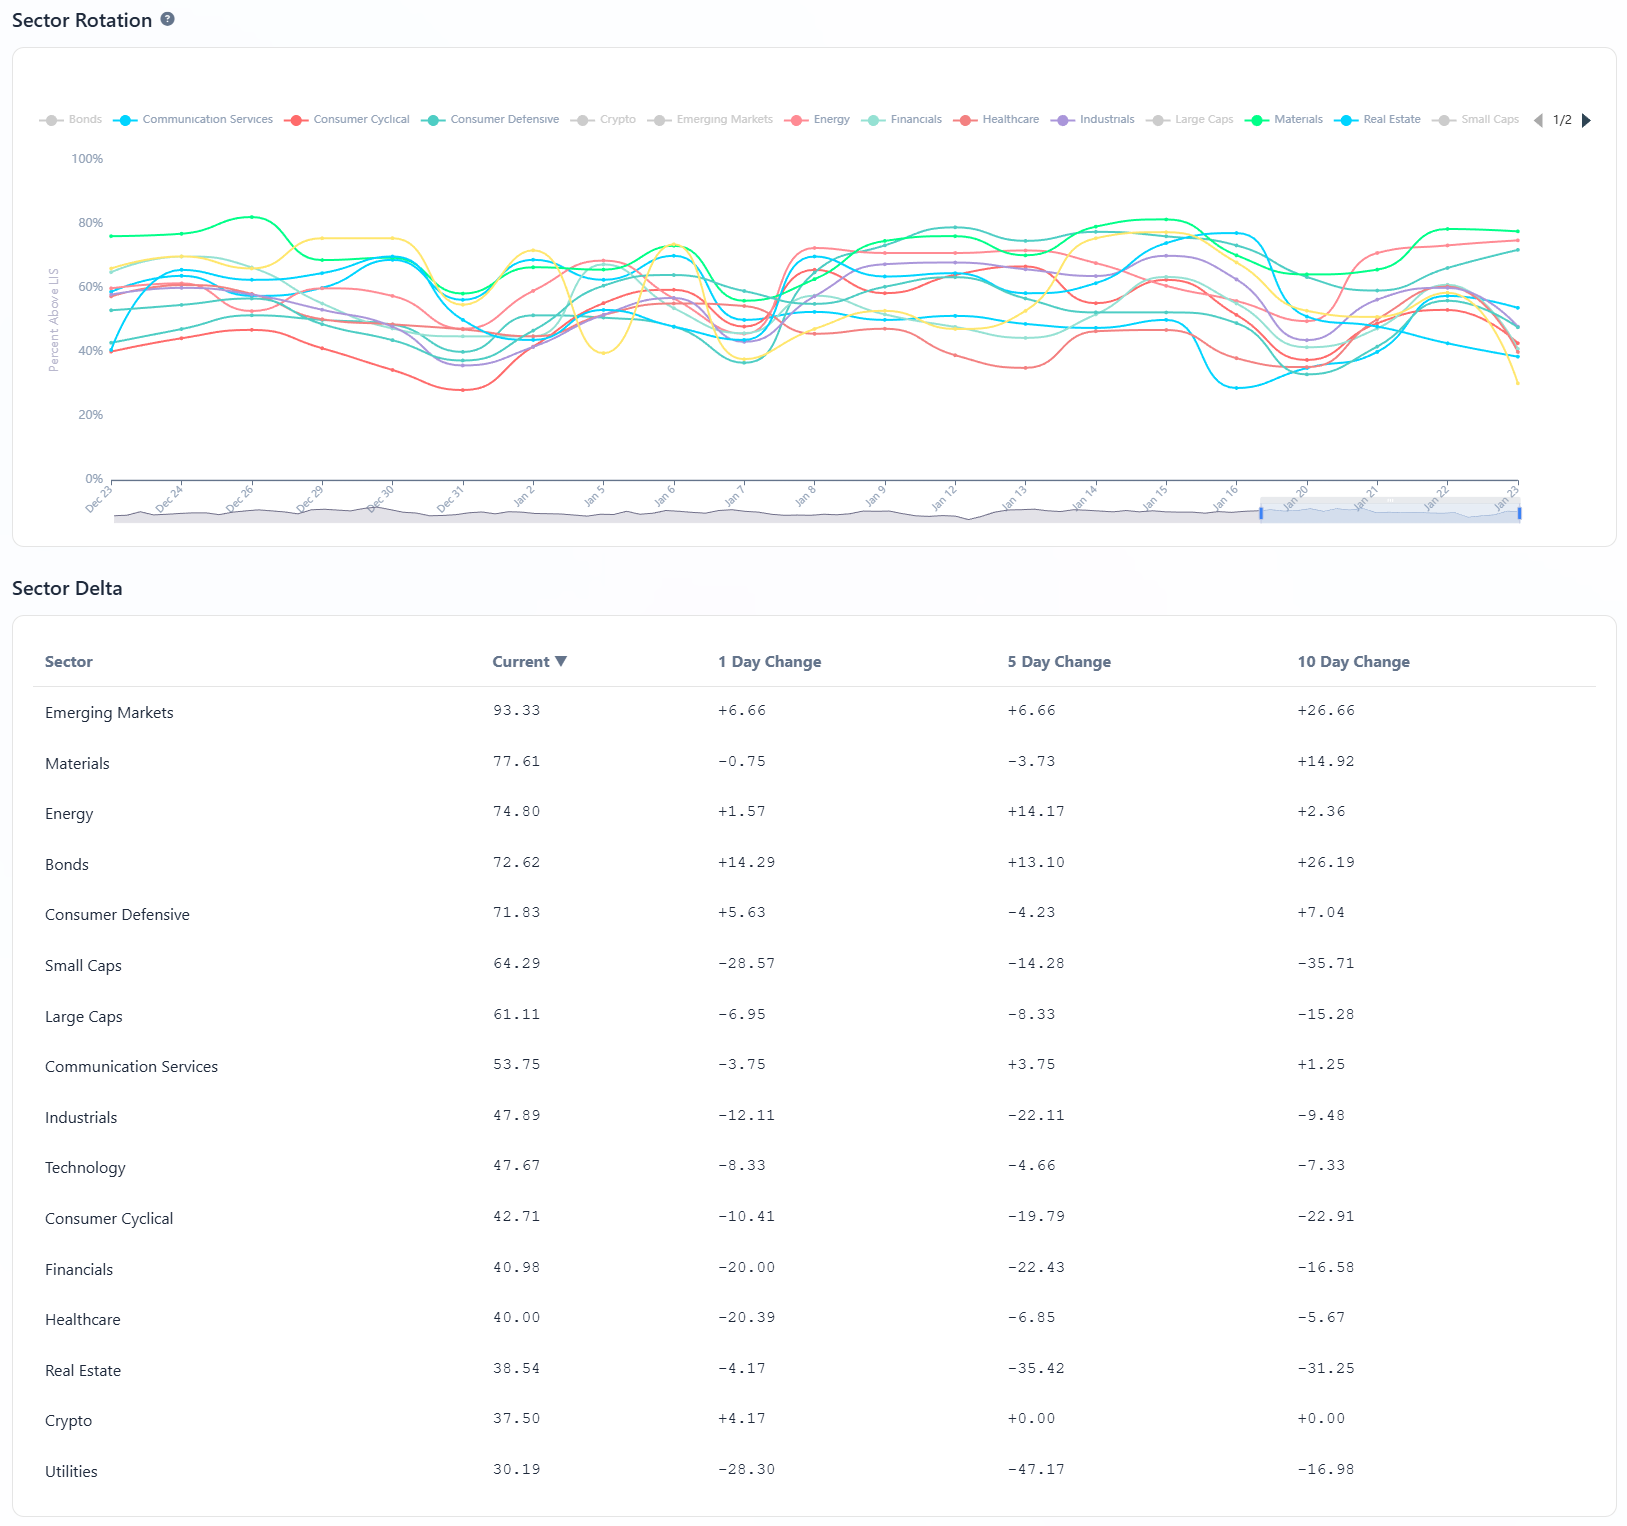
Starting with liquidity, the defining feature of this period is not a single dominating surge but persistent engagement. Institutional dollars show up day after day, with intermittent spikes, but no one session overwhelms the rest of the sample. That pattern matters. When liquidity is episodic, it often reflects mechanical events. When it is persistent, it reflects ongoing repositioning. The data here argues for the latter. Capital is being actively moved, rebalanced, or re-expressed rather than rushed in or pulled out.
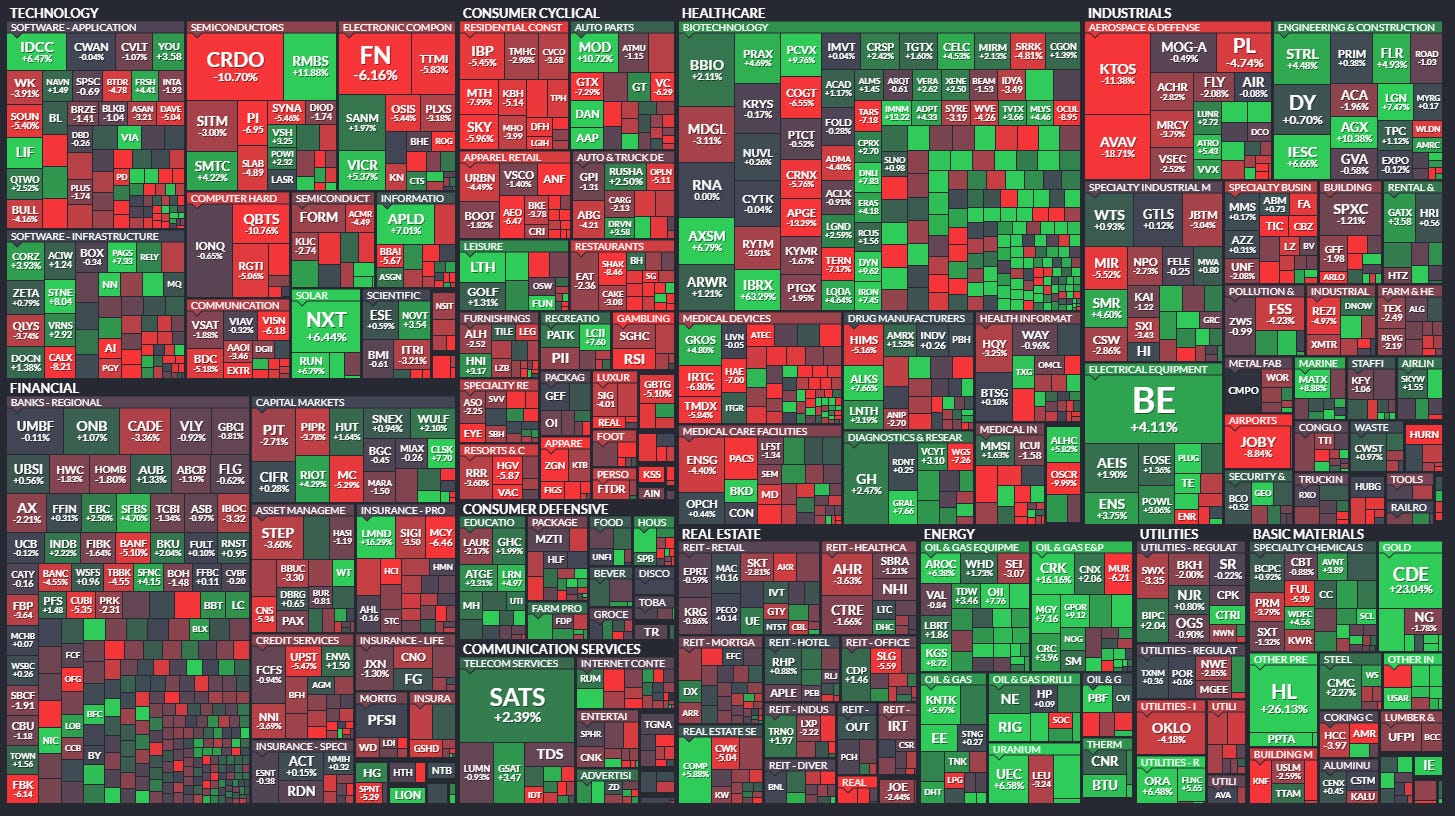
Looking at sector-level dollars, the first conclusion is not about direction but about where attention concentrates. Technology consistently absorbs the largest share of institutional volume across the period. On several days it sits in the $30b to $40b range, and on Friday January 16 OPEX it spikes dramatically to roughly $83b. That does not automatically mean aggressive buying, but it does mean that Technology is the primary battlefield. If capital were broadly de-risking, we would expect that activity to migrate toward Bonds or defensives. It does not. If capital were rotating late-cycle, Materials or Energy would begin to dominate. They do not. The implication is that whatever decisions institutions are making, they are being made through Technology exposure.
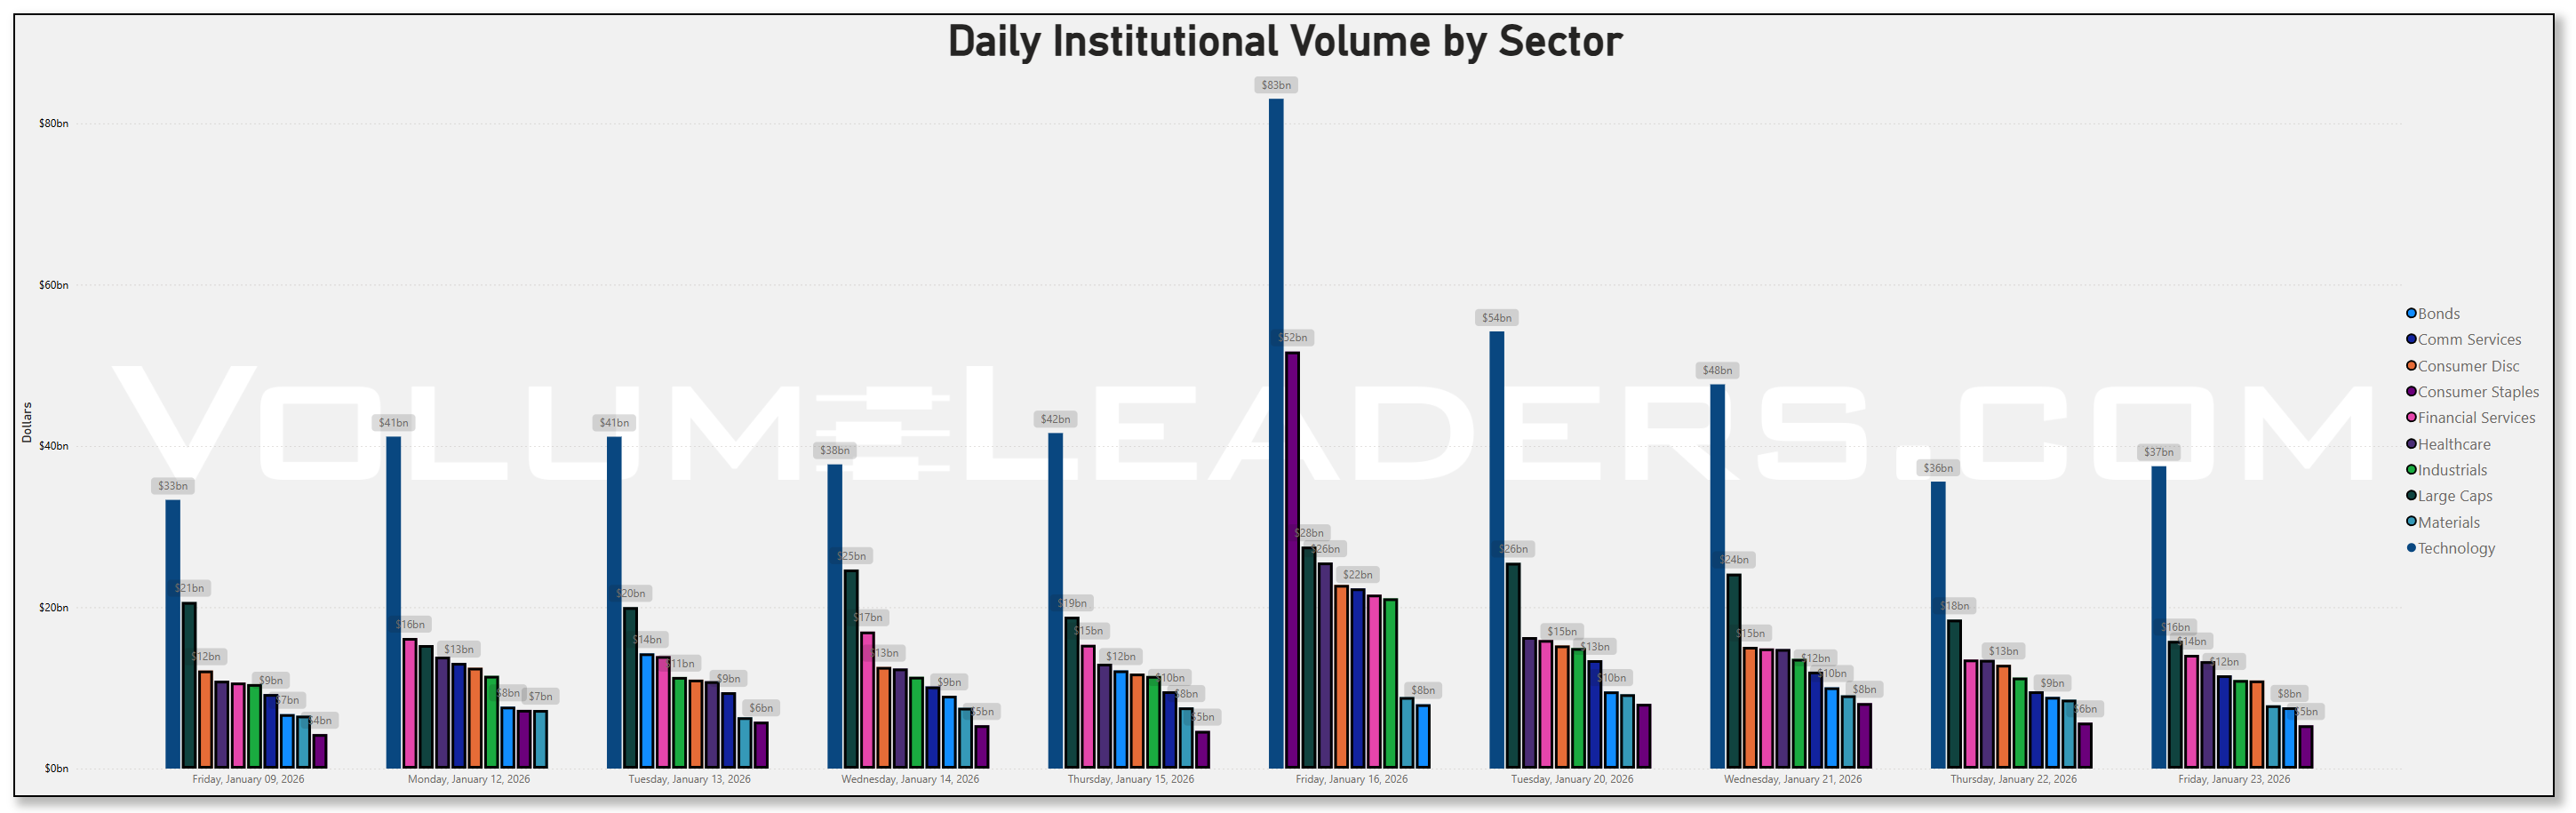
Large Caps require a more careful read. They appear consistently every day, typically in the mid-teens to low-$20b range, with a peak near $27.5b on January 16. That steadiness suggests maintenance rather than conviction. If Large Caps were the dominant expression of risk appetite, we would expect them to lead in magnitude and variability. Instead, they function more like infrastructure. If Technology is where views are being expressed, Large Caps look like where portfolios are being kept balanced. If flows into Large Caps were collapsing while Tech surged, that would suggest concentrated risk-taking. If both were rising together, it would suggest broad exposure expansion. What we see instead is persistence without dominance, which argues for positioning continuity rather than a new regime.
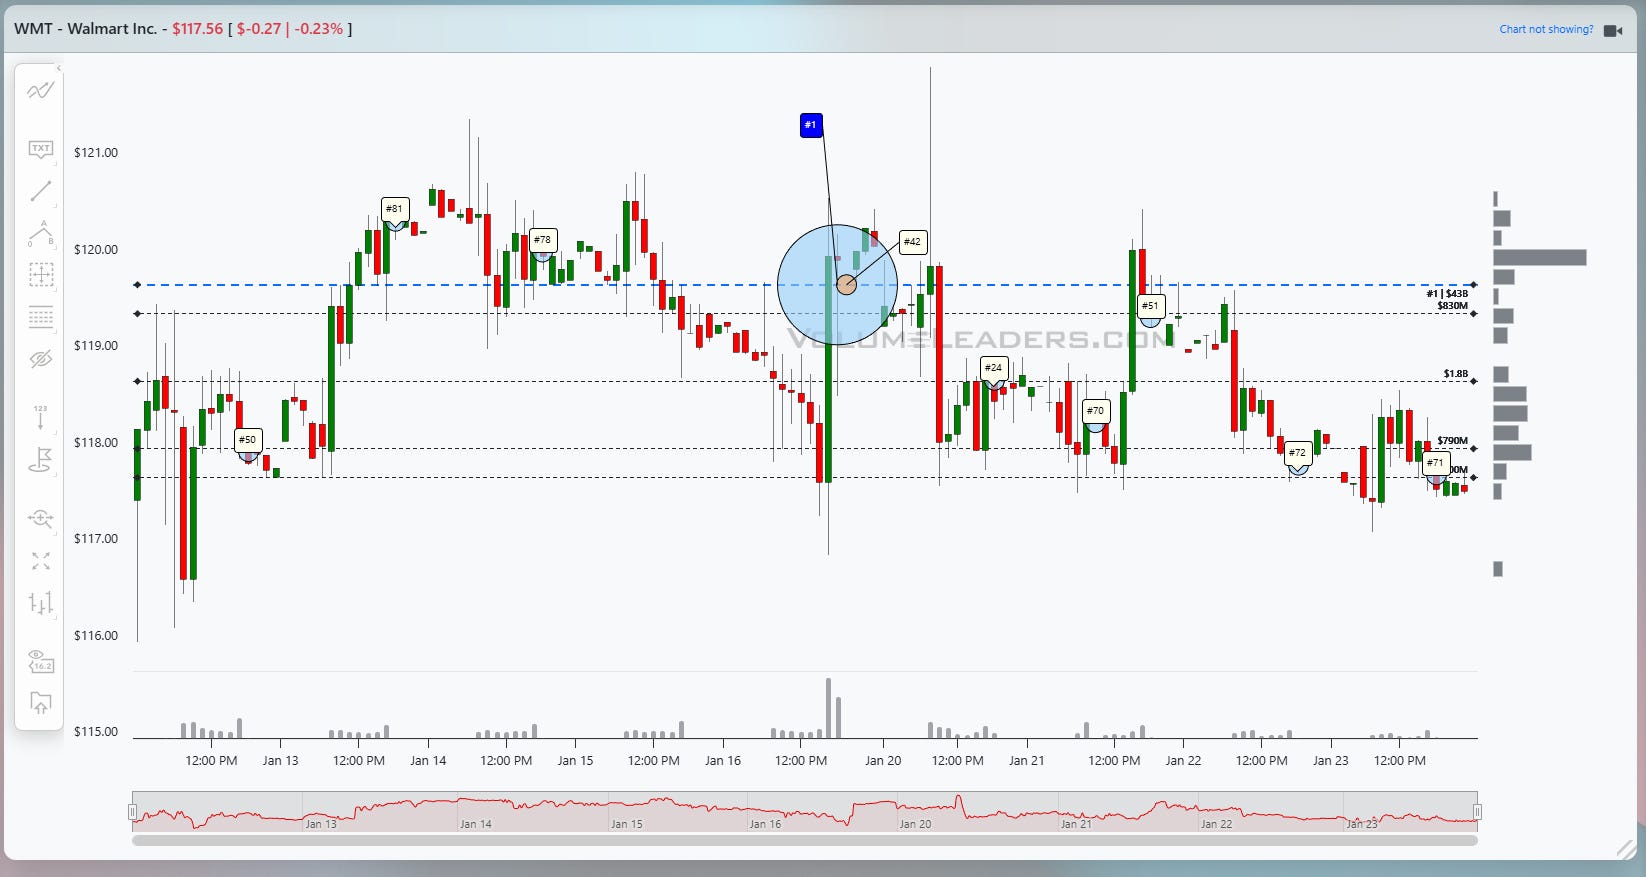
Consumer Discretionary adds a conditional wrinkle. Most days it sits comfortably below Technology, but on January 16 it spikes to roughly $22.8b, rivaling Large Caps, due in small part to the #1-ranked Walmart position we saw established last week. That kind of one-day expansion is not definitive on its own, but it becomes meaningful when paired with the simultaneous Technology surge. If that Discretionary activity were hedging or distribution, we would expect a corresponding rise in Staples or Bonds. We do not see that. If it were opportunistic rotation, we would expect follow-through in subsequent sessions. Instead, it looks episodic. The clean inference is that Discretionary was used tactically, and we’ve not seen price move substantively from the print, so we’ve yet to see what’s in store.
Healthcare and Financial Services occupy a stable middle tier. They attract consistent but unremarkable dollar volume, occasionally pushing into the mid-teens or higher. This profile fits portfolio adjustment, not a thematic shift. If Healthcare were being accumulated defensively, it would begin to displace Technology during volatility. If Financials were being leaned into on rate expectations, their share would expand more aggressively. Neither happens. Their role here is contextual rather than directive.
Bonds are present but never dominant. Daily flows generally sit in the mid-single-digit to low-teens billions, with a notable increase on January 13. That isolated bump reads as duration management, not a flight to safety. If Bonds were being used as a primary hedge, they would challenge other sectors for top billing. They do not. If equity exposure were being reduced materially, Bond flows would persist at elevated levels. They do not. The inference is that Bonds are being adjusted at the margin, not used to express a core macro view.
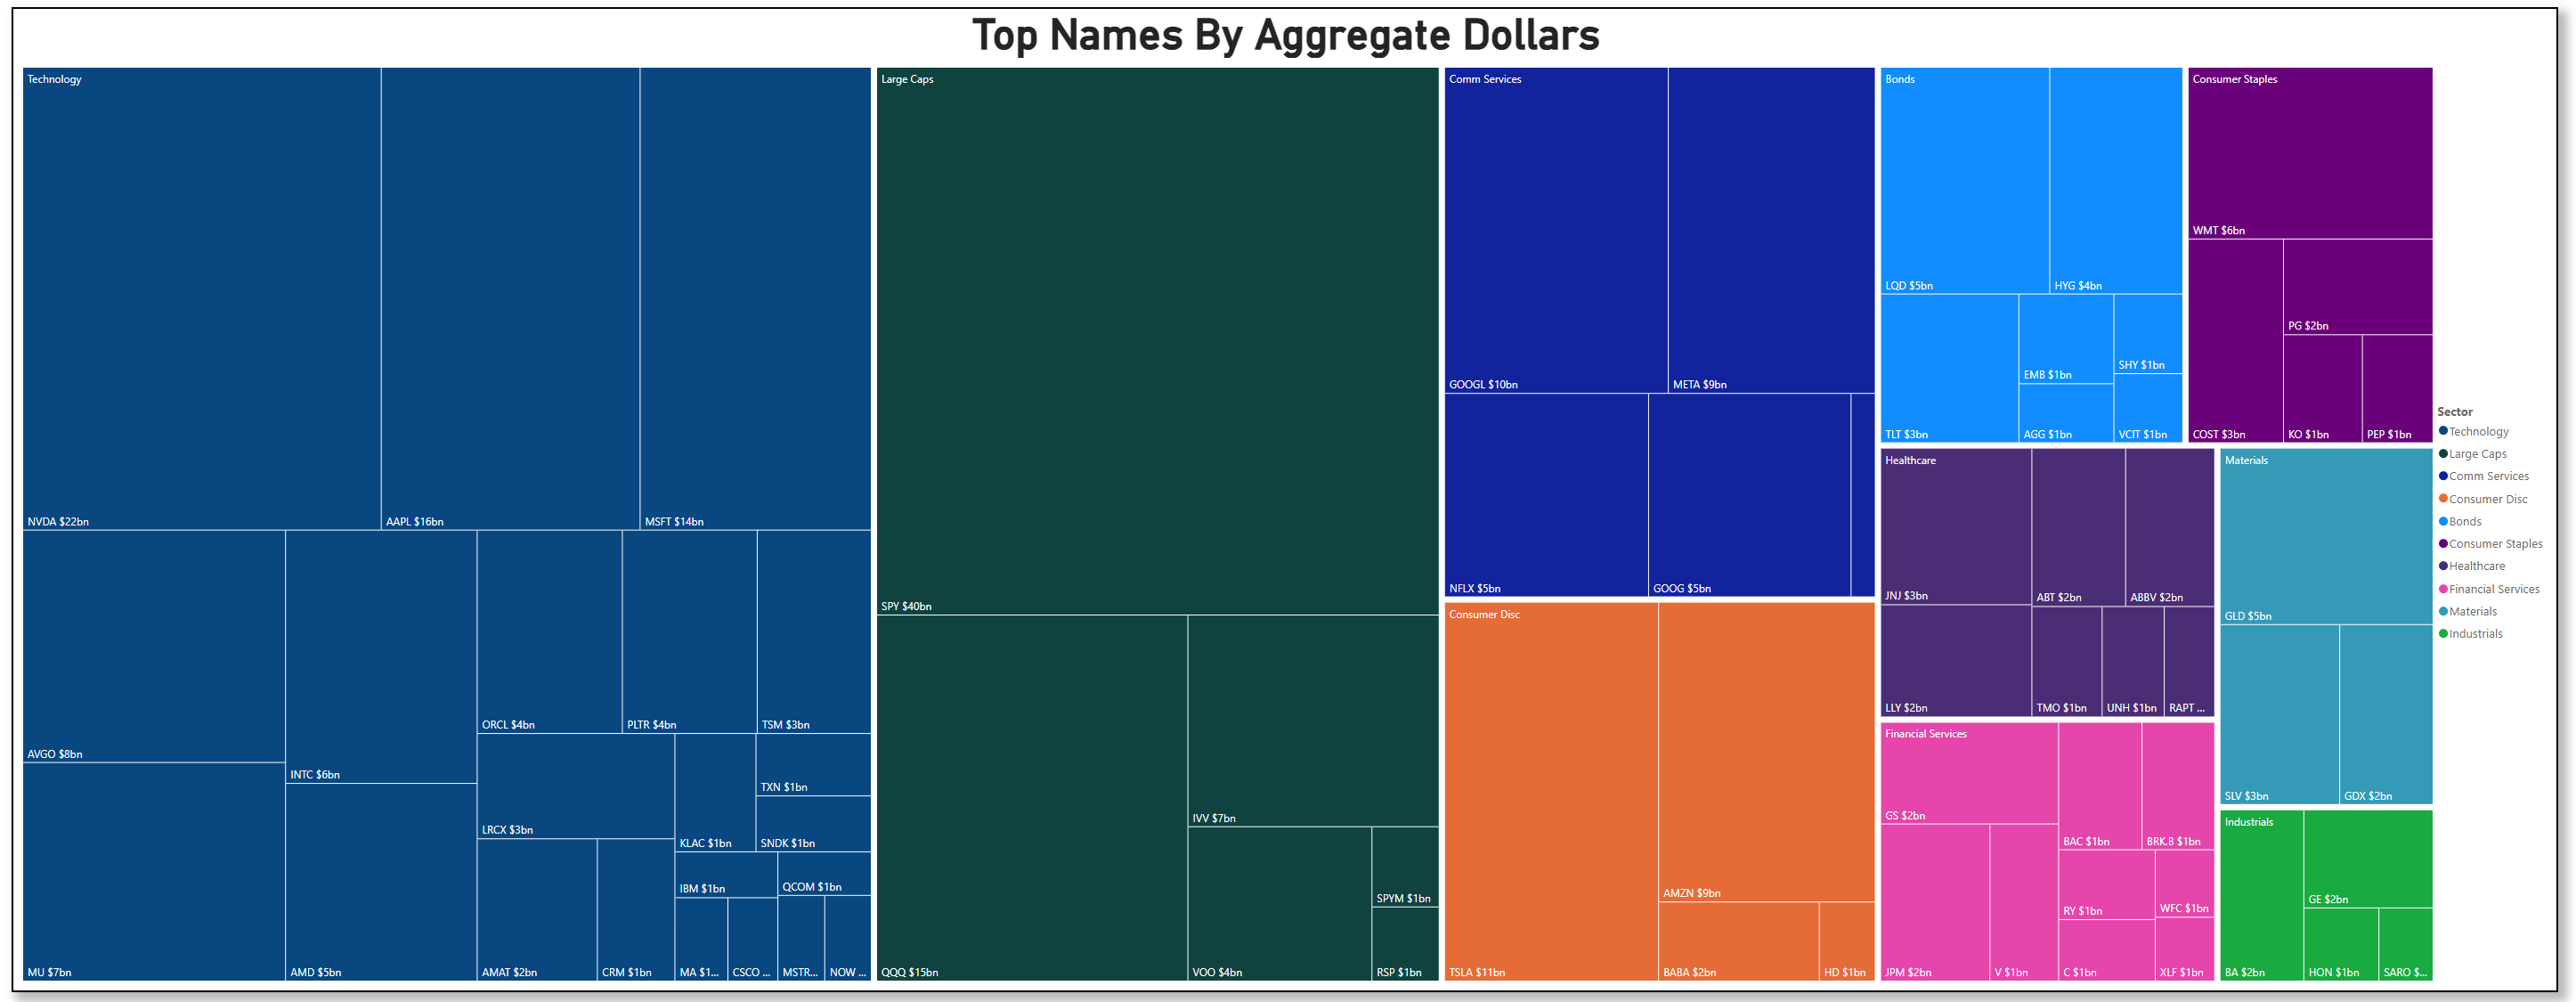
Industrials and Materials remain clearly secondary throughout. Industrials hold a steady but modest share, while Materials rarely break out of single-digit billions. If the market were positioning for accelerating real economic growth or inflation persistence, these sectors would attract disproportionate attention. Their absence from the top tier suggests that capital is not anchoring around cyclicality or hard assets.
Stepping back, the aggregate picture is one of concentrated positioning without directional unanimity, which is very simply a continuation of what we saw in the prior week. The market continues to sit perched at an inflection point, ahead of some large tech earnings in a few sessions and a seasonally weak month waiting in the wings. Technology dominates not because it is being blindly bought, but because it is the most efficient place to express views, hedge exposure, and rebalance risk. Large Caps act as stabilizers. Consumer Discretionary flares when optionality is desired. Defensives remain involved but not ascendant.
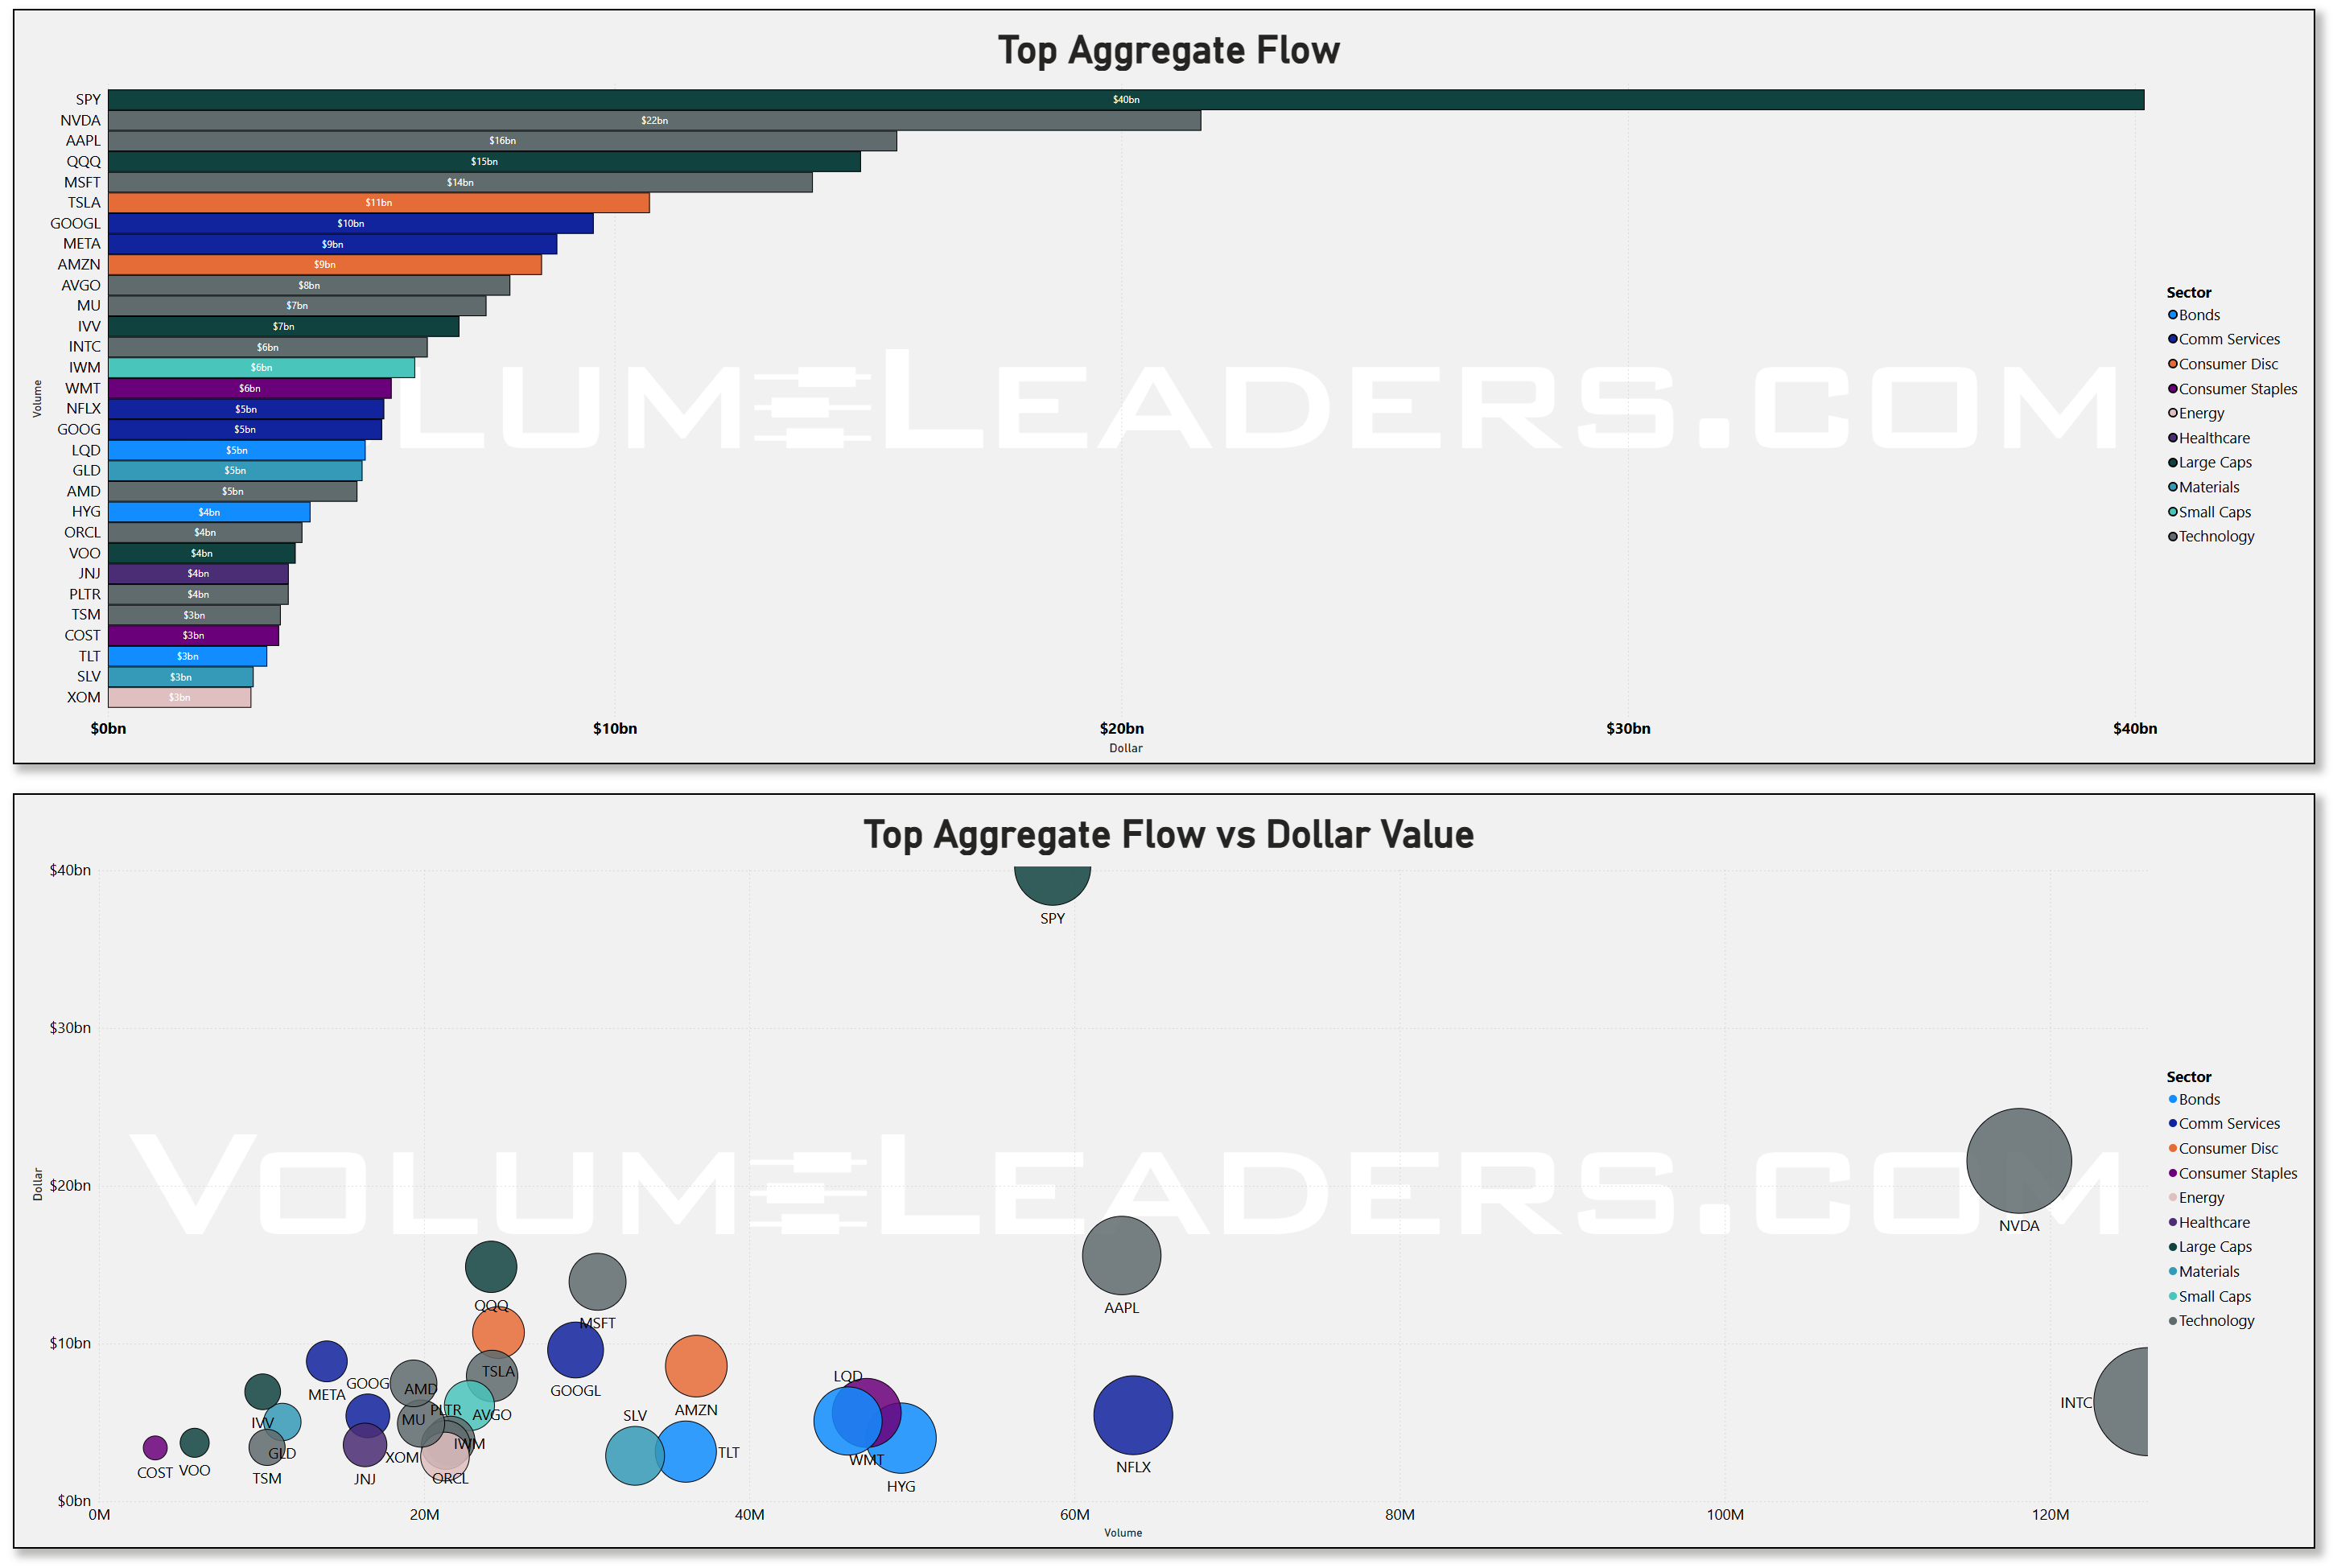
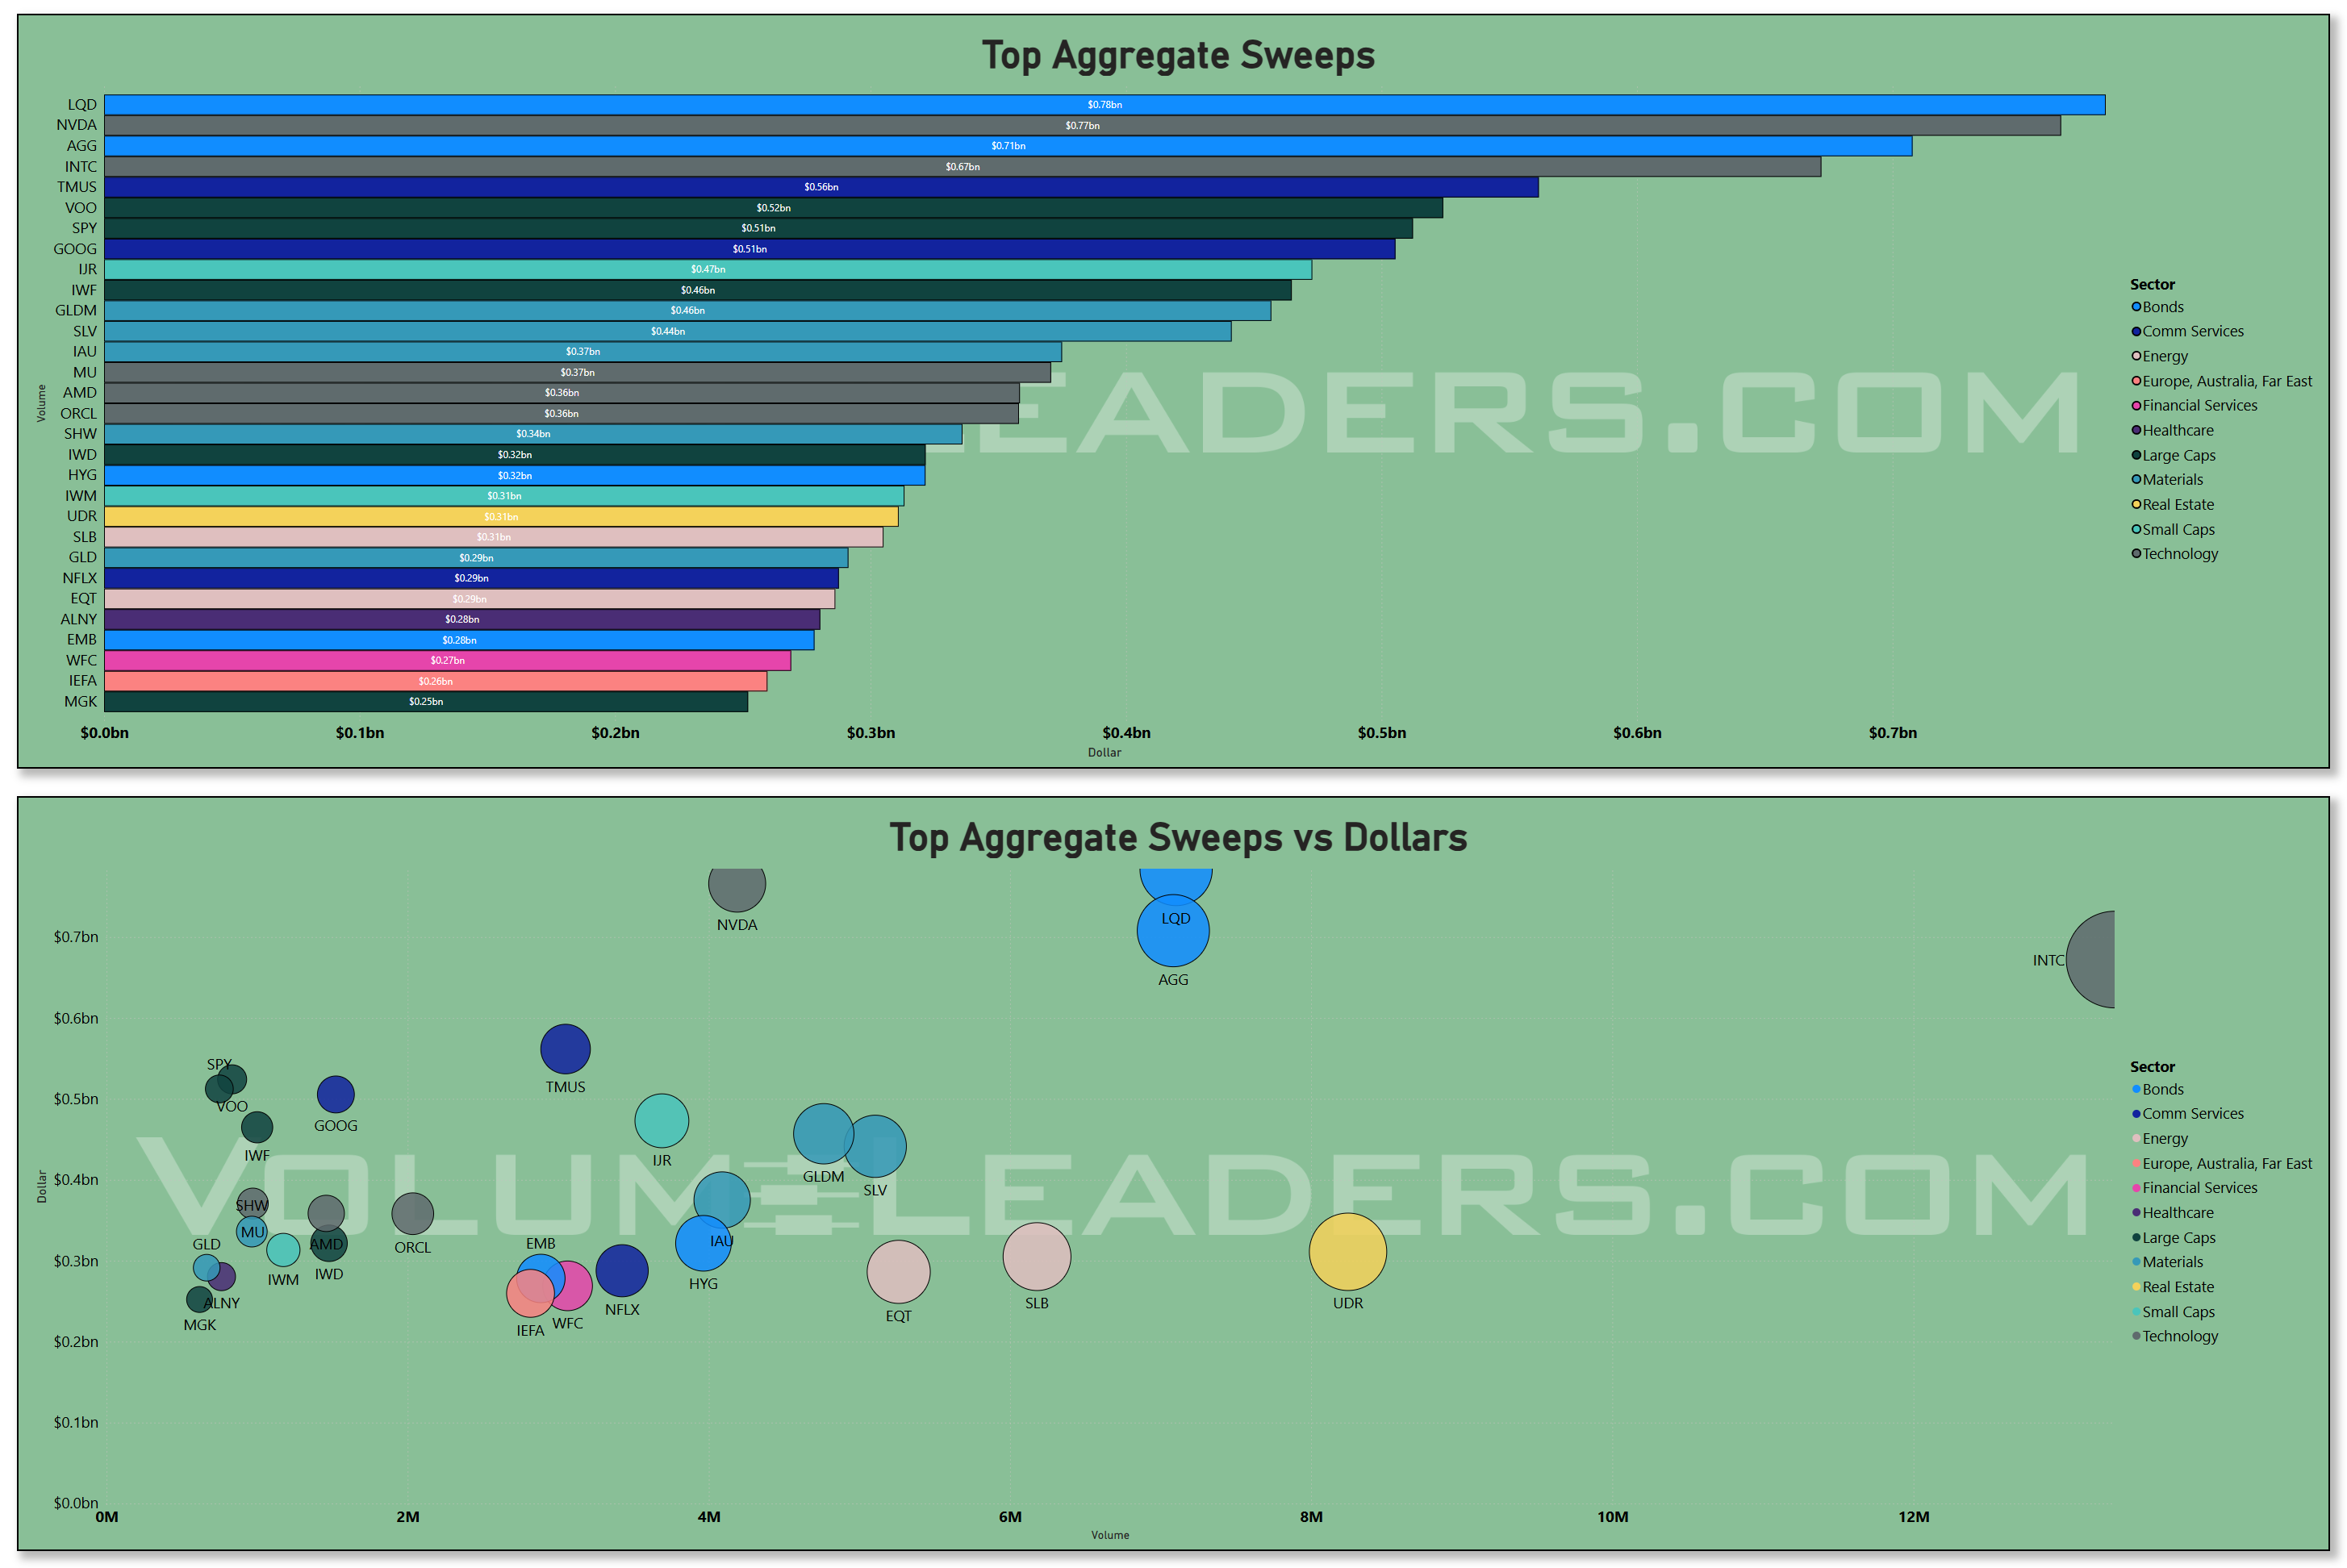
The dark pool and sweep lenses reinforce this conditional framing. Heavy off-exchange activity in large, liquid names is consistent with inventory transfer, but with broader indices balanced, fractured leadership in names and equal parts strength and weakness in most areas, it’s difficult to assess context.
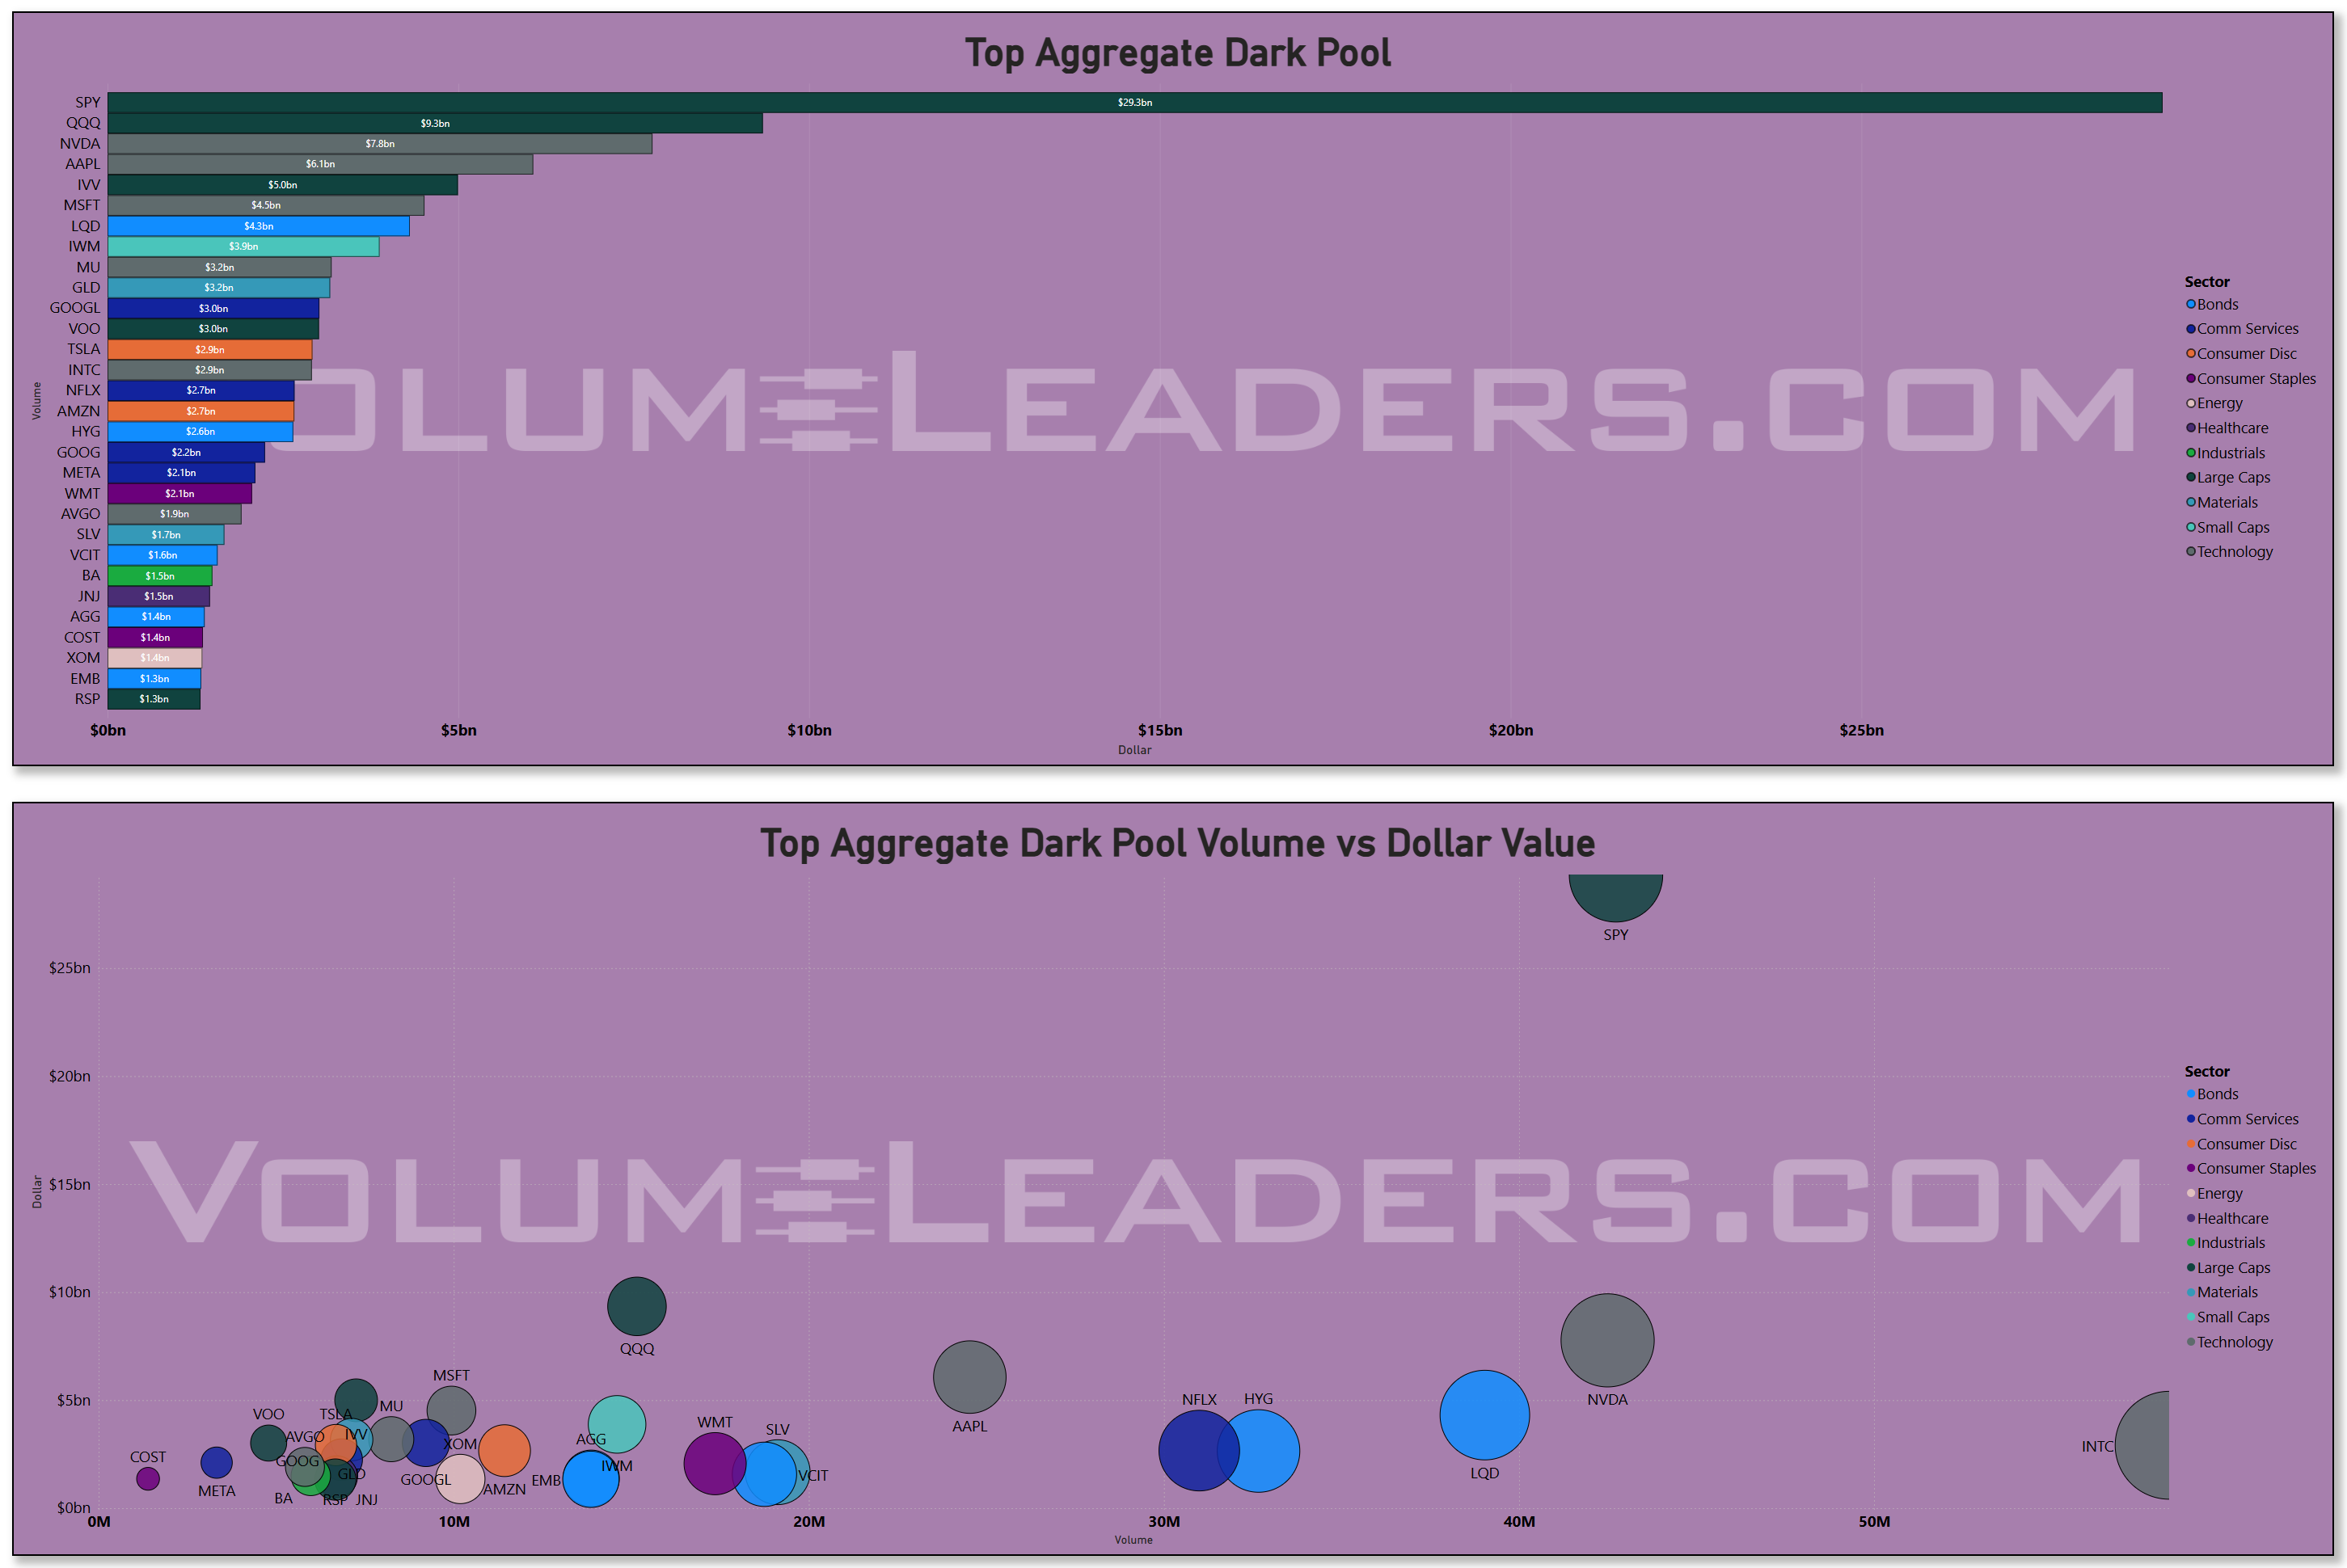
Sweeps clustered in indices and select single names suggest urgency, but urgency can accompany hedging just as easily as chasing. If those sweeps persist alongside rising index exposure, they argue for directional conviction. If they fade while dark pool activity remains elevated, they argue for quiet repositioning.
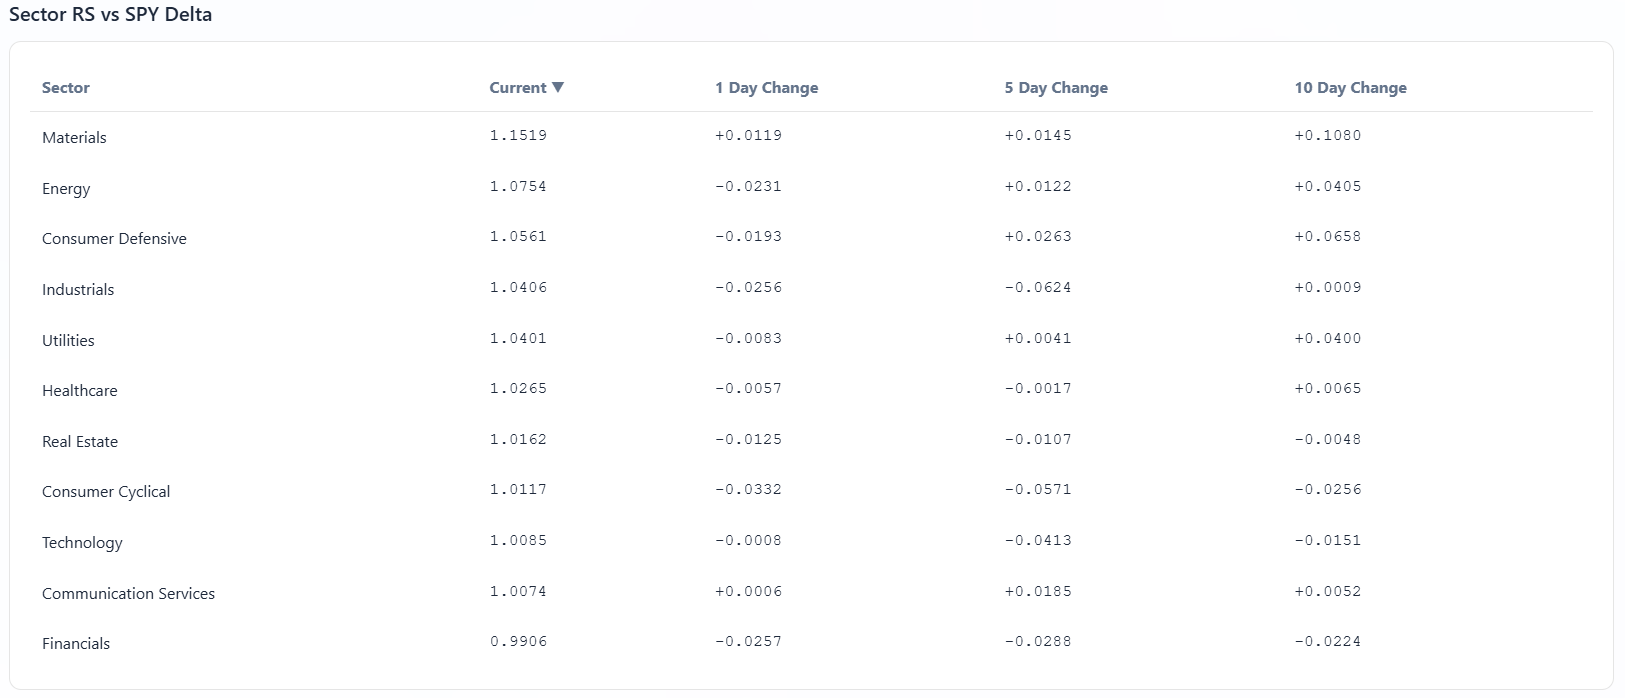
Sector leadership and relative strength complete the picture. Leadership tilts toward growth-aligned sectors, but momentum is uneven. That combination usually resolves not through collapse but through rotation and digestion.
If Technology continues to command the largest share of institutional dollars, the regime remains intact. If that attention disperses into defensives or Bonds, the tape changes character.
Bottom line: this is not a market screaming buy or sell, it is a market actively choosing where to stand, and right now institutions are choosing to do their thinking, hedging, and expressing through Technology first, with everything else adjusting around it.
MIR Part 2: Individual Names From The Institutional Tape
VolumeLeaders tracks several proprietary signals designed to spotlight names drawing significant institutional interest. Below, we’ve surfaced the latest results and analyzed them to highlight emergent themes. If any of the sectors, narratives, or positioning trends resonate, the names mentioned here offer a strong starting point for deeper research and watchlist consideration.
VL Trade Rank Velocity™ (TRV)
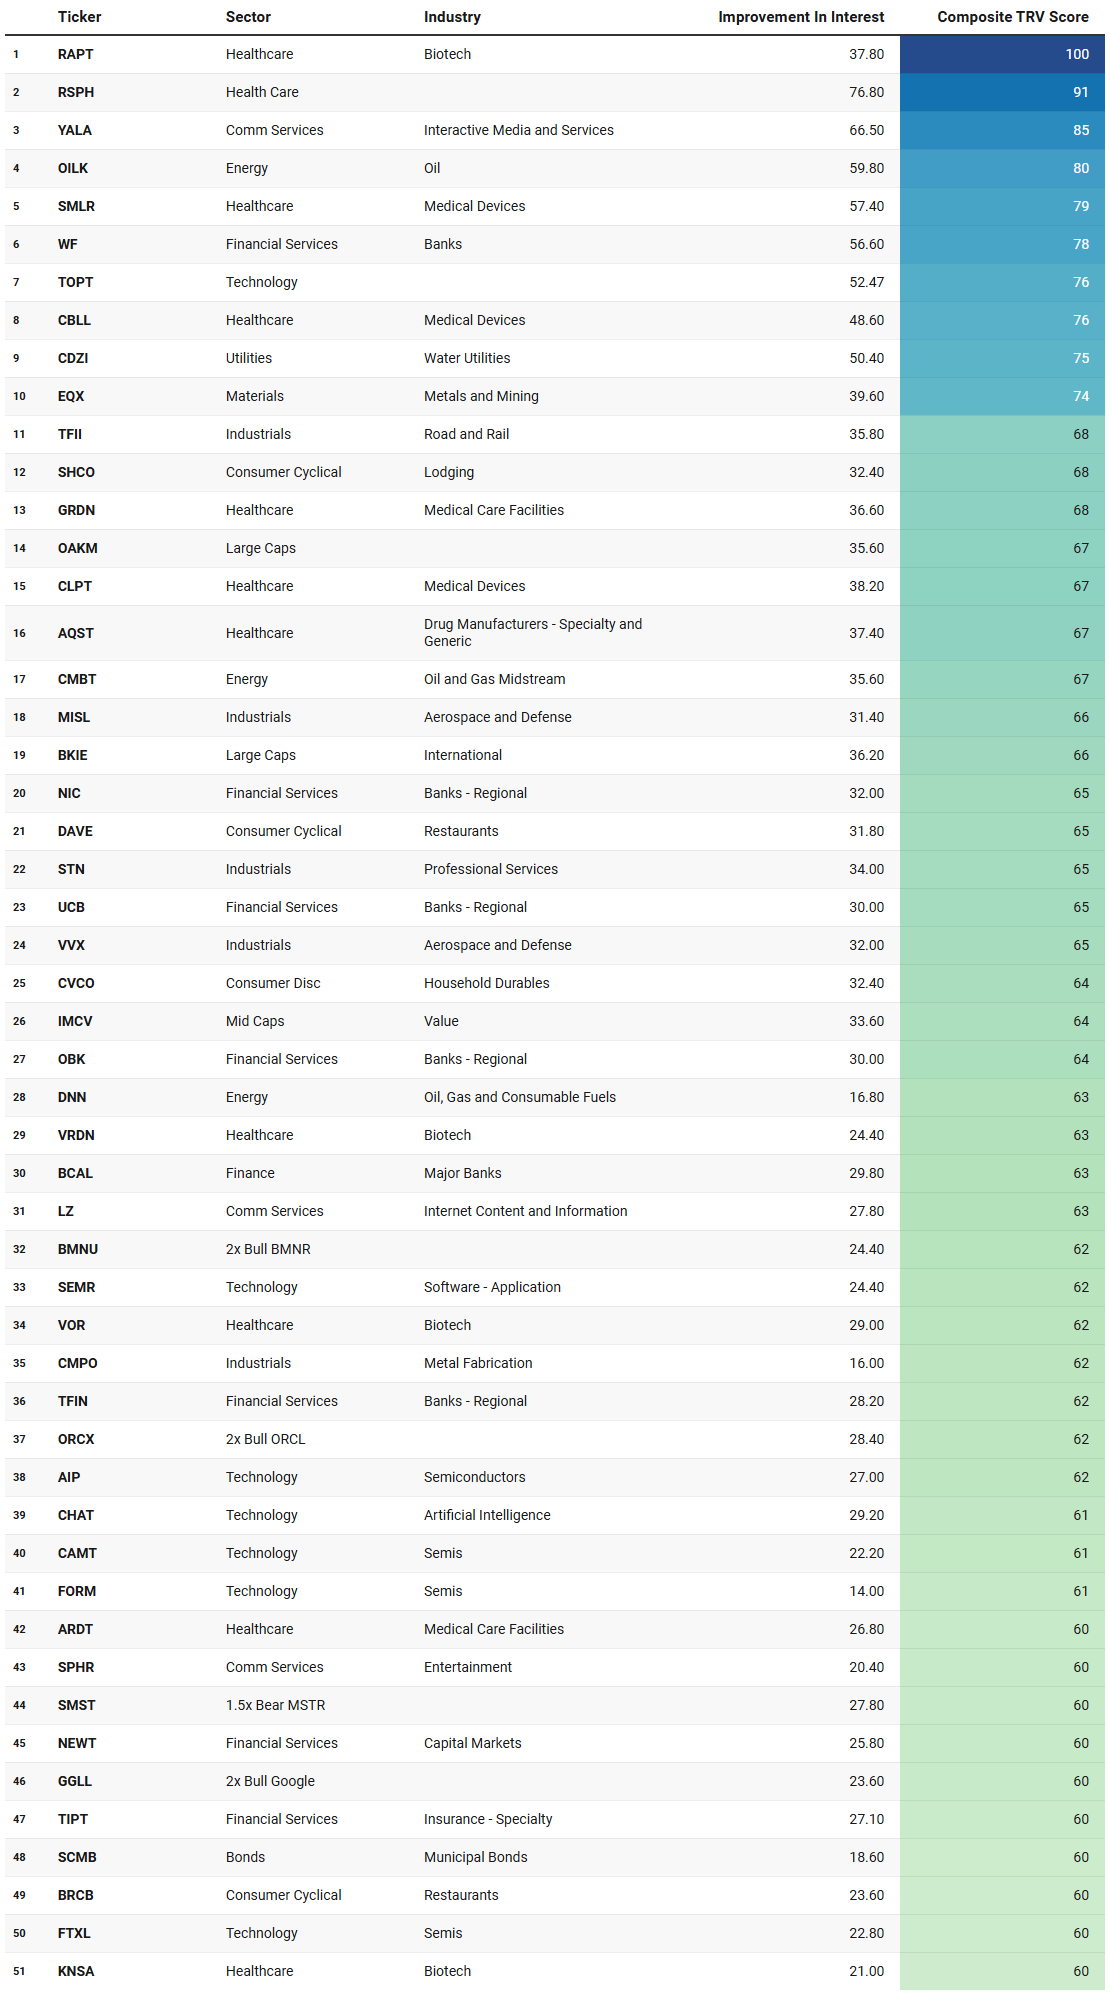
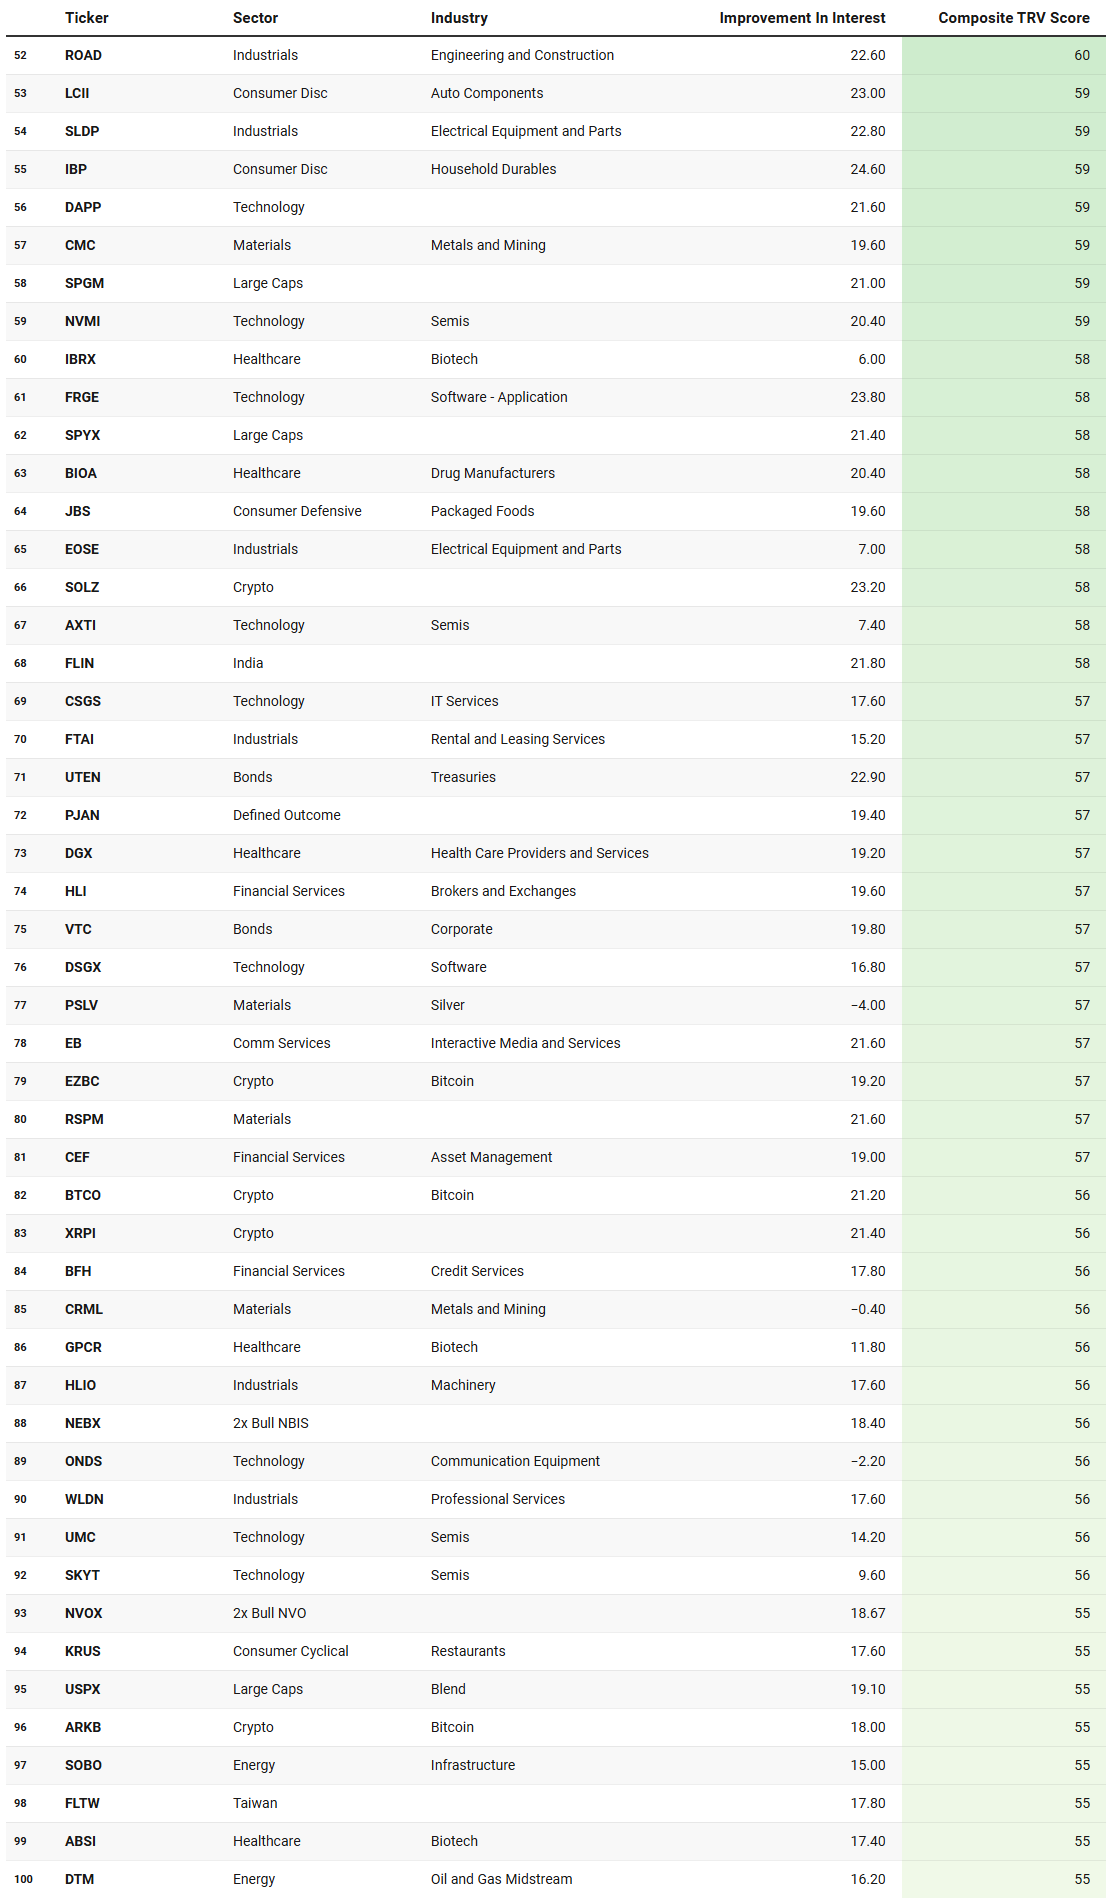
TRV is a proprietary metric that measures the recent acceleration or deceleration in institutional trading activity for a given stock by comparing its average trade rank over the past few days to its average in recent weeks. A sharp improvement in TRV typically reflects a notable shift in positioning, often accompanied by sustained trade activity, suggesting institutions are actively engaging with the name and that intensity of activity is rising. This often precludes meaningful price or narrative shifts. This isn’t a buy-list or sell-list; it’s meant to draw your eyes to names where institutions are putting money to work.
What jumps out immediately from this week’s TRV watchlist is not a single dominant sector but a patterned clustering of intent, very much in line with the positioning-first, not direction-first, narrative we have been developing.
The most coherent theme is the continued centrality of Technology as an expression layer, but importantly, it is not showing up purely through mega-cap proxies. Instead, the list is littered with second- and third-derivative Tech exposures: semiconductors, equipment, software infrastructure, and levered or thematic vehicles tied to AI and platform incumbents. Names like AIP, CAMT, FORM, NVMI, AXTI, UMC, SKYT, FTXL, and CHAT all appear with varying mixes of improving interest and sustained activity. The commonality is not size but duration. If this were late-stage chasing, we would expect improvement-in-interest to dominate without follow-through. Instead, many of these names show moderate improvement paired with elevated sustained activity, which is consistent with ongoing evaluation or staged positioning rather than one-off speculation. If Technology exposure were being reduced broadly, we would expect these to fall off the list quickly. They are not.
Running parallel to that is a persistent Healthcare complex, especially Biotech and Medical Devices. This is one of the most striking features of the list. RAPT sits at the very top with extreme sustained activity, and it is joined by a deep bench of Biotech names like VRDN, VOR, KNSA, IBRX, GPCR, ABSI, and AQST, as well as Medical Devices and care facilities. The dispersion here matters. If Healthcare were being treated defensively, we would expect large-cap pharma or broad ETFs to dominate. Instead, the activity concentrates in idiosyncratic, research-driven names, often with high sustained activity and improving interest. That suggests capital is not hiding, but selectively probing. If risk tolerance were collapsing, these names would be abandoned quickly. Their persistence implies that institutions are comfortable maintaining exposure to uncertainty as long as it is uncorrelated and optional.
Another important thread is the quiet reappearance of Financials, particularly regional banks and specialty finance. WF, NIC, UCB, OBK, TFIN, BCAL, NEWT, HLI, BFH, and CEF all appear, none with explosive improvement metrics, but many with steady sustained activity. This fits well with the earlier observation that Financials are being adjusted, not aggressively leaned into. If this were a rates-driven bull case, we would expect improvement scores to dominate and clustering around majors. Instead, the pattern suggests balance-sheet triage and relative value work. If stress were building in the system, this category would likely light up in either direction. The current behavior reads as monitoring and positioning, not panic or exuberance.
Energy and Materials form a subtler, but telling, backdrop. Names like OILK, DNN, EQX, CMC, CRML, and midstream exposures such as CMBT and DTM show up alongside silver-related vehicles like PSLV. Notably, several of these have very high sustained activity with low or even negative recent improvement. That combination is important. It suggests that positions are already established and are being maintained or reworked, not newly initiated. This dovetails with the earlier silver narrative and broader materials behavior: if this were a fresh inflation impulse, improvement scores would be surging. Instead, the data argues for inventory management and optionality preservation.
Consumer Cyclical exposure is present but measured. Restaurants, lodging, household durables, and auto components appear repeatedly, but rarely with extreme scores. This supports the idea that discretionary exposure is being treated as a tactical overlay, not a core thesis. If consumer confidence were the primary bet, these names would crowd the top of the list. They do not. Their presence is meaningful, but conditional.
Large Cap and broad-market proxies like OAKM, BKIE, SPGM, SPYX, and USPX reinforce the earlier conclusion about Large Caps: they function as structural scaffolding. Their TRV scores are respectable but not dominant, and their improvement metrics are modest. If portfolios were being aggressively re-risked or de-risked, these instruments would spike sharply. Instead, they show continuity.
Finally, the presence of crypto-related vehicles and defined outcome or bond products adds an important layer. SOLZ, EZBC, BTCO, ARKB, XRPI, along with UTEN, SCMB, VTC, and PJAN, suggest that capital is actively managing convexity and tail exposure. The fact that these coexist with high-TRV Technology and Biotech names argues against a binary risk-on or risk-off regime. If fear were dominant, crypto and leveraged equity expressions would vanish. If greed were dominant, bonds and defined outcomes would. Neither happens.
Taken together, the TRV list reinforces a single, consistent conclusion presents itself as the most likely outcome given all things: institutions are positioning across multiple dimensions at once, using Technology as the primary expression layer, Healthcare as an idiosyncratic alpha sleeve, Financials and Large Caps for balance, and Energy, Materials, bonds, and crypto as optionality and hedge vectors. If this positioning resolves higher, it will do so through Tech and selective growth. If it resolves lower, the groundwork for rotation and defense is already partially laid. That is the signature of a market thinking, not reacting.
VL Institutional Outliers™ (IO)
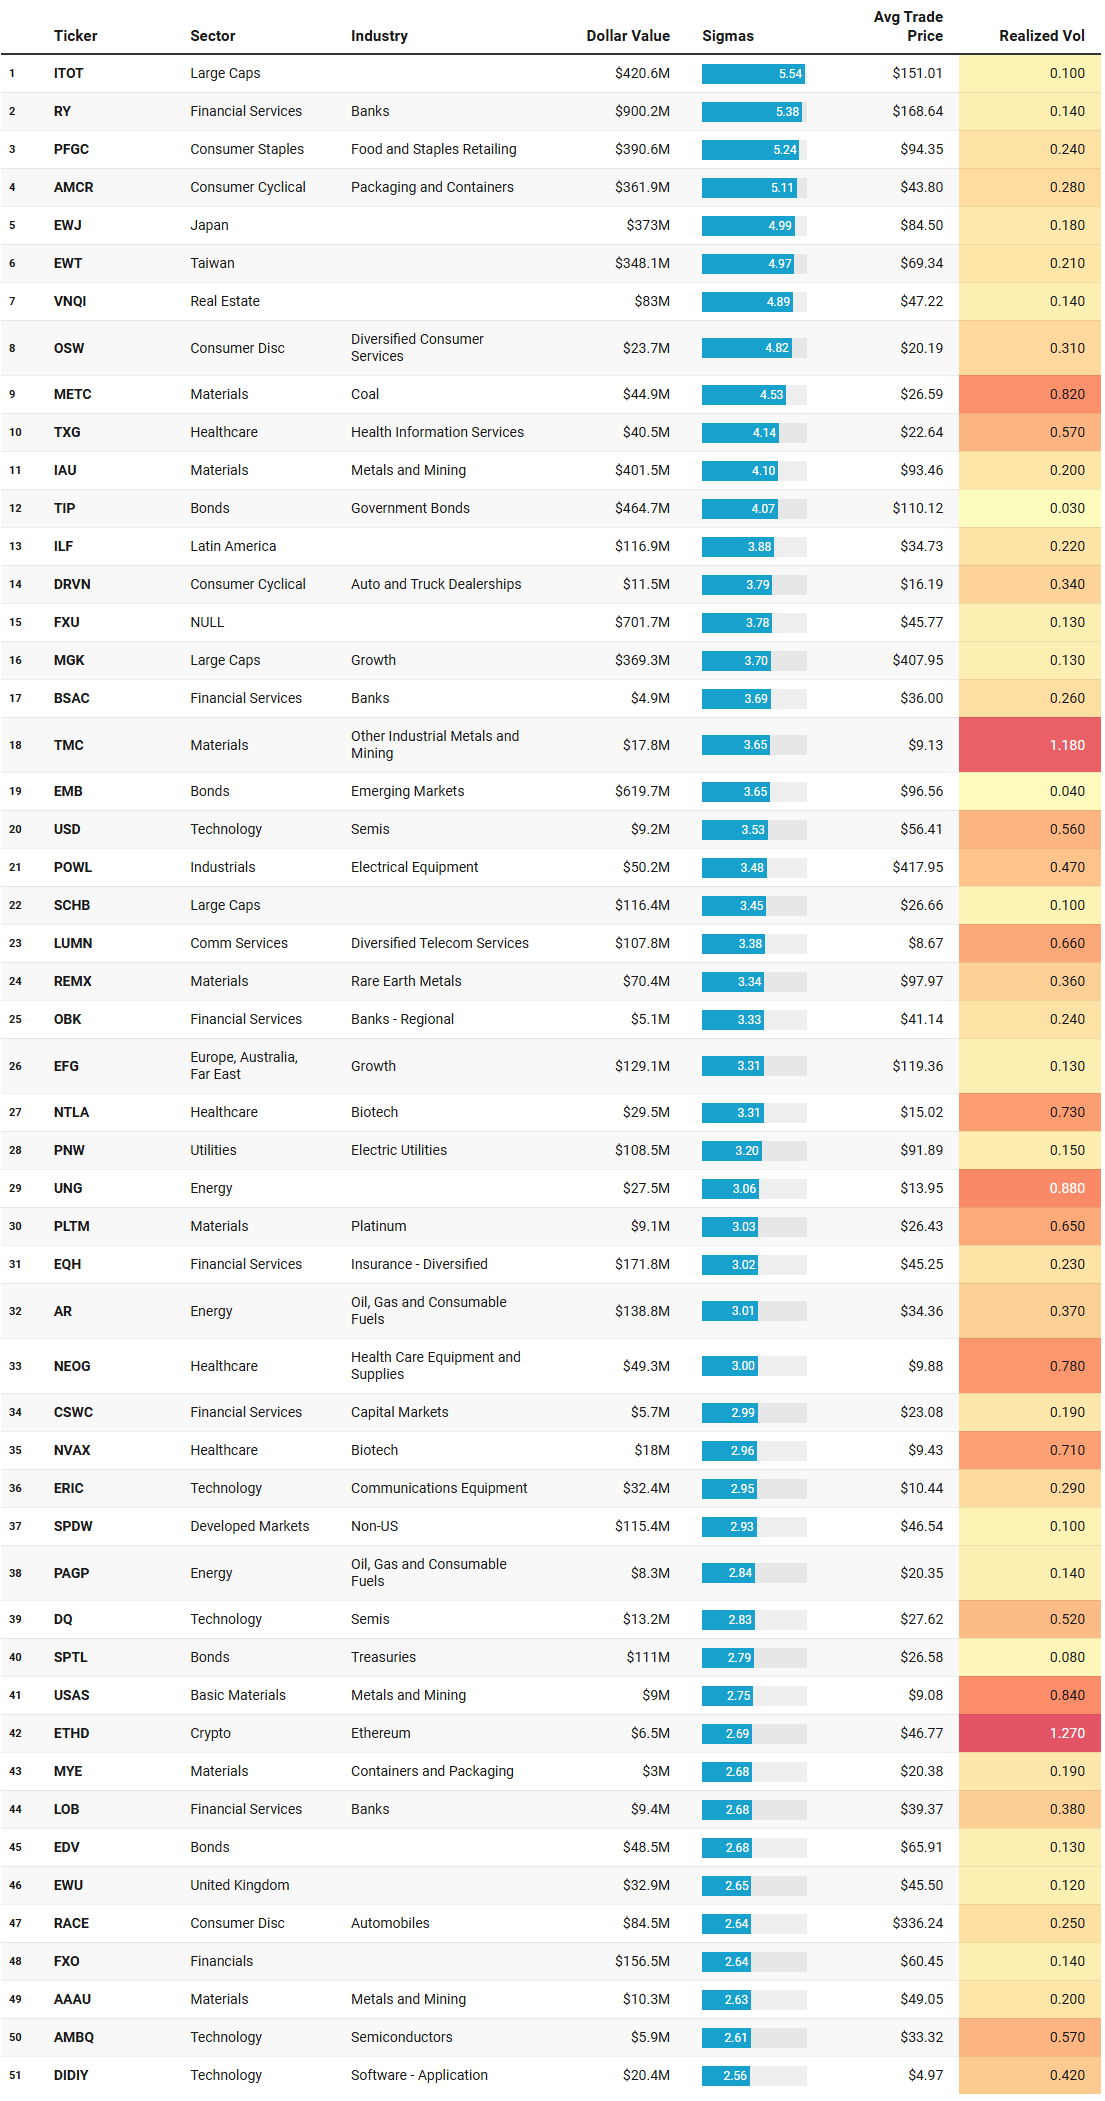
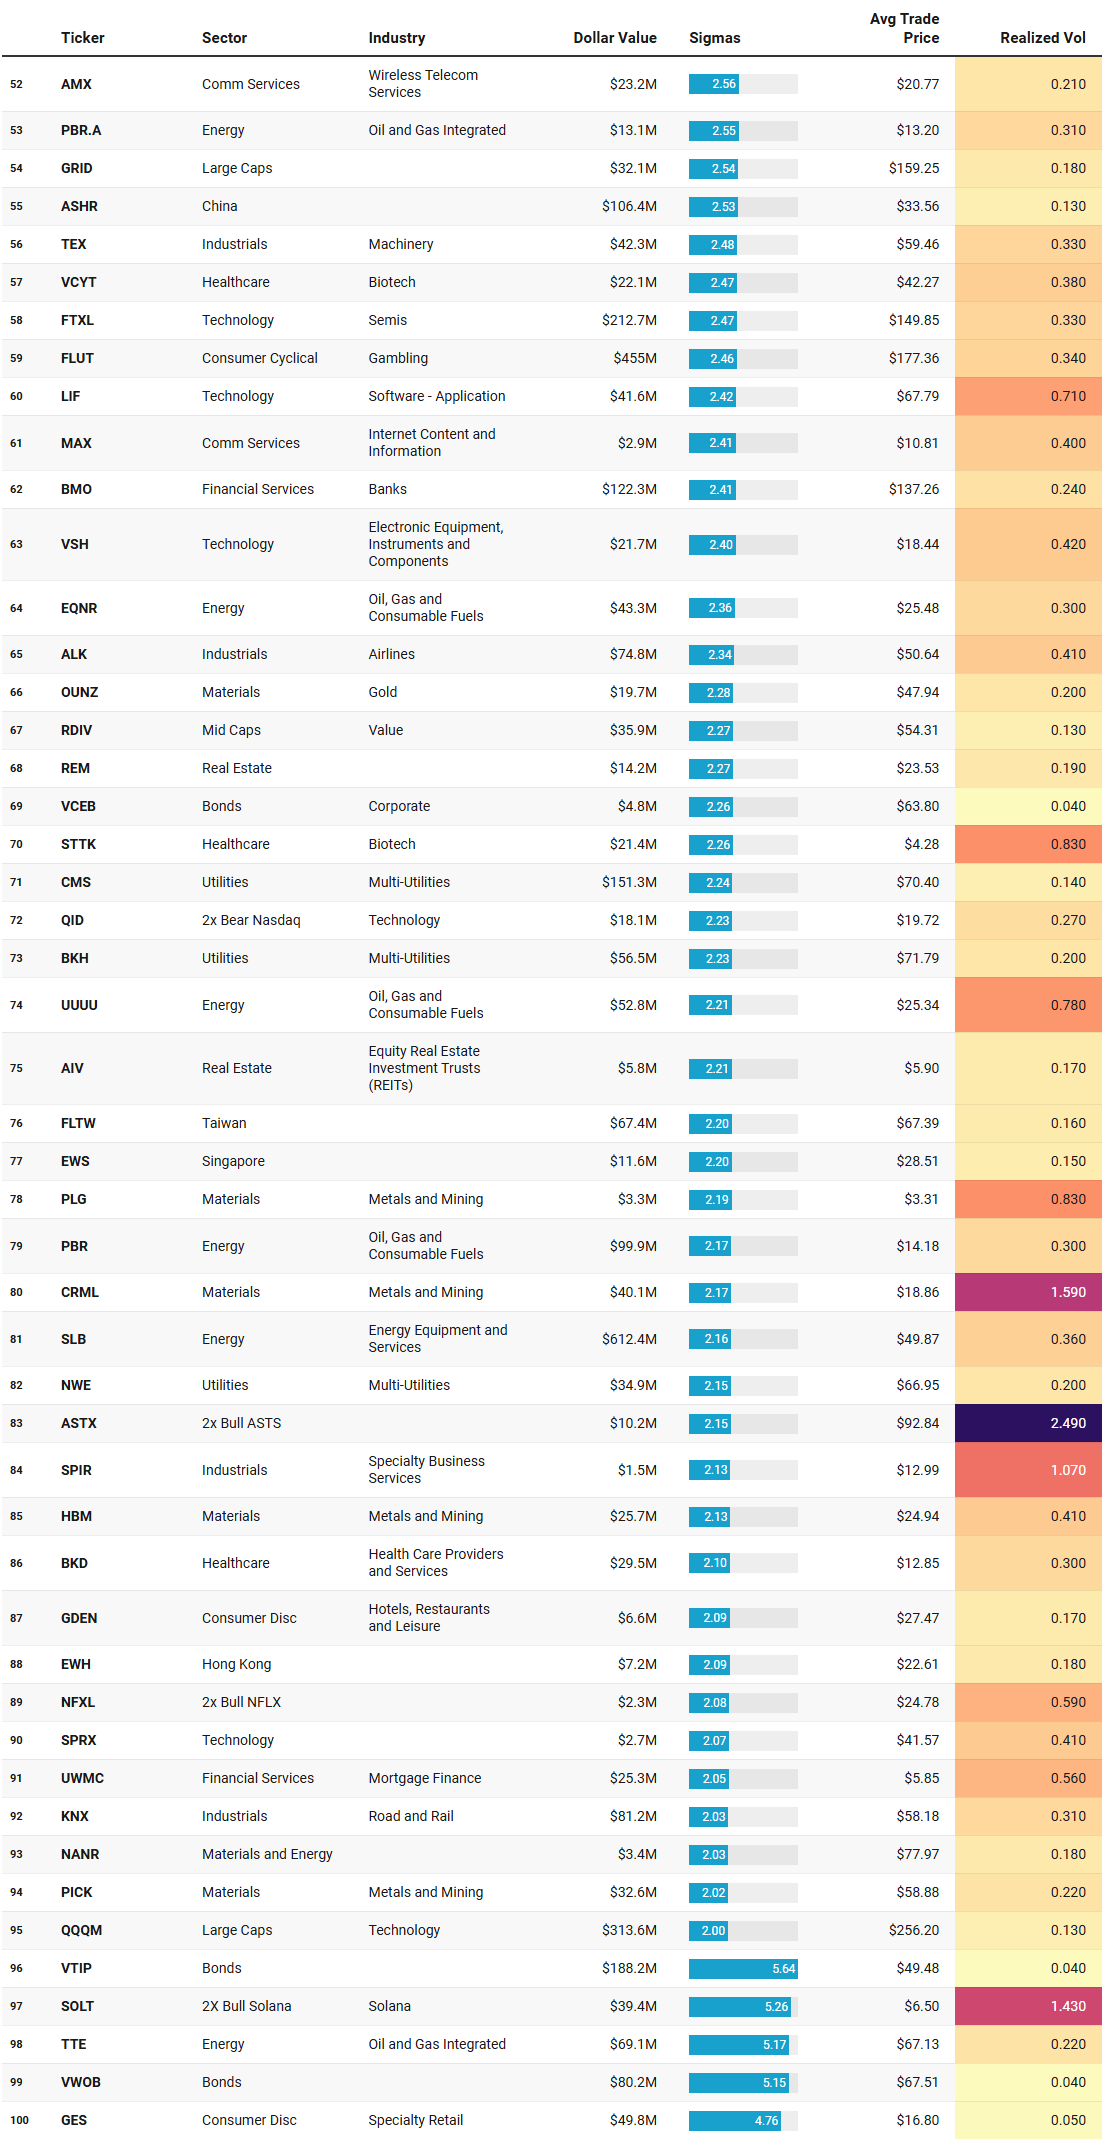
Institutional Outliers is a proprietary metric designed to spotlight trades that significantly exceed a stock’s recent institutional activity—specifically in terms of dollar volume. By comparing current trade size against each security's recent normalized history, the metric flags outlier events that may indicate sudden institutional interest but may be missed because the activity doesn’t raise any flags/alerts when comparing the activity against the ticker’s entire history. For example, it’s conceivable that a ticker today receives the largest trade it has had in the last 6 months but the trade is unranked and would therefore be missed by current alerts built off Trade Ranks. Day traders can use “Realized Vol” to identify tickers that are moving swiftly with large price displacement while others can use it to size your risk appropriately.
This IO list reads like a map of where the tape got leaned on hard enough to register as statistically abnormal, and the first thing to internalize is what that means. These are not your highest dollar names by default. These are the prints that were large relative to each ticker’s own recent history, which is why you get a clean mix of index beta, macro sleeves, and a handful of single-name shocks.
Start with the highest-sigma cluster at the top, because it tells you what kind of week it was. ITOT prints $420.6m at 5.54 sigmas with an average trade price of ~151.01 against a close of ~150.97. That is essentially flat on the day, which is the point: when you see a broad beta instrument hit that kind of sigma without much percent change, it usually reads as allocation or rebalance-like positioning rather than panic. If this were forced selling, you would expect the close to be meaningfully displaced from the average trade price and the percent change to be decisively negative. Here it is basically unchanged. The if-then is straightforward: if broad index wrappers are seeing outlier prints without large price displacement, then the flow is more consistent with systematic size moving through the market than it is with one-sided risk liquidation.
Now look at how that theme repeats across other broad sleeves. MGK shows $369.3m at 3.7 sigmas, also essentially flat (-0.11%). SCHB shows $116.4m at 3.45 sigmas, also nearly flat (-0.10%). QQQM shows $313.6m at 2.0 sigmas, basically unchanged (+0.09%). When multiple broad beta vehicles show outlier-like behavior without directional follow-through, the implication is not “bullish” or “bearish” by itself. It is “positioning intensity is elevated.” If that intensity persists and begins to coincide with directional closes, then you get a tradable regime shift. If it stays high while price remains pinned, you are in balance with heavy two-way business.
The next big tell is the macro hedge complex. TIP prints $464.7m at 4.07 sigmas with realized vol of 0.03, basically unchanged on the day. VTIP is even louder: 5.64 sigmas and $188.2m with very low realized vol (0.04). EMB hits $619.7m at 3.65 sigmas, also nearly unchanged with realized vol 0.04. EDV and SPTL show up as well. That is a whole term-structure and inflation-protection cross-section lighting up at once, with very small percent changes. If this were a directional rates shock, you would expect larger percent changes in the duration products and more dispersion across the curve. Instead you have a signature of institutions actively managing rate and inflation exposure into a catalyst window, not necessarily pressing a single bet. The if-then: if TIP/VTIP and EM credit are printing outliers while realized vol stays suppressed and percent change stays small, then hedging, rebalancing, and cross-asset risk control are likely dominating the tape rather than outright fear.
Now overlay the commodities and materials complex, because this is where you do see bigger price displacement and higher realized vol. IAU posts $401.5m at 4.1 sigmas with a modest positive day (+0.36%) and realized vol 0.2. OUNZ and AAAU are there too. Then you have more explosive, higher-volatility metals and miners: CRML is notable with +9.33% on realized vol 1.59 at 2.17 sigmas, PLG +4.83% at 0.83 vol, USAS +2.29% at 0.84 vol, METC +4.29% at 0.82 vol, TMC +3.54% at 1.18 vol, PICK shows up, and REMX (rare earth metals) prints $70.4m at 3.34 sigmas. That is not a single commodity story. It is a grab bag across precious metals, rare earths, and miners. The if-then here is different: if outlier positioning in the commodity complex coincides with large percent change and high realized vol, then you can more reasonably infer that these are not just passive allocations. Something is being chased or defended. Whether it is accumulation or distribution depends on where the average trade price sits relative to the close. CRML is instructive: average trade price ~18.86 and close ~20.62. That is positive displacement after the outlier activity. If that pattern repeats for multiple days, it is consistent with demand overwhelming supply. If it reverses and closes below the average trade price on the next session, then it reads more like a blow-off and redistribution.
Energy shows the same split personality. You have very large dollar outliers in SLB ($612.4m at 2.16 sigmas) with a negative close (-1.44%), AR at $138.8m and slightly down, plus PAGP and PBR/PBR.A up on the day, and TTE with a strong +3.09% on 5.17 sigmas. UNG also shows up with high realized vol (0.88) but little price change. This is not a clean risk-on energy rotation. It is positioning across the stack: integrated, services, midstream, gas. The if-then: if energy outliers are mixed in sign while credit and rates hedges are active, then the market is not expressing a single macro view; it is managing exposures and letting idiosyncratic catalysts like Fern do the work.
Financials are similarly mixed but meaningful, with very large prints in banks. RY is the second-highest sigma in the whole list: $900.2m at 5.38 sigmas, closing above its average trade price (avg ~168.64 vs close ~169.70) and up +0.63%. EQH prints $171.8m at 3.02 sigmas and up. BMO appears. Smaller regionals like OBK and LOB appear. UWMC prints with a negative day. The if-then is: if the biggest bank outliers are closing above the average trade price, then demand held through the session and the prints likely represent accumulation or at least supported inventory placement. If those same names start closing below their average trade prices while sigmas remain elevated, then the same activity becomes a warning: size is transferring risk, not adding it.
There is a quiet international sleeve embedded here that matters because it is broad and consistent. EWJ (Japan) at 4.99 sigmas and $373.0m is nearly flat but present. EWT (Taiwan) at 4.97 sigmas and $348.1m is up. ILF (LatAm) appears. EFG (EAFE growth), SPDW (developed ex-US), ASHR (China), EWU (UK), EWS (Singapore), EWH (Hong Kong) appear. This is a lot of geographic beta showing outlier positioning at once, mostly without huge percent changes. That reads as reallocation work more than a hot money chase. If this persists with improving closes across multiple regions, then you have a regime narrative. If it fades immediately, it is likely calendar-driven or benchmark-related.
On the single-name side, two things stand out. First, pockets of high realized vol tech and comm services with outlier prints but not necessarily positive outcomes: LUMN shows $107.8m at 3.38 sigmas and down, DQ down, ERIC down, AMBQ slightly down, DIDIY slightly down. Second, the presence of explicit downside or hedge expressions like QID (2x bear Nasdaq) with $18.1m at 2.23 sigmas. If hedges show up while index wrappers also print, that is frequently a sign of institutions tightening the distribution around a base case rather than abandoning it. If QID-like vehicles climb the sigma list in subsequent sessions and index wrappers begin closing with larger negative percent changes, that is when the posture tilts from hedged to defensive.
The cleanest emergent themes in IO, then, are not sector leadership calls. They are structure calls. Broad beta saw unusually large relative prints with minimal displacement. Rates, inflation protection, and EM credit all lit up as outliers with very low realized volatility, which is classic “risk control week.” Commodities and miners were the opposite: outlier prints with big percent change and high realized vol, which is where the tape actually moved. International equity sleeves quietly registered across multiple regions, suggesting allocation work. And within financials, the bank outliers that closed above their average trade price are the closest thing here to a directional tell.
If you want this in tradeable if-then form: if the next 2-3 sessions show broad wrappers like ITOT/MGK/QQQM continuing to print outliers and beginning to close meaningfully away from their average trade prices in one direction, then you should respect that as a regime push rather than noise. If TIP/VTIP/EMB outliers remain elevated while equities trend, then the equity move is likely being carried with a hedge, which tends to cap volatility but also can fuel persistence. If the materials complex keeps printing outliers where closes stay above the average trade price (as with CRML), then you treat pullbacks as potentially sponsored until that relationship flips.
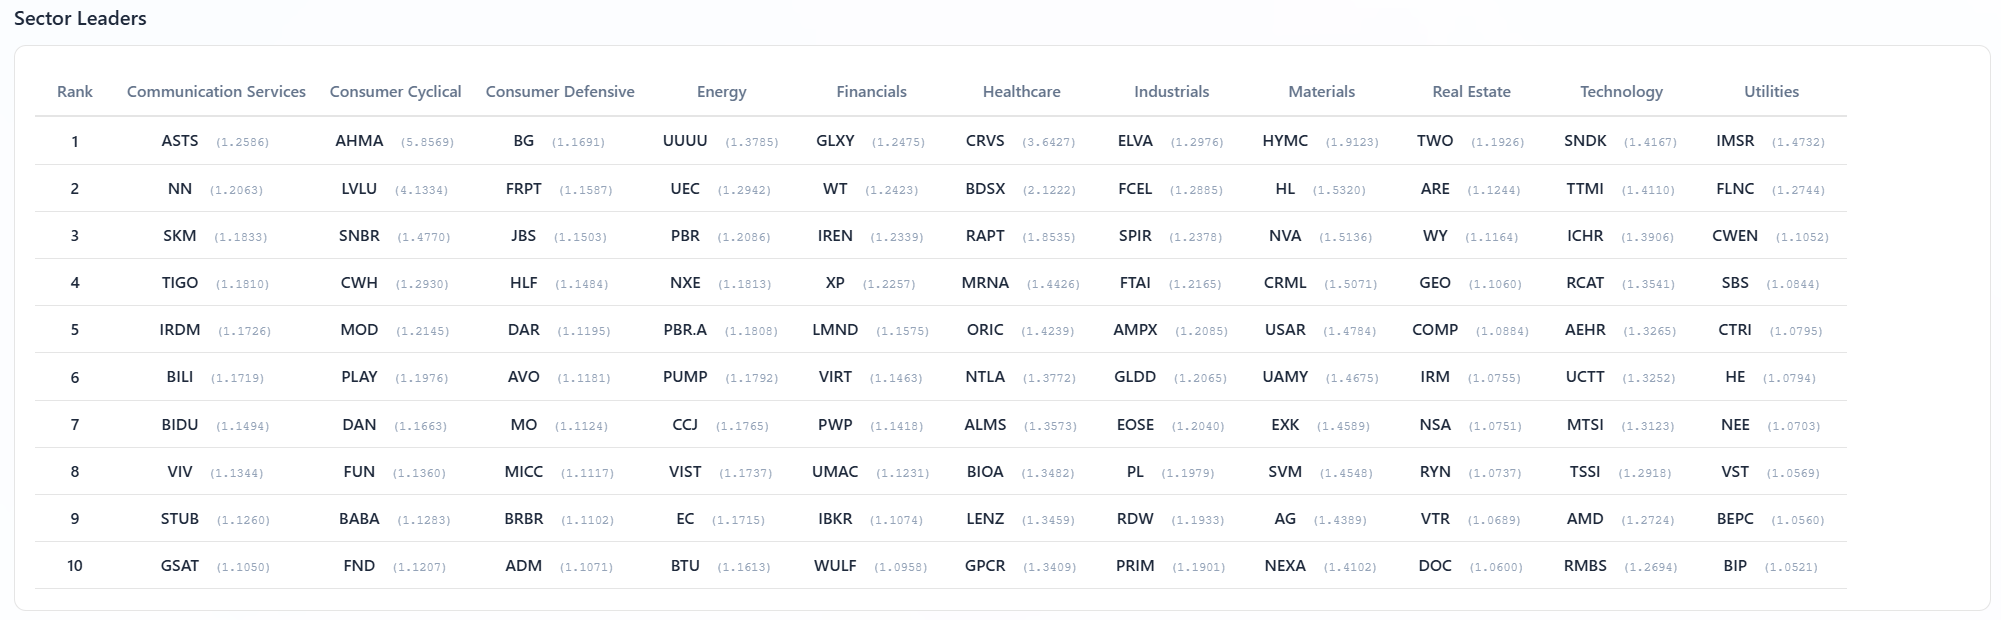
VL Sector Leaders
VL Sector Leaders is a weekly snapshot of where true leadership is asserting itself inside the market, stripped of the distortions that come from broad, style-mixed indices. Rather than asking which stocks look strong in absolute terms, this list focuses on which names are outperforming within the environments they actually compete in.
Each week, we surface the ten stocks demonstrating the most persistent relative strength inside their respective sectors. These are not headline chasers or one-day wonders. They are names that continue to separate themselves from peers through real price behavior, often reflecting sustained demand rather than fleeting attention.
For day traders, this list is a powerful awareness tool. Sector Leaders tend to offer cleaner intraday structure, better follow-through, and more predictable reactions around key levels because they already sit on the right side of relative strength. Even on choppy tape, leadership names often remain tradeable while the rest of the market degrades.
For swing traders, VL Sector Leaders helps narrow the universe to stocks with the highest probability of staying relevant. Relative leaders are more likely to hold trends, survive pullbacks, and reassert themselves after consolidation. When markets rotate, these names are often among the first to resume leadership — or the last to break.
This Sector Leaders list is useful precisely because it strips away the temptation to argue about intent. These names are not here because someone decided to buy them. They are here because, relative to their peers, they are winning. That makes the exercise less about narrative and more about alignment: where performance leadership is clustering, and whether those clusters rhyme with the positioning and flow patterns already discussed.
Start with what immediately stands out: this is not a single-sector market. Leadership is broad, but it is not random. Communication Services shows a familiar split between speculative growth and international telecom. ASTS sits at the top, which fits with a continued willingness to reward high beta, story-driven upside when conditions allow. But that is paired with names like NN, SKM, TIGO, and VIV, which are not momentum darlings so much as steady international or cash-flow-oriented exposures. If Communication Services leadership were purely risk-on, you would expect it to concentrate narrowly. Instead, it is bifurcated. If this list continues to include both speculative and defensive comm services, then the sector is being used as a diversified sleeve rather than a directional bet.
Consumer Cyclical tells a similar story. AHMA, LIVU, SNBR, CWH, MOD, PLAY, FUN, and even BABA show up. This is not a clean consumer boom signal. It is a selective one. Housing-linked, leisure, and discretionary experience names are doing well, but there is no uniform retail or apparel surge. If leadership here were about aggressive growth expectations, you would expect tighter clustering. The if-then is simple: if cyclicals continue to lead in this scattered, sub-theme-driven way, then consumption is being treated as resilient but not overheating. A sharp narrowing toward pure discretionary beta would be the warning sign.
Consumer Defensive is quietly one of the more interesting columns. BG, FRPT, JBS, HLF, DAR, AVO, MO, MICC, BRBR, ADM. This is food, staples, and steady cash flow. Leadership here alongside cyclicals is not contradictory; it is consistent with a market that is not forced to choose between offense and defense. If defensives were absent, you could argue speculative excess. If defensives were dominant, you would argue fear. Instead, they are participating. That reinforces the idea of balance rather than conviction.
Energy and Materials remain tightly linked, which fits the broader narrative from both TRV and IO. UUUU, UEC, PBR, NEXE, PBR.A, PUMP, CCJ, VIST, EC, BTU on the energy side, and HYMC, HL, NVA, CRML, USAR, UAMY, EXK, SVM, AG, NEXA on the materials side. These lists are heavy with uranium, metals, and mining-adjacent names. This is not just oil beta. It is resource scarcity and real asset exposure. If leadership in Energy were limited to integrated majors, you could call it defensive yield chasing. Instead, the presence of miners and uranium-linked names suggests that the market is rewarding exposure to physical constraints and long-cycle supply themes. If this leadership persists while broad indices chop, then resources remain a relative safe harbor for capital seeking returns without crowding tech.
Financials are notable for what they are not. You do not see a clean sweep of megabank dominance. Instead you see GLXY, WT, IREN, XP, LMND, VIRT, IBKR, WULF. This is a mix of crypto-adjacent, trading infrastructure, fintech, and selective financial platforms. If financial leadership were purely macro-driven, you would expect traditional banks to dominate. The if-then here is telling: if market structure, trading activity, and alternative finance names continue to lead, then volatility and participation are healthy enough to support them. A rotation back to only large banks would imply a more conservative posture.
Healthcare leadership leans heavily toward biotech and specialized care: CRVS, BDSX, RAPT, MRNA, ORIC, NTLA, ALMS, BIOA, LENZ, GPCR. This aligns cleanly with the TRV and IO watchlists, where healthcare repeatedly appeared as a sustained interest area. If healthcare leadership broadens into managed care and large providers, that would suggest defensive rotation. As it stands, this is risk-tolerant, research-driven leadership.
Industrials are quietly constructive: ELVA, FCEL, SPIR, FTAI, AMPX, GLDD, EOSE, PL, RDW, PRIM. Aerospace, electrification, infrastructure, and specialty services dominate. This fits with a capital expenditure and reindustrialization narrative without requiring a straight-line growth boom. If industrial leadership begins to include more transport and economically sensitive cyclicals exclusively, then growth expectations are rising. For now, it is selective and thematic.
Technology leadership is narrower than the headlines would suggest. SNDK, TTMI, ICHR, RCAT, AEHR, UCTT, MTSI, TSSI, AMD, RMBS. This is not mega-cap software dominance. It is hardware, semis, tooling, and manufacturing exposure. That is consistent with the IO list, where semis and equipment showed repeated outlier activity without euphoric price action. If tech leadership remains concentrated in the supply chain rather than the platform layer, then the market is favoring tangible earnings and demand visibility over narrative growth.
Utilities and Real Estate are present but not dominant. IMSR, FLNC, CWEN, SBS, CTRI, HE, NEE, VST on utilities, and TWO, ARE, WY, GEO, COMP, IRM, NSA, RYN, VTR, DOC on real estate. Their presence is a stabilizer, not a driver. If these columns suddenly climb in rank while others fade, that would mark a defensive turn. Right now they coexist.
MIR Part 3: Framing-Up A Trade
At this point the tape has done most of the talking for us. The common thread across sentiment, flows, TRV, IO, and sector leadership is not conviction in one outcome, but commitment to staying engaged while hedging optionality. Capital is active, but it is being distributed across themes that benefit from persistence rather than prediction. That argues against an all-in directional bet and instead favors a portfolio that is structurally long participation, tactically flexible, and biased toward areas where positioning can be defended even if the tape gets noisy.
The first conclusion is that this is not a week to fade strength reflexively. Institutional activity has consistently shown up on pullbacks, not at highs, and leadership remains broad. If price continues to trend while volatility stays contained, then the path of least resistance remains higher, but with rotation underneath. If volatility spikes without a corresponding breakdown in leadership, that becomes a buying opportunity rather than a reason to de-risk.
From a desk perspective, that translates into a core-plus structure: a stable participation sleeve, a thematic expression sleeve aligned with flow persistence, a tactical trading sleeve for opportunistic adds, and a modest ballast sleeve to control left-tail risk.
Portfolio Summary (100%)
#########################################################################
Core Participation Sleeve – 40%
#########################################################################
Purpose: stay engaged with broad positioning where institutions consistently transact, without assuming direction. This sleeve maximizes optionality and liquidity.
20% ITOT – US Total Market
Rationale: repeated IO outliers, ultra-low realized vol, clear evidence of positioning rather than capitulation. If flows remain steady, this stays on. If volatility spikes without trend failure, this is the first add.
10% MGK – US Large Cap Growth
Rationale: persistent large-cap growth exposure without single-name risk. Captures continued allocation into growth leadership while avoiding overconcentration in mega-cap tech.
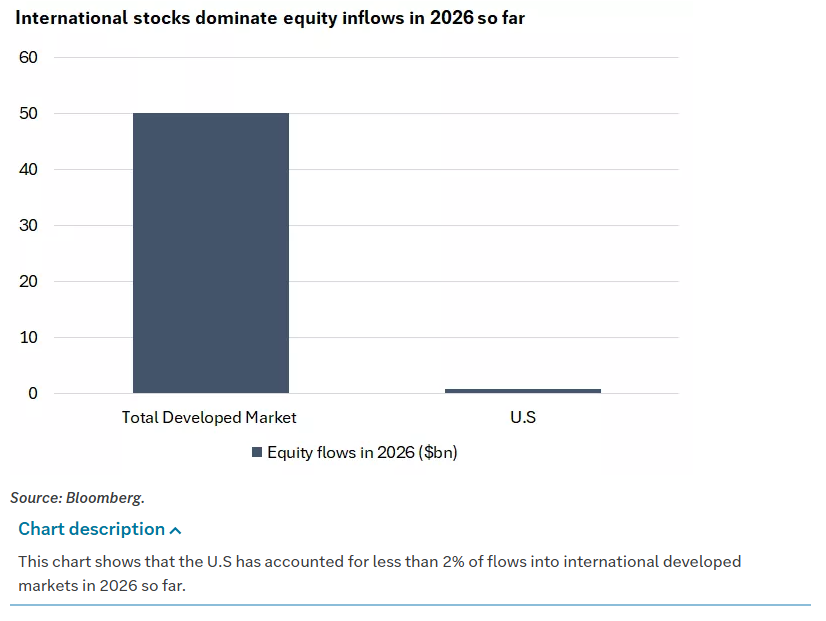
10% EFG – Developed ex-US Growth
Rationale: IO activity across EWJ, EWT, EFG, SPDW suggests international diversification is being rebuilt quietly. This expresses that theme without EM beta.
#########################################################################
Thematic Flow Alignment Sleeve – 35%
#########################################################################
Purpose: express the highest overlap between TRV persistence, IO outliers, sector leadership, and relative strength. These are areas institutions continue to engage even during rotation.
[Materials and Metals – 12%]
6% IAU – Gold
Rationale: repeated IO outliers, low realized vol, positioning behavior consistent with ballast and optionality rather than panic.
4% SLV – Silver
Rationale: shows up in ranked trades and TRV lists. Higher beta cousin to gold that benefits if reflation or volatility picks up.
2% PICK – Global Metals & Mining
Rationale: industrial metals exposure aligned with infrastructure and electrification themes showing sustained interest.
[Energy and Infrastructure – 10%]
4% SLB – Energy Services
Rationale: IO outliers, large dollar values, and persistent positioning despite modest price action suggest inventory transfer and longer-cycle exposure.
3% PBR.A – Integrated Energy
Rationale: shows up in IO with positive price response. Expresses energy exposure with valuation buffer.
3% UUUU – Energy / Materials Hybrid
Rationale: leadership in sector dashboard, exposure to uranium and critical materials narrative.
[Healthcare – 8%]
3% RSPH – Equal-weight healthcare
Rationale: smooth way to capture broad healthcare leadership without single-name risk.
3% NTLA – Biotech
Rationale: repeated IO prints despite weak price response. If positioning resolves higher, payoff is convex. If not, size is controlled.
2% RAPT – Biotech
Rationale: top TRV name, clear sustained interest. High-risk, high-signal position sized appropriately.
[Industrials – 5%]
3% POWL – Electrical Equipment
Rationale: IO outlier, infrastructure and electrification exposure, steady positioning.
2% KNX – Transportation / Rail
Rationale: shows up in IO with elevated dollar values. Expresses economic activity without consumer beta.
#########################################################################
Tactical Opportunity Sleeve – 15%
#########################################################################
Purpose: exploit short-term dislocations, pullbacks into liquidity, and ranked-trade persistence. This sleeve is actively managed.
[Metals Tactical – 6%]
3% PSLV – Physical Silver Trust
Rationale: TRV persistence and negative short-term performance suggests accumulation rather than distribution.
3% PLG – Platinum Group Metals
Rationale: IO outliers with high realized vol. Tactical trade, not a core hold.
[Technology Tactical – 5%]
3% FTXL – Semiconductor ETF
Rationale: shows up in IO with large dollar values but muted price change. This is positioning, not chasing.
2% CAMT – Semiconductor Equipment
Rationale: sustained TRV activity. Benefits if capex cycle reaccelerates.
[Event-Driven / Idiosyncratic – 4%]
2% FLUT – Consumer discretionary / gaming
Rationale: large IO dollar value with negative price response. Classic candidate for mean reversion if positioning resolves.
2% TXG – Healthcare data / diagnostics
Rationale: IO activity despite drawdown. Tactical rebound candidate only if volume stabilizes.
#########################################################################
Risk Control and Optionality Sleeve – 10%
#########################################################################
Purpose: dampen volatility, preserve flexibility, and allow risk reloading without forced selling.
[Bonds – 7%]
3% TIP – Inflation-protected Treasuries
Rationale: repeated IO activity, extremely low realized vol. Hedge against inflation surprises.
2% EMB – EM Sovereign Debt
Rationale: IO outliers suggest allocation, not fear. Offers yield with diversification.
2% VCEB – Investment Grade Credit
Rationale: credit staying bid supports risk-on framework. If this breaks, portfolio posture changes.
[Defensive / Hedge – 3%]
2% CMS – Utilities
Rationale: IO activity with positive price response. Defensive equity ballast.
1% QID – Inverse Nasdaq
Rationale: tactical hedge only. Sized small, used to manage tail risk during tech-driven volatility spikes.This portfolio does not require the market to be right. It requires institutions to keep doing what they have been doing: positioning patiently, rotating internally, and defending liquidity zones. If that behavior persists, this structure compounds quietly. If it breaks, the portfolio is liquid enough to adapt without damage.

Thank you for being part of our community and for dedicating your time to this edition. Your insights and engagement drive everything we do, and we’re honored to share this space with such committed, thoughtful readers. Here’s to a week filled with clear opportunities and strong performance 💰💰💰
— VolumeLeaders