Market Momentum: Your Weekly Financial Forecast & Market Prep
Issue 76 / What to expect Jan 19, 2026 thru Jan 23, 2026


In This Issue
Weekly Market-On-Close Report: All the macro moves, market drivers, and must-know narratives—covered in less than five minutes.
Weekly Benchmark Breakdown: Our weekly intelligence report on major indices cuts through the index-level noise to uncover participation, momentum, and structural integrity and tell you whether markets are rising on solid ground or skating on thin breadth. This is where bull markets prove themselves—or quietly start to unravel.
The Latest Investor Sentiment Readings: Track the emotional pulse of the market with our curated dashboard of sentiment indicators. From fear-fueled flight to euphoric overreach, this week's readings reveal whether investors are cautiously creeping in—or stampeding toward the exits.
Institutional Support & Resistance Levels For Major Indices: Exactly where to look for support and resistance this coming week in SPY, QQQ, IWM & DIA
Normalized Performance By Thematics YTD: Which corners of the markets are beating benchmarks, which are overlooked and which ones are over-crowded!
Key Econ Events & Earnings On-Deck For This Coming Week
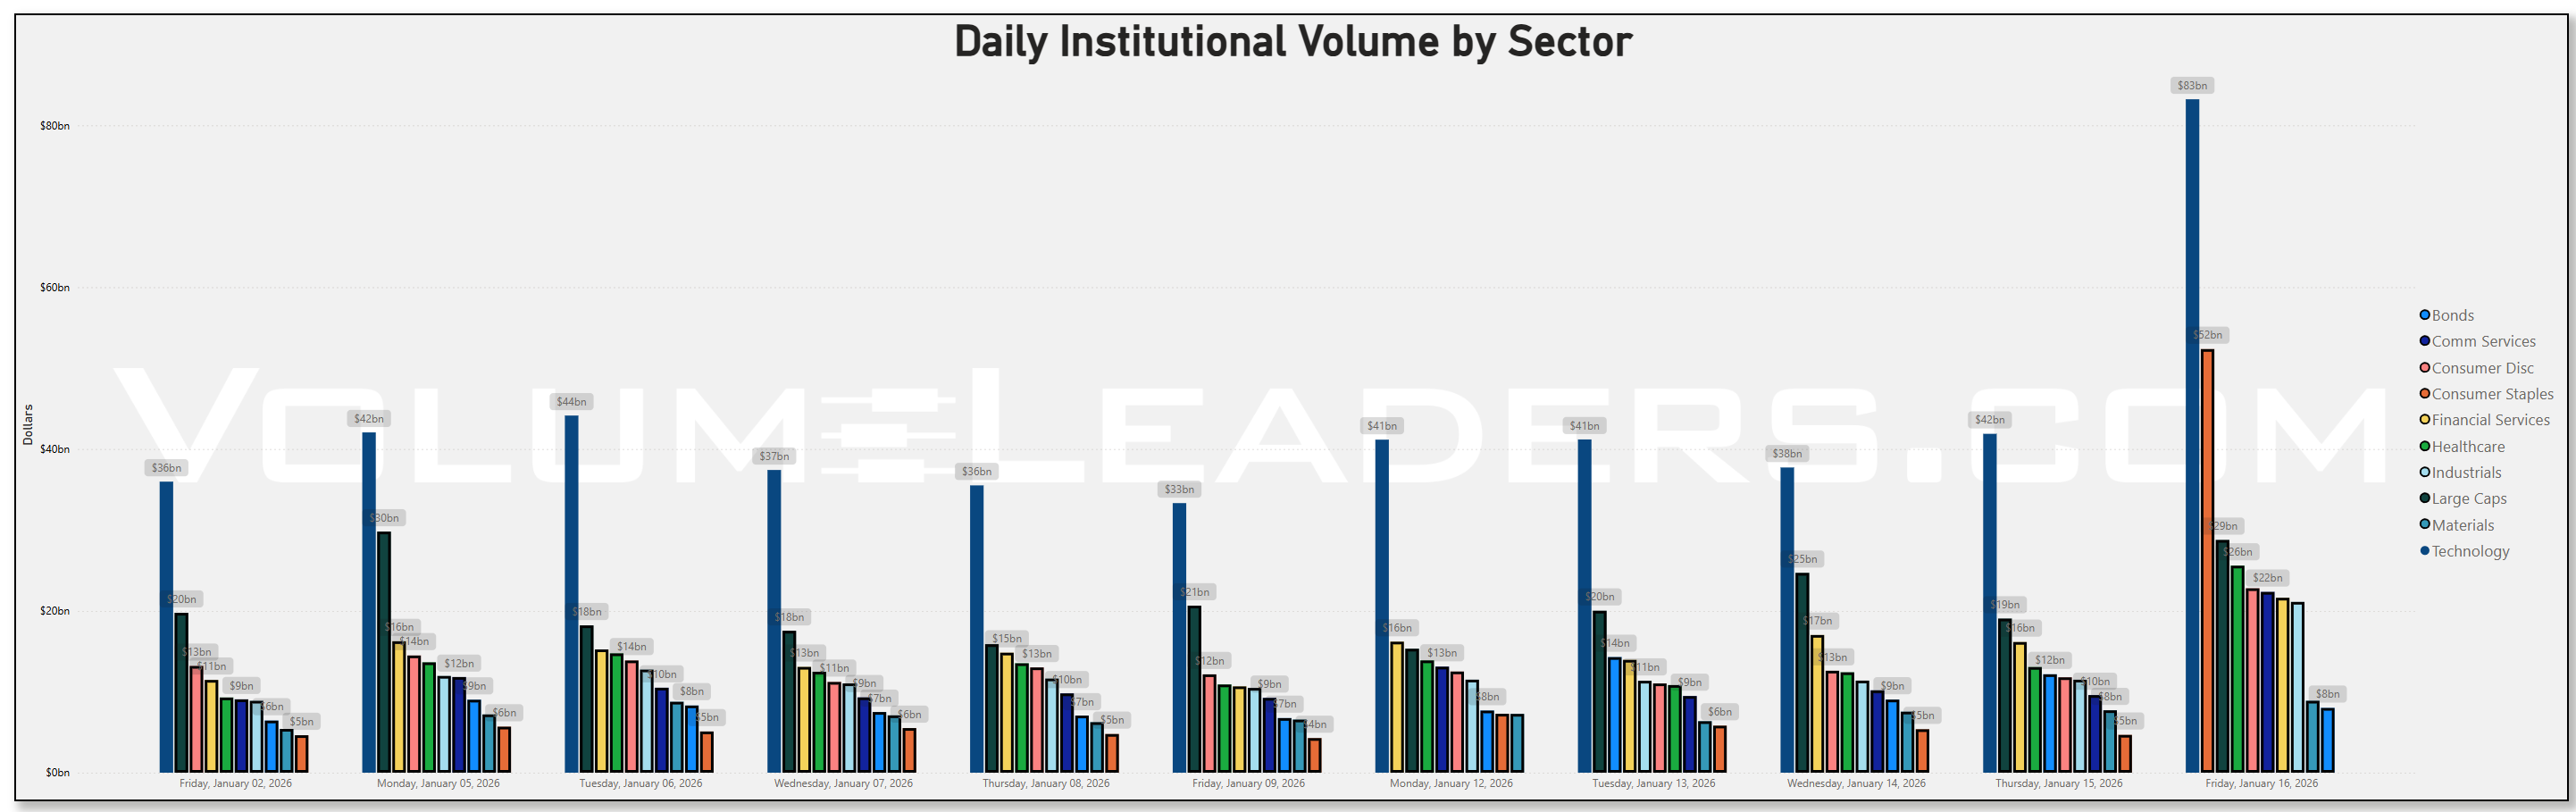
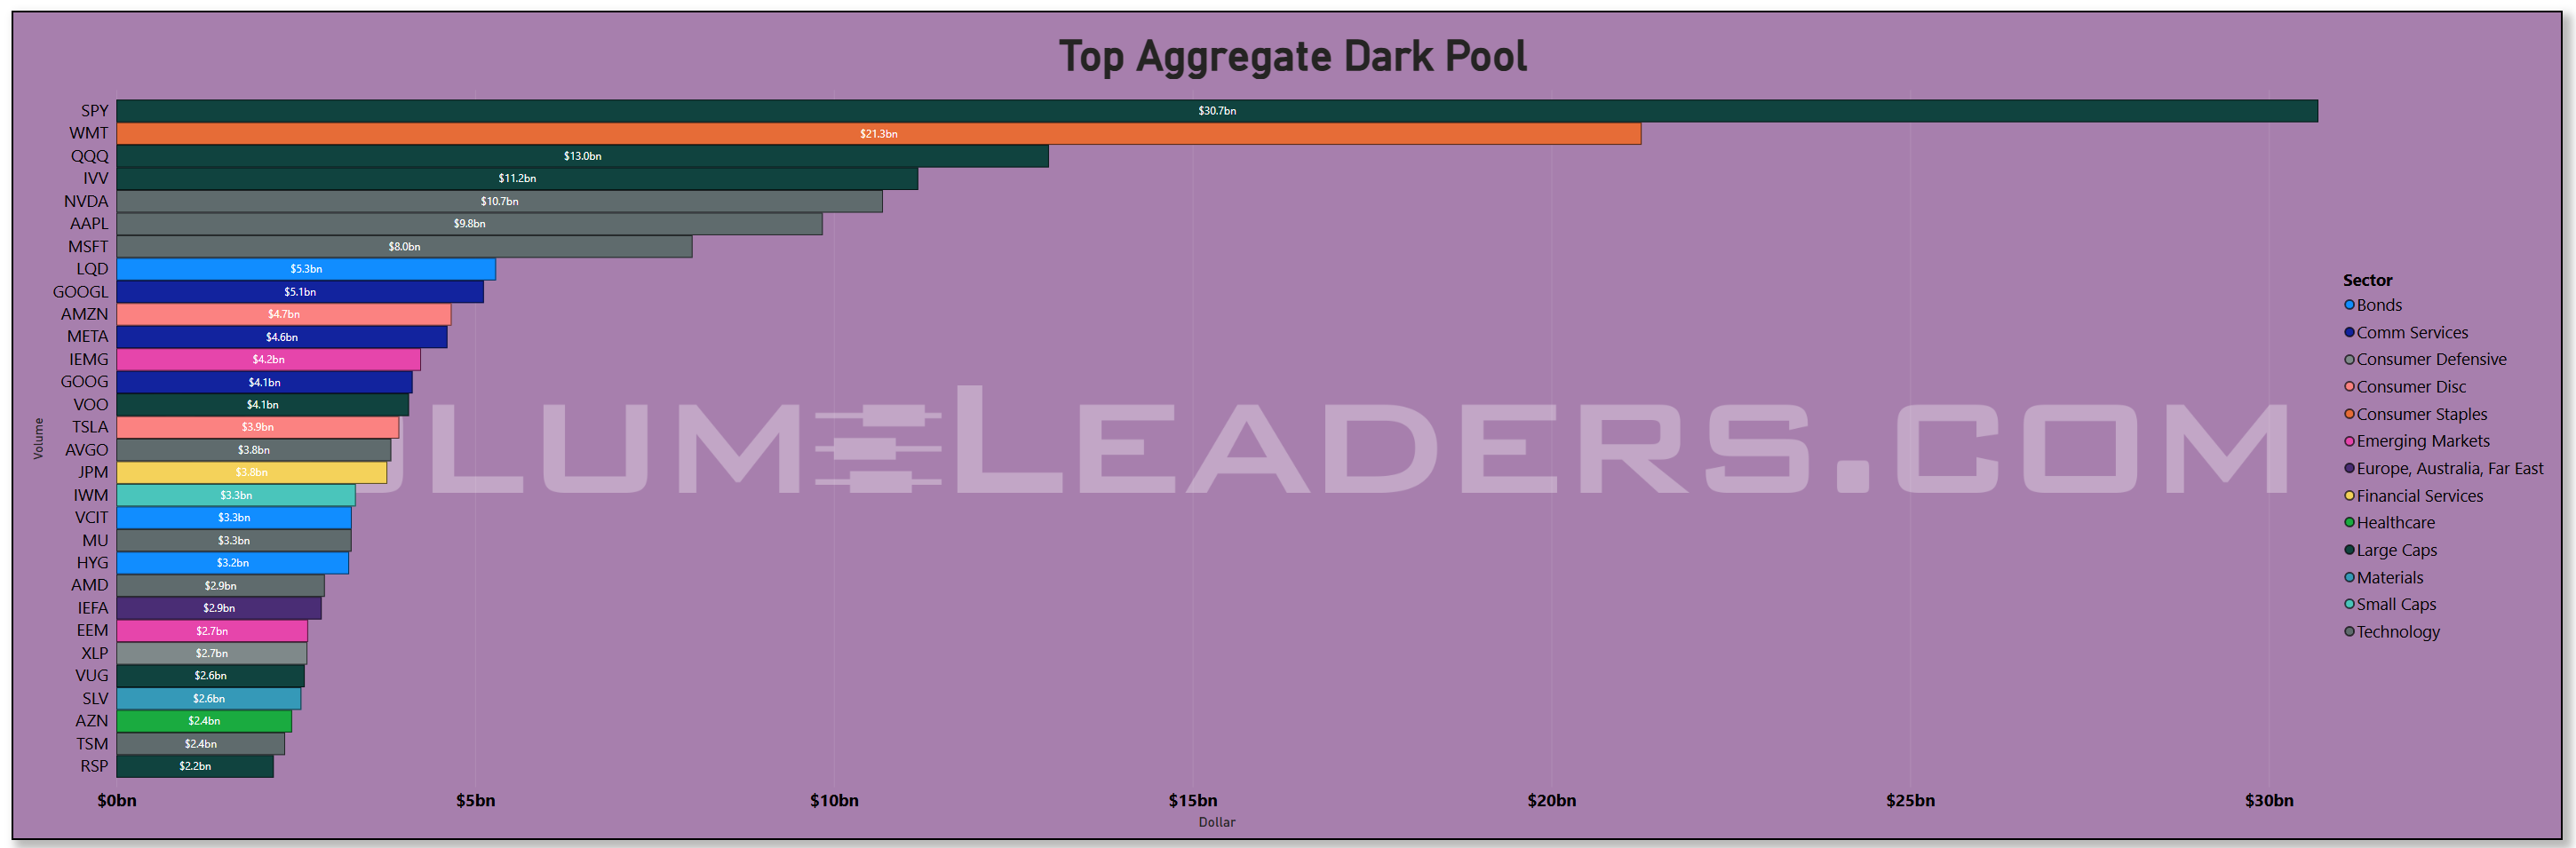
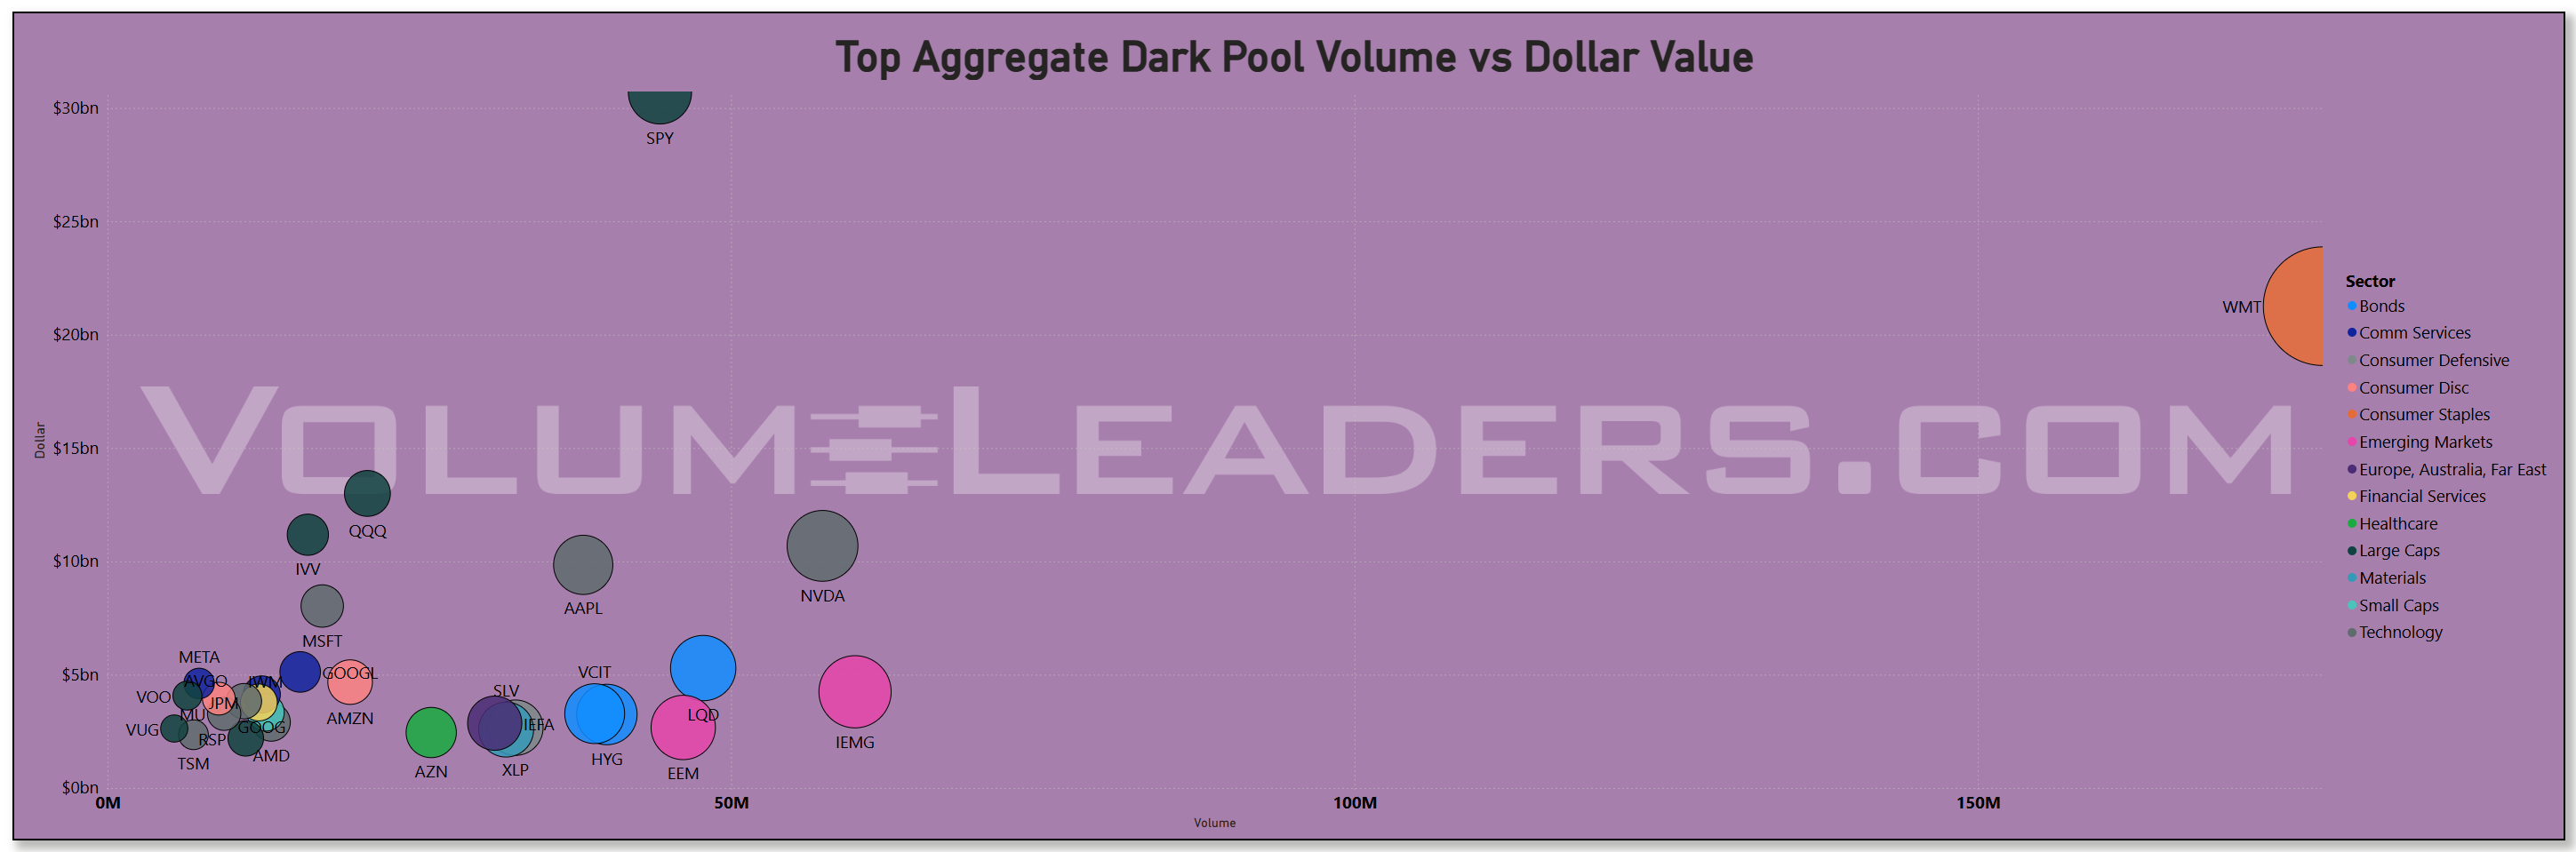
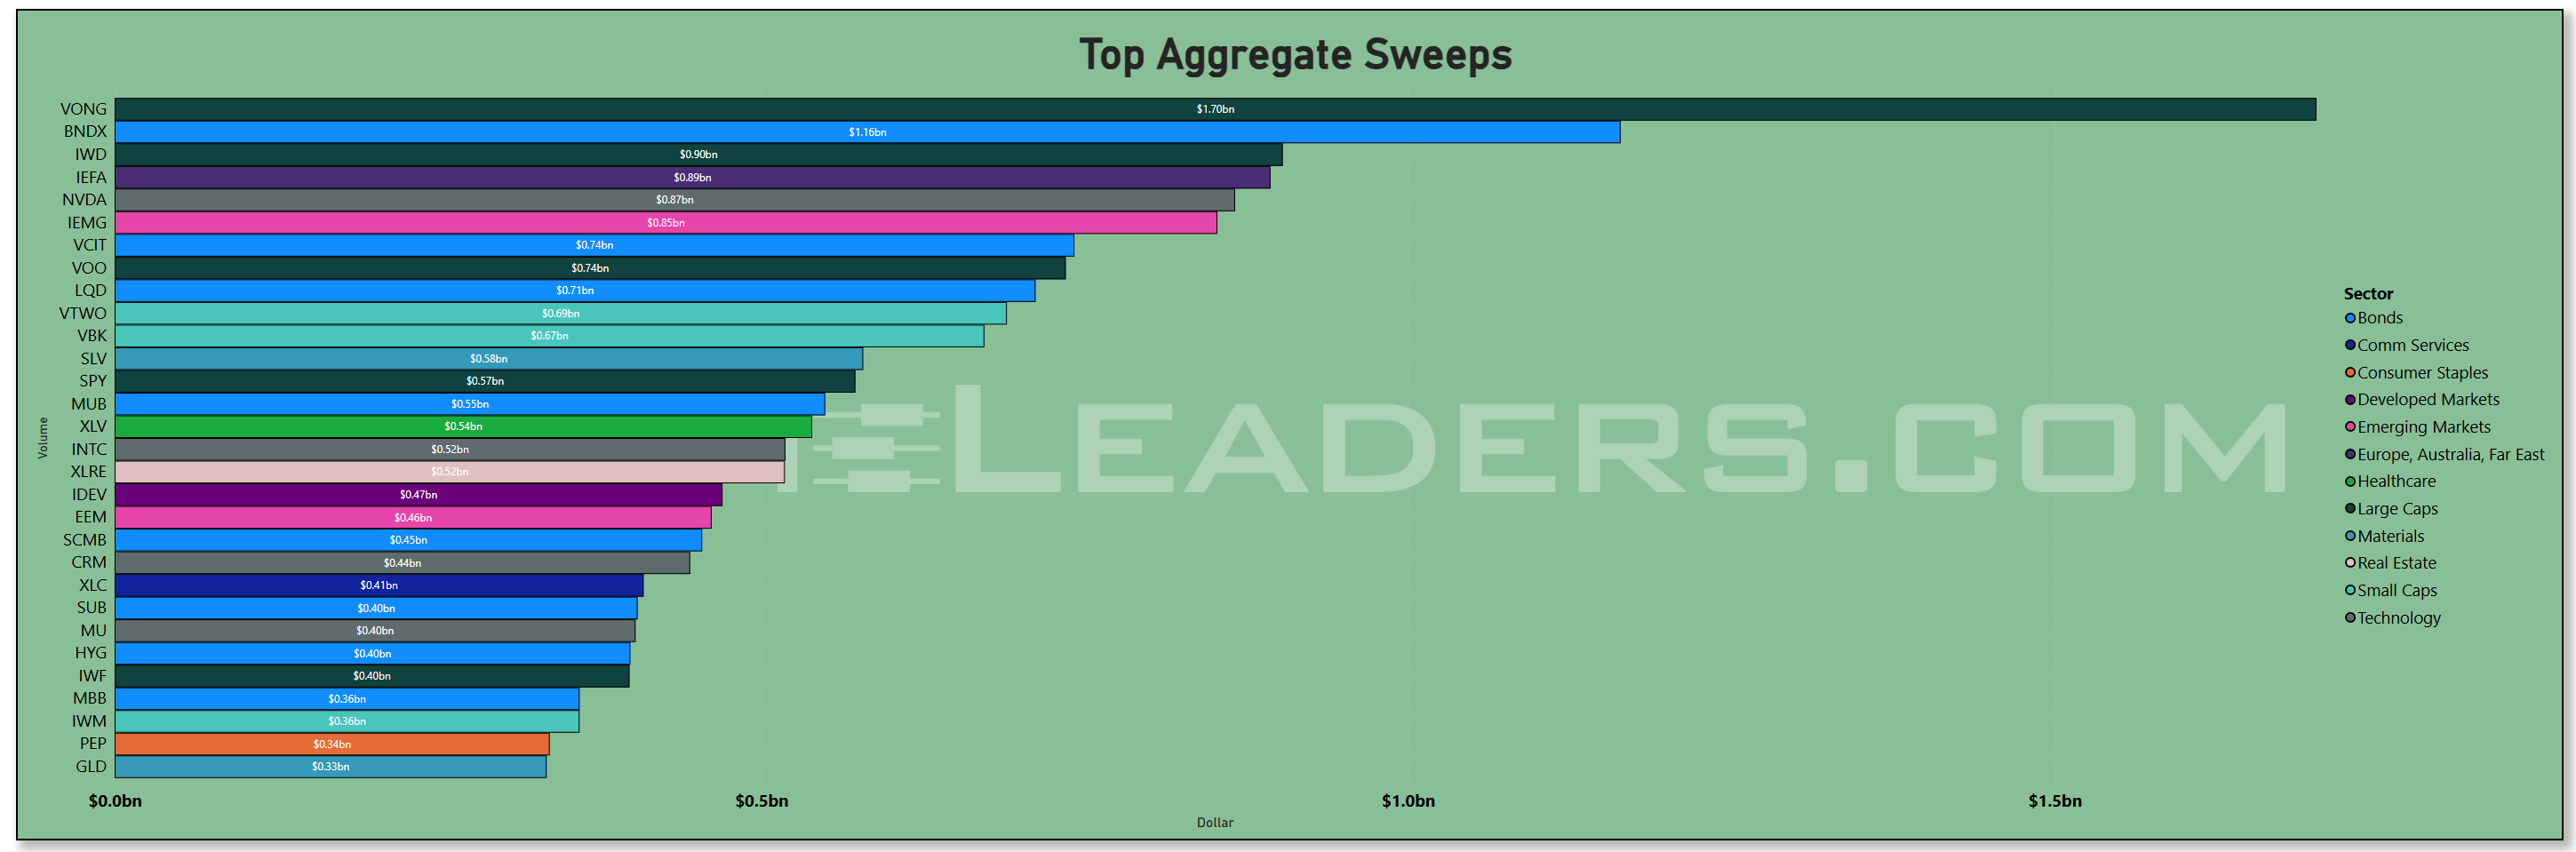
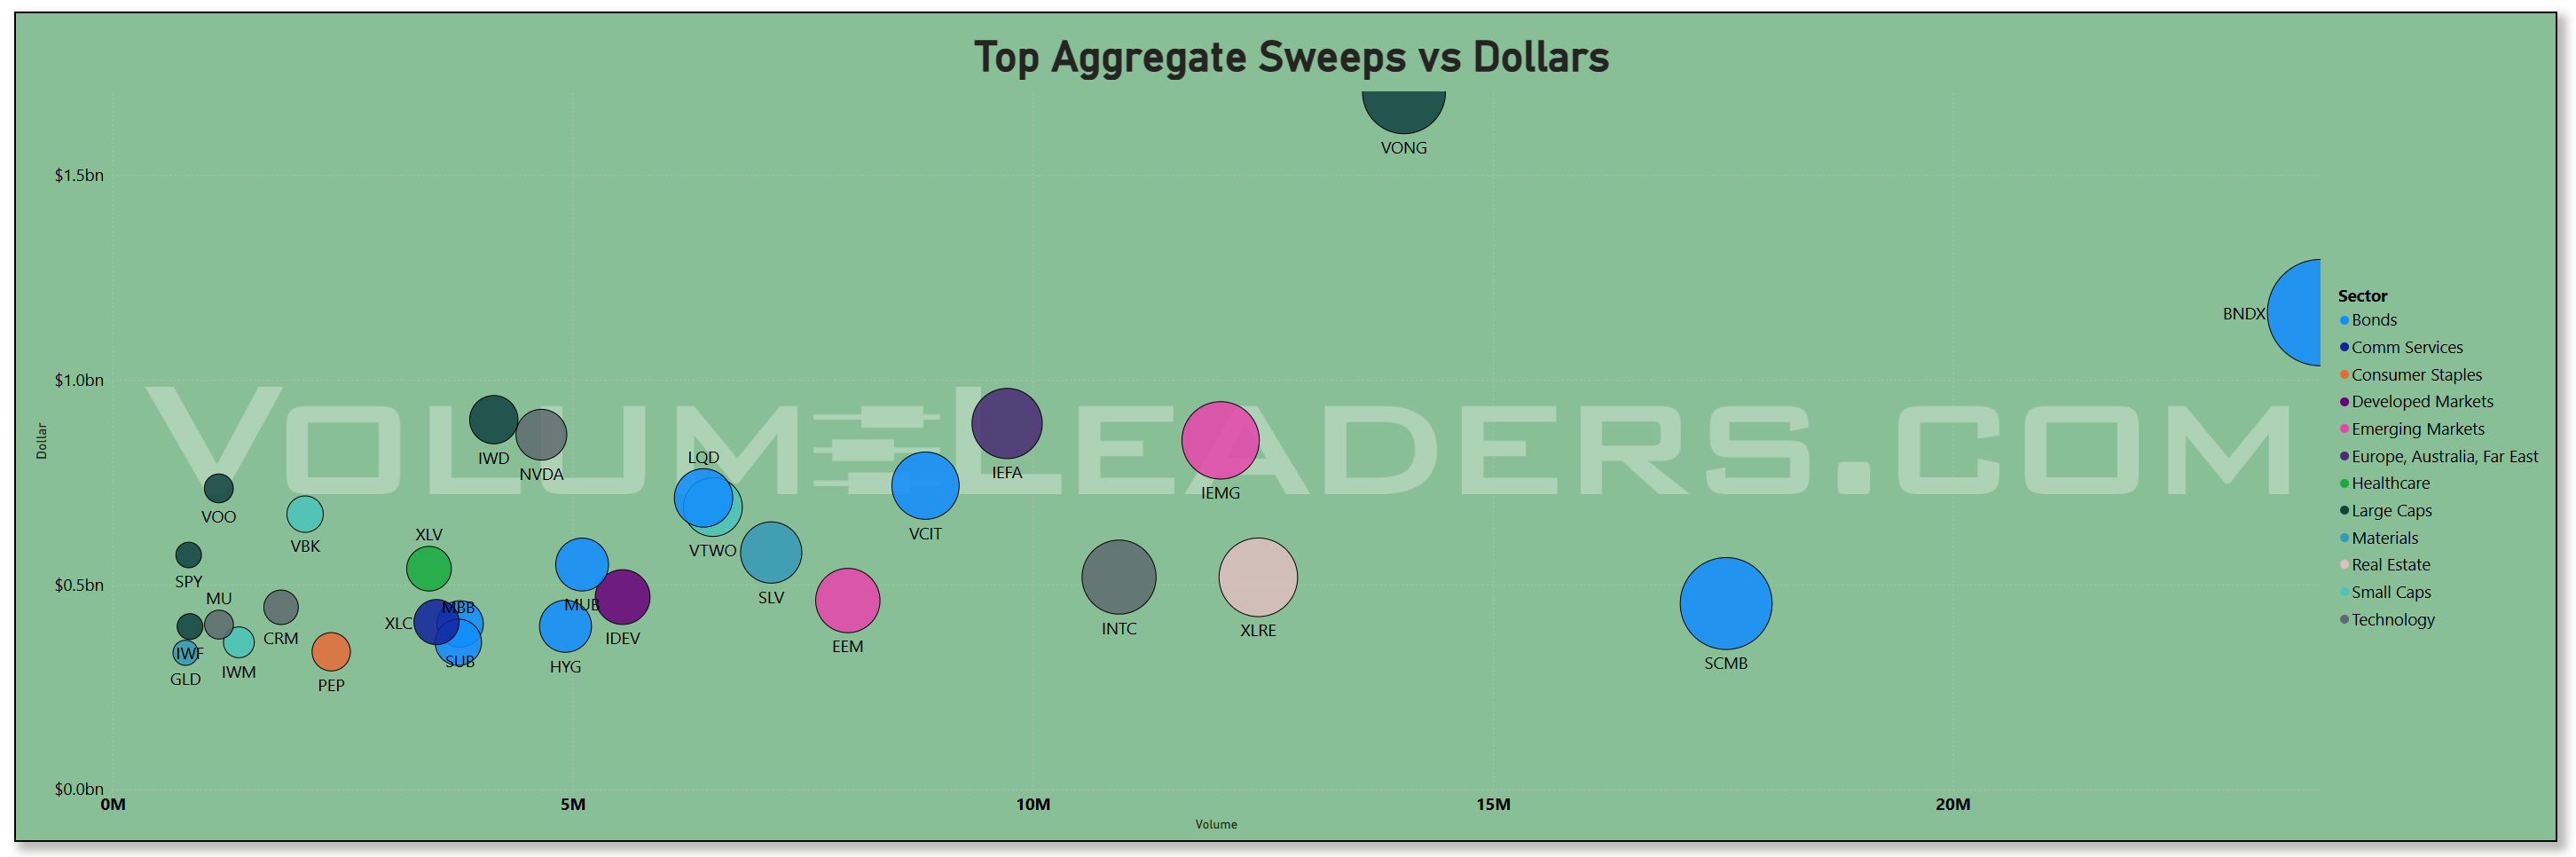
Market Intelligence Report: Track the real money. This section dissects where institutions are actively putting capital to work—and where they are quietly stepping aside. We start with a sector-by-sector view of flows, identifying which areas are commanding attention and which are losing sponsorship. From there, we move into the tape itself, highlighting the week’s most meaningful block trades and sweep activity across both lit exchanges and dark pools to distinguish durable allocation from short-term positioning.
Each week, we synthesize those signals into a cohesive, realistic portfolio that reflects how a professional allocator might express the dominant themes. The goal is not prediction, but alignment—showing how institutional conviction, optionality, and risk management come together in practice. Whether you’re leaning into momentum or staying selective around crowded trades, this report offers a grounded framework for understanding where size is moving, how it is being expressed, and why it matters.

Weekly Market-On-Close Report
The first thing worth noting about this week is not what markets did, but what they did not do. Despite a relentless stream of policy headlines, geopolitical noise, and renewed questions around Federal Reserve independence, equities remained remarkably composed. Volatility flickered, leadership rotated, yields moved, but the broader tape never showed signs of stress. This calm is not accidental. It is being underwritten by fundamentals that remain firmly in control, even as investors are forced to continuously recalibrate expectations around rates, growth, and policy.
Stocks entered Friday with modest upside momentum, led early in the session by semiconductor strength. That bid faded as the day progressed, and major indexes finished slightly lower as bond yields pushed higher. The catalyst was political, but the transmission mechanism was purely financial. The 10-year Treasury yield rose 6 basis points to a 4.5-month high of 4.23% after President Donald Trump expressed reluctance to nominate Kevin Hassett as Federal Reserve Chair. Hassett had been widely viewed by markets as the most dovish candidate and the leading contender for the role. By signaling a preference to keep Hassett as National Economic Council director instead, attention shifted toward Kevin Warsh, the second-most-likely candidate and a known hawk. That shift dampened speculation about future rate cuts, pushed yields higher, and weighed on equities late in the session.
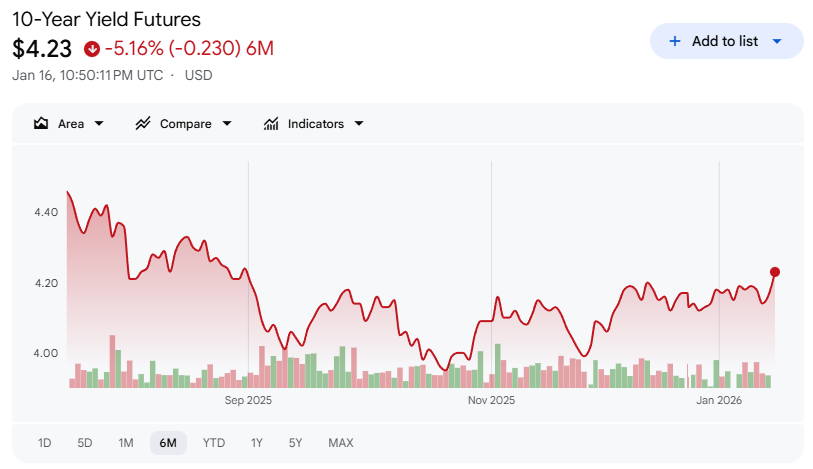
The market reaction was textbook. When rate-cut expectations recede, duration-sensitive assets reprice quickly. March 10-year Treasury notes (ZNH6) closed down 15 ticks on Friday, with the 10-year yield finishing at 4.225% after touching 4.231% intraday, the highest level in four and a half months. The move was reinforced by rising inflation expectations, with the 10-year breakeven inflation rate climbing to a 2.25-month high of 2.326%. The unexpected strength in December manufacturing production added a second layer of pressure. Output rose 0.2% month over month, beating expectations for a 0.1% decline, while November production was revised up to a 0.3% increase from unchanged. Stronger manufacturing data is hawkish at the margin, and the bond market responded accordingly.
Equities, however, absorbed the rate move without drama. That resilience has been a defining feature of the early weeks of 2026. Even as yields rise and policy uncertainty builds, stocks have continued to trade as though the underlying economic engine remains intact.
Earnings have played a central role in reinforcing that confidence. The first full week of fourth-quarter earnings season has been supportive, with 89% of the 28 S&P 500 companies that have reported beating expectations. According to Bloomberg Intelligence, S&P 500 earnings growth is expected to climb 8.4% in the fourth quarter. Even excluding the so-called Magnificent Seven megacap technology stocks, earnings are still projected to rise 4.6%. That distinction matters. It suggests profit growth is broadening rather than narrowing, a critical ingredient for sustaining market leadership beyond a handful of names.
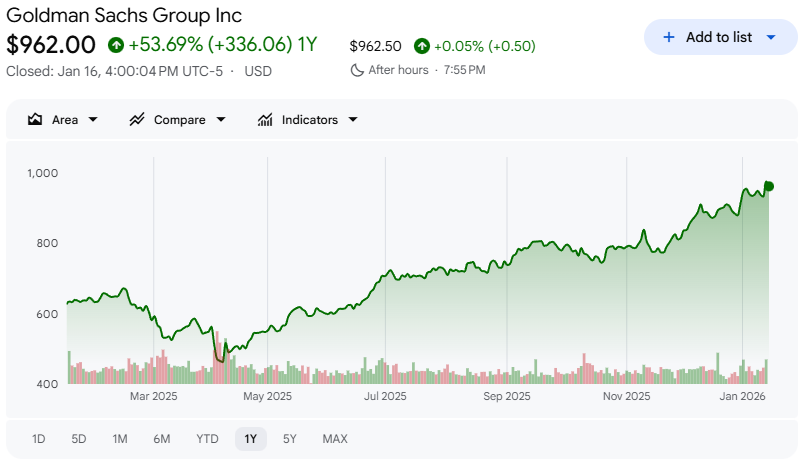
The tone from corporate America has been largely constructive, though not without nuance. Early bank earnings set the stage. JPMorgan Chase (JPM) and Citigroup (C) both reported declines in quarterly profits, and their shares fell in response. In contrast, Morgan Stanley (MS) and Goldman Sachs (GS) delivered results that largely topped analyst forecasts, and their shares rose. The divergence underscored a broader theme: results matter, guidance matters more, and investors are becoming increasingly selective.
Technology earnings added another layer. Taiwan Semiconductor Manufacturing Co (TSMC) reported a jump in fourth-quarter profits and boosted its 2026 capital expenditure forecast from $46 billion to around $54 billion. That guidance increase energized semiconductor and data storage names, reinforcing confidence that spending on artificial intelligence infrastructure will continue. The market rewarded the companies most directly tied to physical capacity and systems, while remaining more cautious toward software models perceived as vulnerable to AI-driven disruption.

That split within technology became more pronounced as the week progressed. Semiconductor and equipment names held firm, while software struggled. Concerns are growing that AI adoption could displace certain application-layer products rather than enhance them. Those fears intensified on Friday after OpenAI announced it would begin testing advertisements within ChatGPT in the coming weeks. The move was widely expected, but it pressured advertising-linked technology names nonetheless. Alphabet (GOOGL) and The Trade Desk (TTD) were among the laggards.

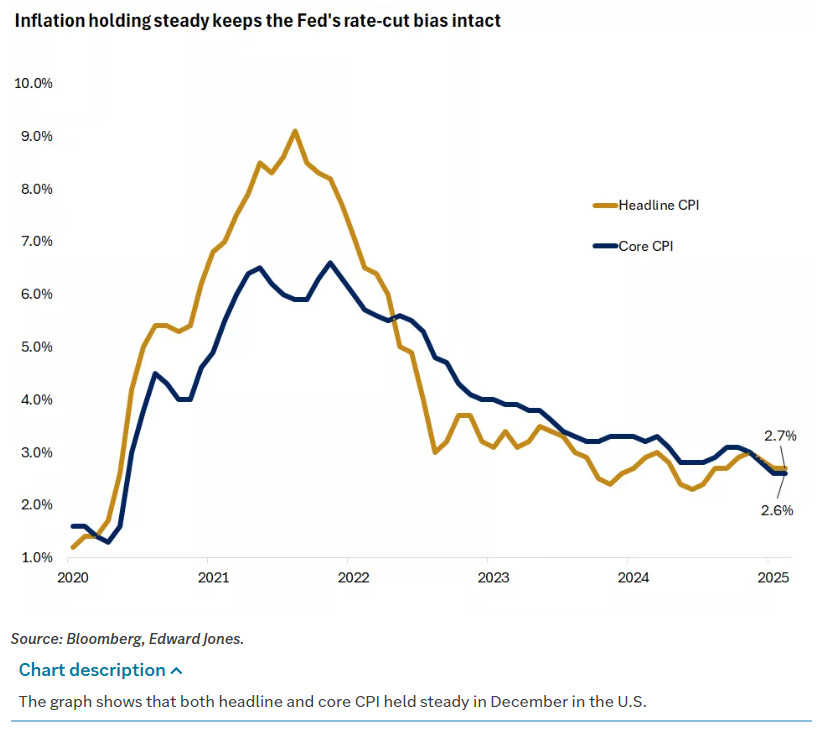
Outside earnings, economic data offered a mixed but broadly supportive picture. Inflation readings were encouraging. According to the Bureau of Labor Statistics, core consumer prices rose 0.2% month over month and 2.6% year over year in December, the slowest annual pace since March 2021. Both figures came in below expectations of 0.3% and 2.7%, respectively. Headline CPI rose 0.3% month over month and 2.7% year over year, in line with estimates. At the wholesale level, producer prices rose 0.2% month over month and 3% year over year in November, up from 0.1% and 2.8% previously, driven primarily by energy prices.
Consumer activity remained resilient. Retail sales rose 0.6% in November, beating expectations for a 0.4% increase and rebounding from a slight decline in October. Control group sales, which feed into GDP calculations, slowed to a 0.4% increase from 0.6% the prior month, but the overall picture still points to steady consumption.
Housing data surprised to the upside. New single-family home sales came in at a seasonally adjusted annual rate of 737,000 in October, above expectations for 725,000. Existing home sales rose 5.1% in December to a rate of 4.35 million, exceeding estimates of 4.18 million. Gains were broad-based across regions, supported by declining mortgage rates and slower home price growth. The average 30-year fixed mortgage rate approached 6% toward the end of the week, according to Freddie Mac.
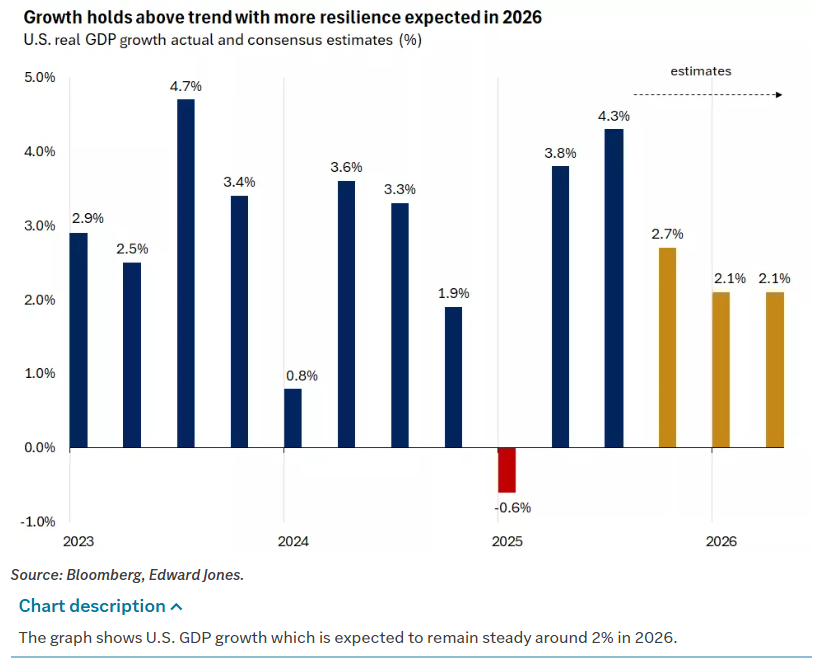
These data points collectively support the idea that economic momentum remains durable. Real GDP rose 3.8% in the second quarter and 4.3% in the third, with estimates pointing to another expansion above 2% in the fourth quarter of 2025. Consumer spending remains the backbone of that growth, bolstered by a stabilizing labor market and a forthcoming $100 billion to $150 billion boost from tax refunds related to last year’s tax bill.
The bond market reflected that balance between growth resilience and policy uncertainty. Treasury yields fluctuated throughout the week, with short-term yields edging higher and long-term yields modestly lower before Friday’s selloff. The spread between the 2-year and 10-year Treasury notes dipped below 60 basis points for the first time since mid-December. Municipal and corporate bonds outperformed Treasuries, with investment-grade spreads tightening and steady demand absorbing heavy new issuance. High-yield activity remained strong, though energy-related bonds lagged amid oil price moves and geopolitical concerns.
Overseas markets were less forgiving. The Euro Stoxx 50 fell 0.19% on Friday, China’s Shanghai Composite declined 0.26%, and Japan’s Nikkei 225 slipped 0.32%. European government bond yields rose, with the 10-year German bund yield up 1.6 basis points to 2.835% and the UK gilt yield up 1.2 basis points to 4.400%. ECB Chief Economist Philip Lane reiterated that there is no near-term interest rate debate, noting that inflation is near target and growth is close to potential.

Back in the U.S., policy headlines continued to swirl. President Trump outlined plans for a 10% cap on credit card interest rates and backed a cap on swipe fees. Payments and consumer credit names reacted swiftly. Mastercard (MA), Visa (V), Synchrony Financial (SYF), Capital One (COF), and American Express (AXP) fell between 3% and 7% during the week. Homebuilders also came under scrutiny as the administration examined corporate repurchase programs, following similar attention directed at defense contractors.
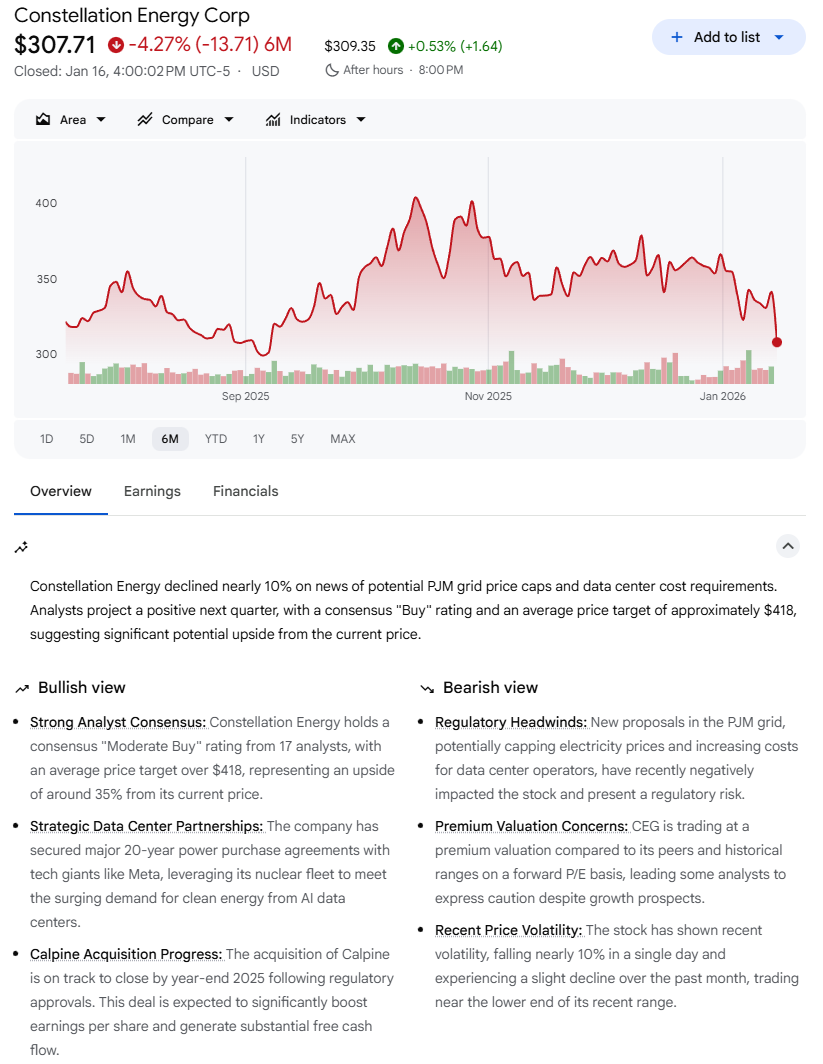
Another policy development emerged around energy infrastructure. The administration proposed that PJM, the country’s largest electrical grid operator, hold an emergency auction that would force technology companies without dedicated power production to cover the costs of new power infrastructure. Power equipment makers rallied on the news, while independent power producers sold off sharply. Constellation Energy (CEG), Vistra (VST), and Talen Energy (TLN) fell roughly 10% on the day, reflecting concerns that pricing could be hit. This followed Microsoft (MSFT) outlining plans to ensure its energy demands do not raise consumer electricity prices, a notable signal in a midterm election year.
Geopolitical developments added to the noise. Reports included escalating protests and a violent crackdown in Iran, renewed sanctions, and threats of military action. The Supreme Court declined to rule on challenges to President Trump’s tariffs, leaving uncertainty around trade policy. The Court may issue additional opinions next week. Meanwhile, the U.S. captured Venezuela’s leader Nicolas Maduro, and White House officials floated the idea of the U.S. taking over Greenland.
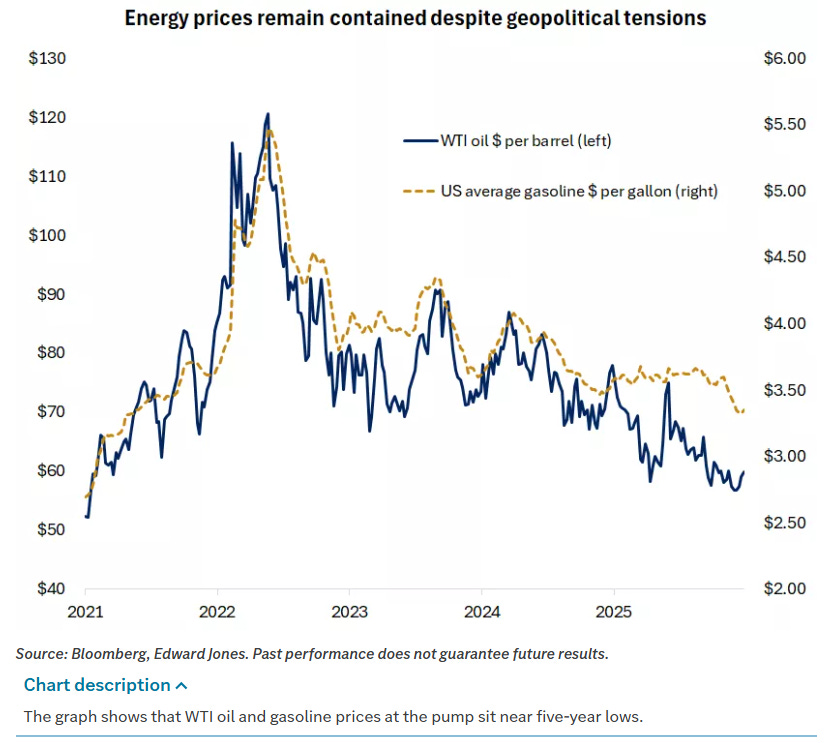
Despite all of this, markets have remained focused on fundamentals. Energy prices have been a key stabilizer. WTI crude sits near five-year lows around $60 per barrel, and U.S. gasoline prices hover near $3.35 per gallon. Even as geopolitical tensions flare, the International Energy Agency projects the global oil market will remain oversupplied in 2026, with rising OPEC+ output outpacing modest demand growth. That supply backdrop has helped cap energy-driven inflation risks.
Monetary policy expectations have adjusted accordingly. Markets are now pricing just a 5% chance of a 25 basis point rate cut at the January 27-28 FOMC meeting. While moderating inflation gives the Fed room to ease gradually, the path remains data-dependent. Political pressure and investigations into Fed Chair Jerome Powell have not materially altered expectations, as structural safeguards within the Federal Reserve system limit the influence of any single individual.
Perhaps the most important development this year has been the rotation in market leadership. Small-cap and mid-cap stocks have extended their year-to-date leads over large-cap peers. The Russell 2000 and S&P MidCap 400 both reached all-time highs during the week, while large-cap indexes pulled back from record levels. Value stocks have outperformed growth for three consecutive weeks. International equities have gained traction. Cyclical sectors such as materials, industrials, and consumer discretionary have moved into leadership roles.
This rotation began in November and has accelerated in early 2026. It represents a stark contrast to the narrow, mega-cap-driven leadership that defined the prior three years. The common thread across the new leaders is sensitivity to improving economic conditions and potential Fed easing. While technology remains an earnings leader, its dominance has become more selective and infrastructure-oriented.
The takeaway is not that the bull market is ending, but that it is evolving. As long as economic resilience persists, broader leadership can help ease valuation concerns and extend the cycle. Volatility may flare as policy and geopolitical headlines ebb and flow, but the market continues to distinguish between noise and developments that materially alter growth or earnings trajectories.
That distinction has been the defining feature of this tape. Investors are no longer reacting reflexively to every headline. Instead, capital is flowing toward areas with tangible demand, durable cash flows, and improving fundamentals. In that environment, patience is being rewarded more than urgency, and discipline more than speculation.

Weekly Benchmark Breakdown
Breadth Says Risk-On, But Tech Is Not Carrying Its Weight
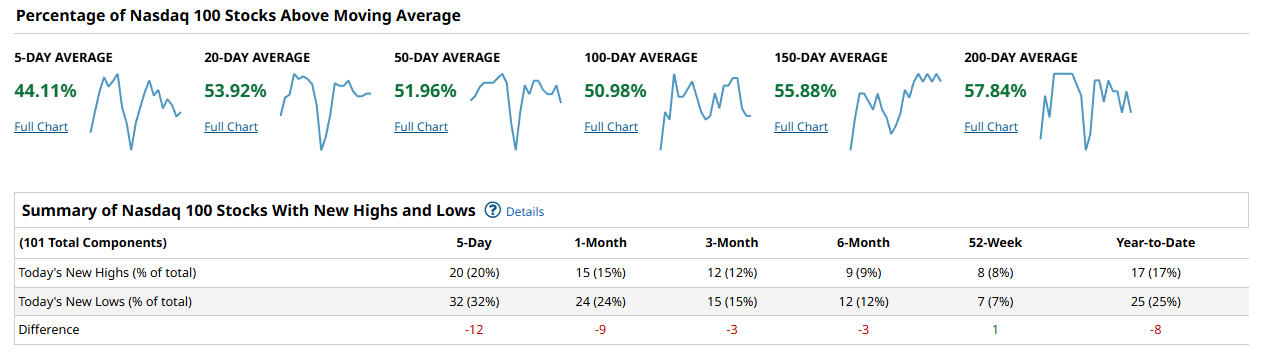
The broad tape still has a constructive, risk-on feel, but it is not a single, uniform thrust. Participation is healthy across the wider market, with most intermediate and long-term breadth measures sitting comfortably above the midline. The wrinkle is that the Nasdaq 100 is lagging on both moving-average participation and new highs versus new lows, which is exactly the kind of split that can either resolve into a second-leg advance (if tech rejoins) or into a choppier, more rotational market (if it does not).
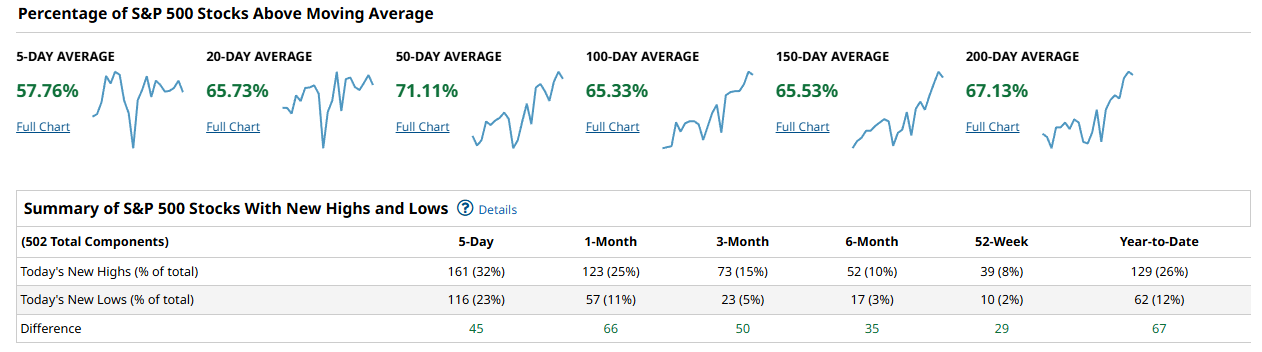
For the S&P 500, breadth is in a good place across every timeframe that matters. 57.76% of constituents are above the 5-day, 65.73% above the 20-day, and a strong 71.11% above the 50-day. Longer-term participation is also solid with 65.33% above the 100-day, 65.53% above the 150-day, and 67.13% above the 200-day. That is not just “stocks up,” that is “stocks staying up” across multiple cohorts. The highs-minus-lows table reinforces it: over the last 5 days there are 161 new highs versus 116 new lows, a net +45. On a 1-month lookback it is +66 (123 vs 57), on 3-month +50 (73 vs 23), on 6-month +35 (52 vs 17), on a 52-week window +29 (39 vs 10), and year-to-date +67 (129 vs 62). In plain English, the S&P is still producing more breakouts than breakdowns, and it is doing so across short and intermediate horizons.
The Nasdaq 100 is the problem child this week, and the numbers make it hard to hand-wave away. Only 44.11% of constituents are above the 5-day, 53.92% above the 20-day, and 51.96% above the 50-day. Even the longer baselines are merely middling: 50.98% above the 100-day, 55.88% above the 150-day, and 57.84% above the 200-day. That is a very different profile than the S&P and Russell. More importantly, highs minus lows is negative across most windows: -12 over 5 days (20 highs vs 32 lows), -9 over 1 month (15 vs 24), -3 over 3 months (12 vs 15), -3 over 6 months (9 vs 12), a small +1 on the 52-week view (8 vs 7), and -8 year-to-date (17 vs 25). When a cap-weighted growth-heavy index cannot outproduce new lows, it usually means leadership is narrowing or rotating away from the very names that often make market advances feel effortless.
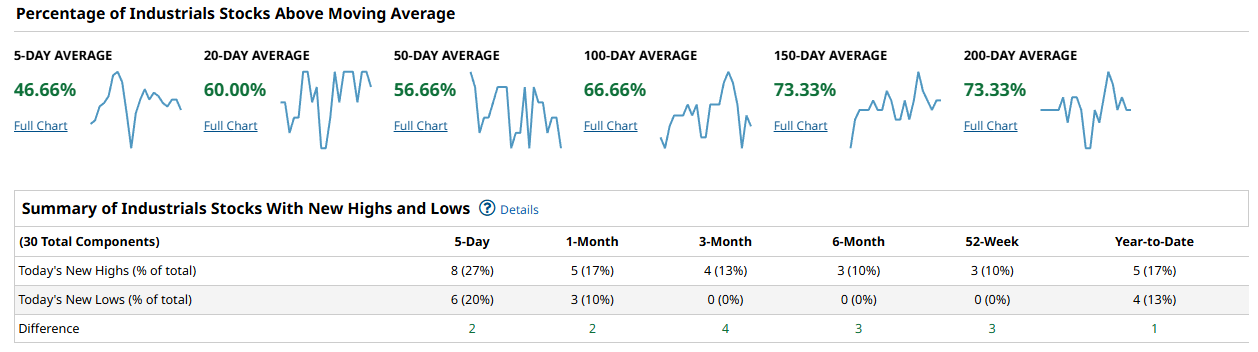
The Dow/Industrials snapshot looks more like a market that is digesting rather than breaking down. Short-term participation is softer with 46.66% above the 5-day, while 60.00% are above the 20-day and 56.66% above the 50-day. The longer-term measures are the encouraging part: 66.66% above the 100-day, and a notable 73.33% above both the 150-day and the 200-day. In other words, the primary trend is intact, but the short-term tape has cooled. New highs minus new lows is positive but small: +2 over 5 days (8 vs 6), +2 over 1 month (5 vs 3), +4 over 3 months (4 vs 0), +3 over 6 months (3 vs 0), +3 on the 52-week window (3 vs 0), and +1 year-to-date (5 vs 4). That reads like steady underlying health without a broad breakout impulse.
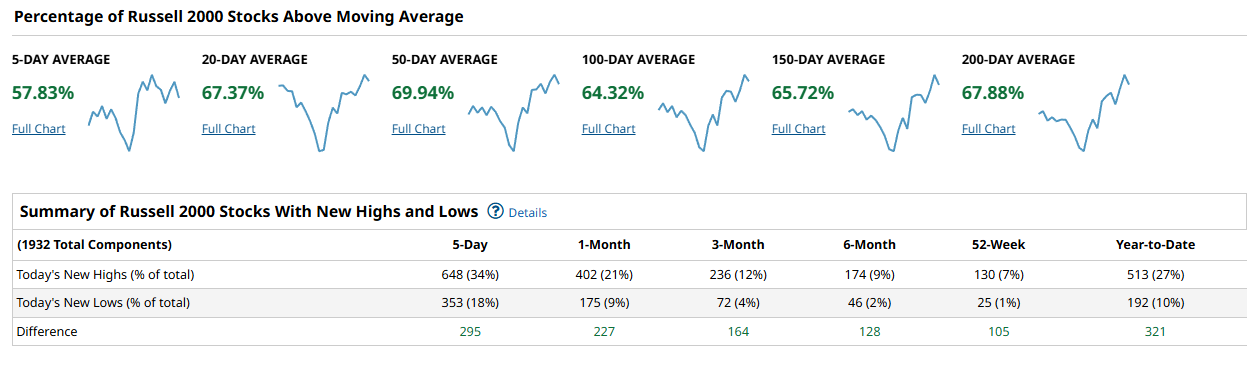
The Russell 2000 is the most bullish breadth read of the four, and it is not close. 57.83% of constituents are above the 5-day, 67.37% above the 20-day, and 69.94% above the 50-day. The longer-term cohorts are also strong with 64.32% above the 100-day, 65.72% above the 150-day, and 67.88% above the 200-day. The highs-minus-lows data is outright emphatic: +295 over 5 days (648 highs vs 353 lows), +227 over 1 month (402 vs 175), +164 over 3 months (236 vs 72), +128 over 6 months (174 vs 46), +105 on the 52-week window (130 vs 25), and +321 year-to-date (513 vs 192). That is what broad, durable participation looks like when risk appetite is real and not just concentrated in a few mega-caps.
Putting it together, the cap-weighted message is mixed while the broad-market message is strong. The S&P and Russell are both showing a market with plenty of stocks above their 50-day averages (71.11% and 69.94%) and consistently positive new highs minus new lows across every window. That is the kind of foundation that can support a durable advance. The Nasdaq 100, however, is not confirming. With only 51.96% above the 50-day and negative highs-minus-lows across 5-day, 1-month, 3-month, 6-month, and year-to-date windows, the market is effectively saying, “breadth is fine, but the growth complex is still working through something.” A durable advance would be easier to believe if the Nasdaq’s 50-day cohort pushes north of 60% and the new highs minus new lows flips positive on at least the 5-day and 1-month views. On the other hand, concern rises if the S&P’s 50-day cohort falls back under 60% and the net new highs compress toward zero, because that would signal participation is fading rather than rotating.
My playbook this week is to respect the broad-market strength while staying selective where the lag is obvious. I want to favor areas that benefit from wide participation and steady intermediate uptrends, and I want to avoid chasing the parts of the tape that are still printing more new lows than new highs. I will be watching for confirmation through improvement in Nasdaq breadth (more names reclaiming their 20-day and 50-day) and a turn in its highs-minus-lows back into positive territory. If that happens, it would argue for a cleaner, more synchronized risk-on push. If it does not, I will assume the market remains rotational, with leadership living outside the usual mega-cap growth bucket.
Bottom line: breadth is broadly healthy and supportive of higher prices, but the rally will look a lot more durable once the Nasdaq 100 stops bleeding new lows and starts confirming the strength already evident in the S&P 500 and Russell 2000.

Investor Sentiment Report
%Bull-Bear Spread
The %Bull-Bear Spread measures the gap between bullish and bearish investor sentiment, often from surveys like AAII. It’s a contrarian indicator—extreme optimism may signal a coming pullback, while extreme pessimism can hint at a potential rally. Large positive or negative spreads often mark market turning points.
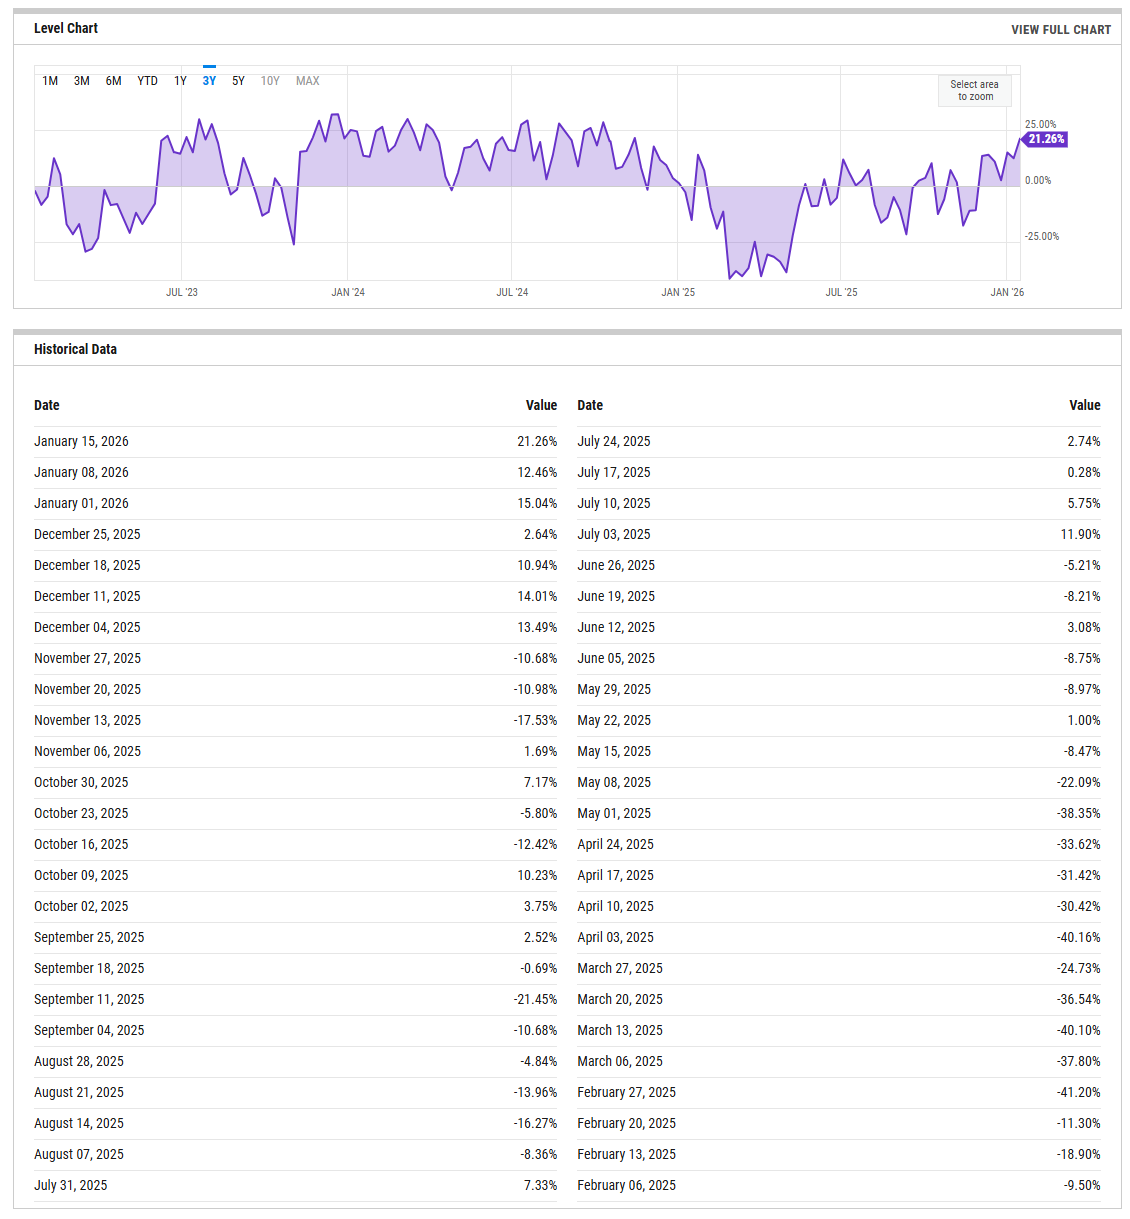
The bull minus bear spread has moved decisively into a crowded zone. The most recent reading visible is 21.26% dated January 15, 2026, up sharply from 12.46% a week earlier and 15.04% at the start of the year. That is a fast sentiment turn after spending late December near indifference, with a 2.64% reading on December 25. In practical terms, optimism has accelerated quickly rather than building slowly. From a tape-reading perspective, that tells me risk appetite is real and traders are leaning into upside follow-through, but it also means the market is no longer climbing a wall of worry. Historically, sub-zero or single-digit readings tend to support rebounds, while sustained readings north of 20% can coincide with momentum slowing as positioning gets crowded. The tripwire here is persistence. If the spread stays above 20% and price keeps advancing, sentiment is confirming trend. If the spread remains elevated while price chops or stalls, the risk shifts toward air pockets rather than smooth pullbacks.
NAAIM Exposure Index
The NAAIM Exposure Index (National Association of Active Investment Managers Exposure Index) measures the average exposure to U.S. equity markets as reported by its member firms. These are typically active money managers who provide their equity exposure levels weekly. The index offers insight into how much these managers are investing in equities at any given time, ranging from being fully short (-100%) to leveraged long (up to +200%).
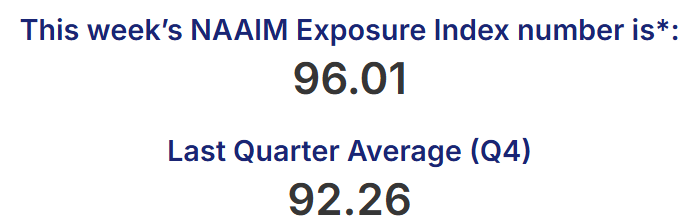
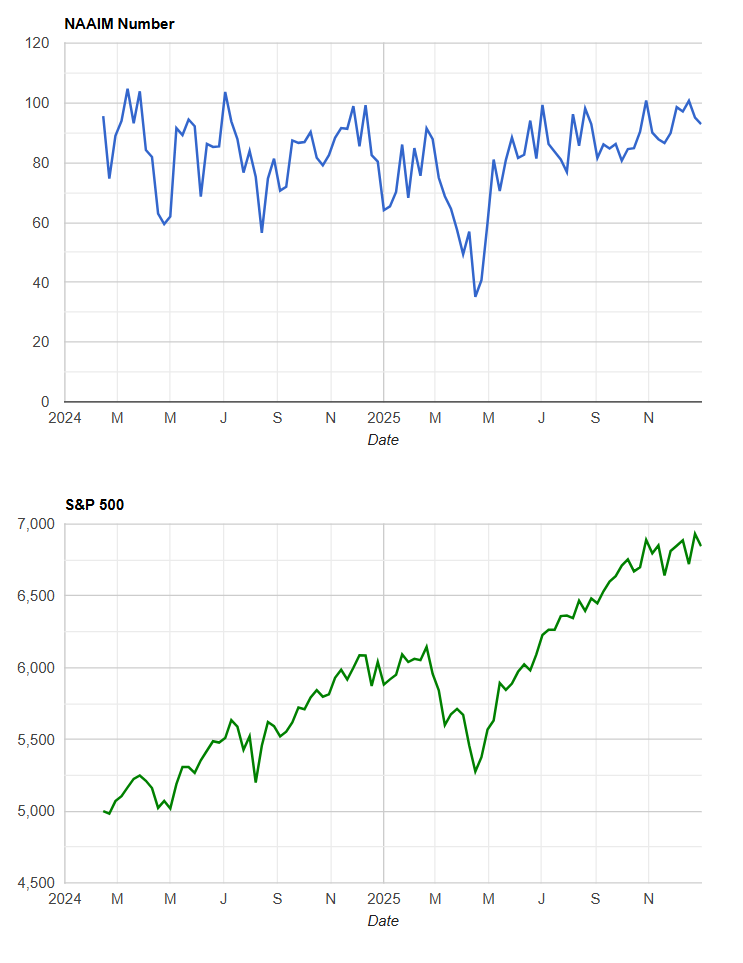
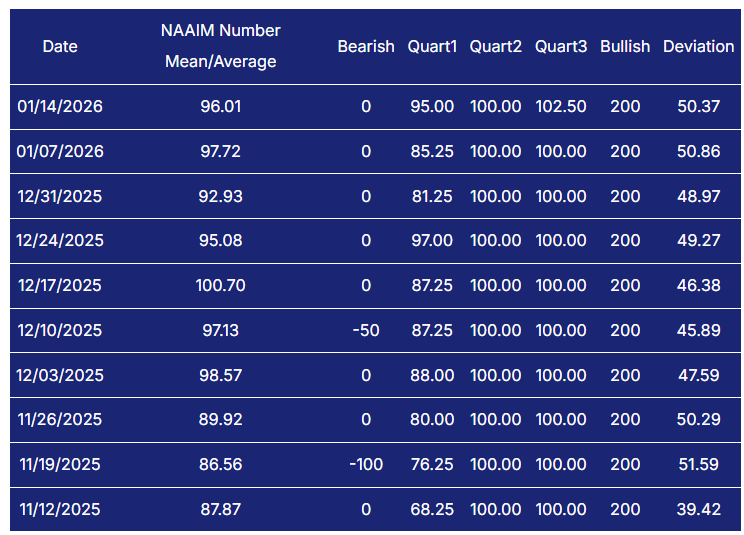
The NAAIM Exposure Index confirms that active managers are already heavily committed. The latest reading shown is 96.01 on January 14, following 97.72 on January 7 and 92.93 on December 31. That cluster near full exposure tells me there is very little dry powder left among this cohort. The bullish interpretation is that managers believe the path of least resistance is higher and are willing to stay involved. The cautionary interpretation is that when exposure is this high, incremental buying power is limited and downside can accelerate if price falters. What matters now is not the absolute level but the direction of travel. A pullback in exposure into the 50s without corresponding price damage would be constructive, as it would rebuild fuel for a later advance. A sharp exposure cut while prices are still near highs would be a more concerning signal that de-risking is leading the tape.
CBOE Total Put/Call Ratio
CBOE's total put/call ratio includes index options and equity options. It's a popular indicator for market sentiment. A high put/call ratio suggests that the market is overly bearish and stocks might rebound. A low put/call ratio suggests that market exuberance could result in a sharp fall.
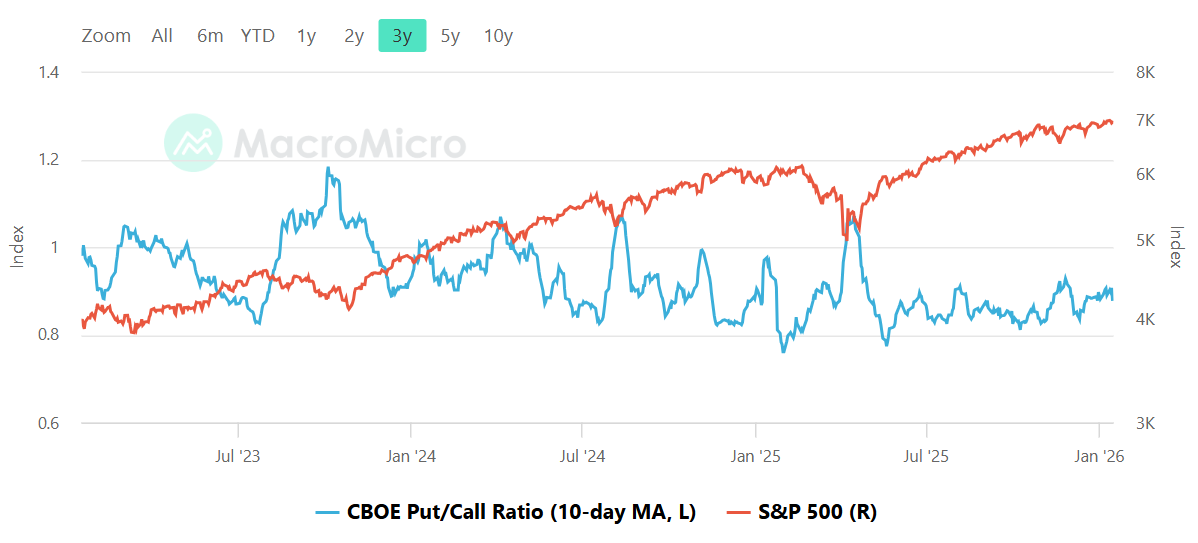
The chart shows the 10-day moving average of the total put/call ratio, but no precise numeric value is legible. Qualitatively, it sits below 1.0 and well under the fear spikes seen at prior stress points. That keeps the tone closer to complacent than defensive. When put/call runs low, it tells me hedging demand is muted and traders are not paying up for downside protection. This usually supports trend continuation but changes the character of pullbacks. Without a cushion of heavy hedging, declines can feel sharper and rebounds can be less explosive because there is less forced covering. The practical tripwires are behavioral. A rising 10-day average toward the 1.0 area would signal fear returning and would improve the odds that dips are bought more aggressively. Continued suppression while prices extend would increase the odds that any surprise shock produces a fast, uncomfortable drawdown.
Equity vs Bond Volatility
The Merrill Lynch Option Volatility Estimate [MOVE] Index from BofAML and the CBOE Volatility Index [VIX] respectively represent market volatility of U.S. Treasury futures and the S&P 500 index. They typically move in tandem but when they diverge, an opportunity can emerge from one having to “catch-up” to the other.
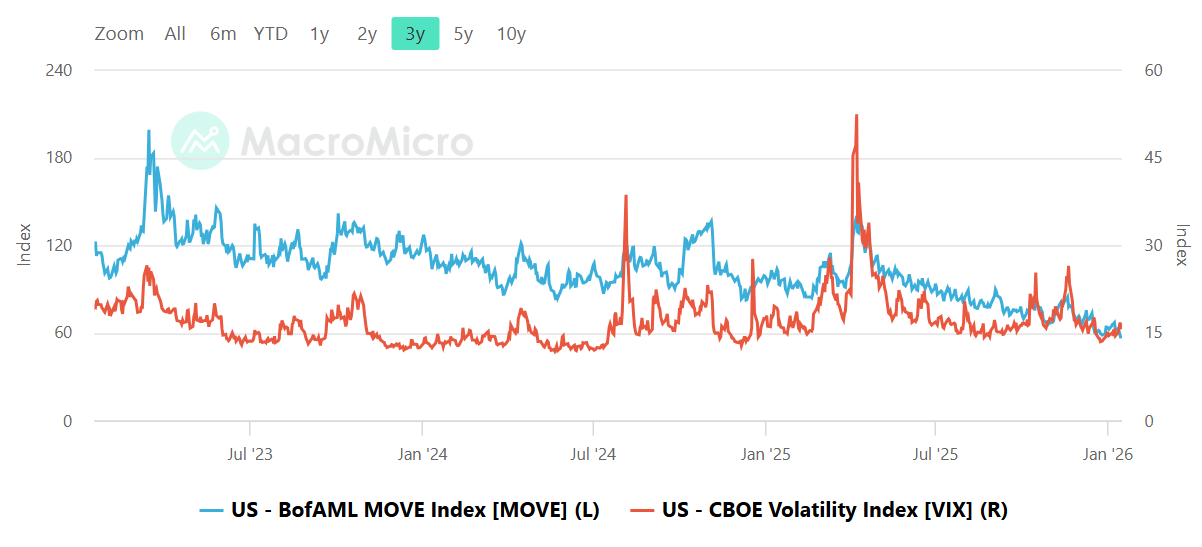
The MOVE versus VIX panel shows both bond and equity volatility subdued relative to their historical stress episodes. Exact end values are not readable, but the overall configuration is calm: rates volatility has been trending lower, and equity volatility remains contained. This combination is typically friendly to risk assets, as stable bond markets reduce the chance of sudden cross-asset shocks. The nuance is timing. Bond volatility often moves first, with equities responding later. That makes the relationship more important than the level. A renewed rise in MOVE while VIX stays sleepy would be an early warning that macro stress is brewing beneath the surface. A separate tripwire is VIX itself. A sustained push into the high teens would signal that realized calm is ending and that drawdowns may deepen rather than resolve quickly.
CNN Fear & Greed
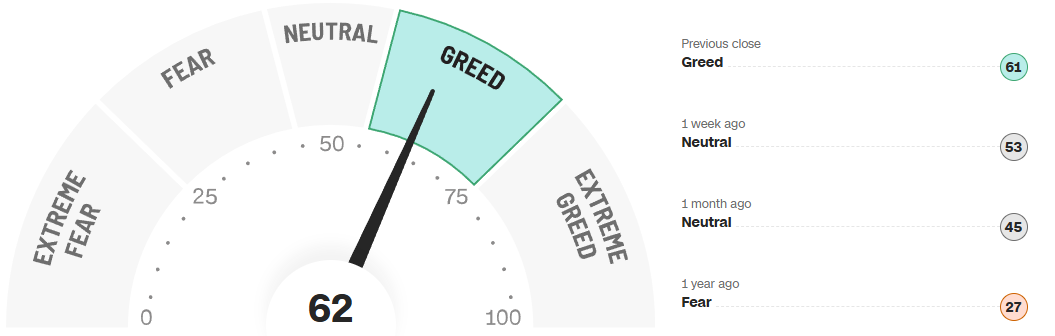
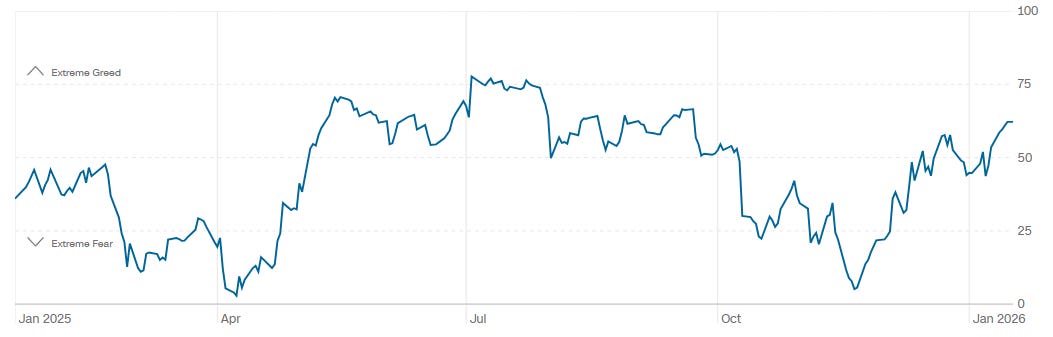
The Fear and Greed composite currently reads 62, squarely in the Greed zone. Context matters here. One week ago the reading was Neutral at 53, one month ago Neutral at 45, and one year ago Fear at 27. The one-year trend shows a clear recovery from fear toward optimism, with the latest move representing an acceleration rather than an extreme. This is not the kind of sentiment that automatically caps rallies, but it does change the asymmetry. Upside tends to come more slowly, while downside reactions can be sharper because more participants are leaning the same way. My exhaustion signal would be a sustained push toward the upper end of the scale, while my constructive reset would be a pullback toward neutral without significant price damage, which would refresh the sentiment backdrop.
Social Media Favs
Social sentiment offers a real-time view of investor mood, often revealing market shifts before traditional indicators. It can signal momentum changes, spot emerging trends, and gauge retail investor impact—especially in high-volatility names. Tracking sentiment around events or earnings provides actionable insights, and when layered with quantitative models, can enhance predictive accuracy and risk management. Sustained sentiment trends often mirror broader market cycles, making this data a valuable tool for both short-term trades and long-term positioning.

Technician’s Playbook: Trading the Majors (SPY/QQQ/IWM/DIA)
When you’re a large institutional player, your primary goal is to find liquidity - places to do a ton of business with the least amount of slippage possible. VolumeLeaders.com automatically identifies and visually plots the exact spots where institutions are doing business and where they are likely to return for more. It’s one of the primary reasons “support” and “resistance” concepts work and truly one of the reasons “price has memory”.
The tape across the major ETFs continues to resolve higher in a grinding, two-sided way rather than a clean, one-directional sprint. That matters, because the path of least resistance still looks up, but it is being negotiated through balance zones where size is active on both sides.
SPY
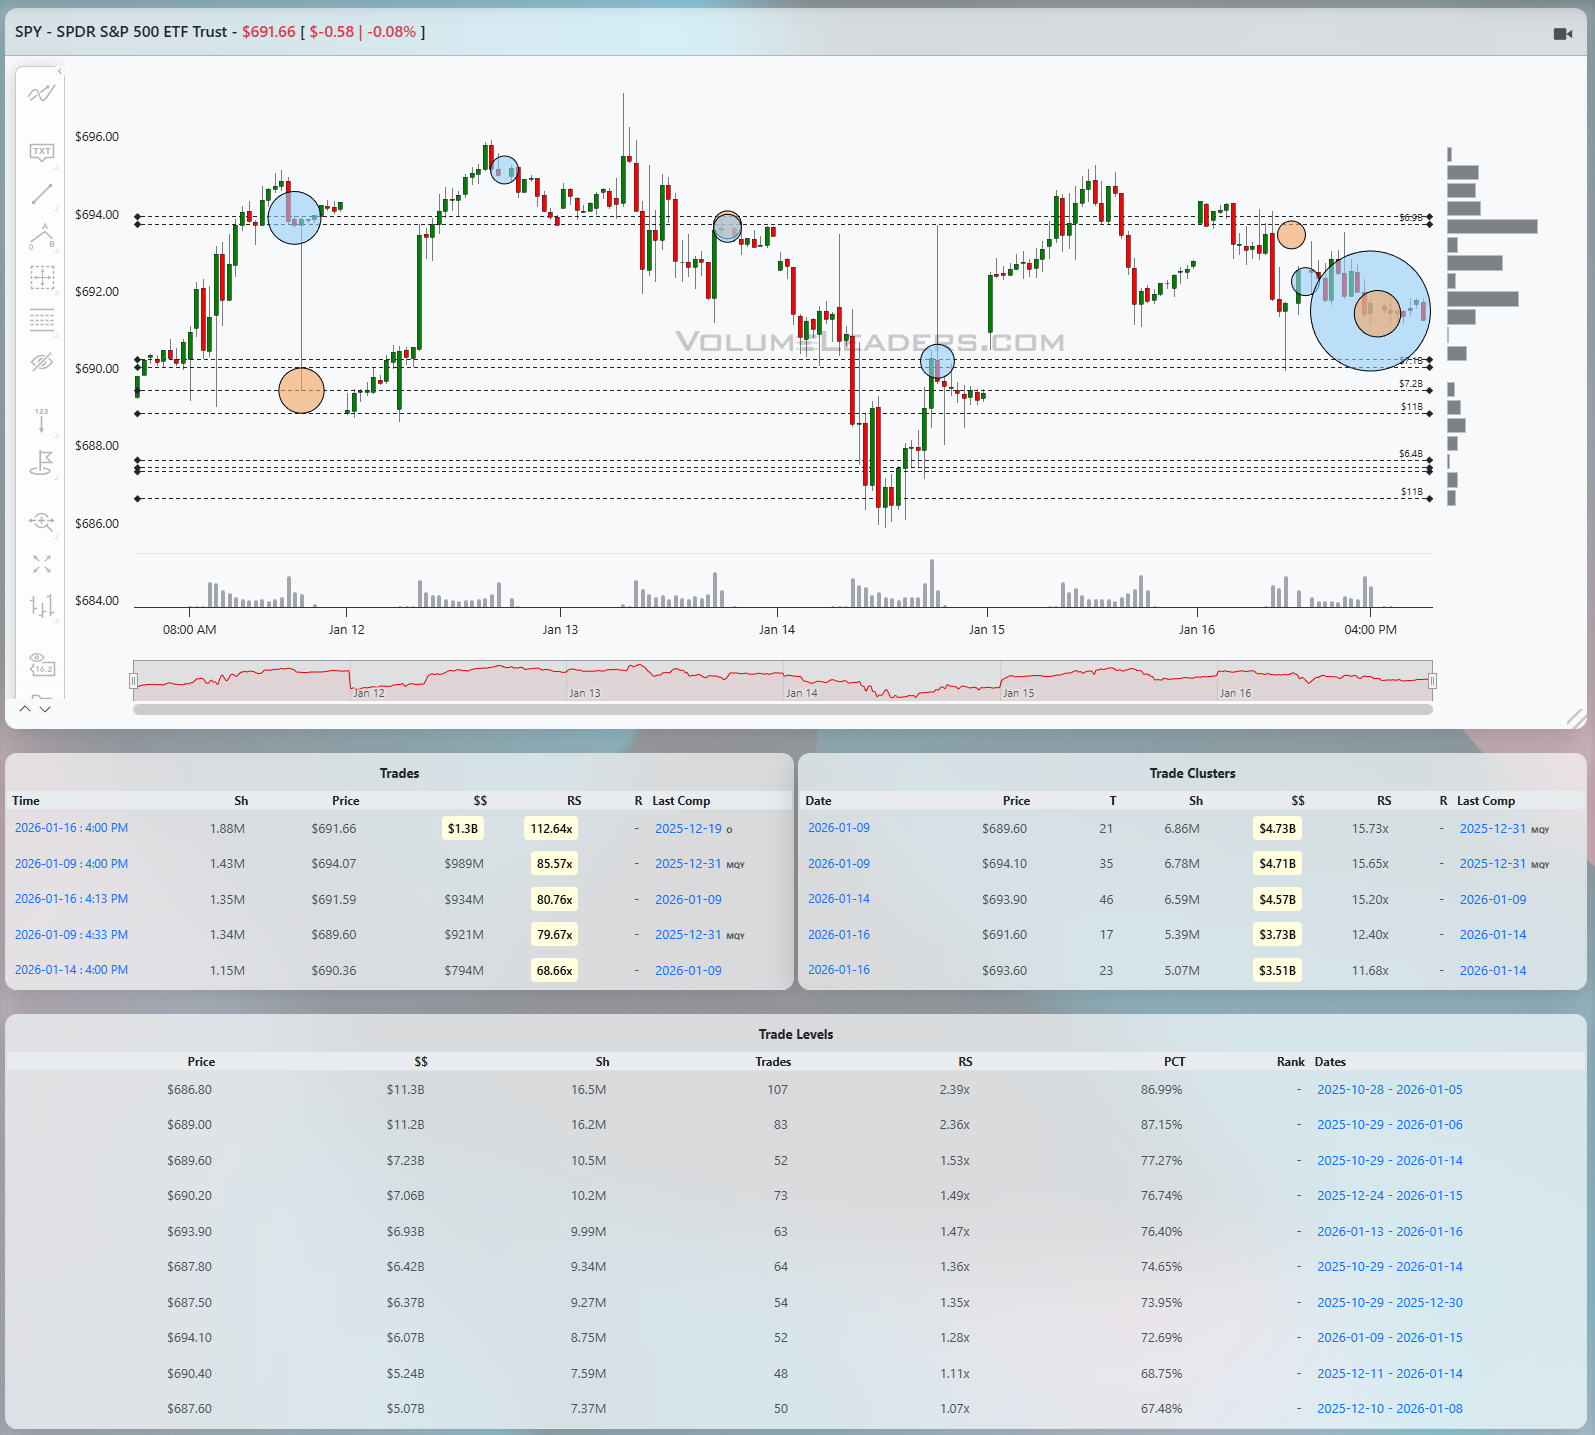
SPY has spent the last several sessions oscillating around a well-defined balance area rather than trending cleanly. The structure is impulse higher, sharp pullback mid-week, and then a recovery that stalls back into prior acceptance. The most obvious line of scrimmage is the 689 to 690 area. That zone stands out in the Levels table with roughly $11.3B at 686.80 and $11.2B at 689.00, both with RS north of 2.3x and PCT in the mid-to-high 80s. Those are not casual levels; they represent repeated agreement. Price dipped into the high 686s during the selloff and was immediately met with responsive buying, suggesting absorption rather than panic liquidation. On the upside, repeated attempts into the mid-694s have struggled. That area aligns with lighter but still meaningful Levels near 694 to 695 and multiple large individual prints that failed to extend. The presence of large blue and orange circles near the recent highs tells me size was active, but the lack of follow-through suggests more distribution than fresh initiative buying. Acceptance above the mid-694s would flip the tape back into continuation mode with the next magnet toward the upper 695s. Failure back below 689 opens the door to a deeper rotation toward the high 686s, where buyers have already shown their hand.
QQQ
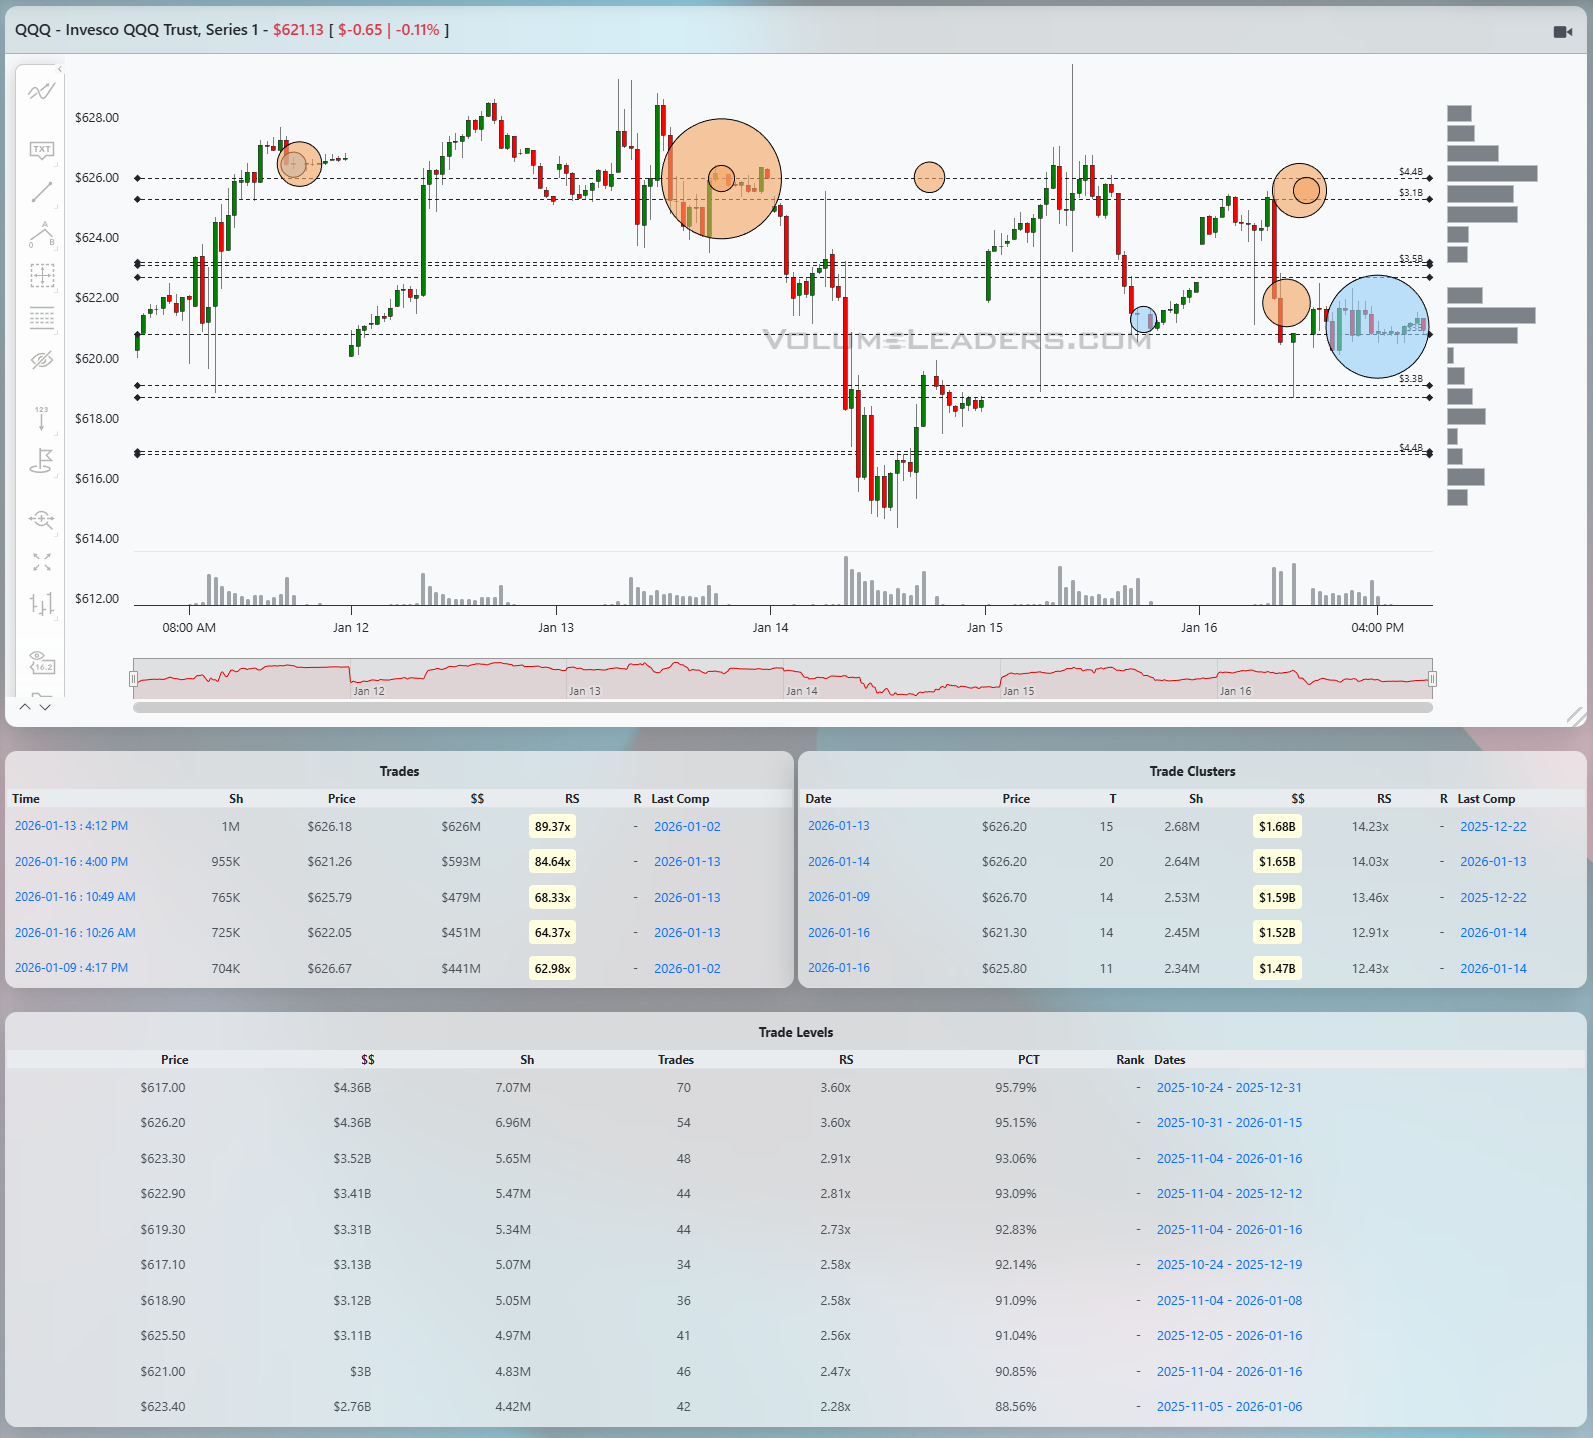
QQQ looks more fragile than SPY, both structurally and in the way size has behaved. The mid-week selloff was sharper, and the recovery has been choppier, carving out a lower, overlapping range. The dominant feature here is the heavy cluster of activity around 626 to 627. That zone shows multiple clusters in the $1.6B to $1.7B range with RS in the mid-teens, marking it as a key decision point. Large prints near 626 earlier in the week coincided with rejection rather than clean acceptance, and subsequent attempts higher stalled quickly. Below, the low 620s to high teens acted as a fast downside magnet during the liquidation, but price did not spend much time there, which hints at responsive buying rather than longer-term acceptance. For QQQ, the pass-fail is simple. Acceptance back above 626 to 627 would suggest the tape is repairing and could target the upper 620s again. Rejection there, followed by a loss of 622 to 621, would likely reopen the door to another test of the mid-teens lows.
IWM
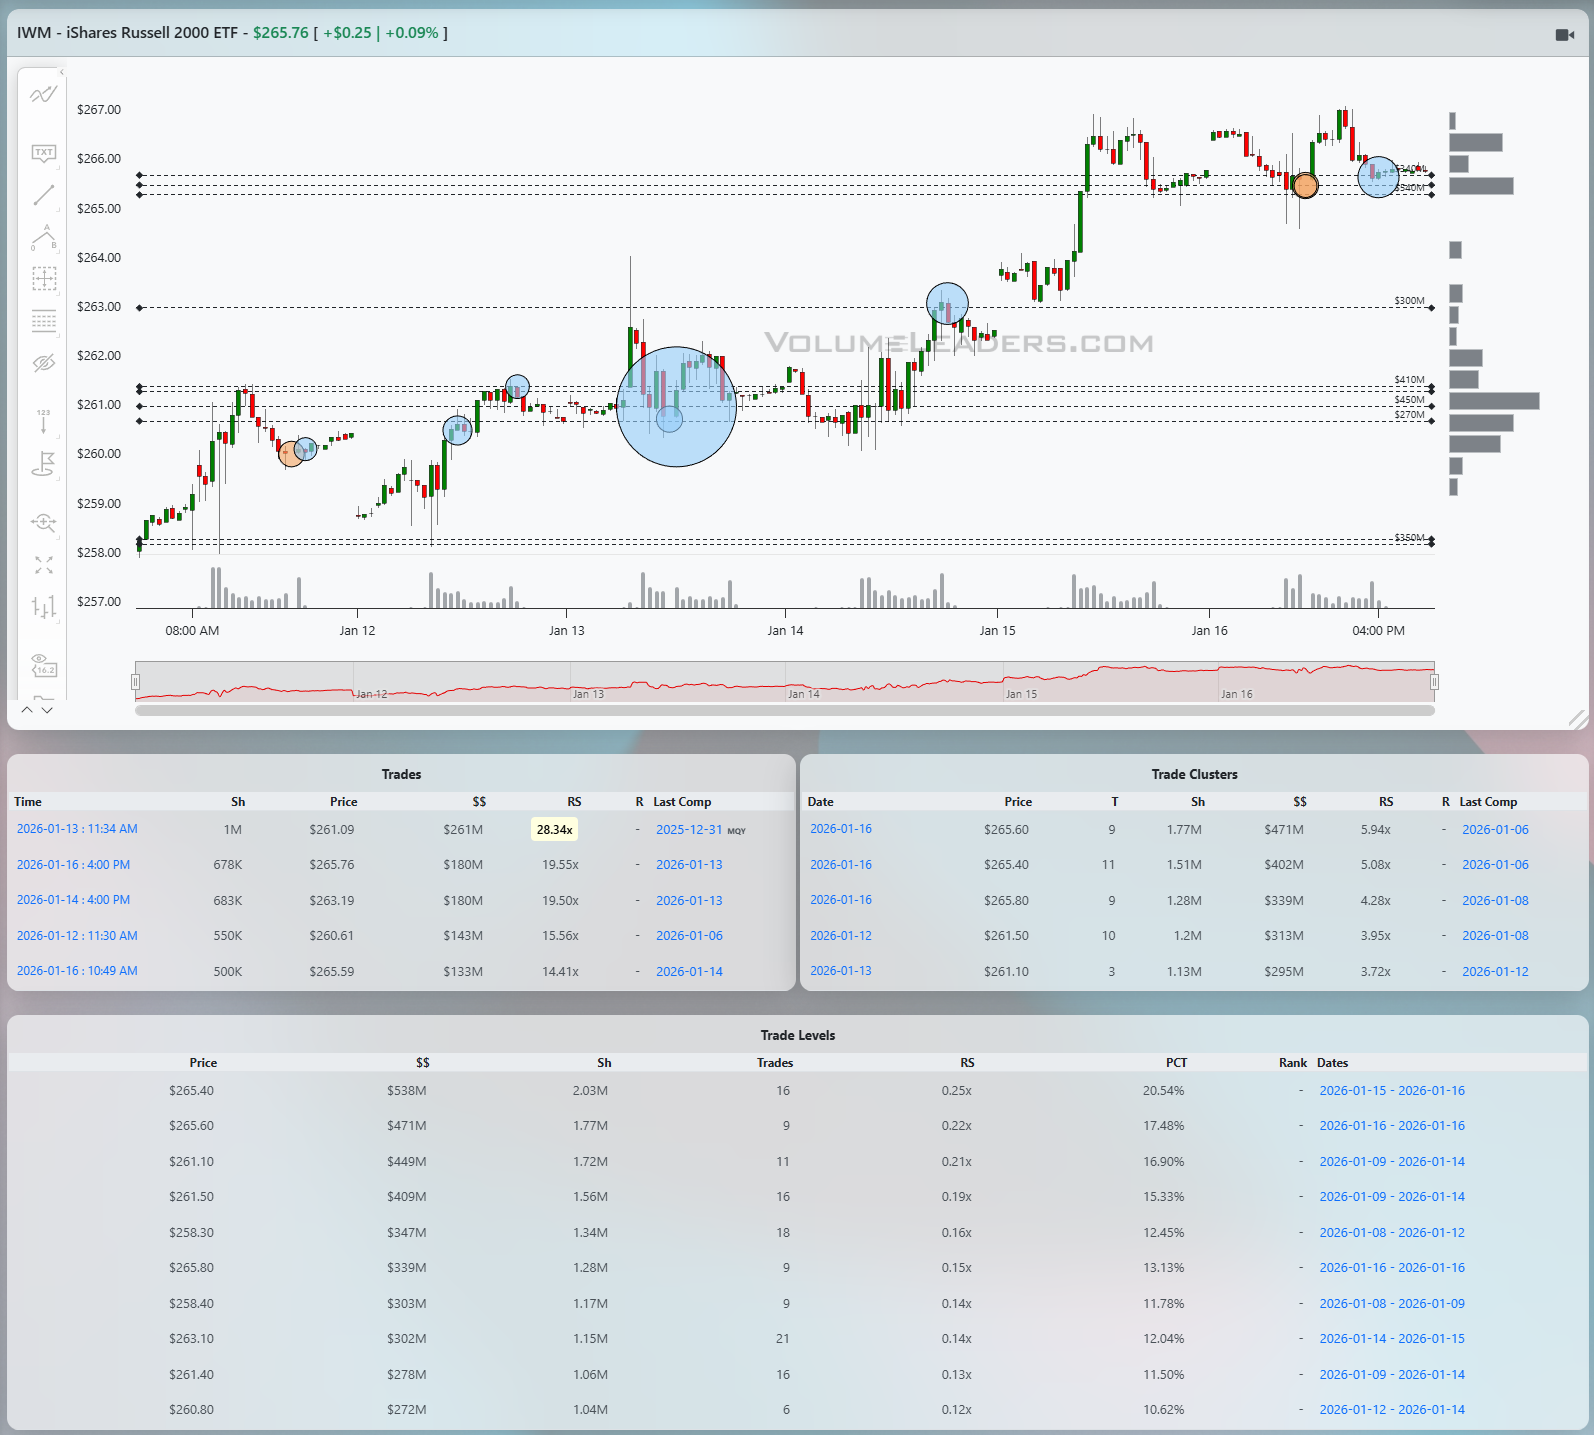
IWM remains the relative strength leader in terms of structure. The path has been higher highs and higher lows, with pullbacks staying shallow and corrective rather than impulsive. The most important reference is the broad acceptance zone from roughly 260 to 261, where several large trades and a notable blue-highlighted print coincided with consolidation before the next leg higher. That area also aligns with Levels carrying several hundred million dollars in notional and elevated percentiles, making it a legitimate support shelf. Above, price pushed into the mid-266s and briefly probed higher, where small orange prints appeared but did not spark immediate rejection. That tells me sellers are present but not dominant. As long as IWM holds above the low 264s, the structure remains constructive with scope to retest and potentially exceed the recent highs. A decisive loss of 261 would be the first real warning that the character is changing and that a deeper rotation toward the high 258s could unfold.
DIA
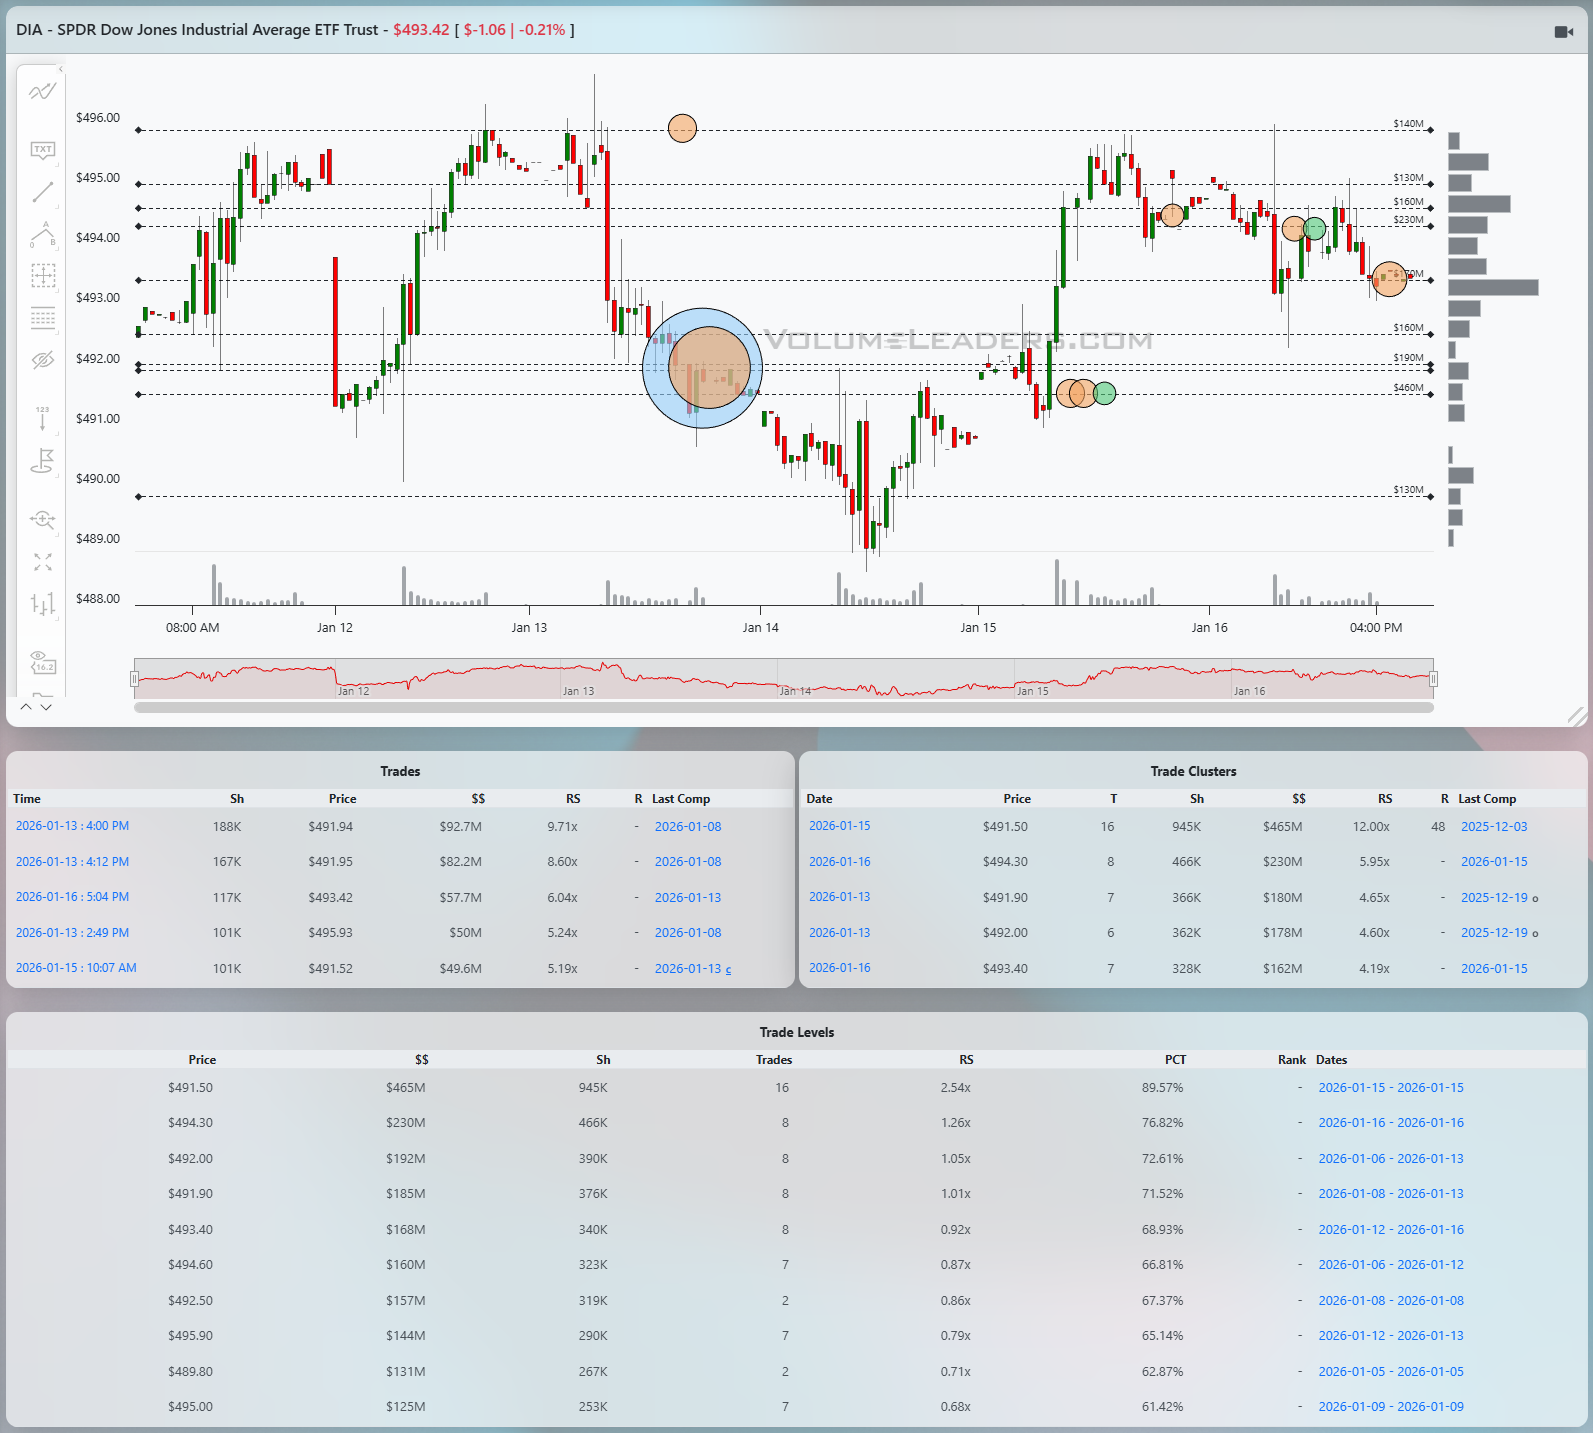
DIA sits somewhere between SPY and QQQ in tone. The selloff mid-week was sharp but brief, followed by a strong snapback that reclaimed prior balance. The key area here is the 491 to 492 zone, where a large cluster north of $450M with RS above 12x stands out. That level acted as both resistance and then support, classic role reversal behavior. Above it, price has struggled to sustain trade above the mid-494s, where multiple smaller clusters and prints suggest distribution rather than accumulation. Below, the next meaningful shelf sits closer to 489 to 490, which caught the bulk of the liquidation before buyers stepped in. Acceptance above 494 would signal that the Dow is ready to participate more fully in upside continuation. Failure back through 491 would shift focus to whether 489 can hold as responsive support.
From an execution standpoint, this is still a market where patience around key shelves matters more than chasing candles. The highest-quality trades remain those framed against the thickest levels, where $$, RS, and percentile all agree that real business has been done. Continuation setups require acceptance above balance highs, while mean-reversion trades need clean rejection and quick response at support.
Bottom line: the tape is constructive but selective, with SPY balancing around 689 to 690, QQQ struggling near 626 to 627, IWM holding strength above 261, and DIA negotiating 491 to 494.

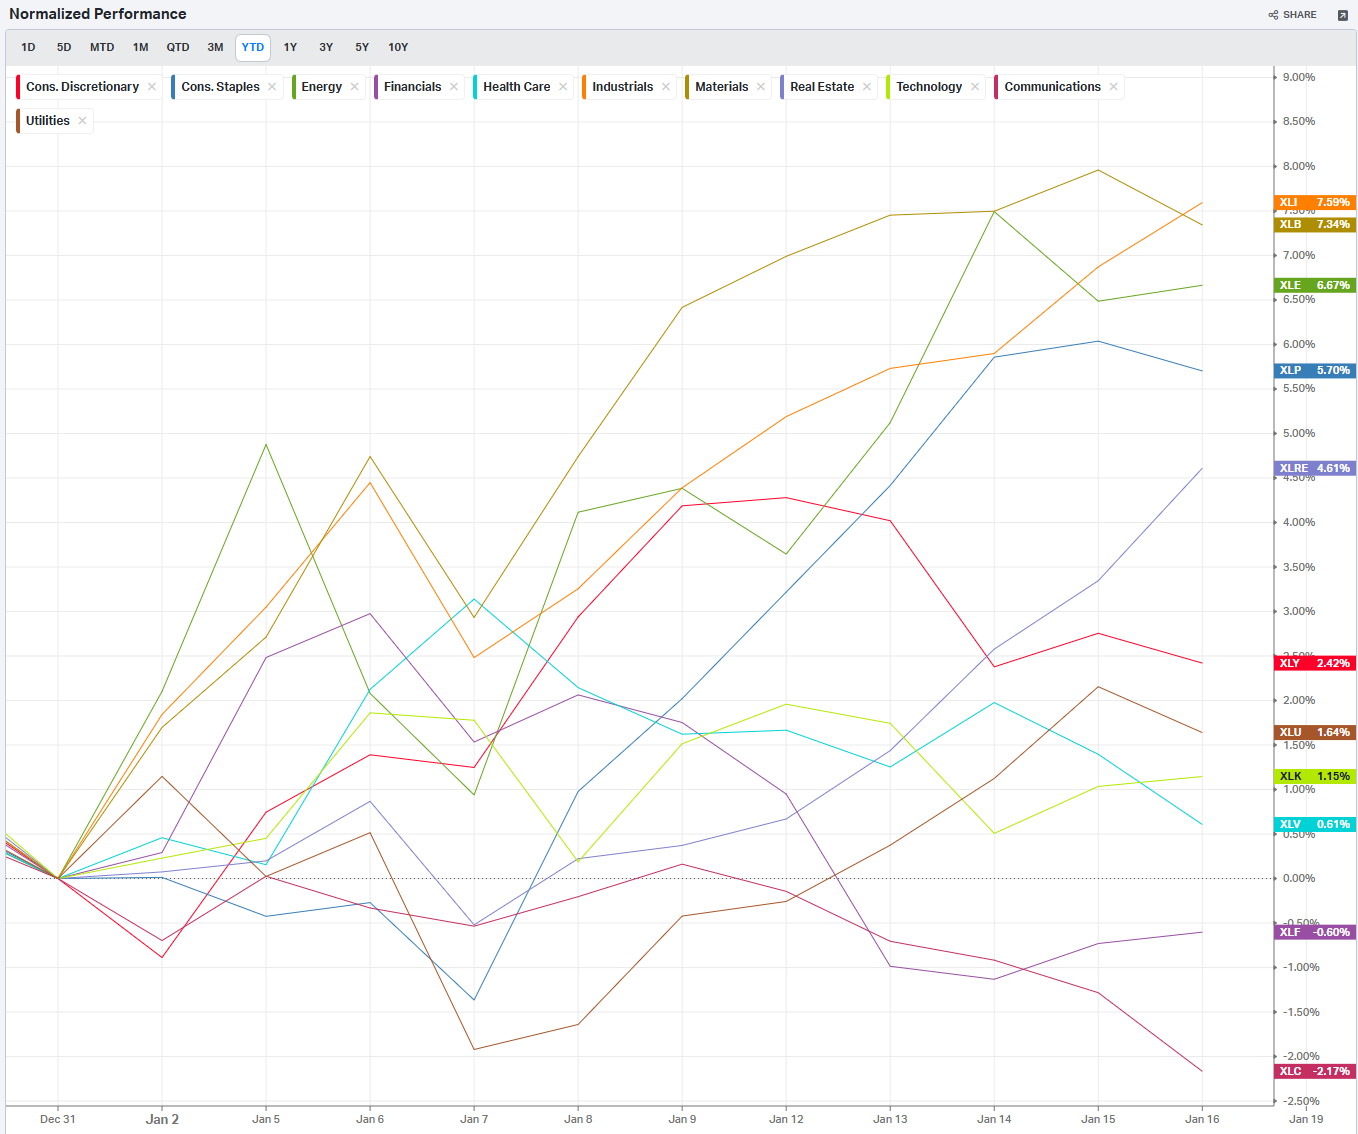
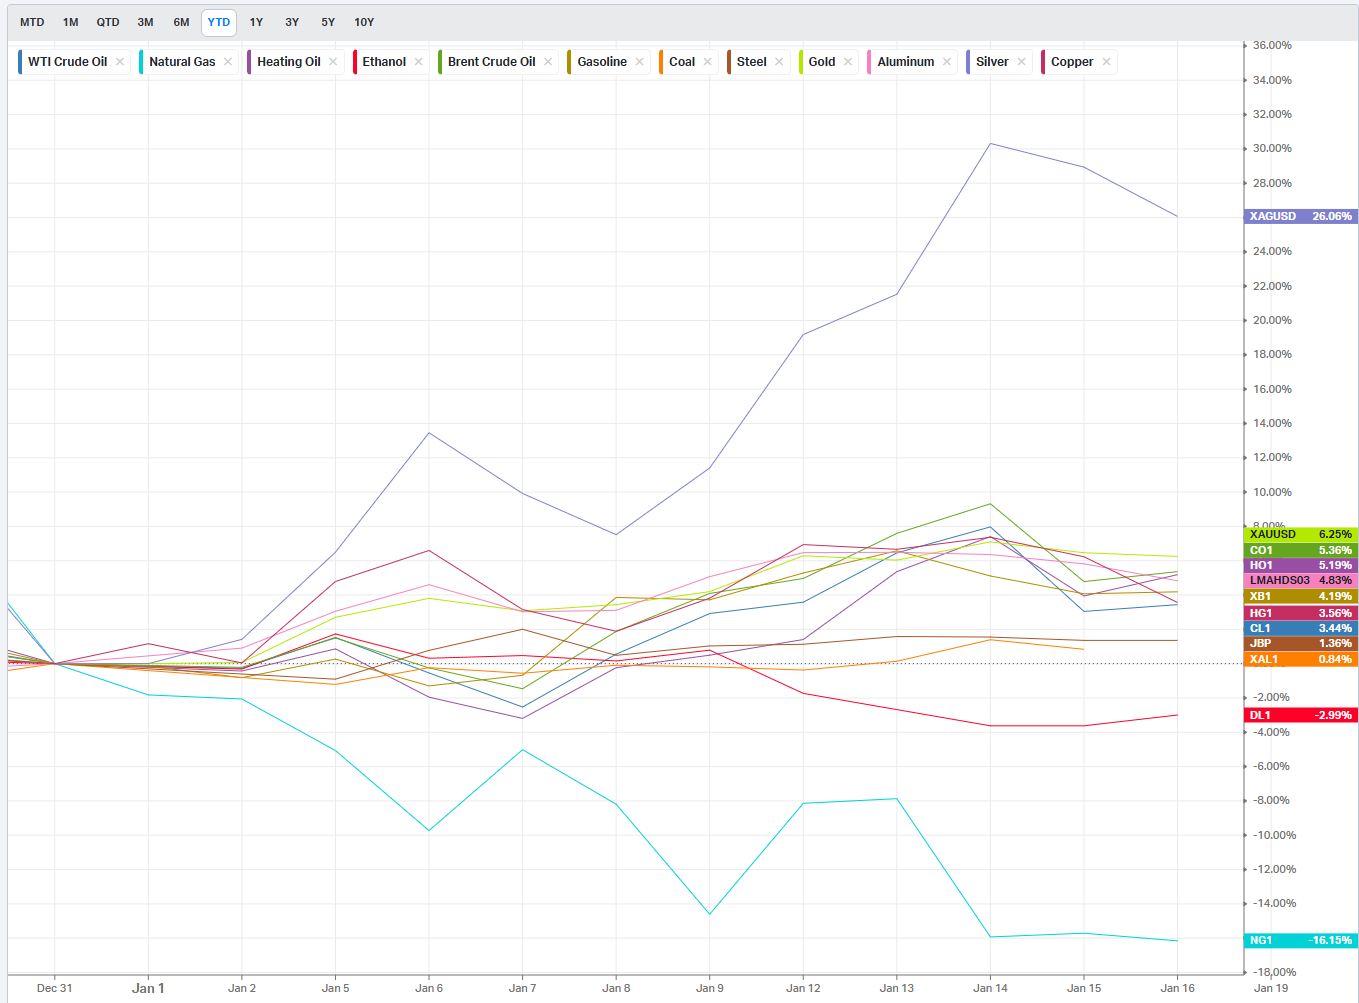
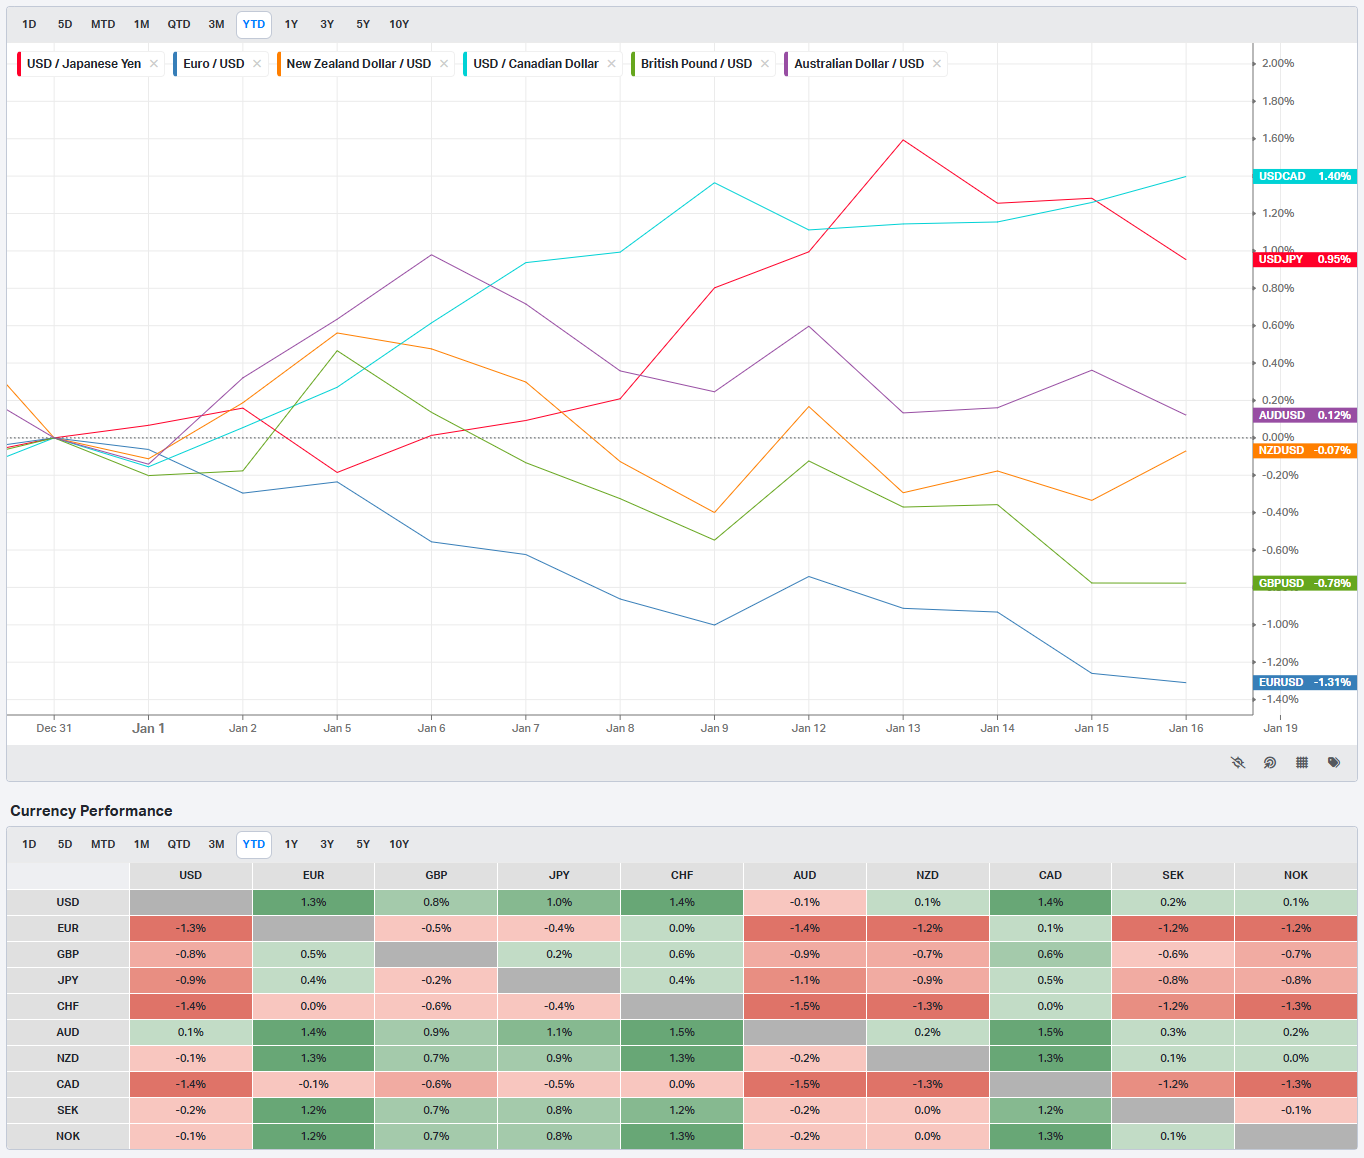
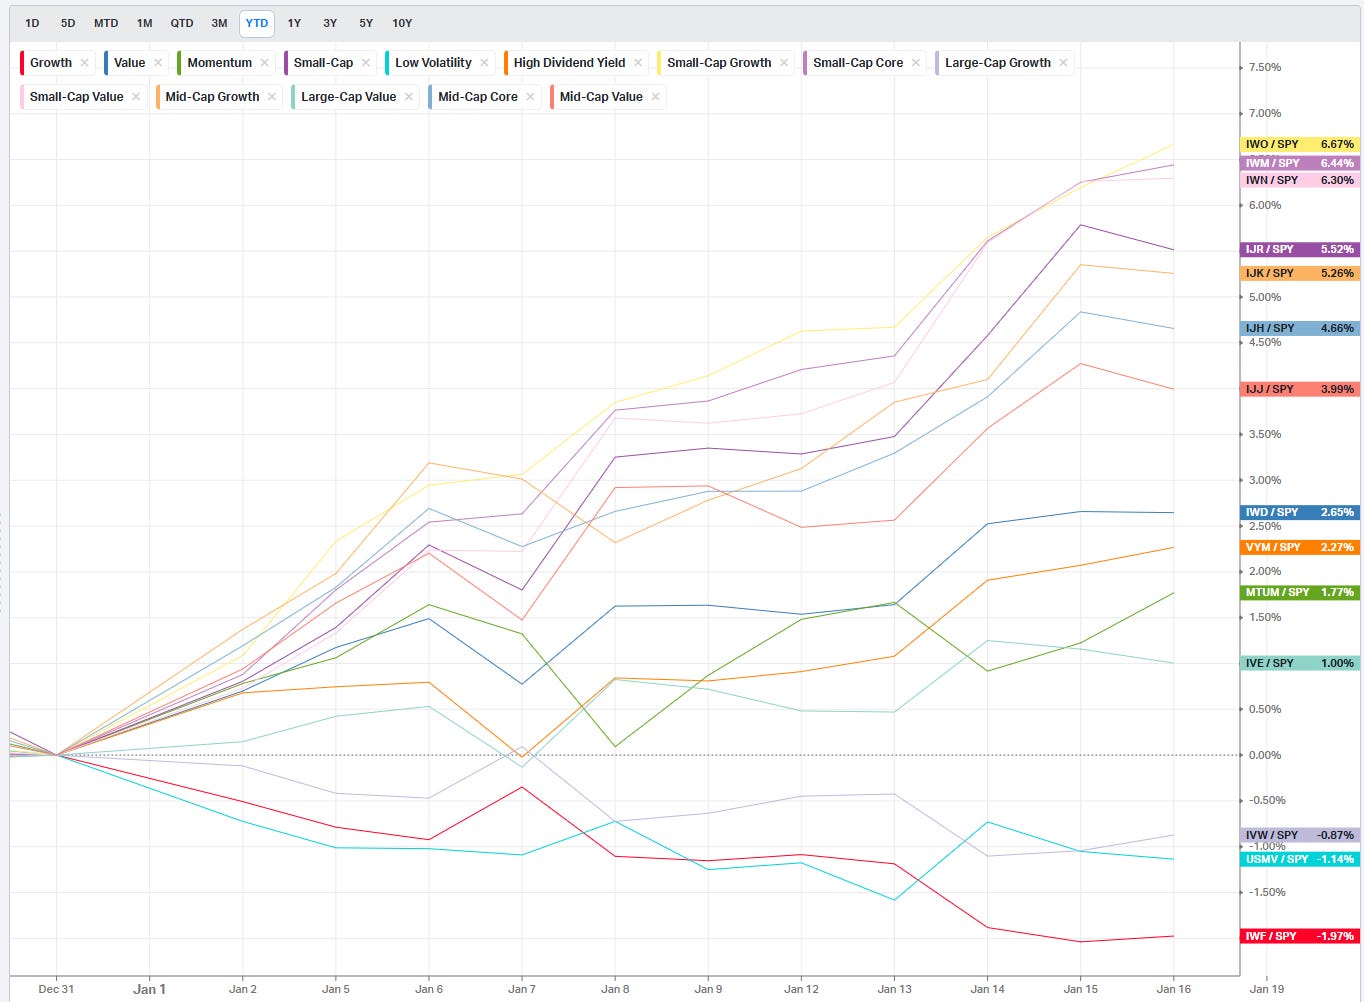
Summary Of Thematic Performance YTD
VolumeLeaders.com offers a robust set of pre-built thematic filters, allowing you to instantly explore specific market segments. These performance snapshots are provided purely for context and inspiration—think about zeroing in on the leaders and laggards within the strongest and weakest sectors, for example.
S&P By Sector
S&P By Industry
Commodities: Energy & Metals
Currencies/Major FX Crosses
Factors: Style vs Size-vs-Value

Events On Deck This Week
Here are key events happening this week that have the potential to cause outsized moves in the market or heightened short-term volatility.
Data-Heavy Week With Inflation and Growth in the Driver’s Seat
The market comes into the week with momentum still intact but increasingly sensitive to confirmation from macro data. With Monday closed for the holiday, the calendar compresses risk into the middle of the week, where growth, inflation, and labor signals all cluster together. The balance between cooling prices and resilient activity will decide whether risk appetite extends or stalls.
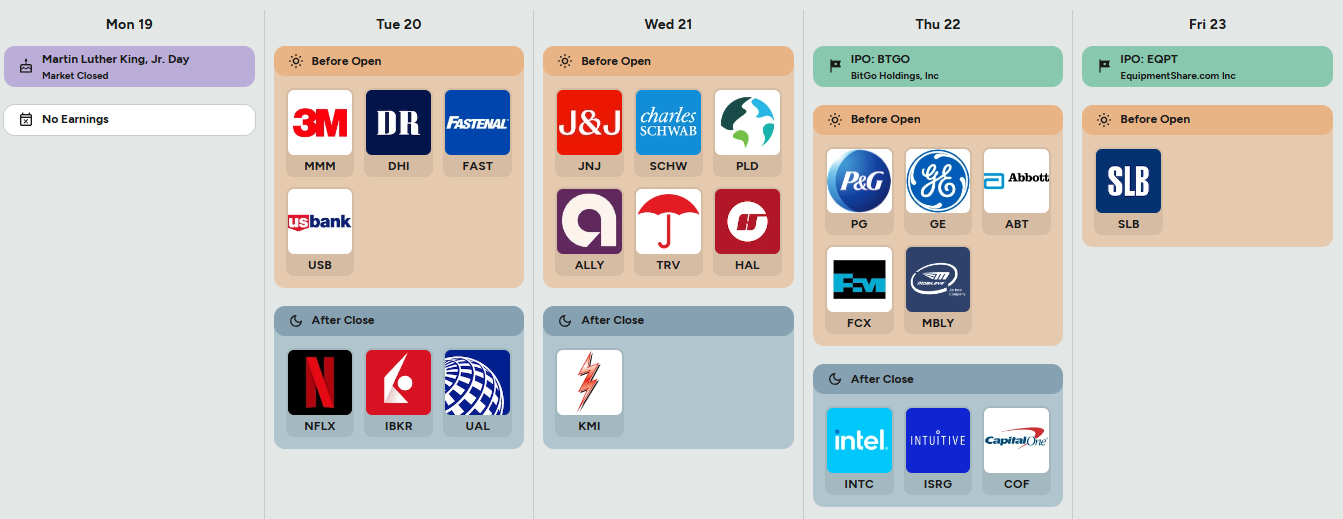
Monday is straightforward. Markets are closed for Martin Luther King Jr. Day and there are no earnings on the board. Liquidity will be thin globally, and the real setup work happens in futures positioning ahead of Tuesday’s data flow.
Tuesday starts quietly but sets the tone for energy and labor expectations. ADP Employment Change shows a previous reading of 11.75K. There is no visible consensus or forecast. A materially stronger print would reinforce the idea that the labor market remains firm, which could reintroduce upward pressure on rates. Later in the day, API Crude Oil Stock Change previously printed 5.27M. Another large build would lean risk-off for energy and inflation expectations, while a draw would support the reflation narrative that has been simmering under the surface.
Wednesday brings housing into focus. MBA 30-year mortgage rates previously sat at 6.18%, still restrictive but no longer rising sharply. Pending Home Sales for December show a MoM forecast of 1.4% and a YoY forecast of 0.2%, while the prior YoY is shown at 2.6%. Upside here would reinforce the soft-landing narrative and support cyclicals. A miss would keep pressure on housing-sensitive equities and rate expectations. Earnings before the open include Johnson & Johnson, Charles Schwab, Prologis, Ally, Travelers, and Halliburton. Financials and industrials will be sensitive to commentary around credit demand, capex, and energy services activity.
Thursday is the fulcrum of the week. GDP Growth Rate QoQ Final for Q3 previously printed 3.8% versus a 4.3% consensus and forecast. GDP Price Index QoQ Final previously came in at 2.1% against a 3.7% consensus and forecast. That combination already leans growth-resilient and inflation-cooling. Any revision higher in prices or lower in growth would matter. Initial Jobless Claims previously printed 198K versus a 205K consensus, still signaling tight labor. At 11:00 AM, Core PCE Price Index MoM prints 0.2% for October versus a 0.1% forecast, with November forecast at 0.1%. PCE YoY shows 2.8% for October versus a 2.7% forecast, while November YoY is listed as unreadable but treated as a key inflation checkpoint. Personal Income MoM previously printed 0.4% versus a 0.3% forecast, and Personal Spending MoM printed 0.3% versus a 0.1% forecast. Strong income and spending with contained inflation would be unequivocally risk-on. Hot inflation with firm spending would be the most problematic mix. Energy data follows, with EIA Crude Oil Stocks previously at 3.391M and Gasoline Stocks at 8.977M, keeping inflation-sensitive assets on alert. Earnings include Procter & Gamble, General Electric, Abbott, Freeport-McMoRan, and Mobileye before the open, with Intel, Intuitive Surgical, and Capital One after the close. Guidance here will spill into staples, industrials, materials, semis, and consumer credit.
Friday wraps with global activity and sentiment. S&P Global Composite PMI Flash printed 52.7 previously versus a 52.8 forecast. Manufacturing PMI printed 51.8 versus 52.1 consensus, while Services PMI printed 52.5 versus 52.8. These are expansionary but decelerating. Michigan Consumer Sentiment Final printed 52.9 versus a 54.0 forecast, suggesting consumers remain cautious. Improvement here would support discretionary and cyclicals; further softness would reinforce a defensive tilt.
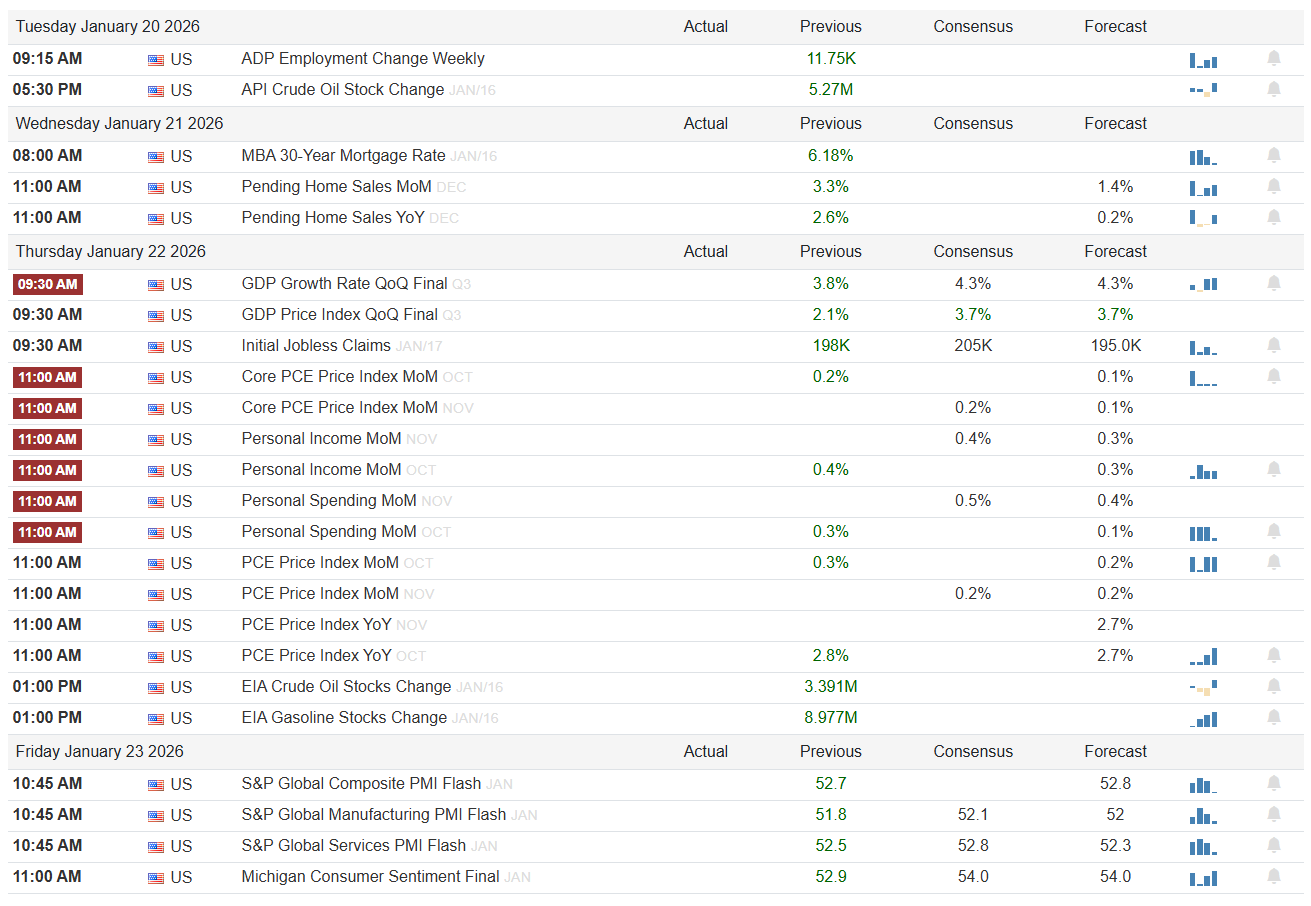
The earnings and IPO board adds texture. 3M, DR Horton, Fastenal, Netflix, United Airlines, Charles Schwab, Halliburton, Procter & Gamble, GE, Abbott, Intel, Capital One, and Schlumberger provide a cross-section of housing, industrial demand, energy, semiconductors, and consumer health. Housing orders, industrial backlog, net interest margins, cloud and AI spend, and consumer credit trends are the lines that matter most. IPOs from BitGo and EquipmentShare add risk appetite signals but are secondary to the macro prints.
Three sign-posts for active traders:
Core PCE MoM at or below the 0.1% forecast keeps rates pressure muted and favors risk-on continuation.
GDP Price Index holding near the prior 2.1% while growth stays firm reinforces the soft-landing trade.
Initial Jobless Claims staying sub-200K keeps cyclicals supported, while a sudden spike would flip the tone.
Bottom line: this is a confirmation week, and risk stays supported only if inflation continues to cool without growth rolling over.

Order Flow in Focus: Reading Smart Money Tells
Order Flow in Focus: Reading Smart Money Tells is a recurring segment that spotlights unique intraday opportunities revealed through institutional order flow. Each feature dissects a moment when the tape quietly shifted—when large, ranked prints clustered at key liquidity locations and informed players positioned ahead of the move. The goal isn’t hindsight; it’s pattern recognition—learning to spot the footprints of capital that knows before the crowd does.
This Tesla sequence is a cleaner illustration of auction dynamics doing exactly what they are supposed to do when liquidity concentrates at the extremes.
The story starts with December OPEX. That session mattered because it was not just elevated volume, it was organized volume. Two top-ranked historical prints, tagged #4 and #19, printed in the same window at 481. Those were not isolated executions. They coincided with one of the most active price levels on the chart, ranked #2 with over $13B in business done at the same price. The tape told you everything you needed to know in how price behaved afterward. Despite the size, price failed to hold above that print and that level. Candles stalled, progress slowed, and follow-through disappeared.
Once price slipped back below that upper blue liquidity line, the auction changed character. What had been a balance area turned into a rejection zone. From there, the move lower was not random or emotional. It was a displacement. Price feel quickly with little pause.
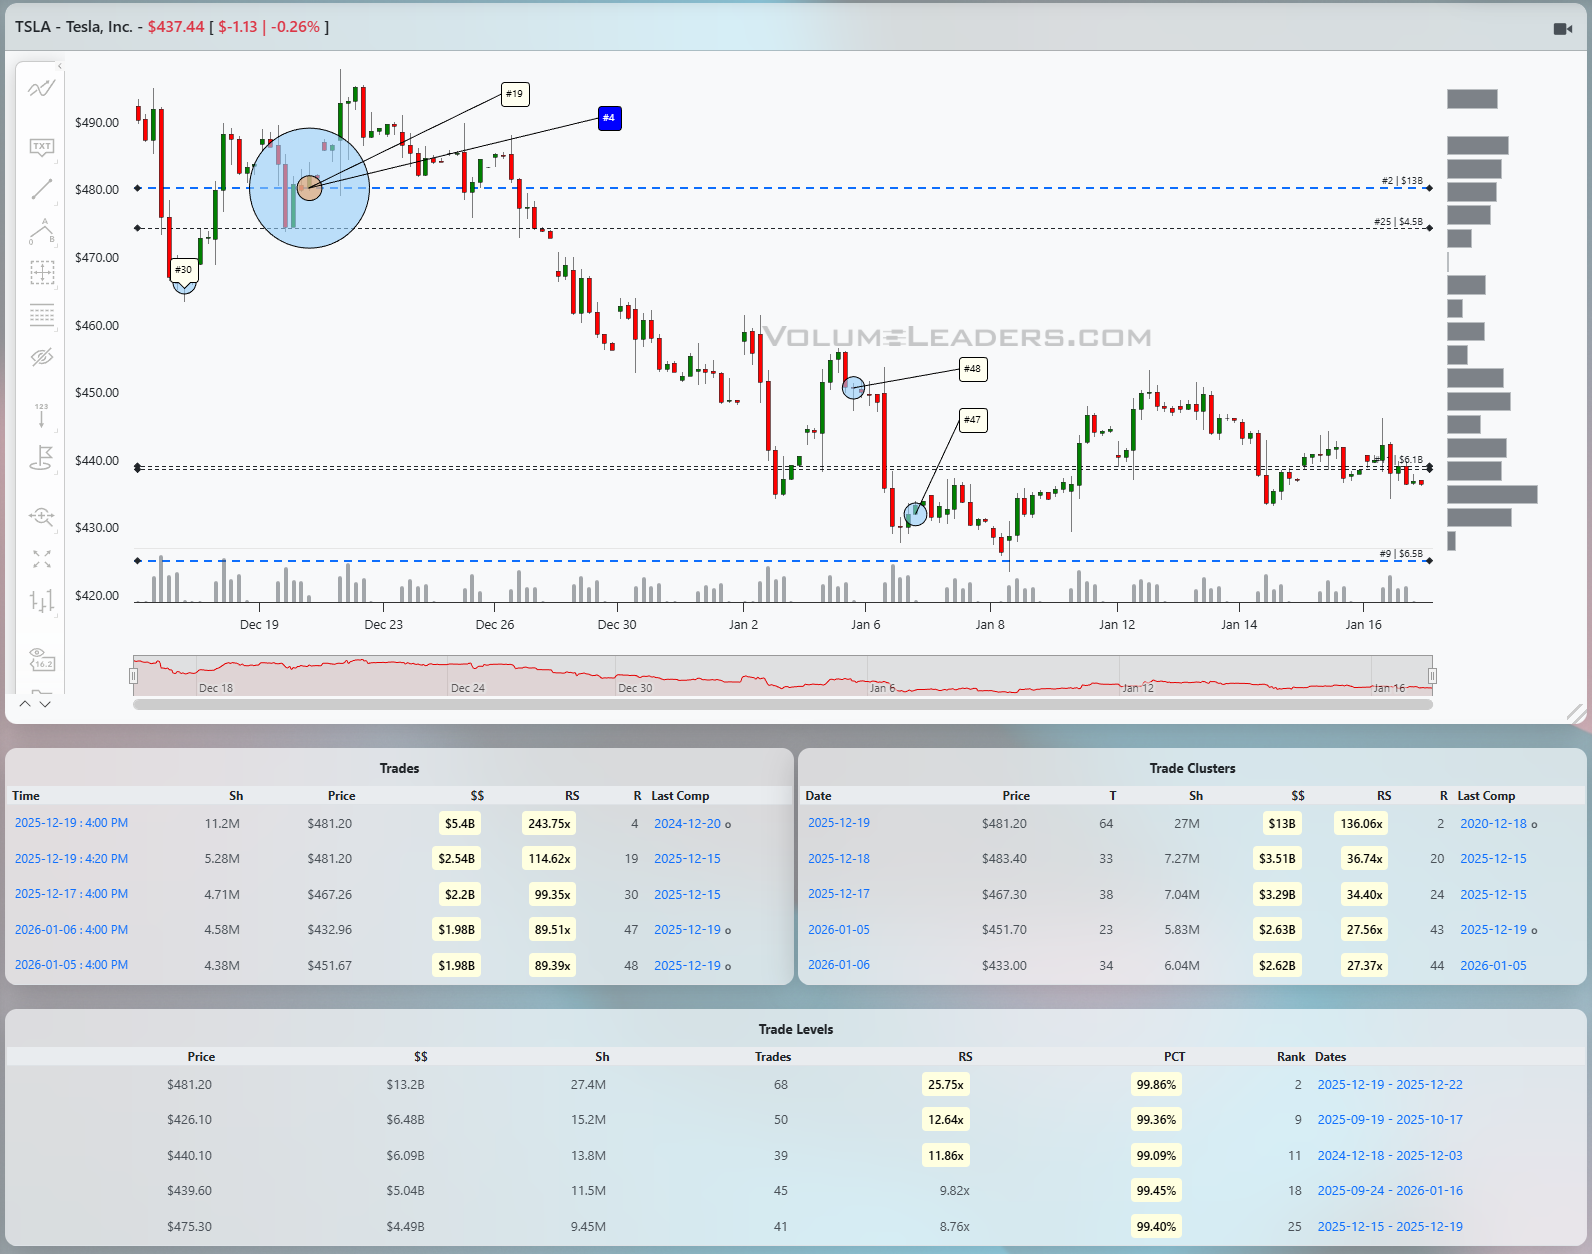
Non-blue levels at $440 tease out a bounce but it isn’t until price arrives at the #9-ranked blue price-level at $420 at the bottom of the charts that we see a floor being put in. Selling pressure slowed, ranges compressed, and downside follow-through diminished. That is the market discovering liquidity again. The presence of ranked prints near this zone reinforced the idea that larger participants were active, not chasing price lower but facilitating trade.
From a trade perspective, the opportunity was not about predicting a collapse. It was about recognizing when the auction looked above large prints and a huge liquidity level and failed. The target was not arbitrary. It was the next ranked liquidity zone below. As price moved through the mid-440s without acceptance, the path to the lower blue band opened cleanly.
Equally important, the cover was obvious. Once price reached the lower ranked-level and began to stabilize, the trade had done its job. Auction theory does not ask you to predict what happens next, only to recognize when the current auction has completed its objective. This sequence is a reminder that markets move between value areas, not because of headlines, but because liquidity dictates where trade can and cannot occur.

Market Intelligence Report
A desk-grade synthesis of institutional positioning and market structure—unpacking the flows, levels, and emerging themes that shaped the week, and translating them into a model portfolio built the same way professional desks prepare for the week ahead.
MIR Part 1: The Backdrop
The market is no longer debating whether participation exists; it does. The question now is where that participation is being expressed, and what kind of risk it is willing to carry. Recent flow patterns make it clear that we are in an inflectionary phase where capital remains active, but increasingly selective. This is not a broad-based unwind, nor is it a clean continuation of the prior leadership regime. Instead, the tape is signaling a redistribution of risk, with money rotating rather than exiting.
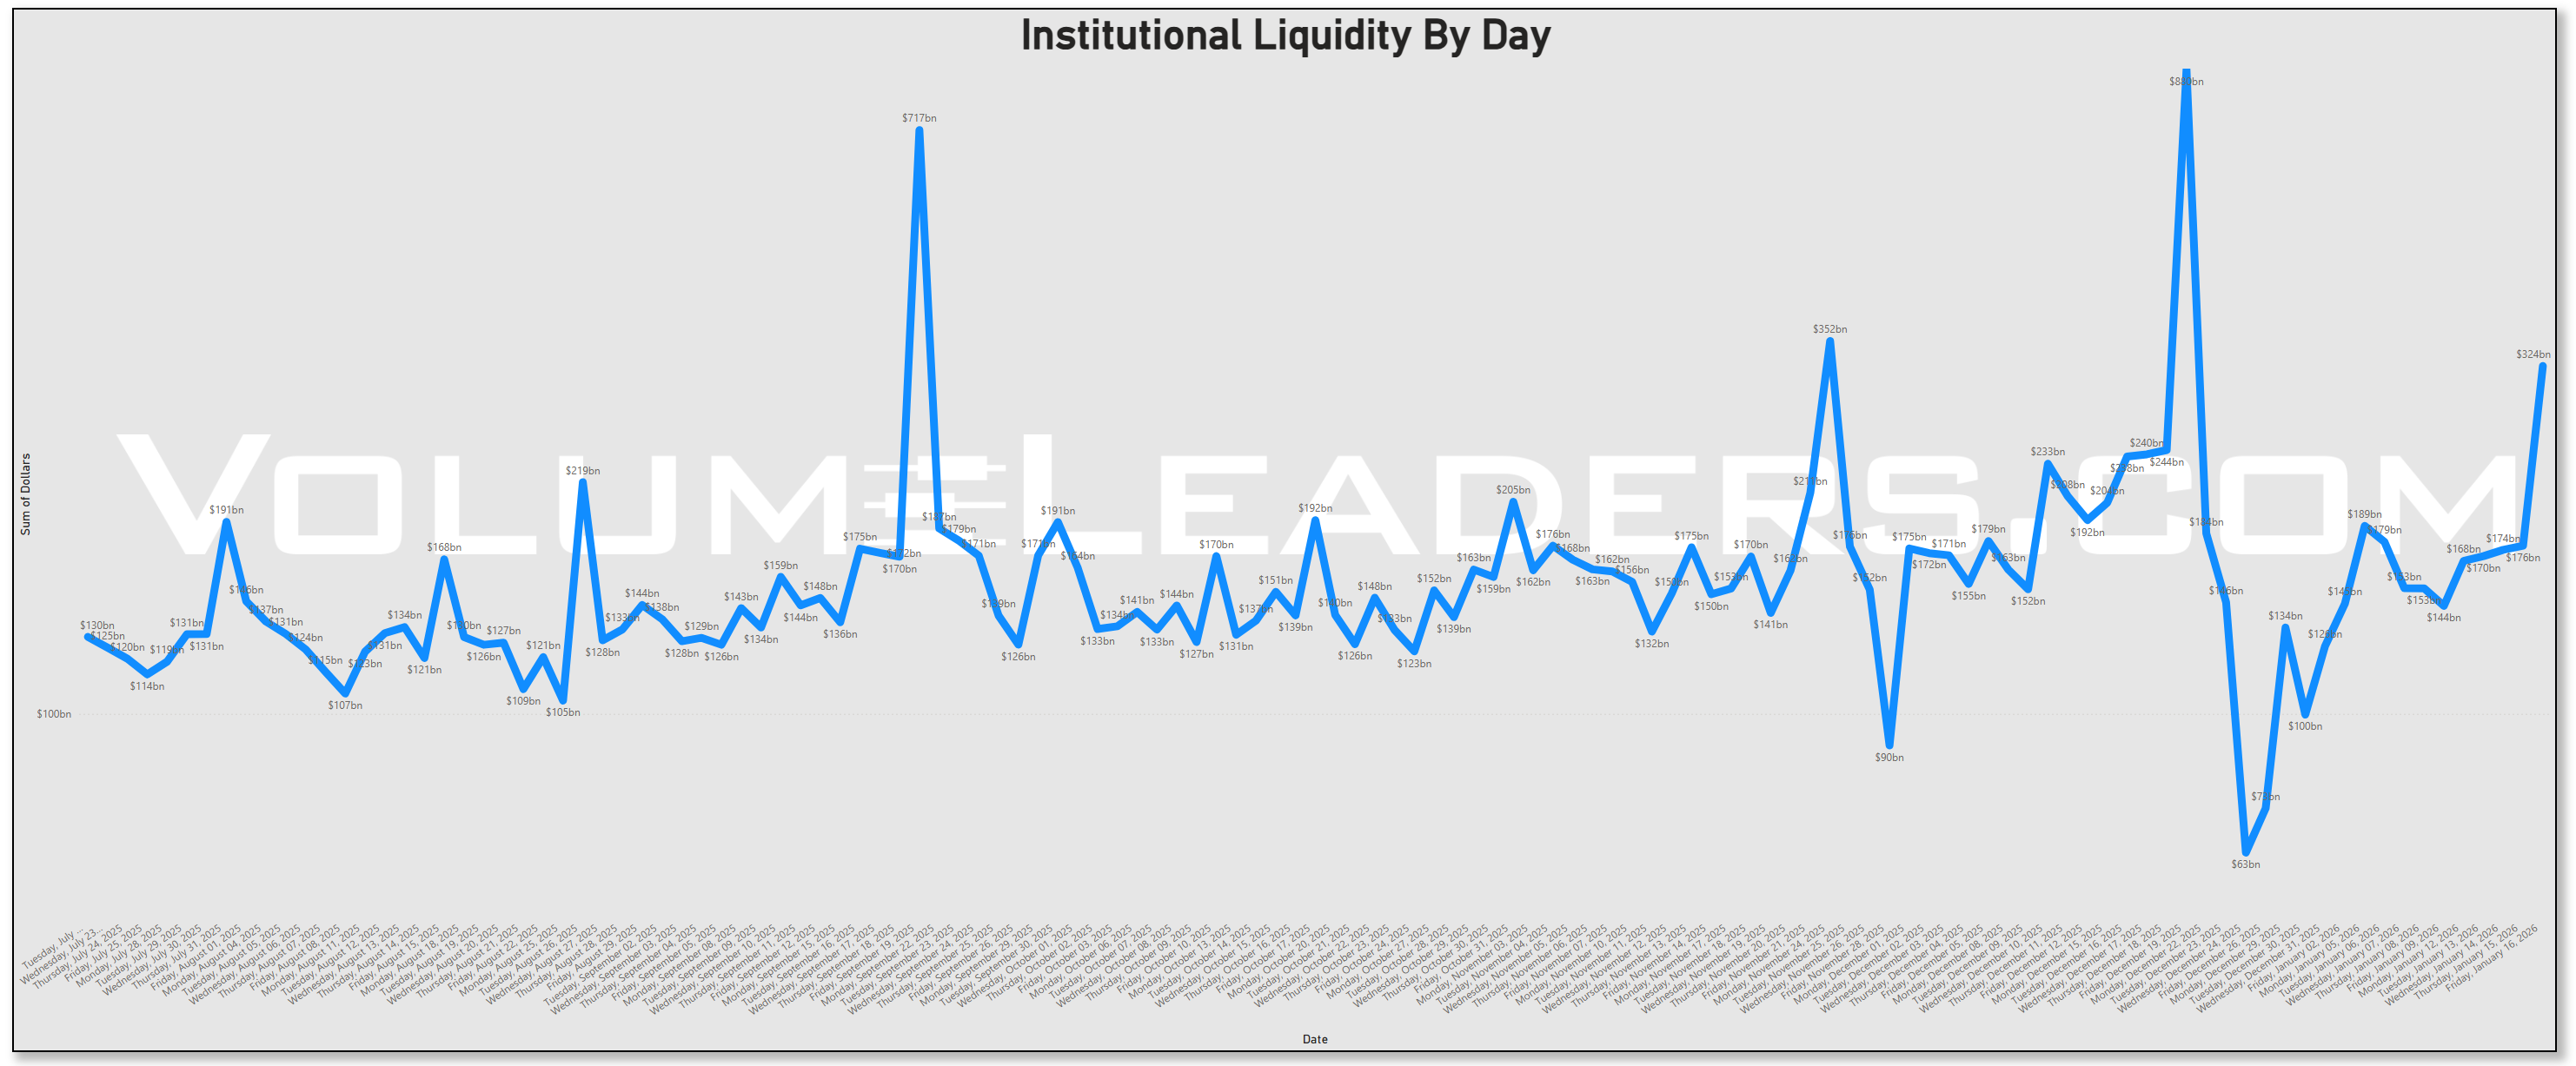
At the index level, aggregate liquidity remains healthy, but its composition has changed. Large, liquid vehicles continue to attract size, confirming that institutions are not stepping away from equities altogether. However, the nature of that exposure has shifted from momentum-seeking to balance-seeking. Broad beta is being used as a framework, while incremental risk is being expressed through more targeted sector and single-name positioning. This combination typically emerges when conviction is present, but uncertainty about duration, rates, or macro follow-through tempers enthusiasm for crowded trades.
Beneath the surface, participation has become increasingly fragmented. Defensive and value-adjacent areas are holding their ground and, in some cases, quietly improving, while segments that previously anchored market strength are losing cohesion. This is most evident in areas tied to growth narratives and communication-heavy business models, where flow has become less persistent and volatility more two-sided. That divergence matters. Markets can advance with uneven participation, but sustained trends require leadership to broaden, not narrow.
The aggregate flow distribution reinforces this message. Capital remains concentrated in a familiar set of large-cap names and index products, but the breadth within those allocations has thinned. Select mega-cap leaders continue to command attention, yet fewer names are contributing meaningfully to upside progress. When institutions want exposure without committing to narrative risk, they default to liquidity and optionality. That is exactly what current positioning suggests: participation without complacency.
Off-exchange activity adds another important layer. Dark-pool flows are elevated in the same large, liquid instruments that dominate headline allocations, a hallmark of steady accumulation rather than forced liquidation. This is patient capital at work, prioritizing price stability and minimizing signaling risk. At the same time, the absence of broad-based dark-pool expansion into higher-beta or lower-quality cohorts implies restraint. Institutions are choosing where to lean in, not indiscriminately deploying capital.
The fastest money tells a complementary story. Sweeps have been active, but not reckless. Rather than a one-directional chase, they reflect tactical positioning and hedging behavior, often clustered around broad market exposure and macro-sensitive instruments. This pattern aligns with a market that is actively recalibrating risk rather than pressing it. Urgency exists, but it is being applied surgically, not emotionally.
Sector rotation charts confirm that leadership is evolving. Areas associated with tangible assets, yield, and balance-sheet durability are gaining relative footing, while prior leaders are slipping from dominance into consolidation or outright underperformance. This rotation is not random. It is consistent with an environment where capital is reassessing forward returns, discounting uncertainty around growth trajectories, and placing a premium on resilience. Importantly, this is happening without a collapse in overall participation, which distinguishes rotation from risk-off.
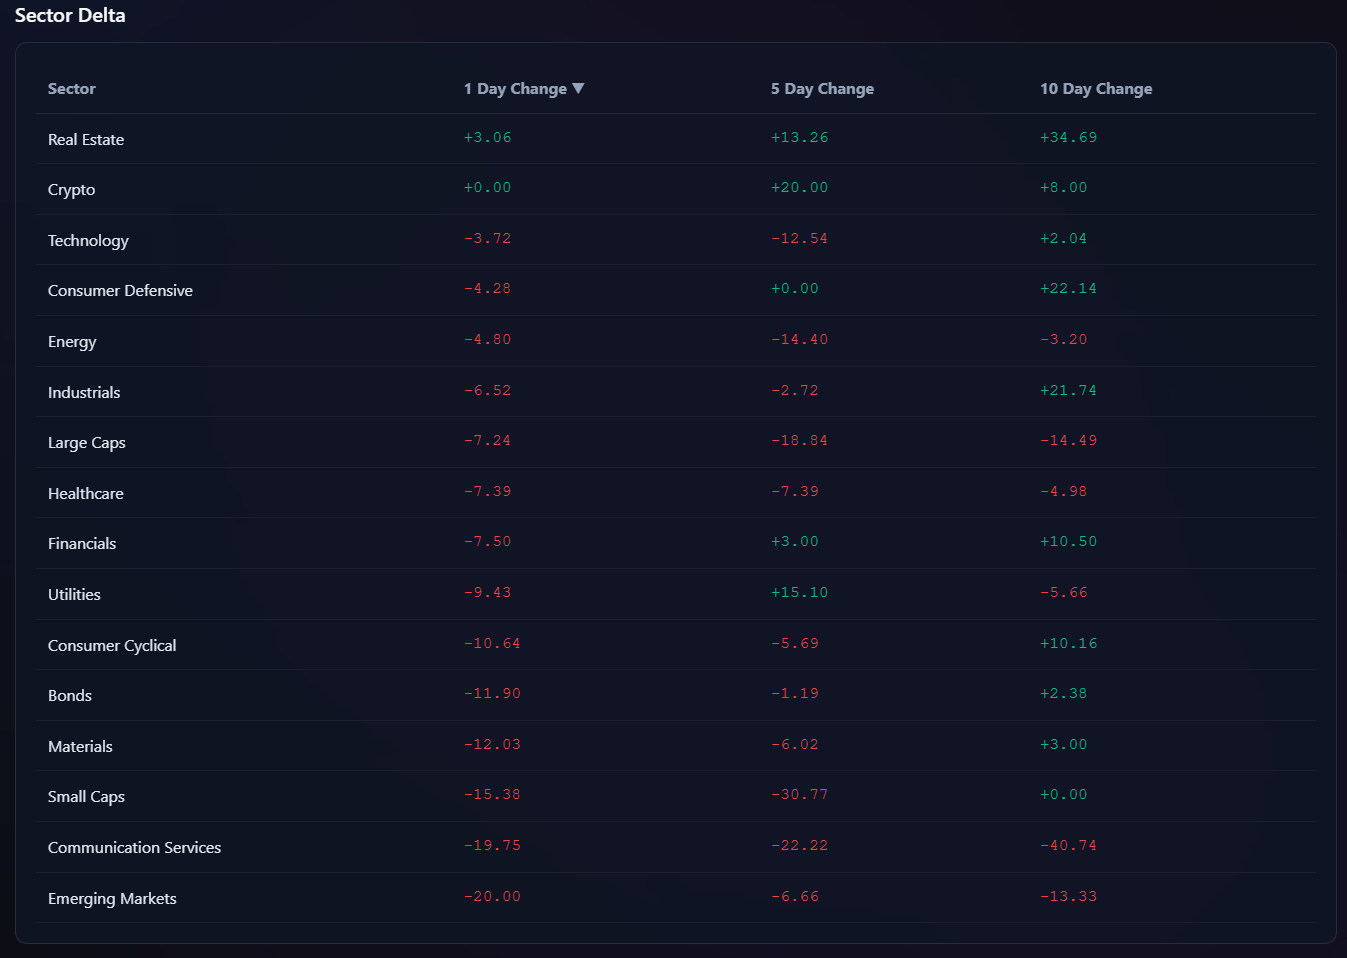
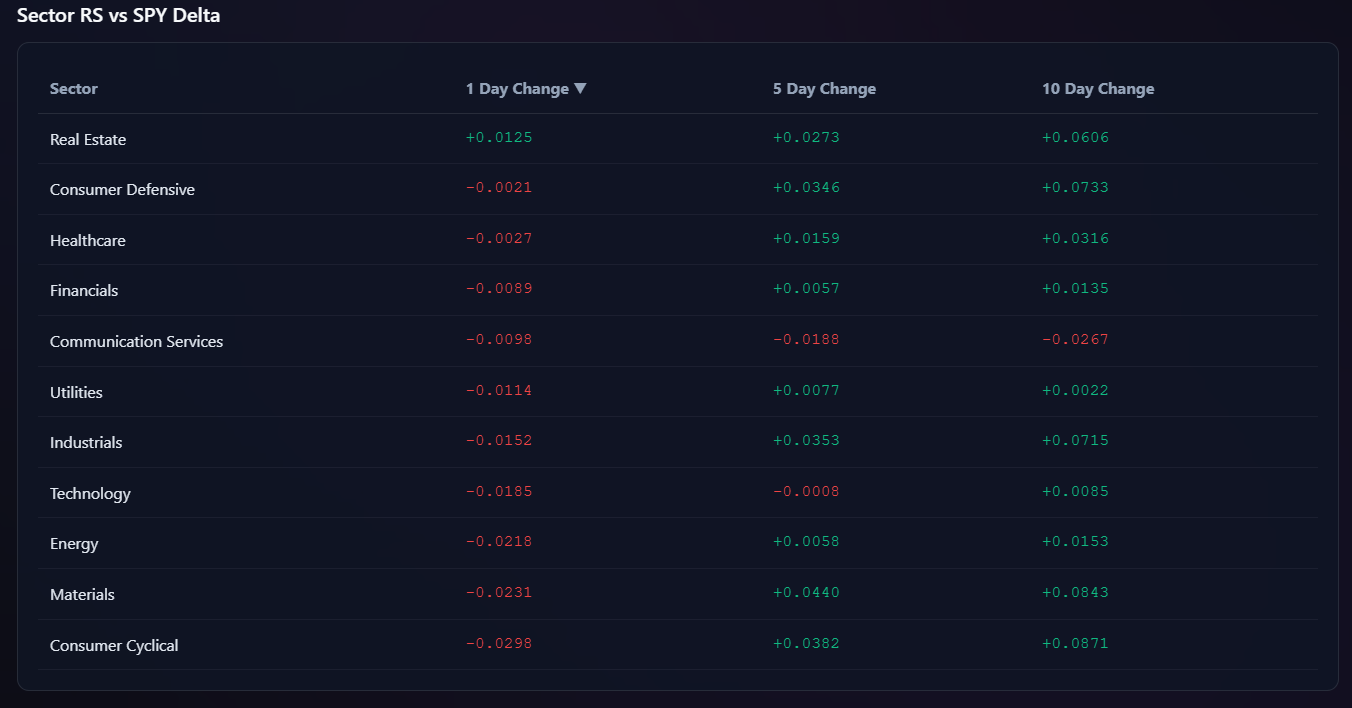
Relative strength trends echo the same theme. Outperformance is emerging in places that benefit from stability and near-term cash flow, while sectors tied to longer-duration expectations are facing increasing friction. This does not preclude rallies in growth-oriented areas, but it does suggest that those rallies are likely to be more tactical than structural until participation re-expands.
Macro context helps frame why this behavior makes sense. Seasonal reinvestment flows, combined with unresolved policy and rate-path questions, often produce exactly this kind of market: active, liquid, but discerning. Institutions are willing to stay engaged, but they demand confirmation before extending exposure aggressively. In that environment, selectivity is rewarded and crowding is punished.
The key tells to watch are persistence and confirmation. Continued activity in broad market vehicles would suggest that allocation is ongoing rather than complete. Stability in off-exchange activity among core leaders would reinforce the idea that institutions are building positions, not distributing them. Conversely, further erosion in participation among former leaders without offsetting improvement elsewhere would increase the risk of a broader reset.
Bottom line: the market is not breaking down, but it is no longer forgiving indiscriminate exposure, favoring patient, selective positioning as leadership rotates and risk is repriced rather than abandoned. The market is at an inflection point right now.

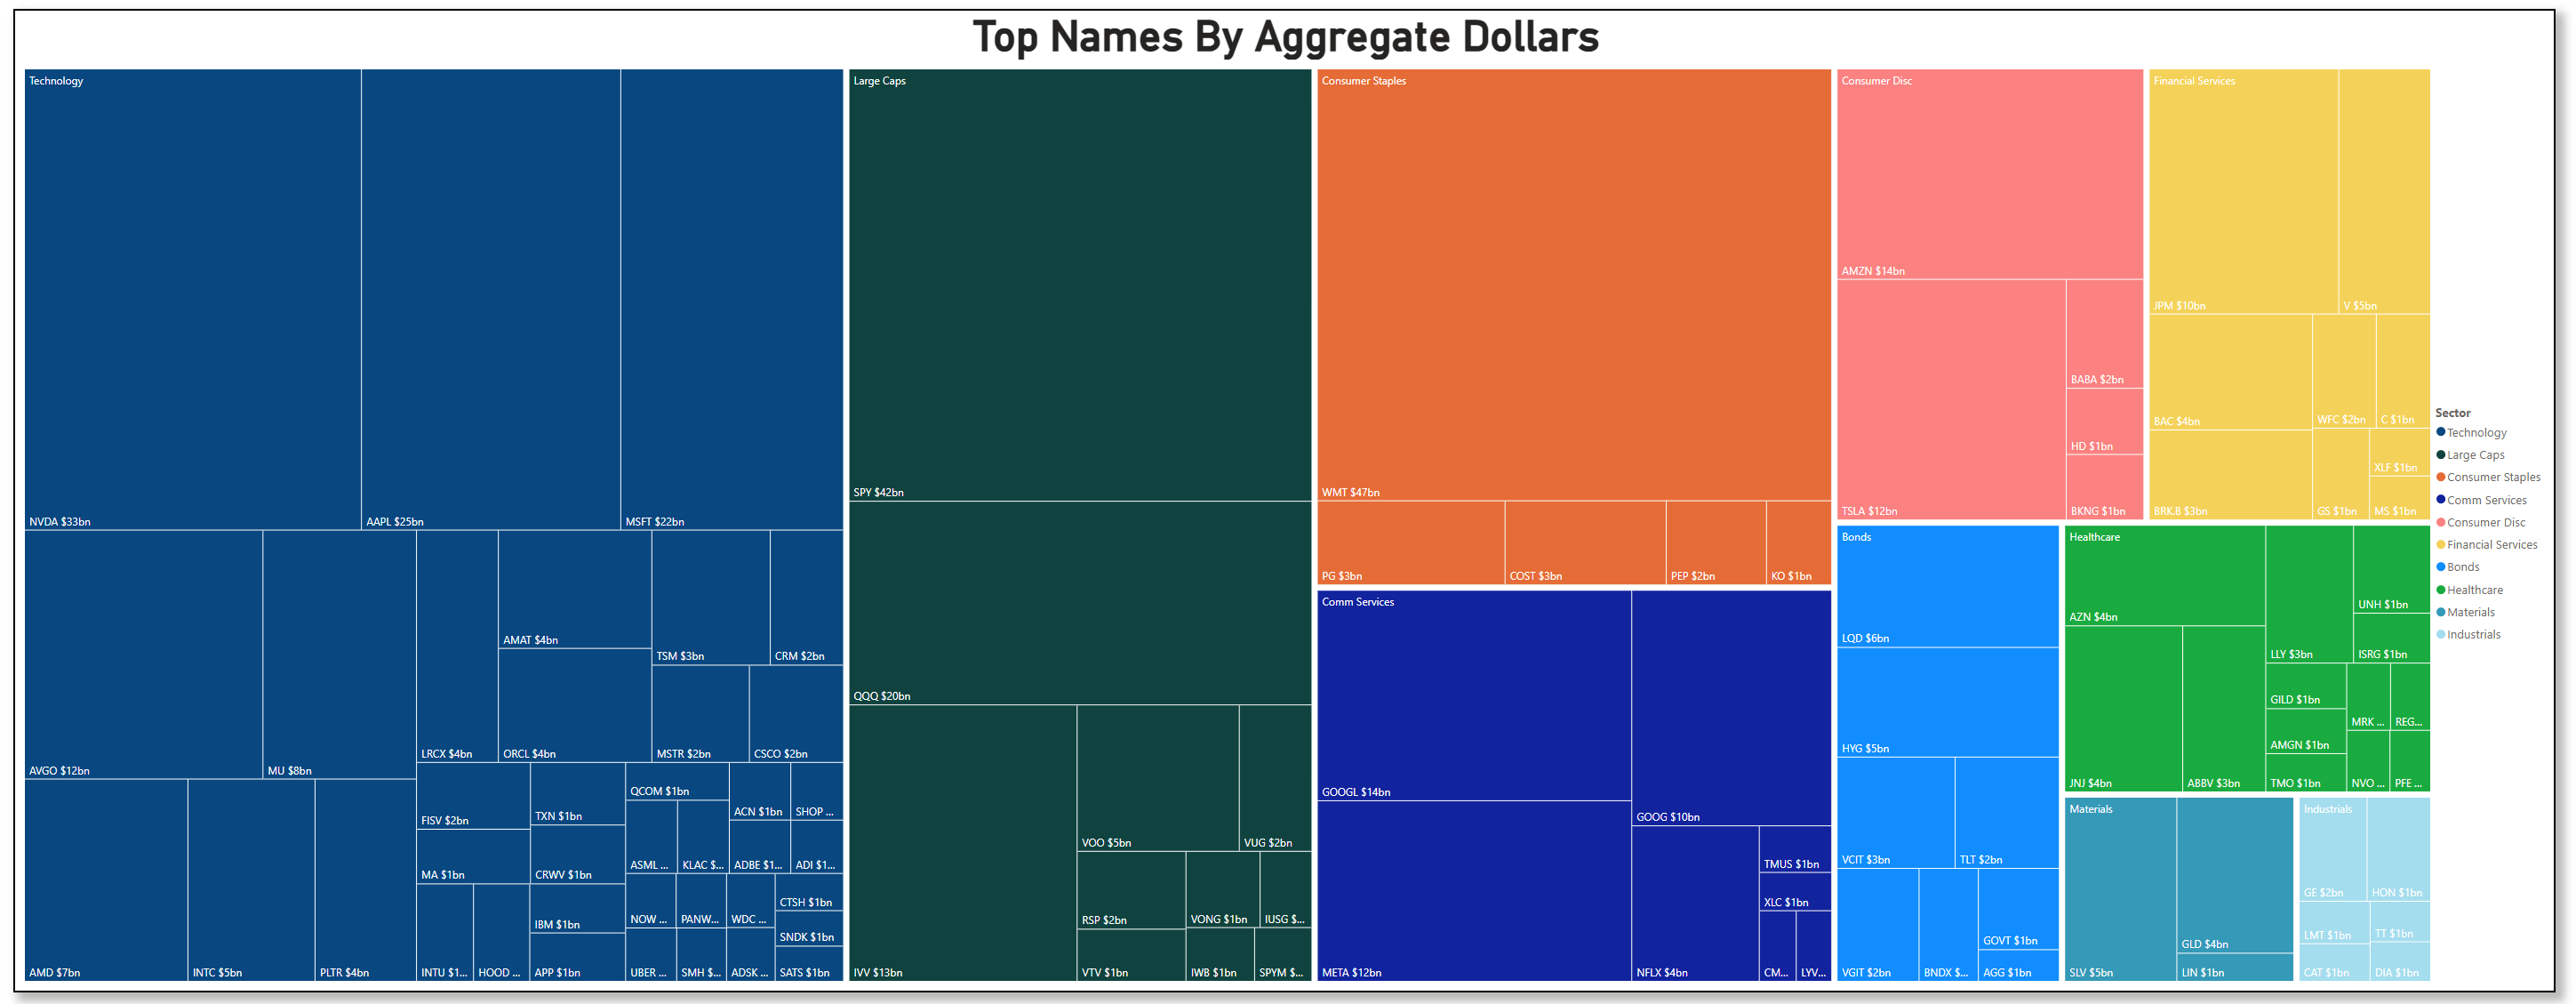
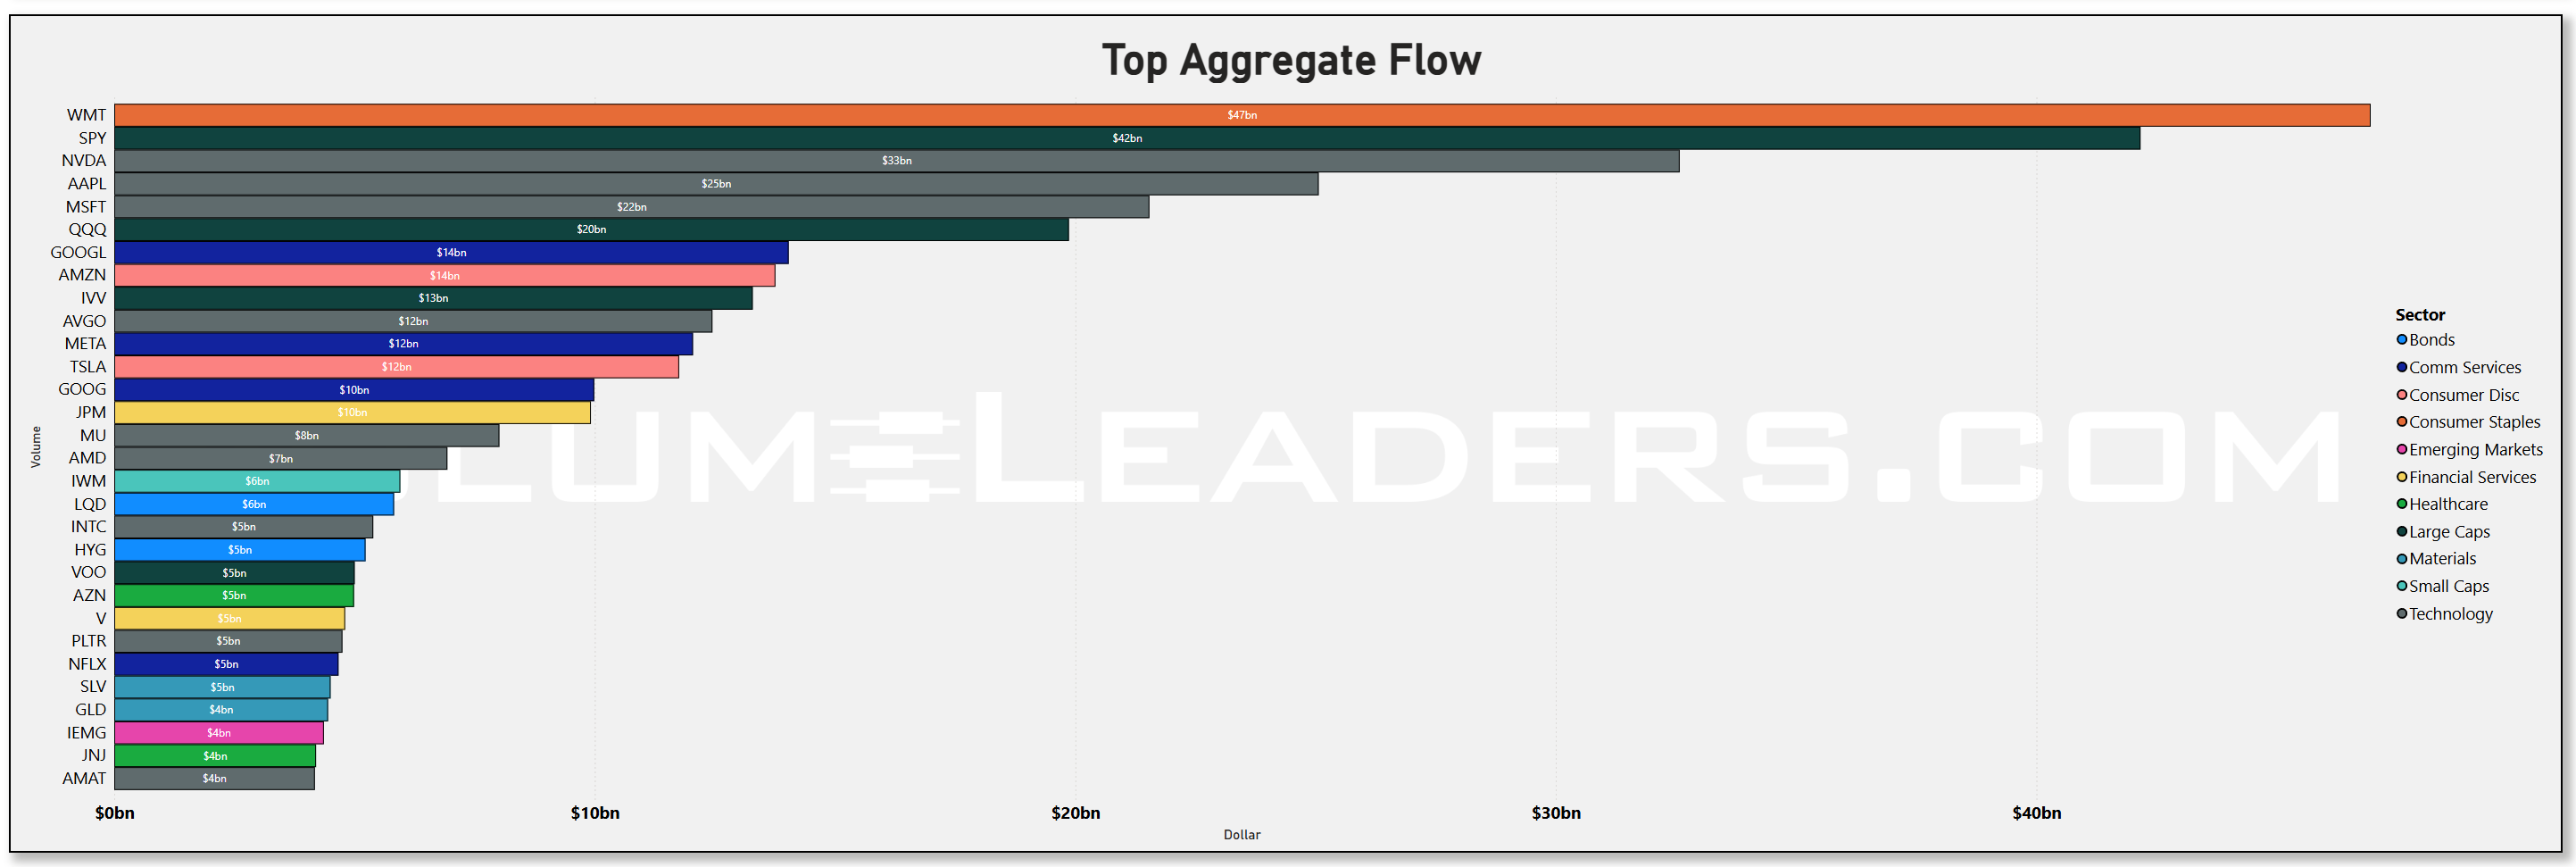
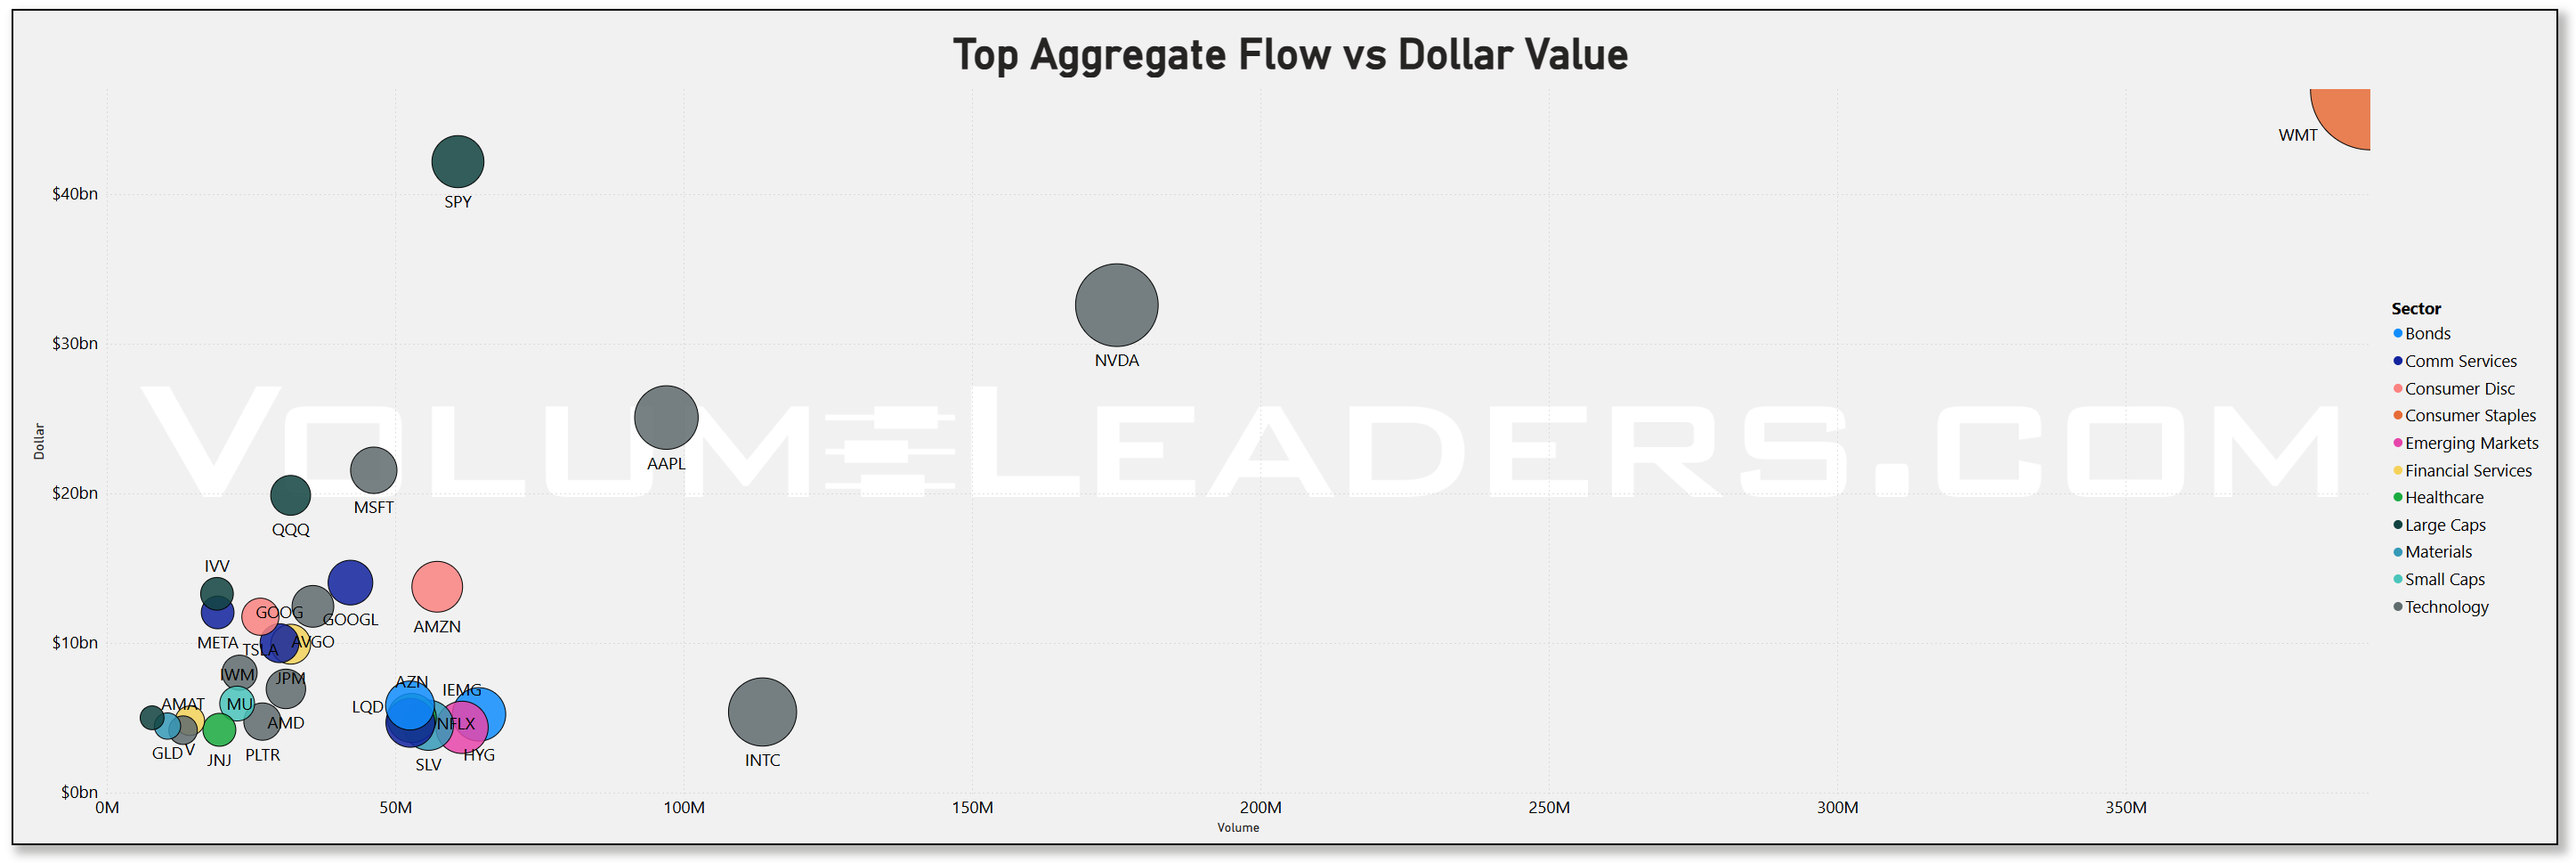
Walmart deserves to be treated as its own signal this week, not folded into a generic discussion of defensives or staples. The scale and persistence of capital moving through the name set it apart from the rest of the tape and reframed how to read institutional intent.
What stood out was not just that Walmart ranked near the very top by aggregate dollars, but that it did so in a week where capital was otherwise fragmenting. Index products, select mega-caps, and a handful of defensives absorbed flow, yet Walmart rose above its peer group and competed directly with vehicles that typically dominate institutional allocation. That is not a function of short-term speculation or headline-driven trading. It reflects deliberate positioning.
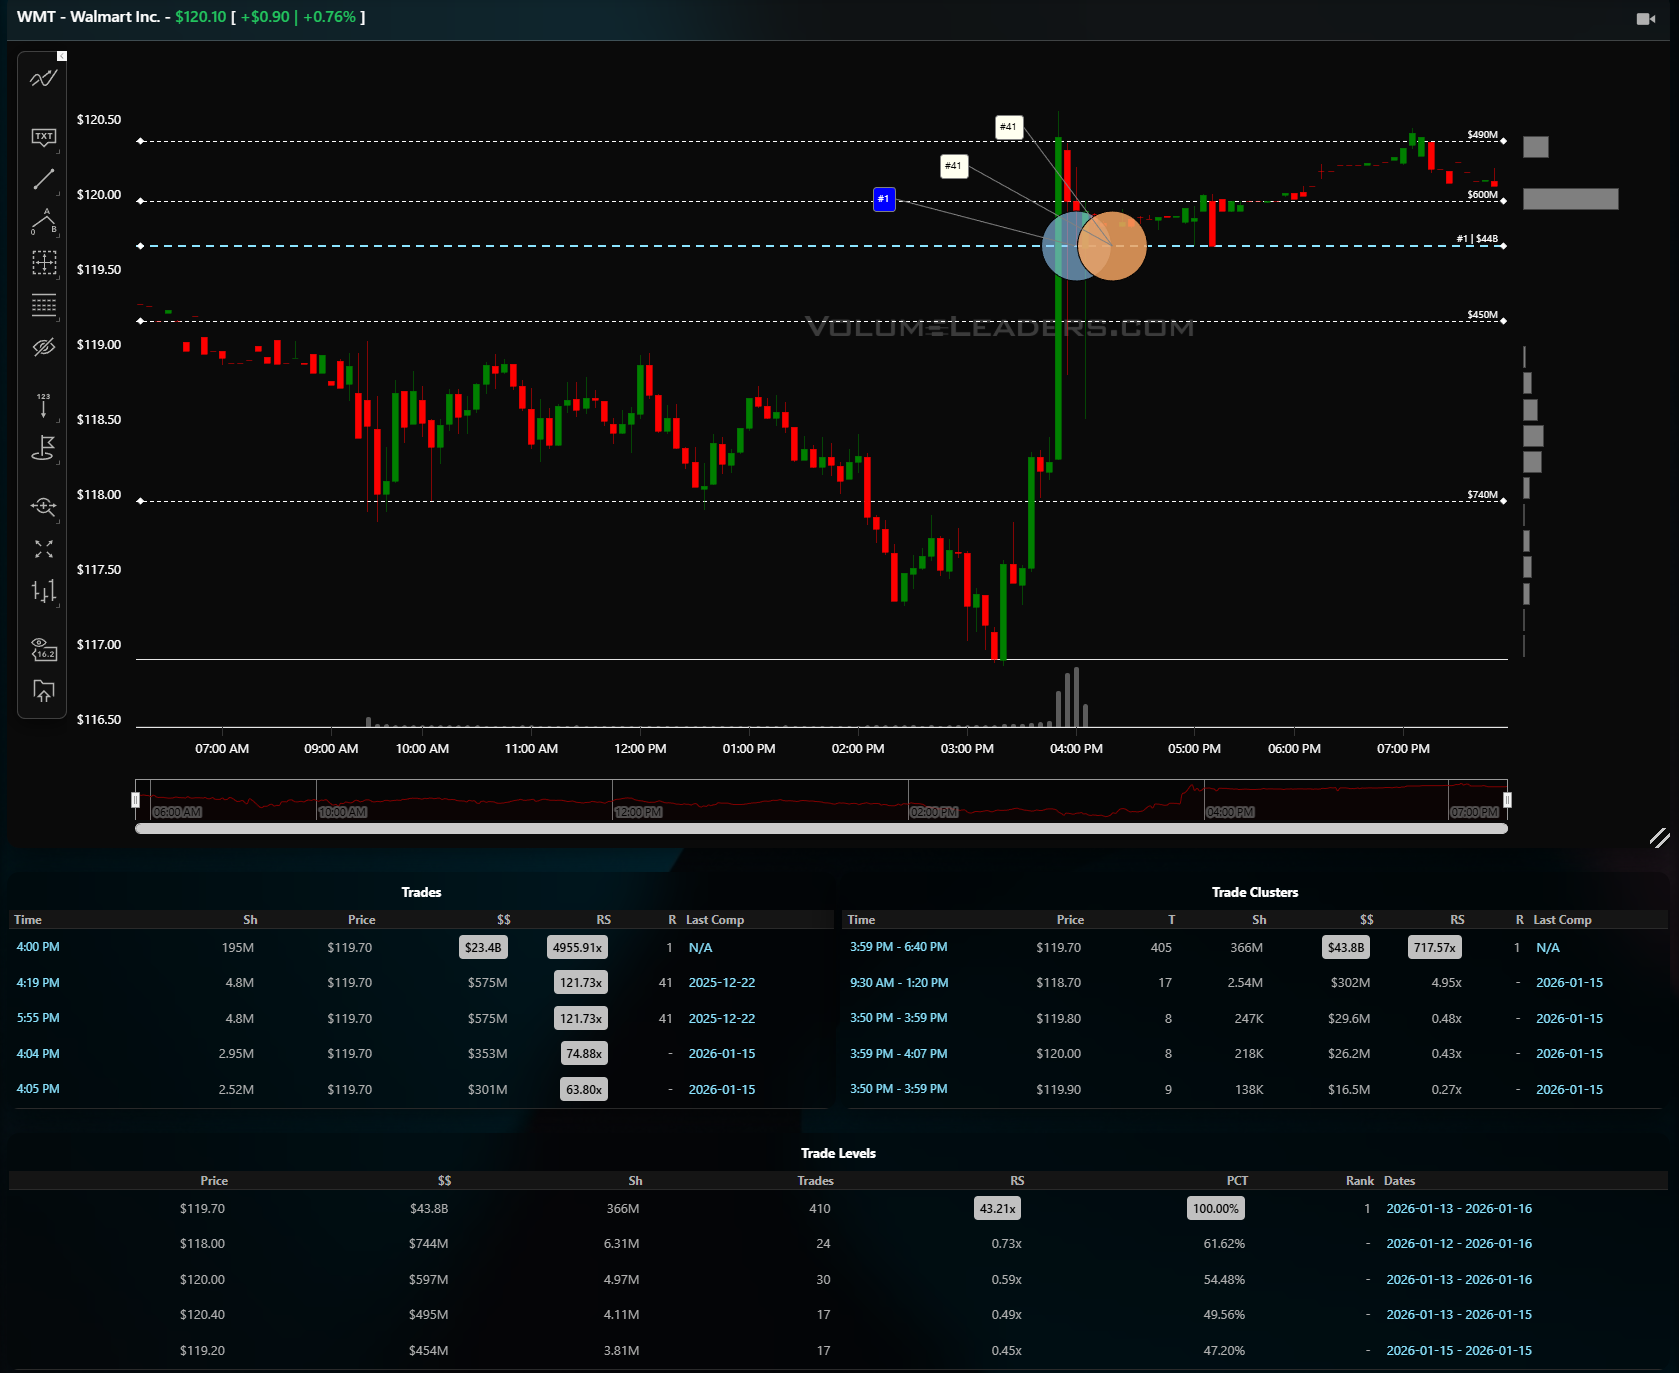
The composition of the activity matters. Walmart appeared across multiple flow lenses, including heavy aggregate dollars and meaningful off-exchange participation, which points to balance-sheet allocation rather than tactical churn. Institutions do not chase Walmart. They use it. When size concentrates there, it signals a preference for reliability, pricing power, and steady demand at a moment when leadership elsewhere is becoming less dependable. This kind of flow tends to occur when portfolios are being stabilized, not when risk is being aggressively added or removed. With the broader flows at an inflection point and a data-heavy week ahead, you’re going to want to get defensive around existing positioning and keep your head on a swivel.
MIR Part 2: Individual Names From The Institutional Tape
VolumeLeaders tracks several proprietary signals designed to spotlight names drawing significant institutional interest. Below, we’ve surfaced the latest results and analyzed them to highlight emergent themes. If any of the sectors, narratives, or positioning trends resonate, the names mentioned here offer a strong starting point for deeper research and watchlist consideration.
VL Trade Rank Velocity™ (TRV)
TRV is a proprietary metric that measures the recent acceleration or deceleration in institutional trading activity for a given stock by comparing its average trade rank over the past few days to its average in recent weeks. A sharp improvement in TRV typically reflects a notable shift in positioning, often accompanied by sustained trade activity, suggesting institutions are actively engaging with the name and that intensity of activity is rising. This often precludes meaningful price or narrative shifts. This isn’t a buy-list or sell-list; it’s meant to draw your eyes to names where institutions are putting money to work.
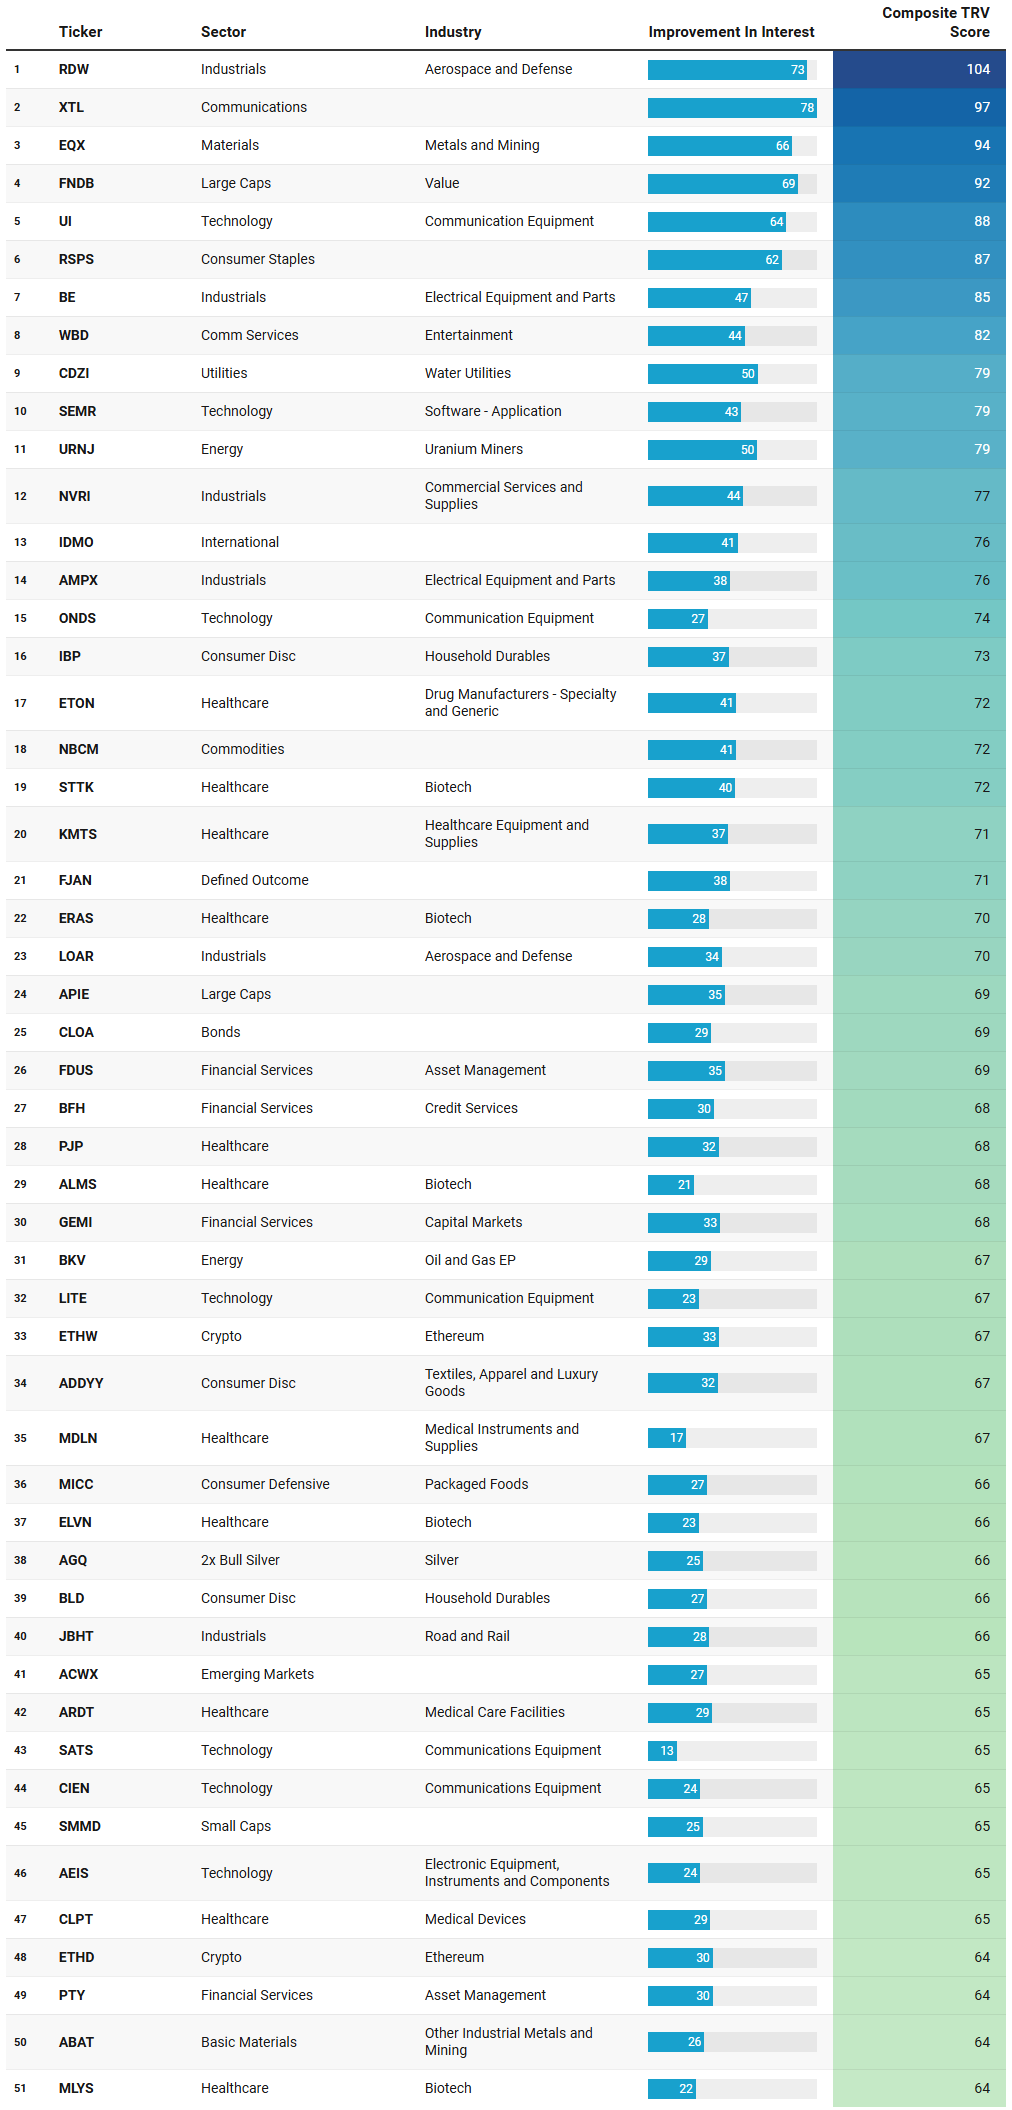
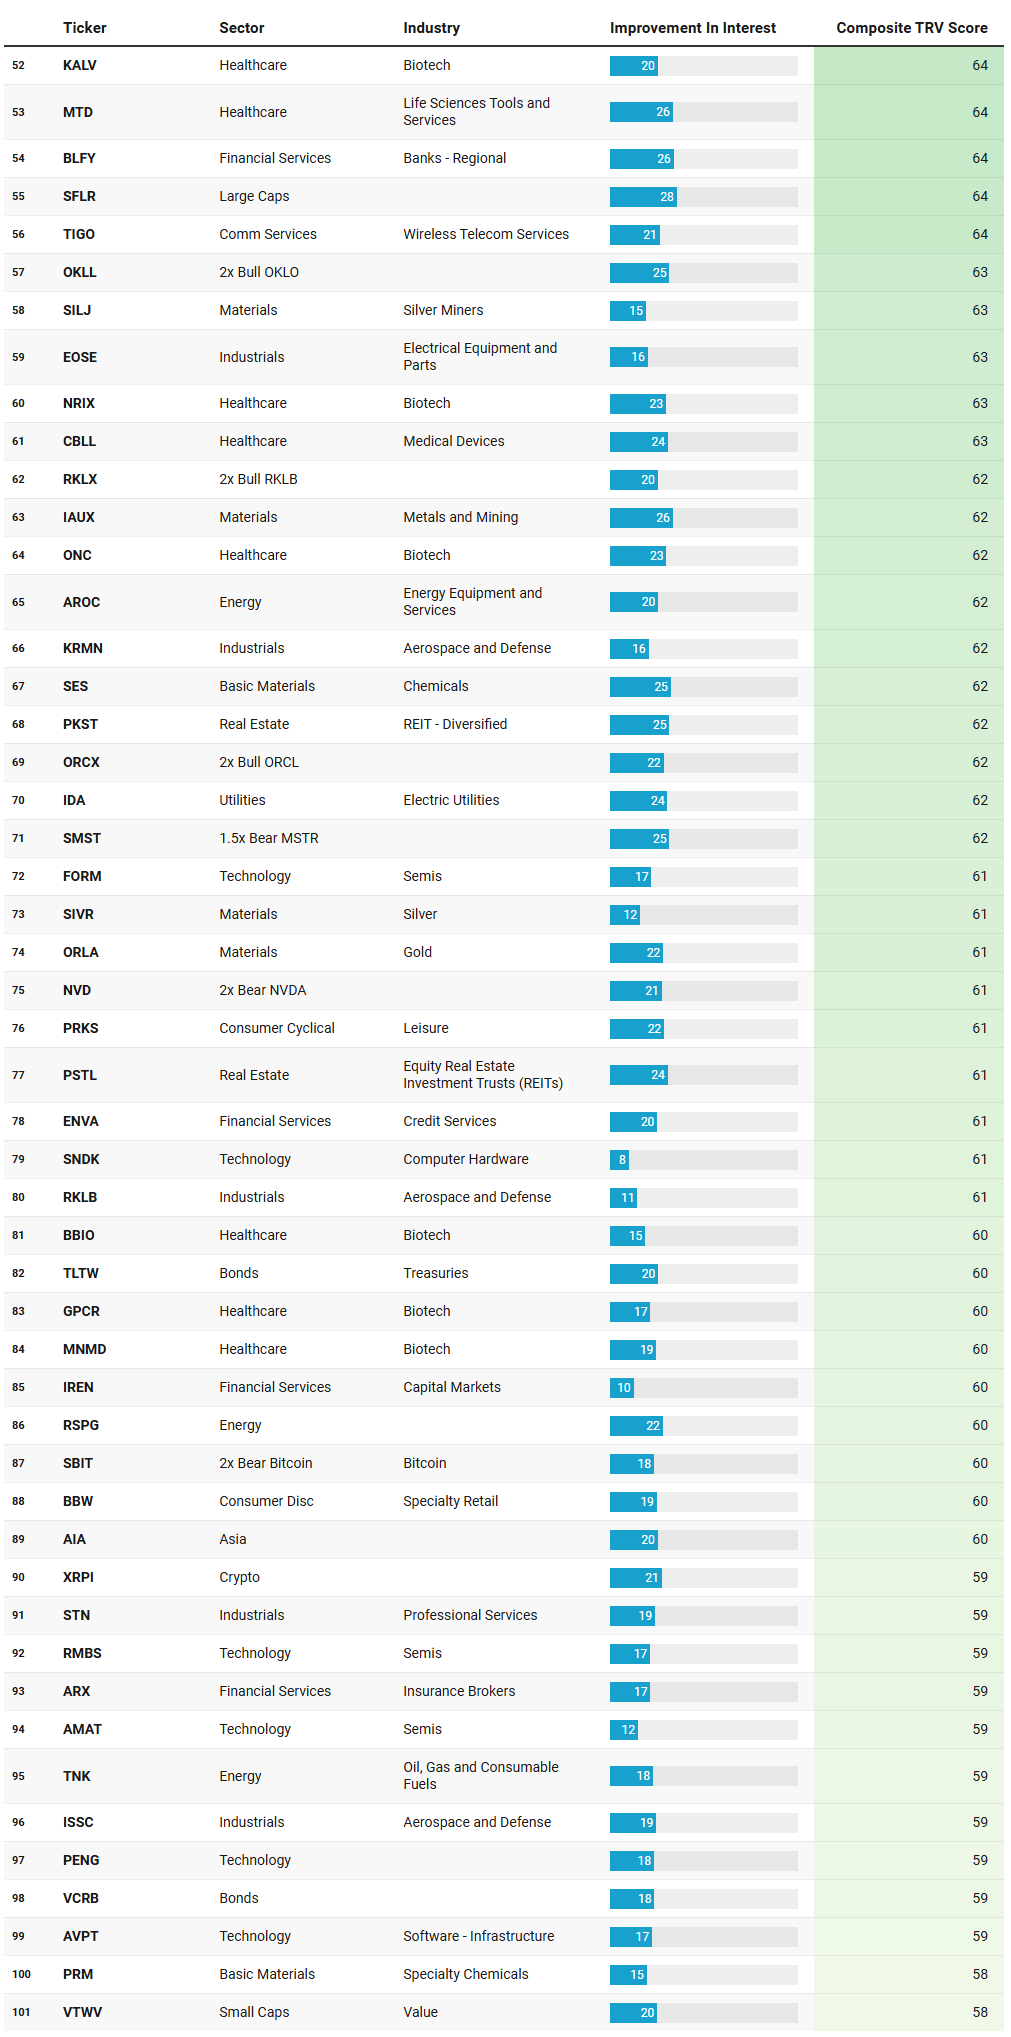
Taken as a whole, this TRV leaderboard reinforces the same message that has been bleeding through the broader flow, participation, and rotation data: this is not a market chasing growth narratives, but one quietly reallocating toward durability, real assets, and infrastructure-adjacent cash flows, while selectively speculating at the margins.
The most striking theme is the density of Industrials, particularly aerospace, defense, electrical equipment, and professional services. Names like RDW, BE, AMPX, LOAR, RKLB, KRMN, ISSC, and STN show up repeatedly with high sustained activity scores, which tells you this is not single-day curiosity. This is a cohort that benefits from long-cycle spending, government and enterprise demand, and backlog visibility. In a regime where duration risk is being questioned and large-cap growth leadership is fraying, capital is gravitating toward businesses tied to physical output, infrastructure, and contracted demand. This fits cleanly with the earlier narrative of capital rotating away from abstract growth and toward tangible economic exposure.
A second clear theme is materials and real assets, especially metals, mining, and precious metals. EQX, IAUX, ABAT, ORLA, SILJ, SIVR, AGQ, and multiple silver- and gold-linked instruments cluster tightly across the list. The presence of both miners and leveraged metal products suggests a mix of structural allocation and tactical expression, which is typical when investors are hedging purchasing power while also positioning for episodic upside. This dovetails with the broader preference for inflation-resilient assets and complements the strength seen in real estate and utilities elsewhere in the data.
Energy shows up not as a dominant headline theme, but as a persistent undercurrent. Uranium exposure through URNJ, traditional oil and gas via BKV and TNK, and energy equipment through AROC all point to selective interest rather than a wholesale sector bet. This aligns with a market that is not making a blanket inflation call, but is instead keeping optionality in areas tied to supply constraints, geopolitics, and longer-term energy transition dynamics.
Technology’s presence is telling precisely because of what kind of technology is showing up. The list is dominated not by consumer-facing mega-cap growth, but by communication equipment, semiconductors tied to infrastructure, and hardware-adjacent names such as UI, ONDS, LITE, CIEN, AEIS, FORM, RMBS, AMAT, and SNDK. This is not momentum chasing; it is selective exposure to picks-and-shovels technology that supports networks, compute, and industrial systems. The absence of headline software and platform names reinforces the idea that capital is differentiating sharply within tech, favoring utility over narrative.
Healthcare deserves its own mention, but with nuance. The repeated appearance of biotech and medical device names with high sustained activity suggests dispersion rather than sector-wide conviction. This is classic late-cycle behavior: targeted bets on idiosyncratic pipelines, tools, and instruments rather than broad exposure. Capital here is selective, research-driven, and opportunistic, consistent with a market rewarding specificity over beta.
On the factor and structure side, the presence of value-oriented vehicles, defined outcome products, bonds, and even inverse or leveraged crypto and equity instruments highlights a barbell mindset. FNDB, RSPS, FJAN, CLOA, TLTW, alongside crypto-linked products and inverse exposures, indicate portfolios being actively shaped for multiple outcomes rather than a single directional thesis. This is risk being managed, not abandoned.
Perhaps most importantly, the lack of dominance by consumer discretionary growth stands out. Outside of a few niche retail and leisure names, discretionary exposure is sparse. That absence is as informative as the presence of other themes and reinforces the broader point: this market is not paying up for optionality tied to sentiment or multiple expansion.
In sum, the TRV list reads like a blueprint for the current regime. Capital is flowing toward industrial capacity, real assets, infrastructure technology, and selective healthcare, while avoiding crowded growth narratives. It is a market defined by rotation, discrimination, and patience, where sustained interest matters more than sudden spikes, and where understanding why capital is flowing is far more important than simply knowing where it went.
VL Institutional Outliers™ (IO)
Institutional Outliers is a proprietary metric designed to spotlight trades that significantly exceed a stock’s recent institutional activity—specifically in terms of dollar volume. By comparing current trade size against each security's recent normalized history, the metric flags outlier events that may indicate sudden institutional interest but may be missed because the activity doesn’t raise any flags/alerts when comparing the activity against the ticker’s entire history. For example, it’s conceivable that a ticker today receives the largest trade it has had in the last 6 months but the trade is unranked and would therefore be missed by current alerts built off Trade Ranks. Day traders can use “Realized Vol” to identify tickers that are moving swiftly with large price displacement while others can use it to size your risk appropriately.
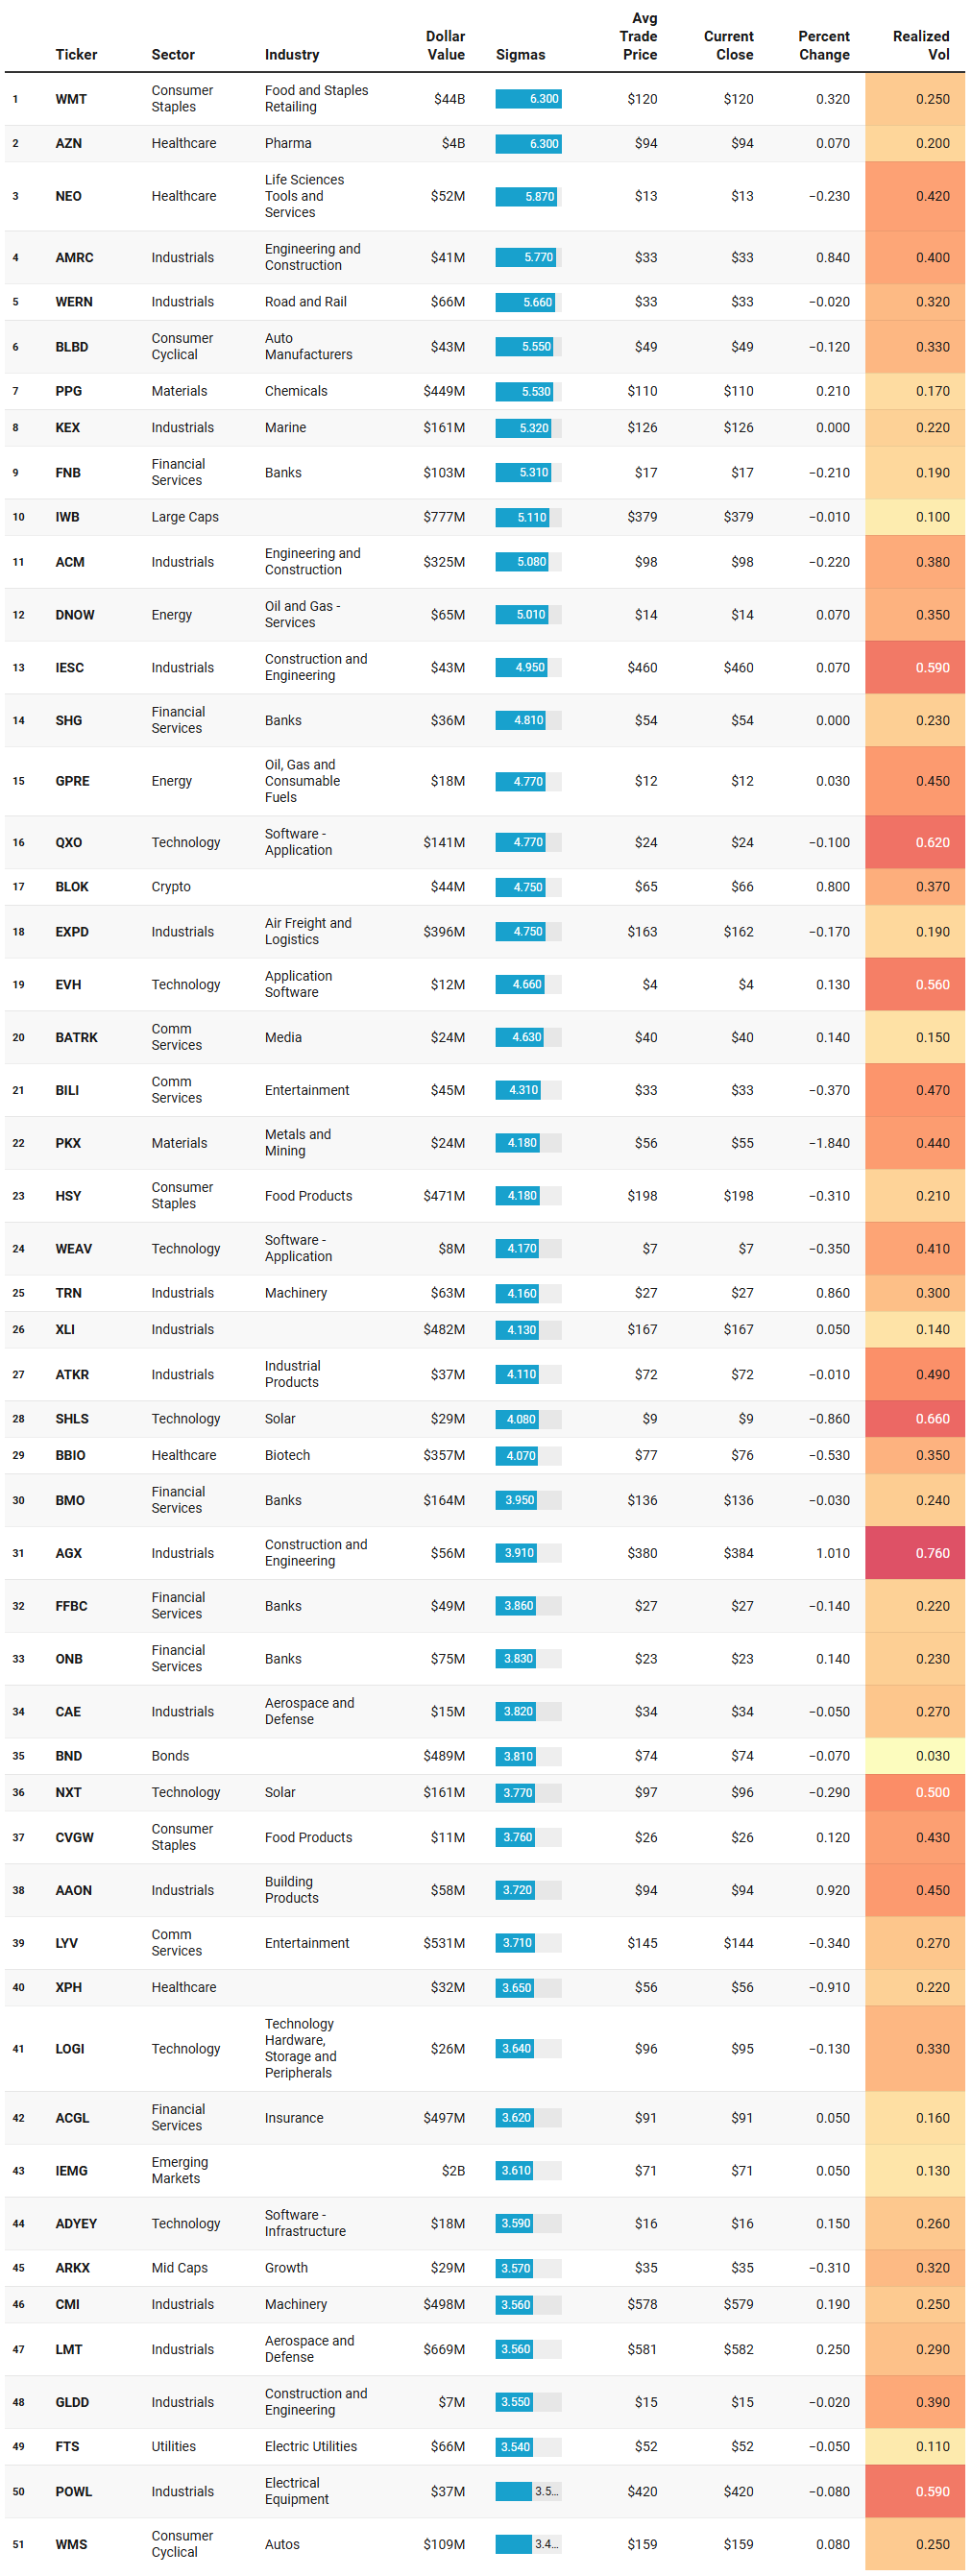
Viewed through the institutional outliers lens, this week’s tape sharpens the same underlying message but with far more contrast: capital is not just rotating, it is concentrating, and when it concentrates it is doing so in places that combine scale, defensiveness, and liquidity with very low tolerance for drawdown.
The most dominant signal is impossible to miss. Walmart sits completely alone at the top of the distribution, not merely as a large-cap staple, but as a liquidity event in its own right. The dollar value transacted in WMT overwhelms everything else on the list by an order of magnitude, and it did so with elevated sigma intensity and muted realized volatility. When capital chooses Walmart as its primary expression, it is making a statement about risk preference: safety, pricing power, and cash-flow durability over narrative growth.
Outside of Walmart, a second tier of outliers clusters around healthcare, industrials, and materials. Healthcare exposure spans pharma, life sciences tools, and biotech, but the pattern is selective rather than broad. Large, globally scaled pharma names appear alongside highly specific biotech and tools plays, suggesting that investors are comfortable underwriting idiosyncratic risk only when it is paired with either balance-sheet strength or asymmetric payoff. This fits with a regime where volatility is tolerated only when it is intentional.
Industrials show up repeatedly, and across multiple sub-industries. Engineering and construction, aerospace and defense, logistics, machinery, and electrical equipment all register abnormal activity. Importantly, much of this flow occurred with modest price change and contained realized volatility. Capital here appears to be leaning into backlog visibility, infrastructure exposure, and long-duration demand without paying for multiple expansion. This aligns with a broader preference for tangible output and contract-driven revenues.
Materials and real assets continue to surface as quiet beneficiaries. Chemicals, metals, uranium, and precious-metal vehicles all register as outliers, often with higher realized volatility than staples or industrials but still attracting size. The coexistence of gold-linked exposure alongside uranium and specialty chemicals suggests portfolios are being built with inflation resilience and supply-side optionality in mind, rather than a single macro bet.
Technology’s role in the IO list is revealing by what it excludes. While software and hardware names appear, they are rarely consumer-facing growth leaders. Instead, the activity is concentrated in infrastructure software, communications equipment, semiconductors, and hardware tied to enterprise or industrial use. Even when volatility is higher, capital is willing to engage where technology is functional rather than aspirational. The presence of inverse and leveraged technology products further reinforces the idea that positioning here is tactical and risk-aware, not complacent.
Financials appear consistently but without dominance. Banks, insurers, and asset managers show steady but controlled activity, often with low realized volatility. This suggests positioning for yield, balance-sheet strength, or relative value rather than a directional macro call on growth acceleration or credit stress.
Finally, the tail of the list tells its own story. The presence of inverse equity products, leveraged single-name expressions, and crypto-linked vehicles alongside defensive staples and bonds highlights a barbell mentality. Capital is not confident enough to commit fully to a single outcome, but it is confident enough to size exposures precisely.
VL Sector Leaders
VL Sector Leaders is a weekly snapshot of where true leadership is asserting itself inside the market, stripped of the distortions that come from broad, style-mixed indices. Rather than asking which stocks look strong in absolute terms, this list focuses on which names are outperforming within the environments they actually compete in.
Each week, we surface the ten stocks demonstrating the most persistent relative strength inside their respective sectors. These are not headline chasers or one-day wonders. They are names that continue to separate themselves from peers through real price behavior, often reflecting sustained demand rather than fleeting attention.
For day traders, this list is a powerful awareness tool. Sector Leaders tend to offer cleaner intraday structure, better follow-through, and more predictable reactions around key levels because they already sit on the right side of relative strength. Even on choppy tape, leadership names often remain tradeable while the rest of the market degrades.
For swing traders, VL Sector Leaders helps narrow the universe to stocks with the highest probability of staying relevant. Relative leaders are more likely to hold trends, survive pullbacks, and reassert themselves after consolidation. When markets rotate, these names are often among the first to resume leadership — or the last to break.
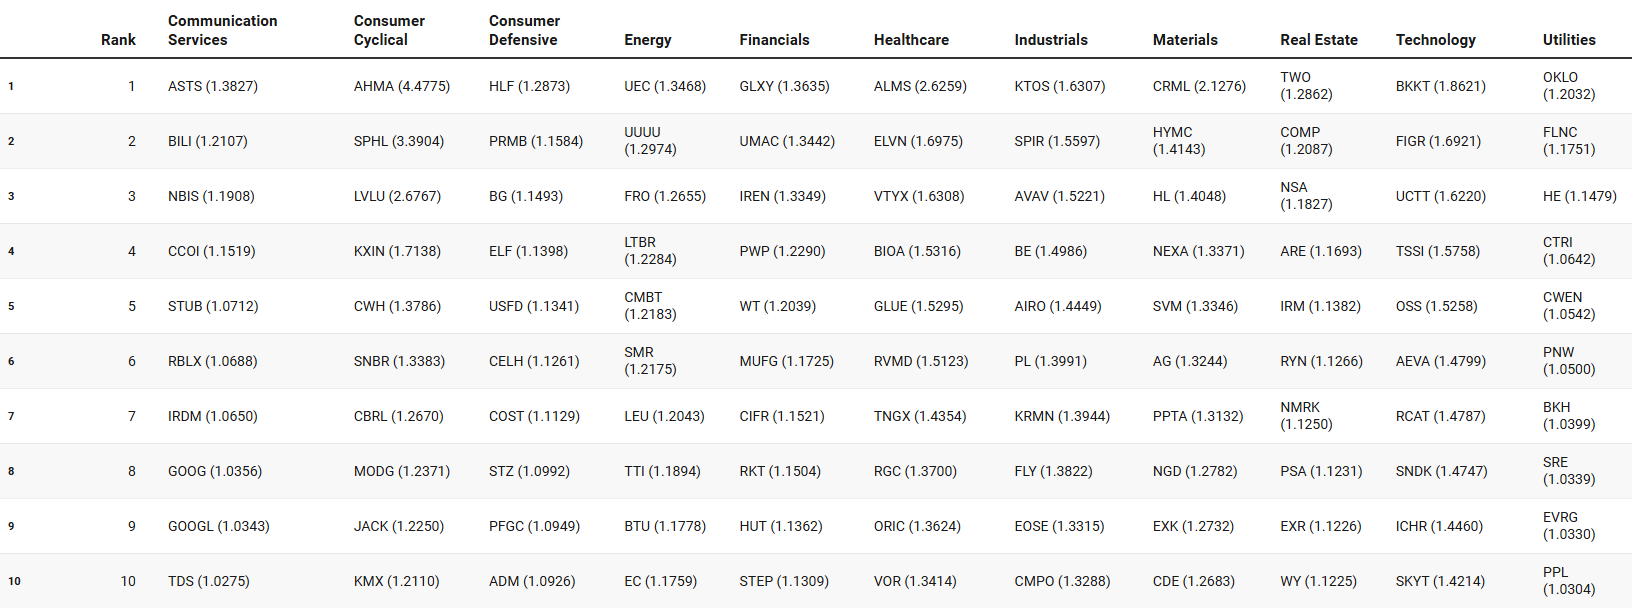
Read as a standalone signal, the VL Sector Leaders list reinforces and sharpens the same story that has been building across the broader flow data: leadership is narrow, selective, and increasingly tilted toward durability, infrastructure, and idiosyncratic cash-flow narratives rather than broad growth beta.
Communication services leadership is fragmented and defensive in character. The presence of legacy platforms, infrastructure-adjacent names, and mature internet franchises at the top suggests that capital is favoring scale and embedded distribution over advertising-sensitive or discretionary media exposure. Even where well-known mega-cap platforms appear, their leadership reads more as stability within the sector than renewed growth enthusiasm.
Consumer behavior splits cleanly along cyclical versus defensive lines. On the cyclical side, leadership is dominated by niche, experience-driven, or value-oriented consumer plays rather than broad retail or aspirational discretionary brands. By contrast, consumer defensive leadership is anchored by staples, food, and beverage names with consistent demand profiles. This aligns neatly with the heavy Walmart flow seen elsewhere and confirms that institutions are expressing consumer exposure through reliability and pricing power, not margin expansion stories.
Energy leadership is notable for its diversity. Traditional hydrocarbons, shipping-related exposure, and nuclear-linked names all appear, indicating that capital is not making a single directional bet on crude prices but is instead positioning across the energy value chain. This kind of leadership mix usually appears when energy is being treated as a strategic allocation rather than a short-term trade.
Financials leadership remains measured. Banks, insurers, and asset managers show up, but none dominate decisively. That suggests participation without conviction, consistent with an environment where rates and macro outcomes remain uncertain and financials are being held rather than pressed.
Healthcare leadership is one of the more telling signals. Rather than being dominated by a single theme, the leaders span biotech, life sciences tools, and specialty pharma. This breadth within the sector implies that capital is comfortable underwriting scientific and regulatory risk selectively, especially where upside is asymmetric. It also fits a broader pattern of investors seeking growth that is uncorrelated with the economic cycle.
Industrials stand out for their consistency. Aerospace and defense, engineering, specialty manufacturing, and logistics-related names populate the top ranks, reinforcing the idea that institutions are leaning into tangible output, infrastructure, and long-cycle demand. This leadership dovetails with the industrial-heavy activity seen in the institutional outliers list and supports the thesis that this rotation is intentional and multi-week in nature.
Materials leadership skews toward metals, mining, and specialty inputs, echoing the preference for real assets and supply-constrained commodities. These leaders often emerge when investors are positioning for inflation resilience or geopolitical optionality rather than pure growth acceleration.
Real estate leadership is subdued but focused, with selective REIT exposure rather than broad property beta. This suggests stabilization and income-seeking behavior rather than a full risk-on embrace of real estate.
Technology leadership is perhaps the most nuanced. The leaders are not consumer-facing software darlings or speculative AI proxies. Instead, communications equipment, semiconductors, and infrastructure-oriented technology dominate. This points to capital favoring technology that enables systems and networks rather than technology that relies on sentiment or multiple expansion.
Utilities leadership rounds out the picture by emphasizing regulated, predictable cash-flow names. Their presence near the top of the sector lists underscores the premium being placed on stability as portfolios are rebalanced.
Taken together, the VL Sector Leaders watchlist confirms a market where leadership is earned through consistency, cash flow, and real-world utility. Institutions are not abandoning risk, but they are demanding that risk be compensated with visibility. This is a leadership regime built on selectivity, not momentum, and it continues to favor names that can anchor portfolios rather than excite them.
MIR Part 3: Framing-Up A Trade
Stepping back from the individual prints and looking at the tape as a whole, the message from institutions this week is not confused. Capital is working, but it is working with intention. The dominant flows favor durability over optionality, infrastructure over narratives, and steady accumulation over momentum chasing. This is not a market positioning for a sharp risk-off event, but it is very clearly a market demanding compensation for risk and visibility into cash flows. The way to trade that is not by swinging for beta, but by constructing exposure that aligns with where size is already comfortable leaning in.
From a desk perspective, this argues for a barbell that is anchored by defensive and real-asset exposure, complemented by selective cyclicals and infrastructure growth, while keeping traditional high-beta growth as a controlled, secondary expression rather than a core bet. The portfolio below reflects how I would position for the coming week if I wanted to stay aligned with the institutional tape rather than fight it.
I would frame the book across four sleeves, each with a clear job to do, and each populated by names that have already been validated by sustained or unusual institutional interest.
The first sleeve is Defensive Consumption and Staples, sized at 30 percent of the portfolio. This is the anchor. The sheer dominance of Walmart in aggregate dollars, combined with follow-through across staples and defensive food names, tells you institutions are comfortable parking large sums in consumer demand that does not depend on sentiment or credit expansion. This sleeve is not about upside surprise, it is about stability and ballast. Within this sleeve I would allocate roughly 18 percent to WMT as the core expression, with the remaining 12 percent split across complementary staples exposure such as broad consumer defensive baskets or high-quality food producers that showed steady accumulation. The justification here is simple: if the market grinds, these names absorb capital; if volatility picks up, they tend to be where money hides without fully exiting equities.
The second sleeve is Industrials, Infrastructure, and Defense, sized at 25 percent. This sleeve captures the most consistent through-line in the outlier and leadership data. Aerospace, engineering, construction, logistics, and electrical equipment repeatedly show up with improving interest and sustained activity. This is capital positioning for long-cycle demand, government and infrastructure spend, and tangible output. I would express this with a mix of large, liquid industrial leaders and a small allocation to specialty names that continue to attract attention. Roughly 10 percent would sit in a broad industrial ETF or large-cap industrial bellwethers, 8 percent in aerospace and defense exposure, and 7 percent in engineering, construction, and logistics-oriented names. This sleeve works if growth slows modestly, if fiscal spending remains supportive, or if geopolitical uncertainty persists. It is not fast money, but it is persistent money.
The third sleeve is Real Assets and Yield-Adjacent Exposure, sized at 25 percent. This sleeve reflects the rotation into materials, energy-adjacent plays, real estate stabilization, and credit instruments that continue to hold bids. Institutions are not making a one-way call on commodities, but they are clearly maintaining exposure to hard assets and income-producing vehicles. I would allocate around 10 percent to materials and metals exposure, including gold-related instruments that continue to show institutional interest. Another 8 percent would go into energy and energy infrastructure exposure, diversified across traditional and alternative energy themes rather than concentrated in a single commodity bet. The remaining 7 percent would be split between real estate and high-quality bond or credit ETFs that showed consistent participation. This sleeve provides inflation resilience, yield support, and diversification away from pure equity beta.
The fourth sleeve is Selective Growth and Infrastructure Technology, sized at 20 percent. This is where discipline matters most. Technology is not absent from the tape, but leadership is narrow and focused on enablers rather than storytellers. Communications equipment, semiconductors tied to infrastructure, and enterprise or application software with real adoption continue to attract capital, while speculative growth does not. I would keep this sleeve intentionally smaller than it might have been in a different regime. Roughly 8 percent would go into semis and hardware tied to systems and networks, 6 percent into software or platforms showing sustained institutional interest rather than one-day spikes, and the remaining 6 percent into diversified large-cap growth exposure as optionality, not conviction. This sleeve is there to participate if growth resumes, but it is sized so that it does not dominate the portfolio if the rotation continues away from momentum.
Portfolio Summary (100%)
--------------------------------------------------------
Defensive Consumption and Staples: 30%
Industrials, Infrastructure and Defense: 25%
Real Assets and Yield-Adjacent Exposure: 25%
Selective Growth and Infrastructure Technology: 20%
--------------------------------------------------------
--------------------------------------------------------
Defensive Consumption and Staples (30%)
--------------------------------------------------------
WMT: 18%
XLP: 6%
PG: 3%
HSY: 3%
Rationale: Walmart is the dominant expression of institutional capital parking in non-discretionary demand. XLP broadens the ballast across staples leadership, while PG and HSY represent high-quality food and household names that continue to absorb capital in risk-aware environments.
--------------------------------------------------------
Industrials, Infrastructure and Defense (25%)
--------------------------------------------------------
XLI: 10%
LMT: 4%
KTOS: 4%
ACM: 4%
JBHT: 3%
Rationale: This sleeve reflects sustained interest across aerospace and defense, engineering and construction, and logistics. XLI anchors liquidity and breadth. LMT and KTOS express defense and aerospace leadership. ACM captures engineering and infrastructure buildout, while JBHT aligns with freight and physical distribution demand.
--------------------------------------------------------
Real Assets and Yield-Adjacent Exposure (25%)
--------------------------------------------------------
GLD: 5%
SIVR: 3%
SCCO: 4%
XLE: 4%
VNQ: 4%
LQD: 5%
Rationale: This sleeve blends metals, energy, real estate, and high-quality credit. GLD and SIVR provide monetary and industrial metal exposure. SCCO reflects industrial metals demand. XLE captures diversified energy exposure. VNQ and LQD provide yield-adjacent stability and diversification away from pure equity beta.
--------------------------------------------------------
Selective Growth and Infrastructure Technology (20%)
--------------------------------------------------------
SMH: 8%
CIEN: 4%
UI: 3%
MSFT: 3%
QQQM: 2%
Rationale: Growth exposure is narrow and infrastructure-focused. SMH anchors semiconductors tied to systems and capacity. CIEN and UI reflect communications and networking infrastructure. MSFT provides enterprise software durability. QQQM is retained as small optionality, not conviction.Put together, this portfolio expresses exactly what the institutional tape has been communicating. It is long equities, but not indiscriminately. It is positioned for persistence, not fireworks. It leans into where capital is accumulating quietly and consistently, while keeping growth exposure controlled and intentional. If the coming week brings follow-through in liquidity and continued dominance from staples, industrials, and real assets, this structure should perform as intended. If instead growth reasserts itself, the selective technology sleeve provides participation without forcing a wholesale reposition.
The bottom line is that this is not a week to be clever. It is a week to be aligned. Institutions have already told us where they are comfortable committing size, and the highest-probability trade is to respect that message rather than fade it. There may be something in the cards for bears in coming sessions…it’s the first time in a while the tape has been anything remotely defensive. This is a capital-preservation-first portfolio built around defensive consumption and tangible output, with disciplined exposure to infrastructure growth and real assets, designed to hopefully compound quietly while the market works through rotation since right now it does not look like the week to be chasing fragile momentum.
Thank you for being part of our community and for dedicating your time to this edition. Your insights and engagement drive everything we do, and we’re honored to share this space with such committed, thoughtful readers. Here’s to a week filled with clear opportunities and strong performance 💰💰💰
— VolumeLeaders