Market Momentum: Your Weekly Financial Forecast & Market Prep
Issue 75 / What to expect Jan 12, 2026 thru Jan 16, 2026


In This Issue
Weekly Market-On-Close Report: All the macro moves, market drivers, and must-know narratives—covered in less than five minutes.
Weekly Benchmark Breakdown: Our weekly intelligence report on major indices cuts through the index-level noise to uncover participation, momentum, and structural integrity and tell you whether markets are rising on solid ground or skating on thin breadth. This is where bull markets prove themselves—or quietly start to unravel.
The Latest Investor Sentiment Readings: Track the emotional pulse of the market with our curated dashboard of sentiment indicators. From fear-fueled flight to euphoric overreach, this week's readings reveal whether investors are cautiously creeping in—or stampeding toward the exits.
Institutional Support & Resistance Levels For Major Indices: Exactly where to look for support and resistance this coming week in SPY, QQQ, IWM & DIA
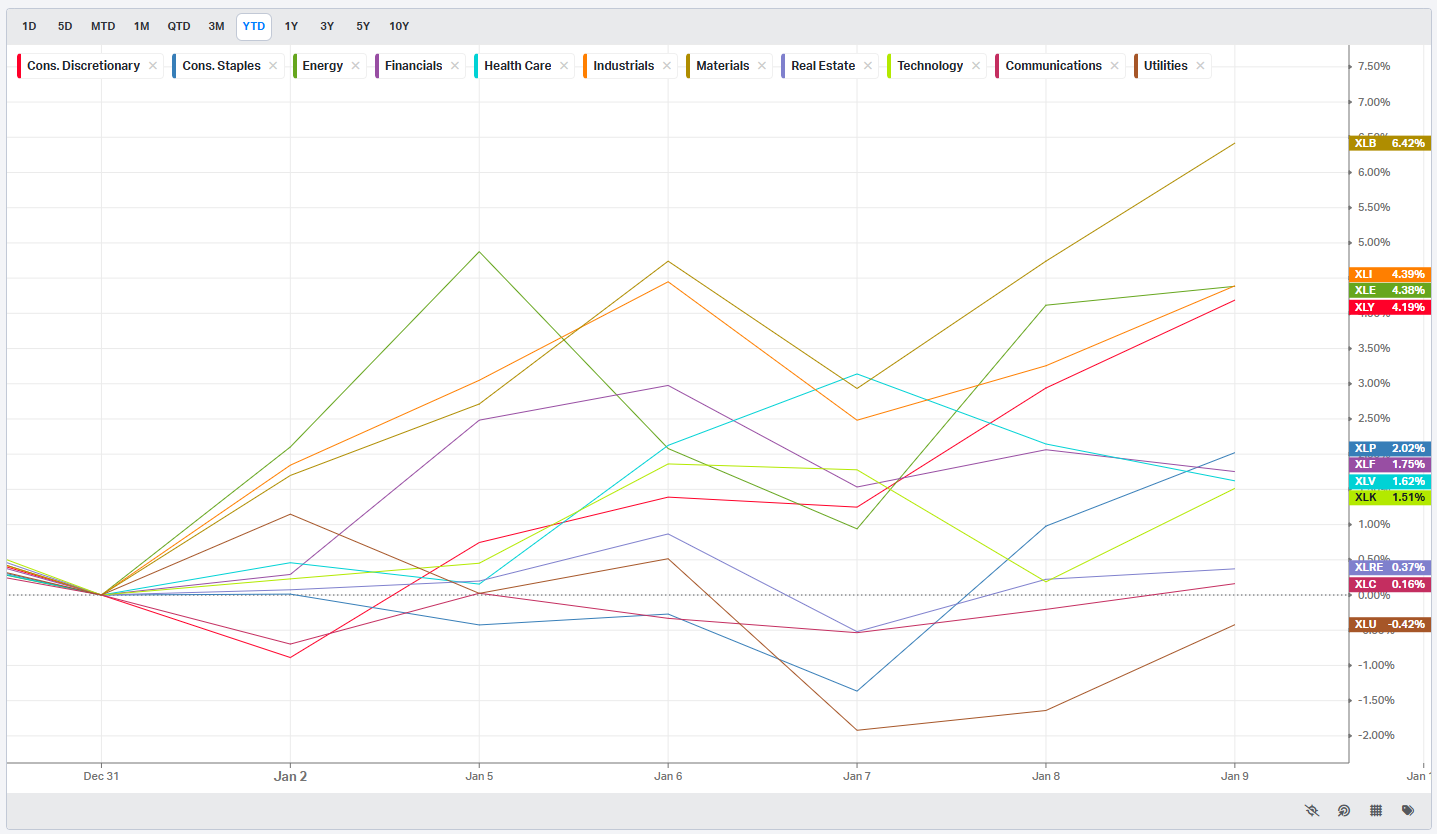
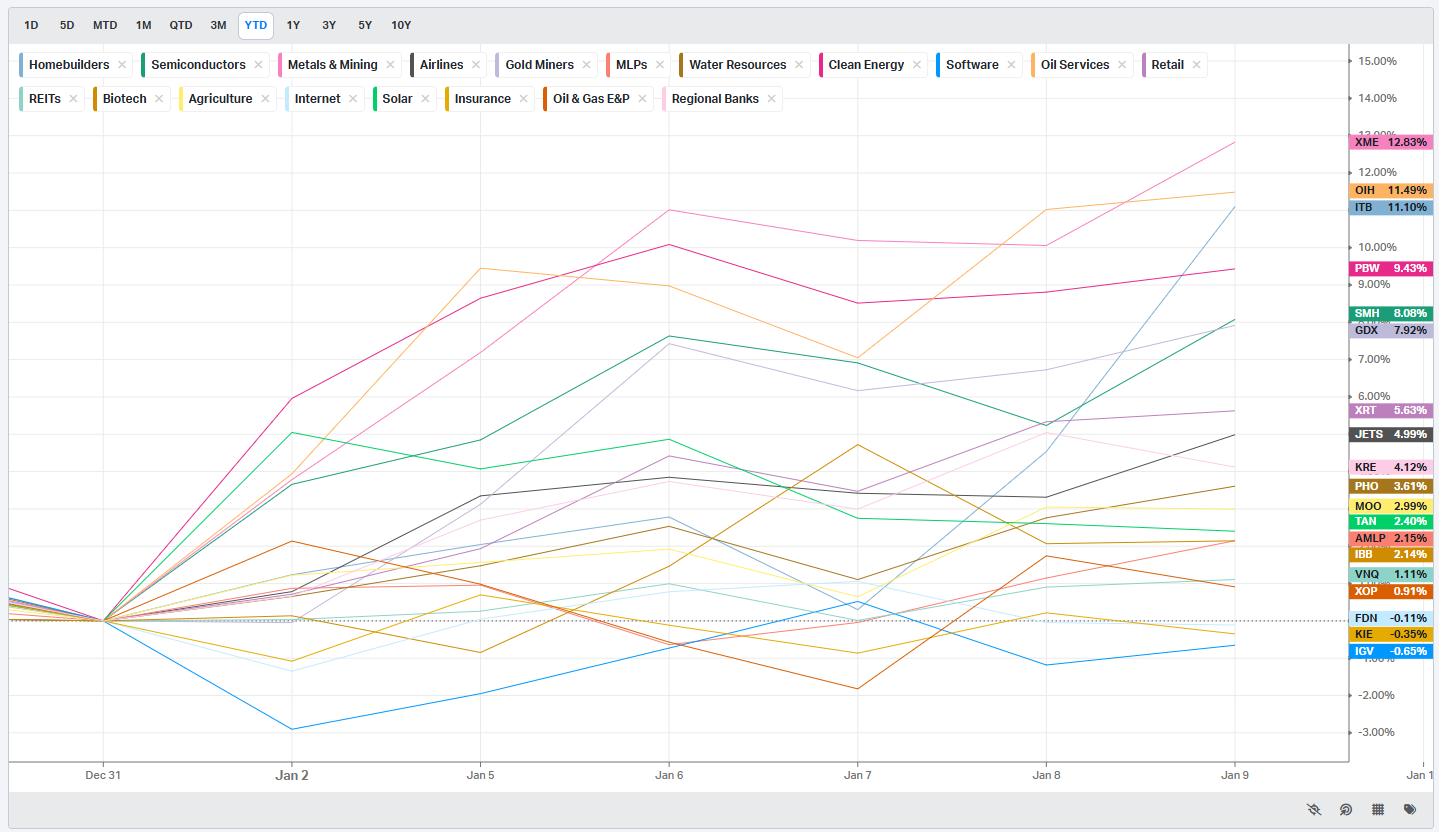
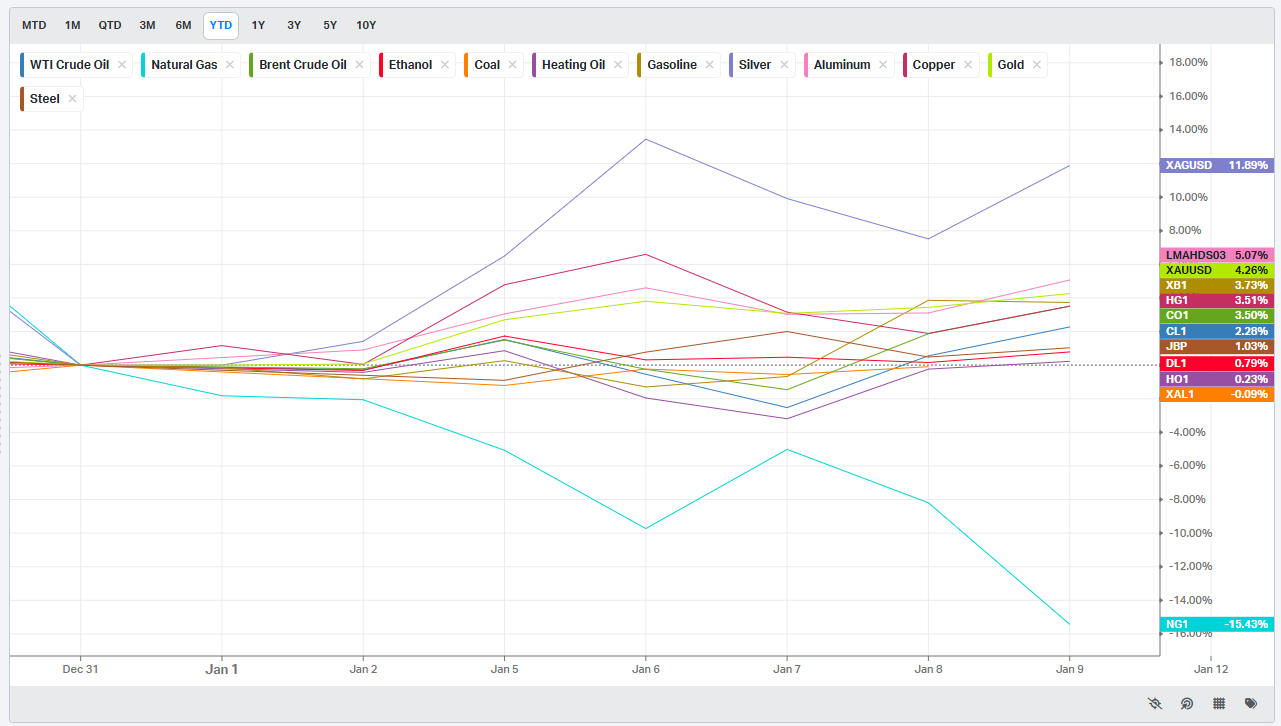
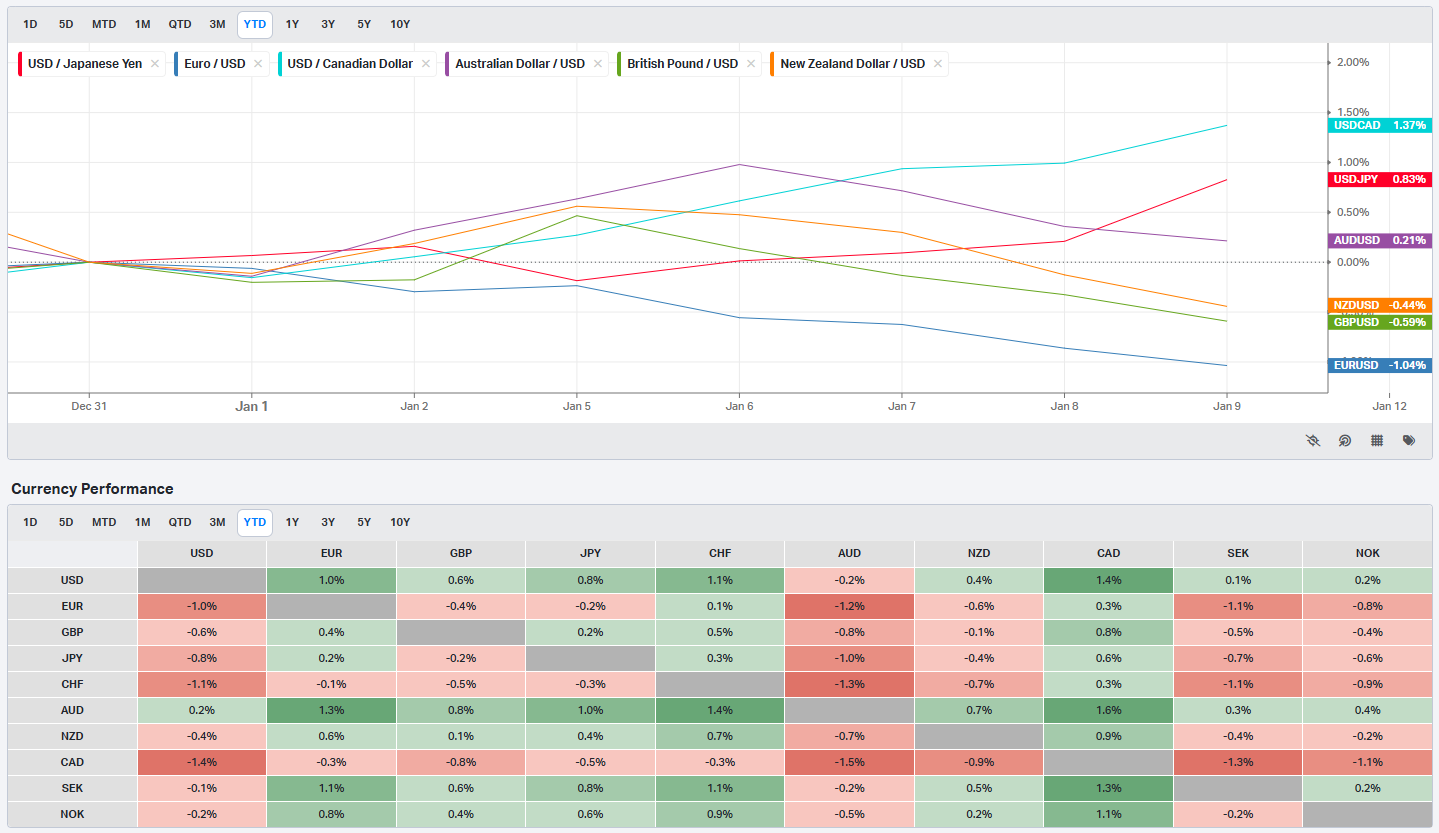
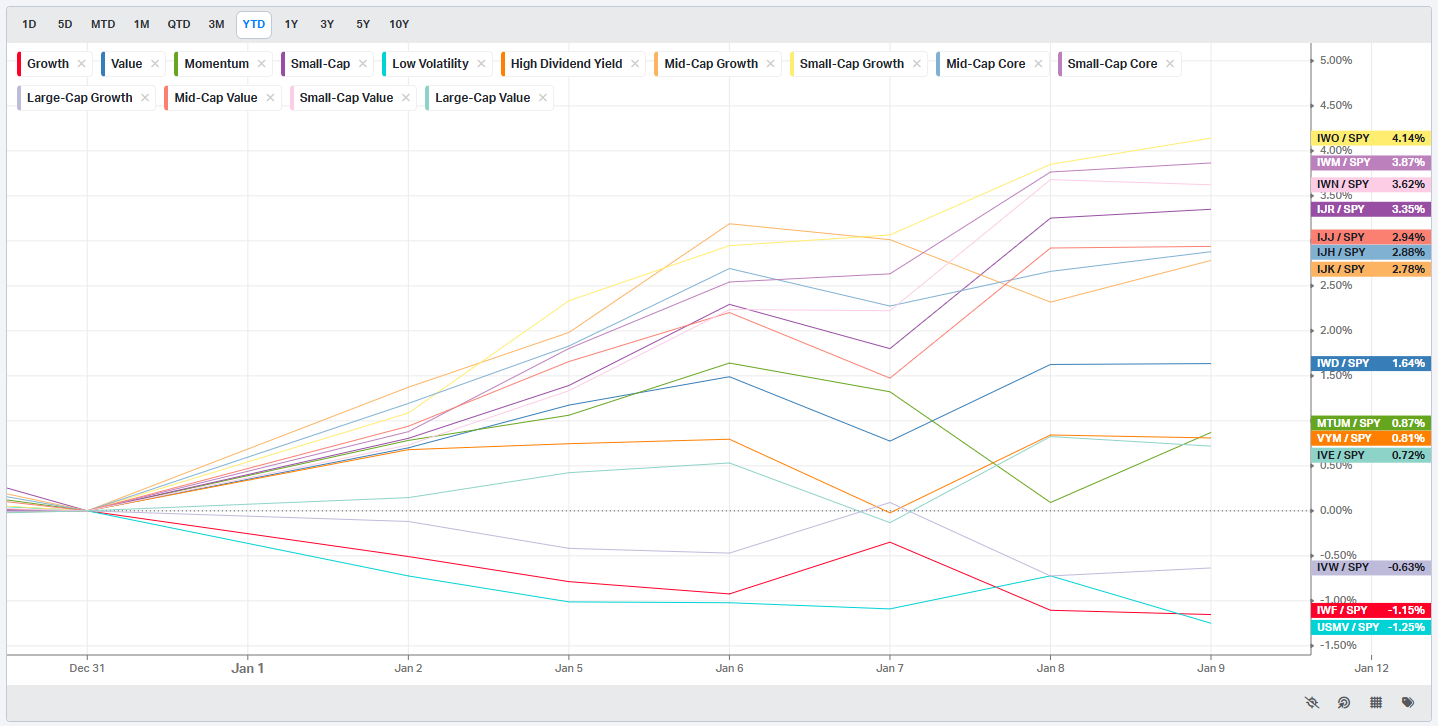
Normalized Performance By Thematics YTD: Which corners of the markets are beating benchmarks, which are overlooked and which ones are over-crowded!
Key Econ Events & Earnings On-Deck For This Coming Week
Market Intelligence Report: Track the real money. This section breaks down where institutions are placing their bets—and pulling their chips. You'll get a sector-by-sector view of flows, highlighting the most active names attracting large-scale buying or selling. We go beyond the headlines and into the tape, surfacing the week’s most notable block trades and sweep orders, both on lit exchanges and hidden dark pools. Whether you're following momentum or fading crowded trades, this is your map to where size is moving and why it matters.

Weekly Market-On-Close Report
A Conviction Start to 2026 as Markets Broaden and Policy Takes Center Stage
The first full week of 2026 delivered an unmistakable message from markets: risk appetite is intact, participation is widening, and investors are willing to put capital to work despite an unusually dense mix of policy headlines and geopolitical uncertainty. Equity indices pushed to new highs, small caps and cyclicals took the lead, and rotation beneath the surface became more pronounced. This was not a fragile melt-up driven by a narrow group of names. It was a week defined by conviction, repositioning, and a growing willingness to look past near-term noise.
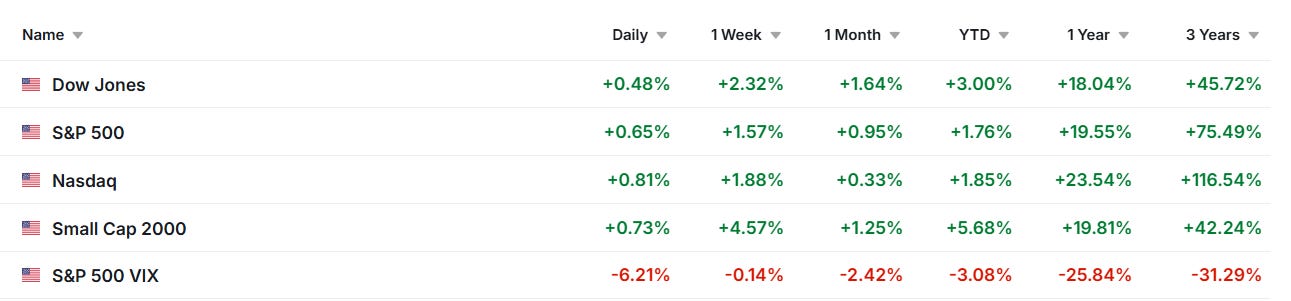
For the week, equities advanced broadly. The Russell 2000 Index outperformed all major benchmarks, climbing +4.62%, while small- and mid-cap stocks significantly outpaced their large-cap counterparts. Even the S&P 500, which lagged relative to smaller indices, still gained +1.57%. An equal-weighted version of the S&P 500 outperformed the traditional cap-weighted index, underscoring a key development: leadership is no longer confined to a narrow slice of the market.
Global markets reinforced the risk-on tone. Europe’s Euro Stoxx 50 Index surged +1.58% to a new record high, China’s Shanghai Composite Index rallied +0.92% to a 10.5-year high, and Japan’s Nikkei Stock Average advanced +1.61%. Strength across regions helped validate the rally in U.S. equities and reduced concerns that domestic gains were occurring in isolation.
Labor Data: Slowing, Not Breaking
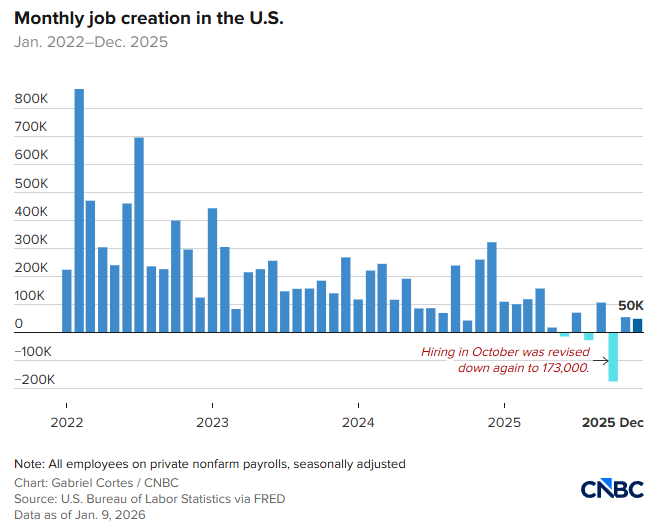
The most closely watched macro catalyst of the week was the December nonfarm payrolls report, which delivered a mixed but ultimately supportive signal. U.S. employers added +50,000 jobs in December, undershooting expectations of +70,000. November payrolls were revised lower to +56,000 from +64,000, and combined revisions for October and November reduced prior job gains by 76,000.
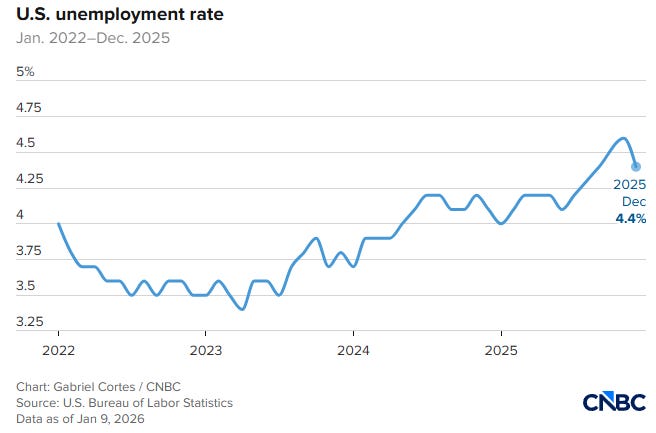
On its own, the headline job growth number suggested a slowing labor market. However, markets quickly focused on two offsetting details. The unemployment rate fell by -0.1 percentage points to 4.4%, beating expectations of 4.5%, and average hourly earnings rose +3.8% year-over-year, exceeding expectations of +3.6%.
Other labor indicators painted a similar picture. The Job Openings and Labor Turnover Summary for November showed job openings declining to 7.1 million, the lowest level since September 2024, while hires fell to 5.1 million from 5.4 million in October. ADP reported private payroll growth of +41,000 in December, rebounding from a net loss in the prior month but still below expectations of +47,000.
The takeaway is increasingly clear. Job growth is cooling, but the labor market is not unraveling. Unemployment remains contained, and wage growth remains firm. Historically, the longer-term average unemployment rate in the U.S. is near 5.5%, providing important context for why markets have not responded defensively to a 4.4% reading.
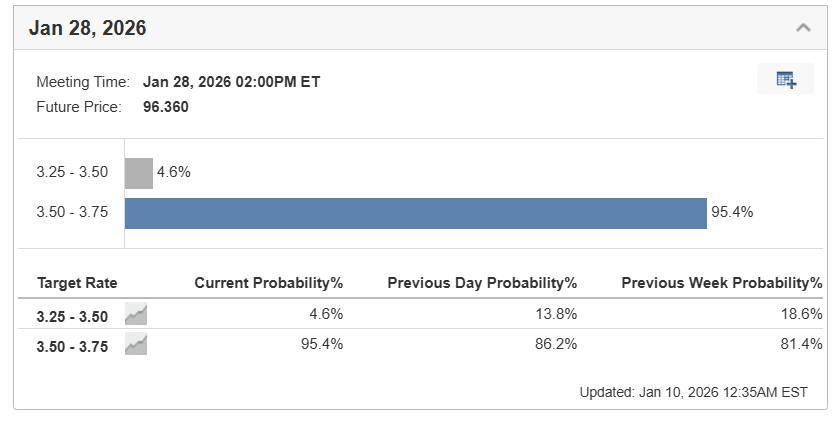
From a policy standpoint, the data does little to accelerate the Federal Reserve’s timeline for easing. Markets are pricing only a 5% probability of a -25 basis point rate cut at the January 27–28 FOMC meeting. Atlanta Fed President Raphael Bostic reinforced the Fed’s cautious posture on Friday, stating that inflation remains “too high” and warning against complacency even as labor markets cool.
Inflation Expectations and Consumer Sentiment
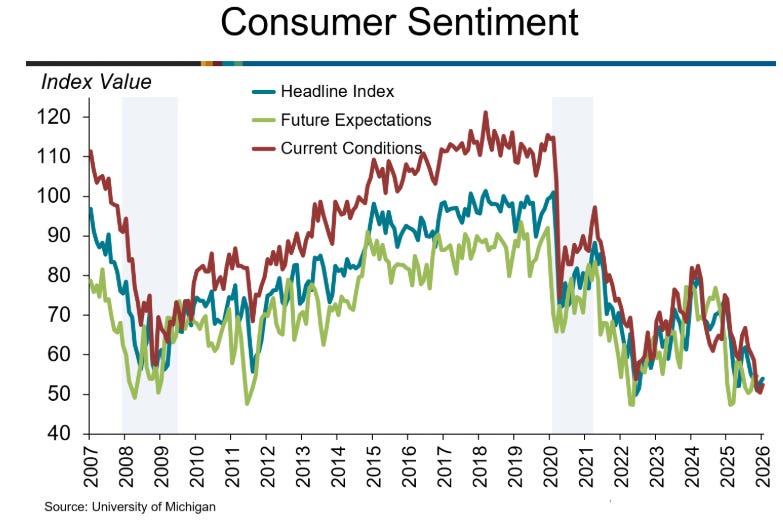
Inflation expectations edged higher during the week, adding another layer of complexity to the policy outlook. The University of Michigan’s January consumer sentiment index rose +1.1 points to 54.0, beating expectations of 53.5 and signaling improving household confidence.
At the same time, inflation expectations moved in the wrong direction from the Fed’s perspective. One-year inflation expectations remained unchanged at 4.2%, stronger than expectations of a decline to 4.1%. More notably, five- to ten-year inflation expectations increased to 3.4% from 3.2% in December, exceeding expectations of 3.3%.
This persistence in inflation expectations helps explain the Fed’s reluctance to signal near-term cuts, even as job growth slows. It also helps explain why interest rates have remained elevated despite softer headline economic data.
Bonds Navigate Crosscurrents
U.S. Treasury markets reflected this tension. March 10-year Treasury note futures (ZNH6) closed down just one tick on Friday, while the 10-year yield rose +0.4 basis points to 4.171% and briefly touched a four-week high of 4.203%.
Several forces weighed on Treasuries. The decline in the unemployment rate and stronger-than-expected wage growth reduced the odds of imminent rate cuts. Rising inflation expectations pushed the 10-year breakeven inflation rate to a 1.5-month high of 2.296%. At the same time, equity markets rallying to record highs reduced demand for safe-haven assets.
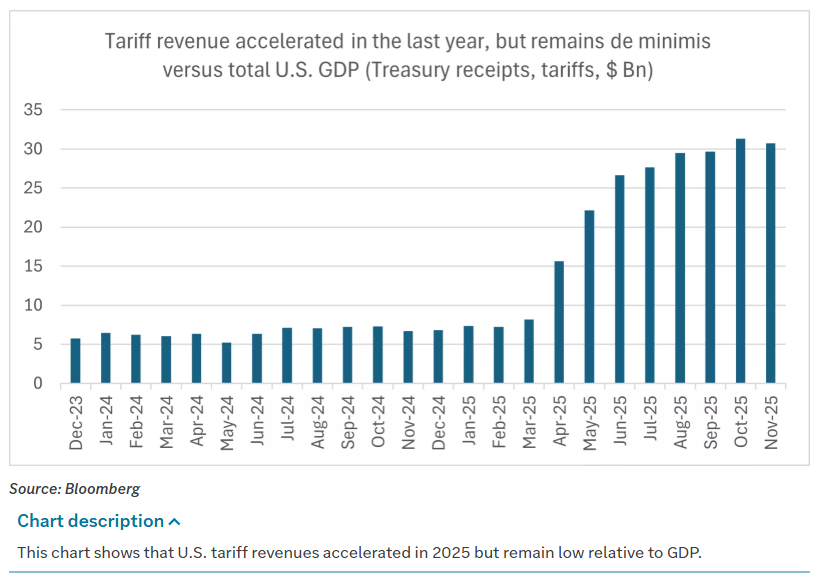
Policy uncertainty provided some counterbalance. The Supreme Court deferred a decision on the legality of President Donald Trump’s tariffs until next Wednesday. If the Court were to strike down the tariffs, yields could rise due to concerns about a widening budget deficit from lost tariff revenue. That uncertainty helped cap yields late in the week.
Treasuries also found support after President Trump announced plans to have Fannie Mae and Freddie Mac purchase $200 billion in mortgage-backed securities to lower longer-term rates and spur housing demand.
In Europe, bond markets were mixed. The 10-year German bund yield finished unchanged at 2.863%, while the 10-year U.K. gilt yield fell -3.0 basis points to 4.374%, a 2.5-month low. Eurozone economic data was modestly supportive, with November retail sales rising +0.2% month-over-month and German industrial production unexpectedly increasing +0.8% month-over-month.
Manufacturing Lags, Services Lead
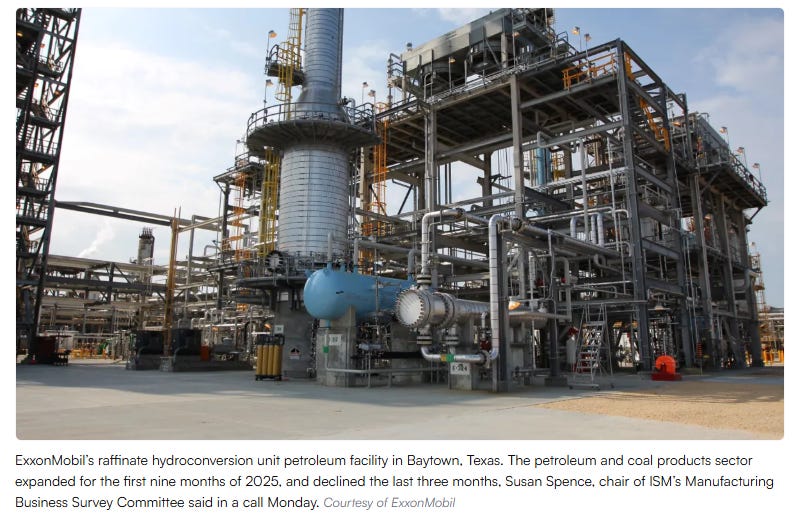
Economic data continued to show a clear divergence between manufacturing and services. The ISM Manufacturing PMI fell 0.3 points to 47.9 in December, marking the tenth consecutive month of contraction and the lowest reading of 2025. The employment subindex remained in contraction for the eleventh straight month, while the prices subindex stayed in expansion for the fifteenth consecutive month, signaling ongoing input cost pressures.
In contrast, the ISM Services PMI expanded for the tenth month in a row and reached its highest level of the year. Gains in new orders, business activity, and a rebound in employment from contraction to expansion underpinned the strength. While price pressures eased slightly, they remained firmly in expansion territory.
This split continues to shape market leadership. Manufacturing-heavy areas have lagged, while services-oriented and consumer-facing sectors have led.
Policy Headlines Drive Sector Rotation
Policy announcements from the Trump administration played a major role in sector-level volatility. Defense stocks experienced sharp swings after President Trump initially criticized aerospace and defense companies for prioritizing dividends and buybacks over production. The following day, the sector reversed higher after the administration proposed a 50% increase in the defense budget.
Housing-related equities followed a similar arc. Early in the week, homebuilders and housing suppliers fell after the administration indicated it would seek to restrict institutional purchases of single-family homes. The group rebounded sharply after Trump directed Fannie Mae and Freddie Mac to purchase $200 billion in mortgage bonds, tightening credit spreads in the agency mortgage-backed securities market and supporting housing demand.

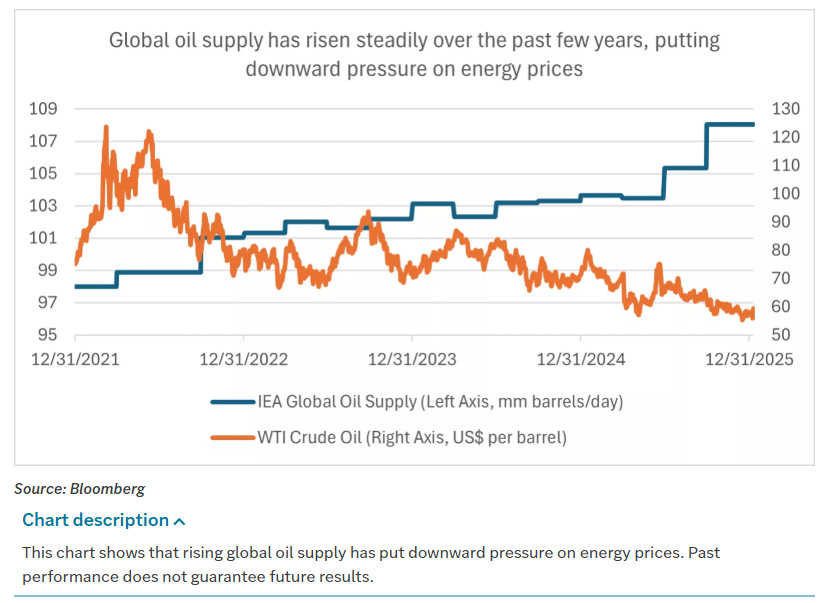
Energy markets were influenced by geopolitical developments tied to Venezuela. The U.S. military captured Venezuelan leader Nicolas Maduro and his wife, Cilia Flores, with the administration signaling plans to oversee a transition of power and rebuild the country’s oil infrastructure with support from U.S. energy companies. While Venezuela represents less than 1% of global GDP and production, it holds approximately 17% of global oil reserves. In the near term, oil markets resolved higher, with strength in oil majors, refiners, and oil services companies, while natural gas-exposed companies underperformed.
Technology, AI, and Infrastructure
Technology stocks delivered mixed but important signals. Semiconductor and memory stocks rallied sharply. Nvidia (NVDA) CEO Jensen Huang unveiled the company’s next-generation AI platform, Vera Rubin, already in full production and expected to be available in the second half of 2026. Huang emphasized applications in robotics and autonomous vehicles, reinforcing the theme of “Physical AI.”

Microchip Technology (MCHP) positively pre-announced for the second time, citing improving conditions in analog chip markets. Memory stocks moved higher following price increases and positive updates from Samsung Electronics. The ICE Semiconductor Index rose nearly 10% year-to-date, following a roughly 40% gain in 2025.
Despite this strength, information technology as a sector lagged the broader market. Software, servers, hardware, and equipment stocks remained under pressure, highlighting a more selective leadership profile within tech.
AI infrastructure spending remained a dominant theme. xAI announced plans to invest $20 billion in a data center in Mississippi. Meta Platforms (META) announced nuclear power agreements with Vistra (VST), Oklo (OKLO), and TerraPower to secure electricity for its data centers. These announcements helped reverse weakness in independent power producers and revived interest in nuclear-related equities.

Broadening Participation and Looking Ahead
Beyond technology, participation broadened meaningfully. Consumer discretionary was the best-performing sector, supported by housing-related stocks and Amazon.com (AMZN). Materials rose more than 5% on strength in miners, chemicals, and packaging, even as steel stocks lagged. Industrials and financials posted solid gains, while healthcare rose roughly 1.5%.
Utilities were the only sector in the red early in the year, weighed down by prior pressure on independent power producers before late-week energy headlines provided relief.
At a high level, the first week of 2026 delivered what could best be described as “better than feared” outcomes across macro data, policy developments, and corporate news. Earnings expectations for 2026 have been revised higher to approximately 14.7% year-over-year. The Atlanta Fed’s GDPNow model estimates fourth-quarter U.S. GDP growth around 5.1%, well above long-term trend growth near 2.0%.
Strong prior returns do not necessarily preclude further gains. Since 1970, trailing three-year S&P 500 gains above 50% have occurred only eight times. Excluding the dot-com bubble, the average return over the following three years has been close to 30%.
It is still early, but markets are sending a clear signal. Leadership is broadening. Growth remains resilient. Policy risk is real but manageable. For now, price action continues to reward engagement rather than retreat, setting a constructive tone as 2026 gets underway.

Weekly Benchmark Breakdown
Breadth Is Healthy, but Leadership Is Not Uniform
This week has the feel of a market that is trending constructively rather than delivering a one-off thrust. Participation is broadly positive across major universes, with most moving-average cohorts sitting in the 60s and new highs continuing to outrun new lows by a comfortable margin. The risk tone is firm: this is not a tape being held up by a tiny corner. At the same time, the leadership map is mixed. Some segments look like they are building a durable advance, while others are merely stable and need to improve.
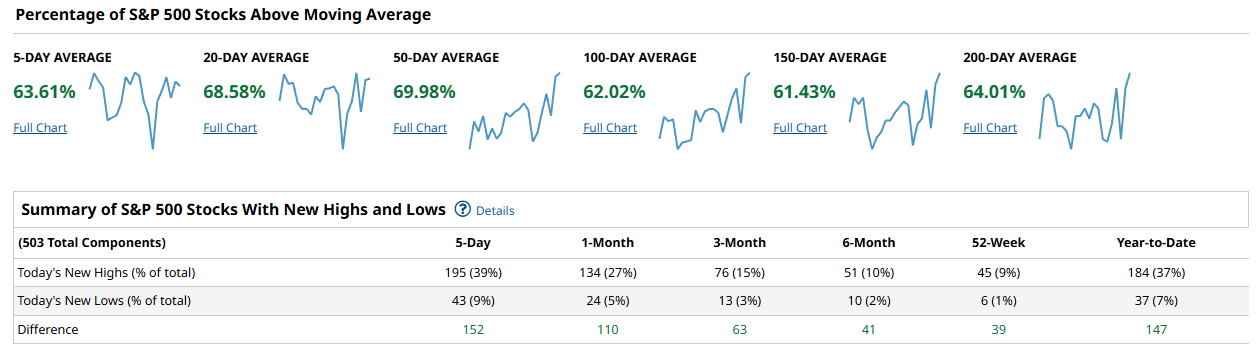
The S&P 500 breadth is the cleanest snapshot of a market in decent internal shape. You have 63.61% of constituents above the 5-day, 68.58% above the 20-day, and 69.98% above the 50-day. That is exactly the kind of profile you want to see in a functioning uptrend: short and intermediate measures are not just positive, they are clustered high enough to suggest the average stock is participating. Longer-term cohorts are also supportive, with 62.02% above the 100-day, 61.43% above the 150-day, and 64.01% above the 200-day. The new highs/new lows table reinforces that constructive tone. Over the last 5 days, 195 names made new highs versus 43 new lows, a net of +152. The net stays positive across all listed windows: +110 over 1-month (134 vs 24), +63 over 3-month (76 vs 13), +41 over 6-month (51 vs 10), +39 on the 52-week view (45 vs 6), and +147 year-to-date (184 vs 37). That combination tells you the market is not just levitating; it is producing expanding upside resolution with limited downside damage.
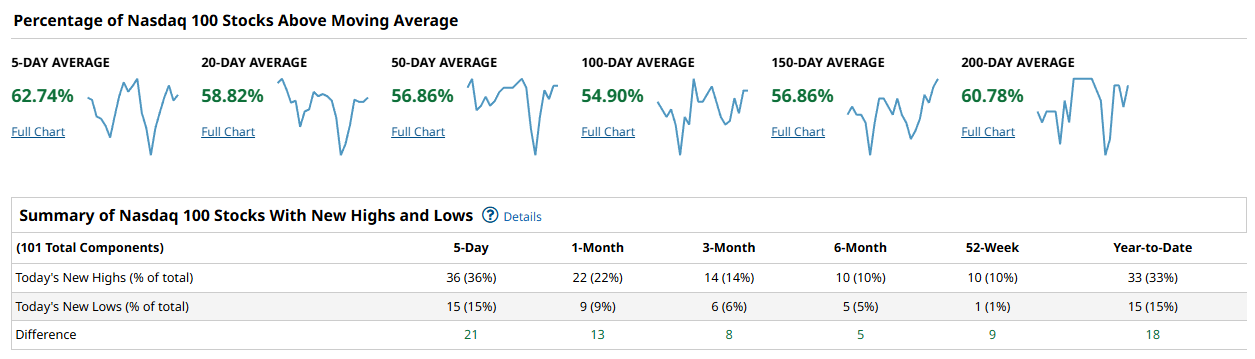
The Nasdaq 100 is positive, but it is the least convincing of the four on the moving-average stack, and that matters because this cohort often sets the tone for cap-weighted indices. Only 58.82% are above the 20-day, 56.86% above the 50-day, and 54.90% above the 100-day. The 5-day is better at 62.74%, and the longer-term measures recover somewhat with 56.86% above the 150-day and 60.78% above the 200-day. In plain English: the short-term bounced, but the intermediate trend participation is still sub-60. New highs are still winning, which keeps this from being a warning flag, but the margin is slimmer than you would like in a true leadership regime. Over 5 days, new highs are 36 versus 15 new lows for +21. Over 1-month its +13 (22 vs 9), over 3-month +8 (14 vs 6), over 6-month +5 (10 vs 5), over the 52-week window +9 (10 vs 1), and year-to-date +18 (33 vs 15). That is constructive, but it reads more like stabilization than acceleration.
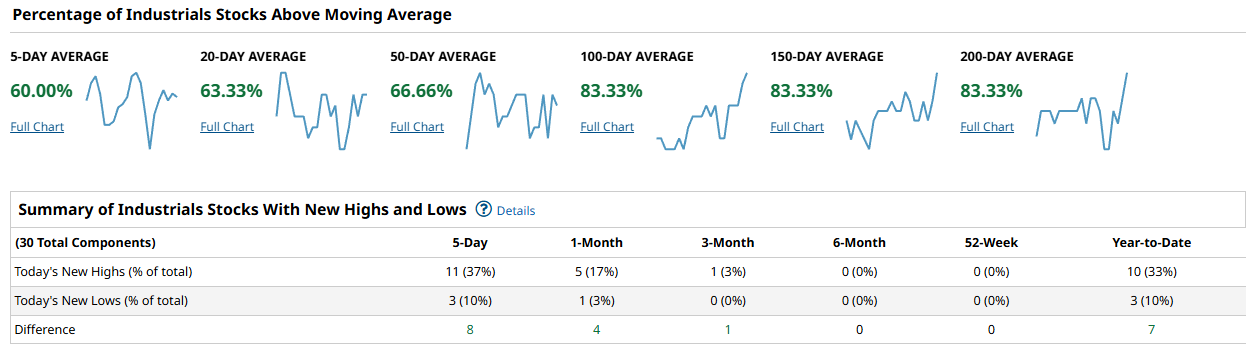
The Dow (shown here as Industrials) is the opposite profile: very strong long-term participation with less punch in the near term. You have 60.00% above the 5-day, 63.33% above the 20-day, and 66.66% above the 50-day, which is fine but not euphoric. The standout is the longer trend: 83.33% above the 100-day, 83.33% above the 150-day, and 83.33% above the 200-day. That is a rare level of longer-term internal strength and suggests this segment has been persistently healthy. New highs versus new lows support the idea that weakness is contained: +8 over 5 days (11 vs 3), +4 over 1-month (5 vs 1), +1 over 3-month (1 vs 0), flat over 6-month and 52-week (0 vs 0 in both), and +7 year-to-date (10 vs 3). The message is not that Industrials are breaking out en masse right now; it is that the base of the trend remains sturdy and pullbacks have not been corrosive.
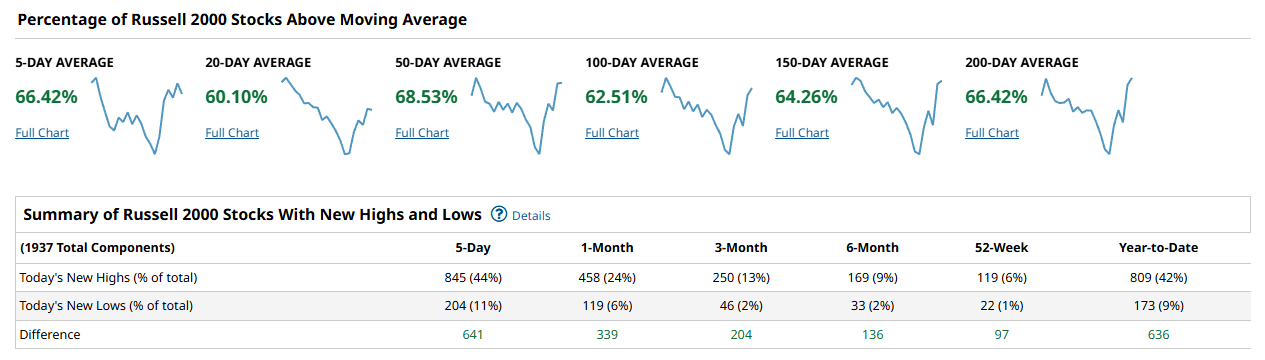
Russell 2000 breadth is the most encouraging from a participation standpoint, and it is the strongest evidence of broad-market buy-in. You have 66.42% above the 5-day, 60.10% above the 20-day, 68.53% above the 50-day, 62.51% above the 100-day, 64.26% above the 150-day, and 66.42% above the 200-day. That is a well-formed breadth stack: not only are short and intermediate measures positive, but the longer cohorts are also sitting comfortably in the mid-60s. The new highs/new lows table is emphatic. Over 5 days, 845 new highs versus 204 new lows gives +641. Over 1-month its +339 (458 vs 119), over 3-month +204 (250 vs 46), over 6-month +136 (169 vs 33), over the 52-week view +97 (119 vs 22), and year-to-date +636 (809 vs 173). When small caps are producing that kind of positive spread between highs and lows, it is difficult to argue that participation is narrowing.
Putting it together, the cap-weighted picture looks solid, but the broad market looks even better. The S&P 500 is near a textbook “healthy trend” profile with the 20-day and 50-day cohorts pushing toward 70% and new highs dominating across time frames. The Russell 2000 is the participation standout, which is exactly what you want to see if the market is trying to mature into a durable advance rather than a top-heavy drift. The one soft spot is the Nasdaq 100, where intermediate participation remains below 60% even as highs exceed lows. A durable advance would be confirmed by the S&P 500 keeping the 50-day cohort in the high-60s and pressing it higher, while the Nasdaq 100 repairs toward and through 60% on the 50-day and 100-day measures. Just as important, you want the new highs minus new lows spreads to remain positive and resist compression. Concern would be justified if the S&P 500 20-day cohort rolls back toward the low-60s while new lows start expanding and the Nasdaq 100 remains stuck with sub-60 intermediate breadth.
The playbook for this week is to respect the positive breadth backdrop, but stay honest about where the trend is strongest. Favor areas and vehicles that benefit from broad participation and improving “average stock” behavior, and be cautious about leaning too hard on a narrow mega-cap bid while the Nasdaq 100’s intermediate cohort is still lagging. Watch for follow-through in the S&P 500 keeping 20-day and 50-day participation elevated, and watch for the Nasdaq 100 to reclaim stronger intermediate breadth as confirmation that leadership is reasserting itself rather than merely stabilizing. If new highs continue to beat new lows by margins like +152 in the S&P 500 and +641 in the Russell 2000 over the 5-day window, the tape should remain forgiving; if those spreads shrink quickly, risk appetite is likely fading.
Bottom line: breadth is decisively positive and broadening, with small caps leading participation, but the Nasdaq 100 needs intermediate breadth repair to fully validate a durable, market-wide advance.

Investor Sentiment Report
%Bull-Bear Spread
The %Bull-Bear Spread measures the gap between bullish and bearish investor sentiment, often from surveys like AAII. It’s a contrarian indicator—extreme optimism may signal a coming pullback, while extreme pessimism can hint at a potential rally. Large positive or negative spreads often mark market turning points.
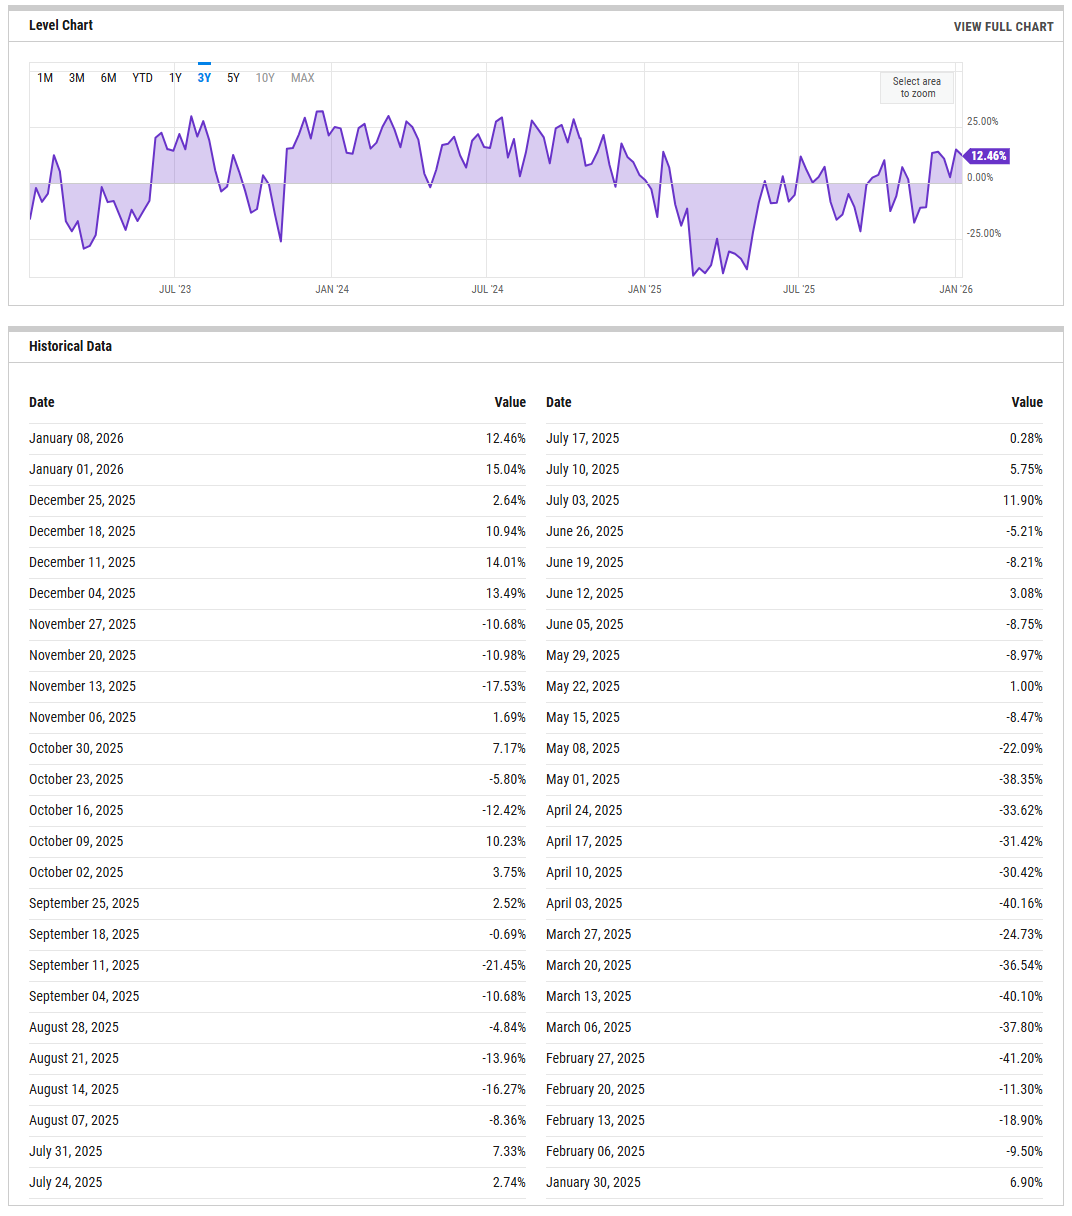
The percent bull minus bear spread is currently 12.46% (January 08, 2026), down from 15.04% the prior reading shown (January 01, 2026). That is a meaningful detail: sentiment is still net-positive, but it is not accelerating into a euphoric squeeze zone. The table also shows how quickly this measure has swung over the past few months, including negative prints in November (for example, -10.68% and -10.98% in late November, and -17.53% on November 13) before recovering back into positive territory through December and into early January. In plain terms, this is a market where optimism has returned, but it is not a one-way stampede. A bull-bear spread slipping back below 0% would argue for a more defensive stance, while a push above 20% would suggest crowding risk.
NAAIM Exposure Index
The NAAIM Exposure Index (National Association of Active Investment Managers Exposure Index) measures the average exposure to U.S. equity markets as reported by its member firms. These are typically active money managers who provide their equity exposure levels weekly. The index offers insight into how much these managers are investing in equities at any given time, ranging from being fully short (-100%) to leveraged long (up to +200%).
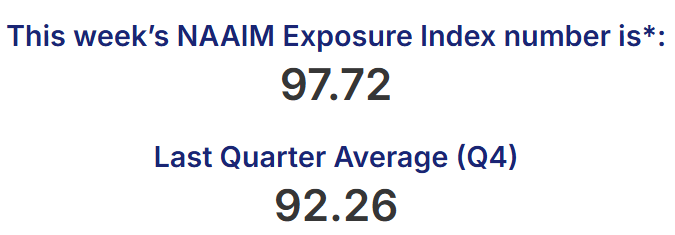
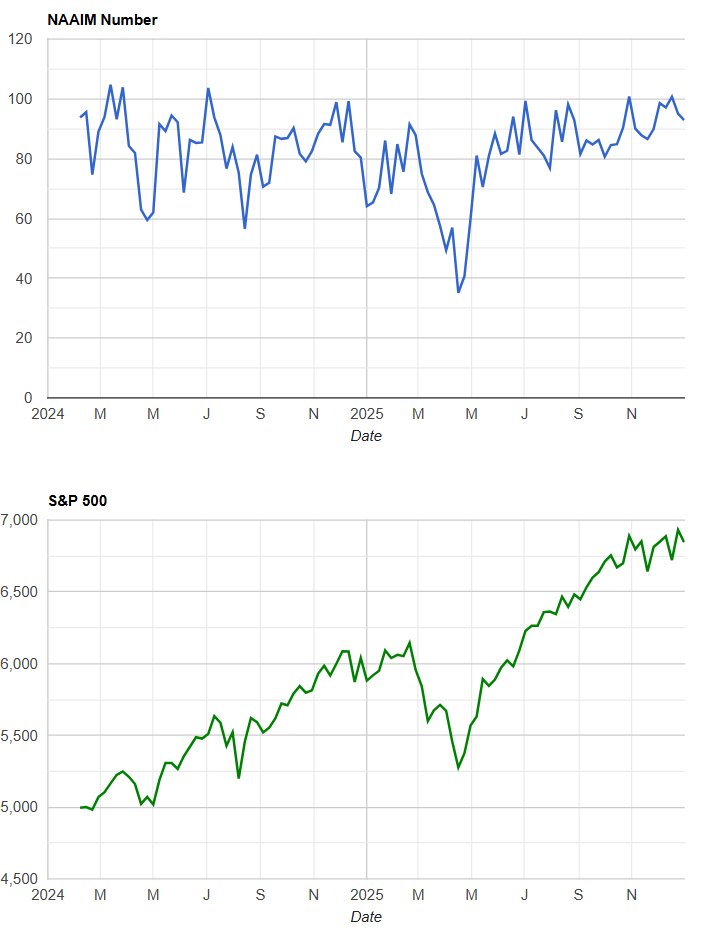
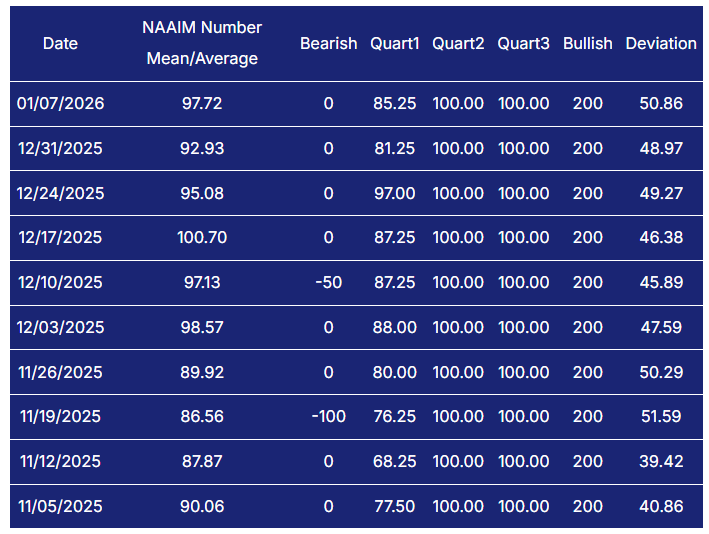
That message is reinforced by the NAAIM Exposure Index, which remains elevated. The most recent reading shown is 97.72 (01/07/2026), following 92.93 (12/31/2025) and 95.08 (12/24/2025), with 100.70 also visible on 12/17/2025. Managers are largely in the pool, which supports trend continuation when price is behaving, but it also reduces the amount of easy incremental buying power if the tape wobbles. A surprise drop into the 50s without meaningful price damage would be a classic "reset" that improves forward reward, while another sustained push back toward the high 90s to around 100 keeps the market more vulnerable to sudden de-risking waves.
CBOE Total Put/Call Ratio
CBOE's total put/call ratio includes index options and equity options. It's a popular indicator for market sentiment. A high put/call ratio suggests that the market is overly bearish and stocks might rebound. A low put/call ratio suggests that market exuberance could result in a sharp fall.
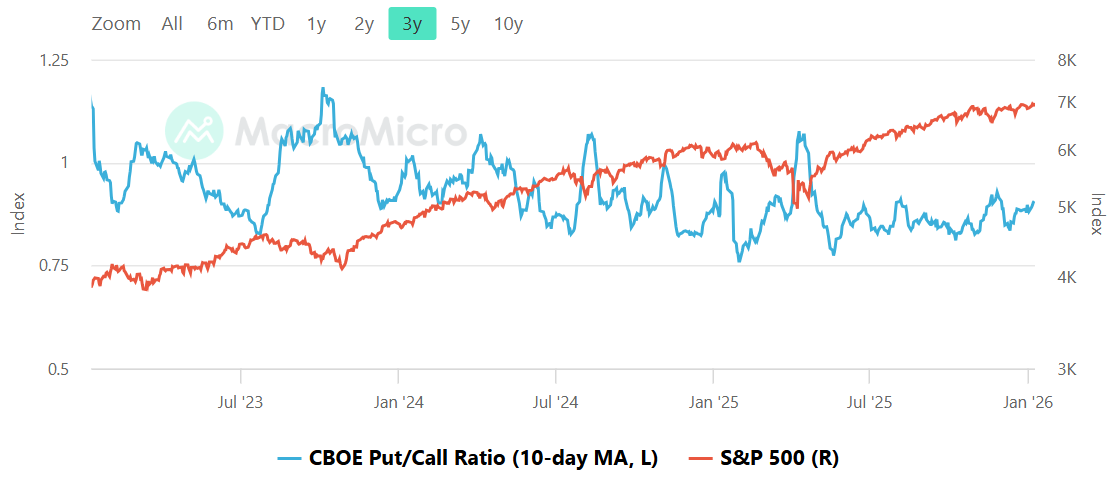
The put/call ratio chart shown is the CBOE total put/call ratio with a 10-day moving average. The line is currently sitting below the 1.0 level on the left axis and above the 0.75 line. That keeps the signal in the "not fearful" camp: traders are not paying up for protection in a way that typically accompanies durable washouts, and the market is not offering the kind of panic premium that tends to fuel violent, high-quality rebounds. At the same time, the reading is not pinned at the lows of the scale, which matters because the most fragile tapes tend to show persistently depressed put/call behavior.
From a risk lens, sub-1.0 put/call tends to be consistent with orderly uptrends and shallow drawdowns, but it also implies that when the market does slip, the first leg down can feel a bit air-pocket-ish because there is less hedging demand to be unwound into strength. The tripwires are the usual ones: a sustained move up through 1.0 would tell you fear is rising and protection is being bought, which can either warn of stress or set up a better entry if price stabilizes. On the other side, a slide toward the 0.75 area would be a sign the tape is getting frothy and complacent, increasing the odds that the next dip is sharper than expected.
Equity vs Bond Volatility
The Merrill Lynch Option Volatility Estimate [MOVE] Index from BofAML and the CBOE Volatility Index [VIX] respectively represent market volatility of U.S. Treasury futures and the S&P 500 index. They typically move in tandem but when they diverge, an opportunity can emerge from one having to “catch-up” to the other.
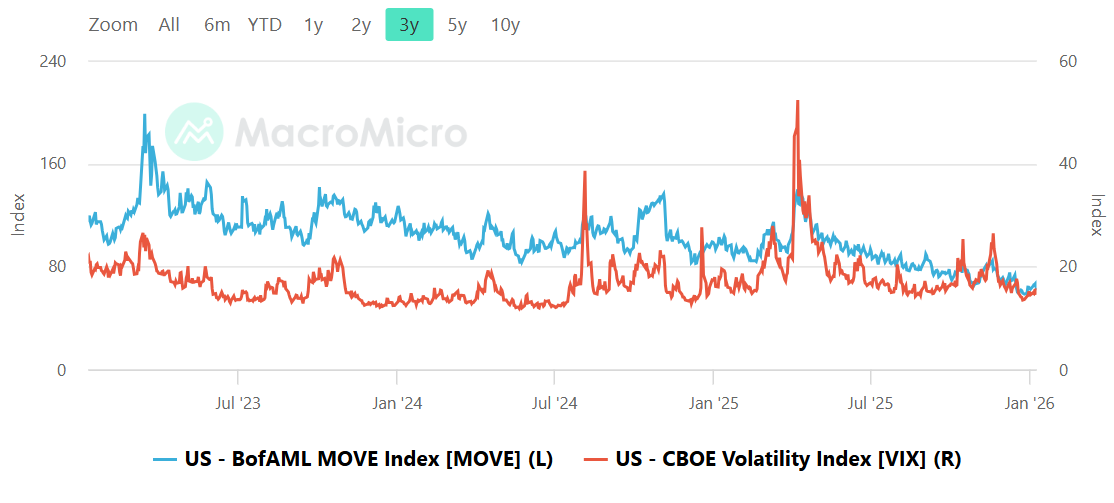
The MOVE versus VIX panel is all about whether rates volatility is quietly undermining equities or whether both markets are calm together. Visually, both series are sitting near the lower portion of their respective ranges, with VIX currently below the 20 mark on the right axis and MOVE also down near the bottom end of its multi-year range on the left axis. That is a supportive backdrop for risk assets: when both equity vol and bond vol are contained, systematic strategies tend to stay engaged, hedging costs are manageable, and intraday liquidity generally behaves.
The main nuance is that bond vol often leads. When MOVE starts rising persistently while VIX stays sleepy, equities can look fine right up until they do not, because rates are the input into discount rates, financing conditions, and cross-asset correlations. Right now, there is no obvious “rates-vol alarm bell” visible in the snapshot. The practical tripwires remain clean: if MOVE were to rip back above roughly 120 while VIX remains subdued, that would be a warning that macro stress is brewing under the surface. If VIX itself pushes up and holds above the high teens and into the 20s, that is the market pricing a different risk regime, and you should expect wider swings and more fragile breakouts until vol cools again.
CNN Fear & Greed
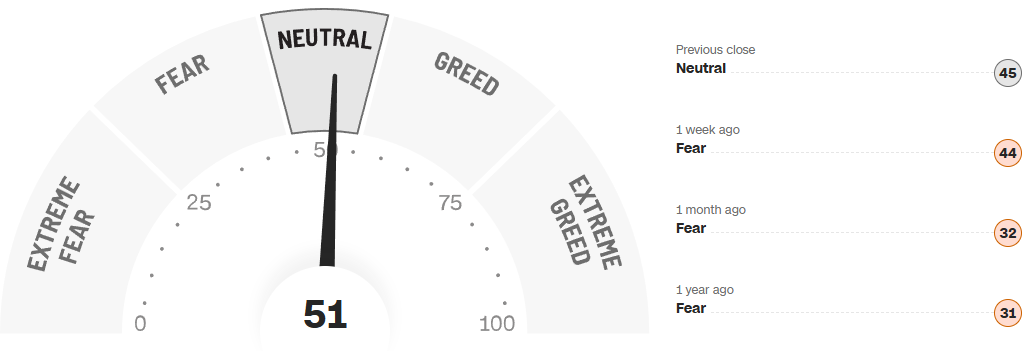
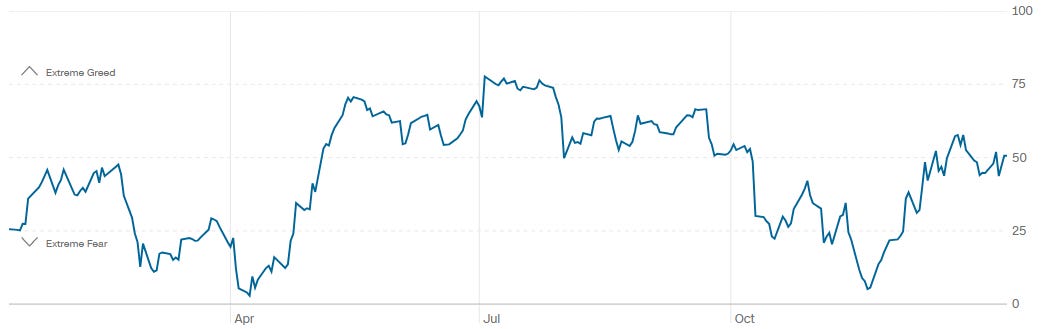
The CNN Fear & Greed composite is 51, which is squarely neutral. The context in the gauge matters: the prior close shown is 45 (Neutral), one week ago is 44 (Fear), one month ago is 32 (Fear), and one year ago is 31 (Fear). So the market has climbed out of a fear-leaning posture and into the middle of the range, without overshooting into the kind of extreme that tends to punish late chasers. That is typically the sweet spot for a trend: risk-taking is being rewarded enough to keep participants engaged, but sentiment is not so hot that the tape becomes hypersensitive to any disappointment.
The one-year path shown reinforces the idea of a regime shift rather than a blow-off. Over the past year, the indicator has swung from fear earlier in the year to a mid-year climb into higher readings, then a notable drop back into fear in the autumn, and now a recovery back toward the 50 area. That arc usually describes a market that has already shaken out weak hands and is rebuilding confidence. The exhaustion tripwire is a move into sustained high readings, particularly into the 70s, which would suggest greed and a higher risk of sharp pullbacks. The more constructive entry tripwire is the opposite: a drop back below roughly 25 that holds briefly while price stabilizes, which tends to offer better reward/risk than buying when the crowd is already comfortable.
Social Media Favs
Social sentiment offers a real-time view of investor mood, often revealing market shifts before traditional indicators. It can signal momentum changes, spot emerging trends, and gauge retail investor impact—especially in high-volatility names. Tracking sentiment around events or earnings provides actionable insights, and when layered with quantitative models, can enhance predictive accuracy and risk management. Sustained sentiment trends often mirror broader market cycles, making this data a valuable tool for both short-term trades and long-term positioning.

Technician’s Playbook: Trading the Majors (SPY/QQQ/IWM/DIA)
When you’re a large institutional player, your primary goal is to find liquidity - places to do a ton of business with the least amount of slippage possible. VolumeLeaders.com automatically identifies and visually plots the exact spots where institutions are doing business and where they are likely to return for more. It’s one of the primary reasons “support” and “resistance” concepts work and truly one of the reasons “price has memory”.
The tape across the major ETFs continues to tell a story of acceptance higher after late-December repair, with buyers showing up consistently at defined shelves rather than chasing impulsively. This is not a runaway melt-up, but it is a market where pullbacks have been met with size and where price keeps resolving back toward the upper end of recent balance.
SPY
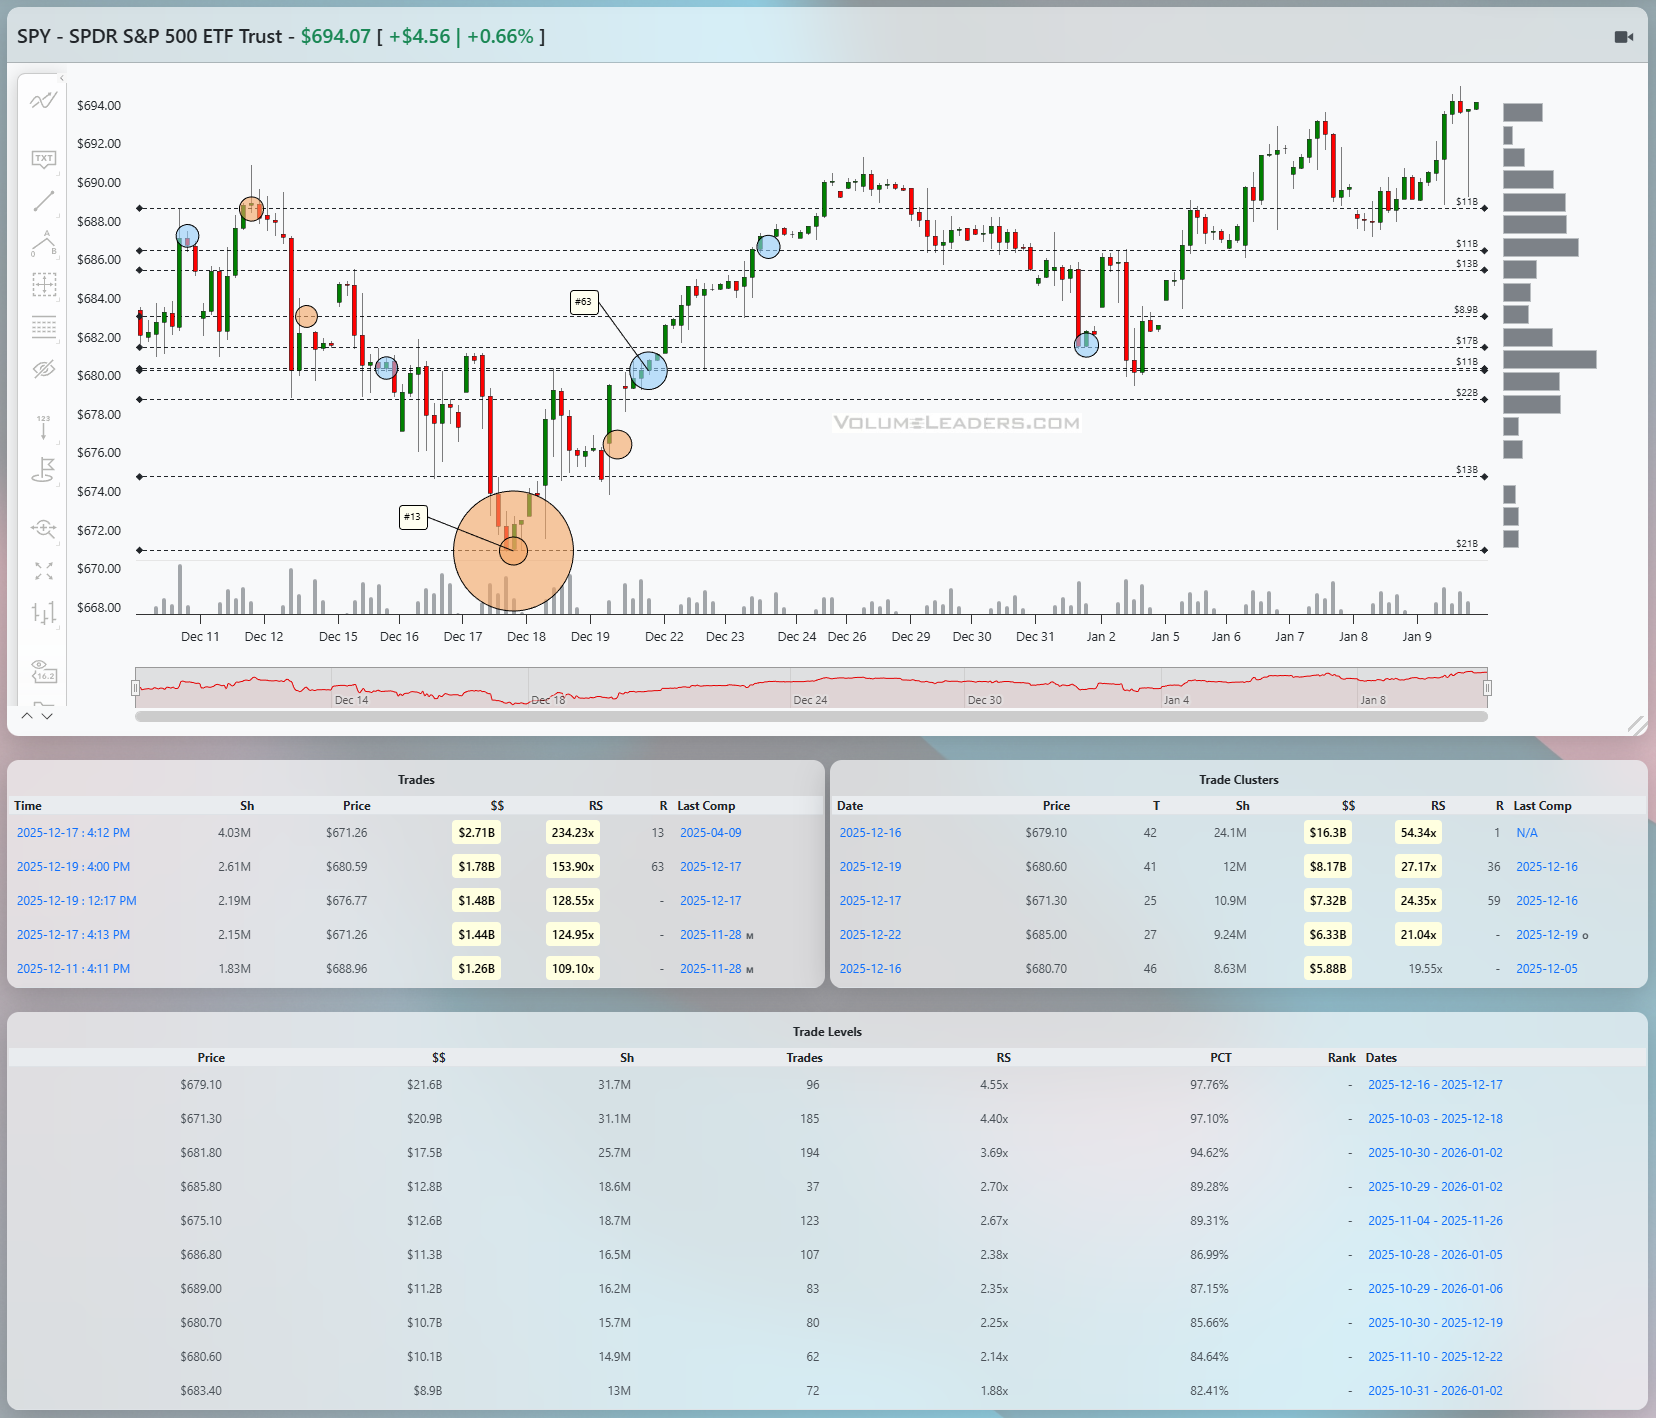
SPY has worked higher in a two-step sequence: an initial impulse off the mid-December lows, a brief pause and pullback into late December, and then a steady grind back toward the highs. The most important feature on the chart is the repeated defense of the upper 680s to low 690s band. Multiple large prints are visible in that zone, including several billion-dollar executions clustered just below 690 and again near the high 670s. The largest cumulative Levels in the table sit around the high 670s and low 680s, with notional north of $20B and RS readings above 4x, putting them deep into the upper percentiles. That tells you real inventory changed hands there. Price dipped into those areas, stalled, and rotated higher, which is classic absorption. The line of scrimmage is now the upper 680s. Acceptance above the low 690s keeps the path open toward the mid- to upper-690s, where the next visible volume shelf sits. Failure back below the high 680s would put the low 680s and then the upper 670s back in play as downside magnets. From an execution standpoint, this is a tape where responsive bids near the upper 680s have been rewarded, while chasing strength away from that shelf carries poorer asymmetry.
QQQ
QQQ shows a similar rhythm but with more defined two-sided trade. After a sharp mid-December selloff, price based in the low 600s before reclaiming the mid-610s and then pushing back toward the low 620s. Several standout prints are visible around 610 to 615, including one large blue-marked trade that coincided with a reversal higher, suggesting sellers were met by size willing to absorb. The Levels table highlights heavy dollar concentration around roughly 612 to 617, with multi-billion notional and RS in the 3x to 4x range, placing those bands in the mid- to high-90th percentiles. That zone is the current fulcrum. Holding above it keeps QQQ in a constructive range with upside magnets near the mid-620s. A clean acceptance above the recent highs would open the door to continuation toward the upper 620s. On the flip side, a loss of the low-610s would likely see price pulled back toward the low 600s, where prior repair occurred. Tactically, the message is to trade around that 612 to 617 shelf: above it, pullbacks are buyable; below it, the tone shifts to defense.
IWM
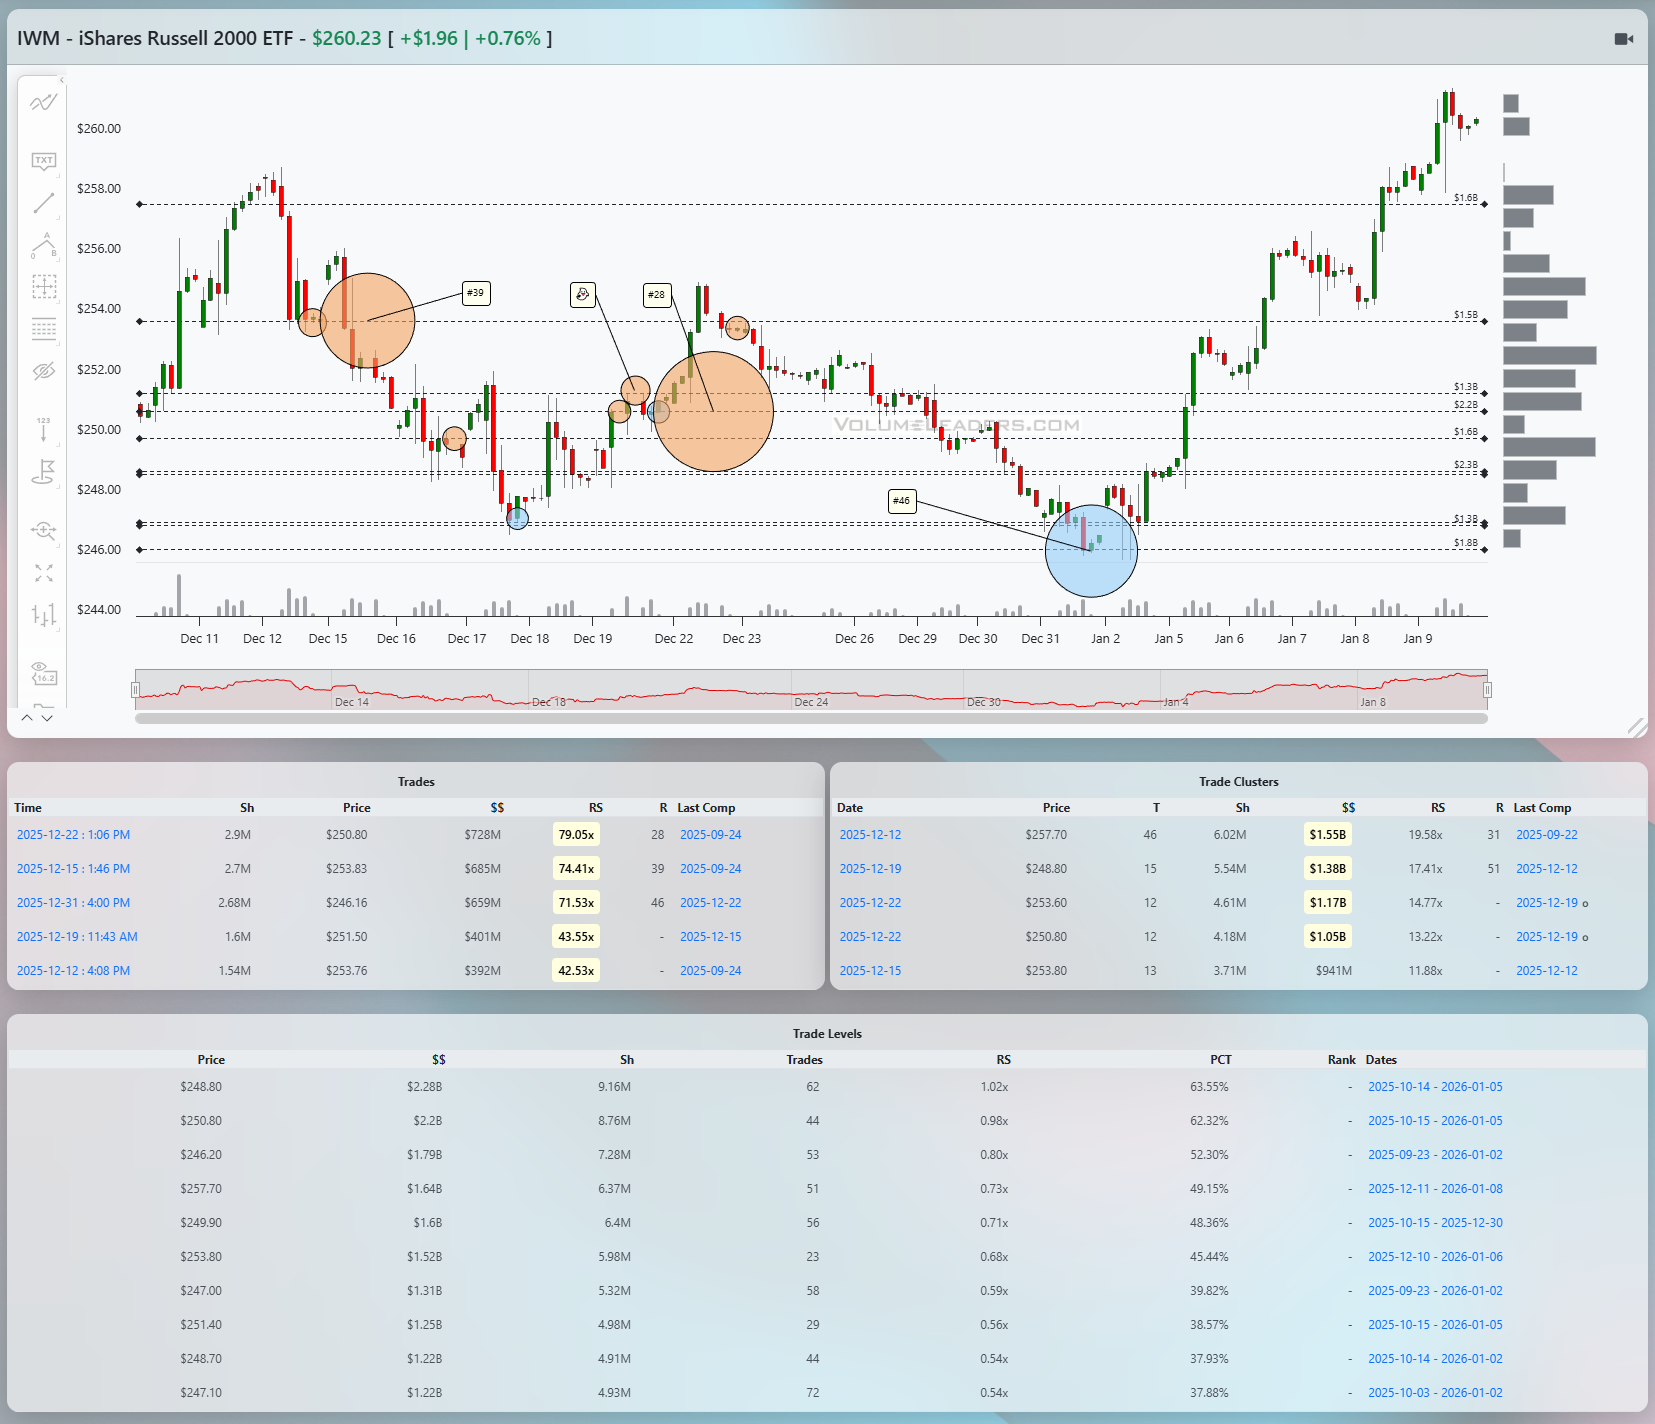
IWM is where participation looks the most assertive. The ETF carved a higher low into late December and then accelerated sharply into early January, clearing multiple prior highs. The most notable feature is the large accumulation cluster in the low 250s, marked by a very large orange circle and supported by cluster data showing over $1.5B in notional with RS near 20x, placing it well into the upper percentile of historical activity. That is not fleeting flow; it is sustained positioning. After briefly dipping into the mid-240s, price snapped higher and has since held above the mid-250s. The current line of scrimmage sits around 255 to 256. As long as IWM remains accepted above that band, the path of least resistance points toward the high 250s and potentially the low 260s. A failure back below 252 would be the first sign that momentum is stalling, with the low 250s then acting as the next test of buyer conviction. Discipline here means respecting how extended price has become while also acknowledging that the strongest hands appear to be involved.
DIA
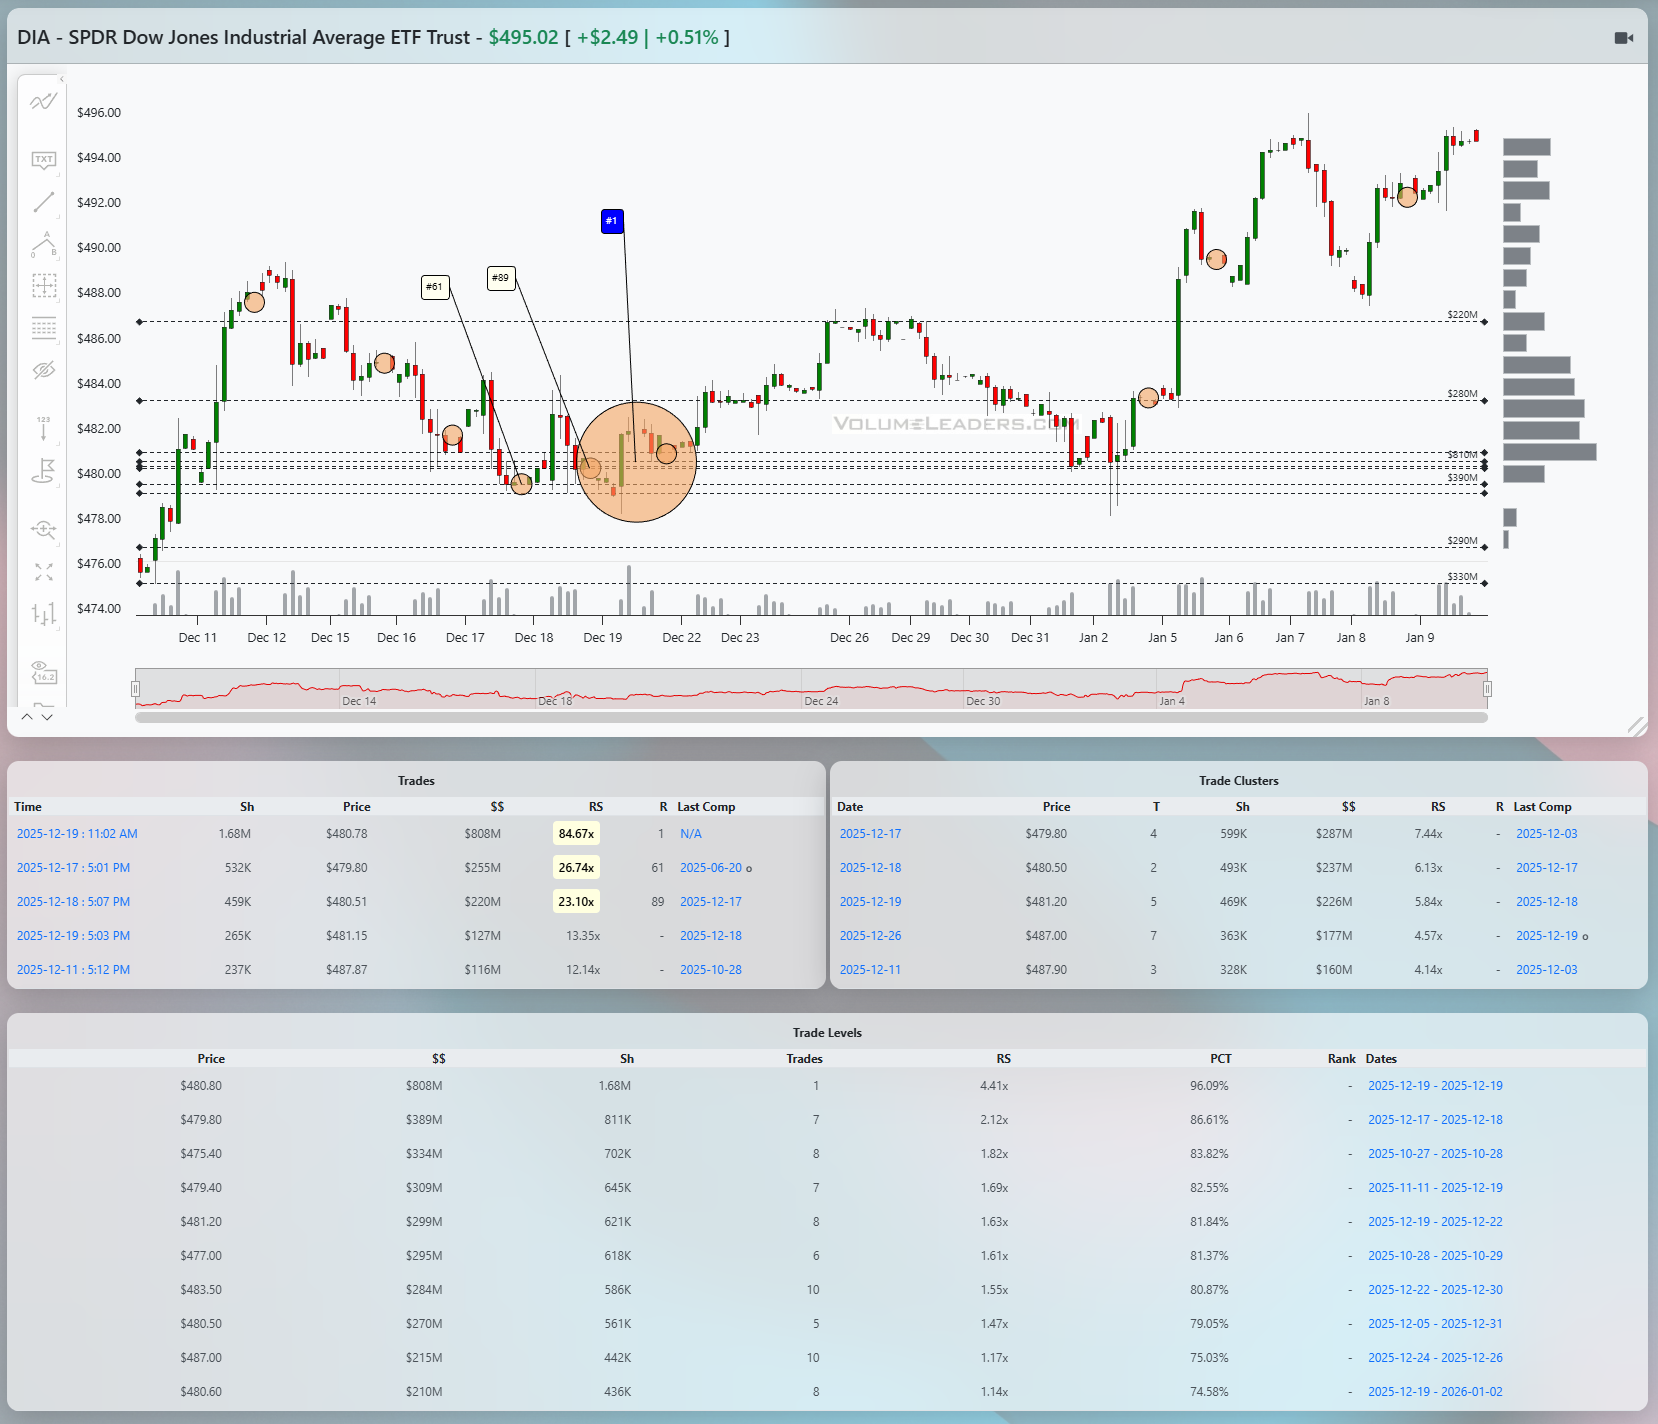
DIA continues to grind higher in a more methodical fashion. After chopping sideways through mid-December, it found solid sponsorship just below 480, where a large top-100 style print occurred around 479 to 480. That print coincided with a transition from balance to trend, and subsequent pullbacks into the low 480s were shallow. The largest Levels on the table sit between roughly 479 and 482, with high percentiles and RS above 2x, confirming that this is a meaningful base. Price is now pressing into the mid-490s. Acceptance above 495 would mark a clean continuation and put the high 490s to low 500s on deck. A slip back below 485 would signal a return to balance, with the low 480s as the first downside magnet. This is a classic grind tape where patience around the base has paid off.
Across all four, the common thread is acceptance above heavy-volume shelves rather than rejection. Buyers are not panicking, but they are consistently willing to defend levels where real size has transacted. That favors continuation until proven otherwise, with the caveat that upside progress may remain incremental rather than explosive.
Bottom line: the tape remains constructive with buyers defending key shelves; SPY 688, 682, 695; QQQ 617, 612, 625; IWM 256, 252, 260; DIA 485, 480, 495.

Summary Of Thematic Performance YTD
VolumeLeaders.com offers a robust set of pre-built thematic filters, allowing you to instantly explore specific market segments. These performance snapshots are provided purely for context and inspiration—think about zeroing in on the leaders and laggards within the strongest and weakest sectors, for example.
S&P By Sector
S&P By Industry
Commodities: Energy & Metals
Currencies/Major FX Crosses
Factors: Style vs Size-vs-Value

Events On Deck This Week
Here are key events happening this week that have the potential to cause outsized moves in the market or heightened short-term volatility.
A Front-Loaded Macro Test as Banks Open the Books
The coming week compresses a lot of signal into the front half of the calendar. Inflation, labor, housing, and a steady drumbeat of Fed speakers all arrive before the first full wave of earnings. The setup matters because markets are entering the week with momentum already established; the question is whether the data validate that trend or introduce enough friction to force a reset.
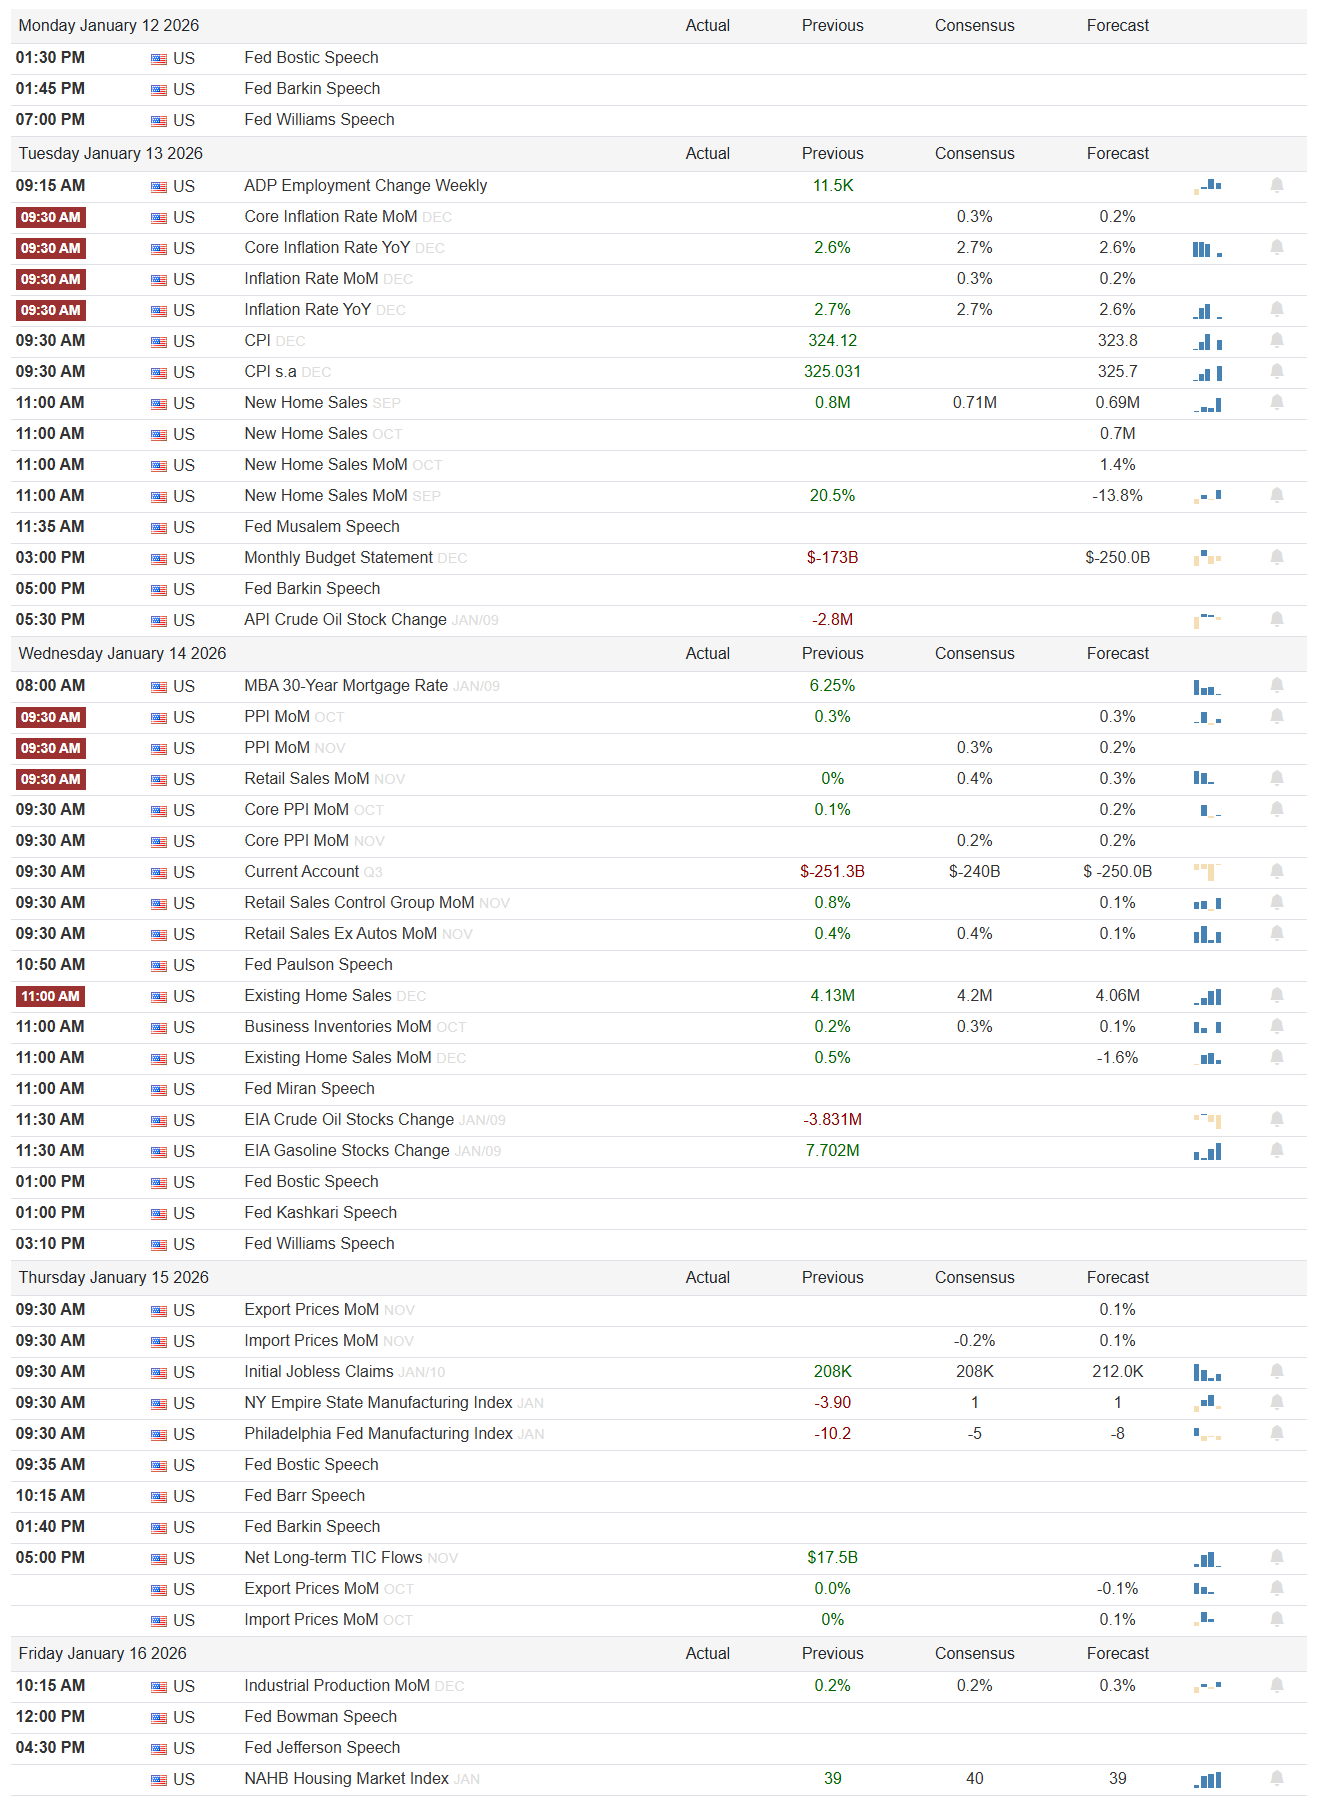
Monday sets the tone quietly on the data front but loudly on the Fed front. There are three scheduled Fed speeches, with Bostic, Barkin, and Williams all on the docket at different points in the day. With no major releases, markets will be sensitive to tone rather than specifics. Anything that leans restrictive, especially emphasis on inflation persistence or financial conditions being “too easy,” would be a mild headwind for risk. A more balanced tone that acknowledges cooling inflation without urgency to tighten further would likely be taken as confirmation that policy risk is not escalating.
Tuesday is the first real macro test. ADP employment change prints with a prior reading of 11.5K. At the same time, the inflation complex hits at 9:30 AM. Core inflation MoM is shown at 0.3% previously with a 0.2% forecast, while Core YoY sits at 2.6% versus a 2.7% prior. Headline inflation MoM shows 0.3% previously with a 0.2% forecast, and YoY is 2.7% previously with a 2.6% forecast. CPI levels are also listed, with CPI at 324.12 previously and CPI s.a. at 325.031, though the directional read is more important than the absolute index values. A mix of softer MoM prints and stable-to-lower YoY readings would reinforce the disinflation narrative and favor risk-on behavior, particularly for rate-sensitive and growth assets. A hotter-than-expected MoM would challenge that assumption quickly. Housing data follows, with New Home Sales previously at 0.71M and forecast at 0.69M, alongside a strong prior New Home Sales MoM of 20.5%. Oil inventory data later in the day adds an energy cross-current, with a prior API crude draw of -2.8M.
Wednesday broadens the lens. MBA 30-year mortgage rates are shown at 6.25%, which remains a key constraint for housing sensitivity. At 9:30 AM, PPI MoM prints at 0.3% previously, with Core PPI MoM at 0.1% previously. Retail Sales MoM is shown at 0% versus a prior 0.4%, while the Control Group MoM is a firmer 0.8%. This split matters: steady consumption without re-acceleration is the market’s preferred outcome. The Current Account balance is listed at -$251.3B versus a prior -$240B, and housing remains in focus with Existing Home Sales at 4.13M previously and Existing Home Sales MoM at 0.5%. Another cluster of Fed speakers rounds out the day, increasing the odds of intraday reversals around commentary.
Thursday shifts attention toward growth and manufacturing. Initial Jobless Claims are 208K previously with a 212.0K forecast, a range that still implies a firm labor market. Regional manufacturing surveys are mixed, with the NY Empire State Manufacturing Index at -3.90 previously and the Philadelphia Fed Manufacturing Index at -10.2 previously. Improvement toward zero would be interpreted as stabilization; further deterioration would revive slowdown concerns. Net long-term TIC flows of $17.5B provide a read on foreign demand for US assets, which matters if rates volatility reappears.
Friday is lighter but still relevant. Industrial Production MoM is shown at 0.2% previously, and the NAHB Housing Market Index is 39 versus a prior 40. These are more confirmatory than catalytic, but a surprise here could shape how the market heads into the following week.
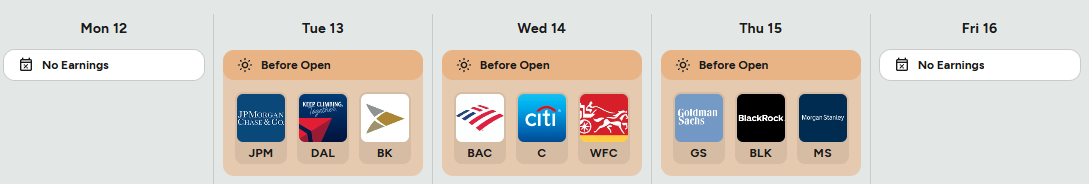
Earnings season begins in earnest with financials. Before the open on Tuesday, JPMorgan Chase, Delta Air Lines, and Bank of New York Mellon report. Wednesday brings Bank of America, Citigroup, and Wells Fargo, followed by Goldman Sachs, BlackRock, and Morgan Stanley on Thursday. The focus will be on net interest income trends, loan growth, credit quality, and any commentary on capital markets activity. For Delta, demand and pricing commentary will spill into the broader travel and consumer complex. Beats paired with confident guidance would reinforce the idea that financial conditions remain supportive; misses tied to credit stress or margin pressure would ripple quickly through cyclicals.
Three sign-posts for active traders:
Core CPI MoM at or below the 0.2% forecast keeps risk-on intact; a hotter print changes the tone immediately.
Retail Sales Control Group holding near 0.8% supports growth without overheating; a sharp downside miss raises slowdown risk.
Initial Claims staying near the 208K to 212K range signals labor stability; a sudden spike would pressure equities.
Bottom line: the week hinges on whether inflation continues to cool without growth rolling over, with early data and bank earnings setting the narrative before midweek.

Order Flow in Focus: Reading Smart Money Tells
Order Flow in Focus: Reading Smart Money Tells is a recurring segment that spotlights unique intraday opportunities revealed through institutional order flow. Each feature dissects a moment when the tape quietly shifted—when large, ranked prints clustered at key liquidity locations and informed players positioned ahead of the move. The goal isn’t hindsight; it’s pattern recognition—learning to spot the footprints of capital that knows before the crowd does.
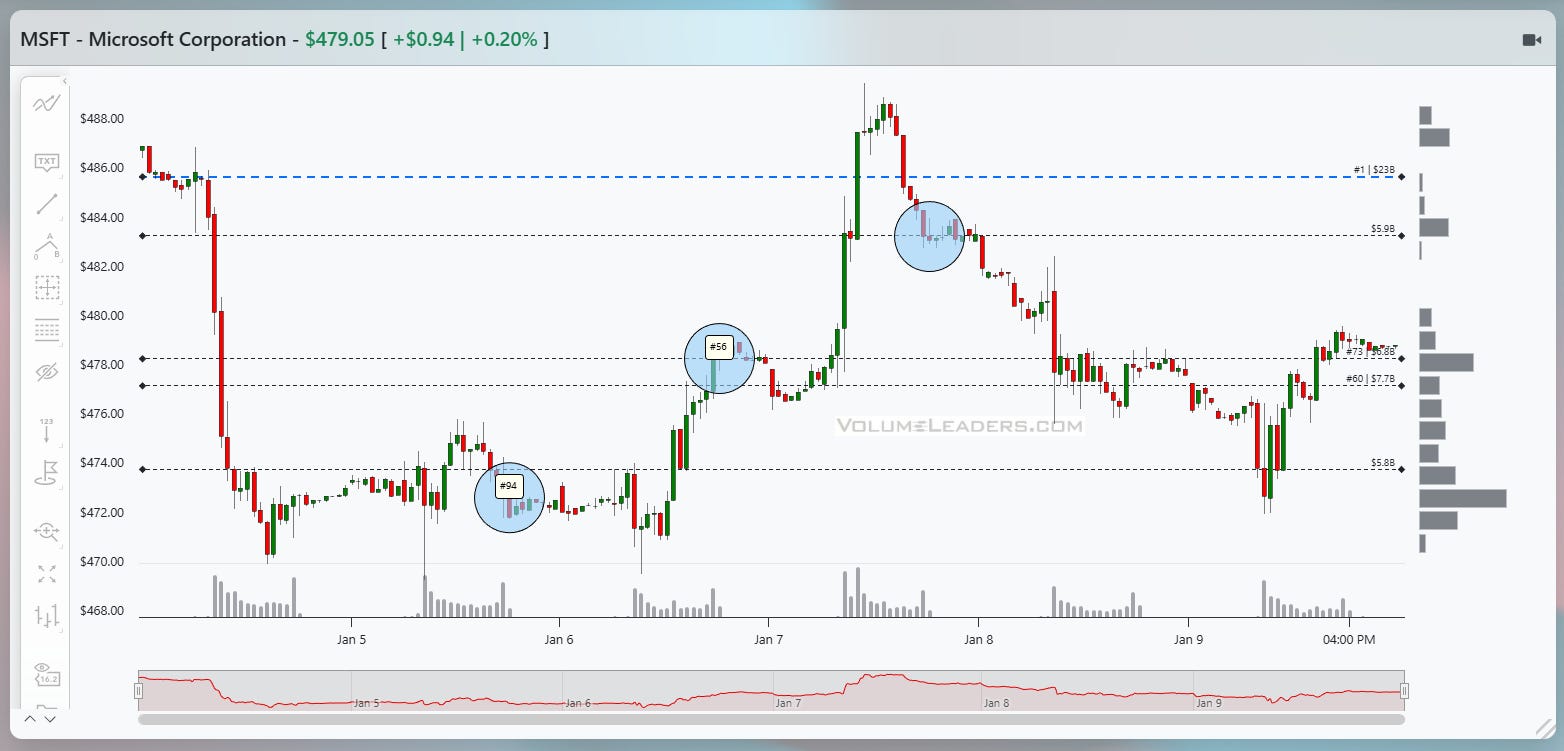
This sequence is a clean example of how informed positioning often shows up first in places most traders ignore. The headline chart is Microsoft, but the tell comes from its inverse, leveraged cousin. When liquidity is thin and participation is narrow, footprints get louder, not quieter.
Start with MSFT. The structure into early January is defined by a sharp liquidation leg, followed by balance and then a fast vertical response higher. Price breaks down hard from the mid-480s, finds acceptance in the low 470s, and begins to coil. What matters here is not the bounce itself, but how it is sponsored. Around the low 470s, a large ranked print appears, labeled #94, sitting directly inside the base. That is not reactive buying after confirmation; that is size stepping in while price is still going nowhere. Shortly after, another ranked print, #56, shows up near 478 as price starts to lift out of balance. That second print is important. It signals that the first buyer is not alone and that inventory is being accumulated as price transitions from repair to initiative.
The payoff comes quickly. MSFT accelerates vertically into the upper 480s before stalling just under the mid-480s shelf. There is a visible reaction there, with price backing off into the low 480s. That pullback is orderly, not panicked. It tells you the move is being digested, not rejected. By itself, this is already a tradeable long sequence: absorption at the lows, confirmation through follow-on size, impulse, then controlled pullback.
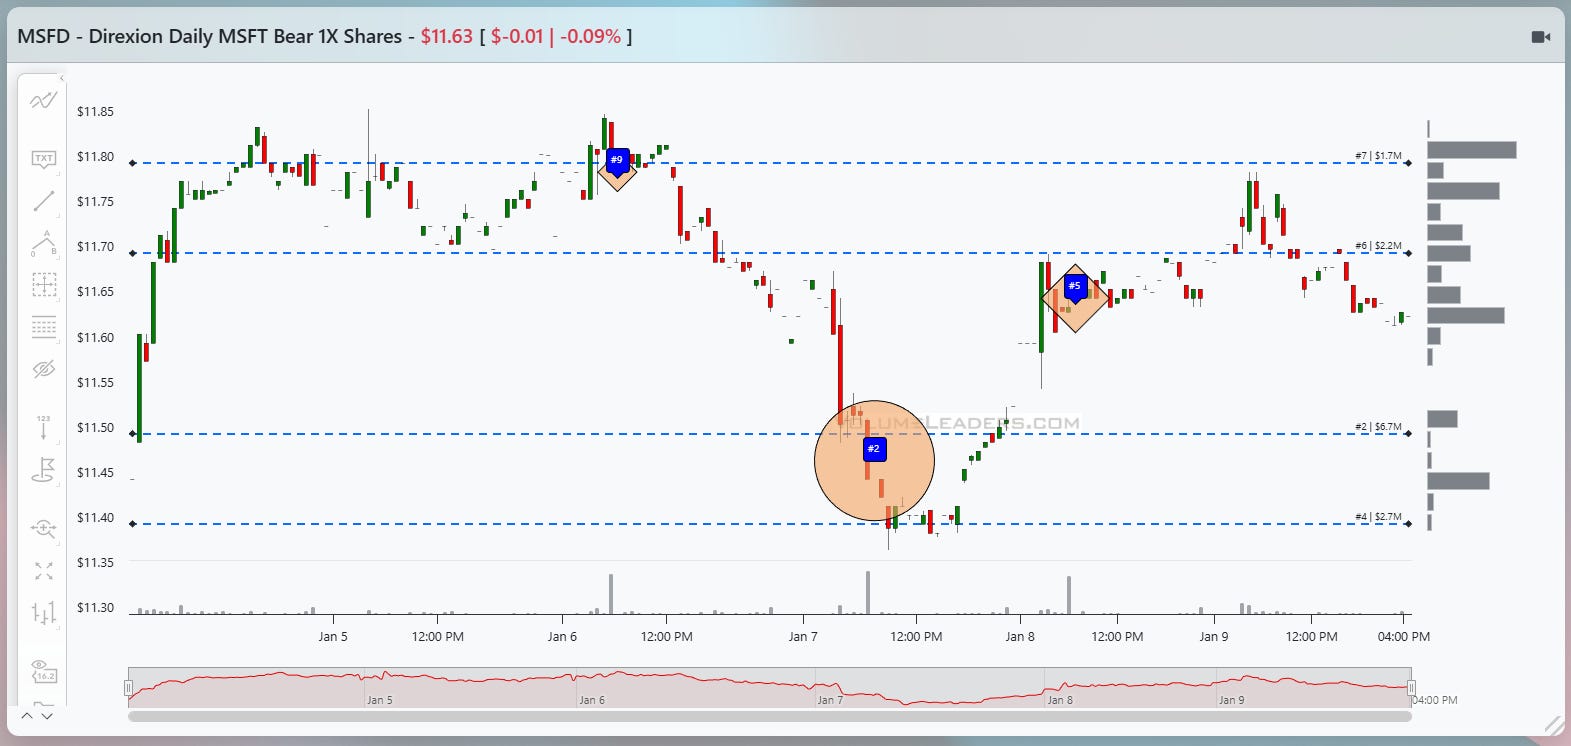
Now look at MSFD. This is where the tape gets interesting.
MSFD is a thin, inverse, single-stock product. It does not attract tourists. When size shows up here, it is almost never accidental. As MSFT is compressing near its lows, MSFD is rallying toward the upper end of its range. Near 11.80, a ranked print #9 appears directly at resistance. That is not someone hedging after the fact. That is a seller leaning into strength at a very specific level. Shortly after, price rolls over. MSFD begins to slide, but the real tell comes on the acceleration lower.
As MSFT transitions from base to breakout, MSFD sells off sharply into the 11.40 to 11.45 zone. Right there, at the lows, a massive ranked print appears, labeled #2, with notional north of $6.7M. That is one of the largest trades this product has ever seen, executed exactly as downside momentum peaks. Price does not continue lower. It stabilizes immediately. That is classic exhaustion paired with absorption. The seller has finished, and a buyer is now willing to take the other side in size.
This is the moment the trade becomes asymmetric. You do not need to predict MSFT earnings, AI narratives, or macro tailwinds. You simply observe that informed players are exiting short exposure in MSFD aggressively, right as MSFT is lifting off its lows. The inverse product is telling you that the downside bet is over.
From an execution standpoint, the trade leg is straightforward. The MSFD flush and absorption near 11.40 to 11.45 is the signal. That is your confirmation that the MSFT long is no longer fighting distribution. The entry on MSFT comes either on the first pullback after the impulse, near the mid-to-high 470s, or on acceptance above the 478 to 480 shelf where the #56 print appeared. The invalidation is equally clean: if MSFD fails to hold above its absorption low and continues to trend higher, the thesis is wrong.
The exit logic writes itself. MSFT runs directly into the upper 480s, where prior supply lived. That is where momentum stalls and where partials or full exits make sense. You are not trying to capture the entire trend, just the leg that was telegraphed by informed positioning.
The broader lesson matters more than the individual trade. With hundreds of leveraged and inverse equity products now trading, smart money has more ways than ever to express views early and quietly. These instruments are thin, which means large players leave clearer footprints. If you are only watching the underlying, you are often late. If you are watching the derivatives, you see the turn being paid for in advance.
This was not hindsight. The ranked prints were there, in both instruments, at precisely the inflection points. Someone knew price was ready to pivot, and they positioned accordingly. The tape told the story before the crowd ever caught on.

Market Intelligence Report
A desk-grade synthesis of institutional positioning and market structure—unpacking the flows, levels, and emerging themes that shaped the week, and translating them into a model portfolio built the same way professional desks prepare for the week ahead.
MIR Part 1: The Backdrop
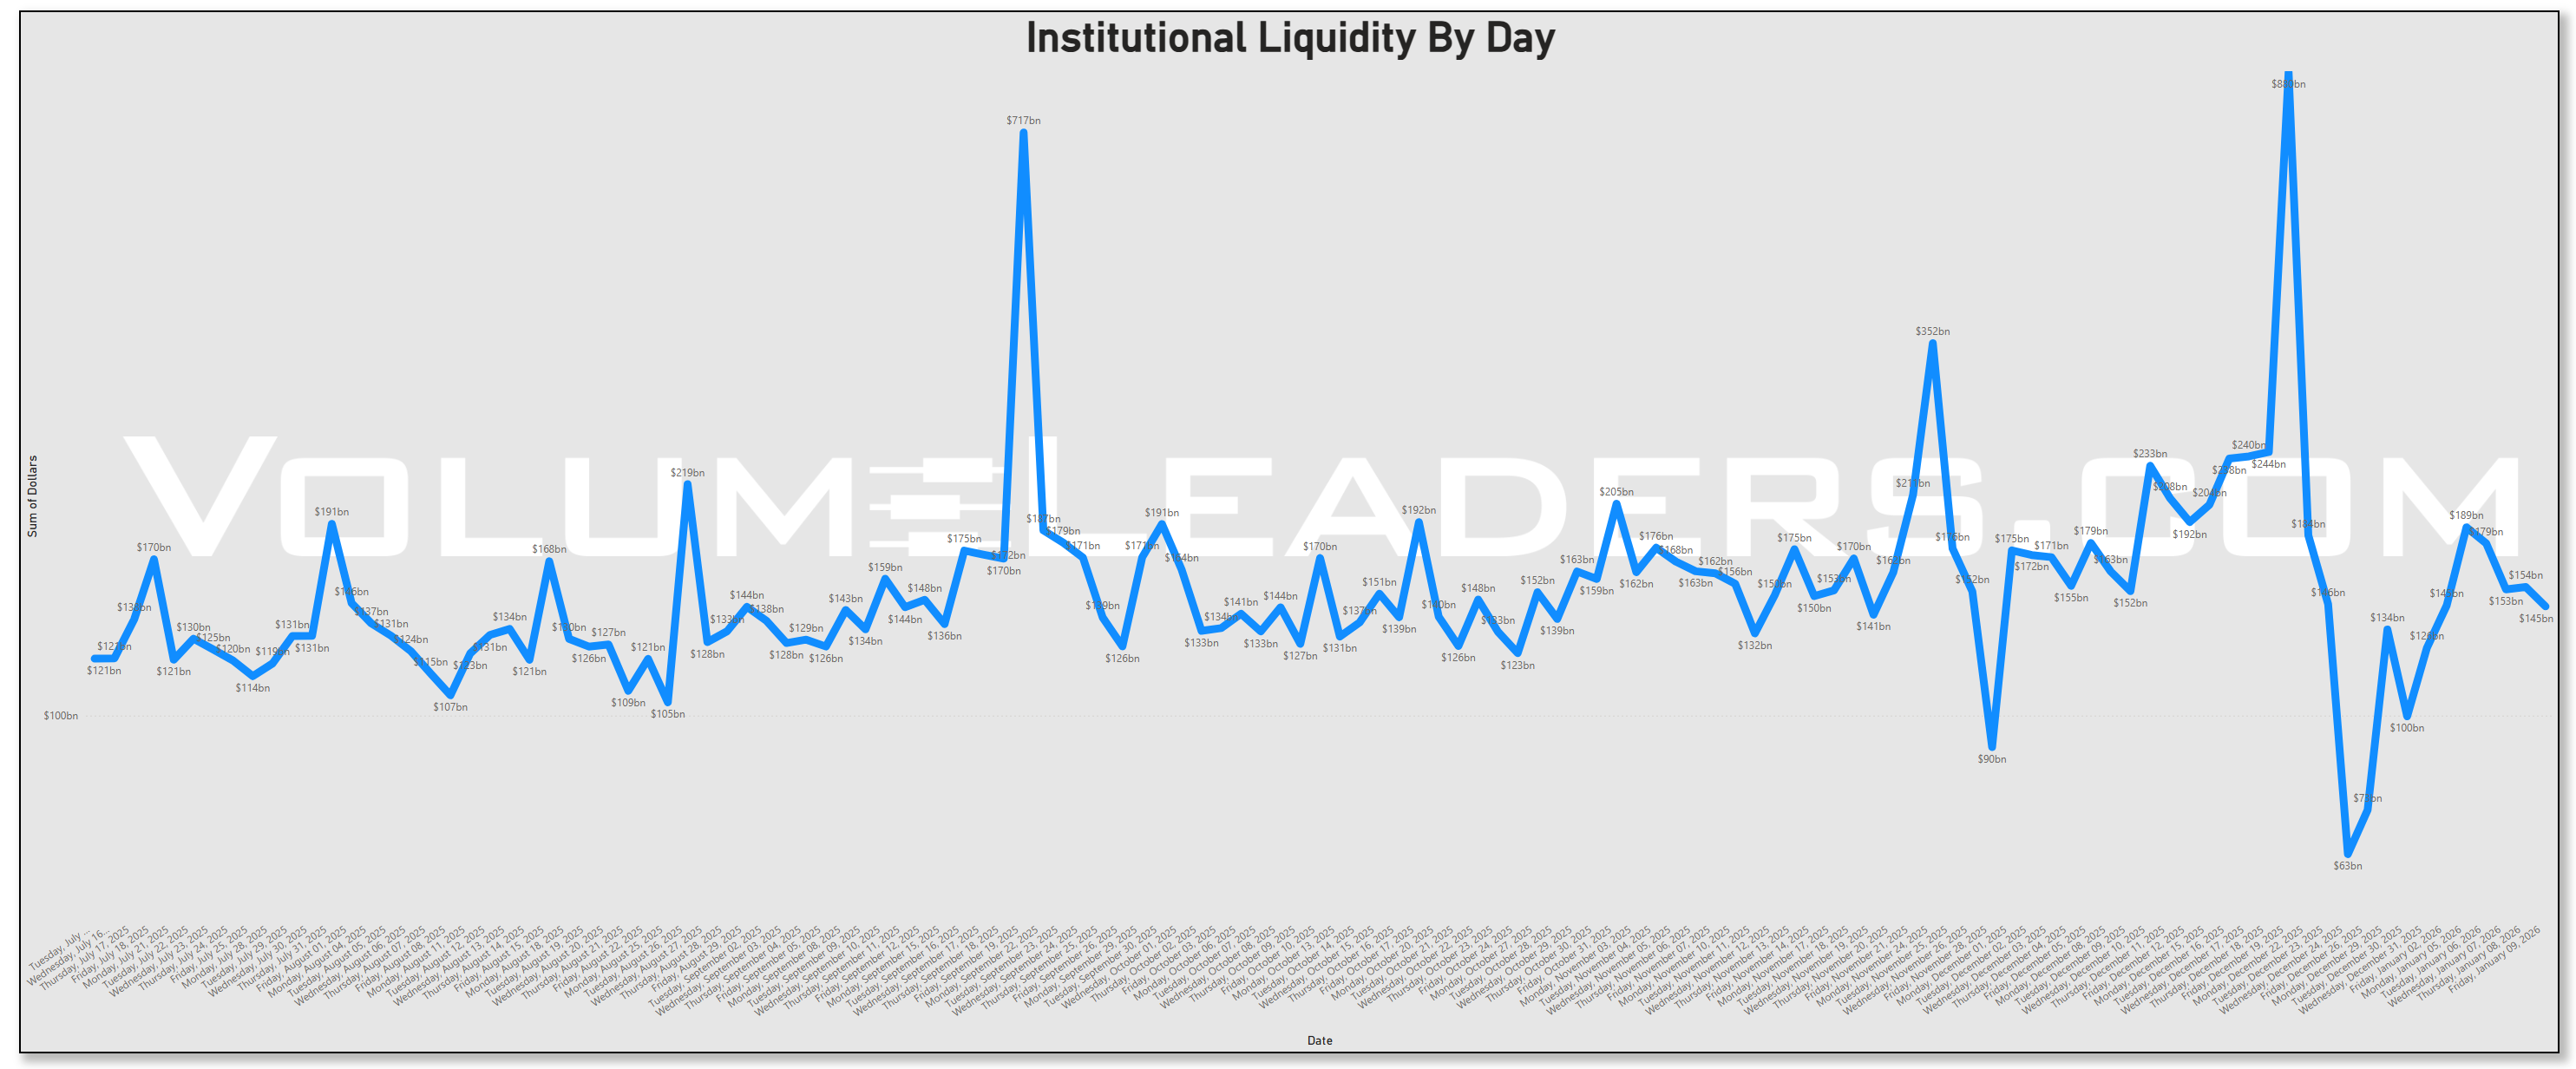
The liquidity backdrop across the first full week of January 2026 reads like a market finally re-engaging after the seasonal and shutdown distortions of late December. The time-series of institutional volume by day shows classic early-January liquidity mechanics where mandates reset and slow volumes convert into high-impact executions as funds get positioned for the new cycle, effectively turning January into a decisive allocation month rather than a continuation of the thin holiday stretch. Seasonally this is consistent with the notion that January often sees mechanical inflows and trend confirmations after the end-of-year lull, though the so-called January Effect itself is not a reliable predictor, but more a structural flow phenomenon as capital rotates back onshore and benchmarks are rebalanced.
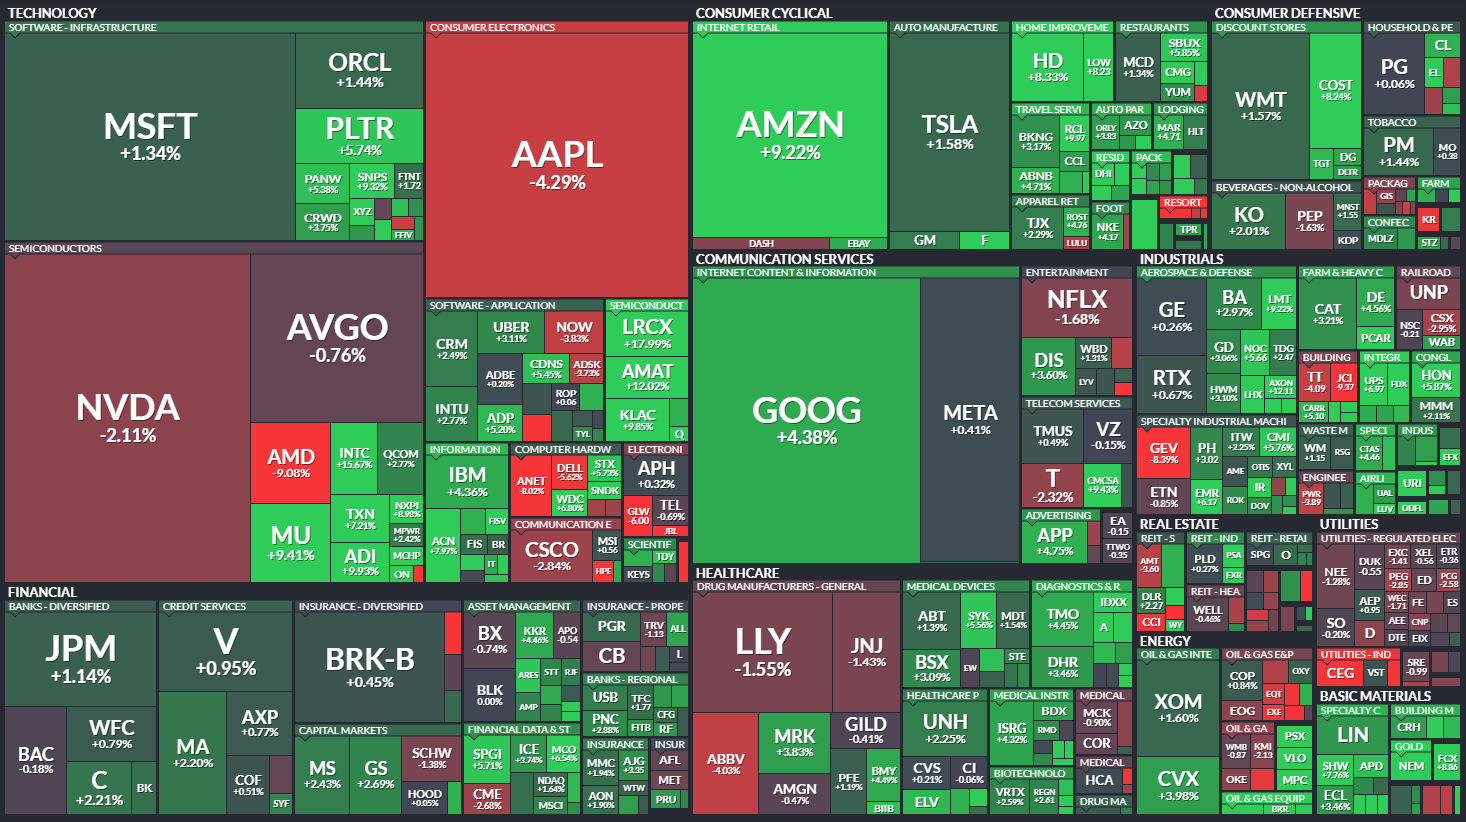
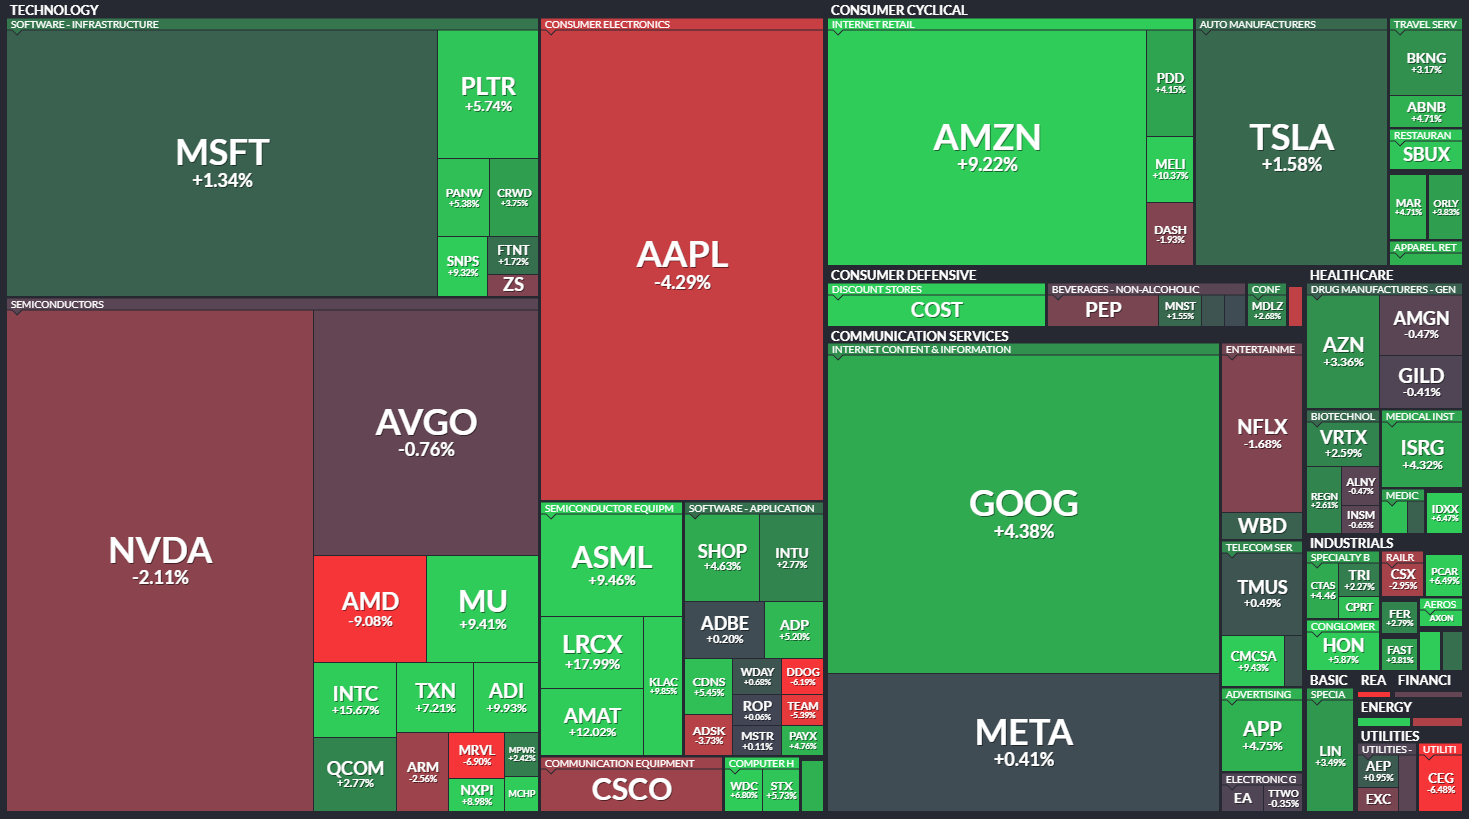
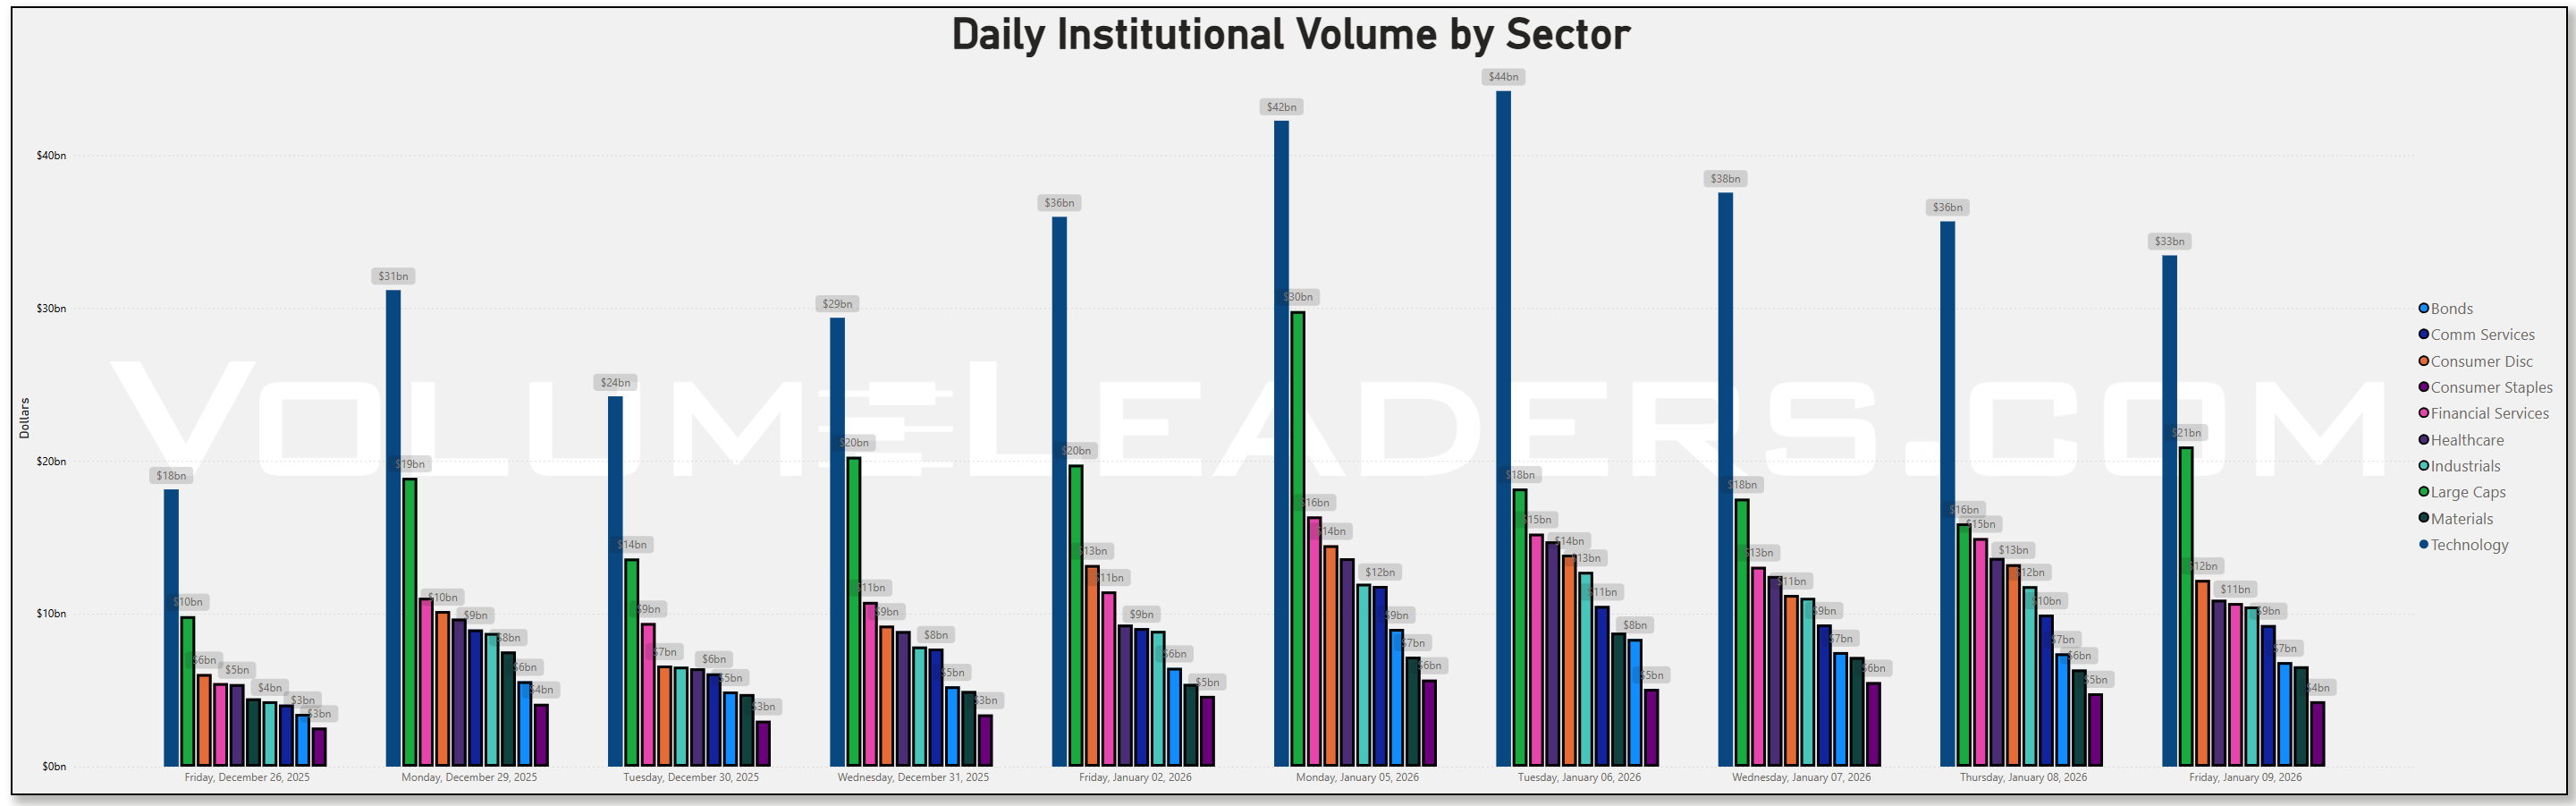
If the first full week of January 2026 reveals anything about institutional intent, it’s that Technology remains the gravitational center of capital, far eclipsing other sectors in sheer dollars moved. Across every session in the institutional volume-by-day series, Technology stands tallest — routinely topping the $30 billion mark — with other sectors like Large Caps, Financials, and Industrials playing supporting roles, not co-leaders. This isn’t a nuance; it’s the definitional priority of capital allocation in play right now. Where many narratives assume broad beta or cyclical catch-ups, the table consistently shows that Technology dwarfs these flows, meaning institutions are anchoring exposure in Tech and then tilting outward, which highlights conviction rather than hedged participation.
Stepping through the week, the largest peaks in daily institutional volume come early and late in the sample, with totals rising well above the surrounding sessions that bracketed the holiday pause. Such elevated session volume in early January reflects not just seasonal reactivation but prioritized deployment into Tech and associated large cap exposures. This echoes the typical structural reset seen as the market reopens after year-end, but here we see Technology carrying the bulk of that restart rather than simply joining a broad beta cohort. Funds don’t reopen their books with halfhearted chips on cyclical catch-ups; they reopen with high-conviction buckets. That behavior is visible in the magnitude and consistency of tech’s campaign across the week.
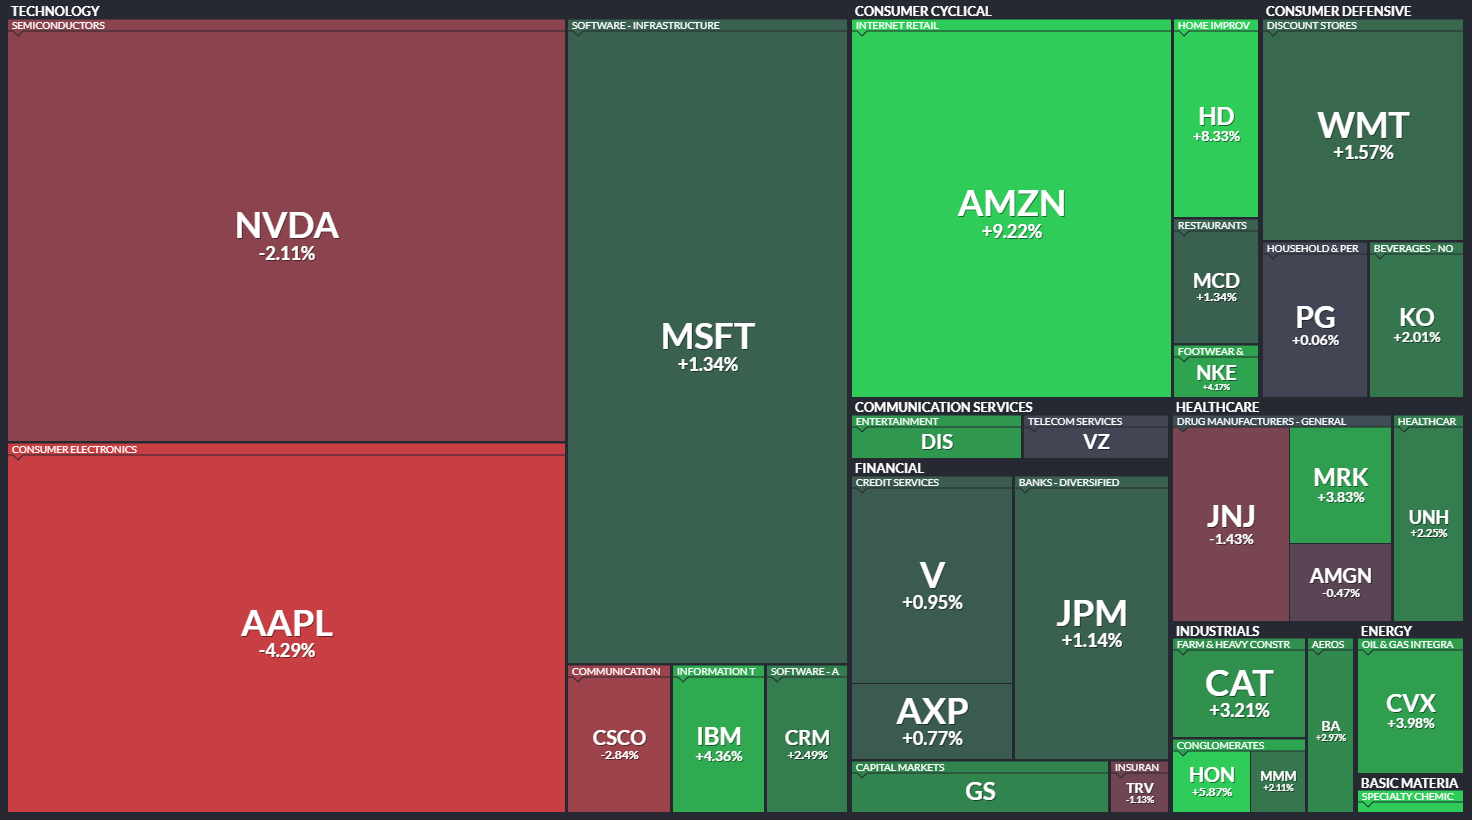
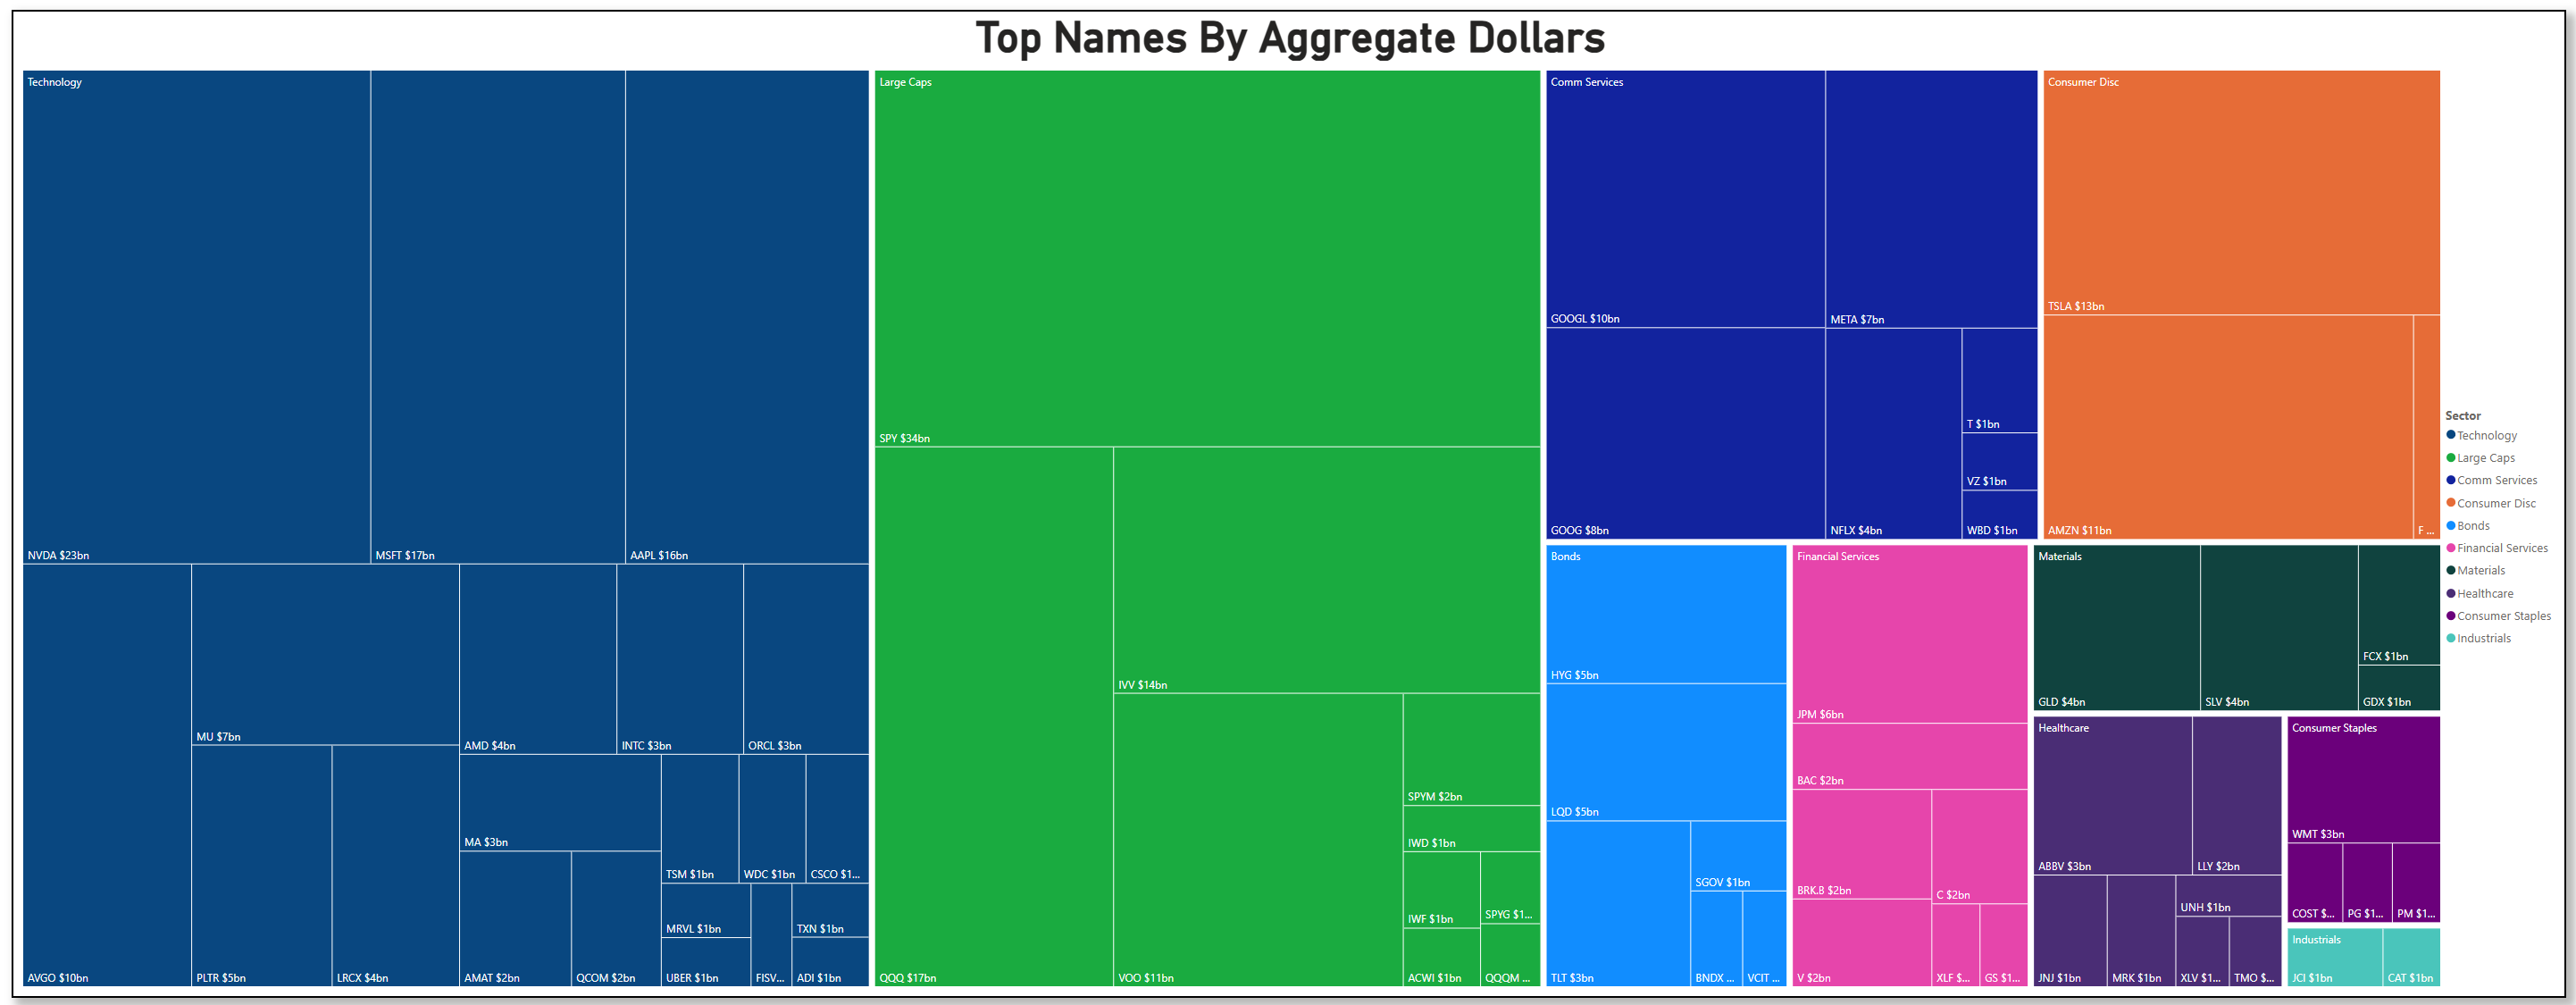
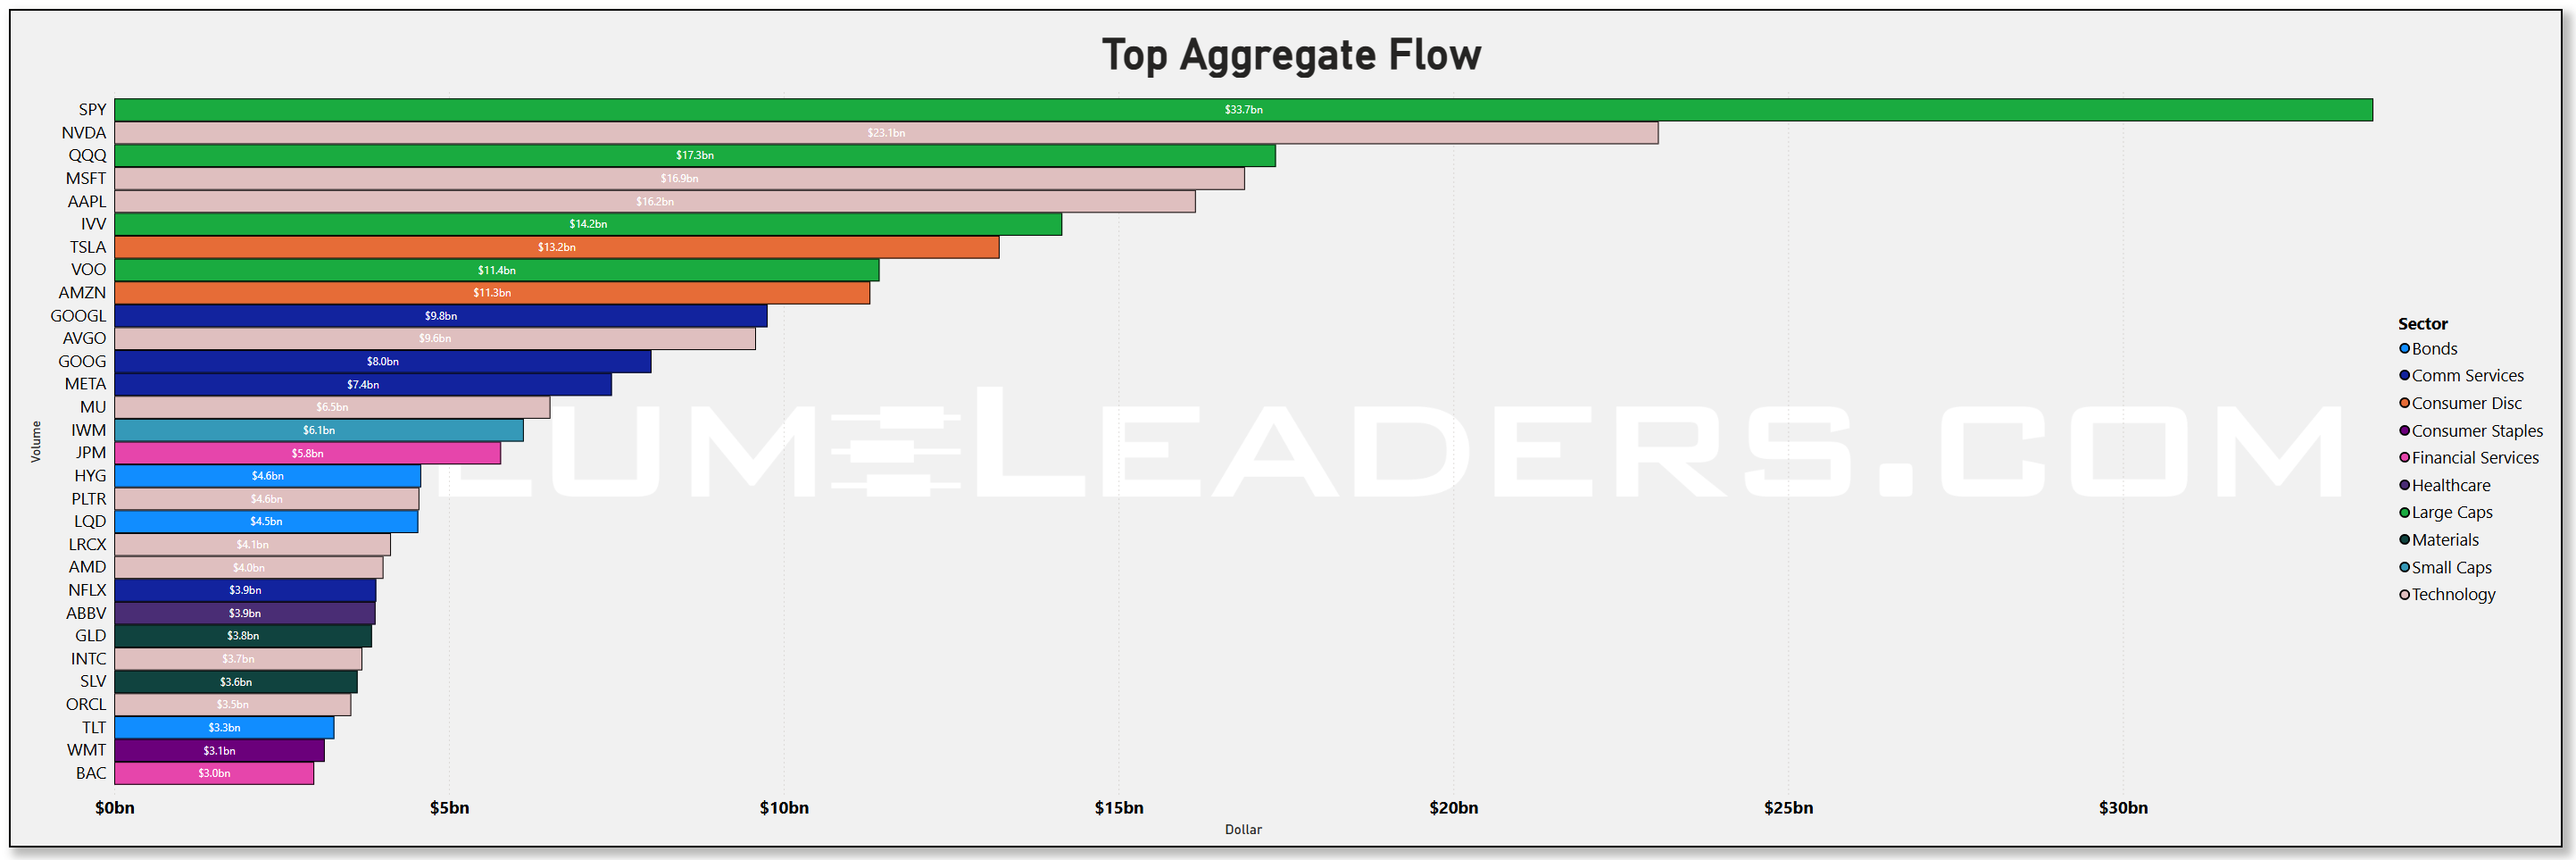
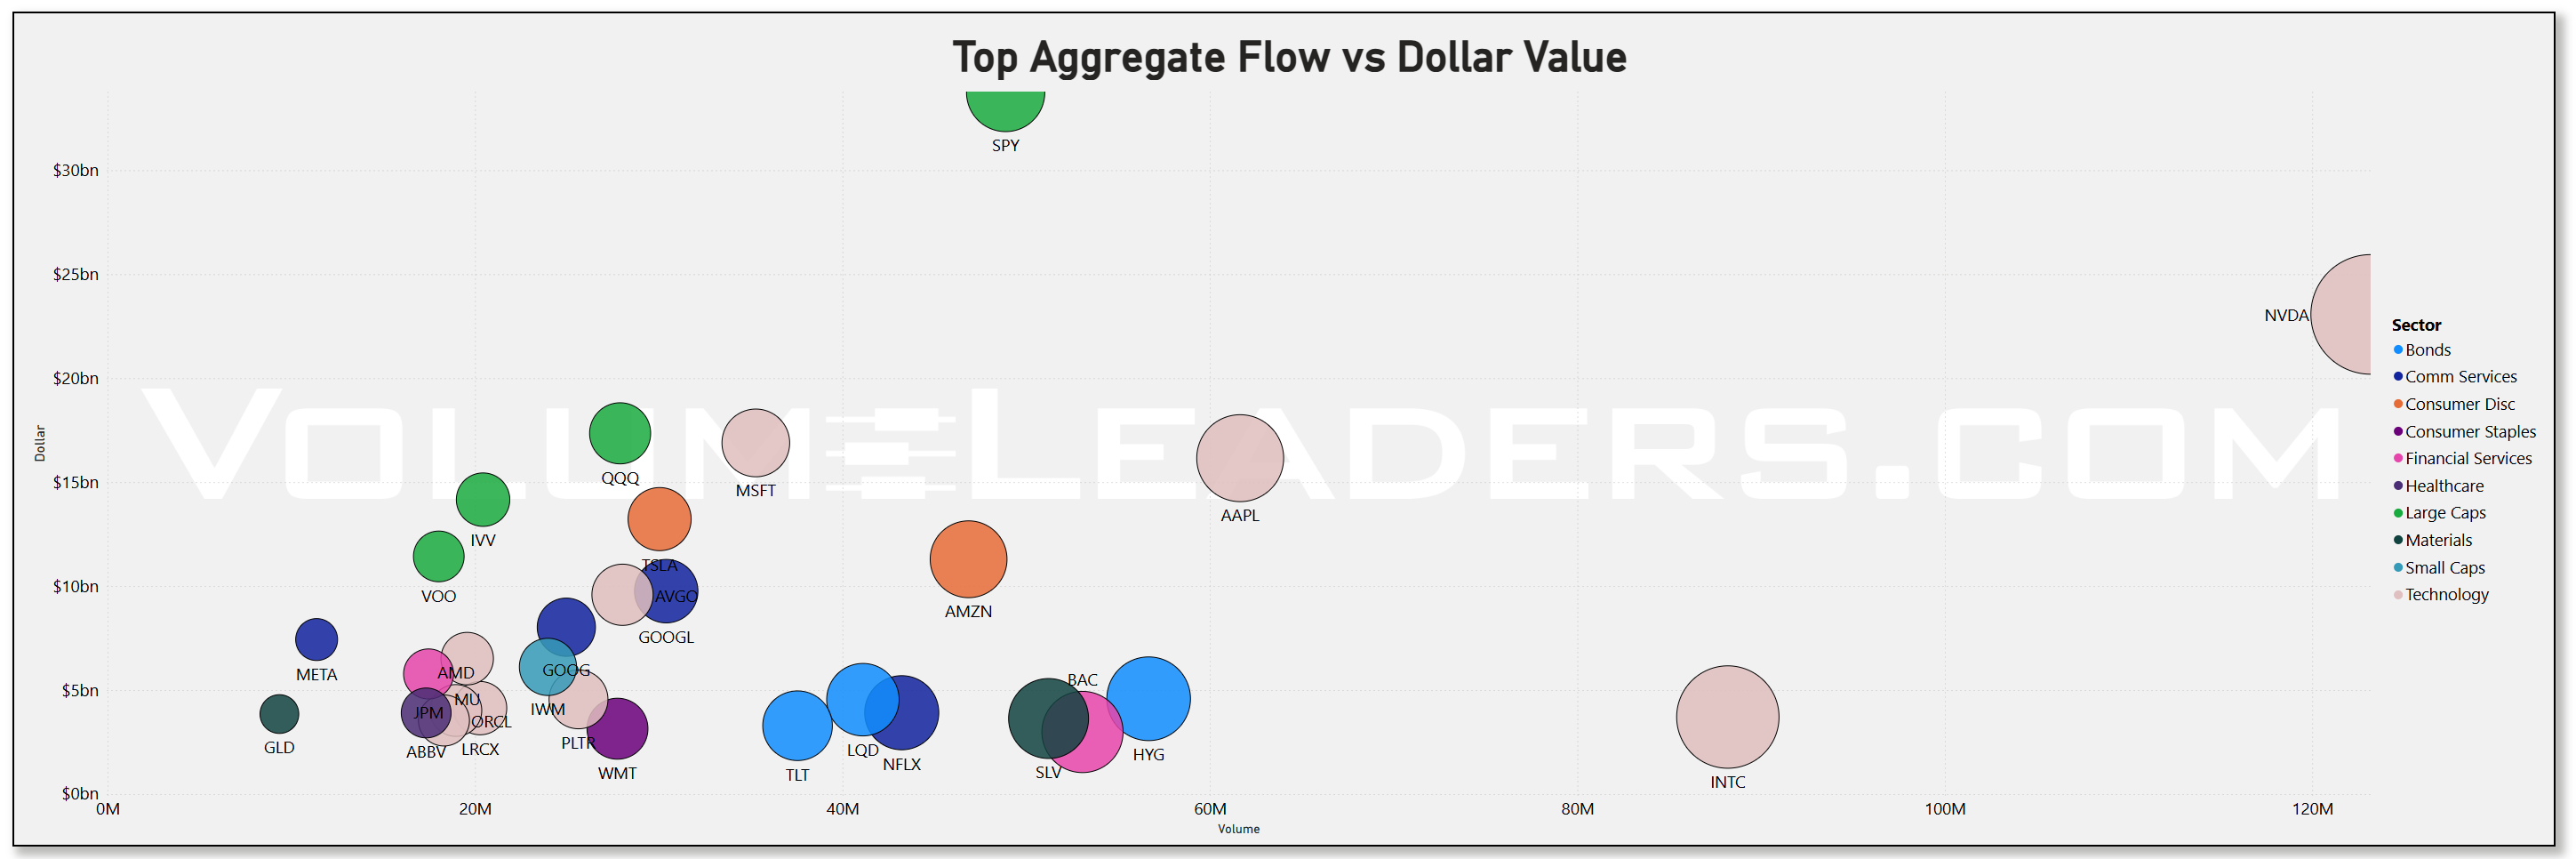
The Aggregate Flow charts tell the same story from a different vantage. While SPY remains one of the single largest dollar magnets — a necessary bedrock for managing broad beta exposure — NVDA, MSFT, and AAPL tower over their peers in aggregate dollars traded. NVDA’s footprint alone rivals broad market proxies in magnitude, and QQQ sits near the top of the scatter as well, making it clear that tech leadership is not a grouping of small bets but principal drivers of capital. These concentrated flows hint at strategic decisions rather than incidental sector rotation, and the scatter of high dollar and volume points across multiple tech names underscores breadth within Technology’s dominance. The conversation is not “Tech vs everything else” in the abstract, it’s Tech first, then everything else second — and that ordering matters for positioning.
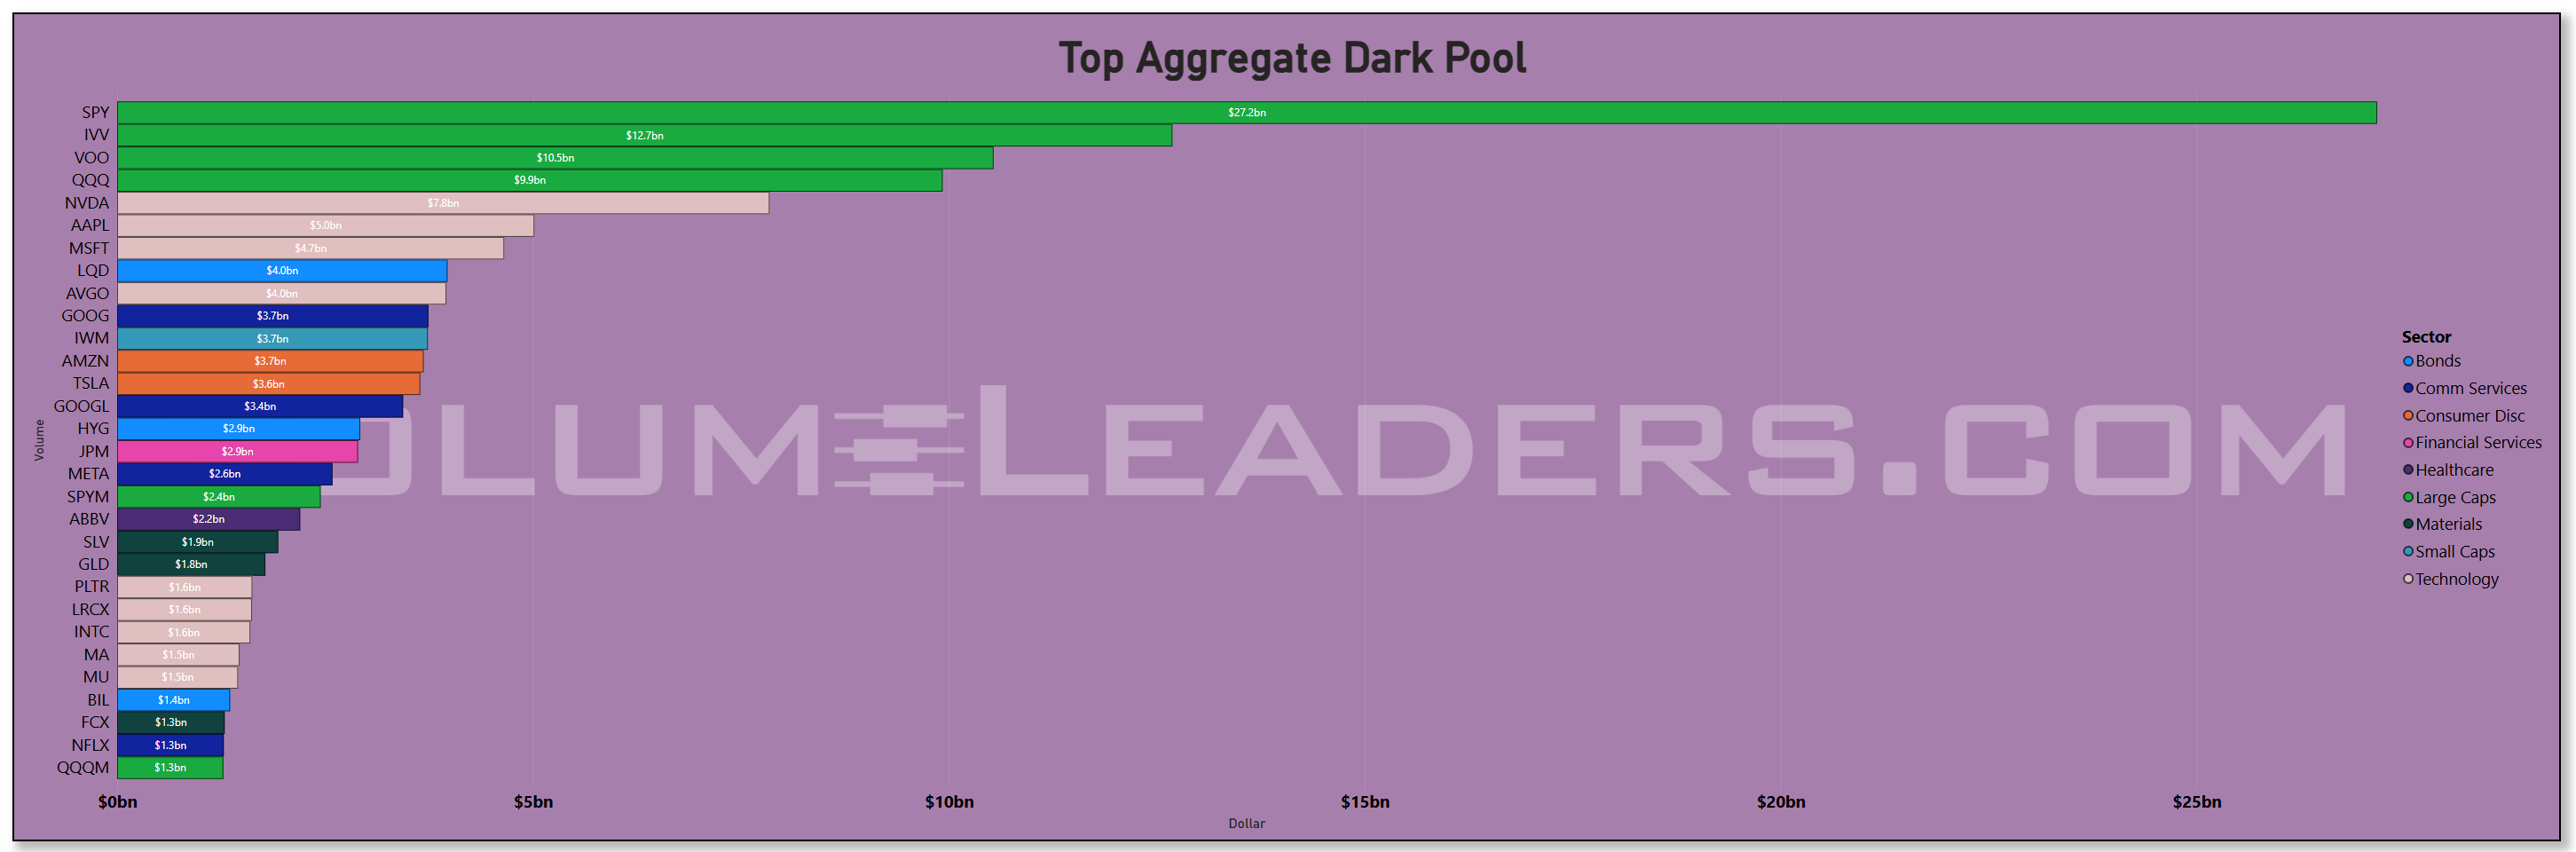
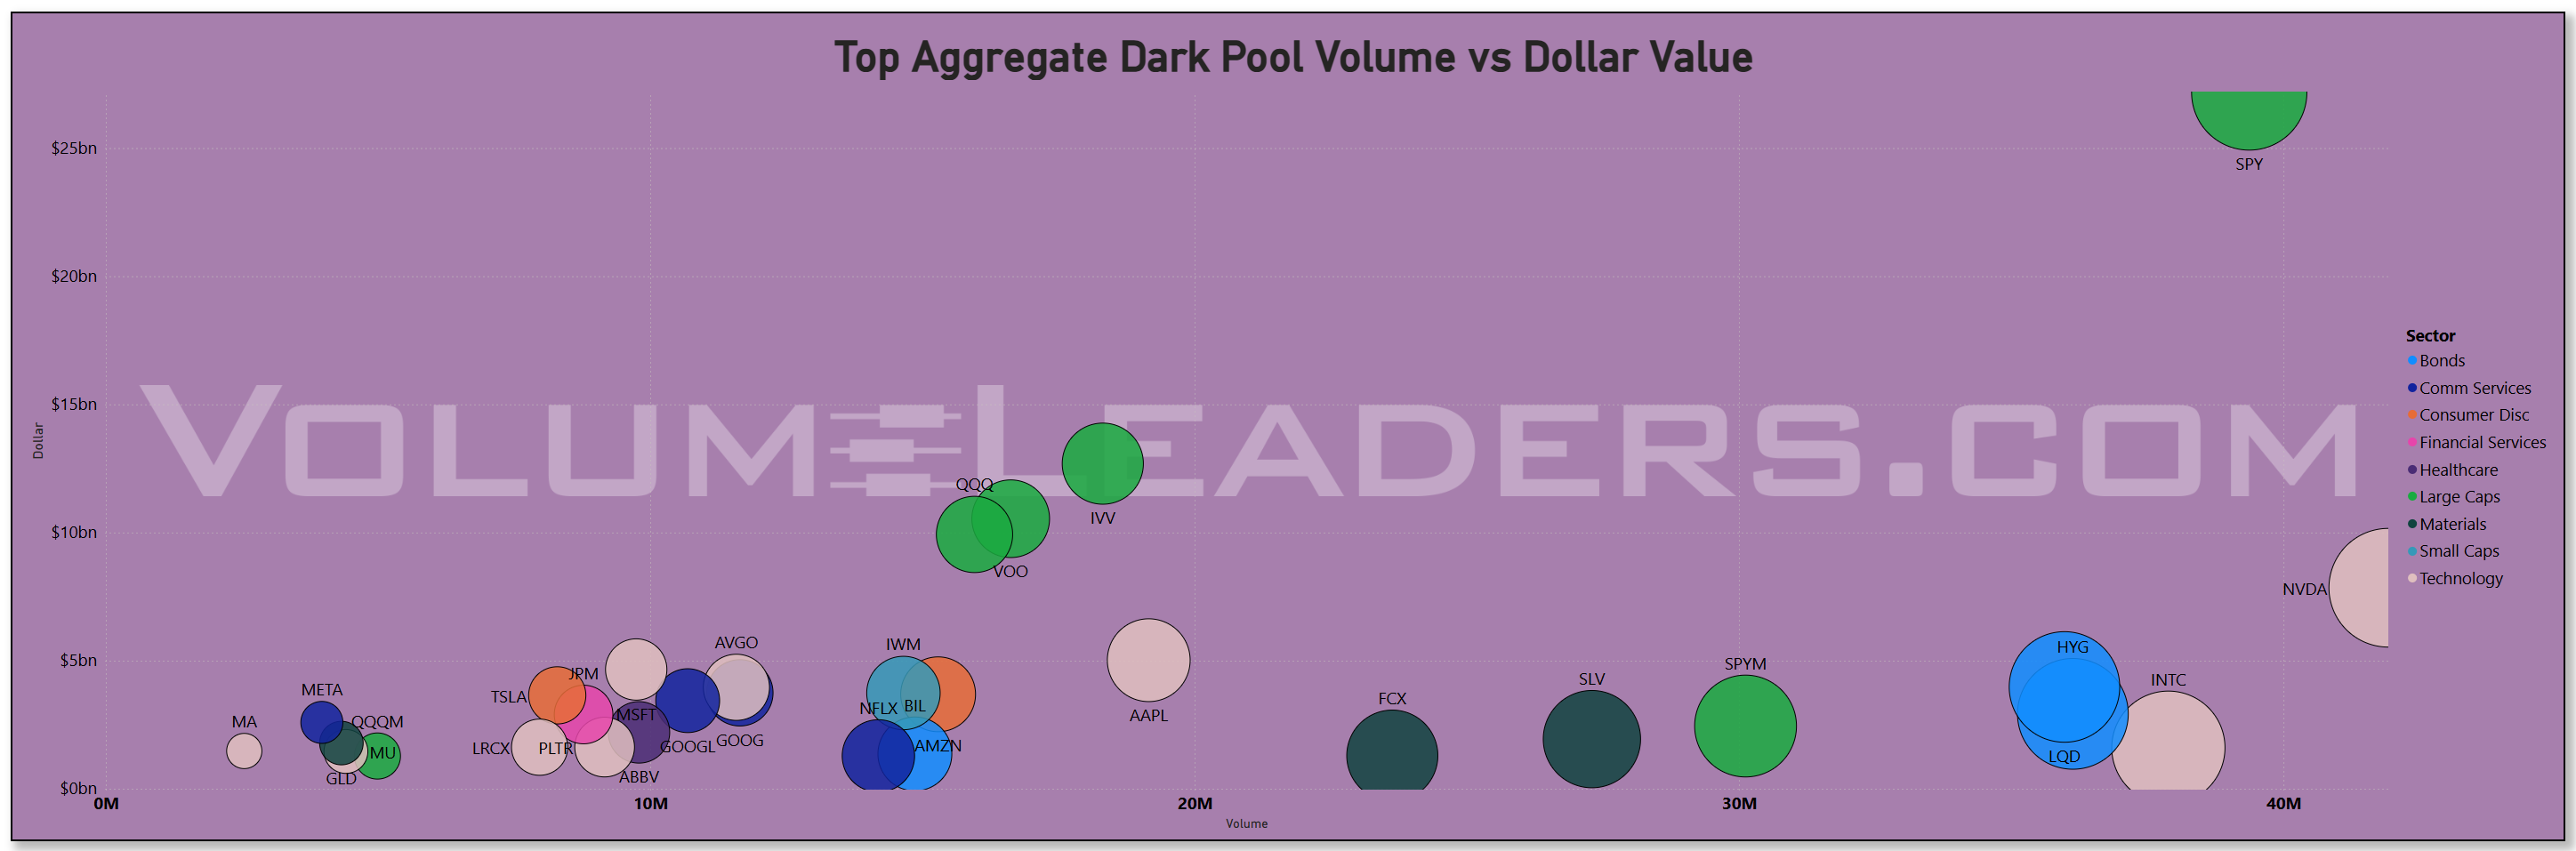
Viewing the week through the dark pool lens unveils how institutions prefer to house those convictions off exchange. SPY’s dark presence is robust, but not surprisingly, the largest off-exchange concentrations after the index instruments come from NVDA and AAPL. Dark volume is where size wants cover, and when the largest dark prints align behind tech mega-names, it typically signals accumulation with discretion, not just visible chase. This is especially interesting in a market where headline macro noise is everywhere; funds aren’t merely responding to headlines in the lit tape — they are likely quietly onboarding tech exposure in size where they can do so with minimal signaling.
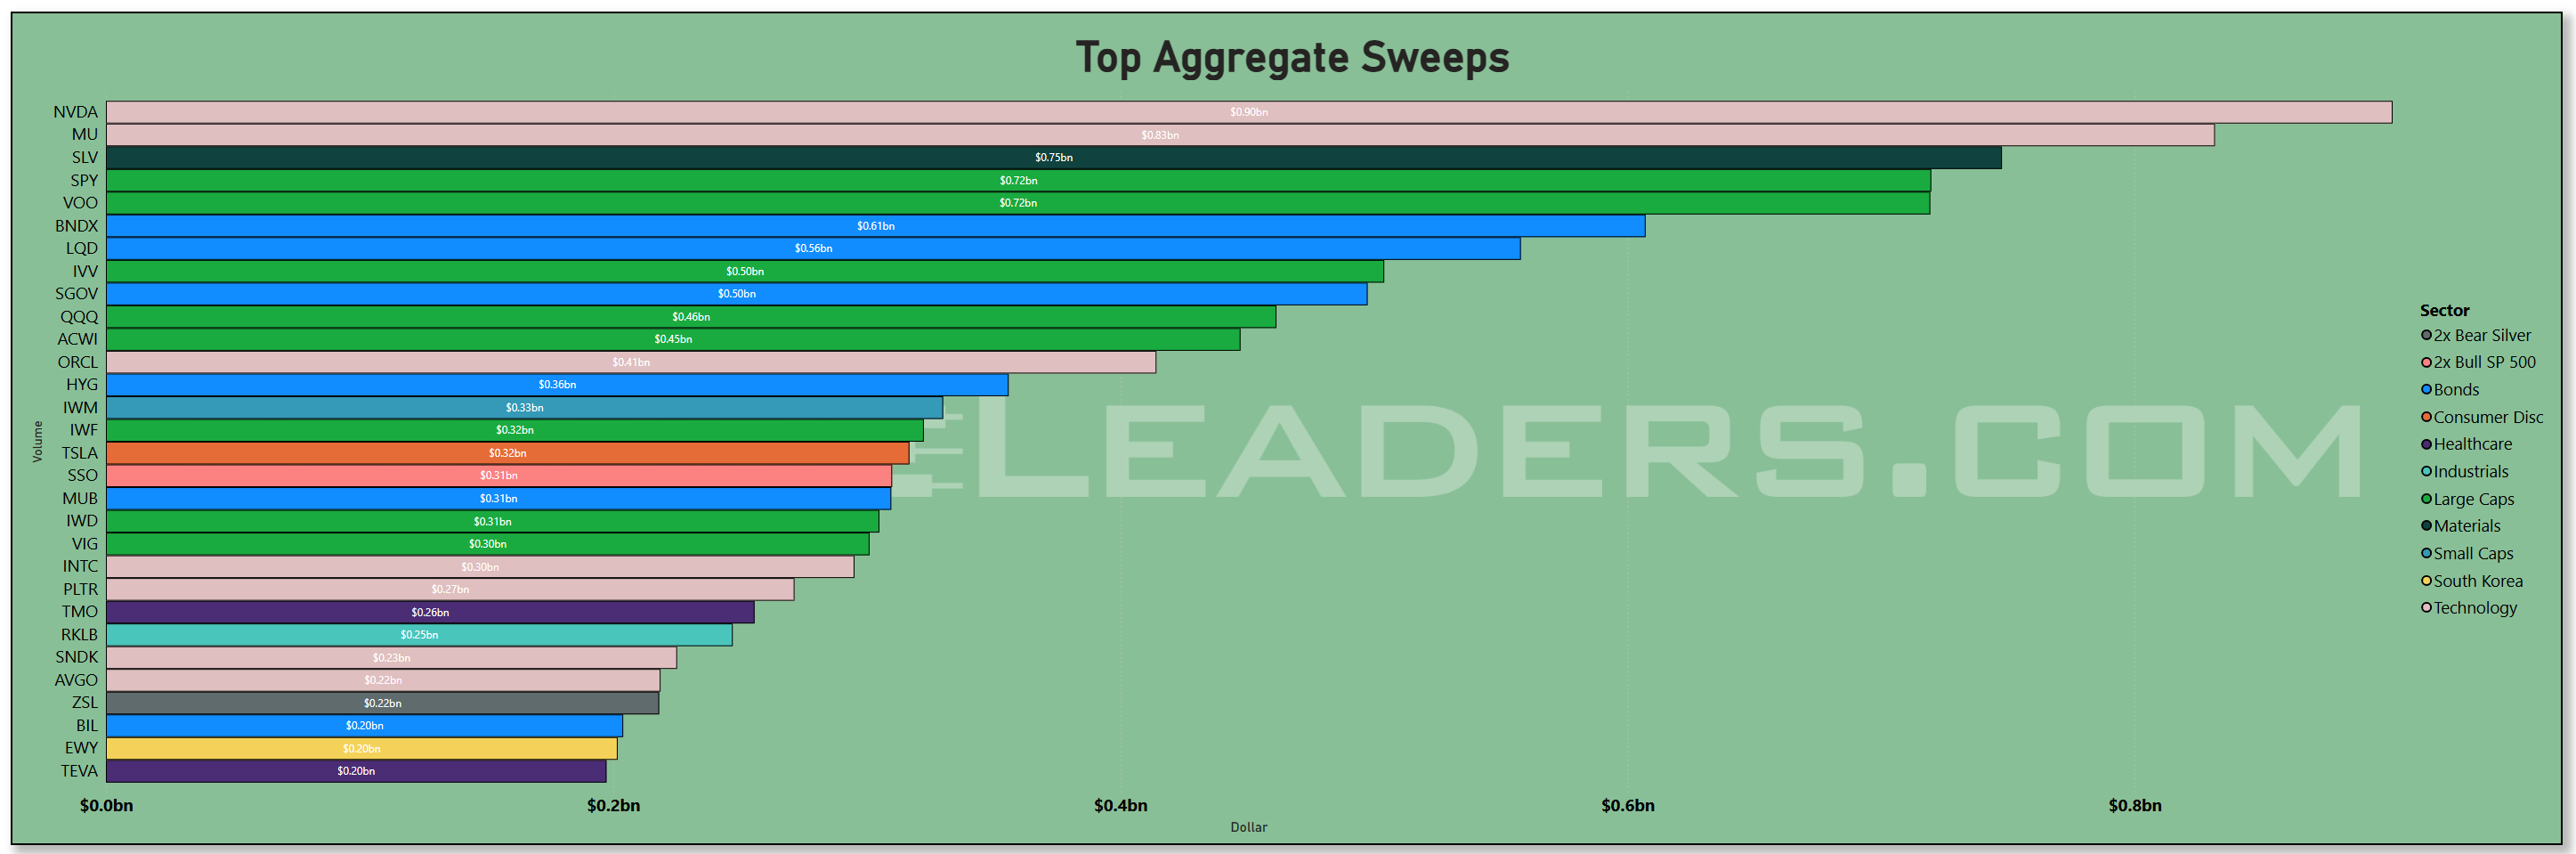
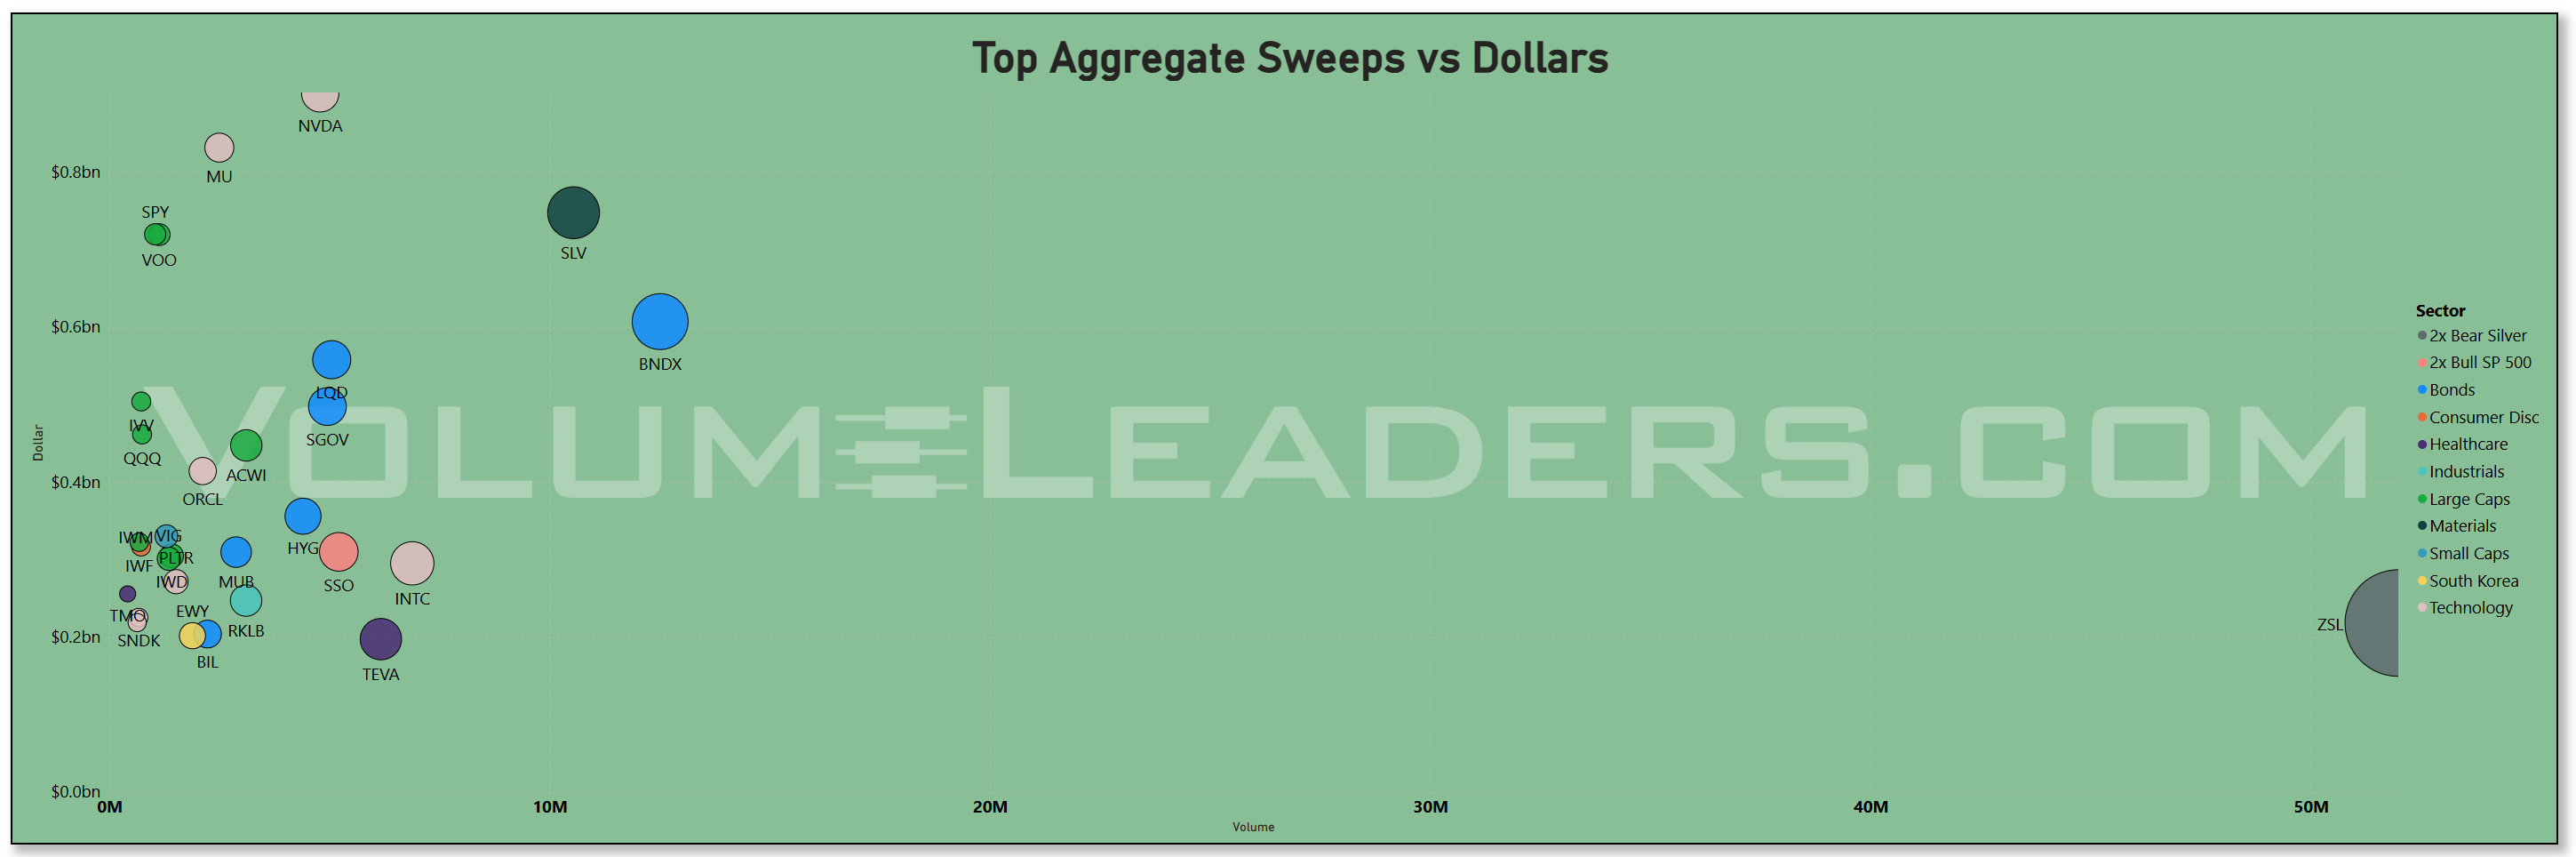
The sweep statistics, reflecting the most aggressive liquidity demands, echo this thesis. The top sweep names again include NVDA and related tech proxies, and the notional sweep tallies for both broad cap ETFs and semiconductor/largest cap tech stocks speak to active liquidity hunting in the tech complex. Sweeps into fixed income proxies like HYG and LQD are nontrivial, suggesting strategic hedges co-located with tech exposure, but the hierarchy is clear: aggressive money is transacting in tech and broad beta first, then hedges alongside.
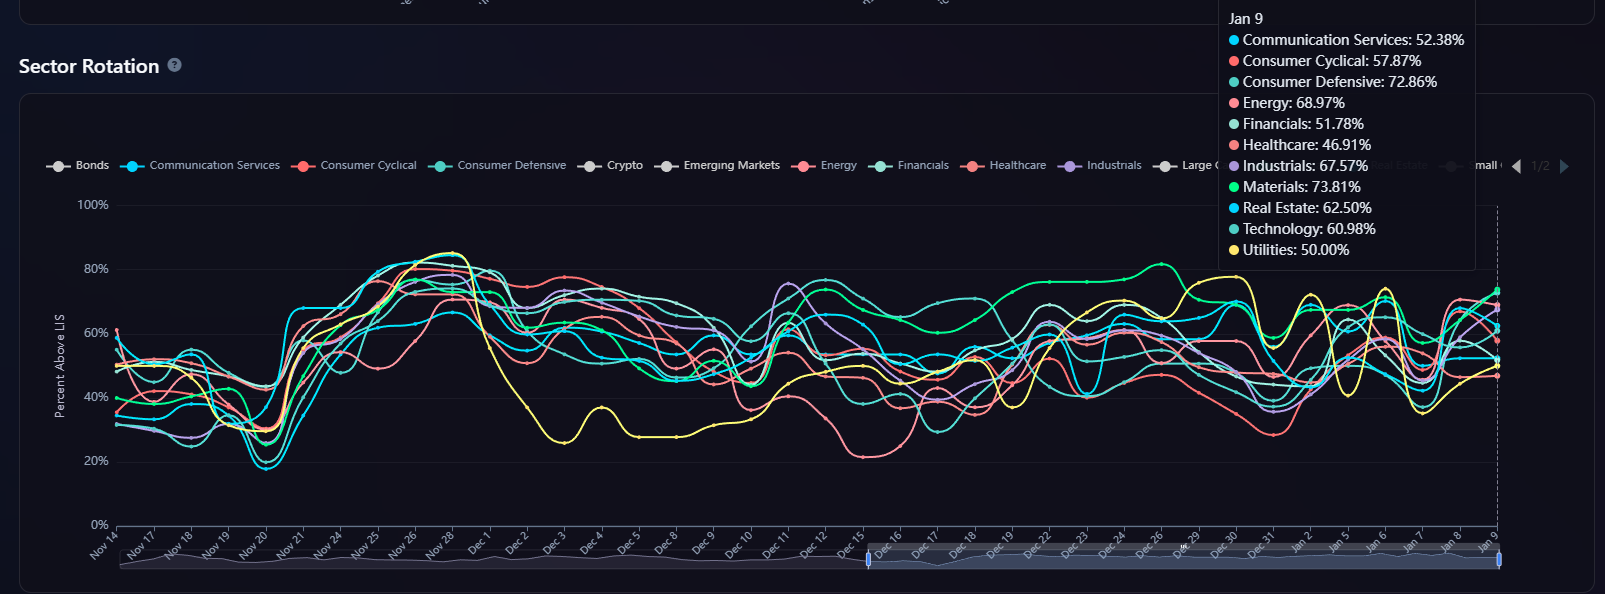
When these execution footprints are reconciled with the sector rotation dashboard, the hierarchy becomes even more coherent. Technology is the relative leader on momentum and participation, Consumer Cyclicals and Materials sit in secondary roles with respectable but smaller uptrends, and defensives lag. Over the past few sessions, there’s been a small but perceptible uptick in cyclicals relative strength, but nothing that threatens Tech’s dominance. Financials remain middling; Healthcare and Utilities lag. The two-day change in rotation metrics shows mild breadth expansion beyond Tech, but institutions are not abandoning their tech anchors — they’re merely broadening the canvas once the anchor is set.
Overlaying macro context helps explain why this hierarchy manifests the way it does. Markets entered the year after a period of disinflationary headlines and sticky labor data, where CPI remained above target and jobs growth softened to levels that suggested slowing growth without immediate recession threat. That combination keeps the discount rate environment benign for growth exposures while raising caution flags at purely cyclical corners. It’s exactly the environment where institutions would lean into structural growth leaders and hedge selectively, not rotate wholesale into value or defensive assets. The spending patterns seen in the cash flows suggest confidence in secular growth underpinned by Tech, with tactical hedges layered in credit and moderate cyclicals rather than forced broad de-risking.
Seasonally, January is often a turning point. The market typically sheds holiday silence as mandates reset, and this year is no exception. What is distinct is the magnitude and consistency of tech-centric activity throughout that reset phase. Rather than tentative engagements in diversified sleeves, funds are transacting most heavily into Technology, which strongly suggests that the narrative heading into the year — that tech earnings resilience and growth secular trends would continue to outperform — is being paid for in real dollars, not just in sentiment, if that narrative holds water through earnings. Pay close attention in January to anything that affects:
AI Dominance and Expansion. The most dominant theme continues to be AI, with investors keenly scrutinizing companies for updates on AI infrastructure spending, cloud growth, and how AI is boosting productivity and margins. Companies like NVIDIA, Alphabet Inc, and Broadcom Inc are seen as first-order beneficiaries, and commentary from management on the "next phase" of AI adoption is highly anticipated.
Broadening Earnings Growth A key narrative is whether earnings growth, which has been heavily concentrated in a few large tech companies in recent years, is broadening out to other sectors. For the first time since 2018, all 11 sectors of the S&P 500 are expected to deliver positive earnings per share (EPS) growth in 2026, a sign of broad economic strength.
Company Guidance With stock valuations near historic highs, actual earnings growth is the key driver for further market gains in 2026. Consequently, management's forward-looking guidance on revenue, earnings, cost controls, and productivity will be critical for determining market leadership and sector performance. Positive guidance can significantly boost investor confidence, while any disappointment can lead to strong negative reactions given the elevated expectations.
Financial Sector Health As banking heavyweights report, investors will focus on net interest income (NII) guidance, loan growth, and expectations for charge-offs, as falling benchmark rates could position banks for a strong year.
Economic Resilience vs. Volatility The ongoing U.S. economic resilience is a major backdrop. Investors are balancing optimism for a "goldilocks" scenario (benign inflation, lower rates, higher earnings) with potential volatility from policy decisions, geopolitical developments, and stretched valuations.
Looking ahead, the most telling flow signals to watch in the next 2–3 sessions are straightforward. If SPY, IVV, and VOO continue to draw the largest absolute notional flows but Tech names like NVDA, MSFT, and AAPL maintain or expand their relative share, then the allocation posture remains clear: institutions are anchoring growth exposures at the center of portfolios. If dark pool accumulation in NVDA and AAPL persists even as lit volumes oscillate, it would confirm that the current tape is structurally driven, not just momentum or headline driven. And if sweep data continues to show heavy percentages into credit hedges like HYG alongside tech proxies, that would underscore a risk-on core with embedded risk mitigation, which is exactly what one would expect in this macro regime.
Bottom line: institutions are unequivocally prioritizing Technology as the heart of risk allocation right now — dominating daily volume, dark accumulation, and sweep aggression — with broad beta and tactical hedges layered around it, defining the tape as structurally tech-led into 2026.
MIR Part 2: Individual Names From The Institutional Tape
VolumeLeaders tracks several proprietary signals designed to spotlight names drawing significant institutional interest. Below, we’ve surfaced the latest results and analyzed them to highlight emergent themes. If any of the sectors, narratives, or positioning trends resonate, the names mentioned here offer a strong starting point for deeper research and watchlist consideration.
VL Trade Rank Velocity™ (TRV)
TRV is a proprietary metric that measures the recent acceleration or deceleration in institutional trading activity for a given stock by comparing its average trade rank over the past few days to its average in recent weeks. A sharp improvement in TRV typically reflects a notable shift in positioning, often accompanied by sustained trade activity, suggesting institutions are actively engaging with the name and that intensity of activity is rising. This often precludes meaningful price or narrative shifts. This isn’t a buy-list or sell-list; it’s meant to draw your eyes to names where institutions are putting money to work.
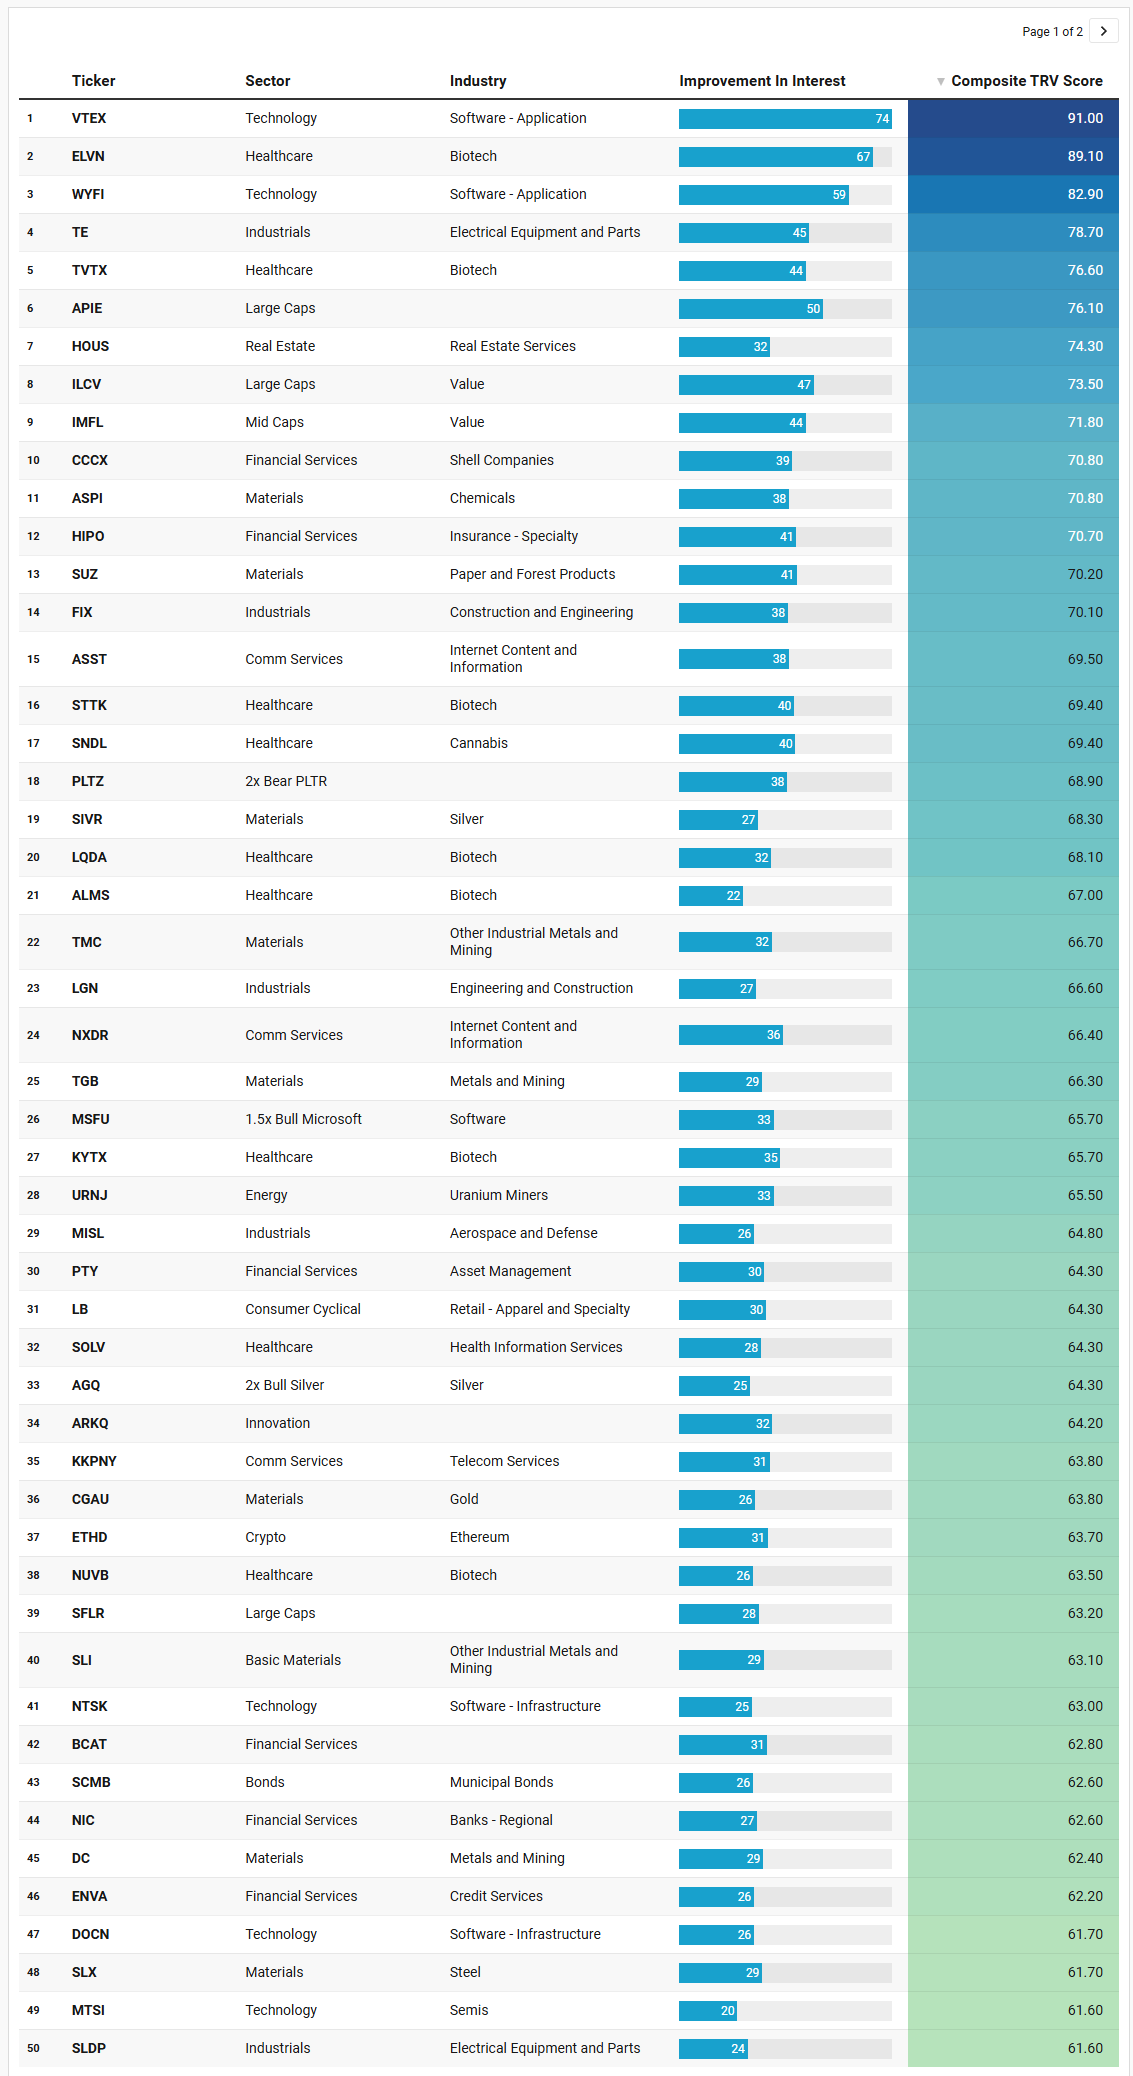
What jumps out immediately from the TRV watchlist is how cleanly it reinforces the flow narrative, rather than contradicting it. The tape has been telling us that Technology is the anchor, and the TRV data shows where within and around that anchor institutions are actively re-positioning as intensity accelerates.
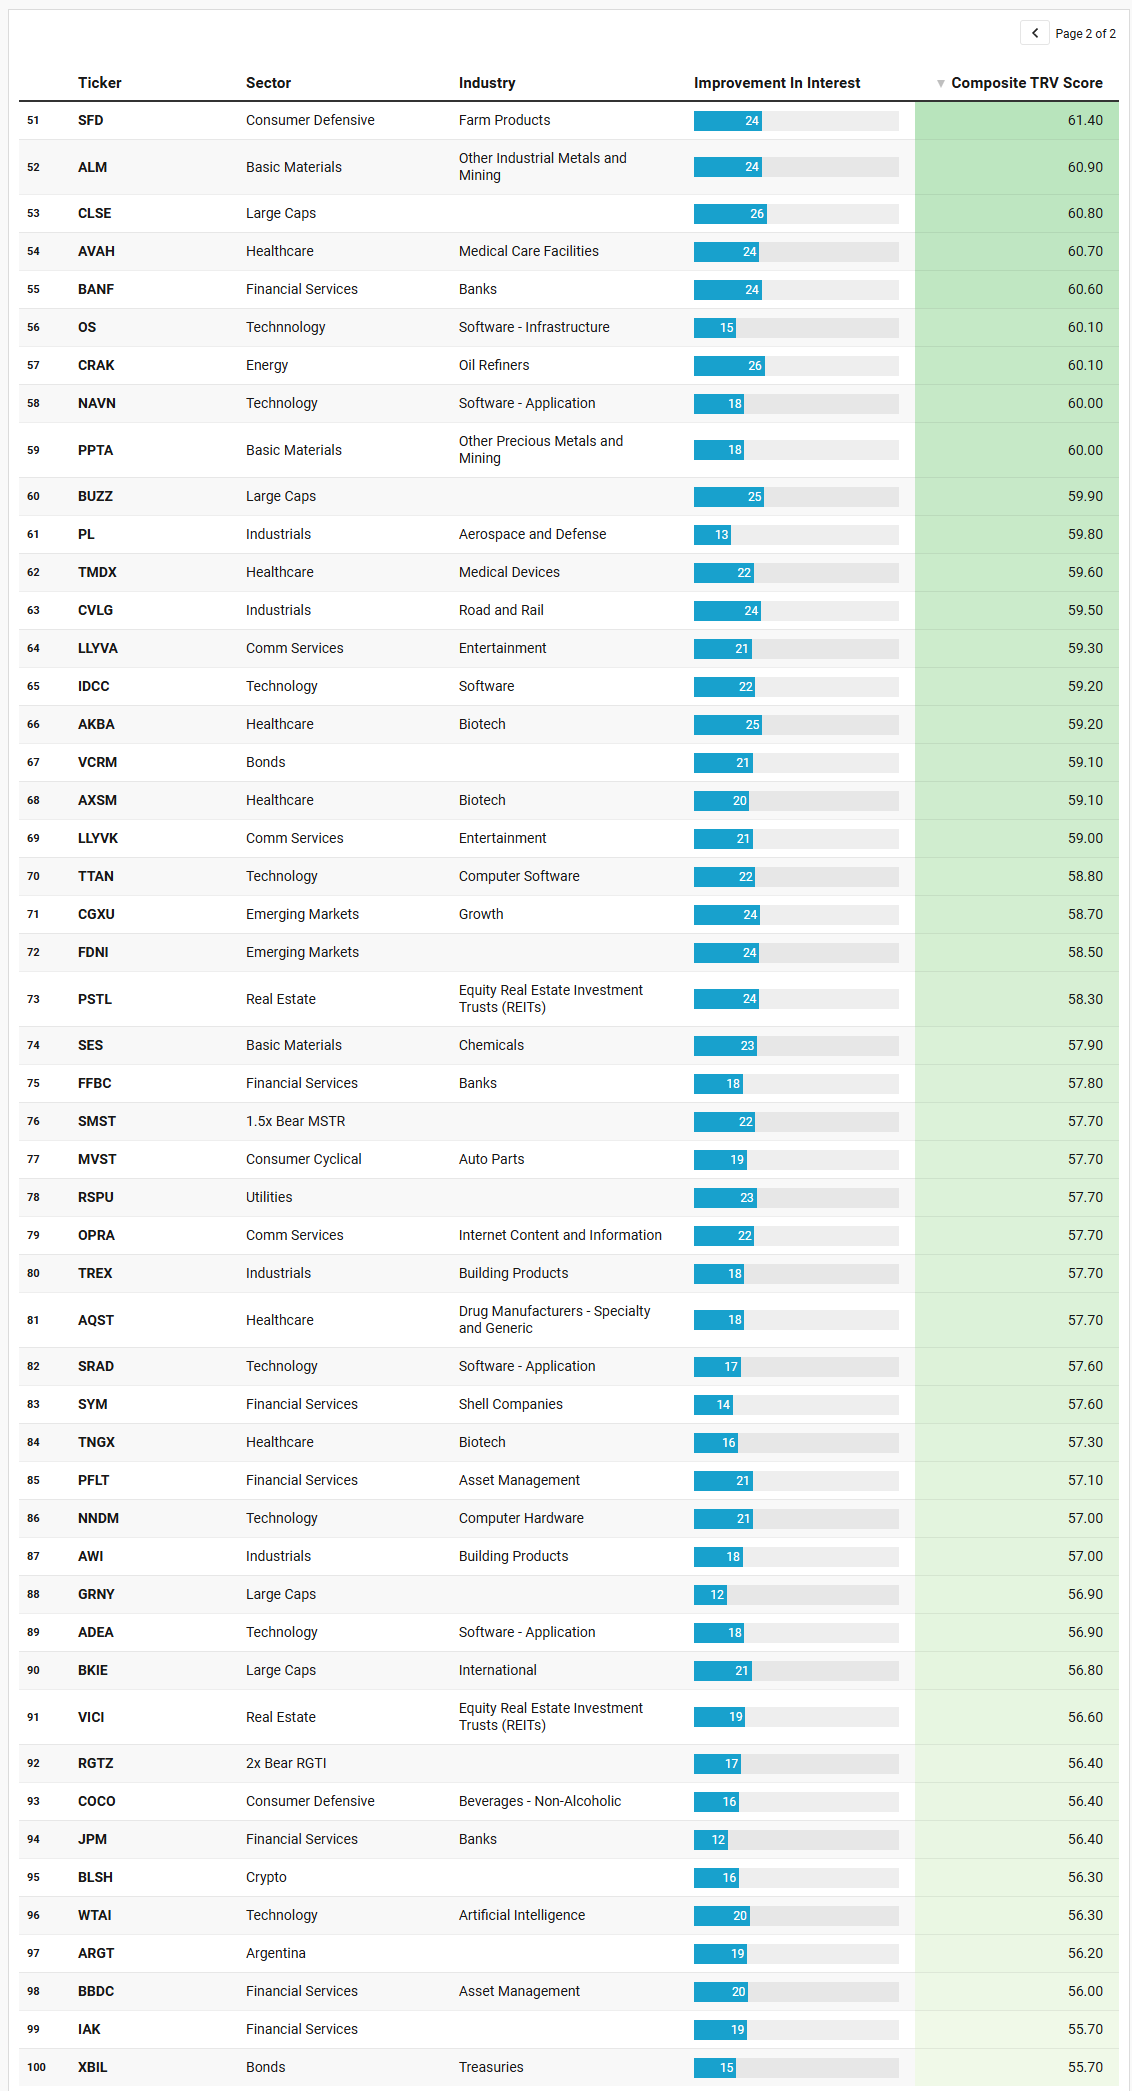
The dominant theme is software-first engagement, not just in megacaps but across the application and infrastructure stack. VTEX and WYFI sitting at the very top with composite TRV scores north of 80 is not random noise; it reflects sustained, rising trade rank intensity in application software at a moment when broader tech flows are already elevated. This aligns with the aggregate dollar picture we’ve seen elsewhere: institutions are not rotating away from Technology, they are moving deeper into specific expressions of it, particularly software platforms and infrastructure names where positioning can be built ahead of earnings, guidance changes, or narrative inflections. The presence of multiple software infrastructure names like DOCN, NTSK, OS, and IDCC further supports the idea that this is not a single-factor trade but a layered build across the digital backbone.
A second, equally important theme is the quiet but persistent resurgence in Healthcare Biotech, which shows up repeatedly across the list with strong improvement-in-interest scores. Names like ELVN, TVTX, STTK, LQDA, ALMS, KYTX, NUVB, AXSM, TNGX, and AQST are not appearing because of index rebalancing or beta exposure; they are appearing because trade activity is accelerating relative to recent weeks. That kind of TRV improvement often precedes either trial-related catalysts or broader risk appetite for idiosyncratic growth. What matters here is not any single biotech story, but the cluster behavior: institutions are selectively re-engaging with biotech risk at the same time they remain heavily committed to Technology, suggesting confidence in liquidity conditions rather than fear of drawdowns.
Materials show a third, structurally consistent theme, particularly precious and industrial metals. Silver-related vehicles like SIVR and AGQ, alongside gold exposure through CGAU and PPTA, sit alongside base and industrial metals names such as TMC, TGB, DC, SLX, ALM, and SLI. This dovetails with what we saw in the broader flow data: Materials are not leading the market, but they are being actively engaged, especially in leveraged or commodity-linked instruments. The presence of both physical proxies and miners implies institutions are expressing a view on metals demand and inflation hedging without abandoning growth exposure elsewhere.
Another notable pattern is the intentional use of leverage and inverse products as timing instruments rather than long-term allocations. MSFU, PLTZ, SMST, RGTZ, and AGQ appearing on the list underscores a point highlighted before: sophisticated players increasingly use leveraged and inverse vehicles as expression tools around inflection points. Their inclusion alongside underlying equities reinforces the idea that TRV is catching moments when institutions are actively pressing or hedging with precision, not passively allocating.
Financial Services appear more selectively, but their presence is telling. Rather than broad banks dominating, we see credit, asset management, and specialty insurance names like ENVA, PTY, PFLT, BBDC, BCAT, and HIPO. This suggests institutions are focusing on where balance sheet dynamics and yield structures matter most, rather than making a blanket bet on financials. The inclusion of municipal and treasury bond products like SCMB and XBIL also reinforces that risk management and income considerations are being layered into portfolios that are otherwise growth-leaning.
Industrials round out the picture with aerospace, defense, construction, and electrical equipment names such as TE, FIX, LGN, MISL, PL, SLDP, TREX, CVLG, and AWI. These are not high-flying momentum trades; they are steady, capital-intensive businesses that tend to benefit from longer-cycle spending themes. Their presence supports the idea that institutions are not narrowly chasing tech beta, but building a diversified exposure profile around a tech-led core.
Finally, the TRV list shows evidence of tactical curiosity at the margins. Crypto-linked products like ETHD and BLSH, AI-themed exposure through WTAI, innovation vehicles like ARKQ, and regional or thematic ETFs like URNJ and ARGT indicate that institutions are probing optionality without committing the balance of capital. These are classic “eyes-on” trades, where rising trade intensity signals monitoring and early positioning rather than full conviction.
Taken together, the TRV watchlist does exactly what it’s supposed to do: it surfaces where institutional attention is accelerating, and those accelerations fit cleanly into the broader story already visible in aggregate flows. Technology remains the anchor. Biotech is quietly re-entering the conversation. Materials are being accumulated as a secondary macro hedge. Financials and Industrials are being chosen selectively rather than broadly. And leverage is being used surgically to express timing views. This does not look like a market bracing for impact but instead one where institutions are actively deploying, probing, and positioning ahead of the next narrative turn.
VL Institutional Outliers™ (IO)
Institutional Outliers is a proprietary metric designed to spotlight trades that significantly exceed a stock’s recent institutional activity—specifically in terms of dollar volume. By comparing current trade size against each security's recent normalized history, the metric flags outlier events that may indicate sudden institutional interest but may be missed because the activity doesn’t raise any flags/alerts when comparing the activity against the ticker’s entire history. For example, it’s conceivable that a ticker today receives the largest trade it has had in the last 6 months but the trade is unranked and would therefore be missed by current alerts built off Trade Ranks. Day traders can use “Realized Vol” to identify tickers that are moving swiftly with large price displacement while others can use it to size your risk appropriately.
The IO list reads like the part of the tape that most people miss: not the marquee, not the obvious ranked prints, but the sudden bursts of size that are abnormal relative to each name’s recent baseline. And the first thing it confirms is that the market’s core posture is still risk-seeking, just expressed through a mix of broad beta and very specific, high-volatility probes.
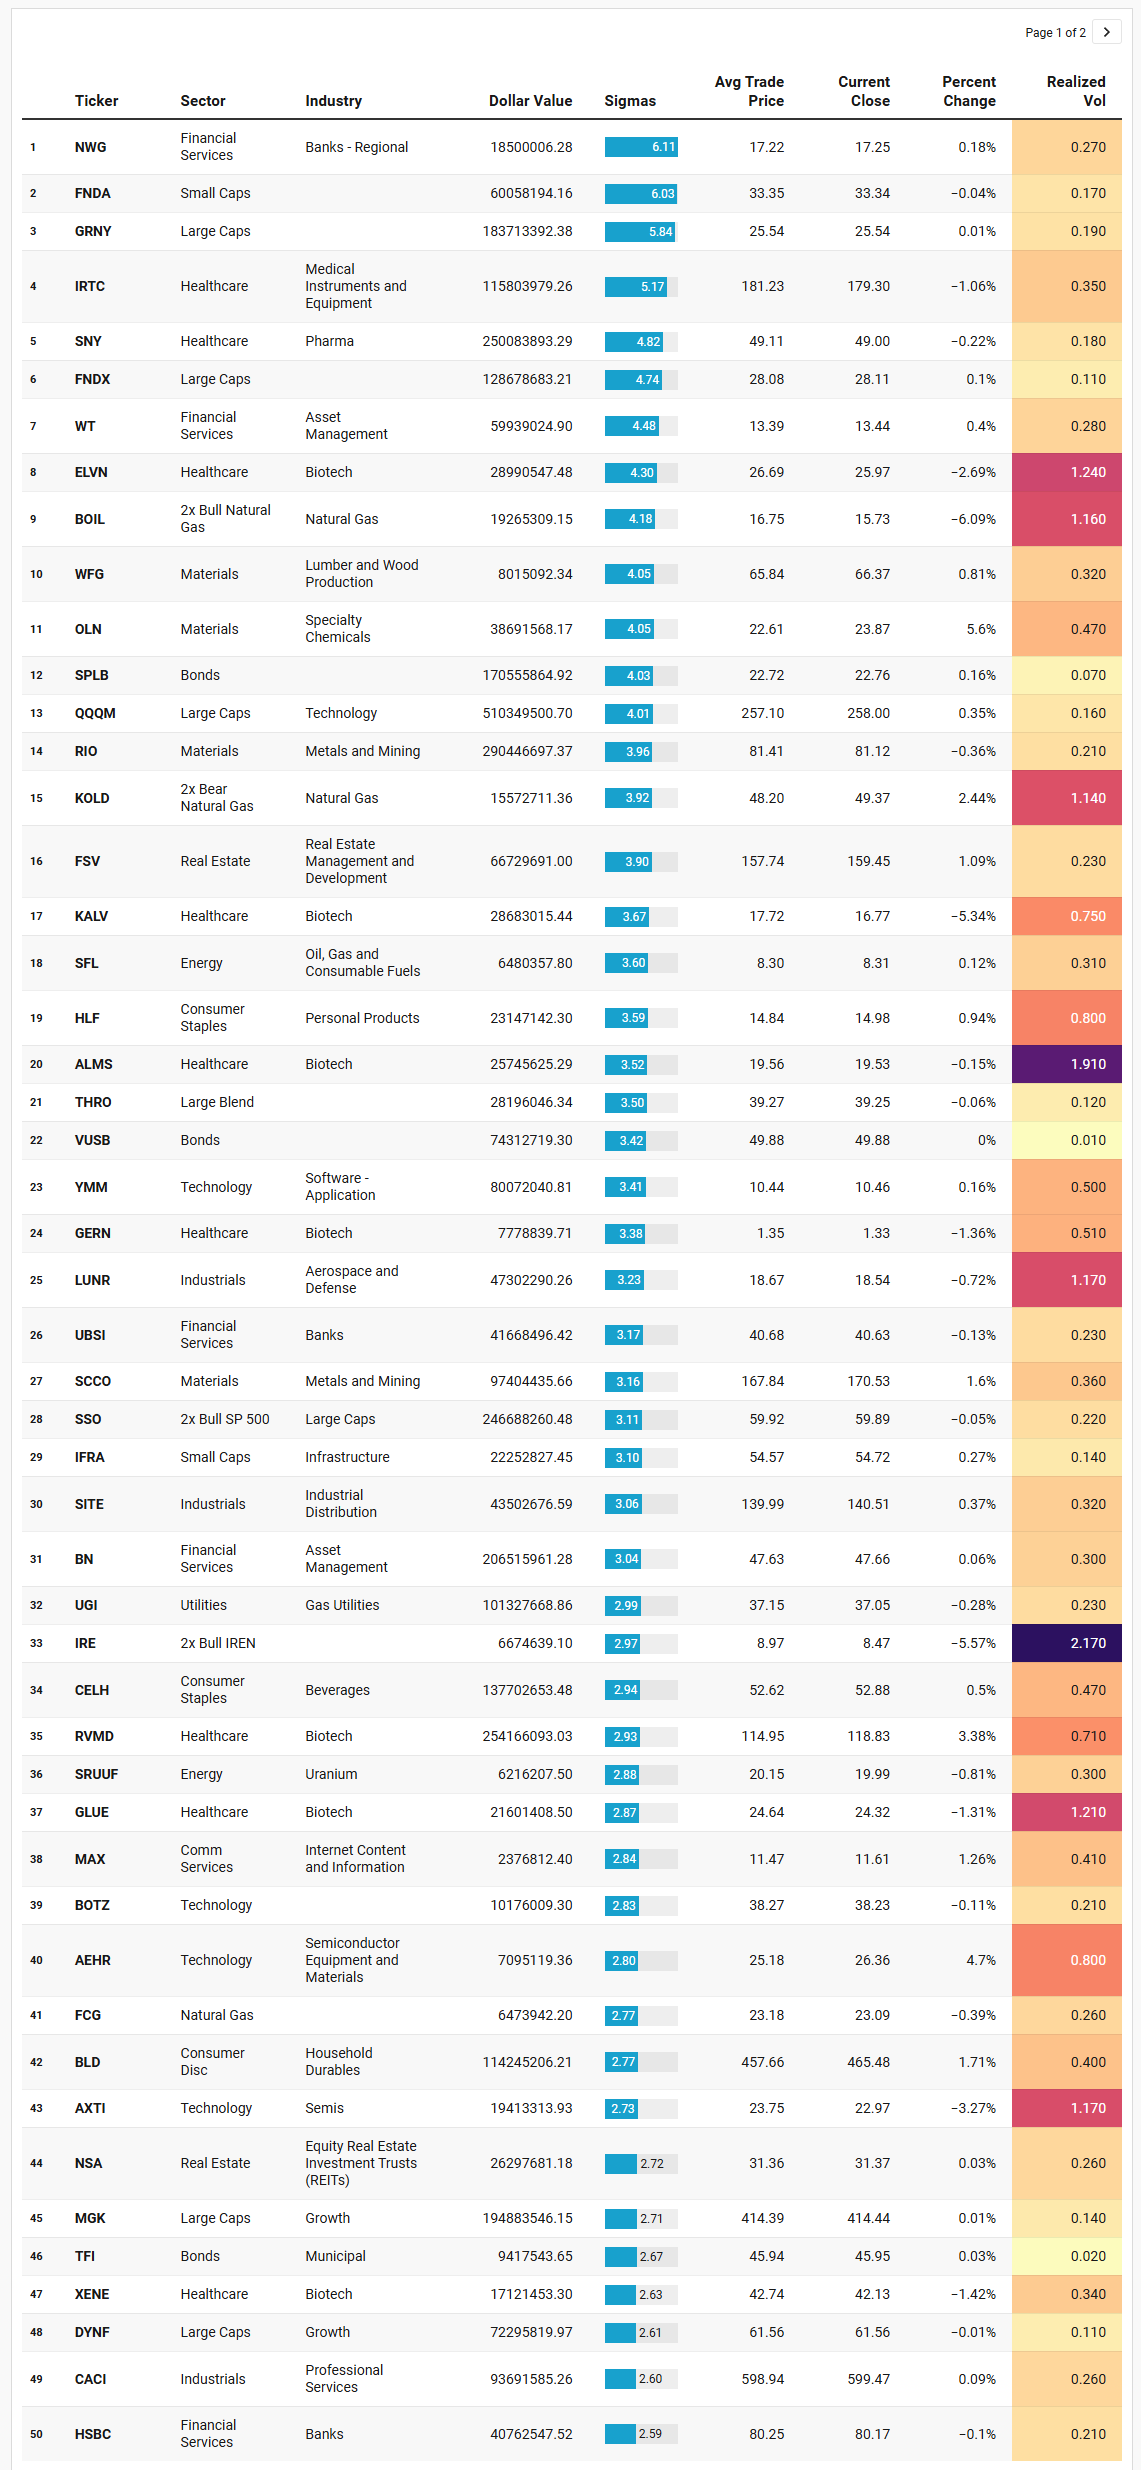
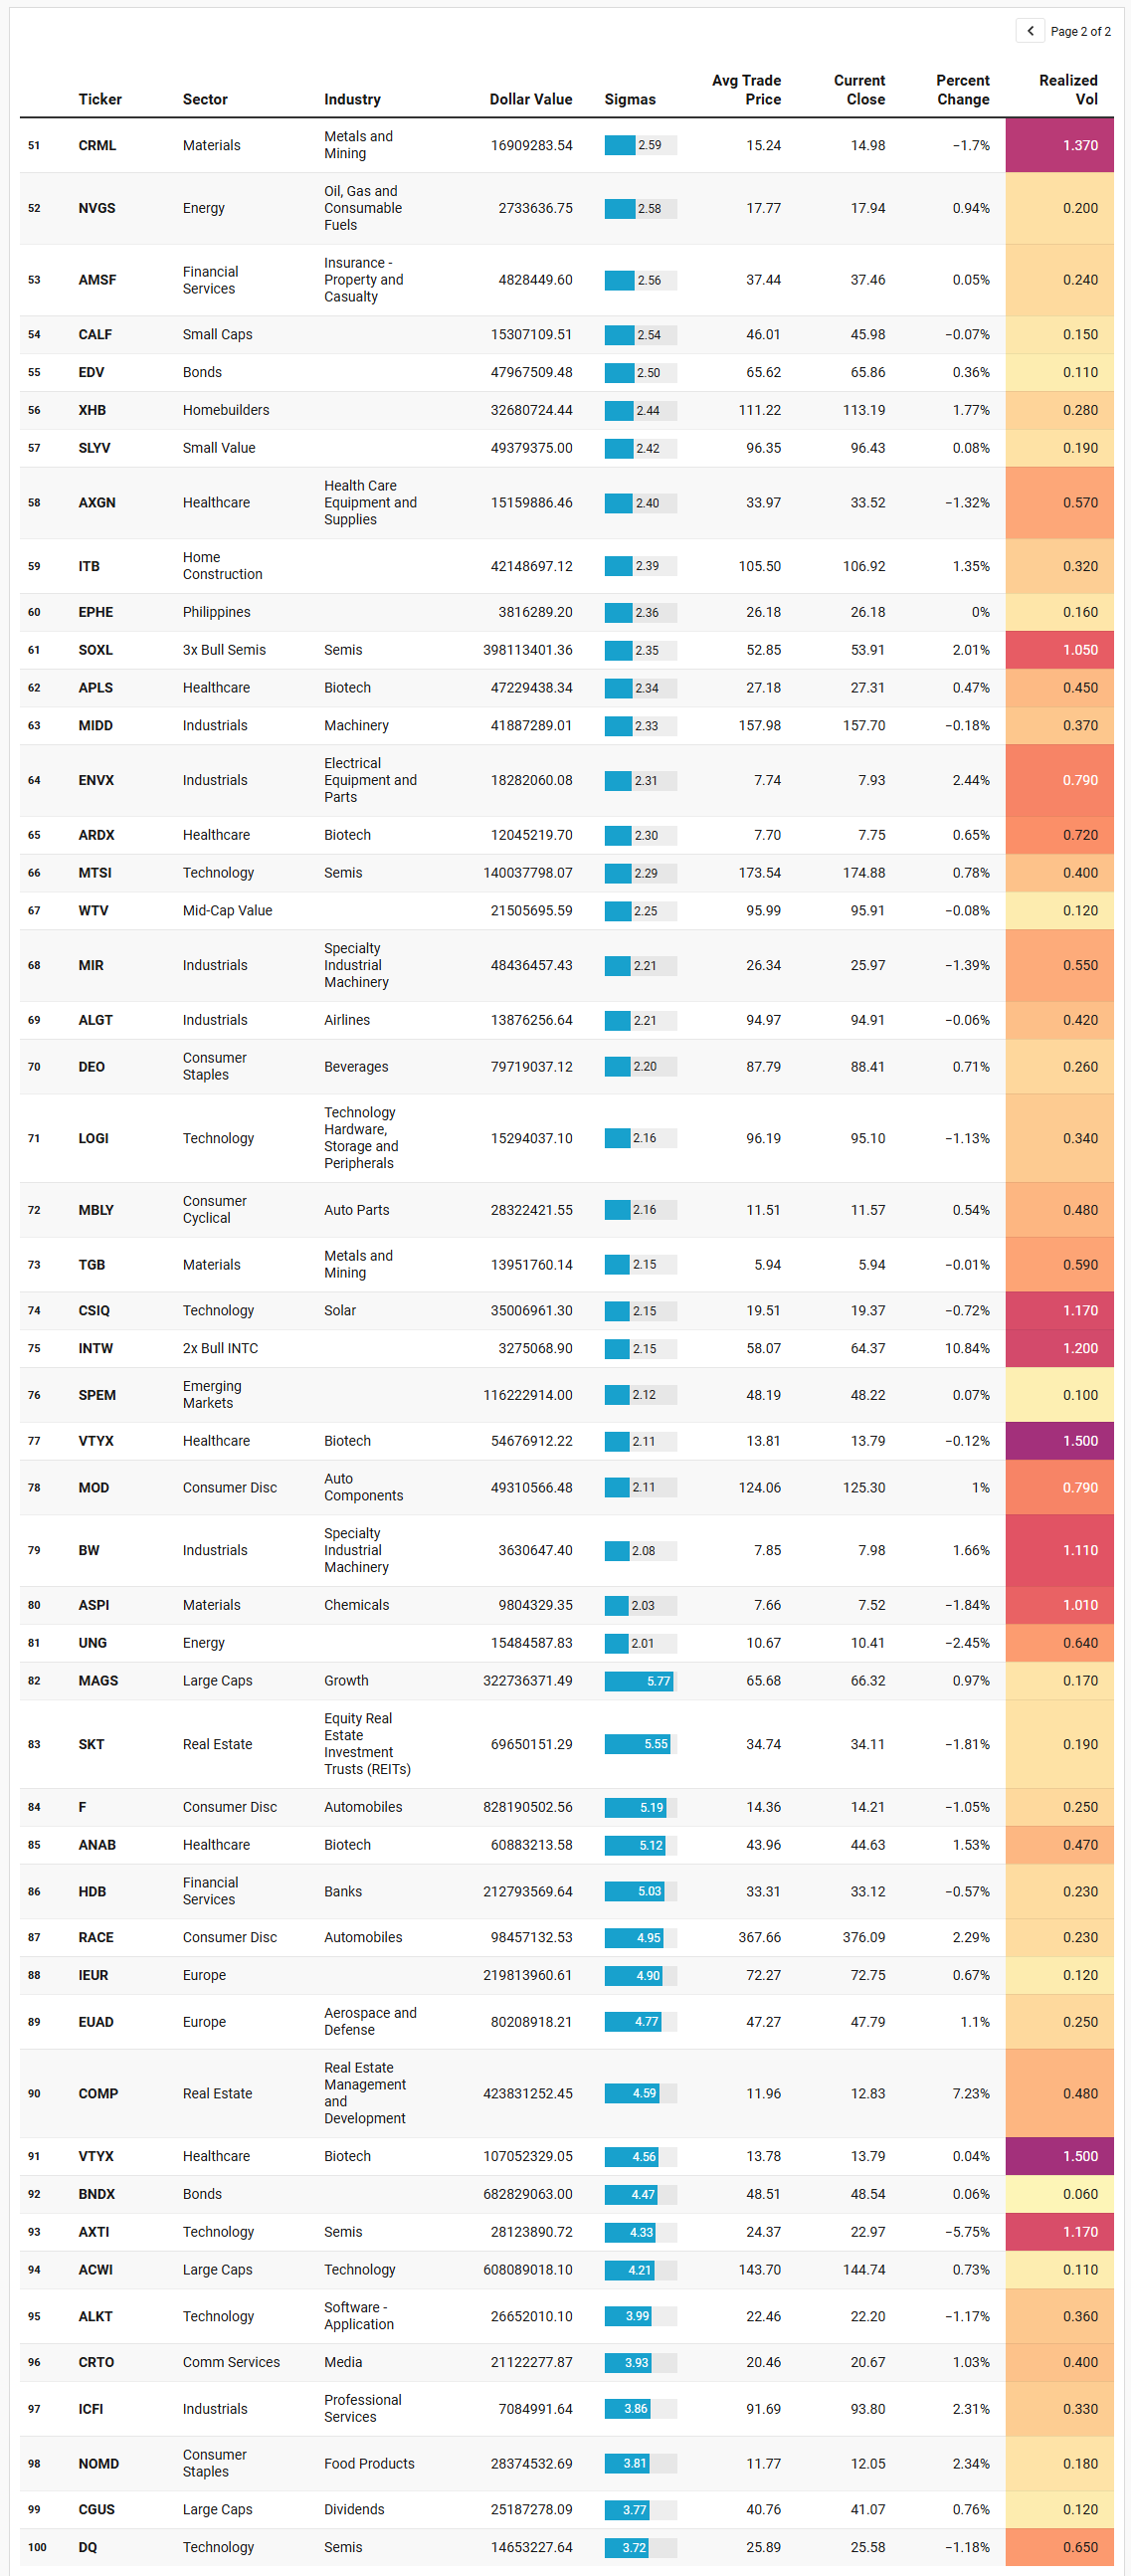
Start with where the dollars are simply too large to ignore. On 1/9, QQQM prints roughly $510.3m at an average trade price of 257.098475 with a close at 258.00 and a modest +0.35% day, showing a clean institutional preference for liquid tech-beta exposure even as the index itself doesn’t have to go anywhere dramatic to absorb it. That theme repeats in the “beta plumbing” names: SPLB at about $170.6m with very low realized vol (0.07), VUSB around $74.3m with realized vol effectively pinned (0.01), and a set of large-cap factor sleeves like GRNY (~$183.7m), FNDX (~$128.7m), MGK (~$194.9m), and DYNF (~$72.3m). The signal here is not “panic buying”; it’s the quieter kind of where large amounts of inventory are being dialed in through ETFs and factor baskets with low realized vol, suggesting active areas to monitors for buyer/seller success.
But the IO list is most useful when you look at what sits next to that calm beta flow: pockets of violent realized vol with meaningful sigma events. Natural gas leverage is the purest example. BOIL throws a 4.18-sigma outlier at ~$19.3m while closing down -6.09% with realized vol 1.16, and KOLD flags too (3.92 sigmas, ~$15.6m) while closing up +2.44% with realized vol 1.14. When both sides of the same underlying show up as outliers, that is rarely “set it and forget it” positioning. It reads like tactical hedging and fast money fighting over direction, with enough urgency to register as abnormal size. It is also a reminder to use your realized vol column as a position-sizing governor: these are not the instruments to treat like a sleepy sector ETF.
Healthcare is the second loud pocket, and it comes in two distinct flavors. One is large, low-drama pharma exposure: SNY prints roughly $250.1m (4.82 sigmas) with a small down day (-0.22%) and realized vol 0.18. That looks like institutional scale that is comfortable sitting in size without needing immediate price displacement. The other flavor is biotech, and it is not subtle. ELVN appears again (4.3 sigmas, ~$29.0m) but with a -2.69% day and realized vol 1.24, while other biotech names show high realized vol and sharp moves: KALV down -5.34% (realized vol 0.75), GLUE down -1.31% with realized vol 1.21, ALMS with realized vol 1.91 even on a small -0.15% close-to-close, and RVMD up +3.38% with realized vol 0.71 on a very large ~$254.2m outlier. The cluster matters more than any single ticker: institutions are both allocating to the defensive healthcare complex and taking swings in higher-beta biotech where price displacement is part of the trade. That combination fits a market that still wants growth optionality but is not abandoning ballast.
Materials are the third pillar, and here the IO list offers a clean read-through into inflation-sensitive and global-growth exposures. RIO shows a large outlier (~$290.4m, 3.96 sigmas) with a mild down day, while SCCO prints nearly $97.4m (3.16 sigmas) and closes up +1.60% with realized vol 0.36. OLN is particularly notable because it combines a strong up day (+5.60%) with a meaningful outlier size (~$38.7m, 4.05 sigmas) and realized vol 0.47. This is the “materials aren’t leading, but they’re being leaned on” behavior: institutions don’t need the whole sector to rip; they just need enough exposure to real assets and industrial inputs to make the portfolio resilient if rates and inflation expectations stay sticky.
Then there is the semi complex, and it’s telling that the outliers show up not just in traditional megacap proxies but in leveraged and higher-vol vehicles. SOXL is a standout at roughly $398.1m (2.35 sigmas) with a +2.01% day and realized vol 1.05. You also have single-name semi exposure like MTSI with about $140.0m (2.29 sigmas) and a modest +0.78% day with realized vol 0.40, and names like AXTI (multiple entries across 1/8 and 1/9, including a -3.27% day with realized vol 1.17) that highlight the difference between “owning the theme” and “trading the theme.” When leveraged semi beta is an outlier while realized vol is elevated, it usually means the market is not merely investing; it is actively expressing conviction about the near-term path.
The rest of the list fills in the character of the tape. You see pockets of consumer cyclicals tied to durable goods and autos: BLD with roughly $114.2m (2.77 sigmas) up +1.71% and F as a massive outlier on 1/8 at about $828.2m (5.19 sigmas) on a -1.05% day. That “huge dollars, negative close” pattern is often where institutional activity is most informative: either distribution into strength failed and rolled, or absorption was happening and the market still couldn’t lift it. Without intraday context you don’t overfit it, but you absolutely take note when size shows up and price closes against it.
Credit and rates sleeves continue to look like controlled-risk scaffolding. EDV (~$48.0m), BNDX on 1/8 (~$682.8m), municipal (TFI), and short-duration cash-like exposure (VUSB) all showing outlier behavior with low realized vol reinforces a simple point: institutions are not “all-gas” across the board. They are running a barbell: pressing equity themes where they want torque, while simultaneously keeping a meaningful portion of the book in lower-vol instruments that stabilize outcomes.
So the emergent IO themes, in plain English, are these. First, tech-beta allocations remain heavy and are being executed through liquid vehicles like QQQM and broad factor sleeves, which is consistent with a market that still wants exposure rather than an exit. Second, volatility is being expressed in targeted arenas where the payoff is convex: natural gas leverage, biotech, and leveraged semis. Third, materials and metals show up as a real but secondary risk budget, more hedge and diversification than leadership. And fourth, the “risk management layer” is active: bonds and short-duration funds don’t show up as outliers unless institutions are doing something purposeful. The outliers are telling you that the market is still leaning risk-on, but it is doing it with a keen awareness that some battlegrounds will won/lost quickly.
VL Sector Leaders
VL Sector Leaders is a weekly snapshot of where true leadership is asserting itself inside the market, stripped of the distortions that come from broad, style-mixed indices. Rather than asking which stocks look strong in absolute terms, this list focuses on which names are outperforming within the environments they actually compete in.
Each week, we surface the ten stocks demonstrating the most persistent relative strength inside their respective sectors. These are not headline chasers or one-day wonders. They are names that continue to separate themselves from peers through real price behavior, often reflecting sustained demand rather than fleeting attention.
For day traders, this list is a powerful awareness tool. Sector Leaders tend to offer cleaner intraday structure, better follow-through, and more predictable reactions around key levels because they already sit on the right side of relative strength. Even on choppy tape, leadership names often remain tradeable while the rest of the market degrades.
For swing traders, VL Sector Leaders helps narrow the universe to stocks with the highest probability of staying relevant. Relative leaders are more likely to hold trends, survive pullbacks, and reassert themselves after consolidation. When markets rotate, these names are often among the first to resume leadership — or the last to break.
This sector-strength snapshot acts as a final consistency check on the institutional narrative that has already taken shape, and importantly, it passes that test without forcing any reinterpretation. What stands out is not just that these names are strong within their respective sectors, but that many of them are the same names or closely related exposures that were already flagged by accelerating activity in TRV and by abnormal dollar-volume events in Institutional Outliers. In other words, this is not a new story. It is corroboration.
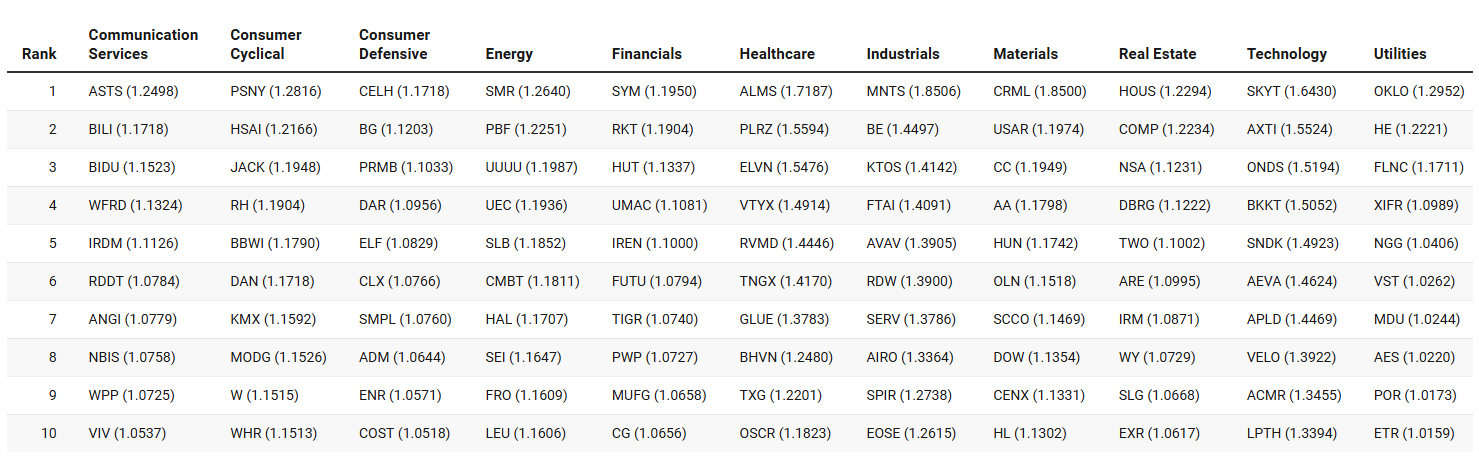
Technology remains the structural anchor. The appearance of names like AXTI, ACMR, ONDS, APLD, and SKYT reinforces the idea that institutions are not simply holding passive mega-cap exposure, but are actively engaging the semiconductor supply chain and infrastructure layer beneath it. AXTI is a particularly clean example, showing up previously as an Institutional Outlier and now ranking highly on a sector-relative basis. That combination suggests sustained engagement rather than a one-off trade, consistent with the broader positioning we described where tech leadership is real, deliberate, and being expressed beyond just index vehicles.
Healthcare, and specifically biotech, is the most compelling secondary confirmation. ALMS, ELVN, VTYX, RVMD, TNGX, and GLUE all rank near the top of the Healthcare column, and several of these names already featured prominently in both the TRV and IO lists. That overlap matters. Rising TRV tells us activity is accelerating over days and weeks, IO tells us institutions are willing to print unusually large tickets, and sector-relative strength tells us that capital is being allocated selectively within healthcare rather than indiscriminately. Together, those signals support the framing that biotech has re-entered institutional risk budgets as optionality, not as a defensive hiding place.
Materials continue to play their role as a macro hedge and diversification sleeve rather than outright leadership, exactly as the earlier flow analysis suggested. CRML sits at the top of the Materials rankings and was also an Institutional Outlier with elevated realized volatility, while SCCO and OLN appear both here and in the IO data. That alignment fits the idea that metals, mining, and chemicals are being used to balance portfolios that are otherwise tilted toward growth and technology, particularly in a world where inflation expectations remain sticky and geopolitical uncertainty persists.
Energy and Utilities together reinforce the re-emergence of the nuclear and uranium theme that had already begun to surface through institutional flow. SMR ranking at the top of Energy and OKLO leading Utilities dovetail cleanly with the earlier observation that power generation for AI and data-center infrastructure is drawing renewed attention. The presence of uranium-linked names such as UUUU, UEC, and LEU further supports the notion that this is not a generic energy trade, but a focused expression tied to supply, geopolitics, and long-term capacity constraints.
Industrials, Real Estate, and Financials round out the picture in a way that supports breadth rather than dominance. In Industrials, aerospace and defense-adjacent names like AVAV and KTOS fit with the policy-driven volatility discussed earlier, while infrastructure and specialty industrial names reinforce the broader theme of capacity buildout. Real Estate names such as HOUS and NSA echo what we saw in TRV and IO, where housing-related policy headlines created pockets of institutional interest without turning the sector into a primary leadership group. Financials and Communication Services show selective strength, consistent with a market that is risk-on but not complacent, willing to allocate to higher-beta expressions without abandoning balance.
Taken as a whole, this sector-strength list does not introduce a new narrative. It tightens the existing one. Technology is still the core, biotech is back as optionality, materials and metals serve as macro ballast, and energy exposure is increasingly nuanced around nuclear and uranium rather than broad oil beta. The key takeaway is coherence: multiple independent lenses are pointing to the same areas of engagement. When sector-relative strength, accelerating activity, and abnormal institutional sizing all converge, it suggests positioning that is intentional, persistent, and unlikely to unwind quietly.
MIR Part 3: Framing-Up A Trade
Stepping back from the individual datasets and stitching the tape together, the message from institutions this week is internally consistent and unusually clean. Capital is not hiding. It is not dispersing randomly. It is being anchored in Technology, supplemented by selective growth optionality, buffered by real assets and income ballast, and actively risk-managed through leverage rather than liquidation. This is the kind of posture desks take when they believe the primary trend is intact, but the path may be noisy.
The first conclusion is about where conviction lives. Technology is the center of gravity. Aggregate dollars, dark-pool accumulation, sweep aggression, TRV acceleration, and IO outliers all point to the same fact: institutions are not merely maintaining tech exposure, they are working it. The emphasis is not just on megacaps, but on the ecosystem around them: software platforms, infrastructure, semiconductors, and AI-adjacent expressions. This is classic “own the engine” behavior. When funds believe growth remains scarce and valuable, they concentrate where earnings durability and narrative gravity overlap.
The second conclusion is about how risk is being expressed. Institutions are not all-in directional. They are pairing core exposure with convex expressions. That shows up clearly in leveraged instruments, both long and inverse, across semis, single names, and commodities like natural gas. This is not speculative froth; it is tactical insurance and timing. Desks are comfortable being exposed, but they want the ability to respond quickly if volatility expands.
The third conclusion is about what is being used as ballast. Materials, precious metals, and select industrials appear repeatedly, but never as leaders. They function as structural hedges against inflation persistence, supply-side shocks, or rate volatility. At the same time, bonds and short-duration instruments continue to absorb size at very low realized volatility, telling you that cash is being parked, not pulled. This is not a defensive market; it is a managed one.
With that framing, a realistic institutional-style portfolio for the week would look something like this.
The Core Growth Sleeve, roughly 45 percent of capital, is where conviction lives. This sleeve is designed to capture the primary trend without overfitting. About 25 percent would sit in broad technology beta, split between QQQ or QQQM at roughly 15 percent and a large-cap growth ETF like MGK or a similar growth factor sleeve at about 10 percent. This reflects the repeated appearance of these vehicles in aggregate dollars, dark pools, and IO outliers. Another 20 percent would be allocated to single-name and thematic tech exposure, diversified across megacaps and infrastructure. A realistic mix here would include NVDA and MSFT at 6 to 7 percent combined, supplemented by semiconductor exposure via a non-levered ETF at around 5 percent, and a smaller allocation to AI or software infrastructure themes, such as BOTZ or DOCN-style exposure, at 3 to 4 percent. This sleeve assumes the trend persists and that institutions continue to defend pullbacks rather than distribute.
The Tactical Convexity Sleeve, about 20 percent of capital, is where desks express timing and protect optionality. This sleeve is deliberately volatile but sized appropriately. Roughly 10 percent would be allocated to leveraged equity expressions tied to leadership, such as SOXL or MSFU-type products, sized small enough to matter but not large enough to destabilize the book. The remaining 10 percent would be split between asymmetric macro and commodity expressions that showed up repeatedly in the IO list, such as natural gas leverage via BOIL and KOLD at 3 to 4 percent combined, and a volatility-aware hedge tied to broader indices, such as SSO or an inverse SPY sleeve, at 5 to 6 percent. The goal here is not prediction, but responsiveness. This sleeve gives the portfolio teeth if momentum accelerates and shock absorbers if it doesn’t.
The Real Assets and Inflation Hedge Sleeve, approximately 15 percent, reflects the steady but persistent accumulation seen in materials and metals. This is not a bet on runaway inflation; it is insurance against it. A realistic construction would include 5 percent in precious metals, split between silver and gold exposure through vehicles like SIVR or CGAU, and 5 percent in industrial metals or miners such as RIO or SCCO. The remaining 5 percent could sit in materials or chemicals exposure like OLN or ASPI-style names that showed both outlier size and positive price displacement. This sleeve benefits if rates stay sticky, commodities tighten, or geopolitics inject supply risk, but it does not dominate outcomes if growth leads cleanly.
The Healthcare Optionality Sleeve, about 10 percent, reflects what the TRV and IO data are quietly flagging: institutions are probing biotech again. This is not a broad healthcare allocation. It is selective and volatility-aware. A desk might allocate 4 percent to a diversified healthcare or pharma name like SNY to anchor the sleeve, then distribute 6 percent across a basket of higher-vol biotech names that showed both rising TRV and IO outliers, such as ELVN, RVMD, or ALMS, sized at 1 to 2 percent each. This sleeve is explicitly asymmetric. It is expected to be choppy, but it provides exposure to upside events that do not require market-wide risk-on conditions.
Finally, the Stability and Carry Sleeve, roughly 10 percent, is what keeps the portfolio investable under stress. This sleeve is boring by design. About 5 percent would sit in short-duration or cash-like bond exposure such as VUSB, and another 5 percent in longer-duration or international bond exposure like BNDX or EDV, both of which absorbed significant institutional size with extremely low realized volatility. This sleeve is not about returns; it is about allowing the rest of the portfolio to stay on without forcing deleveraging during drawdowns.
Portfolio Overview (100%)
----------------------------------------------------
Core Growth (Technology-Led): 45%
Tactical Convexity (Leverage + Timing): 20%
Real Assets / Inflation Hedge: 15%
Healthcare Optionality: 10%
Stability / Carry (Risk Control): 10%
----------------------------------------------------
----------------------------------------------------
----------------------------------------------------
Core Growth Sleeve – 45%
----------------------------------------------------
Purpose: Anchor exposure where institutions show the strongest conviction across lit, dark, TRV, and IO data.
QQQ / QQQM: 15%
MGK (Large-Cap Growth): 10%
NVDA: 4%
MSFT: 3%
Semiconductor ETF (non-levered): 5%
AI / Software Infrastructure ETF (e.g., BOTZ-type): 4%
Software Platform Basket (DOCN / VTEX / WYFI-style exposure): 4%
----------------------------------------------------
Tactical Convexity Sleeve – 20%
----------------------------------------------------
Purpose: Express timing, momentum, and protection without disturbing the core book.
SOXL (3x Semis): 6%
MSFU (Levered MSFT): 4%
BOIL (2x Nat Gas Bull): 3%
KOLD (2x Nat Gas Bear): 2%
SSO (2x SPY): 5%
----------------------------------------------------
Real Assets / Inflation Hedge – 15%
----------------------------------------------------
Purpose: Hedge rate persistence, supply risk, and macro volatility without leading the portfolio.
Silver (SIVR / AGQ blend): 5%
Gold (CGAU / PPTA): 3%
Industrial Metals (RIO / SCCO): 4%
Chemicals / Materials (OLN / ASPI): 3%
----------------------------------------------------
Healthcare Optionality – 10%
----------------------------------------------------
Purpose: Asymmetric upside where TRV and IO signal renewed institutional probing.
SNY (Large Pharma Anchor): 4%
RVMD: 2%
ELVN: 2%
ALMS / GLUE / KALV basket: 2%
----------------------------------------------------
Stability & Carry Sleeve – 10%
----------------------------------------------------
Purpose: Absorb shocks, reduce forced selling, and keep the portfolio investable.
VUSB (Short Duration): 5%
BNDX or EDV (Global / Duration): 5%Put together, this portfolio mirrors exactly what the institutional tape has been telling us. Growth is favored, but not blindly. Risk is embraced, but actively managed. Convexity is owned, but sized. Hedging is present, but not dominant. Nothing in this construction requires heroic assumptions about macro or earnings; it simply respects where capital is actually being deployed and how it is being protected.
For the week ahead, the positioning bias is straightforward. Stay aligned with Technology leadership as long as aggregate and dark-pool flows persist. Allow tactical sleeves to do the work during volatility rather than cutting core exposure prematurely. Watch commodities and biotech not as leaders, but as tells for changing risk appetite. Start with Technology and Semis for trend and momentum. Rotate into Biotech or Nat Gas when volatility expands. Use SPY/QQQ and levels from the Technician’s Playbook as your timing compass. Let Materials and Industrials offer cleaner secondary setups once direction is established.
Thank you for being part of our community and for dedicating your time to this edition. Your insights and engagement drive everything we do, and we’re honored to share this space with such committed, thoughtful readers. Here’s to a week filled with clear opportunities and strong performance 💰💰💰
— VolumeLeaders