Market Momentum: Your Weekly Financial Forecast & Market Prep
Issue 72 / What to expect Dec 29, 2025 thru Jan 02, 2026

NOTE: This weekly periodical is too large for Substack to deliver in its entirety via email - you will only see a portion of this great content if you read from your email client. Click the VOLUMELEADERS logo above to read the full article!
In This Issue
Weekly Market-On-Close Report: All the macro moves, market drivers, and must-know narratives—covered in less than five minutes.
Weekly Benchmark Breakdown: Our weekly intelligence report on major indices cuts through the index-level noise to uncover participation, momentum, and structural integrity and tell you whether markets are rising on solid ground or skating on thin breadth. This is where bull markets prove themselves—or quietly start to unravel.
The Latest Investor Sentiment Readings: Track the emotional pulse of the market with our curated dashboard of sentiment indicators. From fear-fueled flight to euphoric overreach, this week's readings reveal whether investors are cautiously creeping in—or stampeding toward the exits.
Institutional Support & Resistance Levels For Major Indices: Exactly where to look for support and resistance this coming week in SPY, QQQ, IWM & DIA
Normalized Performance By Thematics YTD: Which corners of the markets are beating benchmarks, which are overlooked and which ones are over-crowded!
Order Flow in Focus: Using the VolumeLeaders platform to read Smart Money tells
Key Econ Events & Earnings On-Deck For This Coming Week

Weekly Market-On-Close Report
Records, Relief, and the Shape of Risk as 2025 Winds Down
Friday ended quietly on the surface, but the week as a whole carried an unmistakable message. The S&P 500 Index (SPX) via SPDR S&P 500 ETF Trust (SPY) slipped just -0.03% on the day, the Dow Jones Industrials Index (DOWI) via SPDR Dow Jones Industrial Average ETF Trust (DIA) fell -0.04%, and the Nasdaq 100 Index (IUXX) via Invesco QQQ Trust (QQQ) eased -0.05%. March E-mini S&P futures (ESH26) closed down -0.08% and March E-mini Nasdaq futures (NQH26) finished -0.07%. Those are rounding errors. What matters is that the S&P 500 edged to a fresh all-time high intraday before fading slightly, and that the index still closed the week up +1.4%, with the Nasdaq 100 up +1.2% over the same period.
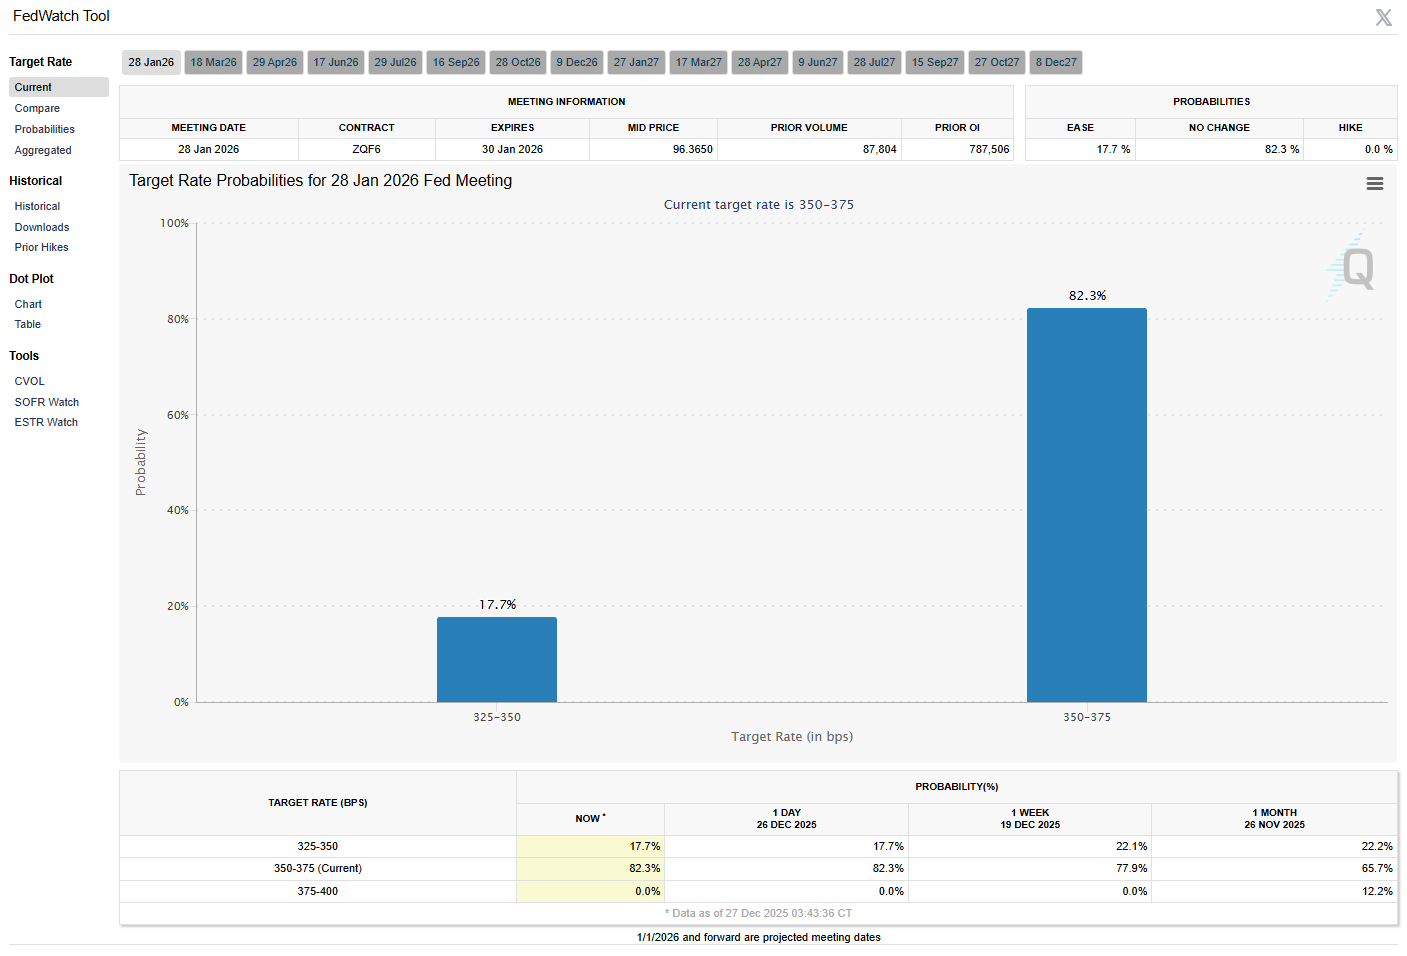
This was a market that did its work earlier in the week and then coasted. By Friday, momentum had cooled, volumes thinned, and traders were content to protect gains rather than press new bets into a weekend filled with geopolitical headlines and a holiday calendar. The underlying tone, however, remained constructive. The 10-year Treasury note yield fell -0.6 basis points on Friday to 4.128%, providing a subtle but important tailwind for risk assets. At the same time, rate expectations stopped deteriorating. Market-implied odds for a -25 basis point rate cut at the January 27-28 FOMC meeting crept back up to 20%, rebounding from a low of 13% seen earlier in the week.
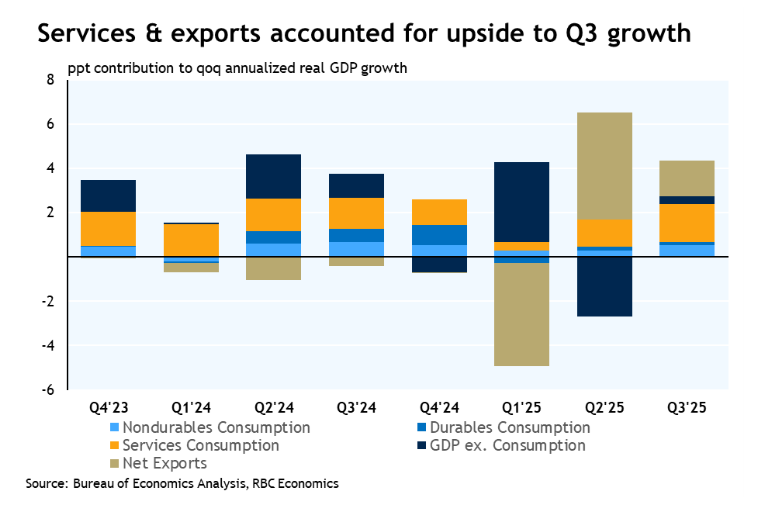
That stabilization in rates mattered because it followed one of the most important macro data points of the quarter. On Tuesday, U.S. Q3 real GDP was reported at +4.3% quarter-over-quarter annualized, well above expectations of +3.3% and stronger than Q2’s already solid +3.8%. This was the fastest pace of U.S. economic growth in two years, and it reset the tone for the entire week. Markets were reminded that the economy is not merely avoiding recession, but expanding at a pace that supports earnings, risk-taking, and confidence in forward growth.
That growth impulse came with nuance. While GDP surged, October durable goods orders fell -2.2% month over month, worse than expectations for a decline of roughly -1.2% and reversing the prior month’s +0.7% increase. The weakness was concentrated in transportation equipment, which tends to be volatile. Stripping out defense and aircraft, durable goods orders rose +0.5%, marking the seventh consecutive monthly increase in that core business investment proxy. The message was mixed but not contradictory: headline manufacturing remains uneven, but underlying capital spending is still grinding higher.
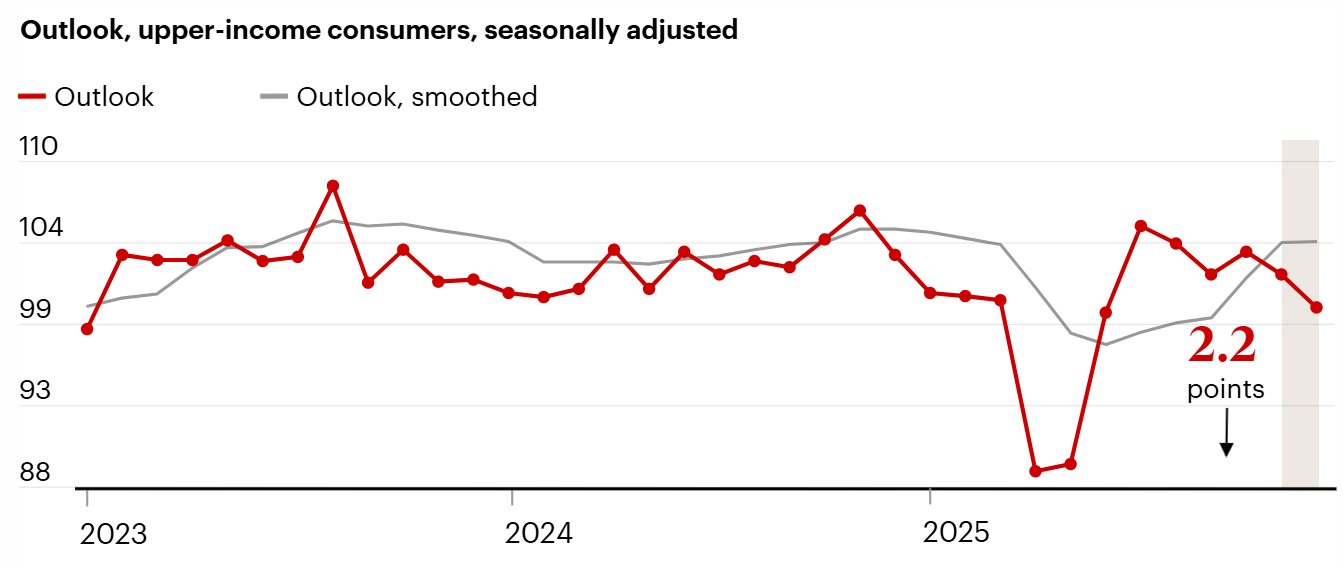
Consumers, however, are showing strain. The Conference Board reported that its Consumer Confidence Index fell for the fifth straight month in December, dropping to 89.1 from November’s upwardly revised 92.9 and missing expectations of around 91.5. Four of the five components declined, and consumers’ net views on current business conditions turned negative for the first time since September 2024. Concerns around employment conditions and household income expectations weighed on sentiment. This deterioration in confidence stands in contrast to the strength in GDP, highlighting a growing disconnect between aggregate economic output and how households feel about their own financial security.
Labor data continues to bridge that gap. Initial jobless claims for the week ended December 20 came in at 214,000, down 10,000 from the prior week and below estimates near 231,000. That remains consistent with a tight labor market. Continuing claims, however, rose to 1.923 million, up 38,000 from the prior week. This combination suggests fewer layoffs, but longer job searches for those who are unemployed. It is not recessionary, but it is consistent with a gradual cooling in labor conditions that the Federal Reserve has been hoping to see.
Treasury markets reflected this balance. U.S. Treasuries advanced during the holiday-shortened week, with yields fluctuating but ending modestly lower across most maturities. Trading was thin, and the benchmark 10-year yield remained range-bound between roughly 4.1% and 4.2%. T-note prices also found support from a sharp -2.5% decline in crude oil prices on Friday and a -1.2 basis point drop in 10-year breakeven inflation expectations to 2.225%. Inflation expectations easing alongside strong growth is the kind of mix equity markets prefer, even if it feels counterintuitive.
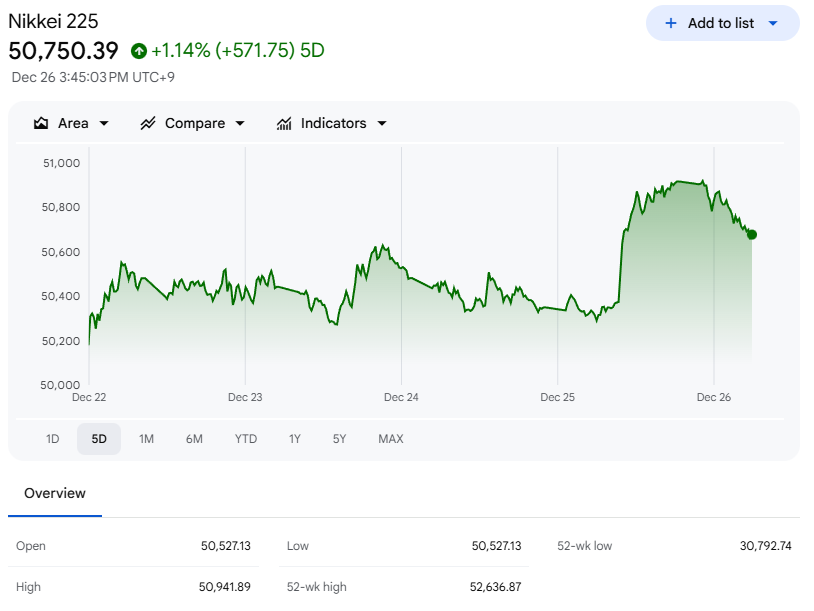
Overseas, markets added to the constructive backdrop. China’s Shanghai Composite rose +0.10%, marking its eighth consecutive daily gain. Japan’s Nikkei Stock 225 advanced +0.68%. European markets were largely closed for Christmas, with the Euro Stoxx 50 shut on Friday. The global picture was one of steady risk appetite, not exuberance.
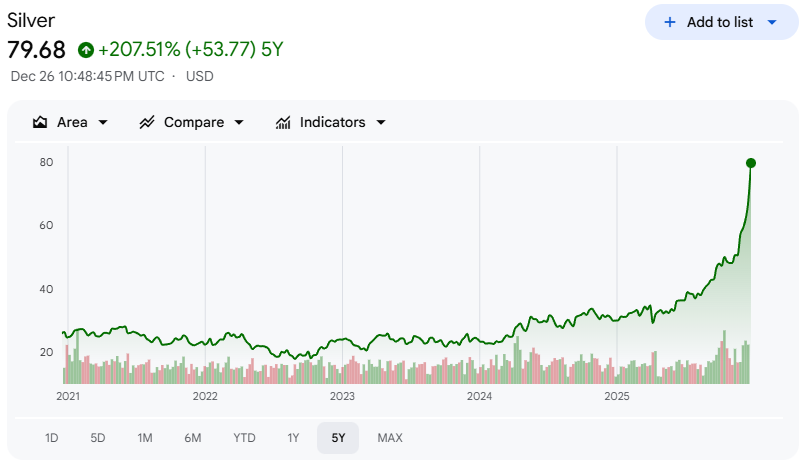
Commodities, however, told a more dramatic story. Gold, silver, and platinum surged to new all-time highs on Friday, driven by early dollar weakness and an escalation in geopolitical risk. The U.S. launched strikes on ISIS targets in Nigeria in collaboration with the Nigerian government, responding to rising terrorist activity. Nigeria is an OPEC member, which immediately raised concerns about energy supply stability. At the same time, U.S. forces forced the sanctioned oil tanker Bella 1 to turn away from Venezuela and head back into the Atlantic Ocean, reinforcing President Trump’s blockade on sanctioned oil tankers connected to Venezuela. U.S. forces reportedly sought to board the vessel near Barbados before it reversed course.
Layered on top of that, there were tentative signals of movement on the Ukraine-Russia front. Ukrainian President Volodymyr Zelensky said he expects to meet President Trump in Florida on Sunday and described a 20-point peace plan that is 90% ready, pending discussions with the U.S., Russia, and Europe. Russia, for its part, has said the plan leaves many questions unanswered. Markets treated this as a low-probability positive optionality rather than a base case, but in an environment where commodities are already sensitive, even the possibility of diplomatic movement matters.

Seasonality also played its role. According to data from Citadel Securities, since 1928 the S&P 500 has risen 75% of the time during the last two weeks of December, with an average gain of 1.3%. The so-called Santa Claus Rally officially began earlier in the week, with the S&P 500 closing modestly higher and printing a new all-time high. While seasonality is never a trading signal on its own, it tends to reinforce existing trends rather than reverse them. In this case, it aligned neatly with improving breadth, easing yields, and supportive macro data.
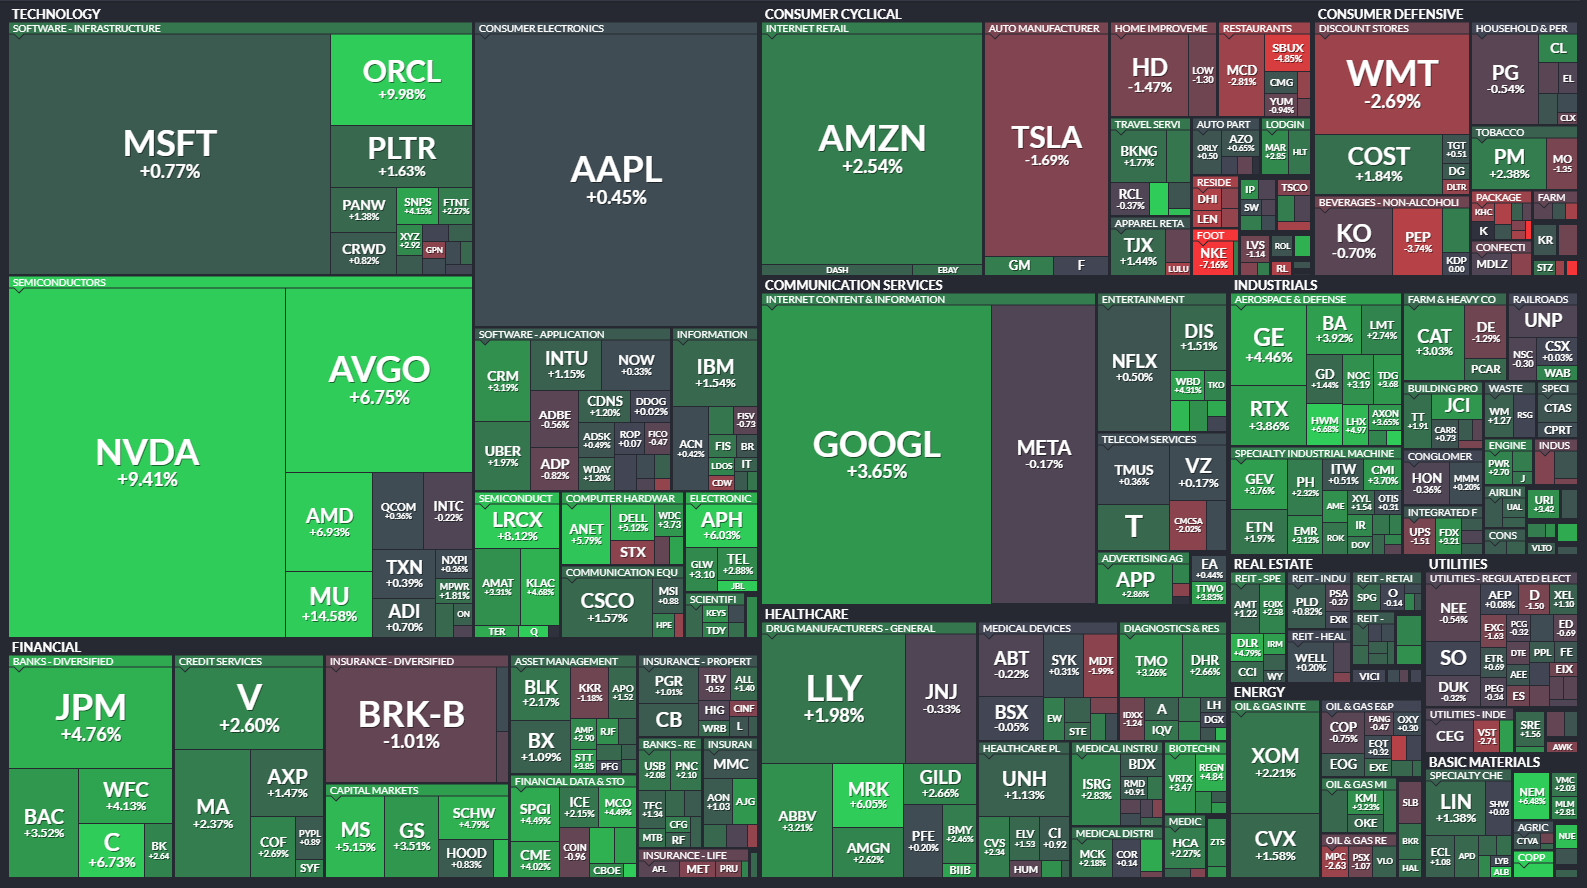
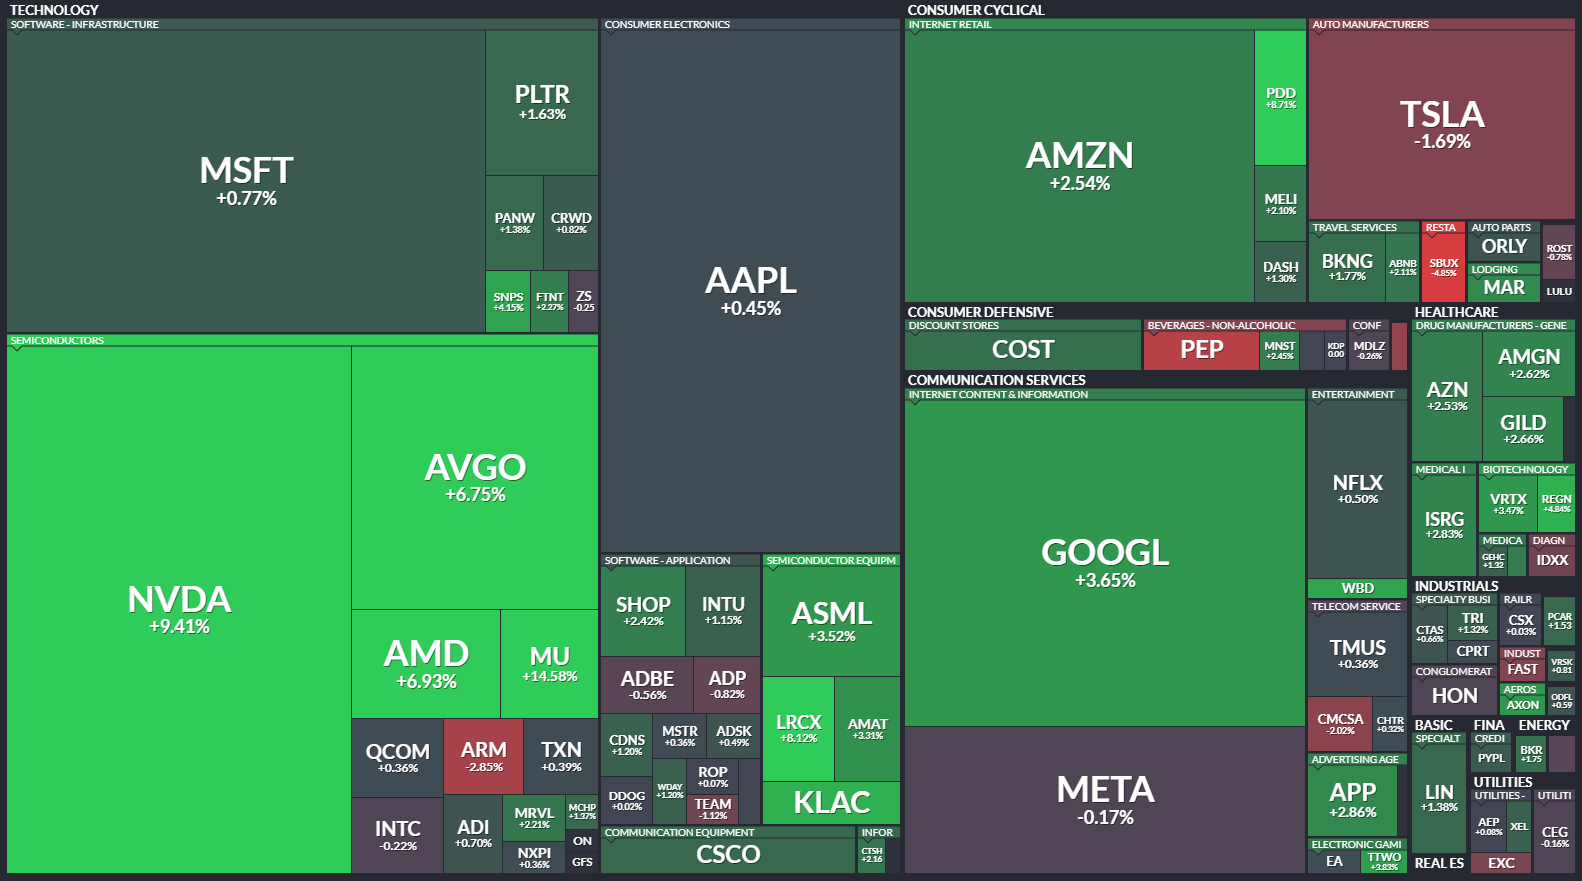
Sector performance on Friday reflected that calm. None of the 11 S&P 500 sectors moved more than +/-0.5%. Technology and materials showed slight outperformance, consistent with the broader themes driving 2025. One headline that caught attention was Nvidia’s (NVDA) investment in AI chip startup Groq, valuing the company at $20 billion just three months after it raised $750 million at a valuation of $6.9 billion. This marked Nvidia’s largest-ever investment, though it remains small relative to Nvidia’s own market capitalization. The strategic importance mattered more than the size. Groq was founded by a creator of Google’s (GOOGL) tensor processing unit, and its emergence challenges Nvidia’s dominance in AI accelerators. Nvidia shares responded positively, up more than +1.5%, while Alphabet hovered near unchanged.
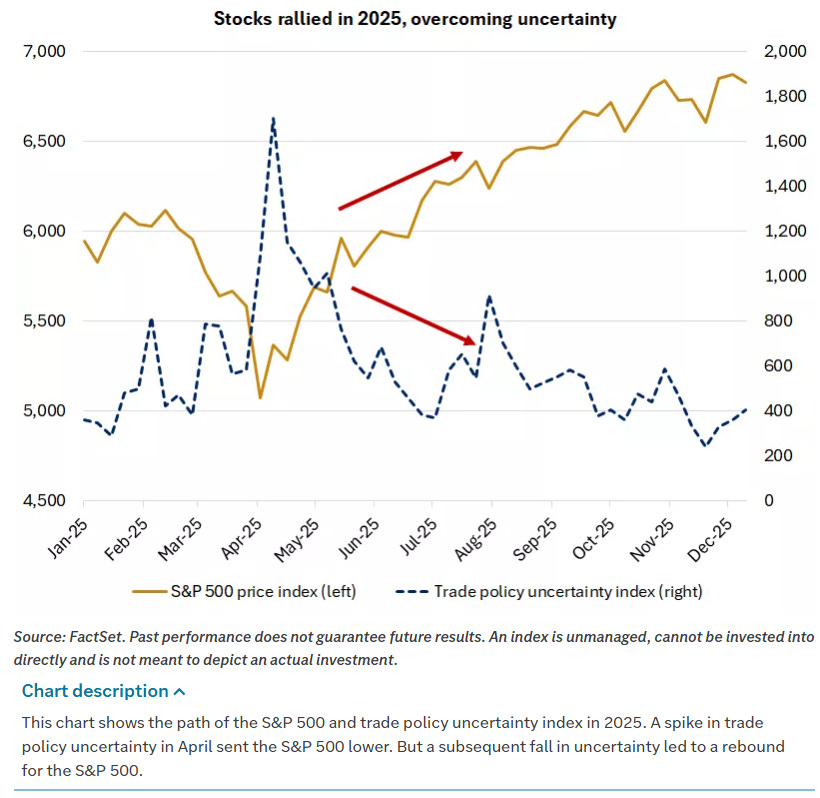
Zooming out, 2025 is shaping up as a year defined by four dominant themes. First, markets overcame significant uncertainty. After two relatively calm years, volatility returned as investors navigated trade-policy upheaval and a record-long government shutdown. The S&P 500 logged 13 daily moves of more than 2%, exceeding the combined total of the prior two years. Twelve of those moves occurred in the first half of the year following the Trump administration’s April tariff announcements, which pushed the U.S. effective tariff rate to its highest level in roughly 100 years. Stocks fell sharply on recession fears, with the S&P 500 declining 19% from its peak. Subsequent negotiations reduced tariffs from their April highs, and steady economic activity combined with AI enthusiasm helped the index recover and post its third consecutive year of returns above 15%.
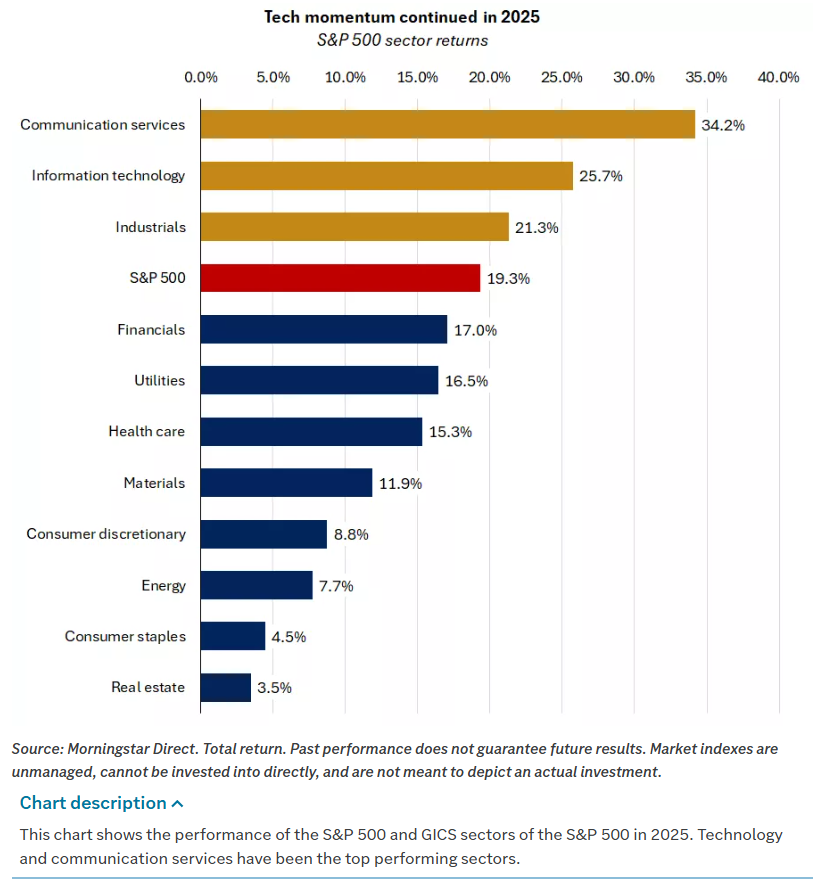
Second, technology led U.S. markets and supported economic growth. The technology and communication services sectors gained more than 25% in 2025, ranking among the top performers for the third straight year. Earnings growth in these sectors is on track to exceed 15%, fueled by sustained AI investment.
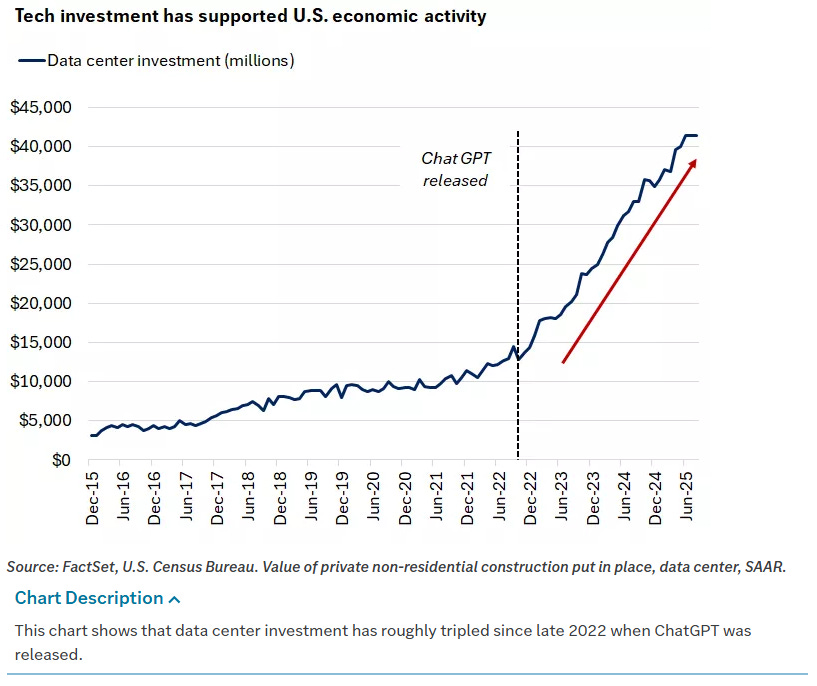
Data center investment has roughly tripled since the launch of ChatGPT in late 2022, and information processing equipment investment grew at an annualized rate of 8.4% in Q3, helping nonresidential investment average 6.5% quarterly growth through the first three quarters of the year.
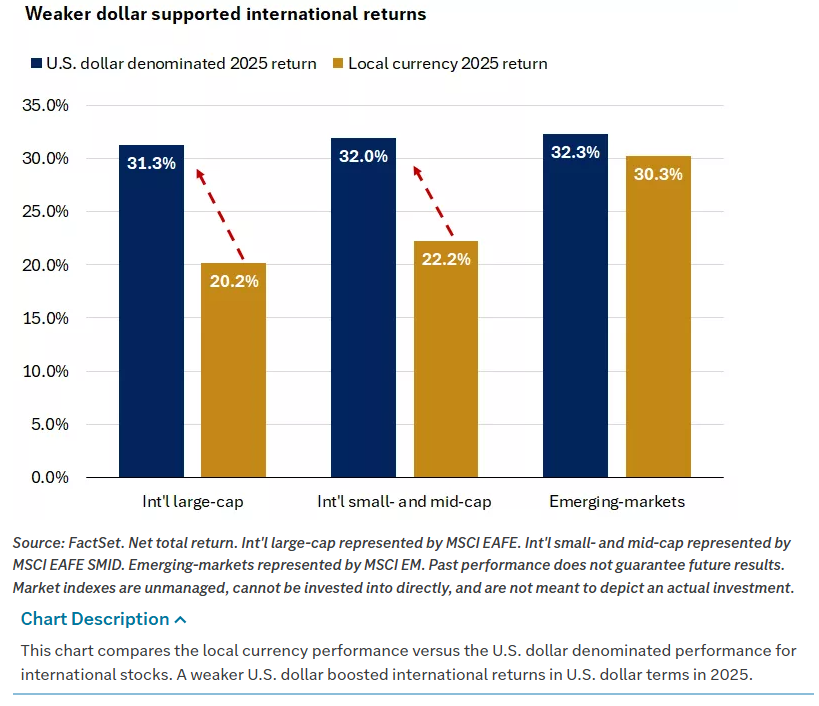
Third, international stocks outperformed U.S. equities by 13%, the largest margin since 2009. Fiscal stimulus in Germany, monetary easing by the European Central Bank, and surging corporate profit margins in Japan supported developed markets. A weaker U.S. dollar played a major role, declining more than 9% on the ICE U.S. Dollar Index, the steepest annual drop since 2017. Emerging market equities gained 32%, led by technology-heavy regions like China and Korea.
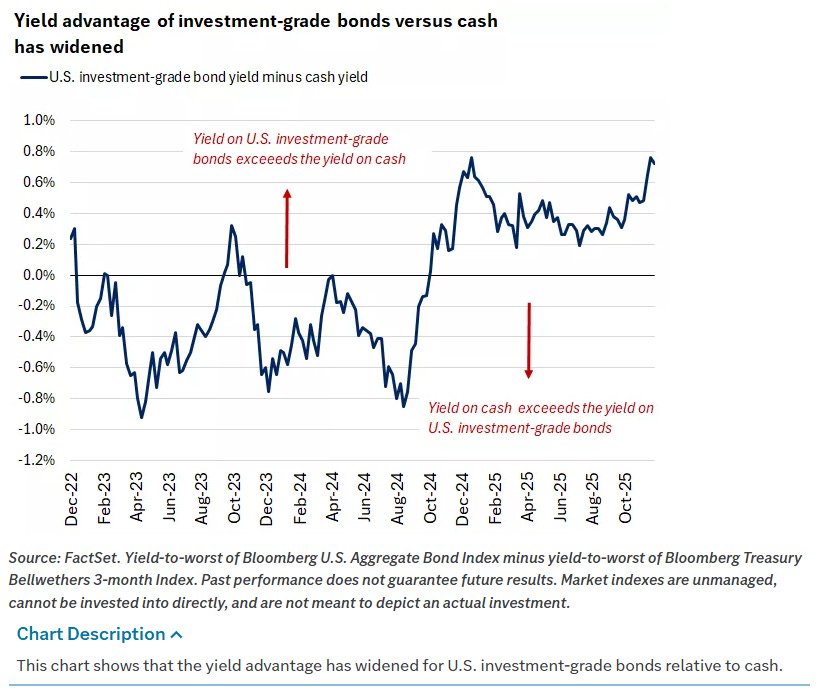
Fourth, bonds reclaimed leadership over cash. U.S. investment-grade bonds gained more than 7% in 2025, outperforming cash by roughly 3%, the widest margin since 2020. Treasury yields declined across most maturities as the Fed cut rates by 0.75% and labor markets cooled. By year-end, the yield on investment-grade bonds was approximately 0.7% higher than that of cash, near the upper end of its three-year range.
As 2025 draws to a close, the picture is clear. Markets are not euphoric, but they are confident. Growth is strong, rates are contained, inflation expectations are easing, and risk assets are being supported rather than forced higher. The final days of the year may be quiet, but the structure underneath suggests that this rally is resting, not rolling over.
Bottom line: stocks end 2025 near record highs with growth at +4.3%, the 10-year yield at 4.128%, rate-cut odds back to 20%, commodities breaking out, and risk appetite intact heading into year-end.
Weekly Benchmark Breakdown
This week felt like a market that wants higher prices and is doing a decent job recruiting participants, especially on shorter time frames. The risk tone is constructive: most of the major cohorts are above their key moving averages, and the new highs lists are comfortably beating new lows across every index you shared. The one thing missing is a full-throated, durable expansion in the intermediate trend measures. We are getting the thrust, but the trend confirmation is still in progress.
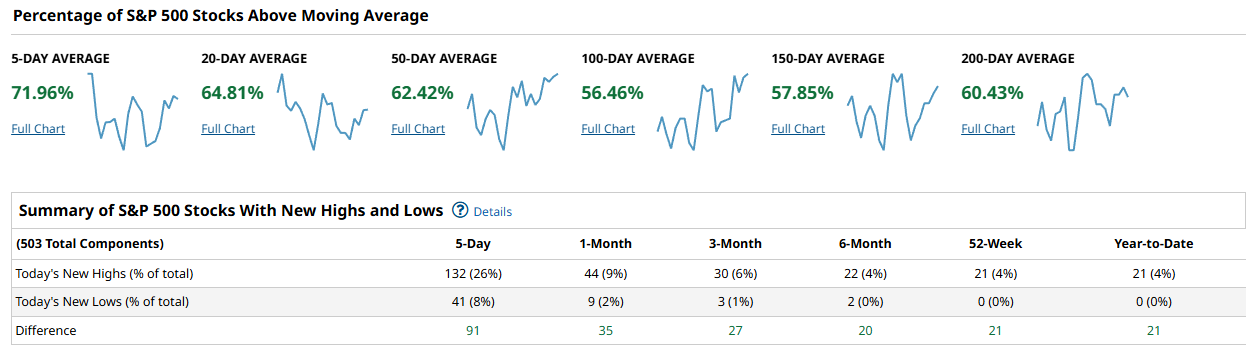
In the S&P 500, participation is clearly on the right side of the ledger. About 71.96% of constituents are above their 5-day average, 64.81% are above the 20-day, and 62.42% are above the 50-day, which is what you want to see when a market is pressing higher without relying on a tiny handful of names. The longer measures are positive but not yet overwhelming, with 56.46% above the 100-day, 57.85% above the 150-day, and 60.43% above the 200-day. That profile reads like an advance that has regained its footing and is trying to turn into something sturdier. The new highs versus new lows data supports that: over the past 5 days there were 132 new highs versus 41 new lows for a net of +91, and even out at 52-week and year-to-date the net is +21 with zero new lows in those buckets. That is not a market under distribution pressure; it is a market where demand is showing up and downside leadership is scarce.
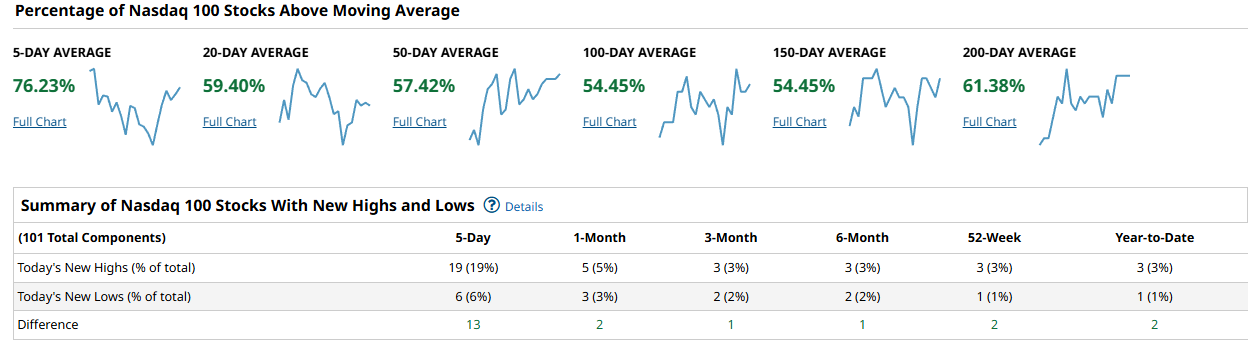
The Nasdaq 100 looks like leadership that is healthy but not as broadly confirmed beneath the surface as the headline strength might imply. Short-term participation is strong with 76.23% above the 5-day, but it drops to 59.40% above the 20-day and 57.42% above the 50-day, with 54.45% above both the 100-day and 150-day. The 200-day improves to 61.38%, which is a reassuring longer-term backdrop, but the mid-range measures being only in the mid-50s tells you there is still churn inside the index. New highs are winning, but not by a landslide: 19 new highs versus 6 new lows over 5 days for +13, and the 1-month net is only +2 (5 highs vs 3 lows). The message is simple: the complex remains a tailwind, but the internal tape is not in runaway mode. It is leadership, not a breadth explosion.
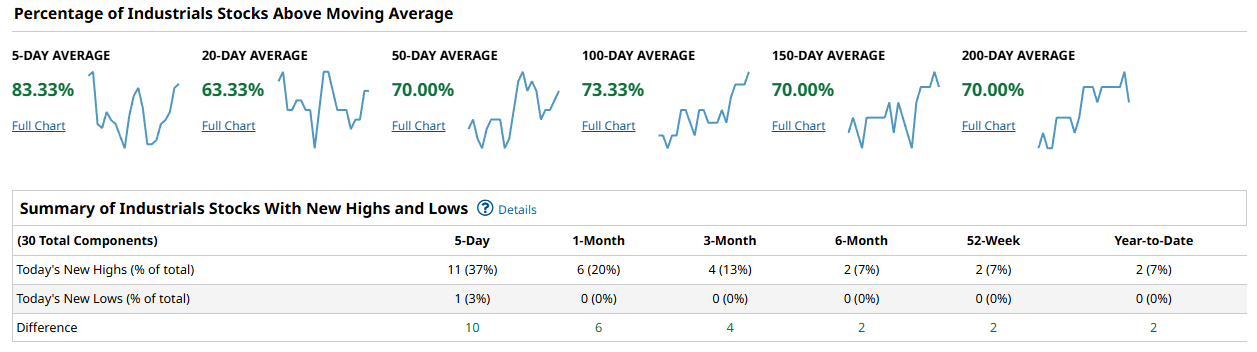
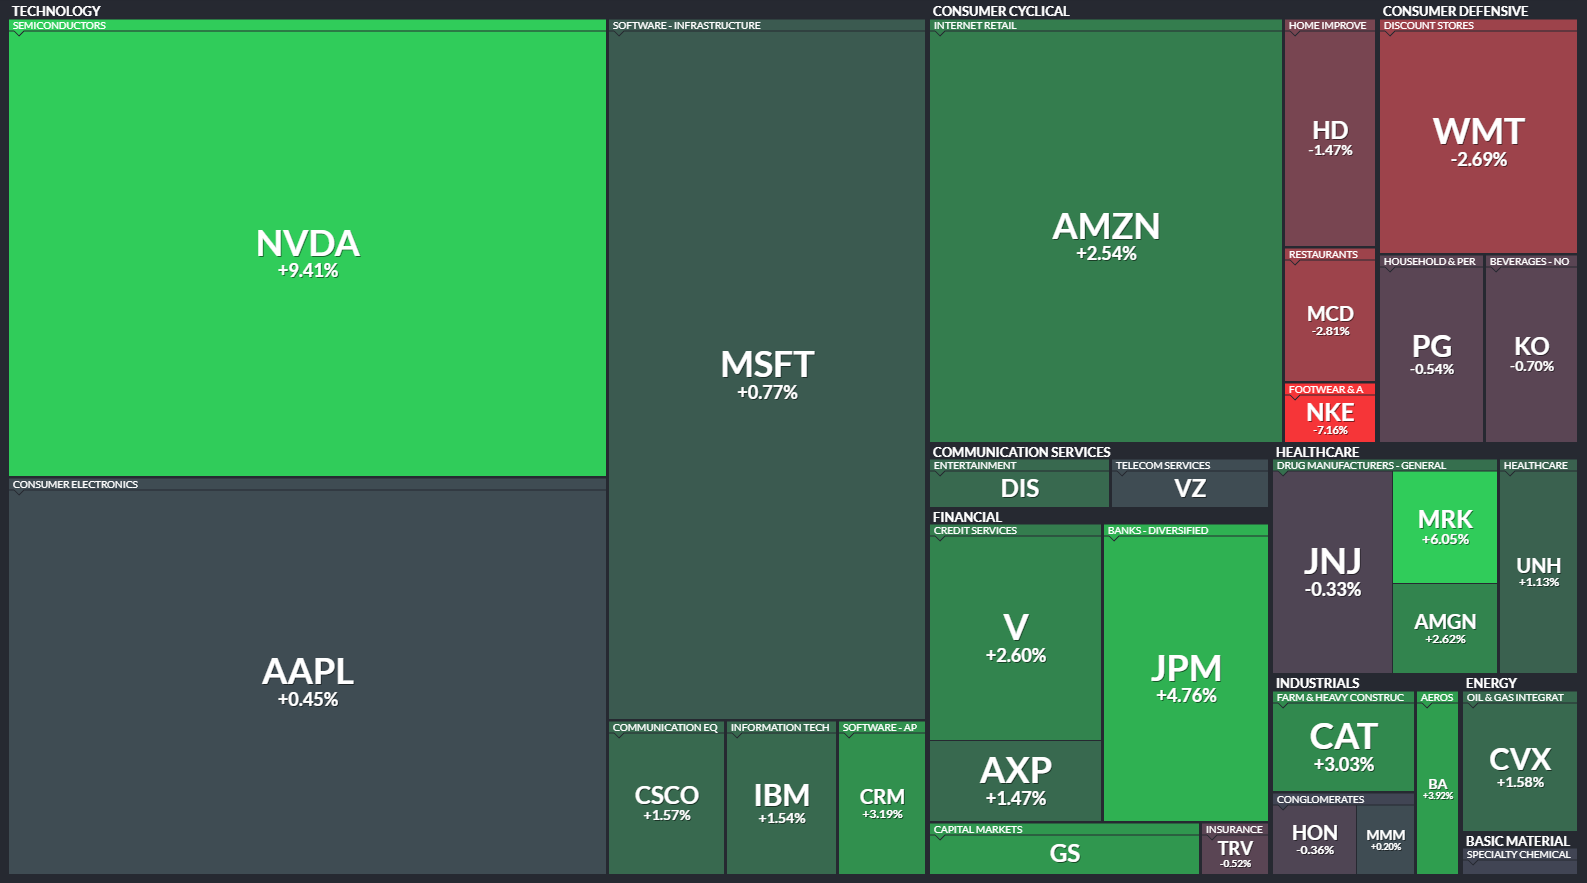
The Dow is the cleanest breadth picture of the four. You have 83.33% above the 5-day, 63.33% above the 20-day, and 70.00% above the 50-day, and it gets even better as you move out in time with 73.33% above the 100-day and 70.00% above both the 150-day and 200-day. That is what durable participation looks like: not just a short-term pop, but an intermediate trend that has a lot of names holding above rising reference levels. The new highs list confirms the tone: 11 new highs versus 1 new low over 5 days for +10, and there are no new lows at all across the 1-month, 3-month, 6-month, 52-week, or year-to-date windows shown. When Industrials breadth looks like this, it usually acts as ballast for the broader market because it signals cyclical appetite and fewer cracks in economically sensitive areas.
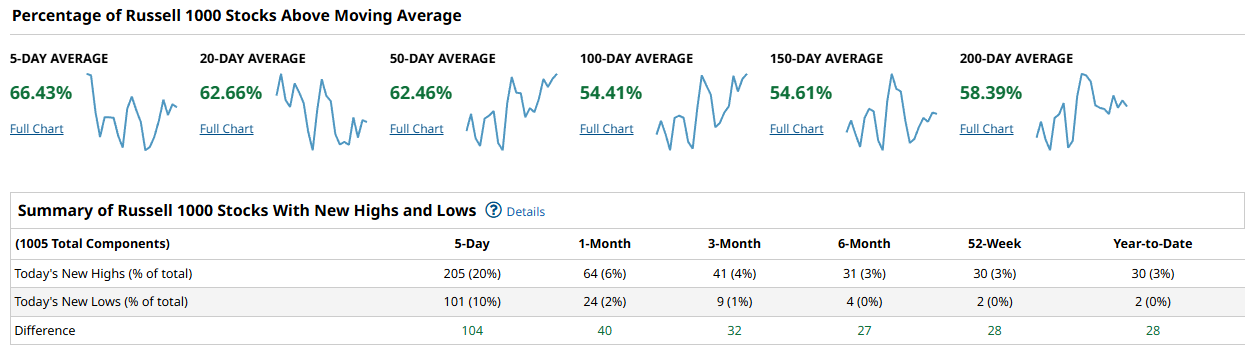
The Russell 1000 is constructive, but it is also the one that best captures the market still working through the middle of the tape. Near term you have 66.43% above the 5-day and 62.66% above the 20-day, with 62.46% above the 50-day. Like the Nasdaq, the intermediate trend measures sit in the mid-50s: 54.41% above the 100-day and 54.61% above the 150-day, with 58.39% above the 200-day. That says the broad large-cap universe is participating, but a meaningful chunk is still either repairing prior damage or lagging just enough to keep the 100 to 150-day cohorts from clearing into the high ground. New highs versus new lows are decisively positive, though: 205 highs versus 101 lows over 5 days for +104, and the net remains positive across the longer lookbacks (+40 over 1-month, +32 over 3-month, +27 over 6-month, and +28 over both 52-week and year-to-date). So while the intermediate participation is not yet robust, the market is still producing more upside breakouts than breakdowns.
Putting it together, the cap-weighted narrative is still favorable, but it is not purely a mega-cap story. The S&P 500 is over 60% above its 50-day and 200-day, and the Russell 1000 is also over 62% above its 50-day, which argues for improving participation beyond a narrow leadership lane. The clearest pocket of broad strength is Industrials, where the 100-day cohort is already north of 70%. The thing that would most convincingly confirm a durable advance from here is the intermediate cohorts continuing to rise, specifically the S&P 500 and Russell 1000 pushing their 100-day and 150-day readings up through 60% while new highs continue to beat new lows by a comfortable margin. The thing that would justify more concern is a reversal where the 20-day and 50-day participation starts slipping materially while new lows expand, especially if the S&P 500 new low list stops being contained.
For the playbook this week, I would treat this as a market where you want to be positioned with the trend, but you still demand confirmation from the middle of the tape. Favor areas showing both short-term thrust and intermediate staying power, which right now is best represented by the Industrials breadth profile, and by extension any cyclicals that are holding above their 50-day and 200-day in size. Be more selective in the high beta growth complex: Nasdaq breadth is positive, but the modest 1-month net new highs versus new lows suggests you want entries that are technically clean rather than chasing everything that is bouncing. What I would avoid is bottom-fishing laggards that cannot reclaim their 50-day, because the intermediate measures in the broad indexes say the market still has a meaningful minority of names below trend. Watch the 100-day and 150-day readings in the S&P 500 and Russell 1000 for follow-through, and keep an eye on whether new lows stay suppressed as price grinds higher.
Bottom line: breadth is bullishly aligned and improving, but the advance becomes truly durable when the 100-day and 150-day participation in the broad indexes clears and holds above 60% while new highs keep outpacing new lows.

Investor Sentiment Report
%Bull-Bear Spread
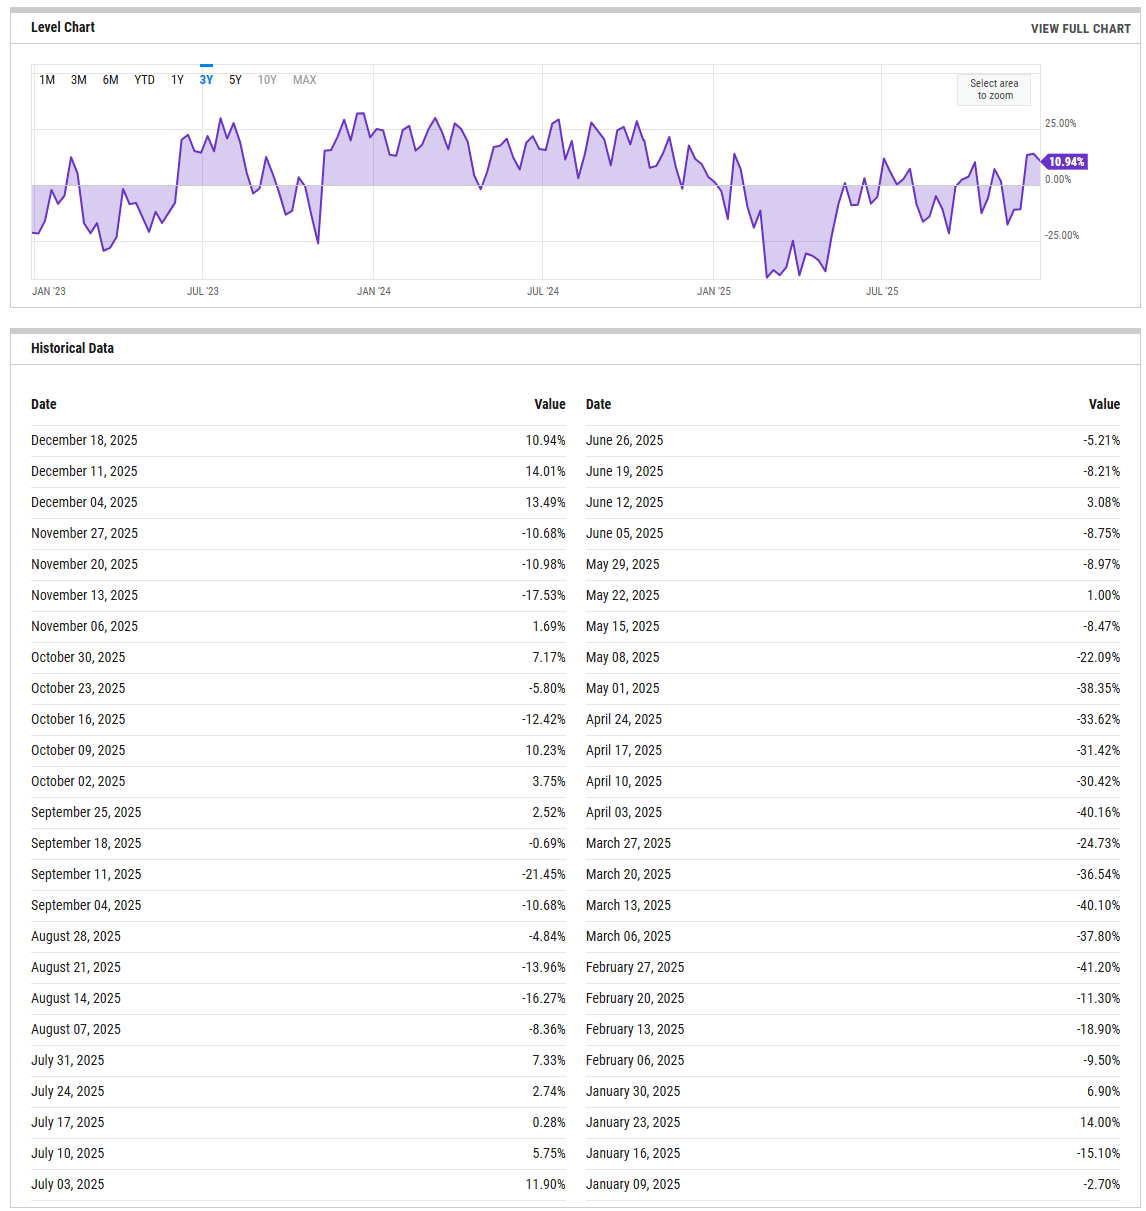
The %Bull-Bear Spread measures the gap between bullish and bearish investor sentiment, often from surveys like AAII. It’s a contrarian indicator—extreme optimism may signal a coming pullback, while extreme pessimism can hint at a potential rally. Large positive or negative spreads often mark market turning points.
The percent bull minus bear spread is back in positive territory at 10.94% (Dec 18, 2025), but it cooled a bit from 14.01% the prior week (Dec 11) and 13.49% the week before that (Dec 04). That little dip matters less than the bigger story in the table: this measure has been whippy all year, with notable drawdowns into negative readings like -10.68% (Nov 27) and -17.53% (Nov 13), and much deeper earlier in the year including -41.20% (Feb 27) and -40.16% (Apr 03). In plain terms, sentiment has improved from washed-out levels, but it is not in a frothy, one-way extreme. The tripwires are straightforward: a bull-bear spread push above 20% would start to look crowded, while a slide back below 0% would swing the contrarian setup back toward rebound-friendly.
NAAIM Exposure Index
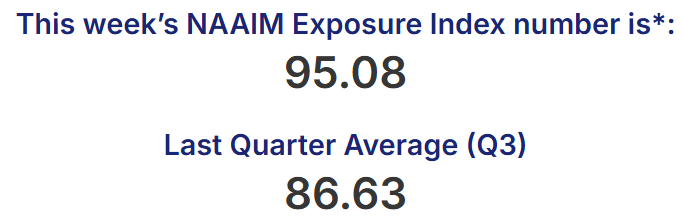
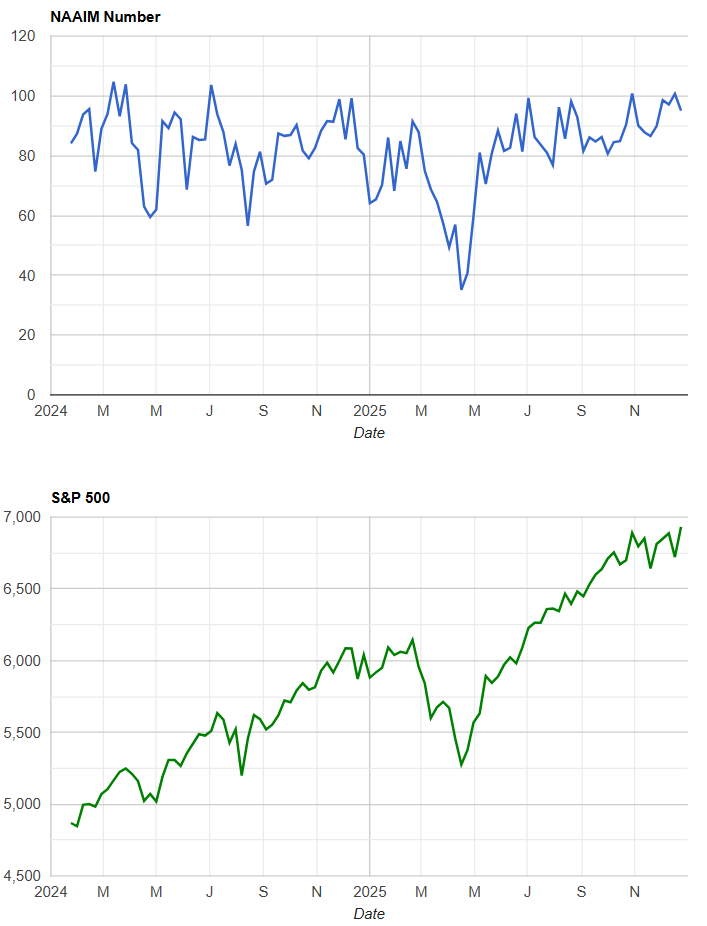
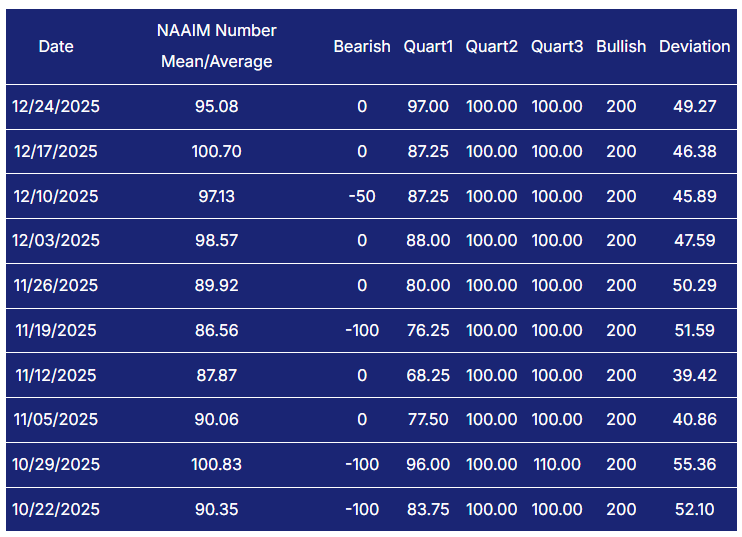
The NAAIM Exposure Index (National Association of Active Investment Managers Exposure Index) measures the average exposure to U.S. equity markets as reported by its member firms. These are typically active money managers who provide their equity exposure levels weekly. The index offers insight into how much these managers are investing in equities at any given time, ranging from being fully short (-100%) to leveraged long (up to +200%).
NAAIM echoes that posture. The exposure index sits at 95.08 on 12/24/2025, down from 100.70 on 12/17, and in line with recent elevated readings like 97.13 (12/10) and 98.57 (12/03). Managers are largely in, which supports trend persistence when price is behaving, but it also reduces the amount of easy buying power left if the tape stumbles. A drop into the 50s without major price damage would be a constructive reset, while a push back toward the high 90s and 100s keeps the market vulnerable to any fast de-risking episode.
CBOE Total Put/Call Ratio
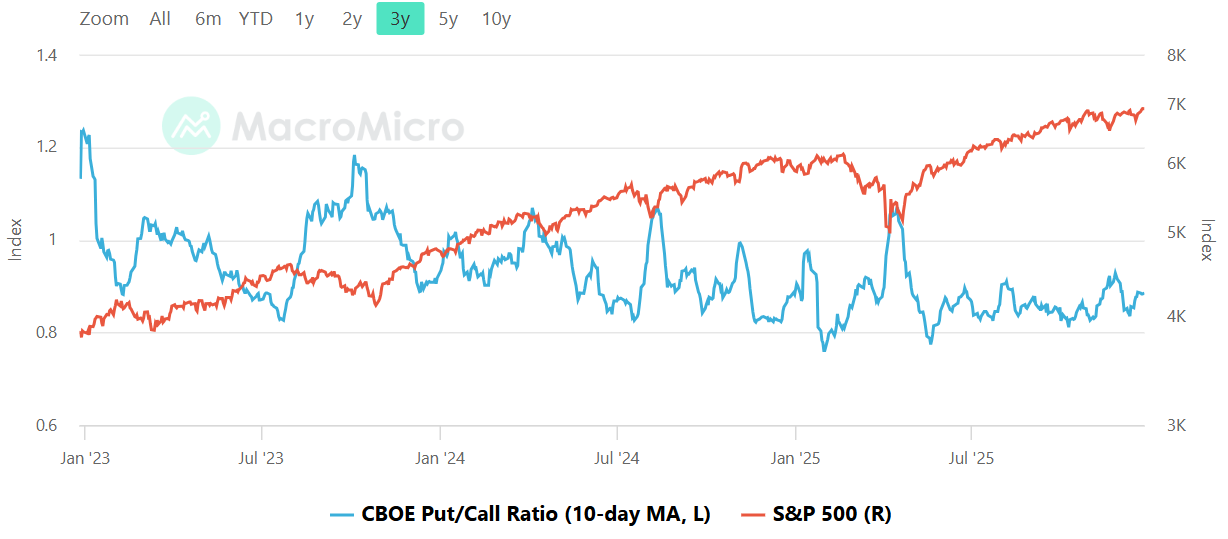
CBOE's total put/call ratio includes index options and equity options. It's a popular indicator for market sentiment. A high put/call ratio suggests that the market is overly bearish and stocks might rebound. A low put/call ratio suggests that market exuberance could result in a sharp fall.
The put/call ratio shown is the 10-day moving average, and the key observable is that it is sitting below 1.0 and has been oscillating in a relatively tight band at the right edge of the chart. There is no visible spike to fear levels, and there is also no sustained collapse toward the frothier end of the range. That reads as a market that is not paying up for heavy protection, but also not completely abandoning it. In risk terms, this tends to produce shallower pullbacks and quicker dip-buying when the trend is intact, because positioning is not primed for a panic unwind. The flip side is that bounces can be more grinding than explosive when the market is already comfortably positioned and hedging is not overly stressed. The practical tripwires are the usual ones: a drop toward the ~0.8 zone is where exuberance starts to show up and marginal upside can get thinner, while a push up toward and through ~1.0 is where fear rises and the market often becomes more tradable on the long side after a wash.
Equity vs Bond Volatility
The Merrill Lynch Option Volatility Estimate [MOVE] Index from BofAML and the CBOE Volatility Index [VIX] respectively represent market volatility of U.S. Treasury futures and the S&P 500 index. They typically move in tandem but when they diverge, an opportunity can emerge from one having to “catch-up” to the other.
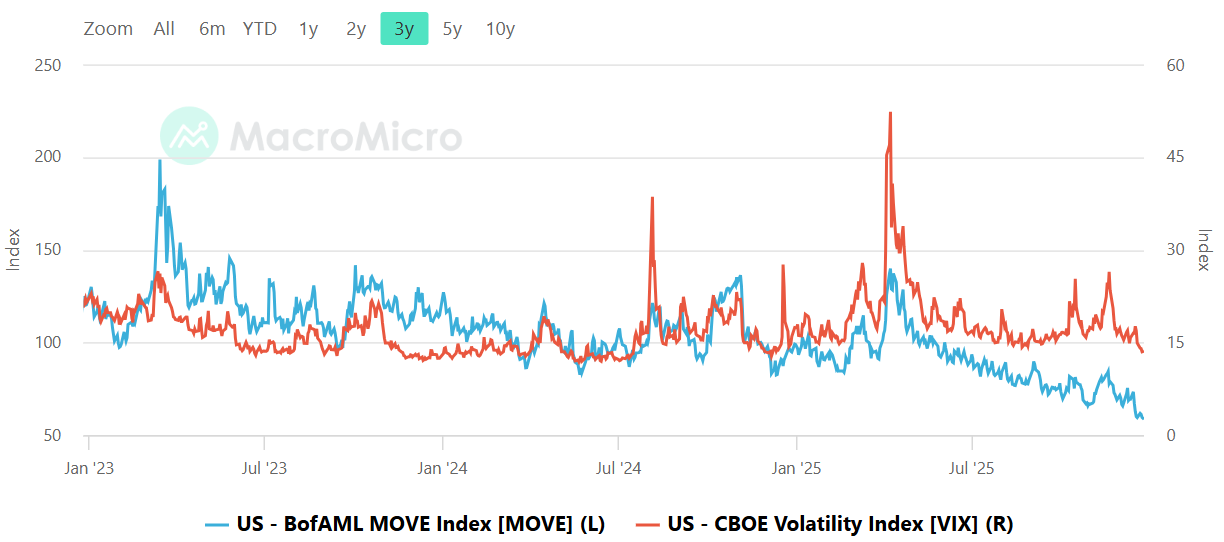
The MOVE and VIX relationship is calm by inspection, with bond volatility trending lower into the right side of the chart while equity volatility remains comparatively subdued and rangebound. There is no visible regime where both are expanding together in a sustained way, which is typically what you see when liquidity is deteriorating and risk assets are under stress. This matters because when the bond market is unstable, it often bleeds into equity via rates, funding conditions, and discount-rate narratives; when bond vol is compressing, equities usually get permission to trend. The message this week is that the volatility complex is not flashing urgent risk, and that tends to support continuation as long as price and breadth stay constructive. The tripwires remain the classic ones: a MOVE surge above roughly 120 while VIX stays sleepy is often an early warning that equities are next, and a VIX push into the high teens and above is where drawdowns begin to feel more persistent and less buyable on the first touch.
CNN Fear & Greed Constituent Data Points & Composite Index
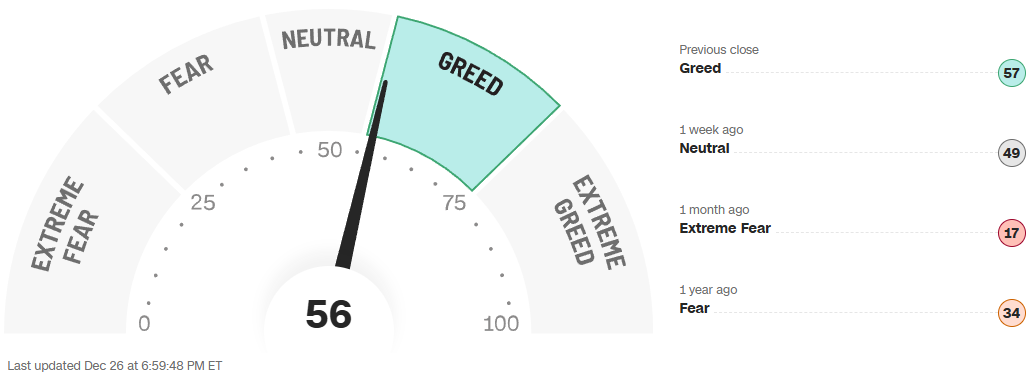
The composite Fear and Greed reading is 56, which sits in Greed, and it is a clear improvement from 49 one week ago. The same panel shows how sharp the swing has been: one month ago it was 17 (Extreme Fear), and one year ago it was 34 (Fear). The 1-year path reinforces that regime shift. The line spent a good portion of the year in a higher band, then suffered a notable air pocket into the low end of the scale later in the year, and has now rebounded back into the mid-range. That is usually the sweet spot for sustained advances: optimistic enough to keep buyers engaged, but not so euphoric that the market becomes fragile to minor disappointments. The levels to watch are clean: a move up toward the mid-70s and beyond is where exhaustion risk starts to rise, especially if it happens alongside weakening breadth. A relapse back under 30 would suggest fear is returning and would often improve forward entry quality, provided price is not breaking major support.
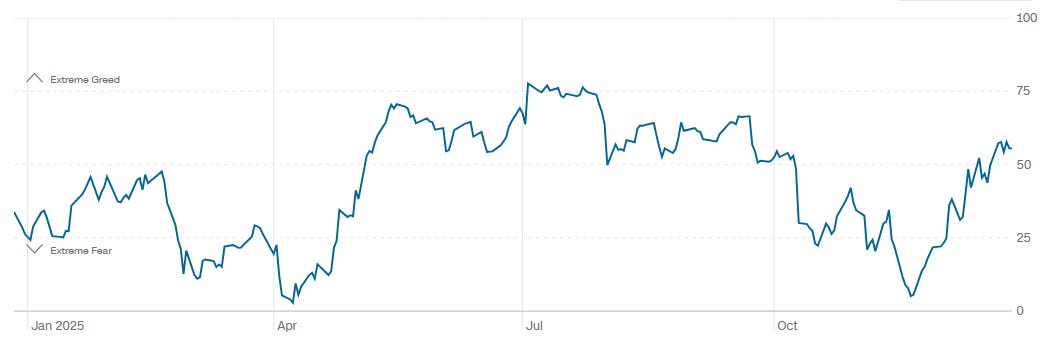
Bottom line: sentiment is constructive but not manic, managers are heavily exposed, and volatility is calm, so the tape favors staying with the uptrend while watching for any sudden de-risking shock that would show up first in exposure slipping and vols waking up.
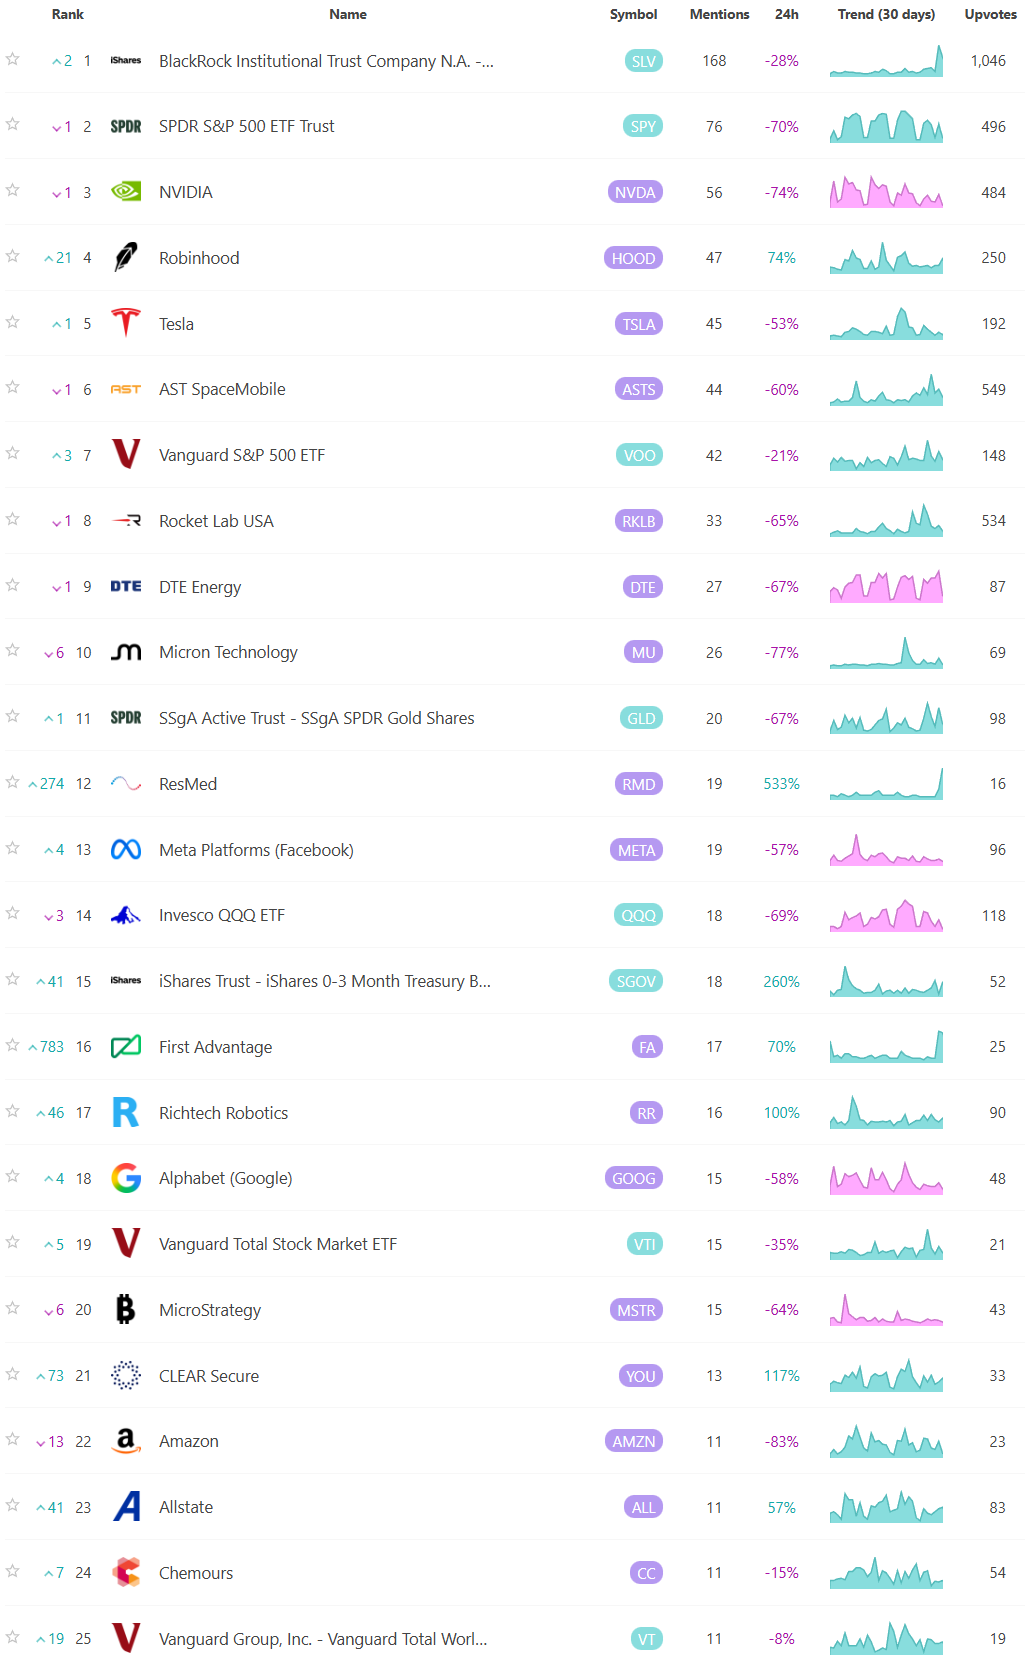
Social Media Favs
Social sentiment offers a real-time view of investor mood, often revealing market shifts before traditional indicators. It can signal momentum changes, spot emerging trends, and gauge retail investor impact—especially in high-volatility names. Tracking sentiment around events or earnings provides actionable insights, and when layered with quantitative models, can enhance predictive accuracy and risk management. Sustained sentiment trends often mirror broader market cycles, making this data a valuable tool for both short-term trades and long-term positioning.

Technician’s Playbook: Trading the Majors (SPY/QQQ/IWM/DIA)
When you’re a large institutional player, your primary goal is to find liquidity - places to do a ton of business with the least amount of slippage possible. VolumeLeaders.com automatically identifies and visually plots the exact spots where institutions are doing business and where they are likely to return for more. It’s one of the primary reasons “support” and “resistance” concepts work and truly one of the reasons “price has memory”.
This tape reads like a market that took its medicine mid-month and came back better organized, with each of the major index ETFs resolving their own version of the same problem: how to convert sharp liquidation into higher acceptance without giving back ground.
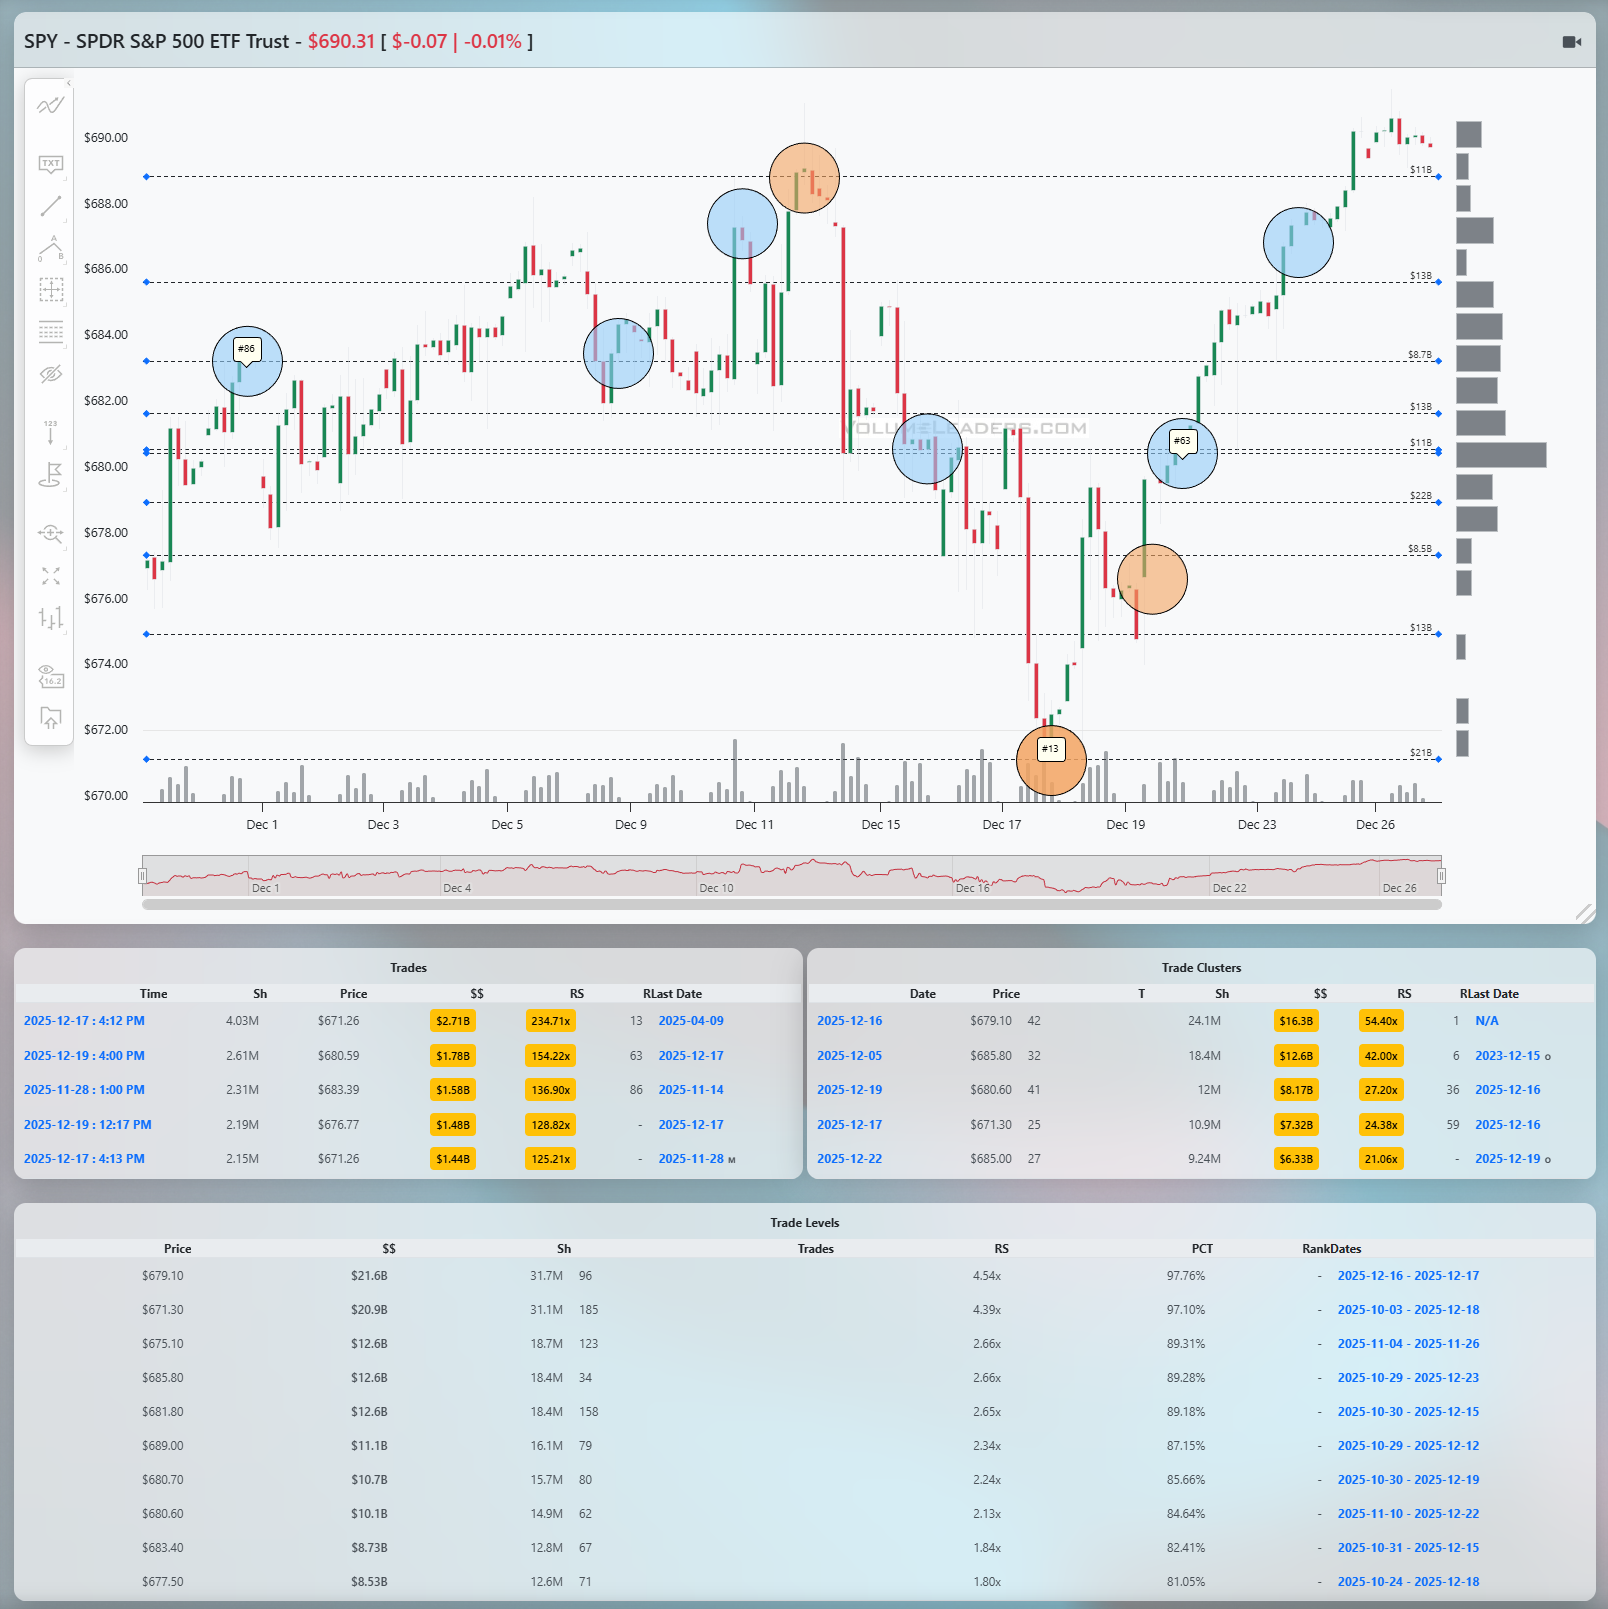
SPY
SPY set the tone. Early December was a steady, directional auction higher, punctuated by brief pauses that resolved upward. That structure broke in the middle of the month with a fast, emotional selloff that drove price into the low 670s. What mattered was not the speed of the drop, but what happened next. A very large print marked the low near 671, tagged as a top-100 historical trade, and price immediately reversed. That is classic absorption. Sellers pressed, size showed up, and the market could not go lower. From there, SPY rebuilt itself methodically. The recovery leg reclaimed the 680 handle, then worked through the low-to-mid 680s where multiple large trades printed without rejection. The highest concentration of notional in the Levels table sits just below current price, clustered around the upper 680s, with high RS and percentile readings that confirm real participation rather than thin air. As of the latest print near 690, SPY is pressing into prior supply from earlier in the month, but it is doing so from a position of balance, not exhaustion. The line of scrimmage is the 682 to 684 band. Acceptance above it keeps the upside case intact, with the next magnet just above 690. A failure back below 680 would be the first sign that this rally is losing sponsorship.
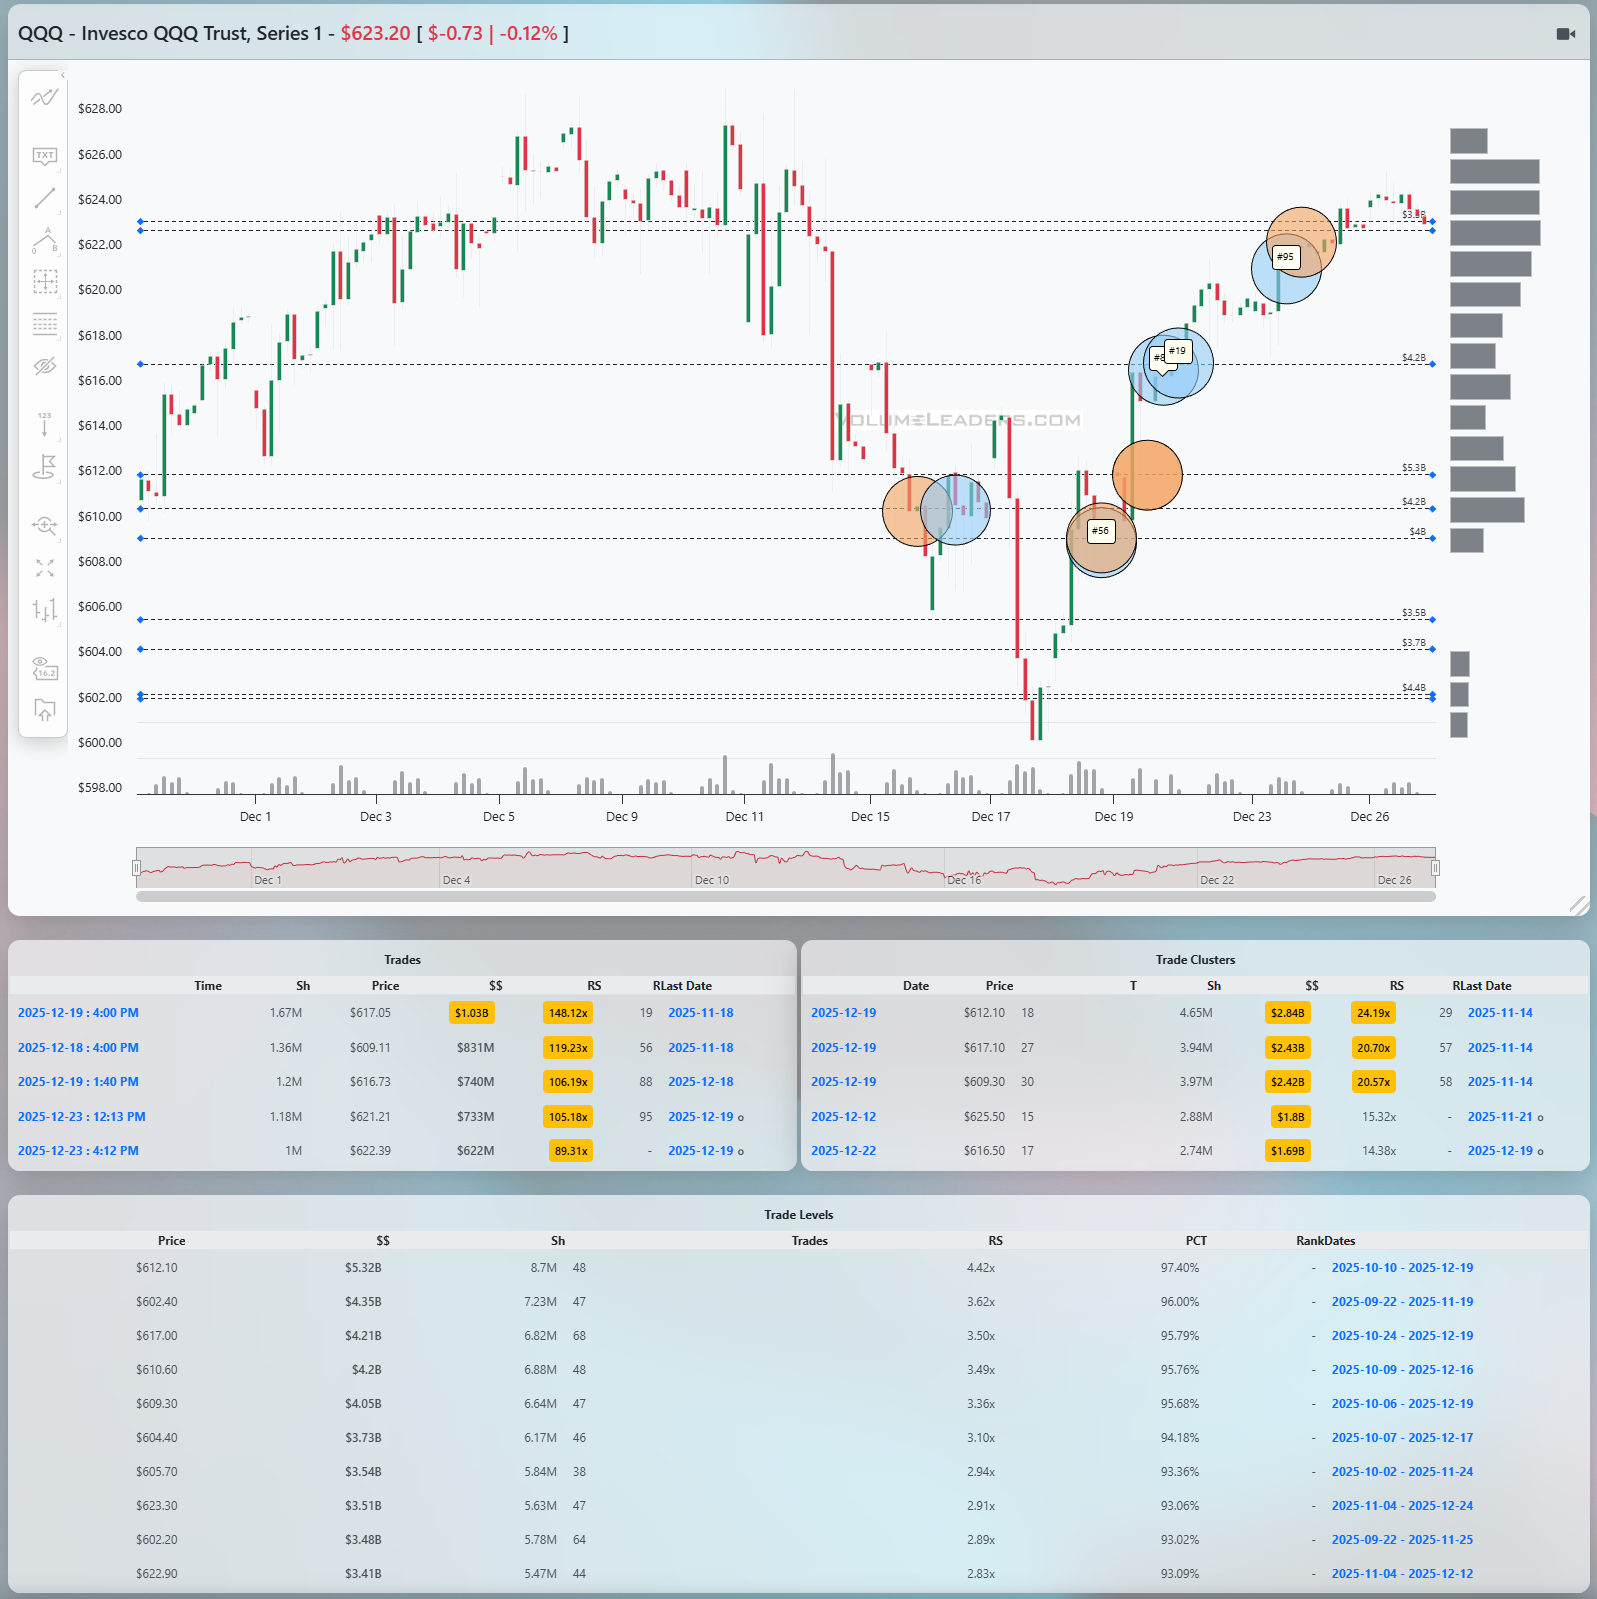
QQQ
QQQ followed a similar script, but with more volatility. The first half of December pushed higher into the mid-620s before rolling over sharply. The selloff was deeper here, driving price down toward the 600 to 605 area. That low was not subtle. Several very large trades printed between roughly 602 and 610, including a tagged top-100 print around 610, and price snapped higher almost immediately. That response tells you the liquidation found a buyer with patience and size. The recovery phase reclaimed the 610s, then the 616 to 618 shelf, where multiple clusters with elevated RS formed. The most important takeaway from the Levels table is that the heaviest dollar-weighted levels now sit between roughly 610 and 617, not at the highs. That is constructive, because it means value migrated higher rather than chasing price at the very top. QQQ is now pressing into the low 620s, where prior balance existed. Acceptance above 623 to 625 would signal continuation toward the mid-620s and potentially higher. Rejection back below 616 would shift this back into a rotational regime rather than a trend.
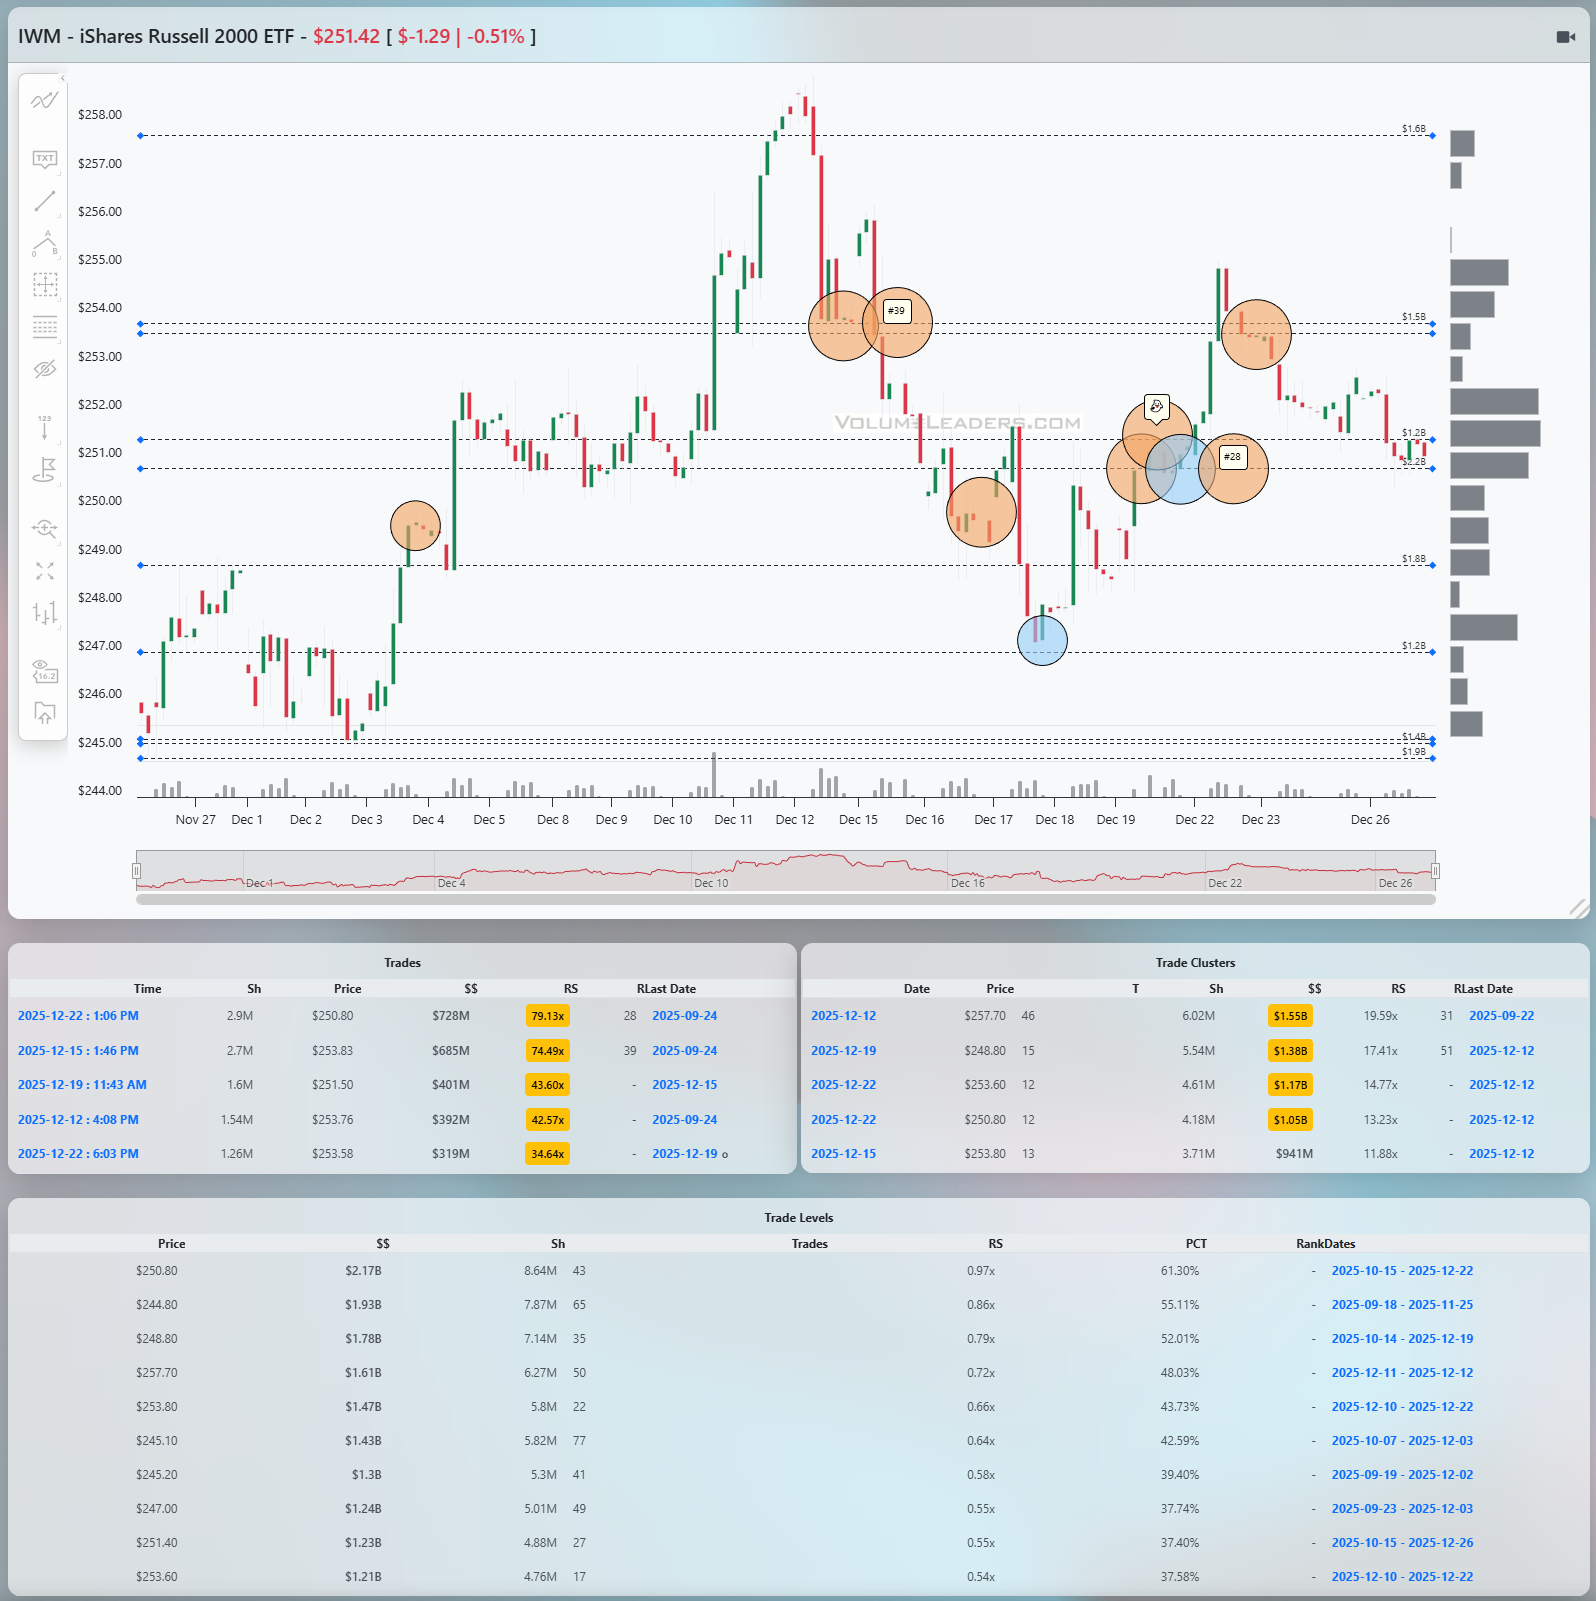
IWM
IWM continues to be the most workmanlike of the group, and also the most honest. It rallied hard into mid-December, topping near the upper 250s, then unwound sharply into the high 240s. The low near 247 was met with a large print and immediate bounce, but unlike SPY and QQQ, the rebound here has been choppier. The Levels table shows the most significant notional concentrated between roughly 248 and 252, with RS readings that are solid but not extreme. That defines the current balance zone. Recent sessions saw attempts higher into the 253 to 254 area, marked by clustered selling, and price was pushed back toward the middle of the range. For IWM, the line of scrimmage is clear: 250 to 251. Acceptance above 253 would open a path back toward the highs, while failure below 248 would put the December lows back in play. Until one of those resolves, small caps are trading rotation, not impulse.
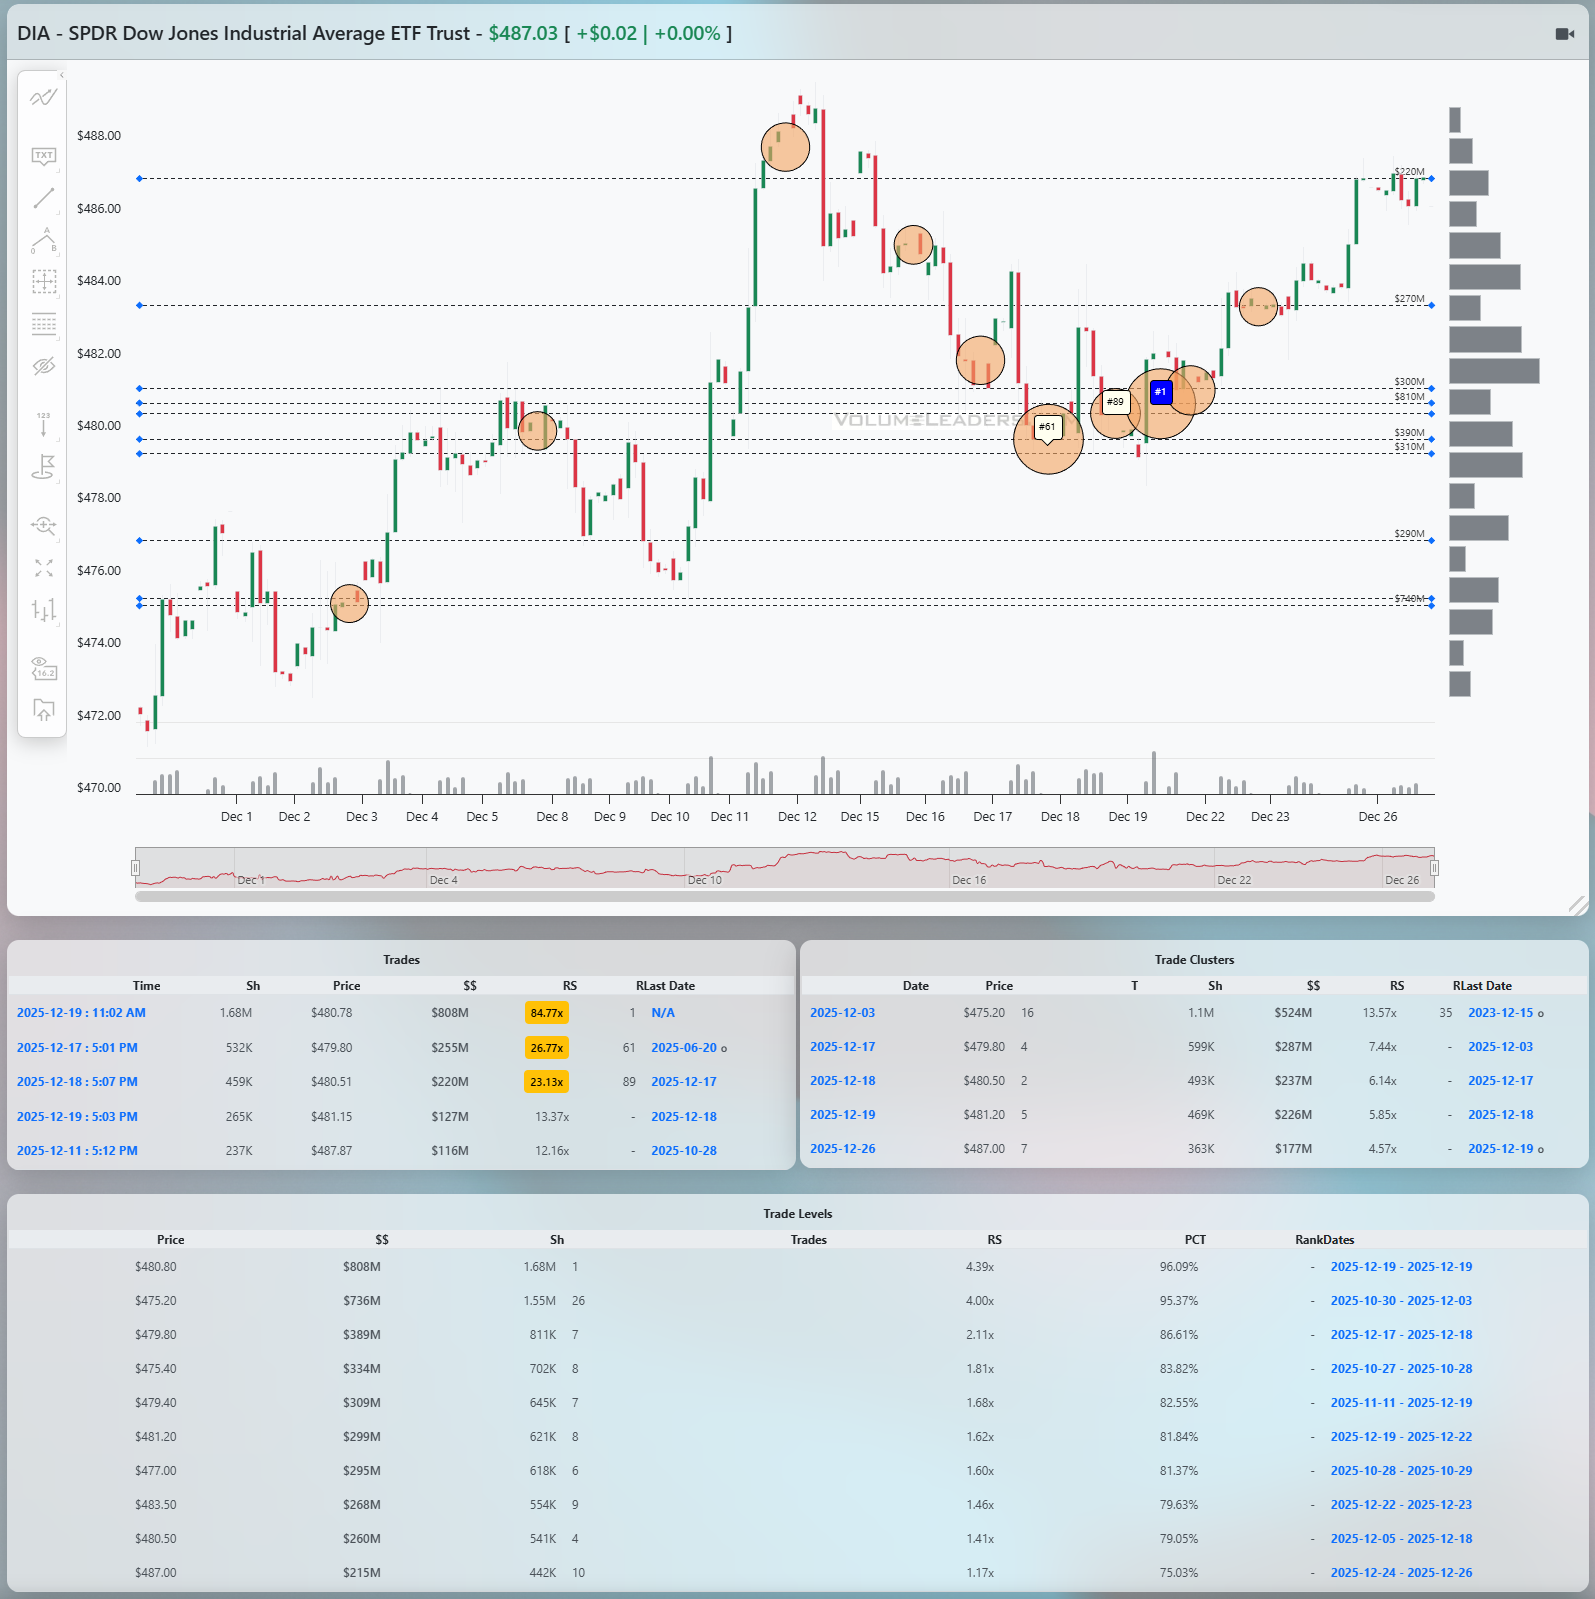
DIA
DIA has quietly been the most technically complete. The early December rally was strong, followed by a controlled pullback into the high 470s. Multiple large trades printed around 479 to 481, including a notable cluster with high percentile readings, and price held. From there, DIA resumed higher, reclaiming 483, then pushing into the upper 480s. The Levels table shows a dominant notional shelf centered around 480, with RS above 4x and percentile readings in the mid to high 90s. That is real sponsorship. Price is now hovering near 487 to 488, just under prior highs. The key is behavior, not direction. As long as DIA holds above 480, pullbacks are corrective. Acceptance above 488 would confirm another leg higher. A failure back through 478 would be the first real warning that this structure is breaking.
Across all four, the common thread is absorption followed by orderly repair. The bearish scenario is straightforward: failure back below the post-recovery shelves, namely SPY under 680, QQQ under 616, IWM under 248, and DIA under 478, would tell you the mid-month liquidation was not finished. The bullish scenario requires less drama: continued acceptance above the repaired levels and shallow pullbacks that attract buyers rather than sellers. For a disciplined trader, this is a tape that rewards patience. Let price come to the high-dollar shelves, define risk just beyond them, and respect the fact that value has already shifted higher.
SPY: 682–684, 688–690, 680
QQQ: 616–618, 623–625, 610–612
IWM: 248–252, 253–254, 248
DIA: 480, 487–488, 478–479

Summary Of Thematic Performance YTD
VolumeLeaders.com offers a robust set of pre-built thematic filters, allowing you to instantly explore specific market segments. These performance snapshots are provided purely for context and inspiration—think about zeroing in on the leaders and laggards within the strongest and weakest sectors, for example.
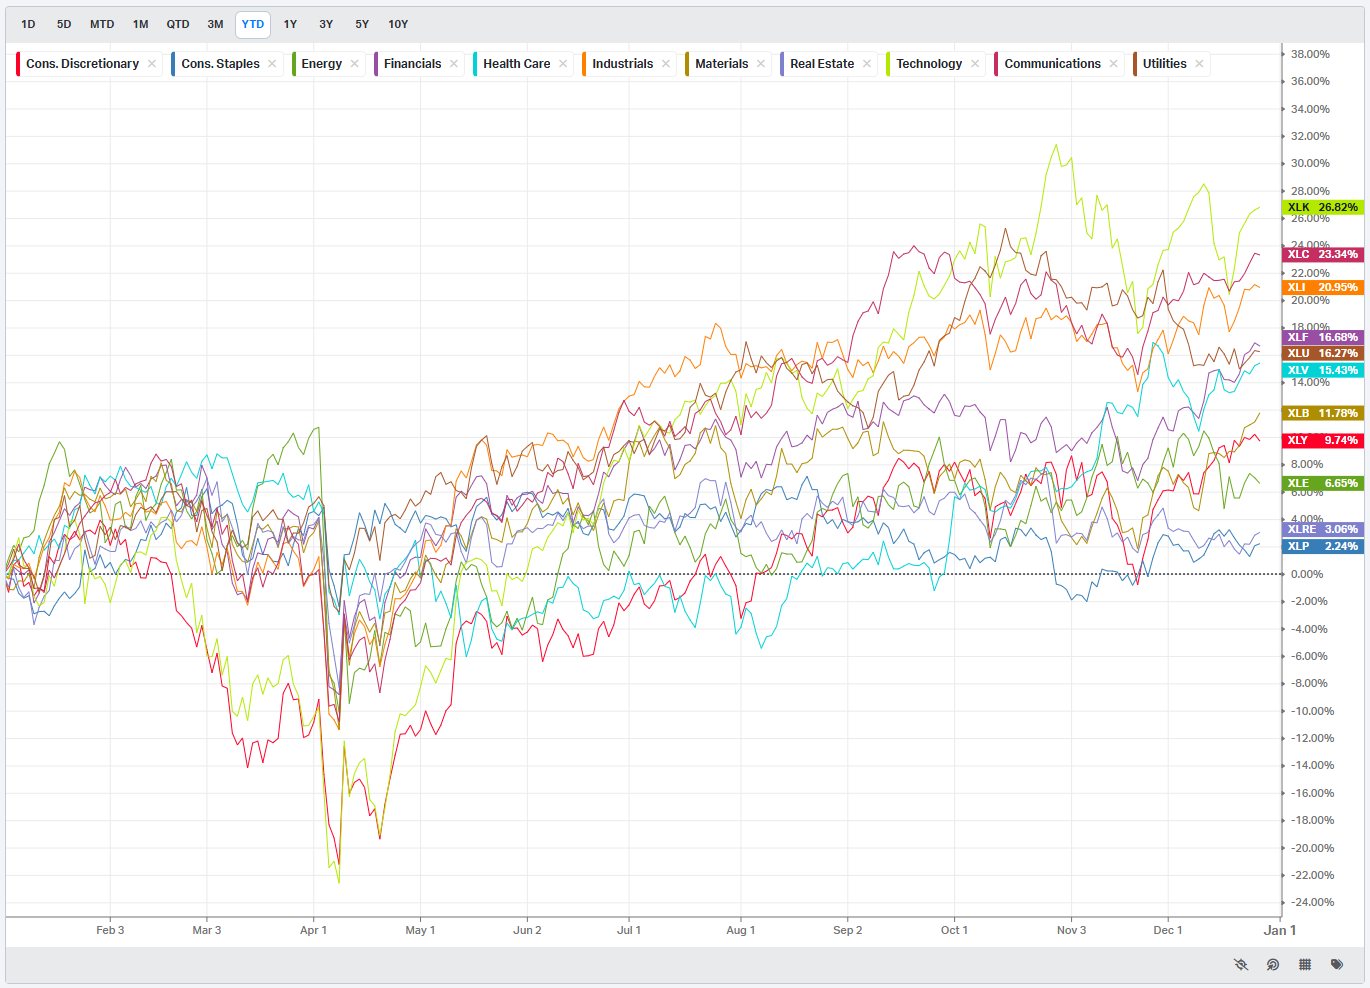
S&P By Sector
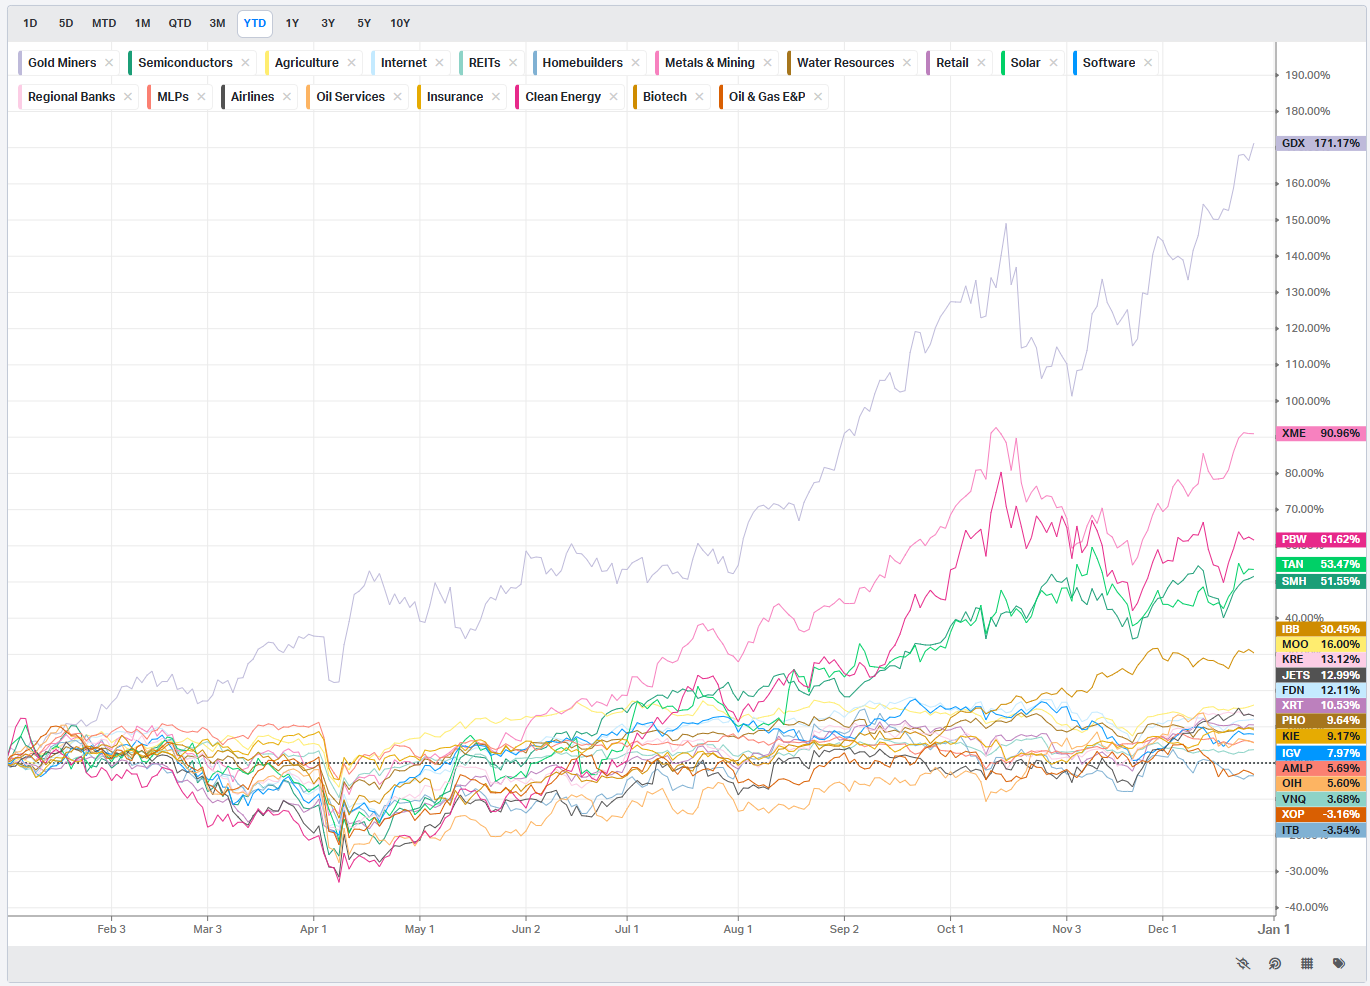
S&P By Industry
Commodities: Energy & Metals
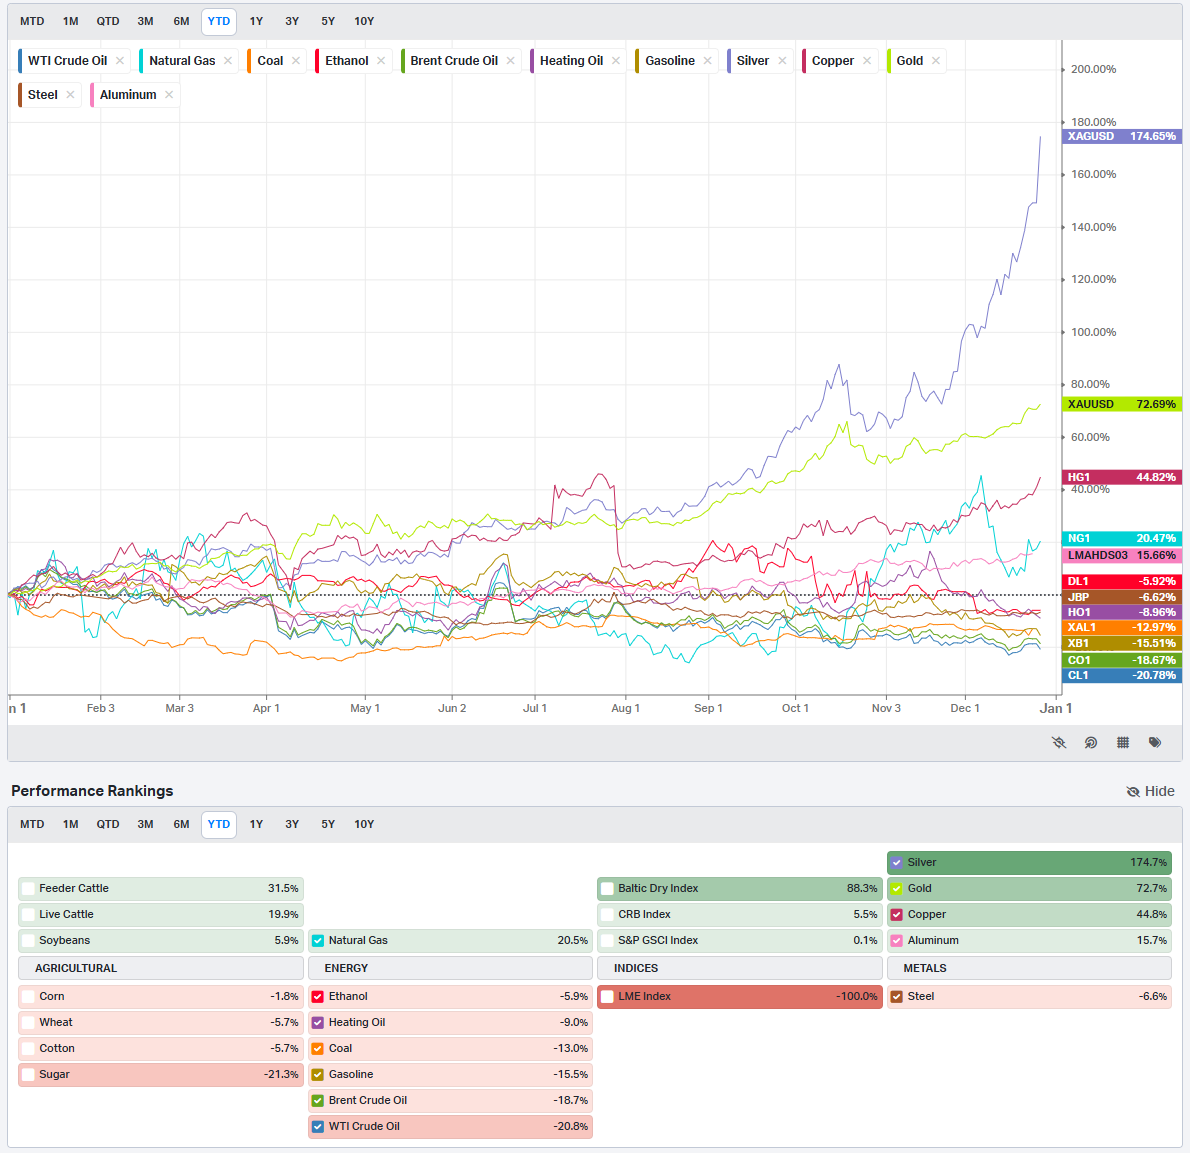
Currencies/Major FX Crosses
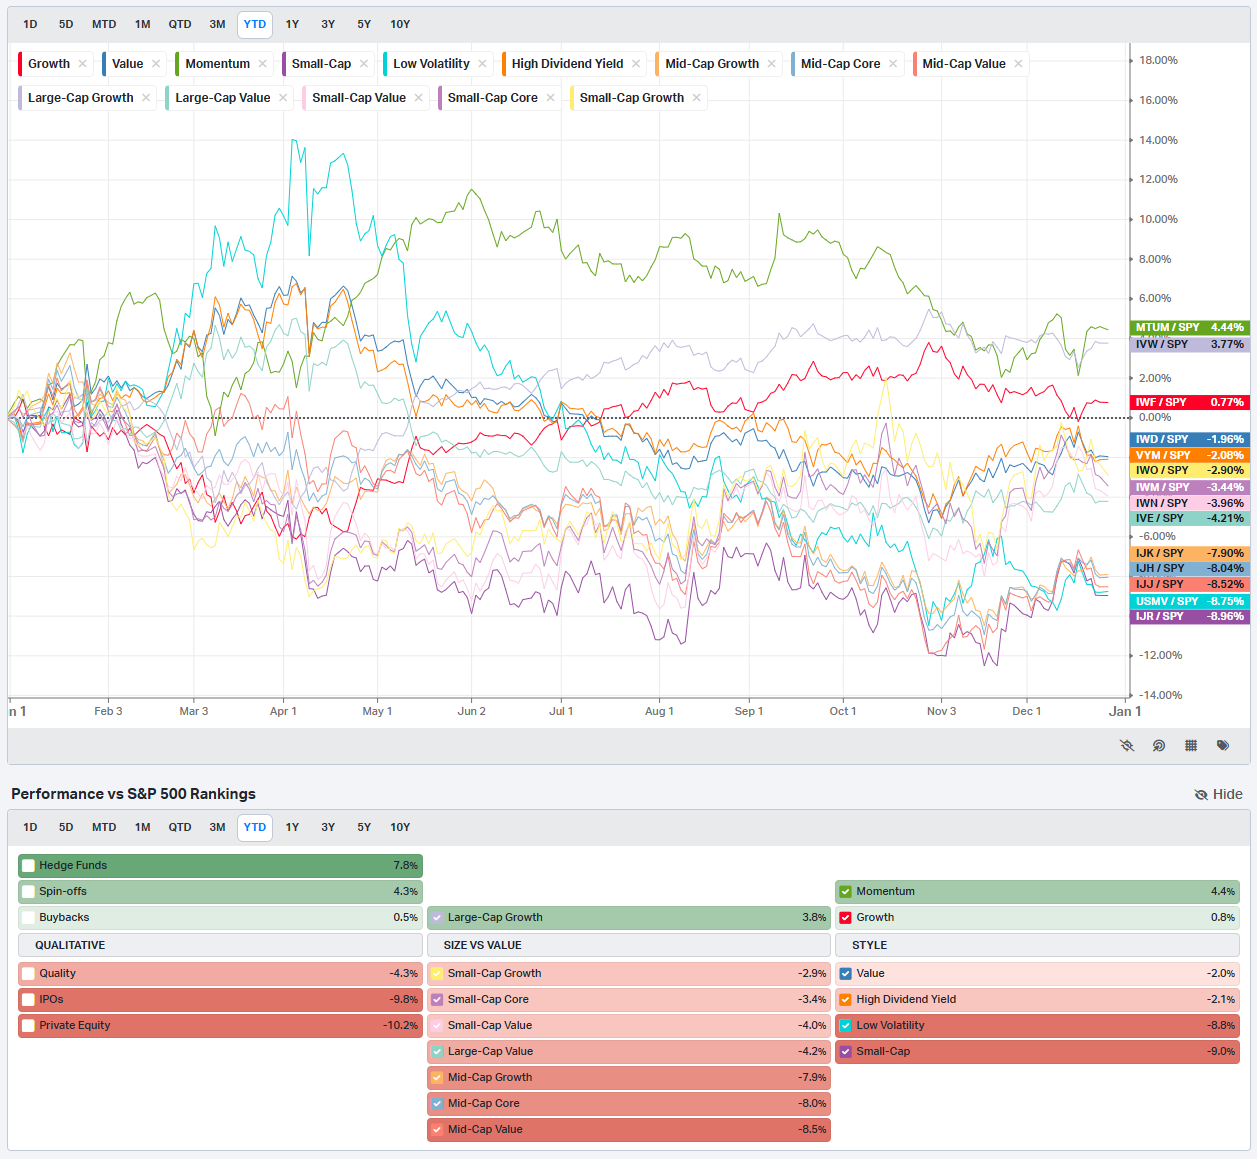
Factors: Style vs Size-vs-Value

Events On Deck This Week
Here are key events happening this week that have the potential to cause outsized moves in the market or heightened short-term volatility.
The final full trading week of the year brings a light but potentially market-moving macro slate, with housing, regional manufacturing, energy inventories, labor, and one last look at Fed thinking via the FOMC minutes. Liquidity will thin as the week progresses, which means reactions may be exaggerated relative to the information content. With no earnings on the calendar and the market closed Thursday for New Years Day, this is a week where macro prints can punch above their weight, especially if they lean consistently in one direction.
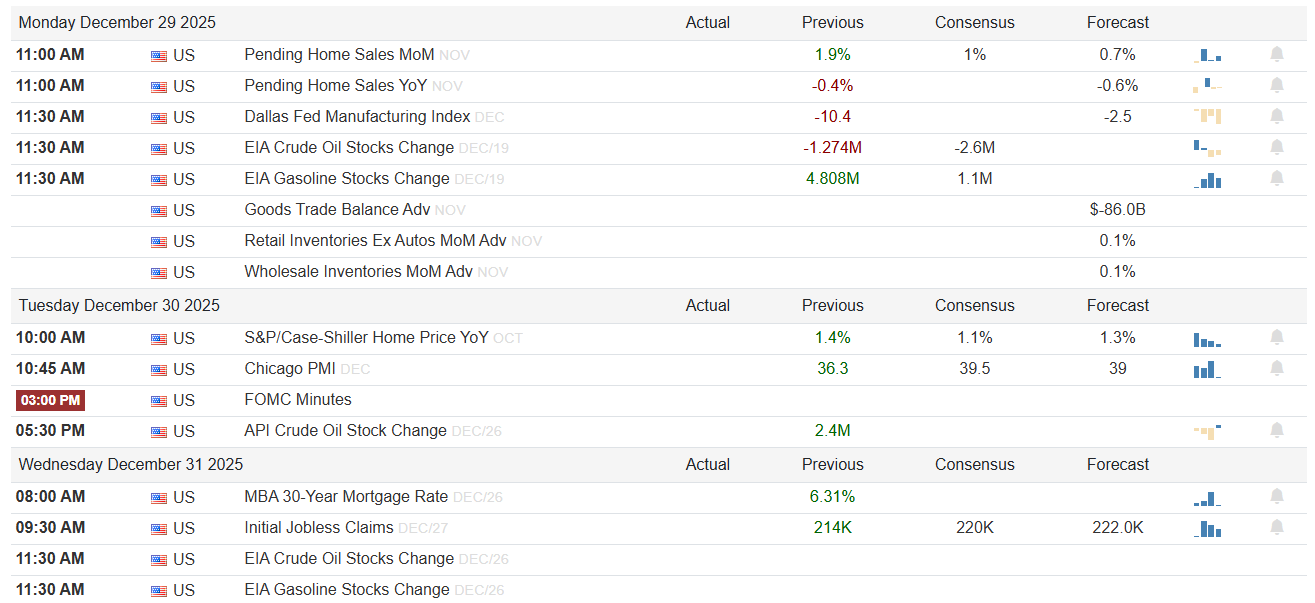
Monday starts with housing and energy. At 11:00 AM, Pending Home Sales for November are on deck. The month-over-month series previously printed 1.9%, with consensus at 1% and a forecast of 0.7%. A result closer to the prior reading would reinforce the idea that housing activity is stabilizing despite elevated mortgage rates, which would be modestly risk-on for equities tied to domestic growth. The year-over-year print previously came in at -0.4%, with a forecast of -0.6%. A less negative or positive surprise there would further support that narrative, while a sharper contraction would reintroduce concerns about demand sensitivity to rates. At 11:30 AM, the Dallas Fed Manufacturing Index for December follows. The prior reading was -10.4, with consensus at -2.5. This is a wide expected improvement, and the direction will matter more than the exact number. A move materially closer to zero would signal easing regional manufacturing stress, while a relapse deeper into negative territory would reinforce the soft-patch story. Also at 11:30 AM are EIA energy inventories for the week ending December 19. Crude stocks previously fell by 1.274M versus a prior draw of 2.6M, while gasoline stocks rose by 4.808M against a prior 1.1M build. Another crude draw paired with a smaller gasoline build would be supportive for energy prices and the energy sector, while a reversal would pressure crude-sensitive names.
Tuesday shifts the focus back to prices, activity, and policy. At 10:00 AM, S&P Case-Shiller Home Prices year-over-year for October are released, with a prior reading of 1.4%, consensus at 1.1%, and forecast at 1.3%. This remains a slow-moving series, but an upside surprise would reinforce the idea that home prices are holding firmer than expected, which can complicate the inflation narrative at the margin. At 10:45 AM, Chicago PMI for December prints, previously 36.3 versus a prior 39.5 and consensus of 39. This index is still deep in contraction. Any improvement toward 40 would be taken as stabilization, while another downside surprise would underline manufacturing weakness. The main event is at 3:00 PM with the release of the FOMC minutes. With no numerical values attached, markets will be listening for tone: how confident the committee is about inflation cooling, how much emphasis is placed on restrictive policy, and whether financial conditions easing is viewed as helpful or premature. Dovish nuance would be risk-on, while language emphasizing vigilance or concern about re-acceleration would lean risk-off. After the close at 5:30 PM, API crude oil stocks for the week ending December 26 are released, with a visible build of 2.4M previously. Another build would pressure crude overnight, while a surprise draw could set the tone for Wednesday energy trading.
Wednesday brings labor and rates into focus. At 8:00 AM, the MBA 30-year mortgage rate prints, previously 6.31%. Direction matters more than level here. A continued drift lower would support housing-sensitive equities, while a move back up would challenge the recent stabilization narrative. At 9:30 AM, Initial Jobless Claims for the week ending December 27 are released. The prior reading was 214K, with consensus at 220K and forecast at 222K. Claims staying near the low 200s would reinforce a still-tight labor market and support consumption, but could also keep the Fed cautious. A move meaningfully above consensus would be taken as an early sign of labor cooling and could push rates lower while supporting growth stocks. At 11:30 AM, EIA crude and gasoline stocks for the week ending December 26 follow, serving as confirmation or contradiction of Tuesday’s API data.
Thursday is New Years Day, and the market is closed. Friday shows no earnings and no major scheduled macro releases visible on the calendar, which means price action will be driven by positioning, liquidity, and reactions to earlier data rather than fresh information
On the earnings and IPO front, the board is empty across the entire week. There are no scheduled earnings from Monday through Friday. That absence matters. With no company-specific catalysts, macro data and policy interpretation will dominate sector flows. Housing-related equities will key off Pending Home Sales, Case-Shiller, and mortgage rates. Industrials and cyclicals will react to Dallas Fed and Chicago PMI. Energy names will remain tethered to the sequence of API and EIA inventory prints. Financials and rate-sensitive growth will take their cues from jobless claims and the tone of the FOMC minutes.
For active traders, the sign-posts are clear:
Pending Home Sales MoM materially above 1% keeps housing and domestic cyclicals bid; a miss toward the 0.7% forecast or below leans risk-off.
Dallas Fed Manufacturing improving toward -2.5 supports industrials; a print back near or below -10 revives growth-scare positioning.
Initial Jobless Claims holding near 214K supports risk; a jump toward or beyond 222K shifts the rate and equity response.
Bottom line: a thin, data-dependent week where modest surprises in housing, manufacturing, labor, or Fed tone can drive outsized moves into year-end positioning.
Order Flow in Focus: Reading Smart Money Tells
Order Flow in Focus: Reading Smart Money Tells is a recurring segment that spotlights unique intraday opportunities revealed through institutional order flow. Each feature dissects a moment when the tape quietly shifted—when large, ranked prints clustered at key liquidity locations and informed players positioned ahead of the move. The goal isn’t hindsight; it’s pattern recognition—learning to spot the footprints of capital that knows before the crowd does.
AGQ offered a textbook example of how institutional order flow tips its hand before the obvious move, and the clues were there early for anyone watching the right things.
The session began quietly in the high 170s, with AGQ drifting sideways after an early dip. Nothing about the price action alone suggested urgency. But just before 9:30 AM, that changed. Two unusually large prints appeared in quick succession around 179 to 181. One of them was a Market Open order, ranked #14 among the top historical trades for the instrument, which immediately separates it from routine liquidity. The second was a sweep, suggesting urgency, and came in even larger at rank #11. These were not scattered, impulsive buys. They clustered tightly at a well-defined level that had already seen prior activity as demonstrated by the VL-tracked Levels (dashed lines). That clustering matters. When size repeatedly shows up at the same price without pushing the market lower, it is a sign of absorption. Supply was being taken in, not chased.
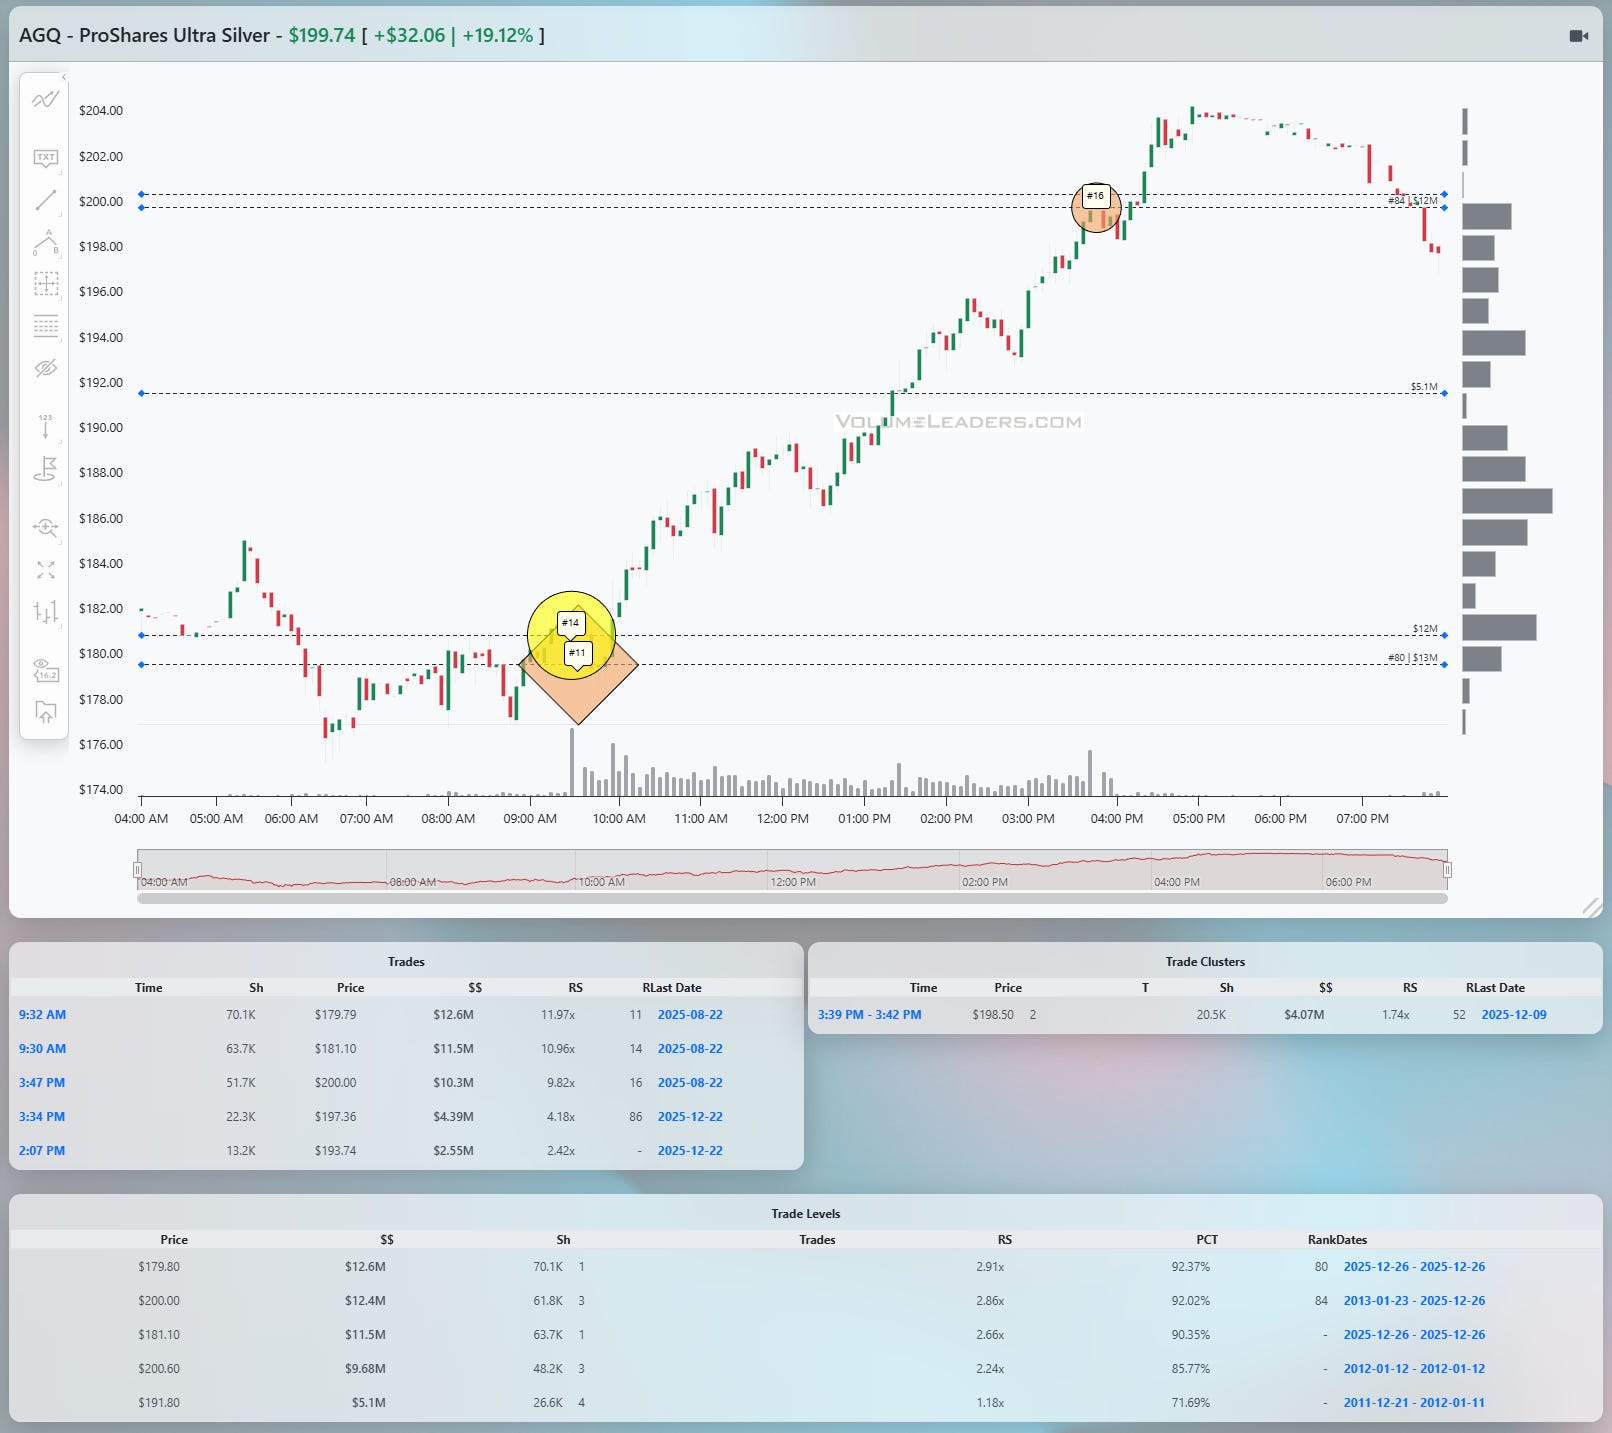
That zone around 180 became the fulcrum. Despite the broader market noise, price refused to break below it after the prints. Instead, AGQ compressed, volatility contracted, and the tape went quiet. This is often the most uncomfortable moment for traders, because nothing is moving yet. But structurally, it was the tell. Smart money had shown its hand, and the market was coiling on top of it.
The next clue came with the break higher out of that compression. Once AGQ cleared the low 180s and held, the auction shifted from balance to initiative. The move that followed was not a slow grind. It was a steady, directional advance punctuated by shallow pauses, each one resolving higher. Importantly, there was no heavy selling response as price moved through the mid and upper 180s. That absence of opposition reinforced the idea that inventory had already been transferred earlier, at better prices.
As AGQ pushed through the 190s, volume expanded, but the character of the tape stayed orderly. This was not a blow-off. It was controlled continuation. The next major tell came late in the afternoon at $200-even. A large cluster printed just below 200, again with elevated relative size; clusters are zones where institutions are busy adjusting inventory. This time, however, the context was different. Price had already traveled a long distance intraday, and this cluster appeared at a psychologically obvious level. It was also clearly punctuated with a rank #16 trade. The market did push slightly higher afterward, but the follow-through was muted. Instead of acceleration, price began to stall.
That shift in behavior, the cluster, the ranked trade and the psychologically even number were your confluence of exit signals. When large size shows up after a sustained move and price stops responding the way it did earlier, it often marks distribution rather than accumulation. AGQ rolled over from just above 200 and faded back toward the high 190s into the close. The trade had already done its job.
From a practical standpoint, the long entry was justified near the 180 area once the initial large prints held and price reclaimed that level. Risk was clearly defined just below the cluster. The best exit was not the exact high, but the change in tone near 200, when upside progress slowed despite fresh size.
The lesson is not about silver, leverage, or a lucky day. It is about sequence. First, ranked prints appear at a logical liquidity level. Second, price stops going down. Third, balance resolves into initiative. Finally, new size appears near a round number and price stops responding. That sequence repeats across instruments and timeframes.
Order flow does not shout. It leaves footprints. In AGQ, those footprints pointed higher well before the crowd noticed, and they also warned when the move was largely complete.
Unlock the Full Intelligence Briefing
You’ve just read the free preview—the institutional breadcrumbs. What you haven’t seen yet is where those trails lead:
The full list of tickers institutions are concentrating in right now—with exact dollar amounts, timestamps, and sizing metrics
The entry zones based on real trade data—not opinion. You’ll get the exact prices to mark up on your charts to make sure you stay on the right side of institutional positioning
A professional-desk-quality weekly playbook—a full breakdown of the key names, themes, and institutional setups that matter, plus a model portfolio built directly from the week’s flow. This is the same type of positioning analysis real desks use to frame the upcoming week.
Access to the trades watchlist that updates all day, everyday, built entirely from high-conviction institutional flow
And a members-only community of sharp, data-driven traders decoding the market in real time
If you’re serious about getting ahead of Wall Street’s next big move—not chasing it—this is your edge. All of this for about $1.64/day.
👇👇👇 Unlock the edge that most retail traders never get. Step into the institutional side of the market. Become an insider today. 👇👇👇


Thank you for being part of our community and for dedicating your time to this edition. Your insights and engagement drive everything we do, and we’re honored to share this space with such committed, thoughtful readers. Here’s to a week filled with clear opportunities and strong performance 💰💰💰
— VolumeLeaders