Market Momentum: Your Weekly Financial Forecast & Market Prep
Issue 71 / What to expect Nov 24, 2025 thru Nov 28, 2025

In This Issue
Weekly Market-On-Close Report: All the macro moves, market drivers, and must-know narratives—covered in less than five minutes.
Weekly Benchmark Breakdown: Our weekly intelligence report on major indices cuts through the index-level noise to uncover participation, momentum, and structural integrity and tell you whether markets are rising on solid ground or skating on thin breadth. This is where bull markets prove themselves—or quietly start to unravel.
The Latest Investor Sentiment Readings: Track the emotional pulse of the market with our curated dashboard of sentiment indicators. From fear-fueled flight to euphoric overreach, this week's readings reveal whether investors are cautiously creeping in—or stampeding toward the exits.
Institutional Support & Resistance Levels For Major Indices: Exactly where to look for support and resistance this coming week in SPY, QQQ, IWM & DIA
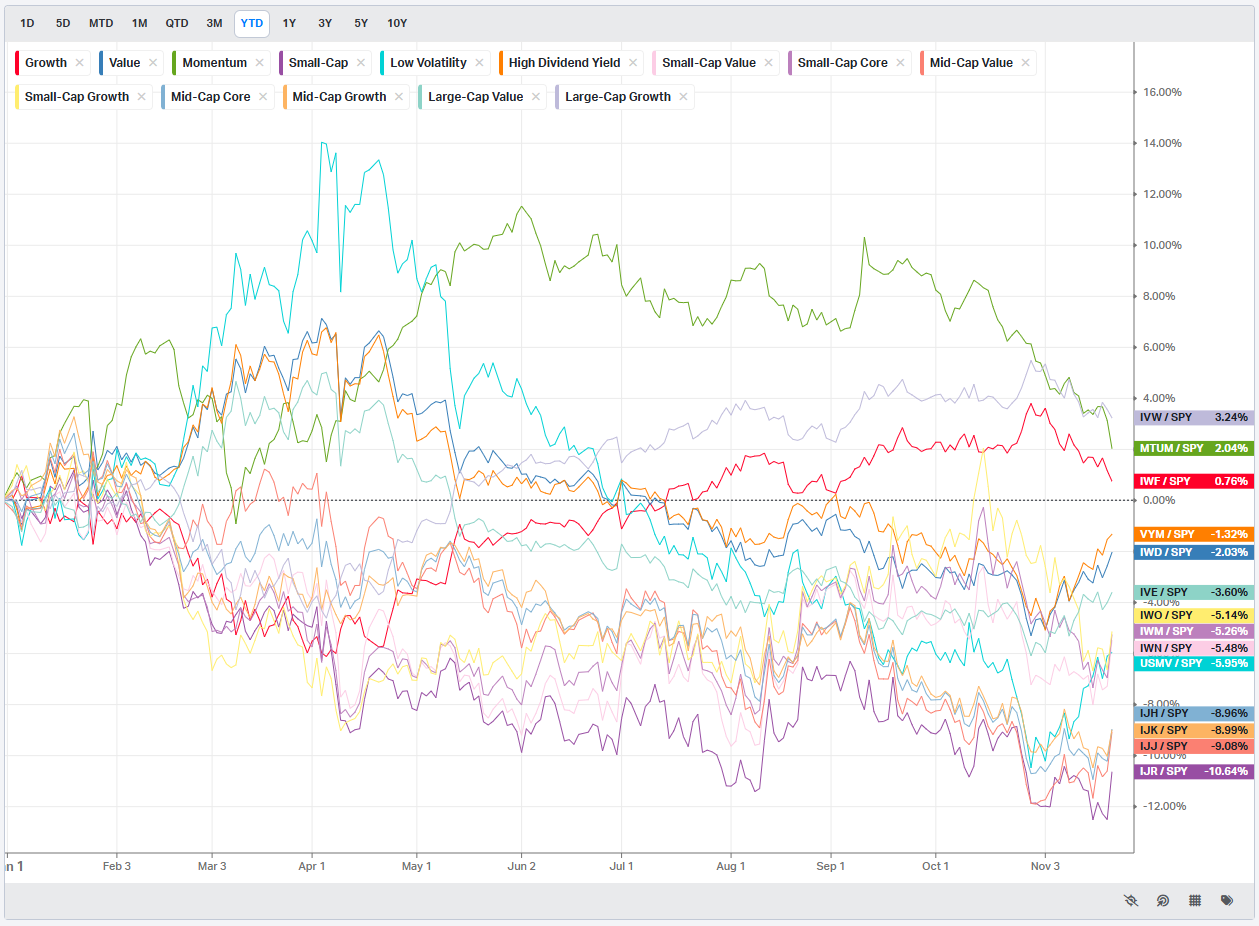
Normalized Performance By Thematics YTD: Which corners of the markets are beating benchmarks, which are overlooked and which ones are over-crowded!
Key Econ Events & Earnings On-Deck For This Coming Week
Market Intelligence Report: Track the real money. This section breaks down where institutions are placing their bets—and pulling their chips. You'll get a sector-by-sector view of flows, highlighting the most active names attracting large-scale buying or selling. We go beyond the headlines and into the tape, surfacing the week’s most notable block trades and sweep orders, both on lit exchanges and hidden dark pools. Whether you're following momentum or fading crowded trades, this is your map to where size is moving and why it matters.

Weekly Market-On-Close Report
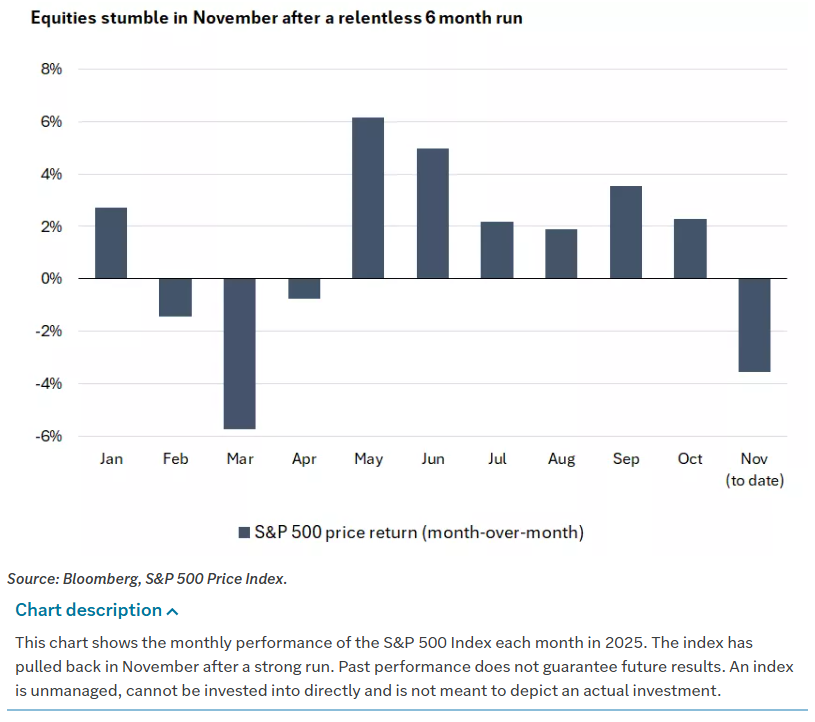
There is an old cliche in the movies: it is quiet, a little too quiet. That is how the equity market has felt for much of this year, grinding steadily higher in a remarkably smooth 40% rally in the S&P 500 from the April lows. That quiet was abruptly interrupted in November. Volatility spiked, leadership wobbled, and the AI trade that had powered so much of the advance finally met some gravity. By the end of this week, US equity indexes had endured another choppy stretch, continuing the worst run since the tariff-driven sell-offs of April, and yet again had to be rescued late on a Friday.
The broad picture is straightforward. Despite some good news on earnings and economic data, US equity markets finished the week lower. The tech-heavy Nasdaq Composite suffered the largest losses, while the S&P MidCap 400 and Russell 2000 held up better but still declined. The large-cap S&P 500 Index remains about 4.4% below the record high it set in late October. The index closed this week at 6603, roughly 4% off its all-time highs. The 100-day moving average around 6550 held as support after a serious test. The 50-day moving average sits about 100 points overhead near 6710, marking the first resistance band on any rebound. The pattern into each Friday has been familiar: dip buyers showing up late in the week to repair damage done earlier. What changed over the past several sessions is that those dips have been getting deeper, and the buy-the-dip habit has finally started to get challenged.
The pressure has been most acute in the very areas that carried the rally for much of the year. The so-called Magnificent Seven mega-cap tech complex is down close to 6% so far in November in market-cap-weighted terms, dragging the Nasdaq and other tech-heavy benchmarks lower. The MSCI Momentum ETF has fallen about 5% since the week of Halloween, and it has been far worse in some of the more speculative corners. A basket of quantum computing names has dropped 30%–50% over the past month. A similar basket of rare earth names has fallen by a comparable amount. Within nuclear-related equities, individual names have been down anywhere from 5% to 50%. This is what a profit-taking phase looks like when it finally hits extended leadership.
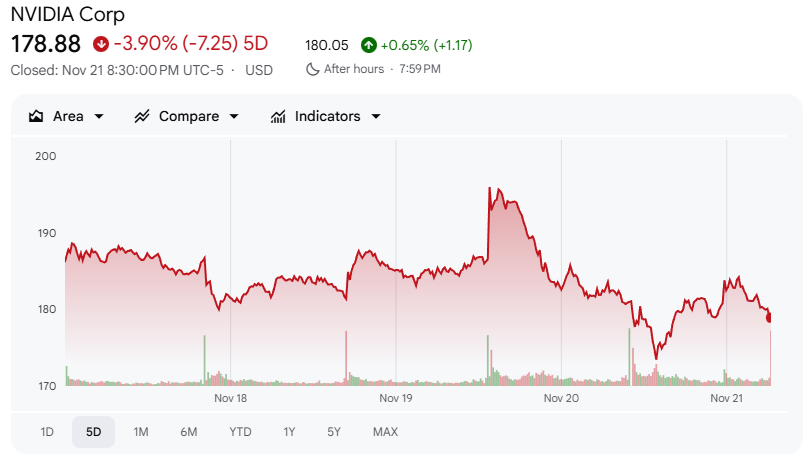
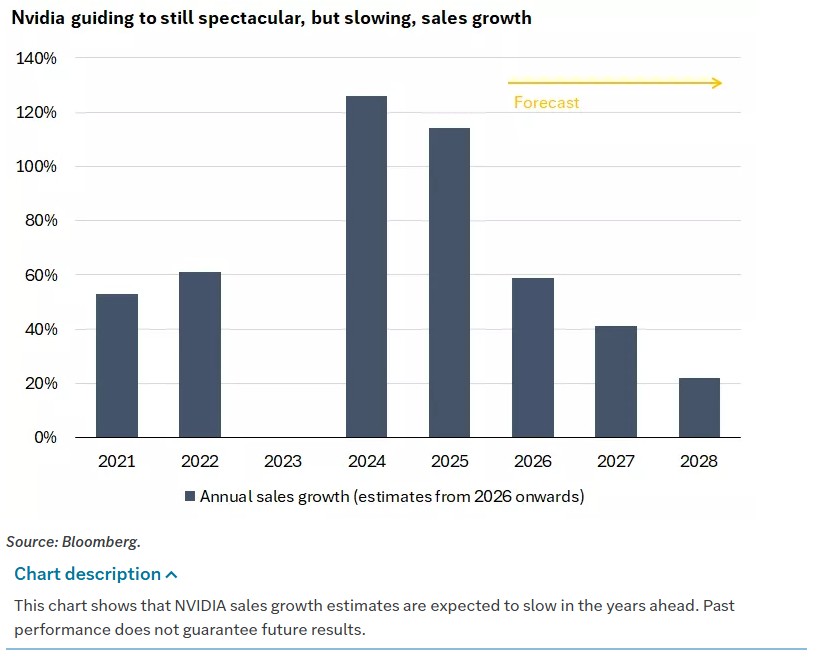
The focal point this week was NVIDIA (NVDA), whose quarterly earnings were the single most anticipated event on the calendar. NVDA, now the largest company by market capitalization in the S&P 500, reported record revenue driven by relentless demand for AI chips. Both the reported numbers and the guidance beat expectations, and management delivered its now-familiar blend of confidence and ambition, including signals that the company could exceed a projected $500 billion uplift in revenue through 2026. On the surface, nothing in the report suggested that AI investment was slowing.

The market’s reaction told a different story. NVDA opened roughly 5% higher on Thursday after the report, pulling the AI complex and broader risk assets up with it. The S&P 500 and Russell 2000 both traded more than 1% higher early in the session, and the S&P 500 briefly regained its 50-day moving average. For an hour or two, it looked like the classic pattern: worry into the event, relief afterward, and a resumption of the prior uptrend.
Then the reversal hit. NVDA faded throughout the session and finished down about 3% on the day, dragging the broader complex with it. The S&P 500 not only failed to hold the 50-day, it sliced through it, then closed just below the 100-day for the first time since early May. It was the fifth decline in six days and one of the largest intraday reversals on record. According to Bespoke data, it was only the fourth time in the SPY ETF’s history that it opened up more than 1.5% and then closed down more than 1.5%. The previous instances occurred twice in 2008 during the financial crisis and once during the tariff shock of April 8 in a later cycle. That is the kind of reversal that forces even the most committed trend followers to reassess their risk.
Underneath that price action, the narrative around AI has shifted. Concerns that had been simmering at the edges are now front and center: lofty valuations, the sustainability of exponential-feeling growth, and whether the current rate of AI-related spending can generate enough profits to justify the capital being deployed. NVDA Chief Executive Jensen Huang tried to push back on the AI bubble story, but the market’s reaction suggests growing unease. Some companies tied to the theme have been taking on more leverage to finance AI investment and shifting toward asset-heavier models, with knock-on concerns for margins and free cash flow. Oracle (ORCL), for example, has seen credit default swap spreads widen, a sign that the credit market is starting to price in these risks around AI infrastructure builds.
None of this means the AI story is over. Mega-cap tech companies continue to deliver strong earnings growth, the investment pipeline remains robust, and valuations, while rich, are not yet in the realm of the most extreme historical bubbles. But it does mean that sentiment and positioning around the theme are now fragile. In a market that had grown accustomed to every dip in AI being bought aggressively, this week showed that investors are finally willing to hit the sell button when reality fails to keep up with narrative.
The pattern of price action around support levels has also shifted. For several weeks prior, the S&P 500 had repeatedly tested its 50-day moving average and bounced, often with Friday rallies that erased earlier weakness. This week broke that rhythm. Last Friday’s rebound did not carry into Monday, the 50-day gave way cleanly, and the index spent several sessions probing lower support. The volatility index (VIX) moved higher, extending a move that began earlier in the month. The move in implied volatility was matched by a pickup in realized volatility, and the overall tone felt more like a little unwinding than a simple shakeout.
Thursday’s failed NVDA rally was the emotional low. Friday once again brought a rebound attempt. S&P futures were soft overnight, and the cash index opened just above the 100-day, then dipped below it early. That could easily have set up a break of support and a sharper flush lower. Instead, dip buyers finally reappeared with conviction. The S&P 500 rallied back above the 100-day, reclaimed the 6600 area intraday, and closed above support, albeit off the highs. This time, the rally was not led by mega-cap tech. The equal-weighted S&P 500 was up about 2%, roughly double the gain in the cap-weighted index. Small caps were stronger still, with the Russell 2000 and S&P 600 both up around 3% and putting in sizable reversals off their lows.
Importantly, the rebound coincided very closely with a shift in the Fed narrative. New York Fed President John Williams, one of the most influential voices on the Committee and a member of the core leadership group, said he saw room for a further adjustment in the near term to the target range for the federal funds rate, moving policy closer to neutral. Markets took that as an endorsement of another rate cut. Treasury futures jumped and equities followed almost tick for tick. In a week dominated by hawkish-leaning Fed commentary and lingering uncertainty around AI, a clear dovish remark from such a senior figure was enough to change the tone, at least for a day.

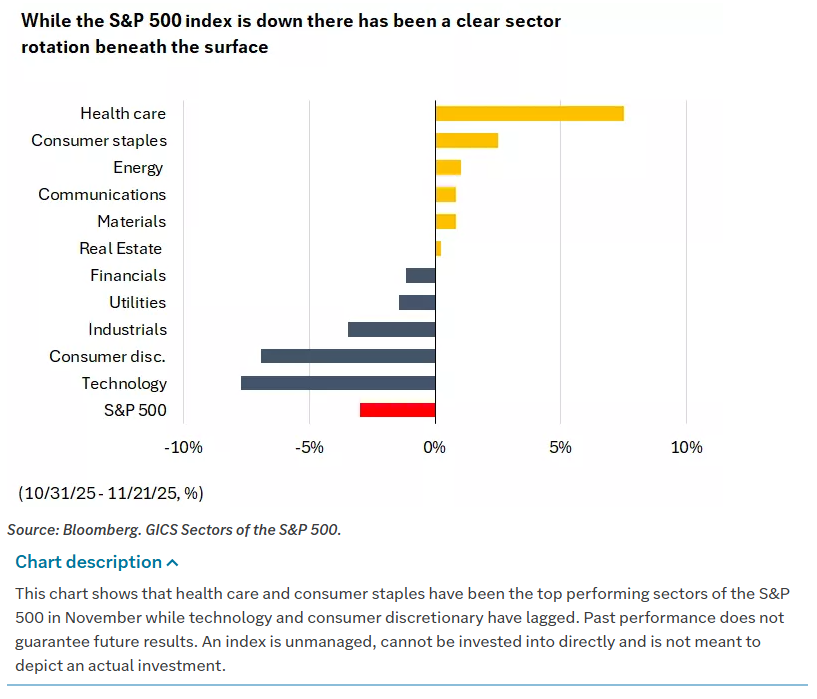
Beneath the index-level noise, there has been a material rotation in leadership. Healthcare led on Friday and has been quietly strong for several weeks. The sector has now caught up with the S&P 500 on a year-to-date basis. Strength has been broad-based across groups, and Eli Lilly (LLY) is now closing in on a trillion-dollar market capitalization, underlining how much capital has gravitated toward quality, defensive growth.
Materials were co-leaders late in the week, driven by major chemical names that had been among the biggest underperformers this year. Unlike healthcare, materials have not yet seen a full catch-up trade, but the price action suggests that investors are finally willing to re-rate some of these laggards. Communication services also outperformed, with Alphabet (GOOGL) adding about 8% for the week. Media and advertising names within the sector showed notable strength as well, as the existential threat to Alphabet’s search business from AI has moved further into the rear-view mirror.
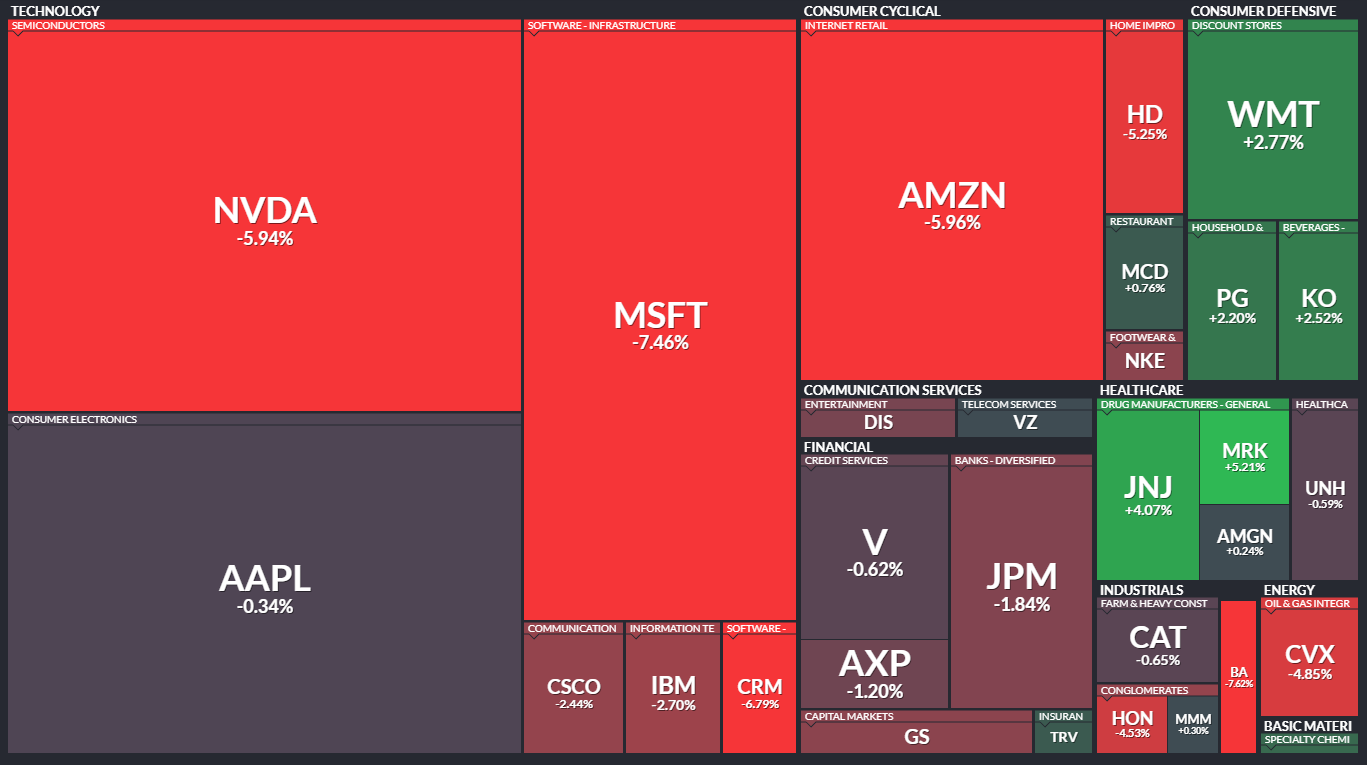
On the other side of the ledger, technology was the clear underperformer for the week. It was not just semiconductors; software names were sold too, reflecting the broader AI valuation concerns. Energy and consumer discretionary also came under pressure. Crude oil and natural gas were weak on the back half of the week as hopes for progress toward a Russia-Ukraine peace deal resurfaced. That weighed on energy stocks. In consumer discretionary, the group managed a roughly 2% gain on Friday but still finished about 3% lower for the week. Travel and leisure names were mixed, while Amazon (AMZN) fell around 6%, dragging on the sector.
Zooming out, these moves fit a broader pattern. The AI-led sell-off over recent weeks has sparked rotation toward previously unloved sectors such as healthcare and materials/energy. With valuations generally lower and earnings profiles less tied to one macro theme, these groups are natural beneficiaries when investors decide to take some money off the AI table and look for catch-up trades. There are signs that this rotation may have further to run if AI-related volatility persists.
Despite the wobble in valuations, the fundamental backdrop from corporate earnings has been better than the price action suggests. Q3 season is nearly complete, with 466 of the S&P 500 companies having reported. According to Bloomberg Intelligence data, about 82% of those companies have beaten earnings forecasts, putting the quarter on track to be the best beat rate since 2021. Aggregate Q3 earnings rose 14.6%, more than double the 7.2% year-over-year growth that had been expected heading into the season.
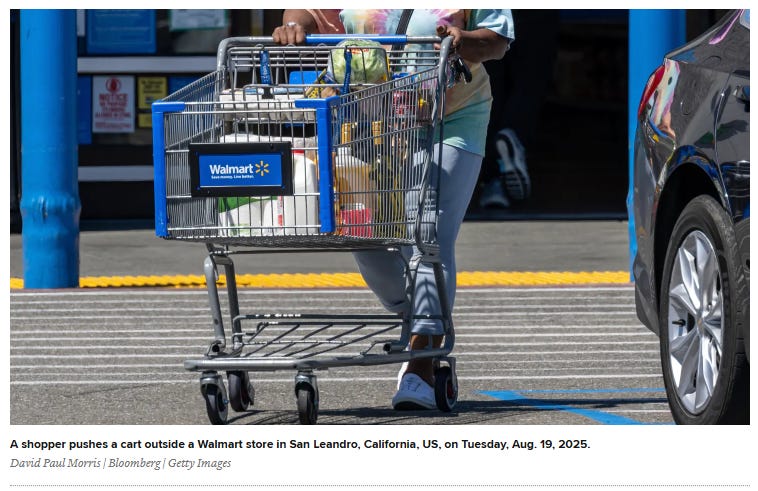
Some of the highest-profile reports captured the dynamic perfectly. NVDA’s numbers were stellar and forward guidance strong, but investors focused on the trajectory of future growth rather than the headline beats. Walmart (WMT), the largest US retailer and private-sector employer, delivered strong results, particularly in e-commerce, beat consensus expectations, and raised its full-year outlook. The tape celebrated briefly and then resumed worrying about macro interest rates, AI, and valuations.
The message is that corporate America, on average, is not in trouble. The correction has been valuation-driven and narrative-driven rather than driven by collapsing earnings. That matters for how much downside ultimately exists from here.
The macro data backdrop is more complicated than usual because of the recent record-length government shutdown, which disrupted the collection and release of several key reports. Some of the data that came in this week is dated and some is incomplete, but it still adds color.
On the labor side, the delayed September employment report from the Bureau of Labor Statistics finally arrived. Payrolls were stronger than expected, with 119,000 jobs added versus a small decline the prior month. Gains were concentrated in healthcare and social assistance and in leisure and hospitality, while transportation, warehousing, and manufacturing saw declines. The separate household survey showed a 251,000 increase in employment, but there were downward revisions to prior months. The labor force increased by 470,000, pushing the unemployment rate up to 4.4% from 4.3%, the highest in four years. Average hourly earnings growth slowed to 0.2% from 0.4% in the prior month, and the average workweek held steady at 34.2 hours.
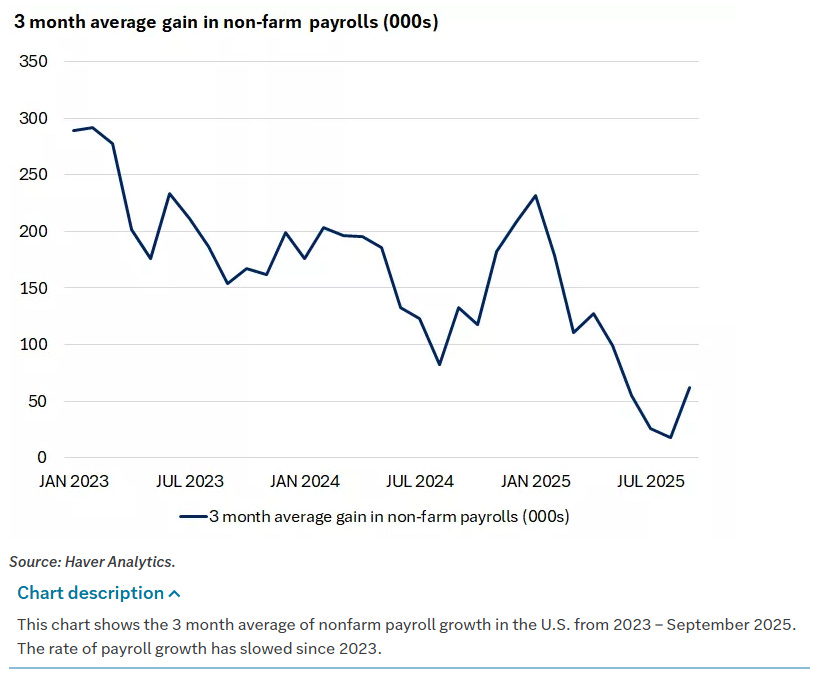
Private-sector indicators painted a similar picture. ADP’s weekly jobs report improved from the previous week but still showed a modest decline, with jobs falling by an average of 2.5k per week for the period ending November 1, versus an 11.3k average decline in the prior report. Initial jobless claims, after some volatility due to reporting delays, showed a modest uptick during October followed by some moderation. For the week ending November 15, initial claims stood at 220k. Continuing claims climbed to 1.974 million, the highest level since November 2021. Taken together, the data still point to a labor market that is cooling but not collapsing.
On the growth and inflation side, survey-based indicators provided a bit of reassurance. The US November S&P manufacturing PMI slipped by 0.6 points to 51.9, roughly in line with expectations of 52.0 and still in expansion territory. S&P Global’s flash PMIs for November showed modest improvement driven by the services sector. Business confidence picked up, aided by expectations of further rate cuts and the end of the government shutdown. Within manufacturing, firms cited slower new orders and rising inventories, a combination worth watching. Employment intentions moderated slightly, with some firms referencing budget-driven cuts. Price components across sectors increased at the second-fastest pace of the past three years, behind only May, driven by a jump in services input costs.
Household inflation expectations eased. The University of Michigan November consumer sentiment index was revised up by 0.7 to 51.0, above expectations of 50.6, though still historically low. One-year inflation expectations were revised down to 4.5% from 4.7%, and five-to-ten-year expectations were revised down to 3.4% from 3.6%. Those are still uncomfortably high relative to the Fed’s 2% target, but the direction of travel is friendly.
The data pipeline itself remains a problem. The BLS canceled the October consumer price report and will fold that data into a combined November release on December 18. The October employment report was also scrapped, with those figures to be incorporated into the November report, now scheduled for December 16. That means the September employment report just released is the last official labor-market data the Fed will see before its December 9–10 meeting. It will also not have a fresh CPI print; the November inflation numbers will arrive after the meeting. For a central bank with a dual mandate targeting inflation and employment, that lack of current data is far from ideal.
The absence of up-to-date data has made an already difficult decision even more contentious. The Fed has already delivered two 25-basis-point rate cuts in September and October. Inflation is running around 3%, still above target but well off its peak. The minutes from the October meeting highlight a divided Committee. Several participants judged that further easing in December could be appropriate if the economy evolves as they expect, while many suggested that under their baseline outlook, keeping the target range unchanged for the rest of the year would likely be more appropriate. The language matters: in Fed-speak, many usually implies a larger group than several.
This split has filtered directly into market pricing. In late October, futures markets were pricing nearly a 100% chance of another 25-basis-point cut at the December meeting. Those odds slid to about 30% early last week as hawkish commentary picked up and data disruptions clouded the picture. By Friday, after the dovish comments from New York Fed President Williams, the probability had rebounded.
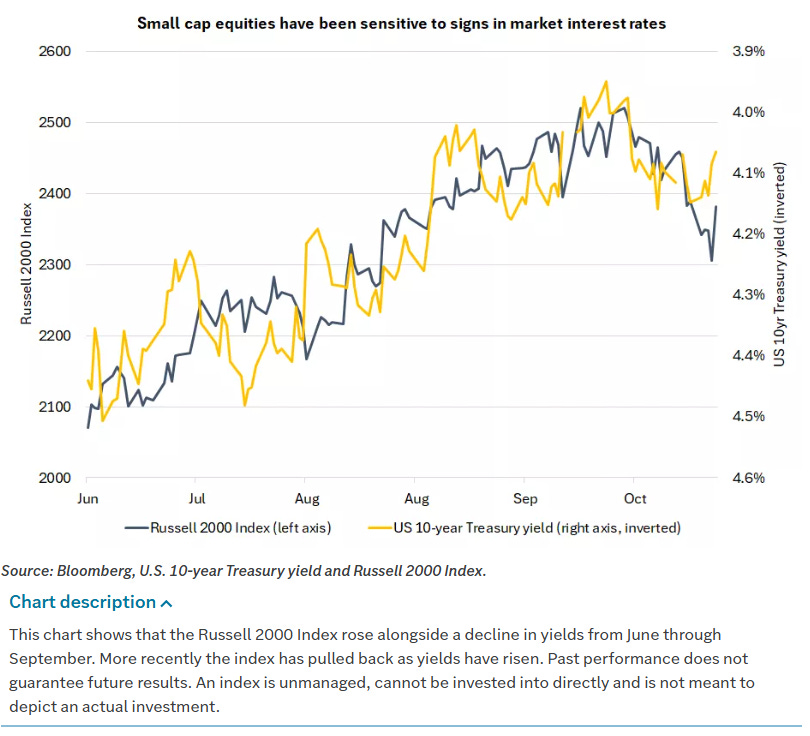
Longer term, the path for the fed funds rate is still lower as the Fed continues to reverse its post-pandemic tightening. The view embedded there is that rates may not fall as far as some market pricing implies. If markets are looking for a trough around 3%, the base case sketched out here is closer to a 3.0%–3.5% range. That gap between market expectations and a somewhat higher equilibrium could pose a risk to interest-rate-sensitive areas such as small caps. However, if the reason for higher terminal rates is a more resilient growth backdrop, the drag from higher interest costs could be partly offset by better earnings.
Treasury markets reflected both the growth uncertainty and the shifting Fed narrative. December 10-year T-note futures (ZNZ5) closed up 12 ticks on Friday. The 10-year yield fell 2.4 basis points to 4.061% and traded as low as 4.034%, a three-week low. On a weekly basis, yields were down roughly 10 basis points across the curve, testing the lower end of the range in place since Chair Jerome Powell warned that the December decision was not a foregone conclusion. The 10-year breakeven inflation rate fell to 2.239%, a 6.5-month low, reflecting easing inflation expectations. Treasuries generated positive returns, and the move lower in yields helped support equities into the close of the week.
Municipal bonds underperformed Treasuries, holding up but lagging, in part due to heavy issuance ahead of the Thanksgiving holiday. US investment-grade corporate bonds produced positive returns but modestly underperformed Treasuries as spreads widened slightly. High yield issues were weighed down by the broader equity weakness and macro jitters, although higher-quality credits within high yield held up better than lower-rated names. Business development companies, which had been under pressure due to concerns about credit and funding conditions, managed solid gains on Friday, helped by the rally in small caps and lower yields.
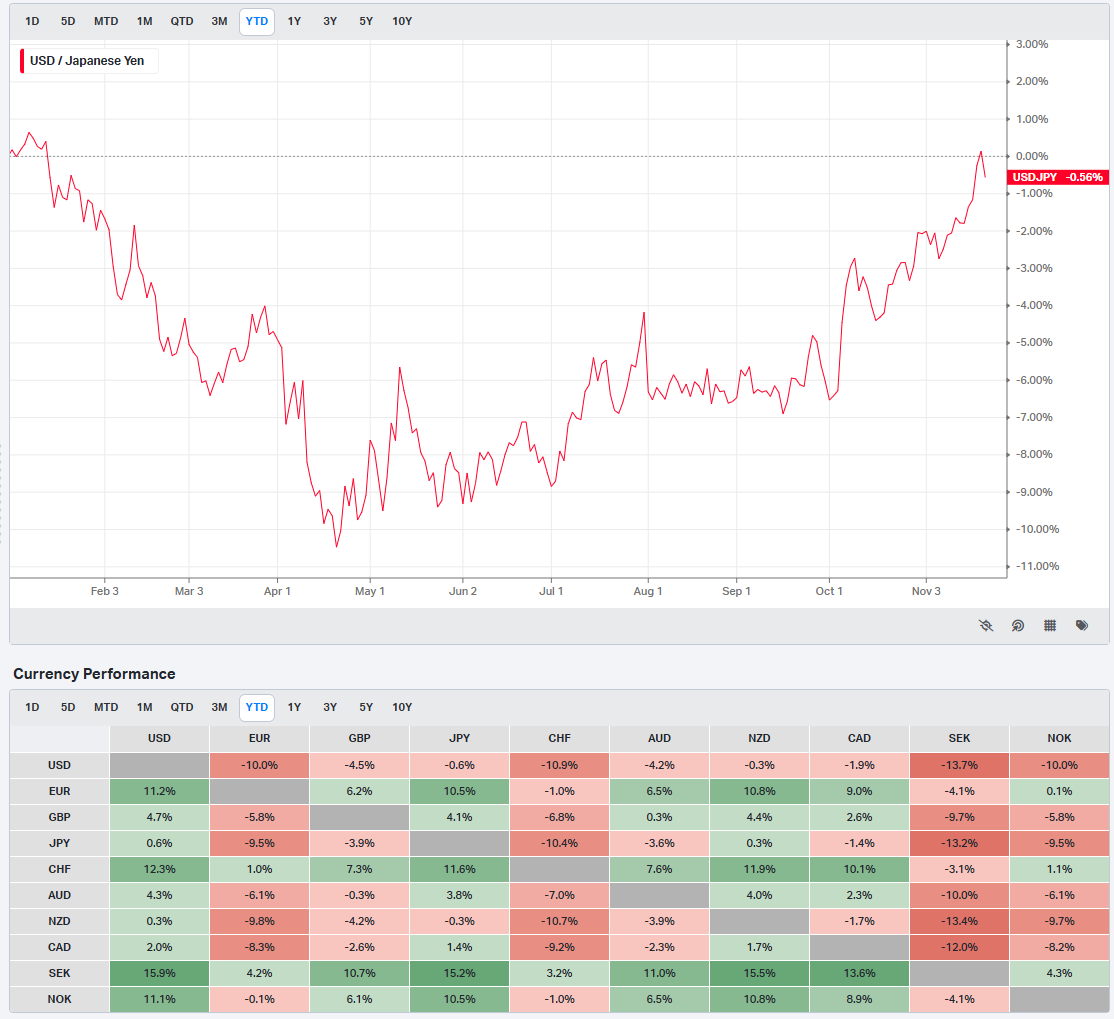
The US dollar strengthened over the week, especially against the Japanese yen, before pulling back on Friday when Japan’s Finance Minister said that FX intervention is naturally conceivable. Japan’s cabinet passed a roughly $135 billion stimulus package, which has pushed local yields higher on expectations of increased issuance. Markets remain split on whether the Bank of Japan will hike rates in December or wait until later in the first quarter. At the same time, tensions between Japan and China have been rising over comments related to Taiwan. The dollar’s role as a potential wrecking ball remains a central variable; renewed dollar strength has the capacity to tighten global financial conditions more than any single datapoint.
In commodities, energy prices were volatile. Oil moved higher early in the week but faded in the back half as hopes for renewed Russia-Ukraine peace talks surfaced again. Gasoline prices fell sharply into the holiday travel season, providing some relief at the pump. US natural gas prices were roughly unchanged for the week, hovering near the 200-day moving average, while European gas prices fell about 3%. The metals complex was comparatively subdued; after strong gains the prior week, metals ended modestly lower, consolidating. Agricultural commodities finished modestly higher, holding last week’s gains, aided by expectations for renewed Chinese buying that kept a bid under the market.
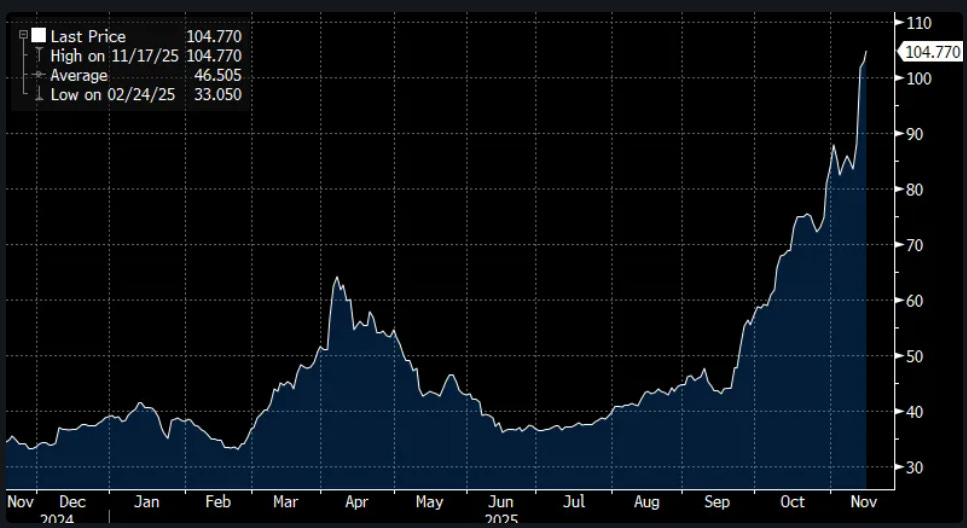
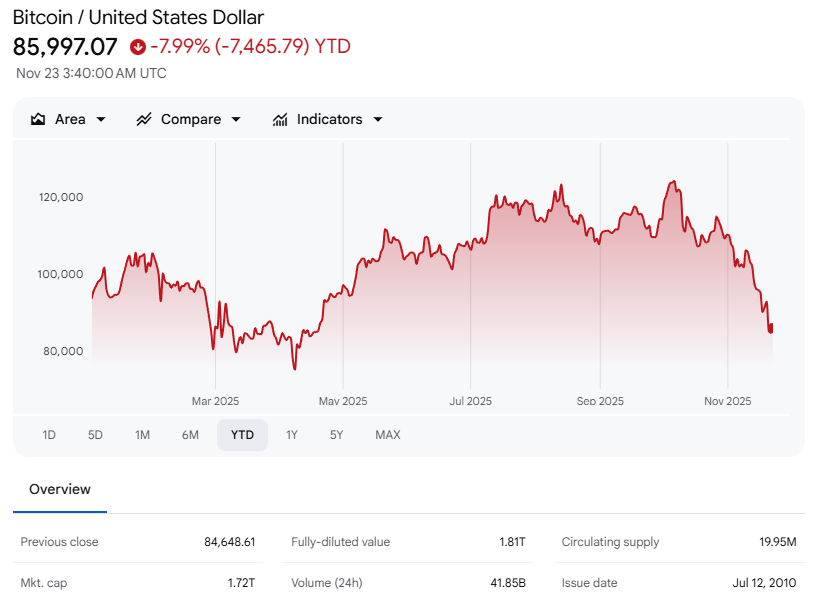
Crypto has been the epicenter of the most extreme volatility. Bitcoin (^BTCUSD) fell more than 2% on Friday to a 7.25-month low and remains in a sharp six-week downtrend, now more than 35% below its record high from last month. From a technical perspective, the crypto complex has struggled to repair itself since the October 10 flash crash. Last week, Bitcoin broke decisively below its 200-day moving average around 104k and the October 10 low, and the downside momentum continued this week. It fell more than 10% for the week and is now lower by a similar amount year-to-date. Intraday this morning, there was something of a crescendo as price tested the 80k area before bouncing back toward 85k. Sentiment in the space remains poor, and crypto notably failed to participate in Friday’s broader risk-asset rebound.
The core message of the week is that a correction in an otherwise buoyant market looked overdue and is now in full swing. The combination of AI valuation concerns, Fed policy uncertainty, and messy data disrupted by the shutdown has given investors enough excuses to take profits in this year’s winners. The moves in November so far amount to roughly a 3% reversal in the S&P 500 and a sharper pullback in the most extended segments. Against the backdrop of a 40% rally from April lows, that is more a reset than a regime change.
The risk is that the Fed’s path from here proves less benign than the most optimistic scenarios currently embedded in some risk assets. The base case seems to be that the fed funds rate ultimately settles in a 3.0%–3.5% range rather than at 3%, and rate cuts are delivered slowly, with ongoing internal debate and occasional data-driven pauses. For small caps and other rate-sensitive segments, that could be a headwind. For the AI complex, which has benefited from both lower discount rates and extraordinary growth expectations, a slower-than-hoped policy tailwind colliding with valuation reset is a recipe for continued volatility.
At the same time, the sell-off is already generating opportunities. Healthcare and consumer staples have been among the top-performing sectors of the S&P 500 in November, while technology and consumer discretionary have lagged. Materials and energy are seeing some catch-up interest. Well-positioned investors can lean into that relative value by diversifying away from the narrowest market leaders and toward areas where earnings are less dependent on a single theme and multiples are more reasonable. You can find opportunities in US mid-caps, international small and mid-cap developed markets, and emerging-market equities as potential diversifiers, especially given signs of an improving economic outlook overseas and more attractive valuations.
The role of cash and bonds is also shifting. With inflation around 3%, real returns on cash-like instruments are now under 1%. That may be comfortable for investors traumatized by the post-pandemic tightening cycle, but from a forward-looking standpoint, it is an expensive form of safety if the next several years bring a continuation of the equity bull market. Lower entry points after the November setback offer a chance to deploy some of that cash into diversified equity and bond allocations with better long-run return potential.
The path ahead is unlikely to be smooth. The data backdrop will remain messy until the delayed reports are caught up. Fed officials will continue to send mixed signals. AI-linked earnings will continue to be scrutinized at a level of detail and skepticism that was absent earlier in the year. Vol spikes after periods of calm are part of how equity markets work. The key is not to mistake a necessary reset in expectations for the end of the story. For investors willing to stay patient, keep portfolios diversified, and add selectively into weakness, the recent volatility looks more like a plot twist than the final act.
Weekly Benchmark Breakdown
Broad equity breadth spent the week moving from defensive to cautiously constructive. There is no thrust here yet, but there is clear evidence of stabilization after several weeks of deterioration. The short-term cohorts lifted sharply while the intermediate groups remain stuck in a muddier middle. New highs improved in the large-cap complex while new lows remain elevated in tech. The market is leaning toward risk, but it has not earned a full-risk posture.
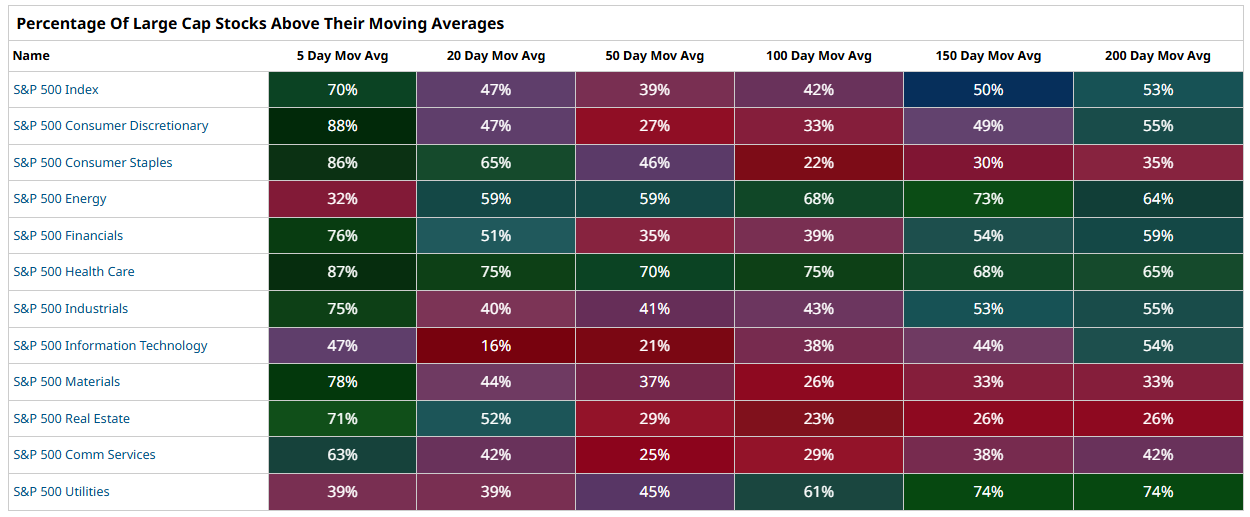
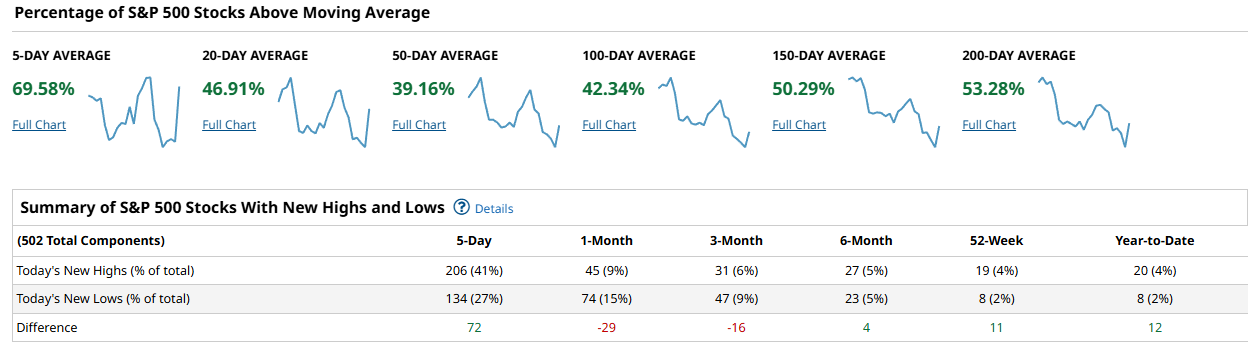
S&P breadth showed the most balanced improvement. Roughly 69 percent of the index now sits above the 5-day moving average, a sharp reset higher that reflects short-term dip buying. The 20-day stands nearer 47 percent and the 50-day only about 39 percent, so the improvement is still thin beyond the very short term. The 100-day sits around 42 percent while the 150-day pushes toward 50 percent and the 200-day holds near 53 percent. The longer-term cohorts never cracked in the recent pullback, and that has helped maintain structural footing. The new-high/new-low table shows 206 new highs and 134 new lows over the past five days, a positive differential of 72. That is an important change in character and gives the index a measure of underlying resilience even as intermediate breadth lags.
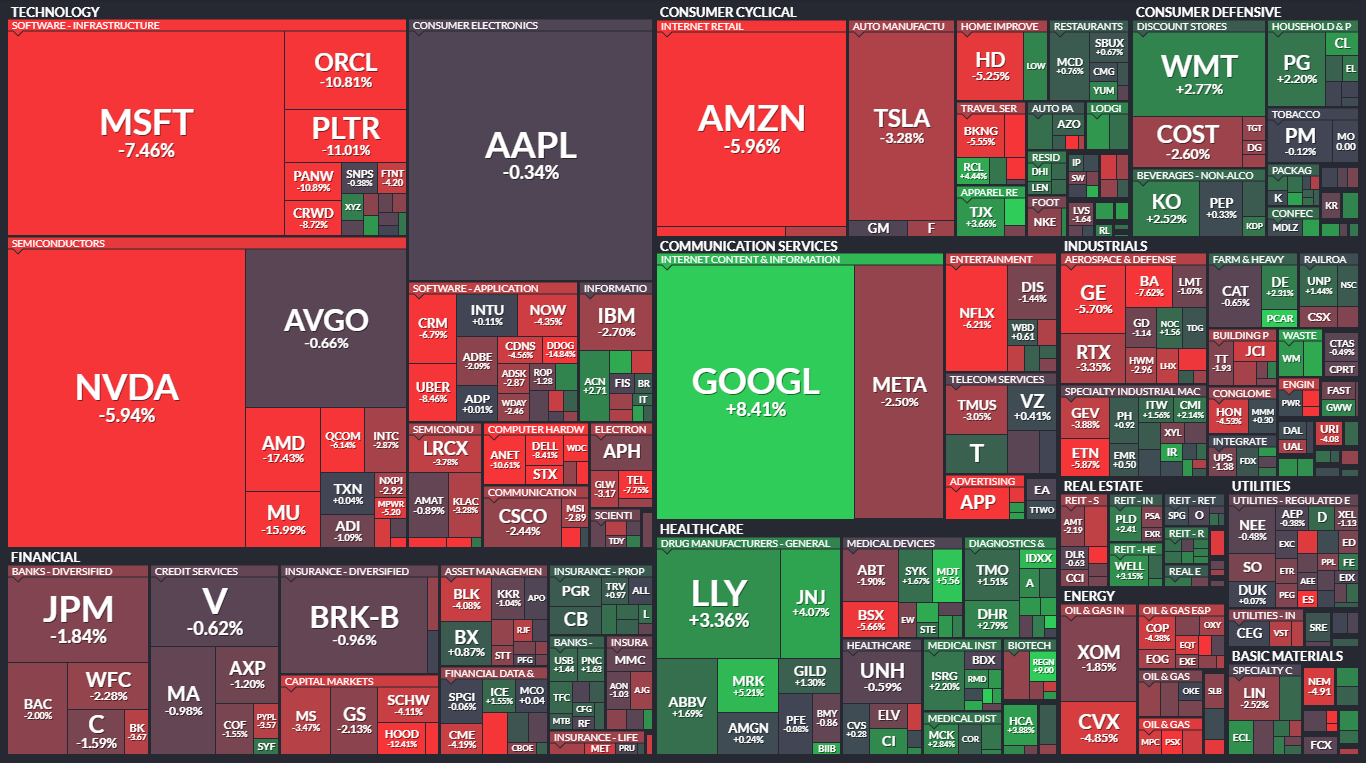
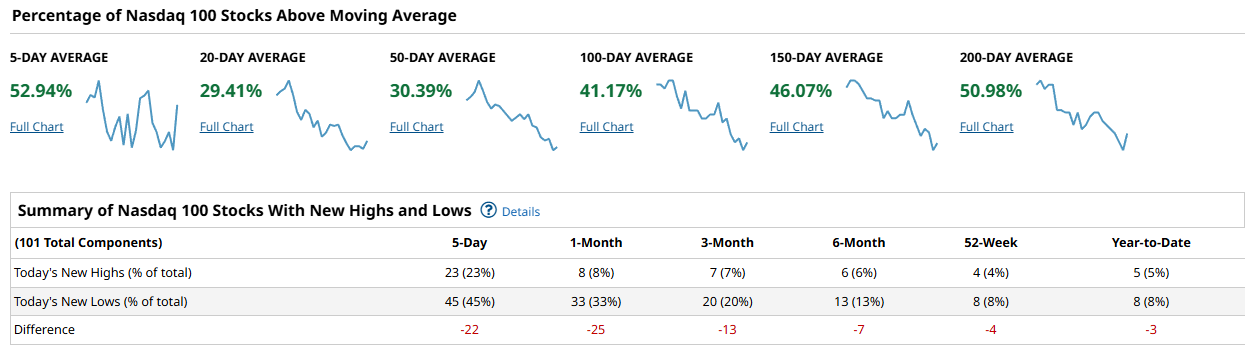
The Nasdaq 100 remains the softest of the major groups. About 53 percent is above the 5-day, but that strength fades immediately, with only about 29 percent above the 20-day and roughly 30 percent above the 50-day. The 100-day sits near 41 percent, the 150-day around 46 percent, and the 200-day just shy of 51 percent. In other words, the index has a heartbeat, but the participation is far narrower than the S&P. New highs and lows echo this imbalance: 23 new highs versus 45 new lows over five days, a negative differential of 22. Tech is not confirming the broader improvement, and until this flips, sustained upside for the broader tape will be harder to trust.
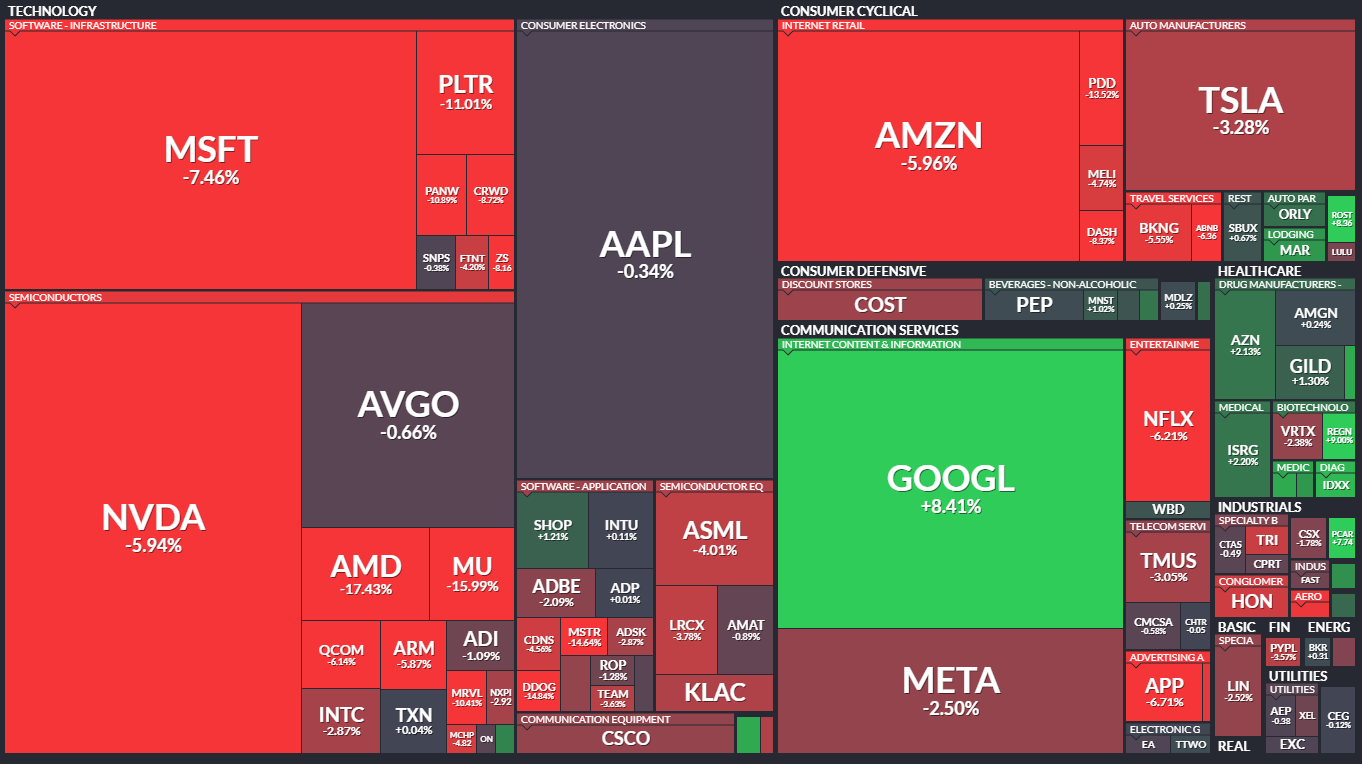
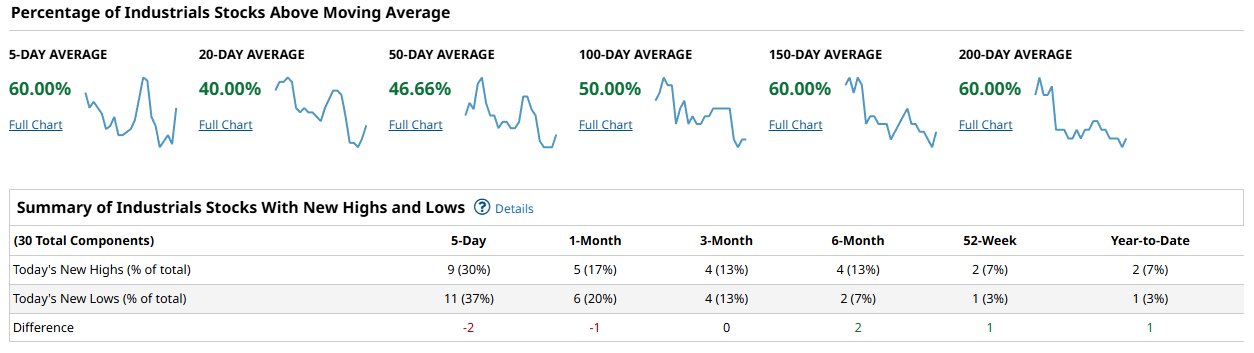
The Dow industrials (as classified in the data: 30 stocks) sit in a middling but stable state. Roughly 60 percent are above the 5-day, 40 percent above the 20-day, and about 47 percent above the 50-day. The 100-day is closer to 50 percent, and both the 150- and 200-day cohorts hover near 60 percent. This is a healthier configuration than the Nasdaq but still lacks the uniformity of the strongest tape regimes. New highs and lows were roughly even, with 9 highs and 11 lows over the past five days, leaving a slight negative differential. Industrials continue to look rotational rather than directional.
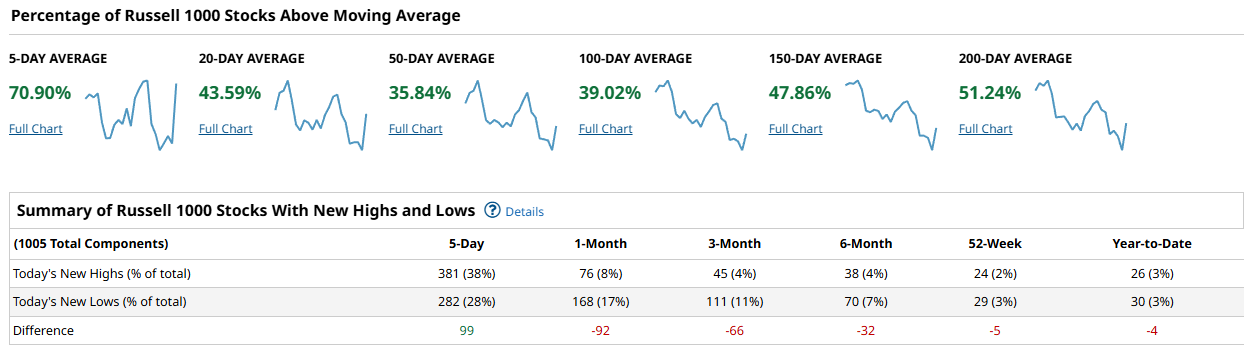
The Russell 1000 showed the broadest underlying strength. About 71 percent sits above the 5-day, but, similar to the S&P, participation drops as you move out the curve: 44 percent above the 20-day, 36 percent above the 50-day, and roughly 39 percent above the 100-day. The longer-term cohorts -- 150-day near 48 percent and 200-day around 51 percent -- remain balanced. The new-high/new-low picture is impressive: 381 highs versus 282 lows for a positive differential of 99. This is the strongest breadth thrust in the dataset and signals that the broad market has more underlying demand than the cap-weighted indices alone might suggest.
Taken together, the picture is constructive but uneven. Relief rallies are finding traction in the short-term cohorts across all major indices, but the 50-day groups remain decisively below the mid-50s threshold that typically characterizes a durable advance. The S&P and Russell 1000 show the healthiest mix of short-term energy and long-term stability, while the Nasdaq 100 continues to flash genuine caution. New highs finally exceed new lows in the S&P and Russell, but tech remains inverted. A sustained improvement would require the 50-day and 100-day cohorts to push through 55–60 percent and the new-high/new-low tables to post consistent positive differentials across all major indices, not just the broad ones.
The playbook this week favors selective risk-on exposure but not a blanket embrace. The S&P and Russell 1000 are the places to lean if you want equity beta, but position sizing should reflect the uneven participation beneath the surface. Tech leadership is absent, so chasing Nasdaq strength is premature. Cyclical areas inside the S&P and Russell are better aligned with the improving breadth profile. The confirmation to watch is simple: rising 50-day breadth and a consistent pattern of more new highs than lows, especially in the Nasdaq. If these conditions develop, the market can transition from bounce to trend. If they do not, expect more rotation than direction.

Investor Sentiment Report
%Bull-Bear Spread
The %Bull-Bear Spread measures the gap between bullish and bearish investor sentiment, often from surveys like AAII. It’s a contrarian indicator—extreme optimism may signal a coming pullback, while extreme pessimism can hint at a potential rally. Large positive or negative spreads often mark market turning points.
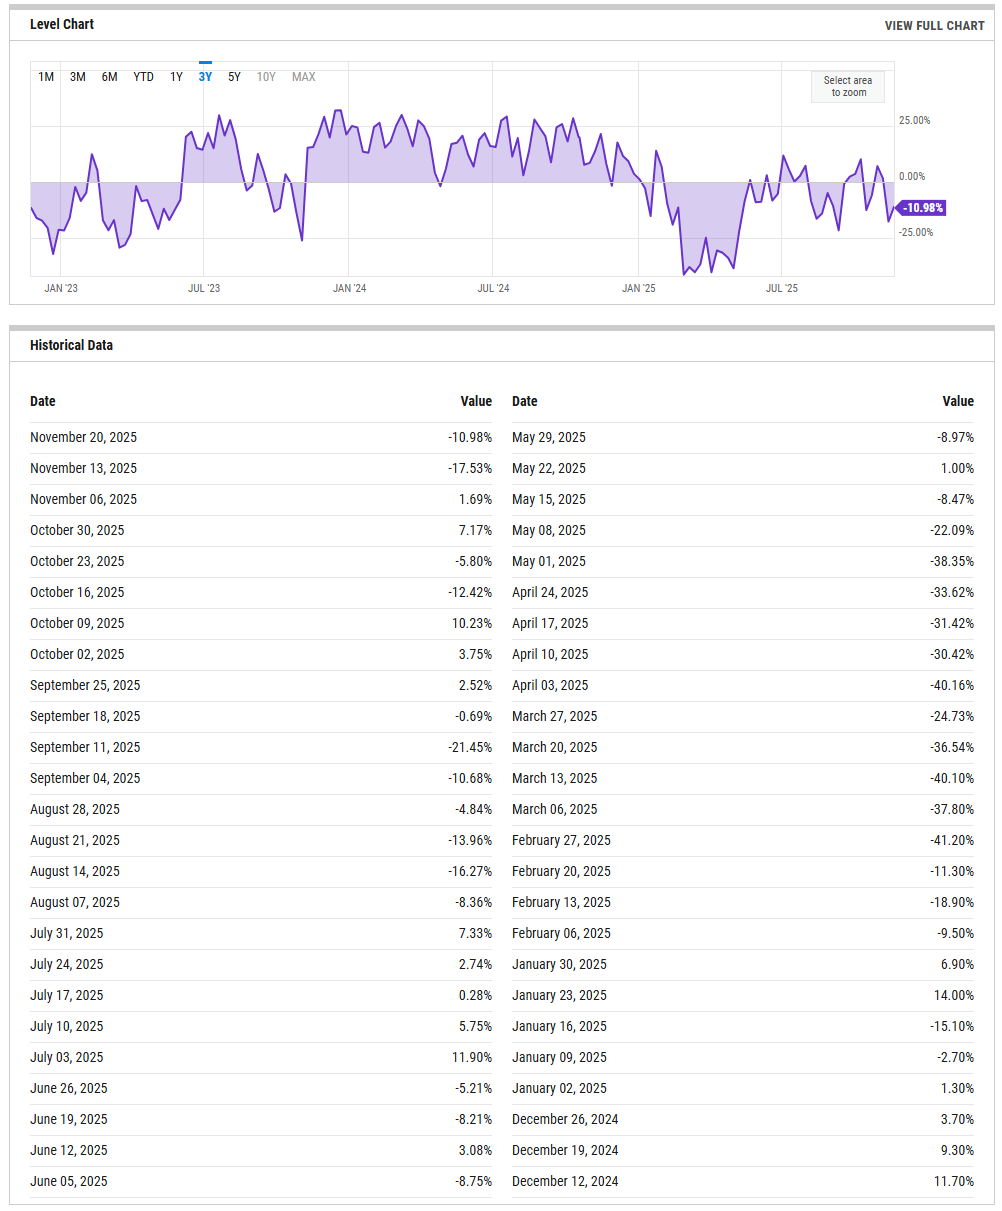
The bull minus bear spread sits at roughly minus eleven percent, a reading that reflects outright pessimism but not outright capitulation. The progression through the fall has been a sequence of sharp drops into deeply negative territory, most recently -17.53% the week before. The series shows repeated drives into double-digit negative territory, which historically has aligned with tradable rebounds, provided the tape is not unraveling structurally. A push back toward zero would signal that pessimism is easing, while another break through the mid-teens on the downside would mark a return to panic levels. Until the spread holds above zero for more than a week or two, sentiment remains in the contrarian support zone where sellers have already expended a meaningful amount of energy.
NAAIM Exposure Index
The NAAIM Exposure Index (National Association of Active Investment Managers Exposure Index) measures the average exposure to U.S. equity markets as reported by its member firms. These are typically active money managers who provide their equity exposure levels weekly. The index offers insight into how much these managers are investing in equities at any given time, ranging from being fully short (-100%) to leveraged long (up to +200%).
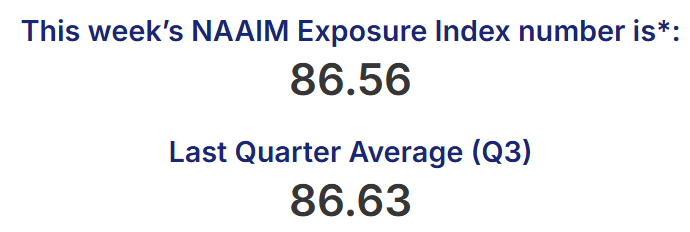
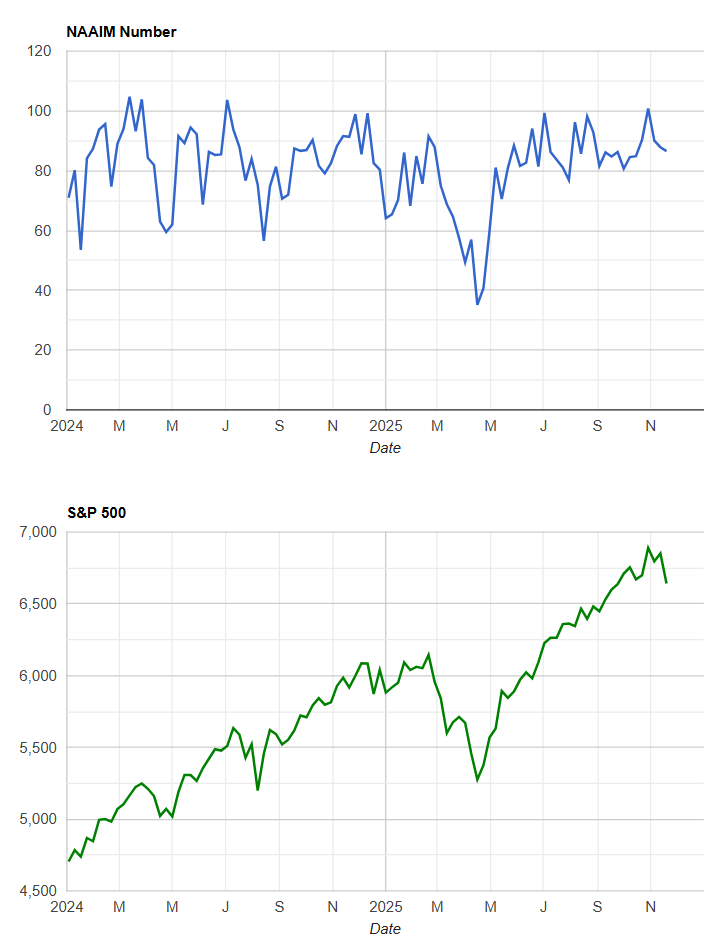
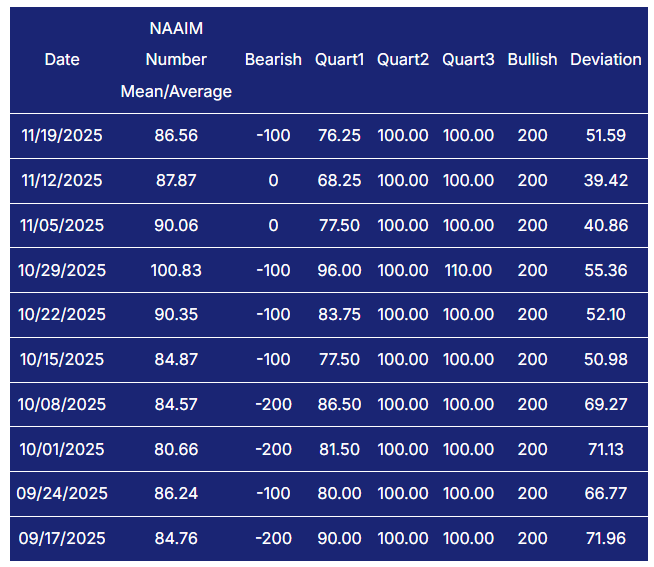
Active managers remain heavily invested. The latest NAAIM reading is about 86, only marginally below last week’s 87.87 and not far from the mid-90s seen in late October. The index has held in the eighties and nineties for two months, with only brief dips. This is not the posture of managers with dry powder; it is the posture of a community leaning long and susceptible to forced reduction if the tape weakens further. The deviation values remain elevated, confirming a wide dispersion of views beneath a high average exposure. A drop into the fifties without corresponding weakness in equity prices would mark a meaningful shift in risk appetite, while another drive toward ninety or above would show renewed confidence and could leave the market more vulnerable to shocks.
CBOE Total Put/Call Ratio
CBOE's total put/call ratio includes index options and equity options. It's a popular indicator for market sentiment. A high put/call ratio suggests that the market is overly bearish and stocks might rebound. A low put/call ratio suggests that market exuberance could result in a sharp fall.
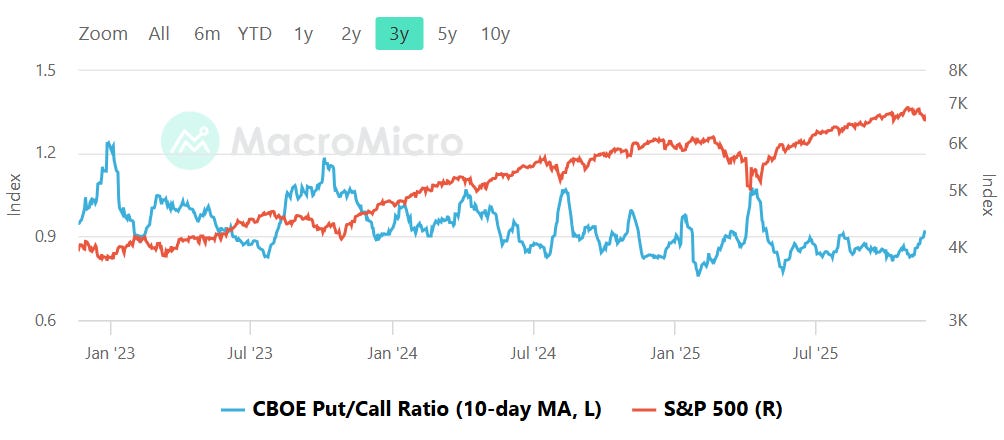
The ten-day moving average of the total put/call ratio remains firm, hovering closer to the upper end of its multi-year range. The chart shows readings holding near or just above 1.0, which is characteristically a fear-tilted zone rather than the complacent backdrop associated with tops. When this average drifts toward 0.8 or lower, markets tend to be extended and prone to air pockets. Holding near 1 offers a buffer: traders are hedged, downside conviction is already priced into options, and pullbacks do not deepen easily unless the ratio collapses. A decisive break below 0.9 would argue that traders are backing off protection and that markets are again vulnerable to sharper retracements. Staying near or above one keeps conditions asymmetric to the upside if headlines stabilize.
Equity vs Bond Volatility
The Merrill Lynch Option Volatility Estimate [MOVE] Index from BofAML and the CBOE Volatility Index [VIX] respectively represent market volatility of U.S. Treasury futures and the S&P 500 index. They typically move in tandem but when they diverge, an opportunity can emerge from one having to “catch-up” to the other.
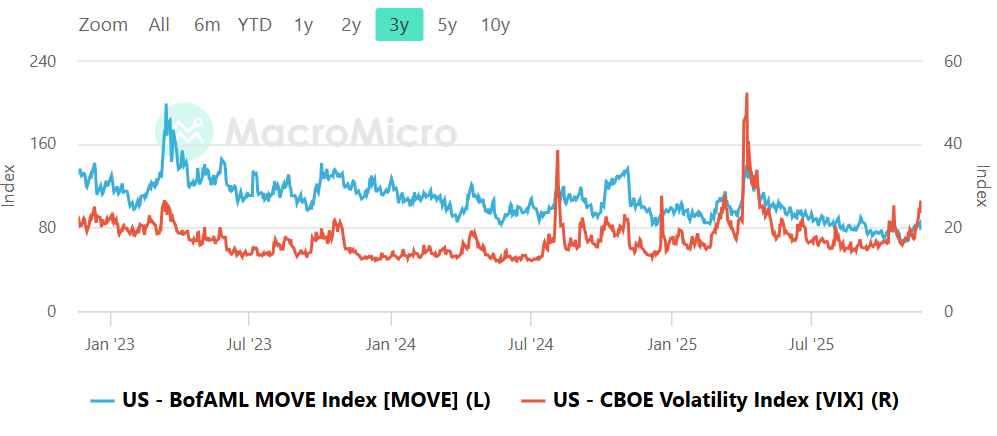
Bond volatility, as measured by the MOVE index, remains elevated relative to equity volatility. The MOVE line is holding in the upper double digits to low triple digits, while VIX sits far lower in the teens. This divergence has been a feature for months, reflecting persistent uncertainty in rates even as equities have traded with suppressed realized volatility. Historically, when MOVE rises while VIX sits still, the equity market eventually responds with stress as rate volatility bleeds into broader risk assets. The tripwires remain straightforward: MOVE pushing decisively above 120 while VIX holds in the teens would signal that equity volatility is lagging dangerously. Conversely, if VIX turns higher into the high teens or low twenties while MOVE remains calm, it would mark the start of an equity-led repricing. For now, the imbalance remains a risk factor rather than an immediate trigger.
CNN Fear & Greed Constituent Data Points & Composite Index
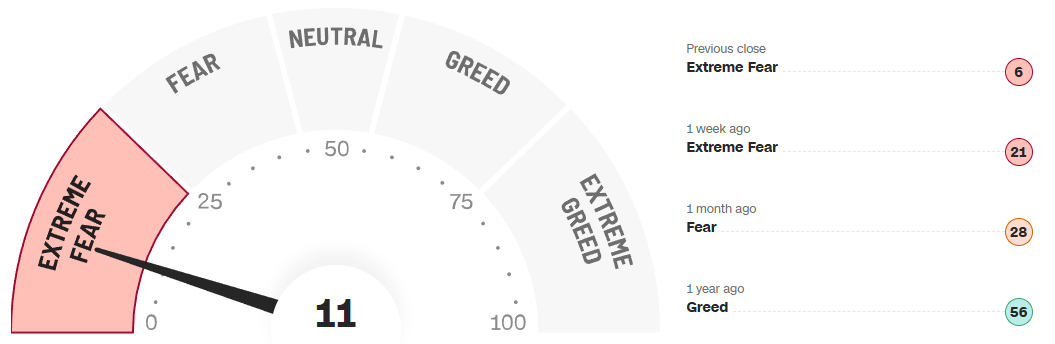
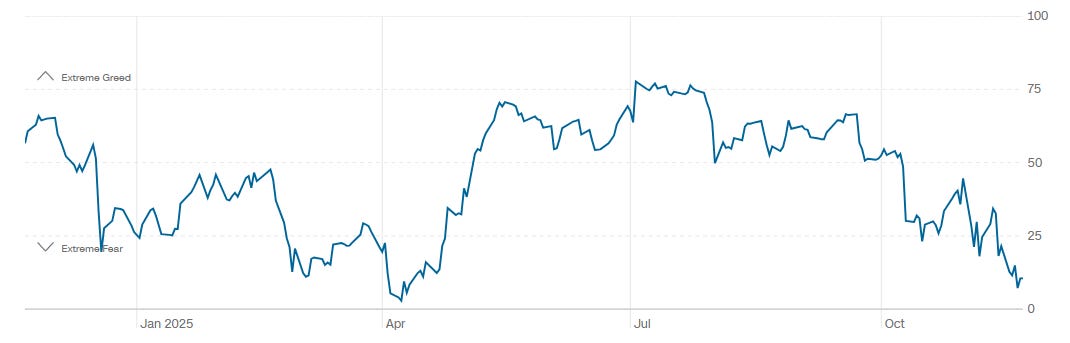
The composite Fear and Greed reading is 11, deep in the extreme fear zone. Last week it 21, also extreme fear, and one month ago it sat near 28, in the fear category. The one-year chart shows a steady descent from summertime optimism into a late-year washout, with the gauge now probing the same low band it reached in prior panic episodes earlier this year. Extreme fear does not guarantee a bottom, but it typically marks late-cycle emotional selling rather than the start of new downtrends. A move back above 25 would indicate that sentiment is stabilizing, while a break below 10 would be a rare event and would coincide with forced selling that often exhausts itself quickly. The regime is clear: markets are operating from a pessimistic base, and that usually compresses forward risk.
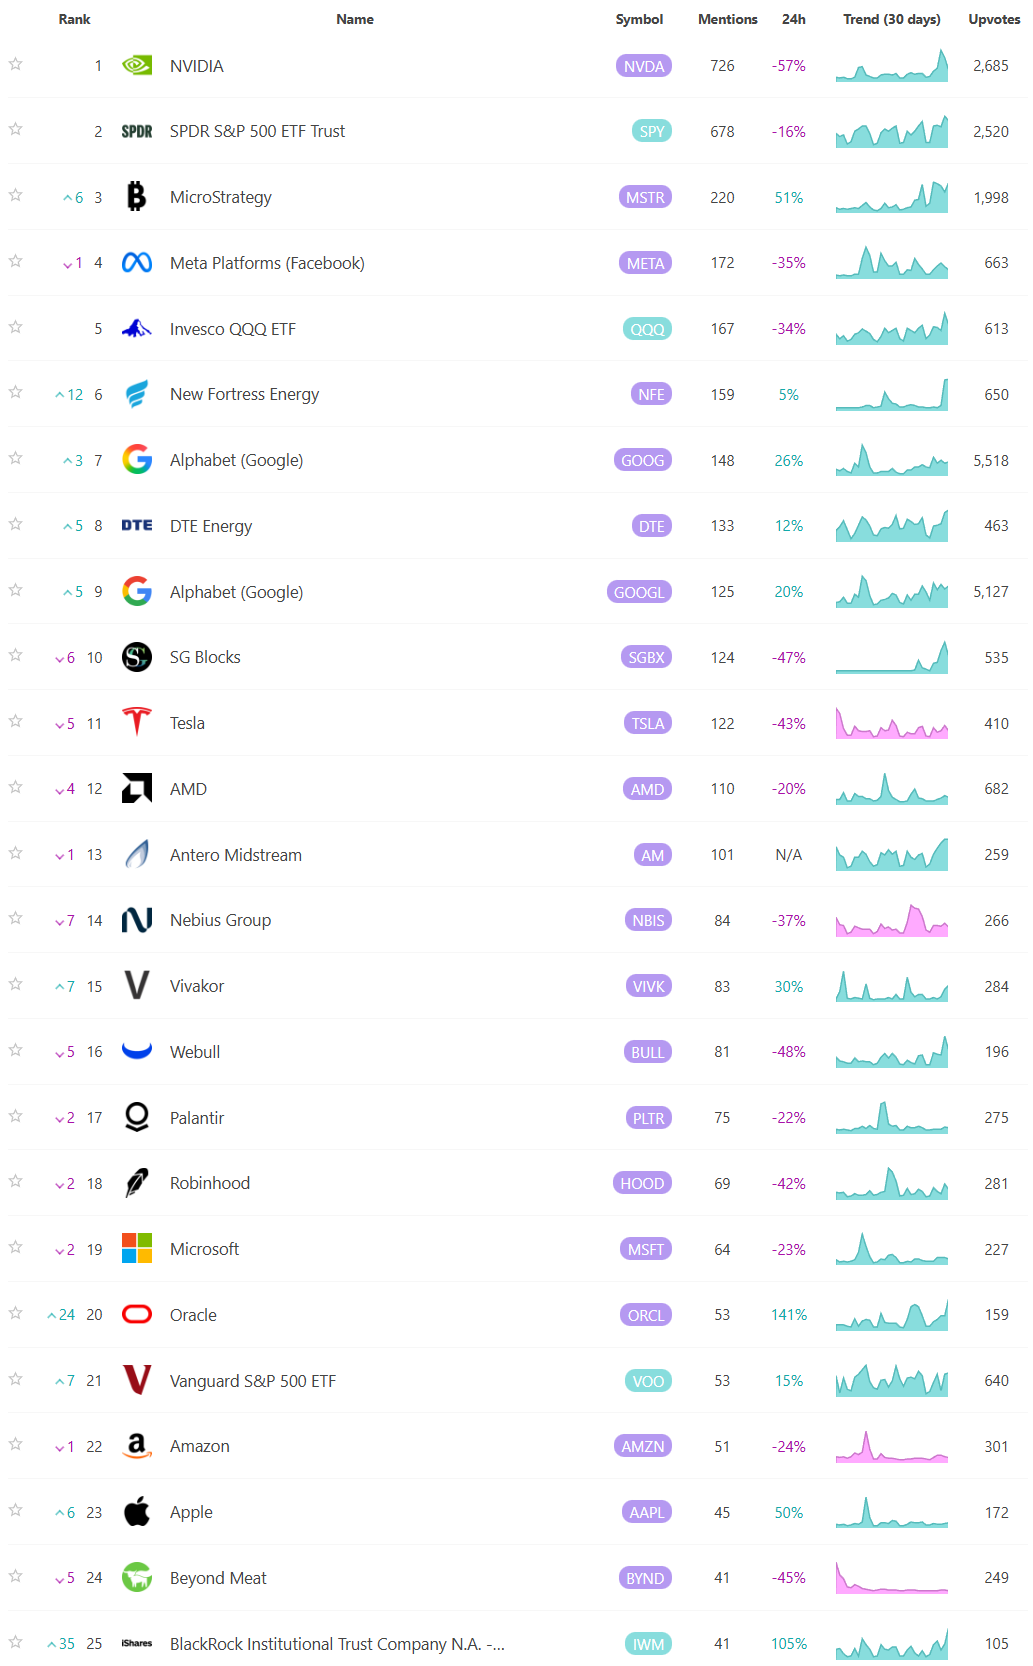
Social Media Favs
Social sentiment offers a real-time view of investor mood, often revealing market shifts before traditional indicators. It can signal momentum changes, spot emerging trends, and gauge retail investor impact—especially in high-volatility names. Tracking sentiment around events or earnings provides actionable insights, and when layered with quantitative models, can enhance predictive accuracy and risk management. Sustained sentiment trends often mirror broader market cycles, making this data a valuable tool for both short-term trades and long-term positioning.

Technician’s Playbook: Trading the Majors (SPY/QQQ/IWM/DIA)
When you’re a large institutional player, your primary goal is to find liquidity - places to do a ton of business with the least amount of slippage possible. VolumeLeaders.com automatically identifies and visually plots the exact spots where institutions are doing business and where they are likely to return for more. It’s one of the primary reasons “support” and “resistance” concepts work and truly one of the reasons “price has memory”.
The tape this week carried the feel of a market that finally found two-way energy after a bruising stretch of one-sided selling. Across SPY, QQQ, IWM, and DIA, the common thread was the same: heavy downside programs earlier in the week met real buyers into the back half, with several prints ranking among the largest of the quarter and even cracking the historical top-100 lists. The path was not elegant. SPY and QQQ opened the week with impulsive fades, IWM lagged badly until Thursday’s vertical reclaim, and DIA carved a slow grind lower before stabilizing. But the tone of the flows shifted meaningfully: large, price-sensitive buyers stepped into defined shelves, and the indices began defending levels they previously sliced through. The tape is not screaming trend reversal, but it is signaling that the sell program dominance has finally met opposition.
SPY
SPY showed the cleanest progression. The early week selloff was hit by several large prints in the 660s, including a top-100 historical block near 672 that acted as the ceiling for the first leg down. After the midweek low near the 648–650 shelf, the structure shifted. Buyers re-accumulated near 657–660 with several hundred-million-dollar prints highlighted in the table: 2.4M shares around 662 dollars for more than 1.6B dollars, 1.8M shares at 652 for about 1.2B, and 1.5M around 656 for over a billion. These are outsized prints for SPY and the RS ranks support their importance, with readings in the eighties and nineties. The trade clusters show concentrated accumulation in the low 660s and once the tape reclaimed those levels, responsive sellers backed off. The line of scrimmage is now 660–663. Acceptance above that zone targets the heavy bands near 670 and then the prior week’s rejection cluster around 675 where more than 11B dollars sits at a major Level. A failure back under 657 reopens the door to the 650 shelf and risks exposing a vacuum toward 645. For execution, the clean long is a hold above 663 with tight invalidation under 657 and first targets at 670.
QQQ
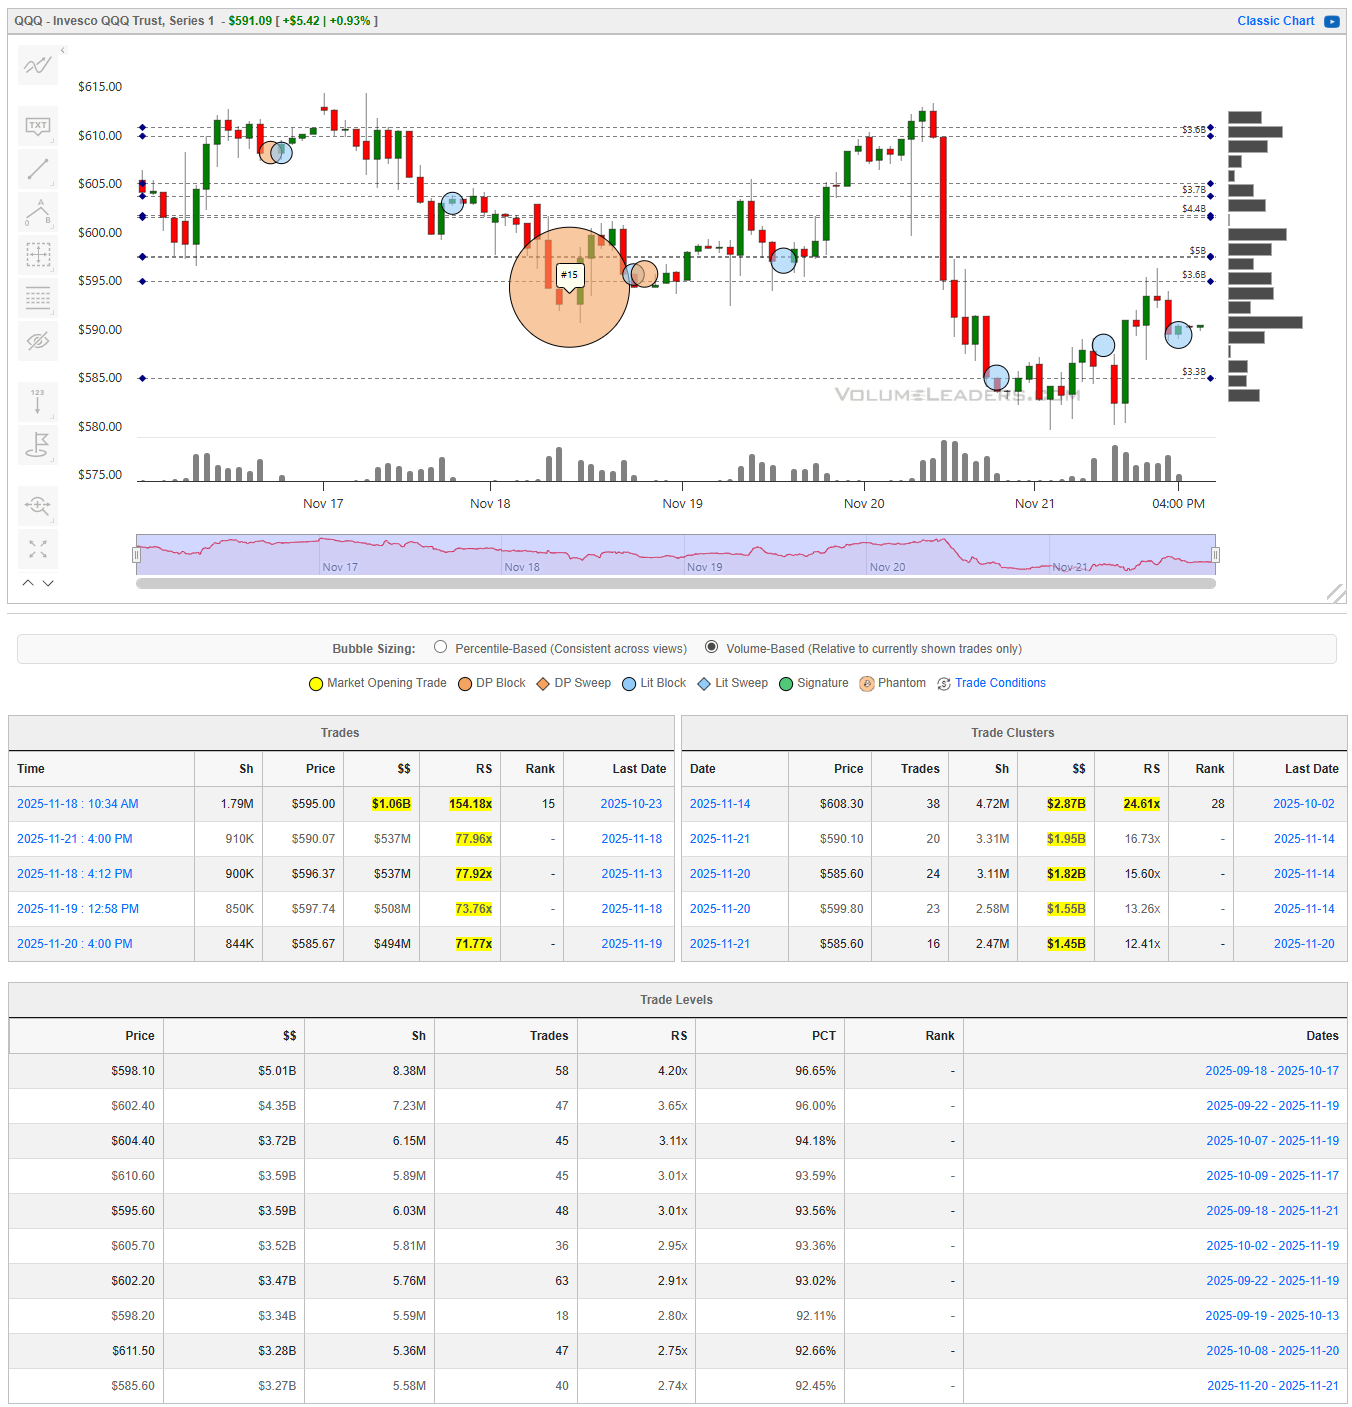
QQQ had a sloppier week but the same signature: large prints defending the mid-590s after a breakdown through 600. The standout is the 1.79M share block at roughly 599 dollars, totaling over a billion dollars and appearing as a top-100 trade. Additional high-RS blocks printed between 597 and 600, each in the several-hundred-million range, and the clusters show repeated buying in the 585–595 corridor. This corridor is now the primary support. A push above 600 begins a transition toward the heavier Levels near 605–610 where more than 5B dollars sits, and acceptance through 610 would mark true momentum shift. Failure back under 590 leaves the tape vulnerable to a retest of the 580 shelf. A disciplined trader frames longs above 600 only if the tape holds bid on dips; below 590, the burden shifts back to sellers.
IWM
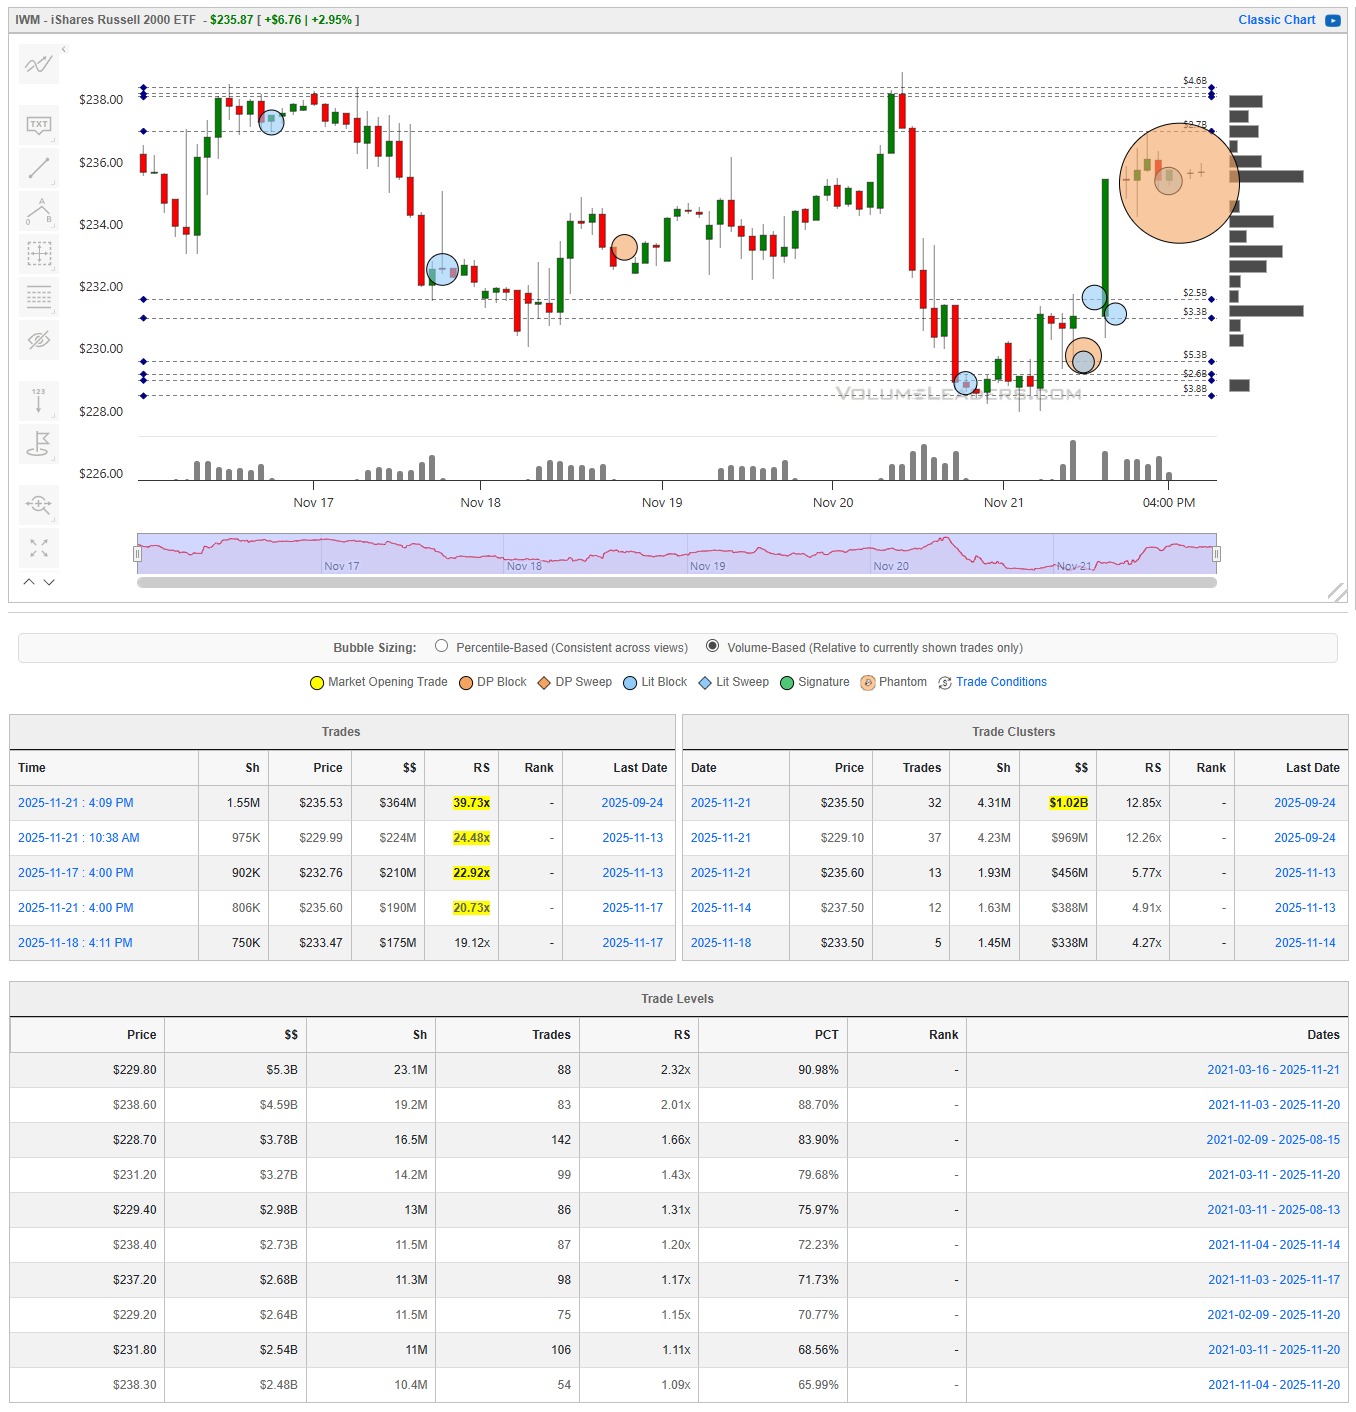
IWM produced the sharpest reversal of the group. After breaking down toward 230, the index printed multiple high-RS blocks in the 232–235 region, including a 1.55M share print around 235 that totaled more than 300M dollars. The end-of-week vertical lift reclaimed every intraday shelf and closed into a major supply band between 238 and 240, where the trade levels show billions in notional and strong percentile ranks. This 238–240 band is the battleground. Acceptance above it opens a cleaner path toward 242–244, while rejection sends the tape back to test the 235 shelf. Because this was a thrust move, traders should expect volatility: the first clean dip-buy is at 235 only if the buyers remain active.
DIA
DIA still looks the weakest, with earlier heavy-selling blocks near 471 and 466 marking firm overhead supply. The prints at the lows were smaller, but clusters show recurring accumulation in the 458–462 range. That zone is essential support. A reclaim of 466 begins a repair process toward 470, but the tall overhead supply makes upside uneven. Breakdown through 458 invites another round of selling and risks a move toward the mid-450s. For now, DIA requires confirmation before trusting upside.
Bottom line: the tape turned two-way, but the burden is still on buyers; key levels are SPY: 657/663/670
QQQ: 590/600/610
IWM: 235/240/242
DIA: 458/466/470.

Summary Of Thematic Performance YTD
VolumeLeaders.com offers a robust set of pre-built thematic filters, allowing you to instantly explore specific market segments. These performance snapshots are provided purely for context and inspiration—think about zeroing in on the leaders and laggards within the strongest and weakest sectors, for example.
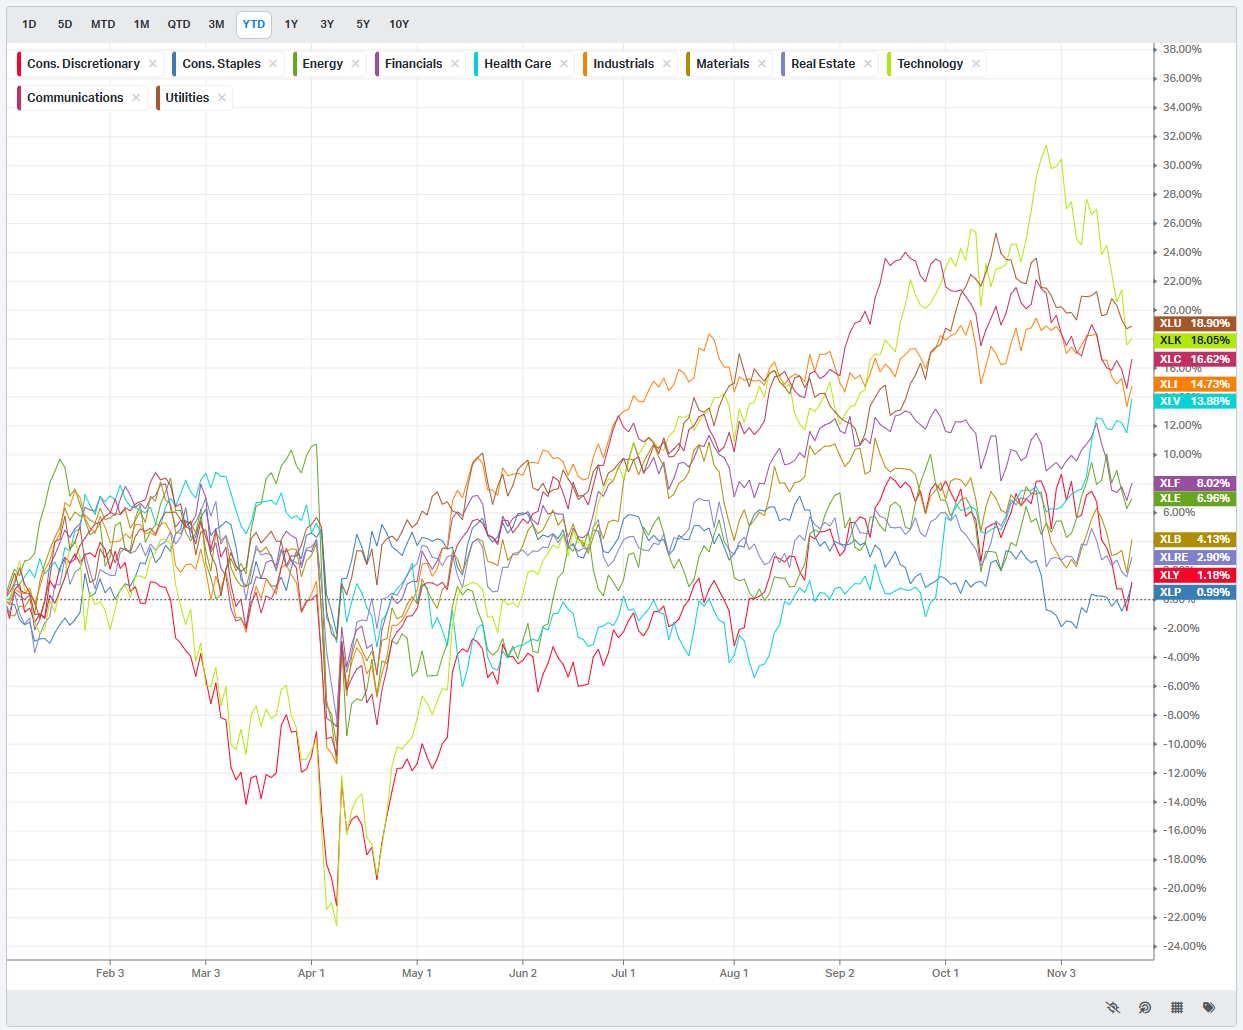
S&P By Sector
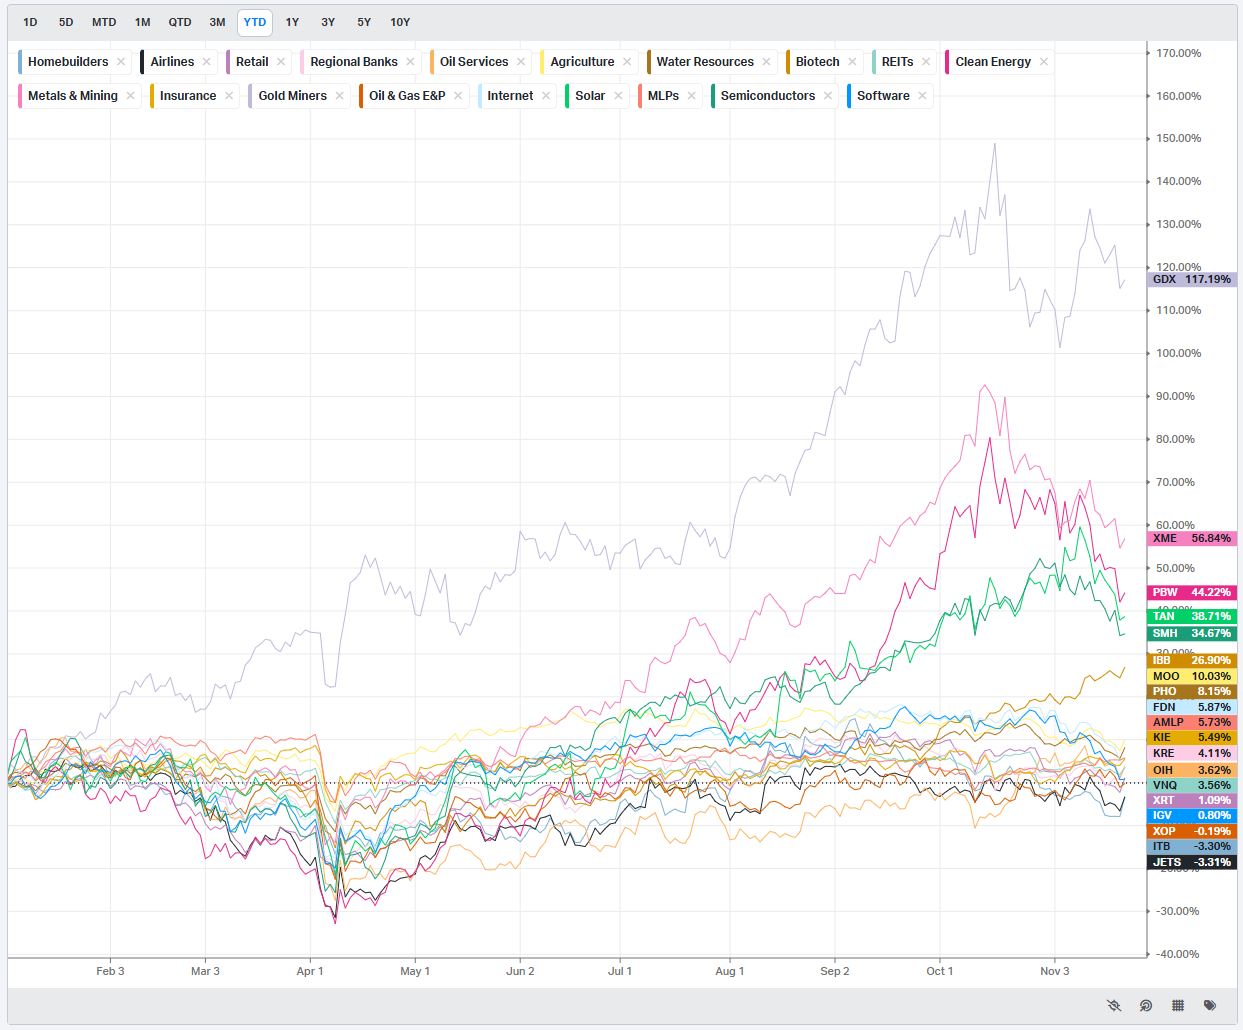
S&P By Industry
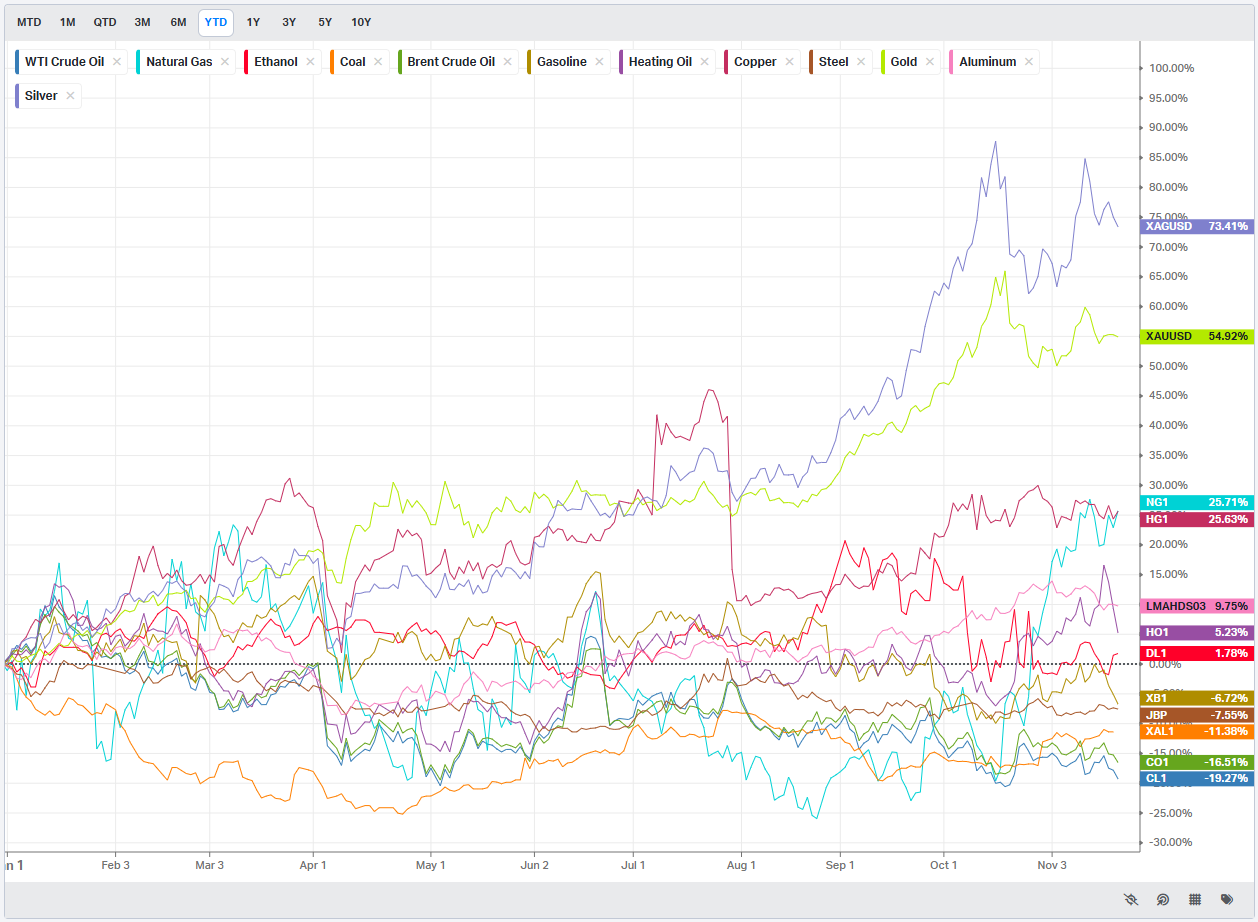
Commodities: Energy & Metals
Currencies/Major FX Crosses
Factors: Style vs Size-vs-Value

Events On Deck This Week
Here are key events happening this week that have the potential to cause outsized moves in the market or heightened short-term volatility.
A Short Week With Heavy Signals: Growth, Housing, and the Consumer Take Center Stage
The Thanksgiving week is truncated, but the data is not. Across Monday through Wednesday the calendar delivers a dense run of growth reads, housing signals, and a fresh sweep of inflation-adjacent indicators. The tape is coming off an oversold sentiment backdrop, and the market will be forced to reconcile that emotional washout with hard data that is finally slowing at the margin. The week’s structure is simple: Monday sets the tone with regional manufacturing and national activity; Tuesday is the heart of the macro load with retail, home prices, consumer confidence, and pending home sales; and Wednesday is a front-loaded barrage of durable goods, jobless claims, income, spending, new home sales, and PCE. The earnings slate is light but includes a few names that can move sentiment in retail, apparel, and enterprise tech. What follows is a clean, day-by-day read of what matters.
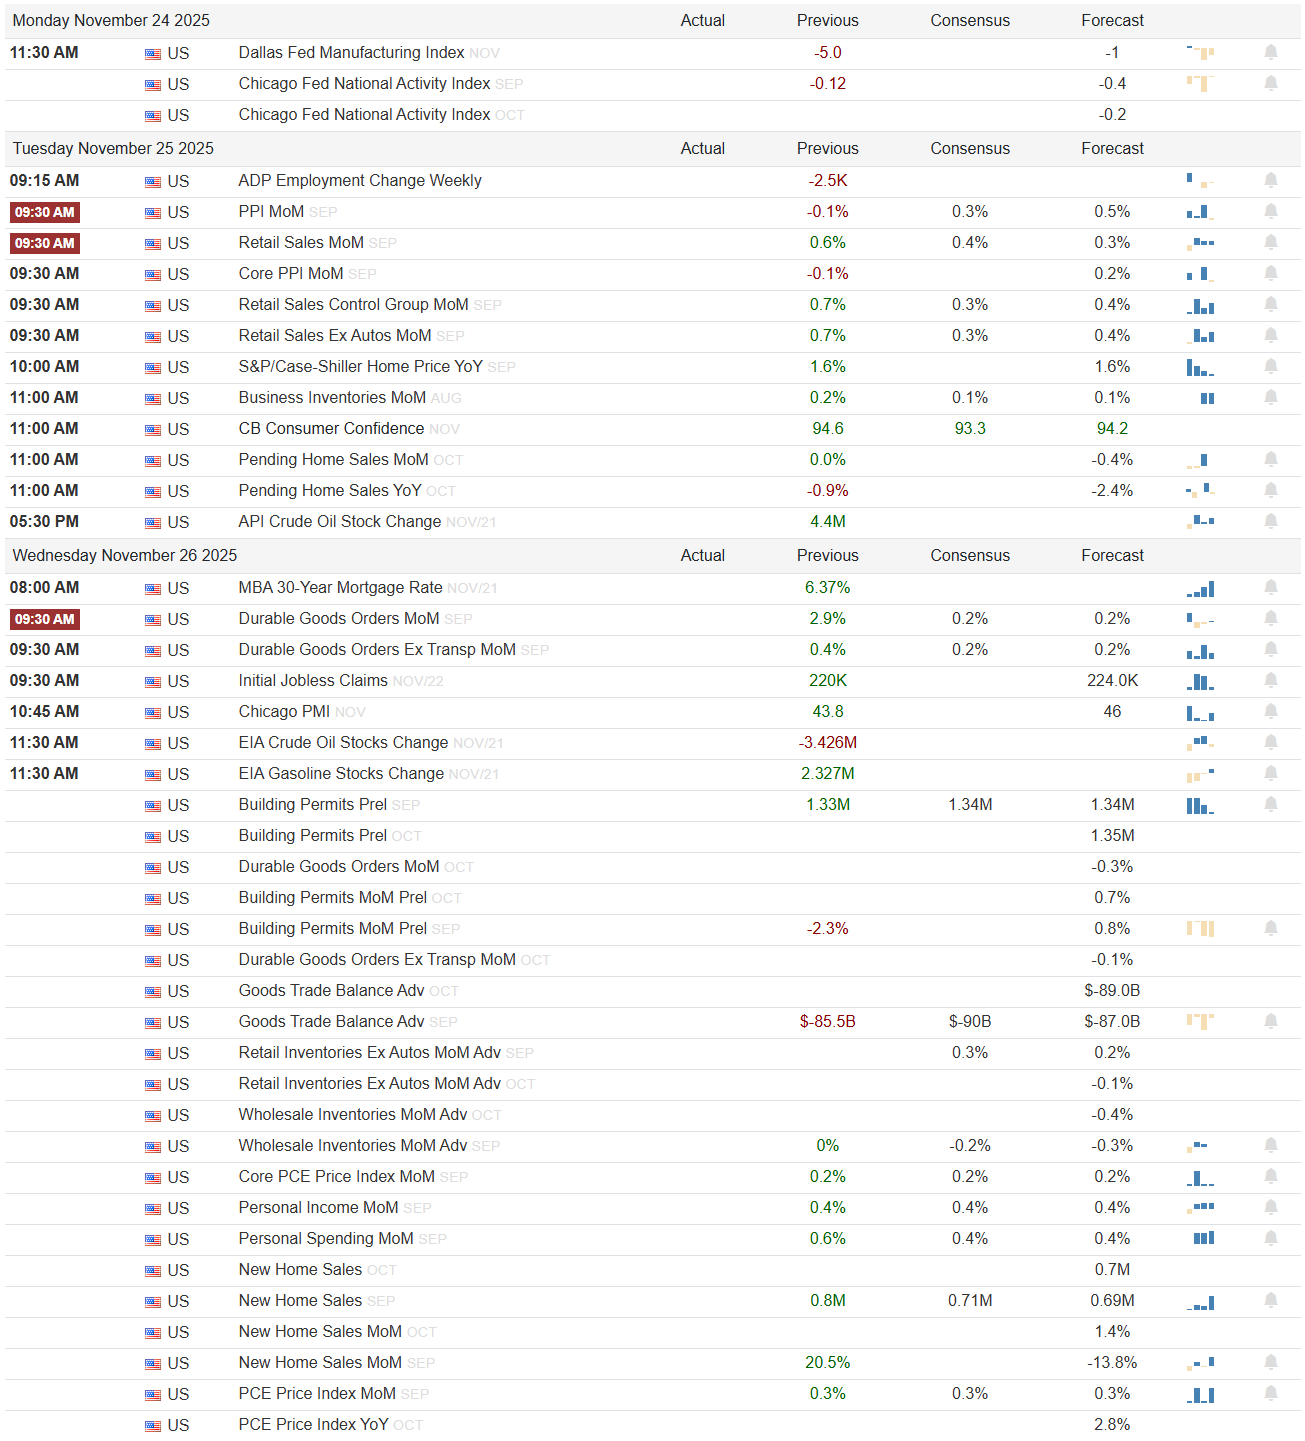
Monday begins quietly but not insignificantly. The Dallas Fed manufacturing index sits at minus five point zero, a modest contraction and materially cooler than the prior minus one point zero consensus. Chicago Fed national activity last posted minus zero point twelve with a prior consensus of minus zero point one. Both of these indicators lean toward cyclical softness rather than inflationary heat. If the Dallas and Chicago readings stay weak or drift weaker, the market will treat it as benign for rates and modestly supportive for equities as long as the numbers do not collapse outright. A downside miss suggests cooling demand without triggering recession alarms; an upside surprise into positive territory would nudge yields higher and test the risk appetite that has only just begun to recover.
Tuesday is the week’s hinge. The ADP employment change previously printed minus two point five thousand, a negative surprise that cast doubt on private‒sector hiring momentum. The consensus and forecast for this week are unreadable, but the direction matters more than the exact figure. A rebound back into positive territory would ease labor-weakness concerns; another negative print will be read as an escalation of labor softening. From there, the focus shifts directly into inflation and the consumer. PPI month-over-month previously posted minus zero point one percent, with the prior consensus near zero point three percent. Retail sales came in at zero point six percent month-over-month against a prior consensus of zero point four percent, with retail control at zero point seven percent. The ex auto series is similarly stable. If retail repeats anything near those stronger prior reads, especially in the face of moderate inflation, equities will welcome it. Weakness in retail sales, especially if it slips toward zero, would unsettle the consumer narrative heading into the holiday stretch. The Case-Shiller home price index previously rose one point six percent year-over-year, a firm reading that suggests shelter remains tight. Business inventories were last at zero point two percent, and consumer confidence posted ninety-four versus a prior consensus of ninety-three point three. Pending home sales have been weak, previously falling zero point nine percent. The entire complex on Tuesday speaks to the backbone of the economy: jobs, spending, sentiment, and housing. Strength is risk-on if paired with soft inflation inputs; weakness in retail or confidence would tilt risk-off.
Wednesday condenses half a month’s worth of macro inputs into one pre-holiday session. Mortgage demand is running at six point three seven percent on the MBA 30-year rate, still elevated and suppressing affordability. Durable goods orders previously printed two point nine percent, with transportation at zero point four percent. Initial jobless claims were last at two hundred twenty thousand, which remains tight. The Chicago PMI is holding at forty-three point eight, still contractionary. The energy releases show crude stock change at minus three point four two six million barrels and gasoline stocks up two point three two seven million. Housing signals follow: building permits preliminary at one point three three million previously, with the revised October reading at minus two point three percent. Wholesale inventories were flat last month, and personal income and spending continue rising at zero point four and zero point six percent respectively. New home sales previously posted zero point eight million and new home sales month-over-month rose twenty point five percent. The PCE price index year-over-year sits at two point eight percent, with the month-over-month read at zero point three percent. This avalanche of data will determine whether markets head into the holiday with a soft-landing narrative or a growth scare. Strong income and spending paired with cooling PCE would be the most risk-on blend available. A surge in PCE or weakness in personal income would cut the legs out from under any relief rally.
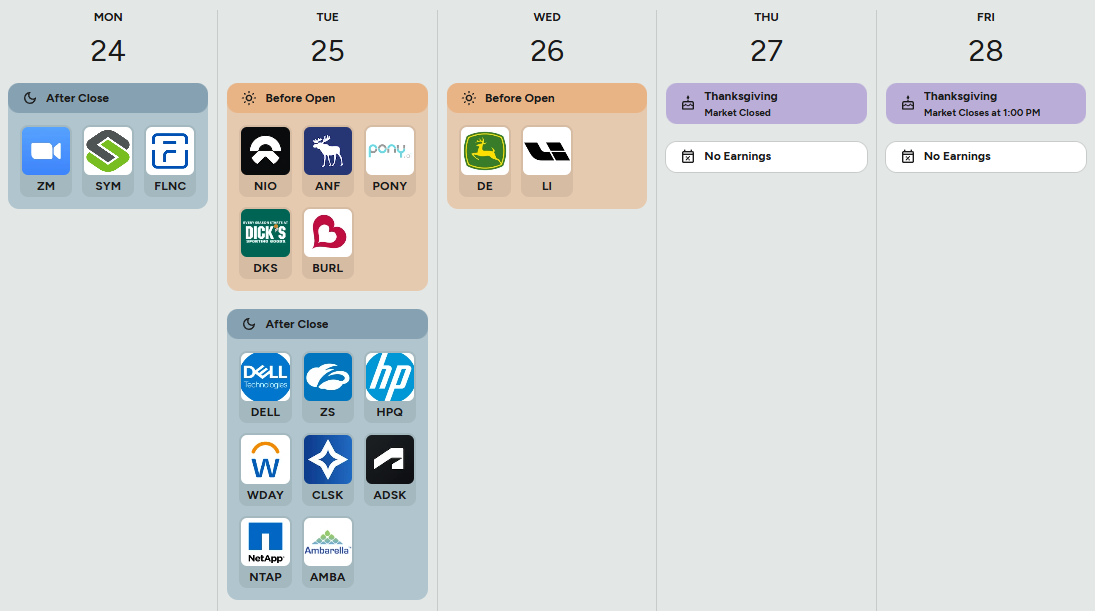
The earnings calendar is light but not meaningless. Monday has Zoom and Symbotic, both useful as barometers of enterprise demand and automation. Tuesday’s pre-market slate includes NIO, Abercrombie, Pony, Dicks, and Burlington, offering a mosaic of EV demand and middle-income retail health. After the close, Dell, Zscaler, HP, Workday, and Autodesk speak directly to IT budgets and cloud spending. Dell and HPQ provide clean reads on hardware refresh cycles; Zscaler and Workday illuminate corporate appetite for subscription expansions. NetApp and Ambarella round out the data-heavy, AI-adjacent picture. Wednesday’s only material print is Deere, a bellwether for capex and industrial demand. A beat-and-raise cycle across retail and enterprise tech would improve the growth tone; misses or cautious guides would narrow risk appetite heading into December.
Order Flow in Focus: Reading Smart Money Tells
Order Flow in Focus: Reading Smart Money Tells is a recurring segment that spotlights unique intraday opportunities revealed through institutional order flow. Each feature dissects a moment when the tape quietly shifted—when large, ranked prints clustered at key liquidity locations and informed players positioned ahead of the move. The goal isn’t hindsight; it’s pattern recognition—learning to spot the footprints of capital that knows before the crowd does.
When One Print Told You the NVDA Gap Wouldn’t Hold
The tell showed up early, long before SPY’s opening euphoria began to unravel. While the market was still digesting NVDA’s blowout report and futures were holding a 1.5 percent gap, SPDN printed an abnormal surge of activity — the kind of footprint that only appears when someone with size steps in with conviction.
At 9:43 AM, SPDN saw a 2.55M share block at 9.59, totaling $24.5M. It carried an RS of 33.5x and a rank of #5 — the fifth-largest print ever recorded in the ETF. SPDN is a 1x inverse S&P instrument; massive prints there are not day-trader noise. They reflect positioning, hedge adjustments, or directional bets from informed players who move early and move large.
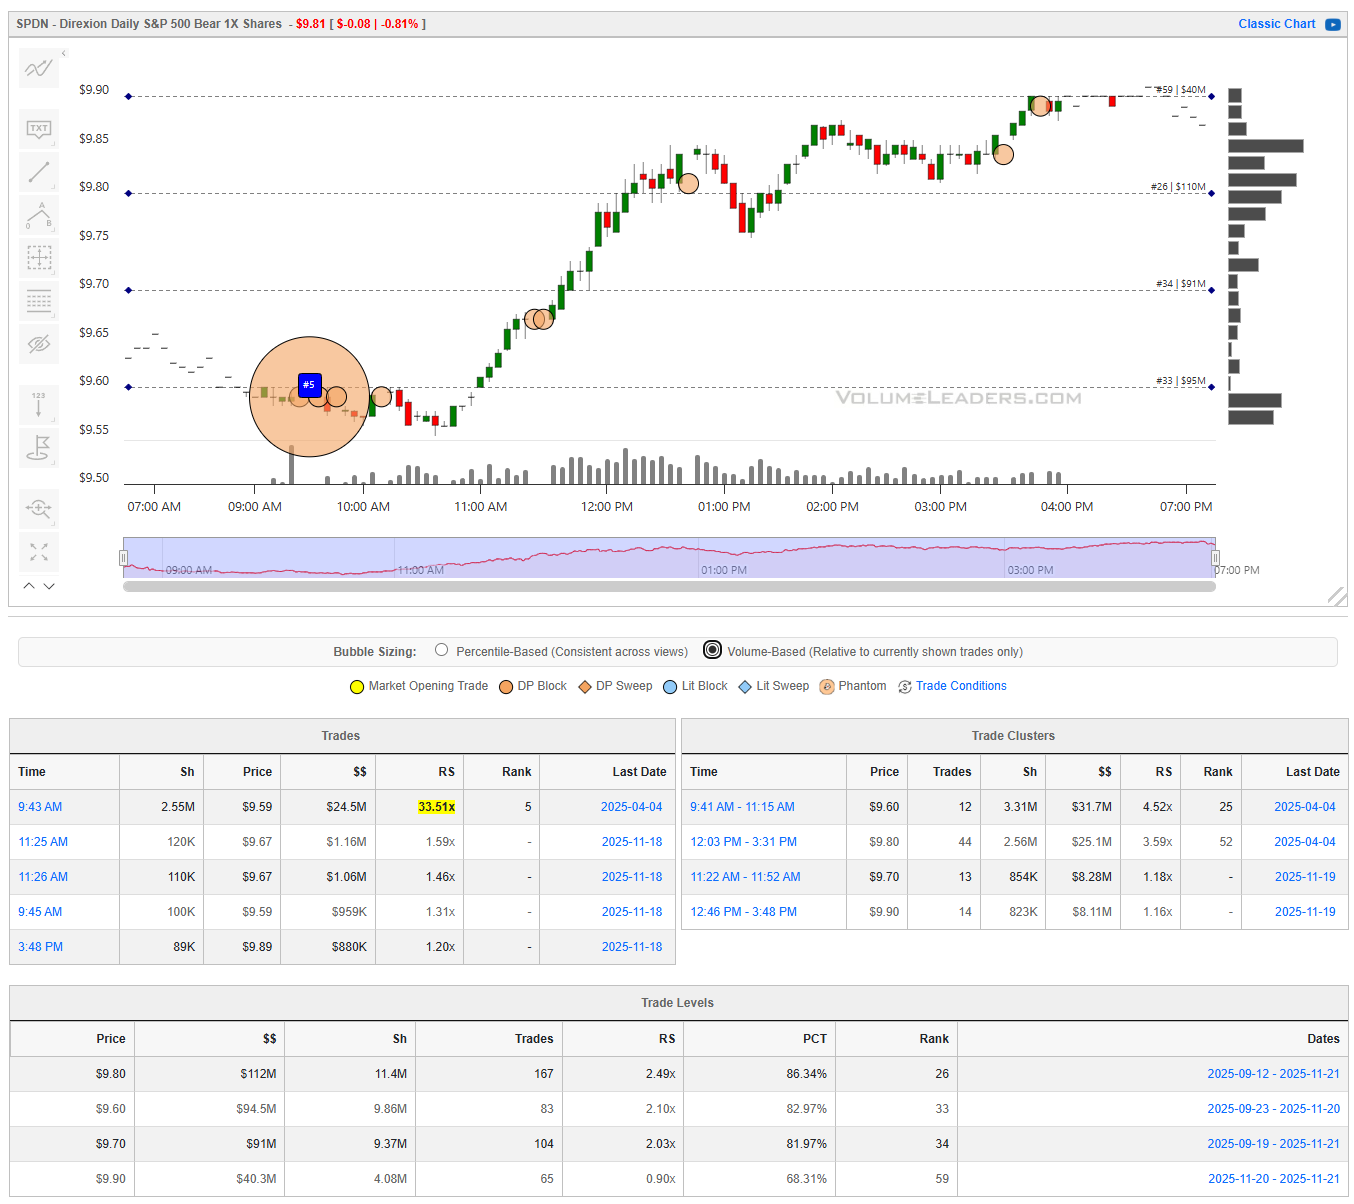
That single print did two things immediately. First, it established the 9.55–9.60 band as an institutional base — someone was building size with urgency, not patience. Second, the RS and historical rank screened it from the clutter of normal intraday volume. When one of the largest prints in a product’s lifetime appears at the open, and it’s an inverse S&P product, you pay attention. Two leveraged products moving high volume was enough to capture our attention.
Traders in the Discord called out the flow and notable prints that painted the top of the drop. The Discord Bot was on the SPDN print, too. The fast money that chases gaps was absorbed immediately, and the failure to make a second push higher in the midst of all of this action sealed the day’s fate.

The trade leg from there was straightforward. The 9.59 SPDN block provided the anchor. The next confirmation was the small cluster between 9.60 and 9.67 — multiple blocks totaling several million dollars that validated the initial print was part of a build rather than an isolated hedge. SPDN held every dip near that zone, and once it cleared 9.70, the tape never looked back. It marched vertically toward 9.80, then into the high 9.80s as SPY continued bleeding into the close. The only problem the VL community had was figuring out how much profit to book.
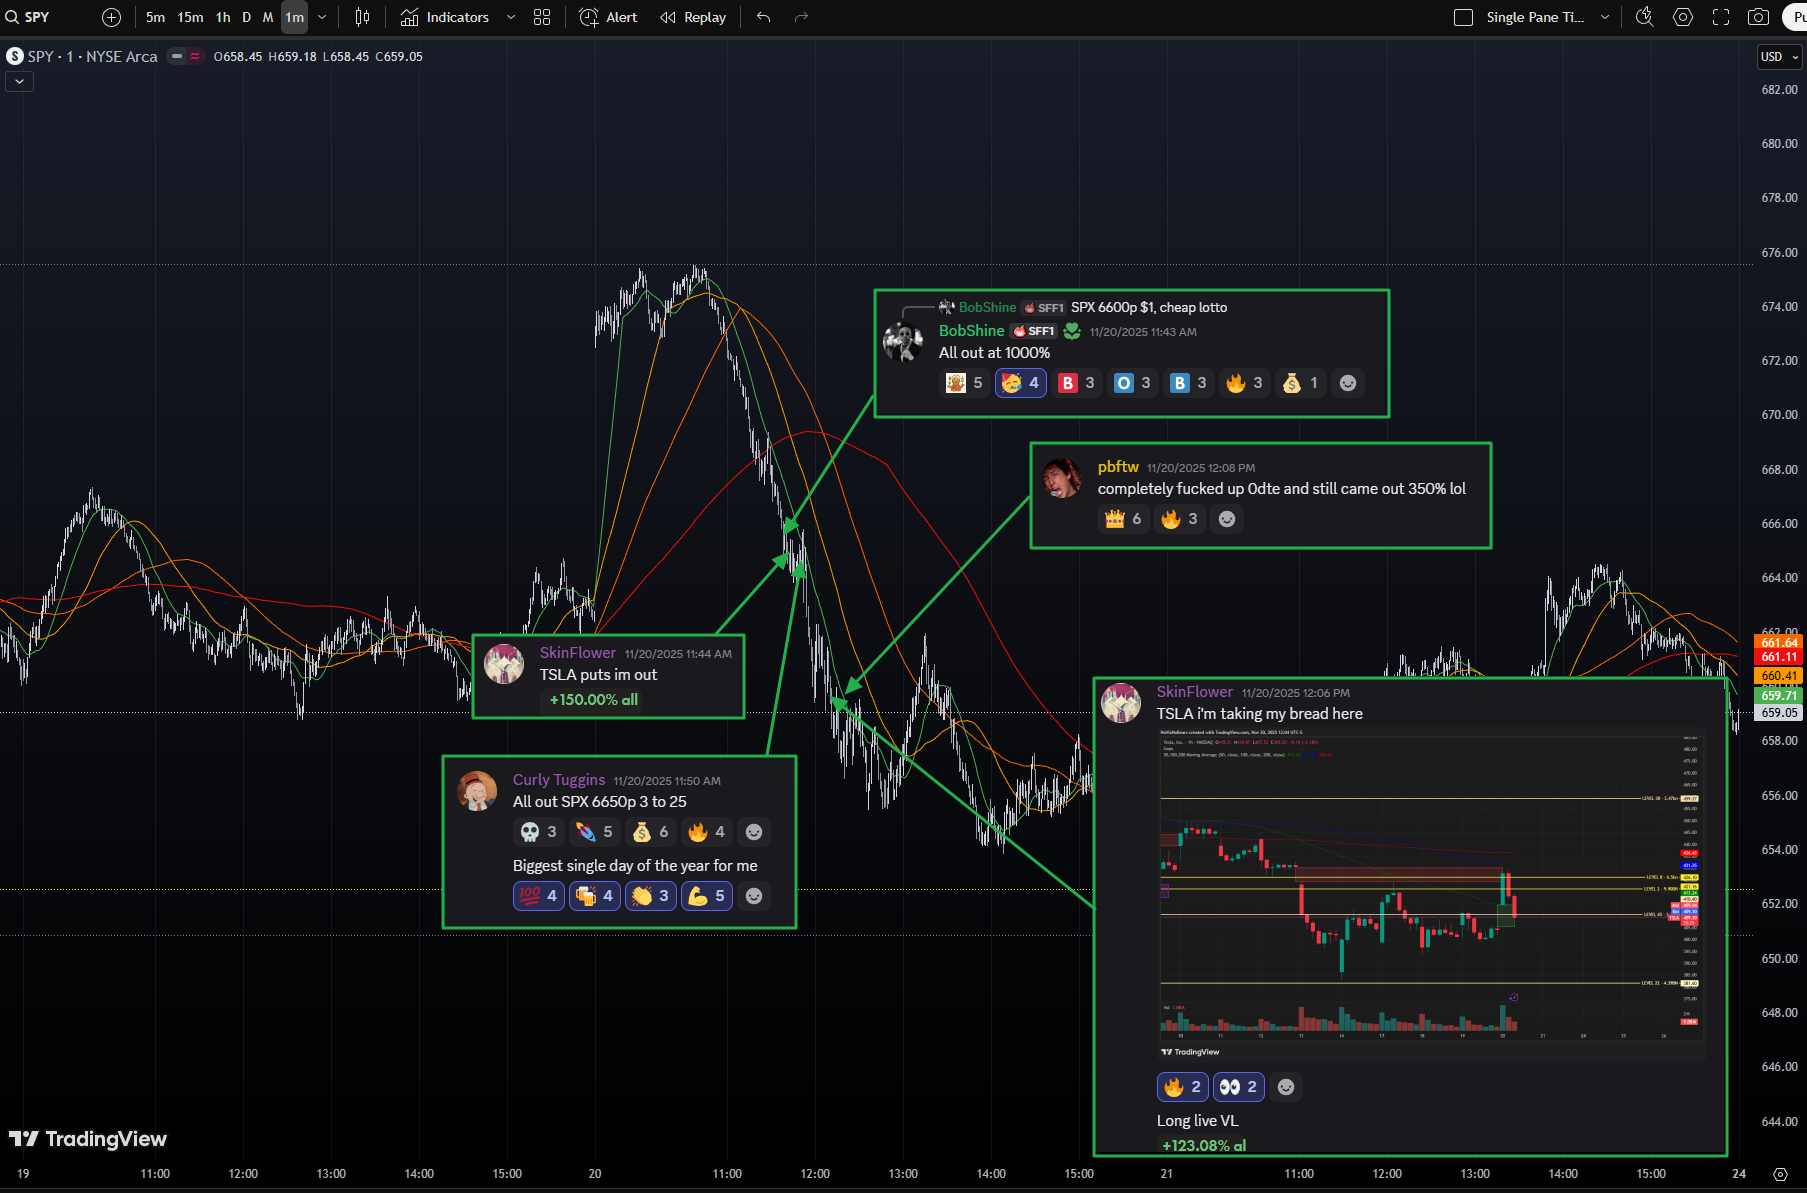
This was a textbook example of how a single dominant print in an inverse ETF, combined with a misfiring gap in the underlying index, sets up a high-confidence intraday reversal trade. It wasn’t predictive magic — it was recognizing that capital that rarely guesses had already shown its hand and not fighting the flow.
Bottom line: the #5-ranked SPDN block at 9.59 was the footprint that telegraphed SPY’s failed NVDA gap and offered a clean, asymmetric ride as the index unwound from 660 to 651. You don’t get opportunities like this every day, but you do get a VL community that’s parsing real-time flow and collaborating at this level every single session. Huge hat-tip to everyone involved—and congrats on a fantastic catch.

Market Intelligence Report
A desk-grade synthesis of institutional positioning and market structure—unpacking the flows, levels, and emerging themes that shaped the week, and translating them into a model portfolio built the same way professional desks prepare for the week ahead.
Weekly Portfolio Review: A Week Where the Hedges Carried the Tape
This was a week defined by a sharp reversal in risk tone, and the portfolio behaved exactly as a balanced, data-driven book should. The discretionary sleeves were mixed, real assets treaded water, and selective tech produced a modest tailwind. But the defining feature of the week was straightforward: the hedges did the heavy lifting, and without them the book would have finished in the red.
The total portfolio return came in at +0.27%, a small number on the surface, but structurally important. Core exposures were soft as cyclicals and quality factor names stalled together. Real assets, despite ongoing dispersion in energy, essentially netted to zero. Meanwhile, the inverse and volatility-sensitive hedges were the one area where institutional footprints actually followed through, and their gains offset the broad-market drift lower. Last week’s rebal:
Core Defensive Allocation — 35%
SCHD 10%
JEPI 10%
SPYD 7%
SPYM 5%
VOO / IVV 3%
Real Assets & Yield — 25%
EQR 5%
KIM 4%
HST 3%
VRE 3%
CURB 3%
SILA 2%
CNQ 2%
CVX 1%
AG 1%
DNOW 1%
Quality Financials — 15%
KEY 3%
BEN 3%
WAFD 2%
WBS 2%
BAM 3%
RITM 2%
Selective Tech Infrastructure — 15%
INFY 3%
WIT 3%
VRNT 2%
NXPI 2%
ZBRA 2%
GPN 2%
CORZ / REKR basket 3%
Hedges & Tactical Overlay — 10%
SQQQ 4%
PSQ 3%
NVDD 2%
SPSB or similar short-duration IG 1%What Worked
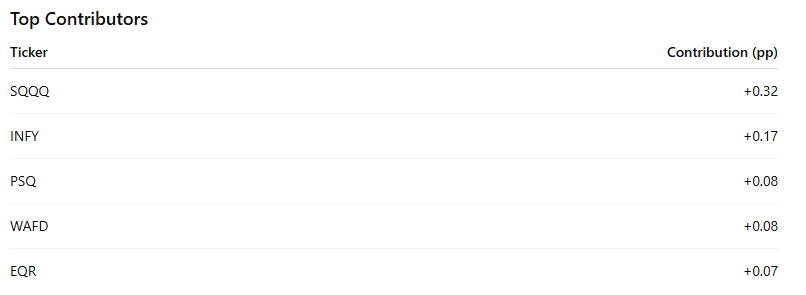
Two themes mattered: idiosyncratic strength in selective tech and the hedges responding to a clean failed-gap setup in the indices.
INFY was the standout discretionary contributor, adding +0.17 percentage points, a consequence of disciplined accumulation ahead of a clean breakout. WAFD, PSQ, DNOW, WIT and EQR formed a cluster of smaller but meaningful positives, each adding between +0.05 and +0.08 percentage points.
But the real story was SQQQ, whose +8.12% return translated into +0.32 percentage points, the single largest contributor in the entire book. Paired with PSQ’s +0.08, the hedge complex alone contributed nearly 0.47 percentage points, more than the entire weekly return. This is exactly why the hedge sleeve exists: to cover the fat-tailed weeks when breadth slips and institutional flows pivot defensively.
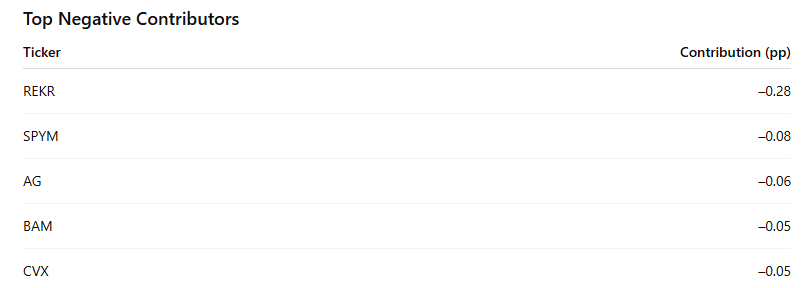
What Didn’t Work
On the negative side, the damage was concentrated but not surprising. REKR, your smallest-cap speculative name, dropped 19.16%, costing the book –0.28 percentage points on its own. That single decline wiped out the gains of five mid-tier contributors. This is the tradeoff inherent in asymmetry-seeking microcaps: they add convexity, but when they misfire, they leave a fingerprint.
Core defensive exposures were broadly soft, with SPYM (–0.08), SCHD (–0.05), BAM (–0.05), CVX (–0.05), and AG (–0.06) combining for –0.30 percentage points of drag — not a breakdown, but a coordinated fade reflective of a risk-off shift across the dividend and value complex. Importantly, nothing in the core sleeves behaved outside expectation: cyclicals weakened with the market’s rejection at the highs, and the low-volatility and income components simply tracked benchmark softness.
Sleeve-Level View
The sleeve attribution makes the week’s structure clearer:
Core Defensive: –0.21 pp
Real Assets & Yield: +0.02 pp
Quality Financials: +0.05 pp
Selective Tech Infrastructure: +0.20 pp
CORZ/REKR basket: –0.26 pp
Hedges & Overlay: +0.47 pp
This is a distribution you expect in a week where the index sells off after a failed macro catalyst and the AI boat getting rocked a bit. The hedges absorbed the impulse, selective tech names provided isolated strength, and the speculative sleeve was the outlier on the downside.
TLDR;
The point of a diversified, data-anchored portfolio isn’t to eliminate drawdowns; it’s to control their shape. This week delivered exactly that. The core exposures behaved as expected in a market that rejected highs. Selective tech provided targeted alpha. The speculative sleeve exposed its volatility. And the hedges, built on identifiable institutional footprints, did precisely what they are designed to do: step in when broad market structure fractures.
The end result wasn’t thrilling, but it was instructive. When the book protects capital in a sloppy tape and the upside comes from deliberate allocations rather than blind beta, that’s the sign of a portfolio that is doing its job. That’s the edge in following institutional positioning.
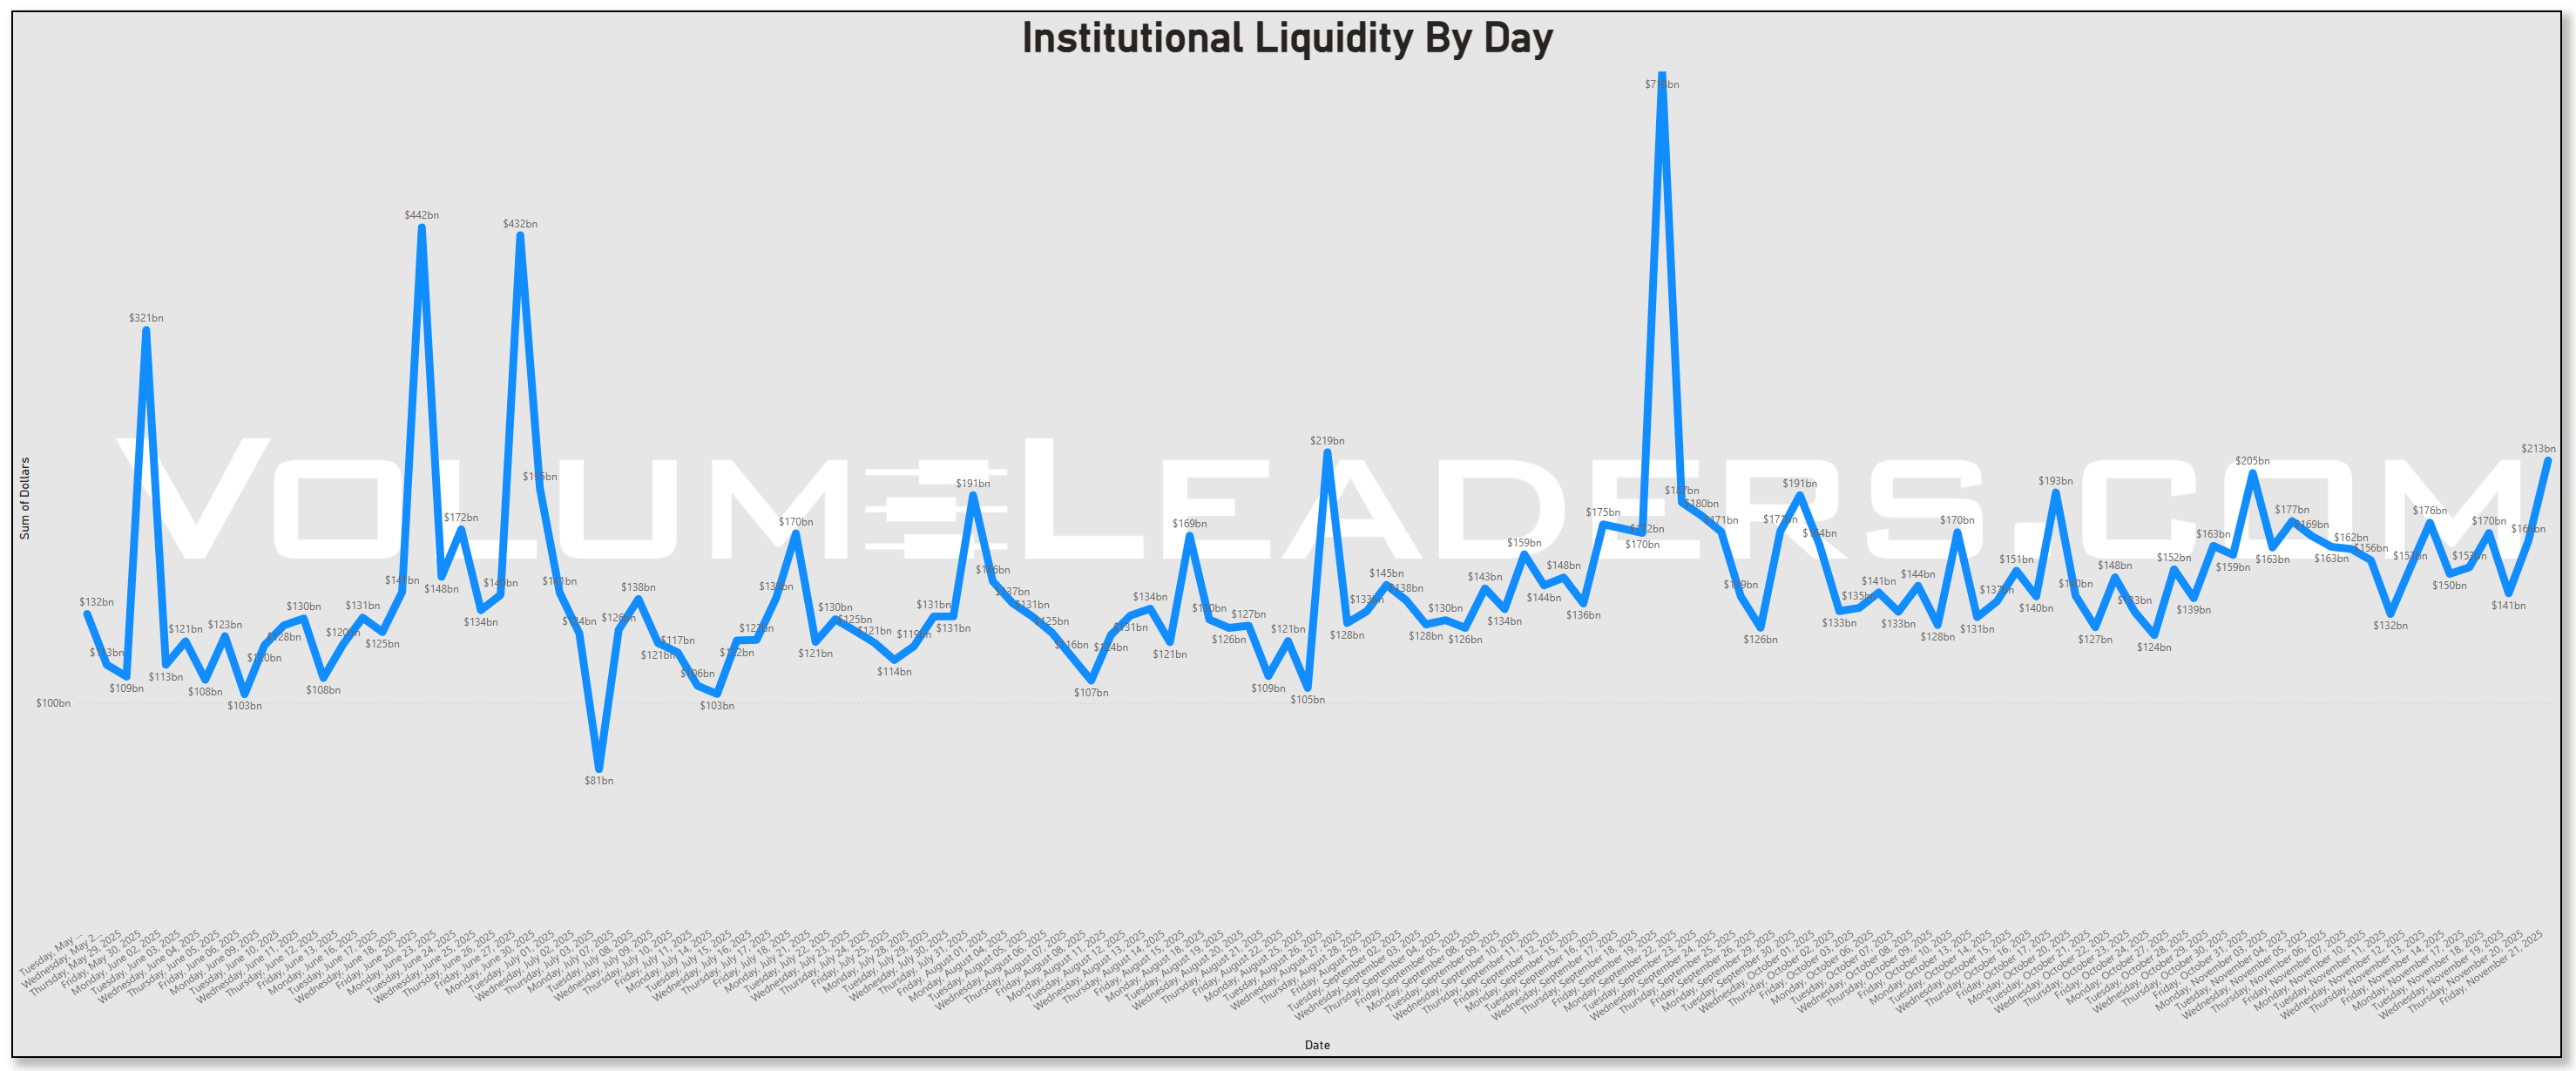
MIR Part 1: The Backdrop
Institutional liquidity spent the week oscillating mid 100b’s, with a pronounced end of week surge that pushed above the two hundred billion, carrying the fingerprint of scheduled flows, particularly the November OPEX window and the mechanical roll of index overlays that tend to cluster in the third week of the month. The pick-up in liquidity suggests tactical reallocations around year-end positioning and the digestion of fresh economic data with healthy participation.
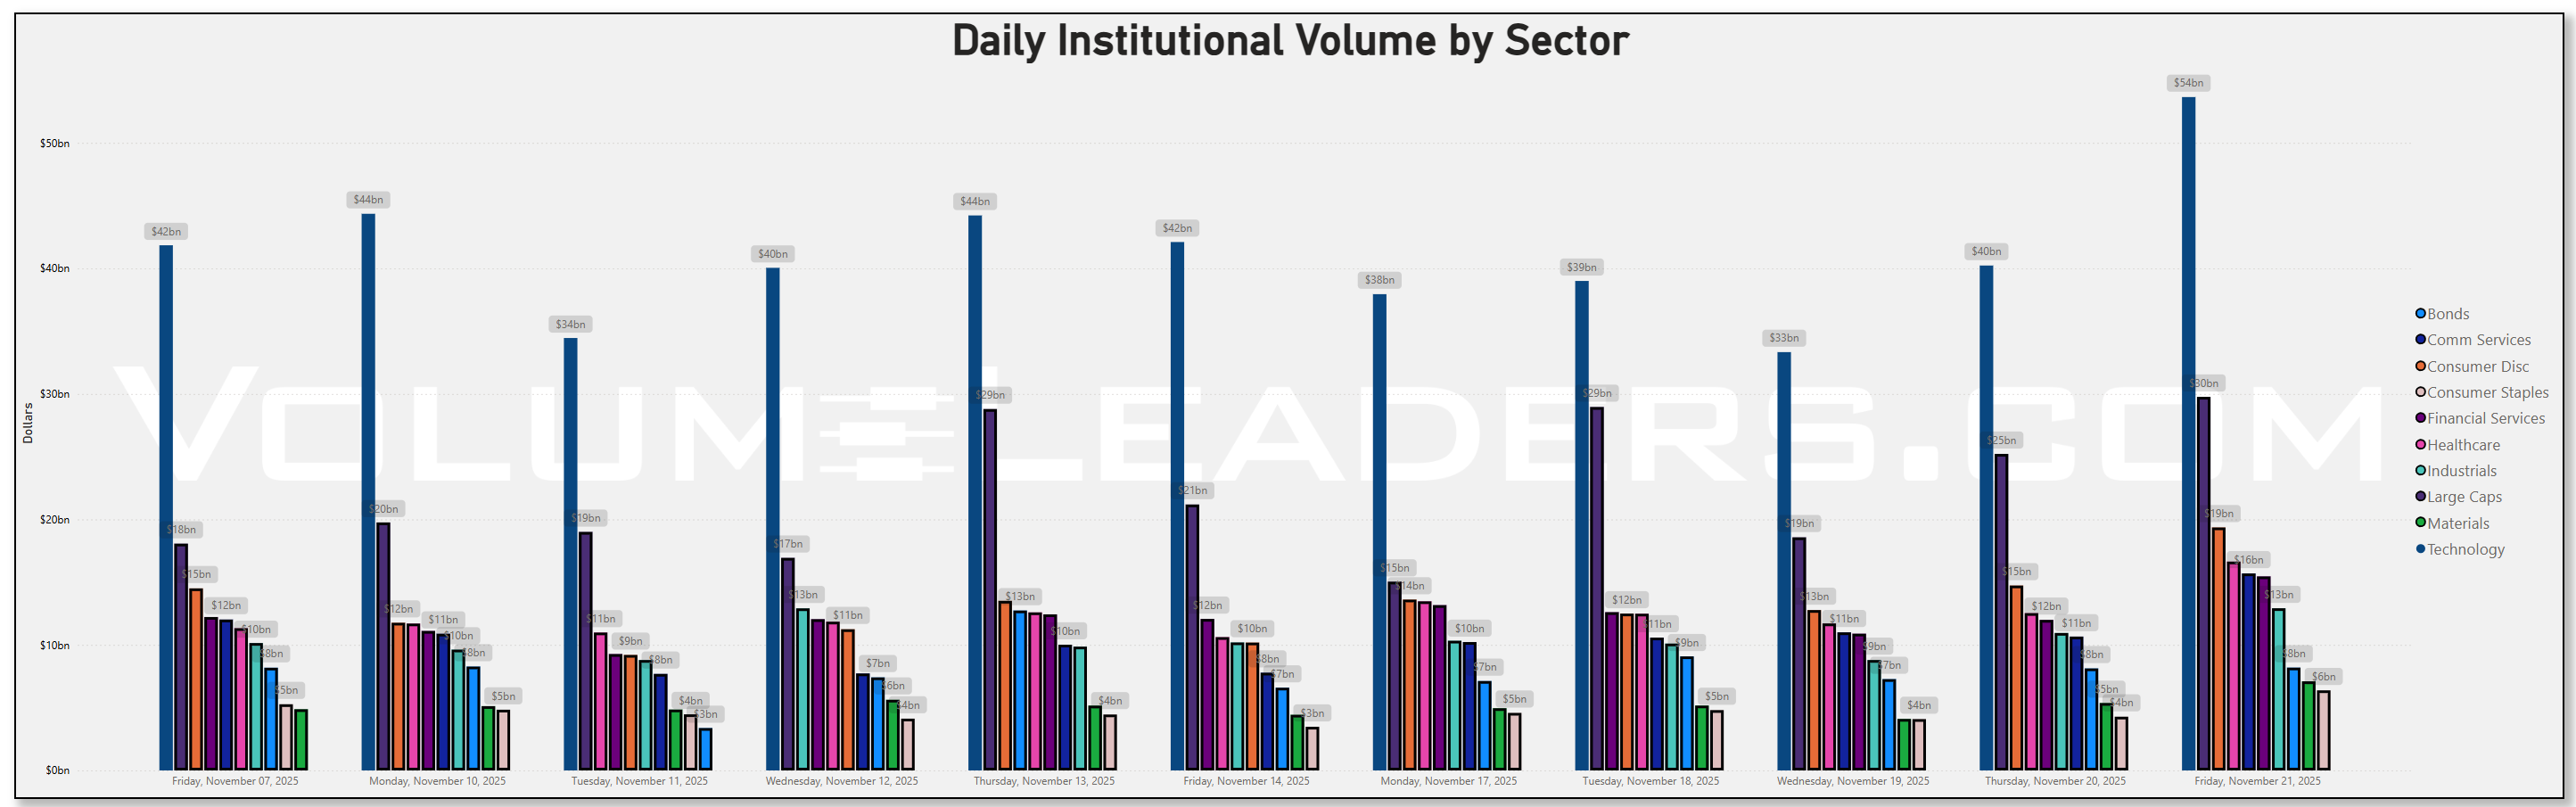
Across daily sector allocations, Technology remained the gravitational center of dollar flow, consistently printing in the thirty to forty billion range day after day. That alone is not unusual, but the persistence relative to last week’s softer prints suggests that allocators leaned back into the mega-cap complex after the brief risk wobble surrounding Nvidia’s earnings. Large Caps followed closely, with repeated sessions in the high twenties and low thirties. The pairing signals that the week belonged to benchmark beta rather than sector-specific conviction. Communication Services held steady in the low teens, neither expanding nor contracting meaningfully, while Consumer Discretionary showed a visible lift compared to the prior week, particularly on the back half where flows shifted into the low to mid teens. Healthcare remained surprisingly firm, grinding in the ten to twelve billion range without the volatility seen in the cyclical sleeves. Energy and Materials faded relative to last week’s levels, sinking toward single-digit billions despite stable crude inventories and muted commodity volatility, reinforcing that the market was not interested in chasing reflation trades. Financials sat in the middle of the pack, printing a steady eleven to thirteen billion per day, but with less of the sharp ranking shifts they experienced earlier in the month. Taken together, sector dollars showed a clear beta-heavy stance, with risk concentrated in the same megacap corridors that have dominated most of 2025.
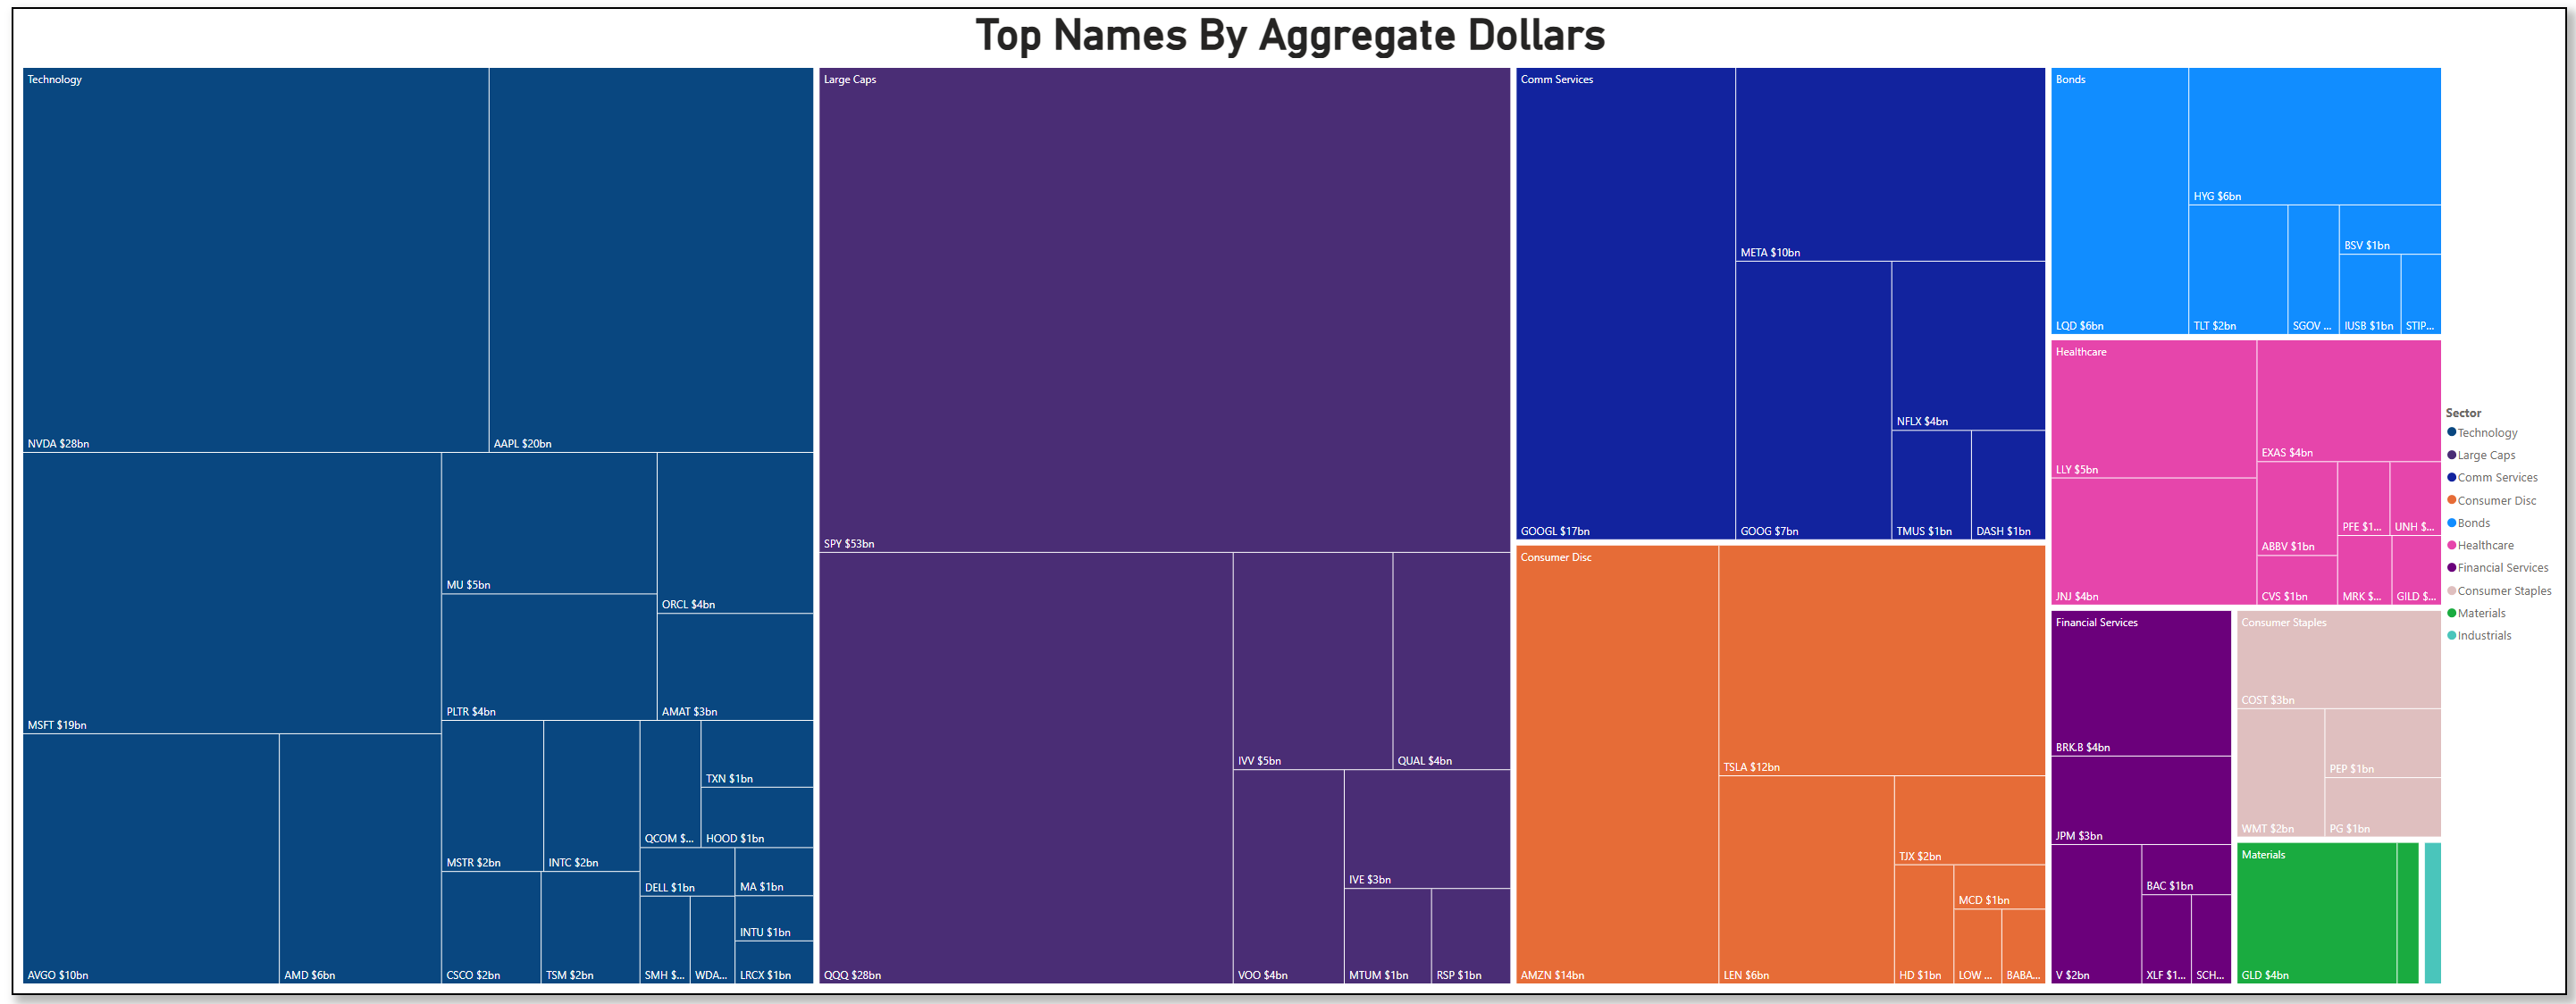
The treemap of top aggregate dollars drove the point home. SPY towered above the rest at roughly fifty-three billion, dwarfing every other instrument. QQQ and NVDA sat tightly clustered in the high twenties, with AAPL and MSFT just below in the twenty to nineteen billion range. These five names alone accounted for an outsized share of total weekly attention, and the breadth within Technology was broad rather than narrow. MU, ORCL, AMAT, INTC, CSCO, TSM, AVGO, and PLTR all showed meaningful blocks ranging from one to five billion. The presence of both semis and software suggests the flows were not thematic but index-driven, consistent with allocation behavior rather than a speculative chase. On the Consumer Discretionary side, AMZN and TSLA both landed in the ten to fourteen billion band, while META and GOOGL dominated Communication Services at ten and seventeen billion respectively. Nothing in the distribution suggested stress; it read as purposeful, diversified accumulation aligned with the weightings of broad indices in favorite names.
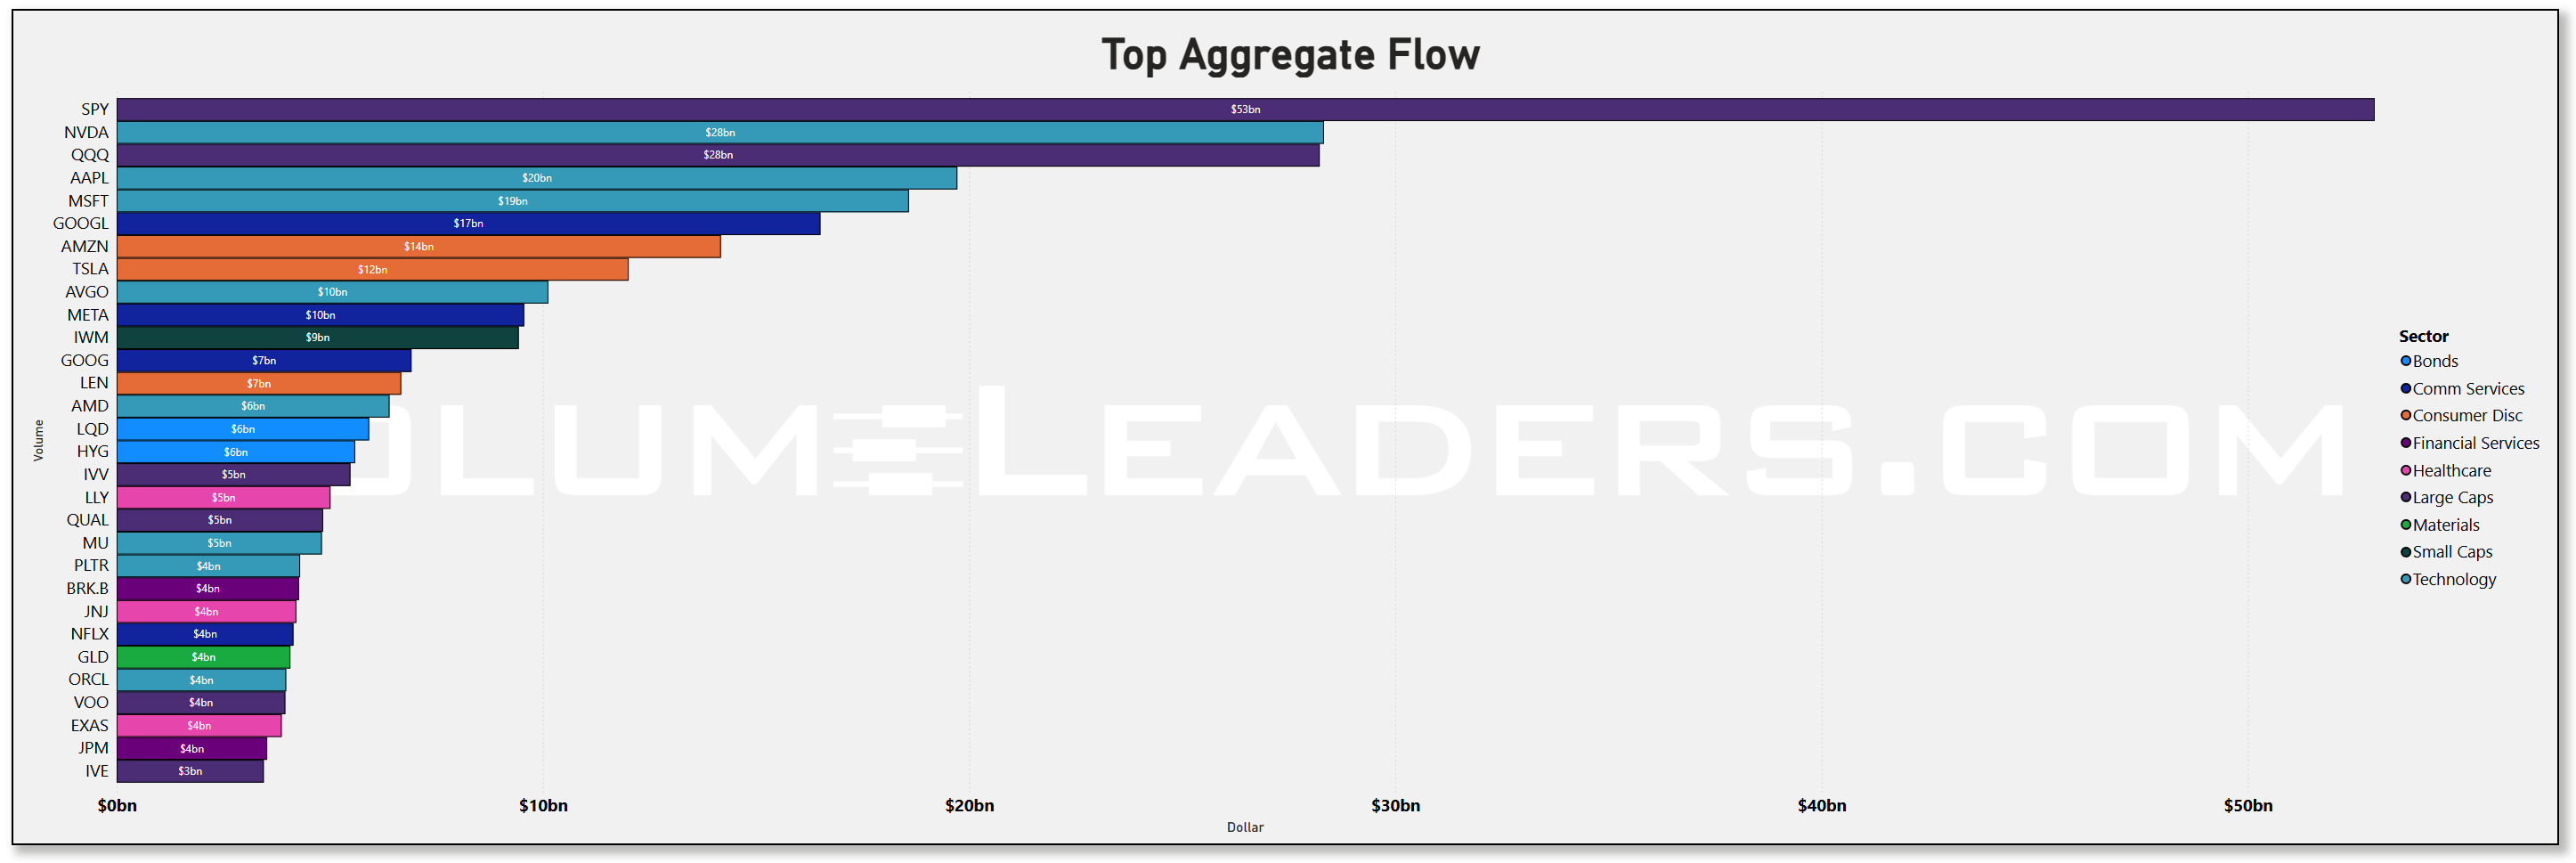
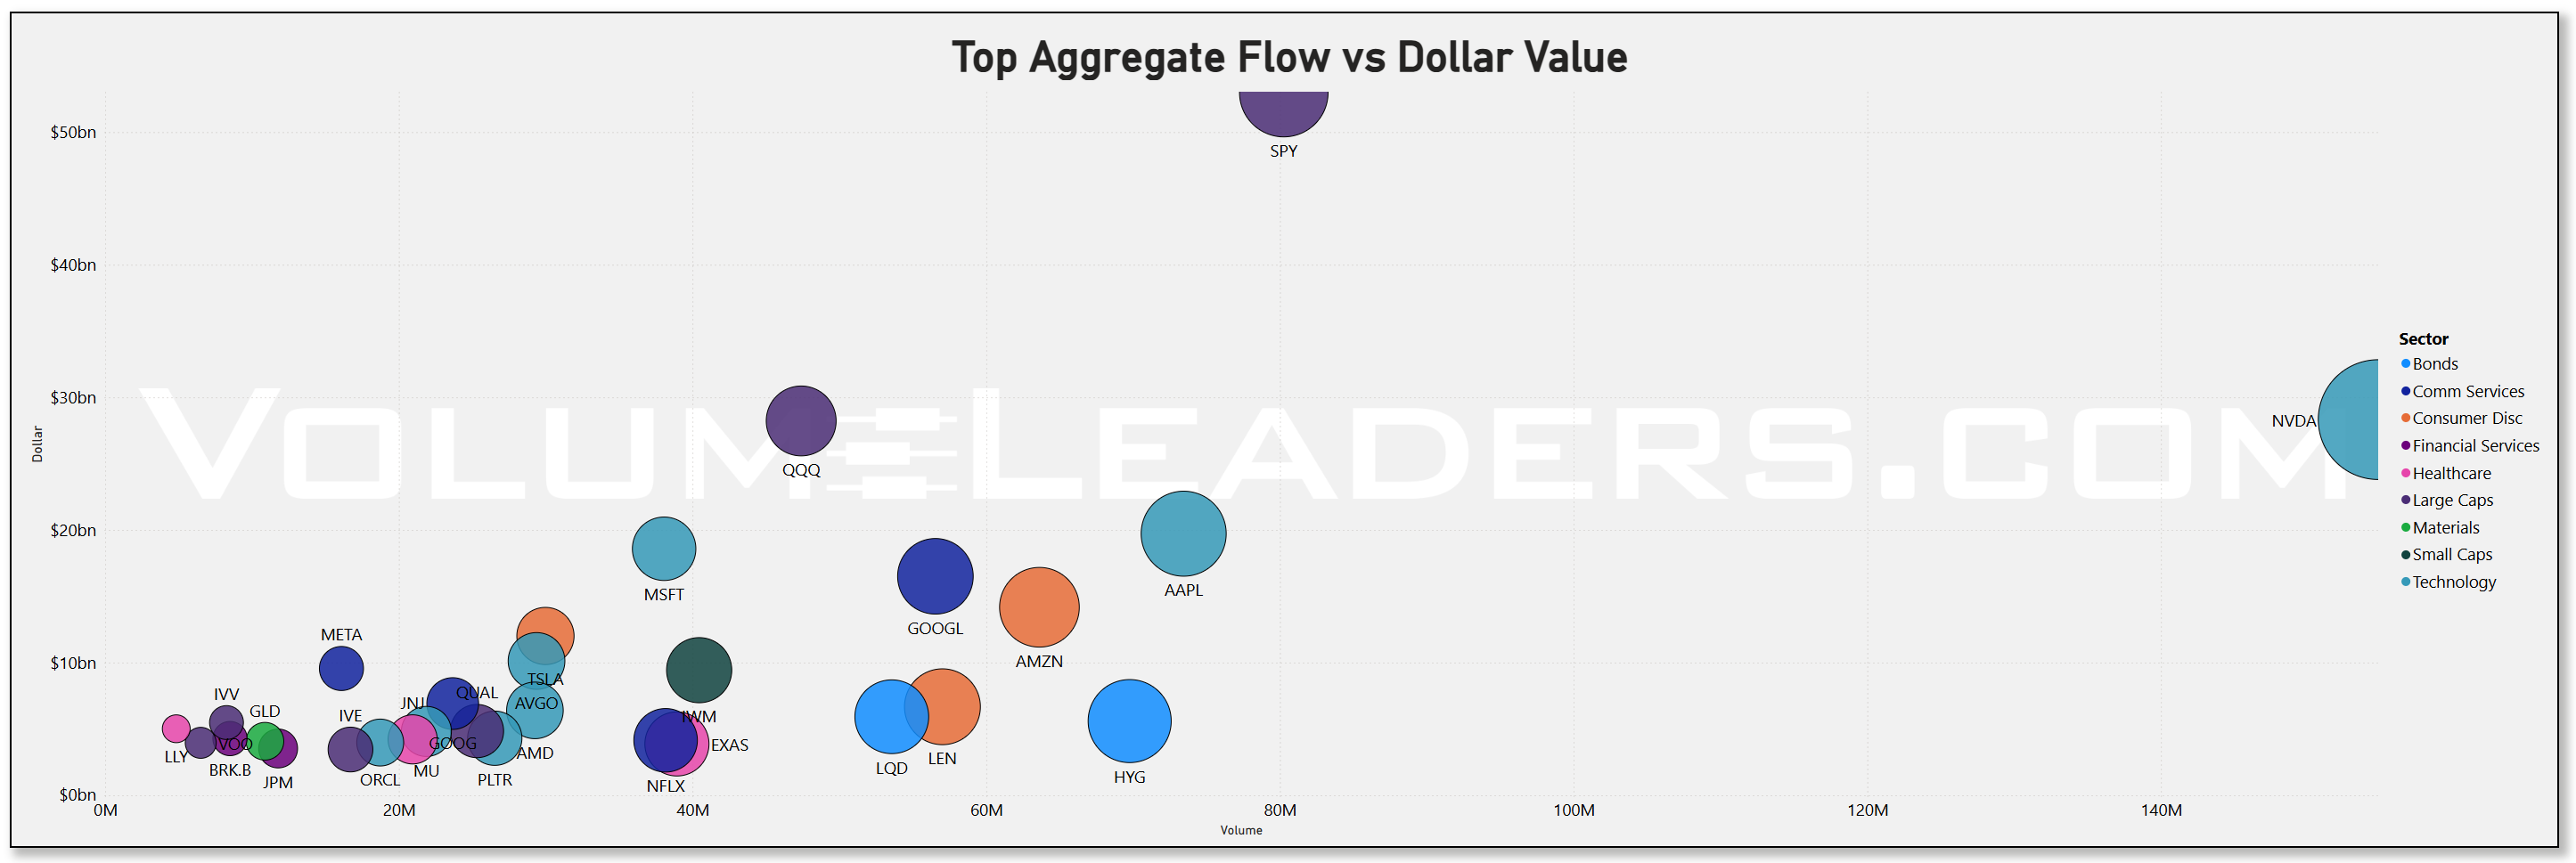
The bar and scatter plots reinforced that interpretation. When volume lined up with dollar value, SPY again sat in a league of its own, with well over one hundred million shares exchanging hands alongside its fifty-plus billion notional. NVDA, by contrast, achieved its nearly thirty billion tally despite materially lower volume, indicating higher average ticket size and cleaner prints. AAPL, MSFT, and AMZN formed a tightly packed cluster in the mid volume and mid-teens to high-teens dollar range. Small caps like IWM registered around nine billion dollars, a modest amount given the index volatility this week, hinting that institutions were not yet ready to embrace a durable risk-on rotation. Qualitative names such as QUAL and VOO appeared in the three to five billion range, another signal of broad ETF hedging and re-risking rather than micro-level stock picking.
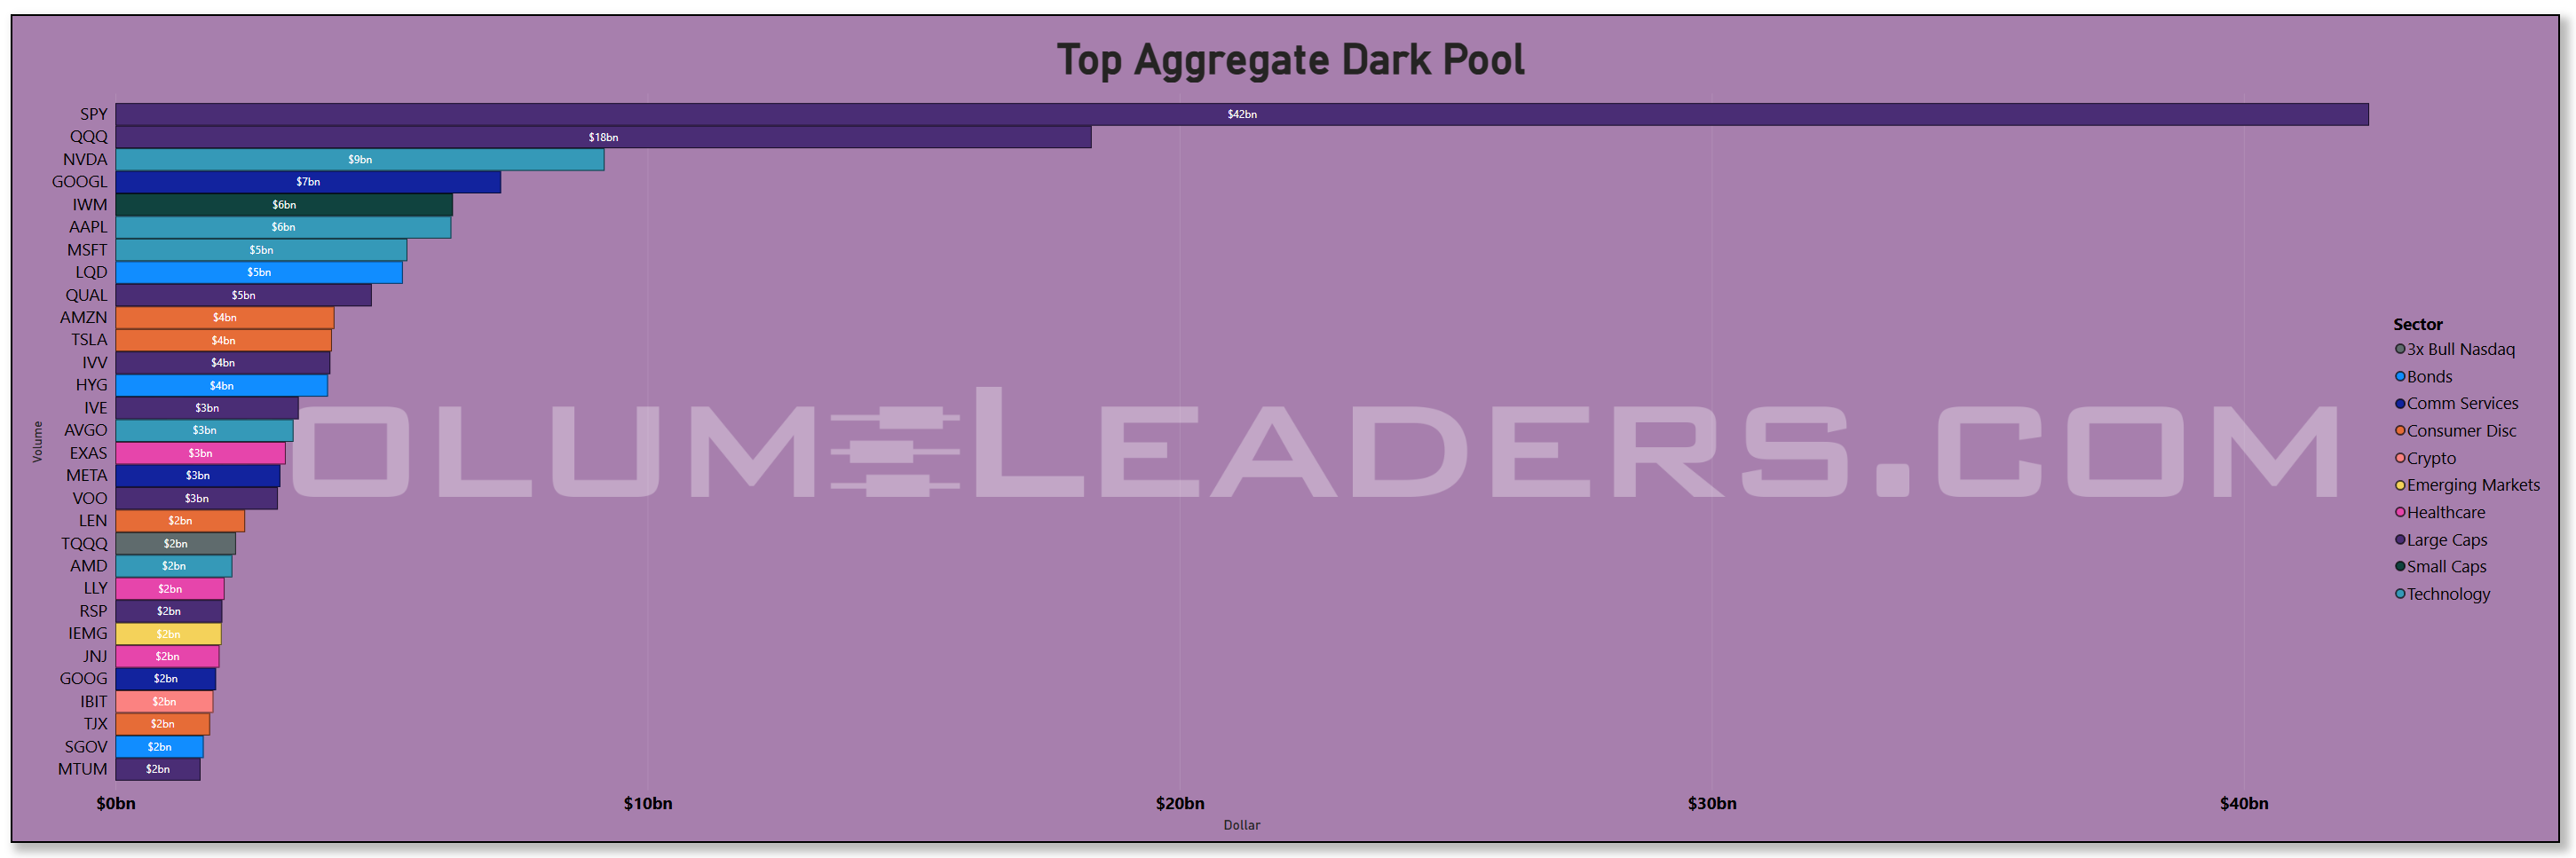
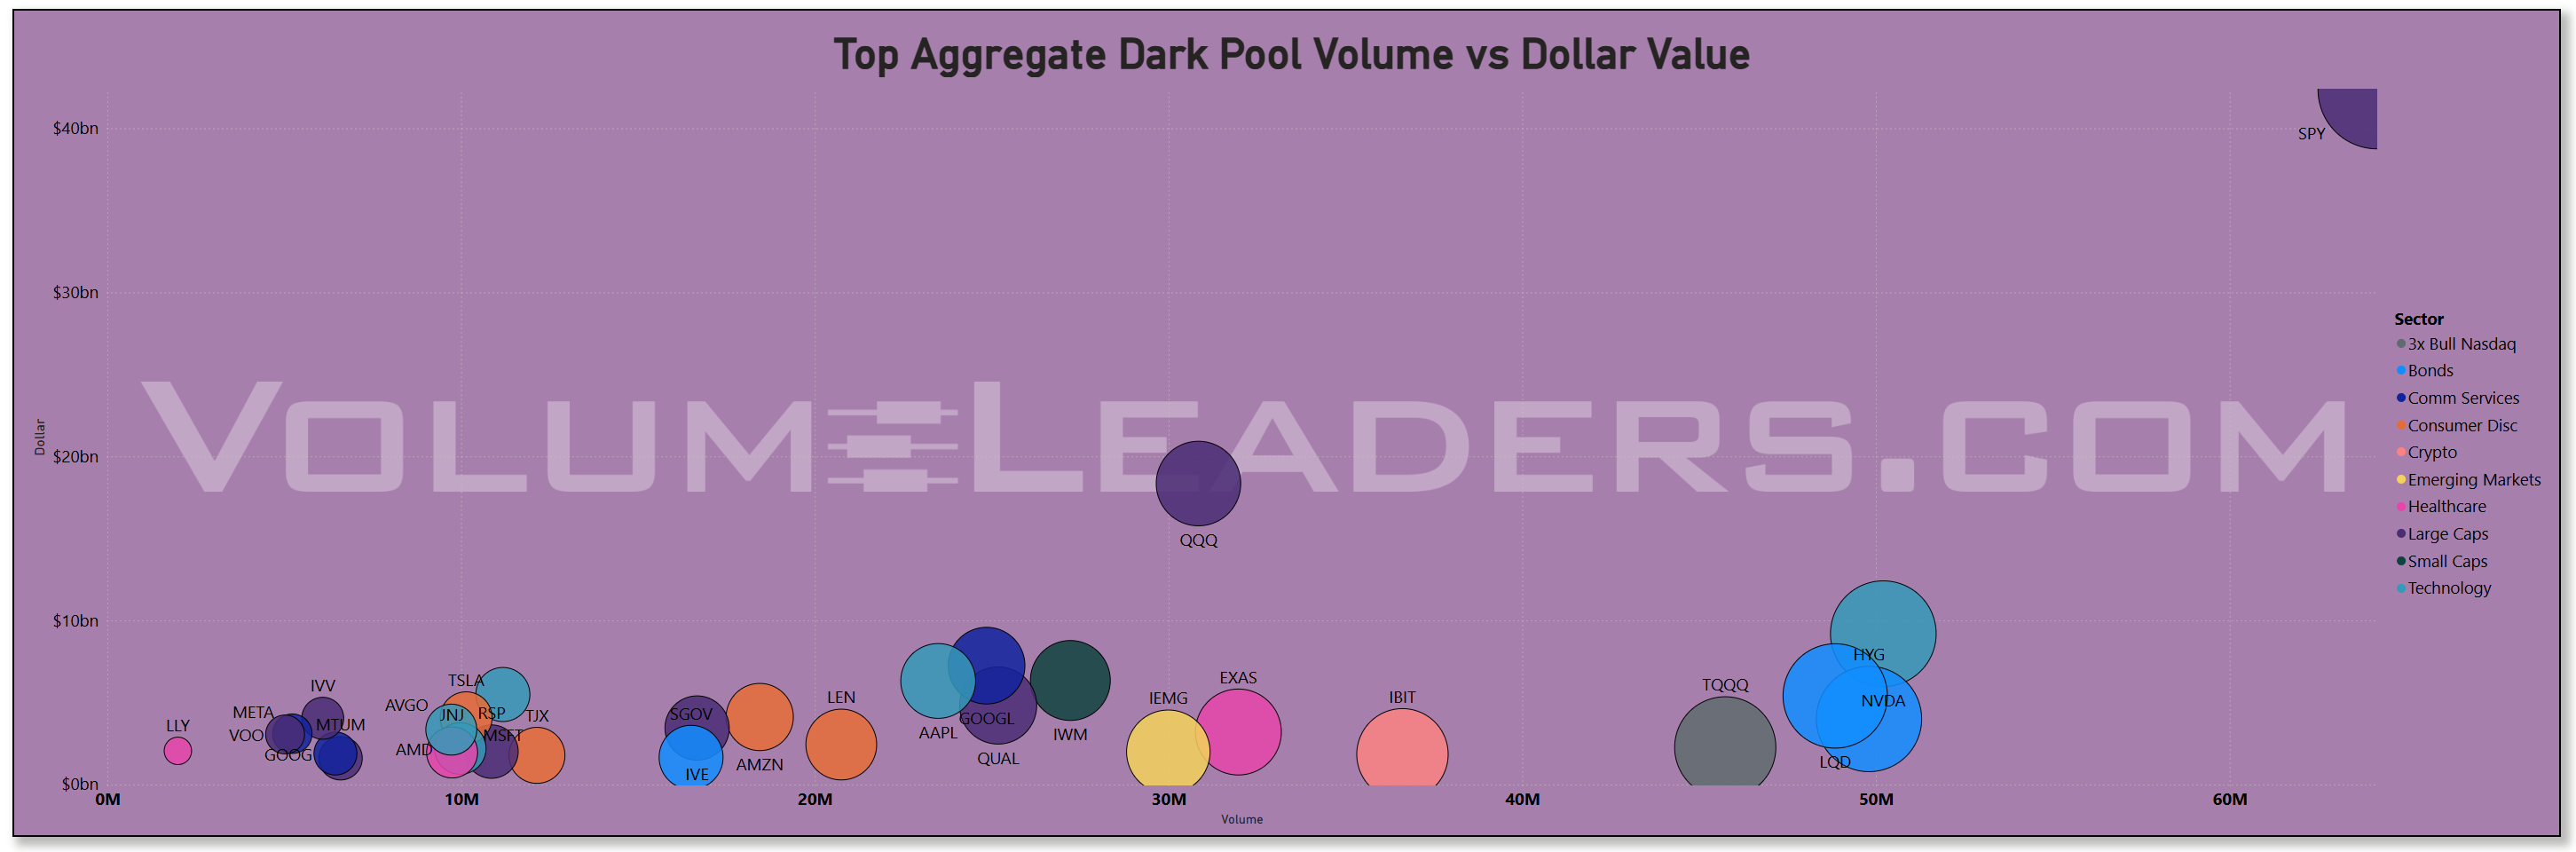
In the dark-pool lens, SPY again dominated with more than forty billion routed off-exchange, a staggering proportion that speaks to the extent of non-displayed liquidity required to process institutional sizing. QQQ followed at eighteen billion, then NVDA and GOOGL at nine to seven billion. What stood out was the density of Technology in the three to six billion band: AAPL, MSFT, AVGO, AMD, EXAS, and LLY all posted consistent off-exchange activity. When dark-pool prints increase even as daily lit volume stays in its normal range, the implication is usually inventory transfer rather than stealth accumulation. The complexion of the print sizes and the lack of forced follow-through suggest this was portfolio-level repositioning rather than directional loading. Bond proxies such as LQD and HYG also printed four to six billion in dark flow, often a precursor to cross-asset hedging around rate expectations.
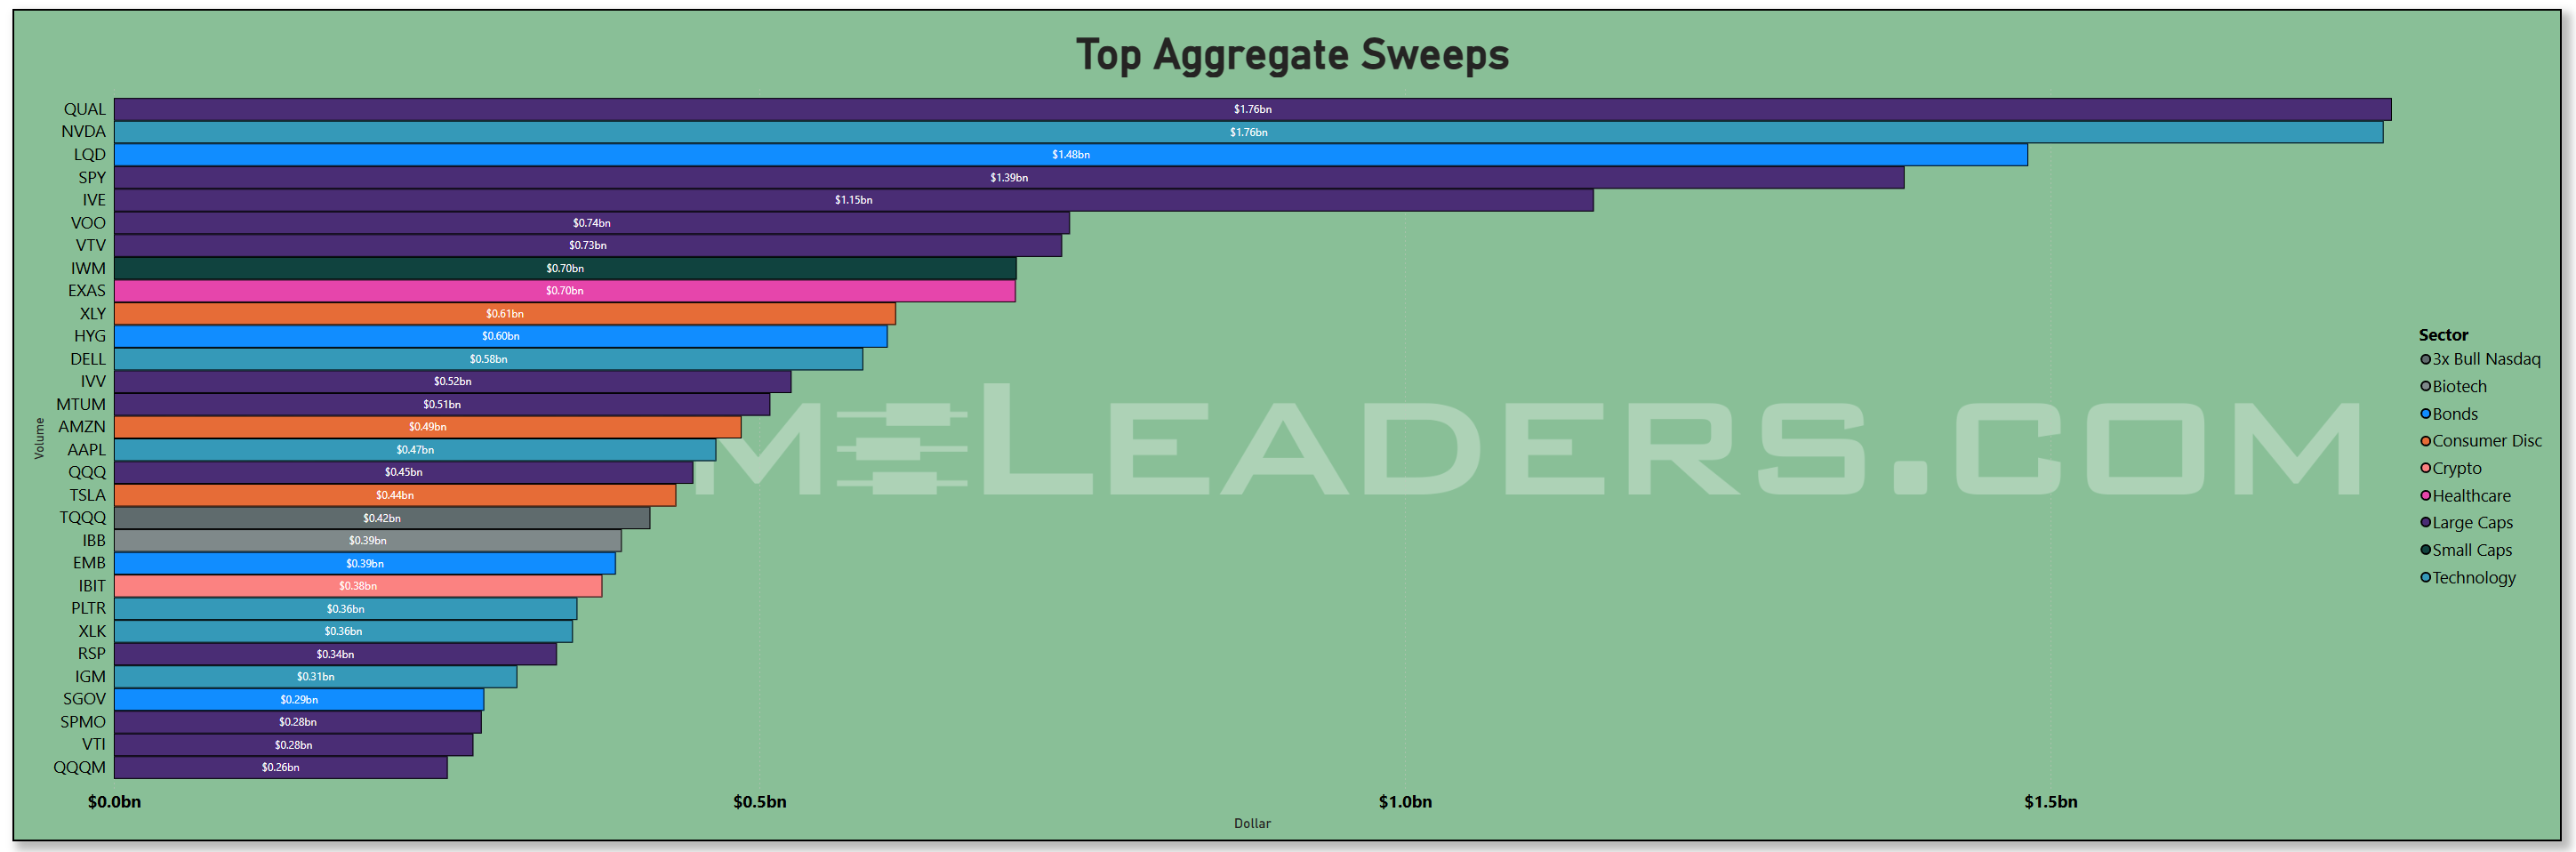
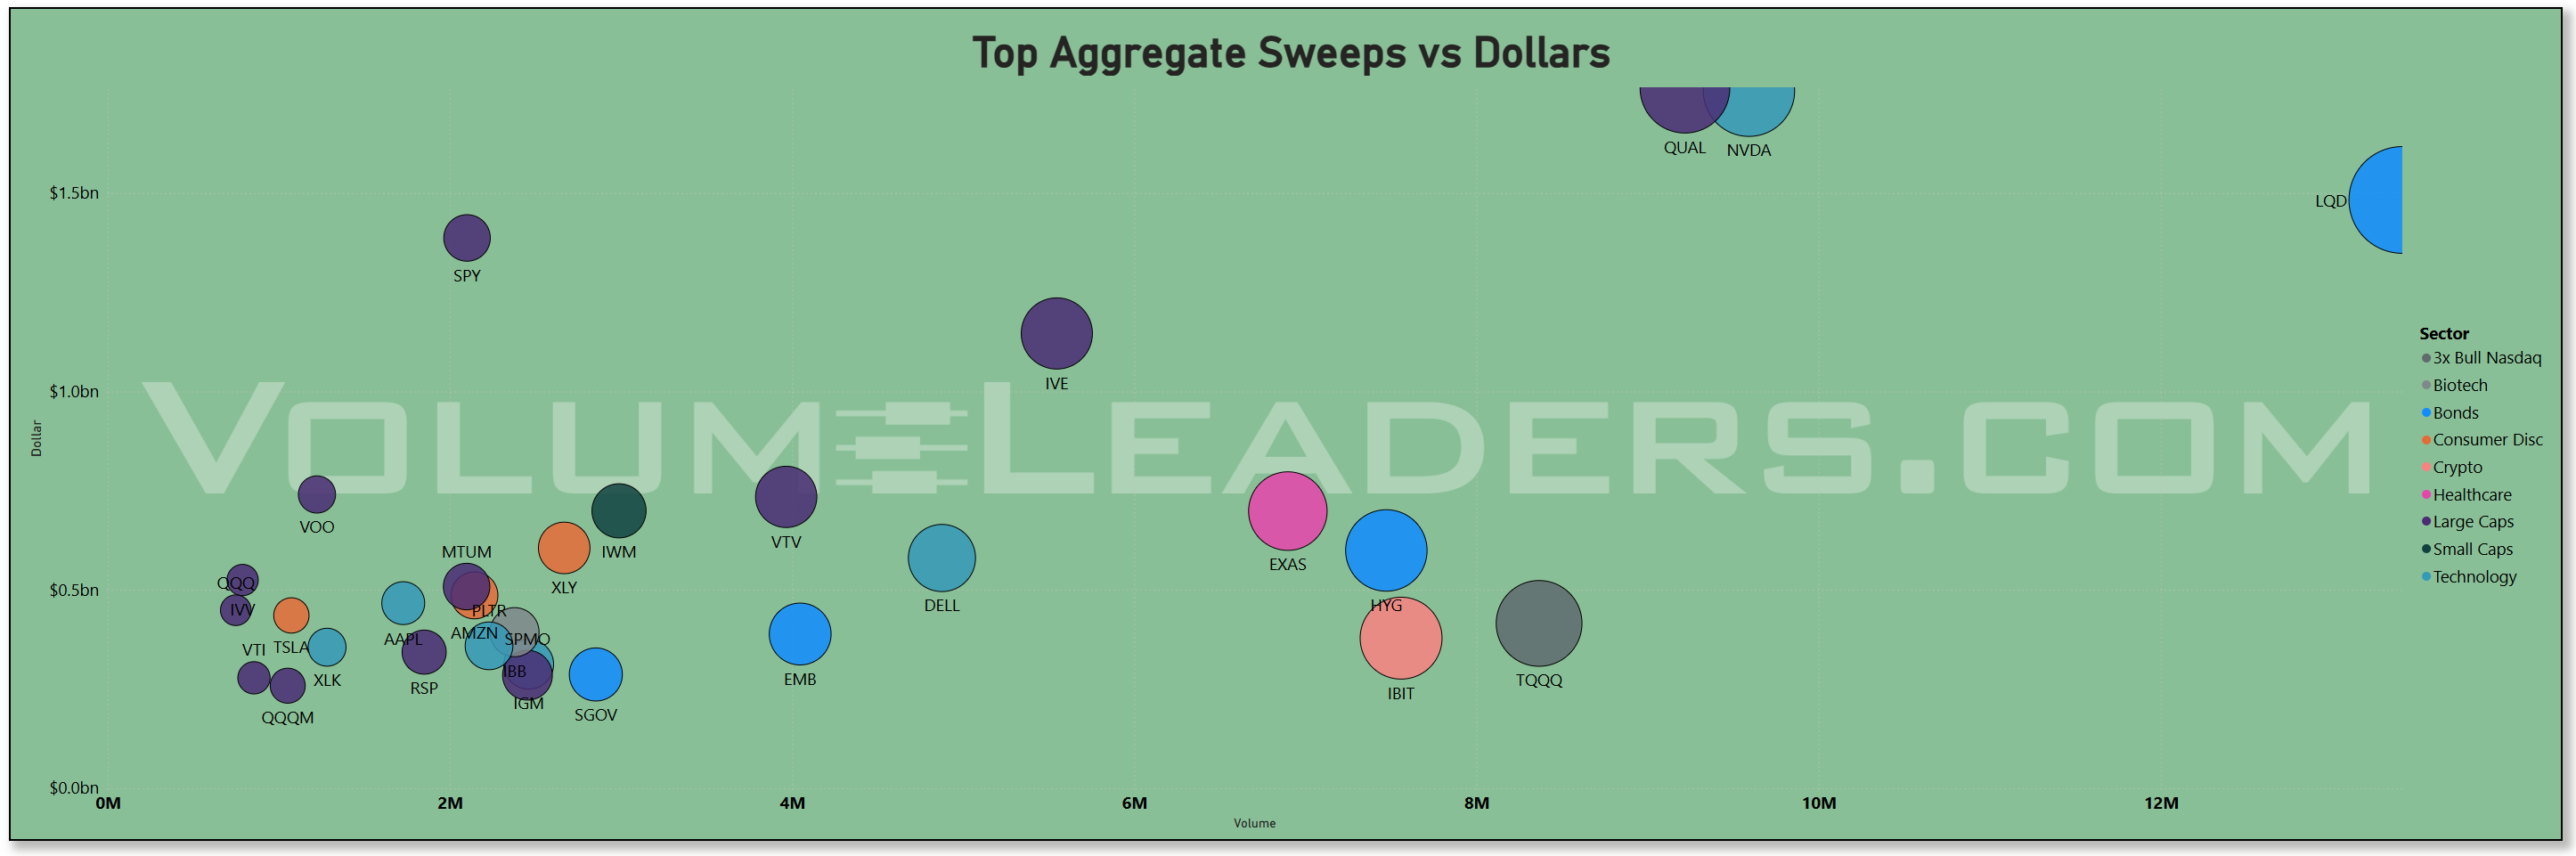
Sweeps told a different, more tactical story. QUAL, NVDA, and LQD sat at the top near one to two billion in swept notional, followed closely by SPY in the high one billions. IVE, VOO, VTV, and IWM filled out the next tier between seven hundred million and one billion. When the fastest money in the market pushes size sweeps into both factor ETFs and technology workhorses, the typical interpretation is that participants are chasing short-term trends rather than building long-duration positions. In fact, the dug-in posture within LQD, HYG, and EMB suggests that rates expectations were being actively expressed intraday. Single-name sweeps in AMZN, AAPL, PLTR, TSLA, and DELL clustered in the four to five hundred million range, showing that momentum players were active but not reckless.
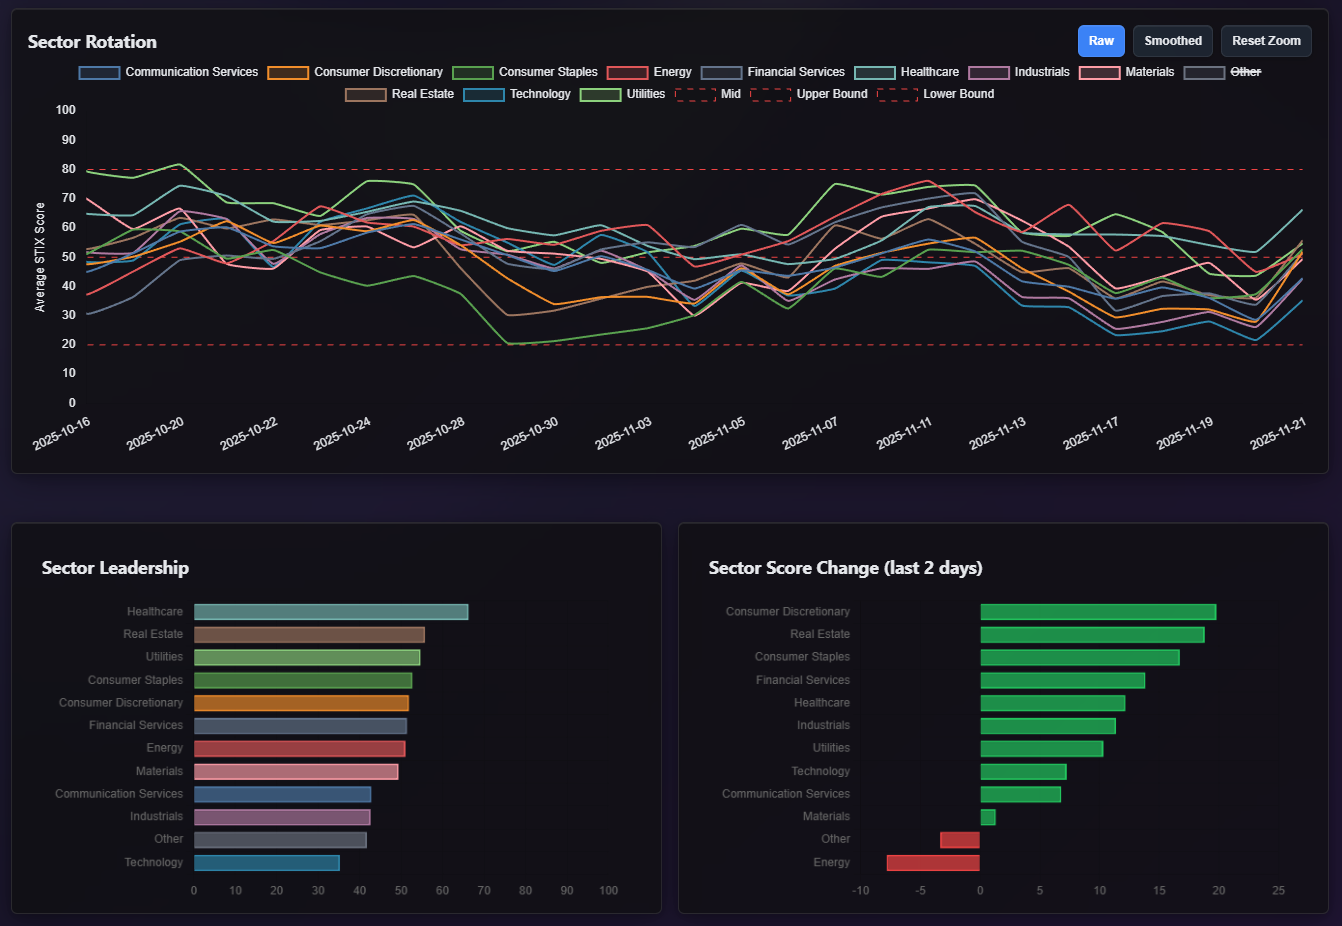
The sector rotation dashboard completed the picture. Healthcare led the field with the highest average score, followed closely by Real Estate and Utilities. Consumer Staples, Consumer Discretionary, and Financials also sat in the upper half, while Technology ranked near the bottom despite heavy dollar flows, a sign that the money entering the space was allocation-driven rather than momentum-driven. The two-day change readings showed Consumer Discretionary, Real Estate, and Staples accelerating sharply, while Energy lagged meaningfully with a negative score shift. Materials barely held flat. Communication Services slipped, and Technology posted only a modest gain. This short-term rotation fits well with the flow picture: large allocators poured money into megacaps for structural reasons, while tactical traders favored discretionary, staples, and real estate during the week’s intraday ranges. The lack of enthusiasm for Energy matched the softening flow trend earlier.
The Market Regime Compass paints an interesting picture of the market in broad strokes right now, on the back of Friday’s lift. Recall, the compass shows the institutional sponsorship as quadrants with each dot representing consecutive dates:
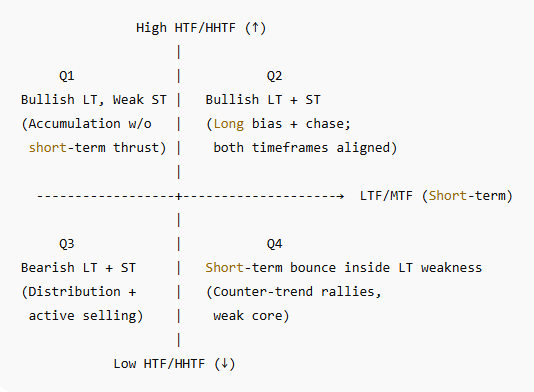
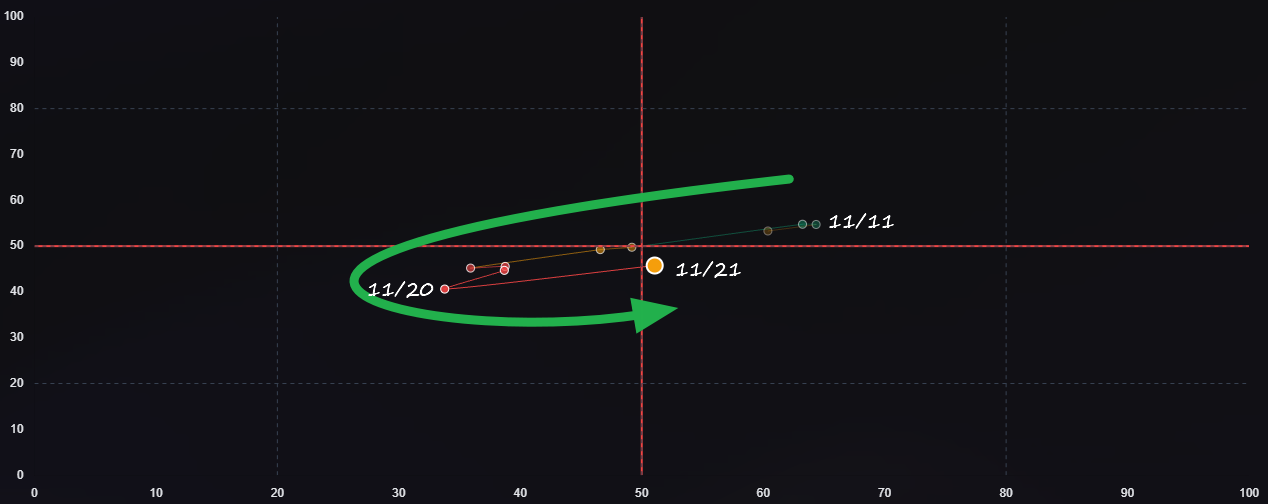
The compass is signaling a market that wants to rotate higher but hasn’t earned the benefit of the doubt yet. Short-term strength is improving across several pockets, and you can see institutions quietly leaning into a handful of names that sit up and to the right — the early-cycle leaders that tend to carry the first leg of any recovery. But the higher-timeframe posture has not followed through, which keeps this from becoming a broad, self-reinforcing advance. What we’re seeing instead is a probing phase: allocation desks deploying small, selective tranches to test supply while leaving the longer-duration playbook unchanged. Leaders continue to lead, laggards continue to lag, and the index can drift higher only if this strength broadens beyond the small cluster currently carrying the tape. It is a mildly constructive backdrop, but not a committed one — a market where being selective still matters more than being bold. We’ll be monitoring the compass day-to-day and watching to see if buyers can prove their commitment to a year-end rally and drive compass-points back into the upper-right quadrant.
In the coming sessions, watch whether SPY, IVV, and VOO continue to absorb size at the same run rate, whether dark-pool activity in NVDA, AAPL, MSFT, and GOOGL and other tech giants remains elevated, and whether credit sleeves like LQD and HYG hold their bid as expectations for a Q1 easing path firm. If those patterns persist, the market’s current posture of structural accumulation with tactical rotation should continue into month-end.
The bottom line: this was another week defined by heavy beta flows, deep mega-cap liquidity, and tactical rotation beneath the surface, with institutions positioning early for the year-end run while keeping macro optionality open.
MIR Part 2: Individual Names From The Institutional Tape
VolumeLeaders tracks several proprietary signals designed to spotlight names drawing significant institutional interest. Below, we’ve surfaced the latest results and analyzed them to highlight emergent themes. If any of the sectors, narratives, or positioning trends resonate, the names mentioned here offer a strong starting point for deeper research and watchlist consideration.
VL Trade Rank Velocity™ (TRV)
TRV is a proprietary metric that measures the recent acceleration or deceleration in institutional trading activity for a given stock by comparing its average trade rank over the past few days to its average in recent weeks. A sharp improvement in TRV typically reflects a notable shift in positioning, often accompanied by sustained trade activity, suggesting institutions are actively engaging with the name and that intensity of activity is rising. This often precludes meaningful price or narrative shifts. This isn’t a buy-list or sell-list; it’s meant to draw your eyes to names where institutions are putting money to work.
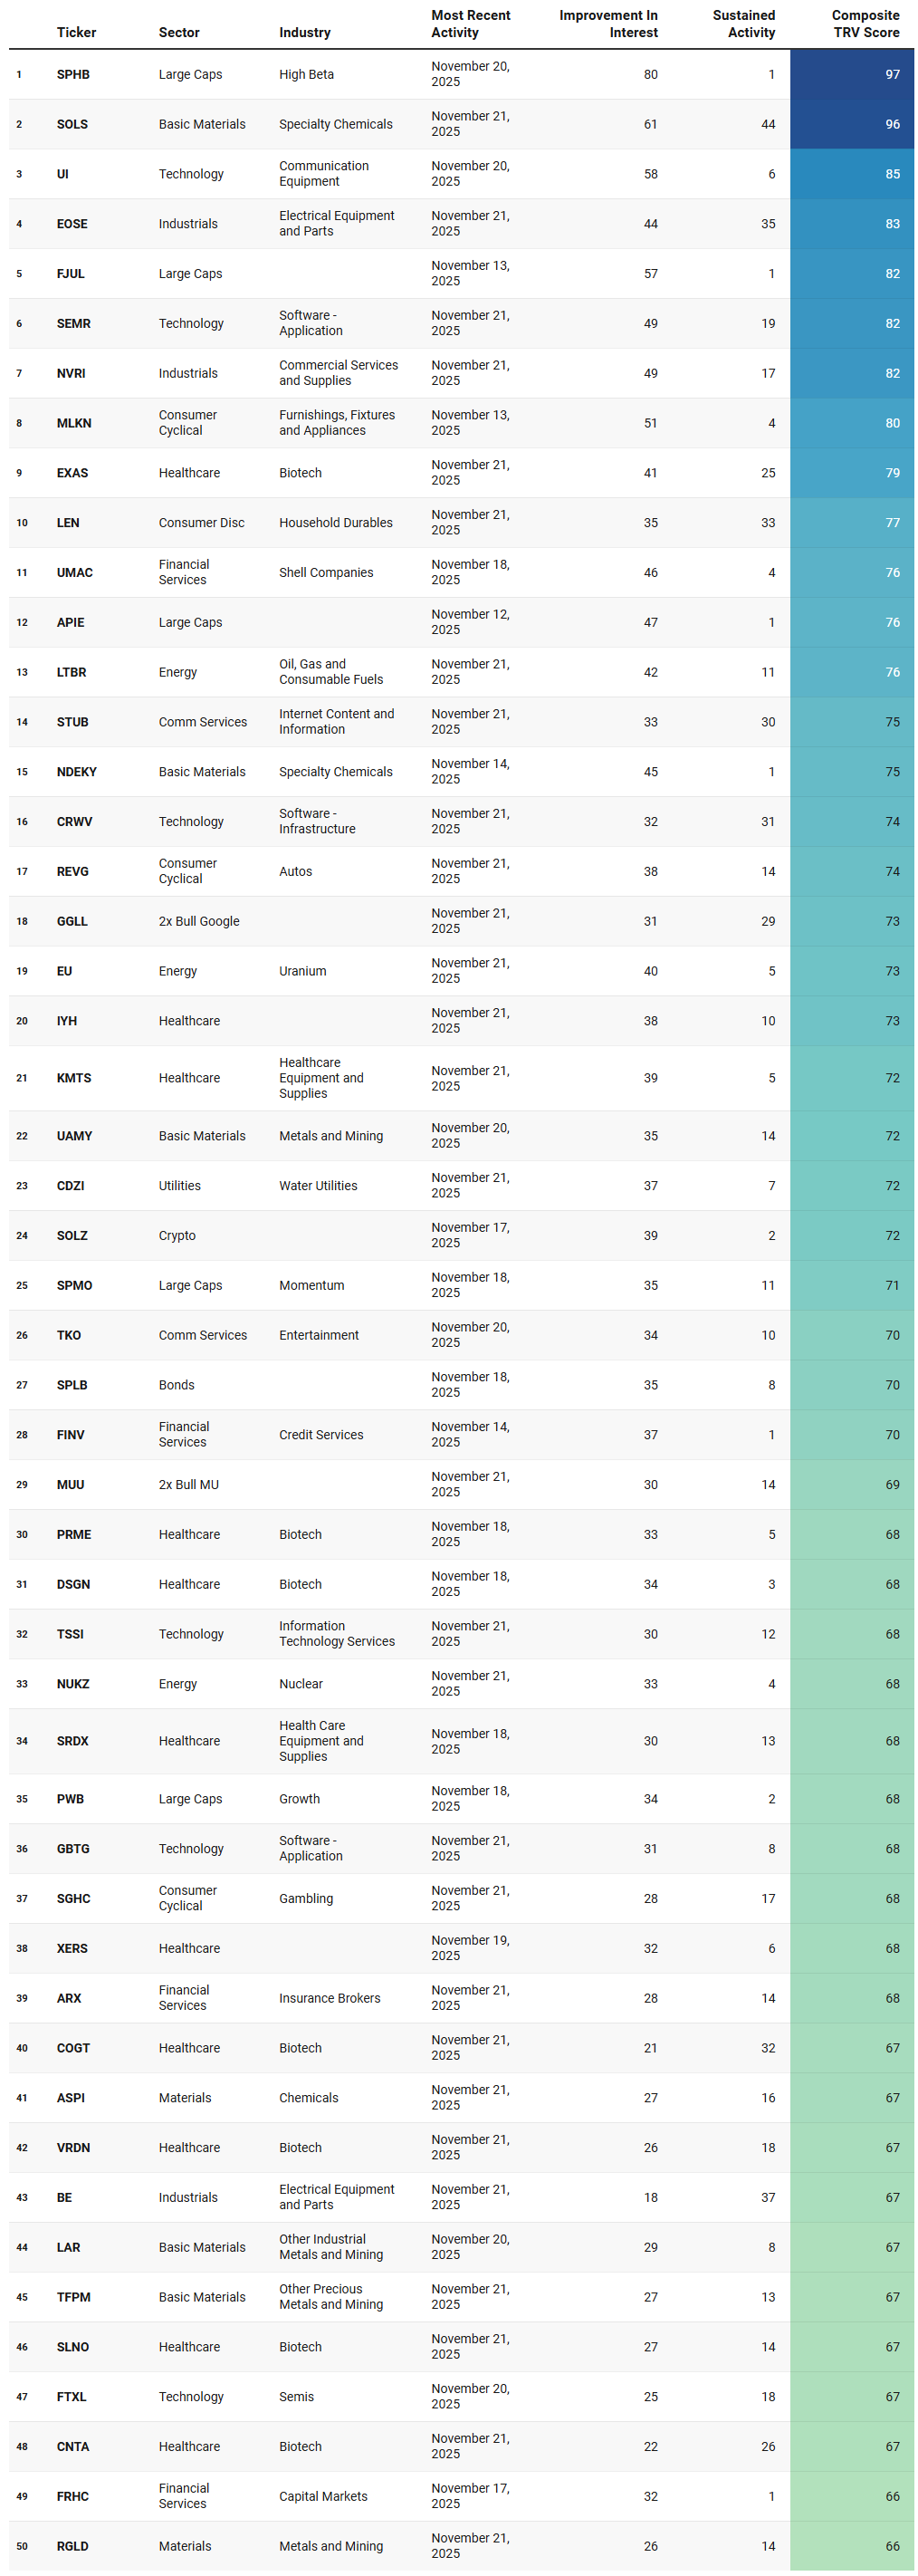
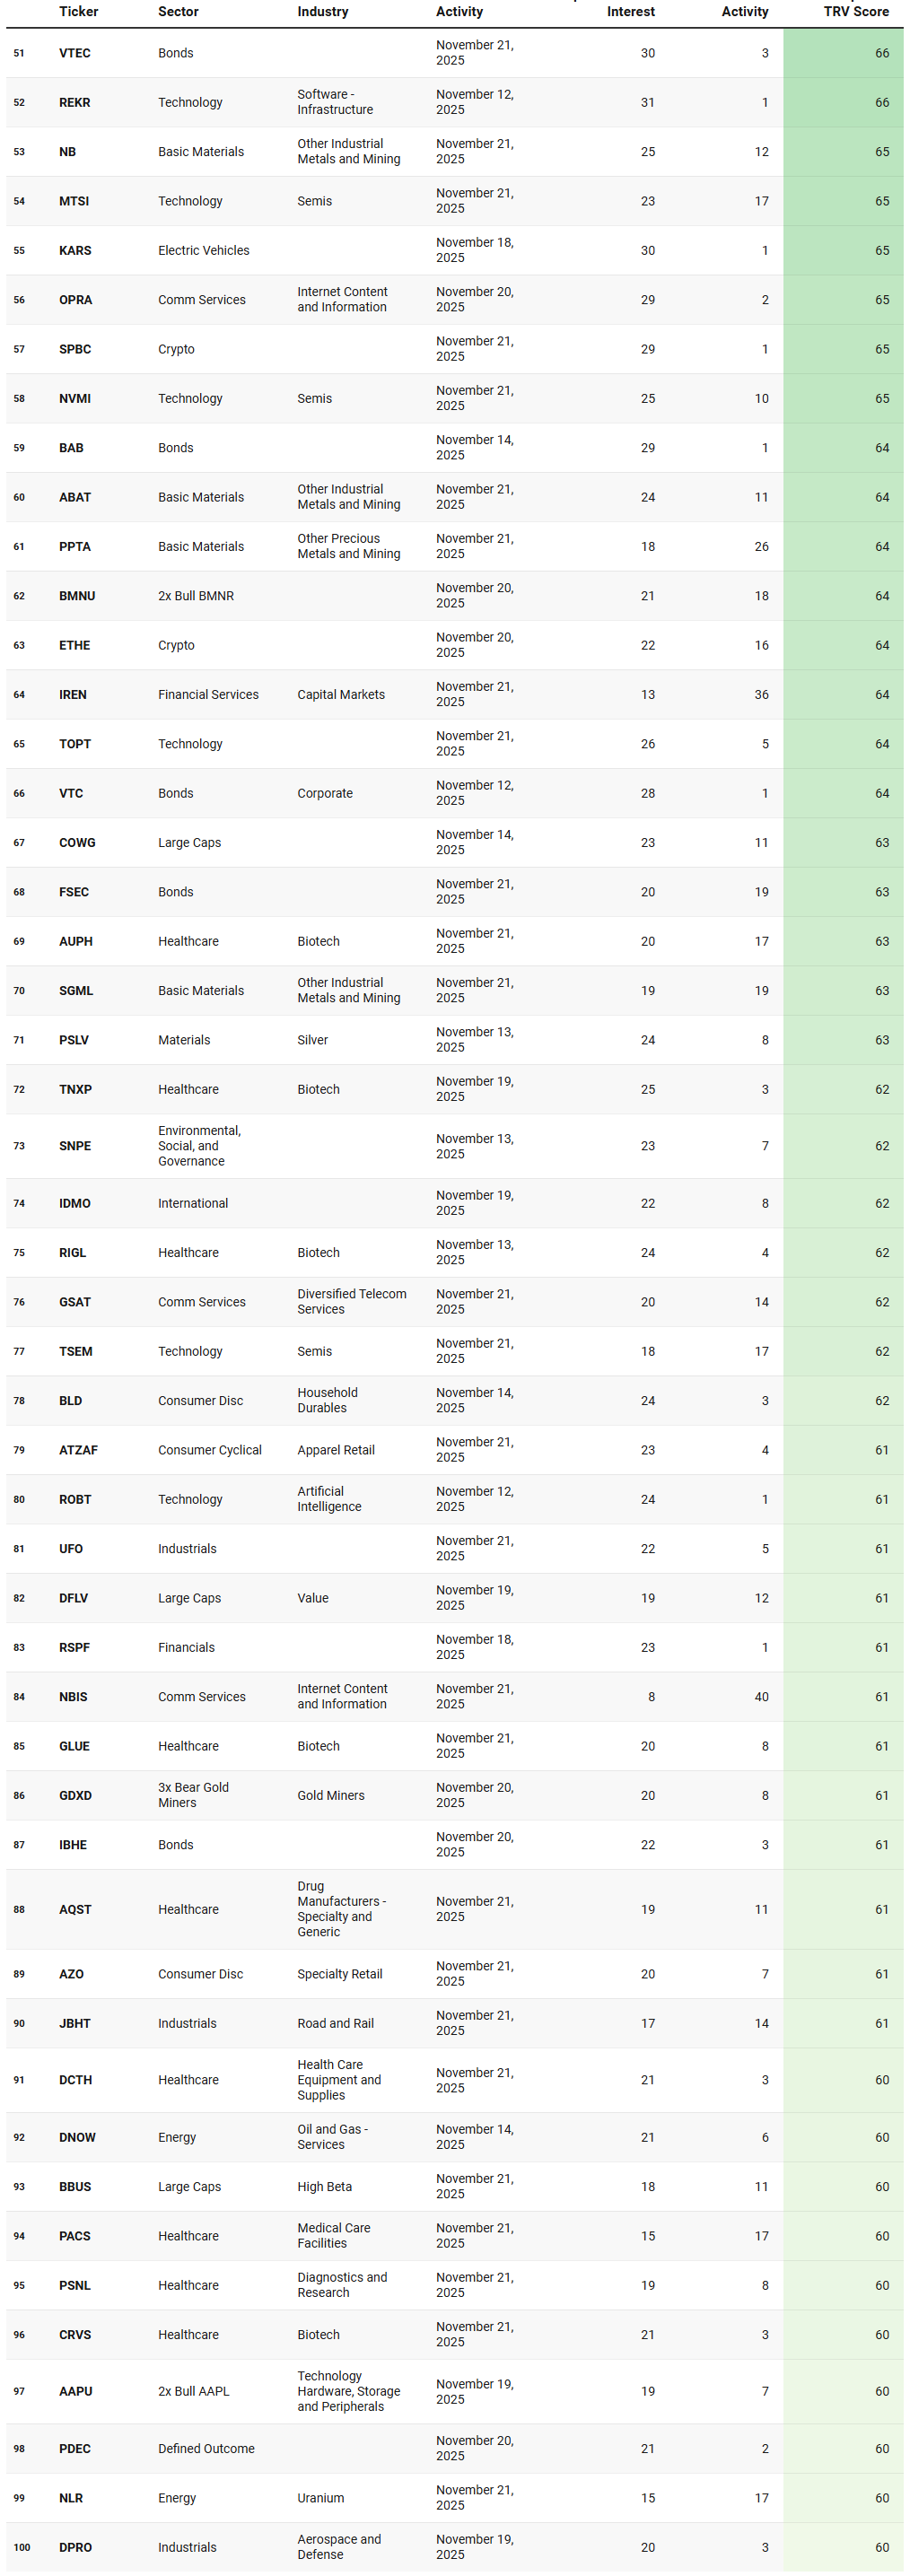
What jumps out immediately from this week’s TRV sheet is how clearly it echoes the same story the institutional flows have been whispering: the market is transitioning, but it is not all-in. You can see that in the way high-beta large-cap factor products like SPHB and BBUS sit near the top of the list with extremely high composite scores. That aligns directly with the flows we saw into SPY, QQQ, NVDA, and the broad momentum complex — allocation-driven buying that favors the parts of the market that behave like leveraged beta without actually requiring a directional commitment from stock pickers. When high-beta factors lead the TRV rankings, institutions are not hiding their hand; they are expressing a desire for upside participation without the need to discriminate heavily across sectors. This is classic “year-end risk appetite, but keep the playbook simple” behavior.
The second major theme is the breadth and persistence of specialty chemicals, industrial metals, and uranium names. SOLS, NDEKY, ASPI, UAMY, LAR, NB, SGML, TFPM, RGLD, PPTA, LTBR, EU, NUKZ, and NLR all cluster tightly across basic materials and alternative energy. That is not random. It fits the same undertone that showed up in the sector rotation dashboard: materials were not leading on the week, but the underlying positioning patterns were firm, especially in places tied to long-cycle themes like electrification supply chains, battery metals, specialty chemicals, and nuclear. Uranium’s presence in particular — EU, LTBR, NUKZ, NLR — strengthens the case that this is structural positioning rather than speculative heat and is a great area to watch. When these names show high improvement scores and sustained activity, institutions could be planting seeds for next year’s secular plays, not chasing quarter-end winners.
The third theme is the outperformance of application and infrastructure software across multiple market-cap tiers. SEMR, CRWV, GBTG, REKR, TSSI, TOPT, ROBT, and AAPU-related leveraged pairs form a clear cluster. This dovetails with what we saw in the dark pools and sweep data earlier in the week: enterprise technology flows were steady, broad, and often hidden. These are not the AI megacaps leading the indices — these are the second-tier enablers that institutions adjust positioning in before the public narrative shifts. The fact that both semis and middle-layer software sit together in the TRV ranking suggests the classic signature of early-cycle tech rotation. Not a chase, but a foundation and this might be a clue that we’re closer to early innings in the AI narrative than later ones.
Another theme is the biotech resurgence, and it is not subtle. EXAS, PRME, DSGN, COGT, VRDN, CNTA, SLNO, XERS, GLUE, TNXP, RIGL, CRVS, and a long tail of mid-quality names represent one of the densest clusters on the entire sheet. That maps directly to the rotation board, where Healthcare quietly led the entire market. The compass view told the same story: healthcare sits firmly in the upper-right cluster — the quadrant that marks multi-timeframe alignment. TRV confirms that institutional demand is not limited to large-cap managed care or medtech. They are positioning across the risk spectrum, suggesting a broader healthcare regime that is still in its early stage.
A quieter but equally important theme is consumer durability and discretionary cyclicals showing up with consistent sustained activity: MLKN, LEN, REVG, BLD, AZO, ATZAF. This syncs with the improvement readings in the sector map and could theoretically support the idea that discretionary is moving out of a bottoming process and into an early-cycle rebuild. It does not have the thrust of tech or healthcare, but the persistence scores imply that accumulation is steady.
Finally, the presence of bond products and income proxies — SPLB, VTEC, VTC, FSEC, BAB, IBHE — confirms the other half of the institutional flow picture: money is not leaving fixed income even as beta gains traction. That barbell posture showed up cleanly in the sweep data earlier in the week. TRV reinforces it. When both beta-heavy equities and corporate bond ETFs rank highly, institutions are not signaling directional certainty; they are signaling portfolio construction — lift the right tail, protect the left.
Taken as a whole, this TRV list matches the broader flow narrative almost too cleanly: this is not a risk-off market, nor a speculative melt-up. It is a probing, selective, tactical tape where leadership is emerging but not yet broad enough to call a full regime shift. High beta, specialty materials, mid-tier software, biotech breadth, and bond ballast — this is exactly what the compass, the rotations, and the institutional liquidity patterns already told us.
VL Institutional Outliers™ (IO)
Institutional Outliers is a proprietary metric designed to spotlight trades that significantly exceed a stock’s recent institutional activity—specifically in terms of dollar volume. By comparing current trade size against each security's recent normalized history, the metric flags outlier events that may indicate sudden institutional interest but may be missed because the activity doesn’t raise any flags/alerts when comparing the activity against the ticker’s entire history. For example, it’s conceivable that a ticker today receives the largest trade it has had in the last 6 months but the trade is unranked and would therefore be missed by current alerts built off Trade Ranks. Use “Realized Vol” to identify tickers with large price displacement and to size your risk appropriately.
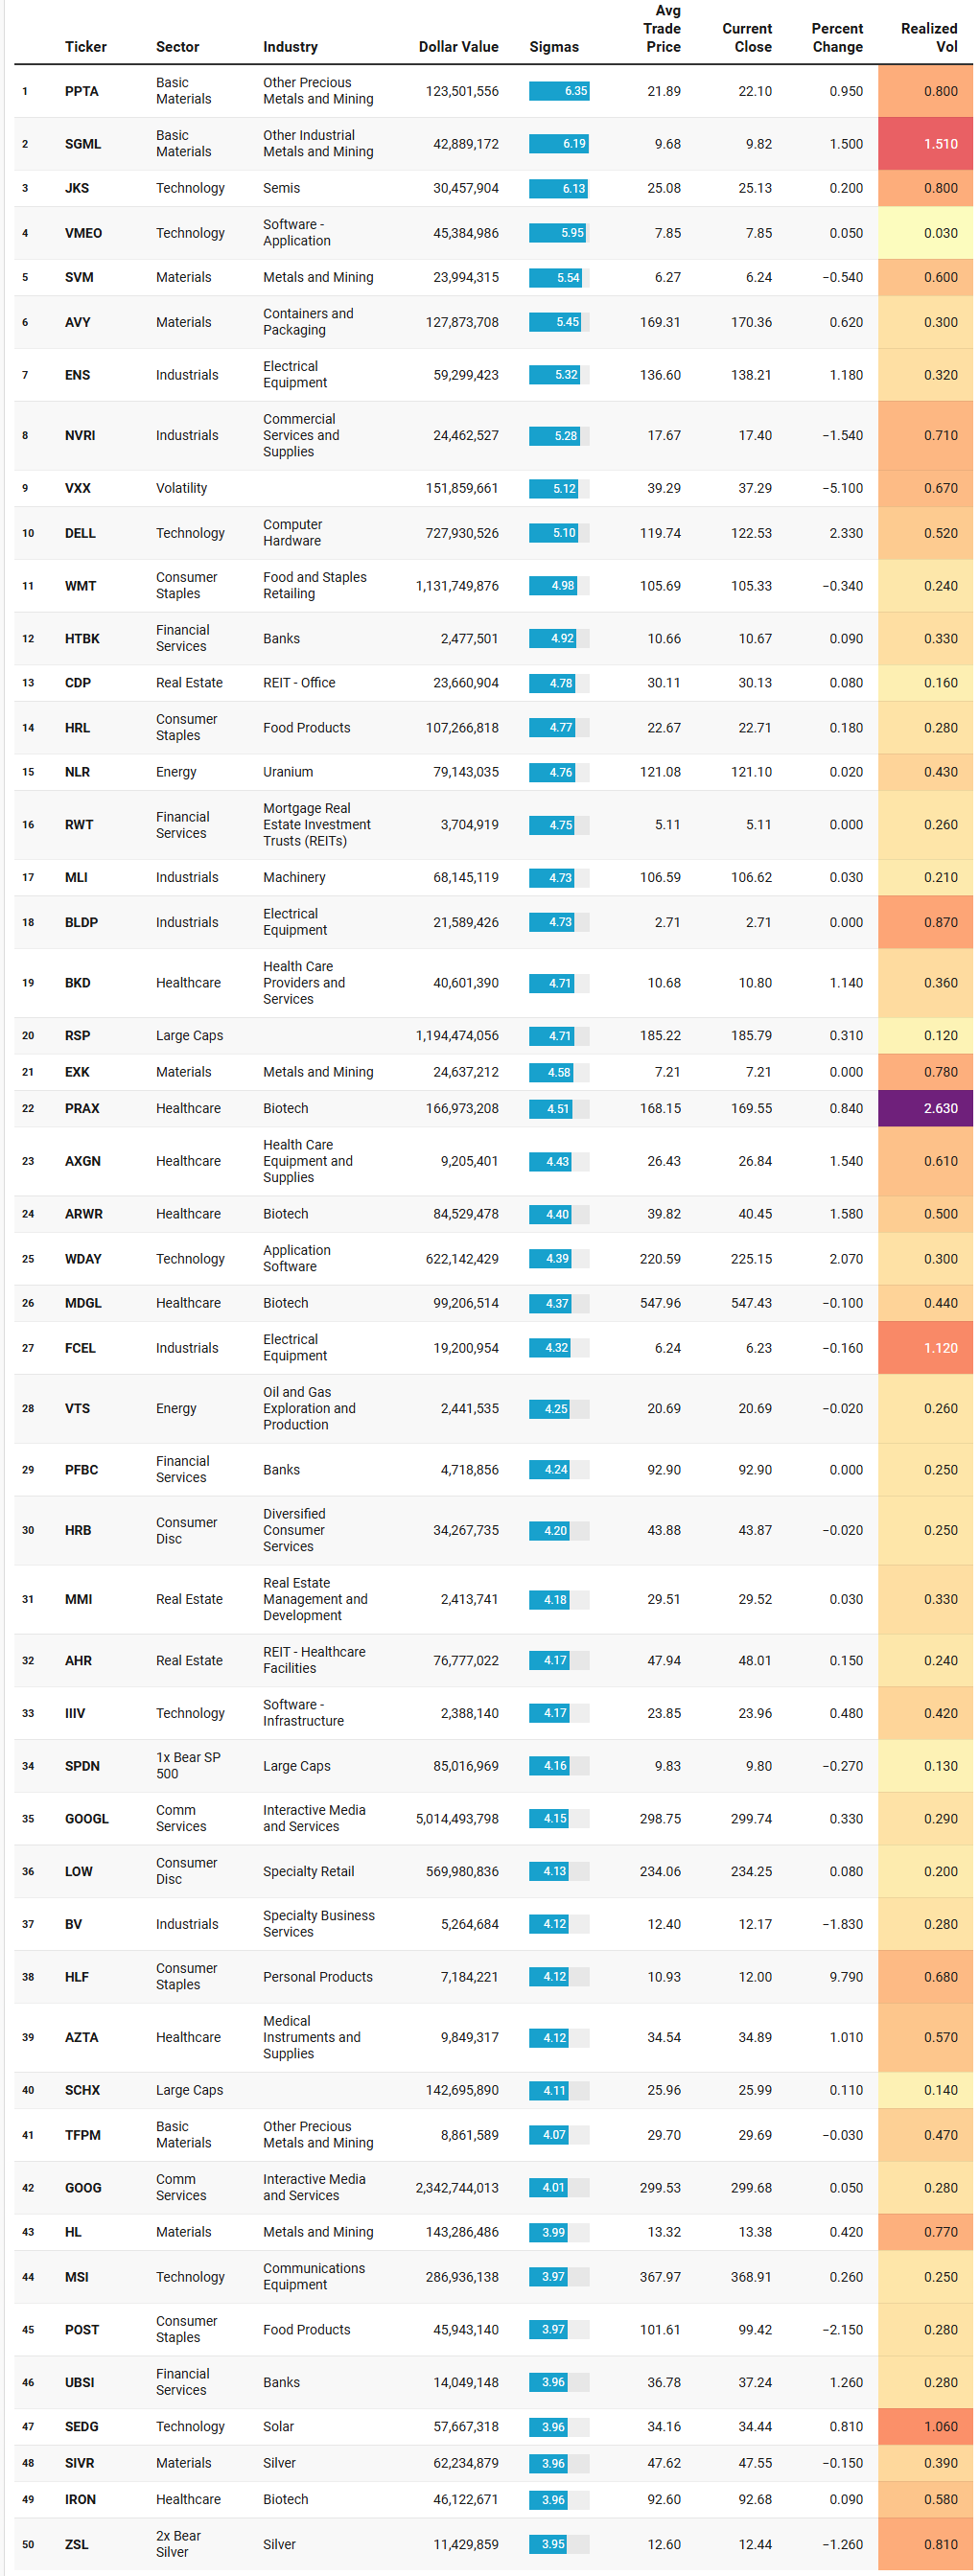
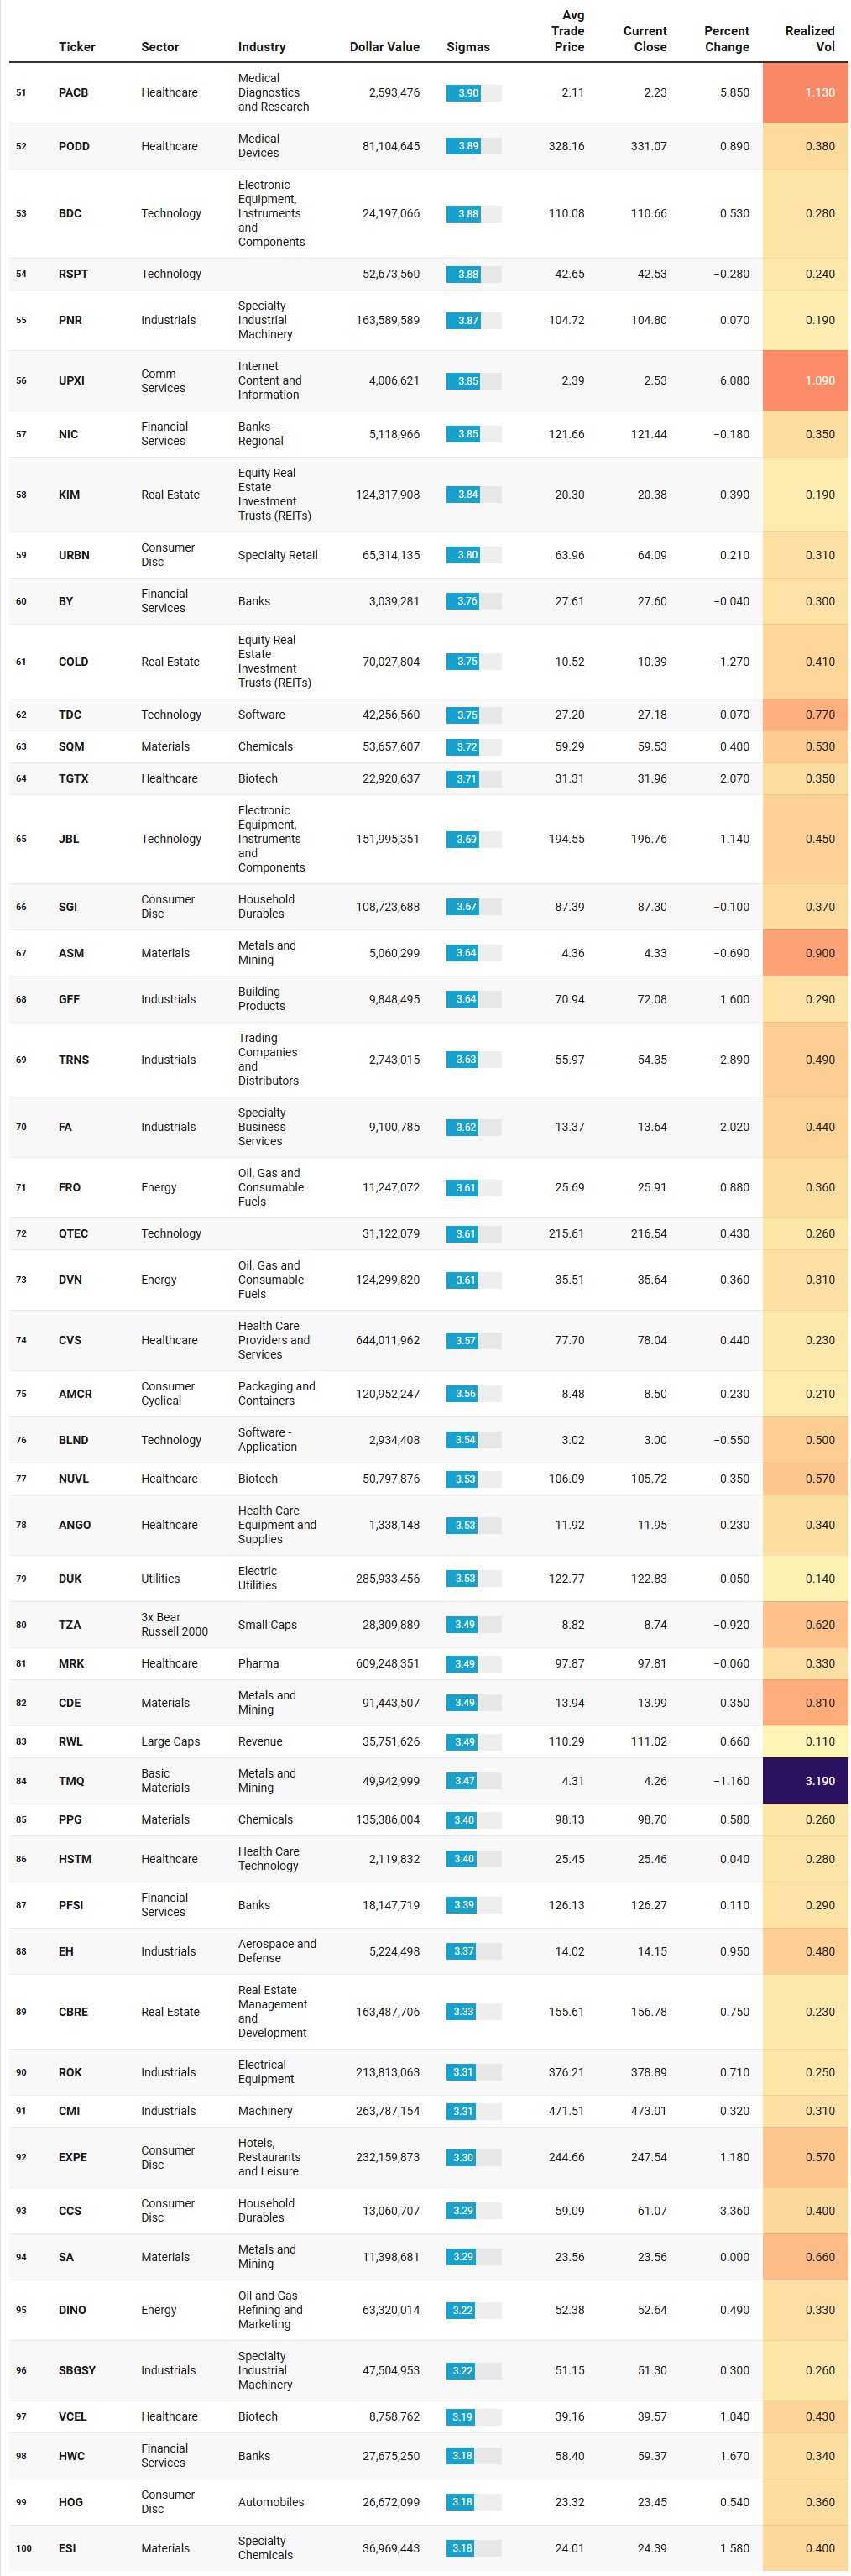
The IO sheet basically confirms that the big money is still moving the furniture, not flipping the table. The outliers this week are huge in dollar terms and extreme in sigmas, but most of them come with tiny percent moves and low realized vol. That combination is classic for structural positioning: large blocks, portfolio-level adjustments, and inventory transfers that barely disturb the tape. It fits perfectly with the broader story we have already seen: institutions are in an active reallocation phase, leaning into their preferred regimes while quietly re-wiring exposures beneath the surface.
Materials and metals sit right at the center of that story. PPTA, SGML, SVM, EXK, HL, CDE, ASM, TMQ, SA, TFPM, PPG, and ESI all show up as multi-sigma outliers. Dollar values range from tens of millions to well over a hundred million, yet realized vol is mostly sub-1.0 and the price changes are modest. Layer on SIVR and ZSL as simultaneous outliers in the silver complex and you can see a lot of metal changing hands without a blowout in either direction. That is not hot money; that is a deep repositioning in precious metals and industrial metals, which dovetails neatly with the TRV view where specialty chemicals, mining, and uranium were already showing sustained interest. NLR reappearing here with a 4.76 sigma event and nearly eighty million in dollar flow reinforces the nuclear/uranium theme: this is being built as a structural sleeve.
The index and factor complex is just as loud. RSP (equal-weight S&P) prints more than a billion dollars at 4.7 sigma, SCHX and RWL show sizeable, abnormal flows as well, and SPDN and TZA appear on the list alongside VXX. RSP and SCHX speak to how institutions are fine-tuning their large-cap exposure: not just piling into cap-weighted leaders but balancing with equal-weight and revenue-weight factors. SPDN and TZA tell you that someone is still expressing downside or hedge views in size, but the fact that their percent changes are small and realized vol muted suggests these trades were absorbed rather than chased or have already played out which may be the case for SPDN. VXX is particularly interesting: more than 150 million in notional at over 5 sigma, but down more than 5 percent on the day. That has the feel of vol exposure being unwound into a softening volatility regime rather than fresh fear being put on at relatively elevated prices.
Healthcare and biotech show up again as a dense cluster of outliers, which is exactly what you would expect given their leadership in the compass and TRV lists. PRAX, ARWR, MDGL, IRON, PACB, TGTX, NUVL, VCEL, CVS, BKD, AXGN, AZTA, PODD, HSTM and others all print multi-sigma days. Some of these are pure biotech, others are devices, diagnostics, or providers, but the pattern is broad, not narrow. This is consistent with a regime where healthcare is transitioning from “defensive ballast” to “offensive leadership” in institutional portfolios. When you see both ETFs like IYH high on the TRV list and single names lighting up as outliers, you know the allocation and the stock-picking desks are in sync.
Real estate and banks are on the sheet as well, but they look like refinement rather than wholesale regime change. CDP, COLD, KIM, AHR, CBRE, and RWT all show outlier prints inside the REIT and property complex, while HTBK, PFBC, UBSI, NIC, BY, HWC, PFSI, and other financials sit on the banking side. Given the macro backdrop of easing rate expectations and ongoing concerns around commercial real estate, it makes sense that institutions would be re-sculpting risk in these pockets. The low realized vol and tiny price changes tell you these are negotiated blocks, not panic trades.
Finally, there is a clear quality-and-cyclical tilt in the large single-name outliers. WMT, HRL, POST, LOW, EXPE, URBN, CCS, HOG, AMCR, JBL, DELL, WDAY, MSI, BDC, ROK, CMI, PNR, DUK, MRK, and CVS all see multi-sigma flows. This is exactly the blend we have been talking about: quality staples, industrials, and selective discretionary where the macro path favors resilient earnings and operating leverage if growth stabilizes. Sprinkle in some idiosyncratic moves like HLF with nearly a 10 percent pop on 4+ sigma flow, and you get the feel of single-name catalysts embedded in a broader quality bid.
Put together, the IO list lines up almost perfectly with the rest of the tape: outsized flows around metals and uranium, equal-weight and broad large-cap factors, healthcare and biotech breadth, refined REIT and regional-bank positioning, and a quality cyclical tilt. It is exactly what you would expect to see in a market that is not fleeing risk, but methodically upgrading its exposures for the next phase of the cycle.
VL Consensus Prices™
These are the most frequently traded #1-Ranked Levels in VL this week. Trades occurring at the highest volume price in a ticker’s history are significant because they represent institutional engagement at a key price memory level—where the market once found consensus. These areas act as liquidity hubs, enabling large players to transact efficiently, and often signal a reassessment of fair value. This activity may precede major moves, mark equilibrium zones, or reflect broader portfolio shifts, making these price levels important to watch even without yet knowing how price will resolve. (Note: many Bond products trade in such a tight range that they dominate the top positions and are therefore omitted to provide better clarity around other flows. The bonds data is still available in the VL platform.)
What this consensus list is really telling you is where the market just agreed, in size, that “this is a fair place to do business.” When you look through it in the context of everything we have already seen – the IO sheet, the TRV list, the sector flows, the compass – it reads like a map of where institutions are quietly locking in their next playbook.
The first big theme is how much of this list is anchored in quality, yield, and large-cap factor product. SCHD and JEPI both show up with enormous trade counts, alongside SPYM, NOBL, OEF, SCHM, MAGS, BUYW, CGUS, DFIC, MGC and RSPF. That is a wall of volume by price concentrated in “own the market, get paid while you wait” structures. The fact that these names are printing highest-ever volume-by-price zones at the same time equal-weight and revenue-weight products were outlier flows on the IO sheet reinforces the idea that institutions are re-basing their core exposure at new consensus levels, not abandoning it. They are redrawing the line in the sand for large-cap beta and factor income.
The second clear cluster is real estate and banks, which ties directly into the rotation we have been seeing around rates and credit. HST is massive here with 671 trades at a historic consensus level, and it is not alone: SCHH, EQR, VRE, SPG, UDR, AVB, SUI, ADC, PLYM, TRNO, WSR, HHH, DOUG, ELME and HAUZ all hit their own price-volume peaks. On the financial side, ITUB, HBAN, WAFD, WBS, OCFC, WSBC, SNV, OFG, BANR, BANC, RNST, OZK, HTH, WSFS, FCF, CBUs, WABC and a long tail of regional and niche banks are doing the same. Put together, that is a lot of “let’s reset our size here” behavior in two rate-sensitive arenas that were under stress a year ago. It matches the IO signals of quiet REIT and bank re-sculpting and supports the idea that institutions are building a new equilibrium under a softer rate trajectory rather than treating the recent backup in yields as a reason to bail.
The metals, mining, and uranium complex is the next obvious spine running through the list. TMQ, UAMY, TX, NGD, PAAS, AG, RS, EGO, HMY, SIL, SPPP, HMY, USAS, ASM, TECK, MAGN, GRO, SLI and NTR all show consensus levels in or around the same period that our IO and TRV sheets flagged PPTA, SGML, TFPM, TMQ, NLR and others as outliers and sustained-interest names. Add uranium and energy – EU, UUUU, UEC, DNN, VTS, CVX, BTU, BTE, FRO, TTE, DIG, GUSH, ERX, PXE – and you get a very consistent picture: large, negotiated zones where institutions have been willing to trade size around long-cycle resource themes. This is exactly what structural positioning looks like: the tape is not exploding in one direction, but the volume-by-price record is being rewritten at key levels.
On top of that sits the whole AI/tech/semis stack: QRVO, QCOM, LASR, NVTS, CEVA, IFNNY, SOXQ, FTXL, CIBR, BUG, AIQ, ARTY, BBAI, TEAM, BOX, JAMF, COIN-adjacent software (COIN, BTDR, MFI, APPF, HUBS, SEMR, VRNT, CORZ, AIOT, CLBT, GCT, IIIV), and the IT-services names INFY, WIT, GPN, BAI, CASS, BGC, BOKF, etc. The presence of so many semis and software names at all-time consensus levels, alongside a small universe of levered wrappers around them – NVDL, NVDU, NVDW, NVDG, MSFW/MSFU, AVGW/AVGX/AVL, AAPW, PLTG, CRMG, INTW, AMDG, AMDL, ASMG – is exactly what you would expect in a regime where AI and digital infrastructure are the secular core, but institutions prefer to express that view via both underlying and structured product. You are seeing both the “plumbing” names (foundry, EDA, infra software) and the wrappers that let funds fine-tune beta and income profiles. That fits the earlier narrative of allocation-driven tech flows rather than a blind chase in just a few megacaps.
Another theme that ties cleanly into the existing story is healthcare and biotech breadth. VTRS, PRAX, CYTK, CRNX, MIRM, ANRO, SLDB, BCAX, SYRE, SEPN, DVAX, EXAS, OLMA, REPL, TECX, QNTM, LYRA, ELVN, DOMH, GKOS, MMSI, SYK, VEEV, ALHC, ONMD, HNGE and a host of medical device and health information names all register consensus levels. That is a big chunk of the sector. It lines up with healthcare’s leadership on the compass, with biotech density on TRV and IO, and with the idea that healthcare is transitioning from pure defense into an offensive growth and innovation sleeve for institutional portfolios.
You can also see the speculative and macro hedging edges of the tape showing up in this consensus book: crypto-linked structures (ETHT, NCIQ, FETH, FDIG, BITQ, BSOL, OBTC, BTFX, FIAT), TSLA and NVDA income and levered products (TSLW, TSLY, TSLQ, TSDD, AMZZ/AMZU/AMZW, GOOY, PLTZ, HOOG, RVNL, OPEX), dollar and Brazil exposure (UUP, EWZ, EFG, AVDE, INCO), and innovation sleeves like ARKK, AIQ, BUG, QTUM. These are the outer rings of the institutional trade: places where risk gets dialed up or down around the core. The fact they are printing record volume-by-price bands now suggests that even the “expression layer” of portfolios – the wrappers, the overlays, the thematic sleeves – is being reset at new consensus zones alongside the core beta and real-asset stacks.
Taken together, the consensus watchlist and the IO/TRV sheets are all telling you the same story: big money is not in flight, it is in reconstruction. Large-cap income and beta are being re-based, real estate and banks are being rebuilt under a new rate regime, metals/uranium and energy are being framed as durable structural themes, AI/tech infrastructure is being expressed both directly and through leveraged and income wrappers, and healthcare/biotech breadth is being upgraded from niche to core. This is exactly what you expect to see when a market moves from late-cycle angst into early-cycle portfolio engineering: not a stampede, but a series of very deliberate, very busy price levels where everyone quietly agrees to meet.
MIR Part 3: Framing-Up A Trade
When you marry the institutional tape to the volatility complex, the conclusion is simple: the market is treading water here but winded on the surface. Breadth has improved slightly into OPEX, the factor sleeves are still being rebuilt in size, and the TRV/IO/Consensus trifecta continues to rotate capital with focus on real assets, healthcare, and AI infrastructure. Nothing about that structure signals a liquidation phase. But the short-term tape is frayed. Implied vol refuses to roll over. Realized vol is ticking higher. VVIX hasn’t relaxed. Credit spreads are widening at the margin. And the indices sit below their 20-day moving averages at a moment when holiday liquidity usually makes the tape fragile, not forgiving.
In that environment, positioning becomes less about aggression and more about shape. You stay long the exposures institutions are building into — the SCHD/JEPI/RSP/SPYM anchor; the metals/miners/uranium complex; the healthcare innovation stack — but you reduce the parts of the book that require perfect conditions to work. You shave leverage-based wrappers. You upgrade from beta to quality. You add carry where credit is still functioning. And you bring in some real hedges: duration, volatility overlays, and a few asymmetric expressions that pay off if something slips during the quiet part of the year.
The idea is simple: maintain the structural posture the tape demands while redistributing risk toward ballast. This way, if the market resumes its advance, you are still fully in the stream; if it cracks, you have the protection to step in rather than step back.
1. Large-Cap Factor Core (Now 38%, slightly reduced but higher quality tilt)
Still the center of gravity, but trimmed at the edges and shifted toward quality and income.
SCHD – 14% ← raised for quality, dividend durability
JEPI – 10% ← kept stable for income + overwriting
RSP – 6% ← trimmed; equal-weight softens in risk-off
SPYM – 4% ← trimmed to reduce beta
NOBL – 4%
Why:
The tape still demands a large-cap factor core, but elevated vol + rising RV argues for emphasizing quality and income (SCHD, JEPI) while trimming broad beta (RSP, SPYM).
2. Real Assets, Metals, Uranium, Energy (Now 20%)
Slight trim for volatility management but keep the core exposures — the institutional case remains intact.
NLR – 5%
EU – 4%
TFPM – 3%
SGML – 2% ← trim on high RV
CVX – 2%
PPTA – 2%
TMQ – 2%
Why:
The theme is structural. But metals/miners can be violent when vol rises. We keep the conviction names while moderating sizing in the more pro-cyclical exposures.
3. Financials + REITs (Now 10%)
Trim slightly — the sector’s signal is still constructive long-term, but rising credit spreads + weak tape means less aggression.
HST – 3%
SCHH – 3%
EQR – 2%
HBAN – 1%
WAFD – 1%
Why:
The flows and consensus levels remain extremely positive, but REITs and regional banks are the first to feel credit tightening. You want exposure, not leverage.
4. Healthcare + Biotech Innovation (Still 16%)
PRAX – 3%
EXAS – 3%
CYTK – 3%
VTRS – 2%
OLMA – 2%
ARWR – 2%
MSI/SYK – 1%
Why:
This sector is the single cleanest long across IO, TRV, and Consensus datasets. It has both durability and upside convexity.
5. AI Infrastructure + Semis + Software (Now 8%)
We want exposure but must reduce cyclicality during an elevated-vol regime.
QCOM – 3%
QRVO – 2%
NVTS – 1%
CIBR – 1%
LASR/IFNNY – 1%
Why:
This theme is potentially long-term positive, but short-term choppy. Reduce sizing, keep the leaders.
6. Defensive / Tactical Overlay Sleeve (Now 8%)
TMF – 3% ← duration hedge; works if growth scares equity
UUP – 2% ← dollar strength tends to appear in stress episodes
VIXY or VIXM – 1% ← vol hedge, light but meaningful
JEPI (incremental) – 1% ← income + short vol replacement for beta
SPDN – 1% ← small downside asymmetry, confirmed by recent IO activity
Why:
Don't get confused - we're buying a little insurance here, not making a macro call. Every instrument is chosen for carry efficiency, negative correlation, or asymmetry.
7. Cash / Ultra-Short (Now 6%)
A new sleeve.
SGOV or BIL – 6%
Why:
Holiday liquidity is thin. A cash sleeve lets you absorb early-week volatility and redeploy into any forced mispricings.
Total: 100%We are still expressing the structural leadership institutions prefer — large-cap factors, real assets, healthcare, and AI infrastructure — but elevating defense by trimming cyclicality, adding duration and vol hedges, and lifting cash so that a holiday-week slip becomes a buying opportunity, not a bruising drawdown. Good luck this week, VL-Fam!

Thank you for being part of our community and for dedicating your time to this edition. Your insights and engagement drive everything we do, and we’re honored to share this space with such committed, thoughtful readers. Here’s to a week filled with clear opportunities and strong performance 💰💰💰
VolumeLeaders