Market Momentum: Your Weekly Financial Forecast & Market Prep
Issue 70 / What to expect Nov 17, 2025 thru Nov 21, 2025

In This Issue
Weekly Market-On-Close Report: All the macro moves, market drivers, and must-know narratives—covered in less than five minutes.
Weekly Benchmark Breakdown: Our weekly intelligence report on major indices cuts through the index-level noise to uncover participation, momentum, and structural integrity and tell you whether markets are rising on solid ground or skating on thin breadth. This is where bull markets prove themselves—or quietly start to unravel.
The Latest Investor Sentiment Readings: Track the emotional pulse of the market with our curated dashboard of sentiment indicators. From fear-fueled flight to euphoric overreach, this week's readings reveal whether investors are cautiously creeping in—or stampeding toward the exits.
Institutional Support & Resistance Levels For Major Indices: Exactly where to look for support and resistance this coming week in SPY, QQQ, IWM & DIA
Normalized Performance By Thematics YTD: Which corners of the markets are beating benchmarks, which are overlooked and which ones are over-crowded!
Key Econ Events & Earnings On-Deck For This Coming Week
Market Intelligence Report: Track the real money. This section breaks down where institutions are placing their bets—and pulling their chips. You'll get a sector-by-sector view of flows, highlighting the most active names attracting large-scale buying or selling. We go beyond the headlines and into the tape, surfacing the week’s most notable block trades and sweep orders, both on lit exchanges and hidden dark pools. Whether you're following momentum or fading crowded trades, this is your map to where size is moving and why it matters.

Weekly Market-On-Close Report
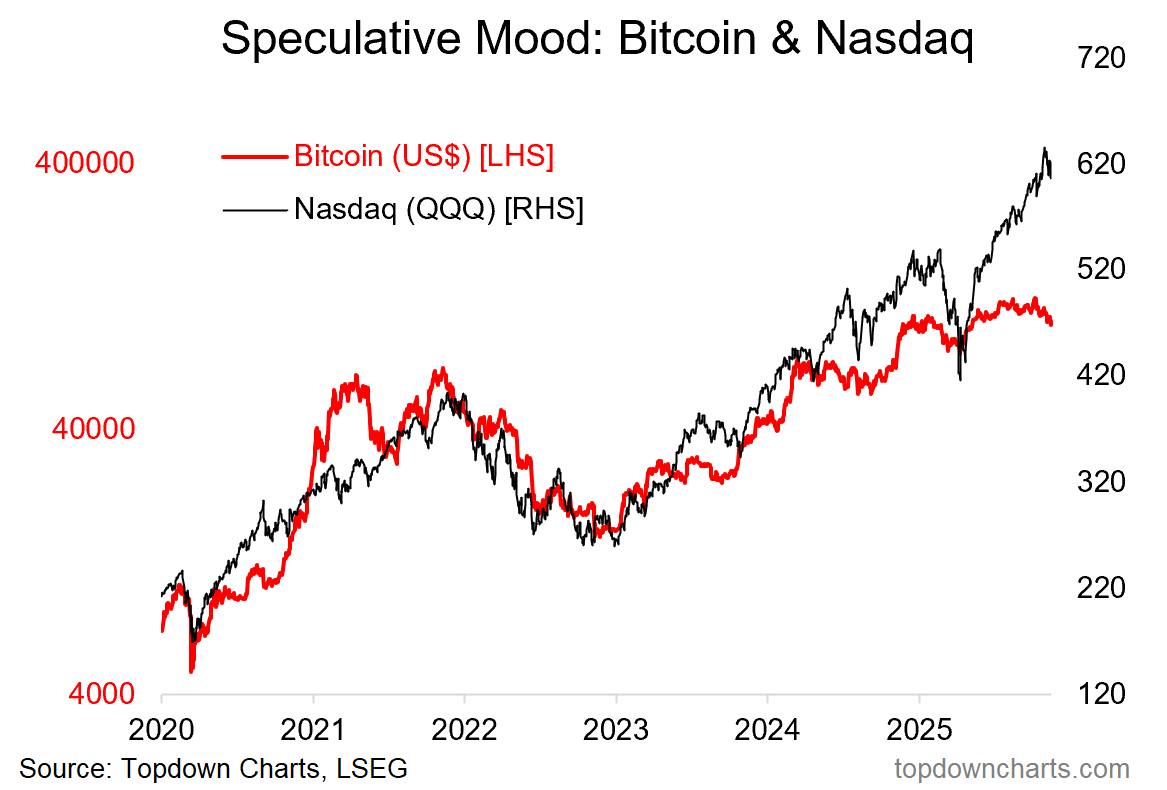
The past week in markets was less about one clean narrative and more about several overlapping stories colliding at once. U.S. stocks wrestled with shifting expectations for December rate policy, the end of the longest government shutdown in history, a re-rating of AI and technology leaders, and another leg down in crypto. Under the surface, sector and style rotations accelerated even as headline indexes finished only modestly changed. The result was a week where the tape felt noisy and fragile, but also one that offered useful tells about where capital is quietly migrating.
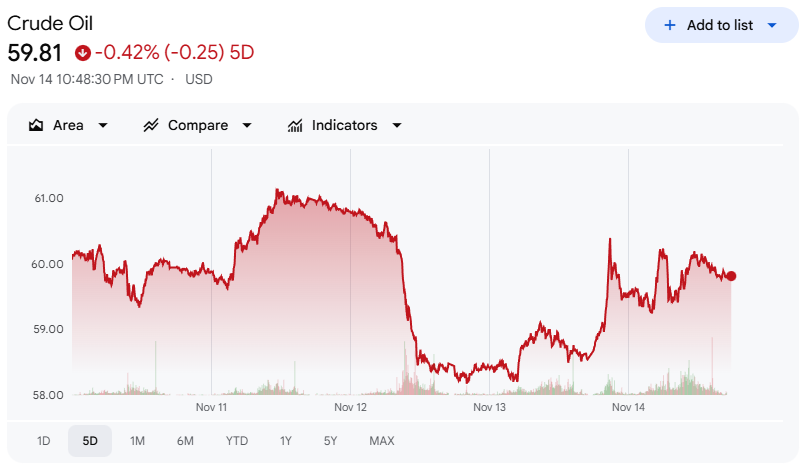
U.S. equity benchmarks ended the week mixed. The Dow Jones Industrial Average and the S&P 500 Index posted modest gains, while the Nasdaq Composite, the S&P MidCap 400, and the small-cap Russell 2000 all lost ground. On Friday, the pattern repeated intraday. Stocks opened weak, extending Thursday’s sell-off as investors digested the latest hawkish commentary from Federal Reserve officials and questioned whether a December rate cut is really in play. The Magnificent Seven technology names, which had been hit hard earlier in the week, recovered from early losses and finished the session mixed. Energy producers caught a bid as WTI crude rallied more than 2%, helping to offset pressure in growth and AI-exposed names.
The price action on Friday captured the broader arc of the week. Early in the session, the S&P 500 broke below its 50-day moving average for the first time since reclaiming it in the aftermath of the earlier tariff turmoil. Selling accelerated, and for a time it looked like the index might finally crack. Then the familiar buy-the-dip impulse reappeared. Traders defended key technical zones, and the S&P 500 rallied nearly 1.5% off the lows to finish close to unchanged. That late surge preserved the streak of closes above the 50-day moving average and helped the S&P 500 avoid back-to-back weekly losses, even as small and mid-cap indexes ended firmly in the red.
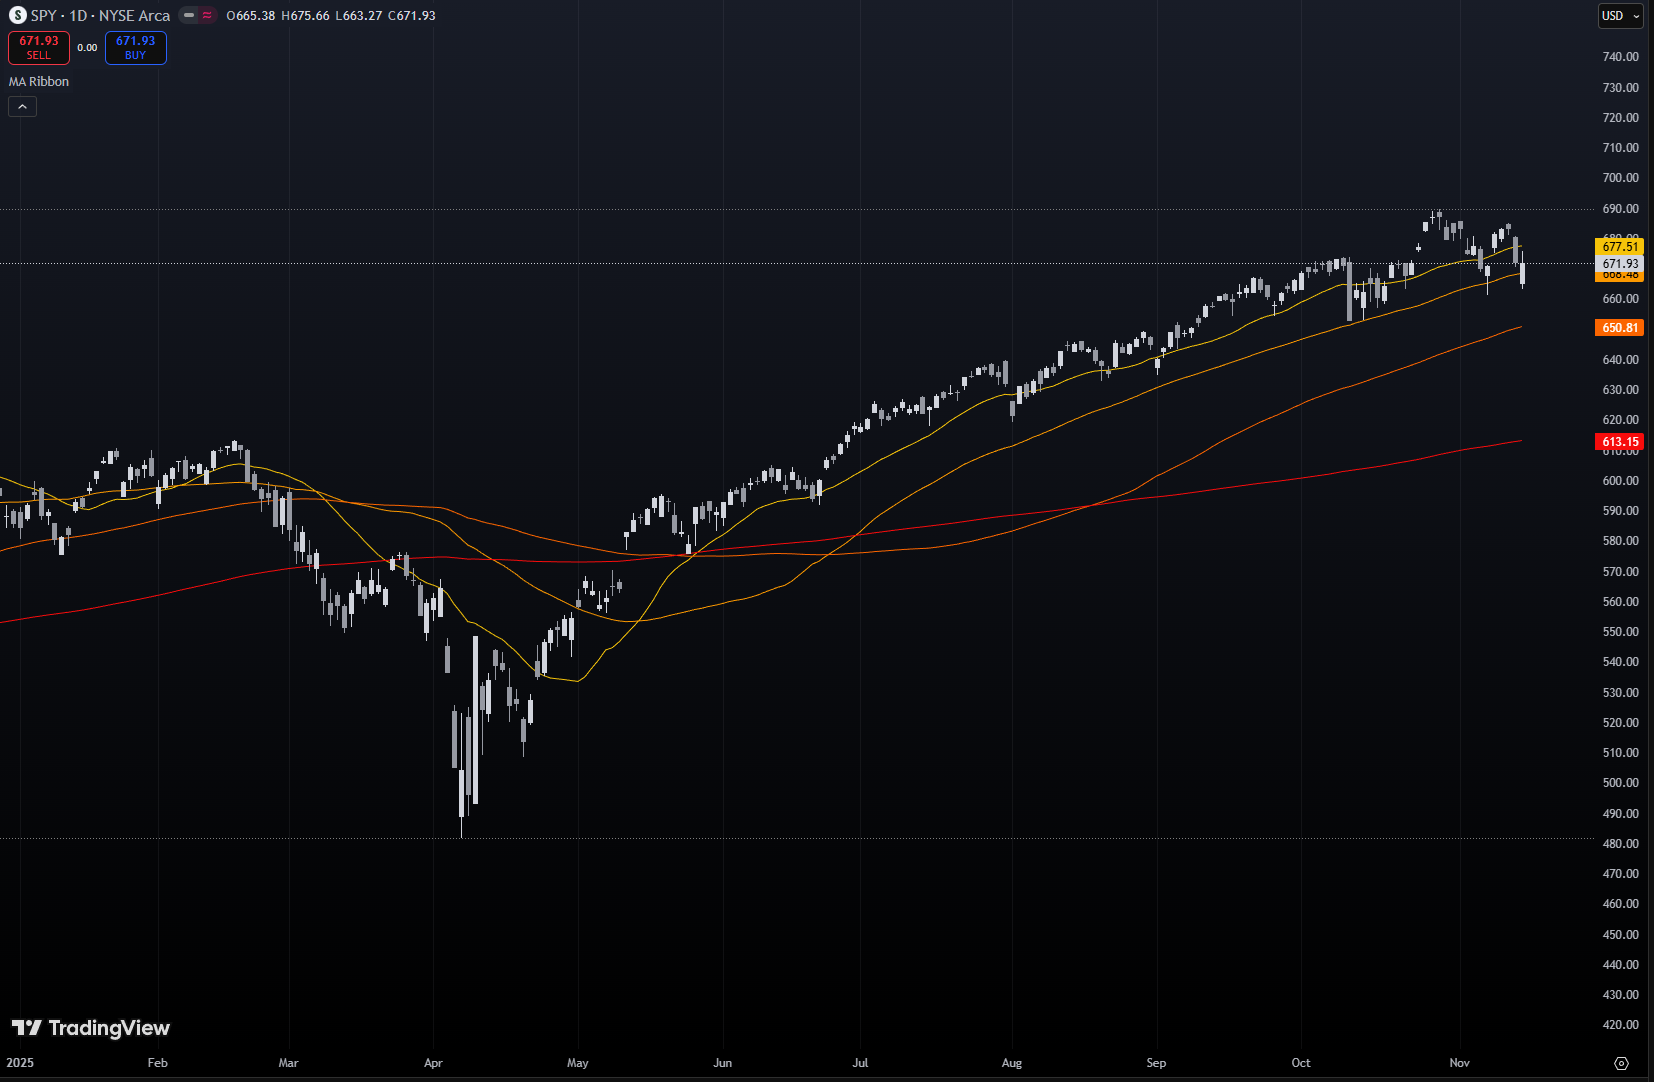
As the week began, it was not obvious that such resilience would be needed. The prior Friday’s rally carried over into Monday as investors responded to tentative progress in government shutdown negotiations and to talk from President Donald Trump about a possible tariff dividend. Risk assets that had been hit hardest earlier in the month bounced. Major indexes moved higher through the first half of the week, with the S&P 500 climbing back toward roughly 6,850 and filling the gap that had been opened by a sell-off tied to warnings from Michael Burry and several Wall Street chief executives. Along the way, there was a subtle shift in character. AI-linked names and other high-beta themes stopped leading and began to stall, even as the broad tape marched higher. The quality rotation became visible when the Dow Jones Industrial Average traded above 48,000 for the first time, an indication that more cyclical and cash-flow-rich names were finally being rewarded after a long stretch in the shadow of mega-cap growth.
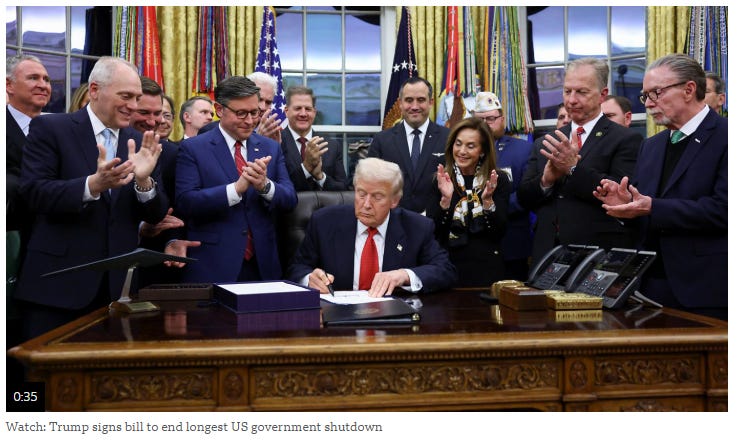
That rotation accelerated midweek. On Wednesday evening, the U.S. government shutdown officially came to an end when President Trump signed a spending bill that funds the government through January 30. Ironically, that headline marked the high for equities for the week. On Thursday, stocks traded sharply lower despite the resolution in Washington, and questions shifted from whether the shutdown would end to how long it will take for conditions to normalize. By Thursday’s close, major indexes were down more than 1.5%, with technology and high-momentum stocks bearing the brunt of the damage. Friday morning began with another wave of selling, S&P futures down more than 1%, and crypto breaking to fresh lows before dip buyers stepped in once again.
Shutdown Ends, Back Pay Flows, And Growth Takes A Hit
The shutdown’s conclusion after 43 days is unquestionably a relief, but it comes with real economic costs and lingering uncertainty. The funding bill signed on November 14 keeps the government open through January 30, 2026. It restores pay for roughly 1.4 million federal workers who went without pay, about half of whom were furloughed, and reverses layoffs for more than 4,000 employees at agencies such as the Departments of Commerce, Education, and Homeland Security. Most back pay is expected to be distributed by Wednesday, November 19, providing a near-term cash flow boost for affected households.
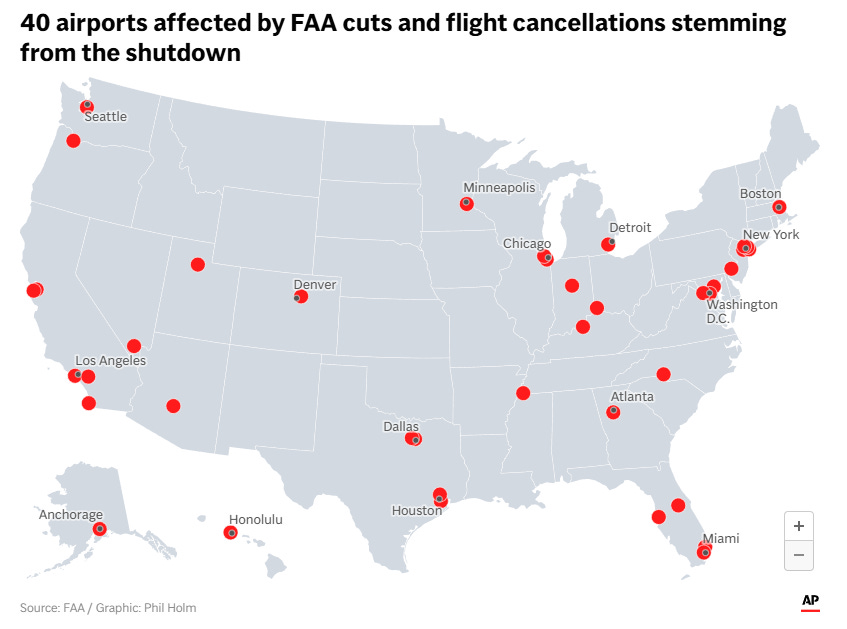
The bill also mandates the restart of critical federal programs. SNAP, the Supplemental Nutrition Assistance Program, is once again funded, with authorization stretching through September 2026 even though the timing of payments may vary by state. Airlines, which had reduced air traffic at 40 of the country’s busiest airports, are expected to ramp back to full capacity in the coming days to accommodate Thanksgiving travel. Federal payments to states and localities resume, and agency employees are being recalled.
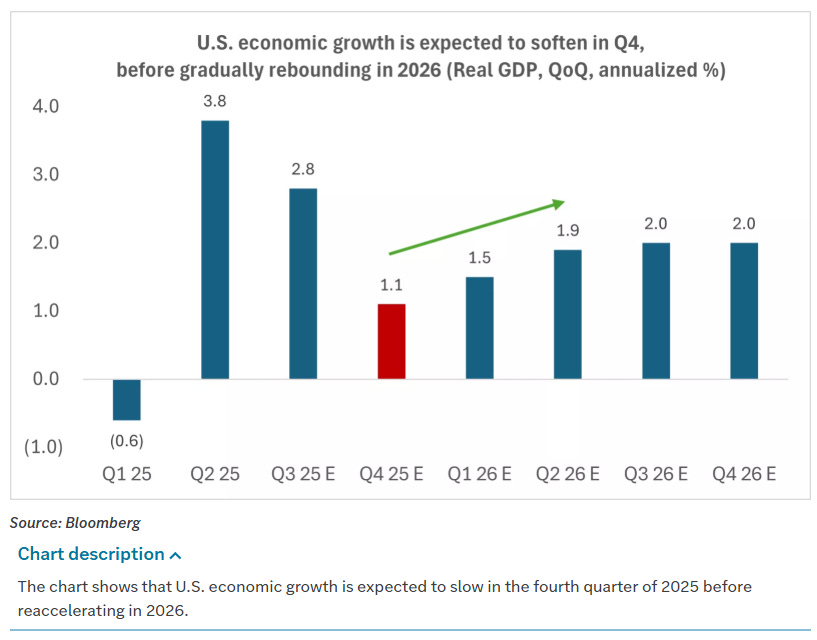
None of this erases the near-term hit to growth. The Congressional Budget Office estimates that the six-week closure will reduce real GDP growth in the current quarter by 1.5 percentage points. Prior to the shutdown, Bloomberg estimated that the U.S. economy was on pace to grow around 2.5% to 3.0% in the fourth quarter of 2025. The CBO’s estimate implies that growth will likely land closer to the 1.0% to 1.5% range. The CBO does, however, expect more than half of the lost activity to be recovered early next year as programs resume and workers receive back pay.
That recovery may be bumpy rather than a clean snap-back, especially for households facing higher health care costs. Healthcare costs remain a wild card. Affordable Care Act subsidies are set to expire for most of the 24 million marketplace enrollees after December 31, 2025. As part of the shutdown resolution, the Senate will schedule a vote by mid-December to extend ACA subsidies for three years. Passage is not guaranteed in either chamber. If Congress fails to act, health insurance premiums are likely to rise and the political incentives for another showdown after January 30, 2026 will increase.

Another legacy of the shutdown is a disrupted economic calendar. During the closure, White House officials said that October jobs and inflation reports might never be released in their usual form, and the Bureau of Labor Statistics acknowledged that it would take time to finalize new dates. The BLS has now indicated that it will publish the September jobs report on Thursday, November 20, and the September real earnings report on Friday, November 21. The October payroll report will eventually be released, but it will include data on jobs added without the unemployment rate because the household survey was not completed. A broader schedule is beginning to re-emerge: the second estimate of Q3 GDP is due at 8:30 a.m. on November 26, October Personal Income and Spending and PCE inflation arrive that same day at 10:00 a.m., and the third estimate of Q3 GDP and November Personal Income, Spending, and PCE are slated for December 19. October CPI remains an open question. There is every reason to expect these releases to be messy, both in the data themselves and in how the market and the Fed choose to discount them.
Fed Officials Push Back On December Cut Hopes
While Washington worked through the shutdown, the Federal Reserve became the main source of volatility. What had been near-unanimous market confidence in a December rate cut has faded as policymakers publicly questioned the need for further easing.
Early in the week, several Fed presidents warned against moving too quickly while inflation remains above target. Kansas City Fed President Jeff Schmid argued that cutting rates will not do much to patch over cracks in the labor market but could have longer-lasting effects on inflation and raise doubts about the Fed’s commitment to its 2% objective. Dallas Fed President Lorie Logan said she would find it hard to support another rate cut without convincing evidence that inflation is coming down faster than currently expected or that the labor market is cooling more than gradually.

Atlanta Fed President Raphael Bostic described signals from the labor market as ambiguous and difficult to interpret, and he does not see them as clear enough to justify an aggressive policy response given the risk of ongoing inflationary pressure. He characterized current policy as “marginally restrictive” and favors holding rates steady until there is clear evidence that inflation is again moving meaningfully toward 2%. St. Louis Fed President Alberto Musalem urged policymakers to “tread with caution” and said the Fed needs to lean against inflation, leaving little room for further cuts. Cleveland Fed President Beth Hammack echoed the view that policy must remain “somewhat restrictive” in light of persistently high inflation.
At the same time, other officials have highlighted downside risks. San Francisco Fed President Mary Daly noted in a blog post that, despite a remarkably resilient economy, the balance of risks has shifted. She sees a rapid softening in the labor market and suggests that the U.S. may be experiencing a negative demand shock for labor coinciding with falling supply. On inflation, she argued that tariff impacts are largely confined to goods and have not spilled over to services or inflation expectations. Her guiding principle is that policymakers do not want to work so hard to avoid repeating the 1970s that they cut off the possibility of a 1990s-style growth episode.
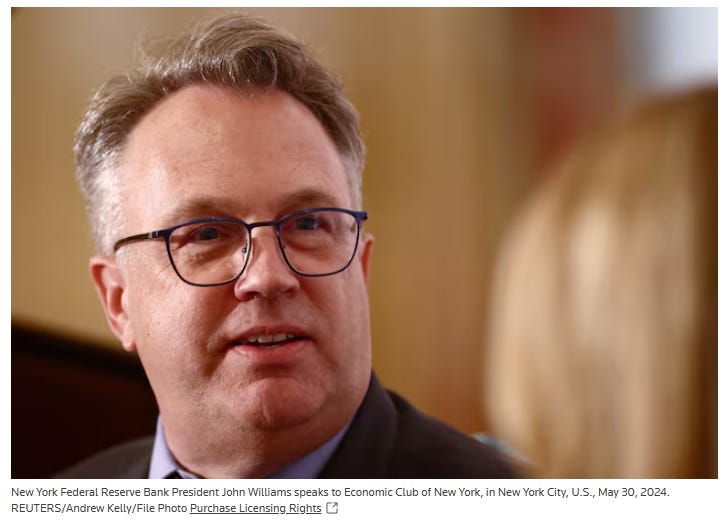
Boston Fed President Susan Collins spoke of a “high bar” for additional cuts. She supported the 25 basis point reduction at the last meeting but believes rates should remain at current levels “for some time.” New York Fed President John Williams focused on the balance sheet, saying that it will not be long before reserves are ample, at which point the Fed would likely begin gradual asset purchases. Treasury Secretary Bessent, speaking at the same conference, said that Treasury expects coupon auction sizes to remain unchanged for the next several quarters and voiced support for changes in the supplementary leverage ratio that could boost demand for Treasuries.
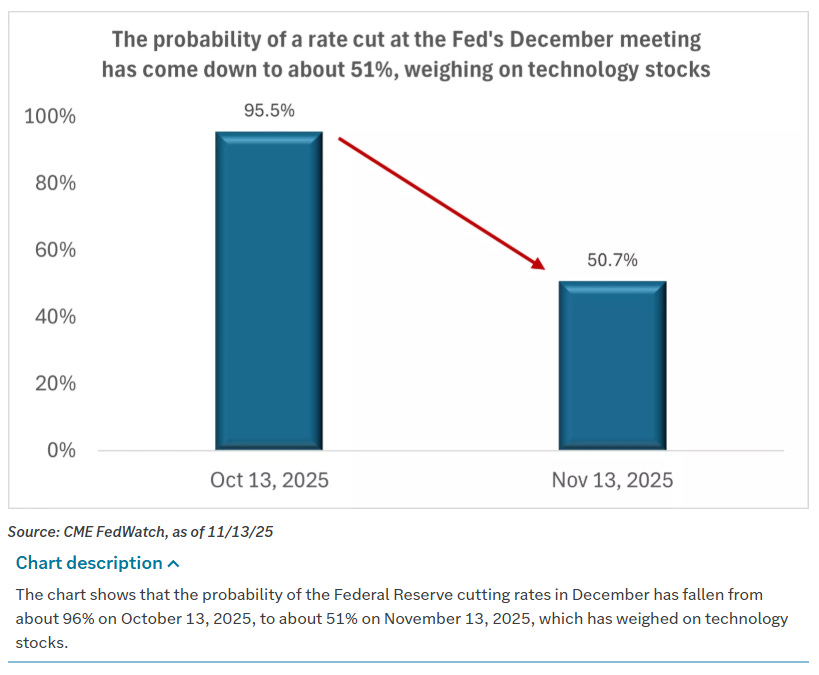
The internal divide at the Fed was highlighted by a widely read article from Wall Street Journal reporter Nick Timiraos, which discussed the idea of pairing a December cut with guidance that sets a higher bar for further reductions. Markets have taken the signal. Depending on the data source and day of the week, the implied probability of a December cut is now somewhere in the 43%–54% range, down sharply from readings near 95% a month ago and from 70% or more just a week earlier. One snapshot puts the probability of a rate cut following the December meeting at around 46%, another at 43%, and another at roughly 51%. The underlying message is clear: the market no longer assumes a December cut is a foregone conclusion.
Rates markets have responded accordingly. December 10-year Treasury note futures closed down 7.5 ticks on Friday, with the 10-year yield up 2.7 basis points to 4.146% after touching a one-week high of 4.150%. T-note prices also carried negative momentum from Thursday, when earlier Fed commentary had knocked December cut odds down to 43% from 70%. Across the curve, yields finished roughly 5 basis points higher for the week. T. Rowe Price traders observed that the benchmark 10-year note continued to oscillate within a roughly 10 basis point range around 4.1%, where it has lingered since the Fed’s October rate cut.
Municipal bonds outperformed Treasuries as issuance ramped up on Wednesday following the Veterans Day holiday and new deals were generally oversubscribed. High yield bonds advanced on idiosyncratic news and earnings before partially retracing gains as the macro tone weakened. In Europe, government bond yields pushed higher as well. The 10-year German bund yield climbed to a five-week high of 2.720% and finished on that level, while the 10-year UK gilt yield rose to a one-month high of 4.579% before closing at 4.574%, up 13.7 basis points. Eurozone Q3 GDP was revised up by 0.1 percentage point to 1.4% year over year. Swaps are discounting only a 3% chance of a 25 basis point rate cut by the ECB at its December 18 meeting.
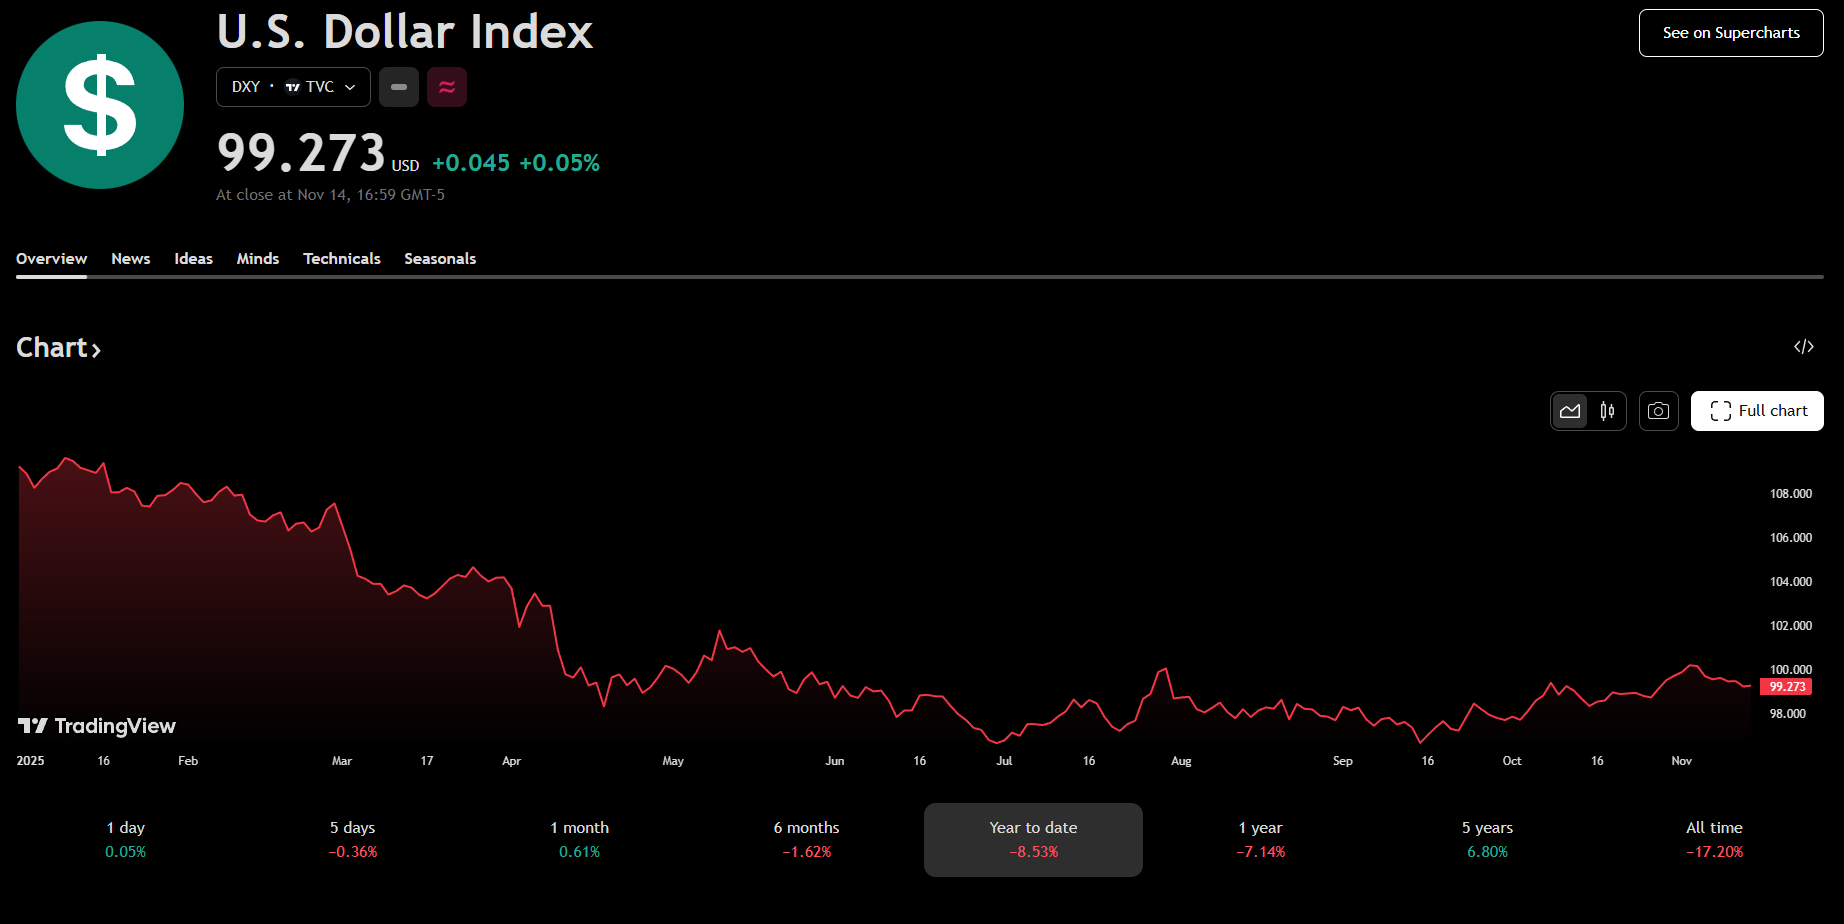
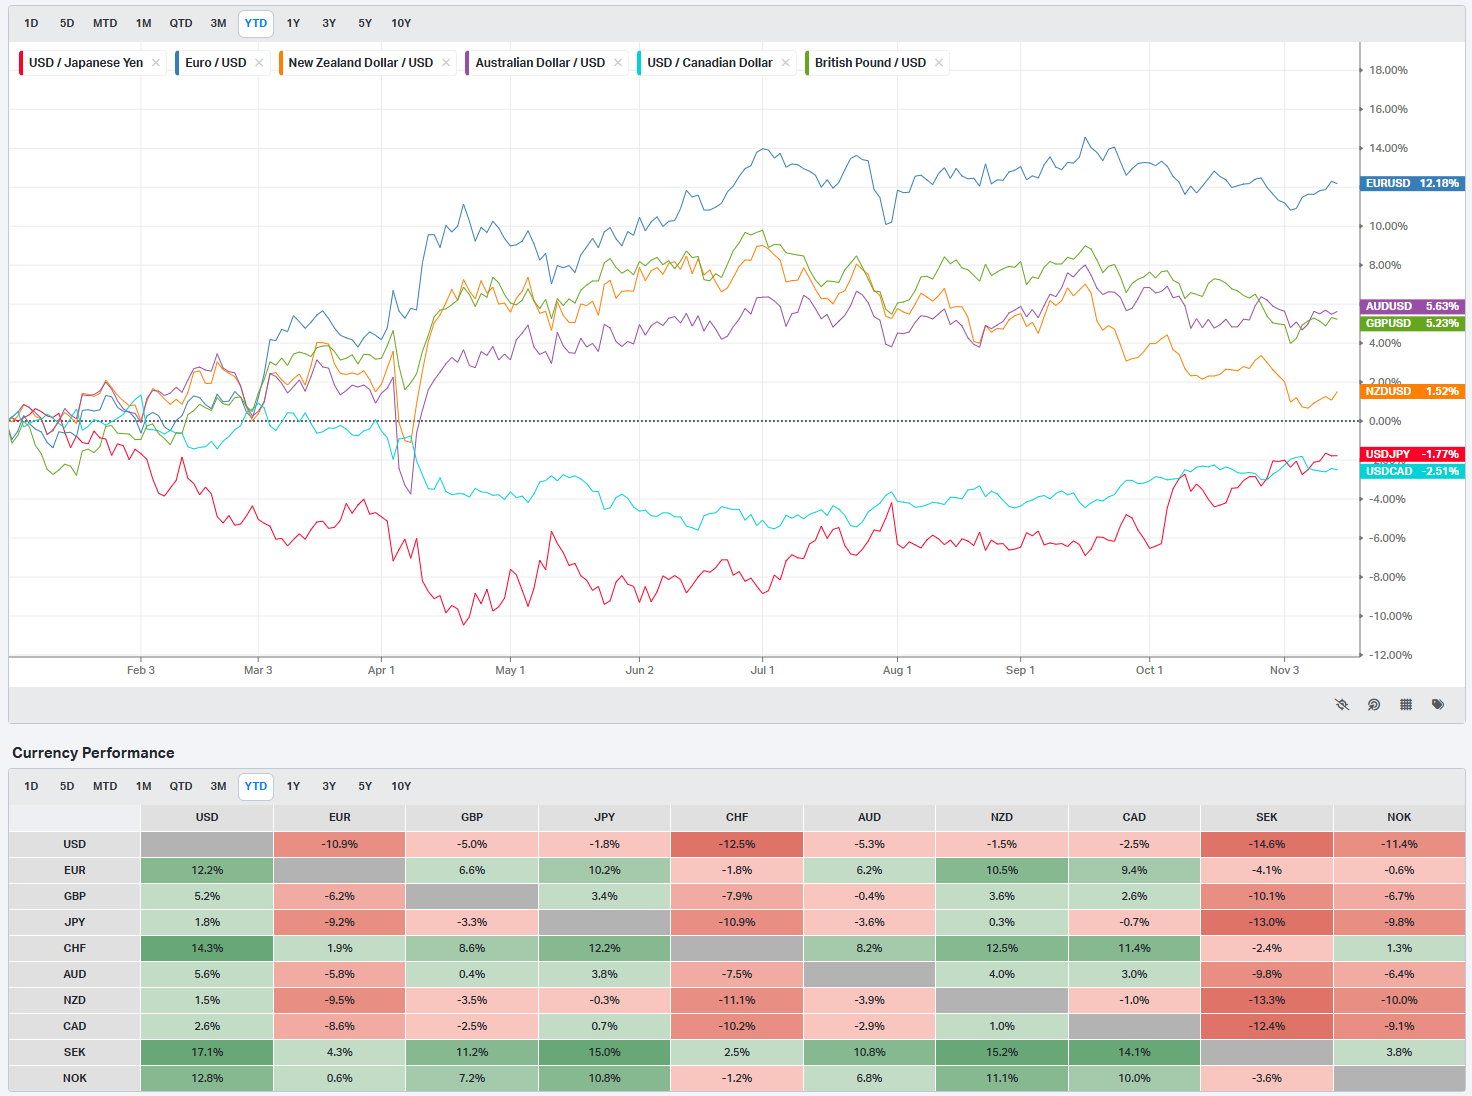
The U.S. Dollar Index ended the week slightly lower and has reversed much of a prior move from 98.50 to 100. The yen weakened, while the euro and Swiss franc strengthened. Against that currency backdrop and with rate cut odds tumbling, rate-sensitive assets such as small-cap equities struggled: the Russell 2000 fell 1.83% for the week.
Earnings, Sectors, And The AI Re-Rating
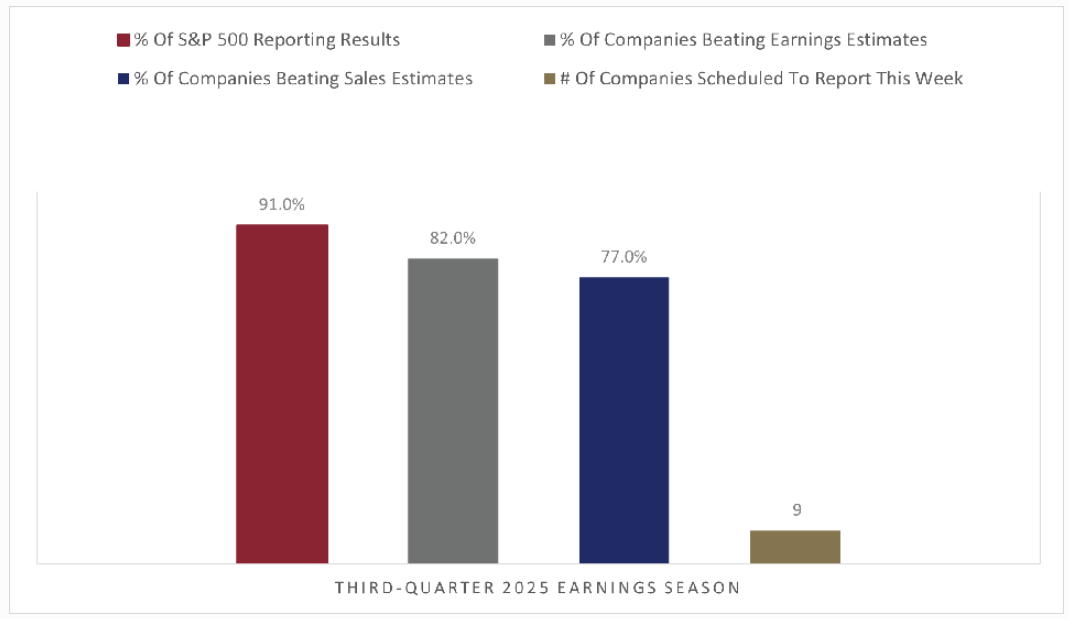
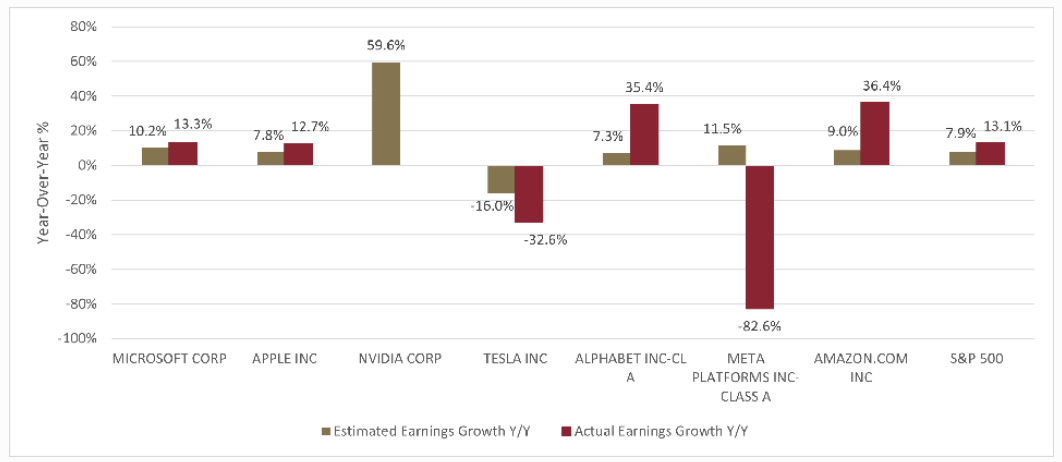
Despite all the macro noise, corporate fundamentals look stronger than the headlines might suggest. Q3 earnings season is nearly complete, and 82% of S&P 500 companies have beaten estimates, on pace for the best beat rate since 2021 according to Bloomberg Intelligence. Aggregate Q3 earnings are up 14.6% year over year, more than double the 7.2% growth that had been expected at the start of the quarter.
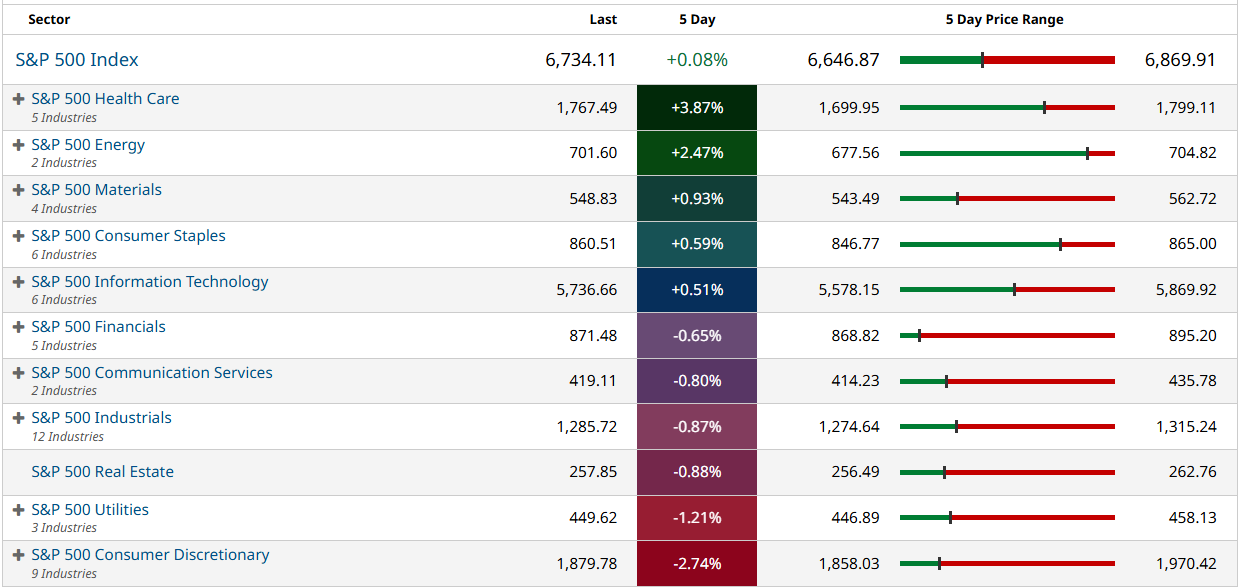
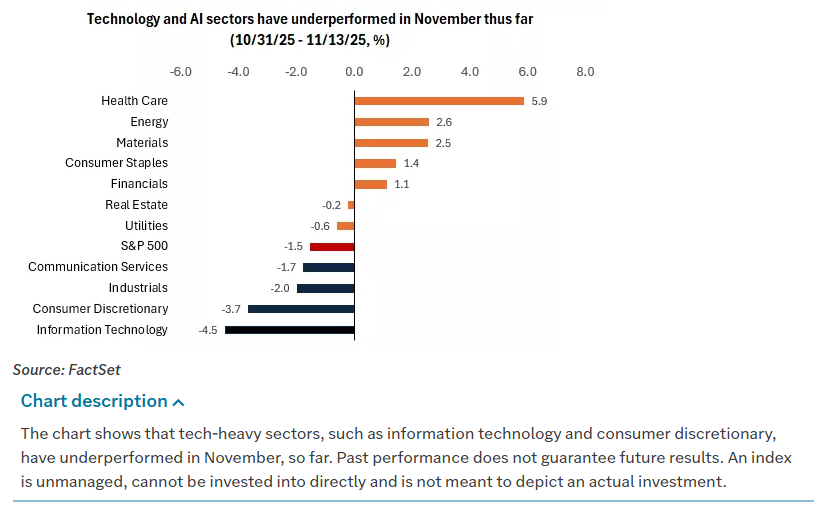
Yet those results have not prevented a marked rotation in equity leadership. After a nearly 55% rally in the Nasdaq since the April 8 lows, technology and AI-related names have been under pressure. Elevated expectations, extended valuations, and rising concerns about the path of rates have all contributed. In November to date, technology has underperformed, while sectors such as health care, energy, and materials have outperformed.
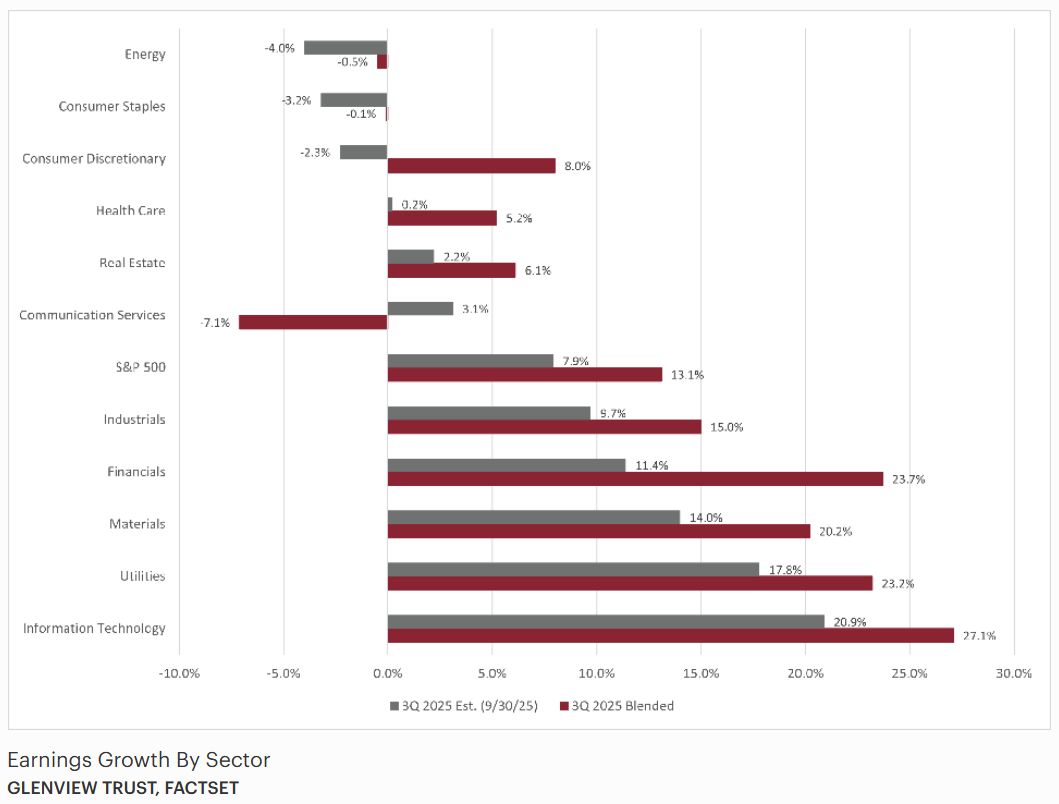
Health care has led the pack for two consecutive weeks. The sector gained 4% this week, narrowing a year-to-date performance gap that had been stubbornly wide. Biotech remained strong, helped by another major M&A transaction as Merck (MRK) agreed to buy CDTX (CDTX) for roughly 9 billion dollars. Large-cap pharma and medical equipment stocks traded higher, while managed care and hospital names lagged because ACA subsidies were not directly addressed in the shutdown legislation. Energy and materials stocks also moved higher despite a volatile commodities backdrop.
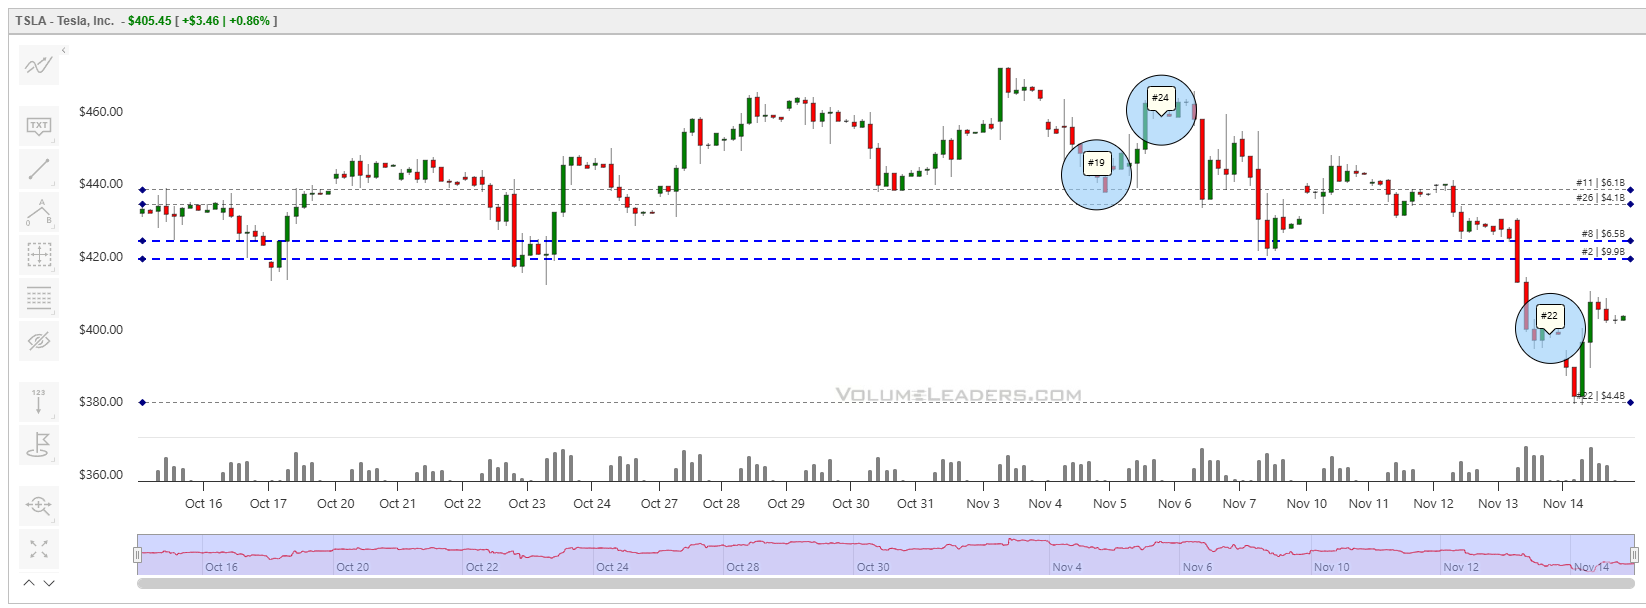
Consumer discretionary lagged, falling more than 2% as Tesla (TSLA) and Amazon (AMZN) weighed heavily. Weakness also showed up in housing and travel-related names, although apparel and restaurant stocks fared better. Communication services declined around 1%. Information technology managed to end the week slightly higher, but only with help from companies such as Advanced Micro Devices (AMD) and Cisco Systems (CSCO), both of which raised guidance on the back of strong demand. Their positive commentary, however, was not enough to offset growing skepticism around AI infrastructure spending.
CoreWeave, described as a neo data center operator, provided a focal point for those concerns. The stock dropped more than 20% on the week after the company cut Q4 revenue guidance due to construction and permitting delays at a third-party developer. Management’s discussion of the operating environment did little to calm nerves. Critical articles underscored the bottlenecks in bringing new capacity online. For investors who had been treating AI data center expansions as a straight-line story, CoreWeave’s update was a reminder that execution risk matters.
Another evolving concern lies in the funding model for AI. For much of this cycle, comparisons to the late 1990s were partially defused by the observation that today’s tech leaders were spending out of cash flow rather than levering up. That narrative has started to shift. Mega-cap technology companies, including Oracle (ORCL), Meta Platforms (META), and Alphabet’s Google (GOOGL), are issuing more debt to fund capital expenditures, particularly for AI infrastructure. This is especially concerning for more debt-burdened companies such as Oracle (ORCL), but even cash-rich giants like Microsoft (MSFT) are seeing rising debt loads.
At the same time, these companies are transitioning from asset-light models to more asset-heavy ones. Investment in data centers and AI infrastructure could reach upwards of 500 billion dollars next year. That level of spending may compress margins and free cash flow in the near term, even if it enables future growth. The shift is occurring just as markets reassess the likelihood of near-term rate cuts, with December cut probabilities sliding from around 96% on October 13, 2025 to about 51% on November 13, 2025. Higher funding costs, more leverage, and heavier balance sheets represent a different environment from the one that powered the last several years of tech outperformance.
Even so, the long-term AI story remains compelling. The mega-cap tech complex has delivered strong earnings growth and robust guidance and continues to signal confidence in capital expenditure plans. The current setback looks less like a fundamental collapse and more like a reset of stretched positioning and valuations after a powerful rally. Historically, bull markets have tended to end either when the Fed is aggressively raising interest rates, as in the late 1990s, or when the economy is on the cusp of recession. Neither condition appears imminent at present. That context offers some comfort that the recent pullback may stay corrective rather than morph into a deeper bear market.

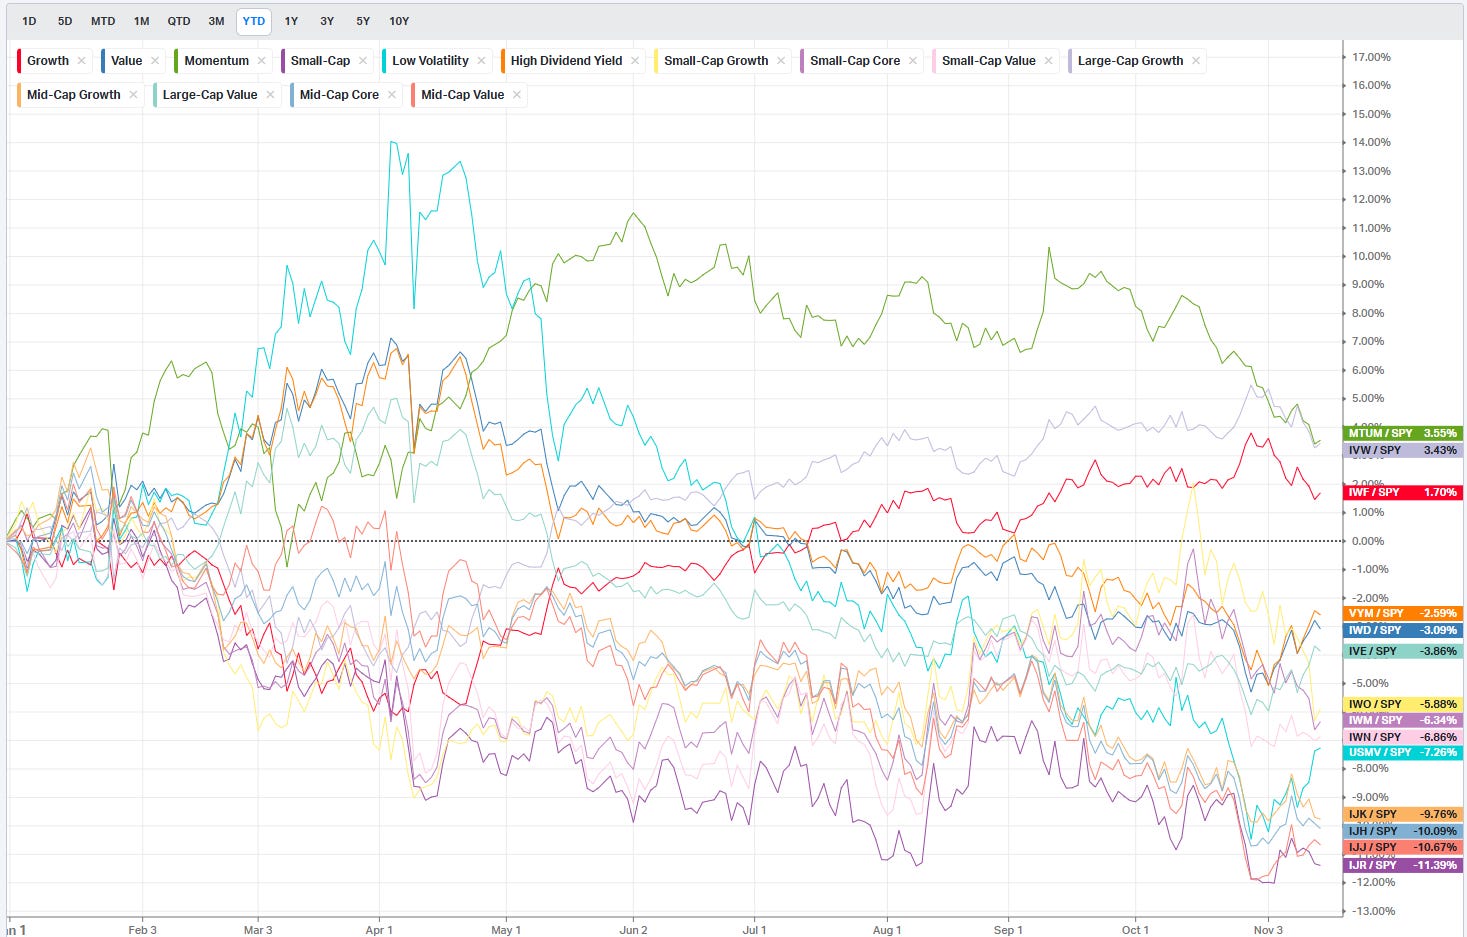
For investors, the message is not to abandon technology but to diversify around it. After three years of gains, portfolios that have drifted too heavily toward AI and growth should consider rebalancing toward intended allocations. U.S. large-cap and mid-cap stocks beyond the narrow AI complex, sectors such as health care and industrials, and emerging-market equities all offer potential for catch-up and valuation expansion.

Global Equities: Europe, Asia, And Emerging Markets
Globally, equity markets experienced their own version of the U.S. story: early strength, late-week giveback, and a growing dispersion between regions. The Euro Stoxx 50 closed down 0.85% on Friday. Germany’s DAX saw sharp gains early in the week, then gave some back as it failed to hold its 50- and 100-day moving averages before rallying off Friday’s lows. Sentiment slipped in the latest ZEW survey. France outperformed as luxury stocks traded higher. The UK underperformed as preliminary GDP and industrial production missed expectations and a controversy over a scrapped income tax plan pressured the pound and contributed to rising gilt yields.
In Asia, returns were mixed with relatively modest moves for much of the week before sharper declines on Friday, ahead of the U.S. rebound. Japan’s Nikkei 225 fell 1.77% Friday as it continued to consolidate a pullback from all-time highs. The index remains well above its major moving averages, however, suggesting that the uptrend is intact even if momentum has cooled. China’s Shanghai Composite dropped 0.97% and retreated from a 10-year high. Chinese macro data leaned soft: October industrial production rose 4.9% year over year versus expectations of 5.5%, the smallest increase in 14 months, and new home prices declined 0.45% month over month, the largest drop in a year and the twenty-ninth consecutive monthly decline.
Policy signals out of China were nuanced. In its Q3 monetary policy report, the People’s Bank of China said it would maintain an appropriately loose stance, but analysts interpreted the language as signaling a smaller chance of additional easing in the near term. Comments from the National Bureau of Statistics reinforced that impression, even as CPI moved back into positive territory and PPI edged closer to that threshold.
One of the more striking developments outside the U.S. is the relative strength of emerging markets. South Korea was higher for the week despite a sharp decline on Friday, when SK Hynix fell 9%. The iShares MSCI Emerging Markets ex-China ETF, which began to pull away from the S&P 500 in September, is now outperforming by roughly 14% year to date. That outperformance underscores the idea that global capital is not fleeing equities altogether; it is rotating toward regions and sectors that offer better valuations and fresher narratives.
Commodities And Crypto: Choppy Energy, Firm Metals, And A Crypto Slide
The commodities complex added its own flavor of volatility. Brent crude oscillated through the week and ended modestly higher. On Friday, it tested resistance near its 50-day moving average around 64.50. OPEC updated its forecasts to show a slight surplus in 2026 compared with a previously expected balanced market, while the International Energy Agency used its monthly report to push out its projected date for peak oil demand to 2050 from 2030. These shifts reinforce the sense that the transition narrative will be long and uneven, with traditional energy still playing a material role.
U.S. natural gas continued the ascent that started around Halloween, breaking above its 200-day moving average near 4.50 and testing recent highs around 4.75. European TTF gas prices moved mostly sideways but briefly touched their August lows near 30.50. After consolidating off all-time highs, precious metals ended the week higher, led by silver. Silver made a run back toward its October record before pulling back to around 50 late in the week. Gold gained as well but retraced some of its move in the back half of the week while holding above its 200-day moving average. Copper traded near 5 throughout the week, with the 100-day moving average just below, suggesting a market still balancing concerns about global growth with tight supply dynamics.
Agricultural commodities were modestly higher across most components despite moving lower after Friday’s WASDE crop report. Corn stood out by reaching a five-month high before easing off.
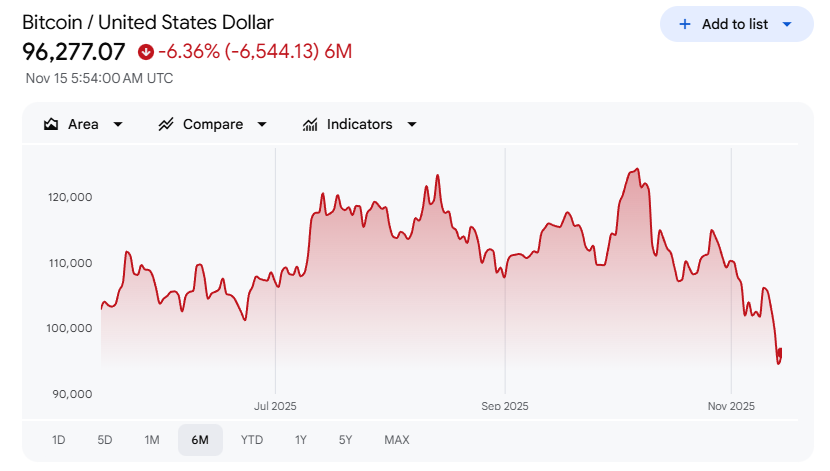
Crypto, by contrast, sustained another sharp blow. Bitcoin (^BTCUSD) tumbled more than 4% to a 6.25-month low, extending a five-week sell-off and leaving it down 24% from its record high last month. Bitcoin ETFs experienced net outflows of about 870 million dollars on Thursday, the second-largest single-day withdrawal since those products began trading. The digital asset complex has now logged its third straight week of declines and has fallen in five of the last six weeks since its all-time high.
Technically, Bitcoin broke below its 200-day moving average and sliced through the psychological 100,000 level on its way to roughly 95,000, a drop of about 25% from the peak. Ethereum followed a similar path and may test the 3,000 level if weakness persists. A key question going forward is whether crypto will continue to decouple from other risk assets on the downside or whether buy-the-dip behavior in equities will eventually spill over to digital assets as well.
Positioning For A Market In Transition
Pulling everything together, the dominant theme is transition. The U.S. government has reopened, but the economic impact of the longest shutdown on record will echo through data and behavior for months. The Fed has shifted from an environment where markets treated a December cut as almost guaranteed to one where December is genuinely uncertain. AI and mega-cap technology have moved from unquestioned leaders to areas where investors are reassessing debt loads, capital intensity, and valuations. Emerging markets and sectors such as health care, energy, and industrials are quietly taking the baton.
Historically, bull markets tend to end when the Fed is slamming on the brakes or when the economy is sliding into recession. For now, neither appears to be the base case. The CBO’s forecast of a fourth-quarter slowdown to 1.0%–1.5% growth, followed by a reacceleration in 2026 as shutdown distortions fade, does not read like a classic recession script. The Fed is debating whether to cut again, not whether to hike aggressively. That does not mean risk is low, only that the backdrop is more consistent with a rotation and valuation reset than with a full-blown cyclical top.

In that environment, the practical takeaway is straightforward. Portfolios that have drifted too far toward AI and technology after a nearly 55% Nasdaq rally since early April should consider rebalancing toward a more diversified stance. U.S. large-cap and mid-cap stocks outside the narrow mega-cap growth complex, sectors such as health care and industrials, and emerging-market equities all offer ways to participate in equity upside while reducing reliance on a single theme. The AI story is not broken, but the price of admission has changed, and the market is finally acting like it knows it.
Weekly Benchmark Breakdown
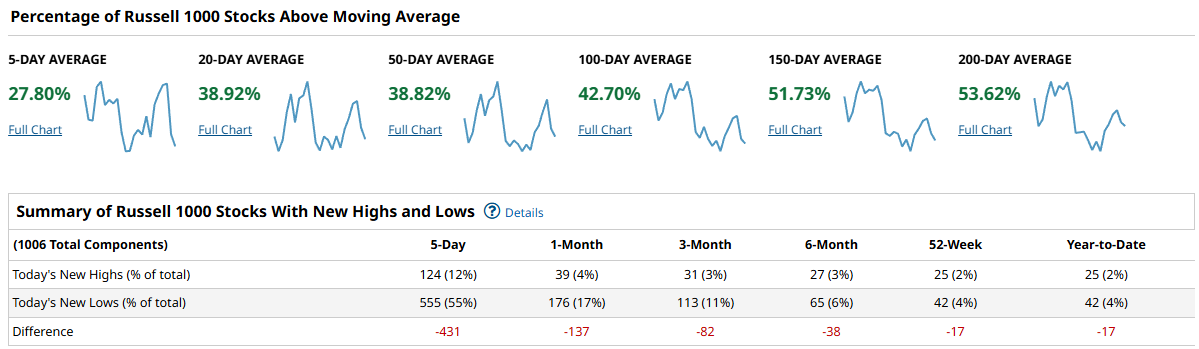
This week’s breadth picture is decisively about deterioration, not thrust. Across the major indices, only about a third of stocks are holding above their short-term moving averages, and new lows are swamping new highs on the 5-day and 1-month lookbacks. At the same time, a slim majority of names still sit above their 150- and 200-day averages, which says we are leaning more toward a correction within an ongoing bull phase than a completed top. The risk tone is cautious: downside pressure is broadening, and buyers have not yet shown the kind of persistence needed to reset the tape.
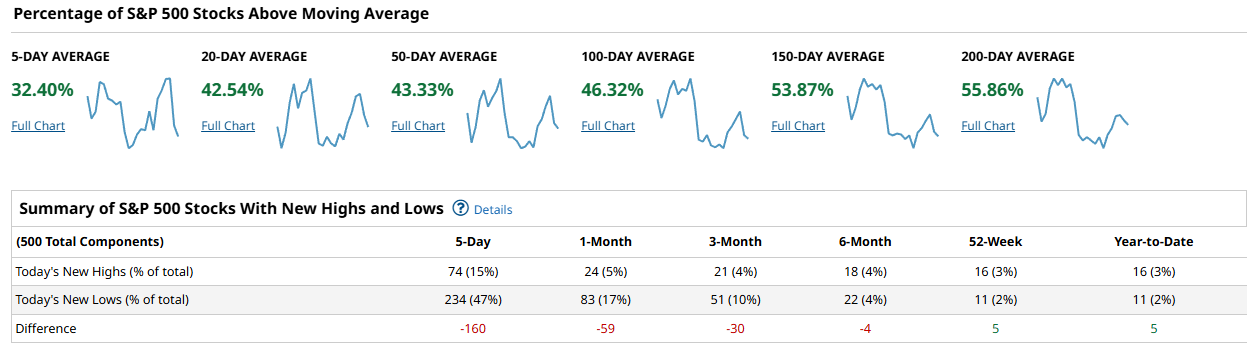
Starting with the S&P 500, only 32.40% of components are above the 5-day average and 42.54% are above the 20-day. The 50-day and 100-day cohorts sit at 43.33% and 46.32%, both below the halfway mark. It is only when you move out to the 150-day and 200-day that you see majority participation, at 53.87% and 55.86%. That combination — weak short- and intermediate-term breadth sitting on top of still-healthy long-term trends — is textbook corrective action. The new high/low table confirms the pressure: over the last 5 days, 74 names (15%) printed new highs while 234 (47%) hit new lows, a net of -160. On a 1-month basis, the difference is -59, and even the 3-month column is negative at -30. Only at the 52-week and year-to-date horizons do highs finally edge out lows, both with a small positive difference of 5. For the S&P, the message is that the long-term uptrend is intact, but sellers are firmly in control in the short term and have been for several weeks.

The Nasdaq 100 is telling a similar story, but with even more fragility in the shorter time frames. Just 32.35% of NDX stocks are above their 5-day average, and only 27.45% are above the 20-day. That is notably weaker than the S&P on a 20-day basis. Participation improves as you lengthen the lens, with 42.15% above the 50-day, 47.05% above the 100-day, and slim majorities of 50.98% and 52.94% above the 150- and 200-day respectively. New highs versus lows are heavily skewed to the downside: 12 highs against 54 lows over 5 days for a net of -42, and -25 over the past month. The negatives persist through the 3-month (-9) and 6-month (-7) columns, and even the 52-week and year-to-date tallies are mildly negative at -2. Large-cap growth leadership is no longer cushioning the tape; instead, the big tech complex is participating in the corrective phase and, on some measures, leading it.


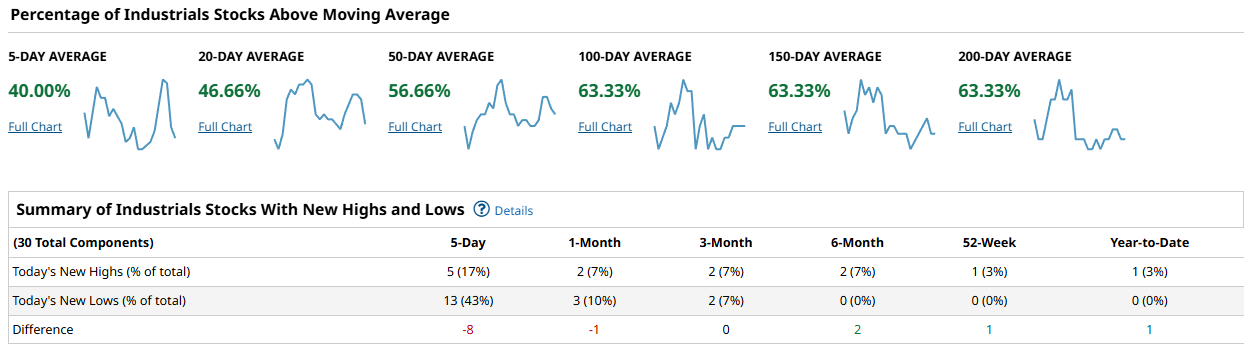
The Dow Industrials, labeled Industrials in the table, are holding up relatively better on a trend basis but not immune to near-term selling. Forty percent of the components are above the 5-day average and 46.66% above the 20-day, which is slightly stronger than the S&P and Nasdaq. Participation then steps up meaningfully, with 56.66% above the 50-day and 63.33% above the 100-, 150-, and 200-day averages. That alignment — a solid majority above every longer moving average — marks the Dow as the structurally strongest of the group. Even here, though, the new high/low profile has turned soft. Over the past 5 days, 5 stocks (17%) have made new highs, but 13 (43%) have printed new lows, for a net -8. The 1-month column is only slightly negative at -1, and by 3-month the difference is flat. The 6-month, 52-week, and year-to-date columns all show small positive nets of 2, 1, and 1. The Dow’s message is that the older, more cyclical leadership still sits in solid uptrends, but even there buyers are taking a breather and allowing some names to roll over.
The Russell 1000 is where you see the real damage. Only 27.80% of constituents are above their 5-day average, and 38.92% above the 20-day. The 50-day cohort is stuck at 38.82% and the 100-day at 42.70%. As with the other indices, breadth only flips positive at the longer horizons, with 51.73% above the 150-day and 53.62% above the 200-day. New highs and lows are ugly: in the last 5 days, 124 stocks (12%) have printed new highs while 555 (55%) have hit new lows, for a crushing net of -431. The 1-month difference is -137, the 3-month is -82, and the 6-month still sits at -38. Even the 52-week and year-to-date columns are negative at -17. This is the broad market telling you that under the hood, the average stock has been under steady pressure for some time.
Putting it all together, cap-weighted indices are being held up by longer-term uptrends and a still-positive majority above the 150- and 200-day moving averages, but the broad market is in a clear corrective phase. The Dow looks the best on trend, the S&P sits in the middle, the Nasdaq 100 has lost much of its leadership aura, and the Russell 1000 is bearing the brunt of the selling. Participation is narrowing, not broadening: on every index, less than half the components are above their 50-day average, and new lows dominate new highs on 5-day and 1-month horizons almost across the board. For a durable advance to reassert itself, we would want to see the percentage of stocks above the 50-day moving average push decisively back above 60% alongside a sustained flip in the high/low tables so that new highs outnumber new lows on both the 5-day and 1-month lookbacks. Until that happens, rallies are suspect.
From a playbook perspective, this argues for a more selective and risk-aware stance. Favor the pockets of the tape that remain above their 100- and 200-day averages and are not bleeding new lows, which currently leans toward the stronger Dow names and the higher-quality segments of the S&P. Be cautious with broad mid- and smaller-large stocks represented in the Russell 1000, where the weight of new lows suggests forced selling and ongoing de-risking. In the growth complex, treat bounces in Nasdaq leaders as opportunities to re-evaluate risk rather than chase, unless and until the short-term breadth metrics turn up decisively. The key confirmation to watch this week is whether the flood of new lows abates and the 5-day and 20-day breadth readings can climb back toward the mid-40s or better. If they continue to deteriorate, expect volatility to stay elevated and for defensive rotations to keep gaining ground.
Bottom line: breadth says this is an ongoing correction in a still-intact longer-term uptrend, and the burden of proof now sits squarely on the buyers.

Investor Sentiment Report
%Bull-Bear Spread
The %Bull-Bear Spread measures the gap between bullish and bearish investor sentiment, often from surveys like AAII. It’s a contrarian indicator—extreme optimism may signal a coming pullback, while extreme pessimism can hint at a potential rally. Large positive or negative spreads often mark market turning points.
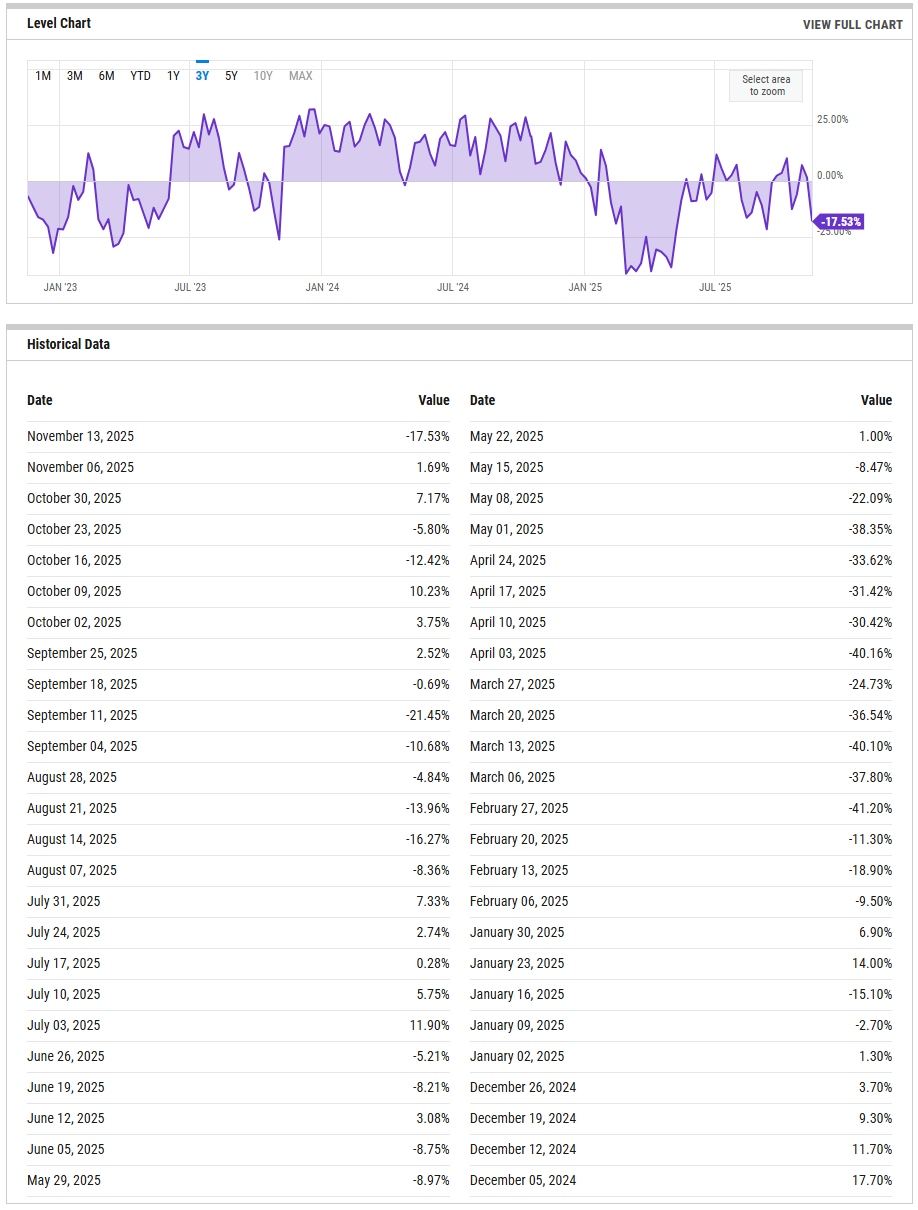
The AAII bull minus bear spread has flipped hard to the pessimistic side. The latest reading for November 13 is -17.53%, down from +1.69% last week and +7.17% the week before. In other words, we have moved from mild optimism to a clear net-bearish stance in just two weeks. The current level is not quite as washed out as the -21.45% seen on September 11, but it is back in the zone where past selloffs have started to exhaust. Historically, readings below 0 tend to support better forward returns as pessimism rises, while anything beyond roughly +20 signals a crowded bullish camp. If the spread were to push through -20 again without price stabilizing, it would argue there is still more forced de-risking to come; a snap back above 0 would be an early tell that dip-buyers are finally overpowering the bears.
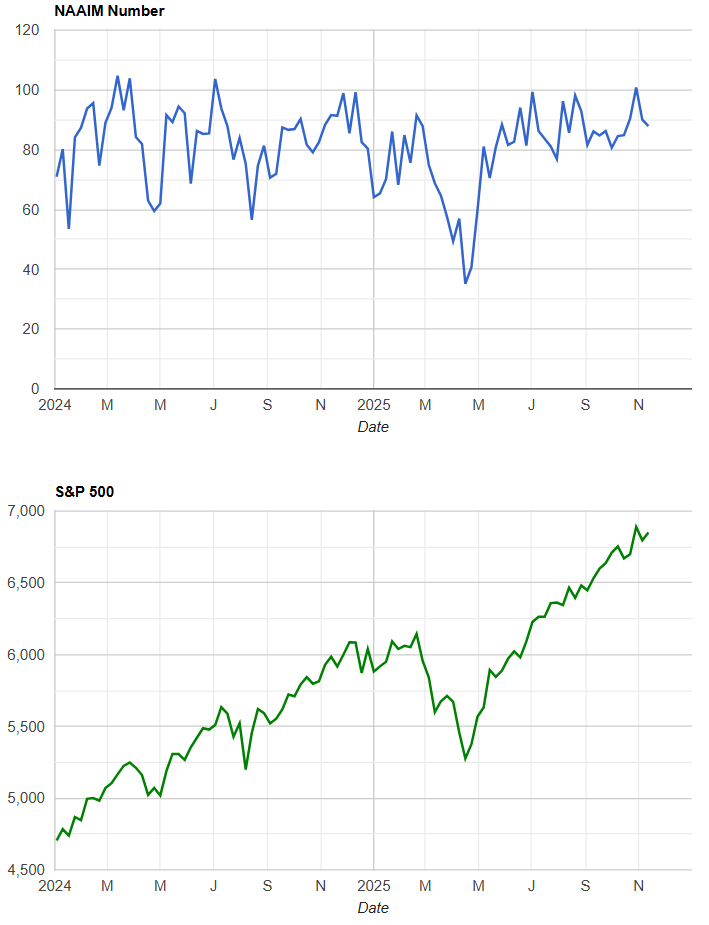
NAAIM Exposure Index
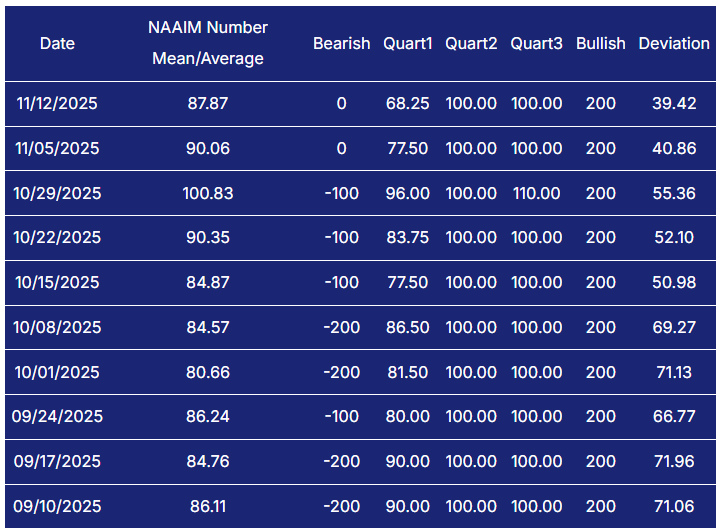
The NAAIM Exposure Index (National Association of Active Investment Managers Exposure Index) measures the average exposure to U.S. equity markets as reported by its member firms. These are typically active money managers who provide their equity exposure levels weekly. The index offers insight into how much these managers are investing in equities at any given time, ranging from being fully short (-100%) to leveraged long (up to +200%).
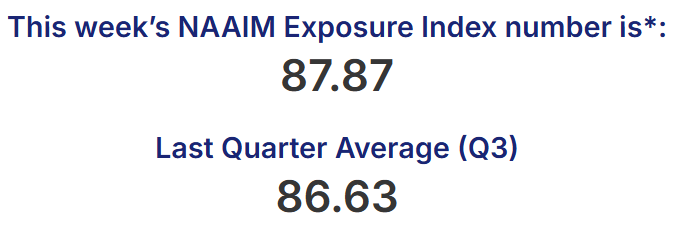
Against that emotional backdrop of the Bull-Bear-Spread%, the NAAIM Exposure Index shows active managers still running hot: the latest mean exposure is 87.87% after 90.06% last week and 100.83% on October 29. That sequence says professional money has trimmed a little, but is still mostly fully invested, leaving only modest dry powder and some vulnerability if selling accelerates. A slide in NAAIM down into the 50s without major index damage would suggest proactive risk management and create room for a more sustainable next leg higher; a push back above the mid-90s would instead mark renewed FOMO and a more fragile tape.
CBOE Total Put/Call Ratio
CBOE's total put/call ratio includes index options and equity options. It's a popular indicator for market sentiment. A high put/call ratio suggests that the market is overly bearish and stocks might rebound. A low put/call ratio suggests that market exuberance could result in a sharp fall.
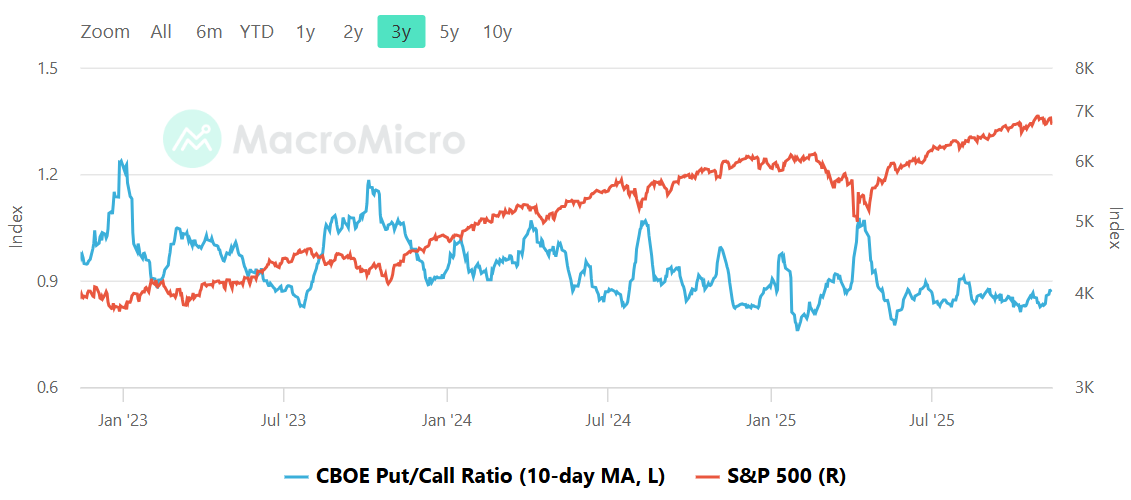
The CBOE total put/call ratio, shown as a 10-day moving average, is hovering around its mid-range near 0.9. Over the past three years, spikes toward roughly 1.2 have lined up with genuine stress events and tradable lows, while dips down near 0.7 have usually marked complacent, late-stage rallies. The current level sits between those extremes, signaling neither panic hedging nor aggressive call-chasing. For risk-taking behavior this week that means the options market is cautious but not seized up; investors are buying some protection, yet there is still a meaningful appetite for upside exposure. If the moving average were to grind up through 1.0 while prices hold, that would indicate growing fear and improve the odds that any downside break is relatively shallow and followed by a sharp bounce. Conversely, a slide back under about 0.8 without a reset in prices would tell you traders are getting comfortable again and any subsequent shock could cut deeper.
Equity vs Bond Volatility
The Merrill Lynch Option Volatility Estimate [MOVE] Index from BofAML and the CBOE Volatility Index [VIX] respectively represent market volatility of U.S. Treasury futures and the S&P 500 index. They typically move in tandem but when they diverge, an opportunity can emerge from one having to “catch-up” to the other.

On the volatility front, both the MOVE index for bonds and the VIX for equities have cooled back toward their recent baselines. After the outsized spikes earlier in the year, the MOVE index now sits in the neighborhood of the high 80s to low 90s, and VIX has slipped back into the high teens. That pairing describes a market that has stepped down from full-blown panic into a watchful, two-way regime: macro and rates risks are still present, but they are no longer being repriced violently day to day. For risk-taking, this combination usually favors more tactical trading rather than all-out defense or offense. The key tripwires remain the same. If MOVE were to rip back above roughly 120 while VIX stayed sleepy, that divergence would be an early warning that rates volatility is about to spill into equities. On the other side, a break in VIX through the low-20s with equities under pressure would confirm a new stress phase and argue for tighter risk budgets and shorter holding periods.
CNN Fear & Greed Constituent Data Points & Composite Index
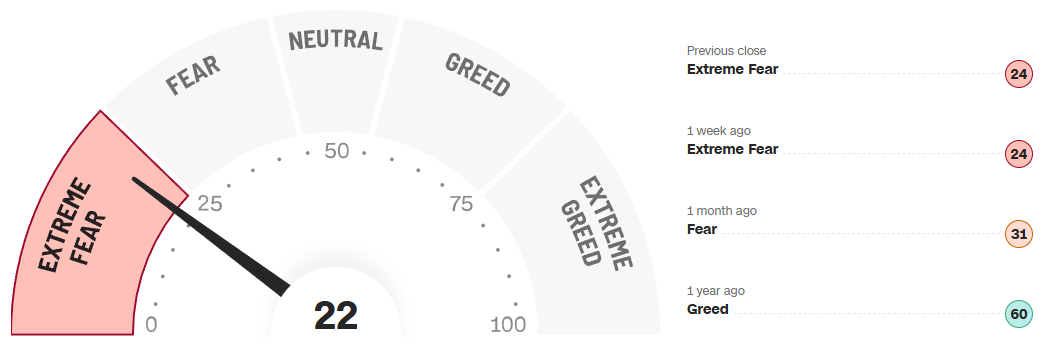
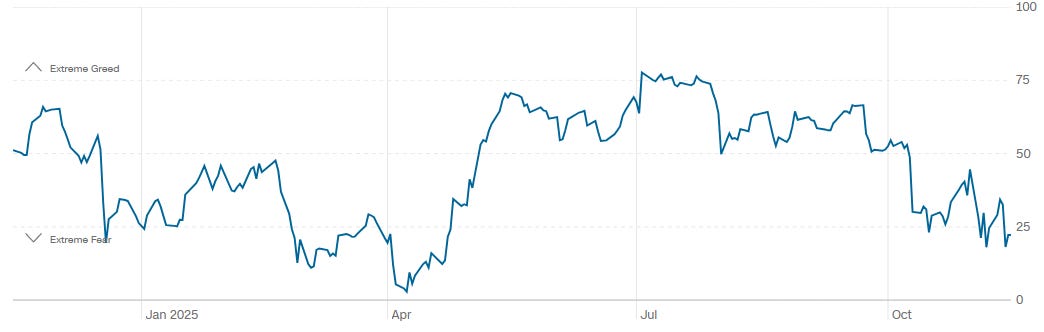
The CNN Fear & Greed composite sits at 22, firmly in the Extreme Fear band. That is a notch below the previous close and last week’s reading of 24, and down from 31 a month ago, when conditions were merely labeled Fear. One year ago the gauge stood at 60, in outright Greed, underscoring how far sentiment has swung from euphoria to caution over the past twelve months. The one-year path shows a full cycle: fear in the spring, a surge to extreme greed above 75 in June and July, and then a steady stair-step lower into today’s low-20s. This kind of persistent fear regime often coincides with choppy tape and reluctant buying, but it also tends to lay the groundwork for better forward returns once selling pressure exhausts. A decisive break below 20 would mark true capitulation and usually offers a better entry window for medium-term buyers; a rebound back toward the 50 zone would signal that the market has digested the scare and is transitioning toward a more neutral, trend-friendly environment.
Bottom line: surveys and composite gauges have swung back to fear while positioning and volatility remain only mid-range, leaving a market that is emotionally fragile but still reasonably invested, where further downside could be sharp but would likely sow the seeds for the next durable rebound.
Social Media Favs
Social sentiment offers a real-time view of investor mood, often revealing market shifts before traditional indicators. It can signal momentum changes, spot emerging trends, and gauge retail investor impact—especially in high-volatility names. Tracking sentiment around events or earnings provides actionable insights, and when layered with quantitative models, can enhance predictive accuracy and risk management. Sustained sentiment trends often mirror broader market cycles, making this data a valuable tool for both short-term trades and long-term positioning.

Technician’s Playbook: Trading the Majors (SPY/QQQ/IWM/DIA)
When you’re a large institutional player, your primary goal is to find liquidity - places to do a ton of business with the least amount of slippage possible. VolumeLeaders.com automatically identifies and visually plots the exact spots where institutions are doing business and where they are likely to return for more. It’s one of the primary reasons “support” and “resistance” concepts work and truly one of the reasons “price has memory”.
The week unfolded as a broad de-risking across all four index ETFs, but the texture of that selling differed meaningfully between SPY, QQQ, IWM, and DIA. What stands out most is how concentrated the pressure became into a handful of high-notional prints sitting directly on or just below major Level shelves, with SPY and QQQ showing clear attempts at absorption at the lows, IWM revealing early responsive buying but no follow-through, and DIA displaying more distributive behavior into strength. The tape reads like a market that hit an air pocket, found willing buyers at first touch of key supports, but has not yet proven it can convert those responses into sustained acceptance back through overhead supply.
SPY
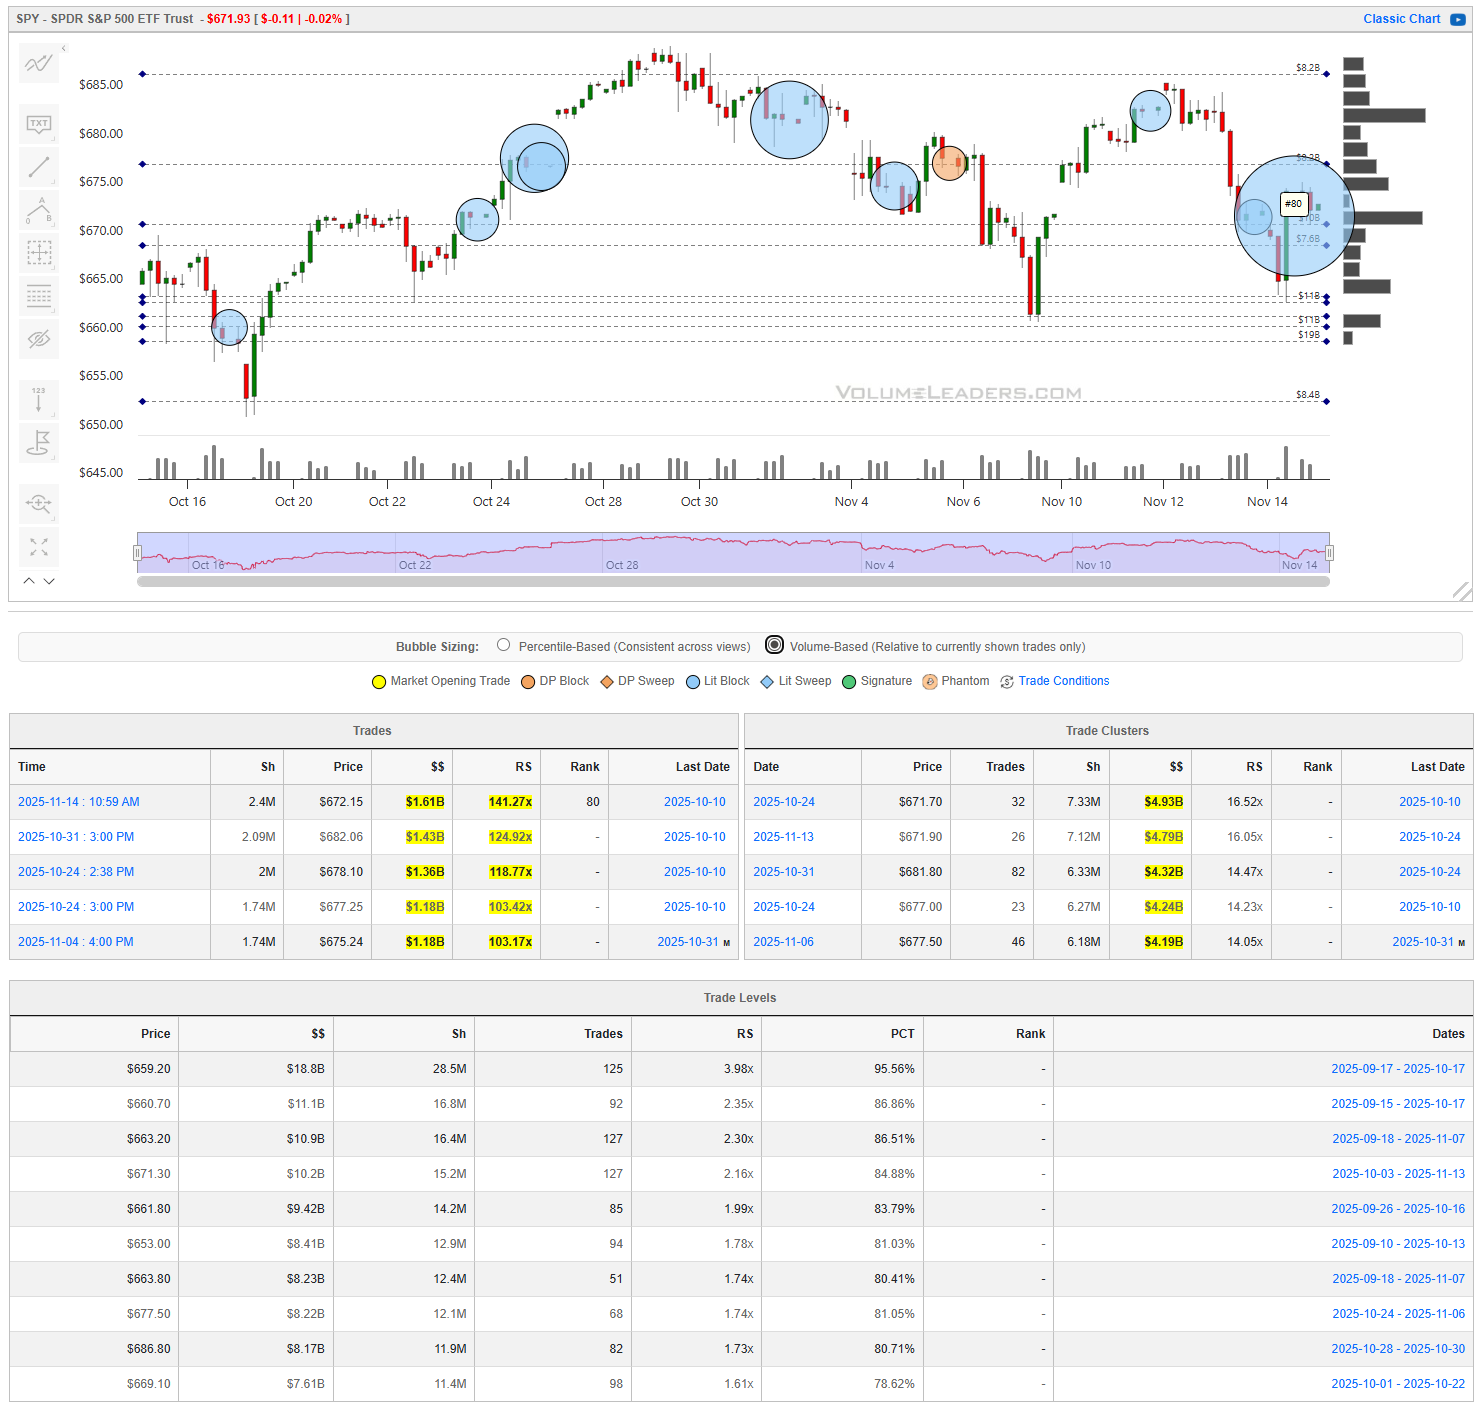
SPY carried the cleanest structure of the four. The cascade lower accelerated into a cluster of heavy prints around the mid-$670s, including notable buys near $671–$672 with $$ values in the $14–$18B range and RS readings north of 140%. Those are meaningful trades, and the #80 tag on one of the clusters highlights that a historically large accumulation occurred just off the lows. Below that area, the Level table shows dense support between roughly $659 and $663, with notional stacks ranging from about $9B to $18B and PCT scores above 80% in several rows. This makes the $663–$671 band the primary line of scrimmage. Acceptance above the weekend lows followed by a push through the $671 shelf would signal buyers are absorbing the liquidation and preparing to rotate back toward the $680–$683 region where prior heavy clusters sit. A failure back through $663 instead reopens the lower shelves toward the high $650s, where only lighter Levels remain and liquidity thins out. For a tactical trader, the cleanest structure favors waiting for either acceptance above $671 for a momentum continuation, or a spike-down rejection below $663 for a fade back into the range. Anything in between is churn.
QQQ
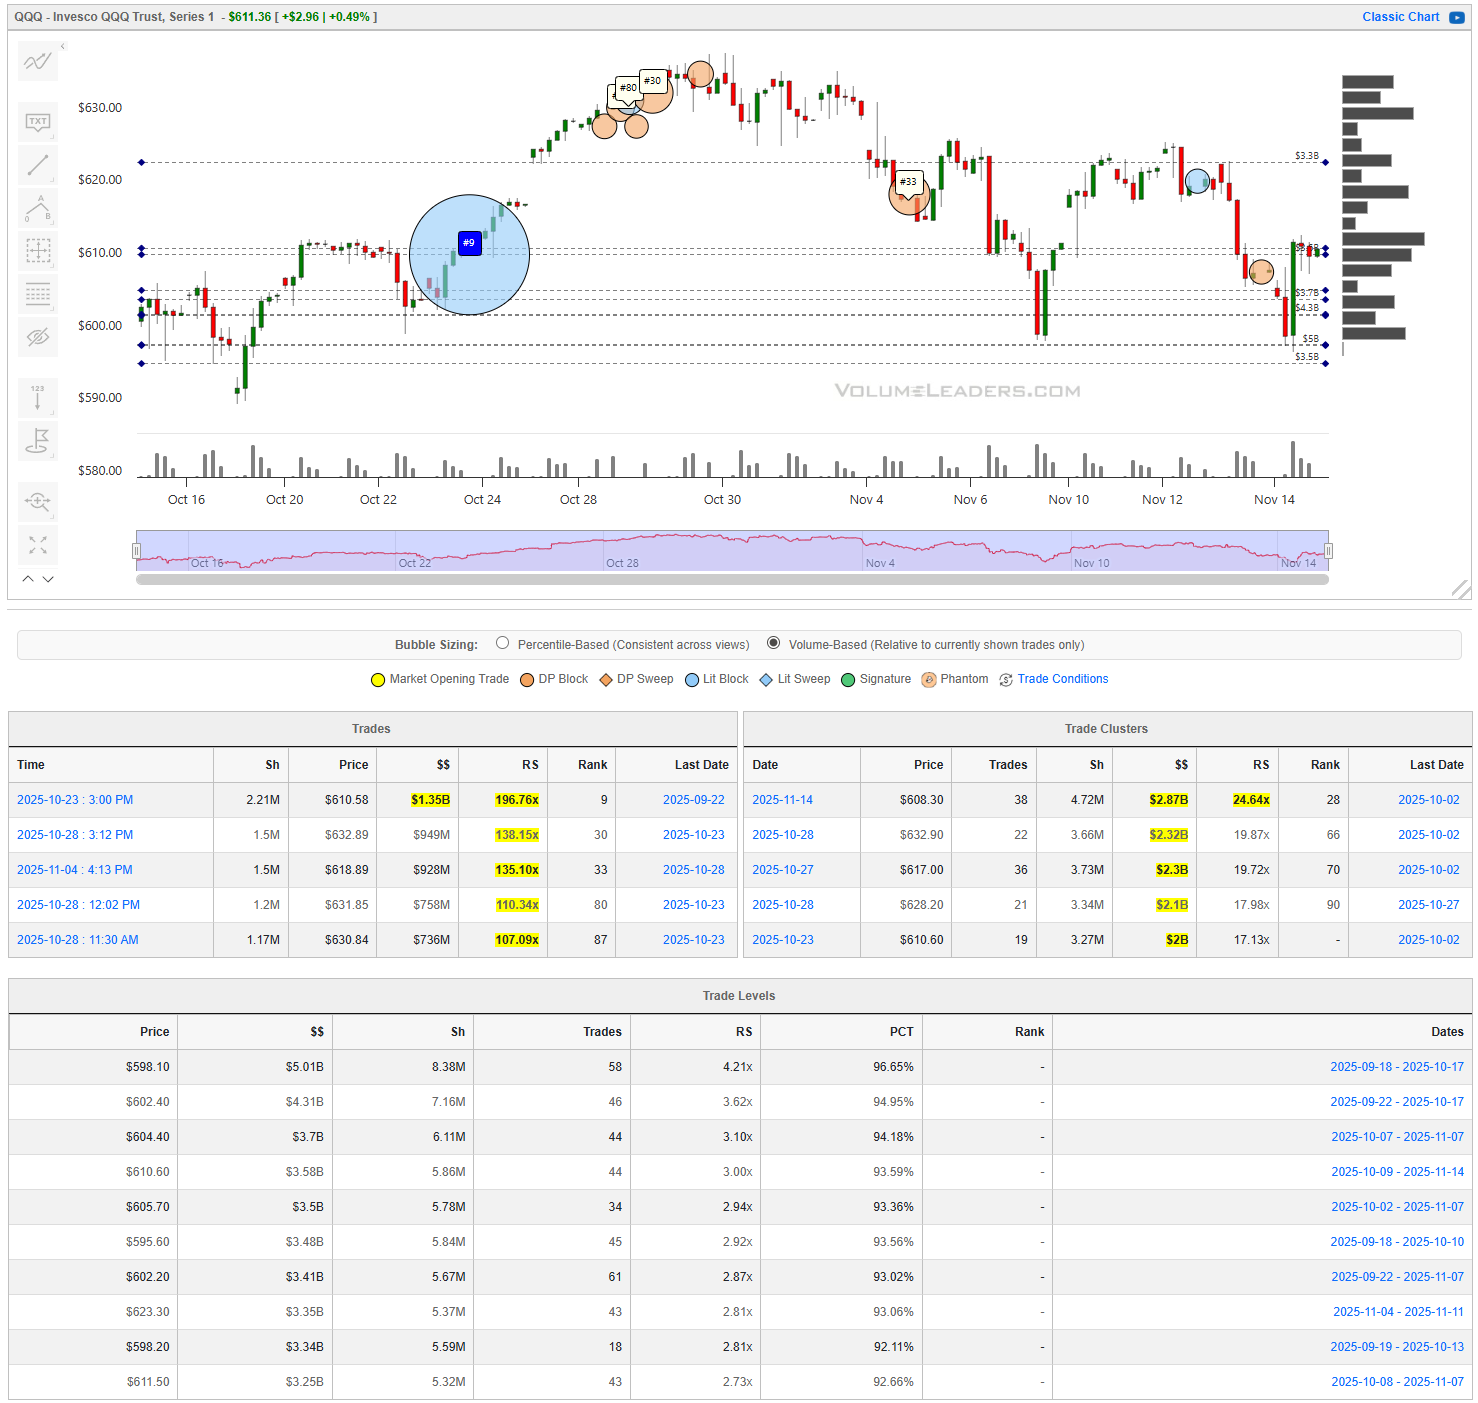
QQQ offers a similar but slightly stronger response dynamic. The standout trade is the 2.21M-share buy around $610.58 with roughly $1.36B in notional and a 196% RS, one of the largest relative prints in the visible dataset. That tells you that real money stepped in aggressively at first touch of the low $610s. The Level grid confirms why: the shelves at $598–$611 are packed with $1.8B–$5B in notional with PCT marks of 85–96%. Once QQQ reclaimed the $610–$615 region, buyers defended it several times. On the upside, clusters around $628–$632 show $$ tallies in the $2.8B–$3.2B range with RS readings around 20X, making that the first major resistance band. A bullish path requires acceptance above $620 and then a clean rotation into the $628–$632 block; if buyers stall below that, the tape remains corrective. A bearish break comes from losing $610 on strong volume, which would force a revisit of the deep support shelf toward the high $590s.
IWM
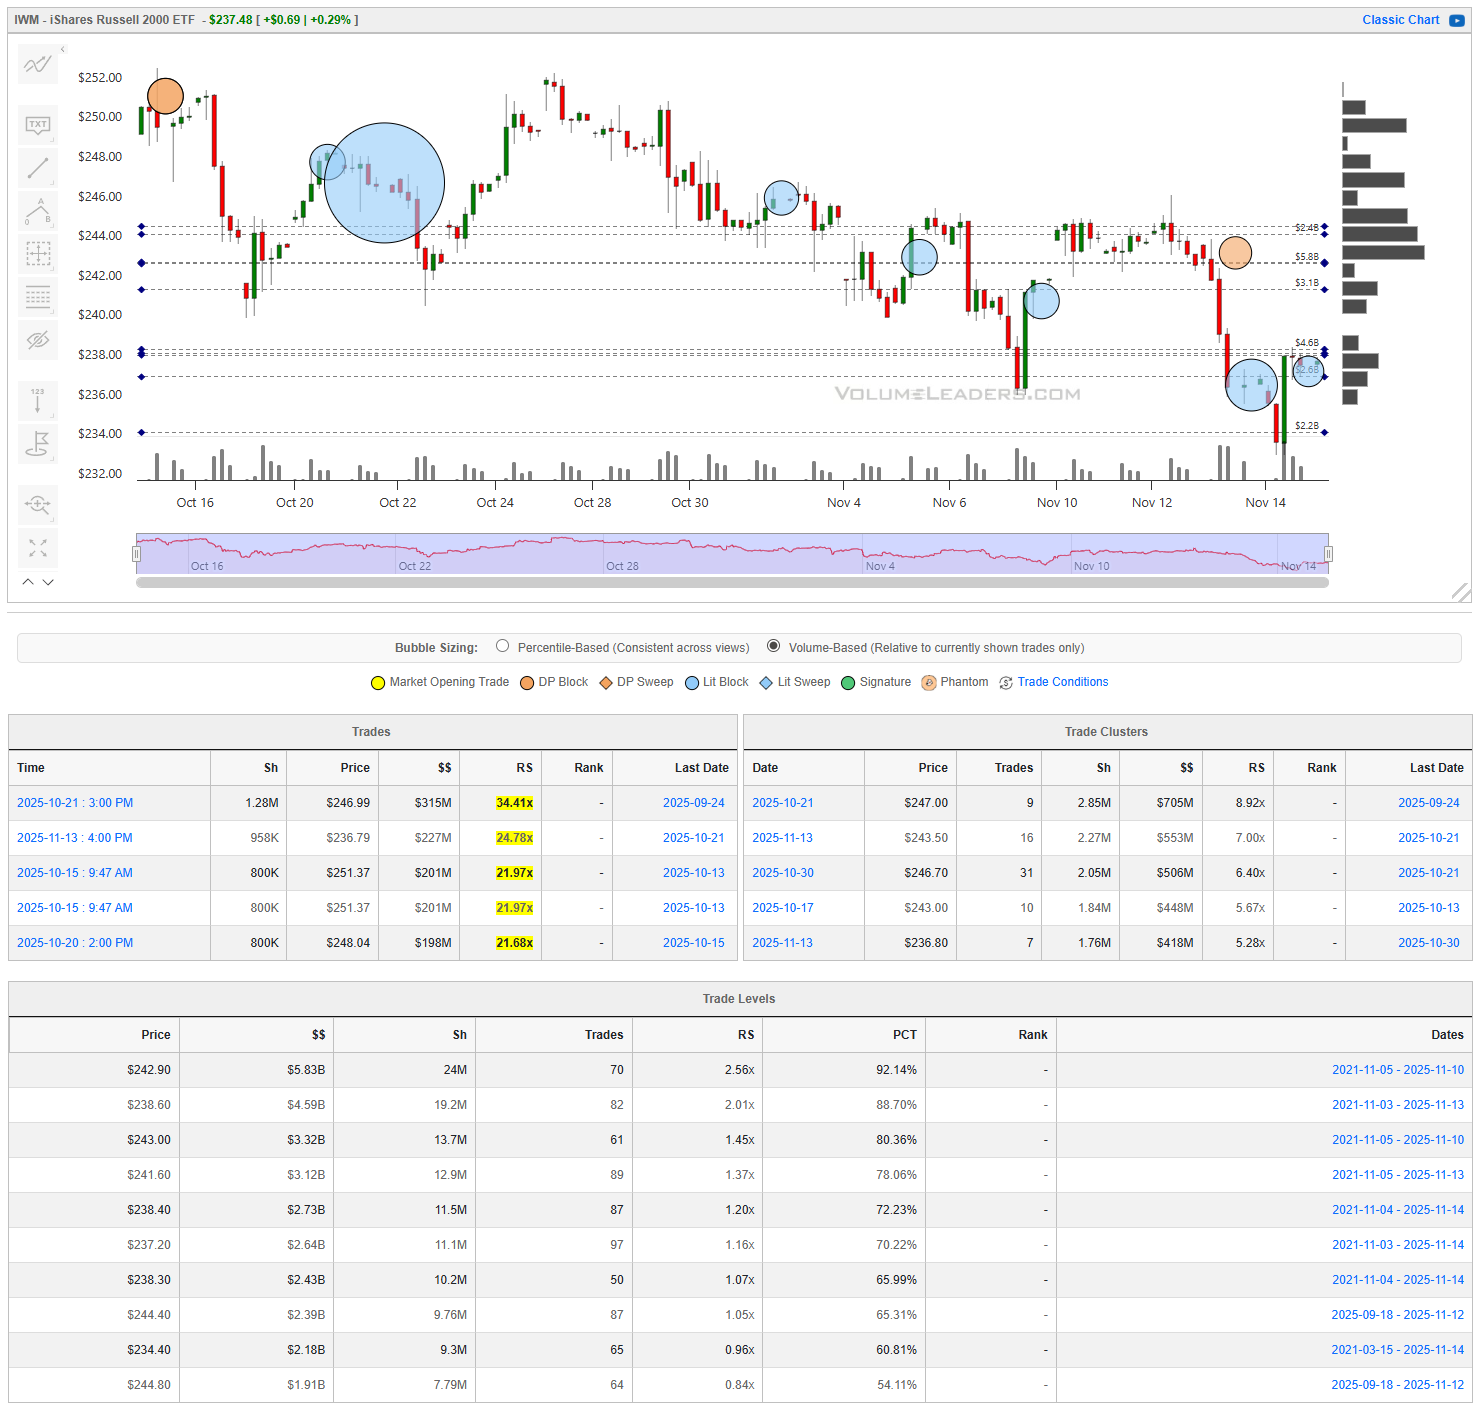
IWM had early signs of responsive buying, including prints in the $246–$249 zone with $200–$300M per block and RS readings in the 20X–34X range. But unlike SPY and QQQ, the follow-through was thin and each attempt to build a higher low met quick rejection. The most critical band is $236–$239, where clusters hold $418M–$705M with RS from about 5X to 9X. IWM’s close just above that region leaves it perched on a knife’s edge. A bullish case requires holding $236 and reclaiming the $243–$246 shelf where several large prints and Level concentrations reside. A loss of $236, especially with a swift pick-up in block selling, reopens air down to the low $230s where no strong Levels appear. Tactically, the asymmetry favors watching for a flush that instantly reverses, rather than preemptively buying support that has not proven itself.
DIA
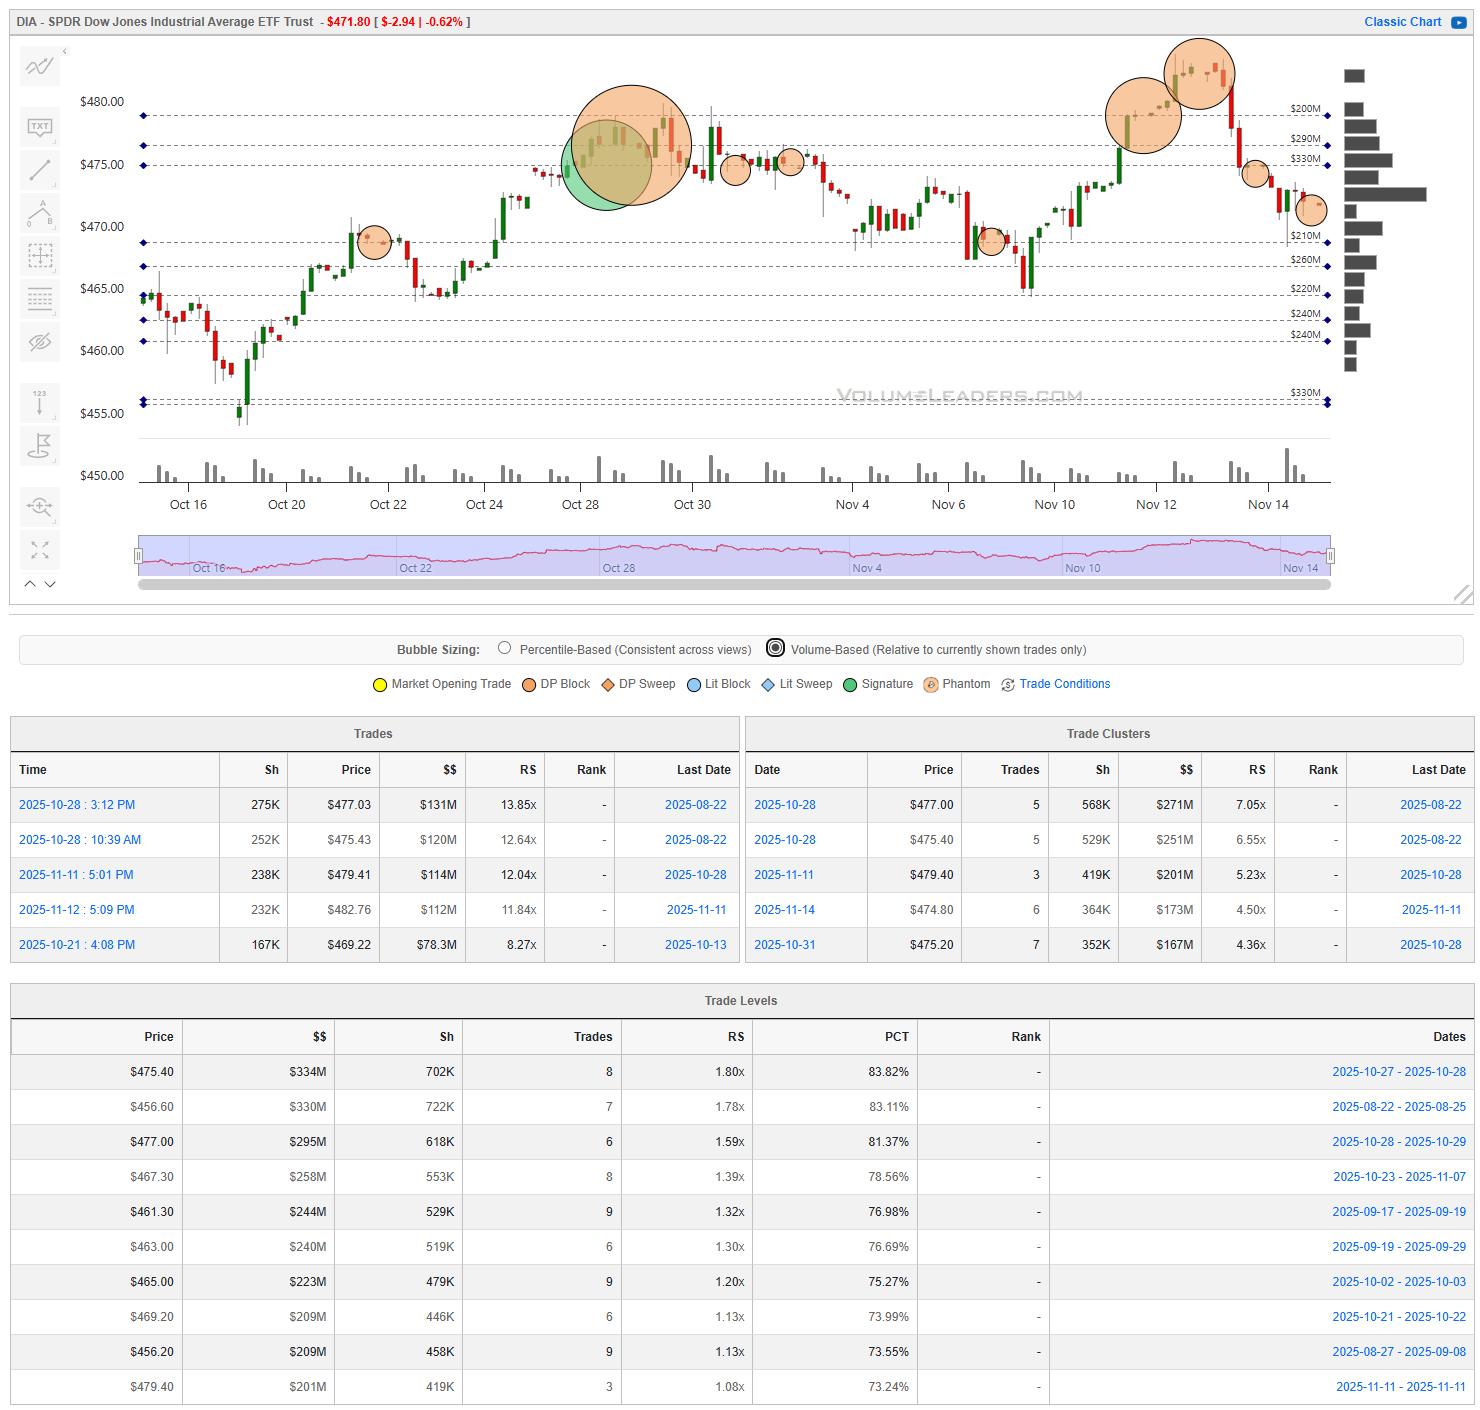
DIA is the most distributive of the four. The large orange circles near $475–$480 show repeated heavy selling, including significant prints in the $470s with eight-figure share sizes and $$ in the $120M–$170M zone. Clusters around $475 carry RS scores above 7X, evidence of sellers dominating that region during the recent balance. Support Levels below sit between $462 and $468 with notional in the $200M–$350M range, but they are not as imposing as SPY’s or QQQ’s shelves. A bullish rotation requires DIA to reclaim $470 with conviction; failure to do so invites further grinding lower toward $463 and potentially $460. For disciplined traders, invalidation becomes simple: strength above $470 is constructive, weakness below $463 keeps the bias pointed down.
Bottom line: the tape shows meaningful attempts at absorption in SPY and QQQ, tentative stabilization in IWM, and ongoing distribution in DIA, leaving the next sessions contingent on whether buyers can reclaim the first overhead shelves before sellers press their advantage again. Key prices:
SPY: 671, 663, 659, 680, 683
QQQ: 610, 615, 620, 628, 632, 598
IWM: 236, 239, 243, 246, 249
DIA: 470, 475, 480, 468, 463, 460

Summary Of Thematic Performance YTD
VolumeLeaders.com offers a robust set of pre-built thematic filters, allowing you to instantly explore specific market segments. These performance snapshots are provided purely for context and inspiration—think about zeroing in on the leaders and laggards within the strongest and weakest sectors, for example.
S&P By Sector
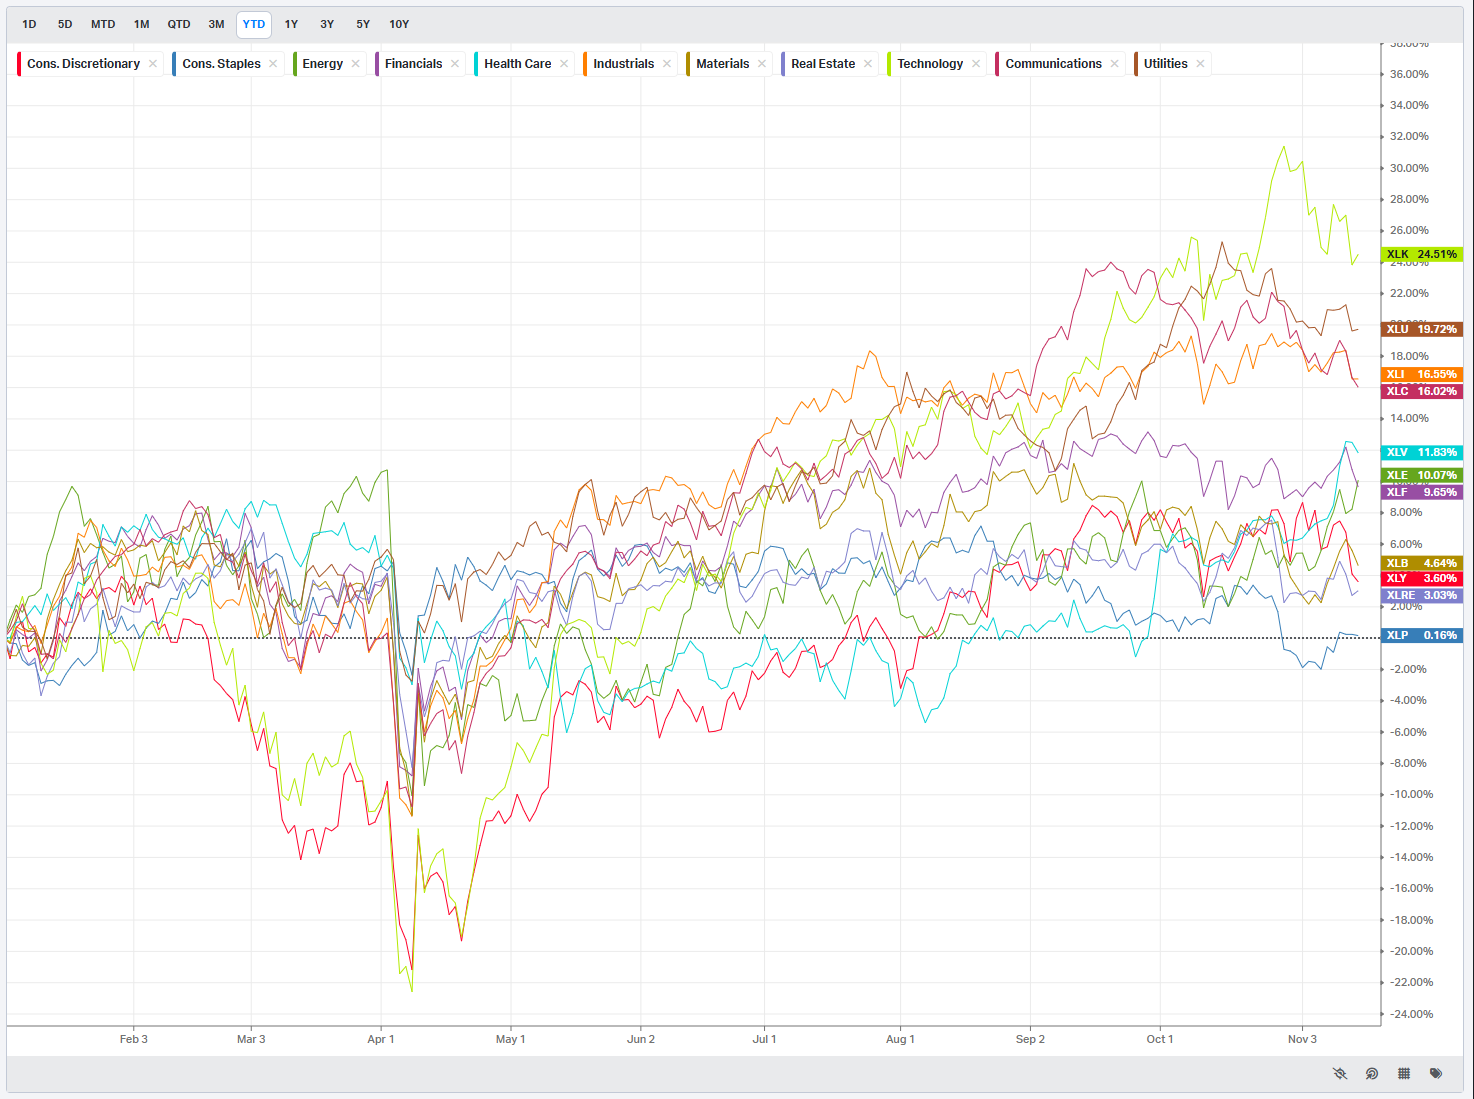
S&P By Industry

Commodities: Energy & Metals

Currencies/Major FX Crosses
Factors: Style vs Size-vs-Value

Events On Deck This Week
Here are key events happening this week that have the potential to cause outsized moves in the market or heightened short-term volatility.
The coming week is shaped by a dense run of Fed speeches, a cluster of housing and production data, and an earnings board that tilts heavily toward retail and mega-cap tech. After several weeks of deteriorating breadth and elevated cross-asset stress, this calendar arrives at a vulnerable moment. The tone of the tape will hinge on whether growth data can stabilize without reigniting inflation concerns, and whether any of the Fed speakers open the door to recalibrating the path of policy.
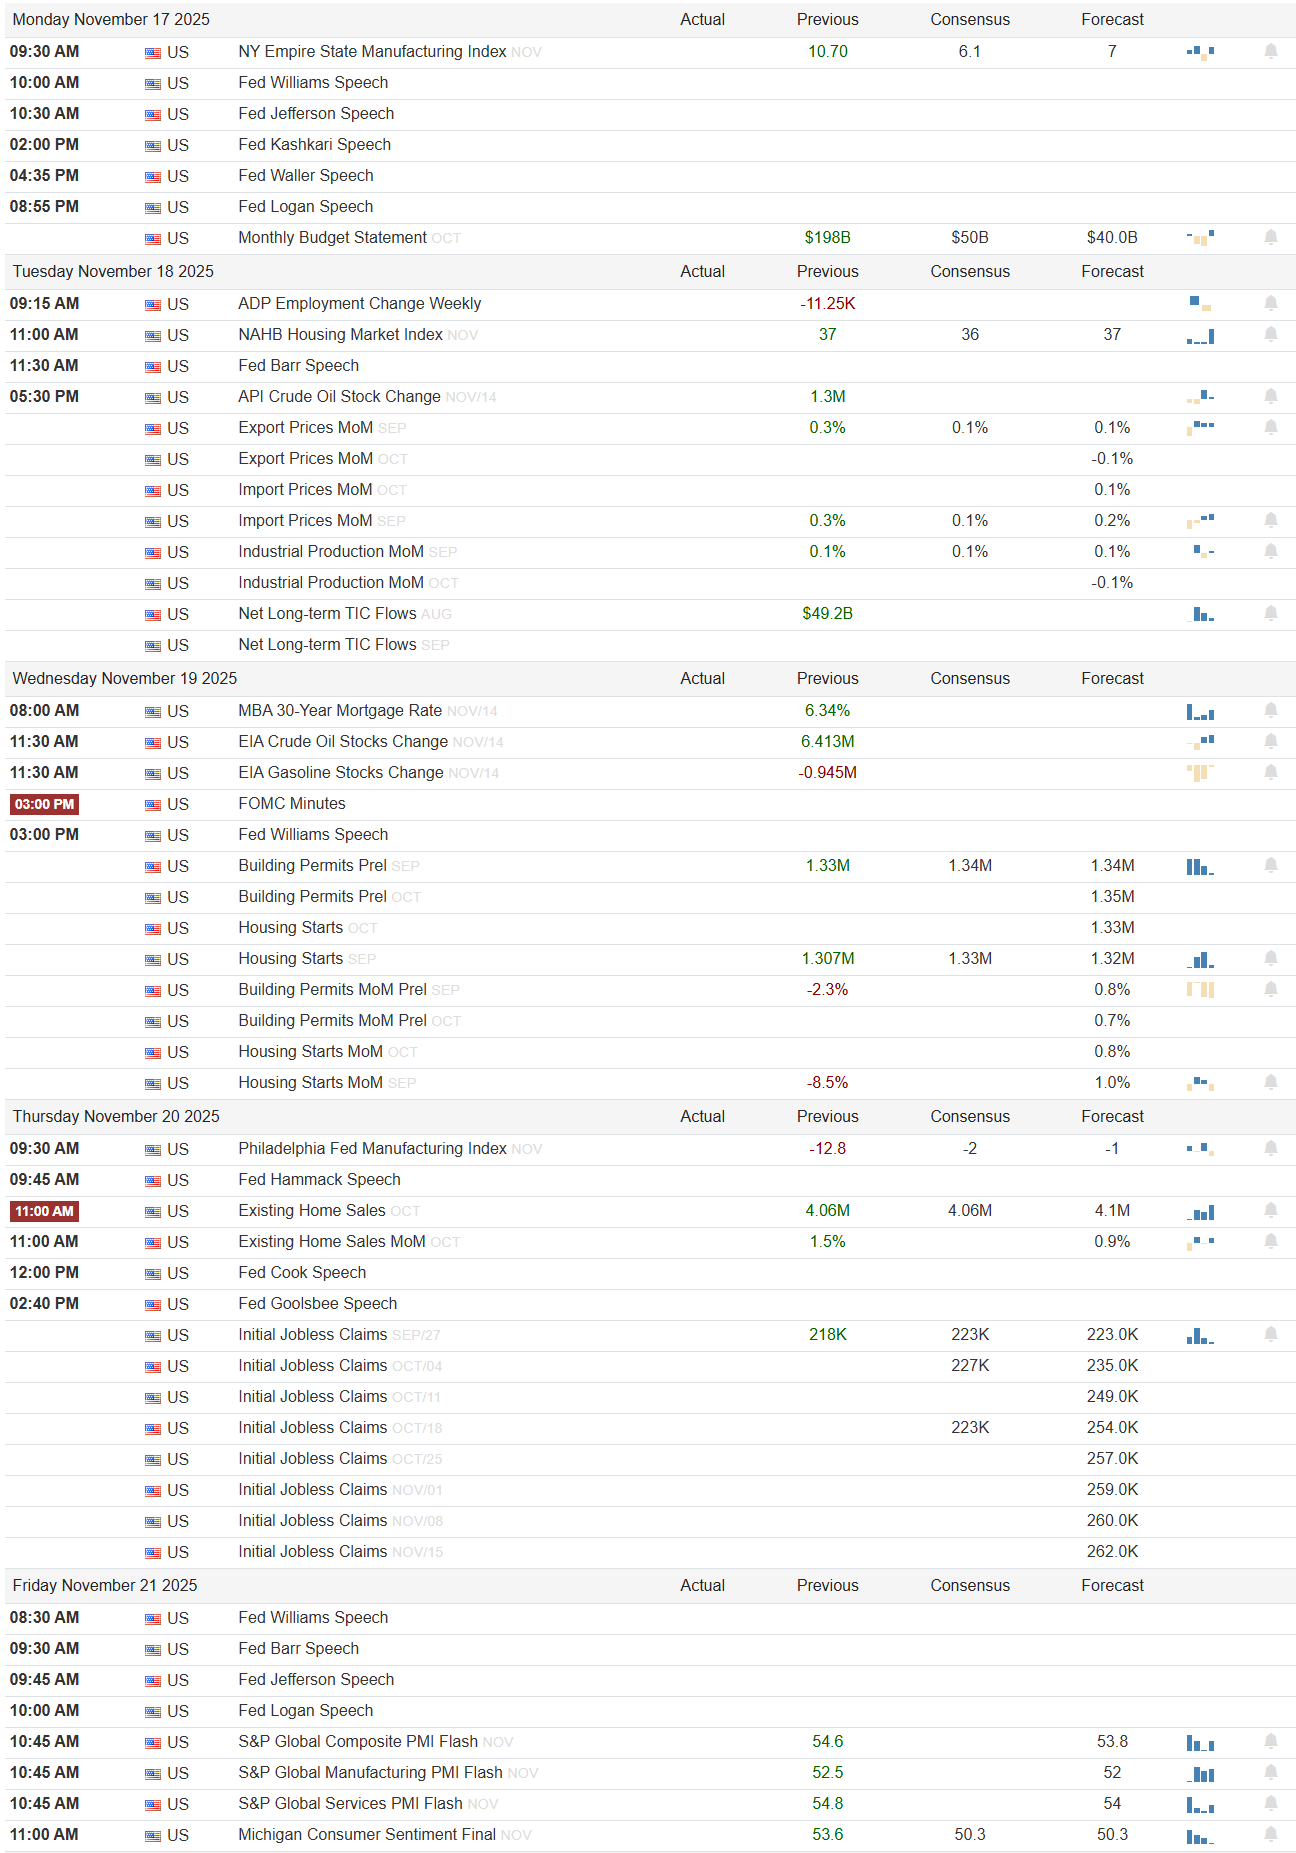
Monday, November 17
The week starts lightly, with the NY Empire State Manufacturing Index showing a previous reading of 10.70 and a consensus of 6.1 with a forecast of 7. A print materially below that range would reinforce the soft manufacturing trend that has been reasserting itself since late summer and would lean risk-off, especially for cyclicals and small caps. Conversely, anything holding in the mid-single digits or better would help stabilize expectations heading into the midweek data cluster. The heavier influence on Monday is the slate of Fed speakers: Williams, Jefferson, Kashkari, Waller, and Logan all appear. With no major releases attached to their remarks, markets will be hyper-sensitive to any comment that validates the recent market view that policy is restrictive enough. A collective lean toward caution or a reiteration of “higher for longer” would add pressure to a tape already fighting weak internals. Treasury’s Monthly Budget Statement is listed at $198B for the previous print; while not typically a market mover intraday, persistent fiscal drag can color macro narratives when rates volatility is elevated.
Tuesday, November 18
Tuesday is the most data-heavy day of the week and carries the greatest potential for directional conviction. The ADP Employment Change comes first with a previous reading of -11.25K. There are no consensus or forecast numbers shown, but any continuation of contraction would add to evidence of softening labor conditions. Housing sentiment hits next through the NAHB Housing Market Index, with a previous of 37, a consensus of 36, and a forecast of 37. Stability here would be modestly risk-on, suggesting rate-sensitive housing is finding footing, while a dip would reinforce the strain from higher mortgage costs.
Later in the day, commodity and trade data arrive: API Crude Oil Stock Change shows a previous +1.3M, while Export Prices MoM and Import Prices MoM show previous readings of 0.3% and 0.3% respectively. Flat to cooler import price figures are risk-on for equities as they ease inflation pressure, whereas a surprise jump would squeeze the soft-landing narrative. Industrial Production MoM remains a key print: the previous reading is 0.1% with matching consensus and forecast at 0.1%. A miss here would add weight to recession watchers; a beat would be welcomed broadly by cyclicals. Finally, Net Long-term TIC Flows previously printed at $49.2B, a level that, if repeated or improved, would signal continued foreign demand for US assets.
Wednesday, November 19
Wednesday brings a split tone. On the one hand, mortgage demand weakens with the MBA 30-Year Mortgage Rate sitting at a previous 6.34%, a level that continues to pressure housing activity. Crude and gasoline inventory data follow: EIA Crude Oil Stocks previously rose 6.413M while gasoline stocks fell -0.945M. Equity markets will read continued crude builds as easing supply tightness, generally risk-on for consumers and transports but risk-off for energy equities.
Building data rounds out the morning with Building Permits Prel at 1.33M (previous), matching consensus and forecast. Housing Starts show a previous 1.307M with consensus at 1.33M and forecast at 1.32M. Should both figures hold near expectations, it would reassure markets that housing is stabilizing. A sharp downside miss, especially alongside higher mortgage rates, would weigh on sentiment. The afternoon is dominated by FOMC Minutes and another round of Fed commentary, with Williams returning to speak. With rates volatility already pulling back, a hawkish tilt here would be risk-off; a balanced tone would help the market absorb the earlier data.
Thursday, November 20
Thursday offers the second major inflection point. The Philadelphia Fed Manufacturing Index shows a previous reading of -12.8 with consensus at -2 and forecast at -1. That spread is wide, and any print confirming deeper contraction would reinforce weakening factory conditions. Housing reappears with Existing Home Sales, showing a previous of 4.06M, a matching consensus of 4.06M, and a forecast of 4.1M. A downside miss here would confirm the mortgage-rate drag highlighted earlier in the week; a beat would be an incremental risk-on surprise. Initial Jobless Claims are broken out across multiple reference periods, with the key previous value at 218K and consensus/forecast at 223K. A move materially above 223K would feed the labor-softening narrative now building underneath the headline figures.
Friday, November 21
Friday carries the macro capstone. The S&P Global Composite PMI Flash shows a previous of 54.6 and a forecast of 53.8, while the Manufacturing PMI Flash has a previous of 52.5 with a forecast of 52. These are still growth-positive readings; a downside surprise would quickly revive slowdown fears. Services PMI Final has a previous of 53.6 against consensus 50.3 and forecast 50. Forecasts point sharply lower; if realized, they would raise questions about the consumer and services resilience that has been propping up the expansion. Additional Fed commentary from Williams, Barr, Jefferson, and Logan keeps rate sensitivity elevated into the weekend.
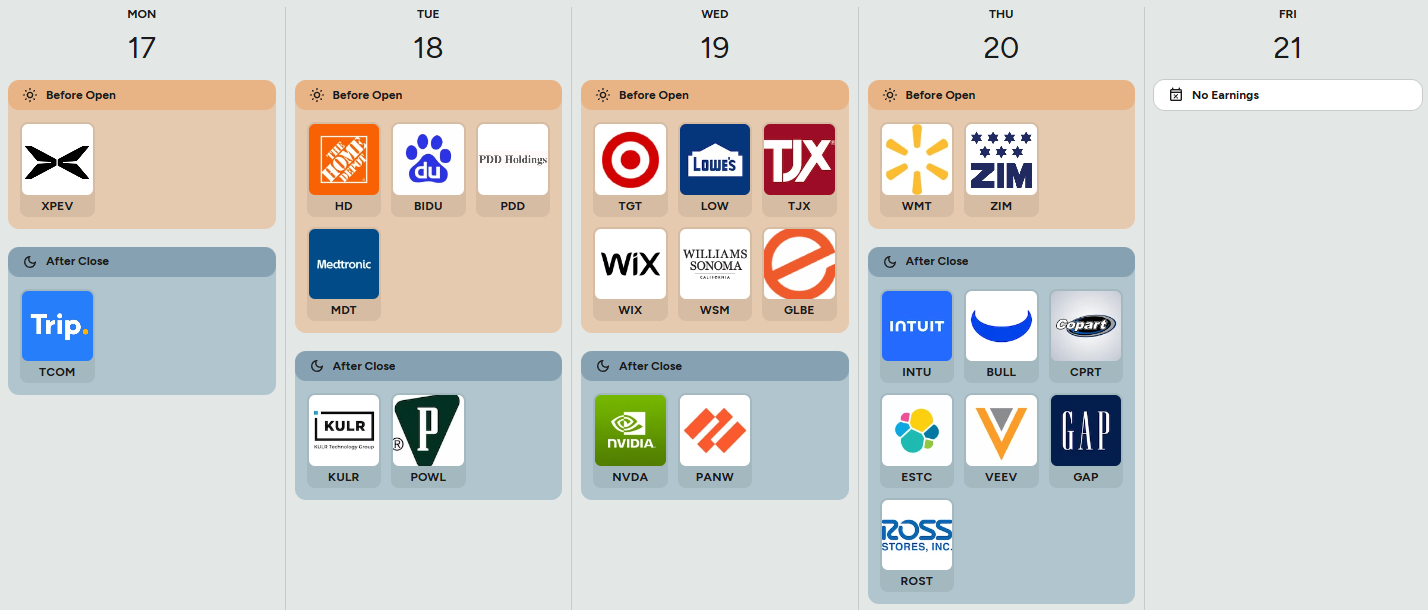
The earnings board tilts heavily toward retail, housing-adjacent names, and two large-cap tech anchors. Home Depot, Lowe’s, Target, TJX, Williams-Sonoma, and Gap deliver a wide read on discretionary demand. The key lines to watch are same-store sales, inventory levels, and margin compression, each a direct tell on the health of the consumer. Walmart adds a mass-market angle before the open on Thursday, with any weakness likely to spill across retail broadly. On Wednesday after the close, Nvidia and Palo Alto Networks report; their guidance will drive semis and security spending sentiment into year-end. A beat from Nvidia, especially on data center, would firm up risk appetite. Misses from any of these names will weigh heavily given the market’s current fragility.
Order Flow in Focus: Reading Smart Money Tells
Order Flow in Focus: Reading Smart Money Tells is a recurring segment that spotlights unique intraday opportunities revealed through institutional order flow. Each feature dissects a moment when the tape quietly shifted—when large, ranked prints clustered at key liquidity locations and informed players positioned ahead of the move. The goal isn’t hindsight; it’s pattern recognition—learning to spot the footprints of capital that knows before the crowd does.
PARR offered a clean, information-led opportunity this week, and the tape left enough footprints that an attentive trader looking to participate in industries showing relative strength this week could have built conviction long before the breakout. The setup began taking shape on November 7th, not during the intraday action, but at the close. At 4:00 PM, a 151K-share closing print hit the tape at $41.15 for $6.26M in notional and a 2.56x RS reading. In a ticker of this size, that is meaningful. Closing prints of size are rarely noise: they are either fund rebalancing or deliberate accumulation, and context decides which. Here, the context was unmistakable—this print landed directly on top of a deep liquidity zone, evidenced by the stacked Levels: $41.10 ($20.7M), $40.48 ($20.1M), and $40.40 ($18M). When size chooses to anchor itself on a wall like that under price and presenting as support/demand, it’s signaling that real money wants to own shares down there and carry inventory higher.
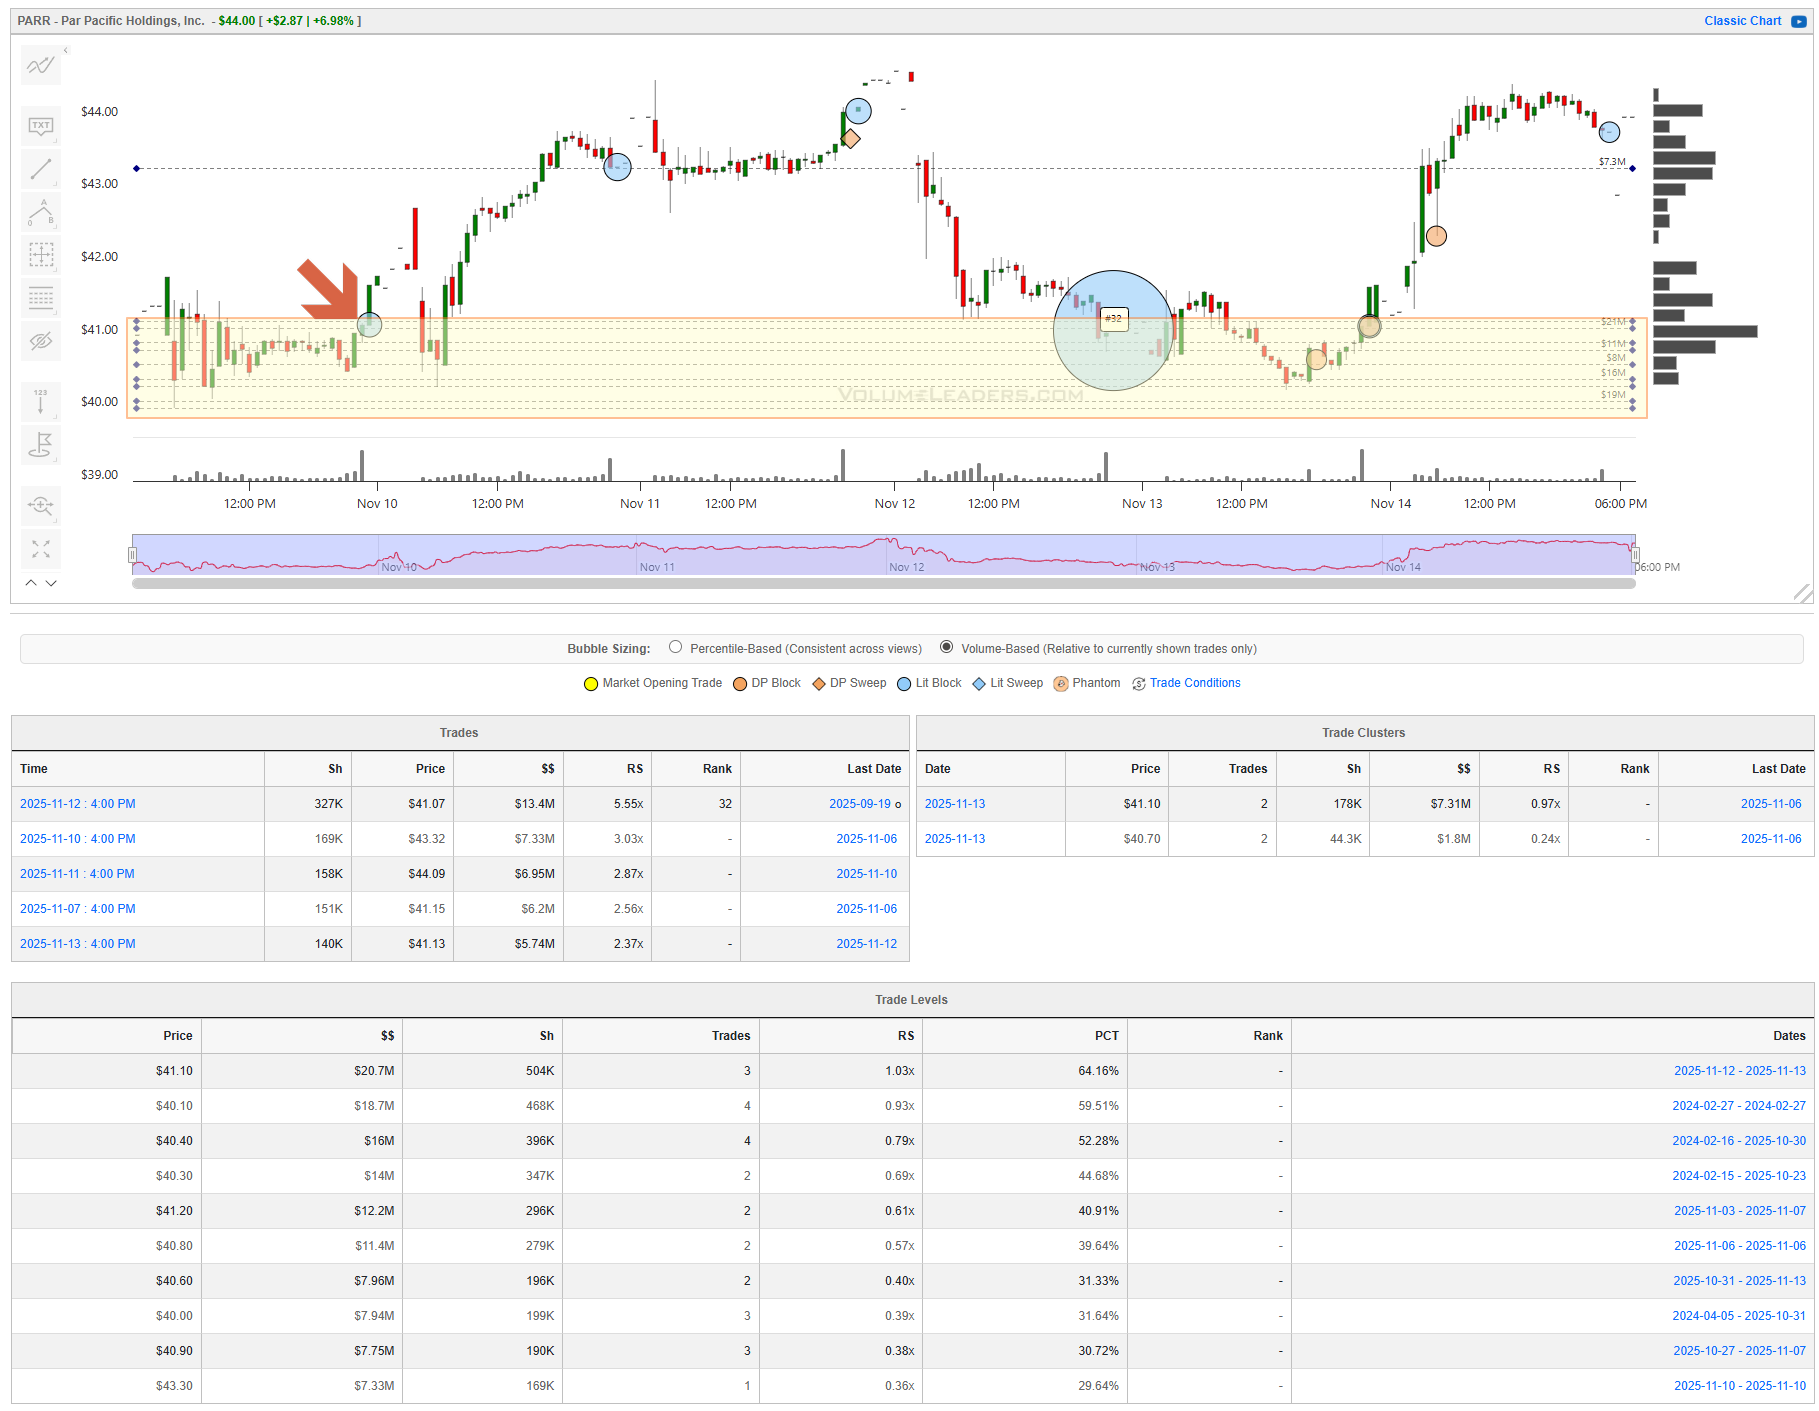
Over the next session, price tested the low $41s repeatedly, and every dip into the Level-stack held, no follow-through to the downside. The real confirmation came five days later. On November 12 at 4:00 PM, another large closing print hit: 327K shares at $41.07 for $13.4M in notional and a 5.55x RS. This one carried a top-100 historical tag (#32) and was more than twice the size of the earlier closing buy. If the November 7 print was a test balloon, this was commitment. Smart money doubled down on the same Level, at the same time of day, in even greater size. Few intraday tells are more powerful than an escalating series of closing-session buys located on a major liquidity shelf.
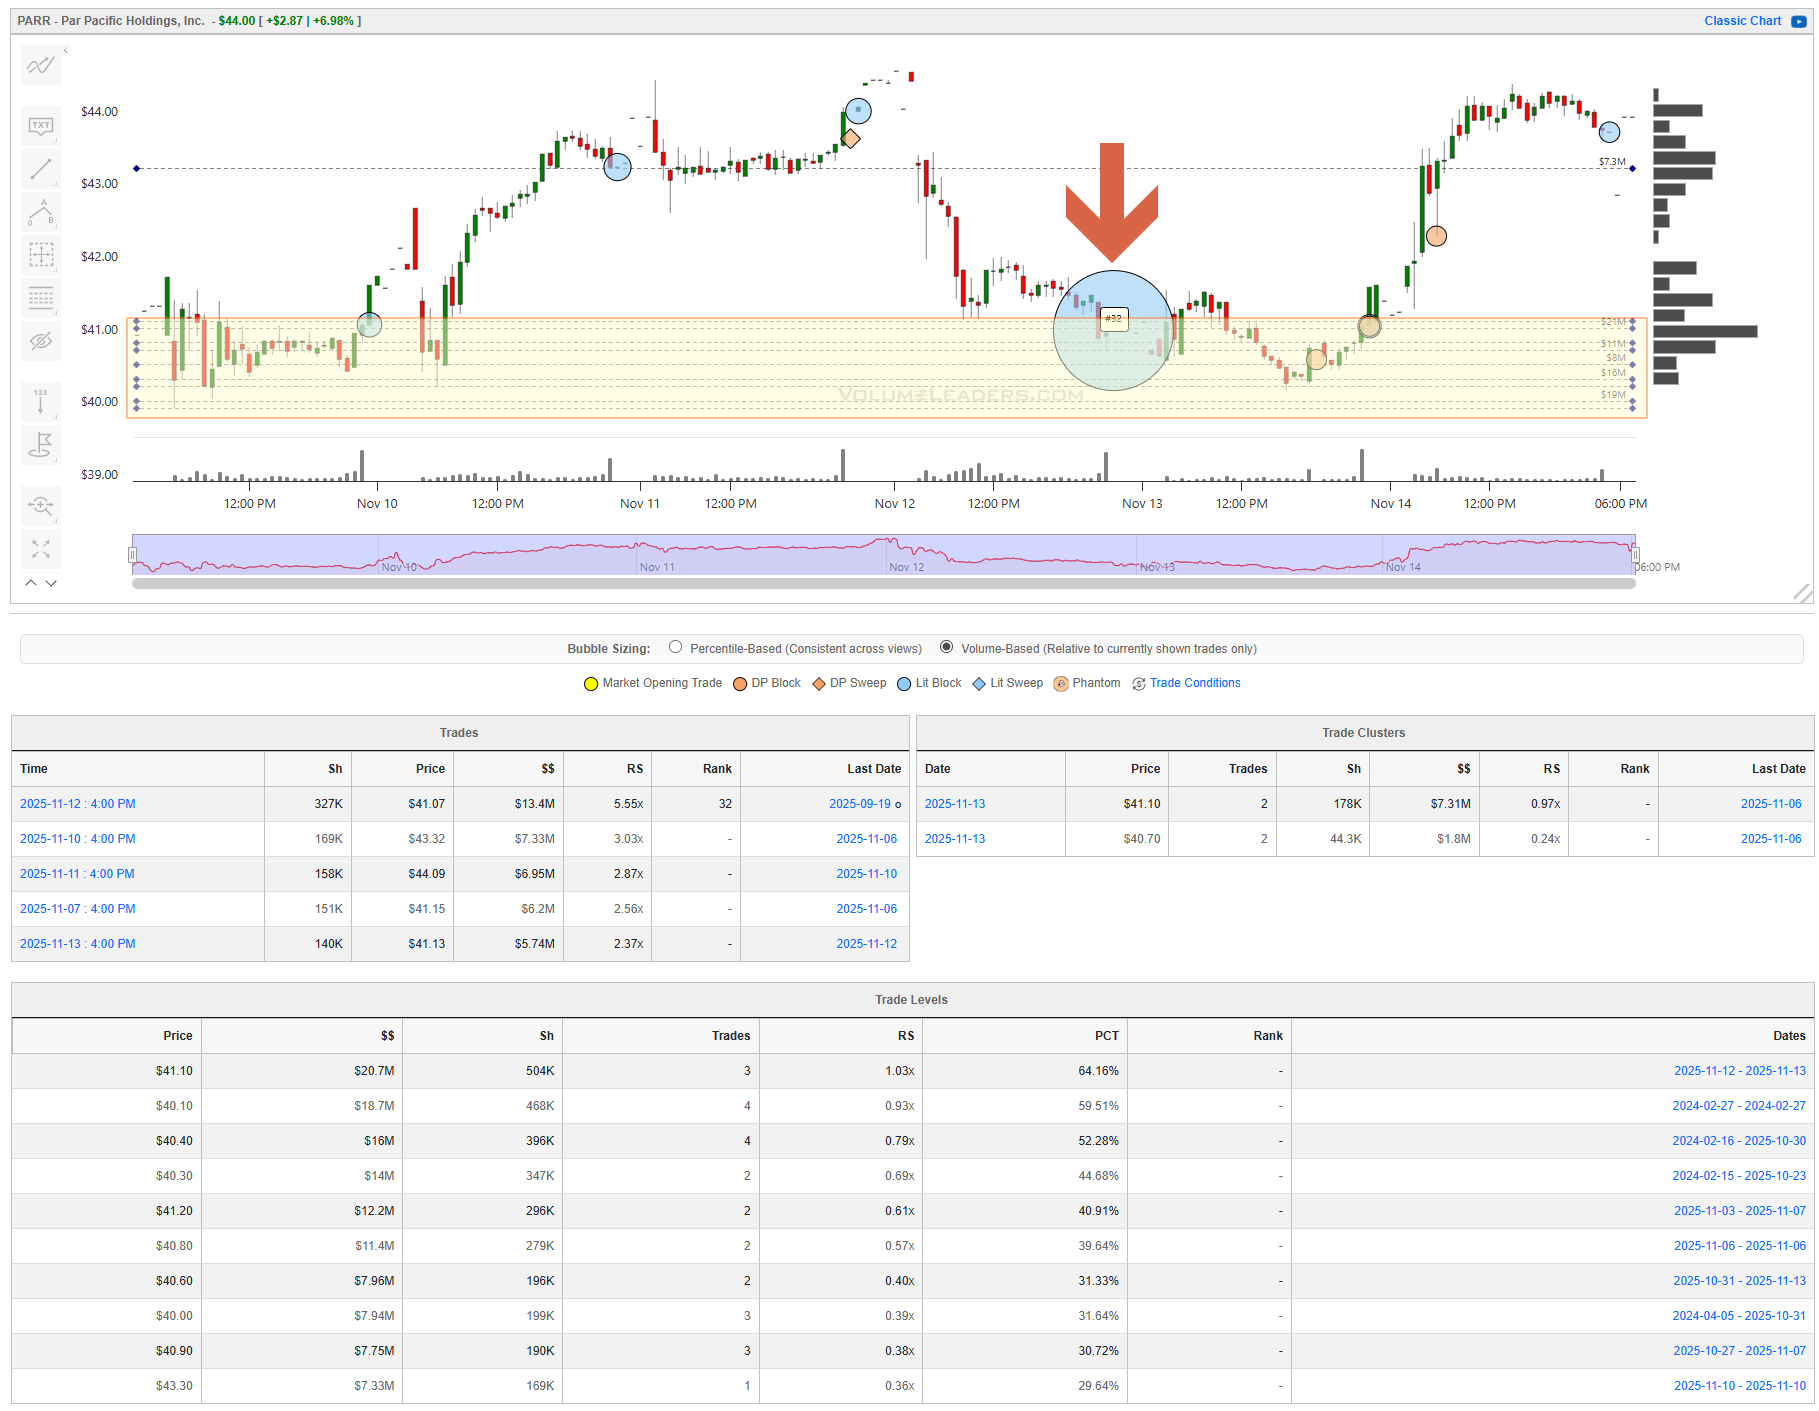
From that moment forward, the long bias became obvious. The first sign of strength appeared when price swept below the print for one last liquidity-grab and to trap miscalculating sellers before it lifted up-and-through $42 without attracting any competing high-RS sells. PARR moved straight through the mid-$42s and into the $43s, unwinding days of built-up energy in a single session. There were no large sellers waiting overhead, no competing clusters, nothing to impede the path.
Clear targets for tactical swings were carved ahead of the trade: the overhead level at $43.30, the gap fill created from the Nov 12 open, and thin interest at prior highs. As price probed into the $43.80–$44.00 region on November 14, the tone shifted and candles started compressing. The size that had been so eager to buy in the low $41s went quiet. When a name that just broke out begins stalling into a thin zone without ranked buyers, the reward-to-risk compresses quickly and it’s time to trim some.

The trade, had you been watching the flow rather than the chart alone, was straightforward: recognize the November 7 closing print as accumulation on a major stack of VL levels, wait for confirmation via the much larger November 12 closing buy, enter as price reclaimed $42 with no resistance, and begin exiting into $43.80–$44 as momentum faded; optionally leave some on with stop at break-even to see if PARR will gift more to the patient in coming session.
Bottom line: PARR telegraphed the entire move—accumulation $40-thru-$41, clear invalidation below the institutional liquidity pool that VL made obvious, confirmation through a ranked closing buy, a second chance to join on a re-test and a momentum release straight into $44 where the tape finally exhaled.

Market Intelligence Report
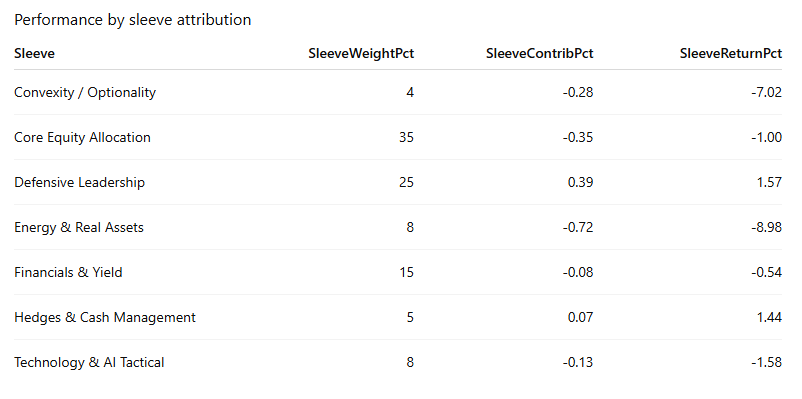
This week the portfolio gave back some ground, finishing down roughly 1.1%. The design did what it was supposed to do in several places: defensive health care exposure and index hedges worked, and the short-vol / carry sleeves were broadly steady. Where we took real heat was in the commodity and uranium complex and in the convexity hedges tied to crypto. In other words, the portfolio did not “break,” but the higher-octane risk expressions more than offset the steady grind from the core and defensive sleeves.
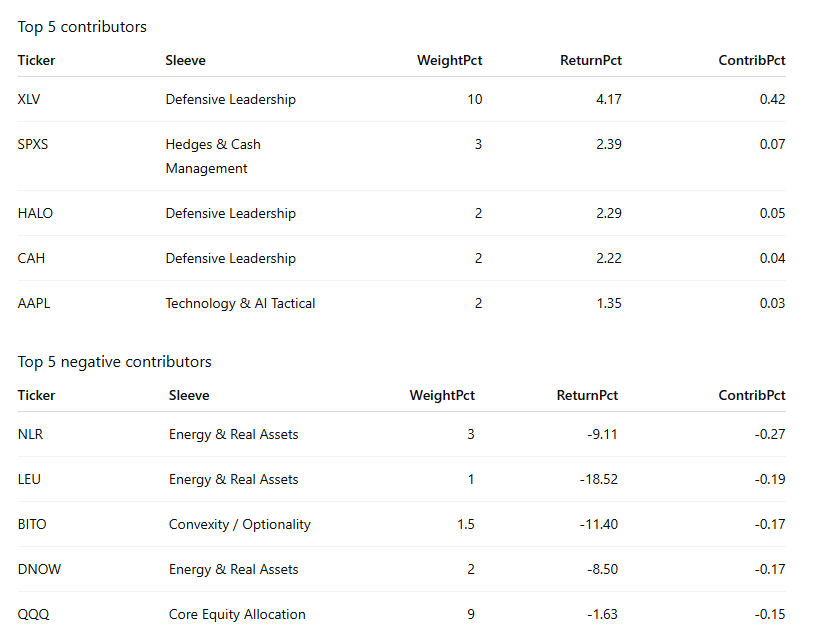
Defensive Leadership was the clear standout. At the sleeve level it returned about +1.6%, contributing roughly +0.4% to total performance. XLV gained 4.2% on the week and alone contributed about +0.42%, with CAH and HALO adding smaller but still meaningful boosts at +2.2% and +2.3% respectively. XLRE and XLU lagged but their losses were modest and easily absorbed by the strength in health care. Hedges & Cash Management also did its job: SPXS rose 2.4%, adding about +0.07%, while VUSB stayed flat and preserved dry powder. Together, these two sleeves delivered a little over +0.5% of positive contribution, cushioning what would otherwise have been a much rougher week.
Core Equity Allocation was a controlled drag. SPY, IVV, and QQQ were all lower, with returns between roughly -0.8% and -1.6%. Because this is a 35% sleeve, even small index moves matter, and Core Equity shaved about -0.35% off the portfolio, or about a -1.0% sleeve return. It is worth noting that the losses were orderly rather than panicky; this still looks like a de-risking and factor rotation tape, not a wholesale liquidation.
Technology & AI Tactical, where we had dialed down leverage but kept high-conviction names, was mildly negative. The sleeve lost about -1.6%, or -0.13% of total portfolio performance. AAPL was a bright spot with a 1.4% gain, contributing +0.03%. That was more than offset by weakness in NVDA (-2.5%), NOVT (-3.0%), and WTAI (-4.9%), each taking a few basis points off performance. RCAI did not move in the data set, effectively flat for the week. Overall, this sleeve behaved like a higher-beta version of the core book: not catastrophic, but no help.
The pain came from Energy & Real Assets and the Convexity / Optionality bucket. Energy & Real Assets fell nearly -9.0% at the sleeve level, costing about -0.72%. NLR was the single worst name in the book with a -9.1% decline, dragging performance by -0.27%. LEU collapsed -18.5% and cost -0.19%, while DNOW (-8.5%) and CEG (-7.8%) added another -0.25% or so of negative contribution. FSM was a minor loser. The sleeve still fits the thesis of owning real-asset beta, but this week it was squarely on the wrong side of flows. Convexity / Optionality lost about -7.0% as a sleeve, subtracting roughly -0.28%. Both BITO (-11.4%) and ETHT (-25.4%) were hit hard alongside crypto, together costing about -0.30%. GLD and SIVR did what they could, with SIVR up 1.7% and GLD flat, but they were too small to counter the crypto drawdown.
Financials & Yield were a minor drag, down about -0.5% at the sleeve level and -0.08% on contribution. VCLT and XLF both slipped just under -1%, each costing about -0.04%, while BOKF edged lower and JEPI and JPST were essentially unchanged. As intended, this sleeve behaved like ballast rather than a driver in either direction.
Net-net, the structure largely behaved as designed: health care, hedges, and metals helped; broad indices and quality tech were small headwinds; and the real hit came from concentrated commodity and crypto risk. The takeaway for next week is not that the framework is broken, but that sizing in the highest-volatility sleeves needs to be respected when those tapes turn.
Bottom line: the portfolio gave up about 1.1% on the week, with health care and hedges doing their job but losses in uranium, broader energy, and crypto-linked convexity more than offsetting those positives. Let’s take a look at what this week’s tape is telling us.
MIR Part 1: The Backdrop
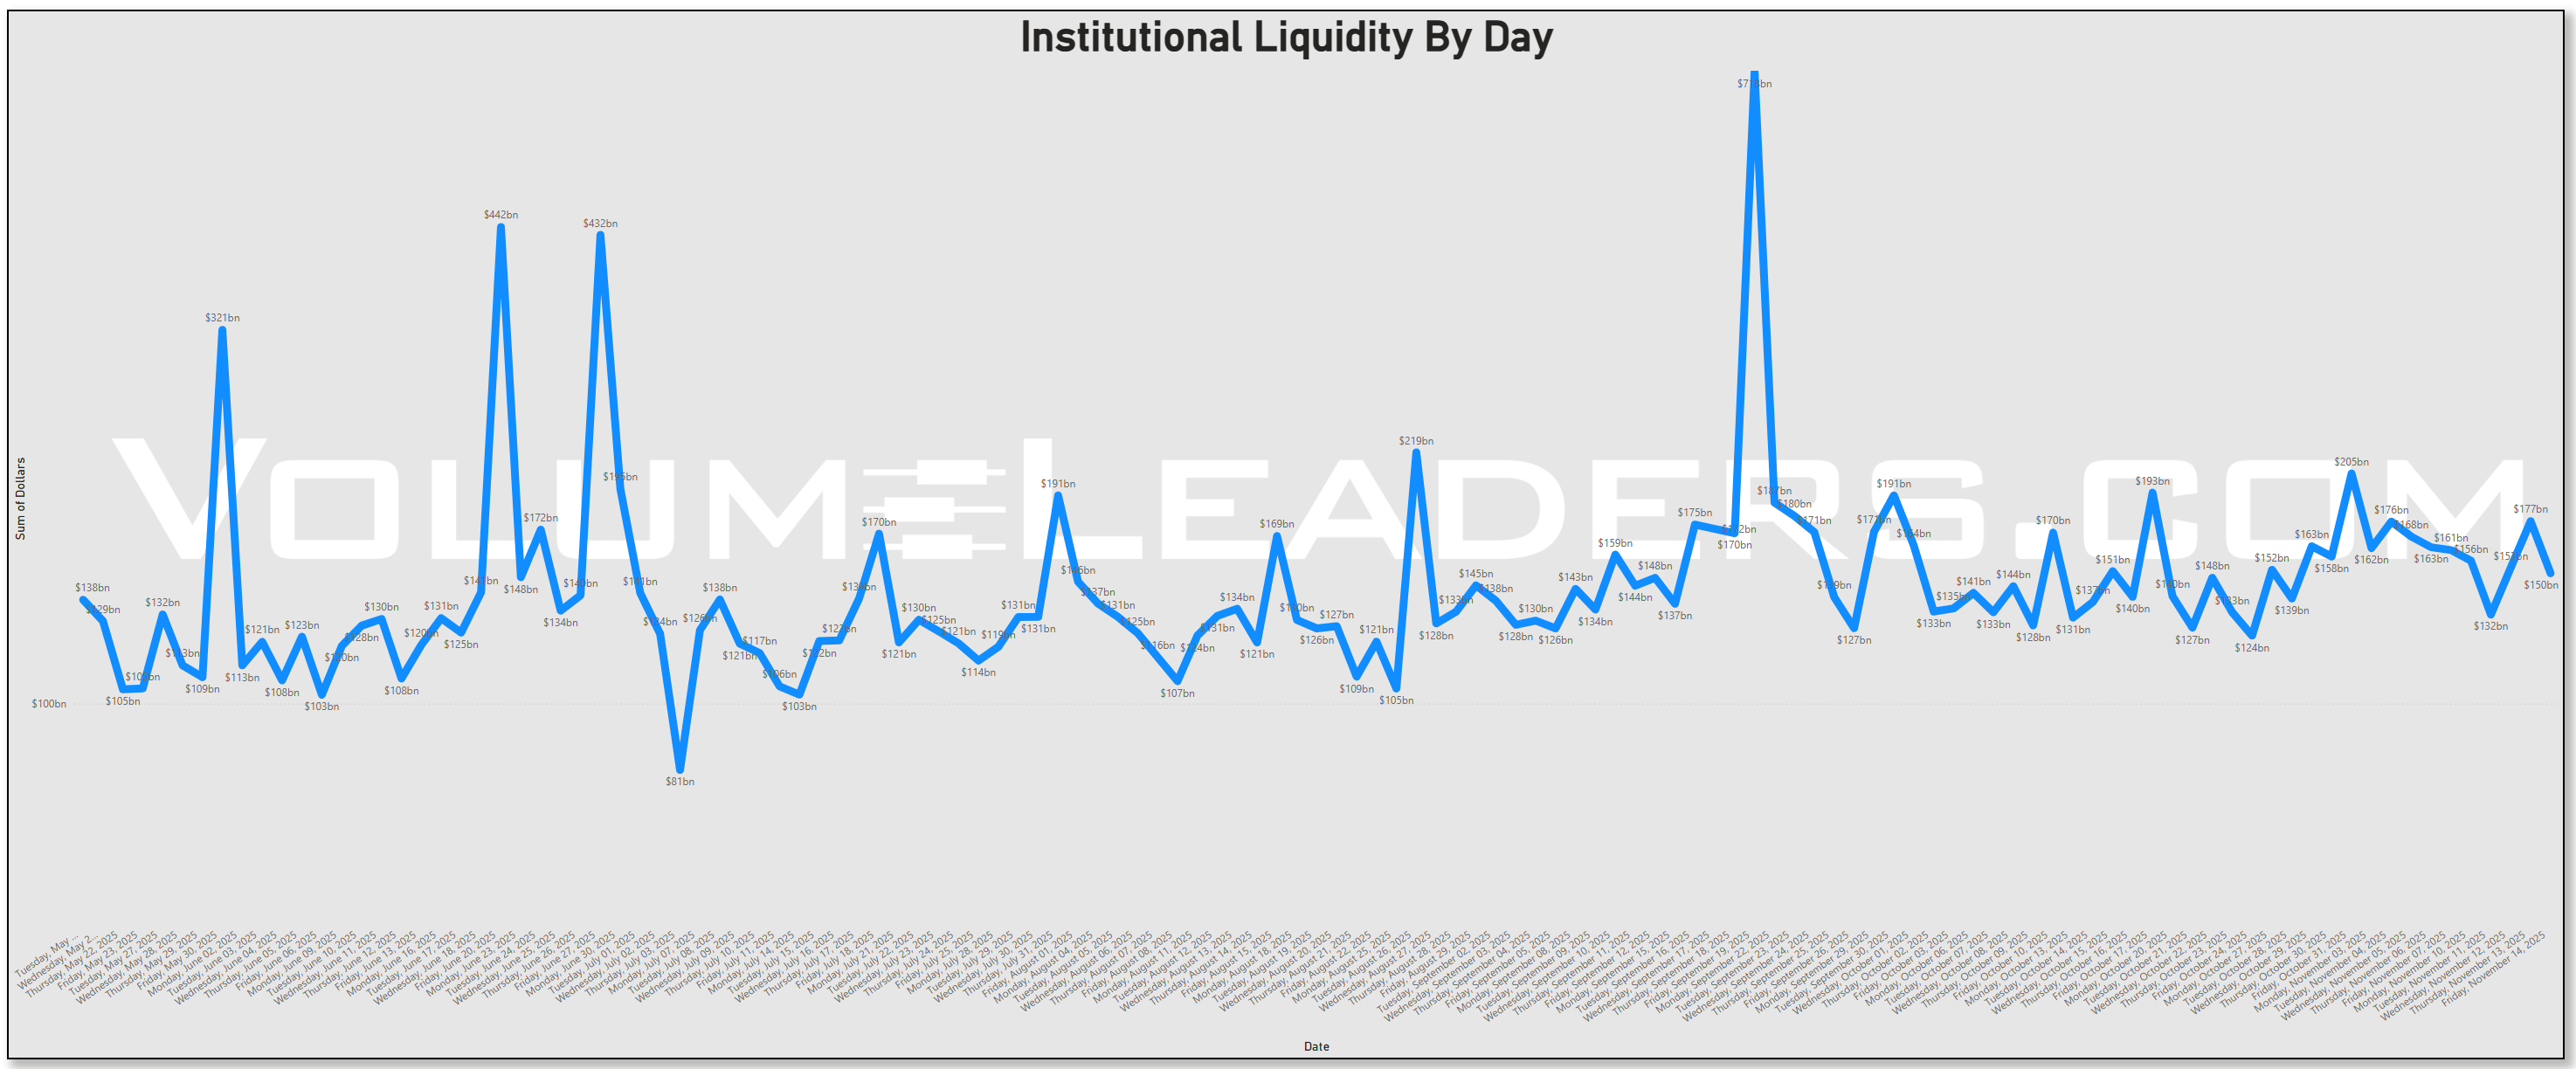
Institutional liquidity stayed robust but no longer manic this week. The multi-month series still shows the monster spikes from earlier in the quarter that coincided with index rebalances and major expiry dates, but the latest stretch has settled into a more sustainable $130B–$180B per day band. That shift matters: we are not in a vacuum of participation, but the tape has transitioned from forced flow to deliberate allocation. The result is a market that still has plenty of depth, yet is far more sensitive to where the marginal dollar chooses to hide.
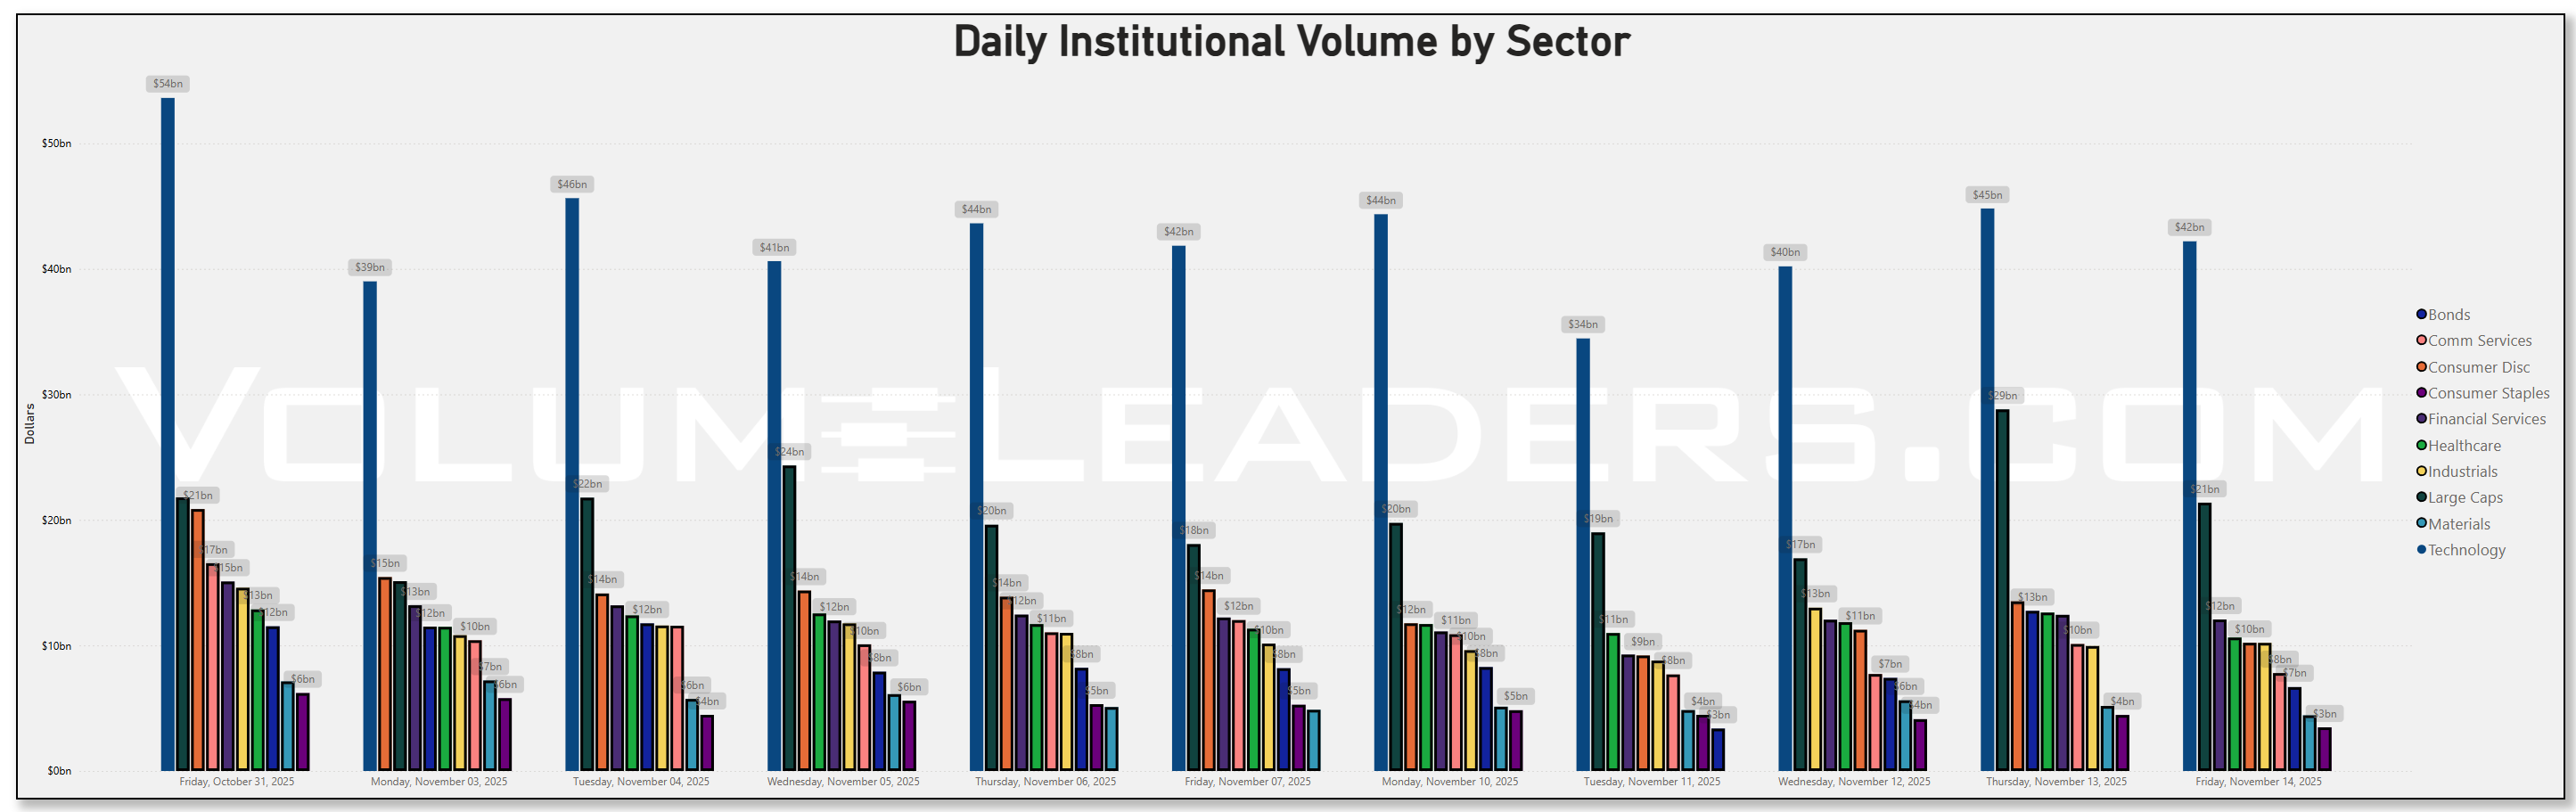
The sector dollar table makes that rotation very clear. Technology remains the single largest sponge for institutional capital, printing $44.3B on Monday and finishing the week with $42.2B on Friday, but that is notably below the $53.6B peak from October 31. Large Caps as a sleeve ran hard into Thursday, with notional volume jumping to $28.8B on November 13 versus $18.1B the prior Friday, before slipping back to $21.4B on Friday. Bonds also saw a surge that day, to $12.7B versus roughly $8.2B a week earlier, suggesting that the same macro tape—fading conviction in a December rate cut and growing unease around AI-heavy growth exposure—drove both de-risking and duration bids at once. Fed officials have spent the past week emphasizing a “high bar” for additional easing, and market-implied odds for a December cut have slid from near 95% in mid-October to roughly one-half in mid-November. That repricing showed up in the flows: Financial Services dollars were steady but not dominant, while defensives such as Healthcare and Utilities held their ground even as Technology dollars ebbed from their late-October extreme.
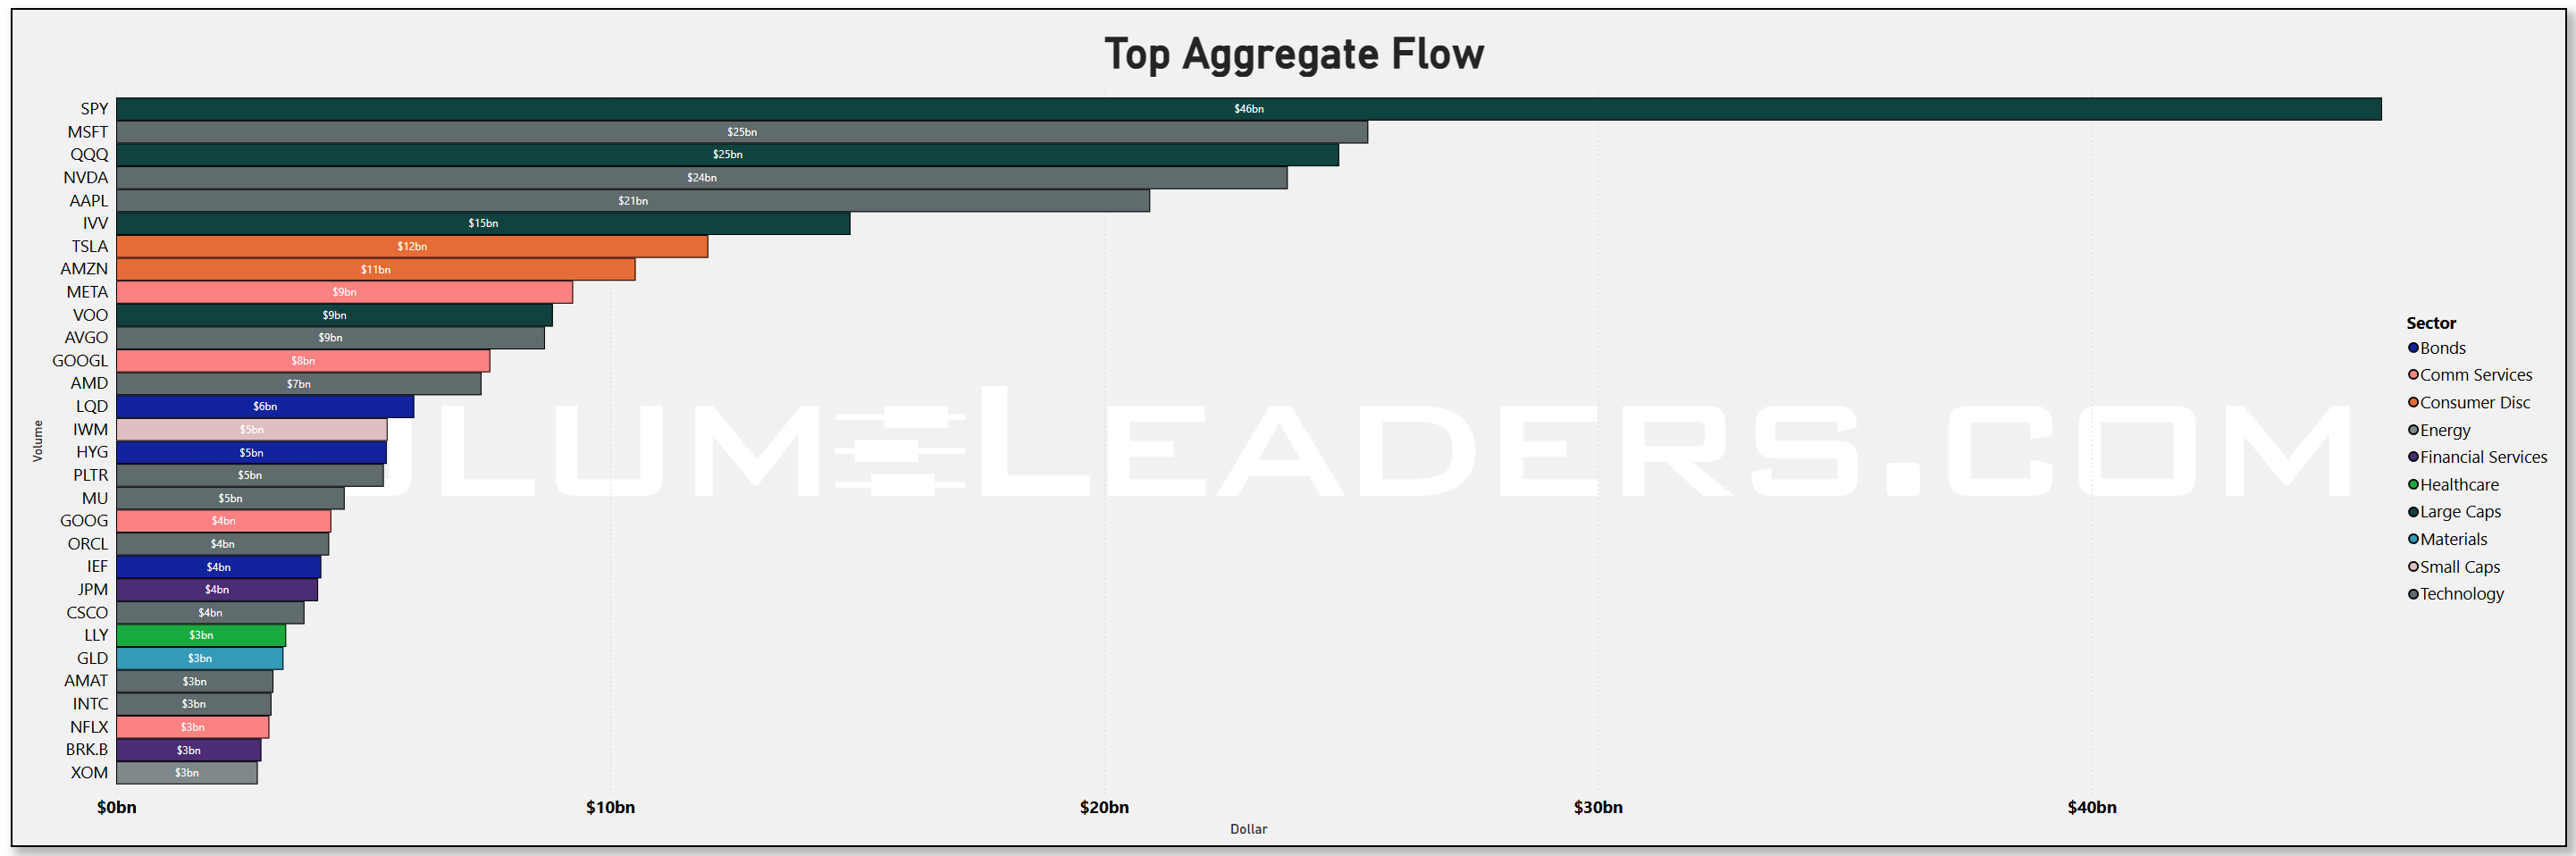
Drilling into names, the treemap and aggregate dollar bars confirm that broad beta and mega-cap tech remain the center of gravity. SPY alone traded about $46B in institutional dollars, dwarfing any single stock. QQQ and IVV added roughly $25B and $15B, respectively, and VOO another ~$9B, underscoring that passive exposure is still the preferred vehicle when allocators want equity risk. Within Technology, Microsoft (MSFT) led with about $25B in flow, followed closely by Nvidia (NVDA) around $24B and Apple (AAPL) near $21B. High-quality “infrastructure” names like Broadcom (AVGO) at ~$9B and Advanced Micro Devices (AMD) at ~$7B round out the spine.
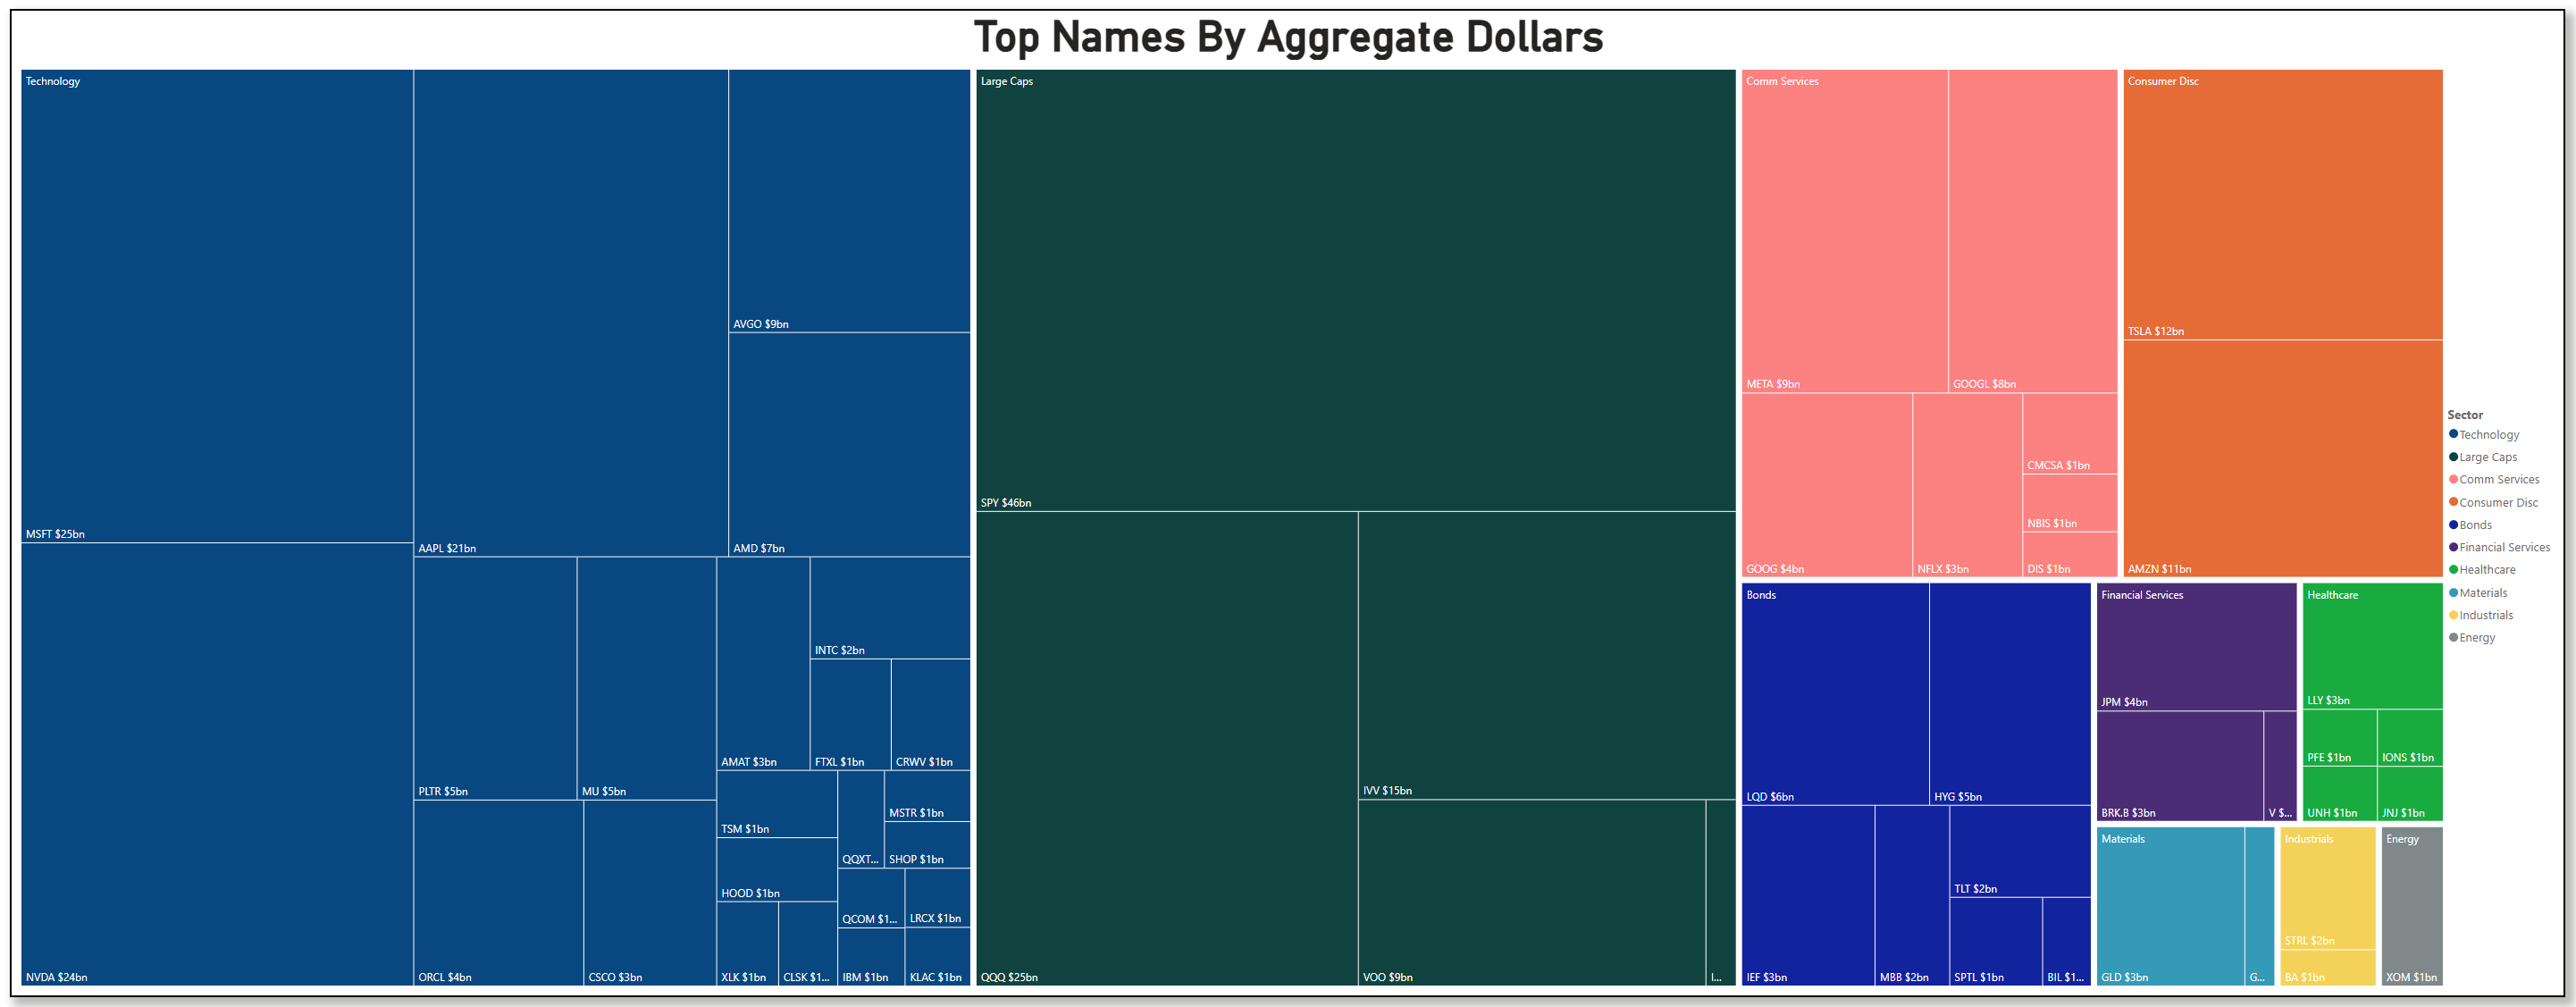
That is not a narrow meme chase; it is a full stack of AI-enabling hardware and software still drawing capital even as valuations and capex paths are being questioned. At the same time, the sector tree gives respectful square footage to Communication Services and Consumer Discretionary: Meta Platforms (META) and Alphabet (GOOG) both sit around the $4B–$5B mark, while Tesla (TSLA) near $12B and Amazon (AMZN) around $11B dominate the discretionary panel. The breadth tells you rotation is happening within growth rather than out of it entirely.
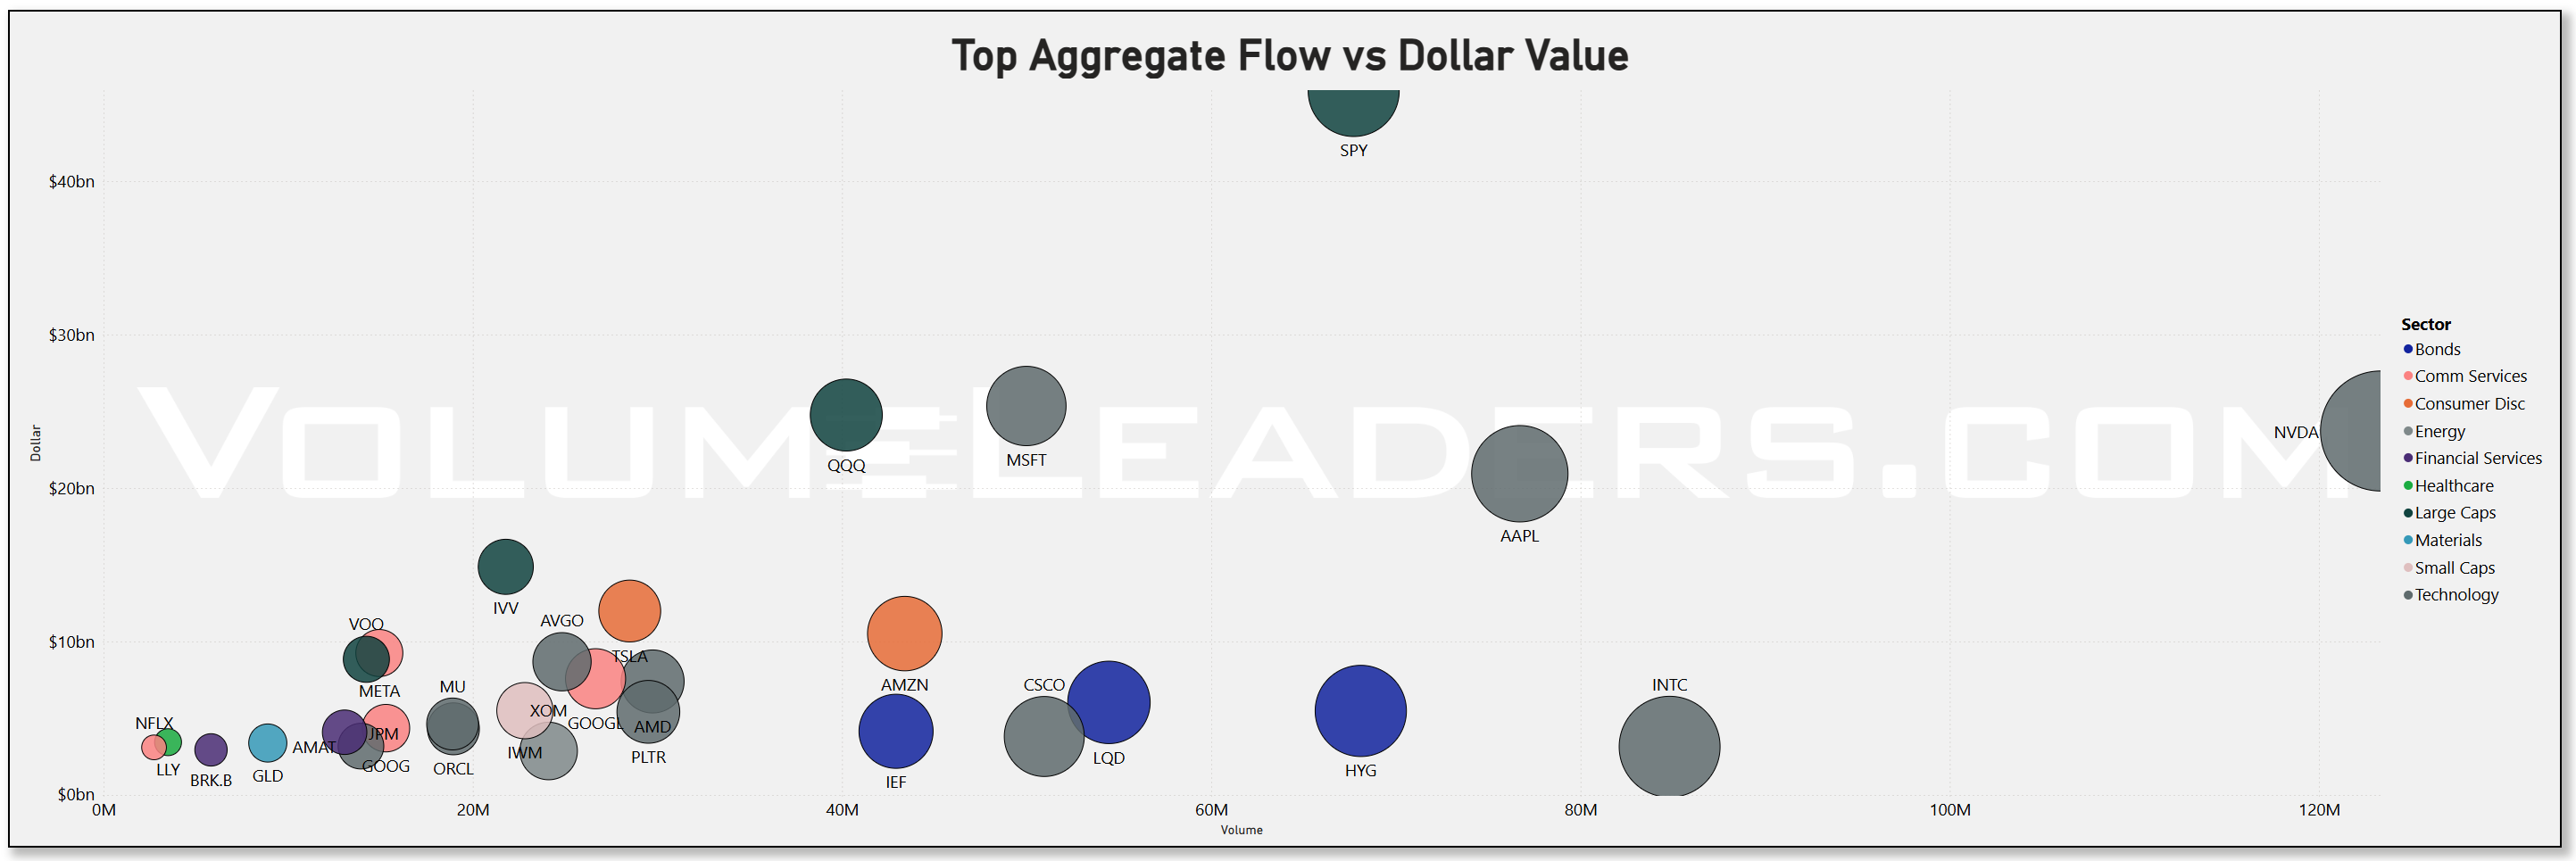
The scatter of volume versus dollars puts a finer point on that story. NVDA is out on the far right with very high share volume and north of $20B in notional turnover, but MSFT and AAPL are not far behind on the dollar axis despite somewhat lower prints. QQQ and SPY cluster at the high-dollar, high-volume pole, joined by IVV; that grouping is textbook “allocation” flow rather than a directional stampede. Credit sleeves like LQD and HYG also show up with multi-billion dollar footprints, reinforcing the idea that some investors are rotating toward carry and credit beta instead of abandoning risk altogether.
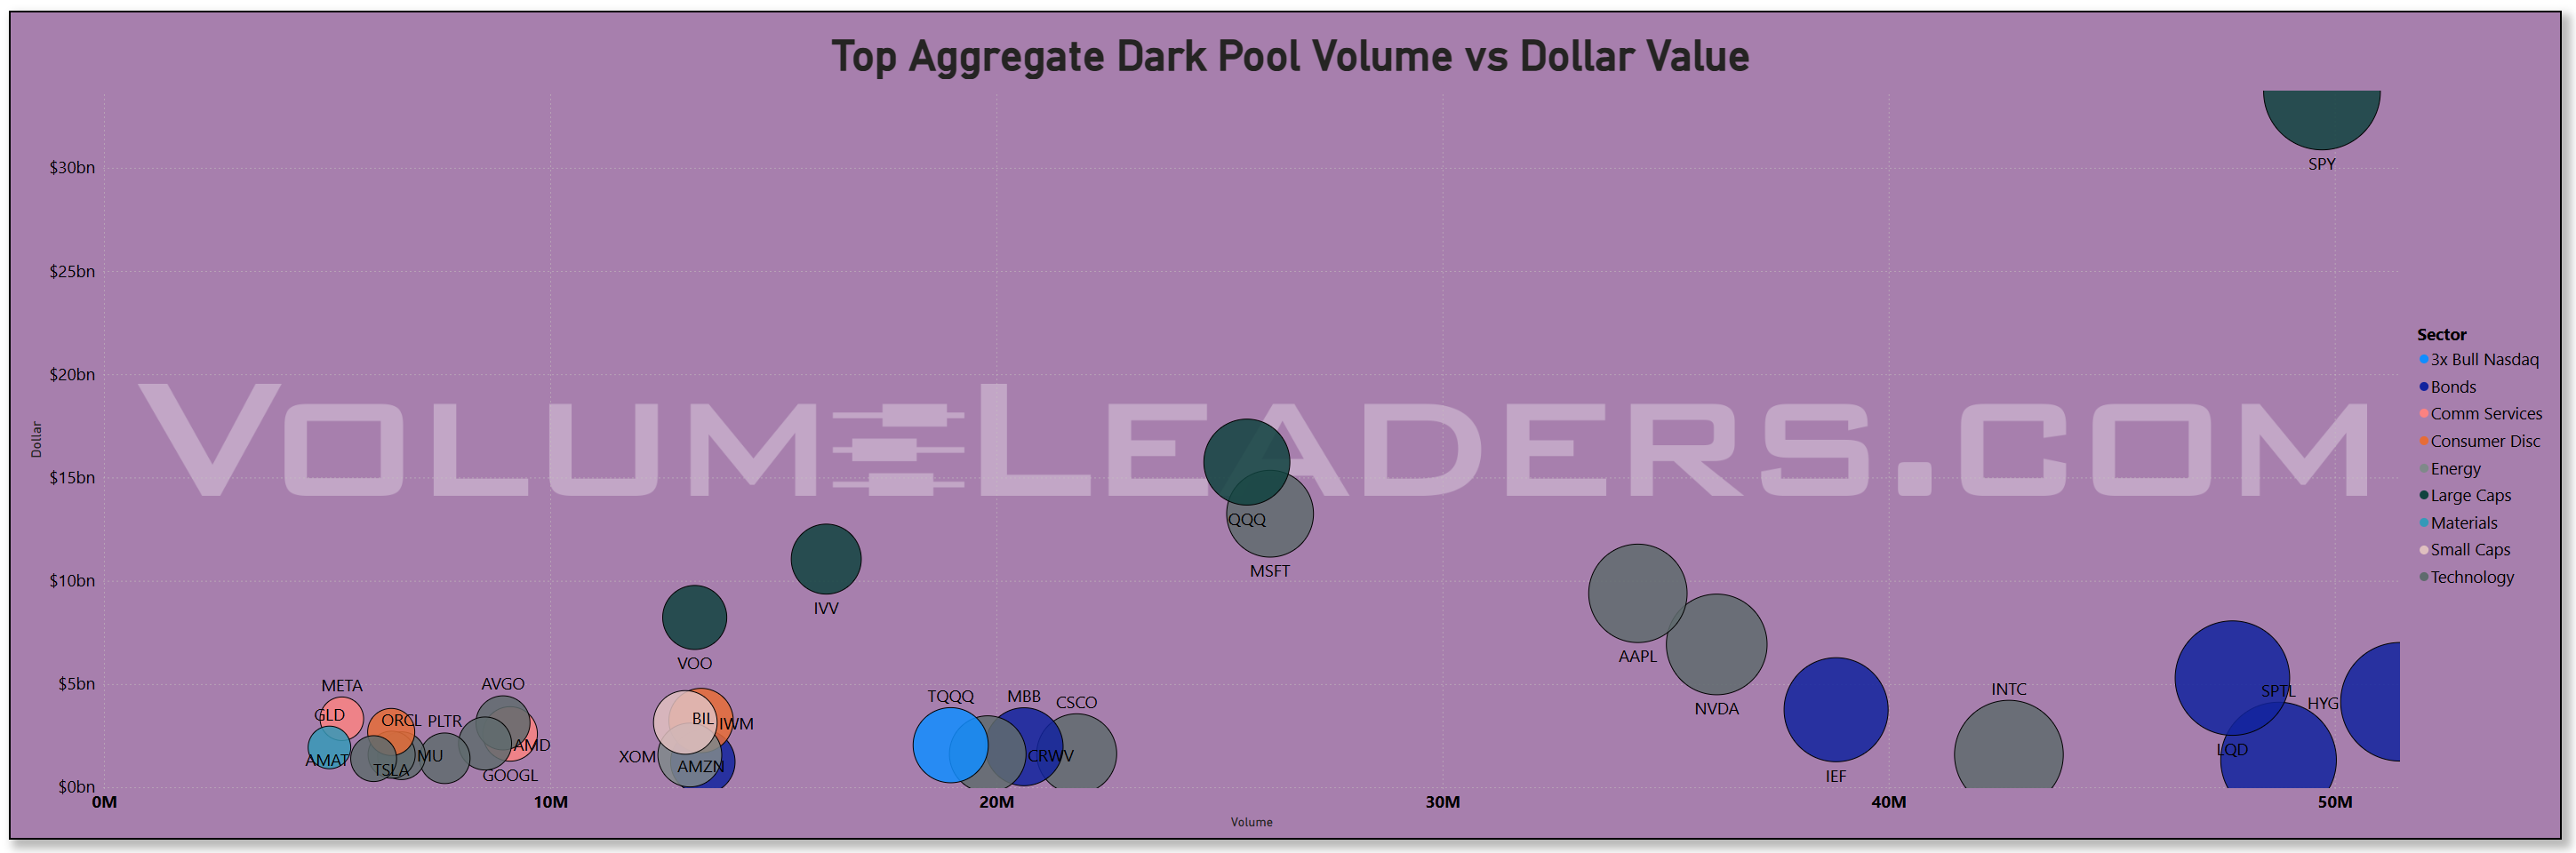
Off-exchange, the dark-pool view shows where the patient hands have been working. SPY again dominates with roughly $33B in dark-pool notional, followed by QQQ, MSFT, and IVV, each in the low-teens billions. AAPL and VOO sit just below that cluster with mid-single-digit billions.
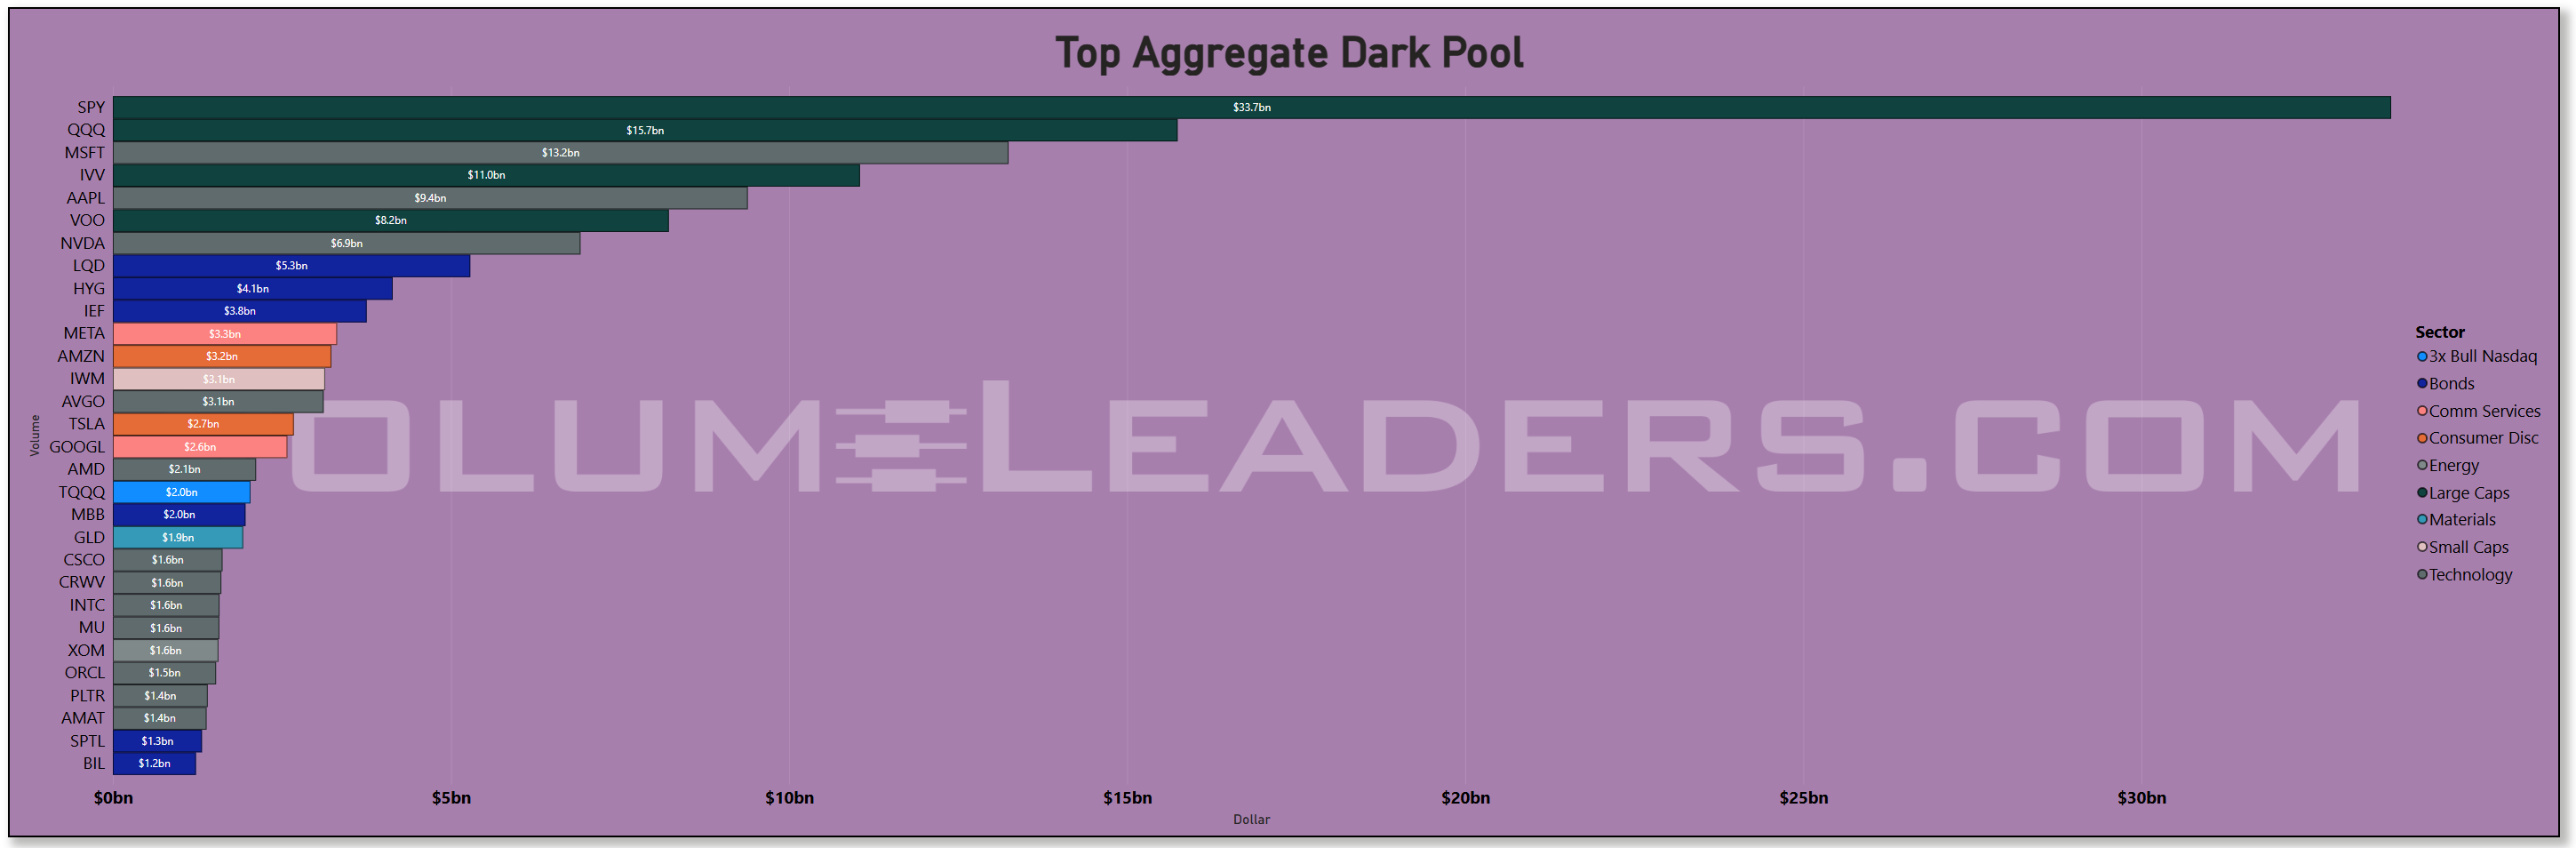
NVDA, META, AMZN, and AVGO all register meaningful dark-pool prints in the $2B–$7B range, while bond ETFs like LQD, HYG, and IEF build sizeable positions quietly. That mix—heavy index and megacap flow plus credit ETFs—looks less like panic and more like inventory transfer and portfolio reshaping into year-end. The fact that SPY and IVV show both lit and dark leadership argues that large asset managers are re-sizing benchmark exposure rather than abandoning equities outright.
Sweeps tell you where the fast money is leaning, and the pattern there is more tactical than thematic. The largest sweep dollars cluster in VOO, AMD, AAPL, NVDA, HYG, LQD, IVV, TSLA, and TQQQ. That is an interesting barbell: on one side, levered beta (TQQQ), broad S&P exposure (VOO, IVV), and high-beta tech (AMD, NVDA, AAPL, TSLA); on the other, investment-grade and high-yield credit (LQD, HYG).
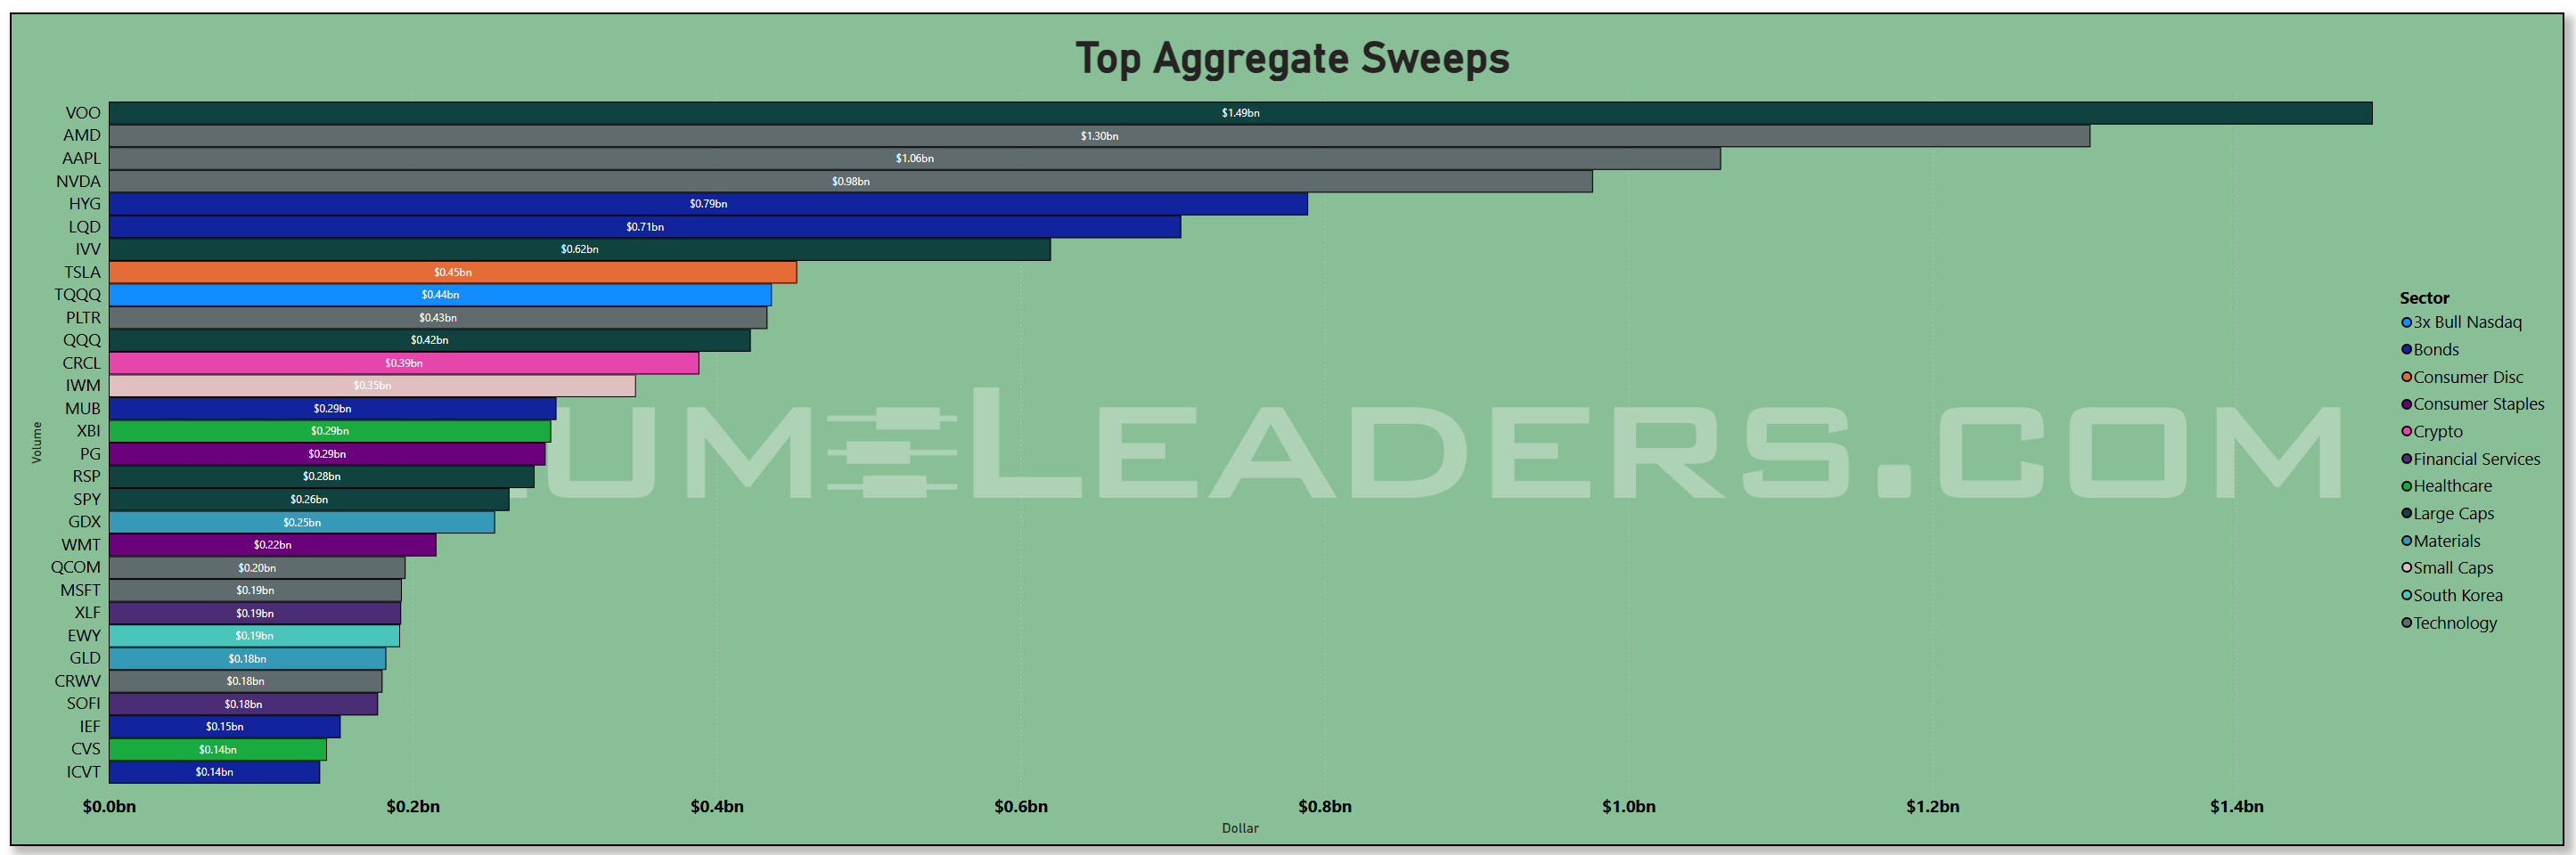
The scatter of sweep volume versus dollars reinforces that view, with HYG and LQD sitting far to the right in terms of contract count and dollar value, while AAPL, NVDA, AMD, and VOO punch above their weight in notional despite lower volume. The takeaway is that short-horizon traders are pressing both sides of the macro coin: upside participation in any year-end melt-up through equity and tech calls, paired with credit and index hedges that pay if the Fed’s “higher for longer” tone bites into growth.

The sector rotation dashboard ties these flows together. Energy sits at the top of the leadership ranking, followed closely by Healthcare and Utilities, with Materials and Real Estate not far behind. Technology, Consumer Discretionary, and Industrials are clustered toward the bottom. Over the last two sessions, Energy has gained the most momentum by far, while Materials, Consumer Discretionary, and Financial Services have given back the most ground. That pattern matches the tape: oil has firmed after OPEC’s latest outlook hinted at a tighter-than-expected market next year, while the International Energy Agency pushed out its projected “peak demand” timeline, supporting longer-dated capex plans across the energy complex. At the same time, renewed scrutiny of AI spending and a more cautious Fed path have taken some shine off high-duration growth stocks, prompting a drift toward cash-flow generative defensives and real-asset plays.

Macro and cross-asset context adds one more piece. The end of the record-long U.S. government shutdown in mid-November removed a major headline risk but came with a cost: the Congressional Budget Office estimates that the six-week closure shaved roughly 1.5 percentage points off Q4 real GDP, even if some of that activity is recouped later as back pay and delayed spending are released. Markets also had to digest the second-largest single-day outflow on record from U.S. spot Bitcoin ETFs—about $870M on November 13—as crypto holders de-risked, with Bitcoin now more than 20% below its October highs. Both developments reinforce the idea that the marginal allocator is becoming more selective: willing to hold benchmark equity and credit risk, but less willing to fund the most speculative corners of the market at any price.
Looking ahead a couple of sessions, the key tells are straightforward. First, watch whether SPY, QQQ, IVV, and VOO remain at the top of both lit and dark-pool dollar rankings; continued dominance there would confirm that the current phase is a rotation within risk, not an exit from it. Second, track persistence of dark-pool accumulation and sweep activity in NVDA, AAPL, MSFT, and AMD; if those names keep seeing multi-billion prints even as headlines fret about AI capex, it suggests institutions are quietly re-loading rather than exiting. Third, keep an eye on credit ETFs like LQD and HYG; a sustained bid in both lit and sweep flow there would validate the “carry over cash” preference and signal that recession fears remain contained even as the Fed keeps its options open.
Bottom line: this week’s tape looks like an orderly, institution-driven rotation out of the most extended growth themes and into defensives, credit, and benchmark beta, with ample liquidity under the surface but a much higher bar for anything that cannot justify its valuation or cash-flow profile.
MIR Part 2: Individual Names From The Institutional Tape
VolumeLeaders tracks several proprietary signals designed to spotlight names drawing significant institutional interest. Below, we’ve surfaced the latest results and analyzed them to highlight emergent themes. If any of the sectors, narratives, or positioning trends resonate, the names mentioned here offer a strong starting point for deeper research and watchlist consideration.
VL Trade Rank Velocity™ (TRV)
TRV is a proprietary metric that measures the recent acceleration or deceleration in institutional trading activity for a given stock by comparing its average trade rank over the past few days to its average in recent weeks. A sharp improvement in TRV typically reflects a notable shift in positioning, often accompanied by sustained trade activity, suggesting institutions are actively engaging with the name and that intensity of activity is rising. This often precludes meaningful price or narrative shifts. This isn’t a buy-list or sell-list; it’s meant to draw your eyes to names where institutions are putting money to work.
Two things jump off this week’s TRV sheet: the barbell between high-octane AI/crypto wrappers and boring, cash-flow heavy “real economy” names, and a very visible migration toward quality and factor-driven large-cap sleeves.
On the tactical side, there is a whole ecosystem of levered and single-name derivatives lighting up: RGTZ (2x bear RGTI), NVDD (1x bear NVDA), AVGX (2x bull AVGO), PLTU (2x bull PLTR), FNGU (3x bull FANG), SPXL (3x bull S&P 500), UNHG (2x bull UNH), plus QQXT as a more selective tech basket. That fits perfectly with the flows we just walked through: institutions are not leaving the AI complex, they are trading around it with precision tools, using single-name bears as hedges and levered products to keep upside optionality while they resize core positions in SPY, QQQ, NVDA, and friends.
There is also a clear drift toward quality, factor, and global beta. SUSA, URTH, VFMO, FJUL, OAKM, APIE, BUZZ, ISCG and other large-/small-cap wrappers show up with high composite scores despite modest sustained-activity readings. That is exactly the “up the quality scale” move the index and sector flow hinted at: take broad equity exposure, but do it through curated screens (ESG/growth, momentum, global ex-US) rather than raw, levered QQQ.
Under the surface, cyclicals and hard-asset plays are well represented. Industrials are everywhere: BE and AMPX in electrical equipment and parts, LGN and DY in construction and engineering, CMPO, CXT, SERV and SXI in specialty machinery, FLY, CDRE, KRMN, AXON and VVX in aerospace and defense, REZI in security and protection. Metals and mining names like EQX, CRML and RS, plus BKV in oil and gas, line up neatly with the leadership we are seeing in Energy, Materials, and industrial beta. It looks like a continuation of the rotation into physical capacity, infrastructure, and defense spending rather than a one-day trade.
Healthcare is another strong cluster and lines up with its sector leadership: RSPH, IDXX, and a long list of biotech and specialty pharma tickers (AQST, NAGE, ATAI, UPB, RAPP, TNGX, ARQT, HRMY, LENZ, SMMT, BCAX) all flag improving interest. This is that “growth, but with different drivers” trade – investors rotating from AI hype into pipelines, devices, and idiosyncratic catalysts in healthcare.
Crypto and crypto-adjacent names form the other side of the speculative barbell. ETHD, BTCS and BITQ sit alongside capital-markets miners and infrastructure like CIFR, IREN and CORZ. Given the heavy outflows and price damage in the core crypto complex, this looks like smart money trying to pick its spots in second-derivative plays rather than blindly buying coins.
Finally, there is a quieter but important bid in fixed-income and balance-sheet proxies: FSEC and VTC in bonds, NIC and NBN in regional banking, HIPO and HRTG in specialty insurance, plus shell vehicles like SYM and UMAC. That dovetails with the growing use of LQD/HYG and other credit ETFs in the main flow deck, and reinforces the idea that allocators are building carry and optionality while they sort out the Fed path.
Net, the TRV list reinforces the same message as the institutional flow dashboards: capital is not leaving the table, it is rotating – out of one-way AI beta and into a barbell of quality large caps, real-asset cyclicals, defensive healthcare, and tightly managed leverage in tech, crypto, and index wrappers.
VL Institutional Outliers™ (IO)
Institutional Outliers is a proprietary metric designed to spotlight trades that significantly exceed a stock’s recent institutional activity—specifically in terms of dollar volume. By comparing current trade size against each security's recent normalized history, the metric flags outlier events that may indicate sudden institutional interest but may be missed because the activity doesn’t raise any flags/alerts when comparing the activity against the ticker’s entire history. For example, it’s conceivable that a ticker today receives the largest trade it has had in the last 6 months but the trade is unranked and would therefore be missed by current alerts built off Trade Ranks. Use “Realized Vol” to identify tickers with large price displacement and to size your risk appropriately.
The IO tape is basically the “where size actually hit” confirmation of the narrative we’re seeing above: big, low-vol rebalancing in rates and factor sleeves, with a very deliberate options-style posture around Nasdaq, crypto, and energy.
The loudest theme is duration and high-grade fixed income. IEF, SPTL, MBB, SPSB, ICVT and TYA all register multi-sigma notional with almost no price movement and microscopic realized vol. That is classic allocator behavior: large, programmatic moves into Treasuries and agency MBS rather than a directional panic. It pairs cleanly with outlier flow in factor/value equity wrappers like DFLV, VOE, IWV, IWL and COWG, which again show big dollars, modest sigmas, and tiny closes-versus-average moves. Taken together, that looks like a structural rebalance toward quality, duration and factor tilts, not a hot-money chase.
Around that core, the Nasdaq complex is where traders are pressing the gas and riding the brakes at the same time. XLK and FDN see outsized prints alongside QQQM, while the levered/hedge sleeves PSQ, TQQQ, QLD and TSLS all light up. Single-digit bps moves in most of these, despite 3–5 sigma dollar flows, scream “positioning and hedging” more than “breakout or breakdown.” It is consistent with what we saw in TRV: institutions are staying engaged with Tech and AI via indexes and sector ETFs while using 1x/2x wrappers to fine-tune net exposure.
Crypto and crypto-adjacent flows are very clearly in risk-management mode. CRCL shows back-to-back outlier days with heavy dollars and negative returns, echoed by BKCH and ARKB on the downside, while BITI puts up a positive outlier. That combination of size and skewed direction suggests institutions are still de-risking the complex and leaning into short or hedged expressions rather than bottom-fishing spot.
Energy and real-asset exposure also stand out. EPD, WES and ASC in midstream and transport, ENB and PBA the day before, and URNM in uranium all post abnormal prints. Price moves are small to moderately positive, but the repeated appearance of pipelines, midstream and uranium ETFs reinforces the idea that the rotation into real assets and capacity build-out is being expressed via liquid, income-producing vehicles rather than speculative E&Ps. TAN and FSLR/CSIQ add a clean “transition” layer on top, with CSIQ in particular putting up both meaningful outlier dollars and a strong price response.
Financials and insurance show methodical accumulation rather than panic. Asset managers BN and BAM, closed-end fund CEF, and Canadian and European banks like LYG, SAN, BBVA and BNS all print 3-plus sigma dollars on sleepy price action, while insurers SLF, MFC and ORI do the same. That lines up with the quality and carry bid: own balance sheets and fee streams that benefit from higher-for-longer yields but are not as valuation-stretched as mega-cap growth.
Healthcare continues to be a magnet for idiosyncratic risk. Biotech and tools names including INBX, SEPN, OMER, ASND, RVMD, ARQT, COGT, ANAB, GPCR, IONS and TXG all show up as outliers, several with 3–6 sigma prints and multi-percentage-point moves. That is exactly the “growth away from AI” leg of the rotation: take risk in pipelines, trials and specialty therapeutics while using Tech indices for systematic exposure.
Finally, there is a subtle but important global and defensive angle. EWZ flags big, unusual Brazil exposure; FXU, FXO and FXR represent factor-style sector baskets rather than single names; ICF brings in real estate; CTAS, PH, TDY, JBHT, APG, RELX and CAE highlight stable industrial and professional-services franchises. None of these are screaming trend reversals, but in aggregate they say the same thing as the rest of the dashboard: size is quietly migrating toward quality, cash flow, and real assets, while traders use levered tech, crypto, and commodity hedges to manage the edges of the distribution.
VL Consensus Prices™
These are the most frequently traded #1-Ranked Levels in VL this week. Trades occurring at the highest volume price in a ticker’s history are significant because they represent institutional engagement at a key price memory level—where the market once found consensus. These areas act as liquidity hubs, enabling large players to transact efficiently, and often signal a reassessment of fair value. This activity may precede major moves, mark equilibrium zones, or reflect broader portfolio shifts, making these price levels important to watch even without yet knowing how price will resolve. (Note: many Bond products trade in such a tight range that they dominate the top positions and are therefore omitted to provide better clarity around other flows. The bonds data is still available in the VL platform.)
On the consensus levels list, the tape is telling you where long memory is being built: the prices where the most shares in a ticker’s entire history have traded. Taken as a group, it looks like institutions are anchoring around quality, income and real assets, while still doing a surprising amount of business in the speculative periphery and in Nasdaq hedges.
Real estate jumps off the page. You have a cluster of equity REITs and related vehicles sitting at or near their all-time highest volume-by-price nodes: HST, KIM, DRH, EQR, UDR, ADC, VRE, CURB, SILA, ELME and mortgage REIT RITM. That is a cross-section of hotels, retail, residential, office, and health-care facilities. When so many REITs share the same characteristic, it usually means a multi-year balance is being resolved: long-only capital, yield tourists and distressed buyers are all transacting around the same bands. It dovetails with the broader rotation you have been seeing into duration, carry and hard-asset exposure. Real estate is being repriced to the new rate regime, and consensus levels say big money is finally agreeing on what those cap rates and cash-flow multiples should be.
The same “yield and quality” motif shows up in the large-cap and dividend sleeves. SCHD, JEPI, SPYD, BUYW, SPYM, COWG and other broad value or income-tilted ETFs are all printing historic volume nodes. That is consistent with allocators de-risking out of narrow mega-cap growth leadership and back into diversified, cash-flow heavy baskets. Add in PFE, CVS and other staple health-care and consumer names, plus defensives like ABEV and SPB, and you get a picture of portfolios being rebuilt around durable earnings, dividends and lower beta, not just chasing the top of the AI stack.
Financials and banks are another clear cluster. KEY, BEN, RKT, BANC, WAFD, WABC, WBS, HTH, OZK and asset managers like CLM and BAM are all sitting at consensus levels. That matches the IO tape where you saw quiet but chunky flows into insurance and bank balance sheets. Here, the long-term volume nodes suggest institutions are willing to take the other side of years of regional-bank derating and mortgage-finance pessimism, but they are doing it with size at a handful of well-defined prices rather than spraying exposure.
On the risk and growth side, consensus levels are forming in a very specific set of stories rather than across the whole speculative complex. Technology is represented less by mega-caps and more by infrastructure and enablers: INFY, WIT and GPN in IT services, VRNT and TDC in software, HOOD, COIN, BTDR, CLSK, BTBT and CWAN in trading, data and crypto-adjacent software, plus NXPI, VSAT, QBTS and ZBRA in semis, communications and hardware. This lines up with your TRV and IO lists where the AI and Nasdaq exposure is being managed via indices and structured products, while single-name conviction is showing up in the rails, platforms and tooling that sit behind the themes. At the same time, SQQQ printing a top-of-history consensus level confirms there is sustained demand for explicit Nasdaq downside protection; the hedge is now a core position for a meaningful cohort of players.
Finally, there is a global and cyclically sensitive undercurrent that connects back to the “real assets plus EM beta” narrative. FXI and TME highlight China exposure trading at historic price levels, while CNQ, CVX, PBF and DNOW pull in energy, and AG adds precious metals. Travel and leisure cyclicals like LUV, MGM, WH, HTHT, WGO, HOG and SHCO are all on the list too. That combination suggests investors are not abandoning cyclicality; instead they are picking their spots where they can tie it to tangible assets, cash flow and secular travel/gambling demand, and they are doing so at price zones that have absorbed years of prior supply.
Net-net, the consensus list reinforces what the rest of the dashboard has been hinting at: institutions are rebuilding their core around income, quality and real assets, using REITs, dividend/value ETFs and financials as anchors; they are selectively leaning into infrastructure-grade tech and crypto rails rather than just the glamour names; and they are making hedges like SQQQ permanent residents in the portfolio. These long-memory volume nodes are likely to act as important battle lines for the next leg of the cycle.
MIR Part 3: Framing-Up A Trade
When you put all the pieces together, the message from the tape this week is less about panic and more about discipline. The bid hasn’t vanished, but it has reshaped itself. The heavy lifting is no longer coming from broad beta or mega-cap leadership; instead it is coming from the defensive arcs of the market, from places where cash flows are tangible and capital can hide when the tape trades heavy. Real estate became the quiet epicenter of activity, with a half-dozen REIT groups printing historic volume nodes and absorbing multi-year supply at the same price shelves. That is almost always the signature of long-only institutions redistributing risk toward stable yield and duration once the growth impulse softens. You saw something similar in the value and dividend complexes: SCHD, JEPI, SPYD, BUYW and SPYM all hit their highest volume-by-price nodes, and the credit-adjacent financials showed interest at well-defined levels. Money is not fleeing the market; it is reorganizing itself around ballast.
Tech, meanwhile, is still in the book, but in a very different way from the momentum-led tapes earlier this year. The money flowing today is not racing into the glamour names. It is spending time in the infrastructure, the rails, the tooling, the places where AI and digitalization depend on pipes rather than narratives. INFY, WIT, VRNT, TDC, NXPI, and ZBRA are where consensus levels have formed. The TRV list leans the same way, focusing on software infrastructure, comms equipment and industrialized tech rather than top-of-stack growth. Even the speculative fringe is selective: crypto rails and crypto-adjacent names keep appearing in both TRV and IO screens, but the flows cluster around infrastructure and platforms, not the headline coins. That echoes the broader shift toward quality and foundation over froth.
Index exposure still matters, but the character of it has changed. The most aggressive flows this week were in hedged or leveraged wrappers like SQQQ, PSQ, NVDD and bear-factor expressions, alongside the traditional core vehicles SPY, IVV, QQQ and their siblings. But the way these products are being used tells the story. The surge in historic volume nodes for SQQQ points to a cohort of allocators that have decided the hedge is no longer tactical but structural. The dark-pool tape reinforces it: persistent, slow-moving blocks in the Nasdaq complex and defensive factor ETFs suggest positioning is being rebuilt for an environment where realized volatility can persist and where the upside is earned rather than gifted. The sweeps confirmed the same temperament. This was not a week of chase. It was a week of probing and rebalancing, using fast money to fine-tune exposures rather than widen them.
All of that fits comfortably with the IO outlier list, which highlighted asset managers, insurers, regional banks and capital-market infrastructure names seeing statistically extreme flow. That is rotation into balance-sheet strength while the market processes higher volatility and rising spreads. In other words, the tape is not shouting “risk-off”; it is whispering “risk-managed.”
Given that backdrop, the posture for the week ahead should stay aligned with what institutions just told us. Favor ballast over torque, cash-flow visibility over long-duration promise, and selectively maintain exposure to the parts of tech and global cyclicals that continue to attract quiet structural interest. Keep hedges in the mix but do not overpay for them. The market is functioning; it is simply functioning at a more sober setting.
A sample portfolio that matches this tape would look something like the following.
Core Defensive Allocation, 35 percent. This sleeve centers the portfolio on the same places the tape did: diversified large-cap value and dividend engines. A mix of SCHD, JEPI, SPYD and SPYM forms the anchor. These instruments took in meaningful volume at long-memory price nodes and sit at the intersection of income, stability and liquidity. They serve as your ballast while the major indices trade below their short-term trend lines. Core ETFs like VOO or IVV can round out the allocation to maintain market participation without levering beta.
Real Assets and Yield, 25 percent. The message here was unambiguous. REITs across residential, health-care, retail and office saw enormous engagement at multi-year volume shelves. A diversified basket including EQR, KIM, HST, VRE, CURB and SILA gives you exposure to the parts of real estate that institutions were actively repricing all week. Energy and metals names tied to real assets and cash-flow durability, such as CNQ, CVX, AG and select services like DNOW, fit as smaller complements. The goal is to align with the tape’s preference for tangible assets that hedge inflation risk and offer secular cash-flow strength.
Quality Financials, 15 percent. Regional banks, insurers, and asset-management names kept appearing across TRV, IO and consensus-level screens. KEY, BEN, WAFD, WBS, BAM and RITM showed institutional appetite at major volume shelves. This sleeve captures the balance-sheet side of the rotation: capital returning to credit creation, underwriting and fee-based franchises that benefit from a stabilizing rate profile and do not depend on explosive growth to deliver returns.
Selective Technology Infrastructure, 15 percent. The days of broad tech beta leading every tape are not here right now, but foundational tech remains in favor. INFY, WIT, VRNT, NXPI, ZBRA, GPN and the software-infrastructure names like CORZ and REKR all flashed sustained interest. This sleeve focuses on the pipes, not the promises. These are the companies that enable cloud, AI and global digitalization and have been quietly accumulated in both lit and dark contexts. Exposure remains important, but it should be sized in a way that respects the market’s current preference for stability over momentum.
Hedges and Tactical Overlay, 10 percent. With SQQQ printing one of the strongest consensus-volume signals and bear expressions showing up in both TRV and IO screens, it is prudent to maintain a modest hedge. A mix of SQQQ, PSQ or even a small NVDD allocation provides portfolio-level convexity without dominating the portfolio’s behavior. This sleeve can also hold short-duration Treasuries or investment-grade ETF exposure like SPSB when spreads widen. The goal is to stay invested while managing left-tail risk in a week where volatility remains elevated across equities and credit.
Core Defensive Allocation — 35%
SCHD 10%
JEPI 10%
SPYD 7%
SPYM 5%
VOO / IVV 3%
Real Assets & Yield — 25%
EQR 5%
KIM 4%
HST 3%
VRE 3%
CURB 3%
SILA 2%
CNQ 2%
CVX 1%
AG 1%
DNOW 1%
Quality Financials — 15%
KEY 3%
BEN 3%
WAFD 2%
WBS 2%
BAM 3%
RITM 2%
Selective Tech Infrastructure — 15%
INFY 3%
WIT 3%
VRNT 2%
NXPI 2%
ZBRA 2%
GPN 2%
CORZ / REKR basket 3%
Hedges & Tactical Overlay — 10%
SQQQ 4%
PSQ 3%
NVDD 2%
SPSB or similar short-duration IG 1%Taken together, this portfolio expresses exactly what the institutional tape told us all week. Stay invested, but tighten the sail. Let yield and real assets do more of the lifting, allocate to the financial plumbing that continues to see multi-sigma flows, hold the tech that institutions are quietly accumulating rather than the tech they are trimming, and keep a small hedge sleeve to absorb the noise until index dynamics improve. The market is not breaking; it is repricing. Position accordingly.

Thank you for being part of our community and for dedicating your time to this edition. Your insights and engagement drive everything we do, and we’re honored to share this space with such committed, thoughtful readers. Here’s to a week filled with clear opportunities and strong performance 💰💰💰
— VolumeLeaders