Market Momentum: Your Weekly Financial Forecast & Market Prep
Issue 69 / What to expect Nov 10, 2025 thru Nov 14, 2025

In This Issue
Weekly Market-On-Close Report: All the macro moves, market drivers, and must-know narratives—covered in less than five minutes.
Weekly Benchmark Breakdown: Our weekly intelligence report on major indices cuts through the index-level noise to uncover participation, momentum, and structural integrity and tell you whether markets are rising on solid ground or skating on thin breadth. This is where bull markets prove themselves—or quietly start to unravel.
The Latest Investor Sentiment Readings: Track the emotional pulse of the market with our curated dashboard of sentiment indicators. From fear-fueled flight to euphoric overreach, this week's readings reveal whether investors are cautiously creeping in—or stampeding toward the exits.
Institutional Support & Resistance Levels For Major Indices: Exactly where to look for support and resistance this coming week in SPY, QQQ, IWM & DIA
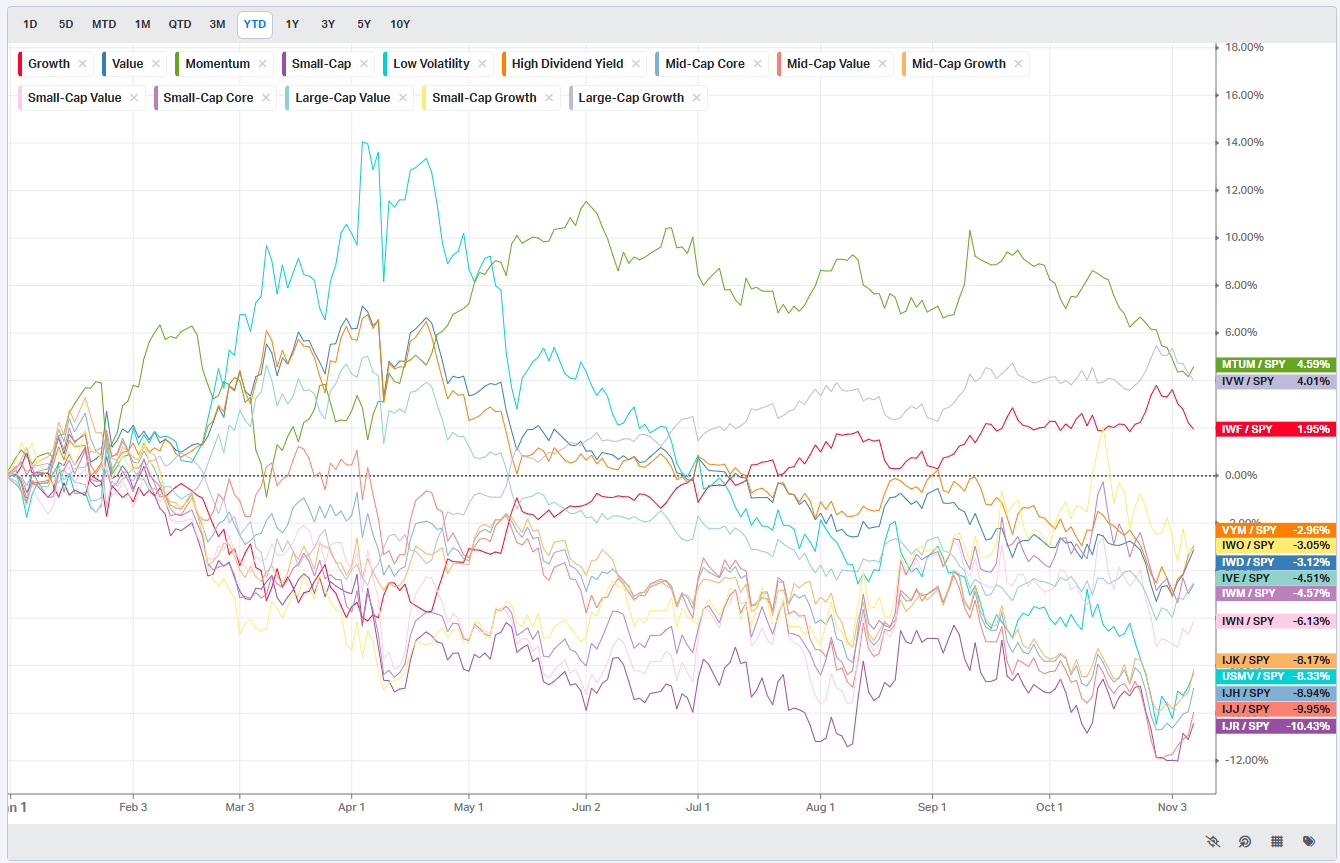
Normalized Performance By Thematics YTD: Which corners of the markets are beating benchmarks, which are overlooked and which ones are over-crowded!
Key Econ Events & Earnings On-Deck For This Coming Week
Market Intelligence Report: Track the real money. This section breaks down where institutions are placing their bets—and pulling their chips. You'll get a sector-by-sector view of flows, highlighting the most active names attracting large-scale buying or selling. We go beyond the headlines and into the tape, surfacing the week’s most notable block trades and sweep orders, both on lit exchanges and hidden dark pools. Whether you're following momentum or fading crowded trades, this is your map to where size is moving and why it matters.

Weekly Market-On-Close Report
The week began on a cautious note. Markets opened to the soft hum of machines marking time, volume low, breadth uneven, and sentiment slightly bruised. After several months of relentless momentum, the tone had changed — not abruptly, but perceptibly. What had once been a one-way trade in tech enthusiasm had started to look more like a two-way conversation. Traders weren’t abandoning their positions; they were trimming sails, respecting the shifting winds.
U.S. equity indexes spent most of the week sliding, with the S&P 500, Dow Jones Industrials, and Nasdaq 100 all setting fresh two-week lows before recovering some ground into Friday’s close. The story of the week was less about panic than fatigue — a slow exhale after seven months of AI-driven exuberance that had carried valuations to their most stretched levels in years. Even the catalysts that once drove manic intraday rallies now met with polite indifference. Corporate earnings were strong, rate expectations stable, and even the government shutdown — the longest in U.S. history, now six weeks deep — was already priced in. The tape was telling traders to stop reaching and start managing.
Friday offered a small reprieve. Stocks rebounded in the afternoon after Senate Democrats and Republicans began trading proposals to end the shutdown. Democrats had offered a one-year extension of expiring health care subsidies; Republicans rejected it but agreed to meet on tax credits tied to reopening. It wasn’t a breakthrough, but it was movement — and after six weeks of paralysis, that was enough. The major indexes closed mixed, with the S&P holding near 6670, the Dow fractionally higher, and the Nasdaq ending modestly lower. Beneath the surface, though, leadership was shifting in ways that mattered.
The semiconductor space, once the torchbearer of this cycle, faltered. Weakness in chipmakers weighed heavily on the broader market, particularly after the Challenger, Gray & Christmas report on Thursday showed that U.S. companies announced the most job cuts in any October in more than 20 years. The data came at a time when macro signals were already softening — the University of Michigan’s November consumer sentiment index fell to 50.3, a 3.5-year low and well below expectations of 53. Inflation expectations rose slightly at the one-year horizon, to 4.7% from 4.6%, but eased at the five- to ten-year horizon, down to 3.6% from 3.8%. In effect, the consumer was exhausted but not yet panicking.

Fed Vice Chair Philip Jefferson didn’t help the mood. In remarks Friday, he said that interest rates remained “somewhat restrictive” and that it “makes sense to proceed slowly with rate cuts as we approach the neutral rate.” That was enough to push the short end of the Treasury curve higher and weigh on the risk complex. December 10-year T-notes closed up a tick, with yields edging higher by 0.4 basis points to 4.087%. The message from the bond market was simple: don’t get ahead of yourself. Rate cuts are still coming, but they’ll arrive on the Fed’s timetable, not the market’s.
The story overseas wasn’t much better. Europe’s major indexes ended lower, with the Euro Stoxx 50 closing down 0.8% at a three-week low. Japan’s Nikkei 225 shed 1.19%, and China’s Shanghai Composite drifted 0.25% lower after a disappointing trade report showed October exports falling 1.1% year-over-year versus expectations for a 2.9% gain. Imports rose just 1%, well below consensus. In other words, global trade was cooling, and the world’s second-largest economy wasn’t pulling its weight.
Back home, the data continued to paint a mixed picture. The Institute for Supply Management reported that services activity had returned to growth, with the ISM Services PMI rebounding to 52.4 in October from 50.0 in September. Eleven industries expanded, led by business services and health care. Manufacturing, by contrast, remained stuck in contraction at 48.7, its eighth straight sub-50 reading. The ISM Manufacturing comments were particularly dour. Susan Spence, who chairs the survey committee, said that for every positive remark about new orders, there were 1.7 expressing concern about near-term demand — most citing tariffs and uncertainty as the chief culprits.
The Challenger job cuts report provided a grim counterpoint to the ADP payroll data released earlier in the week. ADP showed a modest rebound of 42,000 private-sector jobs in October, led by large firms, after two months of declines. But the Challenger data, with 153,074 job cuts announced in October — the highest for that month since 2003 — told a darker story. More than a million jobs have been eliminated this year, a 65% increase over the same period last year. Technology accounted for roughly 33,000 of those cuts, warehousing another 48,000. The firm noted that “AI adoption, softening consumer and corporate spending, and rising costs” were driving a wave of belt-tightening across industries.
Still, even with all that, corporate earnings continued to surprise to the upside. Of the 136 S&P 500 companies that reported this week, 81% beat forecasts, keeping the index on pace for its strongest beat rate since 2021. Profits are expected to rise 7.2% year-over-year, the smallest gain in two years, but a gain nonetheless. Sales growth slowed slightly to 5.9% from 6.4% in the prior quarter. In other words, the earnings cycle is cooling, not cracking.
Even so, the market wasn’t in the mood to celebrate. Valuation anxiety — particularly around the AI complex — weighed heavily on sentiment. The Nasdaq Composite led the week’s declines, while the Russell 1000 Growth Index underperformed its value counterpart by nearly three percentage points, its widest gap since February. The rotation was sharp but not chaotic: money didn’t leave the market so much as it moved. Defensive sectors like health care, consumer staples, and utilities attracted inflows, while energy and real assets found sponsorship among funds looking for ballast.
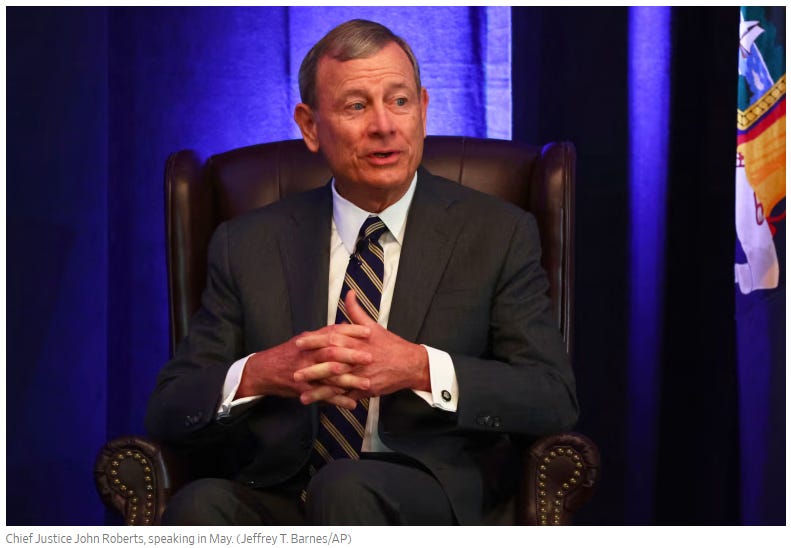
There was no shortage of political theater to stir the pot. The Supreme Court heard arguments over the legality of President Trump’s reciprocal tariffs, with Chief Justice Roberts noting that tariffs were “an imposition of taxes on Americans,” a power traditionally reserved for Congress. If the Court strikes down the tariffs, which lower courts have already deemed illegal, the government could be on the hook for more than $80 billion in refunds. That potential fiscal hole is not trivial, and traders immediately started gaming out what it might mean for the yield curve. A sudden drop in tariff revenue could steepen the curve, worsening the deficit dynamic and, paradoxically, forcing the Fed’s hand on rate cuts sooner than expected.
For now, though, the 10-year yield remains anchored near 4.09%, and swaps markets are pricing a 66% chance of a 25-basis-point cut at the December 9–10 FOMC meeting. In Europe, German bund yields edged higher to 2.666%, the U.K. gilt to 4.466%. ECB officials were mildly upbeat, suggesting that downside risks had been “mitigated.” That was a diplomatic way of saying the region had dodged recession — for now.
Back in U.S. equities, the rhythm of the week followed a familiar arc: early weakness, midweek stabilization, late-week recovery. The S&P 500 tested and held its 50-day moving average near 6666 — an omen of a level if ever there was one — and reversed sharply into Friday’s close. That level hadn’t been breached since May, and its defense drew in tactical buyers. Breadth broadened into the weekend, with small and mid-caps outperforming. The S&P Equal Weight Index fell less than half as much as the cap-weighted benchmark. The ICE Semiconductor Index, FANG+ basket, and Mega Cap Growth ETFs each fell 4–6% on the week, but all finished well off their lows as dip buyers reappeared.
If the last several weeks were about speculative excess, this one was about the market’s immune response. Tech didn’t break — it just stopped going up for the wrong reasons. The XLK technology ETF found buyers at its 50-day average and closed the week back above its opening level. Energy took the baton, driven by strength in natural gas as cold weather and record LNG feedgas flows pushed prices higher. Defensive groups held their bid, with managed care, health care services, and consumer staples outperforming. Insurers rallied on solid earnings and mean reversion after prior weakness. Utilities and real estate lagged early but closed the week with strength, aided by falling long-end yields.
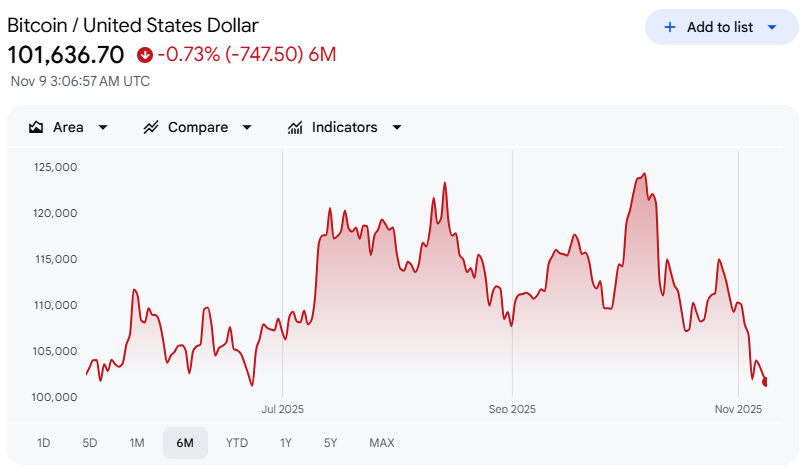
One of the more interesting dynamics was in crypto, which continues to act as a proxy for risk appetite and liquidity. Bitcoin, after repeatedly breaking below the $100,000 mark, stabilized late in the week and closed back above that level. Ethereum fell 10% but found support near its 200-day moving average. Even with the hack of Balancer, a DeFi protocol built on Ethereum, the complex showed resilience. For equity traders, that stabilization was an early tell. Bitcoin’s Friday reversal preceded the S&P’s turn higher by several hours — another reminder that liquidity signals often surface where people least expect them.
The macro backdrop was complicated further by the ongoing government shutdown. The FAA ordered airlines to reduce traffic because of staffing shortages, and the lack of federal data releases forced markets to rely on private-sector reports. The longer the shutdown persists, the greater the risk to GDP and consumer sentiment. The University of Michigan’s data confirmed as much. And while inflation expectations remain anchored, the collapse in personal-finance sentiment and expected business conditions — down 17% and 11%, respectively — speaks to an economy tiring under the weight of political dysfunction.
If there was one bright spot in policy, it was in monetary coordination. The Fed’s balance sheet runoff officially ended, as expected, and the 25-basis-point rate cut earlier in the month was fully absorbed. Chair Powell’s remark that another December cut was “not a foregone conclusion — far from it” had already cooled speculative fever. Multiple Fed officials echoed that caution during the week, from Christopher Waller’s dovish call for continued easing to Austin Goolsbee’s unexpectedly hawkish tone. The net message was clear: the Fed is divided, but not dysfunctional. The center of gravity remains steady — modestly easing, data-dependent, and conscious of the risks of overcorrection.
Treasury yields were volatile but ultimately little changed. Short and intermediate yields drifted lower, long yields higher. Municipal bonds performed in line with Treasuries despite a heavy new-issue calendar. High yield underperformed as equities weakened, reflecting risk aversion rather than credit stress.
In commodities, oil drifted modestly lower, consolidating under its longer-term moving averages after the prior bounce. Industrial metals came under pressure amid weaker global data, while precious metals traded in narrowing ranges. Gold oscillated around $4,000, hugging its 50-day line. Agricultural commodities pulled back slightly after several weeks of gains tied to trade headlines.
International markets largely mirrored the U.S. dynamic: tech-heavy regions like Japan and South Korea underperformed, while Europe held up relatively well. China’s modest decline belied internal fragility, as weaker trade data highlighted the unevenness of its recovery.
By Friday’s close, the picture was clear. What the market had undergone wasn’t a breakdown — it was a rotation. AI enthusiasm had simply collided with valuation gravity. The Nasdaq’s pullback reflected a necessary correction in sentiment, not fundamentals. Corporate earnings remained solid. AI spending plans were intact. The problem was positioning, not profitability.
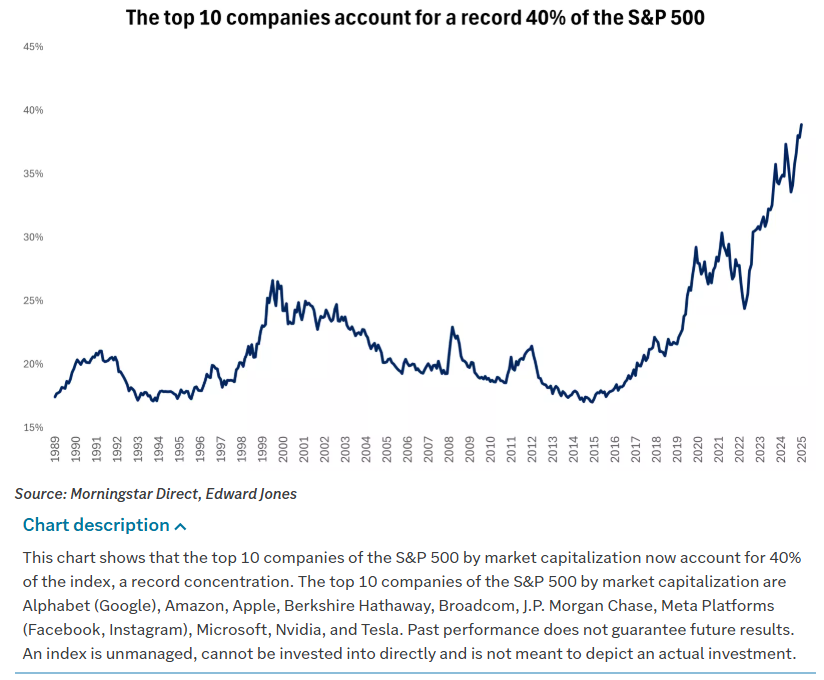
NVIDIA (NVDA), the cornerstone of the AI ecosystem, remains emblematic of that tension. Now a $5 trillion company — larger than five of the S&P 500’s eleven sectors and roughly 60% of the entire Russell 2000’s market cap — NVDA is the gravitational center of the market. Its growth is real, its profits enormous, but its dominance distorts perception. Every tick in NVDA affects index mechanics, sector breadth, and portfolio construction. When NVDA wobbles, everything else ripples.
For perspective, the top 10 companies in the S&P 500 now represent more than 40% of its market capitalization — a record. That concentration invites comparisons to 2000, but the differences are material. Today’s tech leaders are profitable, cash-rich, and funding their expansion internally. The rally is driven by earnings, not just multiple expansion. The risk isn’t collapse — it’s correlation. As the market narrows, volatility rises.
In that sense, this week’s pullback was healthy. It reintroduced balance, forced diversification, and reminded traders that liquidity is not infinite. The equal-weight S&P’s relative outperformance underscored that rotation is still alive beneath the surface. Energy, health care, and staples aren’t leading by accident; they’re where the real money is going.
The labor story adds another wrinkle. AI-related layoffs are increasing, but remain small in aggregate — roughly 6% of announced cuts this year. The link between AI adoption and job displacement is real but still nascent. Sectors most exposed to automation, like software and IT, have seen hiring slow, while services and consumer-facing roles remain resilient. The long-term trade remains productivity-positive, even if the short-term optics are messy.
The week also saw a wave of M&A activity — a reminder that corporate balance sheets remain strong and strategic confidence high. Kimberly-Clark (KMB) announced a nearly $50 billion cash-and-stock deal for Kenvue (KVUE). Pfizer (PFE) and Novo Nordisk (NVO) continued their bidding war for Metsera. Charles Schwab (SCHW) moved to acquire investment-platform provider Forge, while SoftBank was reported to have approached Marvell (MRVL) earlier this year. Deal flow is liquidity in motion, and it reinforces the underlying message: capital is still working.
By the end of the week, it was clear the market wasn’t unraveling; it was rebalancing. Tech had lost altitude, but defensives had picked up the slack. Rates were stable, credit orderly, and volatility controlled. The S&P 500’s failure to break its 50-day average was a technical and psychological victory. The late-week bid into beaten-down cyclicals and small caps suggested re-engagement, not retreat.
As the calendar rolls toward mid-November, traders are acutely aware of seasonality. There are just 36 trading days left in 2025, with Black Friday fifteen sessions away. Positioning will matter more than headlines. Inflation data and Retail Sales mid-week will shape the tone. A cooler CPI print would validate the rotation into defensives, compressing yields and supporting real estate and utilities. A hotter number could flip the script, favoring energy, commodities, and convexity trades in digital assets.
Either way, the tape feels orderly. Liquidity is being redistributed, not withdrawn. The AI trade is recalibrating, not collapsing. And while the market is no longer sprinting, it’s still moving — slower, steadier, and perhaps a little wiser for it.

Investor Sentiment Report
%Bull-Bear Spread
The %Bull-Bear Spread measures the gap between bullish and bearish investor sentiment, often from surveys like AAII. It’s a contrarian indicator—extreme optimism may signal a coming pullback, while extreme pessimism can hint at a potential rally. Large positive or negative spreads often mark market turning points.
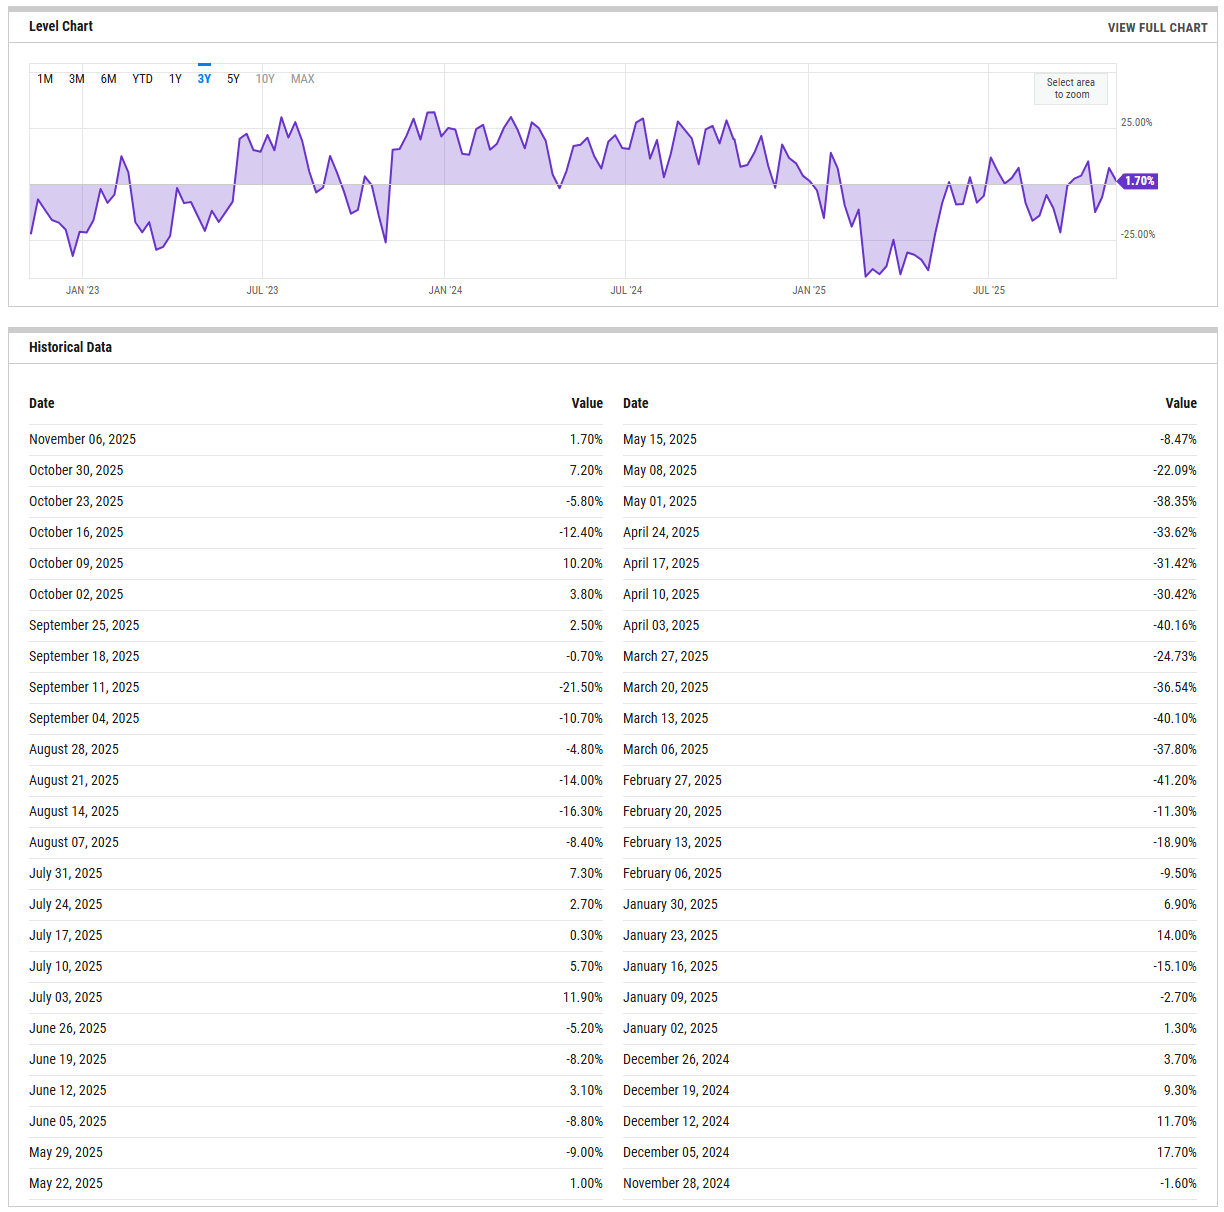
The bull-minus-bear spread improved modestly to +1.7% after last week’s +7.2% print, marking a retracement from optimism rather than a surge in conviction. The prior month’s sequence of deep negative readings in mid-October (-12.4%) and September (-21.5%) still anchors sentiment in a cautious regime. Readings near zero suggest balance, not enthusiasm — below zero remains contrarian-bullish, while sustained prints above +20% typically warn of crowding. A move back below zero without a new price low would imply latent demand and an early setup for a momentum inflection. Conversely, a decisive break north of +10% without confirmation in breadth would risk another failure swing similar to mid-summer. The takeaway is neutral-to-constructive: pessimism has eased, but conviction is shallow. Bulls have room to add, bears have lost urgency, and this balance supports consolidation over trend.
NAAIM Exposure Index
The NAAIM Exposure Index (National Association of Active Investment Managers Exposure Index) measures the average exposure to U.S. equity markets as reported by its member firms. These are typically active money managers who provide their equity exposure levels weekly. The index offers insight into how much these managers are investing in equities at any given time, ranging from being fully short (-100%) to leveraged long (up to +200%).
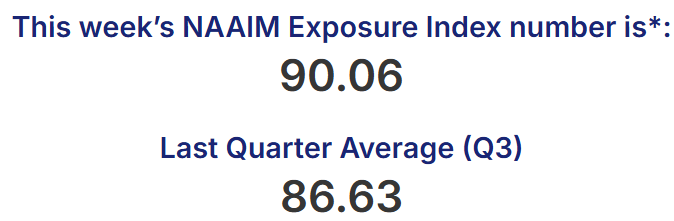
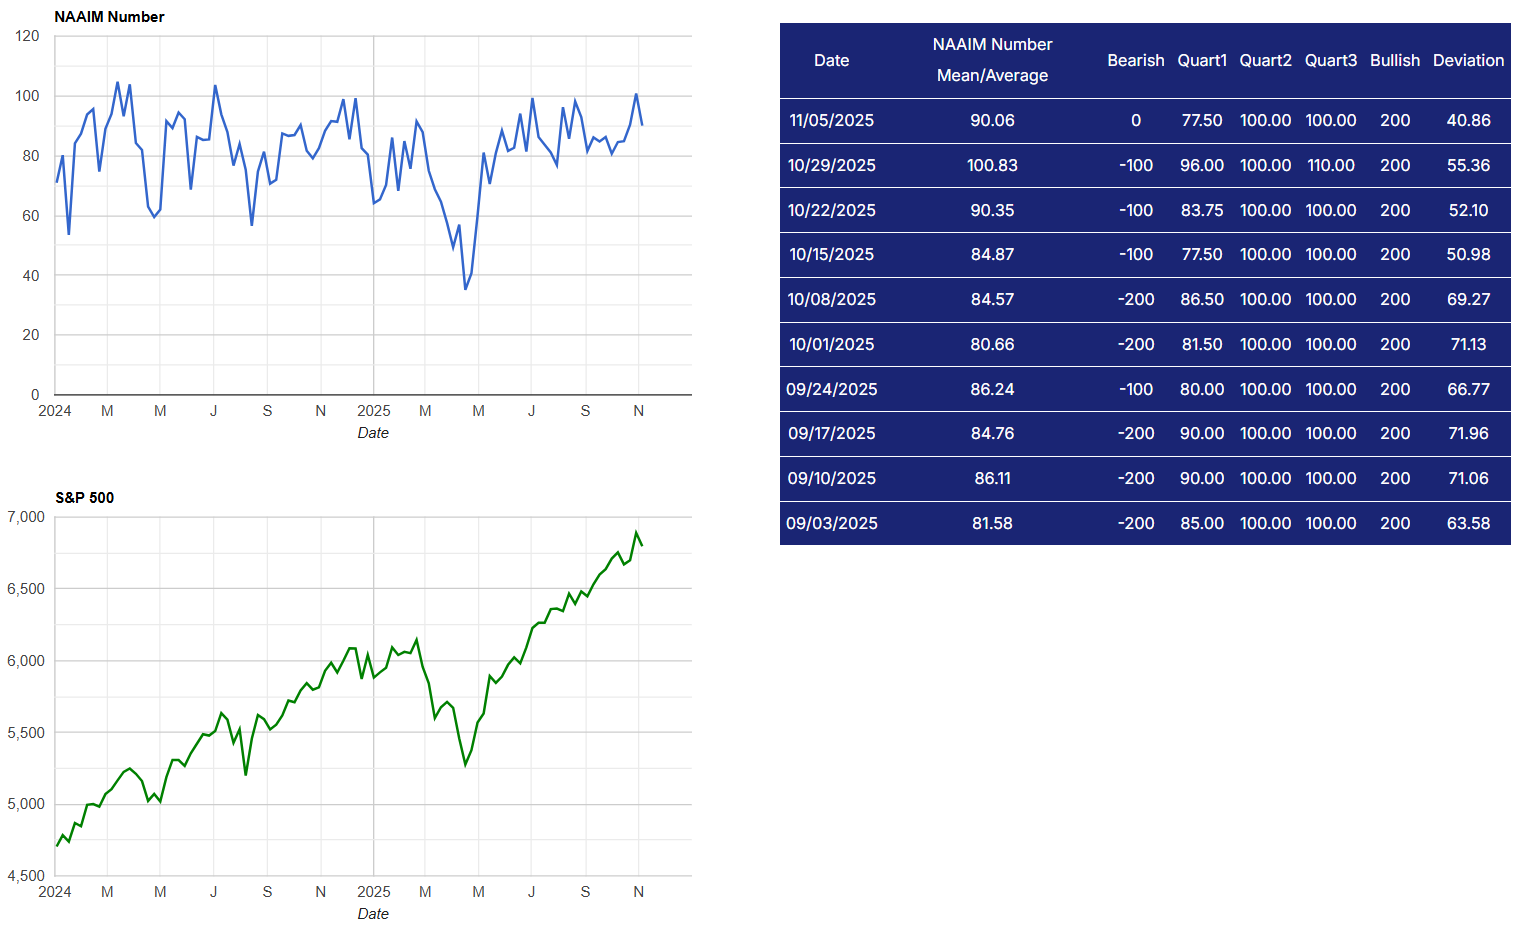
Active manager exposure ticked down to 90.06 from 100.83 last week, keeping allocations high but off extremes. The 10-week range between 80 and 100 shows investors fully engaged but not leveraged. A reading above 90 implies risk capital is largely deployed; the market’s ability to advance from here depends on fresh inflows rather than rotation. The notable stability since September, when exposure briefly slipped into the low 80s, suggests managers are not de-risking aggressively but also have little dry powder left. A decline into the 50s without significant price damage would mark accumulation potential and reset positioning. A renewed push back above 95 would signal overconfidence and raise vulnerability to shakeouts. For now, NAAIM confirms a high-exposure equilibrium — not manic, but fully invested and thinly cushioned against volatility.
CBOE Total Put/Call Ratio
CBOE's total put/call ratio includes index options and equity options. It's a popular indicator for market sentiment. A high put/call ratio suggests that the market is overly bearish and stocks might rebound. A low put/call ratio suggests that market exuberance could result in a sharp fall.
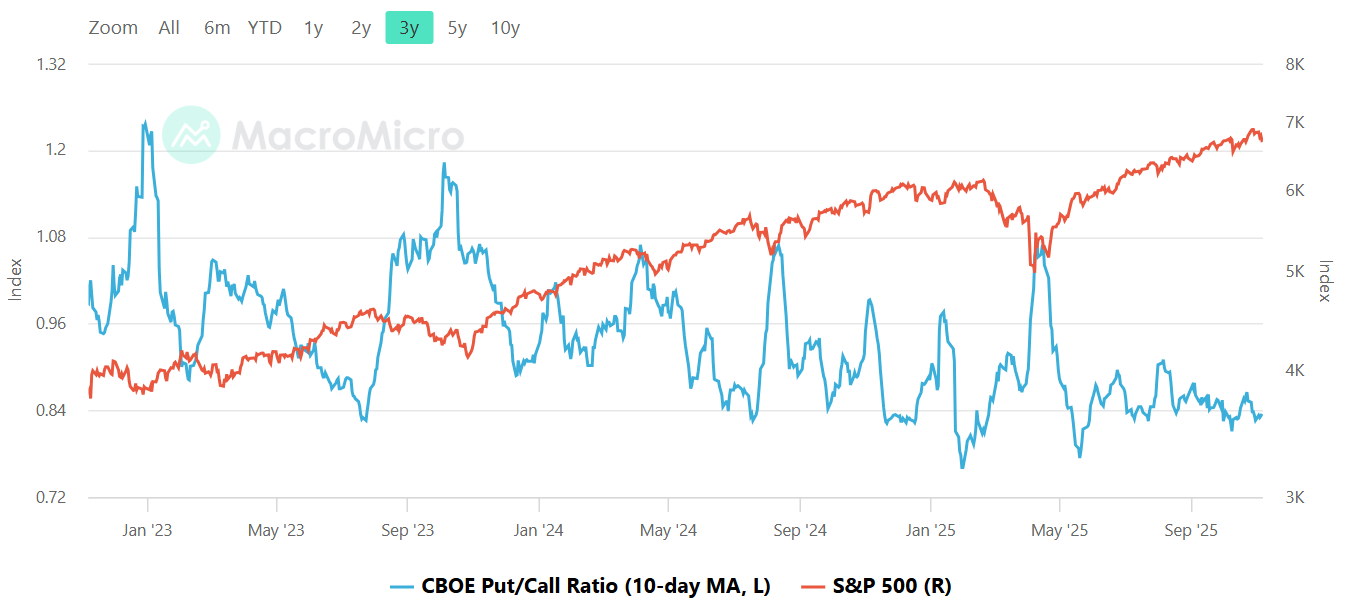
The 10-day moving average of the total put/call ratio sits near the lower bound of its three-year range, hovering around 0.85–0.90, consistent with a mild complacency phase. After spiking in August, the ratio has steadily compressed as equities recovered, showing that traders are again paying up for calls rather than protection. Historically, readings near 0.8 align with overconfidence, while 1.0 or higher reflects fear and sets up tactical lows. The current backdrop implies limited downside insurance and thinner liquidity to absorb shocks. A rise above 1.0 would signal healthy risk repricing; a slide below 0.8 would flag an exhaustion move vulnerable to reversal. The message is simple: protection has gotten cheap because few are asking for it.
Equity vs Bond Volatility
The Merrill Lynch Option Volatility Estimate [MOVE] Index from BofAML and the CBOE Volatility Index [VIX] respectively represent market volatility of U.S. Treasury futures and the S&P 500 index. They typically move in tandem but when they diverge, an opportunity can emerge from one having to “catch-up” to the other.
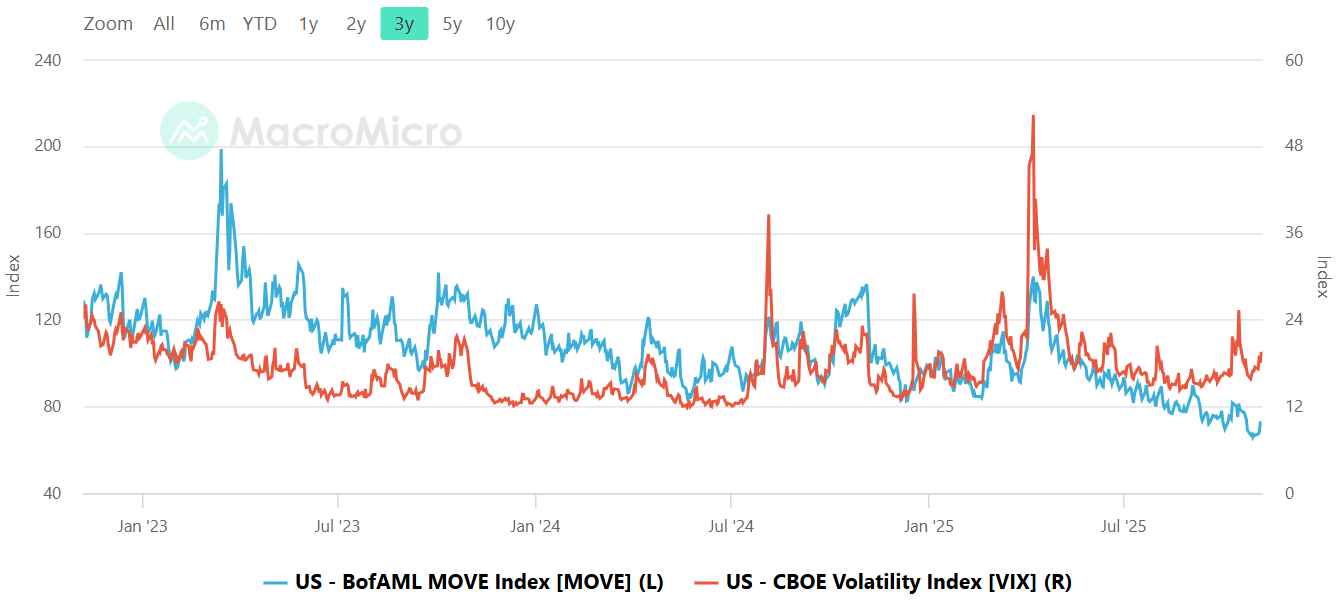
Bond volatility, as measured by MOVE, remains elevated relative to the equity VIX, which has declined back into the low teens. The divergence continues a pattern seen through 2025 — macro uncertainty in rates markets while equities remain sedated. The MOVE index holding north of roughly 110–120 with a sub-15 VIX historically signals latent fragility: credit desks are paying attention while equity traders are not. If MOVE spikes further without a VIX response, equities could face a delayed volatility catch-up. Conversely, simultaneous easing in both would mark genuine risk normalization. For now, fixed income still trades with tension while equities price stability; that asymmetry is often a late-cycle tell.
CNN Fear & Greed Constituent Data Points & Composite Index
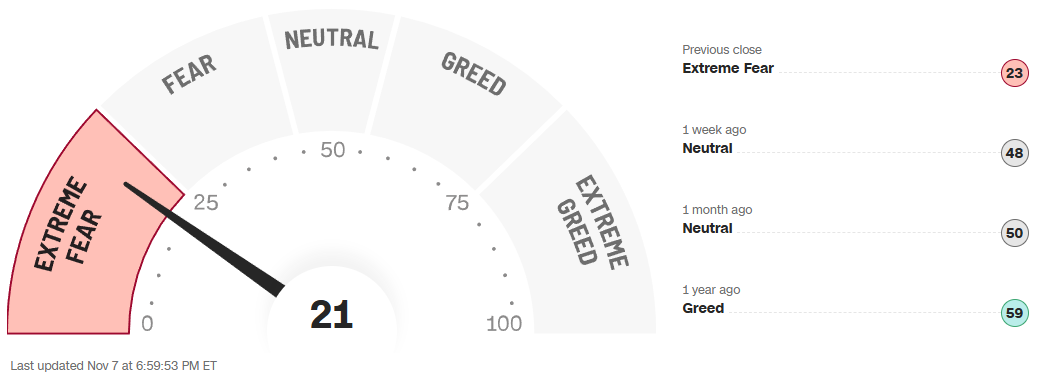
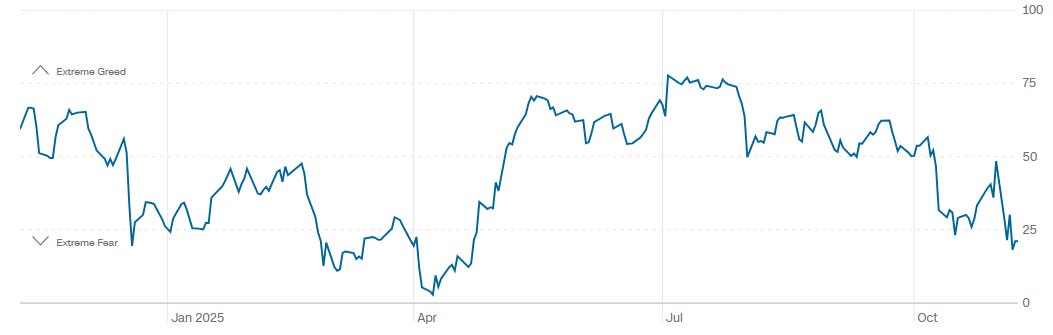
The CNN composite reads 21, down sharply from 48 a week ago and 50 a month ago, placing the market in the “extreme fear” zone. A year ago the same gauge was at 59, or greed. The one-year trend shows sharp oscillations between complacency and panic without sustained mid-range balance, a hallmark of tactical markets rather than trending ones. Extreme fear readings below 25 have historically preceded short-term rebounds as sellers exhaust. A sustained move back above 40 would signal risk appetite stabilizing; a slide under 20 would confirm capitulation. With sentiment this washed out and positioning still full, near-term volatility should fade, but lasting traction will require breadth to improve alongside easing credit and volatility measures.
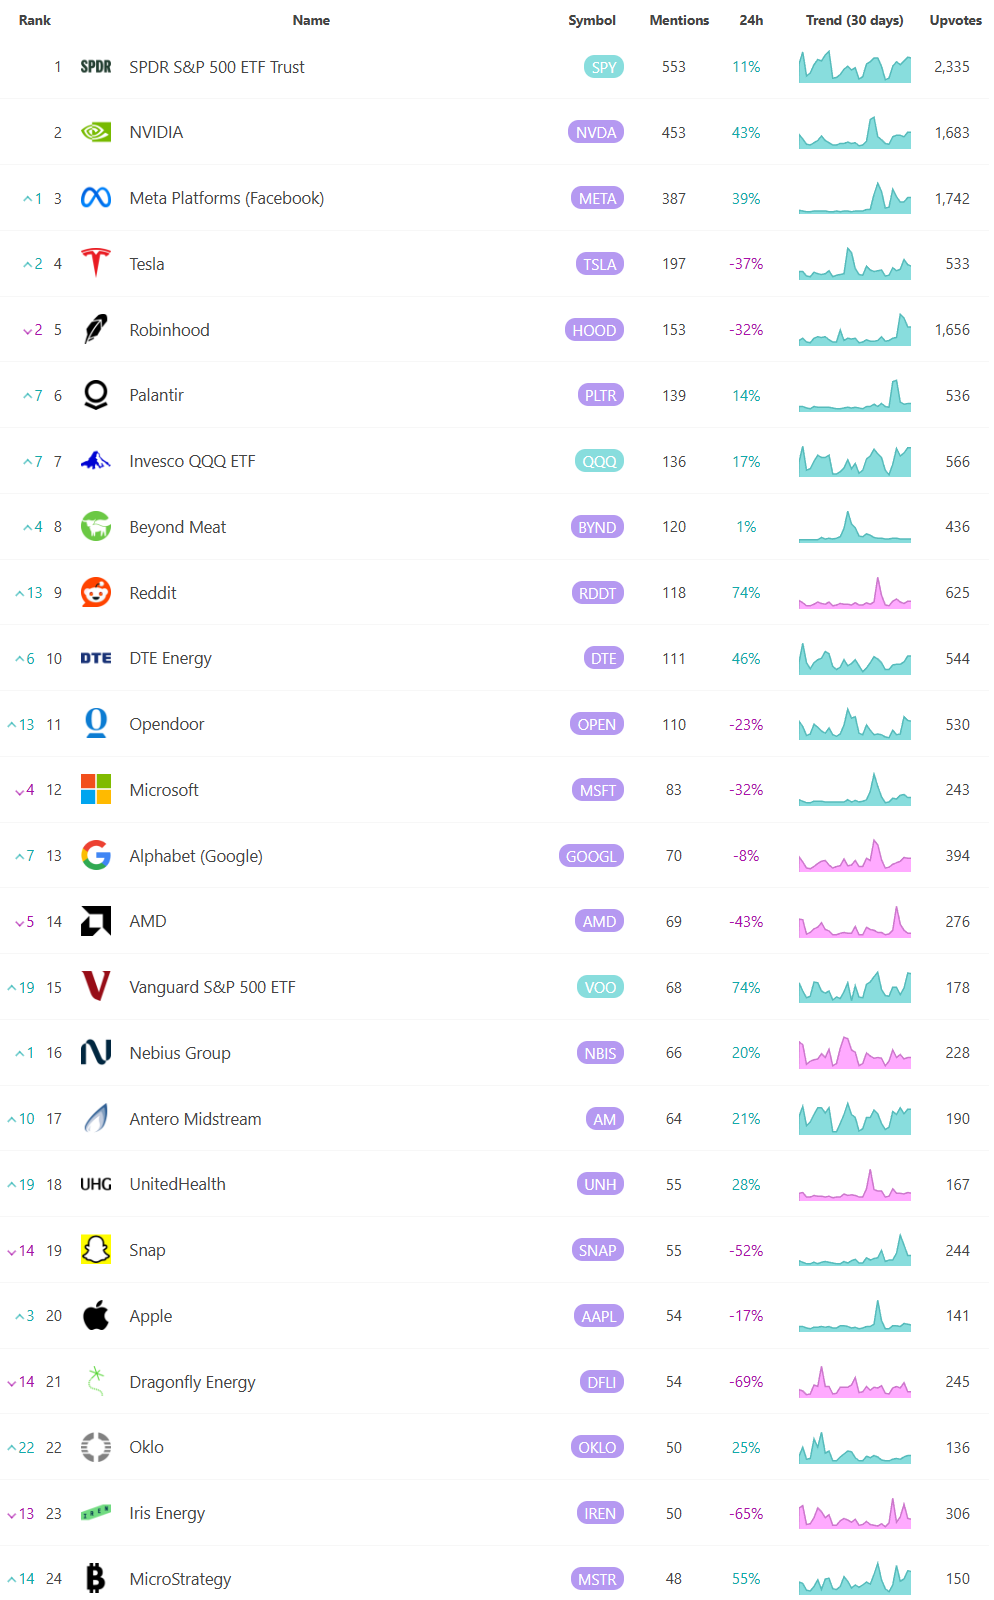
Social Media Favs
Social sentiment offers a real-time view of investor mood, often revealing market shifts before traditional indicators. It can signal momentum changes, spot emerging trends, and gauge retail investor impact—especially in high-volatility names. Tracking sentiment around events or earnings provides actionable insights, and when layered with quantitative models, can enhance predictive accuracy and risk management. Sustained sentiment trends often mirror broader market cycles, making this data a valuable tool for both short-term trades and long-term positioning.

Technician’s Playbook: Trading the Majors (SPY/QQQ/IWM/DIA)
When you’re a large institutional player, your primary goal is to find liquidity - places to do a ton of business with the least amount of slippage possible. VolumeLeaders.com automatically identifies and visually plots the exact spots where institutions are doing business and where they are likely to return for more. It’s one of the primary reasons “support” and “resistance” concepts work and truly one of the reasons “price has memory”.
The week opened with a broad gap higher across all major index ETFs, a classic continuation of the prior Friday’s close that set the tone for a tactical rebound. The structure that followed was not a breakout but a balancing process — a market that absorbed heavy closing flow on October 24, repriced upward on the 27th, and then spent the remainder of the week digesting that impulse under the weight of significant institutional prints at the new range highs. Across SPY, QQQ, DIA, and IWM, the theme was the same: large capital rotated into strength early, leaving heavy footprints that now define the upper edge of the week’s developing balance.
SPY
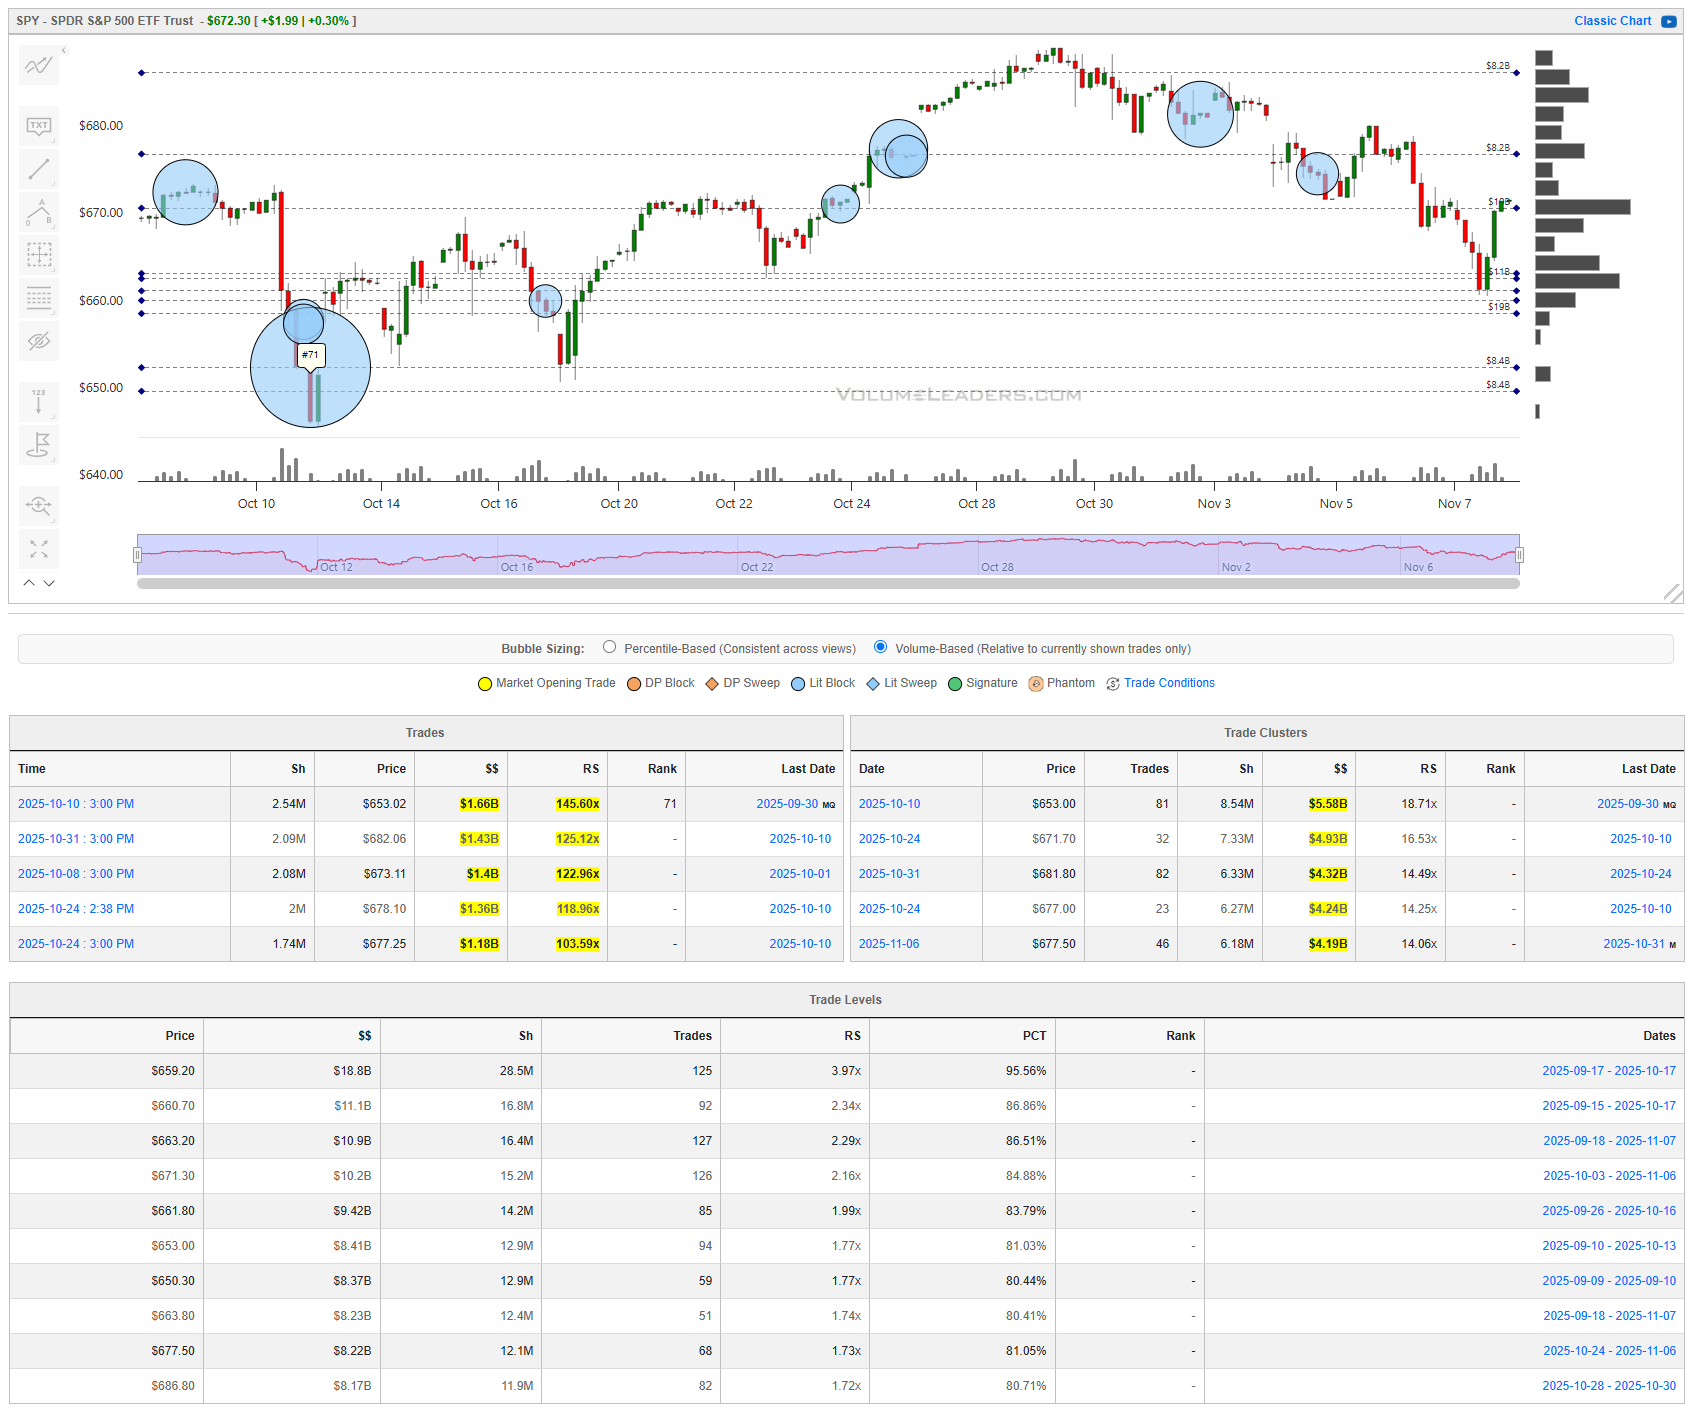
The SPY tape this week carried the marks of institutional repositioning. The early-October downdraft was punctuated by a $1.96B block near 653 — ranked among the 75 largest ever — that caught the falling knife and triggered a two-week impulse higher. Follow-through came via stacked prints between 662 and 678, including multiple billion-dollar sweeps ($1.48B at 662, $1.51B at 670, $1.18B at 677). Those prints built a mid-660s demand shelf where roughly $18.8B in notional transacted, the single largest dollar concentration on the chart with an RS near 4x typical level size. The reversal high near 678 failed to attract new sponsorship, and the last two weeks show distribution prints at 673–674 and 670–671 with RS readings over 3x, suggesting supply rather than renewed buying. The key cluster sits between 663 and 667 ($4.3–$5.5B, RS 14–18x), defining the near-term line of scrimmage. Acceptance below 662 reopens the late-October pocket toward 653 and 650, where prior absorption took place. A reclaim of 673 would flip control back to buyers and set 678–680 as the next magnet. For tactical execution, traders can frame risk below 661 on longs targeting 673–678, while failed retests of 672 should invite tactical shorts with first support near 660 and secondary at 653.
QQQ
The Nasdaq tape told a cleaner story of exhaustion. The largest single print was $1.31B at 610, tagged among top historical trades and carrying a 197x RS — a massive absorption event that halted the October bleed and launched a 5% rebound. Yet as prices climbed through 620–625, trade density thinned while clusters appeared on the sell side: $923M at 617 and $928M at 620, both high-RS blocks forming an overhead wall of supply. The highest cumulative notional sits between 598 and 606 ($5.0–$4.3B, RS 3–4x), which remains the structural demand base. That range is now the key pass/fail zone; buyers must defend the 602–606 area to maintain control. Failure there exposes a retrace toward 590. On strength, clearing 620 and holding above 623 would trigger a test of 630–632, the upper trade cluster ($2.3B, RS 19x) where sellers last overwhelmed the tape. A disciplined trader would wait for confirmation via re-accumulation above 621 before targeting that level, keeping risk contained to a close back below 610.
IWM
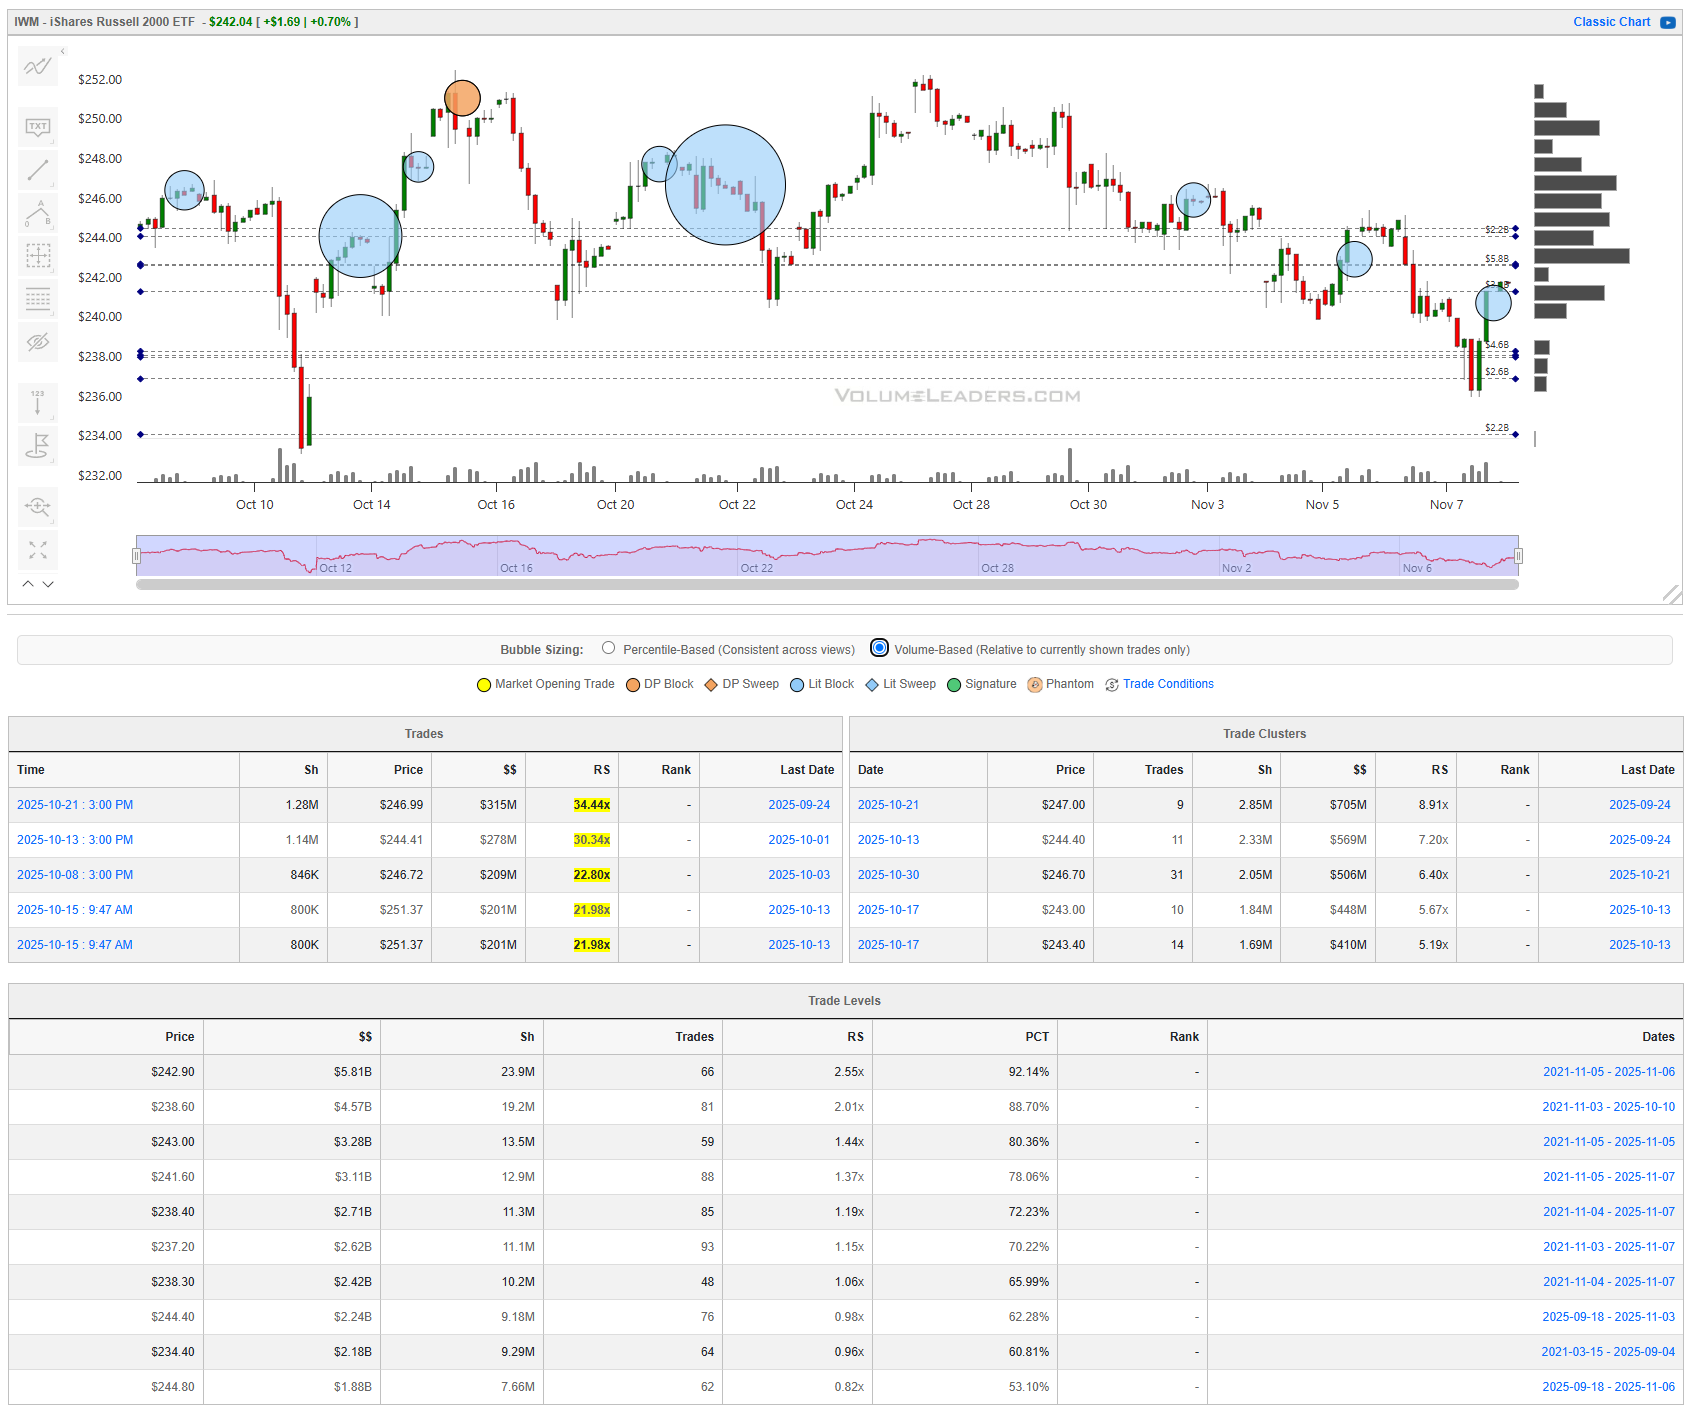
The Russell tape continues to reflect indecision more than commitment. Despite a 1.7% bounce late in the week, institutional flow remains fragmented. The largest prints — $315M at 246.9 and $278M at 244.1 — occurred into weakness, not on breakouts, and RS values (30–34x) show they were significant relative to IWM’s history. The $5.8B cumulative trade level near 242.9 (RS 2.55x, 92nd percentile) remains the most critical anchor. Each test of that band in late October saw responsive buying, but rallies above 248 repeatedly failed to hold. The chart’s trade clusters confirm this range: 243–247 carries multiple billion-dollar aggregates ($750M, $559M, $544M) that define balance. Acceptance above 248 would target 251–252, while losing 243 would complete a breakdown to 239. For tactical traders, the cleanest read lies between 244.5 and 247. A close below 244 signals sellers reclaiming control; a close above 248 invites rotational buying back to mid-October highs.
DIA
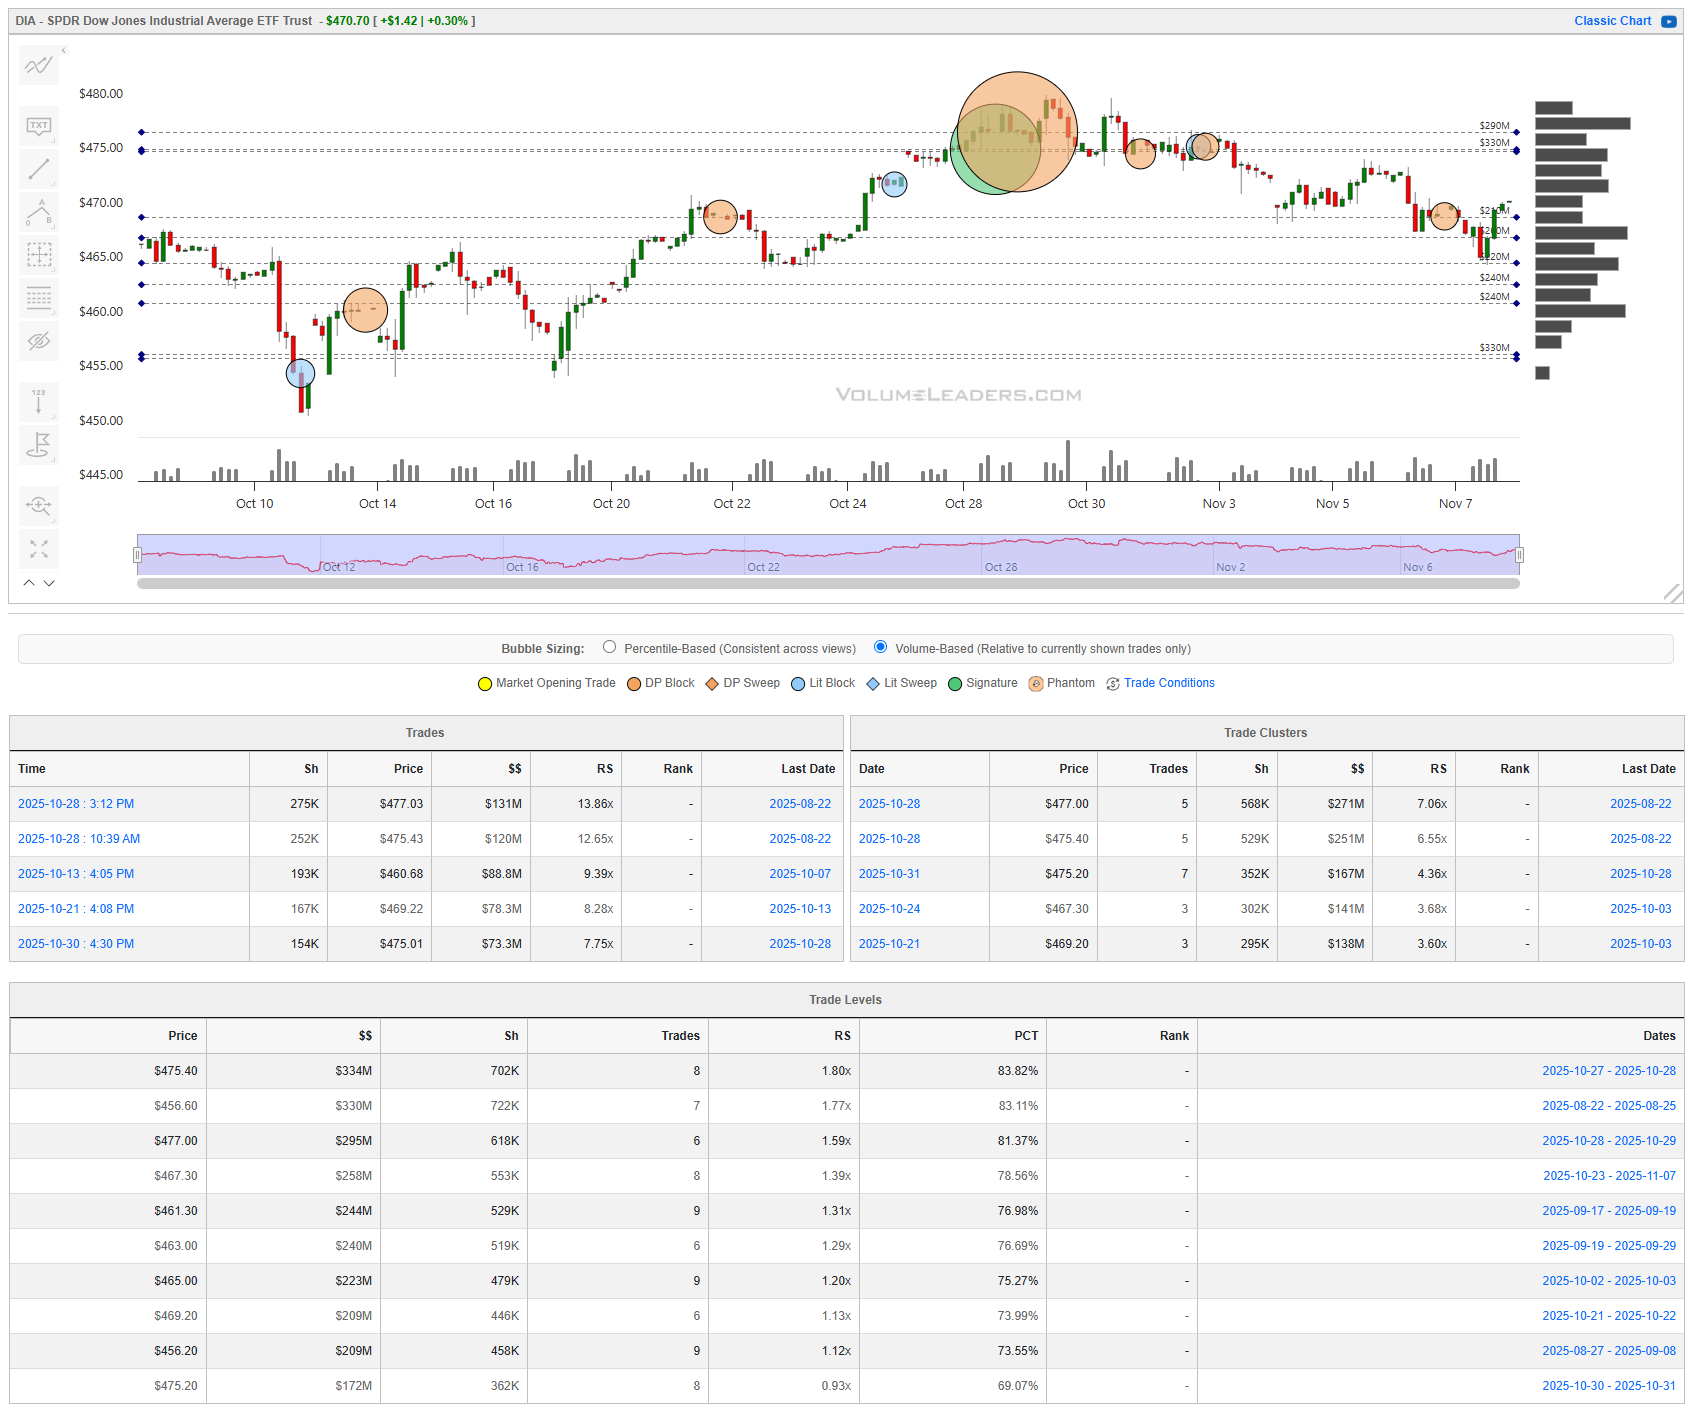
The Dow remains the most structurally stable of the four, but signs of fatigue are visible. The largest cluster sits near 477 ($271M, RS 7x) — a clear ceiling reinforced by the $131M print at that level, which capped the recent rally. Support rests around 469–471, where a smaller but persistent bid ($138M–$114M, RS 3–4x) absorbed each dip through October. The $334M cumulative level at 475 (RS 1.8x, 83rd percentile) now acts as the pivot: acceptance above invites another push toward 480, but continued rejection here suggests rotation back toward 466–468. A disciplined trader can use 475 as the fulcrum: longs above it target 477–480 with stops under 472, while shorts below target the lower shelf with invalidation above 476. The tape remains orderly, but weakening follow-through warns that the Dow’s relative strength may be masking broader loss of sponsorship.
Across the majors, institutional flow shows defensive rotation and supply emerging near recent highs. The market is balanced but heavy, and control for the next leg rests with whether SPY holds the mid-660s and QQQ defends 602–606.

Summary Of Thematic Performance YTD
VolumeLeaders.com offers a robust set of pre-built thematic filters, allowing you to instantly explore specific market segments. These performance snapshots are provided purely for context and inspiration—think about zeroing in on the leaders and laggards within the strongest and weakest sectors, for example.
S&P By Sector
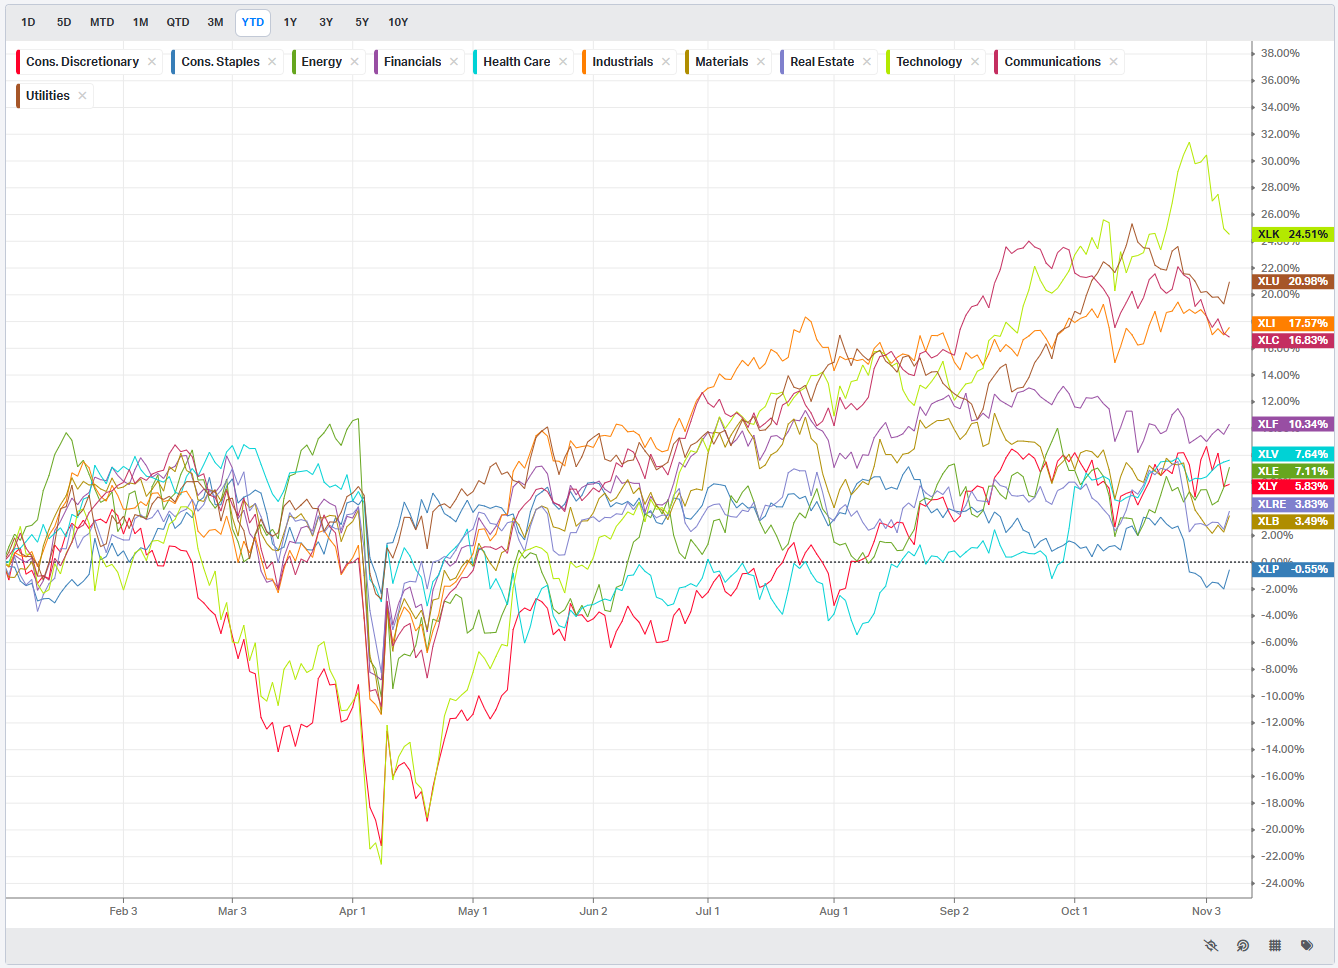
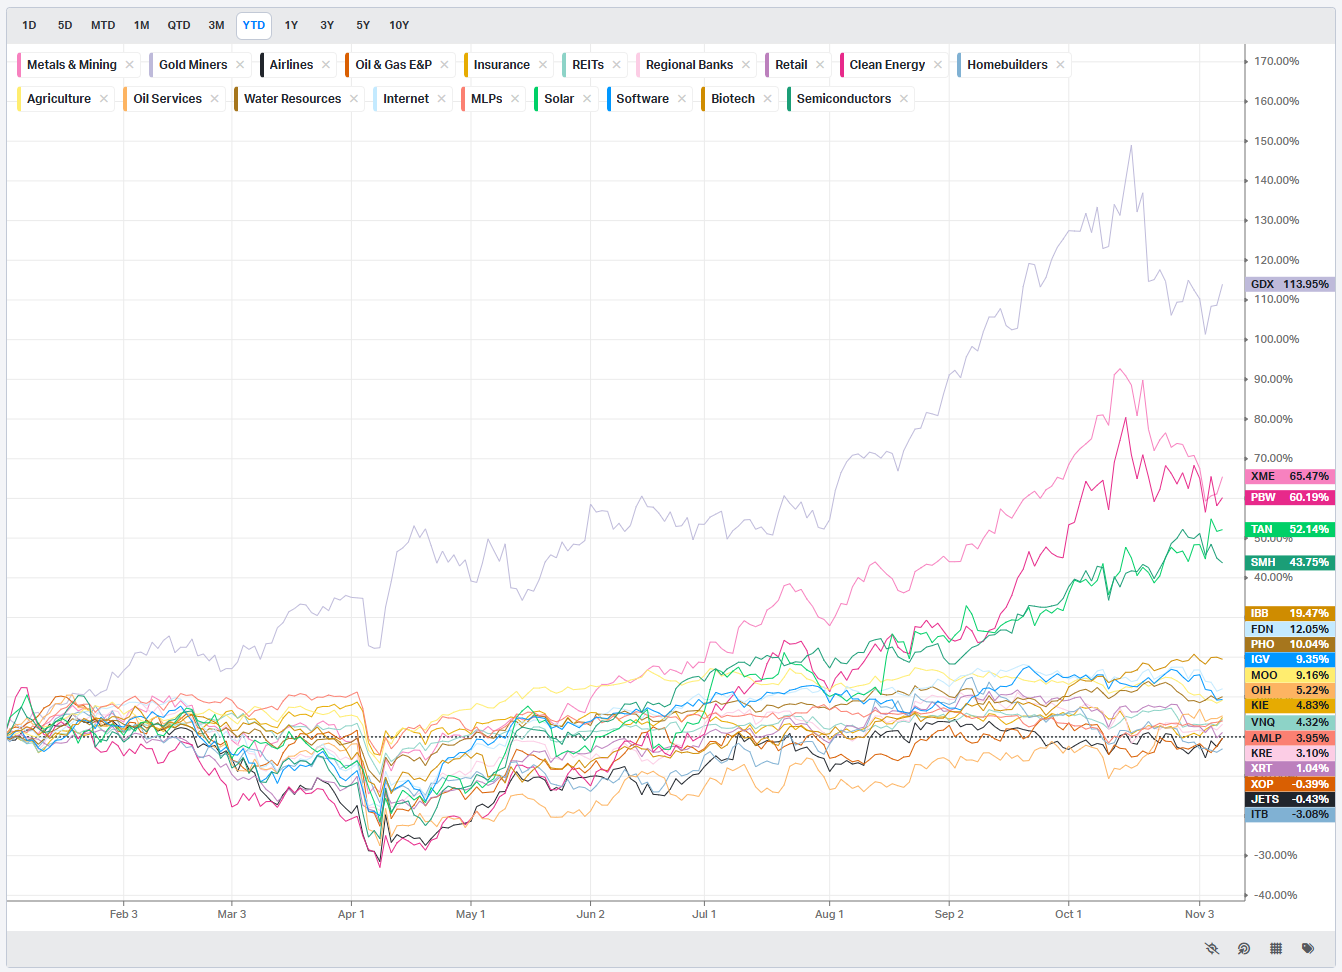
S&P By Industry
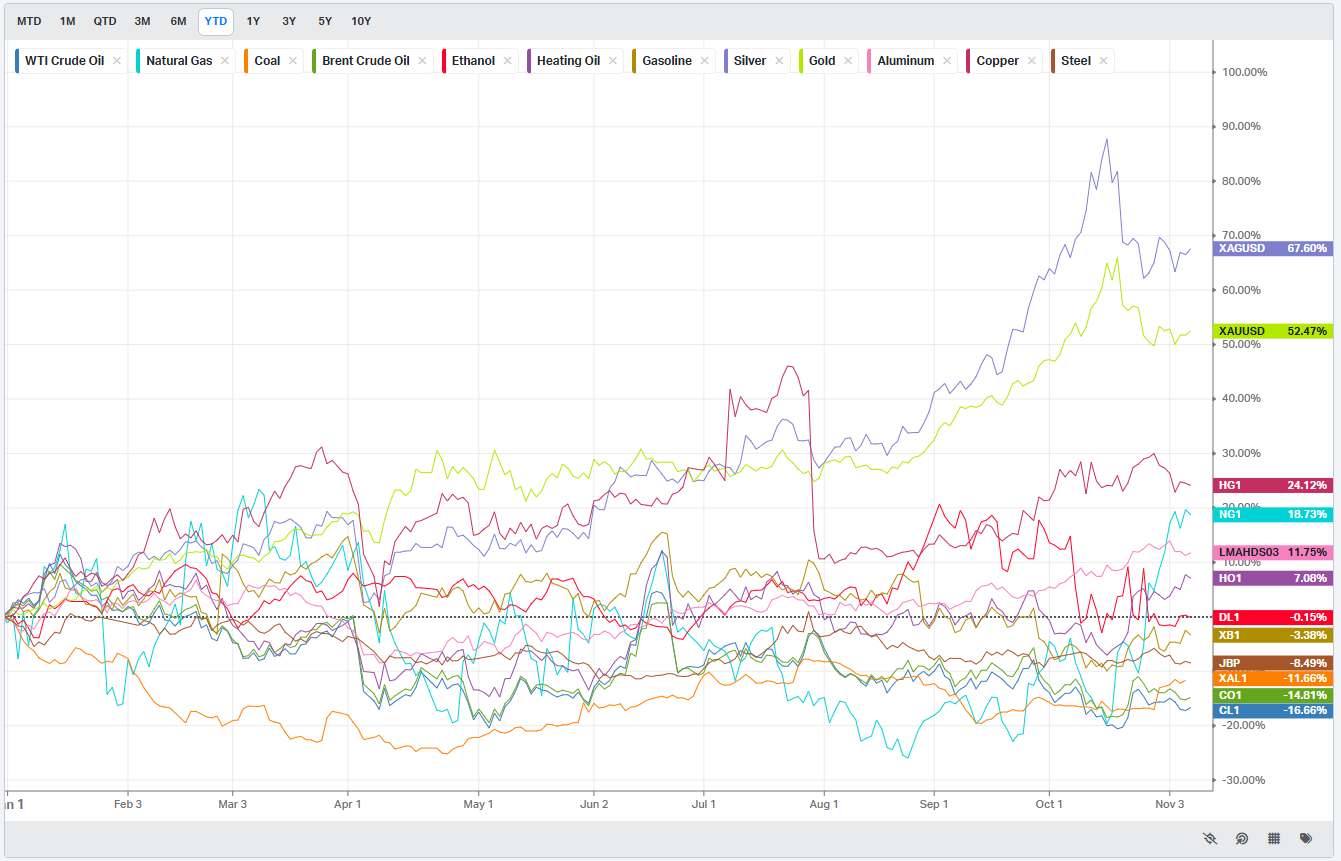
Commodities: Energy & Metals
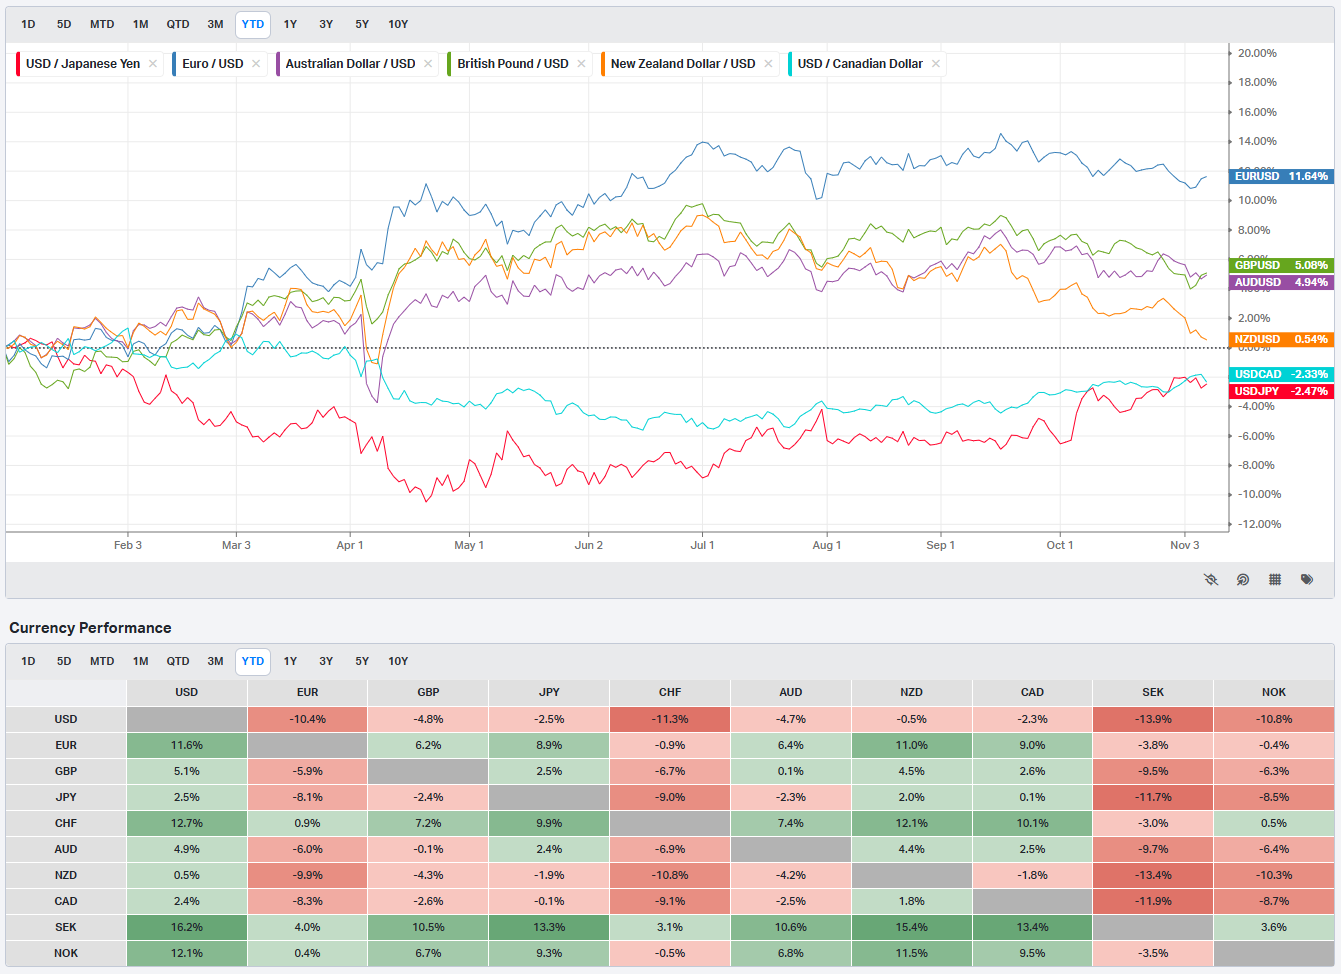
Currencies/Major FX Crosses
Factors: Style vs Size-vs-Value

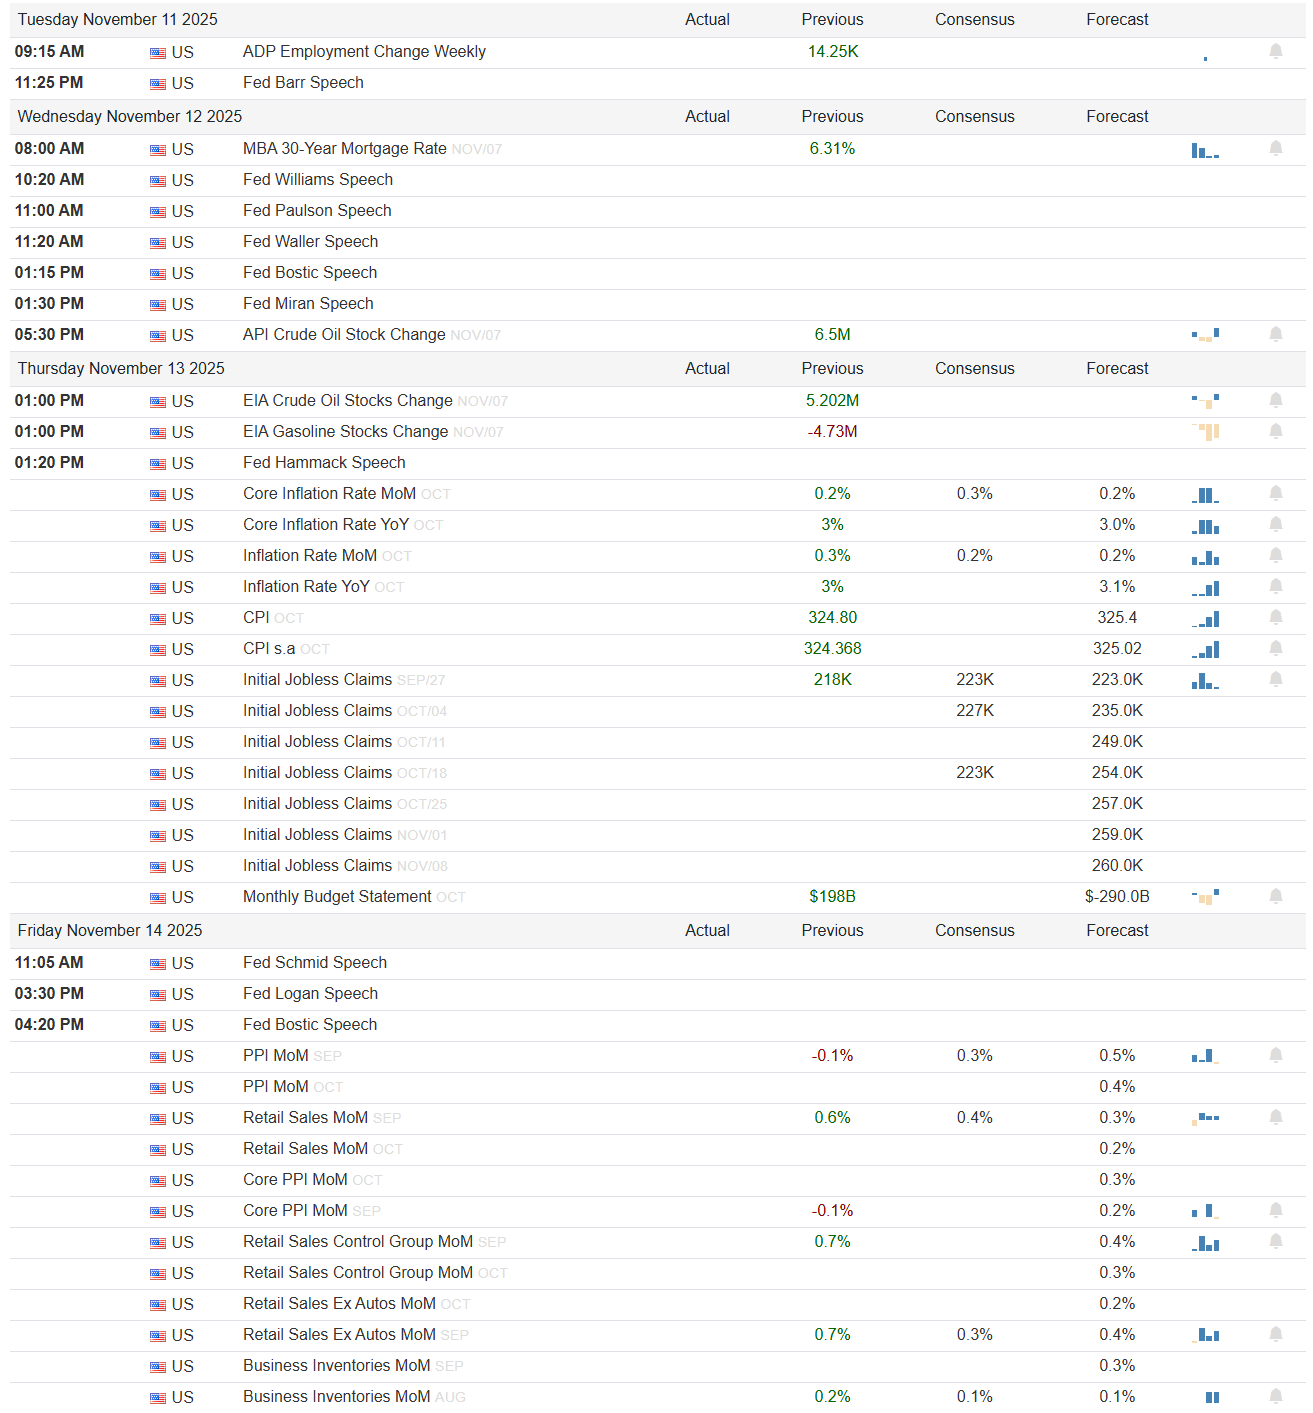
Events On Deck This Week
Here are key events happening this week that have the potential to cause outsized moves in the market or heightened short-term volatility.
The coming week sits squarely at the intersection of macro recalibration and positioning fatigue. With October CPI and PPI on deck, a full slate of Fed speakers, and earnings from large-cap growth and select cyclicals, traders will get a cleaner read on whether the soft-landing narrative still holds or if disinflation is stalling out. After a volatile week that saw equities retrace from late-October highs, the tape is looking for either confirmation of cooling inflation — or evidence the Fed can stay sidelined into year-end.
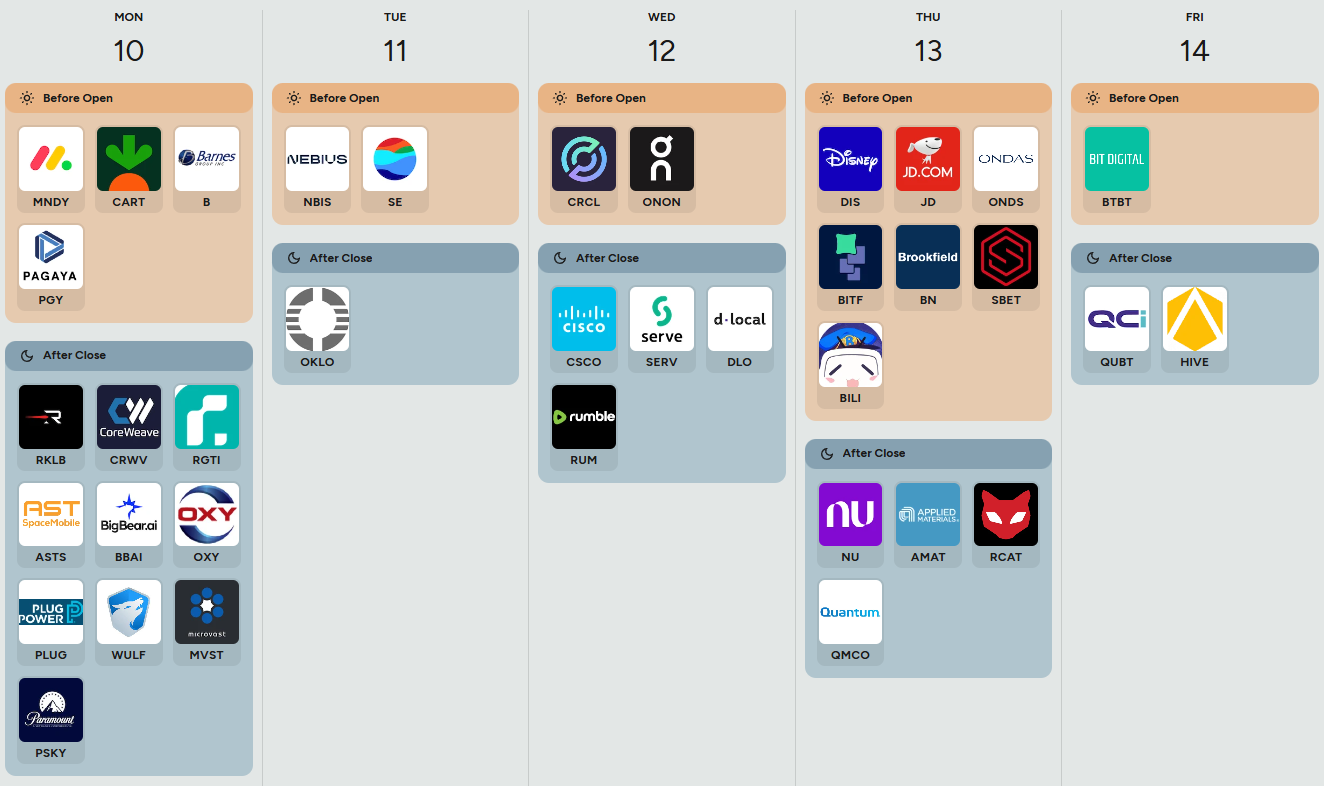
Monday, November 10
The week opens quietly on the data front, with no scheduled macro releases but a handful of earnings names that carry directional read-throughs for software, retail, and industrial demand. Monday.com (MNDY), Instacart (CART), and Pagaya (PGY) report before the open, setting the tone for SaaS and consumer activity. After the close, CoreWeave (CRWV) and Plug Power (PLUG) take the stage — both tied to the broader AI and clean-tech trade. Their margin guidance and order backlog trends will matter for speculative appetite, particularly given how those sectors have lagged since September. With no Fed officials on tap and bonds closed for Veterans Day, risk sentiment will likely key off these micro readings and global futures.
Tuesday, November 11
The macro week begins in earnest with the ADP Employment Change at 9:15 AM. The prior read of 14.25K showed a softer labor tone, and traders will be watching for any reacceleration that could re-anchor inflation expectations. A hotter number would be risk-off for duration and likely weigh on growth stocks, while another soft print would reinforce the “cooling without collapse” narrative. The day also features a Fed Barr speech at 11:25 PM, and while no policy shifts are expected, any remarks on financial stability or consumer credit would matter given the widening gap between credit spreads and equities. Earnings remain sparse, with Nebius (NBIS) and Sea Limited (SE) before the open, and Oklo (OKLO) after close. Sea’s e-commerce and payments metrics will help gauge emerging-market consumption and global discretionary trends.
Wednesday, November 12
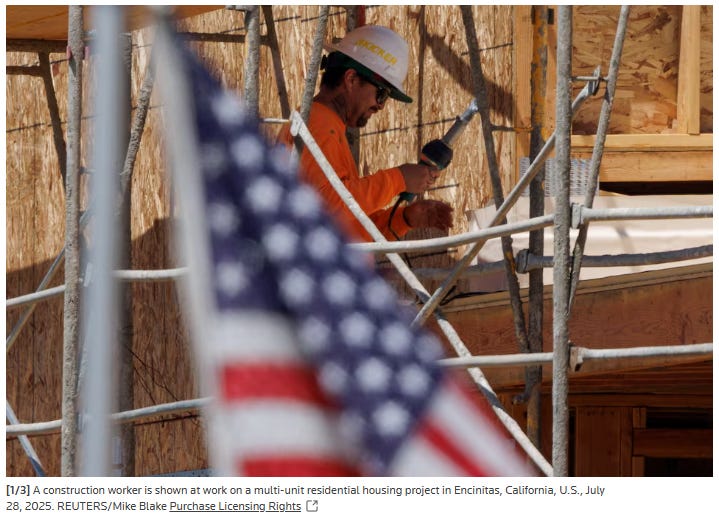
The midweek calendar leans heavily on Fed communication. Five separate speeches — from Williams, Paulson, Waller, Bostic, and Miran — will offer a mosaic on policy tone. Any hints of discomfort with current easing in financial conditions could pressure the front end of the curve. Mortgage rates, tracked by the MBA 30-Year Mortgage Rate (previous 6.31%), will be the key early datapoint; a continued downshift would support housing and consumer cyclicals. Oil inventories at 5:30 PM (previous 6.5M) round out the day, with attention on whether the recent drawdown stabilizes. On the earnings front, the spotlight shifts to Cisco (CSCO) and On Holding (ONON) — the former giving insight into enterprise IT spending, the latter serving as a consumer discretionary proxy. Rumble (RUM) reports after the close, offering a sentiment read on digital ad recovery.
Thursday, November 13
Thursday is the main event. CPI and Core CPI prints hit before the open. The visible data show Core Inflation Rate MoM at 0.2% (previous 0.3%), Inflation Rate YoY at 3.0% (previous 3.1%), and Headline CPI at 324.80 vs 325.4 expected. These levels suggest a mild cooling, but not a collapse. A downside surprise would reinforce the “Goldilocks” case and fuel a duration rally, while a re-acceleration would quickly reverse that tone. Energy adds complexity, with EIA Crude Oil Stocks up 5.202M and gasoline inventories down -4.73M. Rising crude supply but falling gasoline points to refining tightness — inflationary at the consumer level, deflationary at the headline. Initial jobless claims hold at 218K, still showing labor resilience. The balance between sticky core and easing headline will dictate market posture. If the CPI composite holds near 3%, the Fed’s narrative of “extended pause” gains credibility.
Earnings feature Disney (DIS), JD.com (JD), and Brookfield (BN) — all relevant to consumer health and global capital flows. After close, Nubank (NU) and Applied Materials (AMAT) step up, offering read-throughs on fintech adoption and semiconductor demand, respectively.
Friday, November 14
The week closes with the second leg of inflation: PPI and Retail Sales. PPI MoM at -0.1% (previous 0.3%) signals soft producer pricing pressure — a needed offset to sticky consumer prices. Retail Sales MoM at 0.6% (previous 0.4%) shows resilient demand, especially with the Control Group up 0.7%. That mix — weaker PPI and strong retail — supports the “slow glide” thesis: consumers are still spending but price momentum is easing. Fed speakers Schmid, Logan, and Bostic follow through Friday morning and afternoon. Any reinforcement of a “higher-for-longer but not higher-from-here” message would solidify rate expectations into December. The Monthly Budget Statement (previous -$290B, now +$198B) also underscores improved fiscal positioning, though one month doesn’t shift trend risk.
Earnings and IPOs
This week’s earnings slate bridges micro and macro. Software and consumer names early in the week (MNDY, SE) test the stickiness of enterprise budgets and consumer sentiment. Midweek tech and infrastructure reports (CSCO, DLO, SERV) will show whether AI and networking demand remain resilient in a higher-rate environment. Thursday’s DIS results will anchor the consumer narrative, while AMAT after the close on Thursday provides a real-time gauge of semiconductor capacity utilization and supply-chain normalization. JD.com and Nubank add global flavor: both feed into emerging-market demand and capital flow sentiment.
Tripwires for Traders
CPI prints at or below 0.2% MoM would flip sentiment decisively risk-on; a return to 0.3% or higher reawakens rate volatility.
NAAIM exposure staying above 90 with any CPI miss suggests over-commitment and weak downside hedging.
Energy inventories flipping back to draws would challenge the soft inflation read and cap upside for duration trades.
Order Flow in Focus: Reading Smart Money Tells
Order Flow in Focus: Reading Smart Money Tells is a recurring segment that spotlights unique intraday opportunities revealed through institutional order flow. Each feature dissects a moment when the tape quietly shifted—when large, ranked prints clustered at key liquidity locations and informed players positioned ahead of the move. The goal isn’t hindsight; it’s pattern recognition—learning to spot the footprints of capital that knows before the crowd does.
When the Tells Line Up: A Case Study in Institutional Positioning
Every once in a while, the tape gives you a masterclass in how informed capital moves—quietly, deliberately, and well ahead of the crowd. Today’s setup in METU, the leveraged META bull ETF, was one of those textbook tells.
Early in the session, we saw the usual chop—order flow light, liquidity scattered—but around 10:45 to 11:15 AM, the character of the tape changed. Three distinct prints appeared in sequence: first a #9-ranked trade, then a #5, and finally, a #2-ranked print—each larger and more aggressive than the last. These weren’t random bursts of volume. They were institutional-sized orders hitting a well-defined liquidity pocket, one that had already shown historical memory on prior sessions.
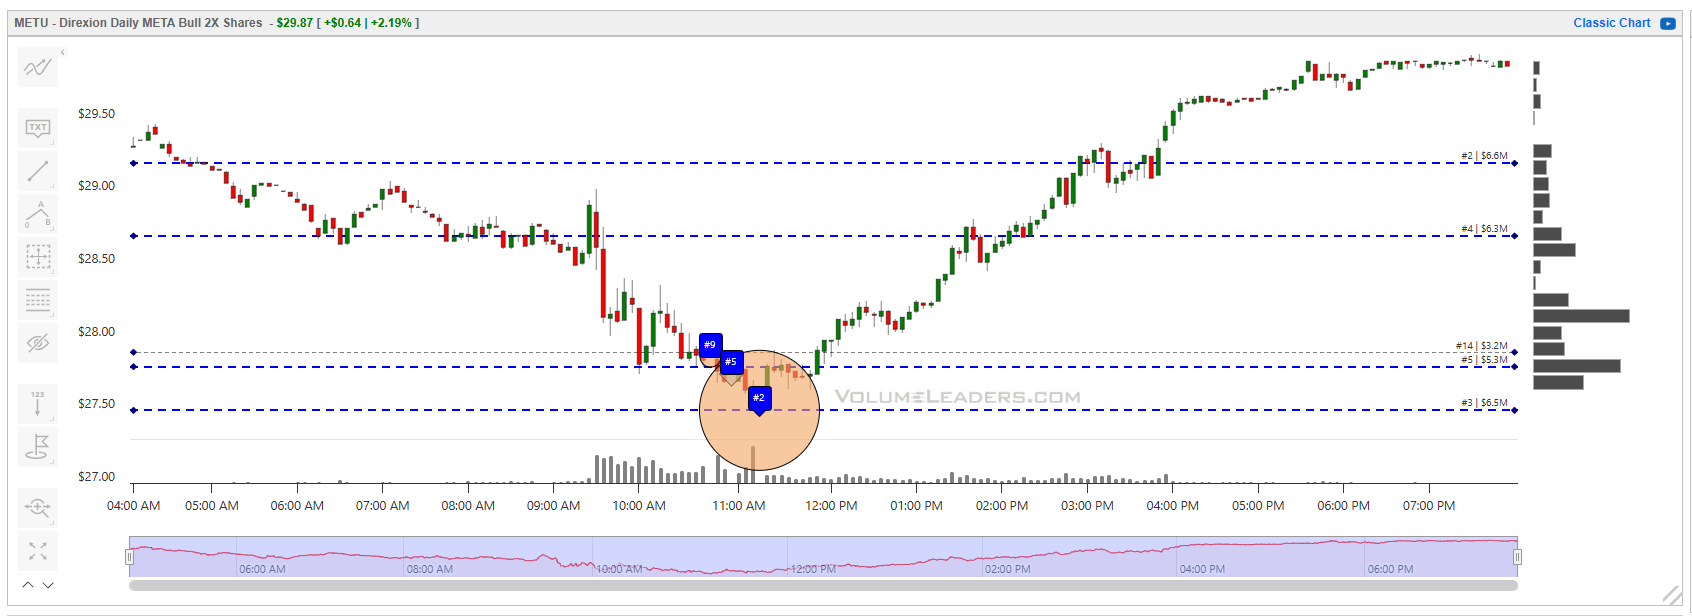
When you zoom in, it’s clear this cluster formed right at a known liquidity location in META itself. The parent ticker (META) printed a massive $1.05B DP Block at $618.94, ranked #87 by relative size—nearly eighty times its typical print magnitude. That’s not retail or algos scalping the spread. That’s real capital taking a stand.
From there, the story wrote itself. META reversed sharply and rallied nearly $20 into the close, dragging METU higher by more than 2% on the day. It was a clean directional expression of institutional intent—a leveraged echo of what the parent stock had already telegraphed hours before the move fully unfolded.
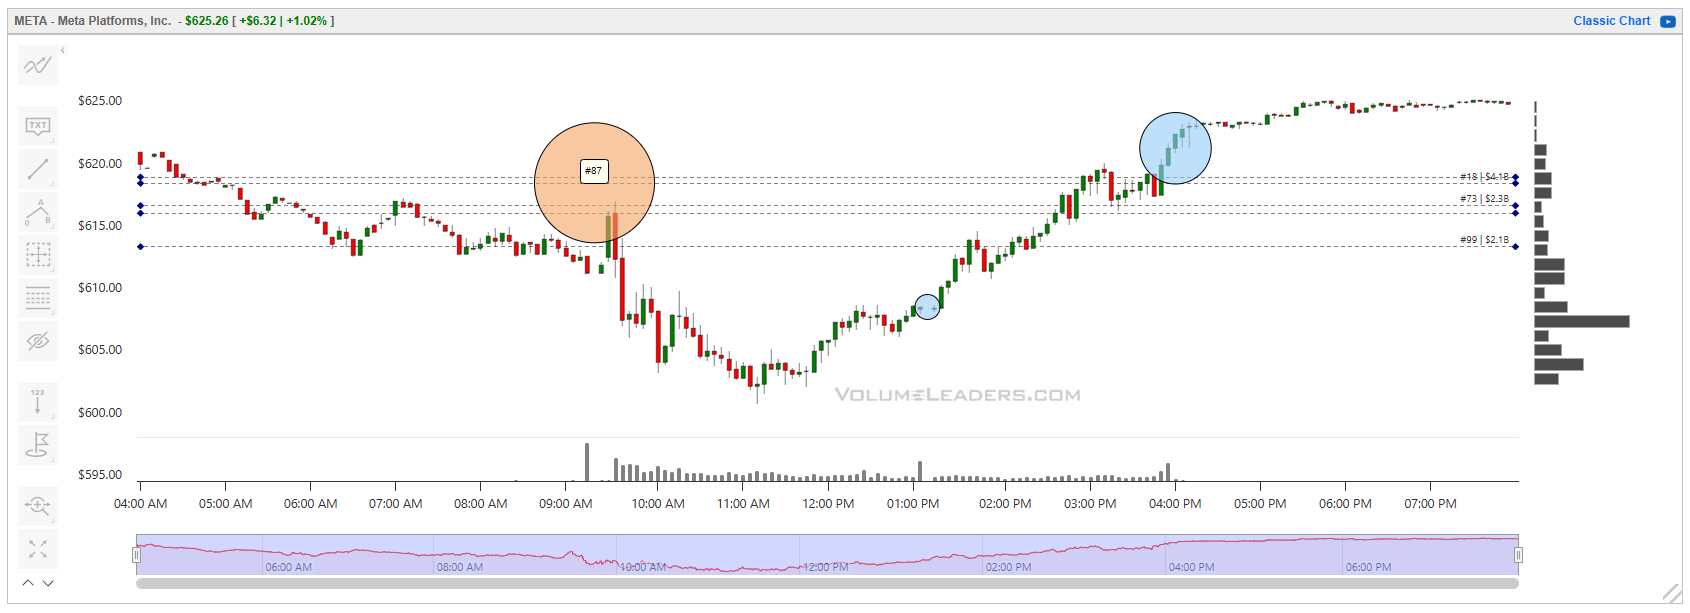
The takeaway? When you see a ranked series like #9 → #5 → #2 converging near a key liquidity shelf, that’s not noise. That’s coordination. Informed players accumulate when volatility compresses, not after the breakout is obvious. By the time social media notices the trend, the real work has already been done—quietly, in those clustered prints.
And here’s the fun fact most traders miss: there are now nearly 500 leveraged tickers just like METU, covering everything from single stocks to sectors and commodities. They print every day, offering a window into how aggressive money expresses conviction before the headlines catch up. Watch the order flow long enough, and you start to see the choreography.

Market Intelligence Report
Over the past several weeks, SPY and QQQ had served as efficient vehicles for expressing directional bias and liquidity re-entry. That trade worked because institutional liquidity was broad but not deep — index-centric flows and delta-hedging by market makers created an illusion of strength. Last week, we noted that this structure was beginning to fracture — that institutional flow (TRV + IO + Consensus) was narrowing, shifting from broad beta to selective accumulation in energy, credit, and infrastructure.
That’s exactly what unfolded. This week’s tape confirmed our thesis: index volumes remained heavy, but rotational, not additive. The market redistributed exposure within the S&P and Nasdaq rather than adding new net exposure to them. The result — leadership compressed, breadth deteriorated, and the once-crowded AI/software sleeve unwound sharply while real-asset and carry themes held their ground.
Our balanced multi-sleeve portfolio finished down roughly 2.05% for the week. Losses in the high-beta innovation complex were partially offset by gains in carry trades, defensives, and targeted infrastructure exposure.
The week’s resilience came from targeted hedges and selective names that bucked the trend. NVDS (+15.7%) — our deliberate offset to stretched megacap exposure — was the single largest contributor, cushioning the AI unwind. DOCN (+14.9%) and COMP (+12.7%) followed, both driven by idiosyncratic buying in smaller software and property-services names. Within Energy & Capacity, APD and BE printed solid gains as investors rotated toward industrial inflation-protection themes. CURE and ATEC helped stabilize Healthcare. Collectively, the Income & Credit Carry sleeve did its job — low volatility, mild positive carry, and ballast in a week where growth bled.
The AI / Software Infrastructure sleeve was the clear laggard (-5.3%), with HUBS, TECL, NET, and TEAM all correcting double-digits. This was less a fundamental unwind than a positioning purge — a classic liquidity-vacuum move when speculative flow dries up. Healthcare & Biotech Momentum slipped (-1.8%) as MNMD and TVTX sold off sharply, offsetting gains in CURE. Energy & Capacity was mixed — APD and BE higher, but URNM and VRT weaker. Our hedges (TZA / TSLS) finished higher — mechanically detracting from performance but functionally preserving risk capital by offsetting cyclical and small-cap weakness.
A tough week across most asset classes with some late-Friday turnarounds that present some interesting setups. Let’s take a look at what this week’s tape is telling us.
MIR Part 1: The Backdrop
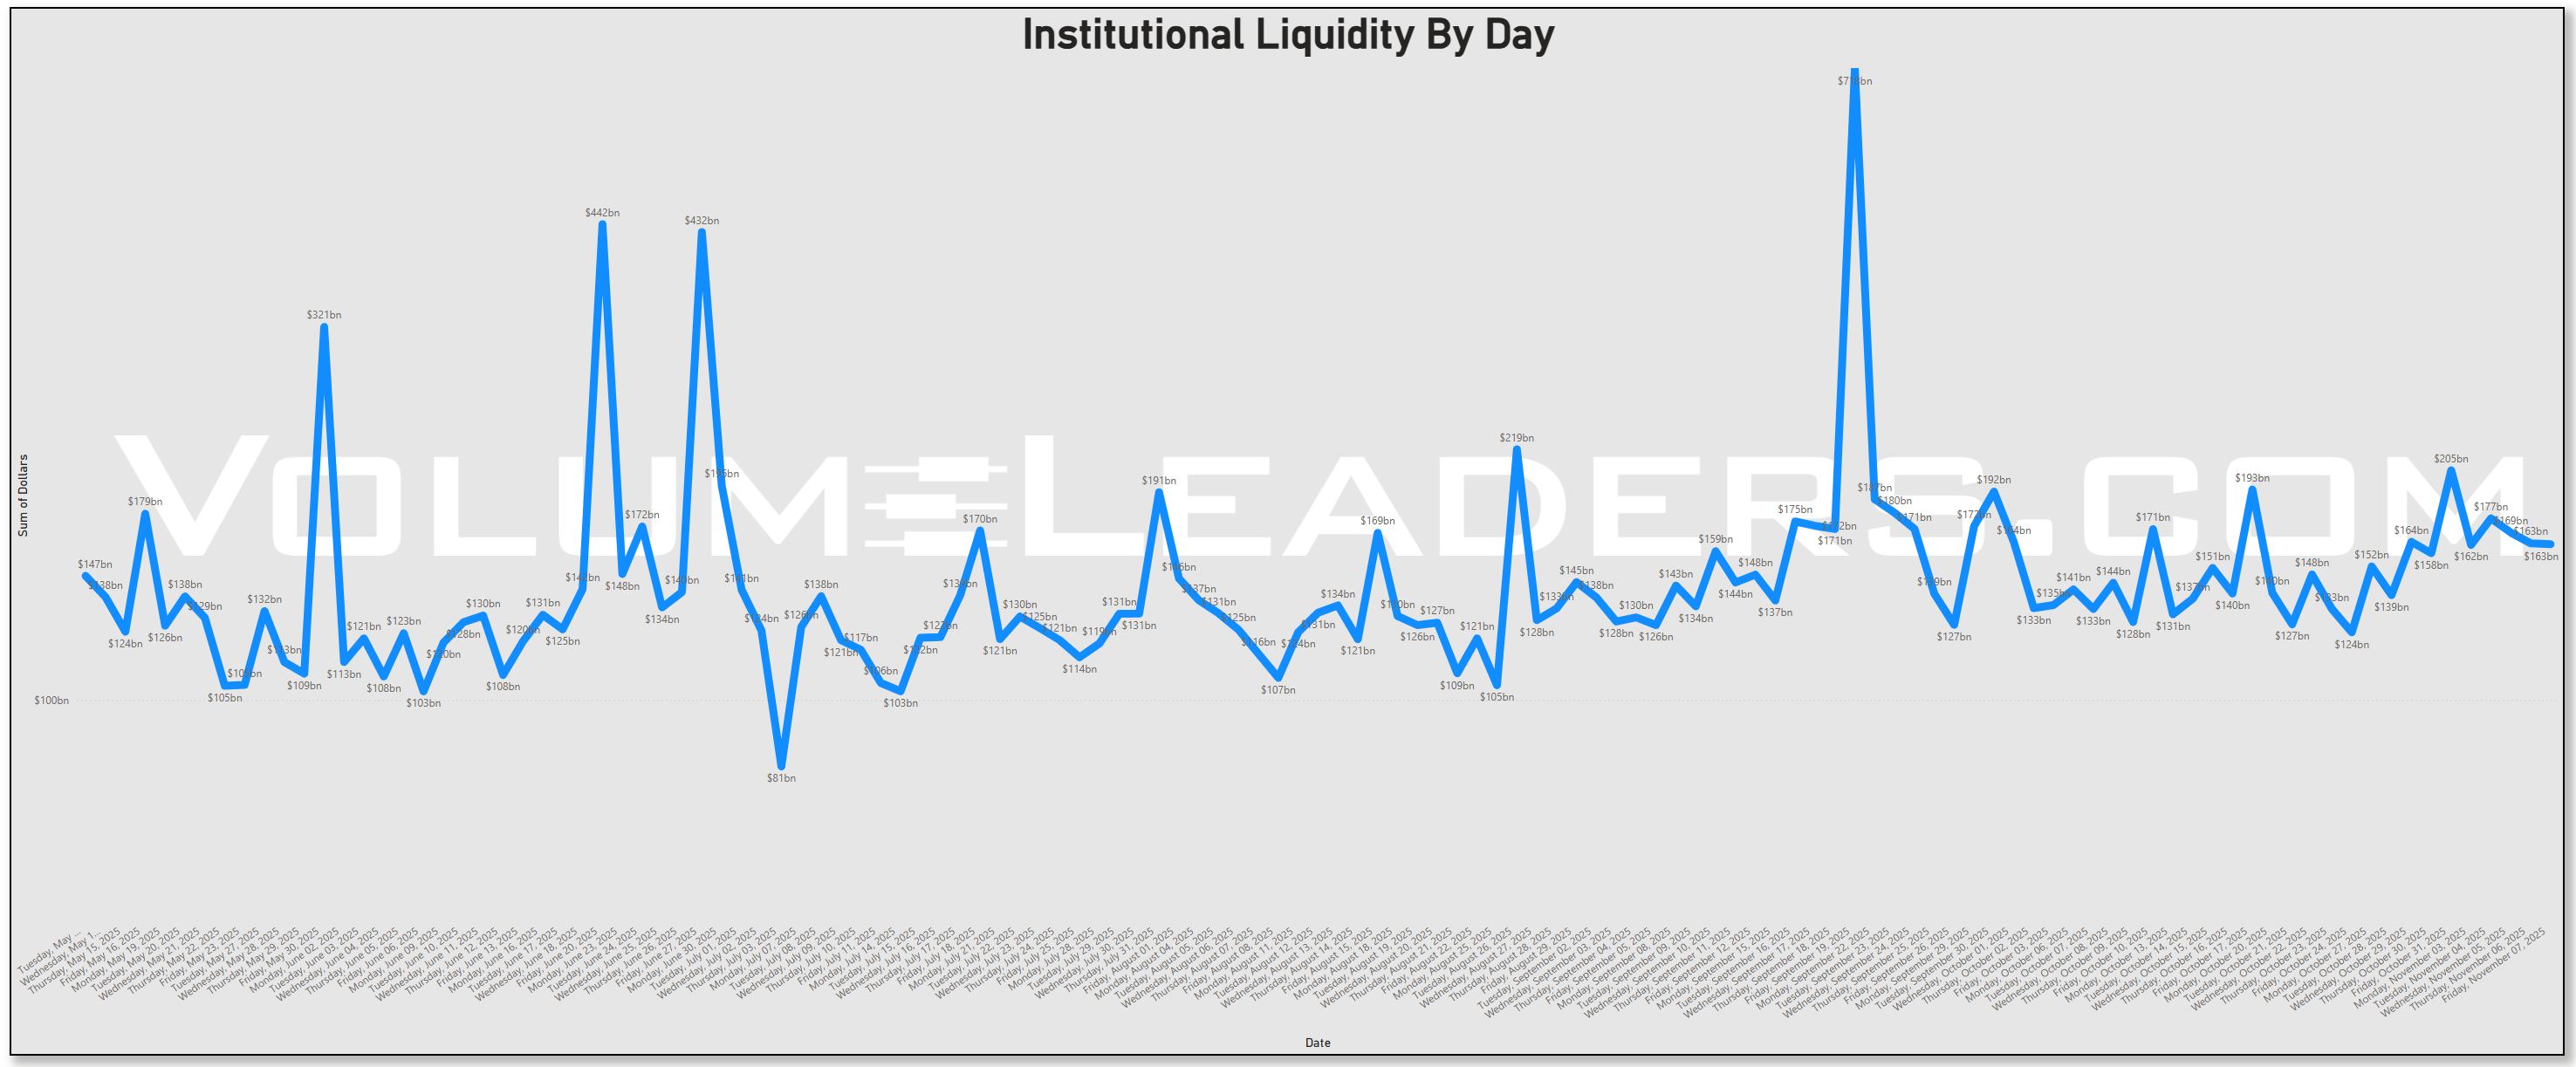
Institutional liquidity this week trended steady but elevated, with mid-week volumes clustering near known rebalance levels rather than an outright liquidity shock. The “Institutional Liquidity by Day” series shows that aggregate dollar flow has settled into a healthy rhythm following last week’s structural spike—more consistent than directional. This kind of cadence typically reflects end-of-month reweighting and early-November allocation activity rather than panic-driven repositioning. With implied volatility fading into the back half of earnings season and OPEX now in view, liquidity looks structural, not distressed.
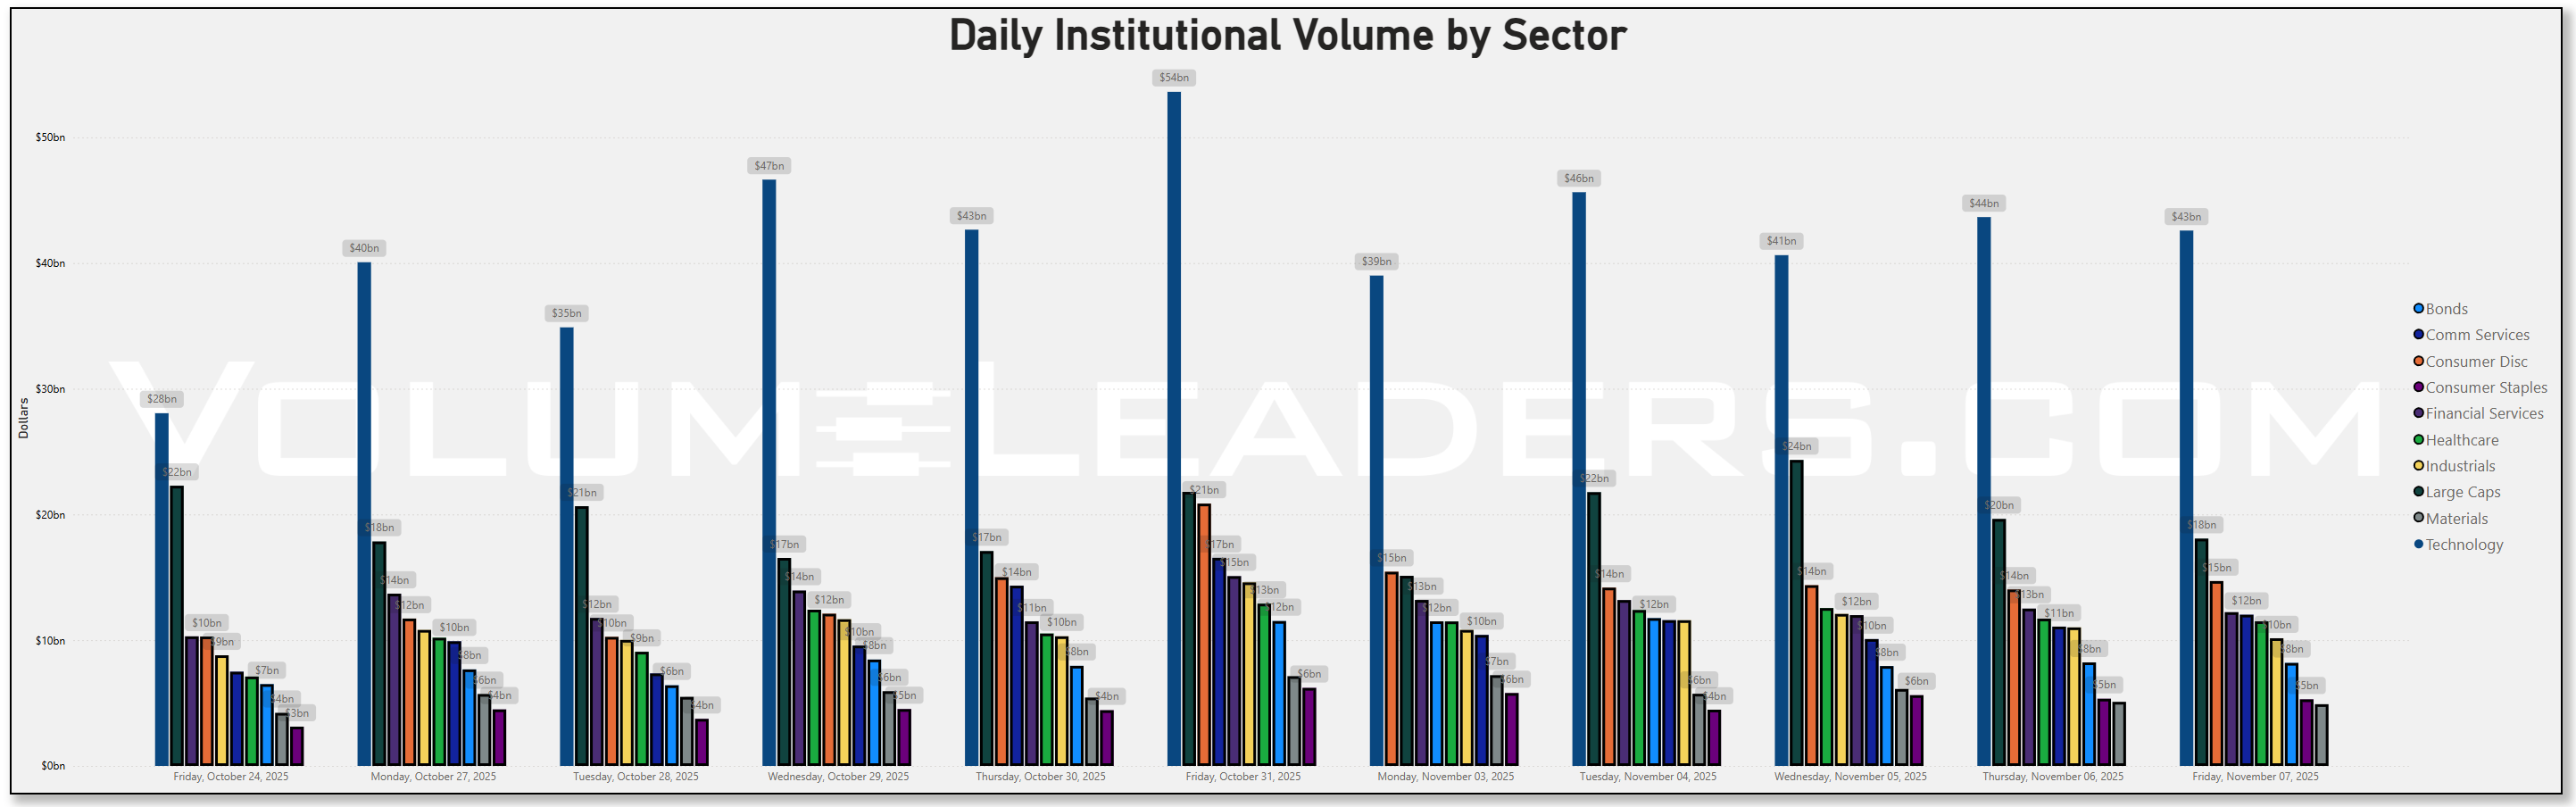
Across the daily sector flows, Technology continued to dominate the dollar totals—$40–46 bn through most sessions—with Communication Services, Consumer Discretionary, and Financials rounding out the upper tiers. Large-Caps again absorbed the lion’s share of aggregate flow, confirming that institutional reallocation continues to express itself through broad index products rather than small-cap rotation. Compared with last week, Financial Services and Communication Services both ticked higher, while Industrials and Materials softened. The pattern suggests that the heavyweights are still attracting capital, but leadership within the tape has begun to drift away from pure growth toward more balanced, rate-sensitive sectors.
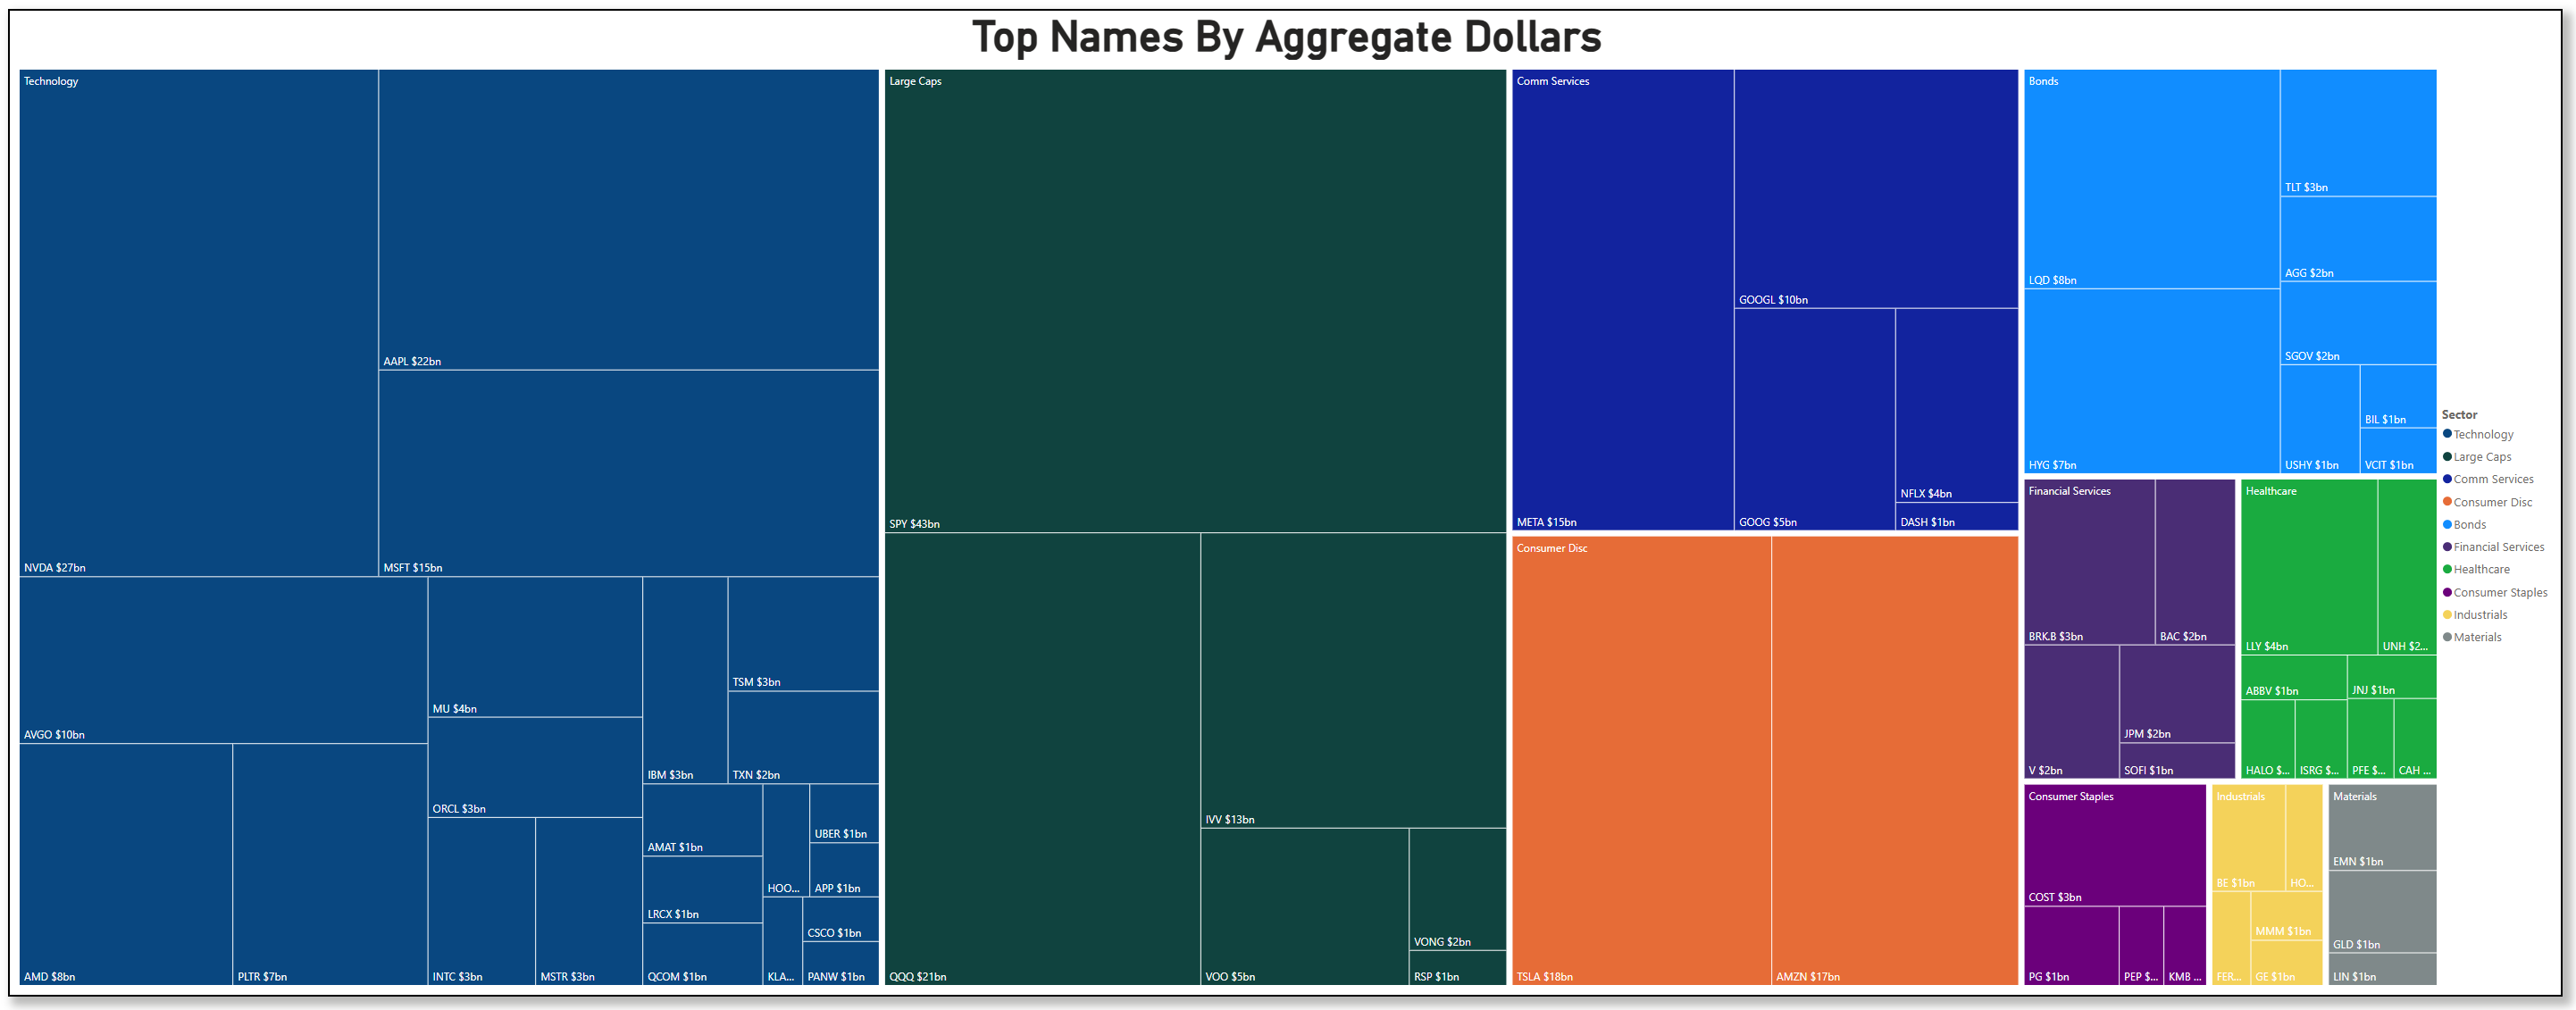
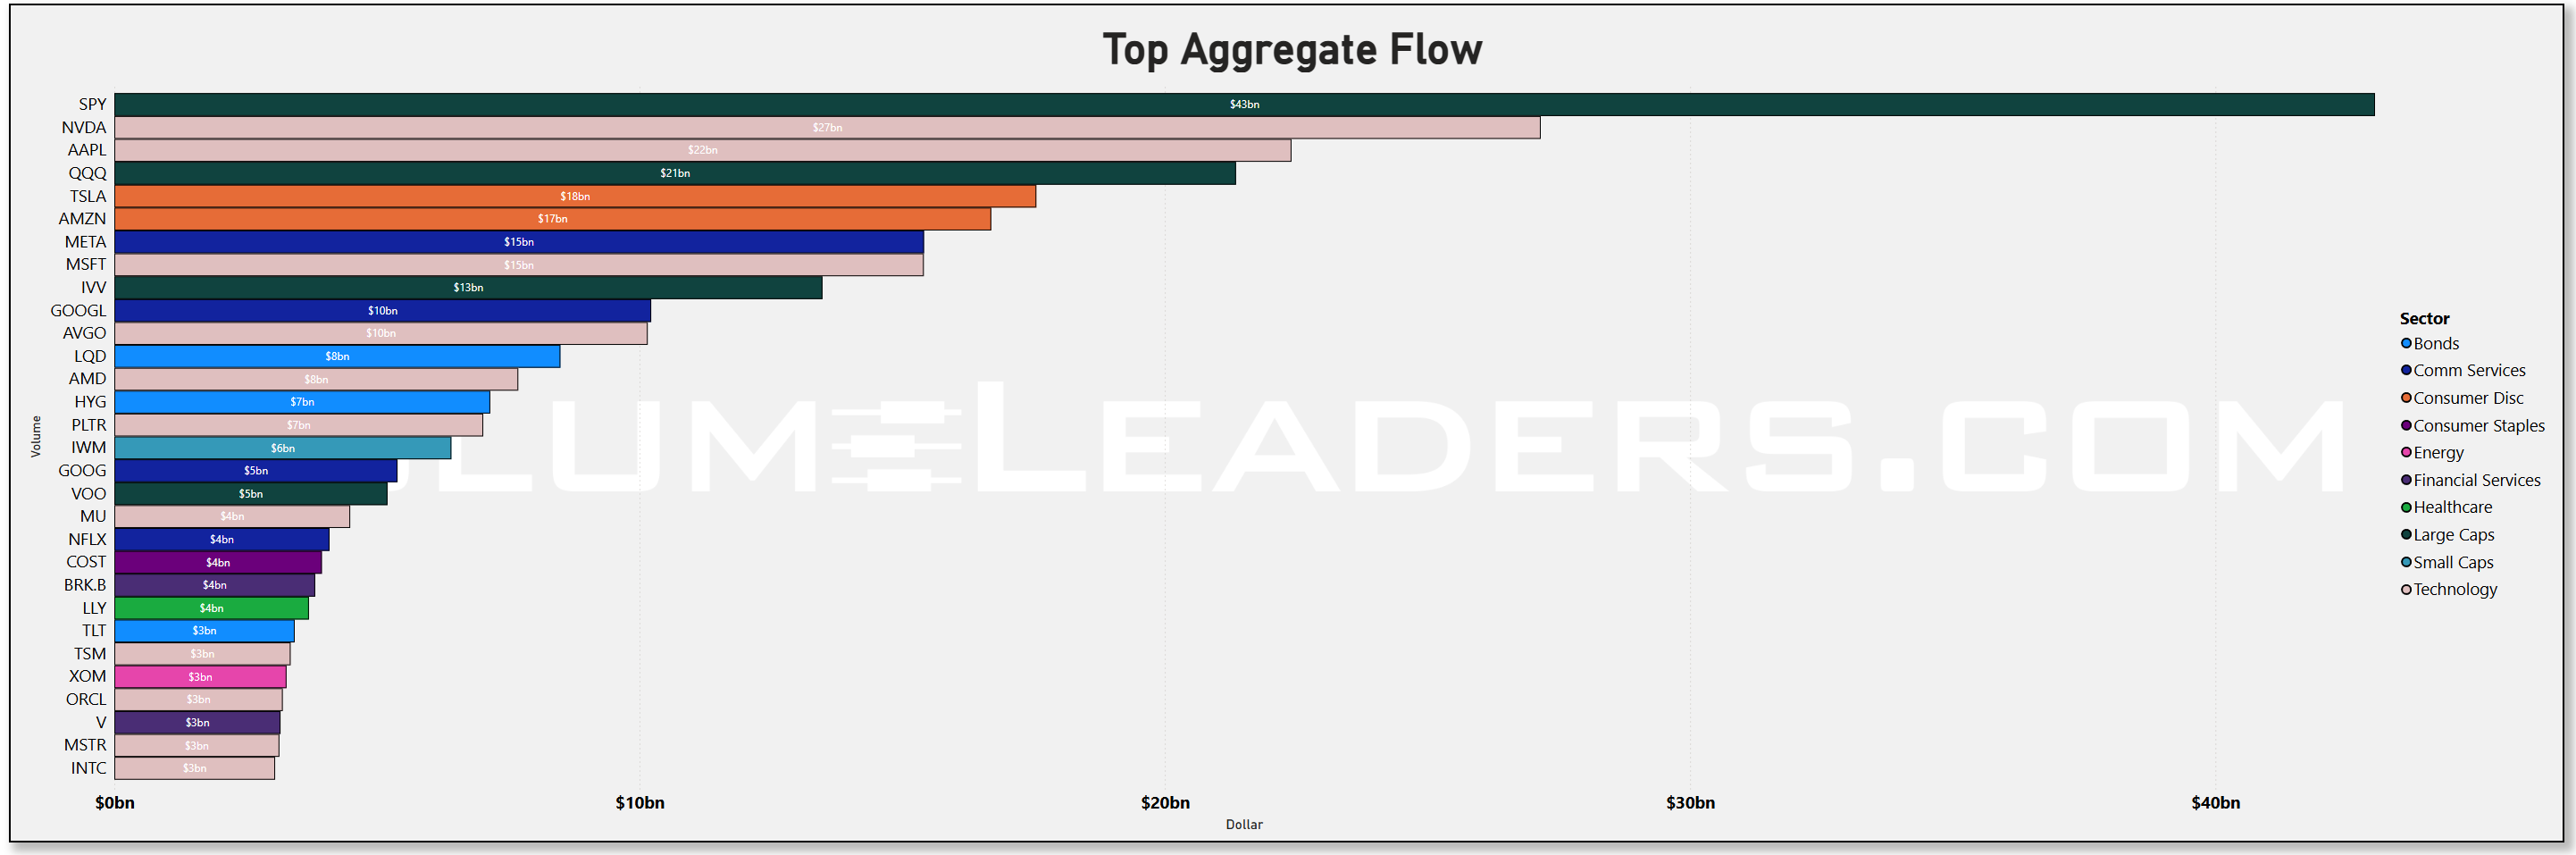
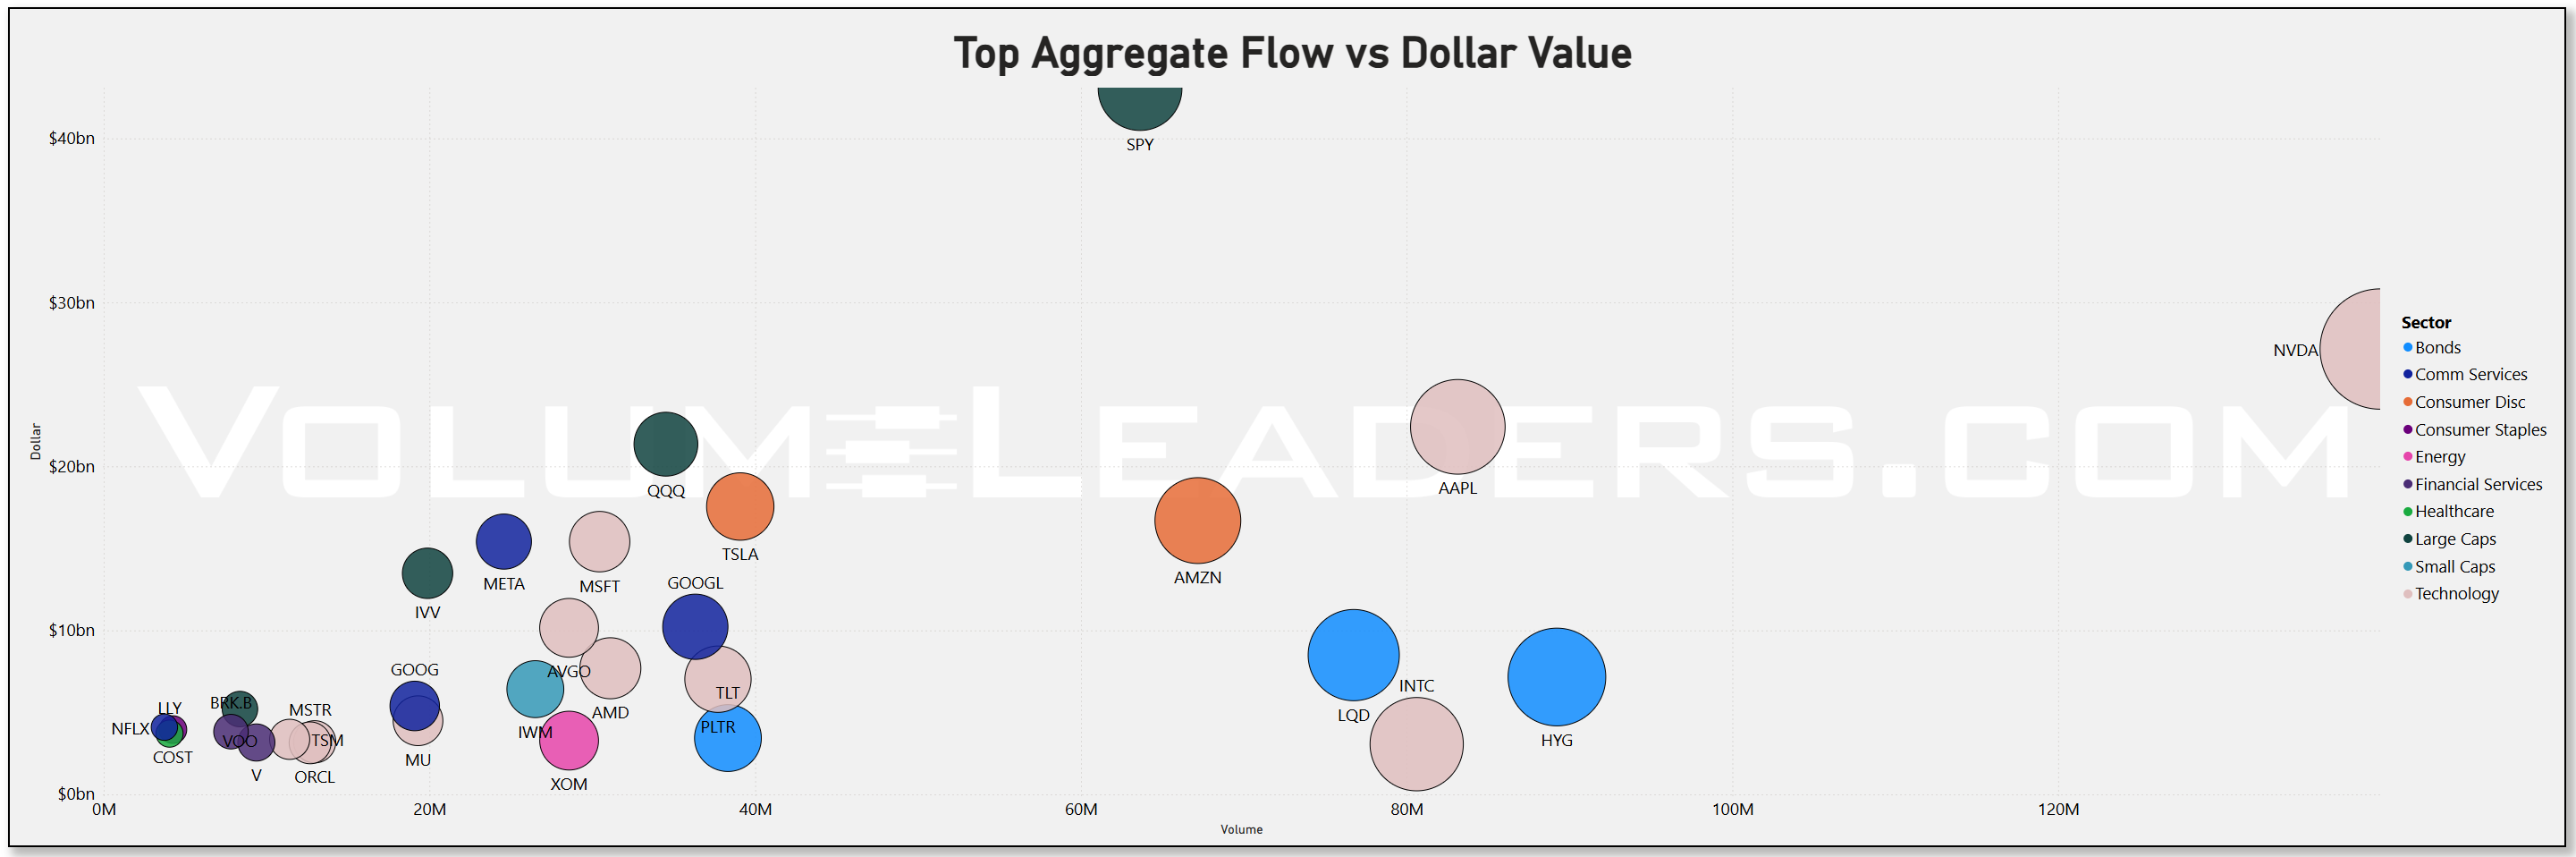
The treemap and aggregate bar charts confirm that concentration remains intense. SPY led with roughly $43 bn in aggregate flow, followed by NVDA at $27 bn, AAPL and QQQ in the low-$20 bn range, and TSLA and AMZN in the high-teens. META, MSFT, and IVV clustered just below that, forming the core of this week’s institutional gravity well. Technology dominated breadth in dollar terms, but it was top-heavy—NVDA, AAPL, MSFT, and META accounted for the majority of tech flow, with the rest of the sector contributing much smaller slices. In short, the institutional bid was alive, but it was not broadening; it was consolidating into the largest, most liquid expressions of equity beta.
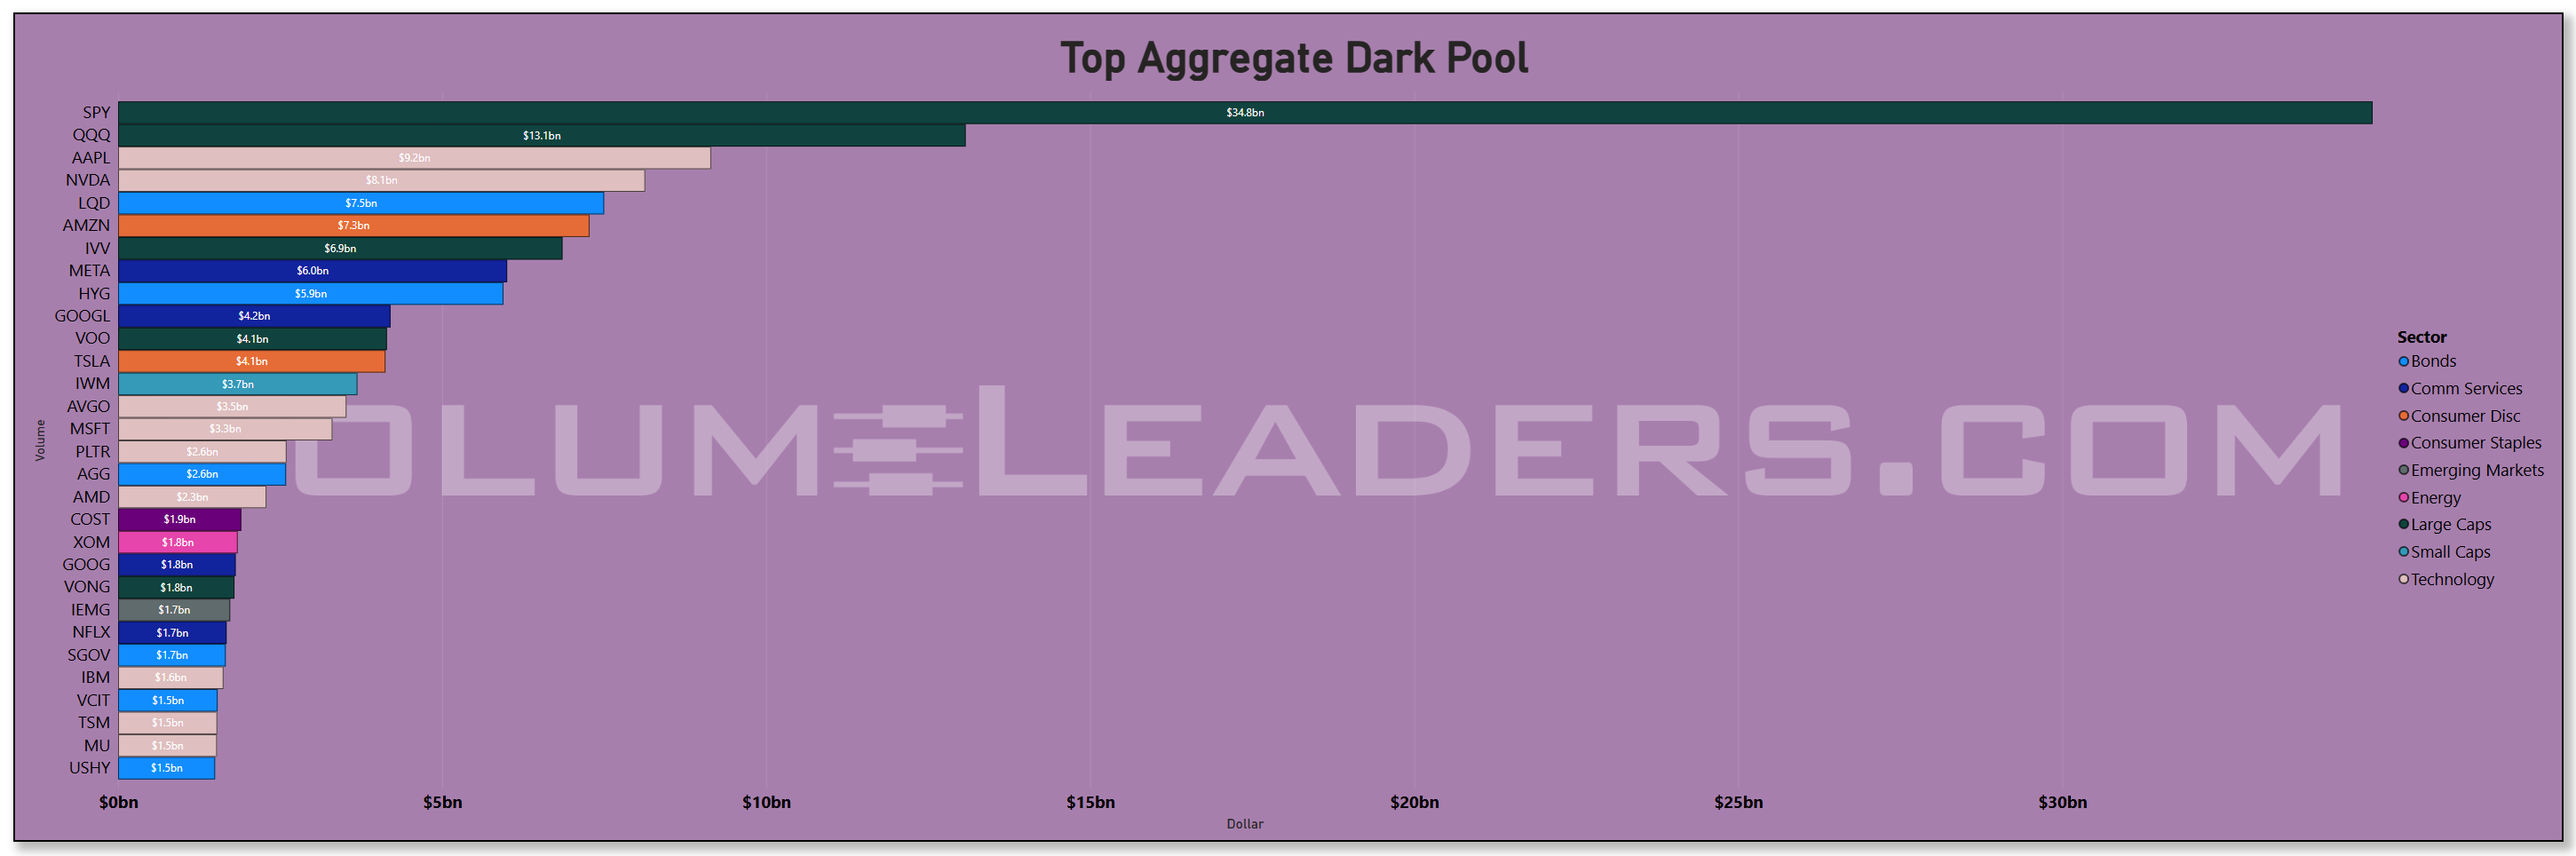
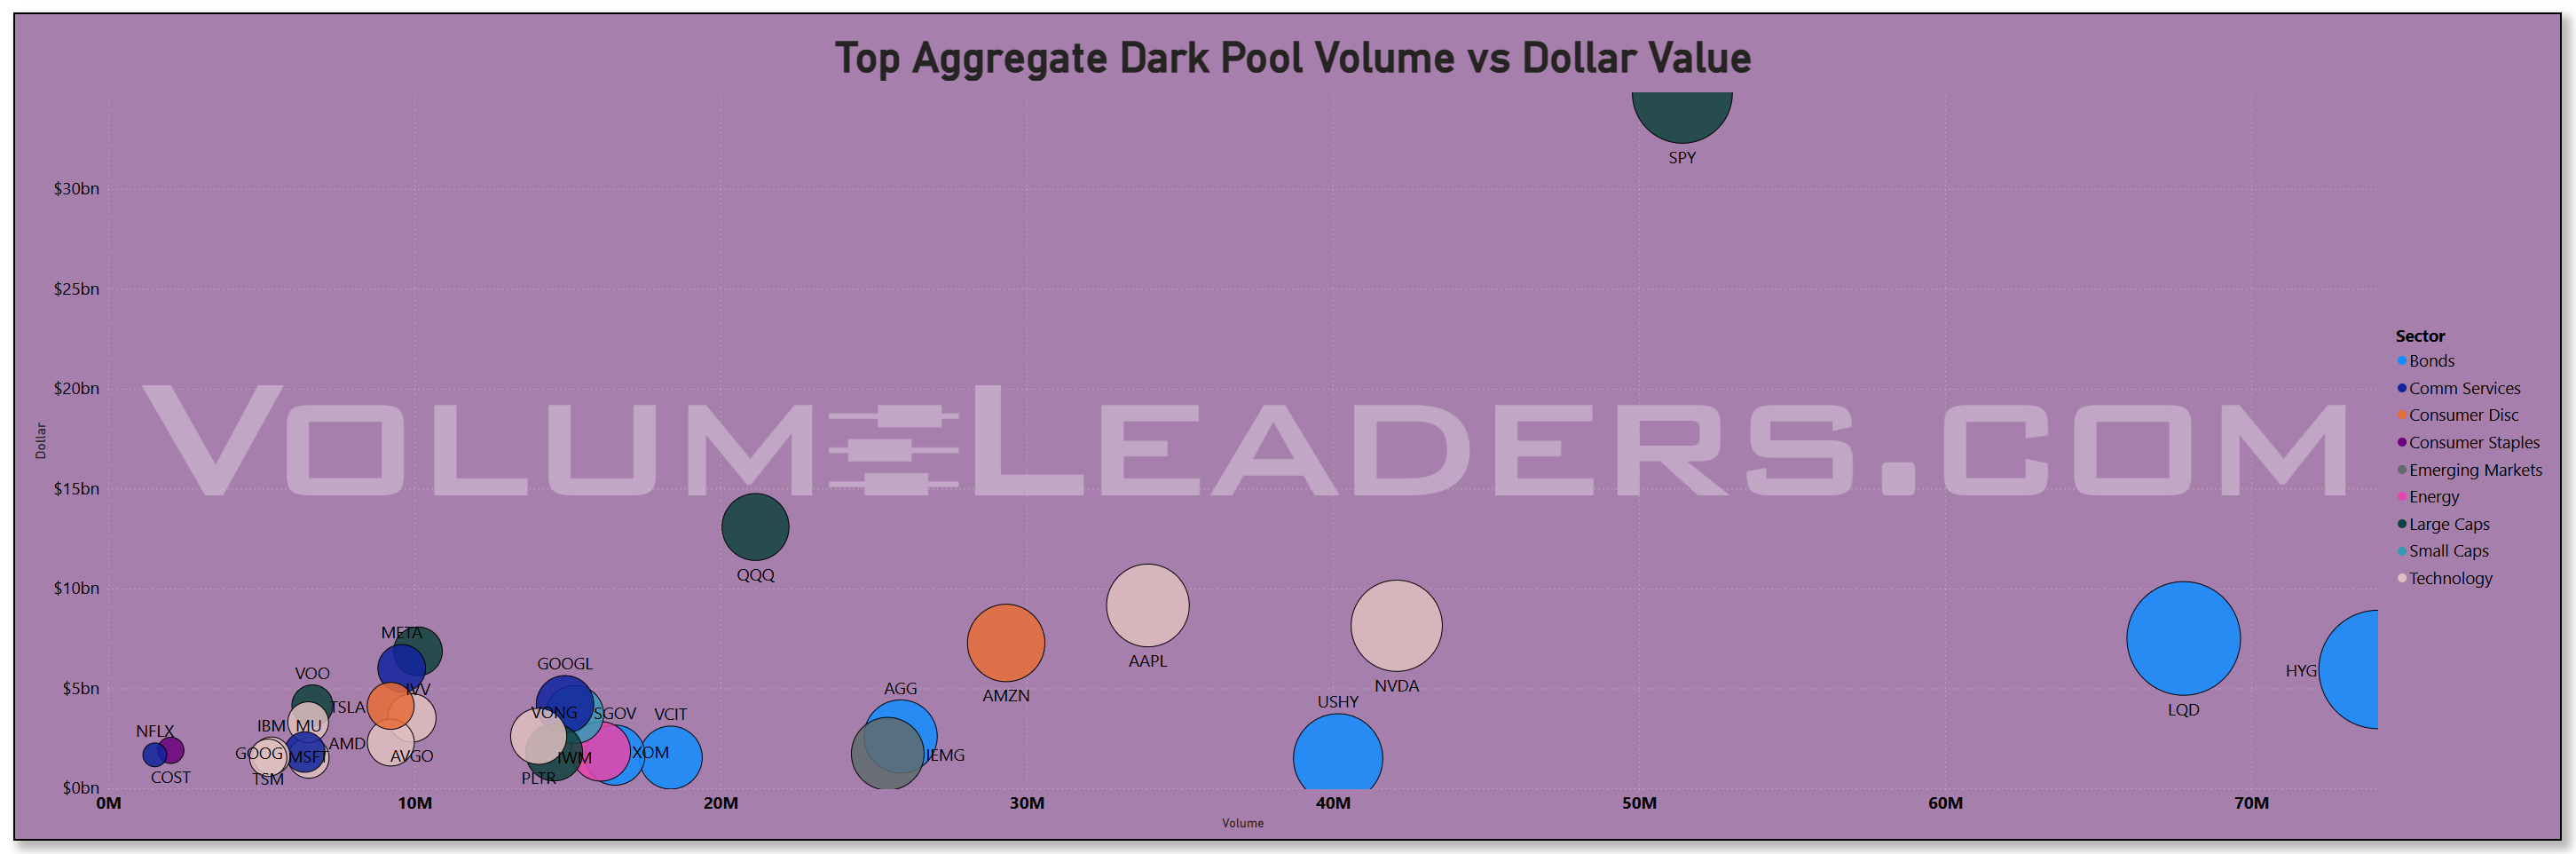
The dark-pool lens adds a subtler texture. Off-exchange prints were heaviest in SPY (~$35 bn), QQQ (~$13 bn), AAPL (~$8 bn), and NVDA (~$8 bn), followed by AMZN, IVV, and META in the mid-single-digit billions. Such scale typically represents accumulation or inventory transfer between large desks rather than short-term speculation. That concentration implies that the biggest players are continuing to build or rotate exposure inside the same megacap complex, possibly positioning for year-end index flows or continued earnings momentum in AI-linked franchises. Informed flow remains quiet but consistent—exactly the kind of backdrop that sustains high-level support without chasing incremental highs.
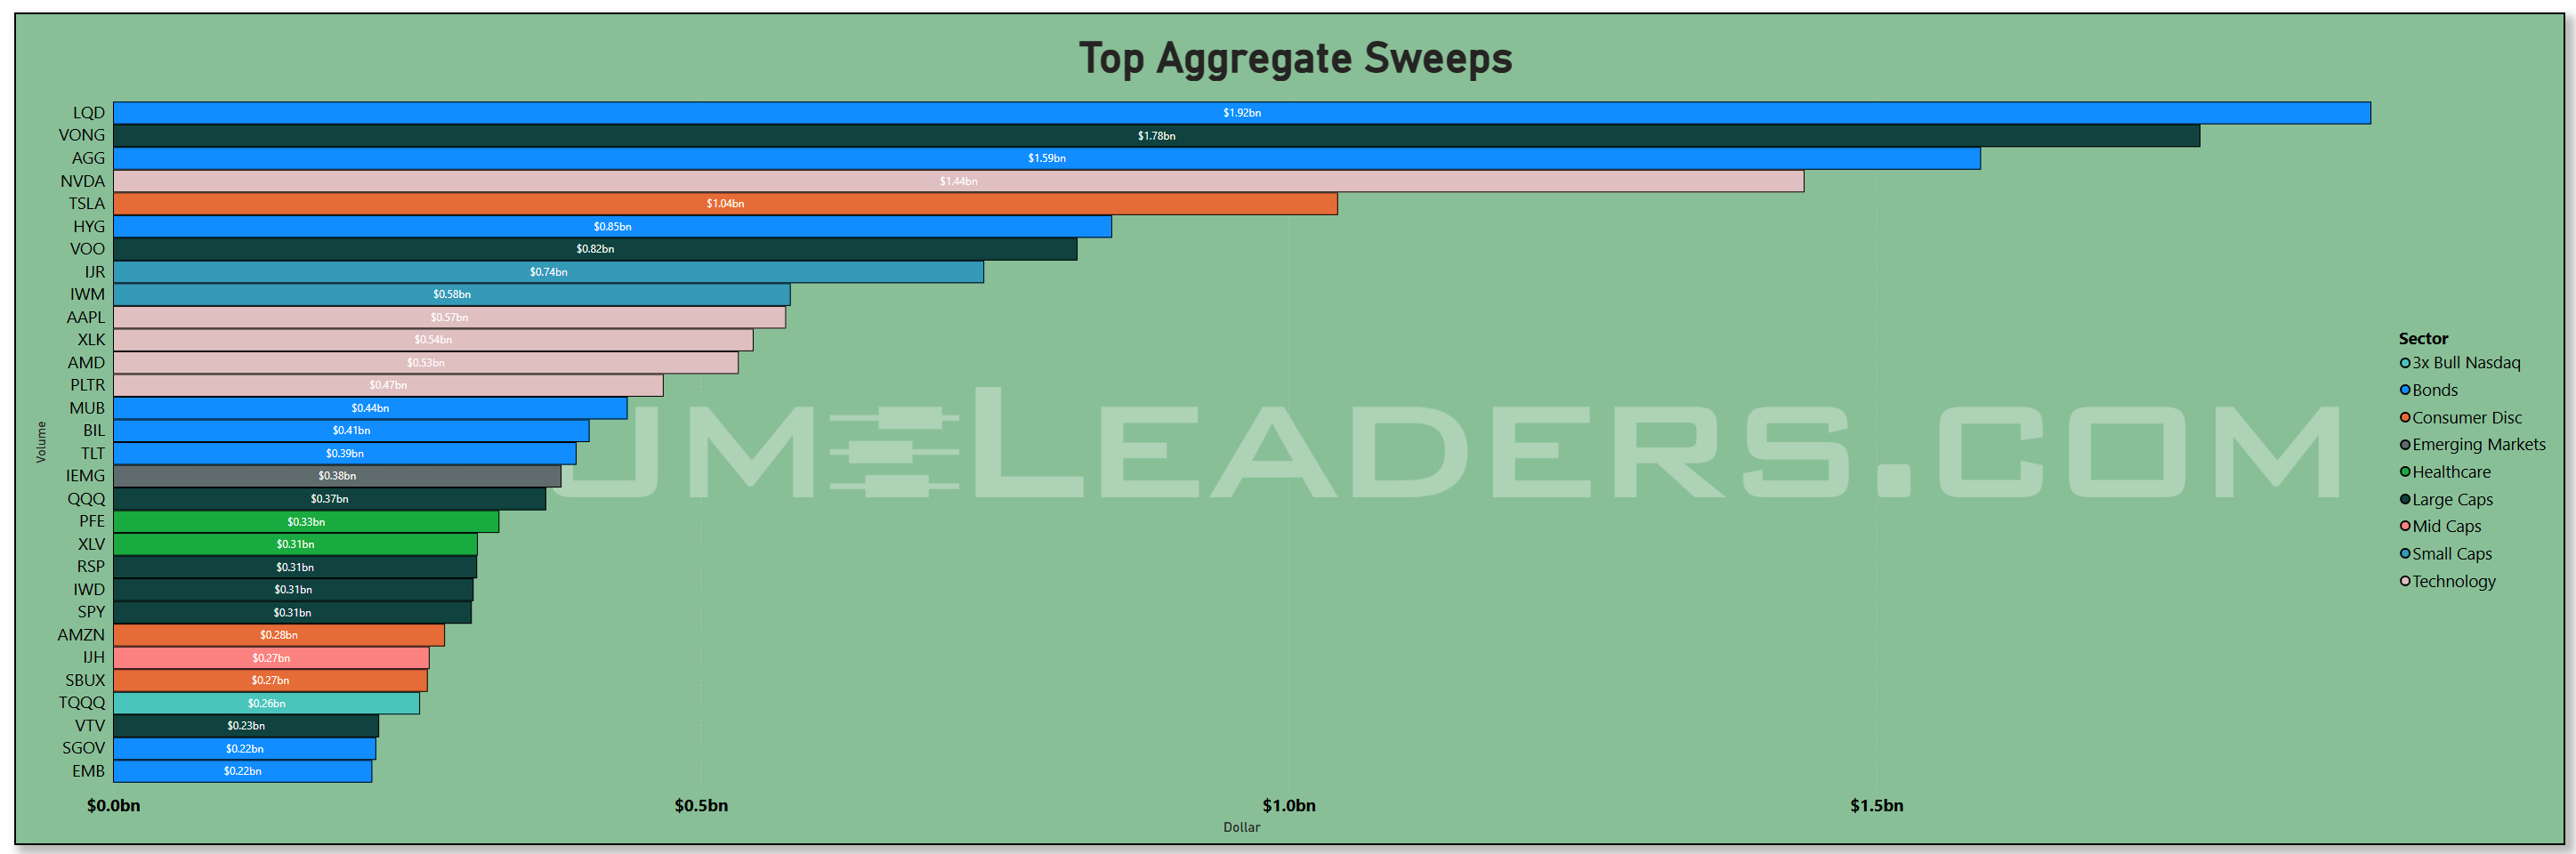
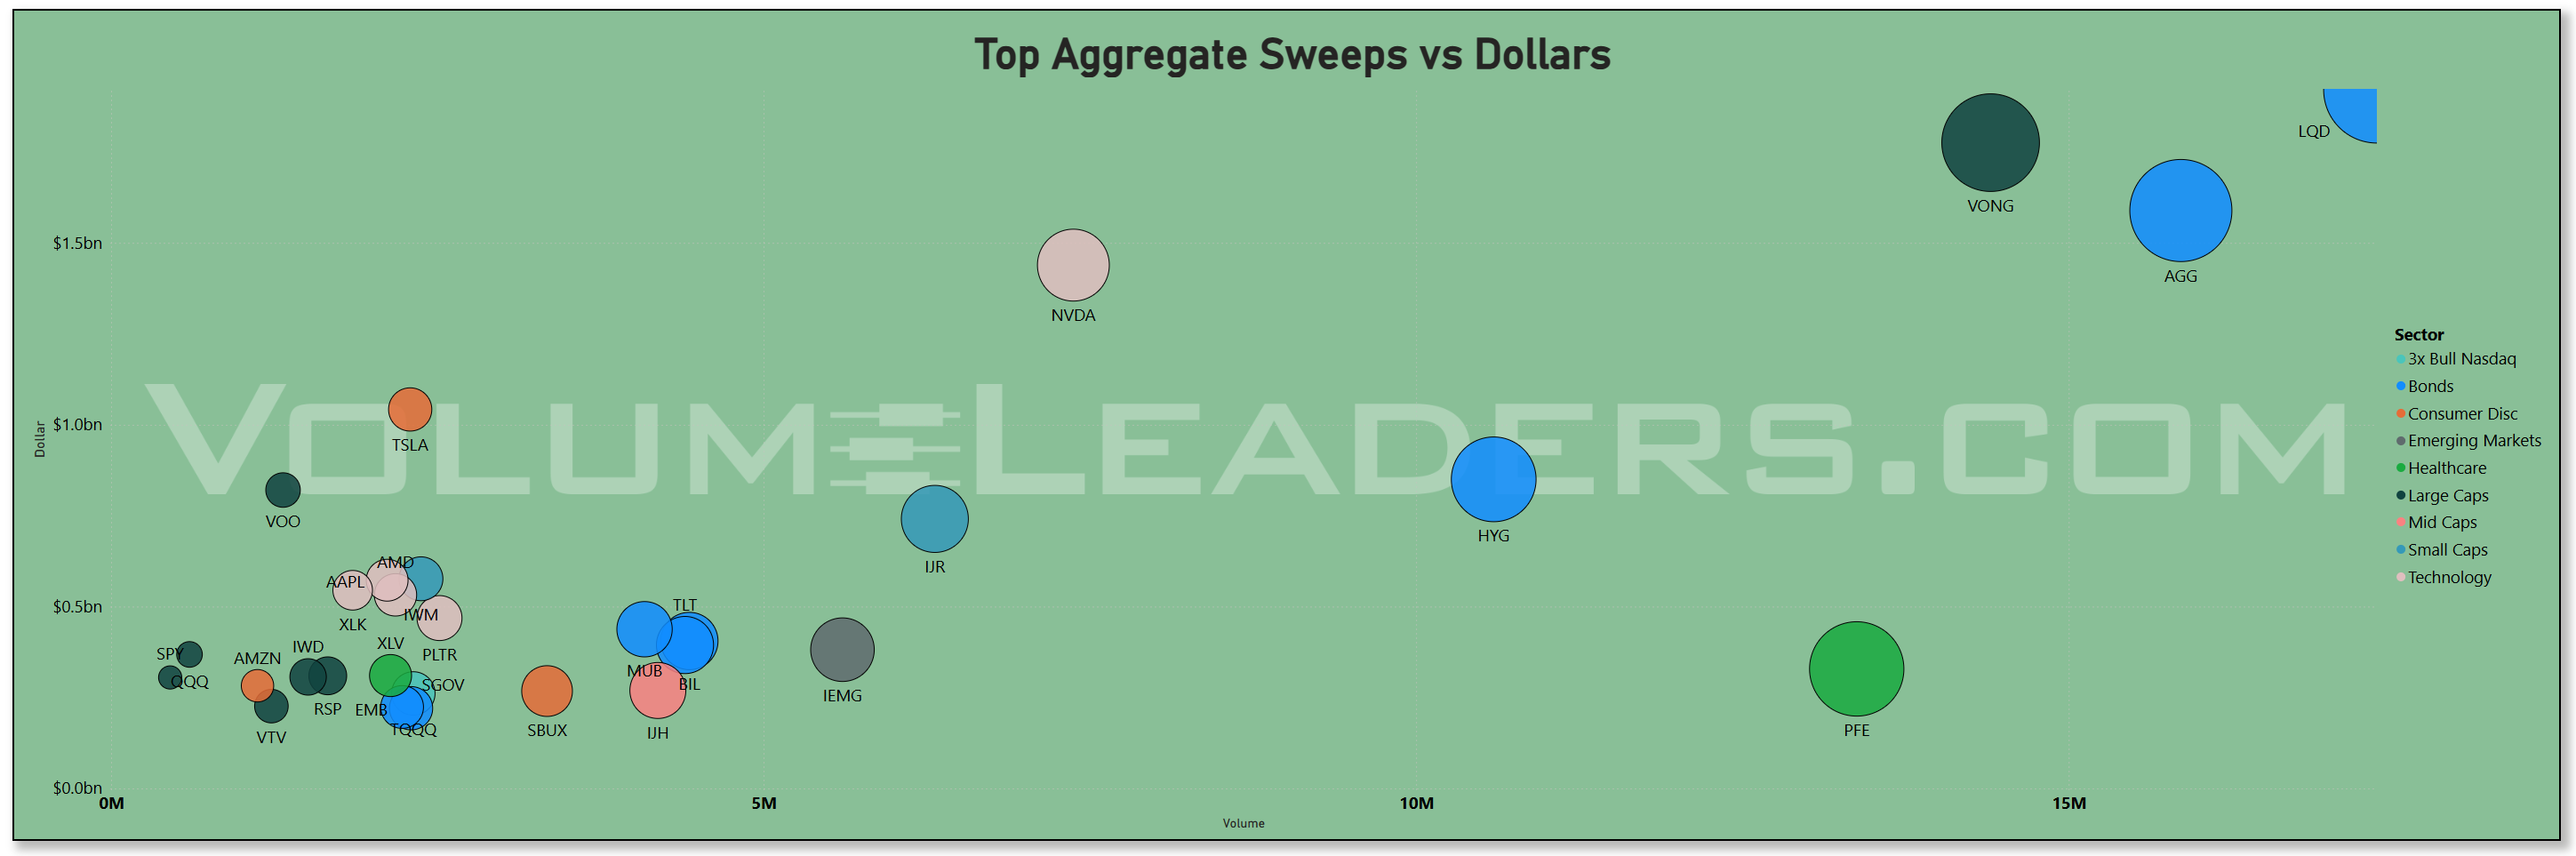
Sweeps tell the other half of the story. The most aggressive activity hit LQD and VONG, both over $1.8–1.9 bn, followed by AGG, NVDA, TSLA, HYG, and VOO. That distribution shows a barbell posture: bond ETFs and large-cap tech both drew fast money. Credit sleeves (LQD, HYG) often act as leading indicators for leverage deployment or de-risking; their prominence this week implies tactical repositioning of exposure rather than fear. The combination of bond sweeps and targeted tech sweeps points to a market recalibrating for lower yields and a more stable risk premium into November’s mid-month data window.
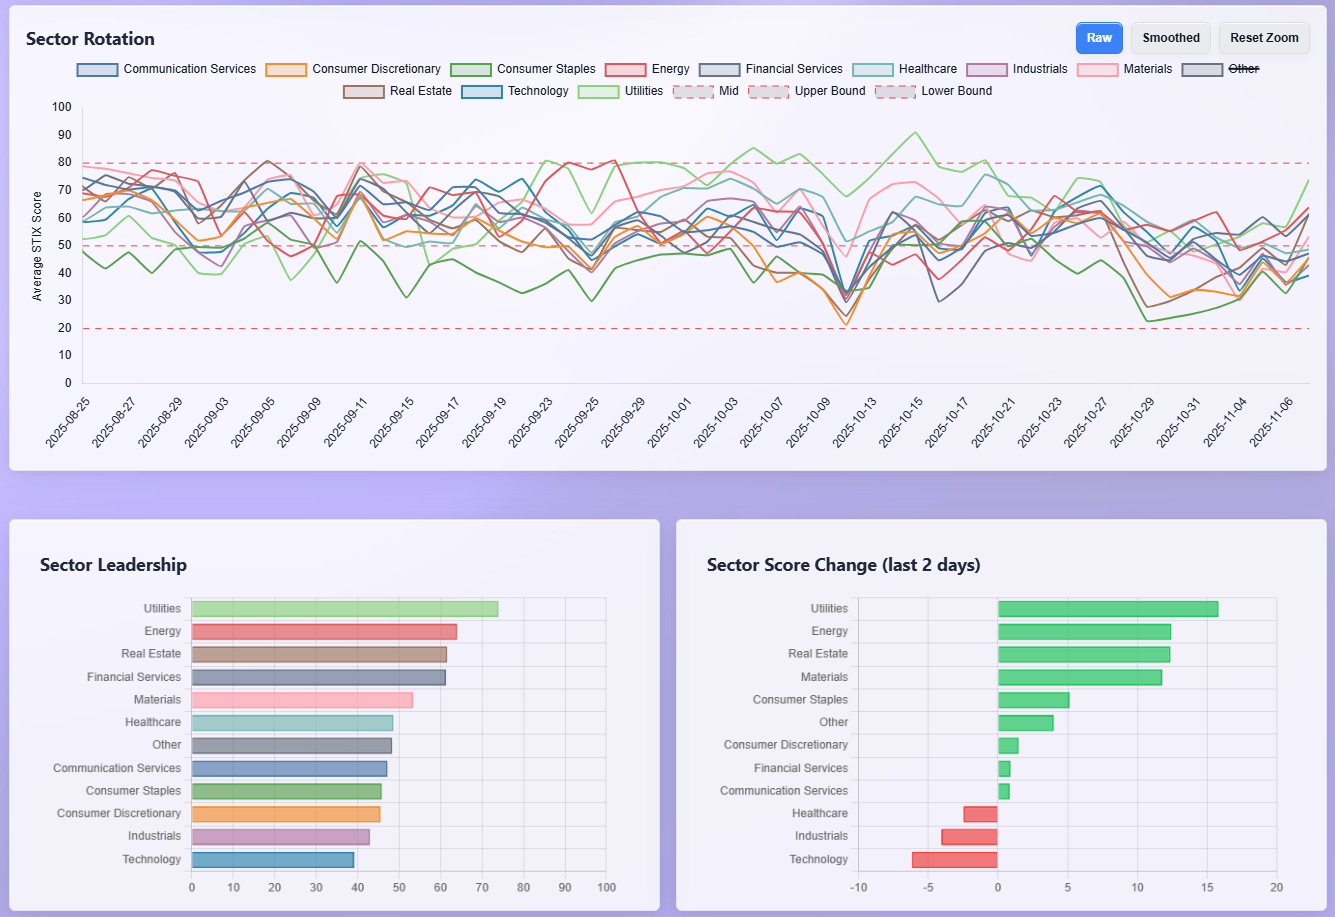
Sector rotation now confirms the defensive turn beneath the surface. The leadership board shows Utilities firmly on top, followed by Energy, Real Estate, Financials, and Materials—all sectors associated with yield stability, tangible cash flow, or commodity linkage. Technology sits at the bottom alongside Industrials and Consumer Discretionary. Over the past two days, Utilities posted the largest score gain, with Energy and Real Estate close behind, while Technology saw the sharpest decline. That inversion between absolute flow and relative strength is important: institutions are maintaining exposure to the big tech names for liquidity and benchmark alignment, but fresh momentum and incremental buying interest have shifted to defensives. The market is hedging leadership—staying long the structures that define performance, while buying protection through sectors that perform when growth expectations cool or rates compress.
Macro context ties this together. November began with a cooler-than-expected October payrolls print and stable but still-firm CPI expectations, reinforcing the narrative of a gradual soft landing. Bond yields have eased as the Treasury’s refunding plan reduced long-duration supply concerns, and Fed officials have signaled no urgency to hike again, with December futures pricing a pause and potential spring-2026 cuts. On the corporate side, megacap tech earnings landed solidly—Apple stabilized guidance, Meta showed margin strength, and Nvidia’s data-center orders surprised to the upside—but management commentary leaned cautious on macro uncertainty, tempering enthusiasm. Combined with seasonal flows heading into mid-November OPEX and the Thanksgiving liquidity lull, this environment naturally channels capital toward stability and yield, explaining the surge in Utilities and Energy leadership even as the absolute dollar flows remain tech-concentrated.
What to watch next: whether large-cap ETF and megacap dark-pool flows persist or taper. Continued size in SPY/IVV/VOO would confirm allocation strength; renewed dark-pool accumulation in NVDA, AAPL, or META would suggest another leg of quiet build. Conversely, if Utilities and Energy keep leading the rotation metrics while tech scores weaken further, that would signal the market’s risk tolerance is fading faster than expected. Watch also whether credit ETFs like LQD and HYG maintain a bid—if they roll over, it would warn that the barbell is breaking.
Bottom line: institutions are still long the market, but they’ve shifted posture—allocating through large-cap index channels, accumulating megacaps quietly, and rotating leadership toward defensives. It’s a positioning regime built for slower growth, steady policy, and year-end carry, not a full-risk chase.
MIR Part 2: Individual Names From The Institutional Tape
VolumeLeaders tracks several proprietary signals designed to spotlight names drawing significant institutional interest. Below, we’ve surfaced the latest results and analyzed them to highlight emergent themes. If any of the sectors, narratives, or positioning trends resonate, the names mentioned here offer a strong starting point for deeper research and watchlist consideration.
VL Trade Rank Velocity™ (TRV)
TRV is a proprietary metric that measures the recent acceleration or deceleration in institutional trading activity for a given stock by comparing its average trade rank over the past few days to its average in recent weeks. A sharp improvement in TRV typically reflects a notable shift in positioning, often accompanied by sustained trade activity, suggesting institutions are actively engaging with the name and that intensity of activity is rising. This often precludes meaningful price or narrative shifts. This isn’t a buy-list or sell-list; it’s meant to draw your eyes to names where institutions are putting money to work.
This week’s TRV composition reinforces the same cross-current the broader flow data revealed: institutions are still deploying capital, but leadership is changing hands. The watchlist has pivoted toward a barbell of defensive accumulation, selective AI and semiconductor exposure, and speculative leverage plays that hedge or amplify macro views—a pattern consistent with a market adjusting to a slower-growth, lower-volatility environment rather than chasing expansionary risk.
The first cluster emerging from the data sits squarely in Healthcare and Biotech, the most populated group in the top decile of TRV scores. Names like RSPH, SMMT, VRDN, BCAX, MDGL, ELVN, GLUE, and ARQT all printed fresh institutional interest, many showing improved participation over the last several sessions. That confirms what the sector rotation board already hinted at—defensive leadership is back. As Utilities, Real Estate, and Financials took the top momentum ranks, the smart-money rotation within Healthcare reflects the same appetite for resilience and idiosyncratic alpha. It’s a familiar late-cycle pattern: when macro visibility narrows, institutions lean on sectors with predictable cash flows and binary event catalysts insulated from global demand noise.
The second distinct theme lies in Financials and Credit-adjacent plays. Multiple regional banks (UCB, OBK, HBNC, FBK) and capital-markets names (HLI, HUT, IREN, GLXY) appeared high on the TRV list, alongside IAK (insurance ETF) and CURE (3x bull healthcare, but functionally a risk proxy). That grouping pairs well with the strong flows we saw in credit ETFs like LQD and HYG. It suggests institutions are using financials both as yield exposure and as a hedge against disinflation risk—the same barbell posture visible in sweep activity. The presence of both bull and bear leveraged tickers (HIBS, HIMZ, FBL, PLTZ) underscores how funds are dynamically hedging portfolio beta rather than exiting exposure outright. This confirms that the market’s risk posture is balanced, not fearful.
A third cluster stands out across Technology and AI, though with a more tactical tone. While megacaps still dominate absolute flow, the TRV list shows elevated interest in smaller AI and semiconductor adjacencies: WTAI, ARTY, RCAT, NOVT, VICR, NVTS, AXTI, KLAC, CHAT, and BTBT. Many of these are niche enablers—semis, infrastructure software, or AI-tooling subcomponents—rather than front-page names. That composition signals that while relative performance in big tech has cooled, alpha-seekers are rotating down-cap within the same theme. Institutions appear to be reallocating from crowded leaders into the next layer of the AI supply chain, echoing the “quiet accumulation” we’ve tracked in the dark-pool tape of the broader sector.
Another strong signal is the resurgence of Industrial and Real-Asset exposure. NPO, KAI, PH, RRX, SWIM, PL, ECG, and AMPX show active accumulation across machinery, electrical equipment, and defense. Coupled with FRMI in Real Estate and LEU and INVX in Energy, the implication is a pivot toward tangible-asset cyclicals—industrials that can benefit from a milder-growth but infrastructure-heavy fiscal backdrop. With U.S. fiscal spending still flowing through manufacturing and clean-energy programs, these flows look structural rather than speculative. It also syncs neatly with the week’s macro tone: cooling inflation data, easing Treasury supply pressure, and talk of a 2026 policy pivot all reinforce the “soft-landing with industrial tailwind” scenario institutions have been quietly leaning into.
The presence of crypto-linked names (WGMI, BTCS, BITU, ETHT, XXRP, BTCI) and precious-metal/mining tickers (UAMY, PPTA, SBSW, RS, METC, SIVR) rounds out the speculative hedge component. Together, they represent an undercurrent of capital positioning for liquidity-regime change—an early bet that easing policy and declining real yields could reflate digital and hard assets. This speculative sleeve has been steadily re-emerging in the TRV data since early Q4, and it pairs naturally with the defensive leadership elsewhere: institutional money is buying downside insurance through hard-asset convexity rather than through index puts.
Lastly, the repeated appearance of leveraged wrappers—2x Bull META (FBL), 2x Bull PLTR (PLTU), 3x Bull Healthcare (CURE), 3x Bear High Beta (HIBS), 2x Bear IONQ (IONZ)—confirms that tactical positioning is alive even as overall risk appetite moderates. It’s a sign of funds expressing conviction and hedges in liquid, short-duration vehicles rather than in fundamental cash equities. The directionality of those instruments skews slightly bullish, which fits the prevailing theme: hedged optimism rather than capitulation.
In aggregate, the TRV list tells the same story the order-flow charts did—just with higher resolution. Institutional capital is redistributing, not retreating. Defensive sectors (Healthcare, Real Estate, Utilities) now lead on momentum and participation. Financials and credit continue to attract steady inflows as yield plays. Meanwhile, tactical money is rotating within Technology—from megacap dominance to niche enablers—while speculative flows resurface in crypto and metals as quiet optionality on policy easing.
It’s a market that’s fully allocated but selectively defensive: participants are maintaining exposure to what works, seeking convexity where it’s cheap, and quietly hedging the possibility that the next leg up in equities comes not from multiple expansion, but from falling rates and renewed liquidity.
VL Institutional Outliers™ (IO)
Institutional Outliers is a proprietary metric designed to spotlight trades that significantly exceed a stock’s recent institutional activity—specifically in terms of dollar volume. By comparing current trade size against each security's recent normalized history, the metric flags outlier events that may indicate sudden institutional interest but may be missed because the activity doesn’t raise any flags/alerts when comparing the activity against the ticker’s entire history. For example, it’s conceivable that a ticker today receives the largest trade it has had in the last 6 months but the trade is unranked and would therefore be missed by current alerts built off Trade Ranks. Use “Realized Vol” to identify tickers with large price displacement and to size your risk appropriately.
The IO list is basically a heat map of where someone really cared this week, and when you line it up with everything we just walked through, it strengthens the same story: money is firmly deployed, rotating under the surface, and doing so in size but in a very controlled volatility regime.
The loudest cluster is in financials and yield-oriented product. BOKF shows up with a 6.5-sigma day and more than $220m traded, and it is not alone. BHF in life insurance printed more than $230m at over 6 sigmas, while smaller banks like BCH and BSAC and asset managers like GRAB all registered statistically extreme prints. At the same time, there is outsized flow in income and value sleeves like JPST, VUSB, VCLT, JEPI, DFLV and ISCG, almost all with tiny realized volatility. That combination is telling: banks and insurers are being traded in “anomalous” size, but the price impact is muted, while low-vol bond and covered-call products attract big, steady demand. It fits perfectly with a market that is leaning into carry and income in a world where rate-hike risk is fading but nobody believes in an unhedged growth boom.
Healthcare is the second major outlier complex and it lines up one-for-one with the defensive leadership we saw in the rotation board and TRV list. HALO prints north of $650m at more than 5.5 sigmas, CAH over $500m at 3.6 sigmas, and GMED, TXG, TNDM, PRCT, TERN, COLL, LFST, VRDN, APLS and other med-device and biotech names all show up with 3–5 sigma prints. Again, realized volatility is generally under 1.0 even on these extreme flow days. That is the footprint of institutions quietly sizing up long-duration healthcare exposures, not tourists chasing a headline spike. Pull that together with CURE on the leveraged bull side and you get a very coherent read: healthcare is a core, conviction long in this regime.
Energy and real assets also pop on the IO radar in a very specific way. DNOW, HP, TNK, XPRO, NPKI and PBR print 3-sigma-plus days, while uranium is represented through NLR and SRUUF with very elevated sigmas in the mid-single digits. Materials show up through SBSW, ALB, MOS and CCK, and there is a big outlier in CEG, a renewable-leaning utility with over $400m traded at a little more than 2 sigmas and a healthy up-day. This is exactly the sort of quiet real-asset bid you would expect when investors are still hedging inflation and supply shocks but believe the worst of the rate cycle is behind them: own the resource and power complex, but do it where cash flows are visible and balance sheets are strong.
On the growth side, the outliers support the idea that tech leadership is becoming more selective rather than disappearing. NOVT, FIG, FROG, FIVN, PCTY, LYFT, LSPD, LASR, AKAM and XYZ all register 3–6 sigma prints across software, infrastructure and semis, with modest but generally positive price changes. TECL, the 3x bull tech ETF, joins them with a 2-sigma day. This is the IO version of what the TRV list was already hinting at: big, dominant tech may not be where the marginal buyer is most aggressive, but there is serious size turning over in high quality and second-tier enablers. It is rotation within tech, not abandonment of the theme.
Crypto and convexity trades show up clearly as well. BITO, ETHD and ETHT all appear as 2.4–2.6 sigma outliers, with ETH products in particular putting up mid-single-digit percentage moves. Combine that with the crypto miners and levered tokens sitting on the TRV list and you get a consistent picture: a growing, but still niche, allocation to digital-asset beta as optionality on a looser liquidity regime. It is not big enough to drive the index, but it is absolutely part of the hedge-and-convexity toolkit institutions are using right now.
Finally, the index and style wrappers tell you how the big books are leaning. UPRO, SPXL, SPYU and TECL all hit the outlier tape on the bull side, while the bear structures SPXS, SPXU, SQQQ, SOXS and TSLZ print smaller but still significant sigma events, many of them closing down on the day. VONG on the growth side and JEPI and DFLV on the value and income side round that out. The skew is gently bullish, but with enough leverage on both sides to fine-tune beta at very short horizons. That is exactly what you would expect in a market that is positioned “risk-on but hedged,” not all-in and not hiding in cash.
Layer this IO picture on top of the TRV and flow work and the narrative tightens: institutions are aggressively active, but their aggression is in how they rotate and structure risk, not in chasing the next momentum squeeze. Defensives and income are being bought in outlier size, healthcare and real assets are clear beneficiaries, tech is seeing selective rotation rather than broad de-risking, and crypto plus leveraged wrappers are being used as efficient convexity and fine-tuning tools. The tape is busy, but it is busy in a way that matches a fully invested, late-cycle playbook.
VL Consensus Prices™
These are the most frequently traded #1-Ranked Levels in VL this week. Trades occurring at the highest volume price in a ticker’s history are significant because they represent institutional engagement at a key price memory level—where the market once found consensus. These areas act as liquidity hubs, enabling large players to transact efficiently, and often signal a reassessment of fair value. This activity may precede major moves, mark equilibrium zones, or reflect broader portfolio shifts, making these price levels important to watch even without yet knowing how price will resolve. (Note: many Bond products trade in such a tight range that they dominate the top positions and are therefore omitted to provide better clarity around other flows. The bonds data is still available in the VL platform.)
The consensus-level list is basically telling us where the market has done the most “thinking” about a name over its life – the prices where volume has stacked up and institutions have repeatedly agreed to transfer risk. When you line this up with the TRV and IO work, the picture is very consistent: the same complexes that are currently seeing outlier flows and rising TRV are also sitting on, or building, long-term high-volume shelves.
Healthcare and biotech are the most obvious cluster. REPL, AKRO, VRDN, TNGX, SPRY, TECX, RDY, CORT, WAT and a handful of smaller biotech and healthcare plan names all sit at or near their historical volume-by-price peaks. That means the tape has spent a lot of time digesting risk in these symbols, and current trading is happening right where the most inventory has changed hands over the past one to three years. Pair that with the outlier prints in HALO, CAH, GMED, TXG and the high TRV scores in biotechs and healthcare facilities and you get a very clean message: healthcare is not just catching a tactical bid, it is trading at long-term “consensus” zones where big money is comfortable building and defending positions.
Financials are a close second. BOKF, WAFD, TOWN, OZK, UCB, FCF, ITUB and XP all show consensus levels stretching back years, with BOKF in particular now printing both IO outliers and a new high-volume node. That tells you banks are being repriced at key acceptance levels rather than on the fringes of their distributions. The large-cap wrappers DFIC, SPYM, BUYW and URTH add another layer: institutions are willing to own banks and broad equity beta right at the prices where the most historical volume has already accumulated. It is exactly what you would expect in a “fully invested but risk-managed” regime – capital clusters around well-defined value areas instead of stretching for blue-sky momentum.
Energy, uranium and real assets also show up loudly on this list. DNOW, NLR, UEC, AREC, EGY, VTS, UUUU, SOBO and UAN, plus metals and mining names like FSM, AEM, SPPP, USAR and IDR, are all trading at or revisiting their highest historical volume prices. We already saw uranium and energy equipment lighting up the IO and TRV dashboards; consensus levels here confirm that those flows are not just short-term squeezes. The market has been negotiating these zones for months or even years, and 2025 activity is reinforcing them as structural ownership areas for anyone who wants convexity to energy security, nuclear build-out, or inflation hedges via metals.
Technology and communication services look a little different but still rhyme with the broader story. There is a long list of software, infra and semi names at their volume peaks – BZAI, ONDS, NTSK, VRNT, BLND, BTBT, DUOL, GEN, KD, LAES, SITM, DOCU, VSAT, NXPI – along with levered wrappers around the marquee stories: PTIR and PLTZ around PLTR, RVNL around RIVN, NVDG around NVDA, TSLQ around TSLA, plus SQQQ sitting on 418 trades worth of consensus. The takeaway here is that the market has spent a lot of volume anchoring around specific “story” levels in AI, software and EVs, and those levels are still in play. Combine that with IO outliers in mid-tier software (FIG, FROG, PCTY, LYFT, XYZ) and TRV interest in smaller AI enablers, and you get a rotation schematic: big tech is no longer racing higher, but tech risk is being re-underwritten at prior high-volume zones and selectively rolled into second-line names and leveraged wrappers.
Real estate and yield-sensitive assets are also quietly represented. VRE and SUI on the REIT side, CIGI in real estate services, TLN in independent power and CURE as a 3x healthcare bull all sit on historical consensus shelves. That dovetails neatly with the sector board that had Utilities and Real Estate at the top of the leadership stack: when those sectors lead, you expect to see their key vehicles trading right where long-term players have the most skin in the game.
Put together, the consensus-level watchlist is the structural backdrop for everything we are seeing in TRV and IO. Healthcare, banks, real assets and selective tech are not just catching short-term flows; they are trading at prices that already represent years of institutional negotiation. Leveraged products around SPX, Nasdaq, PLTR, NVDA, TSLA and crypto are clustering at their own high-volume nodes, creating clear reference points for hedging and beta-tuning. In other words, the market is not drifting randomly – it is rotating and re-levering around well-established volume architecture, which is exactly what you would expect in a late-cycle, fully invested but defensively postured tape.
MIR Part 3: Framing-Up A Trade
The tone of the tape has shifted modestly but meaningfully. Institutions remain largely invested, yet the rhythm of the market has slowed — a steady grind lower since late October that speaks more to exhaustion than panic. Liquidity remains intact, but sponsorship has narrowed. The message here isn’t “risk off,” it’s “be selective.” Big money hasn’t left the field, it’s simply taking tighter formation — rotating into defensives, extending duration, and demanding clearer earnings visibility before re-deploying in size.
We can see that rotation clearly: Healthcare, Utilities, and Real Estate now dominate the relative-strength board, while large-cap Tech is digesting recent gains. Financials and credit continue to attract consistent demand as yield proxies, but not as momentum trades. Energy remains firm thanks to uranium, infrastructure, and select oil-services exposure — areas still showing institutional sponsorship. The recent downtick in indices looks like rebalancing around the 50- and 65-day moving averages, not liquidation, but it does call for a lighter hand and a more defensive tilt.
Core Equity Allocation(35 %)
SPY (17 %), IVV (9 %), QQQ (9 %)
Trimmed modestly to reflect the recent softening in index momentum. Liquidity remains in these instruments, but reduced exposure cushions the portfolio while the tape consolidates above support.

Defensive Leadership (25 %)
XLV (10 %), XLU (7 %), XLRE (4 %), CAH (2 %), HALO (2 %)
Increased allocation as defensives now lead both flow and relative performance. Healthcare and Utilities have overtaken Tech in momentum, with Real Estate acting as beta to falling yields.

Financials & Yield	(15 %)
Maintain weight but rotate toward duration and carry. The bid has shifted from bank equity to credit and high-income products as rates ease and funds front-run a 2026 rate-cut cycle.
XLF (4 %), BOKF (1 %), VCLT (5 %), JPST (3 %), JEPI (2 %)


Technology & AI Tactical (8 %)
Reduce sizing and focus exposure on proven AI enablers showing persistent institutional flow. Trimmed leveraged instruments (TECL, QQQ) to favor quality and cash-generation.
NVDA (3 %), AAPL (2 %), NOVT (1 %), RCAT (1 %), WTAI ETF (1 %)

Energy & Real Assets (8 %)
Maintain exposure to structural commodity beta. Uranium and energy infrastructure remain firm; flows confirm real-asset conviction even as broad equities consolidate.
NLR (3 %), DNOW (2 %), LEU (1 %), FSM (1 %), CEG (1 %)

Convexity / Optionality Sleeve (4 %)
Use crypto and metals as low-correlation convexity hedges. Volatility in these spaces provides positive skew if the grind lower accelerates or inflation surprises to the upside.
BITO (1.5 %), ETHT (0.5 %), GLD (1 %), SIVR (1 %)

Hedges & Cash Management (5 %)
Expanded hedge sleeve to dampen drawdown risk and give dry powder to re-engage on weakness. Keeps portfolio beta near 0.8 while preserving upside optionality.
SPXS (3 %), VUSB (2 %)
Positioning now is about precision. The goal isn’t to predict a breakdown, but to respect the market’s fatigue. Gross exposure should hover around one times NAV, but with an effective beta near 0.8 — enough to participate if support holds, but light enough to absorb another leg lower without undue damage. If the current pullback deepens, your plan shouldn’t be to defend these index weights — it’s to fade them first and hold cash instead. But if the market stabilizes and breadth starts to repair, this modest index footprint ensures we’re not chasing the turn from the outside.
I’d be adding to defensives on any pullback toward the 50-day averages and using intraday strength in QQQ or SPY to quietly trim into rallies. If the indices continue to oscillate around current levels without breadth improvement, patience becomes a position in itself. Institutions appear content to defend intermediate support, and the balance of flow shows they’re accumulating rather than fleeing — but they’re doing so selectively and with tight risk management.
Watch for confirmation through volume behavior in SPY, IVV, and VOO — persistent prints in dark pools would signal the allocation trade remains intact. Flows in CAH, HALO, and NVDA are also critical tells; if they continue to attract real size, the leadership rotation into quality remains valid. Increased activity in credit ETFs (LQD, HYG, VCLT) would argue for expanding the yield sleeve further next week.
Macro still sets the rhythm. CPI and Retail Sales mid-week are the key catalysts, likely defining whether this drift resolves higher or lower. A cooler inflation print should extend the defensive rally and further compress yields, lifting Utilities and Real Estate. A hotter read would turn the spotlight back to Energy and the convexity sleeve, where positioning is already quietly building.
The broader message hasn’t changed — only the tempo. Institutions are still long, just less aggressively so. The correct play now is to stay aligned with them: long quality, overweight defensives, underweight leverage, and ready to add back size the moment breadth and sponsorship confirm the next leg. Good luck, Team-VL!

Thank you for being part of our community and for dedicating your time to this edition. Your insights and engagement drive everything we do, and we’re honored to share this space with such committed, thoughtful readers. Here’s to a week filled with clear opportunities and strong performance 💰💰💰
VolumeLeaders