Market Momentum: Your Weekly Financial Forecast & Market Prep
Issue 68 / What to expect Nov 03, 2025 thru Nov 07, 2025

In This Issue
Weekly Market-On-Close Report: All the macro moves, market drivers, and must-know narratives—covered in less than five minutes.
Weekly Benchmark Breakdown: Our weekly intelligence report on major indices cuts through the index-level noise to uncover participation, momentum, and structural integrity and tell you whether markets are rising on solid ground or skating on thin breadth. This is where bull markets prove themselves—or quietly start to unravel.
The Latest Investor Sentiment Readings: Track the emotional pulse of the market with our curated dashboard of sentiment indicators. From fear-fueled flight to euphoric overreach, this week's readings reveal whether investors are cautiously creeping in—or stampeding toward the exits.
Institutional Support & Resistance Levels For Major Indices: Exactly where to look for support and resistance this coming week in SPY, QQQ, IWM & DIA
Normalized Performance By Thematics YTD: Which corners of the markets are beating benchmarks, which are overlooked and which ones are over-crowded!
Key Econ Events & Earnings On-Deck For This Coming Week
Market Intelligence Report: Track the real money. This section breaks down where institutions are placing their bets—and pulling their chips. You'll get a sector-by-sector view of flows, highlighting the most active names attracting large-scale buying or selling. We go beyond the headlines and into the tape, surfacing the week’s most notable block trades and sweep orders, both on lit exchanges and hidden dark pools. Whether you're following momentum or fading crowded trades, this is your map to where size is moving and why it matters.

Weekly Market-On-Close Report
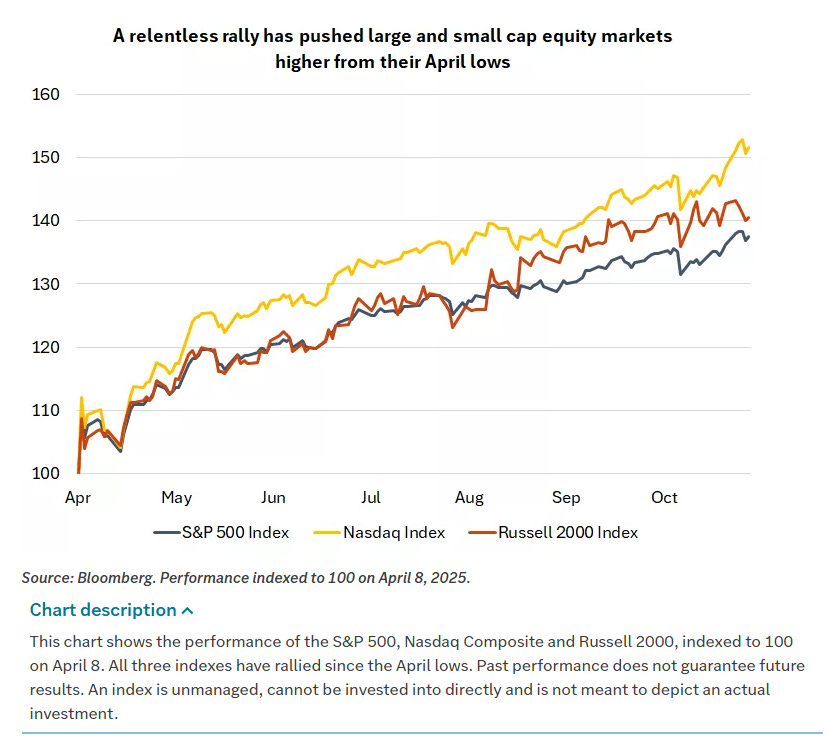
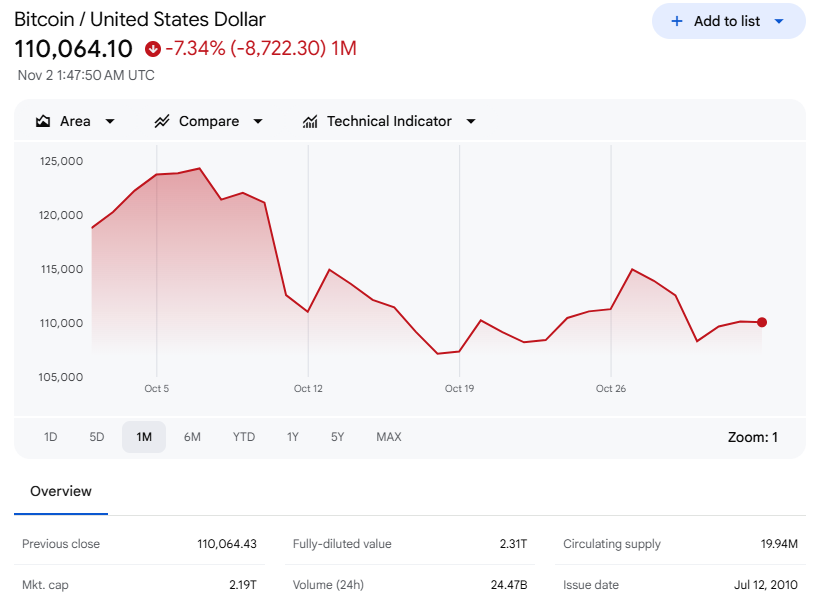
Halloween closed out a month that gave investors plenty of both tricks and treats, and yet the story into month-end is that risk assets continue to climb. Major U.S. equity indexes finished the week with a mixed tone under the surface but positive headlines at the top. The technology-heavy Nasdaq Composite led gains thanks to renewed strength in mega-cap technology that continues to benefit from artificial intelligence spending. The S&P 500 Index also advanced, even though seven of its 11 sectors finished lower and the equal-weighted version of the index underperformed the traditional market-cap weighted index by 268 basis points. That divergence captures the entire mood of the tape right now. A narrow handful of massive technology leaders are doing most of the work while smaller-cap and interest rate sensitive areas struggle to hold on to October’s early momentum. The Russell 2000 closed at 2,479, up 13 points, but small and mid-cap indexes overall fell more than 2% on the week and gave back much of their recent progress as rates drifted higher. The Dow ended the day at 47,563, up 41 points. The S&P 500 settled at 6,840, up 18. The NYSE FANG+ Index ended at 16,920, up 70. Outside equities, ICE Brent Crude finished at 65.07 USD per barrel, up 0.07 USD. Gold ended at 4,018 USD per ounce, up 2 USD. Bitcoin finished near 109.4k, up 1,526.
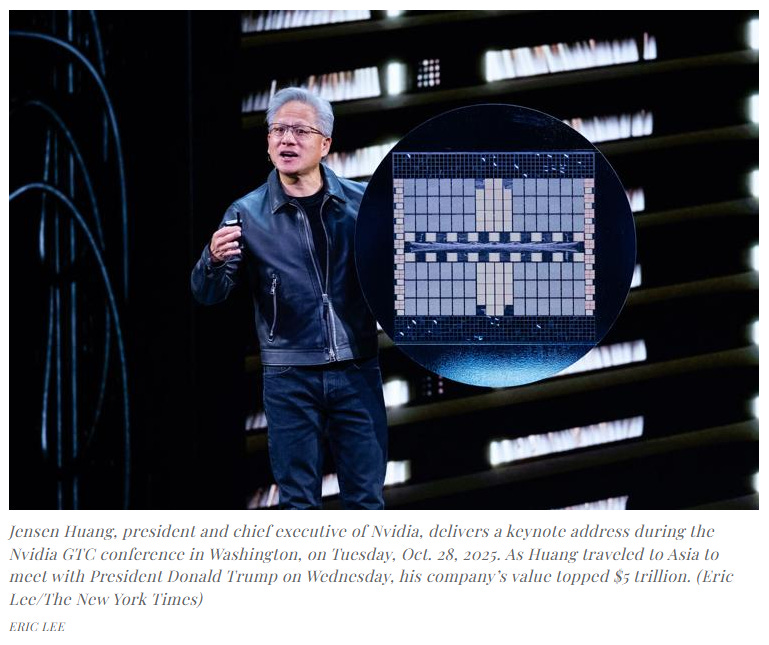
Underneath those index closes, the leadership dynamic continues to harden. The market is increasingly concentrated in a handful of names that investors now treat like essential infrastructure. Amazon.com (AMZN) closed up more than 9% on Friday after what can fairly be called blowout earnings and an upbeat outlook. Western Digital (WDC) closed up more than 8% after reporting Q1 net revenue above consensus. NVIDIA (NVDA) rallied and pushed its market capitalization above 5 trillion USD midweek, the first company ever to cross that line. NVIDIA briefly became the first company to crack the 5 trillion USD market capitalization threshold after Jensen Huang delivered the keynote address at the GTC conference, where he outlined partnerships and investments designed to accelerate progress in 6G networking, autonomous vehicles, robotics, and supercomputers.
Qualcomm (QCOM) said it was building its own AI chip. Advanced Micro Devices (AMD) announced that it would be partnering with the government to build two supercomputers. Those announcements helped the ICE Semiconductor index finish the week up more than 3% and more than 10% for the month. Alphabet (GOOGL) and Amazon.com (AMZN) traded higher following earnings, while Microsoft (MSFT), Apple (AAPL), and Meta Platforms (META) saw more mixed reactions, including pullbacks tied to underwhelming results and investor unease with the cost of future AI-driven investment. Still, even with that push and pull, the AI trade remains the most powerful narrative in equities. The so-called Magnificent Seven companies are still dictating weekly performance for the large-cap complex.
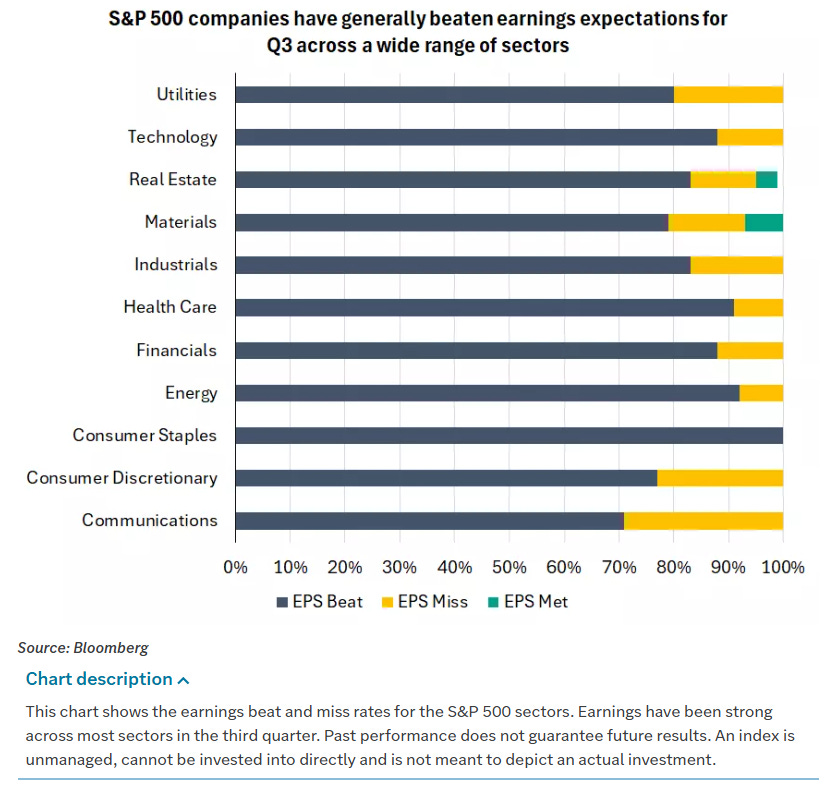
Corporate earnings season is driving that resilience. By Friday, more than 60% of the companies in the S&P 500 had reported Q3 results, and more than 80% of them had beaten earnings estimates, which is an important pillar of support for U.S. equities. According to Bloomberg Intelligence, 80% of S&P 500 companies that have reported so far this quarter have beaten forecasts, putting this quarter on pace to be the strongest since 2021. FactSet data puts the number at 83% beating consensus estimates among the roughly 64% of the index that had reported as of Friday morning. The message so far is that companies have managed to defend profitability even through elevated costs, higher funding rates, and a slowing consumer. It is also true that the absolute rate of profit and sales growth is decelerating, and the market is not blind to that. Q3 profits are expected to have risen by 7.2% year over year, which would be the smallest earnings increase in two years. Q3 sales growth is projected to slow to 5.9% year over year from 6.4% in Q2. Investors have chosen to lean more heavily on forward narrative and the durability of AI-related capital expenditure than on those deceleration markers, but the deceleration is there. The single stock tape has rewarded companies that can point to visibility through 2026 and punished companies that admit to consumer fatigue or cyclical weakness.
Management commentary across sectors came in more nuanced than the headline beats would suggest. Mastercard (MA) described “continued steady growth both across affluent and mass market,” and said that this was true in the U.S. and globally. Mastercard (MA) said gross dollar volume was up 9% year over year and transactions were up 10%, and called out healthy consumer and business spending. That is one side of the consumer. But Kimberly-Clark (KMB) said, “Clearly what you see right now is that consumers are really under pressure and their purchasing power is under pressure. We don’t really see, candidly, a catalyst for that to change any time in the near term.” Kimberly-Clark (KMB) also noted that demand for the company’s products remains relatively resilient given their core nature. Chipotle (CMG) said that “earlier this year, as consumer sentiment declined sharply, we saw a broad-based pullback in frequency across all income cohorts. Since then, the gap has widened with low to middle-income guests further reducing frequency.” That widening gap between the affluent consumer that still spends and the pressured lower and middle income consumer who is pulling back is a theme worth watching, because it feeds directly into how companies are talking about pricing, promotions, and forward guidance.
We are seeing similar splits in industrial and housing-linked commentary. Builders FirstSource (BLDR) said that “single family construction remains soft” and described a market where “builders manage the pace of starts, given affordability concerns, consumer uncertainty and elevated new home inventories.” Builders FirstSource (BLDR) said “demand remains tempered despite Fed rate cuts in 2025,” which makes it clear that lower policy rates alone are not immediately solving affordability. In multifamily, Builders FirstSource (BLDR) said that “activity is expected to remain muted year end in line with our previous thinking. However, we have seen green shoots and quoting activity.” That balance between affordability ceilings and selective early signs of stabilization mirrors what D.R. Horton (DHI) emphasized. D.R. Horton (DHI) continued to highlight affordability issues, the importance of incentives, and still elevated inflation. Sherwin-Williams (SHW) reported solid results but continued to point out weakness in the do-it-yourself segment. C.H. Robinson (CHRW) described a difficult freight environment, saying “Q3 marked a continued soft freight environment,” and “despite a fairly steady exit of trucking capacity over the past three years, truckload spot rates continue to bounce along the bottom due to low demand.” C.H. Robinson (CHRW) also said, “the volume and rate dynamics in Global Forwarding are certainly headwinds we are facing.”

In other words, the industrial, construction, and logistics complex is not only still working through a digestion period, it is doing so against the backdrop of a consumer that is no longer universally robust. The contrast with AI-linked infrastructure demand could not be sharper. The story from the large semiconductor and hyperscale platforms is that spending will remain heavy, and that the beneficiaries include not only chip makers but also power, electrical equipment, and construction firms tied into data center and high performance compute buildouts. Management teams with exposure to that capex cycle guided investors to expect that demand to remain strong “throughout at least 2026.”
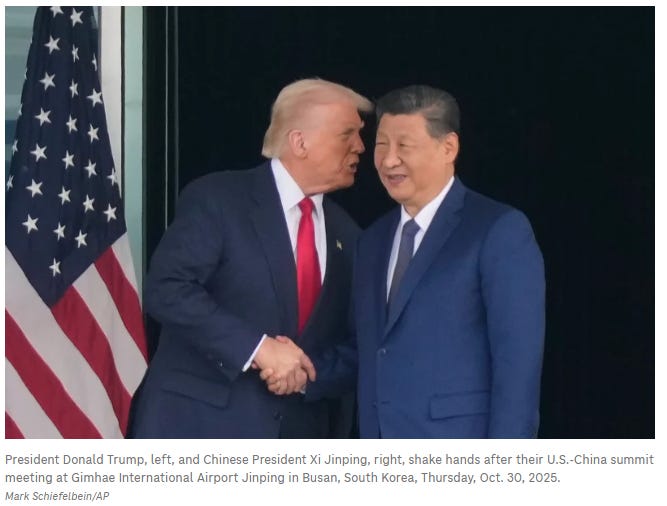
Equities were not the only asset class with a story to tell this month. October was defined by a series of volatility shocks and relief rallies across equities, rates, commodities, and crypto. The first real shock this month came on October 10, when China announced new rare earth export controls. That announcement drew a sharp response from the administration and sparked a 3% drawdown across major U.S. equity indexes, which was the largest single day decline since April at the height of the tariff turmoil. Demand for protection surged. Volatility across asset classes spiked as investors scrambled for hedges. It was the heaviest options volume day on record and the fourth highest in equity market trading measured in shares and notional value, behind only three days in April. After the cash equity close that day, crypto saw a flash crash, with roughly 20 billion USD of forced liquidations pushing prices sharply lower. That kind of cross-asset liquidation is the market’s way of showing stress. It also set up what came next. After conversations over that weekend, the tone around U.S. and China relations softened and that helped pave the way for the long-awaited meeting between President Trump and President Xi Jinping.
That meeting and the broader trade tour shaped the geopolitical backdrop this week. President Trump and President Xi Jinping agreed to extend a tariff truce, roll back export controls, and reduce other trade barriers. The U.S. will cut fentanyl-related tariffs on Chinese goods to 10% from 20% and extend a pause on some reciprocal tariffs for an additional year, while China resumes purchases of U.S. soybeans, sorghum, and other farm products. China also agreed to pause controls on rare-earth magnets in exchange for the U.S. rolling back an expansion of restrictions on Chinese companies. The meeting was described by President Trump as “amazing, a 12 on a scale of 1 - 10.” The result is essentially a one-year trade truce.
The concessions include resumed rare earth exports from China and resumed agriculture purchases from China, while the U.S. cut the fentanyl-related tariffs in half and delayed a rule that would have expanded restrictions on blacklisted Chinese firms. While in Asia this week, President Trump also finalized a trade deal with South Korea and announced partnerships with Japan related to rare earth minerals and nuclear technology. President Trump said South Korea agreed to pay 350 billion USD in exchange for lower tariffs and will buy American oil and gas “in vast quantities.” He also said he gave his approval for South Korea to build a nuclear-powered submarine at a Philadelphia shipyard. More details around a U.S.-Japan trade deal were also cited as supportive for sentiment in Japan. The rumor mill even extended to an anecdote about President Trump pushing for increased U.S. hotdog exports while watching the World Series with new Prime Minister Takaichi in order to offset what he characterized as Japan’s “awesome baseball players” trade imbalance. This is the current backdrop for risk assets: tariff escalation followed by rapid tariff de-escalation, and the sense that, for now, the U.S. and China are content to pause open escalation.
The geopolitical story is not over. Regarding President Trump’s reciprocal tariffs, markets are looking ahead to oral arguments at the Supreme Court scheduled for November 5 on whether those tariffs are legal. Lower courts have already ruled that President Trump’s reciprocal tariffs are illegal, finding they are based on a specious claim of emergency authority. If the U.S. Supreme Court upholds those rulings and strikes down the tariffs, then the U.S. government will have to refund the reciprocal tariffs already collected, and President Trump’s power to impose tariffs will be limited to well-founded sections of U.S. trade law. Observers expect the U.S. Supreme Court to announce its final ruling on the reciprocal tariffs by late 2025 or early 2026. That timing matters because it means tariff relief or tariff reinstatement is now part of a 2026 horizon discussion rather than a next-week discussion. In the meantime, what we have is a one-year truce and a political timeline.

The Federal Reserve added its own drama this week. On Wednesday, the Fed lowered its target range for the federal funds rate by 25 basis points to 3.75% to 4.00%, as widely expected. That puts the fed funds rate some 150 basis points, or 1.5%, below its peak. The Fed also announced that it would stop reducing its holdings of U.S. government bonds in December and effectively end the balance sheet runoff. The Fed had previously built up those bond holdings through large-scale purchases of Treasuries and other assets to help hold down longer-term rates, and then gradually let the balance sheet shrink. The decision to stop the runoff was widely anticipated and did not generate the same market shock as the policy rate cut. What did generate a reaction was the messaging around what happens next.
There were two formal dissents at this meeting. Fed Governor Stephen Miran argued for a 50 basis point cut. Kansas City Fed President Jeffrey Schmid voted to keep rates unchanged. Those dissents highlight an increasingly public divide inside the Committee. The Chair himself made an effort to reset expectations. Chair Jerome Powell said that another cut in December “is not a foregone conclusion.” He said that while there was broad support for this cut, there are decidedly differing views about the path forward, and that those differences center on where the so-called neutral rate sits and how quickly inflation is cooling. He described the labor market as gradually slowing. He said he does not sound overly concerned about tariff-induced inflation, and he said he believes the current policy rate is modestly restrictive. He also acknowledged that the current Fed funds rate is now at the upper end of estimates of neutral, and that those estimates are mostly between 3% and 4%. Chair Powell returned to his “navigating through the fog” analogy, saying policymakers are proceeding with caution because the data picture is clouded, especially with the loss of official government data due to the shutdown. He emphasized that monetary policy is no longer “slamming the brakes,” but he did not suggest that the Fed is “stepping on the gas.” The preferred framing was that policy is moving toward “cruise control,” where rates sit near more neutral settings while the Committee watches how the economy absorbs the tightening already delivered.
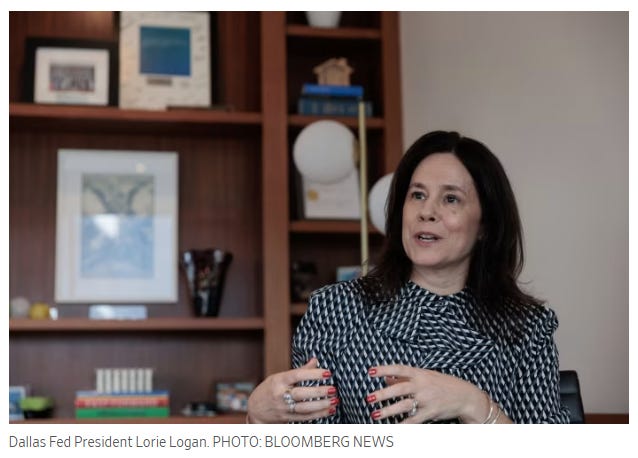
Once the blackout period lifted, the hawks made sure their voices were heard. Kansas City Fed President Jeff Schmid explained his dissent by saying that “the labor market is largely in balance, the economy shows continued momentum, and inflation remains too high.” He also said, “I do not think a 25-basis point reduction in the policy rate will do much to address stresses in the labor market that more likely than not arise from structural changes in technology and demographics. However, a cut could have longer-lasting effects on inflation if the Fed’s commitment to its 2% inflation objective comes into question.” Dallas Fed President Lorie Logan said, “I did not see a need to cut rates this week, and I’d find it difficult to cut rates again in December unless there is clear evidence that inflation will fall faster than expected or that the labor market will cool more rapidly.”
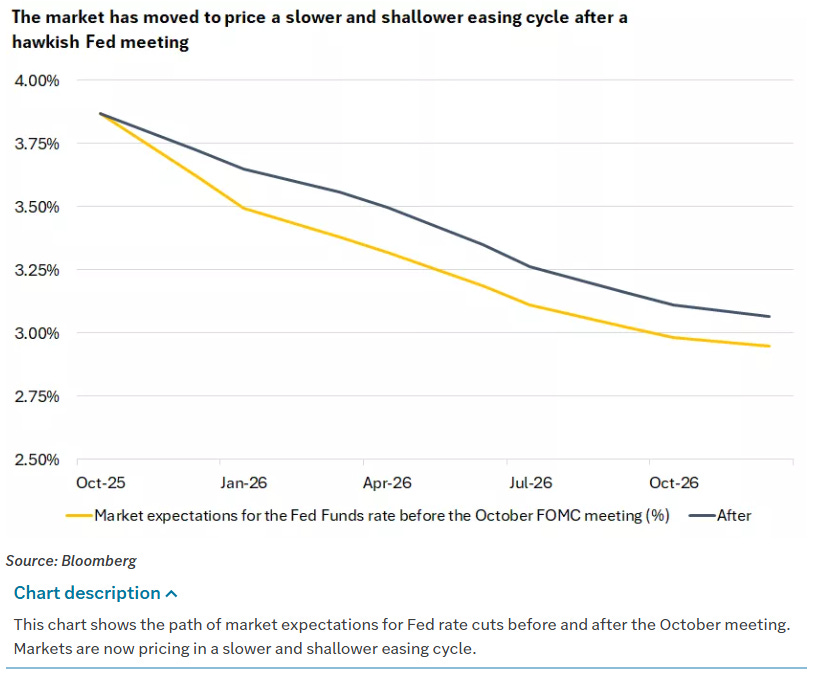
Cleveland Fed President Beth Hammack said she “would have preferred to have held interest rate steady at Wednesday’s FOMC meeting as we need to maintain some amount of restriction to help get inflation back down to target.” The market took those comments seriously. The probability of another 25 basis point cut in December now sits at 63%, down from more than 90% at the end of last week. The market is currently discounting a 64% chance of another 25 basis point rate cut at the next FOMC meeting on December 9-10, and is discounting an overall 82 basis point rate cut by the end of 2026 to 3.06% from the current effective federal funds rate of 3.88%. That repricing pushed Treasury yields higher this week.
Treasuries reflected all of that in real time. December 10-year T-notes (ZNZ5) closed down 1 tick on Friday. The 10-year T-note yield fell 0.2 basis point to 4.095%. T-notes spent much of Friday under pressure. Strength in equities reduced demand for safety, and hawkish commentary from Kansas City Fed President Jeff Schmid, Dallas Fed President Lorie Logan, and Cleveland Fed President Beth Hammack weighed on rate futures. Inflation expectations also leaned against Treasuries after the 10-year breakeven inflation rate rose to a two-week high of 2.312%. Late in the session, T-notes recovered most of their losses as safe-haven demand picked up in response to a Miami Herald report that the U.S. has decided to attack military fixtures in Venezuela and could act at any time. That headline put a geopolitical floor under bonds into the close. The curve flattened modestly on the week as Treasury yields rose 5 to 10 basis points across most maturities. The U.S. dollar index firmed through the week and is now trading just under its declining 200-day moving average, back near its early August highs.
Outside the U.S., European government bond yields moved lower on Friday. The 10-year German bund yield fell 1.0 basis point to 2.633%. The 10-year U.K. gilt yield fell 1.4 basis points to 4.409%. The Eurozone October CPI eased to 2.1% year over year from 2.2% year over year in September, exactly in line with expectations. Core CPI in the Eurozone remained unchanged from September at 2.4% year over year, which was stronger than expectations of 2.3% year over year. German September retail sales rose 0.2% month over month and 2.8% year over year, which was slightly stronger than expectations for 0.2% month over month and 2.7% year over year. Swaps are now discounting a 4% chance for a 25 basis point rate cut by the ECB at its next policy meeting on December 18. European equities had a solid October overall, with the U.K. gaining 4%, France gaining 3% despite political turmoil, and Germany finishing modestly higher. The STOXX 600, FTSE 100, DAX, and CAC all reached all-time highs during the month. For the week, however, major European indexes finished down around 1%. The U.K. outperformed, closing up almost 1%, while Germany lagged, falling 1% this week and closing the DAX below its 50 and 100 day moving averages. GDP readings were mixed across Europe, with France surprising to the upside while Germany registered stagnation. The ECB left rates unchanged, as expected.
Asia told a different story. Japan’s Nikkei reached 50,000 for the first time ever and kept going. The Nikkei is now above 52,000, after gaining 6% for the week and roughly 16% in October. Japanese equities were helped by the continued AI trade, a new administration, the Bank of Japan keeping rates on hold, a weakening yen, and optimism tied to the U.S.-Japan trade deal that was further outlined this week. China was more muted. For October, the Hang Seng fell 3.5% while the Shanghai Composite rose 2%. The Hang Seng has seen a modest pullback after hitting a year-to-date high in early October. The Shanghai Composite reached a 10-year high before fading into month-end and closing near last week’s levels. Chinese markets finished flat to slightly lower this week despite the Trump / Xi Jinping meeting. The current situation can be categorized as a tepid truce. China’s next five-year plan proposal was published this week, focusing on industrial modernization, defined as taking technology breakthroughs into scaled production, and on domestic demand. Official Chinese PMIs this week showed manufacturing activity falling more than expected at 49 versus 49.6 consensus and 49.8 last month. Elsewhere in emerging markets, South Korea continued to surge, gaining 4% this week and 20% for the month. The trade deal with the U.S. that President Trump finalized in Asia helped extend that move, including the commitments on tariffs, energy purchases, and defense cooperation. Argentina exploded higher this week following stronger than expected election results for President Milei’s party, adding to earlier gains that followed U.S. currency interventions aimed at stabilizing the peso.
Commodities and crypto traded like leverage to global macro and policy expectations throughout October. Oil was volatile but ultimately finished lower. ICE Brent Crude failed to clear its 50 and 100 day moving averages in early October and traded down from roughly 66 USD to roughly 61 USD before jumping back up late in the month. Brent then climbed to test all three major moving averages and is now sitting just below its 50 day level of about 65 USD. New Russian sanctions helped push crude prices higher, while traders worked through speculation that OPEC+ might deliver a small output increase at its next meeting. Brent finished the day at 65.07 USD per barrel, up 0.07 USD, and is down roughly 1.5% for the month and a similar amount this week. U.S. natural gas was stronger. Nat gas added 6% on the month and 3% on the week as colder forecasts and lower injections supported price. Agriculture was firm as well. China’s agreement to restart U.S. soybean purchases drove soybeans higher this week, and agricultural products were up solidly on the month.
Gold was one of the cleanest examples of how far momentum can run before it reverses. Gold ripped higher for eight straight weeks and printed record highs near 4,400 USD per ounce earlier in October. That advance made precious metals one of the most crowded momentum trades in the market. Then the air pocket hit. Gold pulled back sharply in the second half of the month, dropped below 4,000 USD, and then recovered that level into the end of the week, closing at 4,018 USD per ounce, up 2 USD on the day. Gold is still up roughly 4% this month, even after being down 3% this week, and remains above its 50 day moving average near 3,850 USD and well north of its 100 and 200 day moving averages. Silver, platinum, and palladium all traded in a similar pattern, and platinum finished up 14% on the month. Crypto behaved like a high-beta expression of the same macro impulses. Bitcoin rallied early in the week alongside the broader “risk on” bid but gave back gains in the back half of the week. Bitcoin traded up to test the cluster of overhead moving averages and the levels that marked pre-flash-crash resistance ahead of the October 10 rare earth shock. It could not hold those gains and finished the week back below 100k. Bitcoin ultimately settled near 109.4k, up 1,526 on the session, but the tone into the weekend was corrective.
All of this is playing out against the backdrop of a U.S. government that remains shut down. The shutdown is now in its fifth week and is weighing on market sentiment and on the real economy. 640,000 federal workers will be furloughed during the shutdown, which will expand jobless claims and push the unemployment rate up to 4.7%. The shutdown is disrupting normal economic data flow. Investors did not receive weekly unemployment claims reports, the September unemployment and payroll report, the August trade balance, September retail sales, September PPI, September housing starts, September industrial production, September leading indicators, and other standard government releases. The Fed itself cited the lack of data as part of the rationale for caution going into December, with some policymakers arguing that, in the absence of timely visibility, the bar for additional rate cuts should be higher.
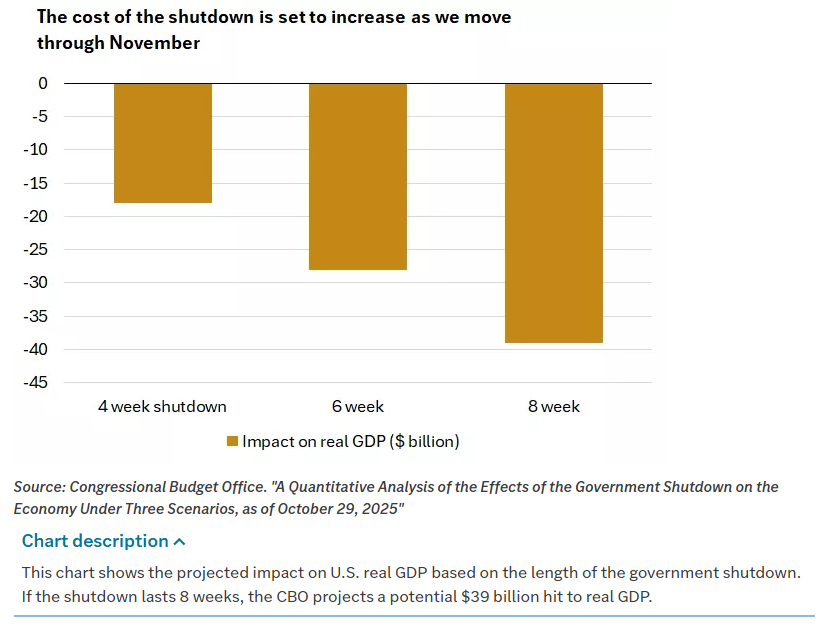
The shutdown is also delaying the first estimate of Q3 GDP, and it threatens to interrupt SNAP benefits for roughly 40 million Americans if it drags on. Bloomberg Economics estimates that the shutdown has already taken around 1% off annualized Q4 GDP growth. That drag could rise to 1.5% by mid-November and 2% by late November. In dollar terms, that would equate to nearly 40 billion USD. The government shutdown is also providing mechanical support for Treasury prices in one respect. The logic is straightforward. If the shutdown leads to additional job losses, reduced consumer spending, and a weaker U.S. economy, that could allow the Fed to continue cutting interest rates. T-notes have received some underlying support from that line of thinking.
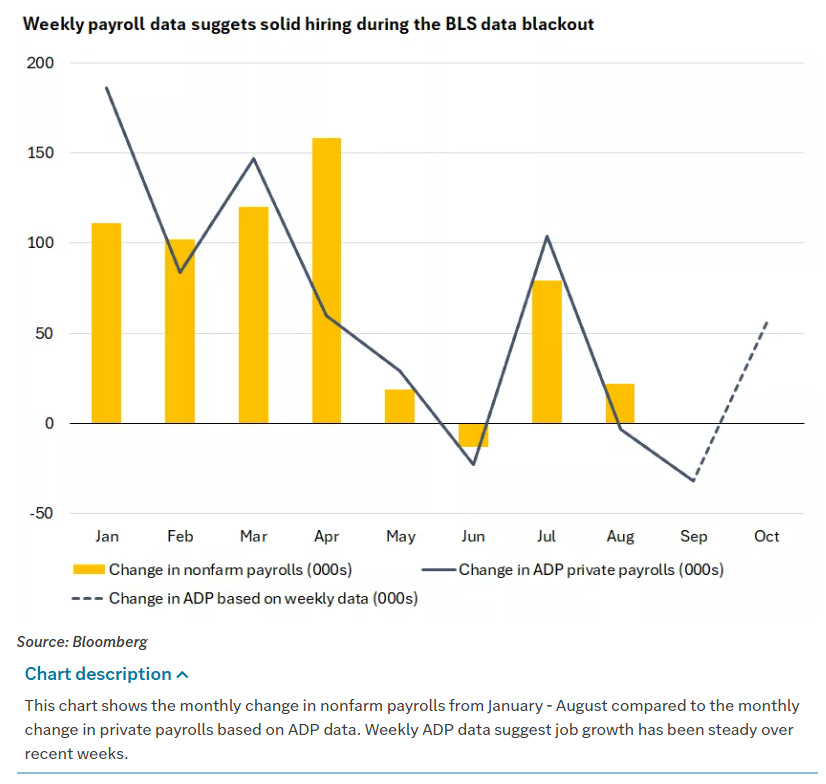
With the federal data pipeline choked off, traders have leaned on private sources to understand where the economy stands. ADP announced that every Tuesday starting this week it will release estimates of its National Employment Report. This week the report showed that 14,250 jobs on average were added for the four weeks ending October 11. That suggests the labor market has improved after job declines in September.
The Conference Board’s Consumer Confidence survey ticked slightly lower from last month. Improvement in current conditions was offset by weakening expectations. One-year inflation expectations ticked up to 5.9% from 5.8%. Preliminary survey data shows that holiday spending is likely to be weaker, with consumers expecting to spend 3.9% less on gifts this year. Housing data confirms a laboring market that is not cracking but is not accelerating either. The Case-Shiller index showed a moderation in home price appreciation to 1.6% year over year from 1.8%. Pending home sales from the National Association of Realtors (NAR) were flat in September versus August and fell 1% year over year. The report noted that contract signings were the second strongest reading of the year, but that they still have not reached the level needed for a healthy market. The report also pointed out that “a record-high stock market and growing housing wealth in September were not enough to offset a likely softening job market,” and that inventory is at a five-year high. The Dallas Fed Manufacturing Survey showed a modest improvement from last month, including in New Orders, but both measures remained negative. Prices paid and received both declined from last month. Expectations moved lower overall and specifically for New Orders.
The fixed income tone reflects this cross-current. U.S. government securities generated negative returns this week, with yields fluctuating but finishing higher across most maturities. Bond prices and yields move in opposite directions. The conclusion of the Fed’s meeting on Wednesday and Chair Powell’s hawkish tone drove most of the move. Investment-grade corporate bonds underperformed Treasuries, and weekly supply came in well above expectations. High yield held up better, with sentiment in the high yield market supported by earnings and issuer-specific news. Municipal bonds were mixed. Munis showed resilience overall, even though they also felt some of the weakness that followed the Fed’s press conference and the move higher in Treasury yields. The dollar strengthened as U.S. yields pushed higher and as investors reassessed the odds of an additional cut in December.
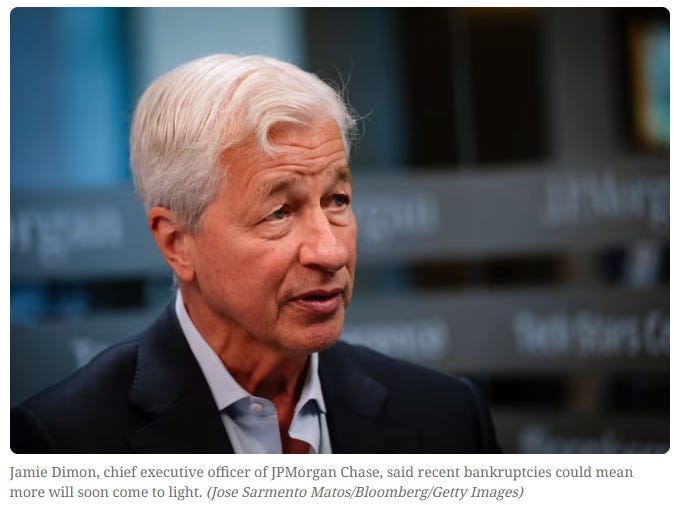
The story of October is that this market absorbed a rare earth shock from China, a 3% single-day drawdown that was the worst since April, the heaviest options day on record, a fourth highest day ever in equity trading by shares and notional value behind only three days in April, a flash crash in crypto that wiped out roughly 20 billion USD in forced liquidations, the “cockroaches” warning from the CEO of JPMorgan Chase (JPM) about regional banks, a wave of credit concern tied to bankruptcies at First Brands and Tricolor Holdings, a government shutdown, a Federal Reserve that cut rates and ended balance sheet runoff but told markets not to expect a December cut, a split FOMC, a global semiconductor arms race, tariff escalation and tariff de-escalation, and a Supreme Court review of executive tariff power. In the middle of that, the major U.S. large-cap equity indexes are sitting near record highs, and Japan just printed a new all-time high on the Nikkei, above 52,000, after gaining 6% this week and roughly 16% in October. That is not a quiet backdrop. It is, however, one that continues to reward investors who stay allocated to assets with structural earnings visibility, pricing power, and exposure to artificial intelligence infrastructure.
Looking ahead to next week, the calendar is lighter than usual because the shutdown continues to limit government data releases. There will be fresh employment data from ADP and Challenger. The Institute for Supply Management will release Manufacturing and Services data, which will give a new read on U.S. activity levels. The final S&P PMIs will be published across the globe. The Fed blackout window is over, so the speaker circuit will ramp, and investors should expect a full slate of Fed commentary after this week’s messaging reset. The Treasury will release its quarterly refunding notices. That matters because it lands right on the heels of the Fed ending its balance sheet runoff, and it will shape expectations for issuance at different maturities. The Bank of England, the Reserve Bank of Australia, the central bank of Mexico, and the central bank of Brazil will all announce interest rate decisions. Earnings season is still in full swing and will continue to deliver cross-currents across sectors. Oral arguments in the IEEPA tariff case at the Supreme Court will begin. Elections across the U.S. will take place on Tuesday.
The tape has been tough and strangely resilient, absorbing one tail risk after another without giving much back. We have watched a shutdown drag into a fifth week, a hawkish Fed pull the market’s expectations for a December cut from more than 90% to 63%, a 3% single day drawdown on October 10 that produced the heaviest options volume on record and a 20 billion USD crypto liquidation, tariff whiplash between the U.S. and China, and open credit stress in the regional banks, and yet the major indexes are still sitting near highs while leadership keeps narrowing. At some point the market will have to decide whether bad news and declining breadth are features to ignore or problems to price. November has a reputation for being a cooperative month for equities, and maybe that seasonal tailwind buys more time for the narrow winners to keep carrying the tape. But the longer this market leans on a smaller and smaller group of stocks to defend headline levels, the more every new shock matters.
Weekly Benchmark Breakdown
The tone this week is classic late-stage squeeze: the headline indexes still look fine, but the internal participation is fading, not broadening. We are seeing thrust at the top but not trend across the body. In plain English, a handful of winners are dragging the tape higher while the median stock is rolling over again.
The risk tone is more defensive than the index levels suggest, and the data shows it clearly. Across the major U.S. cohorts, new lows are swamping new highs on every short-term window except the Dow Industrials, and most indexes have only about one-third to one-half of their members above the key moving averages on a 5-day to 50-day basis. This is not how durable advances are usually built.
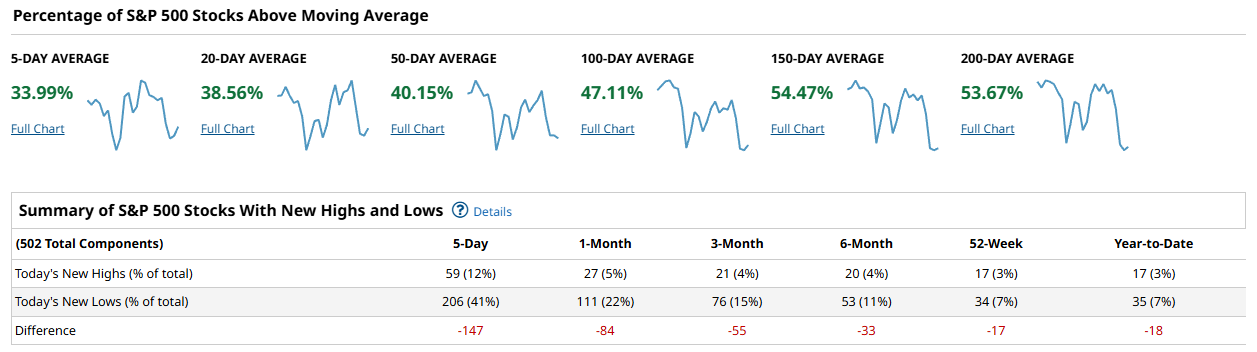
Start with the S&P 500. Only 33.99% of S&P 500 components are above their 5-day moving average, 38.56% are above their 20-day, and 40.15% are above their 50-day. That tells us that on a short- to intermediate-term basis, fewer than half of the names are participating in any bounce. Participation improves as we widen the lens, with 47.11% of stocks above the 100-day, 54.47% above the 150-day, and 53.67% above the 200-day. So structurally, about half the index is still in medium-term uptrends, but tactically, most stocks are slipping. The new high / new low table confirms that weakness. Over the past 5 days, only 59 names, or 12%, printed new highs, while 206 names, or 41%, printed new lows. That is a 5-day net of -147. Over 1 month, we see 27 new highs (5%) against 111 new lows (22%), for a net of -84. Even on a 3-month look, new lows dominate at 76 names (15%) vs 21 new highs (4%), a net of -55. It does not get better on a 6-month basis or even at the 52-week horizon, where the net is still negative at -17. Year-to-date, new lows outnumber new highs by -18. This is not a market where the average S&P 500 stock is quietly breaking out. It is a market where breakdowns are still broad and persistent, and where the index level is being held together by a shrinking group of large-cap leaders.
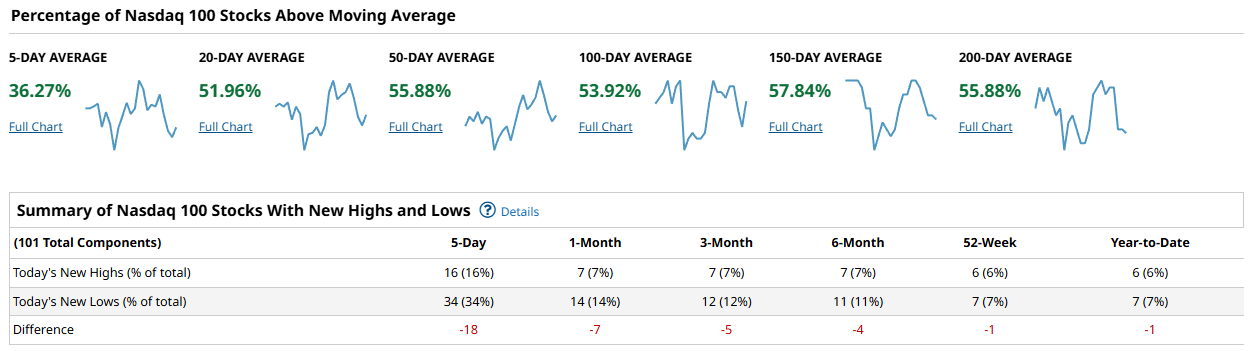
The Nasdaq 100 is telling a similar but slightly different story. On the surface, the megacap tech complex still looks dominant, but internally it is not exactly a picture of health. Only 36.27% of Nasdaq 100 components are above the 5-day moving average. That improves at the 20-day, where 51.96% are above, and again at the 50-day, where 55.88% are above. By the 100-day, participation fades to 53.92%, and by the 150-day and 200-day, the numbers are 57.84% and 55.88%, respectively. So unlike the S&P 500, which cannot get to 50% above the 50-day, the Nasdaq 100 can, and sits in the mid-50s across the 20-day through 200-day lookbacks. That is still not roaring strength, but it is notably better than the broader market. The stress shows up in the new highs and new lows data. Over the past 5 days, 16 names (16%) hit new highs, but 34 names (34%) hit new lows, for a net of -18. Over 1 month, 7 names (7%) made highs while 14 names (14%) made lows, net -7. Over 3 months the net is -5, over 6 months it is -4, and even on a 52-week view, new lows edge out new highs by -1. Year-to-date, it is also -1. The Nasdaq 100 is still leading on relative terms, but even in the engine room of AI and mega-cap growth, new lows are outpacing new highs across almost every time frame. That is not what you typically want to see if you are betting on uninterrupted upside.
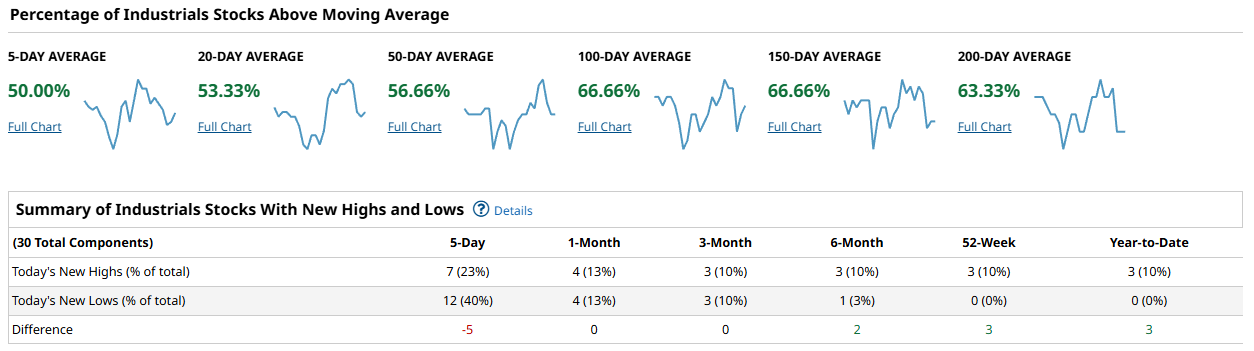
Now look at the Dow Industrials. The Dow screenshot is labeled “Industrials,” and it shows breadth stats for 30 total components. Here, the tone is different, and importantly, it is better. On the shortest horizon, 50.00% of Dow components are above the 5-day moving average. The participation is even stronger on longer windows: 53.33% are above the 20-day, 56.66% above the 50-day, and 66.66% above the 100-day. That 66.66% figure holds at the 150-day as well, and 63.33% are above the 200-day. That is the highest medium-term participation of the four groups. This is what healthy trend looks like. The new high / new low table is also the cleanest of the bunch. Over the past 5 days, 7 Dow names (23%) printed new highs while 12 (40%) printed new lows, for a net of -5. On the 1-month, 4 highs (13%) vs 4 lows (13%), net 0. On 3-month and 6-month views, the net is 0 and +2. On a 52-week basis the net is +3, and year-to-date it is also +3. That is a major contrast with the S&P 500, Nasdaq 100, and Russell 1000, where the net new highs minus new lows is negative across most windows. The Dow has not escaped short-term chop, and the 5-day net is still -5, but it is the only major cohort where the intermediate and longer windows are not flashing broad deterioration.
Finally, the Russell 1000 gives us the read on the broader U.S. large and mid-cap universe. This is where the stress is most obvious. Only 35.67% of Russell 1000 components are above the 5-day moving average. 40.03% are above their 20-day. 37.95% are above their 50-day. That is worse than the S&P 500 on the 50-day measure, and it tells you that most of the Russell 1000 is below intermediate-term trend. Things improve at the 100-day, with 46.18% above, and improve again at the 150-day and 200-day marks, where 53.41% and 52.72% of stocks are above, respectively. So just like the S&P 500, the Russell 1000 still has about half its members hanging on to longer-term trend structures, but fewer than 40% are holding their 50-day. The new highs vs new lows table is where it really breaks down. Over the past 5 days, 119 names (12%) hit new highs, while 433 names (43%) hit new lows. That is a -314 net. Over 1 month, 61 names (6%) hit highs, versus 237 (24%) printing lows, net -176. Over 3 months, 42 highs (4%) vs 164 lows (16%), net -122. Over 6 months, 41 highs (4%) vs 109 lows (11%), net -68. Even on the 52-week view, the net is -43, and year-to-date the net is also -43. This is decisive. The Russell 1000 is not quietly firming under the surface. It is getting wider new low expansion across every major time frame.
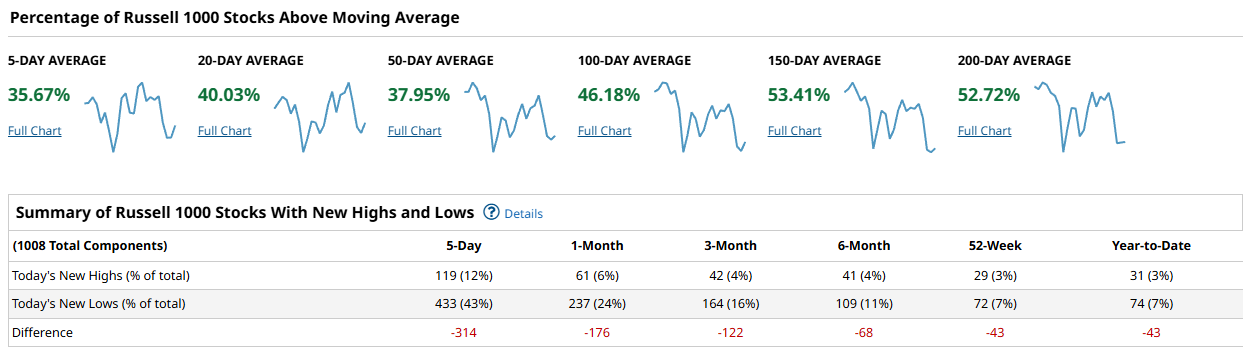
Putting it together, this is a cap-weighted market held up by a shrinking leadership core. The S&P 500 has only 40.15% of its members above the 50-day moving average and a 5-day new high minus new low spread of -147. The Russell 1000 is worse, with just 37.95% of its members above the 50-day and a 5-day net new highs minus new lows of -314. The Nasdaq 100 looks better on percentage above the 20-day through 200-day, sitting mostly in the low-to-high 50s, but even there, new lows outnumber new highs across nearly every horizon, including -18 over 5 days and -7 over 1 month. The Dow Industrials are the only group that still shows trend-like participation, with 66.66% of components above the 100-day and 150-day moving averages, and a flat to slightly positive net new highs minus new lows on 1-month, 3-month, 6-month, 52-week, and year-to-date views. A durable advance usually requires the broader cohorts to start looking more like the Dow: you want to see more than 60% of components reclaiming and holding their 50-day moving averages, and you want new highs to consistently outpace new lows on the 5-day and 1-month windows. We are not there. Instead, we are watching leadership narrow, which raises the risk that the index-level strength is masking internal fragility rather than leading broad follow-through.
In terms of setup, the playbook here is not complicated. Favor the parts of the market that are still acting like trends, and be skeptical of the parts that are sliding back below their 50-day with heavy new lows. The Dow-style leadership, where 66.66% of components sit above the 100-day and 150-day moving averages and the longer-term net new highs minus new lows is positive, is telling you where relative strength still has sponsorship. The Nasdaq 100 still has a bid, with 55.88% of its members above the 50-day, and it continues to benefit from concentrated demand in the mega-cap growth and AI complex, even if short-term net new lows are trying to leak in. The S&P 500 and Russell 1000 are telling you what to avoid pressing blindly: when only 35.67% to 40.15% of names are above the 5-day to 50-day stack, and when you are printing -147 to -314 net new lows over 5 days, you are not in a healthy broad tape. You are in a tape that is quietly distributing while the indexes still look calm. The confirmation signal to flip more constructive would be simple. You would want to see those 50-day cohorts move above 60%, and you would want to see the 5-day and 1-month net new highs minus new lows flip positive in the S&P 500 and the Russell 1000. Until that happens, the burden of proof is on the bulls outside the top-heavy leaders.
Bottom line: The bull case is still alive in the indexes, but under the surface this is not expansion, it is concentration, and the longer that pattern holds, the more fragile the rally becomes.

Investor Sentiment Report
%Bull-Bear Spread
The %Bull-Bear Spread measures the gap between bullish and bearish investor sentiment, often from surveys like AAII. It’s a contrarian indicator—extreme optimism may signal a coming pullback, while extreme pessimism can hint at a potential rally. Large positive or negative spreads often mark market turning points.
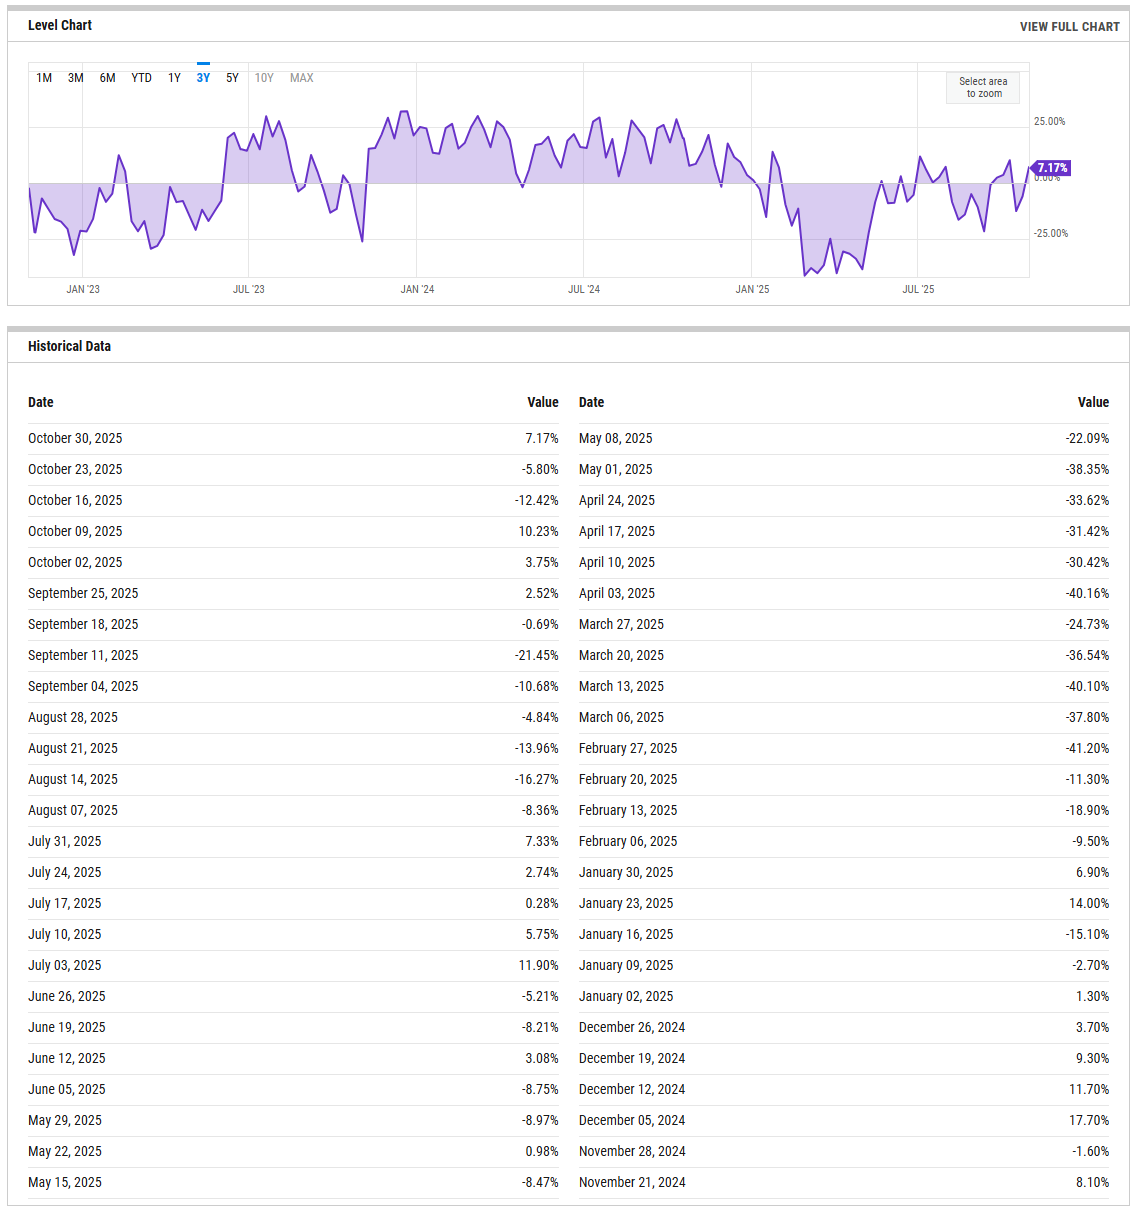
The bull-bear spread has climbed back to +7.17% as of October 30, rebounding from -5.80% last week and a deeply negative -12.42% two weeks ago. This swing from net bearish to modestly positive sentiment signals a fast transition from fear to cautious optimism. Historically, readings below zero tend to coincide with exhaustion phases that precede rebounds, while a sustained move above +20% marks crowding risk. The present level is mid-range — not euphoric, but not washed out either — implying traders have quickly rebuilt confidence without fully re-leveraging. A move above +10% would confirm that optimism is hardening; a drop back below zero would warn that enthusiasm has faded just as quickly as it returned.
NAAIM Exposure Index
The NAAIM Exposure Index (National Association of Active Investment Managers Exposure Index) measures the average exposure to U.S. equity markets as reported by its member firms. These are typically active money managers who provide their equity exposure levels weekly. The index offers insight into how much these managers are investing in equities at any given time, ranging from being fully short (-100%) to leveraged long (up to +200%).
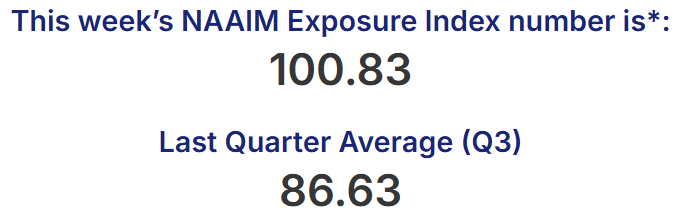
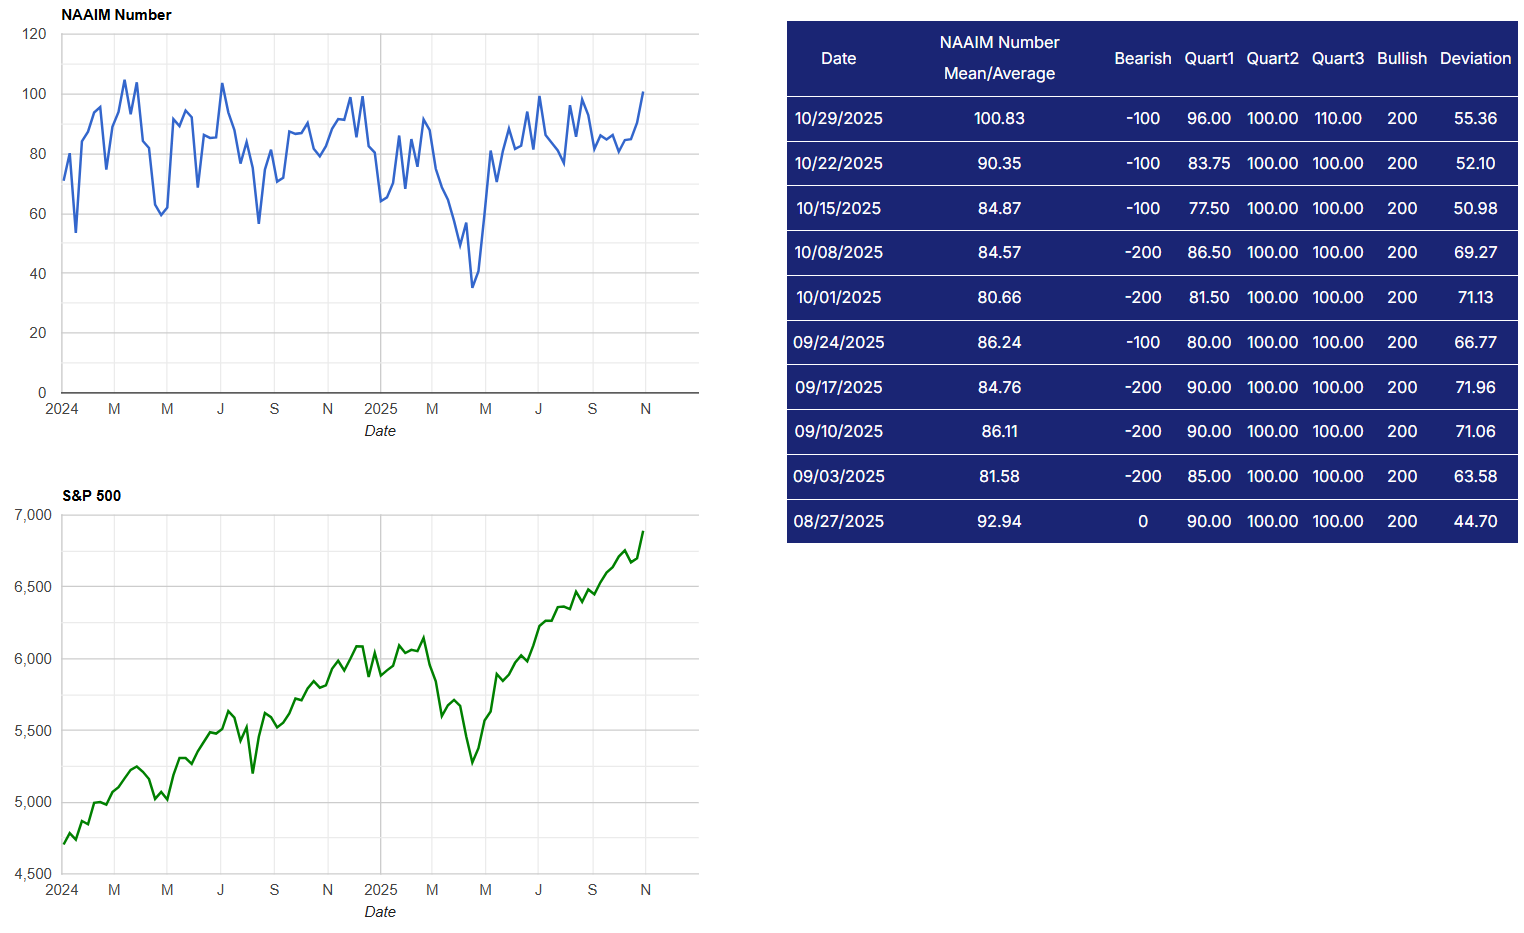
Active managers are once again all-in. The NAAIM Exposure Index surged to 100.83 this week from 90.35 last week, completing a steady climb from the mid-80s in early October. Exposure above 100 implies leveraged long positioning and little dry powder left to deploy. That concentration leaves portfolios vulnerable to any market pullback, as even a routine retracement can trigger de-risking. The last few peaks near this zone have coincided with short-term pauses in price momentum. A slip back into the 80s would suggest some hedging without serious damage, but a drop into the 50s while prices remain stable would flag distribution.
CBOE Total Put/Call Ratio
CBOE's total put/call ratio includes index options and equity options. It's a popular indicator for market sentiment. A high put/call ratio suggests that the market is overly bearish and stocks might rebound. A low put/call ratio suggests that market exuberance could result in a sharp fall.
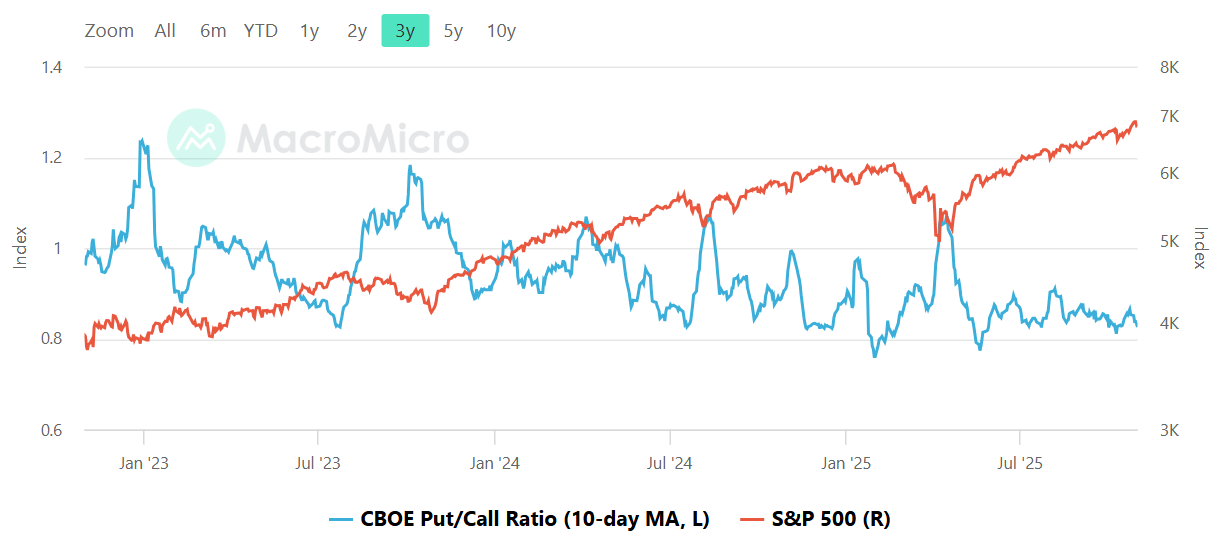
The 10-day moving average of the CBOE total put/call ratio remains near the low end of its three-year range, hovering around 0.75–0.80. That level marks complacency, showing investors are favoring calls over puts at one of the most aggressive skews of the year. Prior rebounds have tended to exhaust when the ratio stays below 0.8 for long stretches, as the absence of downside hedging limits shock absorption capacity. Fearful regimes begin above 1.0, where pessimism is high but contrarian buy setups emerge. For now, sentiment is too one-sided for comfort — a normalization toward 0.9 would actually improve the foundation for any November advance.
Equity vs Bond Volatility
The Merrill Lynch Option Volatility Estimate [MOVE] Index from BofAML and the CBOE Volatility Index [VIX] respectively represent market volatility of U.S. Treasury futures and the S&P 500 index. They typically move in tandem but when they diverge, an opportunity can emerge from one having to “catch-up” to the other.
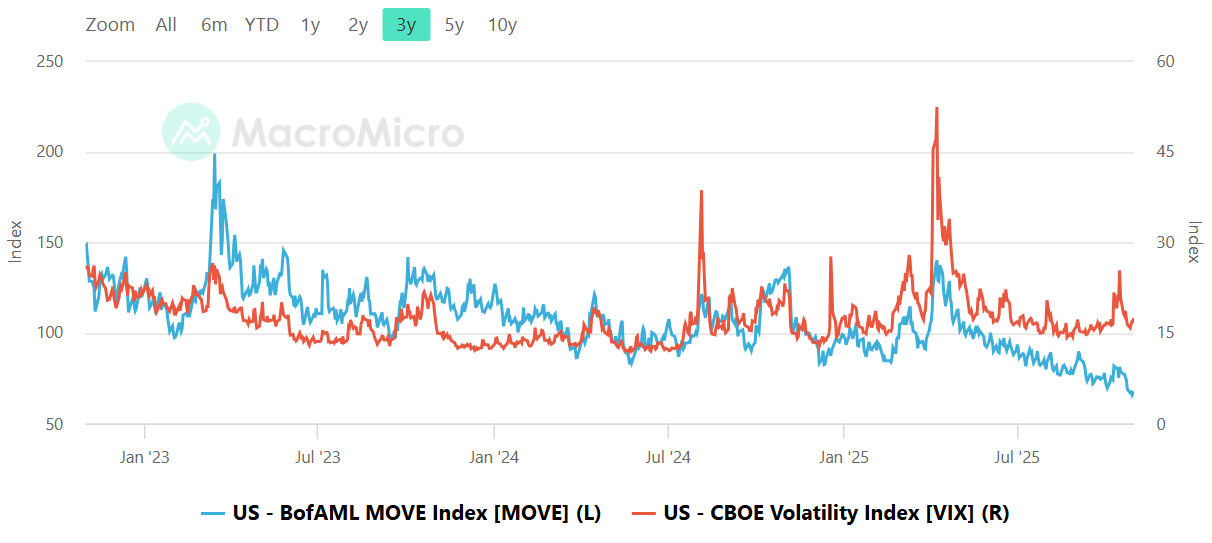
Both volatility gauges remain subdued. The MOVE index, tracking Treasury volatility, has collapsed toward the low 90s, its quietest level since early 2023. The VIX sits near the mid-teens and continues to compress alongside it. Historically, when both vol complexes decline together, risk markets trade with a stable bias, but complacency rises. The tripwire is a MOVE spike back above 120 while VIX remains docile, which often foreshadows equity stress as rates volatility leaks into equities. Conversely, if VIX jumps while MOVE stays calm, it would signal rotation toward hedging equities specifically. For now, cross-asset vol alignment favors stability, but it is approaching the kind of calm that rarely lasts.
CNN Fear & Greed Constituent Data Points & Composite Index
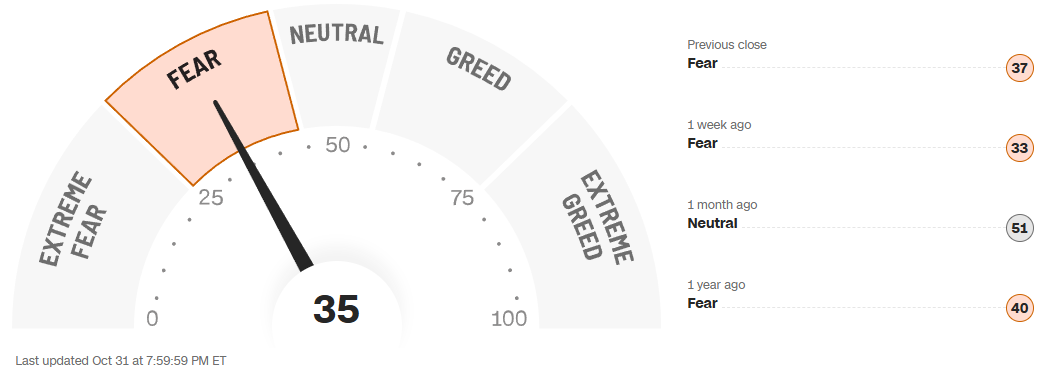
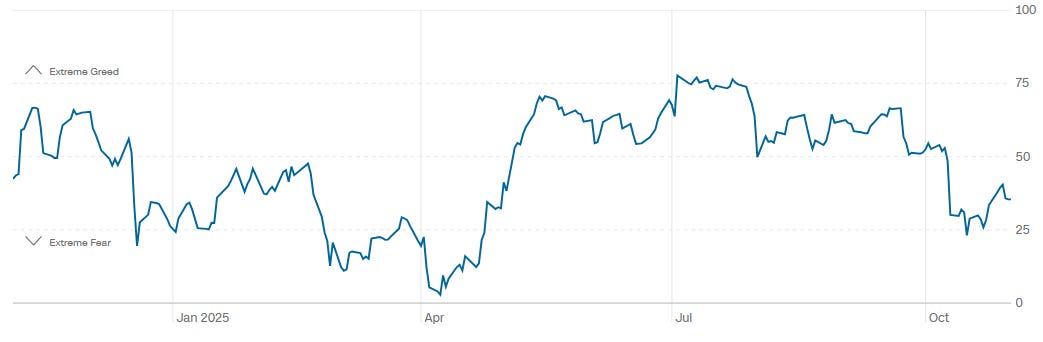
The CNN Fear & Greed composite reads 35, up modestly from 33 last week but still firmly in the “Fear” zone and below the neutral threshold of 50. One month ago the index was 51, while a year ago it was 40. The one-year chart shows sentiment cycling lower since midsummer, with brief rebounds failing to escape the lower half of the range. The pattern suggests investors remain cautious but not panicked. Historically, readings below 25 correspond to washed-out conditions and strong forward returns, while levels above 75 indicate exuberance. With the current score near the upper edge of fear, markets have room to improve if macro data stabilizes, but optimism is still tentative.
Social Media Favs
Social sentiment offers a real-time view of investor mood, often revealing market shifts before traditional indicators. It can signal momentum changes, spot emerging trends, and gauge retail investor impact—especially in high-volatility names. Tracking sentiment around events or earnings provides actionable insights, and when layered with quantitative models, can enhance predictive accuracy and risk management. Sustained sentiment trends often mirror broader market cycles, making this data a valuable tool for both short-term trades and long-term positioning.

Technician’s Playbook: Trading the Majors (SPY/QQQ/IWM/DIA)
When you’re a large institutional player, your primary goal is to find liquidity - places to do a ton of business with the least amount of slippage possible. VolumeLeaders.com automatically identifies and visually plots the exact spots where institutions are doing business and where they are likely to return for more. It’s one of the primary reasons “support” and “resistance” concepts work and truly one of the reasons “price has memory”.
The week opened with a broad gap higher across all major index ETFs, a classic continuation of the prior Friday’s close that set the tone for a tactical rebound. The structure that followed was not a breakout but a balancing process — a market that absorbed heavy closing flow on October 24, repriced upward on the 27th, and then spent the remainder of the week digesting that impulse under the weight of significant institutional prints at the new range highs. Across SPY, QQQ, DIA, and IWM, the theme was the same: large capital rotated into strength early, leaving heavy footprints that now define the upper edge of the week’s developing balance.
SPY
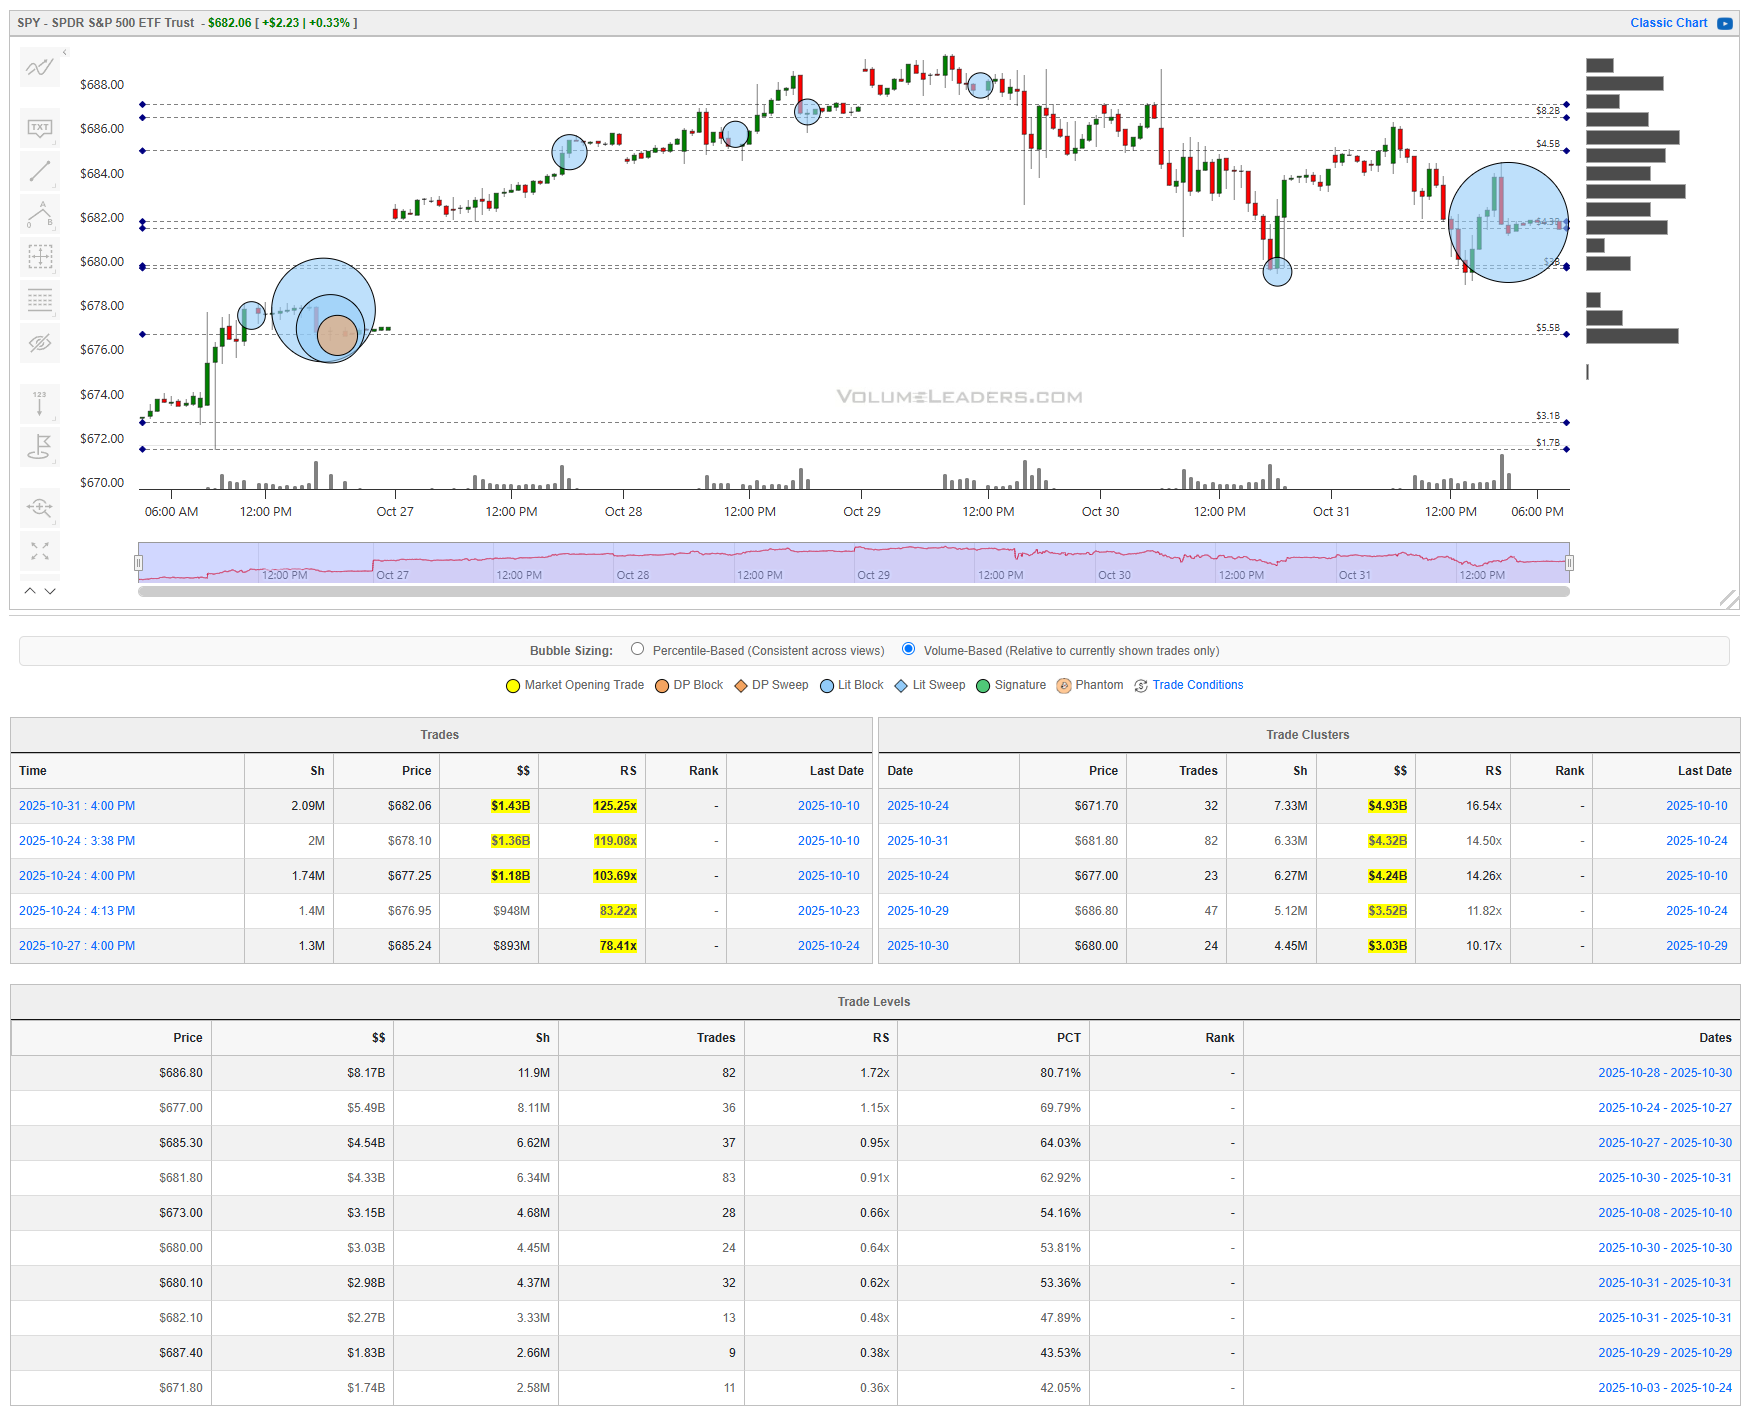
In SPY, the post-gap sequence from $672 to $682 carried strong sponsorship. The tape registered several multi-hundred-million prints: $1.18B at $677.25, $1.31B at $678.10, and a dominant $1.43B closing cross at $682.06 — the largest notional of the period with a 126× relative size multiple. These trades, all ranked in the top percentile of historical activity, reflect institutional distribution into strength rather than panic buying. Supporting that view, trade clusters between $677 and $682 amassed $4–4.3B in flow with RS values above 14×. That band now forms the ceiling of control. Below, $675 and $670 remain layered with $5.4B and $3.2B of volume, creating a deep demand shelf. As long as SPY holds that $674–$677 band on a gap-close, the market can attempt to consolidate and push higher. Acceptance above $682 opens a measured path to $688–$690. A failure back through $674, however, would invalidate the recovery and expose levels from prior weeks. Tactically, disciplined longs should anchor bias to $676 and above for continuation setups; shorts may fade rejections near $682 with $686 as the stop band.
QQQ
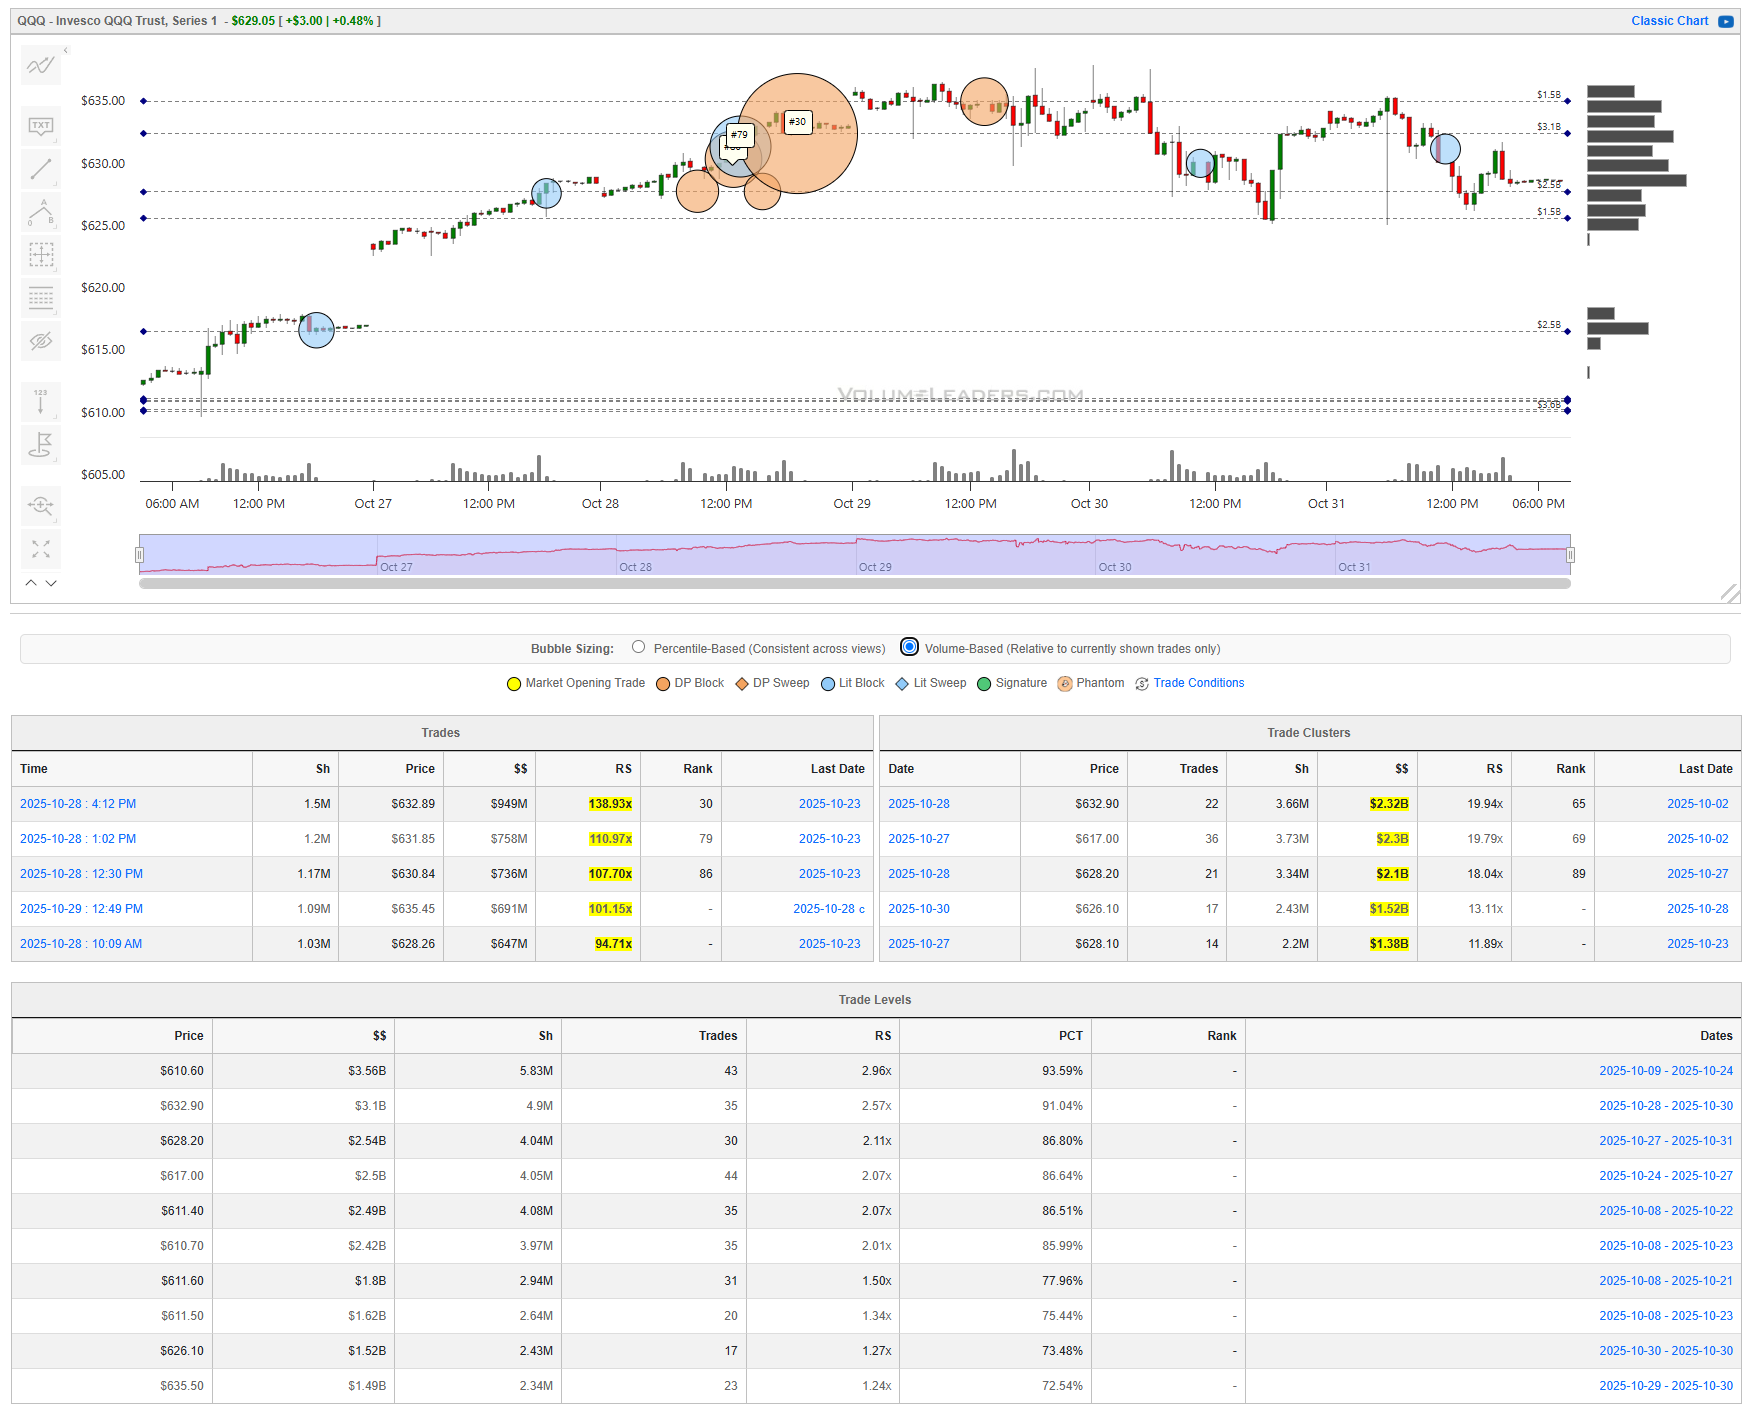
The QQQ tape this week reflected classic distributive behavior following an opening gap and early squeeze that exhausted into size. After a strong lift off the October 24 close, price accelerated through $620 and $625 before encountering a wall of institutional supply on October 28. The key inflection zone centered on $630–$633, where three distinct high-ranking prints anchored the week’s structure: #86 near $617 early in the session, #79 near $621 as follow-through buying extended, and the standout #30 block at $632.90 — a $984M DP block representing 1.5M shares and an exceptional 138.9× relative size multiple. The smaller companion prints that followed at $631.85 ($756M, RS 110.97×) and $630.40 ($630M, RS 107.70×) confirmed that heavy hands were unloading into strength rather than initiating new longs.
From a structural standpoint, the trade clusters show roughly $2.3–$2.9B in cumulative flow between $617 and $623, implying that institutions defended this area on first test and may again on retest. Above, the $630–$633 band is now the ceiling of control — defined by record-scale notional flow and prior profit-taking. Below, liquidity thins out quickly toward $611, where levels around $2.4B–$2.5B in size (80–90th percentile) would serve as the next downside magnet if weakness resumes.
A bullish scenario requires the market to reclaim and hold above $632, converting that heavy block zone from supply to acceptance; if achieved, momentum traders could target $640–$642 as the next logical extension. Failing that, a drift back below $625 would suggest the rebound is unwinding, with $620 as the first test and $617–$611 as the destination range. In practical terms, longs can anchor risk below $620 and scale up only on firm acceptance above $632, while tactical shorts may fade rallies into the $631–$633 band so long as price remains capped beneath that #30 print.
Bottom line: QQQ is coiling beneath a historically large block zone, and the $630–$633 corridor now marks the pivotal battleground between continuation and exhaustion.
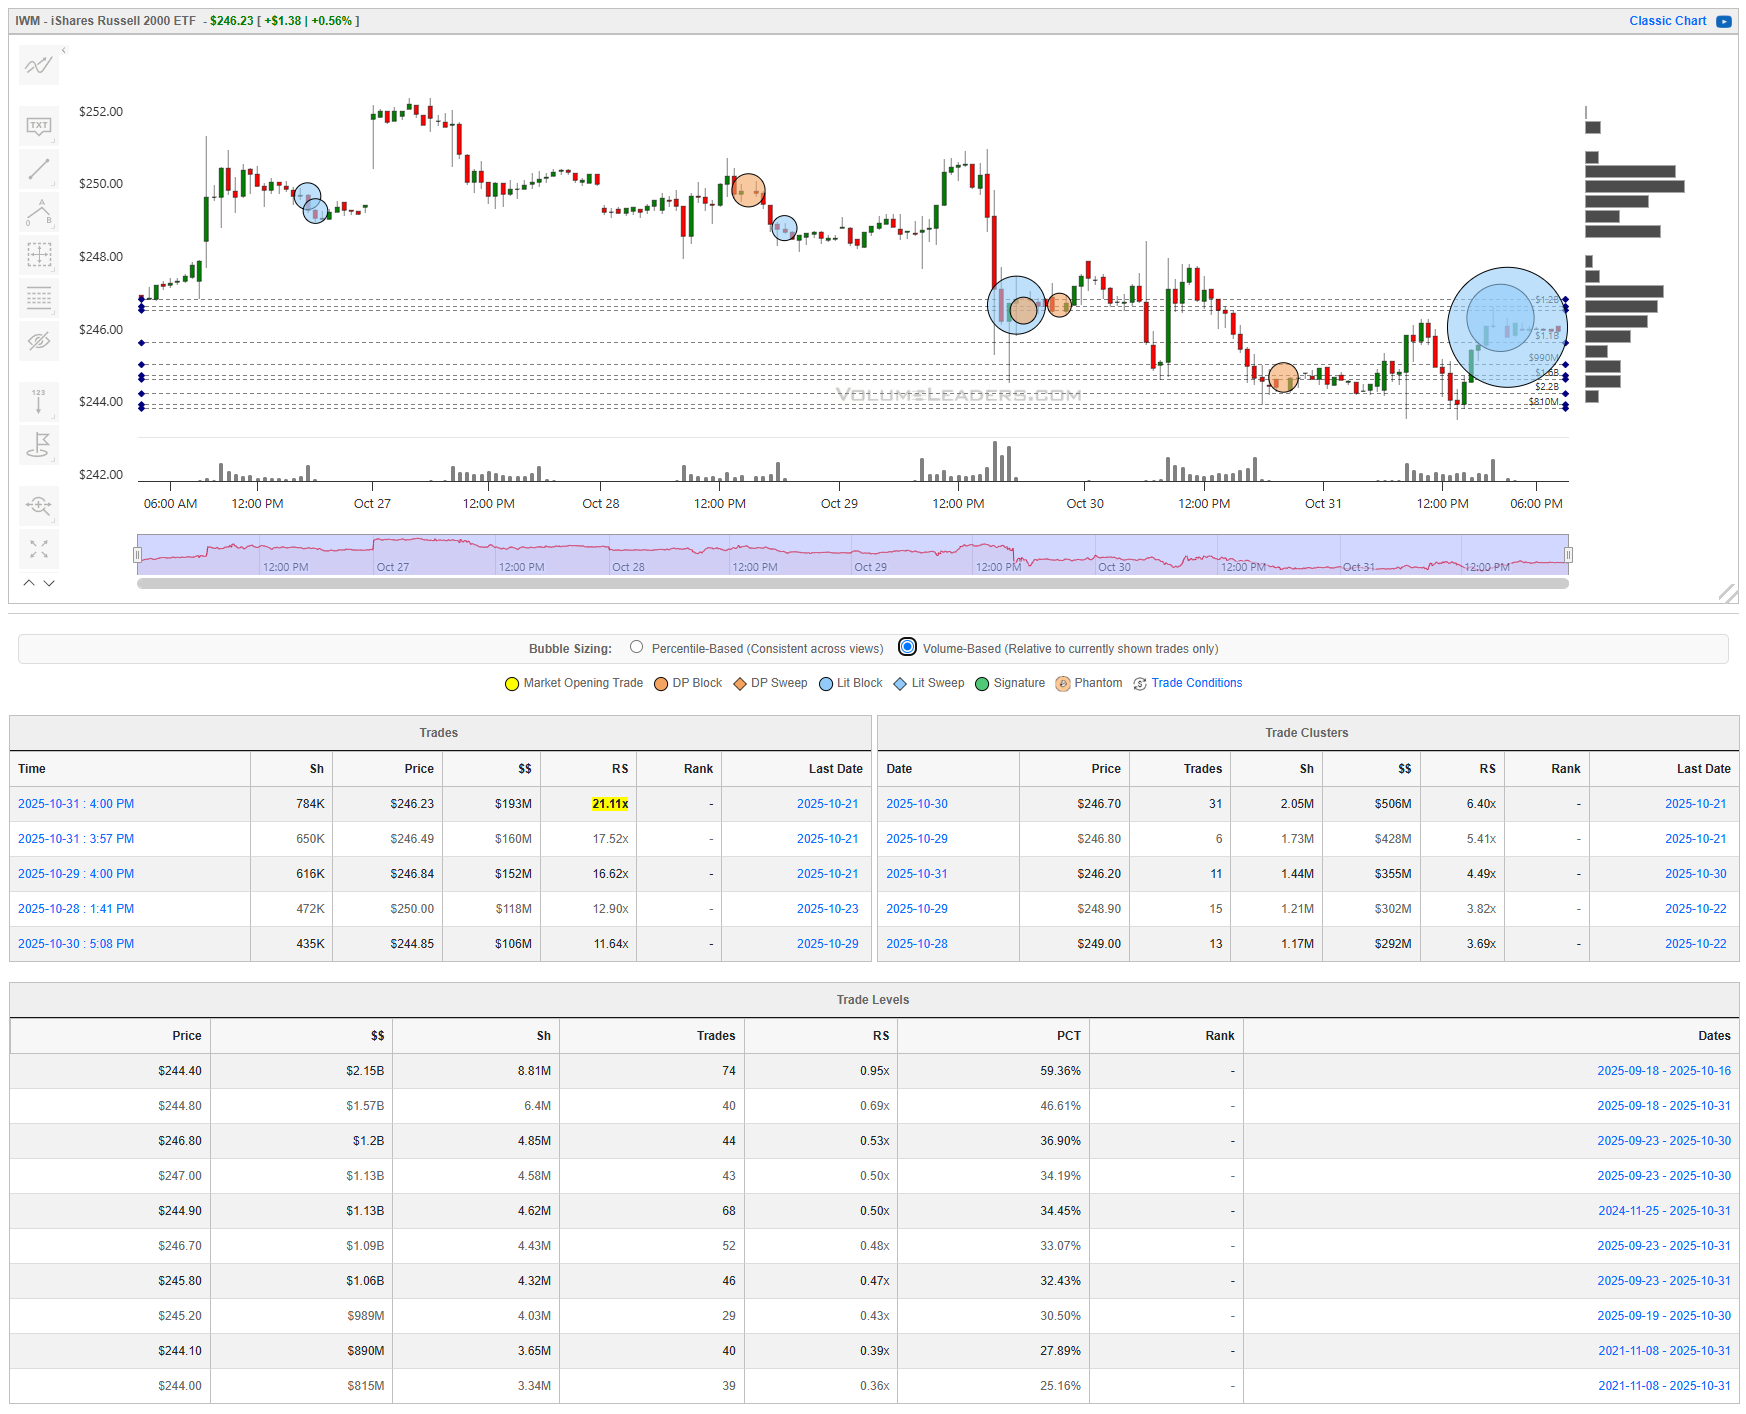
IWM
In IWM, the Russell 2000 ETF, the picture remains choppy but potentially constructive. The index participated in the Monday gap but lacked follow-through, spending the week oscillating between $244 and $247. The largest recorded prints were modest by comparison — $190M at $246.23 and $160M at $246.49 — but carried elevated RS multiples (21× and 17×) relative to average flow, implying meaningful positioning in a typically thin tape. Cluster data show concentrated support near $246.50–$247.00 with $500M notional flow, while the upper resistance zone at $250–$251 capped attempts to trend. A close above $250.50 would indicate renewed appetite for cyclical exposure and could trigger a short-term squeeze. Conversely, losing $244 would hand control back to sellers, with limited structural support and the dashed-levels presenting as resistance and potential place for sellers to reload on a retest from underneath. Active traders should look for confirmation of buyer defense at $246-$247 before committing to a lift above these densely clustered levels; failure here would invite a retest of October lows.
DIA
DIA, representing the Dow 30, painted the cleanest structure. After its own gap, the ETF rallied into $480 before fading into a tight balance between $472 and $476. The week’s largest trades — $131M at $477 and $120M at $475.40 — anchored the top of the range, each with RS above 12×. Supporting demand emerged around $472, where multiple $100M–$150M prints clustered with RS in the 6–7× range. Trade levels confirm a strong positioning $475.40 ($334M, 83rd percentile) and a secondary pocket at $472.20 ($117M). A breakout above $477 would be the first sign of renewed risk-on flow, opening a path to $480+. Conversely, failure to hold the week’s close turns all of this into inventory that would unwind toward $468-$472. Tactical traders might treat $475 as the midpoint for balance trading — long above with $477 targets, short below with $472 as the first stop.
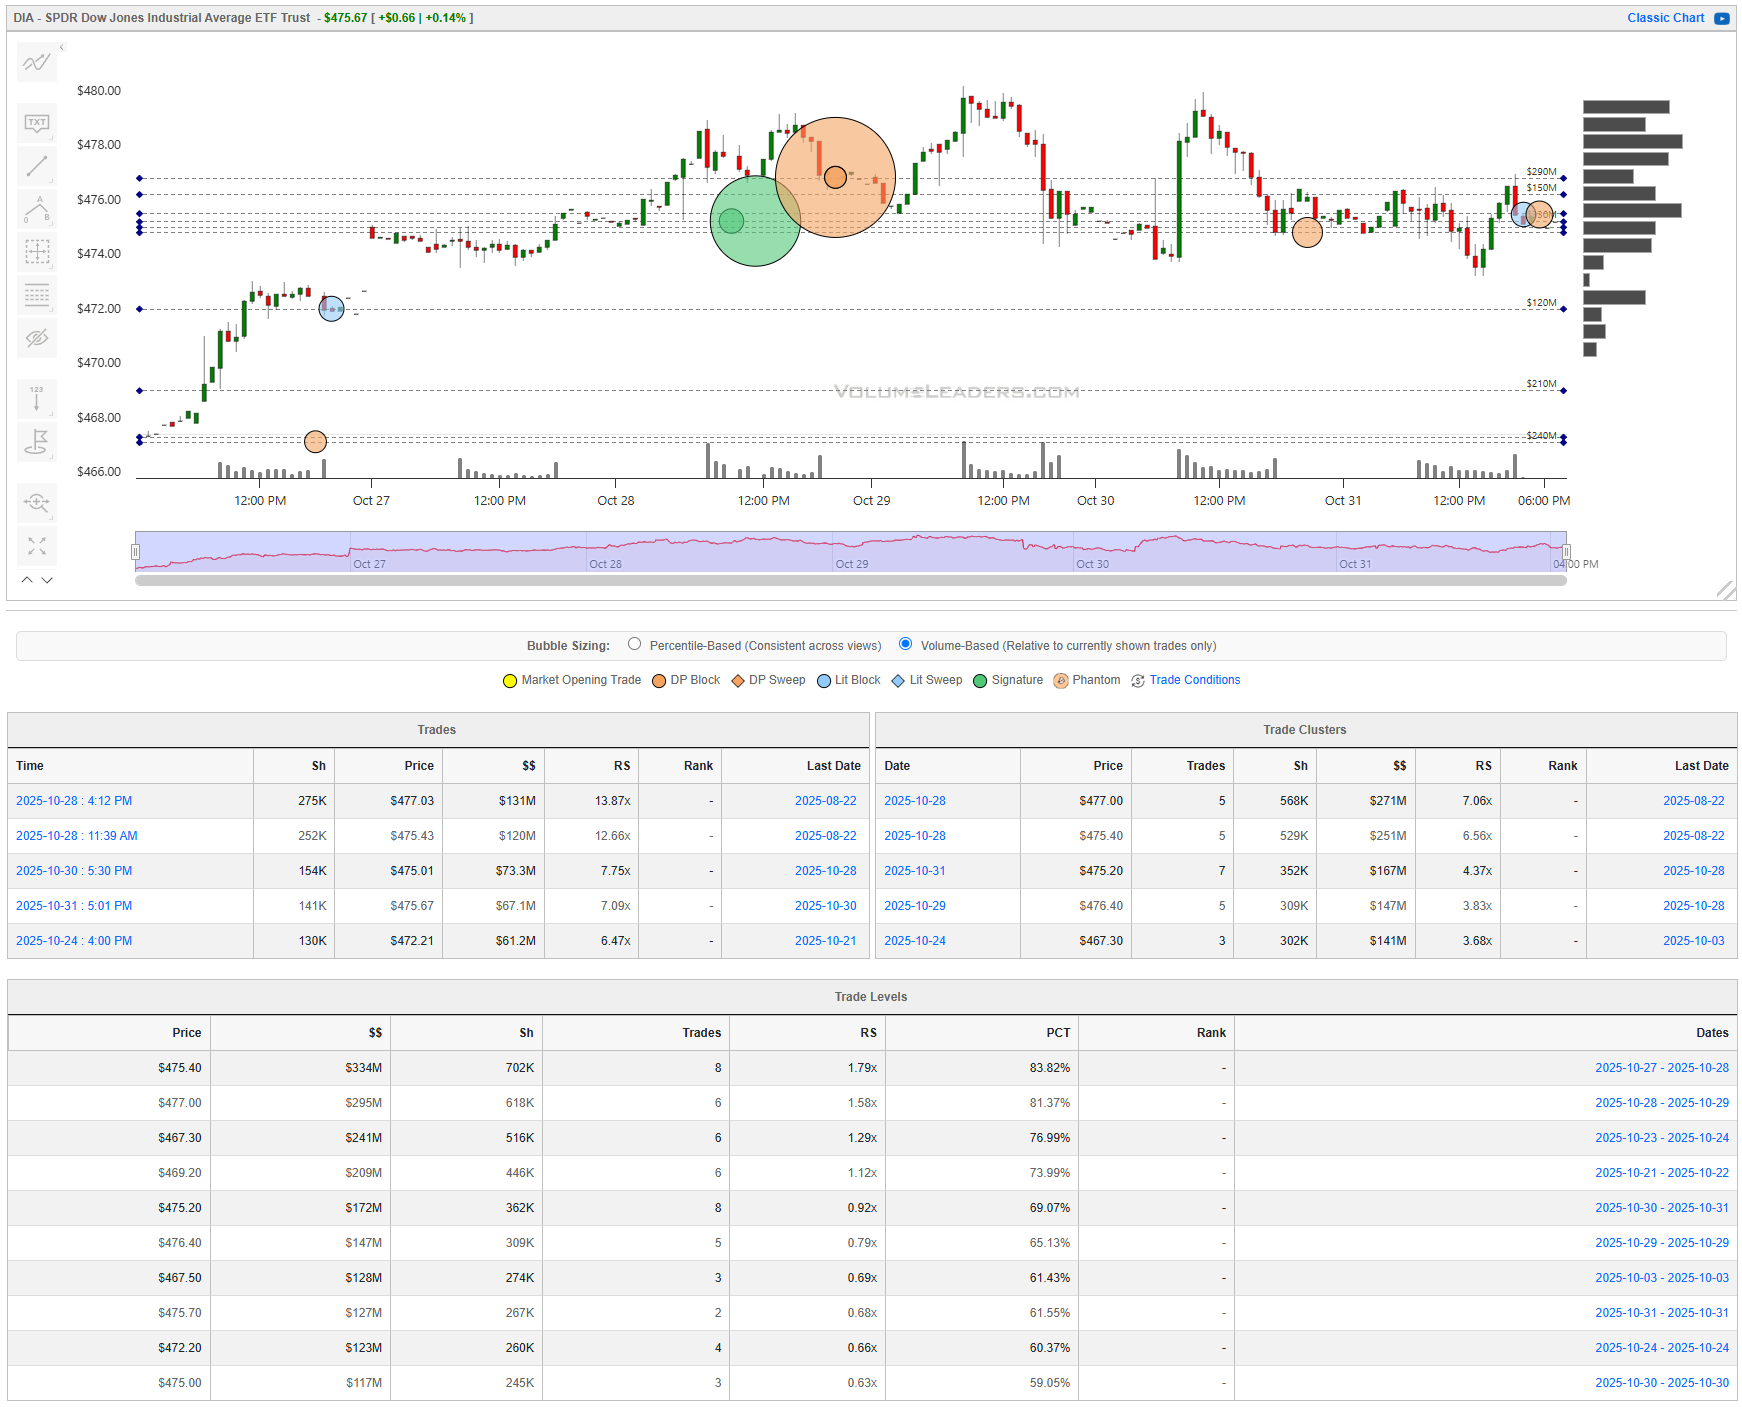
Bottom line: institutional size capped the week’s highs, and the market now rests at equilibrium — sustained closes above resistance would validate trend resumption, while fresh rejection would complete a distributive swing into the lower shelves.

Summary Of Thematic Performance YTD
VolumeLeaders.com offers a robust set of pre-built thematic filters, allowing you to instantly explore specific market segments. These performance snapshots are provided purely for context and inspiration—think about zeroing in on the leaders and laggards within the strongest and weakest sectors, for example.
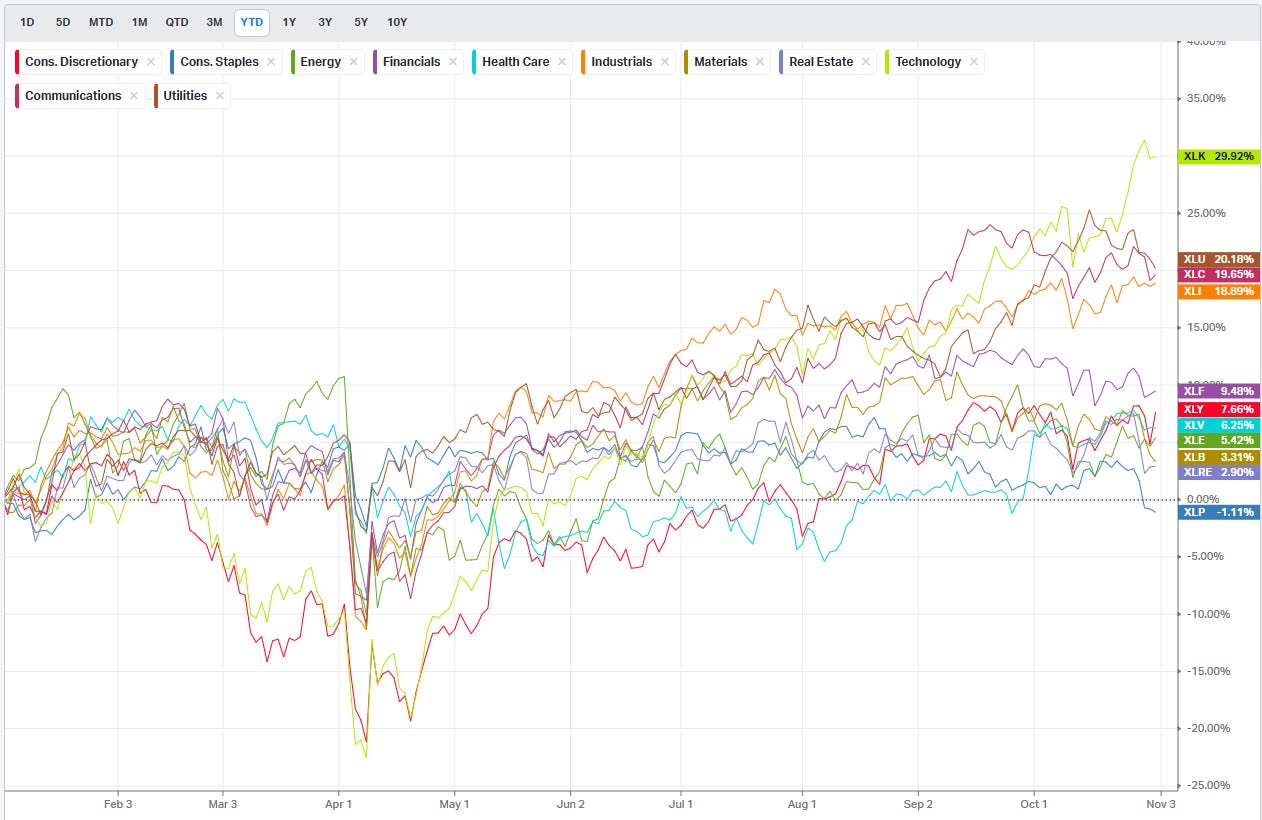
S&P By Sector
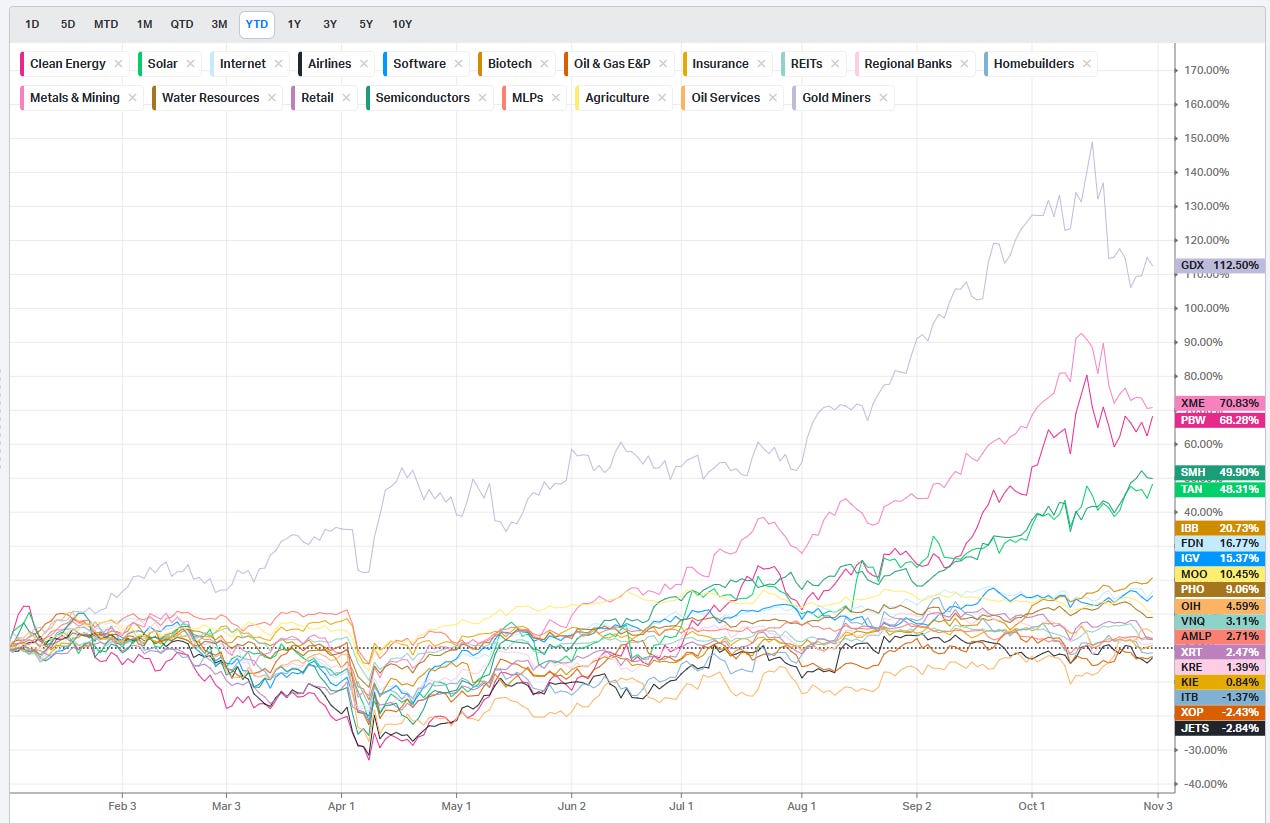
S&P By Industry
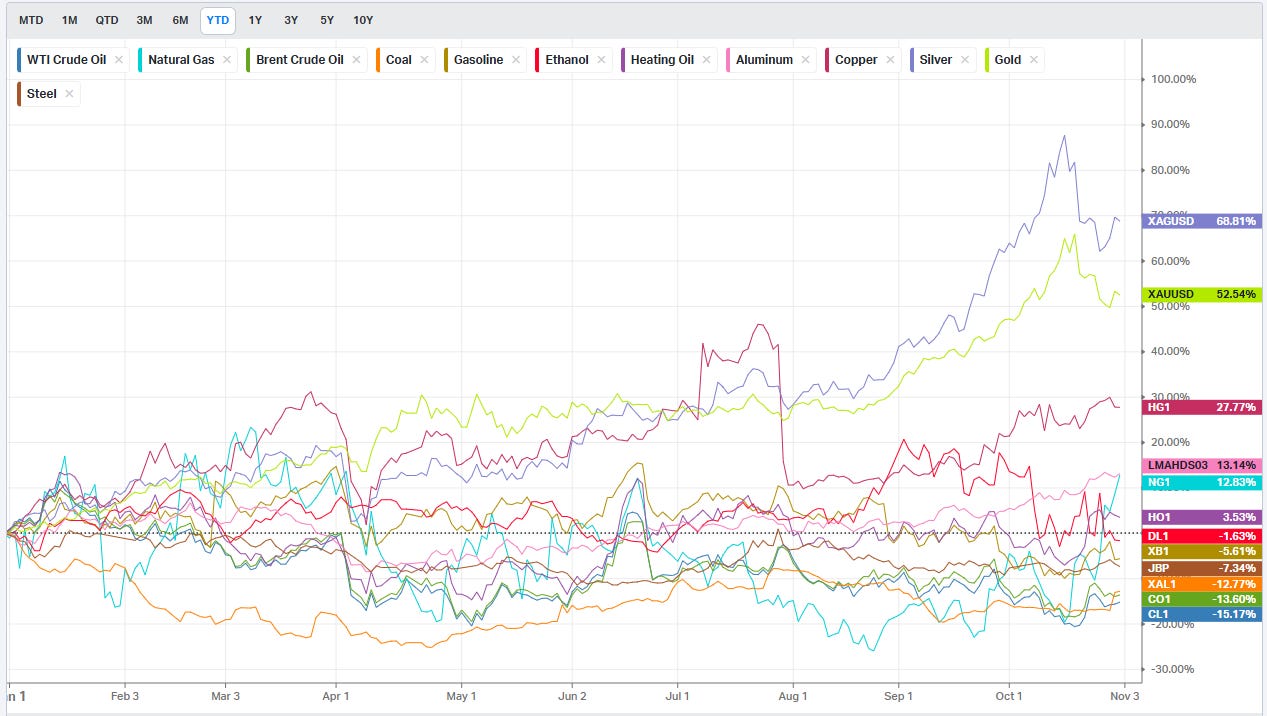
Commodities: Energy & Metals
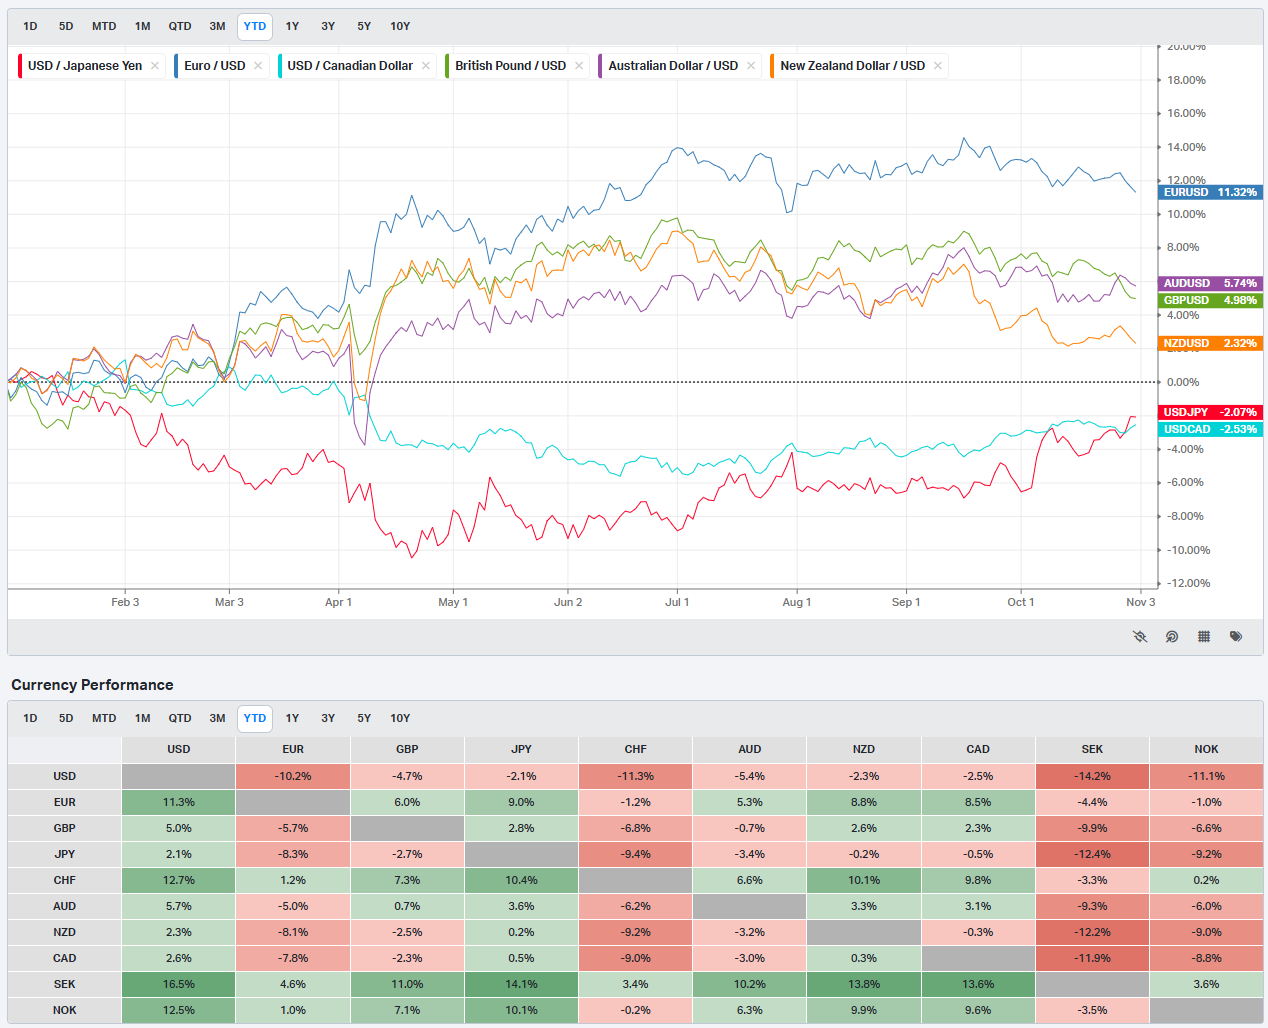
Currencies/Major FX Crosses
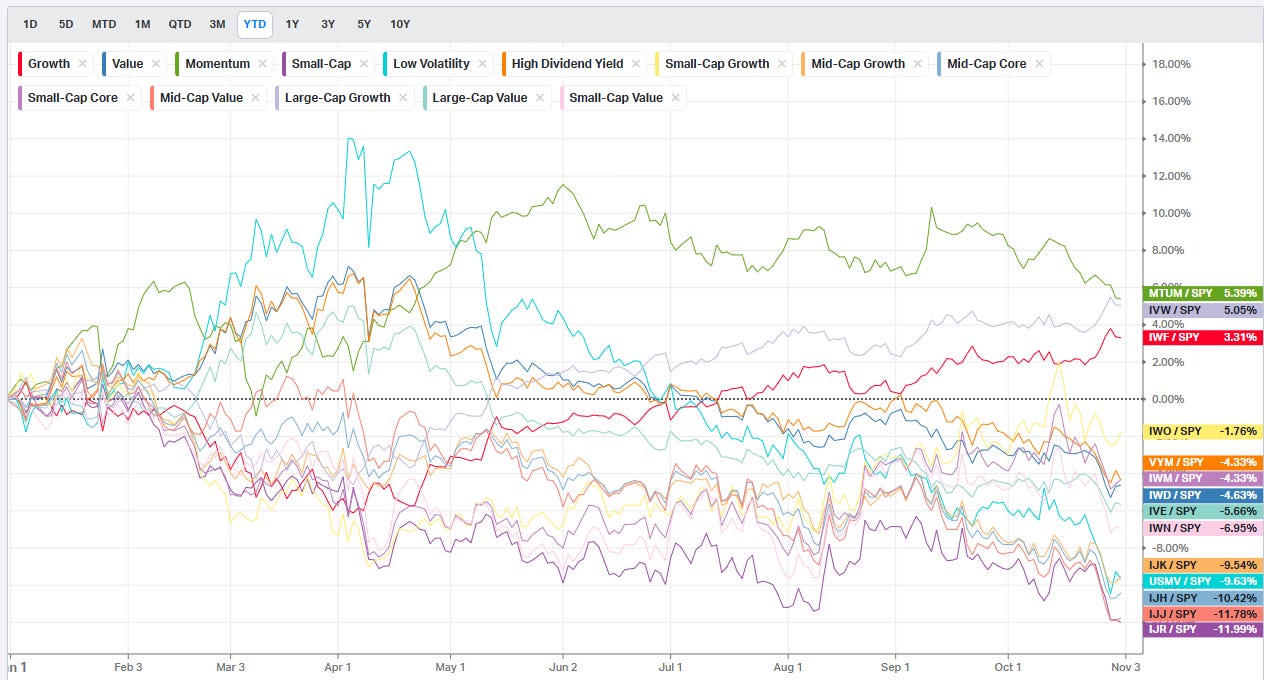
Factors: Style vs Size-vs-Value

Events On Deck This Week
Here are key events happening this week that have the potential to cause outsized moves in the market or heightened short-term volatility.
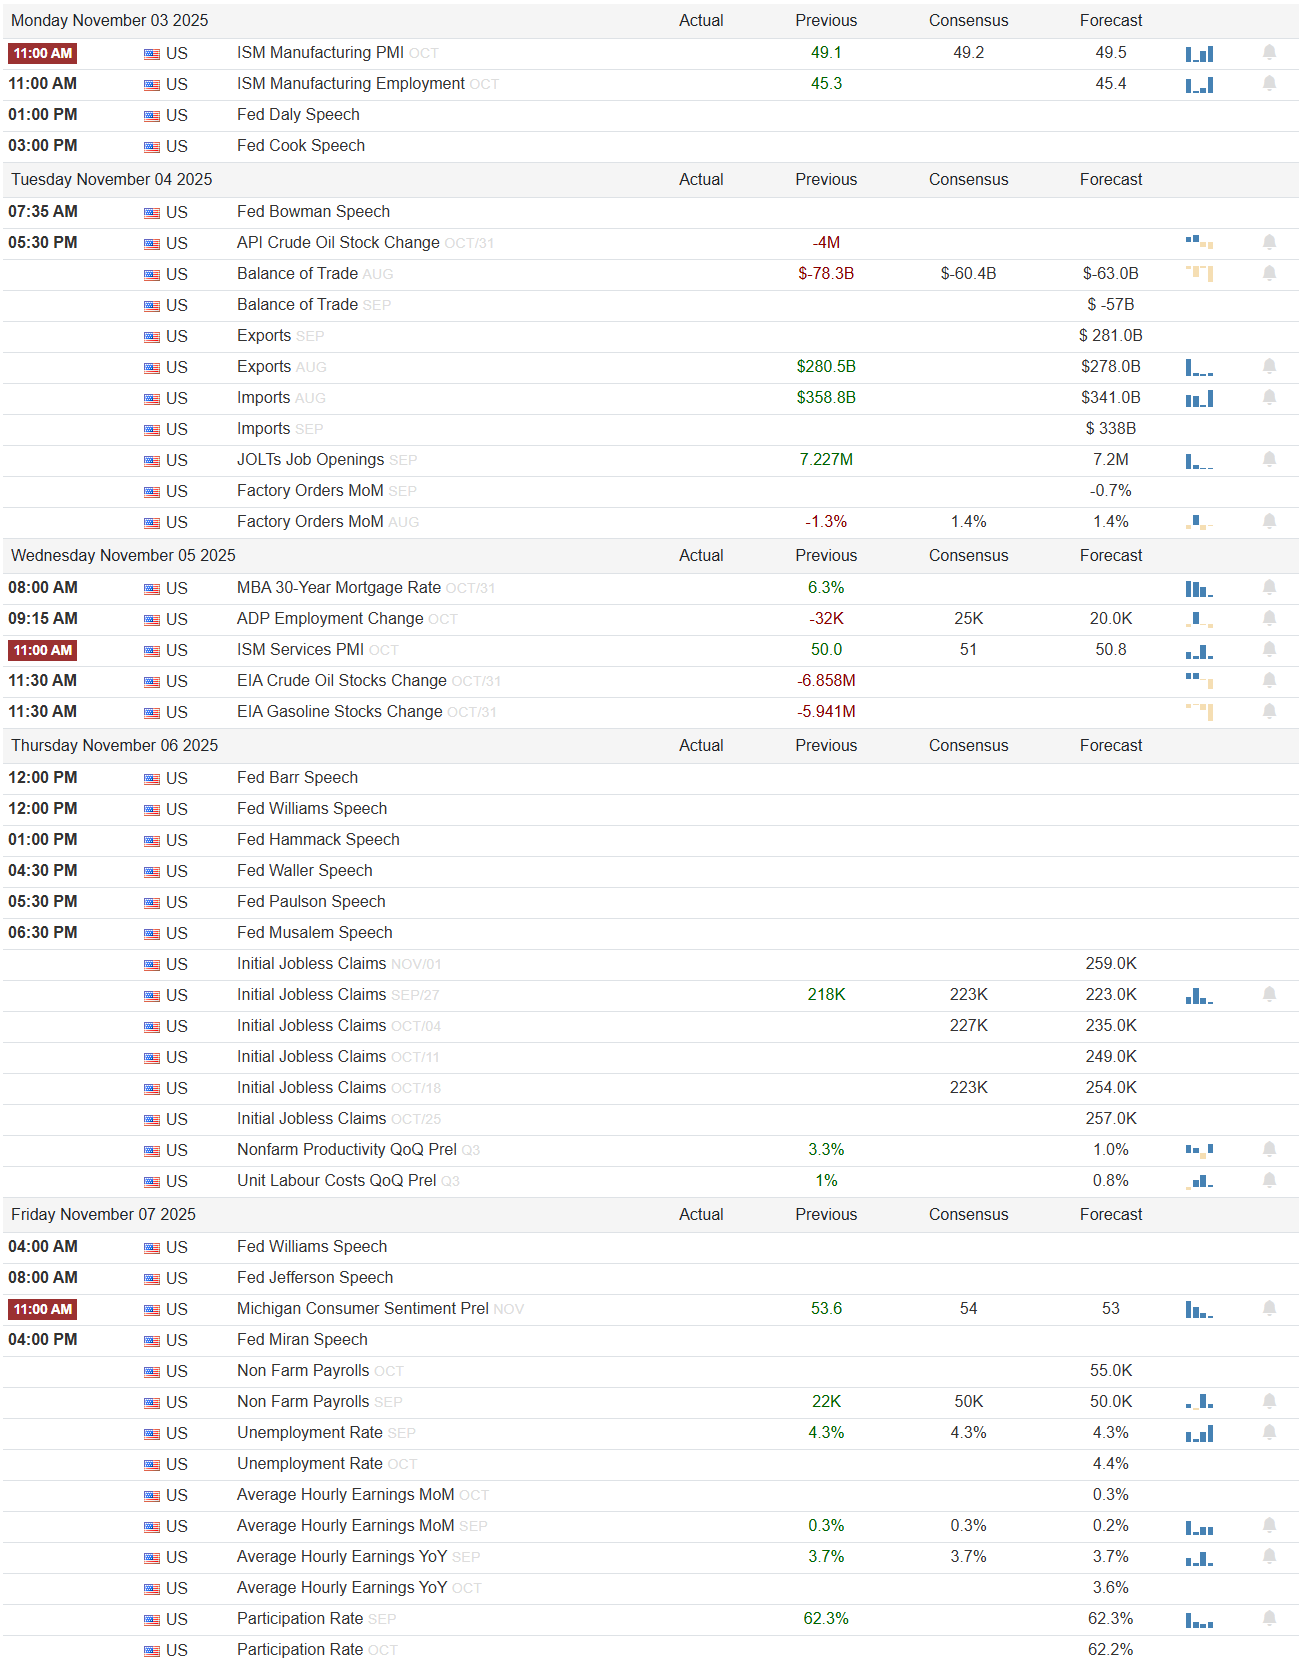
The week ahead opens with manufacturing and labor data that will test the market’s narrative of a soft landing. Monday brings a double-shot of ISM reports at 11:00 AM, with the ISM Manufacturing PMI expected at 49.5 (previous 49.2) and the Manufacturing Employment Index forecast at 45.4 (previous 45.3). Both remain under the 50 expansion line, meaning even a modest upside surprise could fuel a short-term risk-on pulse by hinting at stabilization in industrial activity. Conversely, any miss would confirm contraction and strengthen the case for further Fed easing, pushing yields lower but possibly steepening the curve as traders reposition around growth risk. Fed speakers later in the day—Mester and Cook—could reinforce or challenge that interpretation. If Mester acknowledges weaker employment components, equities might interpret that as dovish confirmation heading into midweek data.
Tuesday delivers a heavy trade balance slate that may set the tone for the dollar. The U.S. balance of trade is expected to narrow to around -$57B from a prior -$78.3B, with exports near $281B and imports at $341B. A smaller deficit would imply an improved net trade contribution to GDP and could add support to the cyclical complex. However, a weak print, particularly if driven by soft exports, could reignite global growth fears. The JOLTs Job Openings figure at 7.227M (previous) will also be closely watched. Any sustained drop below 7M would mark the clearest evidence yet that labor demand is cooling beyond the Fed’s comfort zone. The day also features a cluster of Fed speeches, including Bowman early and multiple appearances later, making this a likely volatility window for rates traders.
Wednesday brings the first of the week’s critical labor inputs. The ADP Employment Change is forecast at 20K after a prior -32K, with consensus sitting at 25K. This mild rebound, if realized, would fit the narrative of a labor market normalizing but not collapsing. The ISM Services PMI, due at 10:00 AM, has consensus at 51 (previous 50), with the services employment index expected at 50.8. Together, they will offer a direct read on demand resilience and wage pressure. A print north of 51.5 on the headline would likely trigger rotation back into cyclicals and small caps, while a sub-50 reading could reignite defensive leadership and Treasury bid. The energy patch adds another layer with EIA crude stock change showing a prior -6.858M draw and gasoline at -5.941M; further draws would keep oil prices firm and sustain the inflation floor that has frustrated the Fed’s disinflation path.
Thursday is thick with Fed communication and fresh labor updates. A full lineup—Williams, Hammack, Waller, Paulson, and Musalem—will speak across the session, coinciding with Initial Jobless Claims, forecast at 223K (previous 218K). A meaningful break below 215K would signal labor resilience, likely boosting yields and pressuring the duration-heavy growth complex. The productivity data for Q3—nonfarm productivity up 3.3% and unit labor costs up 1.0%—should also temper inflation anxiety if confirmed, as those figures imply better efficiency with contained wage pass-through. Any upward revision to labor costs, however, would revive policy uncertainty and risk-off hedging into Friday’s jobs report.
Friday’s Nonfarm Payrolls will anchor the week’s direction. The consensus sits at 50K, sharply lower than prior 55K, with unemployment steady at 4.3%. Average hourly earnings are forecast to rise 0.2% MoM and 3.6% YoY, both slightly cooler than prior readings. A downside surprise in payrolls paired with stable or declining wages would embolden the Fed-dovish camp and likely steepen the yield curve through short-end repricing. In contrast, a hot wage print—anything above 0.3%—could upset that balance and trigger an end-of-week rates selloff. The Michigan Consumer Sentiment Prelim at 53.6 (previous 54, forecast 53) rounds out the session and may offer marginal guidance on consumption tone but will play second fiddle to payrolls.
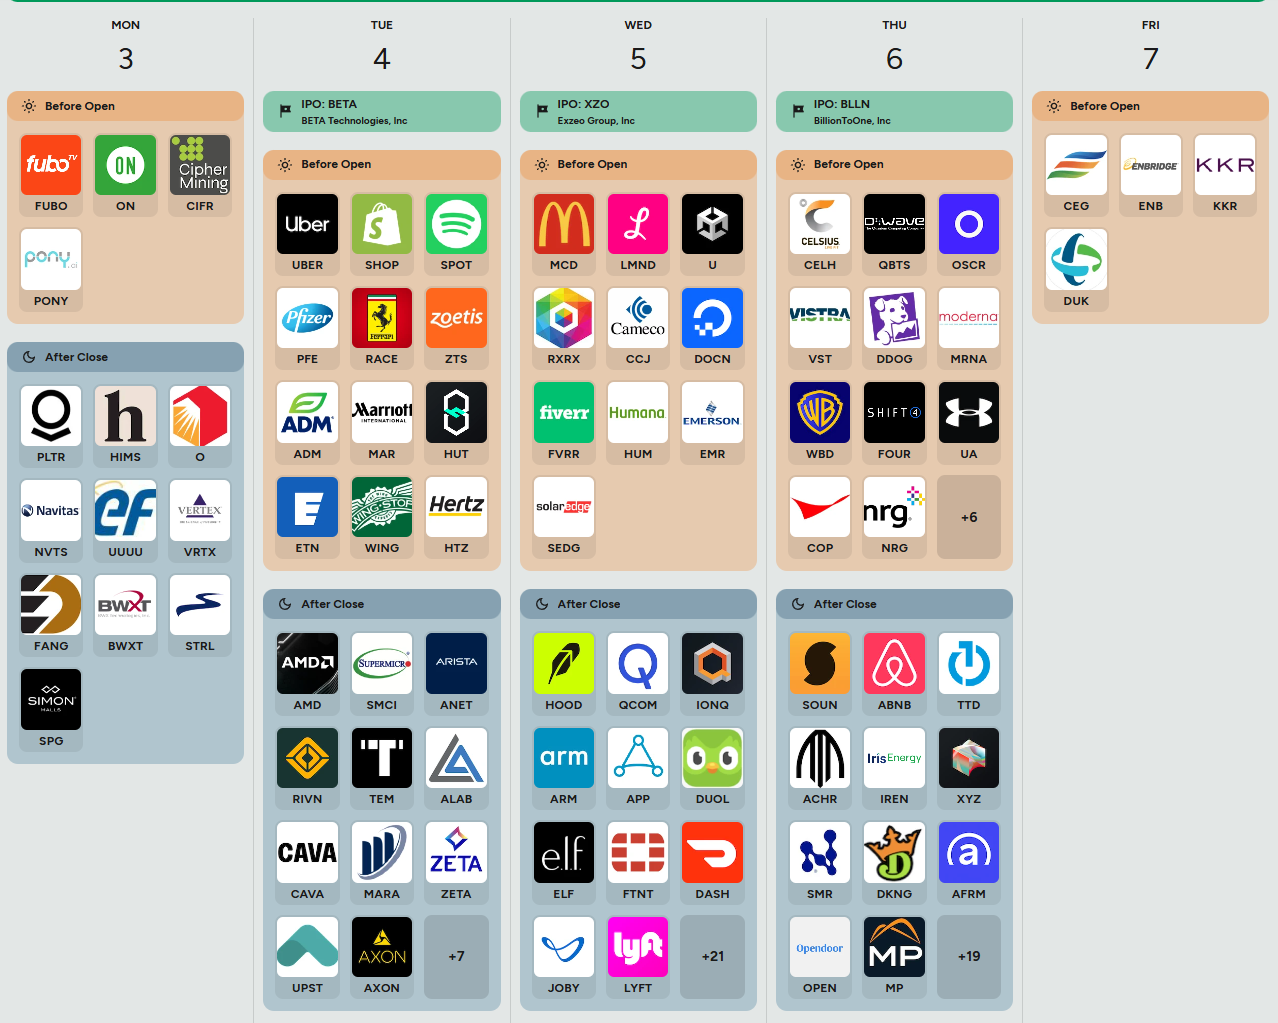
Earnings and IPO Watch: The week’s earnings board features a blend of consumer and tech exposure, offering micro confirmation of macro trends. If consumer names beat on revenue but miss on margins, it would underscore persistent cost pressure even amid stable demand. For tech and semiconductor firms, watch forward guidance on inventory normalization and AI-linked capex cycles—signs of broad reinvestment could signal a durable floor for growth multiples. Any major beat from industrials or energy names would reinforce the notion that cyclical breadth is improving, supporting the rotation theme seen in recent flows.
Community Trade Spotlight
Community Trade Spotlight is a recurring section that features real trades shared by VolumeLeaders members — walking through how they spotted the setup, what they saw in the data, how they managed the position, and what they learned from the outcome. Each story connects platform signals to real-world execution, highlighting how traders apply institutional flow analytics in practice.
#1 Never Disappoints: A member walk-through of spotting the tell, structuring the trade, and sitting on it into earnings.
On October 20 I spotted a dark pool on LRN ranked number one. Whenever I see a top-ranked equity like that, the first thing I check is the next earnings date. It turned out to be October 28, eight days away. That instantly made me think someone might know something ahead of earnings.
The next day LRN popped about 2%, and even when the broader market dipped, especially tech, the stock held strong. That’s when I figured those dark pools were definitely buys. But then things got interesting.
While SPY and QQQ started ripping higher, LRN just sat there, barely moving. That’s when I remembered something I learned from the VolumeLeaders community. Sometimes a stock fakes a move in one direction just to grab liquidity before the real move happens. And #1 never disappoints.
LRN stayed quiet for eight straight days, hovering right above that number one level, not showing much life. So I positioned myself for a fall. I was hoping for a 5% move down. Then the market closed and earnings were released... 40% down and still falling as I type this.
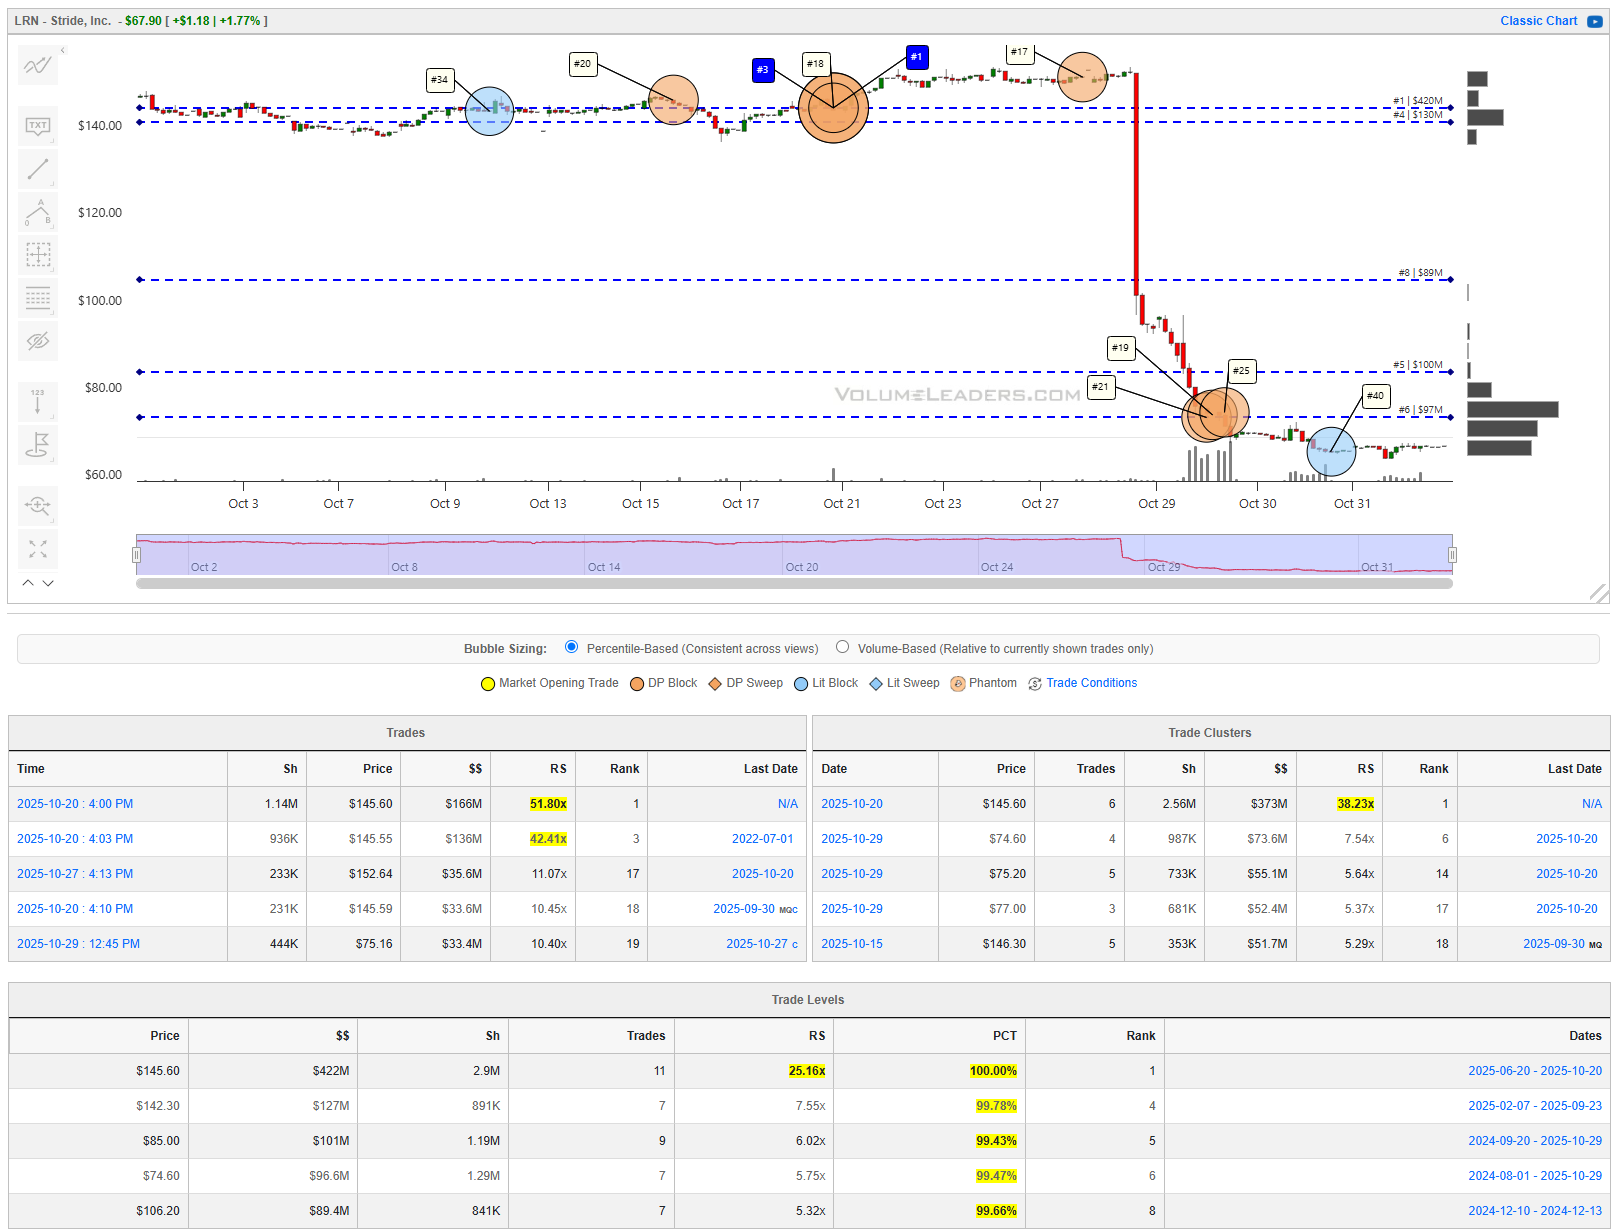
This one was a game changer for me. Gotta love VolumeLeaders. Cheers.
-Tradealgo

Market Intelligence Report
The portfolio closed the week down roughly 0.38%, which is a resilient outcome given how violent the underperformance was in a few sleeves that were explicitly meant to express cyclical and reflationary risk going into a policy heavy week with a GDP print. Leadership was narrow and defensive. The book was carried by semiconductors and platform tech, got real cushion from volatility hedges, and even saw selective strength in biotech. On the other side, financials, real estate, and industrial/capex exposure all leaked hard, and credit ballast did not protect. The net message is that the market rewarded scarce growth and high-margin scale (NVDA, SOXX, QQQ) and punished capital-intensive cyclicals (OSK, XLRE, XLF) while quietly leaning back toward higher-quality healthcare and volatility insurance. Last week’s rebal:
1. Core index liquidity at 28%
SPY 16%
QQQ 10%
IVV 2%.
This is the throttle. SPY and QQQ took the lion’s share of aggregate dollars and the deepest dark-pool sponsorship, which is precisely what you want in front of a Fed and GDP week: you can modulate net exposure in one place without tearing up the rest of the book. If liquidity spikes around the decision or the press conference, this sleeve expands or contracts first. The setup is aided by the event path being crystal clear on timing even if outcomes are debated.


2. Compute/AI barbell at 18%
SOXX 6%
NVDA 4%
AAPL 3%
MSFT 3%
SMH 2%
The platform cohort and the semis complex still attract the real dollars, and breadth beyond the top three has improved. This is the momentum anchor that became sponsorship; it will either be validated by ongoing platform prints and constructive earnings cadence or it will be an easy source of cash if the tone sours. It earns its keep because both the lit and dark prints continue to point to programmatic accumulation rather than one-off chases.

3. Financials at 10%
XLF 6%
KRE 3%
ICE 1%
The sector board’s 1–2 day uptick and the IO outliers in high-quality banks, insurance, and the exchange say “constructive, not stressed.” We keep it ETF-led to avoid idiosyncratic earnings landmines, but the ICE add acknowledges the outsized dollar day that often precedes further flow into index derivatives and capital-markets plumbing when volatility is contained.

4. Credit ballast at 11%
LQD 7%
HYG 4%
Credit leadership showed up across lit, dark, and sweeps, which is the definition of a cross-validated carry bid. We lean investment grade but keep some HY so the book participates if spreads grind tighter on a benign Fed/GDP outcome. If the meeting or GDP disappoints, LQD will likely hold better than HY and can fund de-risking without touching the equity sleeves.

5. Short-duration liquidity at 4%
USFR 2%
VGSH 2%
This is working capital for pulls and a shock absorber if the front end jolts on guidance. With CPI delivered but the rest of the calendar still dense, a small cash-like ballast is prudent.

6. Utilities carry at 3%
XLU 3%
Utilities sat atop the leadership board and accelerated on the 2-day change. In a world where the market expects policy easing soon and the data flow remains compressed, a small regulated-carry sleeve gives rate-sensitive income without giving up too much beta. The add is tactical and will be revisited post-Fed.


7. Real estate income at 7%
XLRE 4%
WELL 2%
SPG 1%
REITs printed new volume-by-price shelves across several sub-industries, which is the definition of institutional acceptance at a new fair value. The mix balances healthcare and mall exposure with the index wrapper, recognizing that a stable rate path is necessary but not sufficient for a durable run. The sleeve is sized so a rates wobble does not derail the book.

8. Industrials/capex at 4%
DOV 1.5%
OSK 1.5%
CMI 1.0%
These names captured outlier and consensus attention and speak to measured capex rather than a reflation chase. If Financials stay firm and the growth data is acceptable, this sleeve compounds quietly; if not, it is easy to clip.

9. International quality at 4%
BBEU 2%
IQLT 2%
Developed ex-US leadership poked through in sweeps and on the watchlists. We keep it modest and quality-tilted until the policy week is behind us; if the dollar softens into year-end and global growth steadies, this can scale.


10. Energy cash flow at 3%
PSX 2%
CVE 1%
Energy flows looked tactical, not thematic, and precious-metals proxies leaned more hedge than destination. We stick to balance-sheet cash and downstream torque, sized to contribute without consuming risk budget.

11. Healthcare selective at 3%
XBI 2%
IYH 1%
Health care is “in play” with rising sector leadership and heavy single-name IO activity across both tails. Pairing diversified biotech beta with a quality ETF gives exposure to the dispersion without buying coin flips.

12. Equal-weight breadth at 1%
RSP 1%
The IO sheet flagged a 5-sigma day, and consensus breadth is improving. A token sleeve lets the book participate if participation widens beyond the platforms into mid- and equal-weight baskets during post-Fed digestion.

13. Crypto toggle at 1%
IBIT 0.6%
ETHE 0.4%
The speculative halo is alive but should not drive the car. Keep optionality, keep it small, and scale only if beta remains bid and Financials/credit hold a tone.

14. Hedges at 3%
SH 1%
PSQ 1%
VIXY 1%
In a rising tape, hedges bled, which is exactly what insurance does; we keep them small and targeted so they offset gap risk around the decision and GDP without taxing PnL if the base case plays out.
By sleeve, the Compute/AI barbell did exactly what it is in the book to do. That sleeve is 18% of capital (SOXX 6%, NVDA 4%, AAPL 3%, MSFT 3%, SMH 2%) and it gained 2.08%, contributing +0.37% to total performance. NVIDIA (NVDA) was up 6.54%, and SOXX gained 1.70%. Even with Microsoft (MSFT) down 2.63%, the sleeve still printed the largest positive attribution of the week. The message is that incremental dollars continue to prefer secular compute spend and high-end silicon capacity. This is still where investors are willing to pay forward for earnings.
Core index liquidity, which is the throttle sleeve (SPY 16%, QQQ 10%, IVV 2%), added a small positive. The sleeve return was 0.20%, good for +0.06% contribution. QQQ was up 0.75% with a +0.07% contribution on its own, helped by AAPL +2.03%. SPY slipped 0.11% and IVV slipped 0.12%, so the index complex did not break out, but it also did not roll over. The lesson is that you did not need broad tape strength to keep the flagship exposure intact, you just needed the biggest, cleanest growth engines to avoid guidance shock.
Hedges worked. The hedge sleeve (SH 1%, PSQ 1%, VIXY 1%) was only 3% of the book and returned 1.90%, adding +0.06% to attribution. The standout there was VIXY, which jumped 6.14%. SH was up 0.22%, PSQ was down 0.67%. That mix tells you two things. First, index-level downside hedges did not pay in index points because the major cap-weight benchmarks held up. Second, owning some explicit volatility premium still provided relief against the cyclical drawdown and financial stress in the rest of the book. The sleeve did its job.
Healthcare selective quietly did its job as well. That sleeve (XBI 2%, IYH 1%) is 3% of capital and returned 1.28%, contributing +0.04%. XBI was up 2.46%, offsetting IYH at -1.09%. That shows why the sleeve exists: it is meant to express idiosyncratic upside in biotech without needing to be long broad, rate-sensitive health care defensives, and that dispersion showed up.
From there the story gets more difficult. Financials, a 10% sleeve (XLF 6%, KRE 3%, ICE 1%), was the worst drag in the entire book. The sleeve fell 2.75% and took out -0.27% of attribution on its own. Intercontinental Exchange (ICE) dropped 7.58%. KRE, the regional bank ETF, was down 2.80%. XLF, the large bank/financials ETF, slipped 1.91%. This is exactly the cluster you want working if credit is calm and rates are stable. Instead, we saw stress transmit into the sector and the market penalized anything even adjacent to funding cost, regional bank credit quality, or exchange rate sensitivity. When the single worst sleeve in the book is also one of the larger weights at 10%, that becomes the portfolio story for the week.
Real estate income, sized at 7% across XLRE 4%, WELL 2%, and SPG 1%, also hurt. The sleeve fell 2.18% and cost -0.15%. XLRE was down 4.17%, offsetting WELL at +1.49%. SPG slipped 1.53%. The takeaway is that the market is still not ready to fully buy the “stable rate path means REITs are investable again” narrative. WELL can outperform on asset-specific quality, but XLRE at the index level is still trading as a rates proxy, and that showed up as a direct drag.
Industrials/capex (DOV 1.5%, OSK 1.5%, CMI 1.0%) was a problem as well. That 4% sleeve fell 3.63% and took off -0.15%. Oshkosh (OSK) dropped 12.66%. That single name was the single worst contributor in the entire portfolio at -0.19%. The read is straightforward. The market did not reward high-beta, capital-goods cyclicals this week. In a tape where megacap tech and biotech worked, heavy equipment and specialty manufacturing were aggressively repriced lower. Even with CMI up 2.76% and DOV up 1.14%, the OSK collapse swamped the sleeve.
Credit ballast, which is supposed to be the stabilizer, did not fully stabilize. That 11% sleeve pairs LQD 7% with HYG 4%. The sleeve return was -1.00%, costing -0.11%. LQD was down 1.30%, HYG down 0.46%. That is important. The idea of the ballast sleeve is that if spreads are contained and rates do not back up violently, you get paid to sit in high grade and high yield. Instead, both LQD and HYG bled, and the sleeve acted more like a slow leak than a cushion. Short-duration liquidity (USFR 2%, VGSH 2%) did better, only down 0.20% and costing less than -0.01%, but that is because the duration is tiny. It is ballast in cash terms, not ballast in total return terms.
Other sleeves mostly bled quietly. Utilities carry (XLU 3%) was down 2.52%, costing -0.08%. International quality (BBEU 2%, IQLT 2%) fell 1.47%, costing -0.06%. Equal-weight breadth (RSP 1%) dropped 2.24%, costing -0.02%, which reiterates that leadership is still very top heavy. Energy cash flow (PSX 2%, CVE 1%) was essentially flat at -0.17%, costing only -0.01%; PSX was up 0.62% while CVE fell 1.74%. Crypto toggle (IBIT 0.6%, ETHE 0.4%), a 1% sleeve, was hit hard at -5.48%, costing -0.05%. Bitcoin and Ethereum proxies gave back -4.71% and -6.64%, respectively. That is acceptable because the sleeve is intentionally tiny and scoped as optional risk, not core thesis.
Put together, the book did what it is designed to do: it stayed levered to secular compute and high-quality growth, kept tactical hedges on, and diversified into rate-sensitive cyclicals and credit to capture carry and breadth if the soft-landing story kept firming. The first two buckets helped. The last two hurt. The damage in Financials, Real Estate, Industrials/Capex, and Credit was not subtle. Those four sleeves alone pulled roughly -0.70% of attribution out of the portfolio. Without them, the book would have been meaningfully green.
TOP 5 POSITIVE CONTRIBUTORS

NVDA 4.0% weight +6.54% return +0.26% contribution
SOXX 6.0% weight +1.70% return +0.10% contribution
QQQ 10.0% weight +0.75% return +0.07% contribution
VIXY 1.0% weight +6.14% return +0.06% contribution
AAPL 3.0% weight +2.03% return +0.06% contribution
TOP 5 NEGATIVE CONTRIBUTORS
OSK 1.5% weight -12.66% return -0.19% contribution
XLRE 4.0% weight -4.17% return -0.17% contribution
XLF 6.0% weight -1.91% return -0.11% contribution
LQD 7.0% weight -1.30% return -0.09% contribution
KRE 3.0% weight -2.80% return -0.08% contributionIn plain English: the book made money where the market still believes in multi-year secular spend (NVDA, SOXX, QQQ), and it got paid to carry volatility in VIXY, but anything tied to balance sheet leverage, credit plumbing, or old-economy capex (Financials, REITs, Industrials/Capex, Credit ballast) traded heavy and was a hard drag on the port. Let’s take a look at what the tape is telling us about this coming week.
MIR Part 1: The Backdrop
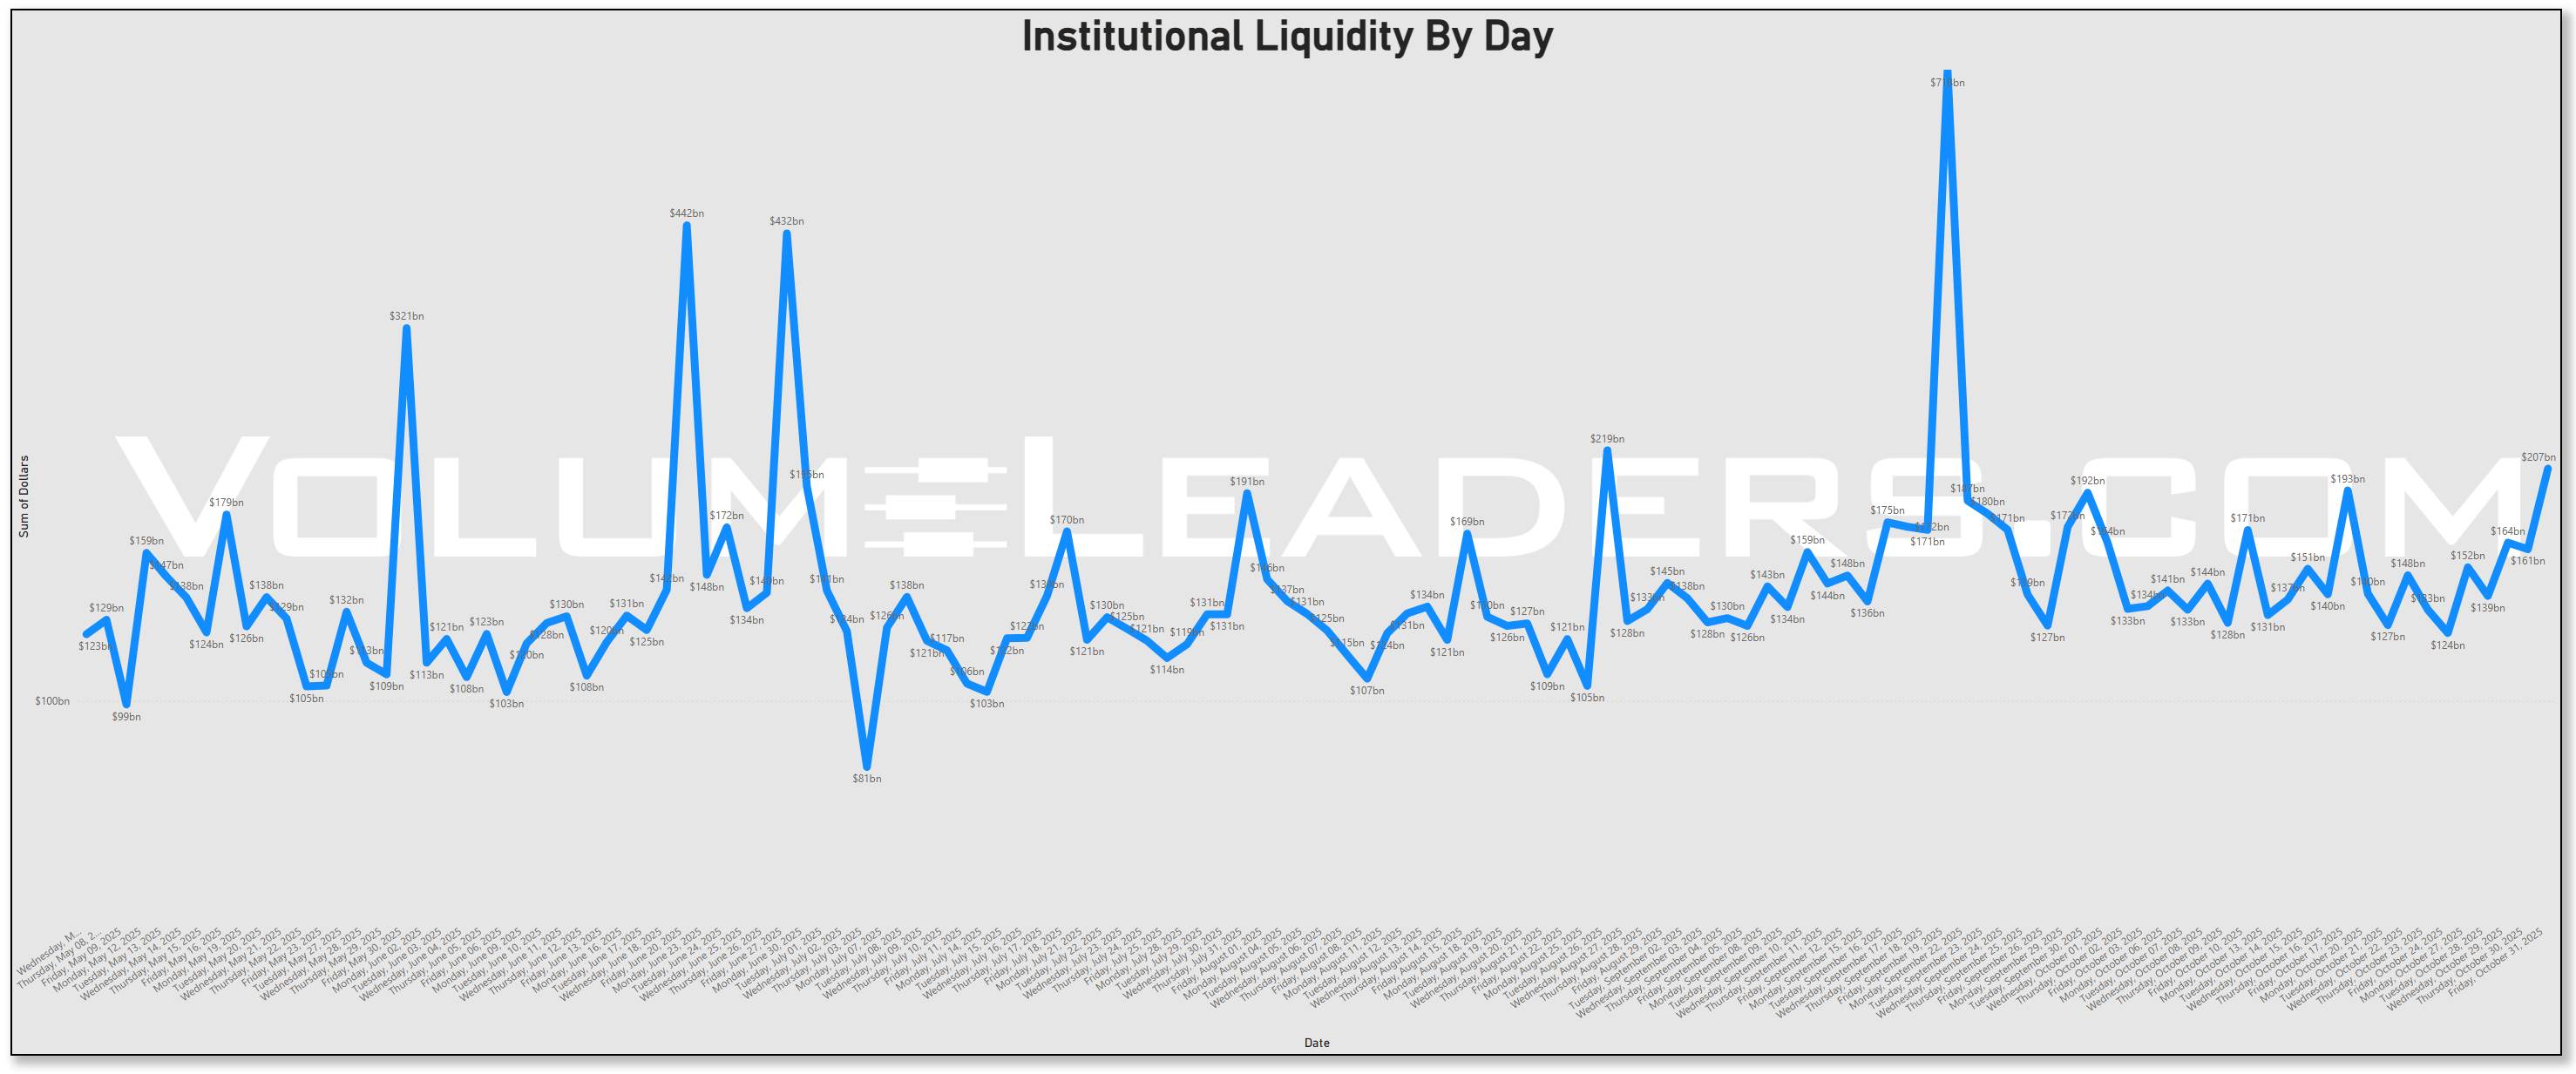
Institutional liquidity rose sharply late in the week, with a pronounced surge on Friday, October 31 that extended into the $207 billion+ range (from levels closer to ~$140 billion earlier in the week). That marks a clear month-end tilt and suggests heavy portfolio rebalancing rather than simply a directional rush. The multi-day uptick around the close supports the idea of funds locking in exposure ahead of the new month, echoing the documented “turn-of-the-month” effect where institutional buying tends to concentrate at the end and start of each month.
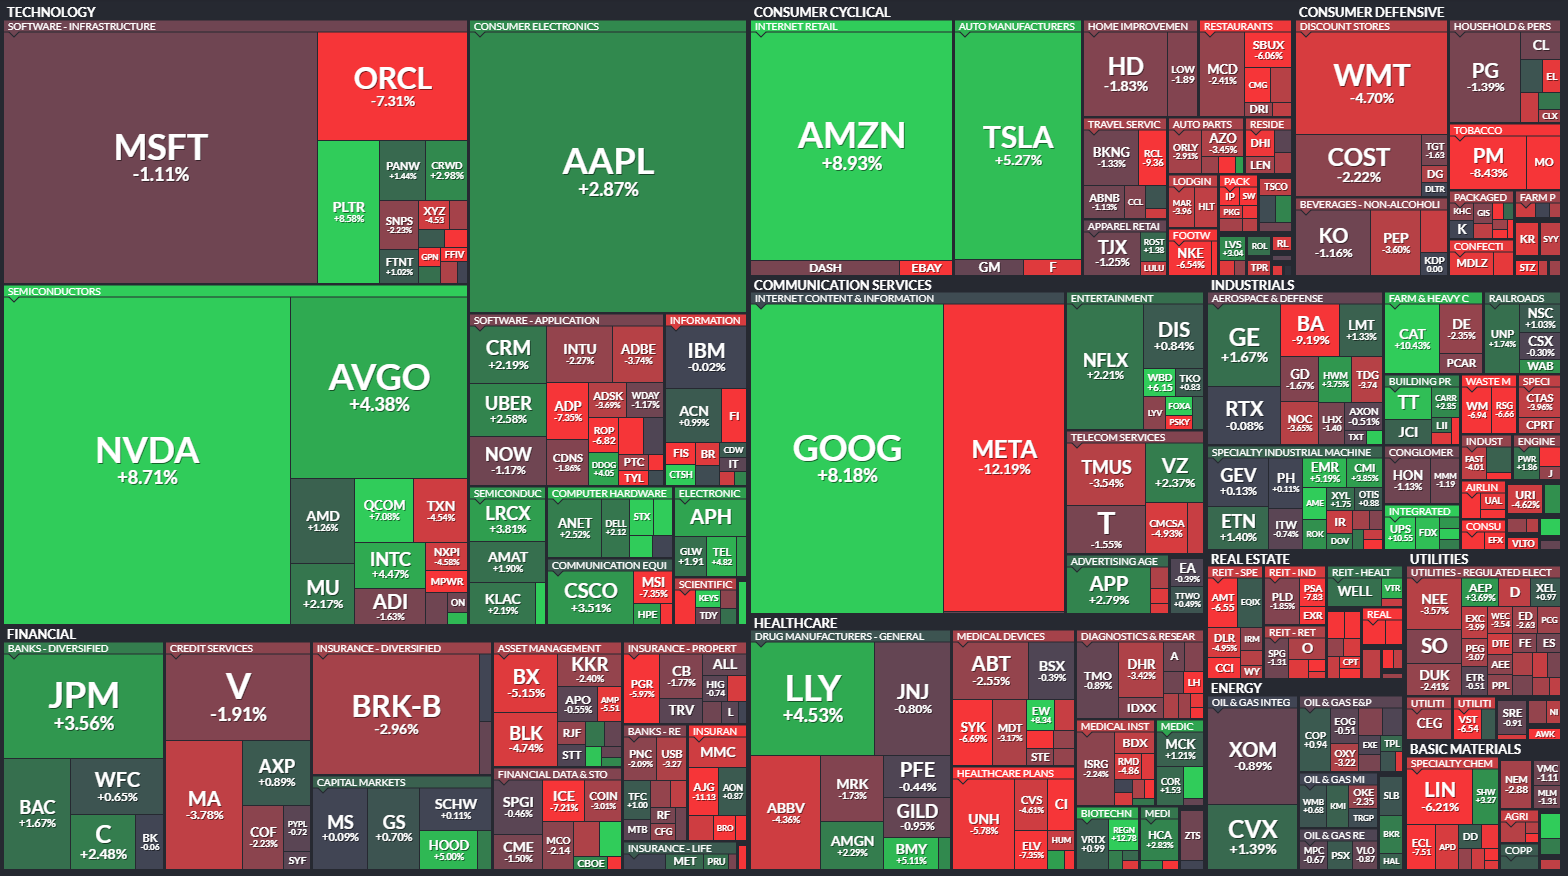
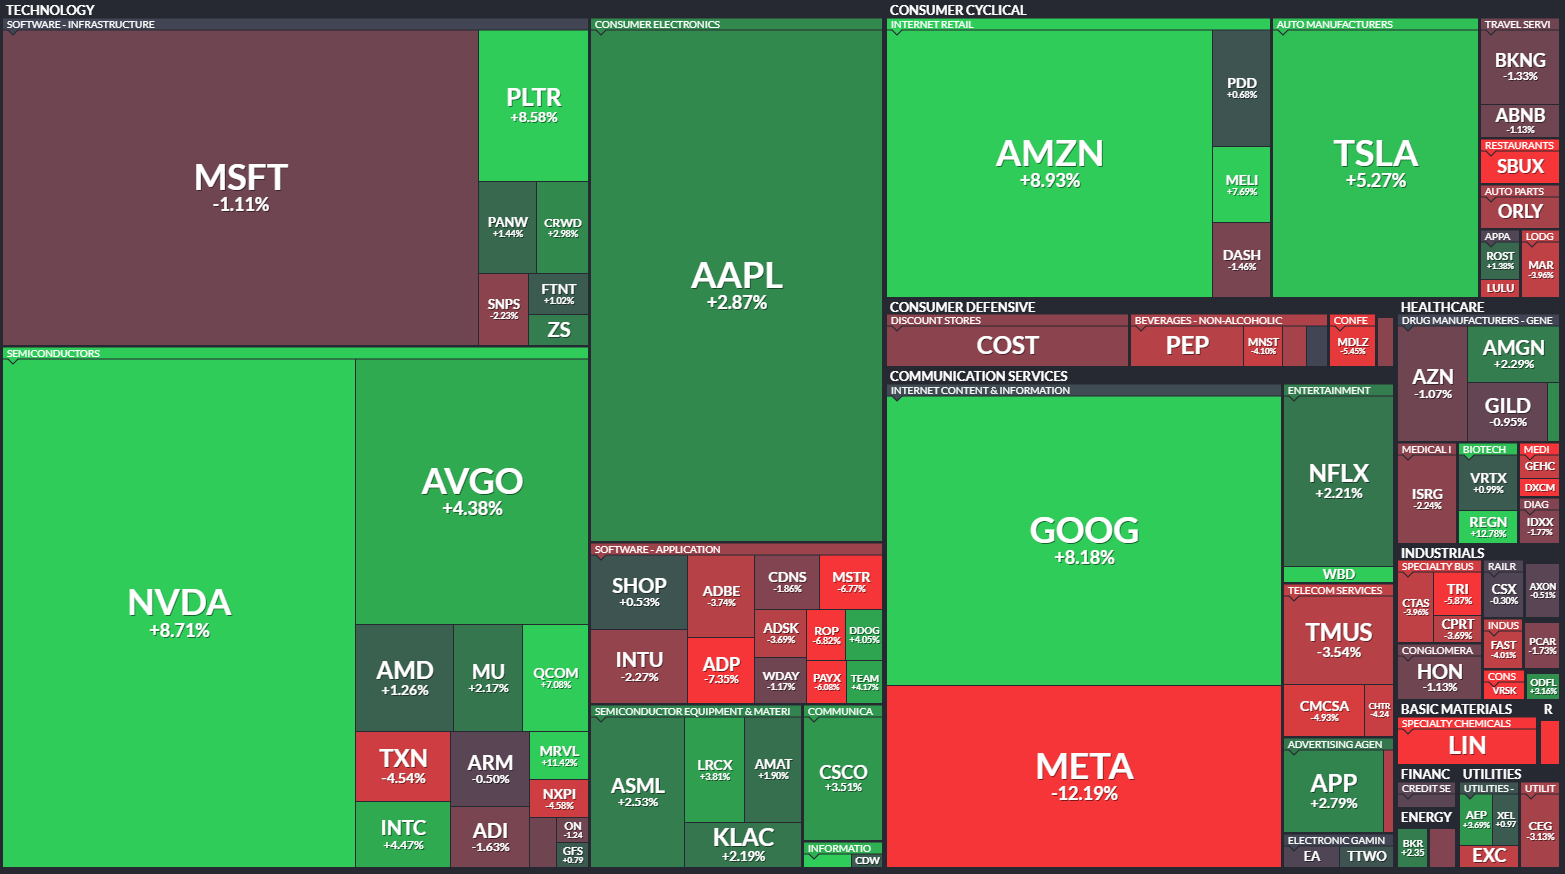
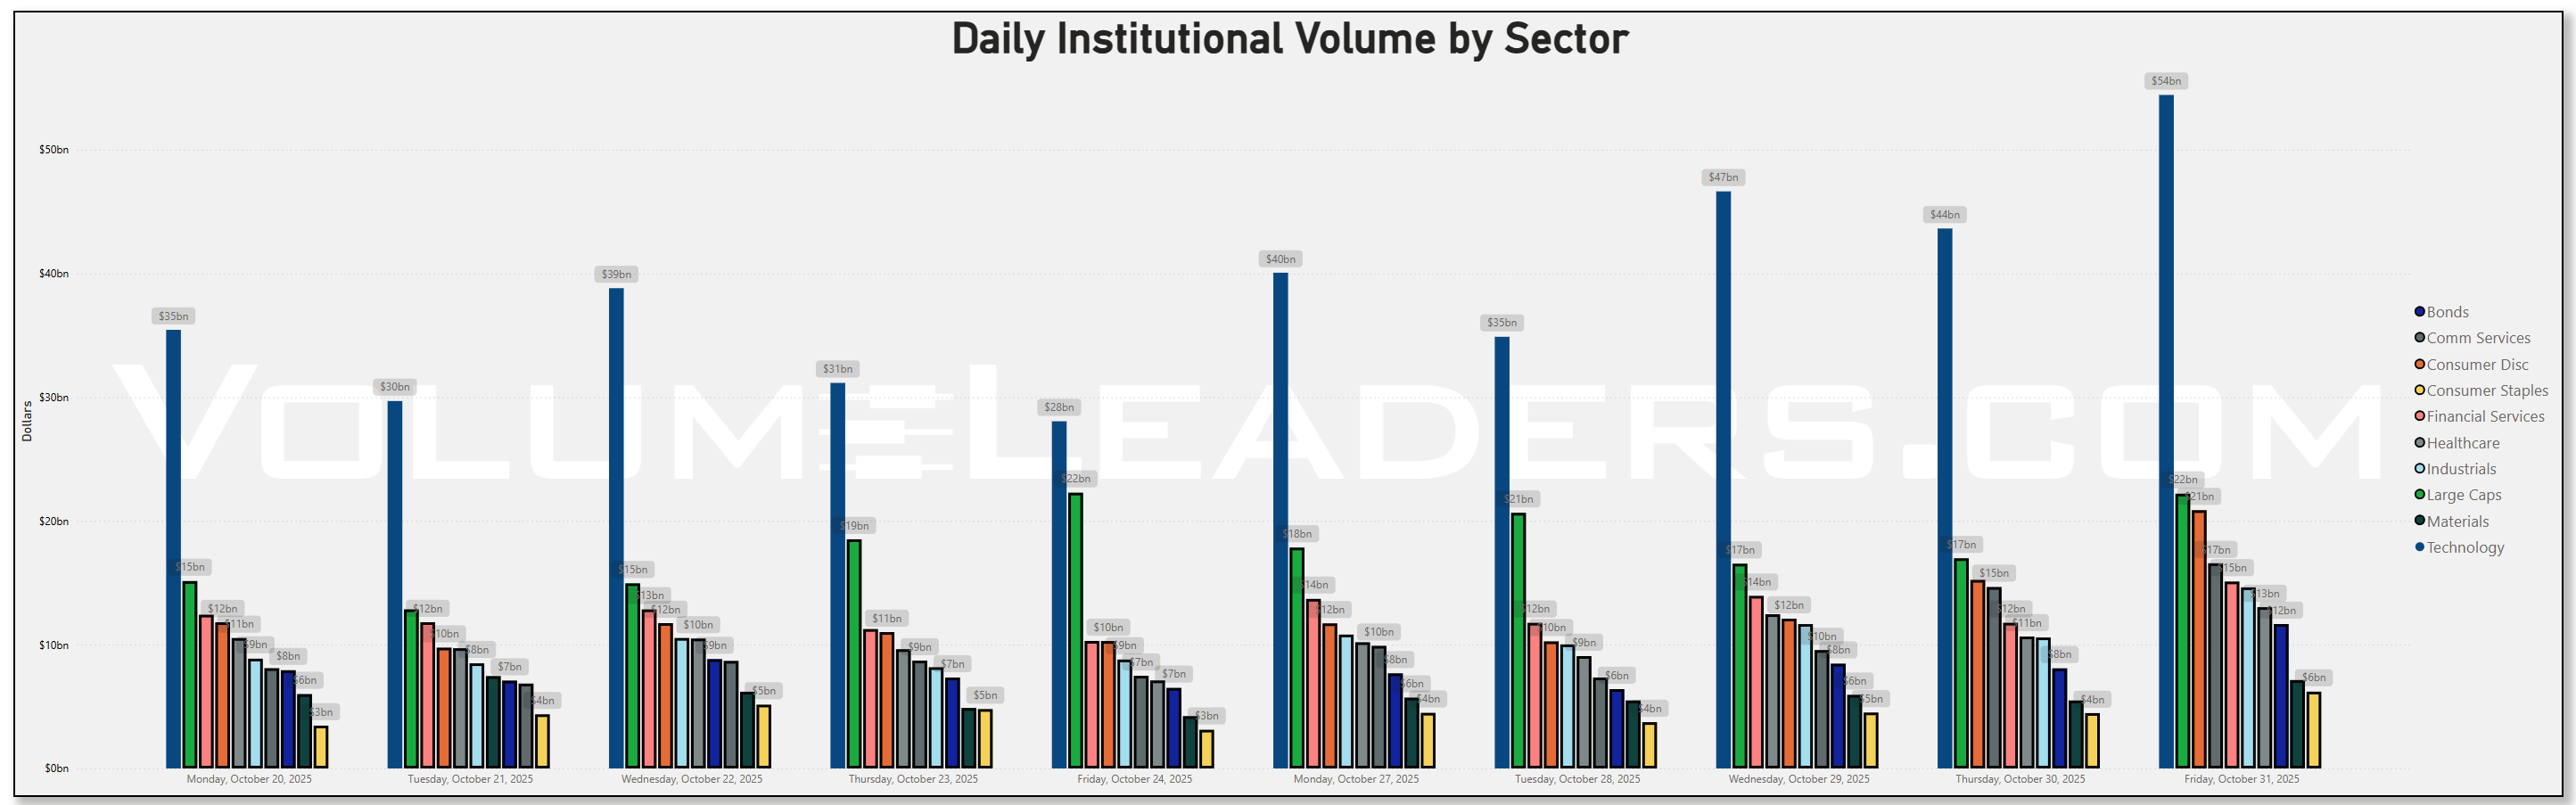
Across sectors, Large Cap equity dominated the flow profile for much of the week, but there was a meaningful narrowing of breadth. On Monday and Tuesday, Technology and Communication Services were prominent, with aggregate daily sector volume in the mid-$40 billion+ range for Tech and the mid-teens for Comm Services. In contrast Financial Services and Industrials trended toward the lower end of the ~$10 billion–$12 billion band by week’s end. Comparing last week’s flows to this week, Tech held its momentum, while cyclicals really lagged: Industrials went from a stronger mid-$14 billion day to approximately ~$10 billion, and Financials slipped from ~$12.4 billion to nearer ~$9 billion by Thursday. This signals institutions piling into defensive/high-quality Growth rather than broad beta or cyclical exposure.
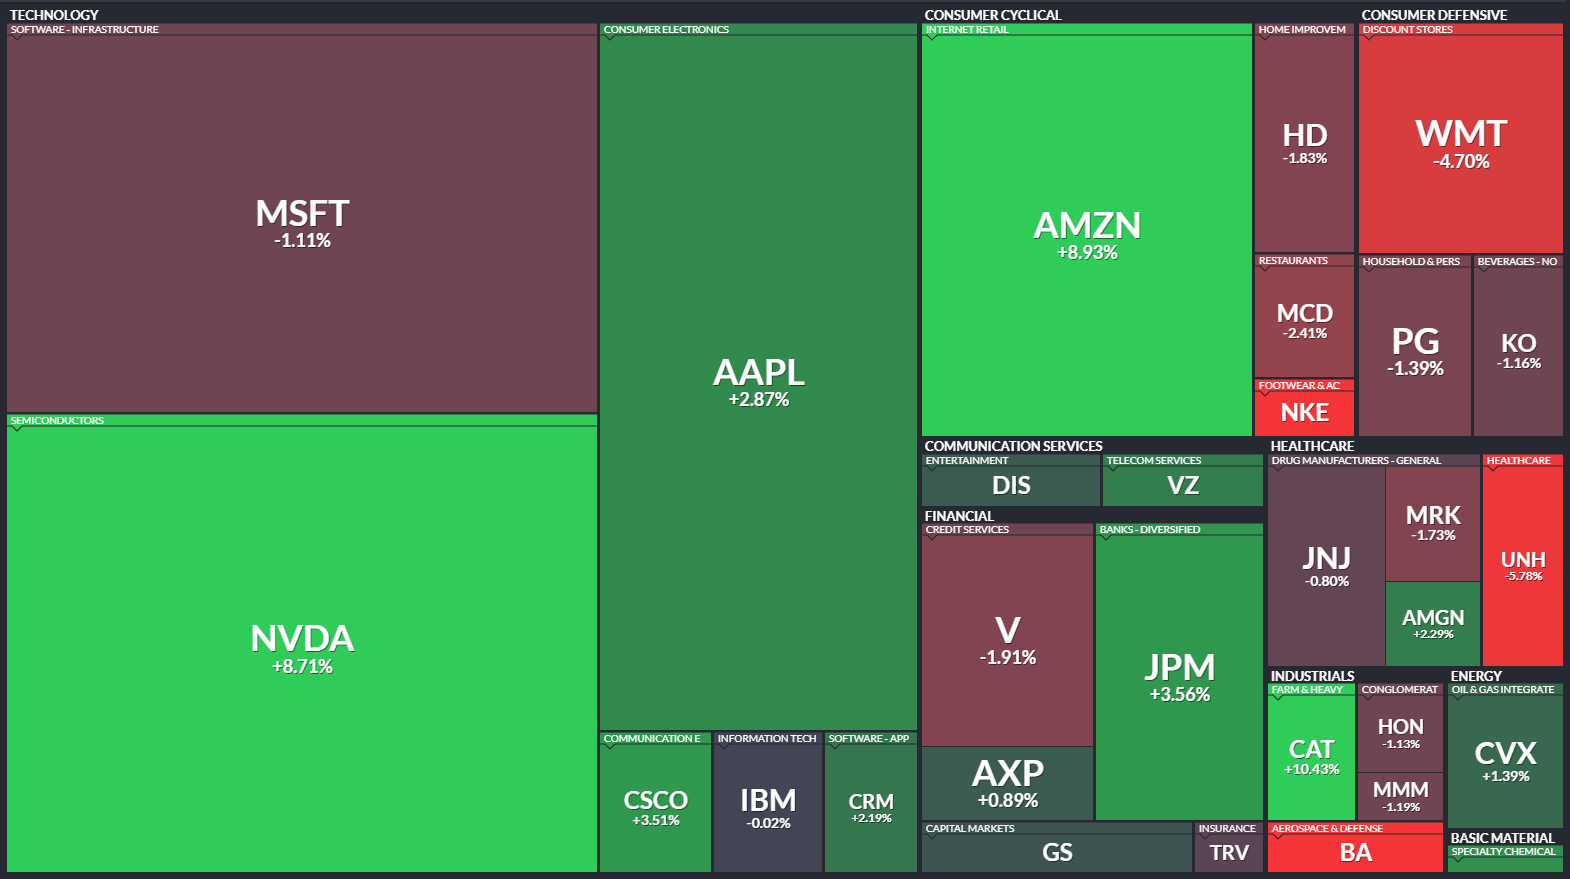
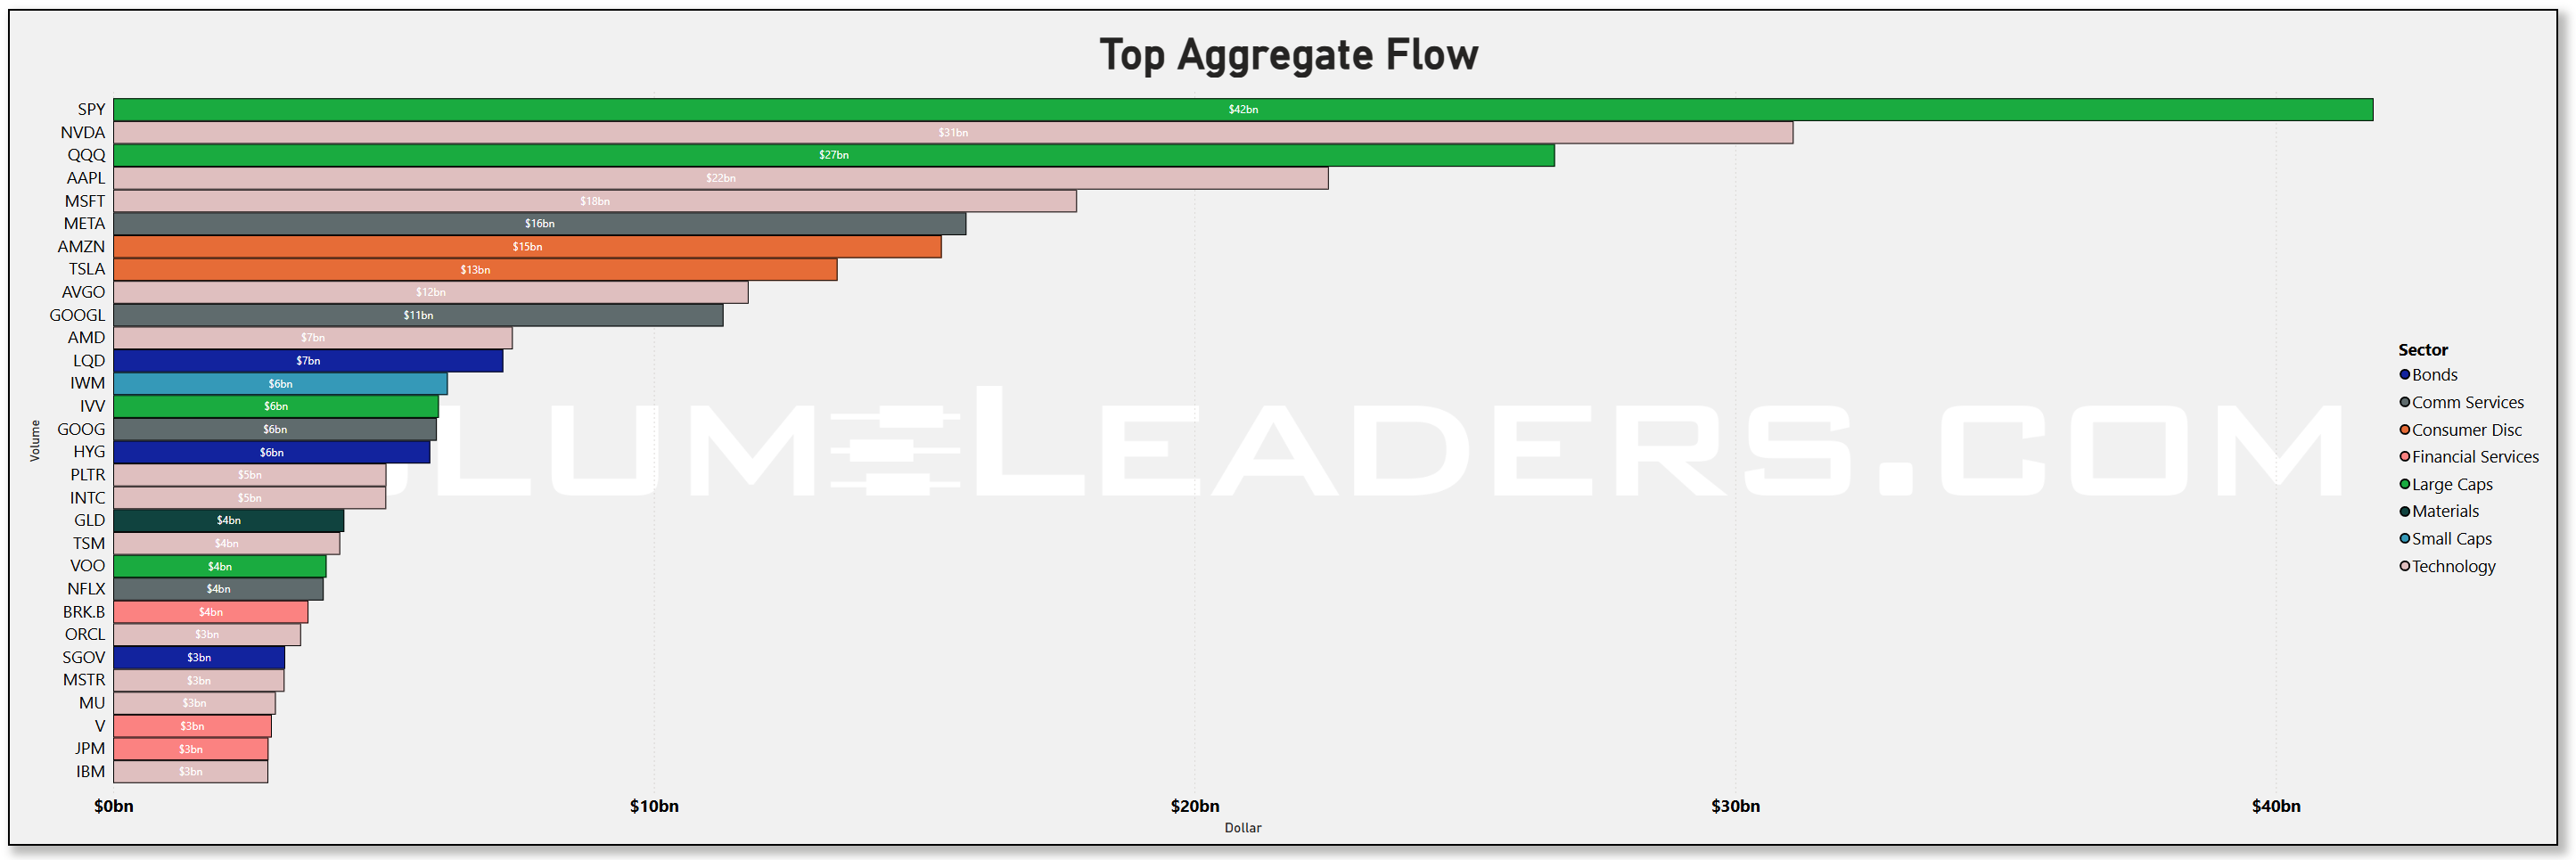
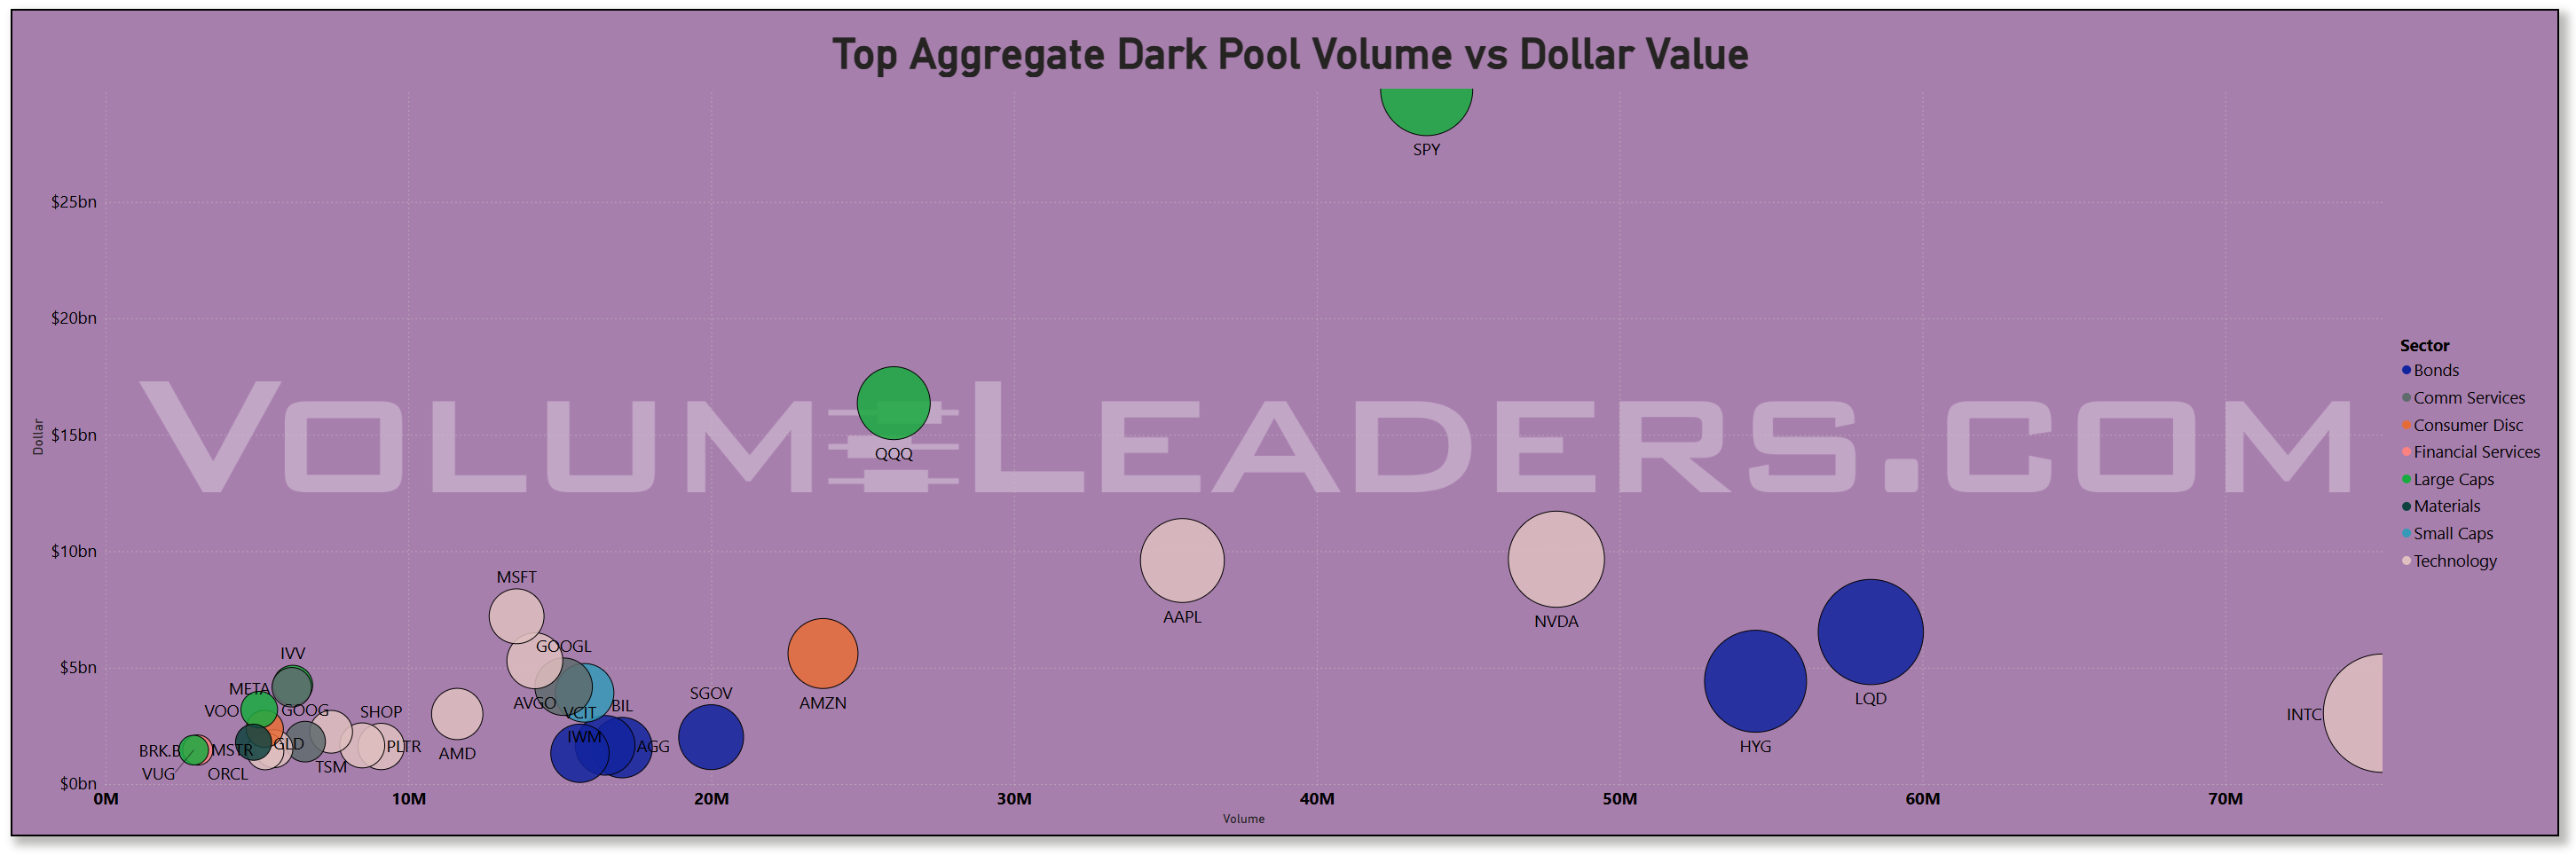
Turning to the concentration of dollars, the treemap and aggregate bars show that portfolios continue to load up on mega-cap names and core indices rather than second-tier breadth. The names at the top include SPY (~$42 billion in aggregate dollars), NVDA (~$31 billion), and QQQ (~$27 billion). AAPL (~$22 billion) ranks just behind MSFT (~$18 billion).
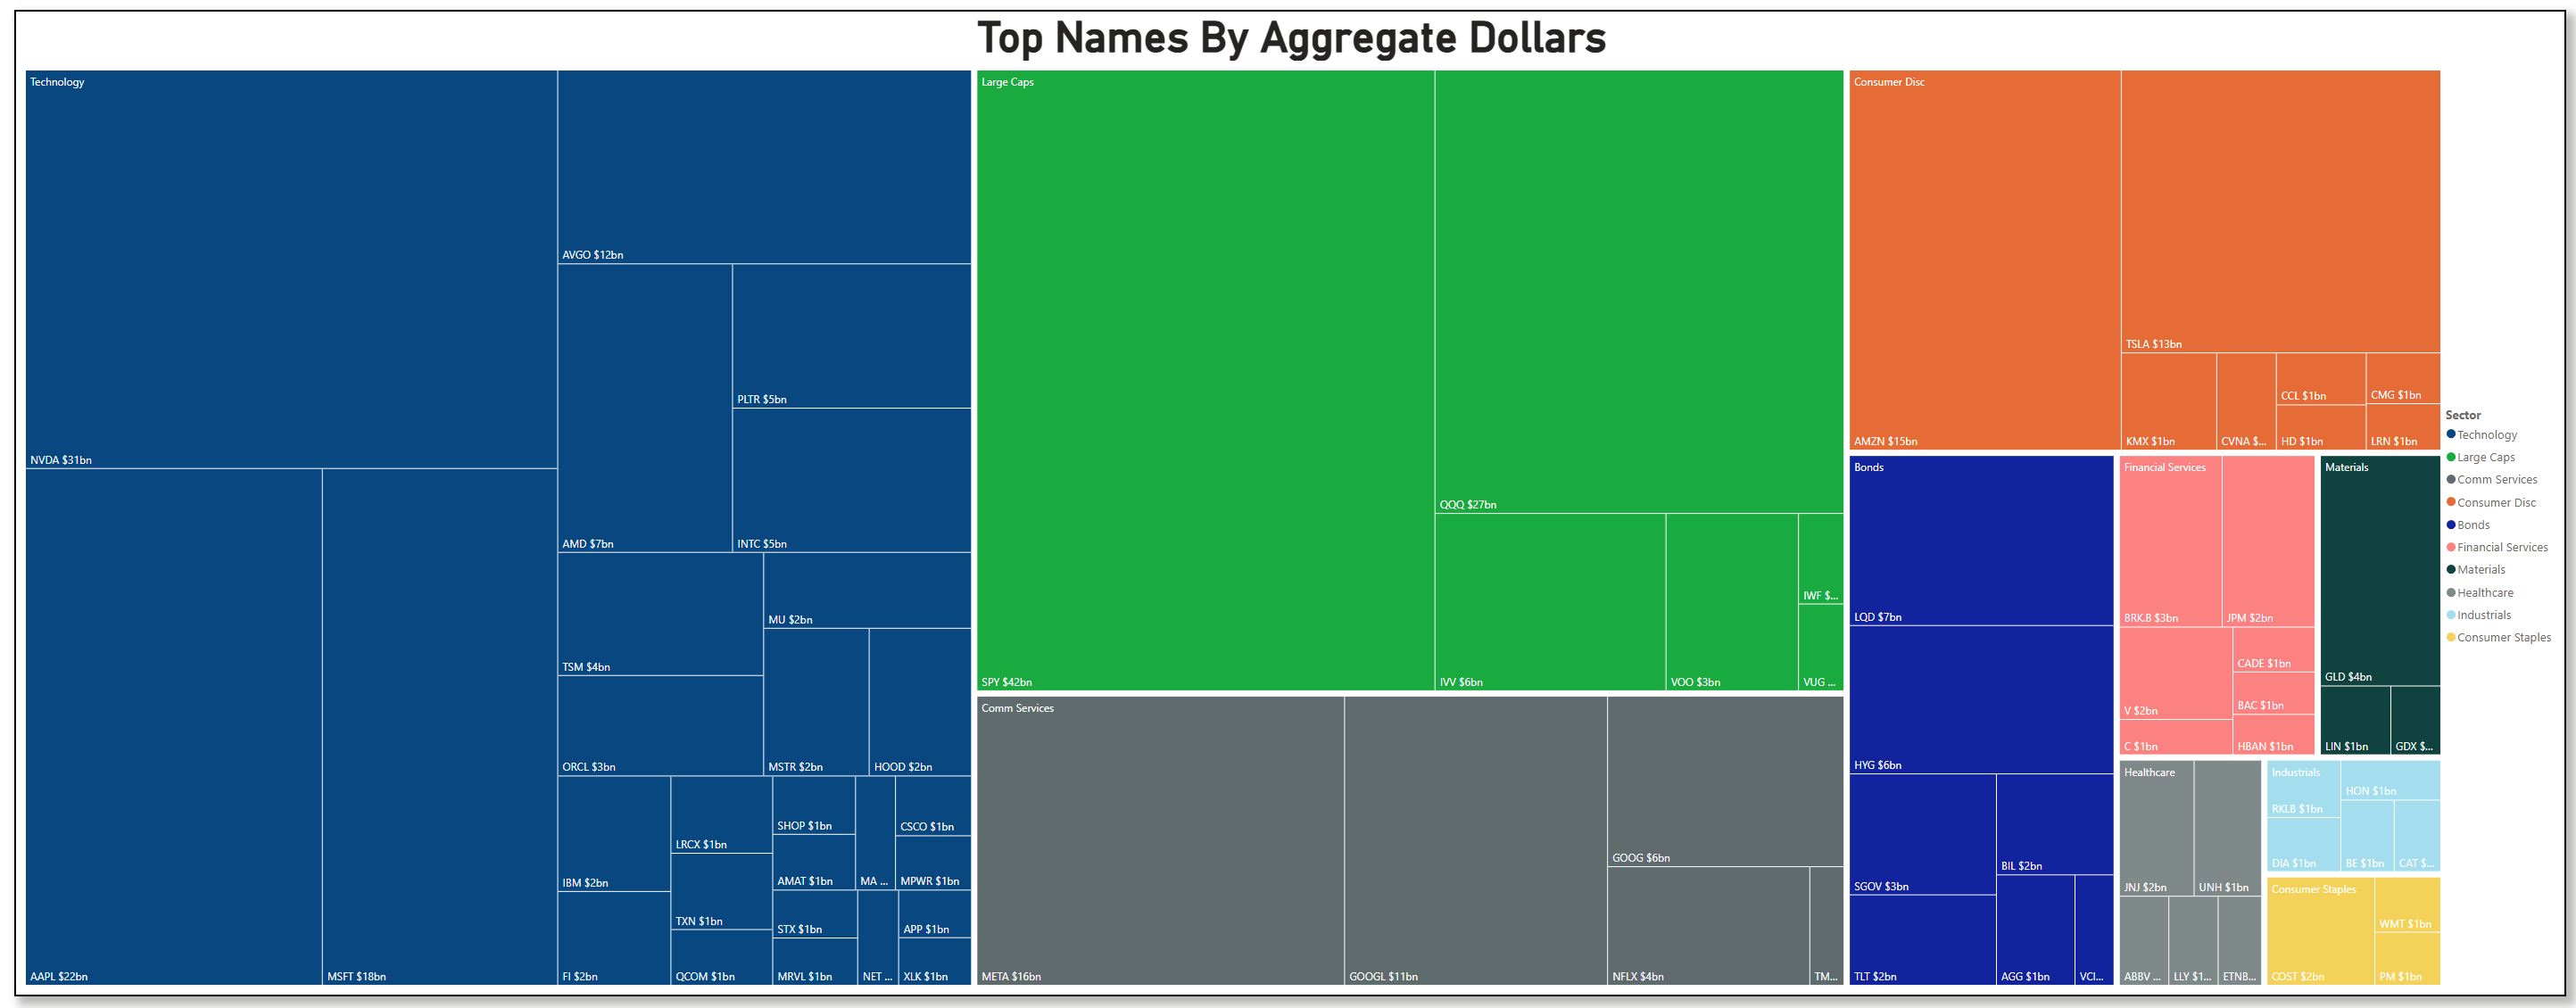
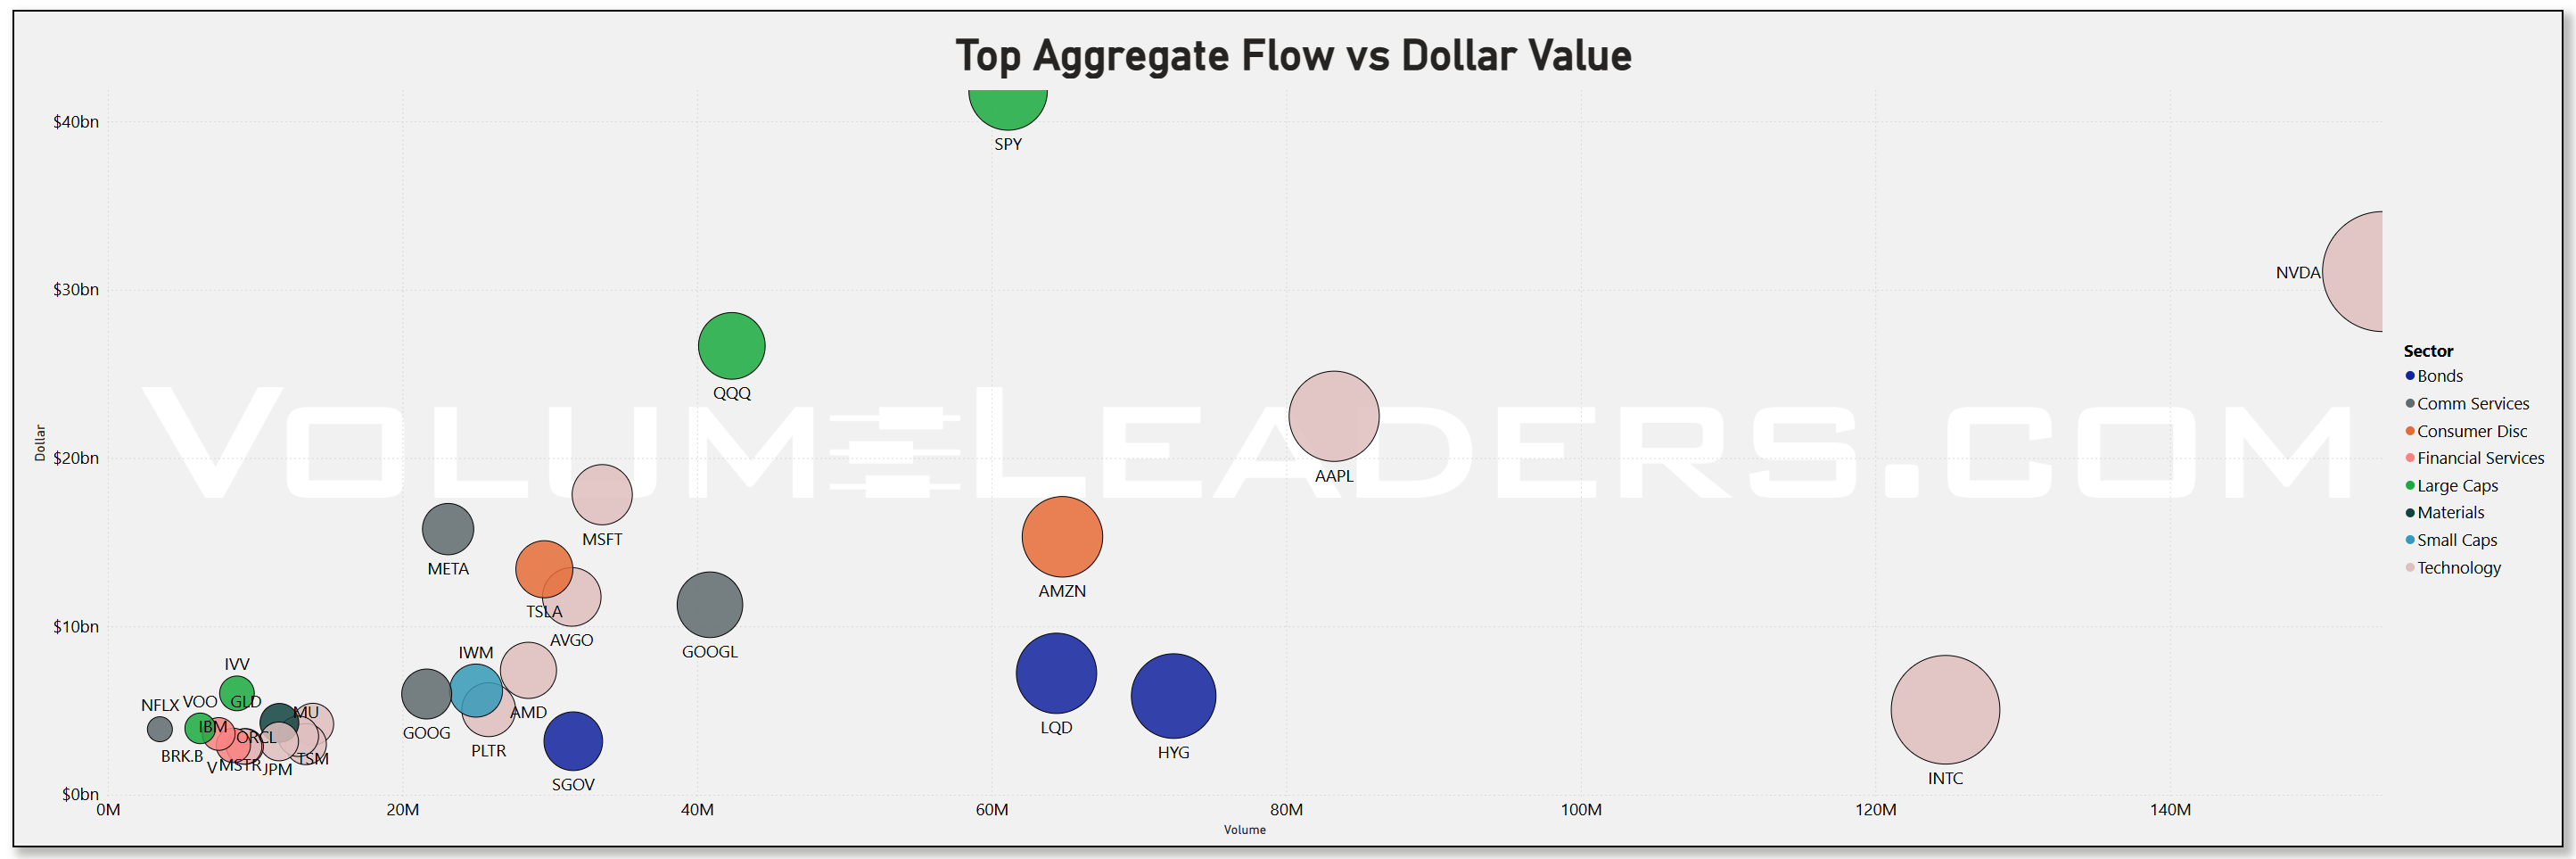
The scatter of volume versus dollars confirms this: NVDA is high on both axes, indicating not just size but also velocity, and SPY dominates the flow spectrum—solid evidence that index liquidity remains the foundation of institutional posture. Breadth beyond the top five names remains thin, reinforcing that we’re in an environment of selective leadership, not broad advance.
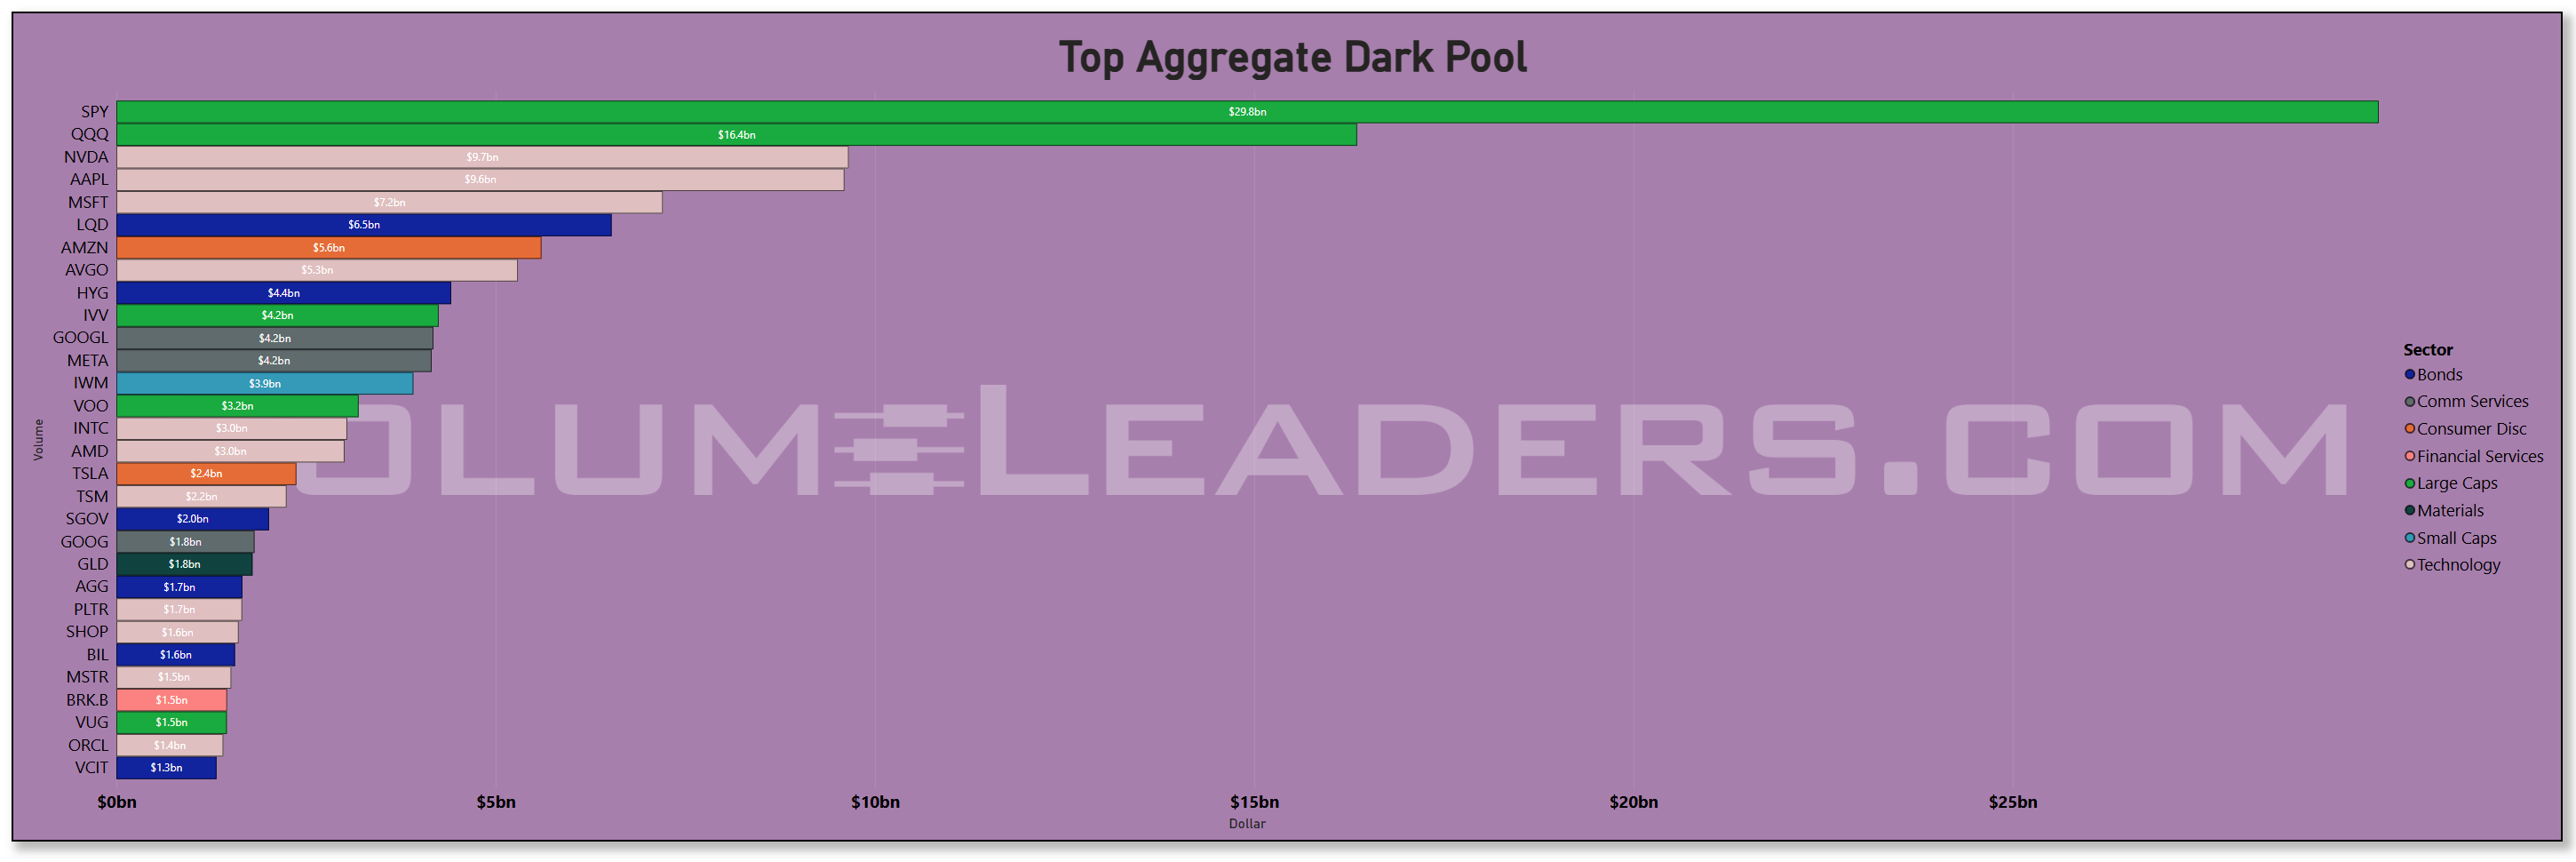
Dark-pool flows further deepen the story. SPY recorded ~$29.8 billion in dark-pool dollars for the week, with QQQ ~$16.4 billion. NVDA and AAPL each had roughly $9.6 billion dark-pool flow. Such off-exchange activity strongly suggests institutional accumulation or hedged positioning, rather than pure retail chase. In particular, the presence of large dark pool prints for NVDA and AAPL implies that these mega caps are still being positioned quietly beneath the surface. That is a positive if you believe in a growth/higher-multiple regime staying intact.
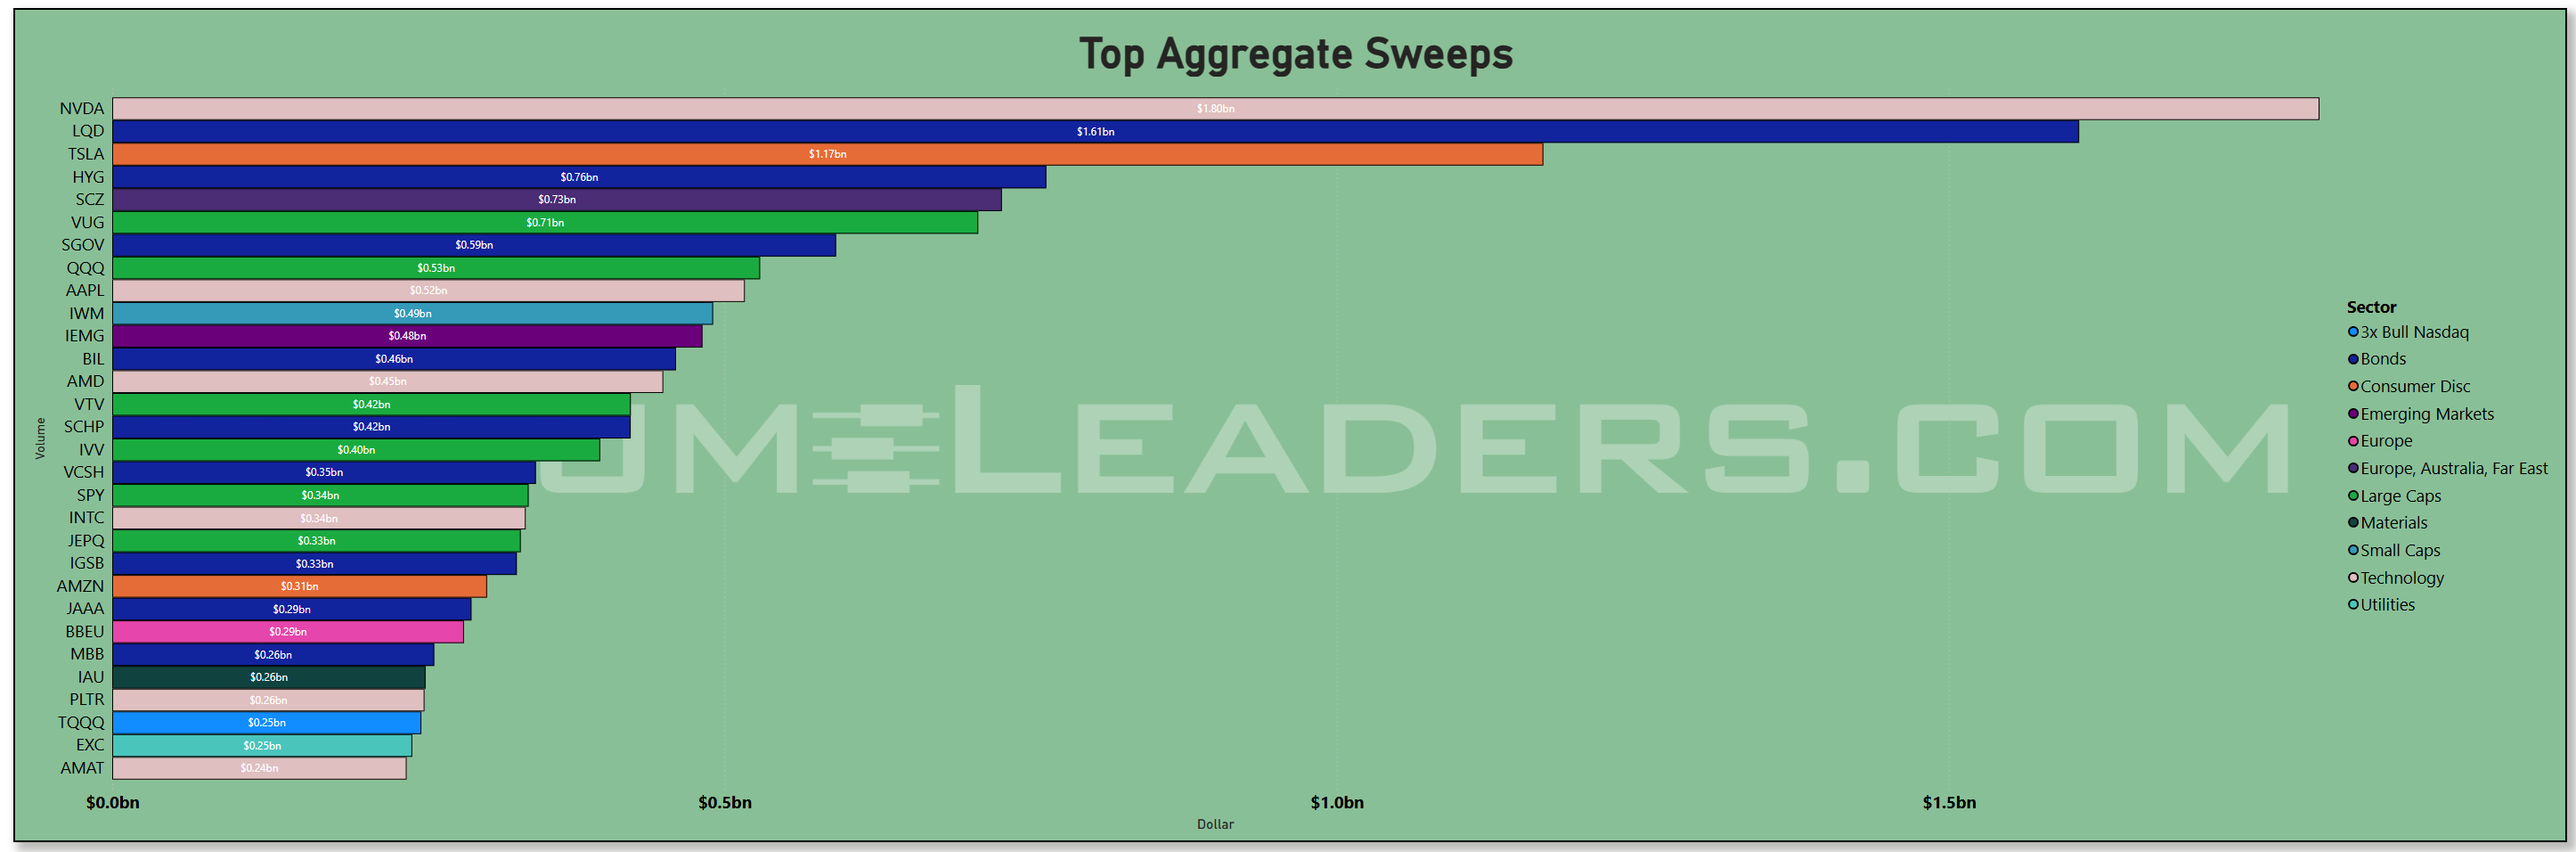
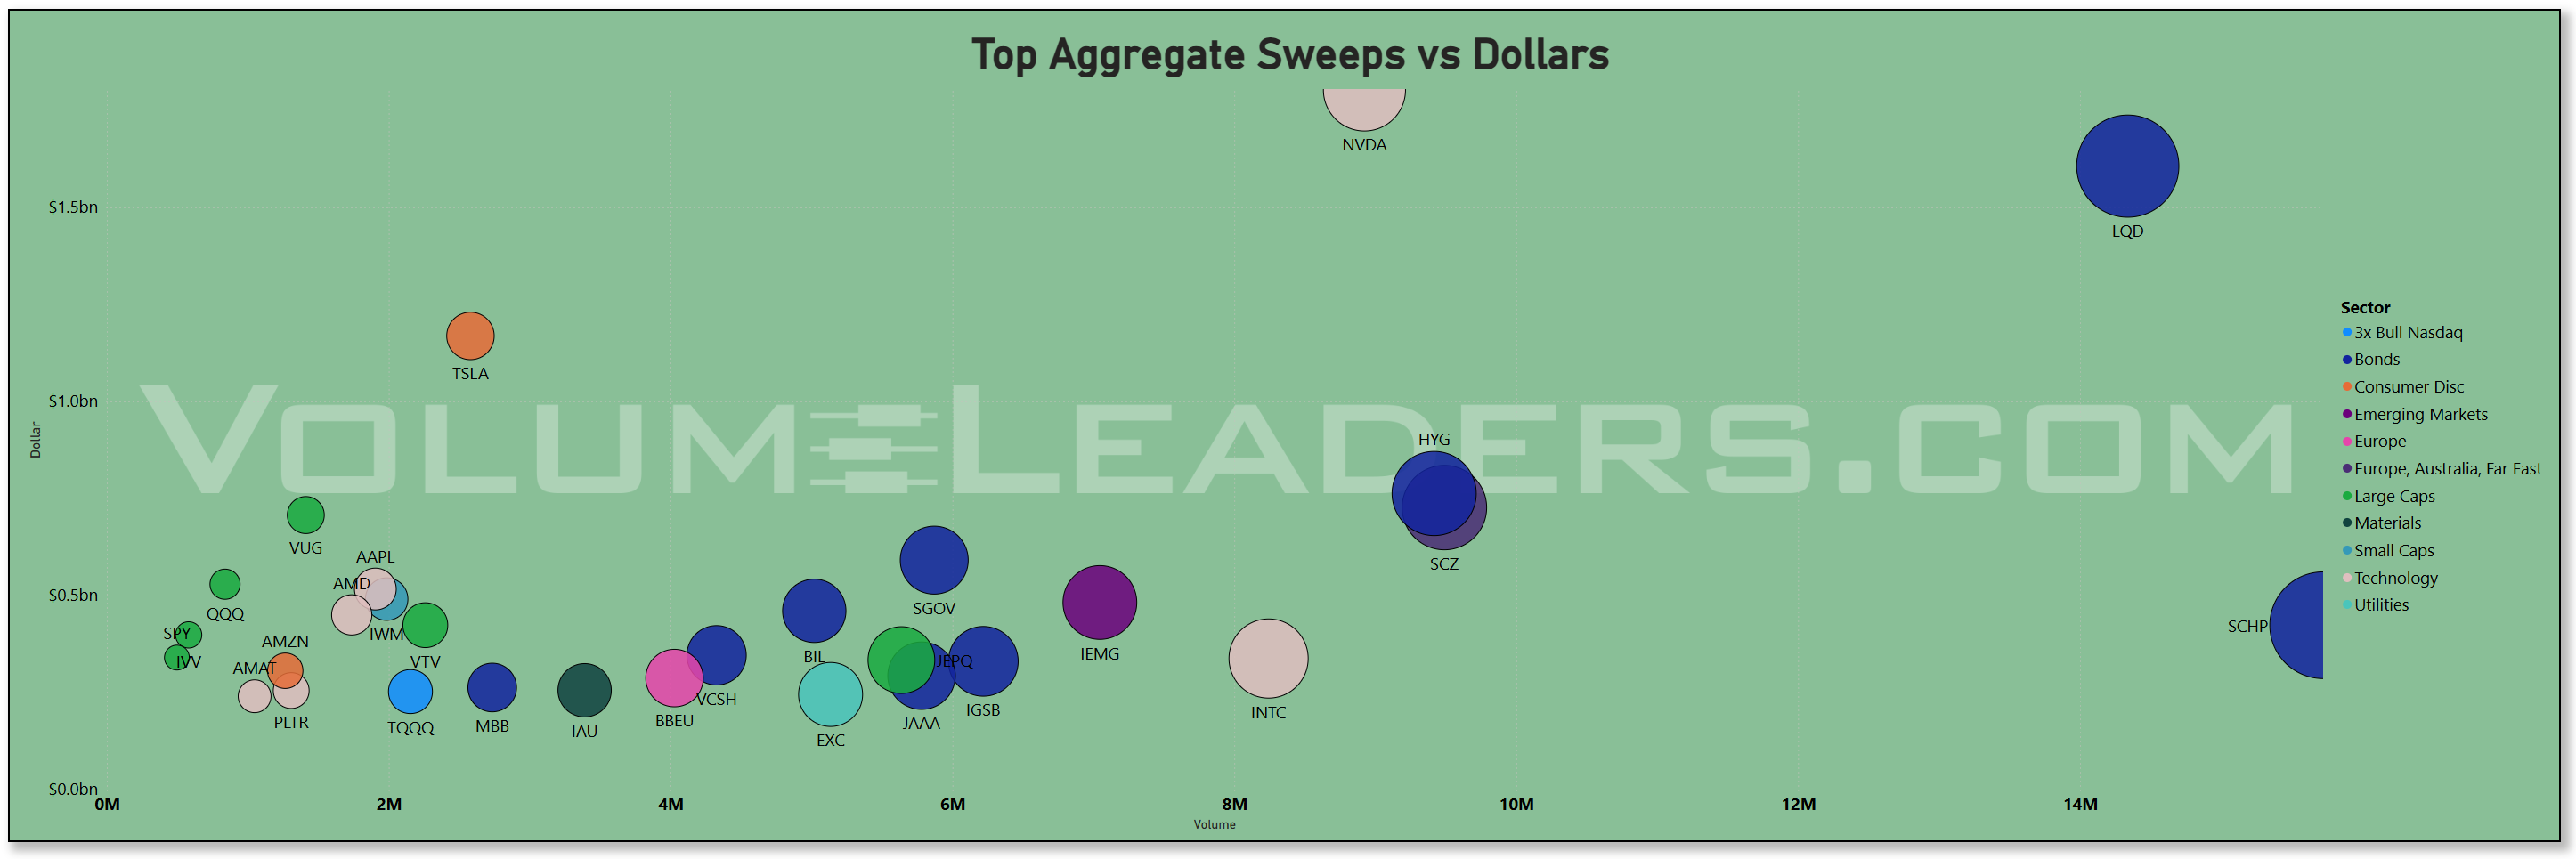
On the sweep front (high-frequency aggressive executions), the top names include NVDA with approximately $1.80 billion in sweep dollars, and LQD among the largest in fixed income sweeps at ~$1.61 billion. The sweep scatter shows NVDA carrying both significant volume and dollar value, while TSLA, VUG and PLTR appear further down but notable. The presence of LQD sweeps suggests that credit traders are actively repositioning, possibly bracing for a pivot in rates. Meanwhile, equity sweeps anchoring on NVDA reinforce the high-growth anchor in the book.
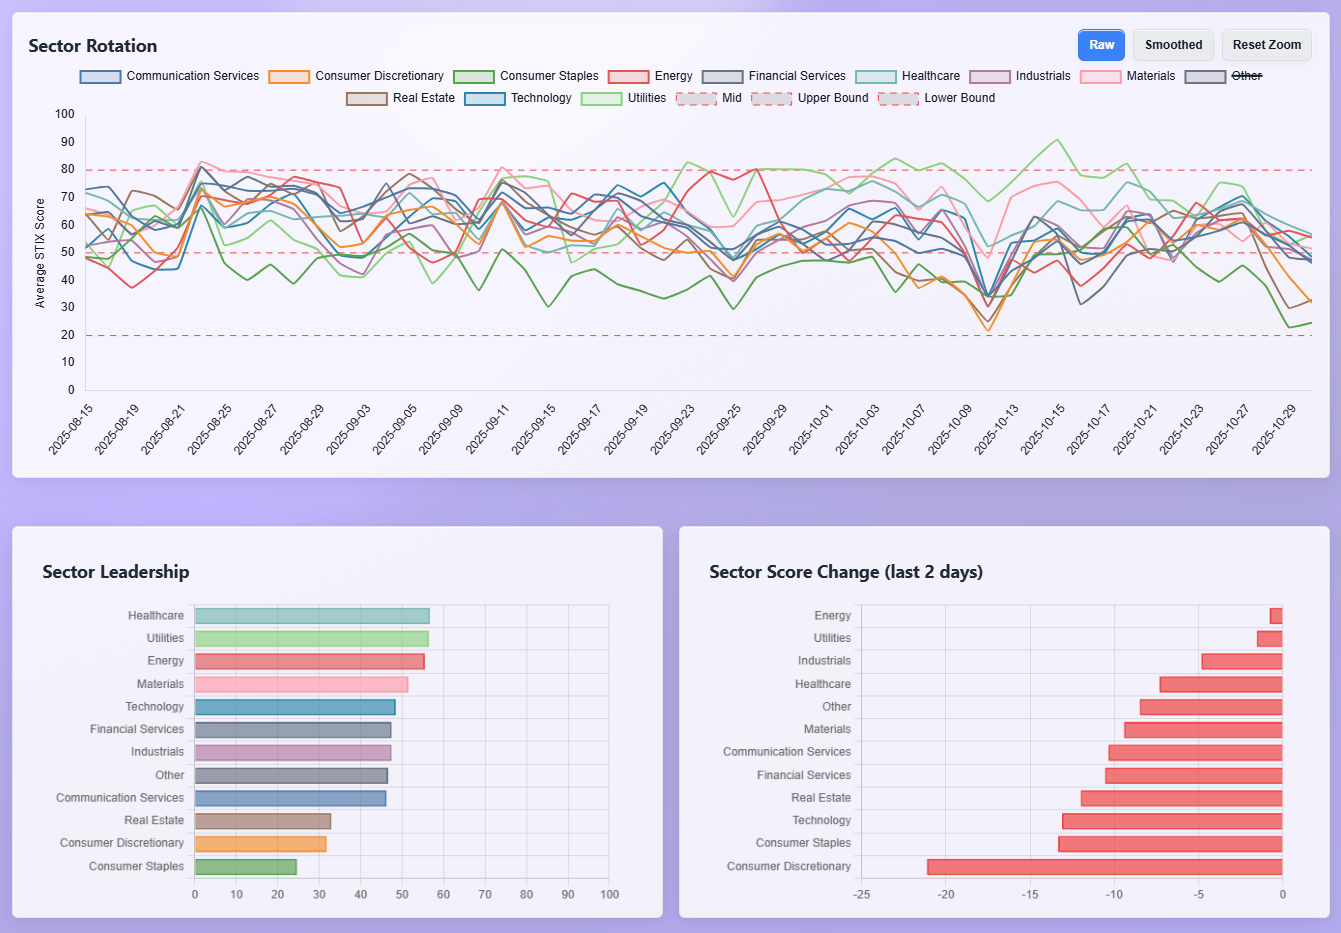
The sector rotation board reveals a subtle but telling shift. Technology and Healthcare still lead on the “Sector Leadership” bar, with Utilities gaining ground in second tier. And in the last 2-day change metric, Financials, Real Estate and Industrials all show despite size, negative momentum, while Energy and Materials are neutral to weak. Technology’s relative strength in the last 48 hours aligns perfectly with the flow analytics (heavy tech concentration). The weakness of cyclicals and financials mirrors the low dollar flows into those sectors and the lack of dark-pool accumulation there.
Macro and seasonal context matter a lot here. The fluid expectation that the Federal Reserve is nearing rate cuts — with markets fully pricing in a 25 bps cut — has heightened the premium on long-duration growth and large-cap tech, and reduced the appeal of cyclicals. At the same time, the week coincided with a fresh month-end cycle, and the liquidity uptick reflects rebalancing flows. Institutional seasonality research shows that these end-of-month and turn-of-month windows often see outsized equity flows. Combine that with visible data vacuum risk (due to the U.S. government shutdown delaying releases) and you get a tactical environment where allocators lean large and liquid rather than niche and cyclical.
What to watch next: first, continued size in SPY, QQQ and perhaps IVV/VOO would confirm the index-anchor posture remains intact. Second, another round of dark-pool flow in NVDA, AAPL or MSFT would validate the internal accumulation thesis in tech. Third, momentum in credit sweeps such as LQD or HYG holding bid would signal that carry trades are still active and the pivot in rates is being positioned. If flows shift into Industrials (say >$12 billion day) or Financials (> $13 billion) it could mark a regime break toward cyclicals; if not, the narrow leadership tilt remains active.
Bottom line: The book continues to reaffirm a growth-dominant posture anchored on mega-cap tech and index liquidity, not breadth or cyclicals.
MIR Part 2: Individual Names From The Institutional Tape
VolumeLeaders tracks several proprietary signals designed to spotlight names drawing significant institutional interest. Below, we’ve surfaced the latest results and analyzed them to highlight emergent themes. If any of the sectors, narratives, or positioning trends resonate, the names mentioned here offer a strong starting point for deeper research and watchlist consideration.
VL Trade Rank Velocity™ (TRV)
TRV is a proprietary metric that measures the recent acceleration or deceleration in institutional trading activity for a given stock by comparing its average trade rank over the past few days to its average in recent weeks. A sharp improvement in TRV typically reflects a notable shift in positioning, often accompanied by sustained trade activity, suggesting institutions are actively engaging with the name and that intensity of activity is rising. This often precludes meaningful price or narrative shifts. This isn’t a buy-list or sell-list; it’s meant to draw your eyes to names where institutions are putting money to work.
Two big stories jump out of this TRV sheet, and they both rhyme with what we just saw in flow: a barbell of high-speculation innovation and mission-critical “hard asset / hard infrastructure,” with almost nothing in classic cyclicals unless it is explicitly levered to government spending, energy transport, or housing credit.
On the innovation/speculation side, this list is loaded with leveraged exposure to secular growth narratives, not broad market beta. You have direct AI and compute plays like WTAI (Artificial Intelligence), IGPT (Artificial Intelligence), QTUM (Quantum Computing), CAMT and ALAB (Semis), and QBTS (Computer Hardware, quantum/accelerator angle). You also have HOOD and CORZ in Software - Infrastructure, plus CRWV, NTSK, BKKT, and TTAN in Software / Application Software / Infrastructure. Even WYFI and BTDR sit in application-layer software and crypto-adjacent compute. The pattern is very clear: persistent interest is clustering in platforms and picks-and-shovels around compute, data, trading, and next-gen hardware, not in old-line enterprise IT. That lines up cleanly with the institutional tape we walked through: mega-cap Tech was already getting the lion’s share of real dollars in both lit and dark venues, and QQQ sat near the top of total flow. Seeing QQQ itself on the list, along with IWY (Large Caps Growth), STRV (Large Caps), FNGS (Megacaps), and AIQ (AI-large-cap tilt), just reinforces that this isn’t about speculative micro-cap tech moonshots in isolation. It is about continuing to concentrate capital in the “growth at scale” complex and then layering high-beta expressions on top of it.
You can see that leverage explicitly. METU (2x Bull META), HIMZ (2x Bull HIMS), CWVX (2x Bull CRWV), ETHU (2x Bull Etherium), CURE (3x Bull Healthcare) are all showing up with meaningful improvement in interest and sustained activity. TSLS (1x Bear TSLA) and AMDD (1x Bear AMD) show the mirror image — traders are comfortable expressing high-conviction relative views on single flagship names, long one superstar, short another, instead of passively owning the whole complex. That matches what we saw in sweeps: fast money was not broadly hedging the market, it was leaning into specific franchises and themes. When you have leveraged bull products in AI, crypto, health, and consumer platforms showing up alongside targeted single-name bear products, that is classic dispersion trading. People are no longer trading “stocks,” they are trading narratives inside the market.
Biotech stands out as the other speculative engine. MLYS, ZVRA, SEPN, NUVB, ANRO, TNGX, GHRS, BCAX, PTCT all hit the list under Healthcare / Biotech or Drug Manufacturers / Diagnostics. That is not defensive healthcare. That is early-stage and event-driven healthcare with high payoff optionality. The list even includes ENSG (Health Care Providers and Services) and HNGE / BTSG (health information services) plus CLPT (Medical Devices), so the health sleeve is not just binary FDA lottery tickets, it is also care delivery and infrastructure. This lines up with what we saw on the sector dashboard: Healthcare was printing as one of the current leaders and continues to push toward the top of the leadership stack while still gaining further in the short-term momentum column. That combination — biotech speculation plus steady healthcare services and a 3x Bull Healthcare instrument (CURE) landing on the sheet — says money is not just hiding in XLV-style safety. It is pressing healthcare beta. That tracks with a falling-rate narrative where the market starts rewarding long-duration growth stories in drug/devices again and treats managed care / providers as cash-flow ballast.
Now flip to the other side of the barbell. Industrials and Energy are not broadly loved, but very specific subsectors are absolutely alive. LGN and IESC (Engineering and Construction), GHM and FSS (Machinery), RKLB, KRMN, VOYG, GPUS, and RYCEY (Aerospace and Defense), plus EOSE (Electrical Equipment and Parts) and OUST / RCAT (Electronic Components / Electronic Equipment) — that is a cluster. The common thread is capacity buildout and national capability: defense contractors, electrification hardware, sensors/LiDAR, grid and transmission equipment, and specialty industrial manufacturing. That’s exactly where fiscal policy and reshoring dollars are flowing: energy infrastructure, defense budgets, and industrial capacity expansion tied to critical systems and supply chain security. U.S. defense outlays have been moving higher as geopolitical tensions remain elevated, particularly around naval and aerospace procurement, as lawmakers argue for sustained modernization of strategic and tactical systems. Simultaneously, the U.S. policy push toward domestic manufacturing capacity for energy transition hardware — including grid components, battery storage, and transmission — continues to direct both private and public capital toward power infrastructure and electrification. The tape is telling you institutions are still quietly building exposure to that spend, even while headline cyclicals like broad Industrials lagged in pure dollar flow this week.
Energy shows a similar nuance. URG and NXE (Oil, Gas and Consumable Fuels) plus LTBR and SRUUF (Uranium / Oil, Gas and Consumable Fuels) and DTM (Oil and Gas Midstream) and FLOC (Oilfield Services) are on the list. This is not a “crude beta” trade, it is transport, midstream toll models, uranium fuel, and services. That lines up with what we saw in sweeps and the weekly rotation: crude-sensitive cyclicals were not the dominant dollar magnet on the sector board, but energy and utilities were gaining near-term momentum, and Utilities themselves were a top short-term improver. Midstream and uranium exposure fits the current macro narrative of structurally tight energy supply, grid demand from AI data centers, and a policy environment that is openly debating nuclear’s role in base-load capacity. In other words, the market is selectively long the “pipes and power” piece of Energy, not the pure commodity beta. That is classic late-cycle behavior: sponsor the infrastructure cash flows, not the volatile barrel.
Financials show up, but not the way traditional macro playbooks would predict. You get MFIC and BUR (Asset Management / Litigation finance), EVR (Capital Markets), HUT (Capital Markets, crypto-adjacent), and mortgage credit proxies like RKT and LDI (Mortgage Finance), plus KMPR and ARX (Insurance / Insurance Brokers), and even CCCX / HOND (Shell Companies/SPAC structures). There is almost nothing here about traditional regional banking, which struggled in our sector rotation board and has not led flows. Instead, this is capital-markets plumbing, specialty finance, and mortgage flow. That fits a world where rate-cut expectations have revived the housing complex and mortgage origination optionality without really fixing credit spread concerns for broad financials. Lower mortgage rates tend to stimulate origination volume and refi optionality, which supports mortgage finance names even if net interest margins are still being squeezed in the banking system when the curve is unstable. Again, selective, not broad.
We also see Real Estate and REIT adjacency in AHR (REIT - Healthcare Facilities), FRMI (REIT), FSV (Real Estate Management and Development), and housing-adjacent consumer cyclicals like REVG (Autos, which often behaves like a consumer credit proxy), ONON / ATZAF / EVLV (Apparel / Specialty Retail), and ZK (Auto Manufacturers). But the REIT focus is narrow: healthcare facilities, management platforms, and niche yield. That lines up with the 2-day improvement we saw in Real Estate on the rotation board even while classic Financials and Industrials momentum cooled. The tape is saying: if rates edge lower, certain yield vehicles and certain housing/consumer discretionary names reprice quickly, but nobody is betting on a generalized “Main Street is booming” soft landing yet.
Finally, there is a clear presence of vehicles that express pure high-beta index or growth tilt: IWY (Large Caps Growth), STRV (Large Caps), QQQ (Large Caps Technology), FNGS (Megacaps), XSHQ (Small Caps Blend), IMCB (Mid Caps), AIQ (AI in Large Caps). These are not sleepy Vanguard core funds — they are style buckets. That matches the top-down flow story we just walked through where SPY, QQQ, and other large-cap wrappers were the single biggest dollar sinks in both lit and dark pools. Institutions are essentially saying: we still want scalable liquidity first, and we will bolt on factor tilt (Growth, AI, Megacap, Small Cap Quality) with targeted ETFs and structured products rather than spray cash across the entire tape.
If you zoom out, the theme set from this TRV watchlist is almost eerily consistent with the institutional flow profile we just analyzed. Money is concentrating in three places: first, scalable growth and AI/platform exposure, including leveraged expressions and targeted long/short single-name views in the tech franchise; second, healthcare as both speculative upside (biotech) and structural cash flow (providers, services) with even levered bull expressions showing up; and third, “real economy critical path” plays in defense, energy infrastructure, uranium, grid hardware, mortgage credit, and specialized REITs. What is missing is broad cyclicals, traditional Industrials beta, and generic Financials beta. The book is not betting on a wide global reacceleration. It is betting on secular spend (defense, infrastructure, grid), policy-supported carry (utilities, midstream, mortgage credit), and long-duration growth (AI, biotech, mega-cap tech).
VL Institutional Outliers™ (IO)
Institutional Outliers is a proprietary metric designed to spotlight trades that significantly exceed a stock’s recent institutional activity—specifically in terms of dollar volume. By comparing current trade size against each security's recent normalized history, the metric flags outlier events that may indicate sudden institutional interest but may be missed because the activity doesn’t raise any flags/alerts when comparing the activity against the ticker’s entire history. For example, it’s conceivable that a ticker today receives the largest trade it has had in the last 6 months but the trade is unranked and would therefore be missed by current alerts built off Trade Ranks. Use “Realized Vol” to identify tickers with large price displacement and to size your risk appropriately.
The IO sheet is basically the tape yelling where size got abnormal, not just active. These are the names and ETFs that printed statistically extreme dollar flow (multi-sigma vs their own recent history even if unranked), and that tells us where institutions were either urgently building, urgently unwinding, or urgently hedging. When you line that up with the TRV profile and the broader flow story we just walked through, three themes come into focus: rates and credit as a first-order macro sleeve, capacity and infrastructure as a structural bet, and targeted high-growth tech/biotech as the discretionary risk sleeve. Underneath that, there is a quiet but important read on housing, TIPS, and small-cap stress.
Start with the credit and rates complex. LQD printed roughly $2.7b at 2.71 sigmas, VCSH (short-term corporate credit) showed size at 2.97 sigmas, SJNK (high yield) had 4.1 sigmas of flow, JPST (ultra-short income) had 3.41 sigmas, and SCHP (TIPS) put up a 6.1 sigma outlier. We also see IAGG (global aggregate bonds) at 2.64 sigmas. That is a wall of money in corporate credit, front-end income, and inflation-linked paper all at once. The key is that this was not a panic bid into duration at the long end; this is credit and cash-like yield product getting stuffed with dollars. That matches what we already saw in the TRV list where mortgage finance, asset managers, insurance carriers, and short-duration liquidity sleeves were being accumulated. It is exactly what you would expect if the market believes policy is moving toward easier financial conditions into year-end and wants to capture carry while front-running a softening in rate volatility. The fact that SCHP (TIPS) saw an extreme 6.1 sigma flow alongside corporate credit says the tape is still hedging the risk that inflation does not die cleanly, even while reaching for spread income. That maps cleanly to the current macro backdrop: the Federal Reserve has been signaling a bias toward eventual easing while still acknowledging that inflation is not yet fully back to target, so the market keeps positioning for disinflation without assuming deflation. LQD also showed up earlier as a recurring destination in both dark pools and tactical sweep flow, and here it is again at the very top of the IO list. That is not a trade, that is allocation.
The second big cluster is “capacity and infrastructure.” There is a whole block of Industrials, Energy infrastructure, Materials, and Utilities showing statistically abnormal prints: BE with ~$598m at 3.46 sigmas in Electrical Equipment and Parts; AOS and CSL in Building Products; GGG and NDSN in Machinery; VRT in Electrical Equipment and Parts; AME in Electrical Equipment; HEI in Aerospace and Defense; CRH in Construction Materials; RIO, CLF, and MT in Metals and Mining; STNG in Oil, Gas and Consumable Fuels; LNG in Oil, Gas and Consumable Fuels; APD and ALB in Chemicals; ATO and OGS (Gas Utilities); BEPC (Independent Power / Renewable Electricity); and URNM in Uranium. This is almost a perfect mirror of what we just pulled out of the TRV list: money is not spraying at “cyclicals,” it is drilling into the plumbing of the real economy. Defense (HEI), grid and energy infrastructure (BE, VRT, BEPC, LNG), specialty industrial process flow (AME, CSL), and critical materials (RIO, CLF, URNM, APD, ALB, CRH) all popped in unusually large dollar blocks. That is the same national-capability / energy-capacity theme we called out in TRV with names like RKLB, IESC, DTM, URG, and NXE. It lines up with two macro forces. One, governments globally are funneling money into rearmament, energy security, transmission capacity, and reshoring of critical inputs, which continues to support defense, grid hardware, and critical minerals demand. Two, the power and thermal load required to support AI-scale compute buildouts is forcing real capital spending into power generation, transmission, backup, and cooling, which pushes dollars toward industrial energy infrastructure and grid tech rather than just software. Seeing BE, VRT, LNG, and ATO/OGS all light up in the same session is not random. That is the market underwriting the “keep the lights on for AI and reshoring” story.
Third, the growth/innovation sleeve is still absolutely alive, and it is not shy size. NET (Software - Infrastructure) showed ~$571m at 4.24 sigmas with a positive percent move. TEAM (Application Software) had ~$205m at 3.02 sigmas and closed higher. HUBS, SPSC, SNOW, DOCN, ALKT, and AMPL all posted multi-sigma flow in software / application software / infrastructure / IT services, many with green closes on the day. WTAI, which screens as Artificial Intelligence, showed 3.26 sigmas of flow. TECL, a 3x Bull Technology product, even shows up here with 2.79 sigmas of flow despite closing slightly red, which tells you there was still levered demand trying to lean into the tech complex intraday. That lines up one-for-one with the “growth at scale plus levered expression” theme from TRV. Institutions continue to pour money into software infrastructure, AI exposure, and platforms, but the IO list adds a nuance: this is not just passive wrappers. These are single tech franchises and pure-play AI thematic products taking statistically abnormal size. That tells you real money is still actively allocating risk budget to software and AI, not just sitting in QQQ.
At the same time, dispersion within tech is very visible. NVDS (1.25x Bear NVDA) shows up at 3.29 sigmas, FORM (Semis / testing and interface) printed 3.53 sigmas but closed down, and TECL got hit while still trading heavy size. That mirrors what we saw in TRV, where there were bull products levered to META and HIMS sitting next to bear products on TSLA and AMD. The message is that the market is no longer treating “tech” as a monolith. It is long infrastructure, security, workflow, and AI distribution platforms, and it is selectively fading the most extended single-name silicon stories on a relative basis. That’s classic late-stage leadership behavior: capital keeps flowing into the theme, but traders are now playing offense and defense inside the same ecosystem.
Healthcare shows up again, and it shows up loud. MNMD (Biotech) at 6.03 sigmas with a green close, LGND (Biotech) at 3.94 sigmas, XBI (Biotech ETF) at 2.76 sigmas, DAWN, TVTX, RCUS (Biotech), plus ATEC and EW (Health Care Equipment and Supplies) all printed multi-sigma flow. Some of these closed up hard, some bled, but the point is that biotech and medtech are not sleepy. They are being traded like a live risk sleeve, the same message we got from TRV where biotech dominated the top scores and where we even saw a 3x Bull Healthcare product. This lines up with what we saw on the sector rotation dashboard: Healthcare is a current leadership sector and still gaining short-term momentum. Money is clearly comfortable paying for upside in drug innovation and specialized devices again. That tends to happen when rate expectations start to lean dovish, because high-duration growth cash flows in biotech and medtech get marked up when financing costs are perceived to be easing.
Consumer and housing sensitivity show up in interesting pockets rather than broad discretionary. CVNA printed an enormous ~$861m at 3.03 sigmas and finished green. CCL was a ~2.8 sigma outlier with a modest gain. TMHC (homebuilder / household durables) saw ~3.74 sigmas. LKQ printed 2.78 sigmas in auto parts/distribution. NWL also shows up with a high-sigma outlier in household durables. These are very specific stories: used autos/credit-driven consumer platforms (CVNA), travel/leisure capacity (CCL), and housing-adjacent durables (TMHC, NWL). That dovetails with what we saw in TRV, where mortgage finance, REIT management, and housing-linked discretionary retail were bid. The market is not saying “the consumer is on fire.” It is saying “credit-sensitive, rate-sensitive corners of the consumer complex can still work if financial conditions ease and if refinancing or discretionary spend pockets reopen.” There is a direct macro link here: if the rate path is perceived to be topping and drifting lower into year-end, housing affordability improves at the margin and refinancing capacity creeps back in, which tends to support homebuilders and mortgage originators before it ever shows up in generic retail sales data.
Real Estate quietly confirms that same read. FRT (REITs), GEO (REITs), AMH (REITs), and FSV (Real Estate Management and Development) all hit multi-sigma flow. GEO is carceral, AMH is single-family rental, FRT is higher-end retail REIT exposure, and FSV is management/services. That is not broad XLRE beta, that is very specific yield and cash-flow stories. We already saw in TRV that REIT exposure is getting more selective, focused on healthcare facilities and management rather than broad office. IO shows the same thing: capital is picking through REIT subsectors for balance-sheet strength and cashflow resiliency rather than buying the entire real estate complex.
Finally, look at the global allocation tells. SCZ (Europe, Australia, Far East small/mid), EFA (developed ex-US large blend), SPEM (emerging markets), SCHC (international small caps), JGRO and VONG (US growth factor), USMV (US low volatility). All printed multi-sigma dollar flow. That is a rotation into style and region exposures in size, not just SPY. We saw this in TRV with IWY (Large Cap Growth), STRV (Large Caps), XSHQ (Small Caps Blend), IMCB (Mid Caps), and so on. IO confirms it: institutions are actively tilting factor sleeves (growth, low vol), geography (developed ex-US, EM), and cap buckets (small-cap international) instead of just buying “the world index.” That tends to happen into macro inflection points where investors want to express relative views on currencies, rate differentials, and global growth pockets, rather than simply increasing gross exposure everywhere. Developed markets ex-US and EM flow at multi-sigma levels alongside domestic growth and low-volatility wrappers suggests portfolio-level rebalancing, not just a headline chase.
In other words, IO is telling the same story as TRV. The most statistically extreme prints are not in generalized cyclicals or broad financials. They are in credit carry, TIPS, infrastructure and capacity buildout, AI/software infrastructure, biotech/healthcare, housing-credit proxies, and carefully chosen global and style tilts. On the margin, you also see targeted dispersion bets inside megacap tech (bear NVDA, levered bull Tech) and inside small caps (TZA, 3x Bear Russell 2000, still showing up), which tells you not everyone believes the soft-landing story extends to the whole curve. The portfolio that emerges from this is the same barbell we have been describing: carry plus capacity plus innovation, with a macro overlay that assumes policy support, structurally high strategic spend, and still-fragile breadth in domestic small caps.
VL Consensus Prices™
These are the most frequently traded #1-Ranked Levels in VL this week. Trades occurring at the highest volume price in a ticker’s history are significant because they represent institutional engagement at a key price memory level—where the market once found consensus. These areas act as liquidity hubs, enabling large players to transact efficiently, and often signal a reassessment of fair value. This activity may precede major moves, mark equilibrium zones, or reflect broader portfolio shifts, making these price levels important to watch even without yet knowing how price will resolve. (Note: many Bond products trade in such a tight range that they dominate the top positions and are therefore omitted to provide better clarity around other flows. The bonds data is still available in the VL platform.)
The consensus levels list is telling us where a ticker is doing the heaviest trading at the most transacted prices in its entire history. When a name sits there, it usually means big money has agreed on a fair value zone and is either quietly accumulating inventory or quietly distributing it. Lined up against what we already saw from TRV and IO, three themes jump out: (1) real assets, energy, and capacity build are still core, not trade; (2) yield, cashflow, and credit-sensitive cash generators are getting institutional sponsorship; and (3) there is a very intentional sorting under the hood of tech, consumer, and housing rather than a broad, dumb beta chase.
First, capacity and energy security are not a side story. They are sitting right at long-term consensus cost bases. BP, CVX, CVE, GLNG, OKE, BTU, IXC, LBRT, FTI, SMR all show up in consensus. That is upstream oil and gas, integrated oil, gas transport, LNG, coal, oilfield services, global energy majors, and even nuclear / small modular reactor exposure. We also see CX (Construction Materials), CNH (Farm and Heavy Construction Machinery), TRN (Machinery), JBI (Building Products and Equipment), APG (Engineering and Construction), and HGV and QSR in services tied to real-world capacity and discretionary spend. This matches the IO outliers we just walked through: industrial buildout names, energy infrastructure names, chemicals, materials, and grid-related plays were all getting abnormal dollar flow. It also matches TRV, where Industrials, Energy infrastructure, and “keep the lights on” components like DTM, IESC, LNG analogs, and uranium/fuel cycle names were showing strong sustained interest. The consensus list tells us that this is not just hot money squeezing a move for a day. We are literally sitting on top of multi-year high-volume shelves in global energy (BP, CVX, CVE), midstream / transport (OKE, GLNG), and build-capacity infrastructure (CNH, TRN, APG). That is what structural accumulation looks like. Institutions are deciding that energy security, logistics, extraction, and build capacity are strategic assets, and they are willing to print their largest-ever volume by price right there instead of waiting for a cheaper reset.
Second, income and cashflow sleeves are locking in levels. JEPI, JEPQ, SPYD, BUYW, and IBIT all show up. JEPI and JEPQ are covered-call style large-cap income / growth-income wrappers. SPYD is high-dividend S&P exposure. BUYW looks like a newer buyback or income-optimized wrapper. IBIT is Bitcoin exposure. This rhymes with what we saw in IO: huge multi-sigma dollar flow in LQD, VCSH, SCHP, JPST, SJNK, USMV, JGRO, VONG. The tape is explicitly carving out factor sleeves for carry, yield, and style (dividends, low vol, growth) instead of just piling into SPY. Consensus-level activity in JEPI, JEPQ, SPYD tells you institutions are literally agreeing on where they want to hold their yield posture in US equities. That is important because it reinforces the “carry plus cashflow” barbell we talked about: credit (LQD, SJNK, VCSH) plus equity income (JEPI/SPYD) plus idiosyncratic cashflow / hard-asset capacity (energy, midstream, LNG). IBIT and BITX (levered Bitcoin) being here alongside those income wrappers says the hunt for nontraditional yield / optionality is still alive. Crypto shows up as a sanctioned risk sleeve on the same list where pension-style products like JEPI sit. That is not speculative retail behavior; that is institutional money treating Bitcoin exposure as a portfolio building block next to dividends and credit, which is something we have seen more of as crypto has been pulled into regulated ETF form and made allocatable.
Third, the housing and credit transmission chain keeps coming up, and that is exactly what TRV and IO also lit up. RKT (mortgage finance), UWMC (mortgage finance), RITM (mortgage REIT), and a wall of REITs tied to specific property types are sitting at consensus shelves: KIM, SCHH, EQR, PECO, OUT, PLYM, DEI, TRNO, EXR, ADC, COMP, SILA. This is not broad XLRE. It is targeted real estate and financing infrastructure. KIM, PECO, OUT, and TRNO point toward retail, necessity real estate, and logistics / industrial leasing rather than trophy offices. RITM and mortgage lenders like RKT and UWMC speak to the rate path: if the market thinks mortgage pressure is near peak and refinancing or origination capacity can come back, those names become levered expressions of “we are past the worst.” That is exactly what we inferred from IO when we saw TMHC (homebuilder), LKQ (auto parts / affordability), and CVNA (credit-driven used autos) drawing high-sigma flow. It is also consistent with the credit bid in LQD and SJNK. The big money bet looks like this: if rate volatility cools and financing stabilizes, cashflow-heavy REIT subsectors and mortgage originators will survive and reprice higher, and we want exposure at these consensus shelves before that moves.
Fourth, banks and capital markets are present, but in a selective and almost surgical way. HBAN, BANC, WABC, RNST, SSB, XP, CRBG, BAM, OWL all sit at long-term consensus levels. These are mostly regionals, specialty finance, capital markets platforms, and alternative asset managers. This lines up cleanly with IO, where we saw insurance, asset managers, and capital markets names getting multi-sigma flow, and with TRV, where Financial Services (asset management, mortgage finance, insurance) was a funded sleeve rather than broad KRE beta. To put it plainly, big money is not saying “the entire US banking system is a buy.” They are saying “we want balance sheets and fee platforms levered to capital markets, private credit, and securitized cashflow if the credit cycle doesn’t break.” That matches the broader market story right now: institutional credit appetite has pushed private credit, structured credit, and alternative lending into mainstream allocation, and that capital prefers fee-rich platforms and specialty lenders over generic regionals. Seeing HBAN at consensus alongside XP and BAM says desks are still very interested in distribution, origination, and fee streams tied to capital raising, M&A, and wealth, not just net interest margin.
Fifth, tech is not going away, but it is segmenting. A lot of software and infrastructure names have reached or are sitting on historic volume shelves: INFY, WIT (IT services, offshore / global services), VRNT, SPNS, PRO, APP, CWAN, VRNS, XYZ, IAS (adtech / advertising infrastructure), AUR and BBAI (autonomy / AI services), IOT and GDDY (infrastructure and web presence), and DIS and AMZN in consumer-facing platform land. We also see ON in semis. This is basically two buckets. One is enterprise software / infrastructure / automation / AI tooling (NET, TEAM, HUBS, SPSC, etc. showed up as IO outliers; here we see their cousins). The other is scaled consumer platforms and engagement engines that monetize attention and data (DIS, AMZN, IAS). What matters is not that tech shows up. It is that tech and AI infrastructure names are literally building consensus volume shelves right now, which implies institutions are still willing to sponsor them at current valuations rather than demanding a big discount first. That lines up with IO, where NET, TEAM, HUBS, and SNOW were all multi-sigma dollar magnets, and with TRV, where AI / infra / workflow tools and levered AI wrappers kept bubbling up. The read is consistent: “AI plus enablement plus distribution of AI at scale” is still where real money is willing to pay. At the same time, consensus footprints in AUR (autonomous driving), BBAI (AI services), and ON (semis) plus the presence of a bear TSLA product in TRV and a bear NVDA product in IO tell you the market is sharpening the knife inside tech leadership. AI-infrastructure and AI-enablement keep getting sponsored; hyper-stretched stories get traded, hedged, and sometimes shorted.
Sixth, China and global ex-US growth are not being ignored. FXI (China large cap ADRs) sits at a historic consensus level with 1,500+ trades going back to 2007. That means US investors and cross-border desks are still willing to transact meaningful size in China at this price zone instead of walking away. You also see XP (Brazil-focused capital markets), PBR-adjacent energy stories via GLNG and CVE-style global fuel, and materials/commodities plays like RIO, CX, and AG. That ties back to IO, where SCZ, EFA, SPEM, and other non-US exposures printed multi-sigma flow. It also supports the TRV observation that capital is actively tilting region and factor rather than just buying SPY. Institutions are clearly trying to express macro views on external demand, FX, and commodity leverage at specific price shelves, not just inside US tech.
Finally, there is a quiet but important appearance of defensive cashflow and staple demand. CL (household products), CVS (health services / pharmacy), MAT (Leisure Products but tied to evergreen IP and consumer staples-like repeatability), AEO and EYE (specialty retail), KMX (auto retail), and even DIS sit alongside more cyclical consumer names like AMZN and QSR. You also have utilities exposure through NWE and SWX, and gas utilities like SWX and the ATO/OGS complex from IO. This lines up with the sector dashboard we just covered: Healthcare, Utilities, and Energy were high on leadership, and those are the classic “defensive cashflow with pricing power or regulated rate base” sleeves. The consensus list says money is actively agreeing on fair value zones for those businesses. That means the market is not pricing a melt-up fantasy. It is building a barbell of regulated cashflow and essentials against high-growth AI/software and strategic energy / capacity build.
So the consensus-level tape basically confirms that what we saw in TRV (sustained accumulation), and IO (statistical aggression) is not a fluke. The heaviest volume shelves in years are clustering around three big arcs. One, energy security and physical capacity build: oil, gas, LNG, uranium, construction, heavy equipment. Two, income and financing transmission: dividend wrappers, covered-call income funds, mortgage finance platforms, focused REIT subsectors, specialty lenders and asset managers, front-end credit and TIPS. Three, targeted secular growth: AI infrastructure, workflow software, data/engagement platforms, and select consumer platforms with scale economics. That is exactly the “carry plus capacity plus innovation” posture we already mapped, but here we can see the market literally choosing where it wants to own those stories for size and duration.
MIR Part 3: Framing-Up A Trade
The tape this week is not random rotation — it is coordinated repricing across three pillars of the modern cycle: carry, capacity, and code. Credit and income vehicles are being accumulated in size; energy and industrial infrastructure are sitting on long-term consensus shelves; and high-quality software and AI infrastructure continue to draw abnormal flows even as the market discriminates within the theme. Taken together, the institutional message is that portfolios are being re-built for policy easing without collapse — a soft-landing, capacity-investment regime with structural spend and disciplined risk.
In that environment, chasing index beta is the wrong trade. The better play is to own the barbell that institutions are clearly constructing: short-duration yield and credit on one side; energy, industrials, and AI infrastructure on the other; with healthcare and selective housing credit as the middle ballast.
Rate-volatility and breadth measures both argue for maintaining exposure but emphasizing resilience over leverage. Credit is being bid, small caps are not, and volatility compression favors high-cashflow assets. At the same time, sustained TRV improvement in AI, infrastructure, and biotech says idiosyncratic alpha is alive. So the correct posture for the week is to run moderately long net exposure (~65-70%), overweight carry and capacity, underweight pure cyclicals, and fund risk through selective short/hedge overlays in over-extended megacaps or small-cap beta.
1. Income & Credit Carry (30%)
Anchor stability and monetize the ongoing institutional bid in credit and yield. The IO tape confirmed massive size in corporate credit, short duration, and equity-income wrappers — a clear sign that carry, not convexity, is driving portfolio construction.

12% LQD – Core investment-grade credit exposure
10% JEPI / SPYD – Equity-income and dividend yield wrappers favored by pensions
5% SJNK – Tactical high-yield spread exposure
3% SCHP – TIPS hedge for residual inflation risk

2. Energy & Capacity Infrastructure (25%)
Express the structural “capacity build” theme — energy security, grid reinforcement, and industrial reshoring — that appeared simultaneously in TRV, IO, and Consensus. This sleeve captures real-asset pricing power and global re-industrialization flows.

8% XLE or CVX/BP – Integrated energy majors anchoring global supply
6% BE / VRT – Electrical equipment and grid infrastructure
5% LNG / STNG – Midstream, storage, and transport
3% URNM – Uranium and nuclear-fuel cycle exposure
3% APD / CRH – Chemicals and construction materials

3. AI / Software Infrastructure (20%)
Stay long innovation, but move down-cap into the infrastructure, workflow, and security layers still drawing real money. This sleeve keeps exposure to the digital build-out without paying stretched megacap multiples.

6% NET / HUBS / TEAM – Core software infrastructure and collaboration platforms
5% SPSC / DOCN / ALKT – Application-layer enablers with recurring growth
4% WTAI – Broad AI theme ETF for diversified exposure
3% TECL – Tactical leveraged bull for short-term participation
2% NVDS – Offset to megacap over-extension, particularly NVDA

4. Healthcare & Biotech Momentum (15%)
Capture sector leadership and volatility expansion in biotech and med-tech. High-duration cashflows here are being re-rated as rate expectations soften, and the IO tape shows sustained risk appetite.

6% XBI – Broad biotech ETF for diversification
4% MNMD / TVTX / RCUS – High-beta innovation leaders
3% EW / ATEC – Device and equipment names with earnings visibility
2% CURE – Leveraged healthcare sector exposure

5. Real Estate, Mortgage Credit & Housing Transmission (10%)
Express easing bias through the credit channel. Institutions are accumulating mortgage finance and selective REIT subsectors, not broad property beta.

4% RITM / RKT / UWMC – Mortgage origination and servicing platforms
3% KIM / PECO / OUT – Necessity-based and retail-anchored REITs
3% FSV / COMP – Real-estate management and services

6. Tactical Overlays & Hedges (up to 10%)
Use flexible, short-dated instruments to neutralize beta and protect gains. Maintain agility as breadth remains fragile.

-3% TZA – Hedge small-cap exposure
-2% TSLS – Hedge concentrated auto and consumer cyclicals

Balance in cash or short-dated Treasury bills as dry powder
Over the past several weeks, SPY and QQQ have served as efficient vehicles for expressing directional bias or liquidity re-entry. They worked because institutional liquidity was broad, not deep — flows were index-centric, and market makers were hedging systemic delta exposure. This week’s tape looks very different.
The institutional flow structure (TRV + IO + Consensus) has narrowed dramatically. Instead of broad-based allocations to beta, we’re seeing selective accumulation inside energy, credit, and infrastructure, while index volumes are heavy but rotational — not additive. In other words, the market is redistributing exposure within the S&P and Nasdaq, not adding net exposure to them.
A few key reasons I stepped away from SPY/QQQ exposure this week:
Liquidity vs Directionality.
The liquidity time series shows strong prints into month-end and quarter-end, but they look structural — rebalancing and dividend capture — not directional. When liquidity is high but not chasing, broad ETFs like SPY/QQQ tend to stall or chop rather than trend.Breadth and Concentration Risk.
Breadth has deteriorated for four consecutive sessions even as the indices held firm. The largest 7–10 names in QQQ now account for an even greater share of flow, but the IO tape flagged hedge activity (bear NVDA product, mixed AI sweeps). That’s not the backdrop for adding passive index risk.Precision over Beta.
When institutional behavior becomes segmented — heavy size in LQD, JEPI, energy infrastructure, uranium, and mid-cap software — buying SPY or QQQ is effectively diluting those edges. The point this week is to mirror the barbell the tape is actually building, not to average it out into index exposure.Carry-Friendly Volatility Regime.
Rate-volatility compression and a dovish-tilting Fed mean carry assets outperform pure equity beta. Allocating to income, credit, and high-cashflow sectors yields better risk-adjusted return than buying an index whose top constituents already reflect perfection.Asymmetric Setup.
Both SPY and QQQ are sitting near consensus volume shelves with limited upside catalysts until CPI and the next FOMC communication. The risk/reward for index exposure is unattractive: plenty of support, little torque.
So, this week’s absence of SPY and QQQ isn’t a bearish statement — it’s a tactical shift from beta to basis. The institutional tape says the opportunity lies in the composition of the market, not its direction. Until breadth confirms and sweeps rotate back into indices, I’d rather extract alpha from the sectors and instruments actually being funded than pay full price for index-level noise. If the coming week’s flows flip — say, renewed sweep activity in SPY/IVV/VOO and a synchronized uptick in QQQ dark-pool accumulation — then I’d reintroduce index beta as a liquidity proxy. But for now, precision beats participation.
Portfolio posture: roughly 65–70% net long after hedges, skewed toward quality, yield, and secular growth. It is a portfolio built for an easing-without-crisis regime — where liquidity is returning, energy and infrastructure remain strategic, and innovation continues to attract real allocation rather than speculative chase. Triggers that would force a mid-week re-evaluation: Breakdown in credit-ETF inflows (LQD/SJNK), VIX > 25 without sector rotation, or sustained outflow from industrial/energy infrastructure ETFs.

Thank you for being part of our community and for dedicating your time to this edition. Your insights and engagement drive everything we do, and we’re honored to share this space with such committed, thoughtful readers. Here’s to a week filled with clear opportunities and strong performance 💰💰💰
— VolumeLeaders