Market Momentum: Your Weekly Financial Forecast & Market Prep
Issue 67 / What to expect Oct 27, 2025 thru Oct 31, 2025

In This Issue
Weekly Market-On-Close Report: All the macro moves, market drivers, and must-know narratives—covered in less than five minutes.
Weekly Benchmark Breakdown: Our weekly intelligence report on major indices cuts through the index-level noise to uncover participation, momentum, and structural integrity and tell you whether markets are rising on solid ground or skating on thin breadth. This is where bull markets prove themselves—or quietly start to unravel.
The Latest Investor Sentiment Readings: Track the emotional pulse of the market with our curated dashboard of sentiment indicators. From fear-fueled flight to euphoric overreach, this week's readings reveal whether investors are cautiously creeping in—or stampeding toward the exits.
Institutional Support & Resistance Levels For Major Indices: Exactly where to look for support and resistance this coming week in SPY, QQQ, IWM & DIA
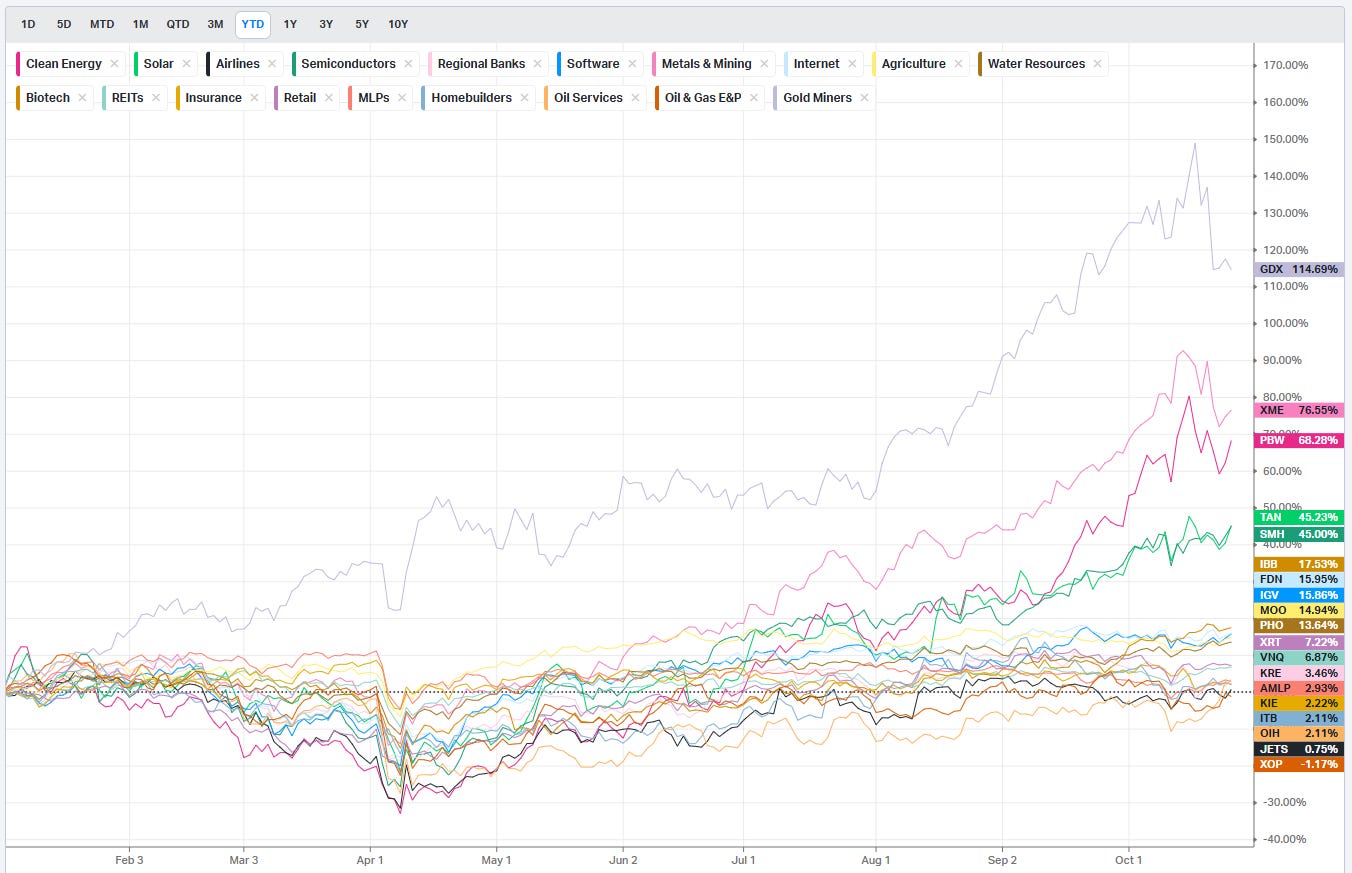
Normalized Performance By Thematics YTD: Which corners of the markets are beating benchmarks, which are overlooked and which ones are over-crowded!
Key Econ Events & Earnings On-Deck For This Coming Week
Market Intelligence Report: Track the real money. This section breaks down where institutions are placing their bets—and pulling their chips. You'll get a sector-by-sector view of flows, highlighting the most active names attracting large-scale buying or selling. We go beyond the headlines and into the tape, surfacing the week’s most notable block trades and sweep orders, both on lit exchanges and hidden dark pools. Whether you're following momentum or fading crowded trades, this is your map to where size is moving and why it matters.

Weekly Market-On-Close Report
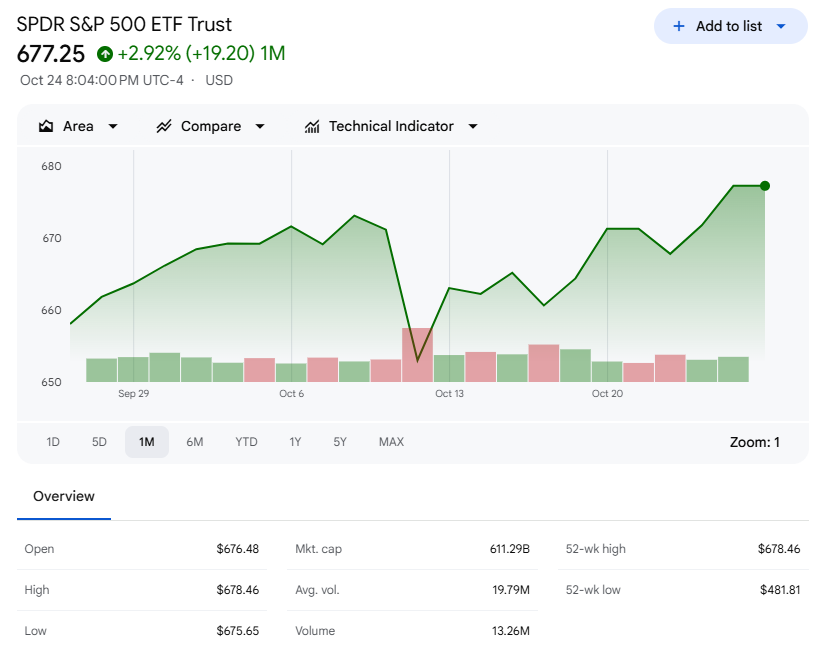
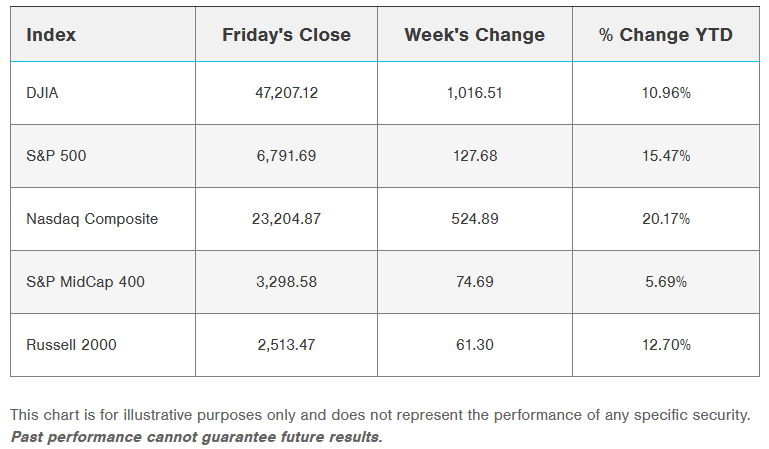
The market closed the week by doing something simple and decisive: it set new records while absorbing policy noise, headline risk, and a still-disrupted data calendar. The S&P 500 Index rose +0.79% on Friday, the Dow Jones Industrials Index gained +1.01%, and the Nasdaq 100 Index advanced +1.04%. The futures market ratified the move with December E-mini S&P (ESZ25) up +0.74% and December E-mini Nasdaq (NQZ25) up +1.00%. Both the S&P 500 and the Nasdaq 100 rallied to new record highs, with the S&P 500 clearing 6,800 for the first time after spending nine straight sessions inside a 200-point intraday range carved out on October 10. That break above range and through the 20-day moving average came with the tape buying dips and respecting the 50-day moving average as support.
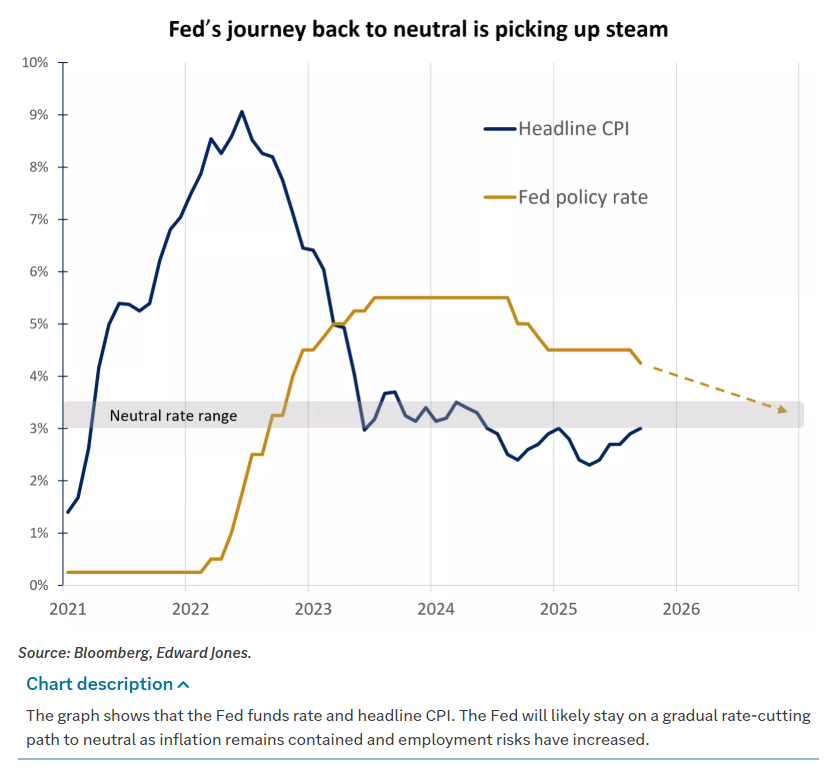
The macro catalyst that mattered most was the September inflation print. The CPI report came in cooler than expected at +0.3% m/m and +3.0% y/y versus +0.4% and +3.1% expected. Core CPI slowed to +0.2% m/m and +3.0% y/y versus +0.3% and +3.1% expected. Markets read that as giving the Federal Reserve more latitude to cut rates. The nuance matters: the headline +3.0% y/y ticked up to match a 16-month high, and the +3.0% y/y core rate is still far above the Fed’s +2.0% target, but directionally the mix eased pressure. Activity data helped too. The October S&P Global U.S. manufacturing PMI rose +0.2 to 52.2 versus 52.0 expected, and services PMI rose +1.0 to 55.2 versus a consensus for a decline to 53.5. The one soft spot was the final October University of Michigan consumer sentiment reading, which slipped -1.4 points to 53.6 versus 54.5 expected. On net, growth held, inflation cooled at the margin, and the policy path opened a bit.
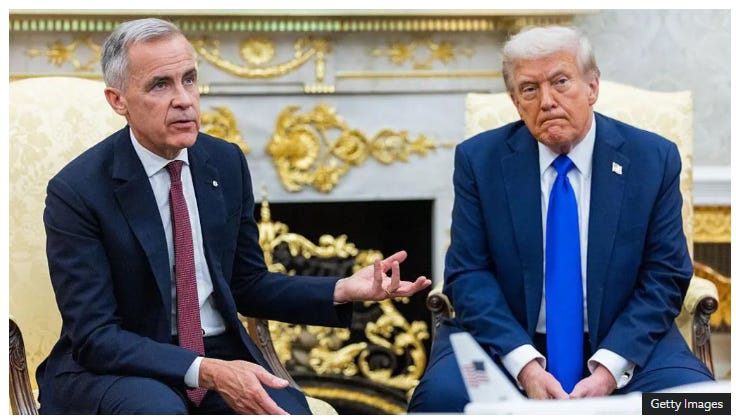
Policy and geopolitics generated noise without changing the market’s mind. The government shutdown rolled into its fourth week, delaying a series of reports including four weeks of initial jobless claims and the September payroll report. Bloomberg Economics estimates 640,000 federal workers are being furloughed during the shutdown, a dynamic that would expand claims and push the unemployment rate to 4.7% if it persists. Trade friction flickered: President Trump announced late Thursday he had terminated talks with Canada, citing an Ontario government advertisement that used a 1987 Ronald Reagan speech criticizing tariffs; he called the ad deceptive and claimed it was designed to influence the U.S. Supreme Court’s November 5 oral arguments on the legality of his reciprocal tariffs. Lower courts have already deemed those tariffs illegal; if the Supreme Court upholds those rulings, previously collected tariffs would be refunded and presidential tariff power constrained to well-founded sections of trade law. Ontario later said it would pause the ad campaign, and Canadian Prime Minister Carney said Canada is prepared to resume talks “when the Americans are ready.”
On China, President Trump reiterated Monday he would boost tariffs “if there isn’t a deal” by November 1, and a Trump–Xi meeting is scheduled for next Thursday on the sidelines of the Asia-Pacific Economic Cooperation conference in South Korea. Markets largely faded the headlines relative to the week’s dominant forces: inflation, PMIs, a persistent shutdown, and corporate earnings.
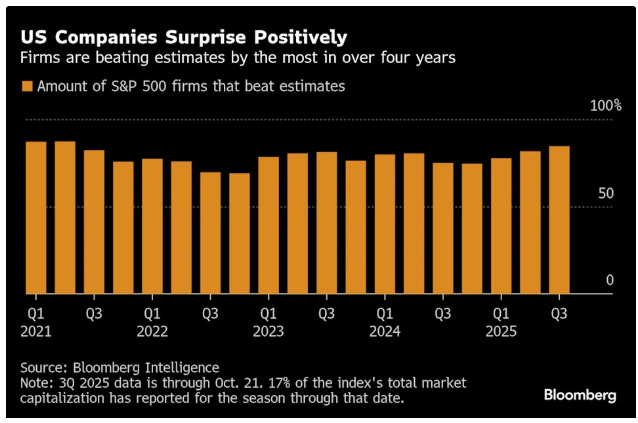
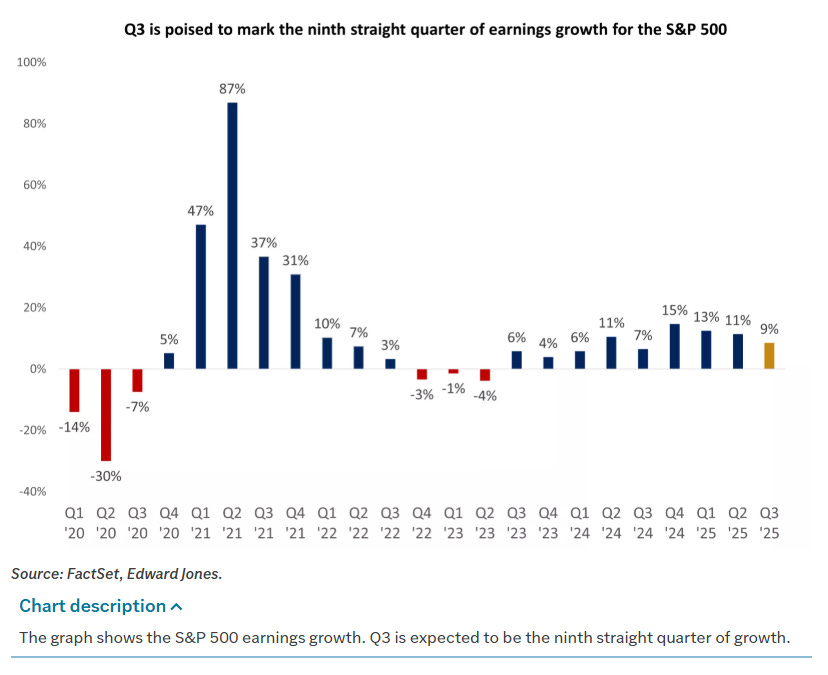
Earnings season added a tailwind even as growth decelerates from a high base. Bloomberg Intelligence noted that 85% of S&P 500 companies that have reported so far have beaten forecasts, pacing for the best quarter since 2021. The bar is not low: Q3 profits are expected to rise +7.2% y/y, the smallest increase in two years, and Q3 sales growth is projected to slow to +5.9% y/y from 6.4% in Q2. That backdrop helps explain a market that both rewards execution and punishes misses while keeping its allocation tilt in place.
A Breakout That Absorbed Volatility And Rotated Leadership
The last two weeks traced a recognizable arc. After a late-arriving cross-asset scare—Friday VIX spike, crypto de-leveraging, heavy options flows, and President Trump’s social post about taking Chinese tariffs “back up to Ben Joyce territory (triple-digits)”—the S&P 500 sank nearly 3% intraday on October 10 across a 200-point range, the largest point swing this year outside the early-April Tariff Tantrum. The index then spent nine straight sessions inside that range. Breadth improved even as the market chopped: small caps and mid caps outperformed large caps, and within the S&P 500, Information Technology and Energy led while Utilities and Consumer Staples lagged. By week’s end, the “momentum meltdown” in FOMO/MOMO/meme pockets—rare earths, nuclear, quantum computing, and short baskets—was already unwinding itself. This week extended that transition. The VIX eased below 20, the S&P 500 climbed +1.9% for the week to just under 6,800, and new highs printed again. Equal-weight still trailed but not disastrously. Thirteen of the 20 largest stocks rose 1–5%, with only modest declines among the rest outside Netflix.
The single-name tape reflected a healthy mix of factor tide and idiosyncratic waves. Among the “Magnificent Seven,” most finished higher Friday, with Tesla (TSLA) the exception at -3.4%. Alphabet (GOOG) and Nvidia (NVDA) each gained more than +2%.
Semiconductor participation broadened: Advanced Micro Devices (AMD) rallied more than +7%, Micron Technology (MU) more than +5%, and Broadcom (AVGO), Arm Holdings (ARM), and Lam Research (LRCX) each added more than +2%. Intel (INTC) rose +0.3% on favorable earnings and strong revenue guidance. Crypto-adjacent equities rallied alongside coin prices: Bitcoin rose +1% and Ethereum +2.7% on the day; Coinbase (COIN) jumped more than +9% on a JPMorgan upgrade to overweight from neutral tied to risk abatement and monetization opportunities, while Riot Platforms (RIOT) gained +4.5% and MARA Holdings (MARA) +1.7%. There were sharp losers too. Ford (F) rallied more than +12% on an earnings beat and optimistic commentary about rebounding from a supplier-fire disruption, Newmont (NEM) fell more than -6% as the company said 2026 gold production may be no higher than in 2025, and Deckers Outdoor (DECK) dropped more than -15% on disappointing 2026 net sales guidance.
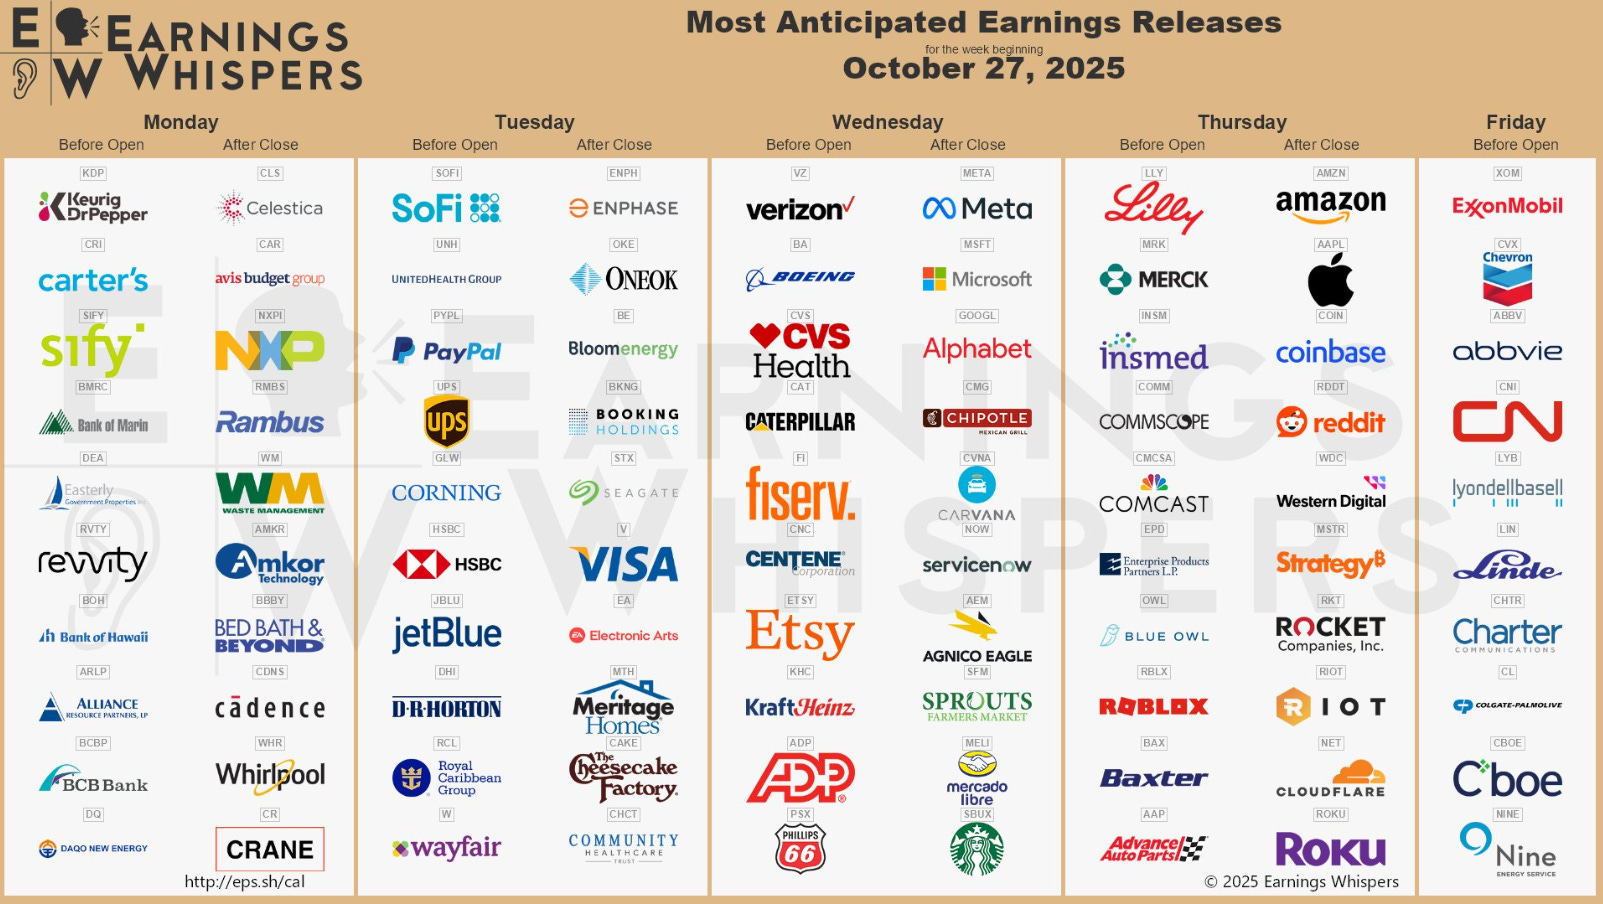
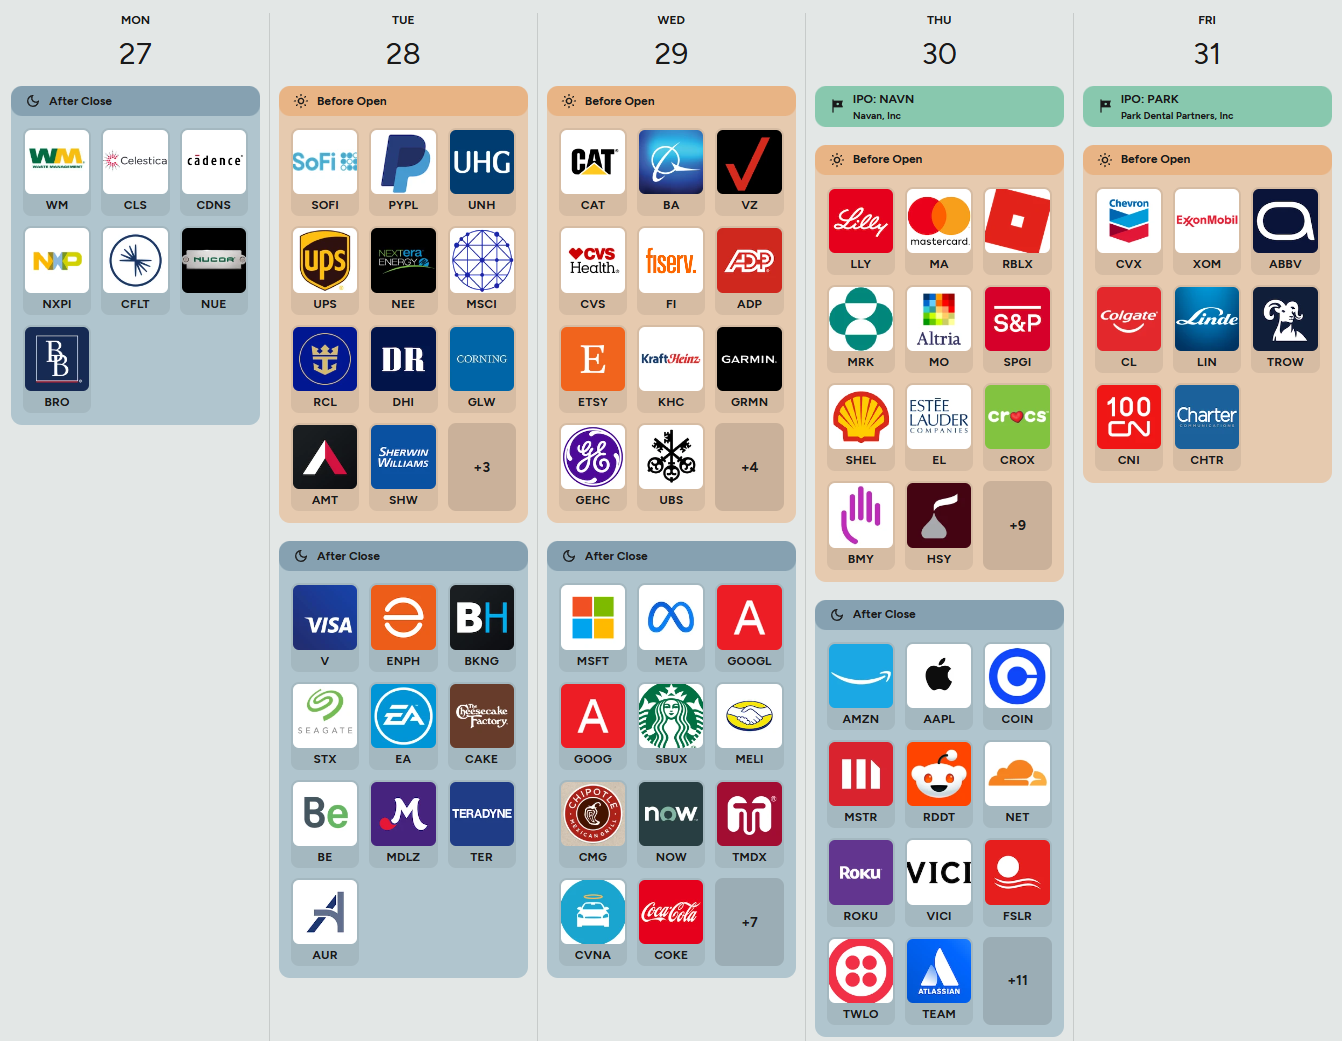
The coming earnings slate is heavy and will test whether leadership can broaden without breaking. On October 27, 2025, Keurig Dr Pepper (KDP), Revvity (RVTY), Arch Capital Group (ACGL), Whirlpool (WHR), Simpson Manufacturing (SSD), Alexandria Real Estate Equities (ARE), Brixmor Property Group (BRX), Nucor (NUE), NOV (NOV), Hartford Insurance Group (HIG), Brown & Brown (BRO), Cincinnati Financial (CINF), Crane (CR), F5 (FFIV), Universal Health Services (UHS), Amkor Technology (AMKR), FTAI Aviation (FTAI), Principal Financial Group (PFG), Kilroy Realty (KRC), Welltower (WELL), Avis Budget Group (CAR), Cadence Design Systems (CDNS), Confluent (CFLT), Olin (OLN), Waste Management (WM), BioMarin Pharmaceutical (BMRN), and NXP Semiconductors (NXPI) are on deck. The following two weeks bring nearly 60% of the index, including much of the heavy platform cohort; that group is expected to post 15% y/y earnings growth compared with 6.7% for the remaining 493 companies and 8.5% for the index overall.
Inflation Mechanics And What They Mean For Margins
The CPI details are worth lingering on because they shape both the Fed path and corporate margins. Food inflation moderated to 0.2% from 0.5%. Energy accelerated to 1.5% from 0.7% on gasoline. Core goods inflation cooled broadly except for apparel. Tariff-sensitive categories rose the fastest in a year: footwear at 0.9% (0.3% prior), appliances at 0.8% (0.4% prior), furniture at 0.9% (0.3% prior), and sporting goods at 1.0% (0.1% prior). Services were friendlier: shelter eased to 0.2% from 0.4% with Owners’ Equivalent Rent down to 0.1% from 0.4%; transportation services moderated with airfare inflation halved to 2.7% and insurance down -0.4%. For the Fed, that combination “solidifies” a -25 bp cut next week even as tariff-linked pockets give hawks talking points. For companies, pricing power may be tested. The October flash PMIs pointed to strengthening activity—manufacturing at 52.2 from 52.0, services at 55.2 from 53.5, composite at 54.8 from 53.9—with a modest uptick in employment driven by services, manufacturing new orders improving by the most in nearly two years, and pricing components moderating from a recent rise. Chris Williamson of S&P Global Market Intelligence framed it plainly: many producers front-ran tariffs by buying excess inputs earlier in the year, are now making more goods to use those inputs, but are struggling to sell through inventories, so selling price inflation cooled to the lowest since April as firms competed on price. That is a classic setup for near-term margin pressure even in an expanding economy.
Rates, Credit, And Cross-Asset Tone
Treasuries traded the macro mix calmly. December 10-year T-notes (ZNZ5) fell -1 tick while the 10-year yield dipped -0.4 bp to 3.997%. The 10-year breakeven fell -0.6 bp to 2.298%. Short- and three-year yields ended the week higher, while the 10-year eased. The shutdown acted as a soft underlay for duration: a protracted stoppage risks job losses and softer consumption, increasing the odds of continued rate cuts. Fed funds futures discounted a 97% chance of a -25 bp cut at the October 28–29 FOMC. Municipals performed well on strong cash flow and healthy demand amid limited supply. In Europe, bonds sold off modestly; the 10-year German bund yield rose +4.3 bp to 2.626% and the 10-year U.K. gilt yield rose +0.8 bp to 4.432%. Swaps put just a 1% probability on a -25 bp cut by the ECB at its October 30 meeting. The U.S. dollar edged higher, with particular strength against the yen (election-related) and the pound (local CPI).
Credit’s message echoed equities: carry over convexity. The outlier tape, covered in the Market Intelligence Report for subs, caught multiple high-yield and investment-grade ETFs—HYLB, SHYG, SJNK, IGSB—and mortgage-backed paper like VMBS with above-trend interest, while long-duration expressions such as EDV and ZROZ traded with balance rather than urgency. That blend is consistent with a market that wants to earn income while policy drifts toward neutral.
Commodities And Crypto: Momentum Checked, Then Tempered
Energy reversed sharply higher. Oil rallied more than 5% after the U.S. announced sanctions on Russia’s two largest oil companies and threatened secondary sanctions on foreign financial institutions doing business with sanctioned entities—impacts that fall most directly on China and India. The Discord community sniffed out the trade before the news even printed:
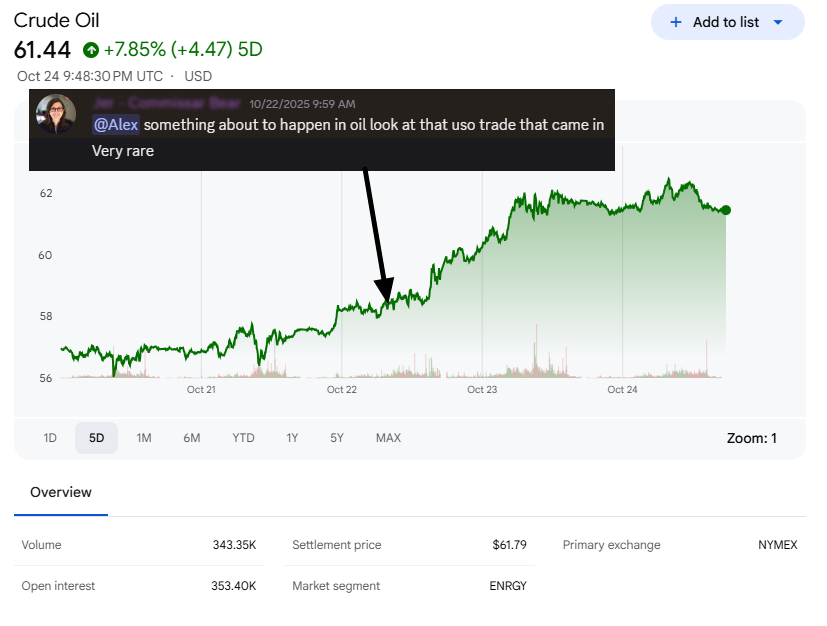
Reports suggested Chinese majors have suspended purchases and India is winding down purchases ahead of Treasury’s November 21 deadline. Prices moved back into the range preceding the October 10 breakdown and tested the 200-day moving average just under $67. Positioning in WTI was stretched, which added to the violence of the move. U.S. natural gas rose about 10% for the week but dipped on Friday as lower production offset warmer weather patterns.
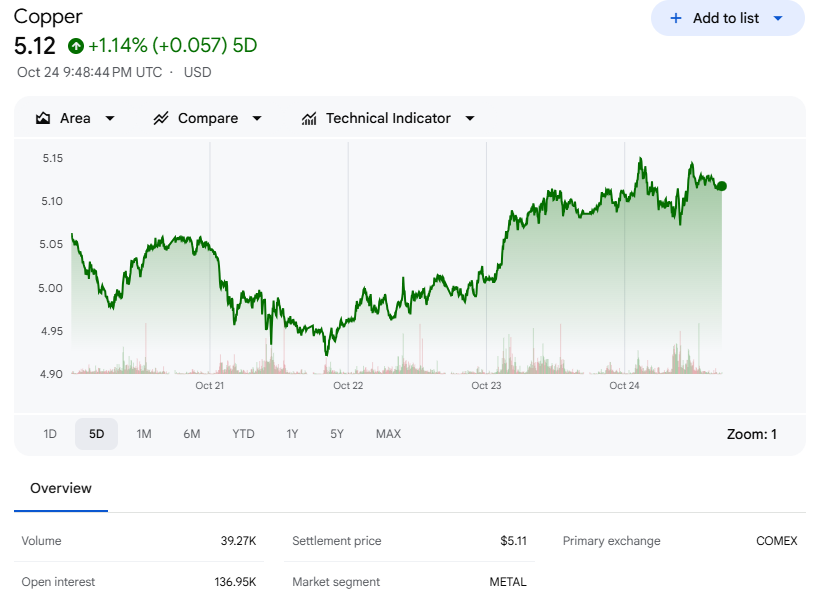
Metals approached a more sustainable posture after an overheated run. Precious metals have become the “mother of all momentum trades.” After a key reversal last week and a bounce on Monday, the fever broke. Gold reversed from roughly ~$4,400 on Tuesday down to around ~$4,025, tagging the 20-day moving average before bouncing; despite sharp intraday losses, the weekly drawdown was reasonably contained. Industrial metals outperformed; copper rose more than 3%. Agriculture moved higher with trade optimism.
Crypto was choppy and mixed. After a reversal last Friday, Bitcoin extended early in the week but failed near ~115k around the 50/100-day moving averages and below the post-liquidation highs, then pulled back toward ~110k. Altcoins were mixed. In equities, Coinbase (COIN) rallied more than +9% on an upgrade tied to risk abatement and monetization opportunities; Riot Platforms (RIOT) rose +4.5% and MARA Holdings (MARA) gained +1.7%. The equity–crypto feedback loop was additive to risk rather than disruptive.
Global Equities: Asia Led, Europe Firmed, And Policy Loomed
Overseas markets closed higher Friday and leaned constructive through the week. The Euro Stoxx 50 rose +0.11% Friday, China’s Shanghai Composite added +0.71%, and Japan’s Nikkei 225 gained +1.35%. Asia outperformed on the week. Europe was modestly higher on better PMIs and generally solid earnings, with expectations for the ECB to leave rates unchanged next week. The U.K. outperformed as CPI improved and yields fell, led by Financials and Energy.
Japan’s story mixed currency, politics, and stimulus. The Nikkei finished up 3.5% with broad participation led by tech and exporters as the yen weakened. After a coalition formed over the weekend, Sanae Takaichi was elected the first female prime minister, fueling optimism for an economic stimulus package expected to exceed last year’s $92B focused on household inflation relief and investment in AI/semis and national security.

China’s tone improved, with local markets up more than 2% on the week. Treasury Secretary Bessent’s meeting with Vice Premier He Lifeng was described as constructive, with additional meetings scheduled in Malaysia. The administration confirmed the October 30 Trump–Xi meeting even as reports suggested expansive restrictions on exports to China made with or containing U.S. software, and the USTR opened an investigation into the 2020 phase-one agreement’s implementation. China leveraged rare earths but suggested the U.S. response was overblown. Economic data came in slightly better than feared. The plenum emphasized self-reliance in science and technology, a modern industrial system, and boosting domestic consumption, signaling macro support “at the appropriate time” without a specific GDP target.
South Korea hit a new all-time high amid indications of progress in U.S.–Korea trade negotiations, with markets leaning toward a deal announcement at the APEC Summit. India finished roughly unchanged with optimism about reducing Russian oil purchases and opening markets to U.S. agriculture. Argentina rose more than 4% into elections, recouping about half the losses since early August over the past two weeks.
The Shutdown And The Calendar: What’s Next
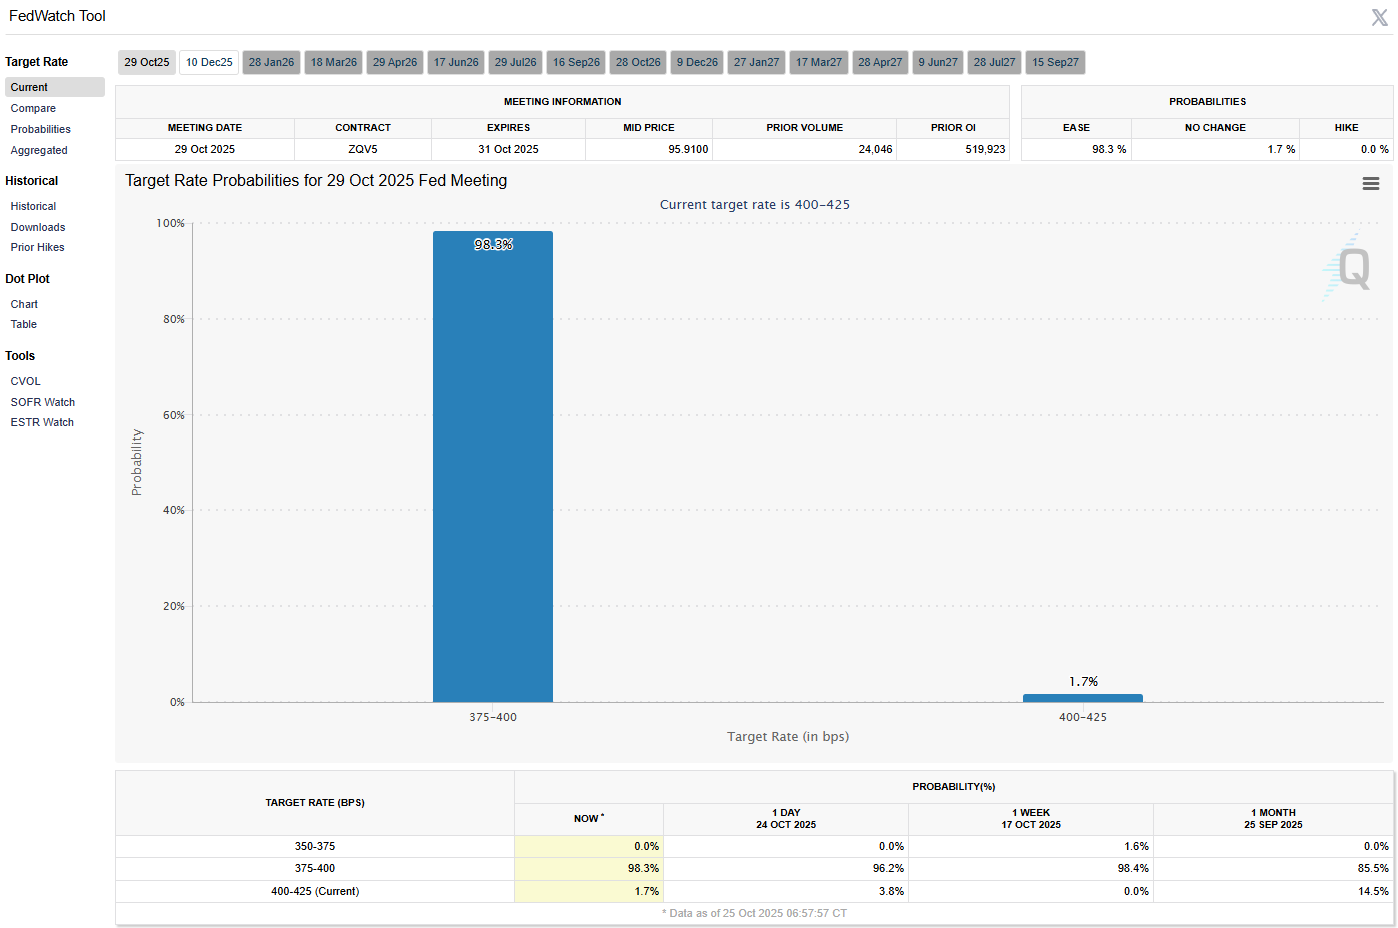
The government shutdown’s fourth week has delayed critical releases and muddied the policy picture, but CPI’s delivery cleared one hurdle because it is required to calculate Social Security’s COLA. The market’s base case is clear anyway: a -25 bp cut at the October 28–29 FOMC has a 97% probability.
The meeting comes amid a busy global schedule: Japan and Canada hold policy meetings next week; the Trump–Xi meeting is set for Thursday, October 30; Argentina’s elections are scheduled for the weekend; China’s official PMIs print Thursday night; and Halloween falls on Friday. Earnings will be a catalyst throughout, with mega caps and tech stocks supplying the heaviest reads into AI-linked capex. With the S&P 500 having gone more than 100 days without a 5% pullback and valuations pushing toward cycle highs, a pause or consolidation would not be out of character—yet the breakout argues buyers remain in control.
The Bull Market At Three: Where It Sits And What Must Drive The Next Leg
This bull market is neither new nor aged; it is working through a middle chapter. Since the October 2022 low, the S&P 500 has gained 90%, or 98% including dividends. Over the past 80 years, the prior 12 bull markets averaged about 200% gains and lasted five years; eight made it past the three-year mark, and the longest (2009–2020) ran 11 years. History does not dictate the future, but the pattern fits the phrase: bull markets don’t die of old age; they end from recessions or Federal Reserve tightening. The current macro setup argues neither is likely in 2026.
Valuations, however, do matter at the margin. Absent a late-year correction, the S&P 500 is tracking toward a third consecutive year of double-digit returns, pushing price-to-earnings multiples to cycle highs and closer to levels where investors balk at paying bubble-era prices. That implies earnings must lead the next phase.
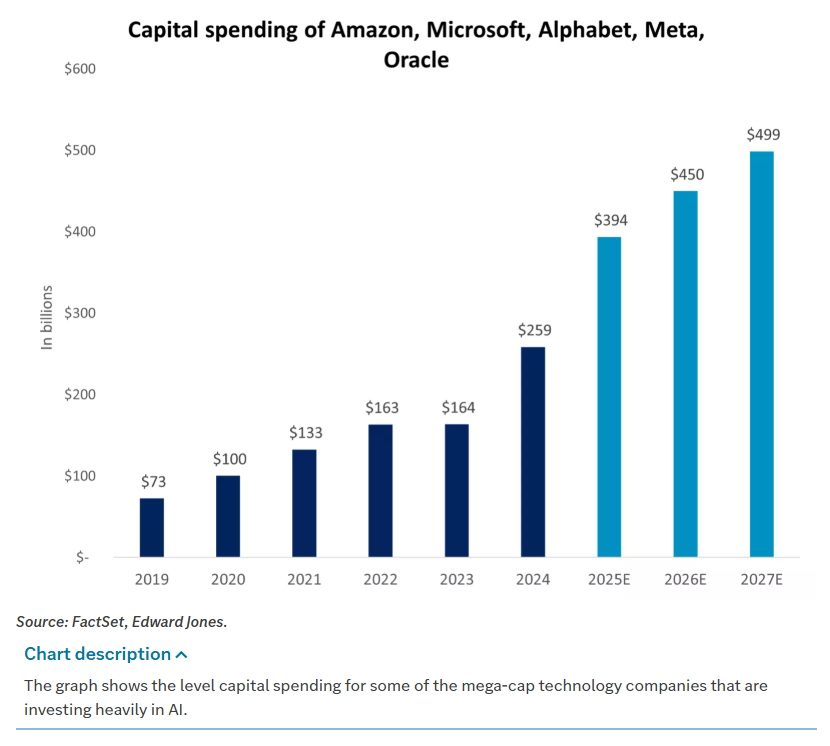
The backdrop is supportive. Corporate profits continue to grow at a healthy pace despite trade disruptions and a cooling labor market. Nearly 60% of S&P 500 companies report in the coming two weeks, including much of the platform cohort. That group is expected to post 15% y/y earnings growth versus 6.7% for the remainder and 8.5% for the index overall. Management commentary to date highlights consumer resilience—especially among high-income households—stable credit quality, and a pickup in M&A. The question investors care most about is whether AI-related capex will translate into returns. AI spending is projected to approach $400 billion this year, nearly one-third of total S&P 500 capex. For now, markets are willing to underwrite that investment; the bar for results will rise as new highs stack up.
Positioning: Overweight Equities, Expect Broader Leadership, Keep Hedges Surgical
The tape’s message has been consistent: own liquidity first, remunerate carry, and take intelligent growth risk where sponsorship is deepest. That translates to an overweight in equities relative to bonds, a view held since 2023, and a willingness to let leadership broaden beyond the platform core. Cyclicals such as Industrials and Consumer Discretionary and the out-of-favor Health Care sector are positioned to participate alongside Technology. Regionally, international small- and mid-caps and emerging markets may extend recent momentum, while developed ex-U.S. quality wrappers can benefit as uncertainty compresses.
Risk management is about precision. A market that has gone more than 100 days without a 5% pullback can produce a sharp air pocket on little news, particularly into an event-dense week. The difference between surgical hedges and blunt hedges was visible in our positioning last week: broad inverse sleeves bled as the rally resumed, but targeted overlays around single-name or theme risk worked without taxing P&L. In cross-asset terms, the oil rebound and controlled pullback in precious metals look more like normalization than stress, and crypto’s mixed tone added noise rather than systemic signal. In rates, the curve’s modest moves and a 97% probability of a -25 bp cut tell you the Fed is unlikely to fight the trend; the ECB is priced with only a 1% chance of easing at its next meeting.
What Could Interrupt The Glide Path
The near-term headline deck is crowded enough to check momentum even in a sturdy uptrend. Trade dates cluster: an October 30 tariff negotiation deadline with Mexico, a November 1 threat of a 100% tariff on Chinese goods, and a November 10 deadline for a new U.S.–China truce. The Trump–Xi meeting at APEC is Thursday, October 30. The shutdown’s duration matters for data continuity and perception; four weeks without claims and a delayed payrolls report is unusual. Oil’s rebound to the 200-day moving average just under $67 bears watching if sanctions enforcement tightens. The “momentum meltdown” in speculative pockets stabilized, but dispersion risk remains high into the heaviest two weeks of earnings. None of these are new; all of them argue for flexibility rather than fear.
Bottom Line
The market chose allocation over anxiety. Friday’s close—SPY +0.79%, DIA +1.01%, QQQ +1.04%, ESZ25 +0.74%, NQZ25 +1.00%—capped a week when the S&P 500 and Nasdaq 100 printed new record highs and the S&P 500 claimed 6,800 for the first time. The macro mix did its part: CPI came in a tenth cooler on both headline and core, PMIs beat with manufacturing at 52.2 and services at 55.2, and despite a shutdown now in its fourth week, the market still prices a 97% chance of a -25 bp Fed cut on October 28–29. Earnings breadth helped—85% of reporters have beaten forecasts even as growth decelerates—and sector rotation turned constructive with Information Technology and Energy leading while Utilities and Consumer Staples lagged. Small caps and mid caps outperformed. Single names showed healthy dispersion. Oil rallied more than 5% back to its 200-day moving average just under $67 on sanctions headlines and positioning; natural gas rose ~10% on the week; gold reversed from about ~$4,400 to ~$4,025 before bouncing; copper rose more than 3%. Overseas, Europe firmed on PMIs and earnings, the U.K. rallied on CPI and yields, Asia outperformed with Japan up 3.5% on stimulus hopes and currency, China up more than 2% on improved tone into APEC, South Korea at new highs, and Argentina up more than 4% into elections.
This bull market turned three this month. From the October 2022 low, the S&P 500 is up 90%, or 98% including dividends. History says that is middle-aged for an expansion, not late-cycle. What sustains the next leg is not narrative but numbers. Earnings must lead while the Fed steps back from the brake and toward neutral. The good news is the tape is already positioned that way: own liquidity, sponsor platforms and semis, earn carry in credit and rate-sensitives, and keep hedges sharp. A pause would be healthy. A pullback would be normal. But in a week that delivered new highs, lighter inflation, solid PMIs, and a policy path that points to a cut, the market again voted with its dollars: allocation first.
Weekly Benchmark Breakdown
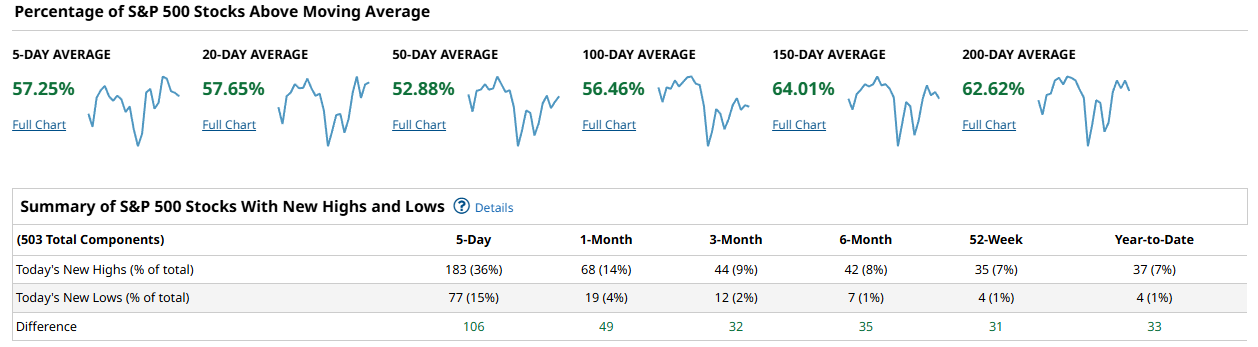
Breadth improved this week across the majors, and it looks more like steady trend than a one-day thrust. The risk tone is positive: more stocks are back above their moving averages, and new highs exceed new lows on every lookback I can read. It is not a blow-off, and it is not narrow to just a handful of megacaps. Participation is good enough to lean risk-on while still demanding confirmation from the 50-day cohort and the new-high lists.
In the S&P 500, 57.25% of members sit above their 5-day, 57.65% above the 20-day, and 52.88% above the 50-day. Intermediate breadth is firmer: 56.46% above the 100-day, 64.01% above the 150-day, and 62.62% above the 200-day. That is a healthy profile: short-term and intermediate moving averages are both being reclaimed, with the longer bases already in decent shape. The new-high/new-low table backs that up. Over 5 days, there were 183 highs versus 77 lows, a positive spread of 106. One month shows 68 highs to 19 lows (diff 49), three months 44 to 12 (diff 32), six months 42 to 7 (diff 35), 52-week 35 to 4 (diff 31), and year-to-date 37 to 4 (diff 33). When every column is green on NH minus NL, buyers have the ball.
The Nasdaq 100 is not just riding a few giants. Near-term participation is solid with 58.41% above the 5-day and a strong 67.32% above the 20-day. The 50-day cohort sits at 63.36%, while 54.45% are above the 100-day. Longer-term, 63.36% clear the 150-day and 61.38% the 200-day. New highs dominate: 42 highs vs 14 lows over 5 days (diff 28). One month is 15 vs 2 (diff 13), three months 11 vs 2 (diff 9), six months 11 vs 1 (diff 10), and both 52-week and YTD stand at 11 highs with zero lows (diff 11 each). That is a sturdy setup for large-cap growth and semis, with enough depth to avoid the usual narrow-leadership warning.

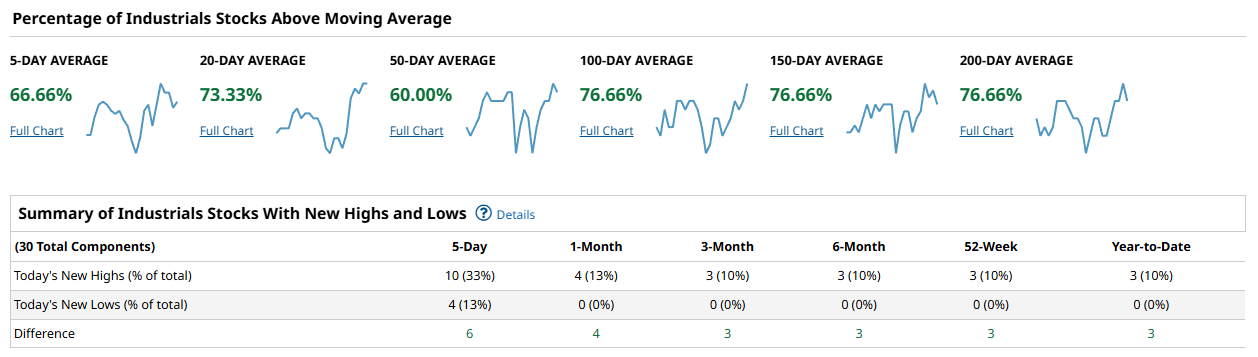
The Dow 30 looks especially well bid across the tape. A hefty 66.66% are above the 5-day, 73.33% above the 20-day, and 60.00% above the 50-day. The intermediate and longer measures are even better: 76.66% above the 100-day, and the same 76.66% above both 150-day and 200-day. New highs outnumber lows across all horizons: 5-day 10 vs 4 (diff 6); one month 4 vs 0 (diff 4); three months 3 vs 0 (diff 3); six months 3 vs 0 (diff 3); 52-week 3 vs 0 (diff 3); YTD 3 vs 0 (diff 3). This is what a durable uptrend looks like in a price-weighted index: broad, not just a couple of heavyweights doing all the lifting.
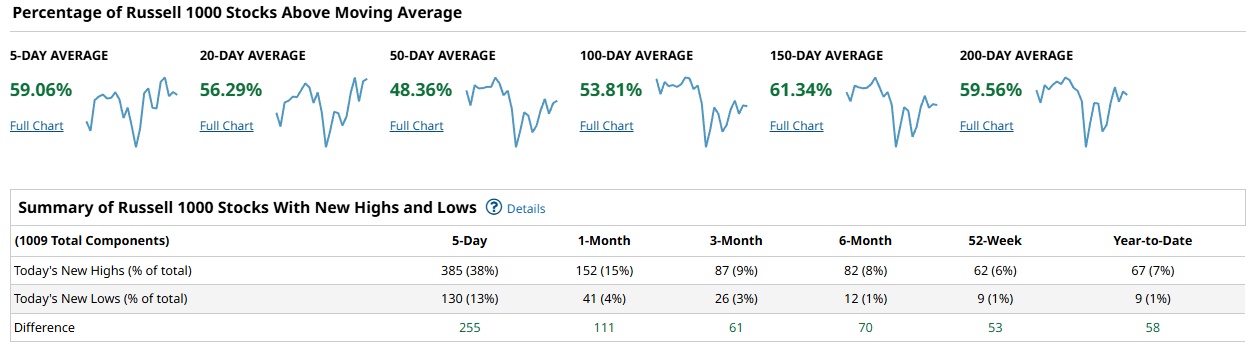
The Russell 1000 shows the broad market is coming along, not lagging. We have 59.06% above the 5-day and 56.29% above the 20-day, so the near-term trend is positive. The 50-day is still sub-50% at 48.36%, but the 100-day flips back to 53.81%, with 61.34% above the 150-day and 59.56% above the 200-day. That pattern suggests a recent pullback within a larger uptrend is being repaired from the inside out. New highs to new lows are convincingly positive: 5-day 385 vs 130 (diff 255), one month 152 vs 41 (diff 111), three months 87 vs 26 (diff 61), six months 82 vs 12 (diff 70), 52-week 62 vs 9 (diff 53), and YTD 67 vs 9 (diff 58). This is what you want to see if you are looking for participation beyond the biggest names.
Put together, cap-weight leadership remains in good shape, and the broad market is following rather than fighting. The NDX100 and Dow have the strongest percentage-above-MA profiles today, but the SPX and Russell 1000 are not far behind, with improving short-term breadth and solid intermediate foundations. To confirm a durable advance rather than a bounce, I would like to see the 50-day cohorts push and hold above 60% in SPX and the Russell 1000, coupled with continued positive spreads on the new-high lists. If those two things occur while the 150- and 200-day cohorts stay north of 60%, pullbacks are buys. Conversely, if the 5- and 20-day cohorts roll over from here and NH minus NL compresses toward zero, expect chop and a retest of support.
For the playbook, tilt long with a bias to quality growth and cyclicals that already show both price above the 50- and 100-day and a rising 20-day. In NDX100, favor leaders with persistent 52-week high activity; the zero 52-week lows there is a tell. In the Dow, ride the trend but avoid crowded laggards that are only now tagging short MAs without the 100- or 200-day confirmation. In the broad Russell 1000, prefer names participating in the new-high expansions and avoid those still below the 50-day unless you are trading mean reversion. Watch for a continued rise in the SPX and Russell 1000 50-day percentages toward and through 60%, and keep an eye on whether 5-day highs continue to outpace lows by triple digits in SPX and by a couple hundred in the Russell 1000.
Bottom line: breadth is constructive and broadening, with numbers good enough to lean risk-on while we wait for the 50-day cohorts to clear 60% to confirm a durable uptrend.

Investor Sentiment Report
%Bull-Bear Spread
The %Bull-Bear Spread measures the gap between bullish and bearish investor sentiment, often from surveys like AAII. It’s a contrarian indicator—extreme optimism may signal a coming pullback, while extreme pessimism can hint at a potential rally. Large positive or negative spreads often mark market turning points.
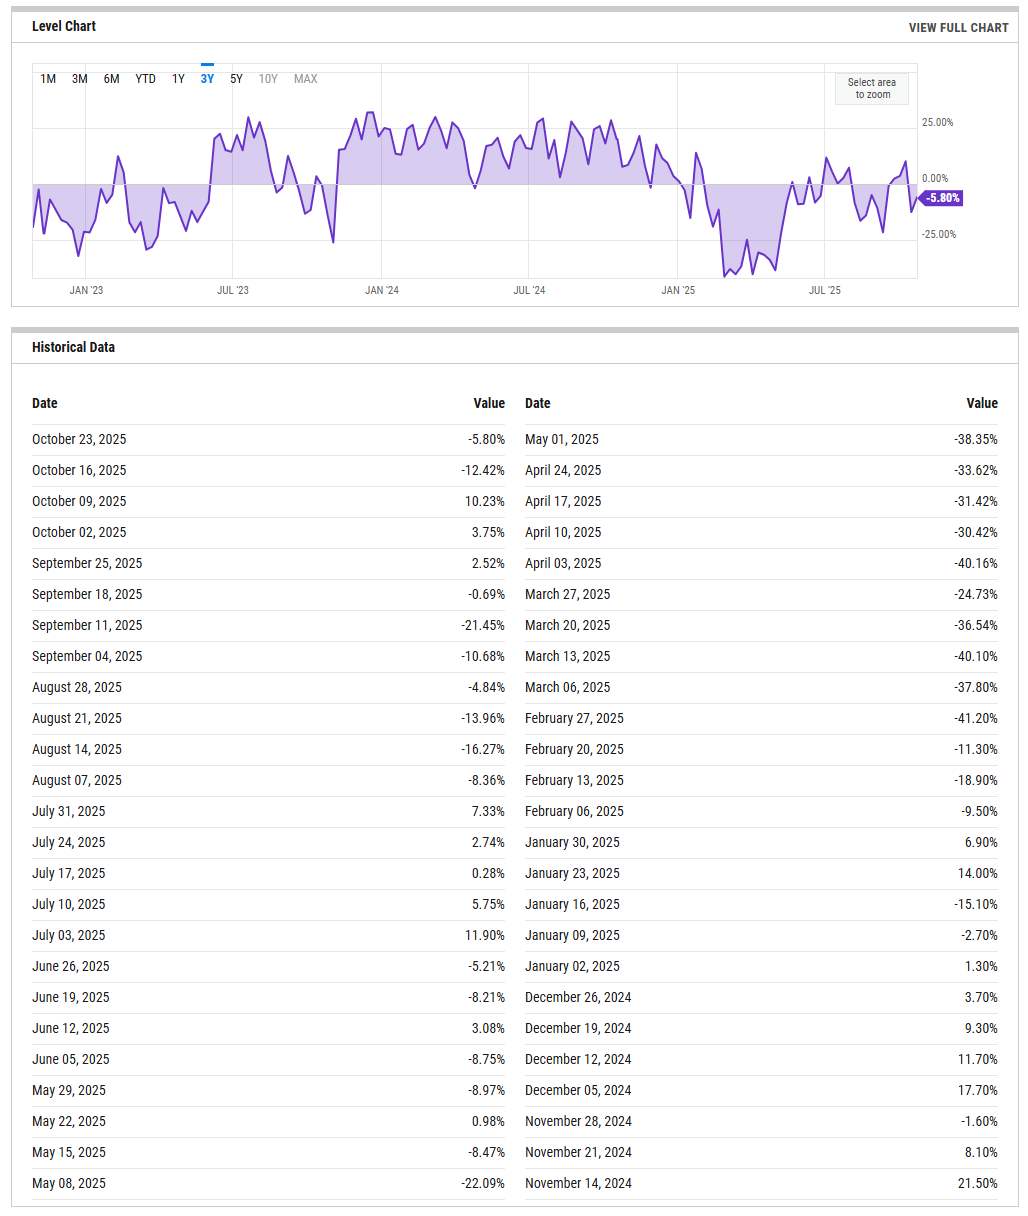
The AAII percent bull minus bear spread sits at -5.80% for the week of Oct 23, 2025, an improvement from -12.42% a week earlier but still slightly negative. Over the past month the spread has flipped around zero several times, including a +10.23% print on Oct 9. Negative spreads below zero typically provide contrarian support because pessimists outnumber optimists; sustained moves back above +20% would instead flag a crowding risk. Side by side with that survey, professional equity managers are leaning aggressive.
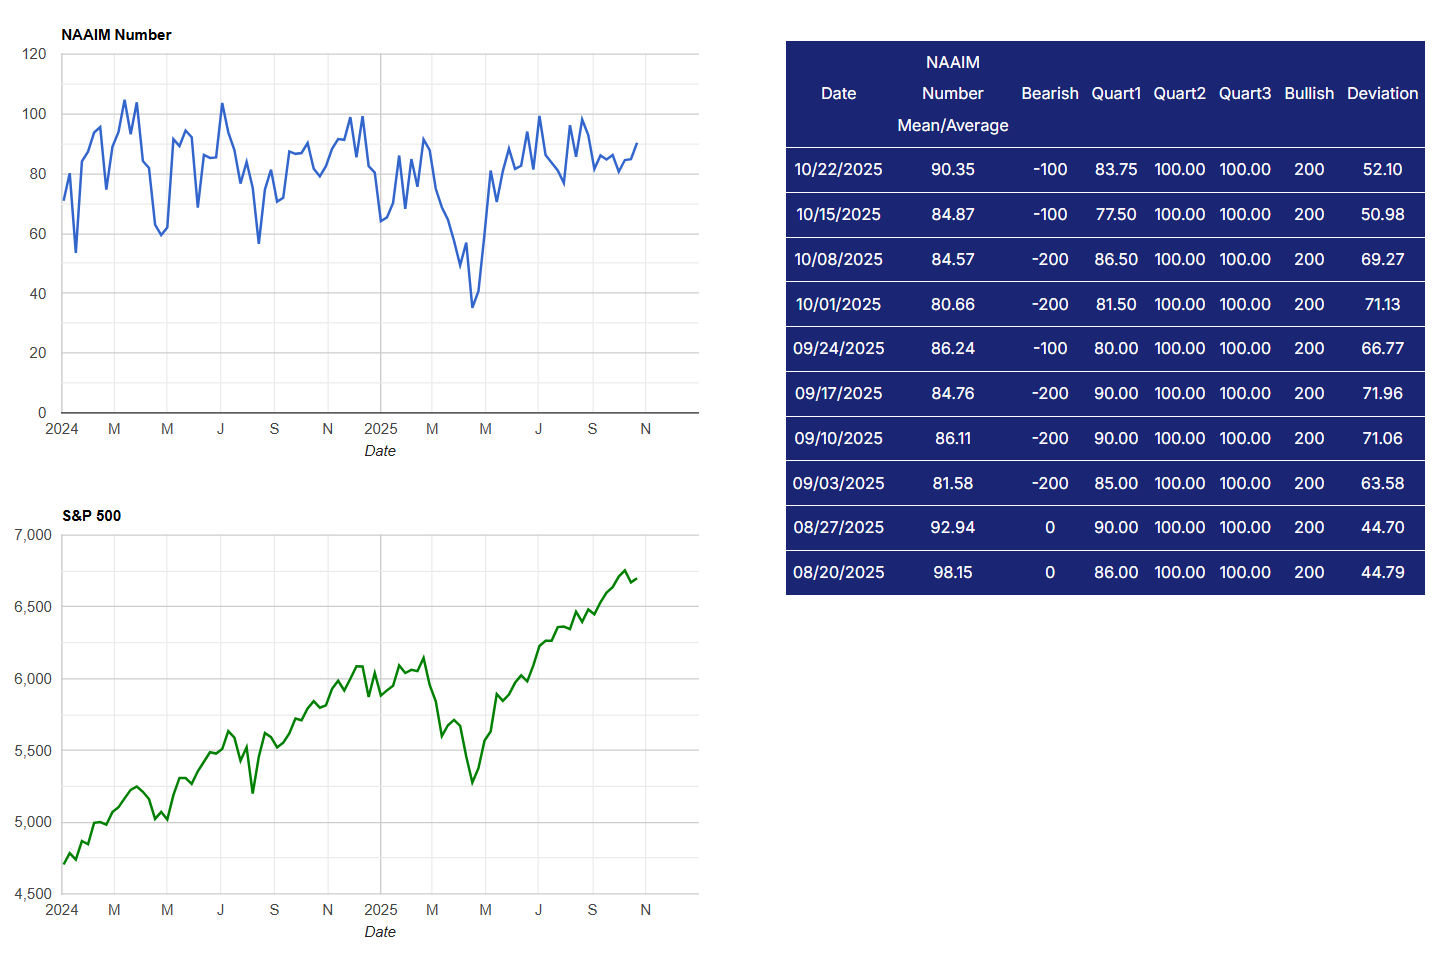
NAAIM Exposure Index
The NAAIM Exposure Index (National Association of Active Investment Managers Exposure Index) measures the average exposure to U.S. equity markets as reported by its member firms. These are typically active money managers who provide their equity exposure levels weekly. The index offers insight into how much these managers are investing in equities at any given time, ranging from being fully short (-100%) to leveraged long (up to +200%).
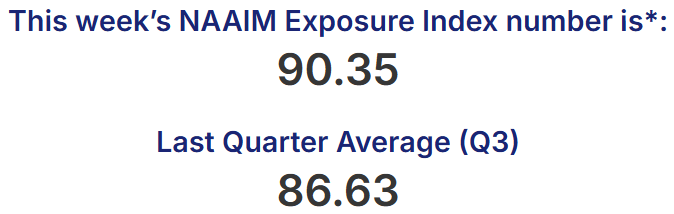
The NAAIM Exposure Index rose to 90.35 on 10/22 from 84.87 and 84.57 the prior two weeks, and it has spent most of the past two months in the 80s to 90s. That mix says retail remains wary while allocators are largely in-the-pool. From a risk-taking lens, the combination favors buying dips but also raises vulnerability to de-risking if price stumbles. Tripwires: a drop in NAAIM into the 50s without much price damage would warn of distribution under the surface; conversely, an AAII spread pushing through +20% while NAAIM grinds back into the 90s would argue for trimming strength.
CBOE Total Put/Call Ratio
CBOE's total put/call ratio includes index options and equity options. It's a popular indicator for market sentiment. A high put/call ratio suggests that the market is overly bearish and stocks might rebound. A low put/call ratio suggests that market exuberance could result in a sharp fall.
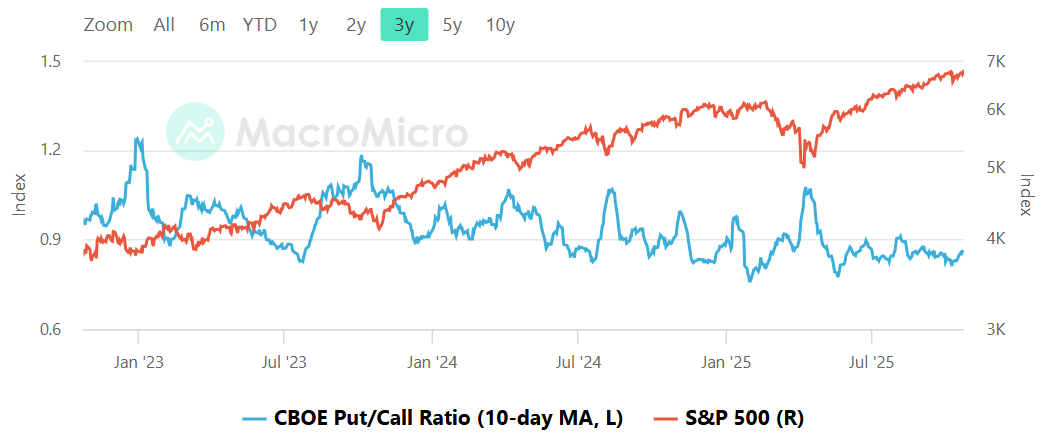
The total put/call’s 10-day average is hovering just under 1.0, closer to neutral-to-cautious than exuberant. Over the past three years, bounces toward ~0.8 have tended to mark froth and poor forward returns, while pushes above ~1.0 reflect fear that often cushions drawdowns. With the average near 1.0, there is enough hedging in the system to temper downside velocity, but not so much to fuel a face-ripping squeeze unless price leadership broadens. A decisive roll down toward ~0.85 would signal risk-on positioning and raise the odds of a shakeout. A push up through ~1.05 while price holds support would be the higher-quality setup for a durable rally, as it would indicate capitulative protection that can later be unwound.
Equity vs Bond Volatility
The Merrill Lynch Option Volatility Estimate [MOVE] Index from BofAML and the CBOE Volatility Index [VIX] respectively represent market volatility of U.S. Treasury futures and the S&P 500 index. They typically move in tandem but when they diverge, an opportunity can emerge from one having to “catch-up” to the other.
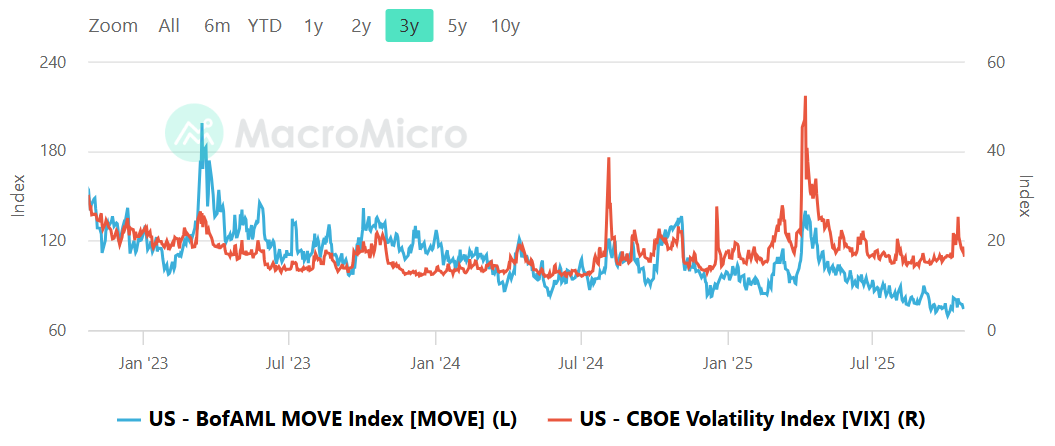
Bond volatility (MOVE) is subdued versus the past two years, sitting in a low-to-mid range, while equity volatility (VIX) is in the mid-to-high teens with a recent upward nudge but no spike. The lack of stress in rates helps equities stabilize; the absence of a VIX surge argues against a full-fledged panic. Historically, when MOVE jumps above roughly 120 while VIX stays sleepy, equities feel the pain a few days later as macro shock ripples through risk assets. That is not today’s setup. Conversely, if VIX pushes decisively into the high teens or low 20s with MOVE still contained, it often marks tradable equity dips rather than regime breaks. Tripwires are clear: watch for MOVE > ~120 with VIX sub-18 as an early warning, or VIX > ~20 with contained MOVE for a buy-the-fear window.
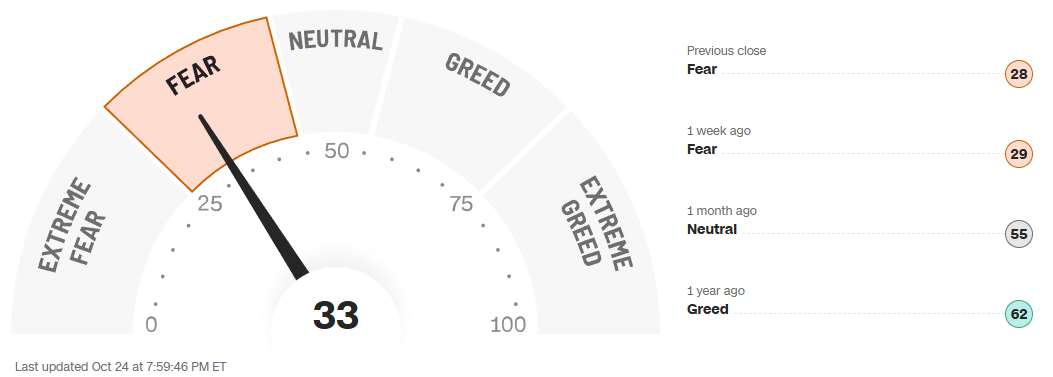
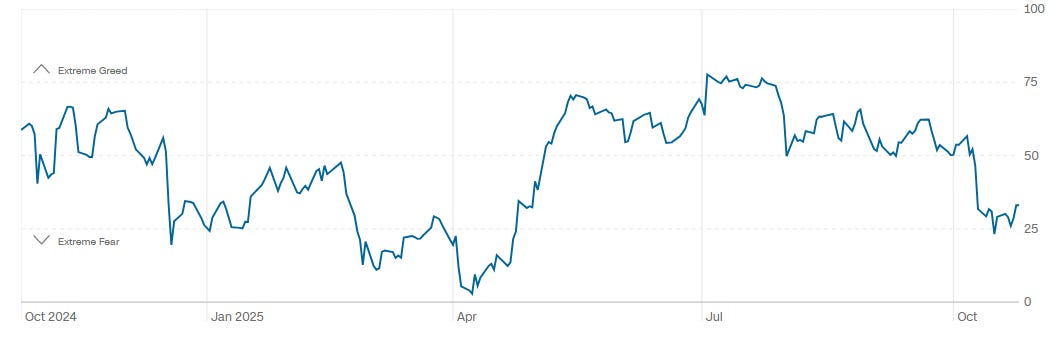
CNN Fear & Greed Constituent Data Points & Composite Index
CNN’s composite Fear & Greed gauge reads 33, up from 28 at the prior close and 29 a week ago, but down from 55 a month ago and 62 a year ago. The one-year path shows a summer period of greed followed by a sharp slide into fear in early autumn, with a tentative bounce off the lows in recent days. That puts us in a cautious regime where sentiment can fuel upside if data and earnings stay cooperative. If the index falters back into the low 20s, odds favor a better entry after forced selling; if it recovers into the 50s while breadth expands, the wall of worry would be under active climb and pullbacks should be shallow.
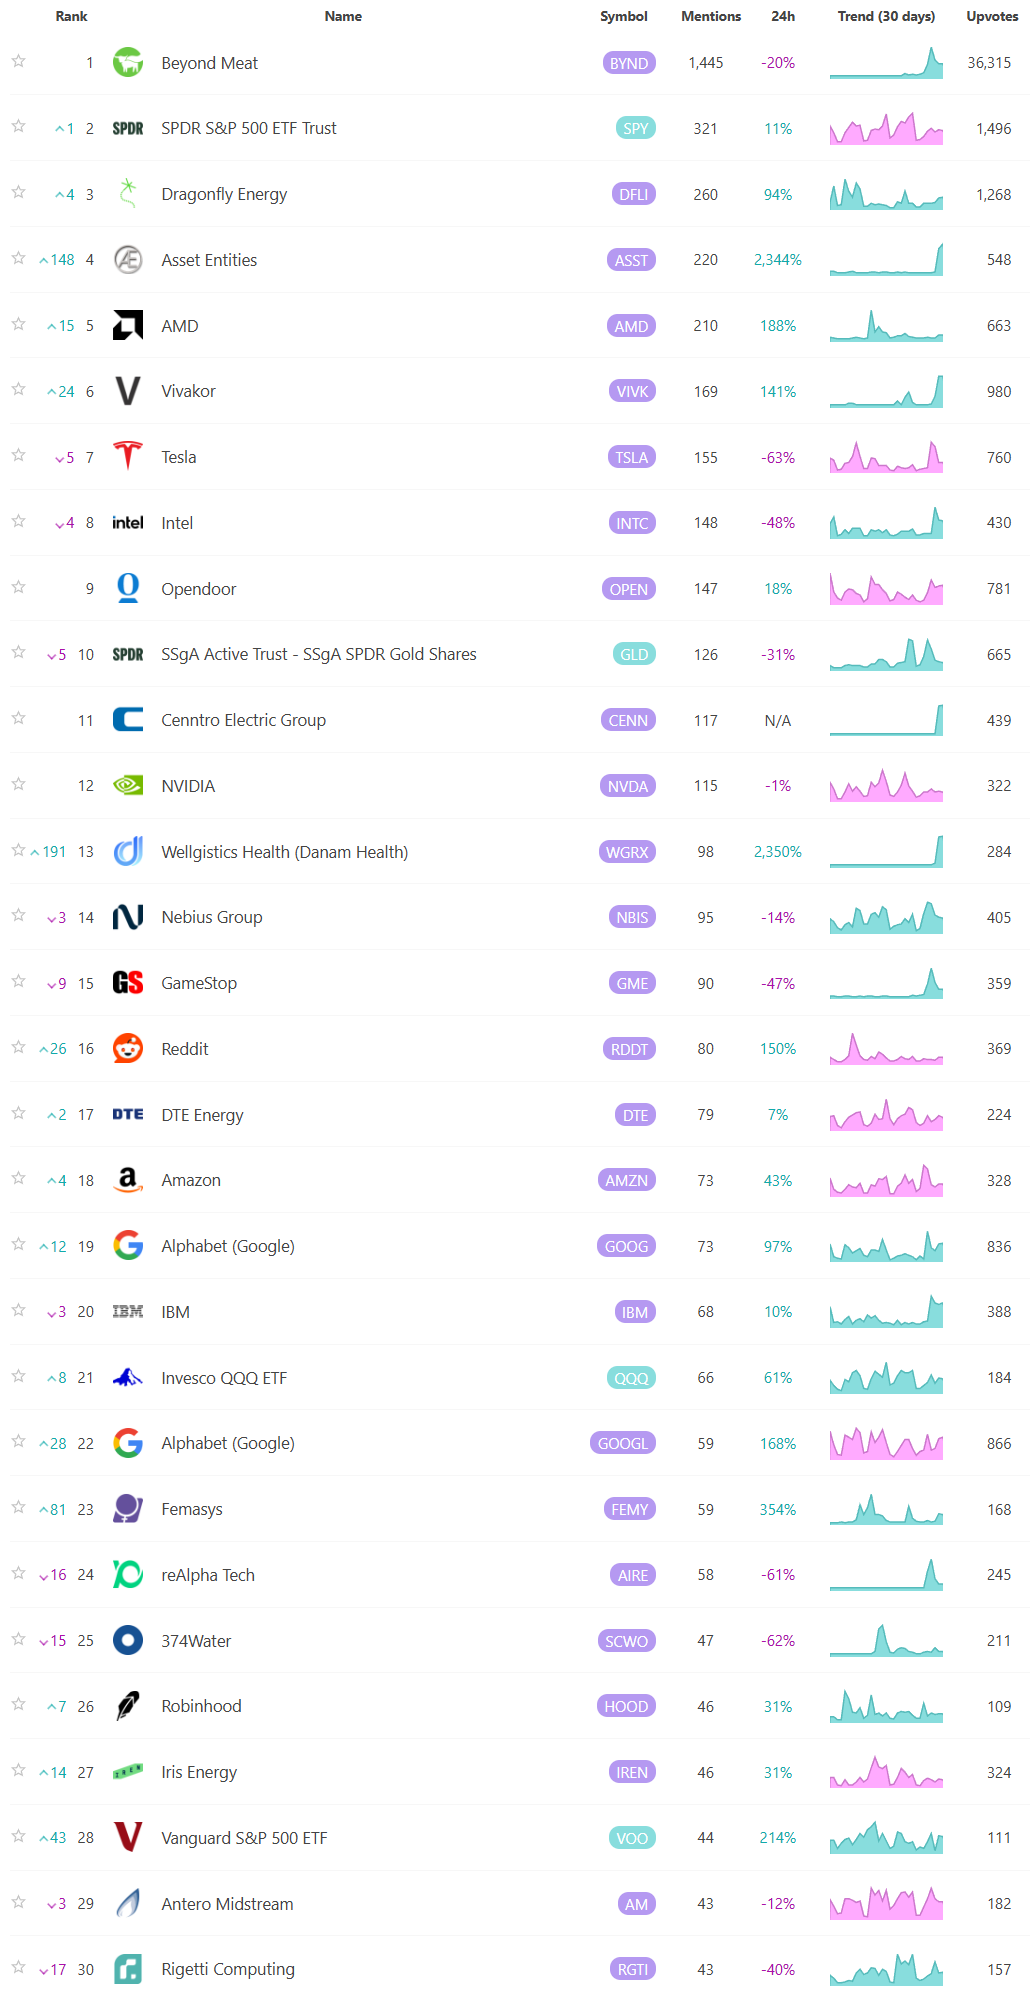
Social Media Favs
Social sentiment offers a real-time view of investor mood, often revealing market shifts before traditional indicators. It can signal momentum changes, spot emerging trends, and gauge retail investor impact—especially in high-volatility names. Tracking sentiment around events or earnings provides actionable insights, and when layered with quantitative models, can enhance predictive accuracy and risk management. Sustained sentiment trends often mirror broader market cycles, making this data a valuable tool for both short-term trades and long-term positioning.

Technician’s Playbook: Trading the Majors (SPY/QQQ/IWM/DIA)
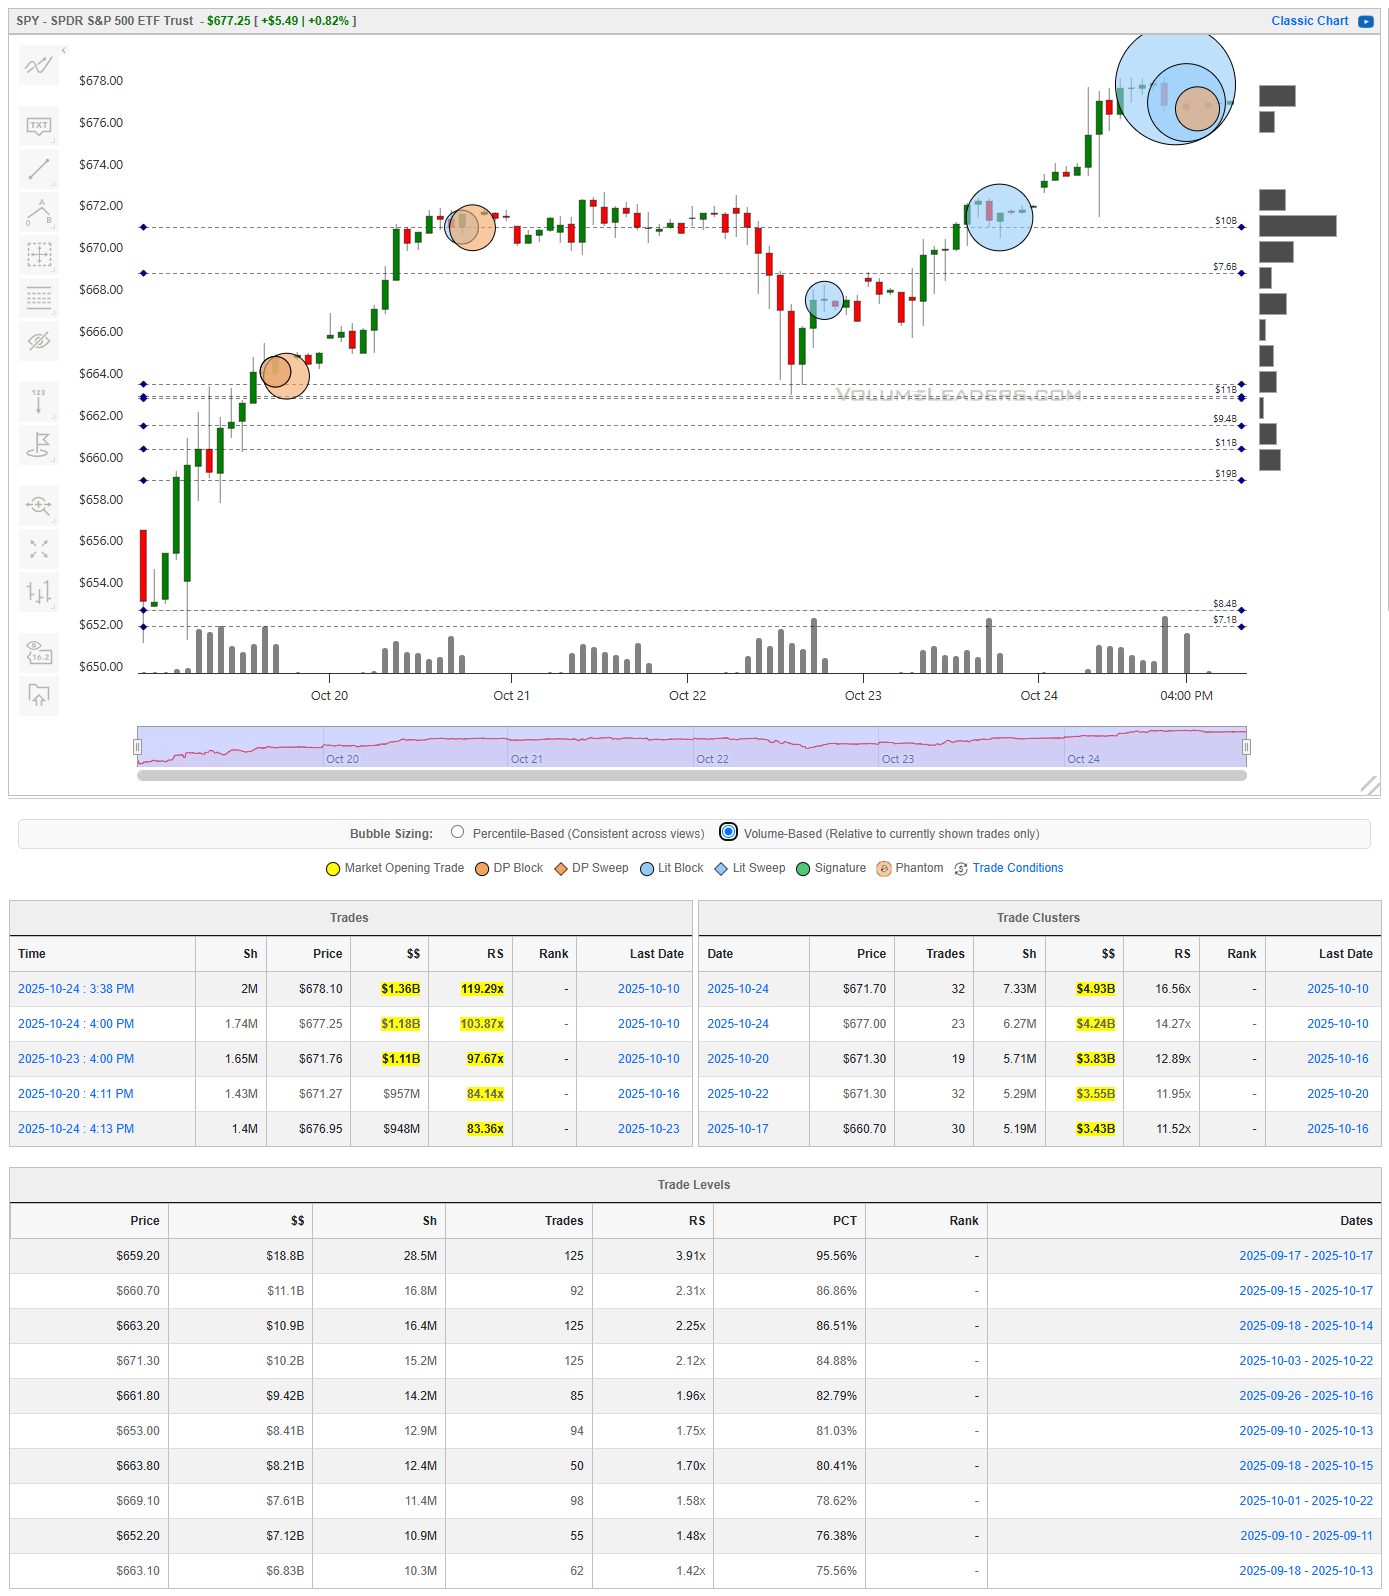
When you’re a large institutional player, your primary goal is to find liquidity - places to do a ton of business with the least amount of slippage possible. VolumeLeaders.com automatically identifies and visually plots the exact spots where institutions are doing business and where they are likely to return for more. It’s one of the primary reasons “support” and “resistance” concepts work and truly one of the reasons “price has memory”.
SPY
SPY spent the week carving out a bullish recovery sequence that began with a sharp drive higher from the mid-$650s, consolidated under $671, and then reclaimed control into the Friday close. The session structure was a clean impulse, pullback, and extension—classic of institutional accumulation following a volatility flush. The standout trade activity came late in the week, with multiple prints between $671 and $677, including a $1.18B block at $671.7 and another $1.13B at $677.5. The heaviest volume-weighted Level sits around $663, with over $8.4B notional traded (PCT near 95%), making it the primary demand shelf. A second band of liquidity appears around $669–$671, where large prints stacked up ahead of the breakout. That cluster marks the market’s line of scrimmage. Acceptance above it keeps the tape constructive toward $680–$682, the next magnet zone. Failure back below $669 would imply the late-week chase was faded and likely brings a retrace toward the $661–$663 demand shelf. A disciplined trader can frame risk beneath $668, targeting a retest of $680 first and $684 if momentum persists. Below $668, the bullish structure fails and sellers likely press into the high $650s to test levels currently presenting as demand.
QQQ
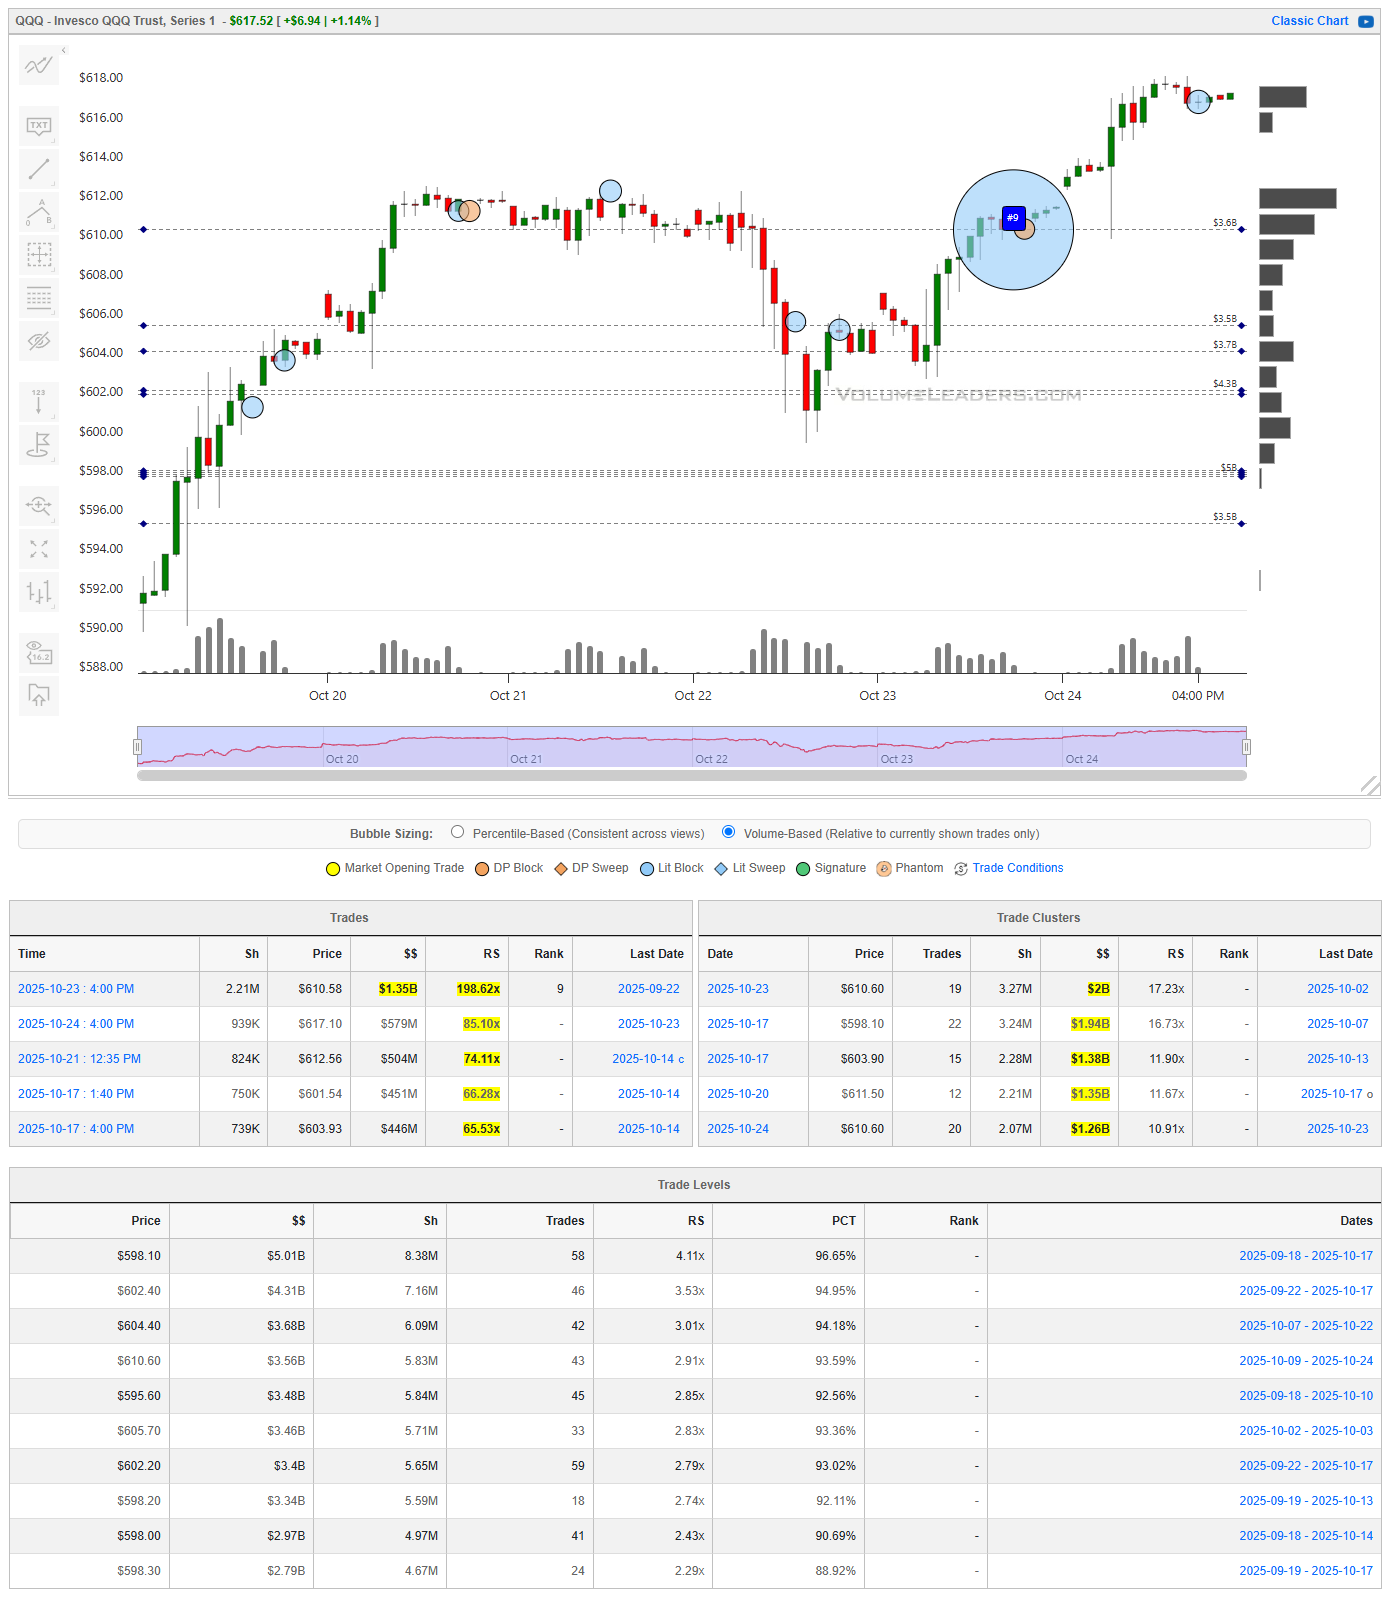
QQQ mirrored the same structural rhythm but with slightly stronger momentum through the back half of the week. After basing around $590, the index launched into a steady sequence of institutional prints between $603 and $610, including a $1.35B sweep at $610.5 tagged as one of the largest on record (RS ~98%) and another $1.3B around $611.1. The upper trade clusters centered at $610–$612 define the near-term battleground. Beneath, heavy volume levels line up at $598–$600 ($5B+ notional, PCT >90%), forming a high-confidence demand zone. The trend bias remains up while holding above that lower range. Acceptance over $617 would open a clear technical vacuum to $622–$625. A rejection below $603 would flip tone short-term, implying trapped longs above and targeting the $594 shelf. Tactical positioning favors buying shallow pullbacks into $605–$608 with invalidation just under $603; strength above $617 signals trend continuation.
IWM
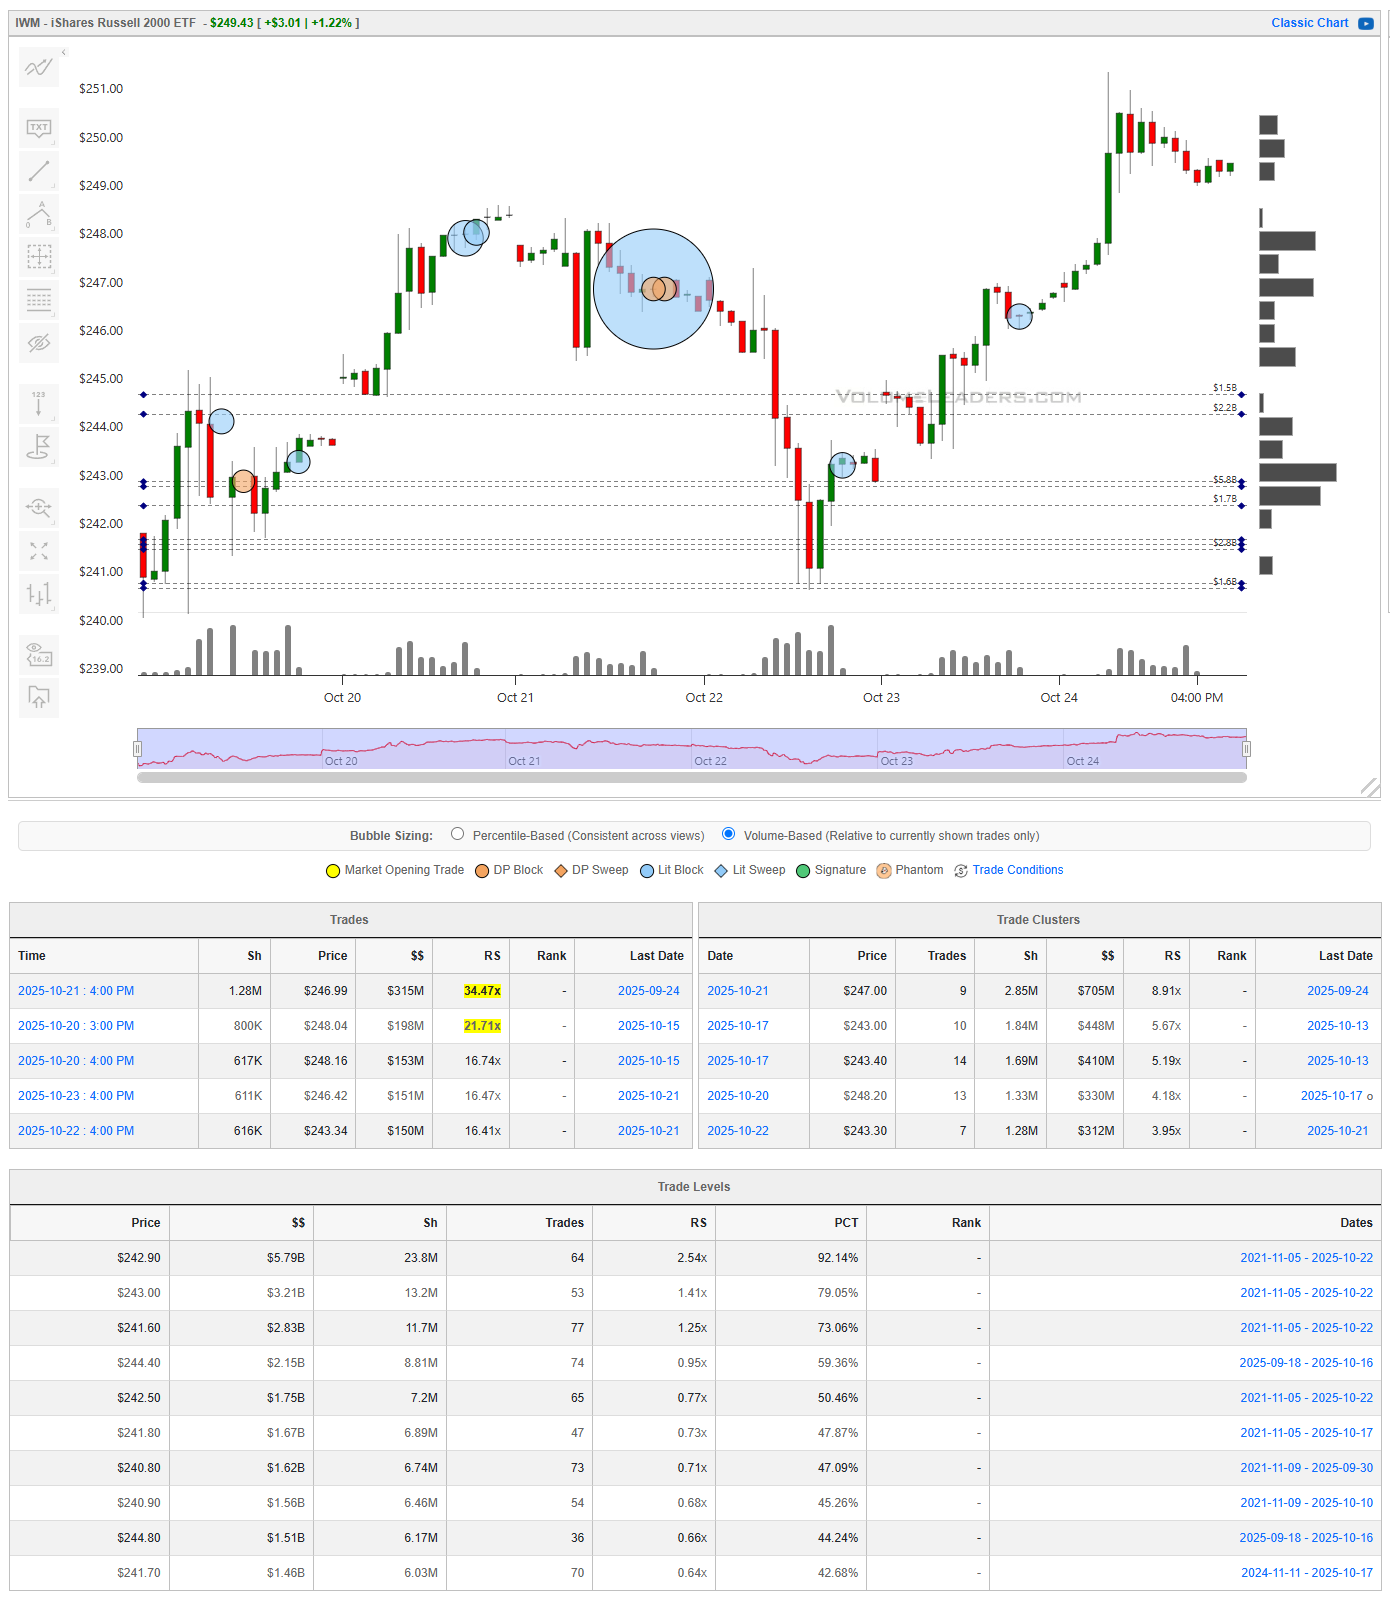
IWM’s tape confirmed growing risk appetite in small caps, delivering a 1.4% impulse that erased the early-week pullback. The critical data points are the $247 high-volume node ($315M notional, RS ~34%) and the $243–$244 consolidation zone where repeated prints clustered, including $195M at $243.3. The primary cluster of size rests between $241.8 and $243.5, with multiple billion-dollar shelves above the 90th percentile of historical volume, making it the strongest support band in weeks. The $248 handle is now key; acceptance above would likely extend the rally toward $251–$252, where liquidity thins out. On the downside, a break below $243 re-exposes $241.0–$241.5, which remains a tested but intact demand area. Traders can frame longs near $243.5–$244.0 with risk defined beneath $242.5, looking for $248.0–$250.0 as a measured continuation zone.
DIA
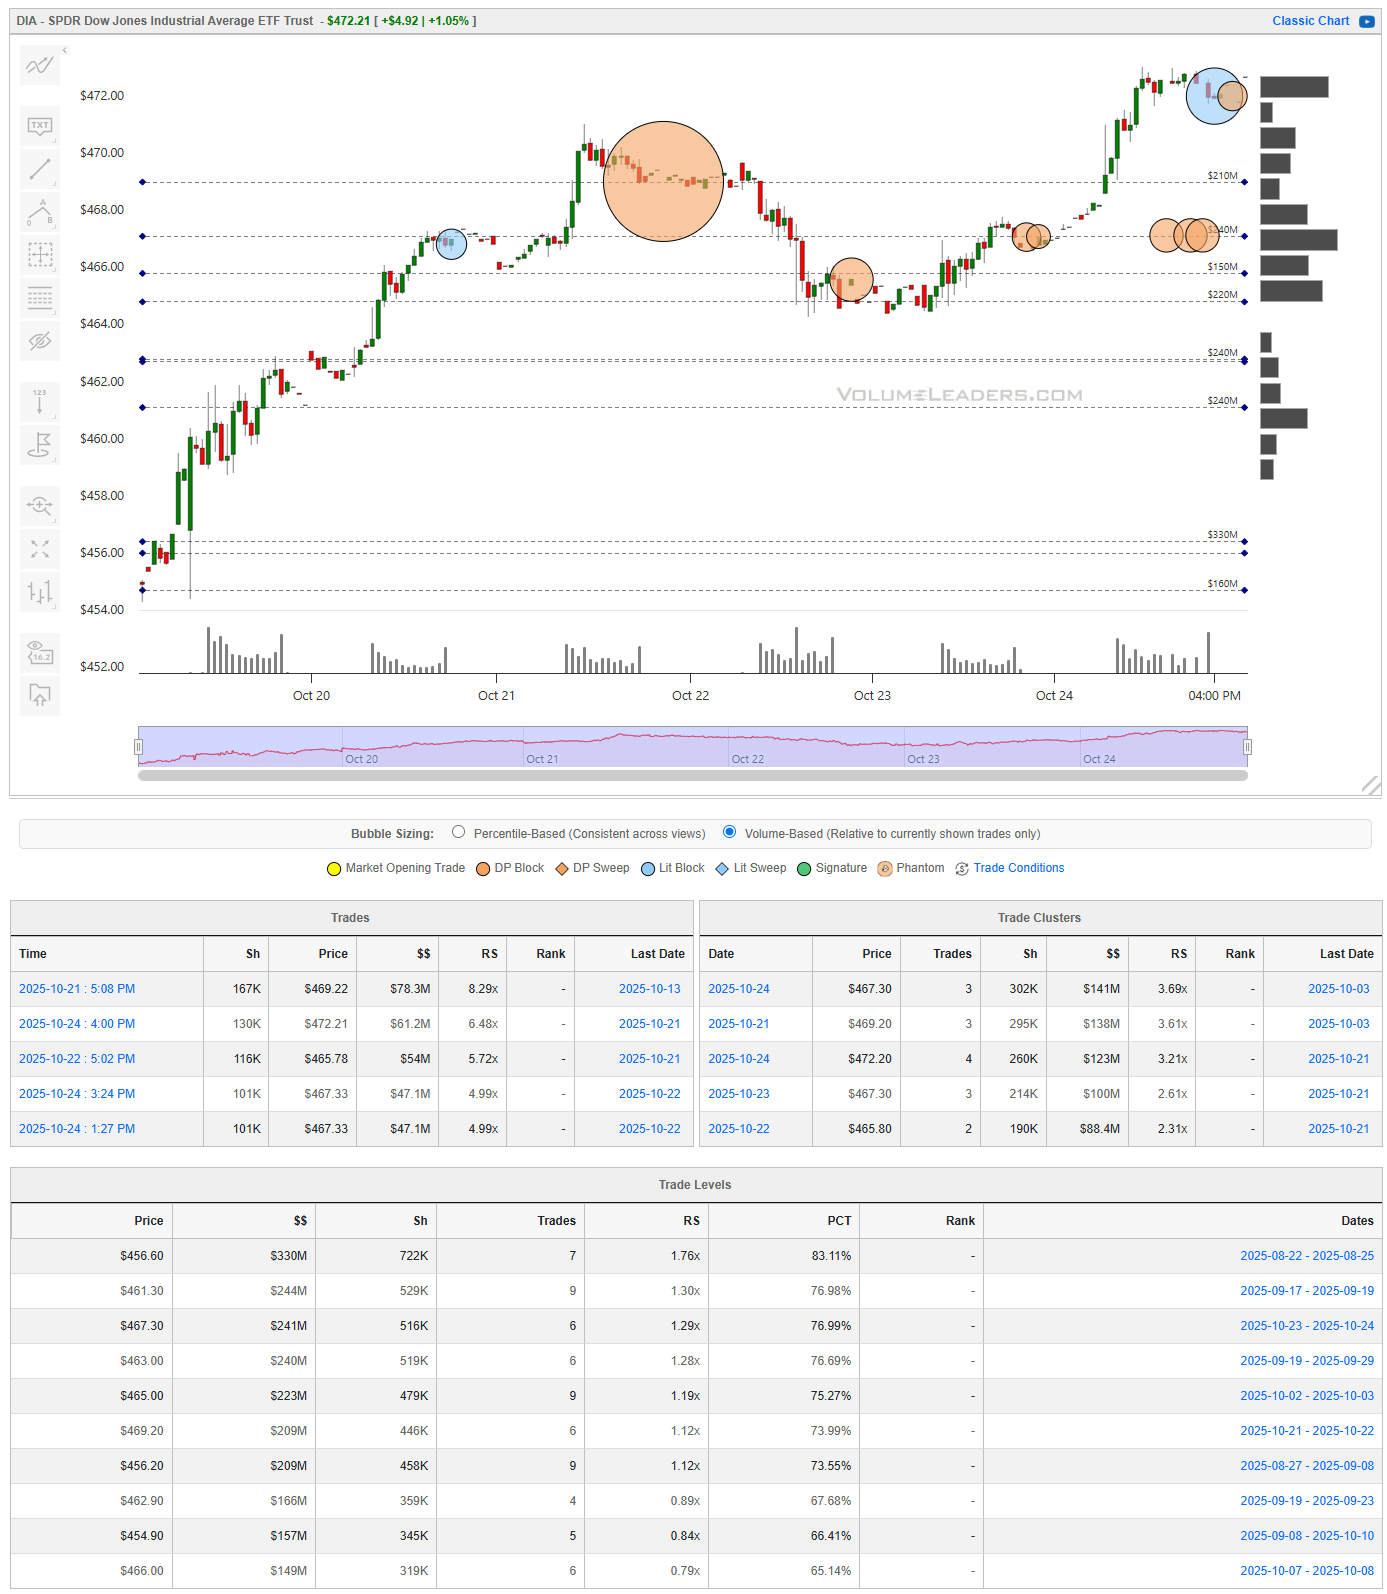
DIA traced a parallel structure but showed heavier intraday liquidity concentration and more aggressive re-accumulation on the rebound. The largest visible prints include a $78.3M block at $469.2 and a series of $47–$51M prints near $467–$472, carrying RS values between 5x and 8x normal. That flow behavior signals strong institutional interest defending higher ground. Cumulative trade levels highlight $456.6 ($330M notional, 83rd percentile) as the anchored demand shelf, while upper nodes build around $469–$471. Price closed near the top of that cluster, implying short-term acceptance above resistance. Holding over $468 sustains the advance toward $474–$476. A failure below $466, however, would flip the structure into a distribution phase with downside magnet at $460.5. For tactical bias, entries near $468 with a stop under $466 offer favorable skew; failure back inside prior balance warns of rotation.

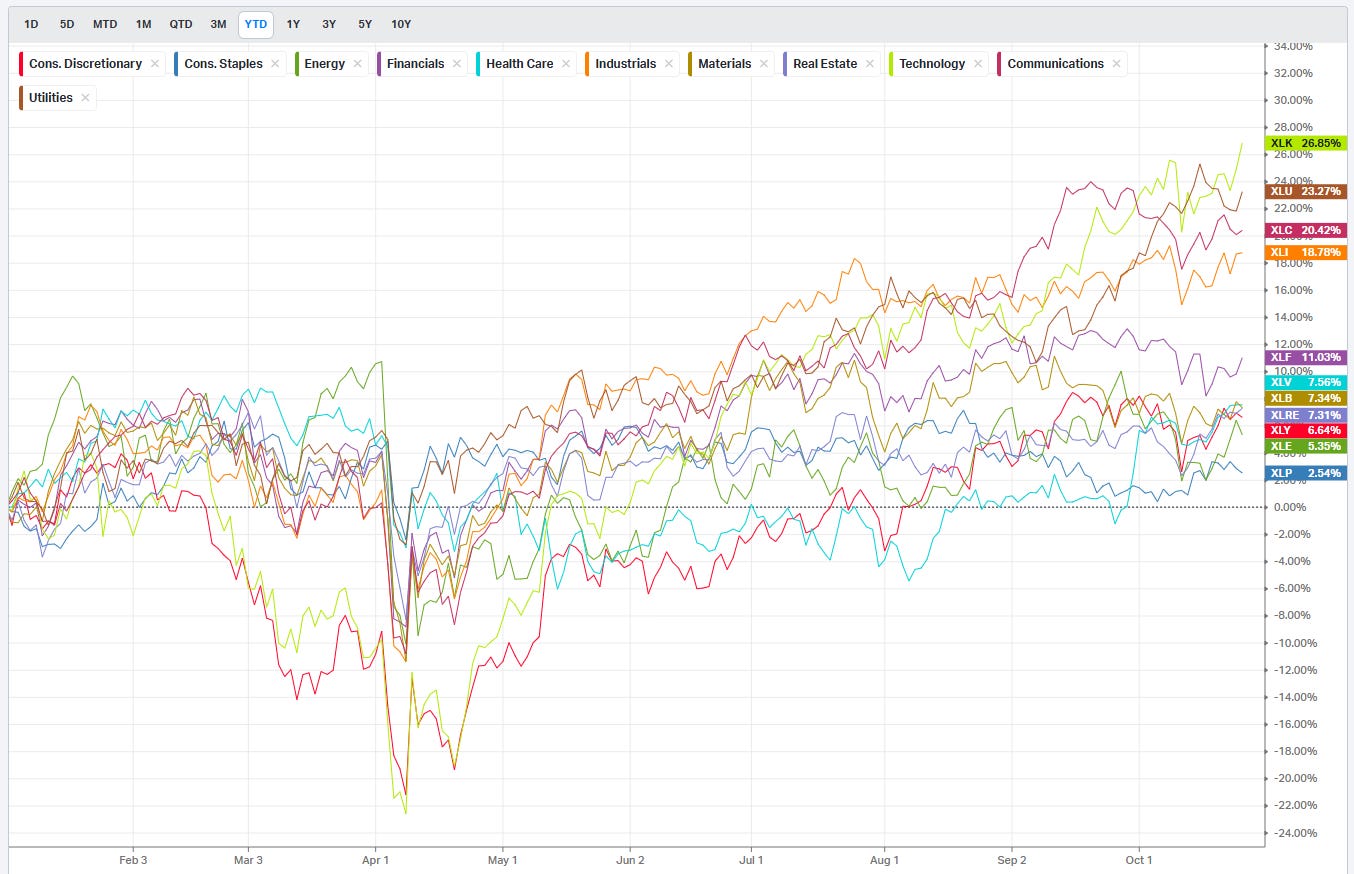
Summary Of Thematic Performance YTD
VolumeLeaders.com offers a robust set of pre-built thematic filters, allowing you to instantly explore specific market segments. These performance snapshots are provided purely for context and inspiration—think about zeroing in on the leaders and laggards within the strongest and weakest sectors, for example.
S&P By Sector
S&P By Industry
Commodities: Energy & Metals

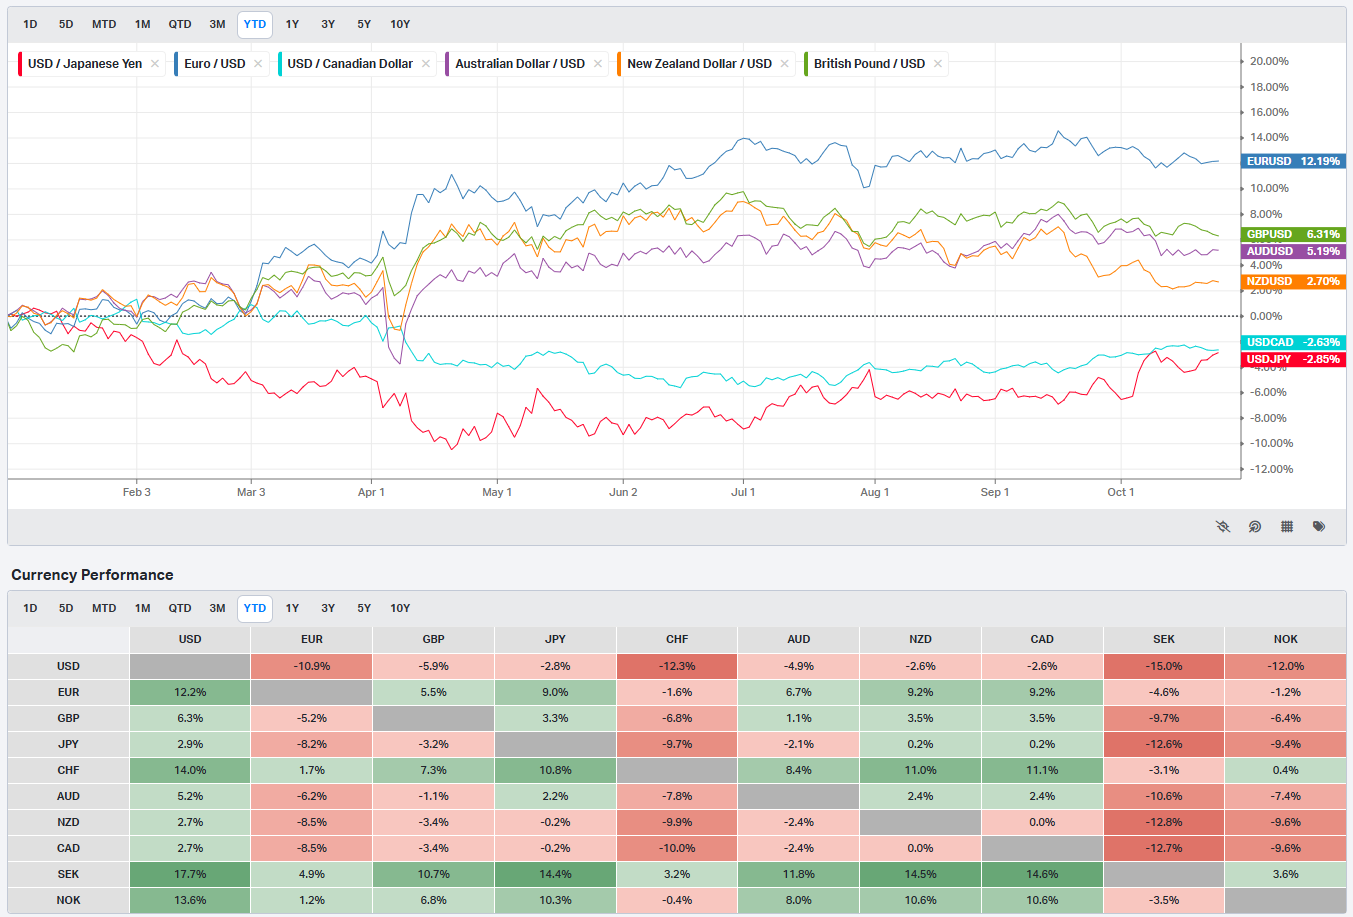
Currencies/Major FX Crosses
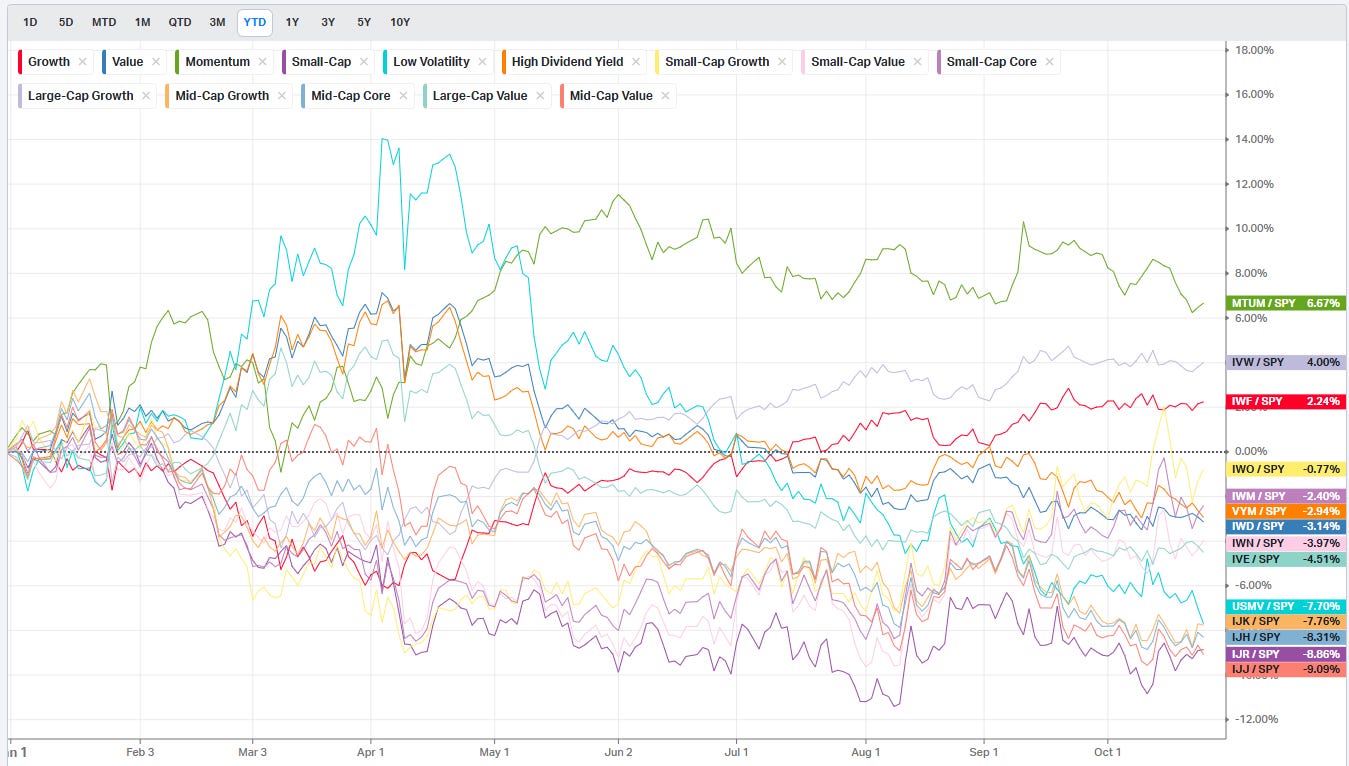
Factors: Style vs Size-vs-Value

Events On Deck This Week
Here are key events happening this week that have the potential to cause outsized moves in the market or heightened short-term volatility.
Market Eyes GDP and Mega-Cap Earnings in a Critical Stretch for Risk Appetite
The final week of October brings a packed slate of catalysts: a heavy macro calendar anchored by the Fed’s policy decision, the first read on Q3 GDP, and a dense cluster of mega-cap earnings that will help define whether the recent rally extends into November or stalls into the election-year endgame. The setup is asymmetric—growth data is likely to run hotter than comfort allows for dovish repricing, yet sentiment and positioning remain fragile enough that good news could still be good news if earnings breadth cooperates.
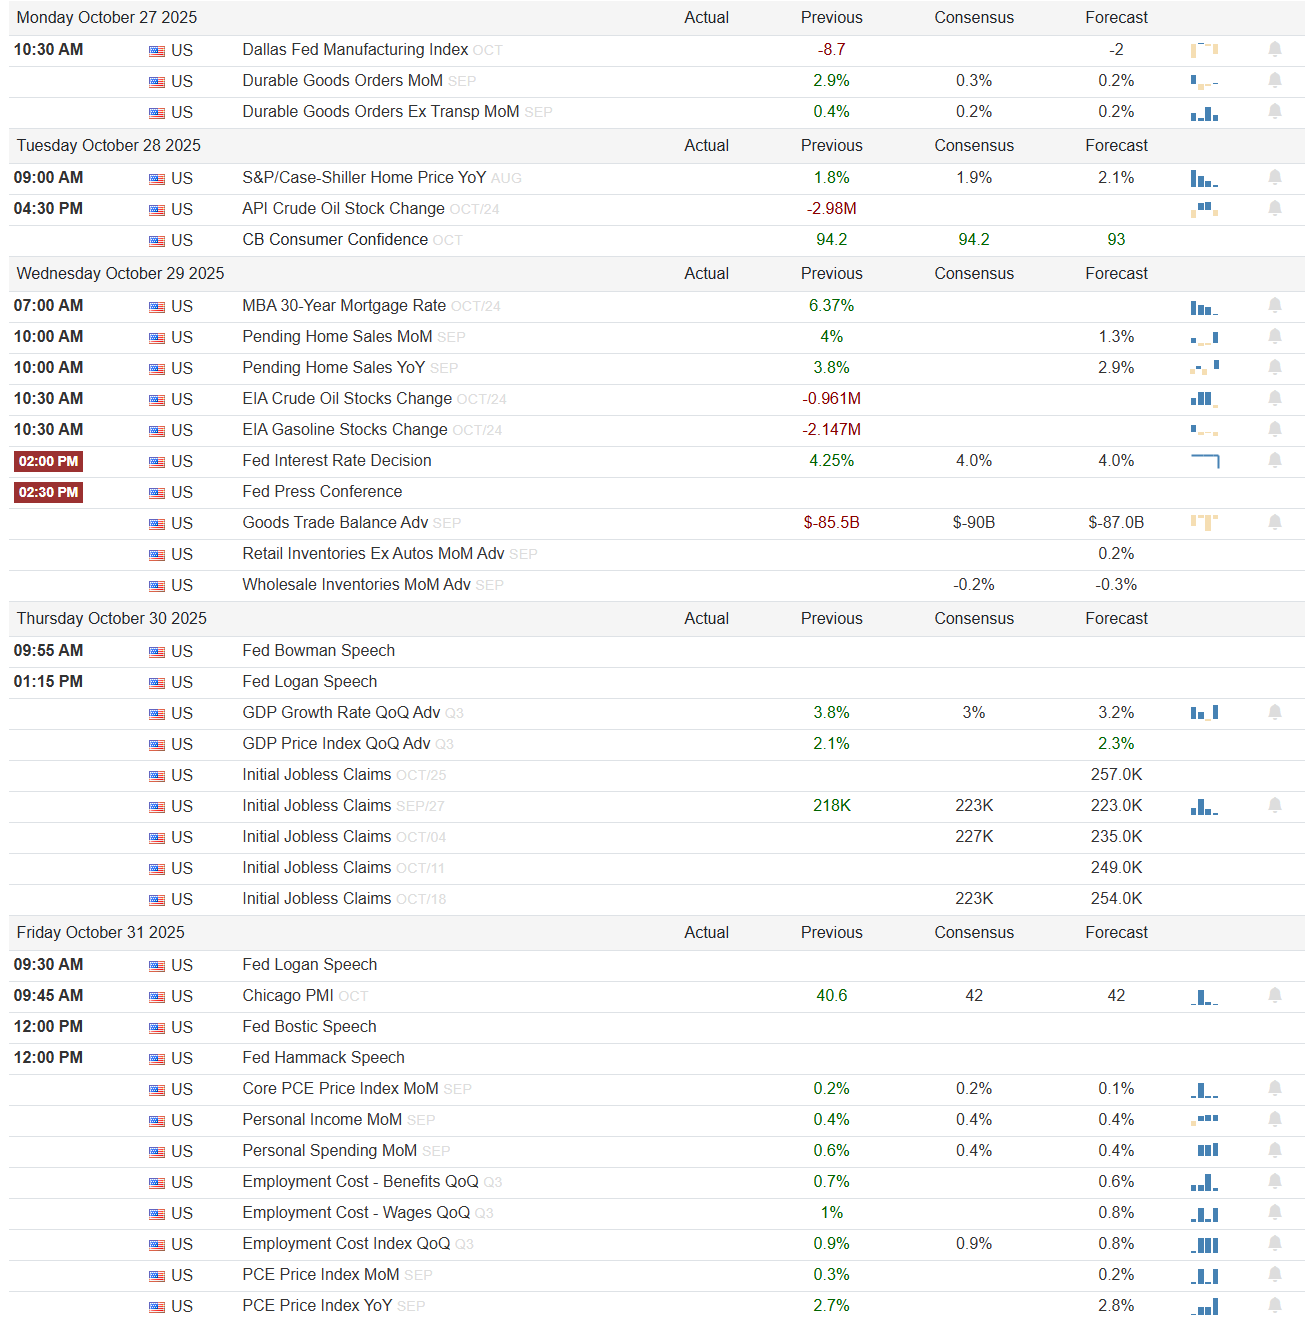
Monday, October 27
The week opens quietly with the Dallas Fed Manufacturing Index at -8.7, following -17.2 previously, alongside durable goods orders that printed 2.9% (consensus 0.3%) and ex-transportation up 0.4%. The headline bounce in durables signals firm business investment momentum heading into Q4, though the Dallas print keeps the industrial picture uneven. A risk-on read requires follow-through in orders ex-transport above zero; a relapse would tilt defensive, favoring duration and large-cap defensives. Earnings after the close include Cadence Design, NXP Semiconductors, and Fluor—names that test sentiment across the semiconductor supply chain and industrial engineering space.
Tuesday, October 28
Housing and consumer data take focus with S&P/Case-Shiller home prices expected at 2.1% (prior 1.8%) and Conference Board confidence at 93 (prior 94.2). Small misses here would not move markets, but a hot price print paired with resilient sentiment could reinforce the Fed’s higher-for-longer bias. Energy markets will watch the API crude change after last week’s -2.98M draw. On the earnings front, the morning lineup includes SoFi, UPS, Sherwin-Williams, and U.S. housing bellwethers like D.R. Horton and NEE, followed by Visa, Enphase, and Booking Holdings after the bell. Visa’s cross-border spending trends and UPS’s shipping volumes provide real-time signals on global demand; strong beats there would skew risk-on through cyclicals and logistics, while misses would weigh on transport and discretionary names.
Wednesday, October 29
A macro heavyweight day anchored by the Fed’s rate decision. The target rate is expected to hold at 4.25%, but Powell’s 2:30 p.m. press conference will be pivotal. Market focus will be on any shift in tone regarding balance sheet runoff or labor softness acknowledgment. Ahead of the Fed, we get mortgage applications (+6.37% prior), pending home sales (+4.0%), and energy inventories. The DOE’s crude draw of -0.961M and gasoline stock build of +2.147M suggest mixed energy conditions, while trade balance data at -$85.5B signals external demand still running cold. Risk-on would be a dovish-leaning Fed coupled with a contained energy build; a hawkish reaffirmation of 4.25% with inflation vigilance could jolt yields higher and cap equities. The earnings wave peaks here with Microsoft, Meta, Alphabet, and Chipotle—all before the close. Meta’s ad revenue and AI capex commentary, paired with Alphabet’s cloud growth and Microsoft’s Azure metrics, will dominate the macro narrative for the week. This is the fulcrum session for beta.
Thursday, October 30
The focus pivots to growth with Q3 GDP and inflation reads. GDP is forecast to accelerate to 3.8% QoQ from 2.1%, a sizable beat if realized, while the GDP price index sits at 2.1% versus 2.3% prior. Strong GDP alongside softening inflation would deliver the ideal “goldilocks” mix for equities, while a hot GDP price index would rekindle stagflation chatter. Initial jobless claims are seen steady near 218K, keeping labor tight. Fed speakers Bowman and Logan take the mic midmorning and early afternoon; tone around policy lags or inflation stickiness could define the post-Fed digestion phase. Before the open, earnings from Eli Lilly, Mastercard, McDonald’s, Shell, and Estee Lauder bring a cross-sector pulse—from biotech to global consumer demand and energy pricing. After hours, Amazon, Apple, and Coinbase close out the mega-cap gauntlet. Amazon’s retail margins, Apple’s services growth, and Coinbase’s trading revenue will dictate the next rotation between growth and value.
Friday, October 31
The week closes with inflation follow-through and labor cost data. PCE inflation is expected at 0.3% MoM and 2.7% YoY, unchanged from prior, while the core index holds at 0.2% and 2.8%. Employment cost growth is seen at 0.9% QoQ, wages at 0.7%. These will be critical confirmation points for Thursday’s GDP and Fed takeaways: cooling inflation and stable wage growth would cement the soft-landing narrative. The Chicago PMI, expected at 42.0, remains contractionary but could tick higher, offering incremental support to cyclical sentiment. Chevron, Exxon, AbbVie, and Colgate lead Friday’s earnings, rounding out energy, healthcare, and staples—all key for the defensive end of portfolios.
Earnings and IPO Read-Through
This is one of the heaviest earnings weeks of the season, dominated by big tech, banks, and industrial cyclicals. The data dependency narrative will run parallel to corporate execution. If the tech megacaps deliver clean beats and guide cautiously optimistic, it will anchor the market’s leadership profile into November. Watch for whether financials and transports confirm that momentum is broadening—Visa, UPS, and Booking are as important for global growth tone as the trillion-dollar techs. Meanwhile, energy majors’ capex and buyback commentary will feed into the inflation-versus-demand debate that shapes the next Fed meeting.
Sign-Posts for Active Traders
GDP print above 3.5% with PCE at or below 0.2% MoM = momentum extension through 6800 SPX.
Fed tone explicitly neutral or data-dependent = 10-year yields likely stall below 4.4%.
Mega-cap misses combined with hawkish Fed = reversal risk toward 6550 SPX support.
Bottom line: The week ahead sits on the knife-edge between confirmation of a soft-landing and the reassertion of tightening fatigue; if GDP and tech earnings align, risk appetite should extend decisively into month-end.

Market Intelligence Report
A clear risk-on week. Core beta and semis did the heavy lifting, financials and industrials followed through, while hedges and precious metals bled. Real-estate income hung in despite one storage laggard. Credit and short duration were small but positive. Net: +0.95% portfolio return (weighted).
Last week we put together sleeves around where institutions transacted. Core beta and compute were the sponsored risk; Financials/REITs were where consensus price acceptance just formed; credit and short duration were the scaffolding that kept realized vol muted in the IO sheet; metals provided convexity; small satellites in industrials, healthcare, and international round out factor balance. The mix is elastic: increase Core/Compute when SPY 659–662 and QQQ 602–606 flip to support with breadth confirmation; rotate 2–3% back to short duration and GLD if HYG/LQD wobble while equities climb. Last week’s rebal:
--------------------------------------------------
Core index liquidity — 28%

SPY 16%, QQQ 10%, IVV 2%
Justification: largest lit + dark-pool sponsorship and easiest to scale. Use these as the throttle for gross exposure around VL levels.
--------------------------------------------------
Compute/AI barbell — 18%

SOXX 6%, NVDA 4%, AAPL 3%, MSFT 3%, SMH 2%
Justification: dollars concentrated in megacap platforms and semis with broadening participation (storage, comms, infra). ETFs (SOXX/SMH) carry the breadth; single names capture platform torque. Add on QQQ acceptance; harvest at 610–612 if momentum stalls.
--------------------------------------------------
Financials — 10%

XLF 6%, KRE 3%, RJF or TROW 1%
Justification: banks and asset managers printed outlier and consensus activity; they are the second engine when rates steady. KRE gives cyclicality; XLF gives balance-sheet scale. Keep unless KRE rolls below its new shelf while 10y backs up hard.
--------------------------------------------------
Real estate income — 10%

XLRE 4%, EXR 2%, WELL 2%, KIM 1%, EQR 1%
Justification: multiple REITs set highest-ever volume-by-price nodes; that is institutional acceptance around new “fair value.” Provides yield and duration sensitivity without leaving equities. Pair with short duration to dampen rate shocks.
--------------------------------------------------
Credit ballast — 10%

LQD 6%, HYG 4%
Justification: both carried heavy dark-pool and sweep dollars. They should be firm on up-equity days; if they leak while SPY/QQQ rise, treat the equity move as distributive and slow adds.
--------------------------------------------------
Short-duration Treasuries — 5%

USFR 3%, VGSH 2%
Justification: the IO sheet showed multi-sigma size here with tiny vol. This is working capital for pulls, your dry powder and shock absorber if rates twitch.
--------------------------------------------------
Precious metals convexity — 3%

GLD 2%, RGLD 1%
Justification: two-way flow in metals/miners with light drift lower; keep a toe for policy or FX surprises. Add only if credit softens or DXY rolls.
--------------------------------------------------
Industrials/capex sleeve — 3%

OSK 1%, DOV 1%, CMI 1%
Justification: consensus levels in specialty machinery and distributors. It is not a reflation chase; it is measured exposure to ongoing capex.
--------------------------------------------------
Healthcare selective — 3%

XBI 2%, CVS or PODD 1%
Justification: TRV showed strong biotech interest; use XBI for diversified optionality and one quality cash-flow name for ballast. Trim if QQQ loses 602–606.
--------------------------------------------------
International diversifiers — 4%

BBEU 1.5%, OSEA 1.5%, EEM 1%
Justification: outliers and TRV showed renewed non-US interest. Keep small, additive to beta without crowding liquidity.
--------------------------------------------------
Energy cash-flow — 2%

PSX 1%, CVE 1%
Justification: consensus-level participation in refiners/producers; hold for cash yield and inflation hedge, not for a crude beta chase.
--------------------------------------------------
Crypto toggle — 1%

IBIT 0.6%, ETHE 0.4%
Justification: maintain optionality while small; scale only with QQQ acceptance and firm credit.
--------------------------------------------------
Hedges — 3%

SH 1.5%, PSQ 1%, VIXY 0.5%
Justification: live until acceptance is proven and NH > NL with 50d cohorts improving. Bleed these first on strength and redeploy to core beta/semis.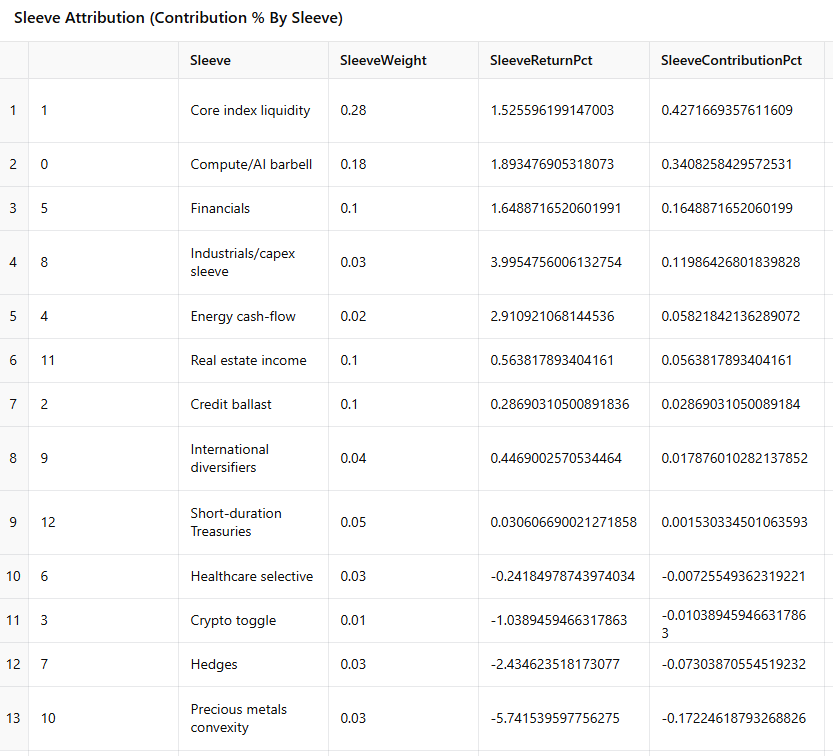
What worked
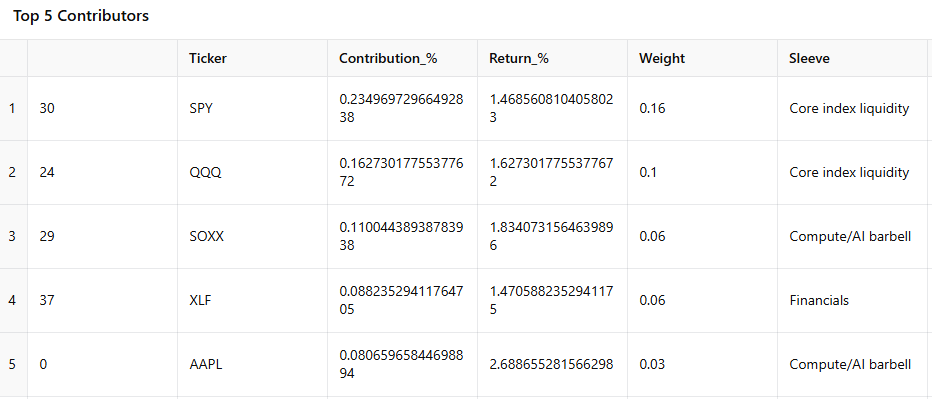
Core index liquidity (+0.43% contrib): SPY (+0.235%) and QQQ (+0.163%) were the two largest contributors; IVV added a small tail (+0.030%). This sleeve did exactly what it’s supposed to do—carry the book when broad risk is accepted.
Compute/AI barbell (+0.34% contrib): SOXX (+0.110%) led; AAPL (+0.081%), NVDA (+0.069%), MSFT (+0.052%), and SMH (+0.030%) all green. Semis breadth and mega-cap platforms both worked.
Financials (+0.165% contrib): XLF (+0.088%) and KRE (+0.080%) rode the “rates steady” tape; the two 1% single-names were near flat (small drags).
Industrials/Capex (+0.120% contrib): DOV (+5.84% ret; +0.058% contrib) and OSK (+0.047%) were standouts; CMI modestly positive.
Energy cash-flow (+0.058% contrib): PSX (+0.043%) and CVE (+0.015%) did their job—carry yield and a bit of inflation hedge beta.
Real estate income (+0.056% contrib): XLRE, WELL, KIM, and EQR offset a weak EXR; sleeve still printed positive.
Credit & short duration (together +0.030% contrib): Small greens (LQD, HYG, USFR, VGSH) as ballast.
What didn’t
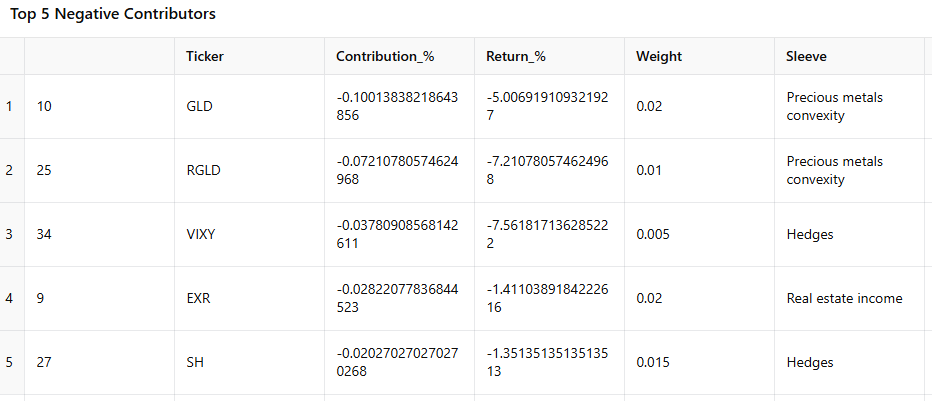
Precious metals convexity (-0.172% contrib): GLD (-0.100%) and RGLD (-0.072%) were the largest sleeve drag—policy/FX mix didn’t favor the toe-hold here.
Hedges (-0.073% contrib): VIXY (-0.038%), SH (-0.020%), PSQ (-0.015%) bled in a rising tape—as intended insurance cost.
Crypto toggle (-0.010% contrib): ETHE weakness outweighed flat BTC proxy (IBIT).
Healthcare selective (-0.007% contrib): XBI drifted; PODD slightly up, CVS slightly down—net small red.
Let’s take a look at what the tape is telling us about this coming week.
MIR Part 1: The Backdrop
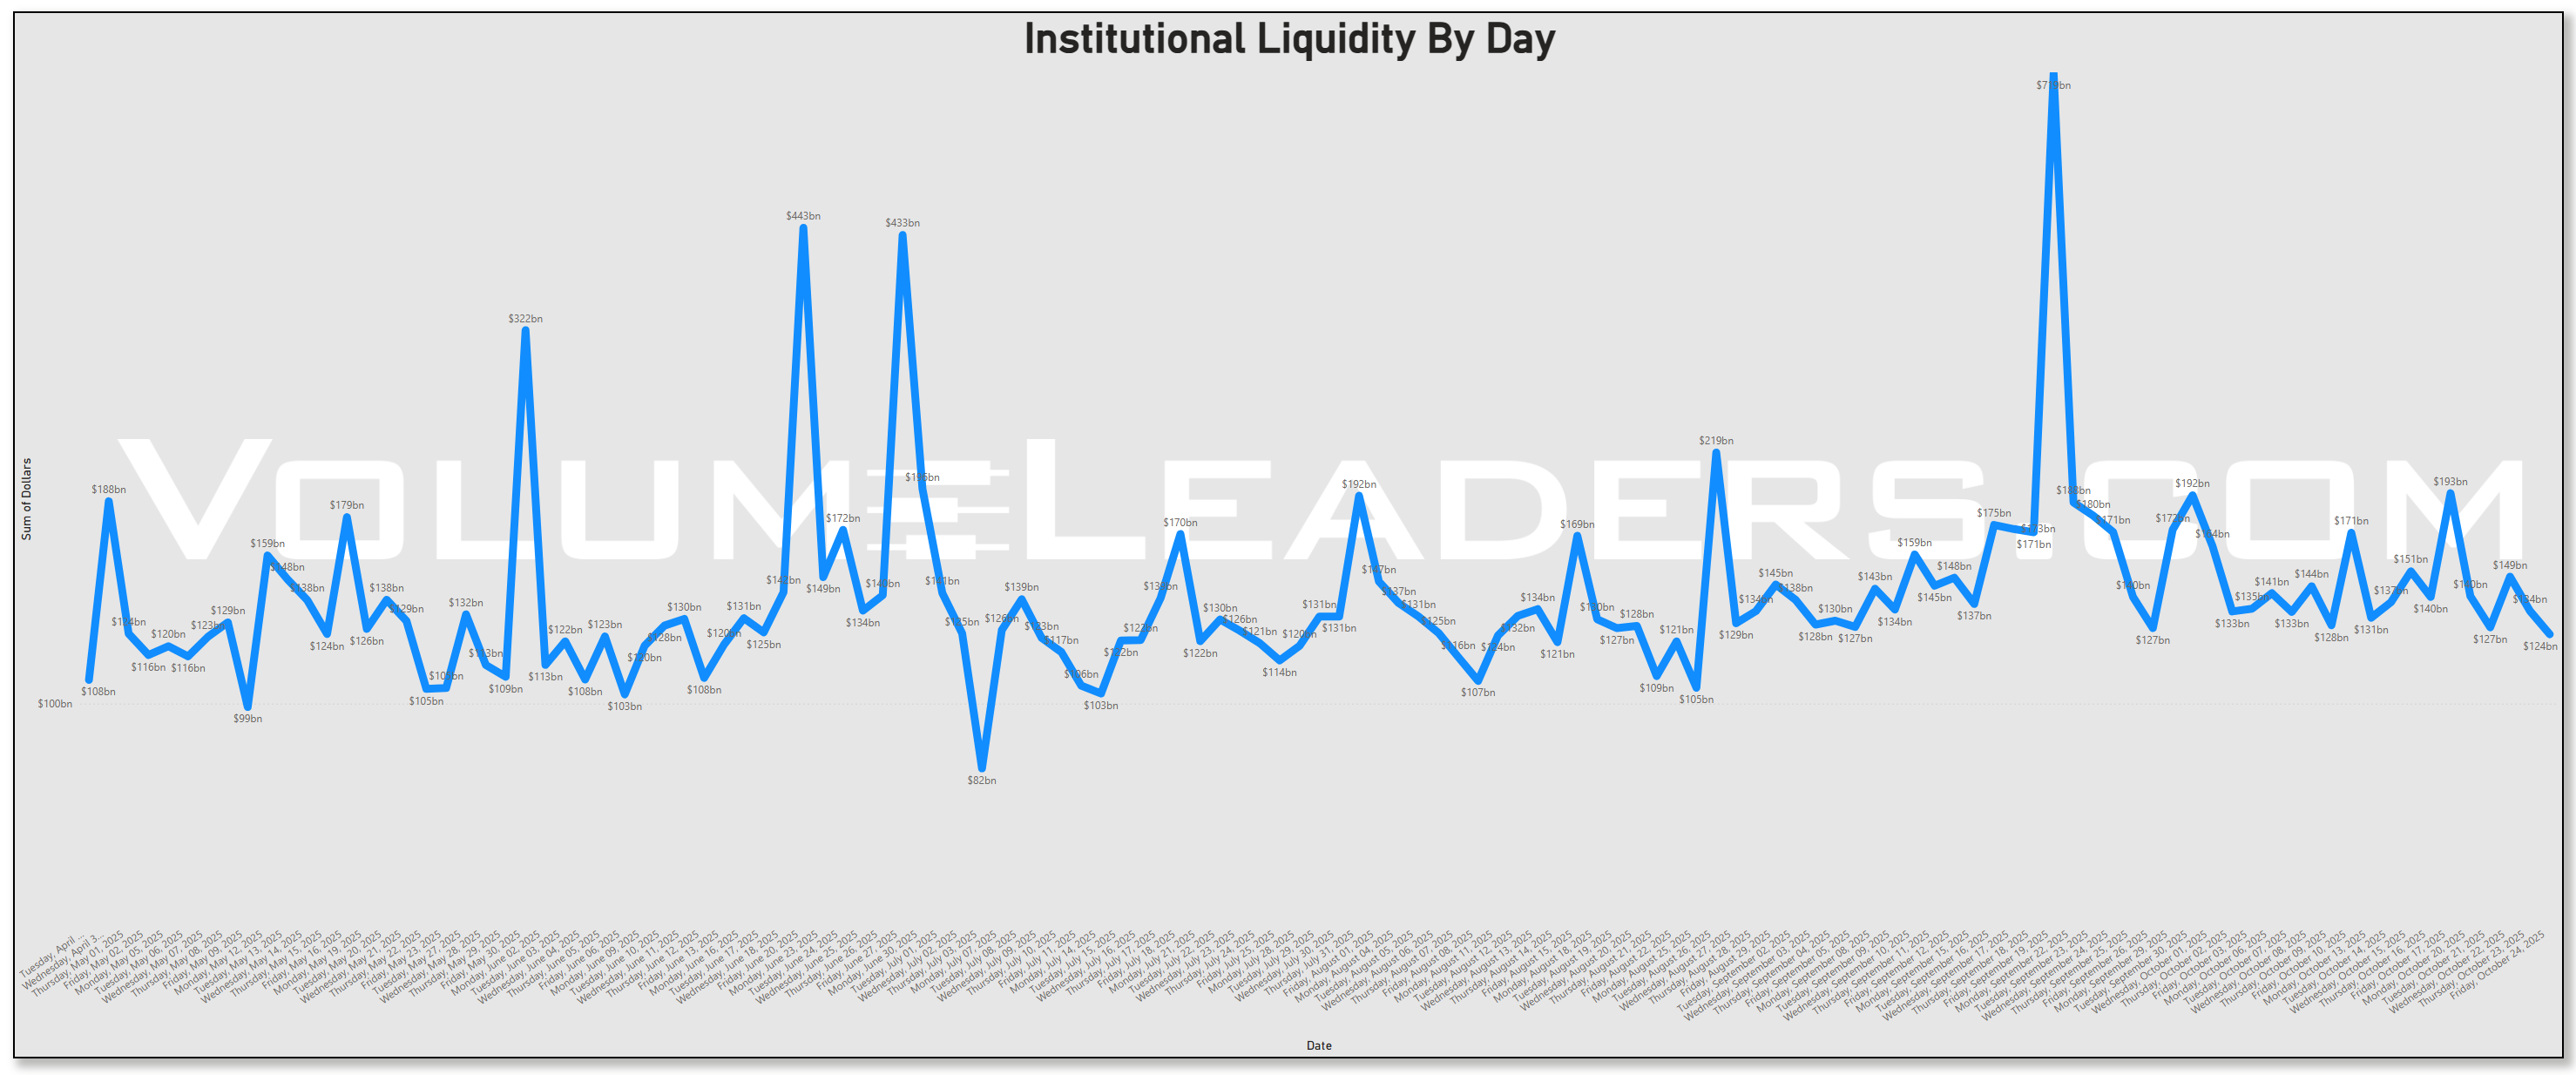
The most evident pattern this week is the post-OPEX digestion we’re seeing after elevated liquidity levels last week: liquidity compresses, then redistributes as dealers rebalance. Into this week, aggregate dollars trended lower from the prior Friday’s burst but remained firm enough to support broad risk acceptance rather than a defensive grab for duration.
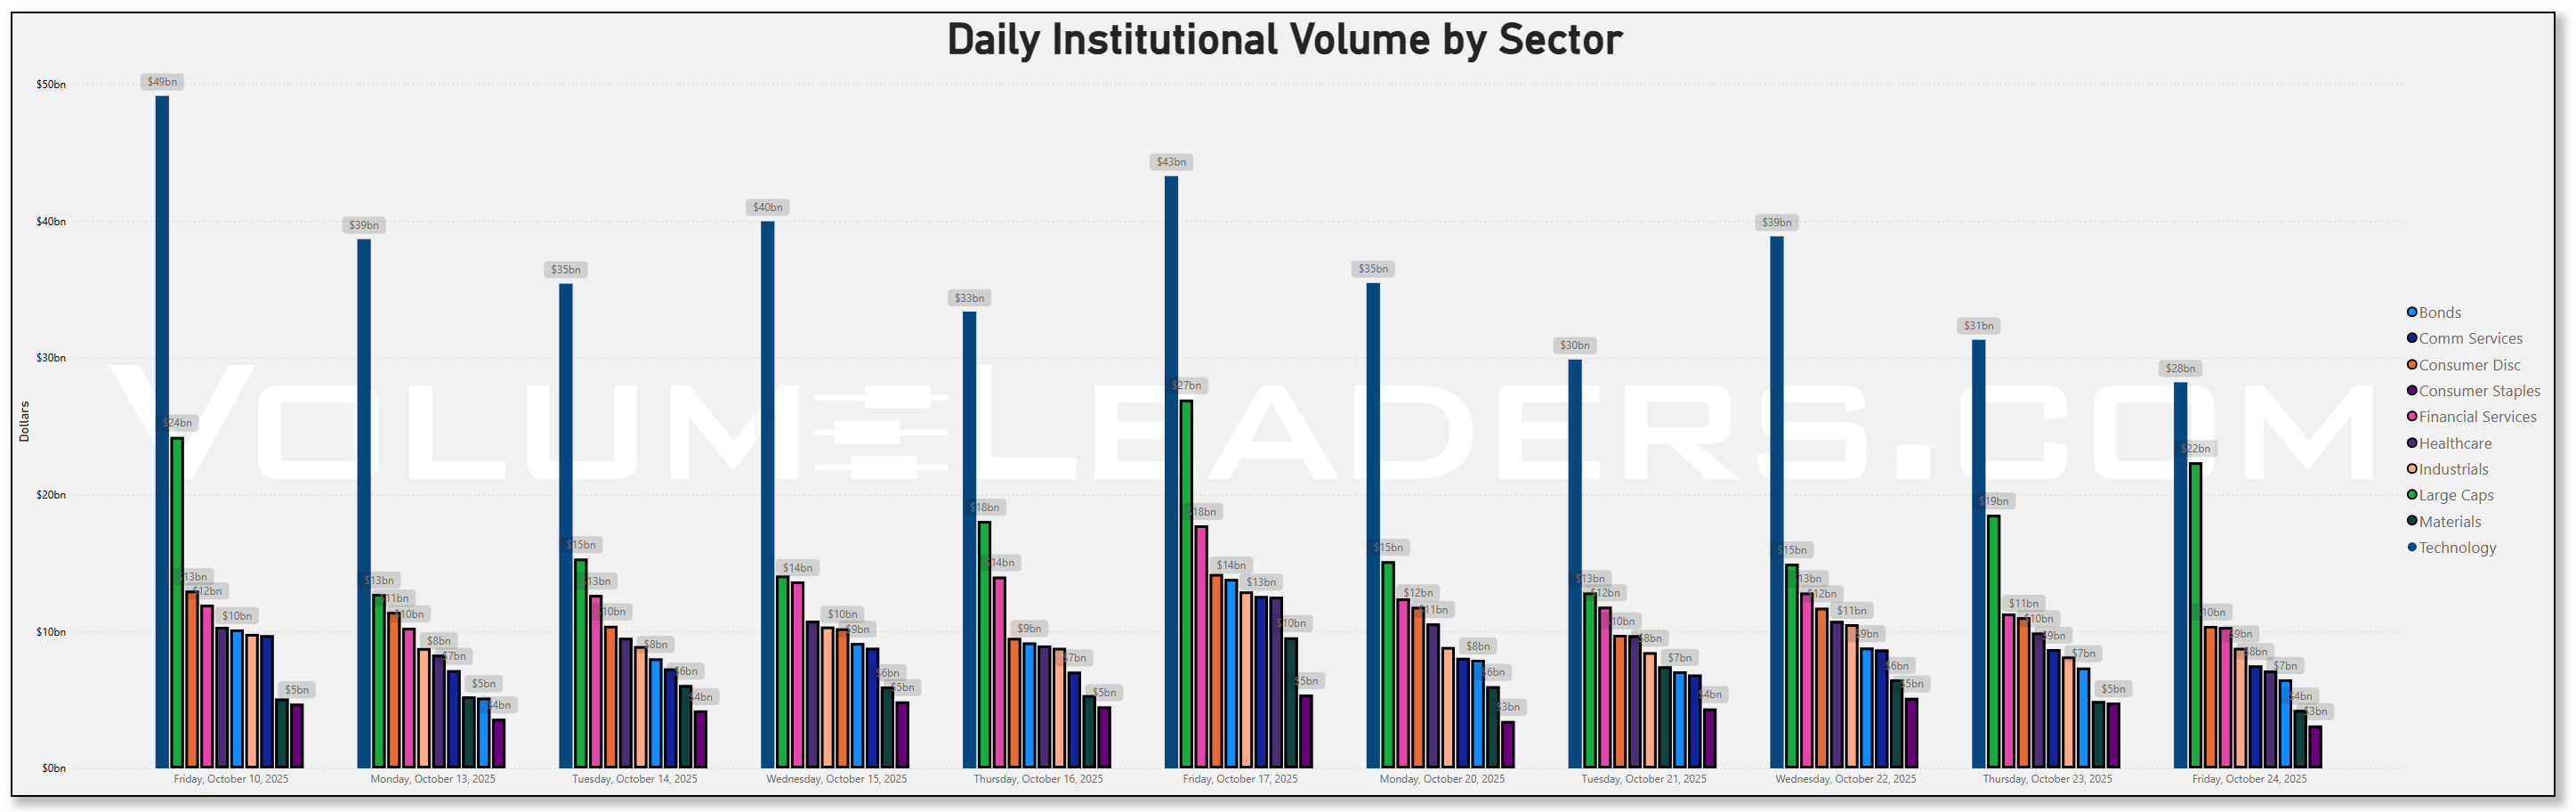
On the daily sector dollars, Technology owned the early narrative and then ceded the baton to broad beta. Tech printed roughly $43bn last Friday and stayed heavy through mid-week in the $30–40bn zone before easing toward the high-$20b range by Friday. Large Caps (the index sleeve) marched alongside: about $27bn last Friday, then ~$15bn Monday, ~$13bn Tuesday, a mid-week rebuild near ~$21bn Wednesday, ~$19bn Thursday, and a firmer ~$22bn to finish the week. Financials and Health care held a persistent middle tier near the low-to-mid teens, while cyclicals like Industrials and Materials remained steady single-digit billions. Versus last week, the clearest change was a narrowing of the Tech dominance premium and a broadening of participation across the index sleeve—consistent with allocators adding exposure into the Federal Reserve’s meeting window rather than simply chasing a handful of winners. The setup fits the macro calendar: the FOMC meets Oct 28–29, with the market leaning toward another rate cut after September’s move, and GDP (advance) hits Oct 30—both catalysts that typically pull passive and rules-based dollars into the complex.
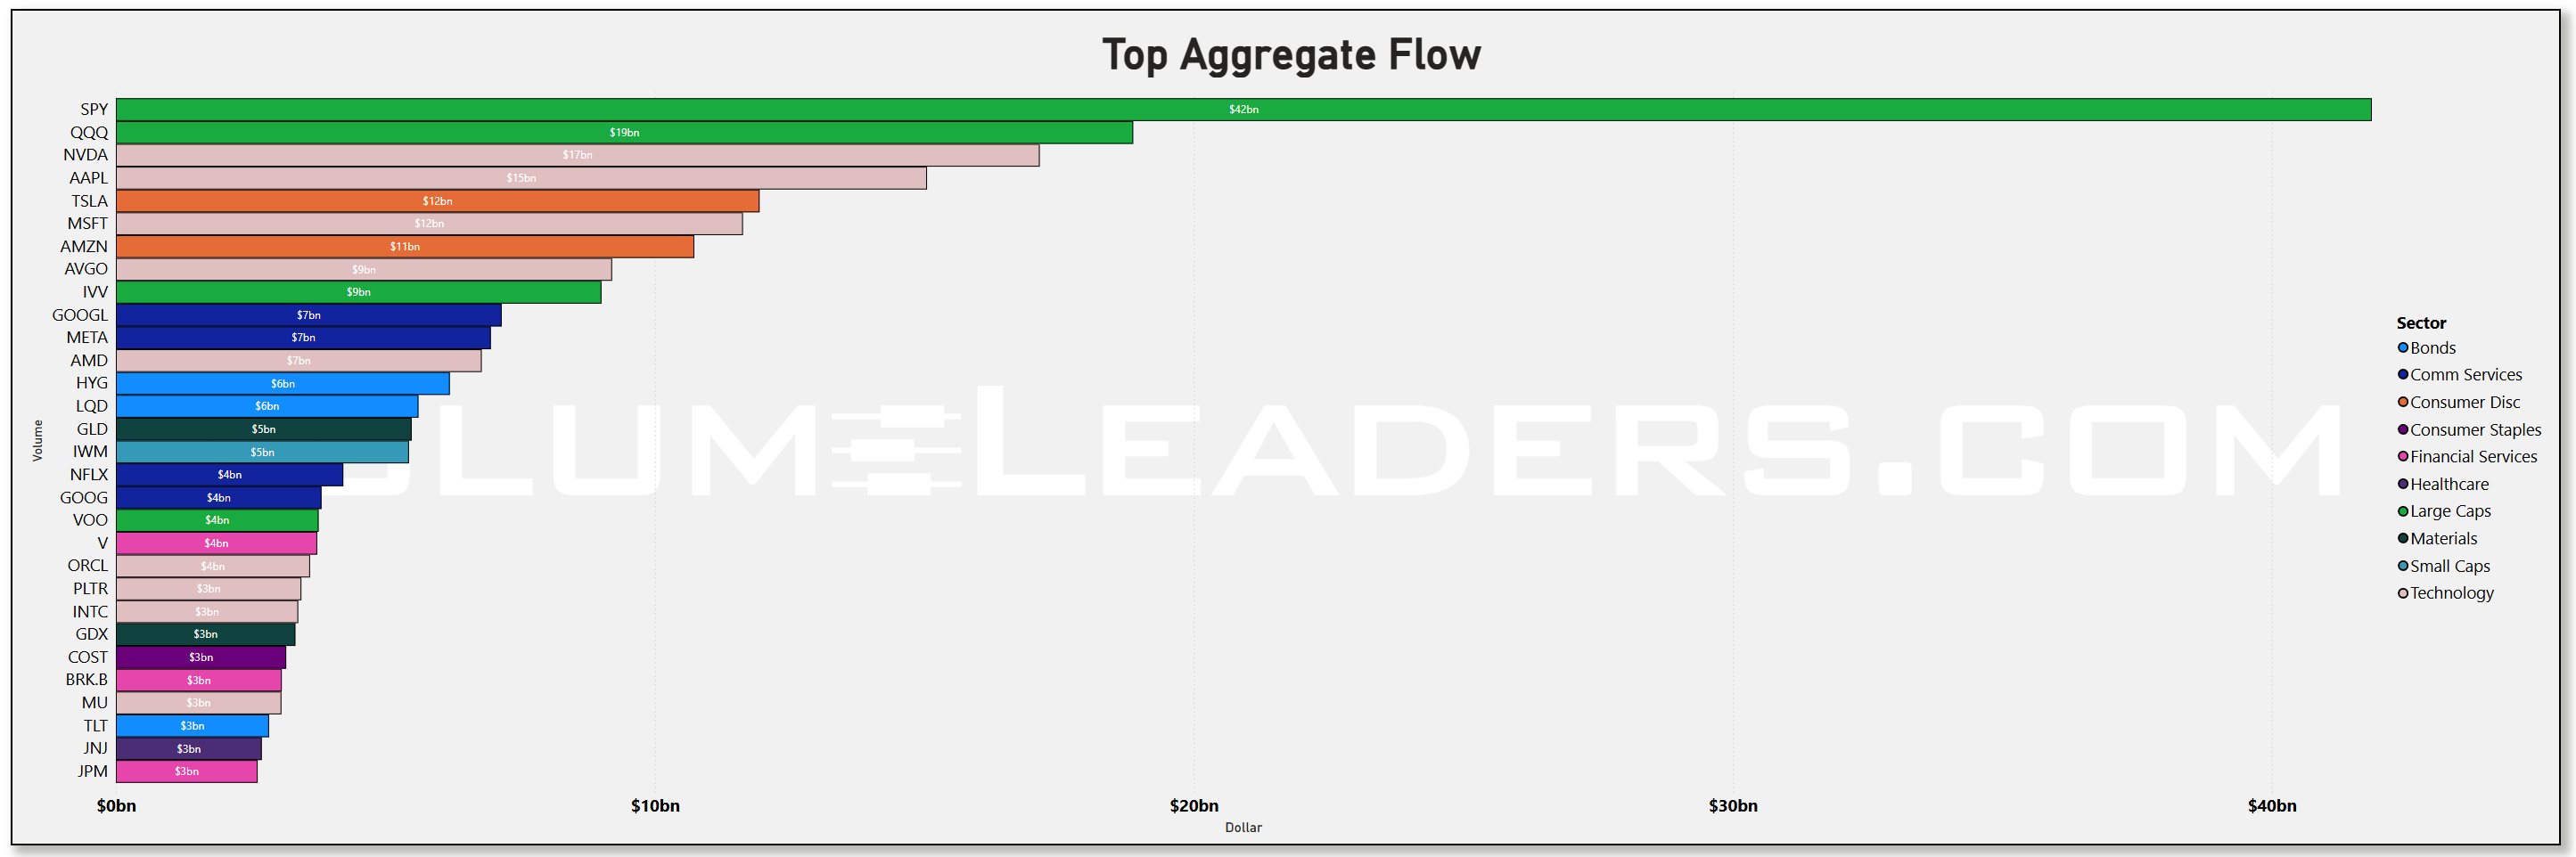
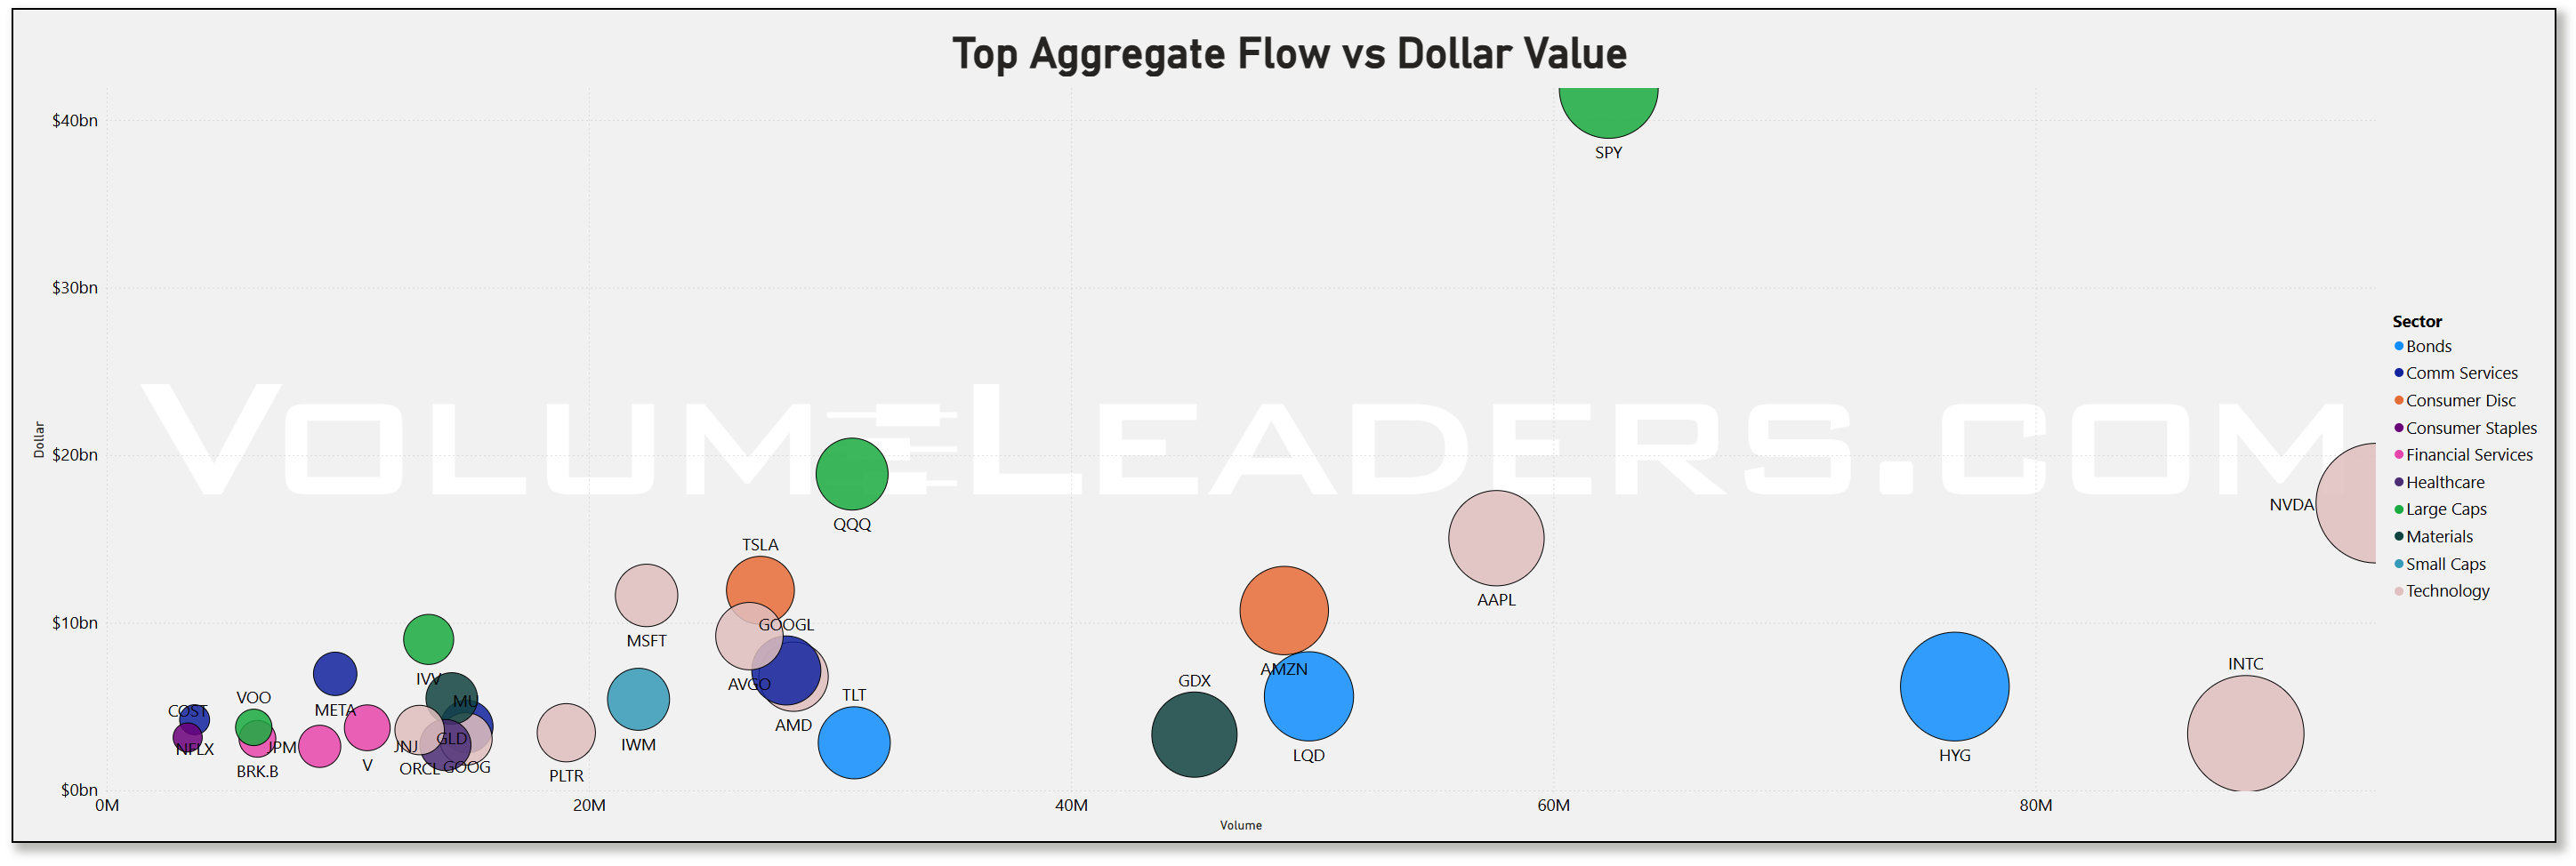
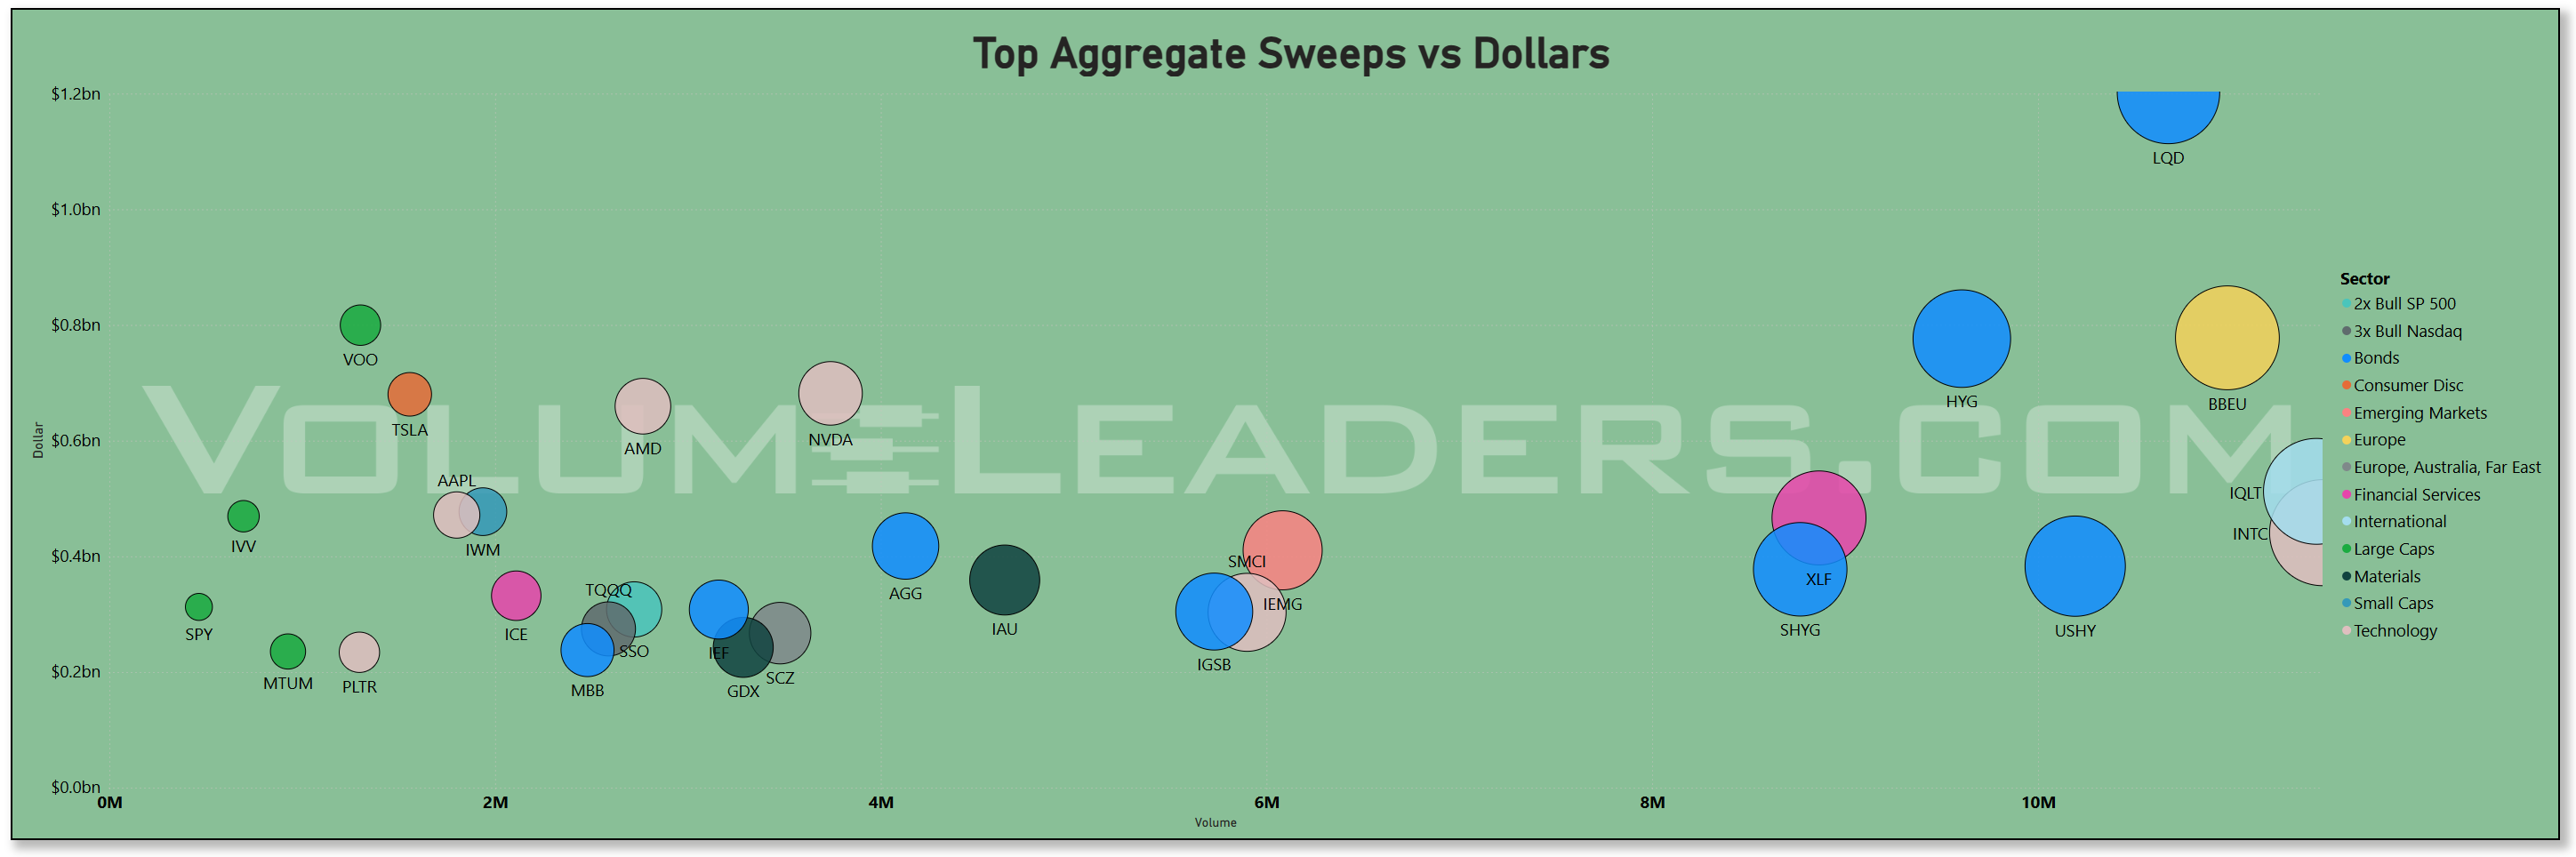
Where the dollars concentrated was unambiguous. The treemap and aggregate bars put SPY at roughly $42bn, with QQQ around $19bn and IVV/VOO adding several more billions—a classic allocation footprint.
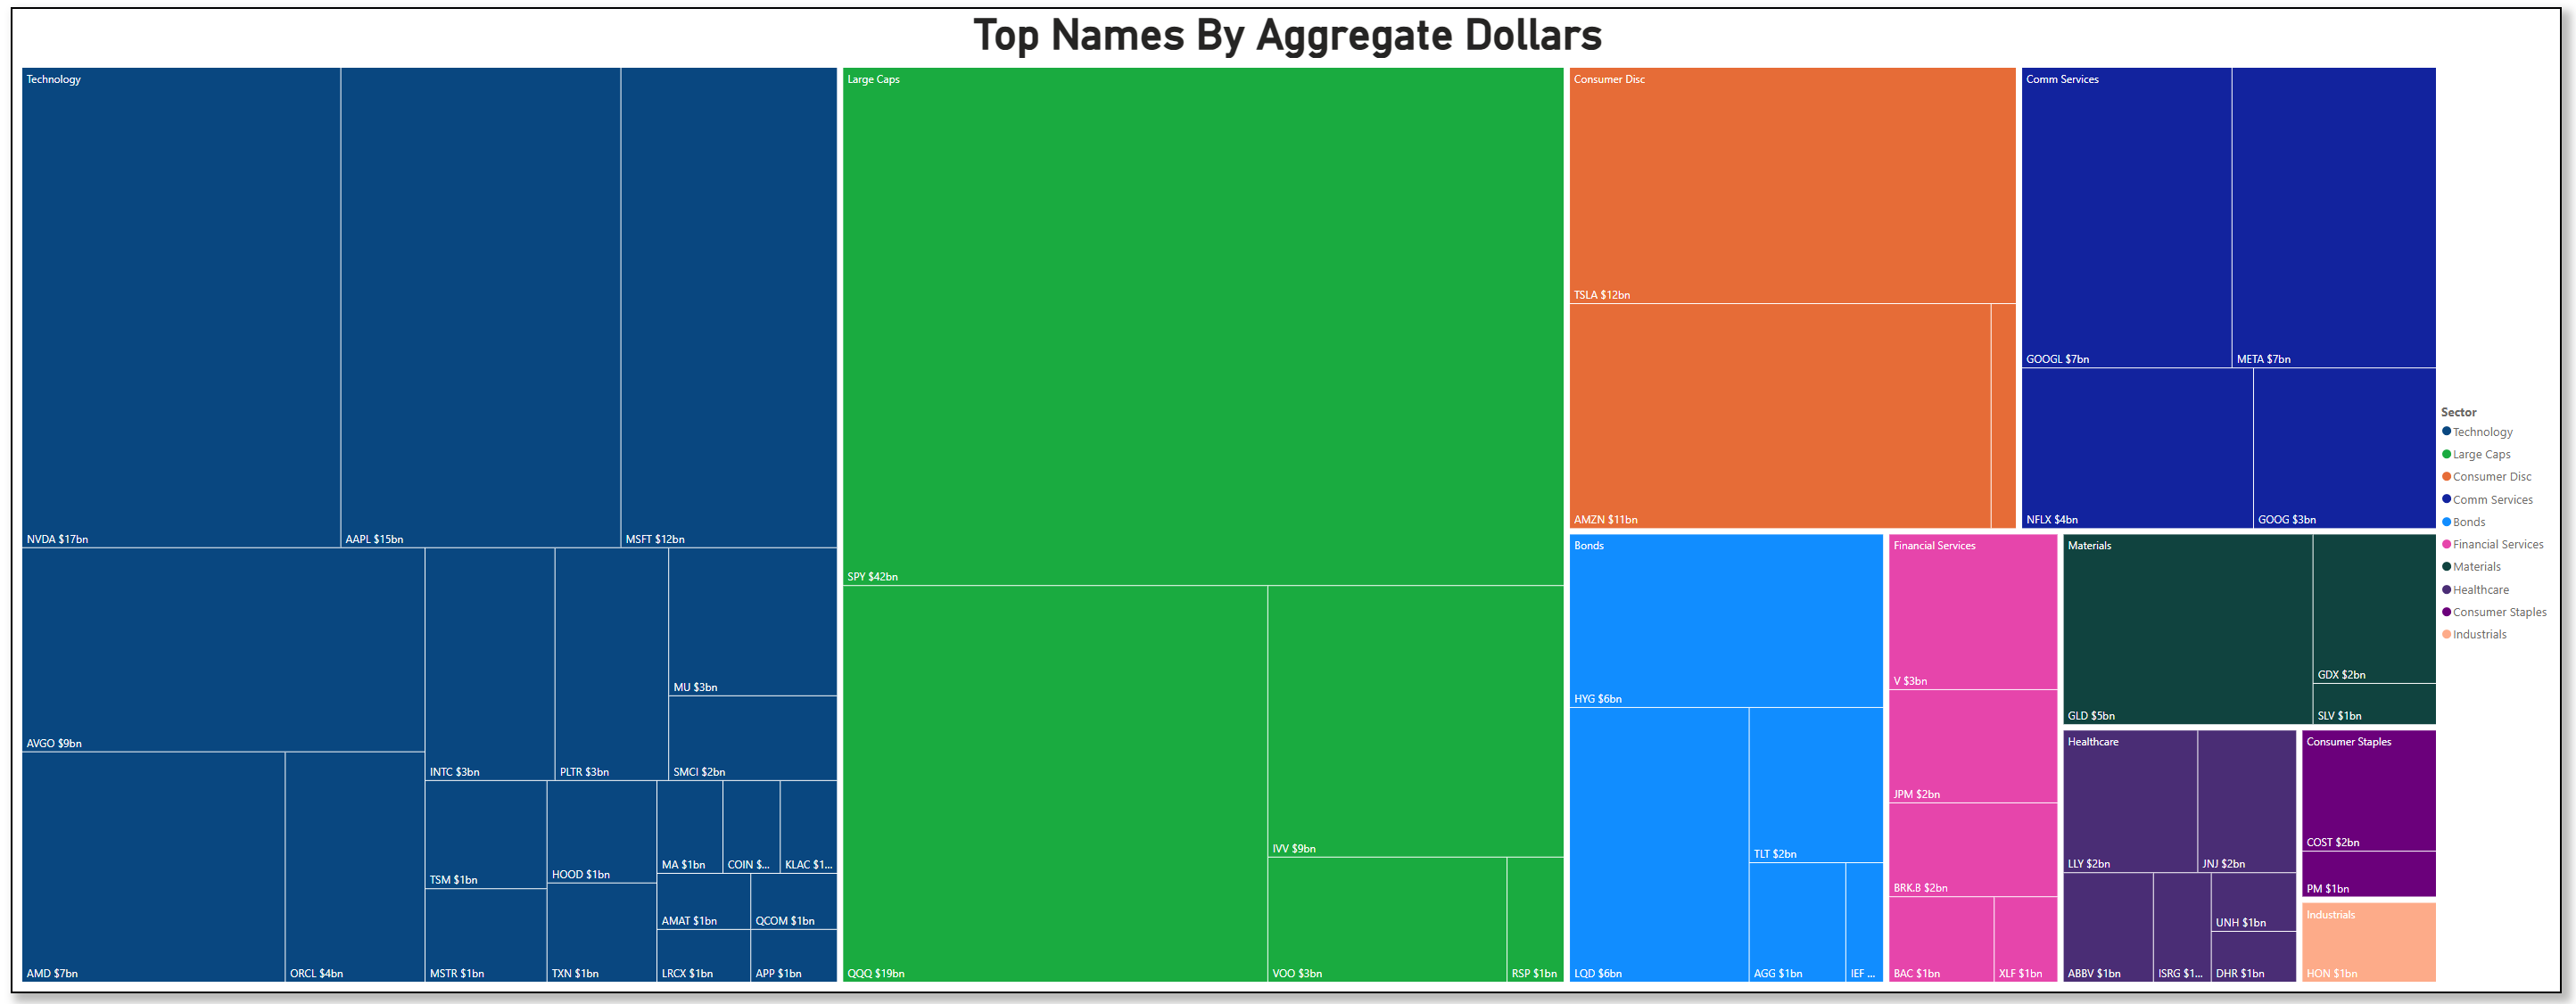
Inside single-names, NVDA (~$17bn), AAPL (~$15bn) and MSFT (~$12bn) led the platform cohort, with AMZN (~$11bn) and AVGO (~$9bn) rounding out the megacap torque. Second-tier tech breadth showed up in AMD (~$7bn) and a long tail of semis and software. The breadth is important: when both the index complex and the top platforms pull size, it usually signals model-driven re-risking rather than a one-off chase. That interpretation also fits with this week’s delayed inflation print—September CPI posted on Oct 24 at 3.0% y/y, near expectations—which reduced near-term macro uncertainty even as the level stays above the Fed’s target.
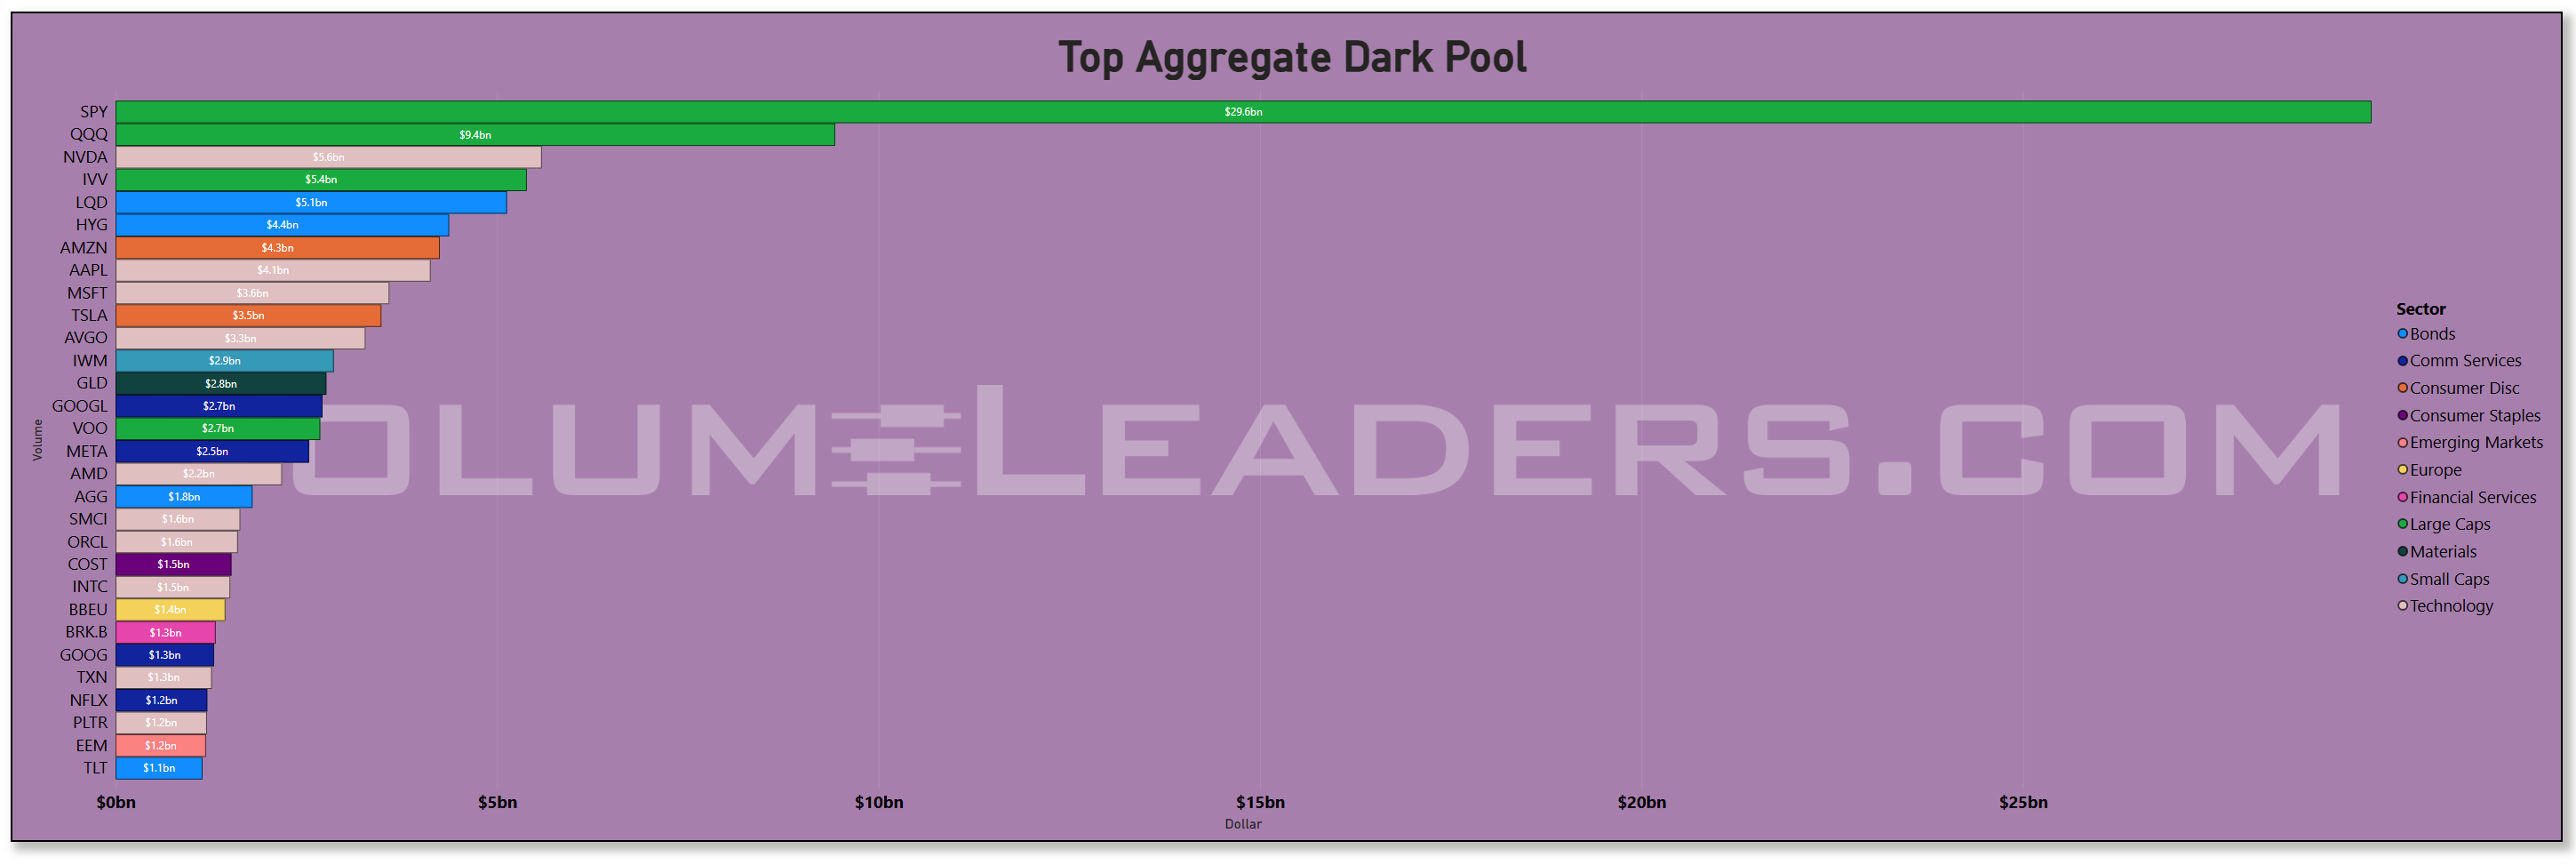
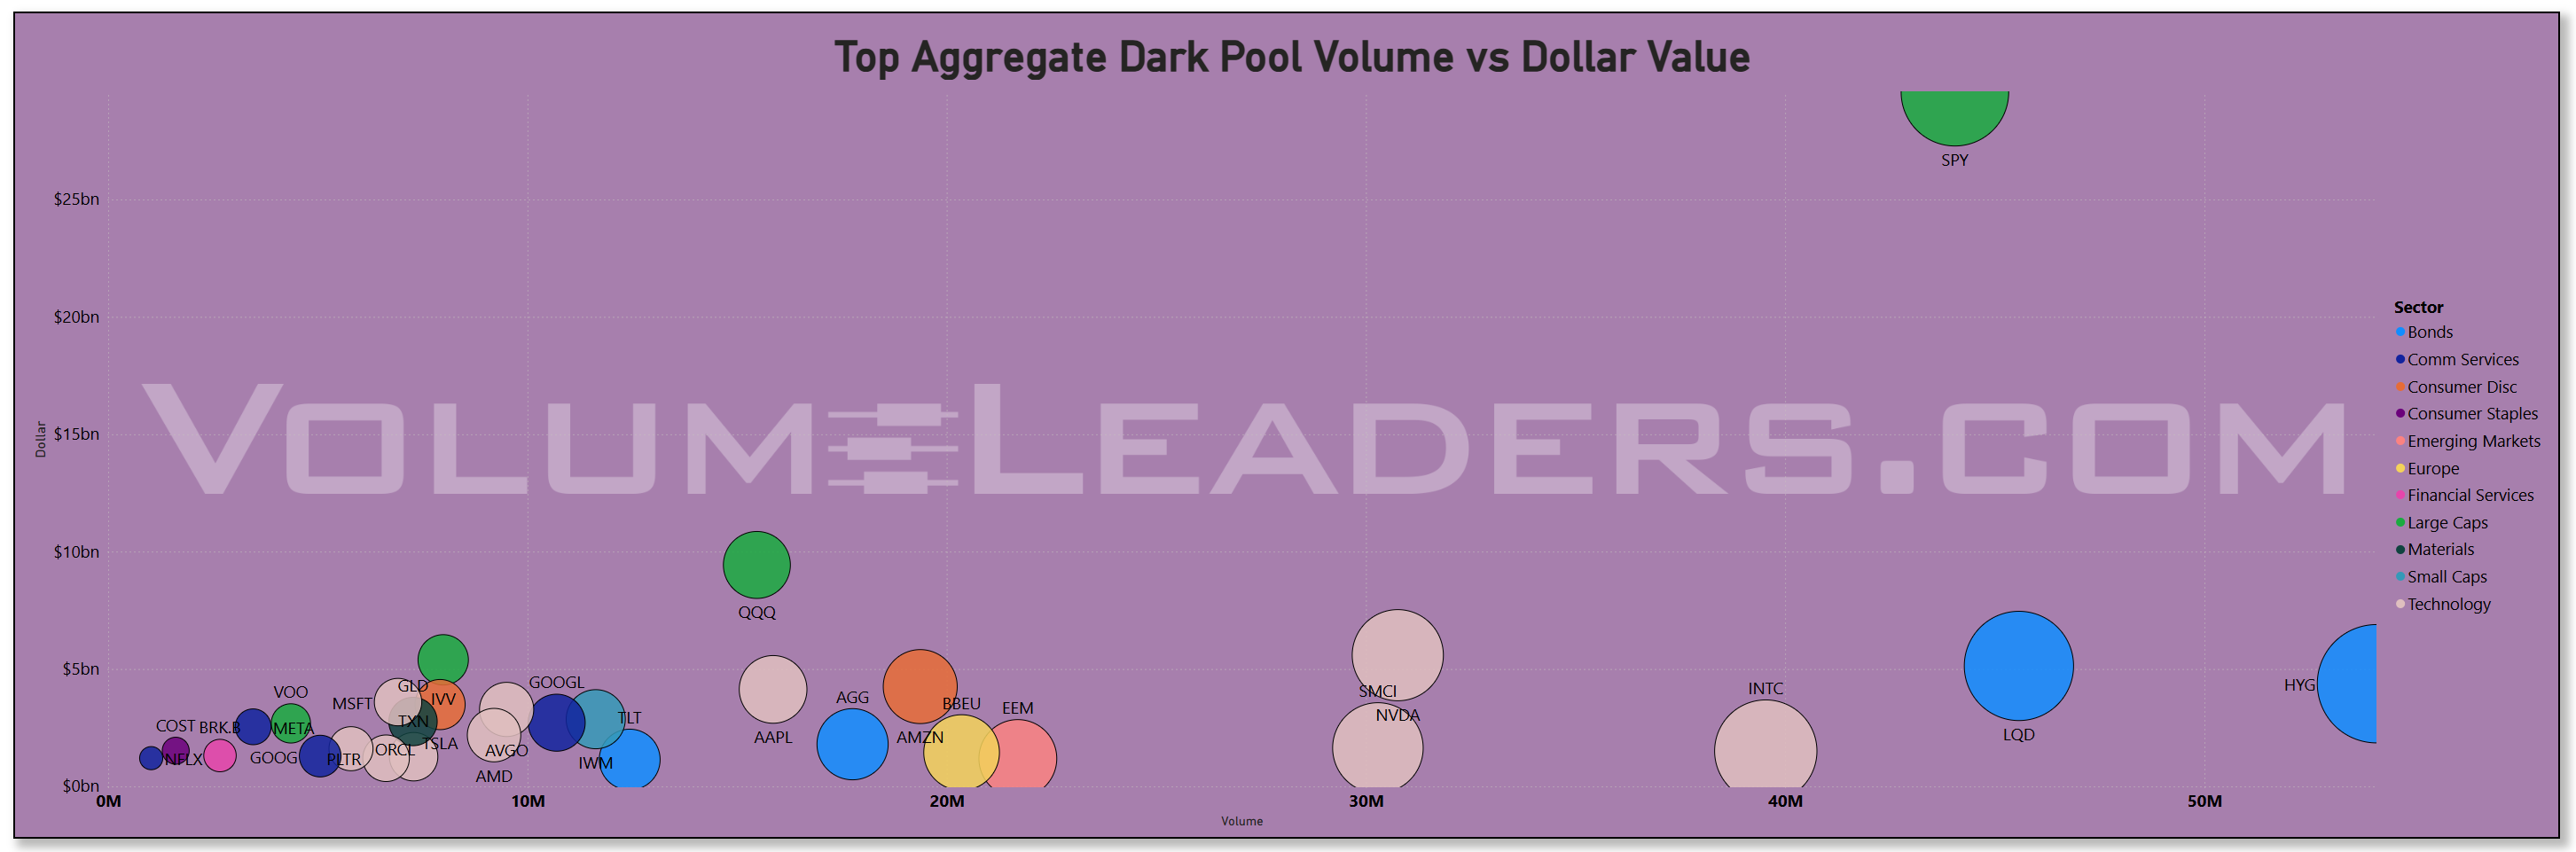
The dark-pool lens sharpened the picture. SPY dominated off-exchange with roughly $29.6bn, and QQQ contributed about $9.4bn—a strong sign of allocator activity that prefers minimal footprint. Credit sleeves were unusually prominent in the dark: LQD (~$5.1bn) and HYG (~$4.4bn) ranked alongside the megacaps, suggesting steady accumulation of IG/HY even as rates volatility cooled. Among single names, AMZN (~$4.3bn), AAPL (~$4.1bn), MSFT (~$3.6bn), TSLA (~$3.5bn) and AVGO (~$3.3bn) carried the baton, while GLD (~$2.8bn) signaled redistribution out of the metals sleeve. Off-exchange flow of this magnitude in the index, credit ETFs, and top platforms is typically programmatic rather than discretionary; combined with the week’s policy backdrop and the CPI release finally landing, it reads as continuation of accumulation rather than a risk-off inventory transfer. The fact that dark activity was broad across both equity beta and credit argues for a multi-asset “ease into risk” posture ahead of the Fed.
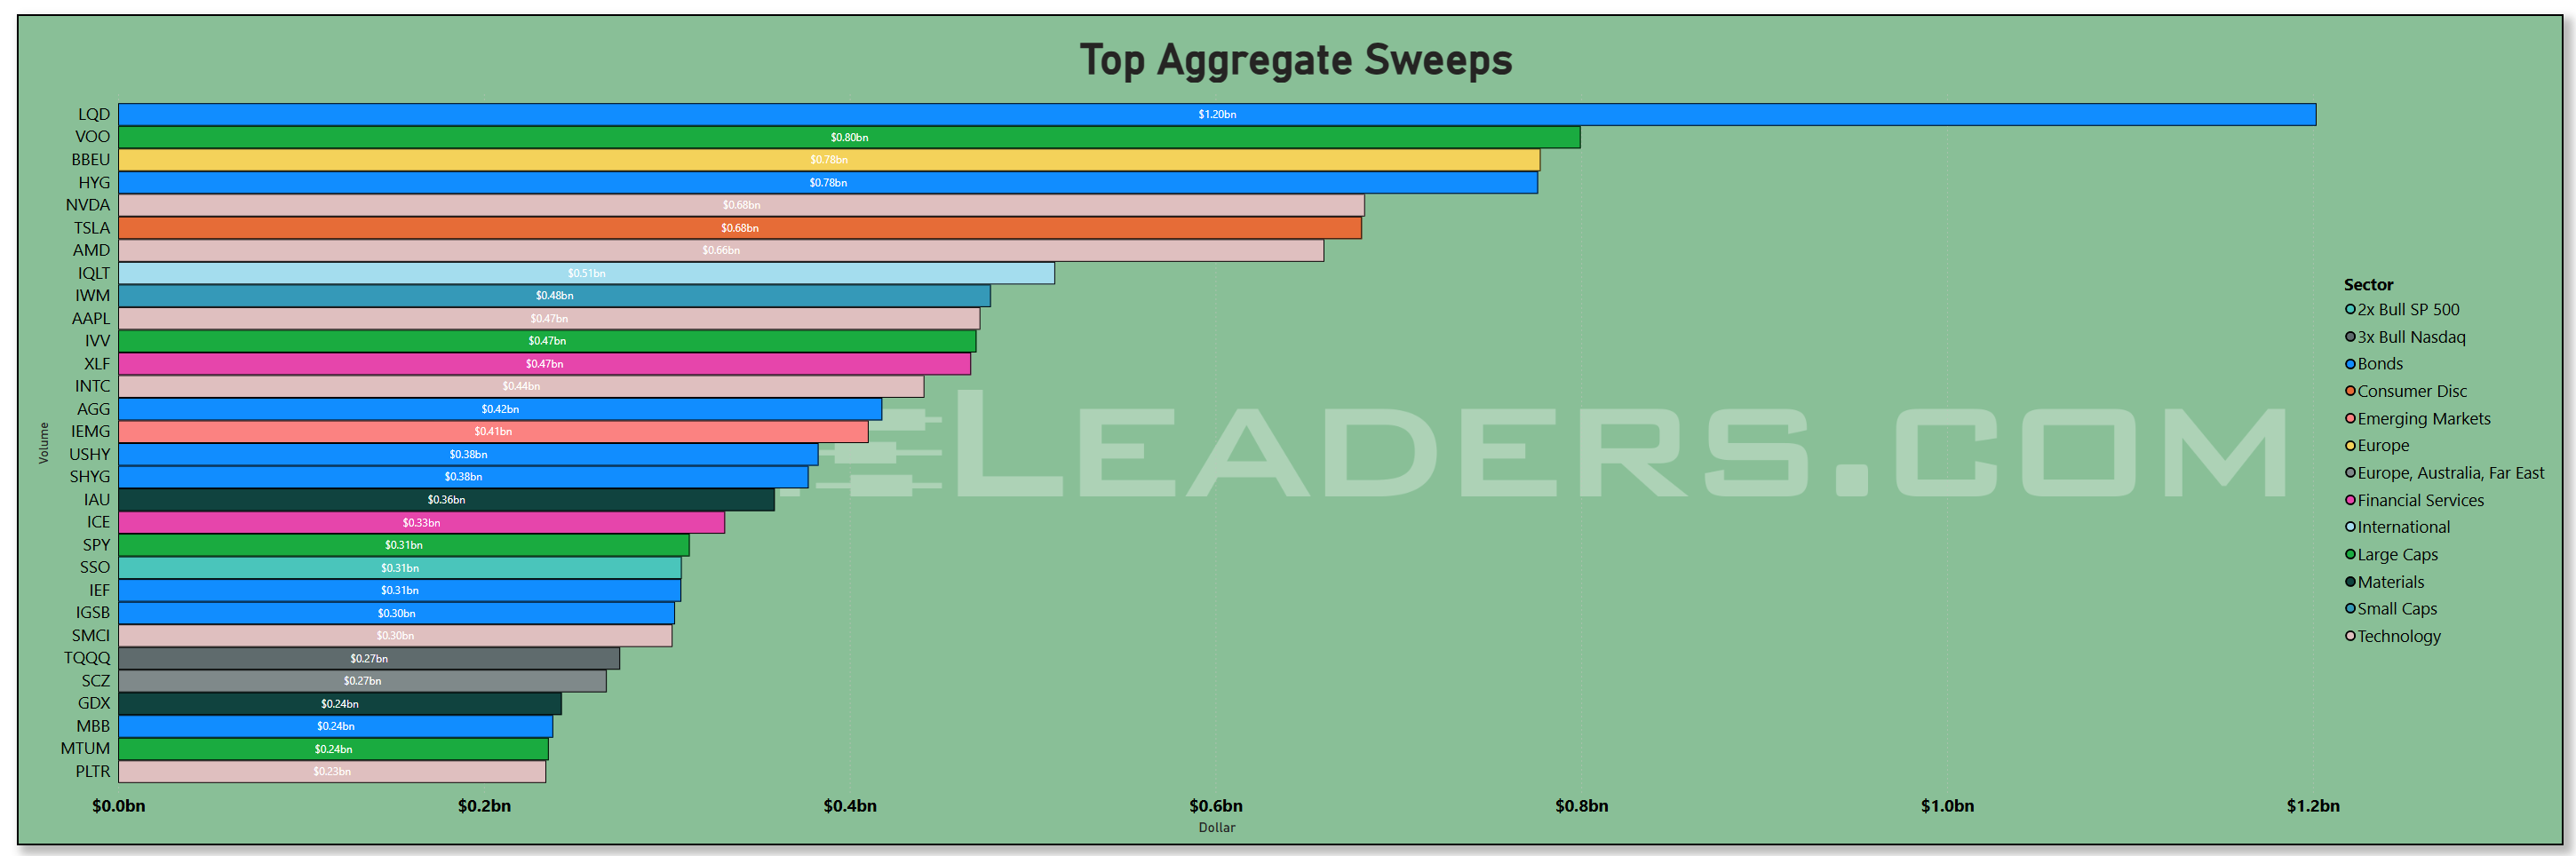
Sweeps told the story of where the fast money pressed. LQD sat at the top near $1.2bn in swept dollars, with VOO (~$0.8bn) and HYG (~$0.78bn) close behind; BBEU (~$0.78bn) was a notable international tilt. In single-names, the chase clustered in the usual torque—NVDA (~$0.68bn), TSLA (~$0.68bn), AMD (~$0.66bn)—and a handful of quality megacaps. That is a barbell: systematic beta in SPX proxies and credit ETFs on one side, plus high-beta tech on the other. When sweeps skew to beta and credit, it often reflects dealers cleaning up client orders and momentum funds leaning pro-cyclical rather than hedgers in distress. The absence of outsized sweep demand in defensives aligns with the sector tapes.
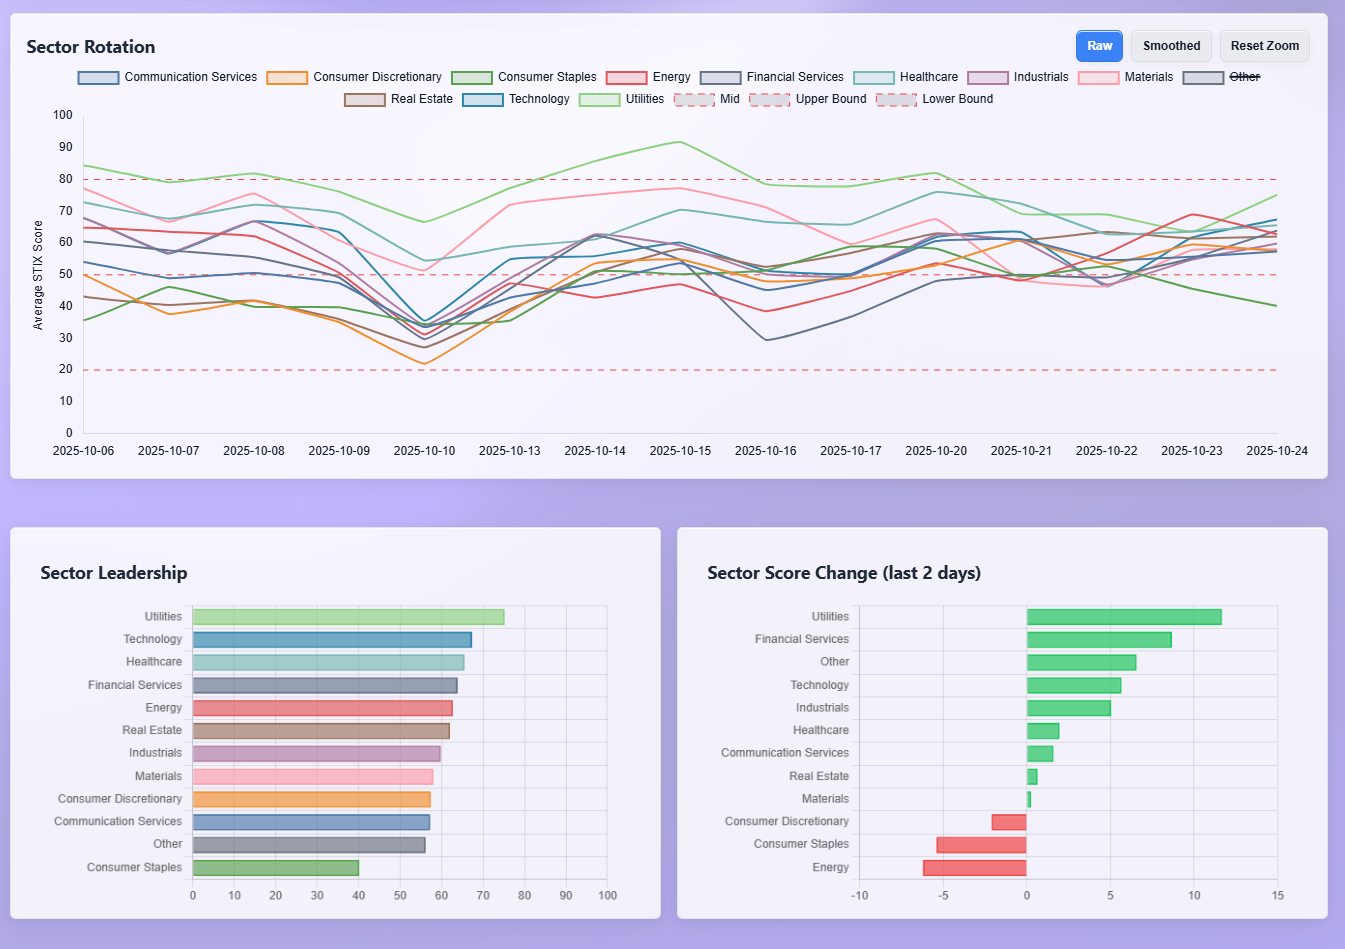
The sector rotation board adds a near-term compass. Leadership now tilts toward Utilities at the top of the composite scores, followed by Technology, Health care, and Financials in a tight cluster. The last 1–2 days show the strongest positive inflection in Utilities and Financials, with smaller gains in Technology and Communications; the clear laggards on recent momentum are Energy and Consumer Staples, with Consumer Discretionary softening as well. That pattern maps to the flows above: credit and index sleeves drawing real money, megacap platforms still in demand, while crude-sensitive and defensives give back some ground. With GDP and the FOMC on deck and the September CPI in hand, investors appear to be tilting toward rate-sensitive carry (Utilities/Financials) and durable growth (Tech/Health) while dialing down commodity beta.
Macro and seasonals matter here. The Fed’s Oct 28–29 meeting is the week’s anchor; officials enter with an already-telegraphed easing bias after September’s cut, and markets are leaning toward another step as growth cools and inflation drifts but remains above target. The statistical calendar is unusually bunched: the advance read on Q3 GDP arrives Oct 30 and September Personal Income & Outlays the next day, each capable of shifting the growth-vs-inflation mix that drives sector relative performance. One wrinkle is the ongoing federal shutdown’s impact on data continuity—September CPI was delayed, and officials have warned some reports could slip—so positioning may trend even more index-heavy until clarity improves. Seasonally, late October often sees flows coalesce around index exposures into earnings clusters and the Fed meeting window; mega-cap reports characteristically land in this period and can concentrate dollars in the platform cohort, reinforcing what we saw in NVDA, AAPL, and MSFT this week.
What should confirm or deny this read over the next two to three sessions is straightforward. First, continued size in SPY/IVV/VOO on both lit and dark prints would validate that allocators are adding ahead of the Fed rather than backing off into the event. Second, persistence in NVDA/AAPL/MSFT dark-pool activity alongside moderate sweep demand would indicate steady platform accumulation rather than a one-day chase. Third, credit sleeves LQD/HYG holding a bid in both dark and sweeps would argue that investors are comfortable with carry and spread risk into GDP and PCE; if those tickers fade while GLD picks up, it would flip the message toward a “growth scare” hedge.
Bottom line: this was an allocation-led, index-plus-platform week—broad beta and credit drew the real money, tech breadth stayed healthy, and hedges didn’t scream—consistent with investors re-risking into the Fed and GDP rather than sprinting for safety.
MIR Part 2: Individual Names From The Institutional Tape
VolumeLeaders tracks several proprietary signals designed to spotlight names drawing significant institutional interest. Below, we’ve surfaced the latest results and analyzed them to highlight emergent themes. If any of the sectors, narratives, or positioning trends resonate, the names mentioned here offer a strong starting point for deeper research and watchlist consideration.
VL Trade Rank Velocity™ (TRV)
TRV is a proprietary metric that measures the recent acceleration or deceleration in institutional trading activity for a given stock by comparing its average trade rank over the past few days to its average in recent weeks. A sharp improvement in TRV typically reflects a notable shift in positioning, often accompanied by sustained trade activity, suggesting institutions are actively engaging with the name and that intensity of activity is rising. This often precludes meaningful price or narrative shifts. This isn’t a buy-list or sell-list; it’s meant to draw your eyes to names where institutions are putting money to work.
Big picture, the TRV metrics say the same thing the flow tape just told us: capital is favoring an allocation-plus-innovation barbell, with a speculative halo forming around AI, biotech, crypto, and select energy/natural-resource themes, while hedges cluster in volatility and precious-metals inverses rather than broad equity shorts.
The top of the list is telling. BITF and other crypto-linked assets (WGMI, BITQ, BTC, EZBC) screen high on both “improvement in interest” and “sustained activity,” which fits a quiet bid in risk proxies that typically re-risk early. That dovetails with the week’s broad index and credit accumulation: if allocators are leaning back into beta and IG/HY sleeves, it’s not unusual to see a parallel revival in crypto-beta exposure as a high-octane expression of the same risk appetite. The presence of VCEB, BRTR, and VCRM (corporate-bond sleeves) in the top 100 reinforces the carry side of the barbell; the weekly sweeps and dark prints in LQD/HYG we just discussed rhyme with that behavior.
On the innovation side, AI is sprawling beyond the mega-platforms and into smaller picks-and-shovels. CRWV and its 2x expression CWVX sit near the top alongside WTAI and IGPT; semis second-line names pop up too (LAES, SKYT), and NVDU (2x NVDA) surfaces as the levered crowd’s way to press the core narrative without stock-picking. That breadth under Tech mirrors the dollar concentration we saw in NVDA/AAPL/MSFT plus the long tail across semis and software; TRV is basically flagging the same dispersion traders are monetizing via smaller enablers and levered wrappers.
Biotech is the other clear cluster. ALEC, NAGE, VOR, RAPP, LRMR, BEAM, IRON, ALC, ATYR, KRRO, UPB, SEPN, ONC, RNA—there’s a deep bench of development-stage and platform names showing both improved and sustained interest. That fits a market leaning into “durable growth without heavy cyclical beta” while rates stabilize. It also lines up with our sector board, where Health care has crept up the leadership ranks and gained momentum in the last two sessions; TRV is picking up the single-name expression of that sector read.
Energy and resources show two distinct sub-plots. First, uranium and fuel-cycle exposure (URG, UEC, NXE) plus infrastructure (SOBO) keep appearing—measured cyclical growth tied to capacity constraints rather than crude beta. Second, precious-metals and miners skew negative via inverses and metals alternatives: GDXD is high on the list, SPPP, TMC, SLI, TGB, NB, USAR, PPTA show active interest but in a way that looks more rotational than outright bullish. That tracks perfectly with this week’s flows: GLD was a drag and dark-pool metals looked more distributive than accumulative; TRV is echoing that the edge in the complex is coming from tactical shorts or alternative exposures rather than long gold.
Financials show up in the constructive camp too. KMPR and HCI (insurance) and INTR (regional banks) sit alongside VCTR (asset management) and capital-markets prints (BITF, MRX). That fits the sector board’s short-term lift in Financials and the tape’s steady XLF/KRE contribution; the watchlist is catching both rate-sensitive carry (insurers) and fee-beta (asset managers) without the stress markers you’d expect if the market were defensively positioned.
Large-cap sleeves on TRV—BUYW, STRV, MAGS, ILCG, SFLR, plus QQQE—underscore the allocation backbone. They are exactly what we expect to surface when the real money is returning to broad beta: equal-weight and growth-tilt wrappers that complement SPY/QQQ in model portfolios and overlay books.
There’s also a clear speculative belt. Volatility longs (UVIX), levered single-name hedges (TSDD for TSLA, PLTD for PLTR), and single-name bear overlays like RGTZ (2x bear RGTI) show that while the center of gravity is risk-on, traders are expressing dispersion and event risk with targeted hedges rather than blanket de-risking. That style choice matches the live tape, where hedges bled in broad inverse ETFs but capital still paid for optionality around idiosyncratic names.
International and EM sleeves—IQLT, FDNI—and EV exposure via IDRV round out the rotation story. They signal a modest broadening beyond the U.S. platforms toward quality ex-U.S. and secular themes that benefit from a stable-to-easing rates backdrop and a soft U.S. dollar path, again consistent with the credit bid and index accumulation we observed.
Bottom line: the TRV heat map reinforces the barbell we’ve been trading—core allocation back into broad beta and credit on one side, innovation/optionality in AI, biotech, and crypto on the other—while precious-metals interest looks skewed to inverse/alt structures and equity hedging is surgical rather than systemic. If this continues, we should expect ongoing leadership from large-cap wrappers and platform Tech, a steady bid in insurers and asset managers, and a persistent, rotational bid in smaller AI/biotech enablers, with uranium and fuel-cycle names as the measured cyclical kicker.
VL Institutional Outliers™ (IO)
Institutional Outliers is a proprietary metric designed to spotlight trades that significantly exceed a stock’s recent institutional activity—specifically in terms of dollar volume. By comparing current trade size against each security's recent normalized history, the metric flags outlier events that may indicate sudden institutional interest but may be missed because the activity doesn’t raise any flags/alerts when comparing the activity against the ticker’s entire history. For example, it’s conceivable that a ticker today receives the largest trade it has had in the last 6 months but the trade is unranked and would therefore be missed by current alerts built off Trade Ranks. Use “Realized Vol” to identify tickers with large price displacement and to size your risk appropriately.
The IO tape is the noisy edge of the same story we just told, with a few sharp tells about where the biggest hands pressed and where they quietly stepped back. Two equity allocation beacons jump off the page first: RSP at roughly $0.8bn and IWR the day prior at about $0.33bn, joined by DIA over $0.3bn and a large print in ICE. That is broadening breadth and old-economy confirmation, not just a mega-cap shadow. When equal-weight and mid-caps flag as 5–6 sigma outliers while the Dow gets love, allocators are leaning into “own the whole ladder” exposure rather than hiding exclusively in the platforms. It fits a market setting up for the Fed’s Oct 28–29 meeting and the Oct 30 GDP advance estimate, where model sleeves typically want neutral factor exposure into event risk.
Credit and rates outliers reinforce the carry bid we saw in dark and sweep flows. Short-duration cash substitutes like PULS and preferreds via FPE pinged near 5 sigma. Mortgage paper VMBS printed meaningfully, and high yield appeared repeatedly through HYLB, SHYG and SJNK, with IGSB and EDV/ZROZ/LTPZ rounding out the duration spectrum. That is exactly the cocktail you see when the street expects the Fed to keep easing into softening macro and patchy data continuity during the shutdown, and when GDP/PCE loom as the next signposts. Public commentary from policymakers and the data calendar back that up: officials have telegraphed an October cut while acknowledging a dearth of fresh releases, CPI for September landed but with caveats, and GDP arrives Thursday.
The commodity and energy sleeves look tactical, not thematic. You have both UCO and BOIL flagging as leveraged bull outliers, but the single-name PBR shows a sizable negative print and PAGP/CQP are flat-to-soft, which reads like inventory shuffling and short-dated trading around curves rather than a sponsored up-cycle. Metals split the difference: SIL was elevated but OUNZ saw selling and GDX inverse exposure was prominent in the TRV list. Net-net, the precious-metals complex is still being used as a trading hedge rather than a structural destination, consistent with this week’s weakness in GLD on the performance sheet.
Tech’s outliers were two-track. On the one hand, VGT, BOTZ and NVDU showed up, and SKYT registered a positive sigma day, all of which tells you the AI/semis impulse is alive beyond just the biggest three. On the other, software dispersion was acute: PD popped on interest, ERIC and AA had idiosyncratic moves, and MLNK’s collapse to zero is the cautionary note on single-name risk even when the factor tide is favorable. That split is exactly what you should expect into a heavy late-October tech earnings cluster: the platforms pull passive dollars while smaller software names trade on event and balance-sheet specifics. The coming week’s mega-cap calendar keeps that dispersion risk elevated.
Health care outliers were everywhere and they rhymed with the rotation board. IYH flagged a multi-sigma day on the ETF side while a string of biotech tickers scattered across both positive and negative tails: IMCR and NOK-adjacent test gear were bid; RLAY, ITGR and a handful of development names saw sharp drawdowns; AXSM and NUVL were liquid but directionally muted. The takeaway is not “health care up,” it is “health care in play.” That dovetails with our leadership read where the sector had crept up the table and gained short-term momentum; IO confirms that capital is probing for idiosyncratic winners inside a sector that screens as defensive growth when the policy backdrop points to lower rates.
Financials read constructive, not stressed. RY and NTB printed among the largest single-name outliers with tiny realized vol, and PUK/KNSA/HCI showed insurance demand, while FAS posted a leveraged bull pulse and ICE carried a near $0.4bn day. If the tape were bracing for policy disappointment or a credit scare, you would expect the opposite: hedges in KRE-style proxies and stress in brokers/exchanges. Instead, you got quiet accumulation and pro-cyclical expression.
Consumer and travel sits in classic dispersion. AAL printed over $0.18bn with a positive day, Ford jumped more than 2% on heavy dollars, yet DECK and TSCO were sold and SHAK saw a modest bid. That is not a factor unwind; it is a reminder that in a broadening tape, idiosyncratic earnings and guidance sensitivity rise, particularly with big-cap reports concentrated into late October.
International diversification is peeking through the door rather than kicking it down. DBEU and SCZ showed real prints, with EWC/EWD and IOO adding steady but smaller interest. That pairs neatly with BBEU’s prominence in sweeps earlier this week and says managers are willing to nibble on developed ex-US quality while the U.S. policy path is center stage. If GDP lands near consensus and the Fed delivers, those wrappers typically see follow-through as macro uncertainty compresses.
Crypto and vol outliers tell you how participants are hedging and speculating at the margin. BLOK and GDLC were elevated, and levered wrappers like XXRP and BABX appeared alongside VIXM. That mix says speculative capital is active, but the hedging impulse is targeted, not systemic. It matches what we saw in performance where broad inverse ETFs bled while single-name and theme hedges traded.
What emerges from the IO list is the same barbell, viewed through a magnifying glass. On one side, allocation products with unusually large prints across equal-weight, mid-caps and Dow proxies, plus a full suite of credit and duration ETFs from cash-like to long bonds, consistent with a market positioning for an October rate cut and the GDP/PCE doubleheader in the next five trading days. On the other, innovation and optionality via AI/semis wrappers, select software, and a deep bench of biotech, with crypto-beta and targeted vol complexes providing the speculative halo. The commodity complex remains a trading sleeve rather than a destination, and energy’s signals skew mixed enough to call it opportunistic rather than trend.
If the policy path and data cooperate, watch for a repeat of these IO signatures: continued size in RSP/IWR/DIA alongside HYLB/SHYG/IGSB and a modest uptick in international wrappers as uncertainty compresses; a steady presence of VGT/BOTZ and levered NVDA expressions as earnings hit; and metals hedges staying tactical rather than sticky. A miss on the macro front would flip the IO sheet quickly: duration outliers would migrate from balanced to one-way, metals would pivot from hedges to havens, and the equal-weight prints would fade in favor of narrow platform shelter. For now, the IO tape is voting the same way the rest of the flow complex is: allocation first, innovation second, hedges surgical, heading into an event-heavy week.
VL Consensus Prices™
These are the most frequently traded #1-Ranked Levels in VL this week. Trades occurring at the highest volume price in a ticker’s history are significant because they represent institutional engagement at a key price memory level—where the market once found consensus. These areas act as liquidity hubs, enabling large players to transact efficiently, and often signal a reassessment of fair value. This activity may precede major moves, mark equilibrium zones, or reflect broader portfolio shifts, making these price levels important to watch even without yet knowing how price will resolve. (Note: many Bond products trade in such a tight range that they dominate the top positions and are therefore omitted to provide better clarity around other flows. The bonds data is still available in the VL platform.)
Consensus levels tell us where big money finally agrees on “fair value,” and this week’s tape shows that agreement forming in all the right places for an allocation-led market. The list is dominated by broad wrappers and large, cash-flowing franchises, with a notable halo in software and semis and a quiet but persistent re-engagement in real estate and financials. That is exactly the barbell we have been trading: index and quality carry on one side, innovation and selective cyclicals on the other, heading into the FOMC on Oct 28–29 and the Q3 GDP advance print on Oct 30.
Start with the allocation backbone. JEPI and SPLG show up alongside BUYW and AMZN at heavy volume-by-price nodes. When a covered-call income sleeve and a low-cost S&P 500 tracker both set fresh consensus zones, you are seeing allocators refresh “set-and-collect” exposures and passive beta at the same time, a pattern we often see into policy weeks when managers would rather own the market than thread single-name event risk. The equal-weight impulse we saw in RSP in the outlier list is echoed here by SPLG hitting acceptance; together they say breadth is not an afterthought. That dovetails cleanly with the macro calendar: with the Fed set to meet and GDP/PCE immediately behind it, the easiest way to stay invested is to park size in the index and income wrappers and let the events play through.
Semis and software are carving out fresh “fair value” shelves, which is how momentum turns into sponsorship. TXN, ON, and STM all print consensus levels; those are not the flashiest AI tickers, but they are the plumbing that sustains the cycle. On the software side, ESTC, DOCU, CWAN, ALKT, SAIL, PRGS, SPNS, VRNT, PRO, and even the smaller XYZ and YOU cluster around new volume nodes, joined by HOOD as a platform-infrastructure hybrid. This is the slow work of institutional accumulation: not a sprint into one headline, but repeated prints around stable price where blocks can be absorbed. It lines up with last week’s dark-pool footprint in the mega-platforms and the broad index bid; once the core is sponsored, the street starts underwriting the middle of the stack.
Health care’s presence is noticeable and balanced. AVDL and CORT flag in pharma while WAY appears in health information services and CLOV shows retail-managed care. The mix tilts toward “defensive growth” rather than binary biotech risk, which fits the sector board’s drift up the leadership table and the tapes we saw in IYH and a run of idiosyncratic biotech outliers. Consensus nodes in these names mean real money is willing to fund compounding cash flows and data pipes even as it keeps optionality for single-name catalysts.
Financials and housing are quietly getting sponsored. VLY, SSB, WBS, PB, and NU build new acceptance zones in banks, while RKT and UWMC show mortgage finance participation. This is the footprint you would expect if markets think the policy path is tilting easier and the macro uncertainty around the data flow is gradually compressing. The Fed meets mid-week and has telegraphed an easing bias; the jobs and CPI cadence has been distorted by the shutdown, but September CPI printed on Oct 24 and came in modest, keeping a lid on front-end fears while we all wait for GDP. That cocktail tends to pull money back into financial intermediation and rate-sensitive cash generators.
Real estate shows up with breadth, not just one or two tickers. SPG, NNN, PECO, OUT, EPR, VRE, SILA, and LADR are all printing their highest volume-by-price nodes. In our framework that reads as institutional acceptance of new “fair value” in REIT land after a long period of duration whipsaws. The balance across malls, triple-net, residential, healthcare facilities, and mortgage REITs suggests investors are no longer treating RE as a monolith. With GDP due and the Fed in play, a stabilizing rate path is the key to this sleeve; the street is building shelves here so it can scale if the tone stays benign.
Energy’s message is mixed but purposeful. CVX, BP, PSX, NOV, FTI, OII, DNOW, TS and EXE appear across integrateds and equipment, joined by IXC on the wrapper side and SMR on the next-gen power theme. This does not look like a speculative chase of crude beta; it looks like balance-sheet energy and services capacity at durable levels, with refiners like PSX and mid/down-stream picks providing cash-flow ballast. The presence of AG and CRS on the materials side and LYB in chemicals suggests a measured appetite for industrial inputs rather than an outright reflation bet.
Consumer is exactly where a broadening tape should be: selective and realistic. F sets a new consensus node after an outlier bid day; DIS and AMZN both print, and leisure names LUV, LVS, WGO, and CAKE mix with payments/advertising adjacency like IAS. The pattern is not “consumer sprinting;” it is the street agreeing on new tradable shelves for the high-turnover, cash-rich franchises while it lets the second-derivative names trade around earnings.
Tech infrastructure extends beyond semis and app software. VSH and ARW show up in electronic components, VIAV and VSAT in communications equipment, AUR in IT services for autonomy, QBTS and QUBT as quantum computing proxies, and PRO/ESTC/PRGS anchoring enterprise software. Put that alongside IBIT and BITX in crypto wrappers and you have the speculative halo firmly attached to the same platform-plus-index core. One reason this can hold together is the macro overlay: the BLS delivered September CPI on Oct 24 despite the shutdown, with a softer-than-feared headline, while GDP prints Oct 30 and PCE follows Oct 31; when the data path is concentrated like this, managers prefer to stay close to liquidity and expressed themes rather than stray.
Industrials and transport are participating at the acceptance layer. PCAR prints a new node in heavy trucks, CNH in farm machinery, RXO in trucking, APG in engineering and construction, JBI in building products, and ACHR in aerospace innovation. That combination reads like steady-state capex and logistics normalization rather than a frantic restock. Utilities and renewables show a measured bid too: NWE and SWX hit new shelves in regulateds, while BEPC ticks the independent power box, a classic rates-sensitive carry pocket that fits with the credit bid we have seen across LQD/HYG and short-duration cash proxies.
China and international exposure are present, but cautious. FXI is here at a fresh consensus price and WIT/INFY print in India IT services, with IXC and JEPI/SPLG providing the global overlay. That looks like managers allowing a controlled amount of ex-US risk into models while the U.S. policy path remains the primary driver. The GDP/PCE one-two and the mid-week Fed decision will decide whether this tentative opening widens.
Net of all the tickers, the emergent theme from consensus levels is simple and consistent with the rest of the flow complex: institutions are building and defending volume-by-price shelves in index wrappers, equity income, and rate-sensitive quality; they are extending sponsorship down the tech stack into semis and enterprise software; they are reopening real estate and financials at pragmatic prices; and they are keeping a measured cyclical sleeve in energy, industrials, and materials without declaring a reflation regime. The macro scaffolding is supportive but unresolved. The Fed is on deck Oct 28–29, CPI just landed, and GDP arrives Oct 30, so acceptance where liquidity is deepest is exactly what we would expect to see. If those catalysts land benignly, these VBP shelves are staging grounds for the next leg higher; if they disappoint, they will be the first places to test for buyers on pullbacks.
MIR Part 3: Framing-Up A Trade
Framing-Up A Trade means leaning into what the tape is already doing and sizing it so the portfolio can absorb the macro hits coming over the next five sessions. The read is allocation-led with platforms and semis still in demand, credit bid on both lit and dark, Utilities and Financials firming on the sector board, precious metals acting as a trading sleeve rather than a destination, and hedges best kept surgical. The policy and data path argues for exactly that posture: the FOMC meets Oct 28–29, with the Fed’s own calendar confirming the event, and the BEA’s advance Q3 GDP prints Oct 30 followed by September Personal Income and Outlays on Oct 31; CPI for September was rescheduled to Oct 24 and is now out, easing some uncertainty but not removing it. Into that cluster, index-heavy positioning with selective growth and carry has the best odds of being paid.
VL Desk Positioning This Week
1. Core index liquidity at 28%
SPY 16%
QQQ 10%
IVV 2%.

This is the throttle. SPY and QQQ took the lion’s share of aggregate dollars and the deepest dark-pool sponsorship, which is precisely what you want in front of a Fed and GDP week: you can modulate net exposure in one place without tearing up the rest of the book. If liquidity spikes around the decision or the press conference, this sleeve expands or contracts first. The setup is aided by the event path being crystal clear on timing even if outcomes are debated.


2. Compute/AI barbell at 18%
SOXX 6%
NVDA 4%
AAPL 3%
MSFT 3%
SMH 2%

The platform cohort and the semis complex still attract the real dollars, and breadth beyond the top three has improved. This is the momentum anchor that became sponsorship; it will either be validated by ongoing platform prints and constructive earnings cadence or it will be an easy source of cash if the tone sours. It earns its keep because both the lit and dark prints continue to point to programmatic accumulation rather than one-off chases.

3. Financials at 10%
XLF 6%
KRE 3%
ICE 1%

The sector board’s 1–2 day uptick and the IO outliers in high-quality banks, insurance, and the exchange say “constructive, not stressed.” We keep it ETF-led to avoid idiosyncratic earnings landmines, but the ICE add acknowledges the outsized dollar day that often precedes further flow into index derivatives and capital-markets plumbing when volatility is contained.

4. Credit ballast at 11%
LQD 7%
HYG 4%

Credit leadership showed up across lit, dark, and sweeps, which is the definition of a cross-validated carry bid. We lean investment grade but keep some HY so the book participates if spreads grind tighter on a benign Fed/GDP outcome. If the meeting or GDP disappoints, LQD will likely hold better than HY and can fund de-risking without touching the equity sleeves.

5. Short-duration liquidity at 4%
USFR 2%
VGSH 2%

This is working capital for pulls and a shock absorber if the front end jolts on guidance. With CPI delivered but the rest of the calendar still dense, a small cash-like ballast is prudent.

6. Utilities carry at 3%
XLU 3%

Utilities sat atop the leadership board and accelerated on the 2-day change. In a world where the market expects policy easing soon and the data flow remains compressed, a small regulated-carry sleeve gives rate-sensitive income without giving up too much beta. The add is tactical and will be revisited post-Fed.


7. Real estate income at 7%
XLRE 4%
WELL 2%
SPG 1%

REITs printed new volume-by-price shelves across several sub-industries, which is the definition of institutional acceptance at a new fair value. The mix balances healthcare and mall exposure with the index wrapper, recognizing that a stable rate path is necessary but not sufficient for a durable run. The sleeve is sized so a rates wobble does not derail the book.

8. Industrials/capex at 4%
DOV 1.5%
OSK 1.5%
CMI 1.0%

These names captured outlier and consensus attention and speak to measured capex rather than a reflation chase. If Financials stay firm and the growth data is acceptable, this sleeve compounds quietly; if not, it is easy to clip.

9. International quality at 4%
BBEU 2%
IQLT 2%

Developed ex-US leadership poked through in sweeps and on the watchlists. We keep it modest and quality-tilted until the policy week is behind us; if the dollar softens into year-end and global growth steadies, this can scale.


10. Energy cash flow at 3%
PSX 2%
CVE 1%

Energy flows looked tactical, not thematic, and precious-metals proxies leaned more hedge than destination. We stick to balance-sheet cash and downstream torque, sized to contribute without consuming risk budget.

11. Healthcare selective at 3%
XBI 2%
IYH 1%

Health care is “in play” with rising sector leadership and heavy single-name IO activity across both tails. Pairing diversified biotech beta with a quality ETF gives exposure to the dispersion without buying coin flips.

12. Equal-weight breadth at 1%
RSP 1%

The IO sheet flagged a 5-sigma day, and consensus breadth is improving. A token sleeve lets the book participate if participation widens beyond the platforms into mid- and equal-weight baskets during post-Fed digestion.

13. Crypto toggle at 1%
IBIT 0.6%
ETHE 0.4%

The speculative halo is alive but should not drive the car. Keep optionality, keep it small, and scale only if beta remains bid and Financials/credit hold a tone.

14. Hedges at 3%
SH 1%
PSQ 1%
VIXY 1%

In a rising tape, hedges bled, which is exactly what insurance does; we keep them small and targeted so they offset gap risk around the decision and GDP without taxing PnL if the base case plays out.
This 100% book is what a real desk would run into a policy and GDP week where the tape is already telling you risk is being added in index beta, platforms, and credit. The sleeves are sized to let SPY/QQQ manage the net exposure, to monetize continued dark-pool persistence in the platform cohort, and to earn carry while Utilities/Financials provide a rate-sensitive buffer. The risk plan is straightforward: if the Fed cuts and the statement tone is benign, add 2–3% to Core index and 1–2% to Compute/AI from Short-duration and Hedges, and rotate 1% from Credit to Financials. If the Fed disappoints or GDP/PCE wobble the growth mix, do the opposite: lift 3–5% from Core and Compute/AI into Short-duration and Credit, cut the International sleeve back to 2%, and increase Hedges to 5% by adding a touch of duration volatility rather than broad inverse equity. The validation tells for adding will be continued size in SPY/IVV/VOO across lit and dark, sticky dark-pool demand in NVDA/AAPL/MSFT, and a steady bid in LQD/HYG; the warnings are a flip in those flows alongside a bid returning to metals and VIX term structure steepening. The calendar concentrates the risk in three sessions rather than ten, but the tape has already chosen an allocation-first posture; this is the portfolio that respects that message while keeping enough dry powder to pivot if the headlines force it.

Thank you for being part of our community and for dedicating your time to this edition. Your insights and engagement drive everything we do, and we’re honored to share this space with such committed, thoughtful readers. Here’s to a week filled with clear opportunities and strong performance.
—VolumeLeaders