Market Momentum: Your Weekly Financial Forecast & Market Prep
Issue 66 / What to expect Oct 20, 2025 thru Oct 24, 2025

NOTE: This weekly periodical is too large for Substack to deliver in its entirety via email - you will only see a portion of this great content if you read from your email client. Click the header/title at the top to read the full article!

In This Issue
Weekly Market-On-Close Report: All the macro moves, market drivers, and must-know narratives—covered in less than five minutes.
Weekly Benchmark Breakdown: Our weekly intelligence report on major indices cuts through the index-level noise to uncover participation, momentum, and structural integrity and tell you whether markets are rising on solid ground or skating on thin breadth. This is where bull markets prove themselves—or quietly start to unravel.
The Latest Investor Sentiment Readings: Track the emotional pulse of the market with our curated dashboard of sentiment indicators. From fear-fueled flight to euphoric overreach, this week's readings reveal whether investors are cautiously creeping in—or stampeding toward the exits.
Institutional Support & Resistance Levels For Major Indices: Exactly where to look for support and resistance this coming week in SPY, QQQ, IWM & DIA, all powered by the uniquely predictive power of the VolumeLeaders institutional order flow dataset.
Normalized Performance By Thematics YTD: Which corners of the markets are beating benchmarks, which are overlooked and which ones are over-crowded!
Key Econ Events & Earnings On-Deck For This Coming Week
Market Intelligence Report: Track the real money. This section breaks down where institutions are placing their bets—and pulling their chips. You'll get a sector-by-sector view of flows, highlighting the most active names attracting large-scale buying or selling. We go beyond the headlines and into the tape, surfacing the week’s most notable trades, both on lit exchanges and hidden dark pools. Whether you're following momentum or fading crowded trades, this is your map to where size is moving and why it matters.
Weekly Market-On-Close Report
A Week That Pivoted From Panic To Positioning
The final session of the week closed on a constructive note for U.S. equities, and it did so for reasons that were notably different from the ones that sent markets reeling the prior Friday. What changed was not a wholesale improvement in growth or inflation, but a subtle easing in the tenor of U.S.–China trade headlines, a distinctly dovish color from the Federal Reserve, and early evidence that the third-quarter earnings season is more resilient than feared. Together those shifts were enough to push stocks higher into Friday’s close, even as the government shutdown dragged on and forced key data off the calendar. It was a week that began with the S&P 500 Index clawing back from its worst single-day loss since April and ended with the tape acting like it wanted to stabilize and re-price risk as uncertainty ebbed at the margin.
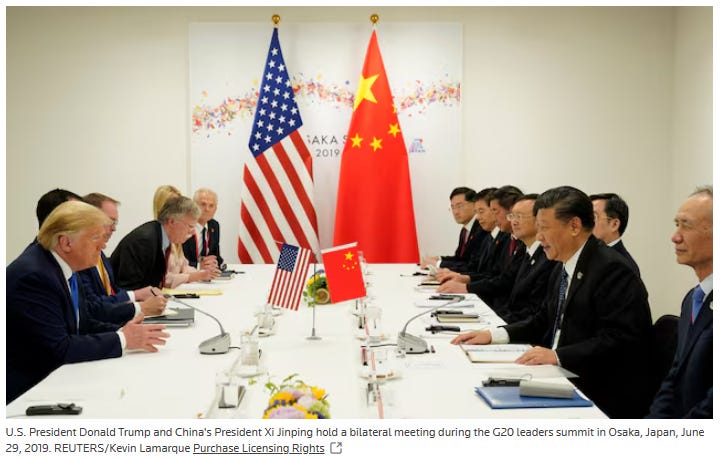
What helped most on Friday was the temperature of China-related rhetoric. President Trump said current tariffs on China were “not sustainable” and affirmed that he will meet with Chinese President Xi Jinping at the end of the month in South Korea. Treasury Secretary Bessent added fuel to the afternoon bid when he expressed optimism that upcoming talks with Chinese leaders could yield a broader trade deal. Those remarks landed into a market that had been scarred by the prior week’s escalation and the threat of tariffs being pushed to 100% on November 1. The simple suggestion that the path could be de-escalatory rather than escalatory mattered for risk assets and for the cross-asset relationships that had been whipsawed by safe-haven demand.
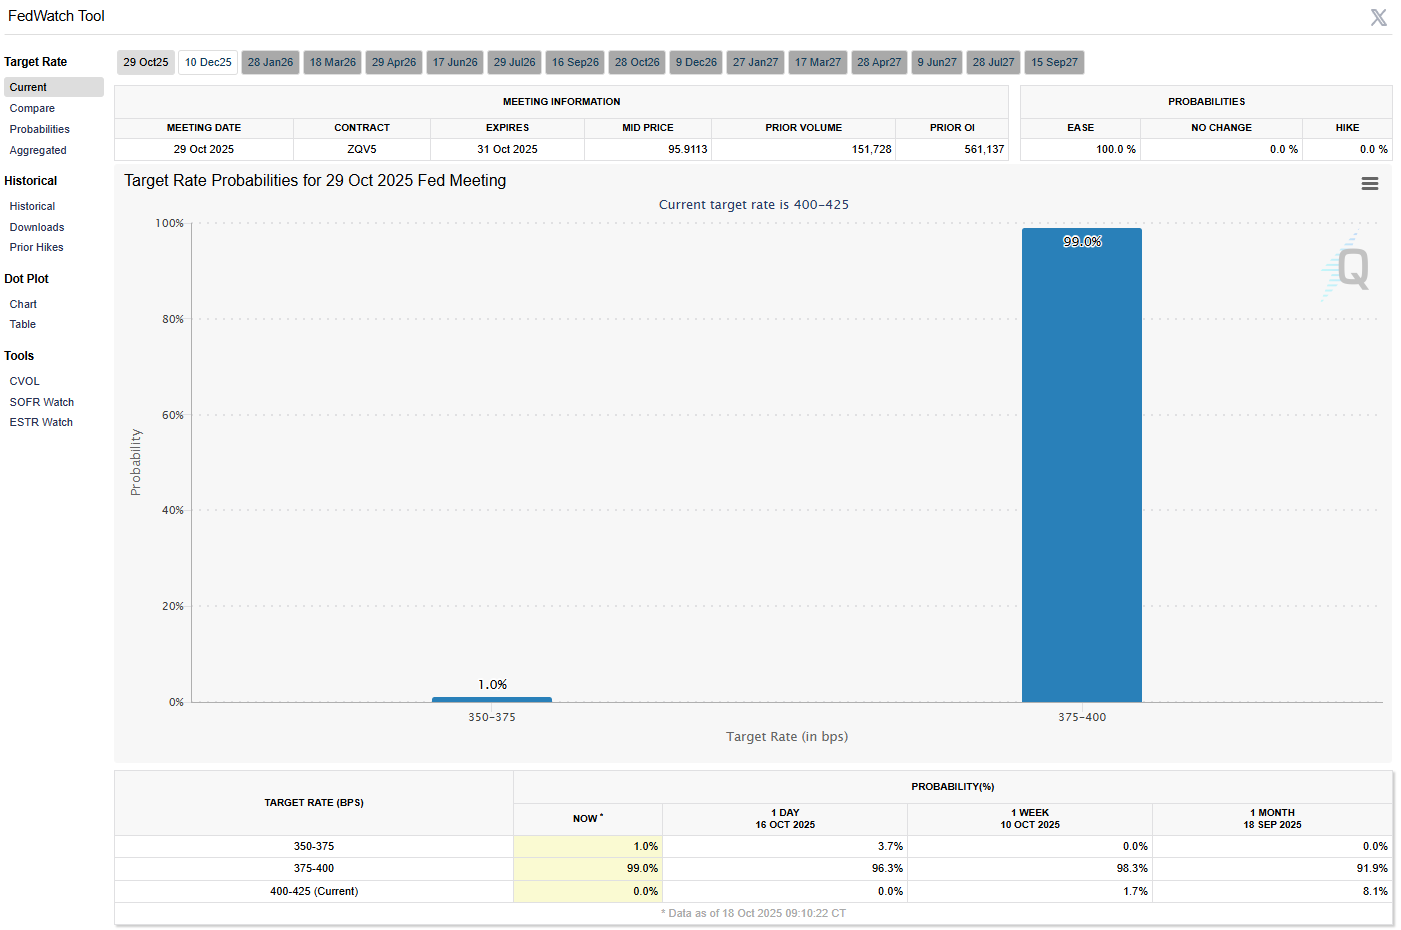
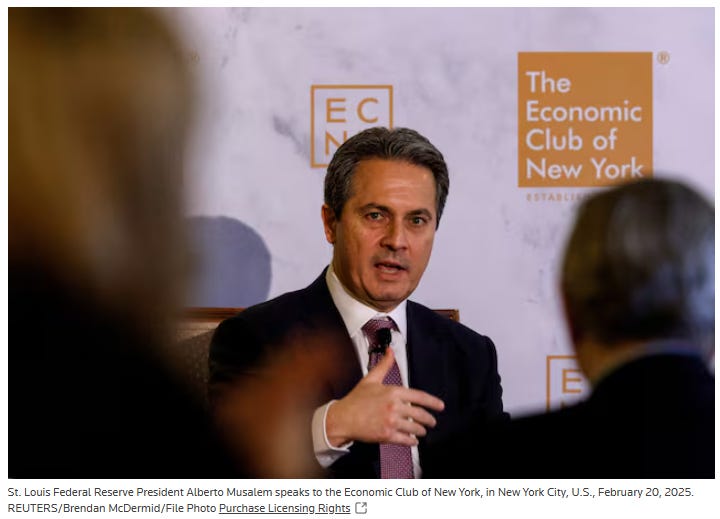
Monetary policy tone helped as well. St. Louis Fed President Alberto Musalem described the current policy stance as “somewhere between modestly restrictive and neutral” and said he could support another interest rate cut to bolster a slowing labor market. That is a clear dovish tilt at a moment when the market is already pricing a 100% chance of a −25 basis point cut at the October 28–29 FOMC meeting. With the labor market at the center of the Fed’s reaction function, any hint that officials are prepared to ease to protect employment becomes a cushion for equity multiples and credit spreads. Those words also intersected with the mechanics of the shutdown: the longer government operations are curtailed, the more the growth impulse weakens and the easier it is to justify additional policy support.
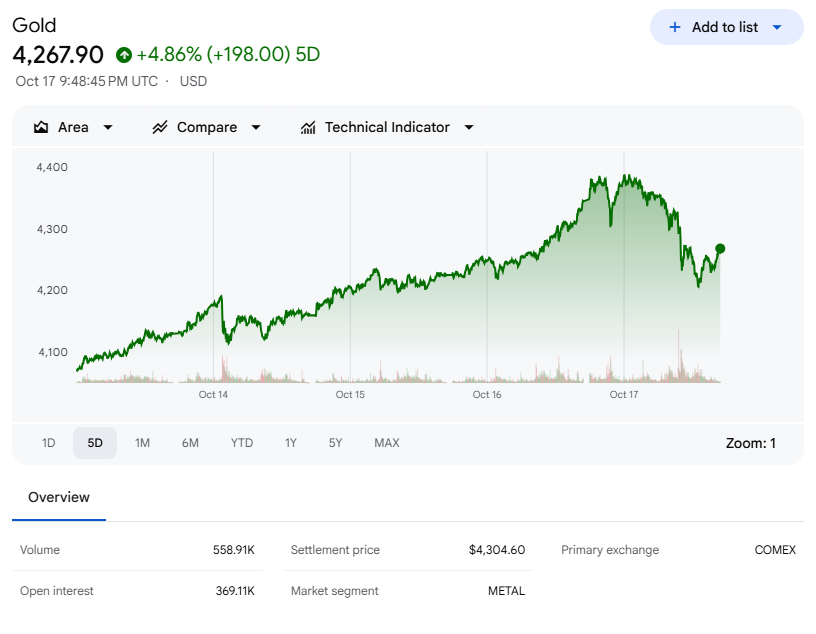
Gold and silver provided the cleanest expression of that shifting mix. Precious metals had been in a full-fledged haven bid on the trilogy of U.S.–China tension, the ongoing U.S. government shutdown, and a flare-up of credit worries. Both gold and silver notched fresh all-time highs on Friday morning, a move that captured the risk premium that had built up across the prior week. Then, almost on a dime, the metals sold off on the combination of easing trade fears and stabilization in bank shares, triggering long liquidation that drove gold sharply lower by the close and saw silver sink by more than 5%. The message was not that macro risk disappeared, but that a one-way flight to haven assets had exhausted itself in the short run once equities found their footing.
The shutdown remained a powerful macro constraint all week. It weighed on sentiment, delayed critical releases, and injected a fog of uncertainty into nowcasting efforts. With the government shuttered, the last three weeks of weekly initial unemployment claims, the August U.S. trade report, and the September payroll report all slipped into limbo. The Bureau of Labor Statistics confirmed that the September consumer price report originally slated for Wednesday would be released on October 24 instead. The White House warned that, should the shutdown linger, there would be widespread dismissals in programs outside the administration’s priorities. Bloomberg Economics estimated that 640,000 federal workers would be furloughed during the shutdown, pushing jobless claims higher and the unemployment rate up to 4.7%. The market digested those estimates with the same split-screen logic that guided trading elsewhere: bad news for growth in the near term increases the probability of policy easing, and that policy easing offsets some of the drag on risk assets, particularly where earnings trajectories remain intact.
Earnings were the other pillar of support. The reporting season is still in its early stages, but the beats are landing. Bloomberg Intelligence tracked that 78% of S&P 500 companies that have reported so far have beaten forecasts. Companies guiding for third-quarter results are turning more positive as well, with more than 22% of the S&P 500 firms providing guidance expected to beat analysts’ expectations, the highest in a year. At the same time the growth math is cooling from torrid to simply healthy: consensus looks for third-quarter profits to have risen by +7.2% year over year, the smallest increase in two years, while Q3 sales growth is projected at +5.9% year over year, down from 6.4% in Q2. That blend—beats riding on conservative positioning, with sales cooling but still positive—tends to be supportive for equities so long as forward commentary does not undercut the trajectory.
Across the Atlantic and in Asia, equity markets closed lower into the weekend. The Euro Stoxx 50 finished down −0.79%. China’s Shanghai Composite fell −1.95%. Japan’s Nikkei Stock 225 dropped −1.44%. Those moves told the same story in different geographies: growth jitters, political noise, and a bid for quality that fades in and out as headline risk waxes and wanes.
Rates: A Dovish Drift Interrupted By Relief
Rates spent the week oscillating between a dovish trend and a tactical relief sell-off. December 10-year T-notes (ZNZ5) ended Friday down −9 ticks, pushing the 10-year yield +2.8 basis points higher to 4.003%. That intraday reversal meant the contract pulled back from a 6.25-month high, while the cash yield rebounded from a 6.25-month low of 3.934% and moved higher into the bell. The cause was straightforward: better-than-expected Q3 earnings from several regional banks alleviated credit-quality anxiety and sparked long liquidation in T-notes. Add the easing tone on U.S.–China trade and the result was a modest rotation out of safe-haven duration and back into risk assets.
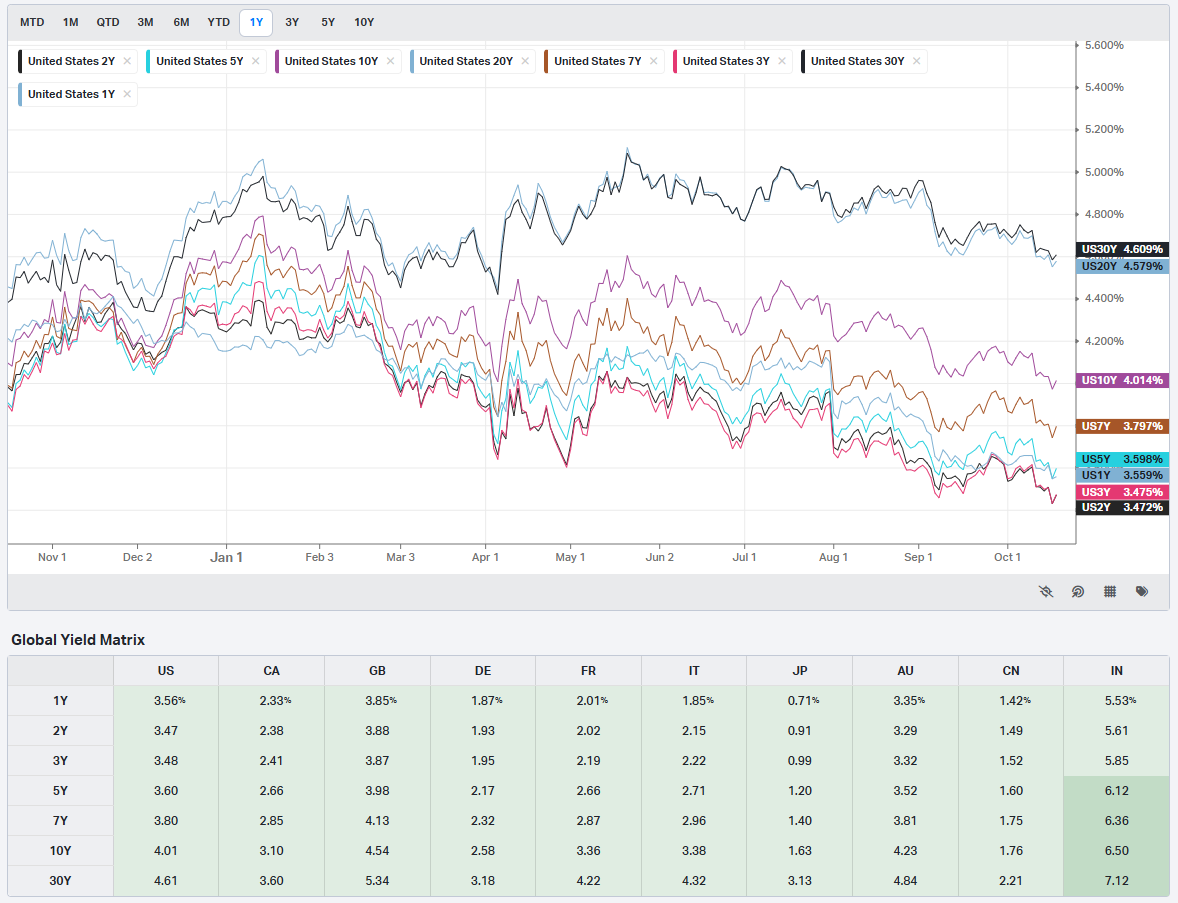
The broader support structure under Treasuries is still there. The shutdown diminishes near-term growth, invites job losses, and crimps consumption; each of those channels gives the Fed more latitude to ease and keeps a floor under high-quality duration. President Musalem’s willingness to back another cut for labor market reasons reinforces that floor. In Europe the move was similar in direction if smaller in magnitude. The 10-year German bund yield bounced from a 3.5-month low of 2.523% to 2.580%, up +1.0 basis point on Friday. The 10-year UK gilt yield recovered from a 3.5-month low of 4.451% to 4.531%, up +3.0 basis points.
European inflation surprised slightly to the upside at the core level, with Eurozone September core CPI revised up by +0.1 to 2.4% year over year, a five-month high. Even so, the European Central Bank messaging stayed watchful. ECB Governing Council member Simkus emphasized “downside risks to both growth and inflation” that may require additional rate cuts in coming months. Swaps priced only a 2% probability of a −25 basis point cut at the October 30 meeting, but the bias in communication was toward accommodation rather than restraint.
Stocks: Leadership Stabilizes, Earnings Steady The Tape
Equities ended a volatile week higher in the U.S. The S&P 500 rose for the week after a prior Friday that delivered the worst single-day decline since April. That Friday’s capitulation set a low that held, and the subsequent rally found sponsorship from improved trade rhetoric, dovish Fed tone, and better-than-feared earnings.
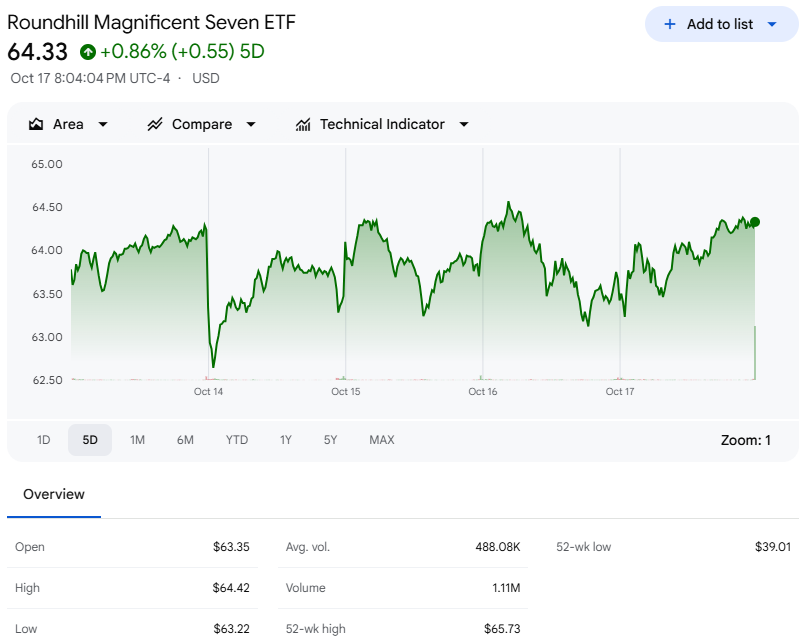
Within the marquee growth cohort, most of the “Magnificent Seven” advanced on Friday. Tesla (TSLA) gained more than +2%. Apple (AAPL) added more than +1%. Nvidia (NVDA) rose +0.78%. Alphabet (GOOGL) climbed +0.76%. Meta Platforms (META) rose +0.68%. Microsoft (MSFT) gained +0.39%. The tone in these megacaps was not euphoric, but it was consistent: investors were willing to add exposure where balance sheets, cash generation, and secular growth are strongest when macro uncertainty eases even modestly.
Earnings-specific winners further steadied the index. American Express (AXP) gained more than +7% to lead the Dow Jones Industrials after Q3 EPS of $4.14 beat the $3.99 consensus. Zions Bancorp (ZION) gained more than +5% after an upgrade to outperform from Baird with a $65 price target. Jefferies Financial Group (JEF) added more than +5% after Oppenheimer & Co. upgraded the shares to outperform from market perform with an $81 target. Truist Financial (TFC) rose more than +3% after reporting Q3 non-interest income of $1.56 billion, ahead of the $1.49 billion consensus. Ally Financial (ALLY) climbed more than +3% after Q3 adjusted EPS of $1.15 topped the $1.00 consensus. CSX Corp (CSX) advanced more than +1% as Q3 revenue of $3.59 billion beat the $3.57 billion estimate. Fifth Third Bancorp (FITB) gained more than +1% after Q3 net interest income of $1.53 billion edged the $1.52 billion consensus. Those beats and upgrades collectively chipped away at the credit-quality concern that had spilled out of the regional-bank space.
Not all growth pockets followed suit. After blistering rallies, chipmakers and AI infrastructure names were primed for long liquidation, and that is what Friday delivered. Oracle (ORCL) slid more than −6%. Super Micro Computer (SMCI) fell more than −3%. ARM Holdings (ARM) declined more than −3% to lead Nasdaq 100 laggards. Broadcom (AVGO), NXP Semiconductors (NXPI), Applied Materials (AMAT), Arista Networks (ANET), and Dell Technologies (DELL) each fell more than −1%. That giveback did not break the broader thesis around compute and AI investment, but it did remind traders that parabolic stretches are vulnerable when macro winds shift and when demand for havens recedes.
Commodity-linked equities mirrored the precious-metals reversal. Mining shares tumbled after gold dropped by more than 1% and silver fell by more than 5%. Kinross Gold (KGC) closed more than −9%. Newmont (NEM) fell more than −7% to lead S&P 500 losers. Barrick Mining (B) declined more than −6%. Freeport-McMoRan (FCX) shed more than −1%. That complex is most sensitive to the trade-and-policy narrative and will continue to swing with the perceived path of tariffs and growth.
Idiosyncratic moves dotted the tape. AST SpaceMobile (ASTS) dropped more than −6% after Barclays double-downgraded the stock to underweight from overweight with a $60 price target. Eli Lilly (LLY) fell more than −2% after President Trump said the White House will negotiate the price of the diabetes drug Ozempic down to as low as $150 a month. State Street (STT) slipped more than −1% after Q3 net interest income of $715 million missed the $731.3 million consensus.
The near-term pipeline is busy enough to sustain the flow of fundamental catalysts. Among the companies slated to report on October 20, 2025 are AGNC Investment (AGNC), BOK Financial (BOKF), Cleveland-Cliffs (CLF), Crown Holdings (CCK), RLI (RLI), Steel Dynamics (STLD), Summit Therapeutics (SMMT), W. R. Berkley (WRB), Wintrust Financial (WTFC), and Zions Bancorp NA (ZION). Each sits in a pocket of the market that is in motion—credit, cyclicals, and regional banks—so guidance will matter as much as results.
A Whiplash Week: From Panic To Process
The most dramatic turn happened at the end of the prior week, and it framed everything that followed. Last Friday’s selloff pushed the S&P 500 to its worst day since April, and the closing prints were on the dead lows. The VIX vaulted over 20 as protection was snapped up in size; it was the heaviest single day for options in history, with more than 100 million contracts trading. The selling pressure did not dissipate at the equity close. With futures markets thinning out, President Trump used social media to announce that tariffs on China would be increased to 100% starting November 1. Liquidity moved to the crypto complex and produced a mini flash crash: nearly $20 billion of levered crypto positions were liquidated, Bitcoin briefly traded down more than 15%, and alt coins fell well over 20%.
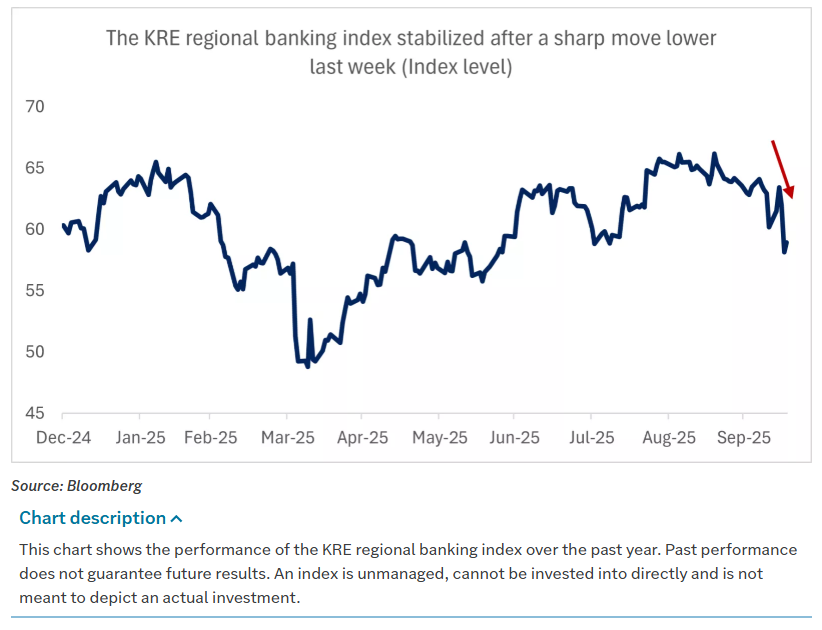
Shocks of that magnitude rarely resolve in one session. The aftershocks bled into this week, and the source was the same: U.S.–China headlines that sent investors toggling between risk-on and risk-off in a matter of minutes. A second source had been building as well: credit-quality concerns linked to the bankruptcies of a subprime auto lender, Tricolor, and an auto-parts company, First Brands. Those concerns lingered over regional banks, and disclosures in early earnings fanned the flames, pushing the SPDR Regional Bank ETF lower by more than 6% yesterday before a bounce today as more results crossed the tape.

The weekly scorecard captured both fear and relief. The S&P 500 finished up 1.7% and recouped a bit more than half of Friday’s losses. Small caps outperformed, rising 2.4% and even hitting new highs on Wednesday before pulling back. Dovish commentary from Fed Chair Jerome Powell earlier in the week, signaling further easing and discussing the end of quantitative tightening, helped push yields lower and encouraged rotation into interest-rate-sensitive equities. Consumer-facing companies found a bid after management commentary on conference calls suggested spending resilience.
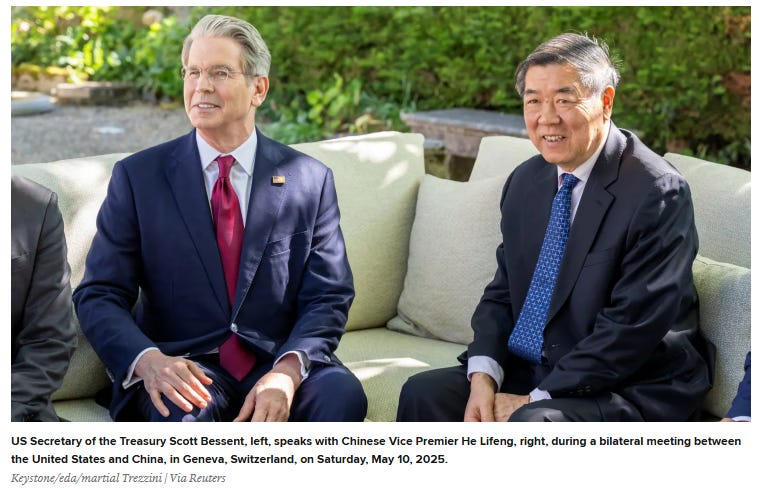
On the China front the rhetoric softened markedly from the prior weekend’s threat. Early in the week the administration toned down its language. President Trump said, “Don’t worry about China. It will all be fine,” and that alone fueled Monday’s bounce. Chinese officials downplayed export-control rhetoric, suggested certain exemptions, and argued that the White House was exaggerating. Headlines about increased port fees on U.S. vessels faded quickly. Treasury Secretary Bessent criticized one Chinese negotiator as “disrespectful” but emphasized that lines of communication remained open; he later spoke with Vice Premier He Lifeng. The meeting with Xi was re-affirmed, and the President repeated that the increased tariffs were “not sustainable.” The timing ensures that headlines will proliferate into the plenum in China, where five-year priorities are developed, but for now the temperature is lower than it was a week ago.
Earnings were a steadying force in their own right. Analysts expect S&P 500 earnings growth up 8% year over year following double-digit growth last quarter. Unusually, estimates have moved higher heading into reporting season for the first time since 2021, rather than drifting down by the typical ~3% during the quarter. Technology has been instrumental in that improvement, with deal announcements and guidance pushes supporting the outlook, but valuation and positioning set a high bar. With major indices hovering near all-time highs and multiples stretched, investors are primed to scrutinize forward commentary and price reaction as much as headline beats, especially because the shutdown has emptied the macro calendar and made corporate color a crucial proxy for the state of the consumer, the labor market, and the inflation backdrop.
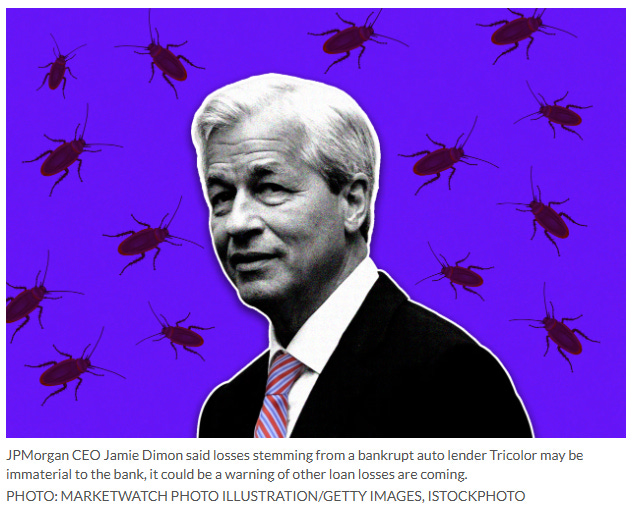
Financials were first to set the tone. Money-center banks posted very strong results, with capital markets, fee businesses, and investment banking all contributing. The tone from the C-suites reinforced the resilience narrative. JPMorgan Chase’s CFO Jeremy Barnum said, “Consumers and small businesses remain resilient based on our data. We are closely watching potentially softening labor market, our credit metrics, including early-stage delinquencies, remain stable and slightly better than expected.” Wells Fargo CEO Charlie Scharf said, “While some economic uncertainty remains, the U.S. economy has been resilient and the financial health of our clients and customers remains strong. Spending on debit and credit cards continued to increase, auto loan originations had strong growth from a year ago…” Provisions generally surprised positively. JPMorgan did take a $170 million charge-off associated with Tricolor, and CEO Jamie Dimon’s comment—“My antenna goes up with things like that happen. And I probably shouldn’t say this, but when you see one cockroach, there are probably more”—grabbed attention. It also framed how investors would interpret any subsequent disclosures.
Regional bank prints landed less spectacularly but mostly fine, as expected for lenders without the same capital-markets tailwinds. A pair of charge-offs linked to C&I loans with alleged fraud triggered Thursday’s downdraft, but the price action felt like a “shoot first, ask questions later” response with 2023’s scars still fresh. Over the ensuing twenty-four hours, additional banks reported and “no new cockroaches” emerged. Fifth Third (FITB), which had already disclosed exposure to First Brands, took a write-off that was smaller than feared. Ally Financial (ALLY) reduced its net charge-off guidance and spoke constructively about originations, echoing earlier remarks from Wells Fargo (WFC). The balance of evidence suggests that the issues are idiosyncratic rather than systemic. Markets often force a binary decision, but the economic reality is rarely binary. High-yield credit spreads widened over the past month but remained well-behaved on any longer view.
Insurers lagged within Financials as management teams prepared investors for slower growth in a more competitive landscape. The sector is still digesting price normalization and capital allocation choices after a strong multi-quarter run.
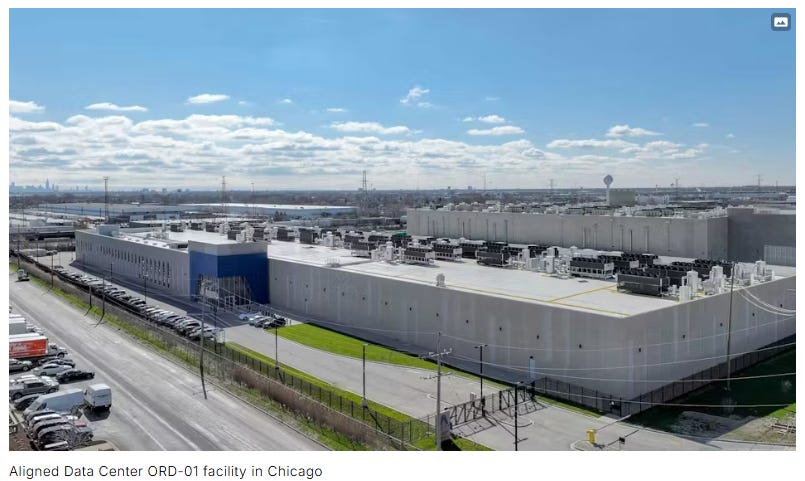
Technology’s corporate commentary stayed firm. ASML (ASML) and Taiwan Semiconductor Manufacturing (TSM) spoke to a healthy demand environment. Salesforce (CRM) and Oracle (ORCL) raised guidance at their analyst days. The week also featured a landmark deal, with a BlackRock-led group acquiring Aligned Data Centers for $40 billion. Those developments confirm that the secular capex cycle around AI infrastructure remains intact even when momentum wobbles in the public market.
Outside of the marquee reports, results were scattered and will accelerate next week as roughly 10% of S&P 500 constituents release numbers. The cadence of beats, revisions, and guidance will matter more than any single print because the macro backdrop is dominated by a data vacuum from the shutdown. Price action will do the work of adjudication.
Volatility, Levels, And A Map For The Next Move
Volatility stayed sticky. The VIX pushed above 20 at the end of last week and held that threshold all week. It peaked near 30 ahead of Friday’s open before easing. That path is exactly what you expect after a shock that triggers a scramble for protection and the heaviest options day in history. The important nuance is that the bond-market analogue did not confirm an acute stress regime. The ICE BofA MOVE Index stayed contained, and Treasuries functioned as a haven over the last week even as the 10-year traded back up on Friday. Equity vol said “respect the risk,” rates vol said “not disorderly.”
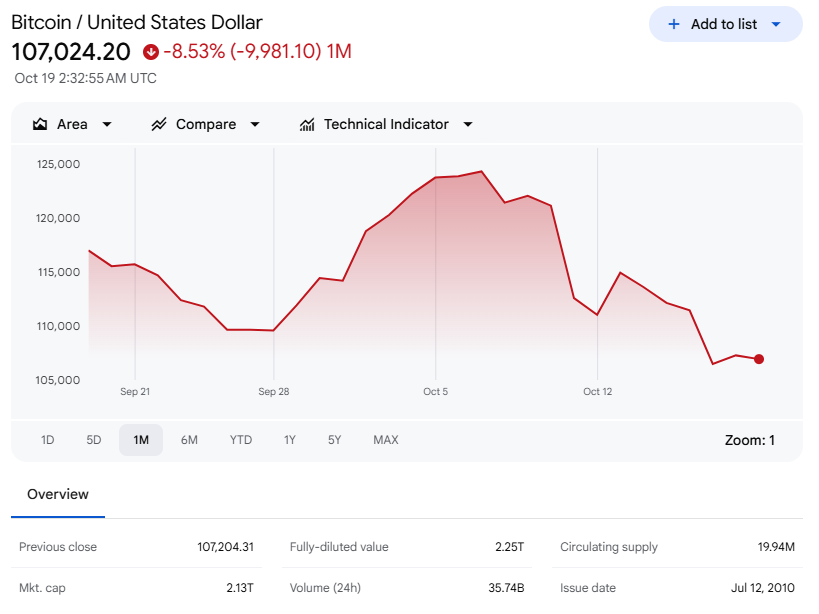
Crypto, which has been a useful leading indicator at turning points this year, could not mount more than a mechanical bounce after the Friday-night liquidation. Bitcoin recouped the flash-crash damage and failed, then broke below recent lows near ~107k, tagged its 200-day moving average, and retested the Friday low around ~103.5k before rebounding. The complex still looks fragile as traders recover from the forced deleveraging.
Hot thematic trades underscored the fragility. Rare earths, nuclear, quantum, unprofitable tech, and short baskets all ripped early in the week only to reverse sharply in the back half. It was a classic lesson in chasing momentum into headline uncertainty. Gold, perhaps the strongest momentum asset over the last year, succumbed to the same gravity, falling $200 from its overnight high before finishing modestly lower; other precious metals fell by well more than 5%. The entire setup begged for a pause and a reset of positioning.
Technically, the S&P 500 drew clear lines for the week ahead. The index struggled to hold above its 20-day moving average near ~6,675. The weekly high sits at 6,725. The more consequential markers are below. On Tuesday the index retested last Friday’s low around ~6,550 and traded within 10 points of the 50-day moving average, a level not tested since it was reclaimed in May. Futures probed that area again overnight before the pre-market reversal on China headlines. Should those lows fail, the measured move from a small head-and-shoulders pattern is roughly 200 points, which would target a pullback into 6,350–6,400. That zone coincides with the 100-day moving average and a retest of the mid-July breakout area. A pullback of that magnitude would reset trend signals across the quantitative community and remove some of the FOMO that had crept into the tape. In a perverse way, such a reset would be healthy if the larger uptrend is to persist.
Global Markets: Europe Mixed, Asia Leaned Lower
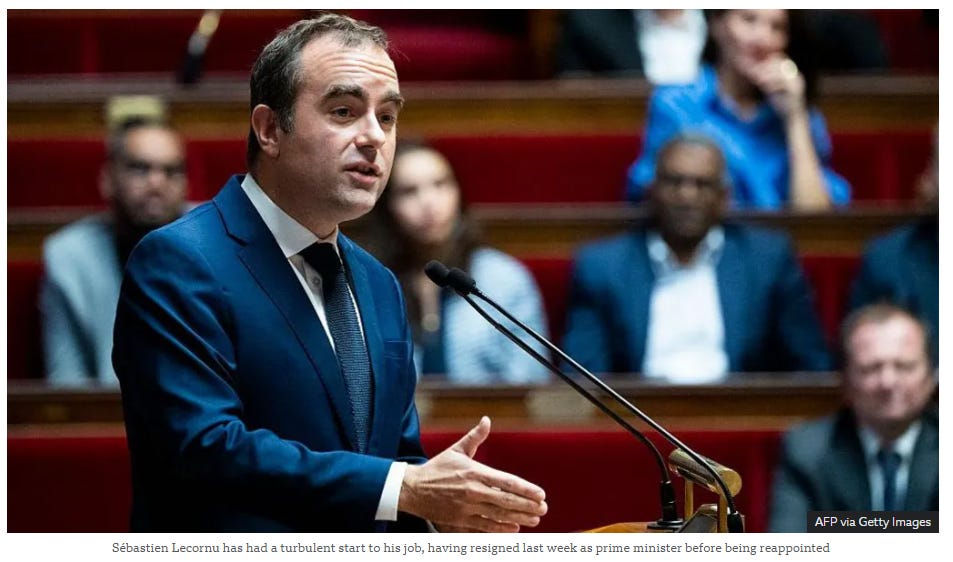
Overseas equities reflected the same oscillation between caution and relief. Europe broadly finished lower, but France posted a solid mid-week rally that kept the STOXX 600 above water. Aerospace and defense were among the laggards while luxury stocks were strong. Major European banks finished lower even as yields slipped across the region. France stood out as an outperformer after sharp gains on Wednesday and Thursday. Prime Minister Lecornu—whose tenure has been on again and off again—returned four days after resigning and pledged to suspend pension reforms that had been central to President Macron’s agenda. That stance helped him survive two no-confidence votes on Thursday. The next test is passing a budget for next year.
Germany lost ground for the week with most of the damage on Friday. The DAX bounced from intraday lows but could not break resistance around ~24,000, which also lines up with the 50- and 100-day moving averages. The stall there keeps the index inside a range and amplifies the sensitivity to global macro headlines in the near term.
Asia leaned lower. Hong Kong fell sharply, and both Japan and Shanghai finished down. In Japan, yen strength was a headwind, and the Nikkei ended down 1%—just off last week’s record high above 48,500. In China, the Hang Seng fell 4% and has now declined in nine of the past ten sessions, sitting just above its 100-day moving average. Technology and semiconductors were weak across the mainland and Hong Kong; Semiconductor Manufacturing International (SMIC), Baidu (BIDU), BYD (BYD), Tencent (TCEHY), and Alibaba (BABA) all fell between 7% and 10% for the week.
Emerging markets were a mosaic of idiosyncratic stories. Argentina extended last week’s pop after the U.S. Treasury and the Federal Reserve announced peso purchases and a currency swap line. In South Korea, the KOSPI chart turned parabolic. SK Hynix (000660.KS) rallied about 9%. LG Energy (373220.KS) climbed roughly 20%. Hyundai Motor (005380.KS) rose about 12%. Hanmi Semiconductor (042700.KS) added about 20%. Those moves reinforced how much of the global equity narrative is flowing through semiconductors, energy transition, and domestic policy actions.
Commodities And Crypto: Gold’s Arc, Oil’s Air Pocket
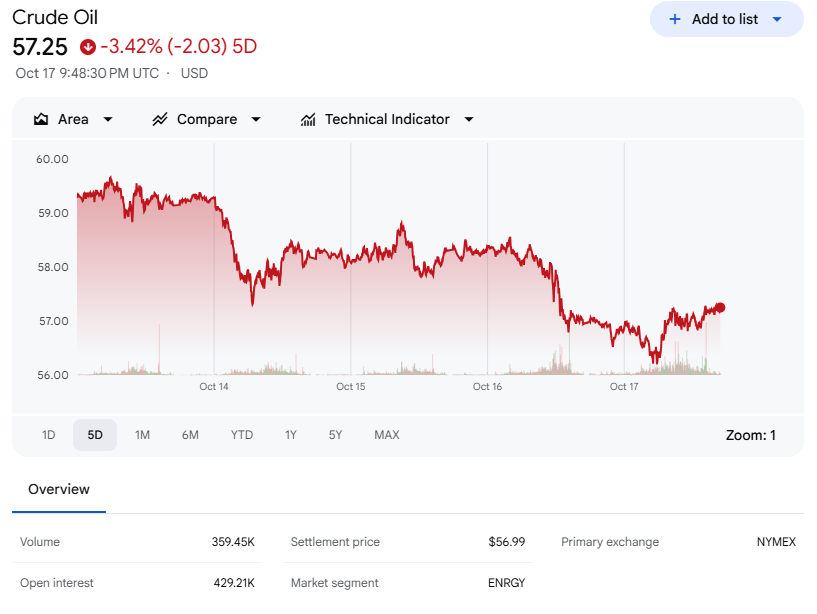
Commodities told a two-part story. The first part was haven demand. Gold’s ascent continued early in the week as trade and banking concerns dominated, setting fresh all-time highs before the Friday fade to $4,262 per ounce, down $43 on the day. Silver followed a similar path and then fell harder. The second part was energy weakness. The geopolitical climate softened at the margins—President Trump initiated fresh contact with President Putin and met with President Zelensky, while a Gaza ceasefire took some urgency out of the supply-risk case. The President also said India agreed to halt purchases of Russian oil soon, removing another potential stress point in trade negotiations. The EIA monthly report kept demand roughly unchanged but increased supply growth for this year and next. Comments from Trafigura’s Head of Oil and from Gunvor’s CEO added a bearish note. Add a splash of regional-bank credit volatility and it was enough to pull crude lower. ICE Brent crude settled at $61.33 per barrel, up $0.27 on the day but down on the week, and traded as low as $60—a key level dating back to the September 2021 breakout. Below $60 sits $58, and a break there would open the door to a larger air pocket. U.S. natural gas fell about 9% for the week but rose on Friday. European gas storage slipped below the five-year average and will remain a swing factor into winter.
Agriculture was broadly higher. Wheat tried to hold above a five-year low, and corn rose on lower ethanol storage numbers. The message across the complex was that supply and inventory dynamics remain the dominant driver now that headline risk has abated slightly.
Crypto stayed under pressure. Bitcoin ended around ~107.1k, down roughly −1300 for the session and off 8% for the week, but it held the 200-day moving average near ~103.4k after an overnight test. Ether fell as well but less dramatically. Most digital asset treasury companies were sharply lower, many dropping 10–30%. There were two non-price headlines that stood out. Florida introduced House Bill 183, which would allow the state to invest up to 10% of public funds and pension assets in digital assets. Paxos accidentally minted $300 trillion of PYUSD, PayPal’s stablecoin, in a “technical error,” and then immediately burned the excess coins. The juxtaposition was striking: a policy initiative that would institutionalize a small slice of crypto exposure for public funds and a reminder that operational risk still lives in the plumbing.
Economic Data: Silence From Washington And Signals Elsewhere
The government shutdown kept the official data spigot closed. There were no unemployment claims, no trade balance, and no payrolls. The BLS moved the September CPI release to October 24. That vacuum did not stop the Fed from speaking. In fact, there was a deluge of Fed commentary ahead of the blackout period.
The NFIB Small Business Index fell 2 points from last month, the first decline in three months, with the shutdown’s impact likely to appear more fully in next month’s survey. Two regional manufacturing surveys diverged. The Empire State headline improved from −8.7 to 10.7, while the Philadelphia Fed survey fell from 23.2 to −12.8. Both pointed to better expectations for future new orders. Price dynamics were mixed. Empire saw modest increases in prices paid and prices received, both now and in expectations. Philadelphia showed a decline from last month in future prices.
Housing sent a small positive signal. The NAHB Housing Index improved across current sales conditions, expectations, and prospective buyer traffic. The average price reduction ticked up to 6% in October from the 5% trend, a sign that pricing power is still adjusting even as demand stabilizes.
The Fed’s speaker circuit focused on the balance between labor risk and inflation stickiness and on balance-sheet plumbing. Governor Chris Waller’s remarks drew attention when he said he was unsure about further cuts after the next one, worried that the economy was not weakening as much as the labor market. Chair Jerome Powell emphasized the end of quantitative tightening and blessed the market’s pricing of 50 basis points more of cuts this year. Powell also flagged early signs of funding-market stress as the reverse repo facility drains to zero and bank reserves move from “abundant” toward “ample.” A slight uptick in the effective fed funds rate and SOFR, coupled with usage of the Standing Repo Facility, remain on the watch list. The SRF was not tapped on Friday, which removed a small point of concern into the weekend.
What’s On Tap
The coming week will be defined by China headlines and earnings. A readout from Treasury Secretary Bessent’s meeting will land over the weekend. On Sunday evening China will release Q3 GDP, retail sales, and industrial production, with the plenum beginning and sparking additional policy chatter. Earnings will accelerate and broaden beyond Financials. Shutdown negotiations will grind on with no obvious end in sight. On Friday the market will get long-awaited economic data as the BLS returns to deliver CPI, which is needed to calculate the annual cost-of-living adjustment before November 1. Global flash PMIs will also arrive Friday, and those diffusion indices will stand in for the missing official series.
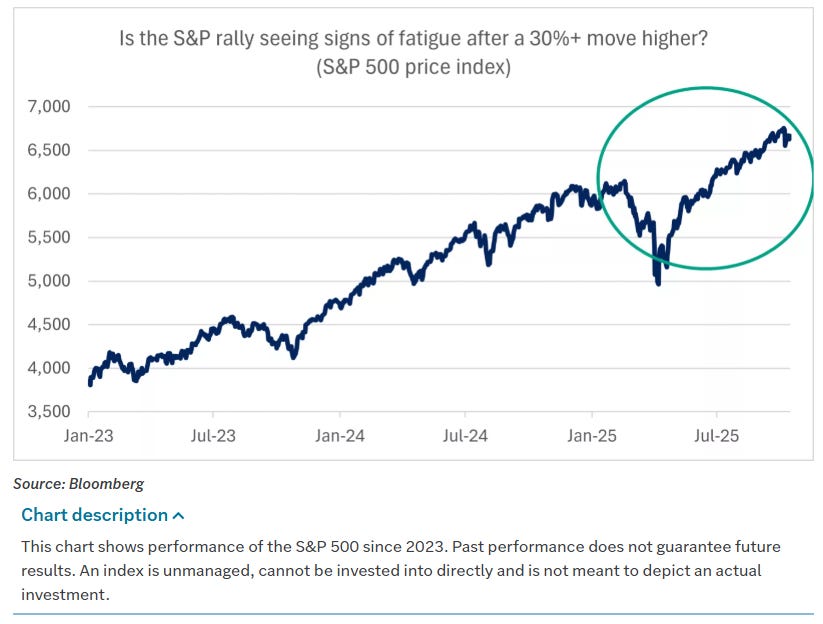
A Market That Wants A Pause, Not A Collapse
After a 35% rally in the S&P 500 with no 5% pullback, the market looks due for a pause. The walls of worry are plain: tariff uncertainty and the shutdown, a watch list around small-regional-bank credit quality, and a volatility regime that has turned less forgiving. The VIX is above 20 and reached 30 before the Friday open. The S&P 500 logged its first 2% down day since April on October 10. Two-year yields fell to the lowest level since 2022, a classic fear indicator. None of those signals exits the bull case on its own, but together they argue for a digestion phase.
It is equally important to note what the tape is not doing. There is no evidence that this will morph into a deep or prolonged bear market. The Fed is on track to cut rates. A U.S. tax bill is slated to support capital expenditures and R&D. Corporate earnings growth remains positive and is poised to broaden beyond technology and AI leadership. For the here and now, roughly 12% of S&P 500 companies have reported and about 85% have surprised positively. Full-year 2025 earnings are forecast to grow about 10.5%, with 2026 accelerating to about 13%. As the earnings cycle broadens, sector leadership should do the same, spreading gains into areas that have lagged and reducing the market’s reliance on a handful of mega-cap engines.
Positioning Into Year-End
Volatility creates opportunity for portfolios that are disciplined about sizing and structure. There are three practical actions worth considering as the tape digests gains. Rebalancing comes first. After a long run in equities, multi-asset portfolios often drift beyond their strategic mix. A 60/40 that benefitted from equity appreciation can be quietly reset to the intended risk budget. Diversifying comes next. With technology and AI doing so much heavy lifting, there is logic in trimming winners and seeding exposure to segments with catch-up potential—Financials stabilized by earnings, quality cyclicals with pricing power, and income-oriented sleeves like REITs that just printed new consensus price nodes. Finally, prepare a buy-list. In a correction, the best entries go to investors who already know which tickers fit their mandate and where they are willing to buy. Dollar-cost averaging remains a strong default, but there are moments—like the last week—when tactical dislocations offer better than average opportunities; get comfortable viewing VL levels from higher timeframe charts to identify strong institutional positioning you can lean on during pullbacks.
A Closing Word
This week’s market told a consistent story across asset classes. The shock of the prior Friday was real, but it did not metastasize. Easing rhetoric on U.S.–China trade, a dovish Fed tone led by St. Louis Fed President Alberto Musalem and reinforced by Chair Jerome Powell, and the early cadence of better-than-feared earnings combined to steady equities. Precious metals confirmed the shift by reversing from fresh highs, and rates respected the balance by firming early and then backing up modestly into Friday’s close. The shutdown remains a risk that mutes the data flow and inserts uncertainty into every macro conversation, but it also increases the probability of additional easing that supports valuations. Outside the U.S., Europe chopped and Asia leaned lower, with China the epicenter of both price action and headline risk. Energy weakened as supply expectations improved and geopolitics cooled at the margin, while crypto stayed fragile after a record options day and forced deleveraging.
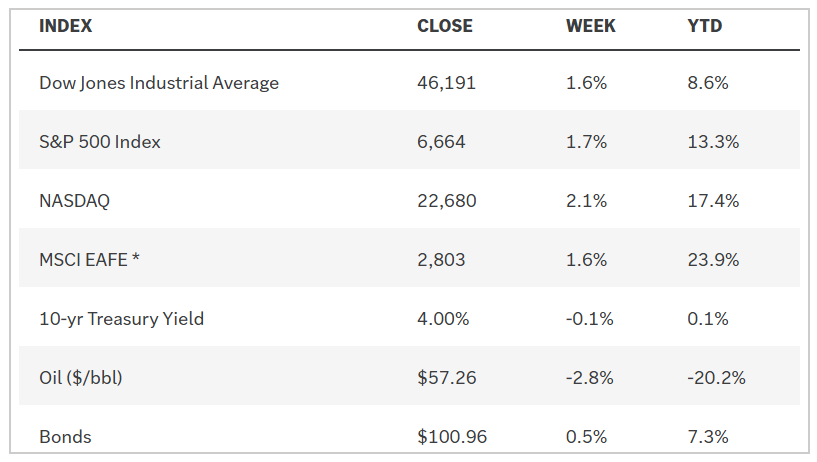
The scoreboard is simple enough to carry forward. DOW 46,191 (up +238), S&P 500 6,664 (up +35), Russell 2000 2,452 (down −15), NYSE FANG+ 16,123 (up +87), ICE Brent crude $61.33 per barrel (up +$0.27), gold $4,262 per ounce (down −$43), Bitcoin around ~107.1k (down −1300). Those are not the prints of a market that lost its anchor. They belong to a market that absorbed a shock, found a bid, and is trying to transition from panic to positioning while it waits for policy and earnings to clarify the path. Let the CPI release on October 24 fill in the macro blanks; and let the earnings calls do the work that government data cannot while the shutdown lasts. If the narrative holds—tariff risks easing, labor risks guiding the Fed toward another −25 basis point cut on October 28–29, and earnings beats coming through—then last week’s rebound can build a more durable base. If not, the levels below are clear enough to define risk and keep the drawdown tactical rather than terminal.
Weekly Benchmark Breakdown
Breadth tilts constructive, but leadership is still narrow
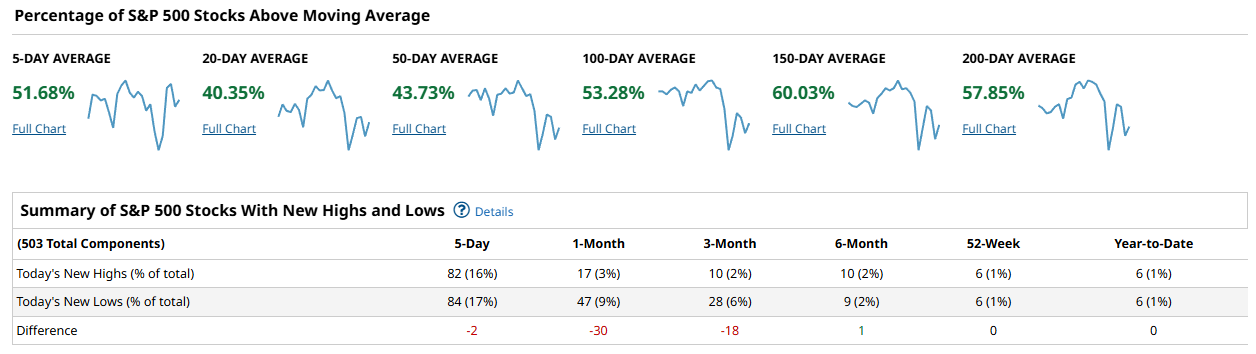
Breadth this week leans cautiously risk-on. We have a modest “trend” feel rather than a thrust: more constituents are reclaiming short-term averages, longer-term cohorts are still OK, and the new-high/new-low tables are mixed but improving at the margin. The takeaway is that the tape is trying to broaden without yet delivering the kind of decisive confirmation that usually marks a durable advance.
For the S&P 500, participation improved at the short end while the longer end continues to carry the load. Fifty-one percent of constituents are back above their 5-day average, 40% above the 20-day, and 44% above the 50-day. The intermediate stack is balanced with 53% above the 100-day, and the longer profiles are better with 60% above the 150-day and 58% above the 200-day. New highs minus new lows tells the story of a market that is rotating rather than stampeding: on the 5-day window we logged 82 NH vs 84 NL for a small -2, the 1-month window sits at 17 NH vs 47 NL for -30, and 3-month at 10 vs 28 for -18. The 6-month flips slightly positive at +1 (10 vs 9), while both 52-week and year-to-date sit flat at 0 (6 vs 6). Net: breadth is decent across 100- to 200-day cohorts, but shorter-term work still needs to flip convincingly green.
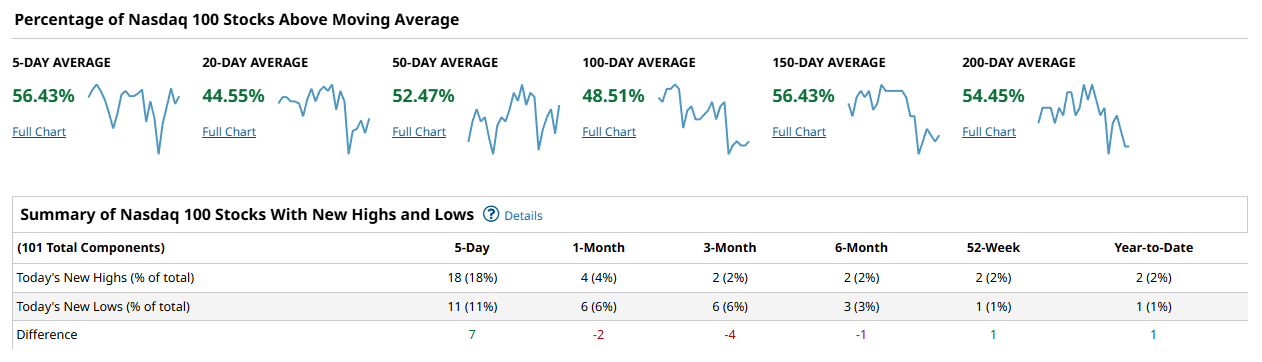
The Nasdaq 100 looks a touch healthier near-term and steadier further out. Fifty-six percent are above the 5-day, 45% above the 20-day, 52% above the 50-day, and 49% above the 100-day. Longer frames hold up: 56% above the 150-day and 54% above the 200-day. The NH/NL table supports that tone: +7 on the 5-day (18 NH vs 11 NL), soft on the 1-month and 3-month at -2 and -4, a marginal -1 at 6-month, and small positives on the 52-week and YTD lines at +1 each. Big tech breadth is not surging, but it is not deteriorating either; the bias remains constructive so long as those 50- and 100-day cohorts stay near or above the 50% line.
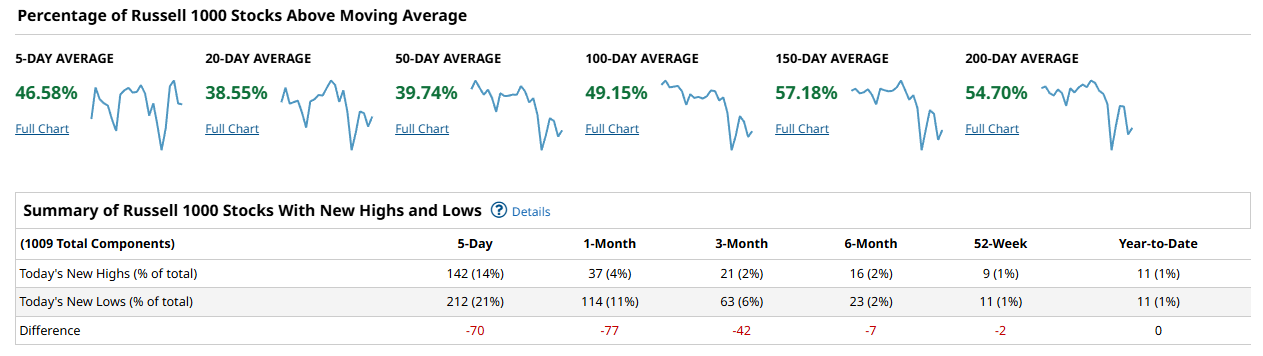
The Russell 1000 is where the breadth tug-of-war is most visible. Only 47% of members are above the 5-day, 39% above the 20-day, and 40% above the 50-day. The intermediate bucket is better at 49% above the 100-day, and the long-term cohorts remain in decent shape with 57% above the 150-day and 55% above the 200-day. New-high/new-low spreads remain negative across most lookbacks: -70 on the 5-day (142 NH vs 212 NL), -77 on 1-month, -42 on 3-month, -7 on 6-month, -2 on 52-week, and flat at 0 for YTD. That tells you participation beneath the megacaps is still hesitant, with more names making fresh short-term lows than highs.
Synthesis: cap-weighted leadership is doing the heavy lifting while the broad market grinds to catch up. The S&P and Nasdaq 100 show majority readings above their 100- to 200-day averages, which keeps the longer-term uptrend intact. But the Russell 1000’s sub-50% readings on the 20- and 50-day cohorts, coupled with persistent negative NH–NL spreads at the shorter lookbacks, say the rally is not yet fully inclusive. Industrials, as a sector proxy, offer a bright spot: 63% above the 5-day, 40% above the 20-day, 47% above the 50-day, and a strong 60%/70%/63% across the 100/150/200-day stack, though even there the 1-month NH–NL is -3. What would confirm a durable advance from here is simple: push the 50-day cohorts north of 60% on both the S&P and Russell 1000 and flip NH–NL positive across the 5-day and 1-month windows. Conversely, a roll back below 40% on the 50-day cohorts with a return to broad negative NH–NL would argue for renewed caution.
Playbook: lean into relative strength where breadth is already holding the line and demand proof of life from the rest. Favor large-cap growth and quality franchises that are maintaining position above their 50- and 100-day averages, with a bias to the names driving the Nasdaq 100’s steadier profile. Be selective in the broad 1000; use strength to upgrade exposure and avoid serial laggards that continue to populate the new-low lists. For confirmation, watch the S&P and Russell 1000 50-day breadth lines versus the 60% threshold and monitor the daily and 1-month NH–NL spreads; a sustained turn to positive on those would green-light a broader risk-on. If instead the Russell 1000 20-/50-day cohorts slip further and NH–NL stays negative, tighten risk and favor more defensive posture even if the cap-weighted indices remain resilient.
Bottom line: constructive, not conclusive—leadership is intact, but the rally needs broader 50-day participation and positive short-term NH–NL to graduate from rotation to trend.

Investor Sentiment Report
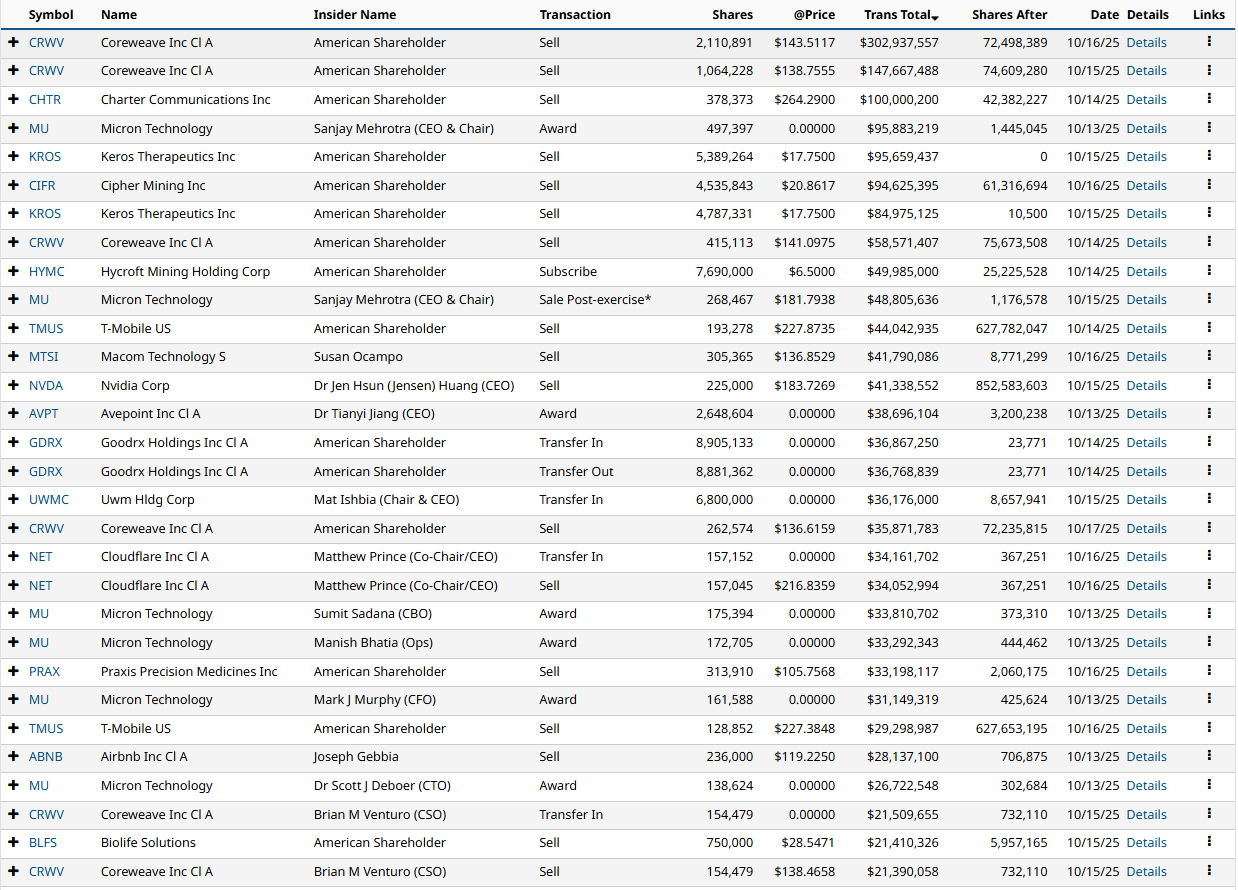
Insider Trading
Insider trading occurs when a company’s leaders or major shareholders trade stock based on non-public information. Tracking these trades can reveal insider expectations about the company’s future. For example, large purchases before an earnings report or drug trial results might indicate confidence in upcoming good news.
Open-market activity over the last 60 days skews to distribution. By count, the most active tickers were Atlassian (84 trades; 2 buys, 82 sells), Coreweave/CRVW (42 trades; 0 buys, 42 sells), and Renaissance Capital RCG (40 trades; 40 buys, 0 sells). By dollars, the leaderboard tilts heavily to sales: Fox Corp B logged about $1.16B of transactions (1 buy, 2 sells), Dell roughly $1.00B (0 buys, 9 sells), Tesla near $1.00B (sales), News Corp B about $824M (1 buy, 2 sells), Coupang $560M, and Coreweave roughly $501M tied to 42 sells.
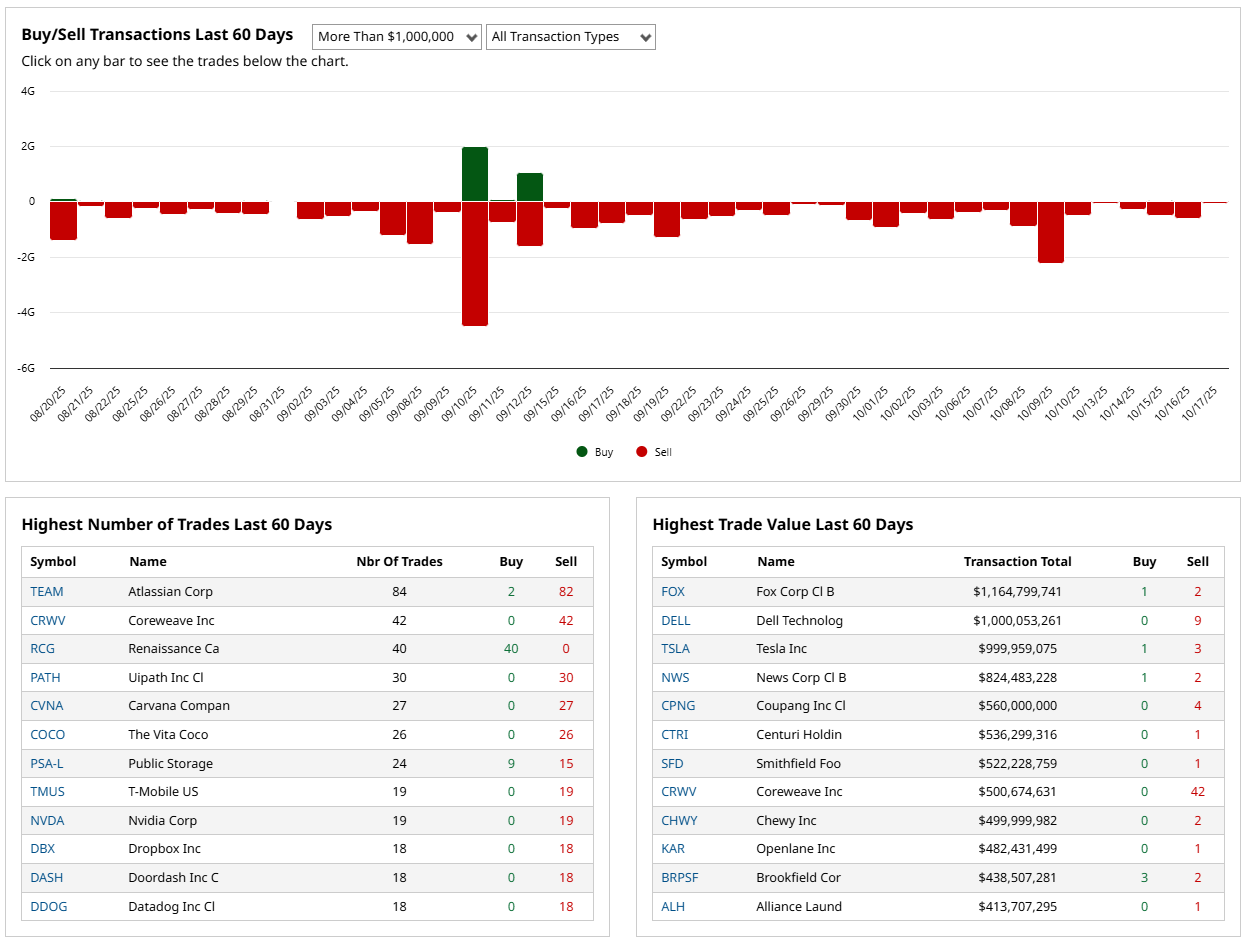
This week’s top ticket items confirm the tone: multiple CRVW open-market sells around $303M and $148M, Charter Communications about $100M sold, Nvidia’s CEO sale near $41M, and several $30M–$50M sales in TMUS, MTSI, and NET. Awards, exercises, and transfers were numerous in MU and GDRX, but those are non-price signals. The net message is that open-market sellers dominated both by frequency and value, and the cluster spans tech, media, and communications. For risk appetite, heavy executive selling while indices chop argues for a cautious read until we see a week with broad, multi-issuer open-market buying. A decisive flip would be a shift to net buying by dollars across several large caps and at least a few insiders printing $5M+ open-market purchases in the same week
%Bull-Bear Spread
The %Bull-Bear Spread measures the gap between bullish and bearish investor sentiment, often from surveys like AAII. It’s a contrarian indicator—extreme optimism may signal a coming pullback, while extreme pessimism can hint at a potential rally. Large positive or negative spreads often mark market turning points.
The weekly spread sits at -12.42% on 10/16/2025 after +10.23% a week ago. That is a sharp swing back into net pessimism and keeps the three-month cadence choppy: small positives in late September flipped from a -21.45% trough in mid-September, and we are back below zero now. Historically, sub-zero readings are a contrarian tailwind once selling pressure abates; deeper than -20% marks tend to align with tradable rebounds, while sustained moves above +20% often precede consolidation.
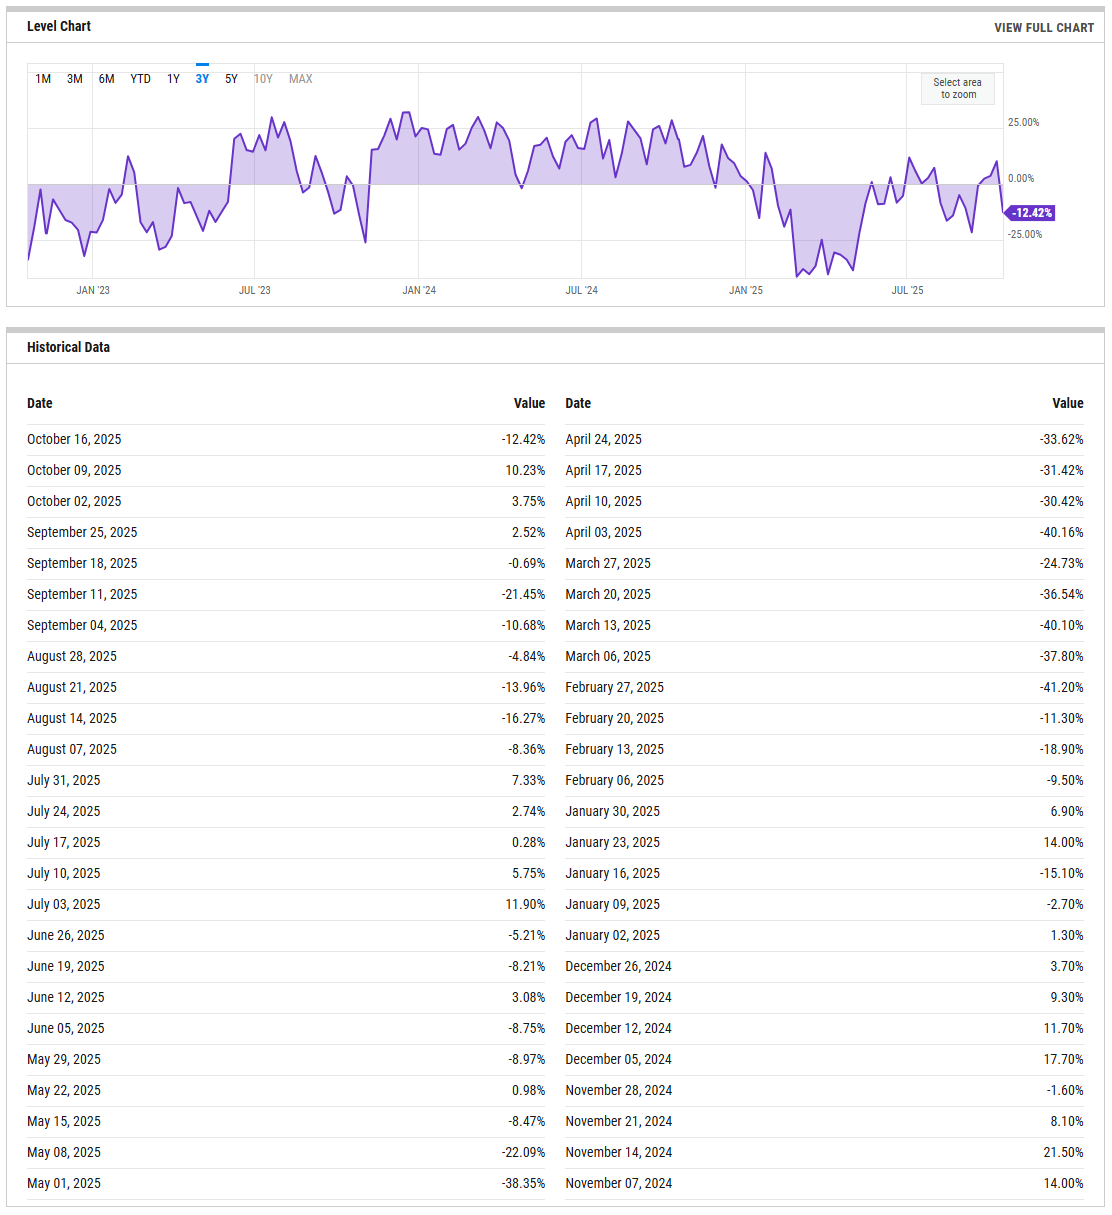
If this series can quickly recover back above zero and hold there for two consecutive prints, it would confirm improving risk appetite. A further slide toward the mid-teens negative or worse without price damage would strengthen a contrarian bull case, but persistence below zero for several weeks would argue that rallies should be sold until sentiment resets.
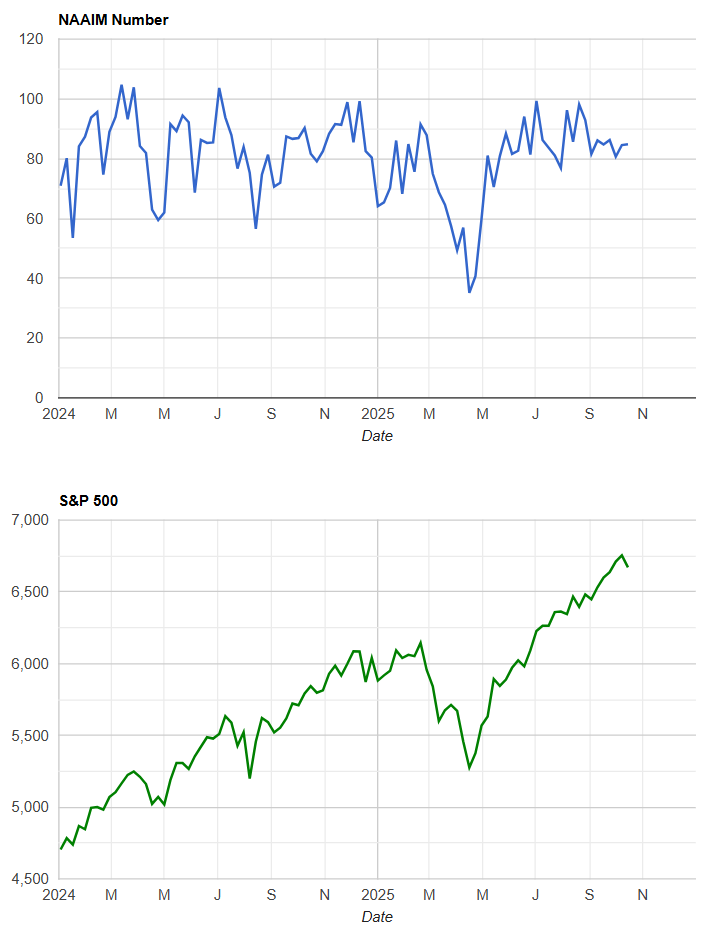
NAAIM Exposure Index
The NAAIM Exposure Index (National Association of Active Investment Managers Exposure Index) measures the average exposure to U.S. equity markets as reported by its member firms. These are typically active money managers who provide their equity exposure levels weekly. The index offers insight into how much these managers are investing in equities at any given time, ranging from being fully short (-100%) to leveraged long (up to +200%).
Active managers remain heavily invested. The latest reading is 84.87 on 10/15/2025, little changed from 84.57 last week and 80.66 two weeks prior, and broadly consistent with the mid-80s range seen across September. That implies limited dry powder and some vulnerability if price weakens, because exposure is already elevated. The constructive interpretation is that managers are buying dips and maintaining risk, which can cushion selloffs so long as breadth holds together.
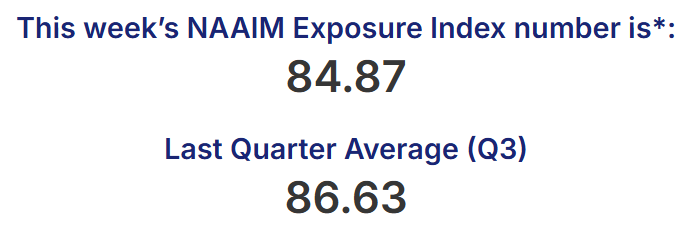
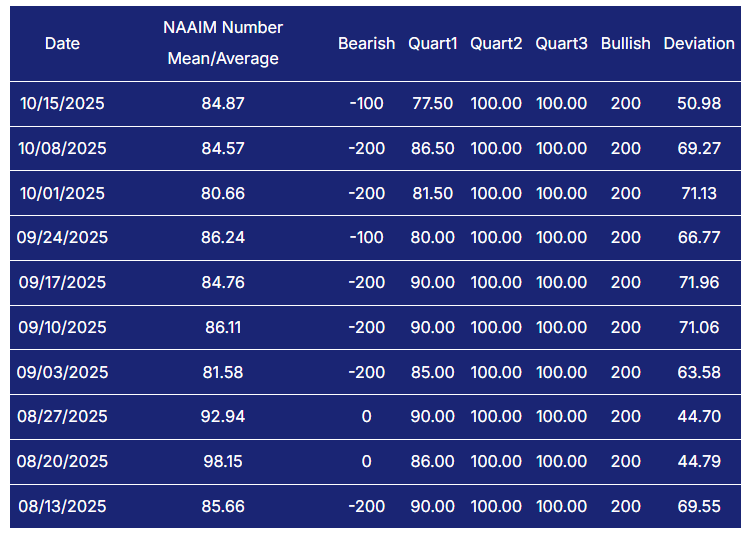
My tripwires are simple: a drop into the 50s without a material index decline would hint at quiet derisking and warn of fragility beneath the surface; a push back into the 90s would leave positioning crowded and reduce the quality of follow-through on breakouts. Absent one of those inflections, the indicator is supportive but not a fresh buy signal on its own.
CBOE Total Put/Call Ratio
CBOE's total put/call ratio includes index options and equity options. It's a popular indicator for market sentiment. A high put/call ratio suggests that the market is overly bearish and stocks might rebound. A low put/call ratio suggests that market exuberance could result in a sharp fall.
The line shown is the 10-day moving average, sitting in the high-0.8s to roughly 0.9 range. That is neither a washout nor frothy complacency. Over the last three years, durable equity lows tend to coincide with a 10-day average near or above 1.0, while short-term tops often print closer to ~0.8. With the average near the middle of that band, options hedging is present but not panicked, suggesting moderate drawdown risk and a tendency for bounces to be tactical rather than explosive.
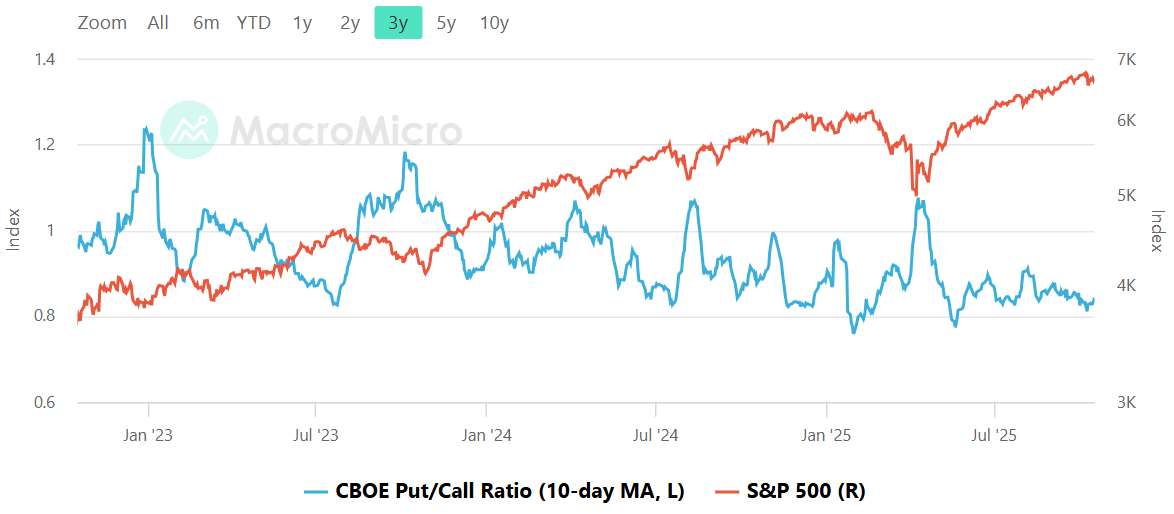
A sustained push of the 10-day above 1.0 would signal capitulation and improve the odds of a higher-quality reversal. Conversely, a drift back toward ~0.8 while prices rally would warn that fuel is getting thin and that upside follow-through might fade without broader participation.
Equity vs Bond Volatility
The Merrill Lynch Option Volatility Estimate [MOVE] Index from BofAML and the CBOE Volatility Index [VIX] respectively represent market volatility of U.S. Treasury futures and the S&P 500 index. They typically move in tandem but when they diverge, an opportunity can emerge from one having to “catch-up” to the other.
Bond volatility (MOVE) is elevated versus its late-summer trough but remains well below the crisis spikes; equity volatility (VIX) has perked up into the high-teens to mid-20s area. The pattern is a mild divergence from earlier in the year when MOVE led the stress; today both curves are rising, with VIX’s lift more acute. The read-through is that cross-asset risk premia are rebuilding yet not disorderly.
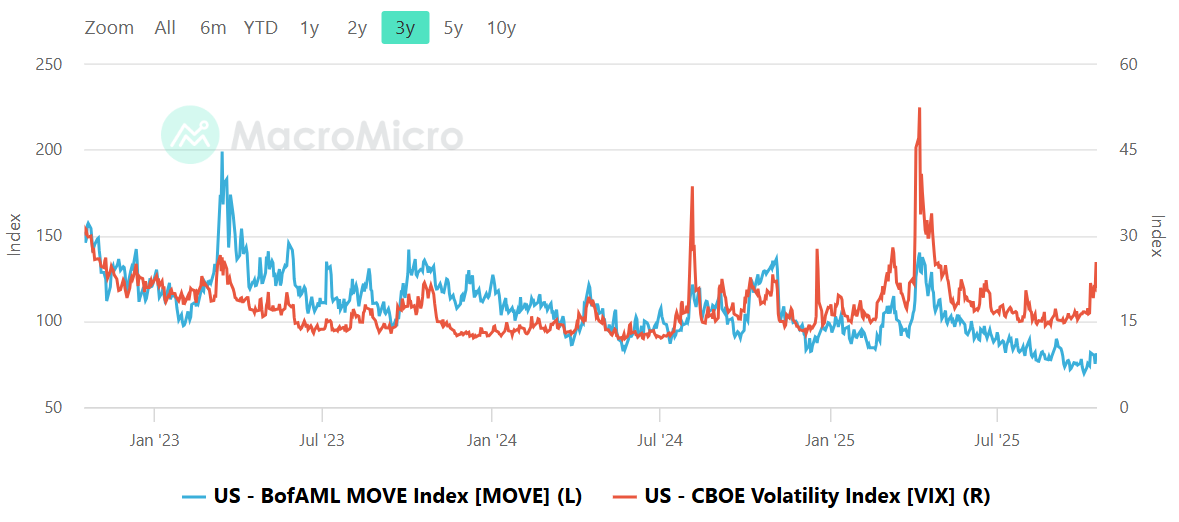
The tripwires are clear: if MOVE pushes back toward ~120 while VIX stays sleepy, equities usually wobble next; if VIX sustains above the high-teens to 20s while MOVE also trends higher, drawdowns deepen and dip-buying becomes harder. A roll lower in both would green-light risk, but until then keep position sizes disciplined and respect stops.
CNN Fear & Greed Constituent Data Points & Composite Index
The composite reads 27, up from 23 at the prior close but down from 31 a week ago and well below 58 a month ago. Over the last year the gauge has shifted from mid-range greed in spring and summer toward fear through October, now probing the lower quartile of its band. That backdrop usually improves forward returns once selling pressure eases, but the signal is most actionable either near extreme fear or during the turn higher.
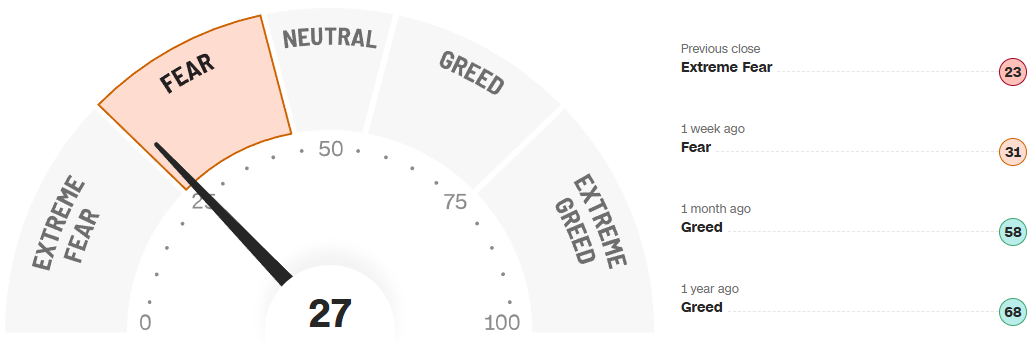
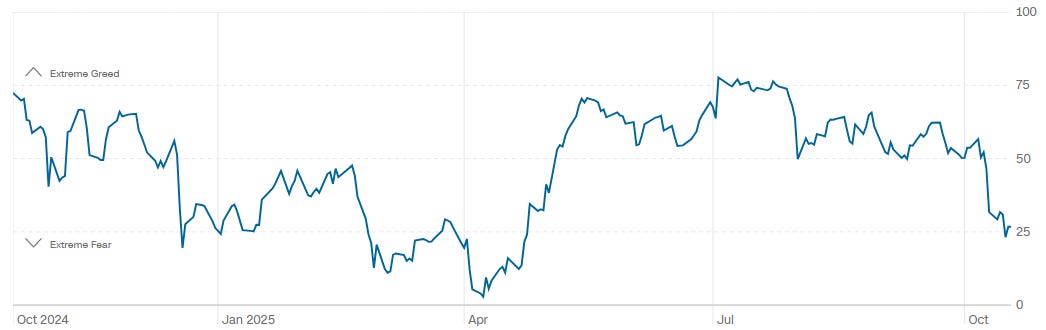
A break below ~20 would mark capitulation territory and set the stage for a cleaner entry; a quick rebound back through ~40 would confirm that buyers have the ball and that risk can be dialed up tactically.
Social Media Favs
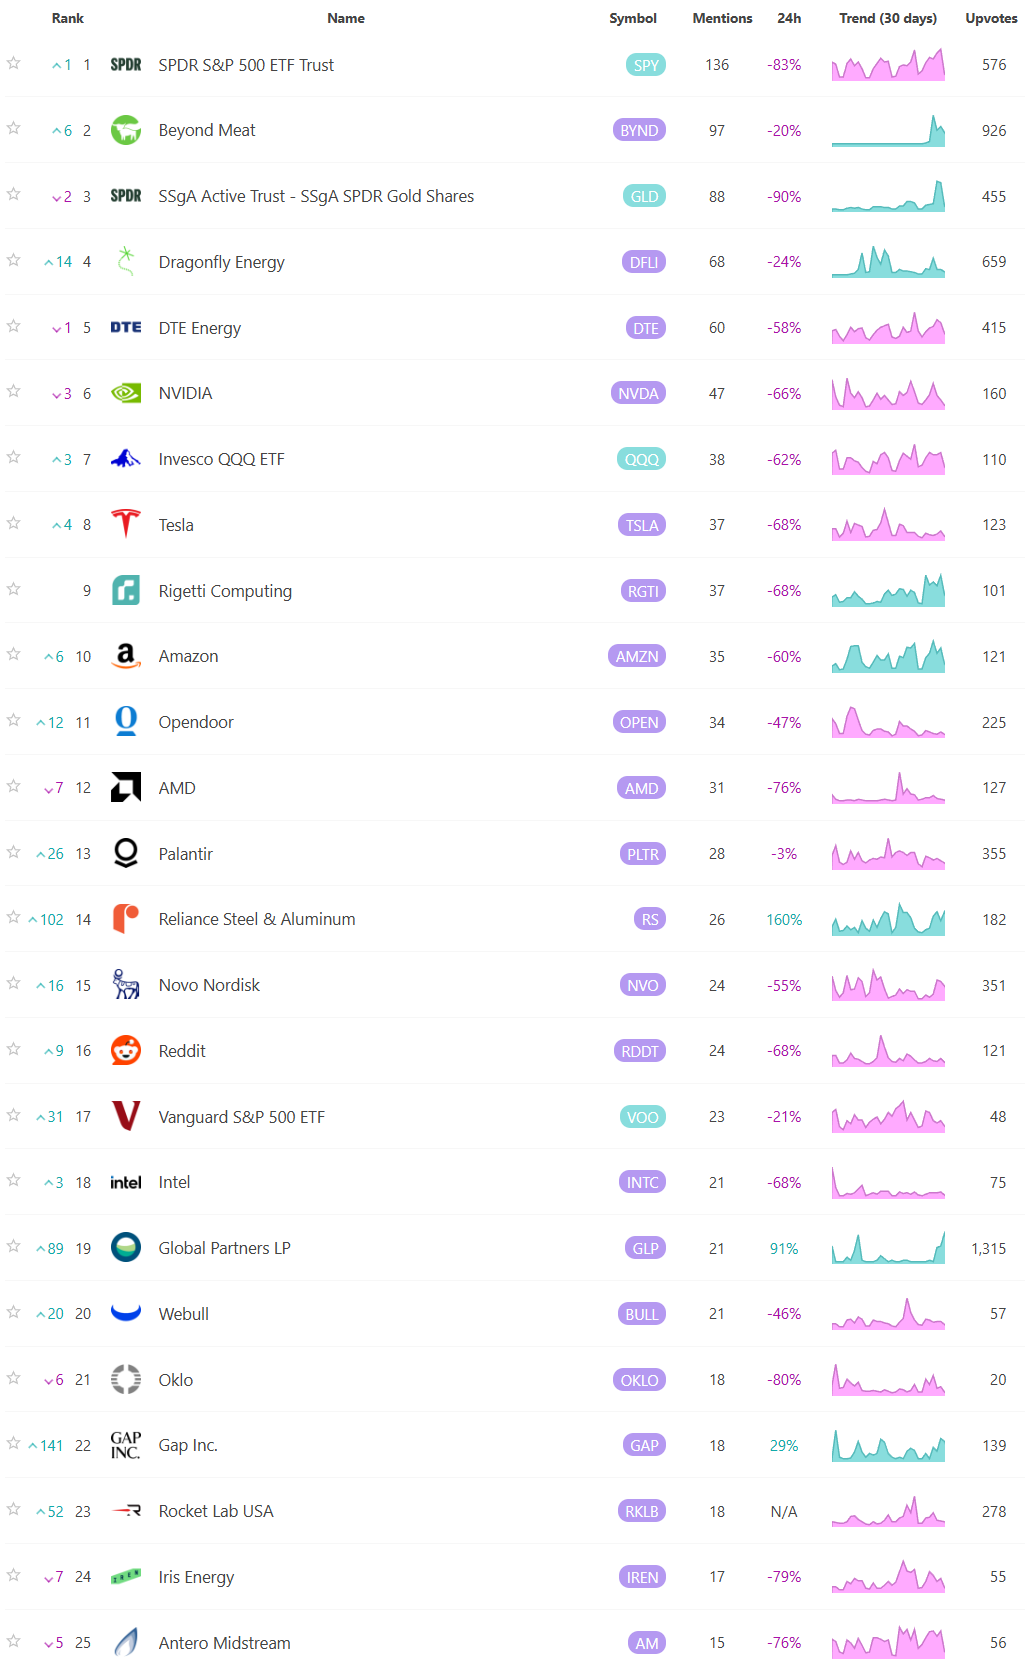
Social sentiment offers a real-time view of investor mood, often revealing market shifts before traditional indicators. It can signal momentum changes, spot emerging trends, and gauge retail investor impact—especially in high-volatility names. Tracking sentiment around events or earnings provides actionable insights, and when layered with quantitative models, can enhance predictive accuracy and risk management. Sustained sentiment trends often mirror broader market cycles, making this data a valuable tool for both short-term trades and long-term positioning.

Technician’s Playbook: Trading the Majors (SPY/QQQ/IWM/DIA)
When you’re a large institutional player, your primary goal is to find liquidity - places to do a ton of business with the least amount of slippage possible. VolumeLeaders.com automatically identifies and visually plots the exact spots where institutions are doing business and where they are likely to return for more. It’s one of the primary reasons “support” and “resistance” concepts work and truly one of the reasons “price has memory”.
SPY
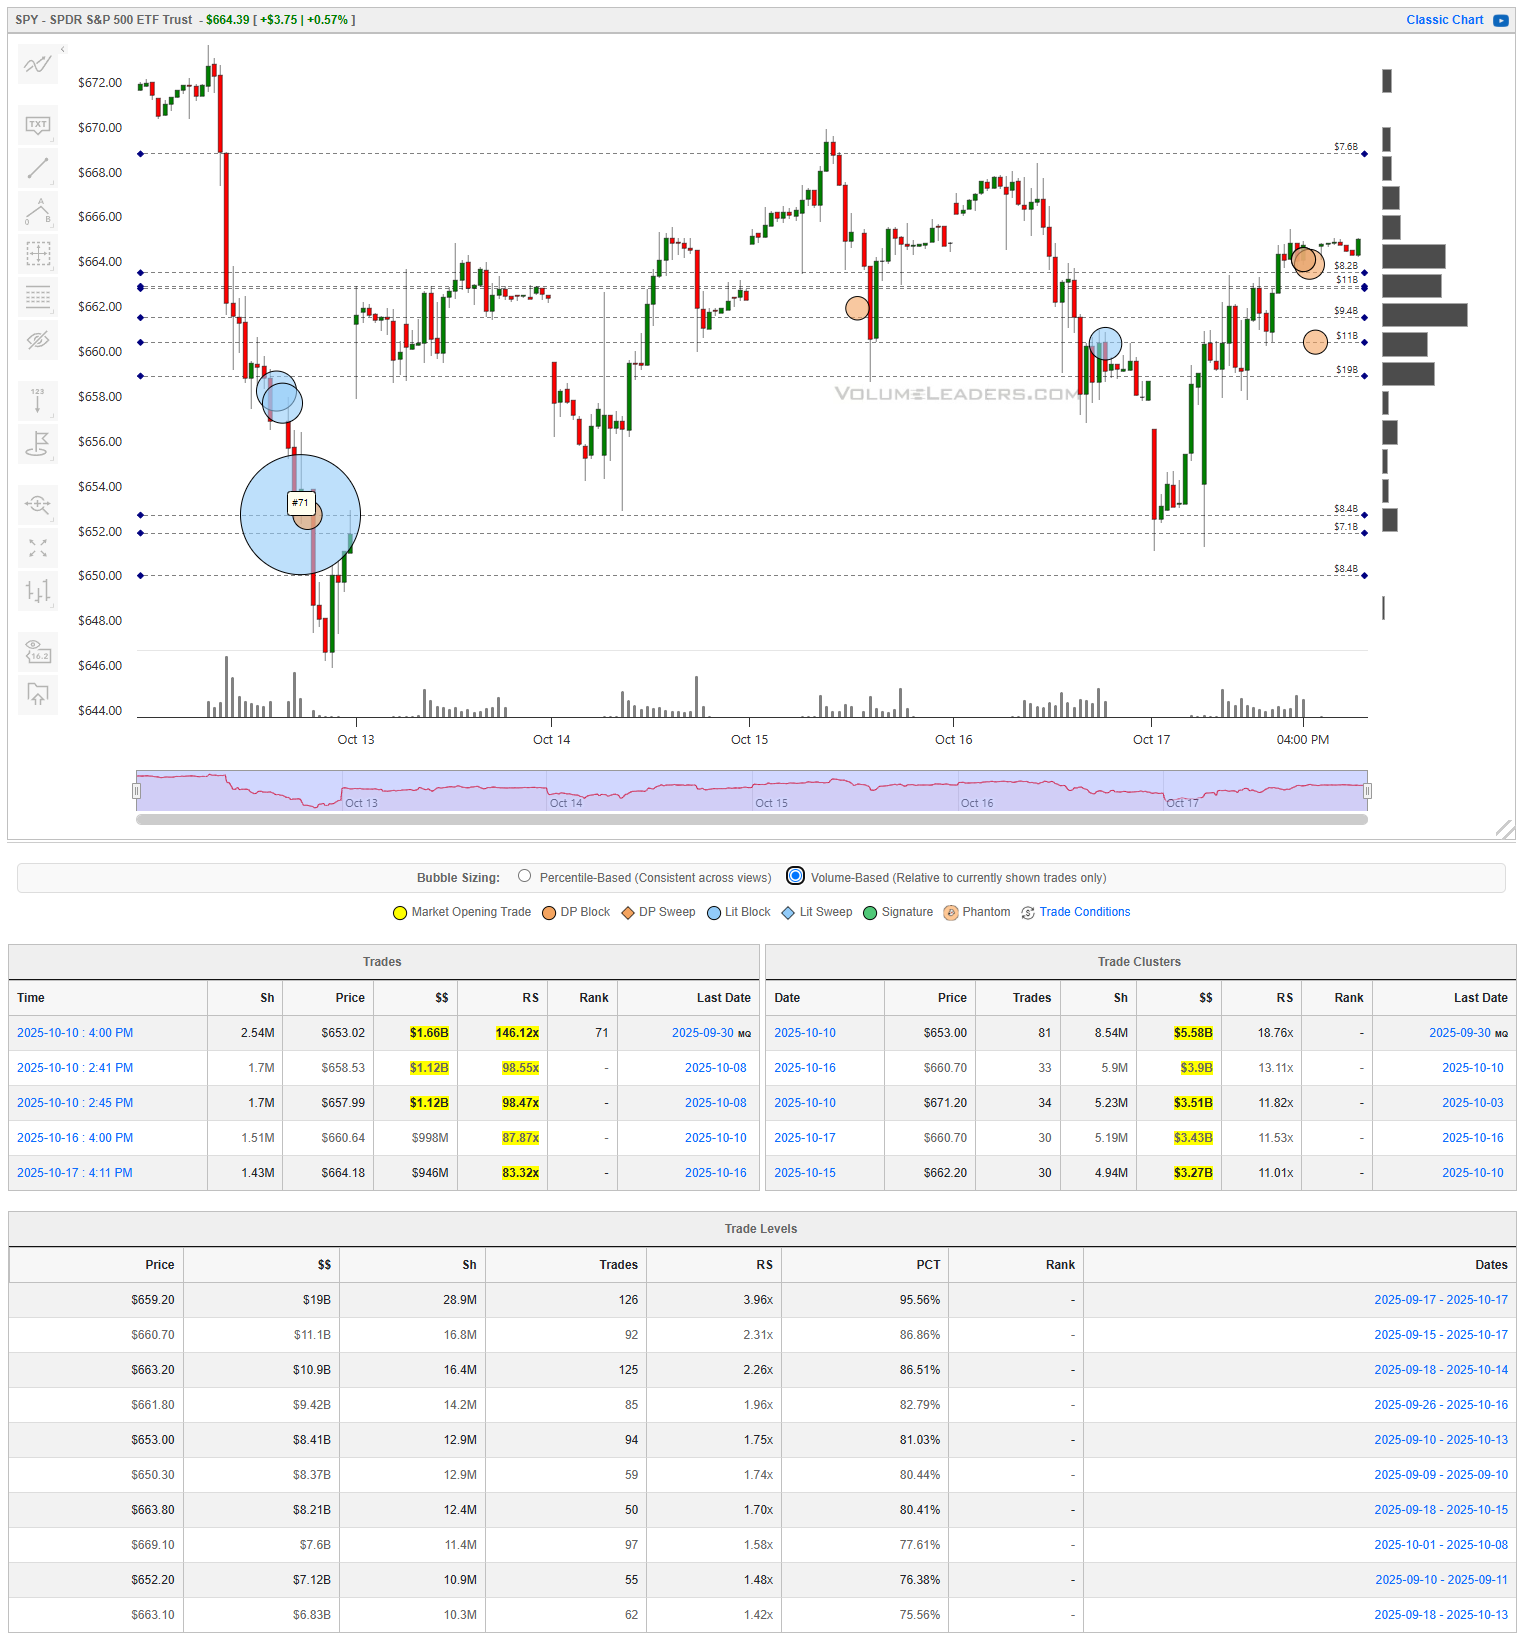
The week opened with an aggressive impulse lower, anchored by a top-100 historical print near 651–652 where roughly $1.6B traded with a 166x relative size. That flush attracted strong absorption, marking a near-term capitulation low from which the tape built progressively higher lows into the weekend. Intermediate rotations were orderly, with key clusters forming between 660–662 ($3.2B, 11x RS) and 664–666 ($3.8B, 11x RS). The volume-weighted “line of scrimmage” now sits squarely around 663–664, where overlapping clusters have traded repeatedly. Acceptance above that band unlocks 668–670, while failure back under 660 would reopen the early-week low. The bullish path requires sustained trade above 664 with rising relative strength and volume confirmation; that would likely drag price toward the 670 shelf where prior heavy distribution occurred. Conversely, a rejection from 664 or a failed retest beneath 660 would suggest the recent rally was purely corrective, setting up a retest of 652. Tactical entries favor waiting for either confirmation of 664 support to hold for continuation or a fade from 668–670 with weakening tape.
QQQ
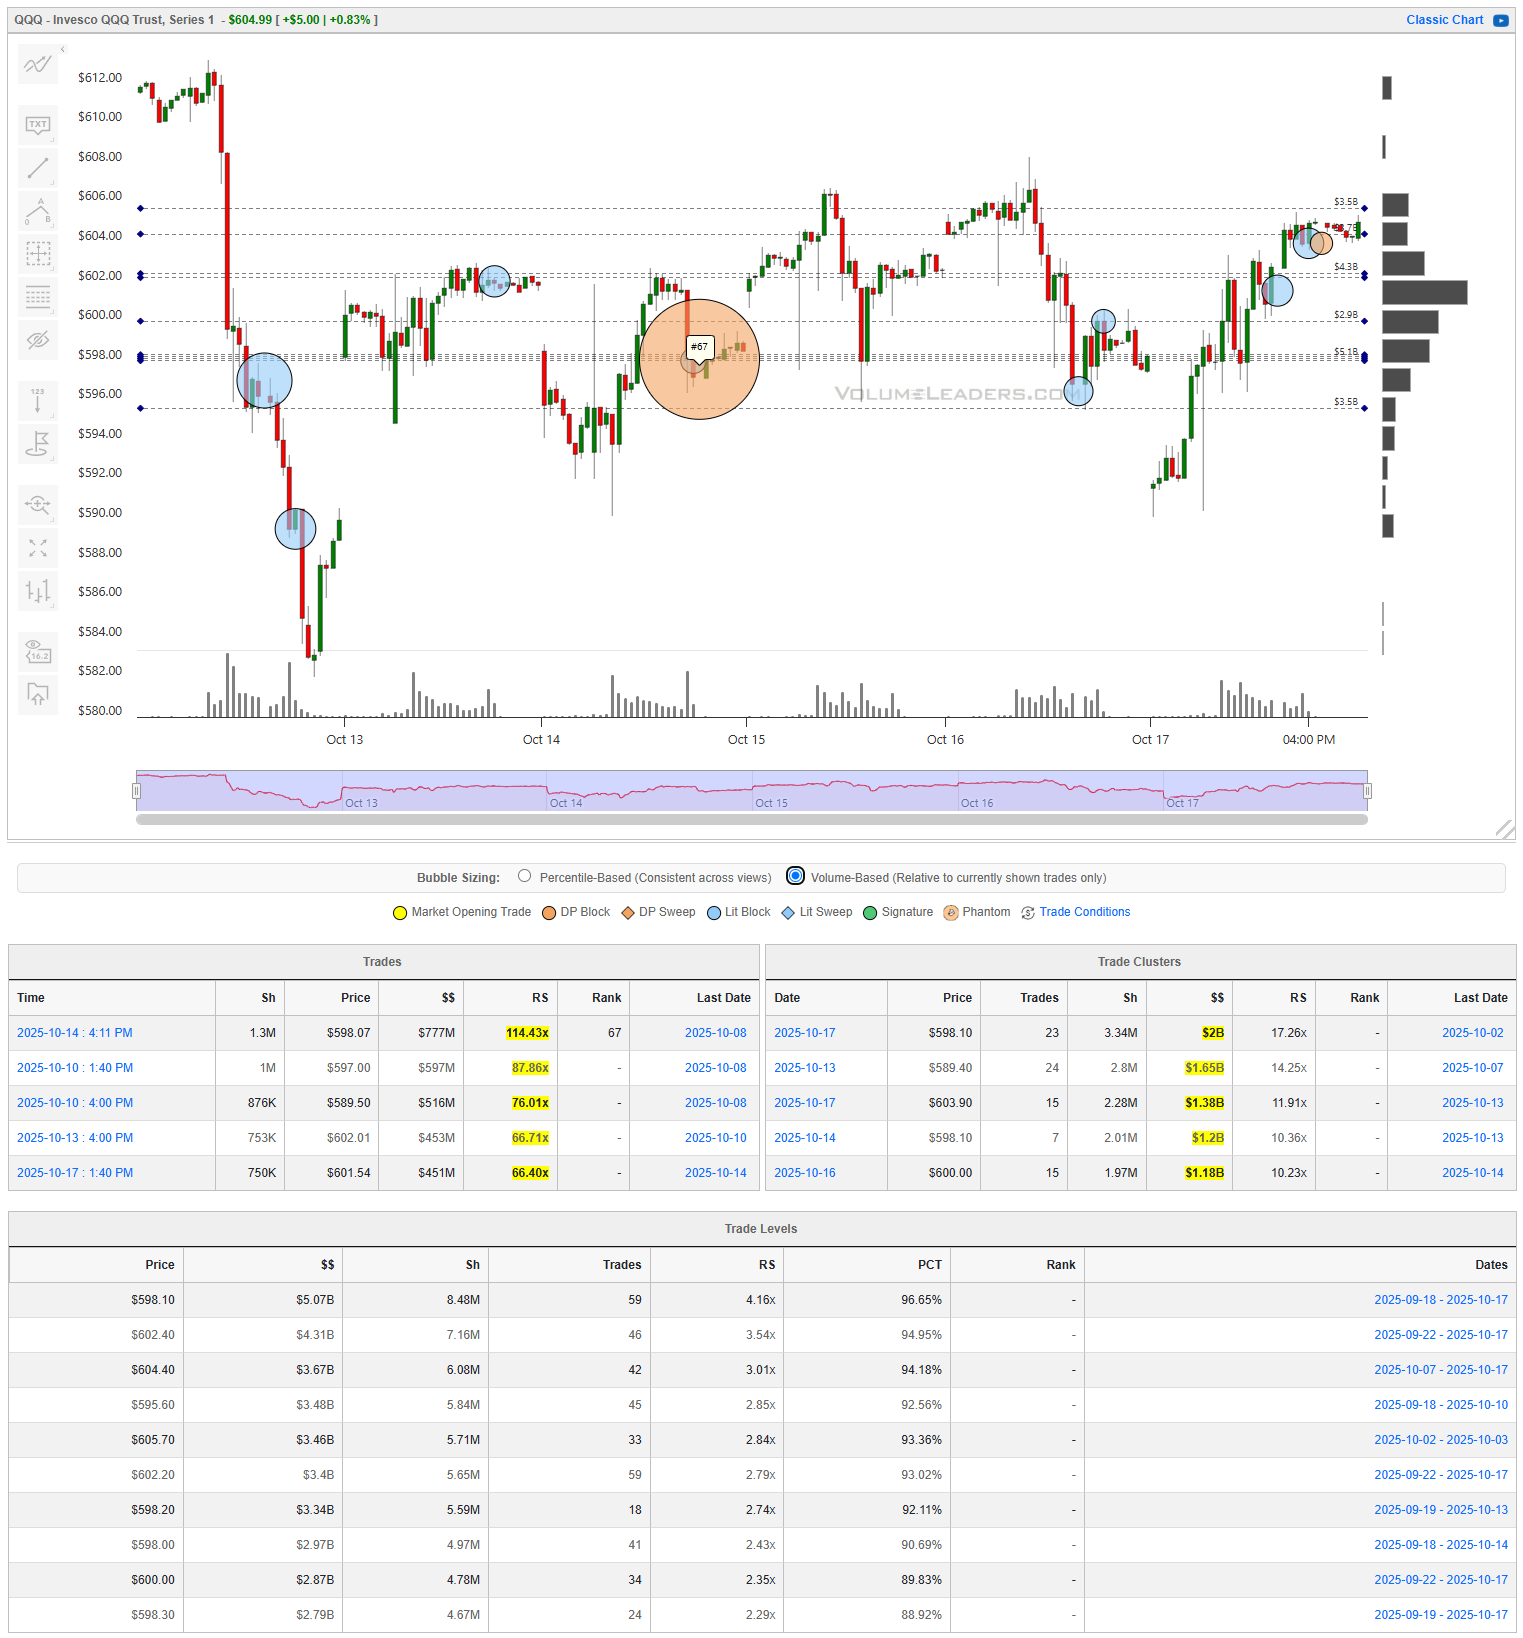
The Nasdaq 100 mirrored SPY’s trajectory but showed cleaner rotation and firmer sponsorship at lows. A massive $777M print near 589–590 (114x RS) marked the inflection, followed by rising structure into clustered resistance at 600–602, where $1.3–1.5B has transacted at 11–13x RS. The tape spent much of midweek digesting that region before regaining it late Friday, establishing 600 as the pivotal zone for next week. The 606–608 band remains the upper magnet, defined by repeated sweeps and stacked clusters ($1.1B–$1.2B, 10–12x RS). On the downside, 594–596 is first support and 589–590 is major structural defense. Bullish continuation requires acceptance above 602 to convert that band into a springboard toward 608; failure back through 596 opens a slide to 590 where earlier absorption may be retested. For tactical traders, risk can be defined tightly around 600–602: breakouts above with follow-through toward 608 favor long rotation, while rejection with sellers reappearing above 604 turns the tape distributive again.
IWM
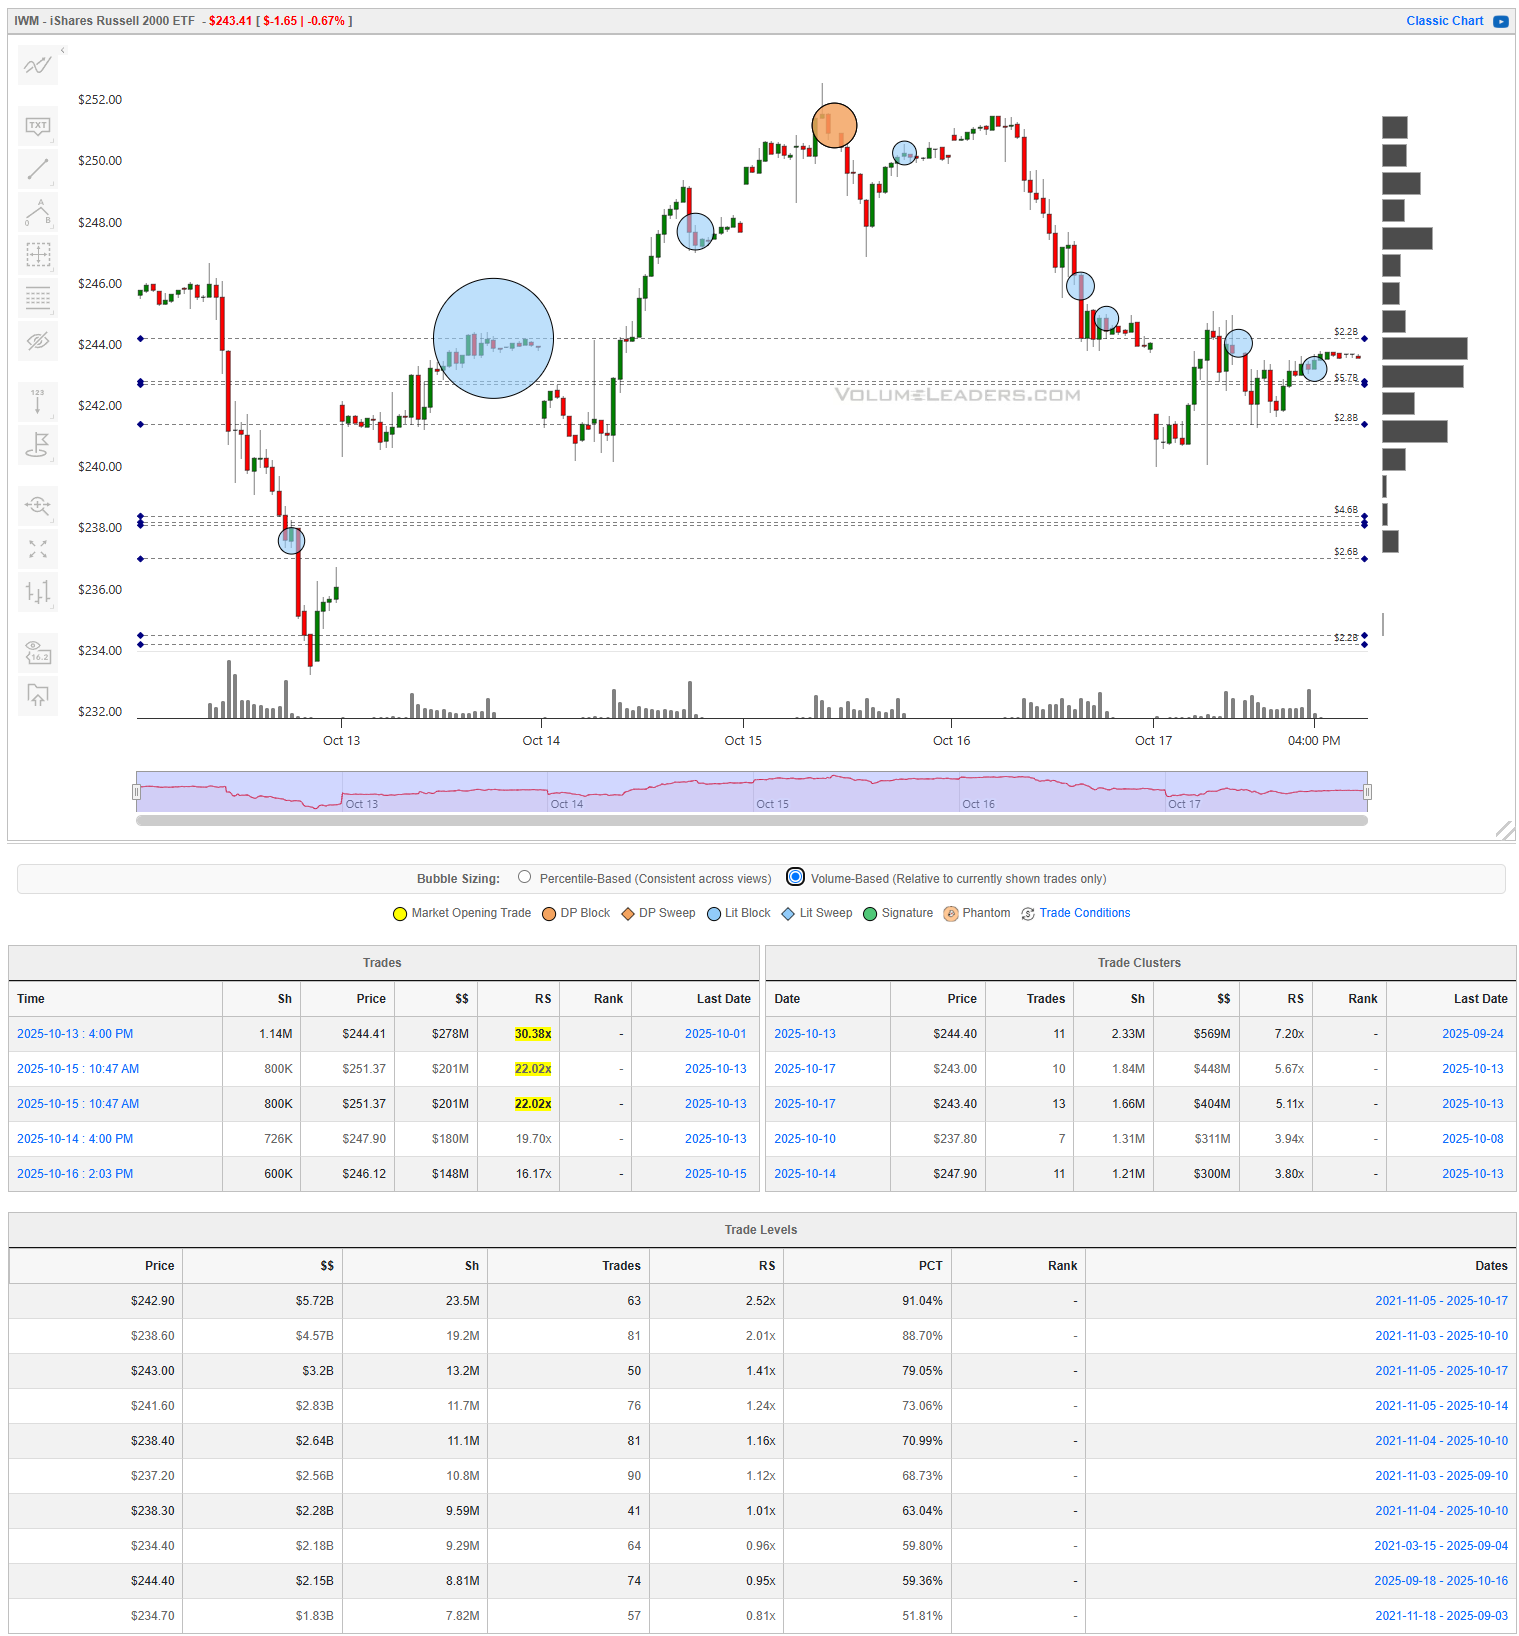
Small caps lagged and leaned heaviest toward distribution. The early-week bounce was met with selling pressure near 249–250, where $278M printed at 30x RS, followed by steady rotation lower. Clusters are stacked between 243–245 ($500–$600M, 7–8x RS), with lighter activity beneath 240. The 244–245 band represents the key battleground: sustained weakness beneath that level shifts control back to sellers with measured potential toward 238–239, where historical absorption first appeared. Bulls need to defend 243 and reclaim 246 on convincing volume to reestablish a base. A push through 248 would then start neutralizing the heavy supply from the midweek high. For execution, traders can fade strength into 247–248 unless strong accumulation reemerges, while sub-243 acceptance would confirm continuation lower. If buyers absorb below 241 and reclaim 243, that would signal exhaustion of the liquidation leg.
DIA
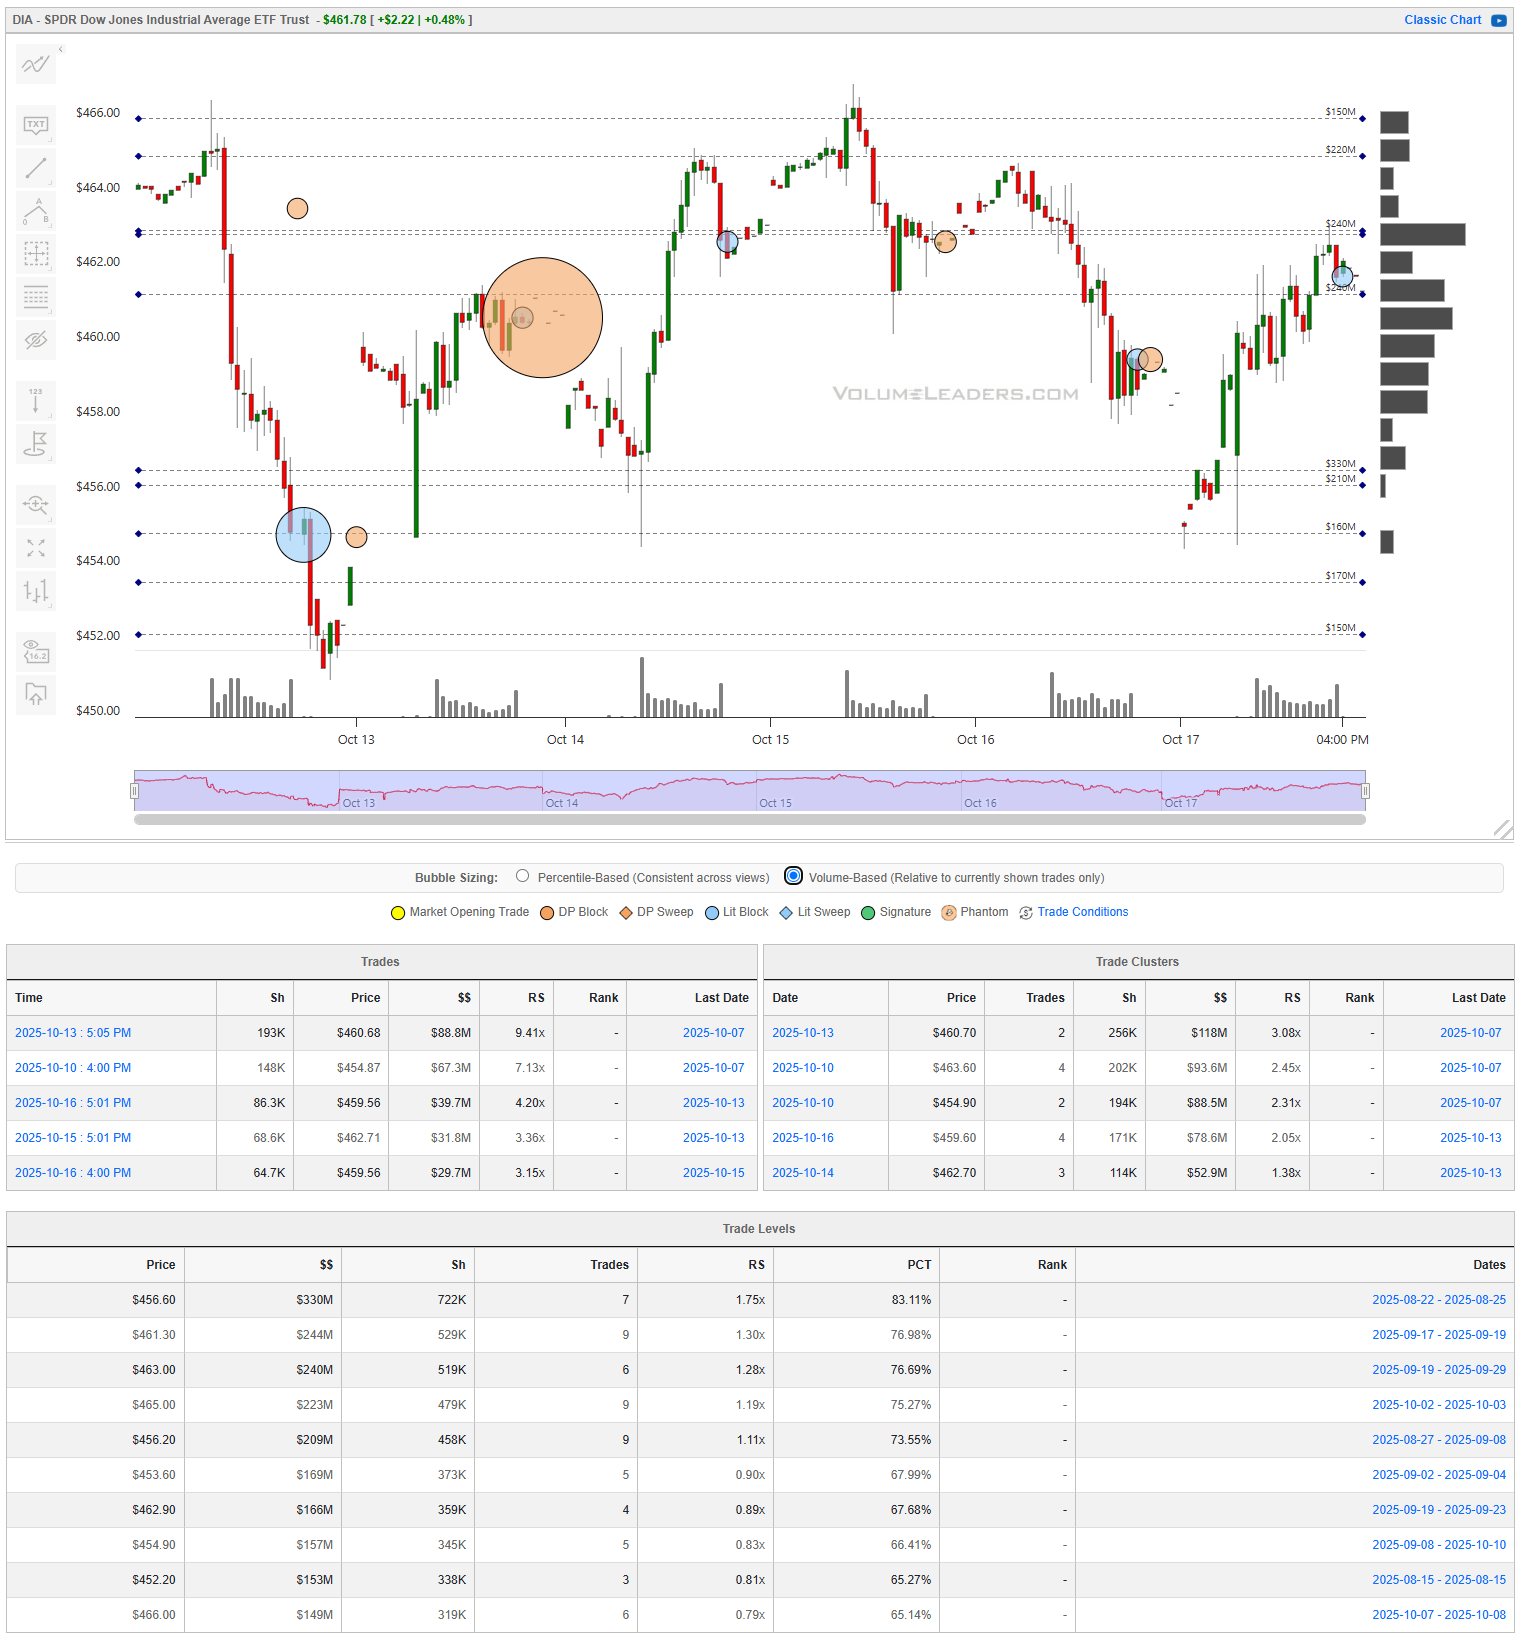
The Dow ETF traded a quieter version of the same range, showing steadier hands but thinner sponsorship. The largest block came early in the week near 460 ($88.8M, 9x RS), marking an early anchor, with follow-through clusters at 463–465 ($200–$300M each, 2–3x RS). The 462–463 zone has since become the defining control area: a volume-dense band repeatedly tested and defended. Resistance caps near 466–467, while first downside support sits at 458. A breakout through 465.50 with confirmation from overlapping $200M+ flows would shift control back to buyers and open 469–470; failure to hold 462 would invite a drift toward 457–458, retracing the prior session’s low-volume pocket. A disciplined trader would frame exposure using 462 as the pivot, adding only on acceptance above 465 with an initial objective toward 469, or shorting rejection back under 462 targeting 458 with a stop above 465.
Bottom line: all four indices staged a technical rebound off well-defined absorption lows, but only SPY and QQQ have rebuilt credible support. The burden now sits on the 663–664 (SPY) and 600–602 (QQQ) zones; hold them and the rally extends, lose them and last week’s lows come back into play.

Summary Of Thematic Performance YTD
VolumeLeaders.com offers a robust set of pre-built thematic filters, allowing you to instantly explore specific market segments. These performance snapshots are provided purely for context and inspiration—think about zeroing in on the leaders and laggards within the strongest and weakest sectors, for example.
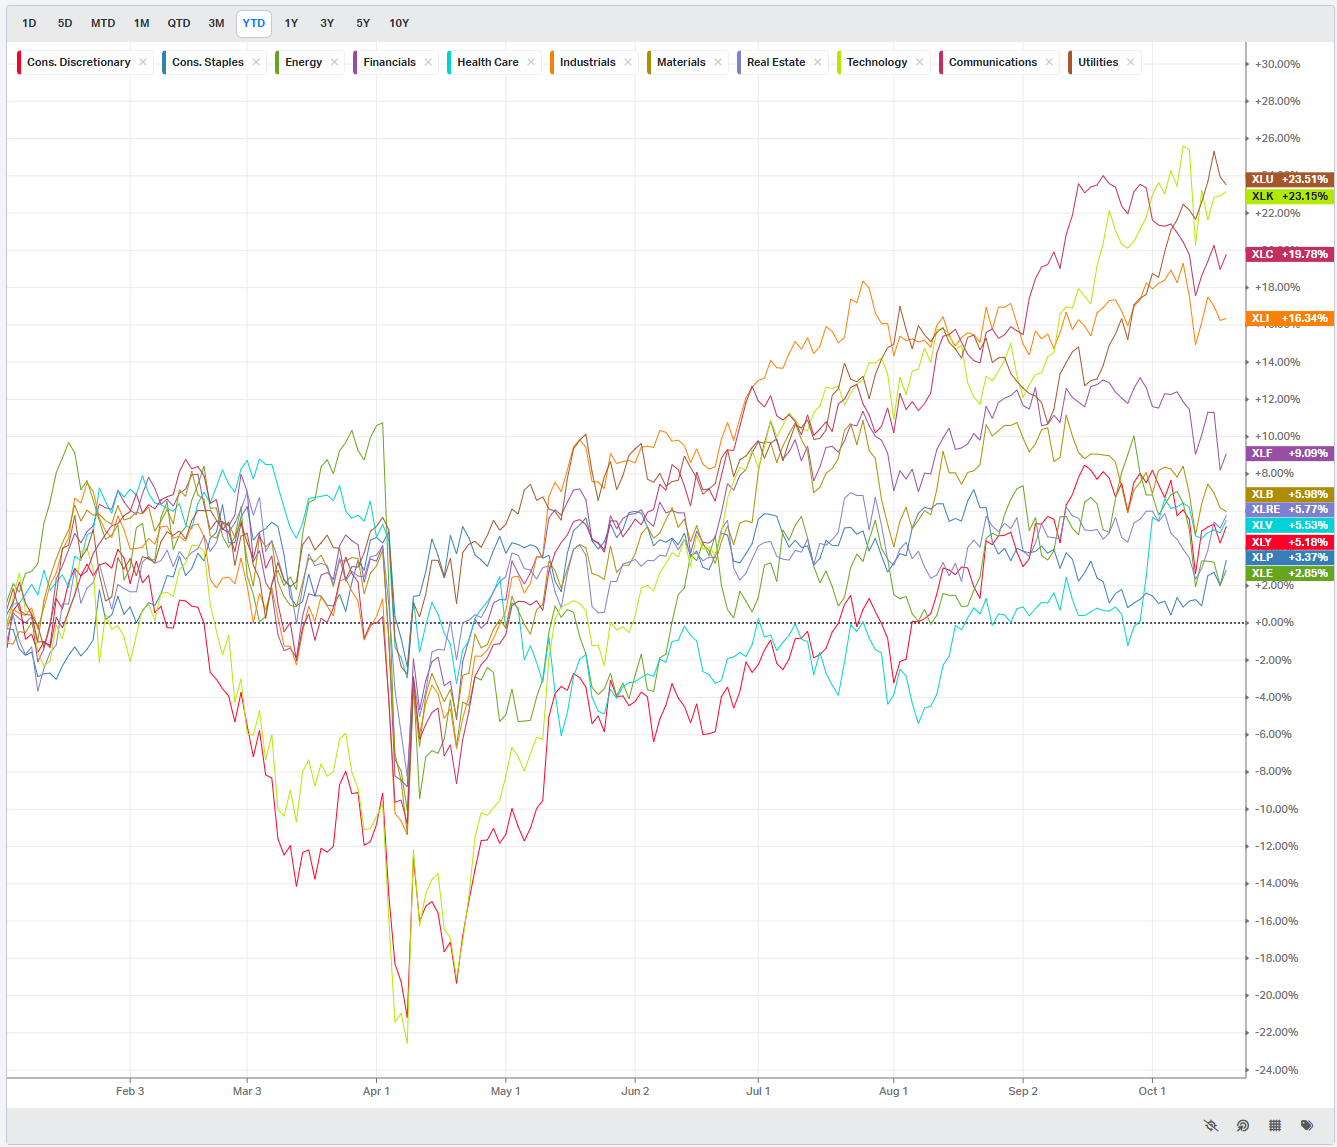
S&P By Sector
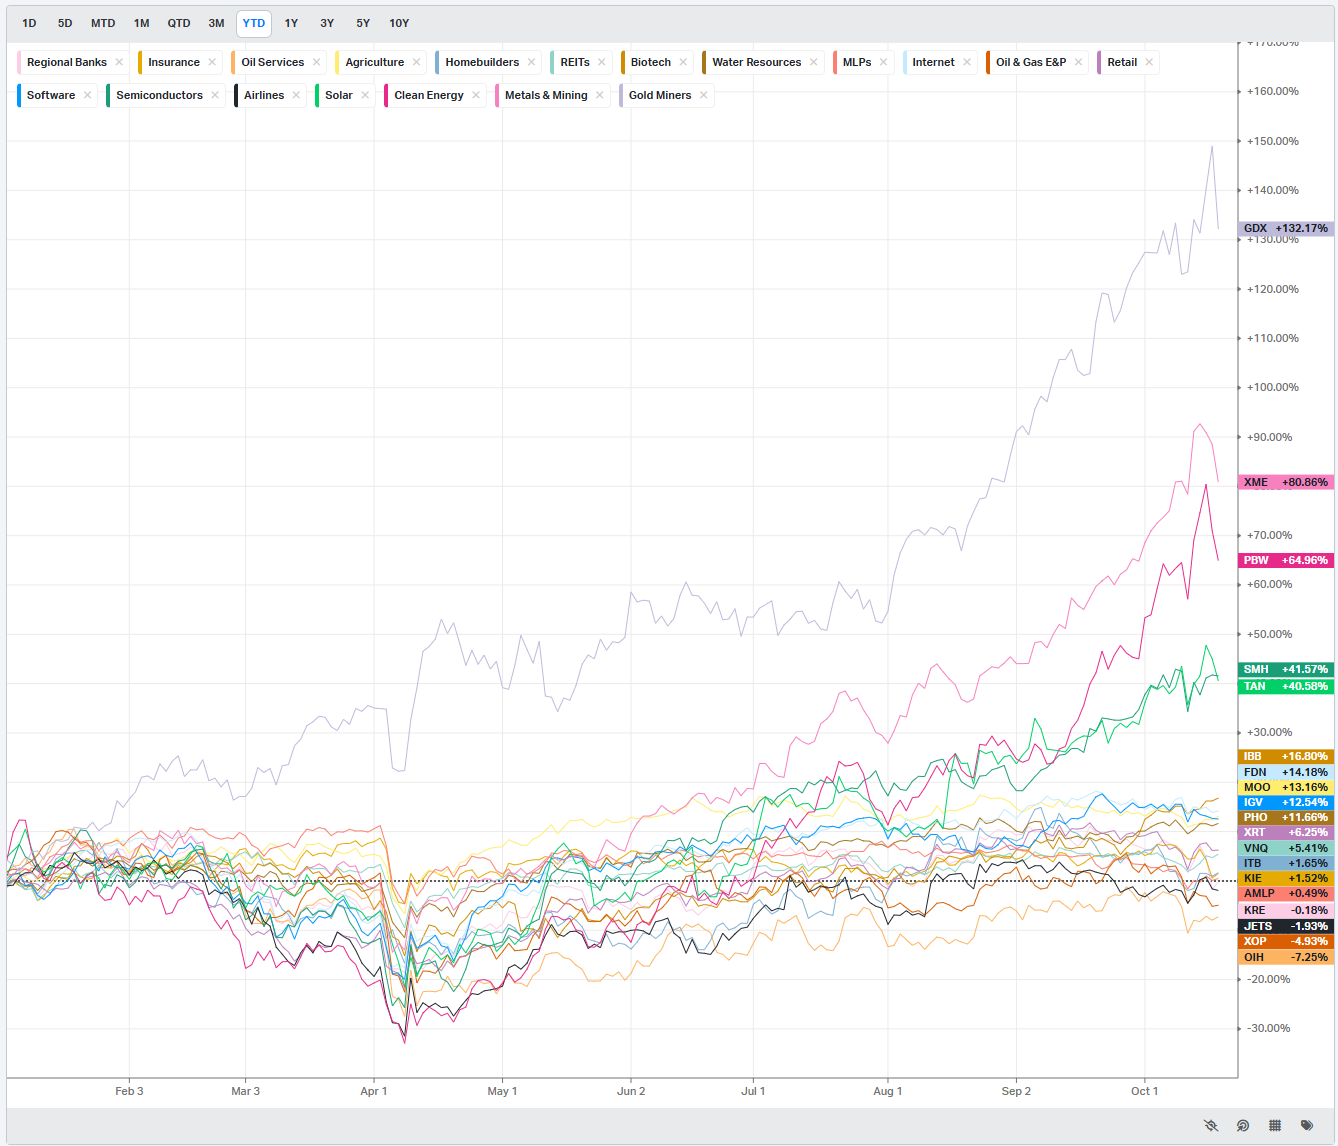
S&P By Industry
Commodities: Energy & Metals
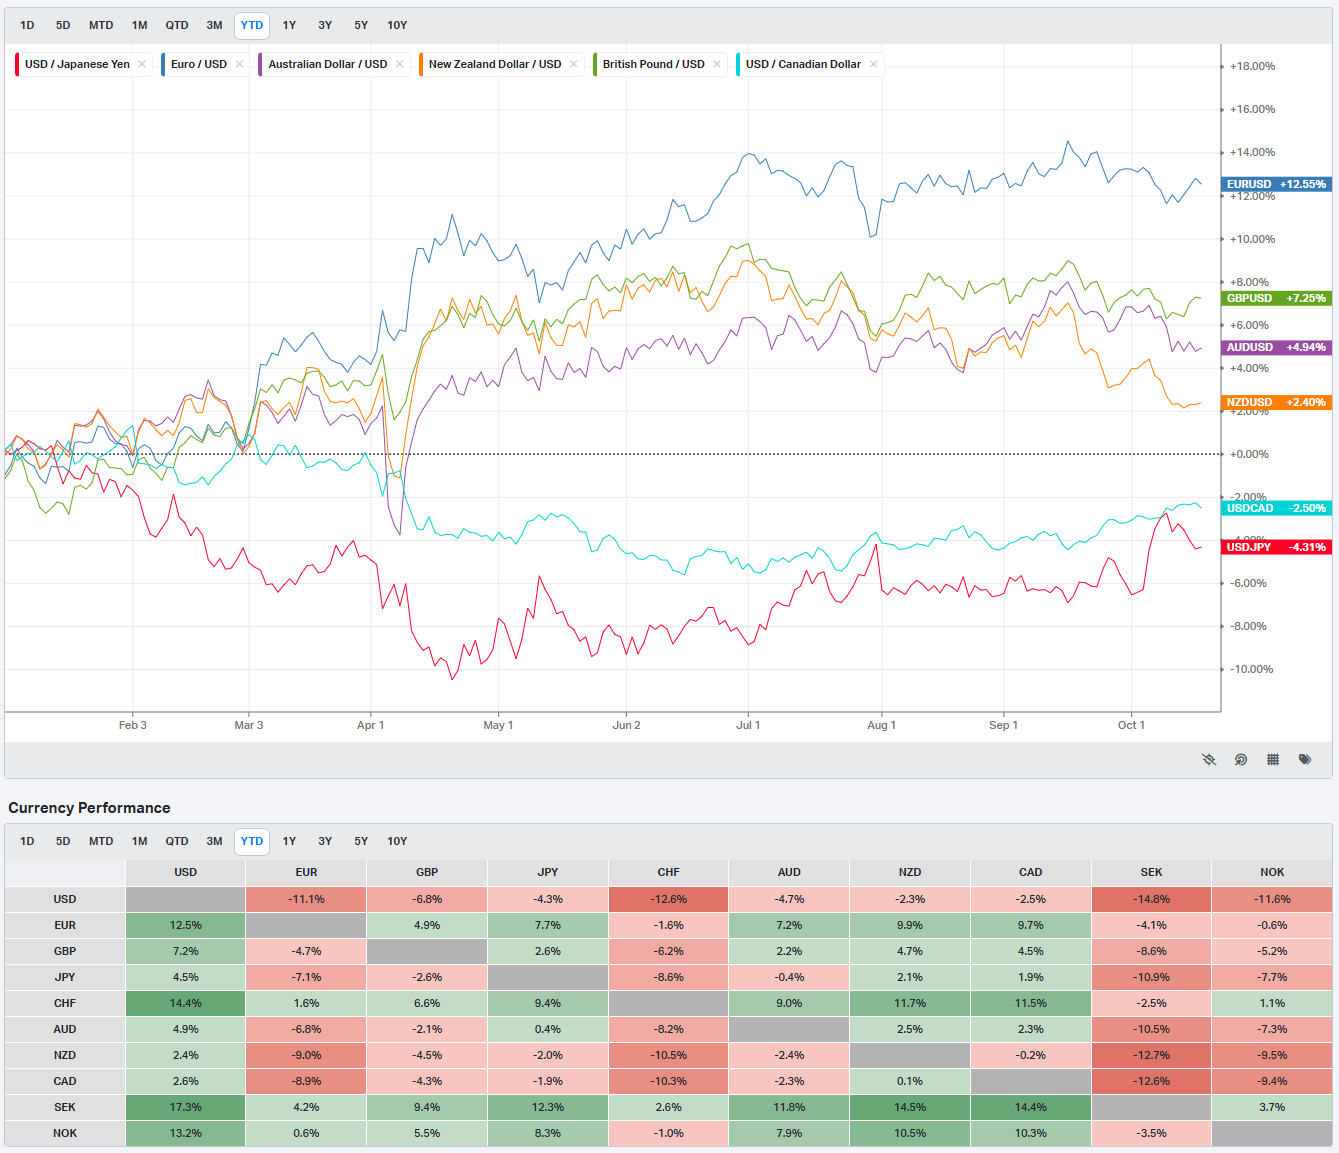
Currencies/Major FX Crosses
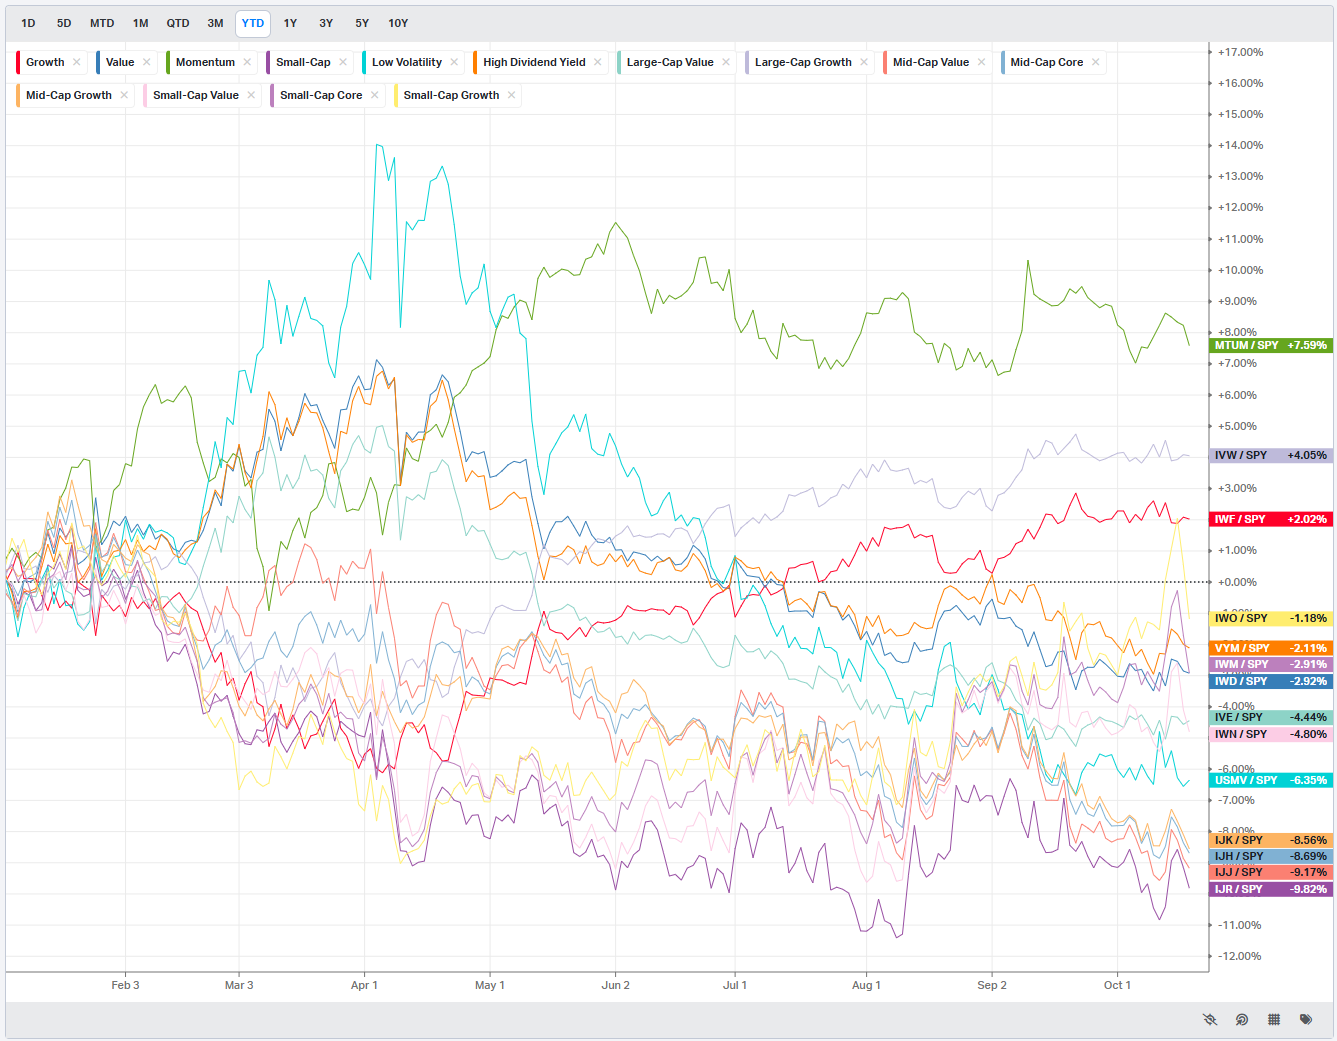
Factors: Style vs Size-vs-Value

Events On Deck This Week
Here are key events happening this week that have the potential to cause outsized moves in the market or heightened short-term volatility.
Markets Enter Peak Crosscurrents: Data, Fed, and Earnings Collide
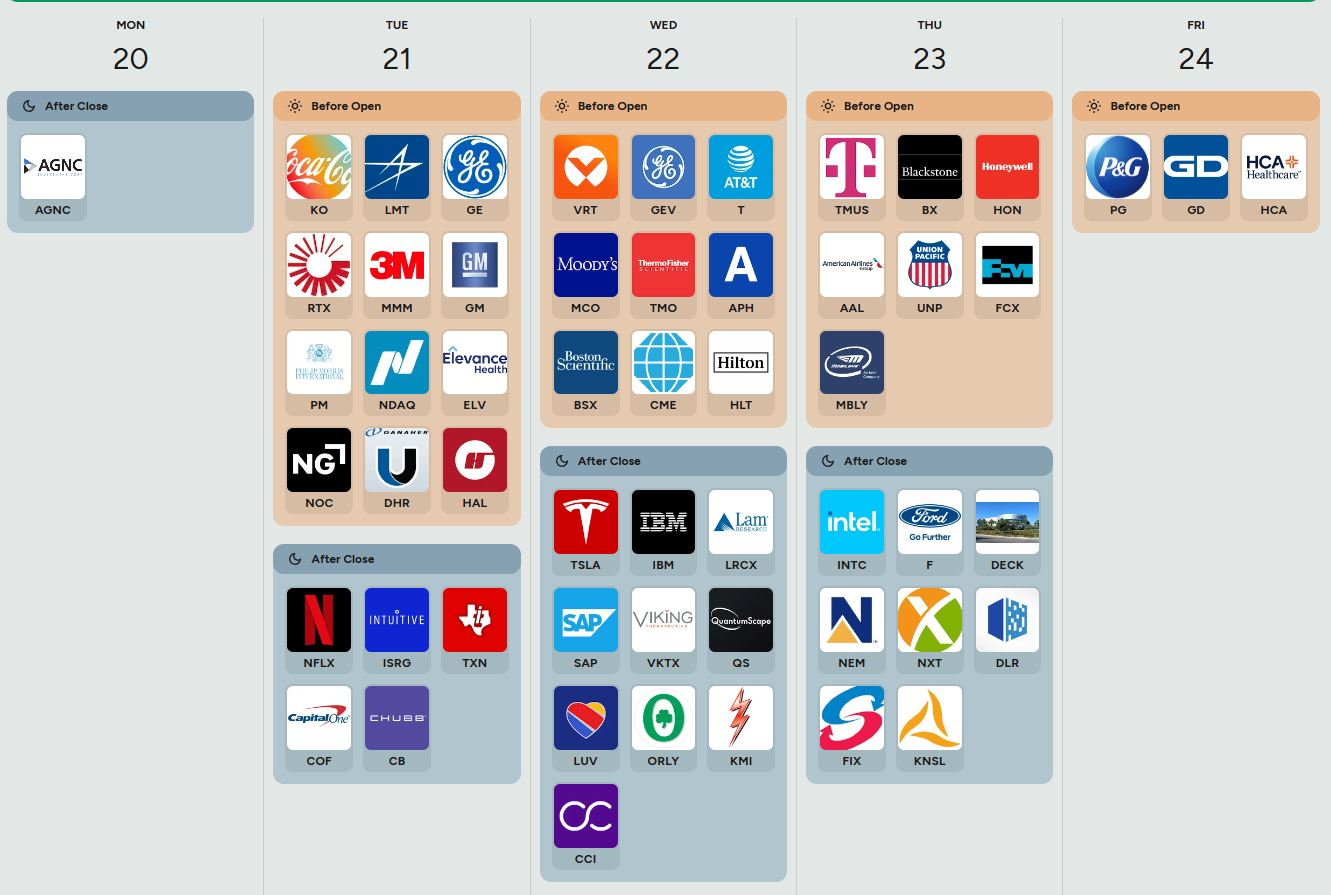
Monday, October 20
The week opens quietly, with only the August US Net Long-term TIC Flows on deck, printing $49.2B. The data speaks to global appetite for US assets—higher flows suggest continued demand for Treasuries and corporate paper, often supportive for the dollar and risk assets if it reflects confidence rather than flight to safety. The absence of other macro catalysts means markets will likely drift on positioning ahead of a dense midweek schedule. Risk tone Monday hinges on yields: steady inflows into Treasuries could soften the long end, favoring a mild risk-on tone if equity traders sense relief in discount rates.
Earnings kick off with AGNC after the close, providing an early read on mortgage REIT spreads and the health of housing credit channels. Any widening in net interest margins would argue that financial conditions remain tight under the surface.
Tuesday, October 21
Tuesday begins with BoJ Governor Ueda’s proxy in BoJ Himino speaking, followed by two Fed speakers (Waller) later in the US session. Waller’s tone will be pivotal: a lean toward patience on rate cuts reinforces higher-for-longer pricing, while any nod to softening inflation or concern over tightening effects could mark the first dovish inflection in weeks.
At 4:30 PM, the API Crude Oil Stock Change shows a prior of 3.524M—a build that helped cap energy last week. The forecast is -170.0B yen for Japan’s trade balance, alongside Exports YoY down 0.1%, confirming weakness in Japan’s external engine. Risk markets typically fade negative export reads as global demand indicators, especially when paired with builds in crude inventories.
Earnings turn heavy: before the bell, Coca-Cola (KO), Lockheed Martin (LMT), GE, 3M, GM, RTX, and Northrop Grumman (NOC) set the tone. This is the most industrially and defensively weighted day of the week—spanning aerospace, manufacturing, and consumer staples. Watch margin commentary and backlog visibility for macro signal: defense and heavy industry outlooks tie directly to fiscal impulse and global order trends. After the close, Netflix (NFLX), Intuitive Surgical (ISRG), Texas Instruments (TXN), and Capital One (COF) will drive the after-hours tone. Software and chip names will gauge the tech sector’s follow-through after a resilient Q3 tape, while TXN’s order book and guidance will act as a semiconductor barometer.
Wednesday, October 22
The macro calendar heats up. MBA 30-Year Mortgage Rate remains elevated at 6.42%, reinforcing the drag on housing. EIA Crude Oil Stocks are expected near 3.524M, while EIA Gasoline Stocks last showed -0.267M—a small draw that may continue if refinery utilization stays tight. A further draw would signal demand resilience, modestly inflationary.
Earnings dominate the morning with AT&T, Thermo Fisher (TMO), Moody’s (MCO), Boston Scientific (BSX), and Hilton (HLT) reporting—spanning telecom, healthcare, and credit analytics. These will color the tone for cyclicals and services. After the close, Tesla (TSLA), IBM, and Lam Research (LRCX) report. Tesla’s margin trajectory and commentary on deliveries will be watched for consumer health and pricing pressure clues. IBM and Lam will provide AI and semiconductor capex context; beats there would underpin the market’s tech-heavy leadership.
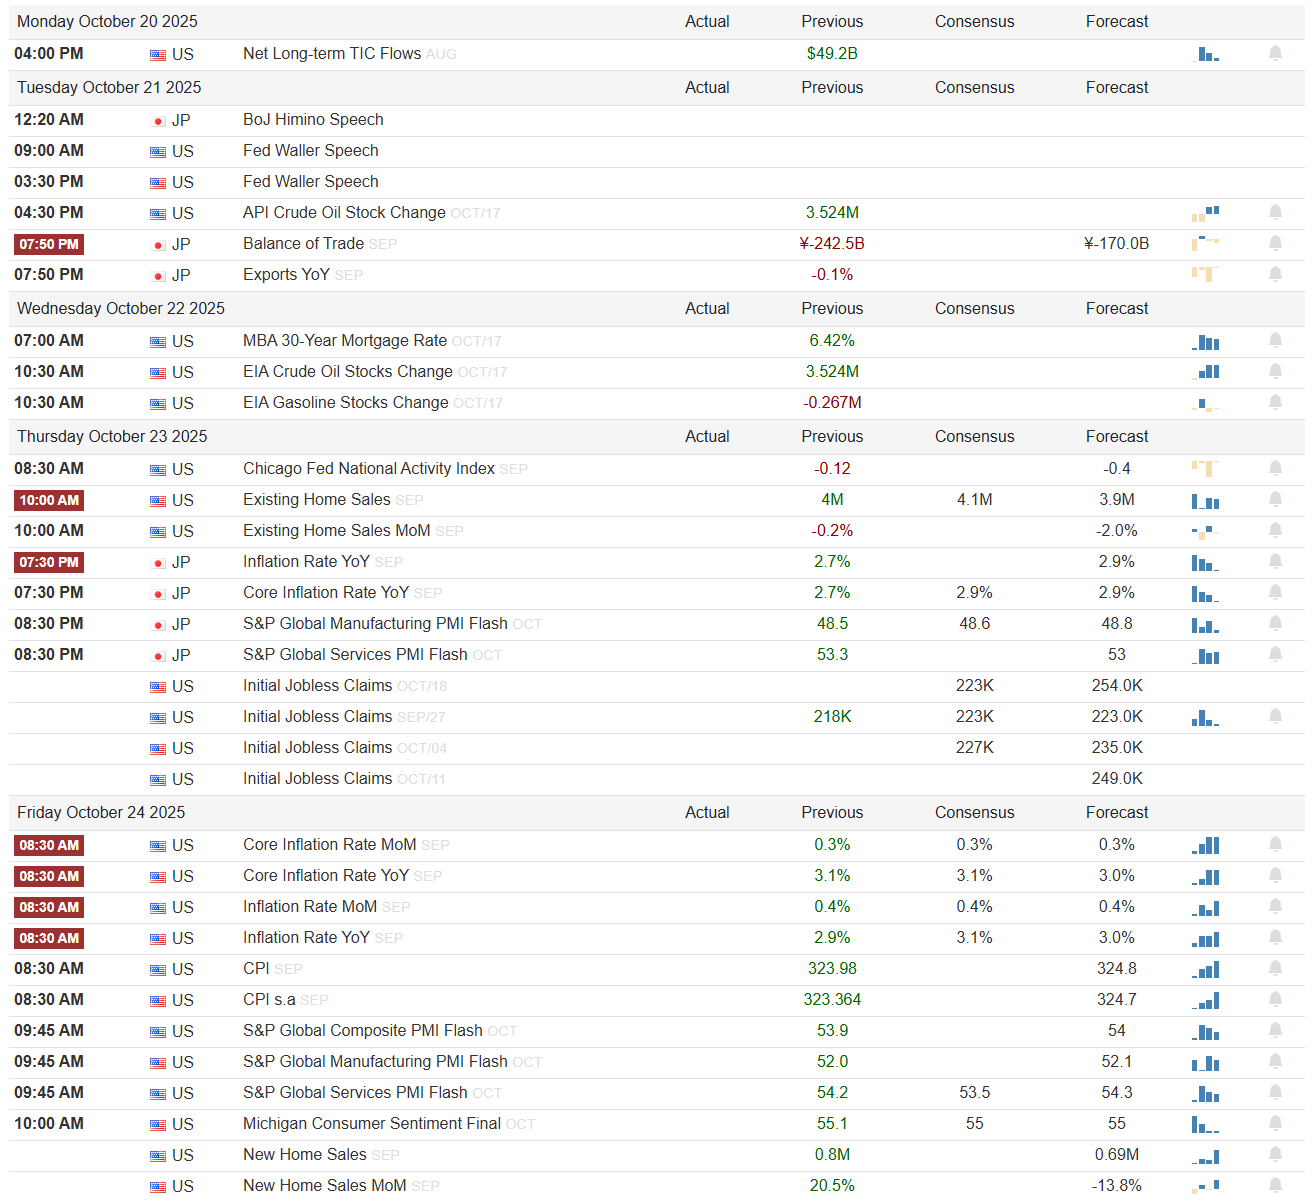
Thursday, October 23
Thursday’s macro mix tightens the focus on US demand and inflation. The Chicago Fed National Activity Index shows a previous -0.12, with consensus -0.4, suggesting a mild deceleration. At 10:00 AM, Existing Home Sales are forecast 3.9M, down from 4.1M—continued softening consistent with restrictive housing conditions.
Japan’s Inflation Rate YoY at 2.7% vs forecast 2.9% anchors expectations for BoJ normalization, while US Initial Jobless Claims print around 218K, below consensus 223K—still signaling tight labor. The Services PMI Flash (53.3) remains expansionary, implying steady service activity, offsetting weakness elsewhere. Together, that mix keeps the US economy in a soft-landing corridor: inflation cooling slightly abroad, labor resilient at home, and services humming.
Earnings before the bell bring T-Mobile (TMUS), Blackstone (BX), Honeywell (HON), American Airlines (AAL), and Union Pacific (UNP). Together, they provide a cross-section of consumer, industrial, and financial leverage to rates and travel. After the close, Intel (INTC), Ford (F), and Deckers (DECK) anchor the session. INTC’s data center and AI commentary will drive semi sentiment; Ford’s guidance will feed into cyclical and consumer discretionary expectations.
Friday, October 24
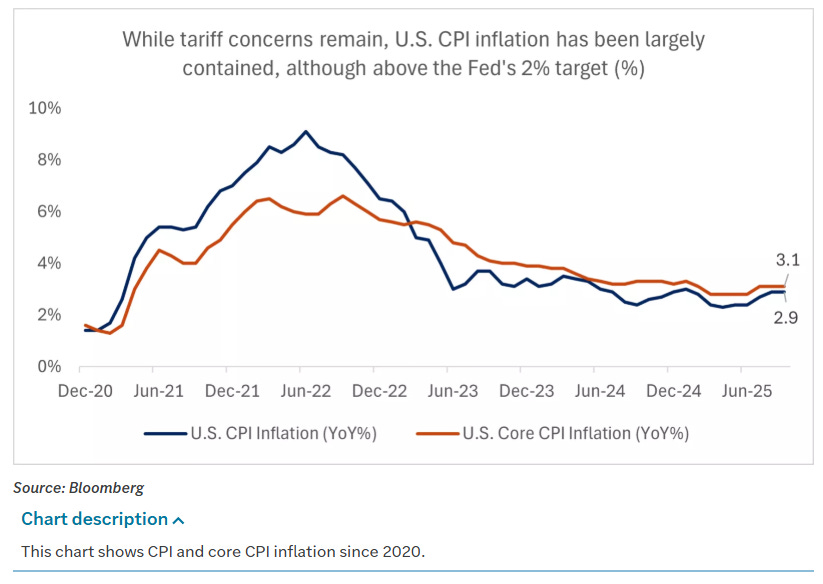
Friday’s data storm will likely dictate weekly tone. The Core Inflation Rate MoM and YoY are both steady near 0.3% and 3.1%, respectively, with CPI levels just below 324, consistent with disinflation progress. The S&P Global Composite PMI Flash (53.9) and Manufacturing PMI (52.0) remain expansionary, while Services (54.2) suggests resilient demand. The Michigan Consumer Sentiment index sits at 55.1, roughly unchanged. Stability across PMIs and sentiment argues that growth remains intact even as inflation continues to edge lower—normally a risk-on backdrop.
Earnings before the open feature Procter & Gamble (PG), General Dynamics (GD), and HCA Healthcare (HCA). These defensive and healthcare names bookend the week, offering a quality read on consumer staples, defense procurement, and healthcare utilization. Strong results there, especially from PG, would reinforce the idea that consumer staples are holding margins despite elevated costs.
Earnings and Macro Read-Through
This is peak earnings convergence week. Heavyweights from industrials (GE, RTX, HON), tech (TSLA, IBM, LRCX, INTC), and consumer sectors (KO, PG, NFLX) will test the breadth of the rally. Watch operating margin commentary and forward guidance tone: expansionary rhetoric amid moderating inflation prints would support equities. Conversely, any indication of cost pressures persisting into 2026 could quickly tilt sentiment risk-off, especially given compressed volatility.
Sign-posts for active traders
S&P Global Services PMI holding above 53.0 will sustain risk appetite; a break below 50 would flip tone defensive.
US Core CPI YoY printing above 3.1% would trigger curve steepening and likely unwind this week’s equity bounce.
Microsoft and Alphabet reaction post-earnings will dictate whether index breadth extends or contracts; weakness in both would negate the recent rally.
Bottom line: A data-rich week where inflation steadiness meets earnings momentum. Unless CPI or Waller surprise hawkishly, risk appetite should stay constructive into month-end.

Market Intelligence Report
Weekly wrap: quiet gain from carry sleeves; beta OK, “alts” and materials dragged
We finished the week essentially flat-to-up, with the portfolio up roughly +0.15% by contribution. What worked was the carry/cushion complex while we probed the pivots: staples/utilities (XLP/XLU), REIT reset (KIM/XLRE), and duration/credit (TLT/LQD/HYG). Core index beta did its job, with SPY/QQQ/IWM eking out small gains. What didn’t work were the convex sidecars we kept small on purpose: crypto (IBIT/ETHT) and strategic materials (REMX/XME); software/infra gave back some of the prior “reset” gains; energy was mixed with XLE flat and VIST soft. The barbell inside semis was net positive: SOXX up, AMD up, offset by NVDA down and MSFT slightly red. Net, the sleeves we intended to carry risk paid for the chop; the optionality sleeves reminded us why we size them tiny until acceptance through key VL levels stick.
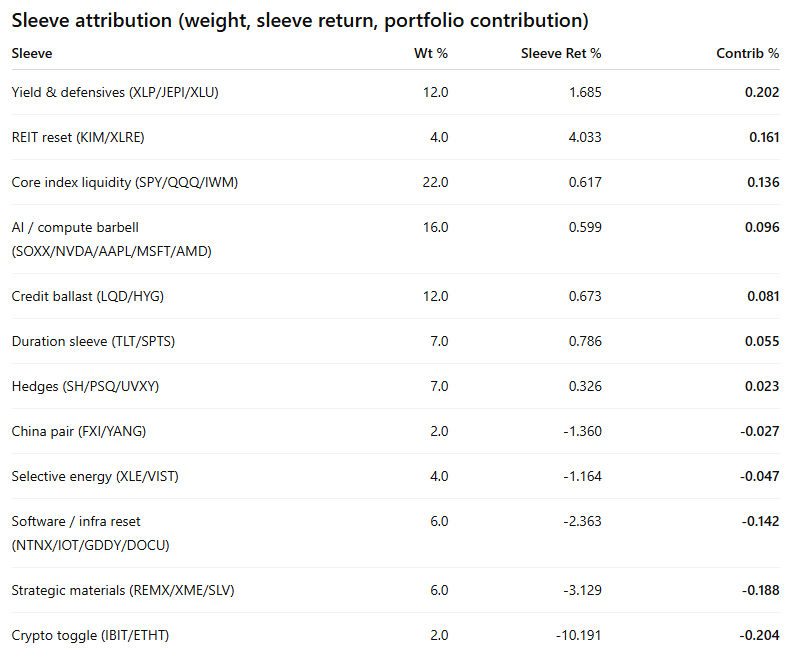
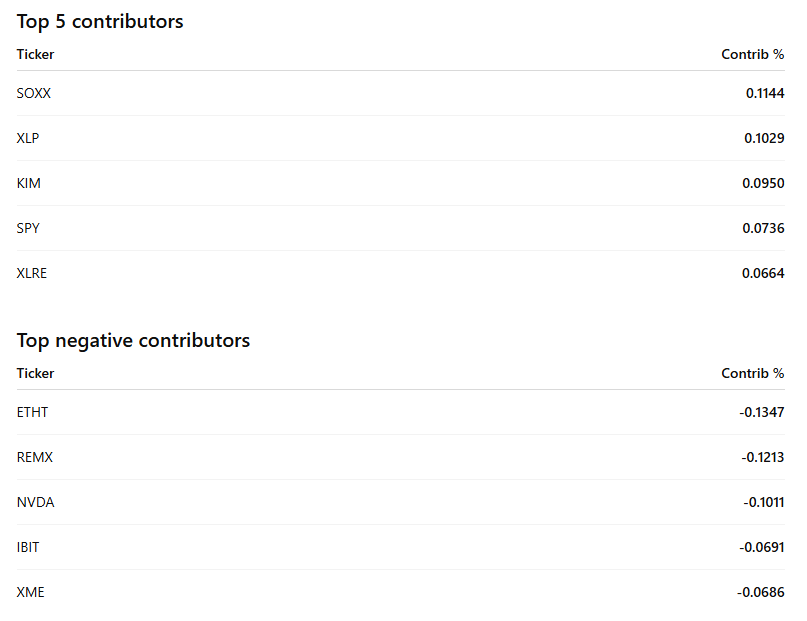
The plan’s throttle worked: SPY/QQQ/IWM all closed above their opens, and we harvested carry from staples/utilities and REITs while duration and credit stayed firm. Semis were mixed but net positive thanks to SOXX breadth and a strong AMD print; NVDA softness kept the barbell honest. Materials and energy proxies reflected macro chop in commodities; we kept those sleeves small and they still detracted, led by REMX and XME with VIST soft. Crypto was the clear drag, which aligned with our rule to keep it tiny until acceptance through 602–606 and firm credit — neither condition held for a scale-up. Hedges cost a touch in inverse beta, partly offset by UVXY’s lift.
Bottom line: the portfolio did what it was designed to do in a chop-and-probe week — carry sleeves funded risk while core beta nudged higher; optionality sleeves stayed a headwind and remain right-sized until we get decisive acceptance through the pivots with credit confirming.
Let’s take a look at what the tape is telling us about this coming week.
MIR Part 1: The Backdrop
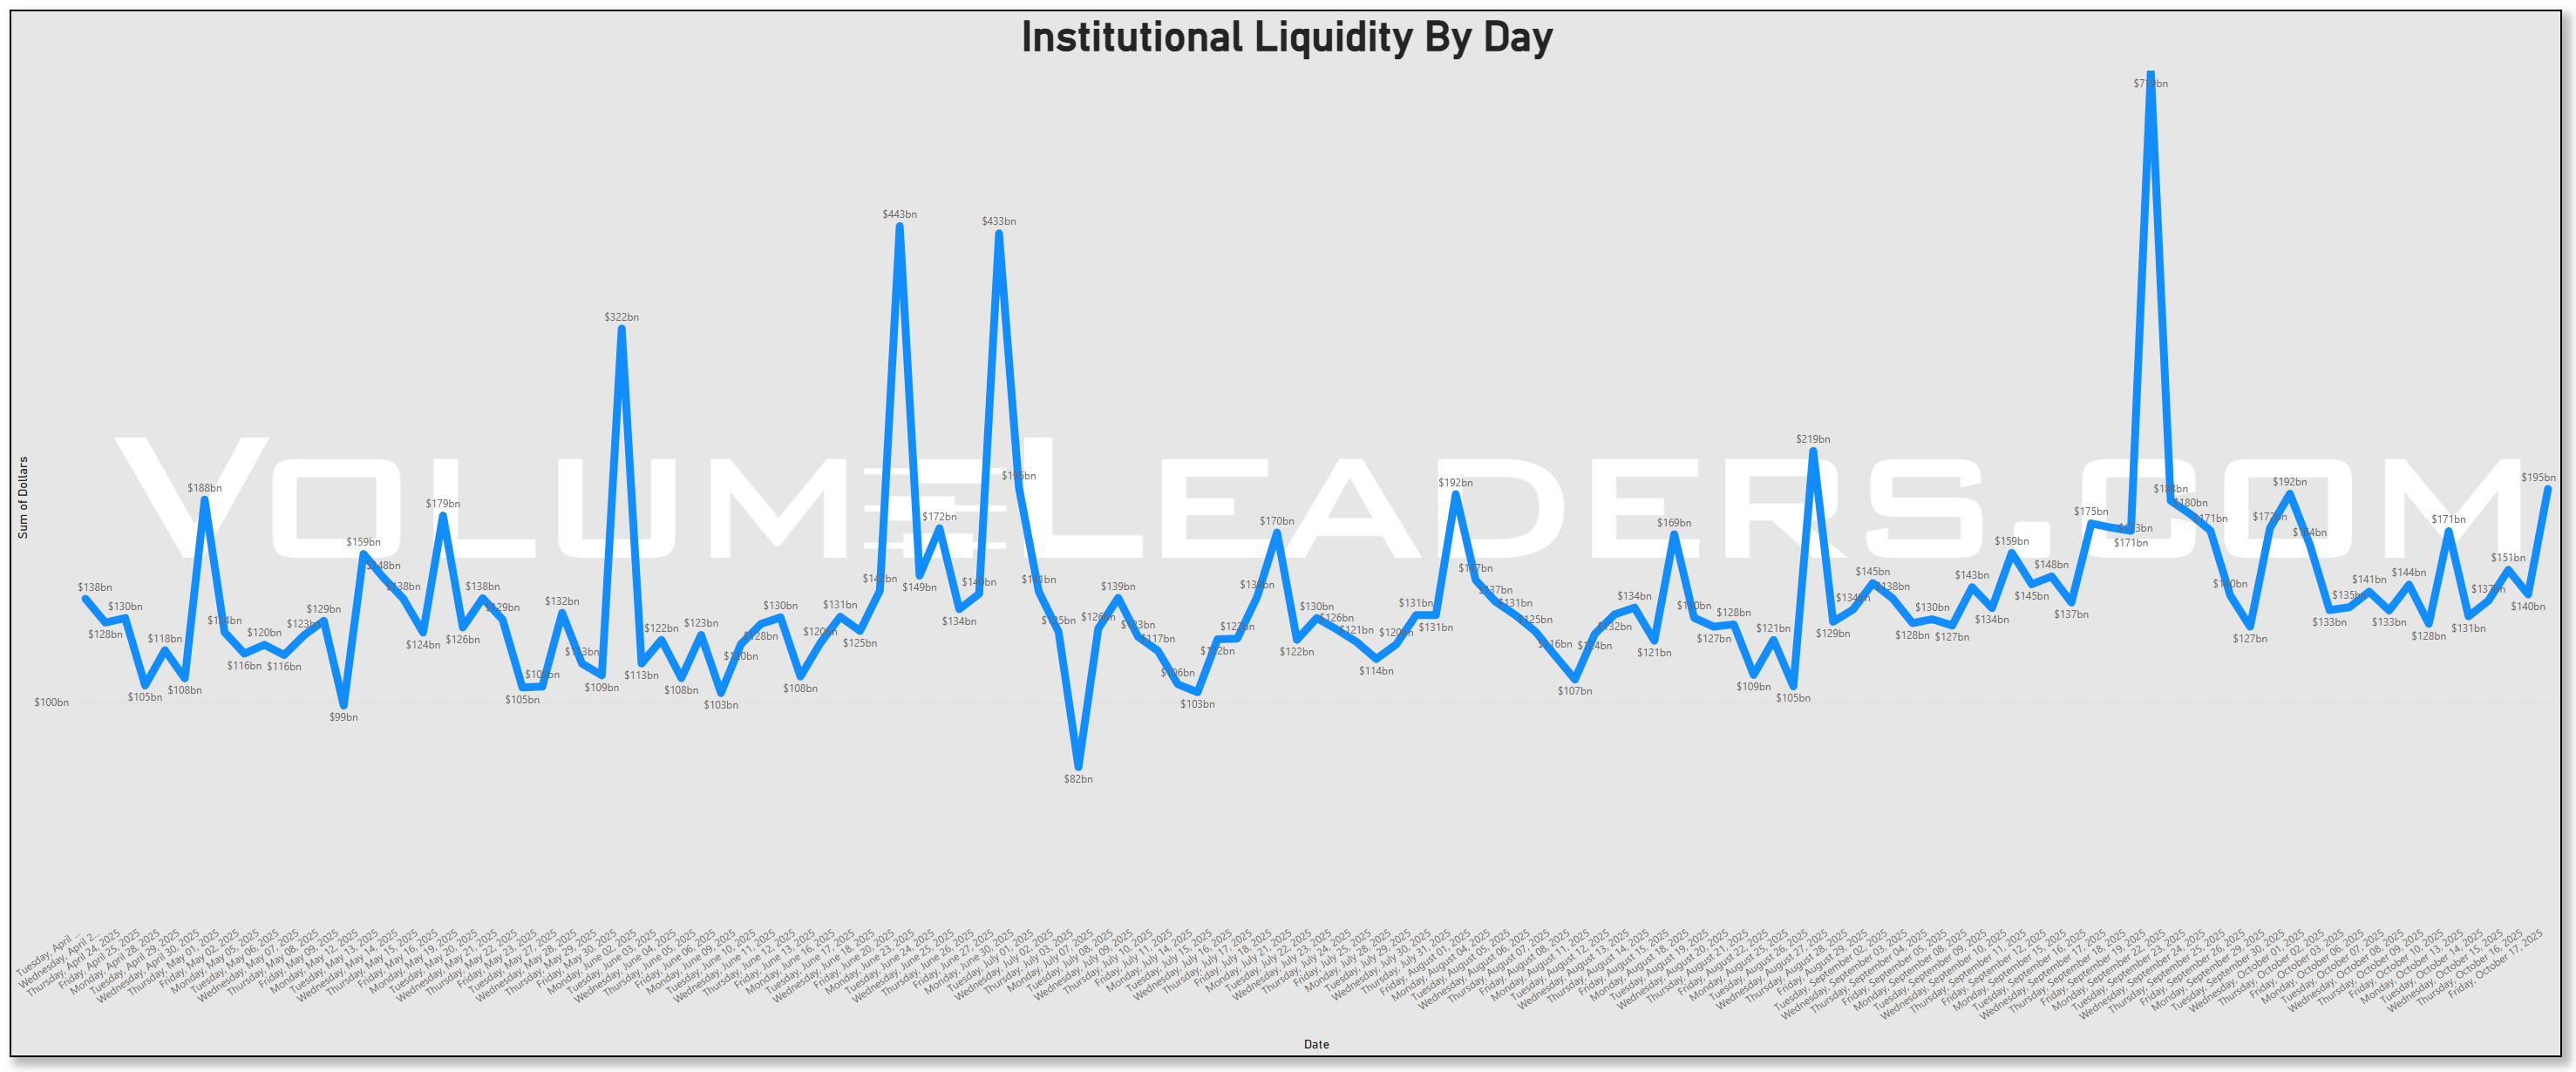
Institutional liquidity rebuilt into week’s end, not as a generic quarter-end swell but as a directional re-risking. The multi-month series shows a familiar sawtooth around expiries, yet the latest upswing was led by equity sleeves rather than carry. After a mid-week plateau, Friday exploded higher with technology and large-cap allocations at the tip of the spear. That’s consistent with a market leaning back into beta as the Fed’s tone stayed cautious-easing and the calendar drifted toward monthly OPEX, a magnet for hedging and roll activity that often amplifies end-of-week prints. Fed officials have been openly entertaining additional cuts this year, with Governor Waller endorsing another quarter-point reduction and Chair Powell emphasizing labor-market risks—messaging that softens the path for risk assets even as headline government data trickles back after the shutdown delays. September CPI was explicitly rescheduled to October 24, removing an immediate inflation landmine and giving allocators a cleaner runway into earnings and OPEX. Preliminary consumer sentiment for October held near 55, hardly exuberant but steady enough to keep the “soft landing” case intact.
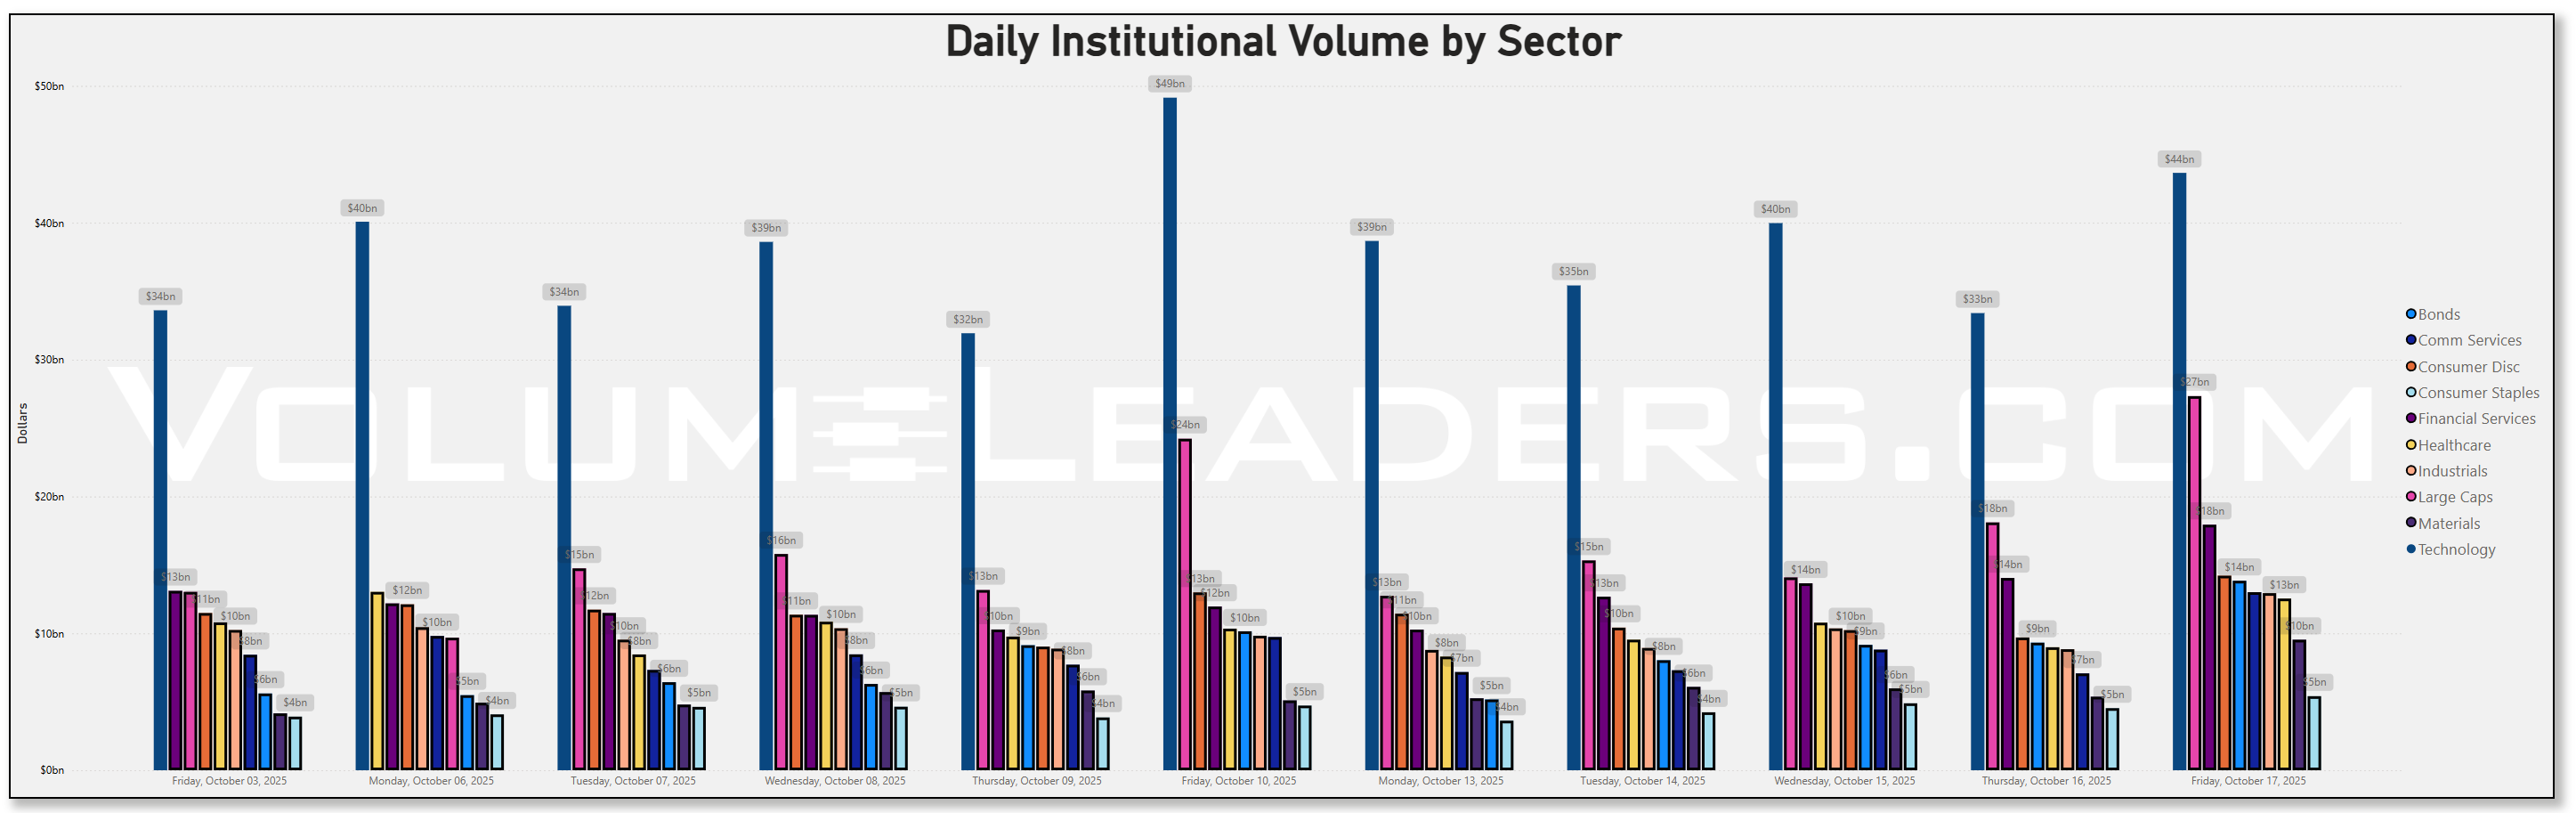
The daily sector dollars make the leadership shift unambiguous. Technology dominated every session and accelerated into the bookends: roughly $33.6b on Friday Oct 3, $40.1b on Monday Oct 6, $38.6b on Wednesday Oct 8, then a blow-off $49.1b on Friday Oct 10; after the brief Monday reset, the desk came back with $38.7b (Mon Oct 13), $35.4b (Tue Oct 14), $40.0b (Wed Oct 15), $33.4b (Thu Oct 16), and a big $43.6b to close the week on Friday Oct 17. Large Caps were the consistent second pillar, printing $13.0b on Oct 3, dipping early the following week, then punching to $24.2b on Oct 10 and finishing with $27.3b on Oct 17. Financial Services climbed in tandem—$11.96b on Oct 10 and $17.94b on Oct 17—while Consumer Discretionary steadily rebuilt from $11.5–12.1b early in the month to $14.2b on Oct 17. Bonds did rise into Friday to $13.84b, but they did not lead; they played catch-up to equity sleeves that had already seized the initiative. Week-over-week, the flow baton moved firmly from defensives and carry to beta and growth: Tech, Large Caps, Financials, and Discretionary all gained share; Staples and Healthcare were stable to softer.
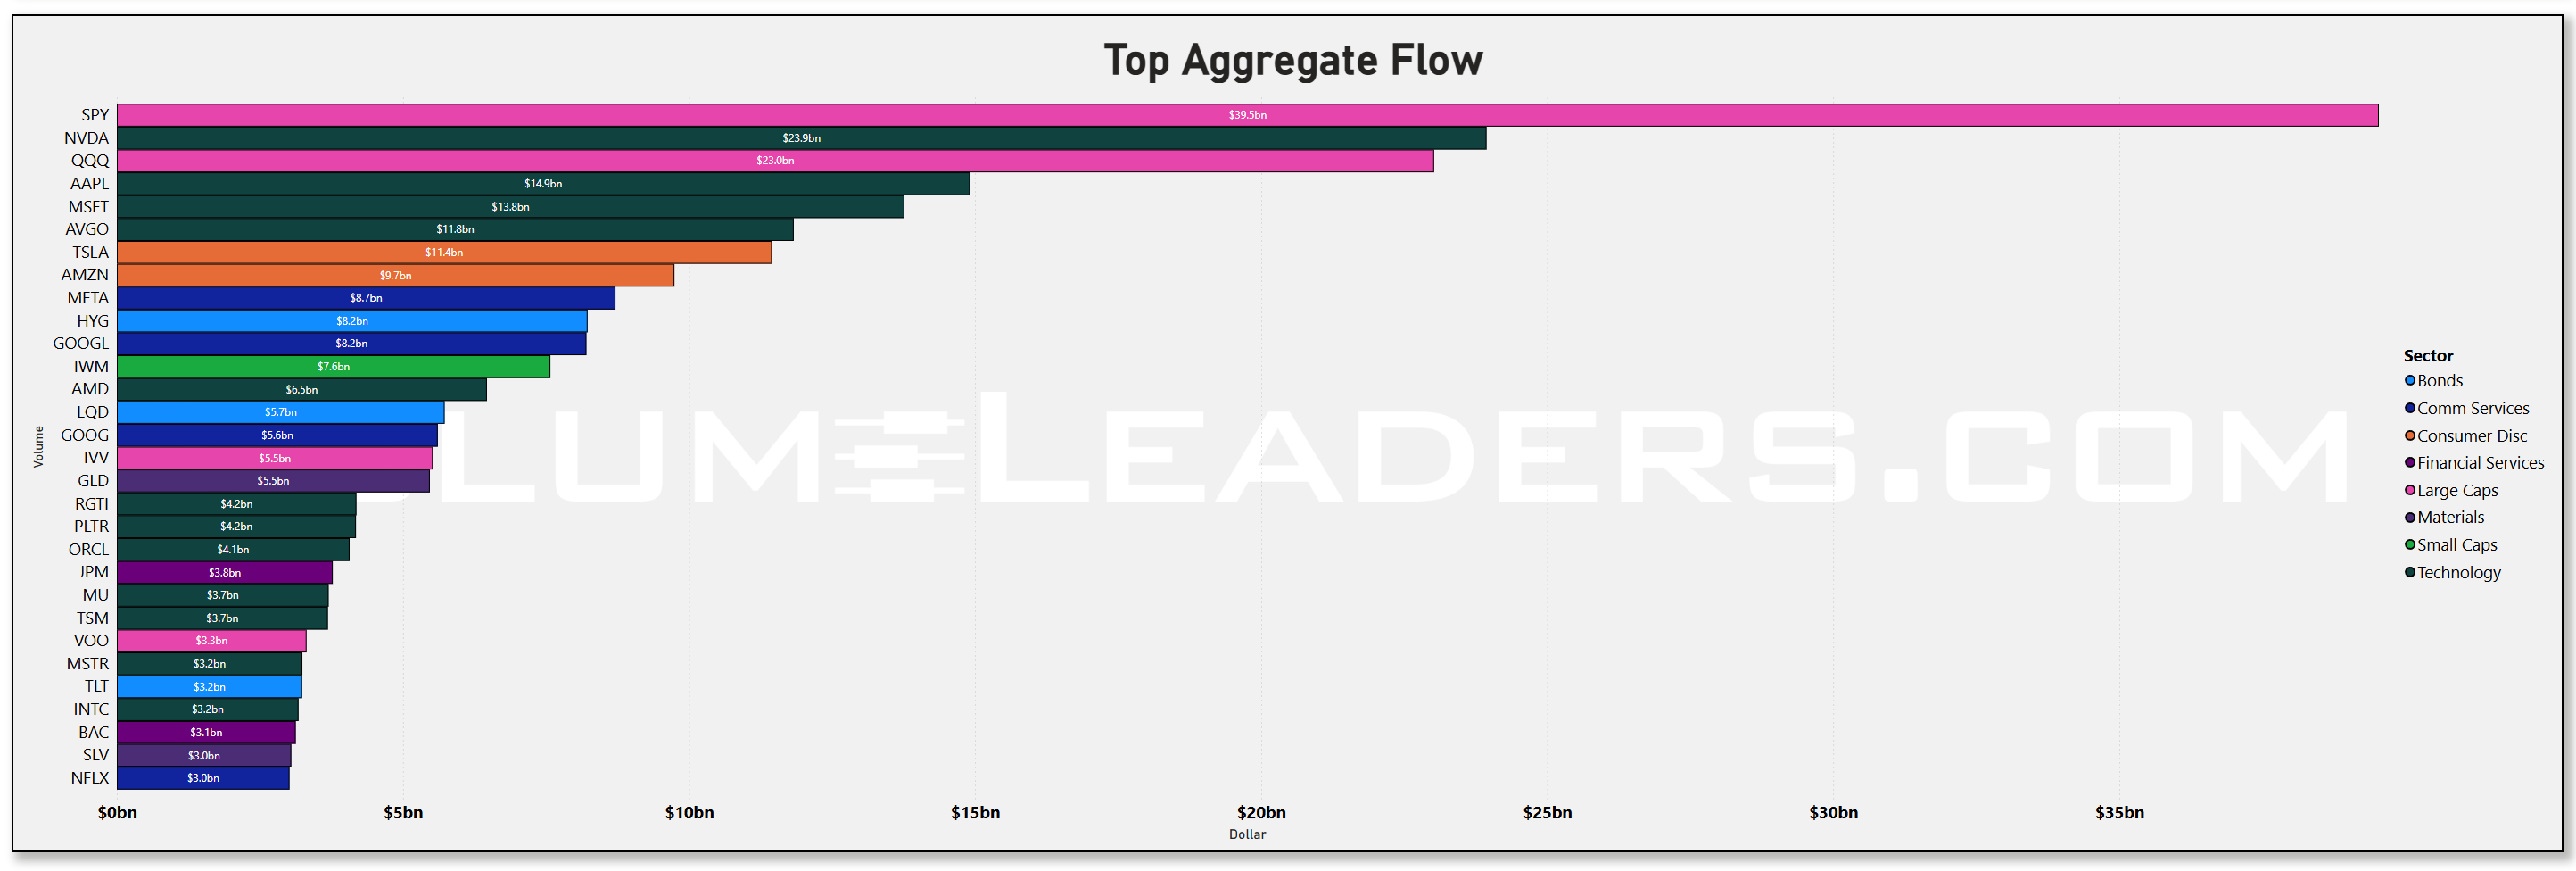
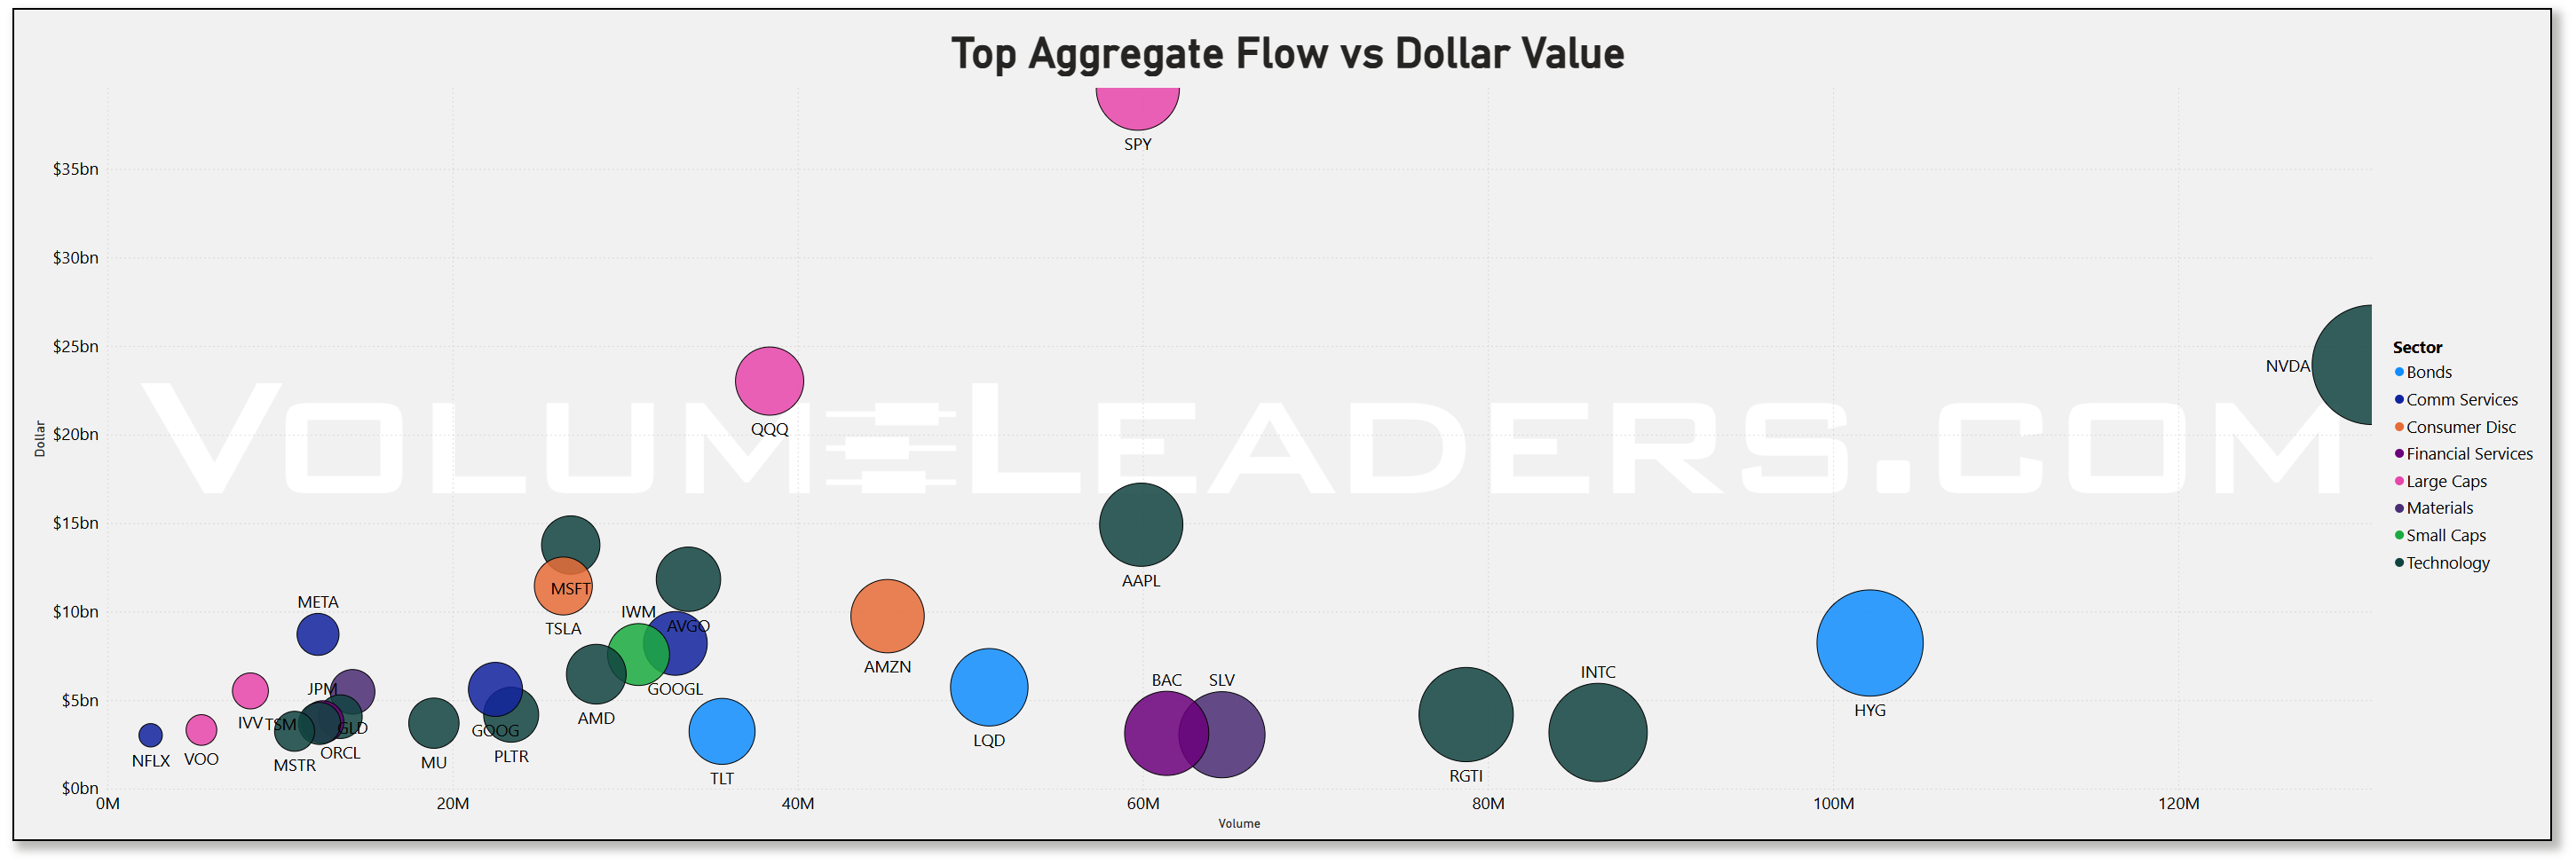
Zooming into concentration, the treemap and the aggregate rankings reveal where dollars really stacked. Technology’s breadth was wide, but the heaviest pails stayed with the platform trio and the compute lane. NVDA captured about $24b, AAPL roughly $15b, and MSFT near $14b, while AMD and AVGO registered healthy mid-single-billion prints. On the allocation side, SPY (~$39.5b) towered over everything; QQQ followed around $23b, then a cluster of core beta like IVV and VOO in the mid-single-billions. That mix—enormous SPY/QQQ plus megacap single-name sponsorship—is classic “get invested now” behavior rather than a frantic short-covering chase. Discretionary’s presence was notably selective: TSLA at about $11b and AMZN near $10b, while most other retail names stayed below the top cohort. Financials were led by money-center banks and the credit ETFs, but their role looked more like ballast underwriting equity exposure than a standalone leadership bet.
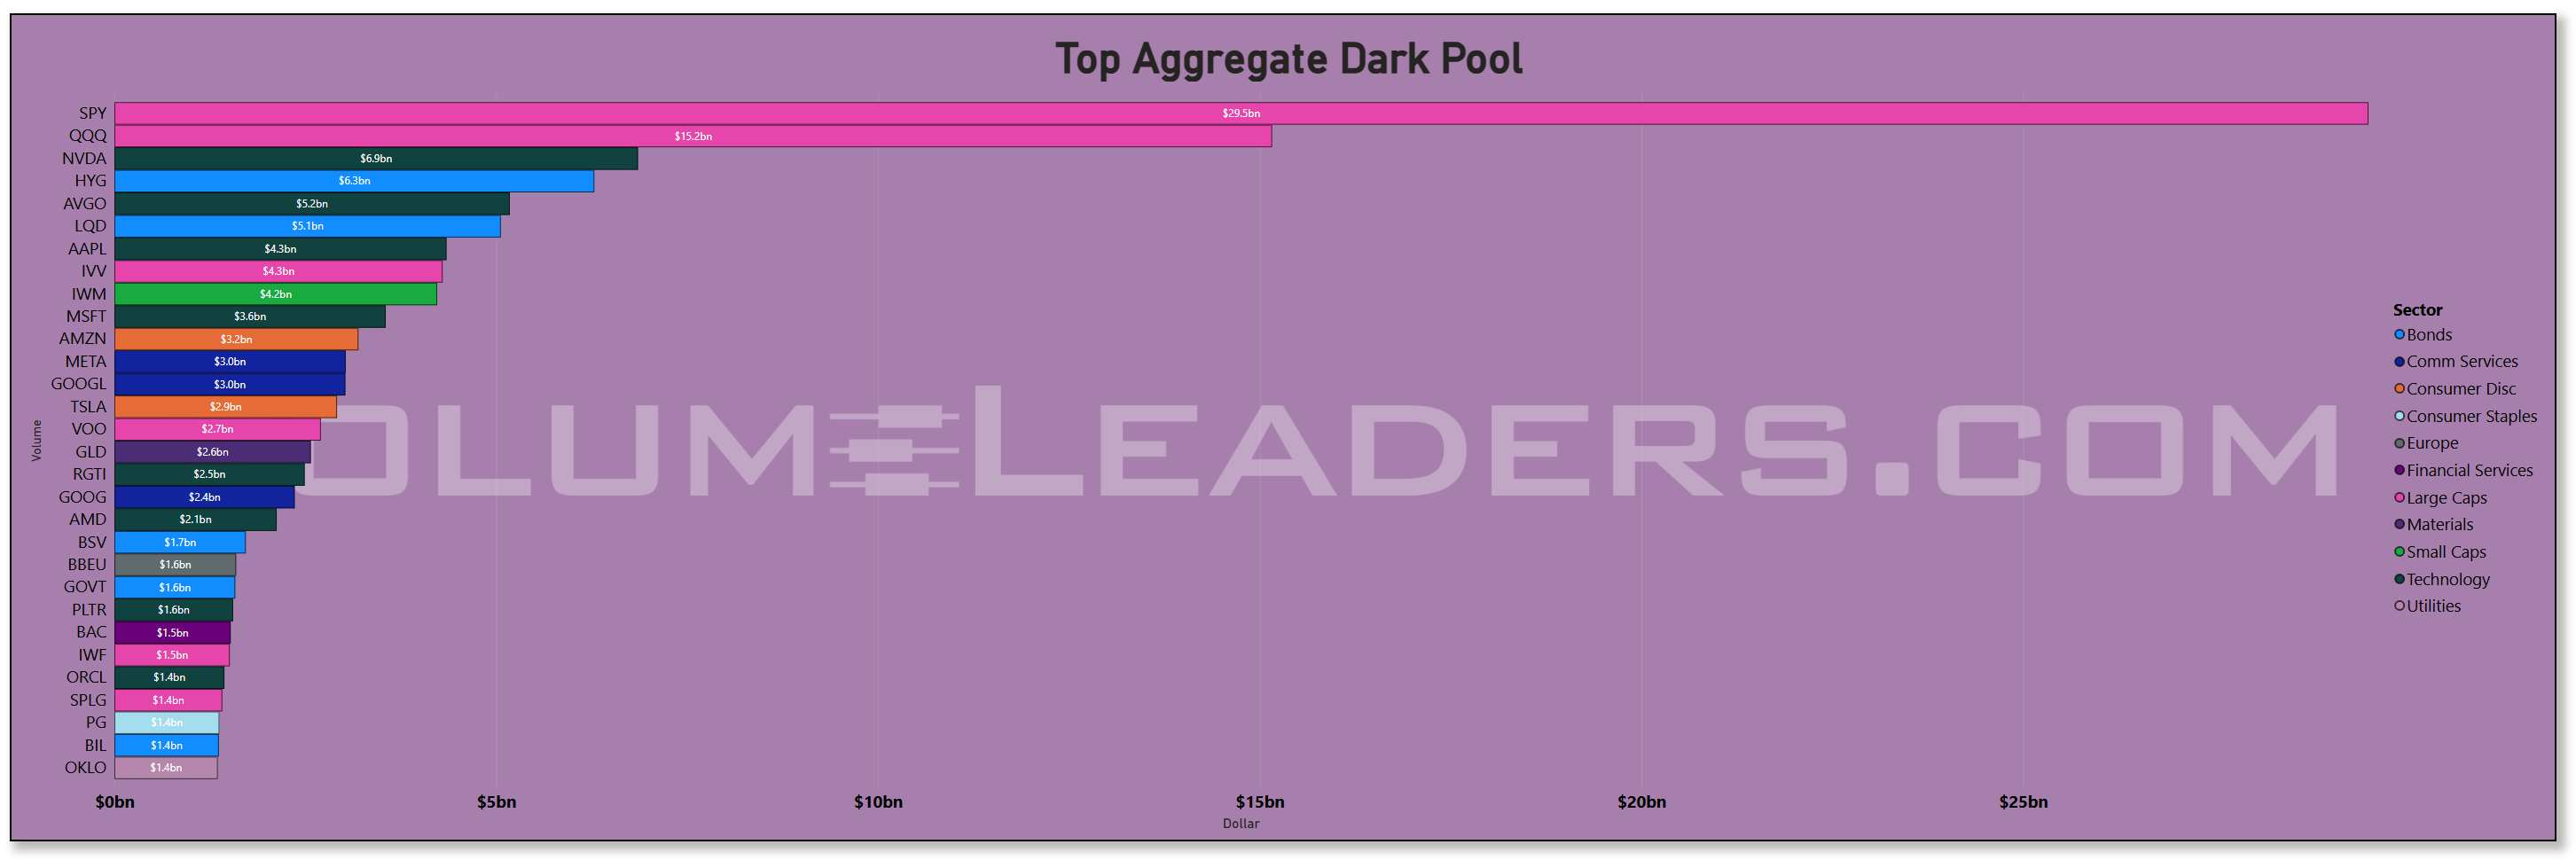
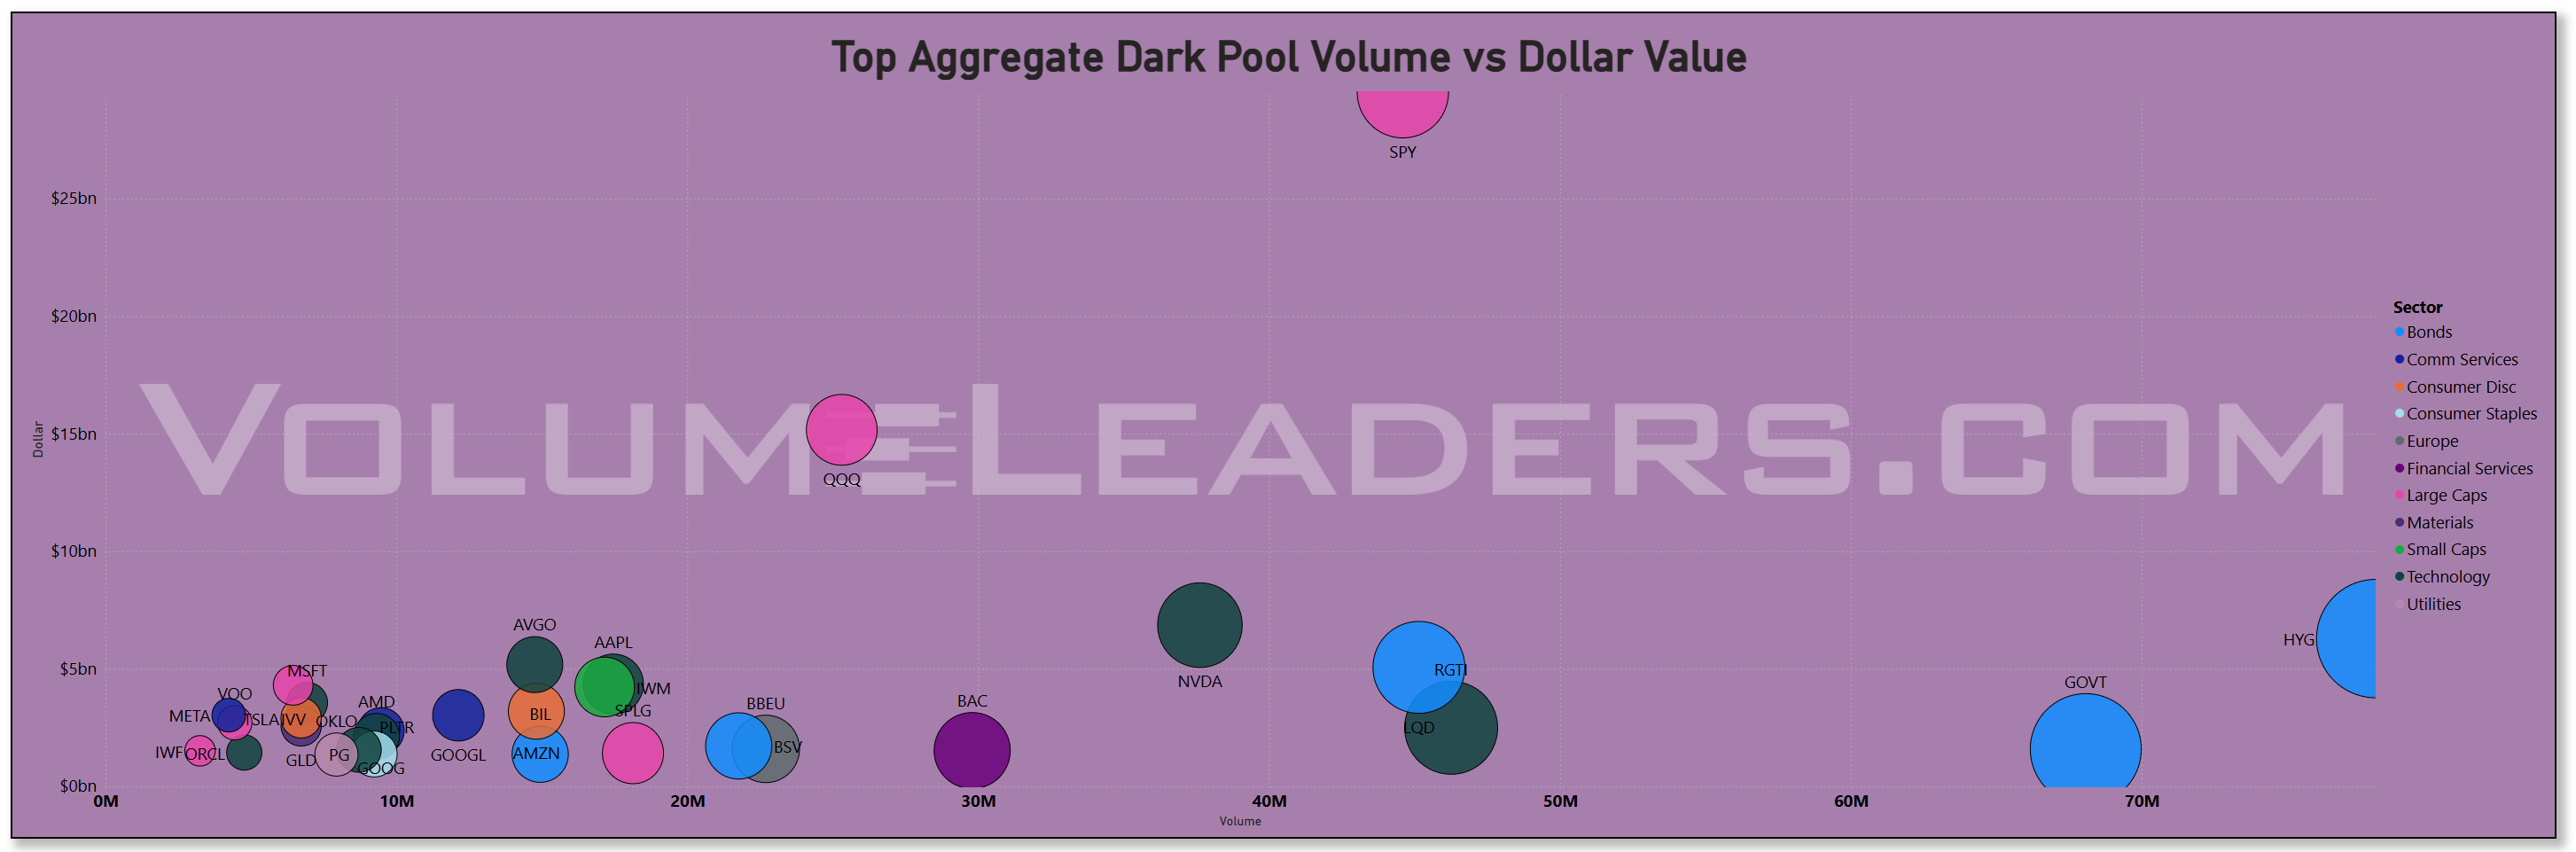
The dark-pool lens underlines accumulation. Off-exchange dollars were headlined by SPY (~$29.5b) and QQQ (~$15.2b), but the most telling prints sat in NVDA (~$6.9b) and the credit sleeves HYG (~$6.3b) and LQD (~$5.1b). When technology leaders and credit ETFs show multi-billion off-exchange prints alongside index behemoths, it typically signals institutions scaling quietly over multiple sessions—inventory transfer and absorption—rather than one-and-done blocks. AAPL and MSFT added mid-single-billion dark-pool totals, and there was steady off-exchange interest in IVV and IWM, suggesting the bid was broad across benchmarks. That pattern matches the policy backdrop: with the Fed telegraphing a cautious easing bias and headline CPI pushed out a week, it is rational for large accounts to add discreetly, then let lit markets validate later.
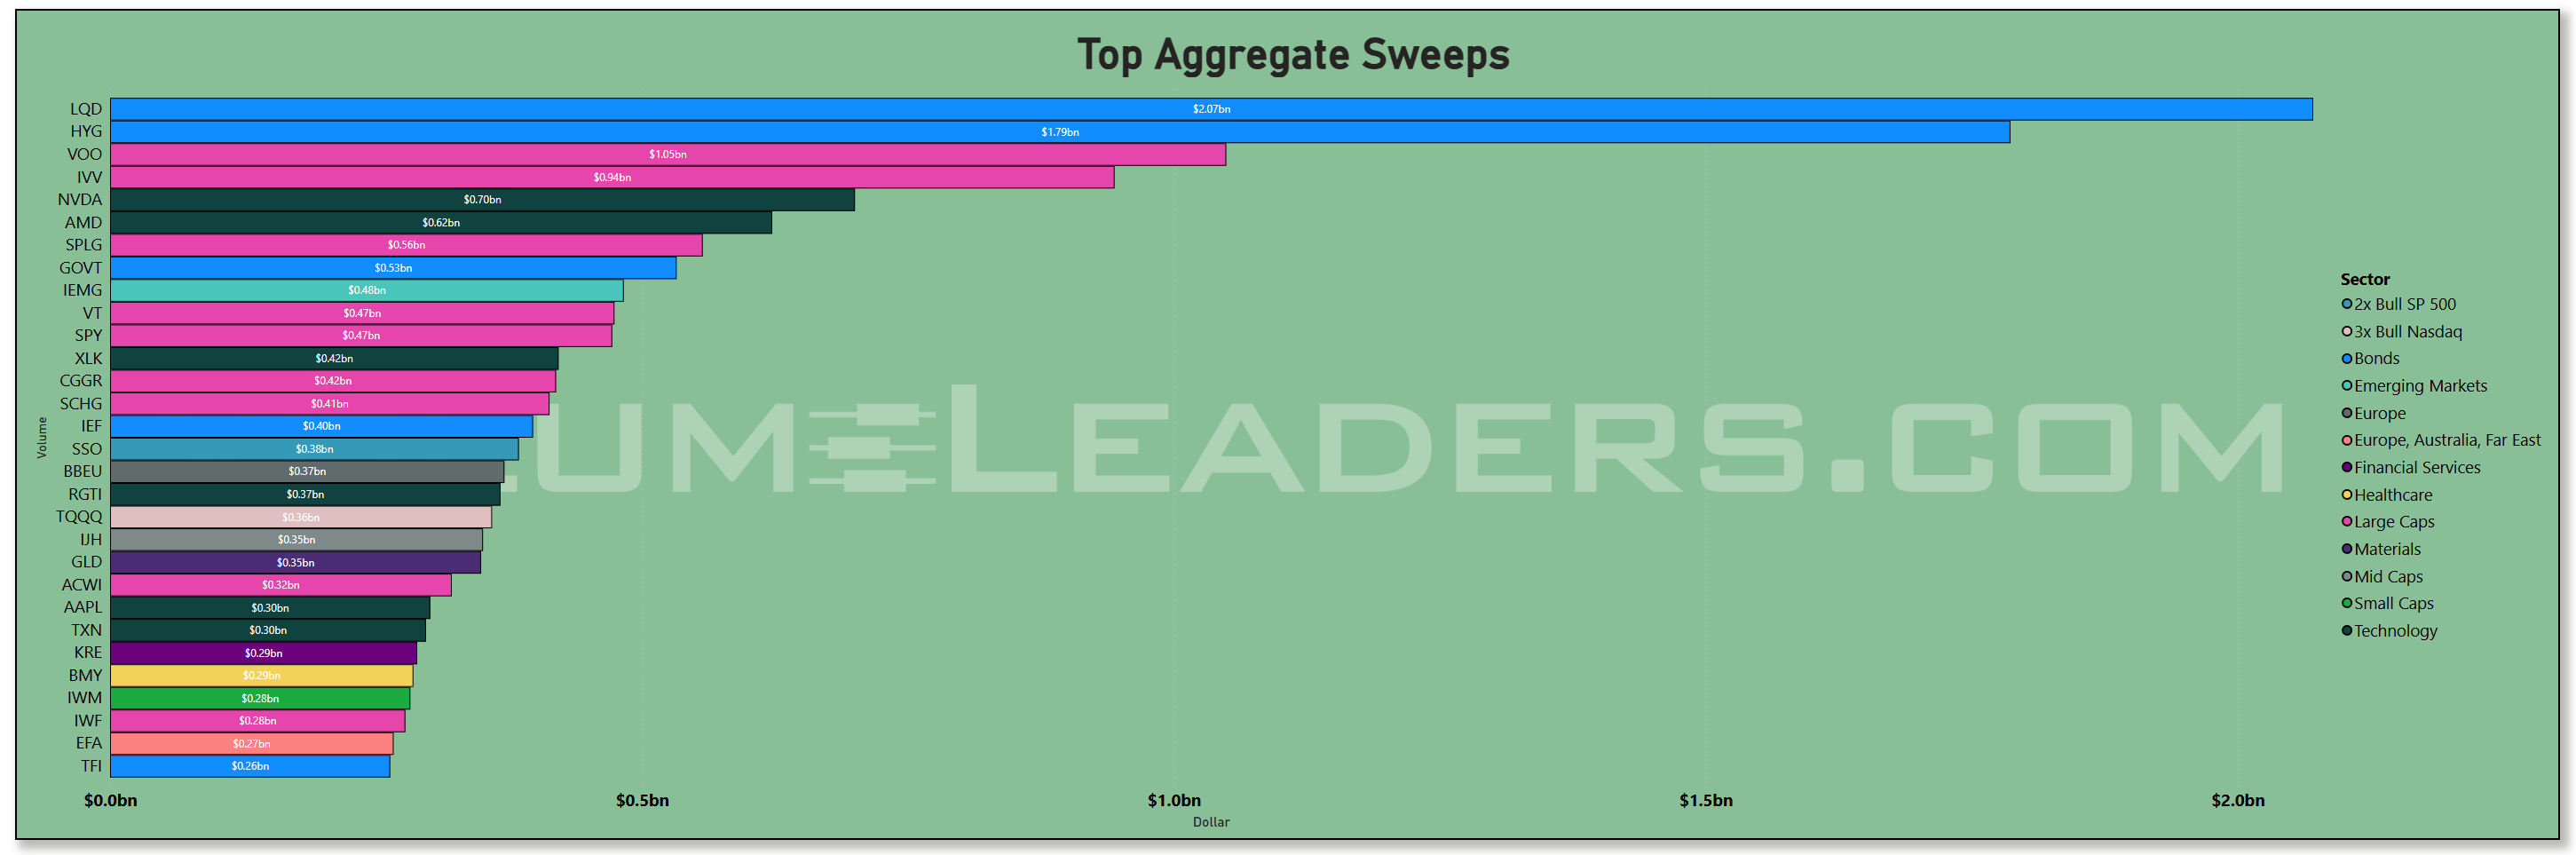
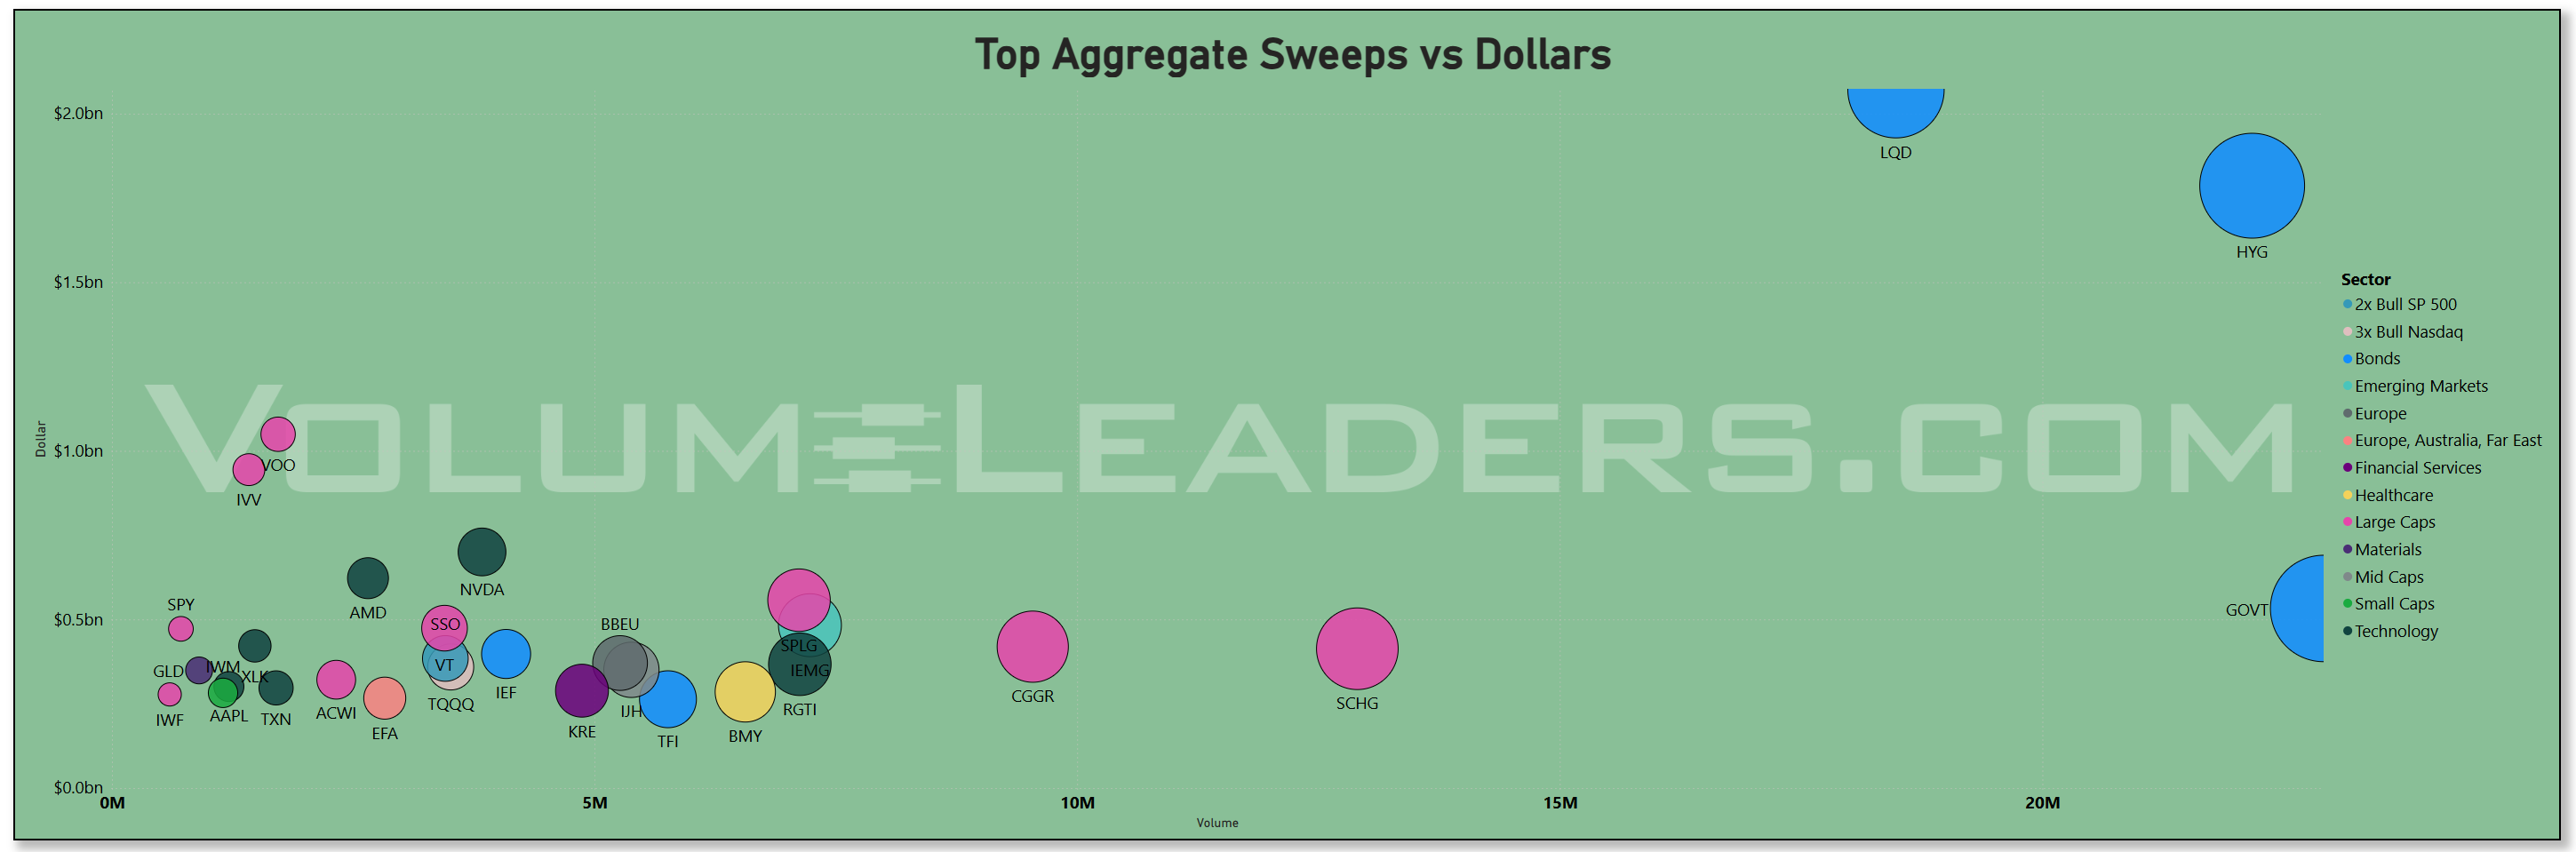
Sweeps painted a complementary, not contradictory, picture. The fastest money pressed most in LQD (~$2.07b) and HYG (~$1.79b), with GOVT not far behind, indicating an active rates/credit overlay riding shotgun on the equity add. Equity sweeps appeared where you would expect in this environment—SPY (~$0.47b) for index gamma and NVDA (~$0.70b) and AMD (~$0.62b) for compute beta—enough to show tactical chase, but not the kind of one-sided blowout that precedes exhaustion. In other words, a barbell of credit hedging and semiconductor leverage attached to a spine of index accumulation.
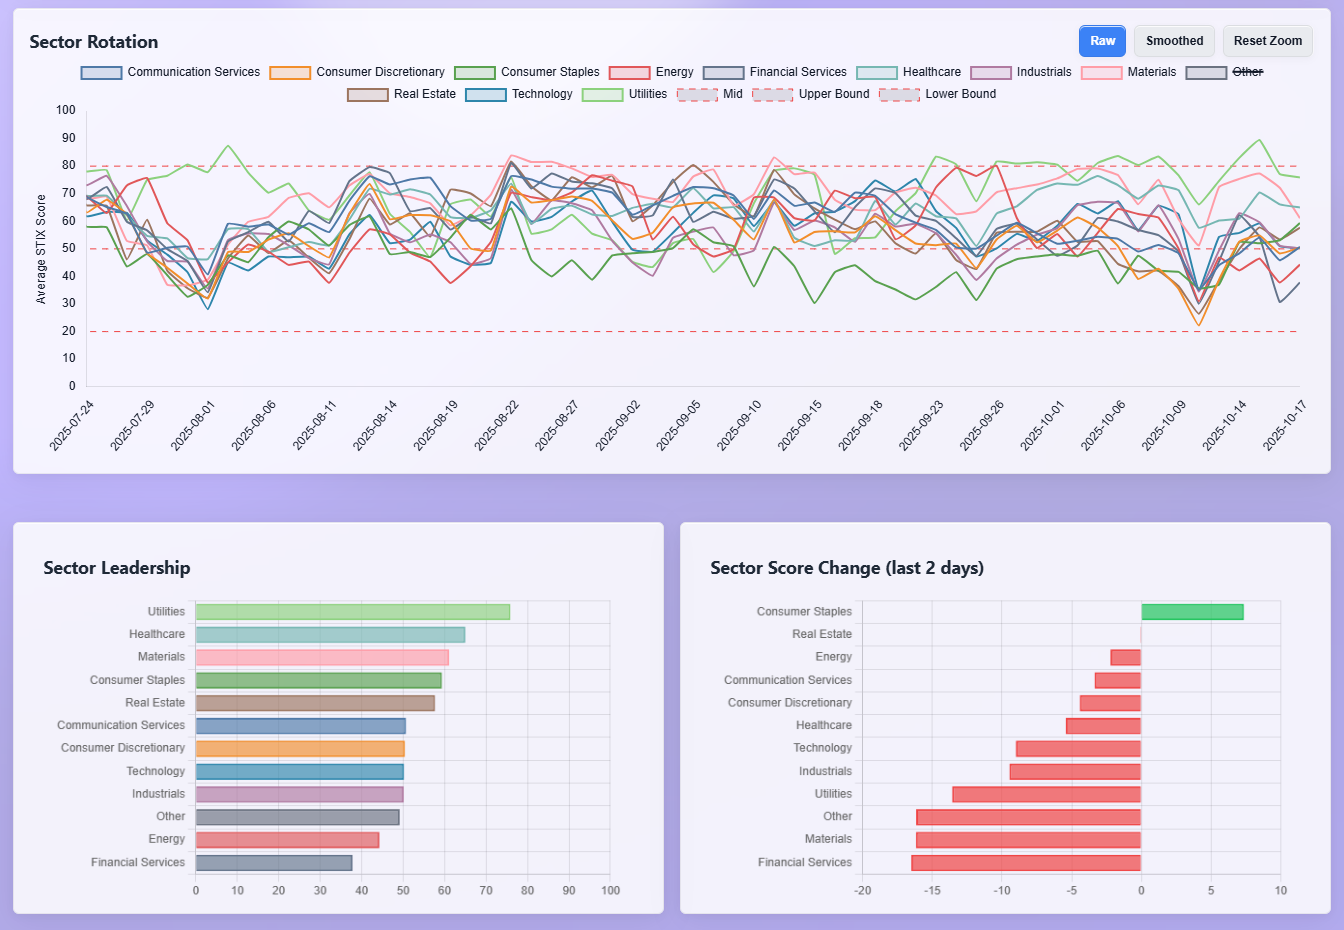
The sector leadership board ties the flows to relative performance. Utilities still sit near the top on a multi-week basis, but two-day momentum swung back in favor of Consumer Staples and Real Estate, both catching a bid late in the week. Technology remains firmly mid-upper tier, consistent with the large, steady dollar prints rather than a manic melt-up. Financials and Materials lag on the recent change metric, which squares with the data: banks garnered healthy dollars on Friday but not enough to outpace Tech or Discretionary; Materials were a side-show as policy and earnings, not commodities, drove a tape that softened up a bit into the end of the week.
Macro and seasonals stitched the tapestry. With the September CPI report delayed to Oct 24, a near-term inflation shock was literally off the calendar, a nontrivial psychological release valve. Powell and Waller’s remarks kept the door open to more easing as the labor market cools at the margin, and consumer sentiment remained stuck near 55—weak enough to keep pressure for cuts, but not collapsing. Into a third-Friday OPEX, that mix tends to nudge dealers and allocators alike toward index rolls and re-hedges that amplify beta flows; the magnitude of Friday’s Tech ($43.6b) and Large Caps ($27.3b) lines reads like that classic OPEX-plus-allocation cocktail.
Bottom line: the tape just pivoted from carry to commitment—technology and large-cap beta reclaimed the flow crown, and institutions expressed that view in the most telling ways they can: big SPY/QQQ, big megacap tech, and steady dark-pool accumulation, with credit hedges riding shotgun.
MIR Part 2: Individual Names From The Institutional Tape
VolumeLeaders tracks several proprietary signals designed to spotlight names drawing significant institutional interest. Below, we’ve surfaced the latest results and analyzed them to highlight emergent themes. If any of the sectors, narratives, or positioning trends resonate, the names mentioned here offer a strong starting point for deeper research and watchlist consideration.
VL Trade Rank Velocity™ (TRV)
TRV is a proprietary metric that measures the recent acceleration or deceleration in institutional trading activity for a given stock by comparing its average trade rank over the past few days to its average in recent weeks. A sharp improvement in TRV typically reflects a notable shift in positioning, often accompanied by sustained trade activity, suggesting institutions are actively engaging with the name and that intensity of activity is rising. This often precludes meaningful price or narrative shifts. This isn’t a buy-list or sell-list; it’s meant to draw your eyes to names where institutions are putting money to work.
Here’s what jumps off the TRV sheet, tied back to the flow story we’ve been tracking.
First, breadth inside “compute” is widening. It’s not just the index proxies (FNGS) — the list is packed with semis and adjacent plumbing: PSI and SKYT on the chip side, STX in storage, FFIV and UI in communications gear, and a thick cluster of software infrastructure (ARQQ, CRWV, HOOD, NTSK) plus application names (LIF, ADEA, SPSC). APLD — data-center services — shows the strongest sustained interest of the tech cohort (35), and quantum pops twice (QTUM, RGTI) alongside AI tickers (IGPT), which says investors are leaning out the risk curve within the same compute theme we saw funded in lit and dark prints last week. Add the levered wrappers — METU (2x META), SMCX (2x SMCI), ORCX (2x ORCL) — and it looks like accounts are augmenting core megacap exposure with high-beta satellites rather than rotating away from the leaders.
Second, risk appetite is clearly turning up in Healthcare, with a decisive tilt to early-stage biotech. The highest composite score on the entire list is PROK (100), and it’s surrounded by ALDX, LENZ, LRMR, ONC, ETNB, MIRM, ATYR, ORIC, RXRX, and diagnostics GRAL; even tools and services (CBLL, TECX, BTSG, NUTX) are represented. Those are the kinds of tickers that typically light up when the tape is comfortable funding optionality again. It fits the “allocation first, chase second” read: broad beta and megacaps got the dollars, and now the speculative sleeves are catching a bid.
Third, there’s a visible barbell between growth risk and duration hedges. On one side you’ve got the compute and biotech complex; on the other you’ve got bond products across the curve — IBHE, GOVZ, VCEB, VTEI, VCRM — plus SVOL in the vol-carry bucket. That echoes last week’s pattern where credit and govies were used to scaffold equity adds rather than as an outright alternative. If those bond tickers keep recurring while tech/large-cap flow stays heavy, the message is the same: institutions are pressing risk with embedded shock absorbers.
Hard-asset hedges are quietly building. Materials and precious-metal names show up repeatedly — RGLD, ORLA, SPPP, TMQ, PPTA — and uranium (UUUU) appears in Energy. That’s consistent with a “just in case” overlay against policy or FX wobbles while the primary bet remains equities. It’s notable that these are royalty/precious-metal exposures and specialty miners rather than broad base-metal beta; that skews more toward convex protection than a pure global-growth call.
Financials are re-engaging beneath the surface. We have banks (VBTX, INTR, MUFG), mortgage finance (RKT, BETR), asset management (VCTR), and several capital-markets tickers (IREN, GLAD, MRX). Mortgage finance on a week with rates stabilizing makes sense, and regional banks alongside Japan’s MUFG points to selective re-risk rather than a wholesale sector grab. If Financials keep showing up while Friday’s sector dollars in that sleeve stay elevated, it adds durability to the beta rotation.
International risk is turning back on. There’s Peru (EPU), broad EM exposure (EET 2x EEM, FDNI), Europe (BBEU), foreign large growth (OSEA), and international value (DDWM). The mix suggests investors are supplementing US beta with diversified ex-US sleeves, again in line with the allocation tone we observed in SPY/QQQ plus core developed/EM ETFs.
A small but telling theme: wrappers expressing view concentration. Beyond the 2x/1x PLTR pair (PLTZ bear, PLTD bear), there are high-beta large-cap baskets (BBUS) and cap-weighted growth (ILCG) and mid-cap growth (IMCG) exposures. That combination usually appears when accounts already hold the anchors (SPY/QQQ) and are fine-tuning factor tilts around momentum and size.
Industrials are present, but the emphasis is on specialty equipment and defense adjacency, not broad cyclicals. ATS, SERV, MIR, STN sit alongside electrical-equipment names (BE, WWR, AMPX, GWH) and defense suppliers (AIRO, CDRE). That looks more like thematic capex and energy-transition hardware than a classic PMI bet, which again aligns with our view that this leg is about targeted allocation rather than a macro “reflation trade.”
Crypto touches show up, but they are balanced and tactical: BTCS, GDLC, BRRR, plus a PLTR bear wrapper and the META/SMCI bulls. That mix suggests positioning for dispersion and event-driven moves rather than a one-way risk binge. If equity leadership wobbles, these sleeves are the first likely to shrink, just as we framed in the broader playbook.
Netting it out, the TRV tape reinforces the same story we saw in last week’s flow: institutions are rebuilding exposure around large-cap tech and the compute stack, extending tentacles into higher-beta software and quantum, while simultaneously reopening the biotech risk window. The hedge leg is alive through bonds, precious-metal royalty/miners, and a sprinkling of vol carry. Financials and selective international ETFs are the second wave of allocation rather than the lead horse. If this week brings continued appearances by the bond sleeves alongside persistent tech and megacap entries — and we keep seeing leveraged wrappers tied to those leaders — the narrative remains “commitment with cushions,” not “gamble and go.”
VL Institutional Outliers™ (IO)
Institutional Outliers is a proprietary metric designed to spotlight trades that significantly exceed a stock’s recent institutional activity—specifically in terms of dollar volume. By comparing current trade size against each security's recent normalized history, the metric flags outlier events that may indicate sudden institutional interest but may be missed because the activity doesn’t raise any flags/alerts when comparing the activity against the ticker’s entire history. For example, it’s conceivable that a ticker today receives the largest trade it has had in the last 6 months but the trade is unranked and would therefore be missed by current alerts built off Trade Ranks. Use “Realized Vol” to identify tickers with large price displacement and to size your risk appropriately.
The highest-sigma prints cluster in three places: short-duration bonds, financials, and the precious-metals complex. On the bond side, USFR, BSV, VGSH, BND, SUB, VGIT, IAGG, SCHP and even SJNK/ANGL all screen 3–6.4 sigmas with de minimis price moves and microscopic realized vol. That is classic allocation or balance-sheet plumbing, not speculation—size shifting into Treasury bills/1–5y duration and IG sleeves while equities are being added elsewhere. The message rhymes with what we saw in lit/dark: institutions are pressing risk, but they are wiring in rate/credit ballast at the same time.
Financials pop broadly and mostly green. Regionals and money-center proxies appear all over the page: VBTX (6.47σ), HBAN (6.11σ), FNB, BBVA, IBN, plus capital-markets and asset-manager flow in RJF, AMP, TROW and FUTU. Prints were price-supportive intraday, and realized vol stayed contained. Taken with the week’s uptick in Financials dollars, this looks like re-engagement rather than de-risking—consistent with a market leaning back into beta while keeping funding spreads on a short leash.
The metals sleeve shows heavy, two-way positioning. GLD (~3.6σ), SLV (~3.0σ), GDX (4.3σ), GDXJ (4.2σ), SIL and royalty RGLD (4.9σ) all carried large notional with slightly negative closes, while hedges DUST (2x bear miners, +2.5%), GLL (1x bear gold, +1.4%) and UGL (2x bull gold, −0.6%) traded actively. That mix screams inventory shuffle and hedge maintenance rather than a clean directional bet—exactly what we expect when equities are in allocation mode and metals are serving as macro shock absorbers.
Growth beta also showed up in size. CGGR (6.44σ), IWF (3.57σ), VT (3.82σ), SCHB and SPYX all posted outlier dollars with small, positive closes—broad benchmark adds, not a narrow chase. Tech and compute were present but selective: SMH printed 3.33σ and FFIV 3.86σ; solar SHLS (5.93σ) edged higher; ORA and RNW in renewables/IPP were mixed. Net: the outlier tape supports “add core growth, keep the satellites disciplined.”
Industrials printed a surprisingly deep bench—OSK, DOV, CMI, TPC, ROAD, IESC, AIT, SAIA, VRSK—most with sub-0.5% price moves and moderate vol. That reads like capex/infrastructure portfolio maintenance rather than a macro reflation impulse, which matches the sector board: Industrials are participating, but they are not the leadership engine.
Vol products bled and saw outlier activity to the downside: VIXY (-5.4% on 3.33σ) and UVIX (-10.7% on 3.08σ). Pair that with the tame realized vol attached to many of the big bond and equity outliers, and it looks like dealers and macro funds were de-grossing volatility exposure into Friday’s liquidity surge—again, consistent with allocation, not fear.
Crypto and adjacent tickers were present but modest: BITF (+2.0% on 5.6σ), ETH (+0.9% on 2.76σ), MSTY (income wrapper) and TIGR/FUTU (brokerage) hint at selective deployment rather than broad risk. Consumer names were idiosyncratic—HSY flat, EBAY slightly lower, ABEV marginally higher—and don’t challenge the core narrative.
Bottom line on the IO list: it validates the “commitment with cushions” regime. Big, low-vol outliers in short-duration Treasuries and IG credit frame the risk budget, while banks, asset managers, growth ETFs and semis absorb incremental equity capital; metals and vol sleeves carry the hedges. That is exactly the posture we want to see if last week’s tech/large-cap leadership is going to stick without turning into a one-way chase.
VL Consensus Prices™
These are the most frequently traded #1-Ranked Levels in VL this week. Trades occurring at the highest volume price in a ticker’s history are significant because they represent institutional engagement at a key price memory level—where the market once found consensus. These areas act as liquidity hubs, enabling large players to transact efficiently, and often signal a reassessment of fair value. This activity may precede major moves, mark equilibrium zones, or reflect broader portfolio shifts, making these price levels important to watch even without yet knowing how price will resolve. (Note: many Bond products trade in such a tight range that they dominate the top positions and are therefore omitted to provide better clarity around other flows. The bonds data is still available in the VL platform.)
1. Financials and Real Estate: the center of gravity
Banks absolutely dominate the list — HBAN, KRE, VLY, SOFI, NU, SSB, RNST, PB, OZK, WBS, AUB, HTH — plus capital-market and asset-management proxies like PDI, CRBG, BAM. These tickers aren’t surging on speculative volume; they’re consolidating at prices where institutions have repeatedly transacted, which often precedes sustained re-rating higher. Add JEPI, SPYD, SPLG, XYLD, BUYW — yield-oriented large-cap products popular with allocators — and it’s clear that the “carry + beta” regime is back. This directly echoes the IO data: banks and asset managers seeing multi-sigma prints as institutions rotate back into Financials while still hugging income streams.
Real Estate is the other standout. The sheer density of REITs (KIM, EQR, NNN, OUT, PECO, TRNO, EXR, ADC, WELL, CURB, SILA, PCH, CUBE) shows deep liquidity coalescing around property income names. That’s a quiet vote of confidence in lower-for-longer yields — consistent with heavy outliers in short-duration Treasuries (USFR, BSV, VGSH) and the Fed’s dovish lean. Together, Financials and REITs form the backbone of a “yield stability + reflation light” narrative: not a high-growth chase, but a normalization trade where capital moves from defense (bonds) into coupon-bearing equities.
2. Technology breadth: volume confirmation of the compute theme
Technology accounts for more than one-third of the entire list, spanning semiconductors (QCOM, ON, TXN, STM, HIMX, VSH), software/application (PRO, DAY, DOCU, SAIL, ESTC, ALKT, PRGS, SPNS), infrastructure (HOOD, VRNT, AUR, BAI), and frontier compute (IONQ). Several of these — HOOD, ON, QCOM, TXN, STM — were already elevated in TRV or IO data, meaning their “liquidity nodes” are aligning with institutional flow.
Volume clustering here suggests institutional price acceptance rather than distribution. In simple terms, big money has found equilibrium around these prices, often a precondition for breakouts when volatility compresses. This affirms the earlier “compute complex” narrative: the market continues to fund AI, data-center, and semiconductor infrastructure, but with a more measured hand — reinforcing the idea that this is a re-risking cycle, not a manic melt-up.
3. Healthcare: selective participation
Healthcare’s representation is broad but cautious: CVS, VTRS, CORT, PODD, CLOV, AKBA, SMMT — a mix of mature providers, device makers, and small biotechs. It’s not an all-out speculative rotation like we saw in TRV’s biotech cluster (PROK, ALDX, LENZ, etc.); instead, these are liquidity consolidations in established tickers. That implies institutional hands are stabilizing exposure rather than chasing early-stage risk — consistent with the “commitment, not gamble” tone of the week.
4. Materials and Energy: hedges, not heroes
Materials prints — CX, GGB, AXTA, DD, ESI, LYB, SXC — track the metals/mining and chemicals complex that showed up in both TRV and IO as supportive hedges. Volumes here align with the same inflation-anchor narrative: gold and base-metal equities attracting liquidity even as prices drift, a sign of strategic rather than speculative positioning. Energy follows the same rhythm: CVE, PSX, TS, CTRA, VVV are high-volume, mid-beta producers or refiners. They’re trading at consensus levels, meaning participants agree on value but aren’t necessarily pressing higher — a healthy equilibrium for portfolios still hedging growth risk via resource exposure.
5. Communications and Consumer: brand franchises, not meme beta
Within Communications, DIS, AMX, IAS, IMAX, VIAV represent traditional franchises and infrastructure rather than social or high-volatility names. The liquidity around DIS and IAS in particular signals long-term money re-entering quality content and advertising channels — a counterpart to the renewed focus on large-cap tech and “compute” exposure. Consumer-facing tickers (K, PBPB, HGV, STRA, SPB) round out a “real economy” pocket that’s trading with conviction but not exuberance. It supports the idea that markets are rebuilding positions in dependable cash-flow names while speculative segments consolidate.
MIR Part 3: Framing-Up A Trade
When you line up the TRV watchlist (where activity is improving), IO outliers (where size is anomalous), and Consensus levels (where volume concentrates), the institutional tape is handing us a coherent playbook. Here’s the picture being painted this week:
Financials + Real Estate: Now the anchor sectors. Liquidity concentration and flow strength confirm institutions are re-establishing income and duration proxies within equities.
Technology: The growth leg of the barbell — compute, semis, and software show alignment between flow acceleration (TRV), outlier sizing (IO), and volume acceptance (Consensus).
Healthcare and Materials: Serving as selective offense and strategic hedge.
Bonds and Yield Products: Continue to absorb residual capital, anchoring risk budgets and keeping vol sellers funded.
In short, the entire market structure is maturing from “defensive carry” into “allocative risk.” Capital is no longer hiding; it’s settling in.
Institutions appear to be rebuilding balanced portfolios with equity beta expressed through large-cap tech and financials, yield captured through REITs and dividend ETFs, and tail protection via metals and bonds — exactly the configuration we’d expect in the early phase of a new cyclical upswing.
Positioning and tripwires
I want my base risk expressed in scalable, liquid beta and the compute barbell, with Financials and REITs as the second engine. Credit and short duration remain on as scaffolding; metals are the convex hedge. I will press when the market confirms acceptance and cut tactically if the scaffolding starts to wobble.
Offense: scale adds on acceptance above SPY 659–662 and QQQ 602–606 with breadth stable or improving. Trim into SPY 669–671 and QQQ 610–612 if up-volume or NH–NL stall; re-add only on clean re-acceptance.
Defense: de-risk on a daily close below SPY 653 or QQQ 598, or if HYG/LQD fade while SPY/QQQ push (distributive tell). If Financials/REITs lose their new high-volume shelves (e.g., KIM/EQR, KRE regionals), I rotate a couple of points back into short duration and metals until sponsorship reappears.
Sample portfolio (100%)
--------------------------------------------------
Core index liquidity — 28%
SPY 16%, QQQ 10%, IVV 2%
Justification: largest lit + dark-pool sponsorship and easiest to scale. Use these as the throttle for gross exposure around VL levels.
--------------------------------------------------
Compute/AI barbell — 18%
SOXX 6%, NVDA 4%, AAPL 3%, MSFT 3%, SMH 2%
Justification: dollars concentrated in megacap platforms and semis with broadening participation (storage, comms, infra). ETFs (SOXX/SMH) carry the breadth; single names capture platform torque. Add on QQQ acceptance; harvest at 610–612 if momentum stalls.
--------------------------------------------------
Financials — 10%
XLF 6%, KRE 3%, RJF or TROW 1%
Justification: banks and asset managers printed outlier and consensus activity; they are the second engine when rates steady. KRE gives cyclicality; XLF gives balance-sheet scale. Keep unless KRE rolls below its new shelf while 10y backs up hard.
--------------------------------------------------
Real estate income — 10%
XLRE 4%, EXR 2%, WELL 2%, KIM 1%, EQR 1%
Justification: multiple REITs set highest-ever volume-by-price nodes; that is institutional acceptance around new “fair value.” Provides yield and duration sensitivity without leaving equities. Pair with short duration to dampen rate shocks.
--------------------------------------------------
Credit ballast — 10%
LQD 6%, HYG 4%
Justification: both carried heavy dark-pool and sweep dollars. They should be firm on up-equity days; if they leak while SPY/QQQ rise, treat the equity move as distributive and slow adds.
--------------------------------------------------
Short-duration Treasuries — 5%
USFR 3%, VGSH 2%
Justification: the IO sheet showed multi-sigma size here with tiny vol. This is working capital for pulls, your dry powder and shock absorber if rates twitch.
--------------------------------------------------
Precious metals convexity — 3%
GLD 2%, RGLD 1%
Justification: two-way flow in metals/miners with light drift lower; keep a toe for policy or FX surprises. Add only if credit softens or DXY rolls.
--------------------------------------------------
Industrials/capex sleeve — 3%
OSK 1%, DOV 1%, CMI 1%
Justification: consensus levels in specialty machinery and distributors. It is not a reflation chase; it is measured exposure to ongoing capex.
--------------------------------------------------
Healthcare selective — 3%
XBI 2%, CVS or PODD 1%
Justification: TRV showed strong biotech interest; use XBI for diversified optionality and one quality cash-flow name for ballast. Trim if QQQ loses 602–606.
--------------------------------------------------
International diversifiers — 4%
BBEU 1.5%, OSEA 1.5%, EEM 1%
Justification: outliers and TRV showed renewed non-US interest. Keep small, additive to beta without crowding liquidity.
--------------------------------------------------
Energy cash-flow — 2%
PSX 1%, CVE 1%
Justification: consensus-level participation in refiners/producers; hold for cash yield and inflation hedge, not for a crude beta chase.
--------------------------------------------------
Crypto toggle — 1%
IBIT 0.6%, ETHE 0.4%
Justification: maintain optionality while small; scale only with QQQ acceptance and firm credit.
--------------------------------------------------
Hedges — 3%
SH 1.5%, PSQ 1%, VIXY 0.5%
Justification: live until acceptance is proven and NH > NL with 50d cohorts improving. Bleed these first on strength and redeploy to core beta/semis.Why this construction works
The sleeves mirror where institutions actually transacted. Core beta and compute are the sponsored risk; Financials/REITs are where consensus price acceptance just formed; credit and short duration are the scaffolding that kept realized vol muted in the IO sheet; metals provide convexity; small satellites in industrials, healthcare, and international round out factor balance. The mix is elastic: increase Core/Compute when SPY 659–662 and QQQ 602–606 flip to support with breadth confirmation; rotate 2–3% back to short duration and GLD if HYG/LQD wobble while equities climb.
Execution color
Stage into Core/Compute around prior heavy nodes and let the market prove acceptance. If we gap above the bands, trim into magnets first and buy back on the first constructive retest. For Financials/REITs, buy against last week’s high-volume shelves with tight invalidations below key VL levels. Credit adds run opposite equity entries to keep portfolio vol stable. Metals adds only on policy/rate catalysts or if credit flashes caution. Keep crypto tiny and tactical - BTC could be putting in a turn here but we don’t need to be heroes - let price prove itself first.
Bottom line
This is an allocation tape with built-in airbags. Let large-cap beta and the compute stack carry the upside, anchor it with banks and income real estate, and keep short duration, IG/HY, and a slice of metals on so you can stay in the trade when the tape breathes.