Market Momentum: Your Weekly Financial Forecast & Market Prep
Issue 65 / What to expect Oct 13, 2025 thru Oct 17, 2025

In This Issue
Weekly Market-On-Close Report: All the macro moves, market drivers, and must-know narratives—covered in less than five minutes.
Weekly Benchmark Breakdown: Our weekly intelligence report on major indices cuts through the index-level noise to uncover participation, momentum, and structural integrity and tell you whether markets are rising on solid ground or skating on thin breadth. This is where bull markets prove themselves—or quietly start to unravel.
The Latest Investor Sentiment Readings: Track the emotional pulse of the market with our curated dashboard of sentiment indicators. From fear-fueled flight to euphoric overreach, this week's readings reveal whether investors are cautiously creeping in—or stampeding toward the exits.
Institutional Support & Resistance Levels For Major Indices: Exactly where to look for support and resistance this coming week in SPY, QQQ, IWM & DIA
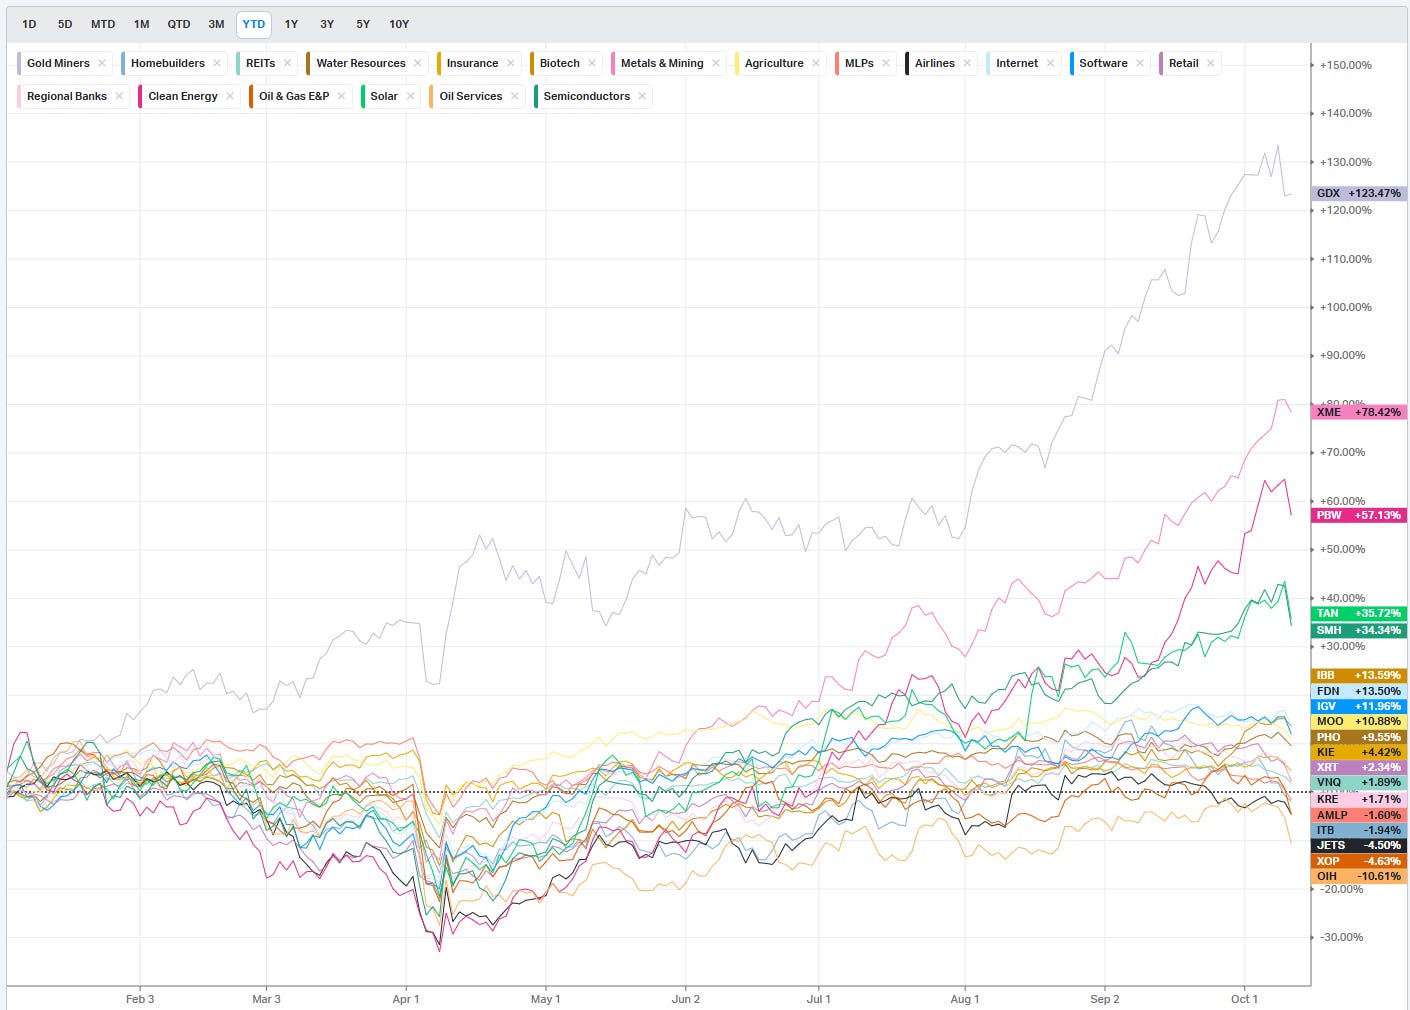
Normalized Performance By Thematics YTD: Which corners of the markets are beating benchmarks, which are overlooked and which ones are over-crowded!
Key Econ Events & Earnings On-Deck For This Coming Week
Market Intelligence Report: Track the real money. This section breaks down where institutions are placing their bets—and pulling their chips. You'll get a sector-by-sector view of flows, highlighting the most active names attracting large-scale buying or selling. We go beyond the headlines and into the tape, surfacing the week’s most notable block trades and sweep orders, both on lit exchanges and hidden dark pools. Whether you're following momentum or fading crowded trades, this is your map to where size is moving and why it matters.

Weekly Market-On-Close Report
Records, tariffs, and a reset at the pivots
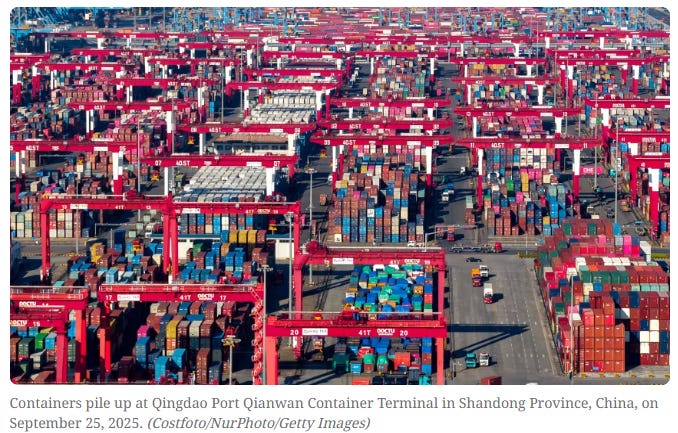
U.S. equities finished the week with the kind of sharp, policy-driven reversal that reminds everyone why risk management matters. On Friday, the S&P 500 Index (SPY) closed down -2.71%, the Dow Jones Industrials Index (DIA) closed down -1.90%, and the Nasdaq 100 Index (QQQ) closed down -3.49%. December E-mini S&P futures (ESZ25) fell -2.61%, and December E-mini Nasdaq futures (NQZ25) fell -3.39%. What began as a session supported by lower yields ended as a broad de-risking when President Trump threatened a “massive increase” of tariffs on Chinese goods and said there seemed to be no reason to meet Chinese President Xi Jinping at the APEC meeting in South Korea later this month. Stocks gave up an early advance, the S&P 500 and Nasdaq 100 slipped to two-week lows, and the Dow Jones Industrials fell to a one-month low.
The setup into the break was deceptively calm. Stocks initially moved higher Friday, with the Nasdaq 100 posting a new all-time high. Lower bond yields offered support after dovish remarks from Fed Governor Christopher Waller and St. Louis Fed President Alberto Musalem, both of whom signaled openness to additional Fed rate cuts. The 10-year T-note yield then fell to a three-week low of 4.04% as the tariff headline hit, and selling pressure broadened. By the close, the day’s tone had shifted from “soft landing optimism” to “repricing policy risk,” with growth leading the downside.
The macro tape had already been complicated by the government shutdown, which is now into its second week and delaying key reports. The Bureau of Labor Statistics (BLS) said it will release the September consumer price report on October 24 if the shutdown continues into next week; that report had been scheduled for October 15. Meanwhile, the University of Michigan’s October consumer sentiment index edged down -0.1 to a five-month low of 55.0, stronger than expectations of 54.0. One-year inflation expectations unexpectedly slipped -0.1 to 4.6% versus an expected 4.7%, and five-to-ten-year expectations held at 3.7%. Those details captured the market’s pre-Friday mood: cautious but constructive, anchored by the idea that inflation is drifting lower, growth is holding, and the Fed is prepared to ease again if the labor market falters.
Fed speakers leaned that way. Fed Governor Christopher Waller said, “The labor market is weak,” and he is open to quarter-point interest rate cuts at coming FOMC meetings. St. Louis Fed President Alberto Musalem added that he is “open-minded about a potential further reduction in interest rates to provide further insurance against labor market weakening.” The market took them at their word. The odds for a -25 bp cut at the October 28–29 FOMC meeting rose to 97% by the end of the week.
That is the context in which Friday’s tariff threat landed. Policy risk intersected with a market that had been making records and leaning heavily on artificial intelligence enthusiasm. The divergence was stark: early strength gave way to a policy shock, and the adjustment was swift.
Breadth, positioning, and price: how the move developed
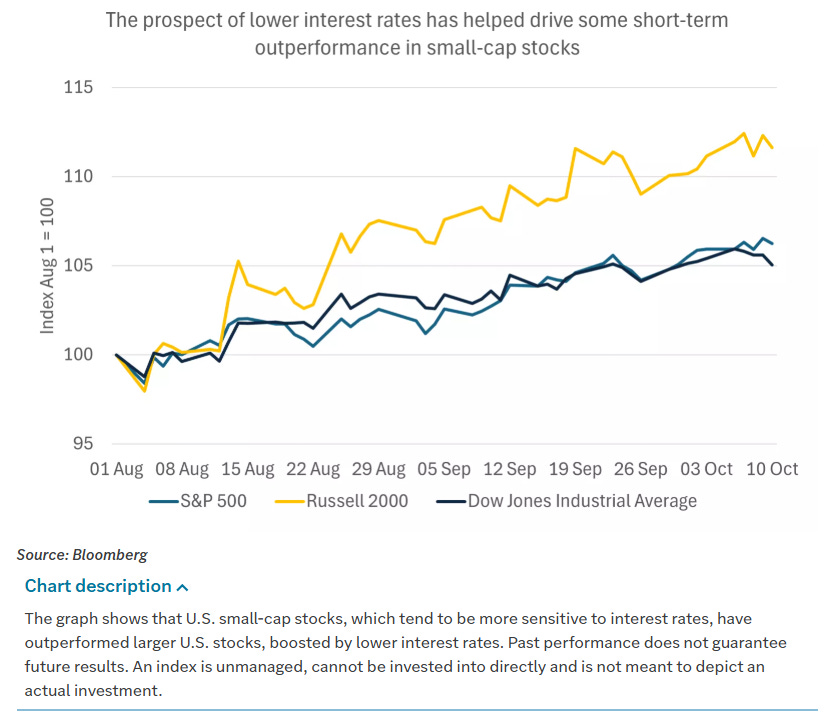
Into Friday morning, the S&P 500 was up 0.3% for the week, supported by large caps and Technology leadership. Equal-weight measures were softer, down about 1%, with meaningful divergence in small caps: the S&P 600 down almost 2% while the Russell 2000 was only down 0.3%. Beneath the surface, the credit complex had already started to wobble: bankruptcies at subprime auto lender Tricolor and auto parts supplier First Brands began to pressure consumer lenders and private credit proxies.

Synchrony Financial (SYF) and Capital One (COF) were each down over 5% for the week, and private equity/credit names Blackstone (BX), KKR (KKR), and Apollo Global Management (APO) showed similar declines. Those signals didn’t derail the broader advance, but they did hint at fragility if a catalyst appeared.
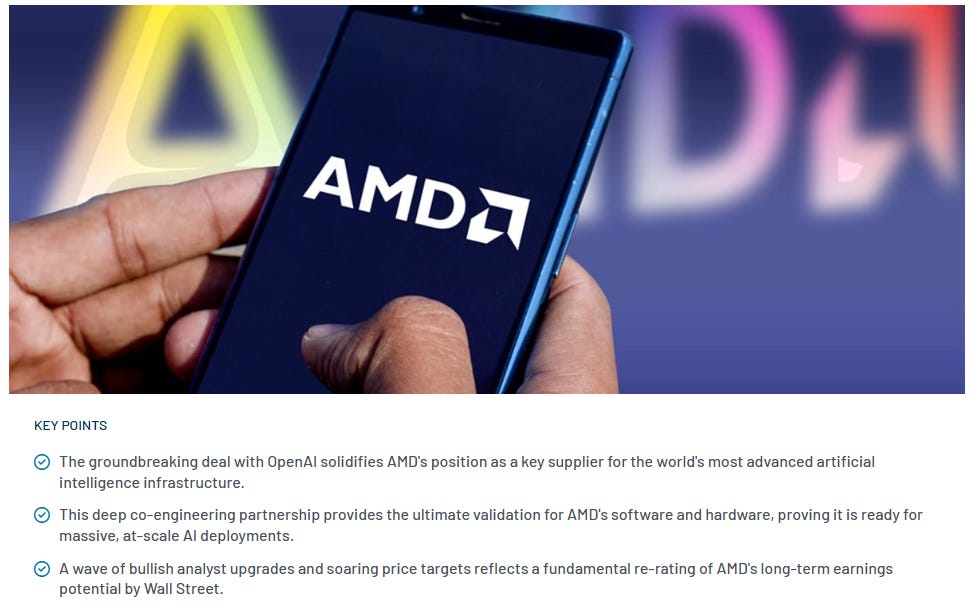
AI-linked momentum was still powerful. Advanced Micro Devices (AMD) rallied more than 20% on Monday after announcing a partnership with OpenAI that included OpenAI purchasing 6 gigawatts of AI chips from AMD and receiving warrants to purchase up to 160 million AMD shares (10% of the company). AMD subsequently climbed even further, at one point up ~40% on the week. Reports also suggested Elon Musk’s xAI was close to raising $20 billion to acquire more AI infrastructure, including GPUs, with Nvidia (NVDA) among the investors. Oracle (ORCL) came under modest pressure on chatter that renting out Nvidia chips was weighing on profitability. The circularity of AI supply and demand—suppliers investing in customers and vice versa—was growing more conspicuous, but until Friday, it had not checked the theme or the market’s drift to new highs.
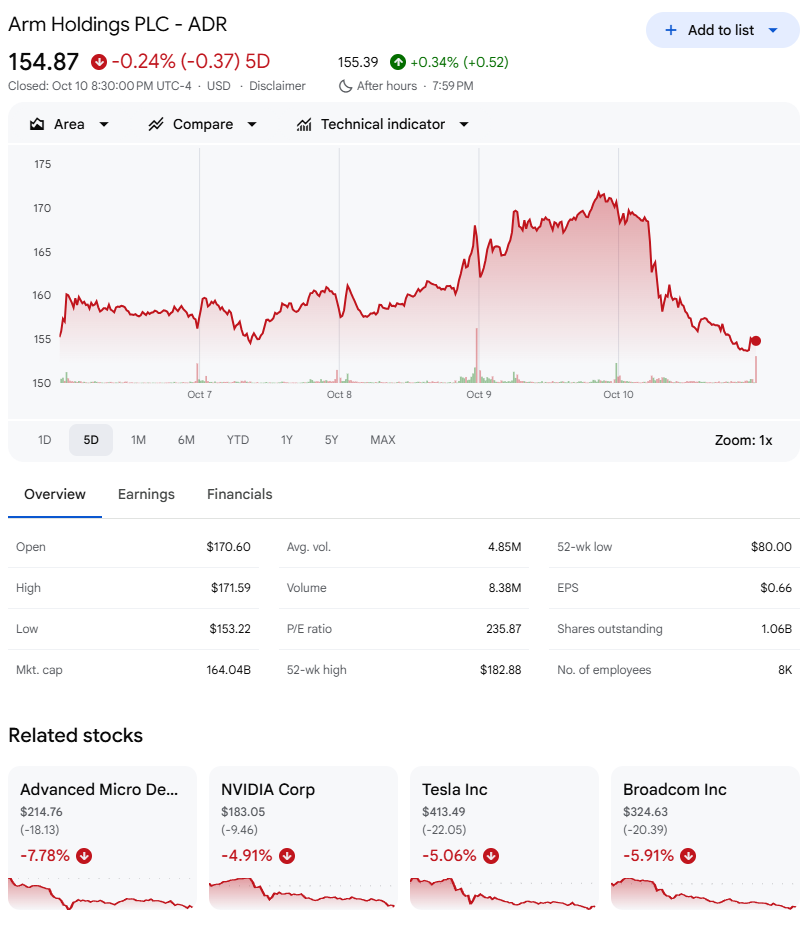
That changed when semiconductors and the megacap leaders became the shock absorbers. Chipmakers fell sharply Friday: ARM Holdings (ARM) closed down more than -9%, Microchip Technology (MCHP) and ON Semiconductor (ON) more than -8%. AMD, NXP Semiconductors (NXPI), and Qualcomm (QCOM) slumped more than -7%. Lam Research (LRCX), KLA Corp (KLAC), and GlobalFoundries (GFS) dropped more than -6%. Analog Devices (ADI), Broadcom (AVGO), Micron Technology (MU), and Marvell Technology (MRVL) fell more than -5%. ASML Holding (ASML) closed down more than -4%. The megacap complex added weight: Tesla (TSLA) fell more than -5%, Amazon (AMZN) more than -4%, Nvidia (NVDA) more than -4%, Apple (AAPL) and Meta Platforms (META) more than -3%, Microsoft (MSFT) more than -2%, and Alphabet (GOOGL) more than -1%.
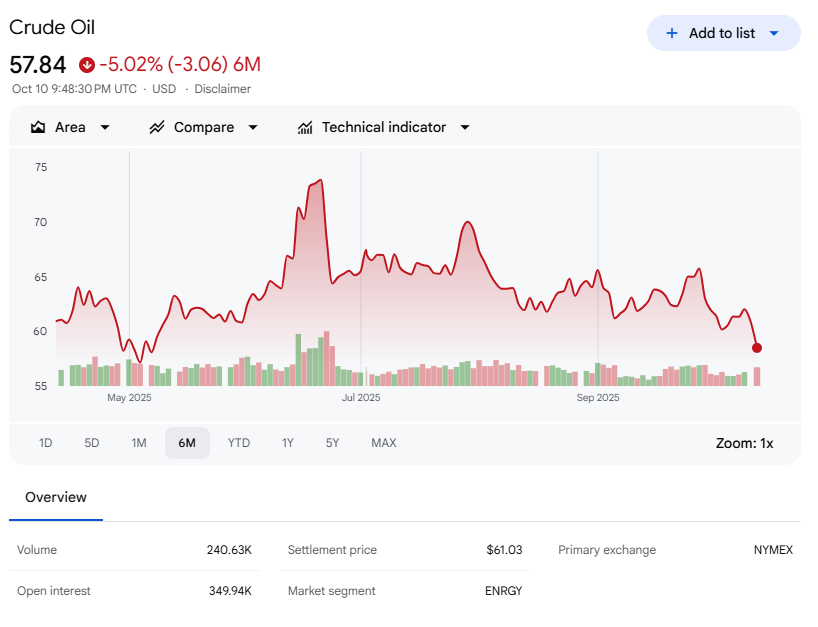
Energy joined the downdraft as WTI crude fell more than 4% to a five-month low. APA Corp (APA) sank more than -7%, Halliburton (HAL) more than -6%, Baker Hughes (BKR), Devon Energy (DVN), and Occidental Petroleum (OXY) more than -5%, and ConocoPhillips (COP) more than -4%. Marathon Petroleum (MPC), Phillips 66 (PSX), and Diamondback Energy (FANG) were each down more than -3%. Venture Global (VG) dropped more than -24% on potential multibillion-dollar damages tied to a BP arbitration over LNG shipments. Levi Strauss (LEVI) fell more than -12% on full-year adjusted EPS guidance of $1.27–$1.32 versus a $1.31 consensus midpoint. Mosaic (MOS) lost more than -9% after preliminary phosphate sales volumes of 1.70 million tons missed the 1.83 million ton consensus. Doximity (DOCS) slid more than -9% after a JPMorgan Chase downgrade to underweight from neutral with a $62 target, and Align Technology (ALGN) more than -4% after a Jefferies downgrade to hold from buy.
There were bright spots. Applied Digital (APLD) rallied more than +15% on advanced discussions with a hyperscaler for its second North Dakota data center. Elastic (ESTC) rose more than +5% after a $500 million buyback authorization and an increased FY2026 sales outlook to $1.697–$1.703 billion from a prior $1.697–$1.689 billion range. PepsiCo (PEP) closed up more than +3%, adding to Thursday’s +4% gain, after Q3 net revenue of $23.94 billion beat the $23.85 billion consensus. CVS Health (CVS) gained more than +1% after final 2026 Medicare Advantage star ratings were released and were seen as likely “a relief” for investors. Amcor (AMCR) climbed more than +1% after forecasting full-year adjusted EPS of $0.80–$0.83 versus a $0.80 consensus.
Rates, the Fed, and the shutdown: why yields fell and why that matters
Treasuries rallied. December 10-year T-notes (ZNZ5) closed up +21 ticks Friday, and the 10-year yield fell -8.3 bp to 4.055% after touching a three-week low of 4.042%. The move reflected dovish Fed commentary and sliding inflation expectations—Friday’s 10-year breakeven inflation rate declined to a 2.25-month low of 2.316%—and accelerated as stocks sold off on tariff threats. European yields moved lower in sympathy: the 10-year German bund fell to a three-week low of 2.633% and finished down -5.9 bp at 2.644%, and the 10-year UK gilt fell to a two-week low of 4.664% and finished down -7.1 bp at 4.675%.
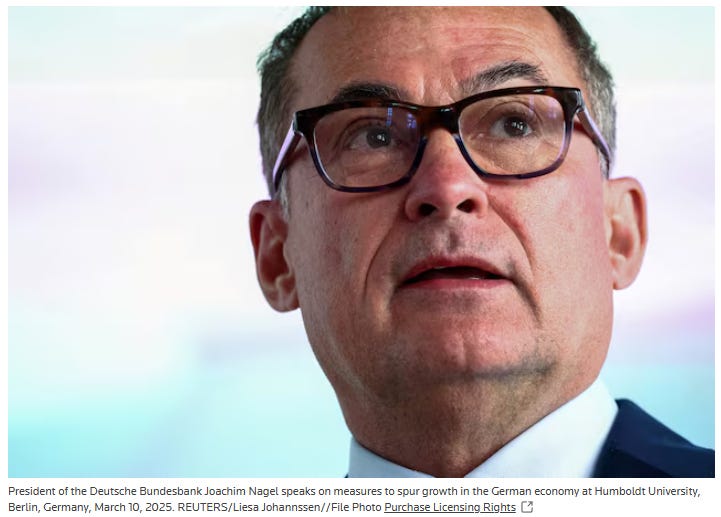
ECB Governing Council member and Bundesbank President Nagel said “the bar is rather high” to alter his view that the current monetary stance is appropriate. ECB Governing Council member Kazaks said policy is around neutral with inflation contained and the current 2% rate appropriate. Swaps are discounting a 2% chance of a -25 bp ECB rate cut at the October 30 meeting.
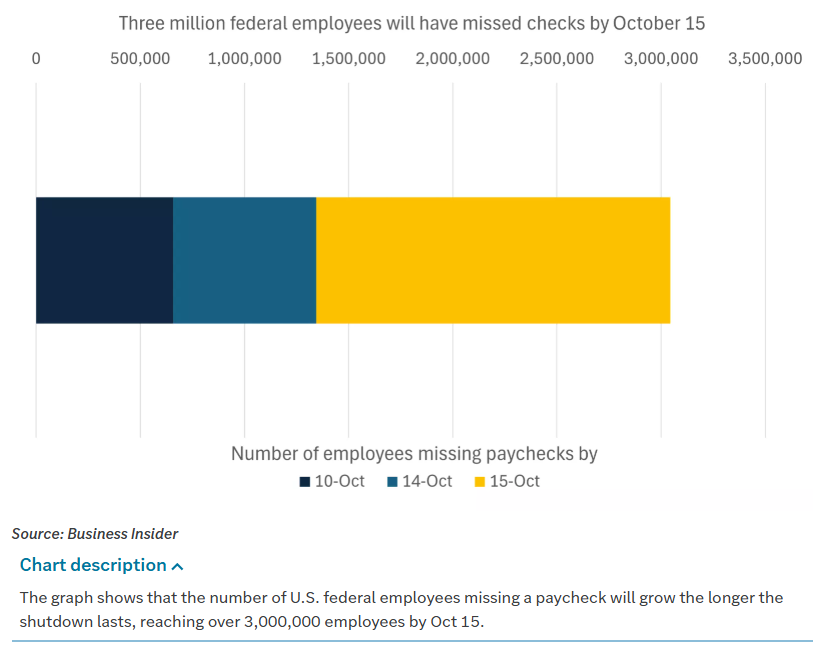
The government shutdown added a second tailwind to bonds. Concerns about additional job losses, reduced consumer spending, and a weaker economy provide a rationale for continued Fed cuts if the shutdown persists. The shutdown is now in its second week. It is weighing on market sentiment and delaying key reports, including the last two weeks of initial jobless claims, Tuesday’s August trade report, and last Friday’s monthly payroll report. The BLS said it will release September CPI on October 24 if the shutdown extends into next week; the original date was October 15. The White House warned that a prolonged shutdown could force broad dismissals of employees in programs that do not align with administration priorities. Bloomberg Economics estimates that 640,000 federal workers will be furloughed during the shutdown, expanding jobless claims and pushing the unemployment rate up to 4.7%.
Even without fresh labor data, the policy signal from the September FOMC minutes was clear enough: “most participants observed that it was appropriate to move the target range for the federal funds rate toward a more neutral setting because they judged that downside risks to employment had increased.” A few participants saw merit in holding steady at that meeting or said they could have supported such a decision, underscoring that opinions differ about how restrictive policy remains and where the balance of risks lies. For markets, the clean takeaway is the same one reflected in pricing: a 97% chance of a -25 bp cut in October.
Overseas equities: records, reversals, and policy sensitivity
Overseas markets finished lower Friday. The Euro Stoxx 50 closed down -1.68%. China’s Shanghai Composite closed down -0.94%. Japan’s Nikkei Stock 225 closed down -1.01%. Europe set fresh records earlier in the week before the same tariff shock hit just ahead of the Friday close. France struggled early after the resignation of yet another Prime Minister—Lecornu’s departure on Monday marked the third since December and the shortest modern tenure at less than one month—before stabilizing alongside broader European indices. European rates initially jumped on French political headlines, then fell with global yields. German data were weak: August Factory Orders declined unexpectedly and Industrial Production dropped more than expected. Asia’s week was holiday-affected, with China mainland markets closed until Thursday and Hong Kong under pressure with Technology stocks (including Alibaba (BABA) and Baidu (BIDU)) down about 10% on valuation worries. Japan outperformed earlier in the week; equities and JGB yields rose after the election of Sanae Takaichi as LDP leader and likely new Prime Minister on a pro-growth platform, and finance officials jawboned yen weakness with implied intervention risk. Emerging markets were largely holiday-sidelined; South Korea was closed until Friday. Argentina popped after the U.S. bought Argentine pesos and opened a swap line to stabilize markets.
Commodities and crypto: energy slips, precious metals run, and beta cracks
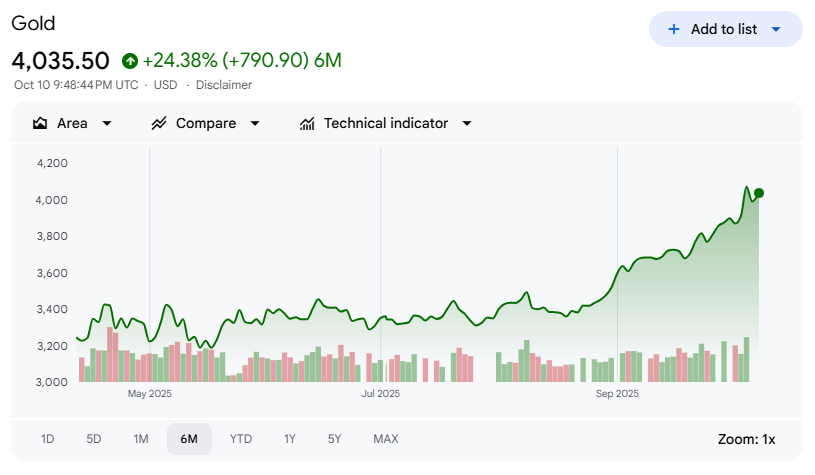
Energy weakened into the week’s end. ICE Brent had rallied off $64 lows and challenged the 50/100-day moving averages around ~$66.50 before the trade-policy bonfire reignited. The ceasefire news Friday had already taken some bid out of crude; the tariff headline accelerated a slide back to June lows. Metals diverged: gold set another all-time high above $4,000 earlier in the week, then dipped sharply Thursday as overbought conditions emerged, only to catch a new bid as the China turmoil re-ignited safe-haven demand.
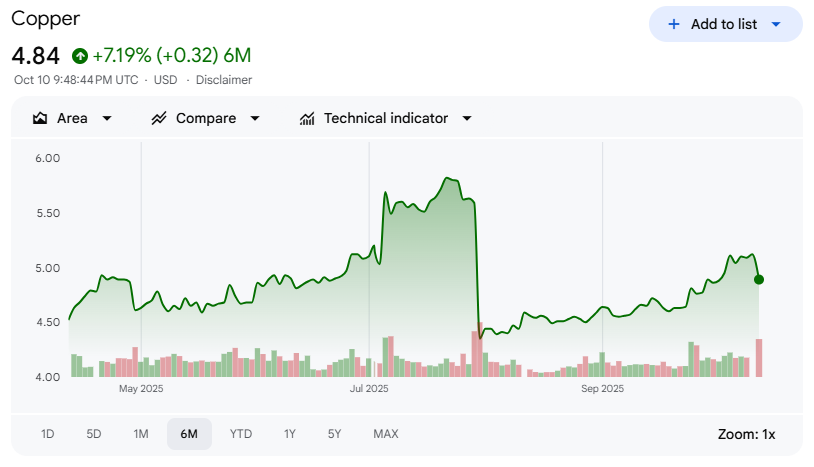
Copper, which had been supported by production concerns, fell to its 100-day moving average by Friday’s close. Agricultural products were broadly lower, with export sales and the monthly WASDE delayed by the shutdown. Crypto fell sharply with Friday’s risk-off move; major coins mirrored the equity de-risking.
Data and the policy backdrop: what we know, what we don’t, and what comes next
The University of Michigan’s preliminary October Index of Consumer Sentiment registered 55.0, essentially unchanged and beating expectations. Current sentiment rose from 60.4 to 61.0; expectations fell from 51.7 to 51.2. One-year inflation expectations edged down to 4.6% from 4.7% in September; long-run expectations stayed at 3.7%. The New York Fed’s consumer inflation expectations were relatively unchanged, unemployment expectations moved higher, and a separate Fed report showed consumer credit rose by just 0.1% y/y in August, the smallest increase since February and a sharp pullback from July’s 4.3% increase. Revolving credit fell 5.5%. That mix points to a consumer that has held up overall but with visible pressure at the lower-income cohorts, where strains have been persistent and significant.

The September Logistics Manager’s Index fell to 57.4 from 59.3, the lowest reading since March. Transportation Utilization printed 50—flat and the first time the subindex has been this low in September, a month that is typically busy for freight. That dovetails with the lack of hiring in last week’s Challenger report when seasonal additions would normally ramp. In aggregate, the data flow argues for vigilance: activity is cooling at the margin, the consumer is mixed, and the shutdown’s data gaps complicate real-time macro reads.
The FOMC minutes showed what speeches underscored all week: the likely path of rates is lower. The phrasing mattered: “most participants observed” policy should be moved toward neutral given rising downside employment risk and diminished upside inflation risk. But a few saw value in waiting. That lack of unanimity explains why markets are so sensitive to incremental labor and inflation prints: with the unemployment side of the mandate suddenly less airtight and inflation drifting lower but still sticky in places, small surprises can move expectations.
For the near term, the market’s modal path is straightforward. The shutdown deprives the Fed of timely labor data, the BLS intends to release September CPI on October 24, and the market has a 97% probability on a -25 bp cut for October 28–29. If CPI is a large upside surprise, the path gets more complicated; if CPI is in line with the softening seen in surveys, the cut looks locked. Either way, Friday’s tariff shock injected a separate volatility source that sits orthogonal to the rates story. Trade policy remains a swing factor.
Looking ahead
The desk is tracking the China trade situation closely. The Senate returns Tuesday. The CPI is scheduled for October 24. The Fed’s blackout arrives at the end of the week, and there is a full slate of speakers before then. Monday is Columbus Day with equities open. Q4 earnings season begins with Financials leading. Oracle (ORCL) and Salesforce (CRM) will host large tech/customer conferences next week, which means more AI news flow.
Rising corporate earnings expectations still anchor the intermediate story. Bloomberg Intelligence notes that more than 22% of S&P 500 companies have guided above consensus for Q3, the highest in a year. Q3 profits are expected to rise +7.2%, the smallest increase in two years, and sales growth is projected to slow to +5.9% from 6.4% in Q2. Those are “good-enough” numbers that, paired with rate cuts, leave room for upside—provided the policy shocks do not metastasize. Earnings season is upon us. JPMorgan Chase (JPM) is slated to kick things off on October 14. In a week hamstrung by the shutdown’s data vacuum, earnings will likely do more than their usual share of sentiment shaping.
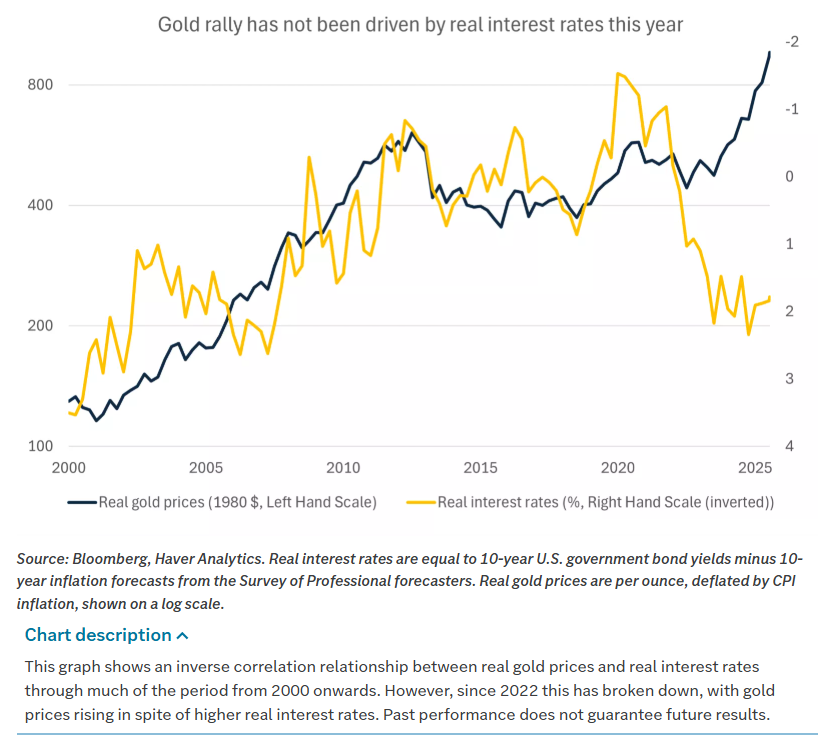
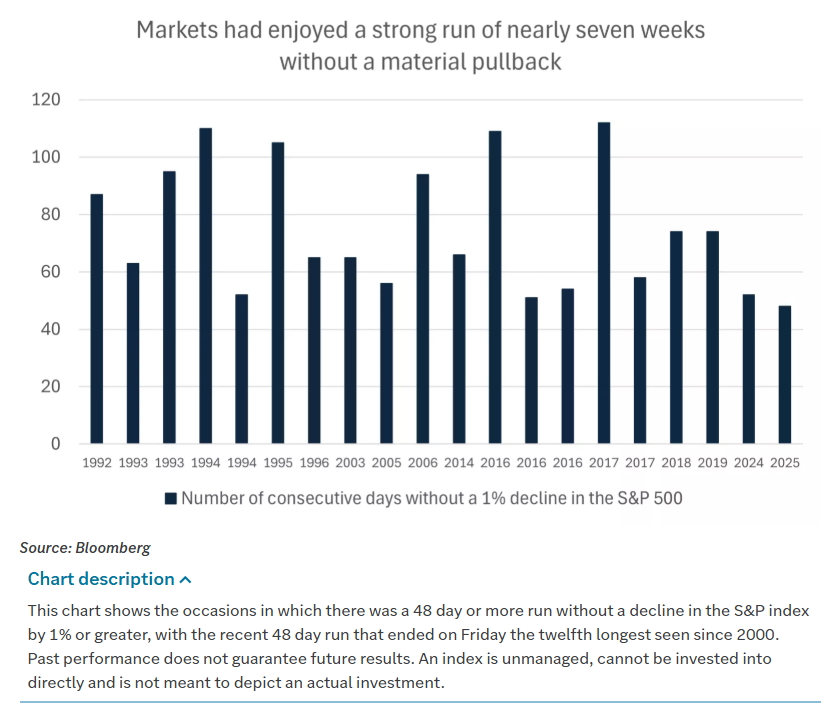
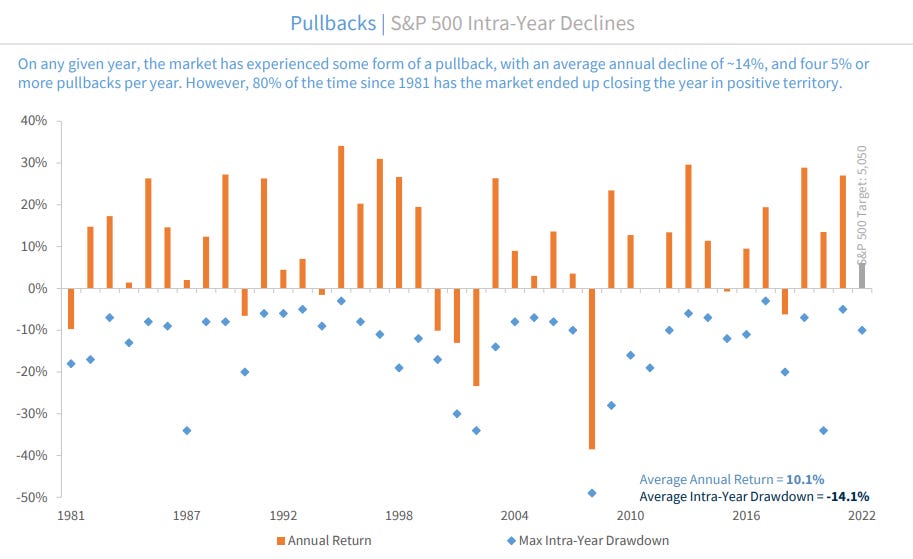
The key takeaways are simple enough. The government shutdown has entered its second week, and the economic impacts grow with each additional day. Markets are largely discounting the shutdown and focusing on AI, rates, and trade policy. Record gold prices are one lens on political dysfunction and longer-term fiscal concerns. Friday’s selloff may inaugurate a more volatile October after a strong run. Volatility is normal; dips of 5%–10% occur three to four times per year on average. If the policy noise cools and earnings hold, those dips will present opportunities for buyers or for diversifying portfolios. If the noise grows louder, those dips will require more selectivity and tighter risk controls.
The longer-horizon view remains constructive. The outlook for economic growth and corporate profits into 2026 is still positive, likely helped by easing trade-policy uncertainty, tax cuts for households and businesses, and lower interest rates. The path will not be linear. But with clear levels to trade against, visible catalysts on the calendar, and a policy mix that still points to easier financial conditions, the discipline that got the market to records remains the discipline that will matter most in the weeks ahead.

Weekly Benchmark Breakdown
Short-term washout, longer-term trend still hanging on
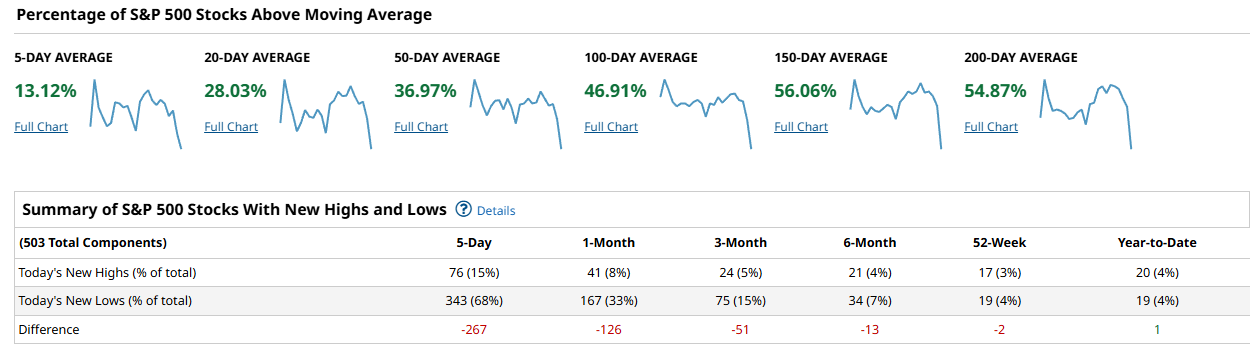
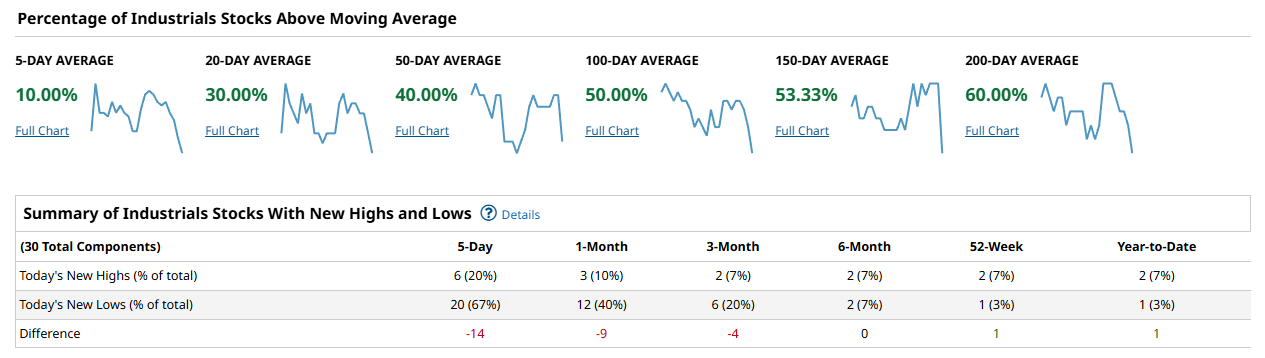
Breadth this week leans corrective rather than thrusty. Across major cohorts, only about one in ten names sits above the 5-day average and fewer than a third are above the 20-day. That is classic short-term exhaustion. At the same time, the 150- and 200-day cohorts remain near or above the mid-50s, which says the bigger trend has not fully broken. New lows swamped new highs on the 5-day lookback in every universe, but longer lookbacks are stabilizing to slightly positive in the leadership complex. Risk tone: cautious, with respect for the longer-term uptrend that is bending, not yet snapped.
SPX: The S&P 500 shows 13.12% above the 5-day, 28.03% above the 20-day, and 36.97% above the 50-day. Participation improves into the intermediate windows with 46.91% above the 100-day, 56.06% above the 150-day, and 54.87% above the 200-day. New highs minus new lows is decisively negative on short windows: -267 over 5-days, -126 over 1-month, and -51 over 3-months. Damage eases further out at -13 over 6-months, nearly flat at -2 over 52-weeks, and marginally positive year-to-date at +1. Read that as a market that just took a hard short-term hit while the long base still holds a slim majority.
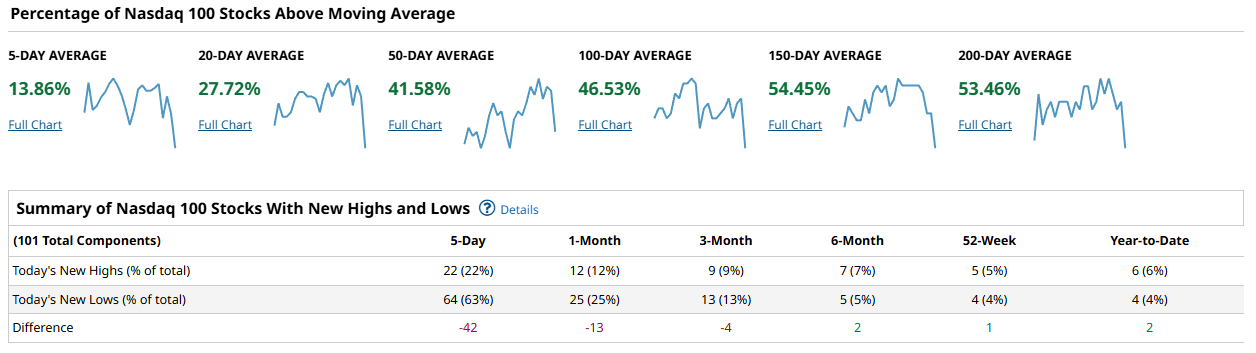
NDX 100: The Nasdaq 100 echoes the same shape but with slightly better resiliency. Only 13.86% are above the 5-day and 27.72% above the 20-day, but 41.58% clear the 50-day and 46.53% the 100-day. The 150- and 200-day cohorts sit at 54.45% and 53.46%. New highs minus lows runs -42 (5-day), -13 (1-month), and -4 (3-month), then flips to +2 (6-month), +1 (52-week), and +2 year-to-date. Leaders were hit, but the longer ledger is still modestly positive, consistent with a corrective pause within a still-viable uptrend.
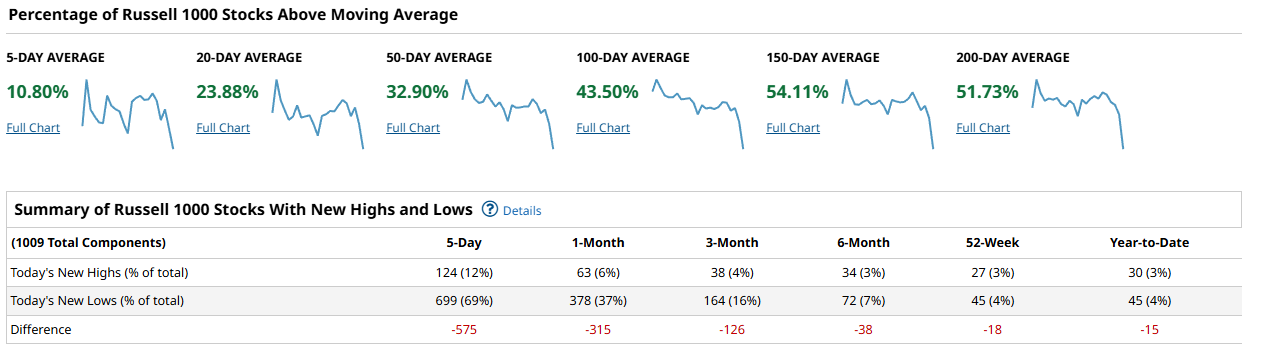
Russell 1000: The broad large-cap universe is where the stress is loudest. Only 10.80% are above the 5-day and 23.88% above the 20-day, with 32.90% above the 50-day and 43.50% above the 100-day. Longer-term participation remains constructive at 54.11% above the 150-day and 51.73% above the 200-day. New highs minus lows shows a deep short-term hole: -575 (5-day), -315 (1-month), and -126 (3-month). Even the longer windows are still negative at -38 (6-month), -18 (52-week), and -15 year-to-date. The message is clear: the average stock remains under pressure and has not yet reclaimed longer-term momentum the way the megacaps have.
DJIA: Participation sits at 10.00% above the 5-day, 30.00% above the 20-day, 40.00% above the 50-day, 50.00% above the 100-day, 53.33% above the 150-day, and 60.00% above the 200-day. New highs minus lows is -14 (5-day), -9 (1-month), -4 (3-month), then 0 (6-month), +1 (52-week), and +1 year-to-date. Short-term weakness is real, but the long base is still intact and even slightly improving at the longest horizons.
Synthesis: Cap-weighted leadership is bruised but not broken; the NDX still carries slightly positive longer-term highs/lows, while the SPX is roughly flat on a 52-week and YTD basis. The broad market is the drag: the Russell 1000 prints heavy negative new-lows breadth across most lookbacks and lags materially on 20- and 50-day participation. To convert this from a pullback to a fresh up-leg, look for the 50-day cohorts to push decisively north of 60% and for daily new highs to consistently outnumber new lows across SPX and R1K. If instead 150-/200-day cohorts slip back below 50% while new lows persist, concern shifts from routine correction to trend deterioration and perhaps the start of a broader and more persistent reversal.
Playbook: Respect the near-term weakness and keep risk light until participation improves. Favor relative strength that already shows 50- and 100-day support, which right now leans toward the sturdier corners of large-cap growth rather than the average stock. Avoid low-quality breadth sinks until the Russell 1000’s 20-day cohort climbs back toward 40% and its 5-day new-highs minus new-lows stops printing deep negatives. For confirmation that buyers are regaining control, watch for SPX and NDX 20-day cohorts to reclaim the 40% handle, 50-day cohorts to press toward 50% and rising, and for the short-window highs/lows to flip positive and stay there for several sessions.
Bottom line: Short-term breadth is washed out while longer-term participation still holds a slim majority, so treat this as a correction within an aging uptrend until the 50-day cohorts and highs/lows confirm a renewed advance.

Investor Sentiment Report
Insider Trading
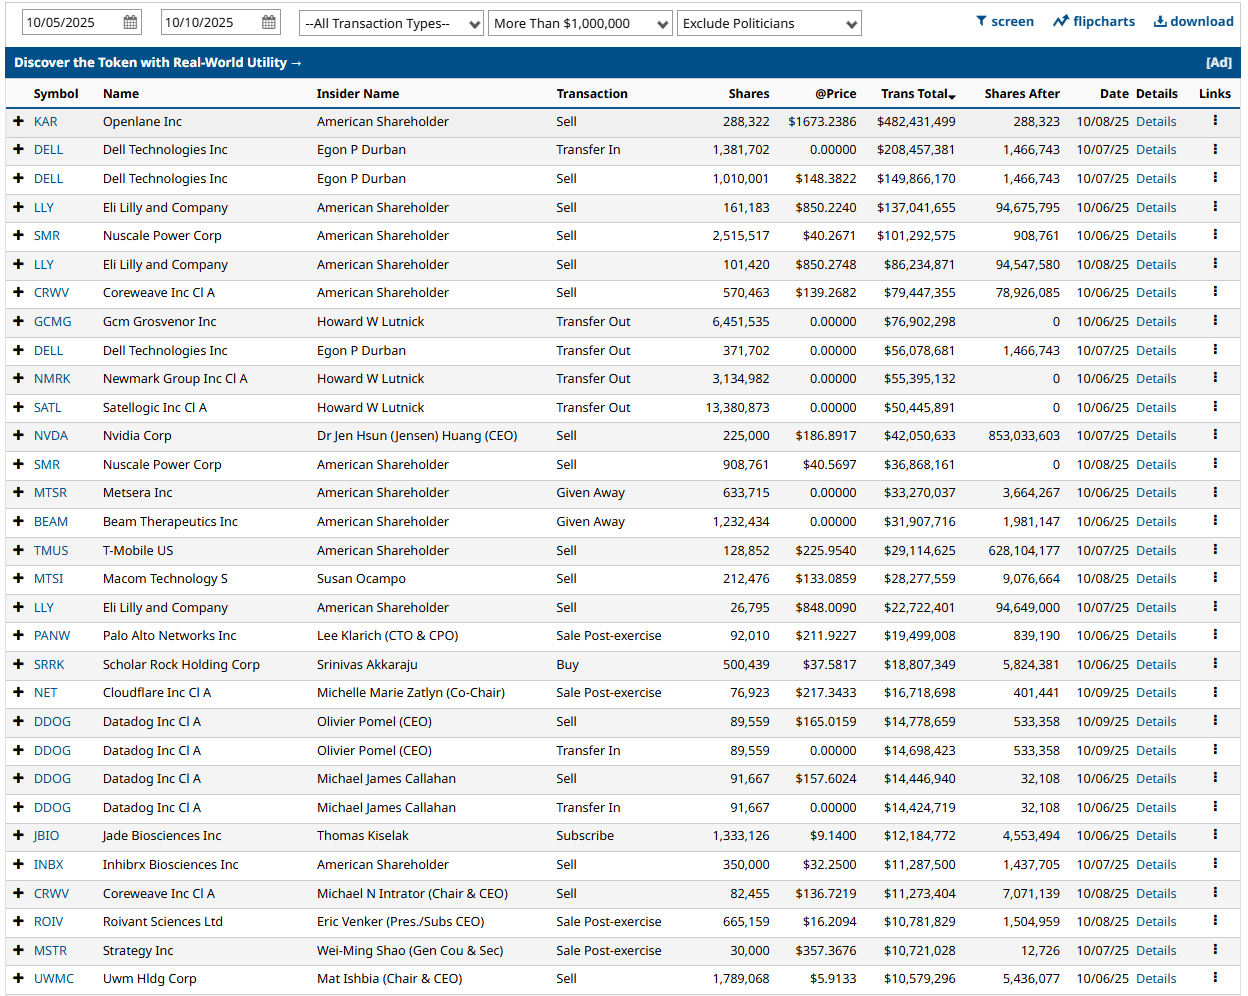
Insider trading occurs when a company’s leaders or major shareholders trade stock based on non-public information. Tracking these trades can reveal insider expectations about the company’s future. For example, large purchases before an earnings report or drug trial results might indicate confidence in upcoming good news.
Insider flow still leans distribution. Over the last 60 days, the bar chart shows mostly red prints with only a couple of green spikes. The most active tickers by number of trades skew heavily to selling: Atlassian (84 trades, 82 sells), Coreweave (36 sells), Carvana (30 sells), The Vita Coco (25 sells), Dropbox (21 sells), T-Mobile (20 sells), Nvidia (19 sells), UiPath (19 sells), and Klaviyo (18 sells). There are some buy clusters, but they are the exception; for example Renaissance Capital shows 42 buys and Public Storage lists a mix with 9 buys. By dollars, the top tickets are dominated by sellers or mixed boards unloading: Fox Corp B at about $1.165B (1 buy, 2 sells), Tesla near $1.0B (1 buy, 3 sells), News Corp B around $824M (1 buy, 2 sells), and a string of one-sided sell totals including Solventum, Coupang, Centuri, Smithfield Foods, Coreweave (~$501M, 36 sells), and Sea. This week’s top-30 tape confirms it: multiple large open-market sales and transfers from Dell’s Egon Durban, LLY sales by an American Shareholder, Nvidia’s CEO selling 225,000 shares (~$42M), plus selling across TMUS, PANW, NDAQ, DDOG, CRVW, and others. A few non-price transactions show up (awards, transfers, given away), but open-market sales are the dominant motif. Until we see broad-based, repeat open-market buys in the high-beta complex, the insider signal stays risk-averse.
%Bull-Bear Spread
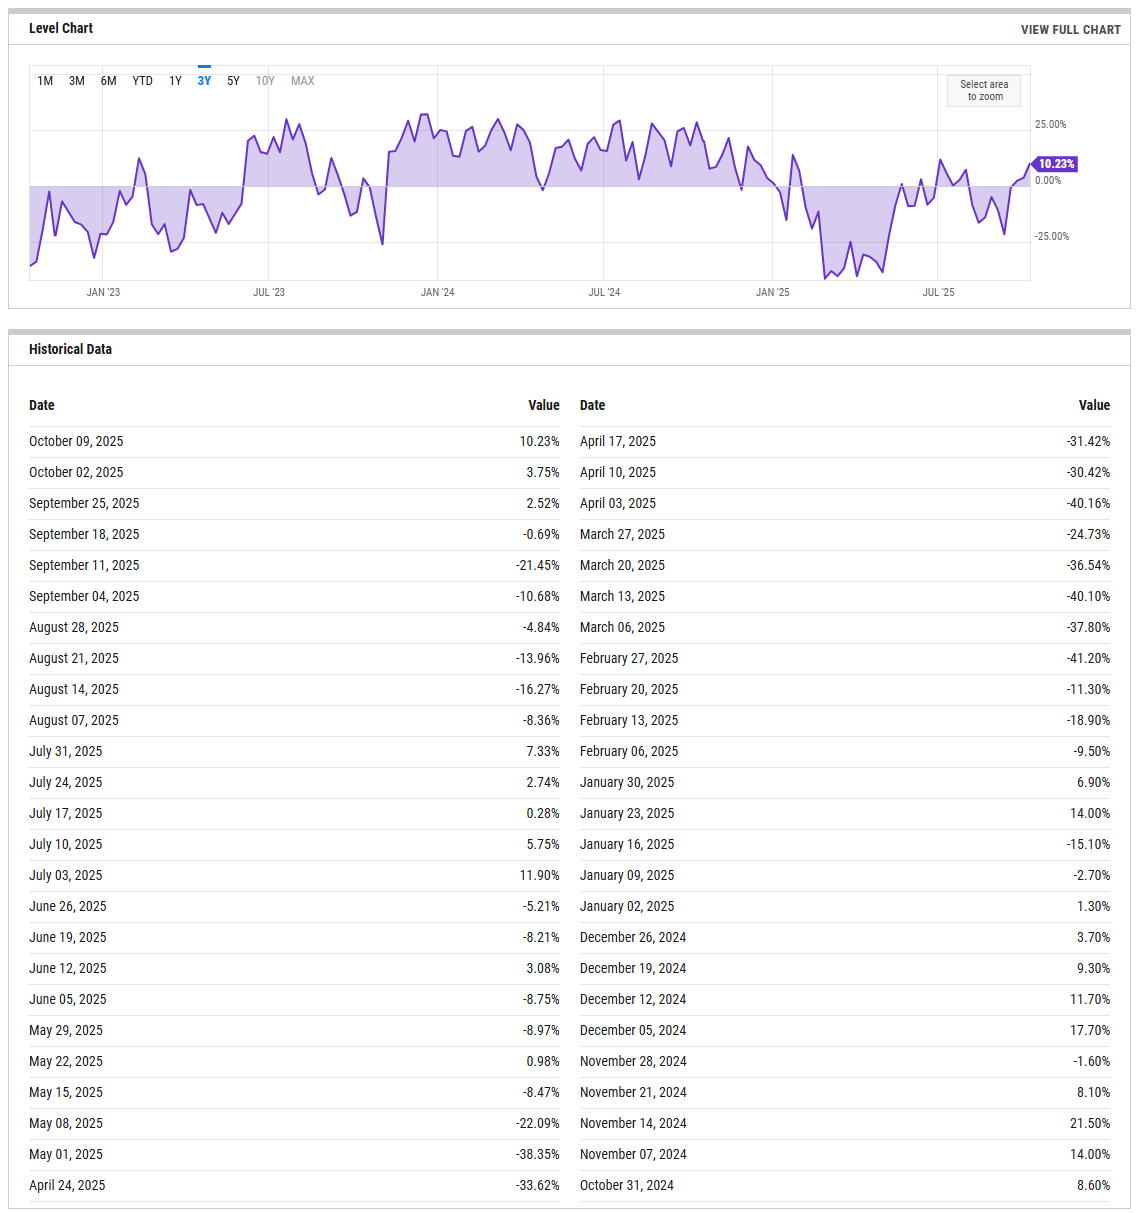
The %Bull-Bear Spread measures the gap between bullish and bearish investor sentiment, often from surveys like AAII. It’s a contrarian indicator—extreme optimism may signal a coming pullback, while extreme pessimism can hint at a potential rally. Large positive or negative spreads often mark market turning points.
The bull minus bear spread has turned up to 10.23% as of 10/09/2025 from 3.75% a week earlier and 2.52% two weeks ago. That is a notable improvement from mid-September’s negative readings, including -21.45% on 09/11/2025. We are back above zero but still well shy of exuberance. Historically, sub-0% is contrarian supportive for rebounds, while persistent readings above ~20% can get crowded. The present 10% zone says pessimism is easing but positioning is not stretched; there is room for sentiment to improve further if price can stabilize. Tripwires: a break back below 0% would warn that the bounce is losing sponsorship; a push through 20% without confirming breadth would caution that optimism is getting ahead of the tape.
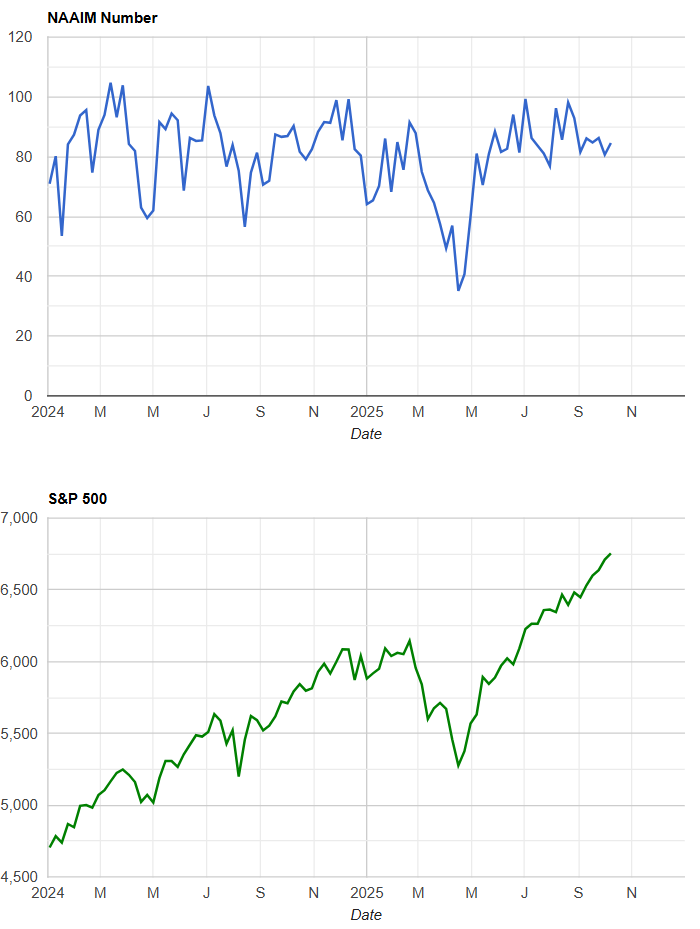
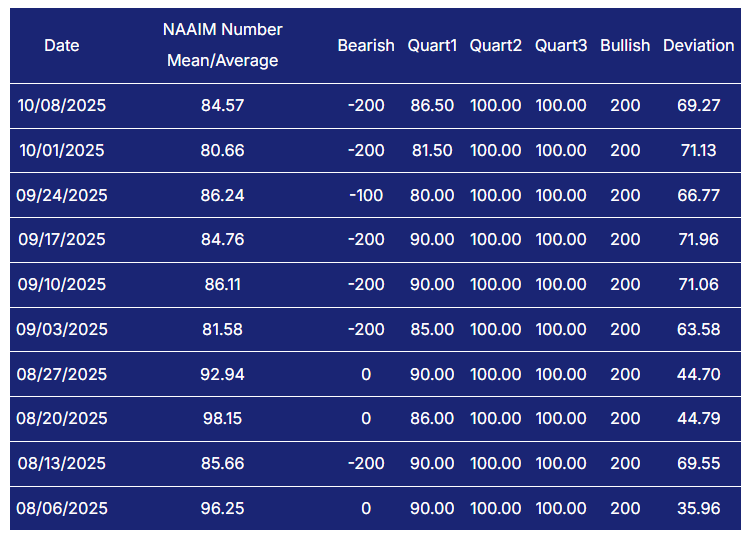
NAAIM Exposure Index
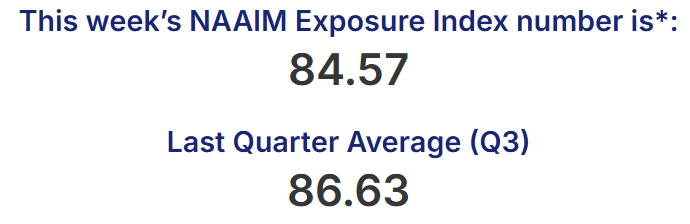
The NAAIM Exposure Index (National Association of Active Investment Managers Exposure Index) measures the average exposure to U.S. equity markets as reported by its member firms. These are typically active money managers who provide their equity exposure levels weekly. The index offers insight into how much these managers are investing in equities at any given time, ranging from being fully short (-100%) to leveraged long (up to +200%).
Active managers remain heavily invested. The latest NAAIM mean prints 84.57 on 10/08/2025, after 80.66 the prior week and a run of readings mostly in the low-to-mid 80s, with late August peaking near 98. This is not defensive positioning; it implies limited dry powder and some vulnerability if downside momentum accelerates. The upshot is that pullbacks can shake weak hands but also fuel quick reflex rallies because exposure is already high and managers are sensitive to lag. Tripwires: a drop into the 50s without major price damage would be a constructive reset that reloads buying power; conversely, a return to the 90s while breadth is weak would increase the risk of air pockets on bad news.
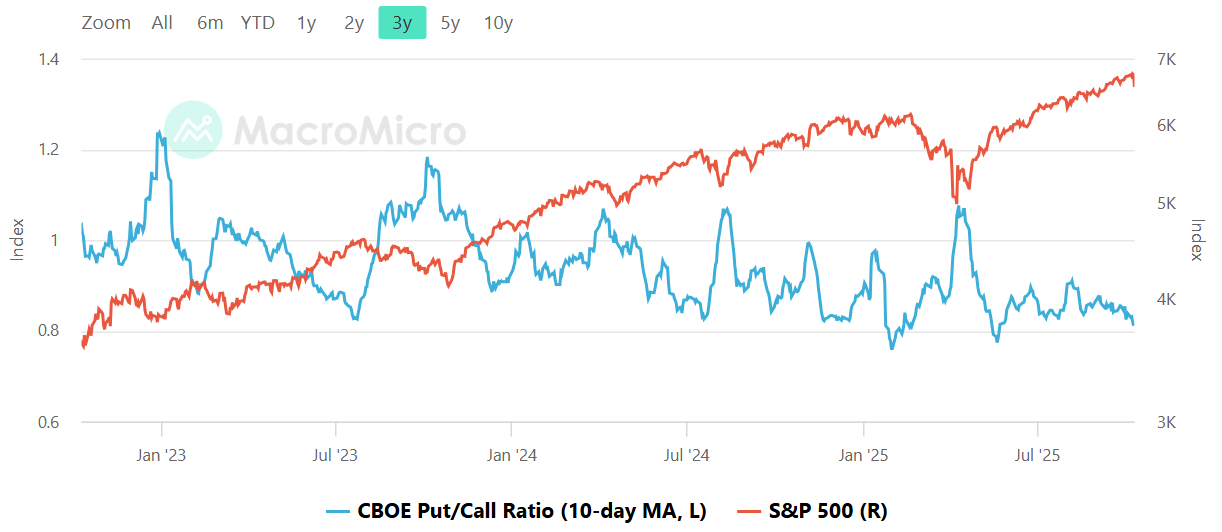
CBOE Total Put/Call Ratio
CBOE's total put/call ratio includes index options and equity options. It's a popular indicator for market sentiment. A high put/call ratio suggests that the market is overly bearish and stocks might rebound. A low put/call ratio suggests that market exuberance could result in a sharp fall.
The 10-day average looks low by recent standards, hovering near the lower-middle of its three-year range rather than at stress levels. In this framework, 0.8 tends to be frothy and 1.0 fearful. Current readings appear closer to the frothy side than the fearful side, which brought us to Friday’s large downside move. If equities wobble and the ratio climbs toward 1.0, that would improve rebound quality by indicating real hedging demand. Tripwires: sustained readings below roughly 0.85 would signal complacency; a spike above ~1.05 would suggest capitulation dynamics are forming and a better tactical buy window.
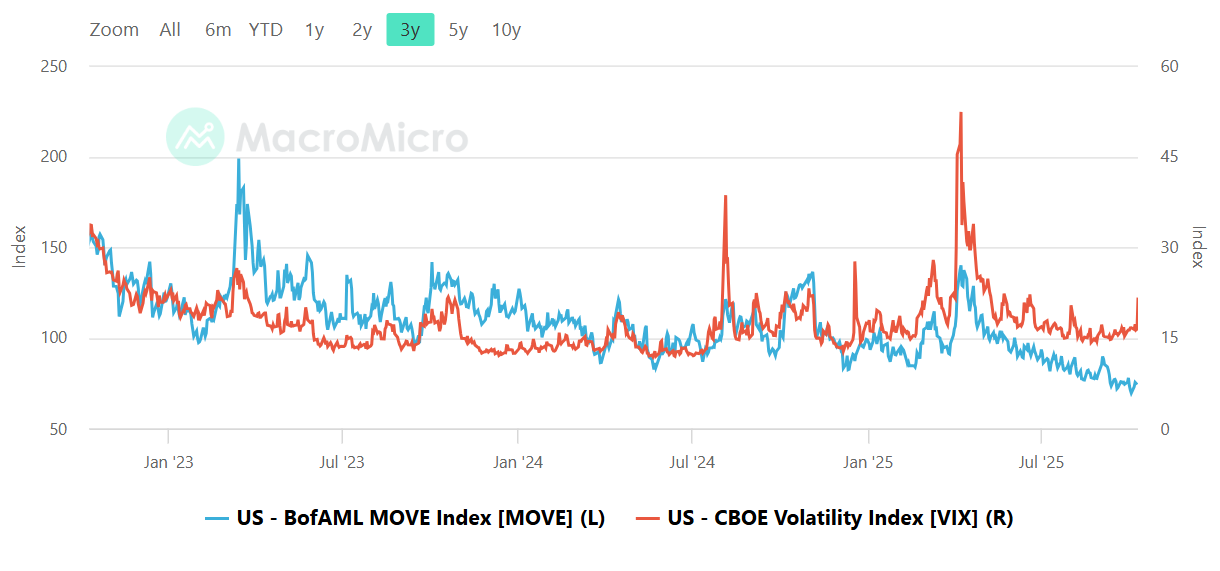
Equity vs Bond Volatility
The Merrill Lynch Option Volatility Estimate [MOVE] Index from BofAML and the CBOE Volatility Index [VIX] respectively represent market volatility of U.S. Treasury futures and the S&P 500 index. They typically move in tandem but when they diverge, an opportunity can emerge from one having to “catch-up” to the other.
Bond vol (MOVE) is subdued and trending lower into the 90s, while equity vol (VIX) has lifted into the mid-to-high teens with a recent uptick. The two have diverged modestly: calmer rates alongside jumpier stocks. Historically, a MOVE spike ahead of VIX often precedes equity stress; we do not have that warning right now. Instead, the setup looks like an equity-specific risk repricing against a steady rates backdrop. That mix can resolve either with VIX cooling if price stabilizes, or with a catch-up MOVE pop if macro shocks reappear. Tripwires: MOVE pushing above ~120 while VIX sits sleepy would be a yellow flag; VIX pushing sustainably above the high teens and into the low 20s without a MOVE echo would argue for tighter risk until the gap closes.
CNN Fear & Greed Constituent Data Points & Composite Index
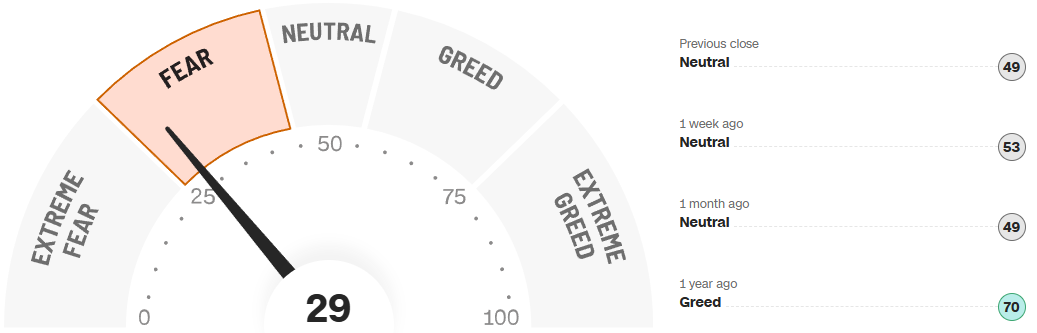
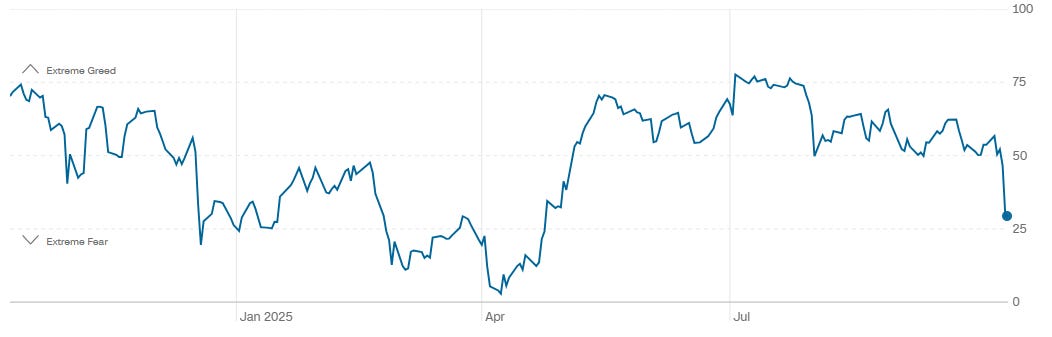
The composite sits at 29, squarely in Fear, down from 49 at the previous close and 53 a week ago, and far below 70 a year ago. The one-year path has rolled over sharply toward the lower quartile of its range. This is not capitulation, but it is a meaningful sentiment reset versus the summer’s mid-50s to 70s prints. In practice, Fear readings in the 20s can be early for contrarians yet often precede tactical rallies if they persist while price bases. A recovery back into the 40s would confirm that selling pressure has dissipated; a dip into the teens would signal exhaustion and improve the odds of a tradable bounce, provided credit and rates stay calm.
Social Media Favs
Social sentiment offers a real-time view of investor mood, often revealing market shifts before traditional indicators. It can signal momentum changes, spot emerging trends, and gauge retail investor impact—especially in high-volatility names. Tracking sentiment around events or earnings provides actionable insights, and when layered with quantitative models, can enhance predictive accuracy and risk management. Sustained sentiment trends often mirror broader market cycles, making this data a valuable tool for both short-term trades and long-term positioning.

Technician’s Playbook: Trading the Majors (SPY/QQQ/IWM/DIA)
When you’re a large institutional player, your primary goal is to find liquidity - places to do a ton of business with the least amount of slippage possible. VolumeLeaders.com automatically identifies and visually plots the exact spots where institutions are doing business and where they are likely to return for more. It’s one of the primary reasons “support” and “resistance” concepts work and truly one of the reasons “price has memory”.
Friday’s tape was an impulsive, one-way break lower across all four indices followed by a tentative, late bounce into the close. The character of flow shifted from orderly balance early in the week to heavy distribution on the break, then to aggressive end-of-day crosses that tried to stabilize prices right at newly formed support shelves. The closing auctions mattered: they concentrated the largest prints of the week at prices that now define the line of scrimmage for the next sessions.
SPY
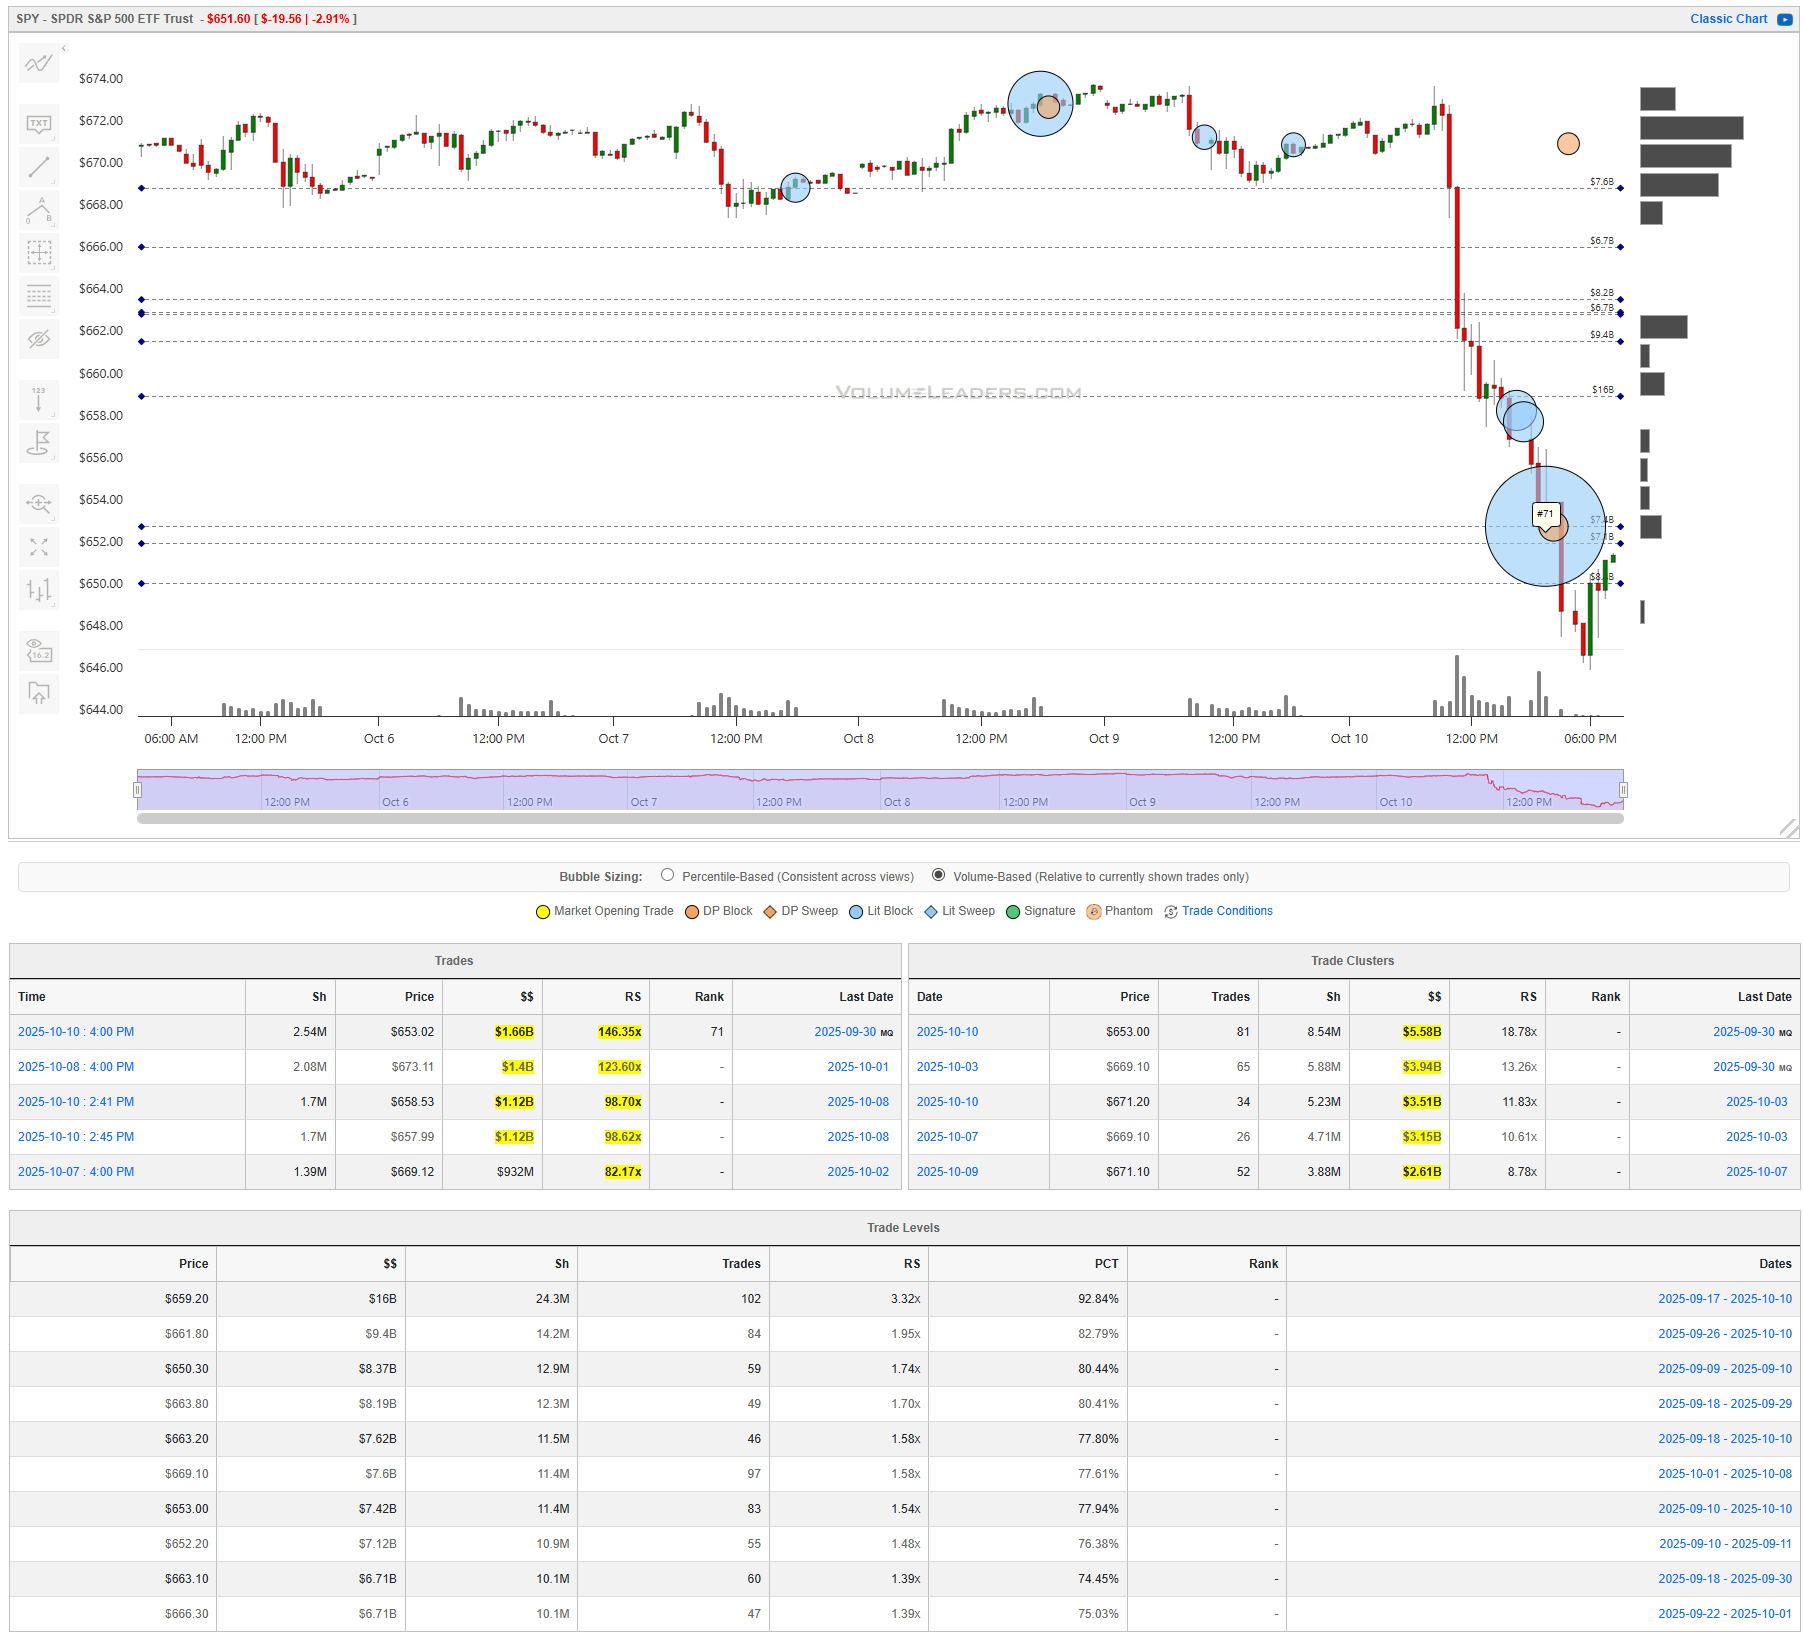
SPY fell hard into the low 650s and printed a top-100 block at 4:00 PM: 2.54M shares at $653.02 for $1.66B (RS 146x, rank 71). That was not alone; a series of billion-dollar prints hit between $657.99 and $673.11 with RS readings in the ~99x–124x zone. The cluster table stacks the heaviest time-bound interest at $653.00 ($5.58B, RS 18.78x), $669.10 ($3.94B, RS 13.26x), $671.20 ($3.51B, RS 11.83x), then again at $669.10 and $671.10. Cumulative Levels reinforce the same map: $659.20 carries $16B (RS 3.32x, 92.84th pct), with thick layers at $661.80 ($9.4B), $653.80 ($8.19B), $653.20 ($7.62B), $669.10 ($7.60B), $653.00 ($7.42B), and $652.20 ($7.12B). That makes $652–654 first support, $659–662 the primary pivot, and $669–671 the immediate supply shelf. Acceptance back above $659–662 would argue for a squeeze toward the $669–671 magnet; rejection under $653 would reopen the lower band around $652–650, where another $8.37B sits at $650.30. Tactically, bulls want to buy pullbacks that hold $653 with an initial target into $659–662 and a trailer toward $669–671; bears are favored on failed retests of $659–662 with risk above $663 and first targets $653 then $652–650.
QQQ
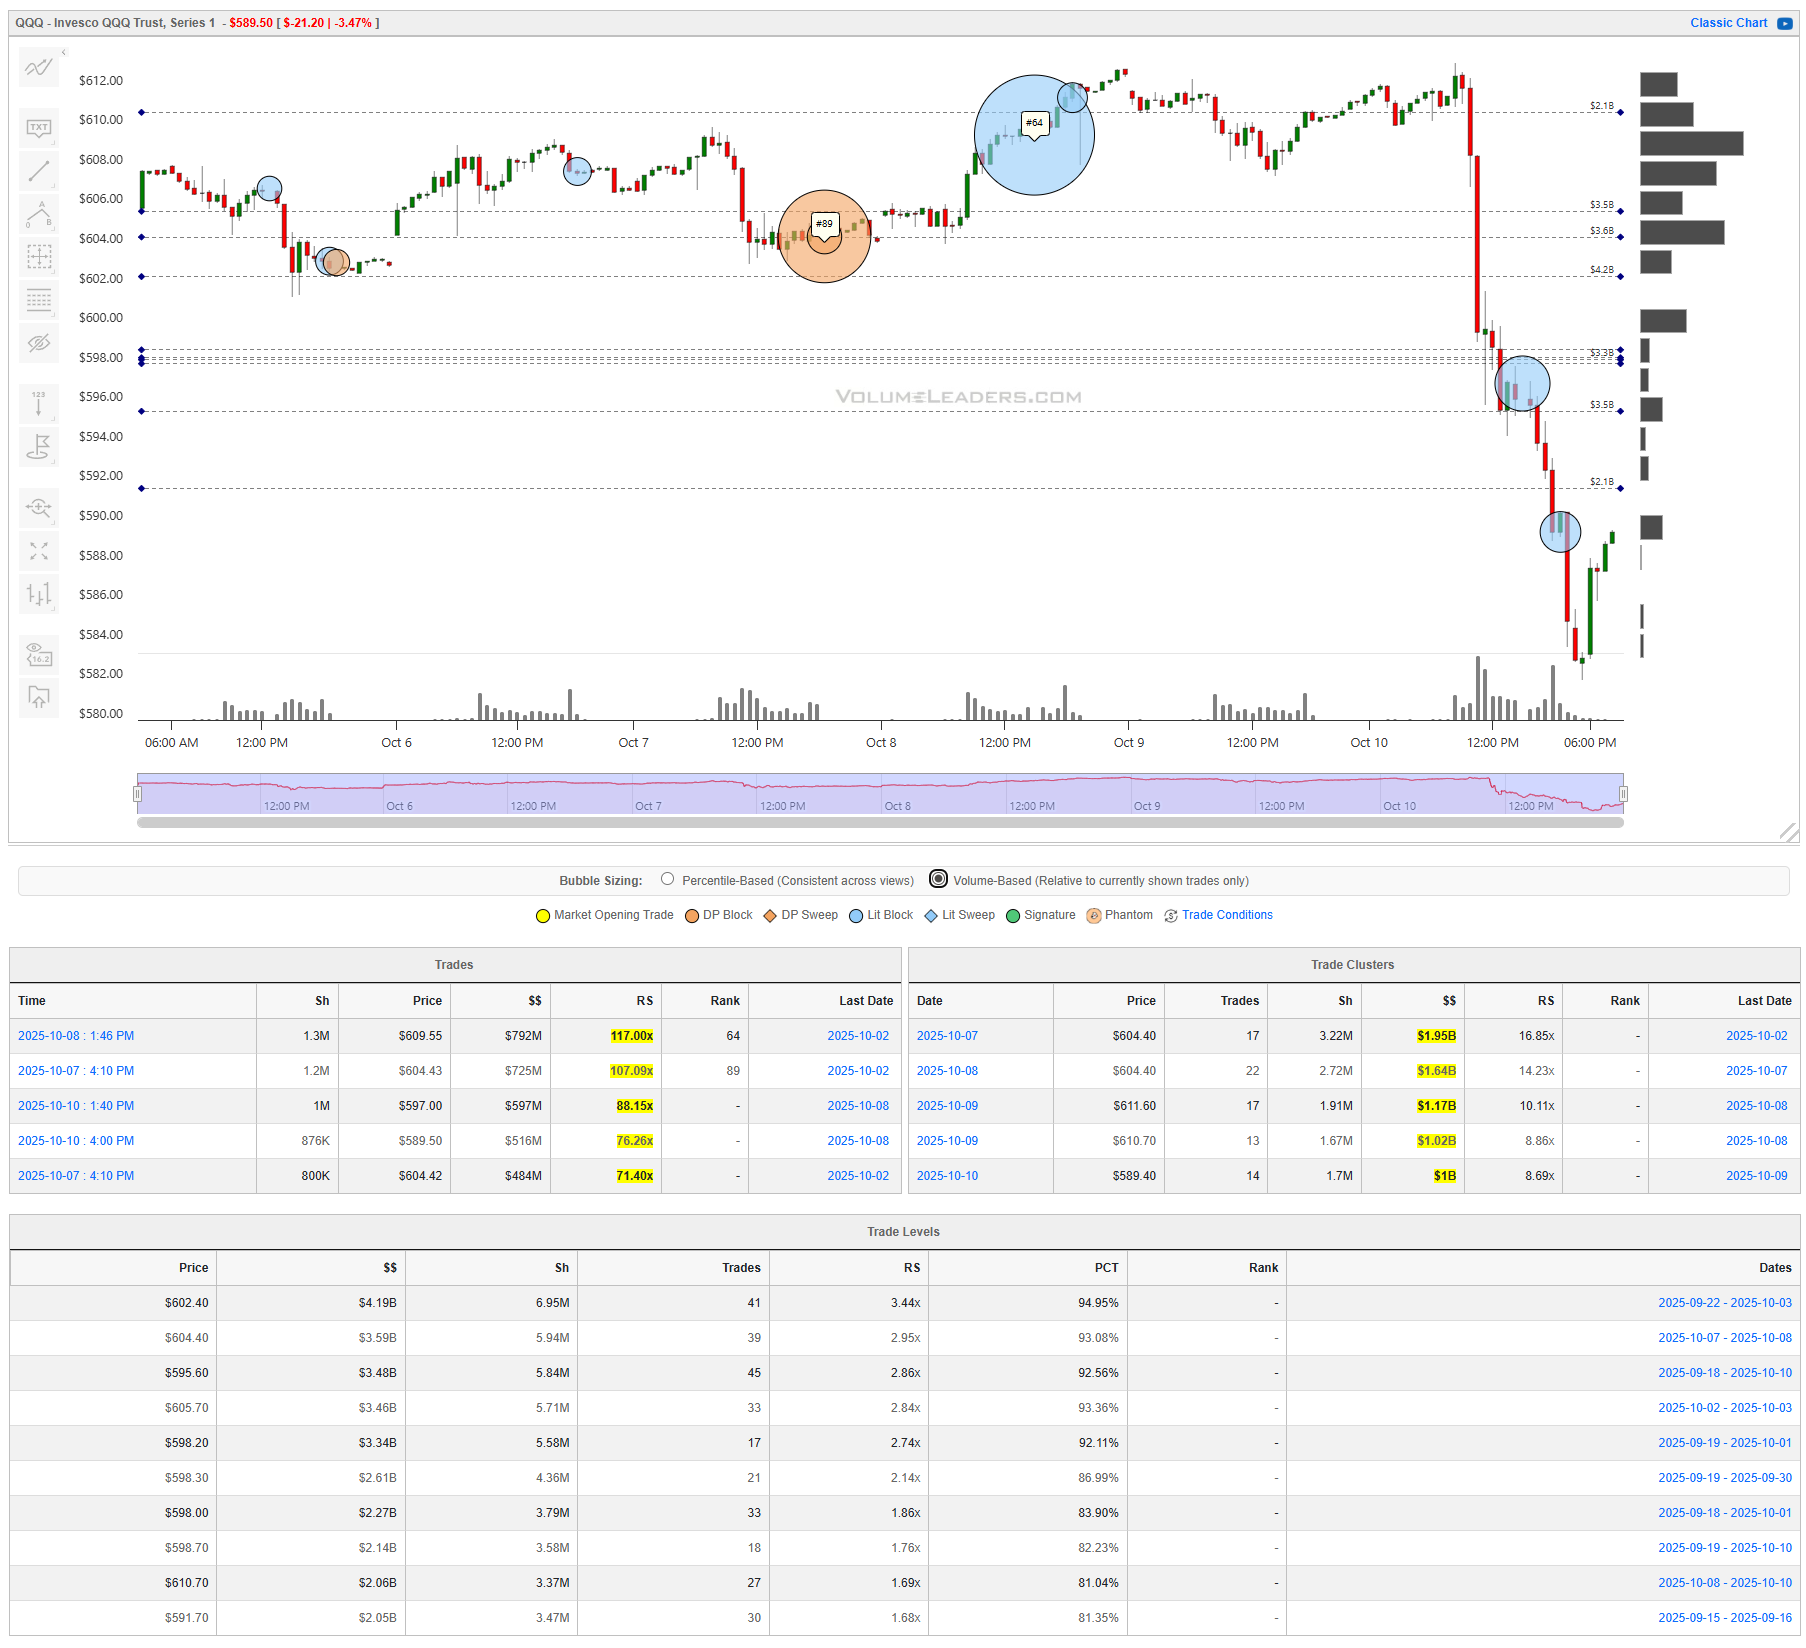
QQQ’s break was equally decisive, but the footprint skews a touch firmer near the lows. Notable prints included 1.3M at $609.55 for $792M (RS 117x, rank 64) and 1.2M at $604.43 for $725M (RS 107x, rank 89), followed by $597.00 ($597M, RS 88x) and $589.50 ($516M, RS 76x). The biggest clusters sit at $604.40 ($1.95B, RS 16.85x) with a second tranche at the same price ($1.64B), then $611.60 ($1.17B), $610.70 ($1.02B), and a lower plate at $589.40 ($1.00B). The Level stack is dense from $598–606: $602.40 carries $4.19B (RS 3.44x, 94.95th pct), $604.40 $3.59B (RS 2.95x), $605.70 $3.46B (RS 2.84x), and $598.20 $3.34B (RS 2.74x), with supportive layers at $598.30–$598.70 and a higher cap near $610.70 ($2.06B). That makes $602–606 the pivot band; above it, $610–612 is the next magnet; below it, $598 then $589 are the risk shelves. Buyers have the better trade pressing holds above $602 with risk just under $598; sellers want to fade failed pushes into $610–612 with risk over $613.
IWM
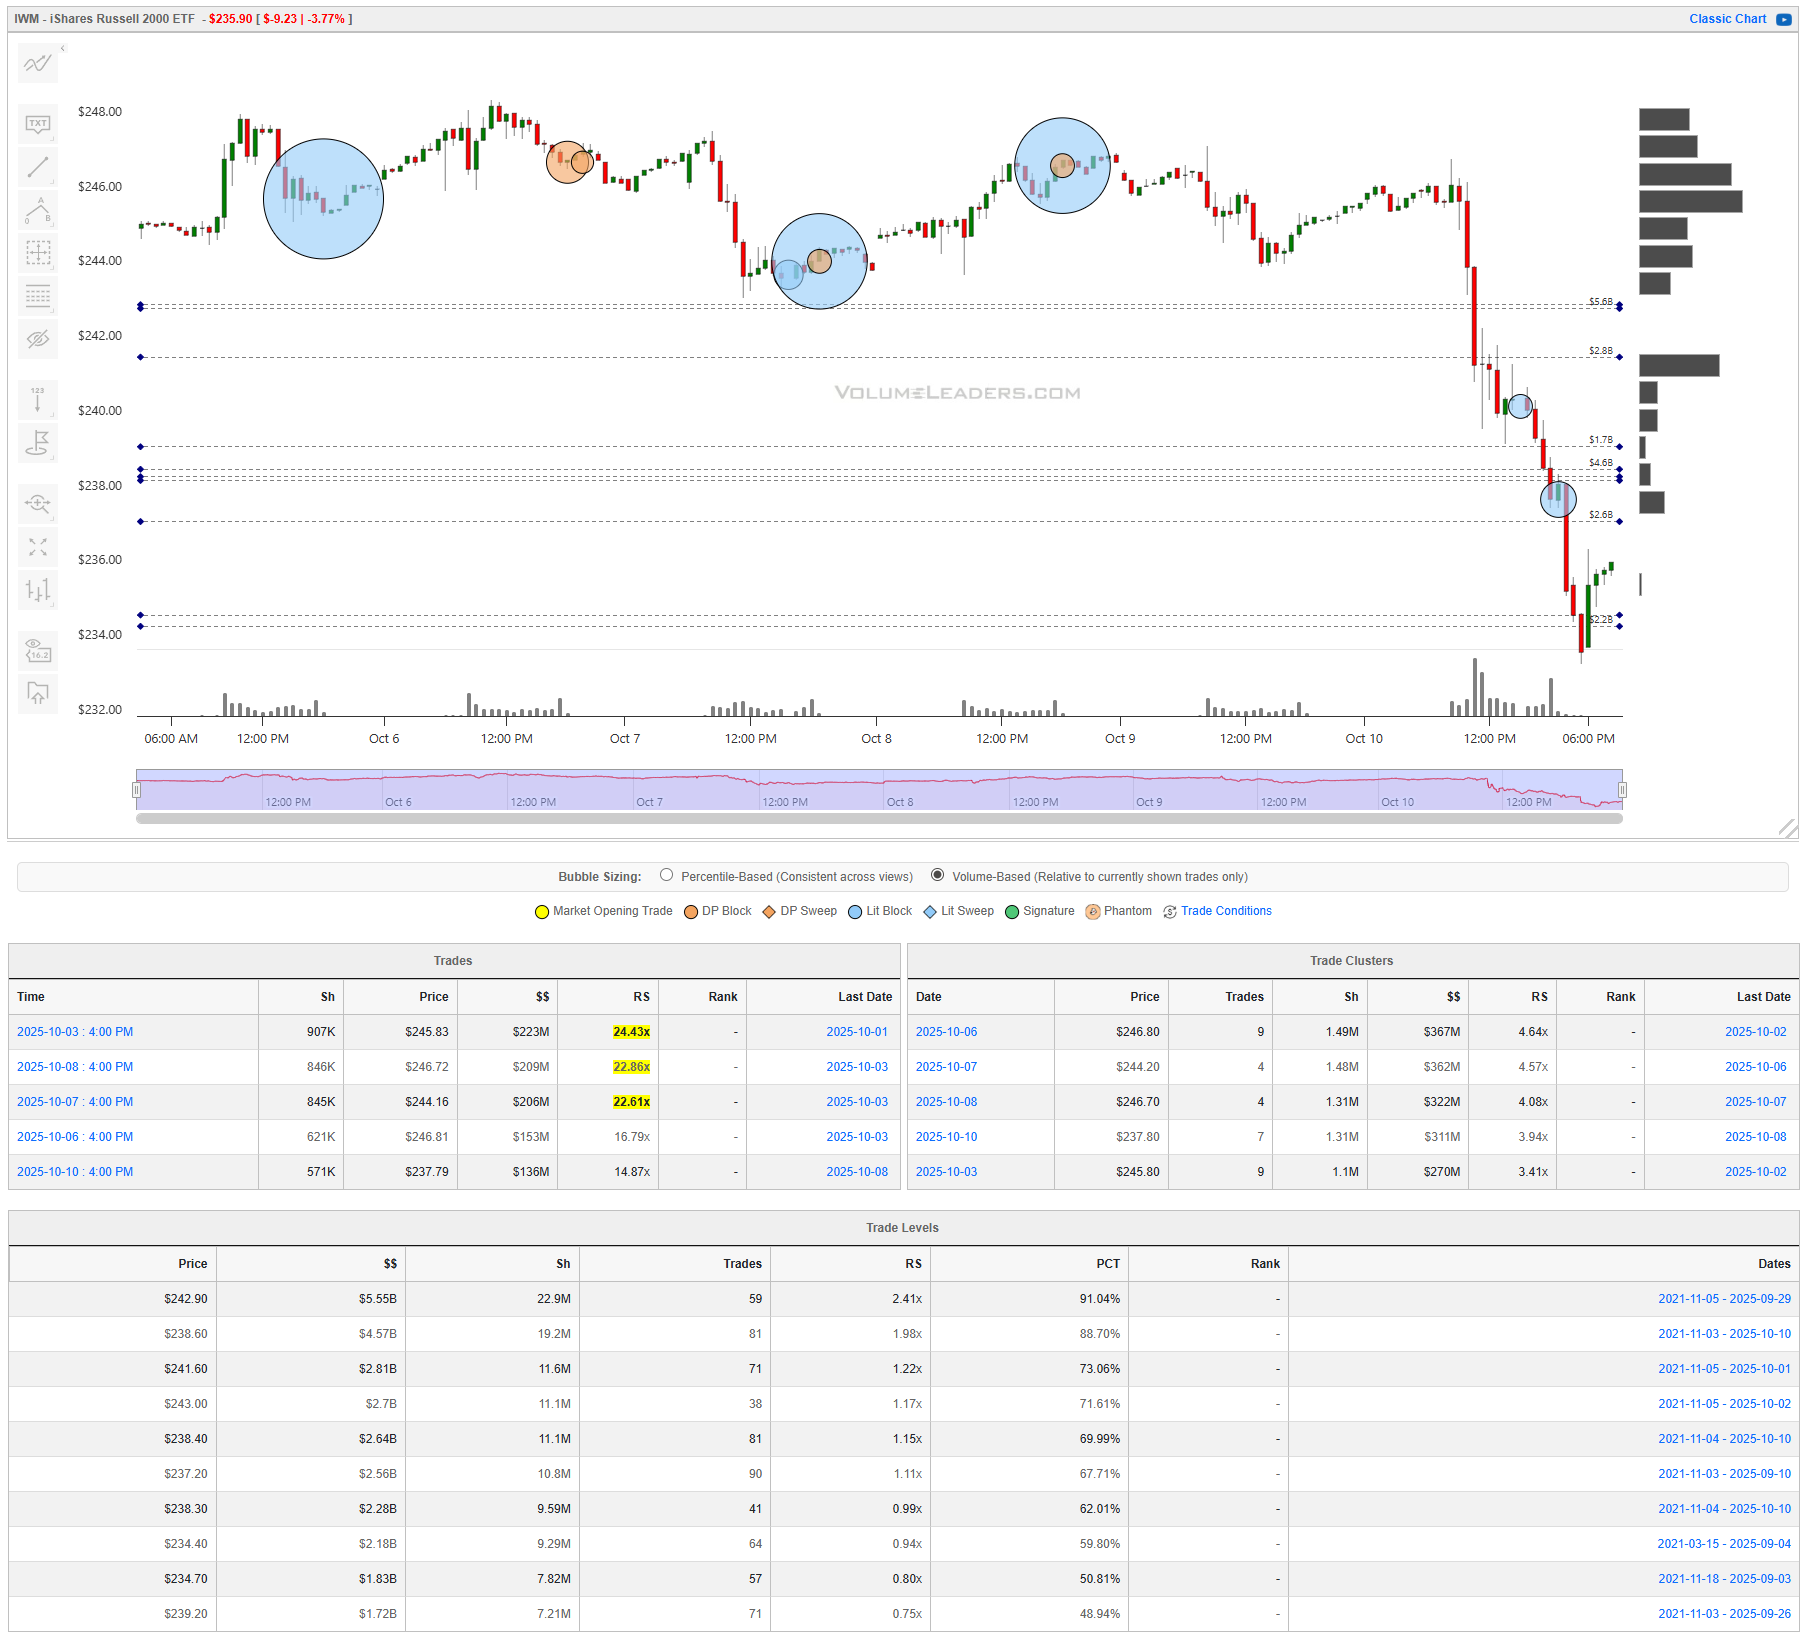
IWM showed the same liquidation but with smaller absolute tickets and a narrower battlefield. The biggest prints came late: 907K at $245.83 for $223M (RS 24.43x), 846K at $246.72 for $209M (RS 22.86x), and 845K at $244.16 for $206M (RS 22.61x). Clusters concentrate at $246.80 ($367M, RS 4.64x) and $244.20 ($362M, RS 4.57x), with smaller nodes at $246.70, $237.80, and $245.80. The Level table turns the $237–243 region into a fulcrum: $242.90 carries $5.55B (RS 2.41x, 91.04th pct) and $238.60 $4.57B (RS 1.98x), with additional layers stepping every dollar through $237.20–$243.00. Translation: $241–243 is the line of scrimmage. Above it, $246–247 is the magnet where this week’s sellers live; below $239, risk shifts to $237 and then the low $234s. Longs should respect invalidation below $239; shorts should lean against $246–247 unless $247 holds, in which case cover toward $249.
DIA
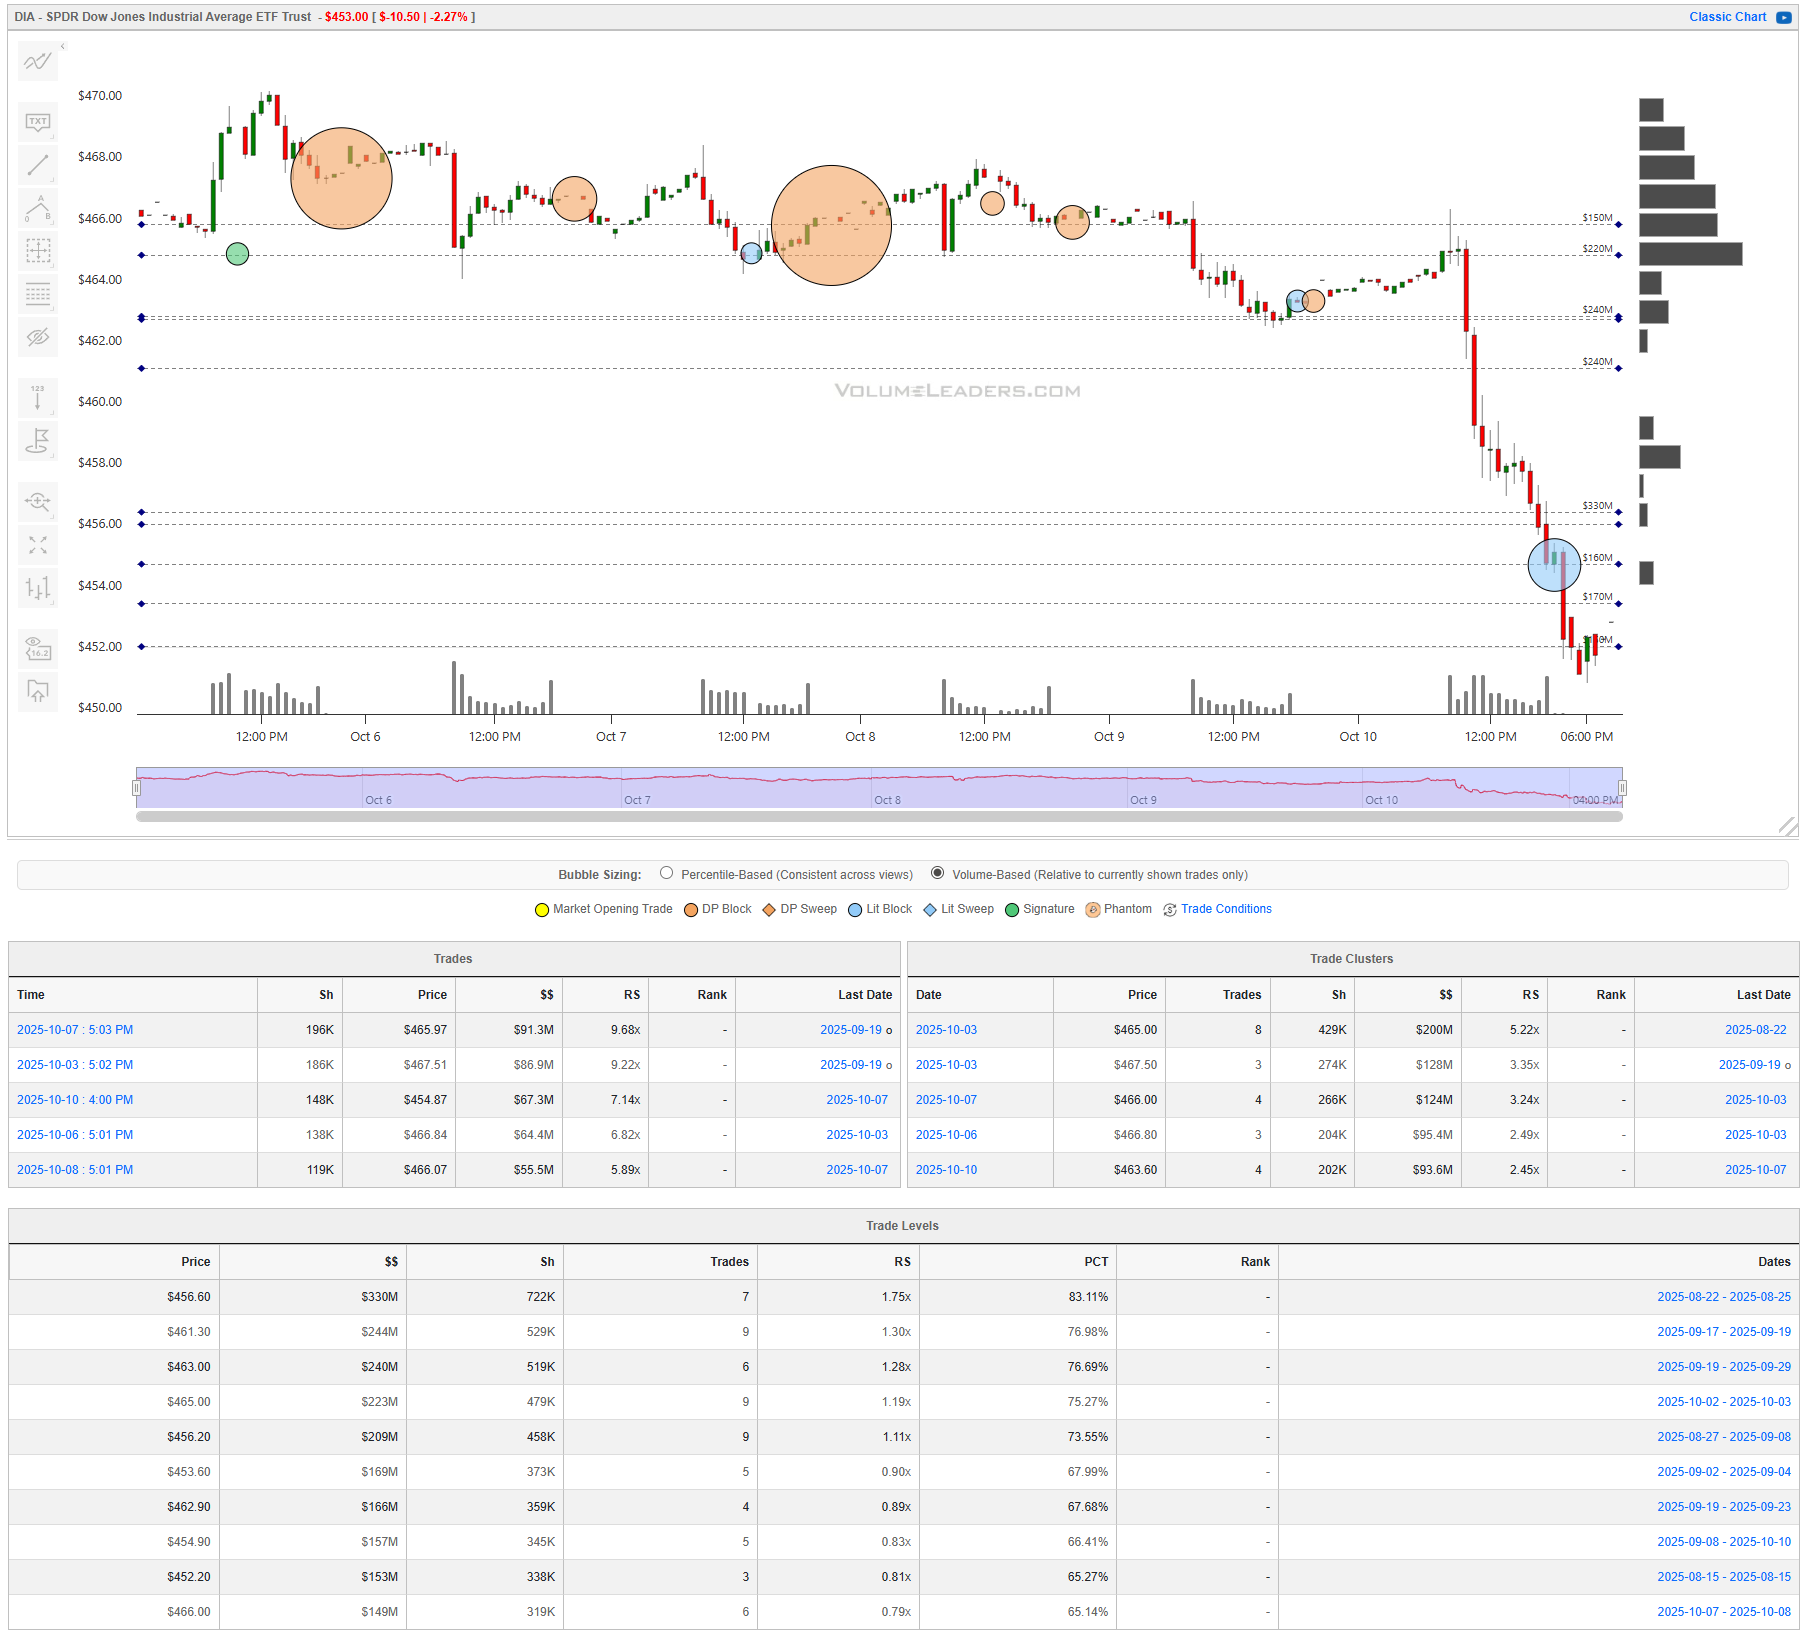
DIA’s map is cleaner: heavy trade centered $463–467 with the close pinned below. Notables include 196K at $465.97 for $91.3M (RS 9.68x) and 186K at $467.51 for $86.9M (RS 9.22x). Clusters top out at $465.00 ($200M, RS 5.22x) and stack at $467.50, $466.00, $466.80, and $463.60. Levels echo the overhead weight: $456.60 ($330M, RS 1.75x, 83.11th pct) is the closest pivot below, while $461.30–$465.00 adds $244–$223M each. For next trade, $456–457 is initial support; recoveries must reclaim and hold above $461–463 to squeeze into $465–468. Failure back under $456.20 points to $454.90 then $452.20.
Bottom line: the break created fresh support right at the lows and thick, well-defined supply just overhead; the first test is whether SPY $659–662 and QQQ $602–606 cap the rally or flip to support, because acceptance above those pivots puts the $669–671 and $610–612 magnets in play, while rejection keeps pressure on newly minted floors at SPY $652–650, QQQ $598/$589, IWM $239, and DIA $456.

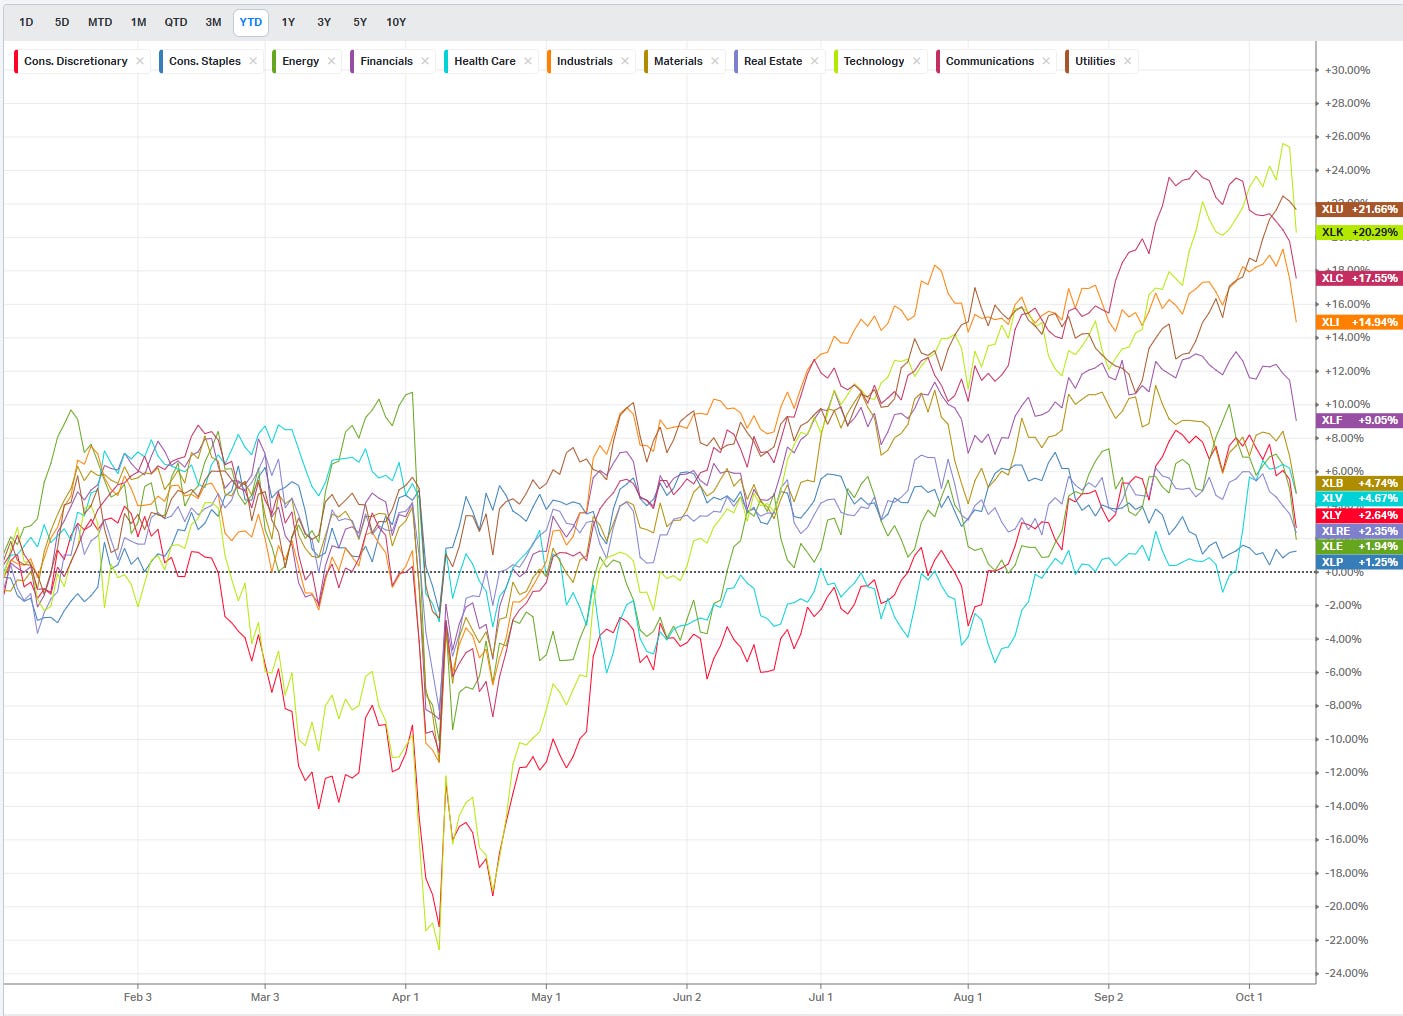
Summary Of Thematic Performance YTD
VolumeLeaders.com offers a robust set of pre-built thematic filters, allowing you to instantly explore specific market segments. These performance snapshots are provided purely for context and inspiration—think about zeroing in on the leaders and laggards within the strongest and weakest sectors, for example.
S&P By Sector
S&P By Industry
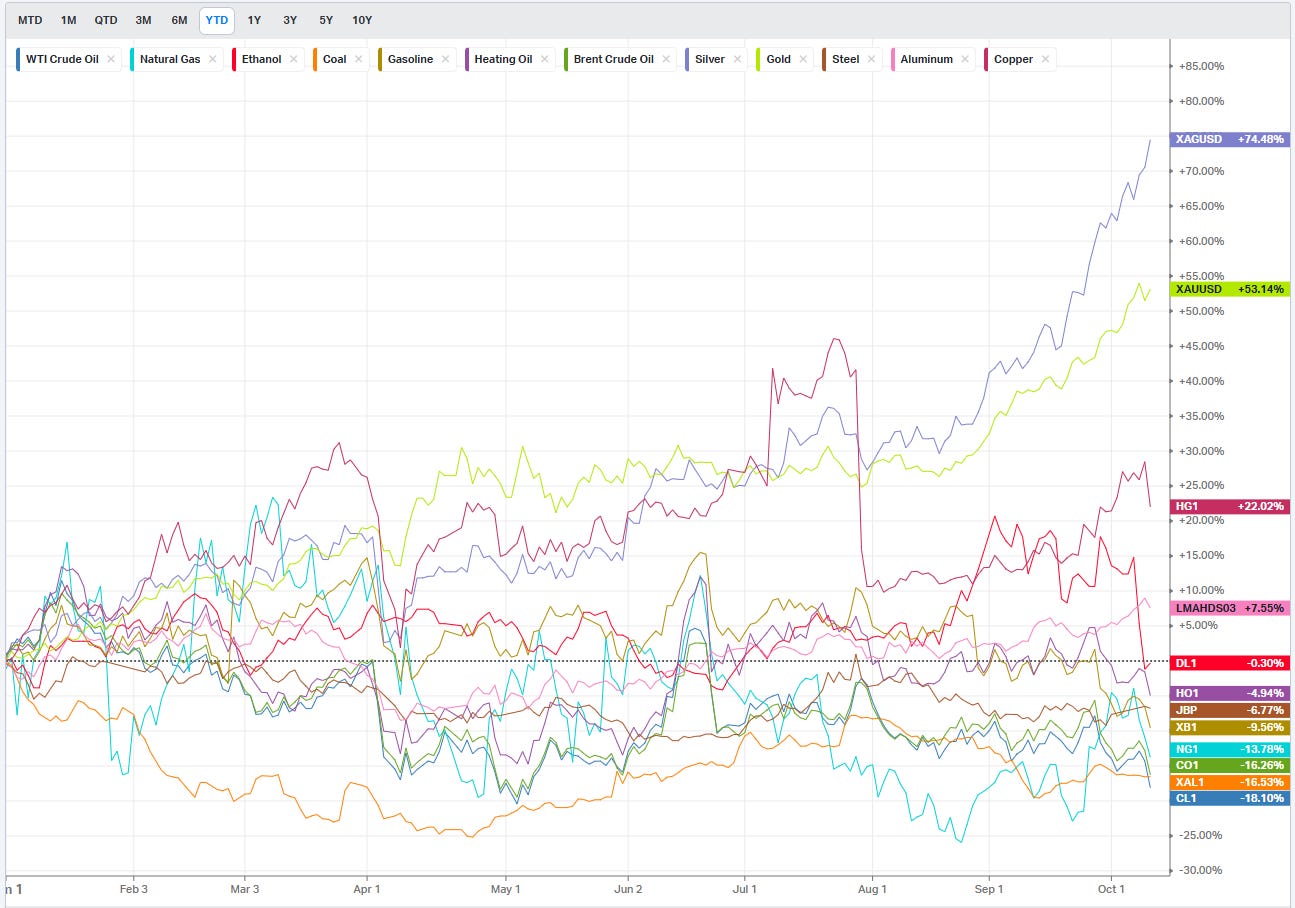
Commodities: Energy & Metals
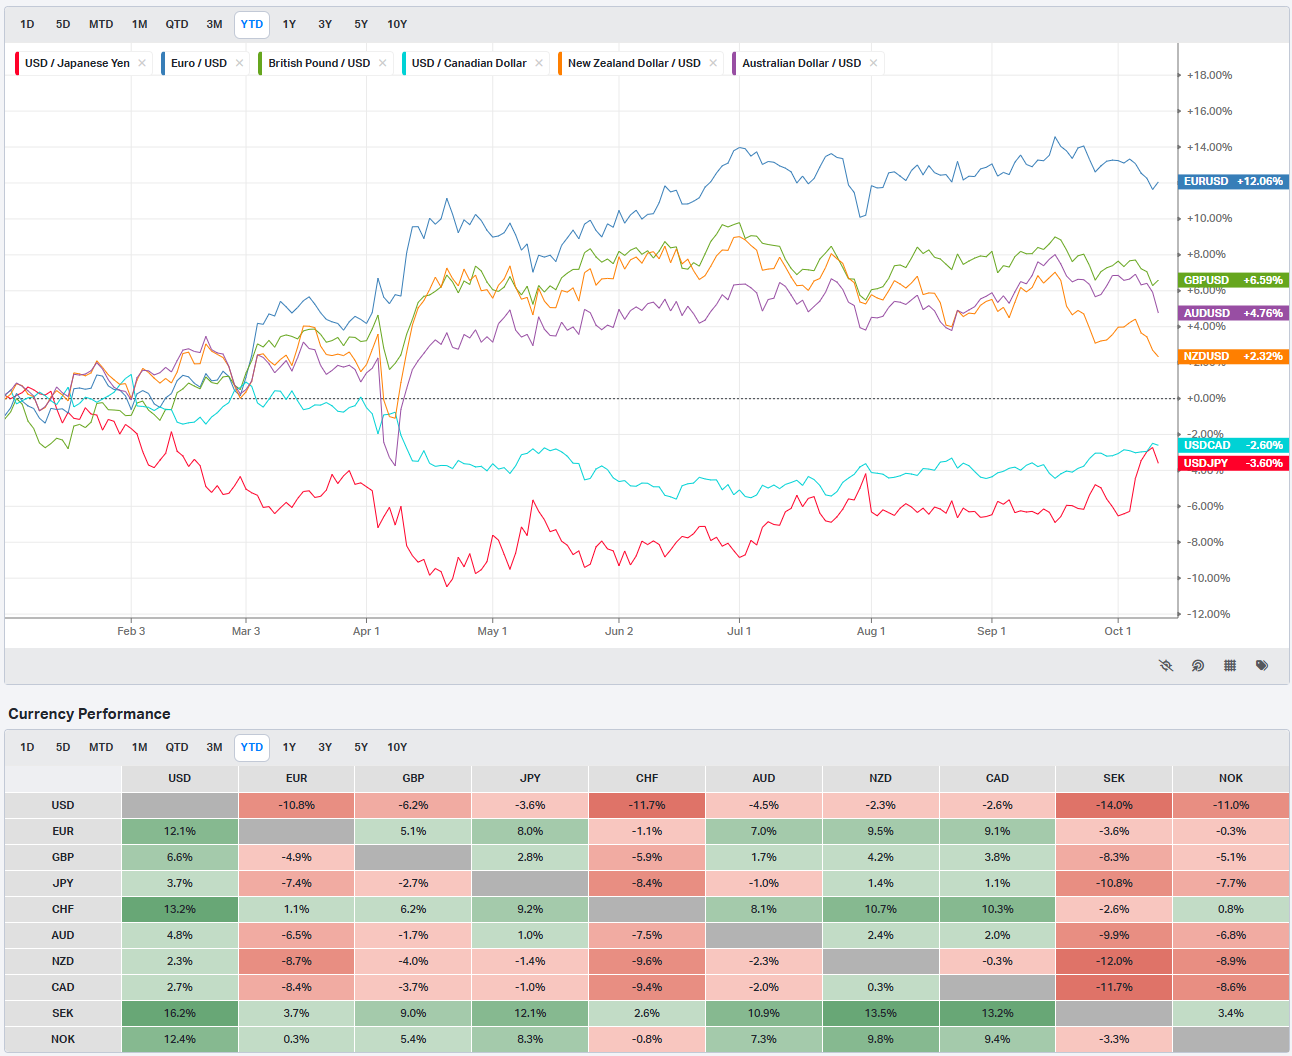
Currencies/Major FX Crosses
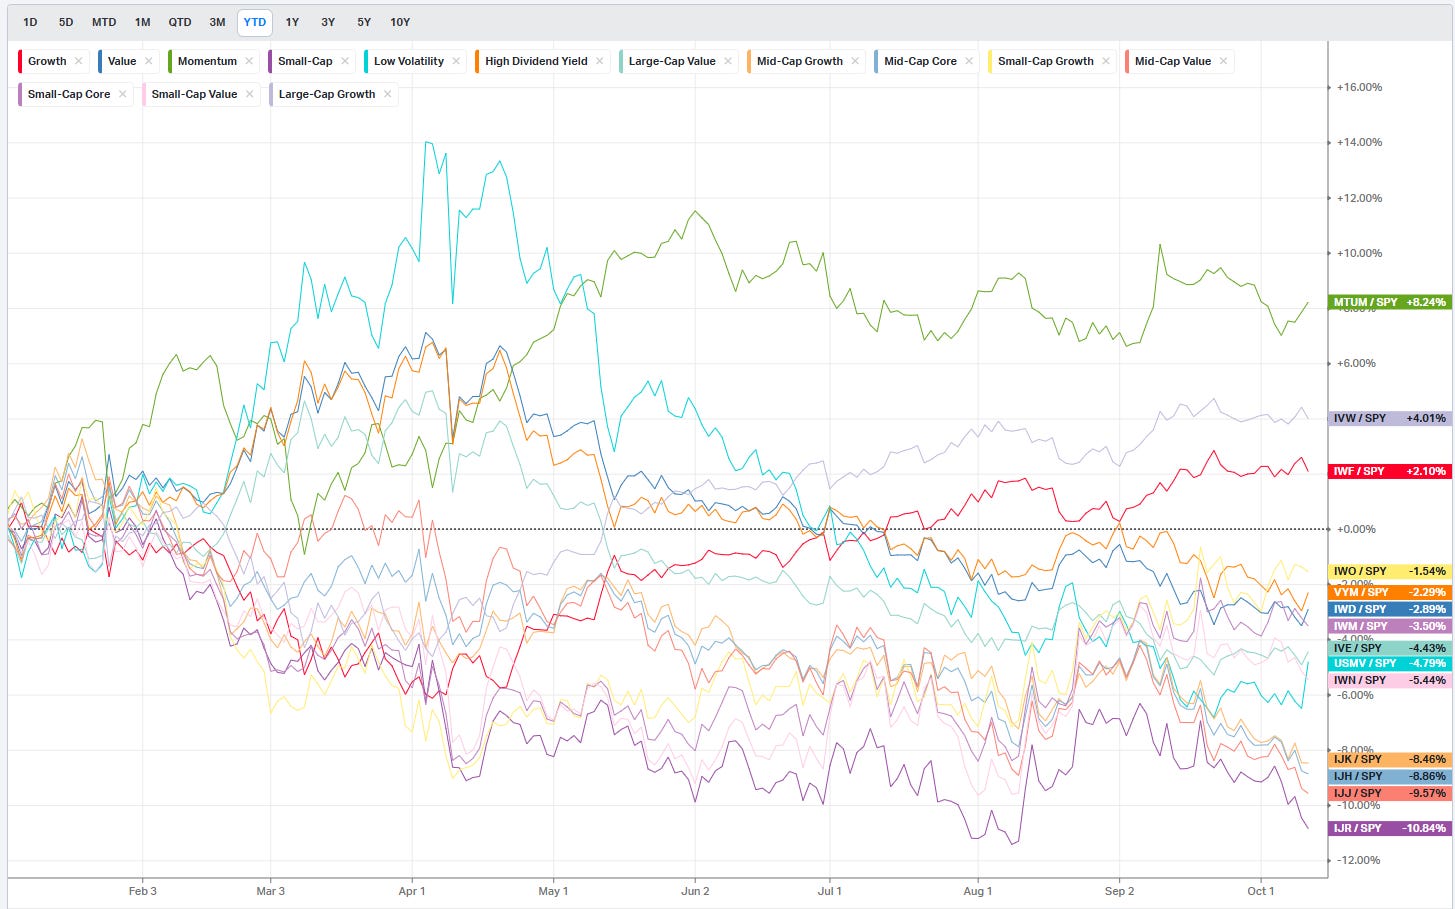
Factors: Style vs Size-vs-Value

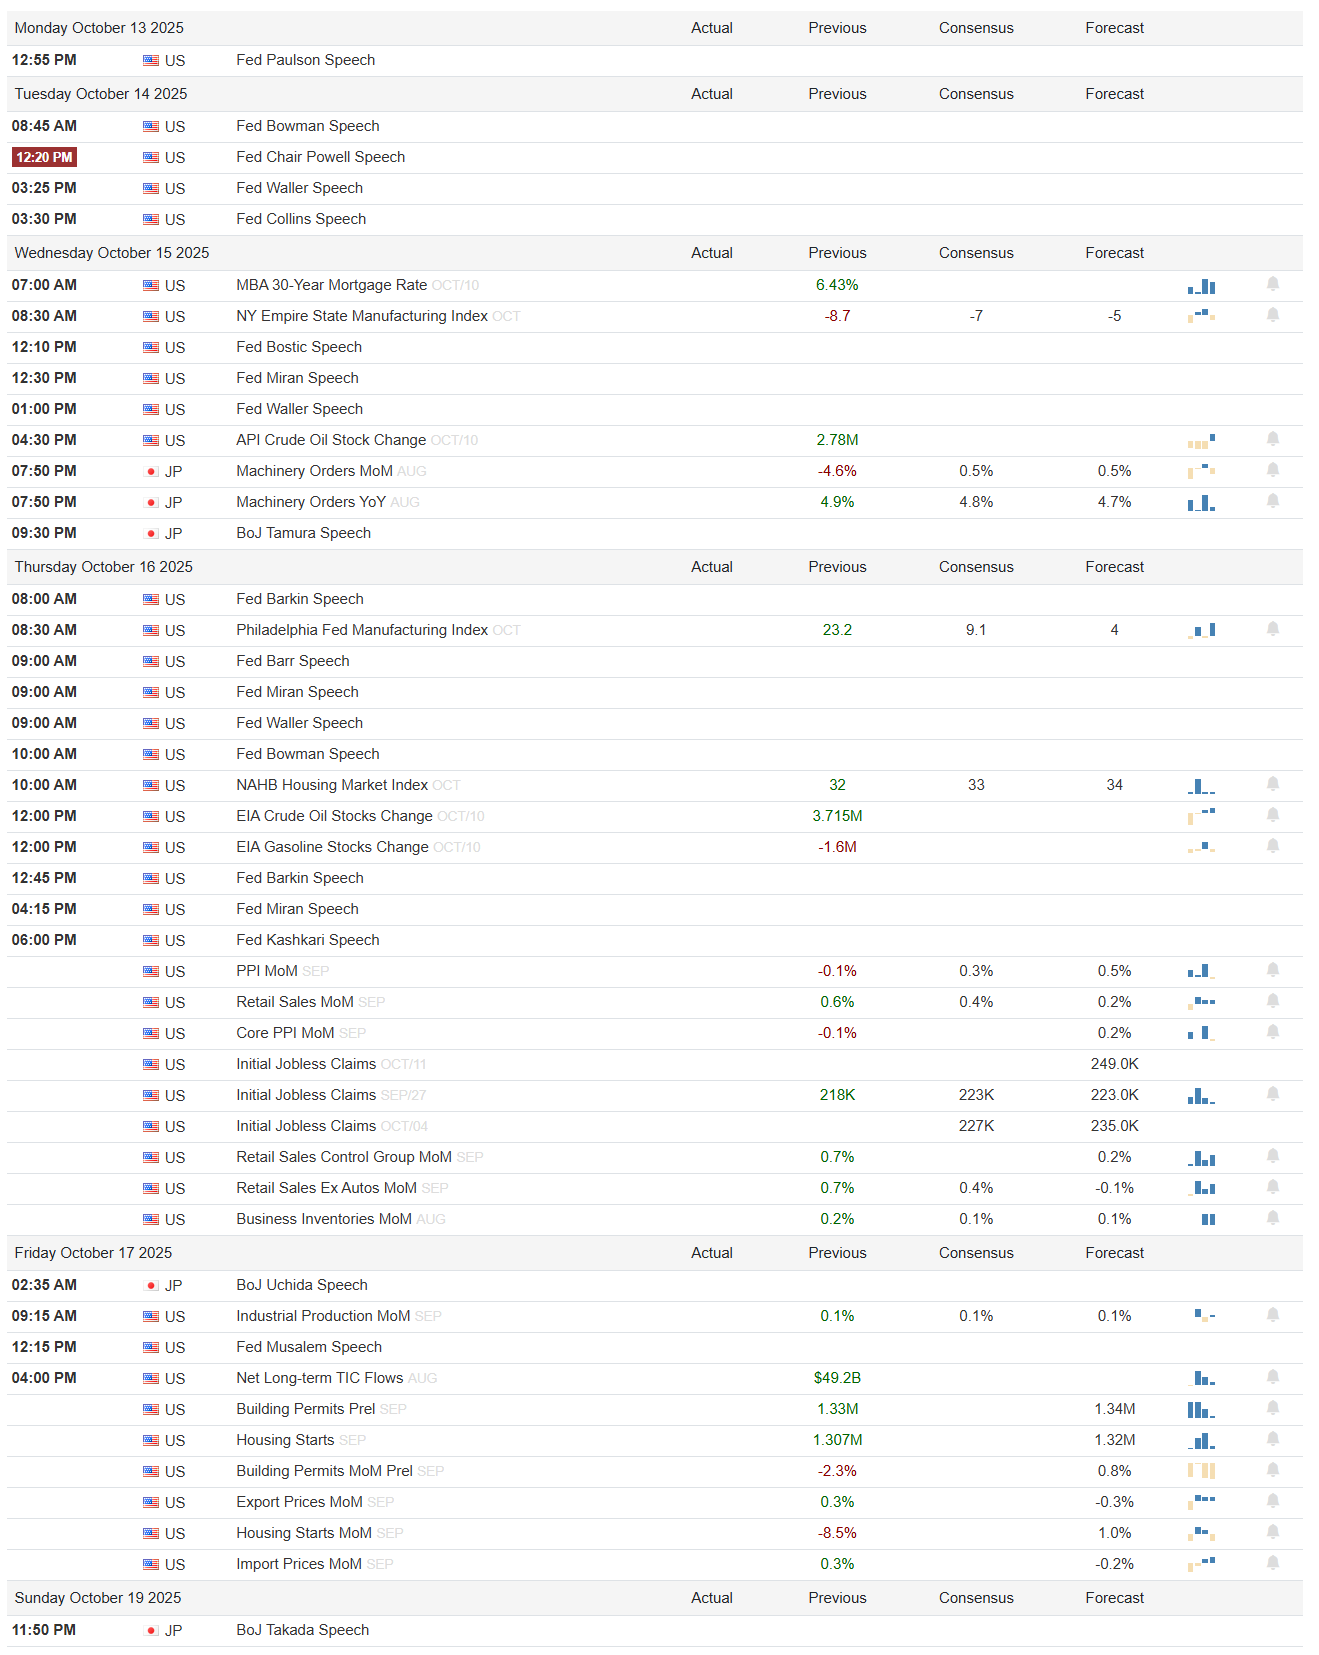
Events On Deck This Week
Here are key events happening this week that have the potential to cause outsized moves in the market or heightened short-term volatility.
Monday, October 13
It is a light macro start with a single scheduled appearance: a U.S. Fed Paulson speech in the early afternoon. With no data to anchor the open, tone will key off cross-asset follow-through and any hints in remarks about the balance between inflation risks and growth fatigue. A risk-on read would be guidance that recent disinflation progress remains intact and that policy can stay on hold; anything that leans toward renewed tightening rhetoric would be risk-off in a thin tape.
Tuesday, October 14
The day is speaker-heavy: Bowman (08:45), Powell (12:20), Waller (15:25), and Collins (evening). There are no scheduled U.S. releases, so equities will trade Powell’s emphasis. Market-friendly would be a patient stance and confidence in the downshift in inflation; risk-off would be concern that financial conditions have eased too much or that labor remains too hot. With big banks reporting before the bell, any Fed pushback against easing expectations would weigh most on financials and cyclicals intraday.
Wednesday, October 15
Macro heats up. MBA 30-year Mortgage Rate shows a prior print of 6.43%, a useful housing affordability tell. The New York Empire State Manufacturing Index carries a previous reading of -8.7 with consensus at -7 and forecast -5; anything above those would signal stabilizing activity, while a deeper negative would reaffirm a manufacturing slowdown. API crude oil stocks previously rose 2.78M; another build would cool the energy impulse. Multiple Fed speakers (Bostic, Miran, Waller) bookend the session. Abroad, Japan’s machinery orders show previous -4.6% m/m with consensus 0.5% and previous 4.9% y/y with consensus 4.8% and forecast 4.7%. Risk-on would be Empire improving toward the forecast and oil builds; risk-off would be a fresh activity slip and hawkish speaker tone.
Thursday, October 16
This is the week’s center of gravity. Philadelphia Fed Manufacturing Index shows a hot prior 23.2 versus consensus 9.1 and forecast 4; anything staying double-digits would argue activity resilience and could revive rate-cut pushback. The NAHB Housing Market Index prints a prior 32 with consensus 33 and forecast 34; a climb would hint at a housing floor. Energy supply arrives with EIA crude stocks (prior +3.715M) and gasoline (prior -1.6M); builds are disinflationary, draws are not. Fresh inflation and spending reads hit at 08:30: PPI m/m sits at -0.1% with a prior 0.3% and forecast 0.5%; core PPI m/m also shows -0.1% versus a prior 0.2%. Retail Sales m/m pop 0.6% versus a 0.4% prior and 0.2% consensus, while the Control Group posts 0.7% versus 0.4% prior and 0.2% consensus. Jobless claims show 218K versus a 223K prior. Business Inventories m/m stand at 0.2% versus 0.1% prior and 0.1% consensus. Layer on Barkin and Kashkari remarks. The risk-on mix would be cooler PPI alongside firm but not hot retail, steady claims, and inventory growth near 0.2%; risk-off would be re-acceleration in PPI or a sales beat that tightens financial conditions via a growth-and-inflation scare.
Friday, October 17
Japan’s BoJ Uchida speaks pre-U.S. session. Stateside, Industrial Production m/m is 0.1% with a 0.1% prior and 0.1% consensus, a neutrality check on manufacturing. Net Long-term TIC Flows show $49.2B in August, a read-through to capital appetite for U.S. assets. Housing takes the stage: Building Permits prelim are 1.33M and Housing Starts 1.307M; permits m/m are -2.3% and starts m/m -8.5%. Import Prices m/m print 0.3% and Export Prices m/m 0.3%. A risk-on close would be steady production, resilient permits toward 1.33M, and import prices holding near 0.3% without upside surprises. A risk-off turn would be a deeper housing retrenchment and hotter price inputs. Fed Musalem is on the docket mid-day; any commentary on the growth/inflation tradeoff could nudge the afternoon tone.
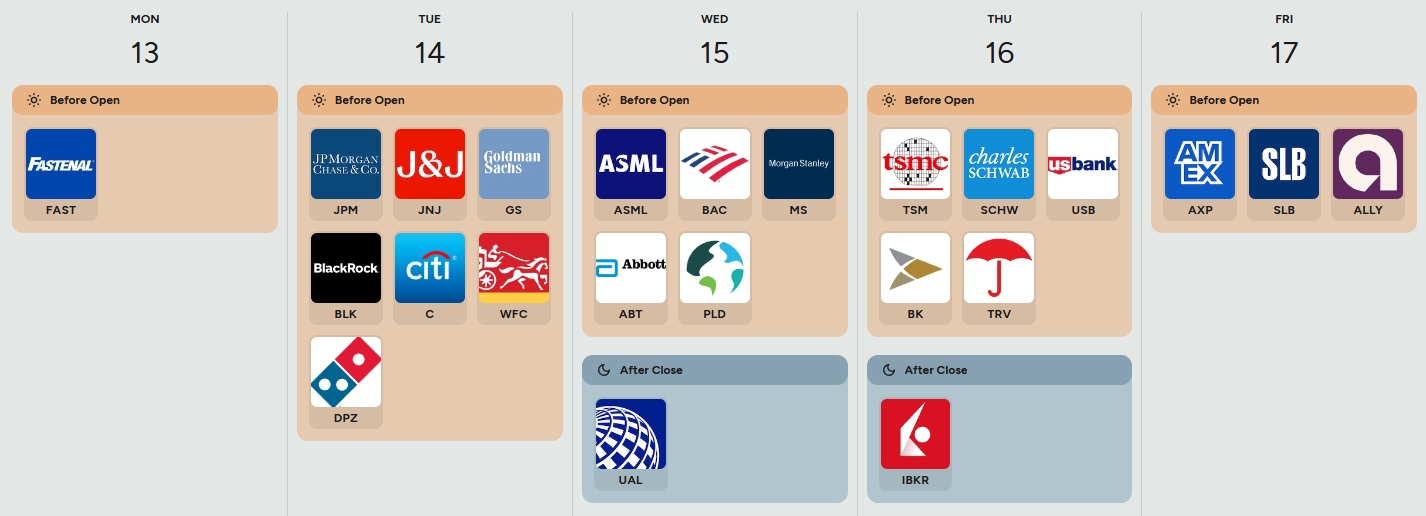
For earnings, the board centers on banks, semis, and payments with macro spillover. Tuesday’s open brings JPM, JNJ, GS, BLK, C, WFC, and DPZ. For the banks, watch net interest income direction versus deposit betas, credit costs, card loss provisioning, and trading fees; beats on markets and stable credit would support broader cyclicals, while margin compression or rising charge-offs would weigh on risk. Wednesday features ASML, BAC, and MS before the bell and UAL after; ASML’s order book and EUV commentary are a read on capex, while BAC/MS echo the money-center themes. Thursday brings TSM, SCHW, USB, BK, and TRV before the open, plus IBKR after; TSM’s capacity utilization and capex guide set tone for semis and equipment. Friday opens with AXP, SLB, and ALLY; AXP’s spend growth guides the consumer, SLB’s international and offshore commentary is an energy capex barometer, and ALLY’s auto credit metrics flag consumer credit stress or relief.
Sign-posts for active traders
Thursday 08:30 ET: if core PPI m/m holds at -0.1% while Retail Sales m/m stays near 0.6%, risk should skew constructive; a PPI upside surprise flips it.
Thursday 10:00–10:30 ET: NAHB above 33 and EIA crude build versus 3.715M prior would cool inflation impulses; a draw with weak NAHB is risk-off.
Friday 08:30–09:15 ET: Housing Starts m/m -8.5% paired with Permits at 1.33M is mixed; a second weak starts print with permits slipping would pressure cyclicals.
Bottom line: this is a speakers-and-data gauntlet anchored by Thursday’s inflation and spending combo and a bank-heavy earnings slate; if PPI stays soft and retail solid but not hot while banks avoid credit slippage, dips should find buyers, but a PPI or retail re-acceleration alongside weak housing would keep risk premia elevated into the weekend.

Market Intelligence Report
Here’s the wrap on last week’s one-week posture. The theme was Playing VL Levels because planned trims (all lines-in-the-sand shared last week) softened the blow in a growth-led drawdown.
Last week’s tape turned decisively risk-off and our “lines in the sand” did exactly what they were meant to do. We planned to trim index beta on weakness below SPY 666, QQQ 602, and IWM 242. All three broke. Executing the cutbacks at the LIS levels turned a rough mark-to-close outcome of about -2.51% into a realized portfolio loss of roughly -1.92%. In core beta alone, the sleeve’s drag shrank from -0.91% to -0.33%, a 58–59 bp save. The rest of the book behaved to script: hedges and defensives steadied the ship, a couple of idiosyncratic longs worked, while semis, miners, and the crypto toggle were the pressure points.
Sleeve                             Wt%   Sleeve rtn%   Contrib %
Core index beta                    30.0     -1.094        -0.33
AI / compute leadership & breadth  20.0     -3.894        -0.78
Biotech optionality                 6.0      0.735         0.04
Hard-asset hedge                   10.0     -2.404        -0.24
Selective energy                    4.0     -2.969        -0.12
Rate-sensitives / defensives       10.0     -0.890        -0.09
Credit ballast                     12.0     -0.336        -0.04
International tilt                  4.0     -3.349        -0.13
Crypto toggle                       2.0    -16.309        -0.33
Risk hedges                         2.0      4.592         0.09
----------------------------------------------------------------
Total portfolio                    100.0                   -1.92
The big drags were exactly where the market got hit. The AI/compute sleeve gave up -0.78% of portfolio performance as SMH (-5.8%) and SOXX (-6.5%) led the downside; NVDA (-1.3%) and IONQ (-1.9%) were milder, but MDB (-5.4%) added to the sleeve cost. Hard-asset hedges detracted -0.24% as GDX (-2.9%) and COPX (-2.7%) fell with the growth scare. Selective energy cost -0.12%, with XLE (-4.8%) and OIH (-8.6%) more than offsetting VIST’s +6.2%. International tilted negative (-0.13%). Crypto was the worst sleeve at -0.33% on ETHT (-25.9%) and IBIT (-6.8%). On the other side, the risk-hedge sleeve added +0.09% with TSLS +6.3% and SH +2.9%, and biotech optionality added +0.04% as XBI finished +0.8%. Rate defensives were mixed: XLU (+0.9%) and EXC (+3.9%) helped, but RWR (-3.7%) and VTR (-2.5%) left the sleeve around -0.09% net. Credit ballast did its job with only a small -0.04% giveback.
Top 5 Contributors Report
RGTI +0.13% | TSLS +0.06% | VIST +0.06% | XBI +0.04% | EXC +0.04%Top 5 Detractors Report
SMH -0.47% | SOXX -0.26% | ETHT -0.26% | SPY* -0.15% | GDX -0.15%Takeaways from the week are straightforward. Always hope for the best but plan for the worst: using VL levels recapped from the Market Technician’s Playbook are excellent lines-in-the-sand if you don’t have your own markers for risk. Had the market firmed-up and semis stabilized, pressing winners like RGTI and VIST and letting hedges bleed back would’ve worked fine; weakness persisted we executed according to our plans: keep beta light under the defined LIS’, hold some SH/TSLS, and lean on credit and utilities for ballast. If you plan for both scenarios, you can focus on execution when the tape gets hot and others are scrambling.
Let’s take a look at what the tape is telling us about this coming week.
MIR Part 1: The Backdrop
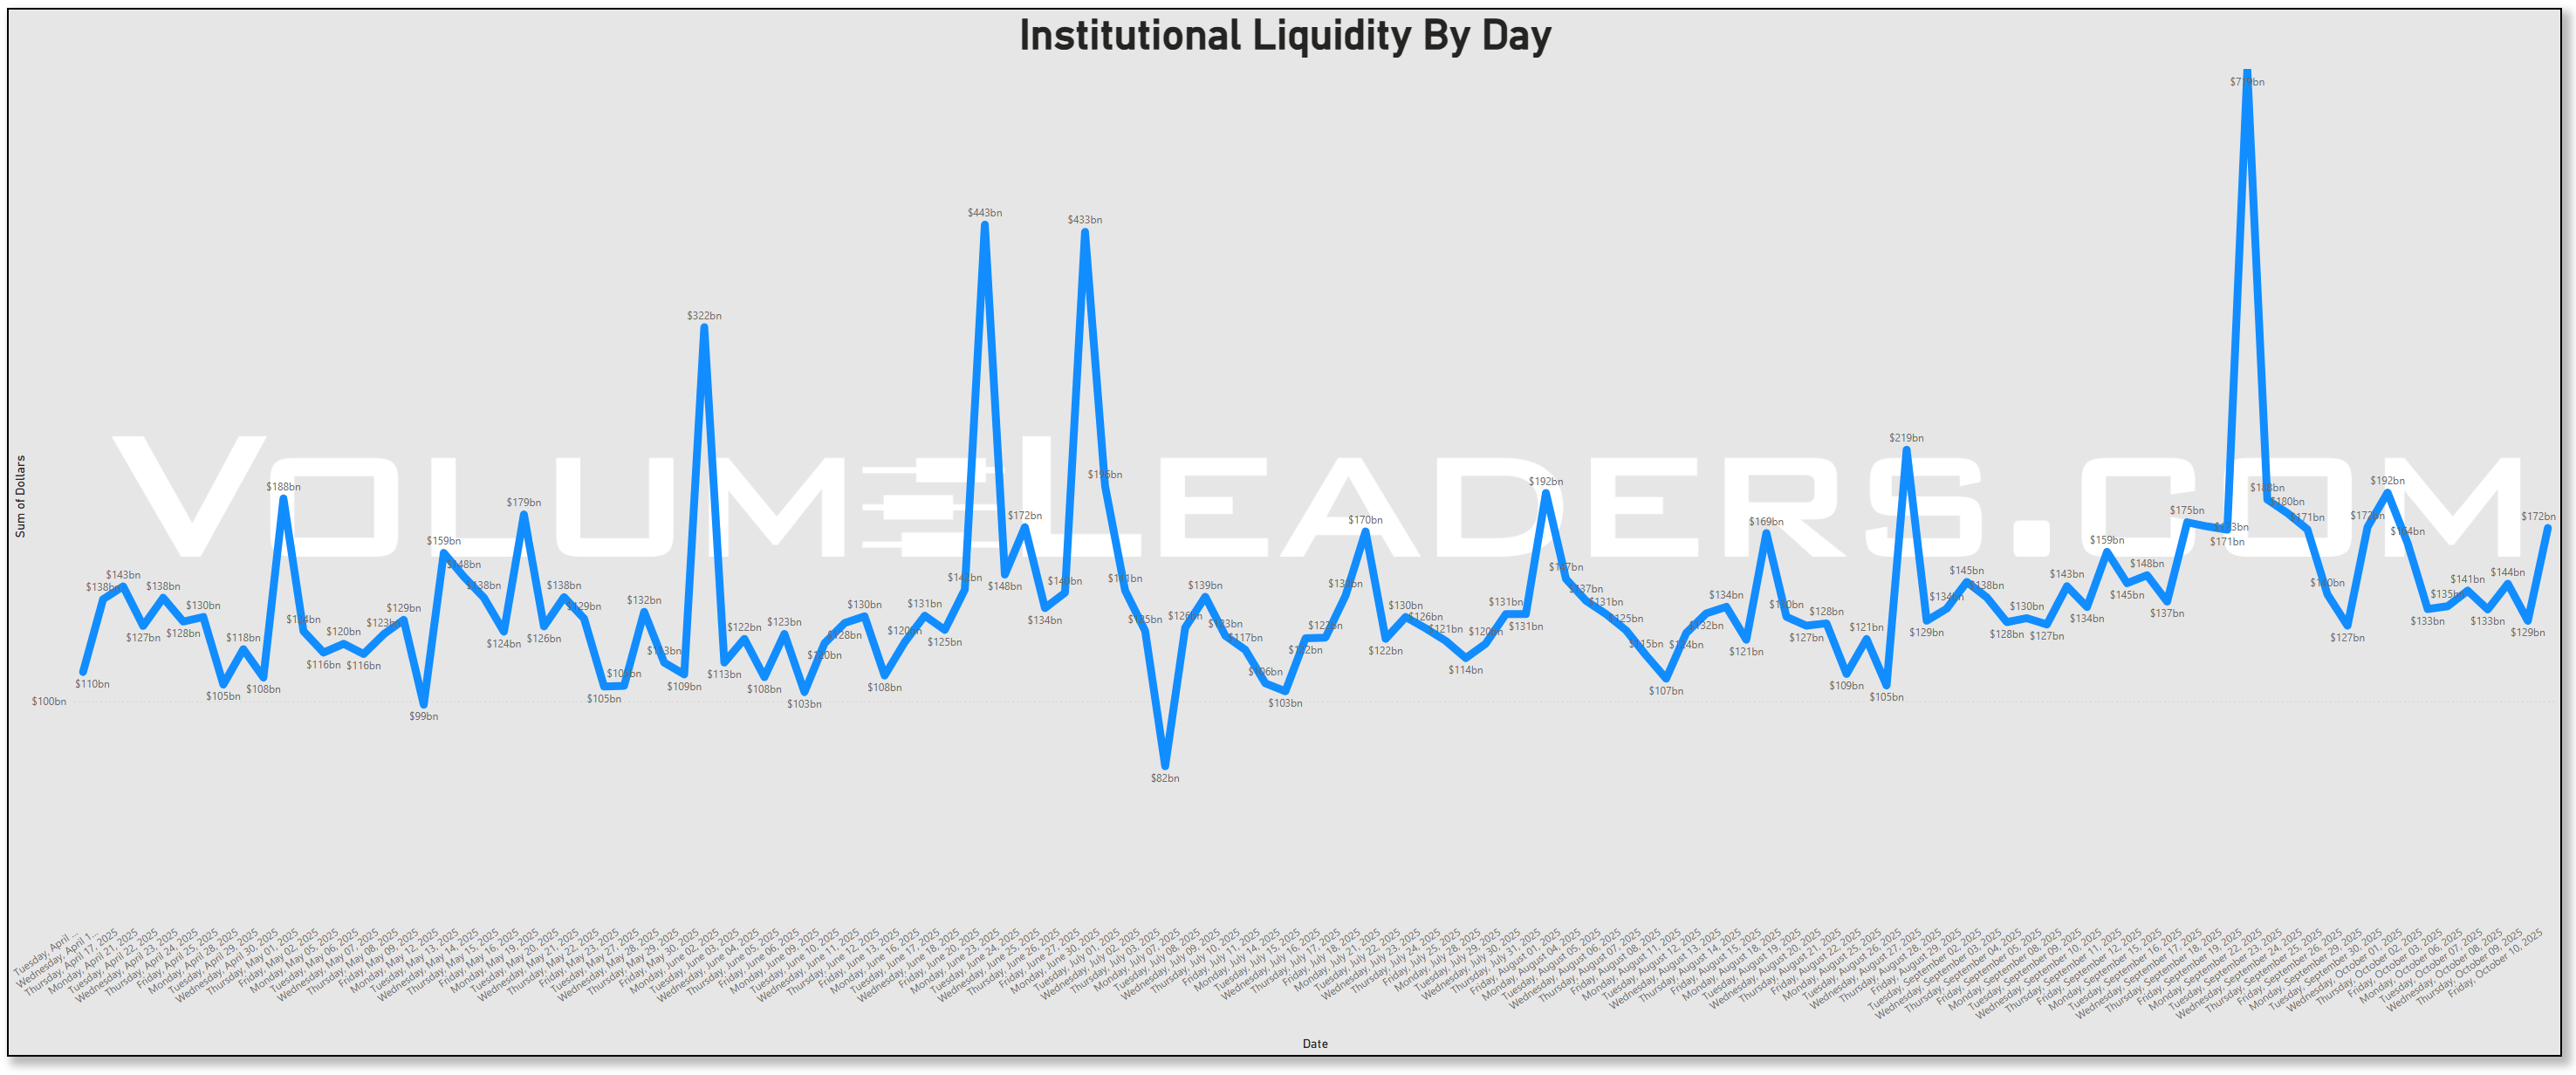
Liquidity set the tone. The multi-month series shows a stair-step of normal sessions in the $120–$150b range punctuated by episodic surges. We printed ~$172b on the latest day after a run of $130–$160b prints. This week’s ramp in dollars came late and felt defensive: liquidity expanded as prices slid, which is consistent with de-risking flows rather than a chase. The pattern also fits the calendar: earnings season is about to open and macro visibility is muddy as official data are delayed during the government shutdown, with the BLS pushing the September CPI release to Oct. 24 to meet statutory COLA deadlines. In short, we got more dollars, but the tone read reallocative, not risk-seeking.
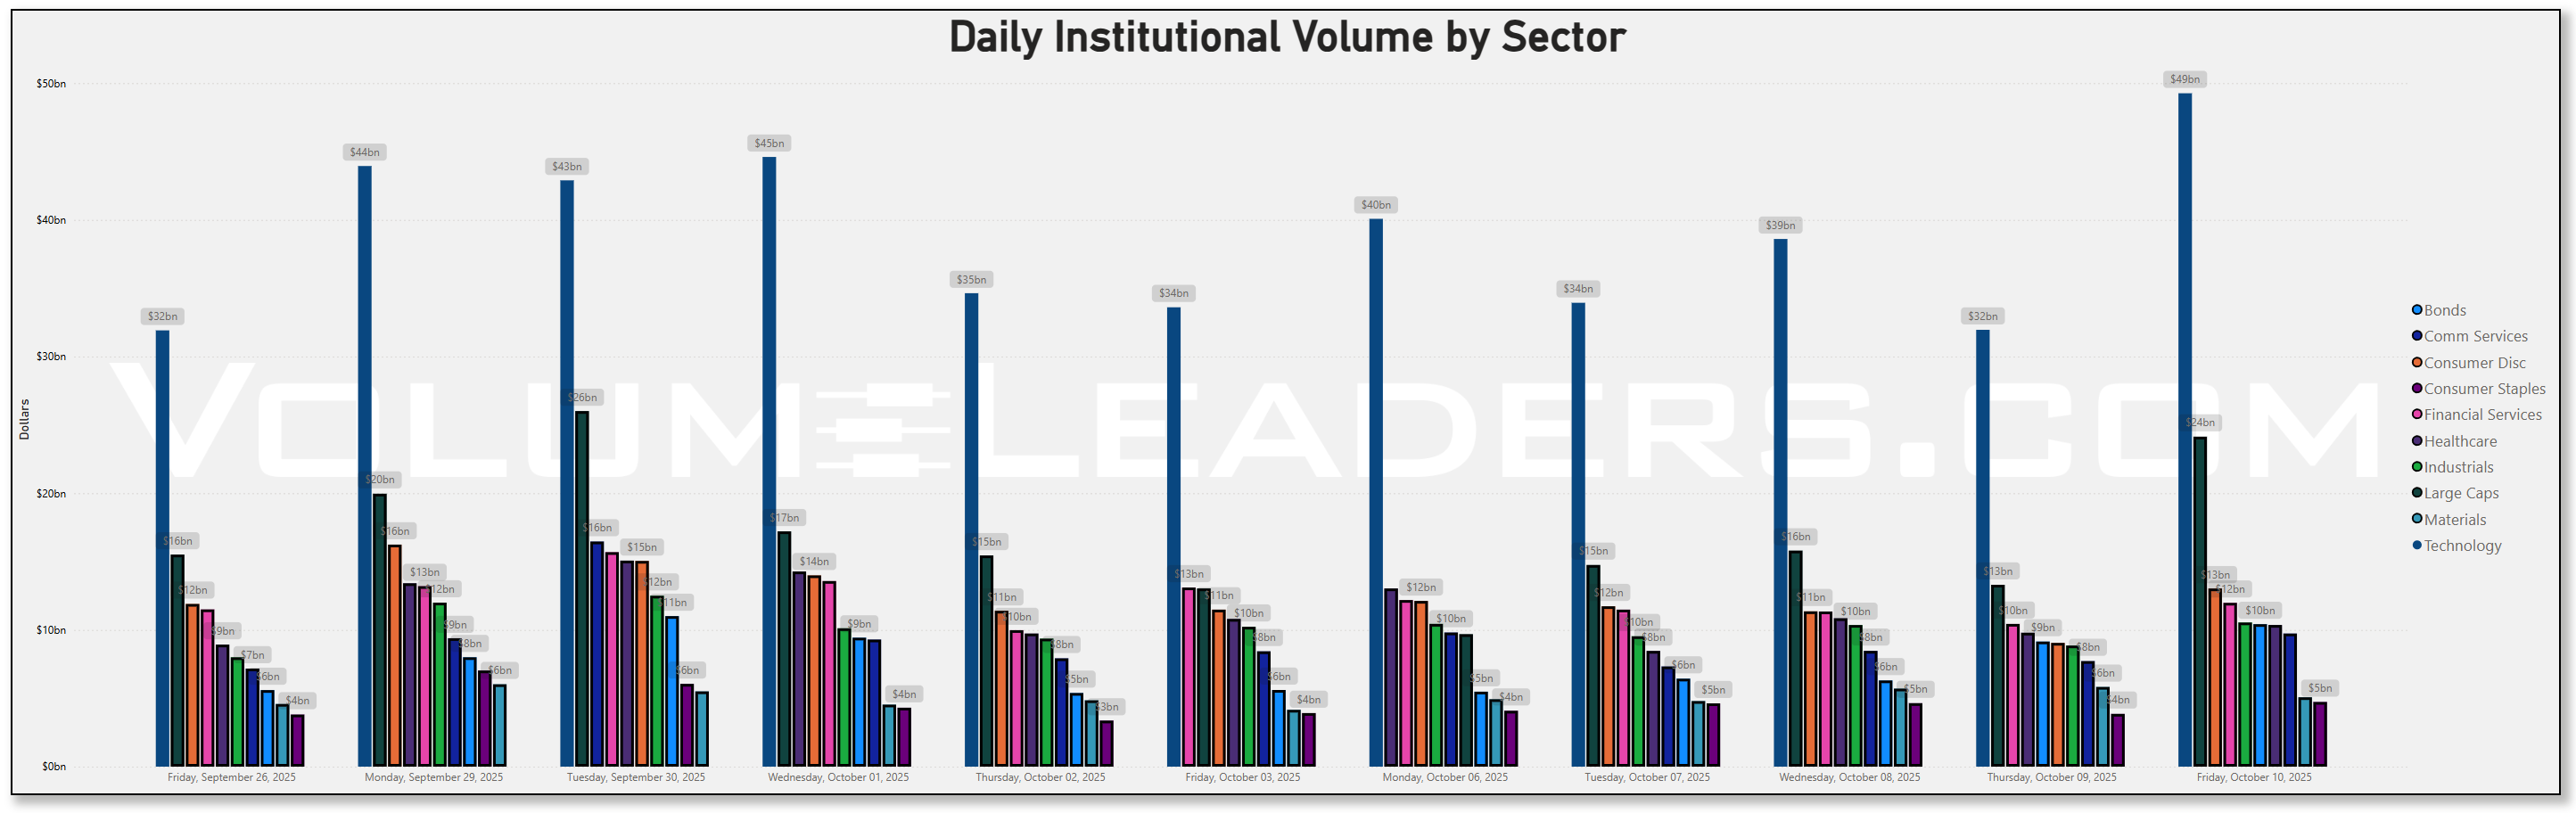
Tech started the week near ~$40b and built into a ~$49b crescendo on Friday. That surge coincided with the tariff shock and the broad selloff, which tells you the largest books transacted where the market’s duration of growth lives. Bonds did ramp through the week, but from a much smaller base—roughly ~$5b early to around ~$10b on Friday—as managers added duration and credit sleeves into the flush. Large Caps were the second engine, finishing the week with a late pop to roughly ~$24b on Friday. Communication Services, Consumer Discretionary, and Industrials printed mid-single to low-teens billions most days, with a catch-up on the final session as de-risking broadened. The pattern says institutions didn’t abandon Tech in advance; they were forced to price a new policy shock in Tech first, then used index and bond wrappers to reshape risk into the close.
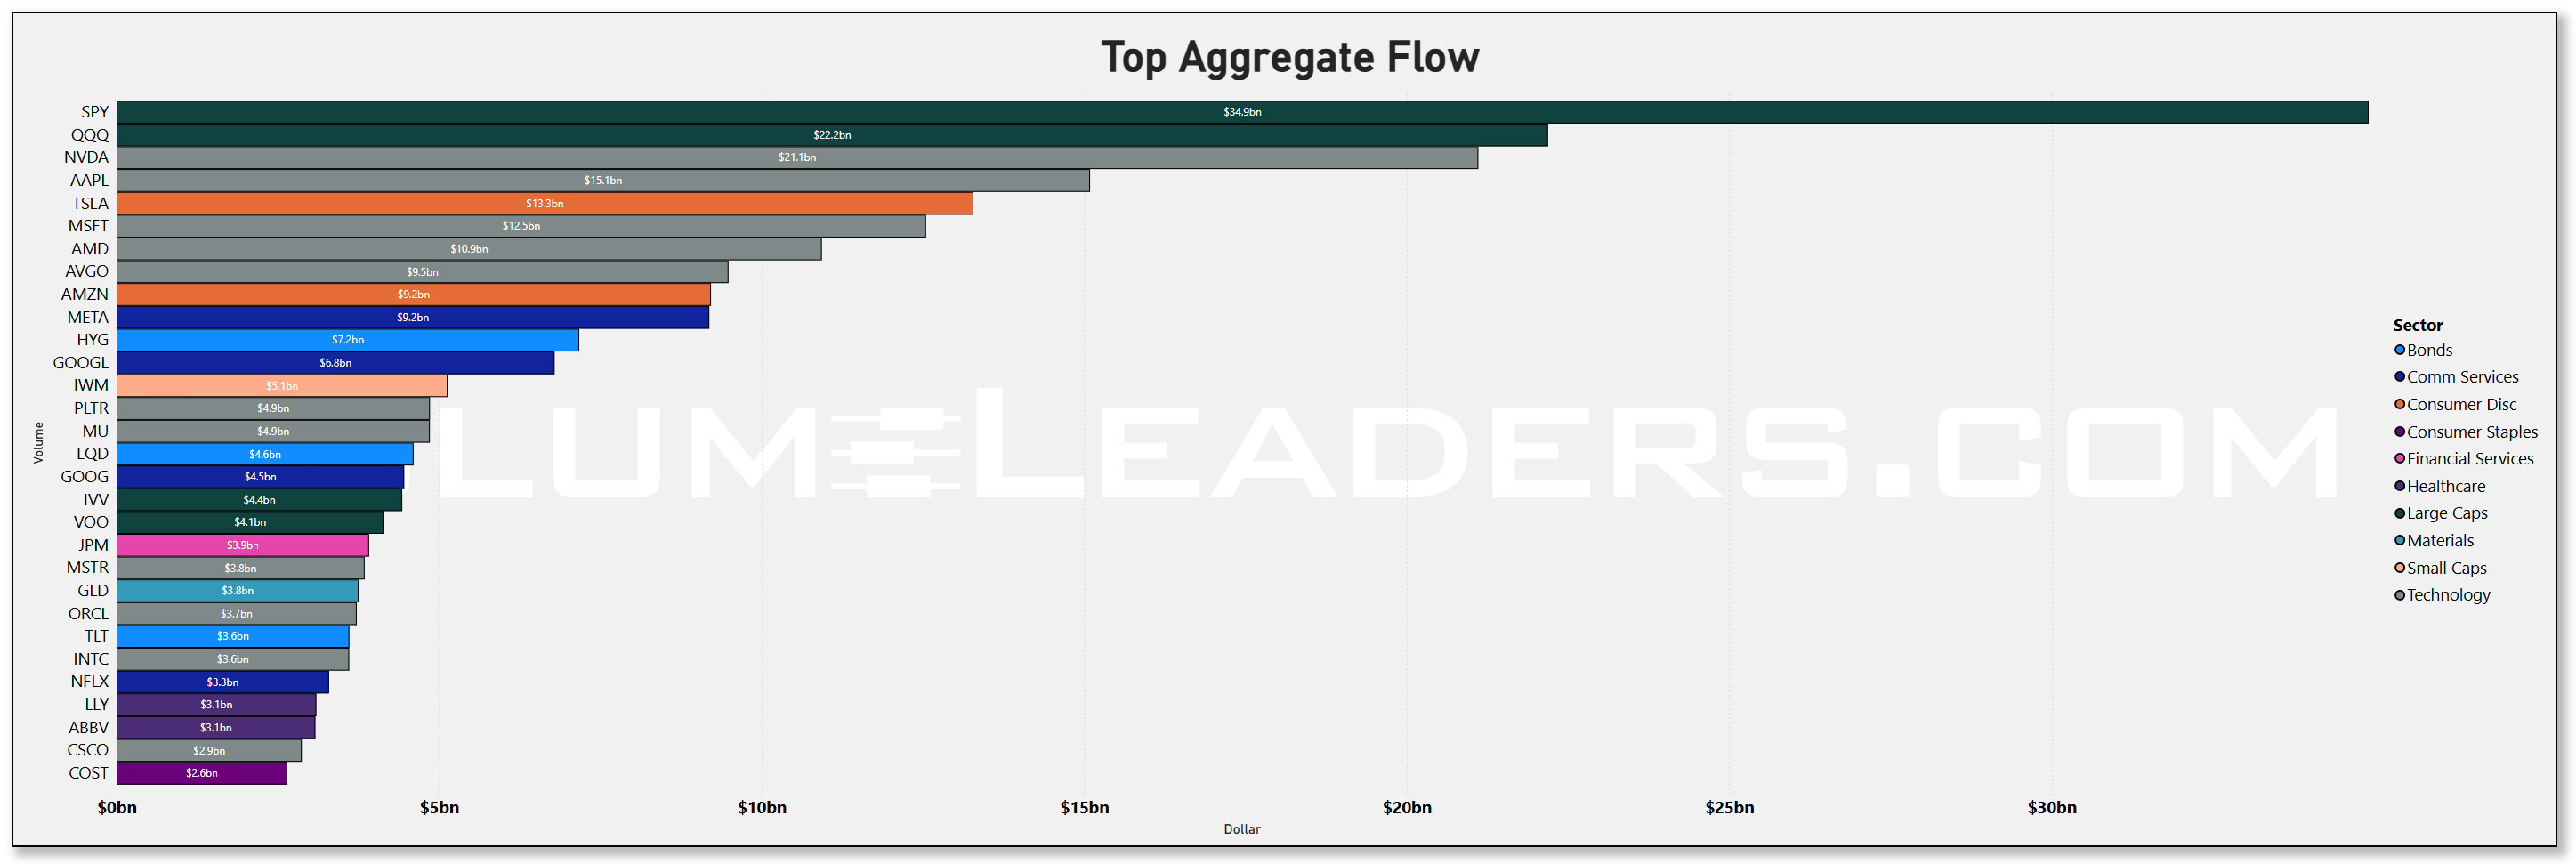
The treemap and the aggregate bars show where the real weight landed. Index vehicles and the megacaps took the lion’s share. SPY printed about $34.9b, QQQ ~$22.2b.
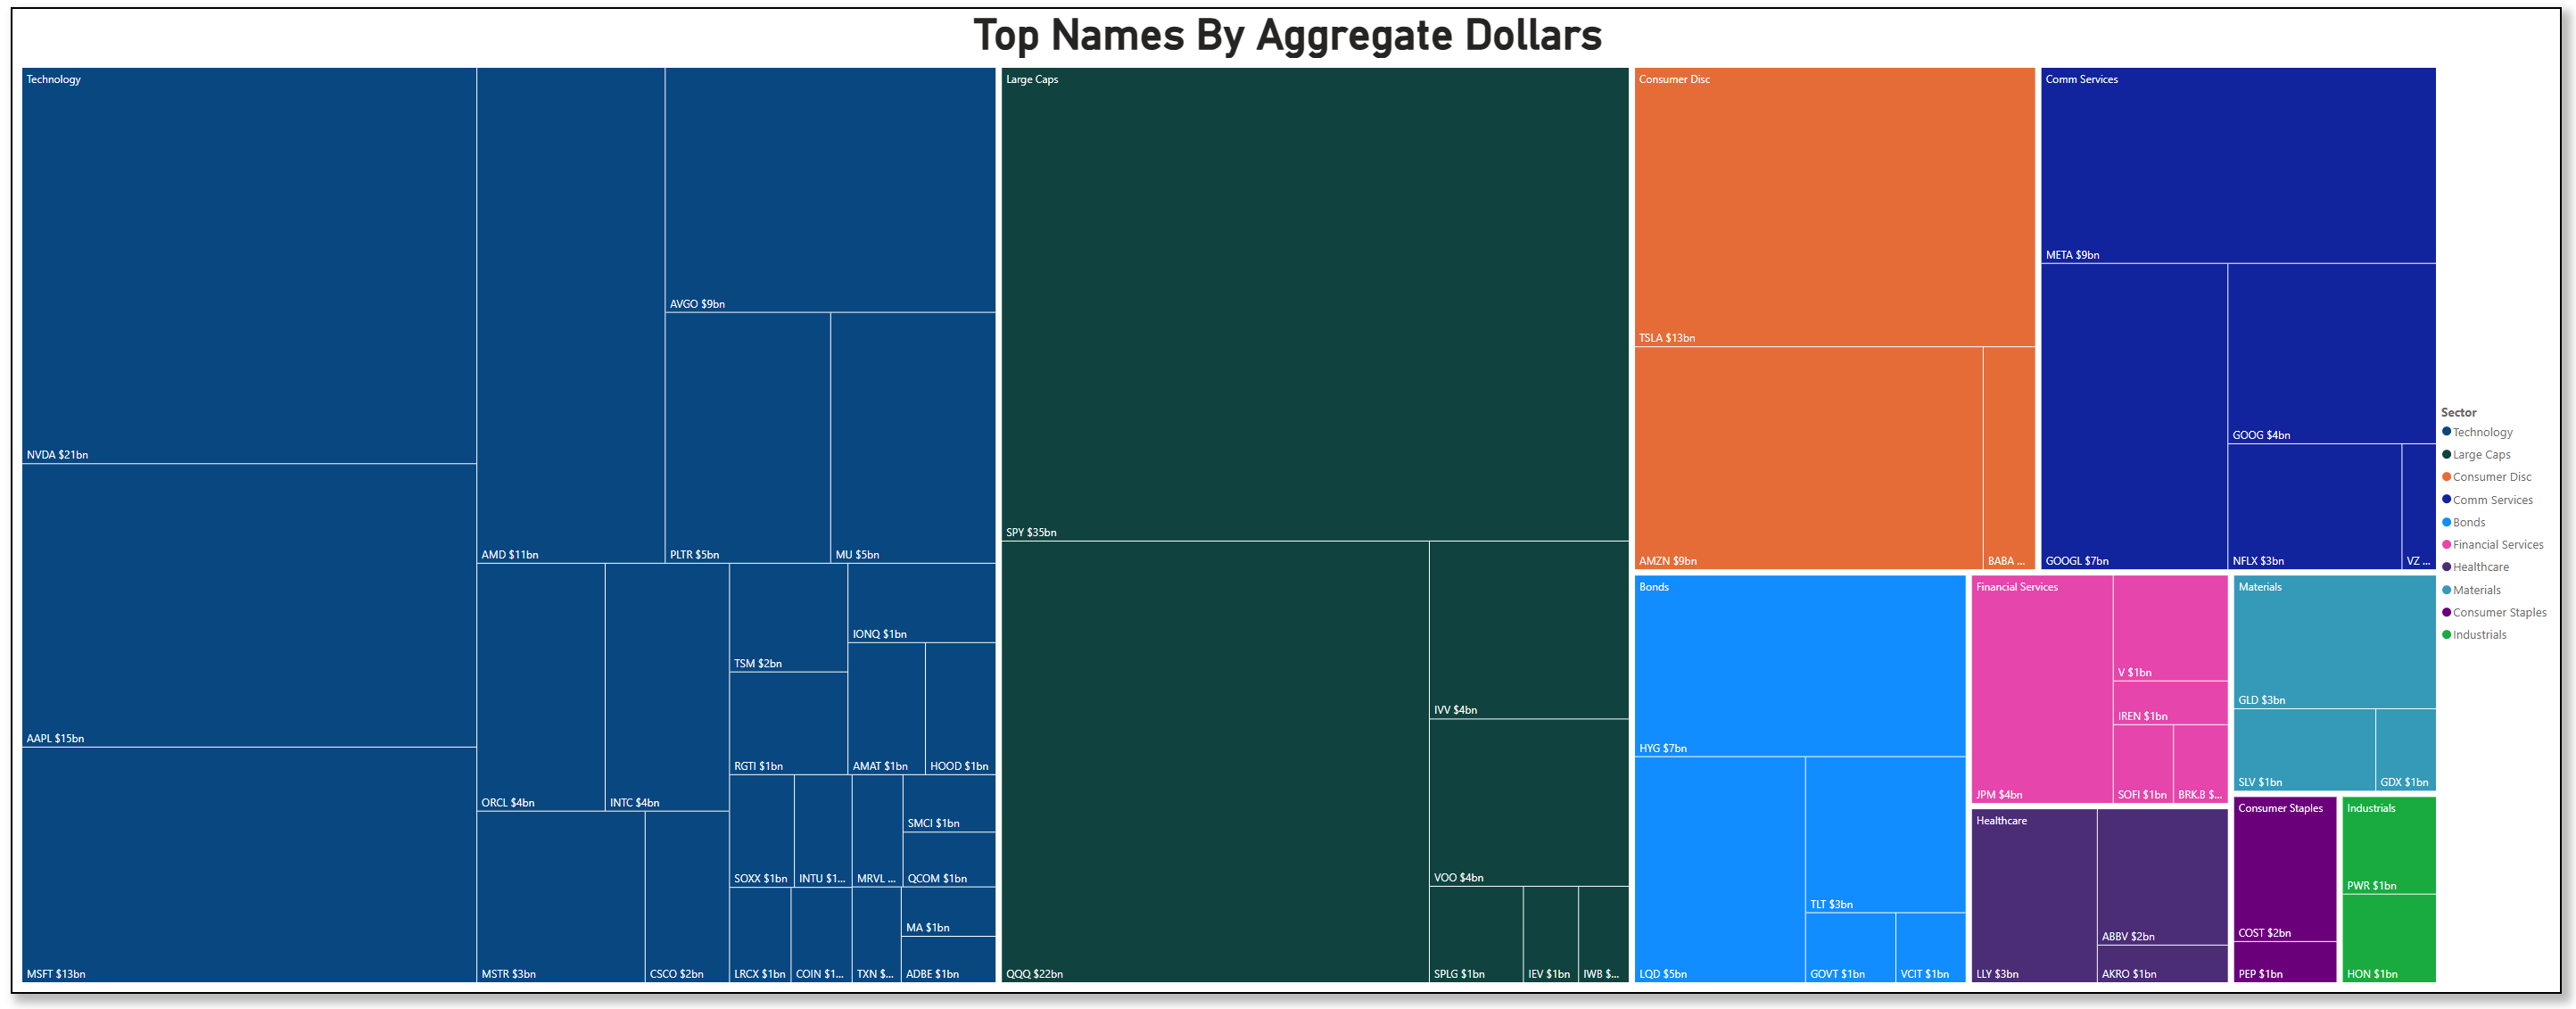
Within single-names the AI complex led by a mile: NVDA ~$21.1b, AAPL ~$15.1b, MSFT ~$12.5b, AMD ~$10.9b, AVGO ~$9.5b. The consumer internet heavyweights were next: TSLA ~$13.8b, AMZN ~$9.2b, META ~$9.2b, and the two Google lines at ~$6.8b (GOOGL on the bar list) and ~$4.5b (GOOG). Credit sleeves showed up in size too, with HYG ~$7.2b and LQD ~$4.6b, while rates risk TLT logged ~$3.6b. Breadth inside Tech was wide, not a single-name anomaly: NVDA, AAPL, MSFT, AMD, AVGO, INTC and MU all carried multi-billion flows, and the treemap shows notable tiles for PLTR (~$5b) and TSM (~$2b). Semiconductor attention tracks the tape: TSMC just reported revenue ahead of forecasts and will guide on Oct. 16, a key input for AI capacity and capex lanes.
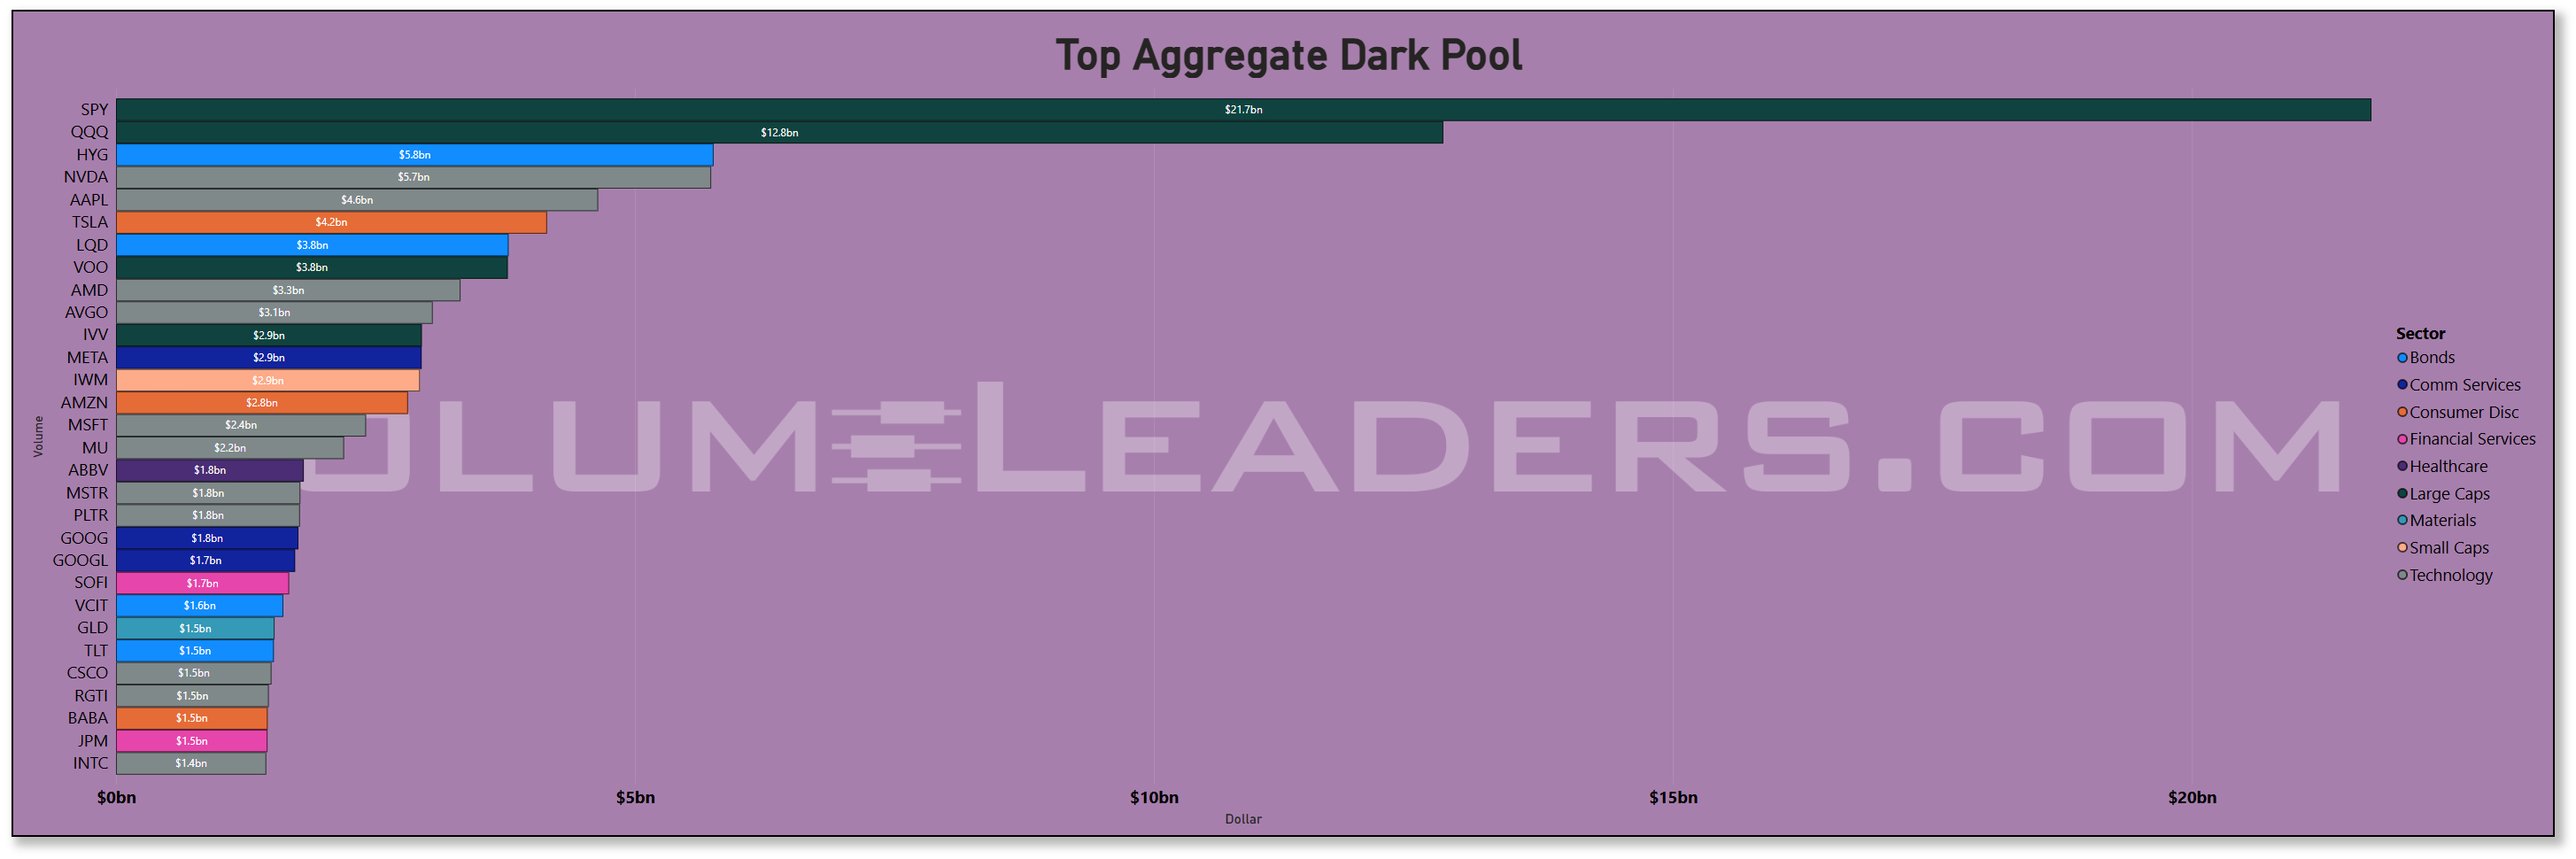
Off-exchange activity adds context. Dark-pool dollars were heavy in the broad indices and the same megacaps: SPY ~$21.7b and QQQ ~$12.8b towered over the list, followed by HYG ~$5.8b, NVDA ~$5.7b, AAPL ~$4.6b, and TSLA ~$4.2b. Investment-grade and Treasury proxies (LQD ~$3.8b, TLT ~$1.5b) plus VOO/IVV each near the ~$3–4b band suggest portfolio-level adjustments rather than a purely speculative burst. When dark interest concentrates in index wrappers and the largest growth leaders during a drawdown, it often signals inventory transfer and hedged accumulation by the slower money rather than hot-hand de-risking.
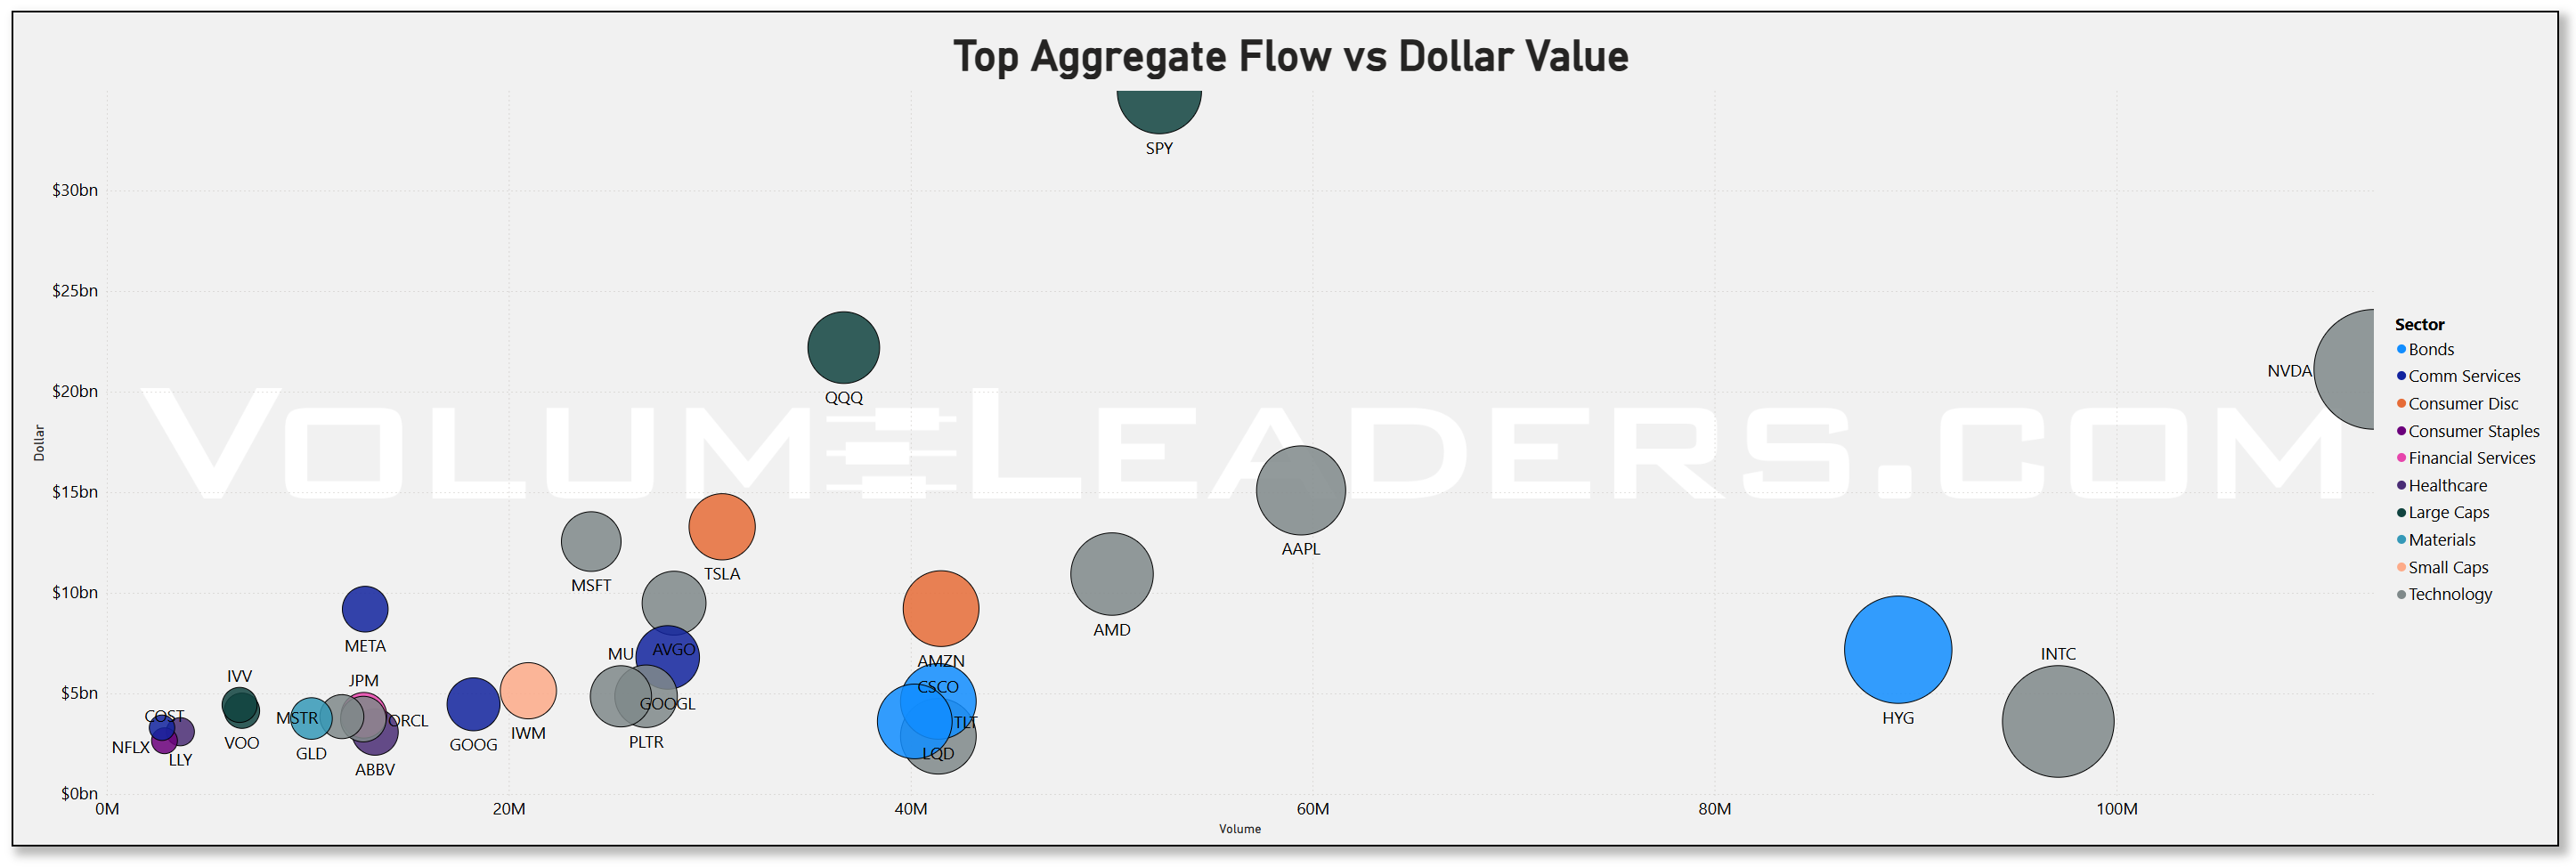
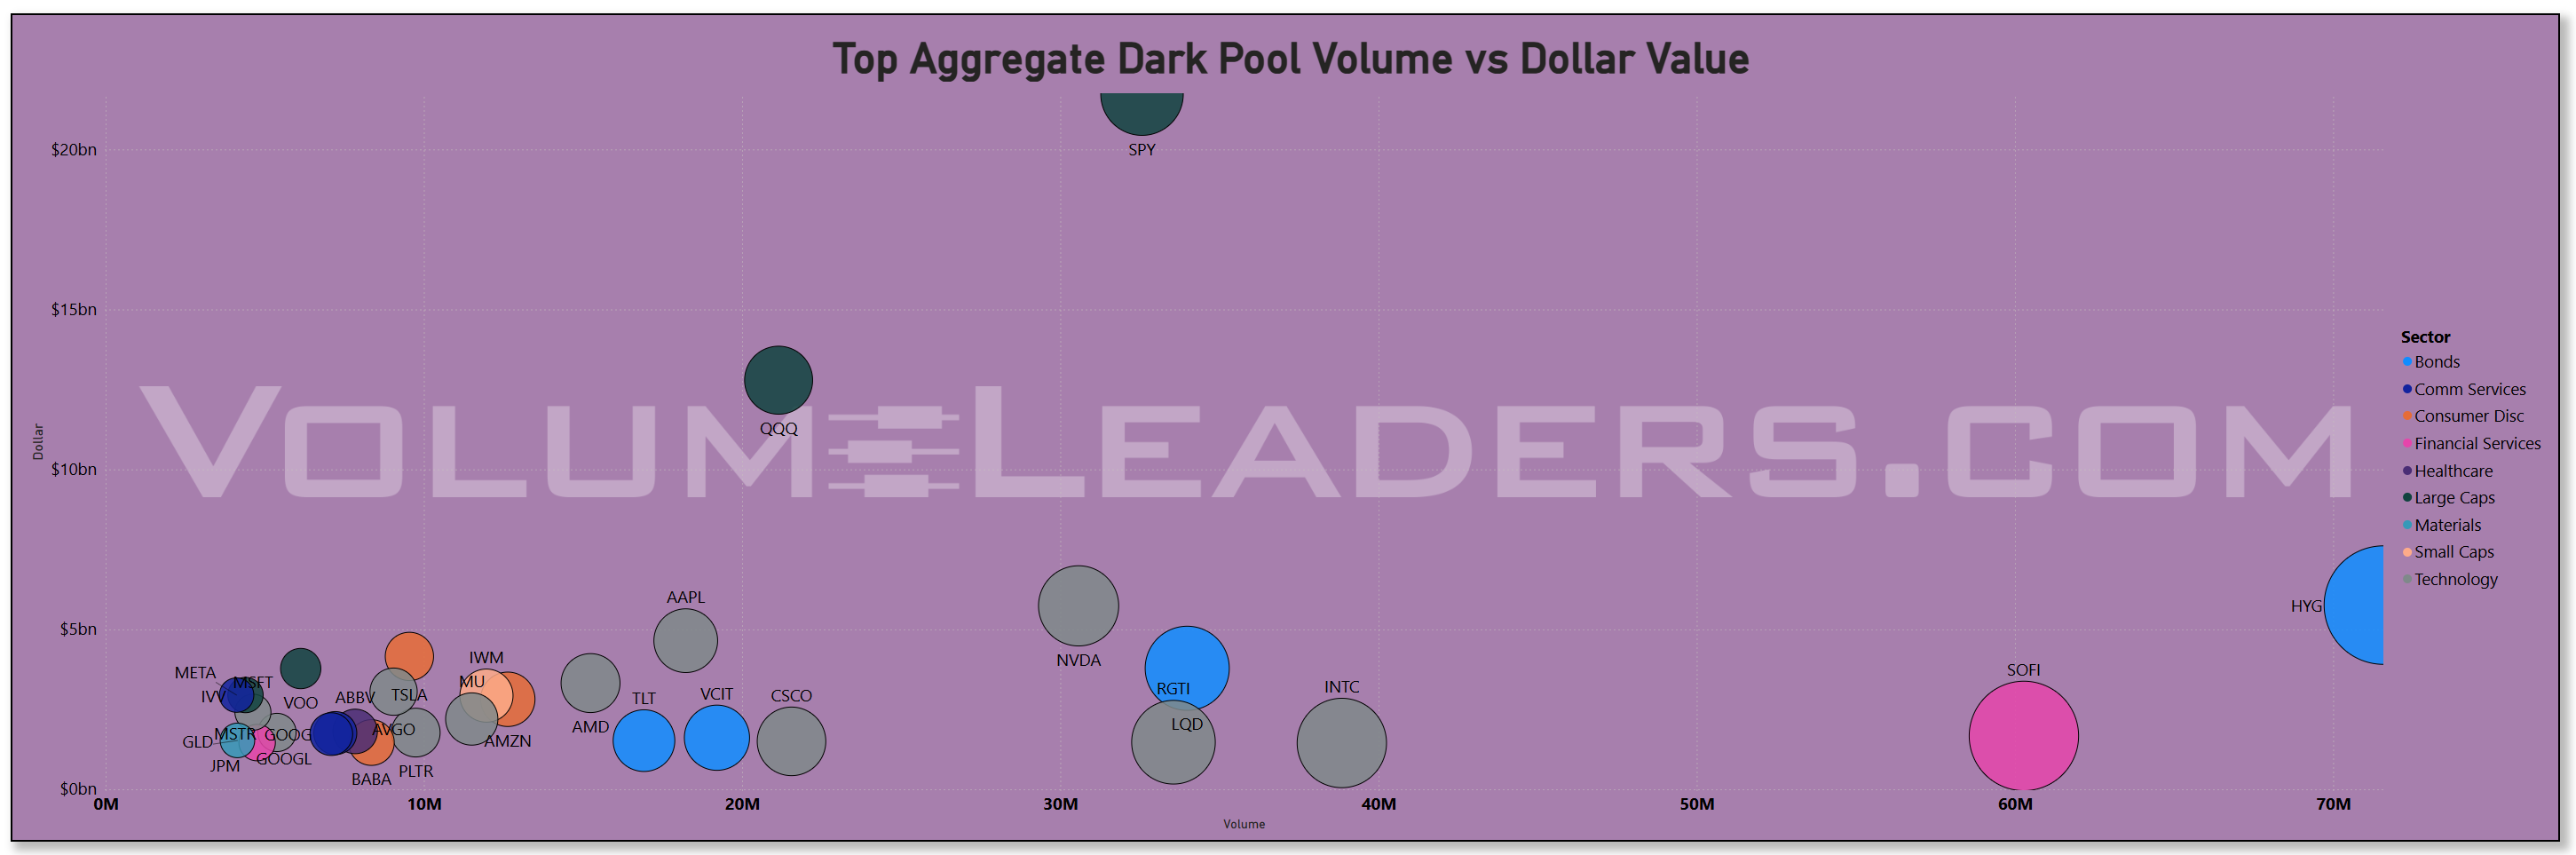
The scatter corroborates it: very large dollar prints at moderate volumes in SPY/QQQ, and unusually busy prints in HYG and SOFI, with HYG pushing toward ~70M shares on the x-axis with multi-billion notional on the y-axis. That is the tape of credit hedging and balance-sheet tuning, not panic.
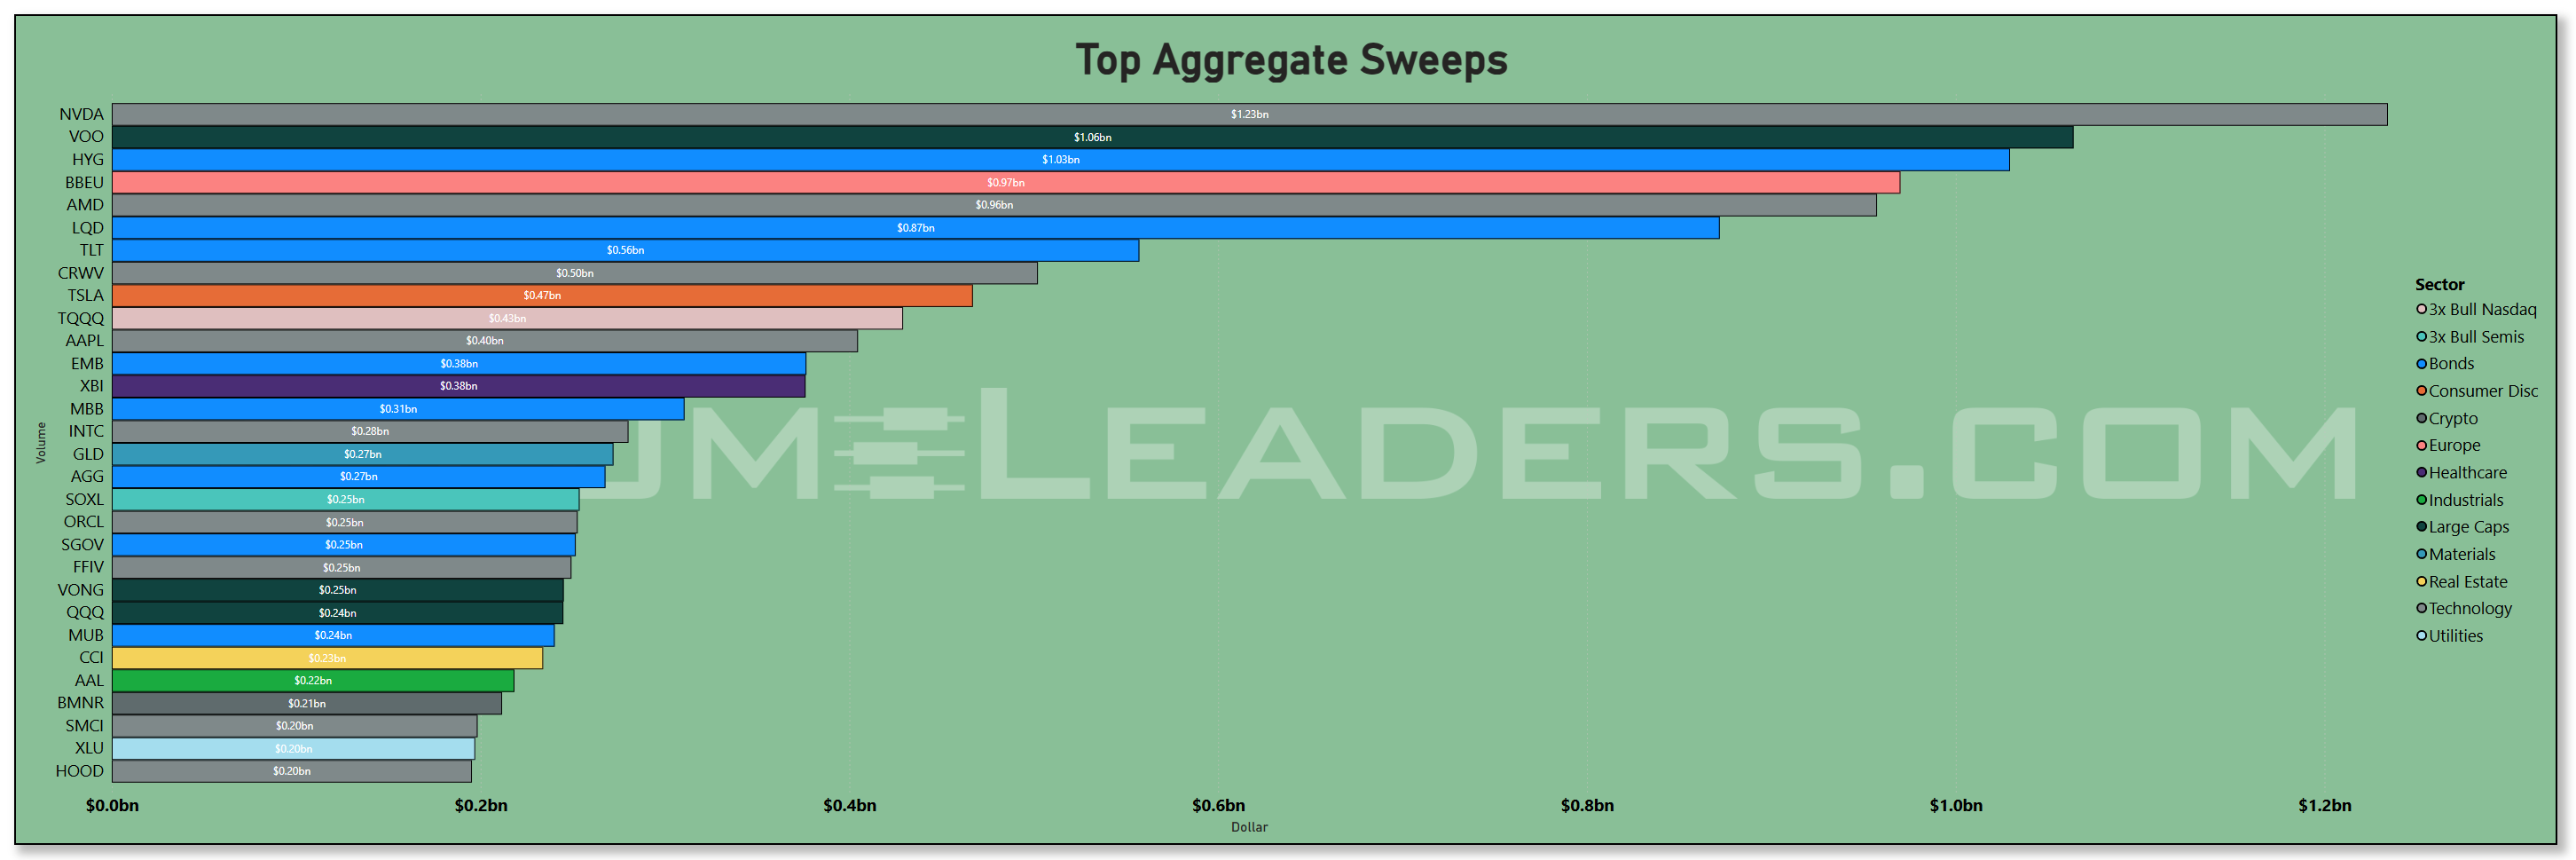
Sweeps tell you who mashed the accelerator. The fastest money pressed NVDA (~$1.23b), VOO (~$1.06b), and HYG (~$1.03b) at the top, then a mix of BBEU (~$0.97b), AMD (~$0.96b), LQD (~$0.87b), and TLT (~$0.56b). TSLA (~$0.47b) and TQQQ (~$0.43b) rounded out the risk levers, with AAPL (~$0.40b) behind them. That is a classic barbell: AI leaders and index beta on one end, credit and duration hedges on the other.
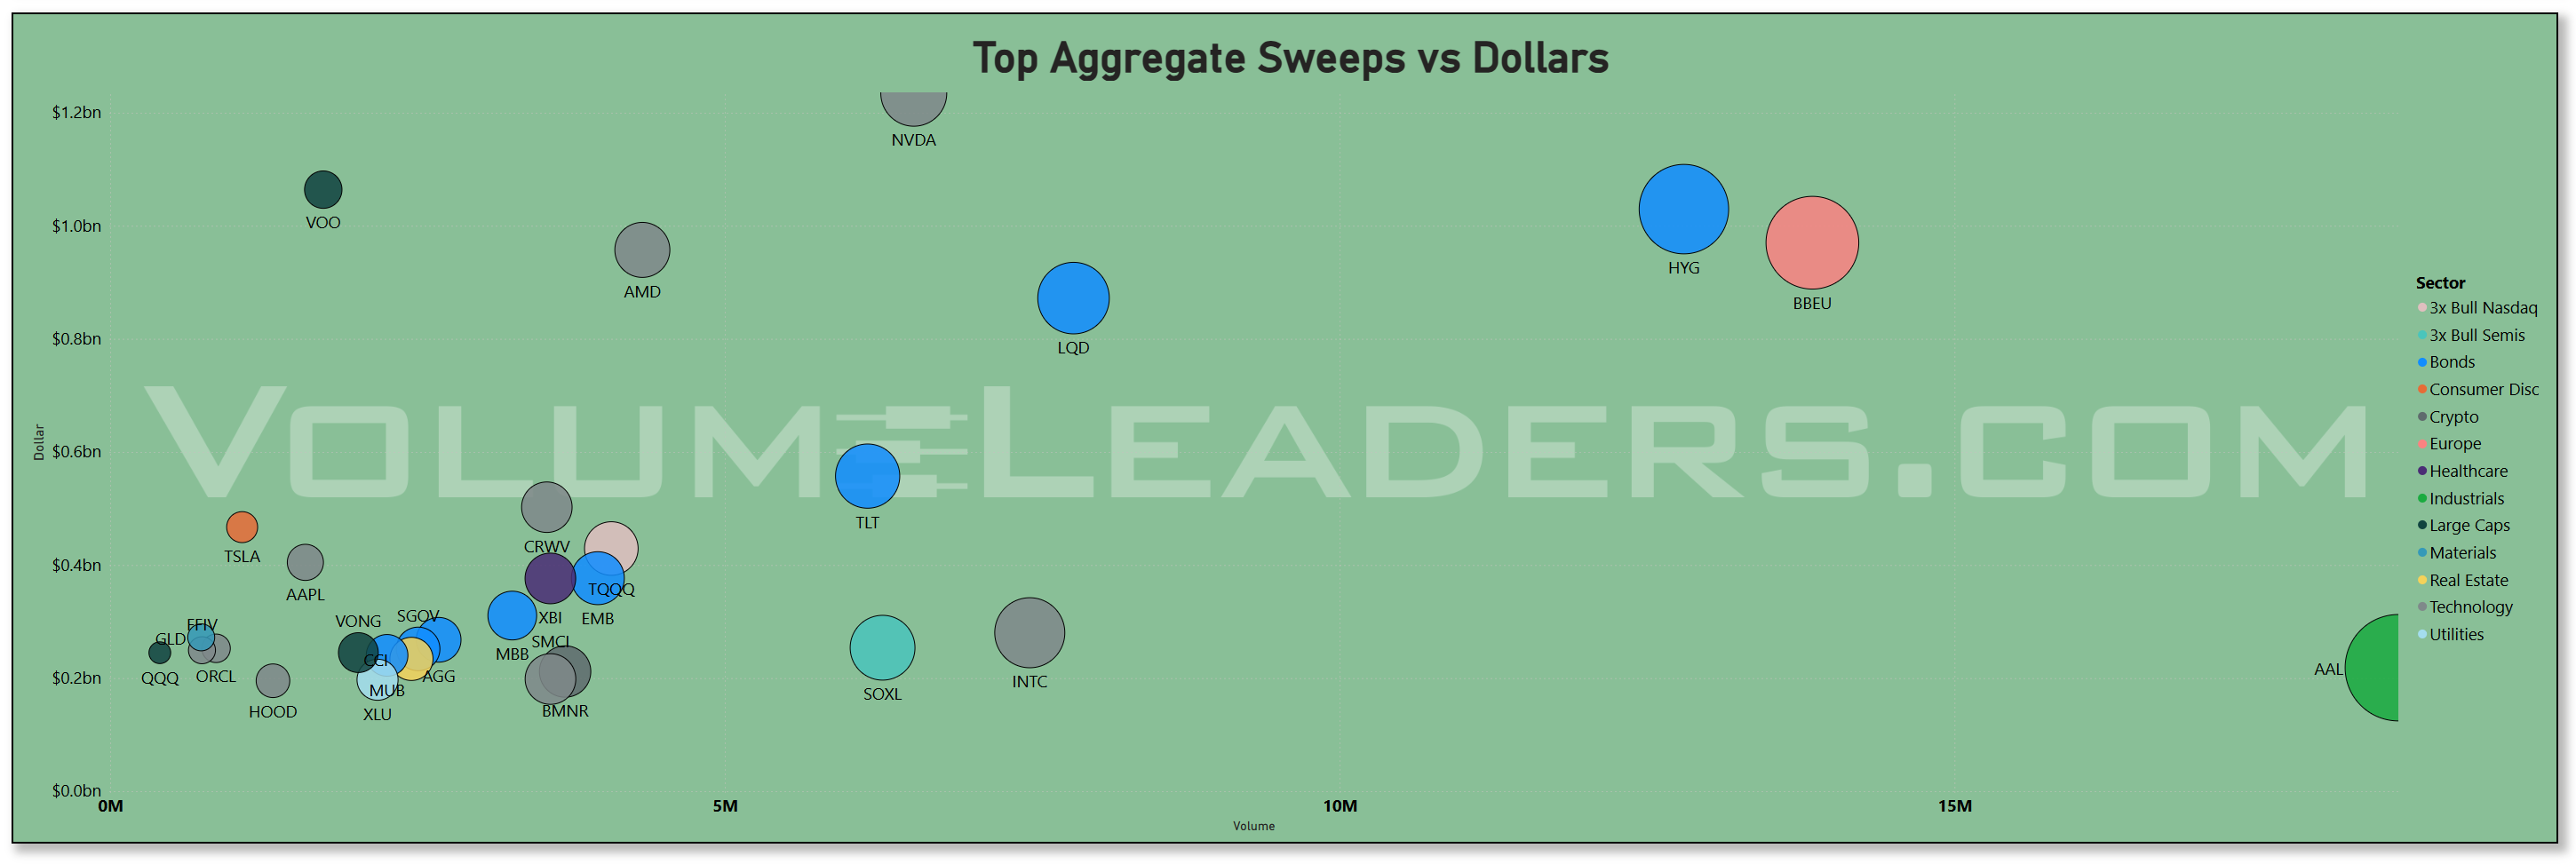
The scatter makes the point cleaner: outsized dollars in HYG and BBEU despite relatively modest volumes hint at institutional protection or cross-regional rotation. It tracks the week’s news flow: a tariff surprise hit semis and mega-tech hardest and jolted the VIX above 21, even as defensives and credit sleeves caught a bid.
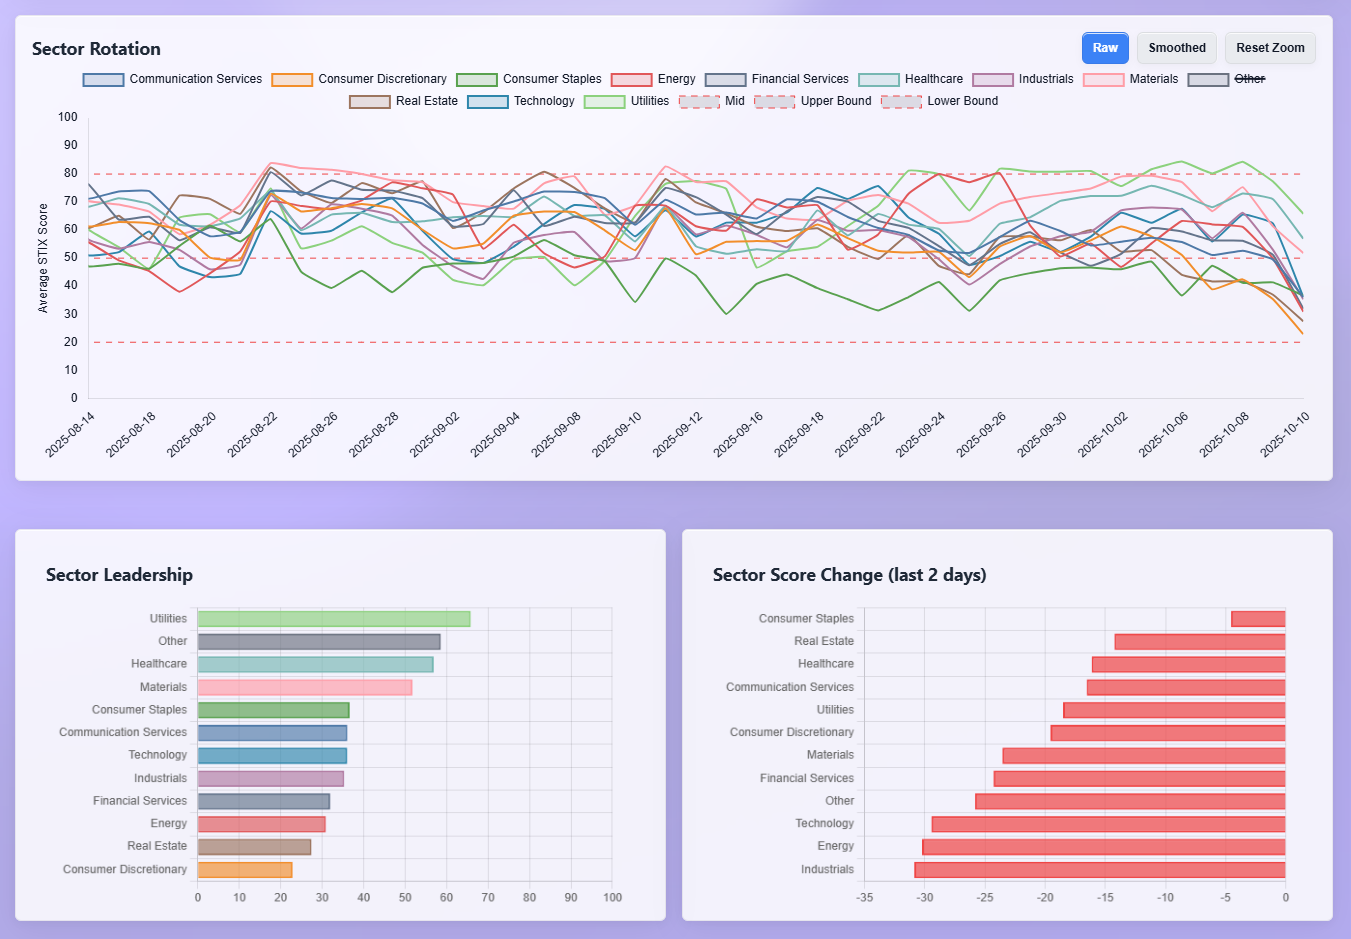
Leadership and momentum at the sector board finish the picture. Utilities sit atop the ranks, with Healthcare and Materials also elevated and holding above 50, while Consumer Discretionary and Real Estate are the laggards on a trend basis. The two-day change shows rotation toward defensives: Consumer Staples up most over 48 hours, Real Estate and Healthcare improving, while Industrials, Energy, and Technology show the steepest negative momentum. That aligns snugly with the flows above: more money into bonds and credit, staples firming, and the growth complex absorbing the shock rather than leading upside. It reads as positioning for fatter tails rather than a blanket risk-off, which matches an environment where policy uncertainty dominates and earnings are about to reset expectations.
Macro and seasonals did the steering. The immediate catalyst was the White House’s escalation of tariffs on Chinese goods, which knocked down semis and big tech and triggered broad selling with the SOX slumping and the S&P and Nasdaq logging their sharpest daily drop since April. Volatility popped, but the options market remained orderly, a sign that hedging demand rose without full-blown capitulation. Overlay the shutdown-driven data vacuum and the BLS decision to push September CPI to Oct. 24, and it is no surprise that index and credit wrappers captured much of the week’s flow. Finally, earnings season is here: the money-center and bulge-bracket banks kick off in coming days with expectations that a deal rebound boosts profits, which naturally pulls flows into SPY/VOO/IVV and the financials complex as books re-balance ahead of prints.
What to watch next is simple and testable. First, whether SPY, QQQ, VOO and their dark-pool prints remain elevated on up days; persistent off-exchange interest would argue that larger funds are absorbing supply, not distributing. Second, whether the AI leaders keep attracting both lit dollars and sweeps after the tariff shock; continued size in NVDA, AAPL and AMD alongside TSMC’s earnings will tell you if buyers are leaning into the secular story or stepping aside. Third, keep an eye on credit sleeves: if HYG/LQD hold a firm bid and TLT participation stays high while VIX backs down from the low-20s, it would imply a controlled de-risking rather than systemic stress; the opposite mix would warn of a more disorderly leg.
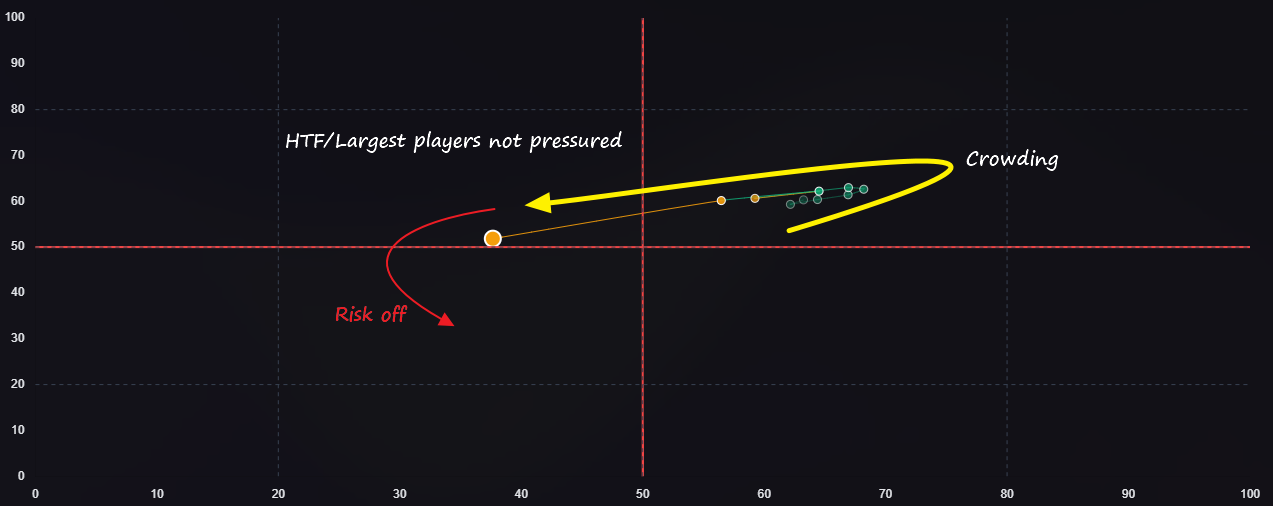
VL’s Market Compass (not yet released; coming soon) has been tracking the deterioration for several days now as the institutional positioning dots have moved from crowded (upper right quadrant) to retail-washout (yellow arc into the upper left quadrant). Broad institutional positioning is not under pressure at this point until we see the compass slip into the lower-left quadrant (theoretical red arc). As it stands now, institutions are perfectly poised ahead of a very important earnings season - one that could shed light on whether investors are ready to lean harder into the AI narrative or if some of the numbers aren’t adding up anymore.
Bottom line: this week’s tape was big-cap and bond-led with megacaps and credit soaking up the dollars, a defensive posture catalyzed by a tariff shock and a data vacuum, and the next tell is whether dark-pool index accumulation and AI-complex demand persist as banks open the earnings gate.
MIR Part 2: Individual Names From The Institutional Tape
VolumeLeaders tracks several proprietary signals designed to spotlight names drawing significant institutional interest. Below, we’ve surfaced the latest results and analyzed them to highlight emergent themes. If any of the sectors, narratives, or positioning trends resonate, the names mentioned here offer a strong starting point for deeper research and watchlist consideration.
VL Trade Rank Velocity™ (TRV)
TRV is a proprietary metric that measures the recent acceleration or deceleration in institutional trading activity for a given stock by comparing its average trade rank over the past few days to its average in recent weeks. A sharp improvement in TRV typically reflects a notable shift in positioning, often accompanied by sustained trade activity, suggesting institutions are actively engaging with the name and that intensity of activity is rising. This often precludes meaningful price or narrative shifts. This isn’t a buy-list or sell-list; it’s meant to draw your eyes to names where institutions are putting money to work.
First, the list is saturated with AI/software and compute-adjacent tickers, but with a “second-ring” feel rather than just the mega-caps. KLAR, ADEA, LIF, FIG, WK, ARTY, IGPT, BTDR, BKSY, ONDS, OUST, STRK, PENG, and PLTU (2x bull PLTR) speak to persistent appetite for application and infra names even as semis reprice. On the chip side you’ve got ALAB, MPWR and POET, plus AMDL (2x bull AMD) as a tactical lever. That matches last week’s flow story: Technology carried the dollar leadership and took the brunt of the policy shock, but liquidity concentrated in broad wrappers and high-velocity tools that let funds keep exposure optional. This watchlist shows the same thing at the single-name level—people still want the AI trade, just with more trading flexibility and torque.
Second, materials and the “strategic inputs” complex are loudly represented. EQX, TGB, LAC, FSM, WS, HWKN, REMX (rare earths), and GDXU (3x bull miners) cluster with BCD (broad commodities). That lines up with the tariff/critical-materials narrative and the rotation we saw into metals and miners as a policy hedge. If institutions believe supply chains and export controls are a live risk, optionality in copper, lithium, rare earths, and gold miners makes sense as both convexity and geopolitical ballast.
Third, duration and credit show up in a way that echoes the tape’s “re-shape risk” posture rather than outright panic. GOVZ and UTEN (Treasury sleeves) and insurance/credit proxies like IAK, HCI, GLAD, ETOR, and CHYM sit alongside BBUS (high beta), IMCG/QGRO (growth), and FCTE/SPGM/DSEP (broad cap sleeves). That mix looks like allocators keeping a toe in beta while reaching for rate/credit hedges they can scale quickly—exactly what we saw in lit and dark pools with HYG/LQD and index wrappers soaking up size.
Fourth, crypto is back on the radar, but in a barbell between pure beta and picks-and-shovels. ETHT, BITQ, HIVE, WGMI, and CWVX (2x bull CRWV) appear despite last week’s drawdown. That mirrors our observation that fast money used sweeps to toggle exposure and that larger players preferred wrappers—TRV is flagging renewed “event” interest even as realized returns remain choppy.
Fifth, defensives and cash-flow “stability” are well represented. UNHG (2x bull UNH), GMAB, PROK/ABVX/ATAI/ANNX/ETNB/UPB/STOK/TSPR in biotech, REYN in staples, ARIS (regulated water), and AAON/AYI/BE in industrial efficiency all fit the late-week rotation toward ballast we picked up in the sector board. The presence of VIOV (small-cap value) alongside mid-cap growth (IMCG) hints at a quality tilt within smaller caps rather than a blind beta grab.
Sixth, geopolitics and regional tilts are present and purposeful. FLTW (Taiwan) and BBEU (Europe) are on the list with ARGT (Argentina) and AIA (Asia). That triangulates with last week’s cross-regional sweeps and dark-pool interest in European beta; managers appear to be diversifying their growth exposure and keeping levers for headline risk.
Finally, there is a clear aerospace/defense and security thread—RDW, VVX, BYRN, SNCY—and a smattering of rate-sensitive housing finance (UWMC, AGM). Those tie into the macro hedges we observed: defense as geopolitical insurance; mortgage finance as a rates-path proxy.
Net-net, the TRV cohort reinforces the narrative we have been trading: big-dollar turnover centered in Tech, but not an abandonment—allocators are rotating within the AI stack, using levered tools for timing, and pairing that exposure with duration/credit sleeves and commodity hedges. Materials tied to strategic supply chains, rate hedges in Treasuries, and selective defensives are getting real attention. If the next sessions bring calmer volatility and constructive guidance from the AI/semis bellwethers, this lineup reads as a “reset and re-deploy” list; if policy risk escalates, the same tickers give managers the torque (AMDL/PLTU/BBUS/GDXU) and ballast (GOVZ/UTEN/IAK/REYN) they need to stay nimble.
VL Institutional Outliers™ (IO)
Institutional Outliers is a proprietary metric designed to spotlight trades that significantly exceed a stock’s recent institutional activity—specifically in terms of dollar volume. By comparing current trade size against each security's recent normalized history, the metric flags outlier events that may indicate sudden institutional interest but may be missed because the activity doesn’t raise any flags/alerts when comparing the activity against the ticker’s entire history. For example, it’s conceivable that a ticker today receives the largest trade it has had in the last 6 months but the trade is unranked and would therefore be missed by current alerts built off Trade Ranks. Use “Realized Vol” to identify tickers with large price displacement and to size your risk appropriately.
The first theme is “hedge and reshape, not abandon.” There is heavy dollar activity in bond and credit sleeves alongside a jump in inverse and volatility products. TLT shows ~$1.67b with a small gain (+0.25%), HYG ~$2.33b (-0.18%), EMB ~$473m (-0.11%), HYLB ~$103m (-0.08%), and SPTS ~$89m (+0.05%). At the same time, UVXY (~$84.6m, +4.97%), UVIX (~$23.8m, +5.27%), VIXY (~$6.4m, +2.51%) and the equity hedges PSQ (~$97.6m, +1.44%), SQQQ (~$323m, +4.20%), and SH (~$156m, +1.34%) all lit up with 4–6 sigma prints. That combination mirrors last week’s tape: institutions added duration/credit while layering index and vol hedges rather than bailing indiscriminately.
Second, the semis complex was at the epicenter of the turnover. AMD prints the single-largest dollar value on the sheet at roughly $2.41b (-2.88%), with SOXX ~$856m (-1.24%). The leverage toggles were active and directional: SOXL ~$325m (-8.65%) versus SOXS ~$71.5m (+6.83%). QTEC (~$17.0m, -0.44%) and XLK (~$411m, -1.55%) show the spillover to broader tech. That’s exactly the “price the shock in growth first” behavior we discussed: big, liquid semis and their wrappers take the brunt, while managers use inverse products to keep net exposure on a short leash.
Third, China de-risking is unmistakable. FXI (~$897m, -1.36%), MCHI (~$241m, -1.86%), CQQQ (~$174m, -2.12%), KWEB (~$432m, -1.99%) are all elevated, flanked by the 3x toggles YINN (~$47.7m, -5.56%) and YANG (~$9.2m, +2.74%). That’s textbook policy-headline repositioning: lighten core China beta, rotate exposure with levered tools, and keep latitude to chase a reversal.
Fourth, crypto flow was busy and skewed risk-off. ETHT (~$11.4m, -5.76%) and BITU (~$19.8m, -1.59%) were hit, while ETHD printed a small contrarian uptick (~$6.6m, +3.47%). Miners and aligned software were pressured: HIVE (~$11.1m, -8.31%), IREN a very large ~$472m (-6.31%), CONL (~$16.9m, -11.97%), BTDR (~$41.8m, -11.51%). This matches our earlier take that fast money used sweeps to toggle exposure while larger books preferred wrappers; here, the IO sheet shows those wrappers and miner proxies absorbing the brunt of de-risking.
Fifth, “strategic inputs” and metals were active and generally softer. SLV (~$635m, -0.33%), PSLV (~$33.7m, -0.53%), XME (~$71.7m, -1.75%), REMX (~$31.0m, -2.21%), URA (~$41.7m, -2.35%), and USAR (~$67.1m, -6.58%) all printed notable sigmas. That lines up with the tariff/critical-materials thread: these sleeves are being used as policy hedges and liquidity valves, not pure safe havens.
Sixth, defensives and cash-flow stability kept a bid. XLP ~ $360m (-0.25%) barely moved despite the broad risk-off, and XLRE ~ $80.7m (-0.63%) and KIM ~ $115m (-0.38%) were orderly. On the banks/financials side the tone was mixed but contained: KBE ~ $79.4m (+0.03%), HSBC ~ $59.9m (-0.99%), TIGR ~ $9.0m (-6.86%). Preferreds (PFF ~ $45.7m, -0.59%) were quiet, consistent with measured, not panicky, de-risking.
Seventh, single-name standouts tell you where conviction still lives. PWR printed a very large ~$1.15b on only a mild slip (-0.34%), hinting at continued institutional interest in U.S. grid/infrastructure even into volatility. ASTS was heavy (~$280m, -4.17%) as space-telecom beta repriced. On the healthcare side, AZN (~$238m, -0.71%), AVXL (~$16.7m, +1.37%), INSP (~$48.6m, -1.01%), VRDN (~$17.7m, -0.14%) show selective, idiosyncratic rotation rather than a blanket dump.
Finally, the levered “FANG/mega-cap” toggles confirm the all-gas/all-brake posture. TQQQ (~$495m, -5.33%) and FNGU (~$38.2m, -3.97%) were sold, while the index hedges PSQ/SQQQ/SH were bought. That is consistent with our dark-pool and sweeps read: big money reduced net exposure via wrappers and hedges while letting the most cyclical growth sleeves take the shock.
In short, the IO watchlist strengthens the narrative: Tech—especially semis—carried the price discovery, China sleeves saw systematic selling, crypto/miners were a funding source, and institutions rotated into duration/credit while standing up index and vol hedges. The exceptions matter: PWR’s size with only a fractional decline shows there’s still demand for structural themes like grid/infrastructure, and the relative calm in staples and preferreds argues for controlled, not disorderly, de-risking. The tell from here will be whether AMD/SOXX/SOXL volumes recede while dark-pool dollars persist in SPY/QQQ and whether TLT/HYG keep printing size on green days; if yes, the tape is resetting risk rather than entering a liquidation phase.
VL Consensus Prices™
These are the most frequently traded #1-Ranked Levels in VL this week. Trades occurring at the highest volume price in a ticker’s history are significant because they represent institutional engagement at a key price memory level—where the market once found consensus. These areas act as liquidity hubs, enabling large players to transact efficiently, and often signal a reassessment of fair value. This activity may precede major moves, mark equilibrium zones, or reflect broader portfolio shifts, making these price levels important to watch even without yet knowing how price will resolve. (Note: many Bond products trade in such a tight range that they dominate the top positions and are therefore omitted to provide better clarity around other flows. The bonds data is still available in the VL platform.)
Here’s what the Consensus Levels tape is saying when we line it up with everything we’ve seen in the flows so far: big money just marked some important price shelves across yield, Tech infrastructure, China proxies, and real-asset sleeves. Highest-ever aggregate-by-price is where institutions agree to do business; it’s where intent shows up.
Yield and income first. SCHD, JEPI, SPYD, XYLD and SPLG all printed record price-by-volume levels, alongside staples like CPB and defensives such as SWX. That cluster echoes the late-week rotation we flagged into ballast and cash-flow durability. It looks less like capitulation and more like a reset of carry at new levels: covered-call wrappers (JEPI, XYLD) to monetize volatility, dividend factor (SCHD, SPYD) for steady yield, and broad beta (SPLG) to retain market exposure without chasing growth. REITs are right beside them: KIM, VICI, NNN, SCHH, RYN, OUT, EPR, SPG and mortgage REIT RITM all hit consensus levels, a sign that rates-sensitive real estate found “fair” prices where both sellers and long-only income funds could meet. That maps to the bond and credit prints we saw elsewhere—allocators are actively re-shelving duration and yield.
Technology shows a different but complementary picture: not just mega-caps, but the software and infra middle class. We have a wide slate of application and infra names (XYZ, VMEO, VRNT, SPNS, PRO, PRGS, APP, BSY, SAIL, ALKT, DOCU), data/AI and IT-services rails (IOT, NTNX, RBRK, CORZ, GDDY, AUR, EXLS, INFY), and payments/credit software (AFRM, PYPL). Semis are here too—QCOM, TXN, STM, HIMX—suggesting the sector-wide price discovery we discussed flowed down the stack: first the broad wrappers and leaders, now the ecosystem where enterprise budgets meet inference and edge. Highest-ever price-by-volume in these mid-cap platforms often marks institutional re-underwriting rather than a hot-money chase; it is exactly what you see when funds resize core growth at new uncertainty premia.
China exposure reached consensus at size. FXI tops the non-US list, and that pairs with earlier IO de-risking in the China sleeves. KWEB isn’t here, but FXI is—the blunt tool. When the tariff/policy shock hit, managers appear to have re-priced China beta to “where we can own it,” and those prints became the new reference zone. Add LI and DIDIY for autos/platforms, and you have the bookend: broad de-risk via ETF, selective participation via single names.
Banks and credit platforms were busy at the same shelves. KEY, VLY, WBS, BAM, CRBG, NU and RKT all marked consensus levels, plus specialty finance (SOFI, CLOV). That lines up with the “hedge and reshape” behavior in HYG/LQD and preferreds elsewhere. When regionals and consumer credit hit new high-volume prices on the same day the index flushed, it’s typically portfolio risk being re-balanced, not indiscriminate dumping.
Energy and real assets show two tracks. On the upstream/services side you’ve got CNQ, CTRA, MGY, EXE, NOV, TS, OII; on the “commodity factor” side, PDBC and IXC. That says the policy shock forced a reset in cyclicals, but the consensus prints suggest two-way interest: E&Ps and service companies at levels funds can live with, plus sector ETFs for exposure that can be scaled. Materials echo the same: AXTA, DD, LIN, ESI on the chemical side; GGB, AG on metals; SEE on packaging. If critical-materials risk persists, expect these shelves to act as the battlegrounds for incremental capital.
Healthcare prints look like quality and event-pathways. PFE, SNY, VTRS, CORT on the pharma side and AKRO/CLOV on the specialty/biotech side all hit consensus levels. That is consistent with our dashboard read—defensives and healthcare holding relative leadership while growth resets.
Consumer and travel are present but selective. AMZN and DIS posted consensus levels, while F, MGM, LUV, WGO, EYE and HGV show where discretionary demand and travel/leisure got repriced to “do business” zones. In stress tapes, those shelves often become short-term pivots: hold them and the tape stabilizes; lose them and the next tranche of de-risking starts.
Finally, the risk levers are on the board too: BITX (2x Bitcoin) and ETHA alongside MSTR show that crypto beta is being toggled at new reference prices, in line with the IO sheet’s risk-off prints in miners and ETH wrappers. Semis again with QCOM/TXN/STM/HIMX reinforces that price discovery radiated out from the core of the growth complex.
How this fits the broader narrative: the market didn’t just puke and walk away—it reset. Technology carried the dollar turnover, but the consensus-level list shows institutions negotiated new price shelves across software/infra and semis rather than abandoning the theme. At the same time, yield wrappers, REITs and dividend factors found fresh equilibrium, consistent with the rotation we saw into duration and credit. China beta printed its new “fair” level in FXI. Energy and materials located battleground zones tied to policy and supply chains. Banks and consumer credit pinned to new balance-sheet risk premia. In other words, the week built a durable map: where allocators will buy or sell the next $1–5 billion.
Trading implications. For follow-through higher, watch those consensus bands in Tech mid-caps and semis; acceptance above them turns last week’s stress into a reset and supports a rotation back into quality growth. For downside, monitor the dividend/covered-call sleeves (SCHD/JEPI/XYLD) and the REIT cluster; a break back below their new high-volume prices would say the hunt for ballast is failing and we’re moving from reshaping risk toward liquidations. FXI’s level is the policy gauge—hold the print, and China remains tradable; lose it, and the de-risking resumes.
MIR Part 3: Framing-Up A Trade
The tape gave us clear markers to work with. We know where the big hands transacted and where the auctions tried to stabilize. For this week, the plan is to run a disciplined barbell and let the “lines in the sand” do the heavy lifting on risk: SPY 659–662 is the primary pivot with a 669–671 magnet above and 652–654 as first support; QQQ 602–606 is the operational band with 610–612 overhead and 598/589 below; IWM 241–243 is the fulcrum with 246–247 as the seller’s shelf and 239/237 as the downside guards; DIA needs 461–463 back to earn offense, with 465–468 above and 456–457/454.9/452.2 stacked beneath. Offense only on acceptance above those pivots - this isn’t the week to try and be a hero - and staying small and tactical while we chop inside them. Defense—trims and hedges—on closes below the lower guards. Volatility has popped nearly enough to justify going straight to cash until the dust settles a bit but if forced to position, this is how we’d run a book this week.
Positioning logic starts with liquidity. Index wrappers remain the cleanest way to scale exposure when SPY and QQQ reclaim and hold their bands. The dark end of the tape concentrated in those wrappers and the largest tech leaders last week, which argues for using SPY/QQQ/IWM as the throttles and keeping the single-name growth sleeve smaller and higher quality. Semis were the epicenter of price discovery; we want them, but through a core ETF plus the highest-signal platforms, and only while QQQ is accepted above 602–606. Carry and ballast matter because we expect push-pull around the pivots: dividends/covered calls, utilities, and credit pay us to wait and give room to buy if semis stabilize. We keep a modest policy hedge in strategic materials after the tariff shock, a small REIT reset sleeve at the new consensus shelves, a paired China sleeve (tiny), and explicit hedges live until breadth and credit confirm.
Sample one-week portfolio (100% notional) aligned to VL Levels
Core index liquidity (22%): SPY 13%, QQQ 6%, IWM 3. This is the throttle. Above SPY 659–662 and QQQ 602–606, we press size and target SPY 669–671 and QQQ 610–612 for staged trims. Lose SPY 653 or QQQ 598 on a close and we cut this sleeve first, letting the downside shelves do their work before re-adding on a decisive reclaim. IWM runs light unless 241–243 is accepted—then we shoot for 246–247.
AI / compute barbell (16%): SOXX 6%, NVDA 4%, AAPL 3%, MSFT 2%, AMD 1. SOXX gives breadth across the semis that just repriced; the platform core (NVDA/AAPL/MSFT/AMD) captures where capex and inference budgets converge. This sleeve only scales when QQQ is above 602–606; if we tag 610–612 and stall, we harvest and only add through 612 on acceptance with improving participation.
Software / infra reset (6%): NTNX 2%, IOT 2%, GDDY 1%, DOCU 1. These printed new consensus price shelves and fit the “reset, not liquidation” theme. We add on days QQQ holds 602–606 with rising up-volume; any close back below 602 and we pare this sleeve to core.
Yield & defensives (12%): XLP 4%, JEPI 4%, XLU 4. Covered-call and staples/utility carry absorb chop at the pivots and monetize volatility while we wait for acceptance. If SPY breaks 653 and stays there, this sleeve becomes the ballast that funds a re-entry later.
Credit ballast (12%): LQD 7%, HYG 5. Credit was actively used to reshape risk. We want it firm on up-equity days; if HYG bleeds while SPY pushes 659–662, we fade index adds and keep hedges on. If HYG/LQD strengthen as QQQ accepts 602–606, we rotate a couple of points from credit into core beta and SOXX.
Duration sleeve (7%): TLT 5%, SPTS 2. Bonds climbed from a small base as protection. A quick equity rally through the pivots will let us bleed TLT into strength to fund adds in SPY/QQQ; if equities slip below the guards, duration stays on and we downshift beta.
Strategic materials (6%): REMX 2%, XME 2%, SLV 2. Policy and supply-chain hedges stay modest but present. We add only on new policy headlines or a sustained dollar roll-over; otherwise we keep this sleeve as convex ballast against further export-control or tariff risk.
Selective energy (4%): XLE 3%, VIST 1. We keep exposure to durable cash flow rather than pure oil beta. If IWM loses 239 and risk compresses, this sleeve stays small; if breadth improves above the pivots, we can add 1–2% via XOP tactically.
REIT reset (4%): KIM 2%, XLRE 2. Both printed high-volume consensus shelves. Adds require acceptance and closes above last week’s heavy price nodes; lose those shelves and we step aside quickly.
China pair (2%): FXI 1% long, YANG 1% long. FXI printed its new “fair” zone; we pair it with a short lever so net is near flat at entry. If FXI accepts above its new shelf while QQQ is above 602–606, we unwind YANG; if FXI loses the shelf, we exit the long and keep the hedge.
Crypto toggle (2%): IBIT 1%, ETHT 1. Keep it tiny. Only scales if QQQ is accepted above 602–606 and HYG/LQD are firm; any renewed risk-off and this sleeve is first to shrink.
Hedges (7%): SH 4%, PSQ 2%, UVXY 1. These stay live until we have acceptance above SPY 659–662 and QQQ 602–606 with breadth confirming. If the pivots flip to support and we see new highs outnumber new lows alongside 50-day cohorts lifting toward 50%+, we bleed hedges first and rotate the freed notional into SPY/QQQ/SOXX.
Operating rules tied to VL Levels
Offense: accepted trade above SPY 659–662, QQQ 602–606, IWM 241–243, DIA 461–463. Scale core beta and semis; first trims into SPY 669–671, QQQ 610–612, IWM 246–247, DIA 465–468. Add through those magnets only on clean acceptance with improving participation.
Small and tactical: when we chop inside the bands (e.g., SPY 659–662 ping-pong), keep positions lighter, trade edges, and let carry sleeves do the work.
Defense: daily close below SPY 653, QQQ 598, IWM 239, or DIA 456.2. Cut index beta, shrink semis/software back to core, keep duration and credit on, and increase hedge utilization. Re-risk only after a decisive reclaim of VL levels.
Breadth needs to improve through the pivots (new highs beating new lows and 50-day cohorts pressing toward 50%+) to move from tactical to durable. Credit must hold a bid on up-equity days; if HYG sinks while SPY/QQQ probe higher, we treat the move as distributive and lean on hedges. Persistent dark-pool interest in SPY/QQQ and the megacaps while we hold above the bands is another sign that large funds are absorbing supply rather than handing it out.
Good luck this week, VL Squad!

Thank you for being part of our community and for dedicating your time to this edition. Your insights and engagement drive everything we do, and we’re honored to share this space with such committed, thoughtful readers. Here’s to a week filled with clear opportunities and strong performance. Wishing you many bags 💰💰💰
—VolumeLeaders