Market Momentum: Your Weekly Financial Forecast & Market Prep
Issue 64 / What to expect Oct 06, 2025 thru Oct 10, 2025

In This Issue
Weekly Market-On-Close Report: All the macro moves, market drivers, and must-know narratives—covered in less than five minutes.
Weekly Benchmark Breakdown: Our weekly intelligence report on major indices cuts through the index-level noise to uncover participation, momentum, and structural integrity and tell you whether markets are rising on solid ground or skating on thin breadth. This is where bull markets prove themselves—or quietly start to unravel.
The Latest Investor Sentiment Readings: Track the emotional pulse of the market with our curated dashboard of sentiment indicators. From fear-fueled flight to euphoric overreach, this week's readings reveal whether investors are cautiously creeping in—or stampeding toward the exits.
Institutional Support & Resistance Levels For Major Indices: Exactly where to look for support and resistance this coming week in SPY, QQQ, IWM & DIA
Normalized Performance By Thematics YTD: Which corners of the markets are beating benchmarks, which are overlooked and which ones are over-crowded!
Key Econ Events & Earnings On-Deck For This Coming Week
Market Intelligence Report: Track the real money. This section breaks down where institutions are placing their bets—and pulling their chips. You'll get a sector-by-sector view of flows, highlighting the most active names attracting large-scale buying or selling. We go beyond the headlines and into the tape, surfacing the week’s most notable block trades and sweep orders, both on lit exchanges and hidden dark pools. Whether you're following momentum or fading crowded trades, this is your map to where size is moving and why it matters.

Weekly Market-On-Close Report
A Range Holds Near Records While the Tape Sorts Growth From Rates
The S&P 500 Index finished Friday up +0.01%, the Dow Jones Industrials Index gained +0.51%, and the Nasdaq 100 Index slipped -0.43%. December E-mini S&P futures (ESZ25) rose +0.01%, while December E-mini Nasdaq futures (NQZ25) fell -0.44%. That left all three major U.S. benchmarks with fresh all-time highs even as the day’s intraday path underscored an unresolved tug-of-war between cyclical growth hopes and rate-sensitive tech positioning. Early strength came from chipmakers and AI-infrastructure shares on optimism that the sector’s build-out will translate into corporate earnings, but that bid faded as Treasury yields climbed. The 10-year T-note yield rose +4 bp to 4.12% following hawkish comments from Chicago Fed President Austan Goolsbee and Dallas Fed President Lorie Logan, both cautioning against additional rate cuts from the Federal Reserve.

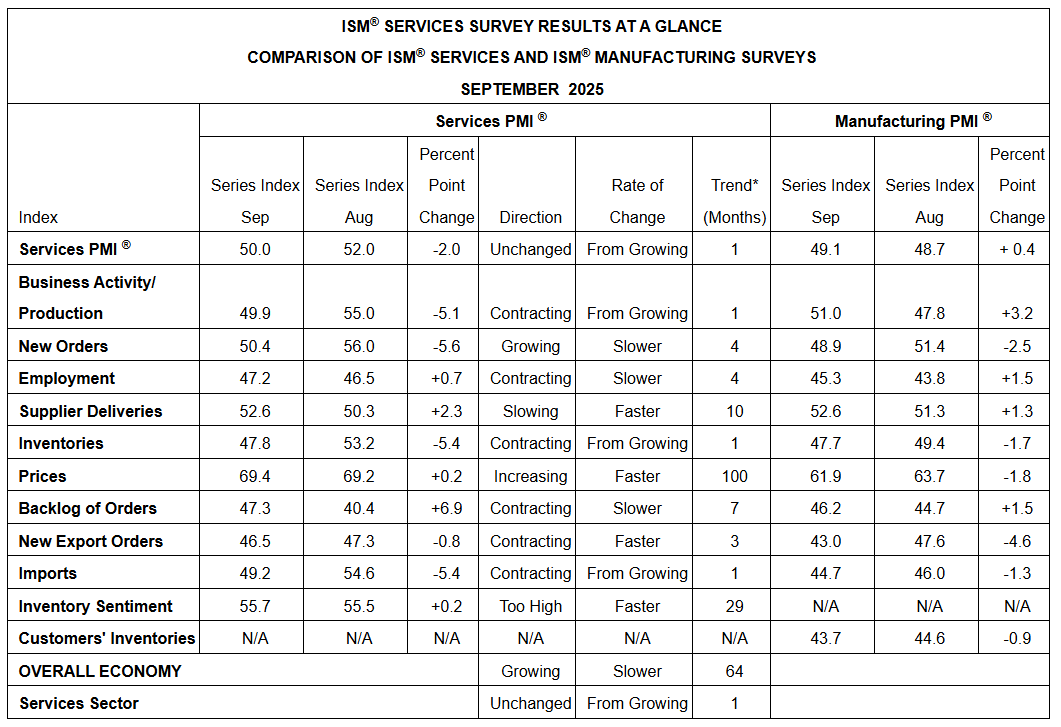
A softer services read complicated the picture: the September ISM services index fell -2.0 to a 4-month low of 50.0 versus expectations for 51.7, while the ISM services price paid sub-index unexpectedly ticked up +0.2 to 69.4 versus consensus for 68.0. The combination—slower activity and firming service-sector prices—clipped some of the early equity enthusiasm and pressured bonds, and by the close equities churned into a flat-to-mixed finish. Layer on top the third day of a U.S. government shutdown and the tape’s hesitation made sense.
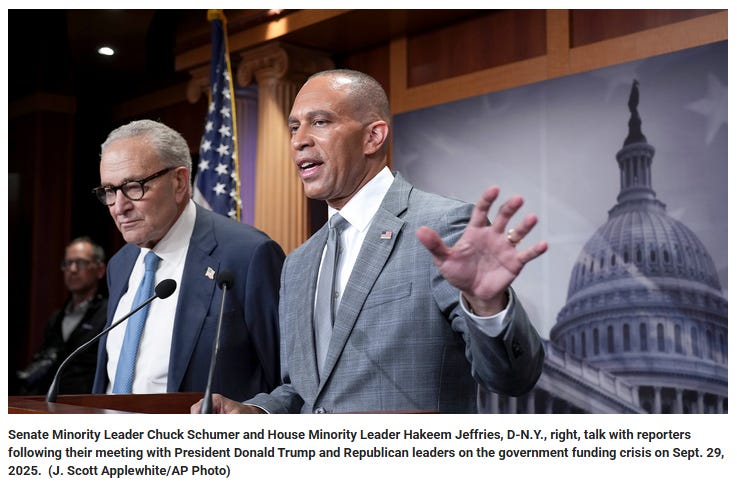
The shutdown introduces a new variable: delayed government data, starting with the monthly payroll report that did not publish Friday and potentially the inflation data slated for October 15 if the disruption lingers. The White House warned that, if the shutdown extends, employees in programs that do not align with President Trump’s priorities could face dismissals. Bloomberg Economics estimates that 640,000 federal workers will be furloughed during a shutdown, a dynamic that would lift jobless claims and push the unemployment rate up to 4.7% if it persisted. Markets will be forced to lean harder on private-sector data for the next stretch, and that shift alone can elevate day-to-day noise, especially when macro messaging from the Fed skews cautious.
Bloomberg Intelligence tallies more than 22% of S&P 500 companies guiding for Q3 beats, the highest in a year, and consensus now looks for +6.9% S&P 500 earnings growth in Q3, up from +6.7% at the end of May. That context matters as the shutdown delays official data releases: profits, not just macro reports, can anchor positioning through October.
Still, there were bright spots in Friday’s data mix. The U.S. September S&P composite PMI was revised up by +0.3 to 53.9 from 53.6, underscoring that the broader private-sector economy remains in expansion. Even so, the growth-inflation balance inside the services reports set the tone: expansion slowed to the 50.0 demarcation line, but input prices broadened. That keeps the policy debate warm and helps explain why rate-sensitive tech faded into the bell even as cyclicals and defensive carry held up.
Rates: A Two-Way Day Ends With Yields Higher
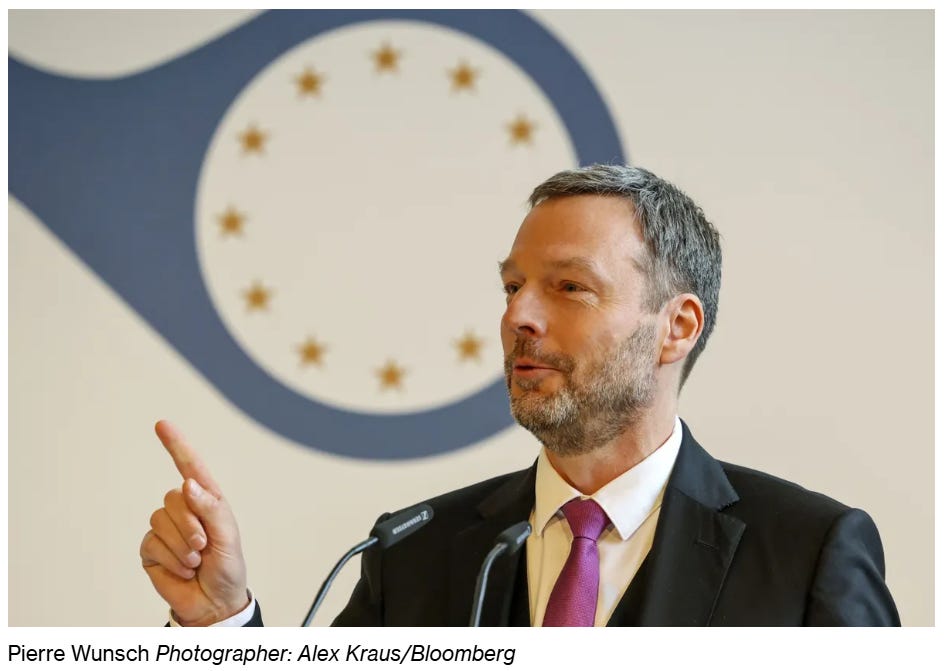
December 10-year T-notes (ZNZ5) settled down -8 ticks, leaving the 10-year yield +3.6 bp higher at 4.119%. Price action captured the macro cross-currents. T-notes initially rallied to a 1-week high as the soft headline in services landed and the shutdown backdrop encouraged a safety bid; the 10-year yield briefly printed a 2-week low of 4.077%. But hawkish remarks from Austan Goolsbee and Lorie Logan, combined with the services price-paid uptick, reversed the move and pushed yields back up on the day. Across the Atlantic, European sovereign yields eased: the 10-year German bund fell to a 2-week low of 2.690% and finished down -0.2 bp at 2.698%, while the 10-year UK gilt yield slipped -2.0 bp to 4.690%. Eurozone September PPI fell -0.3% m/m and -0.6% y/y (vs -0.1% and -0.4% expected), the largest y/y decline in 9 months, and the UK September S&P composite PMI was revised down by -0.9 to a 5-month low of 50.1. ECB Governing Council member Wunsch said policymakers have found the “perfect calibration” for rates to guide inflation toward 2% in the medium term, and swaps discount just a 1% chance of a -25 bp rate cut at the October 30 meeting.
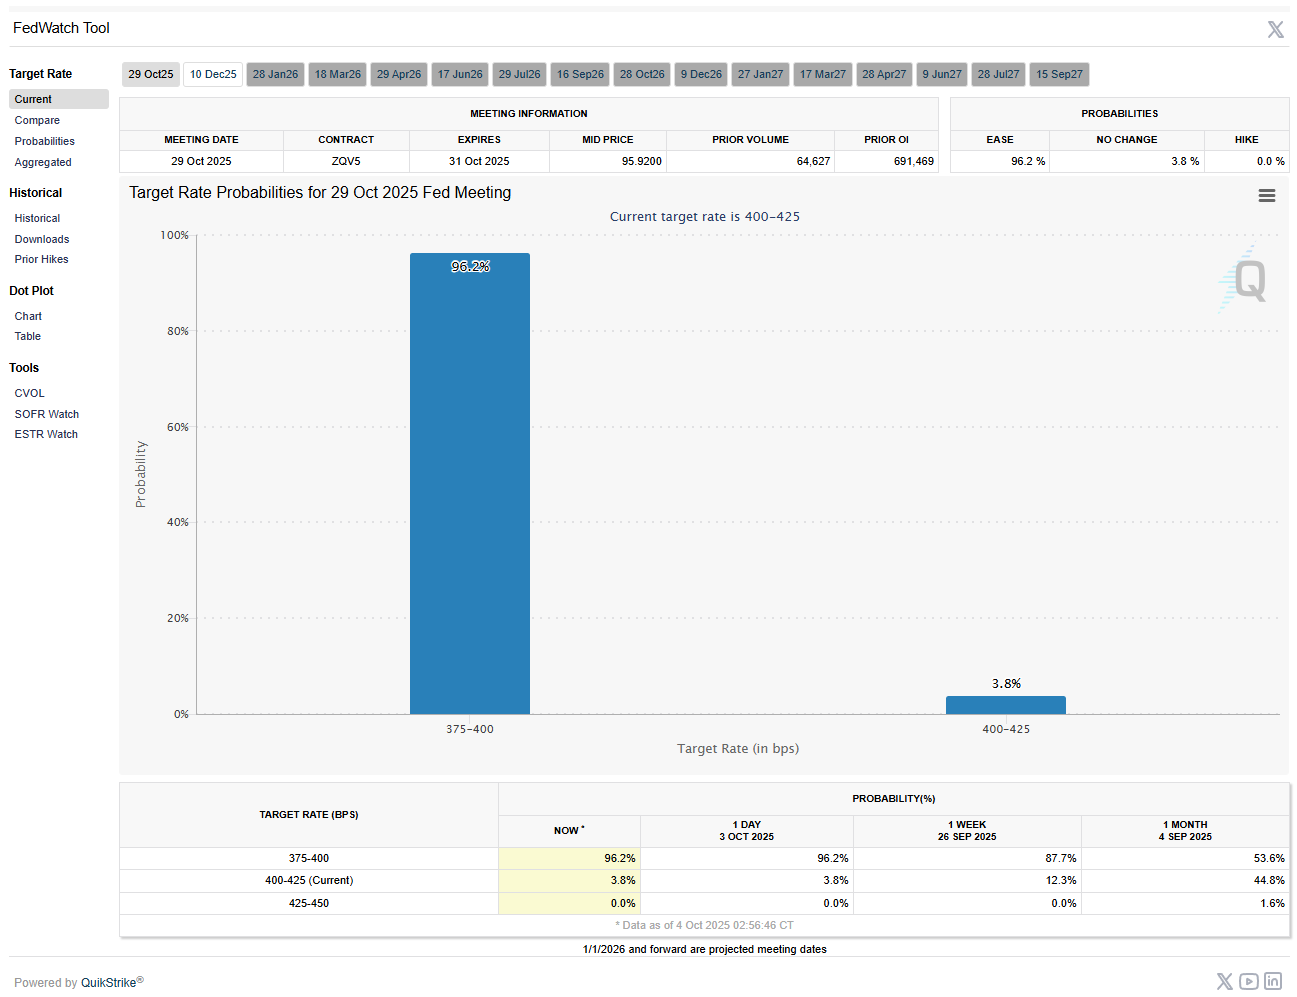
Domestically, despite the day’s backup in yields, the forward policy curve remains firmly tilted to easing. Markets are pricing a 98% chance of a -25 bp rate cut at the next FOMC meeting on Oct 28-29. That expectation sits uneasily next to the Fed-speaker tape, but with the shutdown darkening key data windows, traders appear comfortable defaulting to the idea that growth risks and lagging policy transmission argue for further accommodation unless inflation reaccelerates.
International Equities: Upbeat Into Week’s End
Overseas equity markets closed higher on Friday. The Euro Stoxx 50 gained +0.10%. Japan’s Nikkei Stock 225 climbed to a 1-week high and finished up +1.85%. China’s Shanghai Composite did not trade and remained shut for the week-long Lunar New Year holiday. The international tone fit the U.S. cross-asset picture: resilient growth pockets balanced against policy uncertainty and a still-constricted data calendar.
Sector and Single-Name Moves: Healthcare Leads, AI Blinks, Energy Lags
Healthcare outperformed decisively into week’s end and through the weekly ranking. Humana (HUM) jumped more than +10% Friday, adding to Thursday’s +4%, after reaffirming 2025 earnings guidance. That strength rippled across managed care, with Centene (CNC) up more than +5% and Cigna Group (CI) up more than +4%. Molina Healthcare (MOH) and Elevance Health (ELV) rose more than +3%, and UnitedHealth Group (UNH) added more than +1% to help the Dow. Outside managed care, Fair Isaac (FICO) climbed more than +3% after Thursday’s +17% surge on its decision to sell credit scores directly to mortgage resellers.
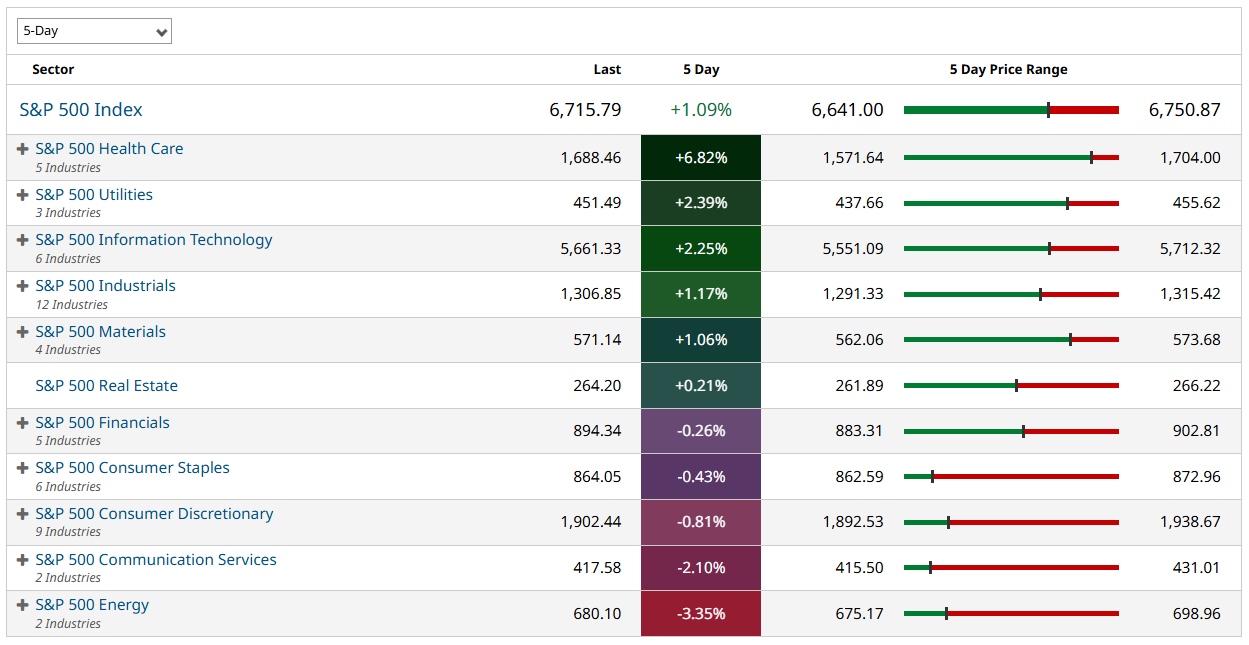
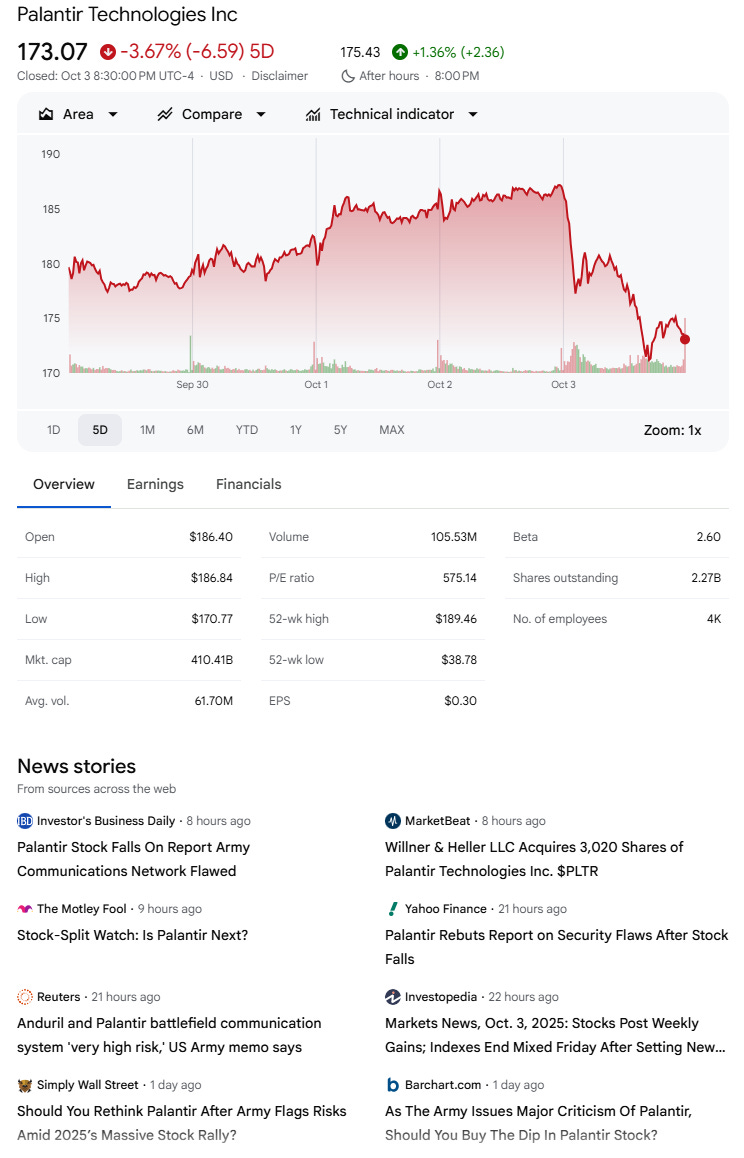
Utilities outperformed, supported by lower rates, M&A headlines, and the drumbeat of datacenter infrastructure needs. Global Infrastructure Partners interest in AES (AES) added another layer to the bid. Technology stayed a leader but rotated inside the complex. Micron Technology (MU) was a standout, up 20%, as memory picked up the baton from GPUs after OpenAI’s agreements with Samsung and SK Hynix. FICO (FICO) ripped after its mortgage score distribution deal. Palantir (PLTR) slid on Friday’s Army memo headlines.
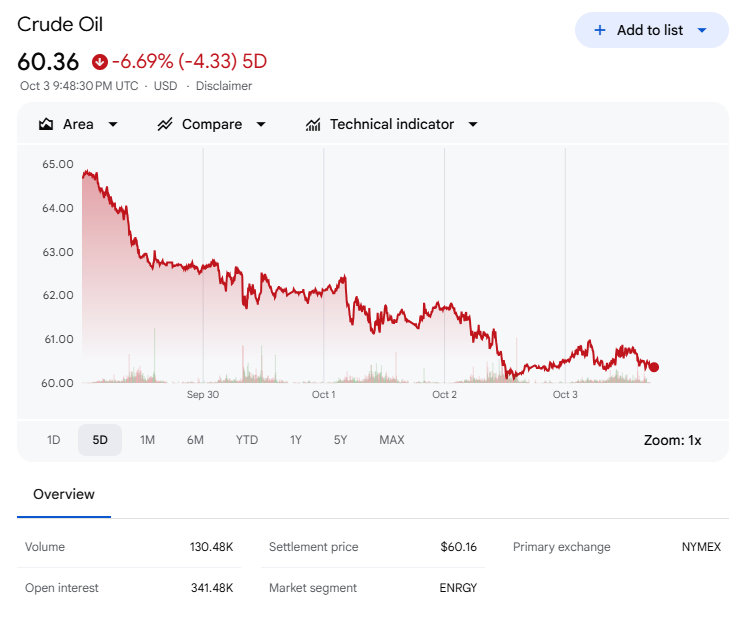
Materials sat mid-pack, but miners broadly rallied, led by lithium on Lithium Americas (LAC) deal news with the U.S. government. Coal names like Peabody Energy (BTU) rose +30%, copper bellwether Freeport-McMoRan (FCX) rose +12%, and steel names Cleveland-Cliffs (CLF), Steel Dynamics (STLD), and ArcelorMittal (MT) added roughly +3%. Energy lagged as oil fell. Crude weakness came alongside concerns about supply and potential OPEC production increases. Communication Services lagged with Meta Platforms (META) leading the sector lower and Alphabet (GOOGL/GOOG) weaker to a lesser extent.
Financials underperformed as rates moved lower. Consumer-credit stress saw fresh headlines from recent bankruptcies at First Brands and Tricolor; Capital One (COF), Synchrony Financial (SYF), and American Express (AXP) fell 3%–4%. Private equity and private credit names Apollo Global (APO), KKR (KKR), Blackstone (BX), and Blue Owl Capital (OWL) lost 3%–10%. IPO delays tied to the shutdown were another headwind to capital-markets activity.
Transport, software, and housing-adjacent names saw selective sponsorship. Knight-Swift (KNX) rose more than +3% after an upgrade to buy at Stifel with a $45 target. Zillow Group (ZG) gained more than +2% on a Gordon Haskett upgrade to buy with a $90 target. Freeport-McMoRan (FCX) advanced more than +2% following a UBS upgrade to buy with a $48 target. Entergy (ETR) added more than +1% after a Scotiabank upgrade to sector outperform with a $105 target, and Occidental Petroleum (OXY) rose more than +1% after a Mizuho upgrade to outperform with a $60 target.
On the downside, chip and AI-infrastructure stocks surrendered early gains. KLA (KLAC) fell more than -3%. Applied Materials (AMAT) slipped more than -2% after guiding that fiscal 2026 net revenue will be reduced by $600 million due to a new U.S. Department of Commerce BIS rule. Advanced Micro Devices (AMD) declined more than -2%, and Intel (INTC) and Texas Instruments (TXN) lost more than -1%. The “Magnificent Seven” cohort leaned red: Meta Platforms (META) fell more than -2%; Tesla (TSLA) and Amazon.com (AMZN) more than -1%; Nvidia (NVDA) -0.67%.
Palantir Technologies (PLTR) slid more than -7% to lead S&P 500 and Nasdaq 100 decliners after a Reuters report cited an Army memo pointing to “fundamental security” flaws in the company’s battlefield communications network. Hecla Mining (HL) fell more than -1% after a downgrade to sell from neutral at Roth with an $8.75 target.
West Texas Intermediate crude fell more than 7% after OPEC+ signaled it will boost production in November, a rotation that weighed on value leadership.
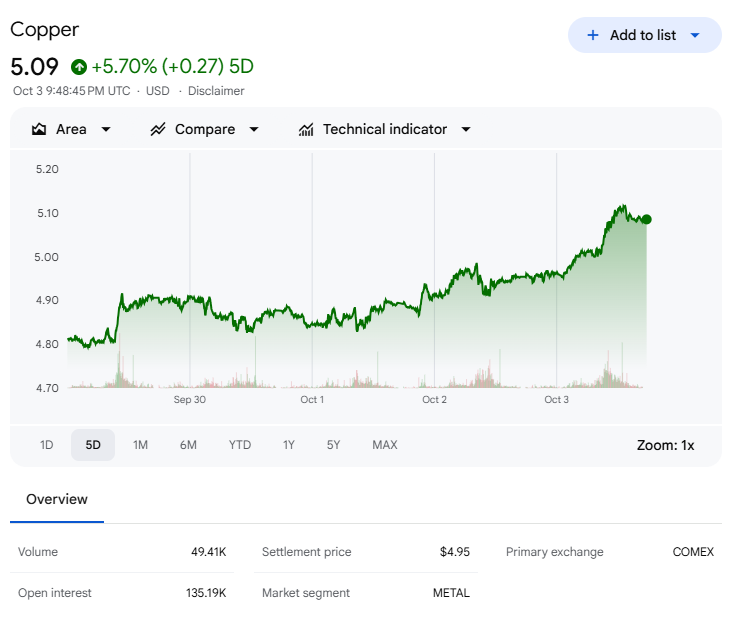
Other commodities fared better: gold gained more than 3% and extended a strong year-to-date run, while copper jumped more than 7%.
Risk-on thematics stayed lively. Quantum computing names surged, many by over 20%. Nuclear names were mostly higher—Oklo (OKLO), NextNewEnergy (NNE), and Constellation Energy (CEG) up around +10%. Digital Treasury companies were modestly to sharply higher.
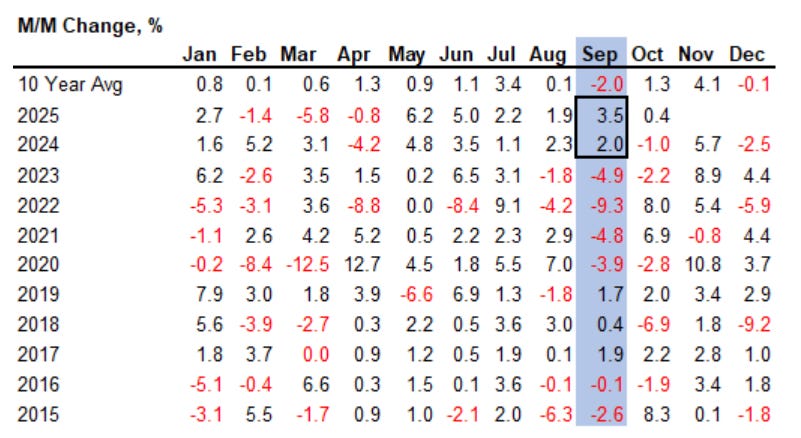
A Month and Quarter That Bucked the Textbook
This week closed September and opened the fourth quarter. Seasonally, September has been the weakest month over the last decade, down an average of 2%. Not this time. The S&P 500 rose 3.5% in September, the second straight year of solid September gains, and is now up 14% year-to-date after rising more than 20% in each of the last two years. October and November are historically strong months, and the question now is whether a 20% “trifecta” is possible again if the AI bid continues to lift multiple sectors and the Fed keeps the gears greased for rate cuts.
Tech powered the month with a 7% sector gain. The ICE Semiconductor Index rose 11%. Communication Services—driven mainly by Alphabet (GOOGL/GOOG)—Utilities, and Consumer Discretionary outperformed. Discretionary was split: Tesla (TSLA) surged more than 30% while many travel, leisure, and restaurant names fell 2%–10%. Materials and Consumer Staples lagged; chemicals were under pressure, and retailers plus food and beverage weighed on Staples.
For Q3, the S&P 500 rose 8%, with the Russell 2000 up 12%. The re-start of the Fed’s rate-cutting cycle was a key driver of that small-cap outperformance. The S&P 600, which applies a profitability screen, rose 9%, a gap to the Russell 2000 that speaks to renewed risk appetite: lower-quality, higher-beta pockets led, and thematic trades in nuclear, quantum computing, and digital-asset treasury names ripped. Biotech rode the same wave; the ICE Biotech index outperformed the ICE Semi index despite a late-quarter chase into chips.
Equal-weight beat, small caps beat, and breadth firmed—constructive signals for trend durability. But the index is stretched: it sits +11% above its 200-day average, the year’s most extended reading, and has not closed below the 200-day since May 9. April 30 was the last close below the 50-day. Stretch can persist in strong tapes, but positioning against that backdrop should respect mean-reversion risk.
A Broader Framing: Growth, Earnings, and the AI Cycle
The economy is still growing. Since July, the balance of reports has surprised to the upside, driven by resilient consumer spending and heavy AI investment. The Atlanta Fed’s nowcast puts Q3 GDP at 3.8% heading into the blackout. Retail sales accelerated through August to their fastest pace since early 2023. September auto sales came in better than expected, and Johnson Redbook same-store sales rose 6% in September. On the capex front, investment in equipment and intellectual property remains a buffer, with AI-linked spending rising at its fastest pace since the late-1990s internet buildout. Major tech platforms—Amazon (AMZN), Alphabet (GOOGL/GOOG), Microsoft (MSFT), and Meta Platforms (META)—are projected to spend nearly $400 billion on capex next year, roughly 30% of total estimated S&P 500 investment.
Shutdown dynamics typically dent growth in the short term, then recover as backpay arrives. Historical precedent suggests a drag of 0.1%–0.2% on quarterly GDP per week of closure. The longer it lasts, the larger the drag and the faster the political pressure to resolve. The upshot is that Q4 growth could slow from a strong starting point and rebound in Q1 if funding restarts within weeks.
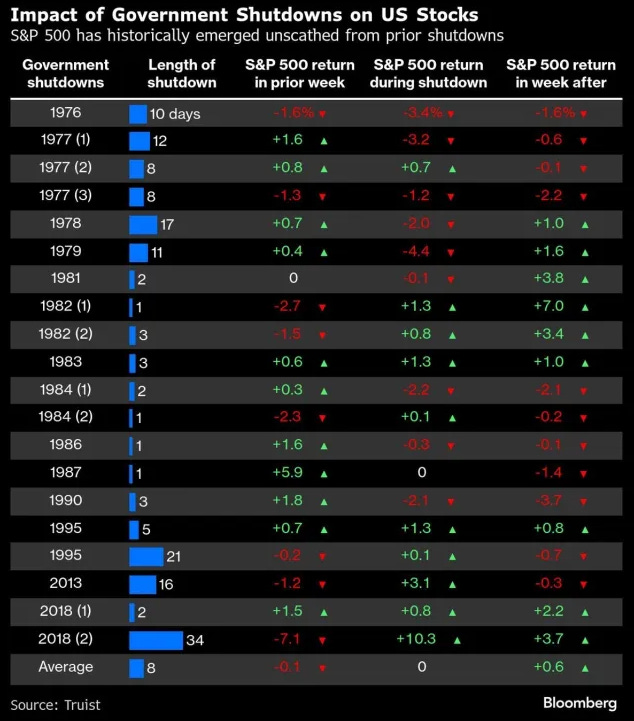
History says shutdowns rarely leave a lasting scar on equities. Stocks have been positive during half of the shutdowns since 1976 and higher three to six months later in many cases. Still, with U.S. stocks up 35% since the April low without a significant pullback, the tape is susceptible to profit-taking as uncertainty increases and the blackout continues. The good news is that profits remain a firm reference point: margins hover near records, and consensus expects double-digit profit growth for the fourth consecutive quarter as earnings season gets underway.
The labor market is cooling—limited hiring and limited firing. The unemployment rate sits at 4.3%, job openings have dipped below the number of unemployed for the first time since 2021, hiring appetite is constrained, and layoffs remain subdued outside government. If the administration’s threat to permanently cut federal employment materializes, that would hasten the cooling.
The Fed is flying with dimmer headlights but appears poised to proceed cautiously with cuts. The committee views policy as restrictive and expects a gradual move toward a 3%–3.5% neutral zone. If weak labor data is the only official input heading into the next meeting because of the shutdown, that bias toward easing strengthens. The modal path remains downward through 2026, even if a December pause becomes plausible if data resumes and improves.
Global Markets: Europe Catches Up, Asia Mixed By Timing
Europe outperformed this week as investors rotated to non-U.S. exposure amid the shutdown’s early days. Many European indices had consolidated while U.S. benchmarks rallied since May, and now they are pushing to fresh highs. Regional PMIs were revised slightly lower and inflation largely matched expectations. In Asia, mainland China was closed for most of the week. AI optimism remained a central driver: Huawei doubled chip production, and DeepSeek released an intermediate model. Industrial profits improved, and focus turned to the late-October plenary session and five-year plan. There is an expectation of a Presidents Trump/Xi meeting later in the month, with Treasury Secretary Bessent anticipating a “big breakthrough,” USTR Greer comfortable with current tariffs, and soybeans a likely focal point. South Korea outperformed on the AI theme after OpenAI signed memory supply agreements with Samsung and SK Hynix.
Bottom Line
The S&P 500 gained nearly 8% in Q3. The Nasdaq rose 11%. The Russell 2000 gained 12%. Despite the shutdown, the S&P 500 logged three more all-time highs this week, bringing the year-to-date total to 31. Two forces explain the persistence: secular AI tailwinds and the cyclical impulse from lower rates. Semiconductor-adjacent infrastructure remains central to leadership; rate-sensitive sleeves—consumer discretionary, small- and mid-caps, and emerging markets—benefit from easier policy.
The combination of continued economic growth, rising corporate earnings expectations, and a policy path tilted toward easing keeps the primary trend pointed higher even as the shutdown scrambles the calendar and a mixed services read tightens the near-term range. Respect the market’s stretch, let profits guide the next leg, and treat pullbacks—especially those born of data delays rather than data deterioration—as opportunities to add selectively to leaders and re-balance into underrepresented areas with catch-up potential such as U.S. mid-caps and targeted cyclicals.

Weekly Benchmark Breakdown
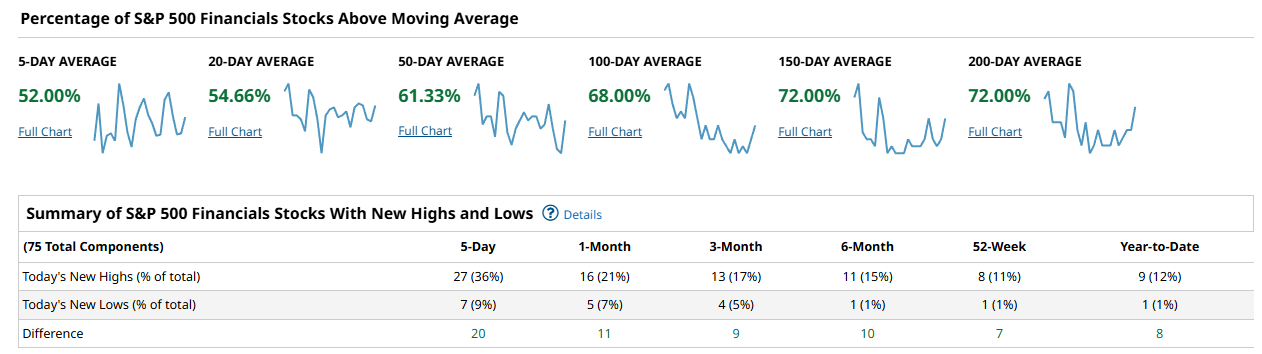
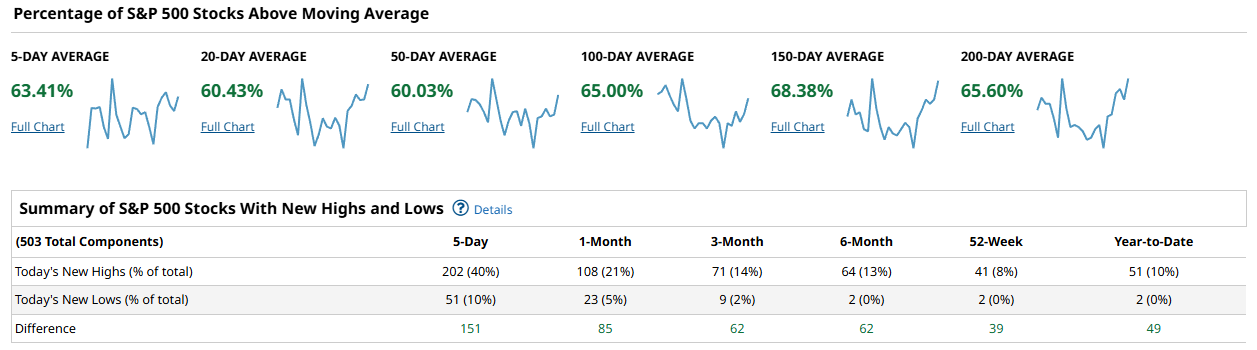
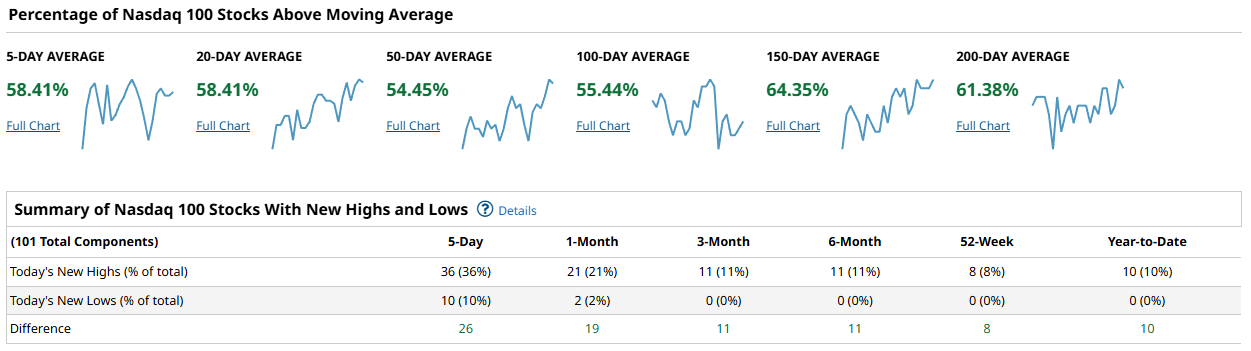
Breadth improved again this week and the tone remains risk-on. Across major cohorts, the percentage of members above their moving averages sits mostly in the 55–70% zone, and new highs outpace new lows at every lookback. This is trend, not a one-day thrust: the 100–200 day cohorts are doing as much work as the 5–20 day, which argues for persistence rather than a short squeeze. The risk to that view would be a quick fade in 50-day participation back under ~55% with new lows expanding; we are not there.
In the S&P 500, participation is balanced to firm. The share of members above their moving averages sits at 63.41% on the 5-day, 60.43% on the 20-day, 60.03% on the 50-day, 65.00% on the 100-day, 68.38% on the 150-day, and 65.60% on the 200-day. New highs beat new lows across every window: 202 highs vs 51 lows over 5 days (diff +151), 108 vs 23 over 1 month (+85), 71 vs 9 over 3 months (+62), 64 vs 2 over 6 months (+62), 41 vs 2 on a 52-week basis (+39), and 51 vs 2 year-to-date (+49). With the 50-day cohort hovering right around 60% and intermediate-term cohorts in the mid-60s, the index has room to grind higher without being overextended. The tell will be whether that 50-day measure pushes and holds meaningfully above 60% while new lows stay subdued.
The Nasdaq 100 is constructive, if a touch less robust at the 50–100 day marks. Above-average readings register 58.41% on both the 5- and 20-day, 54.45% on the 50-day, 55.44% on the 100-day, 64.35% on the 150-day, and 61.38% on the 200-day. New highs dominate: 36 highs vs 10 lows over 5 days (+26), 21 vs 2 over 1 month (+19), 11 vs 0 over both 3 and 6 months (+11 each), 8 vs 0 on 52-week (+8), and 10 vs 0 year-to-date (+10). The message is healthy but more selective than the S&P: leadership is present, deterioration is minimal, yet the 50–100 day cohorts in the mid-50s say rotation underneath the surface is still ongoing. A push in the 50-day measure toward 60% would confirm a broader tech bid.
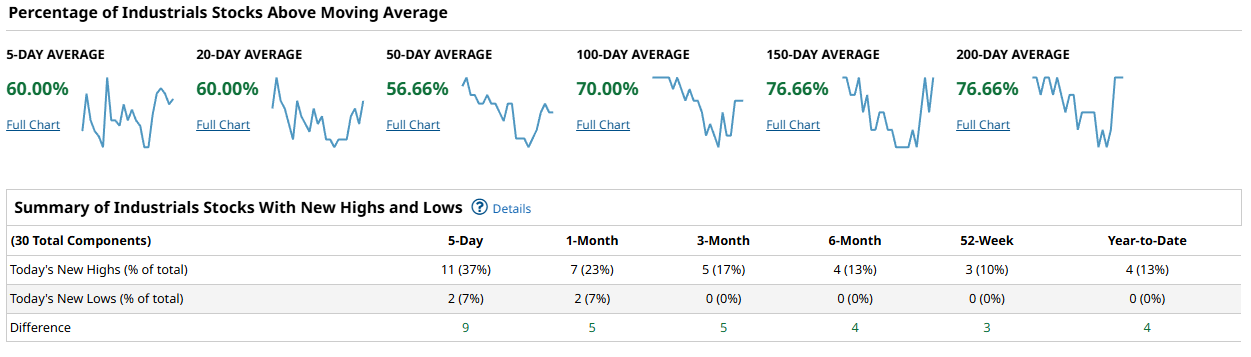
The Dow Jones Industrial Average, with its 30 names, shows surprisingly strong intermediate-term participation. Above-MA readings print 60.00% on the 5-day, 60.00% on the 20-day, 56.66% on the 50-day, 70.00% on the 100-day, 76.66% on the 150-day, and 76.66% on the 200-day. New highs swamp lows at every lookback: 11 vs 2 over 5 days (+9), 7 vs 2 over 1 month (+5), 5 vs 0 over 3 months (+5), 4 vs 0 over 6 months (+4), 3 vs 0 on 52-week (+3), and 4 vs 0 year-to-date (+4). The Dow’s heavier 150–200 day readings signal mature uptrends across many components; the short end is fine, not frothy. That mix supports a steady rather than explosive tape.
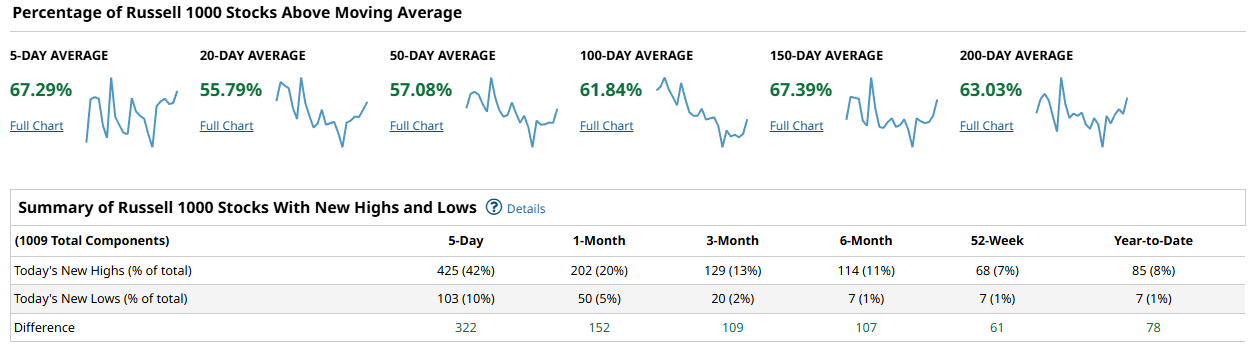
The Russell 1000 tells the breadth story best: participation is broad and improving. Members above their moving averages run at 67.29% on the 5-day, 55.79% on the 20-day, 57.08% on the 50-day, 61.84% on the 100-day, 67.39% on the 150-day, and 63.03% on the 200-day. New highs decisively beat new lows across the board: 425 highs vs 103 lows over 5 days (+322), 202 vs 50 over 1 month (+152), 129 vs 20 over 3 months (+109), 114 vs 7 over 6 months (+107), 68 vs 7 on 52-week (+61), and 85 vs 7 year-to-date (+78). Those figures argue that the advance is not just a mega-cap story; the broader large-cap universe is participating, with the 50- and 100-day cohorts either side of 60% and rising.
Putting it together, cap-weighted leadership remains intact, but the broad market is doing real work. The Russell 1000 and S&P 500 both show 50-day participation near or above 57–60% and healthy 100–200 day readings in the low-to-mid 60s. The Nasdaq 100 lags modestly at the 50–100 day marks, which fits a rotation narrative rather than a breakdown. Confirmation of a durable advance would look like the 50-day cohorts across SPX, NDX, and R1000 pushing and holding north of 60% while 5-day new highs continue to outnumber new lows by triple-digit margins in the broader lists. Concern would rise if the 20- and 50-day measures slip back toward the low-50s alongside a visible pickup in new lows; that is not happening yet.
The playbook favors staying net long, leaning into names and sectors with 100–200 day uptrends already in place and 50-day participation improving. In practice, that means maintaining core exposure to broad large-cap indices, supplementing with selective cyclical and quality growth where the 50-day breadth is inflecting, and avoiding pockets where 50-day participation is stuck in the low-50s and new lows begin to expand. For confirmation this week, watch the SPX and R1000 50-day cohorts for a sustained move and hold above ~60%, and watch that NDX 50-day measure for a nudge higher toward SPX levels; keep an eye on whether 5-day new lows remain contained in all lists.
Bottom line: breadth is supportive and broadening, with new highs firmly ahead of new lows and the 50–200 day cohorts aligned for trend continuation.

Investor Sentiment Report
Insider Trading
Insider trading occurs when a company’s leaders or major shareholders trade stock based on non-public information. Tracking these trades can reveal insider expectations about the company’s future. For example, large purchases before an earnings report or drug trial results might indicate confidence in upcoming good news.
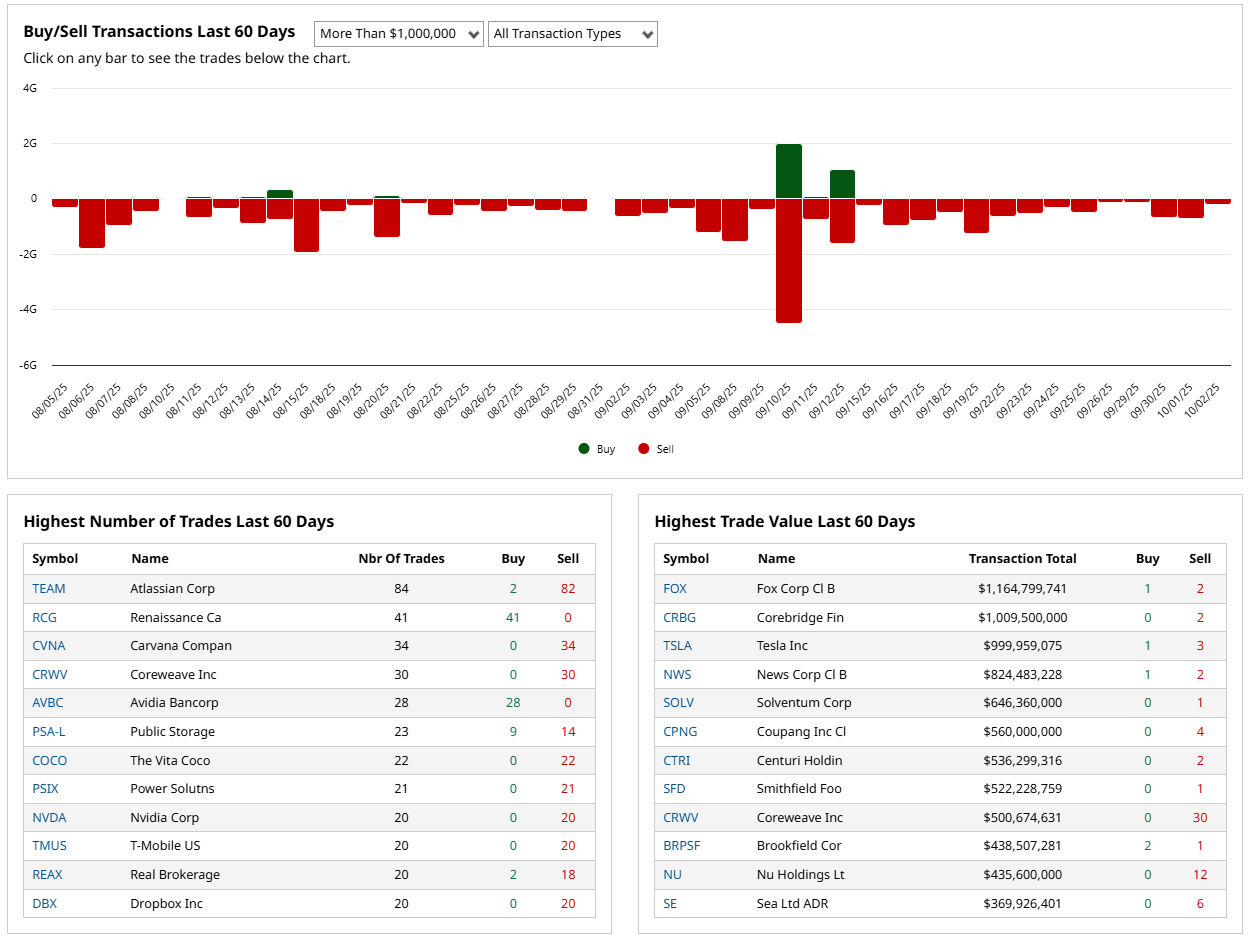
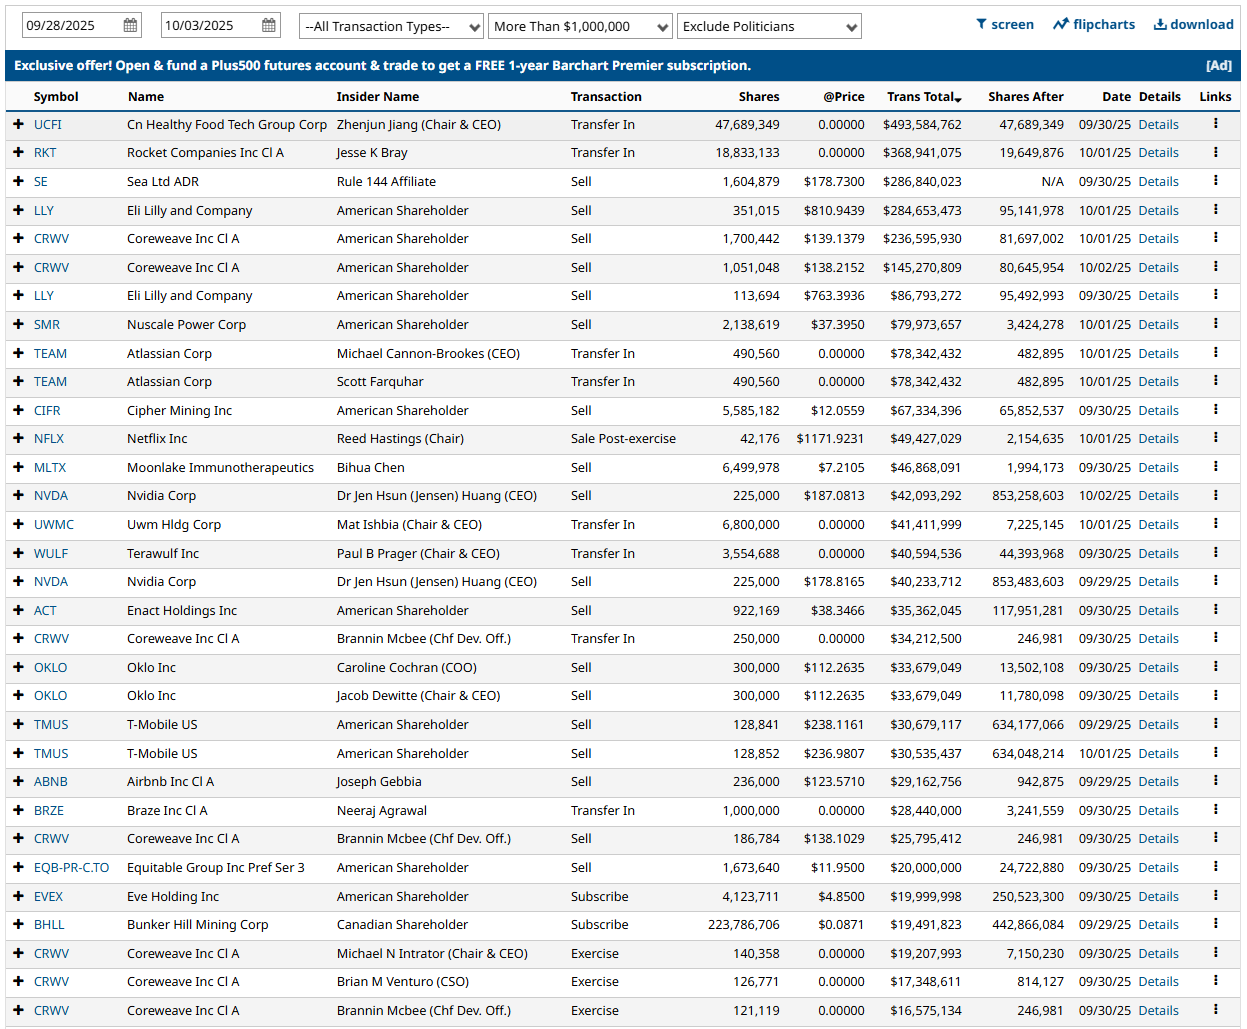
Over the last 60 days, insider flow skews to distribution. The highest-value tape is heavy on sells: Fox Corp B booked $1.165B across 1 buy and 2 sells, Corebridge Financial $1.009B with 0 buys and 2 sells, Tesla $999.96M with 1 buy and 3 sells, News Corp B $824.48M with 1 buy and 2 sells, and Coupang $560.0M with 0 buys and 4 sells. Coreweave stands out with $500.7M and a striking 0 buys vs 30 sells. Nu Holdings shows $435.6M with 0 buys vs 12 sells, and Sea Ltd ADR $369.9M with 0 buys vs 6 sells. There are a few bright spots: Brookfield Corp posted $438.5M with 2 buys vs 1 sell, and at the activity level Renaissance (RCG) logged 41 buys and 0 sells while Avidia Bancorp showed 28 buys and 0 sells. By count, notable clusters of pure selling include Atlassian (82 sells), Carvana (34 sells), Coreweave (30 sells), Nvidia (20 sells), T-Mobile (20 sells), Dropbox (20 sells), Vita Coco (22 sells), and Power Solutions (21 sells). This week’s blotter is dominated by administrative transfers and exercises but also contains large open-market sales: Nuscale Power sold 2,138,619 shares (~$80M), Netflix’s Reed Hastings sold post-exercise (~$49M), and Nvidia’s Jensen Huang sold 225,000 shares twice (~$42M and ~$40M). Net read: insiders are distributing more than accumulating, which tilts defensive unless and until we see a sustained pickup in open-market buys, particularly in the largest-cap leaders.
%Bull-Bear Spread
The %Bull-Bear Spread measures the gap between bullish and bearish investor sentiment, often from surveys like AAII. It’s a contrarian indicator—extreme optimism may signal a coming pullback, while extreme pessimism can hint at a potential rally. Large positive or negative spreads often mark market turning points.
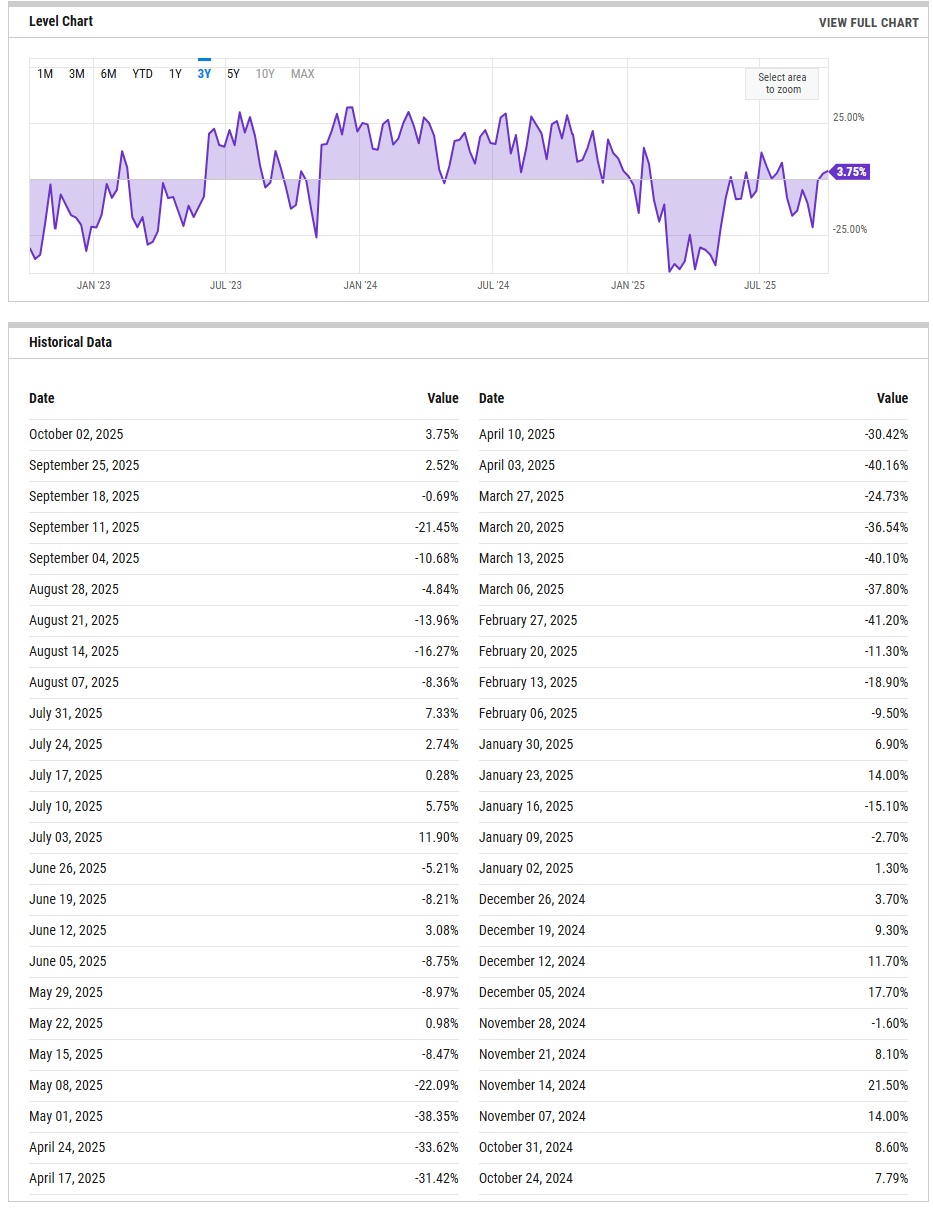
The bull-bear spread sits at 3.75% as of Oct 2, up from 2.52% last week and rebounding from mid-September negatives (e.g., -21.45% on Sep 11 and -16.27% on Aug 14). That is mild optimism, not euphoria. Historically, sub-zero tends to be supportive for rebounds, while sustained readings north of roughly 20% get crowded. A decisive push above the mid-teens would start to compress forward returns; slipping back below zero would say sentiment tailwinds have faded and the tape is vulnerable to headline shocks.
NAAIM Exposure Index
The NAAIM Exposure Index (National Association of Active Investment Managers Exposure Index) measures the average exposure to U.S. equity markets as reported by its member firms. These are typically active money managers who provide their equity exposure levels weekly. The index offers insight into how much these managers are investing in equities at any given time, ranging from being fully short (-100%) to leveraged long (up to +200%).
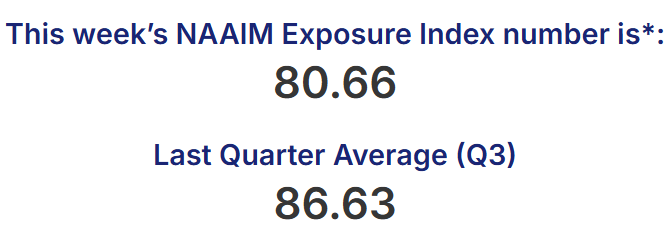
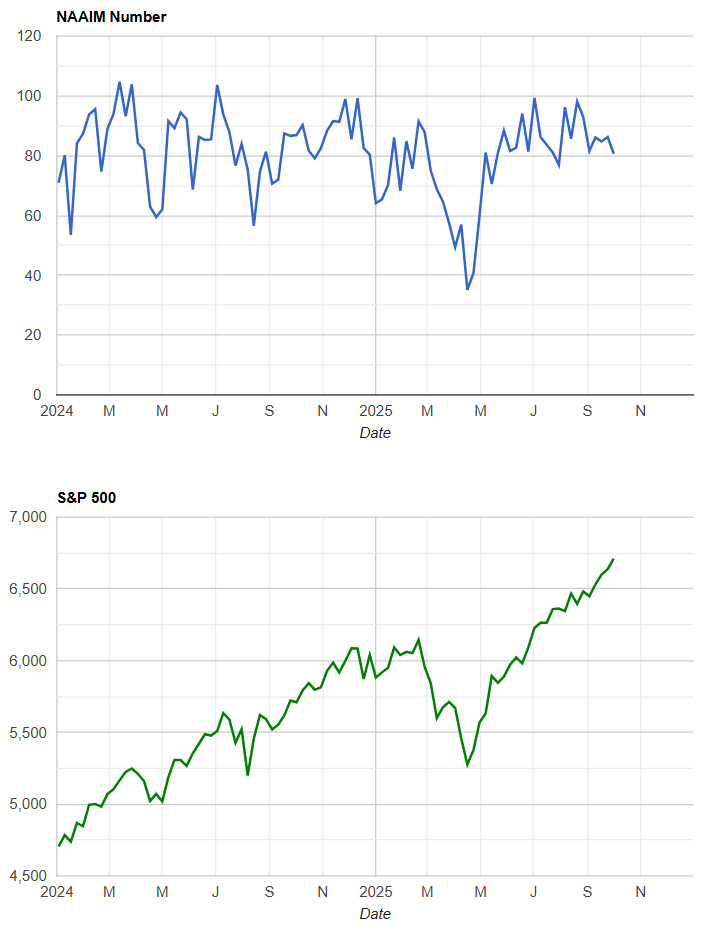
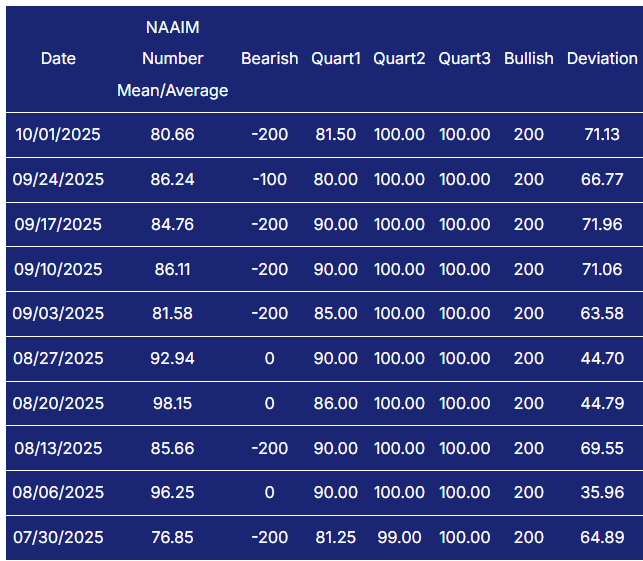
Active managers report 80.66 this week, down from 86.24 and 84.76 in the prior two readings and below late-August highs in the mid- to upper-90s. Positioning is constructive but not maxed, implying some dry powder remains while also leaving the market somewhat exposed to de-risking if prices wobble. A drop into the 50s without material index damage would flag stealth distribution and raise drawdown risk; conversely, a push back into the 90s would indicate chase-mode and make the tape more sensitive to disappointments.
CBOE Total Put/Call Ratio
CBOE's total put/call ratio includes index options and equity options. It's a popular indicator for market sentiment. A high put/call ratio suggests that the market is overly bearish and stocks might rebound. A low put/call ratio suggests that market exuberance could result in a sharp fall.
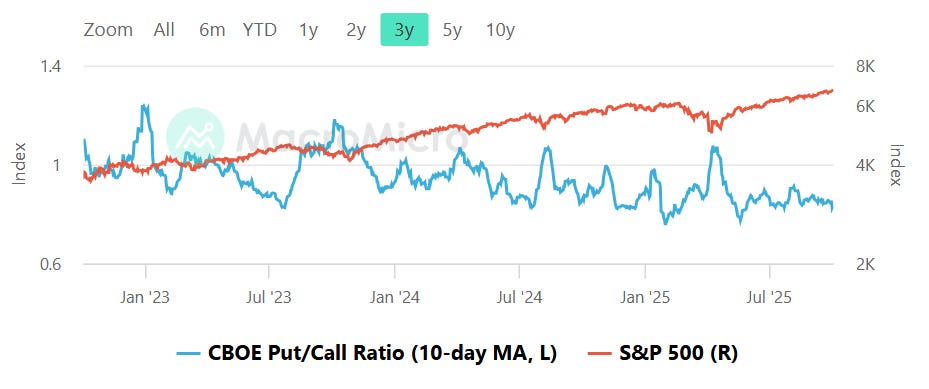
The 10-day average is hovering below 1.0 and closer to the high-0.8s, consistent with lighter hedging than we saw during the summer spikes. This backdrop usually dampens rebound amplitude and can let pullbacks run until demand for protection rises. If the 10-day average sinks toward ~0.8 and sticks there, that would signal froth and raise the risk of mean-reversion chop. A jump back above ~1.0 would indicate renewed fear and improve the quality of dip-buys.
Equity vs Bond Volatility
The Merrill Lynch Option Volatility Estimate [MOVE] Index from BofAML and the CBOE Volatility Index [VIX] respectively represent market volatility of U.S. Treasury futures and the S&P 500 index. They typically move in tandem but when they diverge, an opportunity can emerge from one having to “catch-up” to the other.
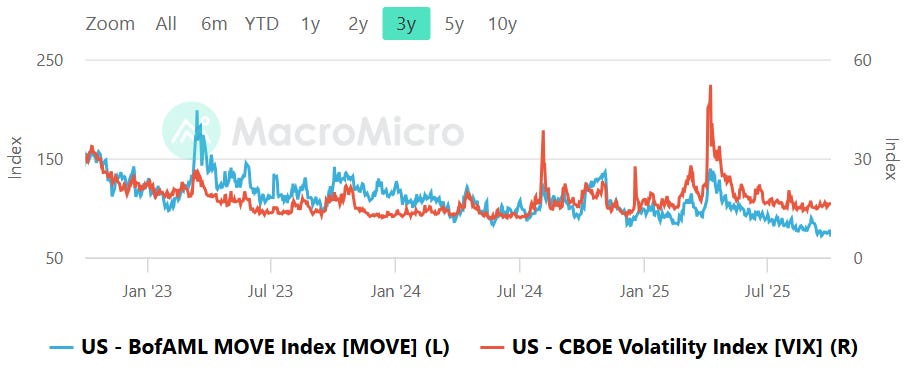
The snapshot does not provide a precise numeric read, and no obvious spike is evident. In this regime the signal is neutral: neither market is clearly warning of cross-asset stress. The tripwires remain straightforward. If MOVE were to jump above roughly 120 while VIX stays subdued, that divergence would often precede equity volatility. Alternatively, if VIX itself pressing into the high teens or higher while MOVE remains calm, treat it as a direct risk-off cue for equities.
CNN Fear & Greed Constituent Data Points & Composite Index
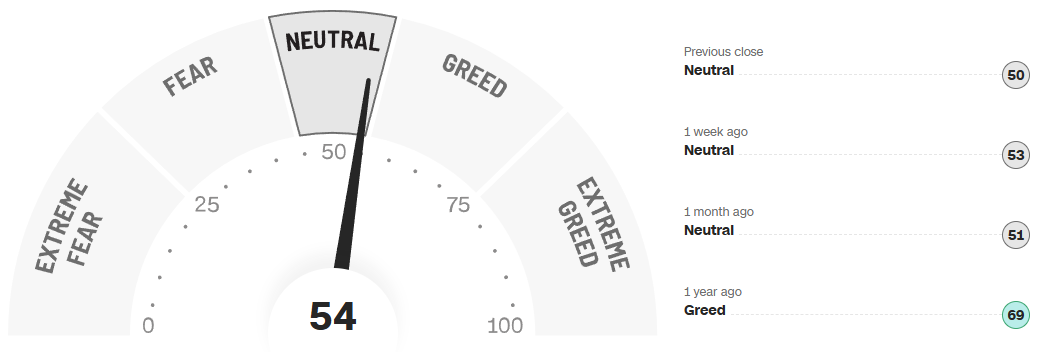
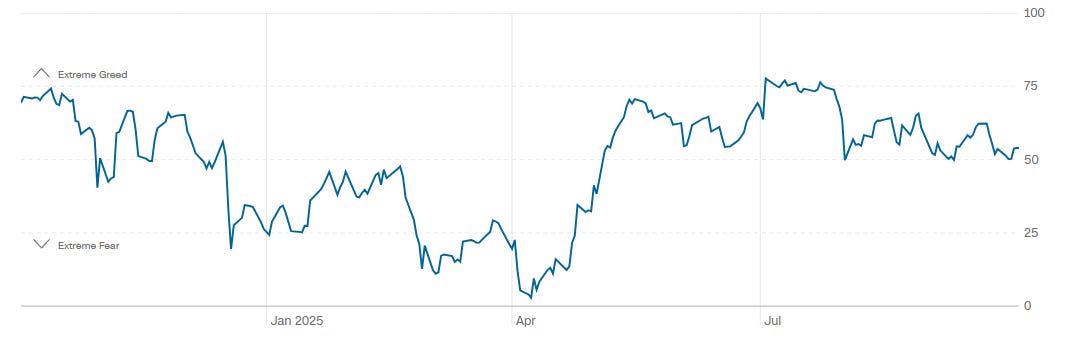
The composite gauge prints 54, up from 50 at the previous close, 53 a week ago, and 51 a month ago; a year ago it was higher at 69. The 1-year path shows a surge toward the 70s in early summer, followed by a cooling into a mid-range, mostly 50s-60s band. That is a balanced backdrop: neither pessimism to power a major squeeze nor exuberance that typically precedes air-pockets. Above ~80 would flag exhaustion risk; a drop toward the low-30s would mark a better entry window for fresh risk.
Social Media Favs
Social sentiment offers a real-time view of investor mood, often revealing market shifts before traditional indicators. It can signal momentum changes, spot emerging trends, and gauge retail investor impact—especially in high-volatility names. Tracking sentiment around events or earnings provides actionable insights, and when layered with quantitative models, can enhance predictive accuracy and risk management. Sustained sentiment trends often mirror broader market cycles, making this data a valuable tool for both short-term trades and long-term positioning.

Technician’s Playbook: Trading the Majors (SPY/QQQ/IWM/DIA)
When you’re a large institutional player, your primary goal is to find liquidity - places to do a ton of business with the least amount of slippage possible. VolumeLeaders.com automatically identifies and visually plots the exact spots where institutions are doing business and where they are likely to return for more. It’s one of the primary reasons “support” and “resistance” concepts work and truly one of the reasons “price has memory”.
SPY
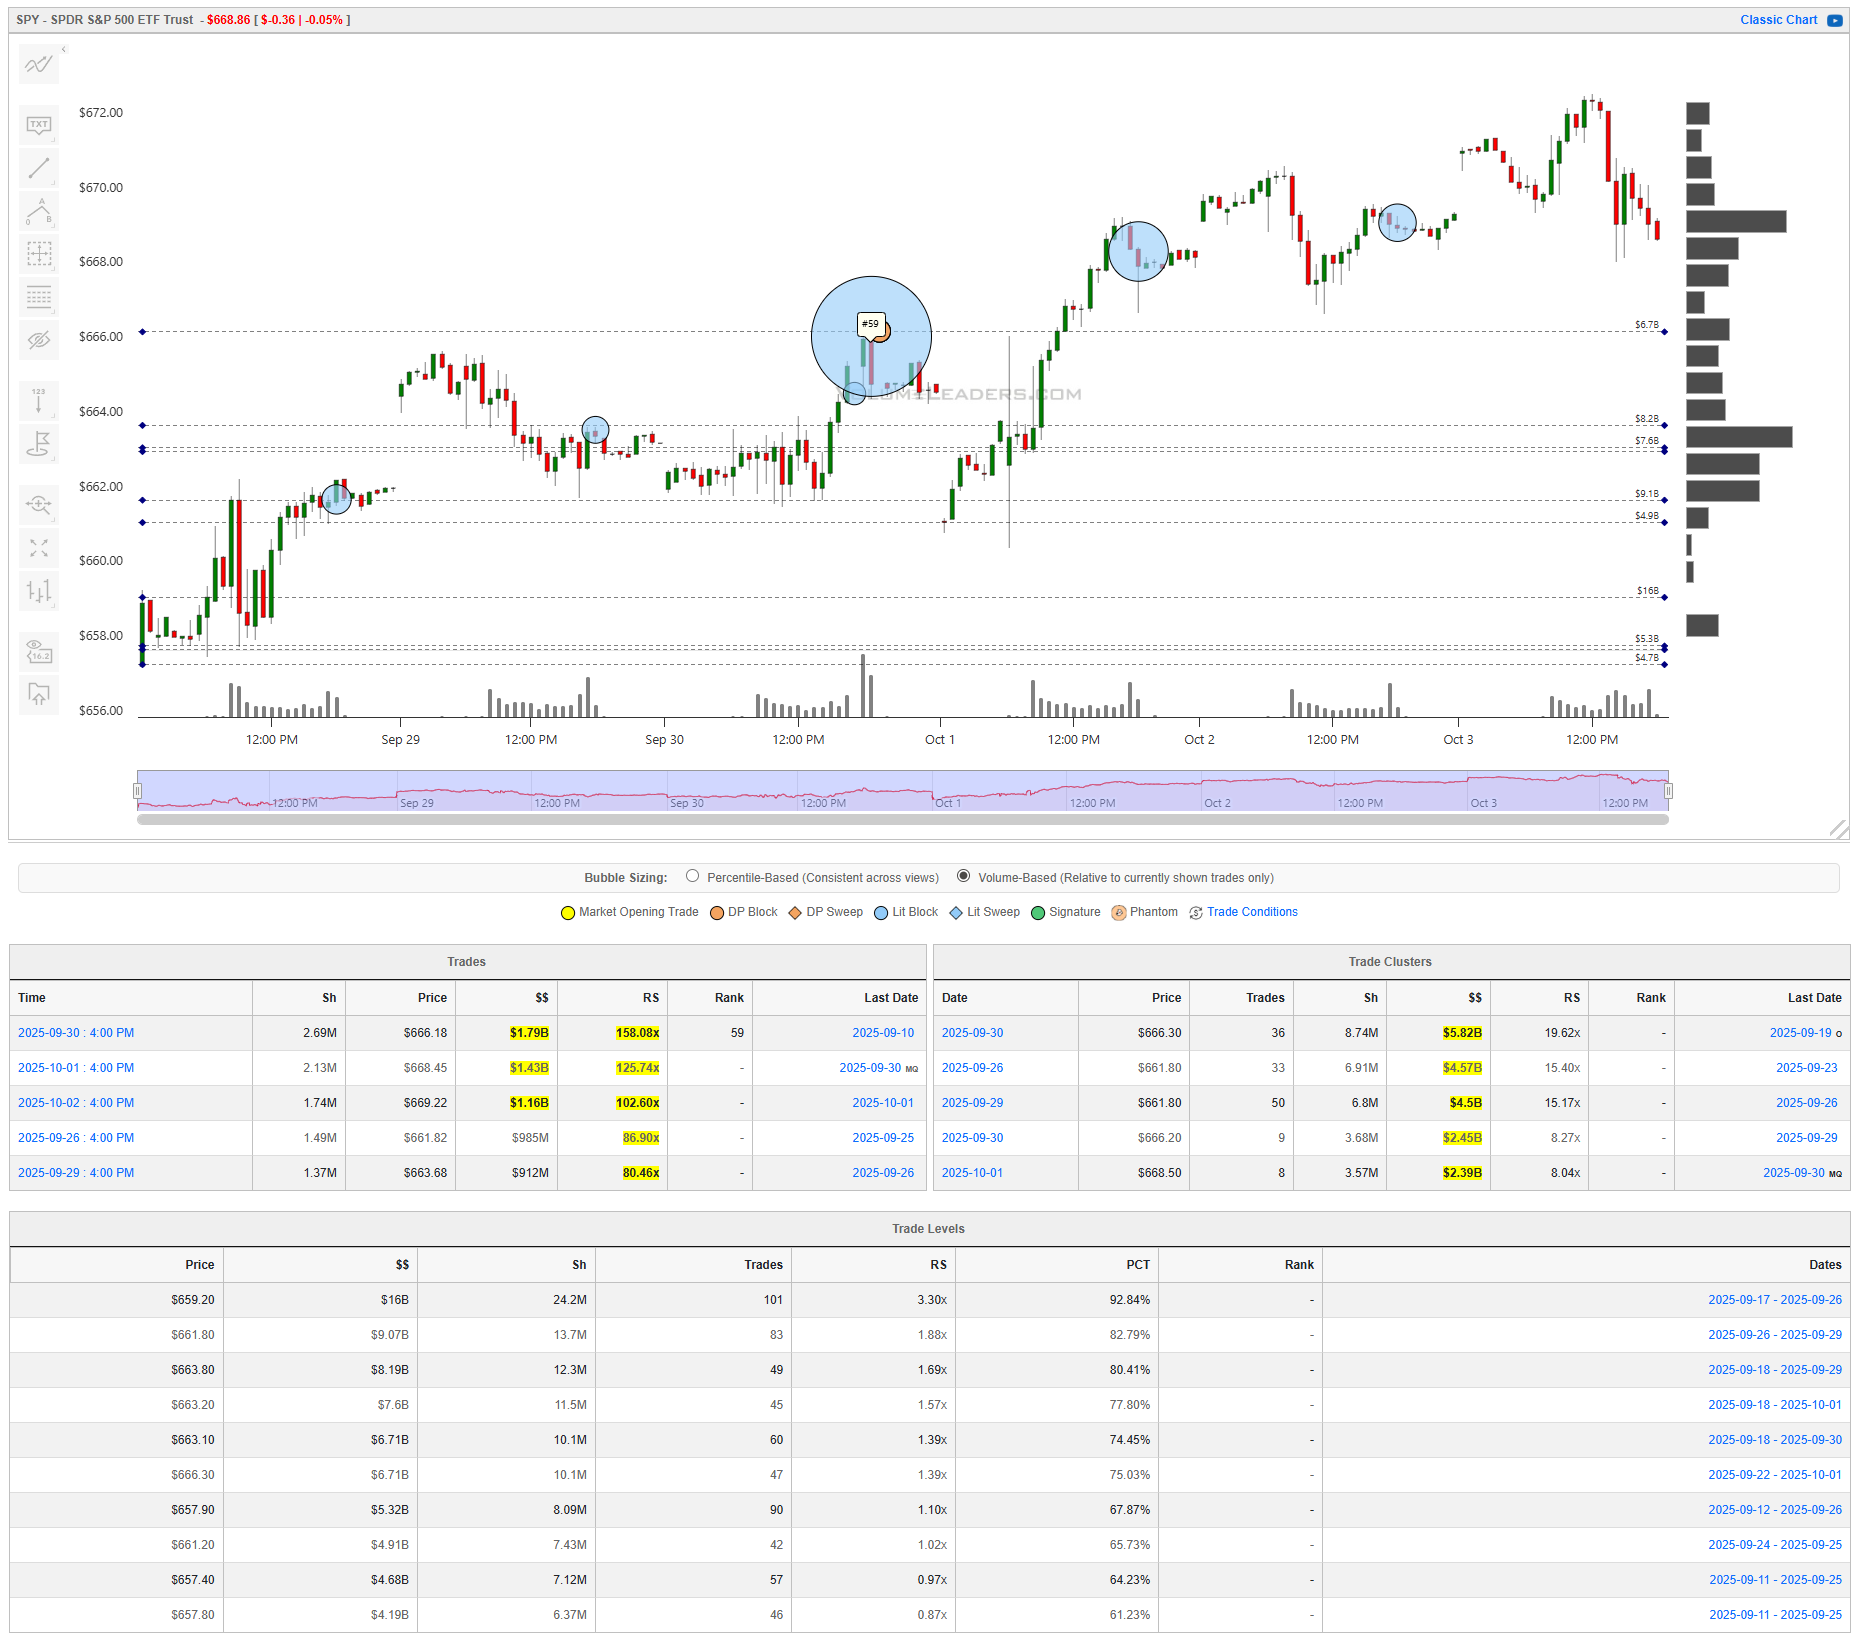
The week built a rising structure that pulled back into Friday. The most revealing prints sat in the mid-660s: three outsized blocks hit at $666.18, $668.45, and $669.22 with notional of $1.79B, $1.43B, and $1.16B, each carrying triple-digit RS (158x, 126x, 103x). A top-100 ranked trade fired earlier in the week, underscoring how aggressively buyers engaged near the first launch out of balance. The heaviest cluster for the window sits at $666.30 with $5.82B traded (RS 19.6x), followed by a twin cluster at $661.80 totaling roughly $9.1B combined (RS ~15–16x). The level stack is equally clear: $659.20 ($16B, RS 3.30x, 92.8% PCT) anchors support, with a dense band from $661.80–$663.80 ($9.07B–$8.19B). The line of scrimmage is $666.30. Hold above and the upper shelves at $668.50 and the week’s highs can re-magnetize; lose $666 and price invites a test of $663s, then $661.8 and finally $659.2. For the next sessions, a bullish path is acceptance back above $666.30 that converts the $668s cluster into a springboard; confirmation is sustained trade above $668.5 with dwindling responsive selling. The bearish path is failure at $666.30 that drives into the $663s band; continuation is a clean break of $661.8 that opens $659.2. Tactically, fade tests into $666.30 only if sellers show impulsivity and the buying remains contained; otherwise buy back-test holds of $666 with tight invalidation beneath $665.8 and first targets $668.3–$668.5.
QQQ
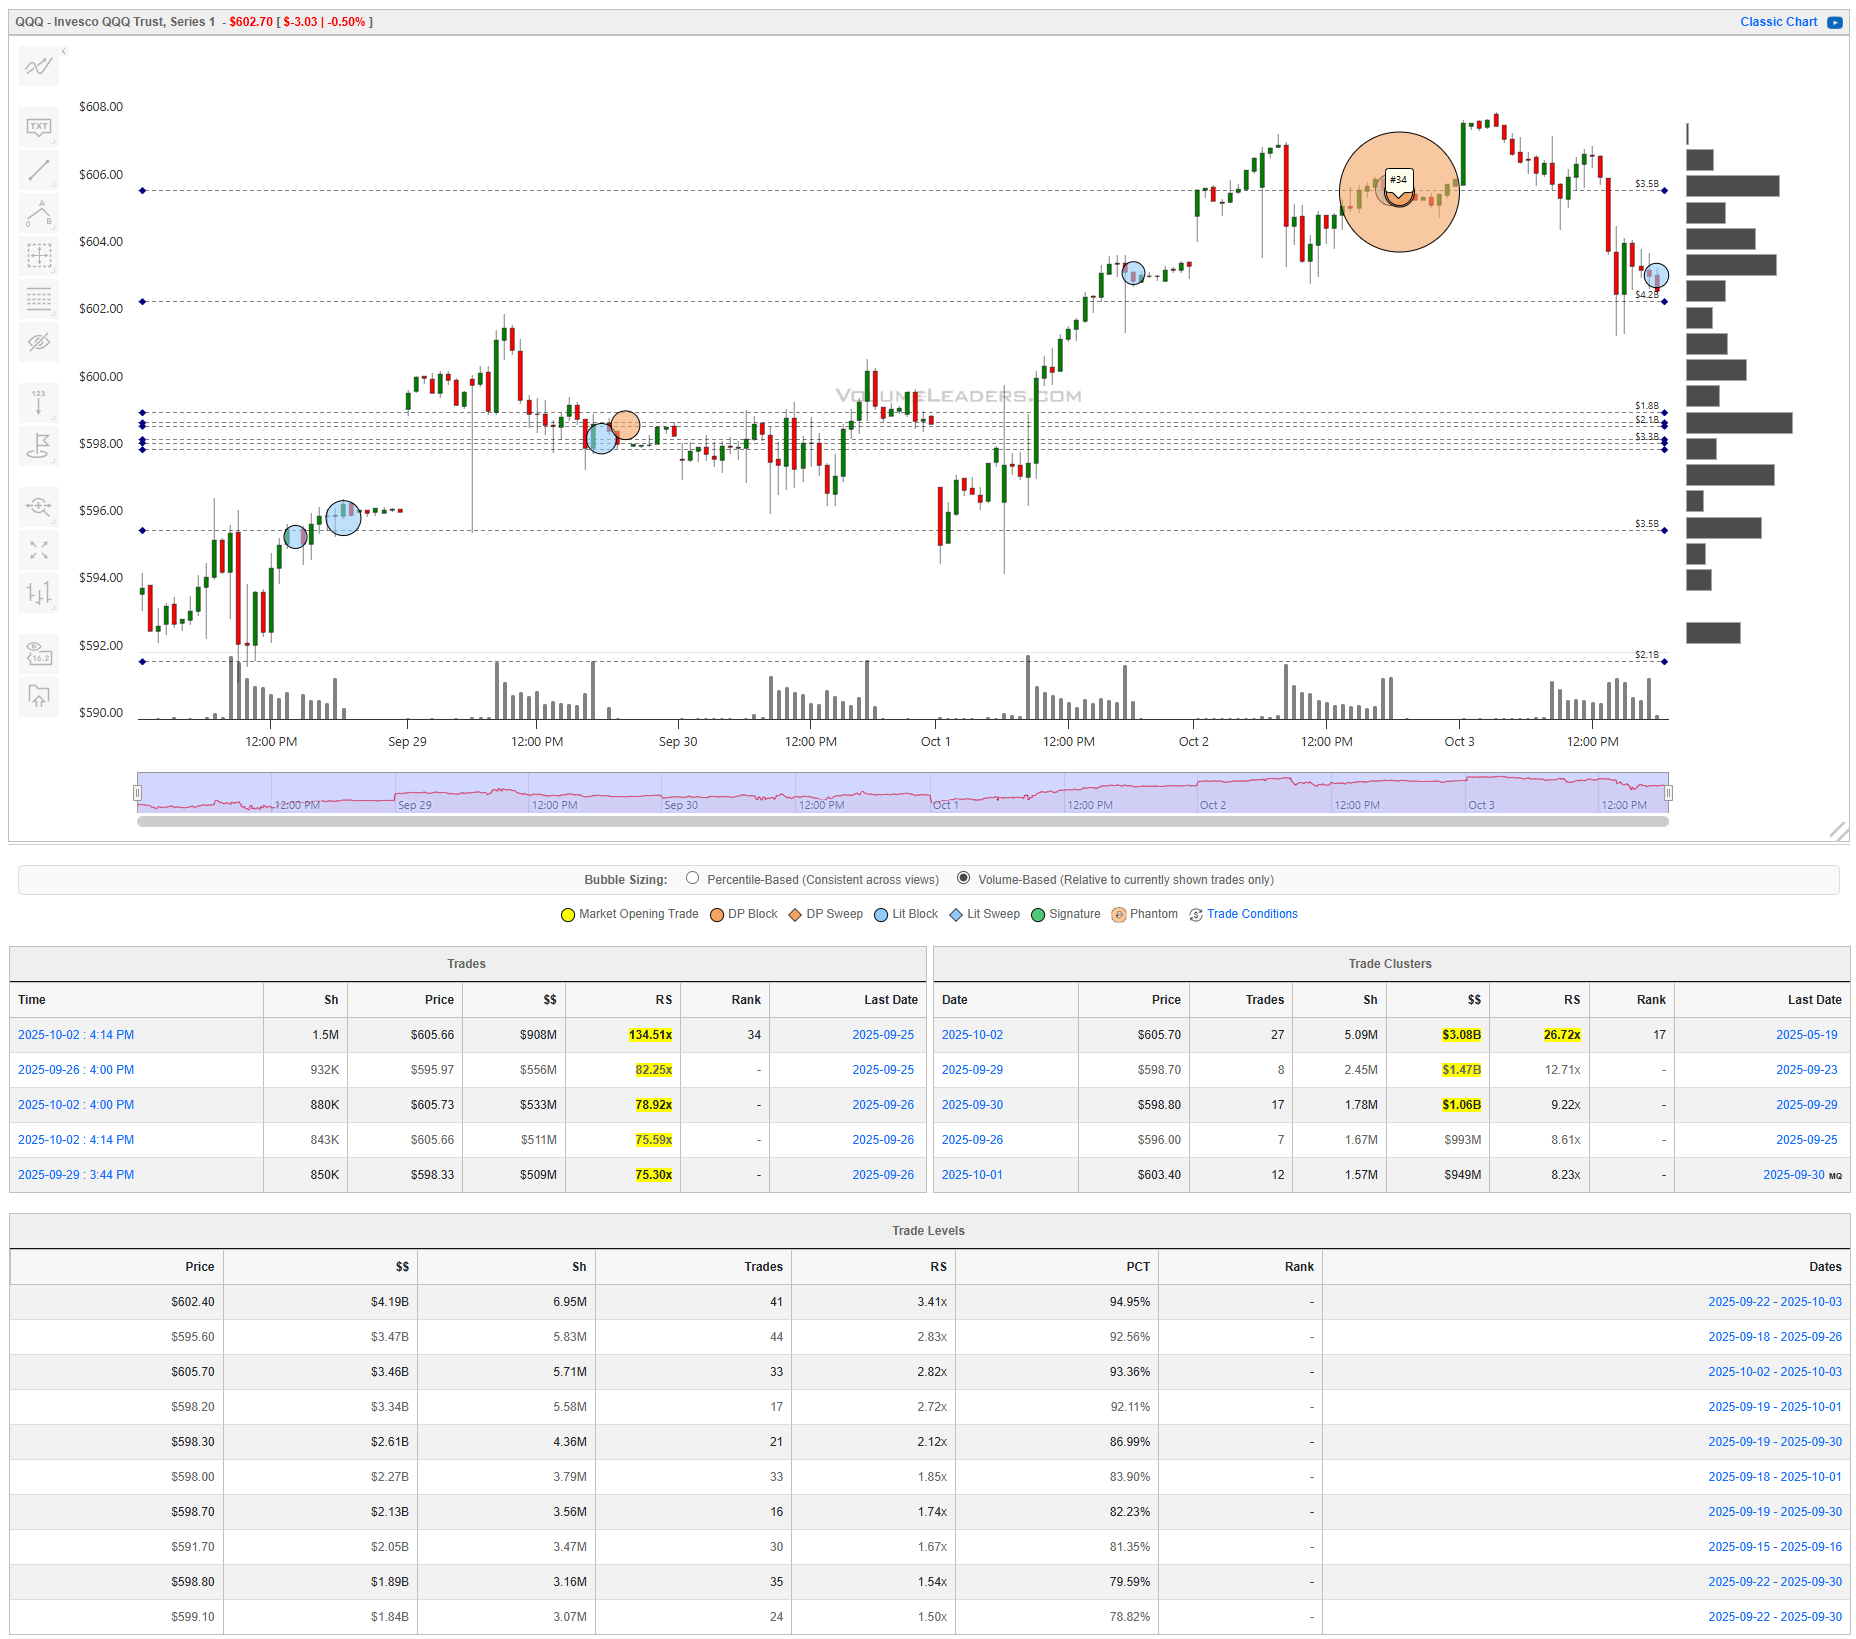
Tech stayed constructive but rotational. The biggest single prints were $605.66 for $908M (RS 134x), $595.97 for $556M (RS 82x), and $605.73 for $533M (RS 79x), showing real size defending the $605 handle and opportunistic activity on dips toward the high-$590s. Clusters are dominated by $605.70 with $3.08B (RS 26.7x), while the $598.70–$598.80 zone holds another $2.1–$1.5B each (RS 9–13x). Levels stack tightly: $602.40 ($4.19B, RS 3.41x, 94.9% PCT) and $605.70 ($3.46B, RS 2.82x) overhead, with support through $598.20–$598.90 ($2.6–$3.3B) and a pivot at $595.60 ($3.47B, RS 2.83x). The line of scrimmage is $602–$603…you can simplify by using the week’s close. Regain and hold above that band and the tape should probe $605.7; rejection there resets the magnet back to $598s. Bulls want acceptance above $605.7 with clusters flipping to support; bears want lower highs under $602 that press into $598.2. Entries framed around $602 with clear stops either side will keep risk tight; first targets sit $605.7 above and $598.7 below.
IWM
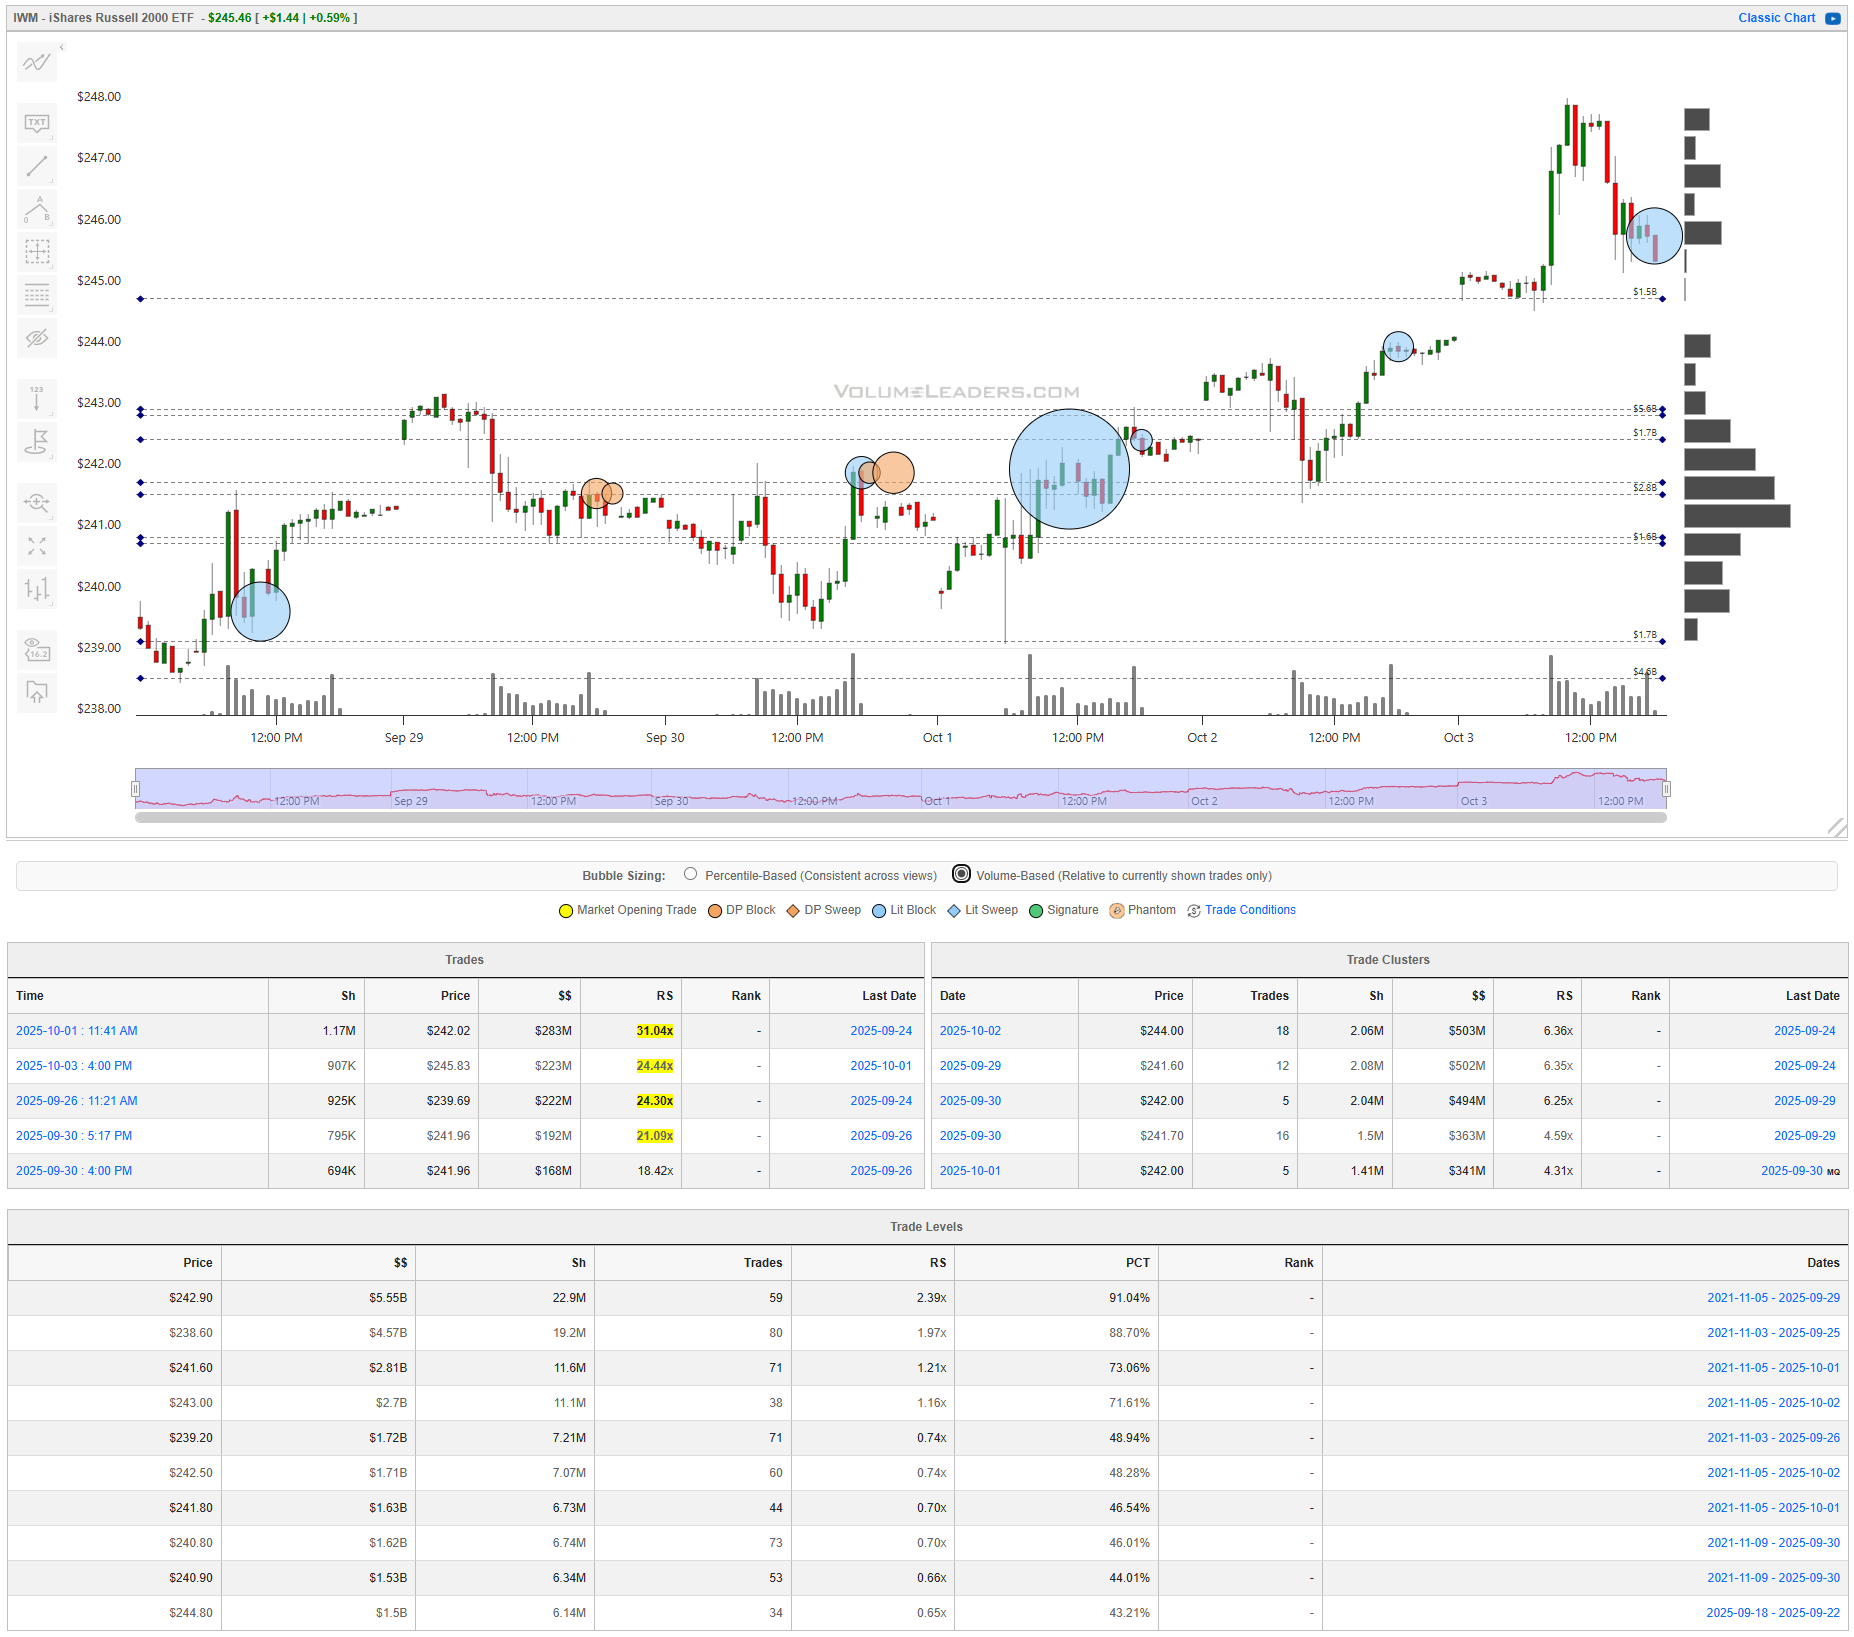
Small caps showed the strongest impulse, then cooled into late-week. Notable blocks printed at $242.02 for $283M (RS 31x), $245.83 for $223M (RS 24x), and $239.69 for $222M (RS 24x), a nice spread that built a fresh ladder of sponsorship. The clusters are unusually even: $244.00 carries $503M (RS 6.36x), $241.60 holds $502M (RS 6.35x), and $242.00 carries $494M (RS 6.25x). Levels confirm a broad platform: $242.90 is the standout with $5.55B (RS 2.39x, 91.0% PCT) and $238.60 with $4.57B (RS 1.97x, 88.7%). The line of scrimmage is the $242–$243 pocket. Acceptance above $243 and the market can re-lean into $244–$246; lose $242 and a rotation into $241.60 and $239.20 ($1.72B) is on deck. For continuation, look for buyers to defend $242.5 on dips; a clean break of $239.2 would negate the near-term uptrend. Intraday, lean against $242.9 with defined stops for longs, or fade into $244 failure with targets back to $242.5 and $241.6.
DIA
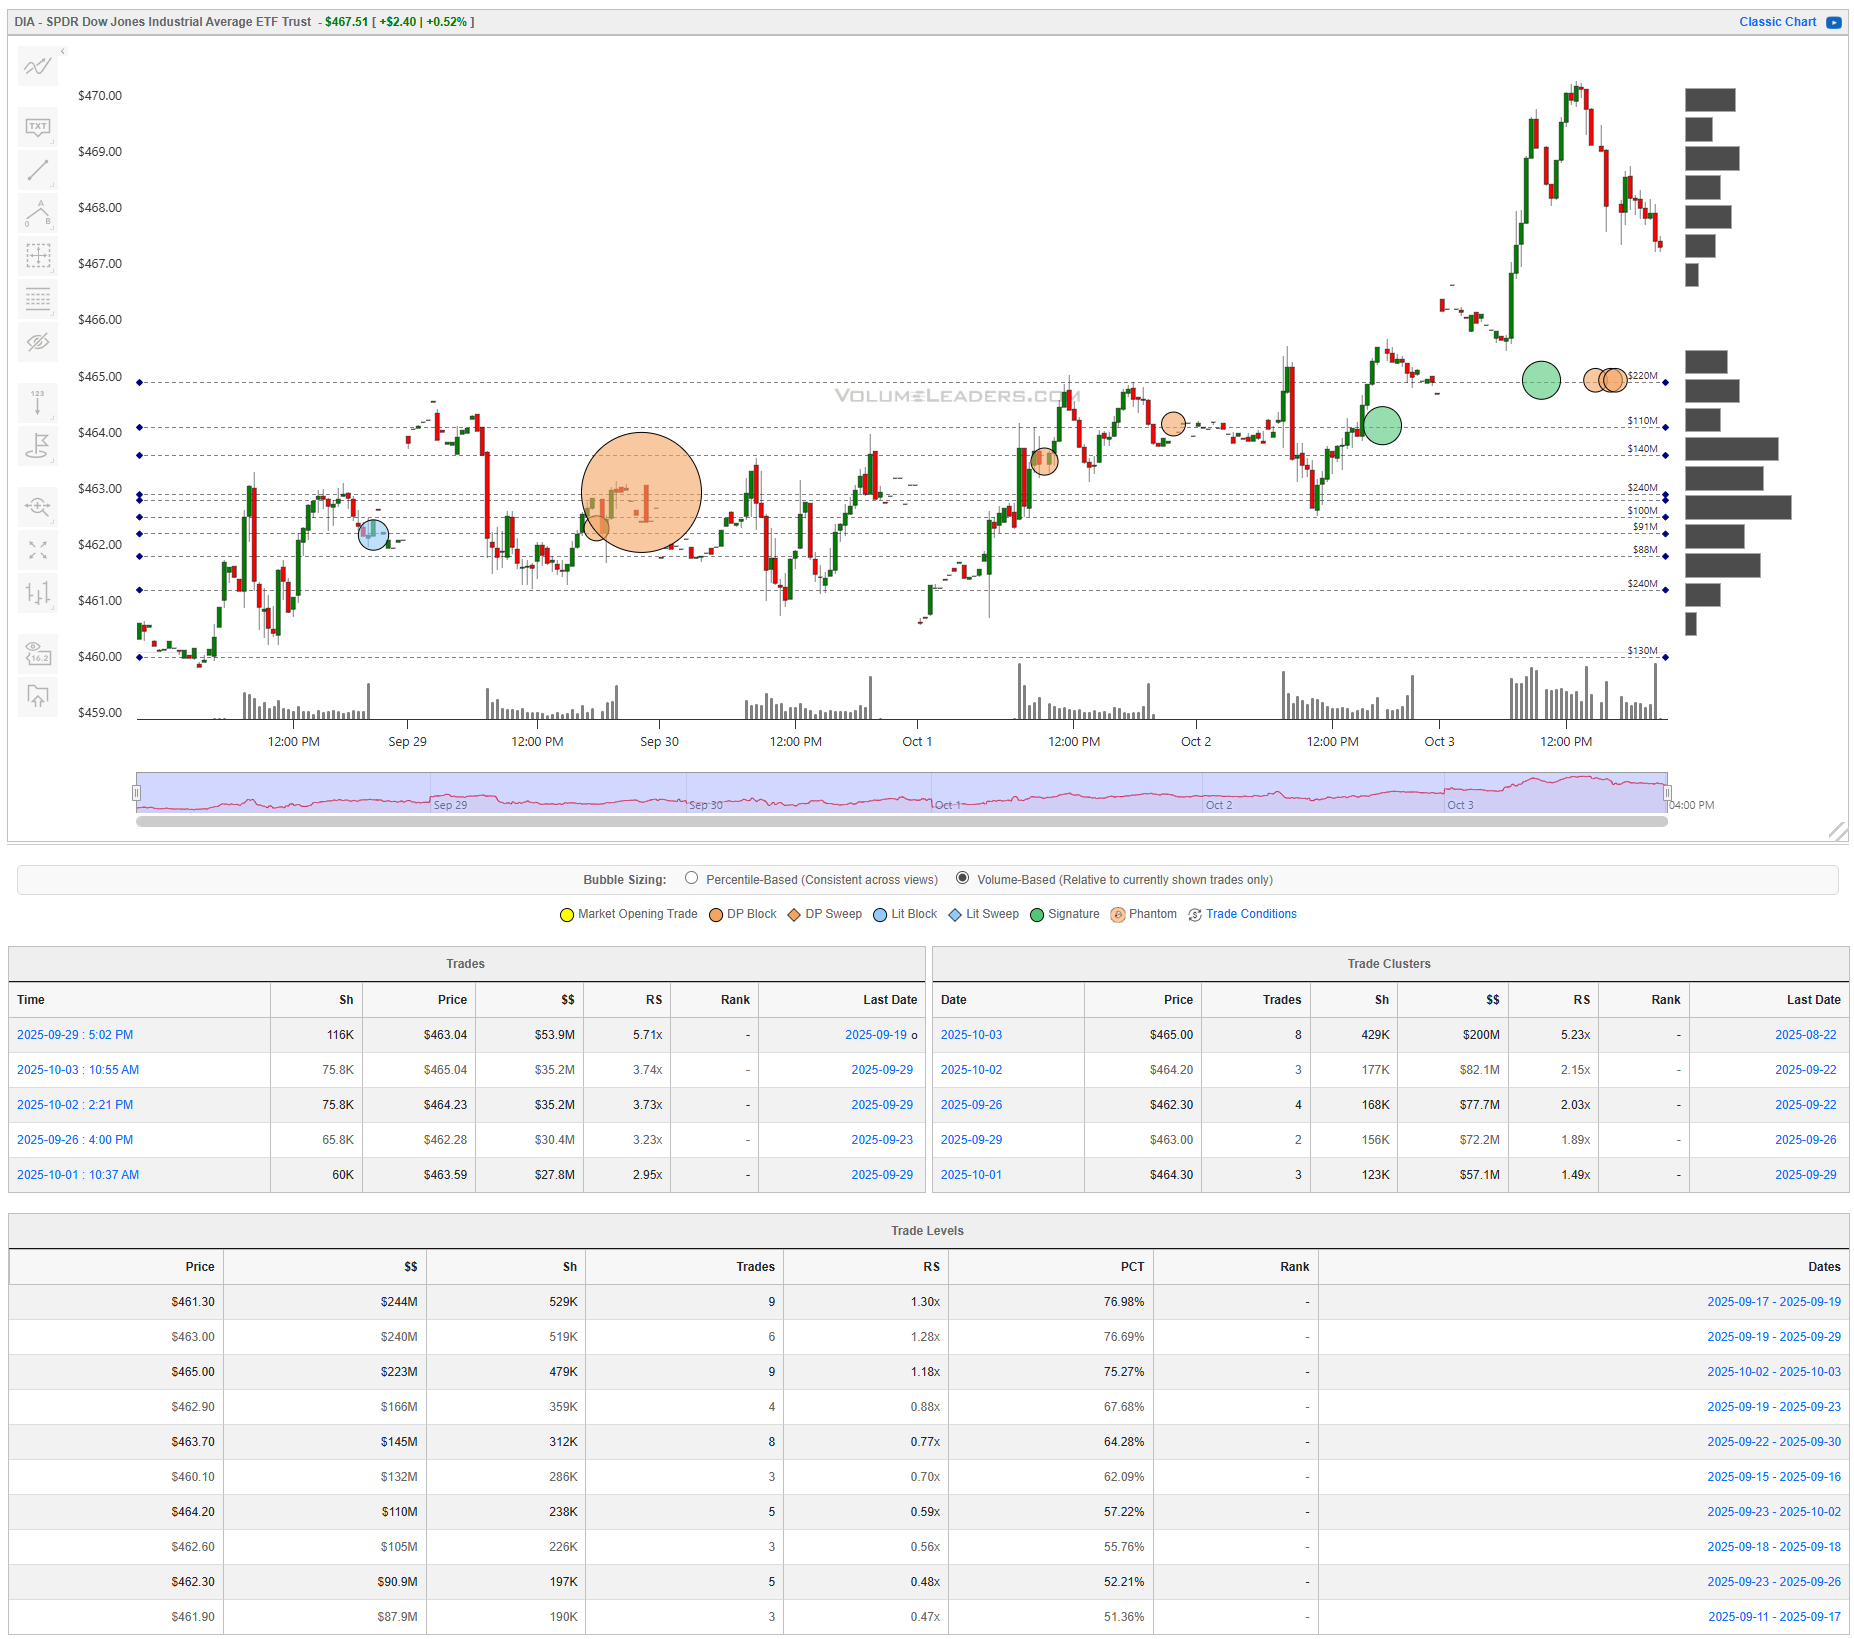
The Dow’s ramp was orderly with late pullback and no levels developing at the highs. The biggest prints were modest in absolute size but meaningful in context: $463.04 for $53.9M (RS 5.71x), $465.04 for $35.2M (RS 3.74x), and $464.23 for $35.2M (RS 3.73x). The dominant cluster sits at $465.00 with $200M (RS 5.23x); nearby bands at $464.20 ($82.1M) and $462.30 ($77.7M) round out the ladder. Levels are layered every dollar: $461.30 ($244M, RS 1.30x, 77.0% PCT), $463.00 ($240M), and $465.00 ($223M) form a tidy staircase. The line of scrimmage is $463. A hold and turn there sets up another look at $465; lose $463 and the magnet is $461.3. Confirmation for bulls is acceptance back above $465 with higher lows; bears want rejections at $463.7–$464.2 that push $462.3. Executions favor tight risk around those dollar handles with first targets one handle away.

Summary Of Thematic Performance YTD
VolumeLeaders.com offers a robust set of pre-built thematic filters, allowing you to instantly explore specific market segments. These performance snapshots are provided purely for context and inspiration—think about zeroing in on the leaders and laggards within the strongest and weakest sectors, for example.
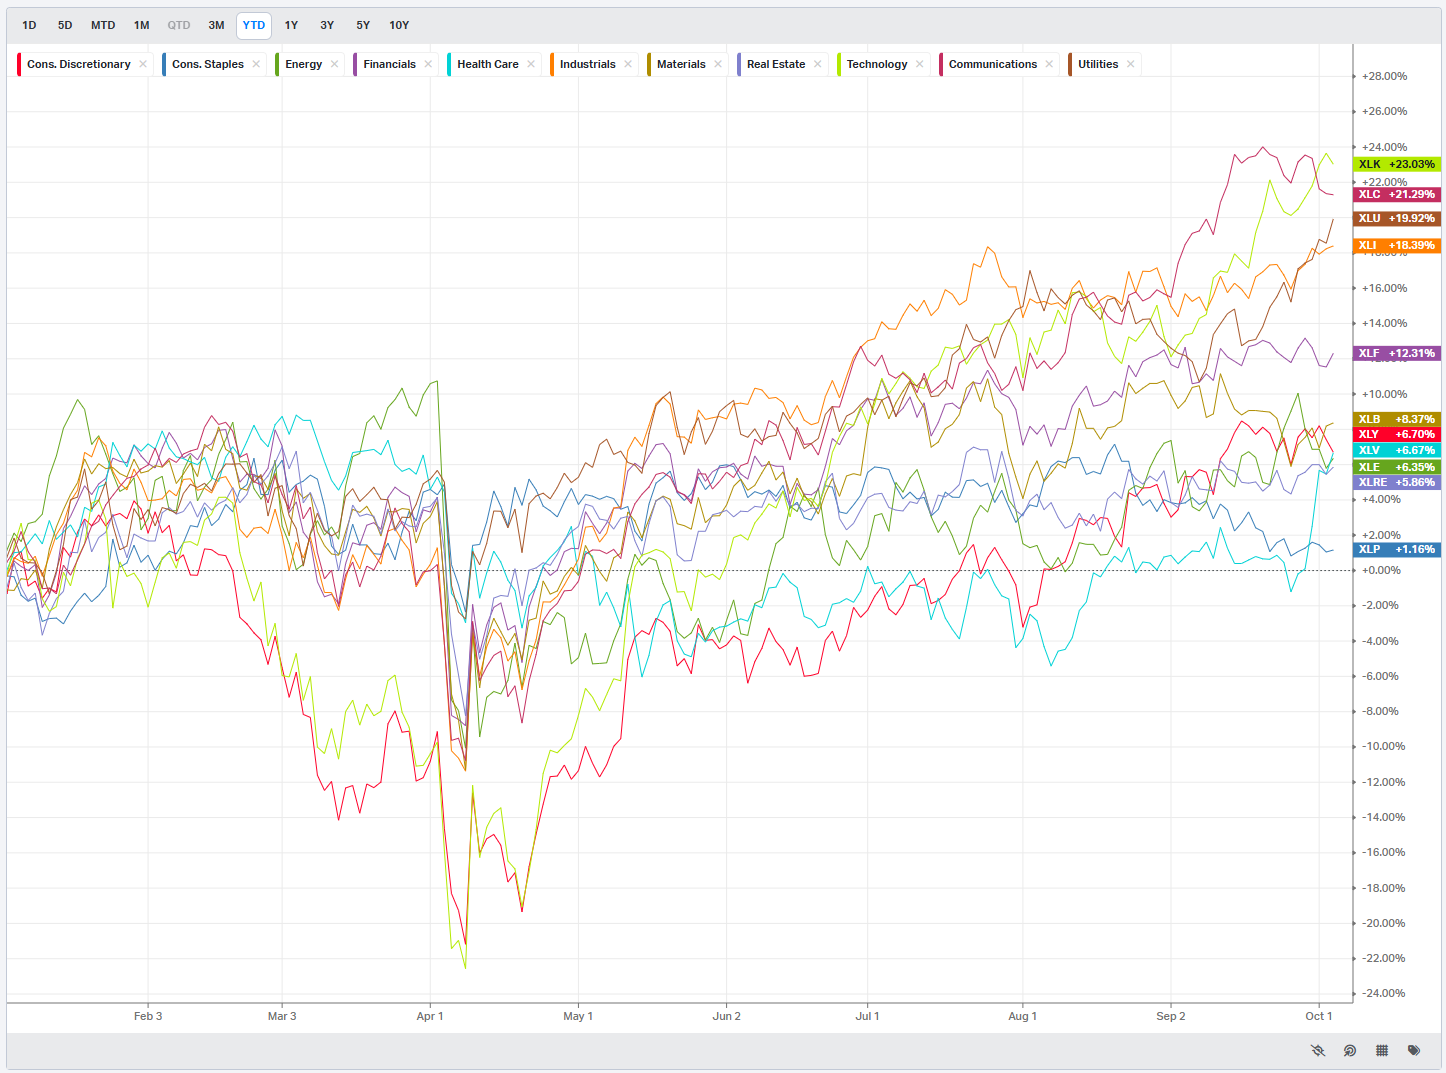
S&P By Sector
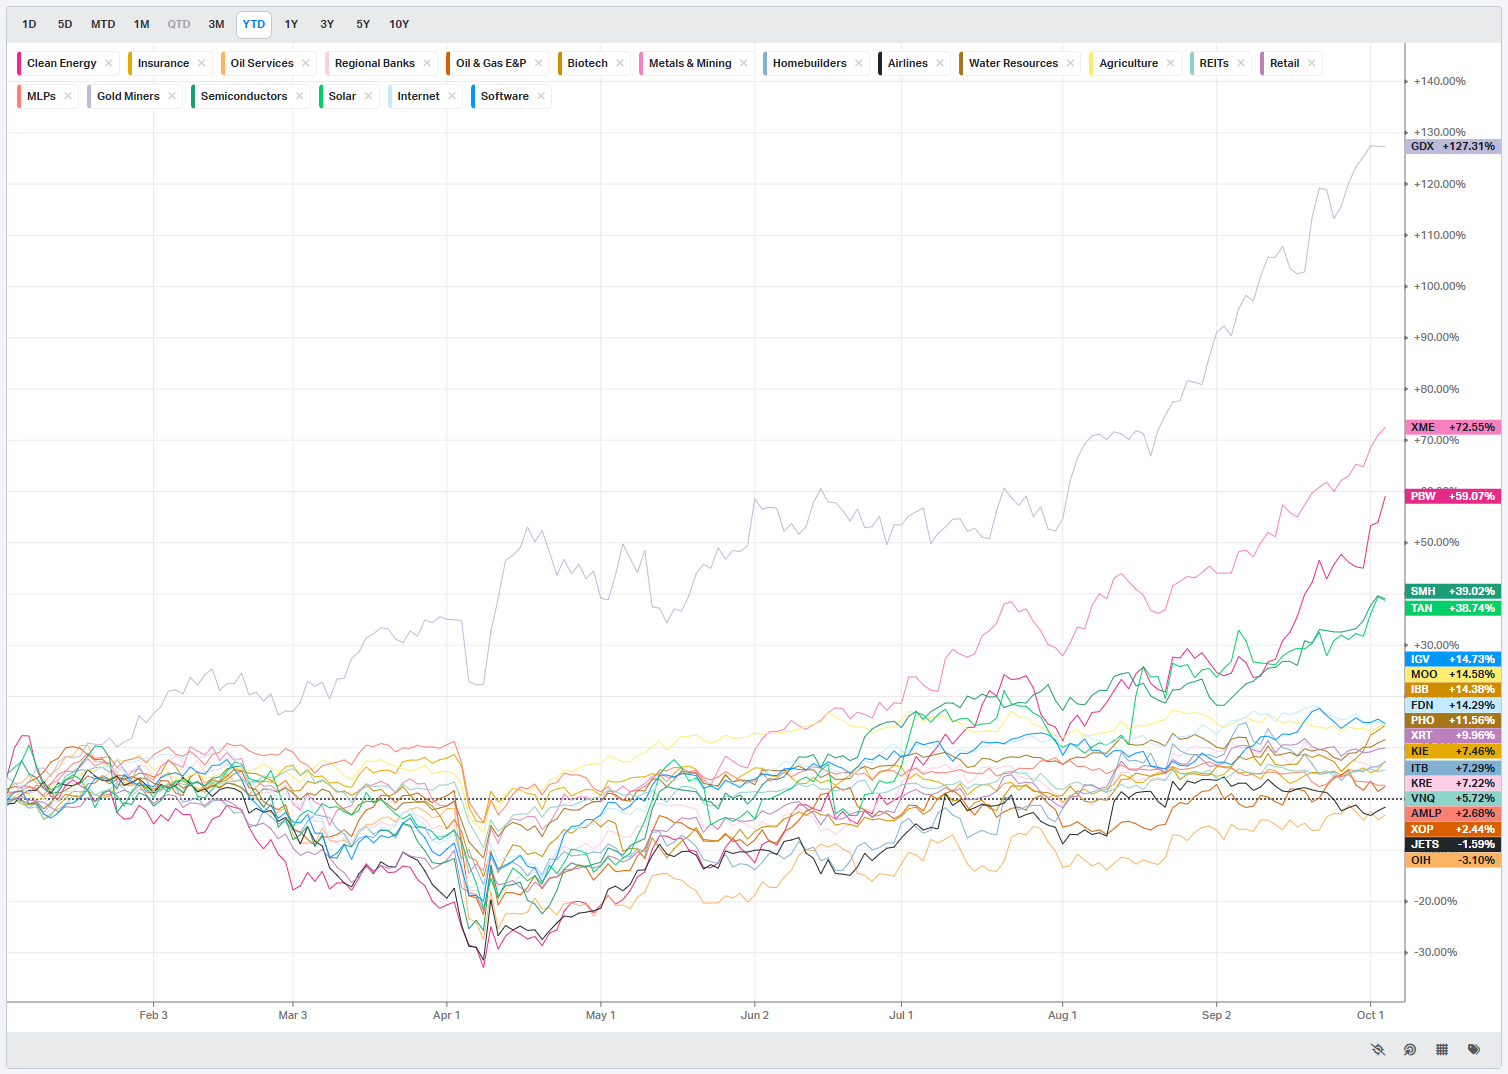
S&P By Industry
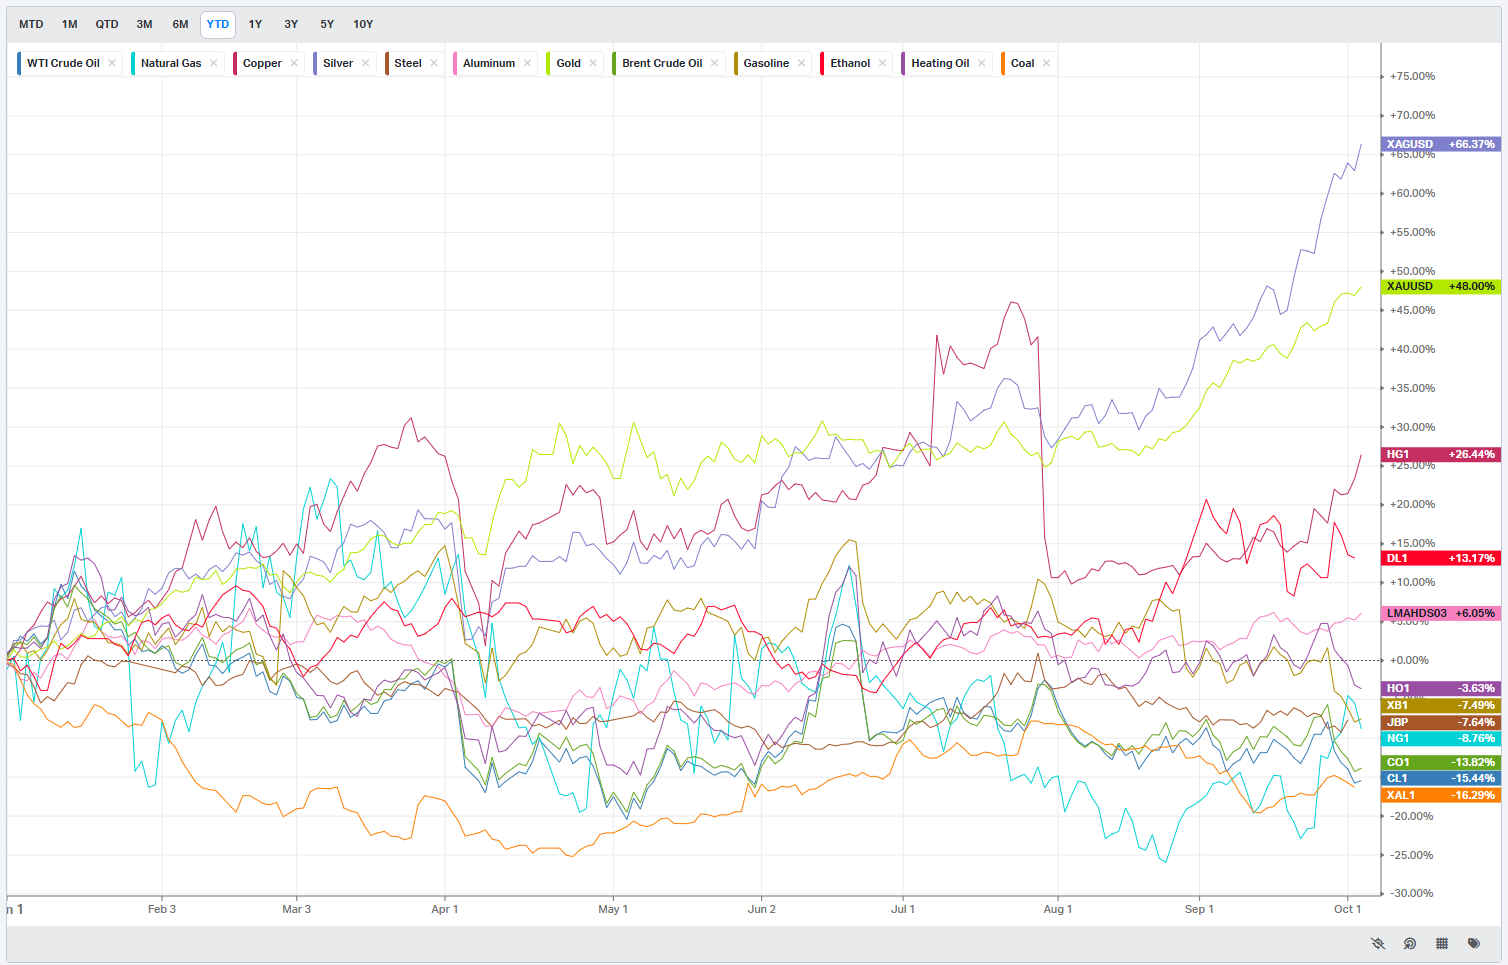
Commodities: Energy & Metals
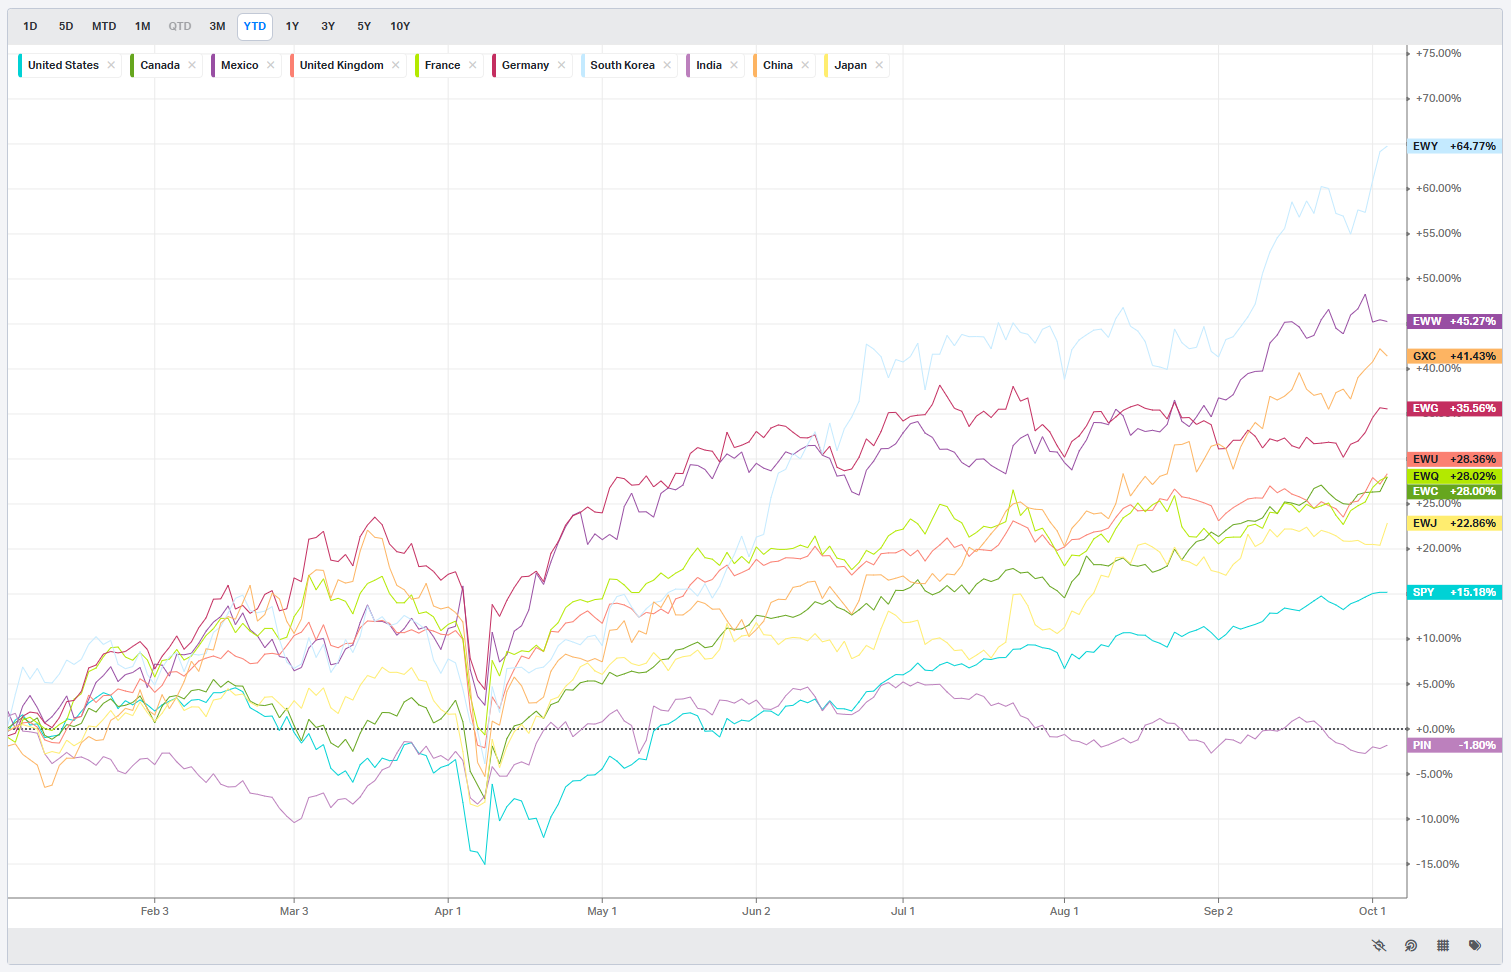
Country ETFs
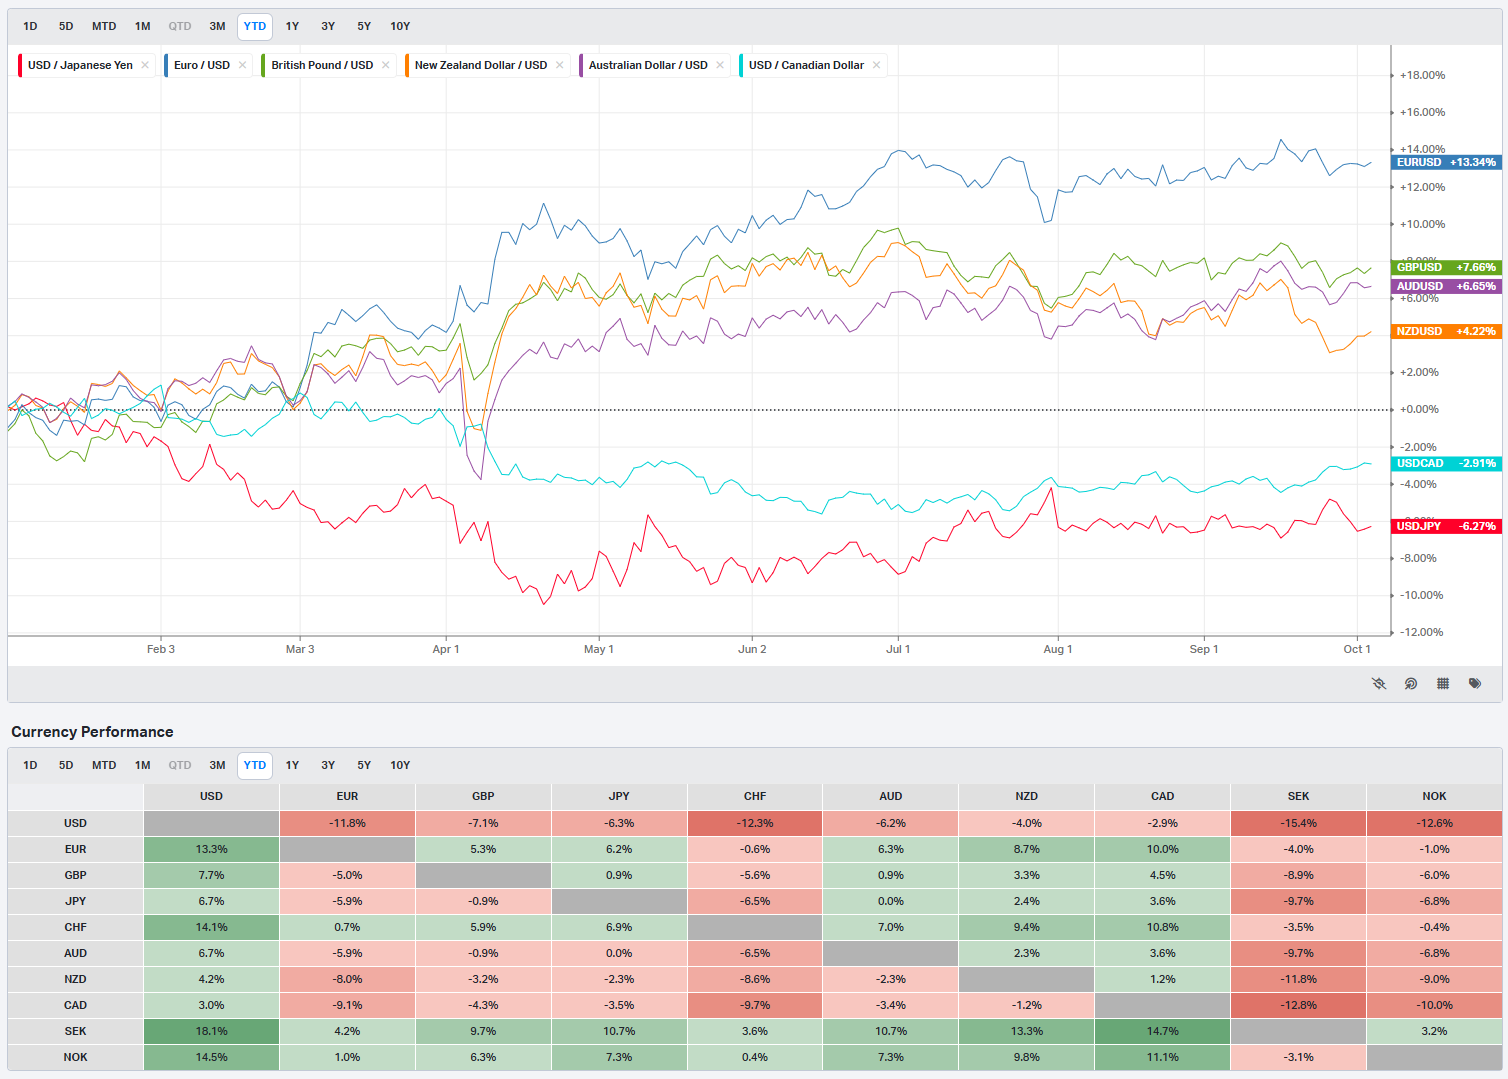
Currencies/Major FX Crosses
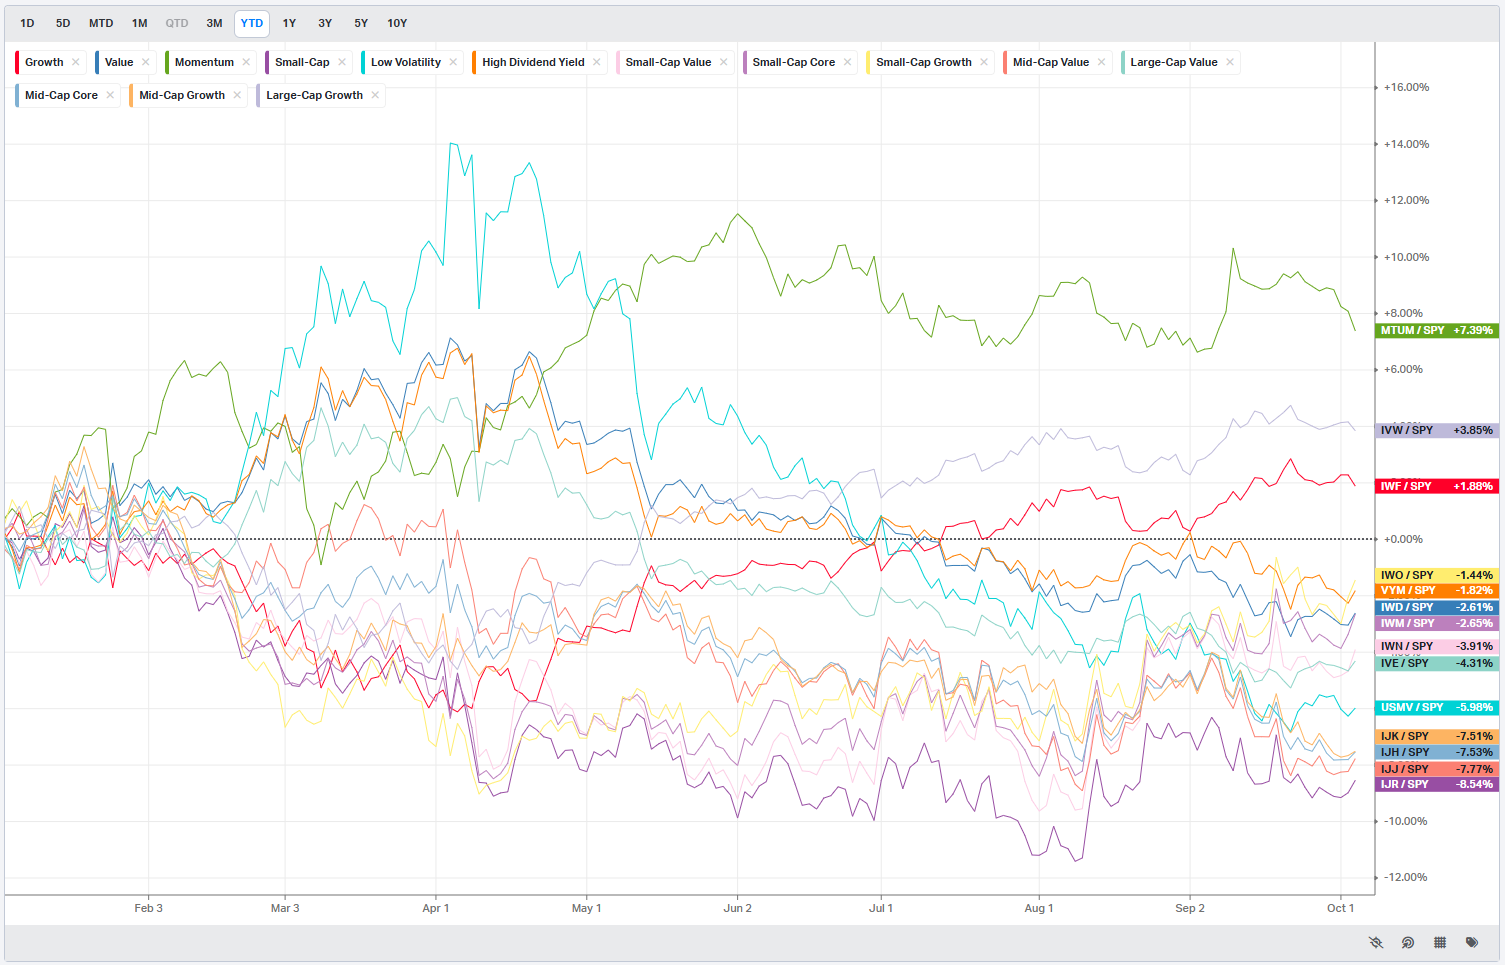
Factors: Style vs Size-vs-Value

Events On Deck This Week
Here are key events happening this week that have the potential to cause outsized moves in the market or heightened short-term volatility.
Monday
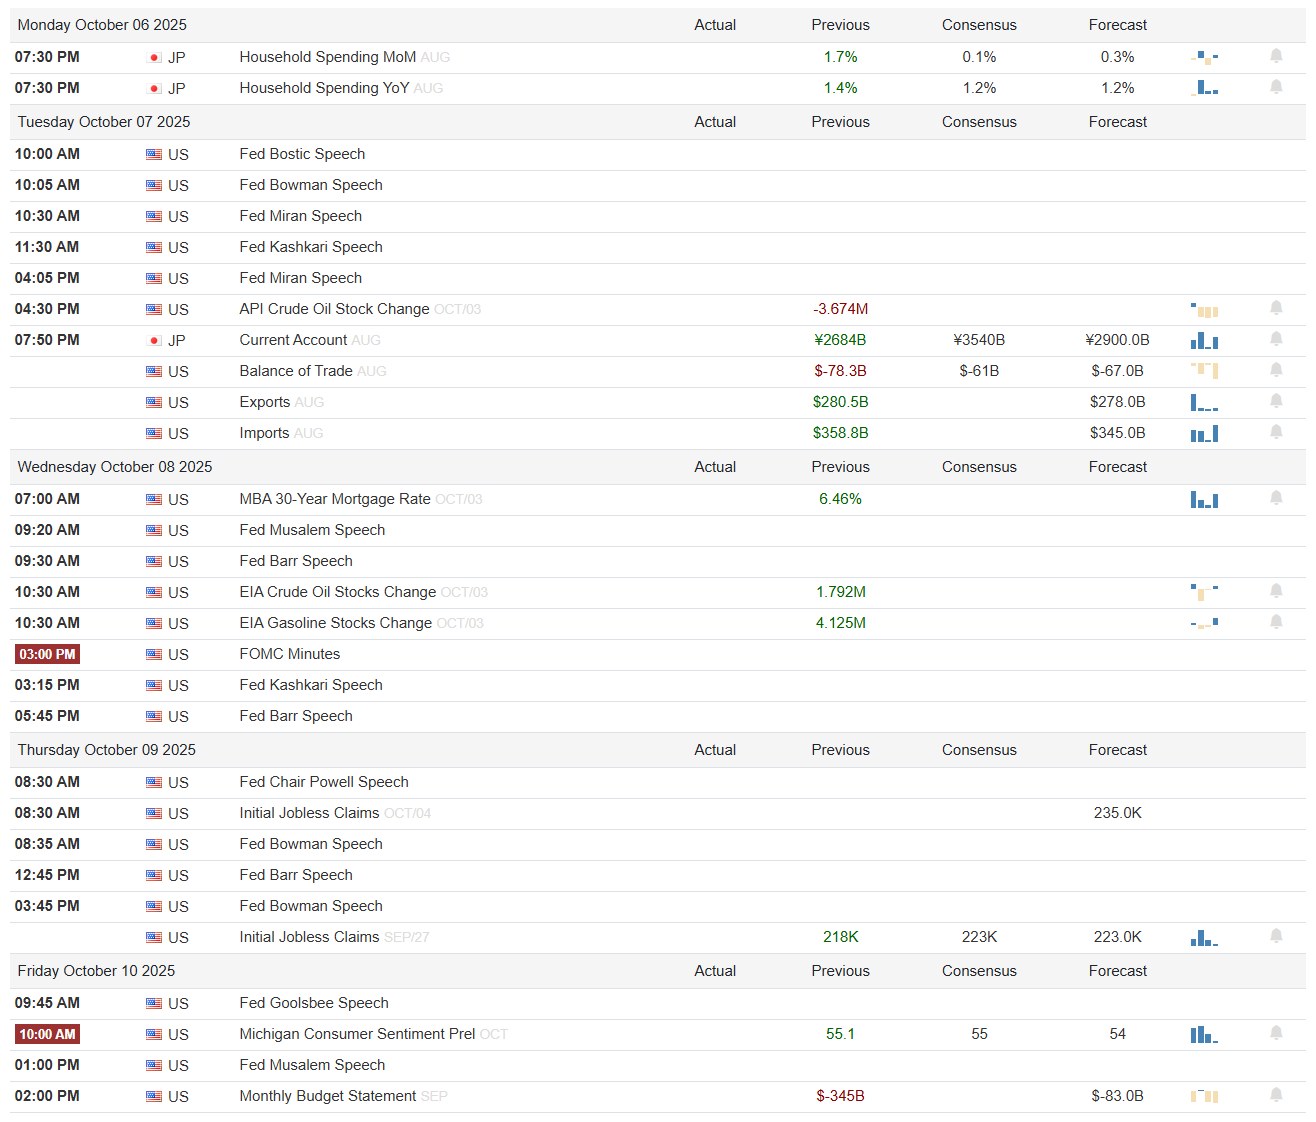
A quiet U.S. session, but Japan sets the overnight tone with a firmer consumer pulse. Household Spending rose 1.7% m/m and 1.4% y/y, both better than the prior baselines shown, a small global growth tailwind. Risk-on if Asia follows through with higher equities and a firmer yen, since that cools imported inflation and steadies carry. No U.S. data or Fed speakers on deck, so index levels will lean on positioning and commodity cues into Tuesday.
Tuesday
It is a speaker-heavy day: Bostic at 10:00, Bowman at 10:05, Miran at 10:30 and again 4:05, and Kashkari at 11:30. Markets will key on any color about the balance between disinflation progress and real activity. Energy supply flows in the afternoon via the API report; the previous crude draw was -3.674M, so another material draw would be inflationary at the margin and risk-off for long-duration assets. After hours, Japan’s current account (previous ¥2684B; consensus ¥3540B; forecast ¥2900.0B) and the U.S. trade balance (previous -$78.3B; consensus -$61B; forecast -$67.0B) frame external demand. A smaller U.S. deficit and steady exports (previous $280.5B) would be risk-on; widening gaps would reinforce a slower global goods cycle and weigh on cyclicals.
Wednesday
Housing finance remains a transmission channel: MBA 30-year mortgage rate previously 6.46%. A stall or downtick is equity-friendly; an uptick tightens financial conditions. Energy inventories follow: EIA crude stocks change previously +1.792M and gasoline +4.125M. Builds on both blunt pump-price pressure and lean risk-on; draws would echo the API and skew risk-off for duration. The FOMC Minutes hit at 3:00 PM. Traders will parse how broad the appetite is for staying on hold vs pre-positioning for insurance cuts; any hint the committee is comfortable with inflation’s glide path without threatening growth should support cyclicals and small caps. Musalem, Barr, and Kashkari speak around the release; guidance that leans data-dependent but patient would keep vol contained.
Thursday
This is the week’s fulcrum. Chair Powell speaks at 8:30 AM, followed by the labor read: Initial Jobless Claims, with previous 218K, consensus 223K, forecast 223.0K. Claims holding near the low-220s preserves the soft-landing narrative and is risk-on unless Powell simultaneously pushes back on easing expectations. A surprise print meaningfully above the consensus would flag cooling demand, helping duration and defensives while pressuring high beta. Bowman and Barr return later; any pushback against easing financial conditions would cap rallies in long duration and mega-cap growth.
Friday
Sentiment and deficits close the week. Michigan Consumer Sentiment (prelim Oct) shows previous 55.1, consensus 55, forecast 54. A bounce would signal resilience in services demand and is risk-on for cyclicals; a drop adds caution around holiday spending. The Monthly Budget Statement carries a prior of -$345B and a forecast of -$83.0B. A narrower gap than forecast eases supply concerns and supports risk; a wider gap would tug yields higher at the margin. Goolsbee and Musalem also speak; anything that ties consumer confidence and labor cooling to a patient, data-dependent Fed keeps the soft-landing lane open.
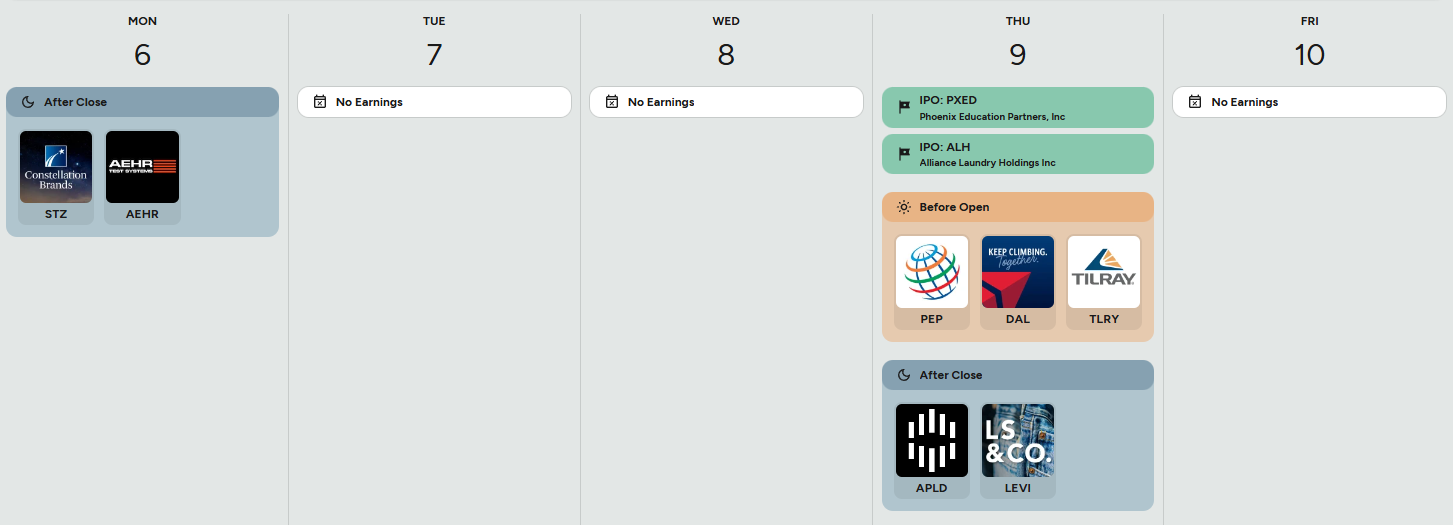
Earnings and IPOs
Micro is sparse but still market-relevant. Monday after the bell, Constellation Brands (STZ) and AEHR set early tone for staples and niche semi-capex. Watch STZ for price/mix versus volumes and margin commentary on glass, ag inputs, and promotions; a gross margin beat would echo easing cost pressure for staples broadly. Thursday is busier. Before the open, PepsiCo (PEP), Delta (DAL), and Tilray (TLRY) offer a three-legged macro check: consumer packaged goods pricing power, airline yields and unit revenue, and cannabis distribution. PEP’s organic growth and gross margin cadence will reflect elasticity; DAL’s PRASM and capacity guidance feed travel-demand views; TLRY’s commentary informs regulatory and retail pricing. After the close, Applied Digital (APLD) and Levi Strauss (LEVI) swing the focus to data-center demand and apparel inventories. Two IPOs, Phoenix Education Partners (PXED) and Alliance Laundry Holdings (ALH), test risk appetite in small-cap cyclicals; healthy day-one reception would confirm liquidity is still there for real-economy issuers.
Sign-posts for active traders
Thursday claims near 223K keeps the soft-landing bid; a break much above consensus flips the tone to defensive.
Michigan sentiment holding ~55 vs the 55.1 prior supports discretionary; a print closer to the 54 forecast pressures retail.
EIA crude and gasoline builds after Tuesday’s API steer yields lower and help growth; back-to-back draws lift energy, pinch duration.
Bottom line: With Powell plus claims and sentiment at center stage, the path of least resistance is a steady, range-with-upside week so long as labor stays near the low-220Ks, energy inventories don’t flash tightness, and PEP/DAL margins confirm resilient demand without reigniting inflation.

Market Intelligence Report
The portfolio finished the week up about +0.67% on a total-book basis, powered by semis/software breadth and a sharp pop in biotech, while energy and one leg of the crypto toggle were the main drags. That’s back-to-back winning weeks for the VL Desk. Index beta did what it should in a steady tape; credit was a small headwind, and the tiny single-name hedges cost a few basis points but kept tail risk covered. Here’s a reminder of where the tape steered us last week:
Core index beta sits at the center (28% total):
SPY 14%
QQQ 9%
IWM 5%
AI and compute get a defined sleeve (18% total):
SMH 7%
NVDA 3%
INTC 2%
IGV 4%
NTNX 1%
ESTC 1%
Hard assets are the counterweight (16%):
XLE 6%
OIH 2%
URNJ 3%
GDX 3%
TFPM 1%
FCX 1%
I want biotech optionality without single-name gap risk, so (4%):
XBI 4%
Crypto remains a small, honest toggle (2%):
BITO 1%
ETHD 1%
For rate-sensitives and ballast on equity down-days (6%):
XLRE 2%
XLU 3%
XLP 1%
Keep some global breadth (4%):
VXUS 3%
FLTW 1%
Credit does the heavy smoothing (18%):
LQD 6%
FLTR 4%
HYG 2%
TBIL 6%
Because we are leaning into growth, I will also carry two tiny single-name hedges to cap the left tail into data (2%):
NVDD 1%
AAPD 1%.
Cash stays at 2% as dry powder.Semis and software were the clear leaders and the right call. SMH (+3.7%) and NVDA (+4.0%) printed clean continuation and INTC (+6.7%) added a high-beta boost, more than offsetting softer prints in IGV (-0.7%), NTNX (-1.7%), and ESTC (-1.0%). Biotech ripped, with XBI up +5.4%, giving us exactly the optionality we wanted without single-name gap risk. The core beta sleeve was constructive as well: SPY (+0.7%), QQQ (+0.7%), and IWM (+1.2%) all helped. On the counterweight side, resources and energy were mixed. FCX popped +9.1% and TFPM gained +1.7% while GDX was marginally higher, but the heavyweights lagged: XLE (-3.5%), OIH (-1.6%), and URNJ (-2.4%) turned the whole sleeve negative. The crypto toggle split decisively: BITO rallied +5.1% while ETHD fell -18.7%, leaving the pair down in aggregate as ETH underperformed. Rate-sensitives did their job with XLU +2.5% and XLRE +0.4%, cushioning equity wobbles; staples were flat. Global breadth worked with VXUS +2.1% and FLTW +2.8%. Credit and cash were ballast: LQD was roughly flat, HYG and FLTR slipped a touch, and TBIL ticked down a hair; the hedges (NVDD -3.8%, AAPD -1.2%) cost a modest ~5 bps in exchange for gap protection into data.
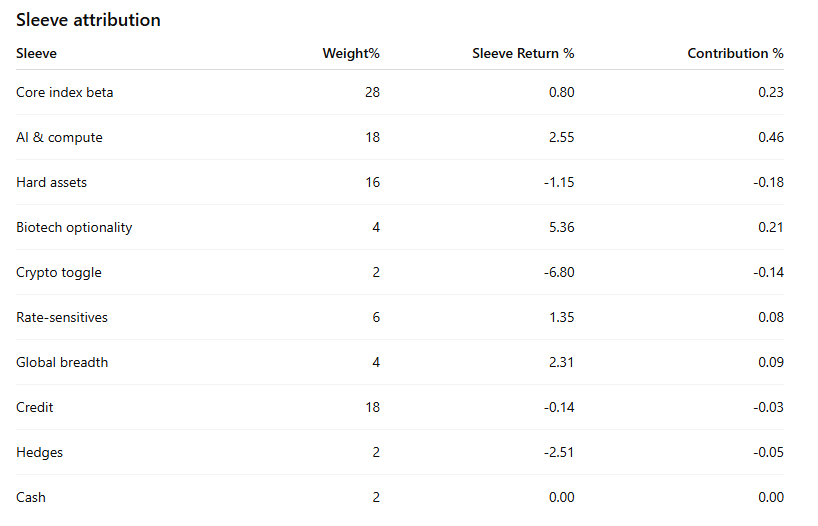
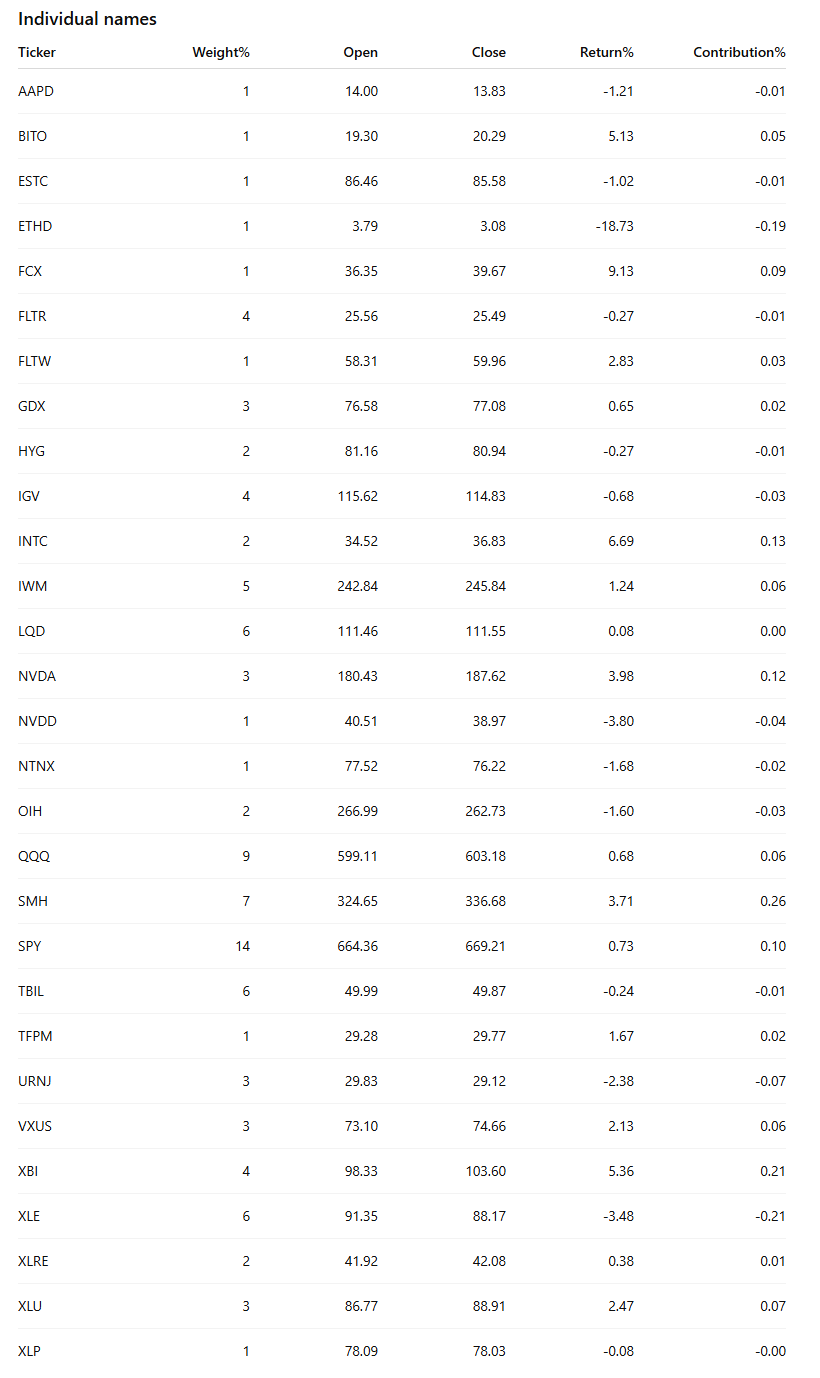
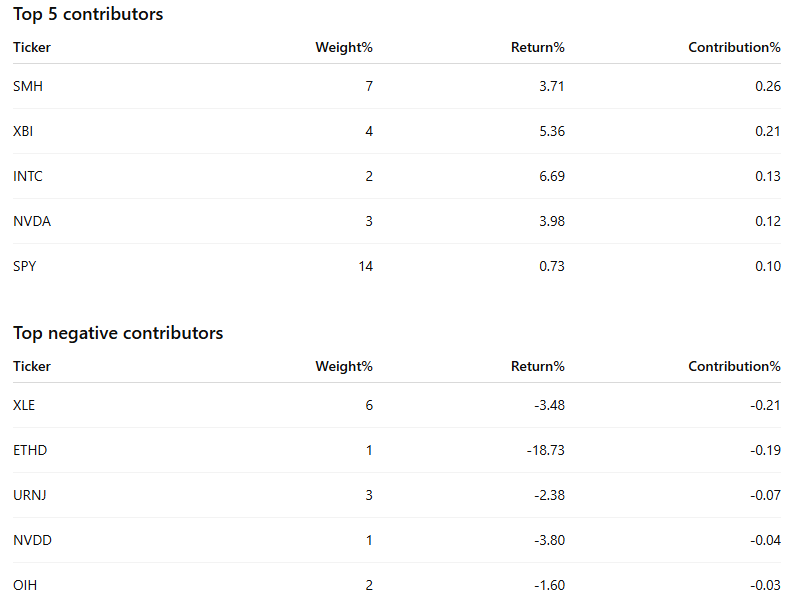
Net of all sleeves and cash, the mix delivered a modest, well-balanced gain with leadership where we wanted it (semis/biotech, utilities) and clear areas to watch (energy and ETH exposure) as we roll into the next data stretch. Let’s take a look at what the tape is telling us about this coming week.
MIR Part 1: The Backdrop
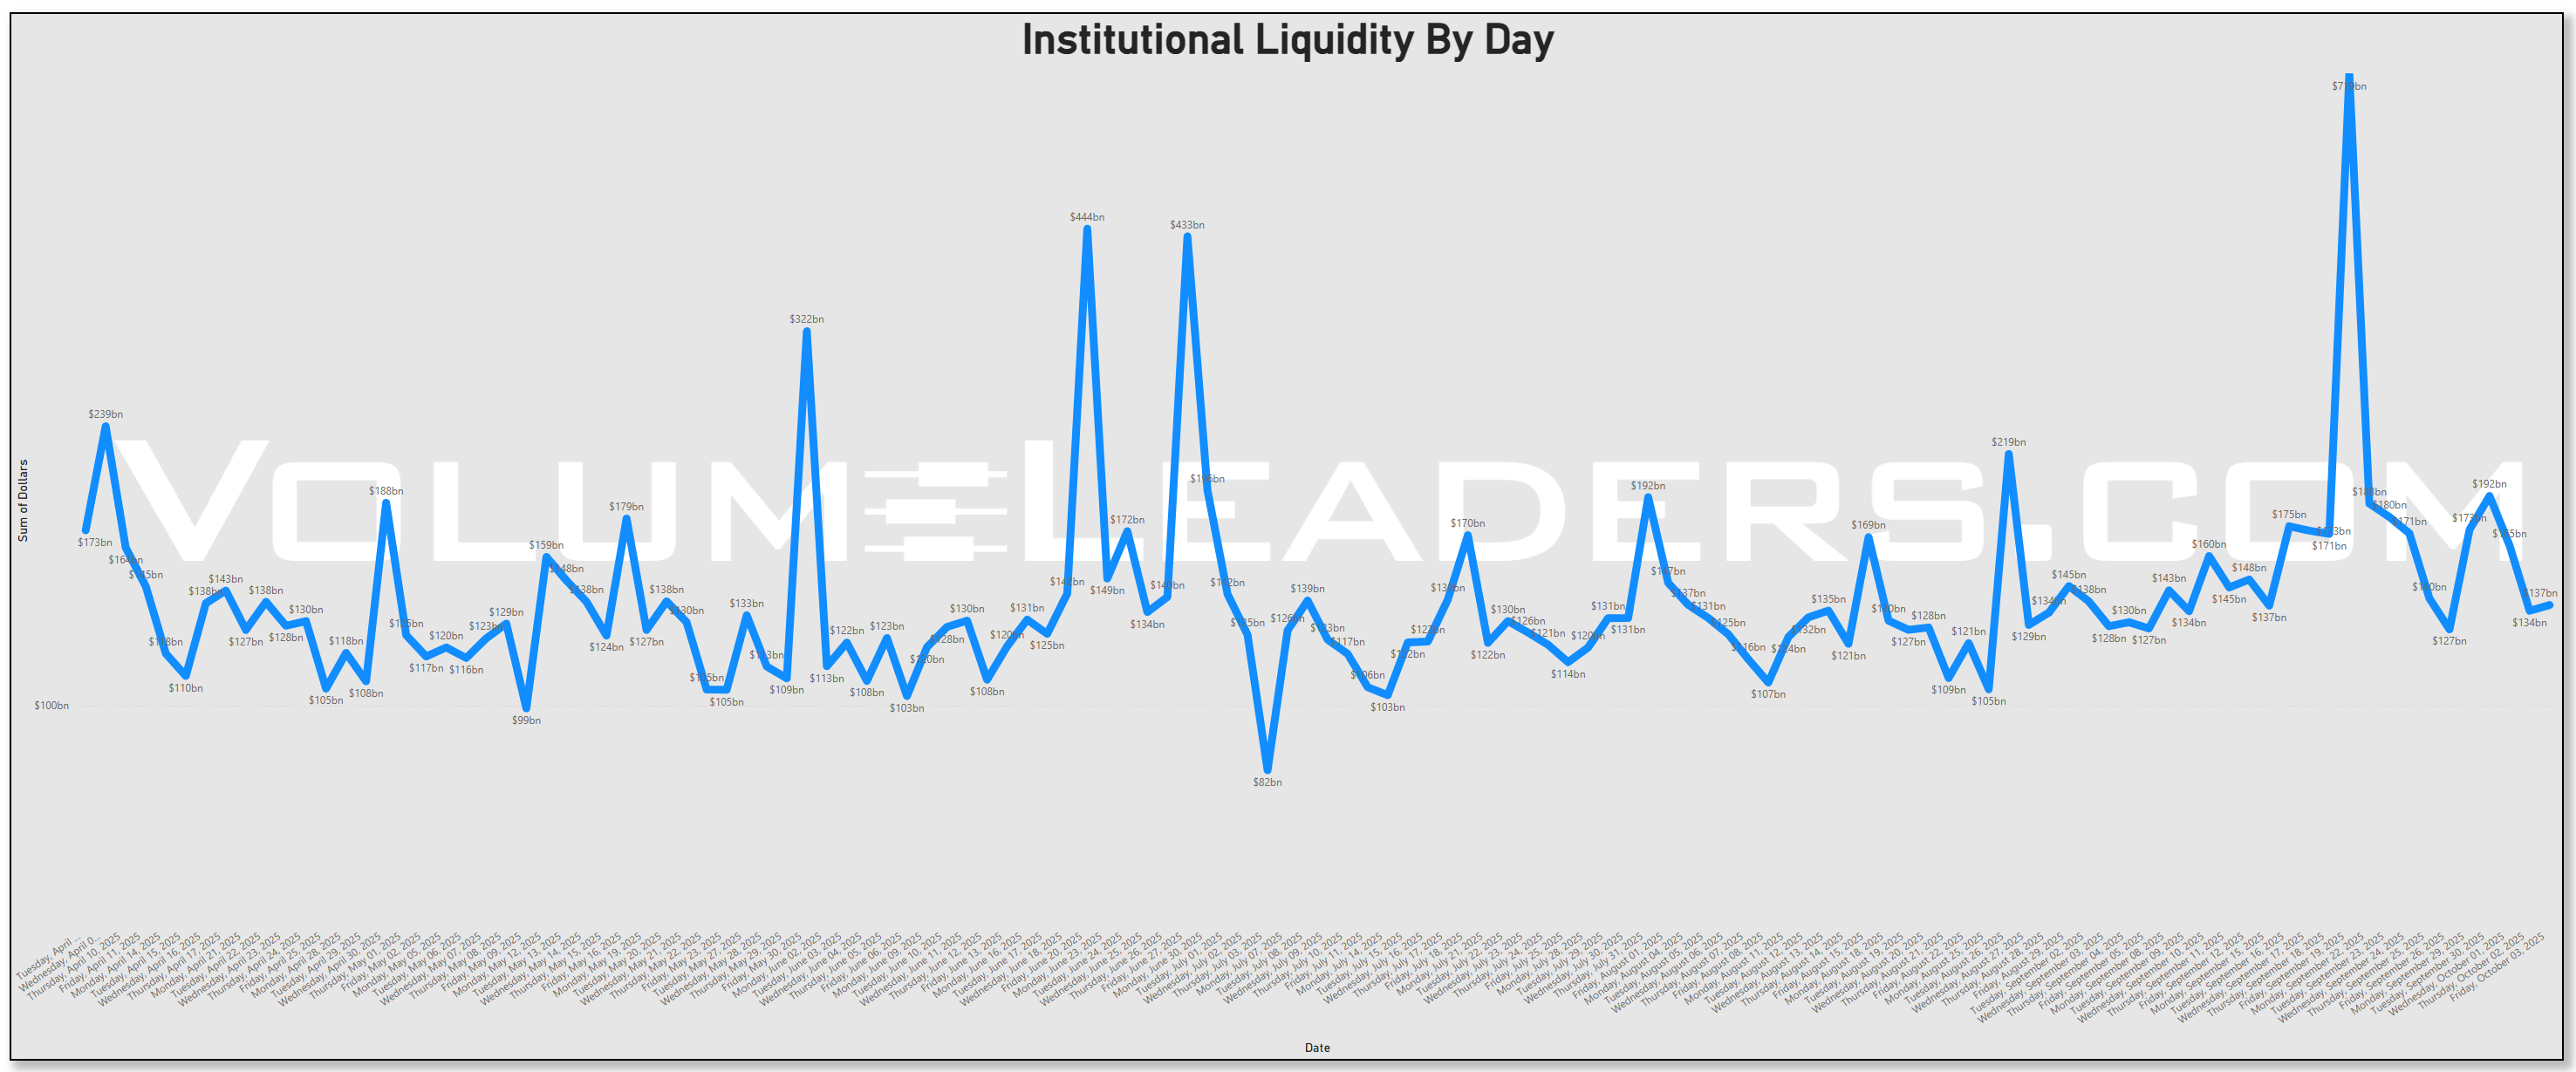
The multi-month tape of institutional dollars shows a series of periodic surges with a standout spike late last month that towers over the surrounding prints, consistent with triple witching, index reweightings, and the roll into a new month. Those bursts are structural: they recur on a roughly four- to five-week cadence and fade back into a $120–$170b daily rhythm afterward. That pattern lines up with what we know about scheduled rebalancing and window-dressing, which can mechanically pull large flows across stocks, bonds, and ETFs without necessarily signaling a durable directional bet. Academic and industry work finds such calendar rebalancing is sizable and repeatable, with measurable next-day price effects as funds move back to targets.
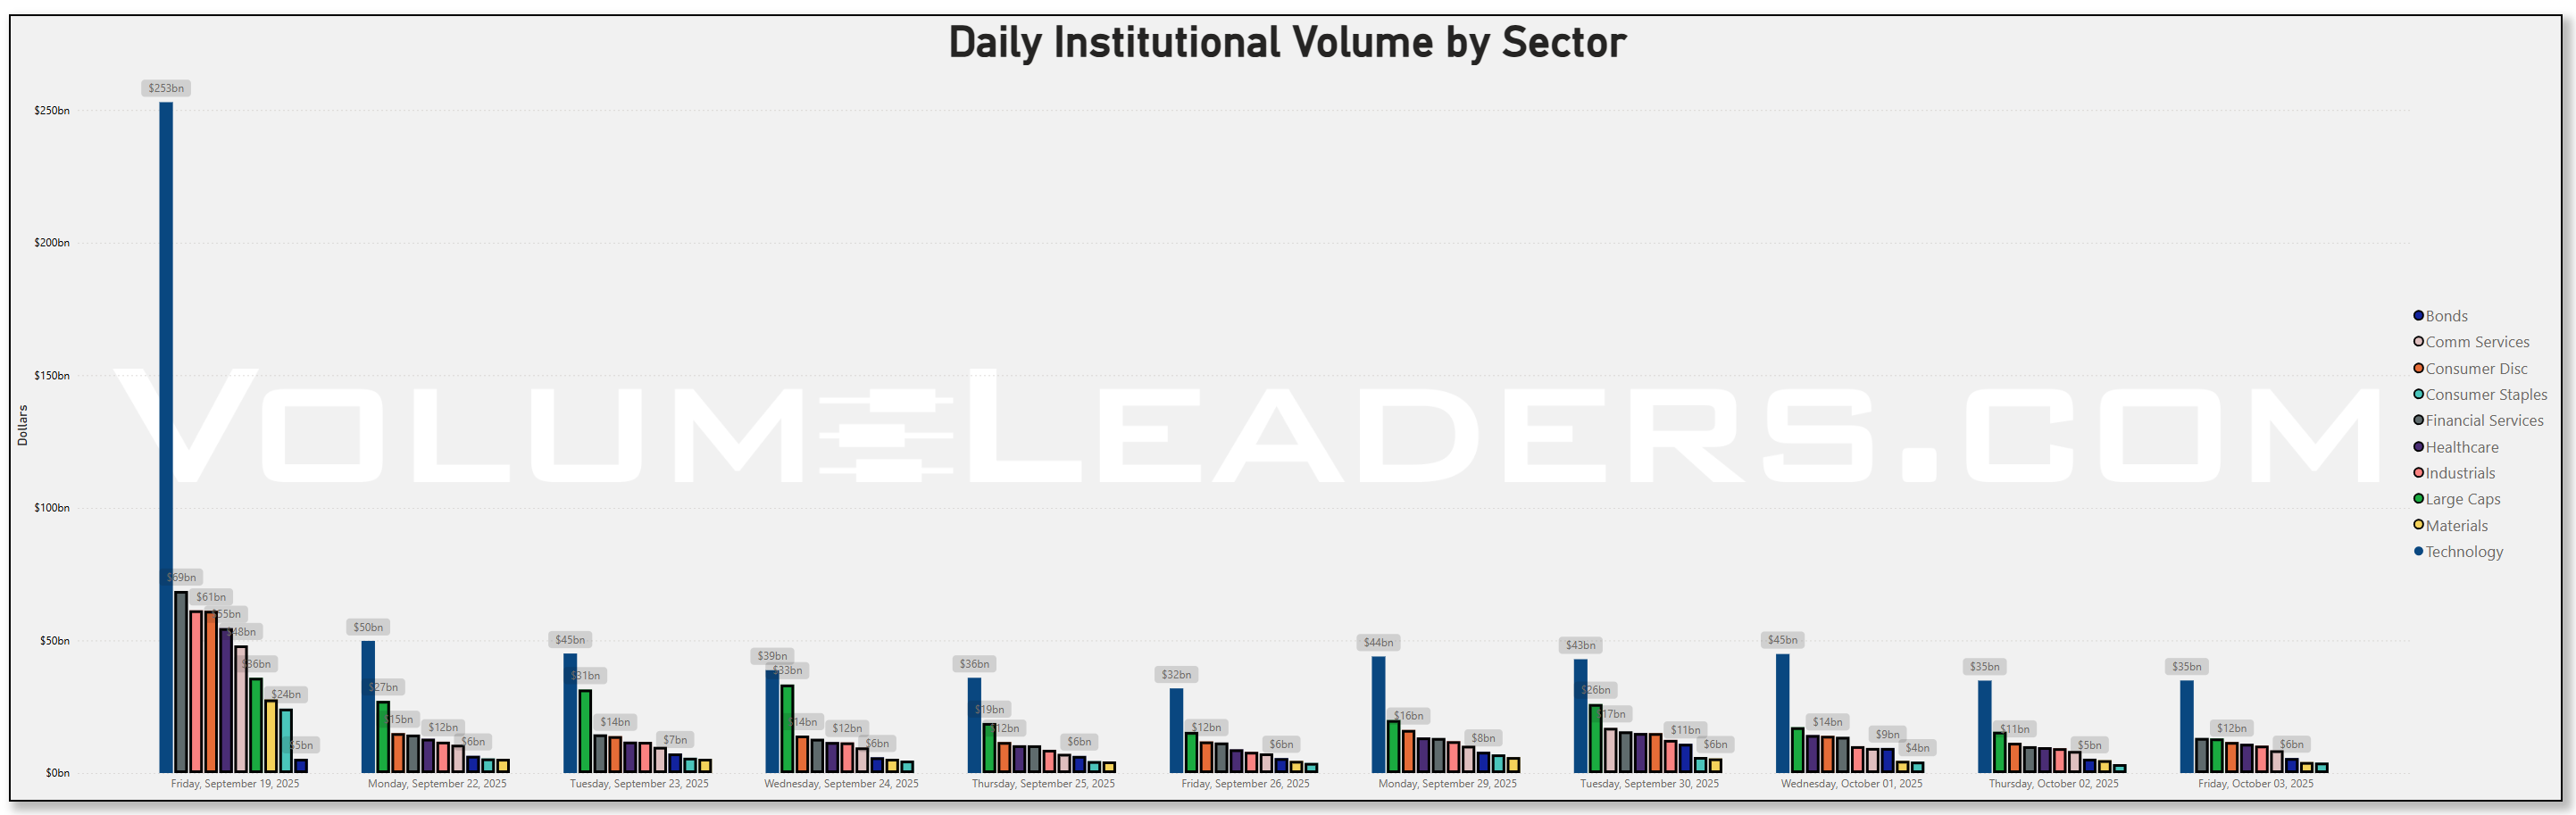
Within the week, daily sector dollars were led by Technology and Large-Cap wrappers on most sessions, with defensives and credit sleeves providing a steady second tier and cyclicals rotating underneath. Monday through Wednesday saw Tech consistently claim the largest bars, while Large Caps and Bonds traded in the low-teens to mid-$20b range per day. Compared with the prior week, Technology’s footprint cooled from that outsized quarter-end surge but still dominated the field; Financials and Health Care gained share mid-week; Energy sat in the middle of the pack rather than leading. The net message is allocation first—broad beta in SPY/IVV/VOO—and stock picking second, led by a familiar AI-centric cohort.
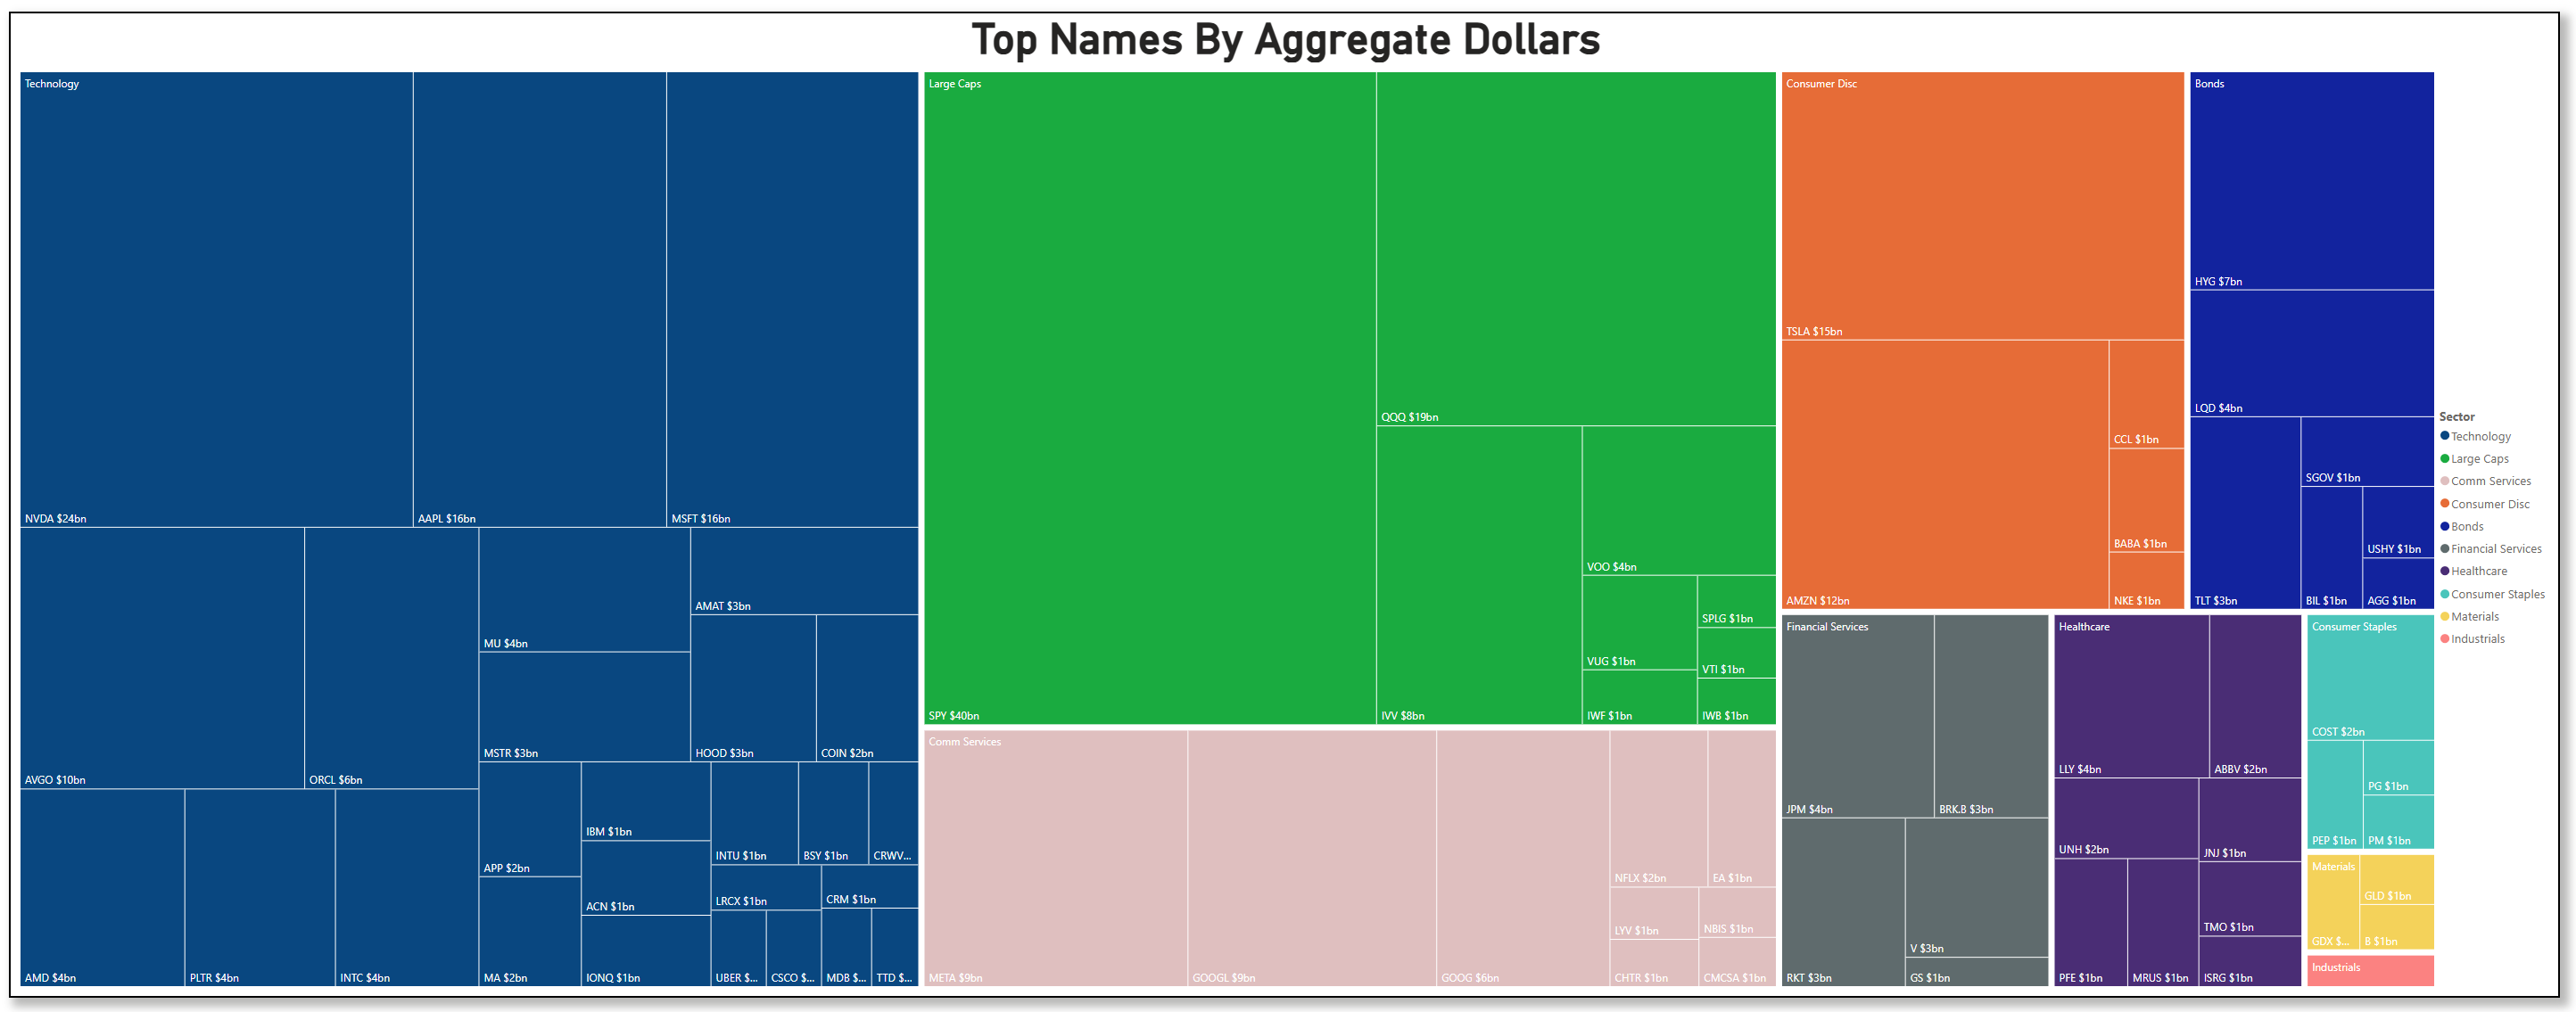
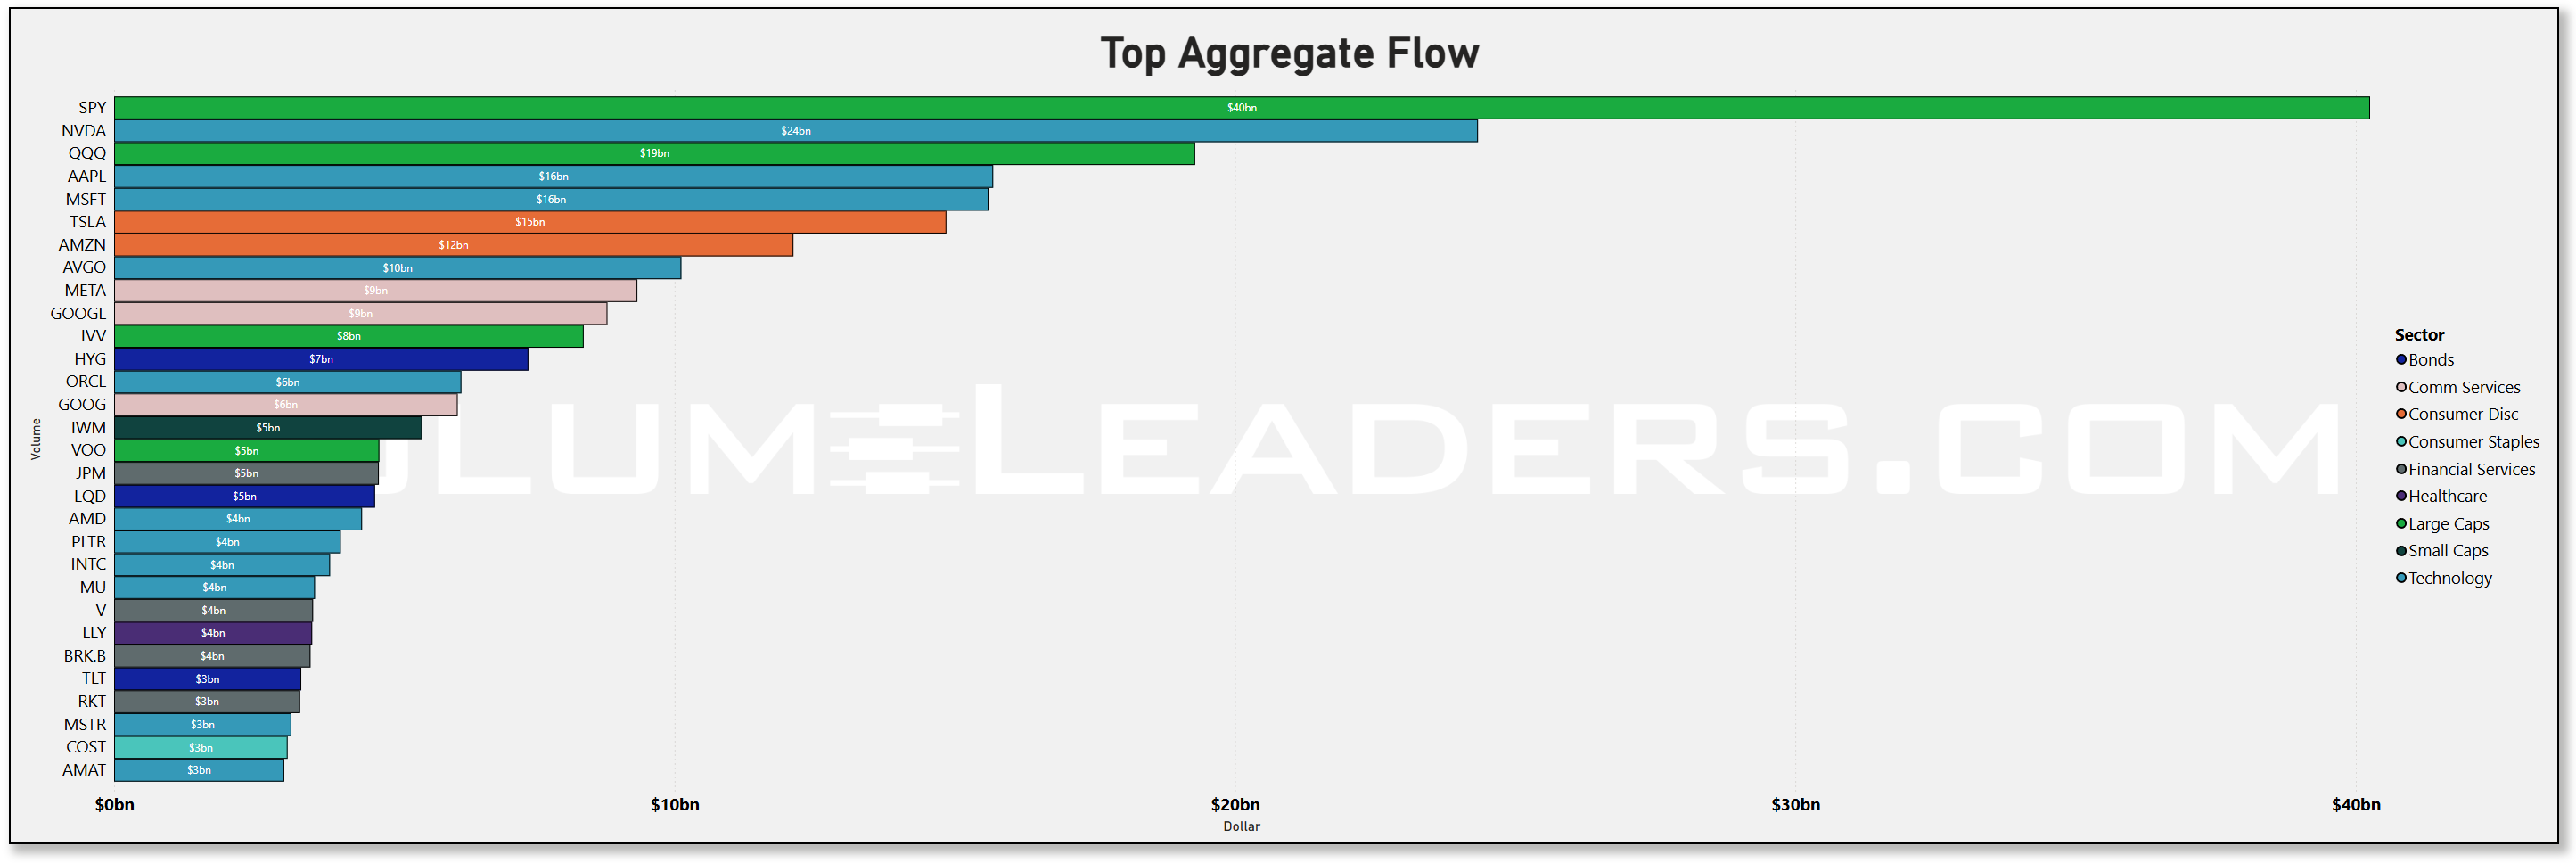
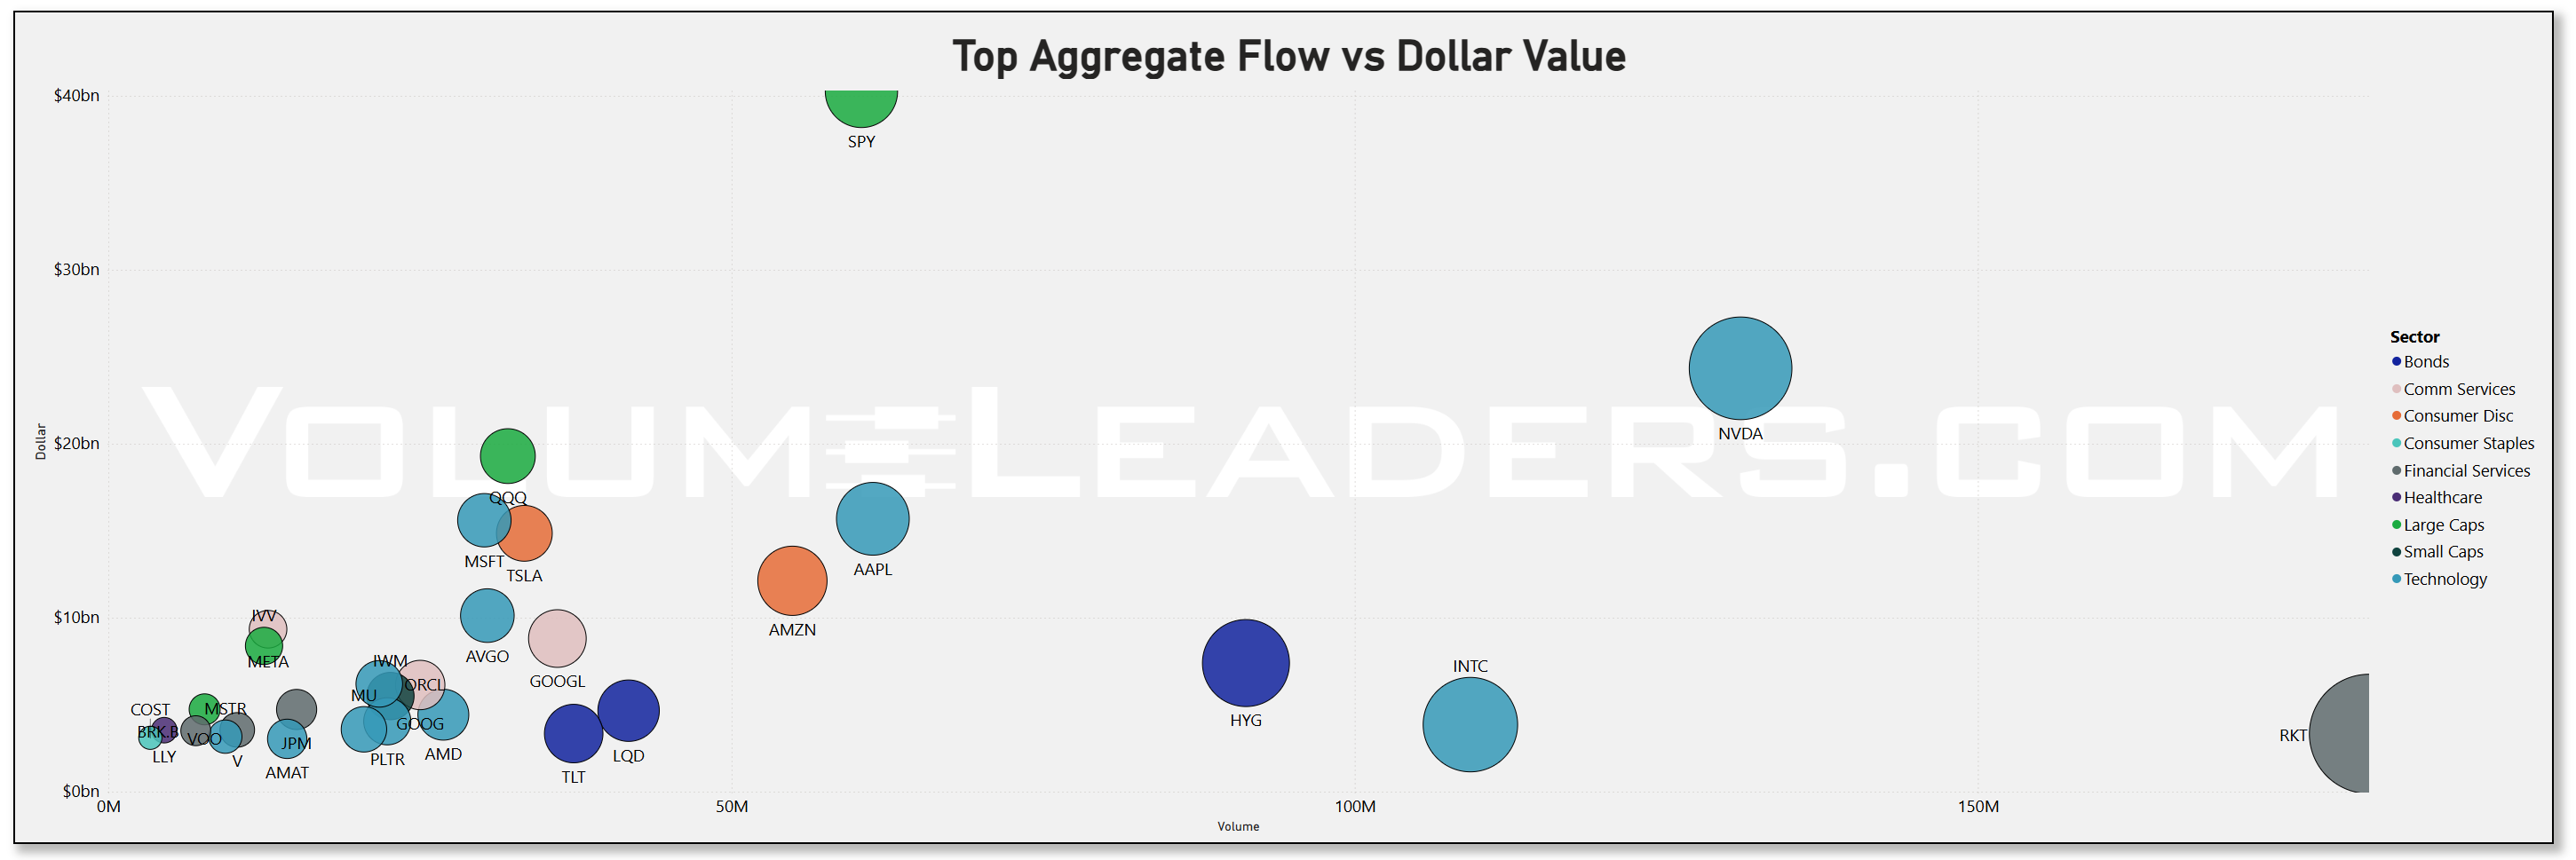
The allocation lens is obvious in the treemap and the aggregate dollars bar. SPY sits on top at roughly $40b this week, followed by NVDA around $24b and QQQ near $19b. AAPL and MSFT cluster at about $16b each, then TSLA around $15b and AMZN near $12b. The breadth inside Tech is real: AVGO (~$10b), ORCL (~$6b), AMD (~$4b), PLTR (~$4b), INTC (~$4b), MU (~$4b), and AMAT (~$3b) all print meaningful dollars alongside the megacaps. Communications shows steady size through META (~$9b) and the GOOG/GOOGL pair (~$9b + ~$6b). Index wrappers beyond SPY/QQQ were well represented with IVV (~$8b) and VOO (~$5b), while credit ETFs logged HYG (~$7b) and LQD (~$5b). That mix—big index sleeves plus a dense cluster of AI semis and platform software—reads like allocation into Q4 strength with deliberate overweight to compute.
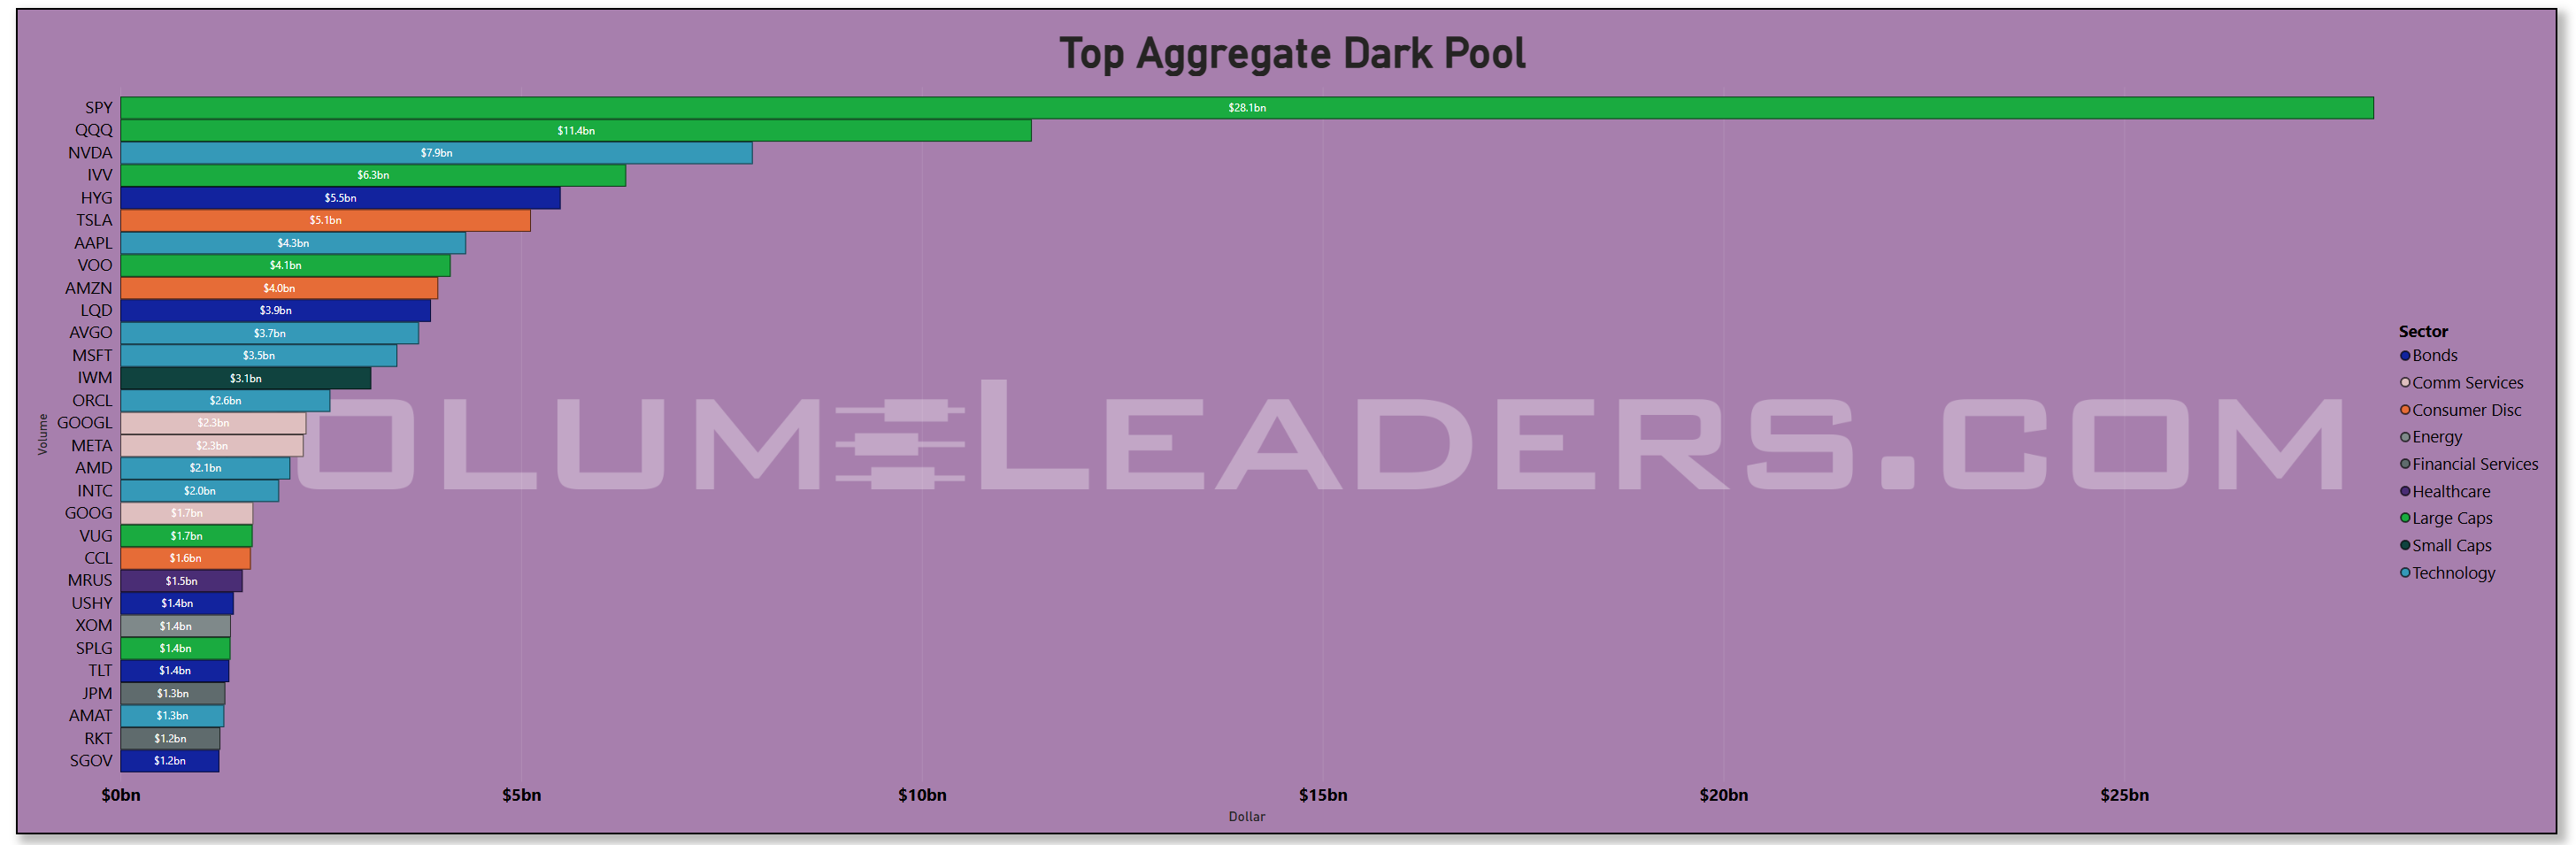
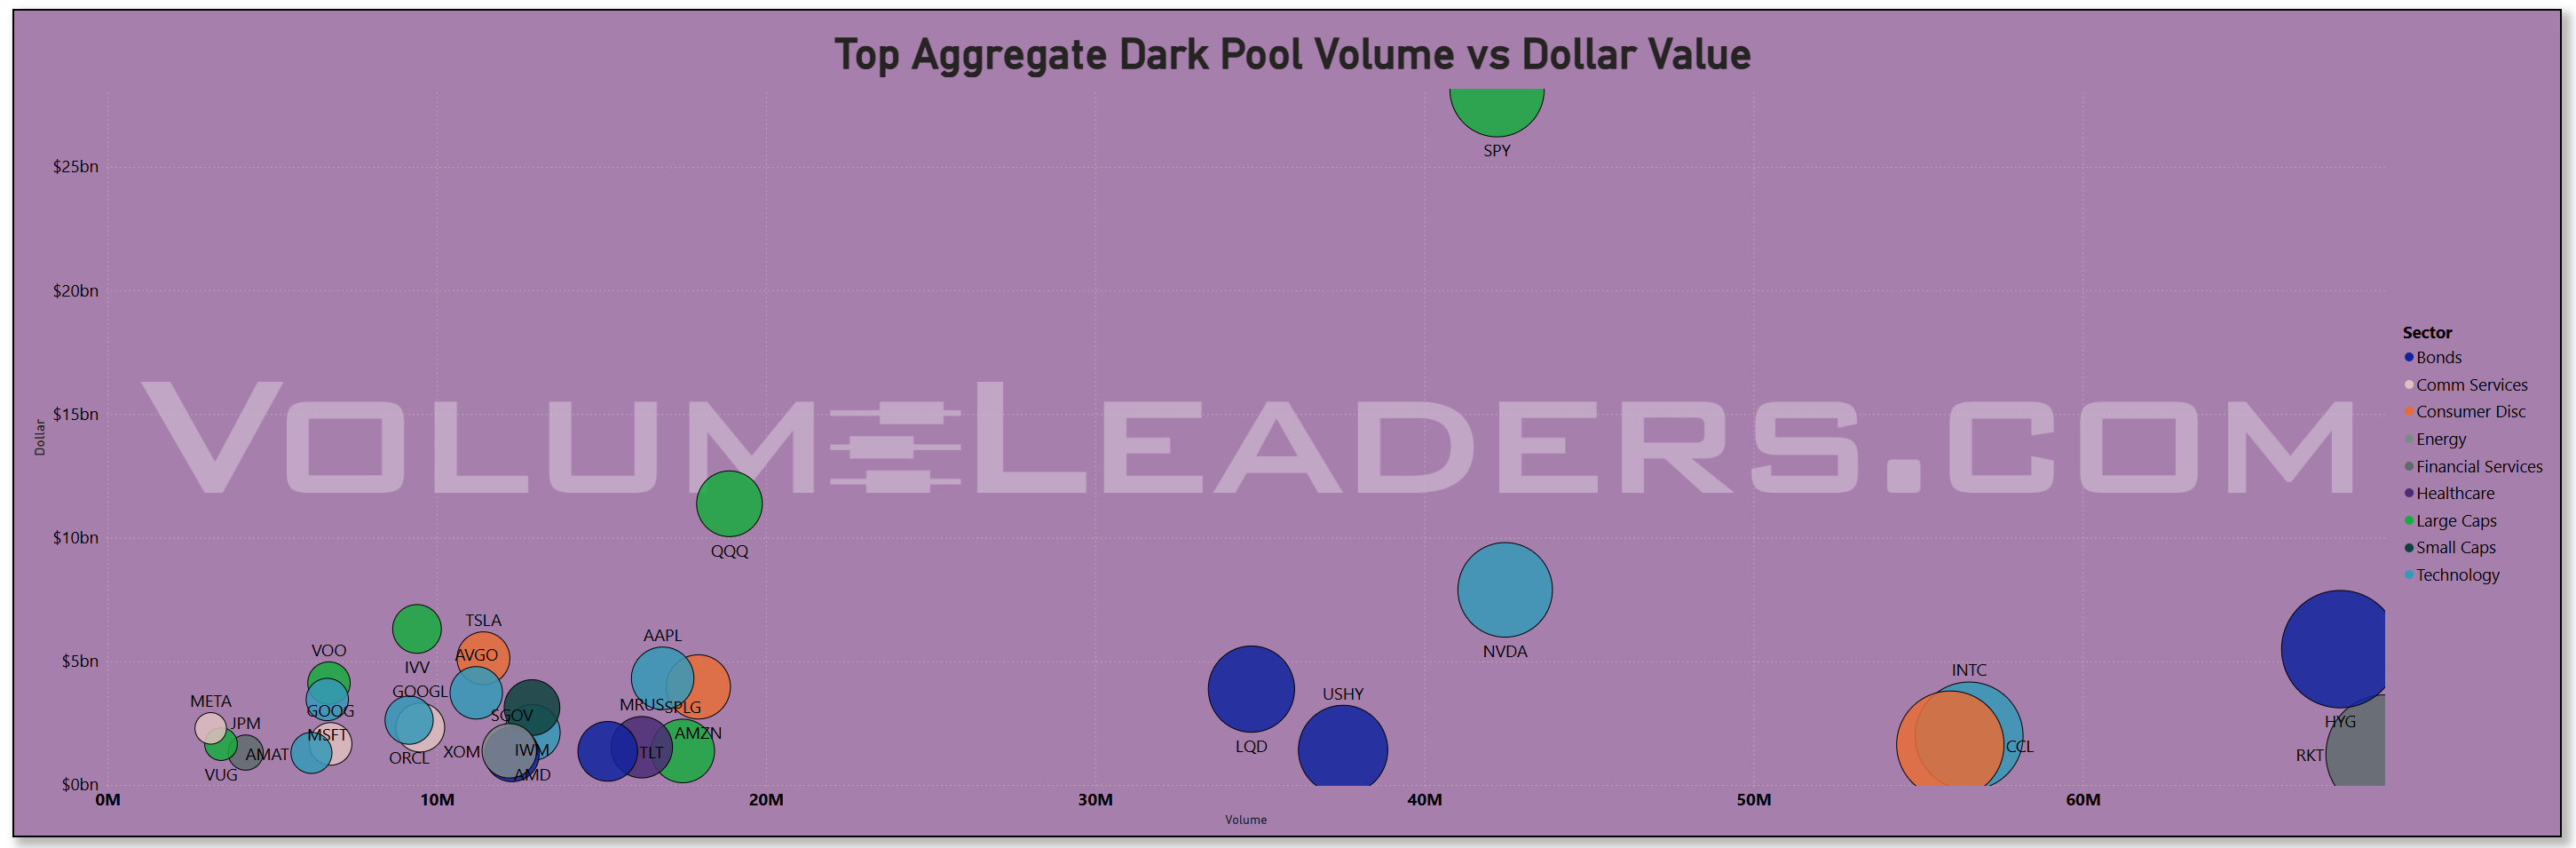
Off-exchange activity backs that up. In dark pools, SPY printed roughly $28.1b and QQQ $11.4b, a classic sign of institutional risk transfer in size. NVDA’s ~$7.9b is the single-name standout, followed by IVV ~$6.3b and HYG ~$5.8b. TSLA (~$5.1b), AAPL (~$4.3b), AMZN (~$4.0b), and MSFT (~$3.5b) round out a heavy top tier. The presence of LQD (~$3.9b) and VOO (~$4.1b) in that same lane says portfolio-level adjustments were happening under the tape, not just tactical punts. When the bulk of the dollars concentrate in broad wrappers and the AI leadership set, it usually signals steady accumulation/redistribution rather than frantic chase. Continuity in those dark-pool prints across several sessions would argue for sponsorship into earnings rather than one-and-done risk.
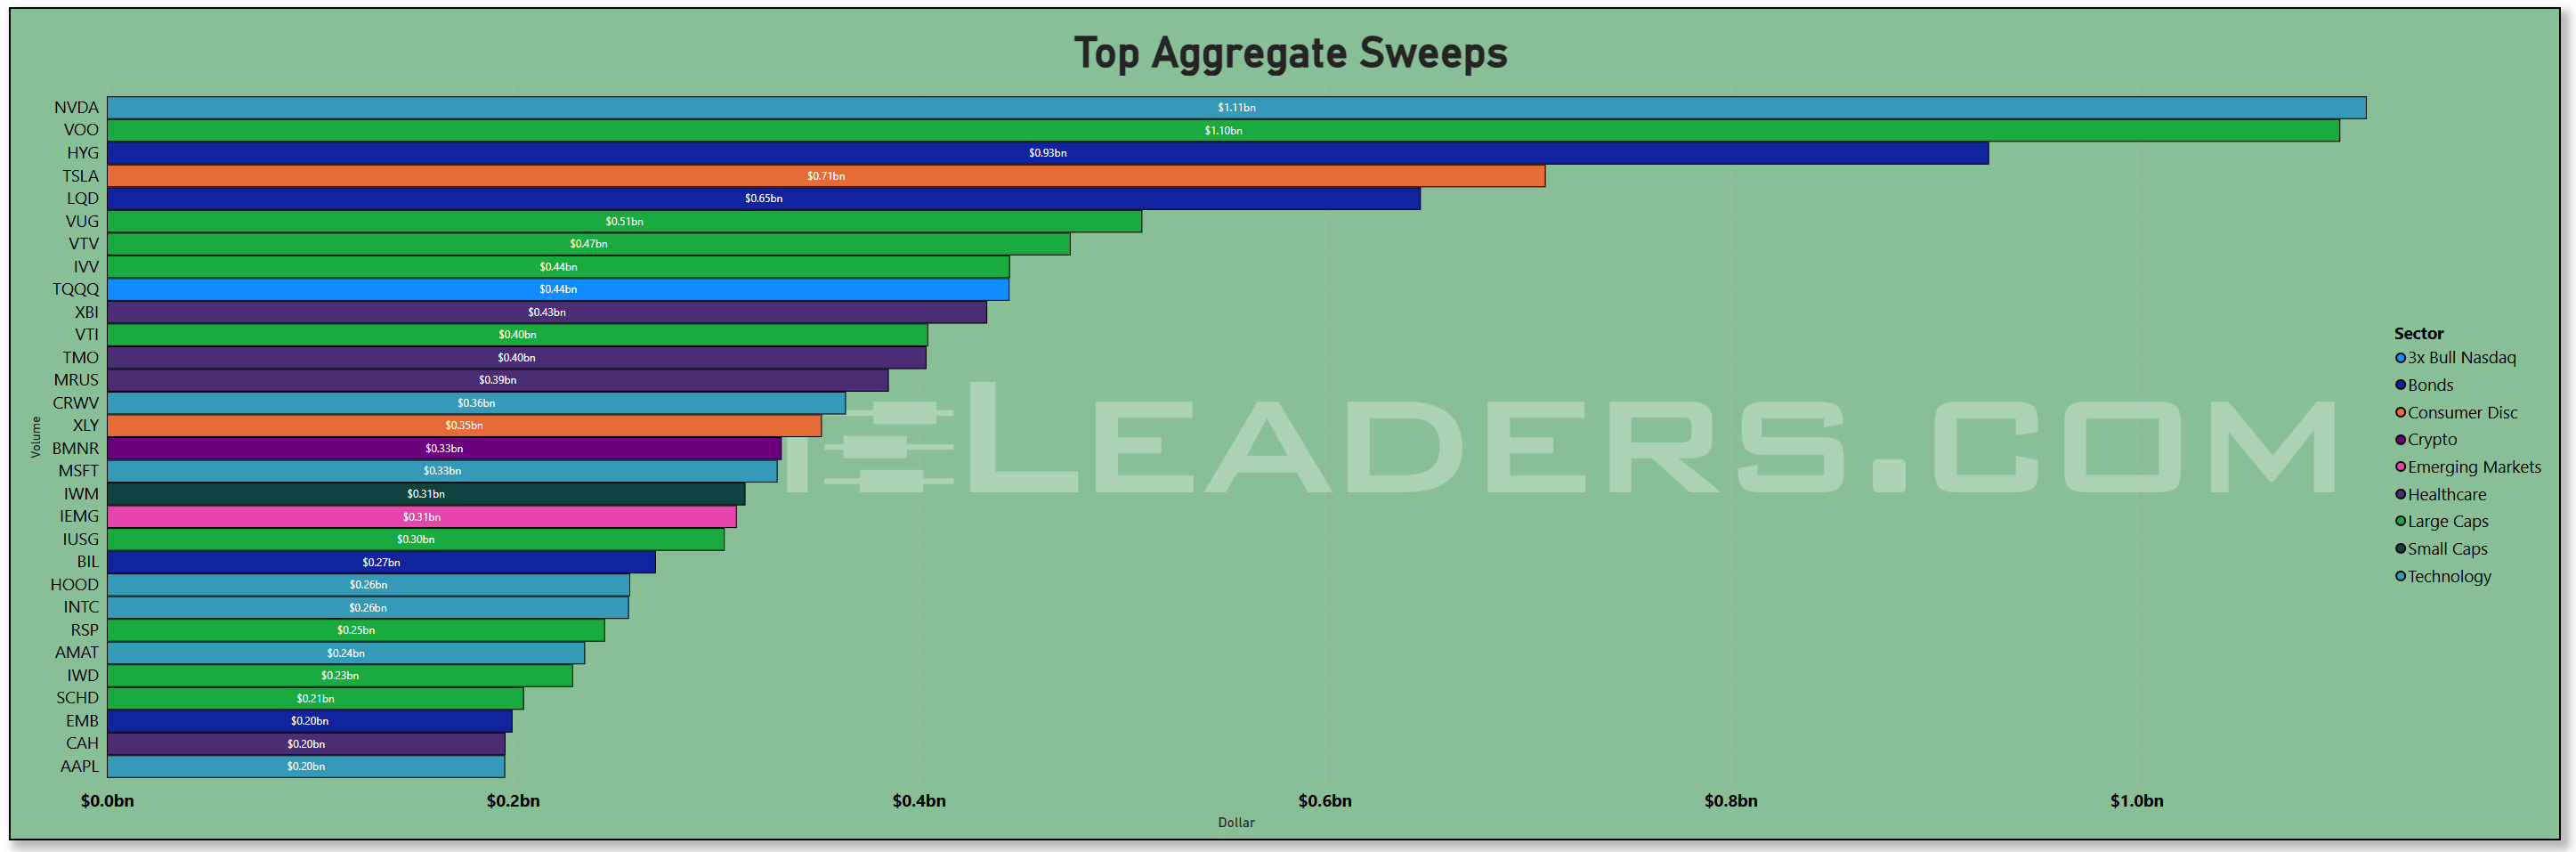
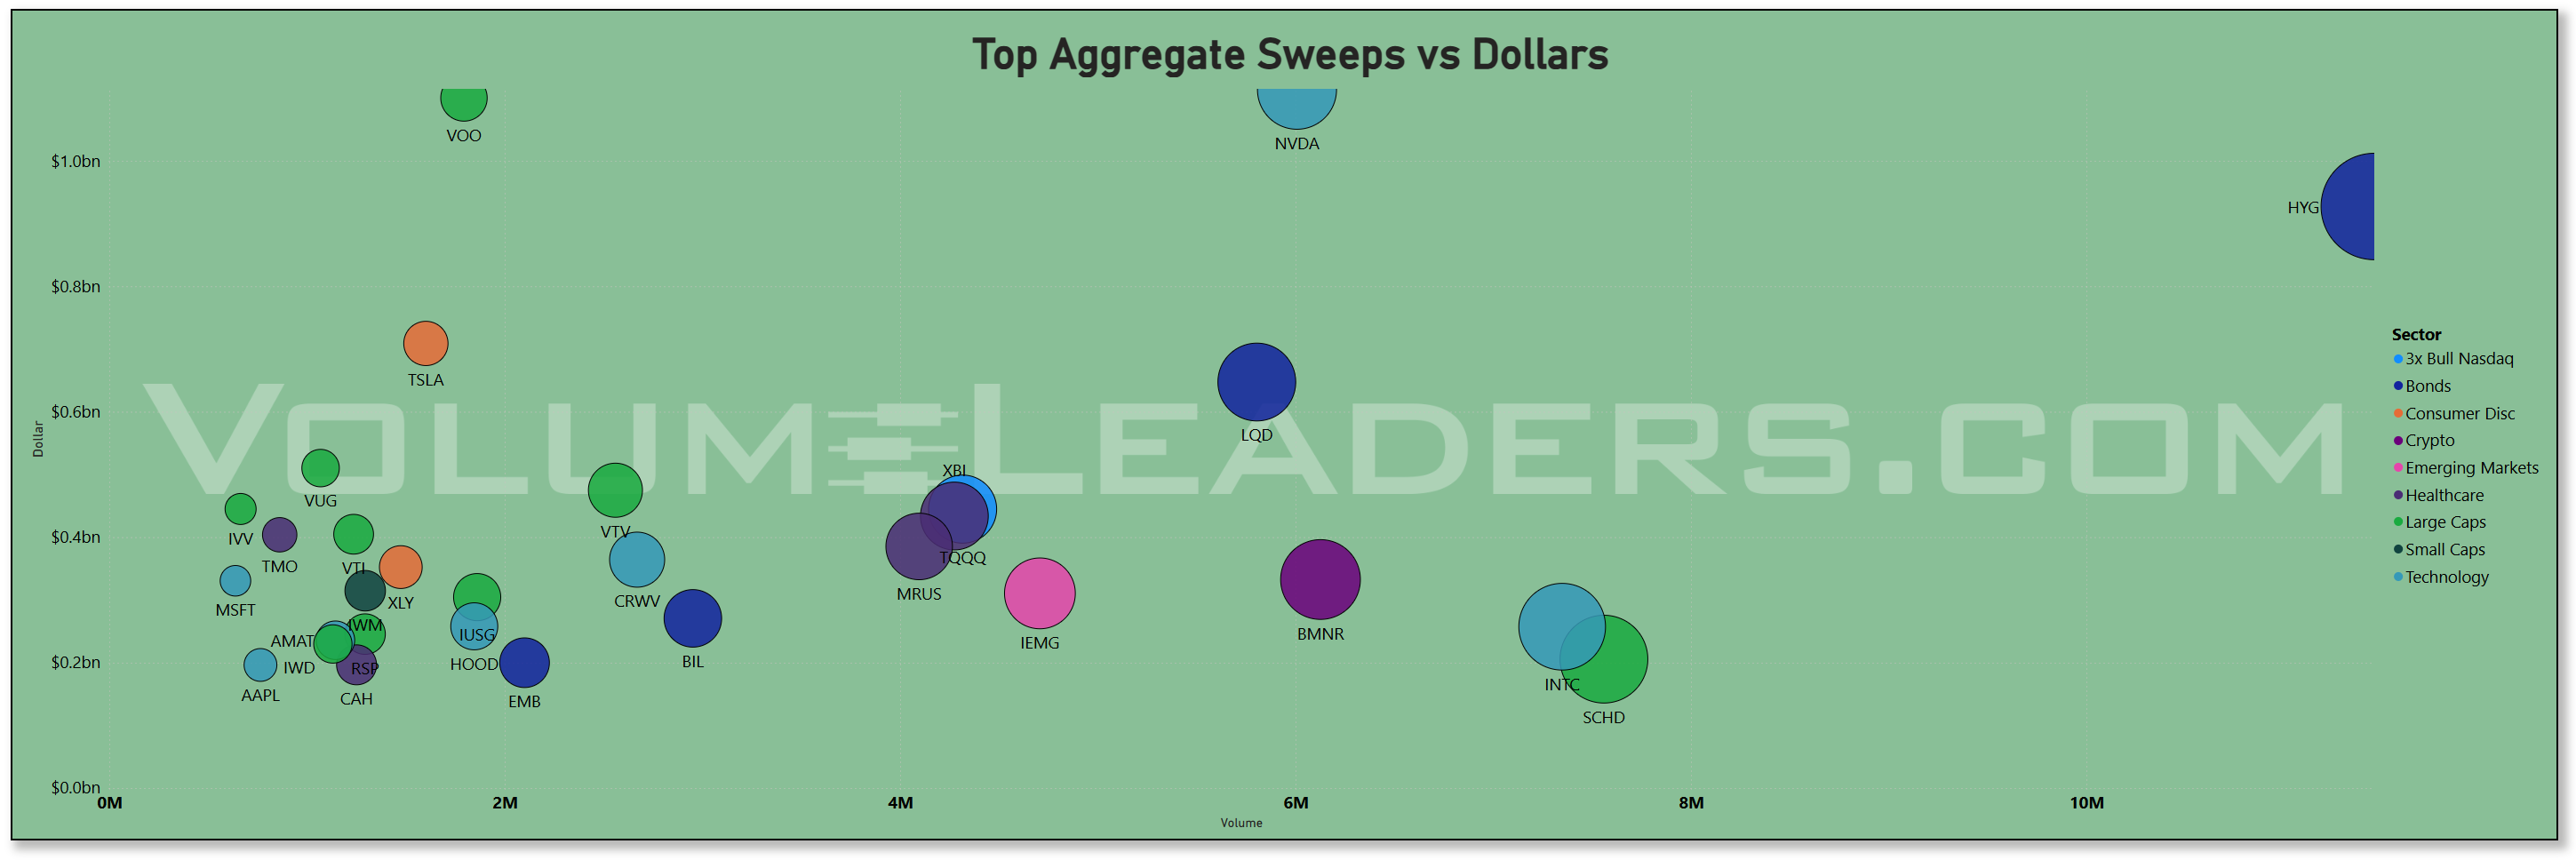
The fastest-money lens—the sweep tape—adds a barbell. NVDA leads with about $1.11b of sweeps, and TSLA follows at ~$0.71b, confirming traders pressed momentum where liquidity is deepest. On the other side of the barbell, we see outsized sweep dollars in VOO (~$1.10b), HYG (~$0.93b), LQD (~$0.65b), and a cluster of growth and total-market factor funds like VUG (~$0.51b), VTI (~$0.40b), and TQQQ (~$0.44b). Small-cap and equal-weight risk participated but at a step down: IWM (~$0.31b) and RSP (~$0.25b). Biotech optionality showed up through XBI (~$0.43b). That is not “all-gas” speculation; it is an index-plus-leaders posture hedged with credit and factor sleeves, consistent with funds leaning into Q4’s favorable seasonal window while respecting the macro calendar. Historically, October through year-end skews constructive for U.S. equities, with Q4 the strongest quarter on average and October often a transition month that hands the baton to November–December strength.
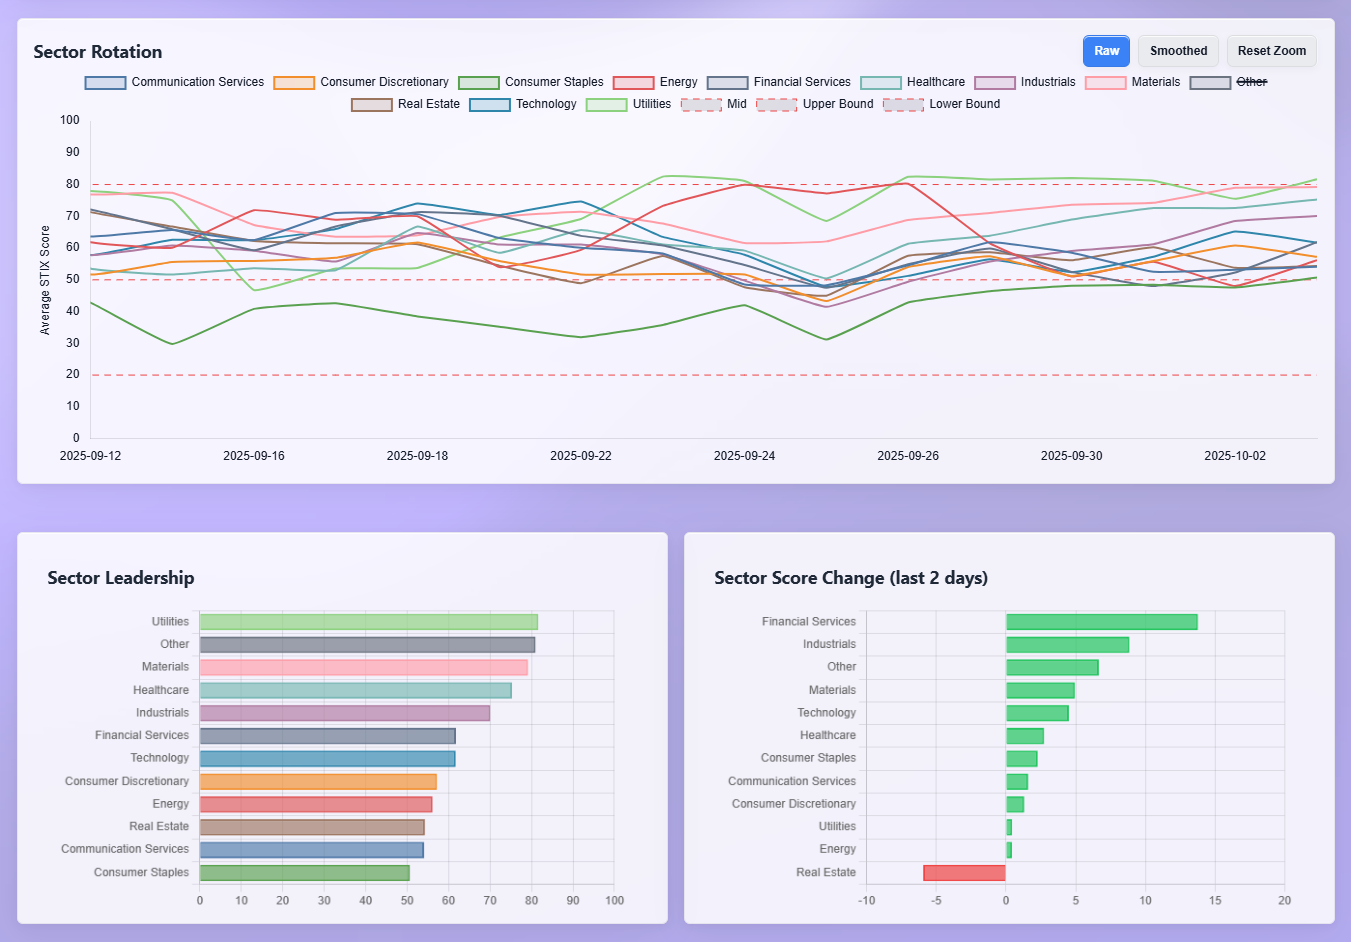
Rotation corroborates the flow. On the leadership board, Utilities sit at the top, with Health Care, Industrials, and Materials not far behind. Technology is mid-pack but rising, and Consumer Discretionary sits below median. The two-day momentum change tilts pro-cyclical: Financials and Industrials show the largest positive jumps, followed by a lift in Materials and Technology. Real Estate is the notable laggard over the last two sessions. That pattern maps cleanly to what crossed the tape: credit ETFs and defensives saw persistent dollars early in the week, then flows expanded toward Financials and industrial cyclicals while AI heavyweights retained sponsorship. If that two-day re-acceleration in Financials sticks, it favors a broadening rally rather than a narrow mega-cap grind.
Macro and seasonals help explain the bid. The week opened with headlines about large global equity inflows tied to growing rate-cut expectations after softer inflation and mixed labor data; U.S. equity funds drew their biggest net purchases in 11 months heading into October, and sector funds saw record inflows led by Tech and Financials. The policy calendar adds potential catalysts but not clear friction: the FOMC will release minutes mid-week (Oct 8), and Chair Powell is slated for remarks the following day at the Fed’s community-bank event—hardly a venue for new guidance but still market-sensitive. Initial jobless claims remain close to the low-220k handle, a level the market has repeatedly read as consistent with soft-landing growth. Layer on the first week of a new quarter—often a time for pension and multi-asset rebalancing—and the blend of heavy wrapper flow, strong dark-pool activity in megacaps, and measured sweep engagement looks exactly like structured allocation with a tactical kicker.
What should confirm or deny this read in the next few sessions is straightforward. First, look for continued leadership of SPY/IVV/VOO in both lit and dark-pool dollars north of the mid-teens per day; if those taper sharply while single-name sweeps spike, the tone shifts from allocate to chase. Second, monitor NVDA, AAPL, MSFT, and TSLA in the dark pools. Persistence near this week’s ~$4–$8b run-rates suggests institutions are still quietly building or transferring risk; a sudden fade would argue for distribution into strength. Third, keep an eye on the credit sleeves. HYG and LQD printed heavy dollars across both lit and dark venues; as long as those hold a bid alongside moderate claims and a quiet inflation path, the equity bid should stay orderly. A credit wobble, by contrast, would be an early warning that the barbell is getting heavier on the defensive side.
Bottom line: flows say “allocate and lean into leaders,” not “max-throttle chase”—broad wrappers and AI megacaps carried the week in both lit and dark pools, sweeps added a tactical nudge, and the rotation board shows Financials and Industrials perking up just as Q4 seasonals and a benign macro backdrop keep the path of least resistance pointed higher.
MIR Part 2: Individual Names From The Institutional Tape
VolumeLeaders tracks several proprietary signals designed to spotlight names drawing significant institutional interest. Below, we’ve surfaced the latest results and analyzed them to highlight emergent themes. If any of the sectors, narratives, or positioning trends resonate, the names mentioned here offer a strong starting point for deeper research and watchlist consideration.
VL Trade Rank Velocity™ (TRV)
TRV is a proprietary metric that measures the recent acceleration or deceleration in institutional trading activity for a given stock by comparing its average trade rank over the past few days to its average in recent weeks. A sharp improvement in TRV typically reflects a notable shift in positioning, often accompanied by sustained trade activity, suggesting institutions are actively engaging with the name and that intensity of activity is rising. This often precludes meaningful price or narrative shifts. This isn’t a buy-list or sell-list; it’s meant to draw your eyes to names where institutions are putting money to work.
First, the tape is still rewarding “index-plus-AI” with an expanding speculative wing. The highest composite scores cluster around technology and adjacent risk proxies. DIDIY posts a 97 with a big improvement in interest (64.6) and meaningful sustained activity (32), while a run of small/mid-cap compute tickers light up: RGTI (quantum hardware, 75.8 with a 43 sustain), IONQ (62.8 with 30 sustain), ACMR/SITM/LAES/MTSI across semis, and software/infrastructure like GRRR, PGY, BSY, NTSK. That mirrors the real-money footprint we saw in NVDA, AAPL, MSFT and the QQQ complex, plus heavy lit and dark-pool allocation to SPY/IVV/VOO. The difference this week is breadth: these TRV prints say the chase has trickled down the cap stack, where improvement and sustain are both present rather than one-off pops.
Biotech optionality is the second clear theme, and it rhymes with the XBI sweep/dollar bid. MRUS sits at 93.9 with a stout 75 sustained score, joined by ATAI and ETNB (both 77.3), LQDA (66.3), and health-tech HNGE (69.8). That is a “stay long optionality, control single-name risk” signal: the heat is not isolated to a meme pocket; it is spread across clinical-stage and platform names, consistent with a soft-landing narrative and lower perceived funding stress. If XBI keeps printing dollars while this TRV cohort’s sustain readings hold above the 20s, it supports a durable biotech leg inside a broader growth tape.
Crypto-linked equities and wrappers form a third pillar. CIFR (87.1) and IREN (75.3) show solid sustained activity (61 and 54), BITF and HIVE are present, and there is a full stack of wrappers and toggles: BLSH (86.7), BITU (71.3), DAPP (68.4), ETH (64.4) and ETHZ (62.1), plus SSK. The pattern is balanced rather than manic: improvement readings are in the 20–40s and sustain readings sit in the 10–20s to 50s, which says consistent interest rather than a one-day squeeze. That lines up with the mixed but active sweep flow in credit and growth we noted, and with the “barbell” posture funds are running.
Selective energy and old-economy build-out is the fourth theme. ACDC tops the board outright with a perfect 100 composite on very high improvement (81) and a non-zero sustain reading, and there is a breadthy follow-through: services and drilling (ACDC, SOC), upstream/EP (VTS, BKV), fuels/royalties (LTBR, TPL, HNRG), and metals tied to the EV chain (TMC at 88.8; COPX shows up too). On the industrial side, aerospace/defense and construction are busy: PL, ATRO, RDW, WWD on the aero side; ACM, GVA, ECG, WLDN on engineering and services; VMC and JHX on construction materials. That matches the sector dashboard’s two-day pop in Financials and Industrials, and it fits the macro mix of resilient services plus public-works backlogs.
Financials are the quiet climber. The list is dense with banks and capital-markets names: SFBS, FBK, HONE, COLB, EVR, NOAH, plus insurance (IAK) and mortgage finance (UWMC). Improvement readings run in the 30–40s with modest sustain—enough to matter, not hot enough to fear exhaustion. It is exactly what you expect if the market is leaning into a Goldilocks glide path and broadening beyond megacaps: loan growth optionality and deal proxies perking up, but without blow-off characteristics.
There is also a subtle “risk-managed growth” sleeve showing through. QGRO and BBUS surface on the large-cap growth and high-beta side; VIOV flags small-cap value interest; FLTW (Taiwan) and IQDG (international growth) suggest a measured overseas tilt; GOVZ (long Treasuries), FNOV (defined-outcome), and JLL (real estate) round out the ballast. Those are not the top composites, but their presence alongside HYG/LQD activity in the institutional tape says allocators are building diversified packages rather than one-note momentum trades.
A few micro-tells are worth watching next. MRUS is unusual for having a very high sustained score (75) at the same time biotech breadth has improved—if that sustain stays elevated while XBI dollars persist, it argues for keeping the biotech sleeve on. Among semis, ACMR, SITM, and MTSI all print 60–72 composites with double-digit sustain; if those hold while NVDA dark-pool dollars remain heavy, breadth in compute can continue. On the energy/minerals side, ACDC at 100 and TMC at 88.8 say the upstream and supply-chain stories are attracting fresh capital; sustained prints above the teens there would turn a trade into a trend.
Net-net, the TRV watchlist reinforces the institutional story we have been tracking: allocation into broad wrappers, persistent sponsorship of AI/compute, a renewed appetite for biotech optionality, and a measured extension into financials, industrial build-out, and selective resources—tempered by a visible risk-management layer in Treasuries, defined outcome, and international growth. If these sustain readings keep inching higher while improvement stays positive, breadth should continue to widen into Q4 rather than narrow back to a handful of megacaps.
VL Institutional Outliers™ (IO)
Institutional Outliers is a proprietary metric designed to spotlight trades that significantly exceed a stock’s recent institutional activity—specifically in terms of dollar volume. By comparing current trade size against each security's recent normalized history, the metric flags outlier events that may indicate sudden institutional interest but may be missed because the activity doesn’t raise any flags/alerts when comparing the activity against the ticker’s entire history. For example, it’s conceivable that a ticker today receives the largest trade it has had in the last 6 months but the trade is unranked and would therefore be missed by current alerts built off Trade Ranks. Use “Realized Vol” to identify tickers with large price displacement and to size your risk appropriately.
The IO tape this week is a clean echo of the “allocate-plus-compute, optionality, and hard-assets” narrative we have been tracking, with a few sharp tells on where risk was pressed and where it was faded.
The single most remarkable print is GVA in Construction & Engineering: ~$657.6m at 6.23 sigmas with price essentially flat (+0.29% from a $108.87 average). That is not chasey; it looks like size inventory transfer or accumulation in an infra-heavy contractor at a stable tape. Realized vol reads just 0.28, which underscores how deliberately the block was executed. Similar low-vol, high-sigma dollars hit RWR (REITs, ~$213m, 3.57 sigmas) and EXC (Utilities, ~$286m, 2.89 sigmas), pointing to steady re-risking into rate-sensitives alongside the beta sleeve.
Allocation wrappers were busy but controlled. VTI (~$542.9m, 4.63 sigmas), ITOT (~$86.4m, 2.45), FNDX (~$102.5m, 6.21), IYF (~$143.1m, 3.02), and VGK/IDEV on developed ex-US all printed above-trend dollars with minimal price movement and subdued realized vol (generally ~0.08–0.13). That is classic “funding the posture” flow we saw in SPY/IVV/VOO and credit last week rather than a directional lunge.
Compute/AI remained the liveliest single-name complex. IONQ (~$653.7m, 2.37 sigmas, +2.51%), RGTI (~$484.5m, 3.01, +3.81%), MDB (~$460.3m, 2.96, +0.87%), SOUN (~$200.4m, 3.29, +1.59%), and SKYT (semis, 4.25 sigmas, +0.74%) all took meaningful dollars with realized vol in the 0.9–1.2 zone, i.e., orderly trend rather than blow-offs. The levered wrappers around TSLA told the other side of the story: TSLT (-4.54% at 4.84 sigmas) and TSLL (-6.74% at 2.39) sold off while the 1x bear TSLS rose +4.86% (2.32). Net read: the AI/compute bid broadened to the quantum/esoteric edge, while EV mega-cap exposure was used as a funding source or hedged.
Biotech optionality stayed bid and broadened. KROS (+2.03%, 3.58 sigmas), SANA (+1.70%, 3.19), NAMS (+1.35%, 2.42), and NVCR (+0.43%, 6.32 sigmas) saw outsized interest with moderate realized vol. That complements the TRV list where MRUS/ATAI/ETNB lit up; buyers continue to prefer platform and pipeline optionality, financed with steady index dollars rather than all-out chase.
Hard-assets were two-way, with precious metals decisively winning the day. GDX (~$741.6m, 3.70 sigmas, +1.49%), GDXJ (~$145.1m, 2.26, +1.69%), RING (~$41.3m, 4.19, +1.27%) and SIL (+0.91%) attracted heavy, high-sigma buying while the inverse DUST fell -4.04%. Energy was mixed to negative: OXY posted ~$263.2m at 2.75 sigmas with price down -1.91%; BOIL lost -4.96% and the services readouts WTTR (-0.42%) and VIST (+0.51%) were tepid. That pattern says macro hedgers reached for gold miners and silver as a convex offset while dialing back upstream beta.
Crypto remained active but measured. IBIT (~$635.7m, 2.29 sigmas, +0.84%), BITX (2x BTC, ~3.47 sigmas, +1.70%), CONL (2x COIN, +2.87%), and ETHT (+1.45% at 3.15) saw steady engagement. Realized vol sits in the 0.7–1.4 range, high enough to matter but not disorderly. That lines up with our earlier take: crypto sleeves are participating as a toggle within diversified packages, not as a solitary risk engine.
Real estate and utilities flows rounded out the risk-managed posture. VTR (~$222.7m, 2.54 sigmas) slipped -0.33% despite size, while NTST and COMP closed green on modest dollars. XEL (-0.16% on ~$302.1m, 2.09 sigmas) and POR (+0.02% on $44.1m, 3.97) illustrate the same theme as EXC: accumulated, not chased, into a low-vol session—consistent with a market leaning into a soft-landing glide path where defensives earn their keep without crowding.
Consumer and idiosyncratic prints were largely tactical. HAS popped +2.63% at 5.22 sigmas; BIRK gained +0.45% on 4.03 sigmas; BOOT was flat; AAL was slightly red. NBIS, an online-content tracker, showed a big ~$536.6m at 2.49 sigmas and +2.38%—another nod to ad-and-engagement sensitivity within the Communication Services bid we have seen.
Finally, note the big losers by sigma and dollars: RKT cratered -7.63% on ~$771.6m at 5.78 sigmas, and CLOV fell -10.49% at 5.65 sigmas. Those look like single-name de-riskings rather than macro tells, with realized vol relatively contained (0.61 and 0.86). The market absorbed them without broader stress, which fits the “allocation with tactical edges” regime.
Netting it out: IO says institutions kept building the barbell. High-sigma, low-vol dollars flowed into broad wrappers, rate-sensitives, and select infra/REITs, while the fastest money pressed breadth in compute and biotech and added convex hedges via gold miners and crypto toggles. Energy beta was the weak link, and EV leverage was used for downside expression. If we keep seeing mid-to-high sigma prints in miners and quantum/AI alongside calm realized vol in the wrappers, the path of least resistance remains a broadening, risk-managed advance.
VL Consensus Prices™
These are the most frequently traded #1-Ranked Levels in VL this week. Trades occurring at the highest volume price in a ticker’s history are significant because they represent institutional engagement at a key price memory level—where the market once found consensus. These areas act as liquidity hubs, enabling large players to transact efficiently, and often signal a reassessment of fair value. This activity may precede major moves, mark equilibrium zones, or reflect broader portfolio shifts, making these price levels important to watch even without yet knowing how price will resolve. (Note: many Bond products trade in such a tight range that they dominate the top positions and are therefore omitted to provide better clarity around other flows. The bonds data is still available in the VL platform.)
The “Consensus Levels” list says participation is broadening and clustering around clear, liquid anchors while the market keeps the allocate-plus-leaders posture we have been tracking.
At the top of the tape, two crowd magnets dominate: Pfizer and Ford. PFE prints the highest trade count by a wide margin (3,357), with MRK and SNY also on the board, plus VTRS and CVS. That is a full pharma stack alongside managed-care exposure, suggesting investors are leaning into defensible cash flows and event paths while the biotech sleeve (MRUS, IBRX, CLOV) provides optionality. Ford’s 2,767 trades lead Consumer Discretionary, and the rest of that lane is busy too: AMZN, DKNG, NKE, LKQ, QSR, MGM, HGV, WGO and CPNG. Autos, e-commerce, travel/leisure, and gaming together say cyclical demand is still being trafficked rather than faded.
Real estate is a second center of gravity. HST and NNN are high on the list, joined by RYN, STAG, PECO, TRNO and mortgage REITs AGNC, RITM and DX. That cluster lines up with the rate-sensitive flows we have seen elsewhere: when yields ebb, REITs draw fast consensus interest; when they back up, these names become the first places to manage duration risk. Utilities echo that read: AES and ALE show up with meaningful participation, reinforcing the idea that investors want steady carry and a ballast sleeve even as they chase growth.
Energy is broad and two-sided but clearly active. Integrateds and upstream (BP, CVX, CVE, CNQ, MGY, EOG, GLNG, BTU, EXE) sit next to equipment and services (NOV, FTI, OII). That split usually appears when crude has been choppy: producers are a bet on commodity direction, while services are a capex read. The presence of IXC (global energy ETF) shows allocators are also using wrappers to express the view. Materials participation supports the “hard-asset hedge” we flagged: GGB and AG print alongside chemicals (DD, AXTA, LIN, ESI) and packaging (SEE), a mix consistent with both industrial throughput and inflation hedging.
Technology breadth is real and looks different from the mega-cap-only tapes of midsummer. Software and IT services are thick on the page: DDOG, TWLO, SOUN, GDDY, BSY, PRGS, VRNT, SPNS, ALKT, SAIL, EXLS and QXO. Fintech and brokerage infra are present via HOOD and AFRM. Semis skew to the mid-cap tier (MCHP, STM, HIMX) rather than only the AI titans. Satellite/telecom ASTS and adtech IAS round out Communication Services. Net read: underneath the heavy dollars in NVDA and the index sleeves, participation is rotating into down-cap application, infrastructure and comms names—exactly what a broadening advance should look like.
Financials show a steady glow rather than a spike, which is what you want in a soft-landing glide path. Banks (KEY, WAFD, WABC), asset managers (OWL, CRBG), mortgage finance (RKT), and capital markets (XP) are all active. That is consistent with the two-day leadership uptick we saw in the sector board and with the dark-pool activity in credit ETFs; it suggests investors are re-risking into lenders and fee businesses as volatility cools.
Two other tells fit the “barbell” framing. First, income and allocation wrappers feature prominently: SCHD, SPLG and XYLD on the U.S. side, and IXC for energy beta. These typically appear when allocators are methodically adding exposure and monetizing carry. Second, the crypto toggle is alive but contained: ETHA and BITX show up, matching the measured IO prints in IBIT/BITX and ETH wrappers—participation without froth.
Under the hood, Industrials and logistics are quietly busy: ACHR (eVTOL), DRS (defense), CNH (heavy machinery), IEX/MIDD/KBR (machinery and services) and ZTO (freight) show up together. That triangulates with the large, low-vol IO prints in GVA and the steady dollars in construction materials; it is a real-economy thread that complements the AI/software bid rather than competing with it.
Putting it together, consensus interest is clustering in four places: defensives with cash flow (pharma, REITs, utilities), broad energy and materials as a macro hedge, a widening tech/software bench beyond the megacaps, and steady financials/industrial throughput. Crypto wrappers and covered-call income strategies round out the risk-managed toolkit. That palette matches the institutional flow narrative: allocation into wrappers, persistent sponsorship of compute, optionality via biotech, and selective hard-asset and rate-sensitive exposure. If these names keep showing up together—software and semis alongside REITs, utilities, and energy services—the breadth message remains intact and the path favors a measured, barbelled risk-on rather than a narrow, momentum-only chase.
MIR Part 3: Framing-Up A Trade
The message from the tape is consistent and tradeable: institutions are allocating first (SPY/IVV/VOO and credit sleeves), sponsoring AI/compute with real dollars (NVDA plus a widening bench in SMH/SOXX/IONQ/RGTI/MDB), keeping a biotech optionality bid (XBI and select single names), adding a measured hard-asset hedge (gold and silver miners), and defending rate-sensitives (utilities/REITs). Energy beta is two-way to soft, while crypto toggles are active but sized like accessories, not drivers. I want a barbelled book that sits on broad beta and credit, leans long compute breadth and biotech, carries a convex metals sleeve, and keeps small hedges on mega-cap and duration shocks.
I’ll anchor the book to SPY/QQQ with IWM as a breadth kicker, then layer semis/software where sweeps and dark-pools remain heavy. Continuation is defined by SPY holding above ~666 and QQQ reclaiming/holding the 602–605 pocket; failure through SPY ~661–662 or a stall under QQQ ~602 pushes me to trim growth beta first (SMH/SOXX) and let credit and defensives carry. I want HYG/LQD to stay bid and their dark-pool flow persistent; deterioration there is my earliest “de-risk” tell. I’ll keep the metals sleeve so long as GDX/GDXJ/SIL see positive dollars on down-tape sessions; if that fades while credit wobbles, I rotate the hedge to more TBIL/PFIX and reduce cyclicals. I’ll keep energy light until services start to lead upstream again. Crypto keeps a toe-hold; if IBIT/ETHT volumes pick up without broad equity confirmation, I cap it at current size.
I’ll Buy back-tests at SPY ~666 and QQQ ~602–603 when sellers fail to extend and stack victories; first targets are week highs with partials into strength. Add to SMH/SOXX on shallow pullbacks that hold prior break levels; reduce only on clear distribution (rising supply into highs, fading dark-pool sponsorship). Treat XBI as the expression of biotech breadth and use single names (e.g., MRUS) sparingly and small. Keep the miners as the left-tail hedge and roll profits if equities and credit both rally. If we get a credit wobble or a MOVE > VIX divergence, I immediately lighten QQQ/SMH and let LQD/HYG and utilities/REITs cushion while the small index hedges pick up delta.
Sample portfolio (one-week posture)
Core index beta (30%)
SPY 18%
QQQ 8%
IWM 4%
AI / compute leadership and breadth (20%)
SMH 8%
SOXX 4%
NVDA 3%
IONQ 2%
RGTI 1%
MDB 2%
Biotech optionality (6%)
XBI 5%
MRUS 1%
Hard-asset hedge (10%)
GDX 5%
GDXJ 2%
SIL 1%
COPX 2%
Selective energy (4%)
XLE 2%
OIH 1%
VIST 1%
Rate-sensitives / defensives (10%)
XLU 4%
RWR 3%
EXC 1%
VTR 2%
Credit ballast (12%)
LQD 6%
HYG 4%
IGIB 2%
International tilt (4%)
IDEV 2%
VGK 1%
FLTW 1%
Crypto toggle (2%)
IBIT 1%
ETHT 1%
Risk hedges (2%)
SH 1% (index shock absorber)
TSLS 1% (TSLA-specific factor hedge)Why this mix works this week? Core wrappers and credit do the heavy smoothing while QQQ/semis capture upside in the still-sponsored AI complex. XBI and a tiny MRUS give us convexity without over-concentrating single-name risk. The miners sleeve offsets macro and policy surprises and has been attracting real dollars; it should work if yields pop or growth jitters return. Defensives and REITs reflect the steady re-risking in utilities/real estate we saw on the IO tape and give us carry if momentum pauses. Energy beta stays intentionally small until we see rotation back into services leadership. Crypto remains a toggle, sized to matter but not to drive the P&L.
Bottom line: buy dips in core and compute while credit and dark-pools confirm, let biotech and miners provide convexity, keep energy light and hedges small, and be ready to rotate toward cyclicals if Financials/Industrials follow-through lifts breadth.

Thank you for being part of our community and for dedicating your time to this edition. Your insights and engagement drive everything we do, and we’re honored to share this space with such committed, thoughtful readers. Here’s to a week filled with clear opportunities and strong performance. Wishing you many bags 💰💰💰
—VolumeLeaders