Market Momentum: Your Weekly Financial Forecast & Market Prep
Issue 63 / What to expect Sept 29, 2025 thru Oct 03, 2025

In This Issue
Weekly Market-On-Close Report: All the macro moves, market drivers, and must-know narratives—covered in less than five minutes.
Weekly Benchmark Breakdown: Our weekly intelligence report on major indices cuts through the index-level noise to uncover participation, momentum, and structural integrity and tell you whether markets are rising on solid ground or skating on thin breadth. This is where bull markets prove themselves—or quietly start to unravel.
The Latest Investor Sentiment Readings: Track the emotional pulse of the market with our curated dashboard of sentiment indicators. From fear-fueled flight to euphoric overreach, this week's readings reveal whether investors are cautiously creeping in—or stampeding toward the exits.
Institutional Support & Resistance Levels For Major Indices: Exactly where to look for support and resistance this coming week in SPY, QQQ, IWM & DIA
Normalized Performance By Thematics YTD: Which corners of the markets are beating benchmarks, which are overlooked and which ones are over-crowded!
Key Econ Events & Earnings On-Deck For This Coming Week
Market Intelligence Report: Track the real money. This section breaks down where institutions are placing their bets—and pulling their chips. You'll get a sector-by-sector view of flows, highlighting the most active names attracting large-scale buying or selling. We go beyond the headlines and into the tape, surfacing the week’s most notable block trades and sweep orders, both on lit exchanges and hidden dark pools. Whether you're following momentum or fading crowded trades, this is your map to where size is moving and why it matters.

Weekly Market-On-Close Report
A Week That Tested the Narrative
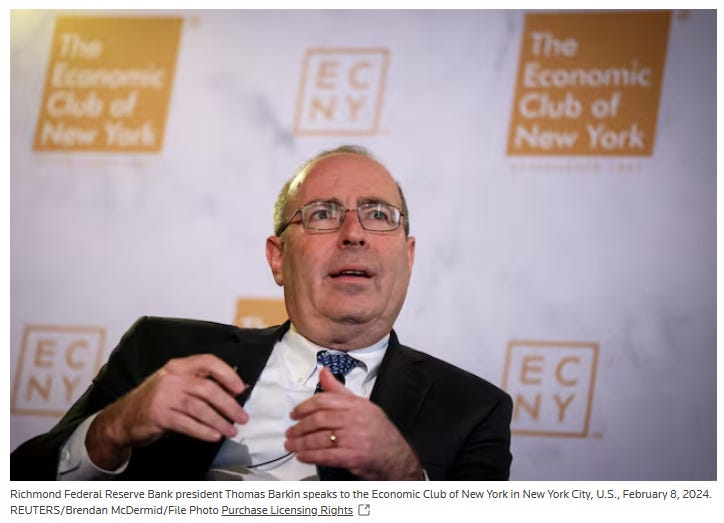
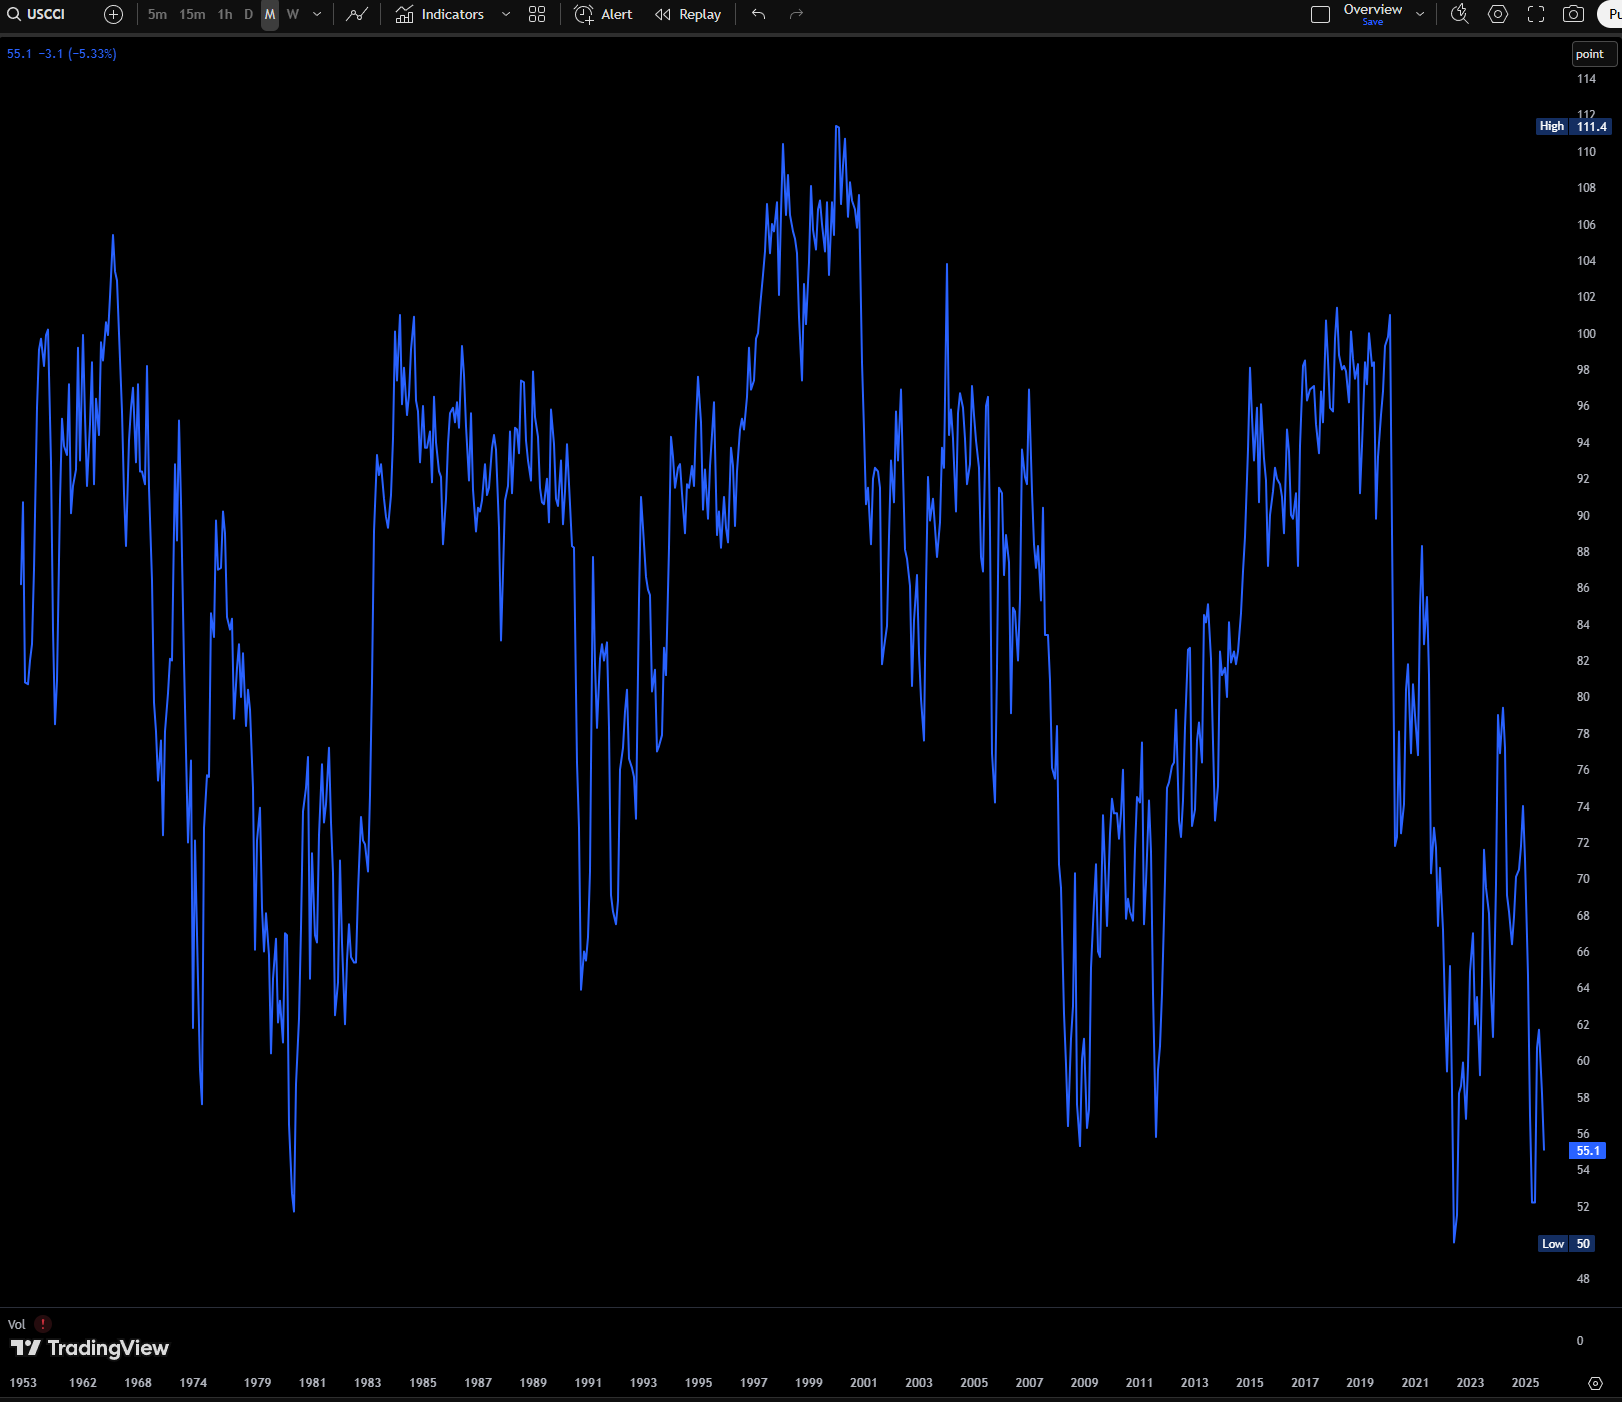
The tape closed Friday with a constructive lean that masked a choppy week beneath the surface. The S&P 500 Index finished the session up +0.59%, the Dow Jones Industrials Index gained +0.65%, and the Nasdaq 100 Index added +0.44%. December E-mini S&P futures (ESZ25) rose +0.60%, and December E-mini Nasdaq futures (NQZ25) climbed +0.44%. The bid into the bell was grounded in two things the market still cares about deeply: the durability of consumer spending and the glide path of inflation as measured by the Fed’s preferred core PCE. Friday’s August personal spending print advanced +0.6% m/m versus +0.5% expected, the strongest pace in five months, while core PCE rose +0.2% m/m and +2.9% y/y, exactly on consensus. That combination—consumers still opening their wallets while the most-watched inflation metric stays contained—supported risk. On the negative side of the ledger, the University of Michigan’s September consumer sentiment index was revised down to 55.1 from 55.4, a 4-month low, and Richmond Fed President Tom Barkin leaned a touch hawkish, noting uncertainty has lifted for U.S. companies and that he sees limited risk of further deterioration in employment and inflation. That mix helped, but it also capped the upside.
Policy and politics threaded through the tape all week. A potential government shutdown on October 1 remains a headline risk if Congress does not pass a spending bill. The White House’s late-Wednesday memo framed the stakes: a shutdown would trigger widespread dismissals of employees in programs that do not align with President Trump’s priorities. Markets, meanwhile, are pricing an 88% probability of a -25 bp cut at the October 28–29 FOMC meeting, suggesting investors still expect the easing cycle to proceed barring a major surprise in labor or inflation data before then.
Breadth told its own story. Overseas, the Euro Stoxx 50 rallied to a 5-week high and closed +1.01%, while China’s Shanghai Composite fell -0.65% and Japan’s Nikkei Stock 225 declined -0.87%. That split mirrored U.S. factor rotations that favored Energy and selected cyclicals late in the week while leaving some growth pockets mixed.
Rates: Firm Data, Tempered Dovishness, And A Gentle Bearish Bias In Duration
Treasuries traded with a mild bearish bias Friday. December 10-year T-notes (ZNZ5) settled down -2 ticks, pushing the 10-year yield +1.3 bp to 4.183%. The drivers were straightforward: stronger-than-expected August personal spending and a tone from Richmond Fed President Tom Barkin that did not validate the most dovish expectations. Equities’ strength bled off some safe-haven demand.
There were offsets that prevented a larger selloff. The August core PCE print met estimates at +0.2% m/m and +2.9% y/y, and the University of Michigan’s inflation expectations were revised lower, with 1-year at 4.7% and 5–10 year at 3.7%. The sentiment index revision down to 55.1—lowest in four months—also leaned bond-supportive at the margin.
Across the Atlantic, European yields eased. The 10-year German bund fell to a 1-week low of 2.728% and closed -2.8 bp at 2.746%. The 10-year UK gilt slipped from a 3-week high of 4.768% to 4.746%, down -1.1 bp. Still, the European inflation expectations backdrop stayed sticky: the ECB’s August 1-year CPI expectations rose to 2.8% from 2.6% in July (versus a 2.5% decline expected), while 3-year expectations held at 2.5% (versus 2.4% expected). Swaps reflected limited near-term policy relief, discounting only a 1% chance of a -25 bp cut at the October 30 ECB meeting.
Equities: A Late-Week Bid, Sector Dispersion, And Clear Policy-Linked Winners And Losers
Semiconductors, Energy, and segments of Pharma wore the leadership mantle Friday, while selected consumer and media names lagged. U.S. chipmakers caught a durable bid after a Wall Street Journal report that the administration is considering a plan to reduce reliance on overseas chip production and reshape supply chains through new domestic requirements and tariffs. Within the group, GlobalFoundries (GFS) rallied more than +7%, Intel (INTC) rose more than +4%, Applied Materials (AMAT) gained more than +2%, and Texas Instruments (TXN) added more than +1%. The policy impulse here—requiring U.S. production at a 1:1 ratio with imports or applying tariffs that could reach up to 100%—kept investors rotating into names seen as direct beneficiaries of onshoring incentives and capacity build-outs.
Energy’s turn higher synced with crude’s move. WTI rallied more than +1% to a 1.75-month high, and the equity response followed the barrels. Devon Energy (DVN) advanced more than +3%, Schlumberger (SLB) gained more than +2%, and a broader cohort—Diamondback Energy (FANG), Halliburton (HAL), ConocoPhillips (COP), APA Corp (APA), Exxon Mobil (XOM), Marathon Petroleum (MPC), and Occidental Petroleum (OXY)—finished more than +1% higher. Correlation to the commodity reasserted itself after a brief wobble the prior week.
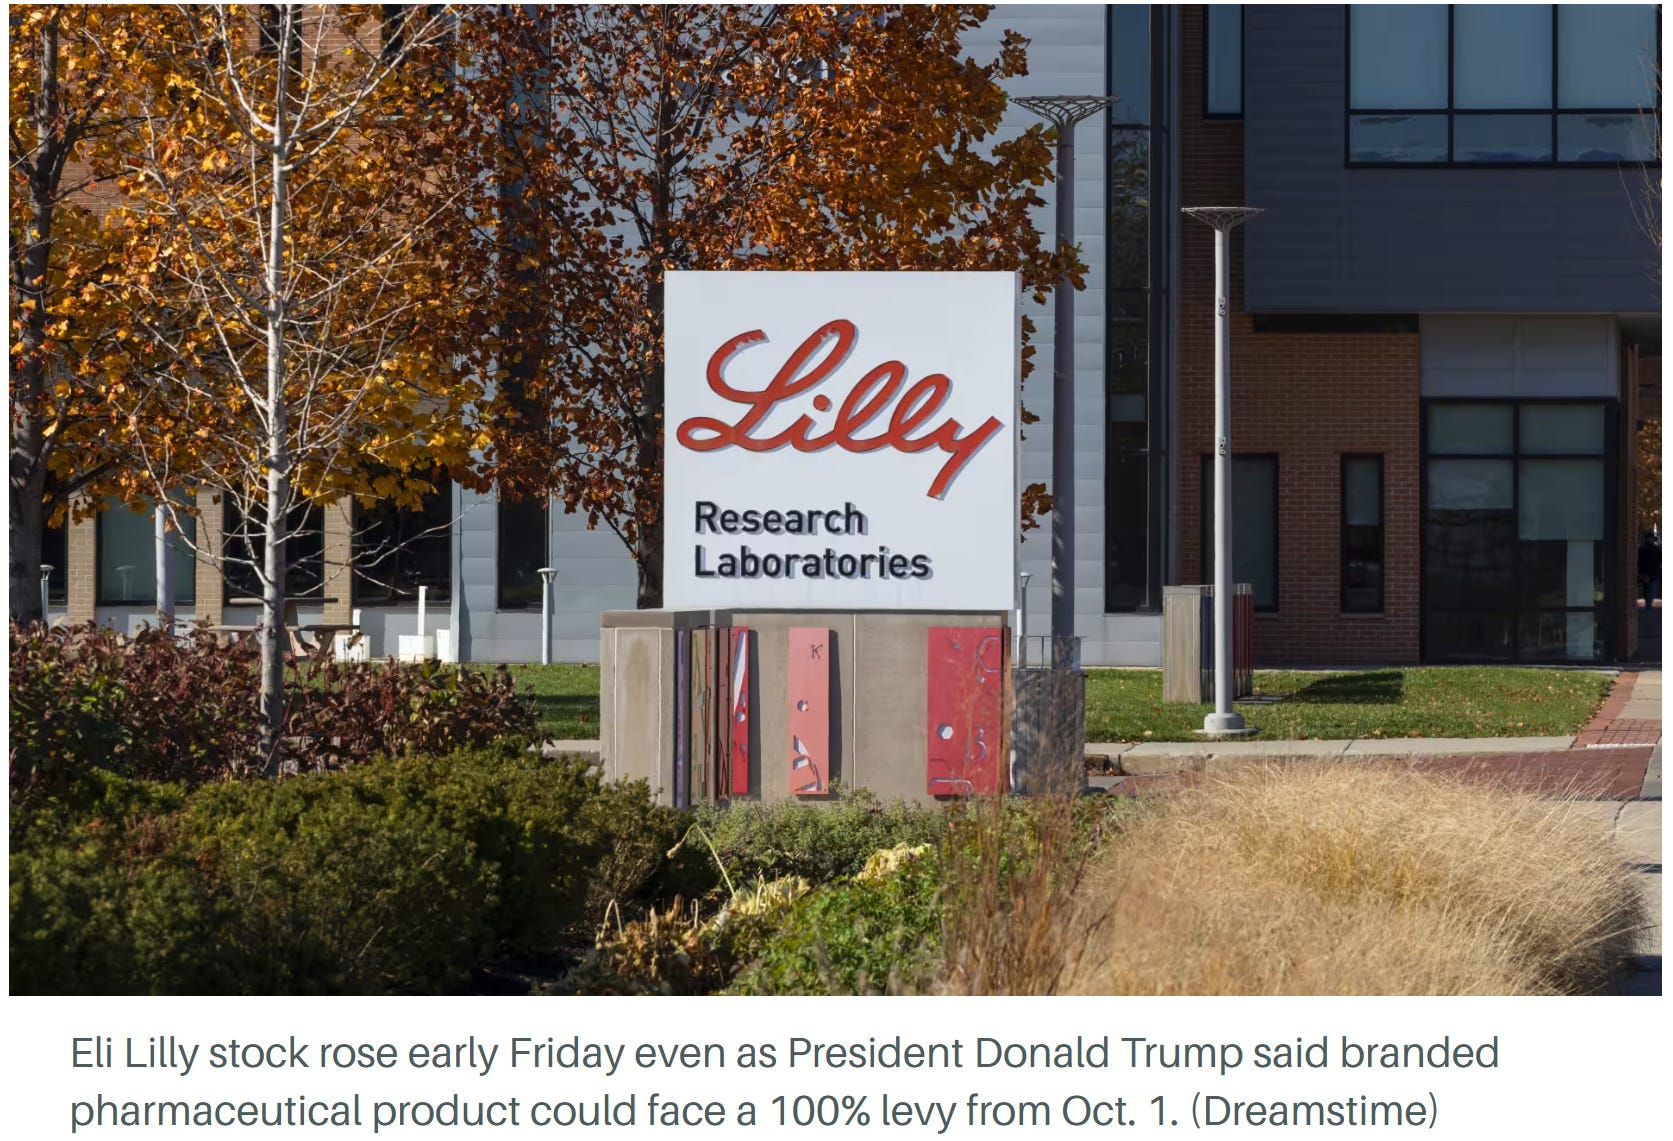
Pharmaceuticals climbed despite the headline of 100% tariffs on branded or patented pharmaceutical imports set for October 1, 2025 unless a producer is actively building a U.S. plant. The reasoning, as framed by Jefferies, is that the structure effectively rewards localized capacity that many large drug makers already possess or are actively expanding. Eli Lilly (LLY) and Merck & Co. (MRK) closed more than +1% higher. AbbVie (ABBV) rose +0.90%, Pfizer (PFE) gained +0.56%, and Amgen (AMGN) added +0.37%.
Takeover talk punctuated the session. Electronic Arts (EA) surged more than +14% on a report of near-final negotiations to take the company private via a consortium led by Silver Lake Management and Saudi Arabia’s Public Investment Fund. Crinetics Pharmaceuticals (CRNX) soared more than +27% on FDA approval of Palsonify to treat acromegaly in adults. Paccar (PCAR) jumped more than +5% after a 25% tariff rate was set on heavy trucks made outside the U.S. Mirion Technologies (MIR) rose more than +10% after JPMorgan initiated overweight with a $28 target. Boeing (BA) rallied more than +3% on a report that the FAA will ease restrictions on 737 MAX deliveries.
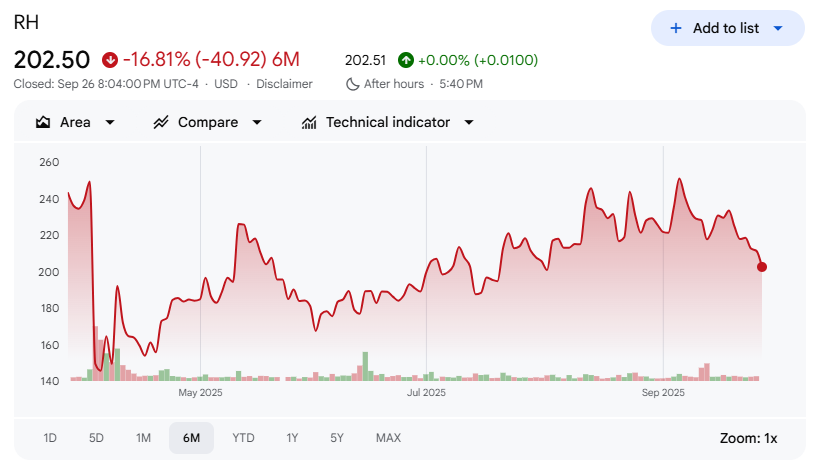
Not all the tape was green. Concentrix (CNXC) fell more than -13% after guiding Q4 adjusted EPS to $2.85–$2.96 versus $3.30 consensus. IREN Ltd (IREN) slid more than -10% after a downgrade to underweight with a $24 target. RH (RH) dropped more than -4% after a 50% tariff on imported kitchen cabinets, bathroom vanities, and associated products was announced for October 1. Costco Wholesale (COST) fell more than -2%, leading S&P 500 and Nasdaq 100 decliners, after reporting Q4 U.S. comparable sales of +5.1% versus +5.21% expected. CarMax (KMX) lost more than -1% on a downgrade to in line, and Warner Bros Discovery (WBD) fell more than -1% after a downgrade to sector weight.
The Week In Indexes: A Mixed Finish And A Narrative Reset
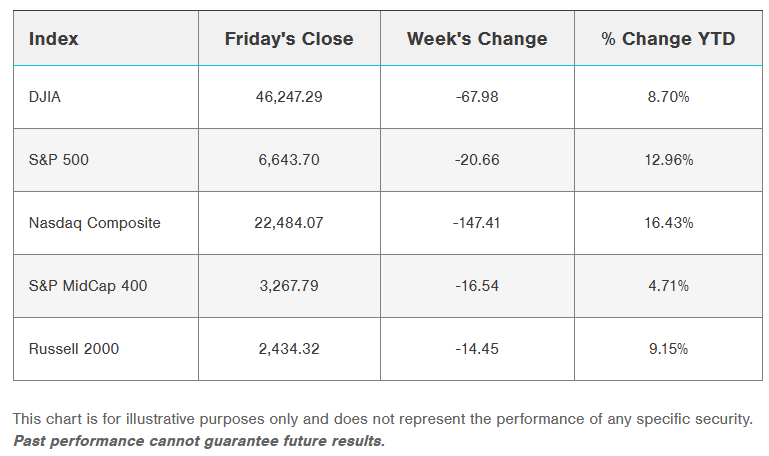
The week ended with a Friday save, but major U.S. averages still slipped. The Nasdaq Composite fell -0.65%, the Russell 2000 posted its first weekly loss since early August, the S&P MidCap 400 and the S&P 500 slipped, and the Dow Jones Industrial Average ended little changed. Within the S&P 500, Energy led in tandem with crude, aided by the policy impulse that pushed European Union nations to end purchases of Russian oil and gas, while most other sectors declined.
Fed communication provided the headwind. Chair Jerome Powell characterized the setting as a “challenging situation,” with upside inflation risks and downside labor market risks, and he noted that “equity prices are fairly highly valued.” St. Louis Fed President Alberto Musalem and Atlanta Fed President Raphael Bostic emphasized caution on further easing on the grounds that inflation remains persistent. The tone did not kill the cut narrative, but it did temper expectations for an aggressive glide lower in policy.
On the macro scorecard, August inflation was little changed on a core PCE basis, rising +0.2% m/m and +2.9% y/y, in line with July’s revised readings. Personal spending and income beat at +0.6% and +0.4%. The third estimate of Q2 GDP rose to a +3.8% annualized pace from +3.3% prior, driven by stronger consumption. S&P Global’s September Flash PMIs cooled but remained in expansion, with Manufacturing at 52.0 (versus 53.0 in August and about 51.9 expected) and Services at 53.9 (versus 54.5 in August, in line with expectations). Expectations for output improved to a 4-month high.
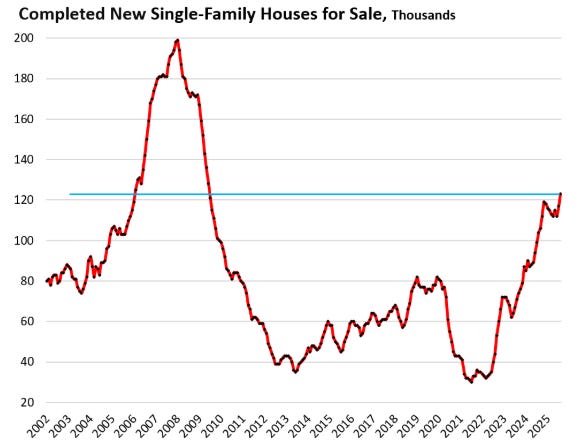
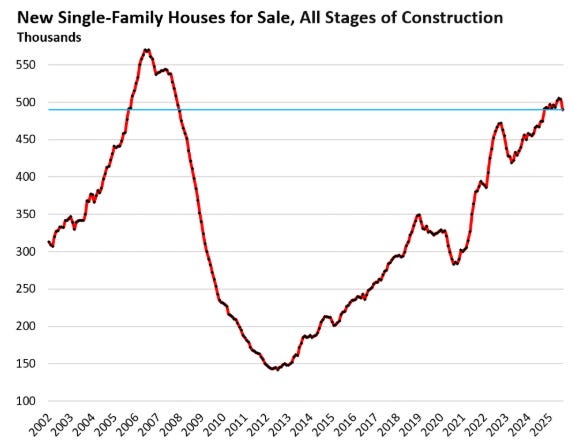
Housing sent the clearest signal of recovery. New single-family homes sales in August jumped to a SAAR of 800,000, the highest since January 2022, more than 20% above July and well ahead of around 650,000 expected. Existing home sales ran at a 4 million SAAR, down -0.2% m/m but ahead of about 3.96 million expected. The median existing home price rose +2% y/y to $422,600, marking the 26th consecutive month of y/y gains.
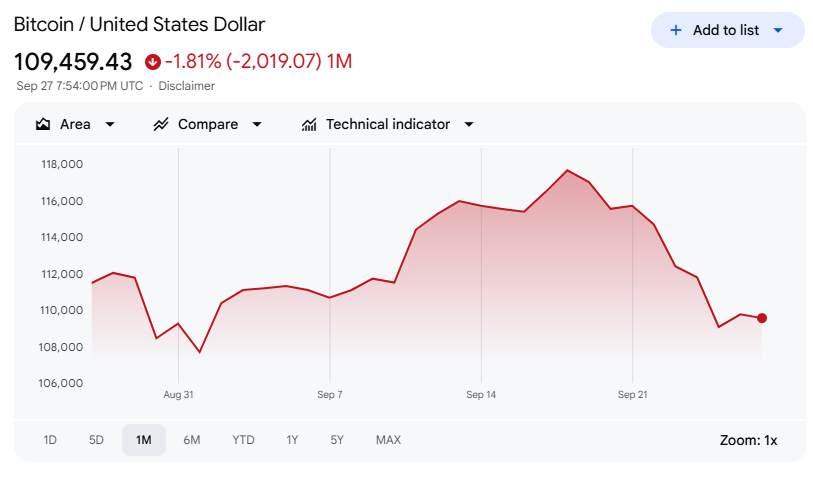
In rates, short and intermediate yields climbed while the long end finished little changed, consistent with ebbing expectations for near-term rate cuts and generally firm data. By Friday’s settle: DOW 46,247 (+300), S&P 500 6,644 (+39), Russell 2000 2,434 (+23), NYSE FANG+ 16,138 (+70), ICE Brent Crude $69.81/barrel (+$0.39), Gold $3,798/oz (+$26), Bitcoin ~109.2k (-205). Heading into the week, the S&P 500 had logged gains in three straight weeks, six of the past seven, and ten of the past thirteen. Seasonality suggested September headwinds, but the index was +3% MTD versus a 10-year average of -2% before the latest stumble.
The rhythm of the week: Monday delivered another record closing high for the S&P 500, then the market faded through midweek before a solid Friday. Equal-weight squeezed out an outperformance. Small caps underperformed on the week but rallied Friday and outpaced the S&P 500 into the bell. The dynamic fits the recent playbook: small caps began to outperform in August as cut odds rose and yields fell, with the Russell 2000 pulling away from the S&P 600 in September—both small-cap benchmarks, but the S&P 600’s profitability screen keeps the cohort higher quality, while the Russell 2000 captures higher-beta, retail-tilted exposure. When rates rise and the curve flattens, lower-quality beta tends to lag, and that is exactly what we saw this week.
Sectors And Factors: Energy On Top, Communication Services Lags, And AI Remains A Cross-Current
Style split the field. Growth lagged Value across market caps. Mega-cap tech was softer, but Apple bucked the tape with a +4% catch-up move versus year-to-date underperformance. Intel (INTC) tacked on +20% after chatter of potential investments tied to Apple and TSMC, following prior commitments from SoftBank, Nvidia, and the administration’s plans—corporate finance by way of industrial policy. Energy and Real Estate joined Utilities among the outperformers, despite an uptick in yields. Materials faced company-specific pressure, including a hit to Freeport, while Chemicals also traded heavy. Consumer Discretionary and Consumer Staples lagged; Amazon was an anchor at roughly -5% on fine headlines tied to Prime, and Travel and Leisure, Apparel, and Homebuilders slipped even with strong new-home sales data.
AI-levered names were mixed to lower, including Micron despite solid results. Chipmakers and equipment fared better, led by Applied Materials (AMAT), TSMC, ASML, and KLA (KLAC) with a positive bias. The AI news flow remained busy: Oracle (ORCL) moved to raise roughly $15B via bonds, the Stargate group identified new data center sites, Alibaba (BABA) outlined additional capex plans, and Microsoft (MSFT) said it will add Anthropic models to its AI Copilot alongside OpenAI. M&A chatter extended beyond Electronic Arts (EA) to a set of deals that included Pfizer (PFE) for Metsera, Patient Square for Premier, Compass for Anywhere and Thoma Bravo for PROS.
Policy, Tariffs, And The Market’s Real-Time Scorecard
Tariff headlines were steady and concentrated. The framework taking shape is explicit:
Pharmaceuticals will be subject to a 100% tariff on branded or patented imports effective October 1, 2025 unless the producer is actively building a U.S. manufacturing plant; generics are excluded. Because many majors already operate or are expanding U.S. capacity, the impact tilts toward a “win” for those with domestic footprints. The price action in Eli Lilly (LLY), Merck & Co. (MRK), AbbVie (ABBV), Pfizer (PFE), and Amgen (AMGN) reflects that assessment.
Furniture and Household Goods will see a 50% tariff on imported kitchen cabinets and bathroom vanities and a 30% tariff on upholstered furniture. Names tied to the category finished mixed: Wayfair, Ethan Allen (ETD), and La-Z-Boy (LZB) closed higher while RH fell.
Heavy Trucks will face a 25% tariff on imported semi-trucks, which helped Paccar (PCAR) rally +5% Friday.
Semiconductors face a proposed rule requiring a 1:1 U.S. production ratio with imports or tariffs up to 100%. The pricing power embedded in that rule is what powered GlobalFoundries (GFS), Intel (INTC), Applied Materials (AMAT), and Texas Instruments (TXN).
Section 232 investigations have been opened in robotics, industrial machinery, and medical devices.
The legal backdrop now points toward a November 5 hearing at the Supreme Court on the validity of IEEPA tariffs. That calendar date matters for the policy risk premium embedded in cyclicals and industrial tech.
President Trump’s UN General Assembly remarks layered another macro theme: strong language on immigration and the green energy movement, with specific admonitions that “both immigration and their suicidal energy ideas will be the death of Western Europe,” and “Your countries are going to hell,” alongside criticism of the UN’s performance. These remarks fed into Energy’s rally and left European equities mixed even as the Euro Stoxx 50 closed the week’s last session higher.
Global Tape: Europe Edges Up, Asia Mixed, EM Diverges
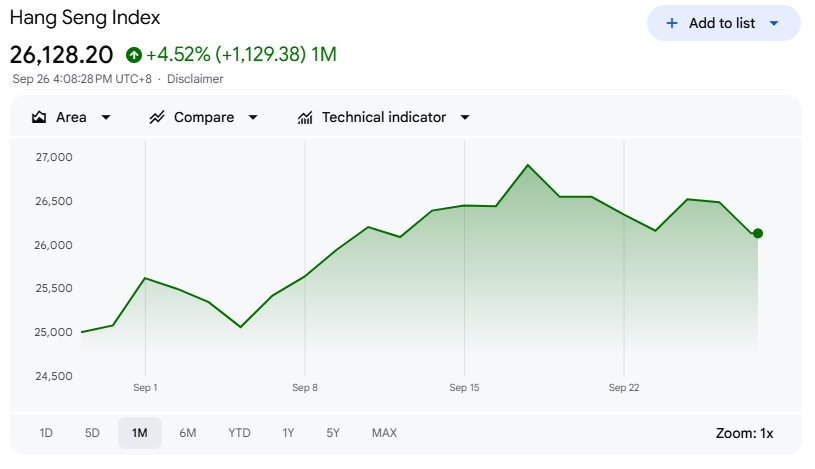
Europe ended with modest gains as regional PMIs moderated back into contraction territory. Energy and miners led, while healthcare absorbed tariff-related pressure. In Asia, South Korea fell roughly -2% for the week, with tech selling on U.S. weakness and the 1:1 semiconductor headline, while the currency weakened to its lowest since May and U.S. trade talks stalled. China’s Shanghai Composite finished slightly higher; Hong Kong’s Hang Seng gave back part of its recent AI-driven bounce.
In emerging markets, India underperformed after the administration announced $100k HB1 Visa Fees, while Argentina stood out after a U.S. bailout was outlined for President Milei following recent political losses. Treasury Secretary Bessent said the U.S. Treasury “stands ready to purchase Argentina’s USD bonds and will do so as conditions warrant. We are also prepared to deliver significant stand-by credit via the Exchange Stabilization Fund, and we have been in active discussions with President Milei’s team to do so.” Midterm elections there are slated for the end of October.
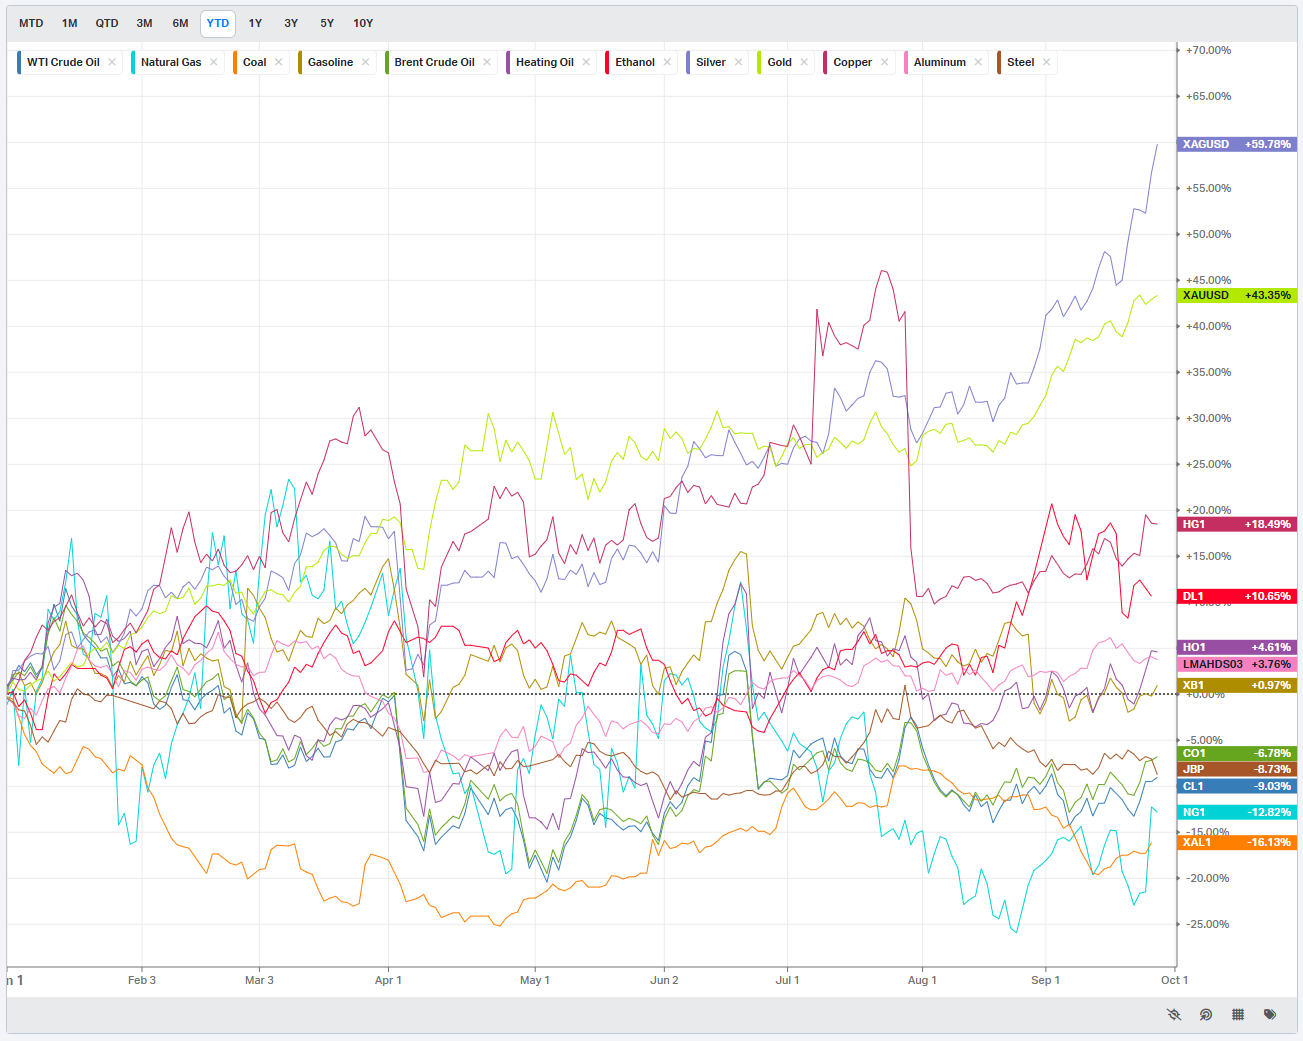
Commodities And Crypto: Energy And Metals Firm, Ag Soft, Crypto Hit
Energy regained momentum. ICE Brent closed the week up more than +5% and broke back above the 200-day moving average near ~$68. The push was linked to tightening supply expectations, firmer sanction rhetoric, and rising geopolitical tension.
Metals were bid across the board. Gold printed a new all-time high near ~$3,800 and finished the week higher by +$26 at $3,798/oz. Silver gained nearly +10%. Copper advanced after Freeport declared force majeure at its Indonesian mine following an accident earlier in the month.
Agriculture traded modestly lower.
Crypto faced broad selling. Bitcoin fell roughly -5%, broke below the 100-day moving average around ~111.5k, but held above the early-September low just over ~107k. A break of that level would open a path toward the 200-day moving average near ~102k.
Ethereum declined about -10% and Solana roughly -15%, while more speculative projects saw deeper drawdowns. The Wall Street Journal reported that regulators are examining unusual trading ahead of crypto treasury announcements. According to StreetAccount, 35 companies participated in crypto treasury activities this week, down from 37 last week, with six new companies announcing digital asset strategies.
The Fed: A Hawkish Tilt At The Margin, But A Cut Still Priced For October
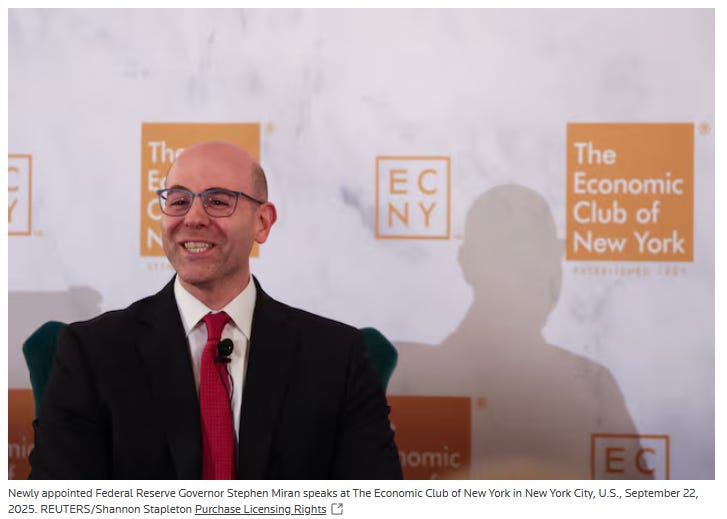
Fed speakers reinforced a cautious stance. The committee’s center of gravity continues to lean toward measured easing, but this week’s rhetoric added friction. Stephen Miran’s Monday speech at the New York Economic Club explained his dissident dot, arguing the policy rate should be at or just above neutral, and that the current setting risks the employment mandate; he prefers -50 bp increments given his assessment of r* (neutral), which he argued sits in the low-to-mid-2% range after adjusting for tariffs, population dynamics, rent inflation, regulation, and One Big Beautiful Bill.
Beth Hammack presented the most hawkish case, saying she is “laser focused on inflation,” expects it to pick up into next year, considers current policy not far from neutral, and favors patience on cuts. Other hawks, including Raphael Bostic and Jeffrey Schmid, emphasized data dependency and a higher bar for further easing.
Market pricing incorporated the tone shift without abandoning the base case. Since last week’s decision, yields have risen across the curve by more than +10 bp in places; this week saw a curve flattening with 2s–10s up more than +5 bp while 30s rose +1 bp. The 10-year has advanced in seven of the past eight sessions. Even so, futures still assign an 88% probability to a -25 bp cut on October 28–29.
Narrative Watch: From Summer Calm To Fall Cross-Currents
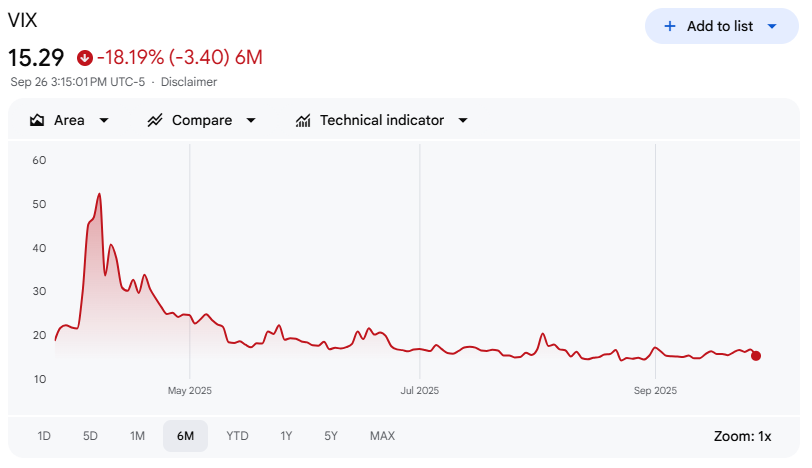
Volatility has been subdued for months. Equity vol as proxied by VIX has largely sat below 20 since mid-June and often below 16, translating to sub-1% implied daily moves. ICE’s MOVE index for bonds has trended lower since January 2022. The past two weeks hint at a gentle turn: a modest VIX lift, a small reset in mega-cap leadership, and factor rotations favoring cash-flow visibility and commodity linkage. Monday delivered another record S&P close before the fade. Equal-weight’s relative bid and small caps’ Friday catch-up signal that investors are still willing to rotate rather than de-risk outright.
Within themes, the market ran a series of stress tests. Quantum computing saw Rigetti (RGTI) up roughly ~10% while peers were flat-to-down ~10%. Nuclear sold off, with NuScale (SMR), Oklo (OKLO), and NNE each down greater than -10%. Crypto-related equities were hit hard: MicroStrategy (MSTR) fell about -10%, Ethereum-linked companies dropped up to ~-20%, and Coinbase (COIN) and BLSH declined around -10%. Emerging data center plays were flat to down ~-15%. These are cyclical hot-money corners; they tend to be the first to move when the rate path, tariff regime, or liquidity assumptions change.
What Is Priced, What Is Not, And What Might Matter Next
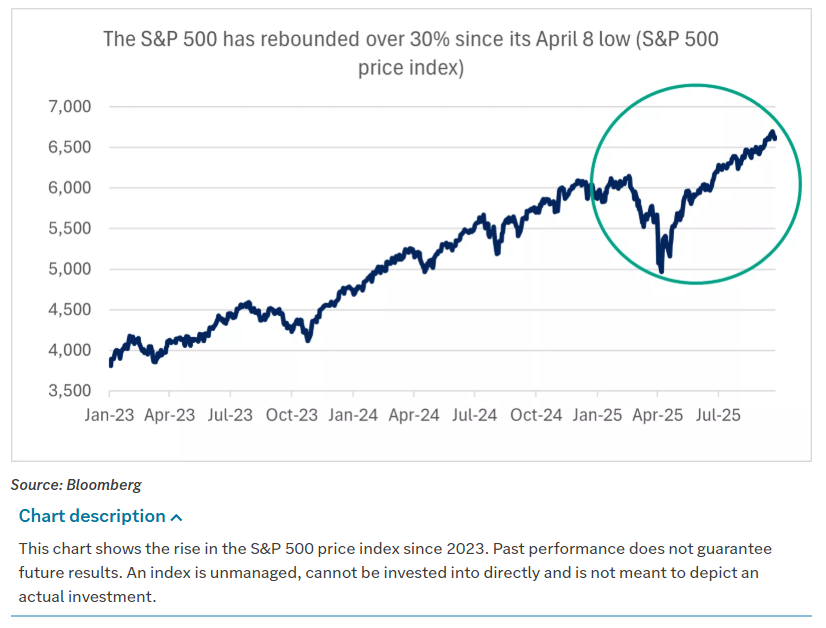
The market has absorbed a lot quickly. From the April lows, the S&P 500 is up more than +30% without a 2% or greater pullback. That does not preclude further gains—momentum can feed on itself—but it raises the probability of a garden-variety 5%–10% reset. We are in a seasonally choppier window, the data calendar has air pockets before earnings season, and a government shutdown remains on the table for October 1. None of those is thesis-breaking on its own, but together they increase the odds that the next few weeks deliver two-sided trade.
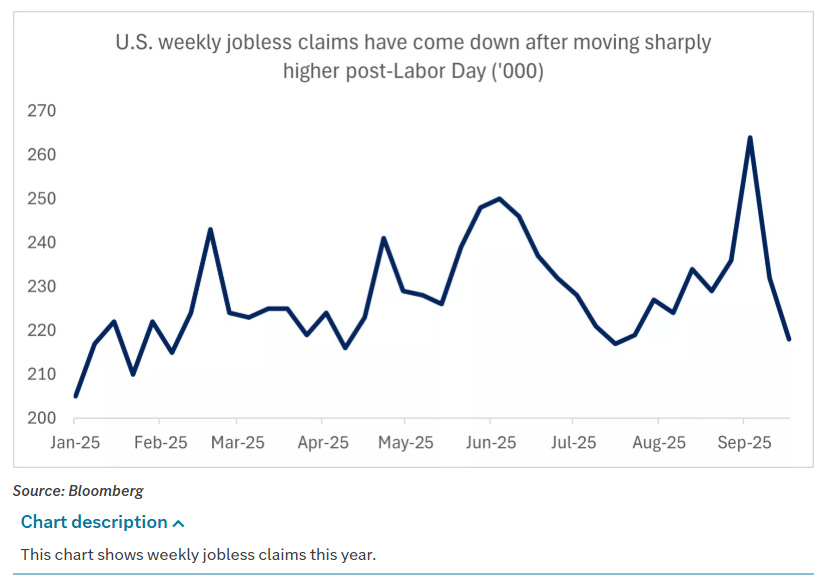
The constructive counterpoints are straightforward. GDP was revised up to +3.8% for Q2. Personal income and spending beat. Core PCE is printing +0.2% m/m and +2.9% y/y. Jobless claims fell to 218k, continuing claims sit at 1.926 million. Housing stabilized and even accelerated in new home sales. Abroad, Europe closed the week in better shape, and even with Asia mixed, the global backdrop remains more balanced than it felt in late spring.
Next Week’s Tape: Calendar Risk And A Labor-Heavy Data Run
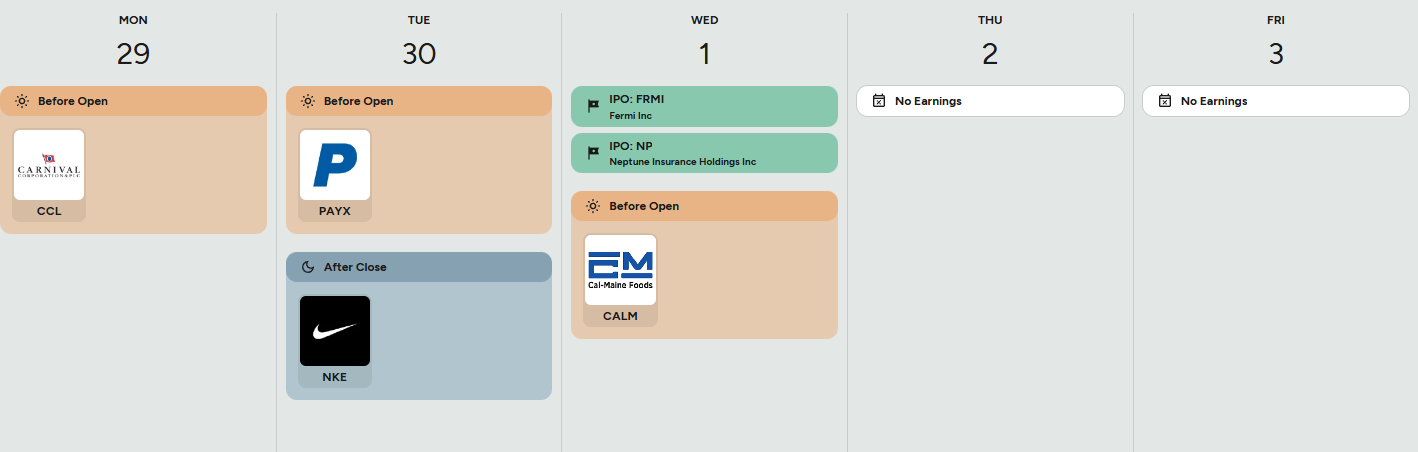
We close the month and quarter on Tuesday, with a government shutdown deadline at midnight the same day. The data focus shifts squarely to labor: JOLTS, ADP, Challenger, weekly claims, and Friday’s nonfarm payrolls will anchor the narrative. ISM prints, final PMIs, and Pending Home Sales are also due. Fed speakers will remain active, particularly early in the week. Internationally, China PMIs and European CPIs are on deck, with rate decisions from Australia and India. The earnings tape is lighter, but Nike, Carnival (CCL), and ConAgra headline, with Jefferies Financial Group (JEF) providing an off-cycle read on financials. For 9/29/2025 specifically, the docket includes Carnival Corp (CCL), IDT Corp (IDT), Jefferies Financial Group Inc (JEF), Lionsgate Studios Corp (LION), Progress Software Corp (PRGS), ReposiTrak Inc (TRAK), and Vail Resorts Inc (MTN).
Portfolio Framing: Where The Evidence Points Today
The data say the U.S. economy is holding up better than expected. The final Q2 GDP estimate came in +3.8% annualized versus +3.3% prior; consumption at +2.5% versus +1.7% expected was the driver. August personal income rose +0.4% versus +0.3% expected; real personal spending rose +0.4% versus +0.2% expected. The Bloomberg U.S. Economic Surprise Index (as cited) shows a clear recent uptick, and the Atlanta Fed’s GDP-Now model points to +3.9% for Q3 with consumption at +3.4%. The two variables to monitor for durability are labor and inflation. Labor looks to be stabilizing after a transient early-September claims spike. Inflation remains above target but in line with estimates, with headline PCE at +2.7% y/y and core at +2.9% y/y.
Risks remain. The market’s run-up has been fast and steep; October seasonality can be unfriendly; the shutdown probability is nontrivial. Historically, shutdowns have produced short-lived growth slowdowns that reverse, but the headlines can amplify volatility. If tariffs ratchet higher or broaden materially, goods inflation could grind up; services inflation, which is roughly 65% of PCE, remains the swing factor for the medium term.
In this setting, a diversified posture across U.S. large caps and mid caps with exposure to both growth and value factors is sensible. Sector-wise, Consumer Discretionary, Financials, and Health Care offer a balanced way to participate in upside while keeping an eye on defensiveness. Investment-grade bonds remain a portfolio ballast if equity volatility resets. For investors with outsized cash or cash-like positions, it is prudent to build a buy-list now, with levels in mind for staged entries should a standard 5%–10% pullback present itself. Over longer horizons, cash typically lags other asset classes and may not keep pace with inflation.
The tape is giving investors clear tells. Energy rides policy and barrels; Pharma is rewarded for domestic capacity; Semis are a policy lever; small caps are a rate derivative. In a week that began with another record S&P close and ended with a modest gain after midweek chop, the signal is straightforward: the market will still reward growth that is funded, inflation that is predictable, and policy that is legible. The rest is execution—company by company, print by print, week by week.

Weekly Benchmark Breakdown
This week looked more like steady repair than a thrust. Short-term participation improved across most lists, new lows stayed contained, and net new highs were positive over every major universe. Risk remains tilted to the upside, but the tape has not yet delivered the kind of intermediate-term confirmation that marks a durable advance. The clear trigger remains the 50-day cohorts pushing through and holding above about 60 percent while new highs keep outpacing new lows.
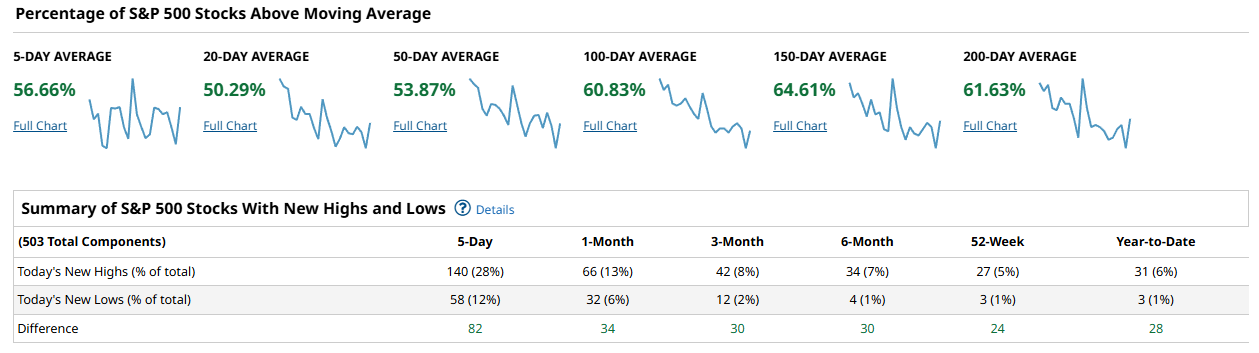
For the S&P 500, the short end firmed while the middle of the curve hovered just above neutral. The share above the 5d sits at 56.66 percent, the 20d at 50.29 percent, and the 50d at 53.87 percent. Longer measures are healthier with 60.83 percent above the 100d, 64.61 percent above the 150d, and 61.63 percent above the 200d. The new-highs minus new-lows spread is positive across lookbacks: +82 over 5 days, +34 over 1 month, +30 over 3 months, +30 over 6 months, +24 over 52 weeks, and +28 year to date. That mix says dips are bought and damage has been limited, but the 50d cohort still needs a stronger push to convert repair into trend.
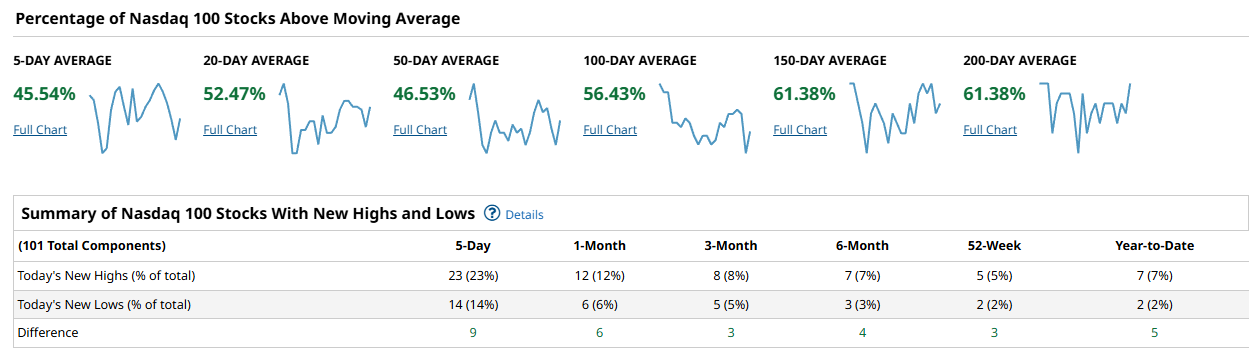
The Nasdaq 100 showed leadership that is still selective rather than broad. Near-term breadth is mixed with 45.54 percent above the 5d, but a better 52.47 percent above the 20d. The 50d sits at 46.53 percent, while the longer averages are sturdier with 56.43 percent above the 100d and 61.38 percent above both the 150d and 200d. Net new highs are positive but modest: +9 over 5 days, +6 over 1 month, +3 over 3 months, +4 over 6 months, +3 over 52 weeks, and +5 year to date. That profile fits a market where a handful of heavyweights keep the index resilient, but the intermediate cohort has not yet joined decisively. A sustained drive that lifts the 50d above 60 percent would be the clean confirmation that participation is widening beyond the marquee names.
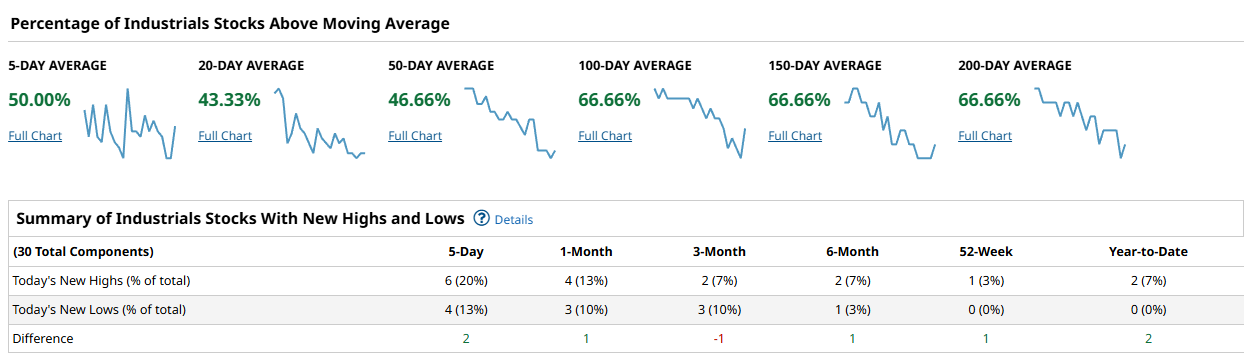
The Dow read as steady but not explosive. Only 50.00 percent are above the 5d and 43.33 percent above the 20d, with 46.66 percent above the 50d. The longer-term lines are stronger at 66.66 percent across the 100d, 150d, and 200d. Net new highs are slightly positive near term at +2 over 5 days and +1 over 1 month, slip to -1 over 3 months, and recover to +1 over 6 months, +1 over 52 weeks, and +2 year to date. That combination points to near-term chop inside a sturdier longer-term base, with cyclicals trying to reassert but defensives still doing a lot of the quiet work.
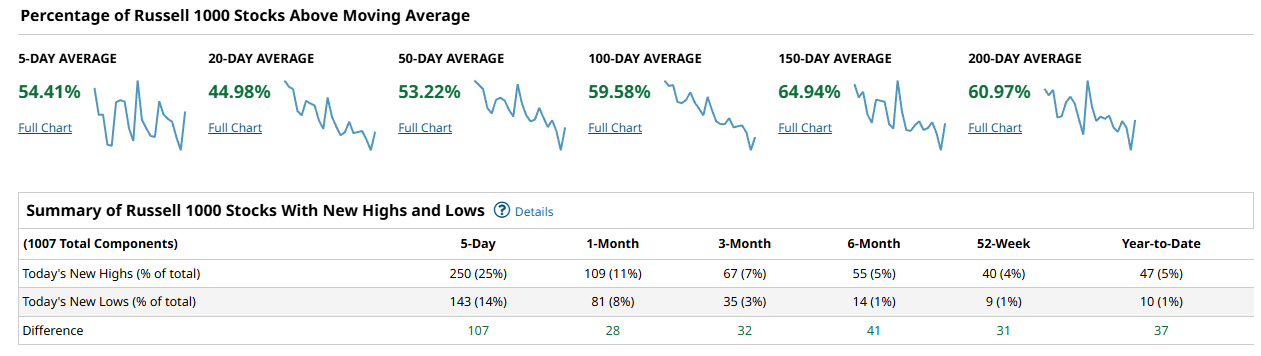
The Russell 1000 sent the clearest broad-market signal. Participation improved on the front end with 54.41 percent above the 5d and 44.98 percent above the 20d, while the 50d cohort held at 53.22 percent. Longer measures remain constructive with 59.58 percent above the 100d, 64.94 percent above the 150d, and 60.97 percent above the 200d. New highs beat new lows decisively: +107 over 5 days, +28 over 1 month, +32 over 3 months, +41 over 6 months, +31 over 52 weeks, and +37 year to date. That says the advance is not just a megacap story and that underlying repair continues to spread through the large-cap universe.
Stepping back, cap-weighted leadership remains intact, but the broad market is participating enough to keep the bull case alive. The most important tell is that long-term cohorts already sit north of 60 percent across all four lists, while the 50d cohorts are still stuck in the low-to-mid 50s for SPX and Russell 1000 and mid-40s for NDX and the Dow. A durable advance is confirmed if those 50d groups push and hold above 60 percent while net new highs remain positive across 5-day and 1-month windows. Concern would rise if the 20d cohorts roll back below 45 percent alongside a turn in net new highs to negative, which would flag a shift from buy-the-dip to sell-the-rip.
For the playbook this week, lean long but be selective. Favor liquid leaders and sectors where the 20d is rising and the 50d is pressing higher, especially inside the SPX and Russell 1000 where net new highs are already supportive. Use pullbacks toward rising 20d supports for entries and ask the 50d to keep improving as your hold-time trigger. Be cautious in areas where the Dow-style profile dominates, with sub-50 percent readings on the 20d and 50d and only marginal new-highs leadership. If the 50d cohorts push through 60 percent, extend holding periods and let winners run. If instead the 5d rolls over broadly and net new lows expand, shorten time frames and tighten risk until the next breadth reset.
Bottom line: breadth is constructive with positive net new highs and firm long-term trends, but the intermediate cohorts still owe us a push; stay net long while demanding the 50d groups do the confirming.

Investor Sentiment Report
Insider Trading
Insider trading occurs when a company’s leaders or major shareholders trade stock based on non-public information. Tracking these trades can reveal insider expectations about the company’s future. For example, large purchases before an earnings report or drug trial results might indicate confidence in upcoming good news.
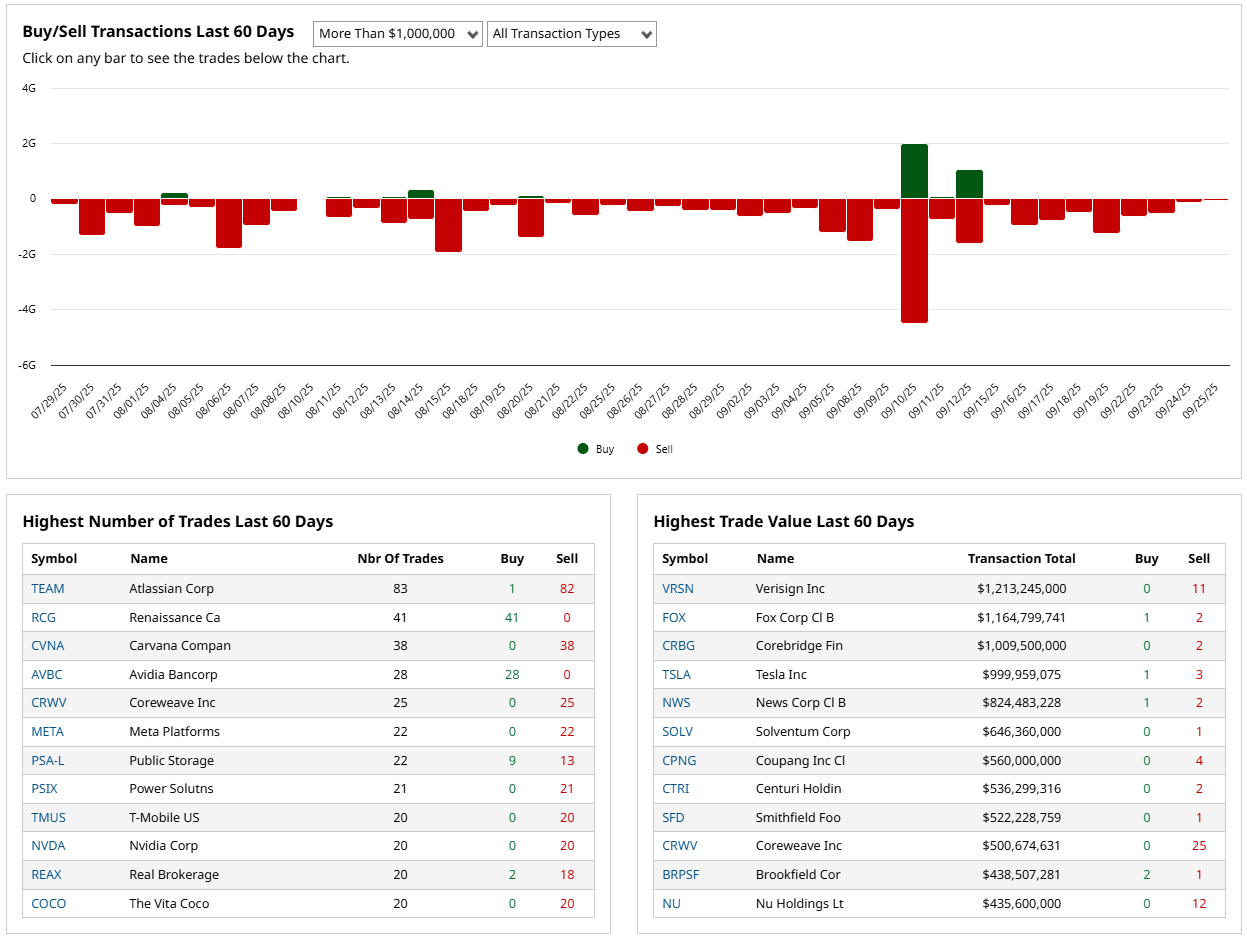
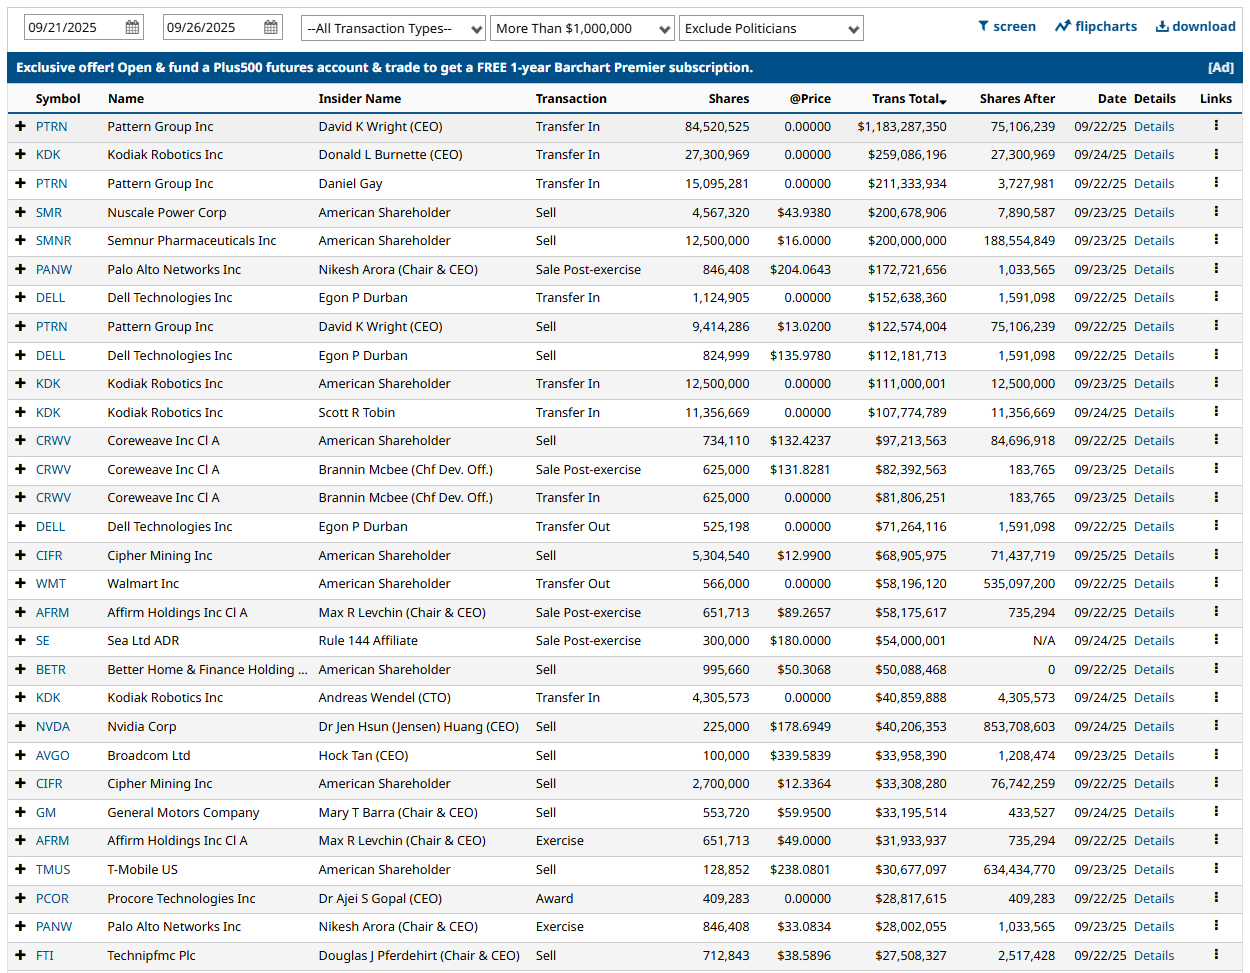
Insider flow over the last 60 days skews to distribution. The bar chart shows persistent net selling with only two brief buy spikes in mid-September and a large sell downdraft clustered the same week. By count, Atlassian (TEAM) posted 83 trades with 82 sells and 1 buy, Carvana (CVNA) logged 38 sells and no buys, Meta (META) 22 sells, Nvidia (NVDA) 20 sells, and T-Mobile (TMUS) 20 sells. Avidia Bancorp (AVBC) and Renaissance Capital (RCG) were notable accumulators with 28 and 41 buys, respectively, but they are smaller totals by value. On dollars, the tape is heavy: Verisign (VRSN) shows about $1.21B in sells, Fox class B roughly $1.16B with light offsetting buys, Corebridge (CRBG) near $1.01B in sells, Tesla (TSLA) just under $1.0B, Solventum (SOLV) about $646M, and Nu Holdings (NU) around $436M, while CoreWeave shows roughly $501M in sells. This week’s top tickets continue the pattern: Palo Alto Networks chair sold post-exercise about 846k shares for roughly $172.7M, Nvidia’s CEO sold 100k shares near $33.96M, Dell’s Egon Durban executed multiple sales north of $100M, NuScale printed a $200.7M sale, and several CoreWeave entries recorded sizable dispositions. Many entries are transfers or post-exercise sales, but open-market sells dominate the biggest tickets. Net read: insiders are distributing into strength. A persistent shift toward multiweek net buying across large caps would be required to flip this signal.
%Bull-Bear Spread
The %Bull-Bear Spread measures the gap between bullish and bearish investor sentiment, often from surveys like AAII. It’s a contrarian indicator—extreme optimism may signal a coming pullback, while extreme pessimism can hint at a potential rally. Large positive or negative spreads often mark market turning points.
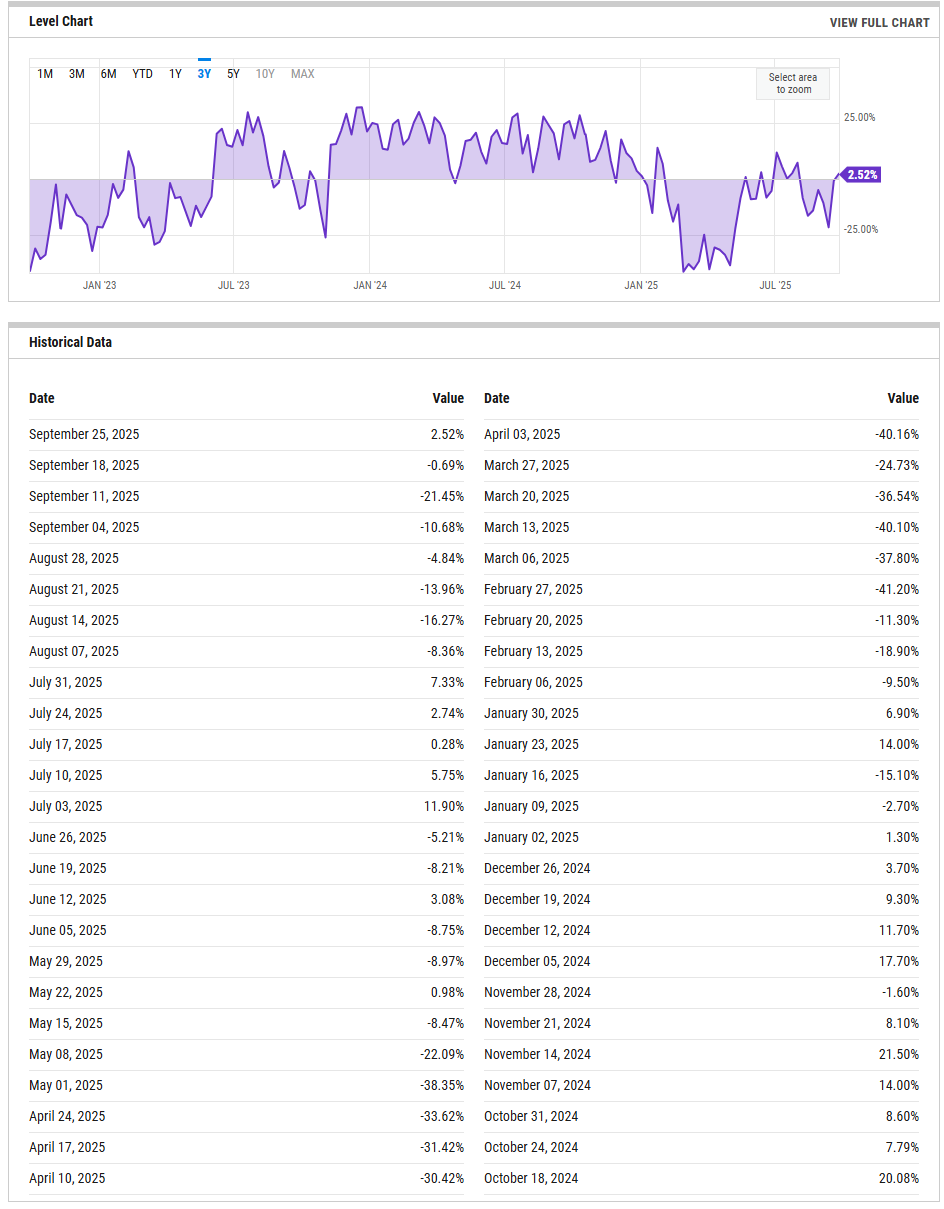
The bulls minus bears spread has recovered to +2.52 percent as of September 25 from -0.69 percent a week earlier and -21.45 percent two weeks ago. The bounce back to a small positive suggests sentiment has normalized from a quick bout of pessimism, but it is far from frothy. Historically, sub-zero reads are contrarian supportive for rebounds, while sustained moves above roughly +20 flag crowding risk. If the spread climbs into the high teens or above, it would warn of a more vulnerable tape; a relapse back below zero, especially after this quick repair, would argue for a choppier market with softer dip demand.
NAAIM Exposure Index
The NAAIM Exposure Index (National Association of Active Investment Managers Exposure Index) measures the average exposure to U.S. equity markets as reported by its member firms. These are typically active money managers who provide their equity exposure levels weekly. The index offers insight into how much these managers are investing in equities at any given time, ranging from being fully short (-100%) to leveraged long (up to +200%).
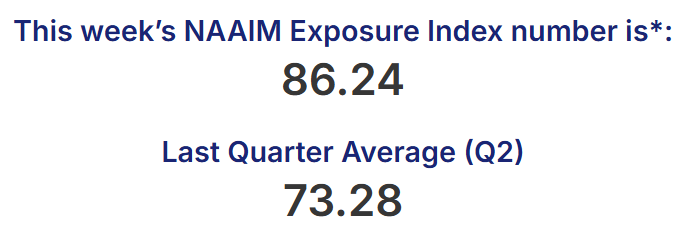
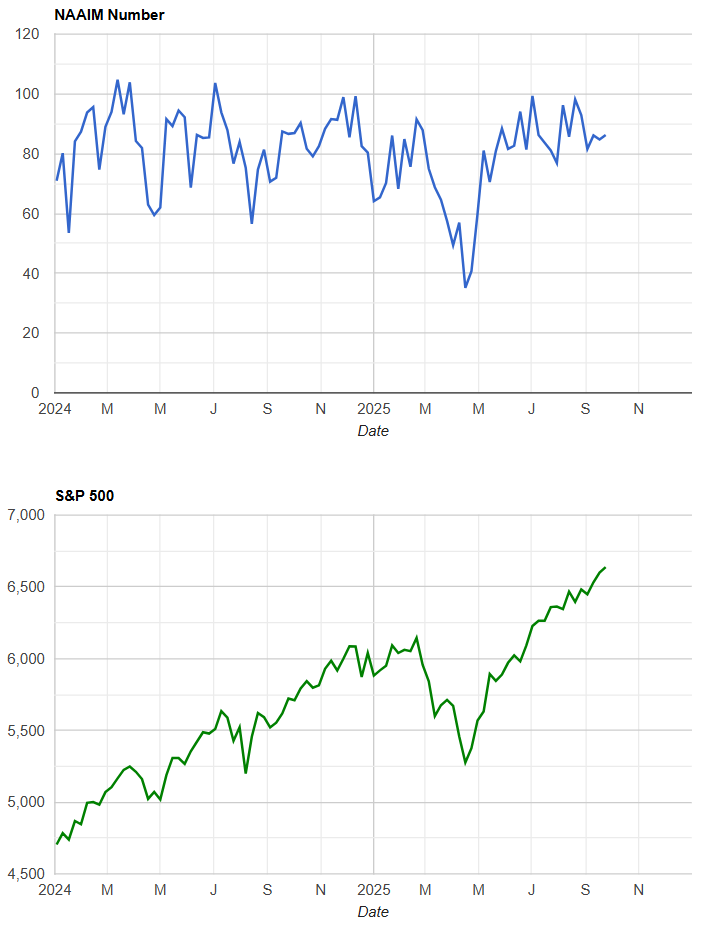

Active managers remain well invested. The latest print is 86.24 on September 24, essentially unchanged from 84.76 and 86.11 over the prior two weeks. That keeps exposure in the upper band of the year and implies limited dry powder if price backs off. The posture is constructive while trends are intact, but it makes the market more sensitive to negative catalysts. A slide toward the 50s without major price damage would mark a healthy reset and improve forward odds; a push back into the 90s would indicate full risk on and set up a sharper reaction to suprises.
CBOE Total Put/Call Ratio
CBOE's total put/call ratio includes index options and equity options. It's a popular indicator for market sentiment. A high put/call ratio suggests that the market is overly bearish and stocks might rebound. A low put/call ratio suggests that market exuberance could result in a sharp fall.
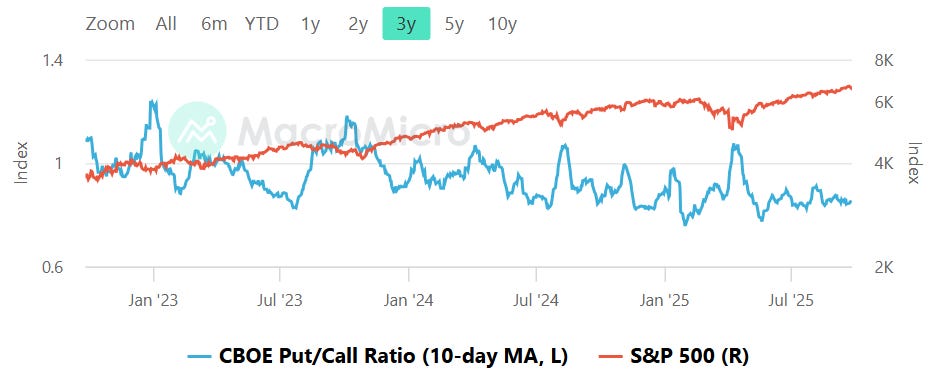
The 10-day average sits in a midrange zone, well off the fearful highs seen during episodic spikes and above the froth that followed summer rallies. In practical terms, that suggests hedging is present but not panicked, which tends to shallow drawdowns and reduce the odds of violent bear squeezes. The tripwires are straightforward. A drift down toward roughly 0.8 would flag complacency and raise risk of air-pocket selloffs. A rise back toward 1.0 to 1.1 would indicate growing caution and usually improves the quality and durability of subsequent bounces.
Equity vs Bond Volatility
The Merrill Lynch Option Volatility Estimate [MOVE] Index from BofAML and the CBOE Volatility Index [VIX] respectively represent market volatility of U.S. Treasury futures and the S&P 500 index. They typically move in tandem but when they diverge, an opportunity can emerge from one having to “catch-up” to the other.
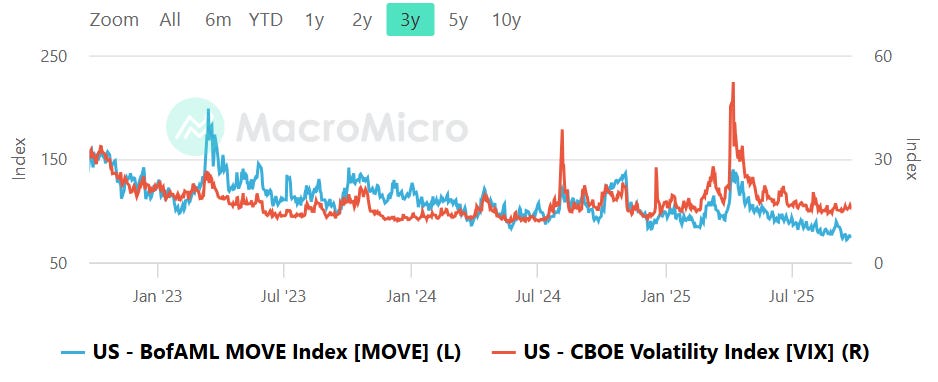
Both curves remain subdued relative to last year’s peaks. MOVE has cooled meaningfully from the 2023 spikes and trends sideways to lower, while VIX sits in a low-teens regime with only brief upticks. There is no glaring divergence at the moment; bond vol is not screaming stress ahead of equities, and equity vol has not decoupled on the upside. The main tripwire would be a MOVE surge north of roughly 120 while VIX stays sleepy, which often precedes equity weakness, or a VIX break into the high teens to low 20s that would signal a shift from orderly pullbacks to disorderly selling.
CNN Fear & Greed Constituent Data Points & Composite Index
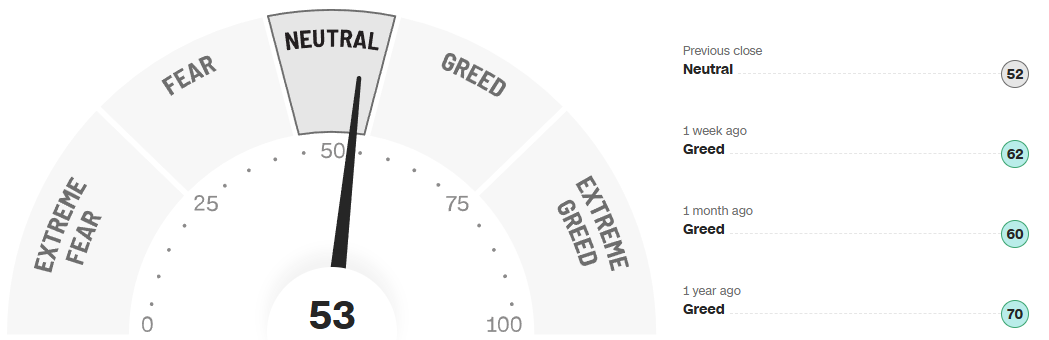
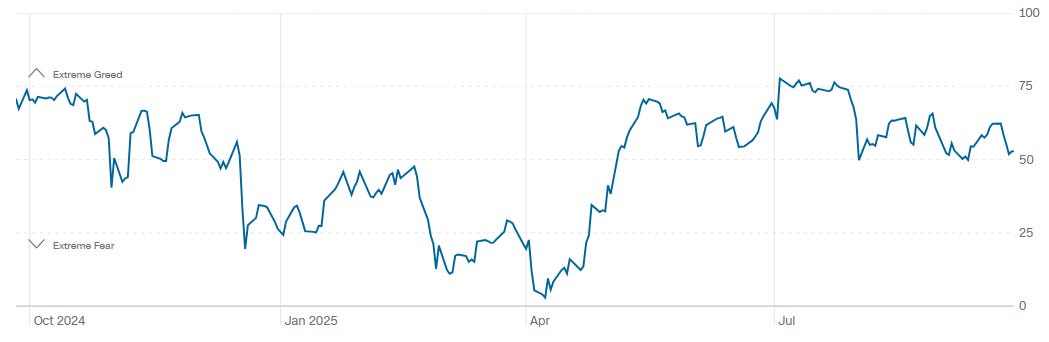
The composite reads 53, up from 52 at the prior close but down from 62 a week ago and 60 a month ago; one year ago sat near 70. The one-year path shows a migration from strong greed in spring to a midrange regime through late summer and early fall. With a 53 print, the market is neither washed out nor euphoric. A push toward the high 70s would flag momentum fatigue and a higher probability of negative asymmetry. A slide toward the low 40s or below would improve the prospective reward by resetting positioning and sentiment without requiring deep price damage.
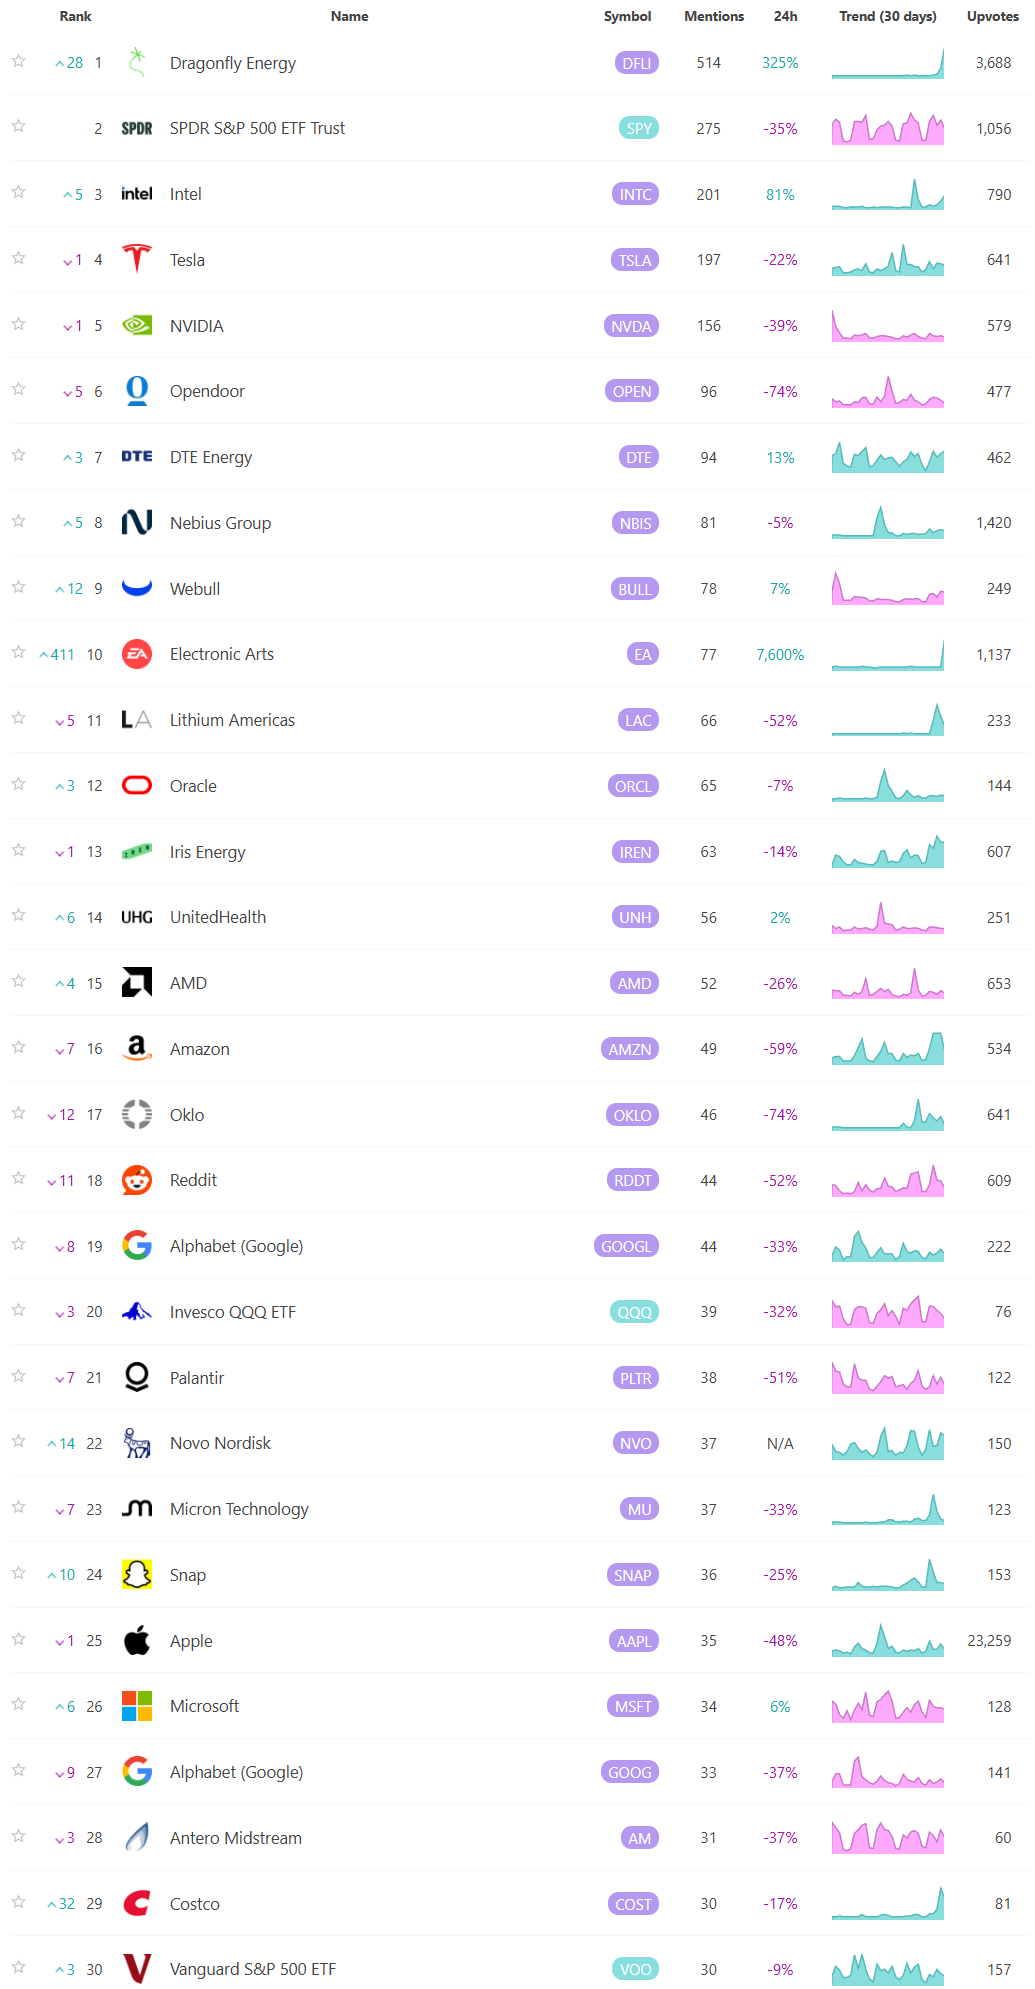
Social Media Favs
Social sentiment offers a real-time view of investor mood, often revealing market shifts before traditional indicators. It can signal momentum changes, spot emerging trends, and gauge retail investor impact—especially in high-volatility names. Tracking sentiment around events or earnings provides actionable insights, and when layered with quantitative models, can enhance predictive accuracy and risk management. Sustained sentiment trends often mirror broader market cycles, making this data a valuable tool for both short-term trades and long-term positioning.

Technician’s Playbook: Trading the Majors (SPY/QQQ/IWM/DIA)
When you’re a large institutional player, your primary goal is to find liquidity - places to do a ton of business with the least amount of slippage possible. VolumeLeaders.com automatically identifies and visually plots the exact spots where institutions are doing business and where they are likely to return for more. It’s one of the primary reasons “support” and “resistance” concepts work and truly one of the reasons “price has memory”.
SPY
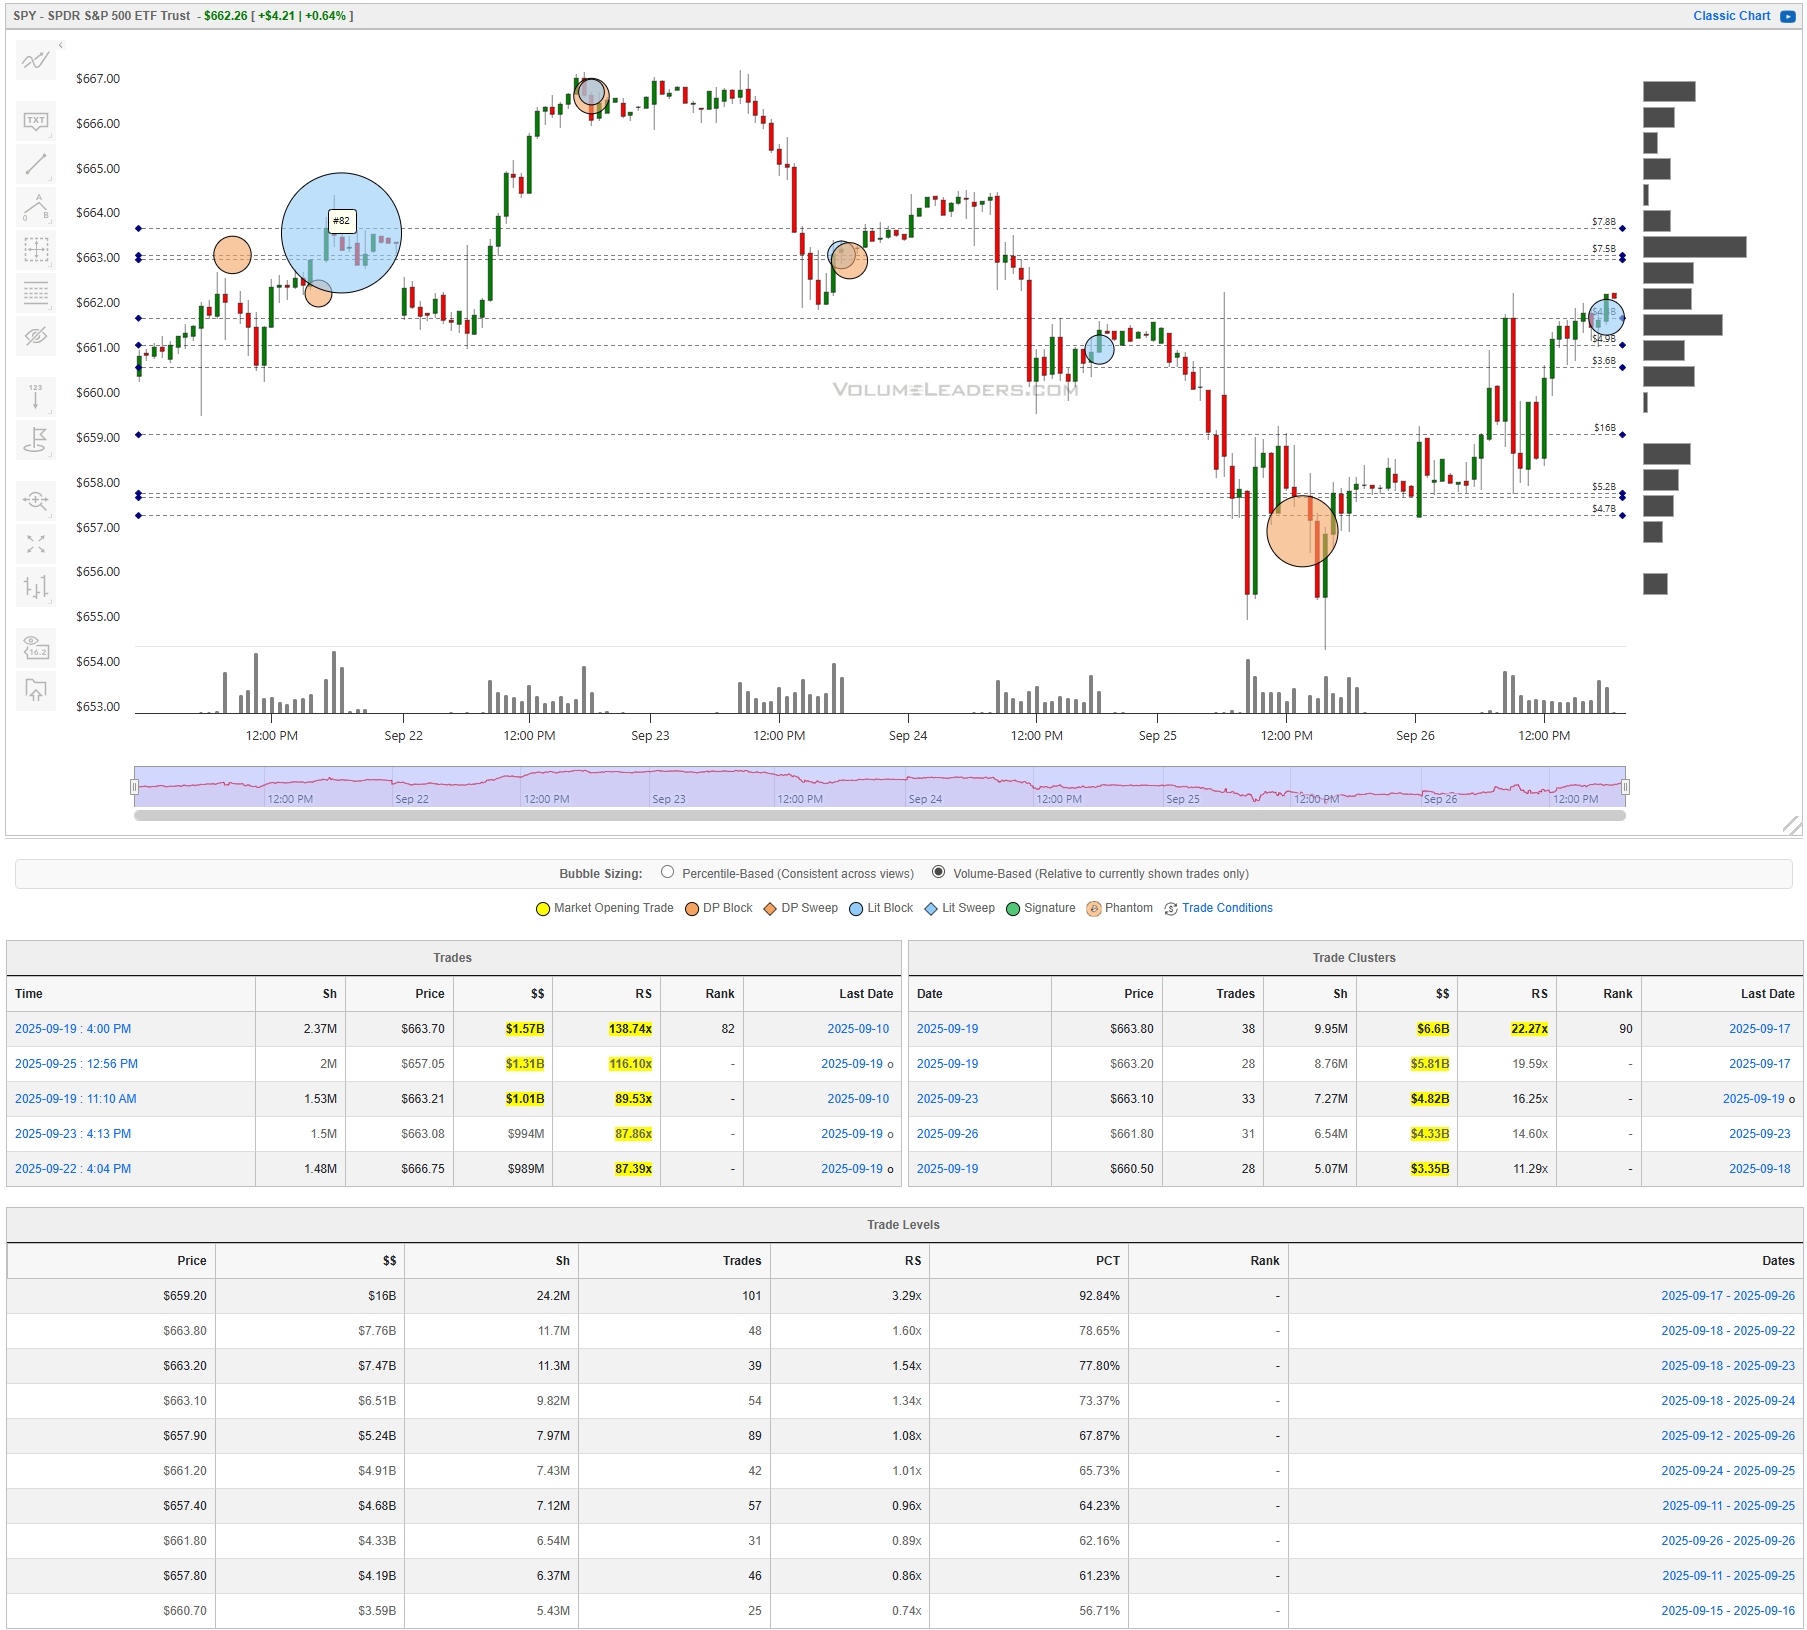
The path was sell, stabilize, and repair into a tight mid 660s decision zone. Early weakness faded into a higher-low base and buyers pressed back through the low 660s, stalling beneath layered supply in the 662s to 663s. Size showed up on both sides, with multiple multi-million share blocks printed around the low 660s and a run of clusters in the 8M to 10M dollar range. Those dollars tell you this band is where control is changing hands. The working line of scrimmage is the low 660s; hold above and the tape can convert overhead supply into support and re-attack the recent highs in the upper 660s. Slip back through 659s and the bounce degrades into a rotation back toward the upper 650s demand that absorbed the midweek break. Bull path: accept above the 661 shelf, backfill shallowly into 660.5 to 661, and pivot higher; confirmation is fresh clustering on upticks and higher lows holding above roughly 659.8. Bear path: fail repeatedly in the 662s to 663s and break back below 659s; lose the upper 650s shelf and the week’s repair reads as distribution. Tactically, lean long on pullbacks that hold 660.5 to 661 with risk a point below and first targets into 662.5 to 663; fade spikes into 662.8 to 663.5 only if momentum stalls and use the prior high as a hard stop.
QQQ

This tape advertised intent with a headline block: about 2.7M shares near 599.95 tagged as a top-100 print (rank 2) with RS over 260x. It was not isolated. Follow-on blocks stacked through the 599s and 598.9s with RS readings north of 100x, and cluster dollars concentrated between roughly 599 and 602, including a 5.26M group near 602 with ~21x RS. That leaves a clean hinge at 600. Above 600 to 602, prior supply becomes a springboard and opens the door to 603s and the earlier breakdown area. Back below 599.5, control flips to sellers and the next magnets are the 598s down into 596.5 where the Level ladder thickens. Bull path: convert 600 from ceiling to floor, then print fresh clusters on strength through 601.5 to 602; confirmation is higher lows that never revisit 599.5. Bear path: reject 601 to 602, then crack 599.5 and accelerate into the 598s; negation is a swift reclaim of 600 with good participation. For execution, frame longs against 599.5 with risk under 598.9 and scale into 601.8 to 602.2; lean short only if 601.8 to 602.5 caps a rally and momentum rolls, with covers back into the 599s.
IWM
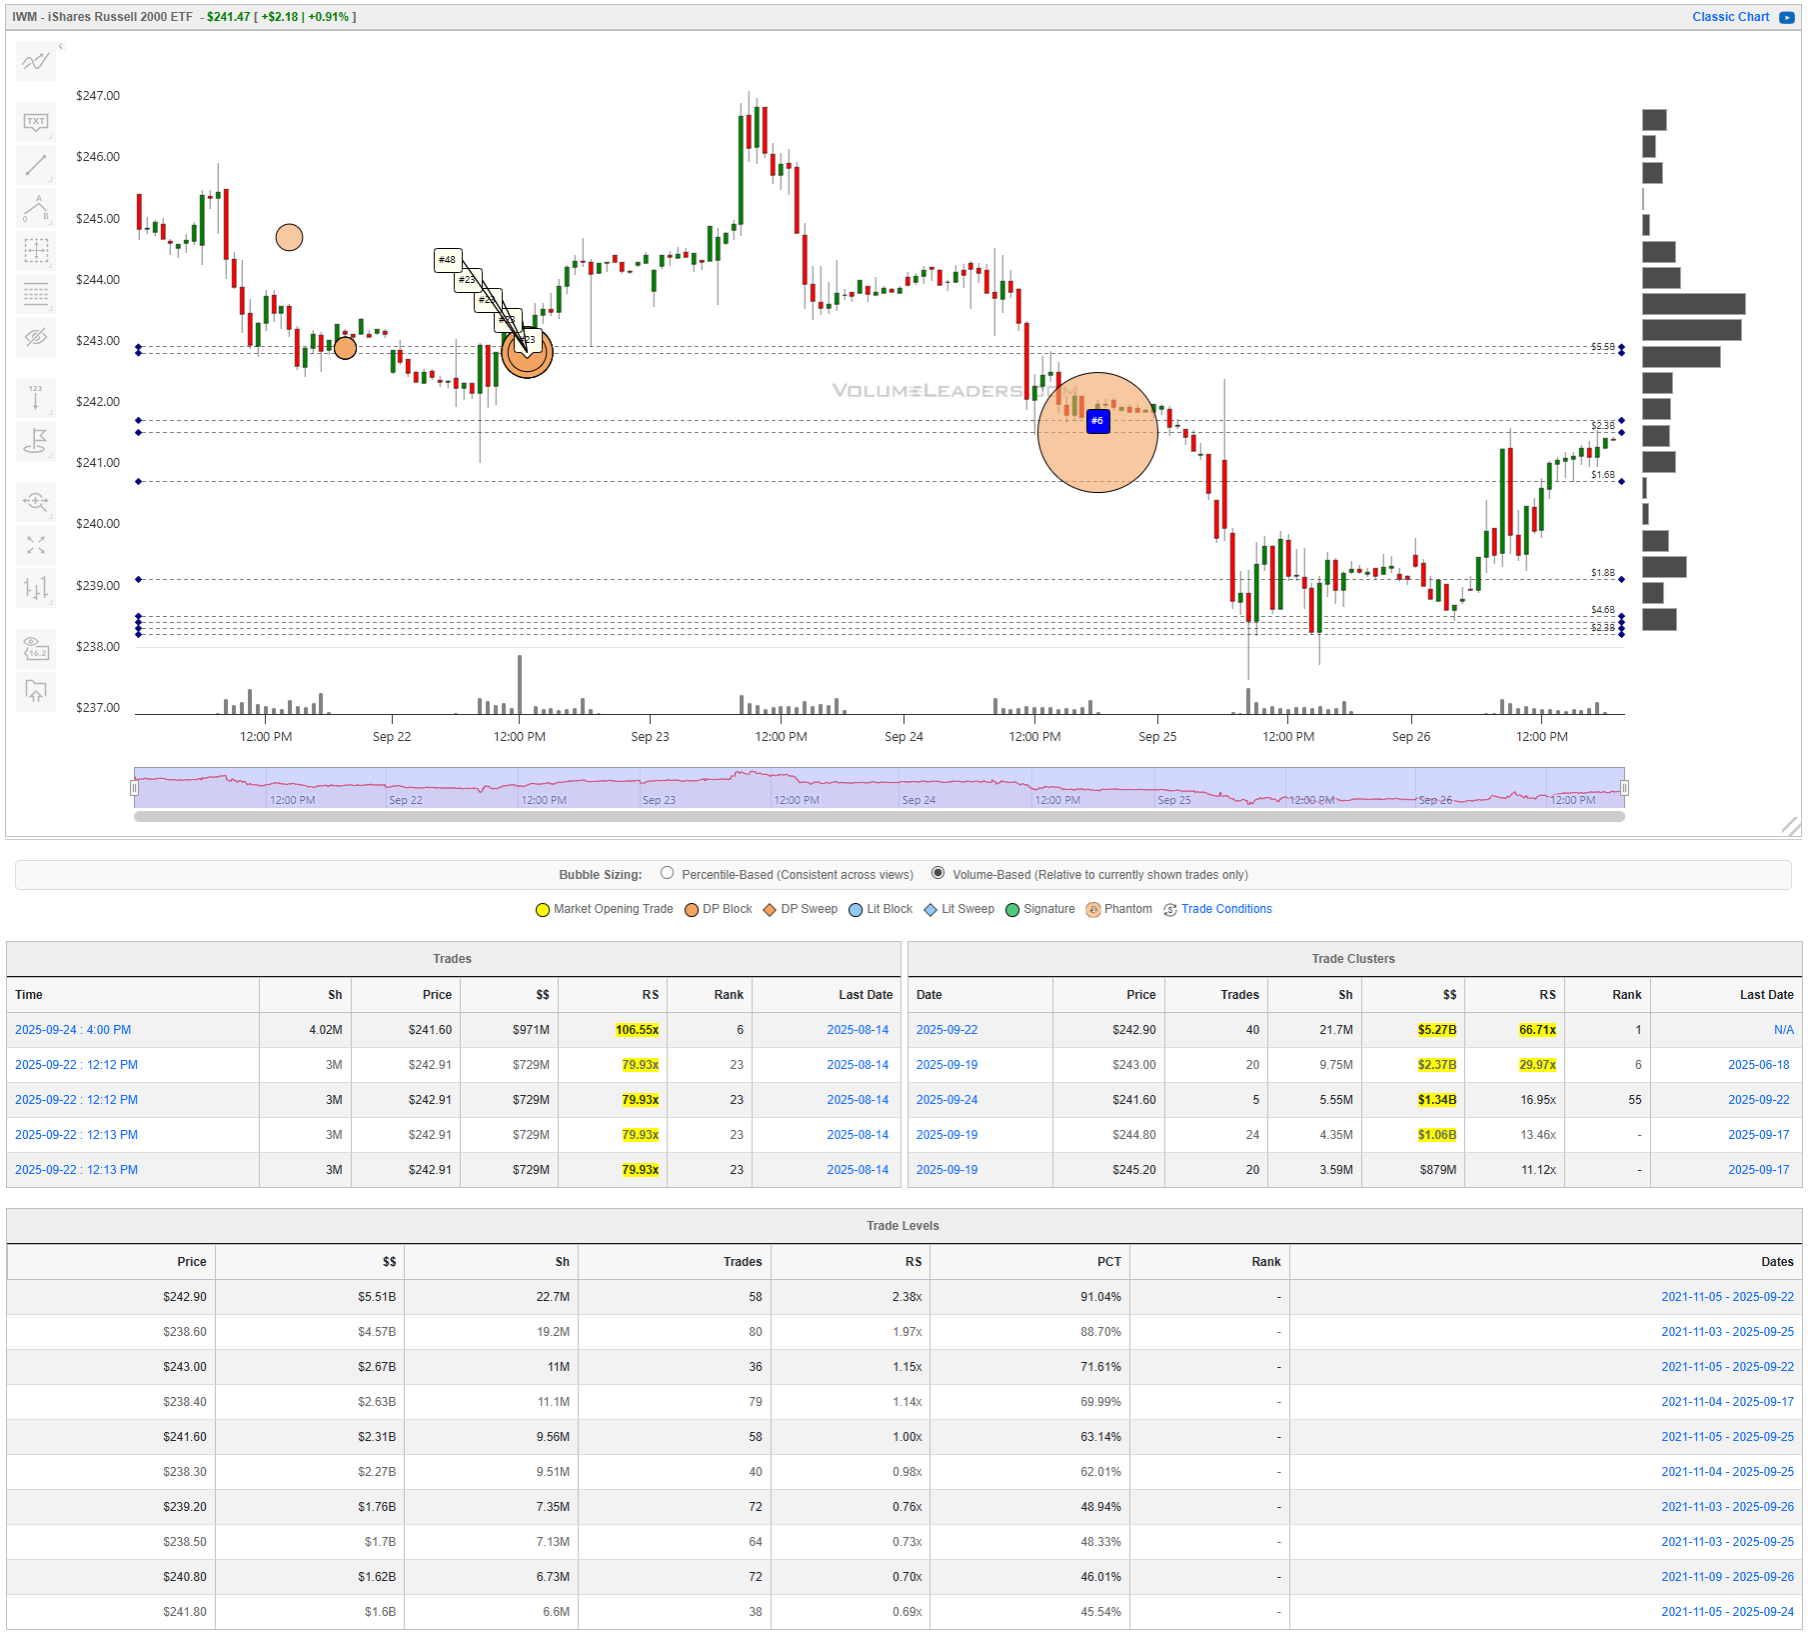
Small caps took the hardest hit midweek and then found footing. Real size printed into the low 242s to low 241s, including about 4.0M shares near 241.60 with RS above 100x, plus 3.0M-share blocks around 242.9 and 242.6 with elevated RS. Clusters echo that story: roughly $5.27M at ~66x RS near 242.9 and about $3.13M near 241.5 around 29x RS. The Level staircase is tight through 242.9, 241.6, 240.8, and 240.0. That defines the range. The first pass/fail is 241.5 to 242.0; acceptance above puts 242.9 to 243.2 in play where heavy dollars already sit. Failure back below 241.5 hands it to sellers for a test of 240.8, and a break there aims at 240.0 and the high 238s. Bull path: build value above 242.0, then convert 242.9 from supply to support; confirmation is a series of higher lows and fresh clusters printing on strength. Bear path: stall in the 242.8 to 243 zone, roll back under 241.5, and press through 240.8; negation is an immediate reclaim of 242 with rising participation. Tactically, buy pullbacks that hold 241.5 with risk beneath 240.8 and aim first for 242.8 to 243.2; fade into 242.8 to 243 only if tape stalls and breadth in small caps does not confirm.
DIA
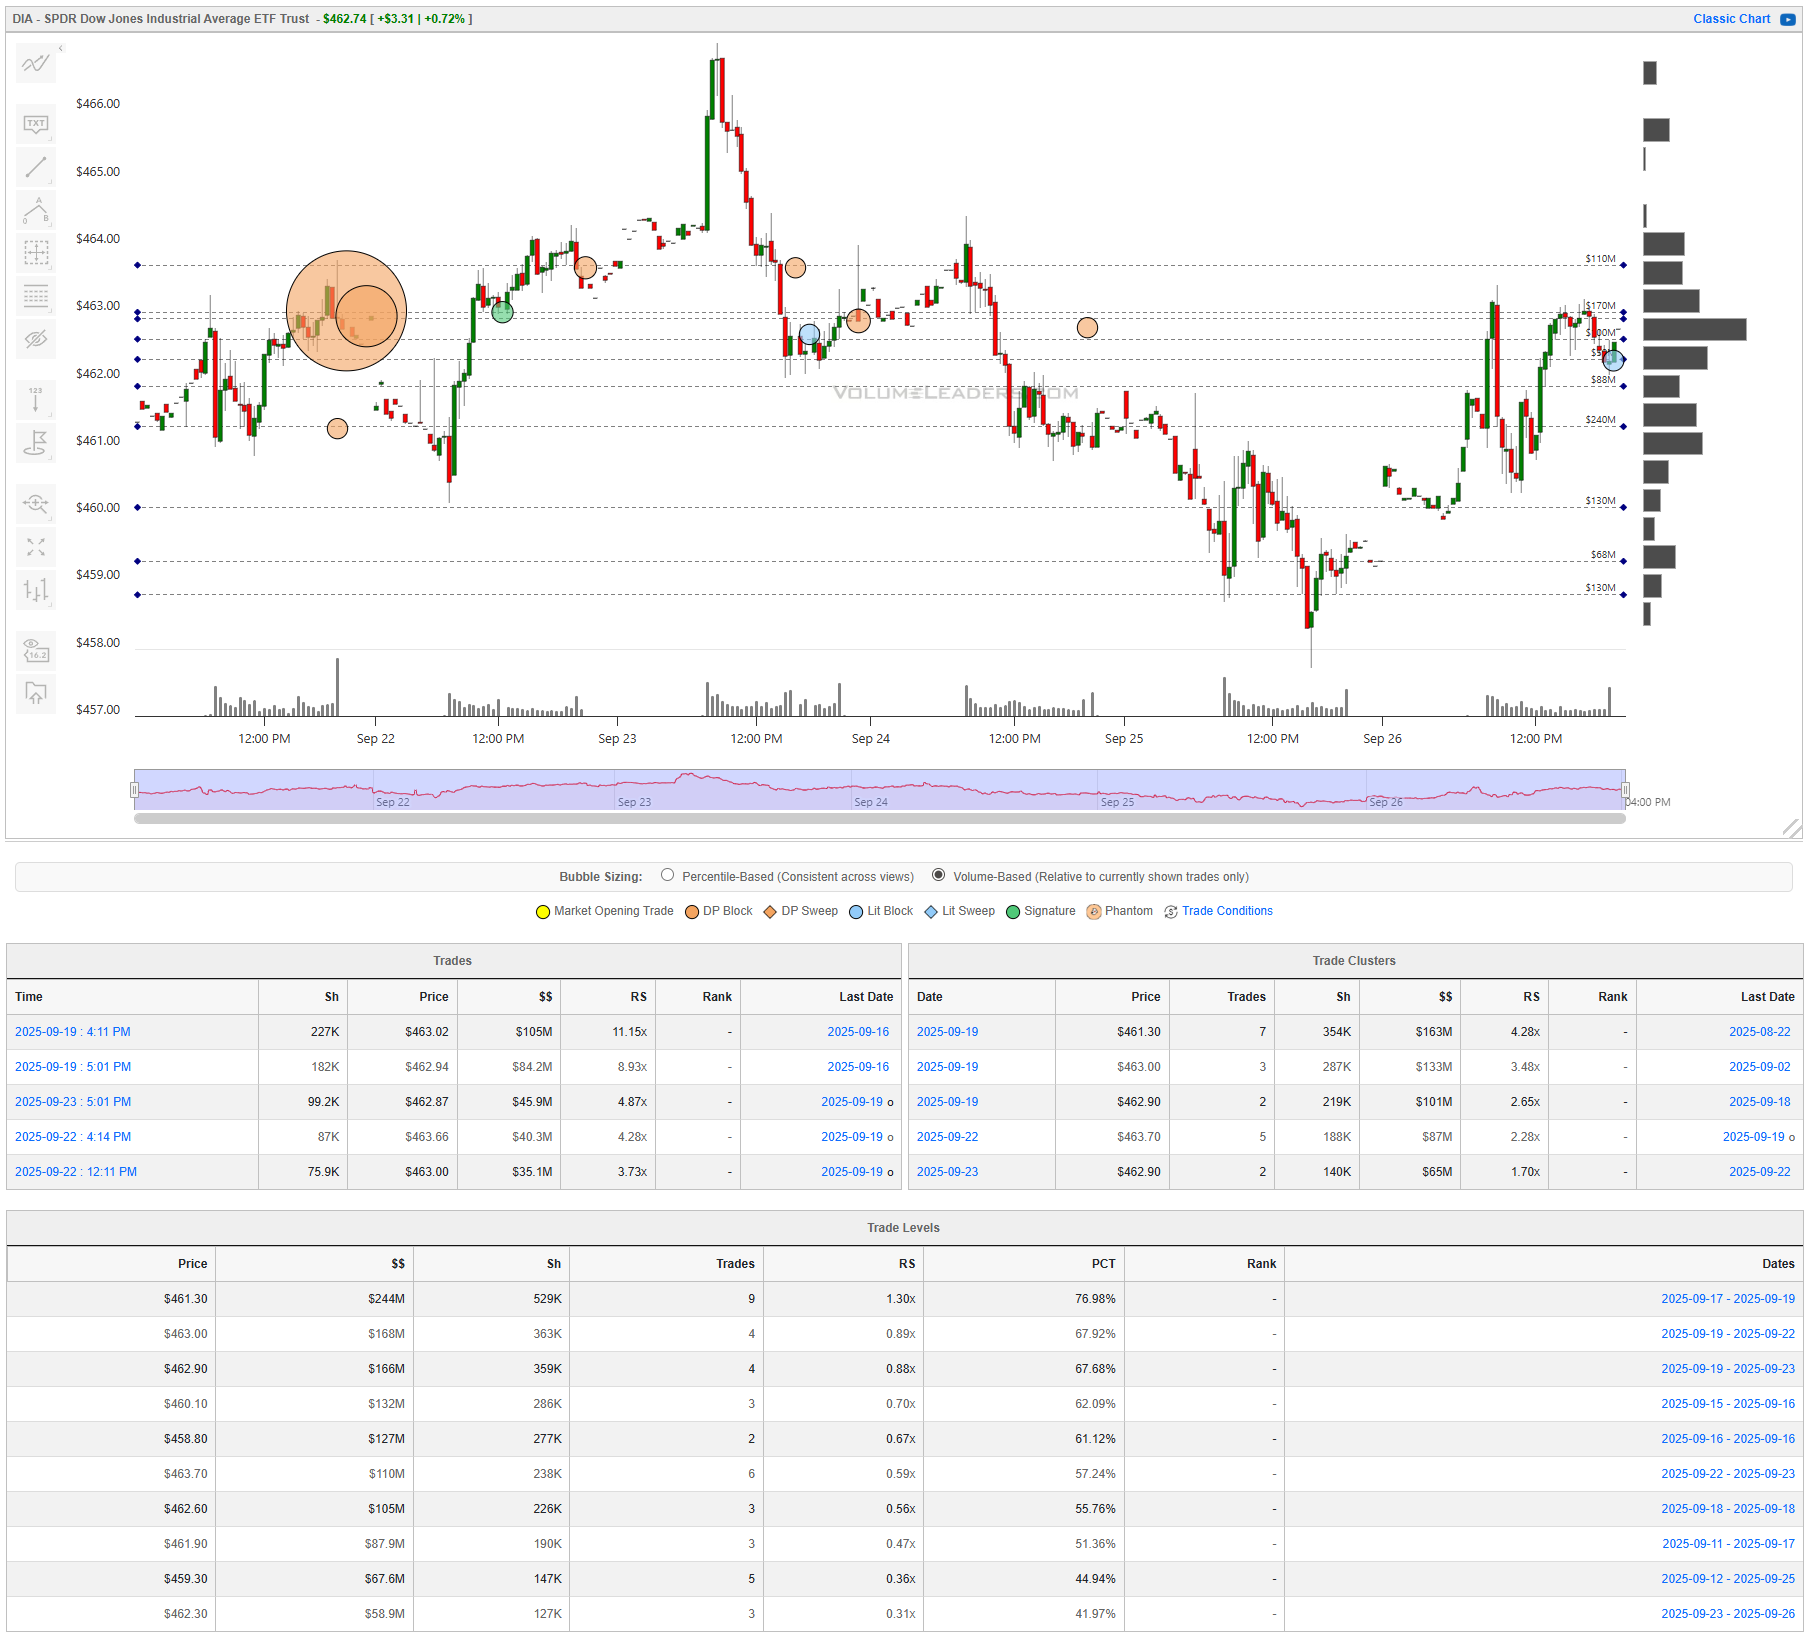
The Dow was a choppy range that broke midweek and repaired into a very local 483 pivot. Notable prints and clusters are smaller than in the tech funds but are concentrated from the high 482s to just over 483, while the Level list steps neatly through 483.3, 482.9, 482.3, 481.9, and 481.0. That gives the tape a straightforward playbook. Above 483, acceptance and build point to 484s and the recent swing highs; confirmation is higher lows that keep price pinned above 482.9 and fresh clustering on upticks. Below 482.3, momentum flips and a drift into 481.9 is the base case; lose 481.9 and 481.0 is the next magnet. Bull path: quick backfill that holds 482.9 to 483.0 and pivots higher into 484. Bear path: repeated failures in the 483s followed by a slip through 482.3; negation is an immediate reclaim of 483 with expanding trade count. Practically, lean long on dips holding 482.3 with risk under 481.9 and first targets into 483.3 to 484; fade strength only if the 483s cap a rally and the tape rolls, then cover down into 482.3 to 481.9.
Bottom line: all four funds rallied back to nearby decision shelves; if SPY holds low 660s, QQQ converts 600, IWM reclaims 242s, and DIA accepts above 483, momentum can extend, but failure at those hinges hands the ball back to sellers and resets this repair to rotation rather than trend.

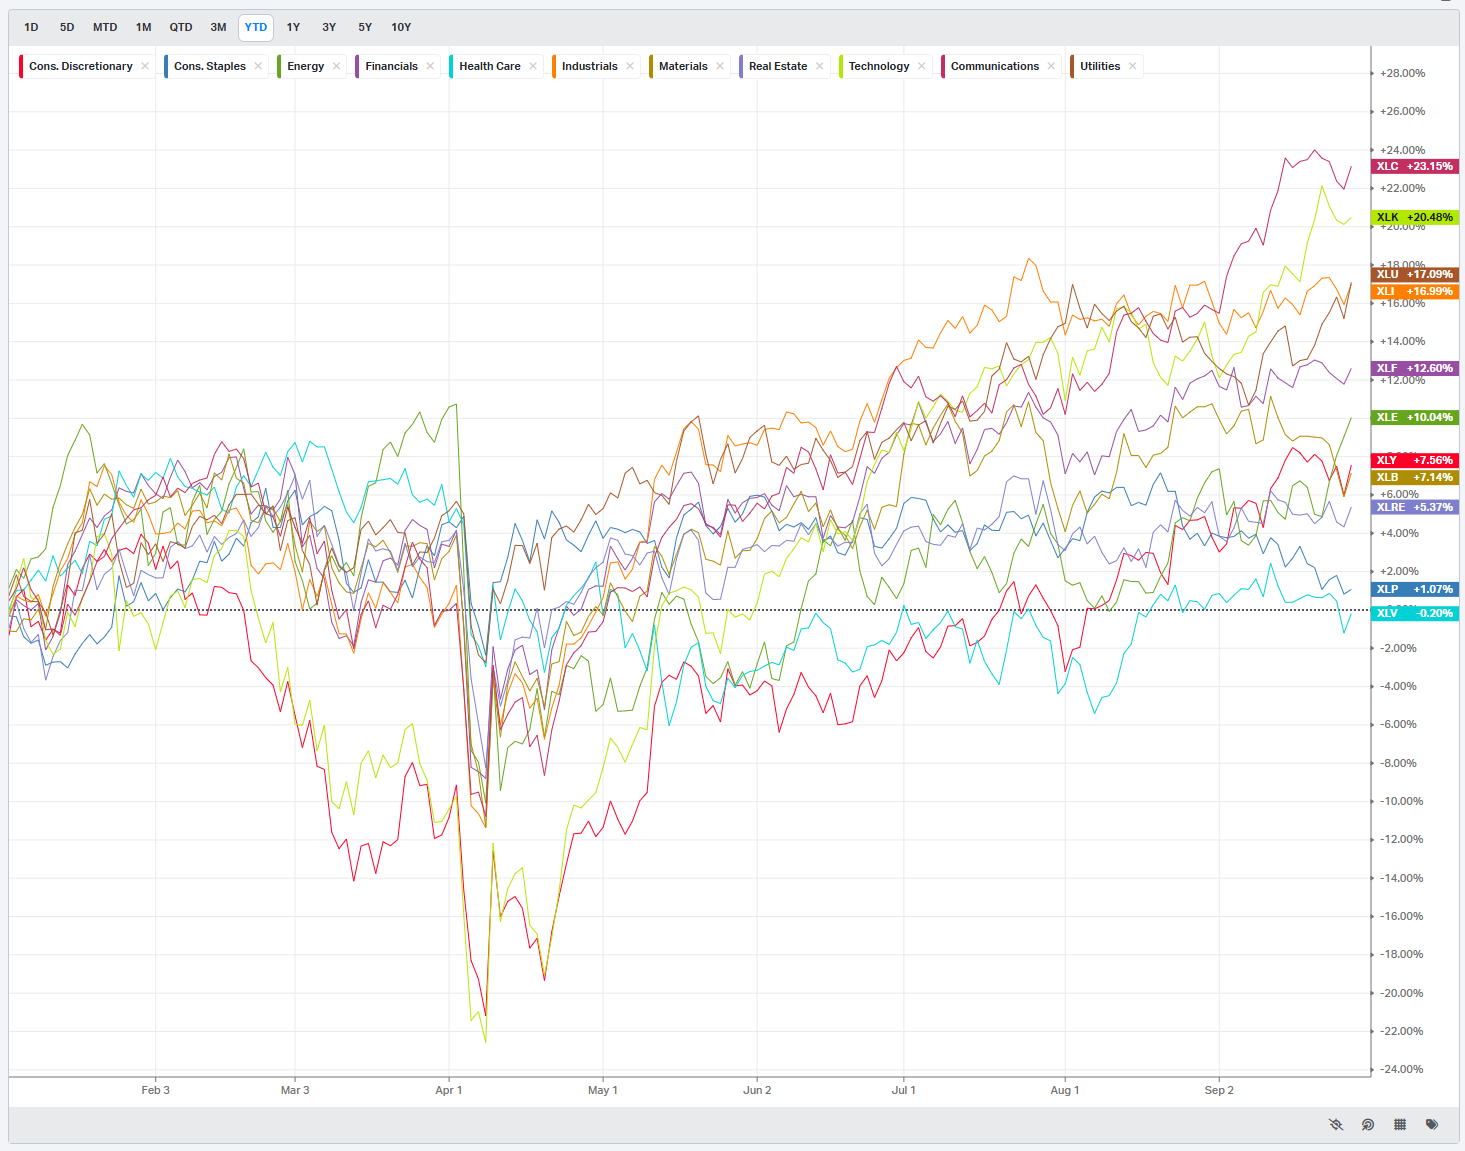
Summary Of Thematic Performance YTD
VolumeLeaders.com offers a robust set of pre-built thematic filters, allowing you to instantly explore specific market segments. These performance snapshots are provided purely for context and inspiration—think about zeroing in on the leaders and laggards within the strongest and weakest sectors, for example.
S&P By Sector
S&P By Industry
Commodities: Energy & Metals
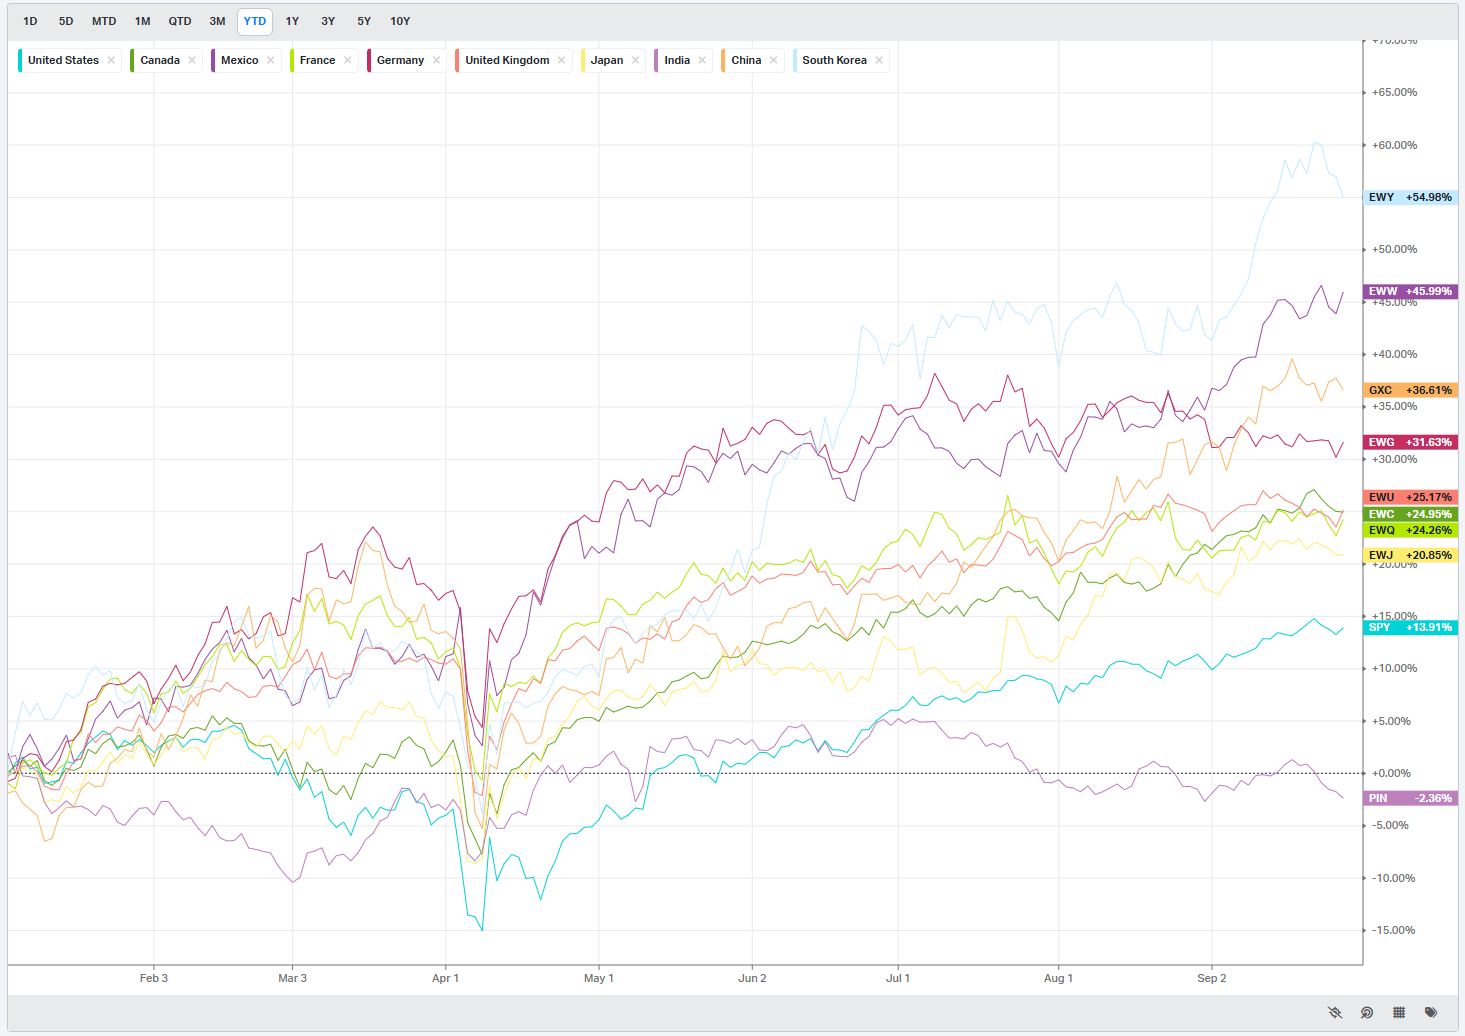
Country ETFs
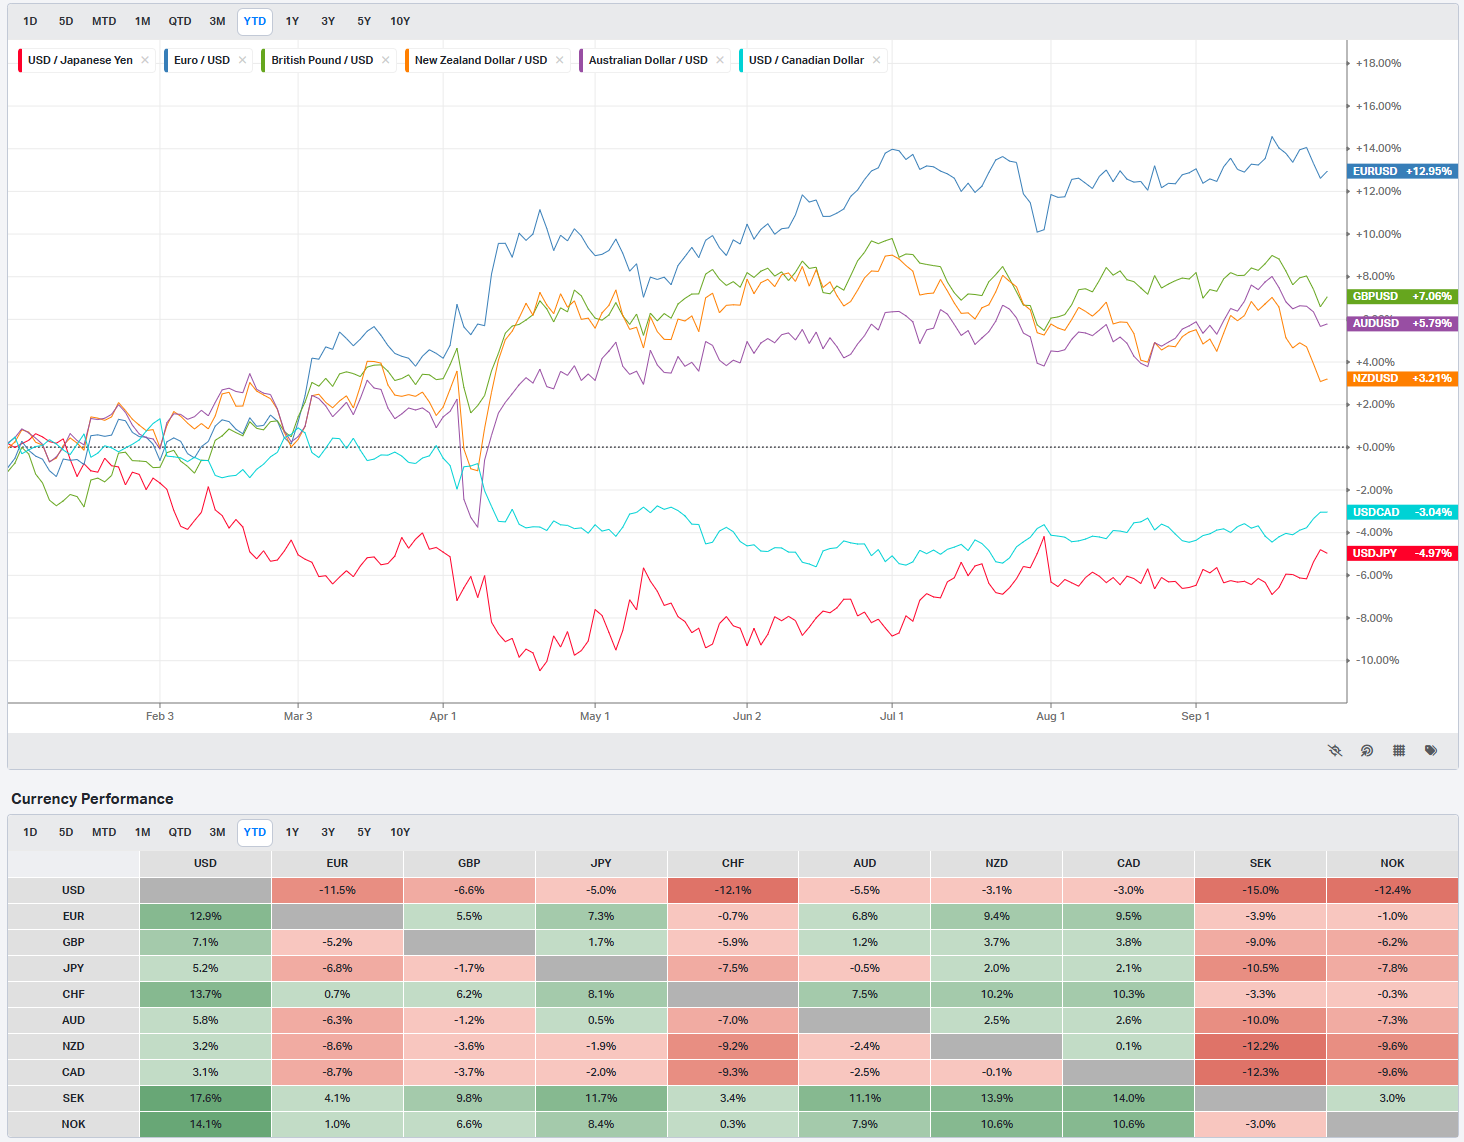
Currencies/Major FX Crosses
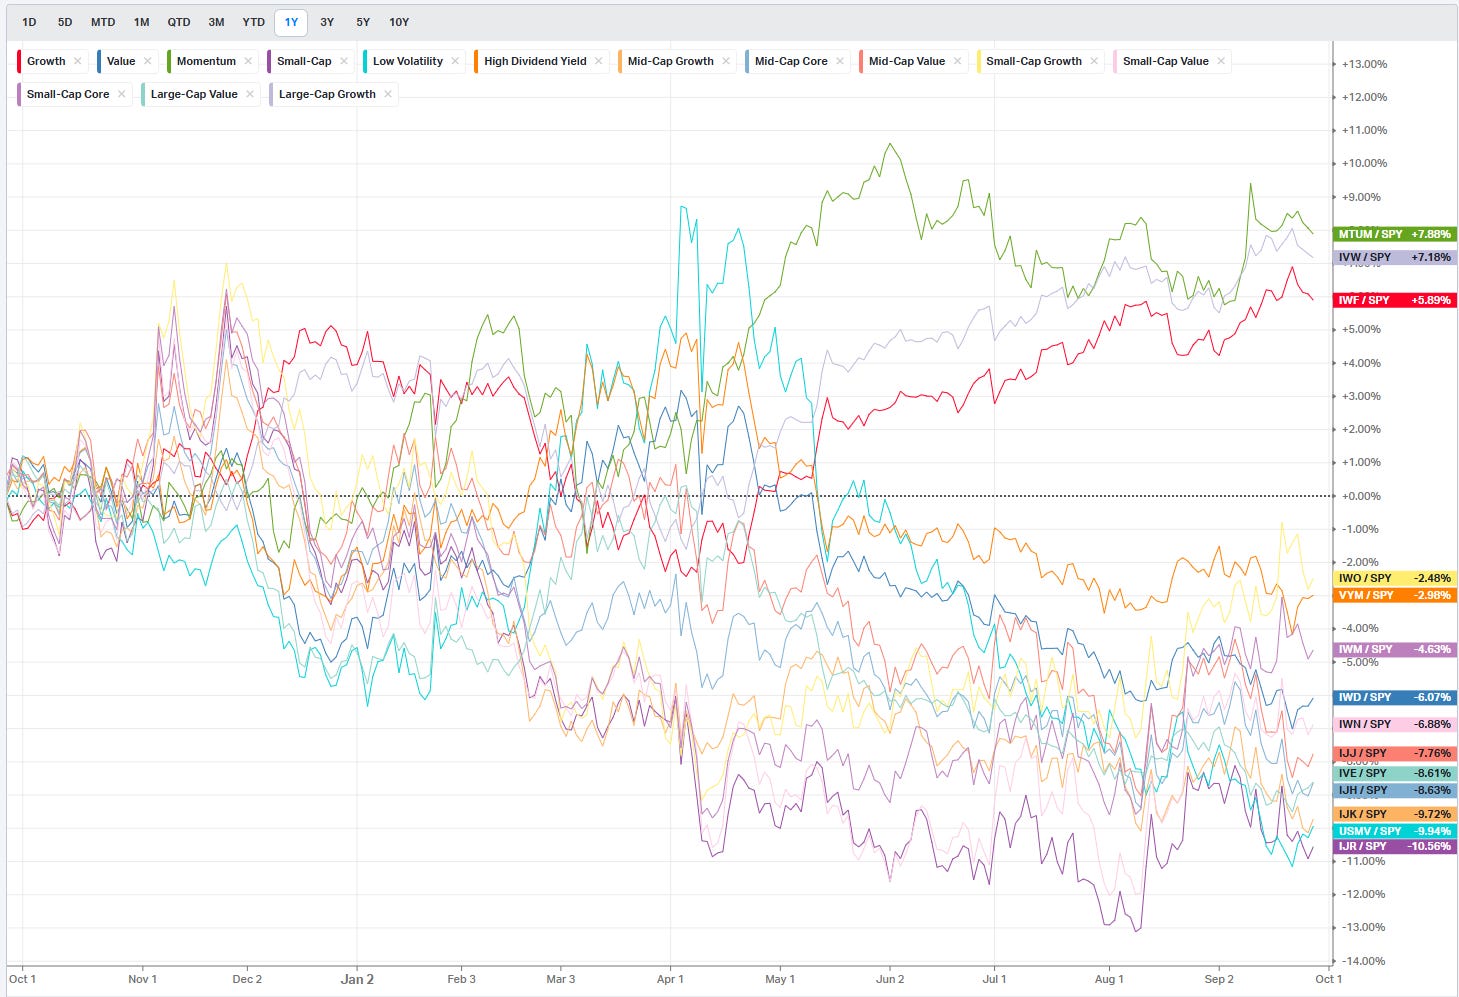
Factors: Style vs Size-vs-Value

Events On Deck This Week
Here are key events happening this week that have the potential to cause outsized moves in the market or heightened short-term volatility.
The week builds toward jobs and services, with a steady drumbeat of Fed speak and a few growth checks in between.
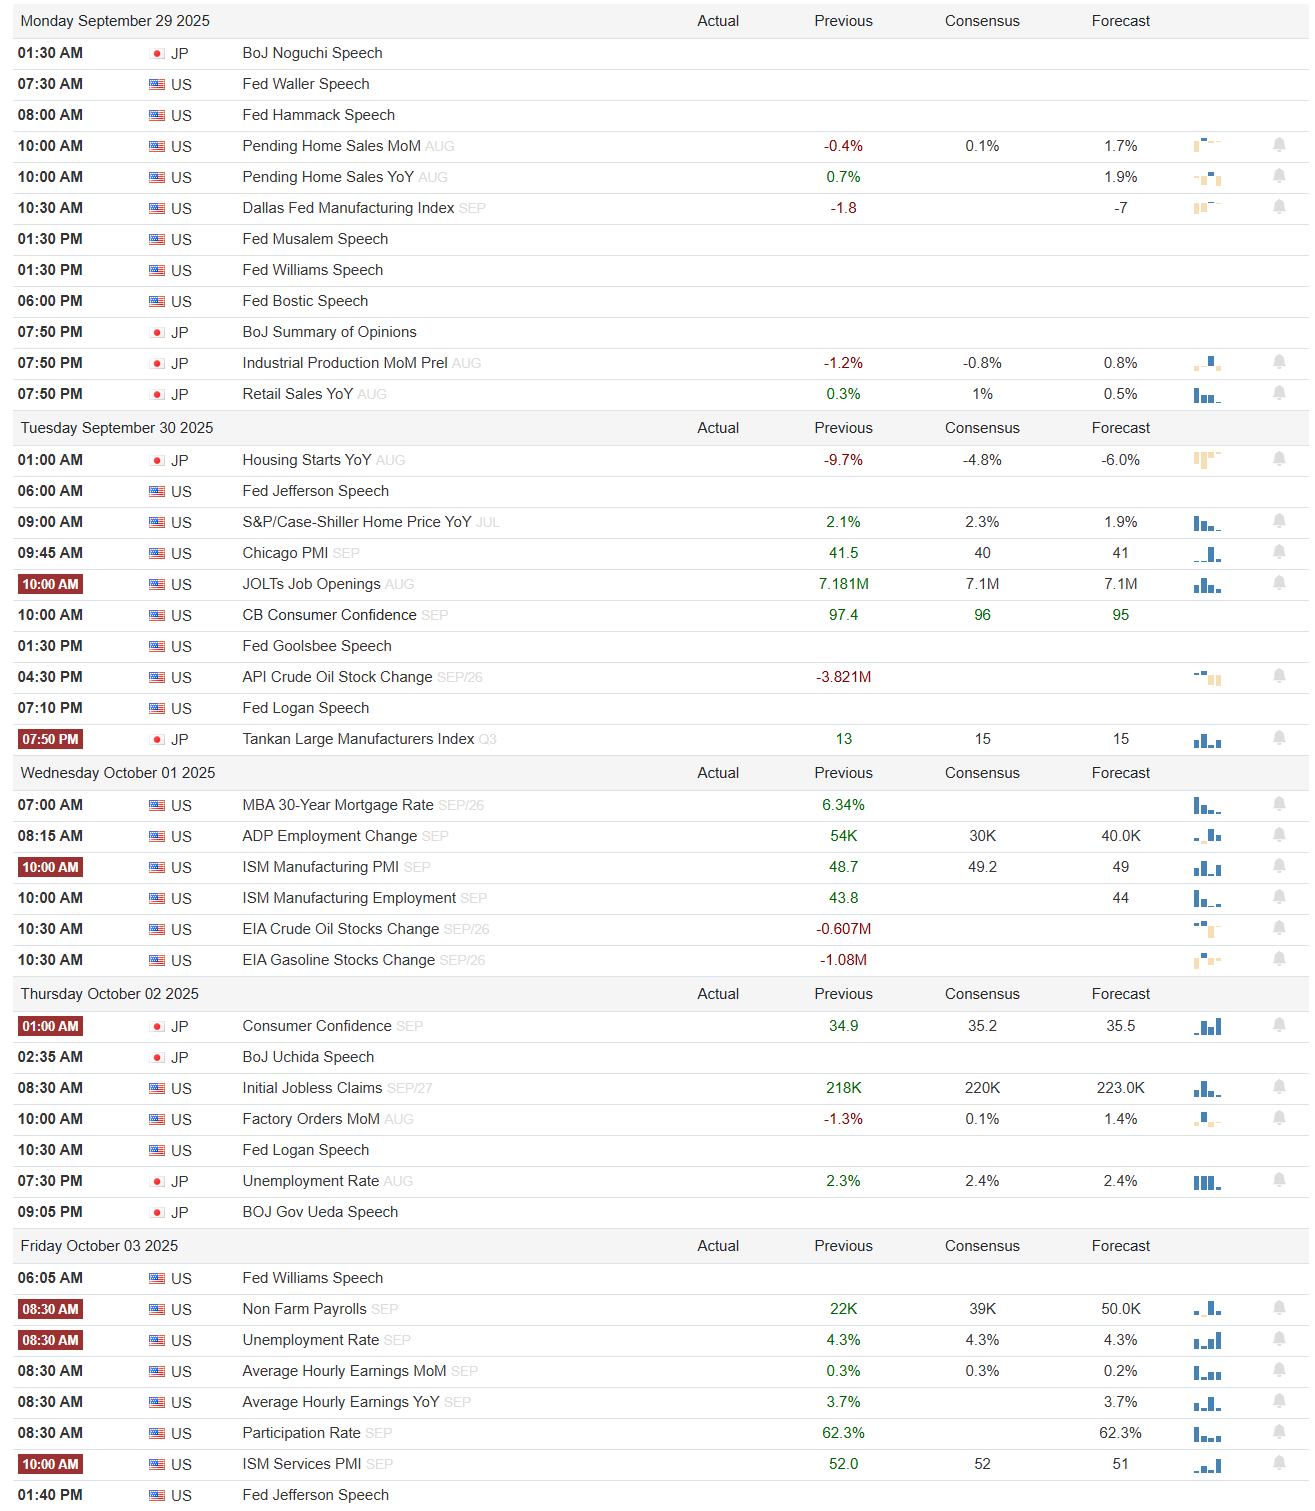
Monday is mostly tone-setting. Housing is in focus with August pending home sales flashing a -0.4 percent month over month vs a small positive consensus, while the year over year line sits near 0.7 percent. Dallas Fed manufacturing for September is negative at about -1.8, keeping the factory side in contraction. It is a speakers’ day, with Williams, Bostic, and Goolsbee sprinkled around the calendar. None of this is a singular catalyst, but it frames the debate into the stronger labor and services prints later in the week. A hotter housing beat would lean risk-on for cyclicals; more slippage would keep duration trades supported.
Tuesday tightens the macro aperture. Case-Shiller home prices for July run near 2.1 percent y/y, a modest deceleration that still argues shelter is sticky. Chicago PMI remains sub-50 around 41.5, so manufacturing stays soft. The two big tells land at 10:00 am ET: JOLTS job openings print about 7.181 million versus ~7.1 million prior/consensus, and Conference Board Consumer Confidence sits near 97.4 versus a 96 consensus. Higher openings and steady confidence favor the soft-landing narrative but keep the Fed vigilant. API crude after the bell shows a roughly -3.8 million draw; if EIA confirms on Wednesday, energy beta should catch a bid. A downside JOLTS surprise back toward 7.0 million with weaker confidence would flip the tone to risk-off and push yields lower.
Wednesday is the first labor plus factory checkpoint. ADP sits around 54k versus ~30k prior and ~40k expected, an incremental firming but not a surge. ISM Manufacturing is still below 50 at roughly 48.7 versus 49.2 prior, so goods remain in contraction. EIA crude and gasoline stocks arrive mid-morning; the preview points to small draws near -0.6 million for crude and about -1.1 million for gasoline. A risk-friendly mix would be ADP near consensus, ISM sub-50 but improving, and inventory draws. A hot ADP paired with firmer ISM would nudge yields higher and make Thursday’s claims more market-sensitive.
Thursday is a cleaner read on growth momentum. Initial claims trend around 218k versus 220k prior and ~223k expected, still historically low. Factory orders for August print negative near -1.3 percent month over month after a small positive prior, so capex remains uneven. If claims firm toward 230k while orders stabilize, equities should tolerate it; if claims stay pinned near 210k with orders still negative, long-duration tech gets more sensitive to Friday’s wage line. Overnight, Japan posts consumer confidence and a BoJ speech; not a primary driver unless the yen or JGBs lurch.
Friday decides the tape with payrolls and services. Nonfarm payrolls carry a low bar, with consensus in the 30k to 50k range versus 22k prior. Unemployment sits near 4.3 percent. Average hourly earnings are pegged at 0.3 percent month over month and 3.7 percent year over year. ISM Services lands at 10:00 am near 52.0 versus 52 prior and 51 forecast. The constructive mix is modest payrolls, a stable 4.3 percent jobless rate, 0.2 to 0.3 percent wages, and services holding north of 50. That keeps yields contained and favors a grind-up with cyclicals participating. A hot surprise looks like a >75k payroll with 0.3 percent wages and services firming; that would pressure duration and shift leadership back to balance-sheet quality.
Earnings are light but useful for read-through. Monday pre-open brings Carnival, a clean consumer discretionary demand gauge on travel propensity and pricing discipline. Tuesday pre-open Paychex offers small-business hiring color in real time; weak bookings or conservative guidance would quietly flag Main Street deceleration. After the bell, Nike sets the tone for global discretionary and China exposure; watch gross margins, inventory progress, and North America demand. Wednesday pre-open Cal-Maine is niche, but protein pricing and retail mix add context for grocery inflation. The rest of the week is quiet on reports, so macro will dominate the tape.
A few sign-posts for active traders. If JOLTS holds near 7.1 million and confidence stays around 97, treat Tuesday as risk-on unless yields lurch higher. If ADP hugs ~50k and ISM stays sub-50, dips should be buyable into Friday. On payrolls day, the easy bullish path is a 0.2 to 0.3 percent wage print with payrolls near consensus and services sticking around 52; a hotter wages plus firm services combo is the cue to tighten risk in long-duration names and lean on cyclical pairs instead.
Bottom line: the market will take its cues from labor and services strength against a still-soft factory backdrop; let Tuesday’s JOLTS and Friday’s wage and ISM prints set the bias, and adjust sector tilts based on how rates digest the data.

Market Intelligence Report
Last week’s port held the line. Energy carried the week while beta chopped; the book finished up about +0.34%. Here’s a reminder of where the tape steered us last week:
Core index beta (32%)
-13% SPY (or IVV/VOO)
-10% QQQ
-3% QUAL (quality factor)
-2% EFG (developed ex-US growth)
-4% VNQ (REITs; duration beneficiary while sponsorship builds)
AI/infra leadership (17%)
-2.5% NVDA
-2.0% AVGO
-2.0% MSFT
-1.5% AAPL
-1.5% META
-2.5% APP
-3.0% SMH (semis basket)
-2.0% IGV (software basket)
Broadening cohort (19%)
-Financials 9%: 4% KRE (regionals), 3% KIE (insurance), 2% IAI (brokers/exchanges)
-Industrials/defense 6%: 3% XLI, 3% ITA
-Healthcare innovation 4%: 4% XBI (mid/small biotech basket)
Energy, hard-asset ballast (13%)
-6% energy selective: 4% AMLP (midstream), 2% XLE (quality integrateds)
-7% hard assets: 4% GDX (gold miners), 2% SIL (silver miners), 1% CPER (copper proxy)
Carry sleeve and cash (19%)
-8% LQD (IG credit)
-3% JAAA (AAA CLO carry)
-4% MUB (munis)
-2% VTIP (front-end TIPS)
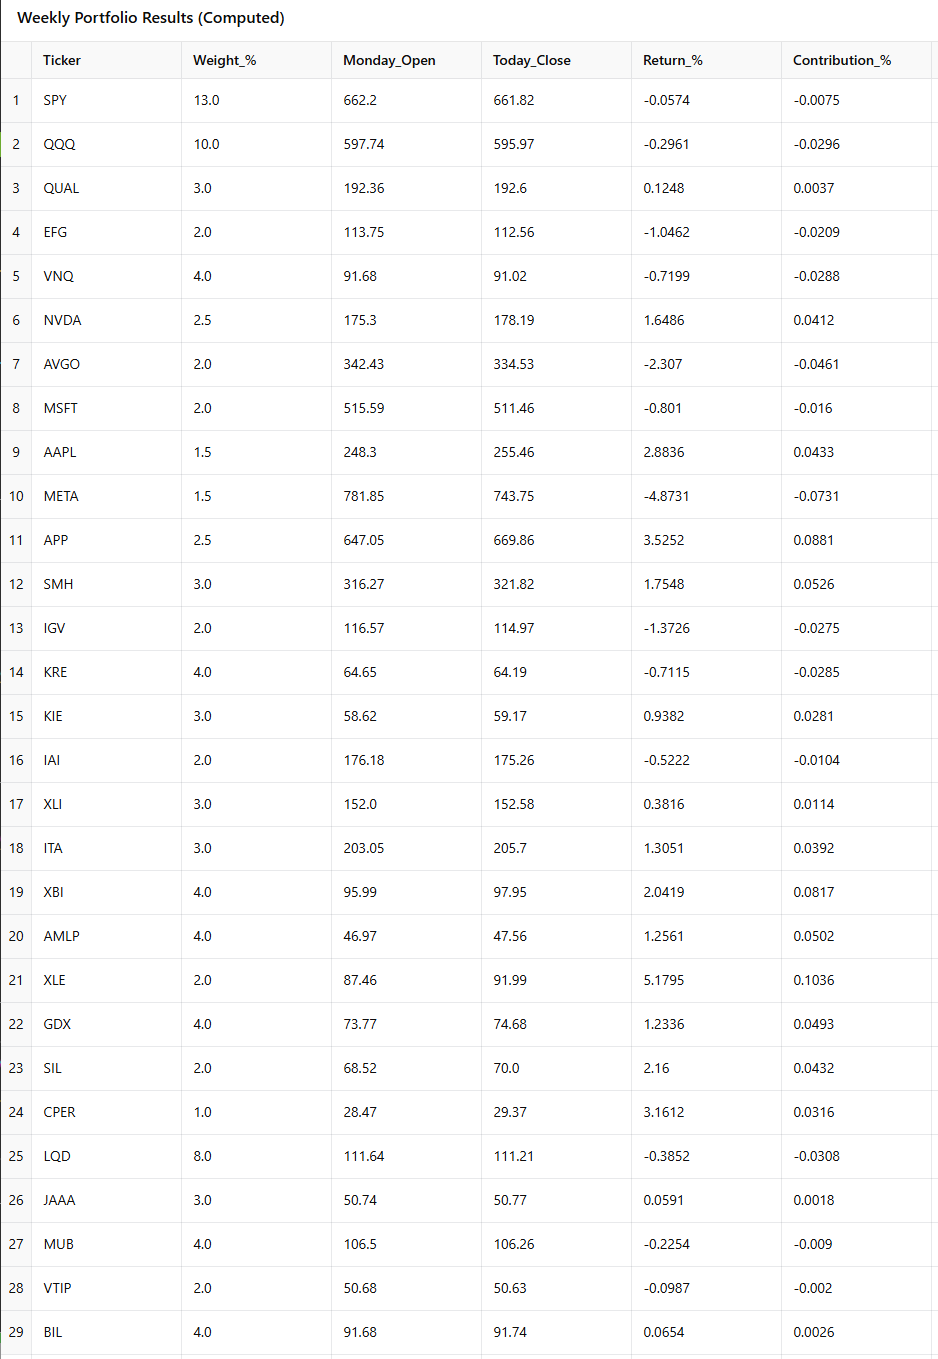
-4% BIL (T-bills/cash buffer)From Monday’s open to Friday’s close the model portfolio gained roughly +0.34%. It was not a thrusty tape so much as a grind where the winners did just enough to outrun a handful of drags. The leadership baton passed to energy and hard assets, small doses of biotech and semis helped, and broad beta was a slight headwind.
The sleeve attribution tells the story cleanly. Core index beta (32% weight) was a small drag at about -0.08% contribution. SPY and QQQ slipped a touch on the week, and REITs lagged, leaving the sleeve at roughly -0.26% on a weighted basis despite a steadier read from quality. That is what a range week looks like for cap-weighted beta: plenty of motion, not much net progress.
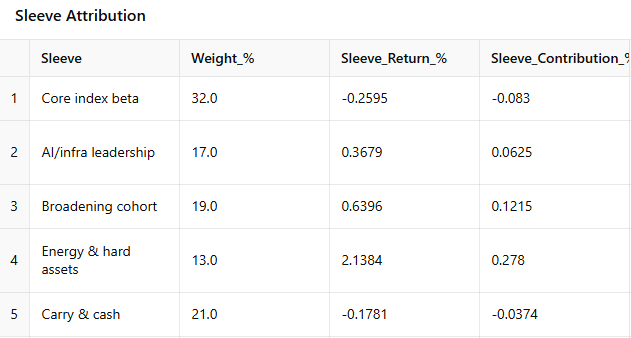
AI and infrastructure leadership (17% weight) chipped in modest green with a +0.06% contribution and about +0.37% sleeve return. The standouts were the semis complex and an APP rebound; SMH added roughly +1.75% and APP popped about +3.53%, more than offsetting softer prints in AVGO and META. The takeaway is straightforward: leadership is intact, but it is rotational rather than a one-way march.
The broadening cohort (19% weight) added a constructive +0.12% contribution, about +0.64% at the sleeve level. Healthcare innovation did the heavy lifting as XBI gained about +2.04%. Industrials were steady and the financials sleeve was mixed, with regionals a touch heavy and insurance/brokers offsetting some of that softness. This is the kind of quiet participation you want to see underneath the big indexes.
Energy and hard assets (13% weight) were the week’s engine at roughly +0.28% contribution, a sleeve return north of +2.1%. XLE led with a +5.18% print, AMLP and GDX each added around +1.25%, and the group generally benefited from a firmer commodity tape. When energy leads and the book is already sized for it, you get paid even if the indexes are marking time.
Carry and cash (21% weight) was a small ballast drag at about -0.04% contribution, roughly -0.18% sleeve return. It did what it is supposed to do during a mild risk-off skew in the week: keep volatility low while giving up a little relative performance. LQD slipped about -0.39% and the short-duration sleeves were flat to slightly negative.
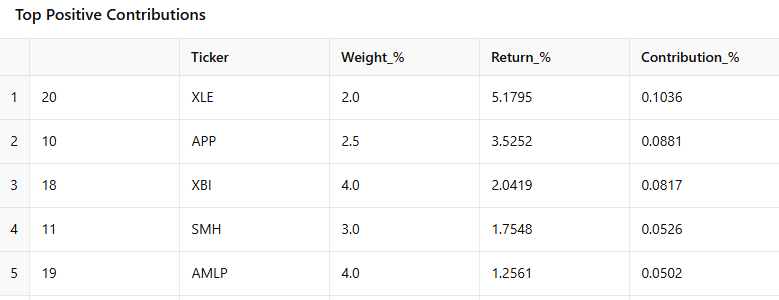
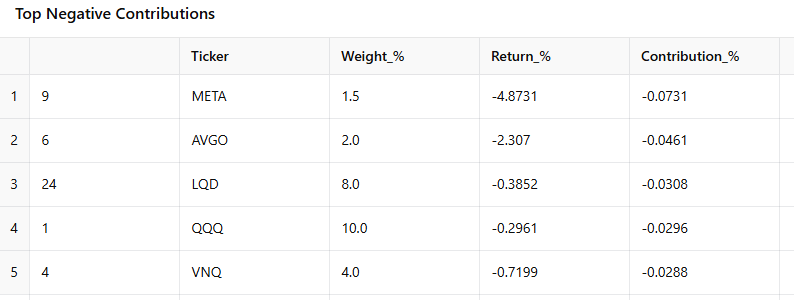
On single-name and ETF contributions, the top helps were XLE (+5.18% for +0.10% contribution), APP (+3.53% for +0.09%), XBI (+2.04% for +0.08%), SMH (+1.75% for +0.05%), AMLP (+1.26% for +0.05%), and GDX (+1.23% for +0.05%). The notable drags were META (-4.87% for -0.07%), AVGO (-2.31% for -0.05%), LQD (-0.39% for -0.03%), QQQ (-0.30% for -0.03%), VNQ (-0.72% for -0.03%), and KRE (-0.71% for -0.03%).
Net read: the portfolio behaved as designed in a week characterized by a broadly weaker tape, with energy and selective growth carrying the load while broad beta idled; as long as the commodity bid and the semis tone hold together, the sleeve mix should continue to grind the equity curve higher even without index breakouts.
Let’s take a look at what the tape is telling us this week.
MIR Part 1: The Backdrop
Liquidity told the story first. The Institutional Liquidity By Day series shows a towering surge to roughly $720b recently on triple witching and then a quick settle back into the $120b–$180b neighborhood, declining into week’s end. The rhythm is structural rather than directional: the giant bursts line up with known expiration and rebalance windows that routinely amplify notional turnover. Equity and index derivatives typically expire on the third Friday of each month, with the March/June/September/December “triple witching” sets producing the largest volume shocks as options and futures roll together. Those days are historically associated with heavy, program-driven prints and wider intraday ranges, not necessarily lasting trend signals. The calendar structure explains why the week following a major expiration often reverts toward baseline liquidity as dealers clean up residual hedges and passive flows normalize. The mechanics are well documented: monthly expiries cluster on the third Friday, and the quarterly “triple” runs drive outsized volume and rebalancing traffic. Liquidity is still elevated over summer troughs so we’re seeing the largest players still staking claims in different corners of the market.
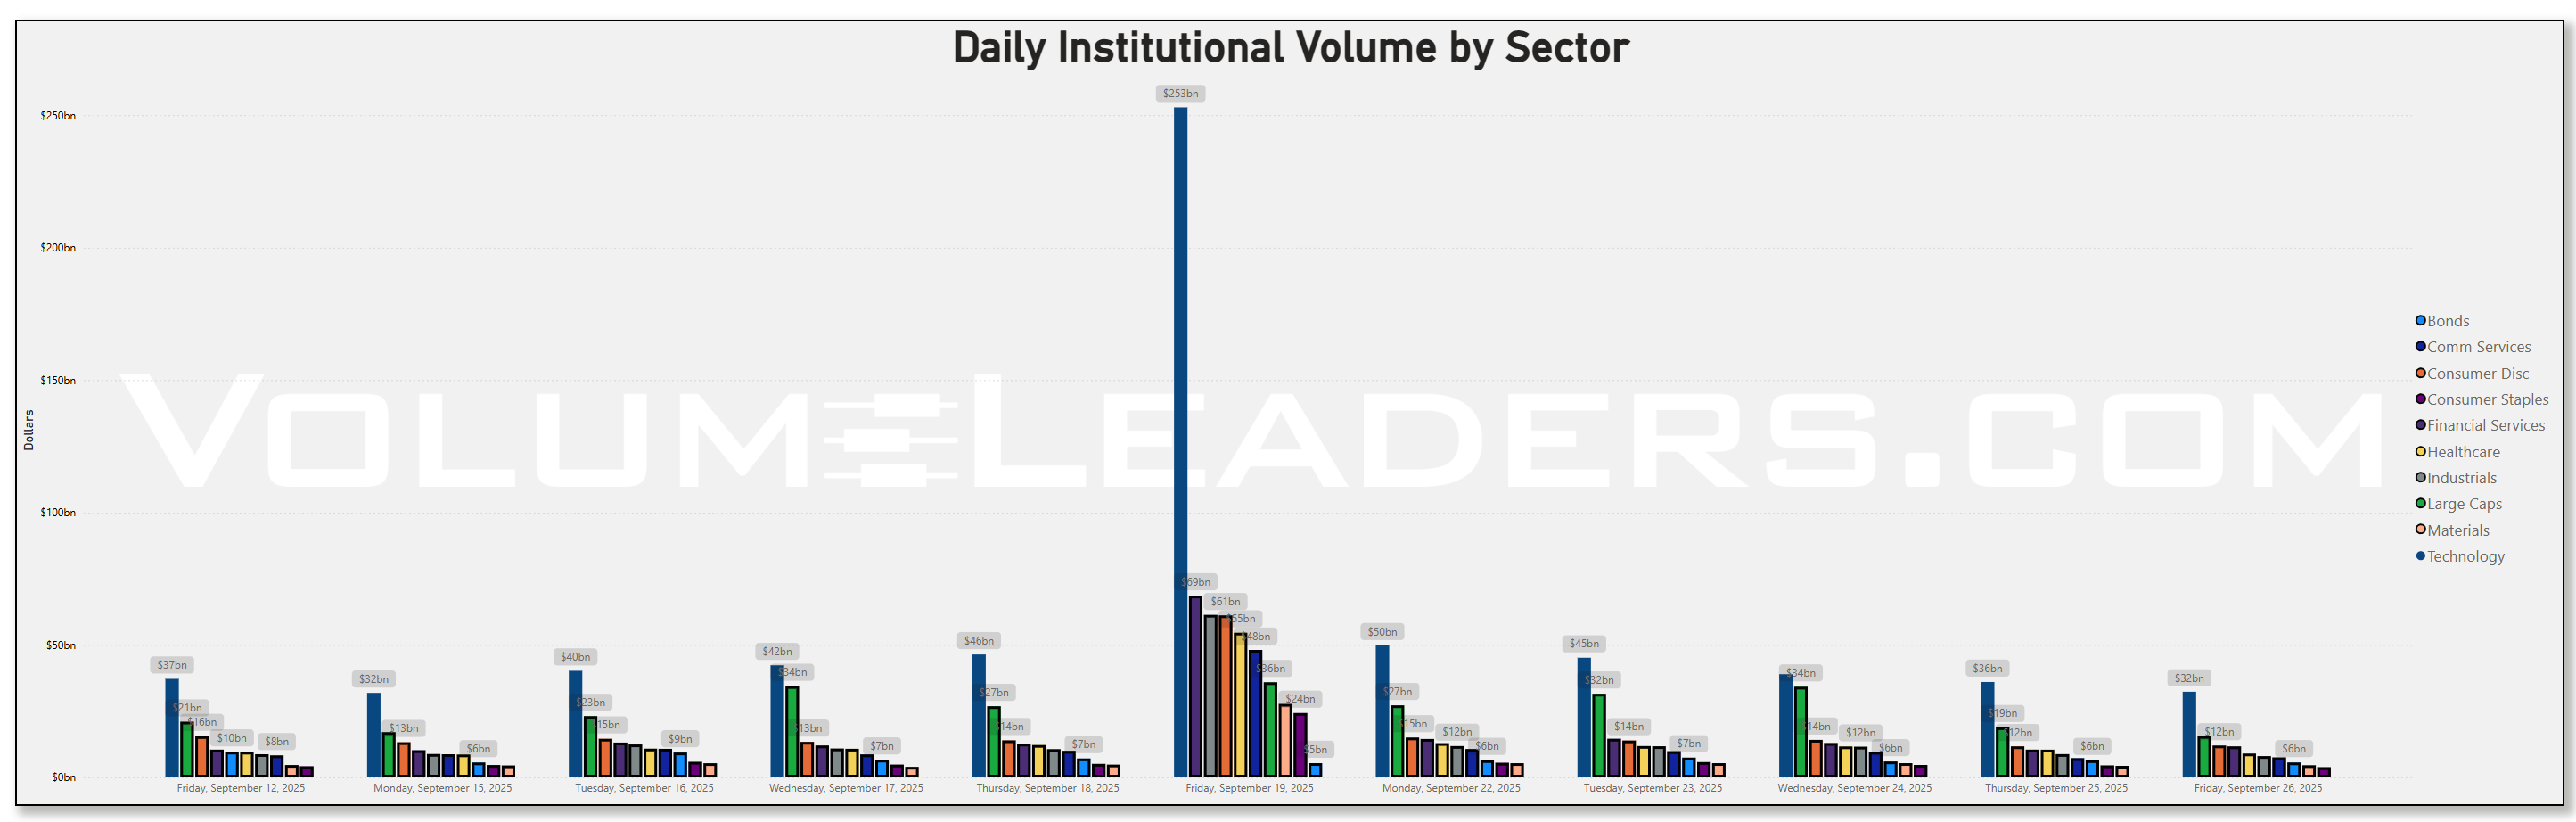
Against that backdrop, daily sector dollars this week showed tech consistently anchoring the tape with roughly $50b Monday, $45b Tuesday, $34b Wednesday, $36b Thursday, and $32b Friday. Large-cap equity allocations sat right behind that tech backbone. Consumer discretionary and Fins took turns in the next 2 slots, with Healthcare and Industrials not far behind. The contrast with the prior week’s expiration day was stark and that week-over-week change is classic post-OPEX cooling: the baseline stayed healthy, but the cross-sector froth faded with the derivatives calendar. The directional takeaway is that allocation flows remained present, yet the absence of another structural catalyst kept daily dollars in a tighter band.
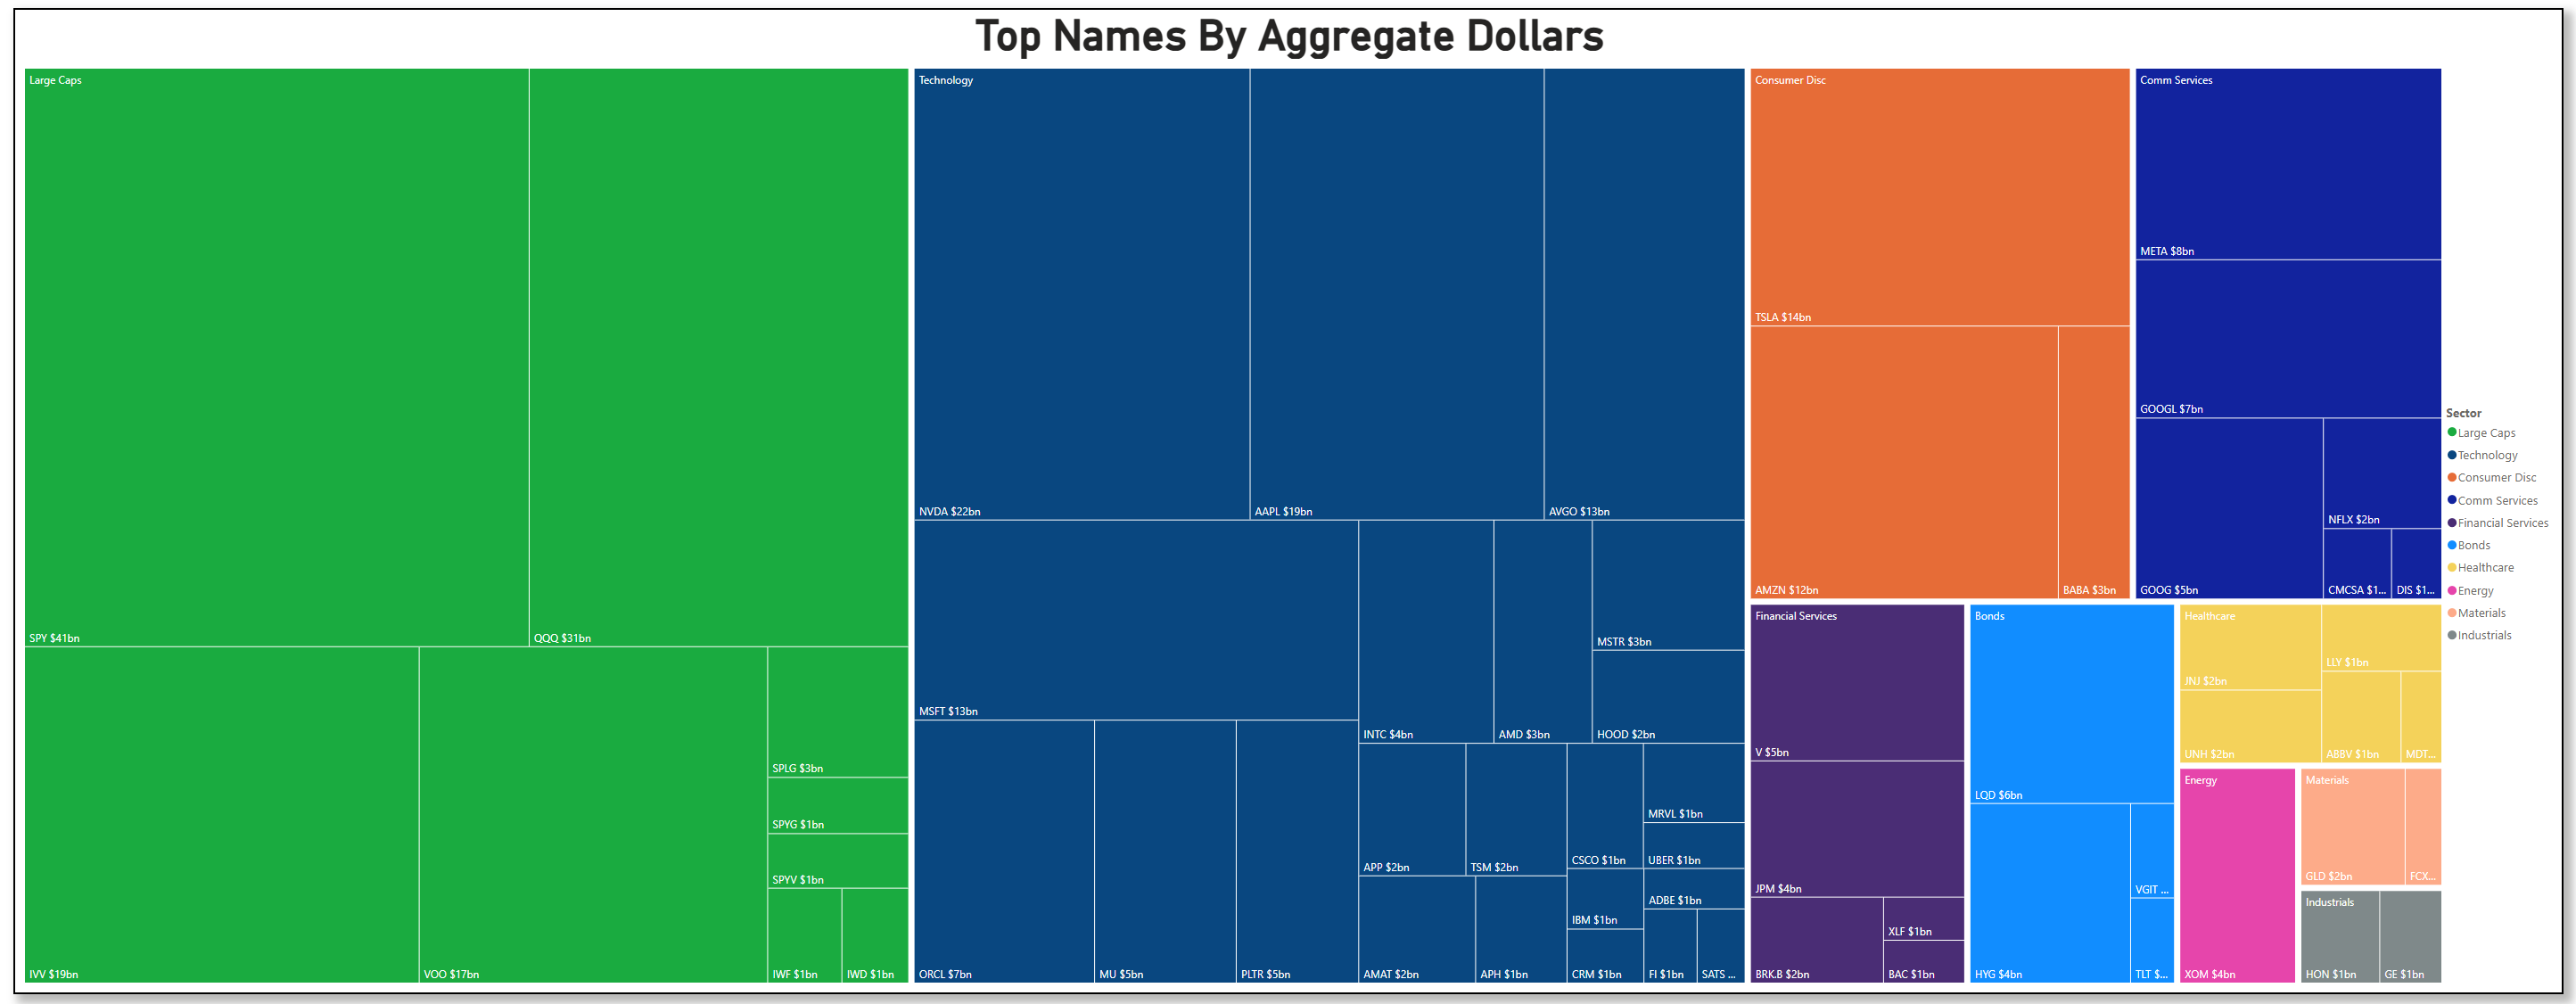
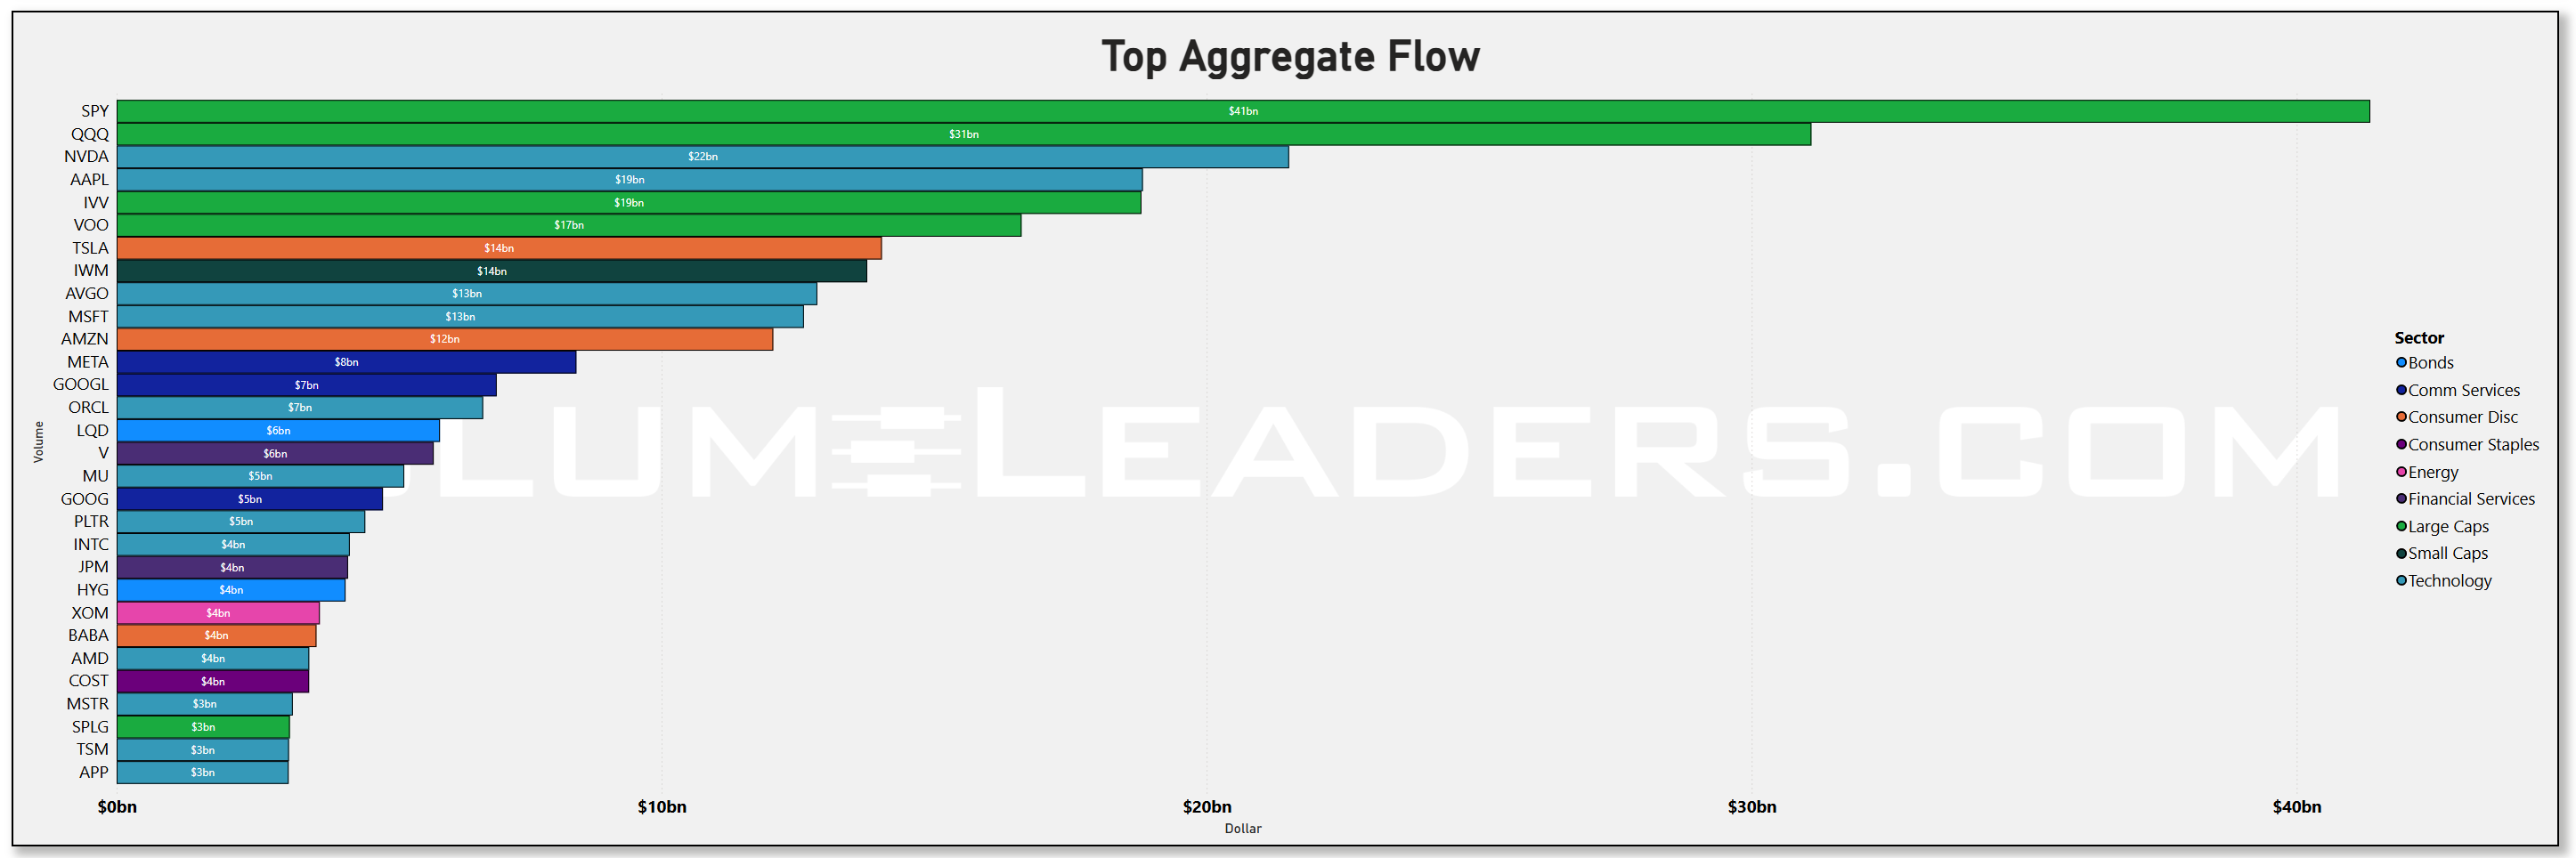
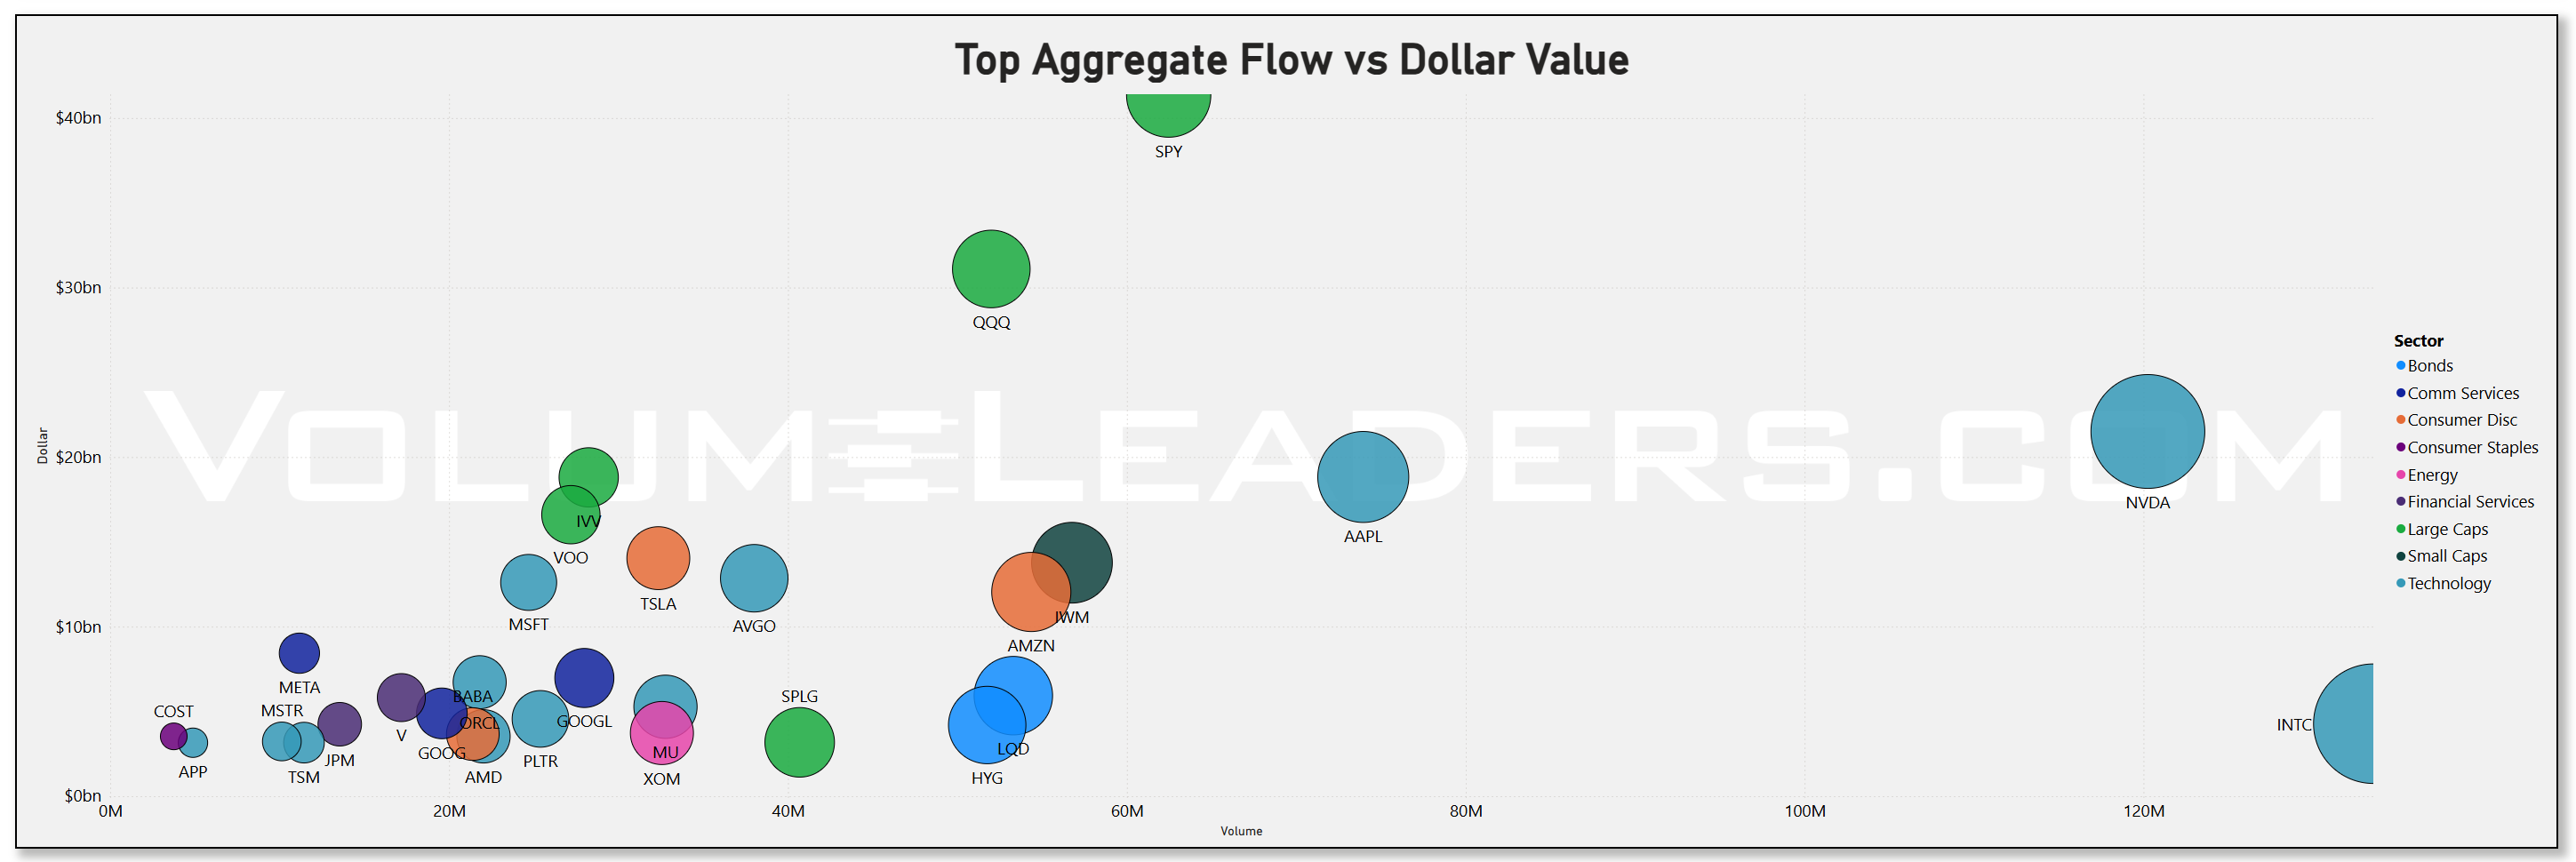
The treemap and aggregate bars make the leadership stack explicit. The top of the board was dominated by index beta: SPY hauled in about $41b, QQQ $31b, IVV $19b, and VOO $17b, with smaller satellites like SPLG around $3b and style tilts such as SPYG and SPYV near $1b each. Inside single-name Tech, NVDA printed roughly $22b, AAPL $19b, MSFT and AVGO about $13b each, then a second tier—ORCL ~$7b, MU and PLTR ~$5b, INTC ~$4b, AMD ~$3b—showing that breadth extended beyond the top two. Consumer Discretionary remained a two-engine cluster with TSLA near $14b and AMZN $12b, while Communication Services showed a healthy trio of META ~$8b and both GOOGL and GOOG around $7b and $5b. Credit sleeves stayed active as well, with LQD around $6b and HYG near $4b. That mix says institutions were still expressing the “index + AI barbell,” adding beta through SPY/IVV/VOO while keeping material singles exposure in the semis, big platforms, and a couple of discretionary leaders. Nothing about that distribution screams capitulation or FOMO; it reads like steady positioning with a growth tilt.
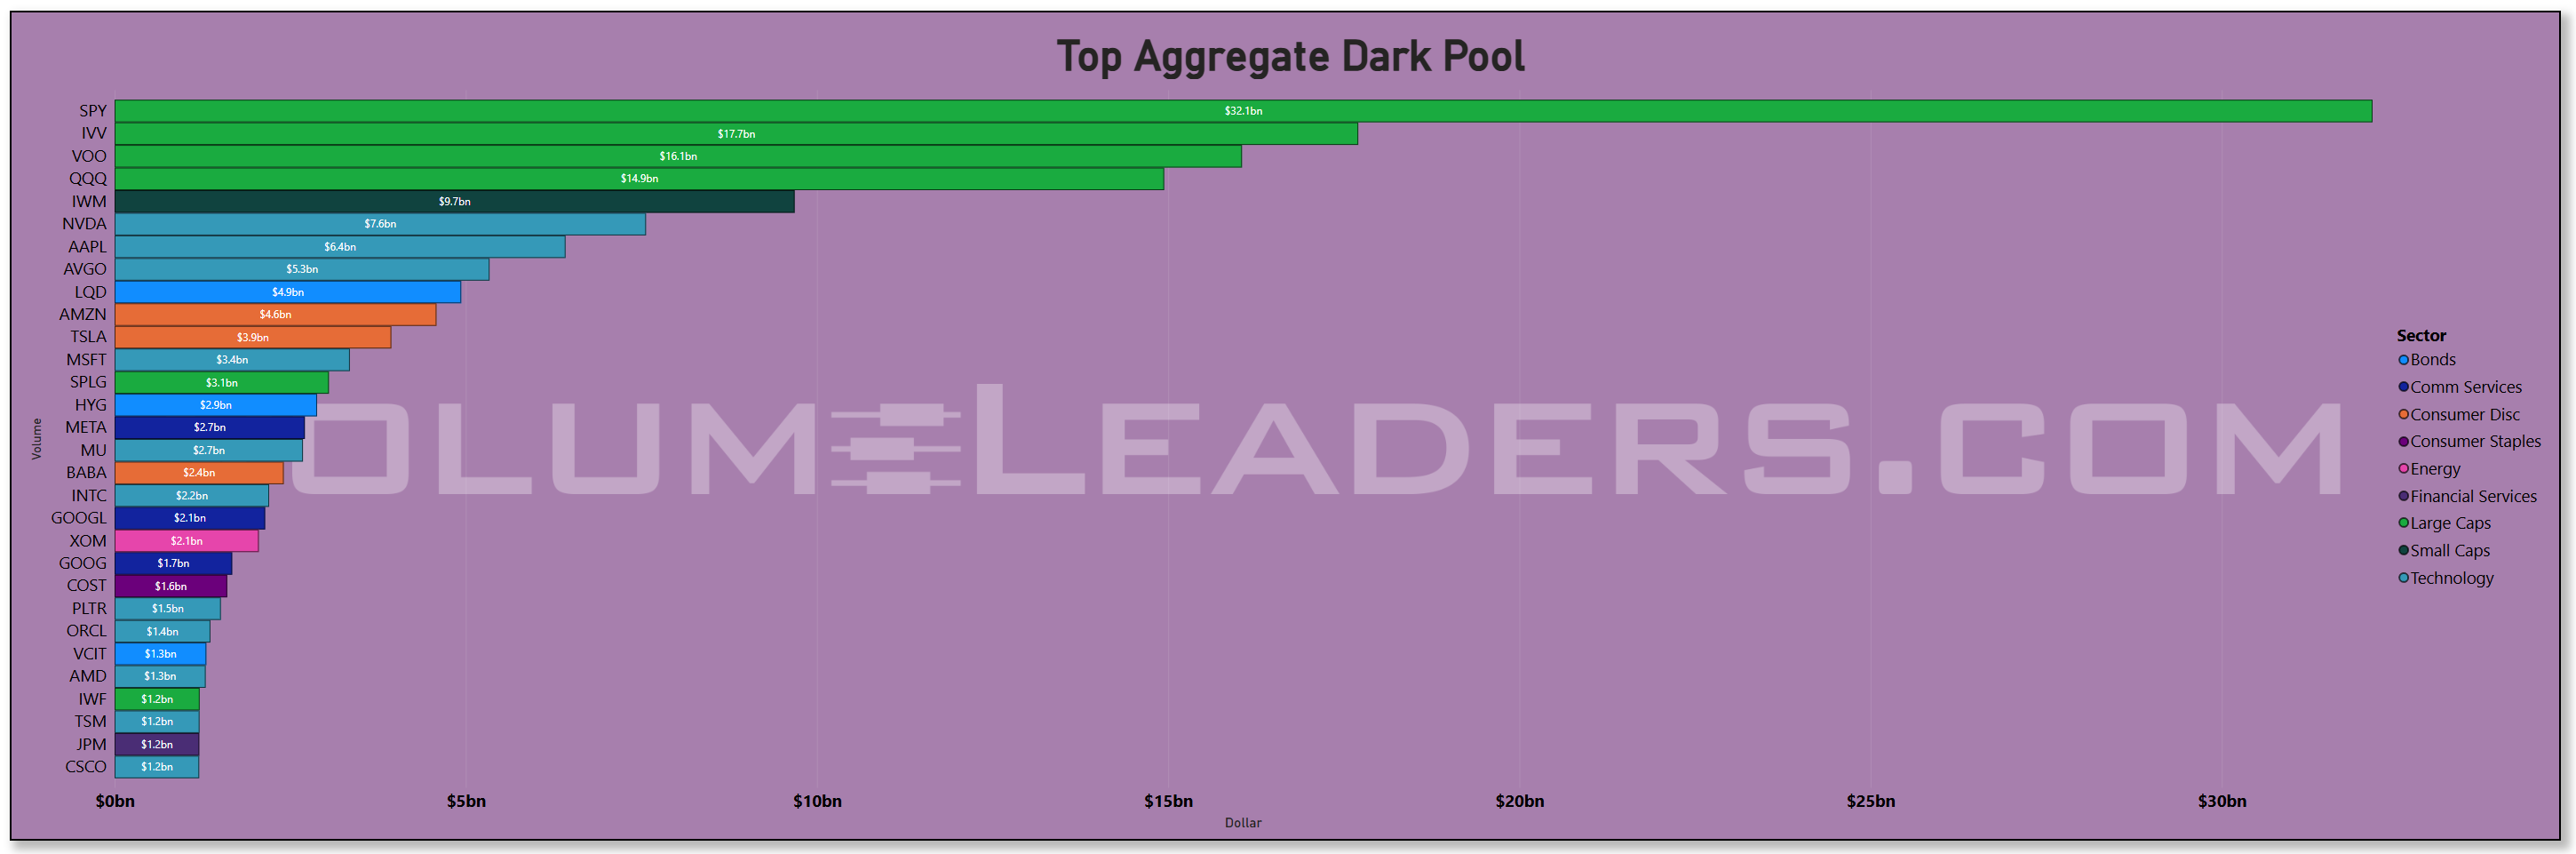
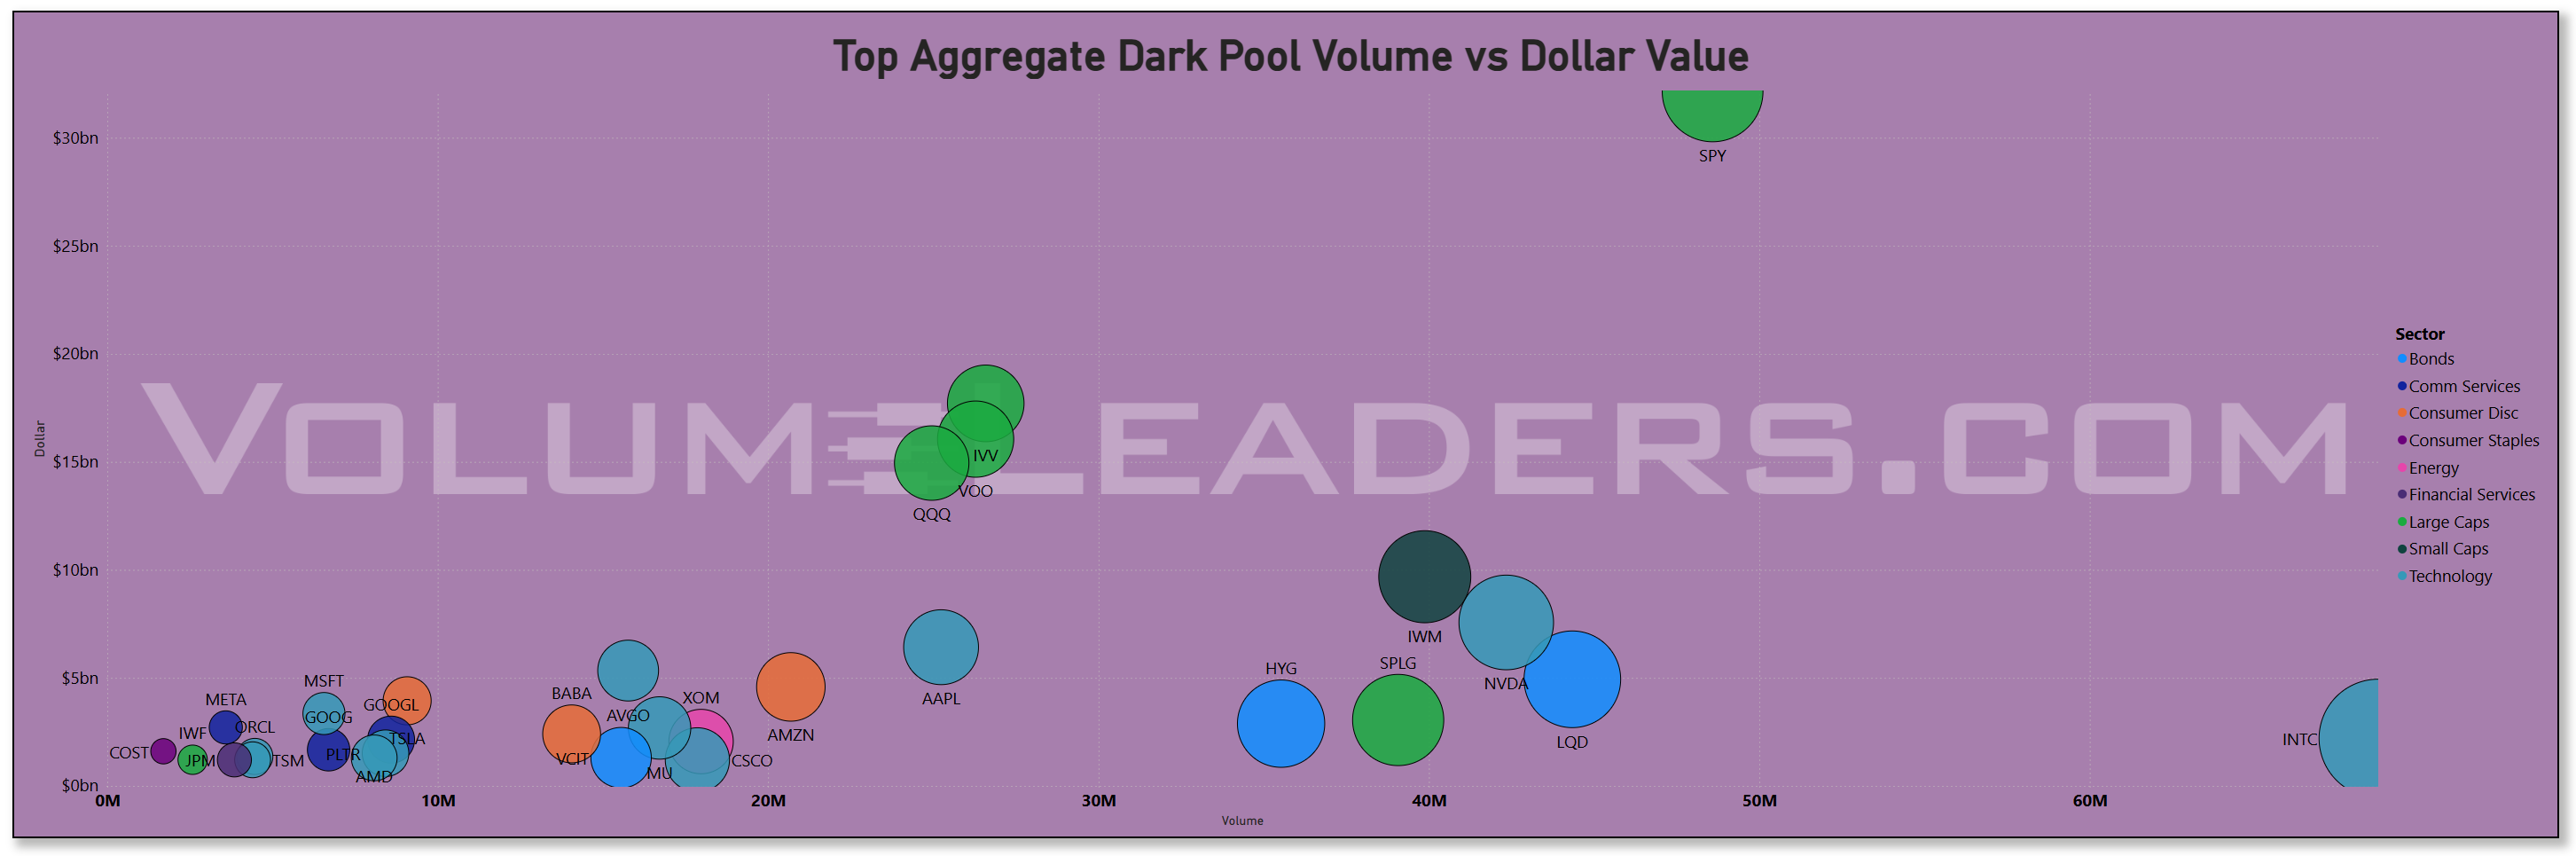
The dark-pool lens sharpened the picture. Off-exchange dollars were heaviest in the same index complex—SPY about $32.1b, IVV $17.7b, VOO $16.1b, QQQ $14.0b—followed by IWM at ~$9.7b. Among single names, NVDA’s ~$7.6b and AAPL’s ~$6.4b led, with AVGO ~$5.3b, AMZN ~$4.6b, TSLA ~$3.9b, and MSFT ~$3.4b close behind. LQD and HYG also showed meaningful dark prints near $4.9b and $2.9b respectively. When broad index trackers dominate the dark tape this way, it usually signals scheduled allocation and risk-transfer rather than outright chase; the consistent presence of mega-cap tech in the same venue suggests ongoing institutional inventory management, i.e., add on weakness and trim on strength without advertising size. The appearance of IWM near the top of dark activity is notable: small caps may not have led on the lit tape, but the off-exchange footprint implies real hands are engaged at key levels.
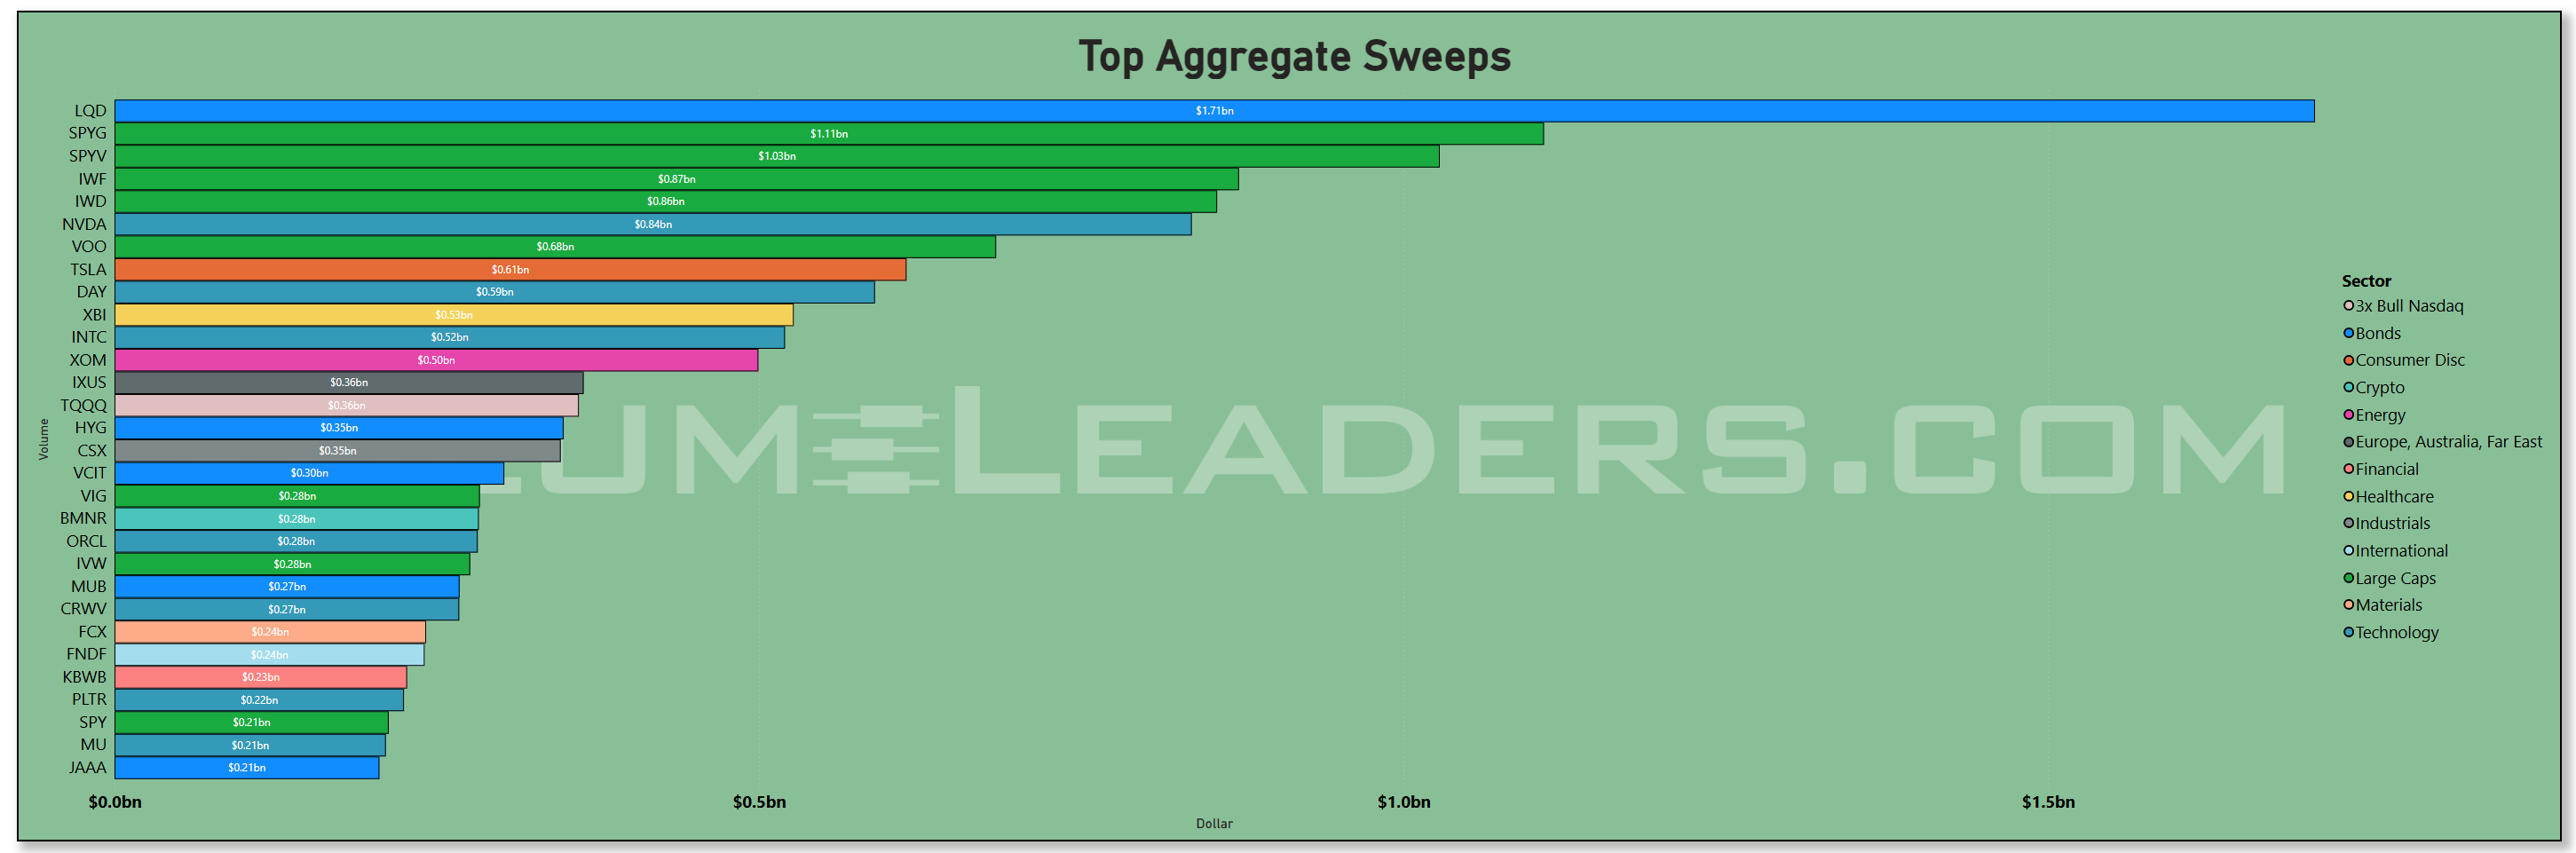
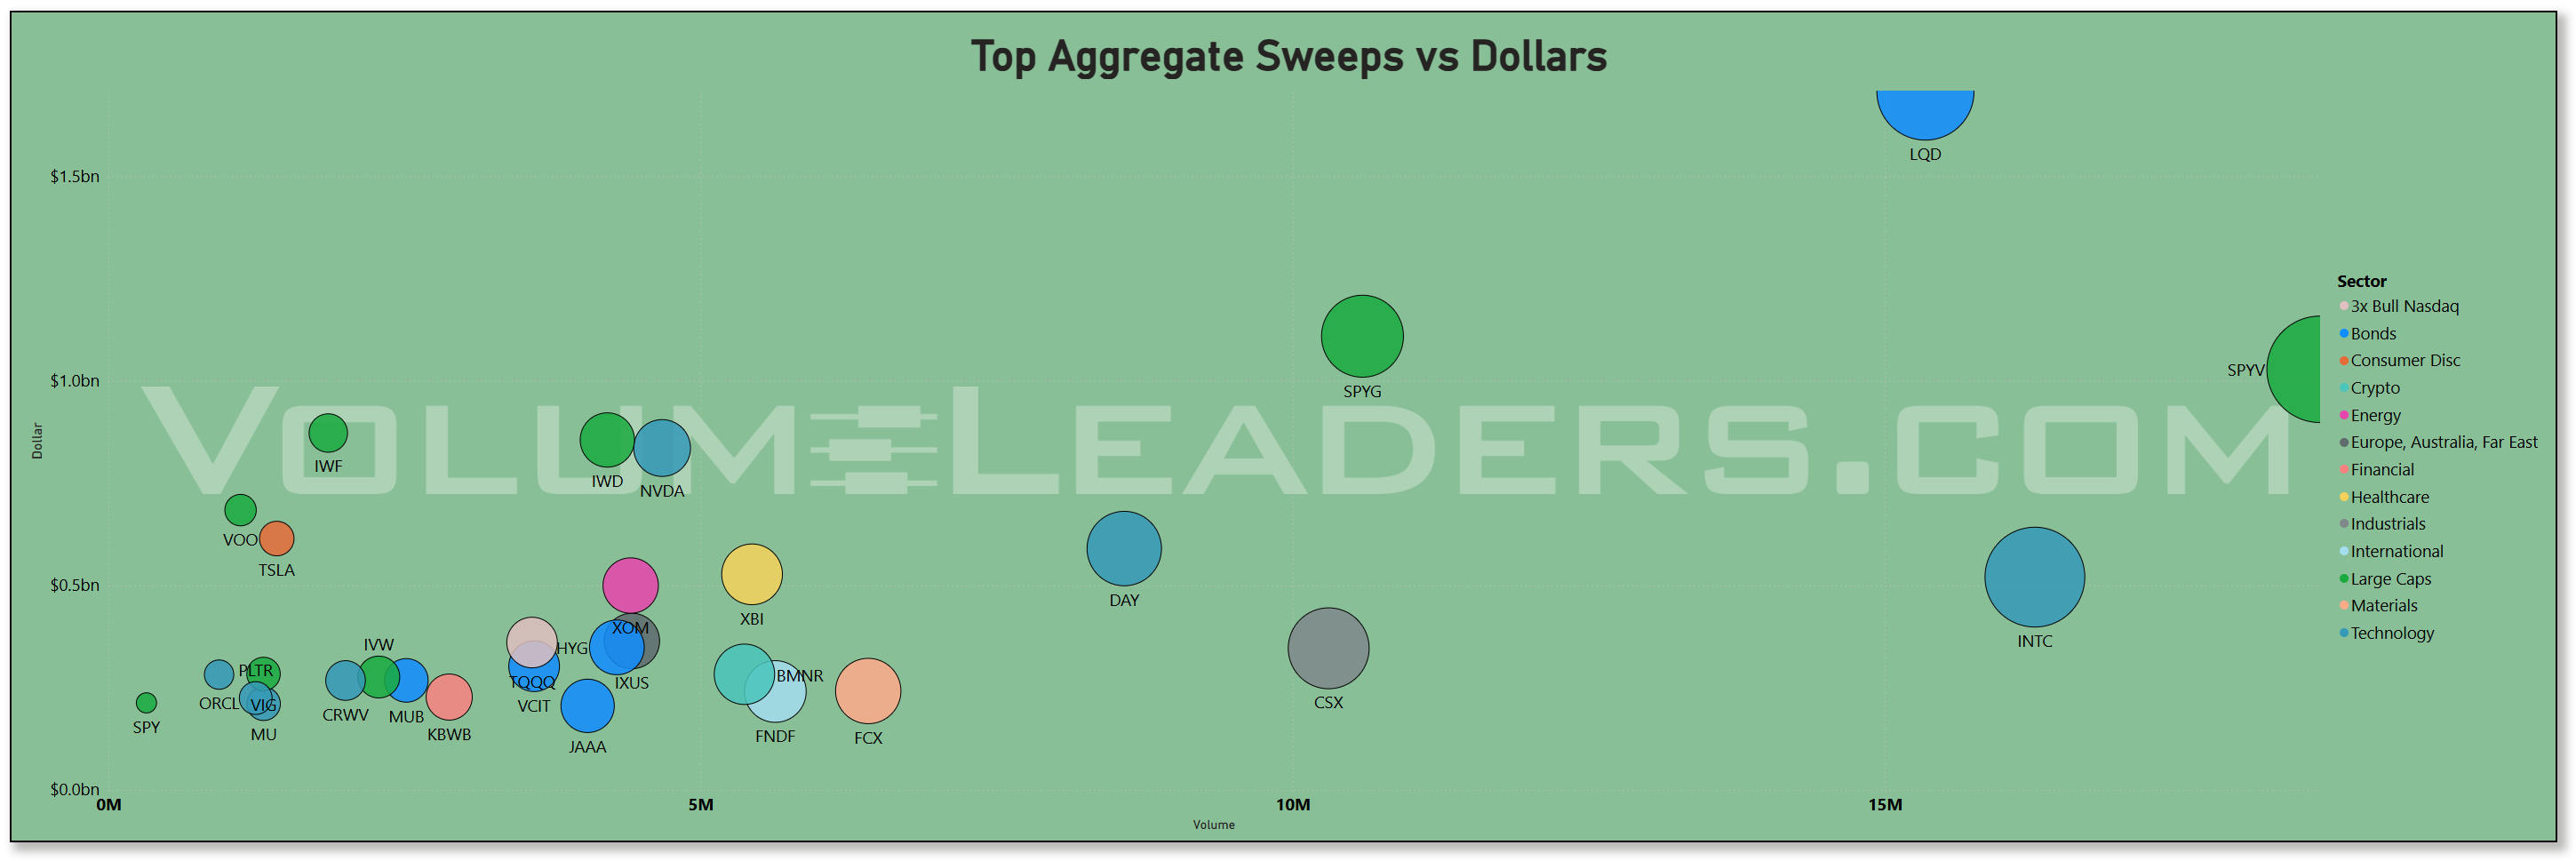
Sweeps told us where the fast money pressed its bets. The largest sweep dollars were in LQD as usual at roughly $1.71b, with style tilts right behind—SPYG about $1.11b and SPYV $1.03b—followed by IWF ~$0.87b and IWD ~$0.78b. That is a classic posture for macro funds toggling duration and equity style rather than whipping single names: lean into IG credit and keep both growth and value levers hot to manage factor risk. Among equities, NVDA (~$0.68b), VOO (~$0.68b), TSLA (~$0.61b), QQQ (~$0.53b), XBI (~$0.53b), INTC (~$0.52b), and XOM (~$0.50b) rounded out the chase list. The mix skewed barbell—AI leaders, a biotech breadth proxy, a mega energy bellwether, and index wrappers—consistent with traders seeking convexity around macro prints rather than calling a new trend.
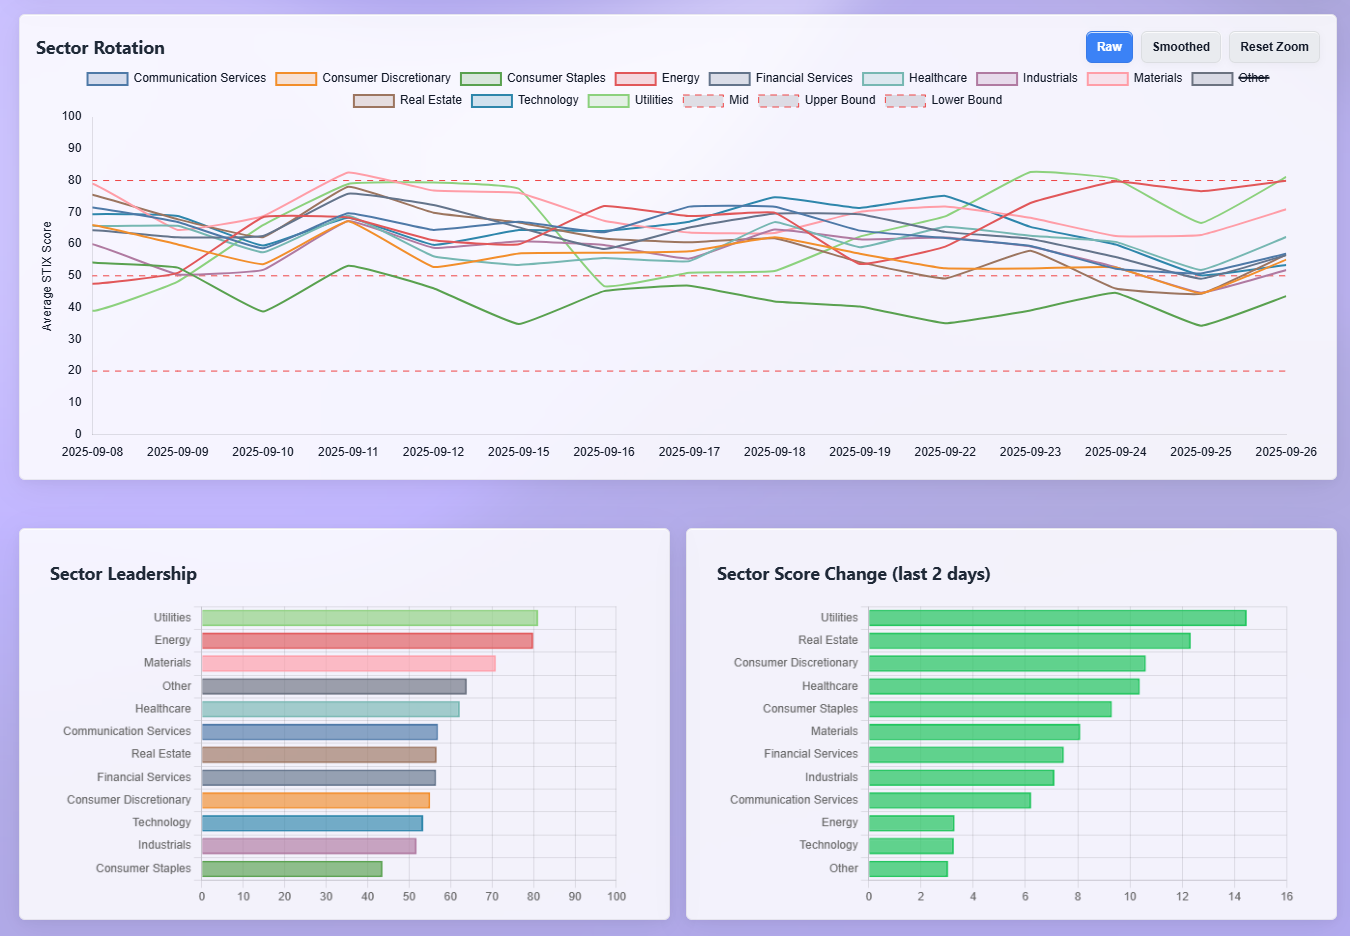
Sector leadership and the 1–2 day momentum board fit that flow. Utilities sat on top of the leadership stack with Energy next, followed by Materials and a mid-pack cluster of Healthcare, Communication Services, Real Estate, and Financials. Over the last two sessions, Utilities and Real Estate showed the biggest positive inflections, with Consumer Discretionary and Healthcare also improving. Technology’s short-term score perked but lagged the defensives’ jump, while Communication Services drifted lower on the two-day change. That combination—defensives gaining momentum, real estate perking, and energy holding high ground—maps to a market triangulating rates and growth without abandoning the AI complex. It also gels with the sweep interest in LQD and the dark-pool heaviness in index wrappers and megacap platforms. All sectors saw healthy lifts into the end of the week.
Macro and seasonals help stitch this together. We are in the inter-event window between the September expiration/rebalance and the next macro catalyst cluster: JOLTS, the ISM surveys, and—most importantly—the Employment Situation on the first Friday of the new month. By schedule, ISM Manufacturing hits the first business day and Services on the third, both at 10:00 a.m. ET, and the jobs report drops at 8:30 a.m. on the first Friday—in this case Oct 3—for the September reference month. Those releases are the near-term governors for yields and factor leadership. In practice, the expiration mechanics we saw last week are known for outsized, program-driven turnover on the third Friday, and index rebalances around quarter-ends can channel additional volume into broad wrappers and the largest constituents. None of that, on its own, dictates direction; it sets the table for the next data impulse.
Here is what matters next for confirmation. First, keep an eye on whether SPY/IVV/VOO continue to dominate both lit and dark prints; persistent size there argues that allocators are still averaging in, which typically dampens volatility on dips. Second, watch NVDA and AAPL in the dark pools—ongoing multi-billion off-exchange dollars paired with orderly lit prints is the tells of quiet accumulation rather than distribution. Third, monitor LQD and HYG: they were prominent in both aggregate dollars and sweeps, and a steady bid into the jobs/ISM window would validate the soft-landing interpretation, while a decisive fade would hand leadership back to pure cyclicals. The macro calendar gives those signals context; a cooler or “just-right” jobs report and ISM mix usually keeps credit firm and the index-plus-AI barbell in play, while a hot surprise pushes factor leadership back to quality and compresses small-cap risk.
Bottom line: post-expiration liquidity normalized, allocations still favored broad wrappers and the AI core, defensives picked up short-term momentum while broader indices showed a tiny bit of weakness, and the next leg rests with jobs and the ISM set - if credit keeps a bid while index and megacap dark prints persist, the grind-up playbook remains the path of least resistance.
MIR Part 2: Individual Names From The Institutional Tape
VolumeLeaders tracks several proprietary signals designed to spotlight names drawing significant institutional interest. Below, we’ve surfaced the latest results and analyzed them to highlight emergent themes. If any of the sectors, narratives, or positioning trends resonate, the names mentioned here offer a strong starting point for deeper research and watchlist consideration.
VL Trade Rank Velocity™ (TRV)
TRV is a proprietary metric that measures the recent acceleration or deceleration in institutional trading activity for a given stock by comparing its average trade rank over the past few days to its average in recent weeks. A sharp improvement in TRV typically reflects a notable shift in positioning, often accompanied by sustained trade activity, suggesting institutions are actively engaging with the name and that intensity of activity is rising. This often precludes meaningful price or narrative shifts. This isn’t a buy-list or sell-list; it’s meant to draw your eyes to names where institutions are putting money to work.
Two themes jump off this TRV sheet right away: the growth/AI complex is still pulling eyeballs, and hard assets are getting a real bid. That lines up with the backdrop we just walked through where tech carried the daily dollars while liquidity cooled after OPEX. I’m seeing broad interest down the stack in software and compute adjacencies—DIDIY, DAY, KVYO, WIX, BKSY, WNS, IBEX—and a healthy helping of hardware/EMS like TTMI, CLS, and RCAT. The AI wrapper shows up explicitly in WTAI and leverage in SMCX (2x Bull SMCI); you’ve even got frontier exposure with IONQ and QTUM. That’s not a narrow mega-cap chase; it’s breadth across the plumbing that powers the theme.
Now look at the other side of the barbell: hard assets. Uranium is on the tape with URNJ, UUUU, and DNN. Precious and strategic metals are here too—ORLA, EXK, TFPM, SPPP, MP—and energy breadth shows up via FTI and VTS, with DHT giving you tankers. That crew fits the factor tone we’ve been seeing: own cash-flow cyclicals and scarcity plays alongside AI. If rates behave and growth stays “okay,” that pairing tends to work. If rates wobble, the resource sleeve can still carry its own weight.
Crypto is quietly present and not just as a side note. You’ve got GDLC, SOLT (2x Bull Solana), ETHD, CRCL, and SSK. That’s the liquid, macro-sensitive end of the spectrum—exactly what you’d expect when the street is running an index-plus-beta playbook and wants clean proxies for risk appetite. What I like here is that the list leans diversified/layer-1 rather than obscure tickers; that’s the institutional way to toggle exposure without getting trapped in liquidity.
Financials split into two stories. Capital-markets and asset-management names—IREN, MKTX, MFIC, CEF, GEMI, WULF—say volumes and balance-sheet rotation are alive post-expiration. Then you’ve got selective bank exposure—AX, SFBS, UMBF—and SOFI on the fintech line. That’s not a broad factor push; it’s a fishing expedition for idiosyncratic winners while rates set the bigger tone. And notice the single-stock hedges: NVDD (1x Bear NVDA) and AAPD (1x Bear AAPL). That’s classic risk management—stay long the secular leaders, but cap the left tail into data and earnings so you can keep pressing the rest of the tree.
Industrials are there, but it’s targeted rather than a blanket bid. WTS and FSS in machinery, PWR in grid/engineering, AIR in aerospace services, TPC in construction, NMM in marine logistics, AMPX in battery components, plus pro-services like KFRC and STN. It reads like real-economy exposure tied to projects, defense, and electrification—not a melt-up, just steady sponsorship. Healthcare is running a barbell of its own: small/mid biotechs (MIRM, FULC, SRRK, ONC, OCUL, SMMT) for optionality, then execution/cash-flow names like CBLL and ARDT to keep the balance. That matches the pop we’ve seen in biotech chase when the tape tilts risk-on for a few sessions.
You’ve also got rate-sensitives and defensives sprinkled in—PSTL and VTMX in real estate, REYN and AVO in staples, CASY in food retail, IPAR in personal care—plus CLOA on the bond side. That’s your ballast, consistent with the bid we saw in credit sweeps. And the broad wrappers—VOO, USPX, ARKX, RSPG—tell you allocation is still the foundation underneath all this stock-picking.
Net, the list says the same thing the flow tape said: this is a pro-growth market that’s being run with a barbell. Tech remains the backbone and it’s broadening beyond the top two; resources and uranium give you a cash-flow and scarcity kicker; crypto provides a fast-twitch risk toggle; credit and defensives steady the ship. The presence of single-name hedges isn’t bearish—it’s how desks stay long the trend while protecting against the next macro surprise.
VL Institutional Outliers™ (IO)
Institutional Outliers is a proprietary metric designed to spotlight trades that significantly exceed a stock’s recent institutional activity—specifically in terms of dollar volume. By comparing current trade size against each security's recent normalized history, the metric flags outlier events that may indicate sudden institutional interest but may be missed because the activity doesn’t raise any flags/alerts when comparing the activity against the ticker’s entire history. For example, it’s conceivable that a ticker today receives the largest trade it has had in the last 6 months but the trade is unranked and would therefore be missed by current alerts built off Trade Ranks. Use “Realized Vol” to identify tickers with large price displacement and to size your risk appropriately.
The first thing that stands out is how much semiconductor and compute risk showed up at high sigma without dramatic price impact. ACMR printed a 6.36-sigma day on roughly $278m with essentially no change at the close, and COHU posted 6.05 sigma with a +0.63% finish. INTC brought real dollars too—about $1.22b at 2.15 sigma and +2.5%—and RGTI tacked on +2.75% at 2.12 sigma. When you see that mix—big prints, modest or muted closes— it usually reads as accumulation and inventory transfer rather than a one-day chase. The one notable fade was WIX at 2.35 sigma and -3.0%, and SNDK down -2.29% at ~2.0 sigma, which is more in the single-name cleanup bucket than a factor unwind. Net, the semis/compute complex remains in the flow spotlight, consistent with the broader “index + AI” leadership.
Hard assets had a real pulse. UUUU put up 5.6 sigma with a +4.99% close, and the uranium sleeve stayed bid via NLR at +1.16% (2.0 sigma). Precious and strategic metals showed a similar tone: GROY +2.93% (2.0 sigma), RING +0.65% (2.2 sigma), UGL +0.34% (3.1 sigma). Copper was the laggard—FCX printed a heavy ~$495m at 2.72 sigma and finished -1.46%—but lithium popped with LAC +4.02% at 3.15 sigma. That is the classic resources counterweight to a growth tape: miners and uranium catching sponsorship even as one of the base-metal bellwethers takes a breather.
Crypto flows were busy but two-sided. ETH wrappers split—ETHT -1.95% at 2.81 sigma while ETHD +1.86% at 2.48 sigma—and the leveraged BTC proxy BITU slipped -2.49% (2.25 sigma). In miners and adjacent “capital markets” tickers the tone leaned heavier: CIFR was hit for -9.48% at 4.65 sigma, WULF -1.9% at 2.12 sigma, while IREN saw ~$372m at 3.52 sigma and closed -1.33%. That reads like de-risking in the crypto complex after a run, even as the theme stays on the TRV sheet. Traders are clearly still toggling the exposure, but the IO tells you they were more willing to sell strength or reduce into size.
Biotech was active and lumpy—exactly what you want if you are watching risk appetite. QURE exploded +25.48% on 5.78 sigma and stayed on the list the next day with follow-through dollars; SRRK and IMCR finished modest green, while LQDA and KOD traded lower on mid-3 sigma prints. When event-driven biotech lights up alongside strong semis flow, the tape is signaling that risk capital is working, not hiding.
Energy outside uranium showed constructive churn. RIG, CLMT, DK, VET all posted positive closes on 2.5–5.5 sigma flow, and PBA held flat-to-up. Nothing blow-off here; more like steady sponsorship across services and E&Ps. On the commodity sleeve, DBC put in a +0.63% day at 3.7 sigma, rounding out the hard-asset bid we have been seeing.
The allocation backbone is intact. SPLG printed a monster ~$1.97b at 5.15 sigma the prior session, TQQQ had ~$378m at 2.36 sigma, and you saw steady prints in global wrappers—URTH, ACWI, VXUS, JIRE, BBIN, SCHE, VYMI—mostly small changes at 2.9–5.1 sigma. That is classic post-expiration positioning: size through the wrappers with only incremental price effect. Even the cash sleeves showed up—TBIL at 2.9 sigma—telling you asset allocators kept parking short-duration while they reset beta.
Rates sensitives and real assets got a nod. BXP, DEI, and NNN were all green on mid-2 sigma flow, with SCHH basically flat. That fits the two-day rotation we’ve been seeing into utilities/real estate while tech keeps the leadership baton. Consumer staples and beverages were mixed—KLG flat at 5.36 sigma, DEO down -1.18%—and the discount grocer GO was off -1.16% on 2.7 sigma, which looks more idiosyncratic than factor.
Industrials showed targeted interest rather than a blanket chase. DY, MTZ, and LII all printed mid-2 sigma with tiny closes, EOSE added +1.97% at 2.28 sigma, and aerospace via RYCEY stayed active the prior day at 5.13 sigma with only a small dip. Put that together with the uranium and grid names and you have a credible real-economy sleeve under the surface.
Bottom line here: the IO list confirms the same barbell the broader tape keeps advertising. There is real size in semis and compute with signs of quiet accumulation, a firm bid across uranium and selective precious-metal proxies, and continued reliance on broad wrappers to express allocation. Crypto is busy but choppy, leaning to reduction in miners while ETH/BTC wrappers churn. Biotech remains a live wire with event-driven spikes that indicate risk capital is still engaged. If semis keep printing high-sigma dollars without price damage, uranium stays bid, and index wrappers continue to absorb size, the path of least resistance remains a growth-led grind with hard-asset ballast, exactly the posture implied by this week’s institutional flow.
VL Consensus Prices™
These are the most frequently traded #1-Ranked Levels in VL this week. Trades occurring at the highest volume price in a ticker’s history are significant because they represent institutional engagement at a key price memory level—where the market once found consensus. These areas act as liquidity hubs, enabling large players to transact efficiently, and often signal a reassessment of fair value. This activity may precede major moves, mark equilibrium zones, or reflect broader portfolio shifts, making these price levels important to watch even without yet knowing how price will resolve. (Note: many Bond products trade in such a tight range that they dominate the top positions and are therefore omitted to provide better clarity around other flows. The bonds data is still available in the VL platform.)
The heaviest motif is…you guessed it…semis and AI adjacencies. You’ve got core chip names and suppliers—STM, HIMX, LASR, NVMI, POET, CLS, ARW—alongside software infrastructure and data center plumbing—NTNX, PDYN, CLBT, CORZ, NTSK, CRWV—plus application names like ESTC, FROG, GRND, SOUN, LIF. That’s breadth, not just a couple of mega caps. The presence of levered wrappers on the same complex seals it: AMDL (2x Bull AMD), NVDU (2x Bull NVDA), SMCZ (2x Bear SMCI), MUU (2x Bull MU), ASMG (2x Bull ASML), IONL (2x Bull IONQ). Desks are keeping the exposure on but want the ability to add or trim delta quickly around data and headlines. That matches the flow tape we just walked through: tech led the daily dollars, dark pools concentrated in index wrappers and mega-cap platforms, and sweeps leaned into style tilts.
Rates and credit are a close second theme. FLTR printed an outsized trade count, which is exactly what you’d expect in a week that pivots on jobs and ISM—carry sleeves and short-duration hedges get busy when macro is about to set the next rates step. On the equity side, rate-sensitives show up in REITs (STAG, CUBE) and a regulated utility (SWX). That combo says “keep the ballast close” even as growth leads. It fits the sector rotation we’ve seen over the past couple of sessions: defensives perking while tech still holds the baton.
Hard assets and materials are alive, and it’s broader than just one metal. You’ve got miners and precious proxies (EQX, WPM, SPPP), steel/coal adjacencies (SXC, HBM), and the strategic chemicals lane via AXTA and DD with real participation. Energy services are there too—NOV and FTI both with healthy counts. That lines up with the resource sleeve we’ve been flagging: if growth stays “good enough” and rates don’t snap higher, the cash-flow cyclicals can continue to get sponsorship as the counterweight to AI.
Crypto is again present and still measured. ETHZ and ETHV/ETHT pop up along with BLOK and BTCL; that’s liquid L1 and wrapper exposure rather than esoterica. Given the mixed IO prints in miners and the two-sided ETH/BTC action we saw, this looks like a toggle rather than a high-conviction push. It still functions as a clean risk gauge: if these wrappers keep appearing alongside the index complex, risk appetite is intact; if they disappear while bonds catch a stronger bid, it’s a tell that traders are dialing back the fast-twitch sleeve.
Financials are split between market structure beneficiaries and idiosyncratic lenders. Asset managers and alternative platforms (OWL), credit and China fintech (QFIN), plus banks (WAL, CNOB, BMA) and specialty insurance (FAF) suggest desks are poking around in balance sheets without making a broad factor bet. That’s exactly what you do when rates dominate: keep a handful of single-name levers while you wait for the next curve move. IAS in ad-tech is a standout in Comm Services by trade count—pairs well with the software/app stack above—while ASTS gives you the space-telecom optionality bid that often shows up when growth leadership is in charge.
On the consumer and industrial side it’s targeted, not blanket. F (massive trade count) and CAR say the autos/transport demand read is live. CAKE and PAG add discretionary micro reads; TNC and ERII point to services and niche industrial products; RYCEY keeps aerospace in the conversation. Utilities and staples crop up enough to notice—SPB in household products, KLG in packaged foods—again, that quiet nod to defensives while the street keeps the growth engine running.
Two risk-management tells round it out. First, the paired single-stock toggles—NVD (bear NVDA) opposite NVDU, SMCZ on the downside opposite the broader AI list—are classic “stay in the trend, cap the tail” tools. Second, the geography and factor wrappers—KBA for China, EZA for South Africa, IMCG/VOT for mid-cap growth—say allocators are widening the aperture at the margin, but doing it with liquid vehicles they can unwind fast if rates or the dollar lurch.
Netting it down, the list says the same thing the institutional flow said: the street is running a pro-growth play with semis and software as the backbone, resources as the ballast, and defensives on a short leash in case rates wobble. Bonds are active enough to matter, crypto toggles are a live risk dial, and the presence of levered single-name wrappers on the AI complex is a feature, not a bug—it’s how you keep pressing upside without giving the tape your stop. If this mix persists—tech breadth stays wide, NOV/FTI and the miners keep showing up, FLTR remains busy, and the REIT/utility pair holds a bid—the path of least resistance is still higher with a barbell that’s working.
MIR Part 3: Framing-Up A Trade
The flow tape says keep running the barbell: index-plus-AI as the spine, hard assets as the counterweight, defensives and credit as the stabilizers, and a couple of small toggles for crypto and single-name hedge risk. I want to be paid if the growth trend simply grinds higher, but I do not want a hot jobs print or a jumpy ISM to knock me off balance. That points to core exposure through broad wrappers, targeted semis/software where dollars are persistent and price damage has been limited, and real-asset sleeves that have sponsorship when rates breathe. The dark-pool heaviness in index trackers and the steady presence of mega-cap tech tells me allocators are still averaging; sweeps leaning into credit and style tilts argue that fast money is managing factor risk, not abandoning it. I am happy to lean with that.
Positioning-wise, I want my “line of scrimmage” defined by how credit and tech breadth behave over the next two to three sessions. If LQD and HYG hold a bid while SPY/QQQ continue to soak dark-pool size and semis print large trades without price damage, I will let winners run and add on shallow pullbacks. If yields pop and defensives (utilities, REITs) keep their short-term momentum edge, I will tighten time frames on long-duration software and let the resource sleeve do more of the work. Crypto stays a toggle—keep the size small and let it signal risk appetite rather than drive it. Uranium and precious metals remain in the cart; they are acting like genuine diversification, not just beta-more.
Here is a sample portfolio that maps directly to the institutional tape we are seeing.
Core index beta sits at the center (28% total):
SPY 14%
QQQ 9%
IWM 5%
AI and compute get a defined sleeve (18% total):
SMH 7%
NVDA 3%
INTC 2%
IGV 4%
NTNX 1%
ESTC 1%
Hard assets are the counterweight (16%):
XLE 6%
OIH 2%
URNJ 3%
GDX 3%
TFPM 1%
FCX 1%
I want biotech optionality without single-name gap risk, so (4%):
XBI 4%
Crypto remains a small, honest toggle (2%):
BITO 1%
ETHD 1%
For rate-sensitives and ballast on equity down-days (6%):
XLRE 2%
XLU 3%
XLP 1%
Keep some global breadth (4%):
VXUS 3%
FLTW 1%
Credit does the heavy smoothing (18%):
LQD 6%
FLTR 4%
HYG 2%
TBIL 6%
Because we are leaning into growth, I will also carry two tiny single-name hedges to cap the left tail into data (2%):
NVDD 1%
AAPD 1%.
Cash stays at 2% as dry powder.The justification is straightforward. Index wrappers and megacaps continue to dominate aggregate dollars and dark pools, so the core belongs in SPY and QQQ with a small IWM kicker for breadth. Semis and software still print size with only modest closing effects, which is what accumulation looks like, so I want SMH and a couple of liquid single names to capture the upside while the hedges police gap risk. Energy, uranium, and precious metals have real sponsorship across venues; that sleeve offsets any day where growth hesitates or yields whip. Defensives and REITs have a two-day momentum edge and should keep doing their job if rates take a lap. Credit strength is the “all clear” for this mix; when LQD and HYG trade well alongside firm equities, the barbell tends to compound.
Execution is tactical. I will add to core on backfills that hold/defend significant VL levels and reduce into spikes that tag recent tops without fresh participation - you have to see willing institutional buyers at the highs to keep the party going. In semis/software, I want to buy dips that respect higher-low structure and show continued high-sigma prints with shallow closes; I will fade only if we see size on the offer and failed reclaims. In resources, I will lean into XLE/URNJ/GDX when crude and metals curves are firm and demonstrating clear relative strength and cut them back if copper rolls while the dollar rises. For crypto, I will keep it mechanical—if BTC/ETH wrappers trade with equities and credit, size stays; if they decouple lower while credit wobbles, I step aside. The hedges are there to let me sleep: if NVDA or AAPL gap lower on a hot macro surprise, NVDD/AAPD pick up a slice of the drawdown and give me time to decide whether to reload or derisk.
Tripwires are clear. Confirmation for staying fully risk-on is credit firming with index dark-pool size persisting and semis breadth holding up. A warning light is a decisive bid in long duration while QQQ underperforms and defensives accelerate—that is when I rotate weight from IGV/QQQ toward the resource and defensive sleeves and let cash drift up from 2% to 5%+. A true risk-off tell is rising credit spreads with tech dark pools flipping from accumulation to distribution; if that shows, I’ll halve the AI sleeve, lift hedges toward 3–4%, and let TBIL and LQD do the heavy lifting until the next data reset.
Bottom line: stay long the trend the tape is funding—index plus AI—with hard assets, defensives, and credit smoothing the ride, keep crypto small and honest, and use tight tripwires around credit and semis breadth to decide whether you press or pare as the week’s data hits.

Thank you for being part of our community and for dedicating your time to this edition. Your insights and engagement drive everything we do, and we’re honored to share this space with such committed, thoughtful readers. Here’s to a week filled with clear opportunities and strong performance. Wishing you many bags 💰💰💰
—VolumeLeaders