Market Momentum: Your Weekly Financial Forecast & Market Prep
Issue 62 / What to expect Sept 22, 2025 thru Sept 26, 2025

NOTE: This weekly periodical is too large for Substack to deliver in its entirety via email - you will only see a portion of this great content if you read from your email client. Click the header/title at the top to read the full article!
In This Issue
Weekly Market-On-Close Report: All the macro moves, market drivers, and must-know narratives—covered in less than five minutes.
Weekly Benchmark Breakdown: Our weekly intelligence report on major indices cuts through the index-level noise to uncover participation, momentum, and structural integrity and tell you whether markets are rising on solid ground or skating on thin breadth. This is where bull markets prove themselves—or quietly start to unravel.
The Latest Investor Sentiment Readings: Track the emotional pulse of the market with our curated dashboard of sentiment indicators. From fear-fueled flight to euphoric overreach, this week's readings reveal whether investors are cautiously creeping in—or stampeding toward the exits.
Institutional Support & Resistance Levels For Major Indices: Exactly where to look for support and resistance this coming week in SPY, QQQ, IWM & DIA
Normalized Performance By Thematics YTD: Which corners of the markets are beating benchmarks, which are overlooked and which ones are over-crowded!
Key Econ Events & Earnings On-Deck For This Coming Week
Market Intelligence Report: Track the real money. This section breaks down where institutions are placing their bets—and pulling their chips. You'll get a sector-by-sector view of flows, highlighting the most active names attracting large-scale buying or selling. We go beyond the headlines and into the tape, surfacing the week’s most notable block trades and sweep orders, both on lit exchanges and hidden dark pools. Whether you're following momentum or fading crowded trades, this is your map to where size is moving and why it matters.

Weekly Market-On-Close Report
The tape closed the week the way it traded most of the week: calm, constructive, and relentlessly upward. On Friday, the S&P 500 Index (SPX; ETF: SPY) finished +0.49%, the Dow Jones Industrials (DJI; ETF: DIA) ended +0.37%, and the Nasdaq 100 (NDX; ETF: QQQ) gained +0.70%. December E-mini S&P futures (ESZ25) added +0.42% and December E-mini Nasdaq futures (NQZ25) rose +0.68%. All three majors posted new all-time highs. The mechanism wasn’t fireworks; it was absorption. The catalyst wasn’t a single headline; it was a mosaic: a Federal Reserve “risk-management” cut, a giant quarterly expiration and index rebalance, and policy headlines that looked spicy at 30,000 feet but left the range surprisingly contained on the ground.
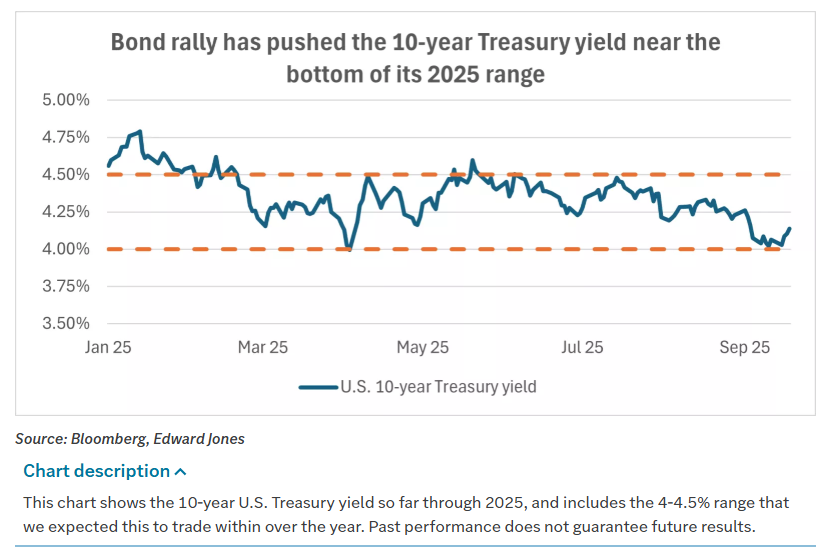
Volatility refused to take the bait. Even with triple-witching—roughly $5T of listed options, futures, and derivatives expiring—realized vol stayed near normal. The 10-year Treasury yield edged up +2 bp on the day to ~4.13%, a headwind but not a brick wall. The net effect: a steady bid under equities and a market that continues to favor patient positioning over adrenaline trading.
Friday’s close deserves its own paragraph. The NYSE closing auction printed the second-largest on record by shares and notional—about 3.1B shares and roughly $195B—trailing only Q1’s triple-witch. That’s the mechanical heartbeat of a modern market running through quarterly rolls, ETF and index housekeeping, and benchmark tracking fixes. The practical question now that the auction has cleared is simple: with a large slice of the S&P 500 drifting into buyback blackout and the structural flows in the rearview, do we finally let volatility expand next week? Historically since 2024, the week after triple-witching often shows a modest uptick in realized vol—but rarely a regime change by itself. Treat Monday–Tuesday as an honesty check: if SPY, QQQ, and DIA hold Friday’s ranges with lighter liquidity, sponsorship is real; if they back through quickly, the auction did more heavy lifting than the intraday tape revealed.
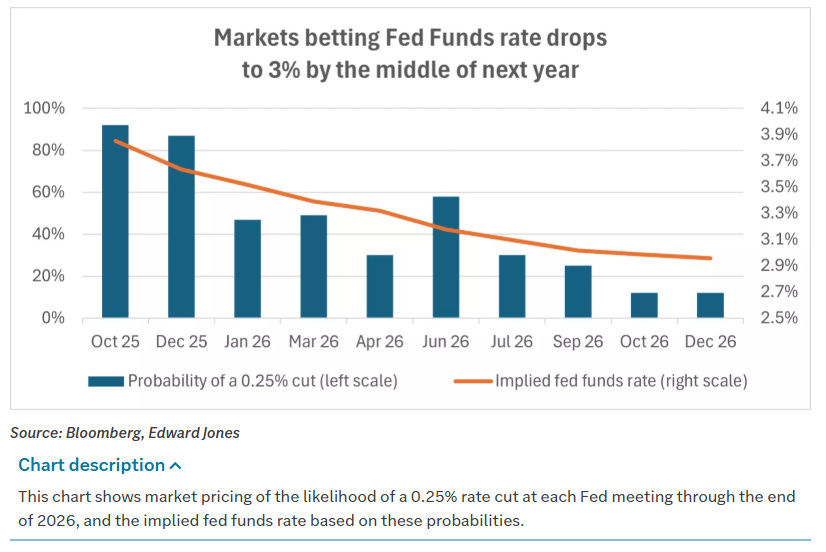
Rates and policy framed the week. The Federal Reserve cut the policy rate by 25 bps—the first move in nine months—and Chair Jerome Powell labeled it a “risk-management” cut aimed at the downside risks in the labor market and a path back toward neutral. The Summary of Economic Projections leaned toward additional easing this year, but the committee’s dots were not monolithic. Newly confirmed Governor Stephen Miran dissented in favor of a 50 bp cut and projected five more cuts by year-end in his dots. Minneapolis Fed President Neel Kashkari publicly supported the 25 bp move and penciled in two additional cuts this year. The market’s takeaway: the cutting cycle has resumed, guidance remains data-dependent, and optionality is intact. Fed funds futures into the October 28–29 FOMC are pricing roughly a 92% probability of another 25 bp cut, but the committee is telling you the cadence will respond to the incoming data rather than ride a preset glidepath.
Treasuries traded the way a well-telegraphed cut and firming risk appetite usually force them to trade. December 10-year note futures (ZNZ5) fell ~7.5 ticks Friday, pushing the 10-year yield to the ~4.131% area and briefly as high as ~4.143%, a two-week high. Some of that was sympathy with Europe (Bund and gilt yields pushed to two-week highs), some was relief from safe-haven demand as stocks made new highs, and some was the market processing the Fed’s “cut but keep optionality” tone. The policy optics added noise as well: worries about Fed independence flickered after headlines around an effort to remove Governor Lisa Cook and Miran’s unusual situation of holding a Board seat while technically retained in a White House Council of Economic Advisers role (says the holdover is to avoid reconfirmation complications when term ends in January). But the market’s verdict was straightforward: yields can back up a little in a risk-on week without derailing the equity impulse.
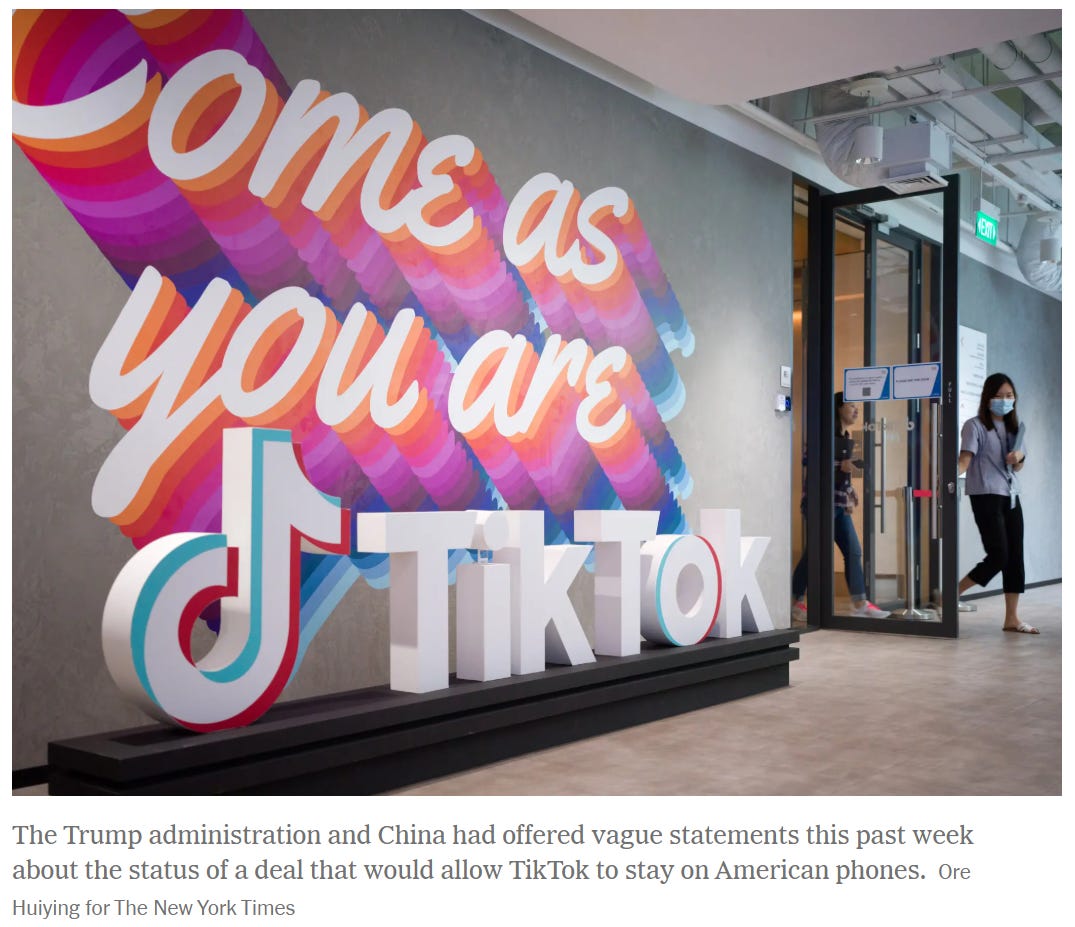
Trade headlines were back in the frame. President Donald Trump spoke by phone with China’s President Xi Jinping on Friday. The conversation centered on a framework to shift control of TikTok’s U.S. operations from ByteDance to a consortium of American investors, with the two leaders planning to meet on the sidelines of APEC in South Korea next month. The tone around broader trade sounded “modestly positive” in initial readouts, but tensions remain. Ahead of the talks, Beijing launched an anti-dumping probe into U.S. analog chipmakers and accused Nvidia (NVDA) of violating anti-monopoly rules, underscoring that the tech supply chain is still a policy chessboard. Markets treated the headlines as a series of micro catalysts rather than a macro pivot.
Earnings and single-name catalysts reinforced that “micro” theme. Oracle (ORCL) rallied more than +4% on a Bloomberg headline that ORCL is in talks with Meta Platforms (META) for a cloud deal on the order of $20B. Klaviyo (KVYO) gained more than +4% after Morgan Stanley upgraded to Overweight with a $50 target. CoreWeave (CRWV) rose more than +3% after Loop Capital initiated coverage at Buy with a $165 target. Lincoln National (LNC) added more than +3% on a Morgan Stanley upgrade to Overweight with a $58 target. FedEx (FDX) rose more than +2% after posting Q1 adjusted EPS of $3.83 vs. $3.59 consensus. Warner Bros. Discovery (WBD) climbed more than +2% after CNBC reported a potential Paramount-Skydance bid could land in the $22–$24 per share range. On the downside, Scholastic (SCHL) fell more than −12% after a wider-than-expected Q1 loss (−$2.52 vs. −$2.44). Hess Midstream (HESM) dropped more than −10% after signaling lower capex in 2026–2027 tied to suspending early work on the Capa gas plant and removing it from the forward plan. Cognizant (CTSH) slid more than −4% on a Bloomberg report that a $100,000 H-1B application fee is under consideration, a direct stress point for outsourcing and staffing-heavy IT services. Humana (HUM) fell more than −4% after Piper Sandler said HUM’s CMS Star Ratings recovery likely won’t arrive until 2027, pushing any boost to quality bonus payments out to 2028. Lennar (LEN) fell more than −4% on Q3 revenue of ~$8.81B vs. ~$9.05B expected and guided Q4 new orders to 20,000–21,000 (vs. ~21,047 consensus). Intel (INTC) lost more than −3% after Citi cut to Sell (PT $29).
Leadership and factor tone were textbook for an easing backdrop. The “Magnificent Seven” cohort provided lift: Apple (AAPL) finished the day up more than +3%, Tesla (TSLA) was up more than +2%, Alphabet (GOOGL) and Microsoft (MSFT) gained more than +1%, Nvidia (NVDA) added about +0.24%, and Amazon (AMZN) rose roughly +0.11%. Communication Services was the best-performing sector with the platform names doing the heavy lifting. Consumer Discretionary finished higher—helped by TSLA’s move after Elon Musk’s ~$1B insider purchase—but housing-sensitive names did not get the “cut” bump you might have expected because LEN’s miss and guide kept the group honest. Restaurants traded heavy after Darden Restaurants (DRI) underwhelmed on results, pulling peers lower. Healthcare trailed overall: medical devices and managed care were pressured amid policy chatter on funding and CMS metrics; within that, HUM’s Star Ratings timeline was the explicit single-name drag.

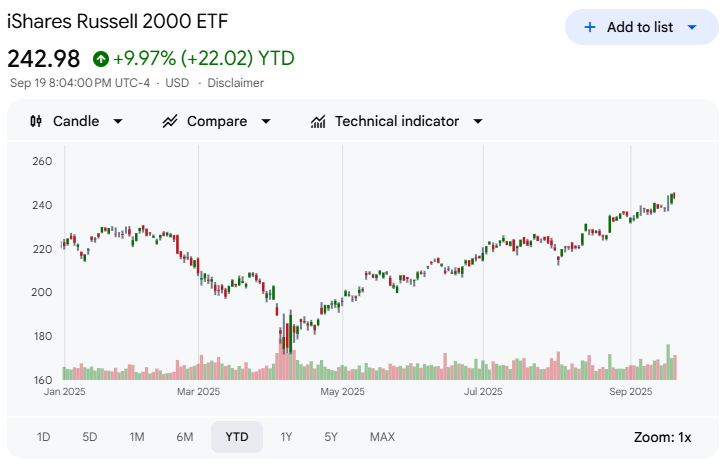
Under the surface, small caps did what small caps are supposed to do when the policy lever moves their way. The Russell 2000 rallied nearly +3% for the week, finally punching through its post-election high and logging its first new all-time high since November 2021. If you prefer signposts: this is what broadening looks like—leadership holds while the next ring of beta responds to a friendlier rate path. Since early May, the S&P 500 has climbed nearly +20% with a max drawdown just over ~3%. Through almost all of Q3 there have been only eight sessions with a >1% intraday range (versus 40 in Q2 and 38 in Q1). The “wall of worry” has been a staircase.
Overseas, the picture was a patchwork. The Euro Stoxx 50 (SX5E) touched a four-week high and finished essentially flat on Friday (+0.03%). Policy guidance was not unified. ECB Governing Council member Mario Centeno said euro-area growth is below potential, inflation will soon fall below target and stay there for some time, and he views further easing as “more likely than not.” GC member Madis Müller said policy is already slightly accommodative and there’s no reason to lower rates further right now. The Bank of England held steady and signaled caution about the market’s appetite for a full cutting cycle. Norges Bank cut as expected. The euro ran toward 1.19 mid-week before fading to the 1.17s; the U.K. posted a +0.8% m/m retail-sales ex-fuel surprise (largest in five months) alongside £18B of August borrowing (highest August in five years), an awkward mix that left gilts heavy. German August PPI printed −0.5% m/m, −2.2% y/y (soft), but European sovereigns still cheapened: the 10-yr Bund settled near 2.748% (+~2.2 bp) and the 10-yr gilt near 4.715% (+~3.9 bp). In Asia, the Shanghai Composite fell −0.30% Friday, the Nikkei 225 closed −0.57% after tagging a record earlier in the week, and elsewhere across the region Japan and South Korea held a constructive tone. The Nikkei remains supported by a modestly weaker yen and a BOJ stance that stayed on hold despite two hawkish dissents. Hong Kong outperformed on tech strength; Baidu (9888 HK; BIDU US) popped ~+15% on the week. The broad takeaway: global risk was mixed to higher where currency and policy were tailwinds, and mixed-to-lower where they weren’t.
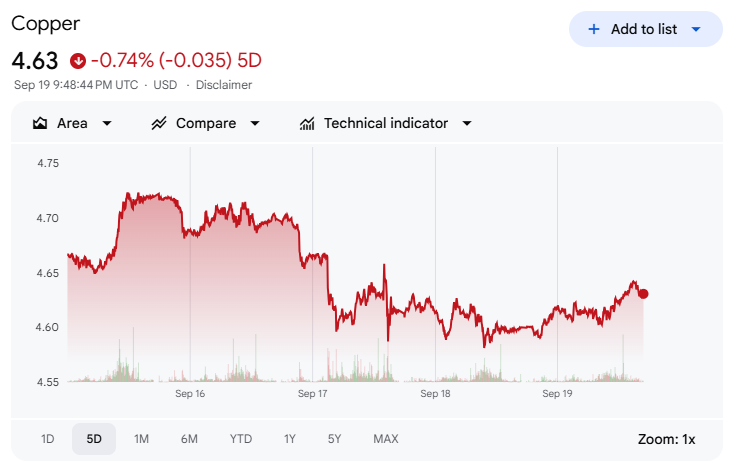
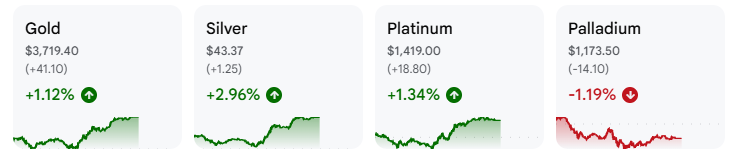
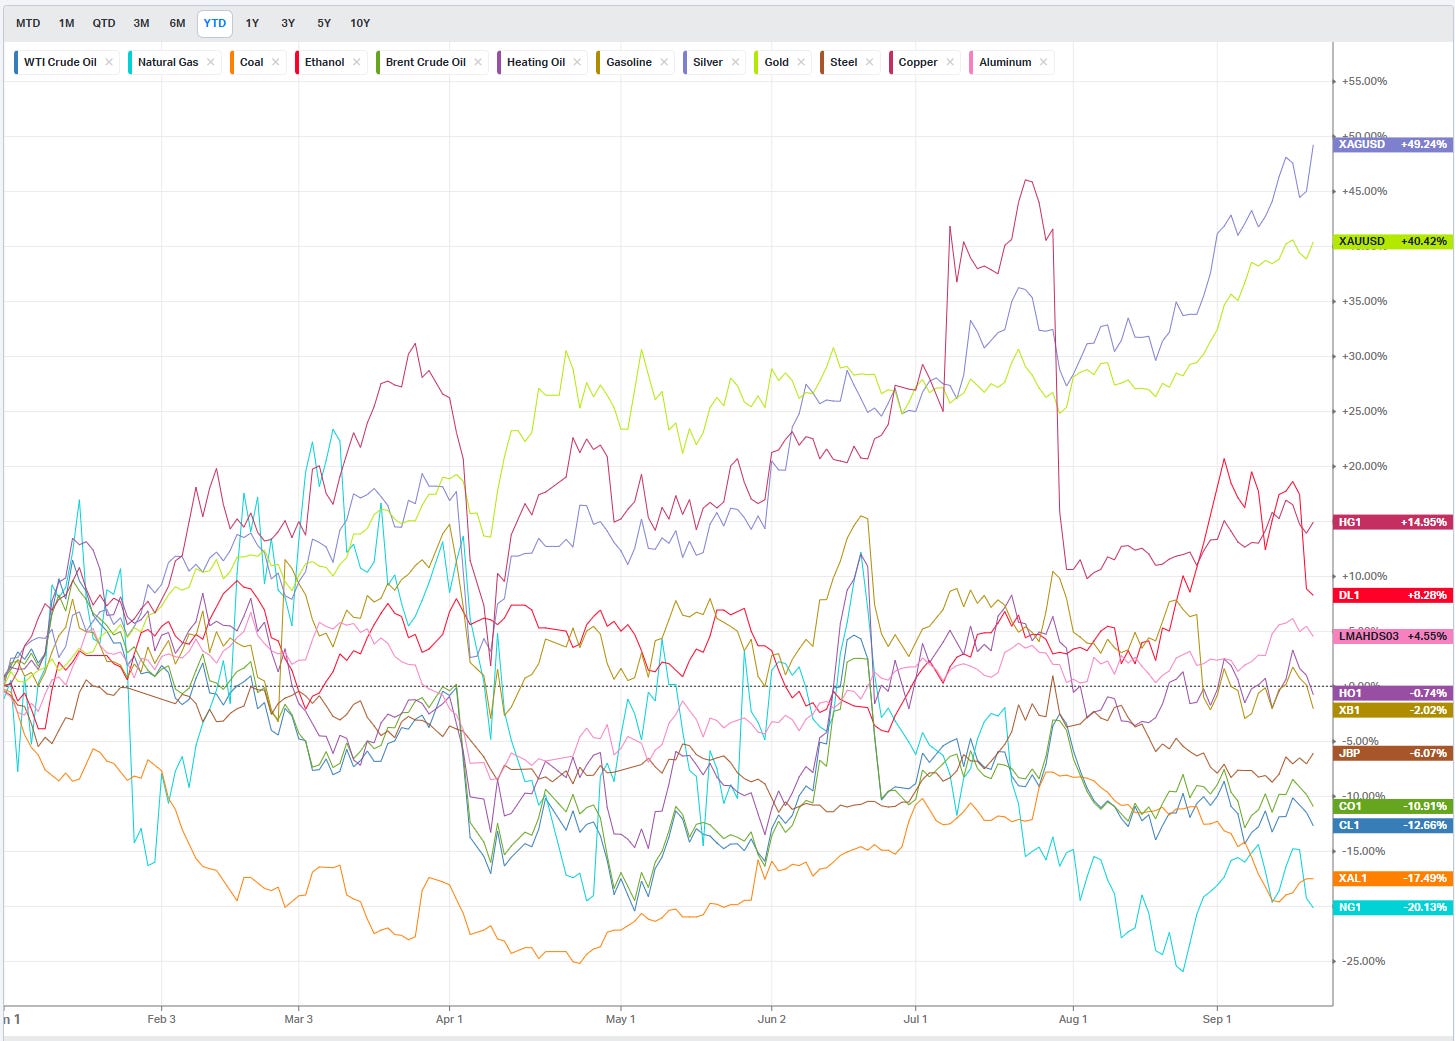
Commodities wrote a study in contrasts. Metals were mostly higher: gold, silver, and platinum gained while palladium fell and copper ticked slightly lower. Gold hovered just below the record it set earlier in the week. Energy split: Brent crude slipped modestly, WTI nudged higher, and U.S. natural gas fell below $3. Brent failed to hold its 200-day (~$68), rolled back to the 100-day (~$66.25), and has not sustained time above the 200-day all year. The EU enacted additional sanctions on Russia but they were less severe than expected. In gas, the U.S. inventory build topped expectations, and Dutch TTF sat in a $31–$33/MWh range that has held since August. The EU set a target to end Russian LNG usage by January 1, 2027—one year earlier than previously penciled. In ags, weakness was broad, led by soy. Notably, for the first time in the modern record back to 1999, China has not purchased U.S. soy at the very start of the export season (it bought ~$12B last year). Treat that as a snapshot of price/policy dynamics rather than a full-year verdict, but it is a clean data point.
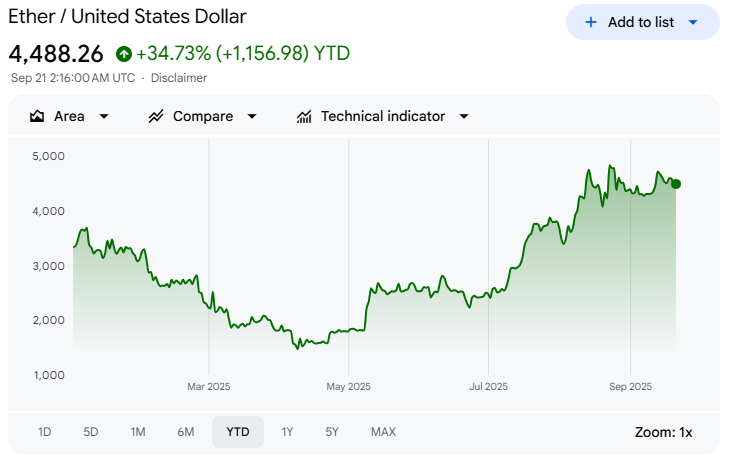
Crypto diverged from crypto-equities. Most major tokens were lower—Ether (ETH) −5% on the week, Bitcoin (BTC) −1%—yet listed equities tied to exchanges, miners, and corporate treasuries were mostly higher, while the “alt-coin treasury” cohort skidded. StreetAccount tallied 37 companies globally with crypto-treasury plans active this week (40 last week): 22 made direct purchases and others announced plans. The SEC approved generic listing standards for commodity-based ETPs, explicitly including cryptocurrencies, which simplifies future listings by avoiding bespoke reviews for every product—especially relevant to alt-coin ETFs. In the meme corner, the pocket sagged: Dogecoin (DOGE) and Pudgy Penguins fell ~2%, dogwifhat ~6%, Fartcoin ~8%.
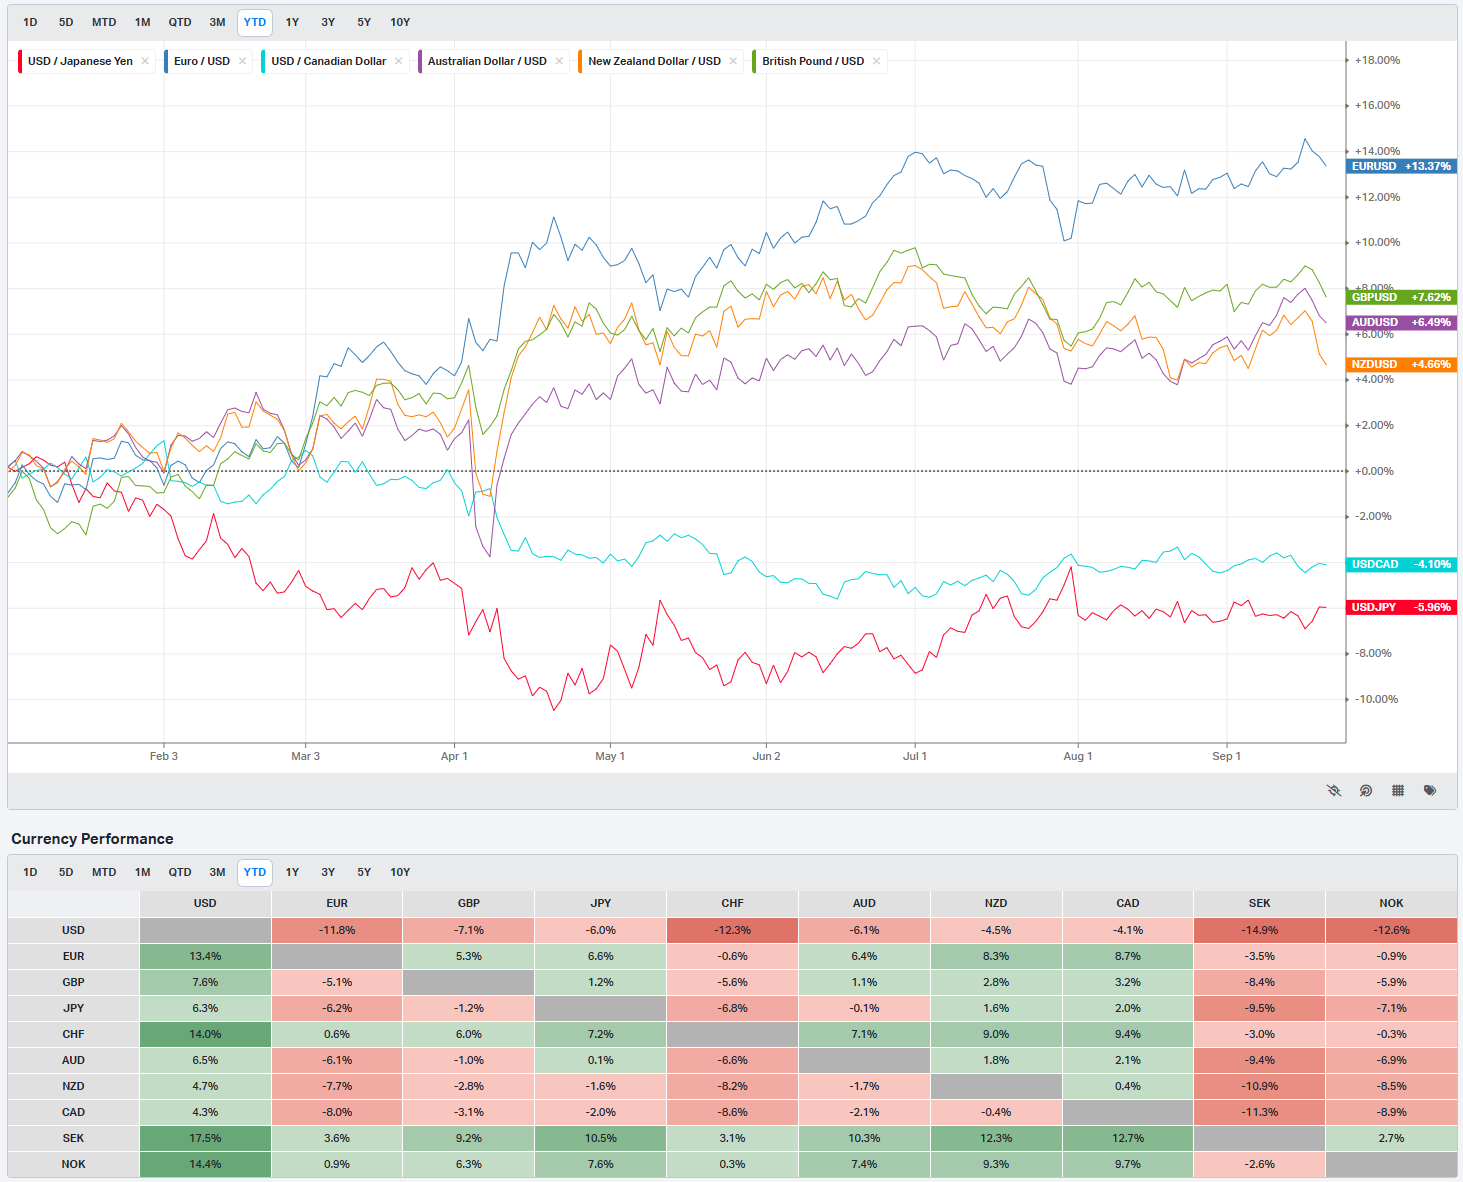
The currency and rates cross-current was straightforward. The U.S. Dollar Index bounced off three-year lows near ~96 after the Fed meeting. Dollar-yen traded in a familiar ¥146–¥148 band. EUR/USD kissed 1.19 mid-week before easing to ~1.175. Despite the 25 bp cut, the Treasury curve steepened modestly as the long end backed up, reflecting Powell’s tone (not aggressively dovish), a single dissent, and the pre-meeting rally that had already dragged yields lower. Long- and intermediate-term yields rose; front-end was comparatively steady. Bond math 101: prices down, yields up; equities shrugged.
The macro dataflow supported the “risk-management cut” narrative rather than undermining it. Weekly jobless claims, which had spiked the prior week and triggered some alarm about a labor wobble, reversed: initial claims fell 33k to 231k, back into the familiar range. A big driver of last week’s jump—Texas—dropped by ~5k. Continuing claims fell but remain elevated relative to H1. The Philly Fed manufacturing index sharply improved month-over-month: current new orders and shipments rose, while prices paid and received fell sharply; the six-month outlook rose, though the internals were mixed. The Empire survey went the other way: new orders and shipments fell, prices eased but not as much. That kind of survey divergence is common near turning points and says more about sector mix and timing than about a macro cliff. Housing stayed two-handed: starts and permits ticked down, with starts just above five-year lows and permits logging a fifth straight monthly decline; at the same time, refi activity spiked +58% in the week ending 9/12 (MBA), as mortgage rates fell to the lowest since October. Advanced Retail Sales beat on the headline and the control group (0.6%/0.7% m/m vs. 0.2%/0.4% expected). The usual caveat applies: these are nominal figures. Import and export prices were hotter than expected, but consumer goods ex-autos are down y/y. Net-net: growth looks fine, inflation not scary, labor softer but not collapsing—textbook justification for a quarter-point “insurance” cut with optionality.
Sector and factor color in detail:
Information Technology (SPDR: XLK). Semiconductors split: analog names underperformed on the China anti-dumping and procurement headlines; AI-adjacent and semi-equipment caught bids tied to the Intel (INTC) tape after Nvidia’s strategic interest chatter earlier in the week. Cybersecurity rallied after CrowdStrike (CRWD) laid out ambitious long-term growth math, soothing nerves frayed by Fortinet’s (FTNT) softer August guidance. Software saw idiosyncratic strength in KVYO (upgrade) and ORCL (Meta cloud headline).
Communication Services (XLC). Best sector on the week with platform names carrying weight: Alphabet (GOOGL) higher, Meta (META) up on the ORCL chatter, and Warner Bros. Discovery (WBD) higher on CNBC’s Paramount-Skydance bid range.
Consumer Discretionary (XLY). Roughly +1% on the week thanks to mega-cap leadership—Tesla (TSLA) rallied >7% after Elon Musk disclosed a ~$1B purchase. Housing-sensitive names lagged on Lennar (LEN) revenue/guidance. Darden Restaurants (DRI) disappointed, and casual dining traded heavy as a group.
Healthcare (XLV). Underperformed. Managed care remains headline-sensitive: Humana (HUM) slipped on a note pushing back its CMS Star Ratings recovery to 2027; devices were a drag without a unifying single-name catalyst in your notes, but policy attention on funding and quality remains a headwind for the group.
Industrials (XLI). FedEx (FDX) helped the narrative with a clean beat (EPS $3.83 vs. $3.59). Construction-engineering and select services stayed bid earlier in the week, then faded into the auction. Professional services (LDOS) didn’t move much Friday, but the cohort’s risk premium stayed tame.
Financials (XLF). Mixed, with insurance and capital markets producing the clearest stock-specific moves: Lincoln National (LNC) upgraded; MarketAxess (MKTX) saw huge “outlier” dollar prints even as price was calm, an indication of heavy credit-market plumbing; regional banks were two-way into the close.
Energy (XLE). Slipped with Brent and mixed micro headlines. Hess Midstream (HESM) cut capex plans in 2026–27 tied to the Capa gas plant suspension. Integrateds and midstream outperformed E&Ps at the margin; U.S. nat gas weakness kept the group from catching a broad bid.
Real Estate (XLRE). Traded in line with rates: a modest headwind from the long end backing up; the bigger question sits ahead—does a calmer, lower-vol rates path let REITs extend from here, or does blackout-season equity liquidity keep a lid on sponsorship?
Staples (XLP) and Utilities (XLU). Underperformed as the bid rotated toward beta/growth and away from defensives, a normal pattern when the Fed is easing and the curve is steepening modestly.
Zooming out, the character of the U.S. equity trend since May remains the key fact: an almost monotonically higher path with shallow dips and quick repairs. The indices are at highs, but the rally has not relied on a surge in realized volatility. The week also wrote new “price memory” into the book at the close—a monster auction at record highs—just as buyback blackout season begins in earnest.
Next week’s calendar will quickly test the market’s patience. Flash PMIs hit Tuesday, the final GDP revision lands Thursday, and PCE arrives Friday. The blackout window is over, which means the microphones are back on: Stephen Miran outlines his framework Monday; Chair Powell speaks Tuesday; other FOMC members fill in around the data. Earnings are light but not trivial: Micron (MU), Costco (COST), KB Home (KBH), Accenture (ACN), and AutoZone (AZO) all report. Add a healthy slate of global sovereign auctions that could tug at the long end of the curve. If the PMIs hold above 50 and PCE core runs ~0.2% m/m with a 2-handle y/y, the “soft landing with easing” script holds. If PMIs slip and PCE runs hot, expect a yield backup and a test of the recent battle-lines we just drew.
Bottom line: we closed a heavily anticipated week at fresh highs, through a giant closing auction, with a central bank easing and keeping optionality, and with cross-currents that never rose to the level of trend breakers. The market keeps telling the same story: buy acceptance, fade rejection, respect institutional positioning as we’ve lifted over all major prints so far, and let the slow vol grind do the heavy lifting until the data or the policy path says otherwise.

Weekly Benchmark Breakdown
This week’s breadth picture reads like a market trying to climb while catching its breath. Across the majors, short-term participation improved from last week’s lows but did not deliver the kind of thrust that resets risk higher with conviction. Intermediate trend gauges remain constructive, which tells me the primary uptrend is still alive, yet the lift is again concentrated in the usual heavyweights.
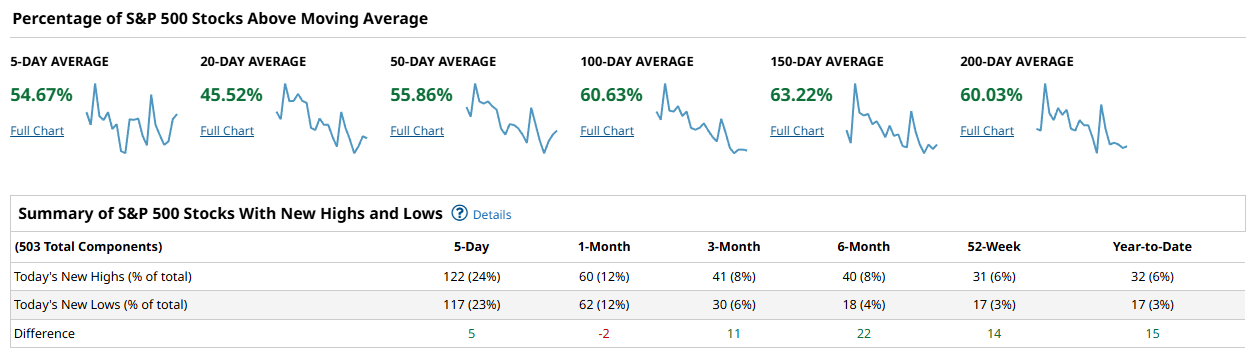
Start with the S&P 500. Roughly 55% of constituents sit above their 5-day average, but only about 46% are above the 20-day. That 20-day dip captures the recent soft patch and says momentum over the past month has been uneven. Step out to the 50- through 200-day windows and the tone brightens: 56% above the 50-day, about 61% above the 100-day, and near 60% above the 200-day. Those levels are not euphoric, but they are firmly supportive of an ongoing primary uptrend. New highs vs new lows for the week finished slightly positive, 122 vs 117, which is the definition of a market leaning higher but not stampeding. In practice, this backdrop favors stock picking and disciplined add-backs over broad beta exposure. The index can grind up while the underlying tape works through rotation.
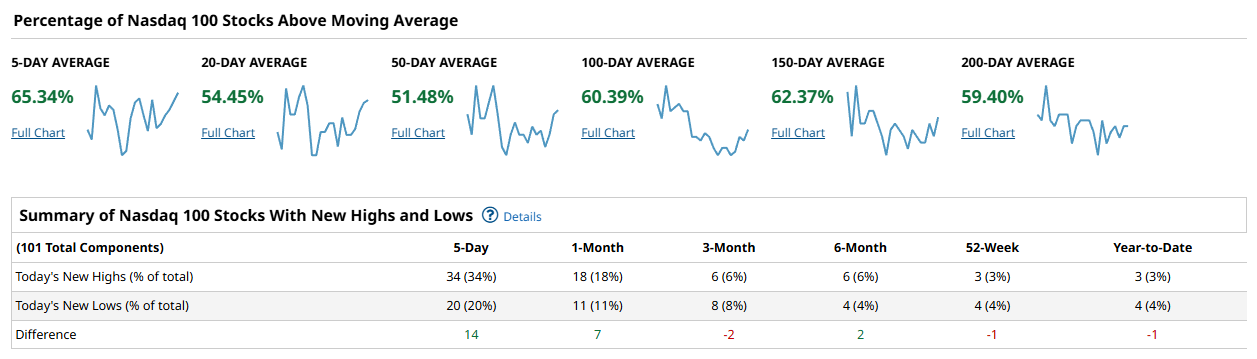
The Nasdaq 100 carried more of the load. About 65% of the basket is above the 5-day and a bit over 54% above the 20-day. Only ~51% are above the 50-day, so the intermediate picture is hardly a blowout, but the weekly new highs to new lows spread pushed to +14. That setup says megacap growth resumed leadership and buyers showed back up in the marquee names. When the near-term breadth is stronger than the 50-day reading, it often marks the early phase of a re-acceleration led by the index generals. The catch is concentration risk. Longer lookbacks are only modestly positive, and 52-week and year-to-date new-high minus new-low tallies are roughly flat to slightly negative, a reminder that not everything inside QQQ is making fresh ground. The read is bullish for index level price, but narrow.
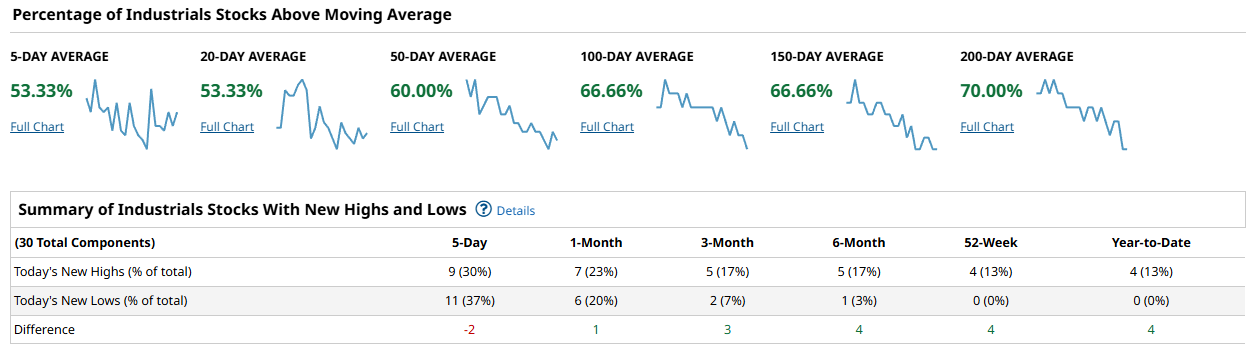
The Dow 30 is steady rather than exciting. About 53% of components are above the 5- and 20-day measures, 60% above the 50-day, and a healthy 67% to 70% above the 100- to 200-day measures. That is classic old-economy resilience: longer-term trend participation is strong, near-term oscillators are middling, and weekly new highs vs new lows came in a touch negative. The Dow tends to lag in thrusty phases and cushion in sloppy ones; its current posture argues for a grind with a mild defensive tilt.
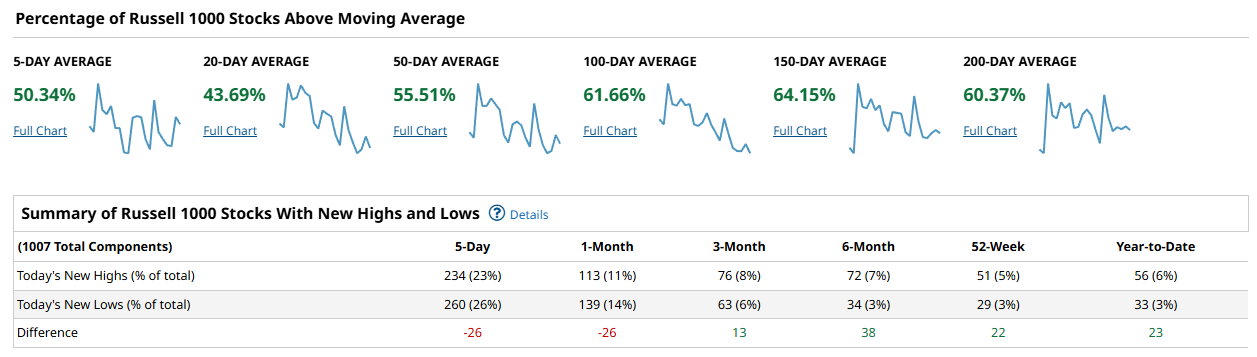
The breadth tell I always respect sits in the Russell 1000 because it proxies the broad large-cap universe without being dominated by a handful of names. Here the message is mixed to soft. Only about 50% are above the 5-day and just 44% above the 20-day, with a more respectable 56% above the 50-day and ~62% above the 100-day. The weekly new-high minus new-low spread printed at -26 and the 1-month tally is also -26. That is not what you want to see if you are betting on a broad advance right now. It says the average stock is still digesting and more names are slipping to short-term lows than pushing to fresh highs. The longer windows, however, remain constructive, which keeps the door open for improvement if the next push broadens beyond the megacaps.
Stitch these together and the state of the union is clear. The primary trend is intact across indices, with 100- to 200-day participation hovering around 60% to 70% on most measures. The short-term tape is better than last week but still choppy, with the 20-day cohorts under 50% on SPX and R1000. Leadership has narrowed again to the Nasdaq 100 heavyweights. That pattern can carry the cap-weighted indices higher in the near term, but durable advances require the lagging cohorts to rejoin the move. If the next leg up is the real thing, I want to see the 50-day percent-above lines push through the low-60s and the weekly new-high minus new-low spreads turn decisively positive in the Russell 1000. If we do not see that, rallies will skate on thinner ice and remain vulnerable to headline shocks.
From a practical standpoint, I am treating this as a buy-the-best environment rather than buy-everything. Favor names already printing fresh 3- to 6-month highs, riding above their 100- and 200-day baselines, and supported by improving short-term momentum. Be selective in areas throwing more new lows than highs, especially if they are sitting below declining 20-day averages. Keep a close eye on breadth follow-through early next week; a second up week with expanding new highs across the broader Russell 1000 would confirm that buyers are rotating down the cap spectrum. Absent that, respect the concentration, keep position sizes honest, and let the leaders do the heavy lifting while the rest of the tape resets.
Bottom line: trend still up, thrust still narrow. Bulls keep the ball, but the drive will not gain speed until participation widens.
Investor Sentiment Report
Insider Trading
Insider trading occurs when a company’s leaders or major shareholders trade stock based on non-public information. Tracking these trades can reveal insider expectations about the company’s future. For example, large purchases before an earnings report or drug trial results might indicate confidence in upcoming good news.
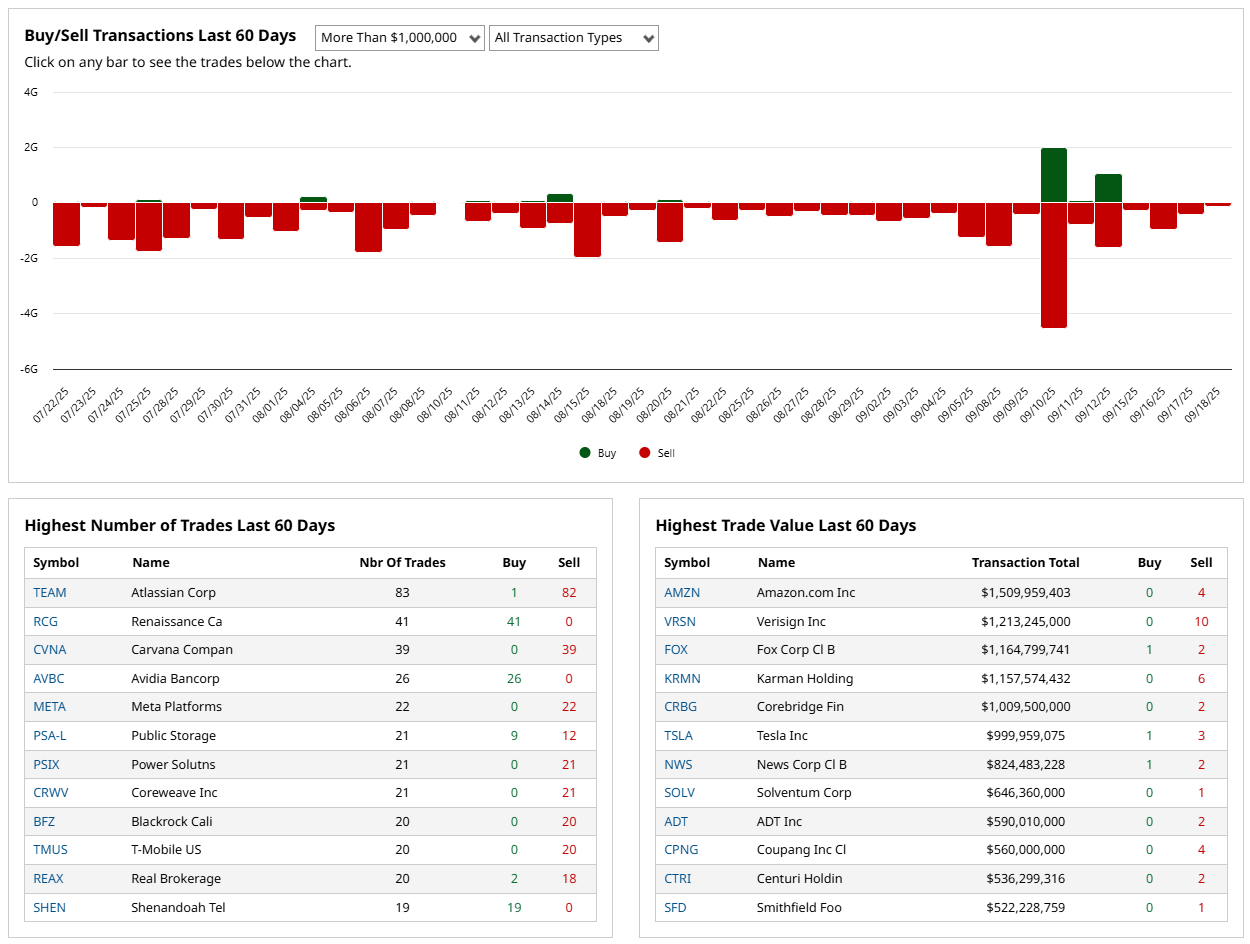
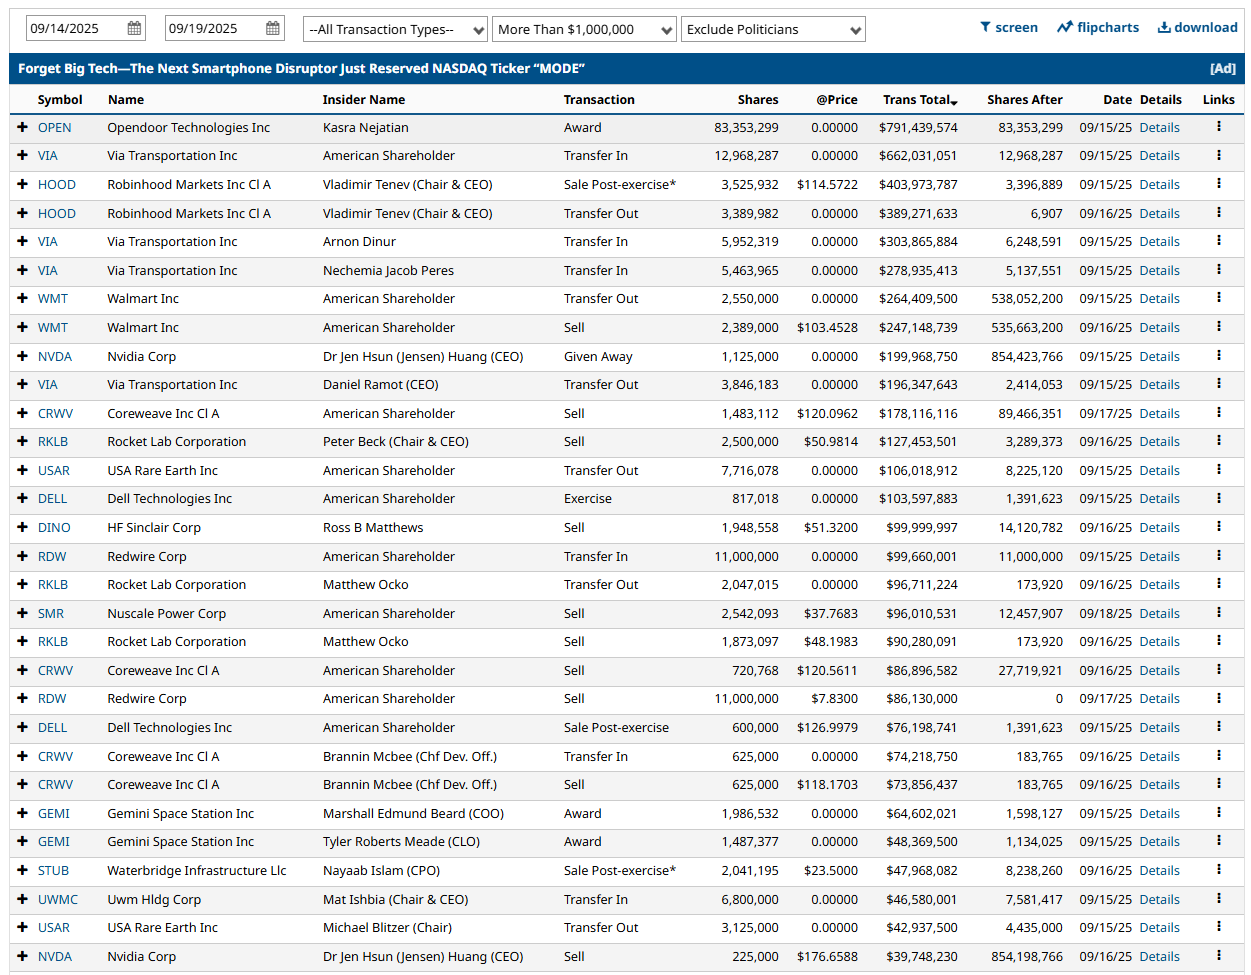
The 60 day ledger is decisively sell skewed. The biggest dollar prints are almost all distributes: AMZN roughly 1.51B across 4 sells, VRSN about 1.21B across 10 sells, TSLA near 1.0B across 5 sells, with similar supply from CRBG, KRMN, FOX, NWS, and others. Trade counts tell the same story: TEAM logged 83 transactions with 82 sells, CVNA shows 39 sells, and META appears net supply. There are pockets of buys in smaller names, but they are dwarfed in value. The top 30 this week continues the theme, but with an important caveat. A large share of the items are awards, exercises, and transfers that are not open market expressions of opinion. Where the activity is true open market, the balance remains sell heavy, including repeat supply from CoreWeave related holders and sales in WMT, RDW, and others. Net take: insiders are not leaning into this tape with cash buys; when size moves, it is mostly distribution, and the cleanest positive signals are scarce.
%Bull-Bear Spread
The %Bull-Bear Spread measures the gap between bullish and bearish investor sentiment, often from surveys like AAII. It’s a contrarian indicator—extreme optimism may signal a coming pullback, while extreme pessimism can hint at a potential rally. Large positive or negative spreads often mark market turning points.
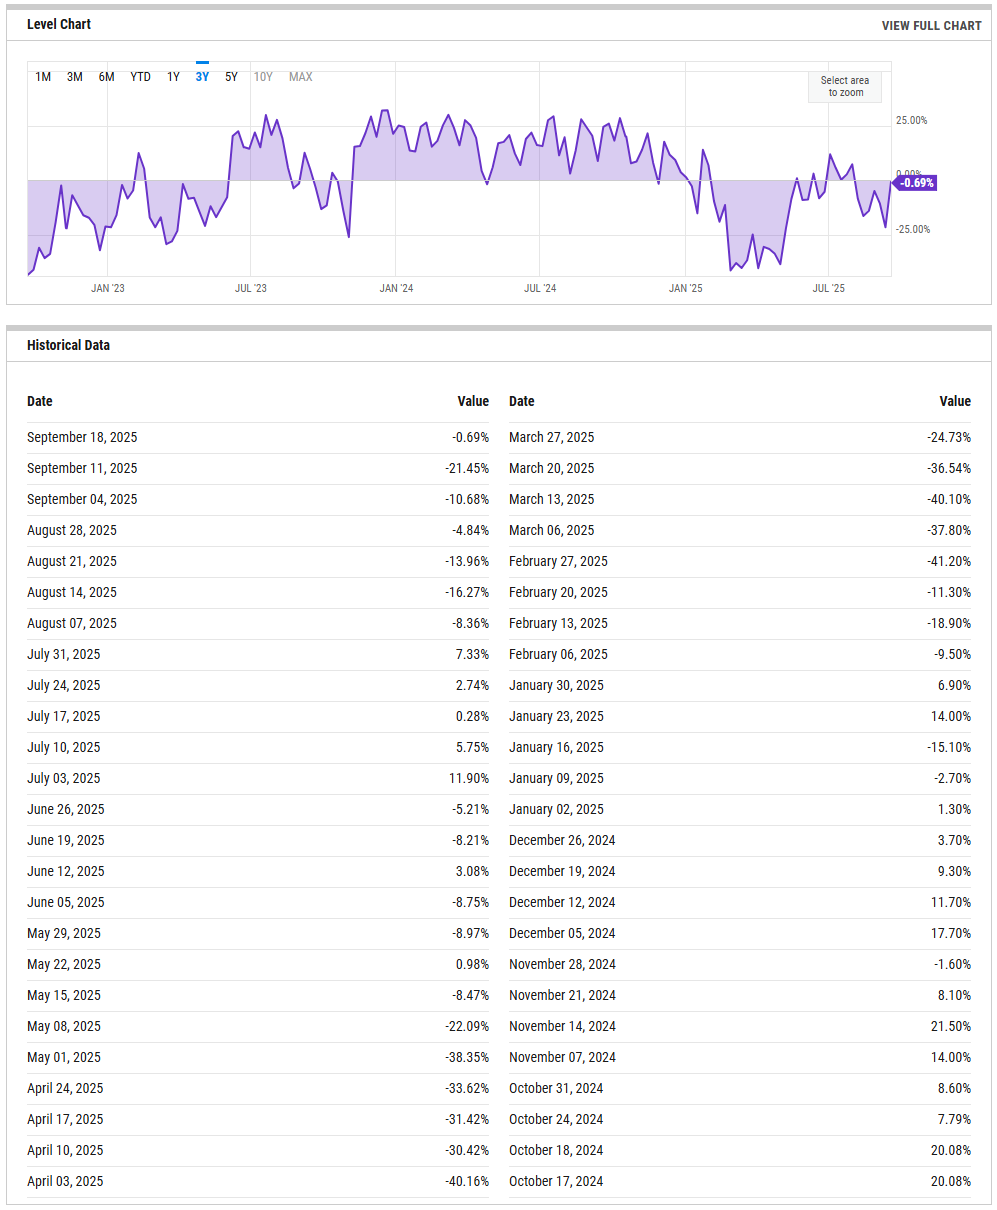
The spread rebounded sharply from about -21 last week to roughly flat near -1 this week. That kind of whiplash is classic bear-to-neutral sentiment repair after a scare: fast de-grossing, then fast re-risking as price stabilizes. Historically, sustained advances tend to begin when the spread lifts back through +5 to +10 and holds; fleeting rallies often fade if the spread rolls back below zero while price makes marginal new highs. I read this as short-term tailwinds from fading pessimism, but not the kind of exuberance that usually precedes a top. A push into +15 to +25 would start to feel crowded; a slip back to -10 would warn that the repair failed.
NAAIM Exposure Index
The NAAIM Exposure Index (National Association of Active Investment Managers Exposure Index) measures the average exposure to U.S. equity markets as reported by its member firms. These are typically active money managers who provide their equity exposure levels weekly. The index offers insight into how much these managers are investing in equities at any given time, ranging from being fully short (-100%) to leveraged long (up to +200%).
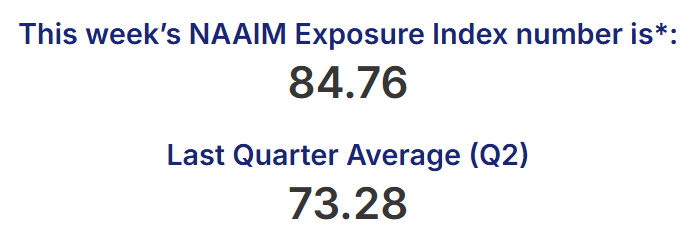
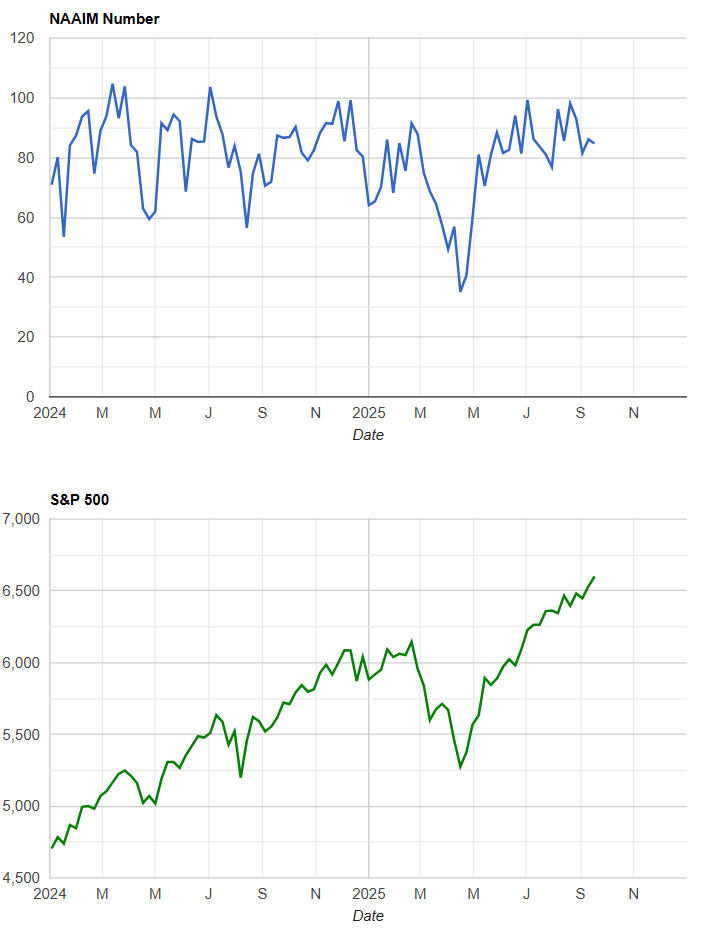
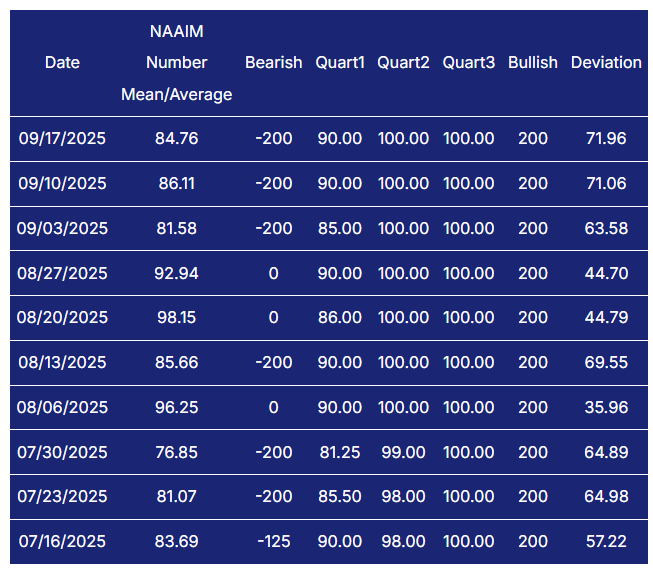
Managers sit around 85, down from the 90s in late August but still firmly long. This is supportive of trend persistence because funds are already invested, yet it also limits incremental fuel since there is not much dry powder to add on strength. The risk is on the downside: if we get an adverse headline, exposure in the 80s can flip to the 60s quickly and amplify volatility as everyone de-risks together. For confirmation of a durable advance I would like to see modest digestion toward the 70s that is bought back on higher highs; for caution, watch for an abrupt drop into the 50s without price damage first.
CBOE Total Put/Call Ratio
CBOE's total put/call ratio includes index options and equity options. It's a popular indicator for market sentiment. A high put/call ratio suggests that the market is overly bearish and stocks might rebound. A low put/call ratio suggests that market exuberance could result in a sharp fall.
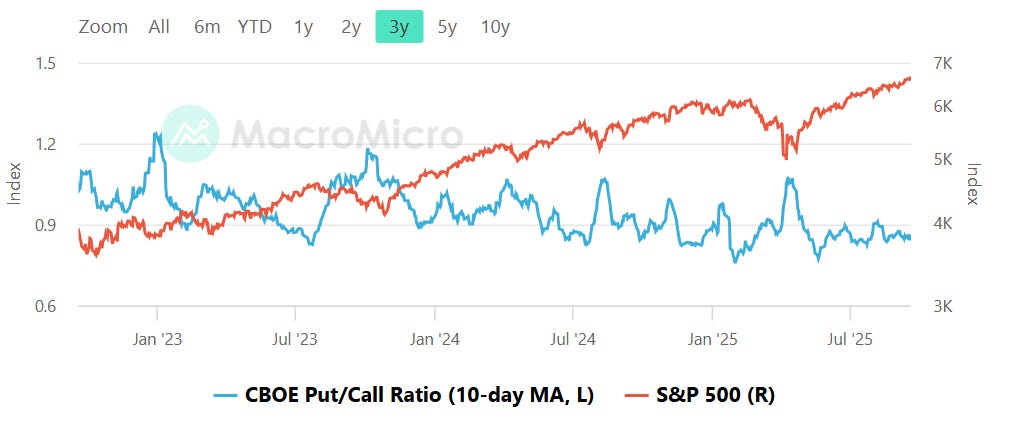
The 10 day average hovers in the low 0.9s, a complacent but not extreme zone. Below ~0.80 has historically aligned with froth and poor short-term forward returns; above ~1.00 reflects fear and has tended to offer better entries. Sitting near 0.9 says hedging is light and dips can travel farther before puts are chased, but there is no outright signal. If we rally while the ratio sinks toward 0.8, I will tighten risk. If we get a shakeout that pushes the average through 1.0, I will look for reversal tells to add.
Equity vs Bond Volatility
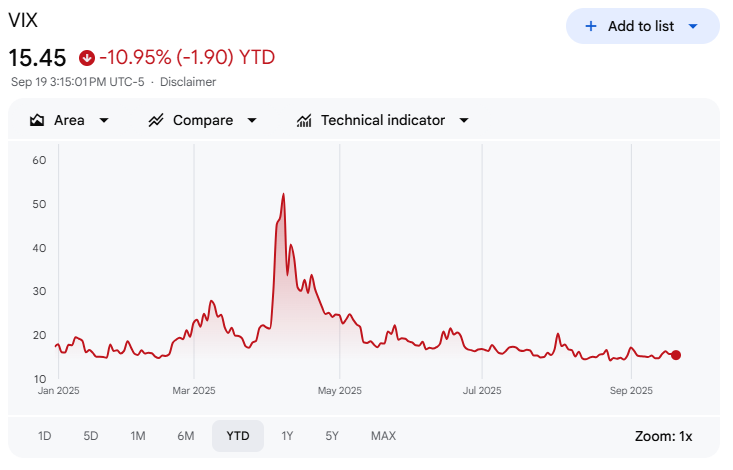
The Merrill Lynch Option Volatility Estimate [MOVE] Index from BofAML and the CBOE Volatility Index [VIX] respectively represent market volatility of U.S. Treasury futures and the S&P 500 index. They typically move in tandem but when they diverge, an opportunity can emerge from one having to “catch-up” to the other.
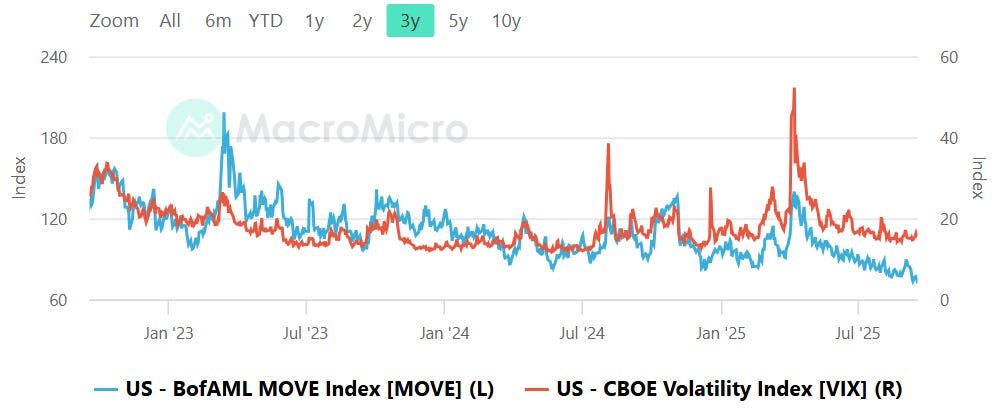
MOVE continues to bleed lower and VIX sits near cycle lows, a friendly carry backdrop that favors trend and mean-reversion strategies. Equity selloffs that matter often begin with a MOVE pop that the VIX initially ignores; when rates vol jumps first, financial conditions tighten and equities catch down with a lag. My tripwires are a MOVE break back above ~120 while VIX stays muted, or a VIX surge through the high teens without a rates shock. Absent that, low cross-asset vol argues for grind-up behavior and shallow pullbacks.
CNN Fear & Greed Constituent Data Points & Composite Index
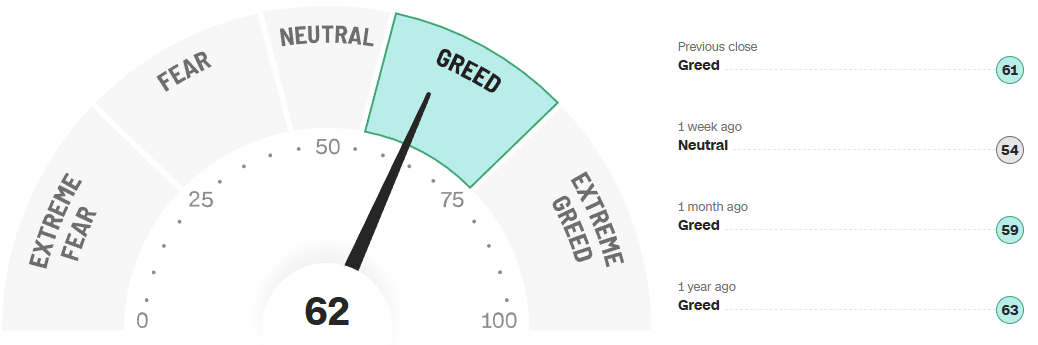
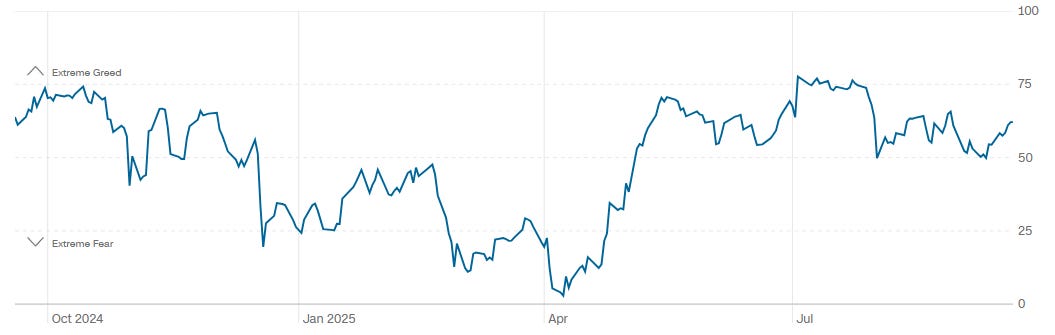
The composite prints 62, up from 54 last week and near the middle of this year’s 50 to 75 corridor. The 12 month path shows a climb out of winter fear into persistent mid-range greed with only brief dips. That mix supports an ongoing uptrend while warning against complacency: it is constructive, not euphoric. Above ~80 I would expect a risk of bull exhaustion; below ~40 I would expect a better asymmetry for adds. Right now, sentiment is permissive of higher prices so long as breadth continues to heal and rates do not reintroduce stress.
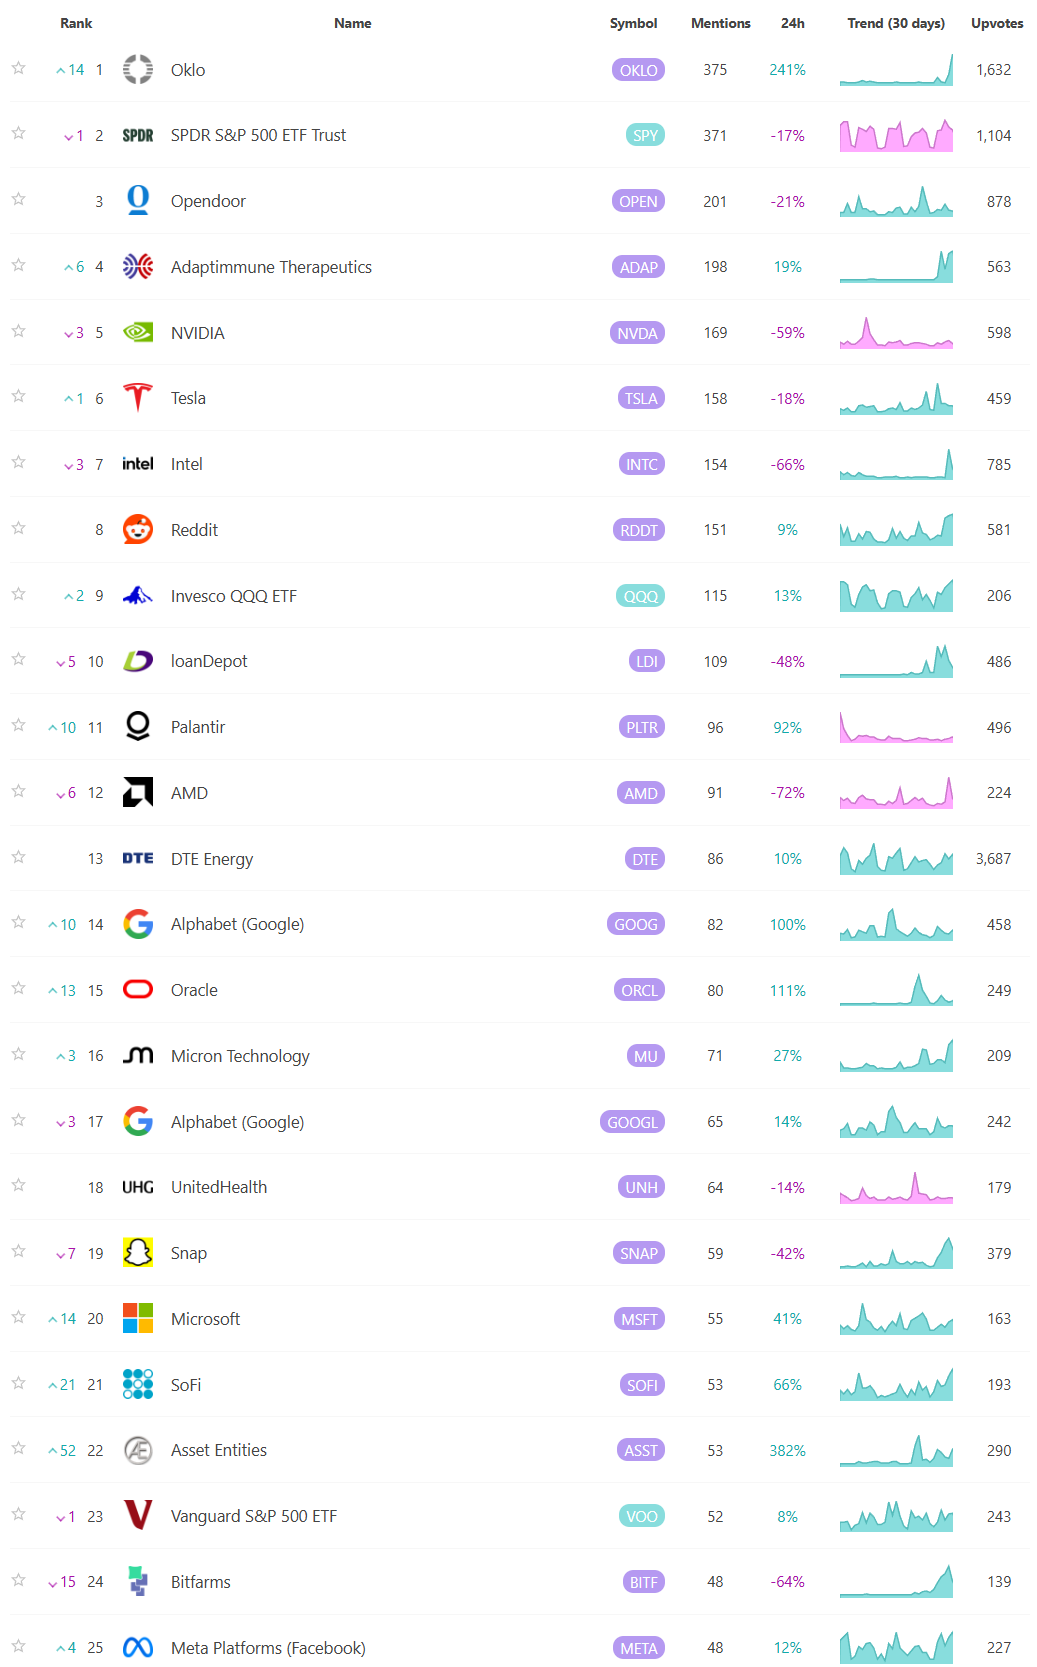
Social Media Favs
Social sentiment offers a real-time view of investor mood, often revealing market shifts before traditional indicators. It can signal momentum changes, spot emerging trends, and gauge retail investor impact—especially in high-volatility names. Tracking sentiment around events or earnings provides actionable insights, and when layered with quantitative models, can enhance predictive accuracy and risk management. Sustained sentiment trends often mirror broader market cycles, making this data a valuable tool for both short-term trades and long-term positioning.
Technician’s Playbook: Trading the Majors (SPY/QQQ/IWM/DIA)
When you’re a large institutional player, your primary goal is to find liquidity - places to do a ton of business with the least amount of slippage possible. VolumeLeaders.com automatically identifies and visually plots the exact spots where institutions are doing business and where they are likely to return for more. It’s one of the primary reasons “support” and “resistance” concepts work and truly one of the reasons “price has memory”.
SPY
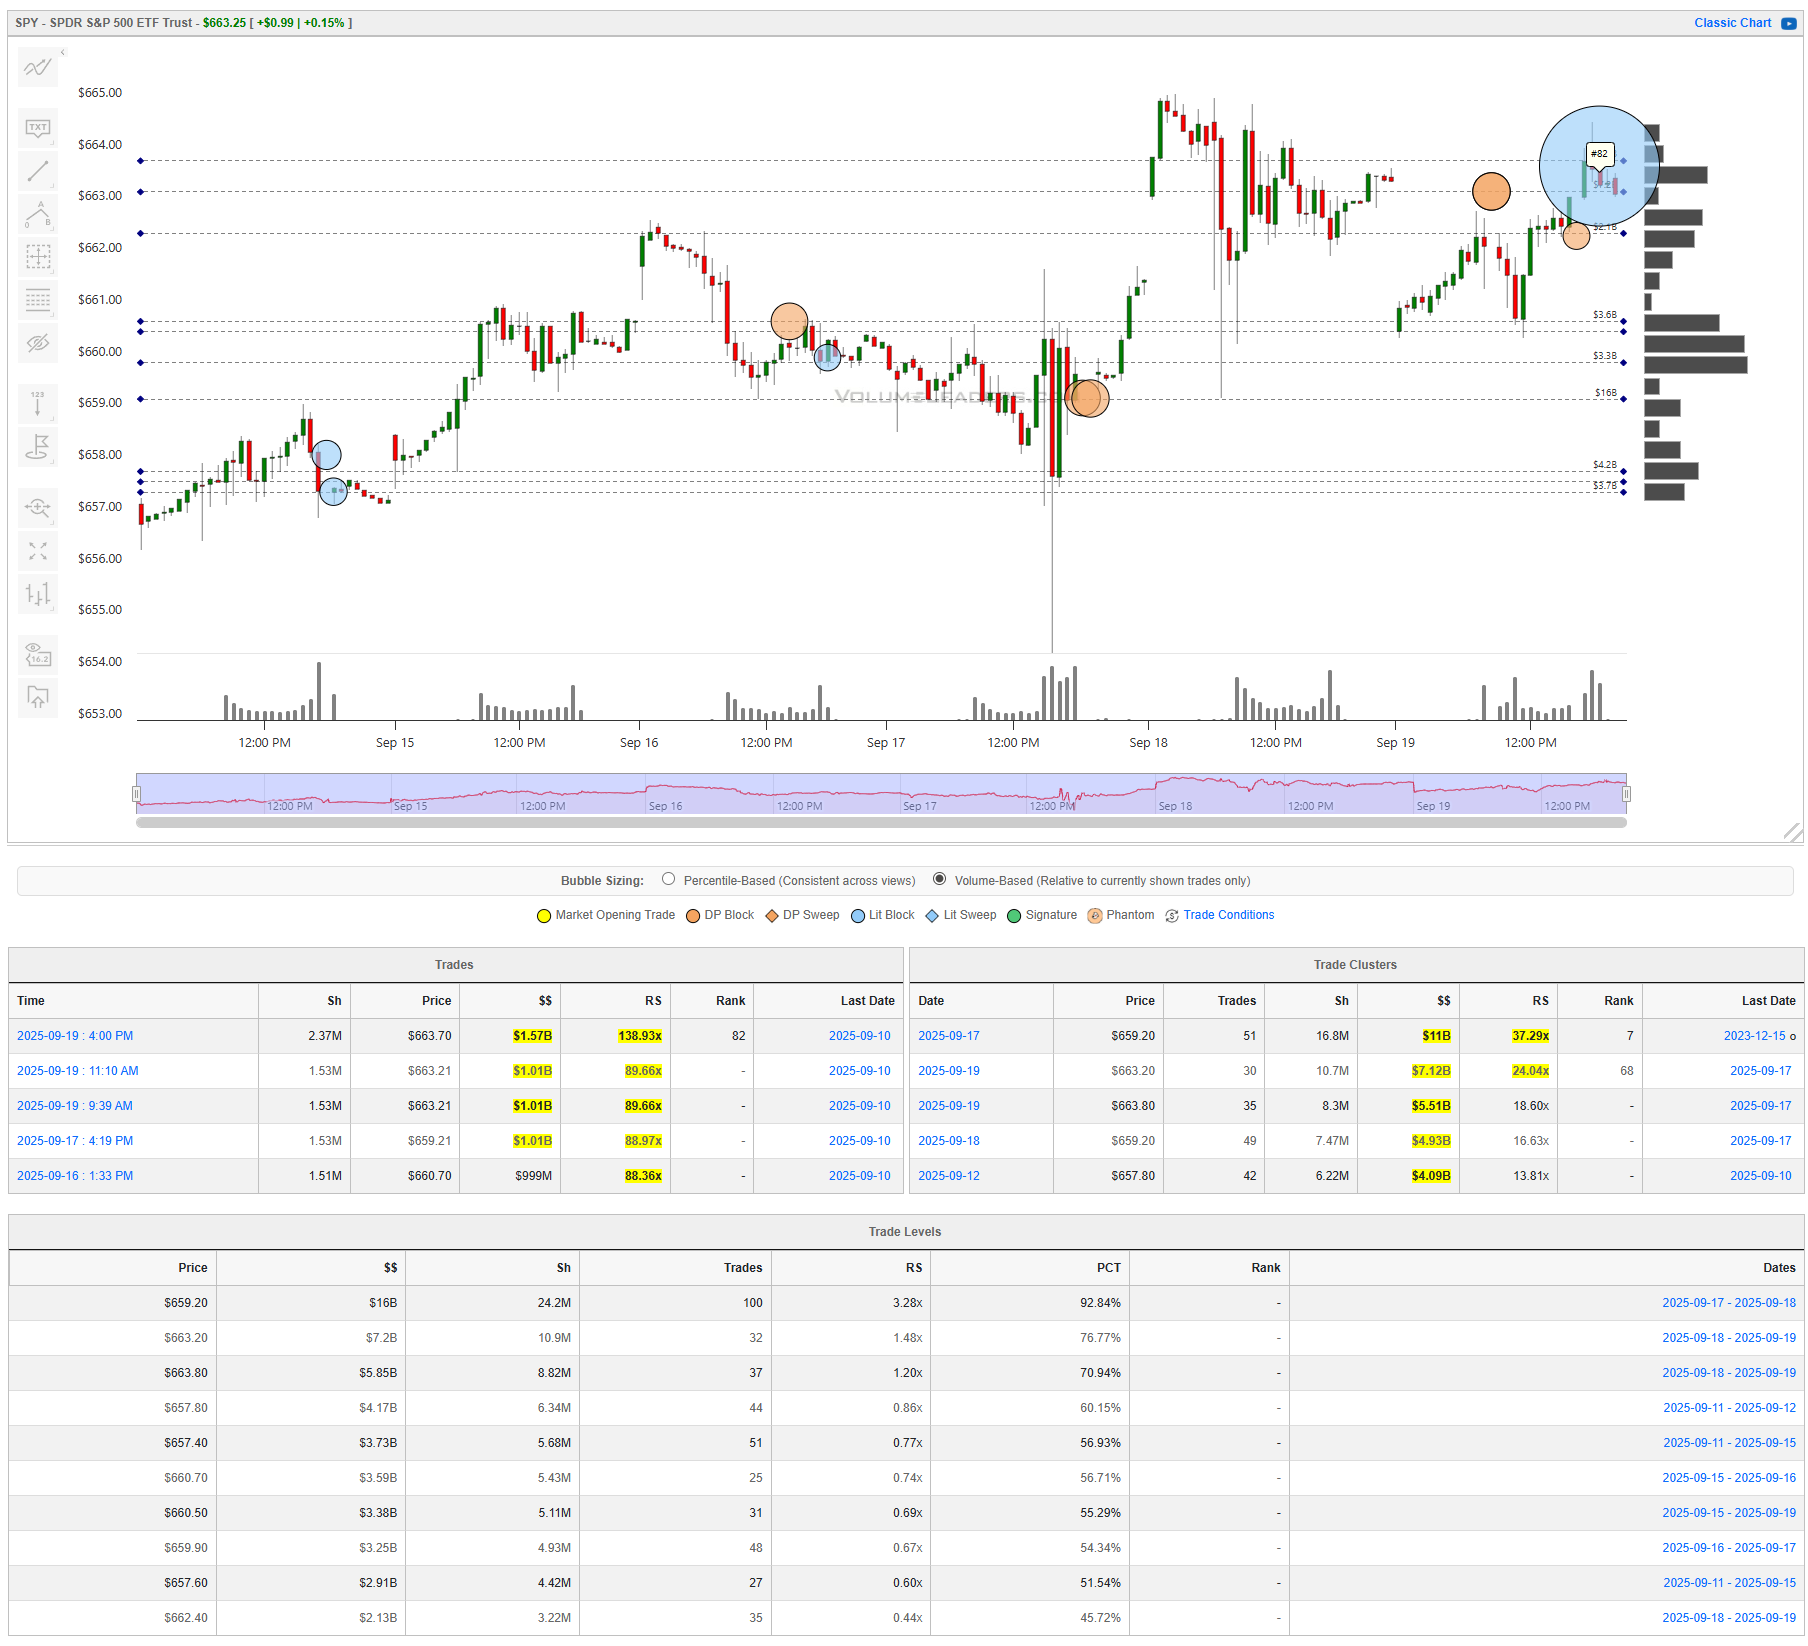
The week opened with a steady climb out of the high 657s, a pause under 661, and then a quick push to the mid 663s. Thursday delivered the range expansion, spiking above 664 before backing off into a sideways coil. Friday opened soft, probed 660, and then buyers stepped back in. The close mattered: a top-100 historical print hit at 4:00 pm near 663.70 (ranked No. 82), 2.37M shares for about 1.57B notional with an RS near 139x. That was not a casual match; it was a statement that big money was active right at the upper band.
The most important price on the chart is 659.20. It is both a dominant cluster (about 11B across 16.8M shares on 9/17) and the highest ranked level on the board by dollars, roughly 16B across 24.2M shares with a 92nd-percentile PCT and RS around 3.3x. That tells you real positioning changed hands there. Every meaningful dip this week either stopped above 659.2 or snapped back after touching it. Treat it as the line of scrimmage for the next leg: above it, the bull case is intact and pullbacks are rotation; lose it with a closing break and the tone shifts from digestion to distribution.
Overhead, supply is layered in a tight band. The 663.20 and 663.80 levels carry 7.2B and 5.9B respectively with fresh clusters on 9/19, and you can see repeated 1B prints around 663.2 intraday. That created a decision zone from roughly 663.2 to 663.8. Buyers pressed into it several times but could not finish the job until the closing auction jammed size at 663.7. If we open next session, backfill toward 663.2, and hold that shelf, the late-day absorption will read as a successful handoff and the path opens for a retest of the Thursday spike highs and then incremental price discovery above 664. If, instead, we slip back below 663.2 and sellers lean on it, expect a quick shuffle back through 661 and a return run at 660.5, 660.7, and ultimately 659.9 to 659.2 where the real battle lives.
Below 659.2 sits a second support band built earlier in the week at 657.8 to 657.4. Dollars and trade counts are smaller there, but it is the last obvious shelf before air pockets begin to show up in the profile. A clean break and hold beneath 659.2 that then fails to reclaim on the first bounce would set 657.8 to 657.4 as the immediate downside magnet. Lose that, and you invite a sentiment shift that goes beyond a routine shakeout.
Net read: the primary trend remains pointed up, but the tape has concentrated a lot of activity into a narrow band. 663.2 to 663.8 is your bull trigger; 659.2 is your bull stop. As long as buyers defend the 659 handle on closing basis, dips are opportunities. Lose it, and the week’s upper-range work will look like distribution rather than staging.
QQQ
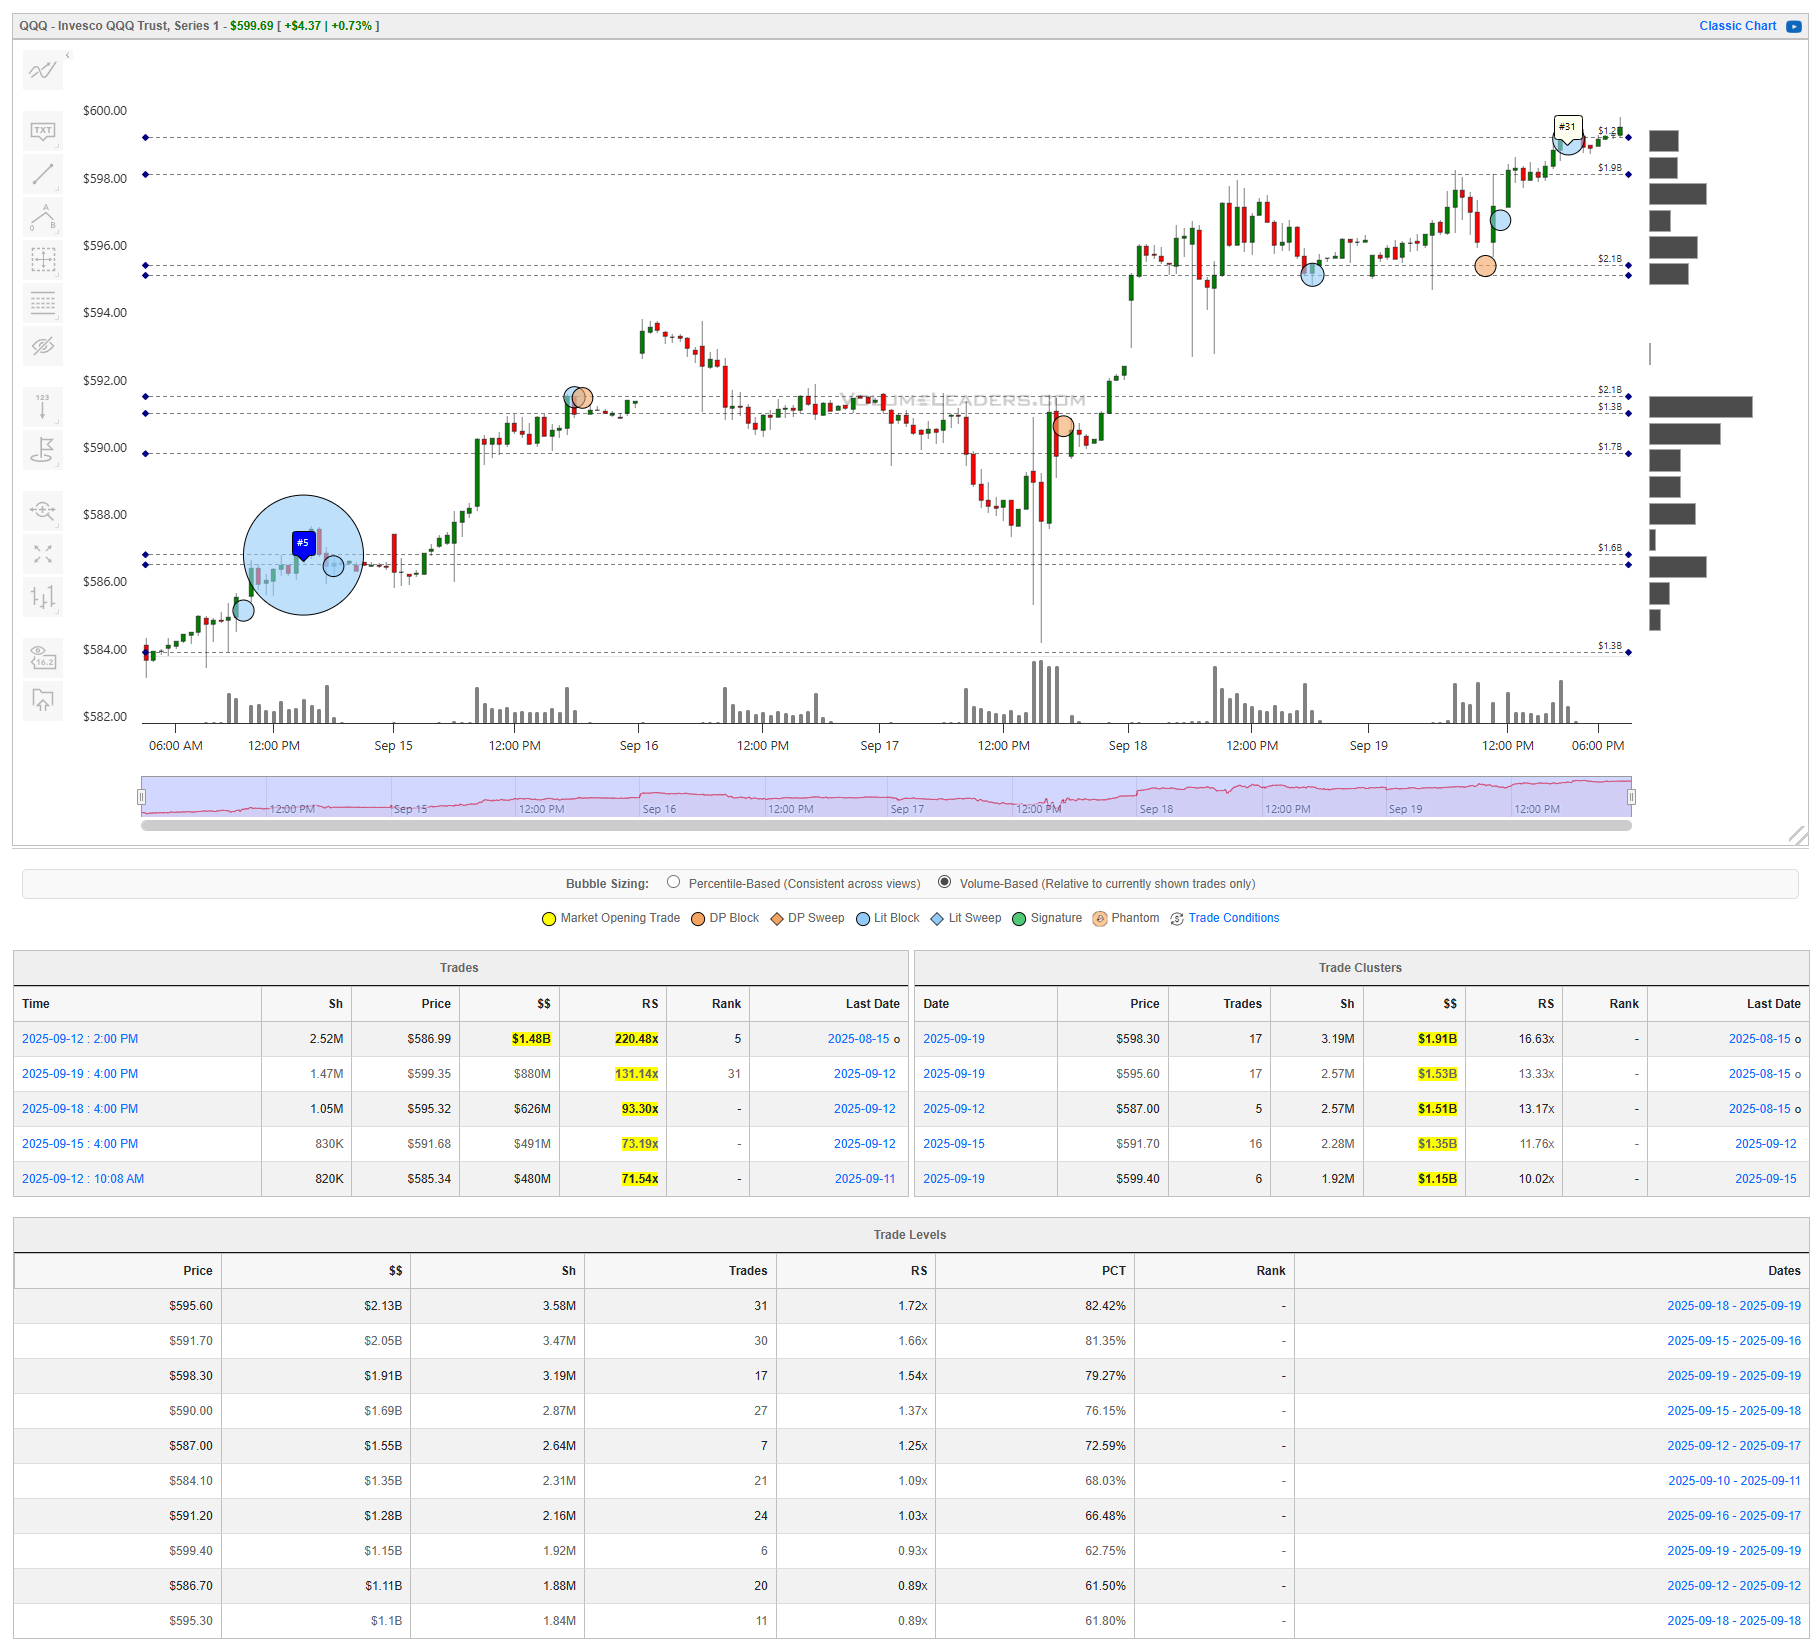
The week was dominated by a clean impulse higher off last Thursday’s closing ramp. Monday opened firm and quickly built a stair-step advance from the low 583s into the 590s, then paused. The tell came on 9/12 at 2:00 pm: a top-100 historical print tagged at $586.99, 2.52M shares for about $1.48B, RS ~220x, ranked No. 5 all-time. That was not random flow; it was sponsorship at a key handoff price. The market respected it. Every subsequent dip checked back toward the upper 580s and found bids, and by Thursday we were probing the upper 590s. Friday’s close added confirmation with another top-100 tag, No. 31, around $599.35 for roughly $880M (RS ~131x). Closing strength on size is usually a signal that the advance is still being pressed, not faded.
The structure underneath price backs that view. On the time-bound side, fresh clusters are stacked like steps: $587.00 (~$1.51B), $591.70 (~$1.35B), $595.60 (~$1.53B), and $599.40 (~$1.15B). That is a well-distributed ladder of liquidity, with the heaviest dollars centered at $595.60 and $587.00. On the cumulative side, the highest-ranking Levels by dollars are $595.60 (~$2.13B, RS ~1.72x, PCT ~82%), $591.70 (~$2.05B, RS ~1.66x), and $598.30 (~$1.91B, RS ~1.54x). Together they define a rising band of support that buyers defended repeatedly all week. When clusters and Levels agree, those prices tend to act as pivots on backtests.
Tactically, treat 599 to 600 as the near-term pass/fail. There is a Level at $599.40 and a cluster at the same price; Friday’s late push pressed right into that band while printing a top-100 close. Acceptance above 600 during regular hours (not just in the auction) would frame a continuation path toward the next untested shelf in the low 602s and then the 605 area, with pullbacks to 600 to 599.4 expected to hold as first support. A tell that bulls are in control would be a backfill into 599.4 that turns immediately, ideally on a new high-RS burst above 600 that sticks.
If buyers cannot hold 599s on the first test next week, the market likely rotates back into 598.3 and then the heavier 595.6 shelf. That 595.6 price matters locally: it is a top Level by dollars and also a fresh cluster high, so it is where longs should try to reload. A decisive break and 30-minute hold beneath 595.6 would weaken the structure and open a move into 591.7, where the next big Level/cluster sits. Lose 591.7 on a closing basis and the burden of proof flips; the tape would be telling you the week’s upper-range work was distribution, not staging, and 587 to 586.9 (the site of that No. 5 tag) becomes the downside magnet.
Execution framing for disciplined traders is straightforward. On strength, buy acceptance above 600 with risk anchored to 599.2 to 599.4 and a first target at the prior spike highs with a runner toward 602 to 605 if momentum persists. On weakness, fade failed pushes that stall under 600 and reclaim under 599.2 for a rotation into 598.3 and 595.6; cover into 595.6 on first touch and reassess. If 595.6 breaks and cannot be reclaimed, do not fight it; step aside or flip bias for a run at 591.7. Throughout, let $$, RS, and PCT on new prints guide conviction. Strong RS bursts at or just above the noted pivots are your confirmation tells; anemic bounces that cannot reclaim a lost Level are your warnings to tighten up.
Bottom line: the trend is up and the tape built a sturdy ladder of sponsorship from 587 to 599; hold 599 to 600 and price should continue to explore higher, but lose 595.6 and the advance will likely retrace into 591.7 with 587 as the fail-safe.
IWM
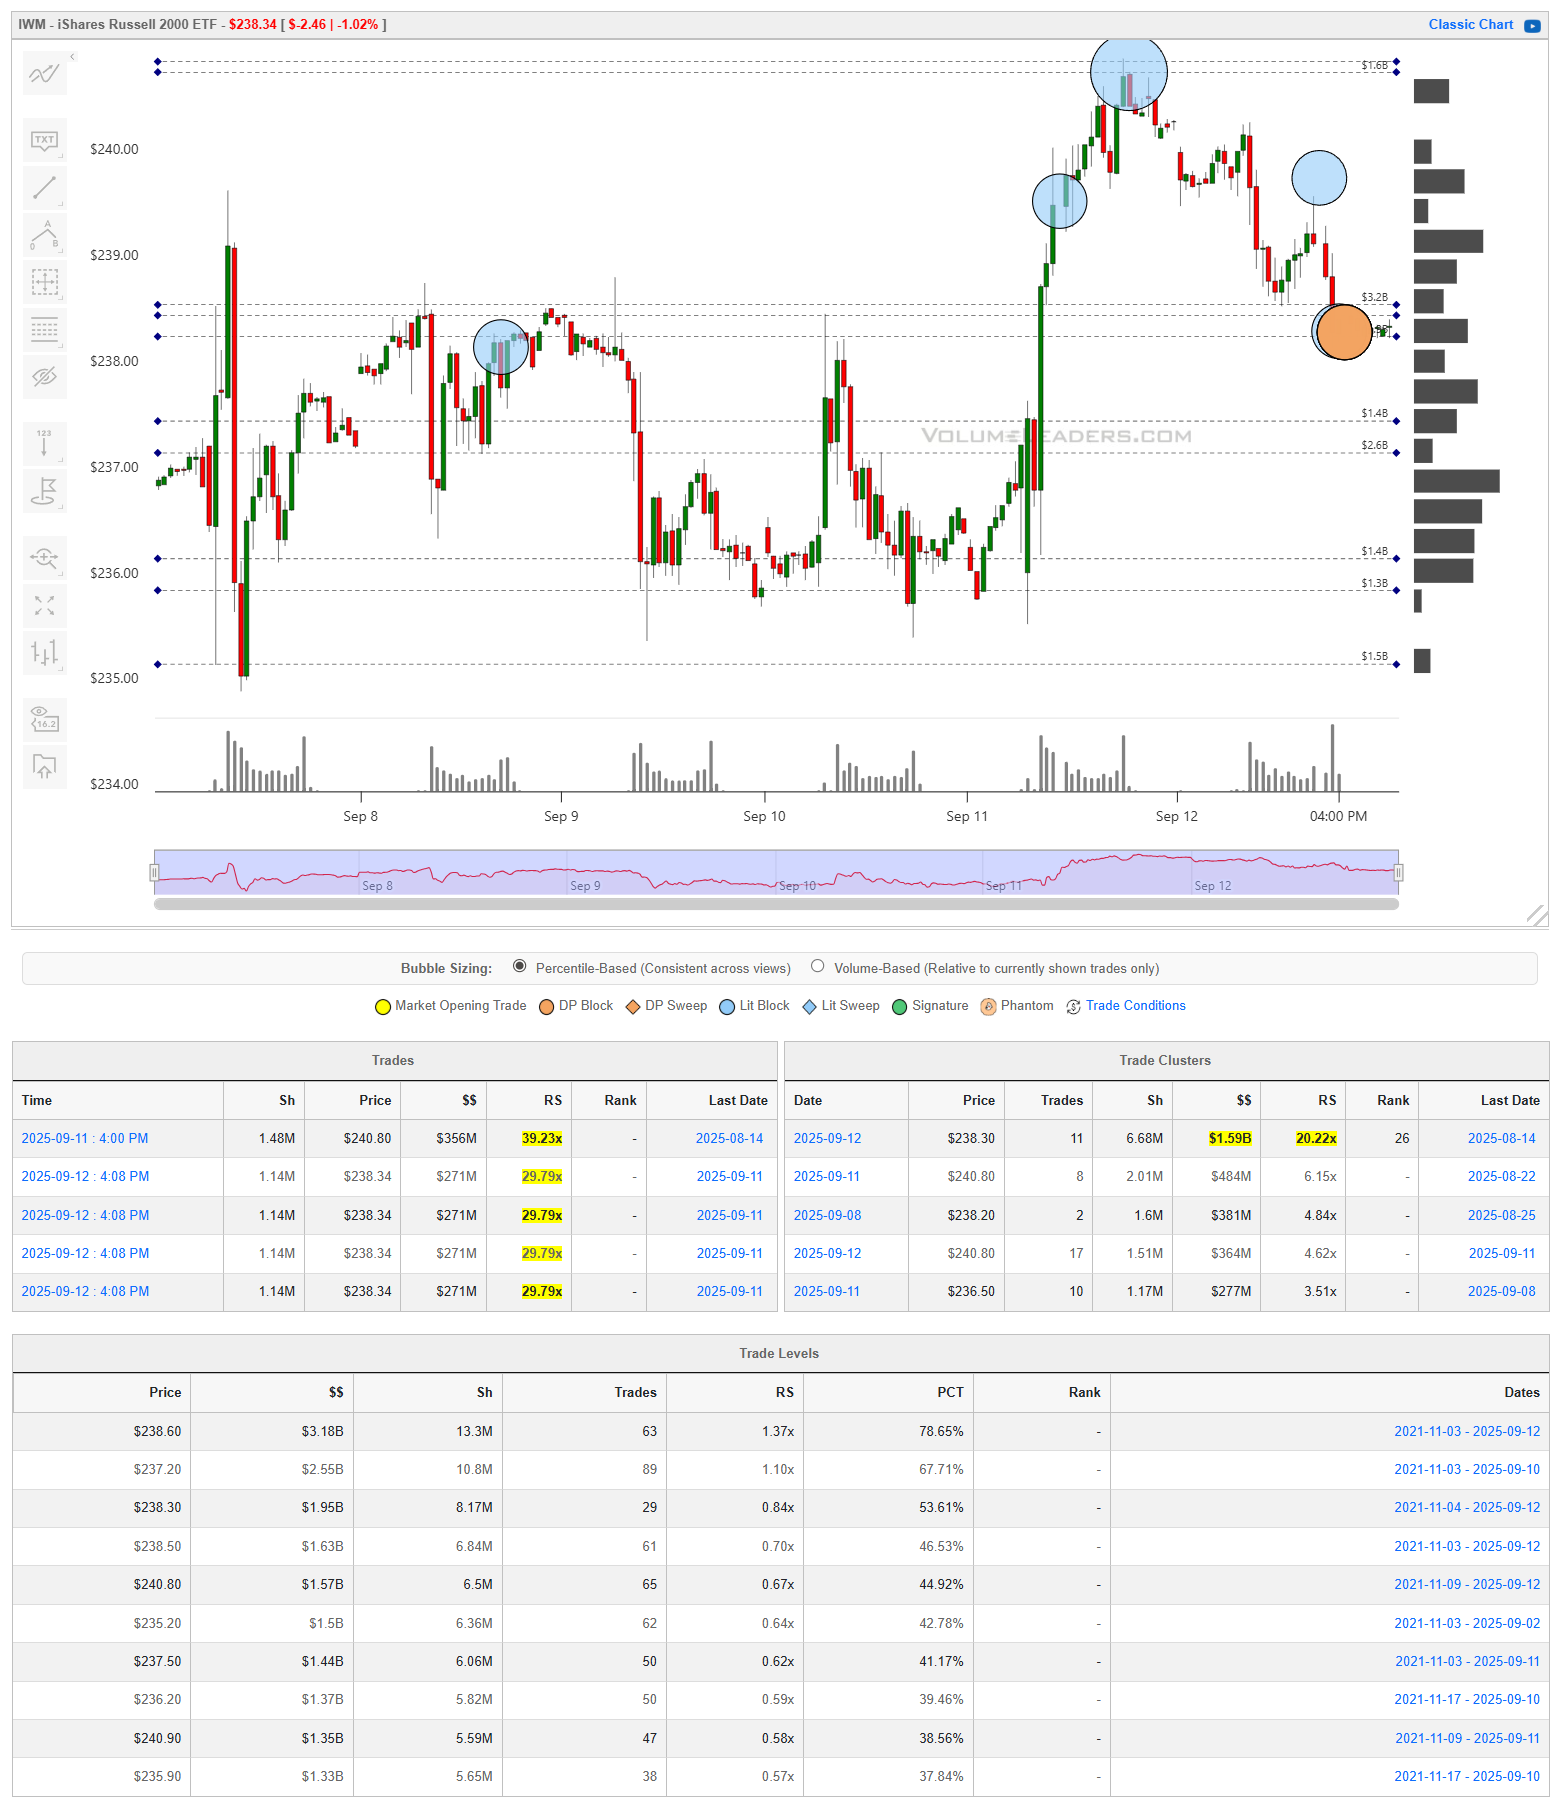
Small caps spent the first half of the week compressing around 238 to 239, then launched into a clean two step advance that topped in the mid 245s before backing off. The ascent was not casual. Repeated high RS prints hit the 238.3 to 238.6 band on 9/16 and 9/17, each near 2.0M shares and roughly 500M notional with RS around 55x. That was sponsorship, not noise. From that base, buyers pushed price vertically, paused, then made a second leg into Friday where a 2.04M share print around 244.79 for about 499M (RS ~55x) met willing supply and knocked price back toward 243s. The day’s largest time bound cluster printed at 243.00 on 9/19 with about 2.49B across 10.3M shares, RS ~31.6x and ranked No. 5. That is an anchor.
The cumulative Levels tell the same story. The heaviest dollars on the board sit at 238.60 with roughly 4.57B, RS ~1.96x and an 88th percentile PCT. Just above it are 238.40 at 2.63B and 239.00 at 2.57B. Together they form a sturdy platform from 238.3 to 239.0. Higher up, 243.00 carries about 2.57B, while 241.80 and 240.80 carry 1.58B and 1.61B. Overhead, 244.80 holds about 1.5B and was also a fresh cluster on 9/19 (~1.06B, RS ~13.5x).
Trade it like this. Treat 243.00 as the line of scrimmage. It is the largest fresh cluster and a high dollar Level in one. As long as the ETF accepts above 243 on regular hours, dips into 243.3 to 243.0 should find bids and set the stage for another run at 244.8 and the mid 245s. A constructive tell would be a quick backfill into 243 that turns with a burst of $$ and high RS, followed by 30 to 60 minutes holding above 244.0. Acceptance above 244.8 turns that shelf into support and opens the door to a measured push into the prior spike highs and then the 246 area where the profile thins. On that path I would anchor risk to 243.0 and trail under higher lows.
If 243 fails on the first test next week, expect rotation. The next magnets are 241.8 and 240.8, both meaningful Levels with 1.5 to 1.6B in notional. A firm response there would keep the uptrend intact and offer a reload. A weak bounce that stalls under 243 after losing it would argue for another leg lower into 239.9 to 239.2 and then the real battleground at 238.6 to 238.3 where the biggest dollars sit. Lose 238.6 on a closing basis and the base morphs into distribution, raising odds of a full retest of 237.2 and even 235.5 if sellers lean.
Execution framing is straightforward. On strength, buy acceptance back above 244.0 with risk to 243.0 and look for a clean hold above 244.8 to confirm continuation. On weakness, fade failed pushes that cannot hold 243 after retests from below and target 241.8 then 240.8, covering into those shelves and reassessing the reaction. Let the tape confirm at the pivots: strong $$ and RS on turns at 243 or 244.8 are green lights; anemic bounces that give back levels are your cue to tighten up.
Bottom line: the trend improved and IWM built a credible base at 238s with a new anchor at 243; hold 243 and a push through 244.8 should retest the highs, but lose 243 and the tape likely rotates into 241.8 to 240.8 with the 238.6 platform as the fail safe.
DIA
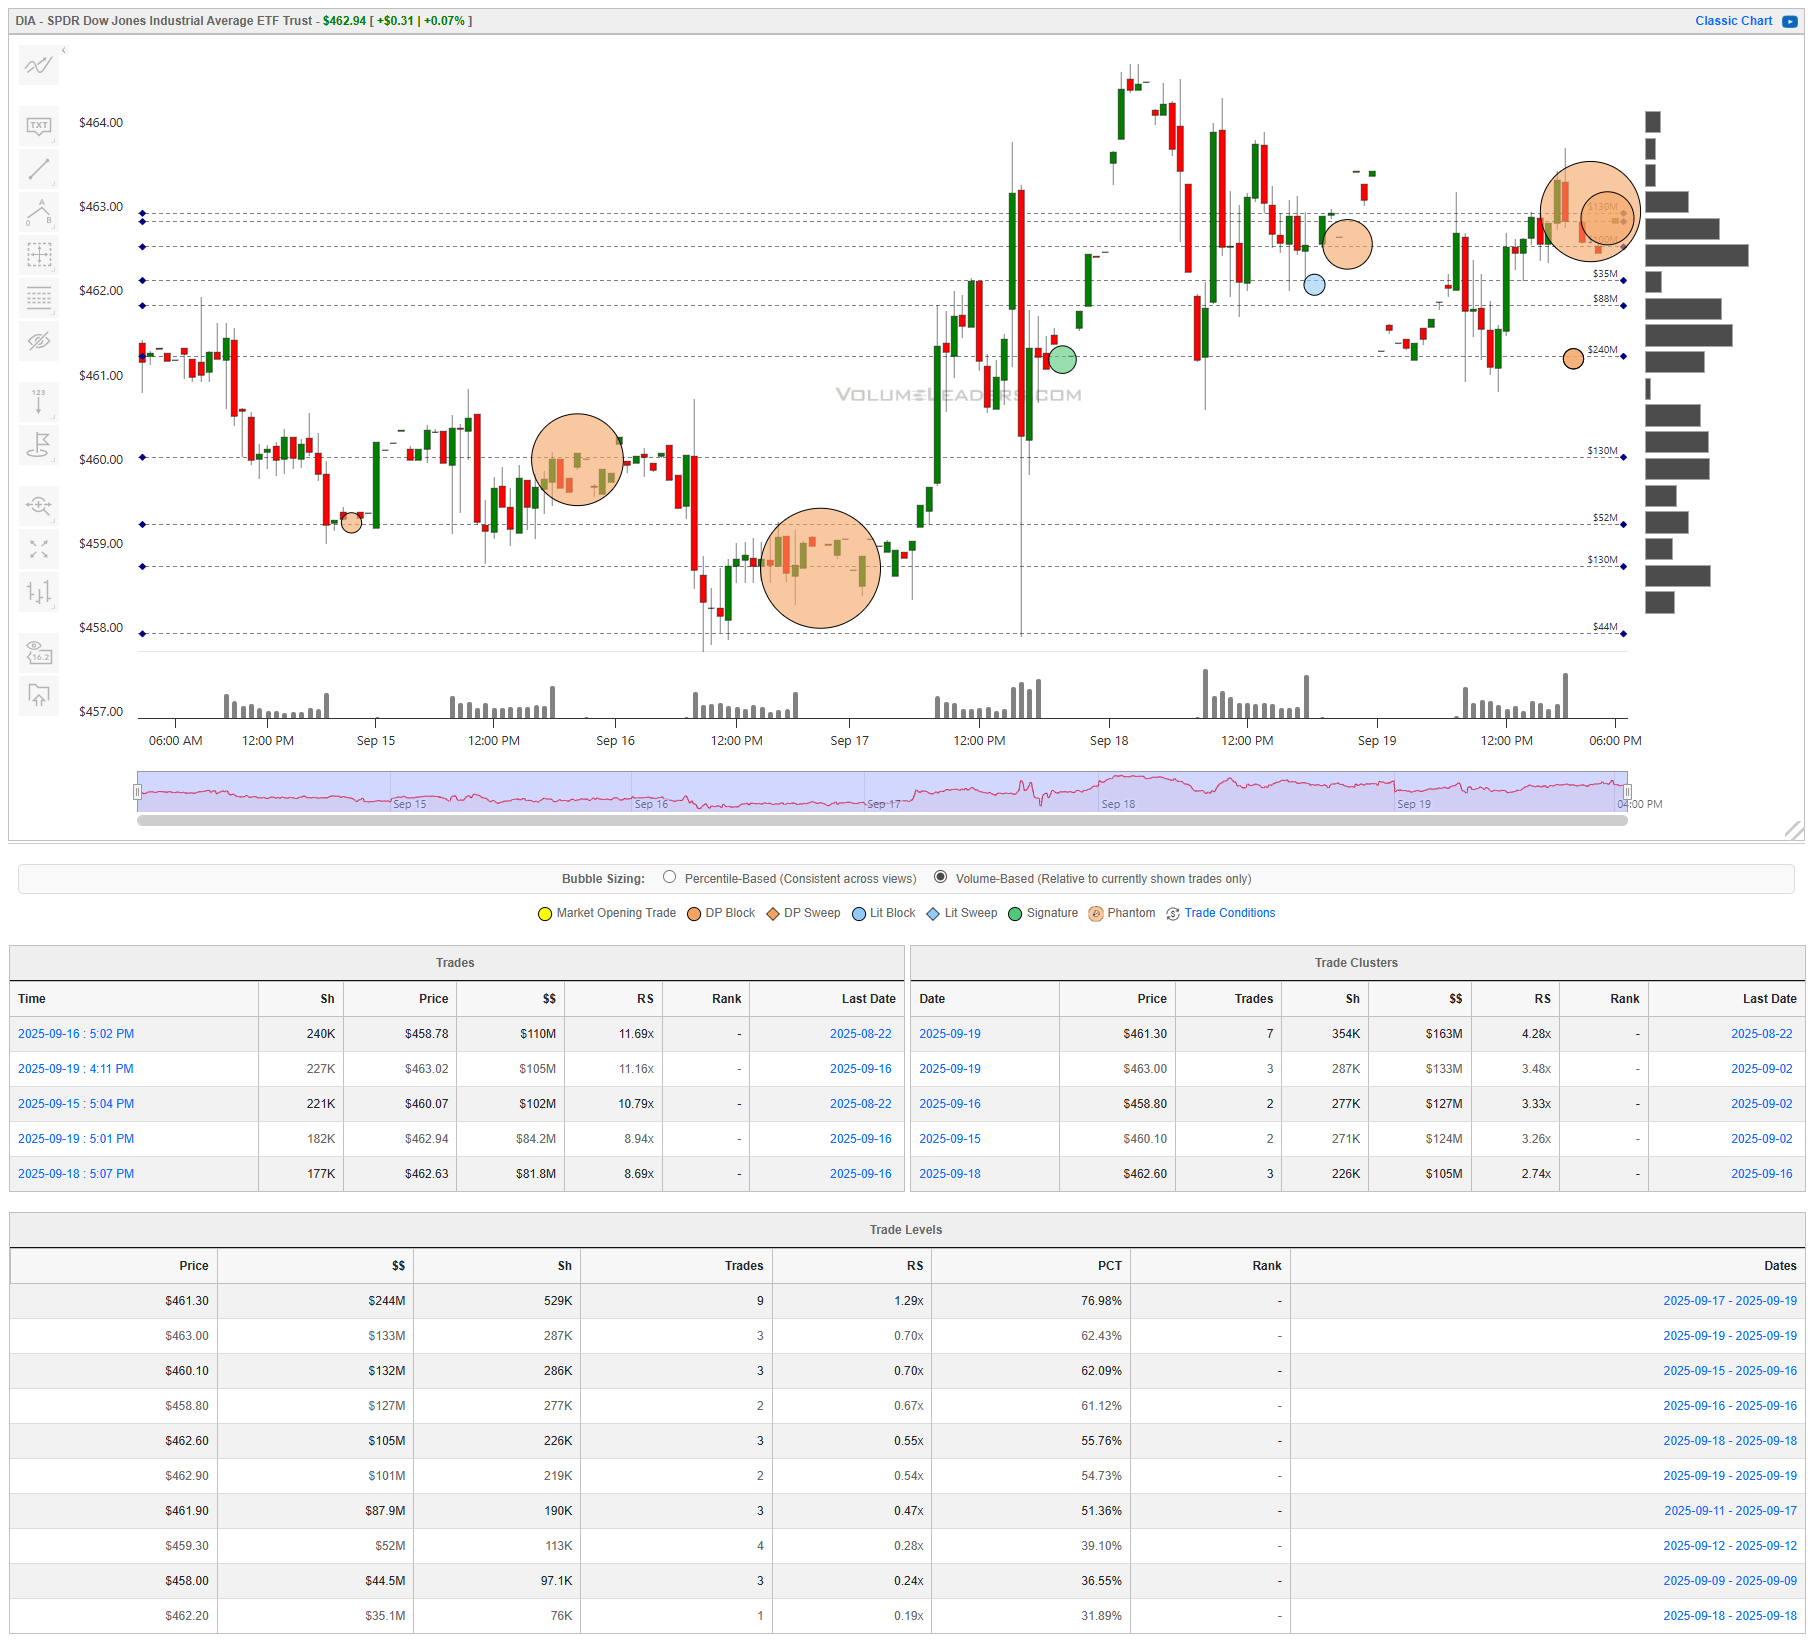
The Dow spent most of the week carving a choppy two sided range, but the character changed into week’s end. After an early dip and base, buyers pushed a vertical run that stalled just under a tight band of overhead supply and then backed off into a higher balance. The notable feature is how much business was conducted in the upper 480s to low 481s. You can see repeated, high RS prints tagging that zone on Friday afternoon, and the time bound cluster table stacks fresh size at 481.30, 481.00, 480.80, and 480.60, with 481.30 carrying the largest dollars and highest RS of the group. That says the auction is negotiating around a decision shelf rather than rejecting it.
The cumulative Levels confirm the same footprint. The heaviest levels by dollars sit at 481.30 and 481.00, with a supporting layer down through 480.90, 480.70, and 480.40. Below that, the profile thickens again near 479.90 to 479.30 and then thins into the 478s. When Levels and fresh clusters agree like this, those prices tend to act as pivots on the next pass.
Treat 481.00 to 481.30 as the near term pass or fail. It is the largest fresh cluster and top Level pairing on the board and price has already tested it from below. If DIA accepts above 481.30 during regular hours for 30 to 60 minutes, the market will have converted heavy overhead supply into support. In that case, the path of least resistance is a push through the recent spike highs with a measured objective into the next thin pocket above, and pullbacks to 481.30 to 481.00 should find bids. The tell that bulls are in control will be a quick backfill into 481.0 that turns immediately on a burst of $$ with elevated RS, followed by higher lows that hold on retests.
If, instead, rallies keep stalling under 481.30 and we slip back through 481.00, expect rotation back into 480.80 and 480.60 where more fresh clusters sit. Those shelves are the first place longs should try to reload; they represent Friday’s handoff. Lose 480.60 on a closing basis and the structure weakens. The next magnets are 480.20 and then the broader, thicker band from 479.90 down toward 479.30. A weak bounce that cannot reclaim 481.00 after losing it would argue for another leg lower into the 478s, where the profile shows air pockets between the heavier shelves. If that lower band prints without fast rejection, the week’s upper range work begins to look like distribution rather than staging.
Execution framing is straightforward. On strength, buy acceptance above 481.30 with risk anchored to just below 481.00 and look for continuation through the recent highs, scaling on the first extension and leaving a runner while price holds above reclaimed support. On weakness, fade failed pushes that reject under 481.30 and cannot reclaim 481.00; target a rotation into 480.80 and 480.60 and cover into those shelves on first touch. If 480.60 breaks and holds, do not fight it; step aside or flip bias for 480.20 and then 479.90 to 479.30. Throughout, let the tape confirm at the pivots: strong $$ and RS on turns at 481.0 or 481.3 are your green lights; anemic bounces that give back reclaimed levels are your warning to tighten up.
One more tell to respect is how the closing auction behaves around 481. When the close pulls in fresh, high RS dollars at or just above a pivot and price holds that handoff early the next day, the follow through tends to be cleaner. If the auction prints size under the band and the next session fails to reclaim quickly, expect a heavier open and a deeper test of 480.6 and 480.2.
Bottom line: DIA built a decision shelf at 481.0 to 481.3 with stacked clusters just below; accept above and the tape should explore higher with 481 turning into support, but lose 480.6 and the auction likely rotates back into 480.2 and the 479s where the next real battle sits.
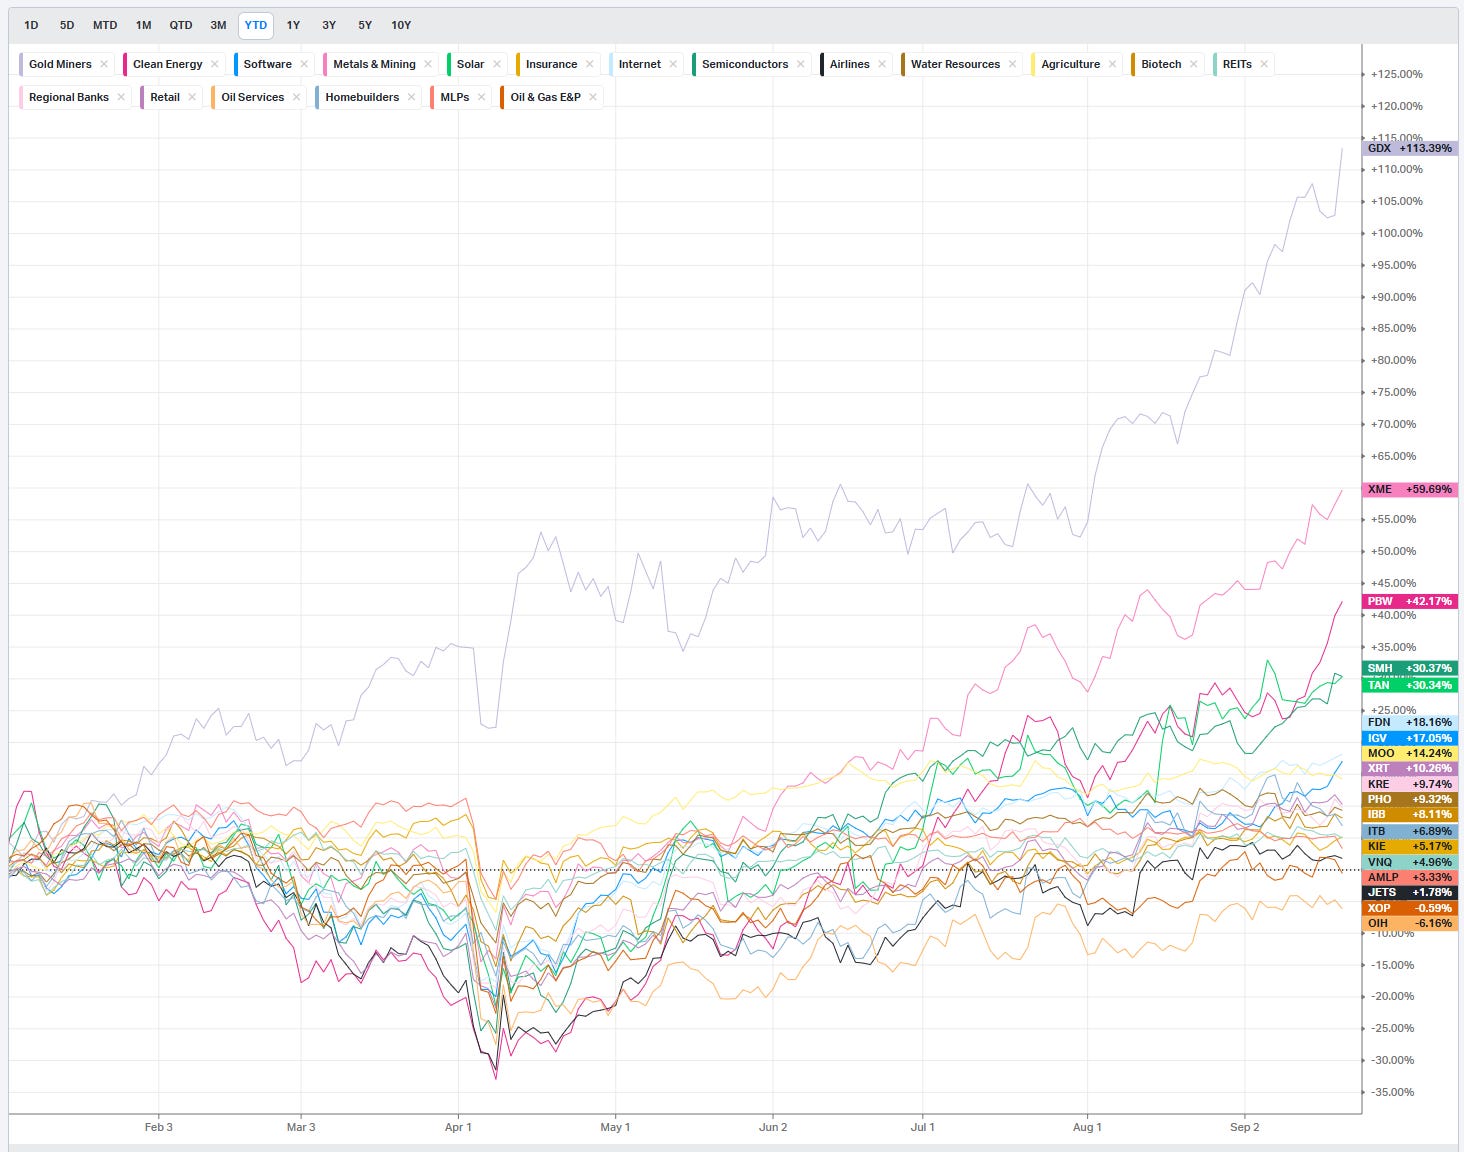
Summary Of Thematic Performance YTD
VolumeLeaders.com offers a robust set of pre-built thematic filters, allowing you to instantly explore specific market segments. These performance snapshots are provided purely for context and inspiration—think about zeroing in on the leaders and laggards within the strongest and weakest sectors, for example.
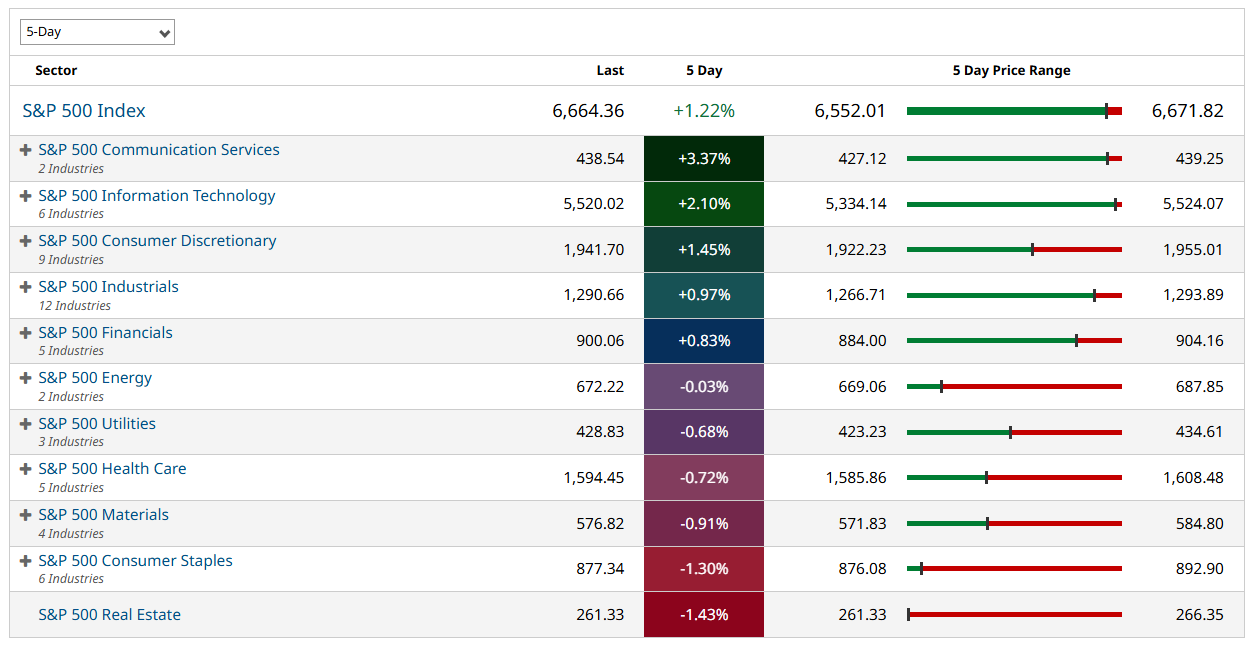
S&P By Sector
S&P By Industry
Commodities: Energy & Metals
Country ETFs
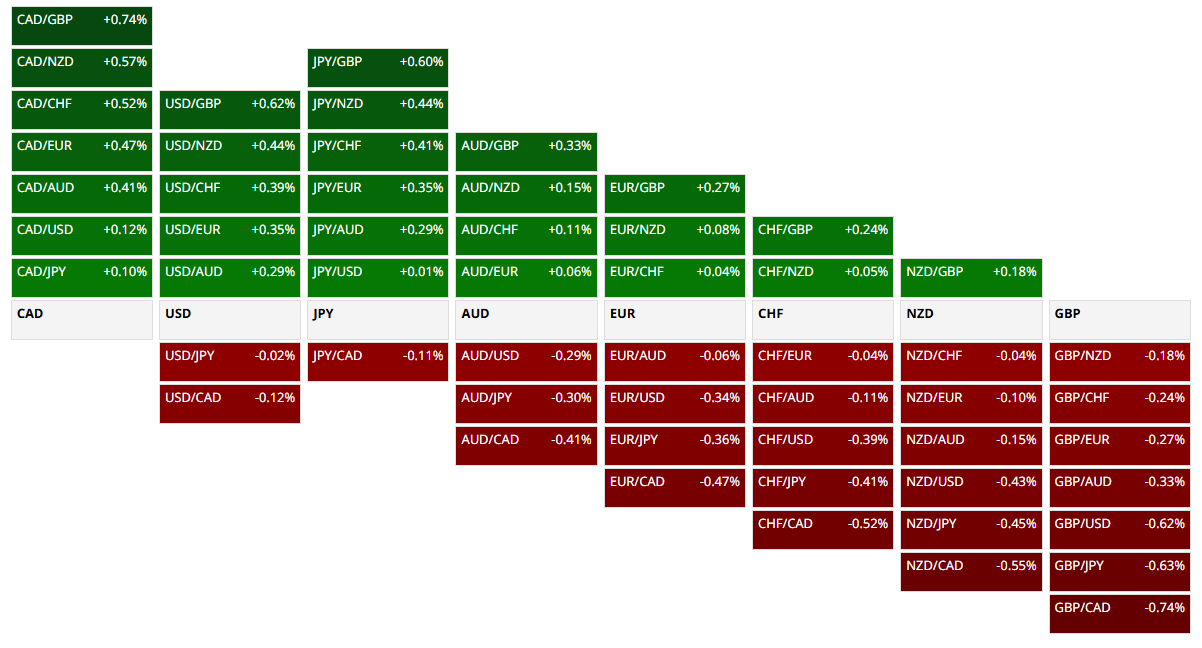
Currencies/Major FX Crosses
Factors: Style vs Size-vs-Value
Events On Deck This Week
Here are key events happening this week that have the potential to cause outsized moves in the market or heightened short-term volatility.
The week is front-loaded with PMI flashes and a Powell appearance, then crescendos into a Thursday data gauntlet and a Friday PCE print. Tuesday sets the tone. The S&P Global flashes are expected to stay in expansion, with manufacturing and services both north of 50 but softer than last month. Hold above 50 and you keep the soft-landing narrative intact; a slip back below 50 in either series would re-open growth scare chatter. At 12:35 pm ET, Chair Powell speaks. Markets will key off any hint that recent labor softening and cooler inflation let the Fed lean more dovish on the path, or any pushback that says not so fast. Into the close you get the weekly API crude update, which matters for energy balance and inflation optics. Overnight, Japan posts PMI flashes, and on Wednesday the BoJ minutes land; not market moving for U.S. equities in a vacuum, but any hint of YCC flexibility has a habit of spilling into bonds and the dollar.
Wednesday brings housing and energy. New home sales and the EIA crude and gasoline reports arrive mid-morning. The bar is modest: sales are expected near 650k annualized and crude inventories to normalize after last week’s draw. Better housing with falling inventories is risk-on friendly; hot inventories into a rising crude tape would keep headline inflation nerves alive. Fed speakers are scattered throughout the day, with Daly later in the afternoon.
Thursday is the main event. Durable goods is expected to rebound ex-transport while the headline lags; watch the core for capex tone. You also get final Q2 GDP and the GDP price index, the advance goods trade balance, retail and wholesale inventories, initial claims near 240k, and existing home sales. It is a full cross-section of growth, jobs, and supply. A Goldilocks mix would look like: durables ex-transport positive but not booming, claims trending sideways, trade gap narrowing a touch, inventories steady, and existing home sales stabilizing. A hot cocktail would be durables and prices both strong while claims slide and inventories build; that would push yields up the curve and pressure duration-sensitive tech. Williams, Bowman, Bostic, and Daly are on the tape around these releases; expect headline algos to chase any policy-colored soundbites.
Friday decides the week with PCE. Consensus looks for core PCE around 0.2 percent m/m and 2.8 percent y/y, personal income near 0.3 percent, and spending near 0.3 to 0.5 percent. Inline to cooler keeps the “cuts are coming, not urgent” stance and should favor a grind-up with cyclicals participating. A 0.3 core with hot spending would revive the sticky-inflation theme and weigh on long duration. The final Michigan sentiment at 10:00 am gives you a read on consumer psyche; weakness there paired with cool PCE is the cleanest bullish mix for multiples. There are more Fed remarks sprinkled through the day, but PCE will drown most of them out unless there is a surprise.
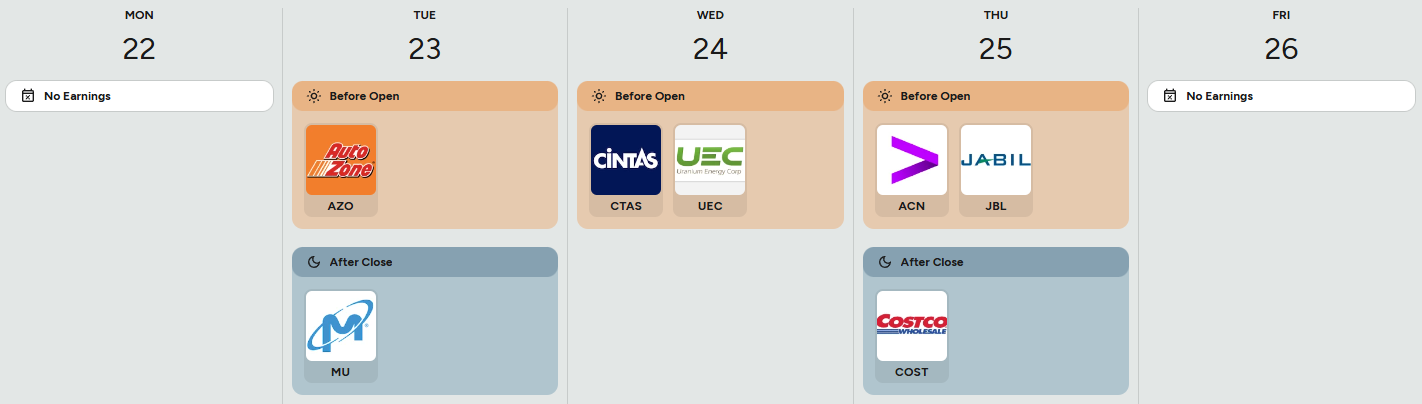
Earnings are light but pointed, with names that punch above their weight for macro read-through. Tuesday pre-open, AutoZone sets the consumer-repair tone; tight budgets usually help DIY auto, so watch gross margins for shrink and wage pressure. After the bell, Micron is the swing factor for semis and QQQ beta; the DRAM/NAND pricing cadence and capex guide matter more than the quarter. A firm bit-pricing outlook and AI memory tailwinds would spill into the broader chip complex. Wednesday pre-open, Cintas offers a clean read on labor intensity and service-economy demand via uniform rentals and ancillary services; decelerating rental growth or conservative guidance would be a quiet warning on Main Street velocity. Thursday pre-open, Accenture and Jabil hit together. Accenture’s bookings and commentary on cloud modernization and GenAI projects are a high-signal tell for enterprise IT spend; Jabil is a supply chain barometer across electronics, mobility, and EVs. After the close, Costco closes the week for the consumer; traffic, membership renewal, and mix are your tells on household resilience and trade-down dynamics. A strong MU plus steady CTAS, ACN, JBL, and COST would support a broad risk bid; misses or cautious guides in that cluster would argue for a quality pivot back to the megacaps.
A couple sign-posts for those trading this tape actively:
First, Powell on Tuesday: dovish tone with PMIs > 50 is a green light for beta into Wednesday.
Second, Thursday data: if claims run hotter than 250k while durables sag and GDP prices cool, that is a soft-landing cocktail and favors cyclicals and small caps; if claims drop and prices/cores run hot, tighten risk in long-duration tech ahead of Friday.
Third, Friday PCE: 0.2 core or better with subdued spending keeps yields contained and should extend the uptrend; a 0.3 core with hot spending is the risk-off print, especially if MU or COST disappoints.
Bottom line: the calendar puts narrative control in Powell’s hands Tuesday and in the inflation tape Friday, with a dense growth check in between; stay flexible, let 8:30 am data set the tone each day, and adjust index playbooks around how yields respond.

Market Intelligence Report
MIR Part 1: The Backdrop
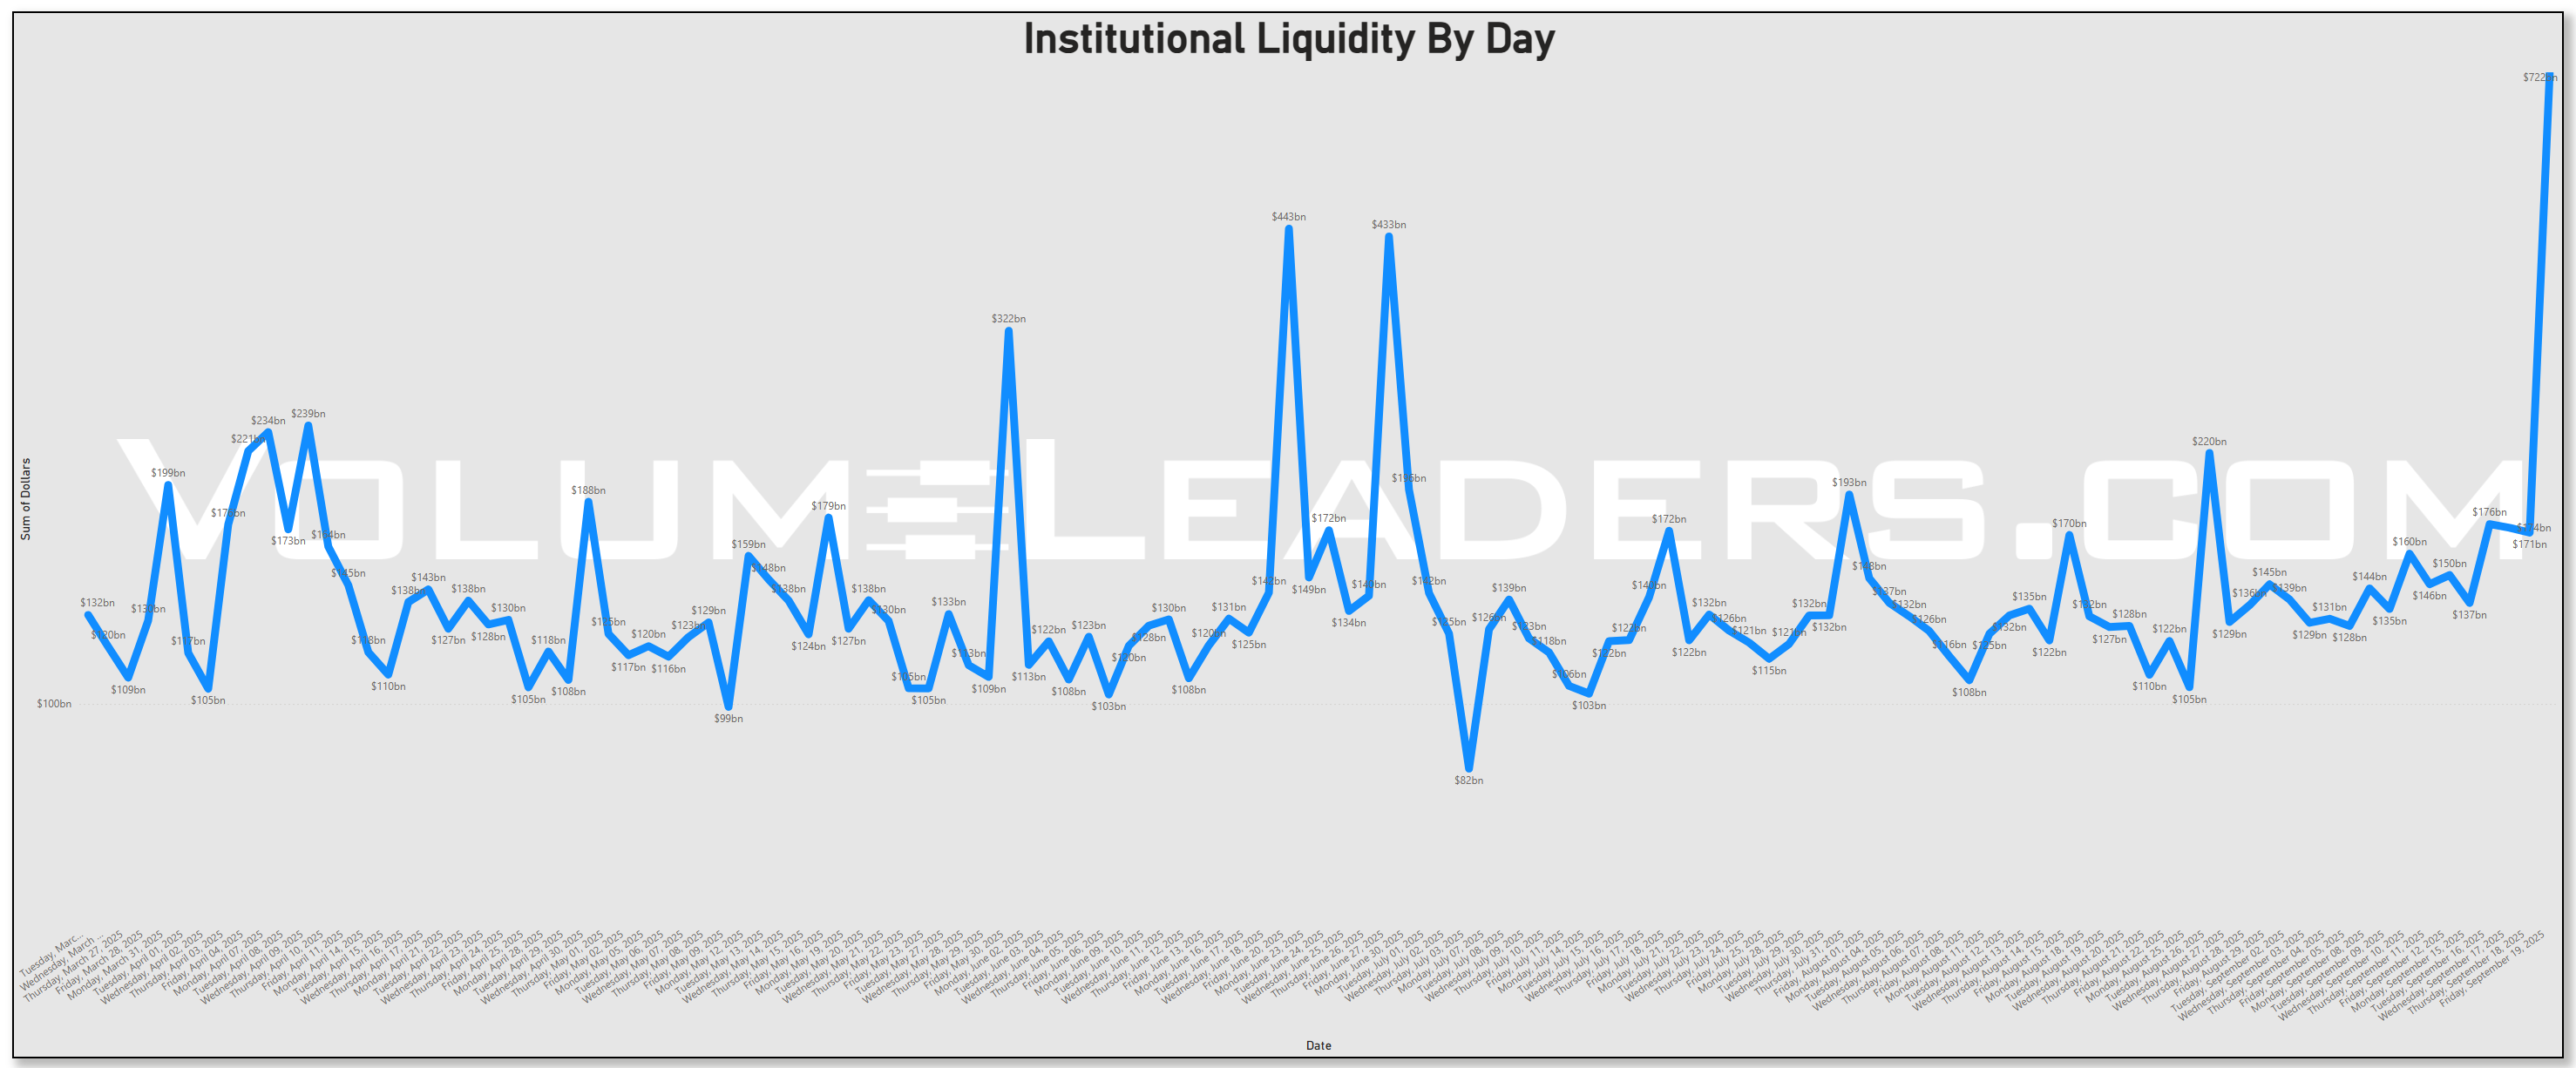
Liquidity first. The “Institutional Liquidity by Day” series ends with a monster print into Friday, dwarfing the prior two months and lining up with the quarterly expiration/rebalance window: $722bn. That kind of one–day, everyone-at-the-tape surge is classic quad-witching plus index housekeeping: lots of mechanical rolls and benchmark tracking, and then real money piggybacks when spreads are good. Translation: a big piece of this week’s dollar surge was structural, not purely directional, so we will need Monday–Tuesday to separate durable sponsorship from expiry noise.
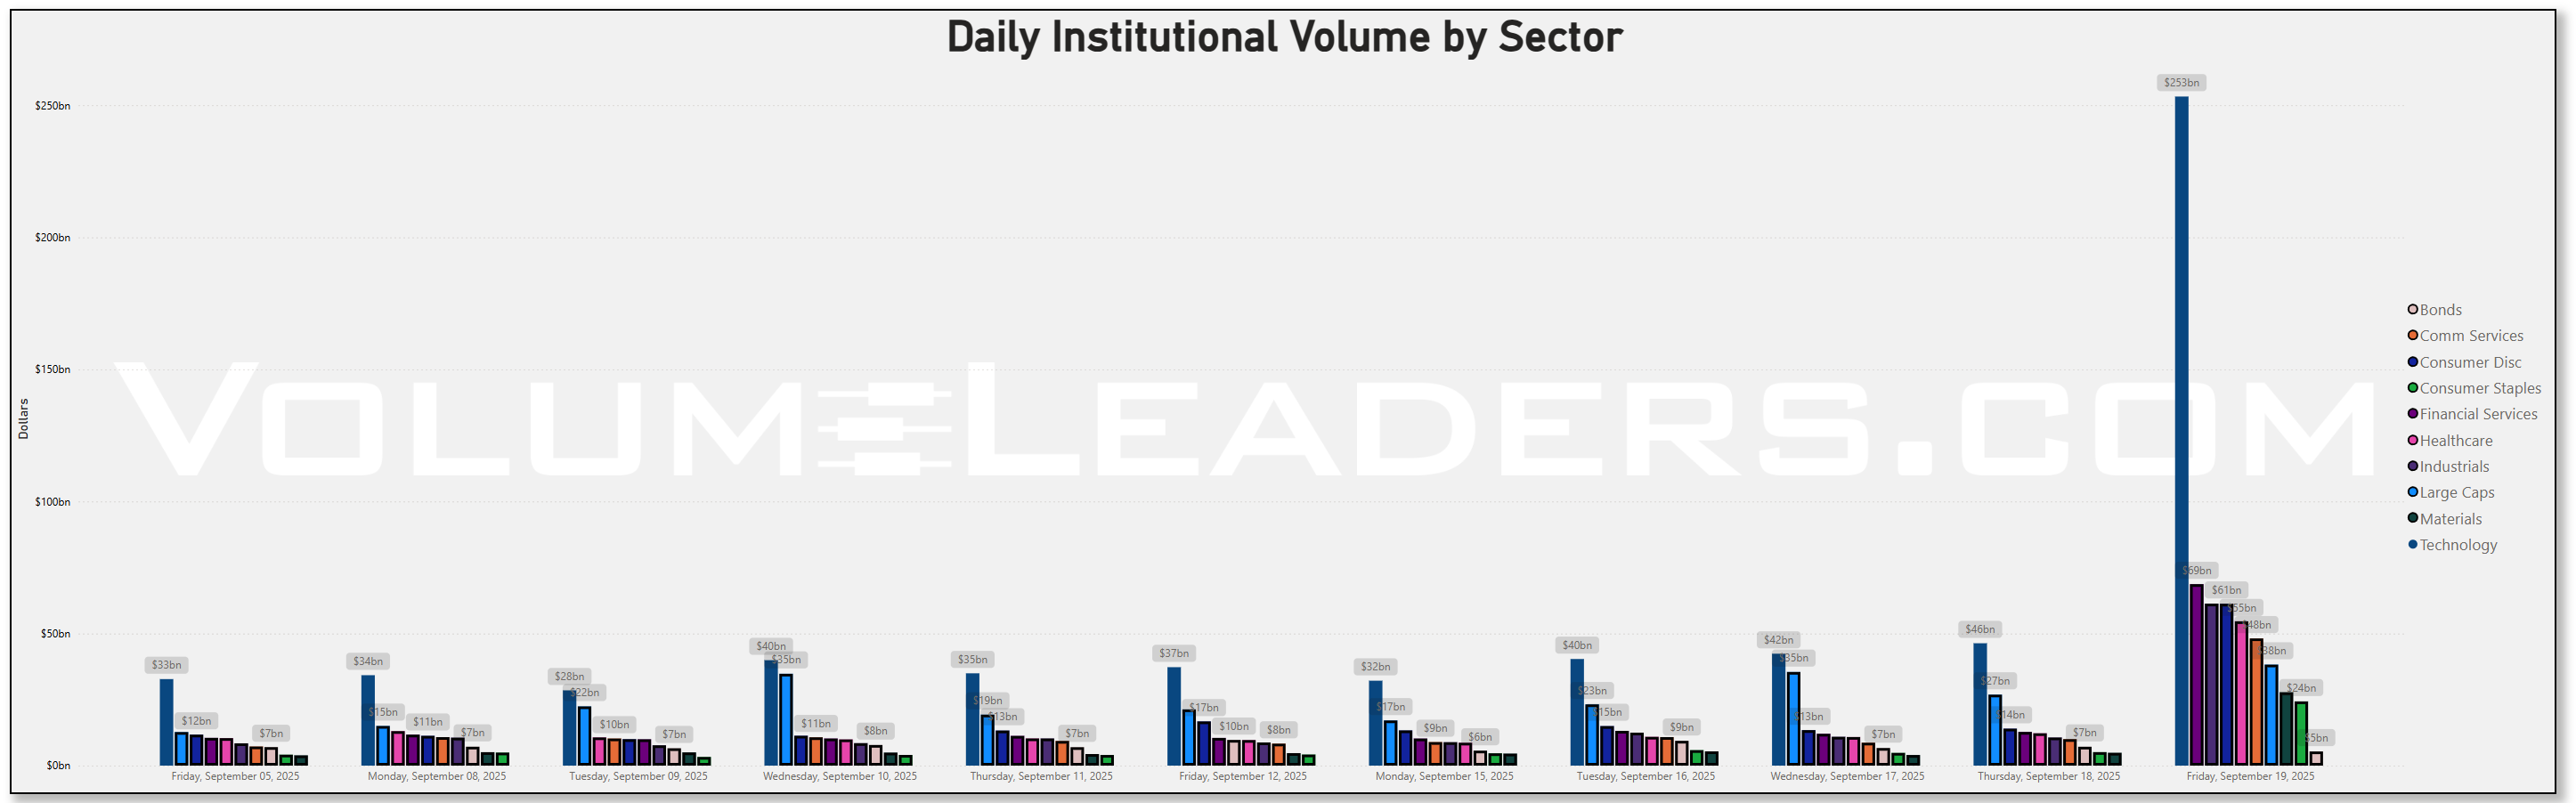
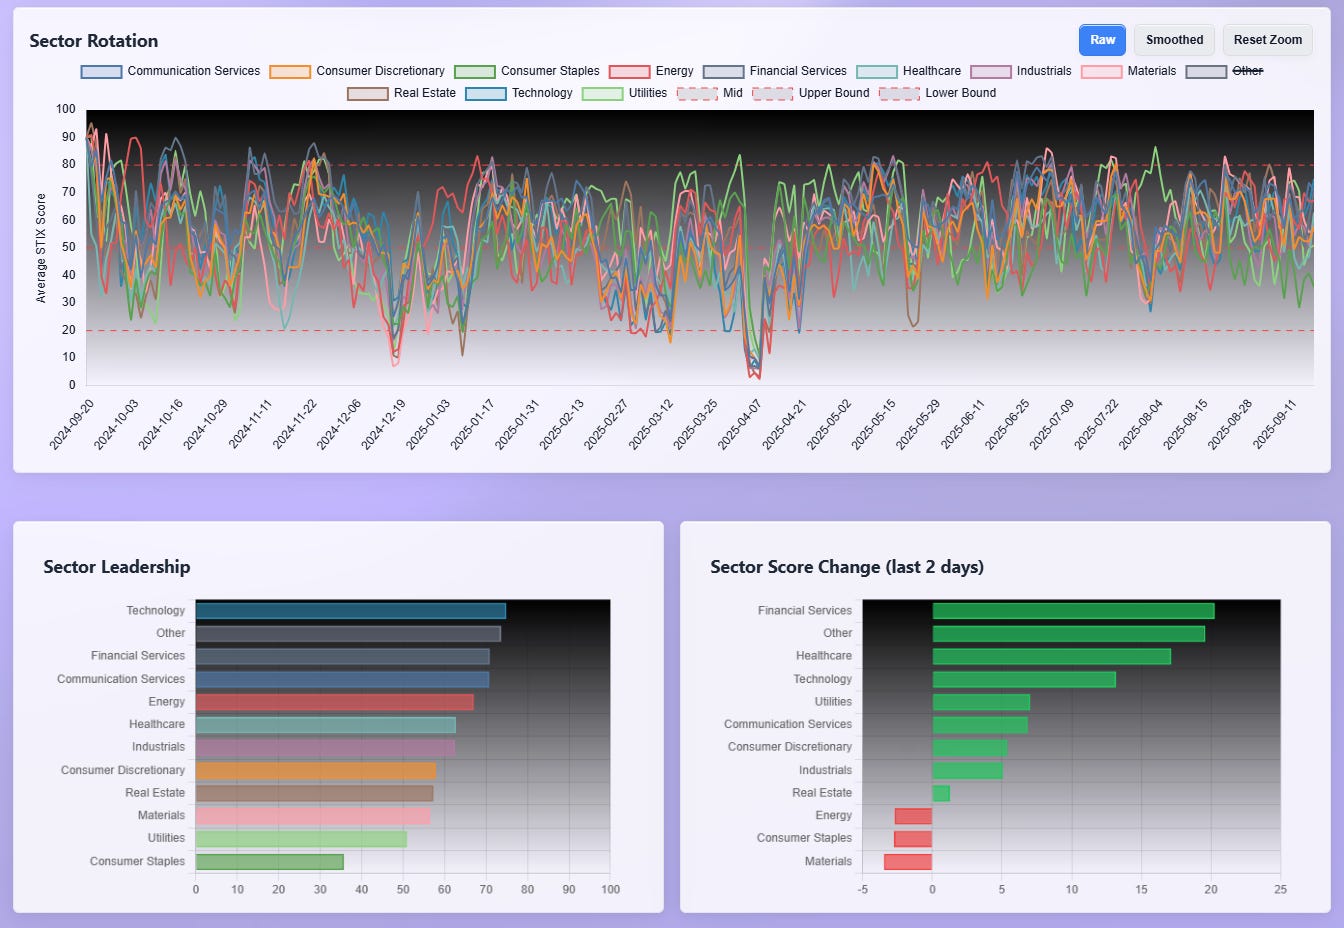
Daily sector dollars tell you where the machines and the humans overlapped. Technology was the dominant sink all week and exploded on Friday, with Large Caps and Financials right behind it. That pairing matters. When Tech and the broad index sleeves are the top three, those are allocators pressing the liquid core while they adjust exposures elsewhere. Communication Services and Healthcare participated; Energy, Materials, and Staples were smaller and, notably, did not see the same Friday crescendo. That is consistent with a market leaning into growth and liquidity over resource cyclicals and classic defensives.
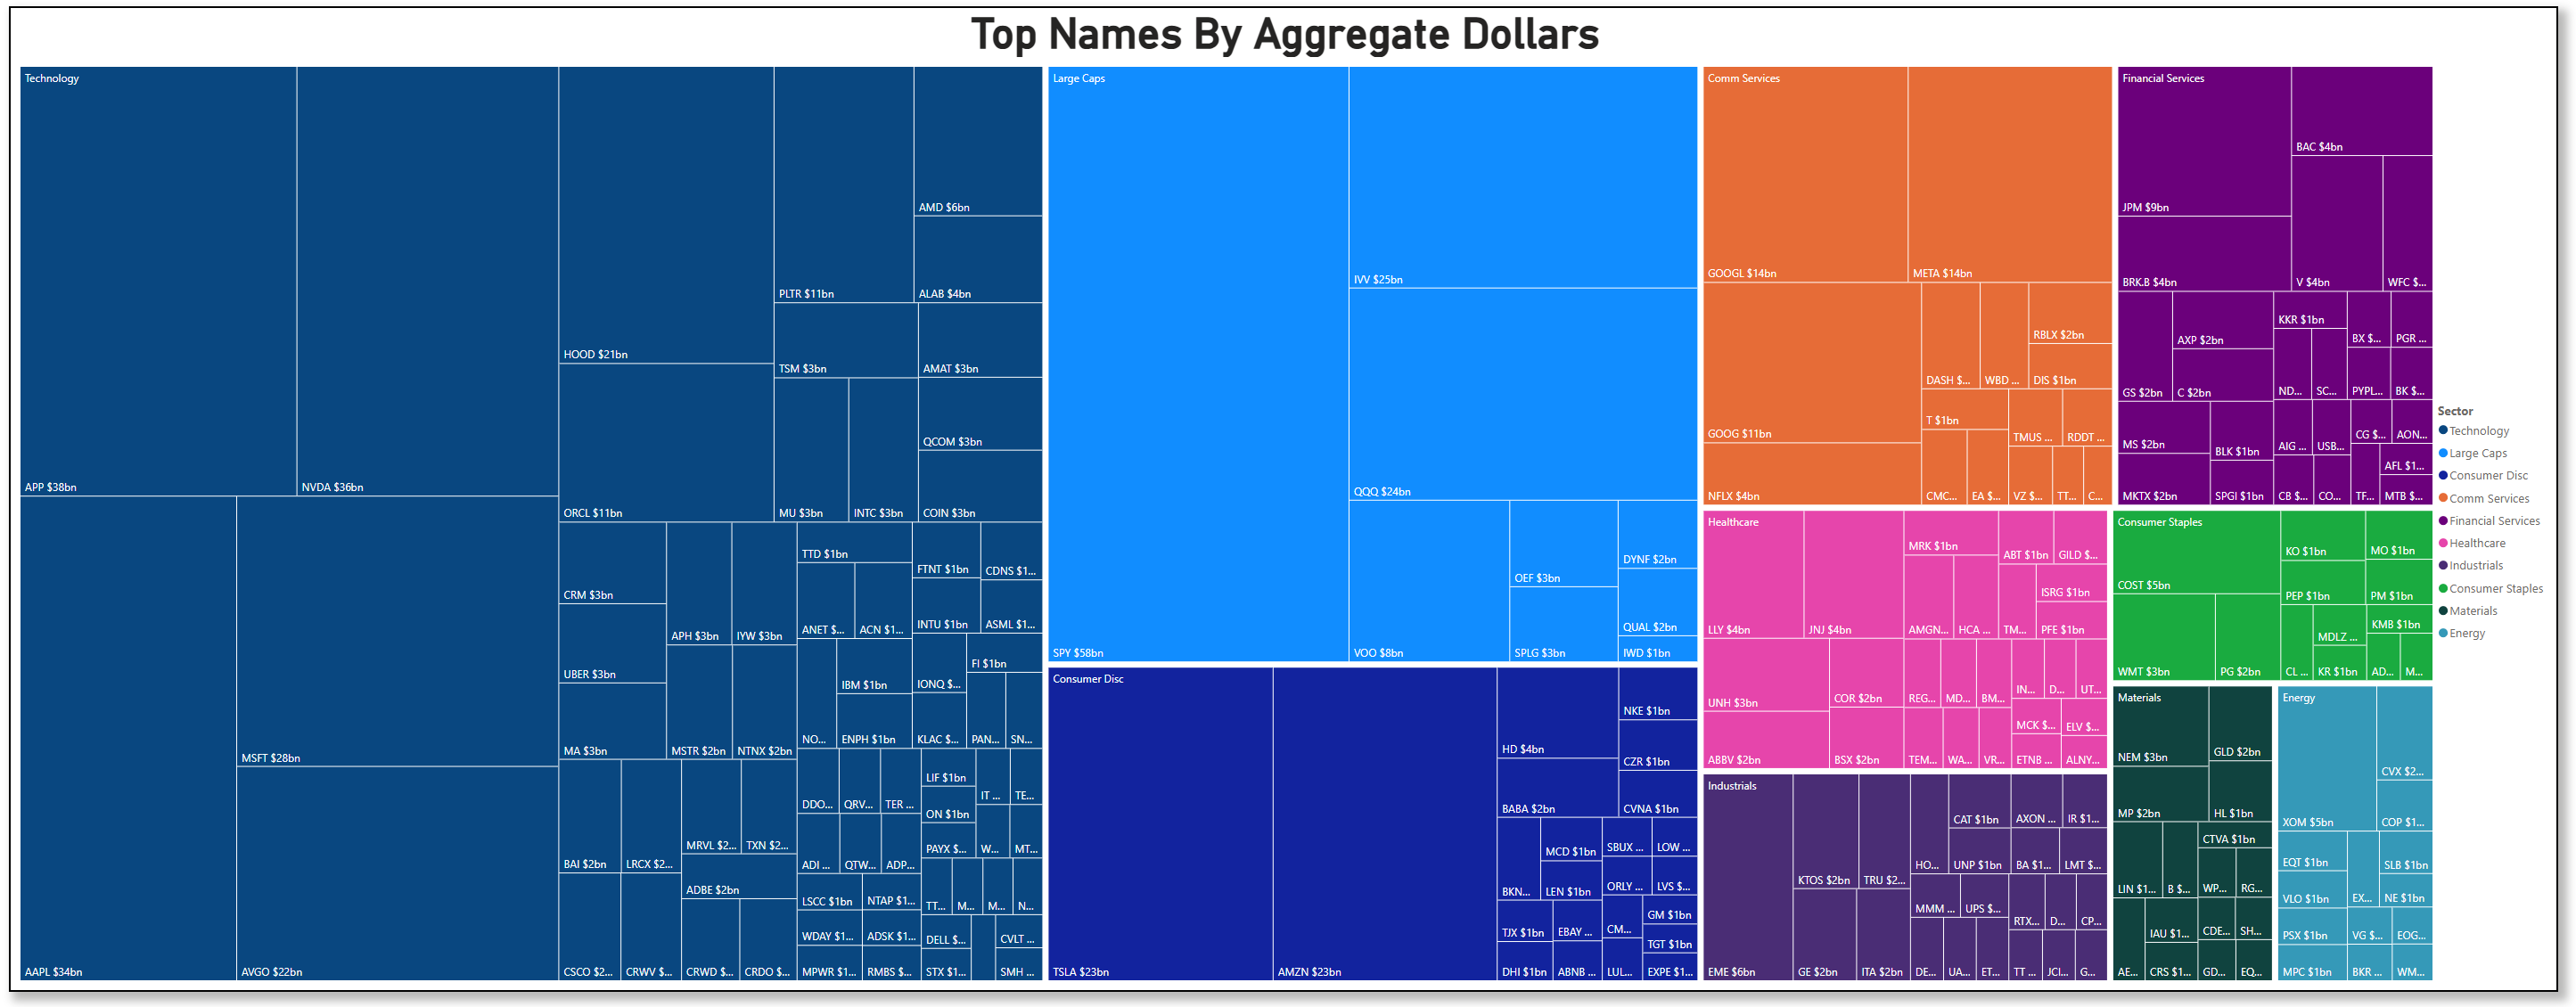
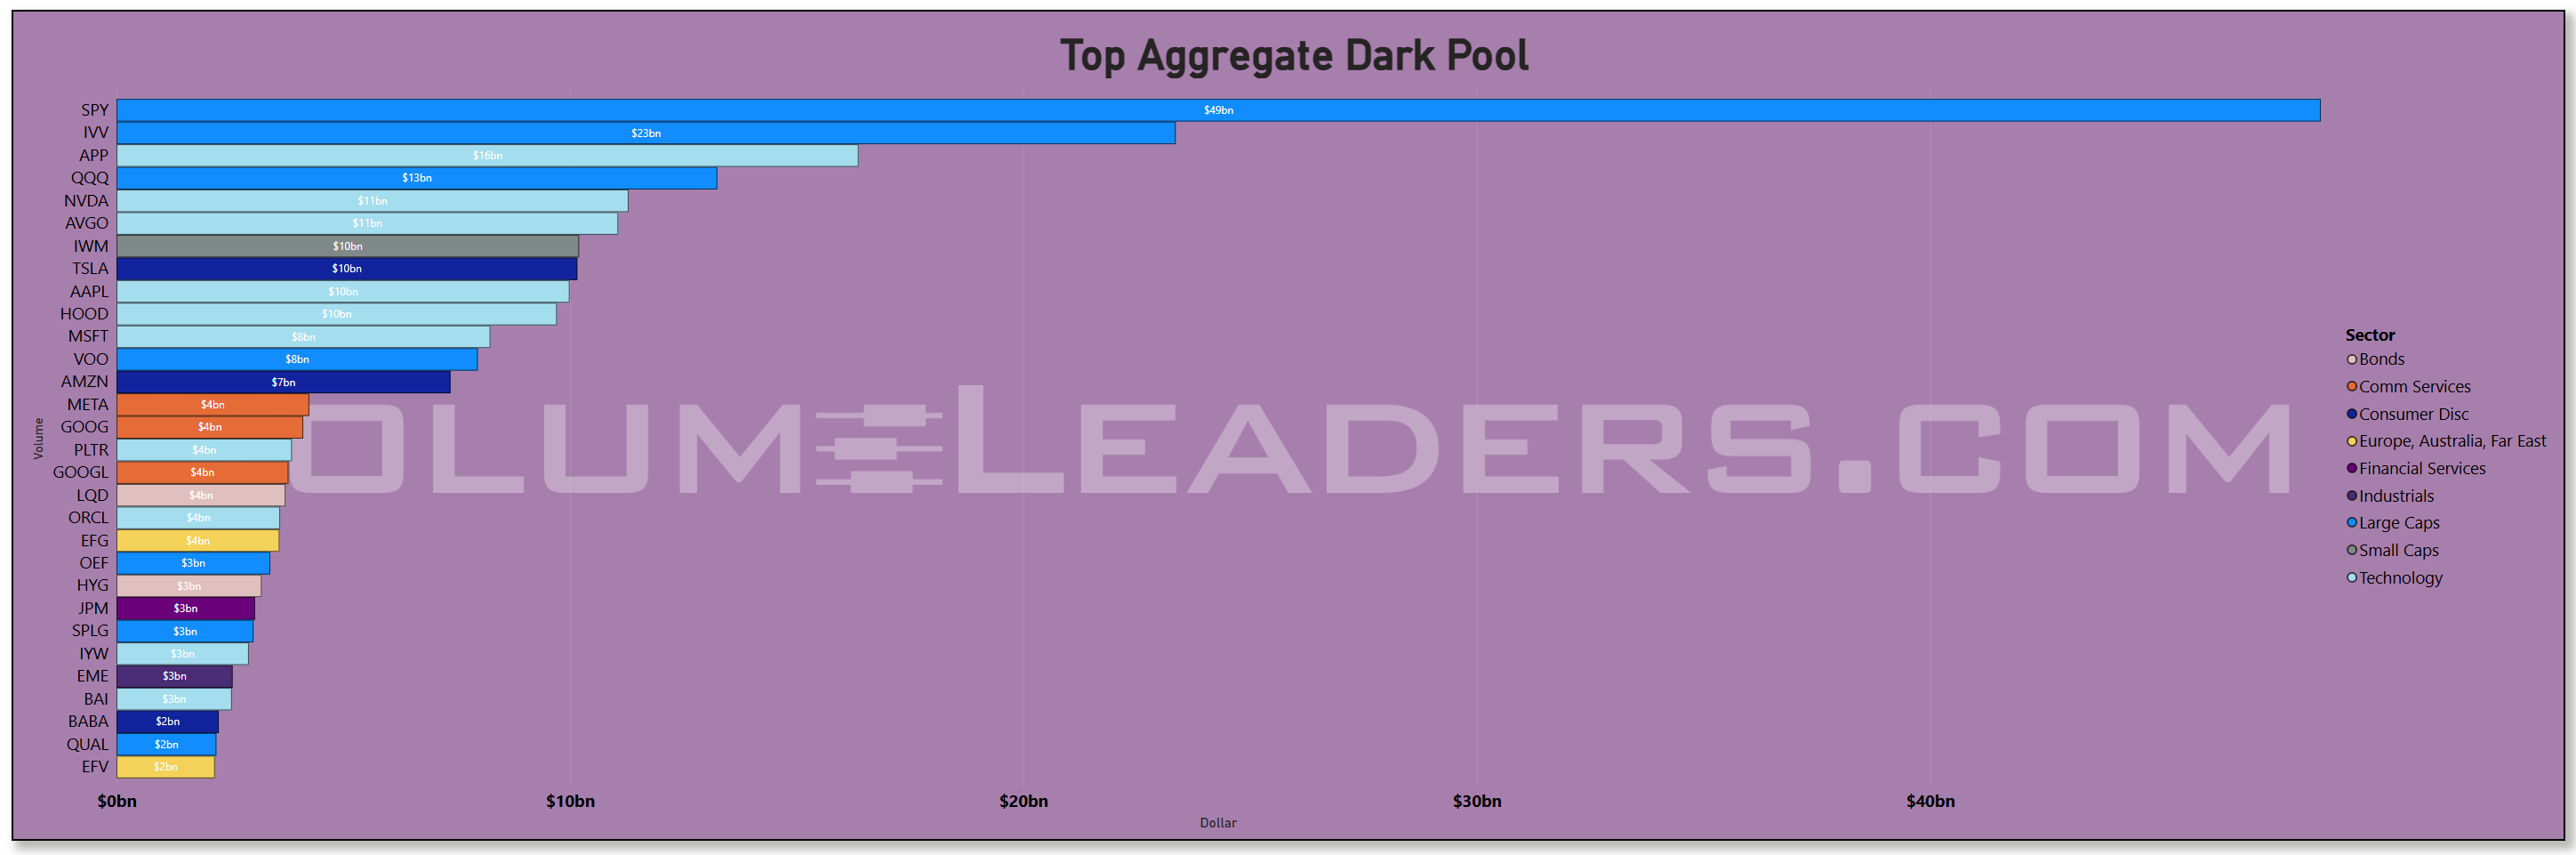
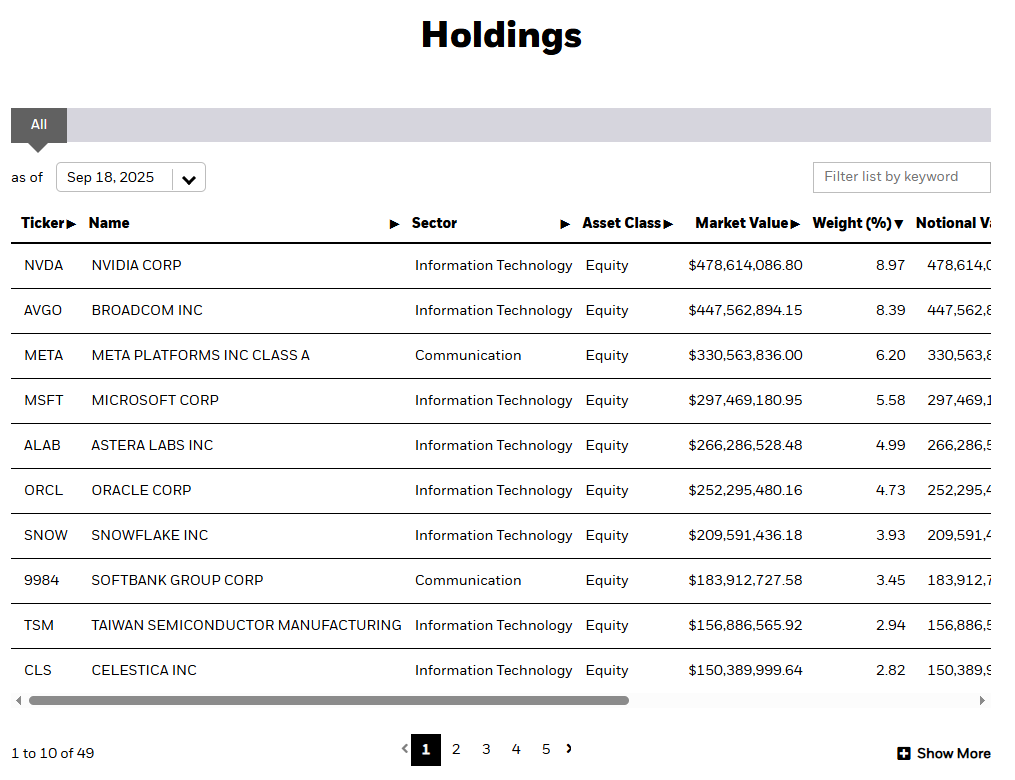
The treemap of “Top Names by Aggregate Dollars” makes the leadership spine obvious: SPY/IVV/VOO on the index side, then APP, NVDA, AAPL, MSFT and the rest of mega-cap tech, with QQQ, TSLA, AMZN, and AVGO filling out the first tier. APP’s and HOOD’s dollar footprint is unusually large due to joining the S&P. Single-name breadth inside Tech is healthy: semis (NVDA/AVGO/AMD), platforms (AAPL/MSFT/GOOGL), and software/infrastructure all printed size, which tends to buffer pullbacks because sponsorship is diversified across the stack.
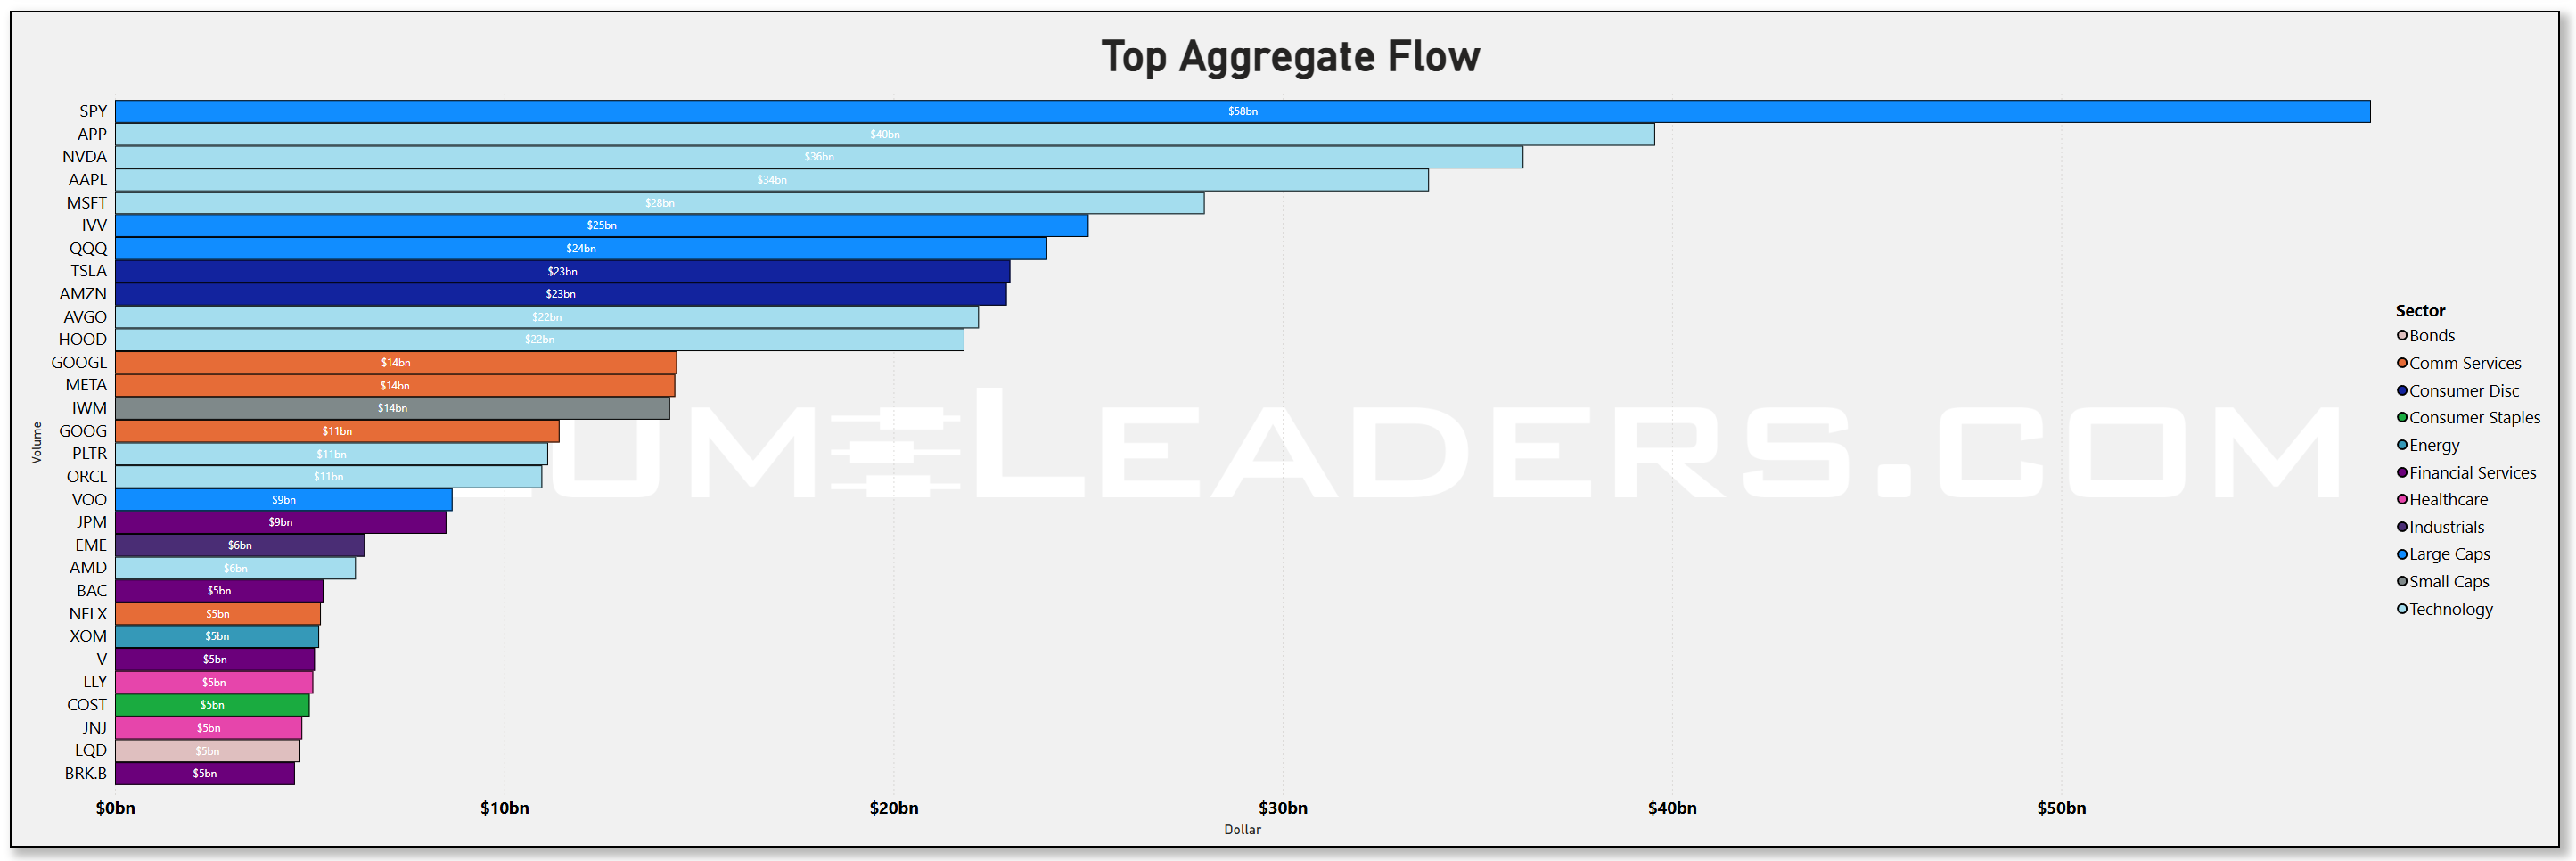
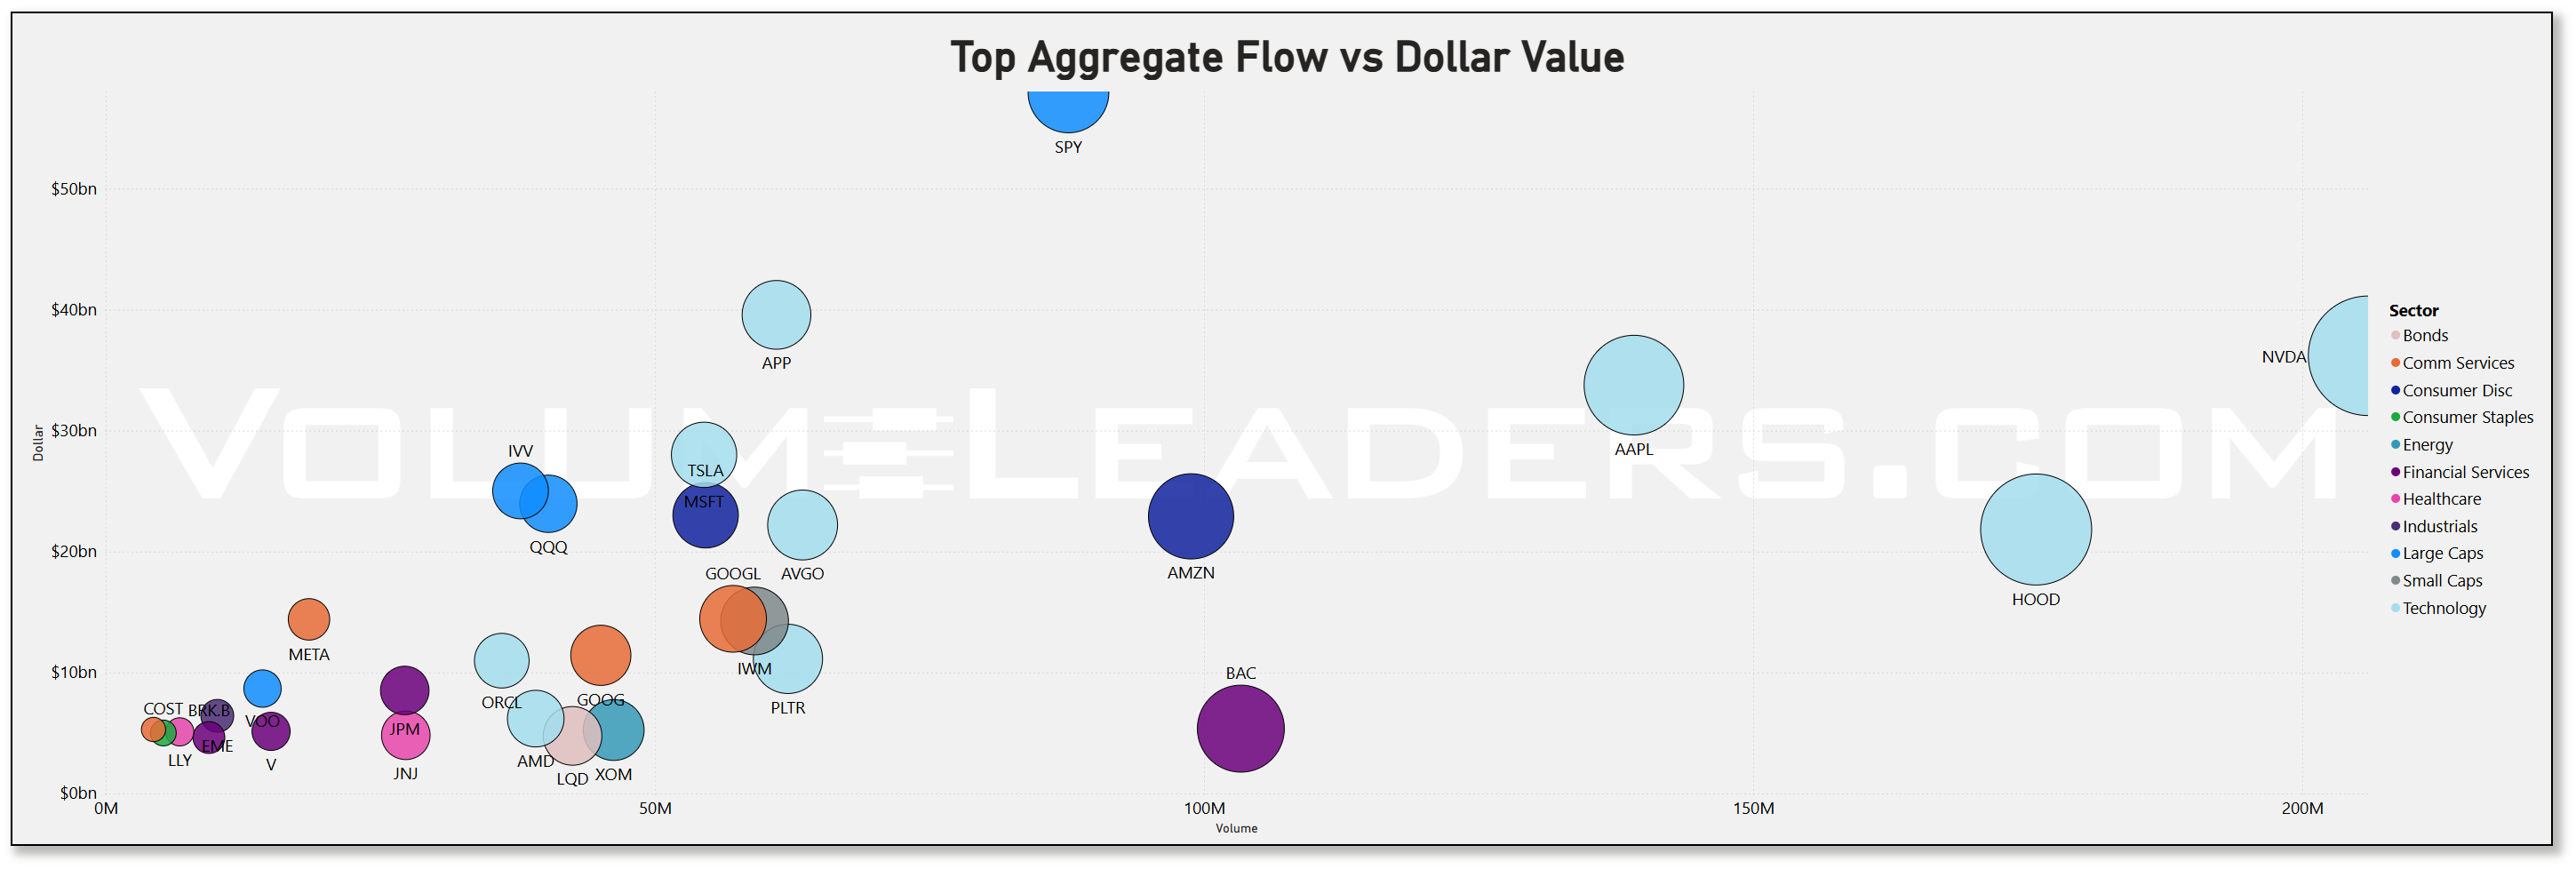
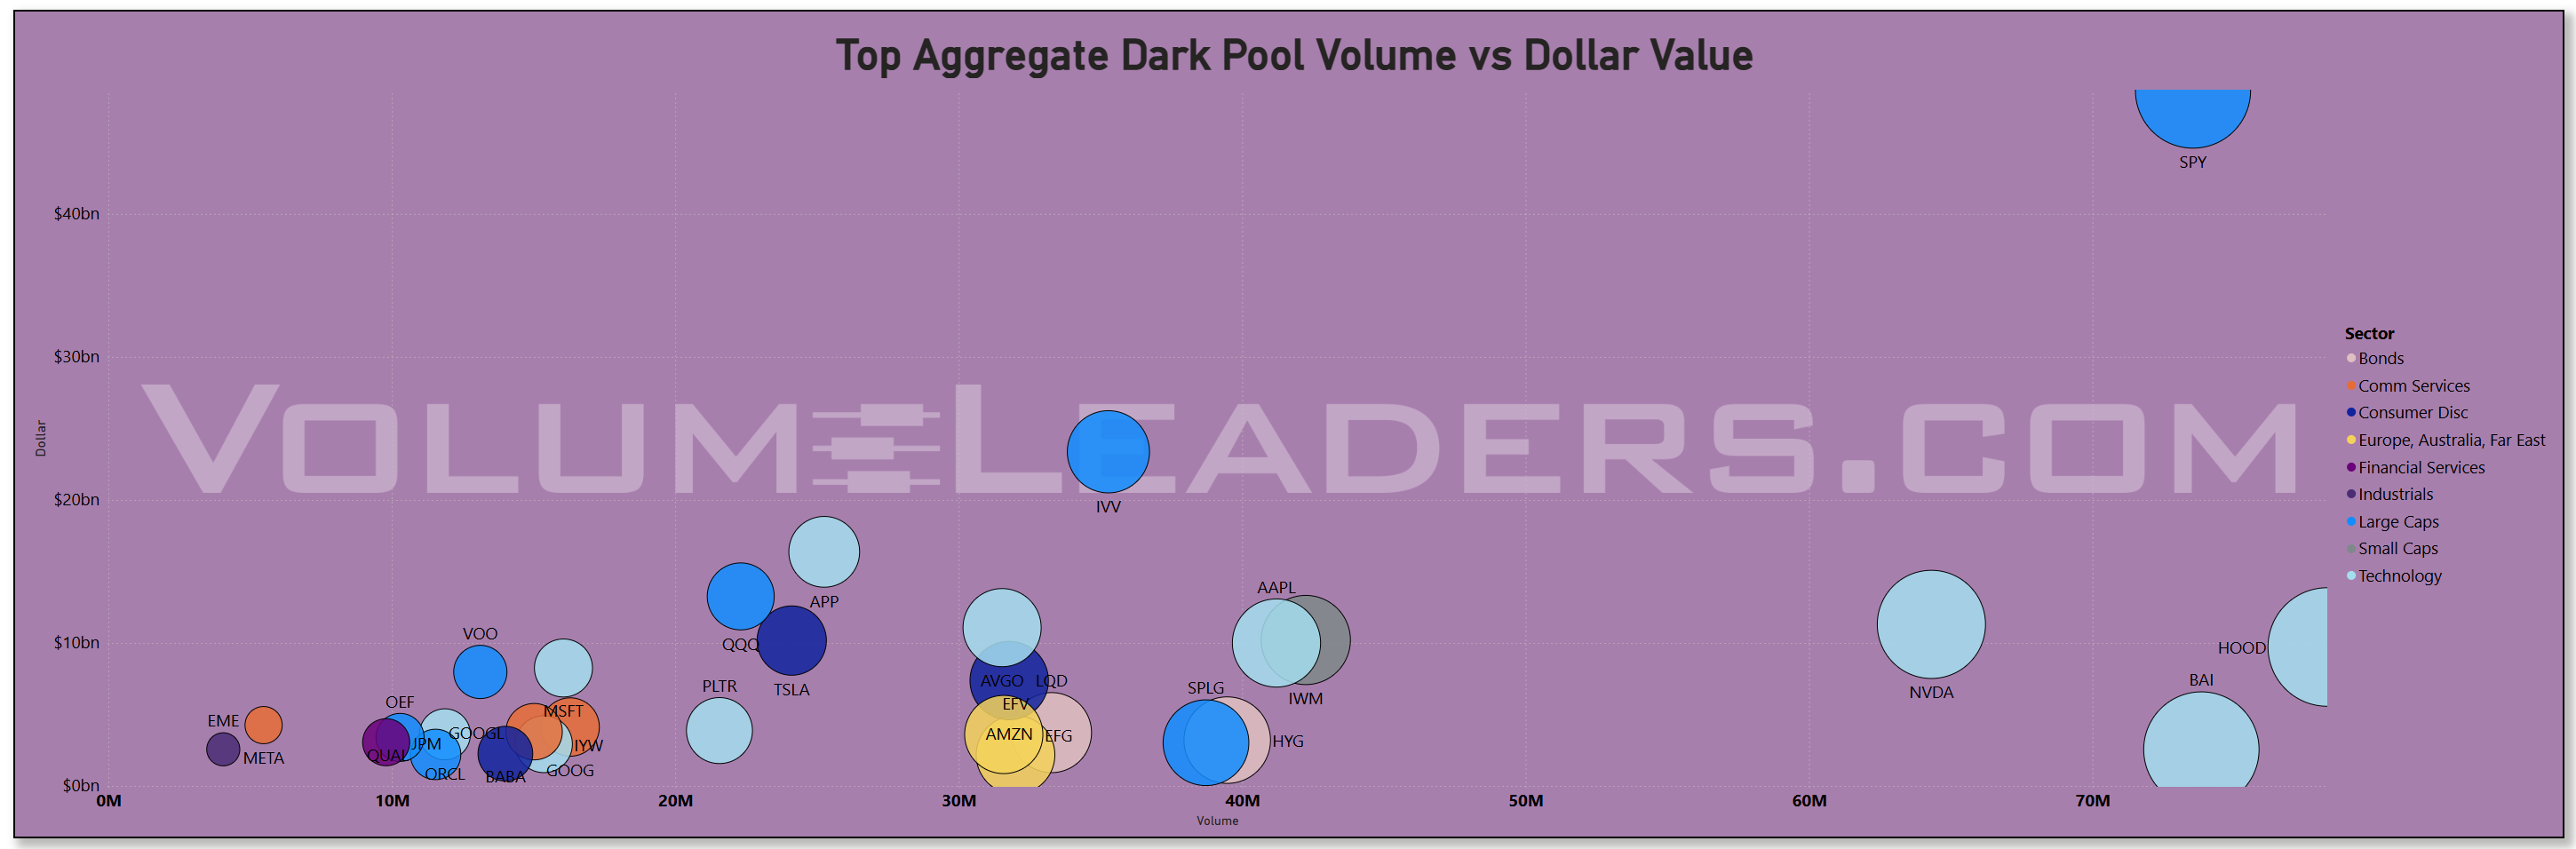
The aggregate bar and the dollar-vs-volume scatter agree on the texture of that sponsorship. SPY towers over everything by dollars, while APP, NVDA, AAPL, MSFT, QQQ, and TSLA form a tight next cluster. On the scatter, NVDA and AAPL run high on both volume and dollars (institutional activity broad and persistent), while APP sits unusually high on dollars at moderate volume (blocky flow, consistent with negotiated prints, again, due to S&P membership). HOOD rides the far-right with very high volume and large dollars. This is precisely what we expect on expiry/rebalance weeks: index sleeves plus the front line of leadership act as the balancing reservoir.
The dark-pool tape backs the story. Off-exchange, SPY and IVV are the two biggest sinks by a wide margin, followed by APP, QQQ, NVDA, AVGO, IWM, TSLA, AAPL, and HOOD. When the hidden tape shows the same names as the lit tape, I give the signal more weight: it implies steady accumulation/redistribution rather than one-off prints. The bubble view reinforces it: IVV and AAPL plot with hefty dollar bubbles at mid-to-high volumes, while NVDA, HOOD, and APP sit even farther to the right with outsize activity. This is how institutions “move the furniture” when they have both benchmark and thematic reasons to act.
Sweeps add the tactical color. The fastest money chased VOO at the top spot, then IG credit via LQD, with NVDA and TSLA next. Quality and international growth (QUAL and EFG) show up with real dollars, while munis (MUB), HY credit (HYG), and small-cap sleeves (IJR/IYW/QQQ) round it out. That is not an all-gas posture; it is a barbell: buy beta and the leadership, add quality carry, and keep ballast nearby. Even SPY/OEF/EMB/TIP appear down the list, telegraphing that macro hedges and income sleeves stayed in play alongside risk.
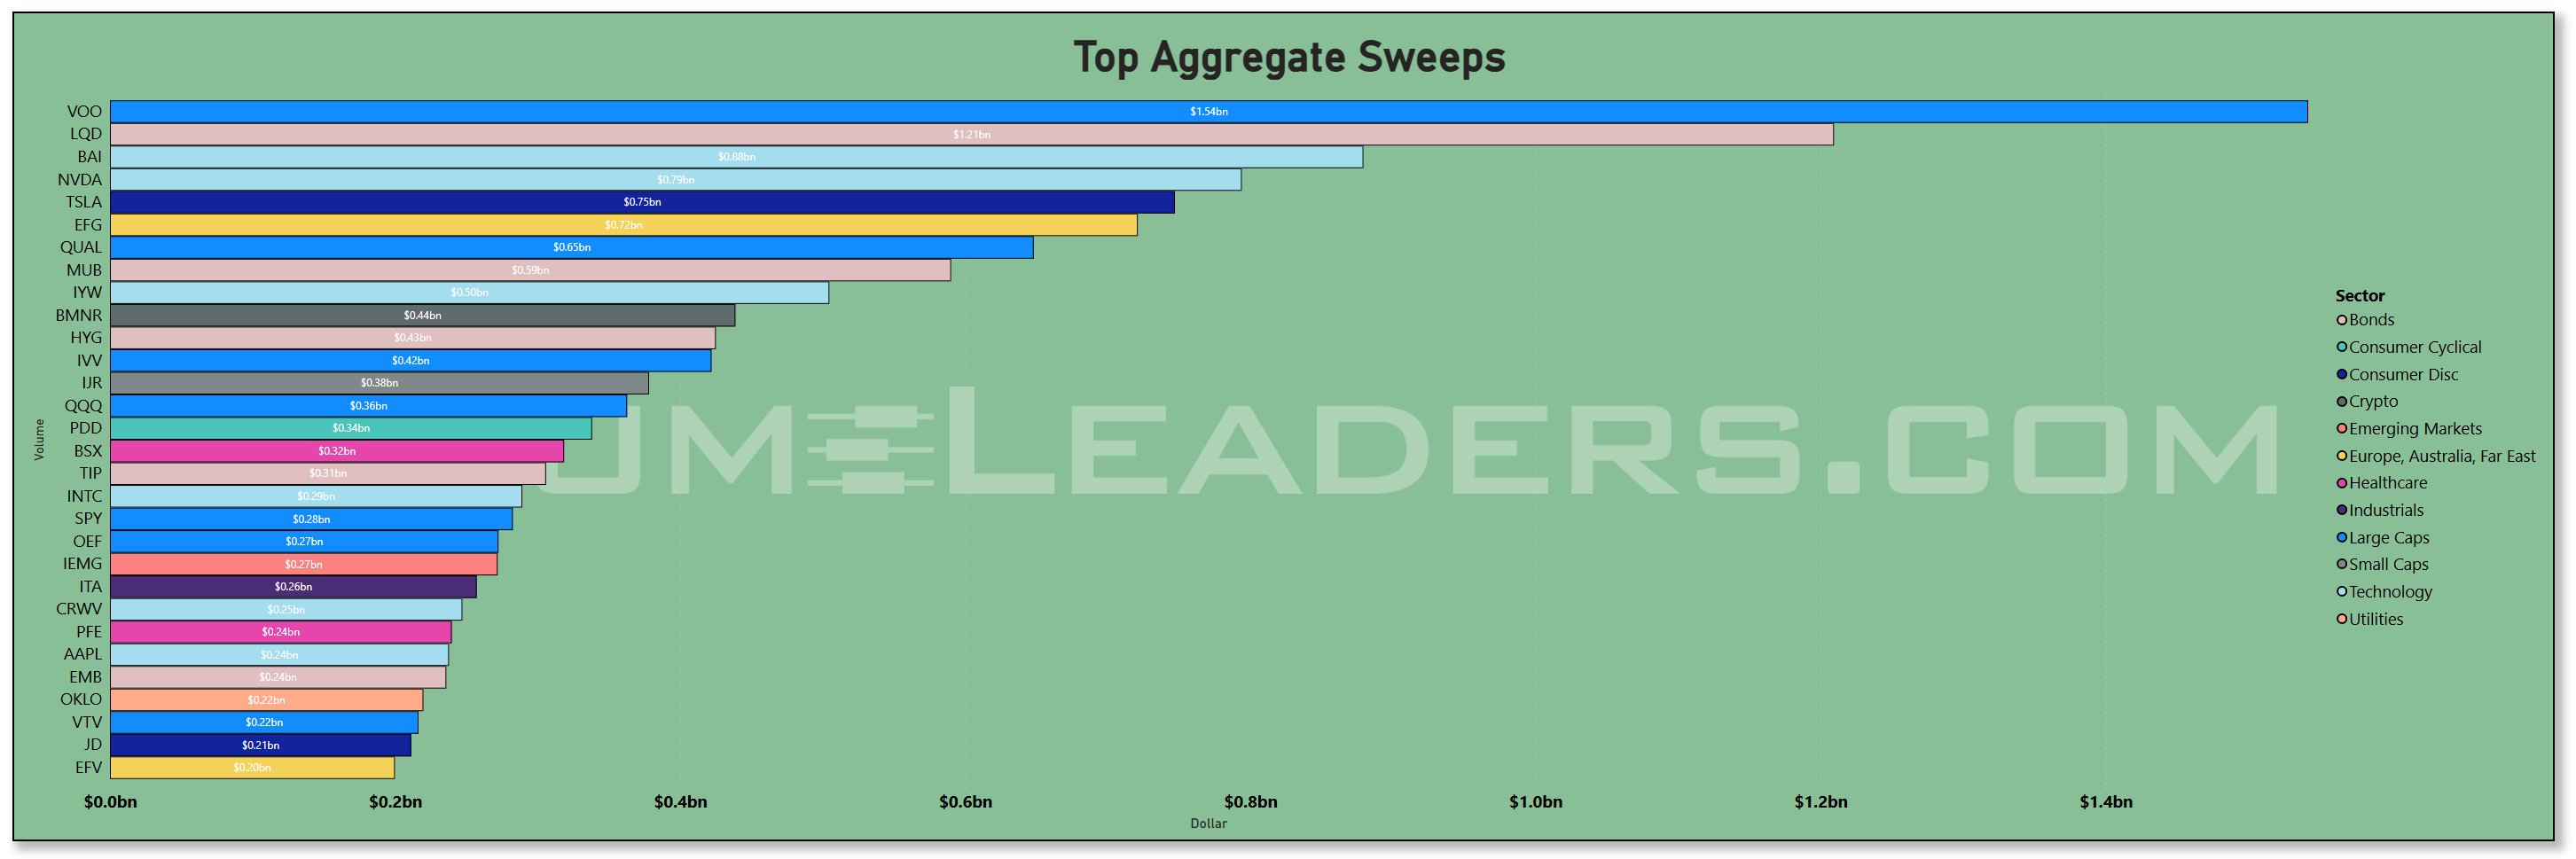
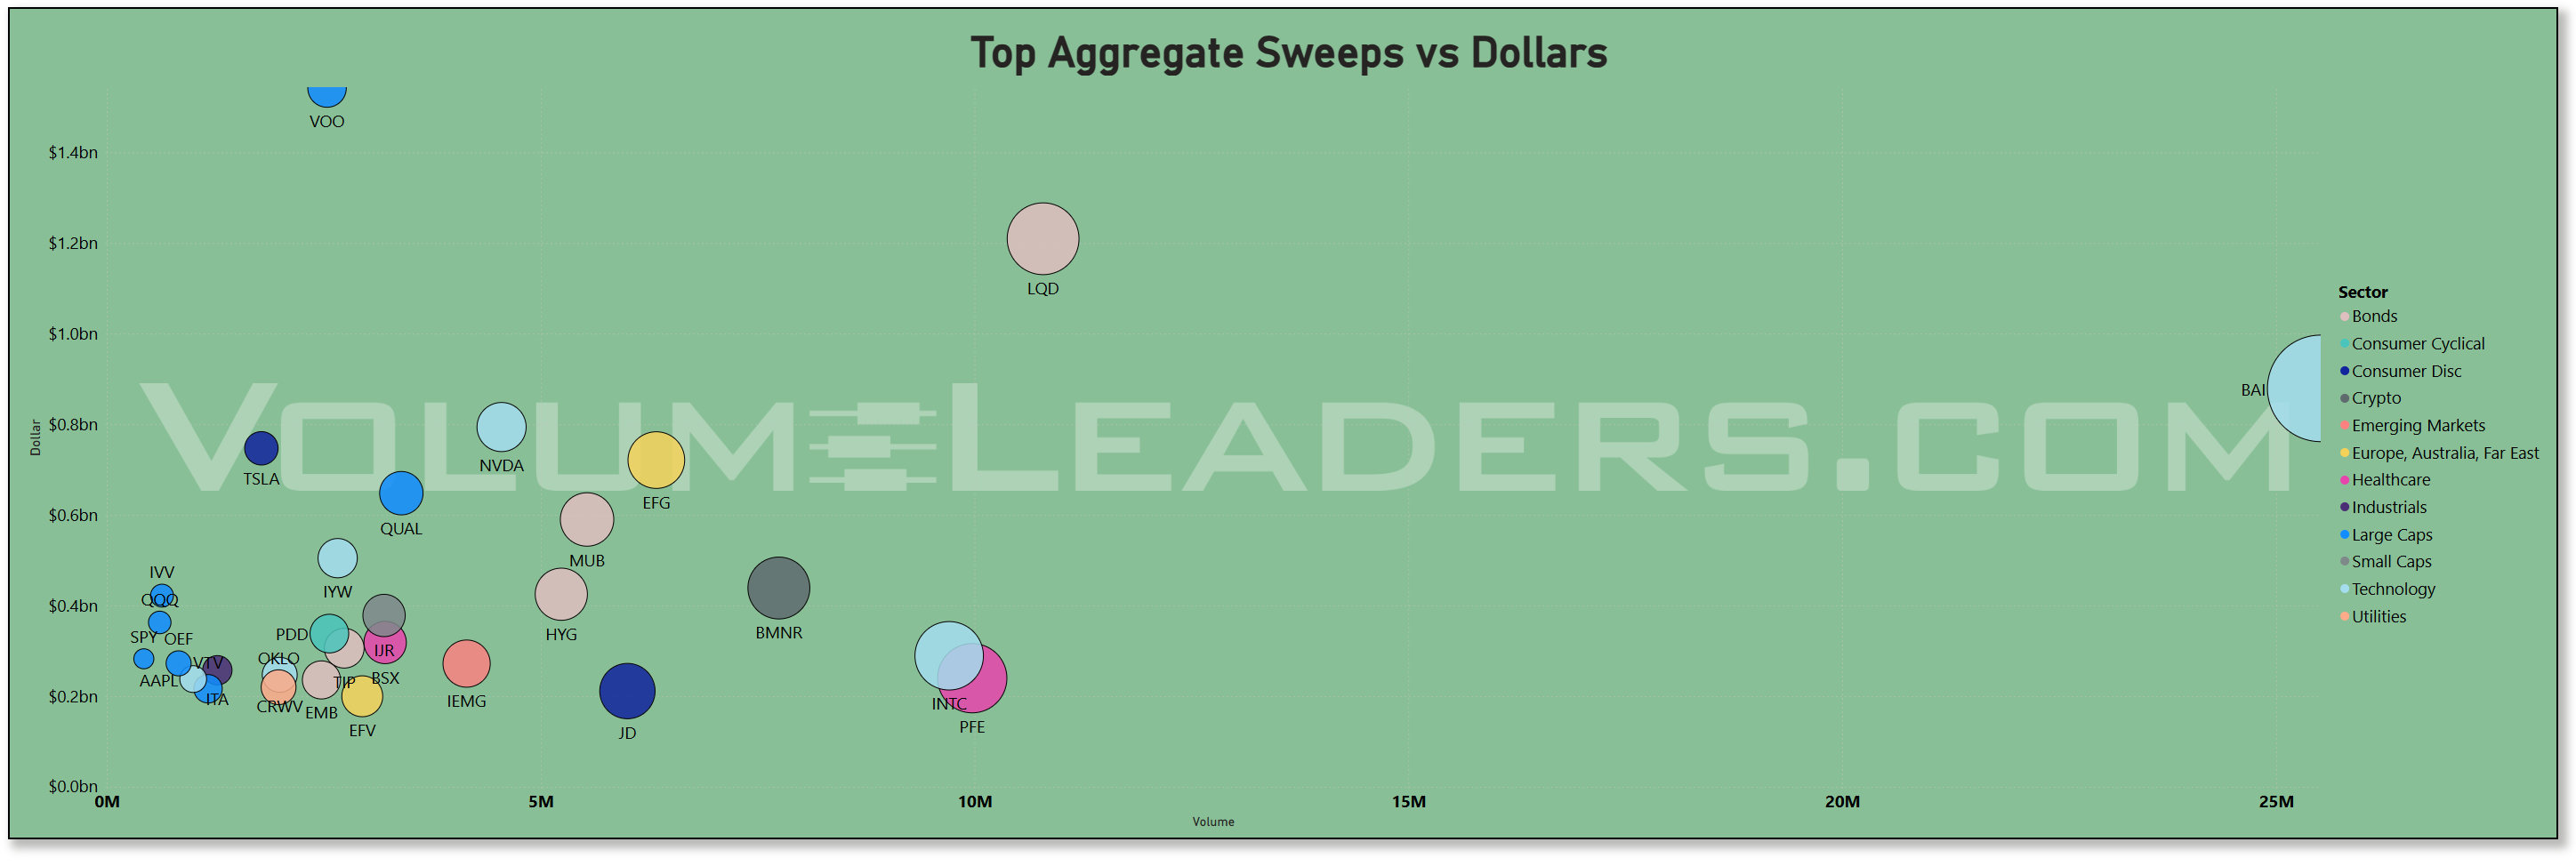
BAI clearly a standout not typically on this list. This ETF is comprised of global AI and technology names of all market caps but the top names are no strangers to readers:
Now stitch in the rotation board. Technology remains the top dog, but the two-day delta shows Financials ripping higher with Healthcare not far behind, while Energy, Staples, and Materials slipped. That mix lines up with this week’s flows: sponsorship into liquid growth plus a catch-up bid in Financials as yields eased and curves stabilized, and less love for commodity-linked or classic defensive sleeves. If that pattern persists into the first 48 hours post-expiry, expect banks/brokers/asset managers to keep a relative bid while the commodity complex takes a breath.
Seasonals and the calendar are the caveats. The back half of September is historically the choppiest stretch of the year, and the quarterly expiration we just saw often distorts volumes and closes before flows normalize the following week. With the Fed easing cycle now in play and rebalances behind us, the test is straightforward: does liquidity remain elevated while the same leadership complex keeps printing in both lit and dark tape? If yes, the path of least resistance is a stair-step higher led by mega-cap tech with Financials participating. If not, expect a mean-revert back into the mid-week ranges that preceded Friday’s surge as a start.
What to watch into early week. First, SPY/IVV/VOO prints: persistent size in both lit and dark lanes says allocators are still putting money to work; a sharp drop-off after the witching spike argues it was mostly mechanical. Second, Tech’s single-name tape: NVDA/AAPL/MSFT/AVGO should continue to show heavy dollar flows with healthy trade counts; if that dries up while index sleeves stay active, we are sliding from leadership to “index and chill.” Third, the credit sleeves: LQD/HYG/MUB/TIP all appeared on the sweep board; if those hold a bid while equities consolidate, the barbell is alive and drawdowns should stay orderly.
Bottom line: institutions used the quarterly expiry week to concentrate flow in the liquid core — SPY/IVV/VOO plus mega-cap tech — with notable off-exchange activity in APP, NVDA, AAPL, and HOOD, and a tactical barbell of beta and investment-grade carry via sweeps; seasonals say fade the noise and verify sponsorship early next week, but if the same names keep printing size after the quad-witch clean-up, the allocation impulse likely extends.
MIR Part 2: Individual Names From The Institutional Tape
VolumeLeaders tracks several proprietary signals designed to spotlight names drawing significant institutional interest. Below, we’ve surfaced the latest results and analyzed them to highlight emergent themes. If any of the sectors, narratives, or positioning trends resonate, the names mentioned here offer a strong starting point for deeper research and watchlist consideration.
VL Trade Rank Velocity™ (TRV)
TRV is a proprietary metric that measures the recent acceleration or deceleration in institutional trading activity for a given stock by comparing its average trade rank over the past few days to its average in recent weeks. A sharp improvement in TRV typically reflects a notable shift in positioning, often accompanied by sustained trade activity, suggesting institutions are actively engaging with the name and that intensity of activity is rising. This often precludes meaningful price or narrative shifts. This isn’t a buy-list or sell-list; it’s meant to draw your eyes to names where institutions are putting money to work.
First, the bond sleeve showing at the very top is not a footnote. VCEB leading the velocity stack says institutions are still fortifying the carry core even as they put risk on. That matches what we saw in the sweeps and dark pools last week: IG credit alongside equity beta. When corporate credit lights up on a persistence metric, it usually means allocators are locking in a base yield and then layering equity risk on top rather than swapping one for the other. It is a “build the keel before you raise more sail” posture.
Financials are the clearest equity theme. You have a spread of regionals and specialty finance (SMBK, OSBC, BY, EWBC, MSBI, PNFP, FCNCA) plus insurance carriers and brokers (HIPO, HCI, BWIN) all scoring high and accelerating. That is breadth, not a single-name anomaly. It fits the rotation we flagged where Financials were gaining on the 2-day and the flow boards showed money stepping into banks and brokers while the curve steadied. In practice, this is the tape telling you institutions are seeding the second line beneath the money-center banks and megacap platforms. If the rates backdrop stays benign, these are the cohorts that typically lead the “broadening” phase.
The next cluster is old-economy “doers”: construction and industrial services (FIX, EME, VSEC), machinery and components (CR, NNE, SANM), and defense/industrial tech (BWXT, AIRO). That looks like a capex/infrastructure thread—steady contract backlogs and margin visibility attract persistent prints because they scale. It also gives the market something to own if growth cools but does not crack: revenues that are less dependent on ad cycles or consumer whim.
Healthcare—especially mid/small biotech—is quietly forming a wave. LQDA, ETNB, TSHA, CRMD, APGE, EYPT, MDGL, TERN, ROIV, MNMD, UPB all carry rising interest and sustained activity. Biotech tends to catch sponsorship when the cost of capital eases and when large pharmas need pipelines. Velocity here says funds are building baskets rather than crowding a single binary. If this persists alongside ongoing interest in credit, it argues for a market that expects lower real rates and is comfortable underwriting duration risk in growthy cash-burners—selectively, not indiscriminately.
Materials and “hard-asset beta” are also on the tape. Precious-metals miners and sleeves (TFPM, BTG, EXK, FSM, SILJ, NGD) show up next to copper (CPER) and aggregates (VMC). That is a classic hedge for softer real yields and a weaker-USD impulse, and a nice portfolio balance against the heavy Tech weight elsewhere. It is notable that Energy’s velocity skew is more in services and infrastructure (SOC, FLOC, SOBO, FLNG) than in the big integrated producers; that reads like pipeline/shipping/capex exposure rather than a pure crude bet.
Tech participation is broad, but it is not just the same megacaps. You have network/optical and semi-cap names (CIEN, NVMI, AMBA), infra/software platforms (APPF, HPE, RCAT, GCT, FIG/FIGR, BTDR, SANM, OLO), and an AI wrapper (CHAT). The presence of AVGX (2x bull AVGO) plus levered FANG exposure (FNGU) and TSLT (2x bull TSLA) tells you there is tactical appetite riding shotgun with the slower, persistent prints. AAPD (1x bear AAPL) on the list is a tell that some managers are hedging single-name concentration while staying long the complex—consistent with “index + leaders + hedge” we keep seeing elsewhere.
Real assets tied to water and power keep creeping in. ZWS (regulated water) and VST (independent power) both post healthy velocity, echoing the recent leadership we have seen from utilities when rates ease. If bond sleeves are being built and power/water continue to attract persistent prints, the market is quietly buying resilience for the next wobble.
International and ex-US growth is not an afterthought. EFG and IEUR (developed), AIA (Asia), EET (2x EEM), and IQDG (dividend growth ex-US) indicate a renewed nibble abroad. That aligns with the index-sleeve behavior we saw around expiry: once the U.S. core is sized, overflow often bleeds into developed growth and selective EM. Watch whether that interest persists once the rebalance dust settles; velocity in these ETFs is often the first place a USD shift shows up.
Consumer prints are selective rather than broad. Restaurants and food—DAVE, KRUS, PBPB, AVO, VITL, WMK—look like idiosyncratic positioning rather than a macro bet. In a “soft-landing, ease-without-breakage” tape, staples-adjacent food producers and niche dine-out concepts can carry steady same-store growth and pricing power; TRV picking them up suggests real buyers are present, but the cohort is too eclectic to call a sector rotation yet.
Crypto adjacency is a side current worth noting. BTDR, HIVE, GLXY, BITQ all flash persistence. That is consistent with the speculative channel we often see when liquidity steps up: some portion of flows leans into the crypto complex as an option on risk. I would treat this as a temperature gauge, not a core thesis—helpful for reading risk appetite day to day.
Finally, real estate and advisory names (NMRK, EVR, PWP) turning up with improving velocity are subtle but important. If transaction pipes reopen—whether in CRE brokerage or corporate deal-making—these tickers tend to sniff it out early. Pair that with the bank/insurance velocity and you have the bones of a broader financial upturn rather than a one-day pop.
Quick take: the “liquid core” remains in place (index sleeves + megacap Tech), but Trade Rank Velocity says institutions are quietly broadening beneath the surface into Financials, industrial doers, and selective healthcare/biotech, with hard-asset hedges and utility resilience built around the edges. The tactical layer—levered Tech and TSLA wrappers, a hedge in AAPD, and crypto proxies—sits on top of that base. If early-week post-expiry prints keep this pattern—credit plus beta in the core, regionals/insurance and industrials climbing, and biotech staying bid—then the market is doing the professional thing: extend leadership while methodically underwriting the next ring of cyclicals and duration. If velocity fades first in Financials and the metals sleeves while only the index/megacaps keep printing, the broadening attempt is stalling and we revert to “index and chill.”
VL Institutional Outliers™ (IO)
Institutional Outliers is a proprietary metric designed to spotlight trades that significantly exceed a stock’s recent institutional activity—specifically in terms of dollar volume. By comparing current trade size against each security's recent normalized history, the metric flags outlier events that may indicate sudden institutional interest but may be missed because the activity doesn’t raise any flags/alerts when comparing the activity against the ticker’s entire history. For example, it’s conceivable that a ticker today receives the largest trade it has had in the last 6 months but the trade is unranked and would therefore be missed by current alerts built off Trade Ranks. Use “Realized Vol” to identify tickers with large price displacement and to size your risk appropriately.
Start with the two billboards: APP and HOOD. Both print truly outsized dollars for a single session, with APP north of $38b and HOOD above $20b, each registering a six-sigma surge versus their own 60-day baselines while closing essentially unchanged and with sub-1 percent realized vol. That is not chasey momentum; that is inventory moving by appointment. In practice, prints like these are what you get on rebalance days when desks use the liquidity to reset position size, hedge single-name exposure against index sleeves, or transfer stock between strong hands without blowing out spreads. Of course, we all know the news by now, these two are joining the S&P.
The next throughline is industrial “doers.” EME shows up with more than $6b and STRL, VSEC, MAN, UFPI, NPO, LDOS, and TILE round it out. Add KTOS and VOYG from aerospace/defense and you have a clear cluster of old-economy operators carrying six-sigma flow while price barely budged. This dovetails with the Trade Rank Velocity signal we saw earlier in construction, engineering, and defense: institutions are building medium-term exposure in companies with backlog visibility and operating leverage to a stable growth tape. When this cohort attracts outsized but low-vol activity, it usually means block buyers are accumulating without telegraphing intent.
Financials are the broadest footprint on the page. You have capital markets and card/consumer finance at the top (MKTX, AXP), a large health-care REIT in WELL, mortgage REITs and BDCs (BXMT, MFA, MAIN), plus a bench of regionals and super-regionals from MTB and ONB to FRME, BY, WAFD, EFSC, FCF, BUSE, EBC, and SFBS. Again, dollars big, prices muted. That is classic reweighting plus quiet allocation when the rates backdrop is friendly. It also rhymes with the TRV theme of breadth inside Financials beyond the money centers and with our sector rotation read where Financials’ two-day momentum was improving. If that sponsorship persists after the expiry dust settles, expect banks, brokers, and asset-gatherers to keep a relative bid on dips.
Materials and hard-asset beta show a coordinated pulse. Precious-metals and royalty names stack up across the list—AEM, NEM, WPM, RGLD, AGI, IAG, EQX, HMY, EGO—alongside HL and silver-adjacent tickers. You also get aggregates (VMC), specialty chemicals (ASPI), and rare earths (MP). When metals miners appear en masse as six-sigma outliers with tiny price moves, it reads like allocation and hedging against the macro mix we have been discussing: easing real yields, a softer dollar bias, or simply a desire to own non-correlated ballast while leaning into growth elsewhere. Pair that with bond and credit strength from the sweep board and you get a portfolio that is adding both carry and hard-asset optionality.
Technology’s footprint is broad and layered rather than one-note. Beyond APP and HOOD, you have software and infra (NTNX, LIF, PEGA, QTWO, FSLY, JKHY, PLUS), communications hardware (CRDO), and a meaningful semicaps cluster (ALAB, MKSI, MTSI, QRVO, LSCC). Notice how many of these printed large yet closed near flat with low realized vol. That is what serious repositioning looks like when it is not a news-driven grab. For trading purposes, it means follow-through should show up in coming sessions: either the dark-pool tape stays active and levels hold, or the activity fades and we revert to the prior balance.
Energy participation was selective. NE posted nearly $600m in dollars at six-plus sigma, with midstream and services names like VG, OII, and HLX showing smaller but still extreme prints. Prices again barely moved. That is consistent with a market fine-tuning exposure to barrels and pipes rather than racing to chase crude beta. If the metals bid persists while energy remains mechanical, it argues that the “inflation hedge” capital is skewing toward gold/silver rather than oil for now.
Healthcare splits cleanly into services and innovation. ACHC, OMI, and WAY represent provider and information-services flow, while a handful of biotech and specialty pharma names pop up (CRNX, CORT, RXRX). The services prints look like index-adjacent reweights; the biotech cluster, together with the TRV basket we saw earlier, looks more like a steady build across mid/small caps into lower real rates.
Consumer activity is idiosyncratic, not a sector wave. You can spot travel and leisure (CZR, VAC), discretionary staples and distributors (POOL, COKE, WMK), durables (LZB), and some services (OSW). None scream chase; most are low-vol outliers that sit well inside their recent ranges. The read is positioning rather than a new macro bet on the consumer.
Two other tells worth highlighting. First, WELL’s size stands out among REITs, and MPW’s appearance alongside it suggests real money leaned into health-care real estate as yields eased. Second, MKTX’s outlier flow coinciding with calm price is the picture of bond-market plumbing getting heavy use; that squares with the strong credit sleeves we have been seeing in the aggregate and sweep dashboards. When MarketAxess prints like this, it usually means the buy side is busy across IG/HY and wants electronic liquidity.
Bottom line: the outlier tape into expiry looked like professionals using abundant liquidity to reset risk — mega-cap software and retail-brokerage as the largest transfers, a methodical build in industrial “doers” and Financials, and a coordinated metals hedge — all with conspicuously low realized vol that points to accumulation and reweights over chase.
VL Consensus Prices™
These are the most frequently traded #1-Ranked Levels in VL this week. Trades occurring at the highest volume price in a ticker’s history are significant because they represent institutional engagement at a key price memory level—where the market once found consensus. These areas act as liquidity hubs, enabling large players to transact efficiently, and often signal a reassessment of fair value. This activity may precede major moves, mark equilibrium zones, or reflect broader portfolio shifts, making these price levels important to watch even without yet knowing how price will resolve. (Note: many Bond products trade in such a tight range that they dominate the top positions and are therefore omitted to provide better clarity around other flows. The bonds data is still available in the VL platform.)
First, the context matters. We just came through an expiry/rebalance week with a record liquidity spike and heavy, non-directional prints in the liquid core. When you see a long roster of names simultaneously interact with their all-time highest volume node, that is the footprint of desks resetting exposure at the most efficient clearing prices they know. Consensus Levels are the market’s gravity wells. Touches and handoffs there are rarely random; they are where asset managers like to rebuild size.
Technology is the most coherent theme, and it is not just one corner of tech. You have software and infra ringing the bell at their primary nodes (HOOD 124.80, NTNX 77.10, QTWO 78.20, KVYO 34.00, IOT 39.60, BASE 24.40, PRCH 19.10, TWLO 105.10, HQY 94.70, FI 131.80, CRWV 124.90, CORZ 16.70), communications hardware at their anchors (CRDO 169.60, CVLT 194.60, AEIS 174.40, CTS 42.80), and a full semicaps stack (APP 649.60, ALAB 245.20, NVMI 309.60, SITM 305.40, MRVL 69.90, ON 52.50, UMC 6.80, ASML 847.60, HIMX 8.60) trading right into the same price memory. Add the quantum/AI wrappers and leverage around the complex (IONQ 70.40 with 2x bull/2x bear wrappers nearby; NVDL/NVDU/NVD; APP at its node while AVGX/FNGU/TSLT show up in velocity) and the picture is consistent: after using the rebalance liquidity to move very large blocks, institutions are now calibrating new cost bases across the whole AI/infra stack. Practically, that tells you to treat those levels as the pass/fail for continuation. Acceptance and buildout above the node is sponsorship; repeated rejection is supply doing its job.
The metals and hard-asset sleeve is just as loud. Gold and silver ecosystems are everywhere on the list—WPM 107.70, AEM 161.20, RGLD 191.70, EGO 27.90, PAAS 36.50, CDE 17.40, DRD 25.60, EQX 10.80, HL 11.00, OR 37.20—and the base-metals/rare-earths side shows up too (TECK 39.20, MP 73.20). Seeing so many resource names touch their primary nodes the same week we observed outsized, low-vol outlier dollars in the miners says the hard-asset hedge is being re-underwritten at first principles prices. That complements the bond-and-carry bid we have been seeing and gives portfolios a non-correlated wing if real yields ease further.
Financials show breadth and depth at price memory. Brokers, exchanges, and asset managers are there (IBKR 61.80, NDAQ 89.60, CNS 69.30, CRBG 32.60), insurers and reinsurers (AJG 286.50, THG 174.90, CNO 39.61, EG 352.40, HGTY 13.00), and a long bench of banks from regionals to super-regionals (FRME 40.30, WABC 48.80, PEBO 30.50, DCOM 31.30, AUB 34.90, WAL 87.70, UMBF 117.90, TCBK 44.40, SYBT 75.90, WSBC 31.80, NNI 127.10). That lines up with the Trade Rank Velocity surge we see in banks and insurance and with the outlier tape that showed big, calm dollars in the group. When the entire cohort meets its all-time heaviest price levels together, it is the market picking where it wants to carry these positions into Q4. If the group can accept and hold above those nodes while rates behave, your broadening thesis has a sturdy financial spine; if they reject and roll, the broadening attempt is not ready.
Real estate is right there with them. REIT heavyweights are tapping their primary nodes—WELL 165.20, SPG 180.70, STAG 35.00, EXR 146.10, VICI 32.10, CUBE 40.40, TRNO 59.00, NNN 42.70, IVT 29.60, HST 17.40, HHH 82.90. That is exactly what you expect when duration cools and allocators test the waters in property again. Watch these levels closely: acceptance above them turns the sector from a rates-relief bounce into a real allocation leg; rejection says the “carry + quality REITs” trade needs more time.
Industrial “doers” and defense continue to align with everything else we are seeing. EME 632.00, KTOS 80.80, AVAV 278.60, HWM 184.90, MRCY 73.20, CAE 26.70, AIRO 19.50, VVX 55.00, KRMN 66.10, SPXC 188.00, TNC 80.30, FSS 125.30, IEX 162.10, SERV 11.40—these are exactly the kinds of companies that showed persistent prints on TRV and quiet but huge outlier dollars on expiry. Hitting the #1 price node now says accumulation is being formalized into a fresh cost basis across the complex.
Energy and utilities show the same “reset” behavior. On the energy side you have EOG 115.80, CVX 156.50, PSX 129.90, CNQ 32.60, GLNG 41.10, MGY 23.90, MUR 25.70, CVE 16.70, OII 24.60, UEC 12.40, VG 13.30, SMR 38.20; on the utilities side EXC 43.40, NEE 70.80, AES 13.00, SWX 78.70, CTRI 21.40, ARIS 24.00. The mix leans quality, infrastructure, and pipeline/refining rather than pure E&P beta—consistent with portfolios prioritizing reliability and yield while keeping commodity optionality. If crude wobbles, these are the sleeves most likely to hold sponsorship.
The crypto and crypto-adjacent complex is thick around its nodes—miners and infra (CIFR 12.30, IREN 38.60, CORZ 16.70), proxies and wrappers (BTCS, BTBT, GDLC, DAPP, XRPT, BITC, BTOP), and even the brokerage nexus (HOOD 124.80). Consensus Levels hits here tell you the speculative channel is being “zeroed” at high-memory prices. If risk appetite stays on, these names usually lead the intraday chase; if appetite fades, they are the first to break back below their nodes.
Consumer is selective and idiosyncratic, not a broad wave, which fits this whole tape. COST 954.10 and DIS 112.00 sit at their primary levels alongside AEO 20.30, CAKE 54.40, PINS 36.90, LKQ 31.40, LAD 341.80, POOL 328.00, WGO 34.80, THO 108.50, HMC 33.80. That is the market differentiating between durable cash-flow franchises, digital ad recovery, and rate-sensitive durables rather than making a monolithic consumer call.
Finally, fixed income and asset-allocation shells are everywhere at their #1 nodes—JAAA 50.70, VTIP 50.70, MUB 106.60, IUSB 46.90, CLOA 51.90, SCHD 27.30, SPIP 26.50, FLTR 25.50, CTA 27.80. That is exactly what you would expect when the flow boards show IG credit and muni sleeves printing alongside equity beta: the ballast is being reset at maximum memory, ready to support equity risk.
MIR Part 3: Framing-Up A Trade
Here is how I would frame up the trade now that we have the full institutional tape, the sentiment backdrop, and precise index control points.
The base case is that institutions just reset risk at the most efficient prices they know. You can see it in the record liquidity spike into expiry, the calm but massive outlier dollars in leadership names, and the swarm of tickers tagging their No. 1 price-memory levels. That is not a market running on fumes; it is a market where big hands used abundant liquidity to formalize new cost bases. In that regime, the play is simple: stay constructive while price accepts above the new shelves, and get small fast if those shelves fail.
For the indices, keep the map tight to start the week. SPY has a clean pass/fail at 663.2 to 663.8 with 659.2 as the bull stop. Above 663.8, treat 663.2 as first support and lean into continuation; lose 663.2 and the auction will likely rotate through 661 and test the 659s where the real battle lives. QQQ has 599 to 600 as its gate with 595.6 as the pivot underneath and 591.7 as the line that flips the burden of proof. IWM drew a new anchor at 243; hold above and you have a path back through 244.8 toward the highs, but slip under 243 and expect 241.8 then 240.8 and, if that breaks, 238s. DIA wrote its decision shelf at 481.0 to 481.3; acceptance above turns it into support, failure hands control back to 480.6 then 480.2. Trade those levels mechanically. Acceptance means time above the shelf.
Portfolio posture follows from there. Keep a core in the liquid spine that institutions favored: index sleeves and the megacap tech complex. The flow mix says allocators emphasized the leaders but did not chase; they built positions by appointment and backed them with quality carry. That argues for core beta plus selective adds in the AI/infra stack when names hold above their No. 1 nodes. You do not need to predict which of the big platforms leads next; let the tape tell you. When NVDA, AAPL, MSFT, AVGO, APP and peers hold above their new cost bases and keep printing size in both lit and dark lanes, buy backfills against those nodes and trail higher lows. If the dark-pool activity dries up while indices climb, you are slipping into index-and-chill; tighten risk and avoid adding single-name exposure until the hidden tape wakes up again.
The broadening layer is Financials, industrial doers, and selective healthcare. The velocity and outlier boards both said banks, insurers, brokers, and asset managers are getting seeded beneath the surface. Express that with a bench of regionals and specialty finance rather than a single bet; risk to the group sits in a disorderly rates pop, so keep your stops just under each name’s primary node and use the index shelves to size. In Industrials and defense, backlog and execution names showed persistent prints and now sit on top of their heaviest price levels; use those levels as your reload zones and let them prove acceptance before you size up. In Healthcare, treat mid/small biotech as a basket; the tape shows steady build rather than a one-off binary chase. If the group holds above its key levels+trades while rates stay orderly, keep a small, diversified sleeve and add on strength; if it loses those areas, cut without debate.
Hard-asset ballast belongs in the mix. The miners across gold and silver ecosystems lit up both on velocity and outlier dollars and many just touched their No. 1 nodes. That is where you own the hedge. Size it to sleep at night, not to win the week. If real yields ease and the dollar drifts, the metals sleeve will do its job while you let the leaders work. If yields jump and the dollar rips, the first thing to cut is the miners that lose their nodes on a closing basis.
Energy remains selective. The print pattern skewed to midstream, services, and quality integrateds rather than pure E&P beta. Own the pipes and balance-sheet winners while they hold above their nodes; avoid chasing high beta until sponsorship shows up in dollars, not just price.
Hedges are straightforward. If you are running concentrated mega-cap exposure, consider single-name overlays or collars that hedge the one or two positions you cannot live without, rather than blunt index hedges that fight the whole tape. If the put/call stays complacent and VIX sits low while indices hover just above their shelves, small upside call rolls can pay for downside protection. Respect the cross-asset tripwires we outlined: a MOVE pop with sleepy VIX, or VIX through the high teens without a rates shock. Either is a cue to take gross down and let the market prove it can reclaim important areas.
Bottom line: institutions just picked their prices. As long as the indices and the leadership complex accept above those newly defined shelves, the path of least resistance is a stair-step higher with Financials, industrial doers, and selective biotech broadening the move and hard assets providing ballast. Trade select locations and let the tape confirm when to press and when to coast.
Here’s a sample portfolio built exactly the way the tape is trading: core index and AI/infra leadership on top, Financials/industrial “doers” and selective biotech as the broadening bet, energy selective rather than all-beta, hard-asset ballast sized to steady the ship, and a carry sleeve that pays you while you wait.
Core index beta (32%)
-13% SPY (or IVV/VOO)
-10% QQQ
-3% QUAL (quality factor)
-2% EFG (developed ex-US growth)
-4% VNQ (REITs; duration beneficiary while sponsorship builds)
AI/infra leadership (17%)
-2.5% NVDA
-2.0% AVGO
-2.0% MSFT
-1.5% AAPL
-1.5% META
-2.5% APP
-3.0% SMH (semis basket)
-2.0% IGV (software basket)
Broadening cohort (19%)
-Financials 9%: 4% KRE (regionals), 3% KIE (insurance), 2% IAI (brokers/exchanges)
-Industrials/defense 6%: 3% XLI, 3% ITA
-Healthcare innovation 4%: 4% XBI (mid/small biotech basket)
Energy, hard-asset ballast (13%)
-6% energy selective: 4% AMLP (midstream), 2% XLE (quality integrateds)
-7% hard assets: 4% GDX (gold miners), 2% SIL (silver miners), 1% CPER (copper proxy)
Carry sleeve and cash (19%)
-8% LQD (IG credit)
-3% JAAA (AAA CLO carry)
-4% MUB (munis)
-2% VTIP (front-end TIPS)
-4% BIL (T-bills/cash buffer)Why this shape works right now: it keeps the “liquid core” that institutions just reset at their preferred shelves (SPY/QQQ + the AI/infra spine), adds the exact broadening we’re seeing in Financials and industrial “doers,” and surrounds it with the carry/ballast complex funds have been building (IG credit, munis, hard-asset hedges). REITs get a dedicated 4% because they sit at high-memory prices and benefit most if rates keep behaving. The cash/T-bill sleeve is deliberate: it funds adds on acceptance above the indexed pass/fail zones without forcing sales into weakness. Cap any single-name at ~2.5% and if key levels are lost, reduce to ETF exposure in the same sleeve for the time being.
Thank you for being part of our community and for dedicating your time to this edition. Your insights and engagement drive everything we do, and we’re honored to share this space with such committed, thoughtful readers. Here’s to a week filled with clear opportunities and strong performance. Wishing you many bags 💰💰💰
—VolumeLeaders