Market Momentum: Your Weekly Financial Forecast & Market Prep
Issue 60 / What to expect Sept 8, 2025 thru Sept 12, 2025


Weekly Market-On-Close Report
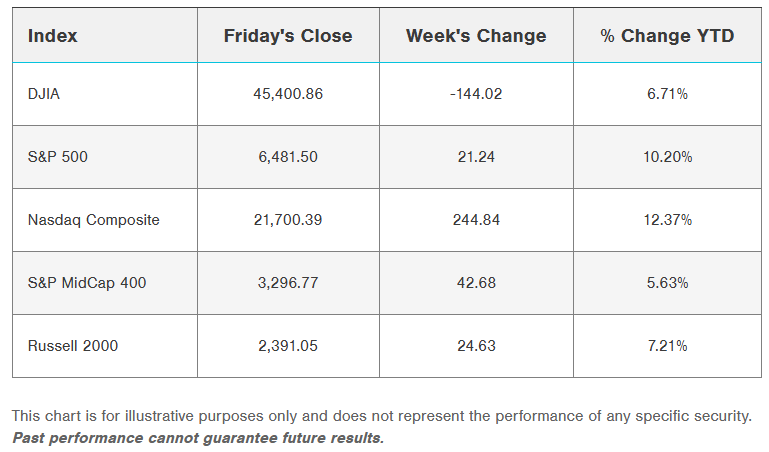
We opened Friday on a relief pop and closed with a sigh. The headline equity indices split three ways: the S&P 500 and Dow faded into the red (-0.32% and -0.48% respectively) while the Nasdaq 100 eked out a small win (+0.08%). On the futures side, September S&P minis finished -0.35%; Nasdaq minis were up a hair at +0.04%. That’s exactly how the whole week felt—optimism in the morning, fatigue by the afternoon, and a market that keeps testing higher only to think twice.
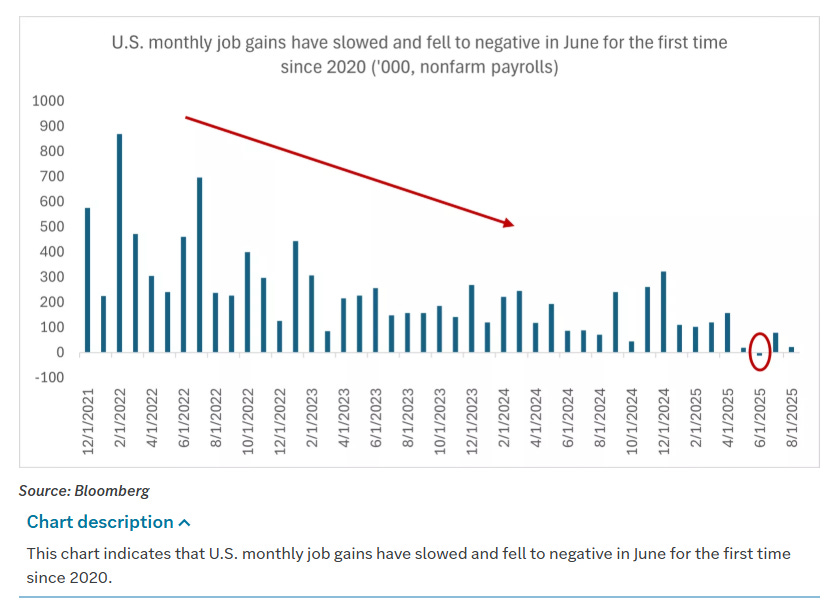
The catalyst was the August jobs print. It wasn’t a disaster, but it was soft enough to hard-wire rate-cut expectations. Payroll growth landed at +22k versus ~+75k expected, with the three-month run rate sliding to +29k. The revisions were a push net-net—July nudged up to +79k, June was shaved into negative territory (-13k). Private payrolls added +38k; factories shed -12k. Unemployment ticked up to 4.3%, the highest since early 2022, which matched consensus. Wages rose +0.3% m/m as expected and cooled to +3.7% y/y from +3.9%.
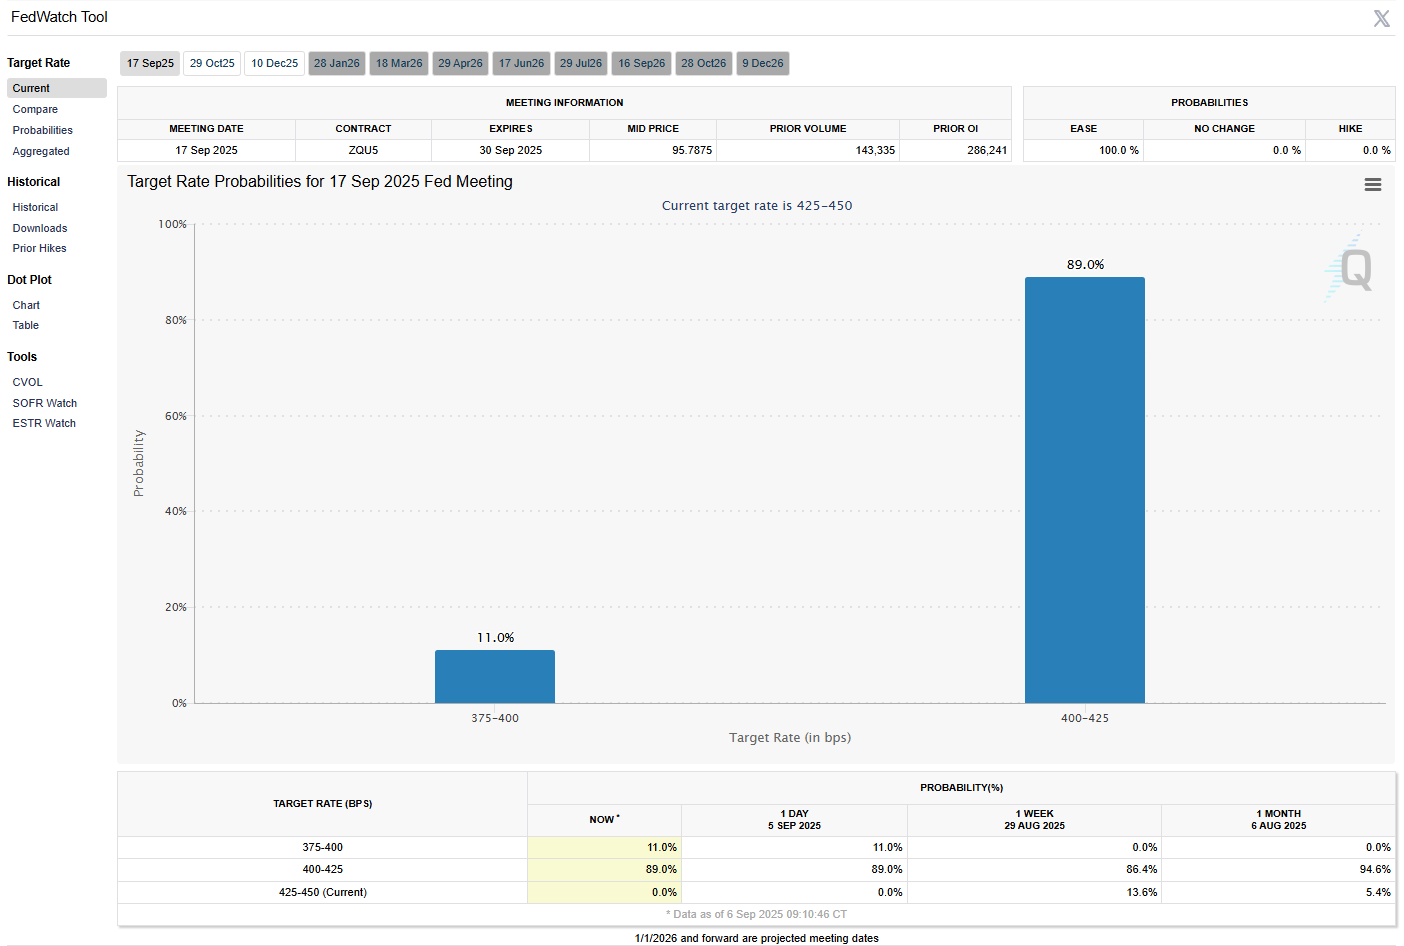
The immediate reaction made sense: rates fell, stocks popped. Ten-year yields dropped 7 bps and tagged a five-month low near 4.09%. That pulled the probability tree toward more accommodation. You can now find a non-trivial tail (about 1 in 10) for a 50 bp move at the September FOMC—something traders weren’t entertaining 24 hours earlier. The base case is still a quarter-point in September and high odds of another quarter in late October. Futures imply roughly 70+ bps of easing by year-end, which would take the policy rate down into the mid-3s.
Then the “good news is bad news” logic kicked in. If the labor market is braking and margins are already tight, what does that say about corporate earnings into Q4? That’s when the early pop turned into afternoon selling, particularly outside of a handful of tech bellwethers.
There was a legal wrinkle too. A federal appeals court ruled the President overstepped on global tariffs without Congress, but left the current tariff structure intact pending further appeals. That keeps uncertainty in the system. A clean reversal isn’t imminent; instead we’re marching toward a Supreme Court date. In practical terms, the tariff overhang persists and could still pinch goods prices at the margin. Bloomberg’s back-of-the-envelope puts average U.S. tariffs near 15% if the latest schedule eventually holds—miles above the ~2% backdrop the economy enjoyed before the new regime.
Overseas, Friday closed mixed: Europe heavy (Euro Stoxx -0.53%), Japan firmer (+1.03%), Shanghai bouncing (+1.24%) after a three-day skid. Call it a shrug across regions—nothing decisive, but no fresh tailwinds either.
Rates: bond bulls finally get a turn
Duration finally had a week. December 10-year note futures gained ~½ point; cash 10s slid 7 bps to 4.09% as breakevens eased. The 10-year inflation expectation dipped to ~2.37%, helped along by softer labor and a 2.5% flush in crude. Europe followed the script: bund yields dropped ~6 bps, gilts ~7–8 bps.
The Fed-watching game is simple right now: softer jobs firm up the case for a cut, and the path of least resistance for yields is lower unless inflation surprises. The wrinkle is institutional drama around Fed independence, but the bond market set that aside and traded the data, not the headlines.
Across the pond, swaps barely price an ECB move next week—call it a rounding-error chance for a cut. For now, the easing baton is clearly in the Fed’s hands.
Leadership: narrow, noisy, and headline-driven
“Magnificent Seven” performance was split. Tesla stole the show (+3.6%) on a fresh pay construct dangled in front of Elon Musk. Apple was slightly negative despite a record year in India. Nvidia fell 2.7% as the market sized up Broadcom creeping into AI silicon. Microsoft and Amazon eased 2–3%.

On the flip side, Broadcom ripped +9% on the OpenAI custom chip headline and a print that let people dream up new TAM math. That lifted the whole semis complex—Micron +5.8% with ASML, KLAC, and ALGN up north of +3%. It’s a good reminder: AI exposure is no longer a single-ticker story; it’s a supply chain, and the margins in that chain are fluid.
Energy stocks were the punching bag as crude sold off on chatter that Saudi wants OPEC+ to speed up production increases. COP, FANG, XOM, CVX, DVN—down 2%-plus into the close. That’s the obvious side-effect of lower yields when they coincide with growth jitters.
Crypto-adjacent equities split despite Bitcoin up 1%. Coinbase lagged (-2.5%) while MicroStrategy tagged a similar-sized gain. The miners were modestly green.
Homebuilders caught a bid as lower yields bled into mortgage rates. DHI, LEN, PHM were all up north of 2%; TOL added ~1½%. That’s textbook yield sensitivity.
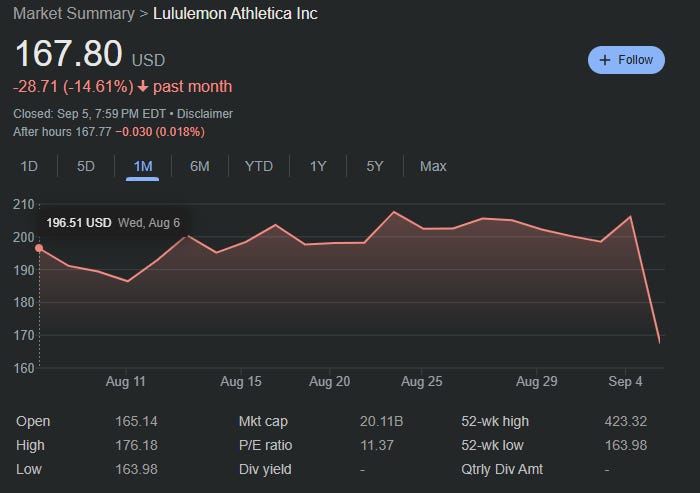
On the downside tape, Lululemon cratered ~19% on guidance cuts tied to a soft consumer and tariff friction. When price-mix is your franchise and input costs wobble, the market takes away your premium swiftly.
Sectors: a tale of dispersion
By week’s end the S&P 500 was slightly higher, but the equal-weight version slipped—classic sign of narrow leadership. Communication Services led (~+5%), almost entirely a Google story. Consumer Discretionary added some juice (housing + TSLA helped). Info Tech squeaked out a gain—hardware beats offsetting software softness.
Laggards were obvious: Energy fell ~3½% with crude; Financials closed down nearly 2% on the day as the yield slide brought NIM anxiety back to the surface. That’s the catch-22—steeper curves can help, but absolute yield declines compress reinvestment income fast if spreads don’t widen.
Retail earnings were a microcosm of the tape: American Eagle was the blowout (stock +~40%) as brand and marketing magic connected. Macy’s followed with a beat-and-raise (+~30%). Smaller names like Zumiez, Zegna, and J.Jill were bid. J.Jill flagged tariffs as a headwind they’ll offset with vendors and merchandising tweaks—a reminder that this policy story drips through P&Ls over quarters, not days. Dollar Tree stumbled on guide as the tariff timing catches up to inventory flow later in the year, and Lululemon’s U.S. softness did the rest.

In tech, Salesforce delivered a “good, not great” beat—enough to clear, not enough to excite. HPE leaned into AI servers and almost doubled AI order intake sequentially. Broadcom’s print and the OpenAI chip line stole the oxygen in that room.
Global picture: mixed with a modest risk-on tilt in Asia
Europe was mostly lower, FTSE the exception. German equities are trying to stabilize around the 100-day after slipping through the 50-day. Long-end yields across the region faded 10–20 bps late-week, which at least removes a headwind. French politics remains messy into Monday’s confidence vote; the U.K. added fresh drama with a resignation story that would be comic if it weren’t so on-brand.

Japan was up ~0.7%. There’s a lot of policy cross-talk—trade headlines, record 30-year yields, and leadership uncertainty—but the equity market keeps climbing the wall. Hong Kong was better, Shanghai cooled after a strong multi-week stretch amid warnings on speculation—semis like Cambricon were the reminder that policymakers still have their hands on the tiller.
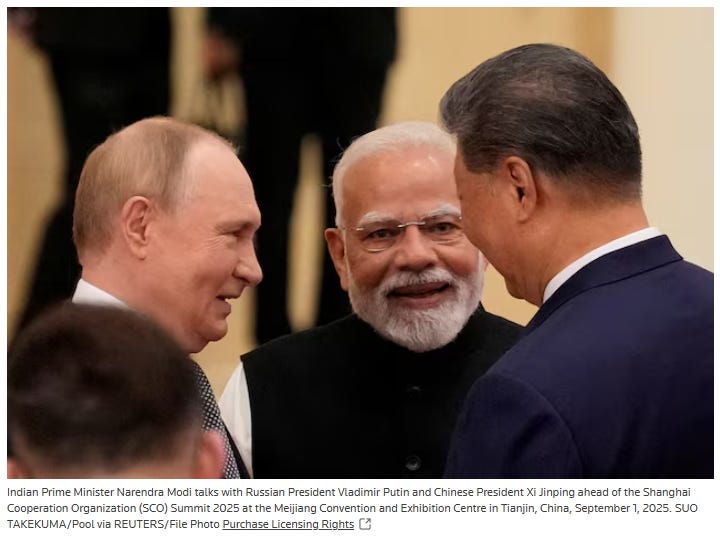
EM was a wash of small positives. Korea is digesting a big YTD run and chopping sideways; India gained ~1% into a high-profile set of diplomatic meetings.
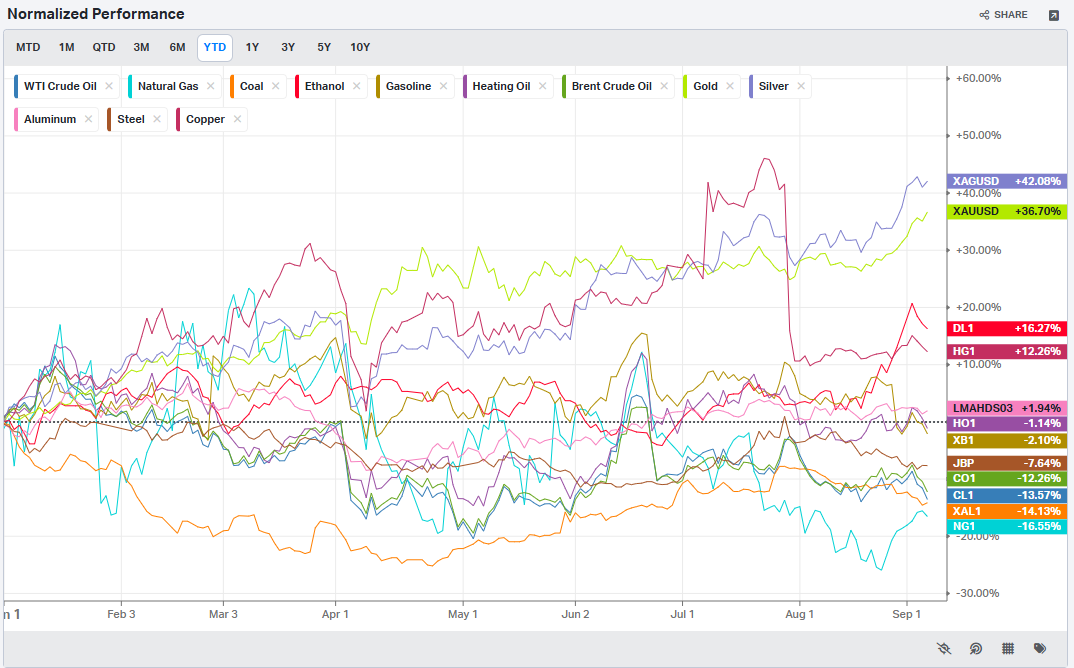
Commodities and crypto: energy leaks, metals pop, Bitcoin steady
Brent slipped ~3% before OPEC+ meets this weekend, with the bias toward more supply. Inventories rose, which didn’t help. Technically, Brent is wrestling with its 100-day after losing both 200- and 100-day earlier in the week.
Gold jumped ~4% to new highs as yields eased and cuts priced in; silver, platinum, and palladium followed. Copper lagged. Agriculture skewed lower. Bitcoin added ~3% while Ether was off ~1%. The 100-day around ~108.7k is acting like a magnet for Bitcoin, with the 50-day up at ~114.5k as the ceiling—that range continues to govern.
The data deck: labor softens, manufacturing still sub-50, services expand
The BLS had a mini-drama pre-release, then got the August jobs numbers out on time. Headline payrolls +22k, under the +75k consensus; July revised up a touch, June revised down hard to -13k. Goods-producing jobs fell ~25k; services added ~63k (healthcare/social assistance +47k led). Government shed ~16k. Participation ticked to 62.3% (from 62.2%); unemployment 4.3% versus 4.2% prior—mostly rounding noise last month, but symbolically a new cycle high.
The chorus of “we’ll revise it up later” began immediately—we’ll see. The historical pattern for August is actually downward revision by the third estimate in recent years. We also get preliminary benchmark revisions this coming week, which have a habit of rewriting some of the last year. Buckle up.
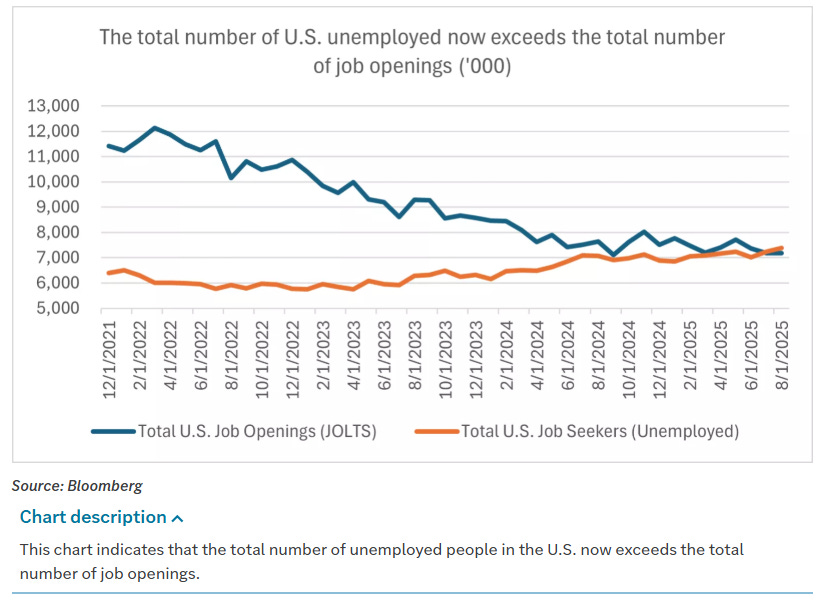
Other labor reads told the same story. Initial claims ticked to 237k; continuing claims eased to ~1.94 million. ADP showed private payrolls +54k (missed ~65k), half of July’s +106k, with leisure/hospitality and construction doing the heavy lifting. Challenger job cuts rose to ~86k, the worst August since the pandemic, with pharma leading (~19k) and a nod to AI adoption as a driver—one to watch. JOLTS revisions were noisy: June layoffs revised up by ~192k; openings revised down by ~80k; hires and quits revised up. July openings fell to 7.18 million and, for the first time since ’21, unemployed exceeded openings. That’s the supply-demand handoff the Fed has been waiting for.
Purchasing manager reads split along familiar lines. ISM Manufacturing stayed in contraction at 48.7 (better than July’s 48.0; shy of ~49 consensus). New Orders, importantly, popped to 51.4. Prices remained expansionary but eased to 63.7 from 64.8. ISM Services improved to 52.0 (from 50.1 and above ~51 consensus). Prices Paid eased a touch but remain elevated (69.2 from 69.9).
The Beige Book sounded the usual careful tone: not falling apart, not accelerating—call it stagnation with pockets of pressure. “Little or no change” was the phrase most districts used. That’s exactly how the tape traded—acceptance of slower data so long as it delivers rate relief.
Fed speak and the governance subplot
There was no shortage of color around the central bank. Media dug into a high-profile resignation, op-eds mused about the proper scope of monetary policy, and confirmation chatter raised fresh questions about independence. On the record, Waller kept beating the drum for cuts, Bostic stayed in the “one cut” camp, Williams noted cooling and said “eventually lower,” and Goolsbee called September “live” but non-committal. The market heard what it wanted: the green light for at least one cut and probably two in quick succession barring an inflation surprise.
Framing next week: inflation takes the mic
We flip from jobs to prices. The CPI/PPI duo lands Wednesday/Thursday and will be the last big read before the September 17 decision. The base case is a modest re-acceleration in headline CPI to ~2.9% y/y with core steady at ~3.1%. PPI is seen easing at the margin. Tariff-related goods inflation can keep the top-line sticky for a few months, but services is the swing vote. If rents and broader services soften as the labor market cools, you can still see overall inflation stabilize or drift lower even with goods noise. That would give the Fed more air cover to cut.
We’ll also get the NFP benchmark revision preview on Tuesday—this can move the narrative around the labor market quickly if the adjustment is meaningful. Overseas, the ECB is expected to sit on its hands, but the press conference matters. French politics and a confidence vote are Monday’s risk wildcard. China’s trade data early in the week will be mined for tariff knock-on effects. Stateside, broker conferences and an Apple event will add micro headlines, and Oracle is in the earnings hot seat as investors recalibrate the AI story.
Big picture: still climbing, but with choppy footing
The market’s come a long way since April’s lows—up more than 25%—and now finds itself staring at the usual September/October seasonal chop with a new set of “what-ifs”: softer jobs, sticky inflation, tariff ambiguity, and central-bank optics. None of that screams “run for the hills.” It does argue for patience and a willingness to buy dips in quality rather than chase every breakout.
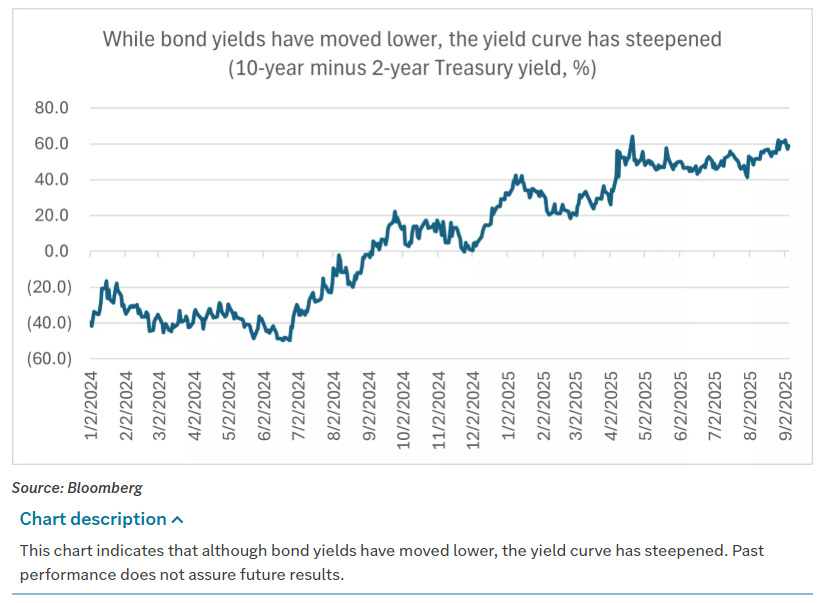
Historically, if the Fed is easing and the economy isn’t falling into recession, equities can handle soft patches. Rate cuts lower hurdle rates, help housing, and eventually filter into capex. You can already see the market handicapping a steeper curve helping lenders down the road, even as absolute yields pressure near-term NII. Fiscal levers on R&D and capex are another medium-term tailwind. And companies tend to exhale once policy fog (tariffs, rate path) clears—even marginally.
That’s the backdrop into year-end: a market that wants to stay aloft, but is now more selective about who gets a hall pass. Mega-caps still command the spotlight, but breadth is trying to improve when yields cooperate. If we get a scare, expect it to come from either a surprise on CPI/PPI or an exogenous policy headline; absent that, dips should find buyers.
What I’m watching into the open
CPI/PPI vs. cut odds: A benign pair keeps the cut path intact; a hot core makes September a one-and-done and pushes the second move to “data dependent.”
Tariff litigation drip: Any sign of acceleration toward a Supreme Court hearing—or an administrative end-run—keeps goods inflation and corporate planning in flux.
Homebuilder follow-through: If 10-year yields hold the breakdown, the housing complex can keep leading on a relative basis.
Energy supply narrative: OPEC+ posture on Sunday matters for crude’s attempt to hold the 100-day; equities in the space are stretched short-term.
Financials vs. curve: If the curve steepens further even as long yields bleed, the group can stabilize despite Friday’s wobble.
That’s the week—no fluff, no detours. We rallied when rates fell, then remembered why rates were falling. September seasonality is a stern teacher; the trick is to keep your head when the media complex gets noisy

Weekly Benchmark Breakdown
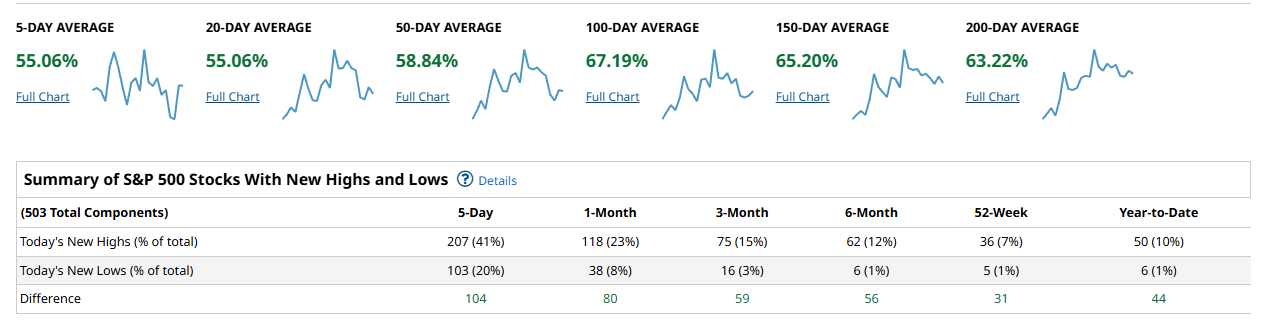
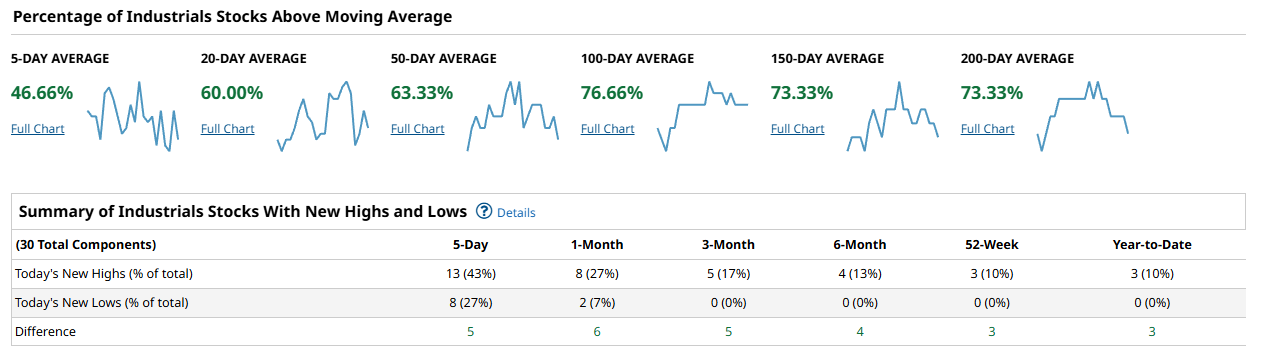
Breadth continues to confirm leadership, but it’s an uneven picture across the benchmarks. The S&P 500 is holding steady with just over half its components trading above key moving averages, and a solid 41% hitting fresh 5-day highs versus 20% new lows.
Industrials are lagging on the short-term measures—barely half the group is above its 5-day, though participation improves once you look out to 50- and 100-day averages, where 63% and 76% are above, respectively. That kind of structure suggests near-term chop but underlying support; in other words, dip buyers are still showing up in the sector even if momentum isn’t clean.
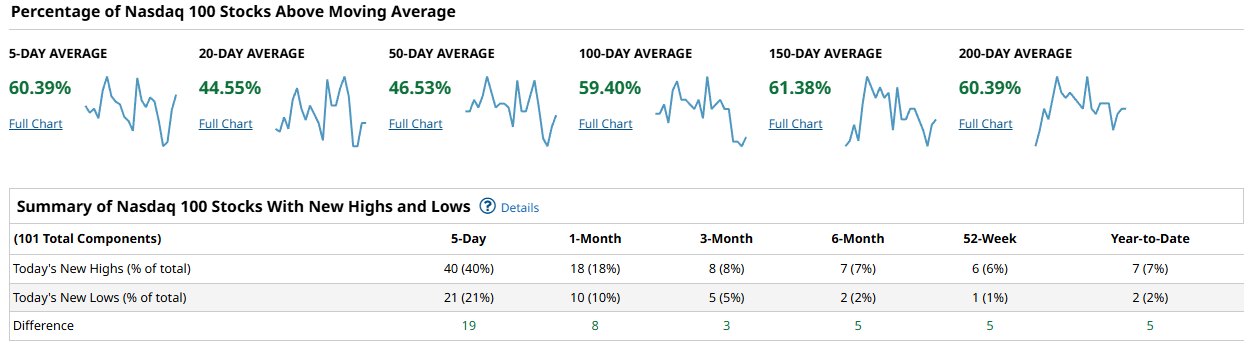
The Nasdaq 100 paints the messiest picture. Just 40% of components posted 5-day highs, while a full 21% notched new lows—hardly a picture of leadership. The averages themselves are mixed, with less than half the index above 20- and 50-day levels, though the 100- and 200-day stats look healthier. That tells you big tech is still digesting, and while capital is circling the space—as last week’s institutional flow confirmed—it hasn’t yet translated into broad-based price strength.
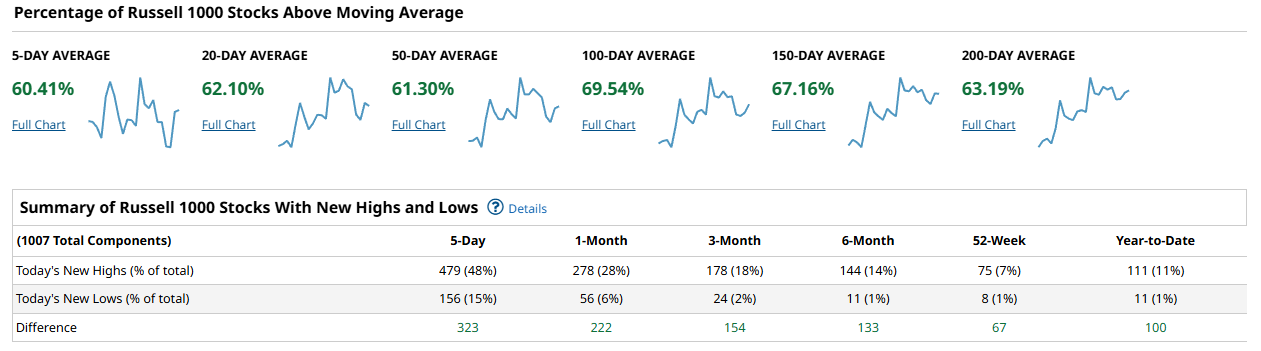
The S&P demonstrated constructive breadth, but the real story this week comes from the Russell 1000, where participation broadened out—nearly half the index printed new highs in the last five days, with the 5-day differential at a commanding +323. That’s the kind of internal thrust you want to see if this market is going to extend
So, the read heading into September is this: breadth remains resilient under the hood, with the Russell 1000 clearly powering the expansion. The S&P is following along in decent shape. The Nasdaq is consolidating and Industrials are stalling, but neither looks broken. For now, the tape is healthy enough to support higher levels, with leadership just rotating more aggressively beneath the surface.
US Investor Sentiment Report
Insider Trading
Insider trading occurs when a company’s leaders or major shareholders trade stock based on non-public information. Tracking these trades can reveal insider expectations about the company’s future. For example, large purchases before an earnings report or drug trial results might indicate confidence in upcoming good news.
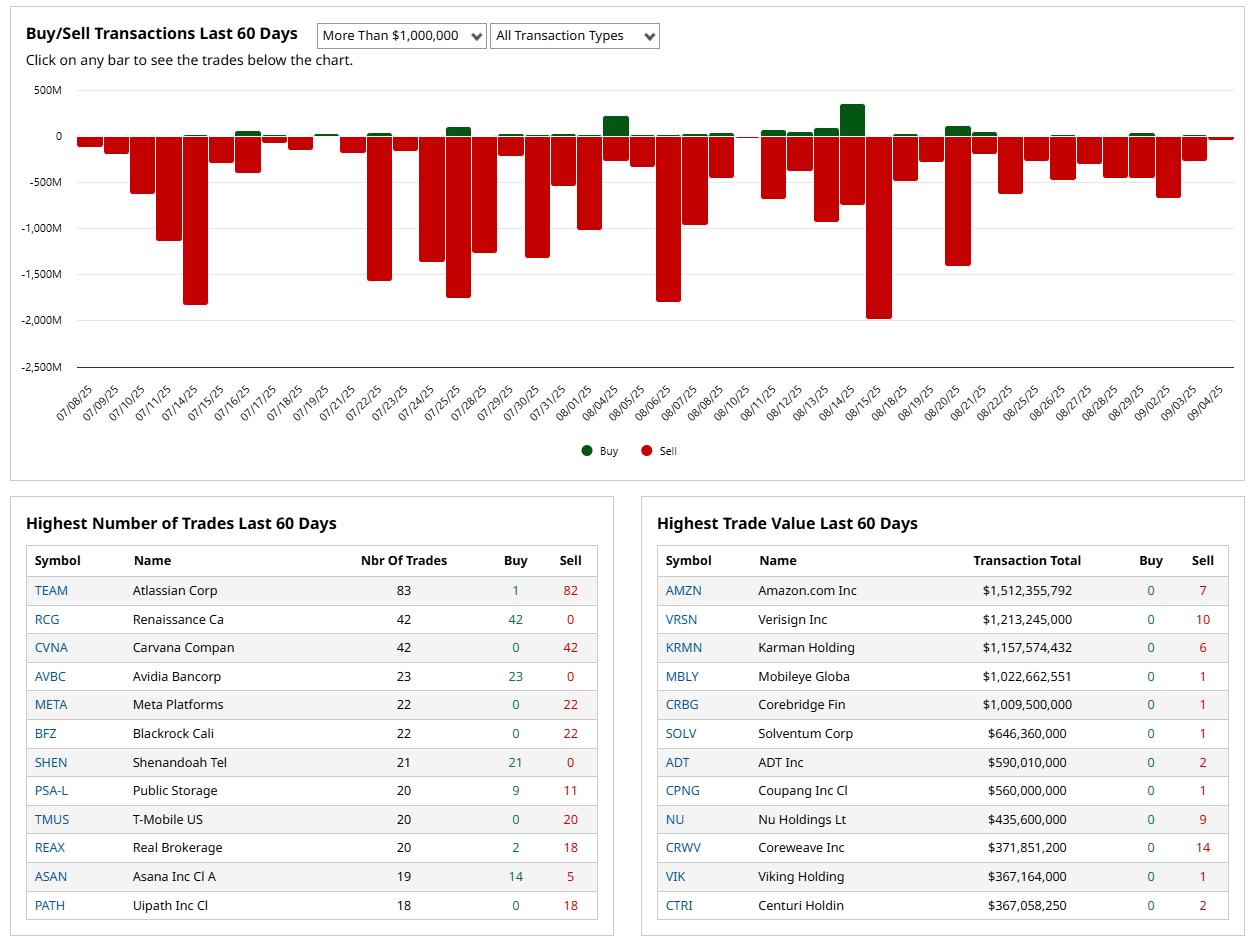
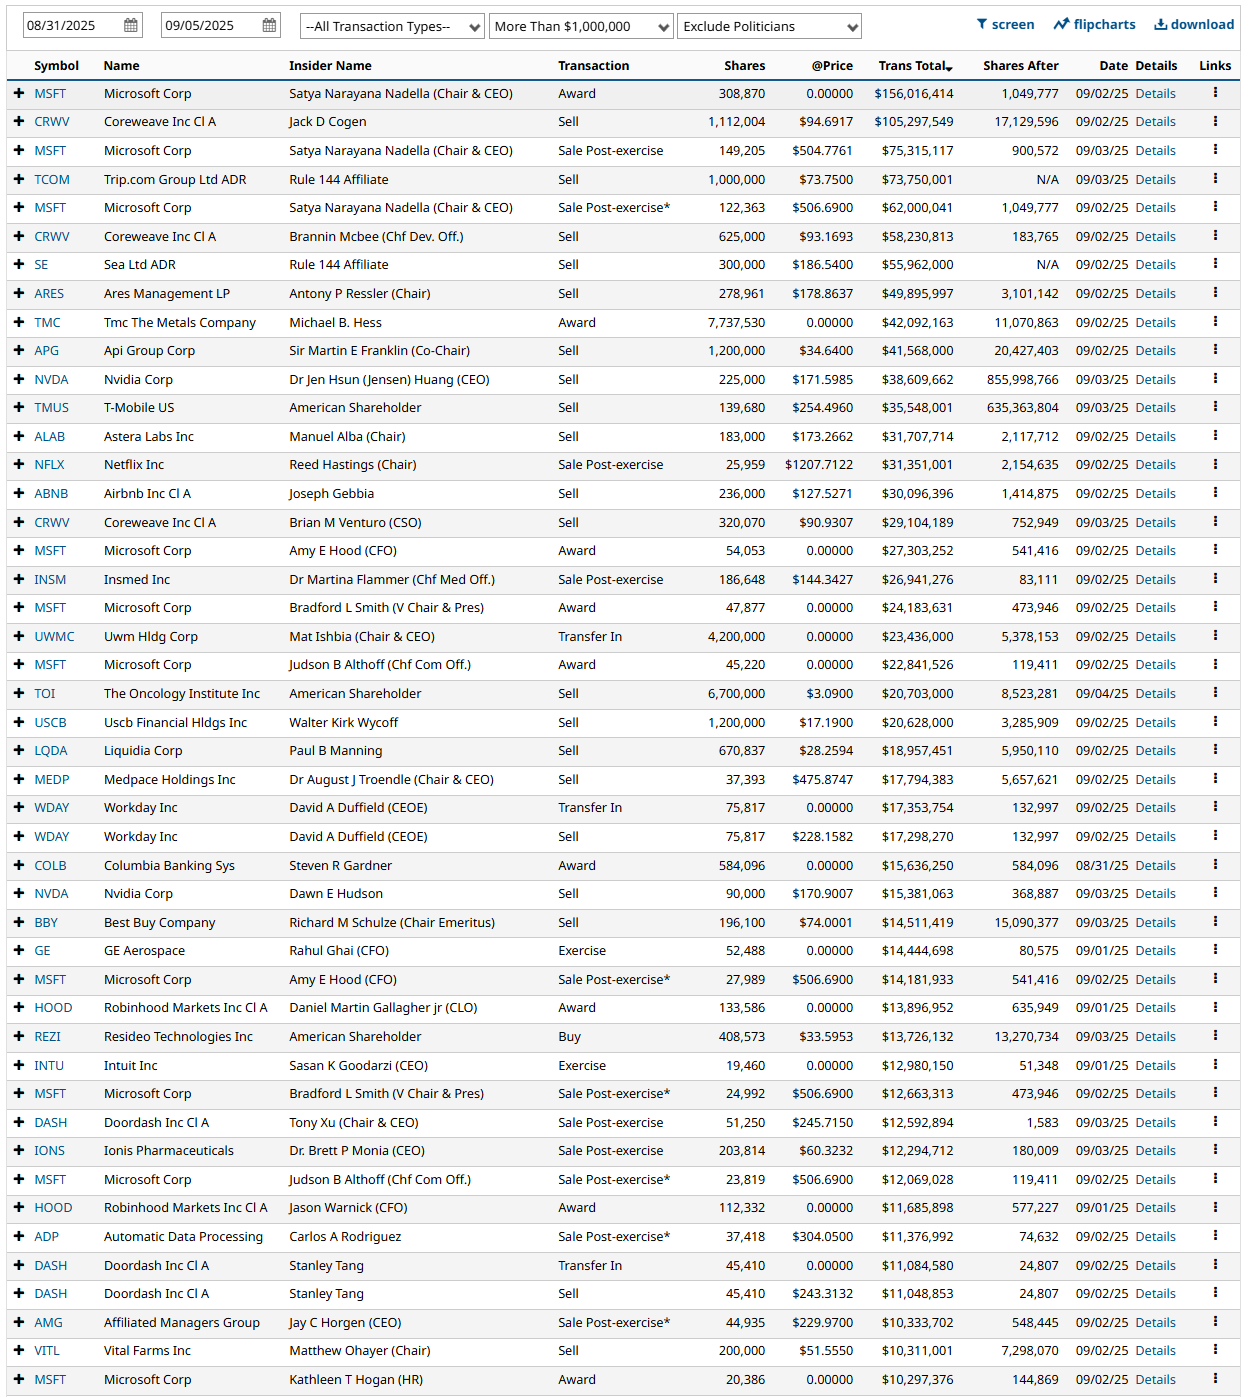
Insider behavior this past week has been unambiguous: distribution. The tape is littered with steady selling across sectors, and the flow isn’t trivial—it’s billion-dollar blocks from AMZN, VRSN, and Karman Holdings, all leaning heavy on the sell side. Even in the high-frequency names, like Atlassian and Carvana, the pattern is the same: insiders are unloading into strength rather than tucking stock away.
Microsoft’s leadership team has been especially active—awards and option exercises immediately paired with sales across multiple executives. Nvidia showed a similar pattern: Jensen Huang collected fresh stock, while other insiders wasted no time cashing in. CrowdStrike had multiple execs lighten up as well. The message is consistent—wherever liquidity is offered, insiders are happy to meet it.
There are isolated bright spots—regional banks like Avidia or Shenandoah saw small insider buys—but the scale is dwarfed by the selling pressure elsewhere. When insiders as a group lean this hard into monetizing, it rarely marks durable lows. It’s more consistent with a market where valuations are still lofty and those closest to the fundamentals are content to convert paper wealth into cash.
%Bull-Bear Spread
The %Bull-Bear Spread measures the gap between bullish and bearish investor sentiment, often from surveys like AAII. It’s a contrarian indicator—extreme optimism may signal a coming pullback, while extreme pessimism can hint at a potential rally. Large positive or negative spreads often mark market turning points.
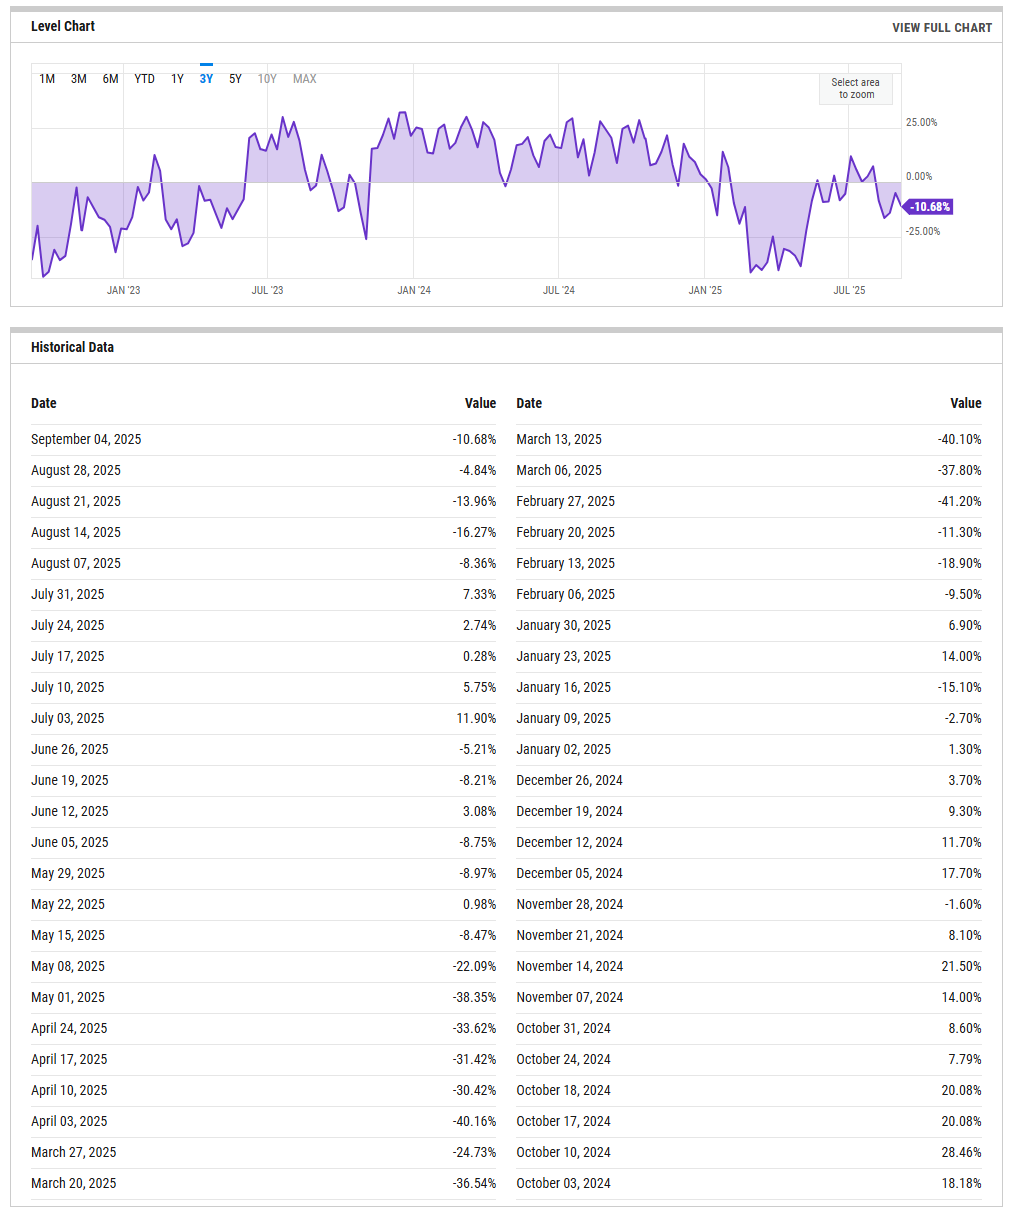
The % bull–bear spread continues to grind in negative territory, closing this week at –10.7%. That’s a meaningful deterioration from late July, when sentiment briefly poked into positive double digits, but it’s not as extreme as the deep washouts we saw back in April and May, when the spread collapsed toward –30 to –40%.
What stands out is the failure to sustain even short-lived optimism. Every attempt at rebuilding bullish consensus since June has been met with a faster fade, suggesting investors remain more inclined to fade strength than chase breakouts. The latest reading doesn’t scream panic, but it does tell us positioning is still cautious and skewed defensive.
For context, these mid-negative readings often coincide with markets trying to base—weak enough to cap enthusiasm, but not yet capitulative. If breadth data holds together and institutional sponsorship continues to reemerge (as we’ve seen in flows), this could mark more of a wall of worry environment than a full reset. But the spread itself still argues against chasing risk without confirmation.
NAAIM Exposure Index
The NAAIM Exposure Index (National Association of Active Investment Managers Exposure Index) measures the average exposure to U.S. equity markets as reported by its member firms. These are typically active money managers who provide their equity exposure levels weekly. The index offers insight into how much these managers are investing in equities at any given time, ranging from being fully short (-100%) to leveraged long (up to +200%).
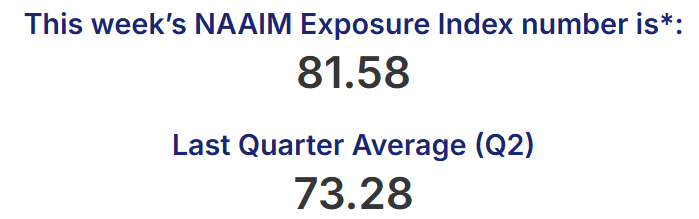
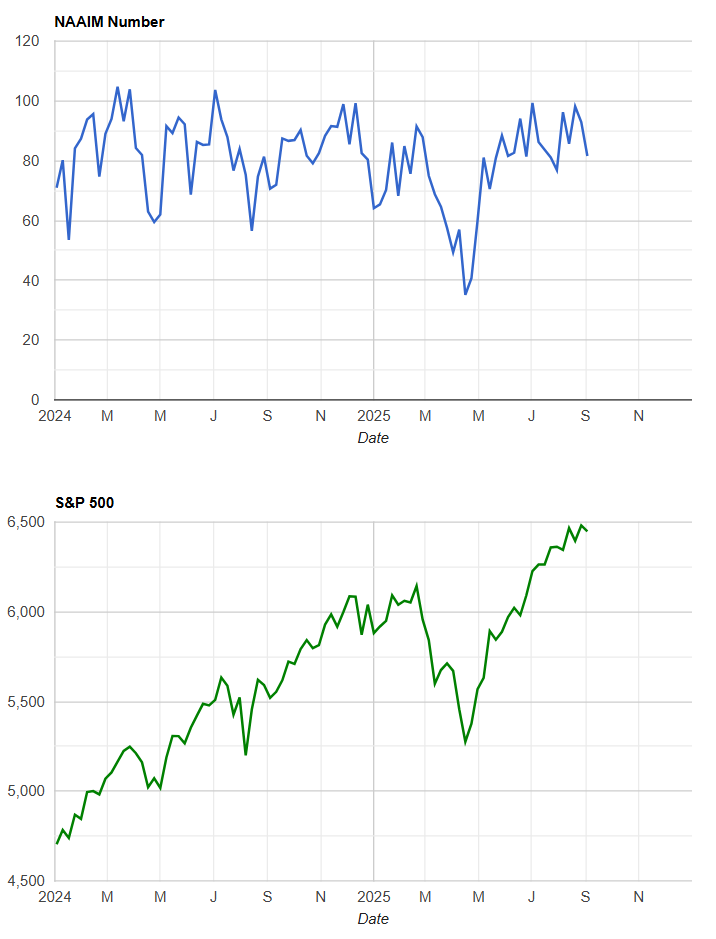
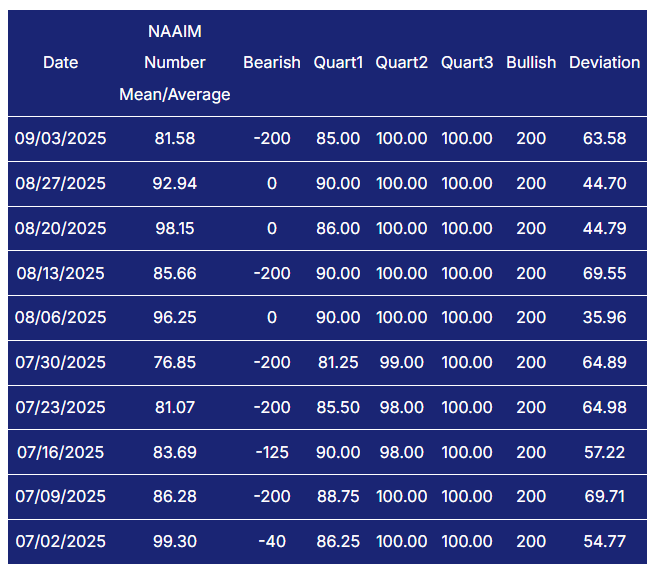
The latest NAAIM Exposure Index shows managers leaning in at 81.58, up from the Q2 average of ~73. That’s a healthy uptick, though still off the mid-August highs in the mid-90s.
The takeaway is that professional money managers are back to running with a decent amount of exposure—well above neutral—but not quite at the max-bullish extremes we saw earlier this summer. The volatility in the week-to-week swings is worth noting too: some managers are fully levered long, while others are running negative exposure, pulling the average into a wide band. That dispersion suggests conviction is there, but positioning isn’t uniform, and it leaves room for forced repositioning if macro data or Fed speak jolt the tape.
In short, sentiment among active managers is constructive but cautious. They’ve moved off the sidelines, but they’re not all-in—leaving plenty of dry powder to add risk on confirmation of strength, or to cut if macro headwinds intensify.
CBOE Total Put/Call Ratio
CBOE's total put/call ratio includes index options and equity options. It's a popular indicator for market sentiment. A high put/call ratio suggests that the market is overly bearish and stocks might rebound. A low put/call ratio suggests that market exuberance could result in a sharp fall.
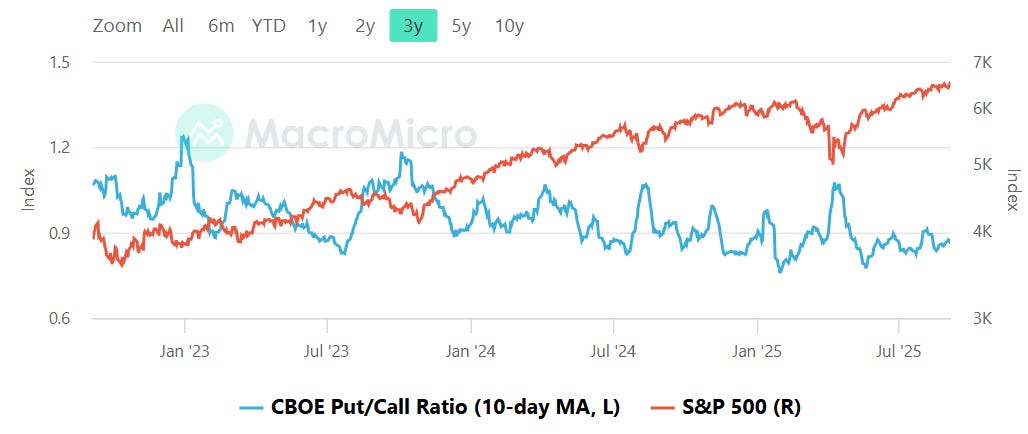
The CBOE total put/call ratio (10-day MA) has pulled back into neutral territory after spiking at points earlier this year. Right now it’s sitting just under the midline of its historical range—well off the panic highs above 1.2 we saw during stress episodes, but also not scraping the complacent lows in the 0.7s.
What this says is traders are leaning balanced: there’s no real fear premium in the options market, but also no exuberance. It matches the tape—indices have climbed back near highs, and the put/call is confirming that investors are engaged but not yet chasing.
As a sentiment gauge, it’s not sending a contrarian warning. If anything, it’s a sign that positioning has reset enough to let the market extend higher without the overhang of excessive call buying. But it also means there’s little hedging pressure—if macro data disappoints, there’s room for a sharp swing as dealers reposition.
Equity vs Bond Volatility
The Merrill Lynch Option Volatility Estimate [MOVE] Index from BofAML and the CBOE Volatility Index [VIX] respectively represent market volatility of U.S. Treasury futures and the S&P 500 index. They typically move in tandem but when they diverge, an opportunity can emerge from one having to “catch-up” to the other.
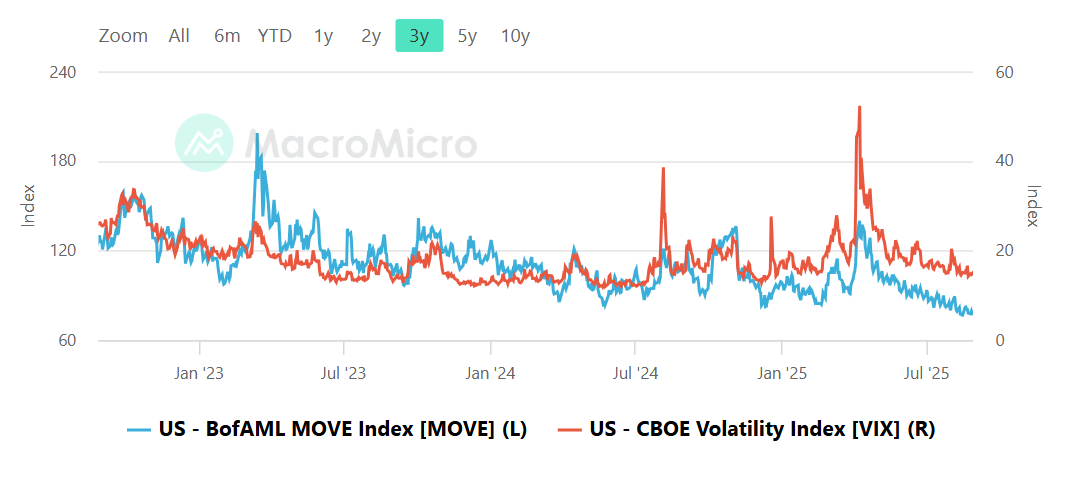
Bond volatility (MOVE index) and equity volatility (VIX) have both cooled dramatically from the stress peaks earlier this year. MOVE is pressing multi-month lows, while the VIX has ground down into the teens, suggesting options markets are pricing in far less uncertainty on both sides of the capital structure.
This alignment—low MOVE and low VIX—usually reflects a market in “wait and see” mode, with neither the bond desk nor the equity desk demanding much protection. Historically, this setup has preceded either quiet grind-higher phases in risk assets or sudden air-pockets if macro data delivers a shock. In other words, the calm is real, but it’s fragile.
The key tell going forward is whether MOVE stays anchored. If Treasury vol perks up—on inflation, auctions, or Fed repricing—it tends to spill quickly into equities. For now though, the takeaway is straightforward: the volatility complex is signaling stability, and institutions are treating both bonds and equities as tradable ranges rather than imminent dislocations.
CNN Fear & Greed Constituent Data Points & Composite Index
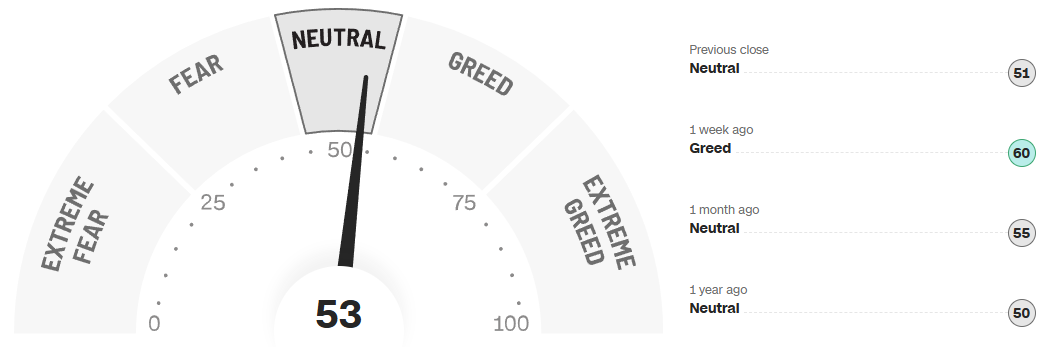
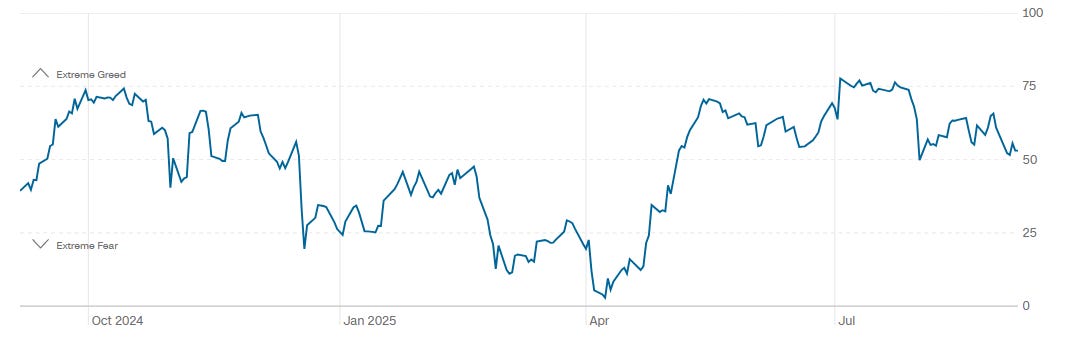
The CNN Fear & Greed Index sits at 53 (Neutral) this week, a touch above last week’s 51 and down from the prior week’s “Greed” reading of 60. One month ago, it was 55, and a year ago almost exactly the same at 50.
Looking at the longer chart, sentiment has been bouncing in a fairly wide band: extreme greed last fall, collapsing to extreme fear in March–April, then grinding steadily higher into summer before leveling out around neutral-to-greed through July and August. The recent slip back into the low 50s suggests momentum has cooled.
In trader’s terms, the market’s no longer running hot on emotion but it’s not panicked either — just balanced. Neutral doesn’t mean directionless; it often means participants are waiting for the next catalyst, with positioning light enough to pivot. That leaves room for either a fresh push higher if earnings or macro surprises skew positive, or a pullback if the growing list of risks (Fed policy, credit stress, geopolitics) comes into sharper focus.
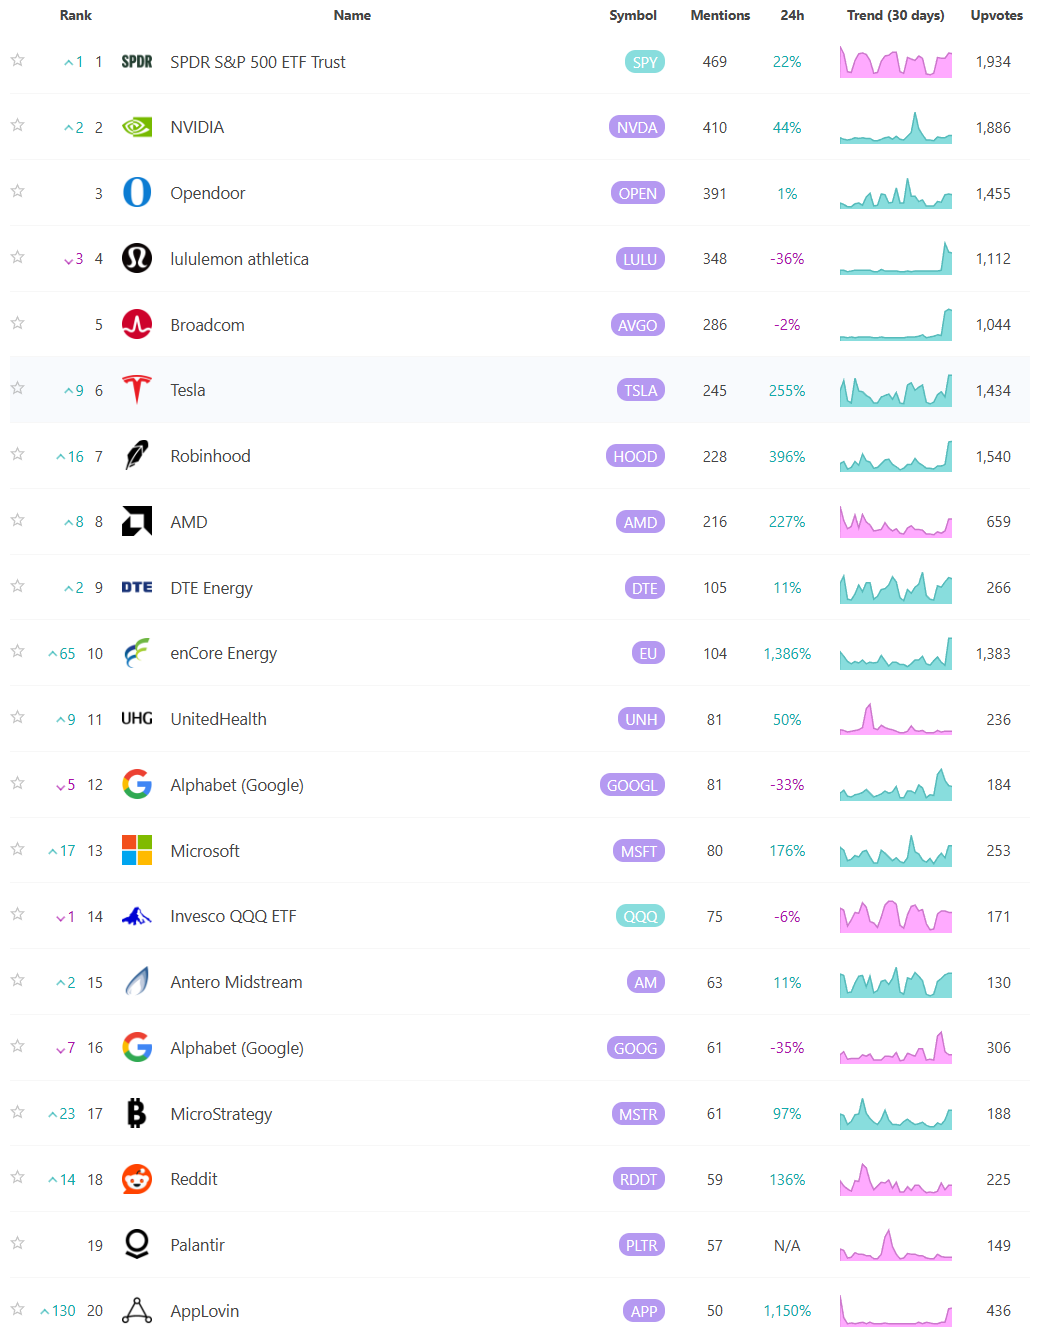
Social Media Favs
Social sentiment offers a real-time view of investor mood, often revealing market shifts before traditional indicators. It can signal momentum changes, spot emerging trends, and gauge retail investor impact—especially in high-volatility names. Tracking sentiment around events or earnings provides actionable insights, and when layered with quantitative models, can enhance predictive accuracy and risk management. Sustained sentiment trends often mirror broader market cycles, making this data a valuable tool for both short-term trades and long-term positioning.
Institutional S/R Levels for Major Indices
When you’re a large institutional player, your primary goal is to find liquidity - places to do a ton of business with the least amount of slippage possible. VolumeLeaders.com automatically identifies and visually plots the exact spots where institutions are doing business and where they are likely to return for more. It’s one of the primary reasons “support” and “resistance” concepts work and truly one of the reasons “price has memory” - take a look at the dashed lines in the images below that the platform plots for you automatically; these are the areas institutions constantly revisit to do more business.
Levels from the VolumeLeaders.com platform can help you formulate trades theses about:
Where to add or take profit
Where to de-risk or hedge
What strikes to target for options
Where to expect support or resistance
And this is just a small sample; there are countless ways to leverage this information into trades that express your views on the market. The platform covers thousands of tickers on multiple timeframes to accommodate all types of traders.
SPY
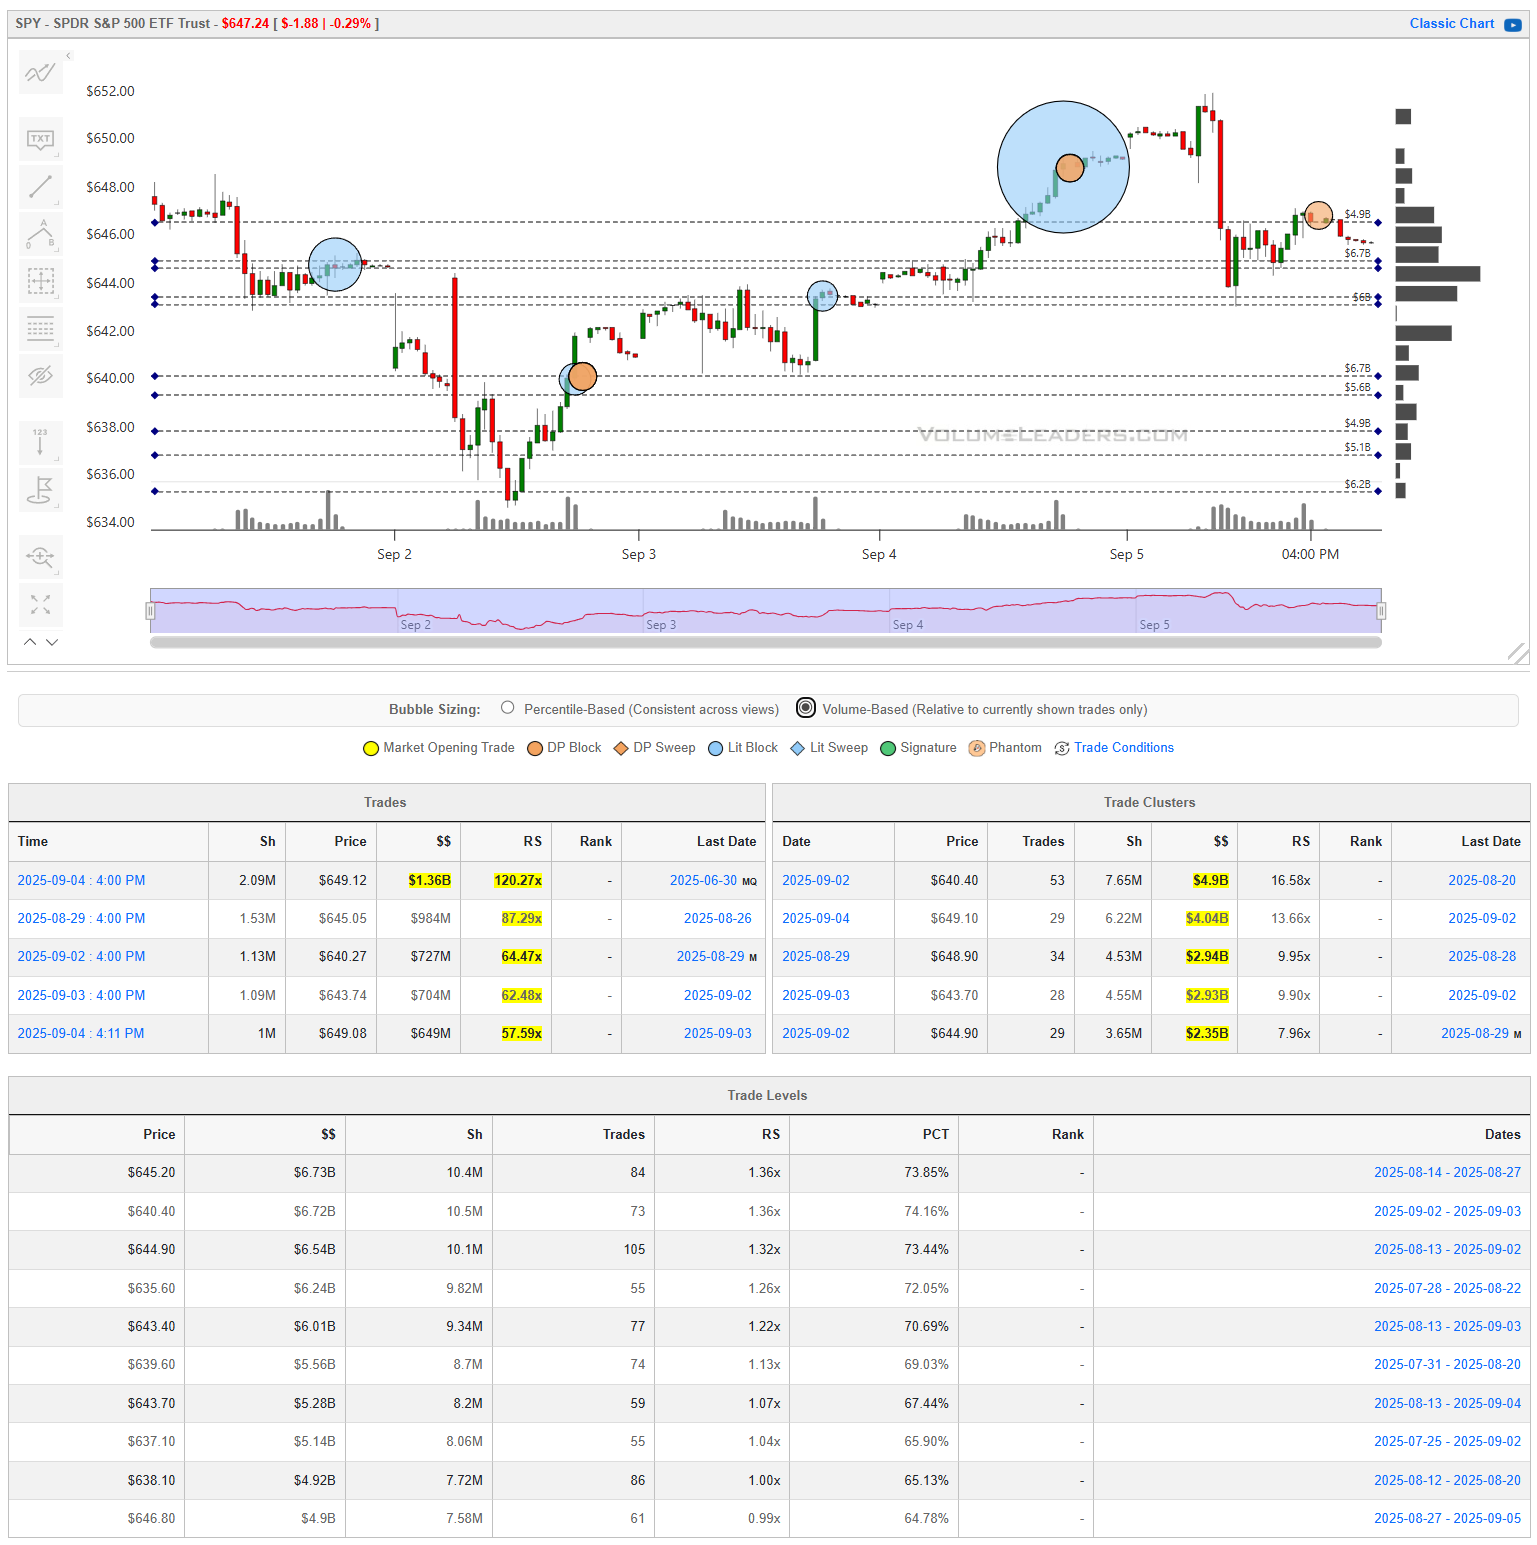
SPY spent the week carving out a battleground between the low 640s and the 650 handle. The most important feature on the tape was the wave of institutional blocks that hit into Thursday’s rally — particularly around $649–650. That cluster wasn’t retail noise; it was deliberate size, right at the top of the week’s range.
Just beneath, you’ve got a shelf of sponsorship between $637–641. Every dip into that zone has drawn responsive buyers, leaving it well-worn but still defended. If that area breaks, you’re staring at air pockets that open the door for a fast flush lower.
On the flip side, there’s little evidence of sponsorship above $652. That’s why attempts higher have been swatted back. If institutions want to rotate leadership into the next leg, they’ll need to layer bids and push size into that area — otherwise, it remains overhead supply.
Big picture: SPY is coiling with heavy footprints on both sides of the range. The bias leans constructive so long as the 640 shelf holds, but it’s binary — defend it and you’ve got fuel for upside extension, lose it and you’ll know quickly that institutions were unloading into strength.
QQQ
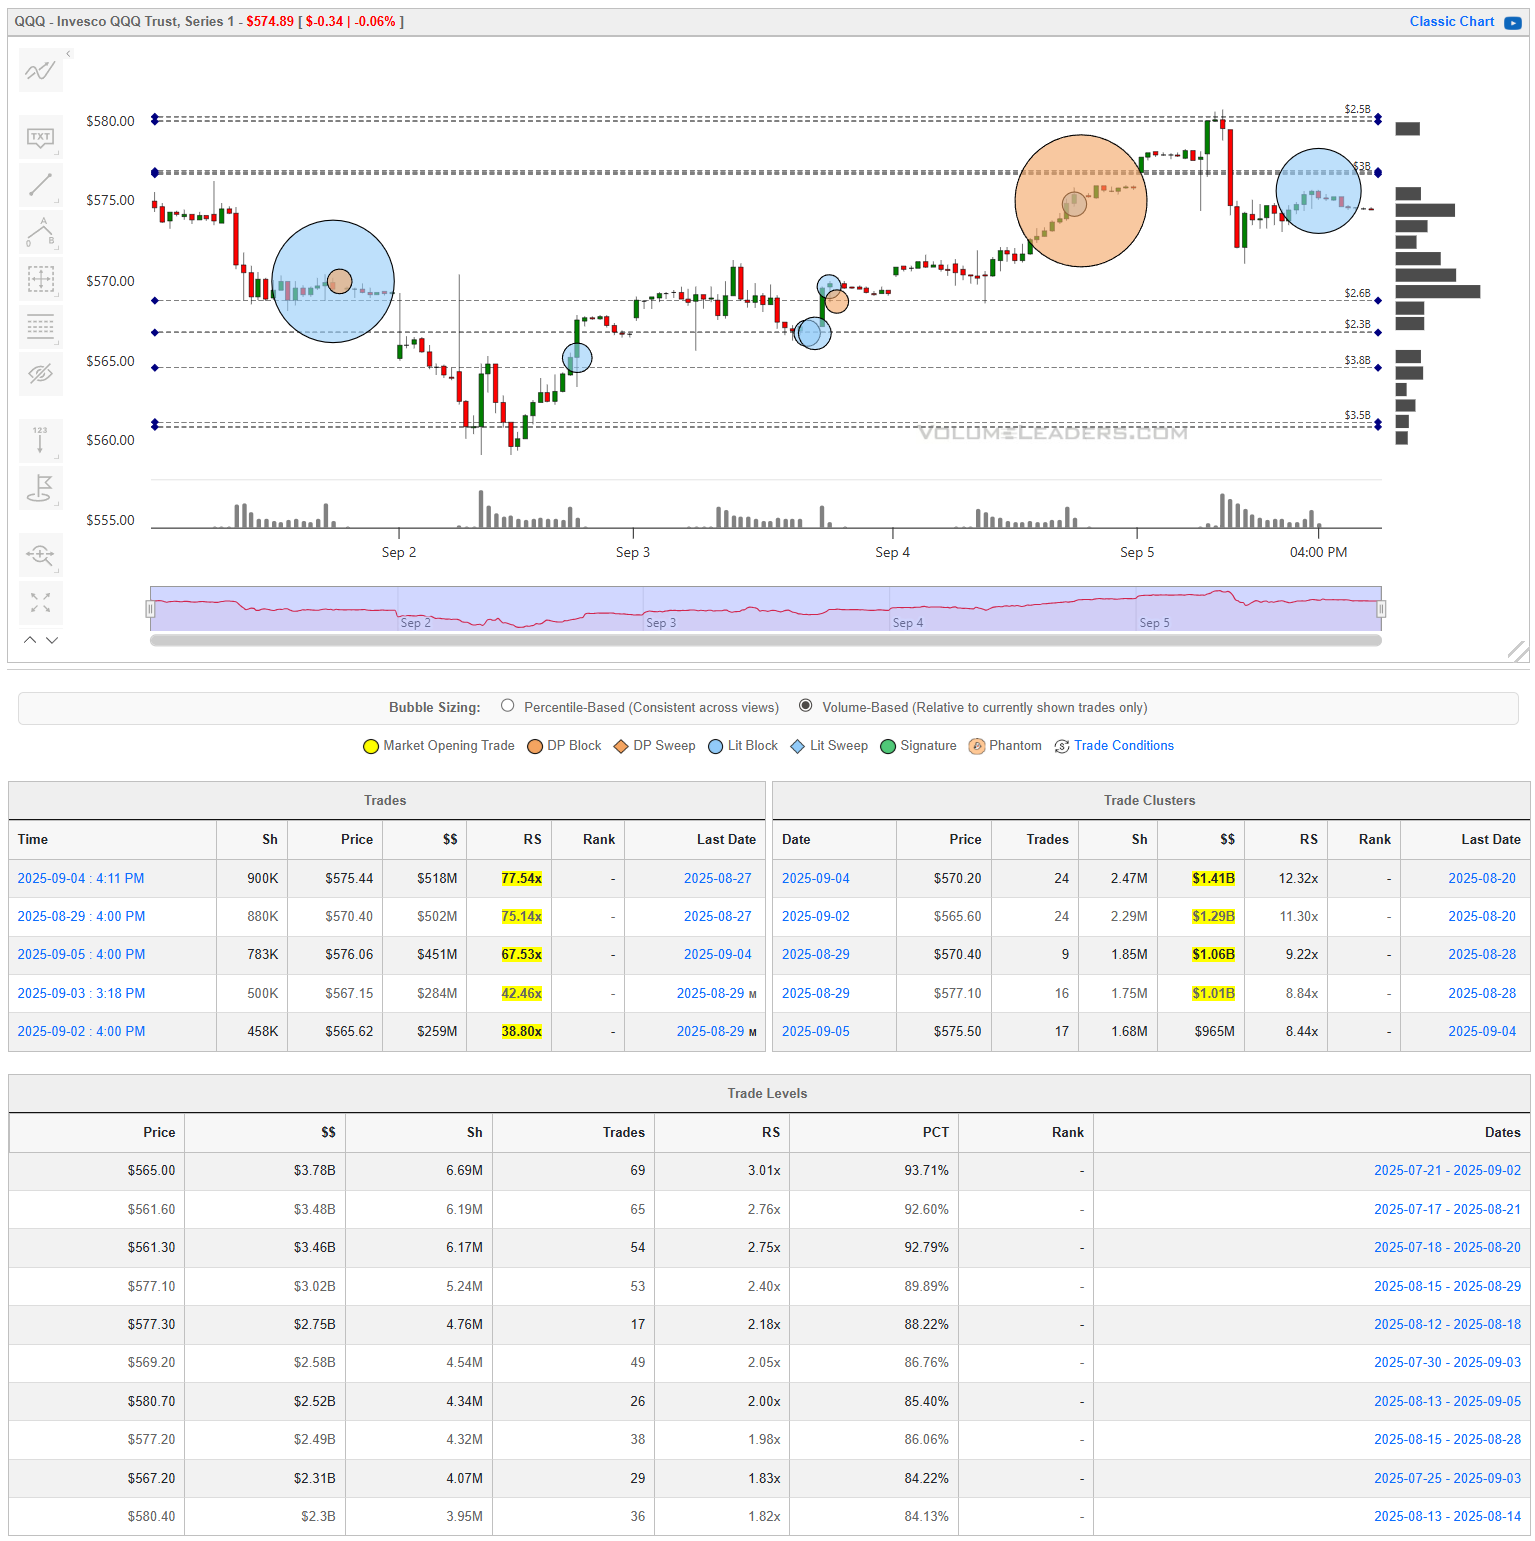
QQQ saw a heavy bout of sponsorship into the early-week weakness, with size flowing in around $556–560. That zone has since hardened into a clear line of defense, with multiple blocks reinforcing it as a foundation.
Into Thursday and Friday, however, the story shifted. Institutions were active sellers into strength near $575–577, leaving a large footprint at the top of the range. That overhead cluster is now supply, and unless it’s absorbed with conviction, every push back into that area will invite distribution.
The tape is caught between those two poles — defended sponsorship beneath, but overhead weight capping rallies. Compared with SPY, QQQ’s ceiling looks heavier, and the divergence between the two continues to widen. That’s notable: tech is still drawing money, but it’s being met with consistent profit-taking up here.
Net-net, QQQ is boxed in. The 556–560 floor needs to hold for bulls to stay in control, but until the 575 lid is cleared with volume, the index remains range-bound with pressure tilting lower.
IWM
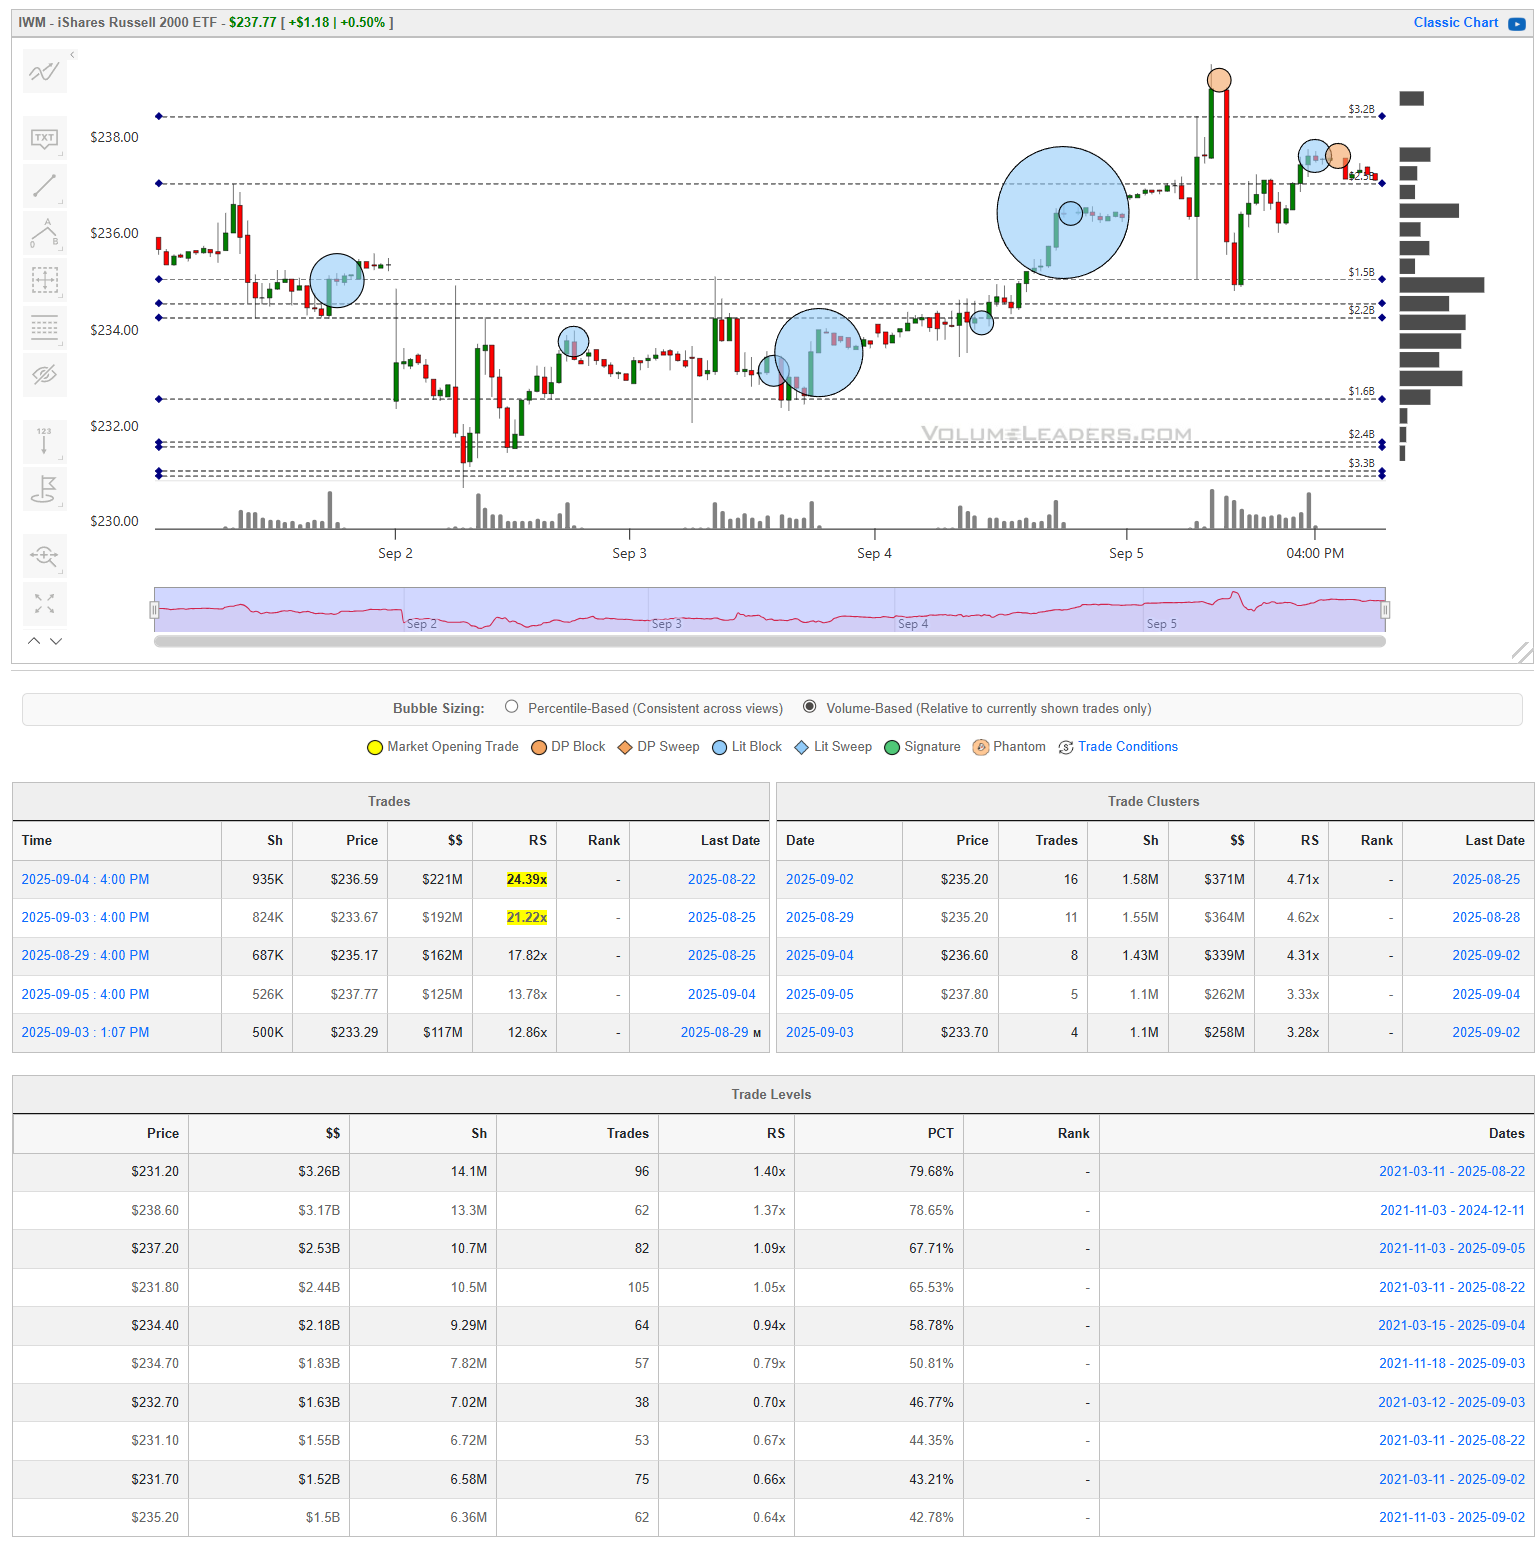
Small caps carried a stronger bid than the big benchmarks this week, with institutions leaning into sponsorship from the $233–235 area and pressing higher without much resistance until late Friday. The biggest footprints came on the breakout leg through $237–238, a clean pocket of accumulation that now serves as the key reference point for the bulls.
Friday’s late-session reversal off $240 did leave some overhead supply, but unlike QQQ, the distribution was lighter and less coordinated. That suggests more of a tactical fade than a structural sell wall.
The bigger picture here is that IWM looks healthier than both SPY and QQQ on a relative basis: sponsorship was persistent, the rally carried more momentum, and the upper bands weren’t met with the same kind of heavy selling we saw in tech.
As long as $233–235 holds on any retest, the small-cap tape has room to keep working higher. A failure back through that zone would neutralize the breakout and put the ball back in the sellers’ court.
DIA
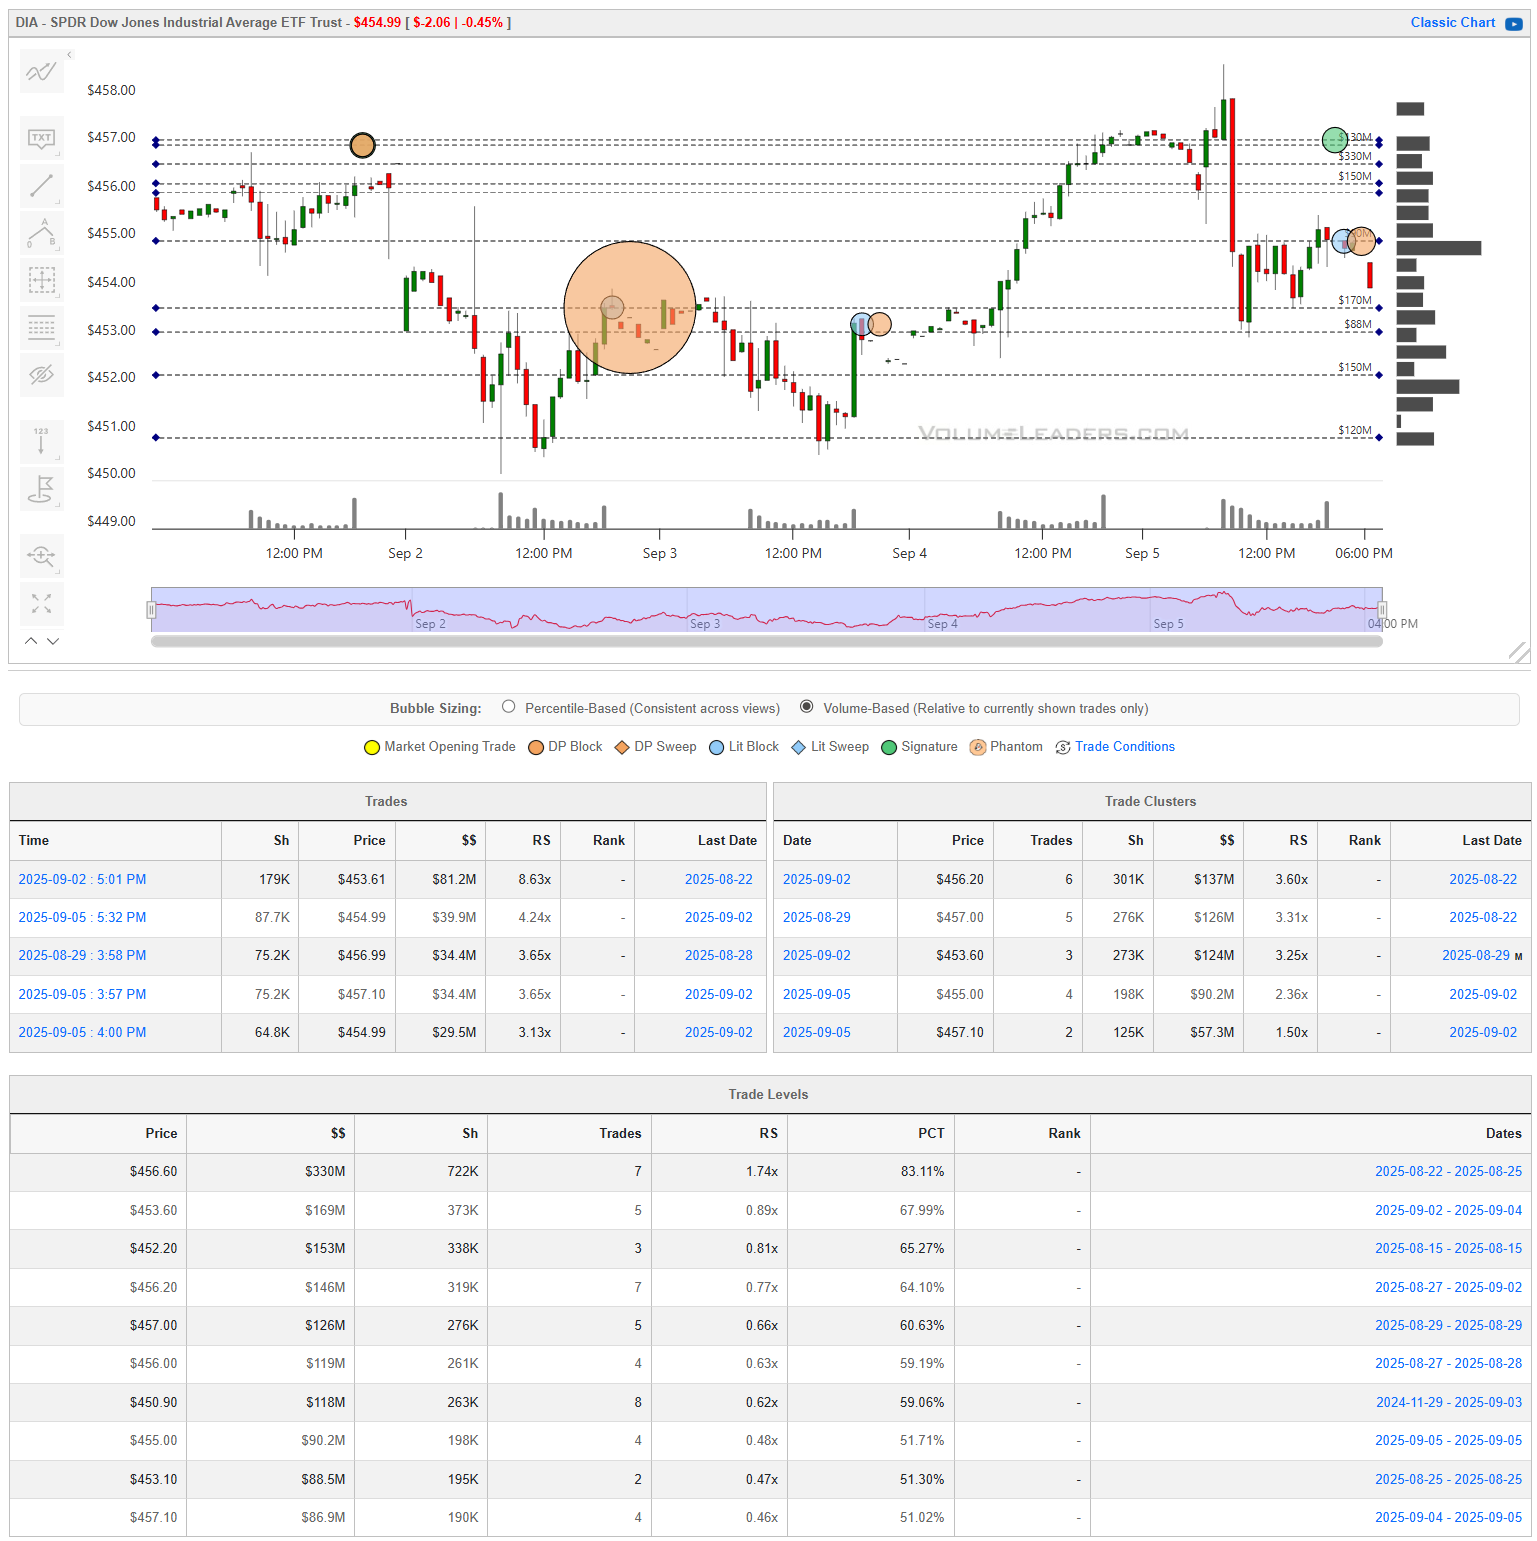
The Dow traded with less conviction than the rest of the tape. Early in the week, sellers hit bids aggressively around $452–454, leaving a notable supply pocket that capped upside attempts. The heavy cluster through $453 marked the clearest institutional footprint, and that pressure stalled momentum until Thursday’s recovery.
Friday’s rally pushed into $457, but sponsorship thinned out quickly, and the late-day fade confirmed that the path higher still runs into resistance at the upper band. On balance, DIA never showed the same sustained appetite we saw in IWM, nor the heavy rotation into megacaps that dominated QQQ.
The structure is constructive above $452, but it’s tough to call the Dow a leadership vehicle here. Until buyers can convincingly clear the $457–458 shelf, it looks more like a laggard index caught between defensive sponsorship and selective distribution.
Summary Of Thematic Performance YTD
VolumeLeaders.com offers a robust set of pre-built thematic filters, allowing you to instantly explore specific market segments. These performance snapshots are provided purely for context and inspiration—think about zeroing in on the leaders and laggards within the strongest and weakest sectors, for example.
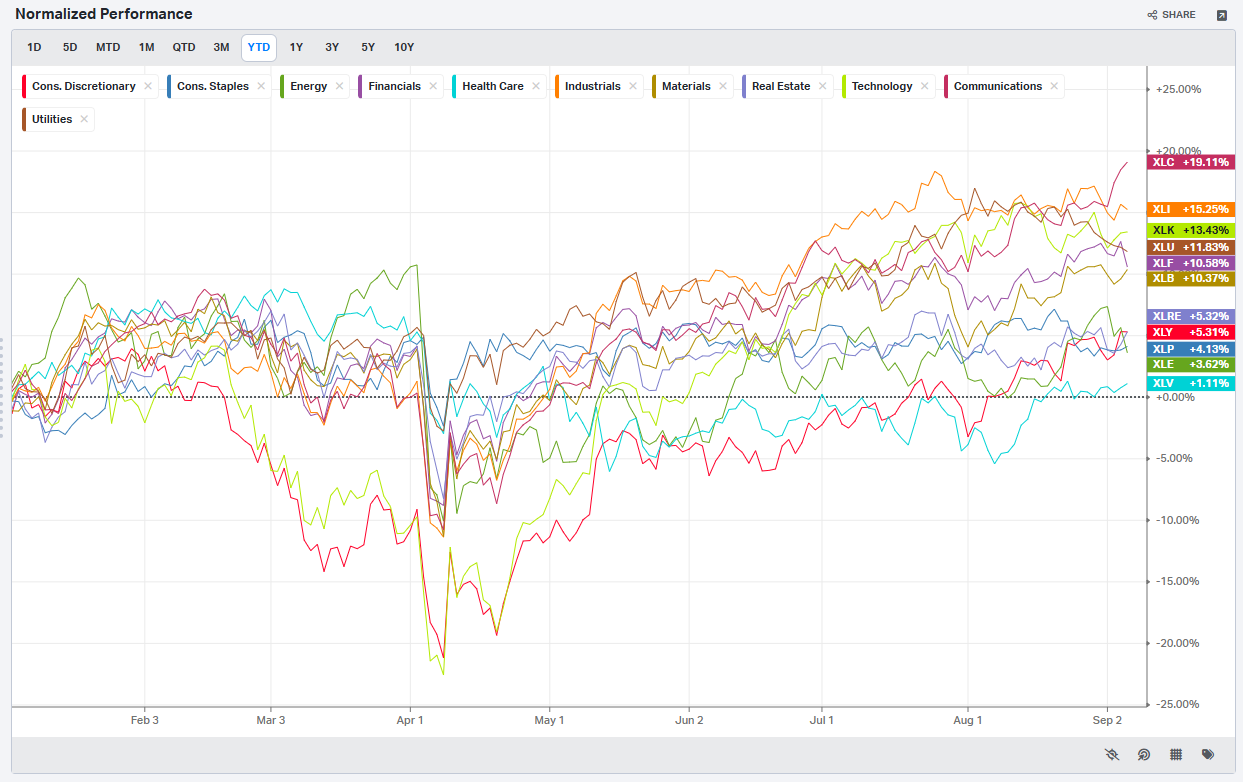
S&P By Sector
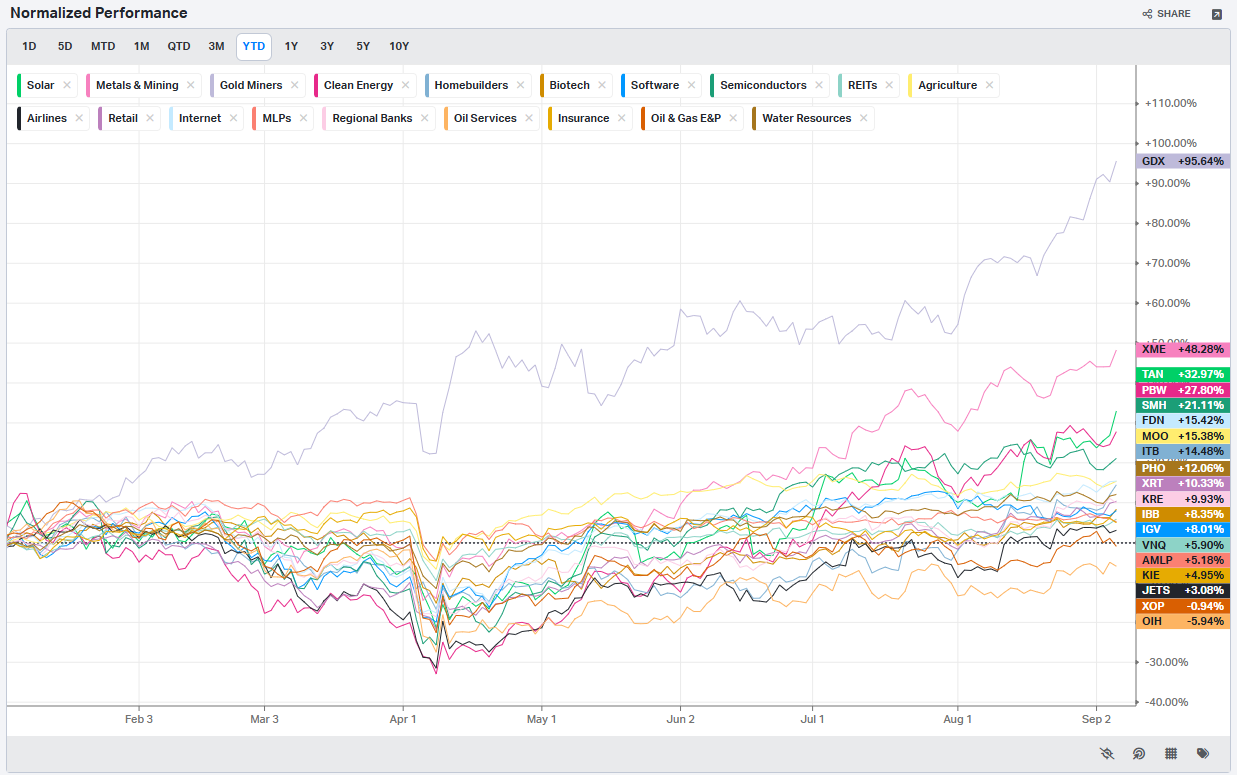
S&P By Industry
Commodities: Energy & Metals
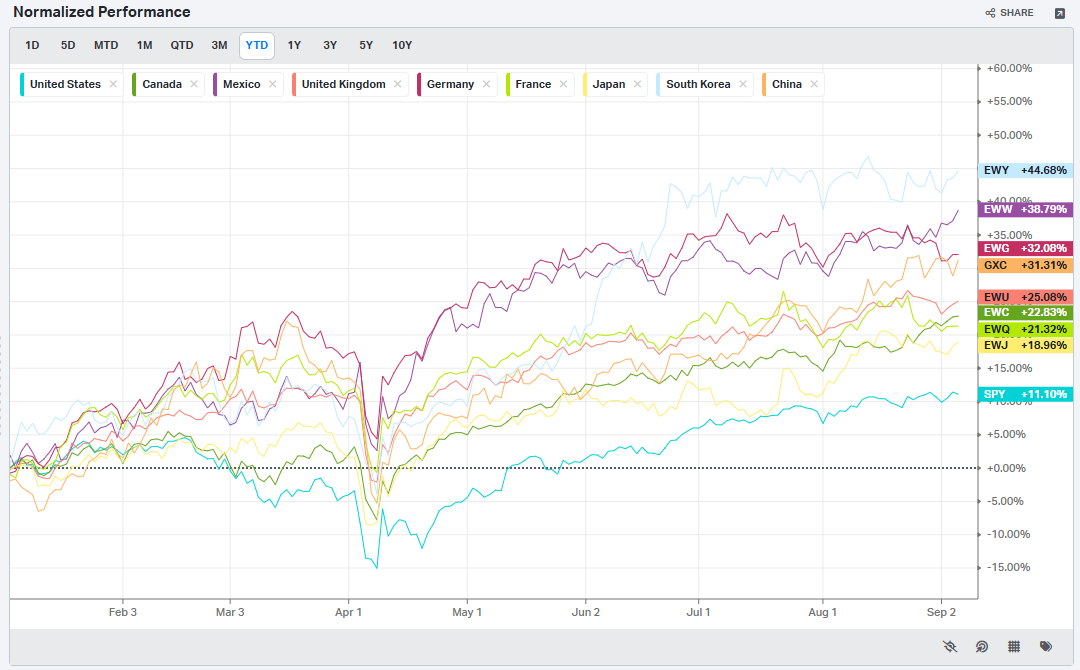
Country ETFs
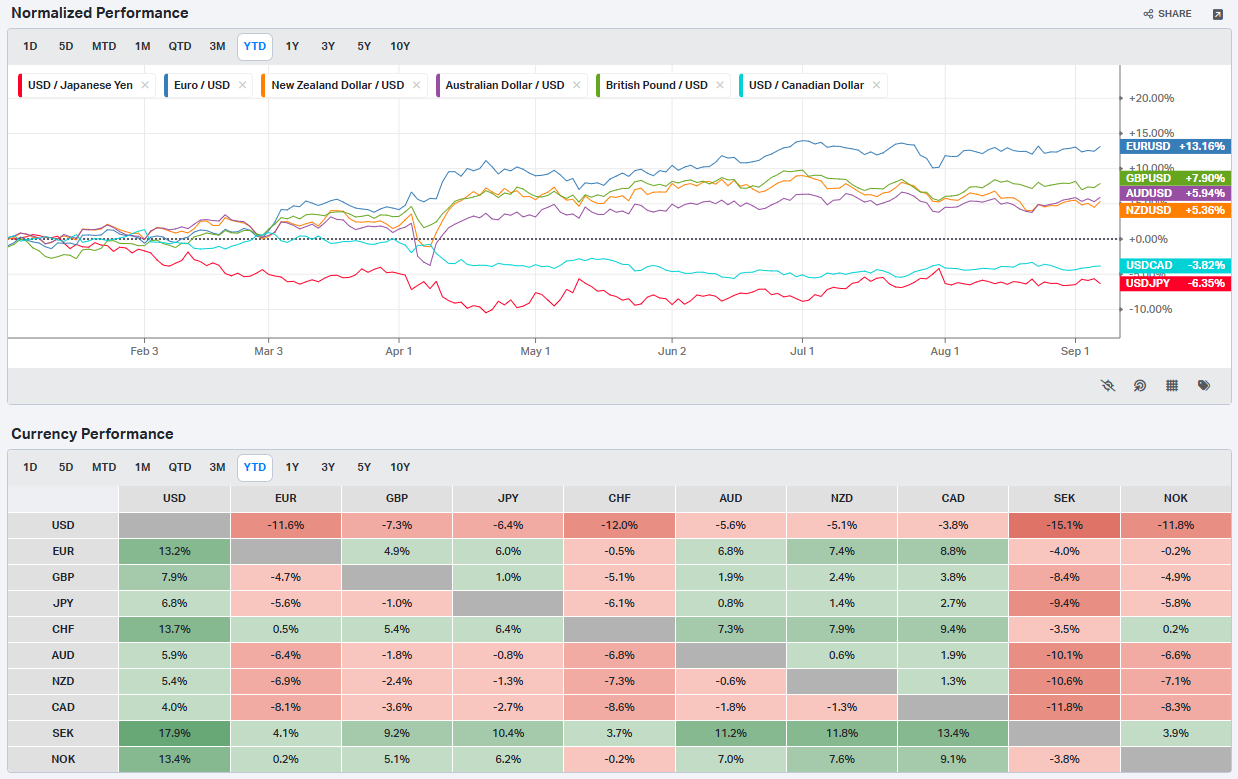
Currencies/Major FX Crosses
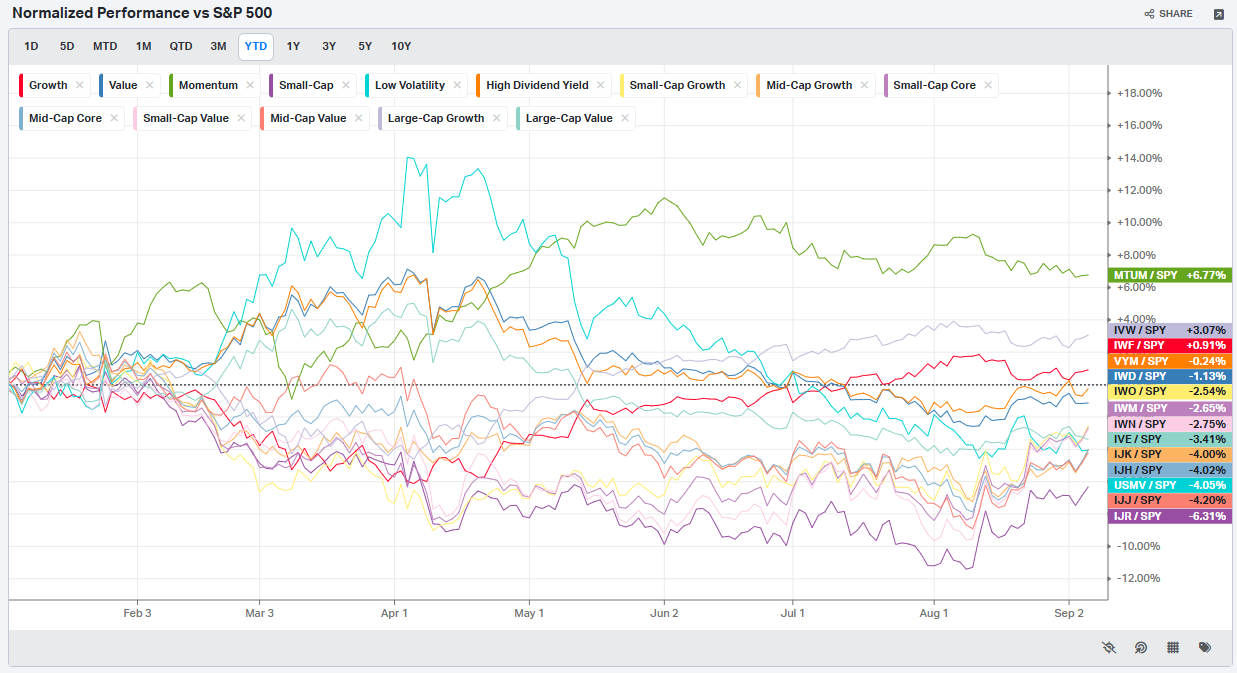
Factors: Style vs Size-vs-Value
Events On Deck This Week
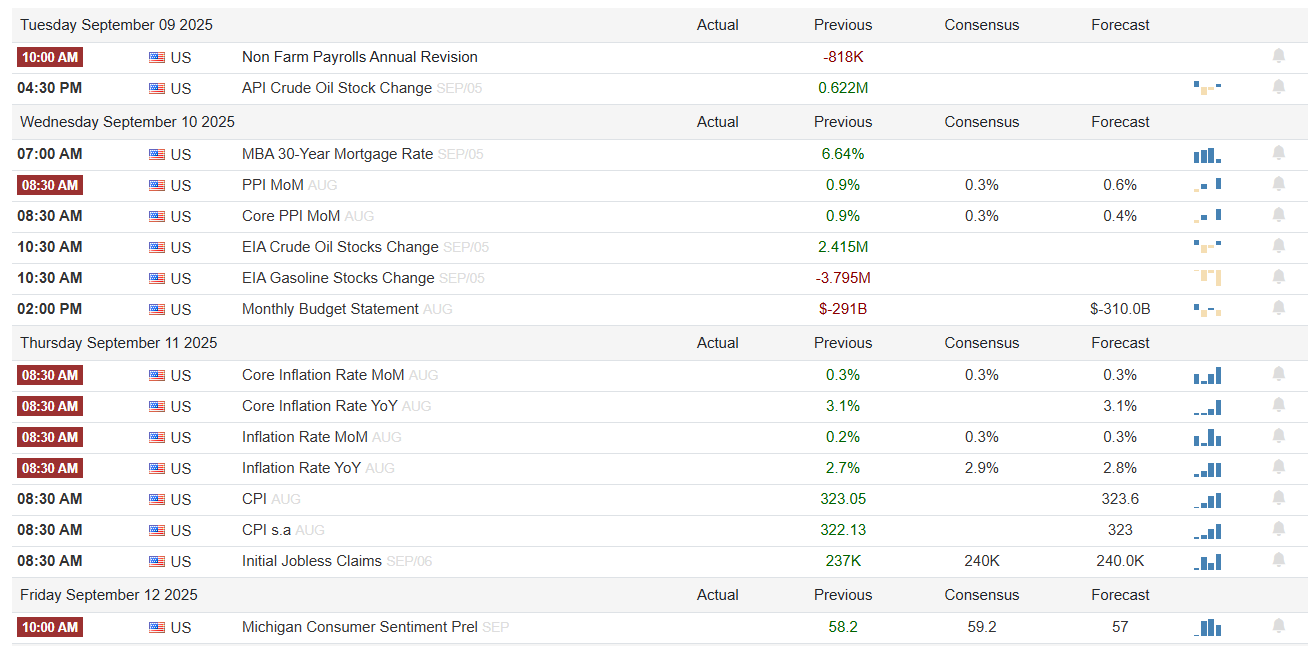
Here are key events happening this week that have the potential to cause outsized moves in the market or heightened short-term volatility.
The coming week tightens the focus back on the tape’s heaviest cross-currents: labor, inflation, and corporate catalysts. On the economic side, we roll right into PPI Wednesday and CPI Thursday, with jobless claims stacked alongside CPI at the same 8:30 slot. These are the prints that matter most—markets are already primed with exposure (as we saw in NAAIM) and leaning long, so any upside surprises in inflation have the potential to force a recalibration. Energy swings only complicate that, given crude inventories and gasoline stock changes remain volatile, a reminder that headline risk isn’t dead. Friday rounds it out with the Michigan consumer sentiment read, which gives us another pulse check on Main Street’s mood.
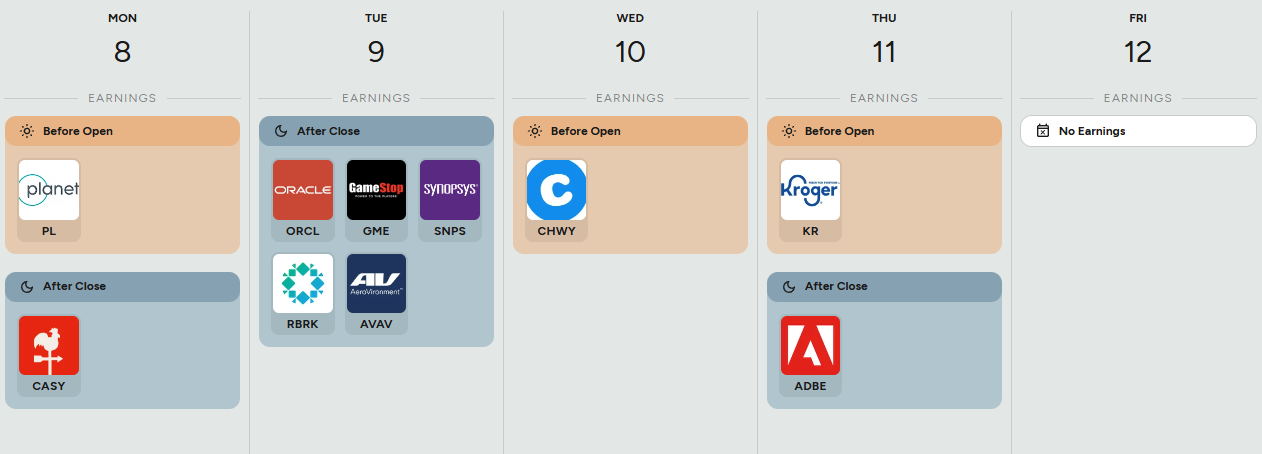
Corporate earnings are lighter but not without punch. Oracle, GameStop, and Synopsys take the stage Tuesday; Chewy on Wednesday morning; Kroger and Adobe later in the week. Oracle and Adobe in particular carry enough weight to nudge broader tech sentiment, while Kroger offers a real-time look at consumer staples resilience. It’s not a heavy season, but it’s a week where single-name reactions can ripple through their sectors.
The upshot: the tape will trade CPI. Earnings add color, energy reports stir the inflation debate, and sentiment inputs help frame positioning. But the fulcrum is inflation data—how it lands relative to expectations, and how quickly positioning adapts.

Market Intelligence Report
MIR Part 1: The Backdrop
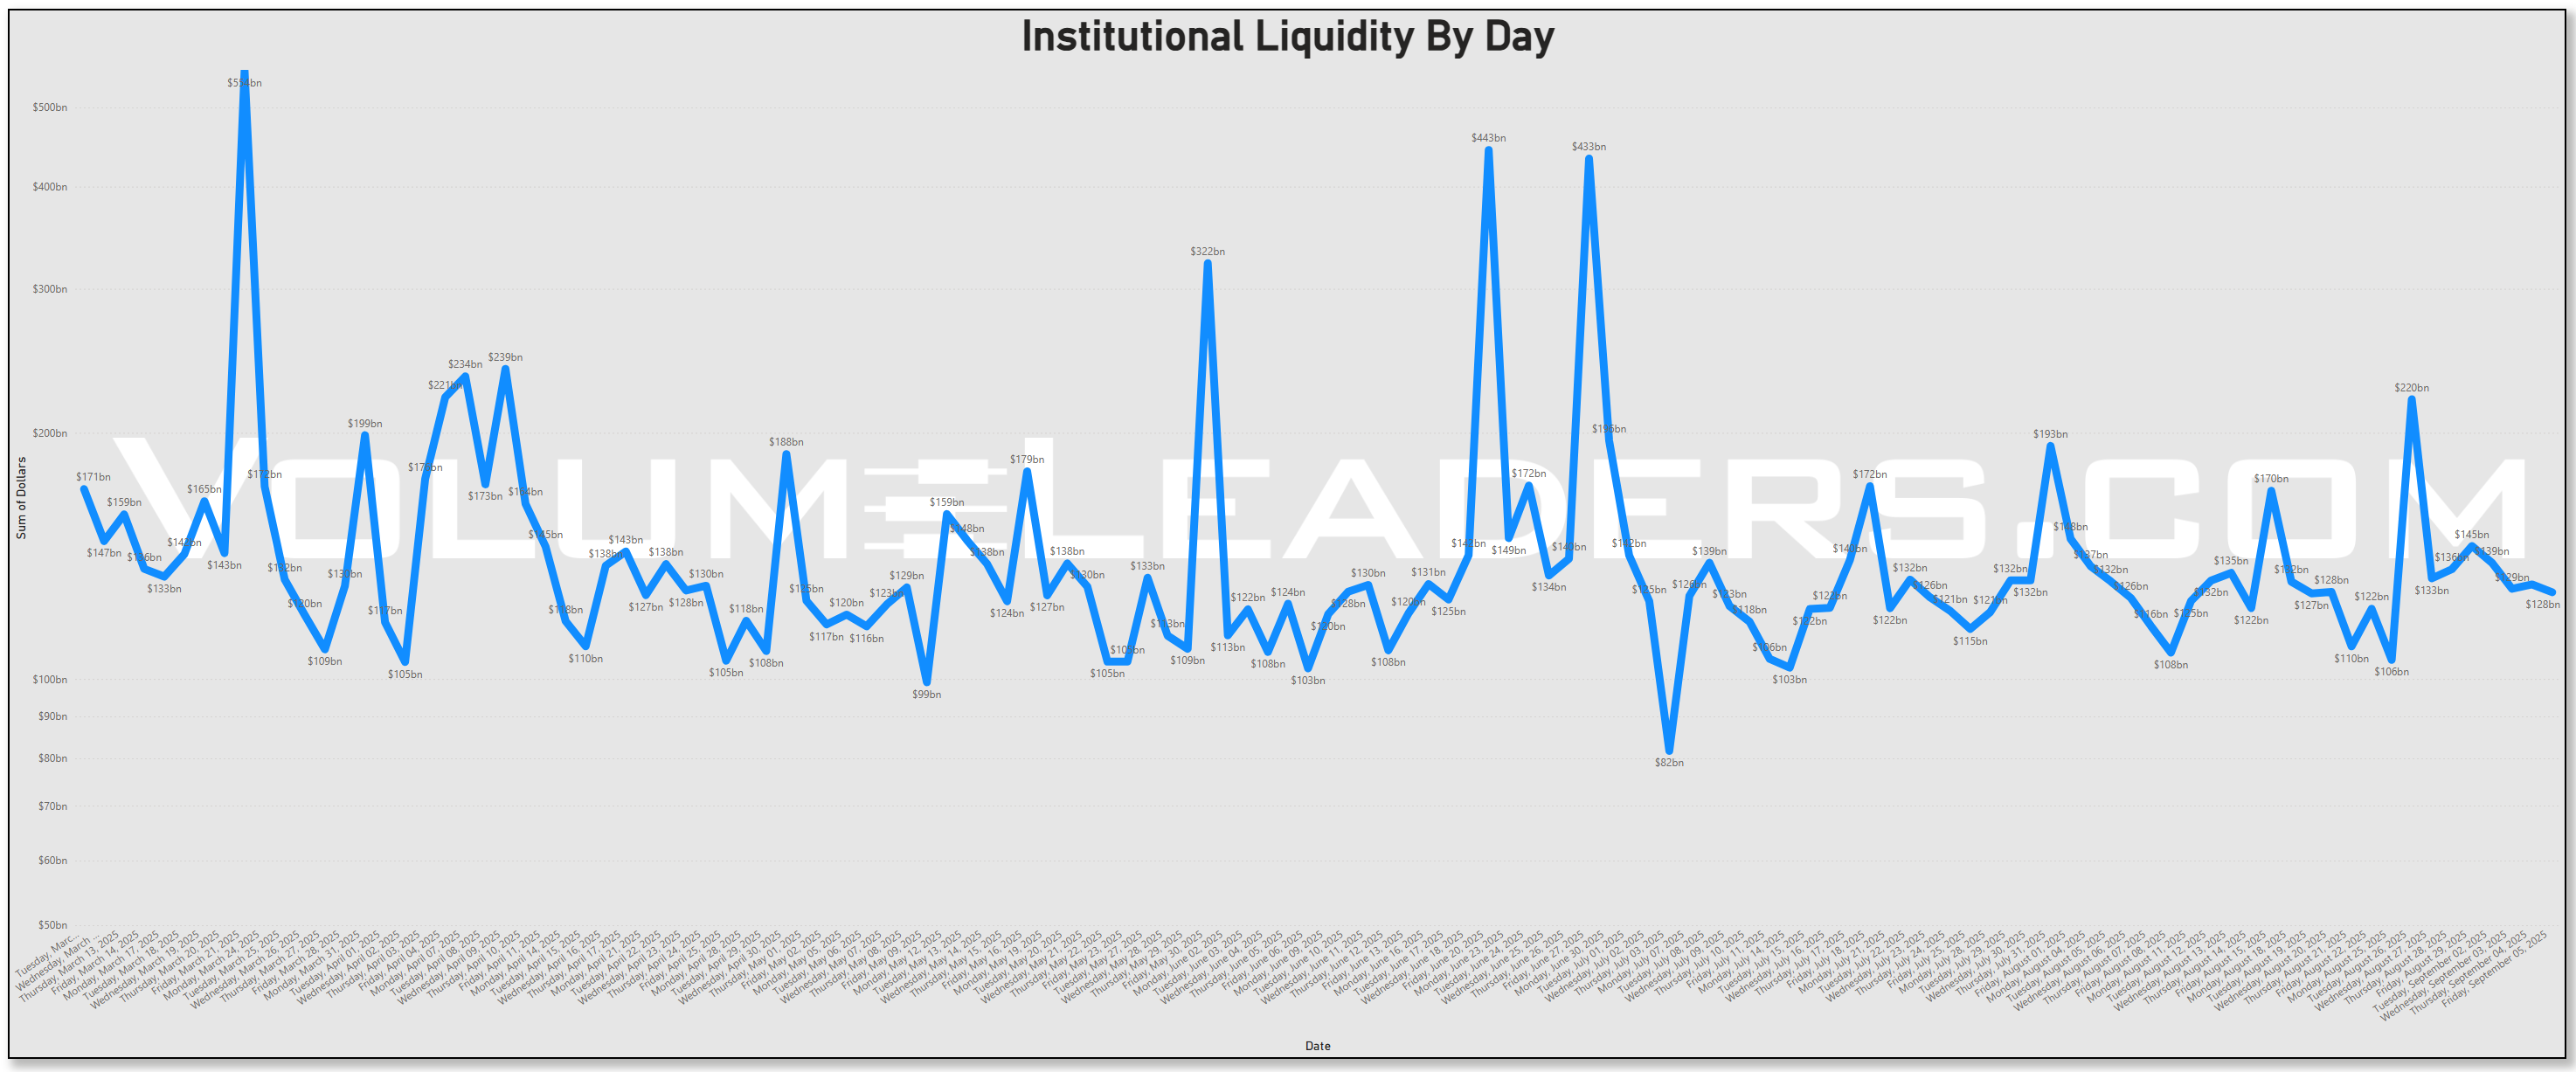
Institutional liquidity has been quietly fading since the MSCI rebalance, and the profile looks less like healthy sponsorship and more like distribution. You can see it in the tape: the big spikes are behind us, the day-to-day flows are getting shallower, and the baseline itself is slipping lower. When price holds steady while liquidity drains, that’s usually not an accumulation story — it’s the kind of backdrop where institutions are handing off inventory rather than adding to it.
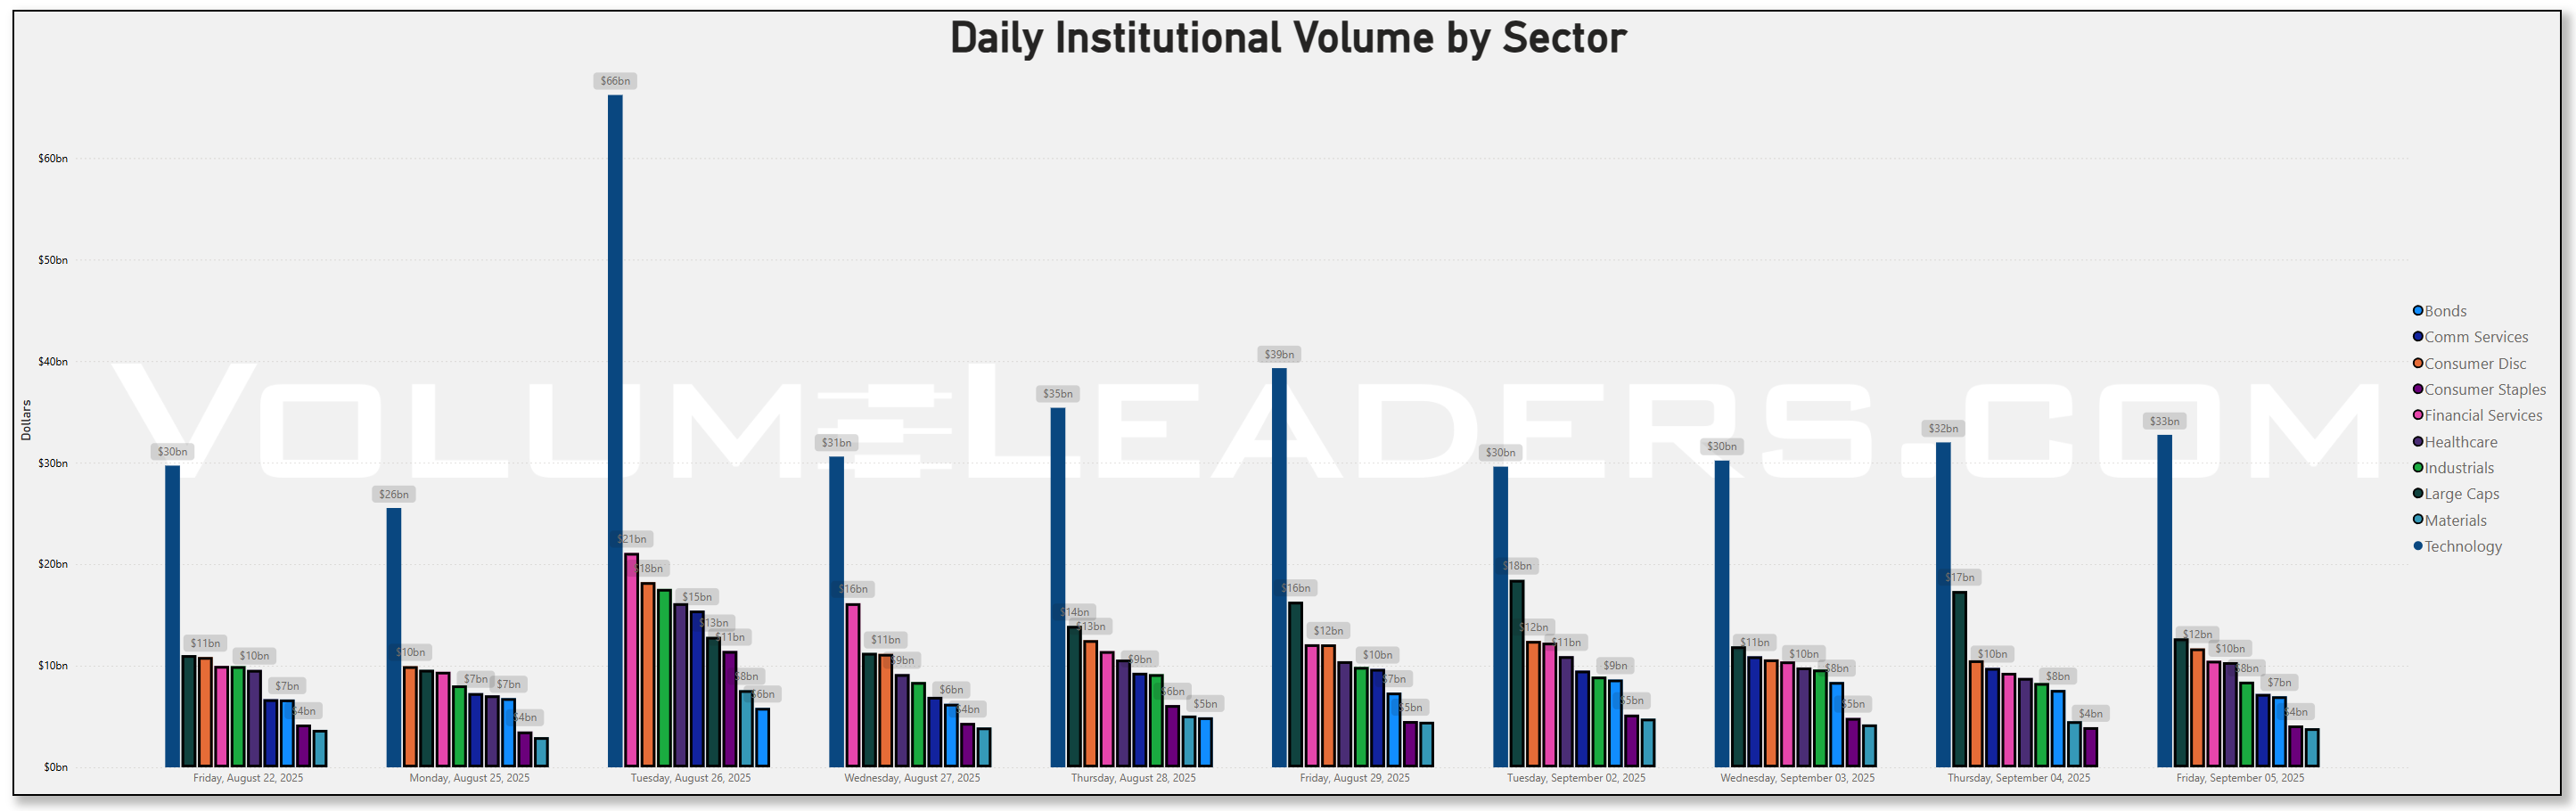
The sector-level flows reinforce that impression. Tech, which has been the market’s engine all year, has cooled off. QQQ spent the better part of the week churning inside prior defined weekly ranges, and the volume picture confirms that sponsorship wasn’t pressing for new ground. By contrast, large caps showed a handful of outsized days relative to their own history, hinting that flows are shifting toward broad index exposure instead of concentrated bets on single-name tech. That’s classic rotation behavior — keeping exposure, but diversifying the source.
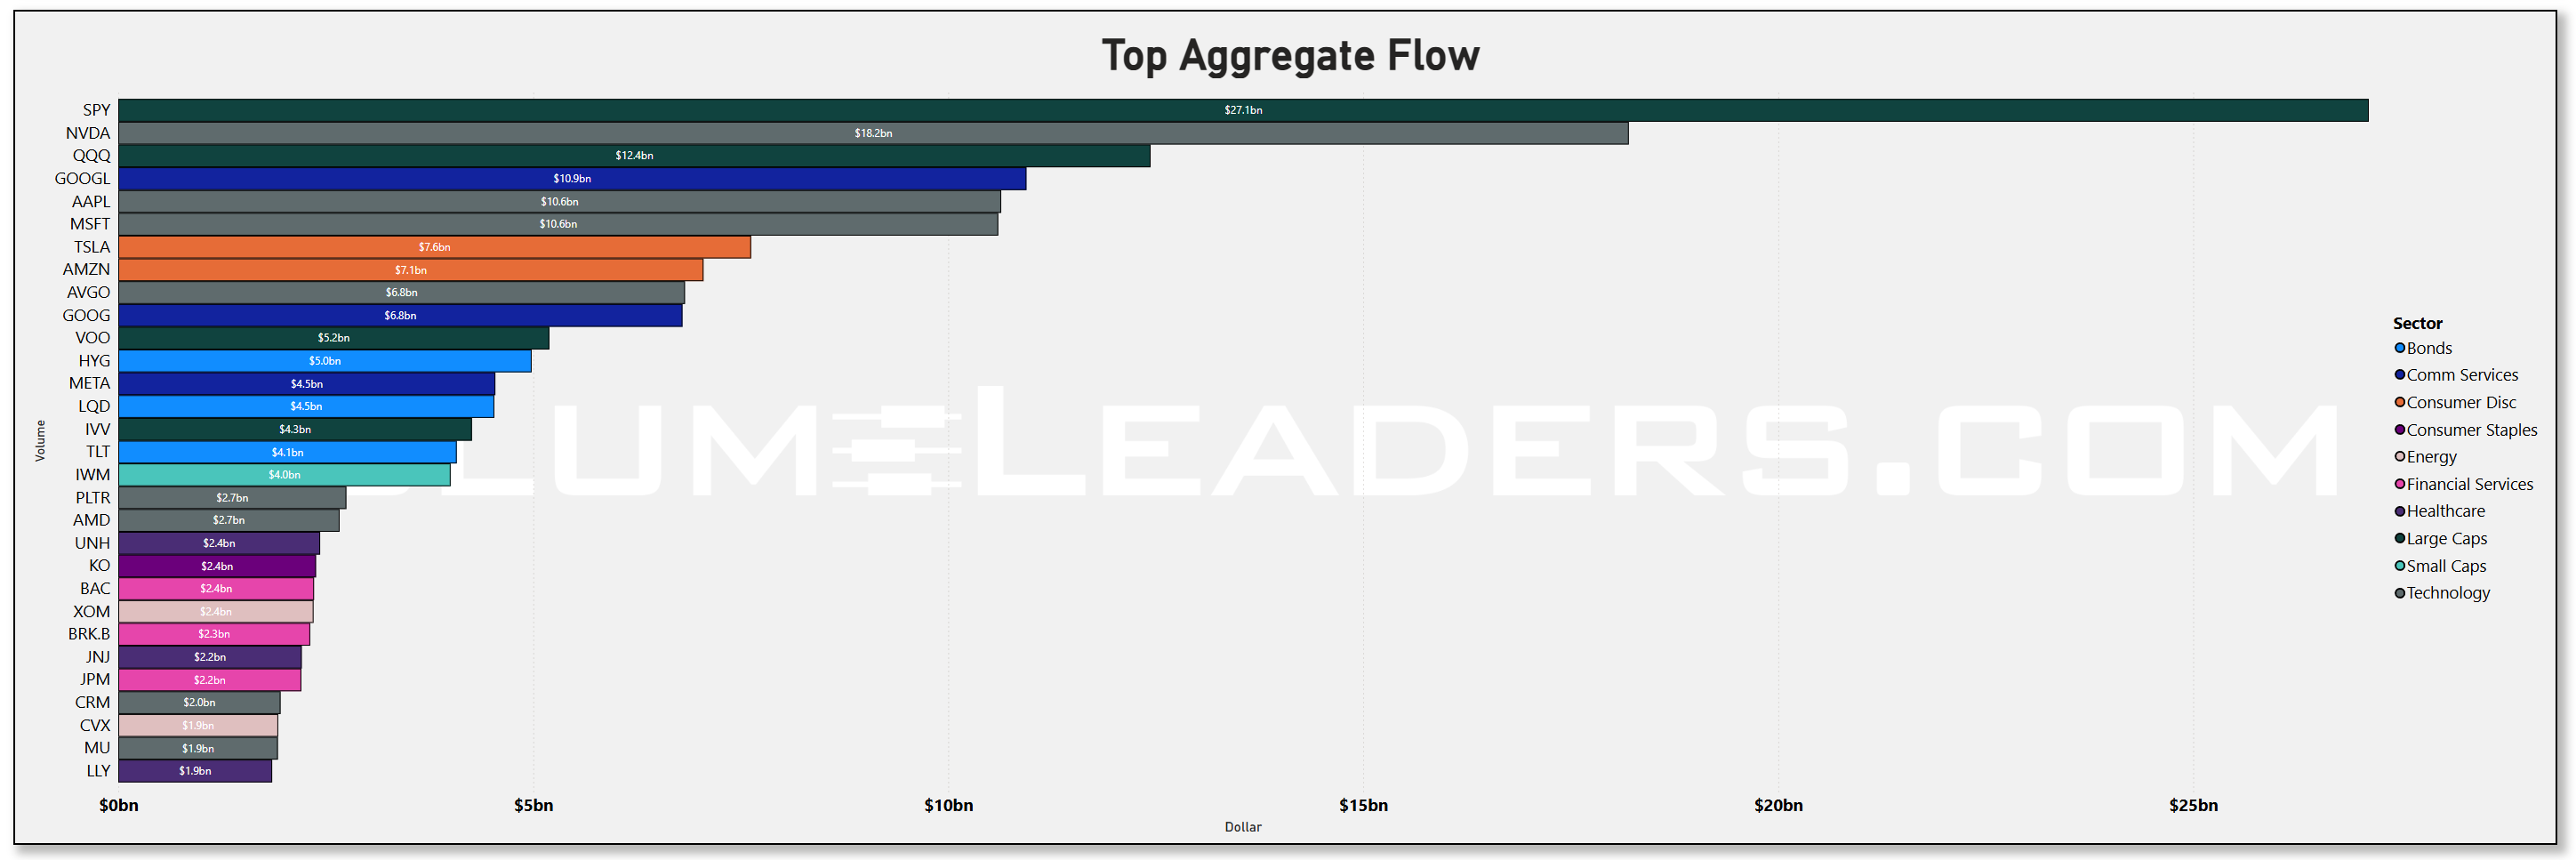
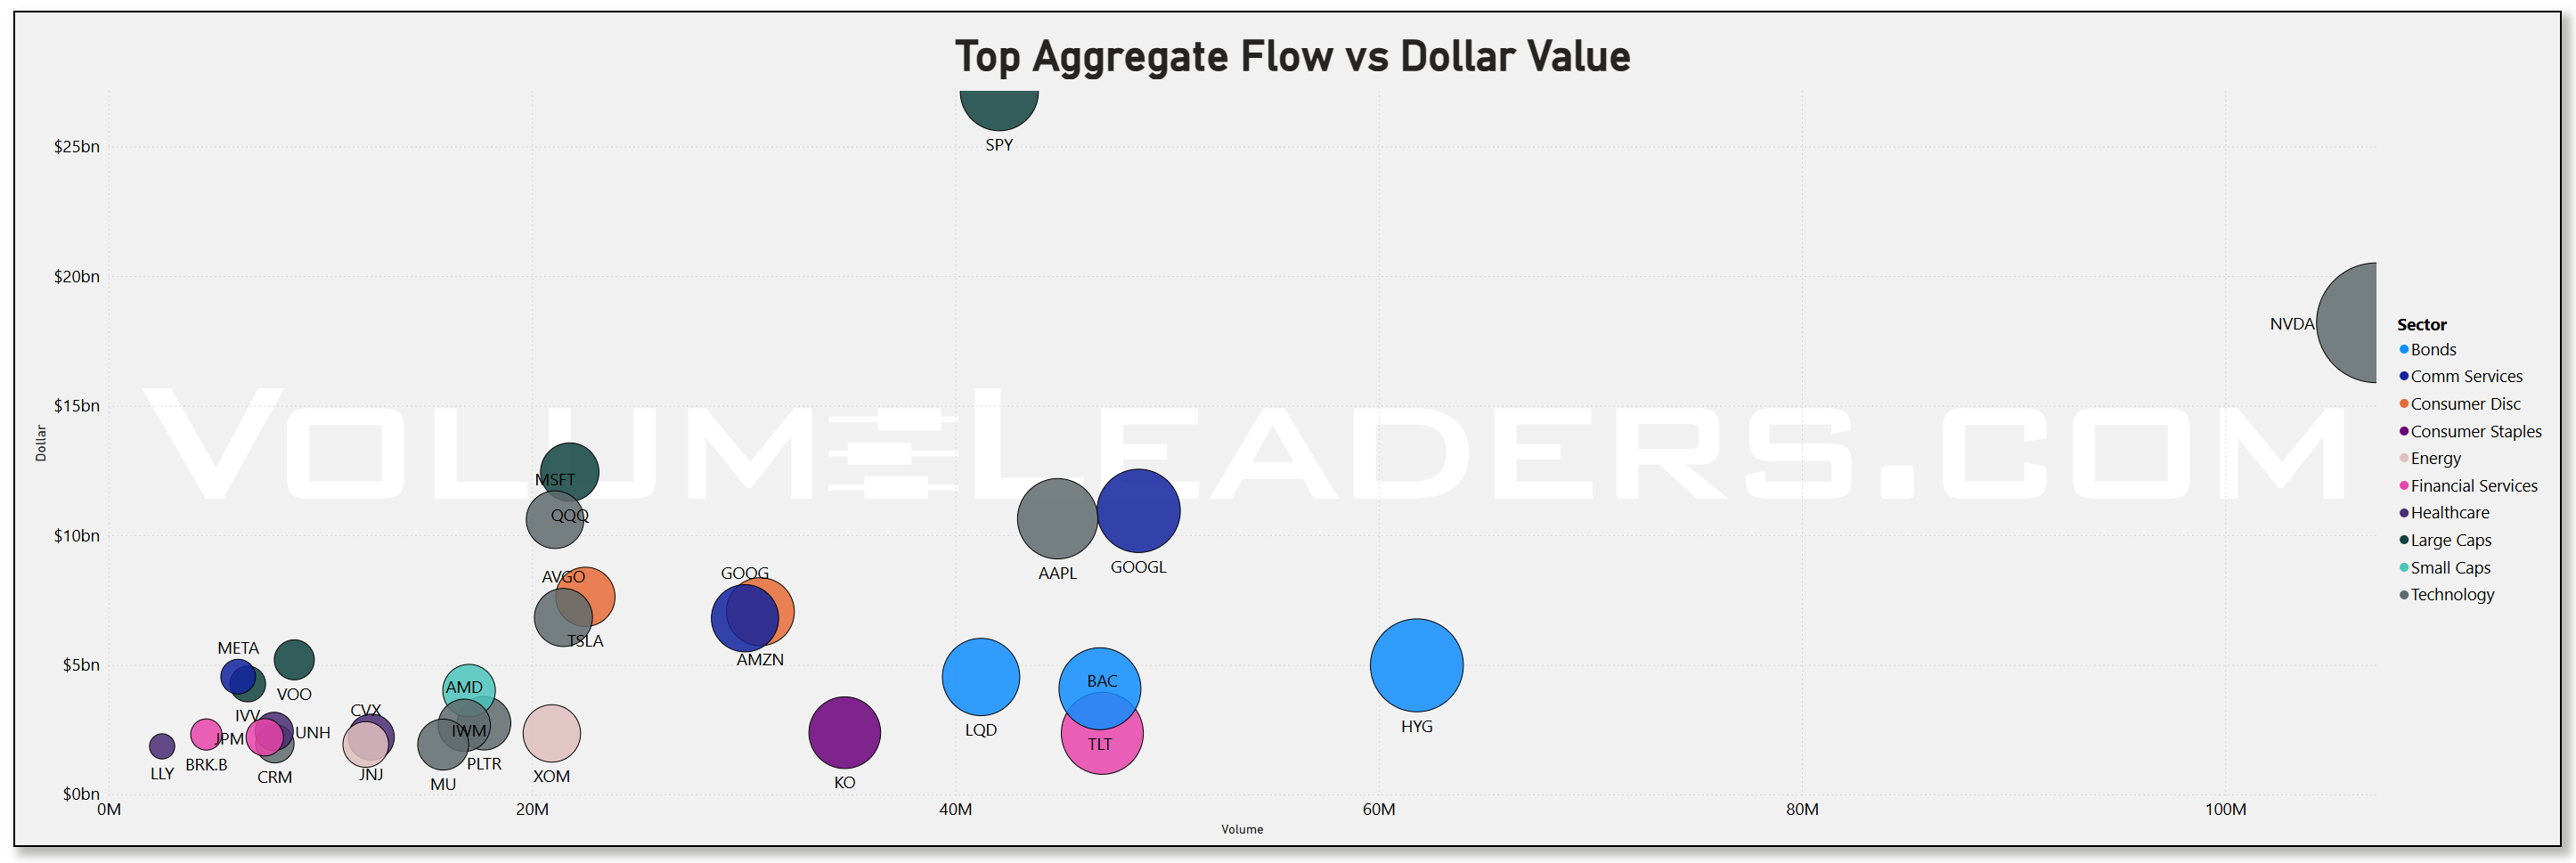
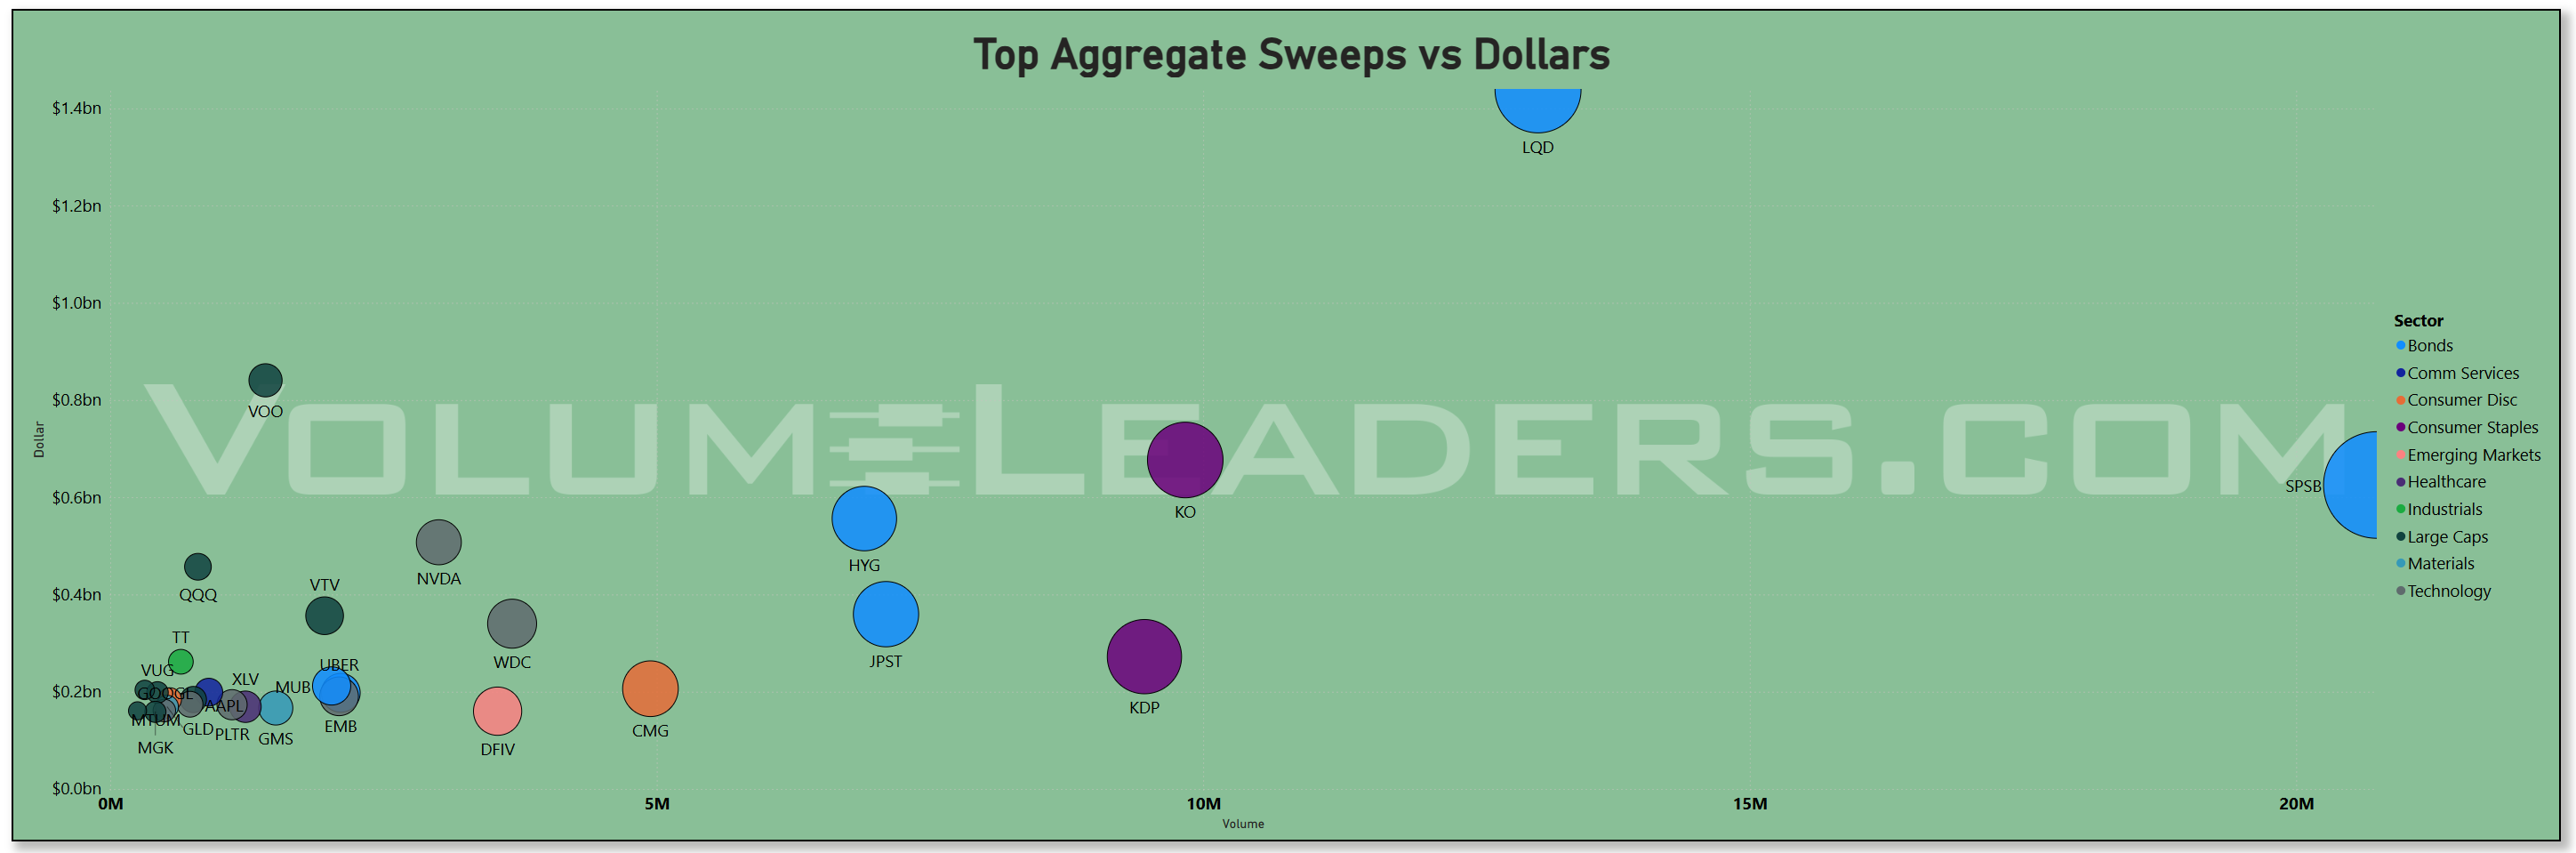
Drilling into aggregate flow, the leaderboard still reads like you’d expect: SPY, NVDA, QQQ, AAPL, MSFT. But a few subtleties stand out.
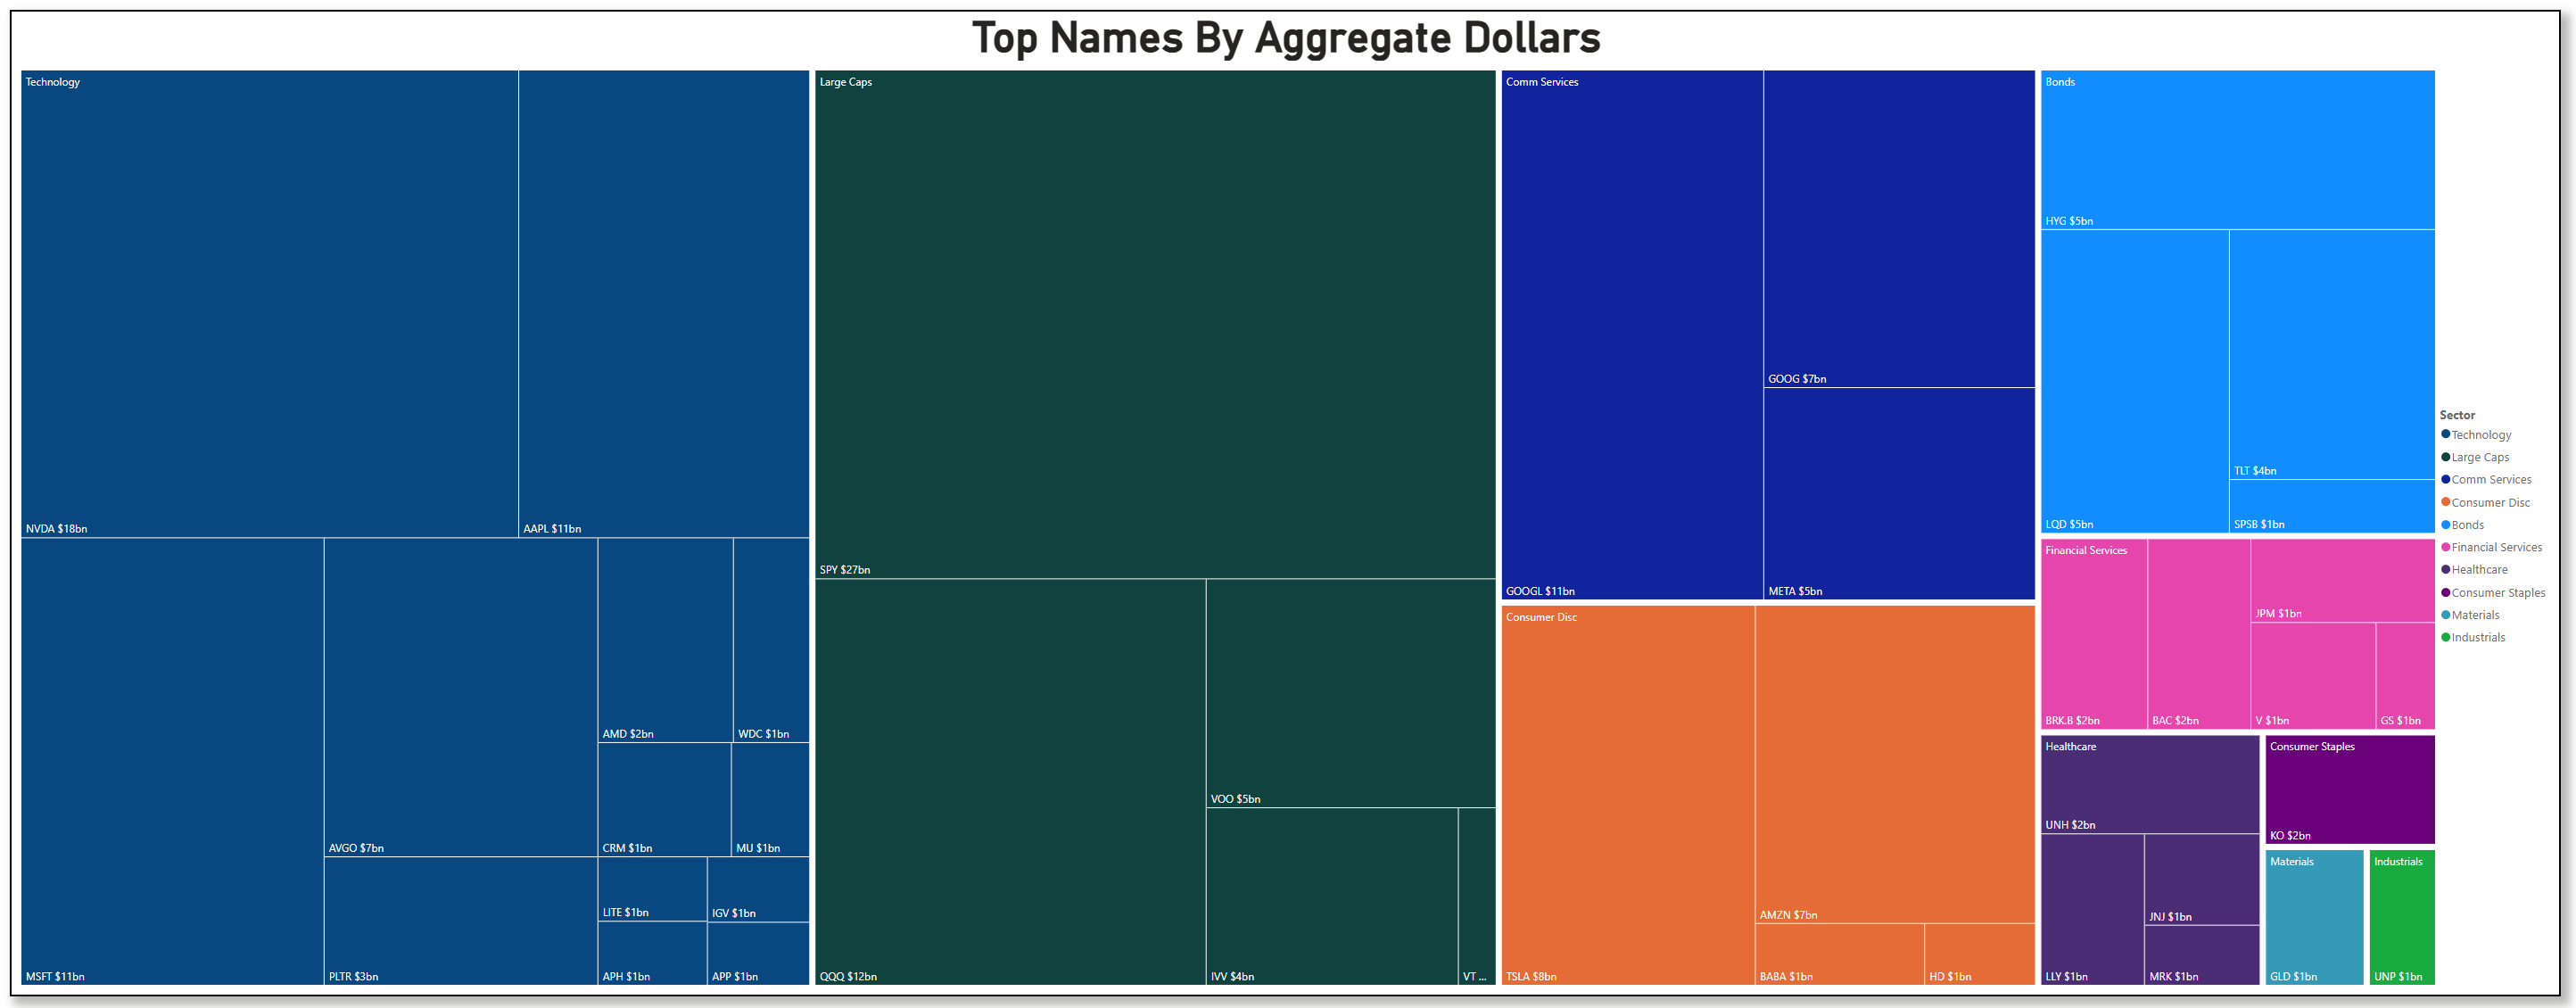
BAC shows up with a meaningful print in the dollar-value scatter — an early tell that financials are starting to pick up sponsorship. And then there’s NVDA, which sticks out like a sore thumb, dwarfing everything else. That’s not new, but it’s worth repeating: the market remains far too dependent on a few single names for comfort.
Sweeps are where the story gets more interesting. LQD continues to dominate, that isn’t anything new.
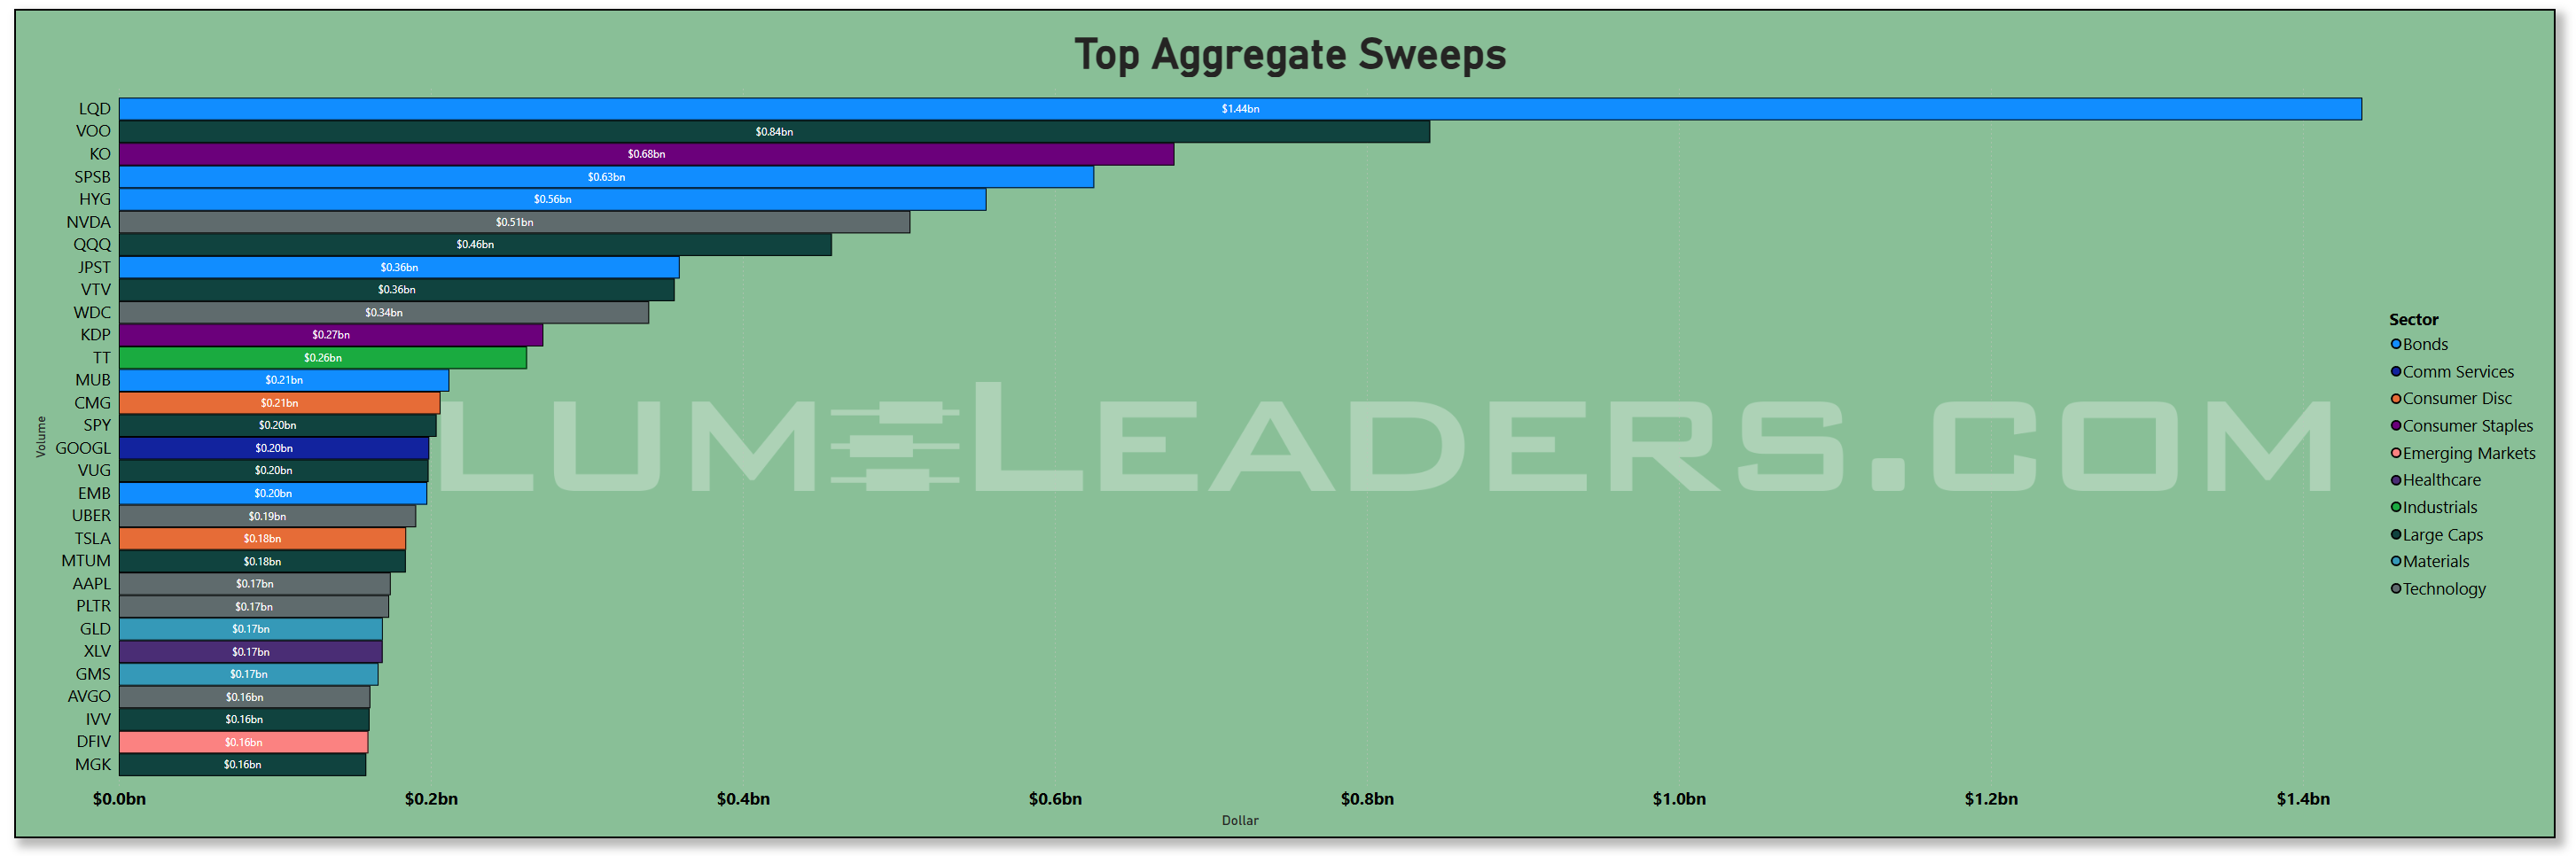
Underneath, you’ve got KO, SPSB, and JPST climbing into the sweep leadership. Those are defensive, short-duration, or income-focused plays — not exactly “growth chase” material. KDP remains active after last week’s acquisition headlines, and DFIV — a relatively obscure international value ETF — makes an appearance that smells like tariff hedging. It’s a very different complexion than we had even a month ago.
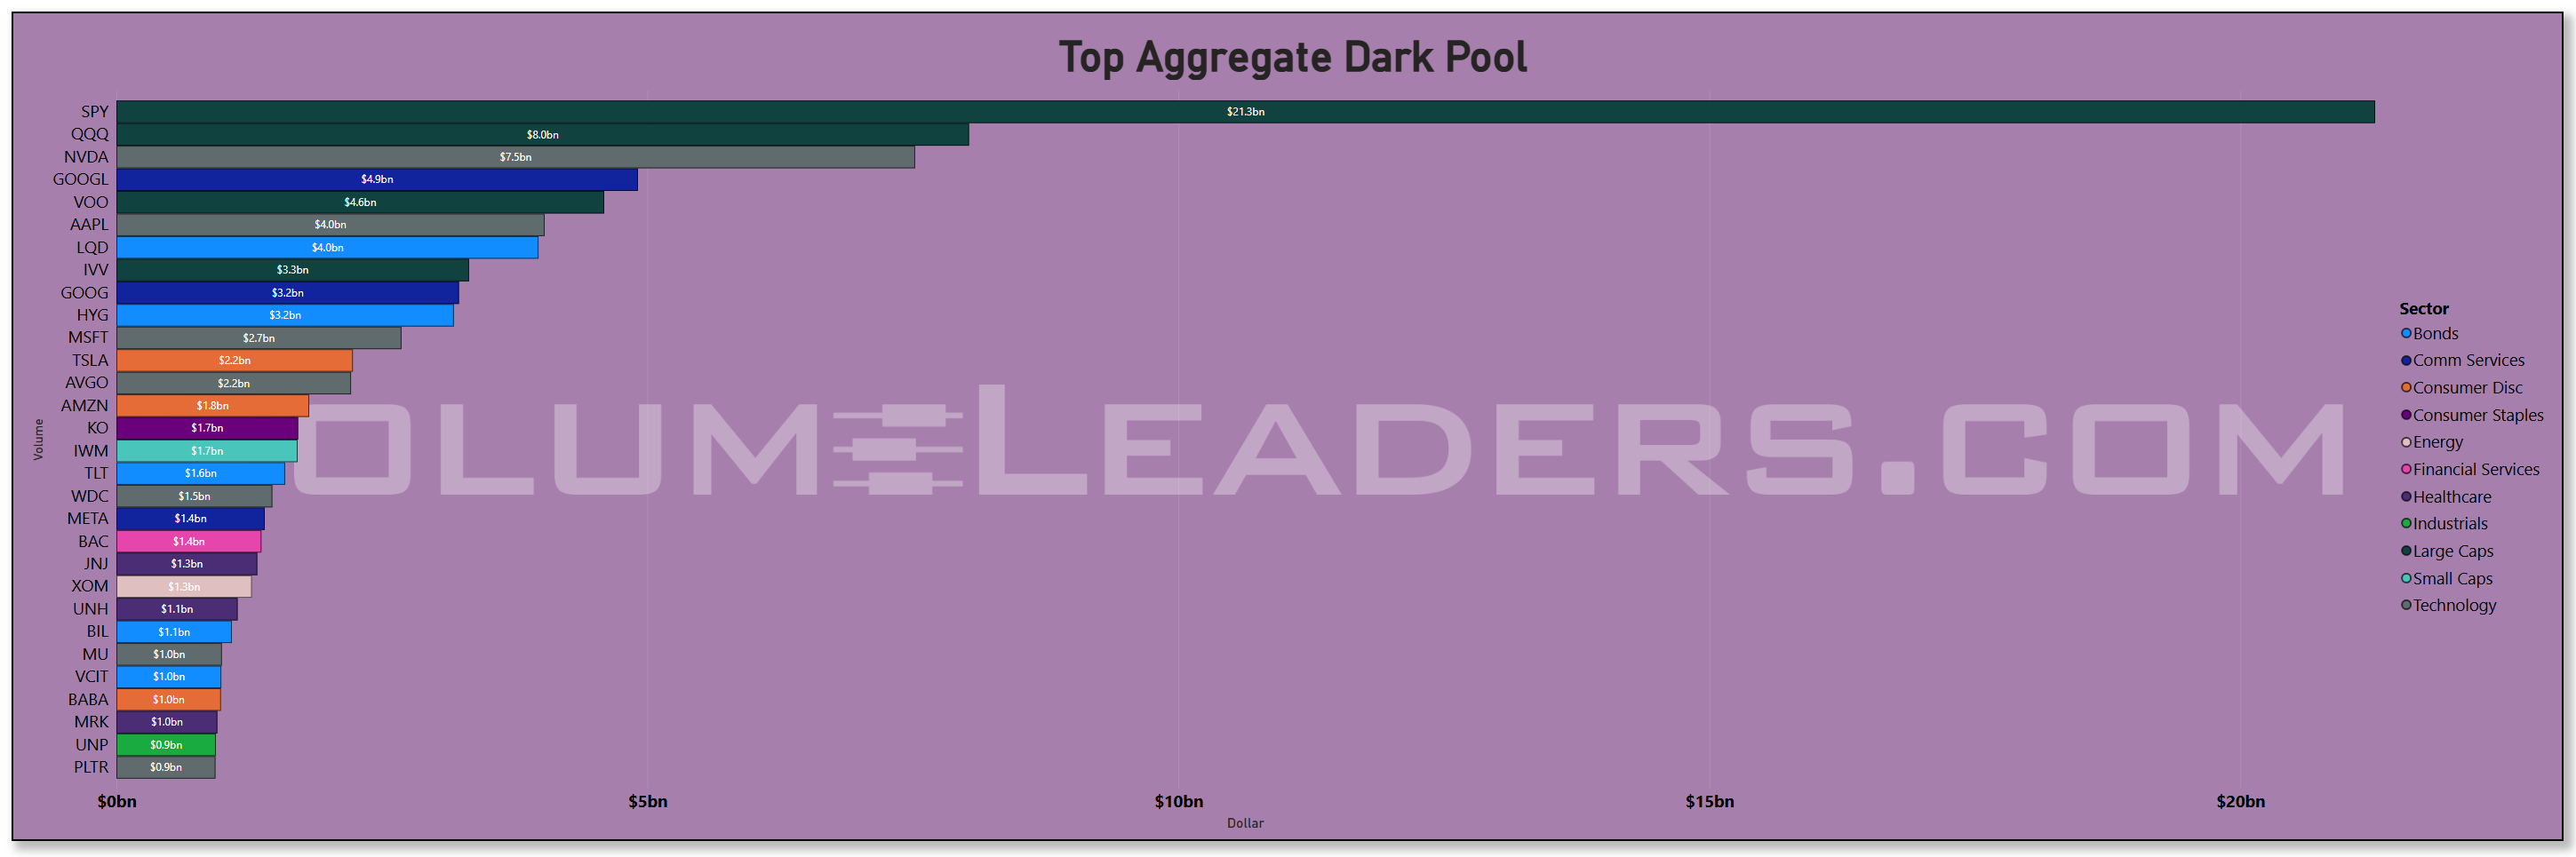
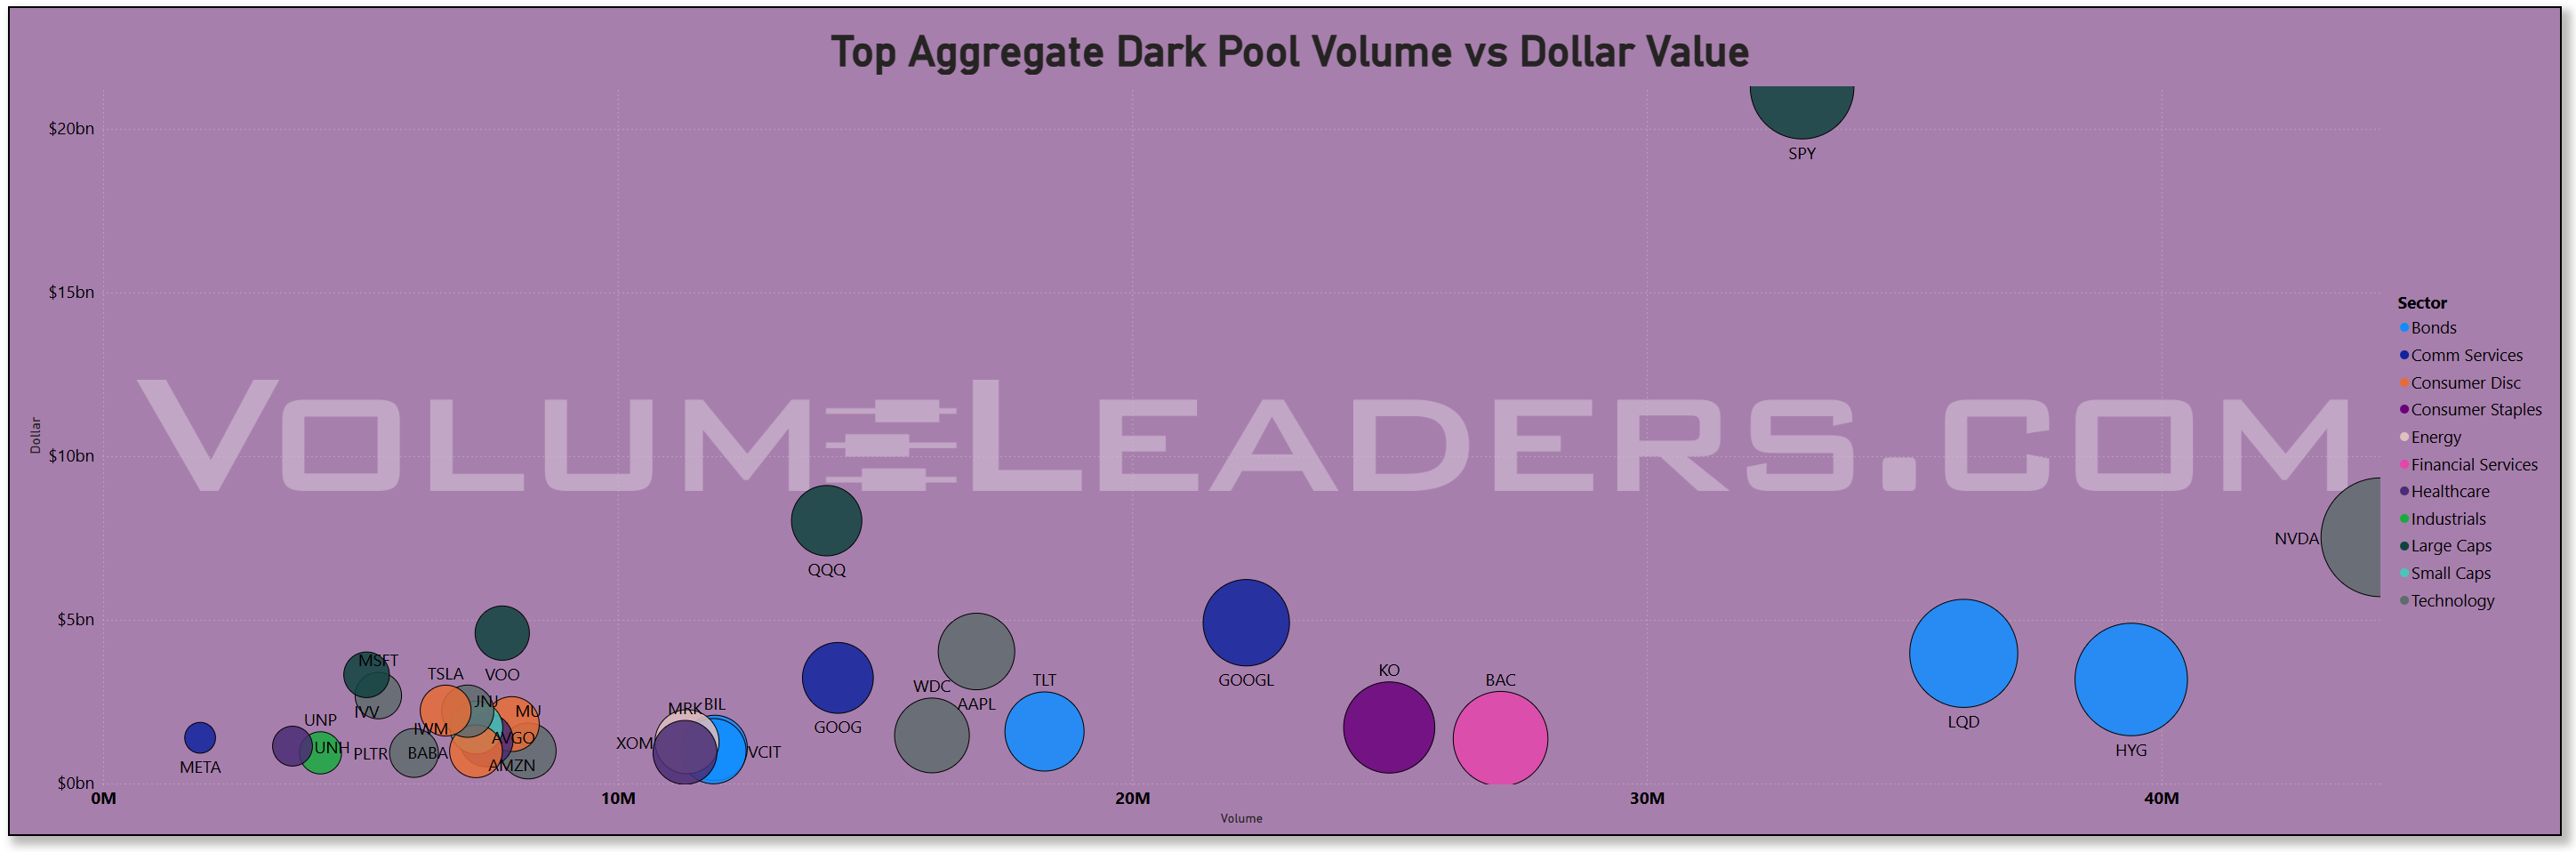
Dark pools are telling the same tale. The top slots are still filled by SPY, QQQ, and NVDA, but bonds are creeping higher (LQD, HYG, TLT), and KO shows up as well. That’s institutions balancing risk in quiet venues, keeping exposures but tilting them toward stability.
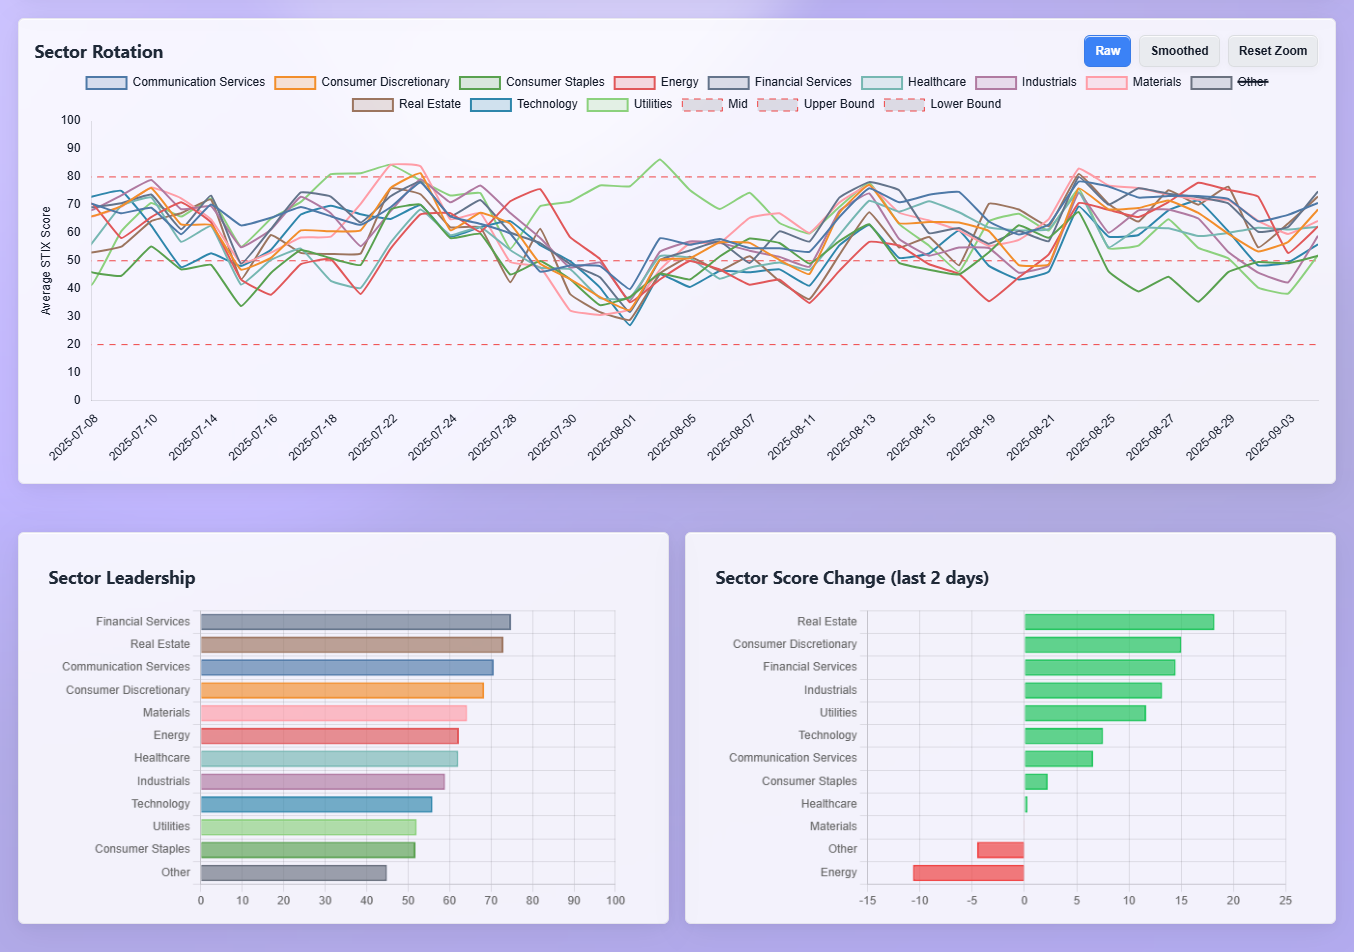
Sector rotation gives us the broad lens: breadth is improving, which we already noted in the benchmark section, but tech is lagging. Financials, real estate, and discretionary are gaining traction, while energy is slipping and defensives are holding firm. That’s a market that’s still willing to put money to work, but it’s not crowding into the old leadership. It’s a handoff, not an expansion.
One last wrinkle: index changes matter. MKTX, CZR, and ENPH are out of the S&P, while HOOD, APP, and EME are in. That’s not just trivia — passive flows will now be directed toward those replacements. APP in particular could see a liquidity tailwind as a result, which is worth keeping on your radar.
The bottom line: institutions aren’t pressing bets on tech anymore. They’re redistributing liquidity — into large caps, financials, bonds, and defensives. The sweep profile and dark pool activity both confirm it. Breadth is improving, but leadership is shifting. NVDA remains the elephant in the room, but the bigger theme is a rotation under the surface: a market leaning toward balance and distribution rather than expansion.
MIR Part 2: Individual Names From The Institutional Tape
VolumeLeaders tracks several proprietary signals designed to spotlight names drawing significant institutional interest. Below, we’ve surfaced the latest results and analyzed them in aggregate to highlight emergent themes. If any of the sectors, narratives, or positioning trends resonate, the names mentioned here offer a strong starting point for deeper research and watchlist consideration in sessions ahead.
VL Trade Rank Velocity™ (TRV)
TRV is a proprietary metric that measures the recent acceleration or deceleration in institutional trading activity for a given stock by comparing its average trade rank over the past few days to its average in recent weeks. A sharp improvement in TRV typically reflects a notable shift in positioning, often accompanied by sustained trade activity, suggesting institutions are actively engaging with the name and that intensity of activity is rising. This often precludes meaningful price or narrative shifts. This isn’t a buy-list or sell-list; it’s meant to draw your eyes to names where institutions are putting money to work.
At the top of the board, the message is clear: industrials, healthcare (especially biotech), and select materials are carrying the momentum baton.
Industrials: MTZ, GMS, ATGE, ZIM, EME, and others populate the upper decile. This isn’t just one pocket of the group; it’s spread across construction, machinery, transport, and even specialty manufacturing. Industrials have that classic “early-cycle” look when breadth improves and sponsorship rotates away from stretched leaders.
Healthcare/Biotech: ABVX, OLMA, CYBR (application software security, but grouped with biotech-type flows), GOSS, GRRR, EQIX — the list is long. Biotech looks like the “risk-on within risk” corner institutions are probing, with multiple small-to-mid caps showing sustained activity. This often happens when big tech sponsorship fades — funds move into biotech as the next asymmetric payoff sector.
Materials: GMS, EQX, HWM, KNF — a broad swath of building materials, metals, and mining names are emerging. That lines up with the tariff chatter and global trade uncertainty we flagged earlier. Institutions may be pre-positioning for a reflationary tilt or supply-chain reshaping.
Meanwhile, technology isn’t absent, but the quality of sponsorship looks different.
It’s the niche, infrastructure, and application names (GRRR, CYBR, LUNR, XERS) rather than the mega-cap generals. The TRV scores tell us sponsorship is probing down the cap stack, not reinforcing leadership in NVDA/MSFT/AAPL. That aligns with what we saw in institutional liquidity by sector — tech is still there, but not being pressed.
Another theme is financials creeping up: BAC shows up in the aggregate flows we noted earlier, but TRV highlights BCAT, NEWT, AGIM. It’s not the big banks yet; it’s the cap markets and niche finance players. That’s usually a prelude to broader sponsorship — smart money probing before scaling.
Finally, Energy is bifurcated. Tariff-related plays (DFIV, PARR, NEXT) appear with meaningful velocity, but the broader group is quiet. That’s selective, not thematic — hedges or policy-driven plays rather than broad allocation.
Narrative
Taken together, the TRV board says leadership is rotating — and it’s not into the usual suspects. Tech mega-caps are on pause; instead, sponsorship is spreading into industrials, materials, and biotech. That’s breadth expansion in the classic sense: funds are reallocating into sectors that benefit from early-cycle dynamics and potential policy or trade shifts.
Biotech’s surge looks like the speculative arm of this rotation, industrials and materials are the cyclical backbone, and financials are the early confirmation layer. Meanwhile, energy is trading more like a tactical hedge than a secular bet.
The emergent story is that institutions are laying groundwork for a regime where breadth matters more than index generals. If NVDA was the star of the first half, industrials and biotech may be the ensemble cast of the second.
VL Institutional Outliers™ (IO)
Institutional Outliers is a proprietary metric designed to spotlight trades that significantly exceed a stock’s recent institutional activity—specifically in terms of dollar volume. By comparing current trade size against each security's recent normalized history, the metric flags outlier events that may indicate sudden institutional interest but may be missed because the activity doesn’t raise any flags/alerts when comparing the activity against the ticker’s entire history. For example, it’s conceivable that a ticker today receives the largest trade it has had in the last 6 months but the trade is unranked and would therefore be missed by current alerts built off Trade Ranks. Use “Realized Vol” to identify tickers with large price displacement and to size your risk appropriately.
1. Scale of Outliers
At the very top, PRKS (Consumer Cyclical / Leisure) and GMAB (Healthcare / Biotech) stand out with 6+ sigma prints. These are not just routine flows — they’re statistically extreme allocations. That kind of signal tells us institutions are deploying meaningful capital into speculative or niche areas, even as headline indices tread water.
PRKS: consumer discretionary at the microcap/midcap level is rarely where you see sustained sponsorship — this looks tactical, maybe tied to discretionary spending resilience or hedging recession-lite scenarios.
GMAB and biotech cluster: multiple biotech names across the list (GMAB, AKRO, RIVN-related supply chain biotech, QURE, SNDX, CTLT, VYGR, etc.) point to a sector-wide allocation push. That fits perfectly with what TRV showed us earlier: healthcare and biotech are emergent leaders.
2. Industrials & Materials
A clear industrials and materials footprint shows up: GMS, JBT, MTZ, HWM, EME, EQX, PLSV (silver), MP (rare earths), MLNK (software but tied to industrial execution), and construction suppliers like KNF. These prints line up with the early-cycle narrative — funds are positioning ahead of potential infrastructure or reshoring booms.
The presence of PSLV (silver trust) alongside metals/mining outliers suggests a commodity tilt as hedge — not full-on gold/silver rotation, but selective positioning into real assets.
3. Technology & Software
Tech is present but narrower in focus: BRZE (software infra), EXFY (fintech software), RXT (REITs/datacenter exposure), and chip-adjacent names like WDC, NVDA, and AMD on smaller sigma. The absence of broad mega-cap participation confirms what we saw in sector flows: tech is no longer being pushed higher as a whole, but select niches are still getting sponsorship.
4. Financials
Financials are another emergent cluster: UBS, FHN, BK, LNC, JPM, COIN-adj exposures, and BAC’s earlier appearance. What’s interesting is that flows aren’t into broad XLF-style plays but into specific cap markets, banks, and insurance. That’s often the prelude to sector-wide rotation — institutions “test” liquidity in single names before scaling exposure to ETFs.
5. Energy & Utilities
Energy remains tactical: FTI, LNG, OXY, PARR, NRPX — but these don’t look like broad sector plays. They’re name-specific bets, tied either to policy (tariffs, trade) or project-level sponsorship. Utilities (FLC, NEE, DUK) show up more strongly, though — institutions may be quietly using them as yield-stability allocations while rotating cyclical risk elsewhere.
6. Crypto and Peripheral Risk
ETHD (Ethereum exposure) appearing here confirms a speculative tilt is alive. When breadth improves and biotech is strong, crypto often tags along. This looks like “risk barometer” behavior — institutions comfortable enough to deploy into fringes when liquidity is available.
Narrative
This week’s Institutional Outliers reinforce the same story we’ve been building:
Breadth rotation is real. Industrial and materials names keep surfacing across TRV and Outlier scans.
Biotech is the standout sector. Not just one or two names — a broad bench is drawing extreme flows.
Tech sponsorship is selective, not general. Niche infrastructure, semis, and data-tied plays are alive; mega-caps aren’t getting pushed.
Financials are stirring. Outlier activity is focused in single names, not the whole sector — early probes that often precede wider allocation.
Energy and metals look tactical, hedged plays, while utilities are providing a quiet anchor.
Even crypto (ETHD) got a seat at the table — a reminder that institutional risk appetite is broadening.
The takeaway: institutions are distributing away from index generals and into new leadership themes — biotech, industrials, and financials. Outliers show that the “new tape” is forming beneath the surface, even as benchmarks chop sideways.
VL Consensus Prices™
These are the most frequently traded #1-Ranked Levels in VL this week. Trades occurring at the highest volume price in a ticker’s history are significant because they represent institutional engagement at a key price memory level—where the market once found consensus. These areas act as liquidity hubs, enabling large players to transact efficiently, and often signal a reassessment of fair value. This activity may precede major moves, mark equilibrium zones, or reflect broader portfolio shifts, making these price levels important to watch even without yet knowing how price will resolve. (Note: many Bond products trade in such a tight range that they dominate the top positions and are therefore omitted to provide better clarity around other flows. The bonds data is still available in the VL platform.)
If we step back and look at the list, the first thing that jumps out is how concentrated sponsorship still is in the “usual generals” — AAPL, AMZN, NKE, NU, CVX, AES, EXC, BP — but the twist here is breadth under the surface.
1. Energy & Utilities Anchoring the Tape
Utilities and energy dominate the upper half of the sheet. AES, EXC, NEE, CVE, DNN, MUR, MGY, PSX, IXC — all show up with size. What this says is institutions are still parking capital in cash flow reliability and real assets. It’s less about betting on explosive growth and more about owning ballast into CPI/PPI week.
Notice too the balance: EXC and NEE on one side (regulated stability) versus CVX, MUR, PSX on the other (upstream cyclicals). That’s hedged positioning, not one-way bullishness.
2. Tech – Selective, Not Broad
Tech’s presence here is thinner than it was a few months ago. You’ve got AAPL, UMC, HLIT, TWLO, ESTC, MLNK — but this isn’t the wall-to-wall buying we saw in the spring. Consensus here is very much niche software and semi-adjacent. The read: Institutions aren’t abandoning tech, but they’re narrowing scope, looking for idiosyncratic winners instead of paying up for the whole sector.
3. Real Estate Rotation
Multiple REITs make this list — AGNC, GLPI, NNN, DX, RYN, TRNO, EXR, CUBE, IRM, VRE. That’s a lot of property exposure for one week. Some of this is rate-sensitivity (a hedge against long-end yields stabilizing), but it also signals rotation into income-bearing assets. In short, REITs are back on radars after being abandoned most of the year.
4. Financials – Quiet but Present
Consensus clustering in NU, XP, SOFI, OWL, IBKR, BX, JPM, WAL, AUB, CURB, BUR points to incremental financial sector accumulation. It’s not the size of tech or energy, but it lines up with what TRV and Outliers showed us: financials are stirring beneath the surface, and institutions are quietly getting positioned.
5. Industrials – Breadth Without Splash
This is where consensus shows its breadth. MTZ, JBI, CARR, TTC, MWA, RXO, BIZD, PRGS, IEX, MIDD, SBLK, NDSN, AAON — that’s a long bench of industrials, building products, machinery, and transports. It reads like early-cycle positioning — money prepping for a pickup in capex, construction, and infrastructure spending. It’s not a high-conviction blast yet, but the foundation is there.
The Read
When you stitch this together, consensus pricing shows institutions:
Defensive where they need to be (energy, utilities, REITs).
Selective where they want exposure (niche tech/software, industrials).
Broadening into financials — quiet but notable.
It’s not speculative like TRV’s biotech surge or Outliers’ crypto prints. This is core positioning, the kind of baseline allocations funds can sit on.
The narrative: Consensus is less about chasing upside and more about building stability. Institutions are anchoring in utilities, energy, and REITs while quietly diversifying into financials and industrials. Tech is no longer a broad “buy everything” — it’s a sniper’s market.
MIR Part 3: Framing-Up A Trade
If we zoom out across Consensus Levels, Outliers, and TRV, the institutional story taking shape right now is one of rotation away from broad beta and toward selective alpha.
Consensus allocations show us where books are anchored. Here, the heavy ballast remains in utilities, energy, and REITs — sectors that provide stability and yield. That’s not an accident. Liquidity has been fading since the MSCI rebalance, and institutions are clearly content to sit on dependable exposures that carry less market risk. Even within tech, consensus positioning has narrowed — the blanket overweight in semis and software that drove leadership earlier this year has given way to a more measured, selective stance.
But the Outliers tell us the other half of the story. Outlier flows highlight where consensus is being challenged — where stress and opportunity collide. This week, the dollar value outliers came in consumer cyclicals and specialty retail, biotech, and metals/mining. It’s not coordinated, but it is revealing. We’re seeing large one-off bets in places that either benefit from tactical macro turns (consumer spending, discretionary) or serve as hedges against policy and inflation risk (metals, materials). Biotech’s appearance across multiple outlier prints shows that institutions are willing to fund riskier growth plays, but they’re doing it opportunistically rather than as part of a broader allocation.
That leaves TRV, which is where we find sustained conviction. TRV leadership this week was biotech, industrials, and niche consumer retail. These are not the sectors you’d expect if institutions were positioning purely defensively — they’re thematic, cyclical, and in the case of biotech, outright speculative. The contrast here is striking: institutions are defensive in their core (consensus), opportunistic at the edges (outliers), but where they’re pressing conviction (TRV) it’s in areas that look a lot more like selective alpha than passive beta.
The takeaway is that institutions are building ballast while rotating toward targeted themes. They’re insulating portfolios with utilities, REITs, and energy while simultaneously pressing into biotech, industrial rebuild plays, and select consumer niches. Tech is still in the mix, but no longer the rising tide that lifts everything — participation has narrowed to select names rather than the entire sector.
In plain English: institutions are telling us they’re done with chasing broad market exposure. The game now is selectivity — protecting the core while seeking asymmetry in pockets that can deliver outsized returns relative to the risk.
If I were trading this positioning story, I’d be thinking in layers.
First, I’d respect what consensus is telling me — that means keeping ballast in utilities, energy, and REITs. They’re not sexy, but they’re serving a purpose: absorbing liquidity bleed and anchoring portfolios. If institutions are parking capital there, I want some of that ballast in my book too.
Second, the TRV names point me to where the real conviction lies. Biotech and industrials stand out. Biotech is always noisy, but when it shows up consistently across TRV and outlier lists, I pay attention — it’s telling me risk is being funded there. Industrials, meanwhile, are giving me a cyclical read: whether it’s construction, machinery, or materials, the bid is there. If I’m leaning into offense, this is where I’d be putting chips on the table.
Third, the outliers are my feelers — places where institutions are probing but not yet committing en masse. That’s consumer cyclicals, metals, and selective retail. These are the early tells of rotation, and I’d want a starter position in some of these to see if they get sponsorship. If they do, that’s my confirmation.
On the hedge side, I’m cautious about tech. Consensus positioning has narrowed and TRV is not supporting it. I wouldn’t short tech outright — too dangerous — but I’d treat it as a funding leg. If I’m long biotech and industrials, I can pair that against underperformers in semis or software that have lost sponsorship.
For invalidation, I’d watch liquidity. If daily institutional liquidity perks back up meaningfully, the defensive consensus exposures become less relevant and broad beta could reassert. But if liquidity keeps grinding lower, then the barbell of ballast plus selective alpha remains the right posture.
So to sketch it simply:
Core ballast: utilities, REITs, energy.
High-conviction longs: biotech, industrials.
Tactical probes: consumer cyclicals, metals/mining, niche retail.
Funding leg / hedge: select tech where sponsorship has faded.
Key tell: whether liquidity rebuilds or continues to fade.
That’s how I’d be trading this tape right now — selective, asymmetric, and always aware of where institutions are hiding versus where they’re pressing.
Thank you for being part of our community and for dedicating your time to this edition. Your insights and engagement drive everything we do, and we’re honored to share this space with such committed, thoughtful readers. Here’s to a week filled with clear opportunities and strong performance. Wishing you many bags 💰💰💰
—VolumeLeaders