Market Momentum: Your Weekly Financial Forecast & Market Prep
Issue 57 / What to expect Aug 18, 2025 thru Aug 22, 2025

NOTE: This weekly periodical is too large for Substack to deliver in its entirety via email - you will only see a portion of this great content if you read from your email client. Click the header/title at the top to read the full article!
In This Issue
Weekly Market-On-Close Report: All the macro moves, market drivers, and must-know narratives—covered in less than five minutes.
Weekly Benchmark Breakdown: Our weekly intelligence report on major indices cuts through the index-level noise to uncover participation, momentum, and structural integrity and tell you whether markets are rising on solid ground or skating on thin breadth. This is where bull markets prove themselves—or quietly start to unravel.
The Latest Investor Sentiment Readings: Track the emotional pulse of the market with our curated dashboard of sentiment indicators. From fear-fueled flight to euphoric overreach, this week's readings reveal whether investors are cautiously creeping in—or stampeding toward the exits.
Institutional Support & Resistance Levels For Major Indices: Exactly where to look for support and resistance this coming week in SPY, QQQ, IWM & DIA
Normalized Performance By Thematics YTD: Which corners of the markets are beating benchmarks, which are overlooked and which ones are over-crowded!
Key Econ Events & Earnings On-Deck For This Coming Week


Weekly Market-On-Close Report
The Week Markets Pivoted From “Soft Landing Cosplay” to “Don’t-Jinx-It” (and Why Breadth Finally Mattered)
If you only glanced at the closing tape on Friday, you could miss the story. Headline indices meandered: the S&P 500 slipped, the Nasdaq underperformed a touch, and the Dow eked out a gain. Under the surface, it was the kind of week technicians circle with a Sharpie. Leadership broadened early, cyclicals and smaller caps carried the baton for once, and then a hotter-than-expected wholesale inflation print forced everyone to recalibrate just as traders started gaming out September rate-cut odds and watching geopolitics out of Alaska.

Let’s build the picture from the tape up, then layer in the macro and policy context that shaped the path of least resistance.
Price First: A Market That Tried to Rotate—Then Hit a Data Speed Bump
We kicked off with breadth. Early in the week, the Russell 2000 ripped on the CPI release and hopes for a September cut; by midweek, major indices—not just megacap-heavy benchmarks—were printing or flirting with fresh highs, a rare case of “upside confirmation” from laggards rather than just the usual suspects. New closing highs for the S&P 500 and Nasdaq printed on Tuesday/Wednesday, while the Russell 2000 logged one of its best days since May as the “lower-for-longer-ish” narrative got air under its wings.
That was the sweet spot—right until Thursday’s PPI landed. The wholesale inflation splash was not subtle: July final-demand rose 0.9% m/m, the strongest monthly print in over three years, with services doing much of the lifting. The move clipped the rotation, nudged yields higher, and took some air out of the “go big” rate-cut chatter. (We’ll come back to the mechanics in a moment.)
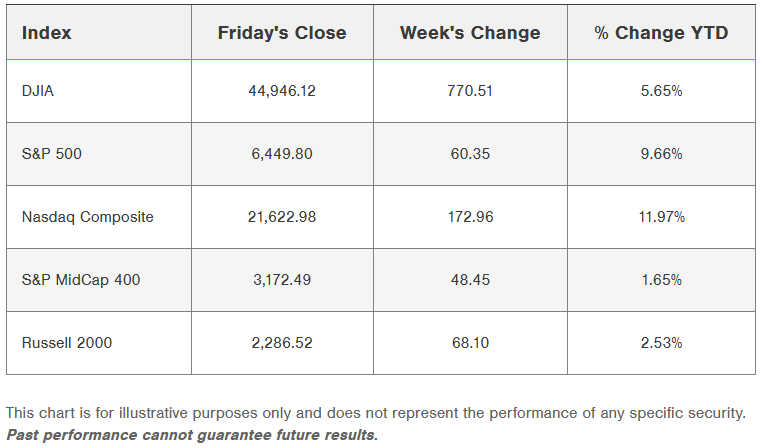
By Friday, the market had morphed into “data-dependent in real time.” Retail sales were fine—not a barnburner, but resilient—while August’s preliminary University of Michigan sentiment surprised negatively and, more importantly, showed inflation expectations backing up. Net of it all, the tape looked indecisive into the close: Dow up a hair thanks to a few idiosyncratic winners, S&P and Nasdaq off a bit, breadth mixed, and leadership muddied by the clash of cyclical hope and services-inflation reality. Most outlets captured the “up on the week despite a wobbly Friday” storyline; the weekly scorecard showed small caps leading, further proof that rotation was more than a one-day wonder—even if it got dented late.
Technically, that’s what matters: when an attempted hand-off—from AI-centric megacaps to “the rest of the market”—survives a macro pothole, even if it limps. You don’t call it a new regime in one week, but you do respect the effort.
Inflation: Two Prints, Two Stories—and Why Services Stole the Show
Let’s parse the inflation sequence because it’s the spine of the week’s repricing.
CPI (Tuesday): Headline stayed contained; core firmed a touch. The broad takeaway was “no upside shock.” The y/y core CPI edged up to ~3.1% on firmer services categories (airfares, medical, repairs) while tariff-sensitive goods were mixed. Markets read that as “good enough” to keep September in play and—critically—not a smoking gun that tariffs had immediately blown up consumer prices.
PPI (Thursday): The wholesale side did surprise—0.9% m/m on final demand, with the ex-food/energy/trade gauge up 0.6% m/m (a hotter-than-comfortable monthly pace). That one number did more to cool the “maybe 50 bps” chatter than any Fed speech could. Why technicians care: producer-price heat in trade/other services often bleeds into margins and, with a lag, into PCE. It’s also where any pass-through from import costs or tariff frictions tends to hide. The BLS release sums up the magnitude and composition of the move.
Import prices (Friday): Add a quiet supporting actor: import prices rose 0.4% m/m in July, a reminder that even before any renewed tariff salvos hit consumer shelves, pipeline costs can tilt upward. Pair that with stronger producer prices and you’ve got a market that—justifiably—dialed back the probability of a jumbo cut.
My read through a technician’s lens: CPI let the risk bid run; PPI reminded traders there’s still a ceiling overhead. You could see that directly in rates (steeper curve into week’s end) and in factor swings (early cyclicals/SMIDs strength, later defensive creep).
Growth & the Consumer: Sturdier Than the Vibes (for Now)
No one should be shocked that retail sales were fine. Headline July sales rose 0.5% m/m, with June revised up to 0.9%—net “okay.” Control group (the GDP-relevant slice) matched the +0.5%. That tells you the consumer hasn’t tapped out, even if the composition is shifting at the margin.
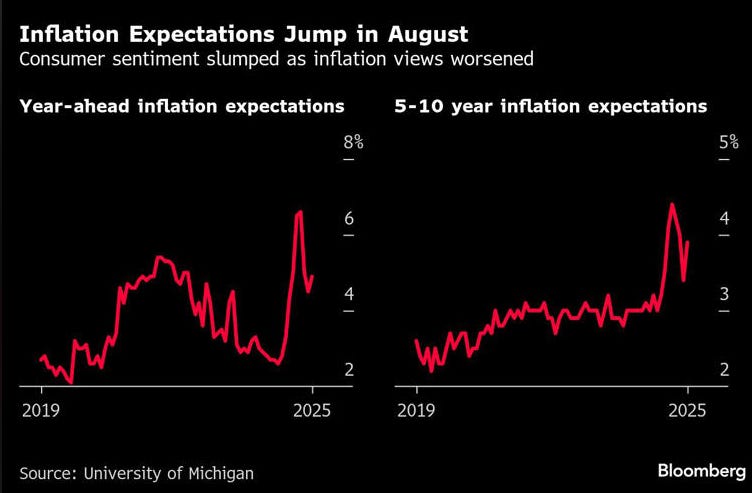
The sentiment backdrop is a different vibe. The University of Michigan’s preliminary August sentiment fell to 58.6 with 1-year inflation expectations up to 4.9% and 5–10-year up to 3.9%. The level isn’t destiny, but when expectations tick higher into tariff chatter, it’s a good way to spook duration and the “go-big” doves.
Add a couple of production data points: Industrial production was essentially flat in July, and the Empire State manufacturing headline surprised to the upside at 11.9 (a volatile index, yes, but better breadth under the hood). The bundle says “resilient with pockets of softening”—not a recessionary setup, but not a slam-dunk disinflationary one either.
The Fed: A Market That Wants to Front-Run, and a Fed That Won’t Be Rushed
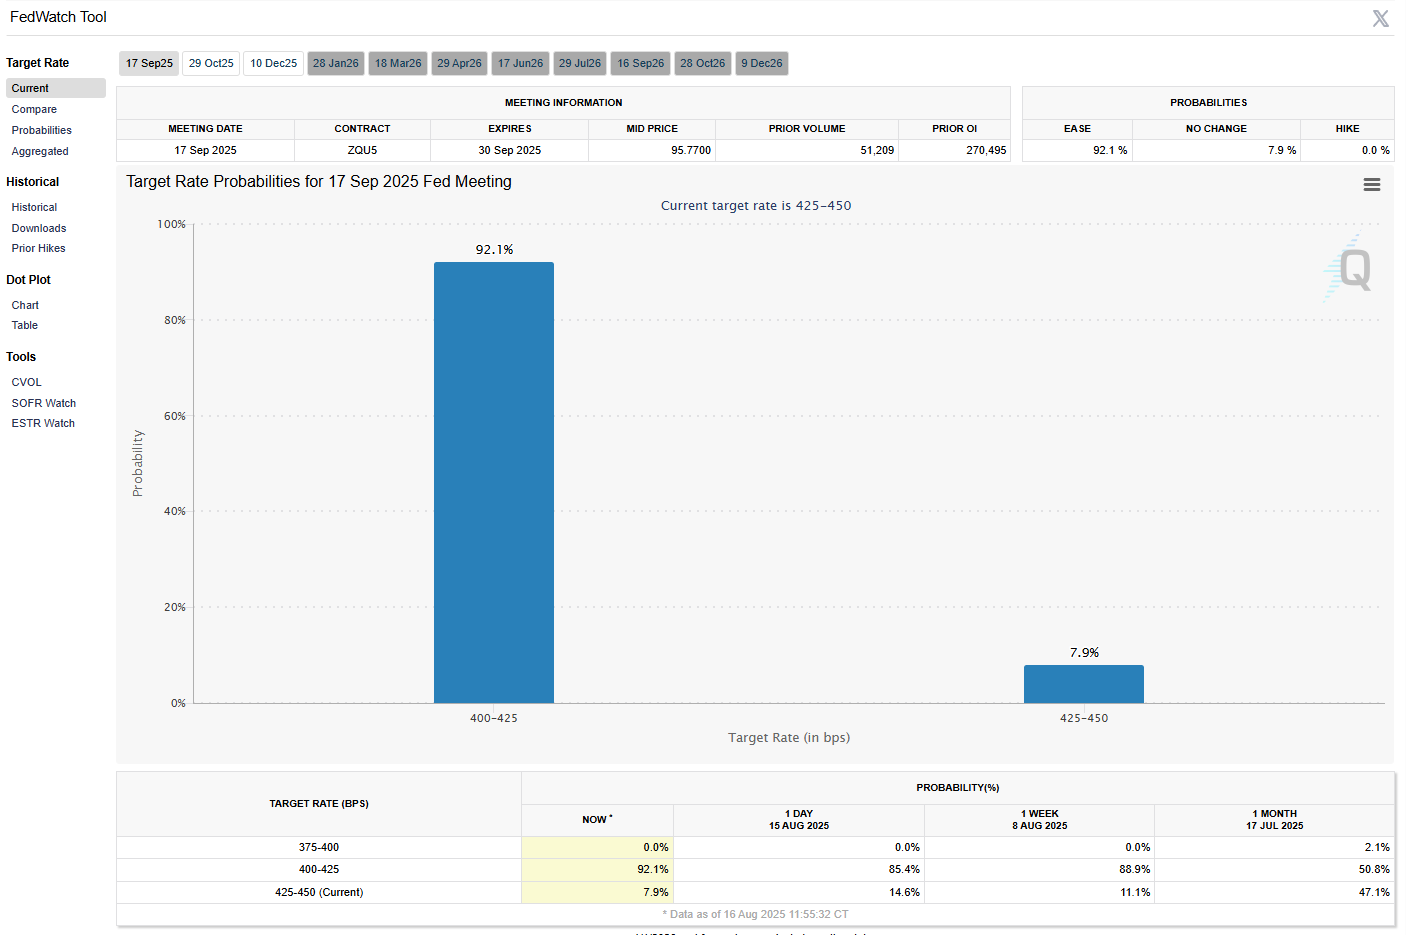
By midweek, fed funds futures were essentially pricing a September quarter-point—and flirting with higher odds after CPI—before PPI took the 50-bp daydream off the table. Most trackers had probabilities wobbling in the ~80s–low-90s% zone at various points, but the common thread is this: the market wants “insurance” easing, not a rescue cut.
Then came the human element: Chicago Fed President Austan Goolsbee signaled he’s open to cutting if the next wave of data cooperates, but he also flagged the same thing technicians saw in the charts—the stickiness in services inflation—and explicitly asked for “one more” inflation read to check that we’re still on the “golden path.” Translation: September is live, but you don’t earn it with wishful thinking.
That’s how you get a market that rallies on Tuesday, breathes out on Thursday, and ends the week braced for Powell’s Jackson Hole tone-setting. Optionality is the name of the game; the charts reflect it.
Policy Shock Absorbers: Tariffs, Truce Extensions, and “Pay-to-Export” Chips
You can’t analyze this tape without running through the trade/policy sequence that framed the week.
1) A 90-day U.S.–China tariff truce extension. That headline helped kick off Monday’s tone: the immediate, mechanical risk of near-term tariff escalation receded. It wasn’t an “all clear,” but it was a real-world reprieve (particularly for retailers staring at Q4).
2) The India shock. Separately, the administration imposed an extra 25% tariff on Indian imports, pushing some lines to as high as 50%—a significant move both politically and for supply-chain math over the next several quarters. Reuters has the details and timing.

3) The semis precedent. Most unusual of all: Nvidia and AMD agreeing to remit 15% of China-related AI chip revenue to the U.S. government in exchange for export licenses on specific “de-rated” accelerators (think Nvidia H20, AMD MI308). Whatever your view on the policy, the market view is simple: it’s a new, material variable in margin modeling and China exposure risk. Truly novel.
Those three threads together explain the week’s factor turbulence: relief where near-term tariff risk eased, valuation friction where policy bled into fundamentals (semis), and an implied bid for domestically oriented or rate-sensitive pockets (homebuilders, regional banks, selected services) when CPI didn’t blow up the “cut in September” case—at least for 48 hours.
Semis: Rotation, a Guidance Air-Pocket, and the Politics of Capacity
Chip equipment and foundry-adjacent names had a rough Friday. Applied Materials cut guidance and pointed at weaker China demand; the stock sank double digits, with peer equipment names falling in sympathy. That’s textbook index-level drag in a market that had already been digesting an August policy overhang.
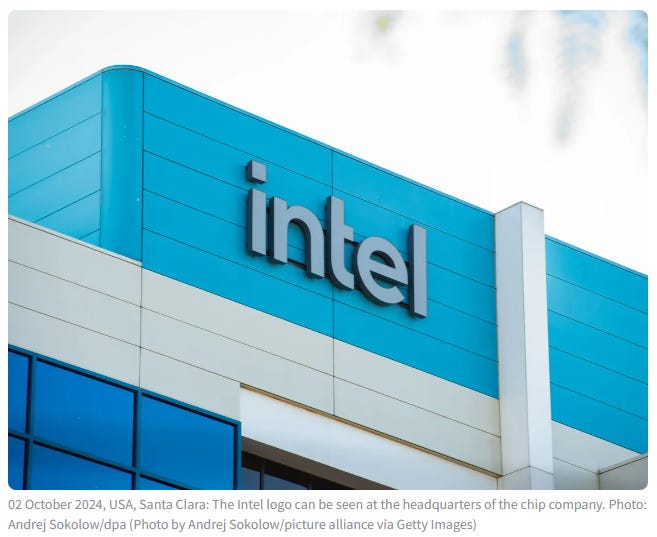
At the same time, investors spent the week gaming out the export-license revenue-share deal (15% to Treasury) alongside chatter about the government potentially taking an equity stake in Intel via CHIPS Act constructs—another unprecedented step if it proceeds. The contours in broad strokes: semis are no longer purely “earnings and TAM” stories; they are policy assets on a more explicit leash. Technically that means you fade breakouts into binary policy windows and buy oversold setups after you’ve seen how Washington writes the next rule.
Zooming out, remember the DeepSeek shock from January—when an open-weights Chinese model hit the tape and Nvidia fell ~17% in a single session, triggering a global AI factor de-gross. That episode reset everyone’s positioning “VAR” instincts in AI land; you could feel those muscle memories kicking in again when AMAT guided down and policy headlines re-accelerated this week. There are some good roundups of both the original selloff and the more recent model-launch delays tied to Huawei chips (which, paradoxically, underscore how entangled U.S. tech still is in the underlying stack) circulating if you’re interested.
Idiosyncratic Flows: The Dow’s Quirky Boost and Health Care’s Cameo
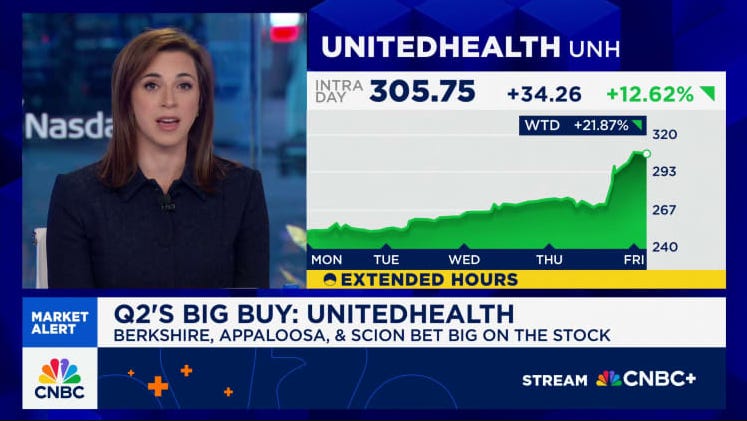
The Dow printed an intraday record during the week, helped by an unusual two-stock shove: UnitedHealth ripped on 13F headlines (Berkshire’s new stake; other whales adding), while a couple of software and staples names posted defensible reactions to results and guidance. The UNH-led push and the Dow’s outperformance versus the growthier indices on Friday was interesting to watch but for the narrative it’s worth reminding that the Dow’s price-weighting means outsized moves in a few heavy stickers can carry the whole.
Health care, more broadly, benefitted from the “breadth experiment” this week—part defensive ballast, part relief rally in high-quality pipelines, and part “where do I hide if tariffs tilt my tech multiples?” No regime change on one week of price action, but the factor work says it’s not just a squeeze.
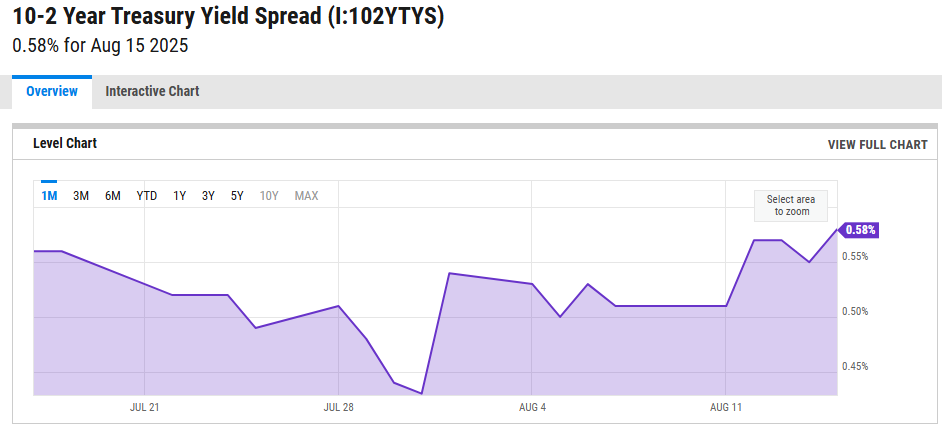
Rates & Curves: A Controlled Steepening, Not a Tantrum
PPI pushed long yields higher into the weekend while front-end expectations remained pinned to the September debate. That is a bear-steepening you can live with: a market saying “the Fed can cut later, but not too fast; growth isn’t cracking; services inflation is sticky.” The post-PPI repricing saw the 30y lead the move, while 2s/10s flattened earlier in the week and steepened again after the data—the sort of choppy, range-bound behavior you expect when policy is near a pivot but inflation refuses to drift cleanly lower. (For all the talk of cuts, multiple trackers still show September priced as a quarter-point base case, not a rescue.)
For positioning, the signal is straightforward: keep duration balanced (7–10y “belly” still screens best on carry/convexity for many mandates) and let the data earn the next leg. This isn’t the tape to force big curve bets into Jackson Hole risk.
The Global Overlay: China’s Slowdown Data and Why It Matters to U.S. Multiples
China’s July macro suite underscored a downshift: retail sales +3.7% y/y, industrial production +5.7%, jobless up to 5.2%, and property investment still deeply negative ytd. “Weaker than expected” was the theme across financial publication runs, and it matters here for two reasons: (1) the global growth impulse isn’t your friend if U.S. policy stays tight; (2) the “made-in-China deflation export” effect helps your goods disinflation narrative while complicating the services story. That mix is exactly what U.S. risk assets “felt” this week.
There’s also the tech supply chain angle: Beijing reportedly nudged local firms to avoid certain U.S. accelerators even as DeepSeek itself hit walls trying to train on domestic chips—FT covered the delays and the policy nudge. That contradiction (policy push vs. hardware reality) is why the semis graph is a mess of cross-currents right now.
Geopolitics, Oil, and Why Alaska Showed Up on Trader Runbooks
Markets spent the back half of the week half-watching the Trump–Putin summit in Alaska. No cease-fire deal emerged, but the outline of proposals and the next-steps choreography (Zelenskyy to Washington; Europeans looped in) were clear enough for energy traders to handicap near-term supply risk. The oil desk’s consensus: headline risk, not barrels risk—for now. If you’re mapping that to equities, it’s “no bid to the oil shock premium yet,” which is exactly what showed up in cyclical relative strength midweek.
The bigger point for risk is uncertainty duration: as long as the process drags with sporadic hard headlines, you’ll see periodic reversals in defense/aero and European cyclicals without a clear trend. Fold that into your stops, don’t build your core book around it.
Earnings Temperature Check: Not a Disaster, Not a Moonshot
Inside the S&P, the blended growth rate for the quarter continues to drift above preseason estimates as beats outnumber misses. Where the market punished, it punished guidance (AMAT the poster child) and policy-sensitive stories with incremental China or tariff exposure. Where it rewarded, it rewarded durable cash flow plus clean balance sheets—which is why some health care and select staples looked better than the macro backdrop alone would imply.
From a technician’s standpoint, that’s healthy. It says the tape is discriminating, not blindly chasing beta. Maybe fundamentals do matter a little right now.
The Technician’s Map: Levels, Leadership, and What Would Confirm the Rotation
Breadth: The early-week advance came with improved advance/decline figures and better up-volume ratios; Thursday’s puke dented, but did not erase, those gains. What I want to see next week is whether equal-weight outperforms cap-weight on up days—if yes, the rotation has a real shot.
Factors: Small/mid and value/cyclicals vs. megacap growth is still a tactical trade, not a secular call. Into Jackson Hole, my bias is to fade extremes: buy quality SMIDs on PPI-type lurches, and sell crowded megacap rallies into resistance unless semis reclaim their 20-day on volume.
Rates-sensitive pockets: Homebuilders and regional banks tend to track real yields and the belly. If Powell guides to a glide-path (not a plunge) and the 10y holds in a 4.0%–4.5% neighborhood, those groups keep a bid. If the long end runs on services heat, let them come to you—no need to be a hero.
Semis: This is the tricky one. The policy tax (15% skim on China sales) and equipment demand resets argue for accumulate on weakness, trade around levels rather than fresh breakouts - consult your VL charts for prices with demonstrated institutional interest. For the higher-beta AI cohort that most benefits from index-level flows, you still have to respect January’s DeepSeek lesson: de-gross quickly when the crowd does.
The Week’s Five Most Market-Moving Facts
Wholesale inflation surprised hot: July PPI +0.9% m/m, strongest since 2021; services were the driver. Markets chopped rate-cut odds for a 50 bp move.
Consumer inflation was “good enough”: July CPI kept headline contained while core rose on services; no tariff shock in goods yet.
Retail sales resilient: July +0.5% m/m, June revised to +0.9%—consumer still spending.
Sentiment deteriorated; expectations ticked up: Michigan prelim 58.6, 1-yr expectations 4.9%, 5–10-yr 3.9%.
Policy shocks shaped factor moves: 90-day tariff truce with China, India’s tariff jump (to as high as 50% on some lines), and the 15% revenue-share on China AI chip sales for Nvidia/AMD.
How I’m Synthesizing It (Without Overreaching)
Macro: The U.S. remains in “resilient growth with sticky services inflation.” CPI let markets lean dovish; PPI reminded them not to sprint. That’s why the curve steepened modestly and why the Fed-sensitive odds settled into a quarter-point base case for September rather than a lunge for 50 bps.
Earnings: Beats continue to outnumber misses, but forward commentary—especially where China demand and policy intersect—now matters more than the headline EPS delta. AMAT’s guide is a template - get your head on a swivel.
Policy: A truce is not a treaty. The 90-day pause buys time; the India tariff shock and the chips revenue-share deal prove policy can insert basis-point-sized holes in valuation on short notice. Build that optionality into position sizing.
Geopolitics: Alaska ended without a cease-fire. Energy traders marked it “watch, not trade” for now. Equities did the same.
What Would Change My Mind (Signals to Watch Next)
Powell at Jackson Hole: If he validates “insurance-cut soon, glide-path after,” the breadth-trade gets a second wind. If he leans hard into services stickiness and optionality, expect a rates-led growth wobble that favors quality over beta.
Next inflation batch: Goolsbee’s “one more report” framework is the market’s framework. Another hot services print would cheapen front-end easing bets and weigh on rates-sensitives.
Policy headline risk: Any wobble in the chips revenue-share mechanics or new categories added to the tariff menu would be a volatility accelerant for semis and multinationals with China/India linkages.
China data glide-path: If retail sales/production continue to miss, expect more “global growth chill” spillovers—good for goods disinflation, awkward for cyclicals.
Bottom Line (and a Positioning Sketch, Not Advice)
Core equity posture: Stay long core U.S. exposure but rebalance toward areas that benefit if breadth persists—quality SMIDs, select cyclicals with balance-sheet strength, and health care franchises with cash-flow visibility. Let megacap growth work as your “index beta,” not your only bet.
Semis: Trade them, don’t marry them, until policy volatility is priced—not just discussed. Favor names with domestic capex visibility over policy-sensitive China revenue fractions.
Rates: Keep the belly as your duration anchor; add on backup toward the top of the recent 10-year range if Powell doesn’t shut the door on September.
Risk management: Use Thursday as a template—into hot prints, lighten cyclicals and high beta; on relief, rebuild with tighter stops.
This week was the market’s first serious attempt in a while to share the load beyond seven tickers. It held up, barely, against a punchy PPI and a noisier policy backdrop. For technicians, that’s enough to keep the “broadening” thesis as the default into Jackson Hole—provided the next services inflation read doesn’t turn a speed bump into a roadblock.

Weekly Benchmark Breakdown
The market’s breadth picture this week paints a nuanced story—one where surface-level resilience hides some uneven undercurrents.
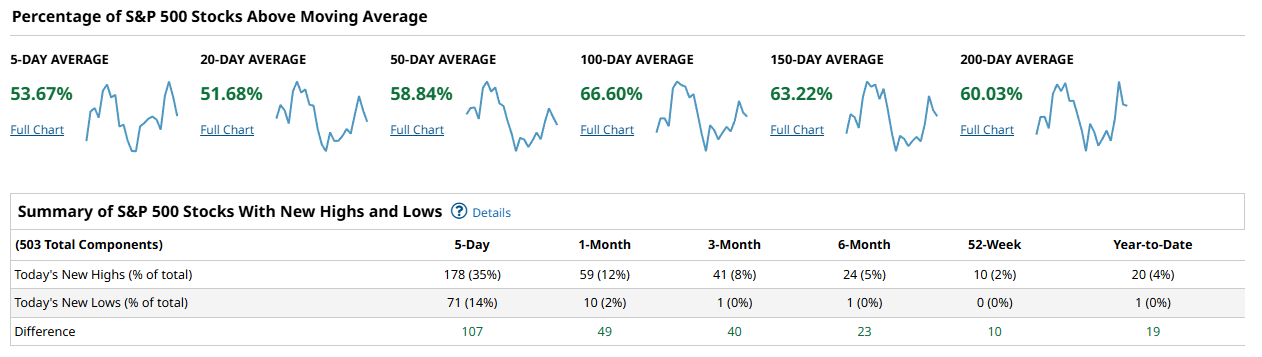
Starting with the S&P 500, just over half of components are holding above their 5- to 20-day moving averages, but strength improves meaningfully over the longer windows, with nearly two-thirds above the 100- and 150-day marks. That tells us the index has decent structural integrity but is consolidating in the near term. The kicker is the surge in new highs—178 stocks in the last five days—suggesting leadership pockets are still pressing higher even as plenty of names lag.
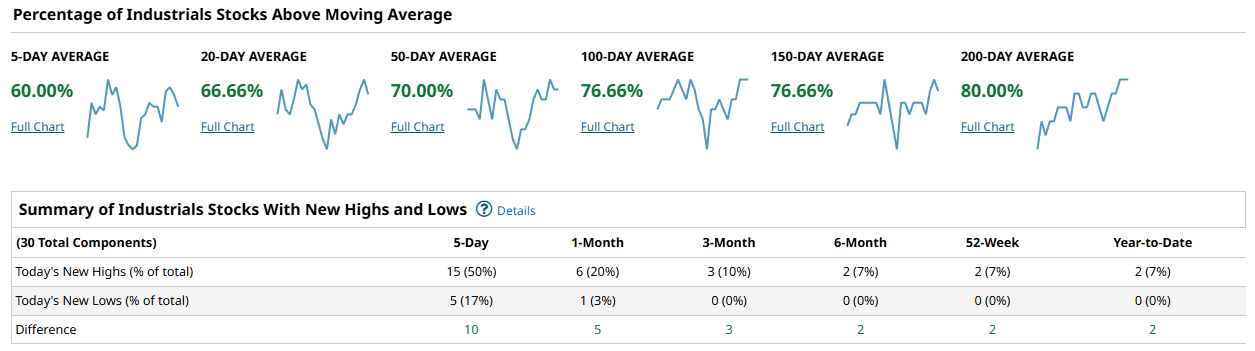
The Dow Industrials (captured here by the industrials slice) look considerably healthier. Between 70% and 80% of components are above their medium-to-long-term averages, with very few printing new lows. This is what “quiet strength” looks like—more participation, less drama, and steady accumulation.
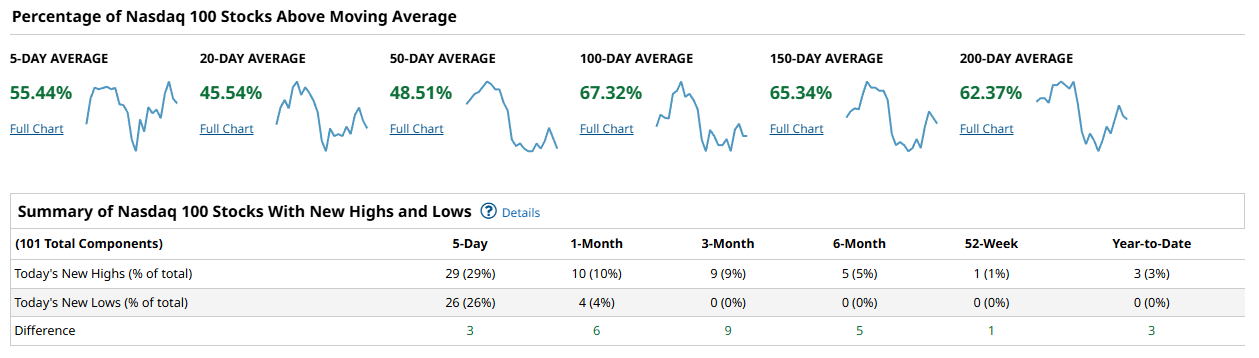
Contrast that with the Nasdaq 100, where the picture is more strained. Less than half the index is above its 20- or 50-day averages, and the balance between new highs and new lows is razor thin—29 versus 26 over the past week. Big-cap tech leadership is keeping the index afloat, but the foundation is narrow, and that’s often when volatility lurks beneath the surface.
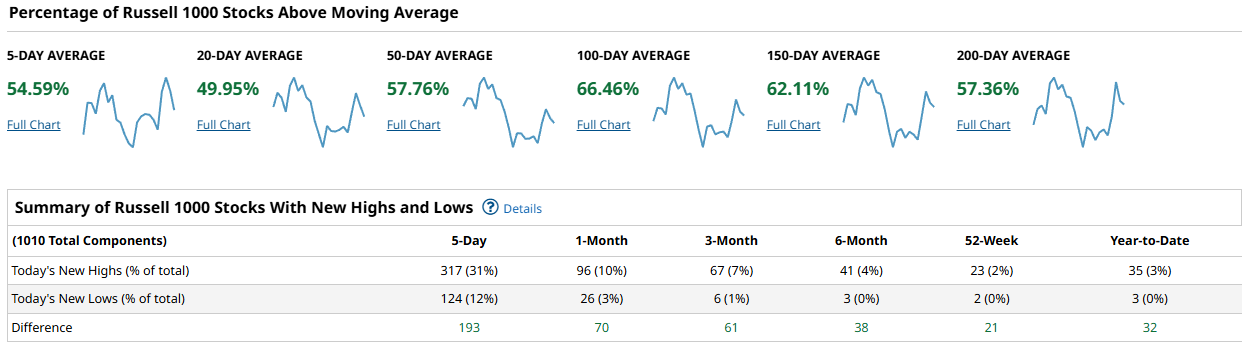
The Russell 1000, representing a broader swath of U.S. equities, sits somewhere in between. About half to two-thirds of stocks are above trend depending on the timeframe, with an impressive 317 new highs over the past five days versus just 124 new lows. This confirms there’s real rotational energy into different corners of the market, even if the leadership isn’t as concentrated as in tech.
Taken together, the state of market breadth suggests a market that’s still structurally sound but reliant on selective strength. The Dow and broader Russell 1000 show the healthiest participation, the S&P 500 is middling but supportive, while the Nasdaq 100 looks fragile beneath the headline performance. The underlying mechanics point to a market that can grind higher, but where leadership rotation—and the risk of sharp reversals in crowded tech trades—will matter more than index-level moves.
US Investor Sentiment Report
Insider Trading
Insider trading occurs when a company’s leaders or major shareholders trade stock based on non-public information. Tracking these trades can reveal insider expectations about the company’s future. For example, large purchases before an earnings report or drug trial results might indicate confidence in upcoming good news.
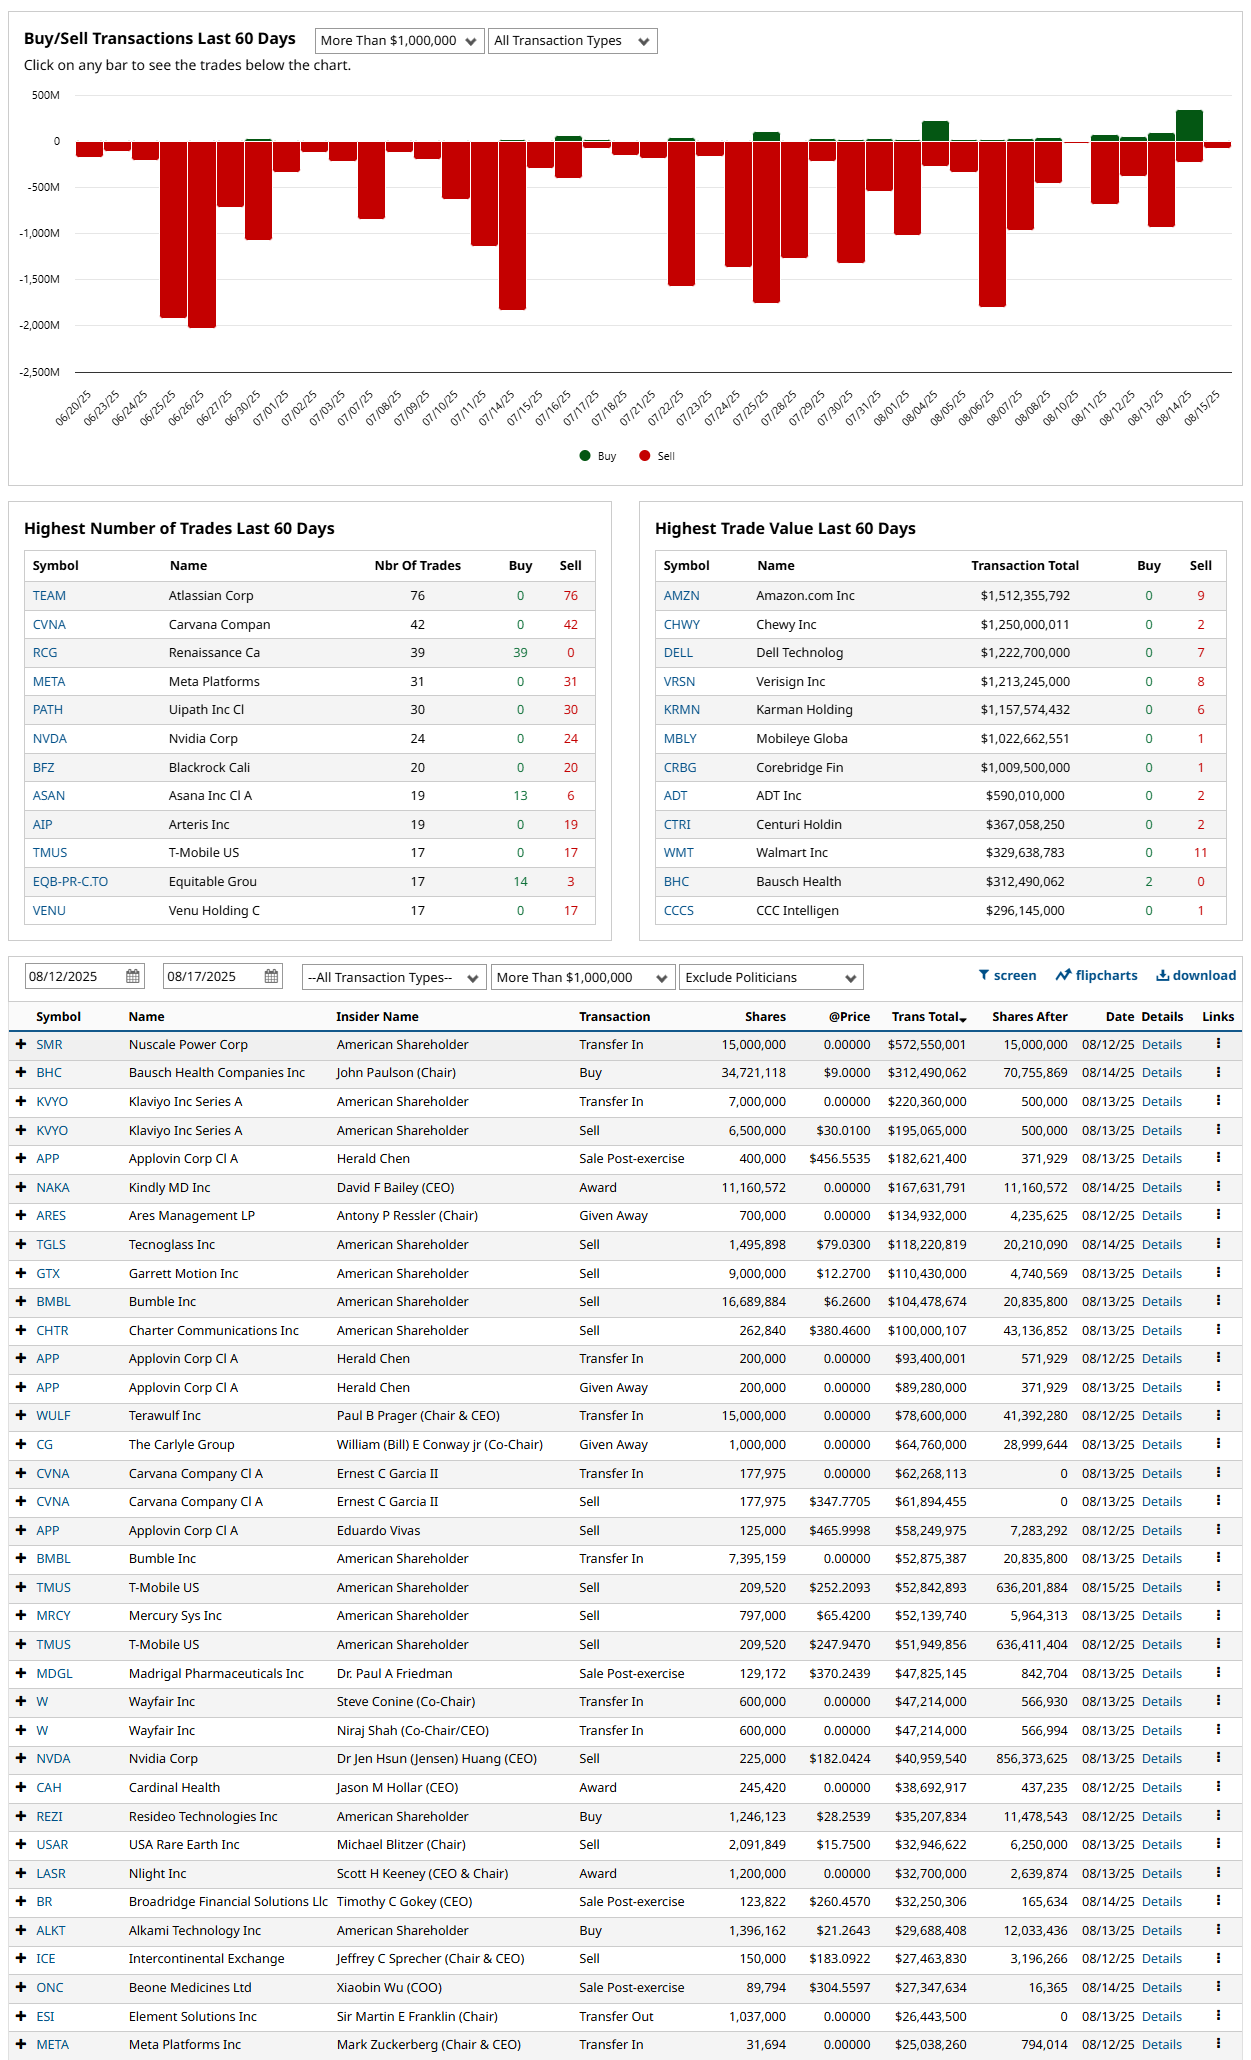
Insider trading over the past 60 days continues to lean heavily toward selling rather than buying, with deep red dominating the transaction flow chart. The bulk of activity is concentrated in tech and growth names—Atlassian (TEAM), Carvana (CVNA), Meta (META), and UiPath (PATH) all show dozens of sales without a single buy. The largest dollar transactions come from Amazon, Chewy, Dell, and Verisign, again entirely on the sell side. Buys are scarce, with only a handful of notable purchases—John Paulson adding to Bausch Health (BHC) and some activity in smaller caps like Arteris (AIP) and Asana (ASAN). Overall, insiders are taking chips off the table in size, particularly in large-cap tech and high-momentum plays, while selective accumulation remains isolated and low-conviction.
AAII %Bull-Bear Spread
The %Bull-Bear Spread measures the gap between bullish and bearish investor sentiment, often from surveys like AAII. It’s a contrarian indicator—extreme optimism may signal a coming pullback, while extreme pessimism can hint at a potential rally. Large positive or negative spreads often mark market turning points.
The AAII sentiment spread has swung sharply negative again, sitting at –16.3% as of August 14, 2025. That marks a steep reversal from late July’s mildly bullish readings (+7–11%) and follows a year of choppy extremes where optimism has repeatedly failed to sustain itself. Earlier in 2025, the spread collapsed to as low as –41% in March before staging a spring rebound, but the persistence of deep negative prints underscores how fragile confidence remains. Historically, such deeply bearish sentiment has often coincided with market bottoms or tradable rallies, but the recent inability to hold positive territory suggests investors are still quick to fade strength and position defensively. In short: the AAII survey reflects a market psychology dominated by skepticism, with persistent bearish bias outweighing optimism despite intermittent rallies.
NAAIM Exposure Index
The NAAIM Exposure Index (National Association of Active Investment Managers Exposure Index) measures the average exposure to U.S. equity markets as reported by its member firms. These are typically active money managers who provide their equity exposure levels weekly. The index offers insight into how much these managers are investing in equities at any given time, ranging from being fully short (-100%) to leveraged long (up to +200%).
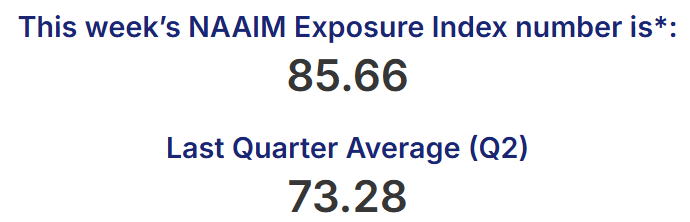
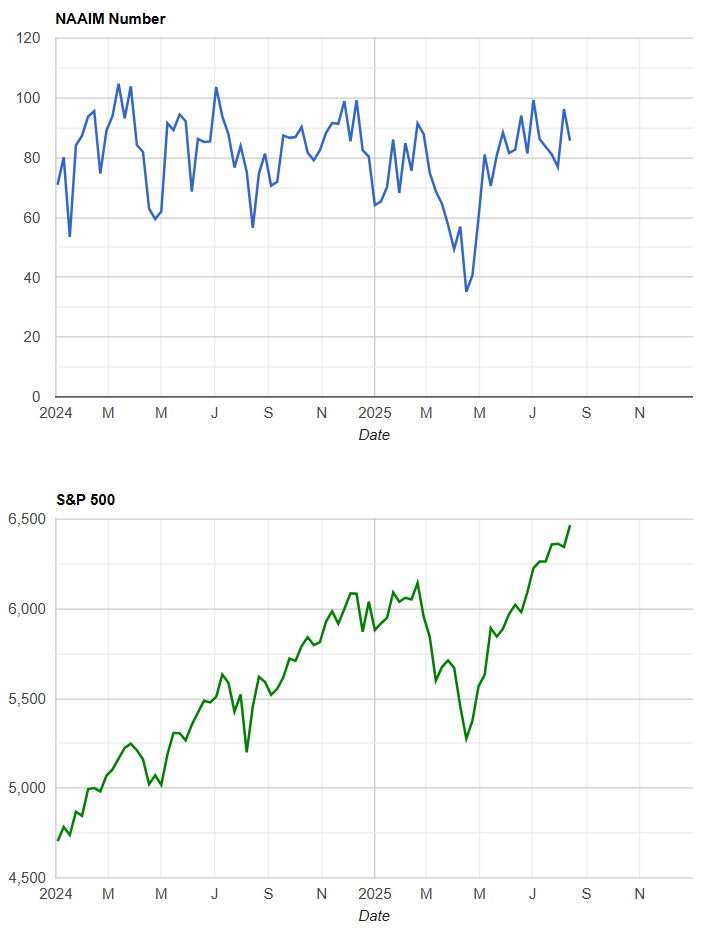
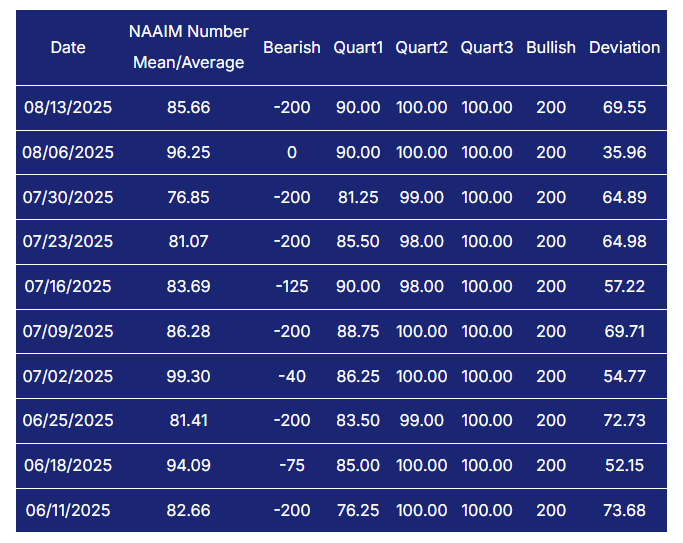
Active managers are running hot into mid-August, with the NAAIM Exposure Index coming in at 85.7, well above the Q2 average of 73.3. This marks a clear shift toward risk-on positioning, with exposure levels holding steadily in the 80–100 range for much of the summer. Even though AAII sentiment shows individual investors leaning bearish, professional managers appear unfazed, leaning into equity strength and matching the S&P’s steady climb back to highs. Historically, readings above 80 indicate aggressive allocation, though not at the euphoric 100+ levels that often precede corrections. Put simply, the pros are staying long, pressing their bets despite retail skepticism, and keeping equity exposure comfortably elevated as markets grind higher.
CBOE Total Put/Call Ratio
CBOE's total put/call ratio includes index options and equity options. It's a popular indicator for market sentiment. A high put/call ratio suggests that the market is overly bearish and stocks might rebound. A low put/call ratio suggests that market exuberance could result in a sharp fall.
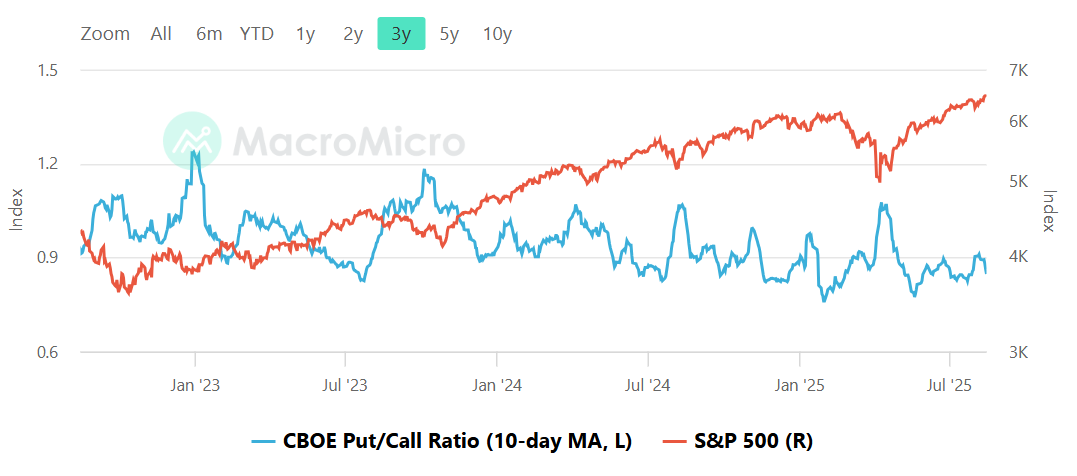
The 10-day moving average of the CBOE total put/call ratio has been hovering just under 1.0, reflecting a fairly balanced but slightly call-heavy market. Compared to the elevated fear spikes of 2023 and early 2024, the current profile suggests less hedging demand and more speculative call buying, which aligns with the S&P 500 grinding toward fresh highs. Every meaningful dip in the ratio over the past three years has coincided with local market tops, while surges above 1.2 have tended to mark fear-driven washouts and subsequent rebounds. At present, the ratio isn’t at an extreme, but the bias toward calls signals a bullish lean among traders, though not yet at euphoric extremes.
Equity vs Bond Volatility
The Merrill Lynch Option Volatility Estimate [MOVE] Index from BofAML and the CBOE Volatility Index [VIX] respectively represent market volatility of U.S. Treasury futures and the S&P 500 index. They typically move in tandem but when they diverge, an opportunity can emerge from one having to “catch-up” to the other.
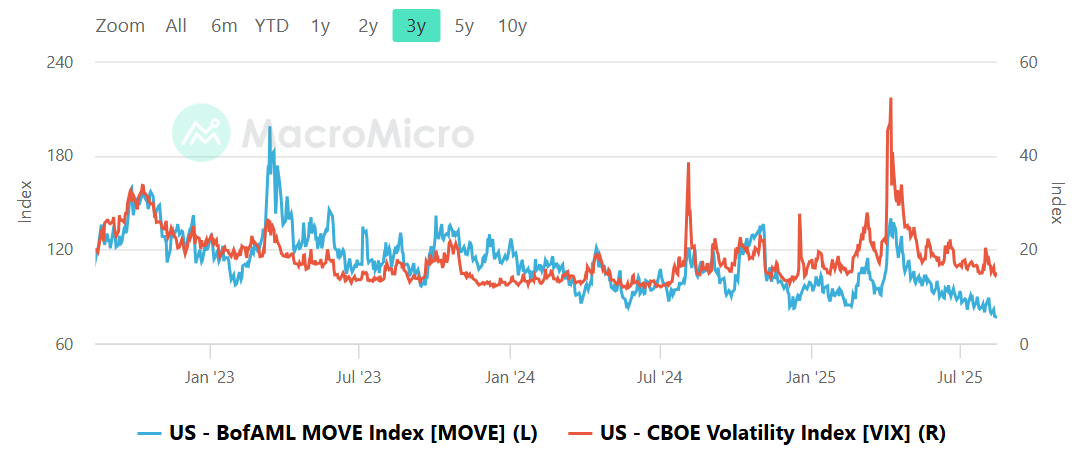
The relationship between Treasury market volatility (MOVE) and equity volatility (VIX) has settled into a calmer regime compared to the spikes of 2023–24. For much of the past three years, MOVE has led the action, with bond market turbulence foreshadowing equity stress. Peaks in MOVE above 160 almost always preceded VIX spikes above 30, reflecting the chain reaction where fixed-income instability bleeds into equity risk premia. Now, both gauges are cooling: MOVE has slipped to multi-year lows near 80, while VIX hovers in the mid-teens. This disconnect—muted bond volatility even as equities retest highs—suggests investors are pricing stability in both asset classes, though history warns that such periods often give way to sudden repricing. In short, markets are calm, perhaps too calm, with credit and equity vol aligned at levels that imply confidence, but also leave little margin for surprise.
CNN Fear & Greed Constituent Data Points & Composite Index
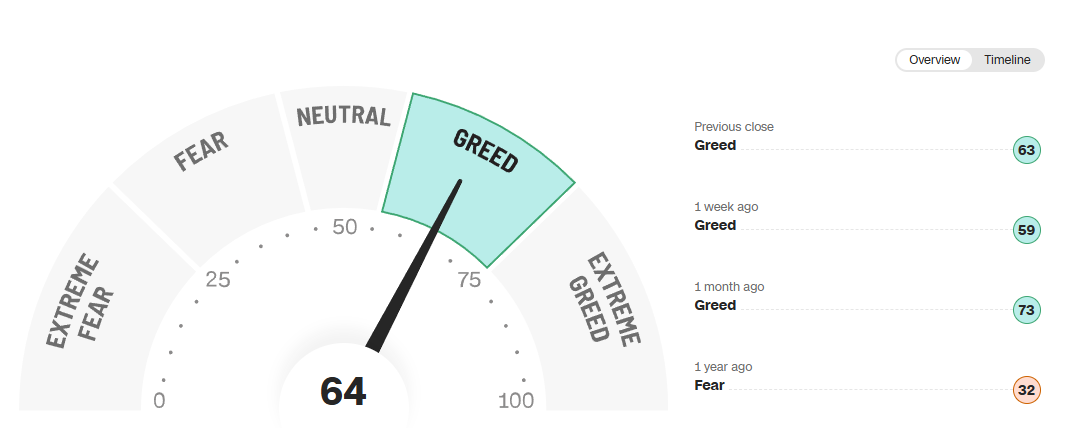
The CNN Fear & Greed Index is reading 64, firmly in the Greed zone. That’s a notch higher than last week’s 59 and almost double the 32 registered a year ago when sentiment leaned toward fear. A month ago, the index spiked to 73 (Greed verging on Extreme Greed), and while it has cooled off slightly, it remains elevated.
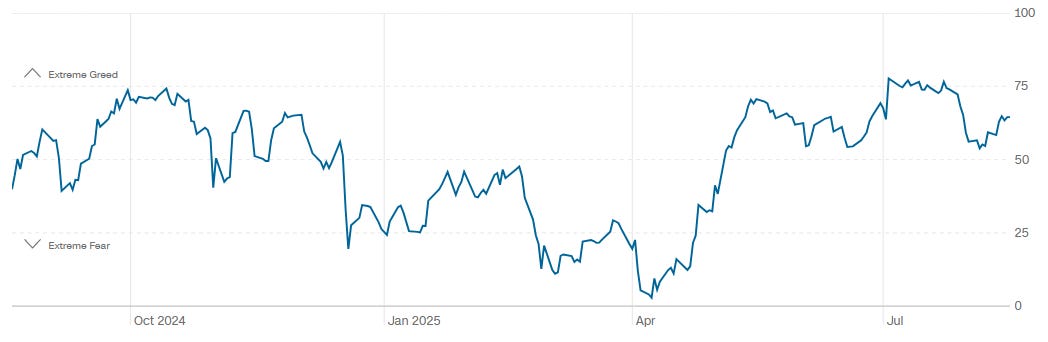
Looking at the timeline, the index has oscillated sharply over the past year: sinking into Extreme Fear around March–April 2025 before staging a steep rebound through the spring and summer. Since July, sentiment has moderated but stayed above neutral, reflecting a market that has embraced risk but isn’t quite at euphoric levels. In short, investors are leaning bullish, but the persistent swings remind us how quickly sentiment can shift when macro or policy shocks hit.
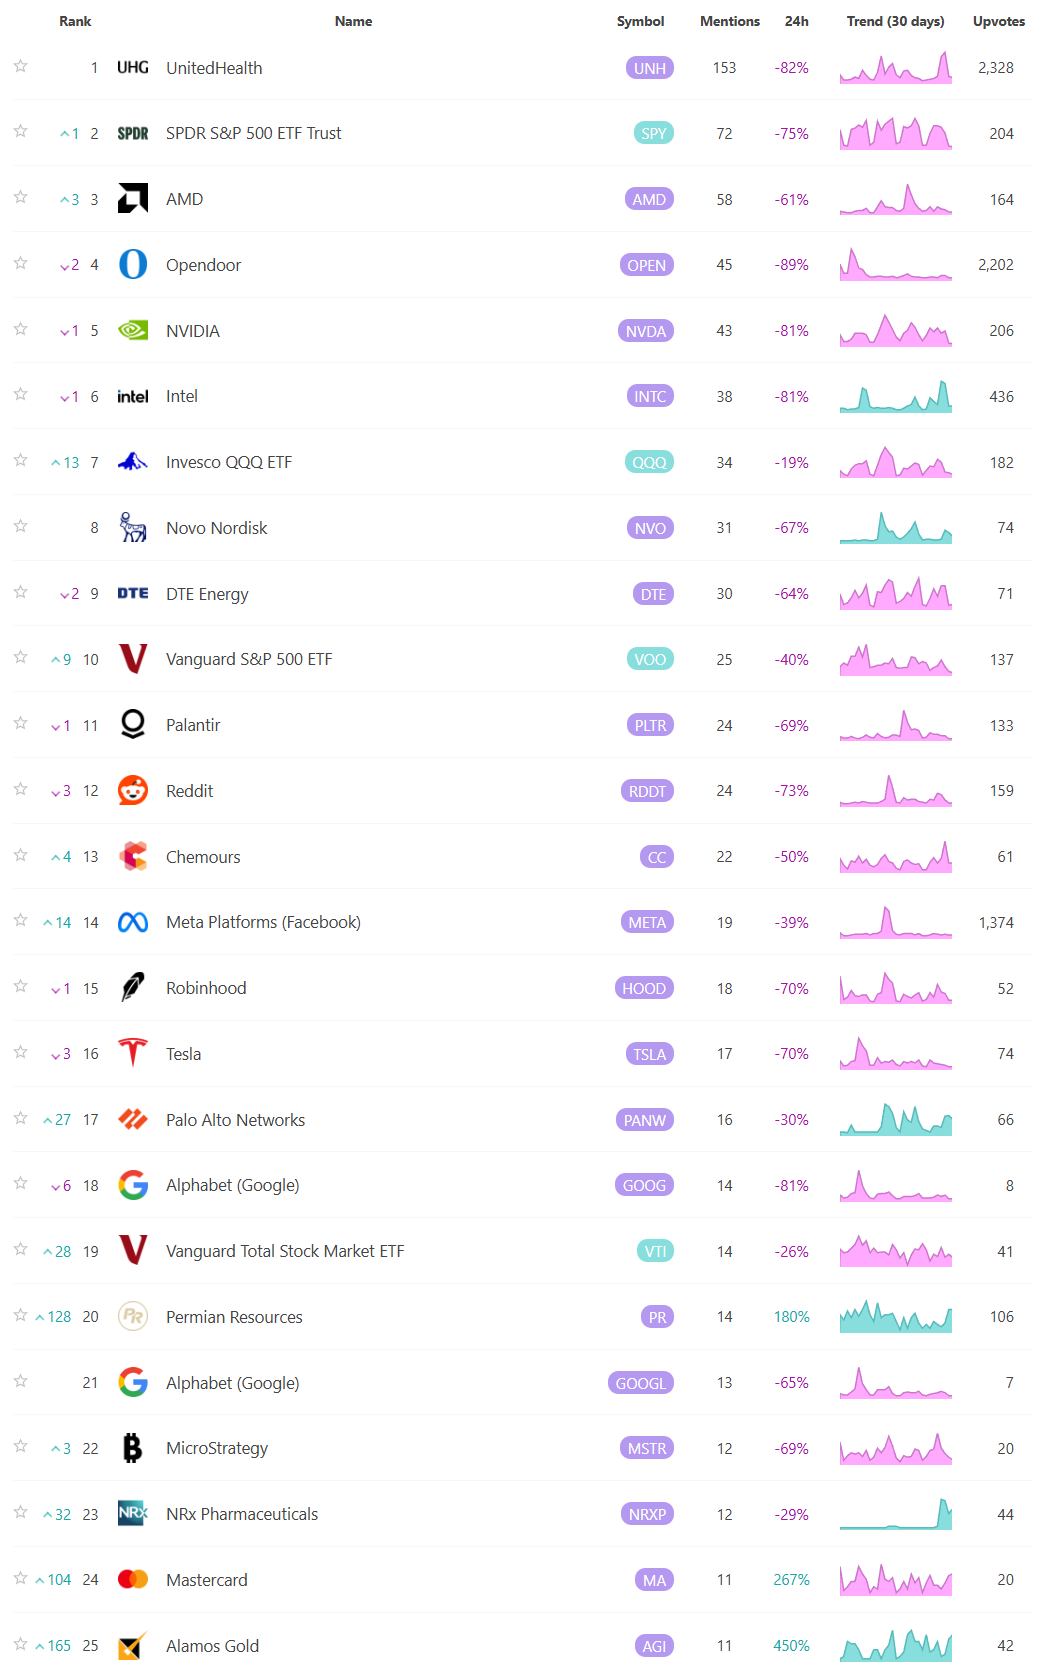
Social Media Favs
Social sentiment offers a real-time view of investor mood, often revealing market shifts before traditional indicators. It can signal momentum changes, spot emerging trends, and gauge retail investor impact—especially in high-volatility names. Tracking sentiment around events or earnings provides actionable insights, and when layered with quantitative models, can enhance predictive accuracy and risk management. Sustained sentiment trends often mirror broader market cycles, making this data a valuable tool for both short-term trades and long-term positioning.
Institutional S/R Levels for Major Indices
When you’re a large institutional player, your primary goal is to find liquidity - places to do a ton of business with the least amount of slippage possible. VolumeLeaders.com automatically identifies and visually plots the exact spots where institutions are doing business and where they are likely to return for more. It’s one of the primary reasons “support” and “resistance” concepts work and truly one of the reasons “price has memory” - take a look at the dashed lines in the images below that the platform plots for you automatically; these are the areas institutions constantly revisit to do more business.
Levels from the VolumeLeaders.com platform can help you formulate trades theses about:
Where to add or take profit
Where to de-risk or hedge
What strikes to target for options
Where to expect support or resistance
And this is just a small sample; there are countless ways to leverage this information into trades that express your views on the market. The platform covers thousands of tickers on multiple timeframes to accommodate all types of traders.
SPY
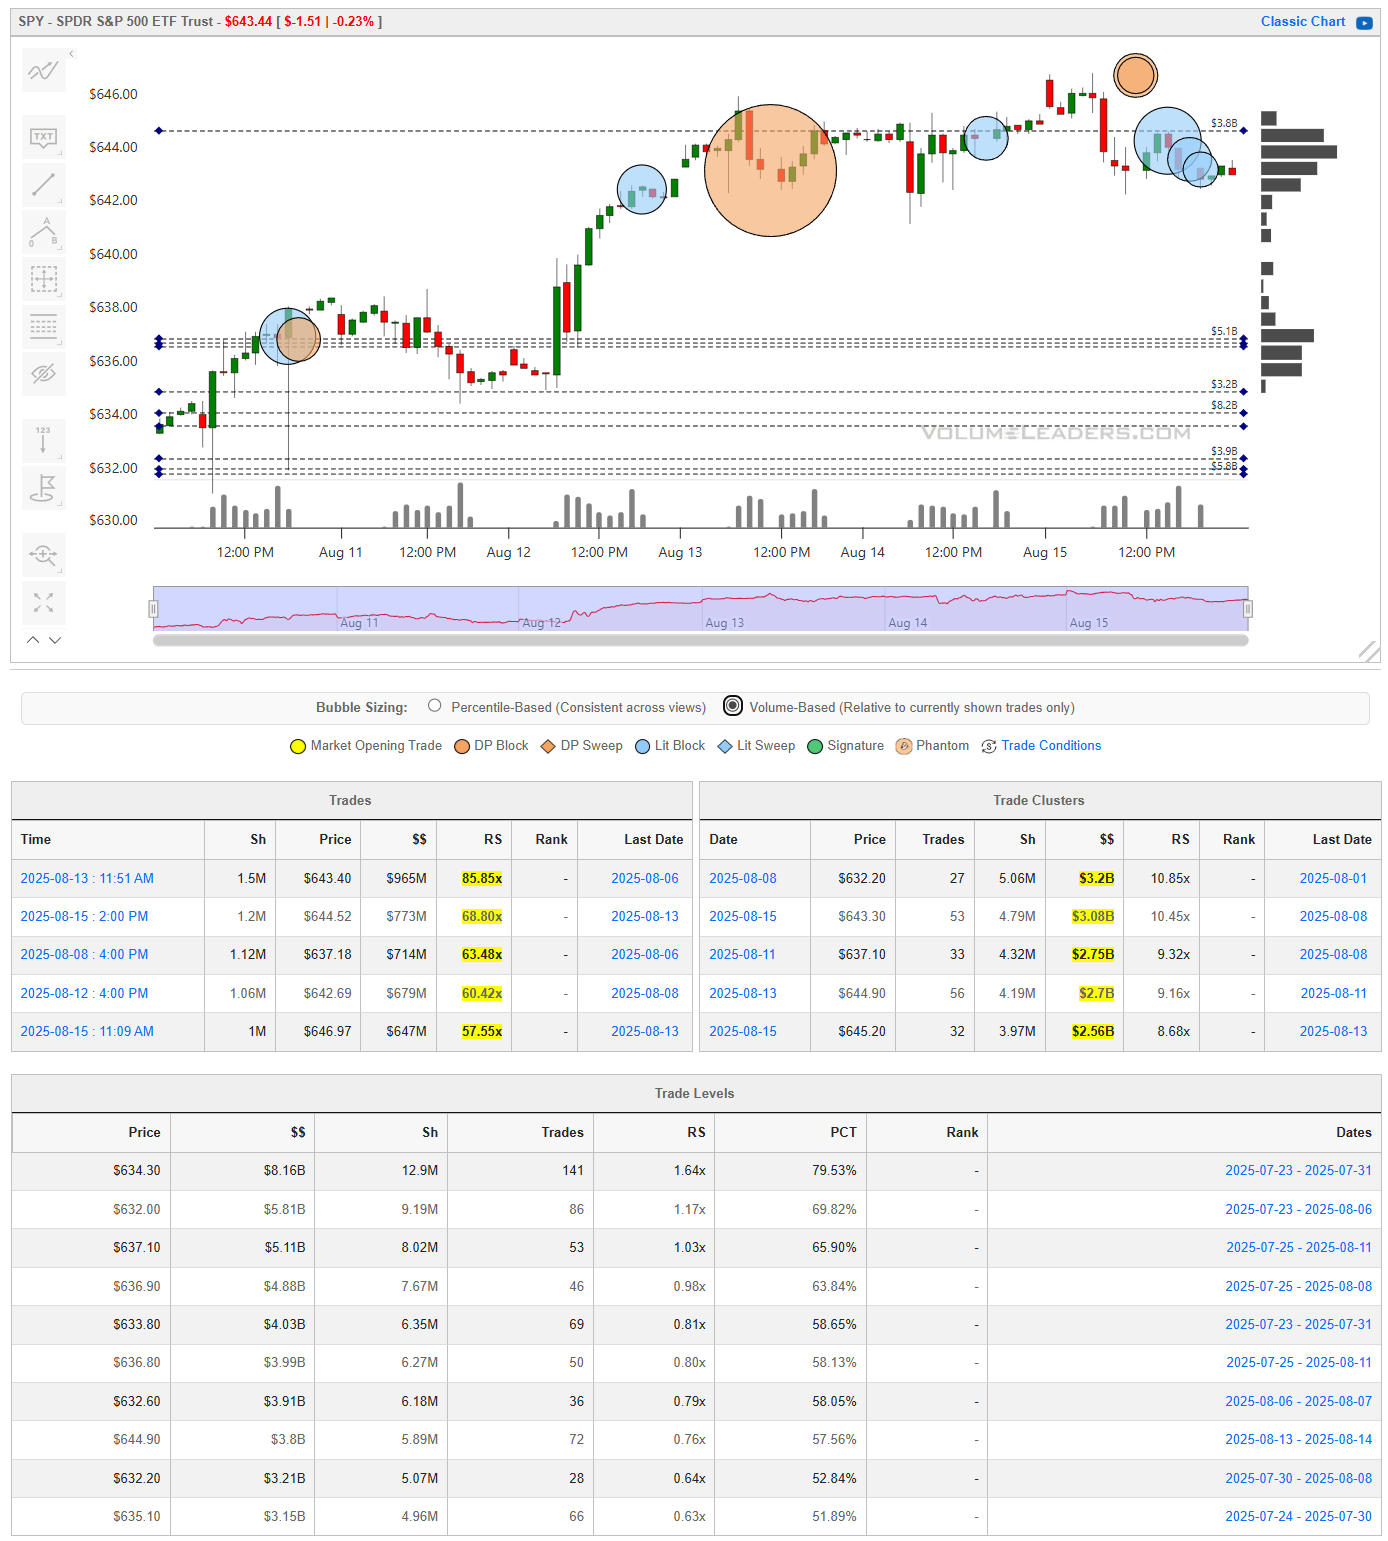
SPY spent the back half of last week bumping its head against resistance, and the tape tells a pretty straightforward story: institutions were more interested in leaning against the highs than chasing them. You can see it in the bubble/trade map—those oversized orange circles at $644–$646 didn’t yield strong follow-through, and the next sequence of trades skewed defensive: smaller sweeps lower, liquidity clusters right beneath the highs, and an unmistakable sense that the strong hands were happy to let late buyers take the other side.
The real tell is in the cluster data. Billions of dollars changed hands at $643–$645, not in breakout mode but in absorption. Meanwhile, the volume-weighted support band at $632–$634—nearly $8 billion in flow—remains the obvious backstop. It’s not that the market can’t rally, but it’s now dependent on that shelf holding firm. If SPY can’t defend that pocket, the imbalance tips quickly, and what looks like quiet distribution today becomes outright supply tomorrow. For now, the setup is less about chasing momentum and more about respecting the levels where size has already declared its intent.
QQQ
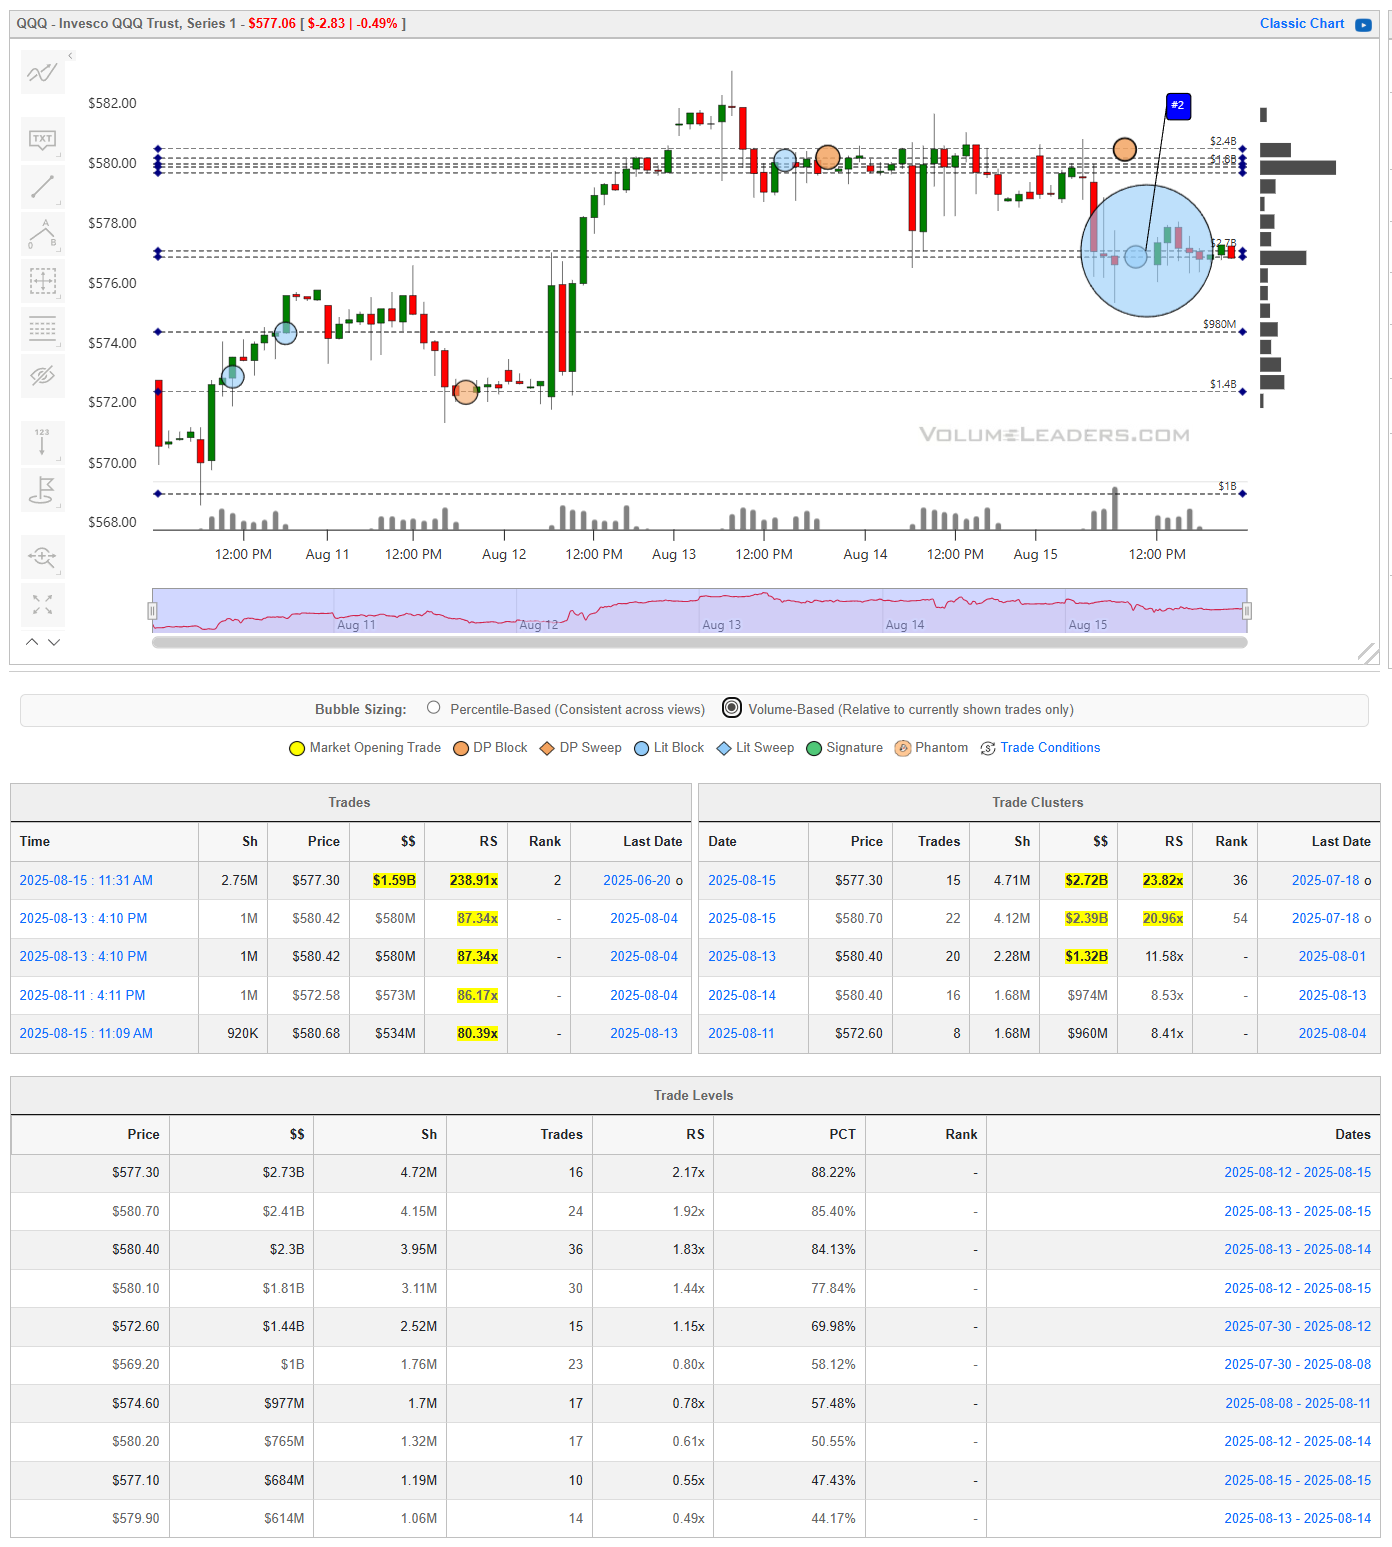
QQQ’s setup has a very different feel than SPY right now, and it’s not just cosmetic. The telling detail is that nearly every major liquidity level sits above Friday’s close, with the ETF finishing under the second-largest ranked trade in its history. That $577.30 block—$1.6B in size—wasn’t casual flow, it was institutions planting a flag, and price couldn’t hold it. When you’ve got trade clusters like that stacked overhead, every rally attempt risks running into trapped supply rather than clean air.
The profile is heavy: you can see it in the wall of volume between $577 and $581, where billions transacted in rapid succession. If buyers had control, those levels would have converted into support, but instead, we closed beneath them. That flips the structure from accumulation to potential distribution. Until QQQ can reclaim that $577 shelf convincingly, the path of least resistance is lower, and even intraday squeezes are likely to stall into the overhead weight of those trades. In other words, SPY may be consolidating, but QQQ looks like it’s leaning forward over its skis. Coming sessions will quickly set the tone.
IWM
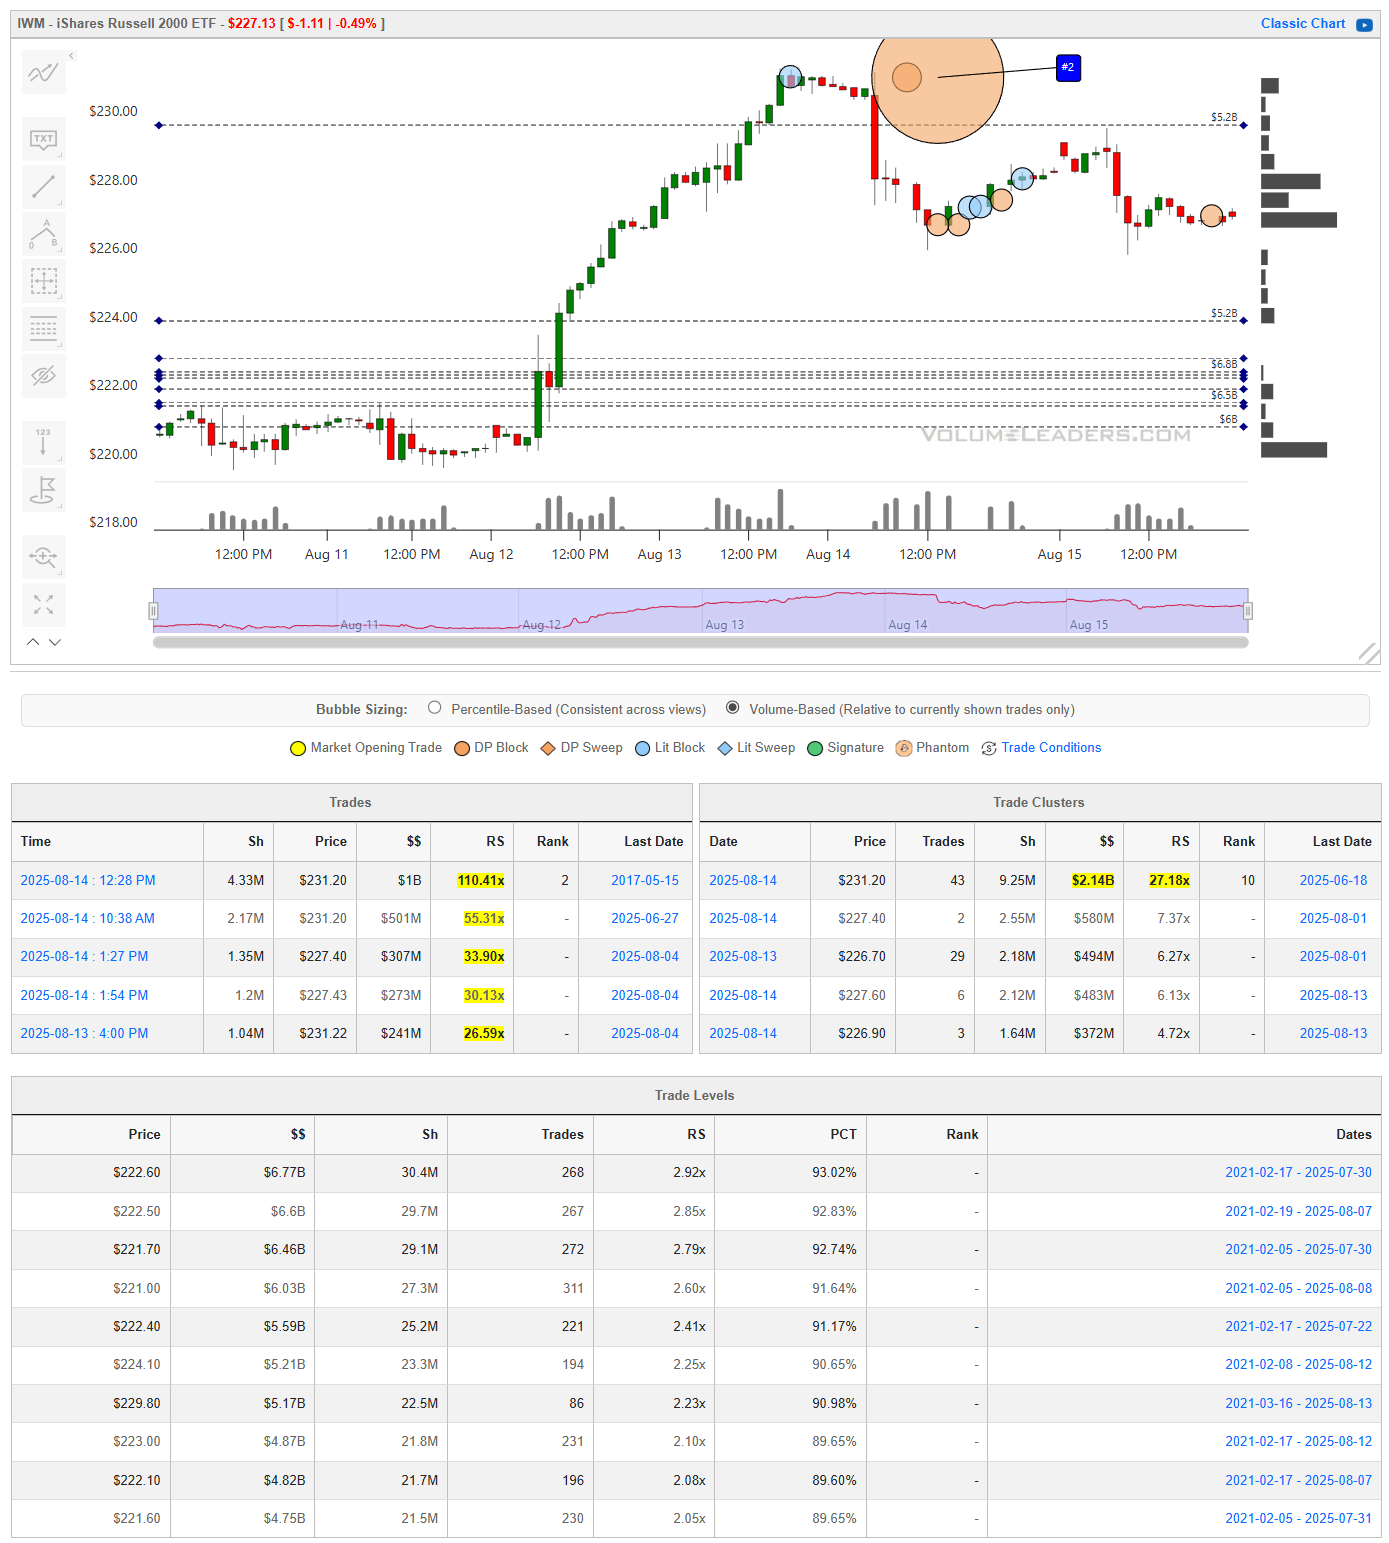
IWM is the most interesting of the bunch right now because small caps finally saw a true “line in the sand” trade—the #2 ranked block in its history at $231.20, over $1B in size. That’s a whale move, and unlike QQQ, the Russell isn’t trading well above a wall of trapped supply. Instead, it’s backing away from that monster block and probing into a series of supportive levels just below.
Look at the distribution: $222–224 is loaded with historical volume, where the PCT readings are north of 90%. That’s sticky liquidity, the kind that doesn’t get chewed through easily. So while the tape looks heavy after the rejection up near $231, this isn’t a clean break into empty space—it’s more like a retreat into a defensive formation. If those levels catch, you’ve got the makings of a base that validates the big August 14th buyer. If not, and $222 fails, then the Russell is wide open to deeper retracement, which would start ringing alarm bells for risk appetite more broadly.
The question for next week is whether small caps can firm up at prior levels and stabilize risk sentiment, or whether that #2 block ends up looking more like a distributive top than a positioning anchor.
DIA
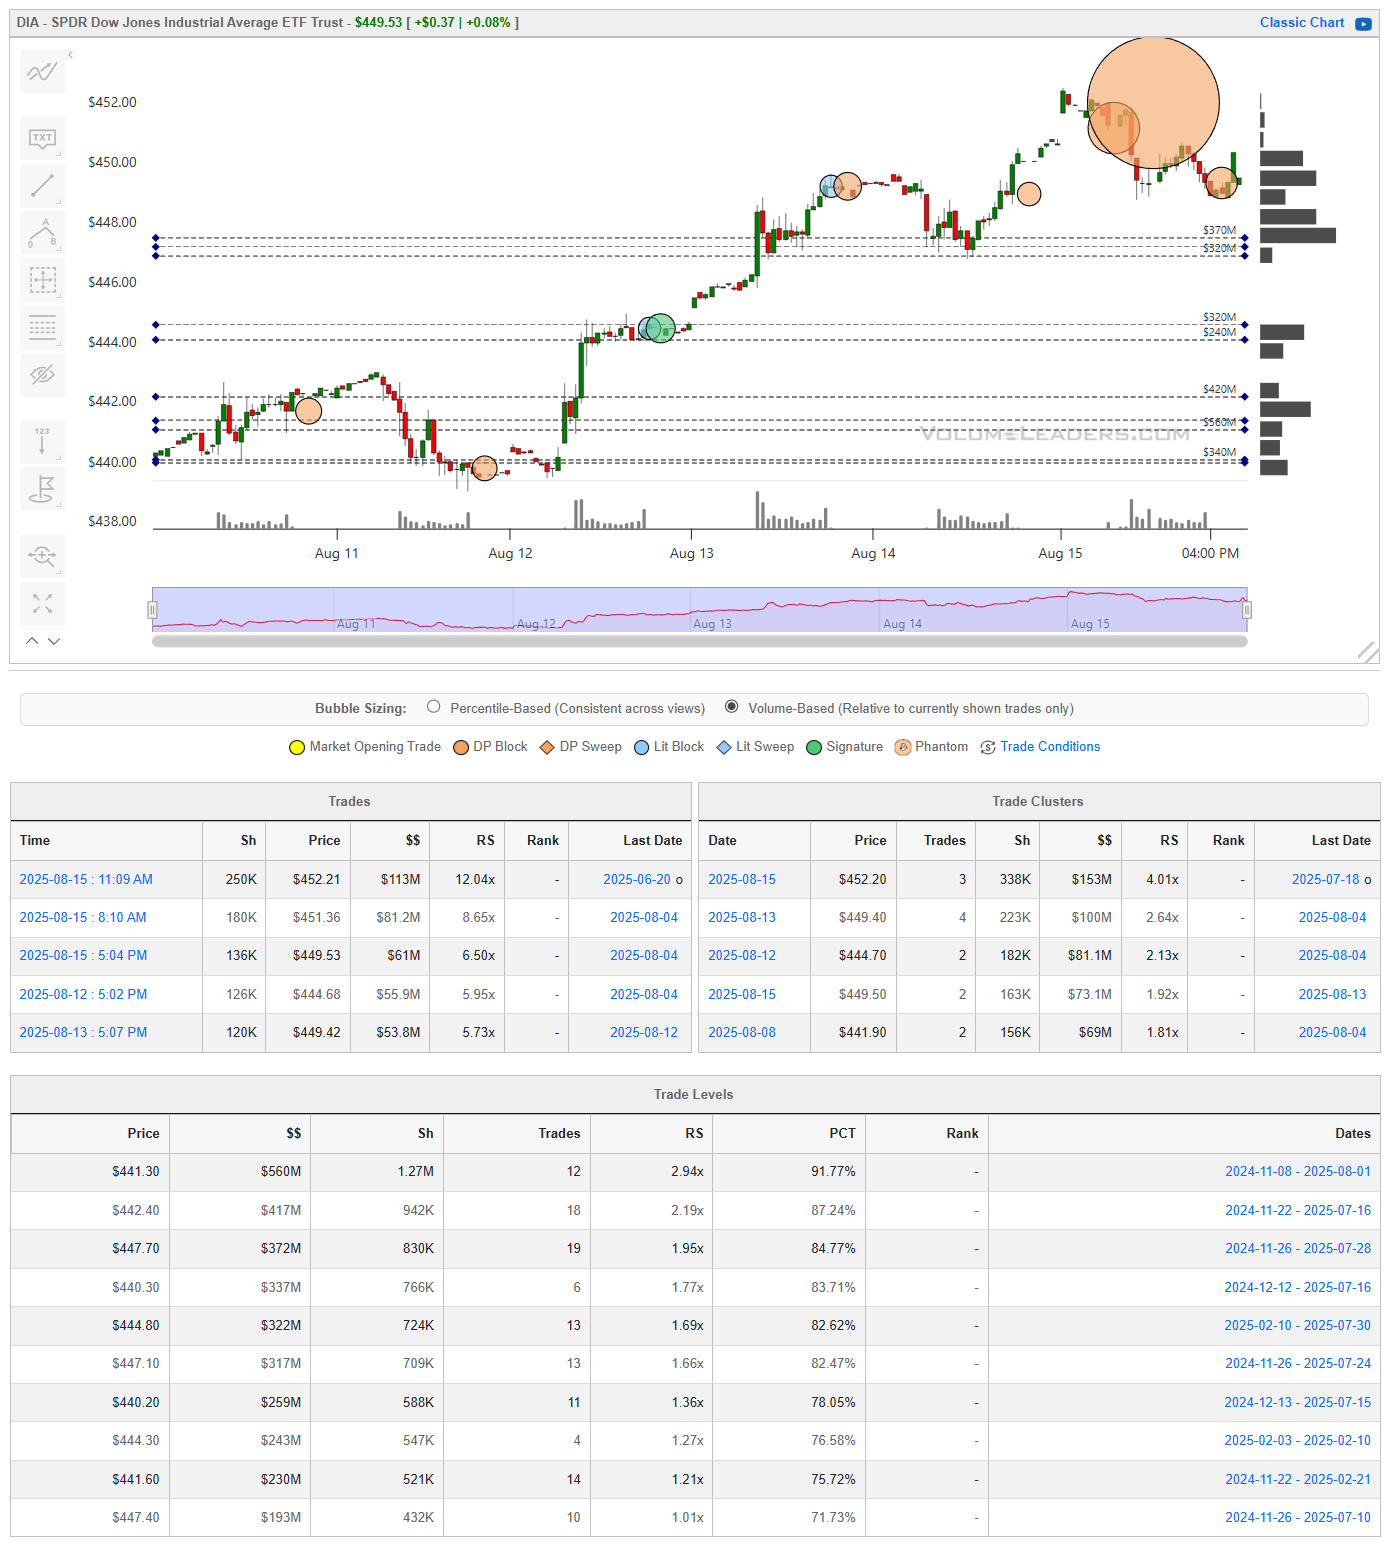
DIA rounds out the picture nicely. While SPY is stable and QQQ is under pressure, the Dow quietly printed a very large block right at the highs. It didn’t show up as a top-ranked trade, but the size and location tell the story: institutions were active at the peak, and that introduces real two-way risk.
What’s notable is the symmetry we’re seeing across the majors. SPY is digesting after a run, QQQ is struggling under the weight of overhead supply, IWM is testing support after a #2 ranked block, and DIA now has a potential distribution print capping its advance. It’s rare to see all four indices flash these kinds of signals in near-unison. That doesn’t mean a top is in, but it does mean the burden of proof shifts to buyers. They’ll need to absorb this new supply and press higher to confirm resilience.
This sets up next week as pivotal: will the market chew through these prints and use them as support, or do we start to see them flip into resistance and mark the turn? Either way, the map is clear — we’re not trading in the void anymore, we’re trading against very visible institutional footprints.
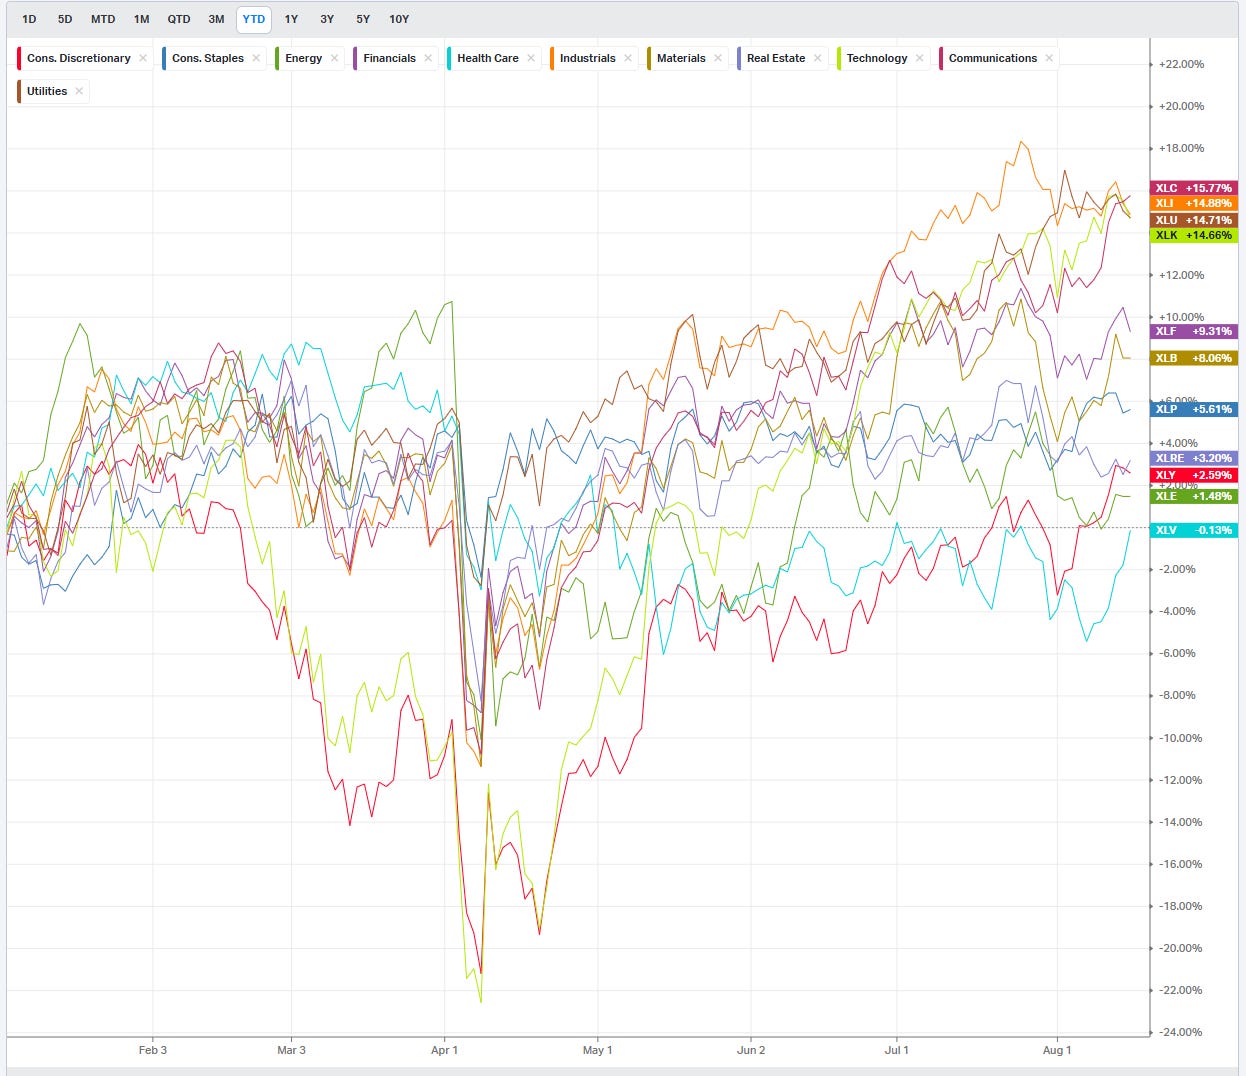
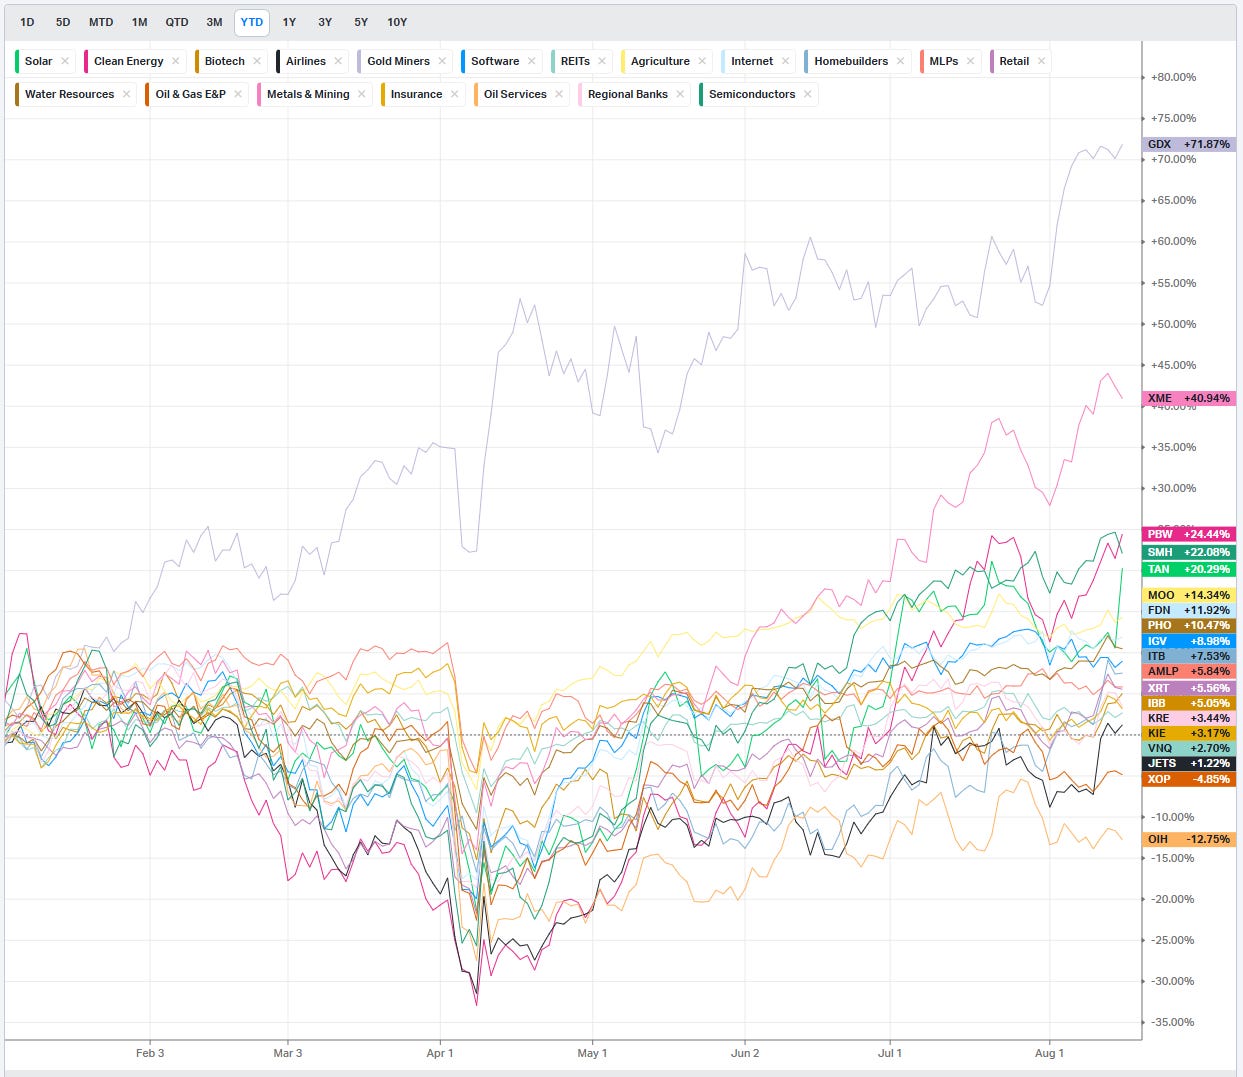
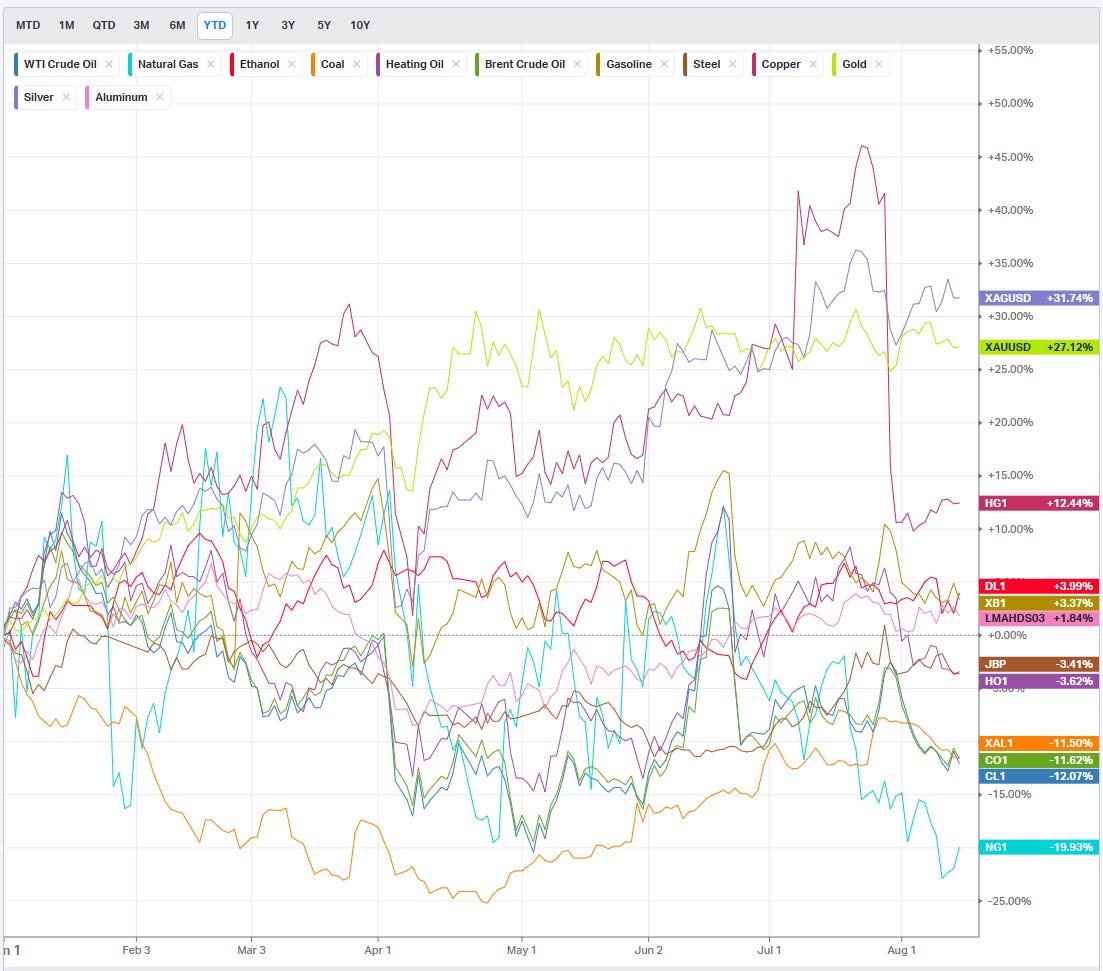
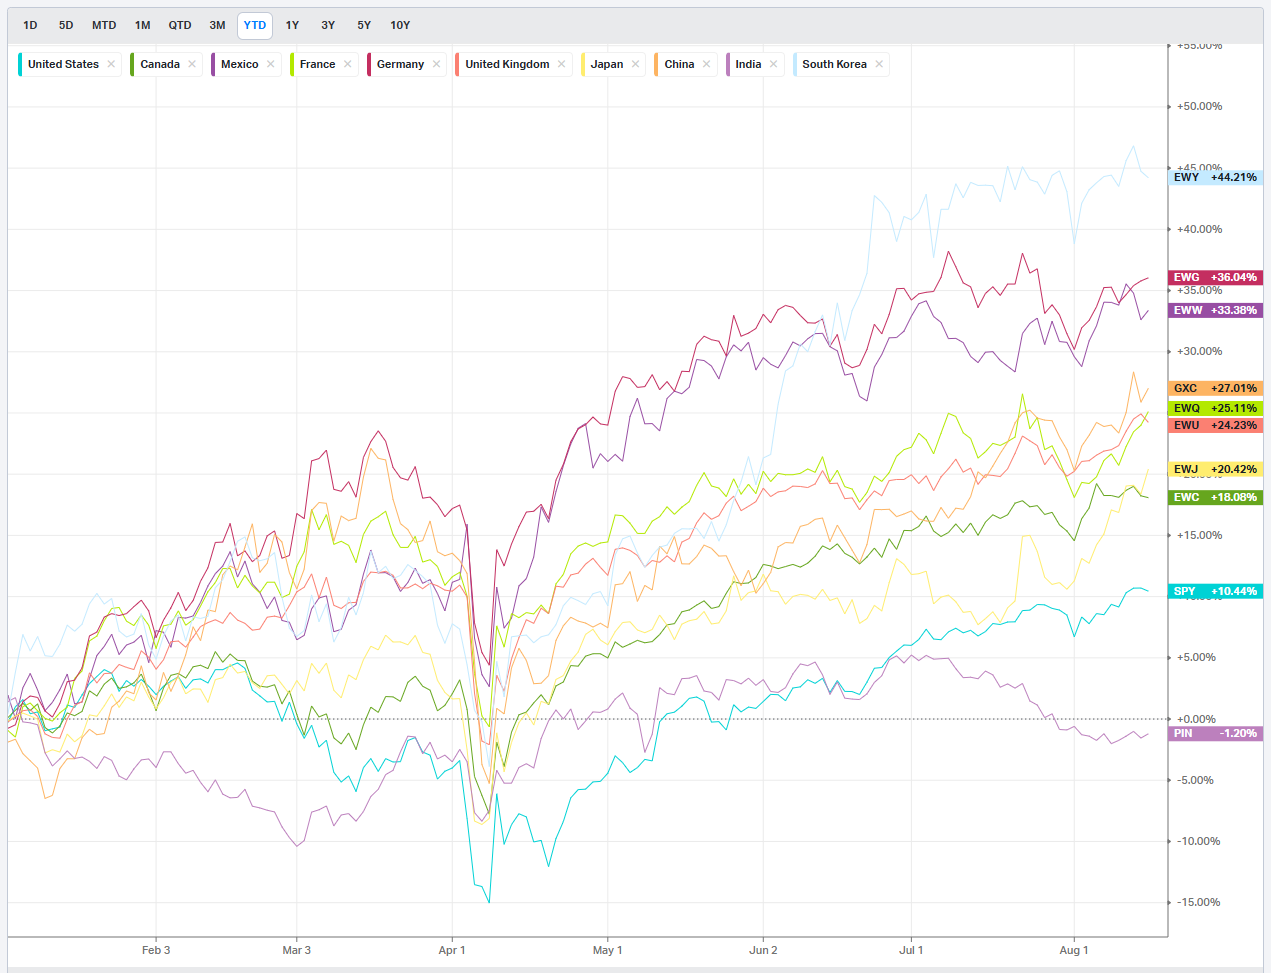
Summary Of Thematic Performance YTD
VolumeLeaders.com offers a robust set of pre-built thematic filters, allowing you to instantly explore specific market segments. These performance snapshots are provided purely for context and inspiration—think about zeroing in on the leaders and laggards within the strongest and weakest sectors, for example.
S&P By Sector
S&P By Industry
Commodities: Energy & Metals
Country ETFs
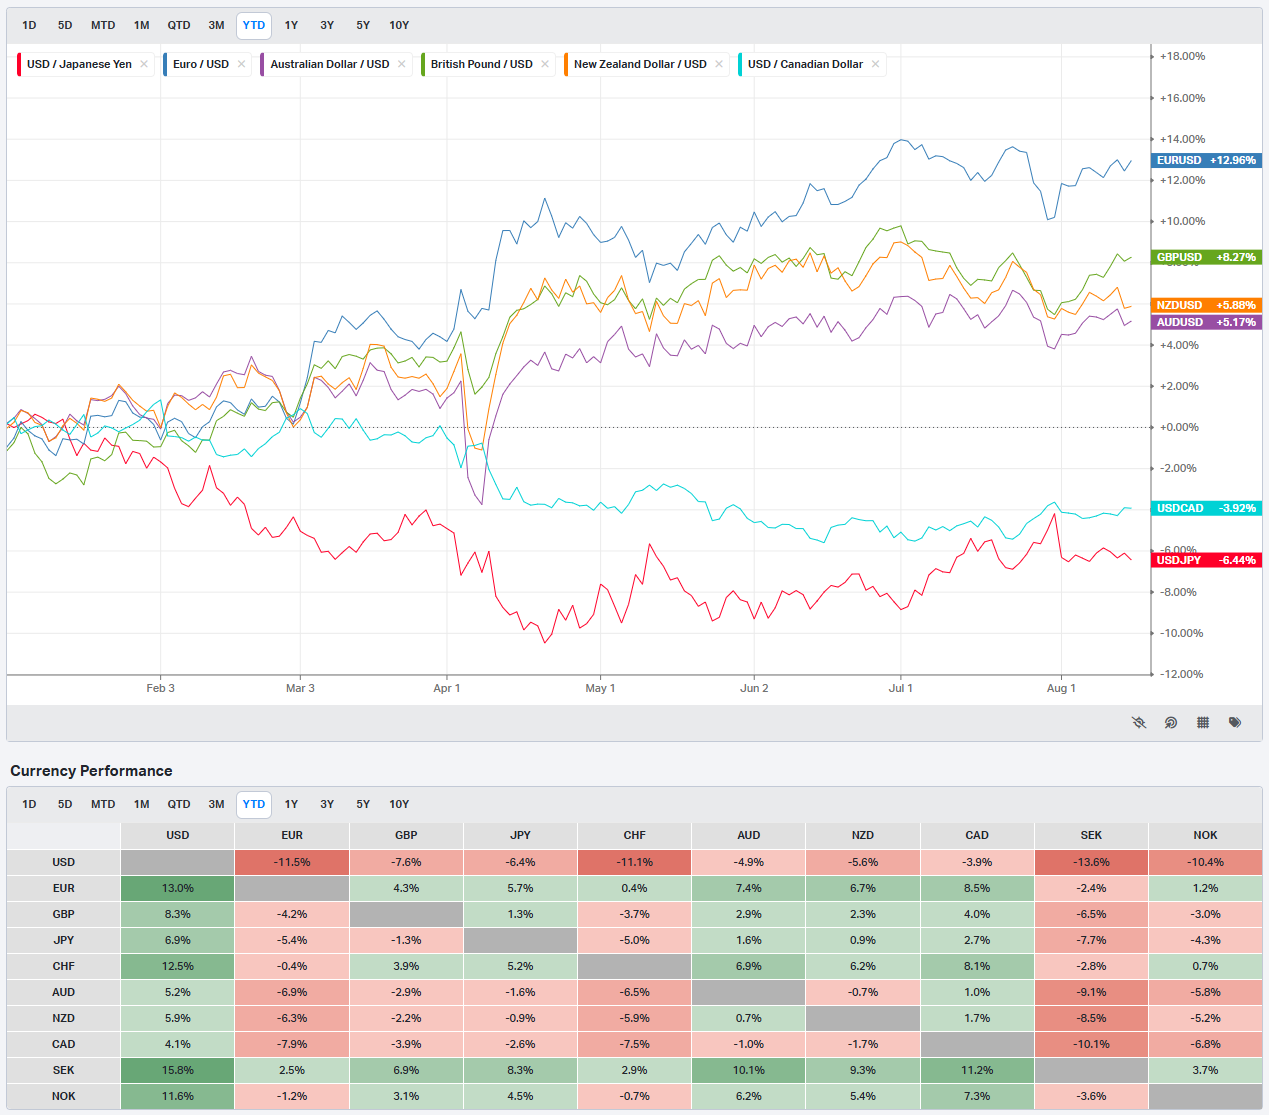
Currencies/Major FX Crosses
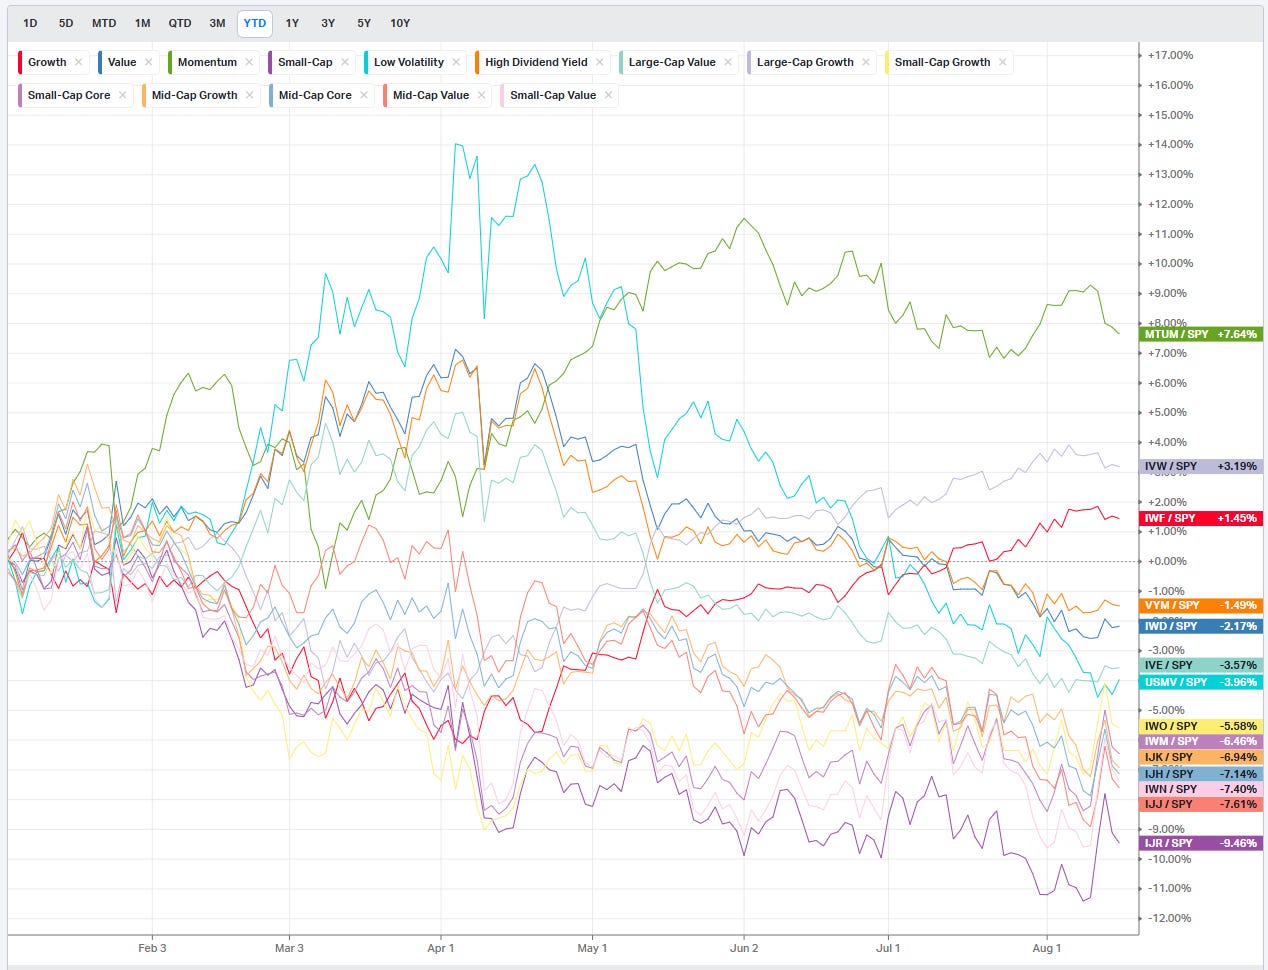
Factors: Style vs Size-vs-Value
Events On Deck This Week
Here are key events happening this week that have the potential to cause outsized moves in the market or heightened short-term volatility.
Econ Events By Day of Week
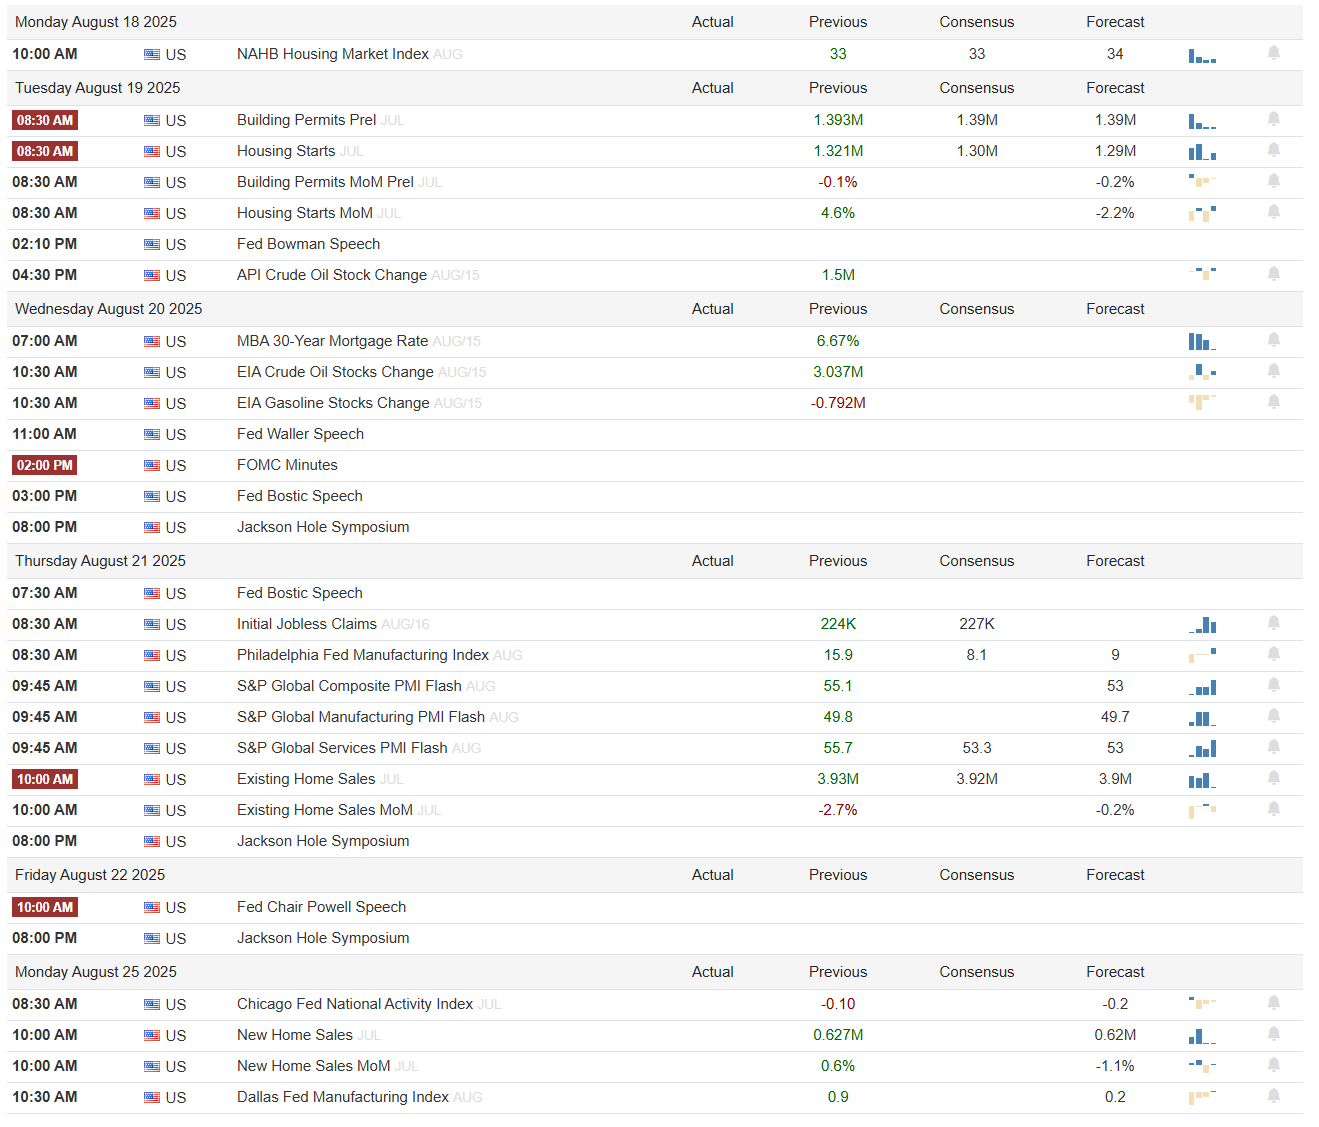
This week’s economic calendar is loaded with data that will test the market’s resilience and perhaps reset expectations heading into Jackson Hole. Housing leads things off, with July permits and starts due Tuesday—both expected to hold steady after a soft patch in June. Wednesday brings the EIA’s weekly energy inventories, but the real market mover will be the FOMC minutes and Fed speak sprinkled throughout the day, which could either confirm or push back on growing rate-cut hopes. Thursday is the heaviest data day: jobless claims, Philly Fed manufacturing, and the full suite of flash PMIs across services and manufacturing. Existing home sales also print, offering another check on consumer demand. Finally, Friday culminates with Chair Powell’s Jackson Hole speech, the event traders have circled in red. Powell’s remarks will set the tone not just for September’s Fed meeting but likely for how markets trade into year-end. In other words, the tape may chop around early in the week, but the real directional cue likely comes when Powell steps up to the podium.
Anticipated Earnings By Day of Week
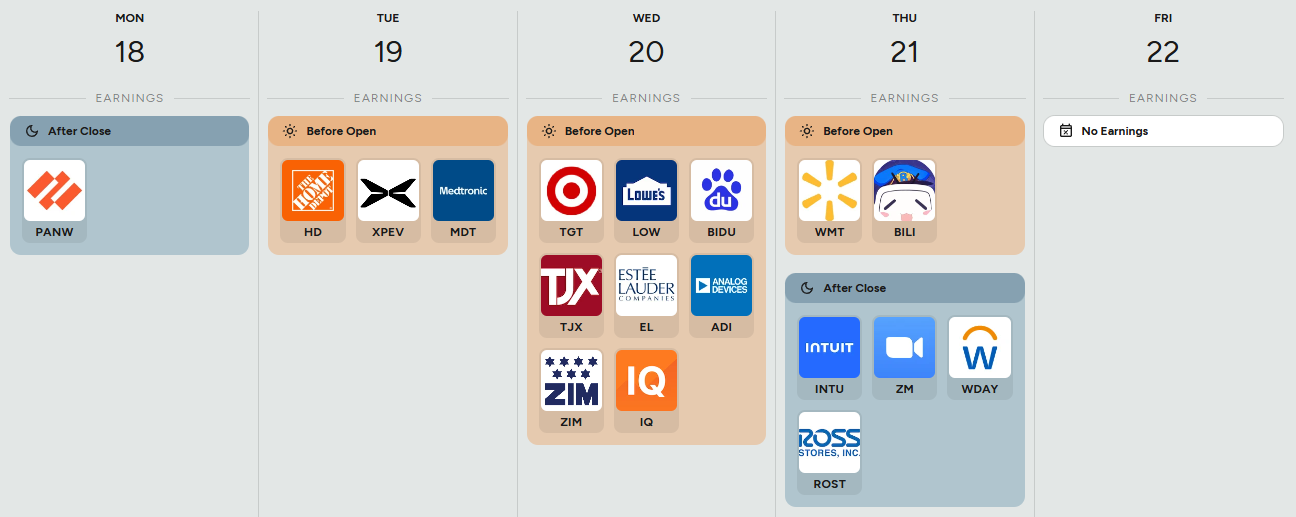
Earnings this week are heavily retail-tilted, giving the market a direct read on consumer health just as macro data piles up. Monday kicks off with Palo Alto Networks, a bellwether for cybersecurity spend, but the real spotlight starts Tuesday with Home Depot, Medtronic, and XPeng. Wednesday is the monster day—Target, Lowe’s, TJX, Estée Lauder, Baidu, and Analog Devices all report before the bell, essentially spanning U.S. retail, luxury, and tech. Thursday brings Walmart, arguably the most important single read on the U.S. consumer, followed by Bilibili. After the close, attention shifts to software and cloud with Intuit, Zoom, Workday, and Ross Stores anchoring the session. Friday has no earnings, so by Thursday night most of the fireworks will be over. Together, this lineup ensures that every angle of spending—from staples to discretionary to enterprise software—gets tested against a backdrop of sticky inflation and shifting rate expectations.
Thank you for being part of our community and for dedicating your time to this edition. Your insights and engagement drive everything we do, and we’re honored to share this space with such committed, thoughtful readers. Here’s to a week filled with clear opportunities and strong performance. Wishing you many bags 💰💰💰
—VolumeLeaders