

Market Momentum: Your Weekly Financial Forecast & Market Prep
Issue 56 / What to expect Aug 11, 2025 thru Aug 15, 2025

NOTE: This weekly periodical is too large for Substack to deliver in its entirety via email - you will only see a portion of this great content if you read from your email client. Click the header/title at the top to read the full article!
In This Issue
Weekly Market-On-Close Report: All the macro moves, market drivers, and must-know narratives—covered in less than five minutes.
Weekly Benchmark Breakdown: Our weekly intelligence report on major indices cuts through the index-level noise to uncover participation, momentum, and structural integrity and tell you whether markets are rising on solid ground or skating on thin breadth. This is where bull markets prove themselves—or quietly start to unravel.
The Latest Investor Sentiment Readings: Track the emotional pulse of the market with our curated dashboard of sentiment indicators. From fear-fueled flight to euphoric overreach, this week's readings reveal whether investors are cautiously creeping in—or stampeding toward the exits.
Institutional Support & Resistance Levels For Major Indices: Exactly where to look for support and resistance this coming week in SPY, QQQ, IWM & DIA
Normalized Performance By Thematics YTD: Which corners of the markets are beating benchmarks, which are overlooked and which ones are over-crowded!
Key Econ Events & Earnings On-Deck For This Coming Week
Market Intelligence Report: Track the real money. This section breaks down where institutions are placing their bets—and pulling their chips. You'll get a sector-by-sector view of flows, highlighting the most active names attracting large-scale buying or selling. We go beyond the headlines and into the tape, surfacing the week’s most notable block trades and sweep orders, both on lit exchanges and hidden dark pools. Whether you're following momentum or fading crowded trades, this is your map to where size is moving and why it matters.


Weekly Market-On-Close Report
It was one of those weeks where the market seemed determined to test both the endurance and the patience of investors. Equity indexes managed to put together a broadly positive performance, but it wasn’t a straight line higher — more like a jagged climb punctuated by bursts of optimism, flashes of doubt, and the occasional headline that seemed to knock the wind out of the rally. By the time the closing bell rang on Friday, the S&P 500 had not only recovered from the prior week’s sell-off but also pushed within striking distance of new highs, led once again by the gravitational pull of mega-cap technology. The Nasdaq 100 even managed to carve out a fresh record close, a reminder that, for all the macro uncertainty swirling around, investors still find comfort in the familiar rhythm of strong tech earnings and dominant market positioning.
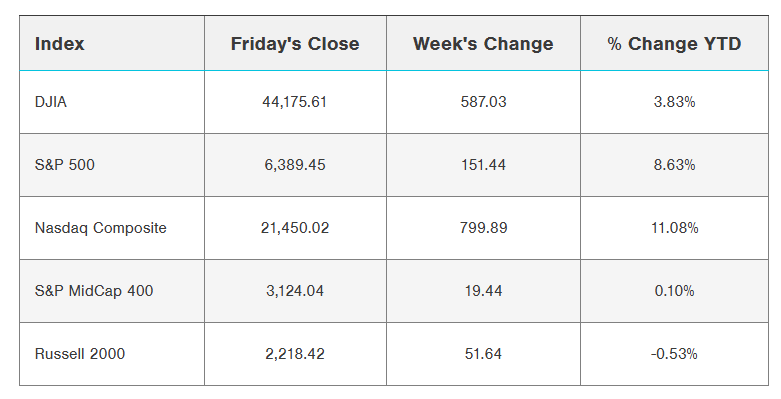
Friday’s session was emblematic of the broader tone. The S&P 500 added 0.78%, the Dow Jones Industrial Average rose 0.47%, and the Nasdaq 100 advanced nearly 1%, with September E-mini S&P and Nasdaq futures posting similar gains. Beneath those numbers was a stew of catalysts: corporate earnings that continued to surprise to the upside, a growing sense that the Federal Reserve might soon be in rate-cutting mode, and — for good measure — a Bloomberg News report suggesting the United States and Russia were exploring terms to end the war in Ukraine. The rumor mill spun quickly: Russia would halt its offensive in certain regions if Ukraine ceded the Donbas and Crimea. The mere possibility of a resolution was enough to feed the day’s risk appetite, even if the details sounded more aspirational than imminent.
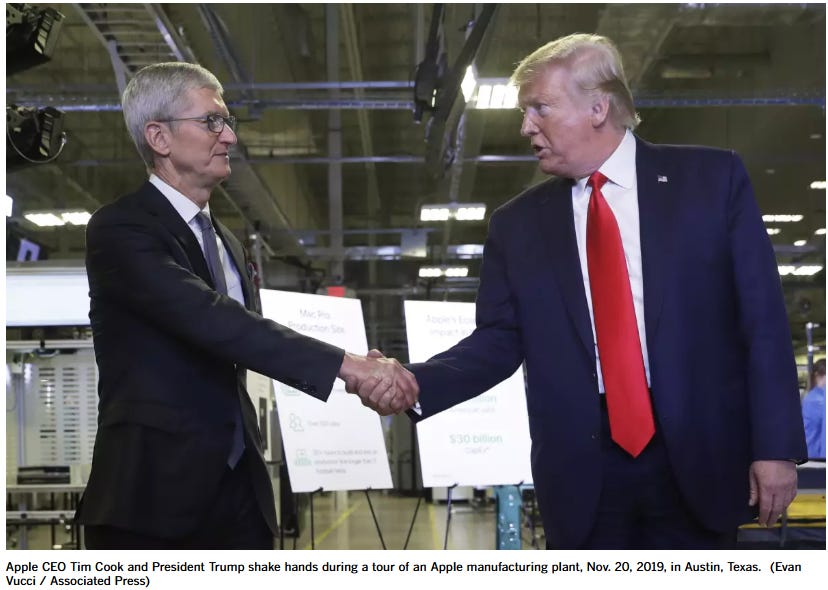
On the earnings front, there was no shortage of standout moves. Monster Beverage jumped more than 6% after topping second-quarter profit forecasts. Expedia gained over 3% after delivering a double win — beating consensus on earnings and raising its full-year guidance. Apple surged more than 4%, capping a three-day, 12% rebound sparked by President Trump’s announcement that the company would commit an additional $100 billion to domestic manufacturing — a move that not only aligns with the administration’s reshoring agenda but also offers potential tariff exemptions for its semiconductor supply chain. That rally alone restored roughly $400 billion in Apple’s market capitalization in under a week.
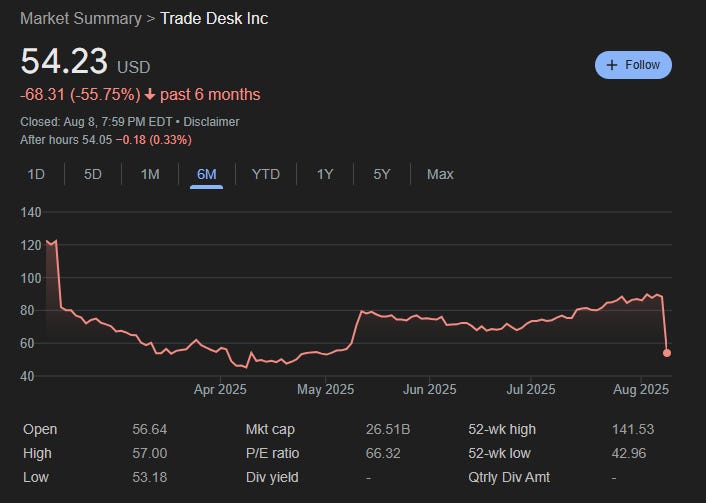
But not every earnings report had a happy ending. The Trade Desk suffered a staggering 38% one-day collapse after delivering guidance that analysts deemed lackluster. Microchip Technology dropped more than 5% after halting most factory expansions and trimming capital expenditure plans. Sweetgreen tumbled 22% on a wider-than-expected loss and a cut to same-store sales guidance, while Twilio, Goodyear, GoDaddy, and Pinterest all endured double-digit declines following their own disappointing updates.
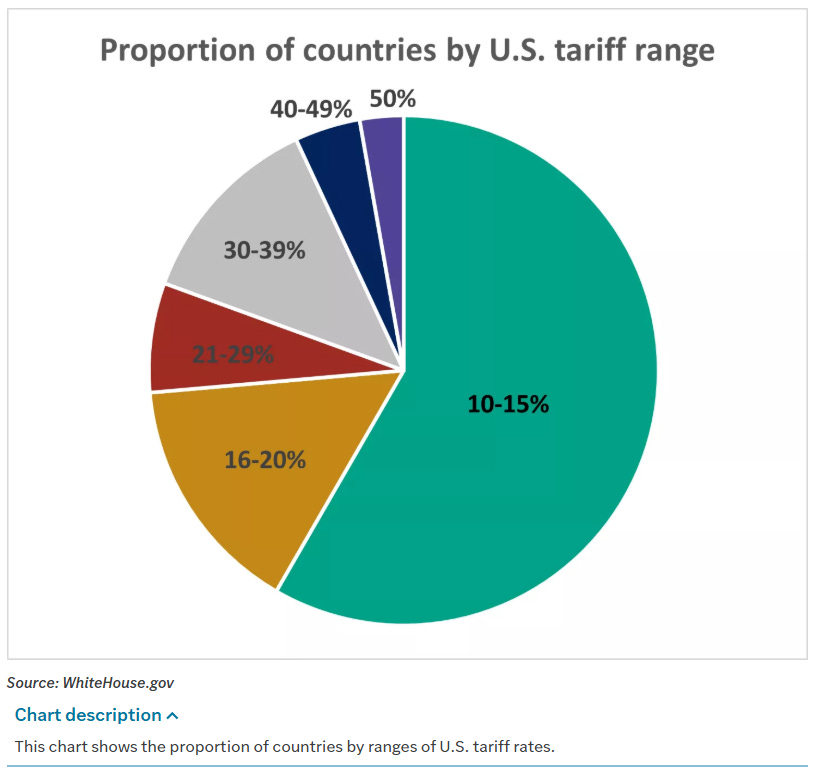
The geopolitical backdrop didn’t stay quiet for long either. Mid-week brought a volley of new trade announcements. President Trump unveiled a 100% tariff on semiconductor imports, though exemptions would be available for companies with meaningful U.S. production. In practice, that means some of the biggest names in the sector — Apple among them — could sidestep the steepest duties. The administration also doubled tariffs on Indian goods to 50% in response to that country’s purchases of Russian oil, and hinted at forthcoming levies on pharmaceutical imports. Bloomberg Economics calculated that, if all of the proposed measures are implemented, the average U.S. tariff rate would rise to 15.2%, up from 13.3% after earlier rounds this year and miles above the 2.3% level seen before the tariff cycle began.
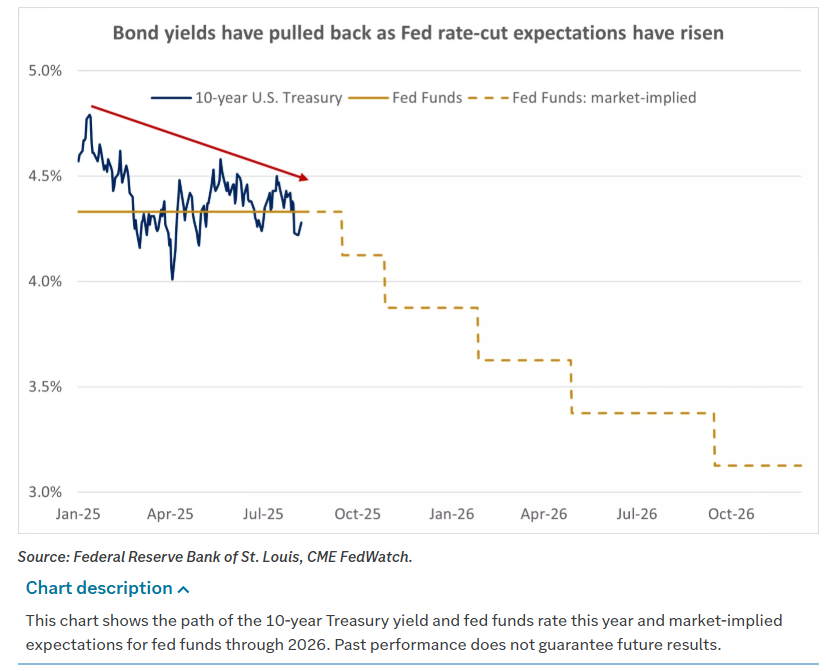
For investors parsing the Federal Reserve’s intentions, the week’s news flow tilted dovish. The odds of a September rate cut jumped to around 90%, according to fed funds futures, up sharply from just 40% a week earlier. That shift was fueled partly by weaker-than-expected economic readings and partly by political developments — namely, the nomination of Stephen Miran to temporarily fill a Fed Board vacancy. Miran, currently serving as chair of the Council of Economic Advisors, is viewed as aligned with President Trump’s preference for easier policy. Still, not all Fed voices sang from the same hymn sheet. St. Louis Fed President Alberto Musalem warned that inflation remains too high for comfort and argued for holding rates steady for now, a reminder that internal debate remains alive.
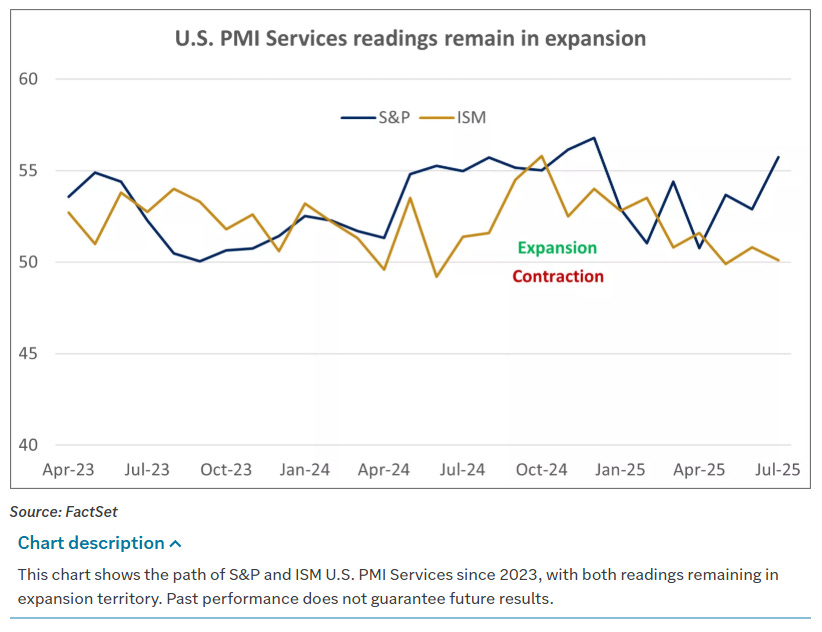
The macro data gave both bulls and bears something to work with. On the services side of the economy — which accounts for roughly 71% of GDP — the S&P Global U.S. Services PMI climbed to a year-high of 55.7 in July, signaling healthy expansion and topping forecasts. Technology and financial services led the improvement, while output prices rose as companies passed along higher input costs linked to tariffs. The Institute for Supply Management’s services index told a more subdued story, slipping to 50.1 and barely holding in expansion territory. New orders and employment contracted, while the prices index jumped to its highest reading since October 2022, hinting at lingering inflationary pressures even as growth cooled.
Labor productivity offered a brighter note. Nonfarm business productivity rose at a 2.4% annualized pace in the second quarter, ahead of expectations, while hourly compensation grew 4.2% year-over-year — comfortably above inflation. The combination kept unit labor costs in check, rising just 1.6% annualized, which could help cushion the inflationary bite of higher tariffs.
Corporate America’s earnings season, meanwhile, continued to outperform the low bar set earlier in the year. With roughly 90% of S&P 500 companies having reported, about 82% have beaten profit estimates, delivering an average upside surprise of 8.5%. Year-over-year earnings growth now looks set to come in near 9.7% for the quarter, up from just 3.8% expected at the end of Q2. Gains have been broad, with only the energy and materials sectors showing year-over-year declines. Communications and technology have been standout performers, each posting earnings growth above 20%.
The bond market spent much of the week adjusting to shifting rate-cut expectations and digesting fresh supply. Treasury yields edged higher overall, with the 10-year closing around 4.29% after a batch of lackluster auctions. The bid-to-cover ratio for the $42 billion 10-year sale slipped to 2.35, below the year-to-date average, as concerns over budget deficits weighed on demand. Still, yields remain well below their July peaks, and most forecasts keep the 10-year in a 4%–4.5% range barring a major surprise on inflation or growth.
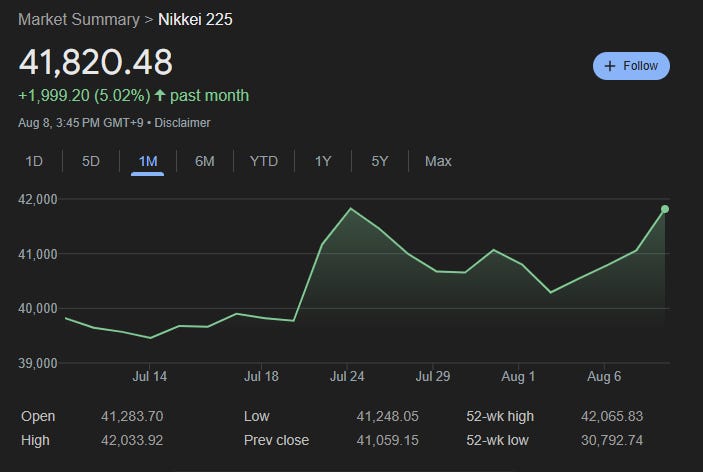
Beyond U.S. borders, global markets largely shared in the rebound. European equities rose 2–3% on the week, aided by strong earnings and tentative optimism over Ukraine peace prospects. The UK lagged, as the Bank of England cut rates by 25 basis points in a narrow 5–4 vote while issuing hawkish guidance. In Asia, Chinese and Hong Kong stocks advanced on better-than-expected trade data, though the looming expiration of a tariff détente kept traders cautious. Japan’s Nikkei 225 jumped nearly 2% on Friday, helped by double-digit gains in SoftBank and a post-earnings rally in Sony. India, by contrast, underperformed after the U.S. tariff hike, with political rhetoric hardening on both sides.
Commodities painted a mixed picture. Crude oil prices eased on de-escalation hopes in Ukraine, with Brent down nearly 4% for the week. European natural gas slipped about 5%. Industrial metals got a lift from China’s trade data and a weaker dollar, though palladium sank over 5% amid auto sector weakness and potential supply shifts from Russia. Gold hovered around $3,450 an ounce after a brief, tariff-driven spike to fresh records proved short-lived. Agricultural commodities were little changed, while crypto markets rebounded — fueled in part by a long-telegraphed executive order allowing 401(k) investments in digital assets. Bitcoin ended the week near $116,500, up 2%, while Ethereum climbed over 10% toward the $4,000 mark.
Sector-wise, technology once again set the pace. Semiconductor and equipment stocks broadly traded well, bolstered mid-week by the White House’s chip tariff plan and Apple’s manufacturing investment pledge. Communication services rose over 3% on mega-cap strength, offsetting weakness in media and entertainment. Consumer discretionary saw similar cross-currents, with housing-related names gaining on rate-cut hopes while apparel and travel earnings proved mixed. Energy and healthcare lagged, the latter weighed down by a sharp drop in Eli Lilly despite otherwise solid pharma and medtech results.
Under the surface, market internals told a familiar story: leadership concentrated in the giants. The equal-weight S&P 500 rose just 0.6% on the week, versus a 2.4% gain for the cap-weighted index. Small- and mid-caps clawed back about half of the prior week’s losses. That dynamic leaves the broader market in a delicate spot — participation is positive but not yet robust enough to signal a full-throated risk-on environment.
As the week wound down, attention began to shift toward the next set of catalysts. On the economic front, inflation and retail sales data will dominate the coming days, offering a clearer view of how tariffs are filtering through to prices and demand. Globally, China’s upcoming data dump — capped by retail sales and industrial production — could reset growth expectations in Asia. Geopolitically, a series of meetings between U.S., European, and Ukrainian officials is on tap, followed by a planned U.S.–Russia sit-down that will test whether the peace chatter has real substance. Trade negotiations with India, Switzerland, and Taiwan remain in motion, as does the legal wrangling over various tariff measures.
For now, the market seems willing to lean on the twin pillars of strong corporate earnings and the prospect of easier monetary policy. But with valuations stretched, macro data sending mixed signals, and trade policy shifting almost daily, the path forward is unlikely to be smooth. Volatility may not be as intense as in the immediate aftermath of last week’s jobs report, but it’s never far from the surface — and in this kind of environment, each headline has the potential to be the next turning point.

Weekly Benchmark Breakdown
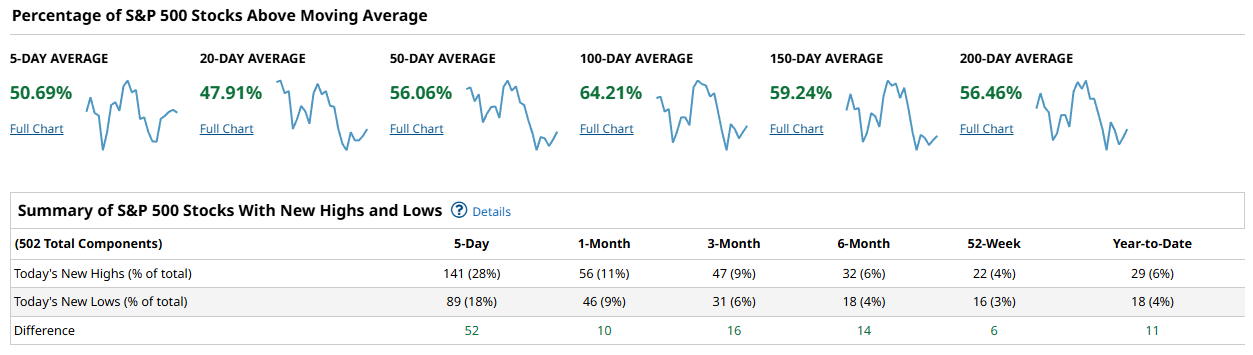
The picture across the major benchmarks this week feels like a market that’s still standing, but showing signs of fatigue just beneath the surface. In the S&P 500, roughly half the index is sitting above short-term moving averages, and fewer than half are above the 20-day. That’s not catastrophic, but it’s a far cry from the kind of broad participation you’d like to see if the rally were firing on all cylinders. The intermediate-term picture is healthier—about two-thirds of names are still above their 100-day averages—but the short-term weakness suggests the recent run has lost some steam. New highs still outpaced new lows over the past five days, but the margin is narrowing, hinting at selective leadership rather than a full-team effort.
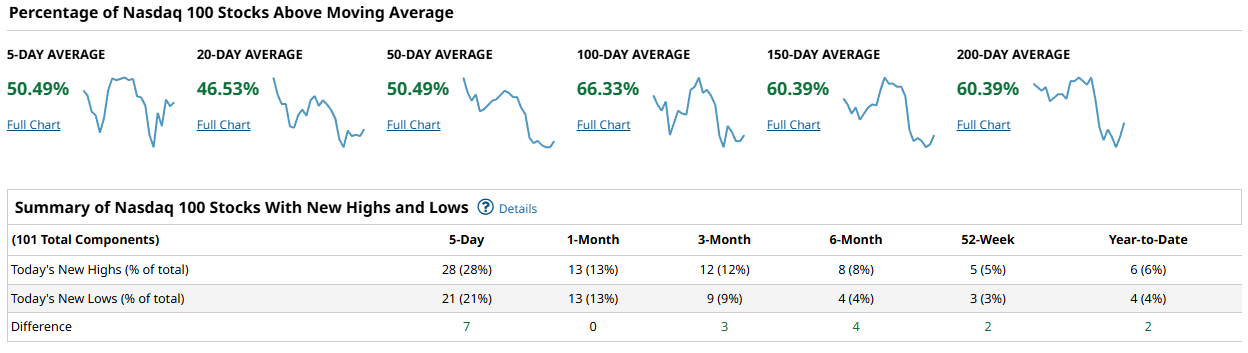
The Nasdaq 100 tells a similar story, though it’s even more dependent on its heavyweights. Breadth there has slipped below 50% on short-term measures, and the cushion of new highs over new lows has shrunk to single digits. The big tech trend is still intact, especially when you zoom out to the longer-term averages, but the index is leaning hard on a handful of mega-cap names. If those leaders take a breather, the whole complex could feel it.
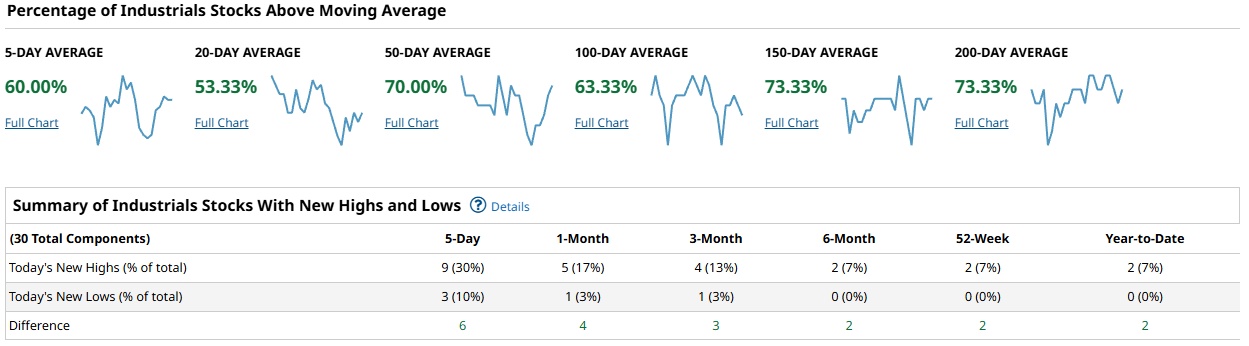
Industrials, by contrast, look like they’re in their own little world right now. This is the one group where breadth is strong at nearly every time frame, with most stocks still riding above even their long-term averages. Lows are scarce, highs are holding up, and the participation here feels far more broad-based. For now, this sector looks like a clear beneficiary of the current rotation.
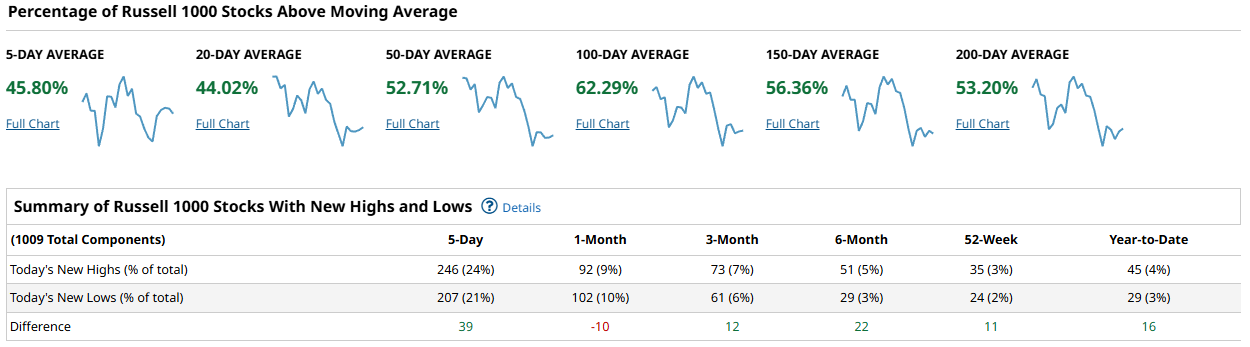
The Russell 1000 is where the cracks really show. Less than half its members are above short-term averages, and even the 20-day measure is sagging in the low 40s. While it still manages to post more highs than lows in the very short term, the one-month tally has actually turned negative, showing that weakness in mid- and small-cap names is dragging on the broader market.
Taken together, this week’s breadth says we’re in a rotational, somewhat choppy phase. The leadership baton has been passed to Industrials and a select few large caps, while much of the market takes a step back. The longer-term trend is still intact, but the narrowing participation hints that the path forward may be sideways rather than straight up—at least until the next wave of buyers shows up.
US Investor Sentiment Report
Insider Trading
Insider trading occurs when a company’s leaders or major shareholders trade stock based on non-public information. Tracking these trades can reveal insider expectations about the company’s future. For example, large purchases before an earnings report or drug trial results might indicate confidence in upcoming good news.
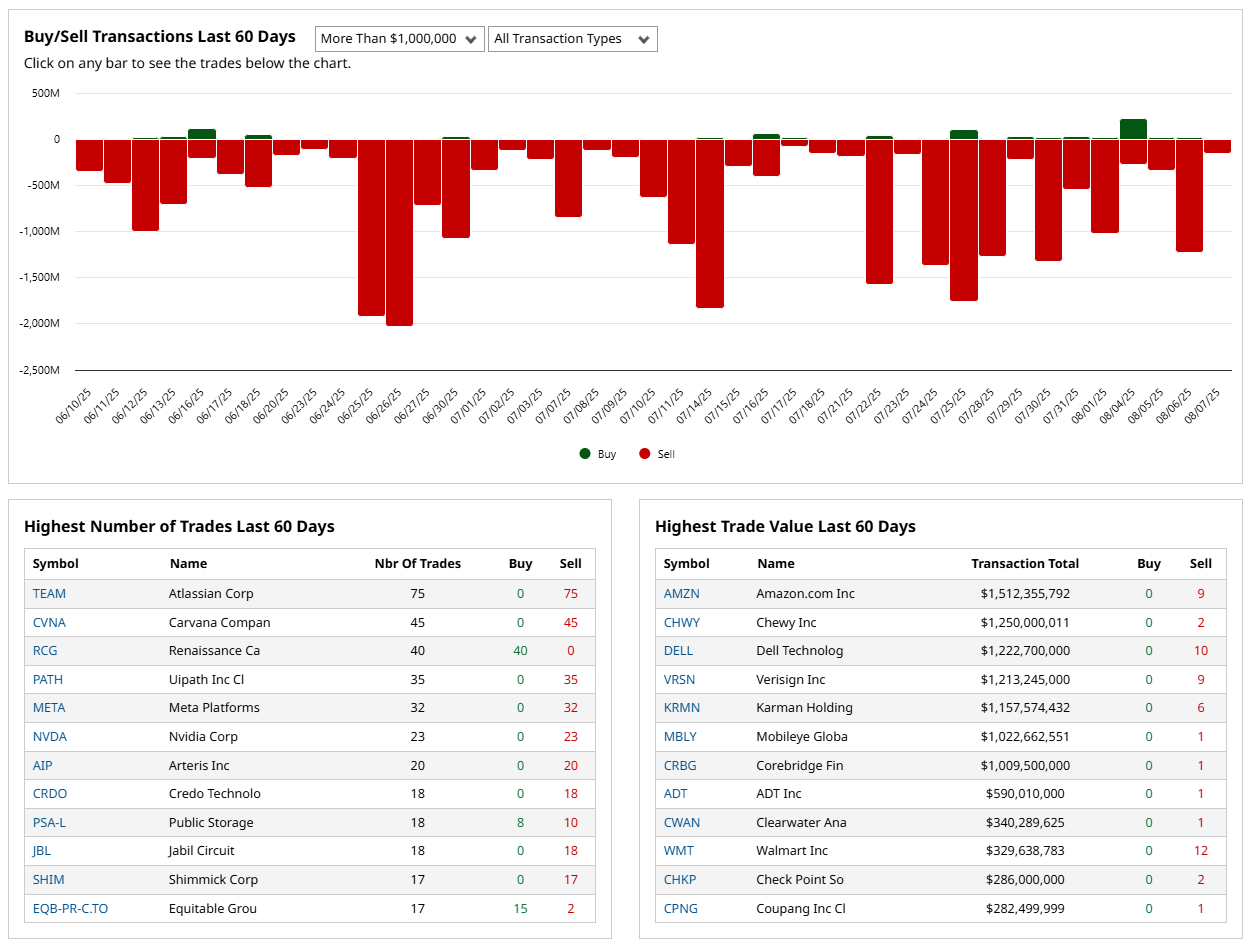
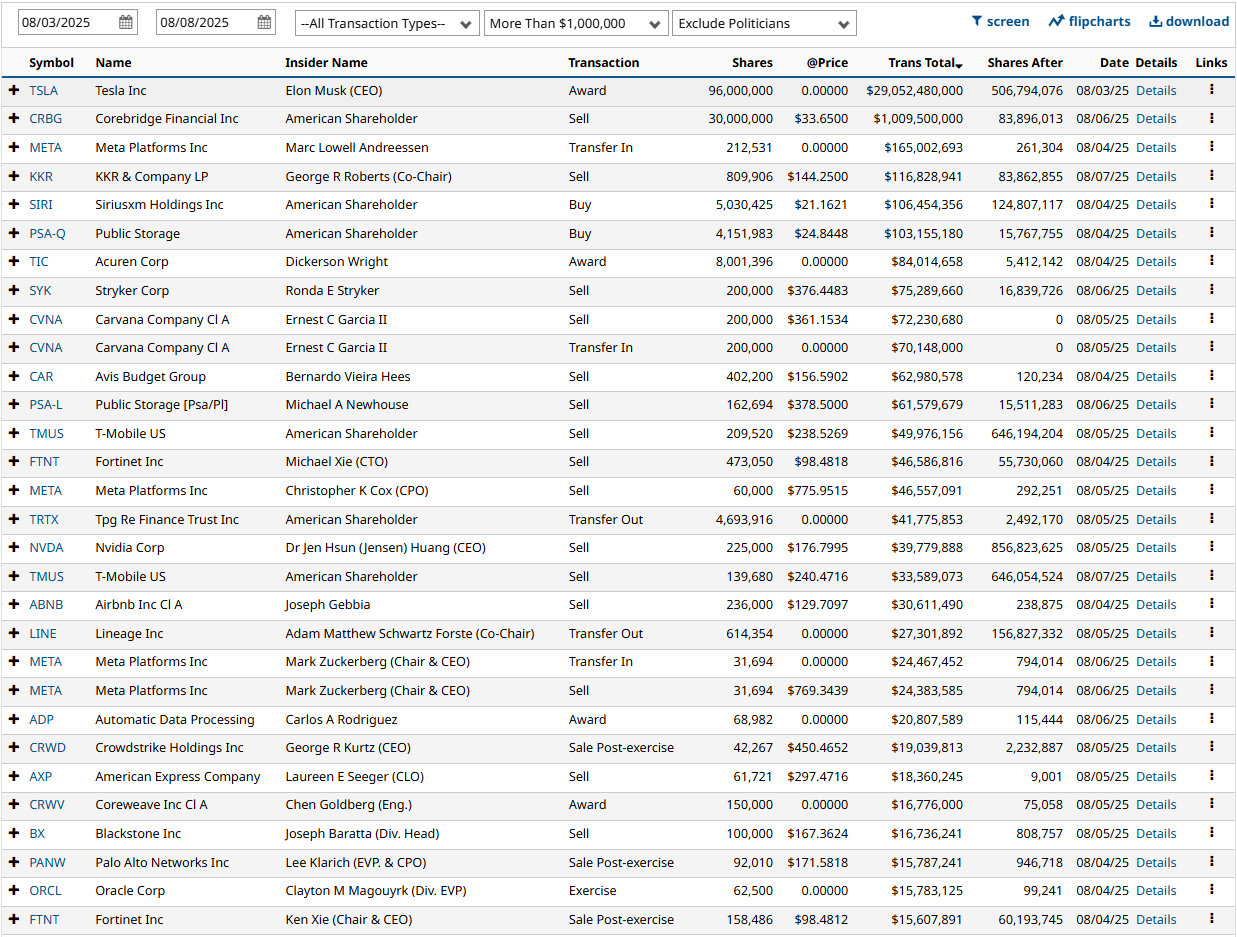
This week’s insider activity leaned heavily toward selling, with large, concentrated transactions in big names like Amazon, Dell, Verisign, Meta, Nvidia, Fortinet, and T-Mobile, alongside Elon Musk’s $29B Tesla share award (non-cash). While a few notable buys surfaced—such as Public Storage and Corebridge—they were dwarfed by the scale of sales, particularly in tech. The breadth and size of these disposals suggest insiders are locking in gains and positioning defensively, adding a cautious undertone to an already softening market backdrop.
%Bull-Bear Spread
The %Bull-Bear Spread measures the gap between bullish and bearish investor sentiment, often from surveys like AAII. It’s a contrarian indicator—extreme optimism may signal a coming pullback, while extreme pessimism can hint at a potential rally. Large positive or negative spreads often mark market turning points.
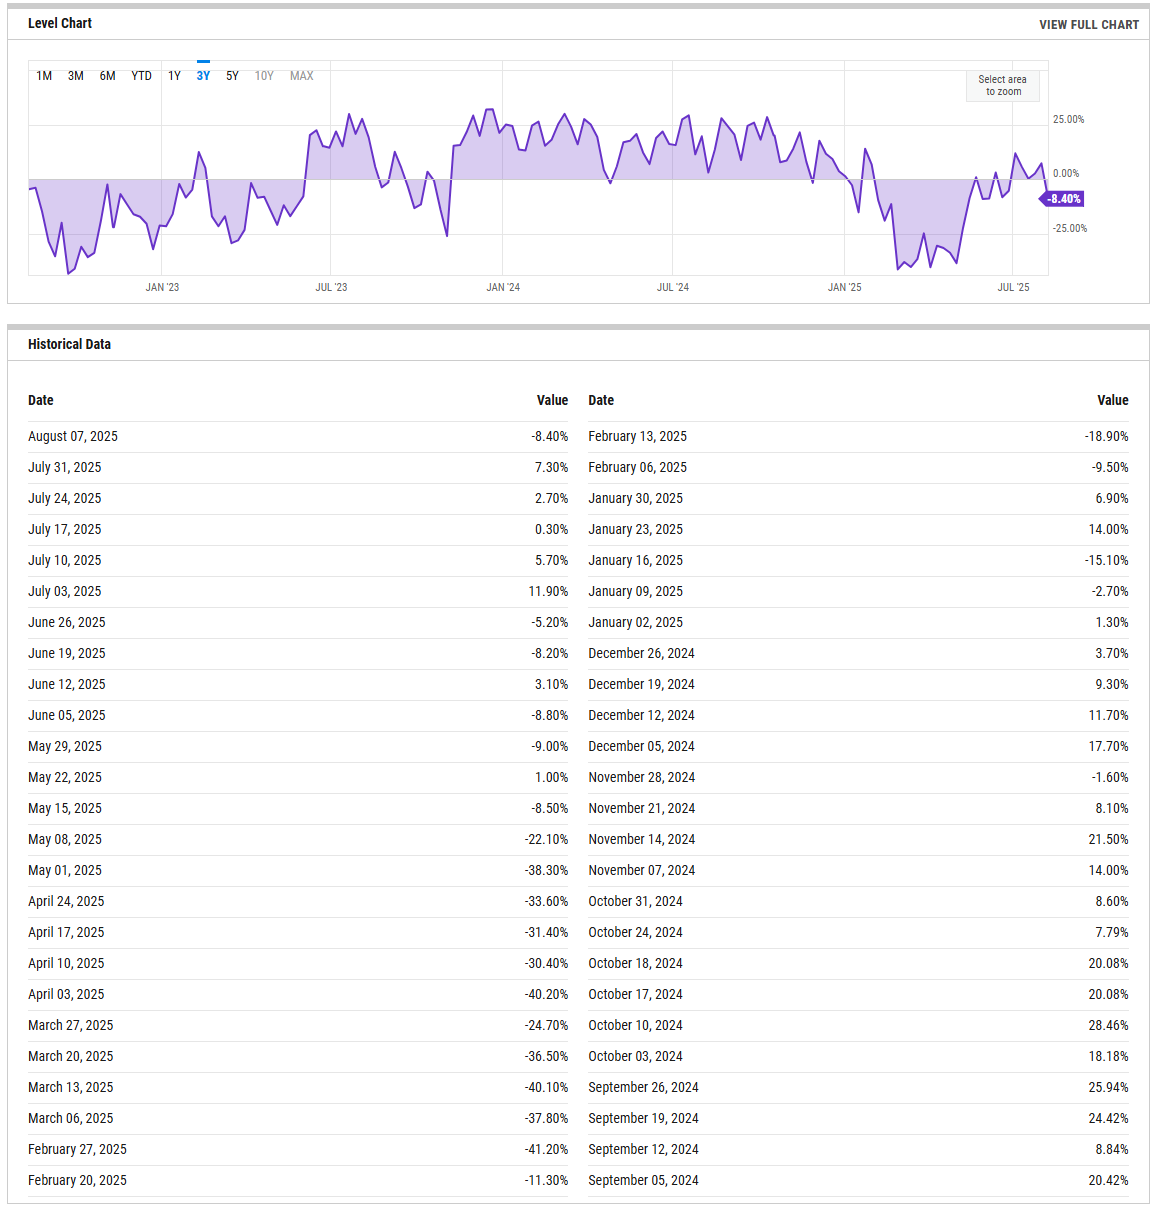
The AAII Bull-Bear Spread slid sharply this week to -8.4%, reversing from last week’s +7.3% and marking the lowest level since late June. This shift reflects a notable swing toward bearish sentiment, with more investors identifying as bears than bulls after a month of choppier price action and rising macro uncertainty. While not yet at capitulation levels, the downturn suggests caution is creeping back into positioning after July’s brief optimism.
NAAIM Exposure Index
The NAAIM Exposure Index (National Association of Active Investment Managers Exposure Index) measures the average exposure to U.S. equity markets as reported by its member firms. These are typically active money managers who provide their equity exposure levels weekly. The index offers insight into how much these managers are investing in equities at any given time, ranging from being fully short (-100%) to leveraged long (up to +200%).
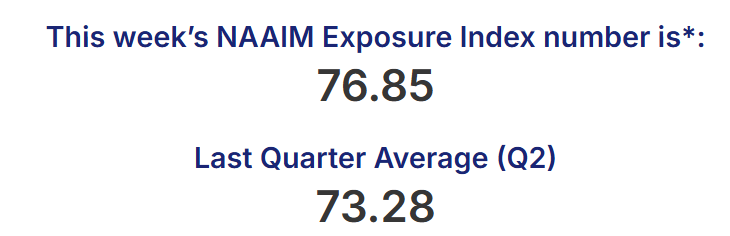
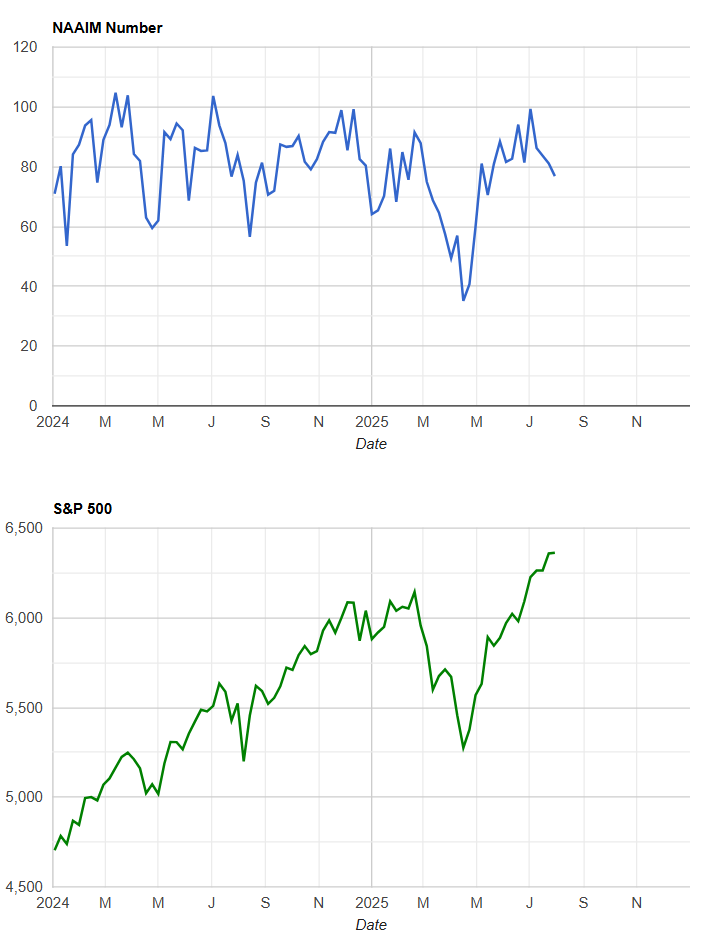
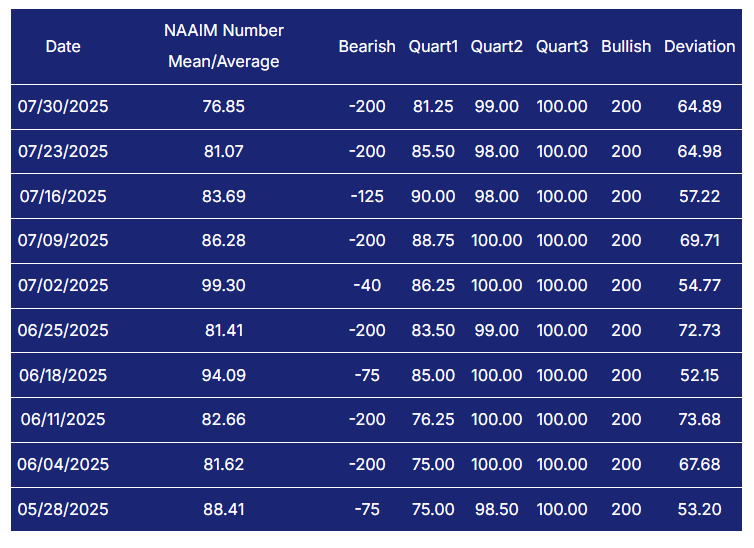
The NAAIM Exposure Index eased to 76.85 this week from 81.07, pulling back modestly from mid-July’s elevated readings but still holding above its Q2 average of 73.28. This level suggests active managers remain broadly constructive on equities despite recent market chop, maintaining allocations well above neutral. The slight dip likely reflects a degree of tactical risk management as sentiment indicators cool, but positioning remains far from defensive.
CBOE Total Put/Call Ratio
CBOE's total put/call ratio includes index options and equity options. It's a popular indicator for market sentiment. A high put/call ratio suggests that the market is overly bearish and stocks might rebound. A low put/call ratio suggests that market exuberance could result in a sharp fall.
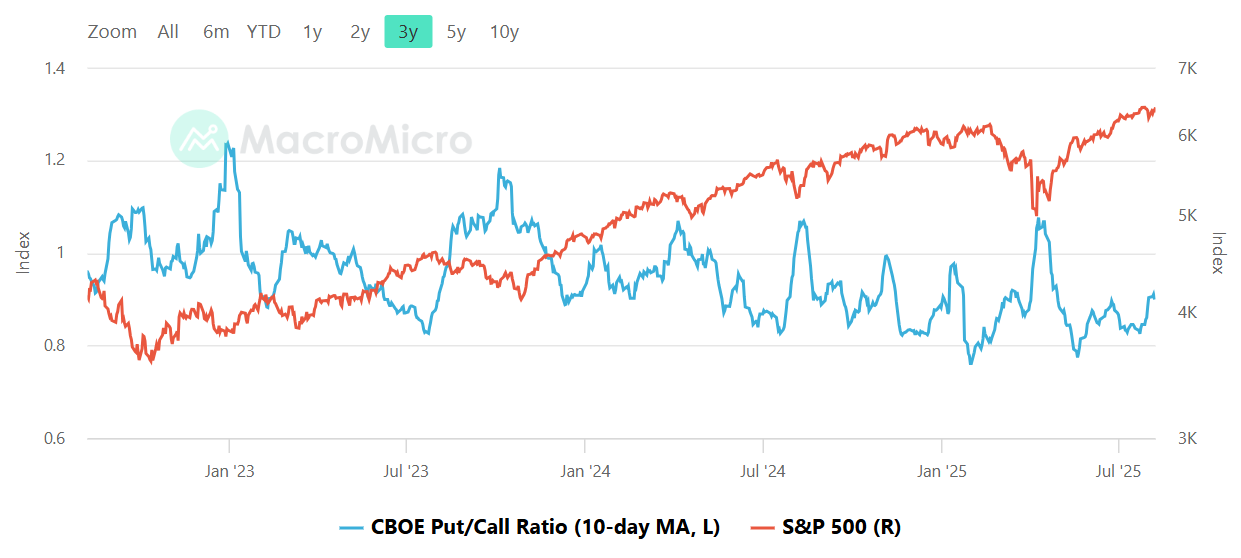
The 10-day moving average of the CBOE Put/Call Ratio has been drifting higher in recent weeks, signaling a modest uptick in hedging or bearish positioning compared to earlier in the summer. While still far from the panic levels seen during sharp market selloffs, the move suggests traders are becoming more cautious as the S&P 500 hovers near record highs, possibly bracing for volatility or short-term pullbacks.
Equity vs Bond Volatility
The Merrill Lynch Option Volatility Estimate [MOVE] Index from BofAML and the CBOE Volatility Index [VIX] respectively represent market volatility of U.S. Treasury futures and the S&P 500 index. They typically move in tandem but when they diverge, an opportunity can emerge from one having to “catch-up” to the other.
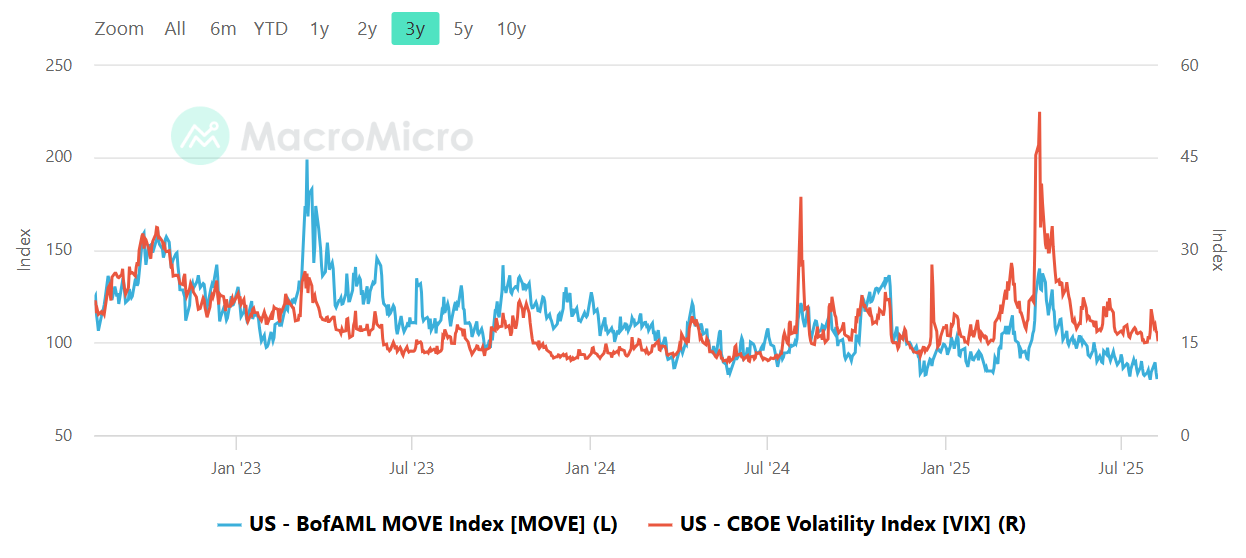
Equity volatility, as measured by the VIX, has eased back toward mid-range levels after the early-year spikes, while bond market volatility, tracked by the MOVE index, has been grinding steadily lower to near its three-year lows. The narrowing gap between the two suggests a calmer cross-asset volatility backdrop, with neither equities nor Treasuries flashing acute stress—though such complacency can sometimes precede sharp repricings if macro conditions shift abruptly.
CNN Fear & Greed Constituent Data Points & Composite Index
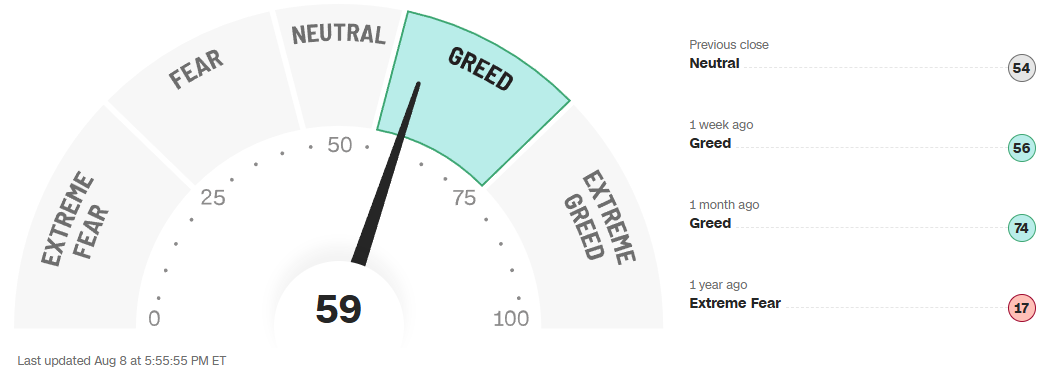
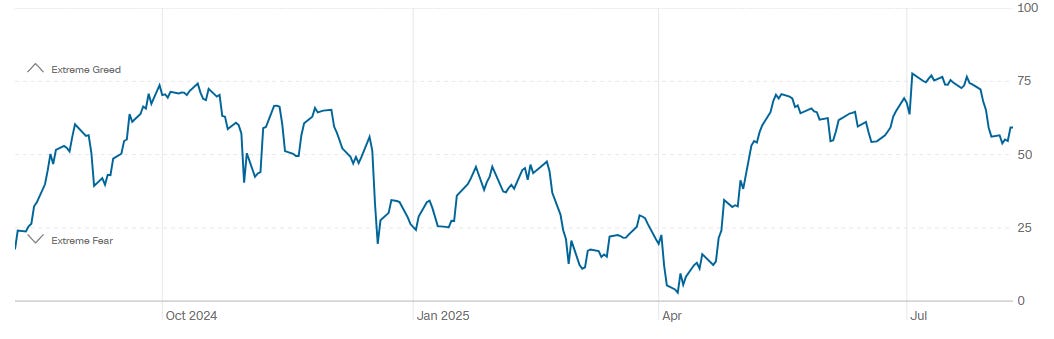
The CNN Fear & Greed Index currently sits at 59, indicating a tilt toward “Greed” after a neutral close the previous session. This marks a slight uptick from last week’s 56, though it’s well off the 74 seen a month ago. A year ago, sentiment was far more pessimistic, deep in “Extreme Fear” at just 17. The chart over the past year shows sentiment swinging between extremes, with notable drops in late 2024 and early 2025 followed by a strong rebound into the summer. While we’re not at euphoric levels, the current reading suggests investors are leaning bullish, though not without some lingering caution.
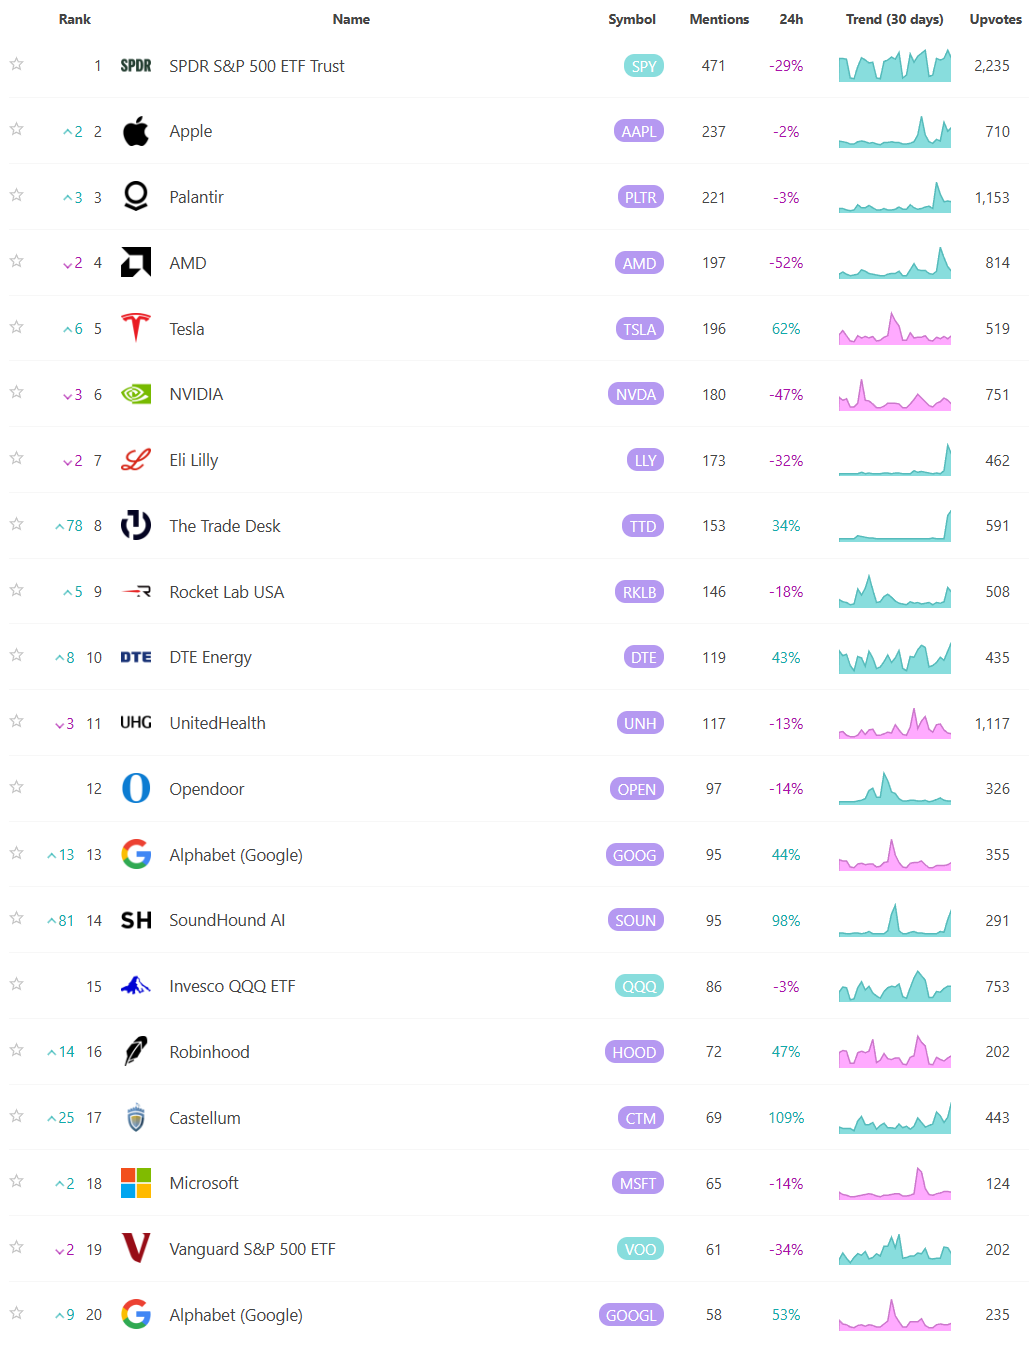
Social Media Favs
Social sentiment offers a real-time view of investor mood, often revealing market shifts before traditional indicators. It can signal momentum changes, spot emerging trends, and gauge retail investor impact—especially in high-volatility names. Tracking sentiment around events or earnings provides actionable insights, and when layered with quantitative models, can enhance predictive accuracy and risk management. Sustained sentiment trends often mirror broader market cycles, making this data a valuable tool for both short-term trades and long-term positioning.
Institutional S/R Levels for Major Indices
When you’re a large institutional player, your primary goal is to find liquidity - places to do a ton of business with the least amount of slippage possible. VolumeLeaders.com automatically identifies and visually plots the exact spots where institutions are doing business and where they are likely to return for more. It’s one of the primary reasons “support” and “resistance” concepts work and truly one of the reasons “price has memory” - take a look at the dashed lines in the images below that the platform plots for you automatically; these are the areas institutions constantly revisit to do more business.
Levels from the VolumeLeaders.com platform can help you formulate trades theses about:
Where to add or take profit
Where to de-risk or hedge
What strikes to target for options
Where to expect support or resistance
And this is just a small sample; there are countless ways to leverage this information into trades that express your views on the market. The platform covers thousands of tickers on multiple timeframes to accommodate all types of traders.
SPY
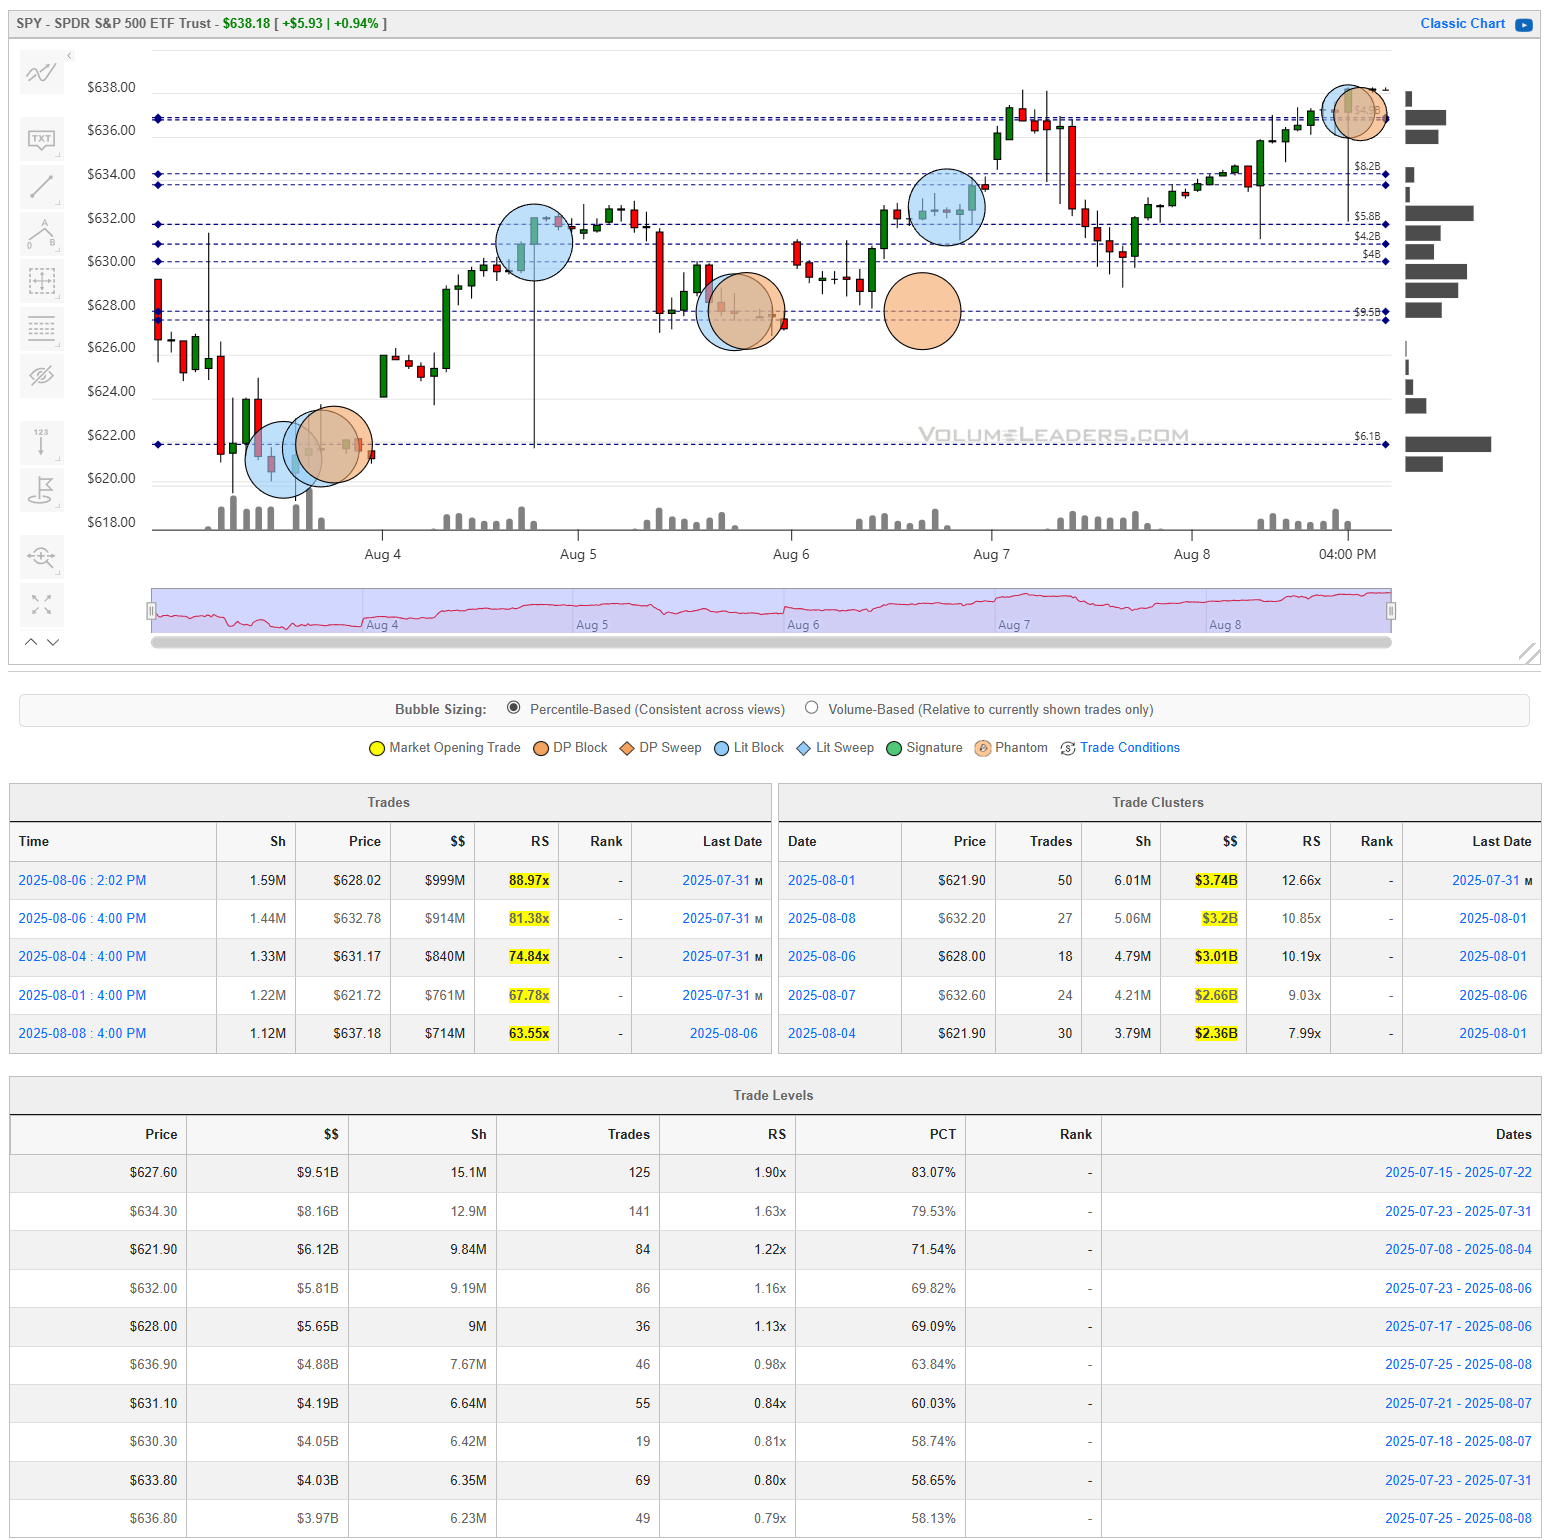
SPY spent the past week carving out a choppy but ultimately constructive range, with institutional activity clustering at key price levels that now serve as meaningful reference points. Large trades—particularly in the $621 to $628 zone earlier in the week—helped form a base that buyers defended multiple times, while more recent heavy prints near $637–$638 suggest a shift in focus toward testing higher ground. The stair-step pattern of volume-backed advances, interrupted by healthy pullbacks into prior liquidity pockets, points to steady accumulation rather than speculative chasing. With resistance zones now clearly defined just above current prices and several strong support shelves below, the tape is showing signs of controlled upward momentum, where dips into prior trade clusters are likely to attract fresh interest.
QQQ
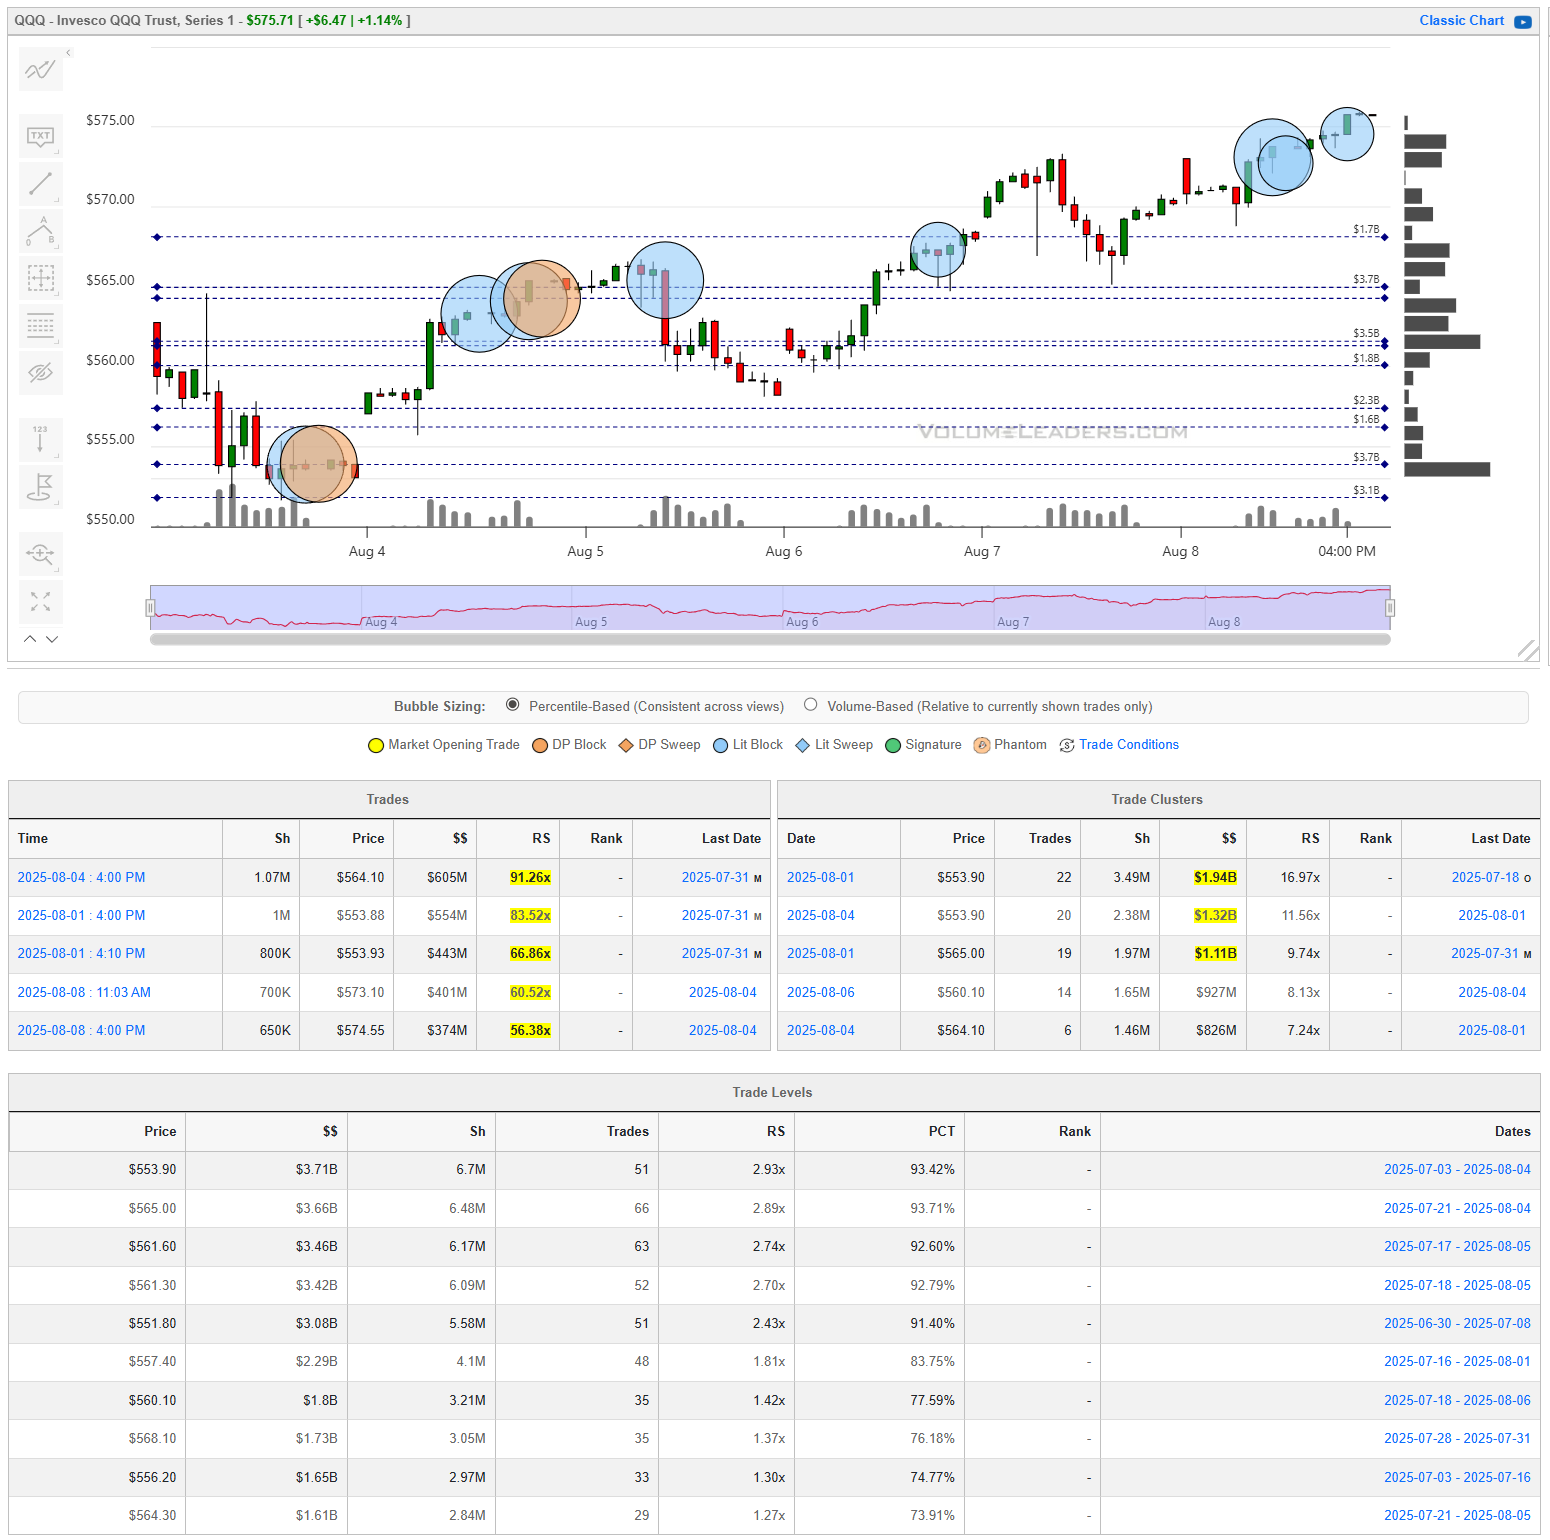
QQQ showed a strong upward bias this week, steadily climbing from early August lows while leaving behind well-defined pockets of institutional activity that now double as support. The heaviest concentrations of large trades were laid down between $553 and $561, and these levels have since served as the foundation for each new leg higher. Notably, recent heavy prints above $570 signal that institutions are willing to commit capital at higher prices, a bullish tell that often precedes further upside follow-through. The price action reflects a controlled advance—pullbacks into prior trade clusters have been shallow and quickly met with renewed buying—suggesting that large players are actively supporting the move and could continue to press the trend if broader market conditions remain favorable.
IWM
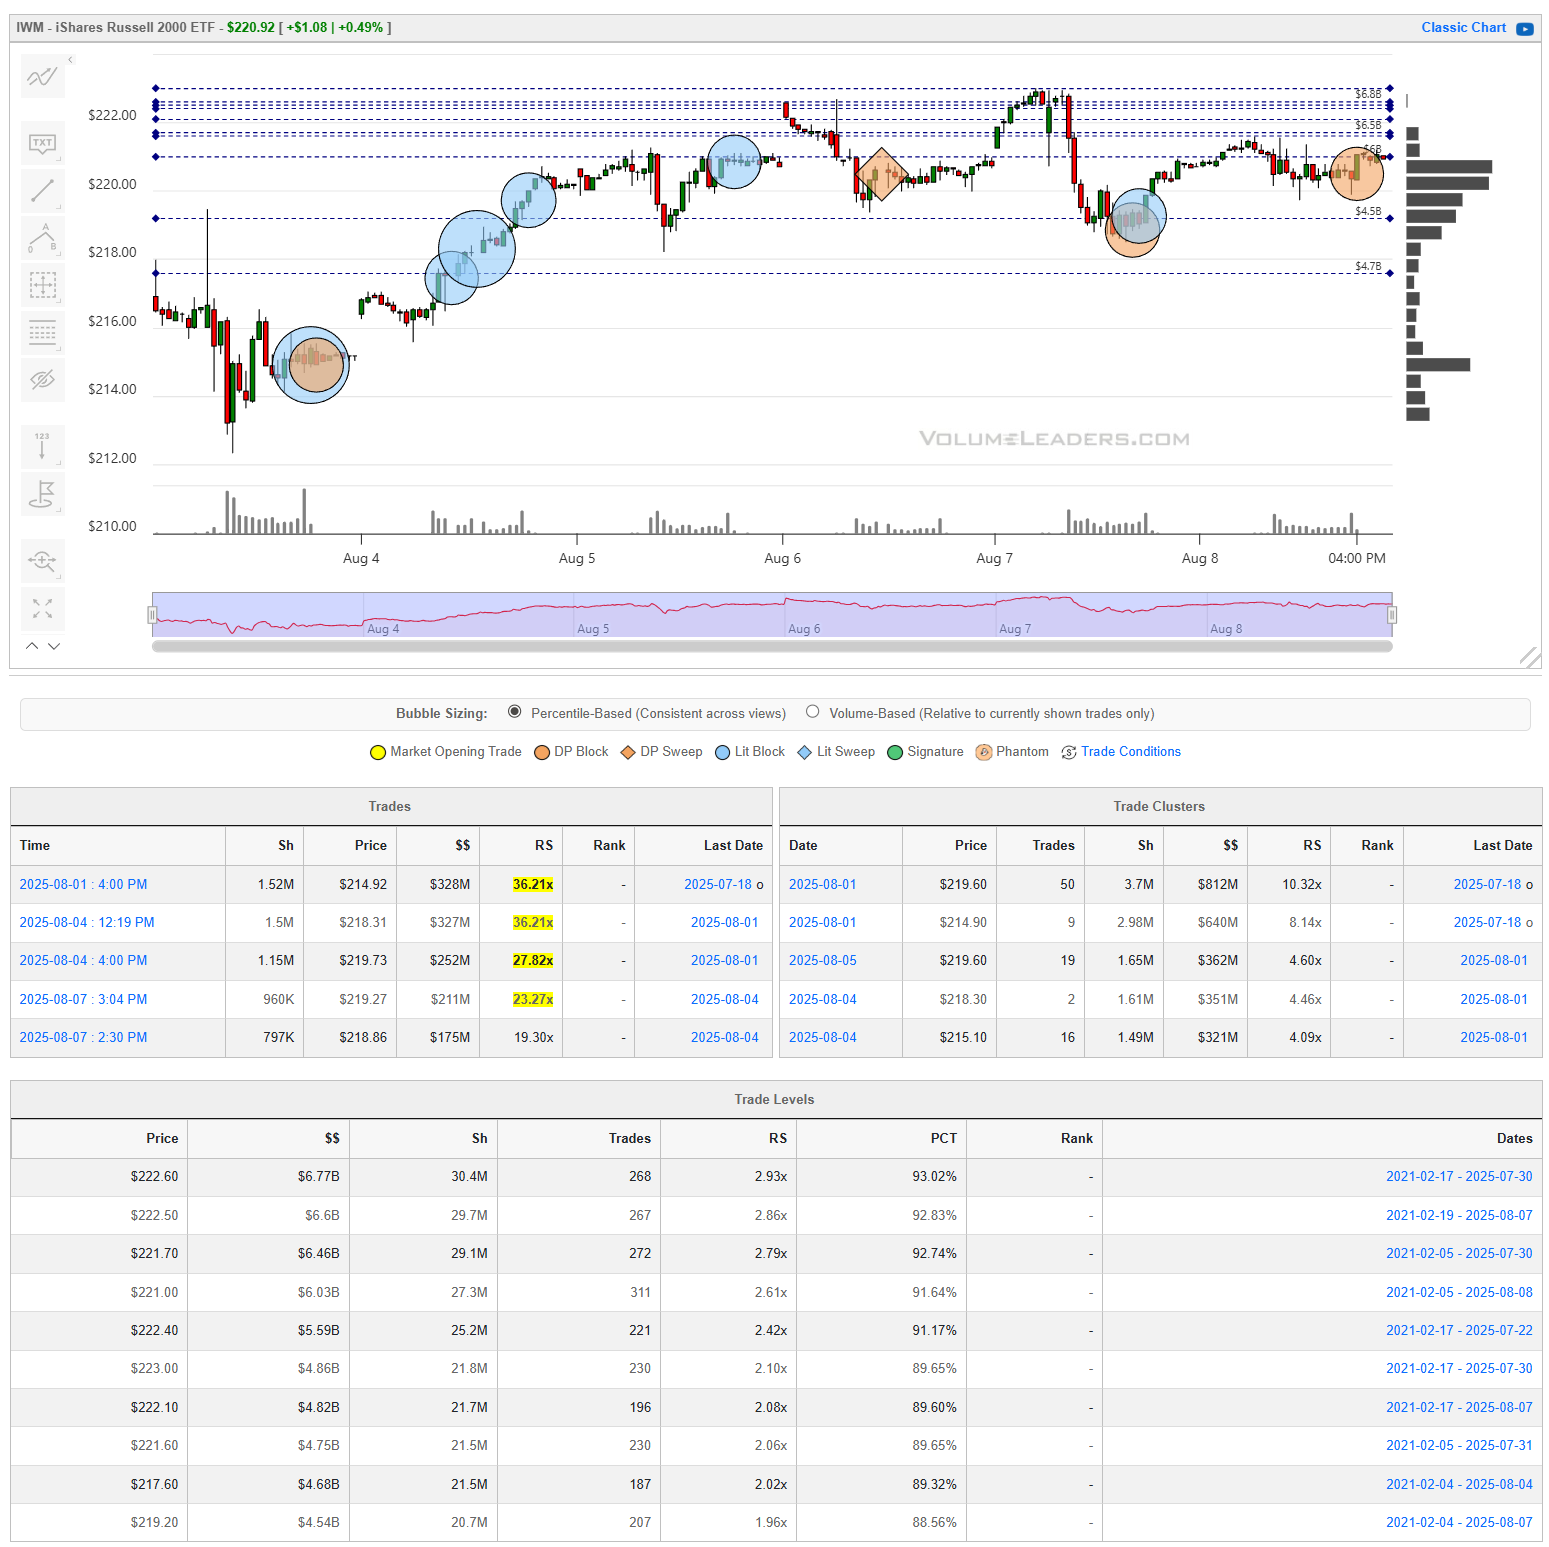
IWM’s early August rally was underpinned by heavy institutional footprints between $214 and $219, which served as springboards for the advance toward the $222–$223 zone. However, unlike SPY and QQQ, the index has since stalled at the highs where a large cluster of levels is keeping upward movement checked and recent trading showing potentially distribution-like clusters above $221. This suggests that while buyers remain active on dips into established support, there’s a tug-of-war developing at current levels. Sustained closes above $222.60 would likely confirm that buyers have absorbed overhead supply, whereas repeated failures here could see price drift back toward the deeper support shelves near $218 and $215, where prior large trades are likely to re-engage.
DIA
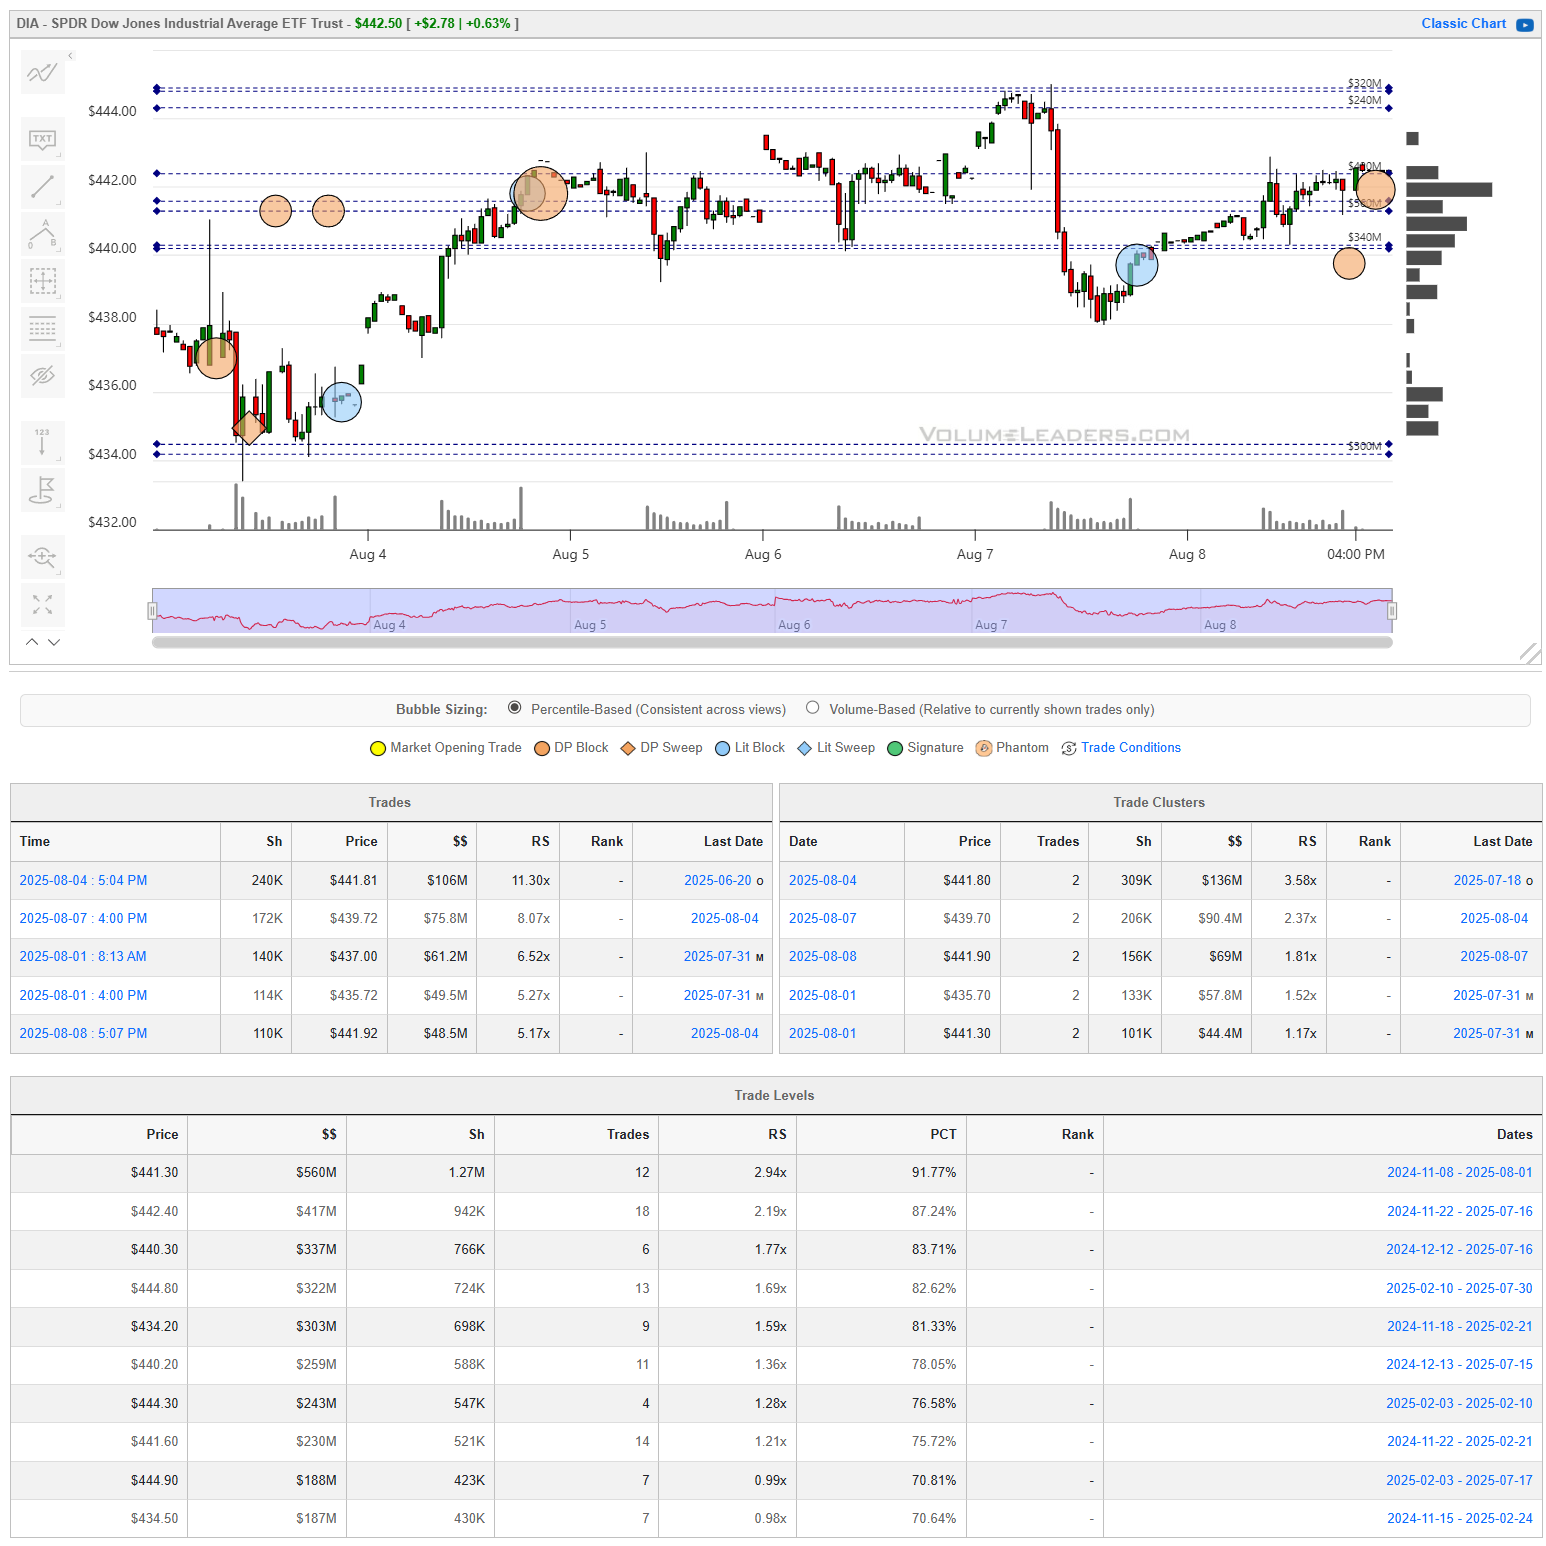
DIA has been trading in a relatively contained range since the early August lift from the $434–$436 zone, where notable positioning first appeared. The $441.30 level has emerged as a key pivot, with repeated clustering of activity around it suggesting it’s a focal point for institutional interest. Above that, there’s been steady engagement in the $439.70–$440.80 band, while the $443–$444 area remains the upper boundary that has yet to give way. The structure implies that while participants are actively positioning on both sides of these key levels, the market has yet to commit to a sustained breakout or breakdown, keeping the focus on these established shelves for clues to the next directional push.
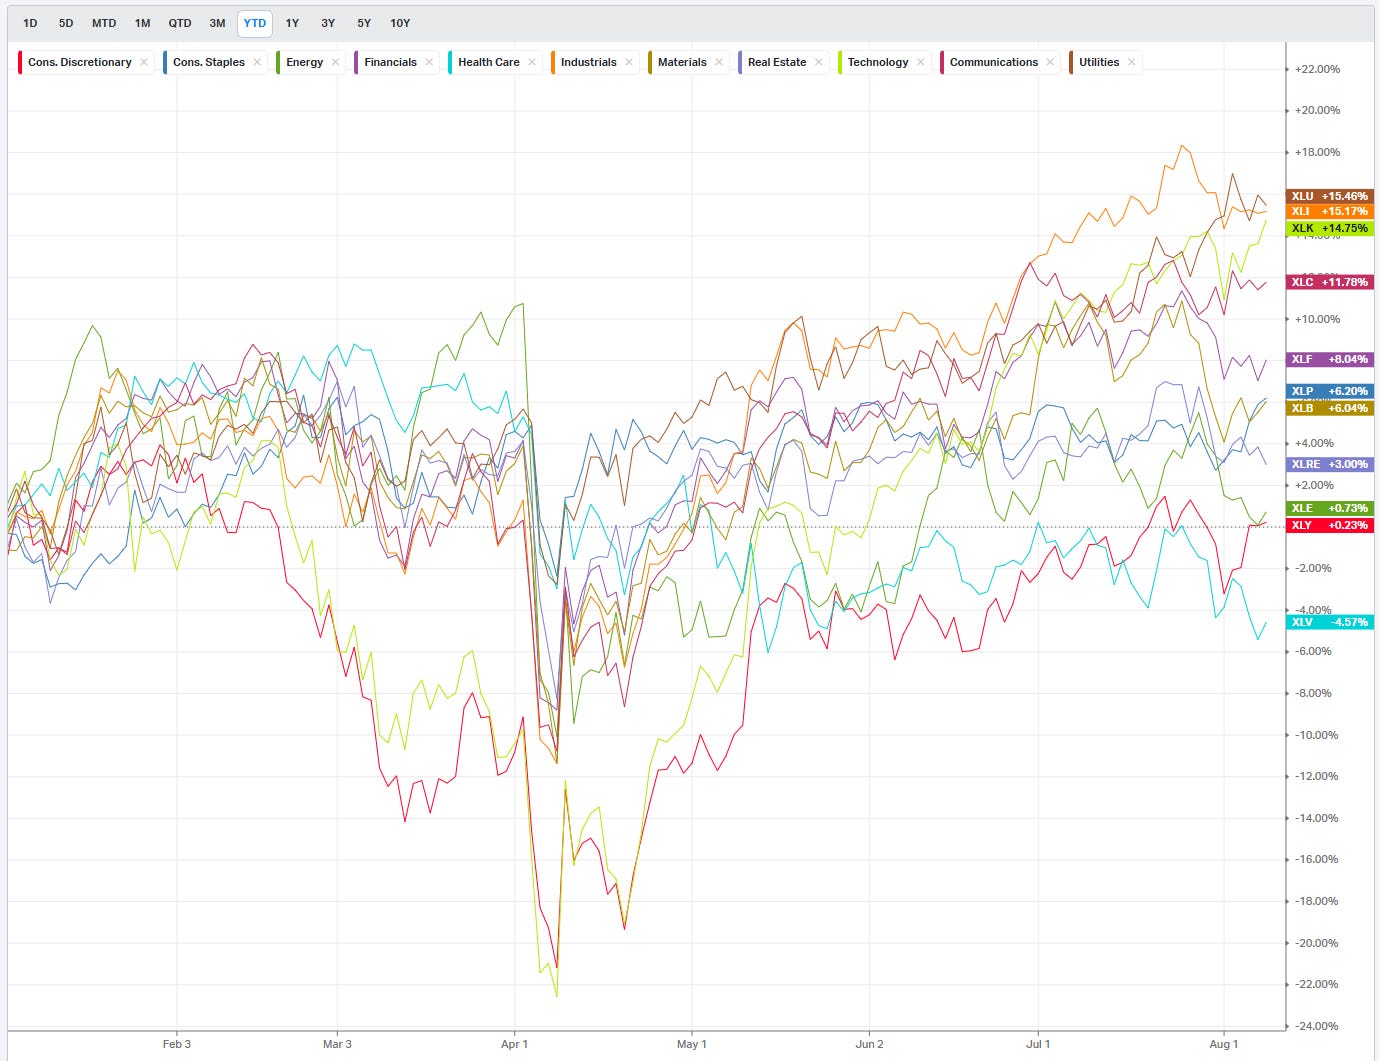
Summary Of Thematic Performance YTD
VolumeLeaders.com offers a robust set of pre-built thematic filters, allowing you to instantly explore specific market segments. These performance snapshots are provided purely for context and inspiration—think about zeroing in on the leaders and laggards within the strongest and weakest sectors, for example.
S&P By Sector
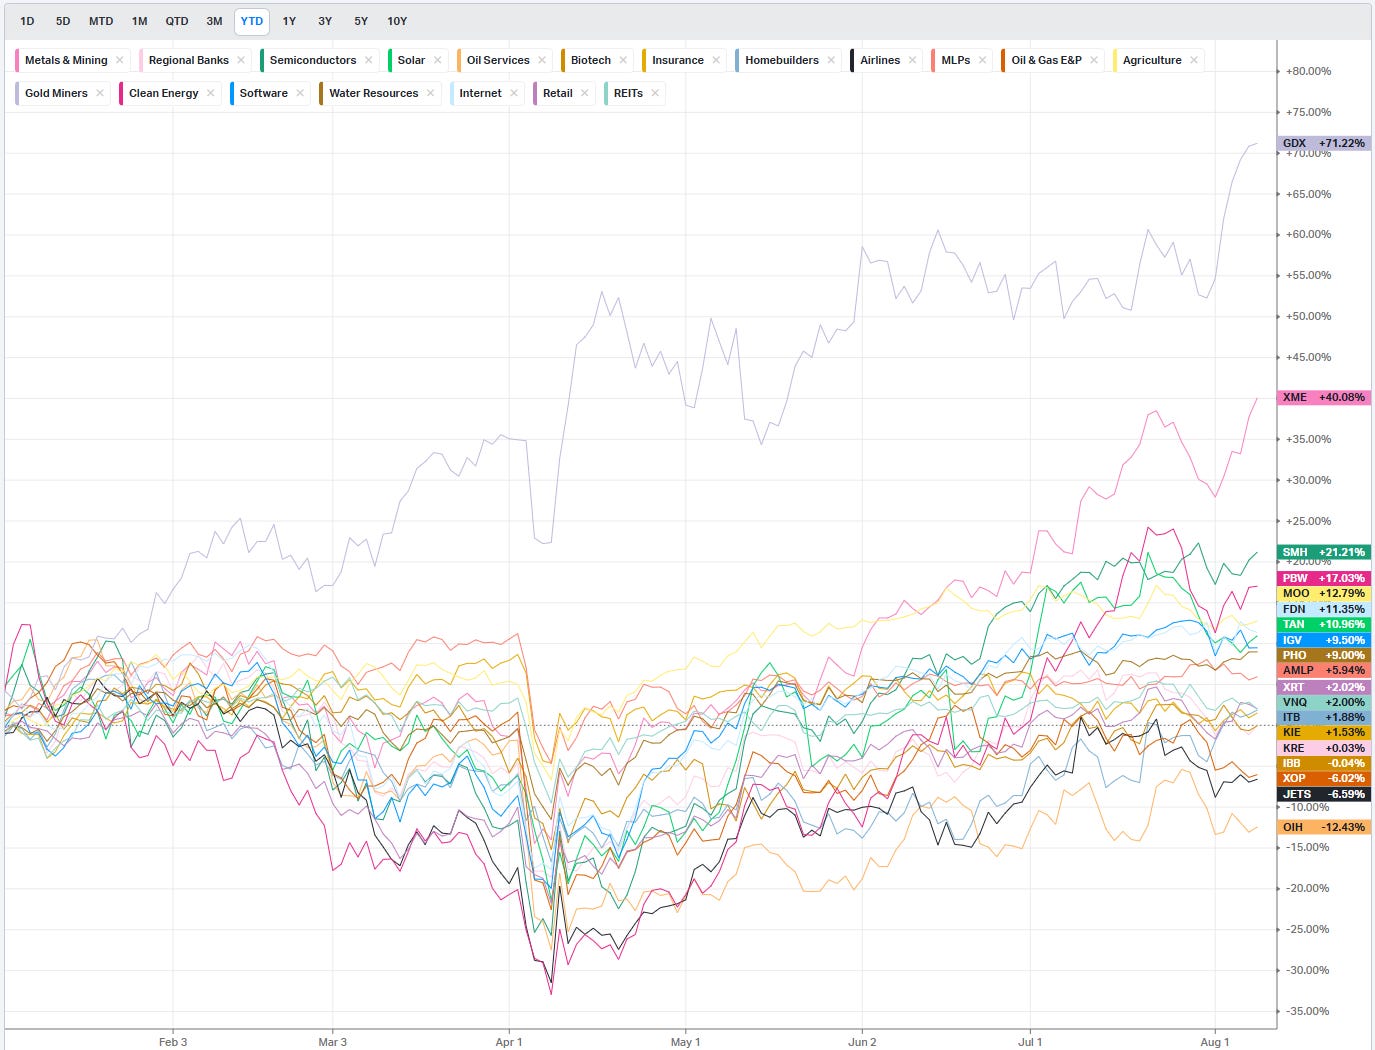
S&P By Industry
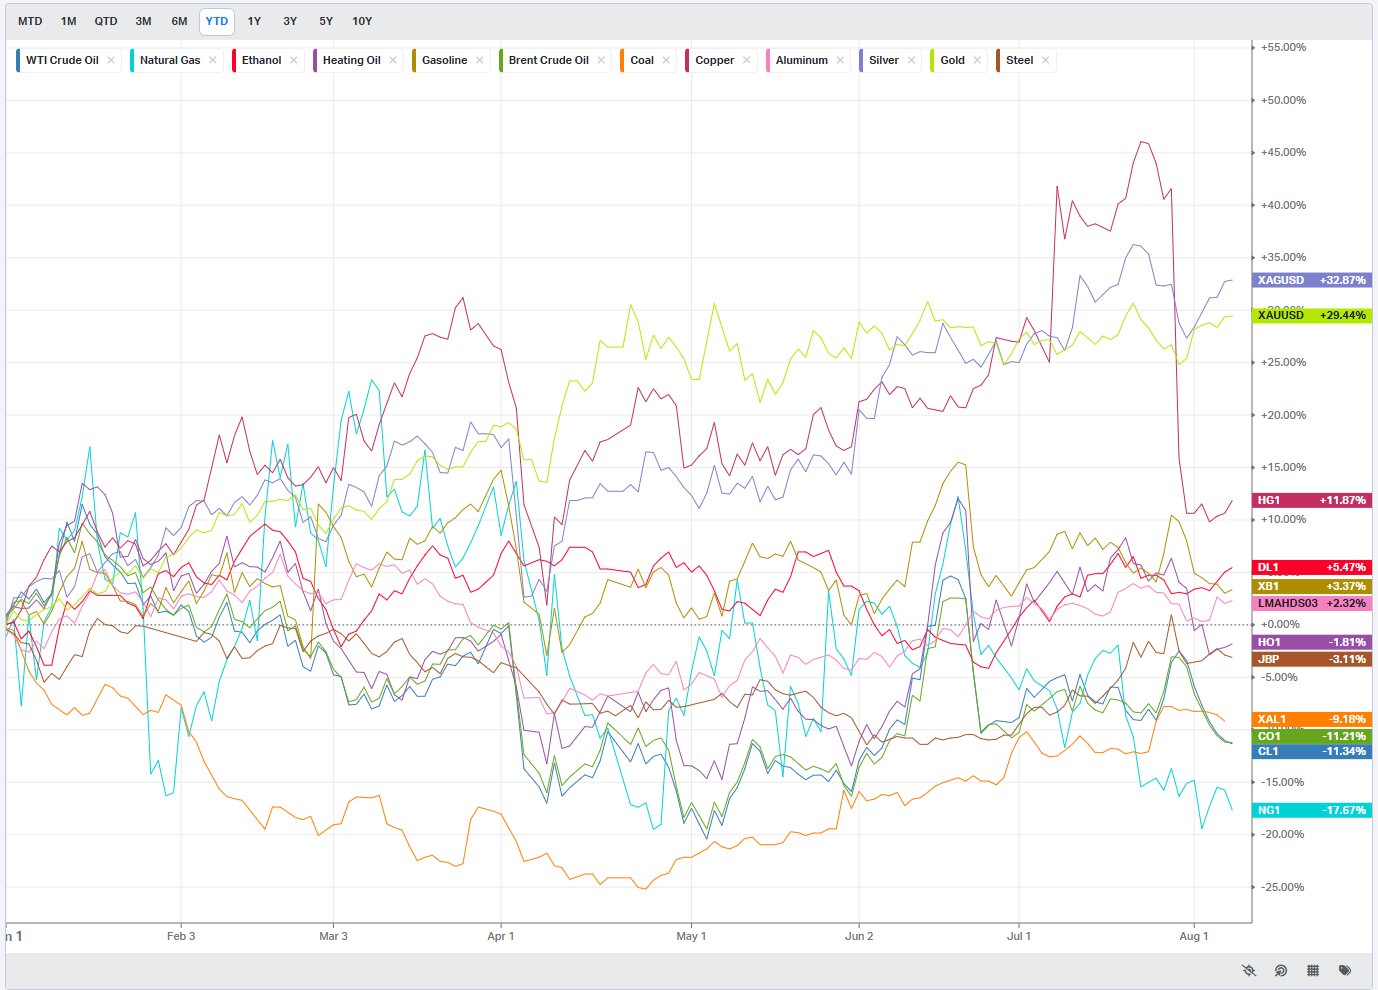
Commodities: Energy & Metals
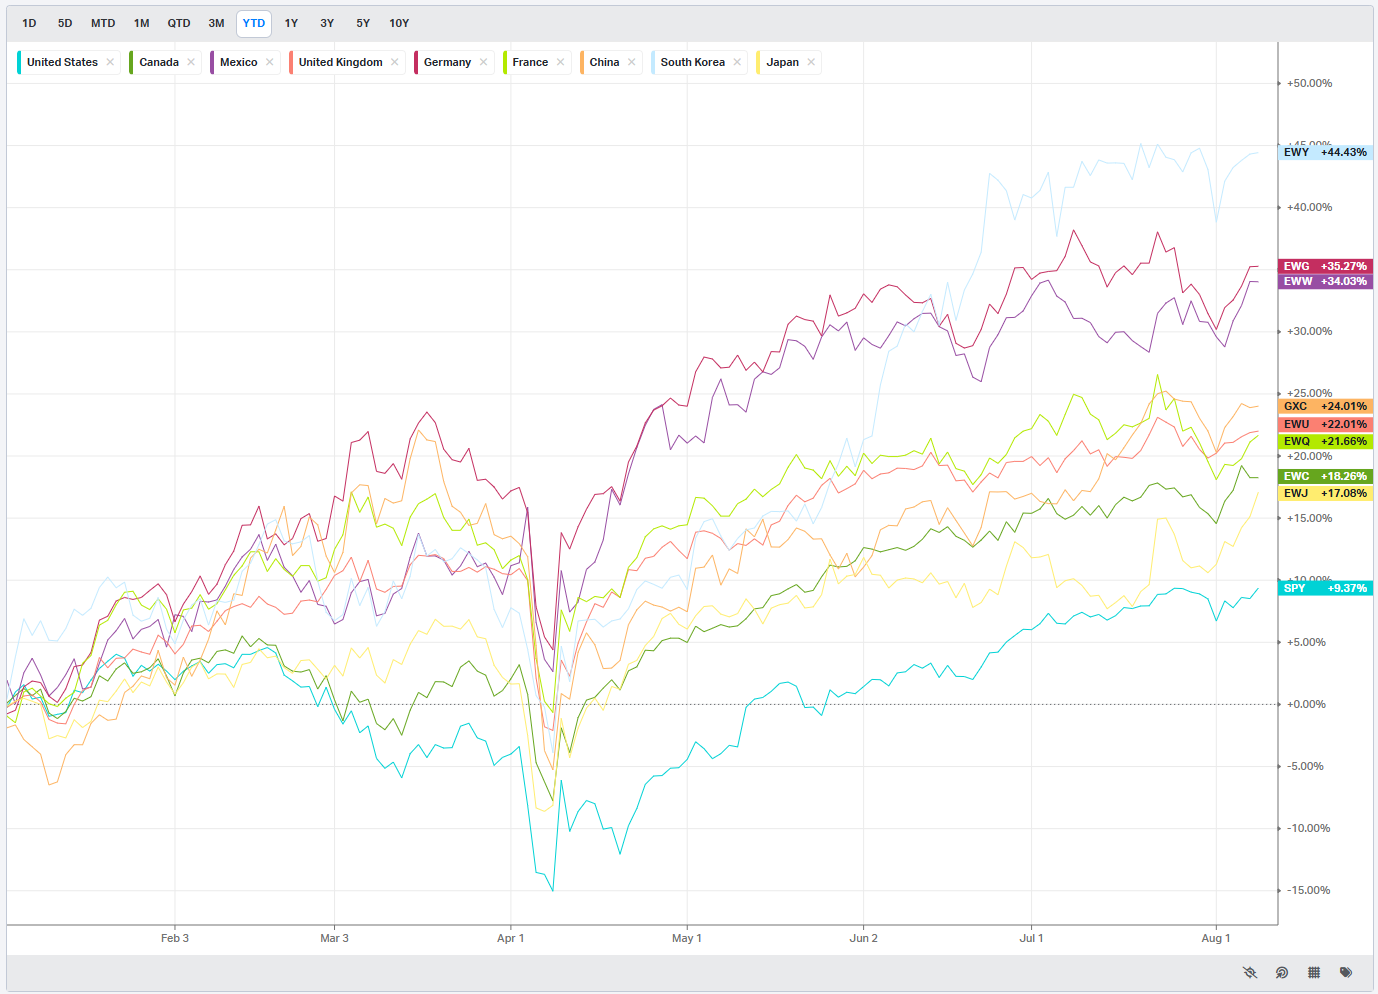
Country ETFs
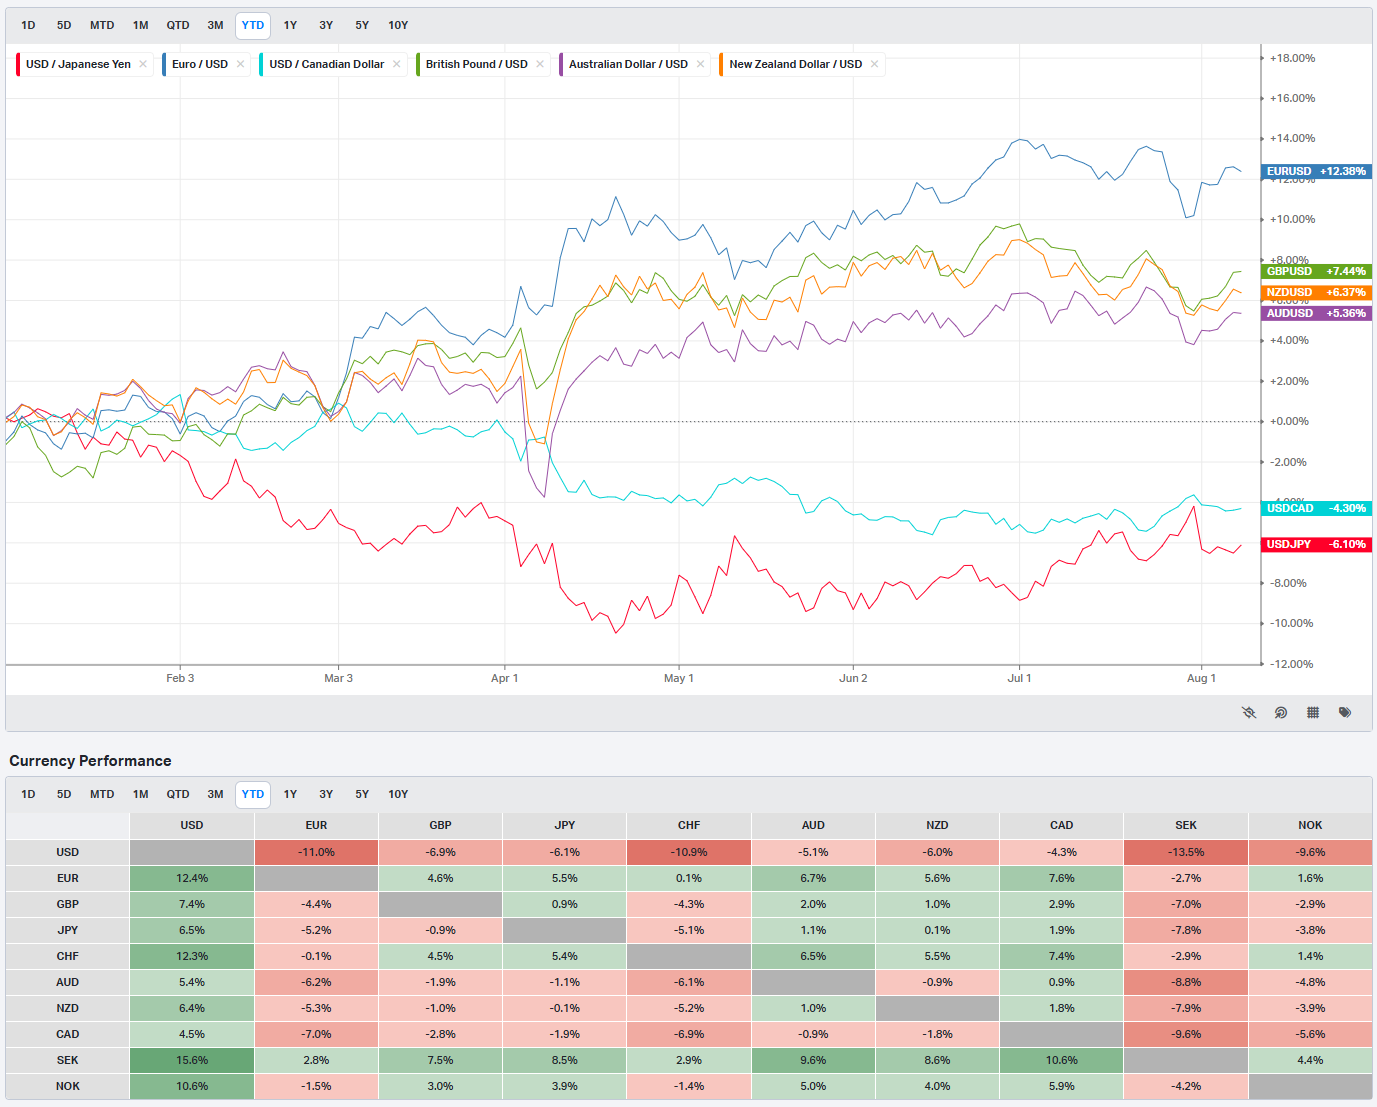
Currencies/Major FX Crosses
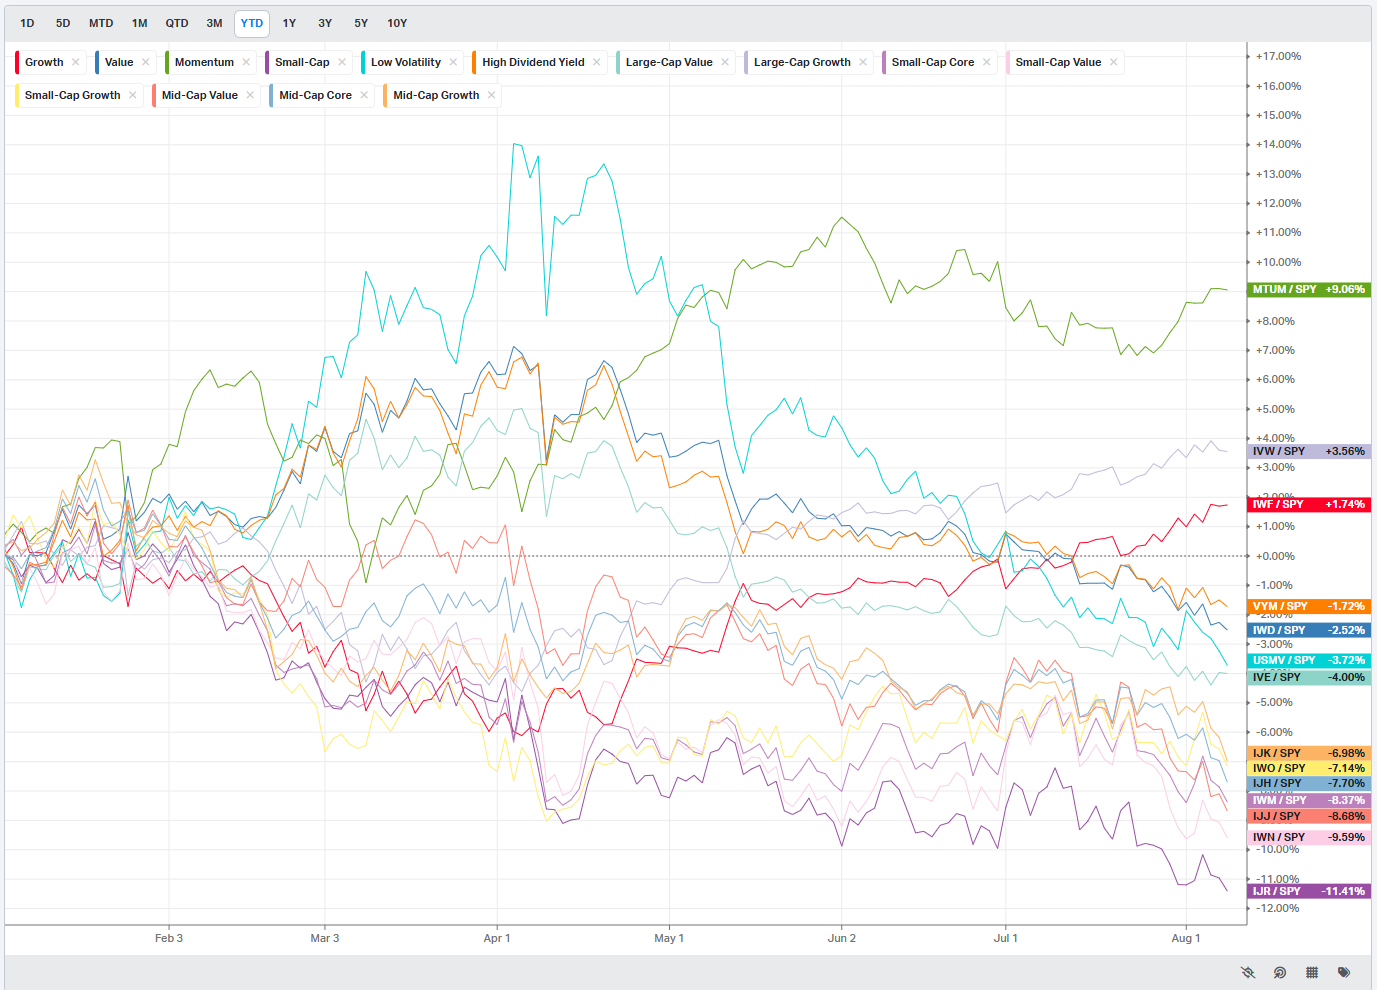
Factors: Style vs Size-vs-Value
Events On Deck This Week
Here are key events happening this week that have the potential to cause outsized moves in the market or heightened short-term volatility.
Econ Events By Day of Week
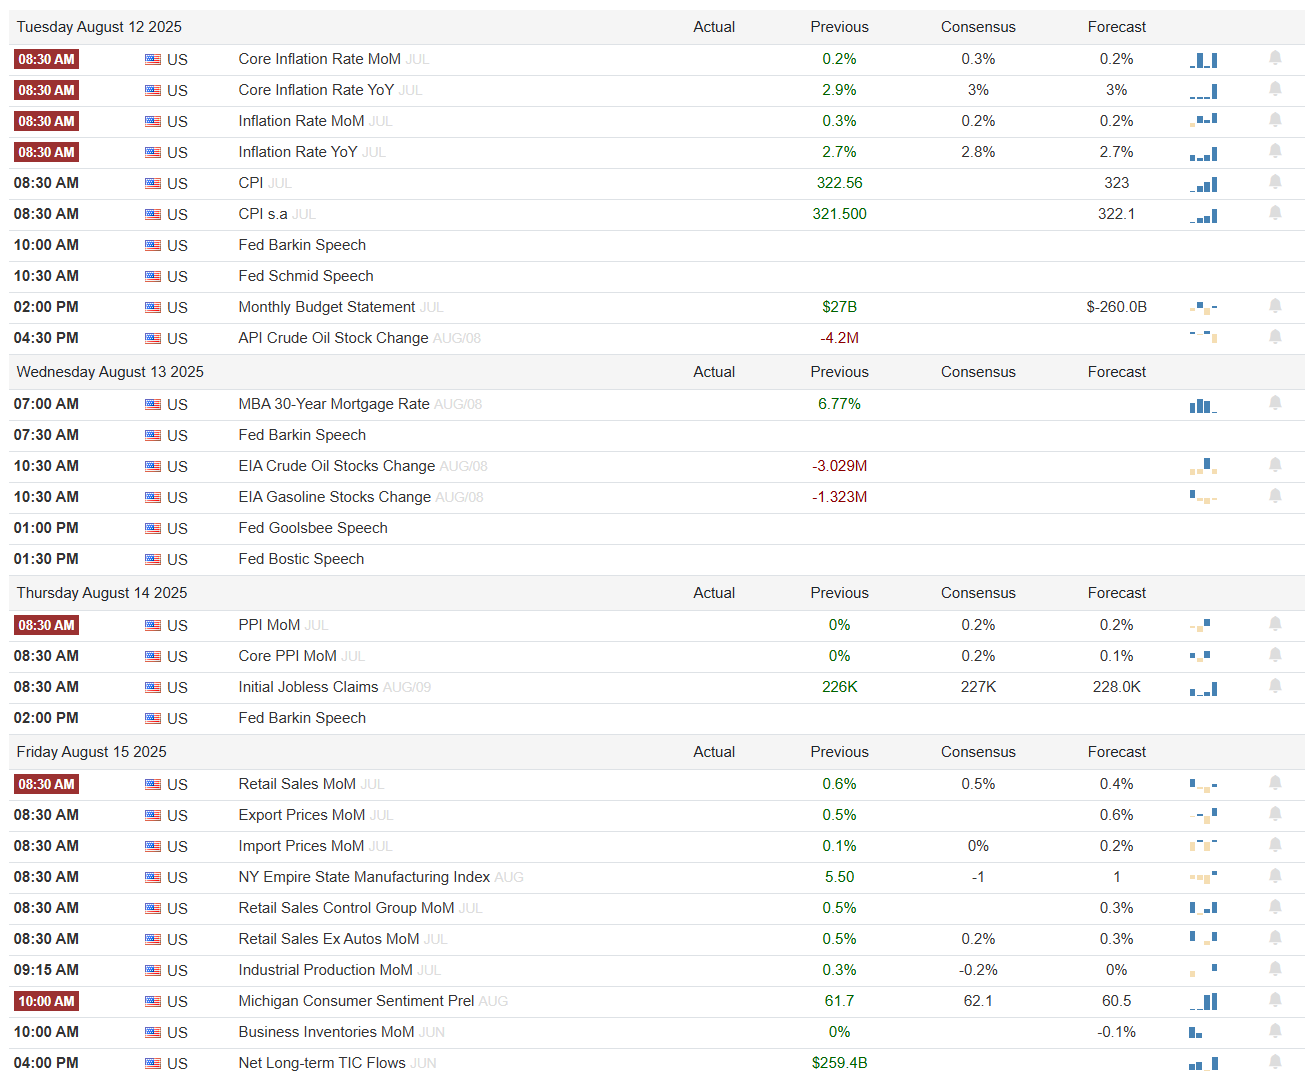
This week’s economic calendar is packed with market-moving data and plenty of Fed speak. Tuesday starts off hot with July inflation numbers — Core CPI, headline CPI, and year-over-year readings — all landing right at 8:30 AM. With inflation readings tracking close to expectations, traders will be weighing how much this keeps the Fed leaning cautious versus opening the door for more easing. The rest of Tuesday includes multiple Fed speeches and the API’s weekly crude oil stock change.
Wednesday brings mortgage rate updates, more Fed commentary, and the official EIA energy inventory reports, which can swing crude and gasoline futures. Thursday shifts the focus to producer prices and jobless claims, giving a read on upstream inflation pressures and labor market tightness.
Friday is arguably the second big day of the week, headlined by retail sales data at 8:30 AM — a key consumer demand gauge — alongside export/import prices, manufacturing sentiment from the NY Empire State survey, and industrial production. Later in the morning, preliminary Michigan consumer sentiment will provide insight into household confidence, while TIC flows at 4 PM will show how foreign capital is moving in and out of U.S. assets.
In short, between inflation prints early in the week and retail/consumer sentiment data on Friday, markets have multiple catalysts lined up that could easily shift positioning across equities, bonds, and the dollar.
Anticipated Earnings By Day of Week
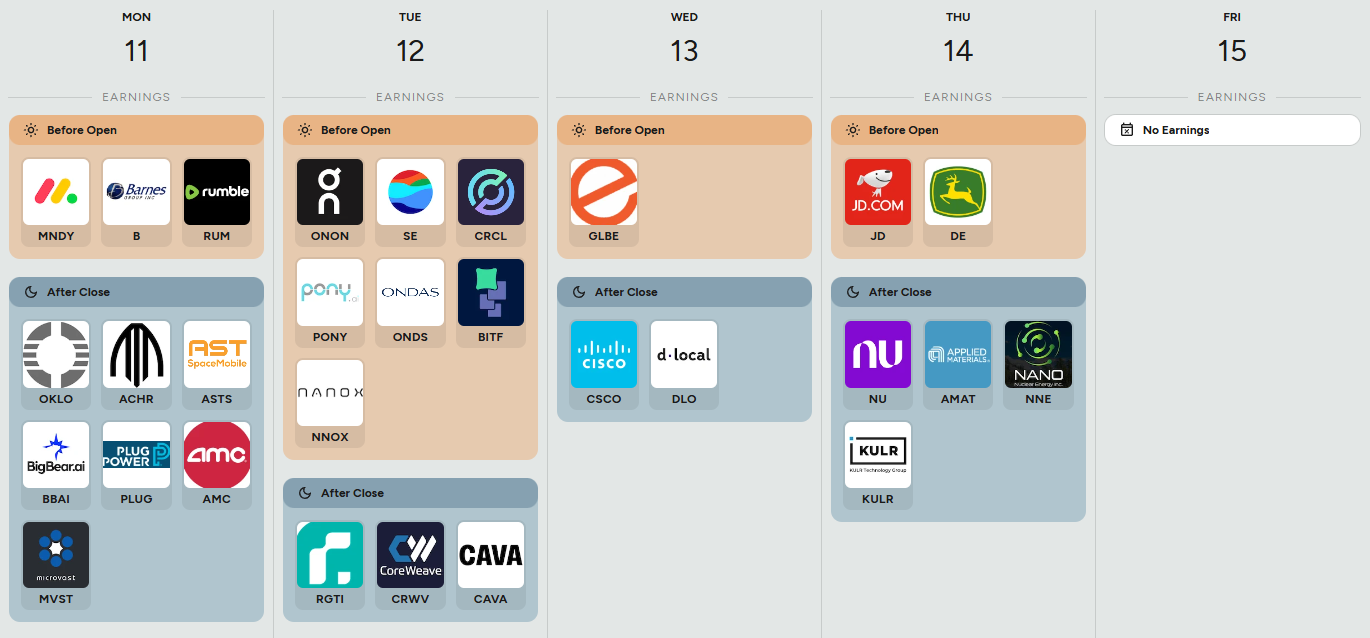
Earnings season is still delivering plenty of names to watch this week, with a mix of growth stories, mega-cap tech, and sector bellwethers. Monday kicks off with Monday.com, Barnes Group, and Rumble before the open, while after-hours brings a wave of smaller-cap and speculative plays like Oklo, AST SpaceMobile, Plug Power, AMC, and BigBear.ai.
Tuesday’s pre-market features On Holding, Sea Limited, and Bitcoin miner Bitfarms, while after the close all eyes will be on Cava, CoreWeave, and Rigetti Computing for updates in the dining, cloud, and quantum spaces.
Wednesday is lighter, with Global-E Online in the morning, followed by Cisco and D-Local reporting after the bell — both of which can move their respective sectors.
Thursday ramps back up with JD.com and Deere before the open, giving a read on Chinese e-commerce and U.S. industrial demand. The day wraps with Applied Materials, Nu Holdings, and Nano Nuclear Energy after hours, which could draw attention across semiconductors, fintech, and clean energy.
Friday closes out quietly with no major earnings scheduled, meaning the week’s fireworks are front-loaded and mid-week.

Market Intelligence Report
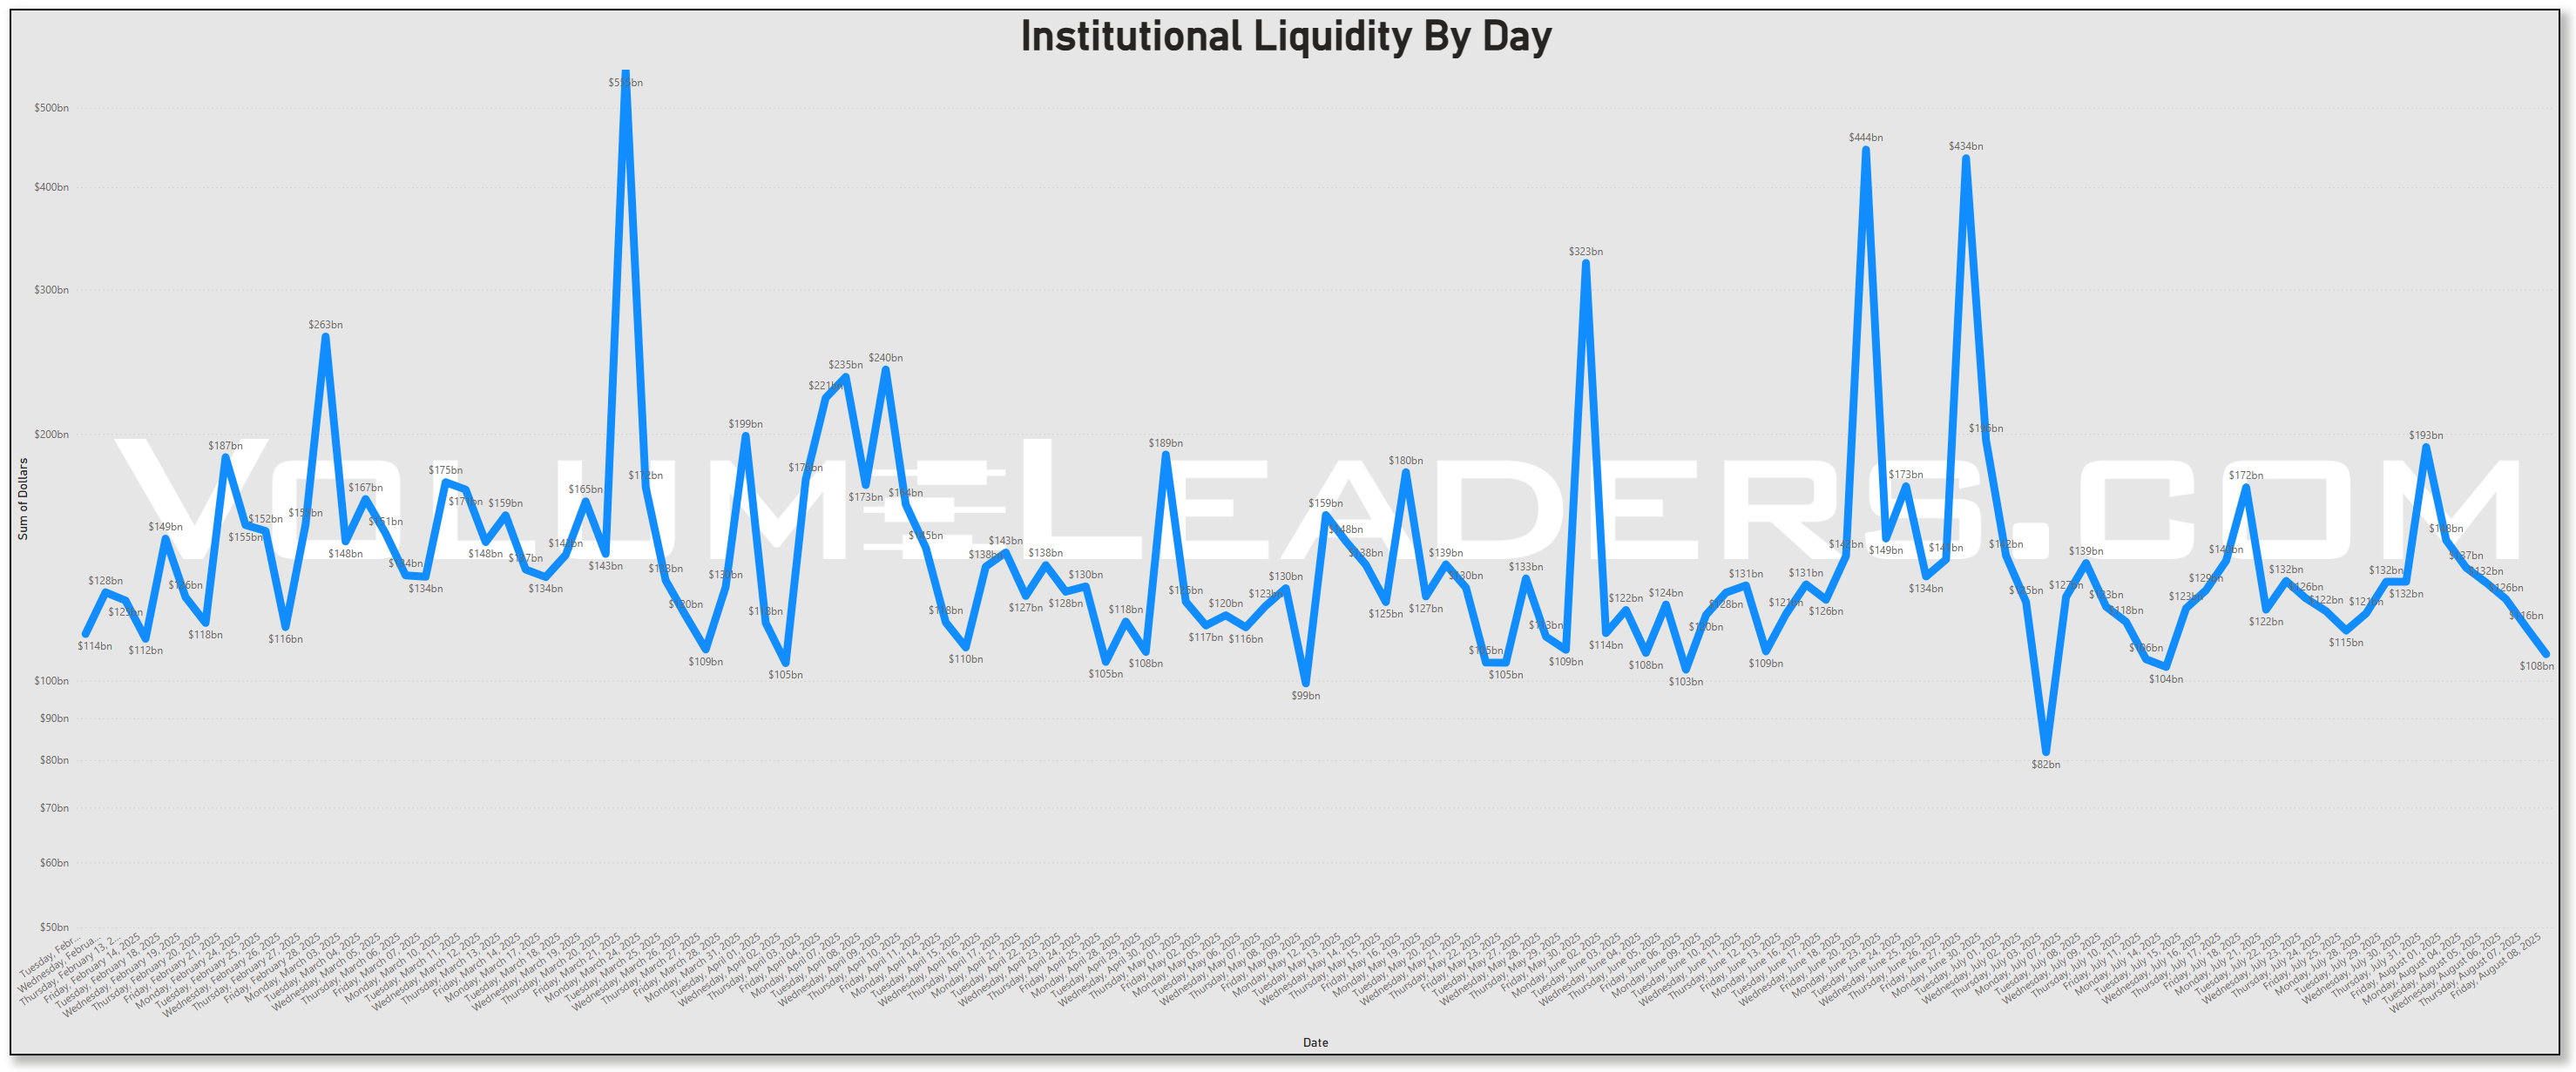
Activity-wise, the tape stayed in the lower half of its yearly liquidity range after the late‑July $193B blow‑off. We had a few decent blips, but nothing resembling an event‑grade surge. That fits the price action: indices retraced and bounced, but the push back toward highs has not been carried by outsized institutional participation. In summer regimes that often means two things at once—range expansions can still print on thinner tape, and sponsored levels (where size previously organized) do more of the signaling than the headline move itself.
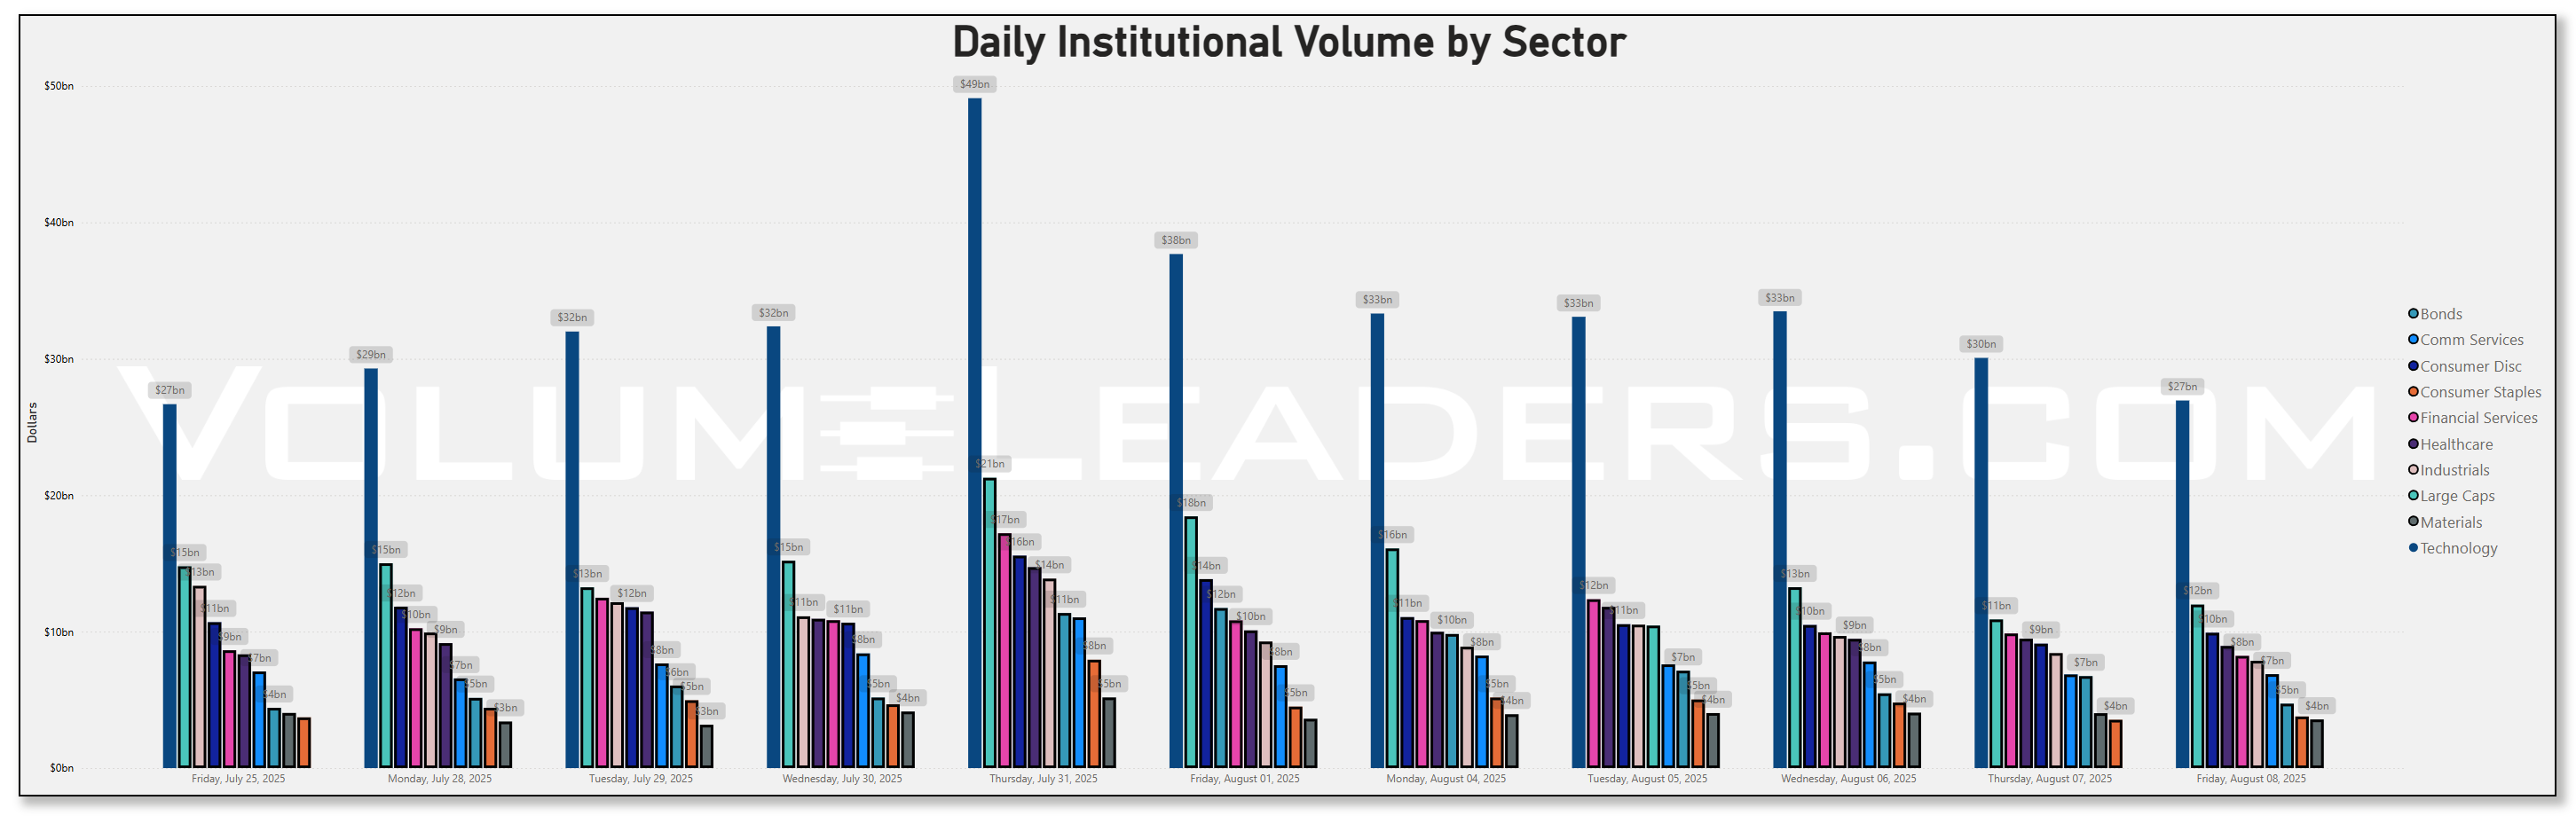
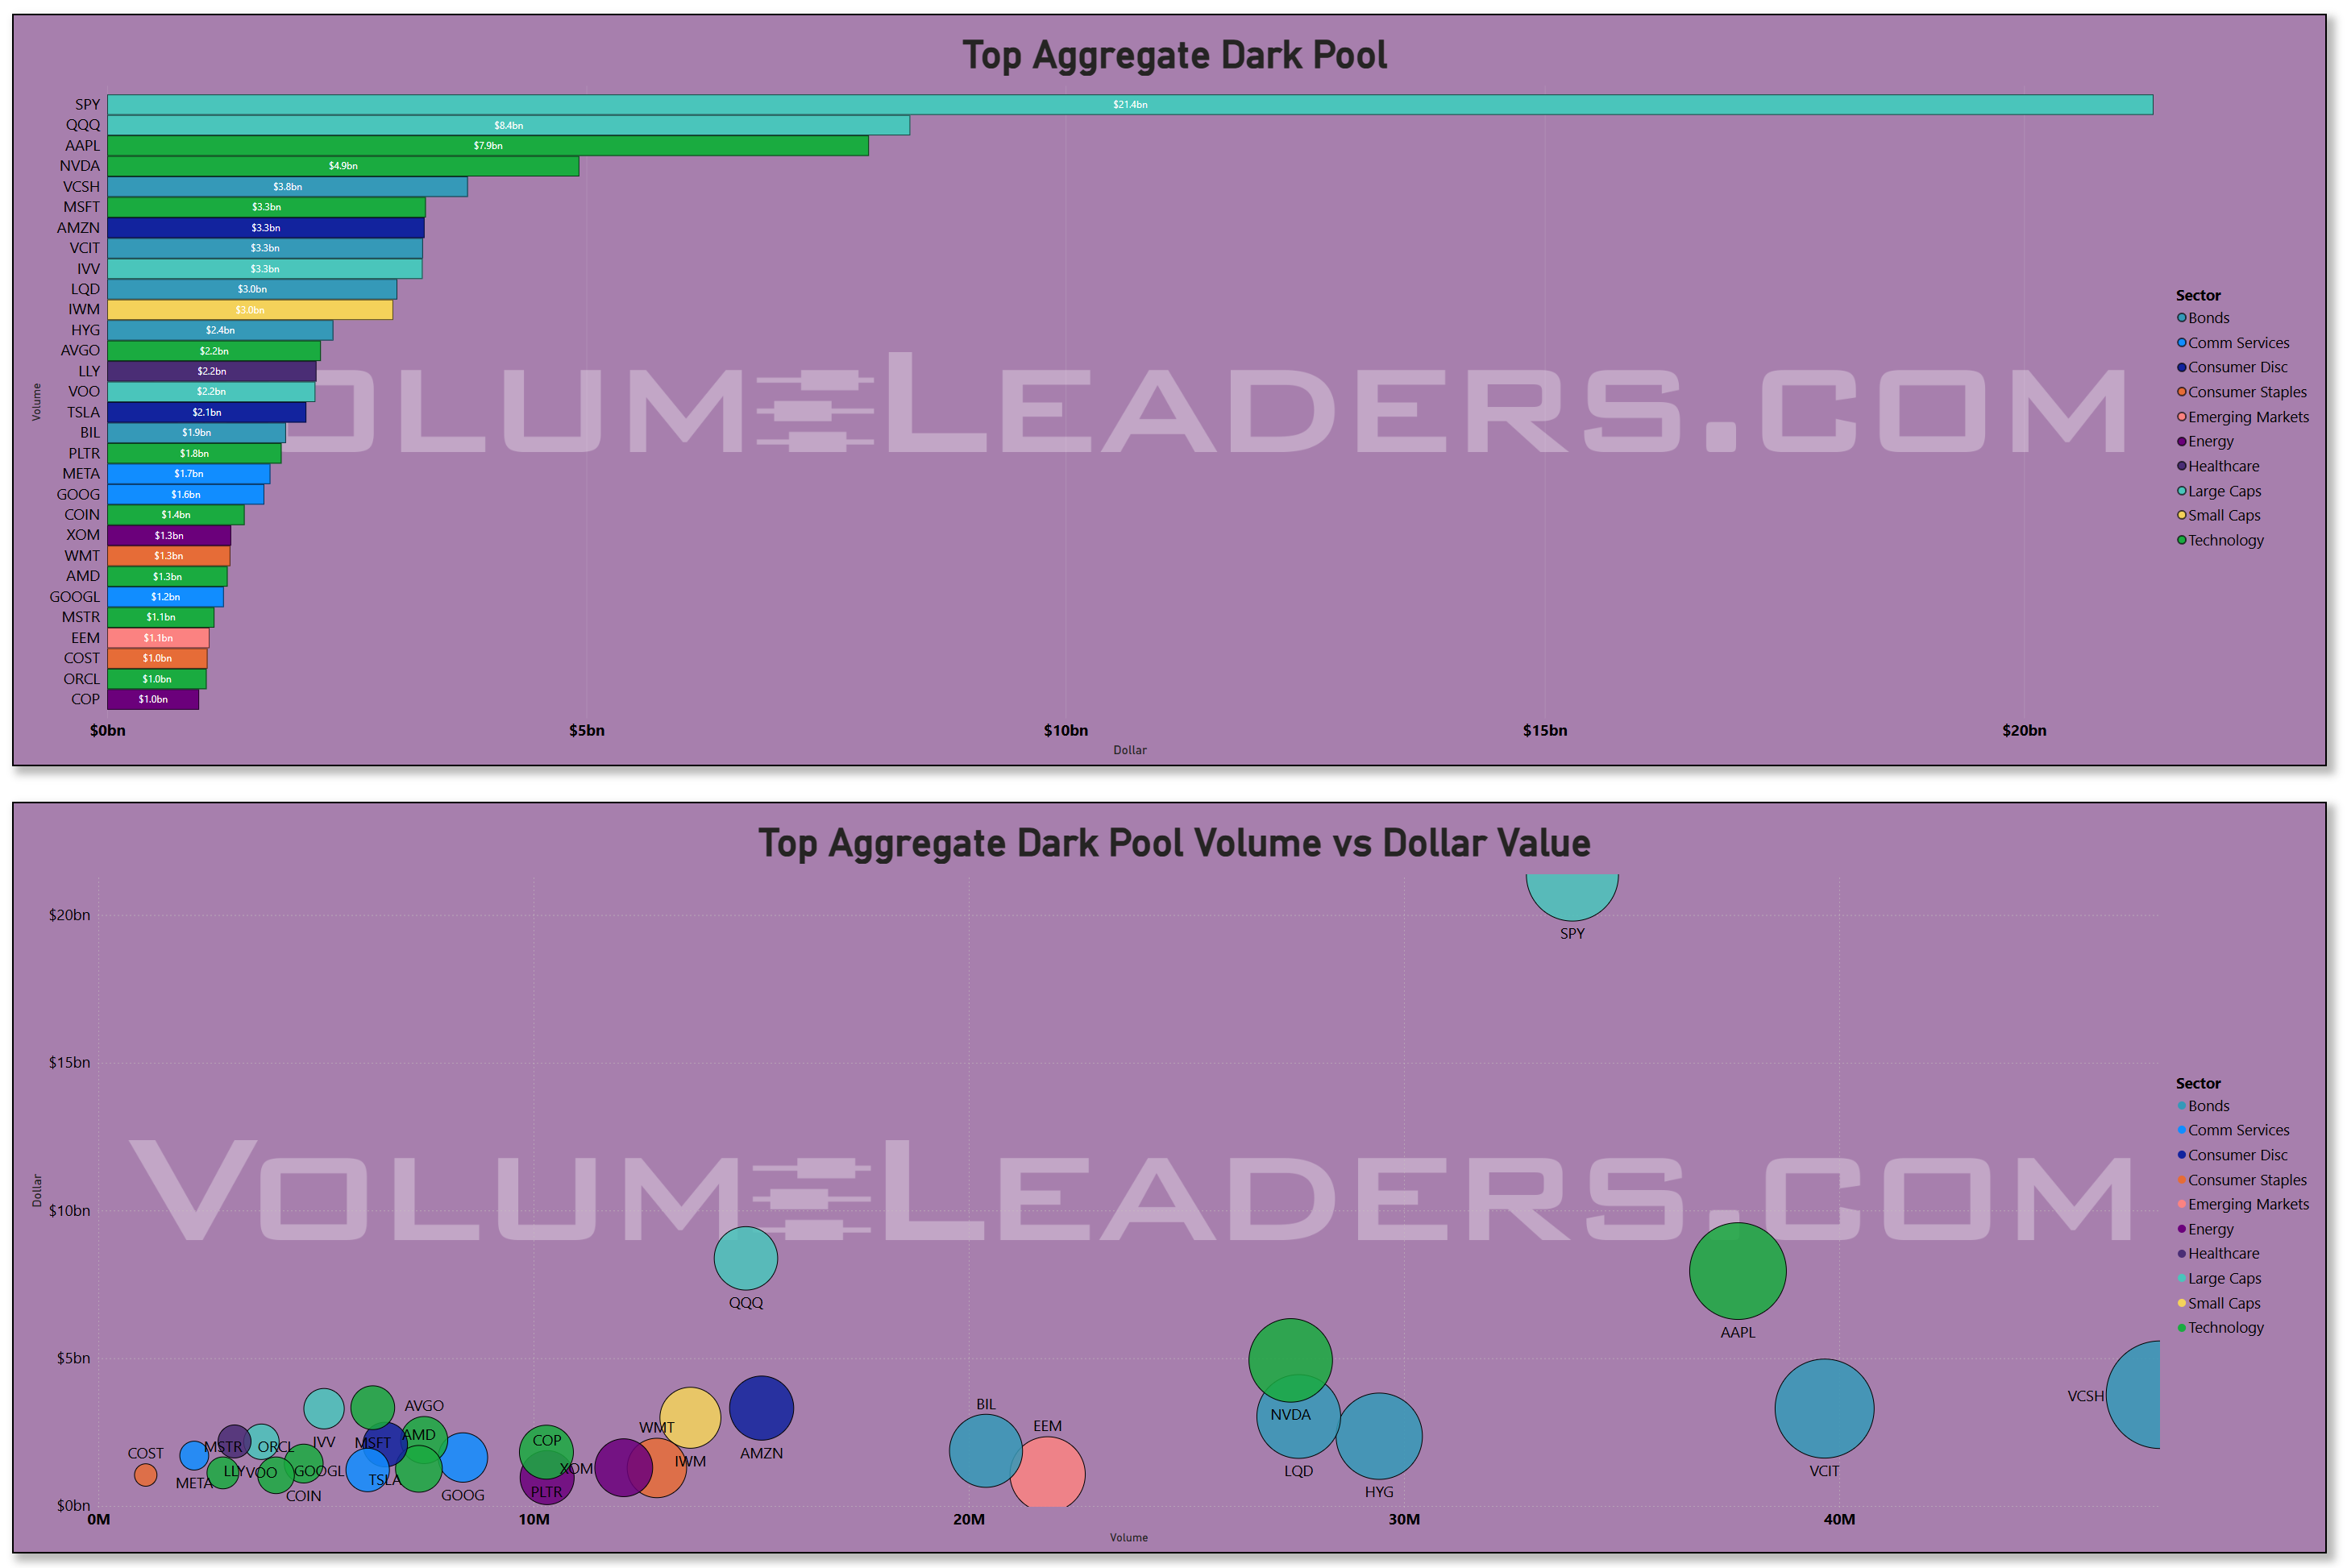
Sector dollars confirm where the big wallets still congregate: Technology remained the weekly dollar magnet, followed by large‑cap index wrappers and Communication Services/Consumer Discretionary. Bonds weren’t quiet either—investment‑grade and short‑duration ETFs showed steady clips most sessions. The mix points to a “barbell” posture: keep the core beta engines funded via SPY/QQQ/VOO/IVV and mega‑caps, while continuously tuning rate and credit exposure in the background.
By name, the treemap and top‑30 flows read like a who’s‑who of liquidity provisioning. SPY sat on top, with QQQ not far behind. Inside single‑names, AAPL and NVDA were neck‑and‑neck for aggregate dollars, with MSFT, AMZN, and TSLA rounding out the usual gravity well. Communication Services flow clustered in META and the GOOG/GOOGL pair; Health Care attention centered on LLY; in Financials, BRK.B plus the money‑center trio stayed present; in Staples, COST and WMT showed up enough to matter. On the bond side, VCSH/VCIT/LQD/HYG/TLT/BIL all printed meaningfully—broad duration and credit tweaks rather than a one‑factor bet.

Unlit venues were busy exactly where you’d expect larger programs to hide their footprints: SPY dominated dark‑pool dollars, with QQQ/AAPL/NVDA/MSFT/AMZN next in line, and a notable presence from bond ETFs (VCSH/VCIT/LQD/HYG) plus cash‑like wrappers (BIL). That mix is classic for portfolio‑level positioning: index overlays, megacap liquidity hubs, and credit/treasury sleeves adjusted off‑exchange to minimize signaling.
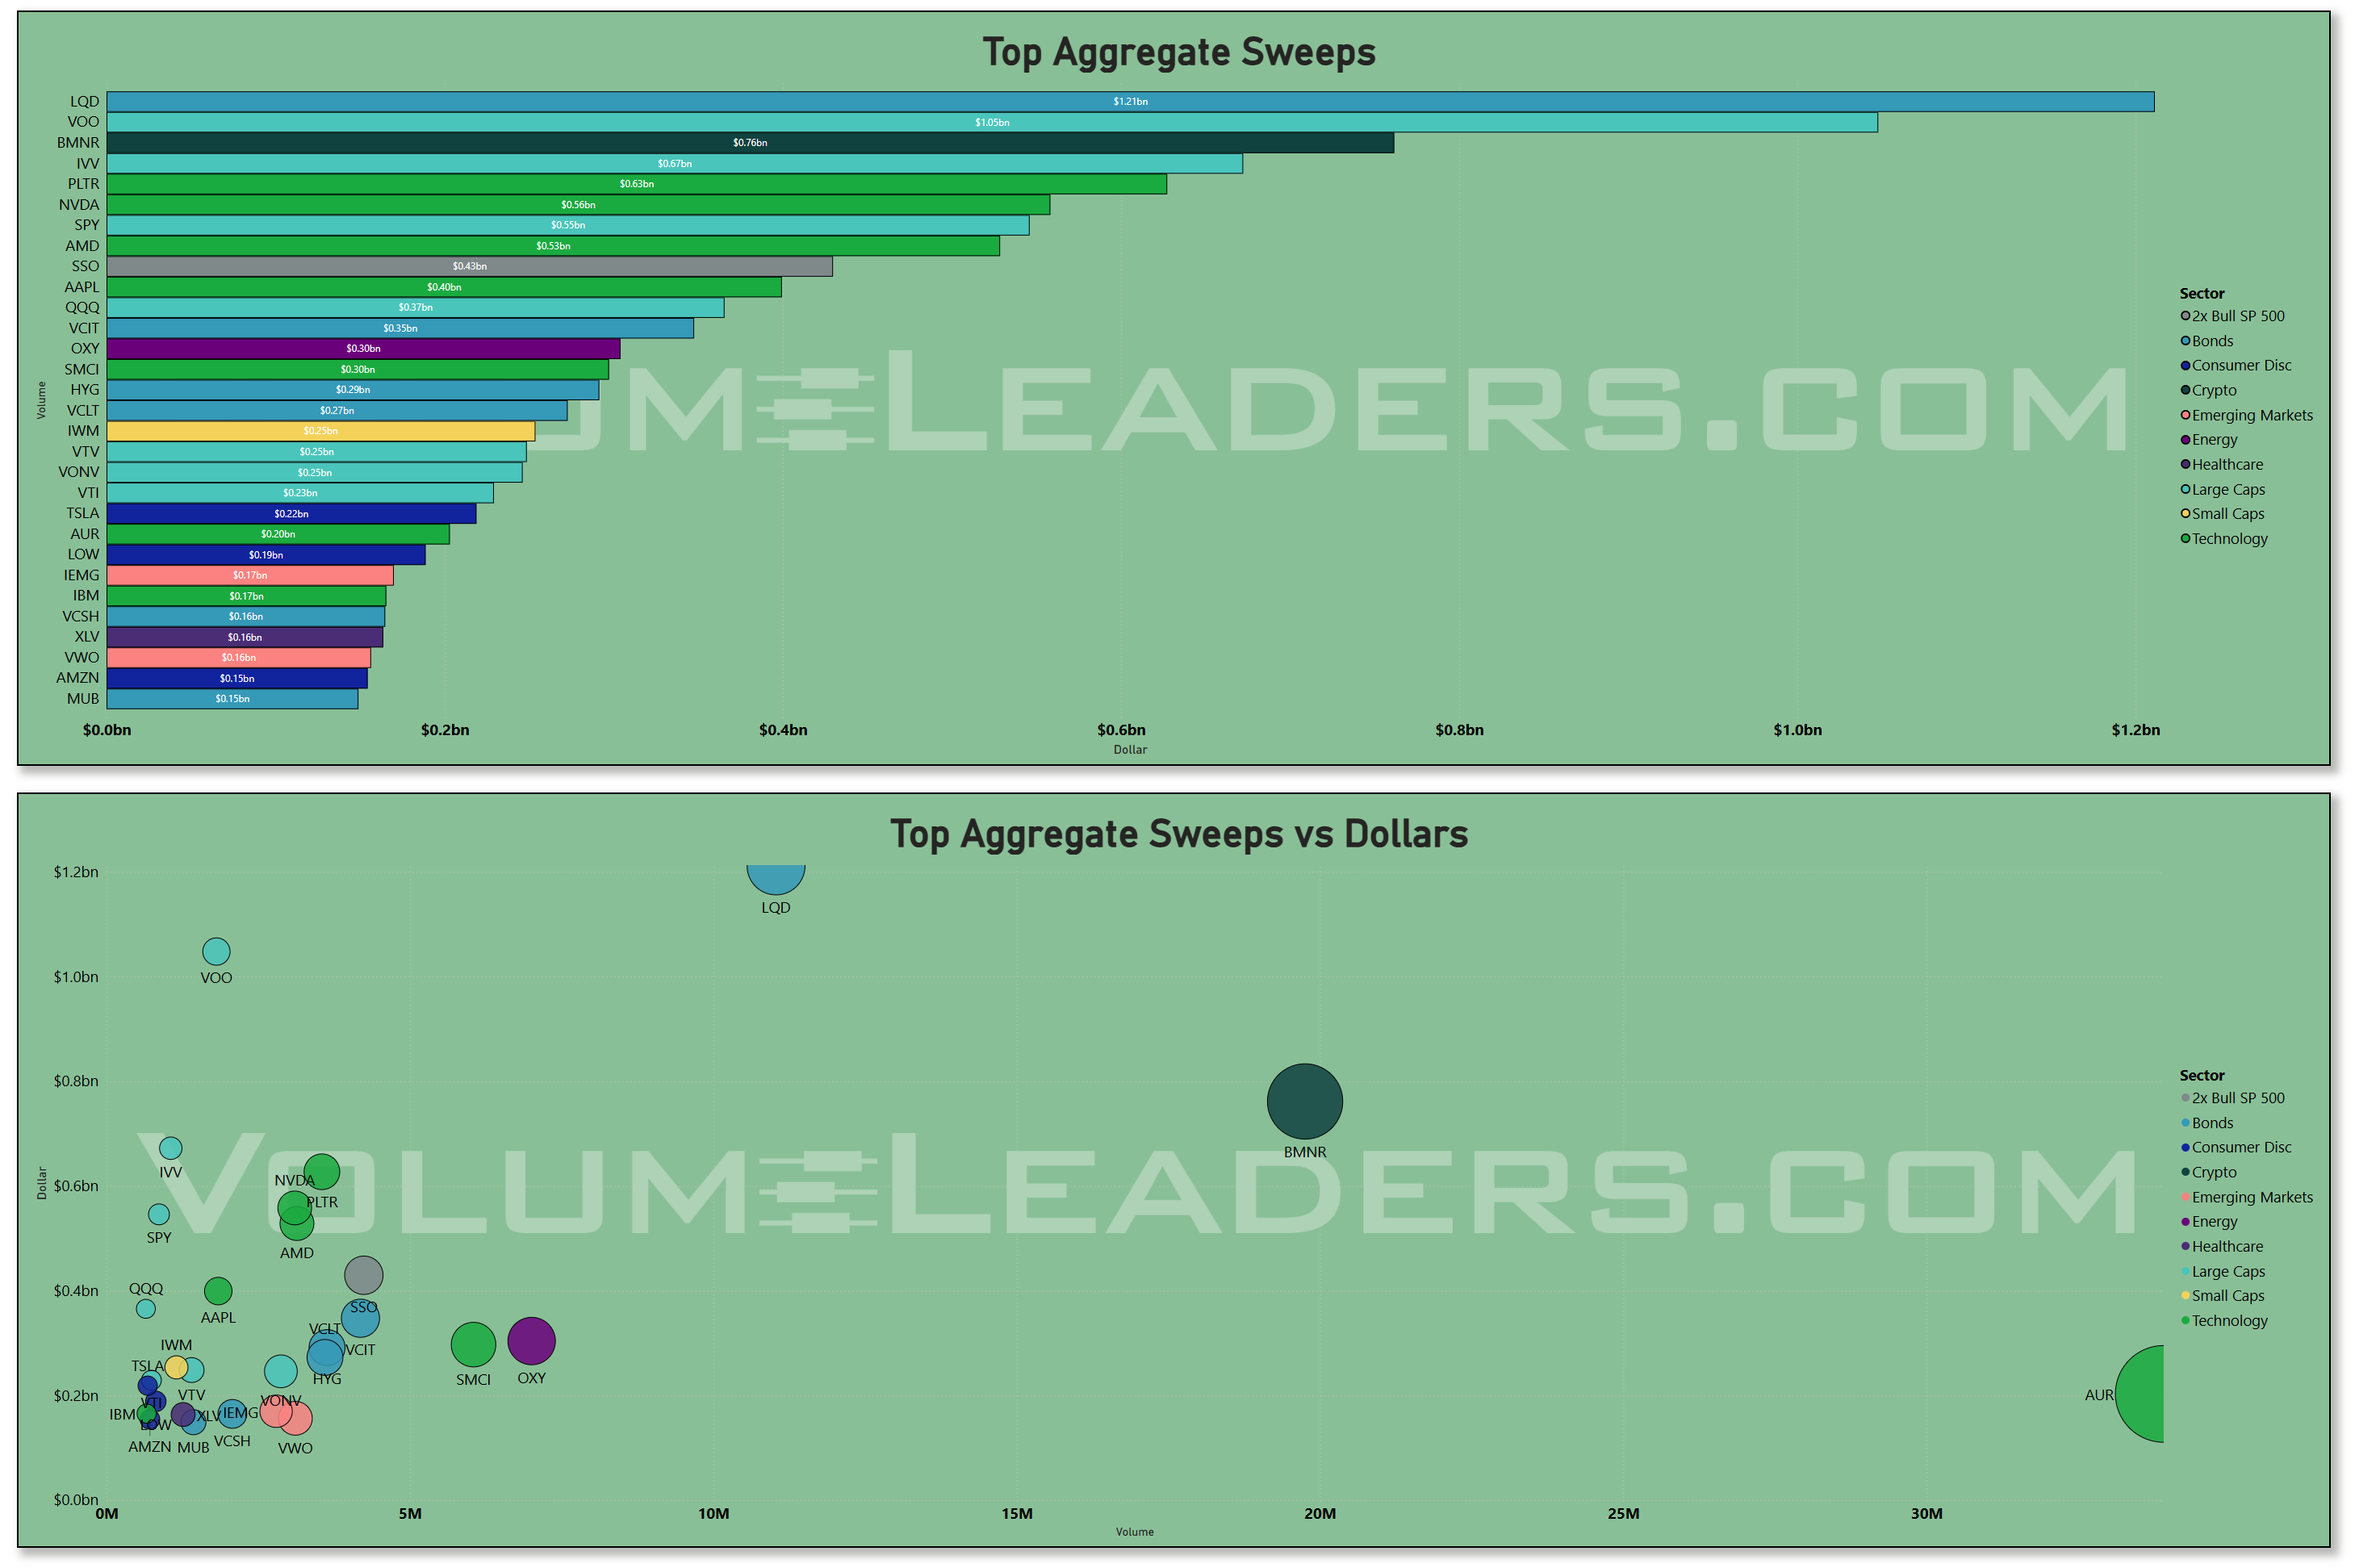
The sweeps tape adds texture on urgency. The week’s largest sweep notional concentrated in LQD and broad beta wrappers (VOO), with additional size in SPY/QQQ and a handful of high‑beta tech tickers (NVDA/AMD/PLTR/AAPL) plus a splash of Energy (OXY) and AI‑hardware adjacents (SMCI). Net‑net, when someone needed to move fast, they did it in investment‑grade credit and index beta first—consistent with hedging, cash‑equitization, or rebalance mechanics—then reached for a short list of volatile single‑names when they wanted idiosyncratic exposure.
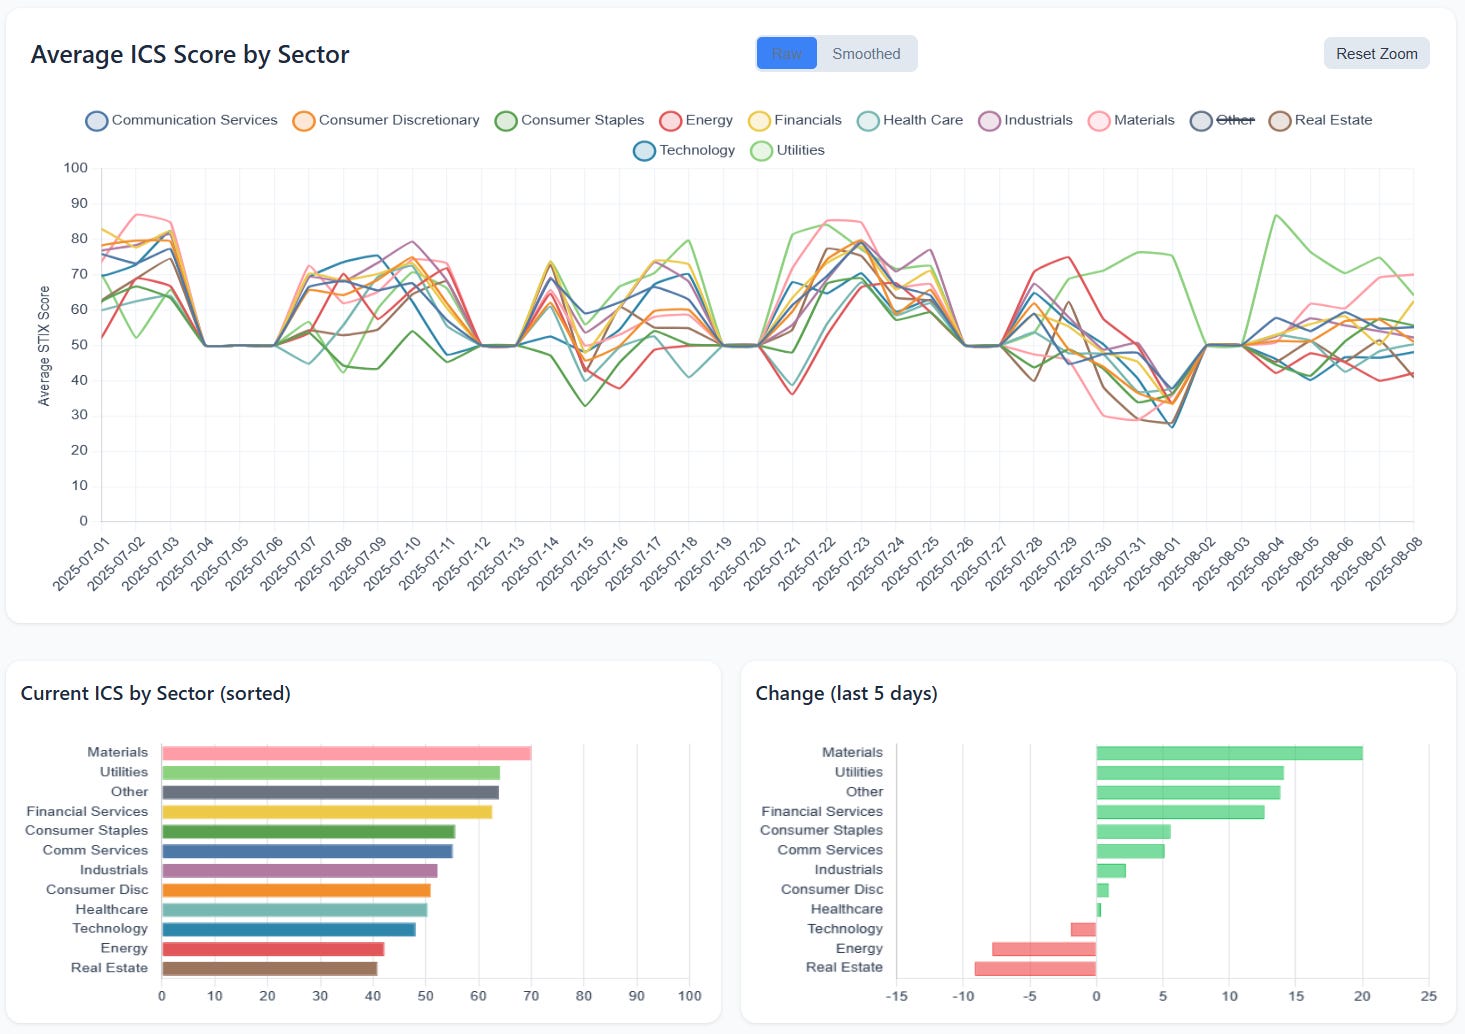
ICS rotation is the most interesting tell. On a level basis, Materials and Utilities now sit at the top of the conviction stack, with Financials, Staples, and Comm Services in the next tier; Tech and Health Care are middling; Energy and Real Estate trail. On momentum, the last five days show rising conviction in Materials and Utilities (largest positive delta), steady improvement in Financials/Staples/Comm Services, and mild deterioration in Technology, with Energy and Real Estate weakening further. Read together with the dollar flows, this looks like quiet re‑balancing: money kept the tech/liquidity engines humming, but conviction rotated toward defensives and Materials, while cyclicals tied to rates and property stayed out of favor.
What this suggests for the next few sessions is a two‑track market. Track one is index/megacap governance: SPY/QQQ and the AAPL/NVDA/MSFT/AMZN complex remain the control knobs, with most of the off‑exchange activity clustered there. Expect clean reactions around their sponsored levels in the VL charts screen; acceptance above those zones would let the tape drift higher on relatively light sponsorship, while rejections would invite mean‑reversion back into July’s composite balances. Track two is sector rotation under the surface: ICS implies a bid for Materials and Utilities and steadier hands in Staples/Financials; Tech conviction slipped a touch even as dollars stayed high, so tech leadership can persist, but it’s more fragile and level‑dependent. Energy/RE are the weak links—treat their bounces as tests of sponsorship rather than new regimes until ICS turns.
Actionably (and still neutral on direction), keep a close eye on: (1) SPY/QQQ levels from VL charts and whether price accepts or rejects those zones; (2) AAPL/NVDA/MSFT/AMZN for sponsorship persistence…they’re likely to be a tough fade in the absence of something exogenous; (3) Materials/Utilities constituents with repeat institutional interest; these are easy sectors to pass-up on the VL Trades screen but keep your eyes open for opportunity in coming session (4) bond ETFs where urgency showed up (LQD/VOO sweeps, VCSH/VCIT/HYG dark flow) as tells on portfolio‑level risk appetite; and (5) Energy/Real Estate news that would mark a logical place to see rotation turn favorably. If we continue to print lower aggregate liquidity, sponsored levels where institutions have concentrated engagement will do more of the heavy lifting in setting the next directional move—traps abound, don’t let anyone fool you into believing that anything about the current market conditions are easy.
Individual Names with Institutional Interest
VolumeLeaders tracks several proprietary signals designed to spotlight names drawing significant institutional interest. Below, we’ve surfaced the latest results and analyzed them in aggregate to highlight emergent themes. If any of the sectors, narratives, or positioning trends resonate, the names mentioned here offer a strong starting point for deeper research and watchlist consideration in sessions ahead.
VL Trade Rank Velocity™ (TRV)
TRV is a proprietary metric that measures the recent acceleration or deceleration in institutional trading activity for a given stock by comparing its average trade rank over the past few days to its average in recent weeks. A sharp improvement in TRV typically reflects a notable shift in positioning, often accompanied by sustained trade activity, suggesting institutions are actively engaging with the name and that intensity of activity is rising. This often precludes meaningful price or narrative shifts. This isn’t a buy-list or sell-list; it’s meant to draw your eyes to names where institutions are putting money to work.
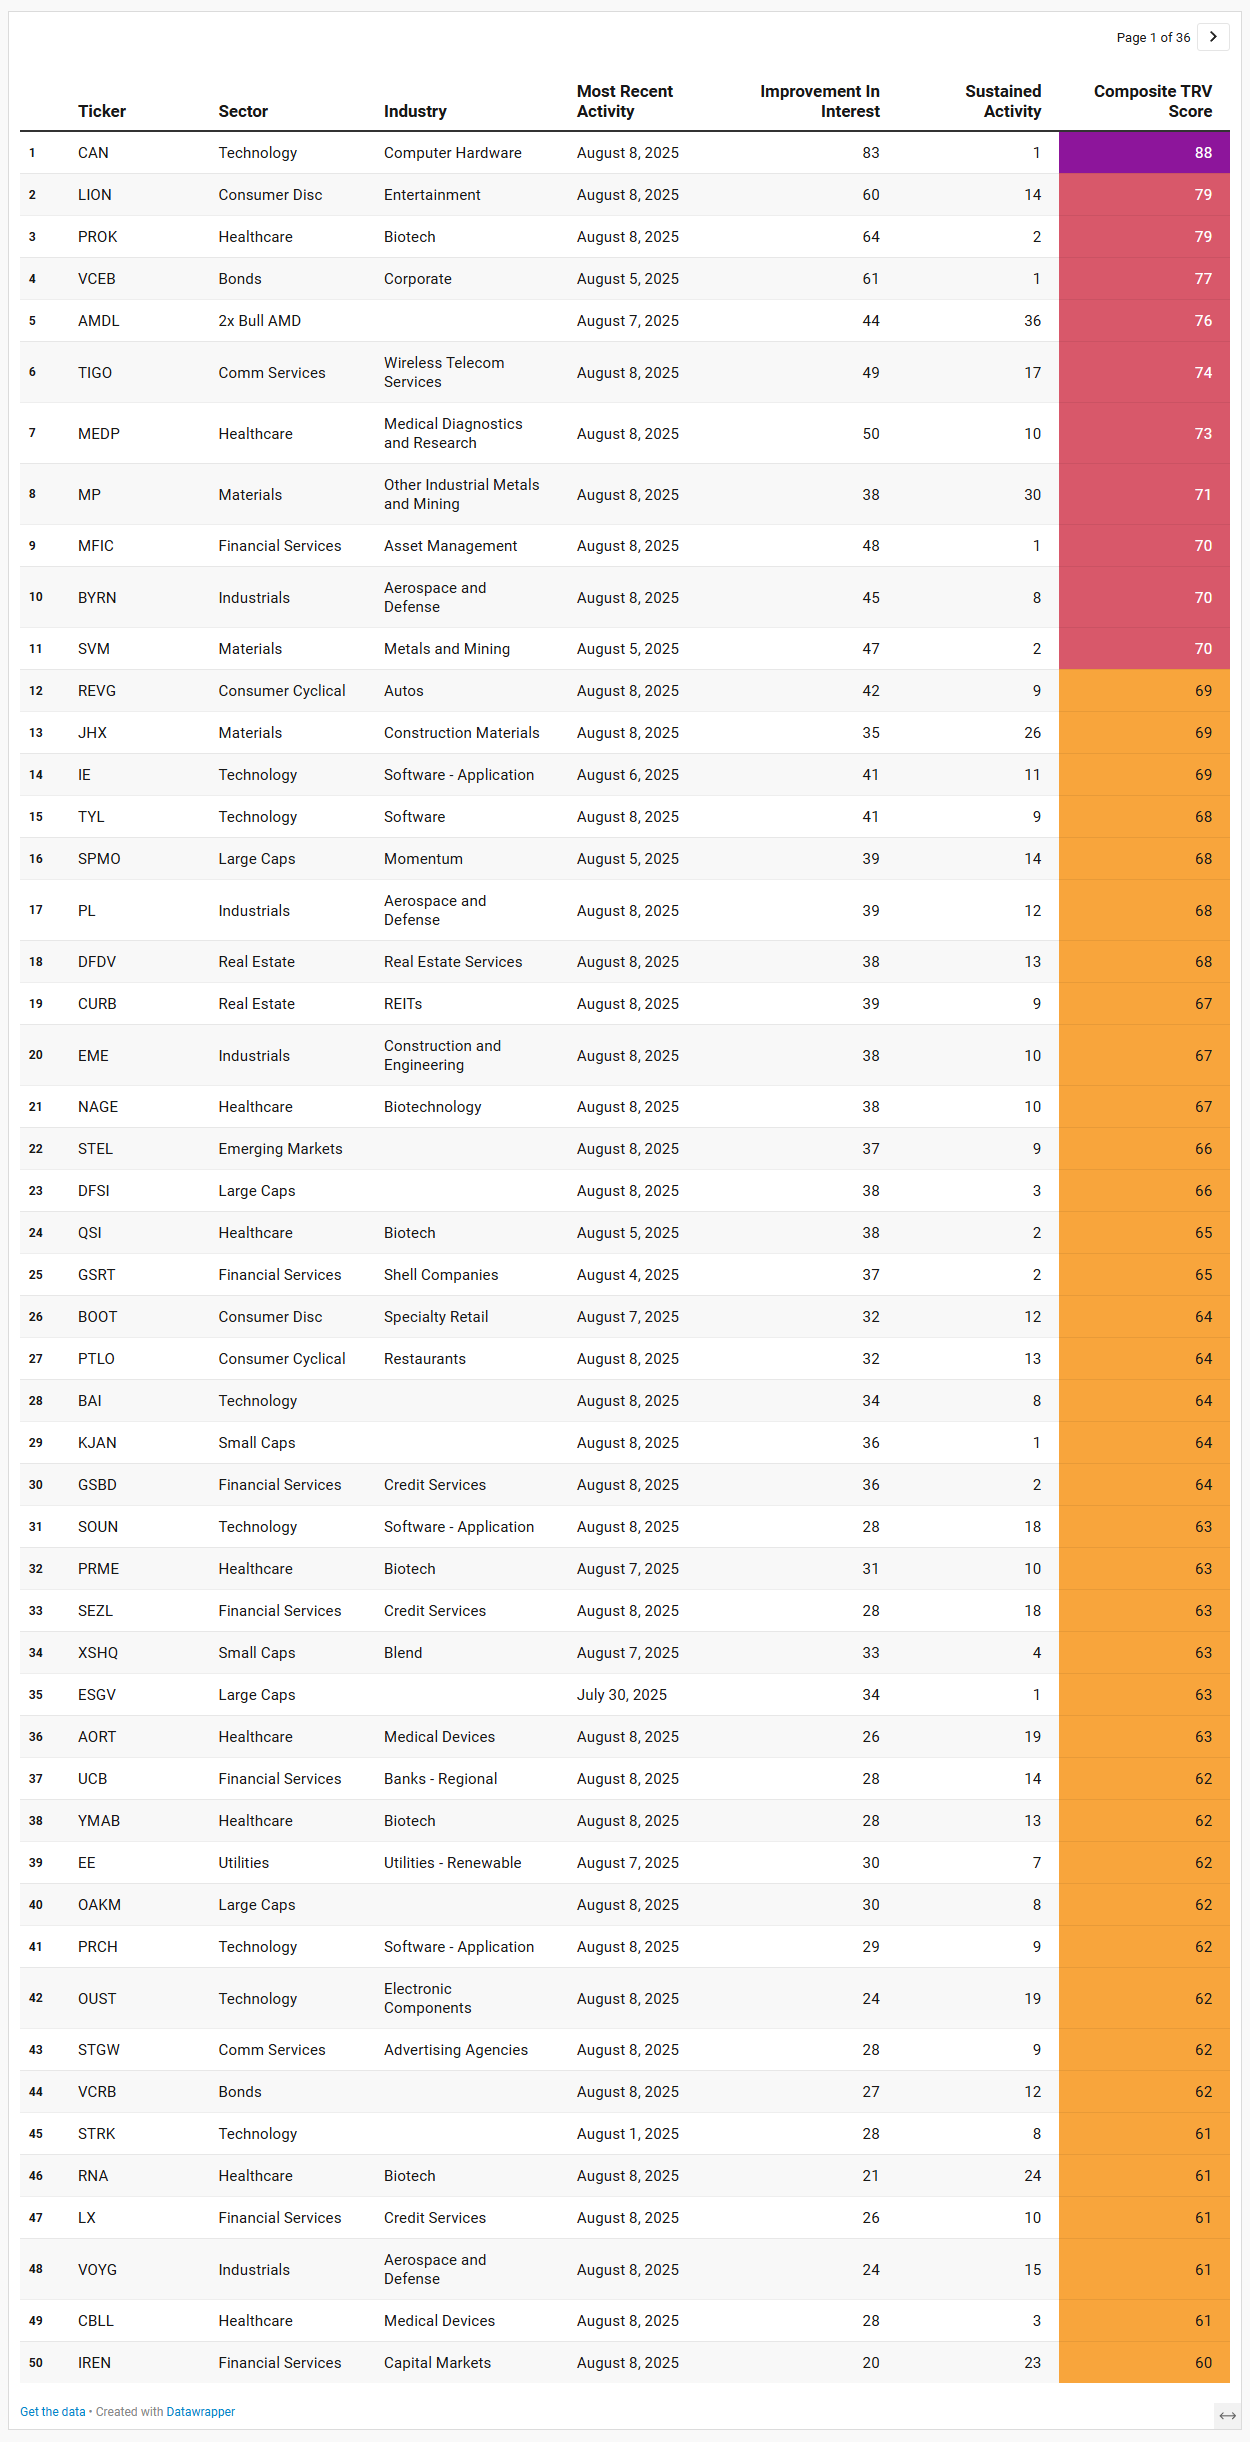
Emergent Themes from the TRV Watchlist
Looking over this week’s top 50 TRV names, a few threads start to weave together into a pretty clear picture of where institutions have been quietly setting up shop. Technology remains a strong undercurrent, but it’s not just the headline megacaps. There’s a noticeable tilt toward the smaller, more agile side of the tech world — semiconductor-adjacent plays, niche hardware makers, and software names that could ride the AI and computing wave into the next product cycle. These aren’t the broad, index-level tech allocations we see in SPY or QQQ flow; they’re more like carefully chosen satellites around the core holdings.
Alongside that, there’s a pocket of activity in consumer discretionary, but it’s not the usual retail ETF exposure. The names here skew toward niche stories — entertainment, specialty retail, and restaurants — where the draw is likely a specific catalyst rather than a sector-wide call. Healthcare, particularly biotech, is another area where conviction has been building. A wide spread of biotech and medical device companies made the list, which often points to event-driven positioning around trial data, M&A speculation, or other episodic catalysts that can move these names sharply in a short window.
Materials and Industrials are also making a strong showing, and that lines up nicely with what ICS has been telling us about improving conviction in those sectors. Mining, metals, and construction materials names are on the list, suggesting that institutions are leaning into plays tied to infrastructure, commodity cycles, or even the energy transition theme. Financials appear here too, but instead of the big banks, the focus is on asset managers, credit services, and specialty finance — higher-yield or more idiosyncratic names that might benefit if rates stay steady and spreads continue to tighten.
There’s also a quiet but consistent presence of small- and micro-cap names. These are the kinds of stocks that don’t normally register much institutional footprint unless there’s a reason — usually a catalyst or a valuation setup that’s too attractive to ignore. And even with all the selective risk-taking elsewhere, there’s still a steady hand in income-oriented trades, with corporate bond ETFs and a couple of REITs making the cut. The real estate presence is interesting, especially since ICS has the sector near the bottom of the conviction ranks; that could be bottom-fishing for yield or the early stages of a rotation if conditions turn.
Taken together, it’s a barbell approach — high-beta, catalyst-driven names on one end, and defensive or income-producing plays on the other. The liquidity data already told us that institutions aren’t pressing the gas across the whole market right now, but when they are putting money to work, they’re doing it in focused, deliberate pockets. It’s less about broad market direction and more about targeting very specific opportunities where they think they can capture outsized returns without having to make an all-in call on the macro backdrop.
VL Institutional Outliers™ (IO)
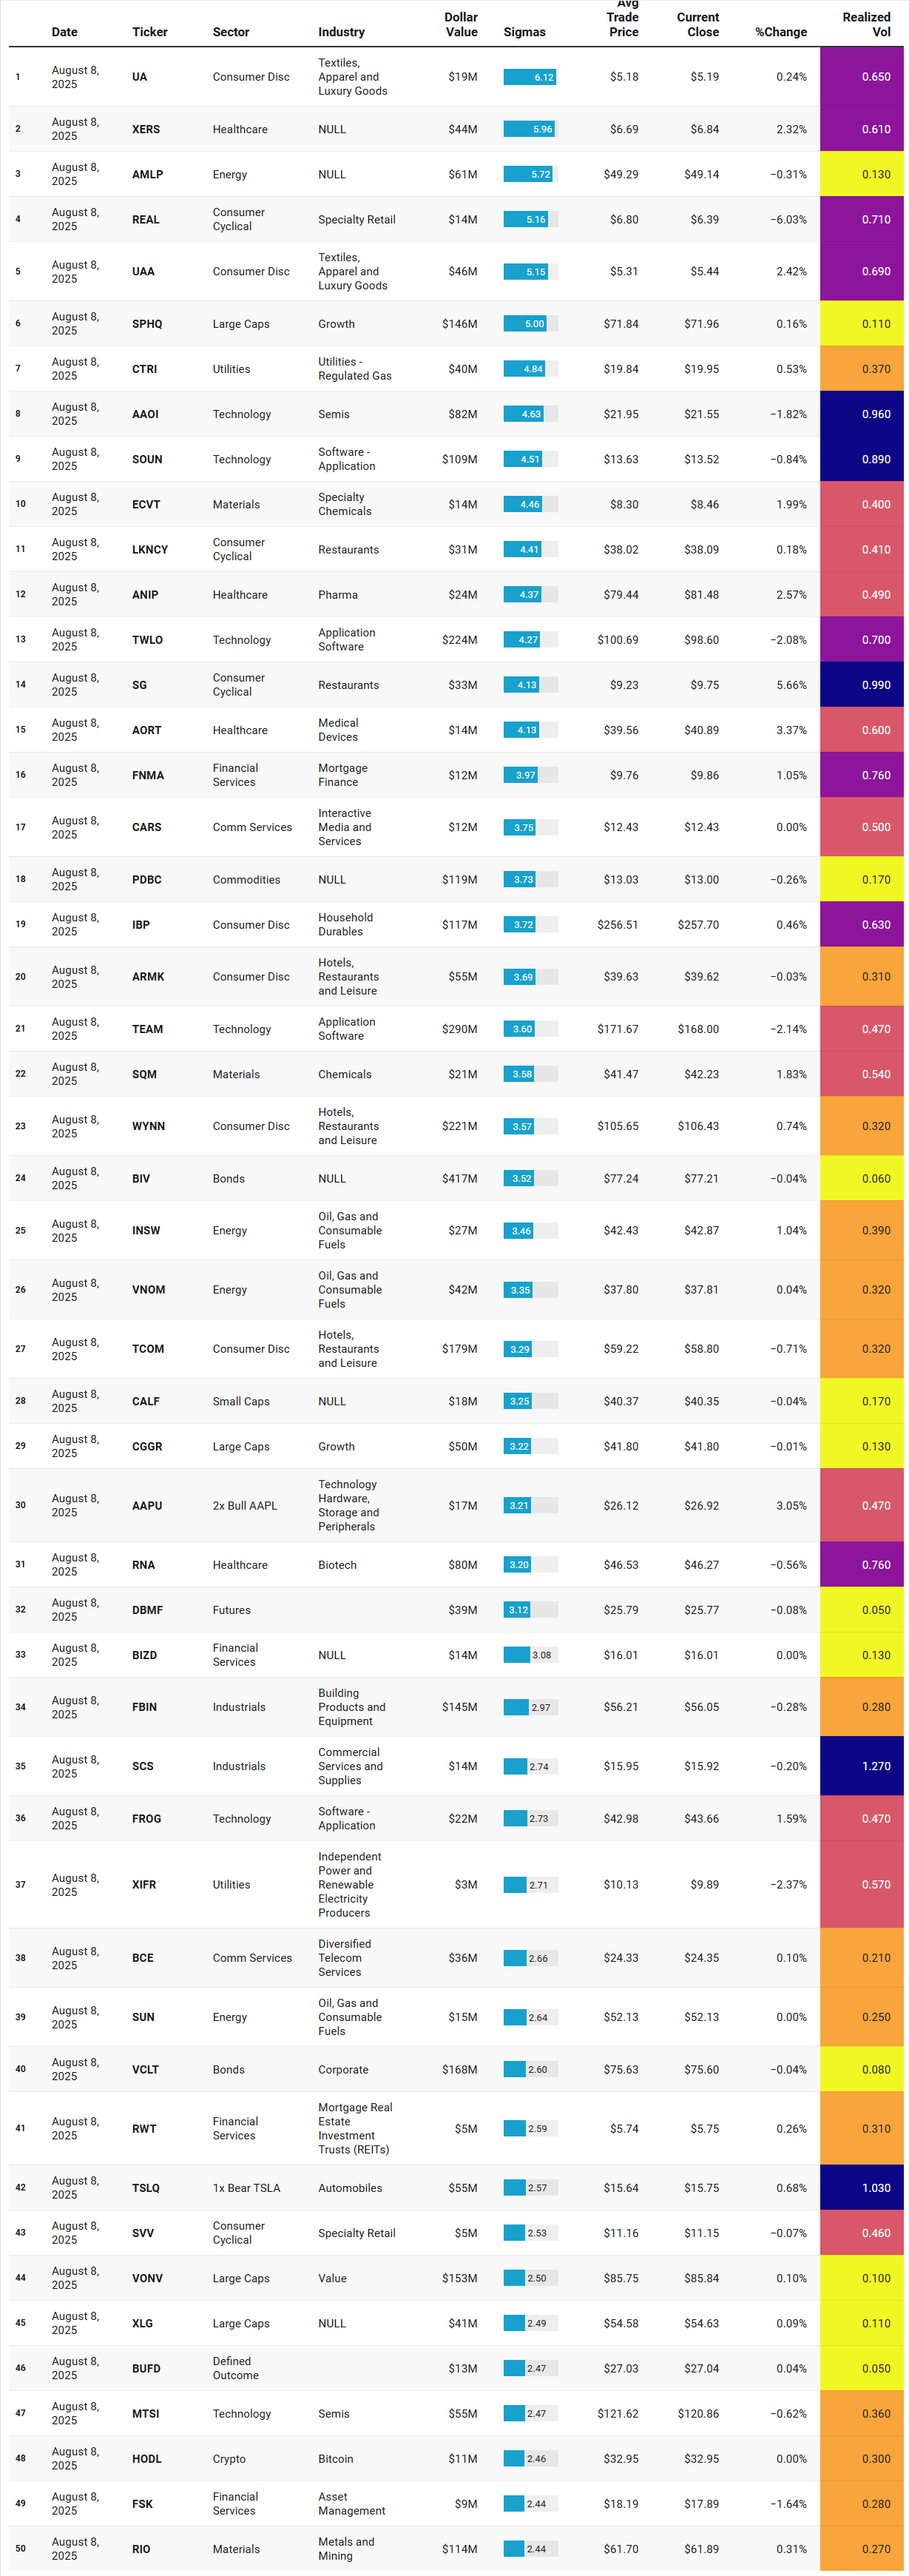
Institutional Outliers is a proprietary metric designed to spotlight trades that significantly exceed a stock’s recent institutional activity—specifically in terms of dollar volume. By comparing current trade size against each security's recent normalized history, the metric flags outlier events that may indicate sudden institutional interest but may be missed because the activity doesn’t raise any flags/alerts when comparing the activity against the ticker’s entire history. For example, it’s conceivable that a ticker today receives the largest trade it has had in the last 6 months but the trade is unranked and would therefore be missed by current alerts built off Trade Ranks. Use “Realized Vol” to identify tickers with large price displacement and to size your risk appropriately.
Emergent Themes from the Institutional Outliers Watchlist
This week’s Institutional Outliers list has a distinctly mixed character, but a few clear themes come through when you look past the individual tickers.
There’s a solid cluster of consumer-facing names, especially in discretionary areas like apparel, specialty retail, restaurants, hotels, and household goods. From Under Armour’s A- and C-shares to REAL, IBP, SG, ARMK, TCOM, WYNN, and even niche specialty chains like SVV, the list tilts toward companies that depend on direct consumer spend. The breadth here suggests institutions are probing across sub-industries rather than making a monolithic call on the consumer, which often happens when they’re looking for stock-specific alpha inside a sector rather than placing a broad macro bet.
Healthcare and biotech names are also prominent — XERS, ANIP, AORT, RNA — alongside medical device and diagnostic plays. These are often associated with event-driven positioning, such as trial data, FDA decisions, or acquisition speculation, rather than sector-wide conviction. The fact they’re surfacing here in the outlier list suggests this activity was large enough relative to each name’s history to stand out, pointing toward active, targeted interest.
Technology shows up in both hardware/semis and software: AAOI, SOUN, TEAM, AAPU, FROG, MTSI. These aren’t just the household megacaps but a mix of mid-tier and niche operators, often higher beta, where outsized positioning can materially move the needle. This complements the TRV list’s earlier takeaway about institutions leaning into selective AI and semiconductor-related names, albeit here it’s more about one-off surges than sustained accumulation.
Energy also has a presence, with AMLP, INSW, VMOH, SUN, and RIO representing oil, gas, shipping, and metals/mining. The activity here spans upstream, downstream, and infrastructure, hinting that interest may be more about commodity exposure in general than a single sub-theme. Materials get a cameo via SQM and RIO, aligning with the recent lift in ICS conviction for that sector.
Financials and credit-oriented names like FNMA, BIZD, RWT, FSK also feature, though the tone here feels opportunistic — smaller in dollar value compared to the headline flows but large enough versus their baseline to trigger the outlier signal. Bonds (BIV, VCLT) and commodities (PDBC, DBMF) round out the list, underscoring the multi-asset flavor of the week’s positioning.
Put together, this list suggests a market where institutions are not pouring capital into one dominant macro theme, but instead sprinkling targeted, outsized bets across a wide array of sectors — consumer names with identifiable catalysts, healthcare and biotech with event-driven potential, mid-cap tech tied to high-beta themes like AI and semis, and a smattering of commodities, energy, and credit plays. It’s a pattern consistent with the broader liquidity picture: selective, deliberate, and spread across uncorrelated opportunities rather than concentrated in a single, high-conviction sector call.
VL Consensus Prices™
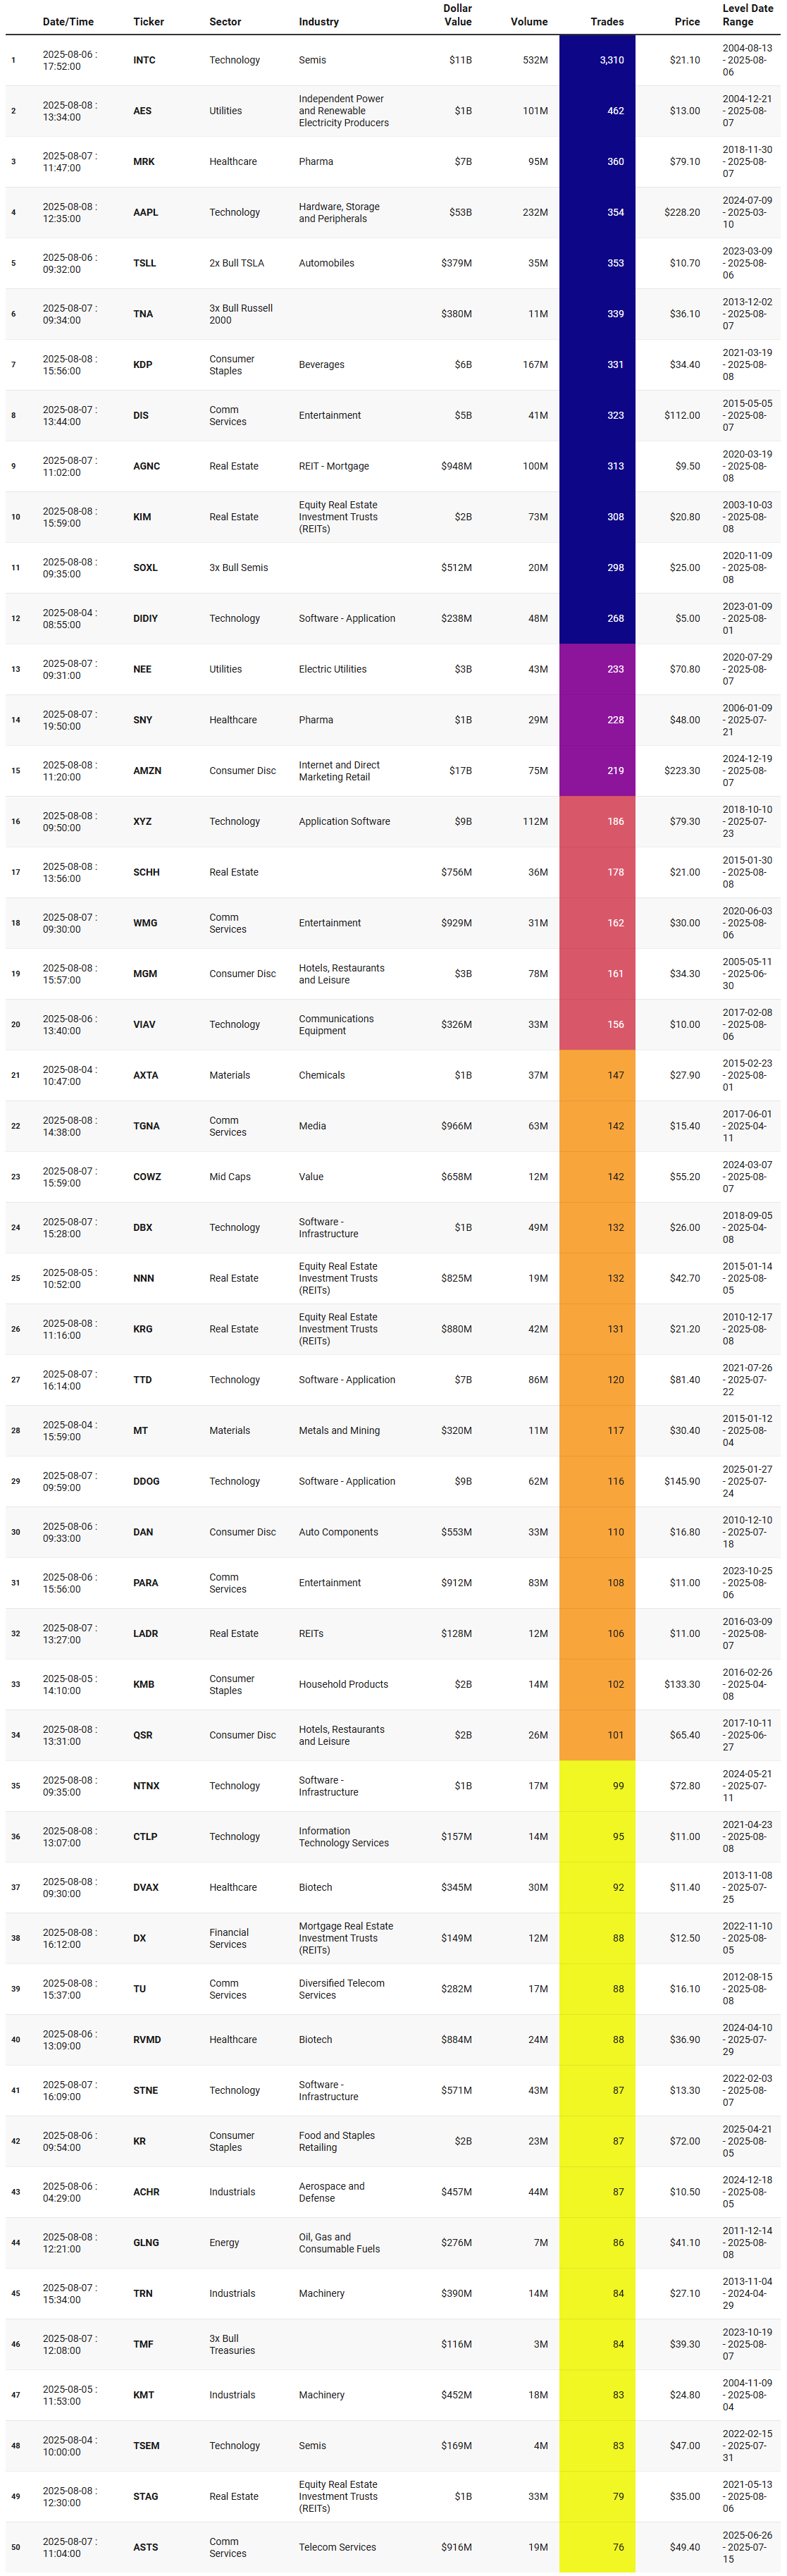
These are the most frequently traded #1-Ranked Levels in VL this week. Trades occurring at the highest volume price in a ticker’s history are significant because they represent institutional engagement at a key price memory level—where the market once found consensus. These areas act as liquidity hubs, enabling large players to transact efficiently, and often signal a reassessment of fair value. This activity may precede major moves, mark equilibrium zones, or reflect broader portfolio shifts, making these price levels important to watch even without yet knowing how price will resolve.
Emergent Themes from the Consensus Prices Runs Watchlist
This week’s Consensus Prices list — names trading right at the single highest-volume level in their entire history — is a pretty eclectic mix, but there are some clear concentrations worth noting.
Technology is heavily represented, and not just in the mega-cap index drivers. We’ve got semis like INTC, SOXL, TSEM, and AAOI; software names such as AAPL, DIDIY, XYZ, DBX, TTD, DDOG, NTNX, CTLP, STNE; and infrastructure/communications equipment in VIAV and ASTS. That’s a broad cross-section of the tech complex, suggesting a lot of high-traffic price interaction in both hardware and software subsectors. When this many tech names are sitting at their historical volume peaks, it can mean institutions are using these zones as major inventory transfer points — places where positions get handed off, built, or unwound in size.
Real Estate is another standout, with REIT-heavy representation: AGNC, KIM, SCHH, NNN, KRG, LADR, DX, STAG. Seeing so many REITs at their highest-volume levels implies the sector is in the midst of a major positioning phase, possibly tied to rate expectations or balance sheet restructuring. These zones often act as magnets until the bulk of repositioning is complete.
Consumer-oriented names are also prominent, spanning discretionary and staples — KDP, MGM, QSR, KR, KMB, DAN — plus entertainment/media heavyweights like DIS, WMG, PARA, and TGNA. This looks less like a single macro call on the consumer and more like a collection of large re-balances in very different business models, from beverages to broadcast.
Utilities (AES, NEE) and Energy/Materials (GLNG, MT, KMT, AXTA) show that the “highest-volume price” phenomenon isn’t confined to growth sectors. The presence of both defensives and cyclicals here suggests that the interaction is less about one prevailing risk-on or risk-off regime, and more about institutions working their books at well-established high-liquidity zones.
The interesting part is that many of these names also sit in sectors where our ICS data showed either improving conviction (Materials, Utilities) or ongoing stability (Consumer Staples, certain Tech subsectors). That alignment raises the odds that some of these high-volume prices aren’t just random noise — they may be the same levels institutions defend or build from in coming sessions.
In short, the emergent theme here isn’t a single directional bet. It’s that we’re seeing multiple sectors — especially Tech, REITs, and select Consumer names — all hitting major, long-term liquidity inflection points at the same time. Historically, when you get this kind of clustering across unrelated industries, the weeks that follow often show clear separation between names where these levels hold (leading to expansion) versus names where they fail (leading to repricing). Watching the reactions around these bands could give some of the cleanest read-throughs for short-term positioning in the current tape.
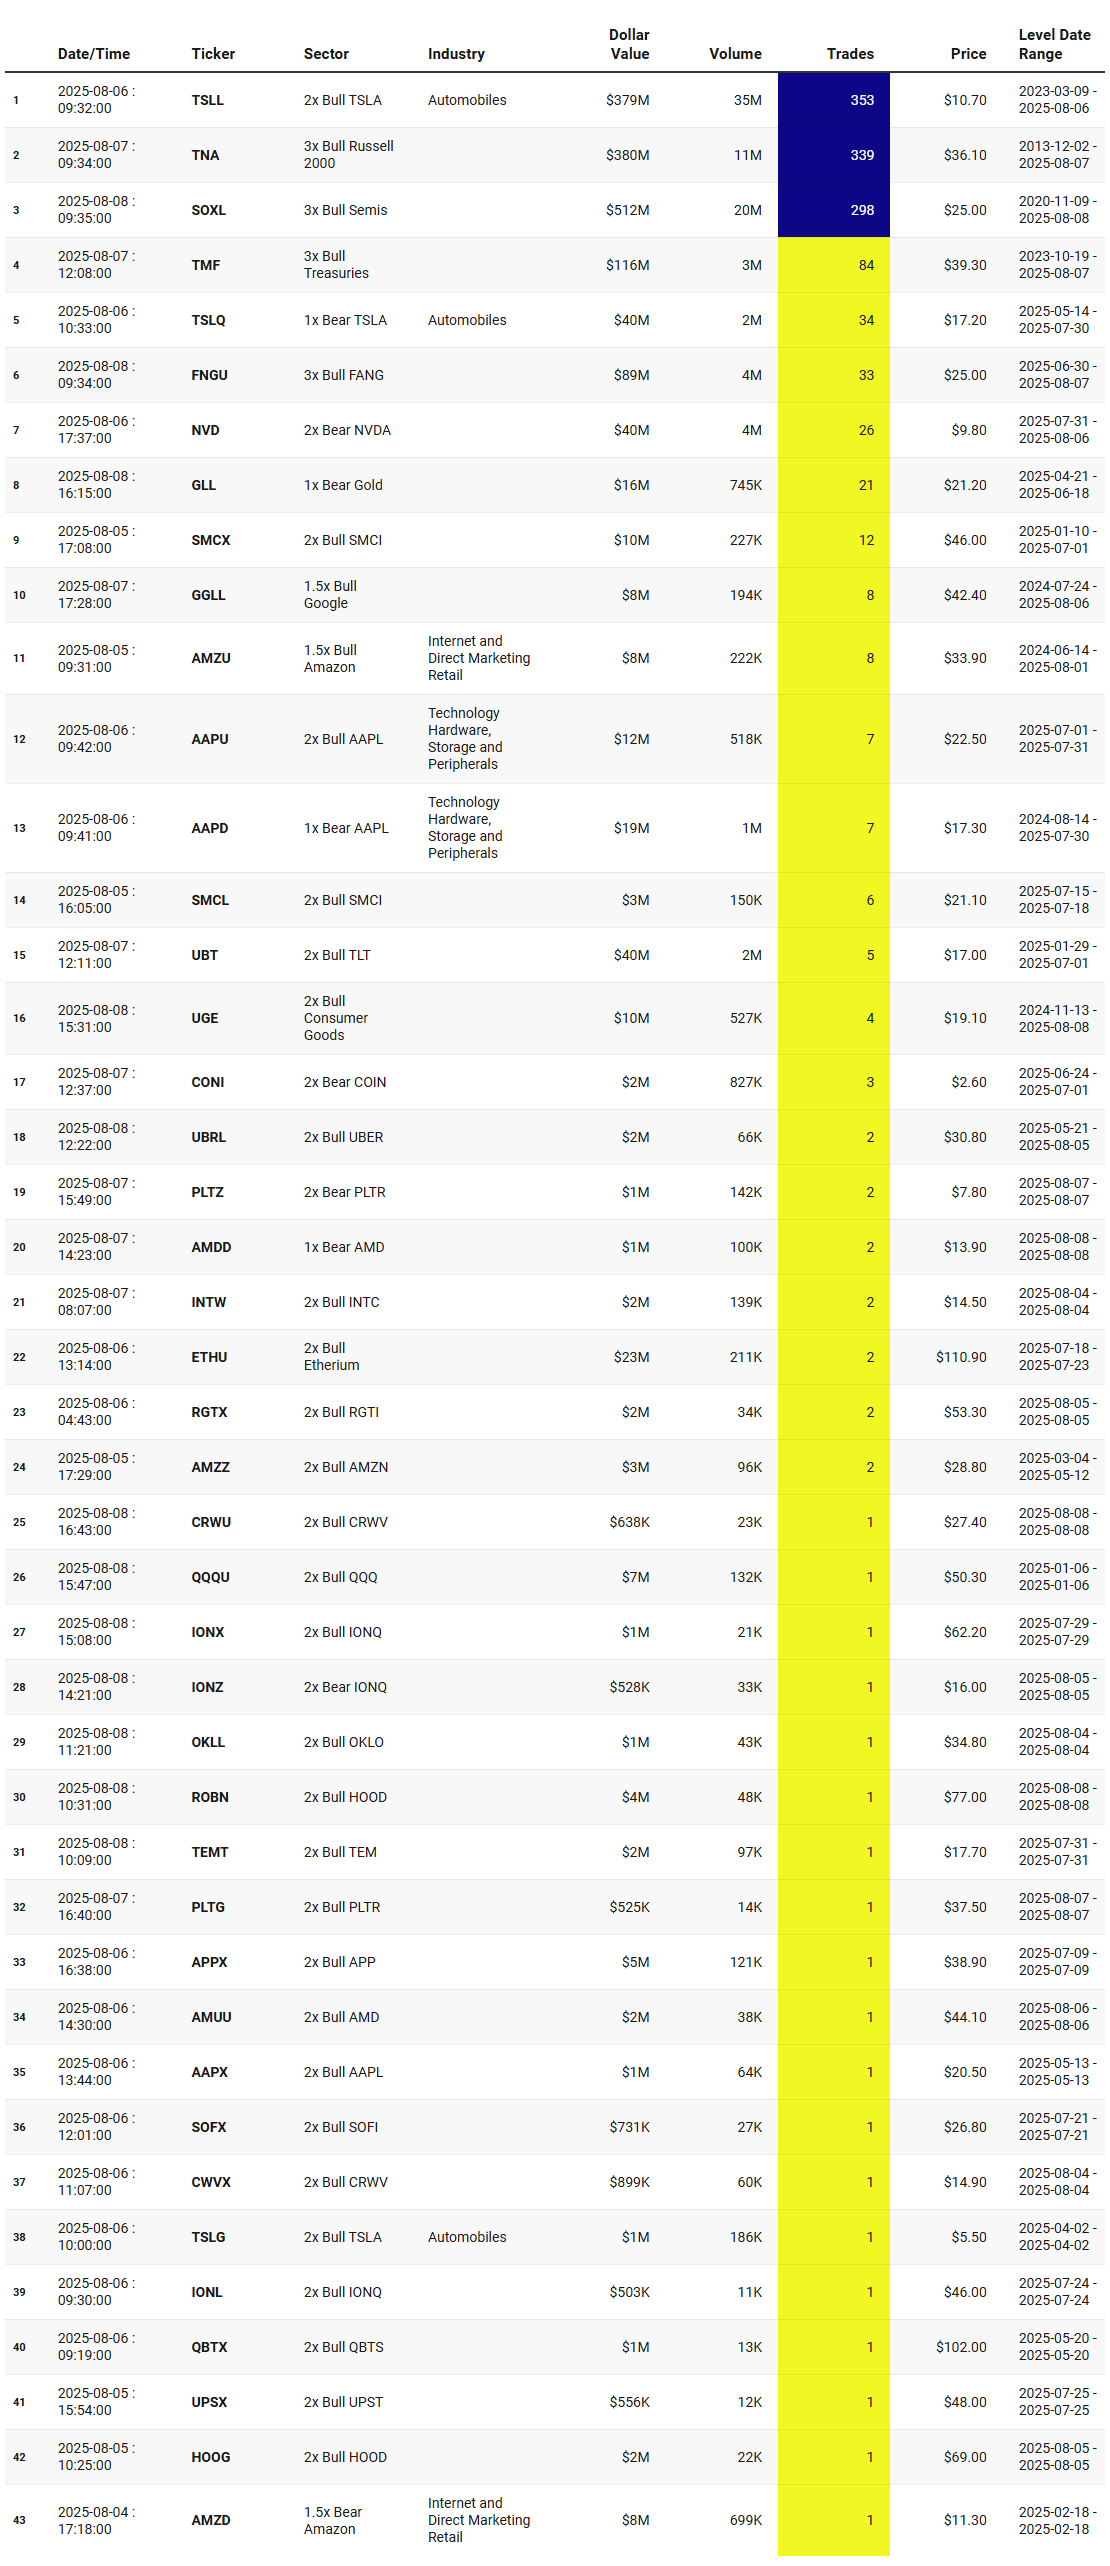
BONUS: Consensus Prices Watchlist for leveraged names from this week:
Thank you for being part of our community and for dedicating your time to this edition. Your insights and engagement drive everything we do, and we’re honored to share this space with such committed, thoughtful readers. Here’s to a week filled with clear opportunities and strong performance. Wishing you many bags 💰💰💰
—VolumeLeaders