

Market Momentum: Your Weekly Financial Forecast & Market Prep
Issue 55 / What to expect Aug 04, 2025 thru Aug 08, 2025

NOTE: This weekly periodical is too large for Substack to deliver in its entirety via email - you will only see a portion of this great content if you read from your email client. Click the header/title at the top to read the full article!
In This Issue
Weekly Market-On-Close Report: All the macro moves, market drivers, and must-know narratives—covered in less than five minutes.
Weekly Benchmark Breakdown: Our weekly intelligence report on major indices cuts through the index-level noise to uncover participation, momentum, and structural integrity and tell you whether markets are rising on solid ground or skating on thin breadth. This is where bull markets prove themselves—or quietly start to unravel.
The Latest Investor Sentiment Readings: Track the emotional pulse of the market with our curated dashboard of sentiment indicators. From fear-fueled flight to euphoric overreach, this week's readings reveal whether investors are cautiously creeping in—or stampeding toward the exits.
Institutional Support & Resistance Levels For Major Indices: Exactly where to look for support and resistance this coming week in SPY, QQQ, IWM & DIA
Normalized Performance By Thematics YTD: Which corners of the markets are beating benchmarks, which are overlooked and which ones are over-crowded!
Key Econ Events & Earnings On-Deck For This Coming Week
Market Intelligence Report: Track the real money. This section breaks down where institutions are placing their bets—and pulling their chips. You'll get a sector-by-sector view of flows, highlighting the most active names attracting large-scale buying or selling. We go beyond the headlines and into the tape, surfacing the week’s most notable block trades and sweep orders, both on lit exchanges and hidden dark pools. Whether you're following momentum or fading crowded trades, this is your map to where size is moving and why it matters.


Weekly Market-On-Close Report
A Week of Tariffs, Tension, and Turning Points: Navigating the Market’s Mid-Summer Shift
It has been one of those weeks in financial markets where the sheer density of headlines risks obscuring the more important narrative threads. On the surface, stocks stumbled; bonds rallied; the dollar was mixed. But beneath those price moves, a number of underlying forces—trade policy, central bank positioning, labor market evolution, and corporate earnings—are quietly rearranging the market’s risk and opportunity set.
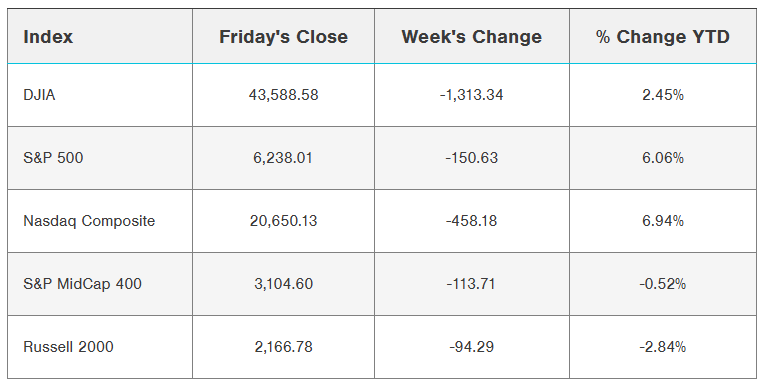
This was a week where the S&P 500 slipped to a two-week low, the Nasdaq 100 retreated nearly 2%, and the Dow marked its lowest close in over a month. The weakness wasn’t driven by a single shock but rather by a sequence of events that layered on top of one another: fresh tariffs, weaker-than-expected payrolls data, and a surprising contraction in manufacturing activity. By Friday afternoon, the broad market had shifted into clear risk-off mode.
And yet, in the background, bond yields were falling, the probability of Federal Reserve rate cuts was rising, and earnings season was quietly delivering better-than-expected profit growth. It was a week that sharpened the contrasts—slowing growth against resilient corporate margins, higher trade barriers against a Fed tilting toward accommodation—and set the stage for a volatile but opportunity-rich second half of the year.
Market Recap: From Rally to Retreat
Through the early part of the summer, the equity rally had seemed nearly unstoppable. Major indexes pushed repeatedly to fresh highs, buoyed by a combination of AI enthusiasm, steady consumer demand, and a labor market that, while cooling, remained historically healthy. That dynamic shifted this week.
The S&P 500 ended the week down more than 2%, its sharpest weekly decline since the tariff-driven pullback in April. The Dow fell nearly 3%, breaking below short-term technical support. The Russell 2000, a proxy for smaller domestic companies more sensitive to trade costs and domestic demand, fared worst—dropping over 4%.
Technology continued to outperform on a relative basis, though even the Nasdaq posted nearly a 2% loss. Mega-cap leaders helped cushion the blow, with standout results from Microsoft and Meta providing ballast, but the broader market was weaker. The equal-weight S&P 500 underperformed its cap-weighted counterpart by more than a percentage point.
Sector performance was uneven. Communication services finished roughly flat—saved almost entirely by Meta’s post-earnings strength—while utilities benefited from late-week defensive flows. Materials, consumer discretionary, and industrials led decliners, with tariff-sensitive companies and trade-exposed manufacturers under the most pressure.
Tariffs and Trade: The August 1 Deadline and Its Fallout
The week’s dominant theme was trade. President Trump’s August 1 deadline for new trade deals came and went with a flurry of announcements: deals with the EU, South Korea, and Japan; a temporary extension for Mexico; and sharply higher tariffs for nearly every other major trading partner.
On Thursday, the White House confirmed a 10% global minimum tariff, with rates of 15% or higher for countries running trade surpluses with the US. Canada saw its tariff rate on certain goods increase from 25% to 35%. Brazil faced a 50% tariff on select exports. By Bloomberg’s calculation, the average US tariff will now rise to roughly 15%, up from around 2% just a year ago and the highest level since the 1930s.
Markets reacted predictably. The announcement rattled equities on Thursday, with selling pressure intensifying into Friday’s close. Investors quickly began reassessing the growth implications of higher trade barriers: more expensive imports, potential retaliatory measures from trading partners, and higher input costs for US companies.
The inflation implications are more complex. In theory, tariffs raise goods prices. But as the Fed noted in its July meeting, goods account for only about a third of the US consumer price basket; services—largely unaffected by tariffs—make up the rest. That distinction may be cold comfort to companies facing compressed margins as supply chain costs rise, but it helps explain why the Fed is still willing to treat the tariff shock as a potentially short-lived price-level adjustment rather than a sustained inflationary trend.
The Federal Reserve: Holding Steady, But Tilting Toward Easing
The Federal Reserve’s July meeting delivered no surprises on rates. The Fed funds target remains at 4.25–4.50%, unchanged for the fifth consecutive meeting. The post-meeting statement acknowledged moderating economic activity in the first half of the year, but there was no explicit signal of imminent cuts.
More interesting were the dissenting votes—two FOMC members favored an immediate quarter-point cut, the first split vote of this kind since the early 1990s. Powell’s press conference leaned cautious: the Fed is still watching how tariffs filter through inflation data, still weighing the balance between a labor market that is losing momentum and inflation that remains slightly above target.
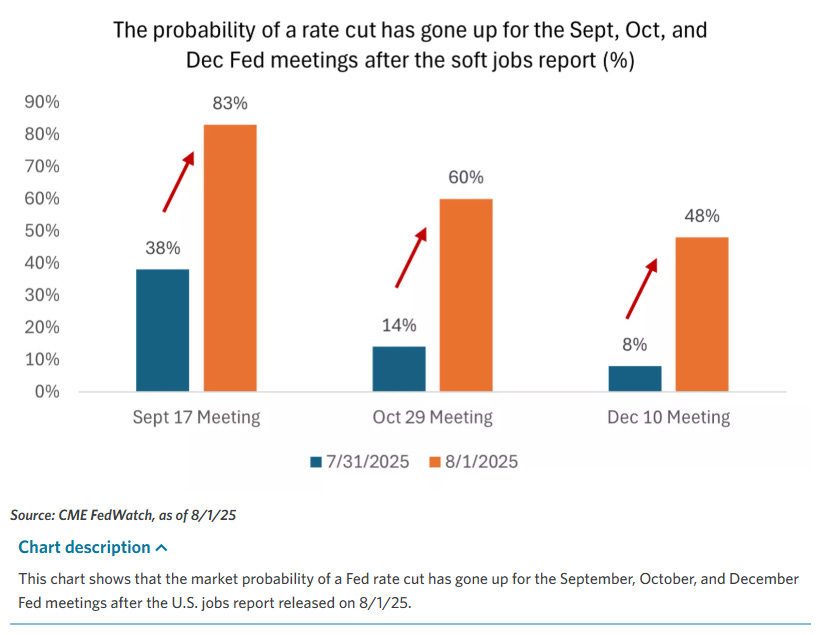
Markets were initially disappointed. September rate cut odds dropped to around 40% in the immediate aftermath. But by Friday afternoon—after the payrolls report and ISM manufacturing data—the implied probability had surged to over 90%. The combination of softer data and higher trade headwinds shifted the market narrative decisively toward easing.
Labor Market: Softening Beneath the Surface
The July jobs report was a clear turning point. Headline payroll growth came in at 73,000, well below expectations for roughly 100,000. More damaging to sentiment were the downward revisions to May and June: over 250,000 jobs were removed from the prior two months’ totals.
The unemployment rate ticked up to 4.2%. Labor force participation slipped to 62.2%, the lowest since late 2022. Wage growth remained solid at 3.9% year-on-year, still comfortably above inflation, but the breadth of hiring narrowed. Health care was the only major sector with meaningful job gains; manufacturing and government shed jobs.
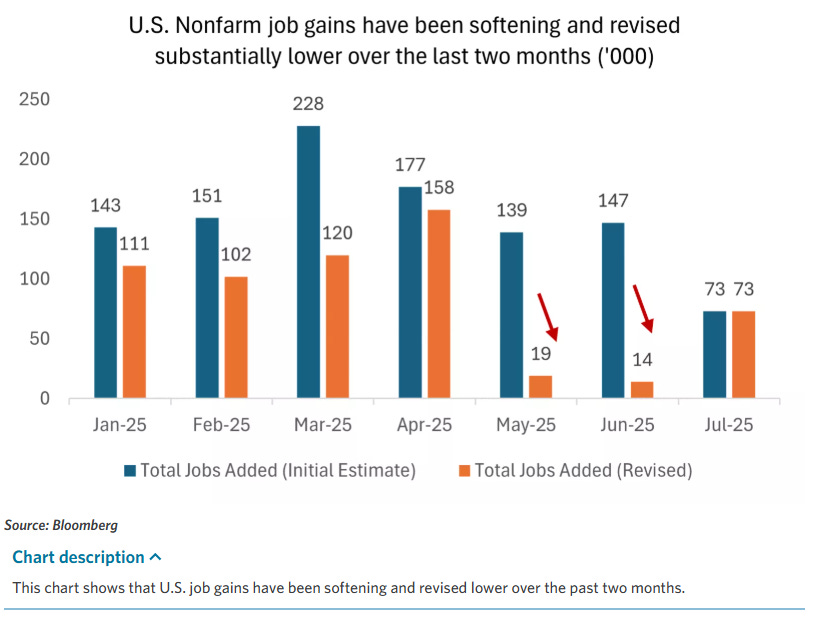
Taken together, the last three months have averaged just 35,000 new jobs, a significant slowdown from the 120,000+ monthly average earlier in the year. For a Fed that has described the labor market as “balanced,” the trend is now pointing more toward slack emerging. That increases the likelihood of policy support in the months ahead.
Inflation, Growth, and Macro Data: Mixed Signals
If the labor data leaned dovish for policy, the inflation data was less straightforward. June’s core PCE—the Fed’s preferred inflation measure—rose 0.3% month-over-month and 2.8% year-over-year. Services inflation continues to moderate, but goods prices are beginning to edge higher, partly reflecting front-loaded inventory building ahead of tariffs.
Second-quarter GDP surprised to the upside at 3%, recovering from a 0.5% contraction in Q1. Much of the improvement came from net exports and inventory adjustments, but personal consumption was solid at 1.4%. The economy is still expanding, though the sources of growth are shifting, and momentum may slow as trade costs rise and labor market gains fade.
Housing remains soft, with higher mortgage rates and limited affordability weighing on activity. Manufacturing sentiment, as measured by the ISM index, contracted to 48.0—its lowest in nine months. Construction spending unexpectedly declined in June. These are not collapse-level numbers, but they underscore that the growth backdrop is losing some of its earlier resilience.
Earnings Season: Strong Headlines, Cautious Guidance
This was one of the busiest weeks of the earnings season, with more than a third of S&P 500 companies reporting. The headline numbers are good: roughly 82% of companies have beaten earnings estimates, and aggregate Q2 earnings growth is tracking above 4% year-on-year—well ahead of pre-season expectations closer to 3%.
Mega-cap technology continues to be the standout. Microsoft and Meta both posted strong results, with AI investment themes continuing to drive sentiment. Meta raised the low end of its capital expenditure guidance by $2 billion, to $66–72 billion, and hinted at the possibility of capex approaching $100 billion next year.
Outside of tech, the picture is more nuanced. Payment processors and travel companies reported steady consumer demand. Industrials and materials flagged headwinds from tariffs. Automakers and luxury goods saw weaker trends, both in the US and abroad. Managed care names came under pressure after the administration sent letters to major pharmaceutical companies urging price reductions.
Fixed Income: Yields Bend Lower
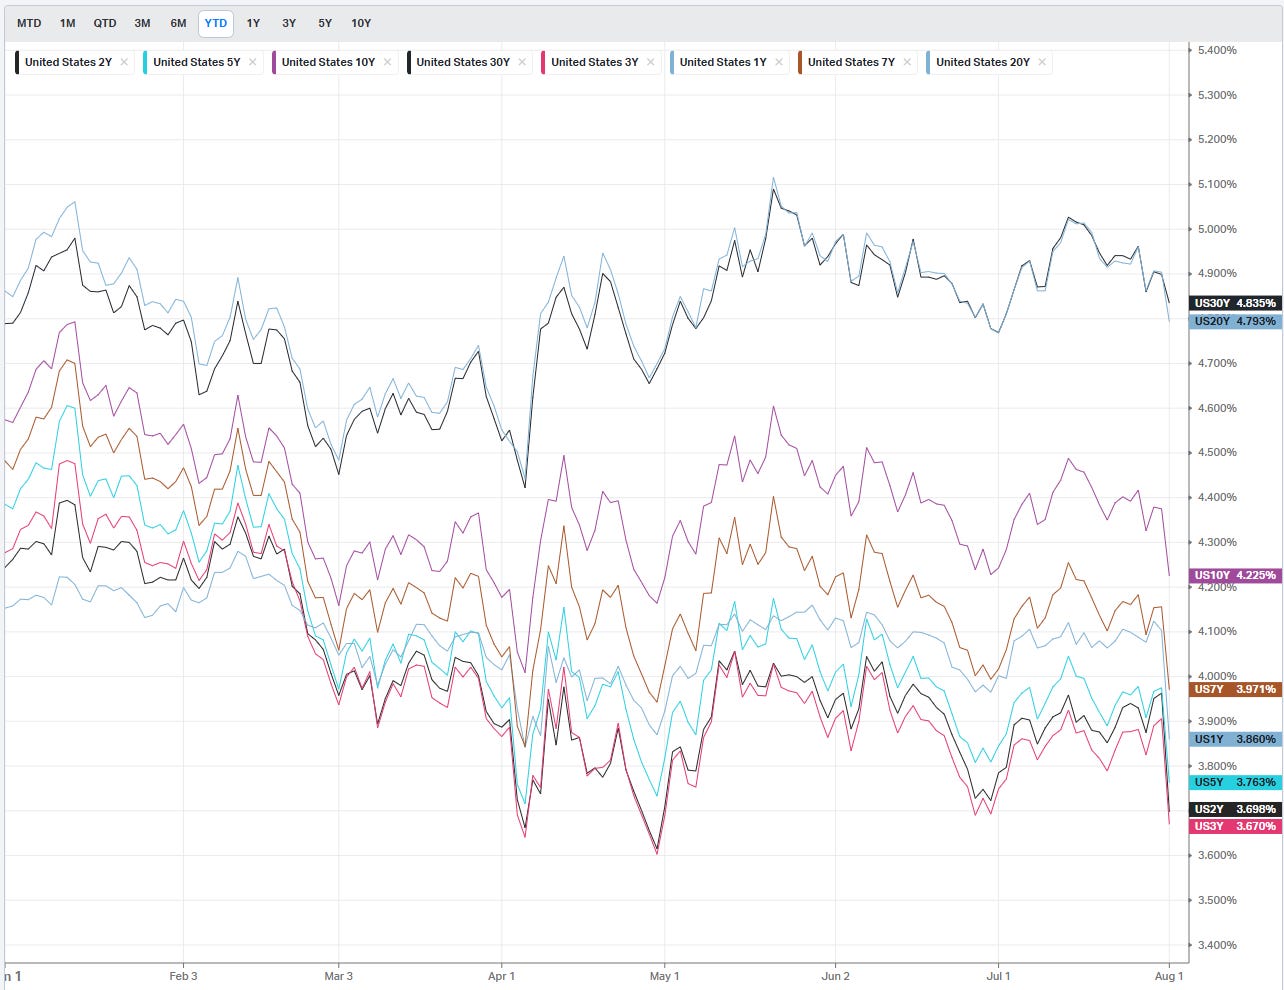
Treasury yields fell sharply as the week progressed. The 10-year yield dropped nearly 16 basis points on Friday alone, closing near 4.22%. The 2-year yield fell about 25 basis points, as rate cut odds surged.
Global yields moved lower in sympathy. The German 10-year Bund closed at 2.68%, the UK 10-year gilt at 4.53%. The ECB meets in September, with markets pricing only a small chance of a cut. Eurozone inflation came in at 2.0% headline, 2.3% core—close enough to target to keep options open.
Global Equities: Weakness Abroad
International equities reflected the same caution seen in US markets. The Euro Stoxx 50 dropped nearly 3% to a three-month low. Japan’s Nikkei fell about 0.7%. China’s Shanghai Composite slipped modestly, weighed by weak property data and continued investor skepticism about stimulus measures.
Positioning: Navigating the Walls of Worry
The S&P 500 has just broken below its 20-day moving average for the first time in over two months, ending a streak that has historically been followed by positive returns over 3, 6, and 12 months. But the immediate setup is more challenging.
Tariffs will likely weigh on margins and certain sectors. The labor market is cooling. The Fed is likely to cut rates, but perhaps not as quickly as markets now expect. Volatility will likely increase.
For investors, that argues for maintaining diversification, favoring high-quality assets, and looking to take advantage of weakness to add to positions. Large- and mid-cap US equities remain attractive relative to global peers. Within fixed income, extending duration in the 7–10 year space offers both carry and potential price appreciation if yields move lower.
Conclusion: Into the Back Half of 2025
The first half of the year was characterized by a surprising resilience: AI-fueled tech gains, consumer strength, and steady corporate earnings. The second half will likely be defined by a different set of forces: higher trade barriers, a softening labor market, and a Fed edging toward accommodation.
That mix doesn’t guarantee smooth sailing, but it does create a backdrop where bouts of volatility will coexist with pockets of opportunity. For long-term investors, the key will be staying invested, staying diversified, and being willing to lean into weakness when the market narrative feels most uncertain.

Weekly Benchmark Breakdown
Market internals across the major benchmarks are flashing a pretty consistent message this week: participation remains narrow, with breadth leaning toward weakness despite a handful of standouts holding the indices together.
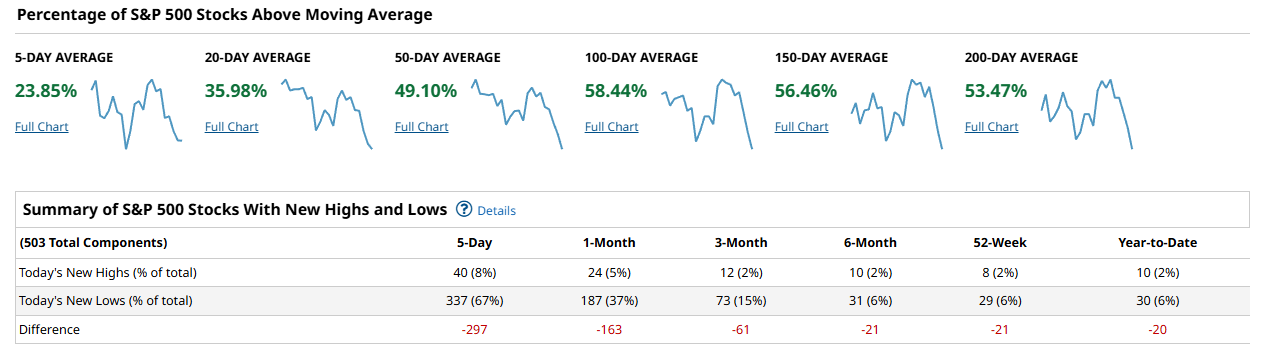
Starting with the S&P 500, fewer than a quarter of constituents are above their 5-day average, and just over a third are above their 20-day. Even stretching out to longer windows, participation is mixed, with about half of stocks above their 50- and 200-day averages. New lows have meaningfully outpaced new highs across every time frame, which suggests that while the index itself may not be under heavy pressure, much of its strength is coming from a smaller group of leaders.
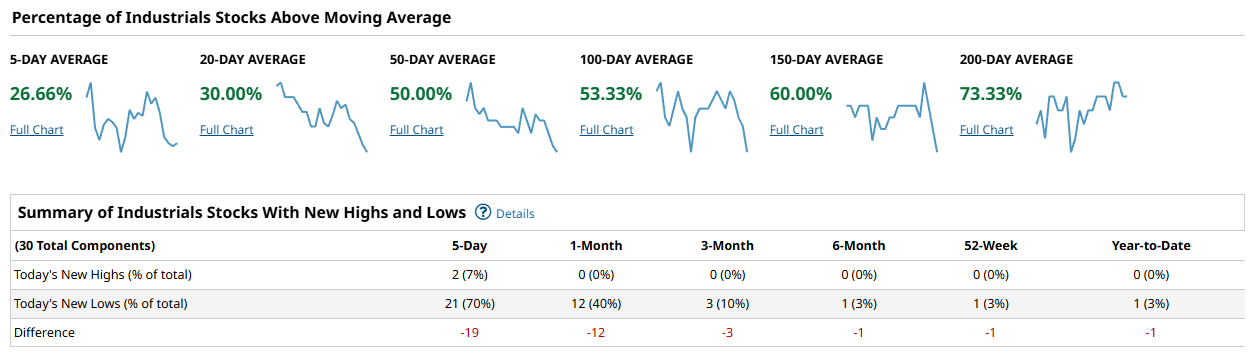
Industrials tell a similar story but with an even thinner top. Barely 27% of names are above the 5-day moving average, and new lows have been outpacing new highs by a wide margin in the short term. While the longer-term averages—particularly the 150- and 200-day—show more constructive levels (60–73% above), that stability looks like it’s being carried by a small number of names that haven’t broken down.
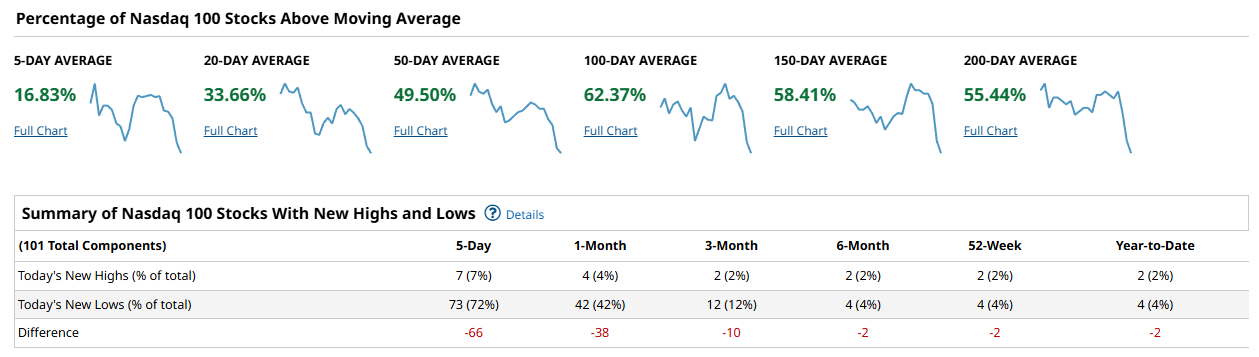
The Nasdaq 100 paints an even more concentrated picture. Only 16% of its members are above their 5-day average, and new lows are swamping new highs in the near term. That said, the longer averages still look decent, with more than half of the index above the 100- and 200-day averages—again pointing to a dynamic where a handful of large-cap leaders are offsetting broader weakness.
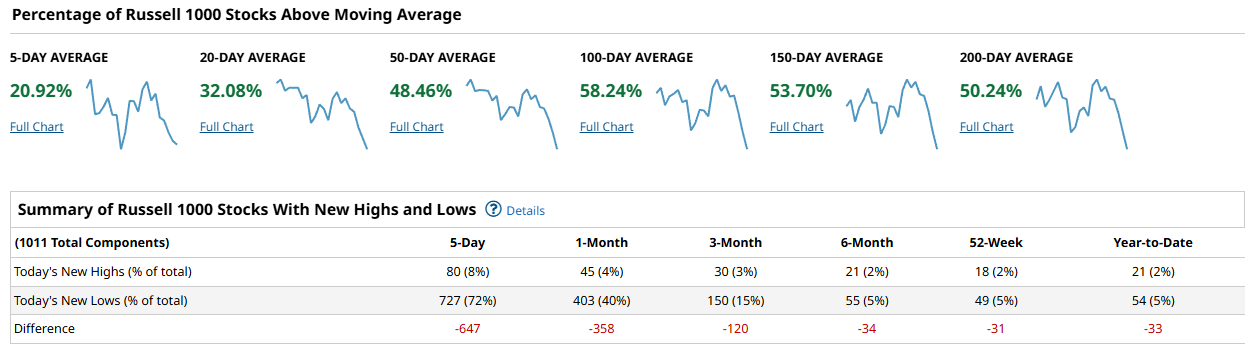
The Russell 1000 offers perhaps the cleanest read on broader participation, and it’s not an especially encouraging one. Just 21% of constituents are above their 5-day average, and short-term new lows are dramatically outpacing new highs. Longer averages still show about half of the index holding up, but the short-term weakness is clear.
Altogether, breadth right now is one of narrow leadership. The indices are holding up, but the underlying participation is not broad. Many stocks are either consolidating or under pressure, while strength is concentrated in a relatively small group of names. This kind of setup can persist for a while—especially in earnings season—but it’s worth watching closely, as any cracks in leadership could have an outsized effect on the broader market tone.
US Investor Sentiment Report
Insider Trading
Insider trading occurs when a company’s leaders or major shareholders trade stock based on non-public information. Tracking these trades can reveal insider expectations about the company’s future. For example, large purchases before an earnings report or drug trial results might indicate confidence in upcoming good news.
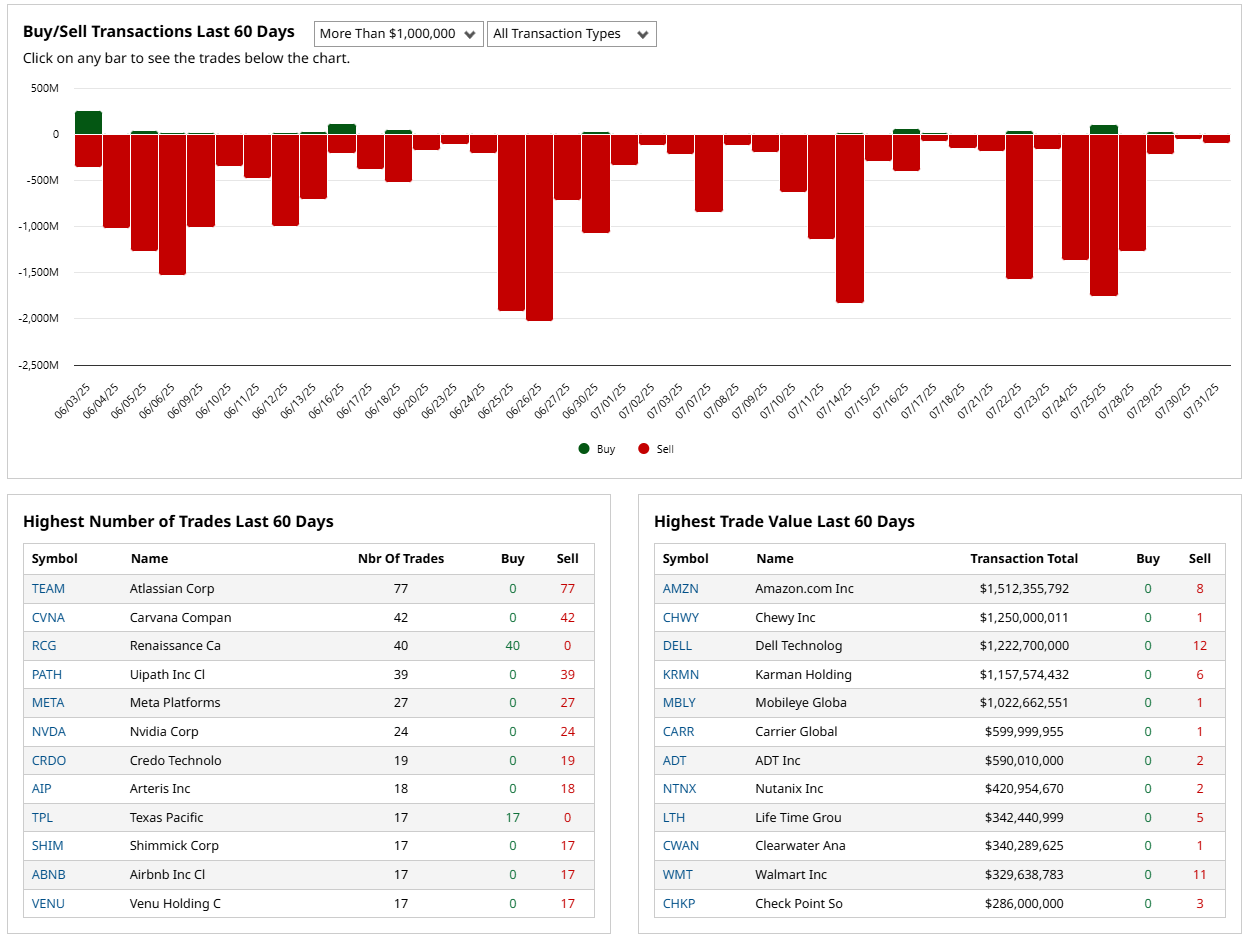
Insider activity this week shows a familiar summer pattern—transaction counts are high, but the tilt remains heavily toward sales. Big-ticket moves in AMZN, CHWY, and DELL dominate the dollar volume list, though almost entirely on the sell side. While some of this reflects post-earnings liquidity events and planned stock sales, the steady drumbeat of insider selling at market leaders suggests executives are happy to take profits at current valuations rather than signaling deep conviction to buy.
%Bull-Bear Spread
The %Bull-Bear Spread measures the gap between bullish and bearish investor sentiment, often from surveys like AAII. It’s a contrarian indicator—extreme optimism may signal a coming pullback, while extreme pessimism can hint at a potential rally. Large positive or negative spreads often mark market turning points.
The AAII Bull-Bear Spread has nudged higher to 7.3% this week, up from 2.7% last week, marking a steady rebound from the deeply negative sentiment we saw in May and June. While not exuberant, the shift into positive territory suggests a gradual warming in retail investor outlook. This kind of slow sentiment recovery often aligns with a “cautiously constructive” market backdrop—participants aren’t euphoric, but the heavy pessimism has eased, which historically creates room for markets to grind higher if macro and earnings remain supportive.
NAAIM Exposure Index
The NAAIM Exposure Index (National Association of Active Investment Managers Exposure Index) measures the average exposure to U.S. equity markets as reported by its member firms. These are typically active money managers who provide their equity exposure levels weekly. The index offers insight into how much these managers are investing in equities at any given time, ranging from being fully short (-100%) to leveraged long (up to +200%).
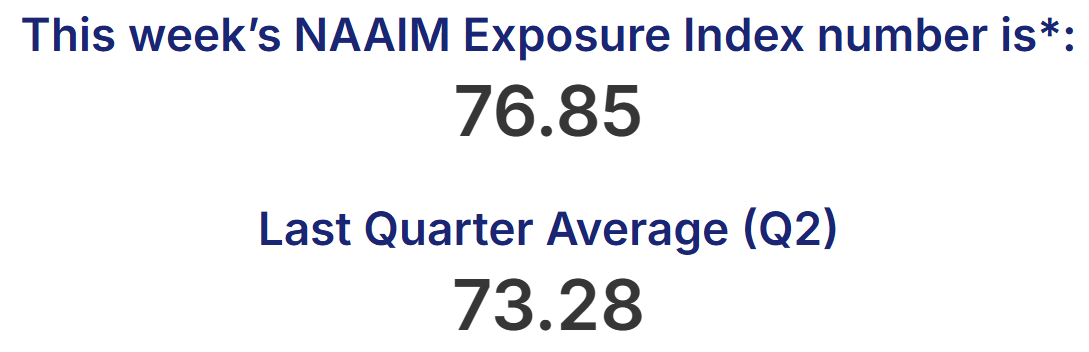
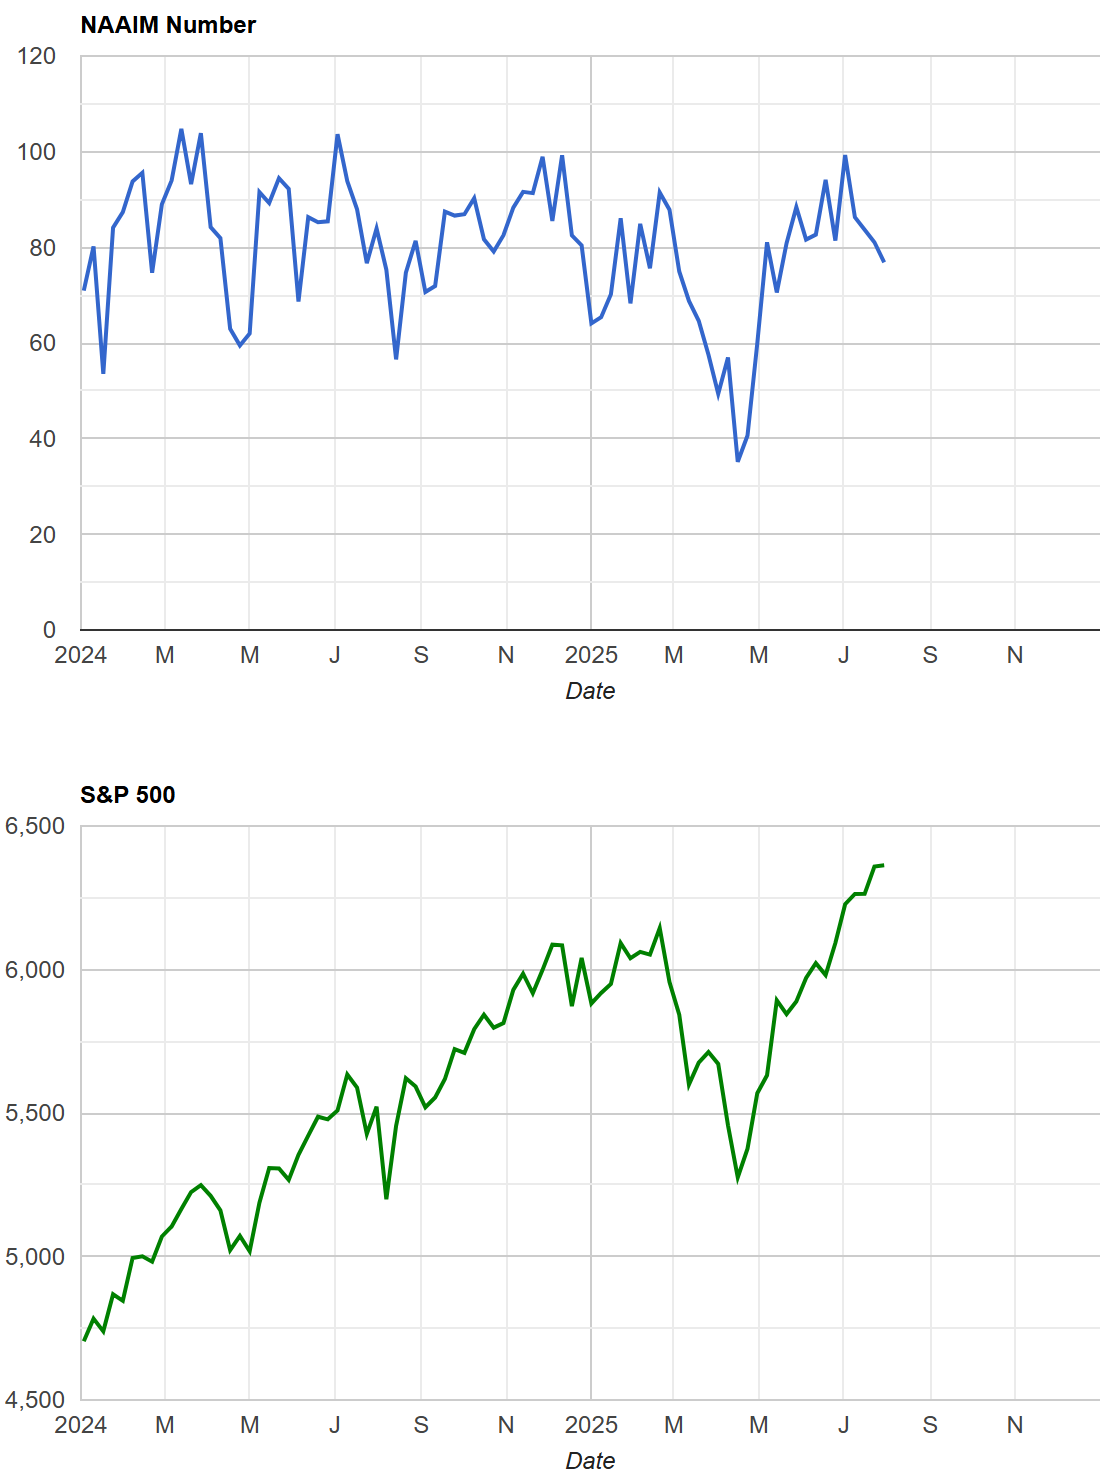
The NAAIM Exposure Index has eased slightly to 76.85 from last week’s 81.07, marking a gradual drift lower from early July’s near-100 reading. Allocations remain firmly bullish by historical standards, but the gentle step back suggests some managers are trimming risk rather than pressing exposure at new highs. With the S&P continuing its push upward, this moderation looks more like tactical risk management—perhaps tied to earnings season and end-of-month flows—than any meaningful loss of confidence.
CBOE Total Put/Call Ratio
CBOE's total put/call ratio includes index options and equity options. It's a popular indicator for market sentiment. A high put/call ratio suggests that the market is overly bearish and stocks might rebound. A low put/call ratio suggests that market exuberance could result in a sharp fall.
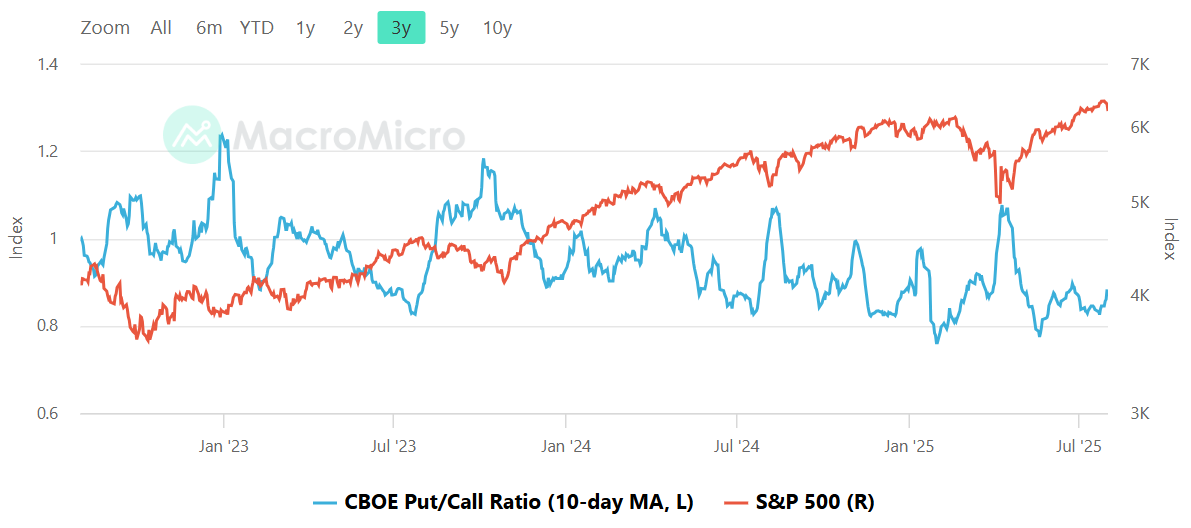
The 10-day moving average of the CBOE Put/Call ratio is sitting toward the lower end of its recent range, signaling a relatively optimistic—or at least less hedged—stance from options traders. Historically, sustained readings at these levels tend to align with markets that are grinding higher, as the S&P 500 is now. While not extreme enough to scream complacency, it does suggest positioning has leaned bullish, which can leave the market a bit more vulnerable to volatility if sentiment shifts suddenly.
Equity vs Bond Volatility
The Merrill Lynch Option Volatility Estimate [MOVE] Index from BofAML and the CBOE Volatility Index [VIX] respectively represent market volatility of U.S. Treasury futures and the S&P 500 index. They typically move in tandem but when they diverge, an opportunity can emerge from one having to “catch-up” to the other.
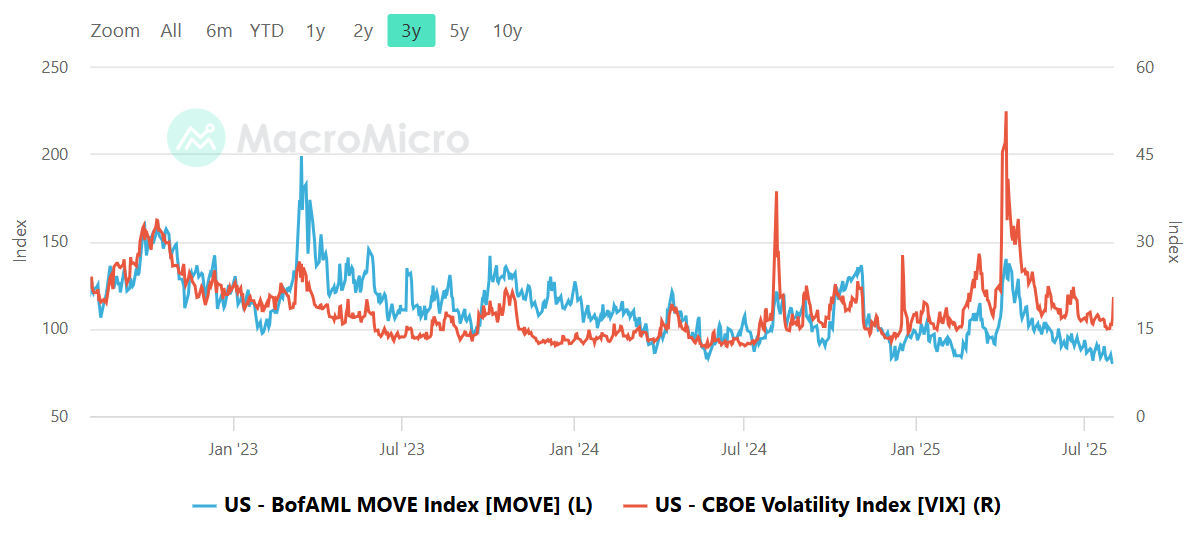
Bond and equity volatility are both sitting at relatively subdued levels, with the MOVE index drifting toward its lower range and the VIX holding well below its recent spikes. This combination points to a market currently comfortable with both interest rate stability and equity risk. The takeaway here is that cross-asset volatility is not sending stress signals—conditions are calm, which often supports steady risk appetite, though it can also mean markets are more sensitive to any surprise catalysts.
CNN Fear & Greed Constituent Data Points & Composite Index
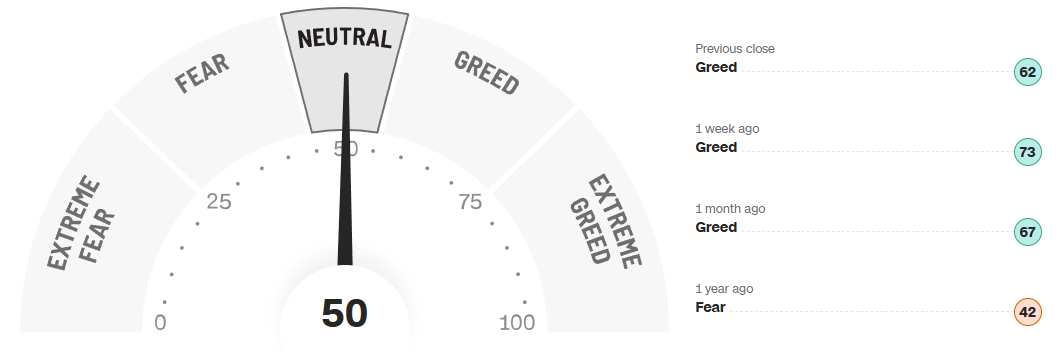
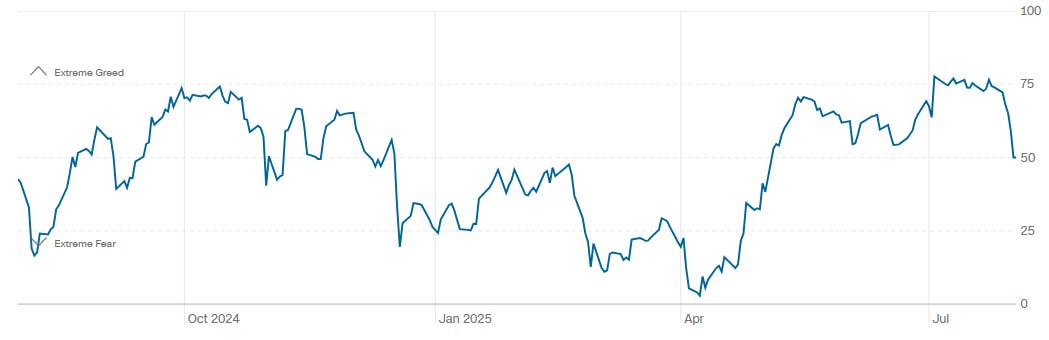
The CNN Fear & Greed Index is sitting at a perfectly balanced 50—right in the middle of neutral—after spending the past several weeks in “Greed” territory. Just a week ago we were at 73, and a month ago at 67, so this is a noticeable shift down. The drop in sentiment has been steady rather than panicked, lining up well with the broader market’s consolidation and the mixed tone of earnings season so far. It’s a sign that bullish enthusiasm has cooled, but we’re not seeing a rush into fear. Markets are in a “wait and see” mode, and the sentiment gauge is reflecting that—poised for a move as catalysts line up in the coming weeks.
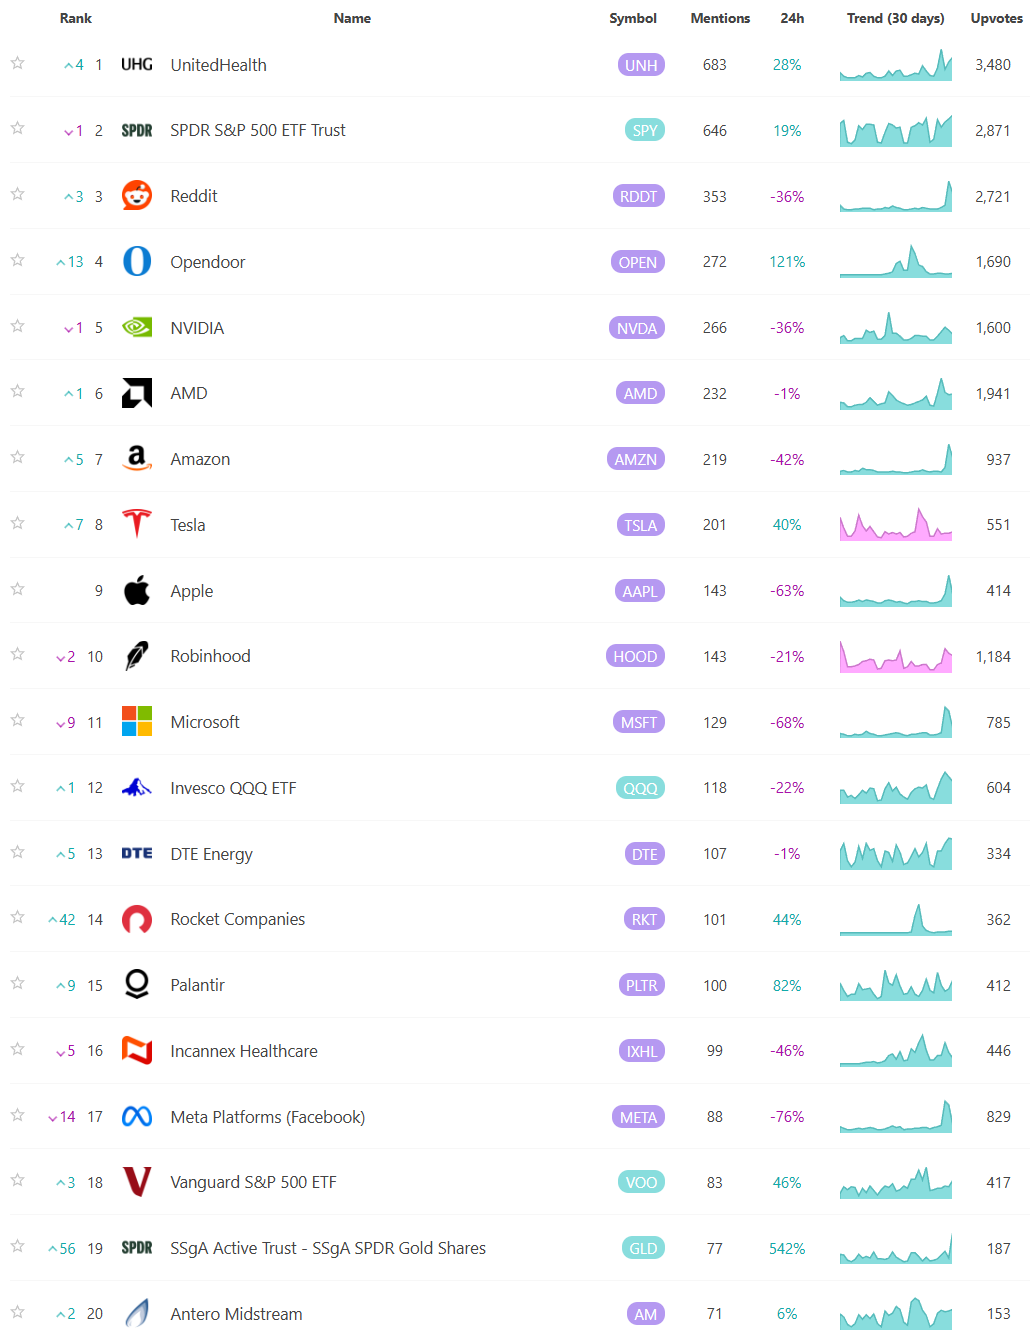
Social Media Favs
Social sentiment offers a real-time view of investor mood, often revealing market shifts before traditional indicators. It can signal momentum changes, spot emerging trends, and gauge retail investor impact—especially in high-volatility names. Tracking sentiment around events or earnings provides actionable insights, and when layered with quantitative models, can enhance predictive accuracy and risk management. Sustained sentiment trends often mirror broader market cycles, making this data a valuable tool for both short-term trades and long-term positioning.
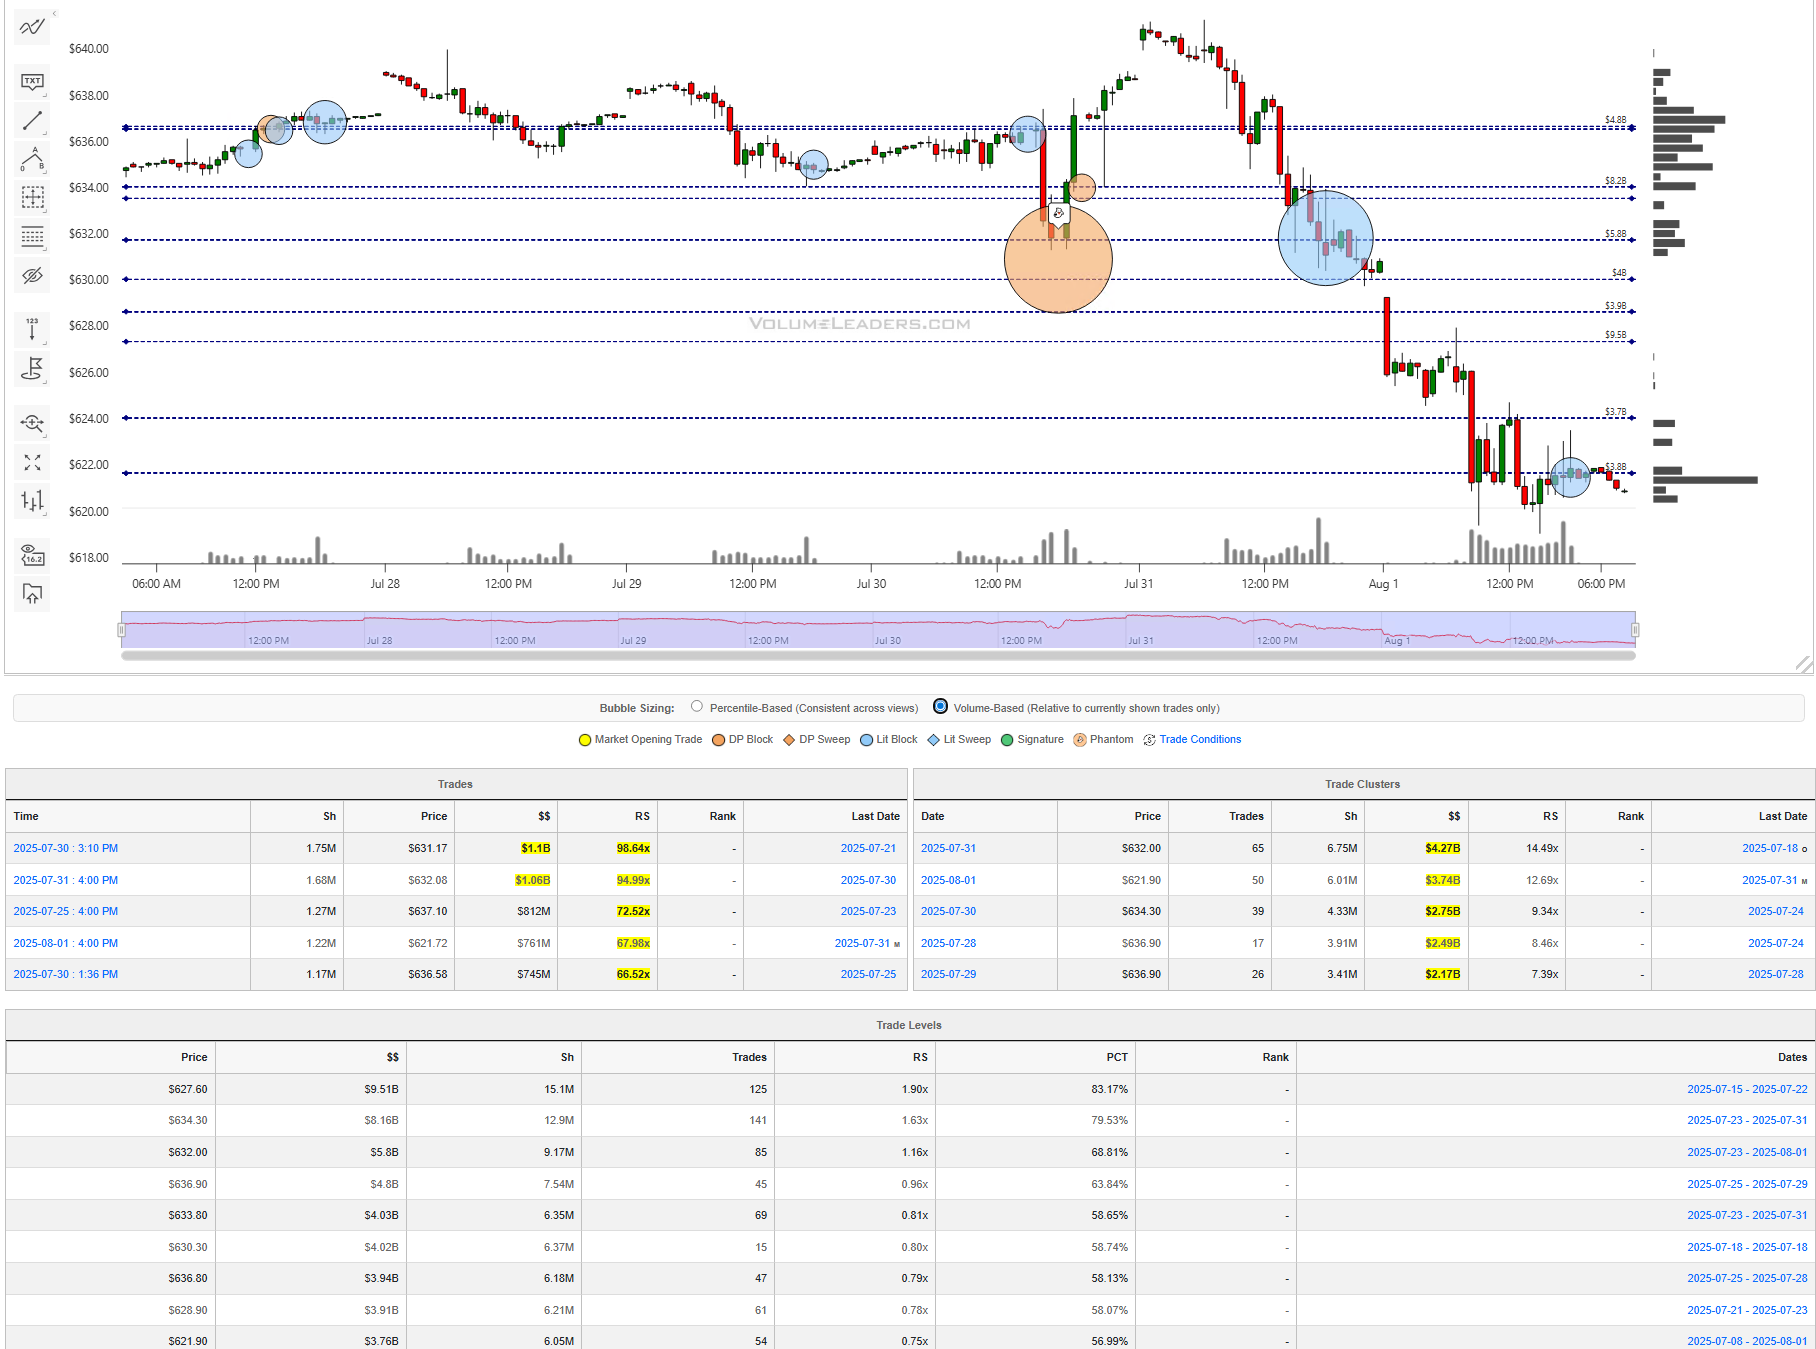
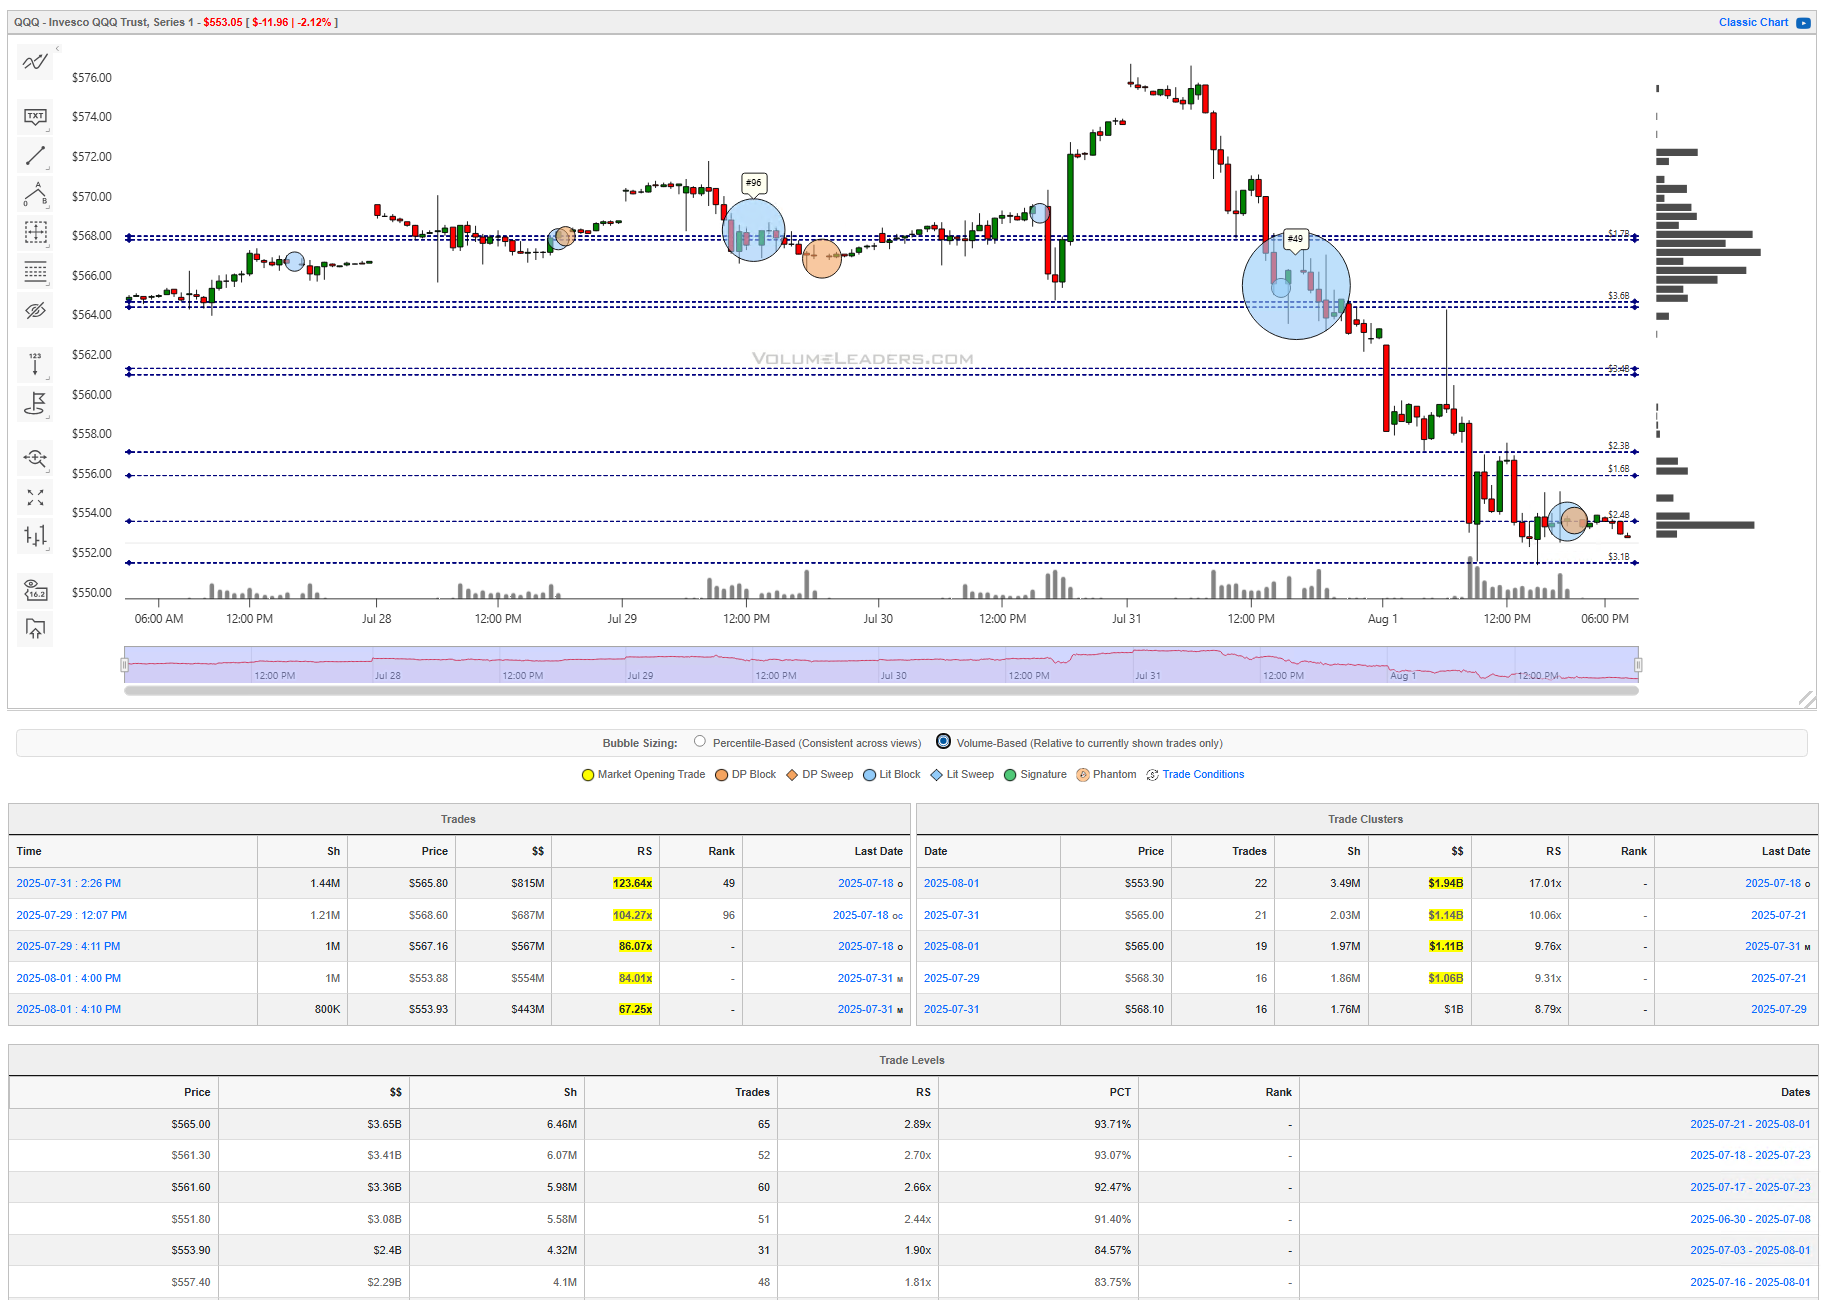
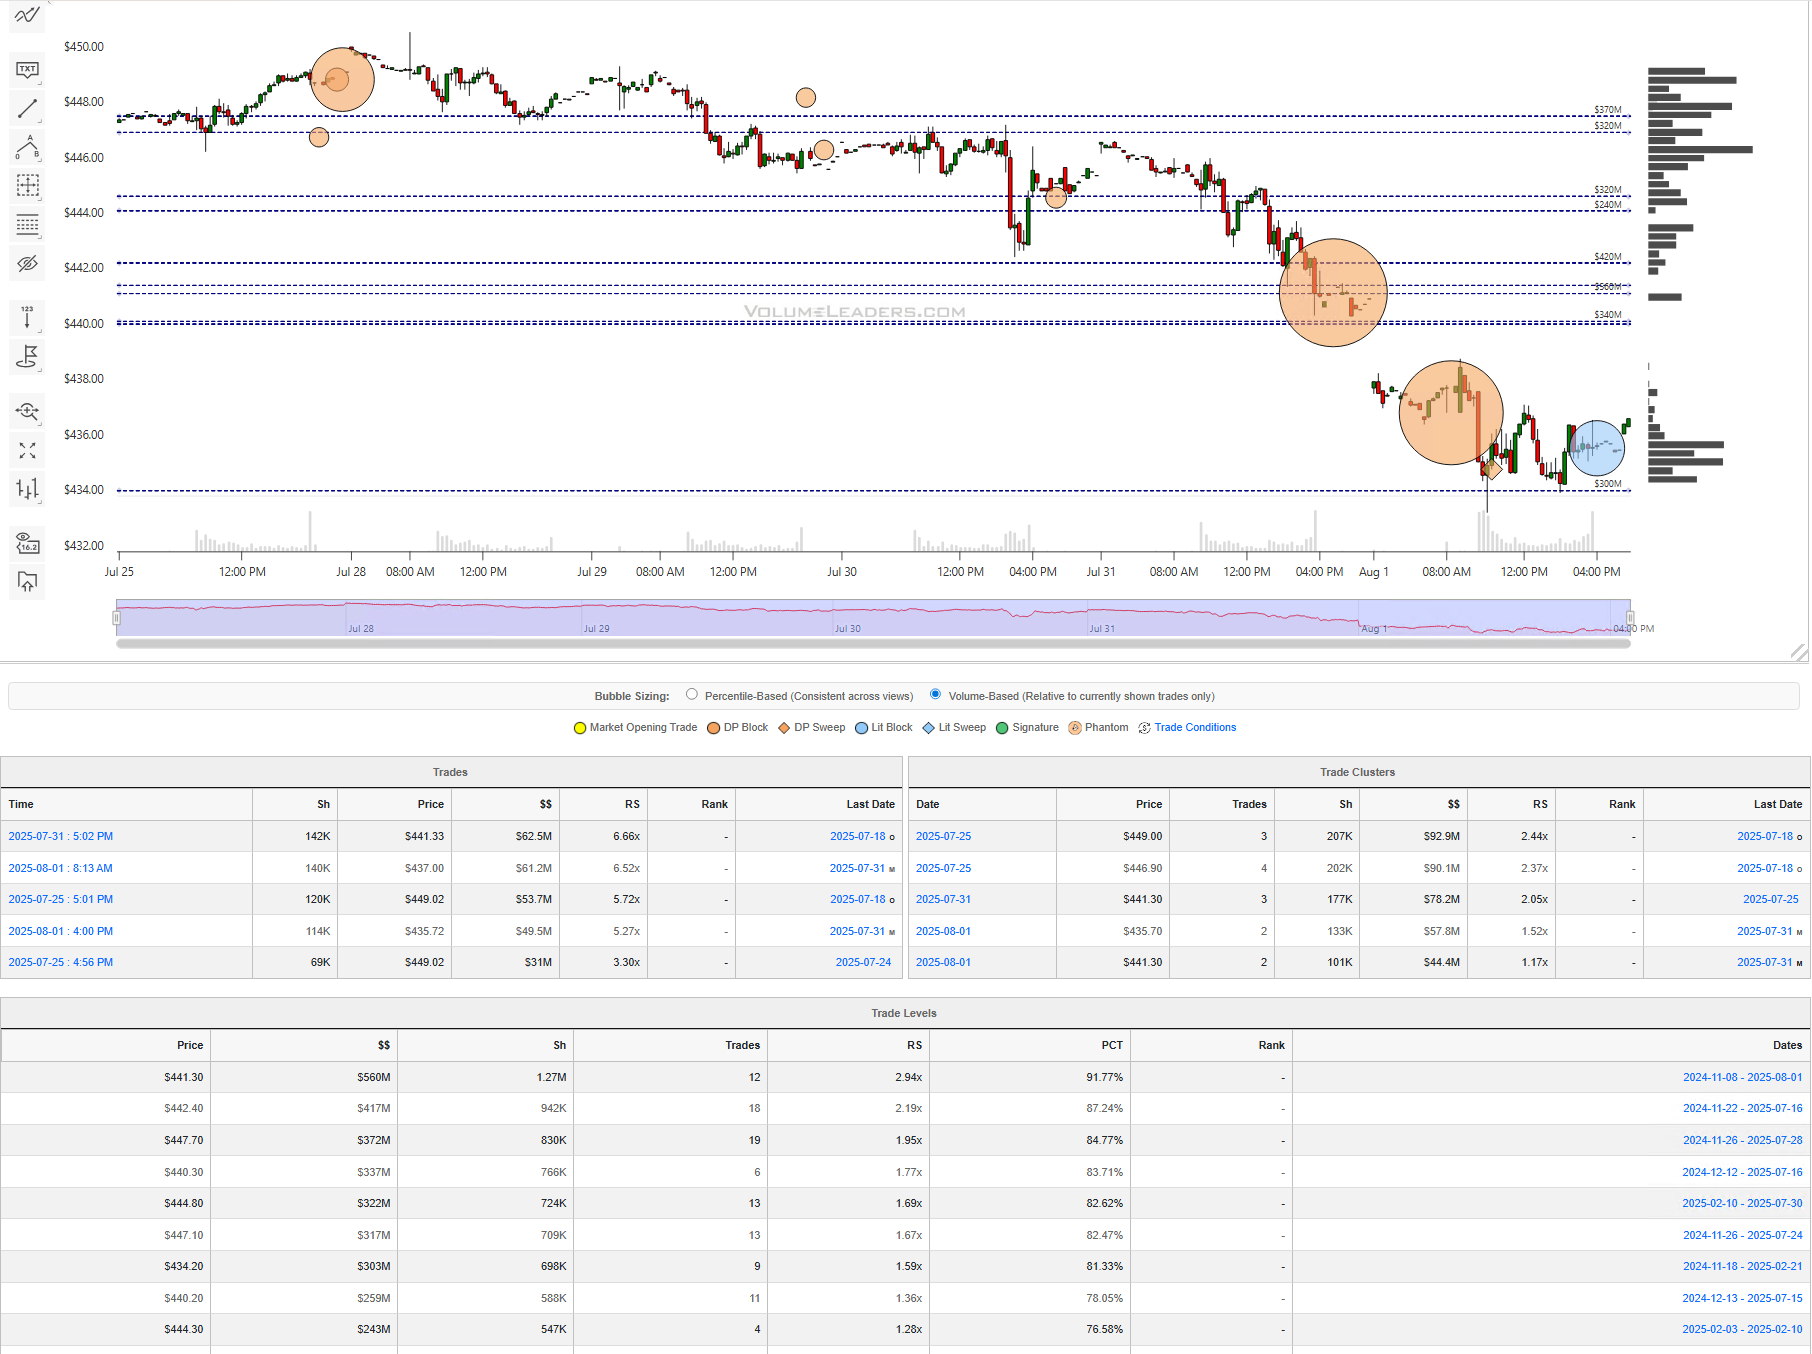
Institutional S/R Levels for Major Indices
When you’re a large institutional player, your primary goal is to find liquidity - places to do a ton of business with the least amount of slippage possible. VolumeLeaders.com automatically identifies and visually plots the exact spots where institutions are doing business and where they are likely to return for more. It’s one of the primary reasons “support” and “resistance” concepts work and truly one of the reasons “price has memory” - take a look at the dashed lines in the images below that the platform plots for you automatically; these are the areas institutions constantly revisit to do more business.
Levels from the VolumeLeaders.com platform can help you formulate trades theses about:
Where to add or take profit
Where to de-risk or hedge
What strikes to target for options
Where to expect support or resistance
And this is just a small sample; there are countless ways to leverage this information into trades that express your views on the market. The platform covers thousands of tickers on multiple timeframes to accommodate all types of traders.
SPY
QQQ
IWM
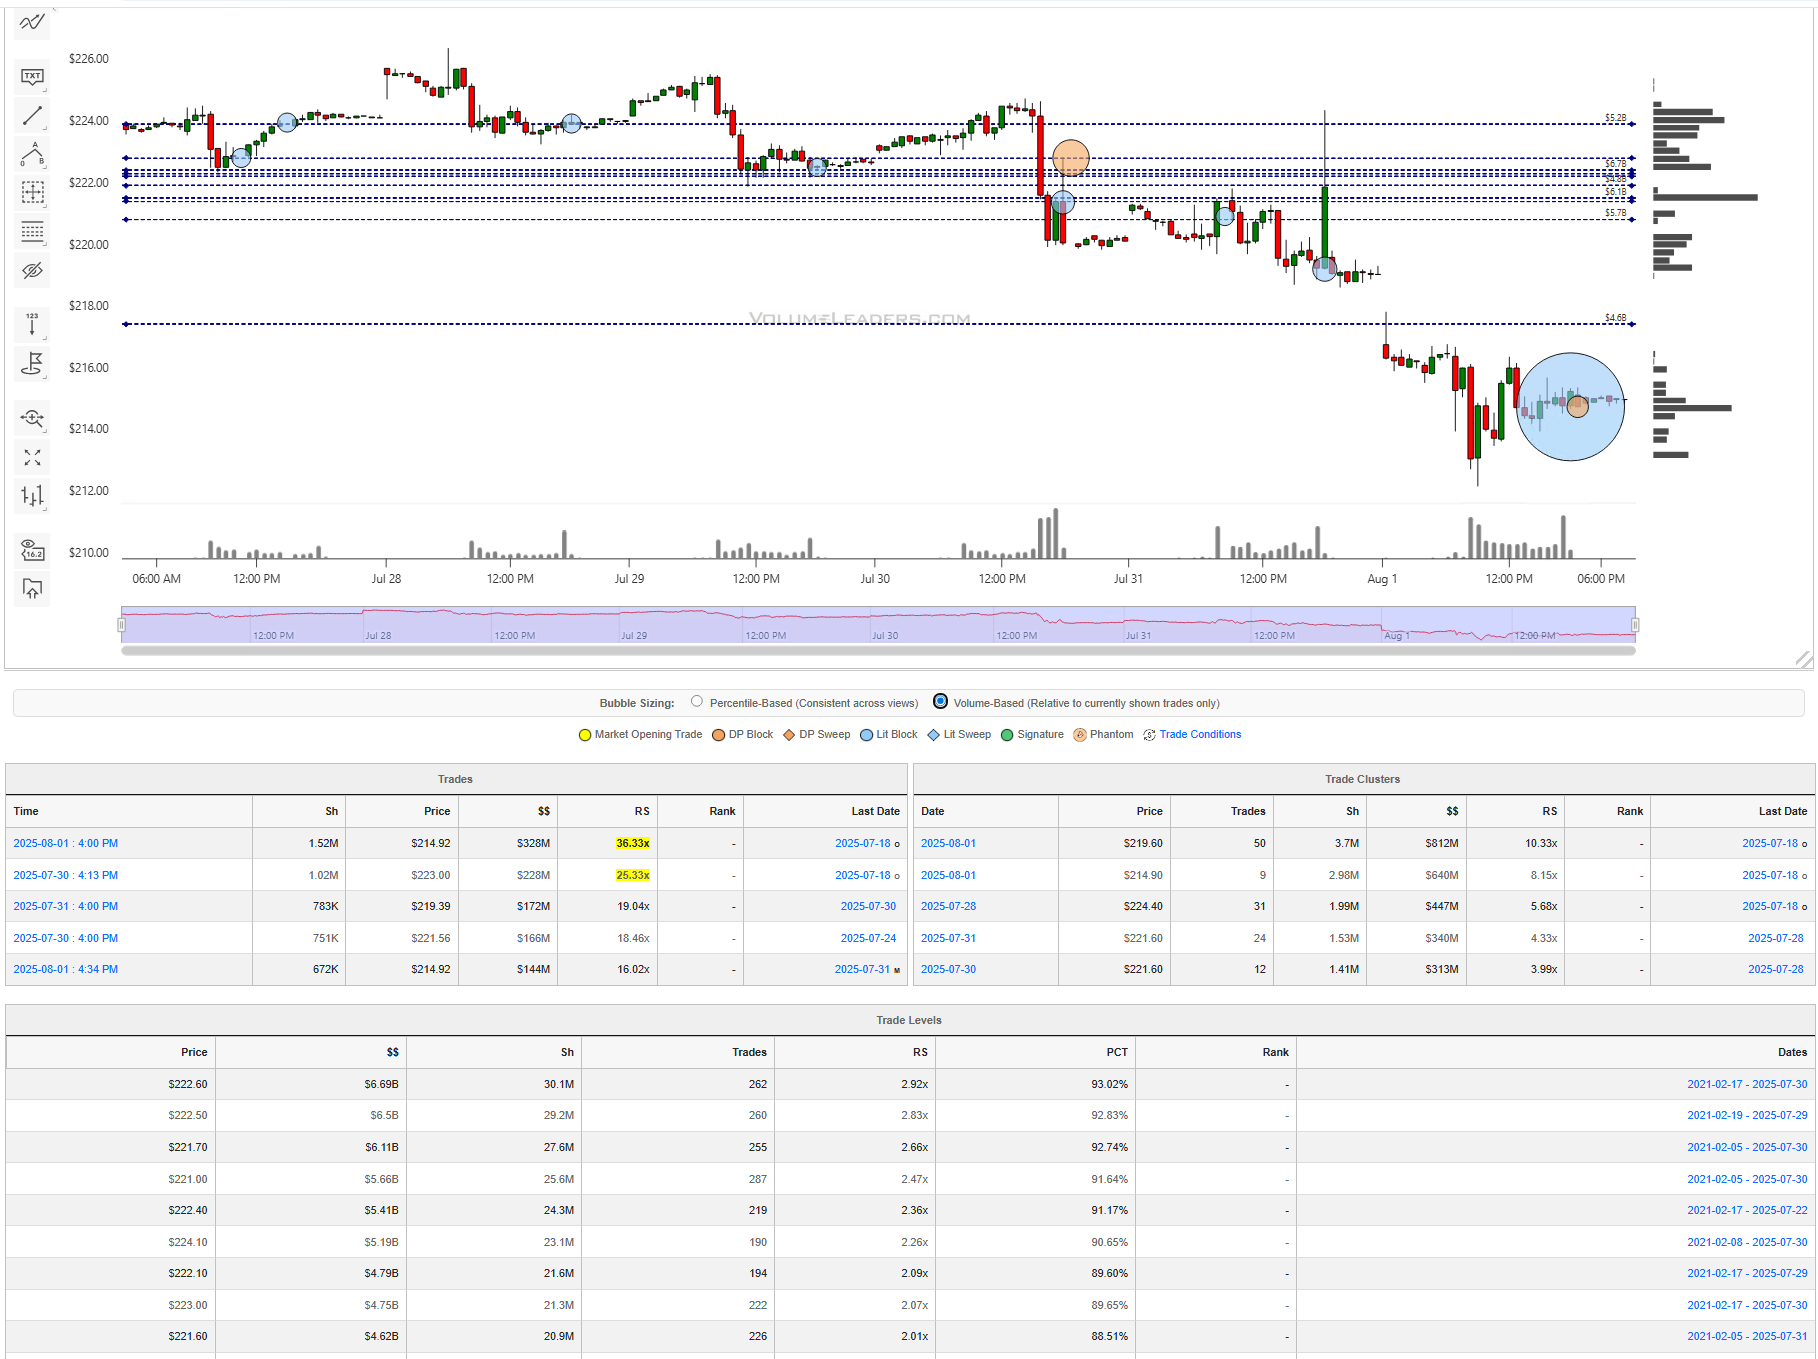
DIA
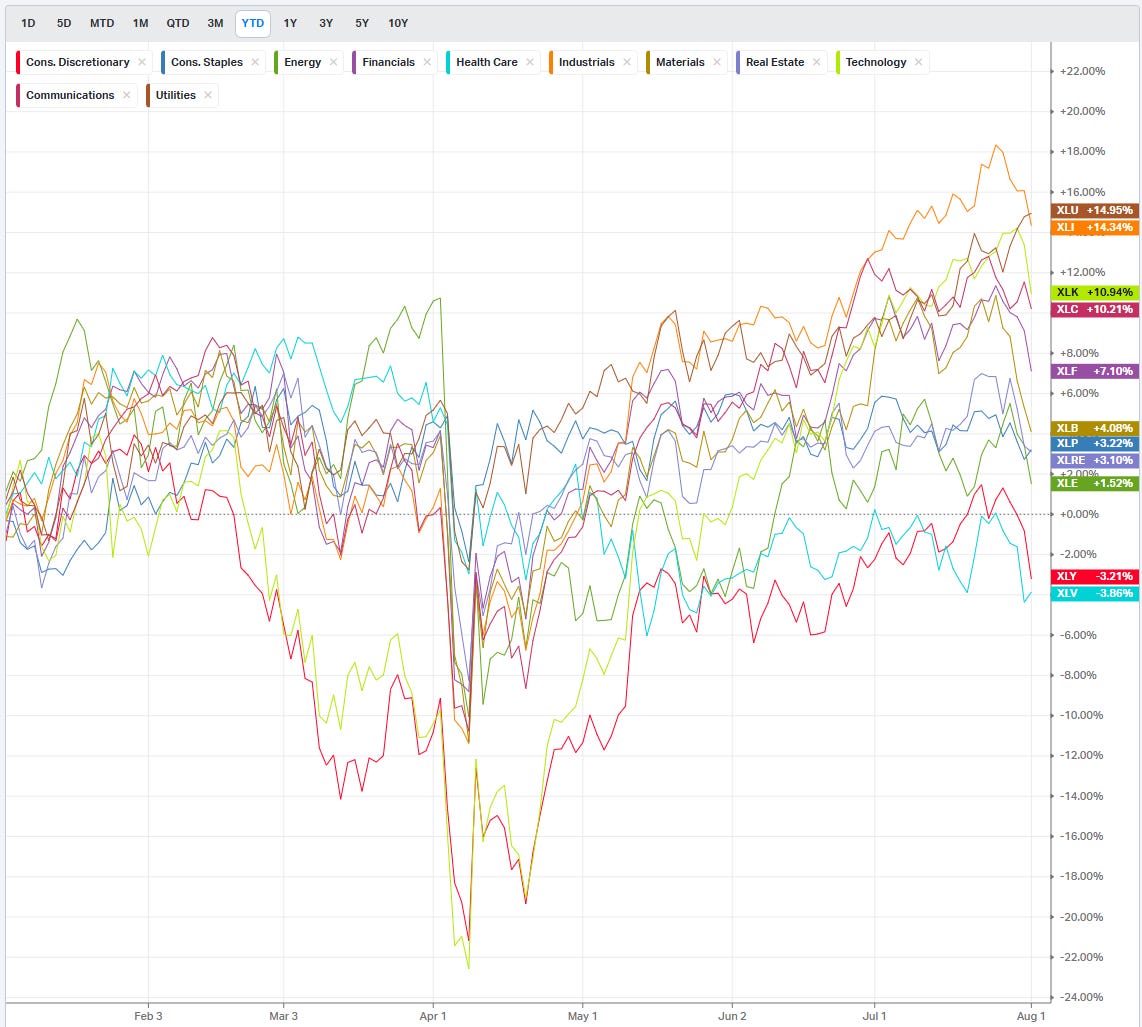
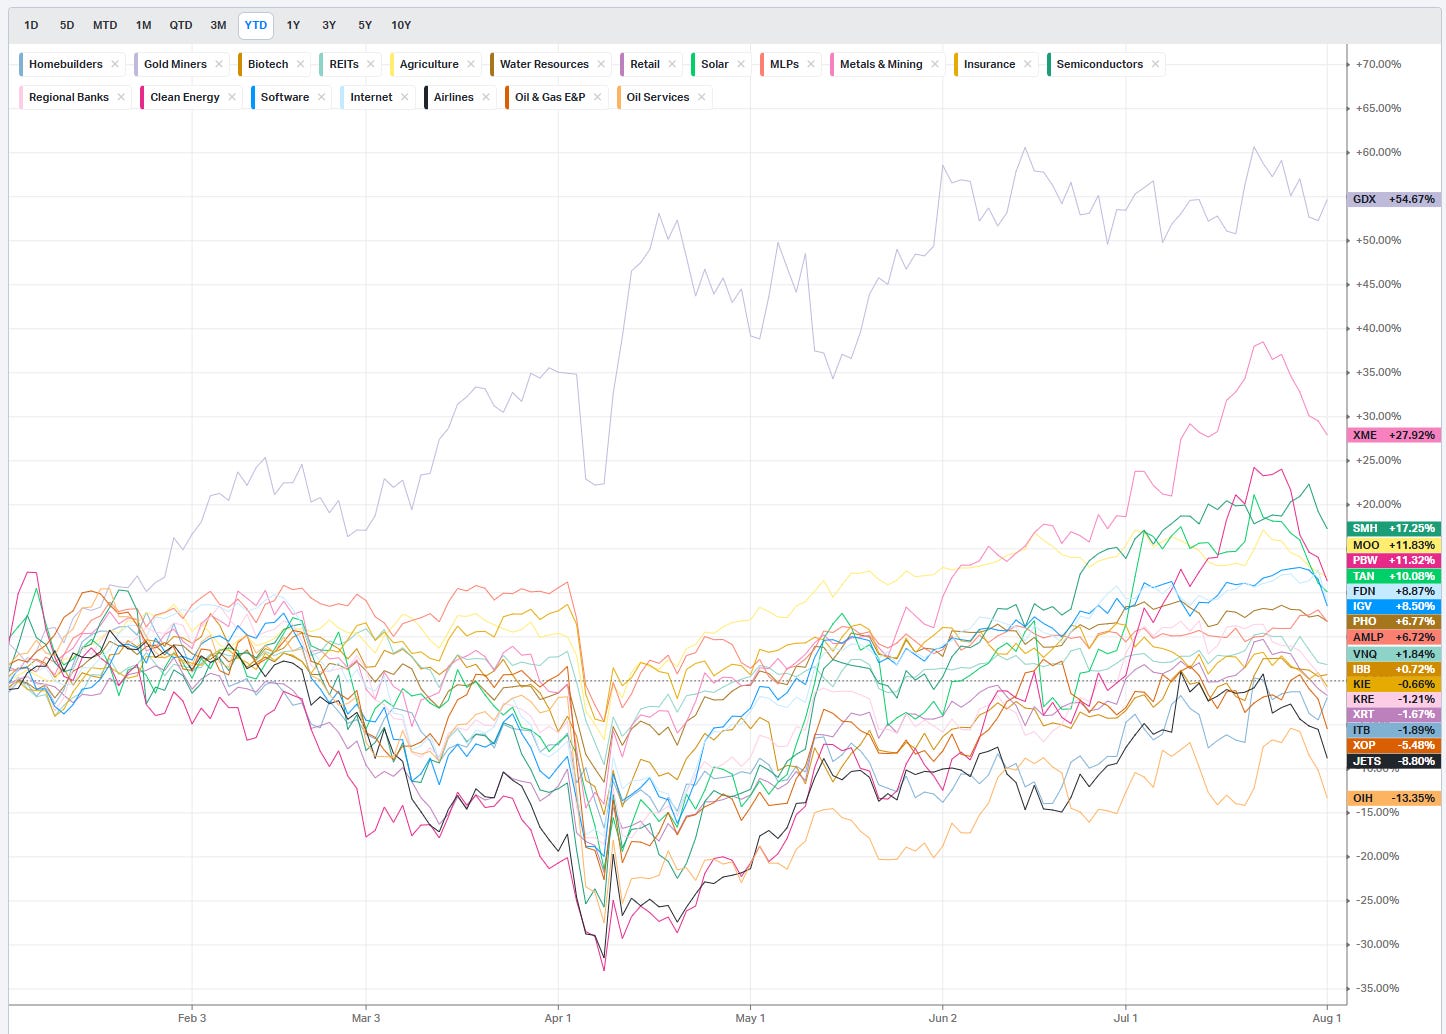
Summary Of Thematic Performance YTD
VolumeLeaders.com offers a robust set of pre-built thematic filters, allowing you to instantly explore specific market segments. These performance snapshots are provided purely for context and inspiration—think about zeroing in on the leaders and laggards within the strongest and weakest sectors, for example.
S&P By Sector
S&P By Industry
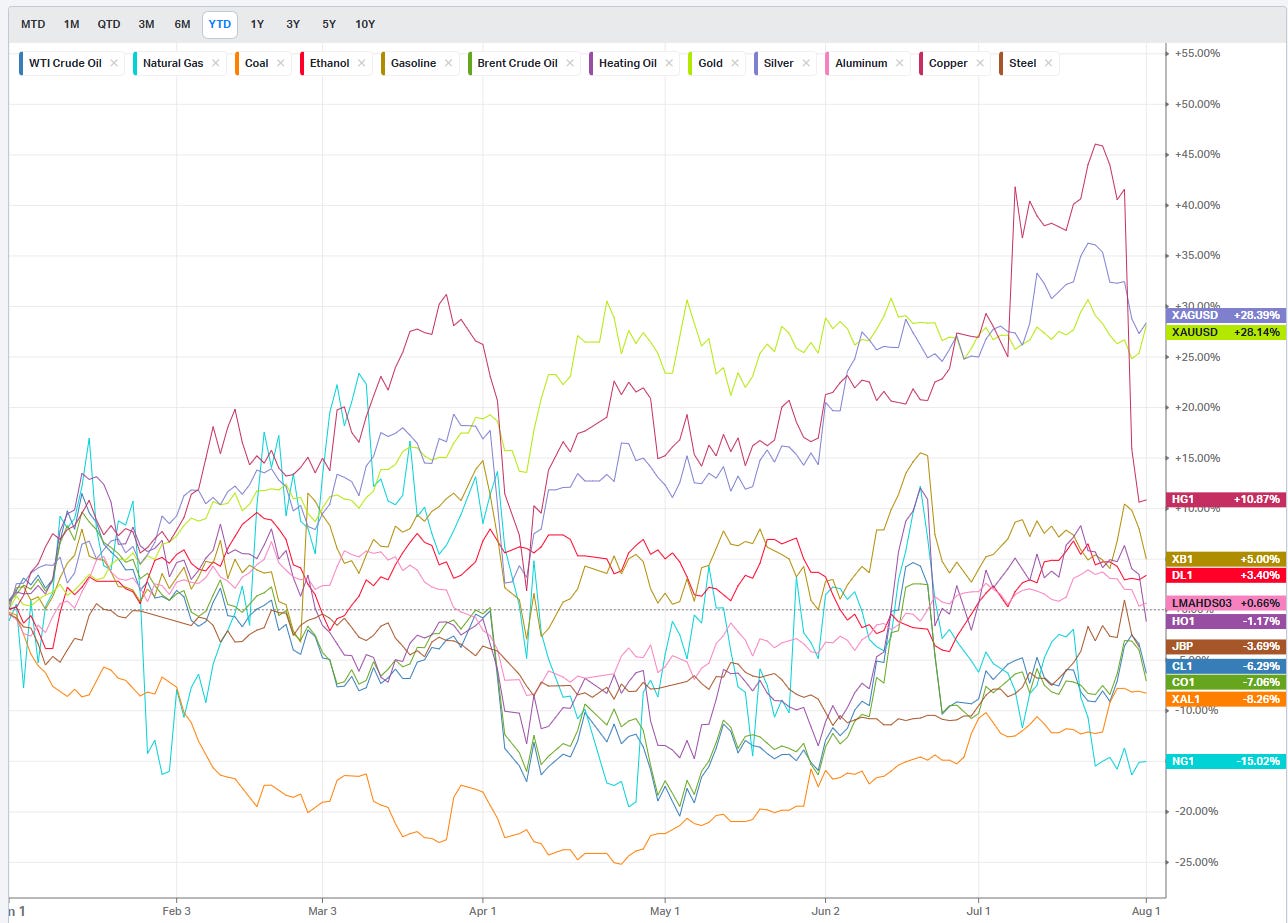
Commodities: Energy & Metals
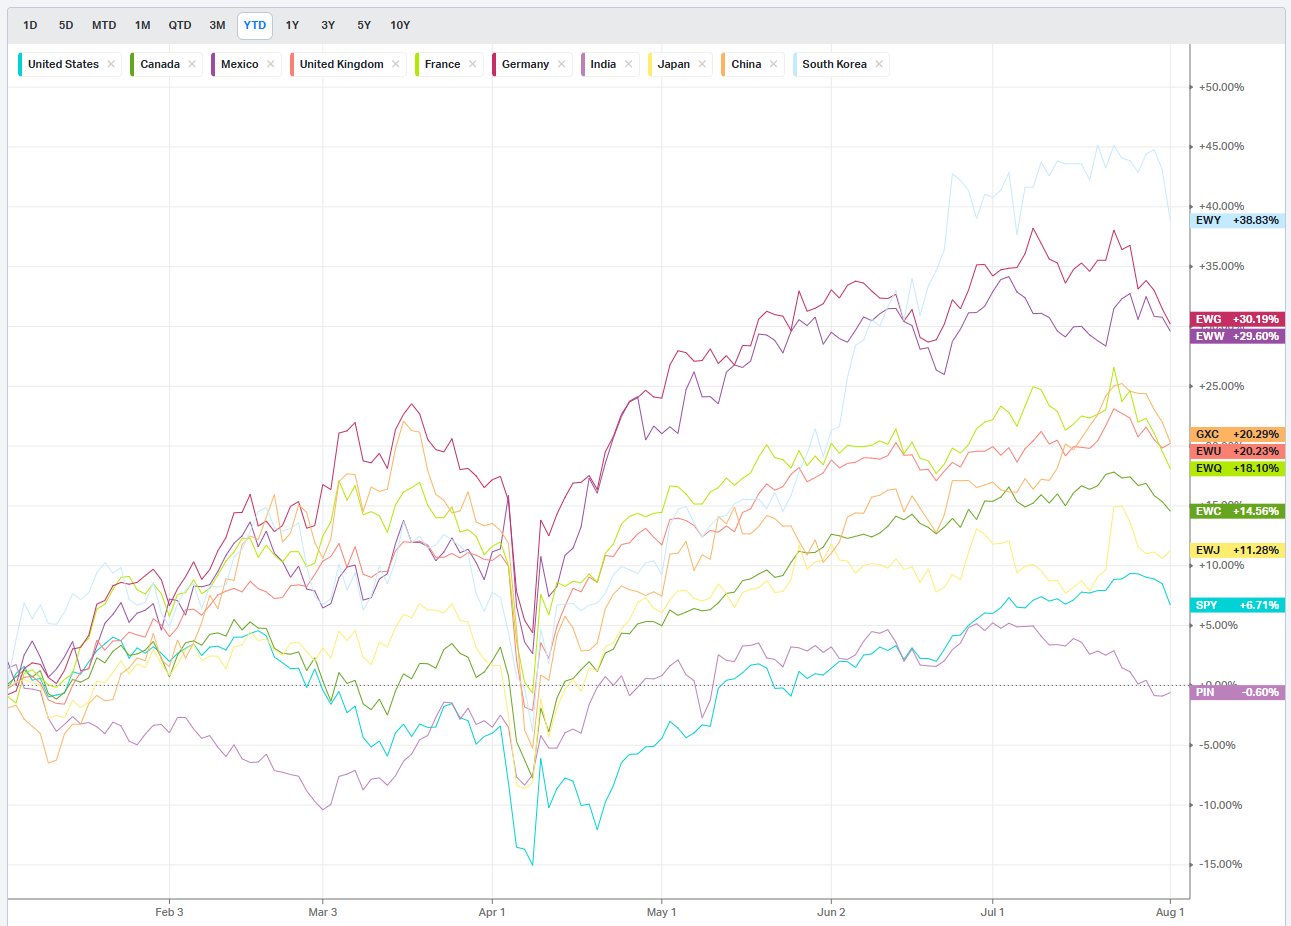
Country ETFs
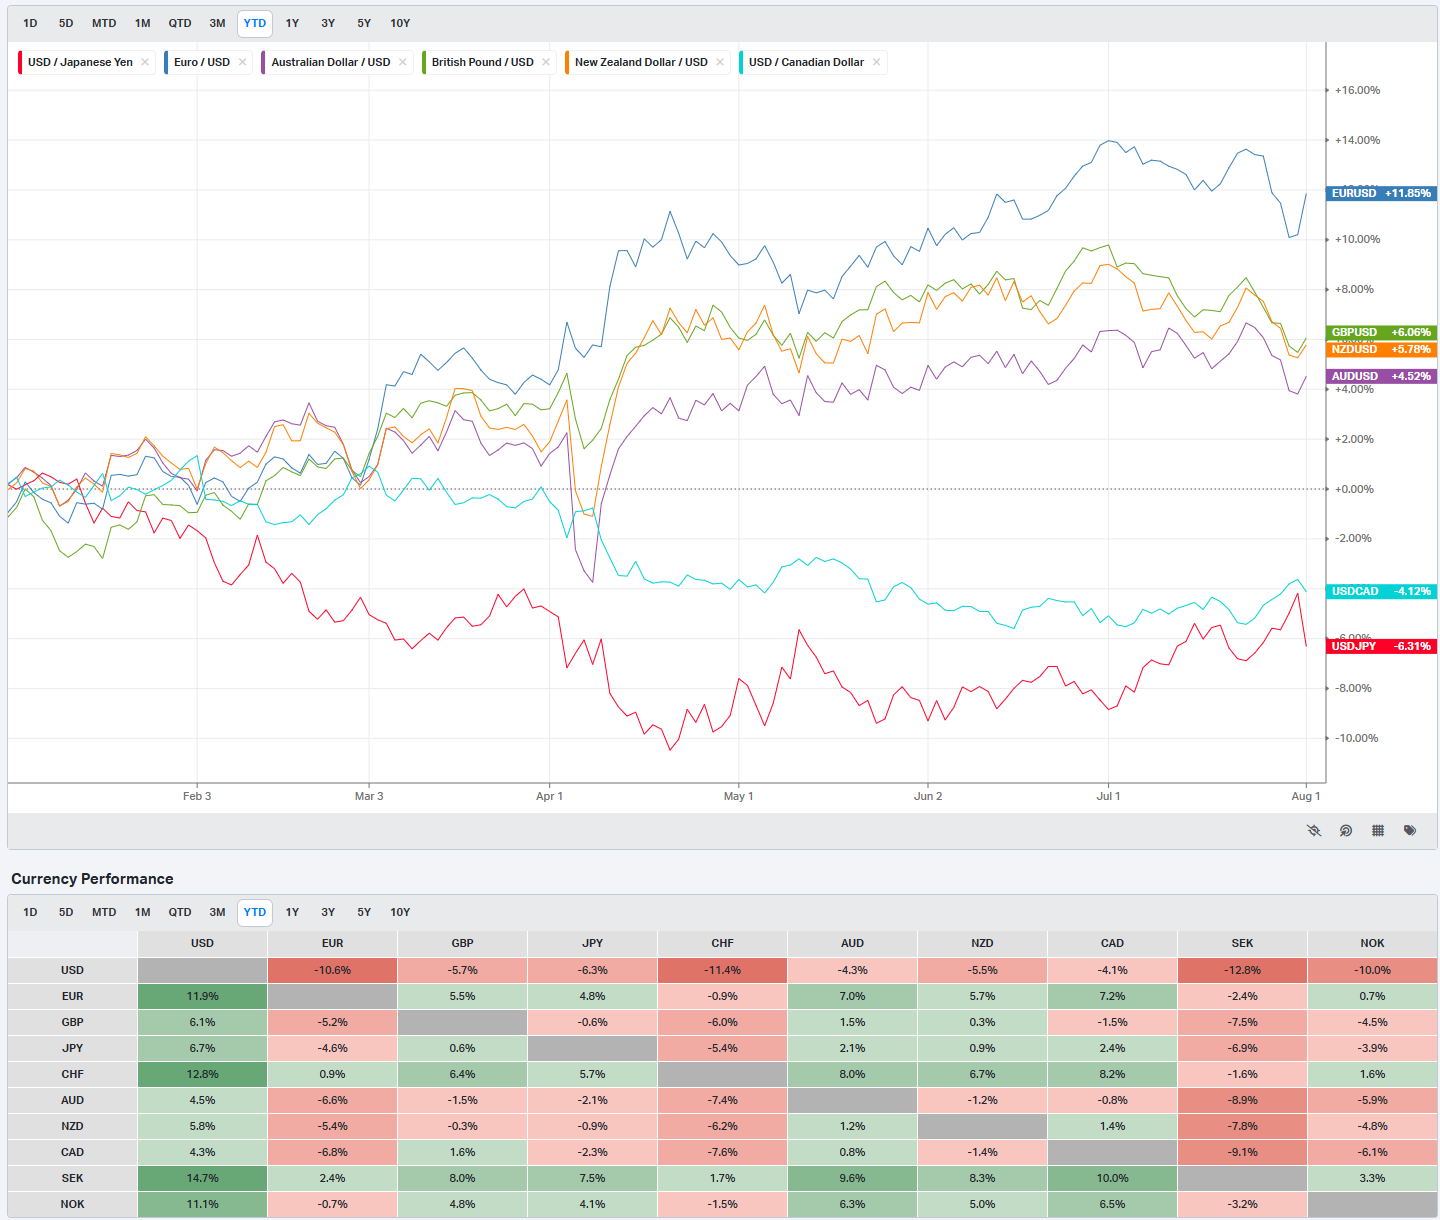
Currencies/Major FX Crosses
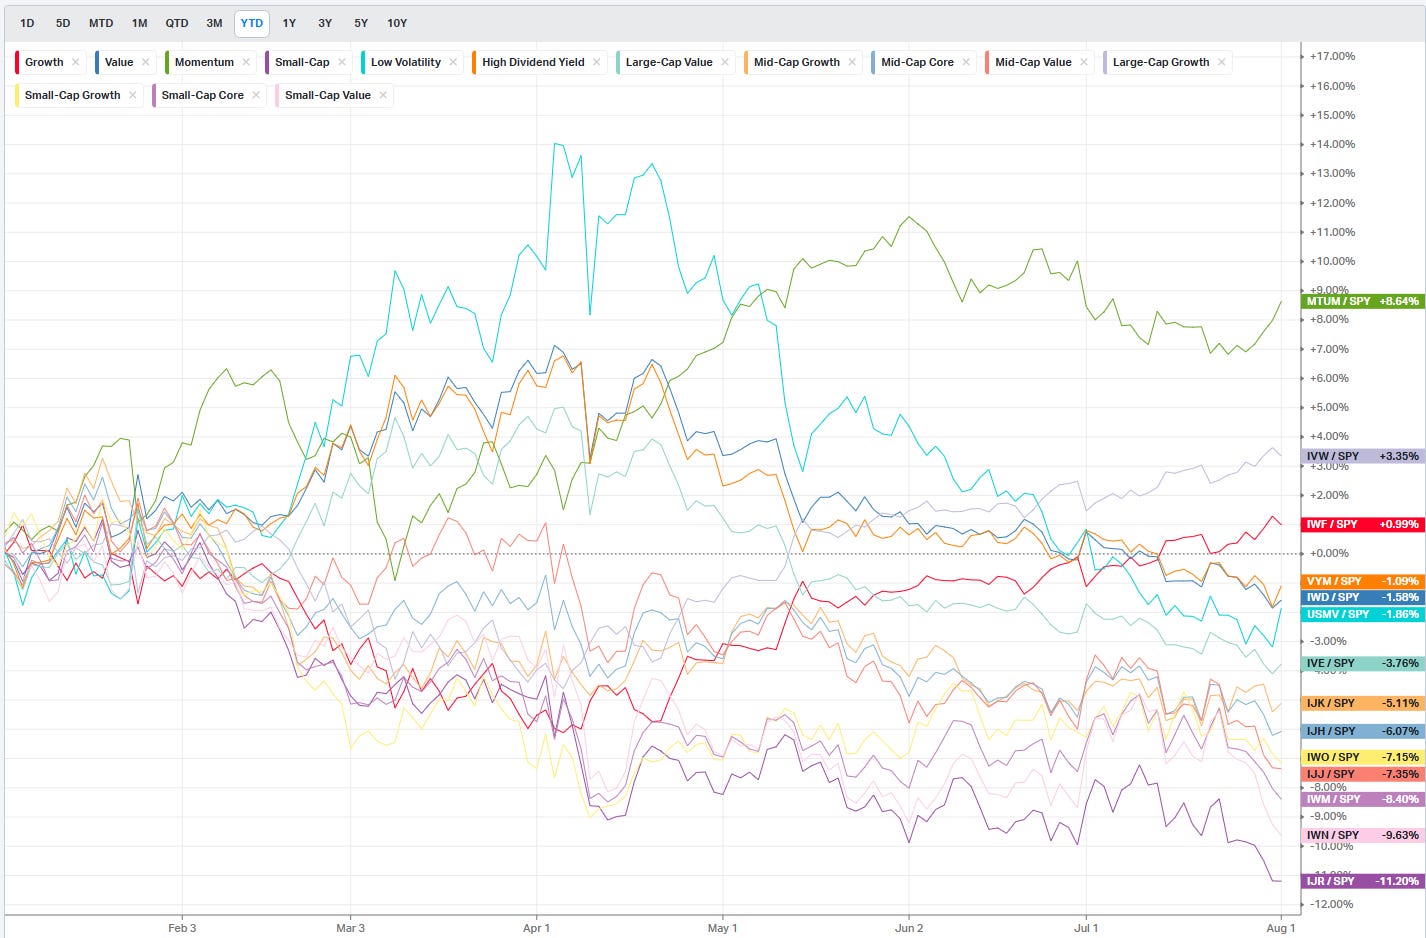
Factors: Style vs Size-vs-Value
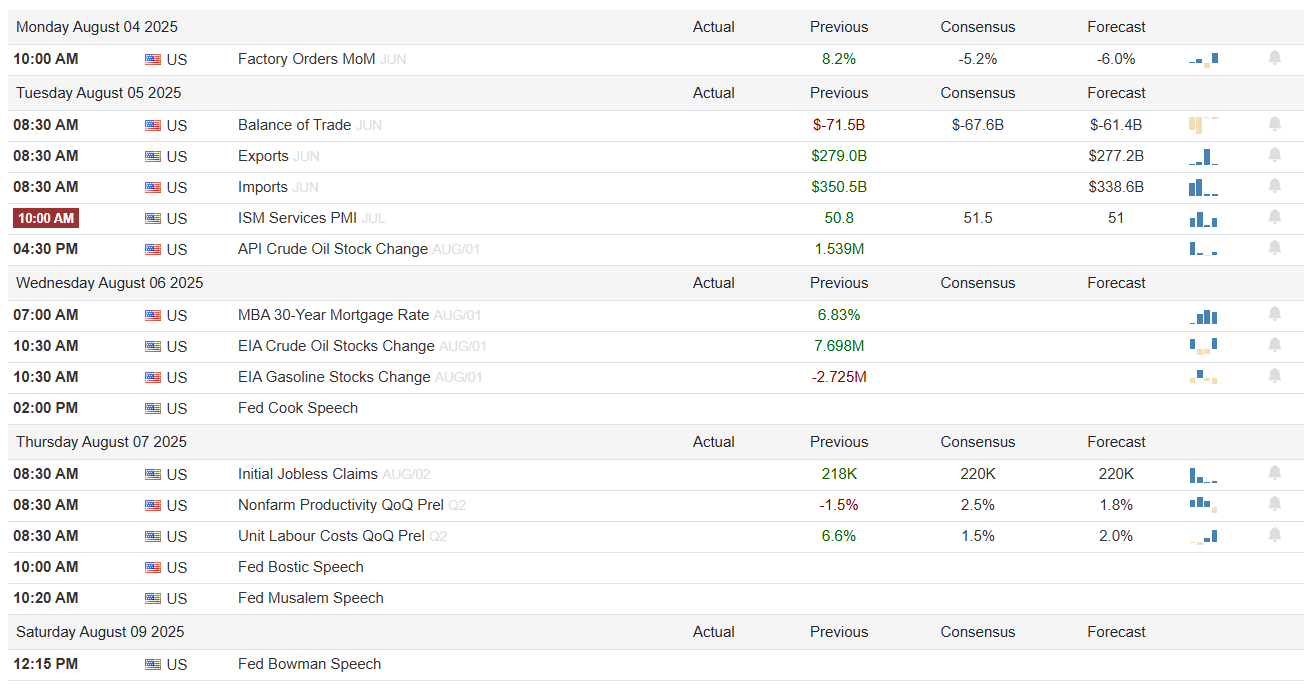
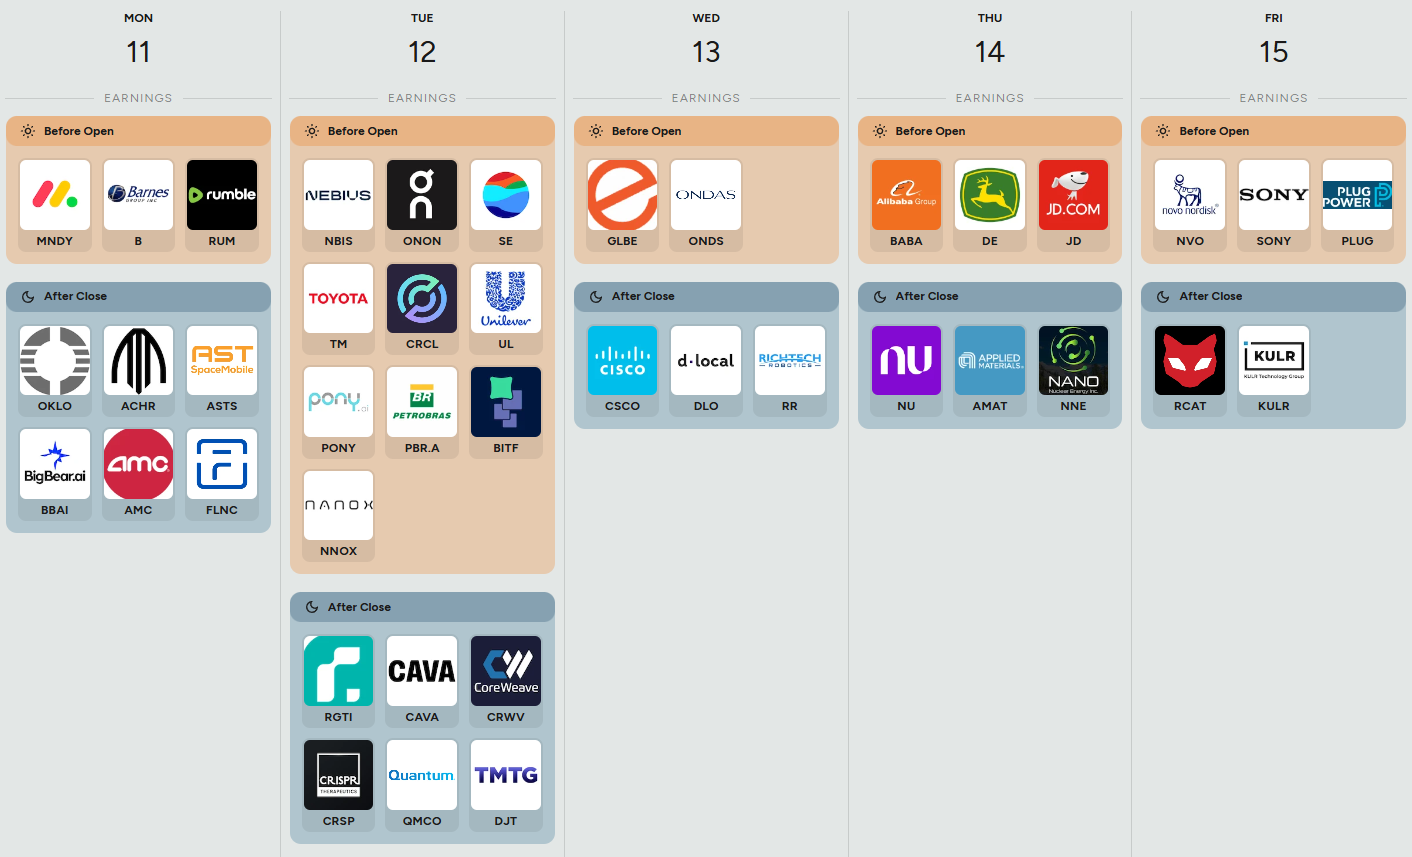
Events On Deck This Week
Here are key events happening this week that have the potential to cause outsized moves in the market or heightened short-term volatility.
Econ Events By Day of Week
Anticipated Earnings By Day of Week

Market Intelligence Report
This week’s institutional flow chart makes one thing stand out clearly: positioning accelerated into the end of the month, but there hasn’t been much follow-through to start the beginning of the month. EOM activity often reflects rebalancing, window dressing, or capital alignment ahead of fresh inflows. But what’s notable here is how quickly things tapered back as we rolled into the new month.
The lack of a big BOM surge could mean institutions are holding back to see how early August unfolds—earnings season is still in full swing, and macro catalysts (like upcoming economic data and policy headlines) are right on deck. This kind of pattern often signals a “wait-and-see” approach rather than a full-on risk-on or risk-off shift.
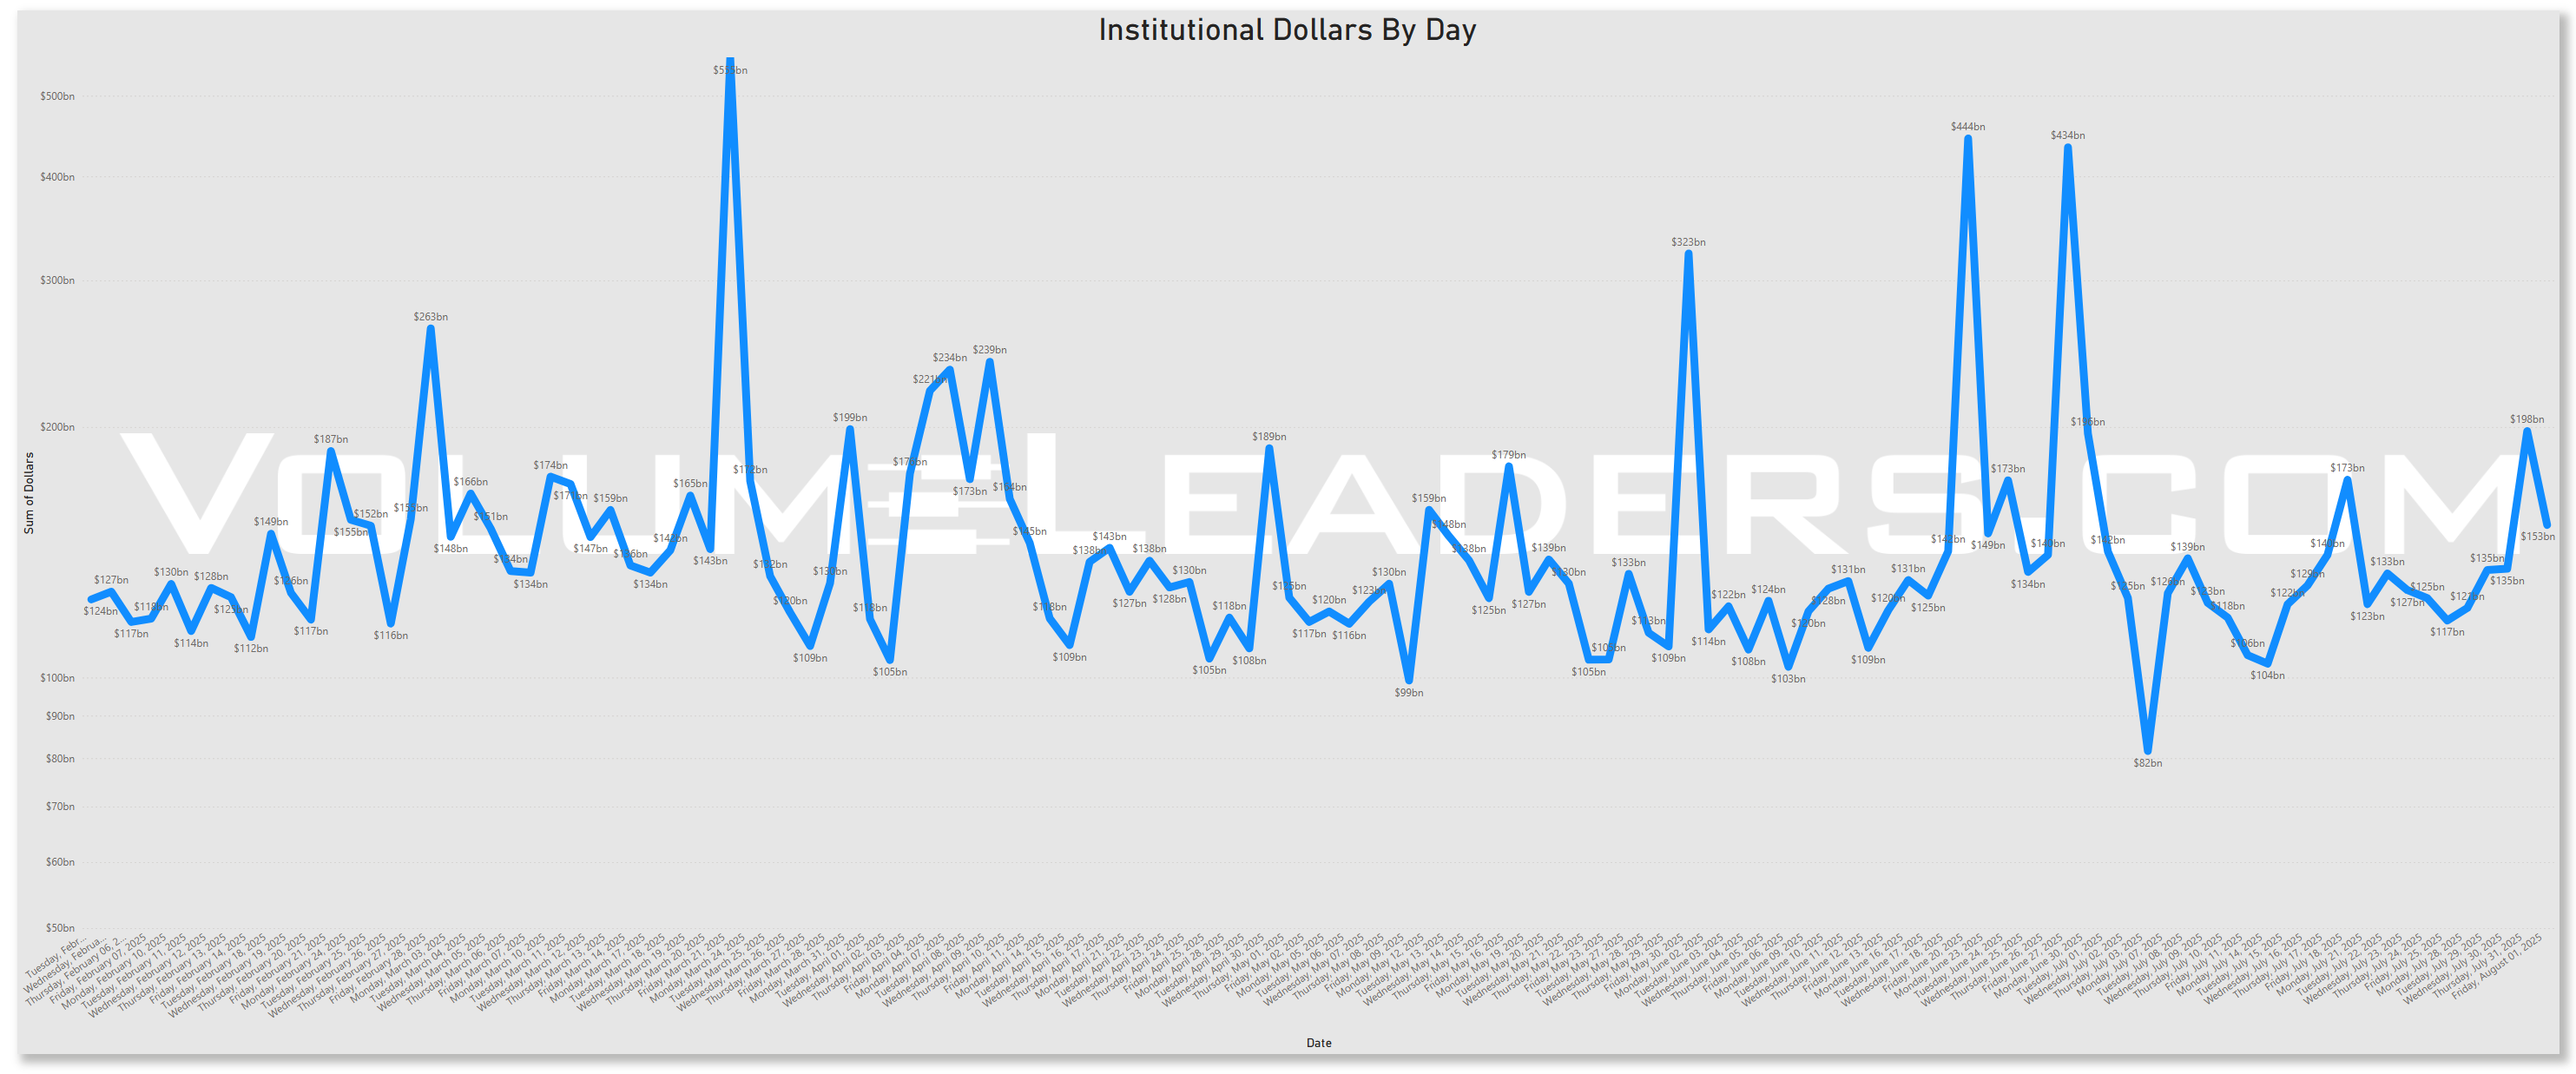
Let’s take a closer look at what the tape is telling us.
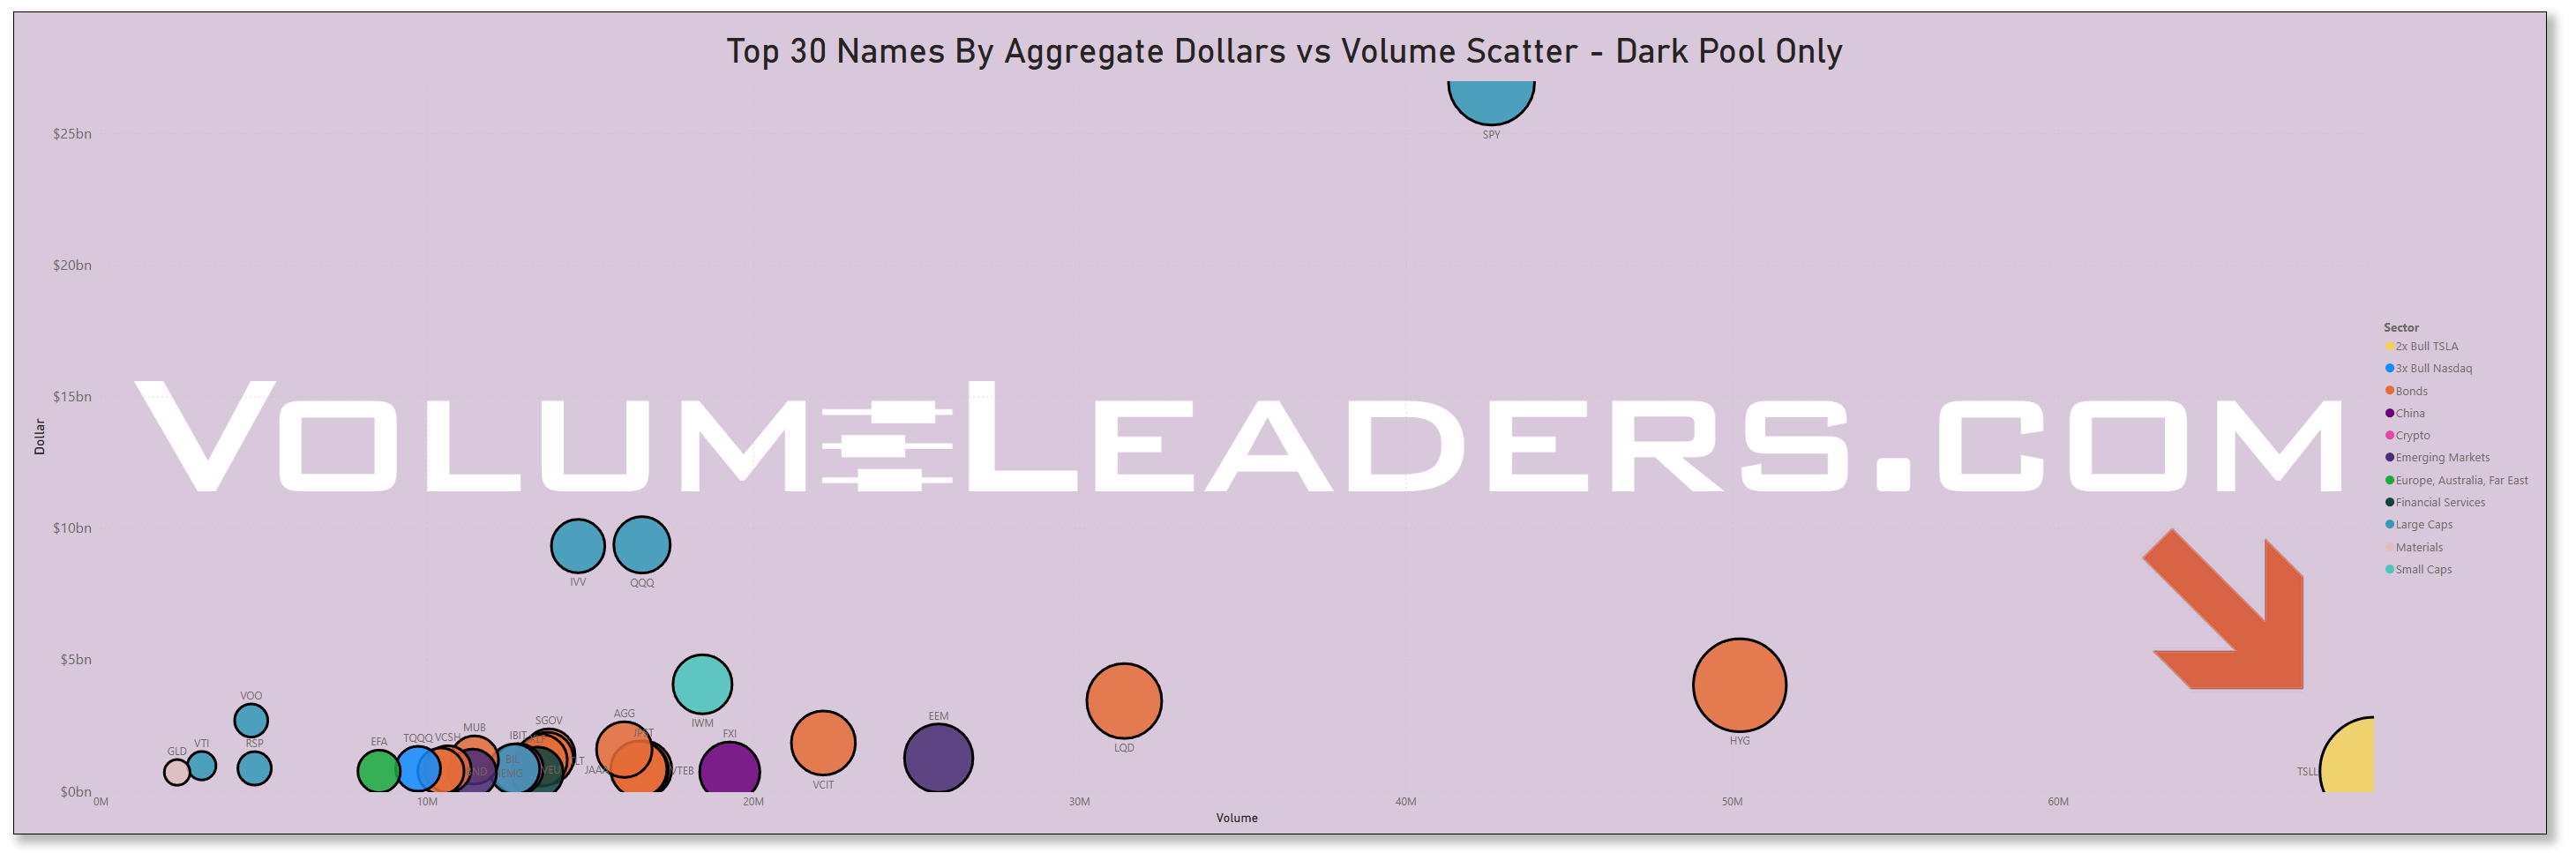
ETF Flows
Looking at this week’s ETF positioning versus last week, the landscape remains broadly consistent. Large caps (SPY, QQQ, IVV) continue to dominate aggregate dollar exposure, with QQQ showing a modest uptick in footprint compared to last week while SPY remains steady. This points to sustained institutional focus on broad-market benchmarks rather than a shift toward narrower strategies.
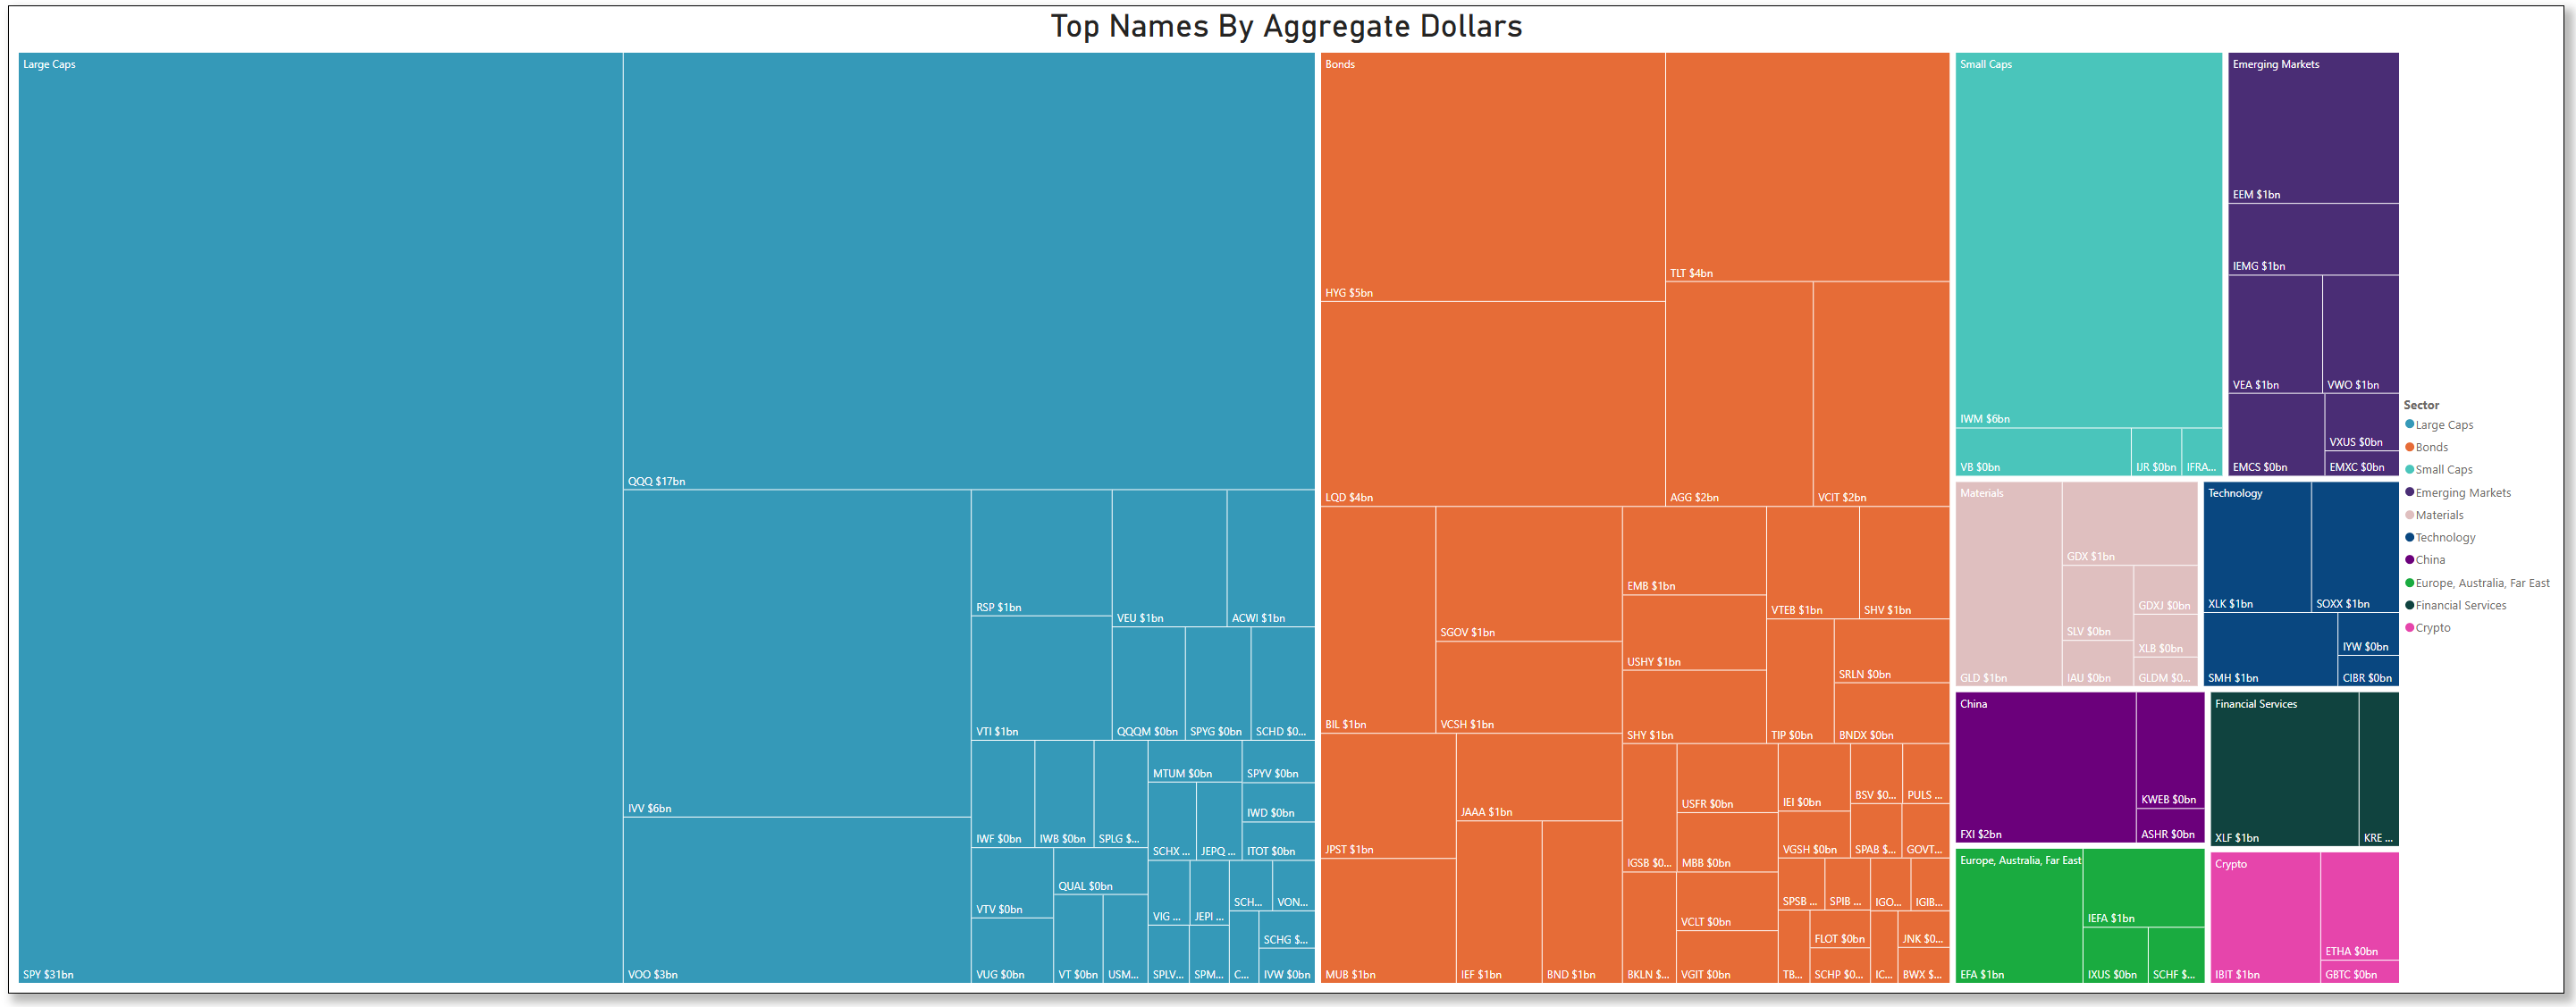
Bonds retain a similar proportional presence. LQD, HYG, and TLT still make up the bulk of fixed-income allocations, with little change in the relative weighting of duration or credit risk segments.
Small caps (IWM) hold a comparable share to last week but remain smaller in proportion to large caps. Materials, anchored by GLD, appear unchanged in footprint, as do emerging markets (EEM, VWO) and China-linked ETFs (FXI, MCHI, KWEB).
Despite the week closing with some weakness, overall, positioning looks stable. There’s no indication from the aggregate dollar sizes of major rotation in or out of any asset class — allocations remain centered on large-cap U.S. equities, with bonds and other categories holding steady week over week.
The uptick in QQQ isn’t too surprising given that several heavyweight tech names reported Q2 earnings:
Microsoft (MSFT) delivered another standout quarter. With Azure revenue up approximately 39%, total revenue of $76.4 billion beat estimates by a wide margin, leading shares to climb over 7% post-market as the company hit an all-time valuation above $4 trillion.
Meta Platforms (META) also exceeded expectations, posting $47.5 billion in revenue and EPS of $7.14 versus the $5.89 consensus. Investors responded with a 12% after‑hours spike, powered by continued strength in advertising and AI momentum.
Amazon (AMZN) and Apple (AAPL) reported shortly after close. Amazon modestly beat estimates but issued cautious guidance—shares slipped despite top‑line growth. Apple posted record revenue ($94 billion) and EPS of $1.57, modestly outperforming, and also flagged planned M&A activity to bolster its AI roadmap.
Alphabet (GOOGL/GOOG) posted solid results, led by AI‑fueled growth in cloud and search, driving its stock to gain over 3%.
In contrast, Tesla (TSLA) missed expectations and issued cautious commentary around future quarters, triggering roughly a 6% decline and prompting investor concern about EV demand softness.
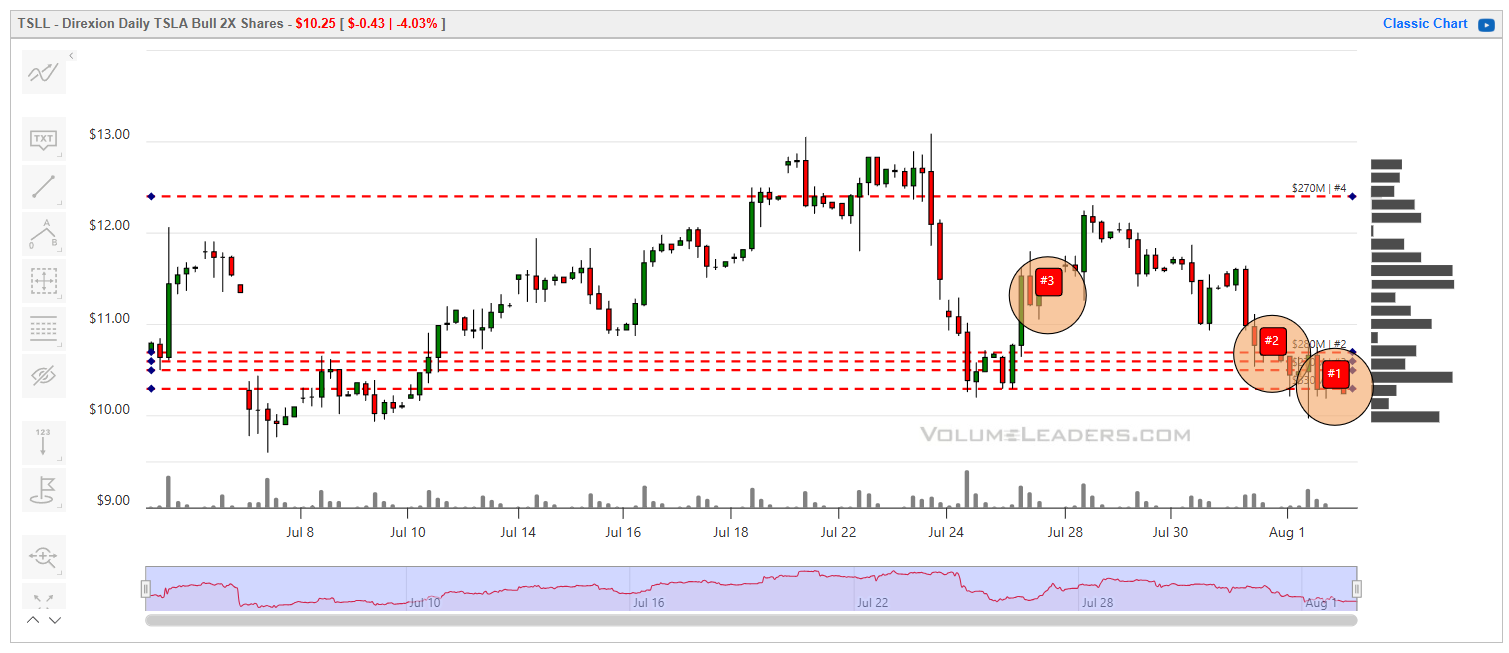
While on the topic of ETFs, the TSLL (Direxion Daily TSLA Bull 1.5x ETF) from this week was a huge standout trade by any measure:
TSLL is one of a growing number of ticker-specific leveraged products and watching these names can clue retail into moves that aren’t always immediately apparent in the underlying:
TSLL is a leveraged product designed to magnify Tesla’s daily moves by 1.5x, so it tends to attract traders who are looking to capitalize on short-term volatility rather than hold long-term.
It’s popular among retail investors who have a strong conviction in Tesla (bullish bias) but want amplified exposure without directly using margin or options.
TSLL gives traders leverage without the complexity or risk structure of options (like theta decay or rolling), though it does carry its own compounding and decay risks over time.
Because it’s a daily-reset product, holding periods are usually short—often intraday or a few sessions at most.
If you like trading TSLA, this one is worth watching as price pulls into some huge levels on the 30-day chart. Also, if you like trading ETFs where TSLA’s has a heavy weighting, you may be interested in setting up some price alerts on this name too.
JPST was another great trade this week that tipped larger hands:
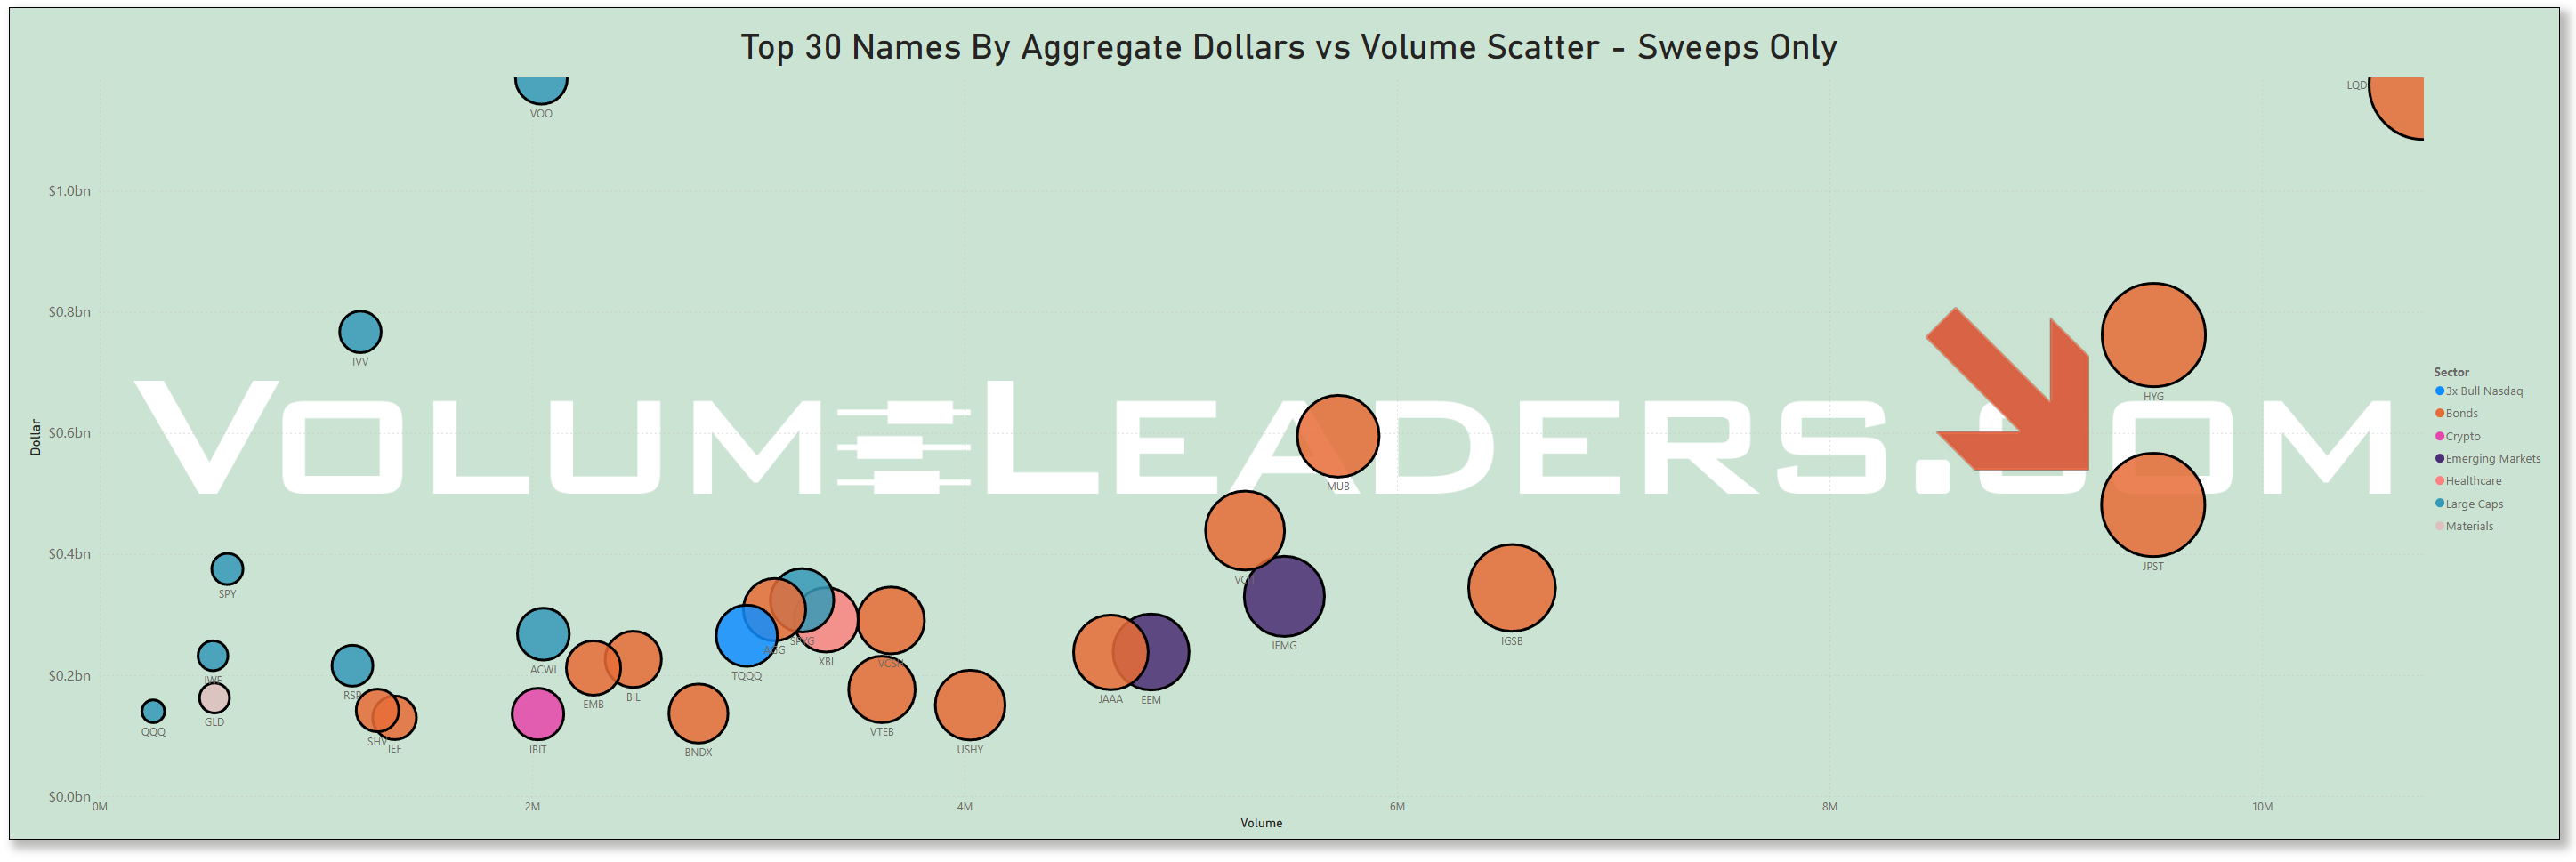
This #10-ranked trade came right after the opening bell on Thurs as a sweep, suggesting urgency. JPST is a great name to watch because:
It’s a capital allocation signal – JPST is essentially a cash-parking vehicle for institutions, with minimal duration risk. When a big trade hits, it can suggest significant capital is either entering or exiting a low-volatility holding. You should see that as a sign that “big money” is shifting liquidity in or out of risk assets.
It can precede rotation – Large inflows to JPST sometimes happen when risk appetite is cooling (capital moving into ultra-short paper for safety). Conversely, large outflows can indicate money leaving cash equivalents and potentially heading toward equities or risk assets.
It’s a low-news ETF with unusual activity – JPST doesn’t usually attract big, sudden trades unless there’s a strategic reason. When volume spikes, it’s often not random, making it a potential tell on institutional sentiment.
Retail traders look for edges in non-obvious places – Unlike high-beta growth names where everyone is watching the same earnings report, unusual size in JPST is quieter and can fly under the radar. Observant traders see it as a potential early read on positioning before moves show up in equity indices or high-beta sectors.
This week’s sector flow data on the equities side paints a measured but revealing picture of institutional positioning. Technology continues to dominate dollar allocations, closing the week just shy of $40 B in notional flow on Thursday before moderating Friday. Communication Services and Consumer Discretionary remain firmly in second and third place, posting consistent $16–18 B and $10–12 B daily ranges, respectively.
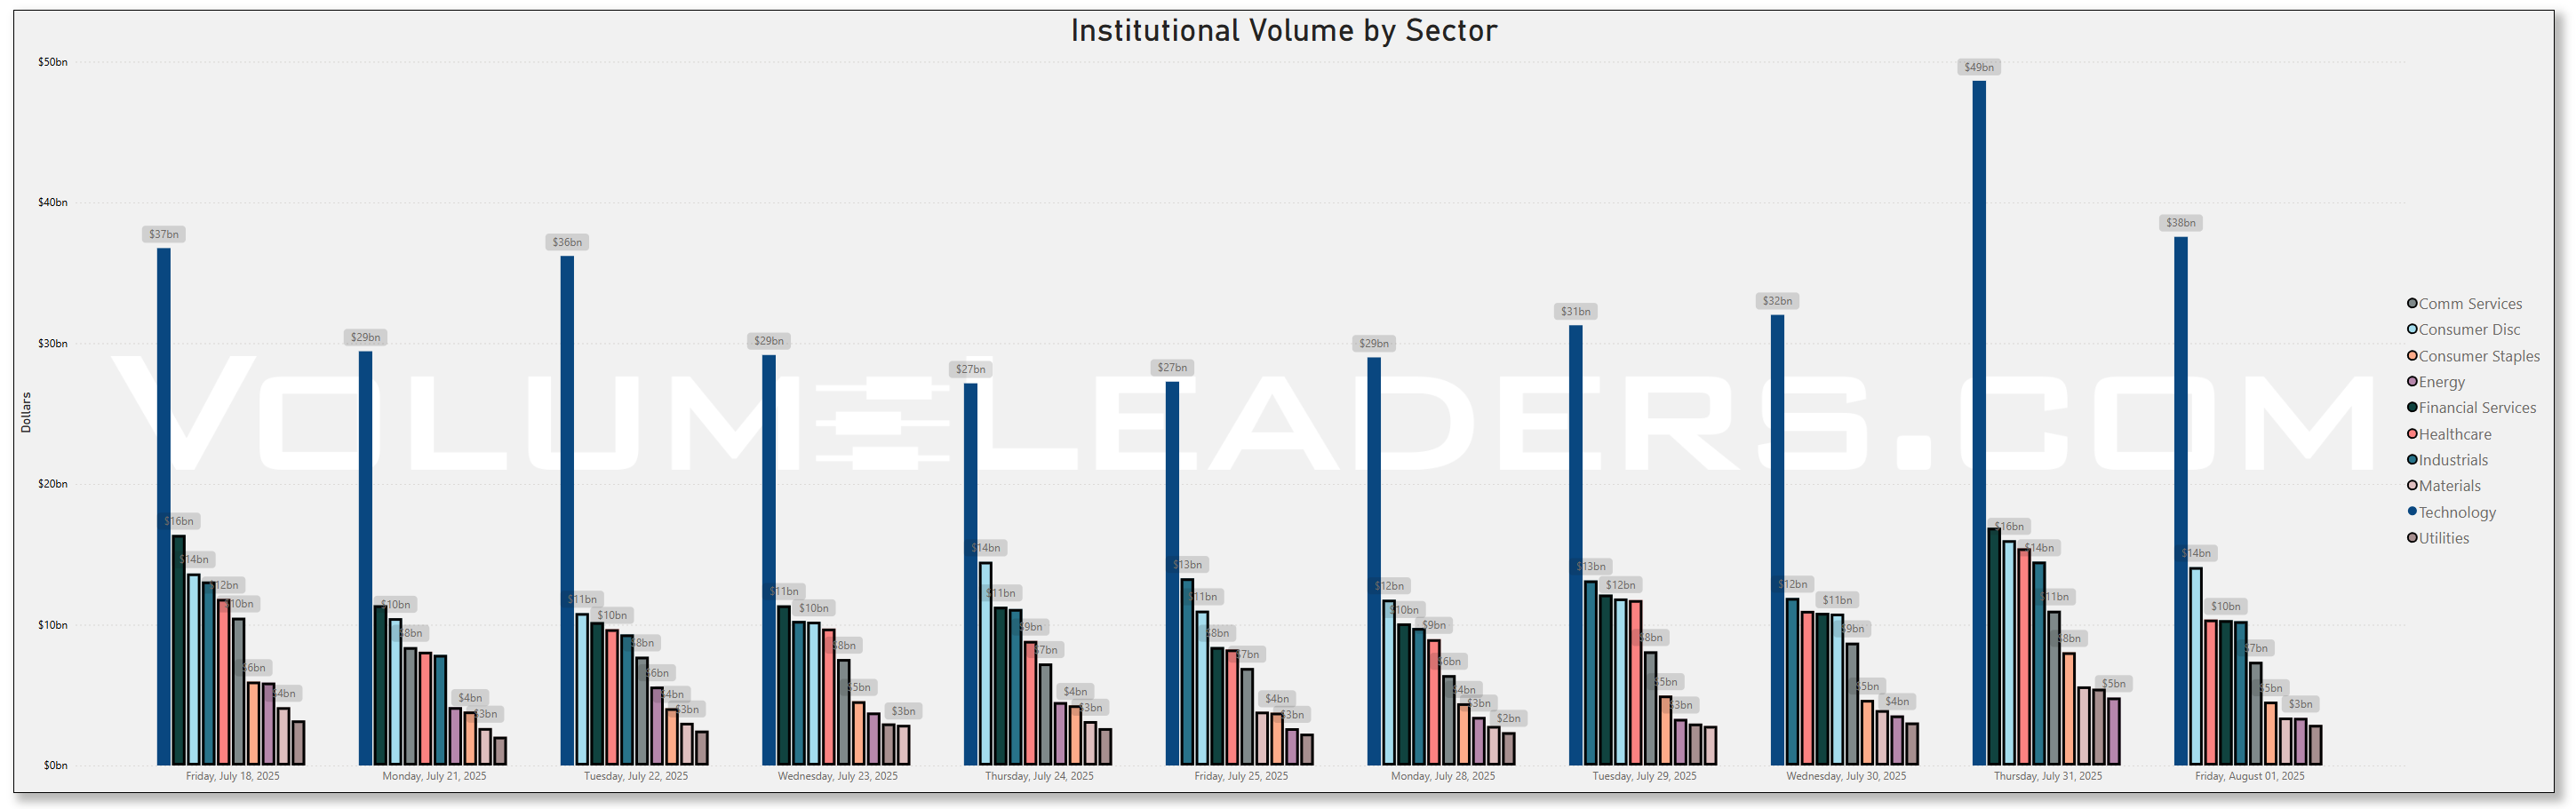
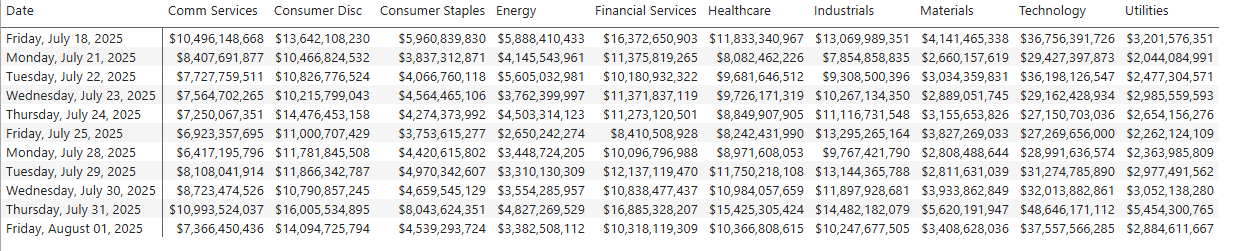
Interestingly, Financials showed a subtle pickup midweek, climbing from ~$11 B Monday to ~$13 B by Thursday before easing slightly—potentially tied to ongoing earnings releases in the banking and asset management space. Industrials and Energy held relatively steady in the $7–10 B and $4–5 B daily ranges, while Utilities and Materials continued to track at the lower end, reflecting subdued institutional appetite in more defensive or cyclically smaller segments.
Overall, the week-over-week profile shows no dramatic allocation shifts but rather steady engagement, with Thursday standing out as the highest activity day across sectors—likely a confluence of month-end positioning, ongoing earnings reactions, and tactical adjustments ahead of early August catalysts.
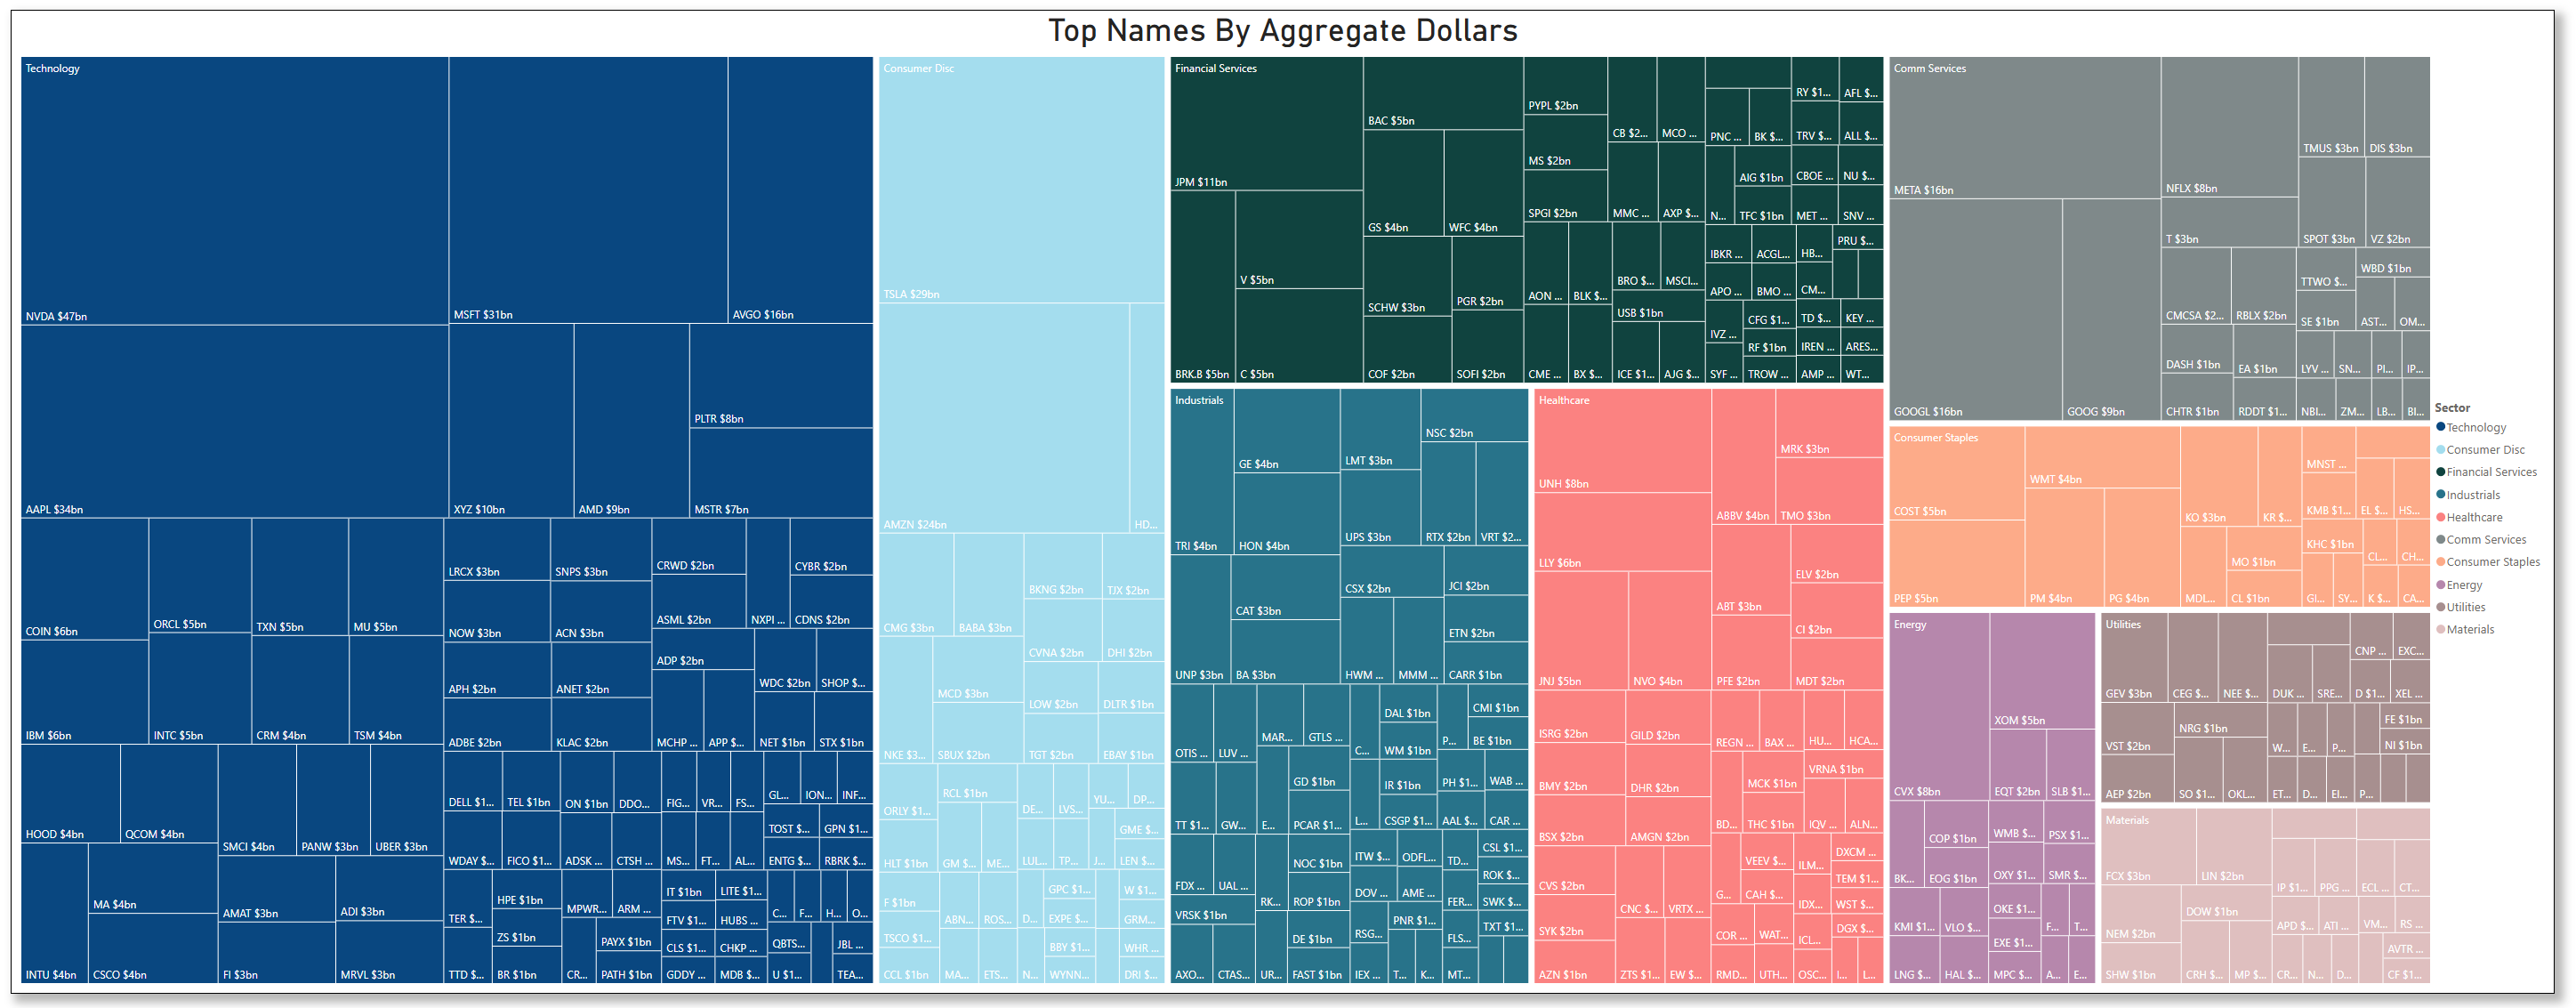
This week’s top institutional equity positioning tells a story that’s less about a wholesale shift and more about reinforcement of existing priorities—though with some interesting nuances compared to last week.
Technology remains the gravitational center of institutional dollars, and the scale of flows through the sector dwarfs other categories. NVDA, MSFT, AAPL, and AVGO again anchor the volume leadership, with NVDA and MSFT showing particularly large notional activity. What’s notable is that the size of individual allocations to names like AAPL, ORCL, and even semis such as TXN and MU points to sustained positioning across multiple layers of the tech stack—hardware, infrastructure, and software alike.
Consumer Discretionary also continues to see meaningful positioning, with TSLA and AMZN holding their place as key recipients. The size of TSLA’s footprint suggests its positioning continues to be institutionally significant even amid a volatile tape.
Financials saw another week of broad participation—JPM, V, BAC, and GS all register prominently. This isn’t the kind of concentrated “big bet” positioning seen in tech, but more a wide net across the sector, perhaps tied to earnings season clarity and a relatively stable rates environment.
Industrials, Healthcare, and Communication Services retain their proportional slices, but the list of top names within them shifts slightly. META and GOOGL continue to draw attention in Comm Services, while UNH, LLY, and MRK remain steady pillars in Healthcare.
Relative to last week, the key difference isn’t so much what’s being positioned into but the magnitude of commitment. Tech’s dollar footprint has expanded further, while sectors like Energy and Consumer Staples have comparatively stable, smaller allocations.
In short, institutions appear to be re-upping their weight on the same horses—Tech remains the lead sector by a wide margin, Discretionary stays important, Financials maintain breadth, and the rest of the field continues in more measured positioning.
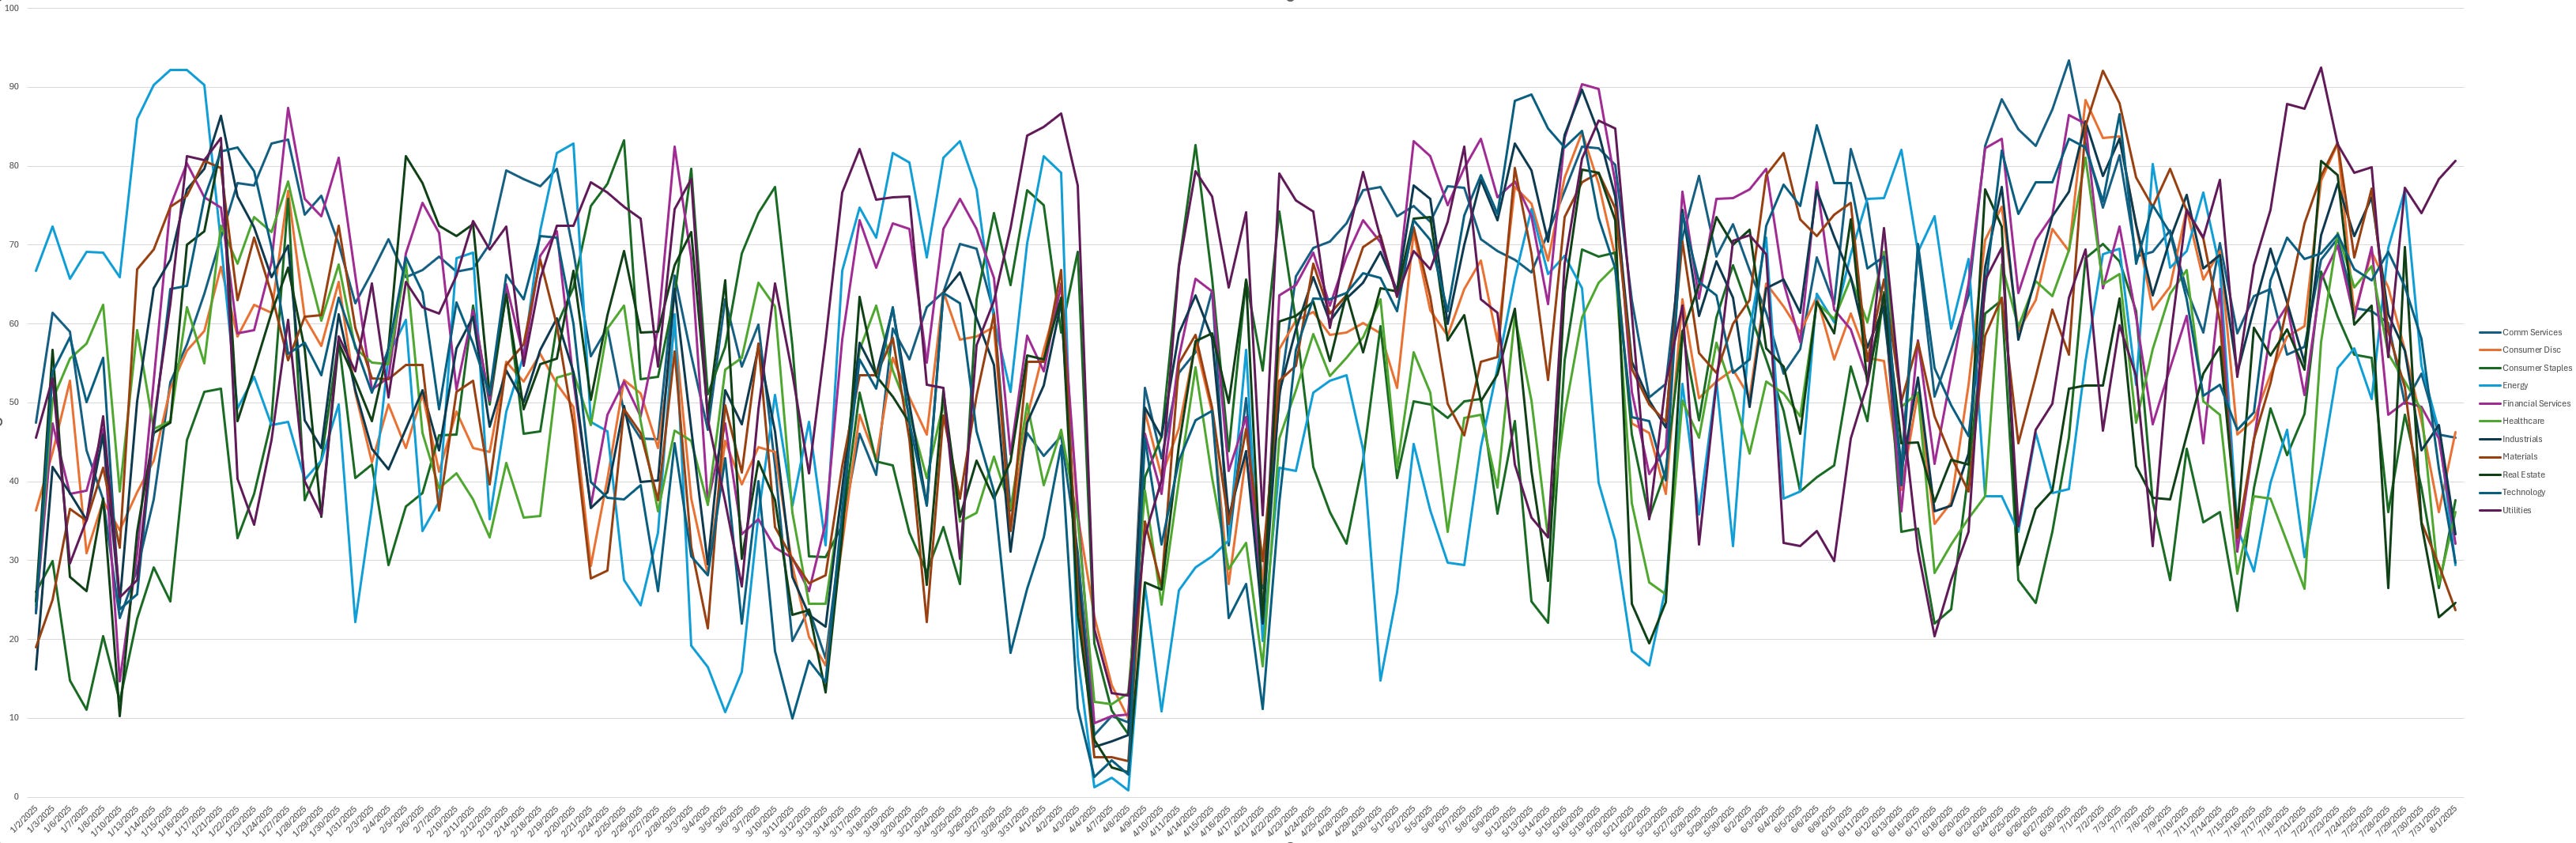
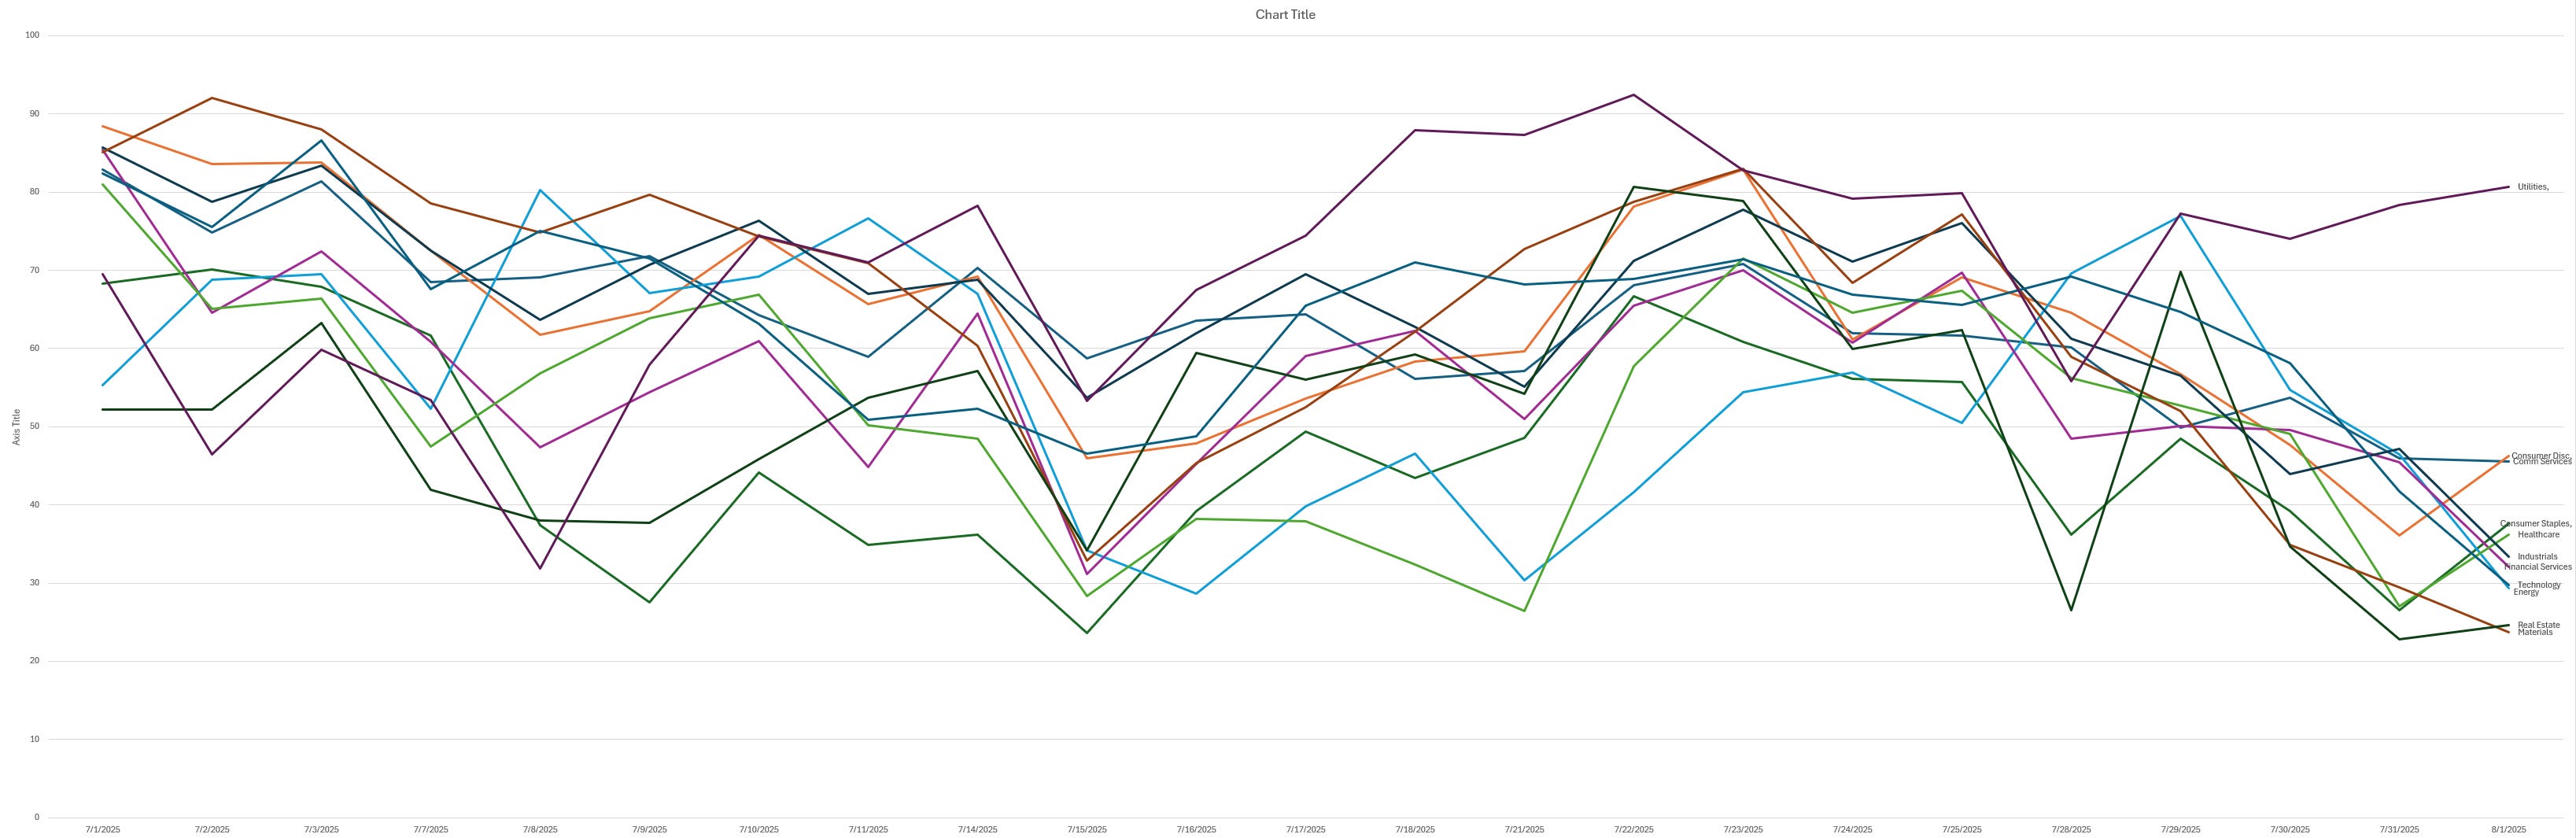
The QTD trendlines for make it clearer that conviction has been sliding across most sectors into the end of July. Technology, while still one of the stronger relative performers, is also rolling over from its mid-month highs — matching what we’ve seen in positioning (big inflows earlier in the month but not a sustained build into BOM).
Consumer Discretionary, Industrials, and Financials are showing more pronounced weakness in conviction. These sectors have steadily trended lower since early July, with only brief pauses. That’s consistent with what we’re seeing in institutional dollars — participation hasn’t vanished, but conviction has been eroding as prices trade under institutional levels.
Utilities stand out on the other end. While still less active in terms of raw dollar flow, they’ve actually been holding or even rising slightly in conviction through the back half of the month. That fits with the classic late-month, low-volatility tilt we sometimes see when there’s sector rotation into defensive pockets.
In short: The QTD ICS trends show broad softening of conviction into the month-end. Tech is still relatively better than most, but losing altitude. Defensives like Utilities are comparatively firm. That matches well with the EOM/BOM positioning pattern we’ve been flagging.
Individual Names with Institutional Interest
VolumeLeaders tracks several proprietary signals designed to spotlight names drawing significant institutional interest. Below, we’ve surfaced the latest results and analyzed them in aggregate to highlight emergent themes. If any of the sectors, narratives, or positioning trends resonate, the names mentioned here offer a strong starting point for deeper research and watchlist consideration in the days ahead.
VL Trade Rank Velocity™ (TRV)
TRV is a proprietary metrics that measures the recent acceleration or deceleration in institutional trading activity for a given stock by comparing its average trade rank over the past few days to its average in recent weeks. A sharp improvement in TRV typically reflects a notable shift in positioning, often accompanied by sustained trade activity, suggesting institutions are actively engaging with the name and that intensity of activity is rising. This often precludes meaningful price or narrative shifts. Traders should use VL’s charting tools to investigate the nature of the trades—price, size, and context—before making any decisions.
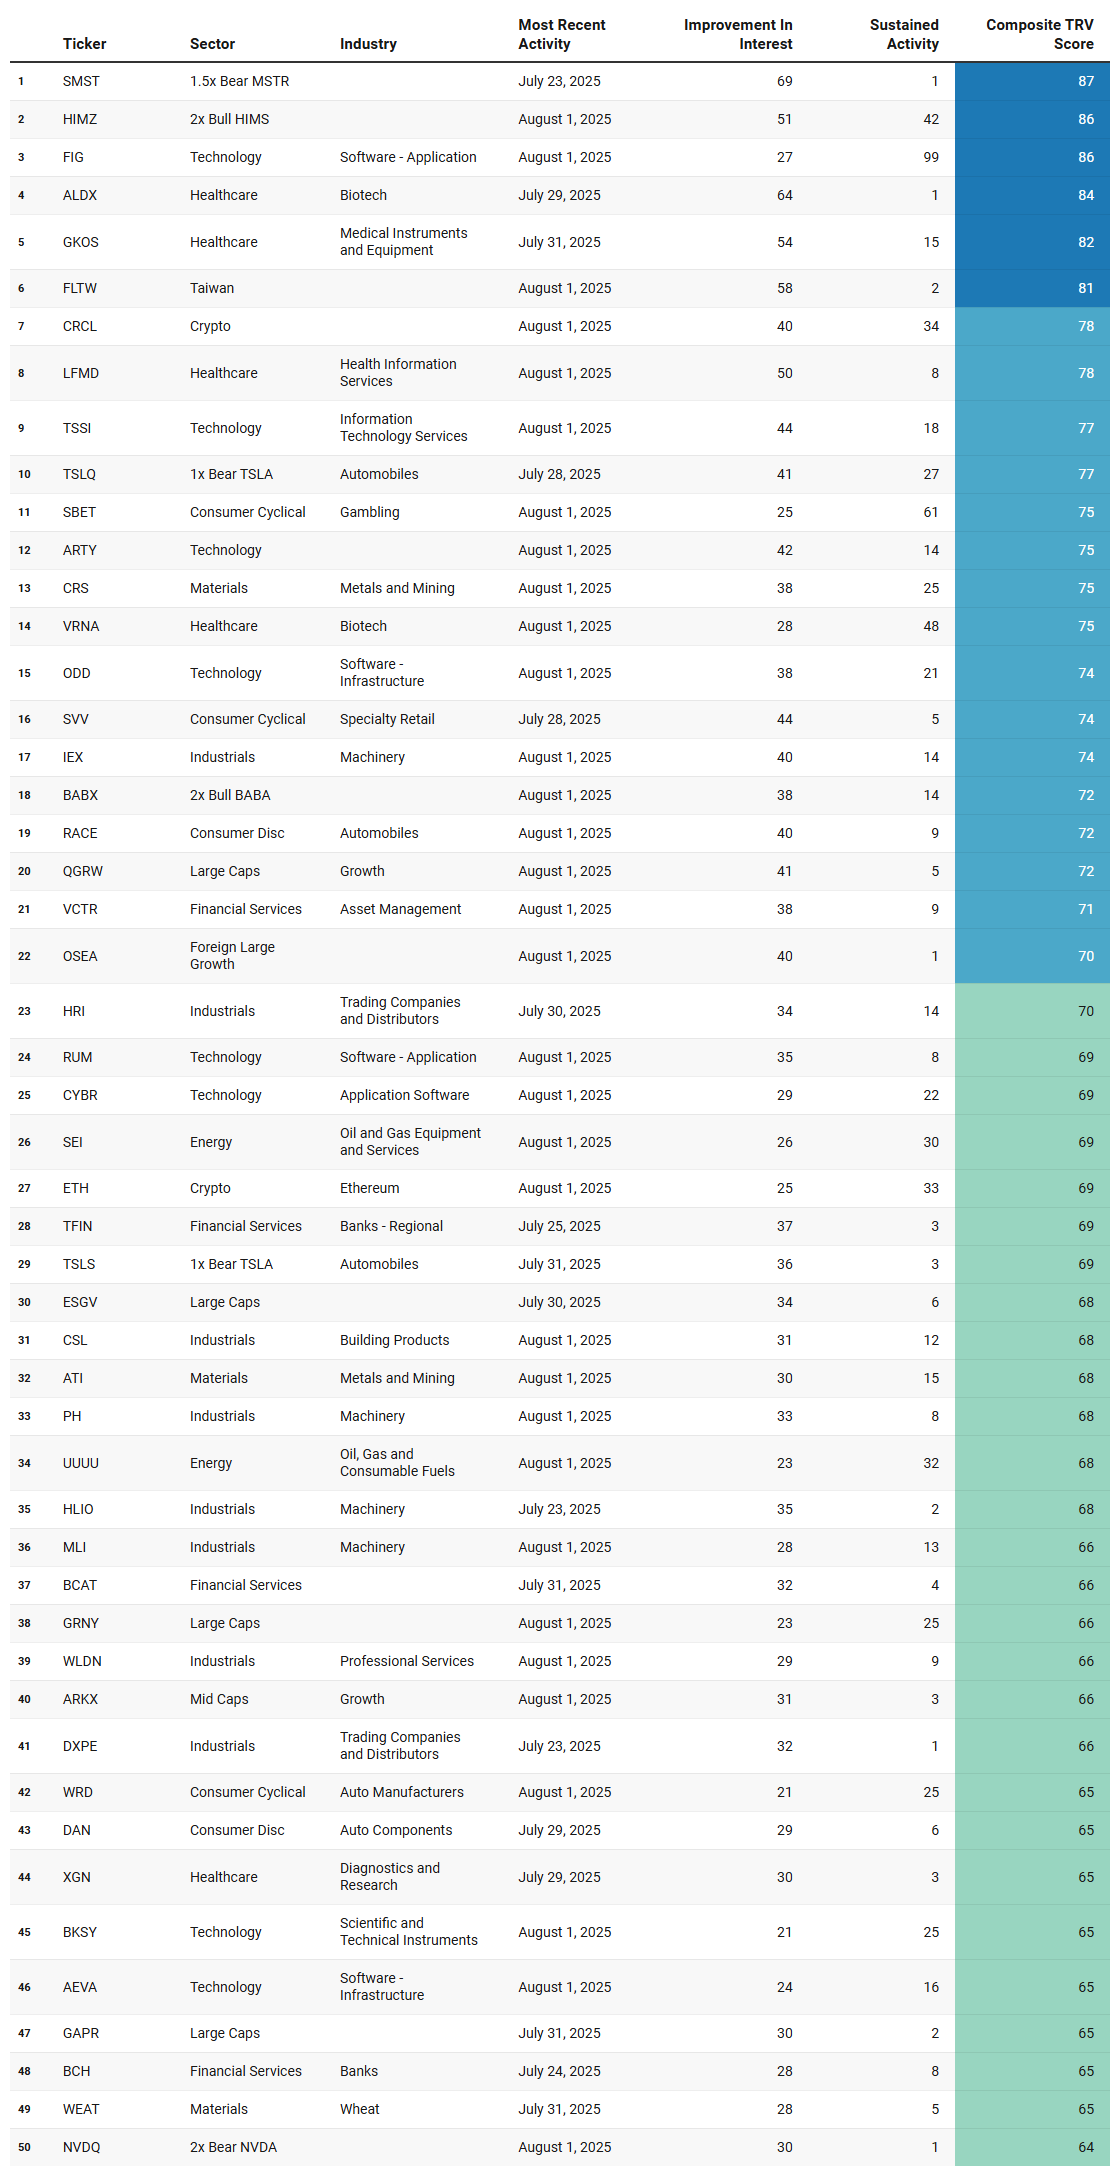
Emergent Themes from the TRV Watchlist
This week’s TRV Top 50 tells a very different story than the broad market narrative. The list isn’t dominated by slow‑moving index names or evenly distributed sector weightings. Instead, it’s stacked with leveraged plays, targeted sector bets, and a handful of thematic curiosities that hint at where institutions are leaning right now.
One of the most striking patterns is the surge in leveraged single‑stock ETFs. Products tied to names like MSTR, HIMS, TSLA, BABA, and NVDA keep showing up. You don’t see that kind of concentration unless there’s serious tactical positioning in play — whether that’s hedging, speculation, or simply riding high‑volatility moves for performance.
Technology continues to hold its ground, but it’s not just the mega‑caps. A number of mid‑cap software and infrastructure names have climbed into the rankings. That tells me institutions are poking around in higher‑beta growth names — areas where the index isn’t necessarily leading but alpha is there for the taking.
The Healthcare story is equally interesting. Biotech and med‑tech make a strong showing, which often happens when sentiment shifts toward speculative growth pockets. These are areas that can move on trial results, M&A chatter, or even just rotation into oversold high‑conviction names.
And then there’s Industrials and Materials — not sectors you’d expect to see dominate a momentum‑based leaderboard, yet they’re right up there. Machinery, metals, and commodity‑linked plays suggest positioning for a cyclical or infrastructure‑driven tailwind, possibly linked to fiscal spend or global demand themes.
Even crypto manages to keep a foothold in the top 50, with Ethereum and a few related names holding spots. It’s a smaller slice of the action, but its persistence suggests there’s still a speculative bid at work — institutions haven’t abandoned the space.
Taken together, the TRV Top 50 leans toward tactical, concentrated bets in high‑beta corners of the market. It’s not a “buy the index” kind of environment. This is selective capital deployment, hunting for outsized moves where conviction and volatility align.
VL Institutional Outliers™ (IO)
Institutional Outliers is a proprietary metric designed to spotlight trades that significantly exceed a stock’s recent institutional activity—specifically in terms of dollar volume. By comparing current trade size against each security's recent normalized history, the metric flags outlier events that may indicate sudden institutional interest but may be missed because the activity doesn’t raise any flags/alerts when comparing the activity against the ticker’s entire history. For example, it’s conceivable that a ticker today receives the largest trade it has had in the last 6 months but the trade is unranked and would therefore be missed by current alerts built off Trade Ranks. Use “Realized Vol” to identify tickers with large price displacement and to size your risk appropriately.
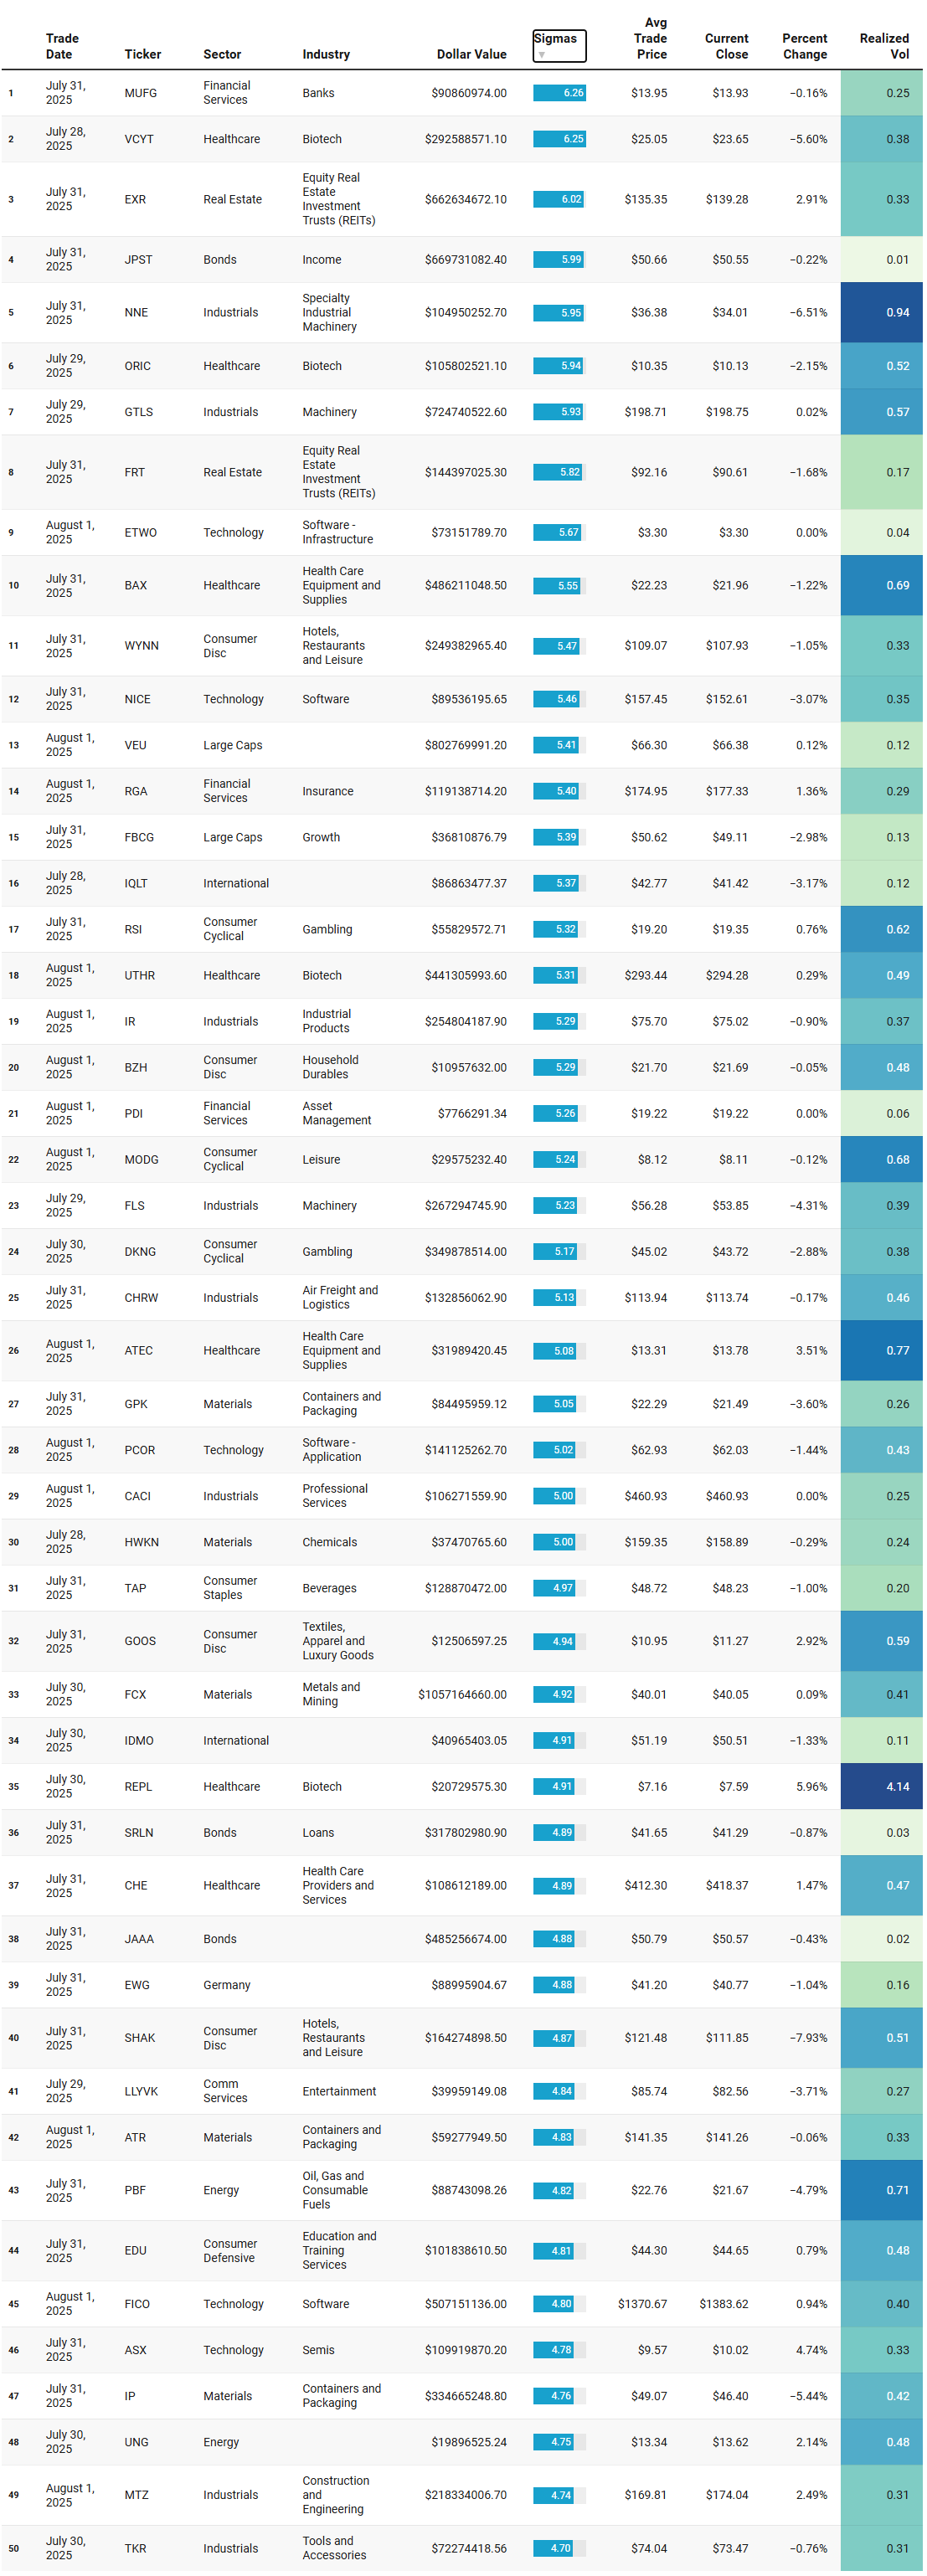
Emergent Themes from the Institutional Outliers Watchlist
This week’s Institutional Outliers list is a bit of a mixed bag — and that’s a good thing. It’s not just one sector driving flows; instead, we’re seeing money move in a few distinct lanes, and some of them are moving fast enough to catch the attention of traders who like volatility.
Real estate jumps out right away. Large trades in names like EXR and FRT are a reminder that institutions still have an appetite for income‑producing assets. These aren’t the highest‑volatility names on the board, but the sheer size of the trades signals meaningful positioning — the kind that often precedes a slow but steady repricing.
Healthcare continues to show up as a theme, and it’s not just the big household names. This week’s activity includes biotech and med‑tech plays like VCYT, ORIC, BAX, ATEC, REPL, and CHE. These tend to be more volatile than the REITs and banks, and some are putting in multi‑percent changes already.
Industrials and materials are well‑represented too. Names like GTLS, IR, CHRW, GPK, ATR, IP, and TKR speak to a steady undercurrent of capital moving toward cyclical and infrastructure‑linked themes. This is the kind of exposure that tends to stick around longer — sometimes quietly outperforming while everyone is focused on the headline sectors.
And then there’s consumer discretionary. A handful of names here are lighting up the volatility screens — WYNN, DKNG, SHAK, and GOOS all made the list, and each of them has been moving with enough speed to keep active traders busy.
Tech has its own pocket of activity, with ETWO, NICE, PCOR, FICO, and ASX seeing chunky institutional trades. These are not broad index buys; they’re targeted positions in specific software and semiconductor names where someone clearly has a view.
All in all, this week’s outliers paint a picture of a market that’s still very much alive under the surface if you know where to look. Institutions are putting money to work selectively — some in slow‑burn positions like REITs, some in volatile healthcare and consumer names, and some in tactical tech plays. For traders, there’s no shortage of movement.
VL Institutional Liquidity Runs™
These are the most frequently traded #1-Ranked Levels in VL. Trades occurring at the highest volume price in a ticker’s history are significant because they represent institutional engagement at a key price memory level—where the market once found consensus. These areas act as liquidity hubs, enabling large players to transact efficiently, and often signal a reassessment of fair value. This activity may precede major moves, mark equilibrium zones, or reflect broader portfolio shifts, making these price levels important to watch even without yet knowing how price will resolve.
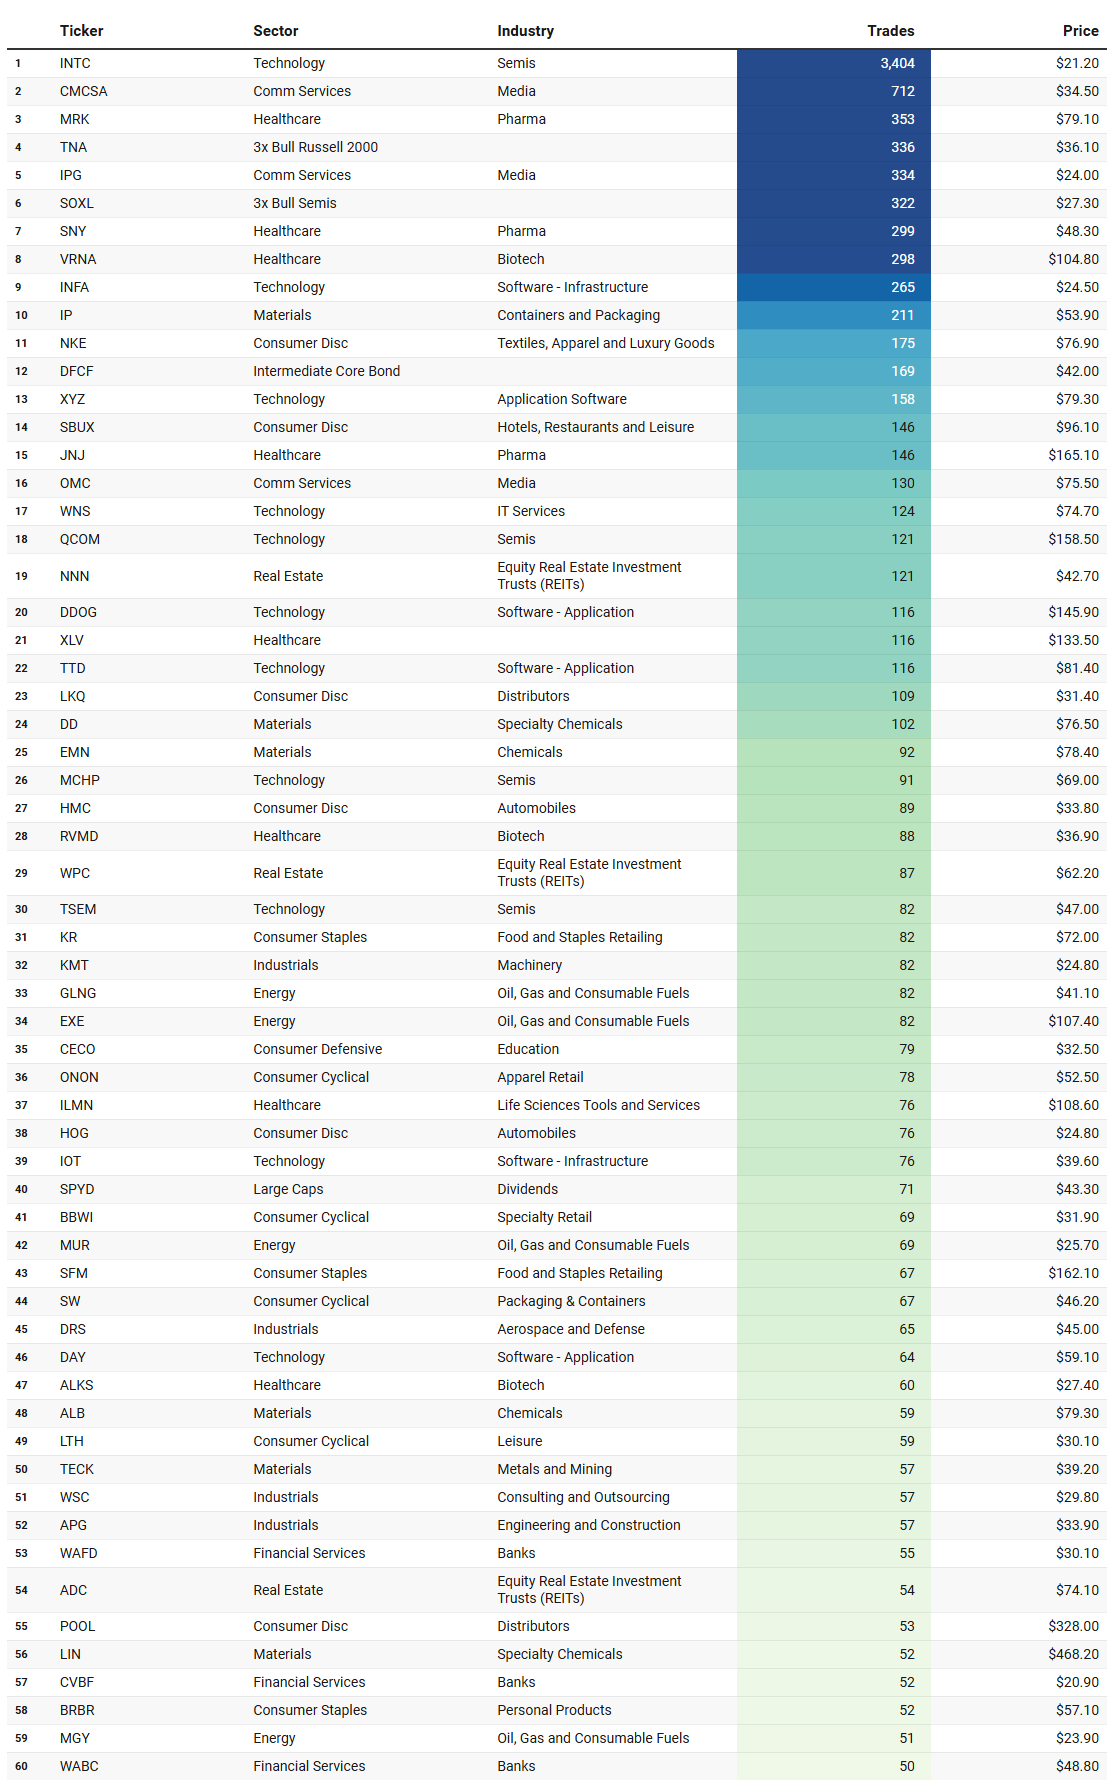
Emergent Themes from the Institutional Liquidity Runs Watchlist
This week’s Institutional Liquidity Runs are sending a pretty clear message: the big money is still circling around semiconductors and consumer names, but there’s also a quieter, steadier rotation into defensives like real estate, utilities, and energy.
Let’s start with the obvious leader — Intel. Over $11 billion traded across more than 3,000 individual trades puts it at the very top of the list. And it’s not alone. Semiconductors show up repeatedly with QCOM, VSH, MCHP, and SOXL all making appearances. This isn’t random noise; it’s consistent, high‑volume institutional activity. Given the timing, this looks like positioning tied to earnings season, AI infrastructure, or broader supply chain bets.
Consumer discretionary is right up there too. Amazon, Nike, Airbnb, Starbucks, LKQ — all names that can move on the strength of consumer spending. What’s interesting is that a lot of this activity comes right after earnings, which suggests institutions are either scaling into positions after a solid report or adjusting size once the market reaction is known.
Then we’ve got the REITs and real estate names — KIM, AGNC, SCHH, NNN, LADR. These don’t make the list because they’re hot speculative trades. They show up when portfolios are rebalancing or when there’s a shift in sector allocations. The message here is that capital is still finding its way into yield‑sensitive assets, which fits with the stabilization we’ve been seeing in interest‑rate expectations.
Utilities and energy aren’t dominating the list, but they’re quietly present. AES, NEE, CVX, CVI, NOV all had big liquidity events. These are classic sectors where institutional money tends to park when they want steady cash flow and stability — a signal that defensive positioning isn’t off the table.
And finally, healthcare remains in play. Between large‑cap pharma like Merck and Johnson & Johnson and smaller biotech names like VRNA and DVAX, the sector continues to attract consistent attention. It’s the same story we’ve been seeing in TRV and Outliers: healthcare is still an active hunting ground.
Put together, this week’s Liquidity Runs show two things: semiconductors and consumer cyclicals are the clear liquidity magnets, while defensives are getting topped up quietly in the background. It’s a market that’s balancing offense and defense — and institutions are making sure they have exposure to both sides of the field.
Thank you for being part of our community and for dedicating your time to this edition. Your insights and engagement drive everything we do, and we’re honored to share this space with such committed, thoughtful readers. Here’s to a week filled with clear opportunities and strong performance. Wishing you many bags 💰💰💰
—VolumeLeaders