Market Momentum: Your Weekly Financial Forecast & Market Prep
Issue 54 / What to expect July 28, 2025 thru Aug 01, 2025

NOTE: This weekly periodical is too large for Substack to deliver in its entirety via email - you will only see a portion of this great content if you read from your email client. Click the header/title at the top to read the full article!
In This Issue
Weekly Market-On-Close Report: All the macro moves, market drivers, and must-know narratives—covered in less than five minutes.
Weekly Benchmark Breakdown: Our weekly intelligence report on major indices cuts through the index-level noise to uncover participation, momentum, and structural integrity and tell you whether markets are rising on solid ground or skating on thin breadth. This is where bull markets prove themselves—or quietly start to unravel.
The Latest Investor Sentiment Readings: Track the emotional pulse of the market with our curated dashboard of sentiment indicators. From fear-fueled flight to euphoric overreach, this week's readings reveal whether investors are cautiously creeping in—or stampeding toward the exits.
Institutional Support & Resistance Levels For Major Indices: Exactly where to look for support and resistance this coming week in SPY, QQQ, IWM & DIA
Normalized Performance By Thematics YTD: Which corners of the markets are beating benchmarks, which are overlooked and which ones are over-crowded!
Key Econ Events & Earnings On-Deck For This Coming Week
This Week’s Institutional Activity In Equities: Track the real money. This section breaks down where institutions are placing their bets—and pulling their chips. You'll get a sector-by-sector view of equity flows, highlighting the most active names attracting large-scale buying or selling. We go beyond the headlines and into the tape, surfacing the week’s most notable block trades and sweep orders, both on lit exchanges and hidden dark pools. Whether you're following momentum or fading crowded trades, this is your map to where size is moving and why it matters.

Weekly Market-On-Close Report
Markets Ride Wave of Trade Optimism as Earnings Season Delivers Strong Results
Record Highs Continue Amid Growing Policy Clarity and Solid Corporate Performance
Financial markets extended their impressive run this week, with major indices reaching fresh peaks as investors found renewed confidence in a combination of promising trade developments, robust corporate earnings, and clearer policy direction from Washington. The sustained rally reflects a fundamental shift in market sentiment from the uncertainty that plagued earlier periods to a more constructive outlook built on tangible progress across multiple fronts.
Equity Markets Paint Bullish Picture
The week's trading sessions demonstrated remarkable consistency in advancing stock prices, with the technology-heavy Nasdaq Composite achieving particular distinction by establishing new all-time highs. This milestone represents more than just numerical achievement—it signals investor confidence in the growth trajectory of the nation's most innovative companies and their capacity to navigate an evolving economic landscape.
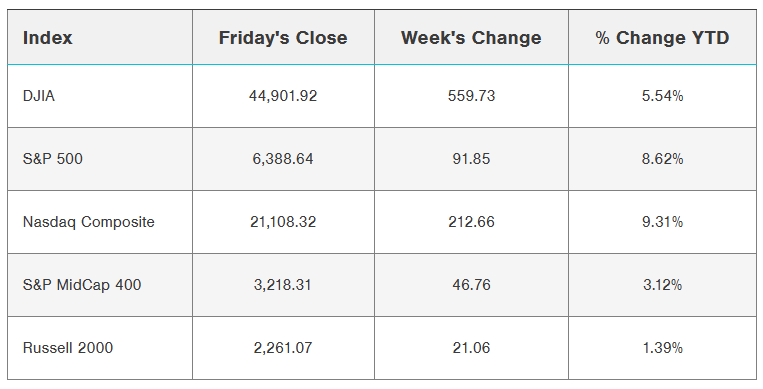
Daily market movements revealed a pattern of steady accumulation rather than speculative fervor, with major indices posting gains of approximately one-quarter percent across the board. The S&P 500 Index climbed 0.25%, matching the performance of the Dow Jones Industrial Average, while the Nasdaq 100 advanced 0.19%. These measured gains suggest institutional participation rather than retail-driven momentum, providing a more sustainable foundation for continued advancement.
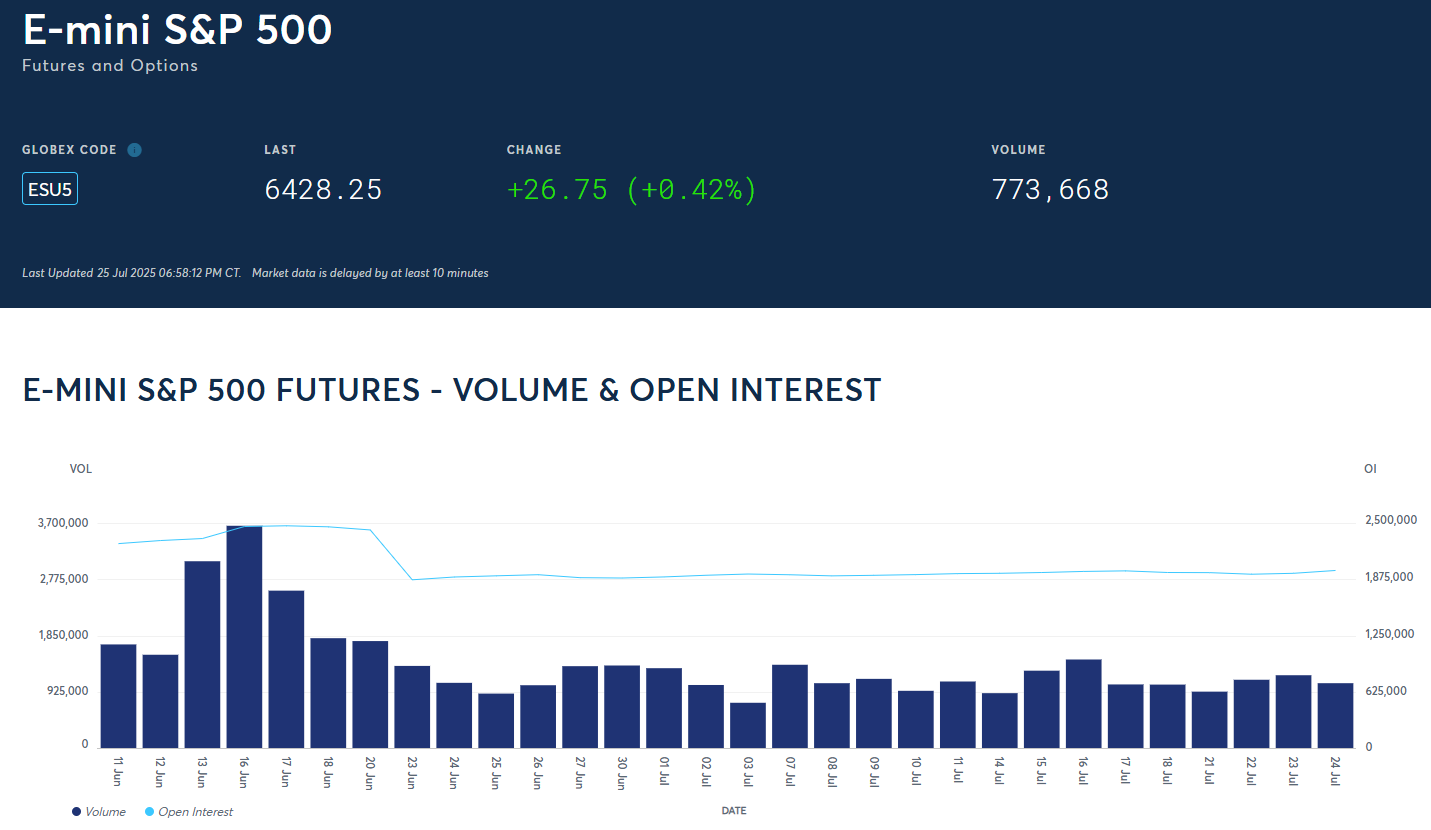
Futures markets echoed the positive sentiment in cash indices, with September E-mini S&P contracts rising 0.18% and September E-mini Nasdaq futures gaining 0.10%. This alignment between spot and forward markets indicates broad-based confidence extending beyond immediate trading sessions into future expectations.
The current market environment bears the hallmarks of a mature bull market phase, where fundamental factors increasingly drive price action rather than sentiment alone. Economic resilience has emerged as a key supporting pillar, with multiple data points confirming the economy's ability to maintain growth momentum despite various headwinds that emerged throughout the year.
Corporate Earnings Exceed Elevated Expectations
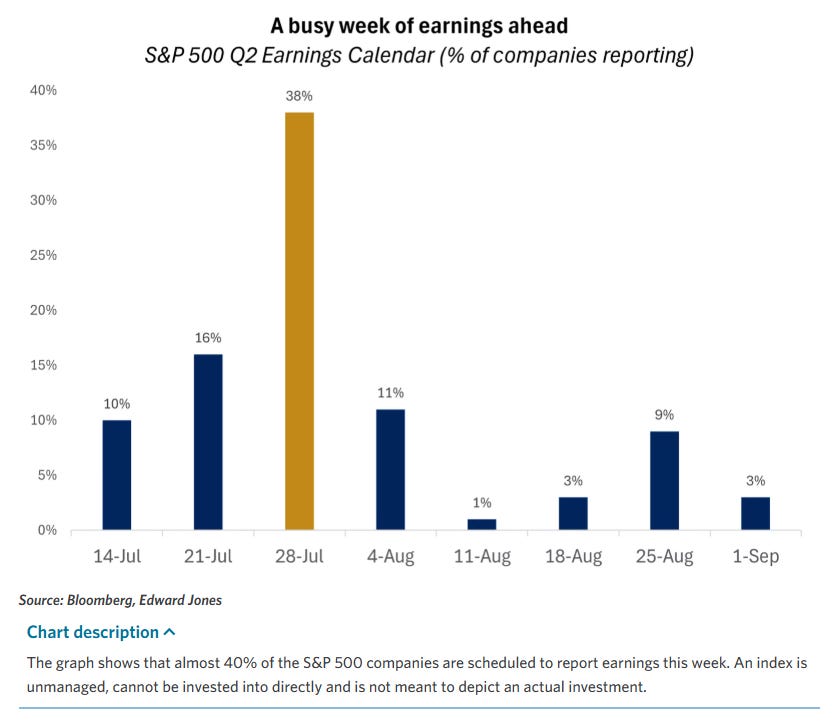
Perhaps no factor has contributed more significantly to market confidence than the exceptional performance of corporate America during the second quarter earnings reporting period. With approximately one-fifth of S&P 500 companies having reported results, the aggregate picture reveals a level of operational excellence that has surprised even seasoned analysts.
Current data indicates that roughly 83% of reporting companies have surpassed profit expectations, a success rate that stands well above historical averages and demonstrates the adaptability of American businesses in challenging conditions. More importantly, the magnitude of these earnings beats has proven substantial, with companies exceeding estimates by an average of 7%—a figure that speaks to conservative guidance and strong execution capabilities.
The aggregate earnings growth picture has improved markedly as reporting has progressed. Initial projections called for year-over-year earnings growth of approximately 2.8% for the second quarter, a relatively modest expansion that reflected concerns about margin pressure and demand uncertainty. However, actual results have driven expectations upward to 4.5% growth, nearly doubling the original forecast and providing concrete evidence of corporate resilience.
This earnings strength has proven broad-based rather than concentrated in a handful of sectors. The healthcare industry delivered particularly impressive results early in the reporting cycle, helping to offset temporary weakness in other areas and demonstrating the diversified nature of the current expansion.
The technology sector's contribution has been especially noteworthy, with Alphabet emerging as a standout performer following its Wednesday earnings release. The company's results not only exceeded consensus estimates across key metrics but also provided encouraging commentary regarding artificial intelligence initiatives that sent positive ripples throughout the broader technology ecosystem.

Mixed Technology Sector Results Tell Nuanced Story
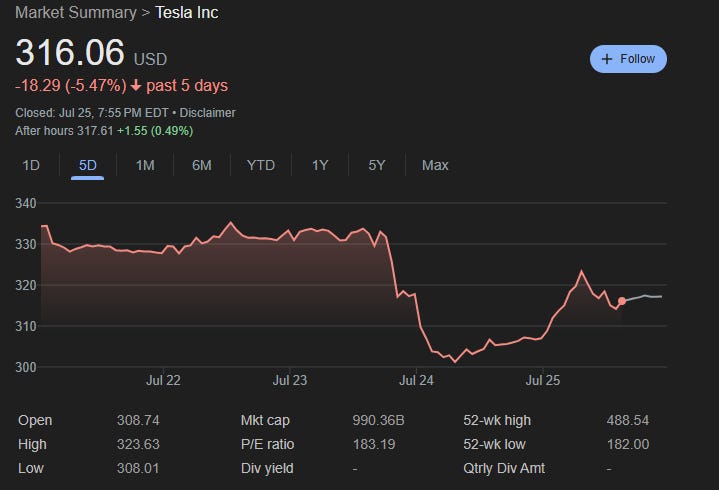
While technology earnings have generally impressed, the sector's performance has not been uniformly positive, illustrating the importance of company-specific execution in the current environment. Tesla's quarterly report fell short of consensus expectations, resulting in a 4.12% weekly decline for the electric vehicle manufacturer's shares and serving as a reminder that even high-profile names face scrutiny in this results-driven market.
The semiconductor space experienced particular volatility, with Intel delivering a shocking performance that sent its shares tumbling more than 9% in a single session. The chip giant reported an unexpected quarterly loss of 10 cents per share, starkly contrasting with analyst expectations for a 1-cent profit. More concerning for investors was management's announcement of significant cost-cutting measures, including a 15% workforce reduction and substantial capital expenditure decreases—moves that signal deeper operational challenges.
Intel's struggles highlight the divergent fortunes within the semiconductor industry, where companies with strong artificial intelligence exposure continue to benefit from robust demand while those focused on traditional computing markets face headwinds. This divergence is likely to persist as the industry continues its transformation around next-generation computing paradigms.
Trade Policy Developments Reduce Uncertainty Premium
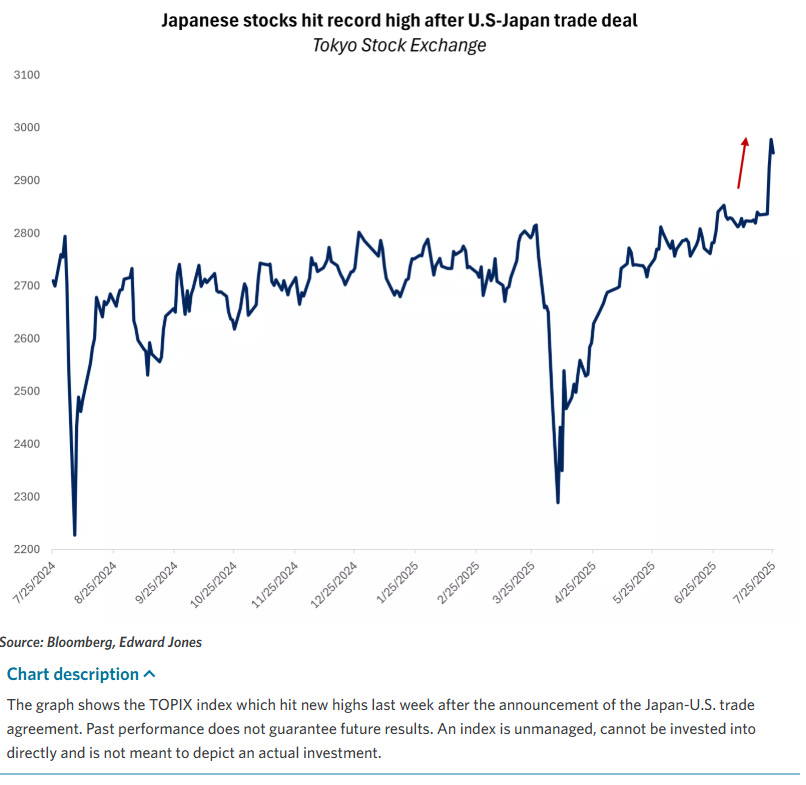
One of the most significant drivers of market performance has been the steady progress in international trade negotiations, which has systematically reduced the uncertainty premium that weighed on valuations during earlier periods. The White House's announcement of a comprehensive trade agreement with Japan stands as the week's most impactful development, providing both immediate market relief and a potential template for additional agreements.
The Japan trade deal represents more than a bilateral achievement—it demonstrates the administration's commitment to replacing threatening rhetoric with substantive negotiations that benefit both parties. The agreement reportedly reduces threatened tariff rates from 25% to 15% while securing a substantial $550 billion investment commitment from Japanese partners, creating a framework that other nations can potentially follow.
This progress comes at a crucial juncture, with the August 1st deadline for additional tariff implementations approaching rapidly. The administration's recent statements regarding tariff rates ranging from 15% to 50% had initially caused concern, but the successful Japan negotiations suggest that constructive outcomes remain possible for other trading partners willing to engage seriously.
The broader trade picture has shown meaningful improvement, with successful agreements now in place with the United Kingdom, Vietnam, Indonesia, Japan, and partial progress with China. Major economies including the European Union, Canada, South Korea, and India remain in active negotiations, creating multiple pathways for additional positive developments in the coming days.
Federal Reserve Policy Remains Data-Dependent
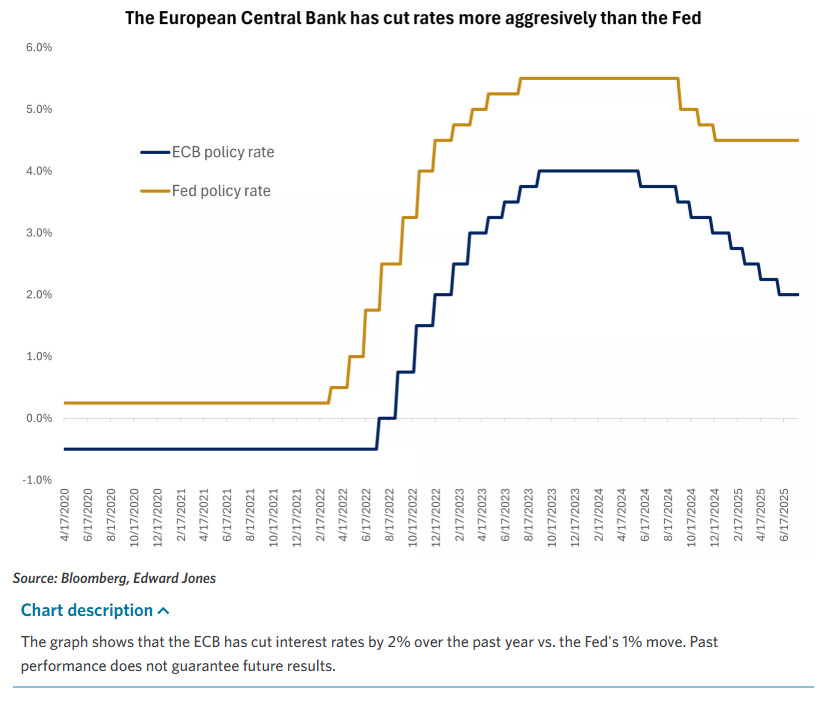
Monetary policy considerations continue to influence market dynamics, though the Federal Reserve's messaging has remained consistent regarding its data-dependent approach to future rate decisions. Current fed funds futures pricing reflects minimal expectations for immediate rate cuts, with only a 3% probability assigned to a 25 basis point reduction at the upcoming July 29-30 Federal Open Market Committee meeting.
However, market expectations shift meaningfully for the subsequent September meeting, where fed funds futures assign a 67% probability to a quarter-point rate reduction. This timing aligns with the Fed's historical preference for allowing sufficient data collection between policy changes and provides flexibility to assess the economic impact of trade policy developments following the August 1st deadline.
The central bank faces a complex balancing act between supporting economic growth and maintaining price stability. Recent economic data has shown mixed signals, with some indicators suggesting continued resilience while others point to emerging softness. June capital goods orders excluding defense and aircraft fell 0.7% month-over-month, disappointing expectations for a 0.1% increase and raising questions about business investment trends.
Fed Chair Jerome Powell's recent comments downplaying tensions with the White House regarding monetary policy have helped stabilize markets and reinforced expectations for continued central bank independence. This dynamic is crucial for maintaining market confidence in the Fed's ability to make decisions based on economic fundamentals rather than political considerations.
International Markets Reflect Global Cautious Sentiment
While domestic markets have demonstrated strength, international equity markets have shown more restrained performance, reflecting region-specific challenges and different policy environments. European markets closed lower, with the Euro Stoxx 50 declining 0.23% as investors grappled with mixed economic data and ongoing policy uncertainty.
Asian markets similarly struggled, with China's Shanghai Composite falling 0.33% and Japan's Nikkei 225 declining 0.88%. These declines occurred despite positive trade developments between Japan and the United States, suggesting that domestic factors continue to weigh on investor sentiment in the region.
The divergence between U.S. and international market performance highlights the relative strength of the American economy and the effectiveness of domestic policy responses to global challenges. This performance gap has important implications for capital flows and currency relationships, potentially supporting continued dollar strength and U.S. asset outperformance.
Fixed Income Markets Navigate Supply Pressures
Bond markets experienced modest pressure during the week, with 10-year Treasury yields rising 1.2 basis points to 4.408% as investors contended with multiple competing forces. Supply concerns weighed on prices as the Treasury Department prepared to auction $69 billion of 2-year notes and $70 billion of 5-year notes, representing significant new issuance that markets must absorb.
European government bond yields moved higher in sympathy with U.S. markets, with German 10-year bund yields reaching a 3.75-month high before settling at 2.722%, up 2.0 basis points for the session. UK gilt yields similarly advanced, rising 1.9 basis points to 4.640%.
The bond market's performance reflects ongoing uncertainty about the future path of monetary policy across major economies. While rate cut expectations have increased for later in the year, the timing and magnitude of such moves remain unclear, creating volatility in duration-sensitive assets.
European Central Bank officials have provided mixed signals regarding future policy direction, with Governing Council member Kazaks suggesting little reason for additional rate cuts unless economic conditions deteriorate significantly. This hawkish stance contrasts with market expectations for continued easing and may contribute to higher European yields.
Economic Data Presents Mixed Picture
The week's economic releases painted a nuanced picture of current conditions, with some indicators showing resilience while others suggested emerging challenges. The S&P Global flash Purchasing Managers' Index data for July provided the most comprehensive view of business activity trends, revealing acceleration in overall growth driven entirely by services sector strength.
The composite PMI output index jumped 1.7 points to a seven-month high of 54.6, well above the 50 threshold that separates expansion from contraction. This improvement was entirely attributable to services sector growth, with the services PMI rising to 55.2 from 52.9 in June, indicating robust demand for service-based businesses.
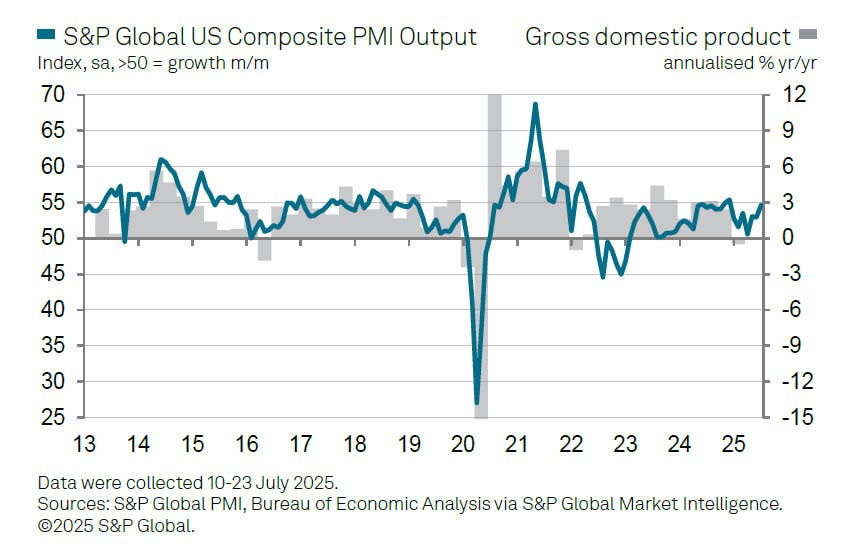
However, the manufacturing sector told a different story, with its PMI falling from 52.9 in June to 49.5 in July—the lowest reading since December and the first contraction reading of the year. This divergence highlights the uneven nature of current economic growth and raises questions about the sustainability of the overall expansion.
Housing market data continued to reflect the challenges posed by elevated mortgage rates, with existing home sales declining 2.7% month-over-month to a seasonally adjusted annual rate of 3.93 million units in June. Simultaneously, the median sales price of existing homes reached a record high of $435,300, illustrating the ongoing supply-demand imbalance that characterizes the residential real estate market.
Sector Performance Reveals Rotation Themes
Sector-level performance during the week revealed important rotation themes that may persist in the coming months. Health technology, communications, and non-energy minerals emerged as the strongest-performing sectors, reflecting continued investor preference for growth-oriented businesses with strong competitive positions.
Conversely, health services, consumer services, and energy minerals lagged broader market performance, suggesting investor discrimination between different business models and end-market exposures within seemingly similar industries.
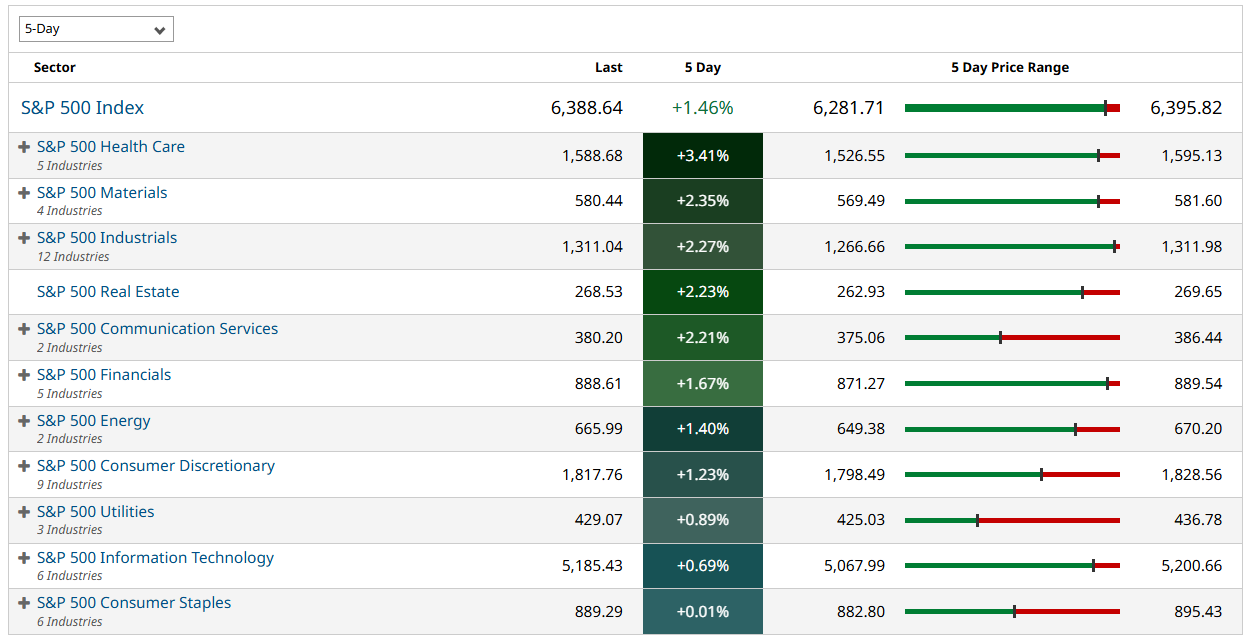
The financial sector deserves particular attention given its strong earnings performance and potential sensitivity to changing interest rate expectations. Banks have emerged as a bright spot in the earnings cycle, with results generally exceeding expectations and commentary suggesting stable credit conditions and healthy consumer demand for lending products.
Cryptocurrency Markets Show Volatility
Digital asset markets experienced notable volatility during the week, with Bitcoin declining more than 2% after a relatively flat period following earlier record highs. The cryptocurrency's weakness following Trump's signing of the "Genius Act" suggests that regulatory clarity alone may not be sufficient to sustain momentum in the space.

Related equity investments also felt pressure, with MicroStrategy and Coinbase shares both declining more than 1% as investors reassessed the near-term outlook for cryptocurrency adoption. The pending Clarity Act, which would establish clearer regulatory frameworks for digital assets, represents the next potential catalyst for the sector but requires Senate approval before implementation.
Credit Markets Demonstrate Resilience
Corporate credit markets showed impressive resilience and demand during the week, with investment-grade bond spreads tightening in the latter half of the period. New issuance met strong demand, with deals generally oversubscribed and pricing at favorable levels for issuers.
The bank loan market experienced particularly robust activity, with Monday representing the fourth-largest notional new issue launch day in the market's history. While much of this activity consisted of repricing transactions rather than new money deals, the volume demonstrates continued institutional appetite for floating-rate credit exposure.
This credit market strength provides an important foundation for continued economic growth by ensuring that businesses maintain access to capital markets at reasonable costs. The combination of tight spreads and strong demand suggests that credit conditions remain supportive of corporate expansion and investment.
Looking Forward: Key Risks and Opportunities
As markets look ahead to the remainder of the year, several key themes are likely to drive performance. The resolution of trade negotiations by the August 1st deadline represents perhaps the most immediate catalyst, with successful outcomes likely to provide additional upside momentum while failures could reverse recent gains.
The Federal Reserve's policy path remains crucial, with the September meeting emerging as a key inflection point for interest rate expectations. Clear communication from Fed officials regarding their reaction function will be essential for maintaining market stability during this transition period.
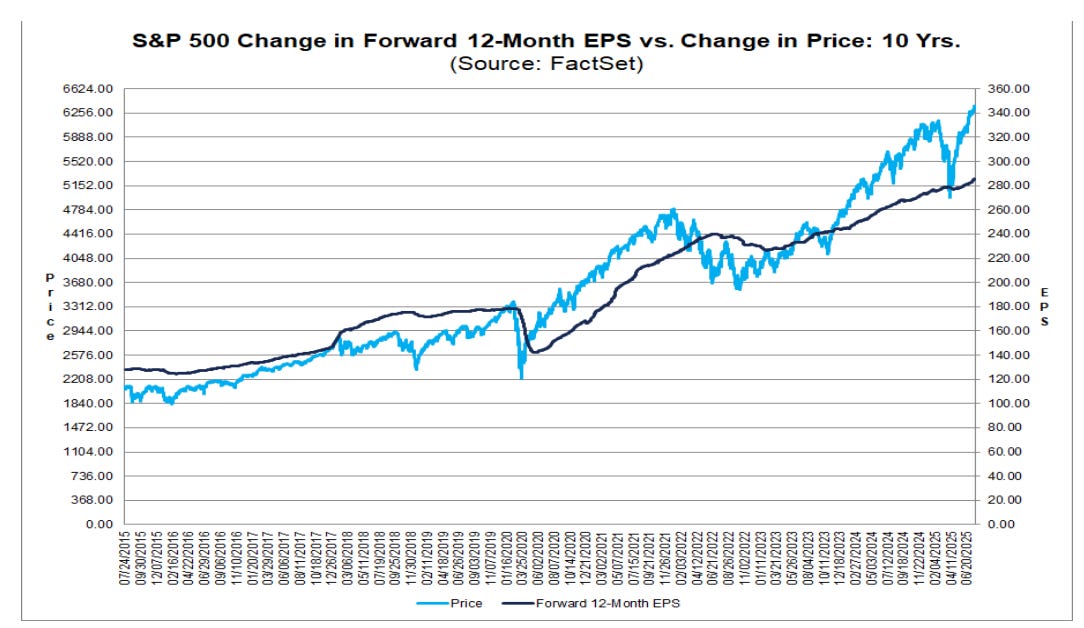
Corporate earnings will continue to play a crucial role, particularly as valuations have advanced to levels that require strong fundamental performance for justification. The forward price-to-earnings ratio for the S&P 500 has risen to over 22 times, the highest level since 2021, placing increased importance on earnings growth for continued market advancement.
Conclusion: Measured Optimism Warranted
The current market environment reflects a mature expansion phase where fundamental factors increasingly drive performance rather than sentiment alone. The combination of strong corporate earnings, progress on trade negotiations, and continued economic resilience provides a solid foundation for measured optimism about the remainder of the year.
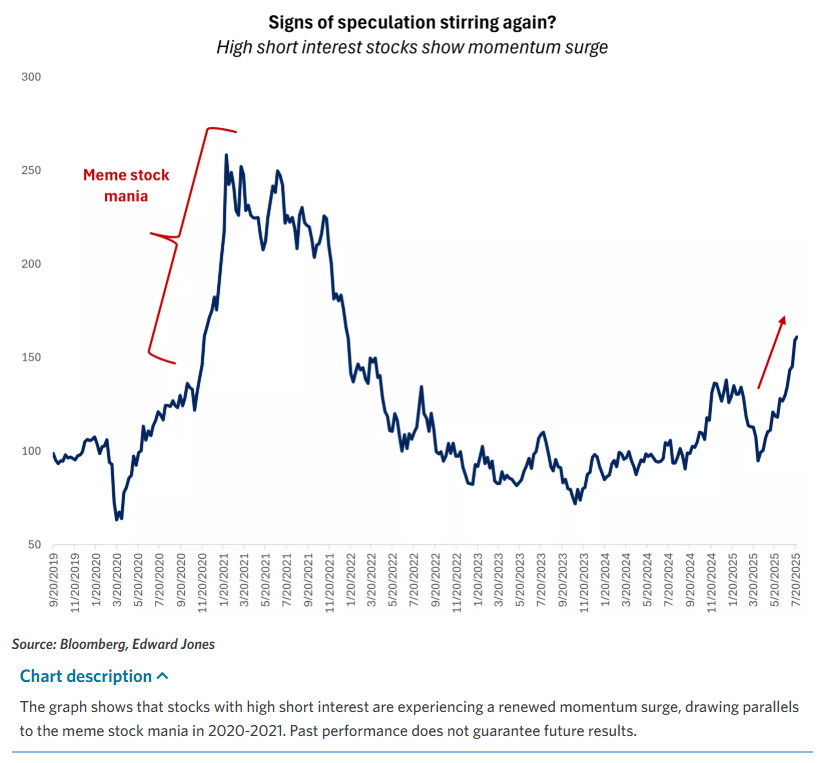
However, elevated valuations and the potential for policy surprises suggest that volatility could return if key developments disappoint expectations. Investors are well-served by maintaining diversified portfolios focused on quality investments rather than chasing speculative opportunities that have begun to resurface in certain market segments.
The prevailing trend remains constructive, supported by improving policy clarity and solid fundamental performance across key sectors of the economy. While uncertainty has not disappeared entirely, the systematic reduction in major risk factors provides reason for cautious optimism about the market's trajectory in the months ahead.

Weekly Benchmark Breakdown
VL Indices Market Score: 81 / 100 (−2 WoW)
This week’s internal market picture remains broadly healthy, even as we see a subtle cooling from the surge that pushed many indices to highs earlier this month. The VL Indices Market Score dipped slightly to 81 from last week’s 83—not due to deterioration, but from digestion. Participation is still strong across major benchmarks, especially on longer timeframes, though some shorter-term breadth metrics have pulled back modestly. Overall, this looks far more like constructive consolidation than anything concerning.
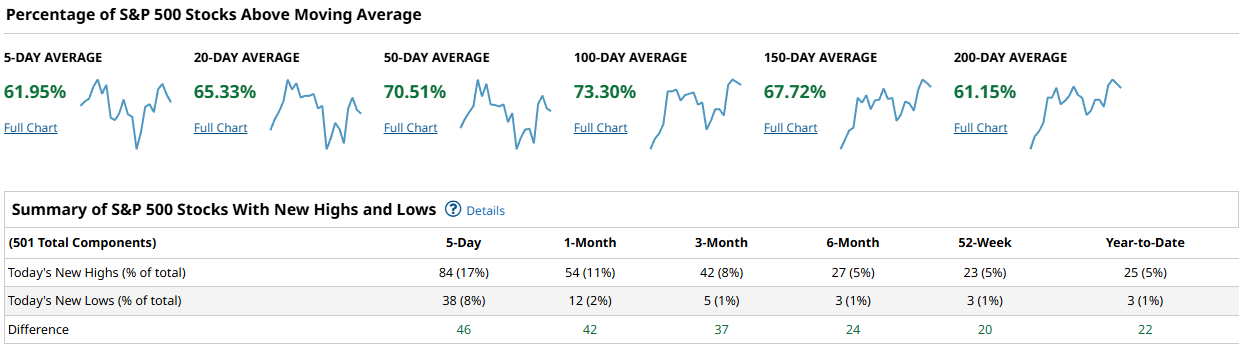
Starting with the S&P 500, internals are still quite impressive. Over 61% of components remain above their 5-day moving average, with that number climbing steadily across longer durations—65% for the 20-day, 70% for the 50-day, and topping out at 73% above the 100-day. While the 200-day sits a bit lower around 61%, that’s still a very healthy showing. New highs are outpacing new lows by nearly a two-to-one margin across all timeframes, and the 5-day high/low spread came in at a firm +46. In short: leadership remains broad, and there's no sign of internal erosion yet.
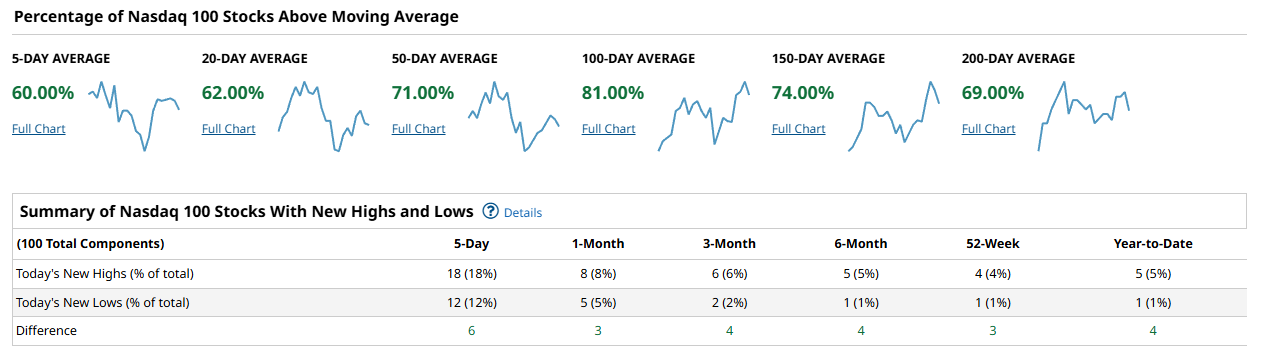
The Nasdaq 100 continues to reflect relative strength, especially over medium and long horizons. Eighty-one percent of components are still above their 100-day moving averages—a testament to the staying power of this year’s tech-led rally. The 50-day and 200-day figures also remain strong at 71% and 69% respectively, but things soften a bit on shorter timeframes. Only 60% of components are above the 5-day average, and the net new high/low count over the last week sits at just +6. Momentum hasn’t vanished, but it is rotating beneath the surface. This index remains technically strong—just less euphoric than it was a few weeks ago.
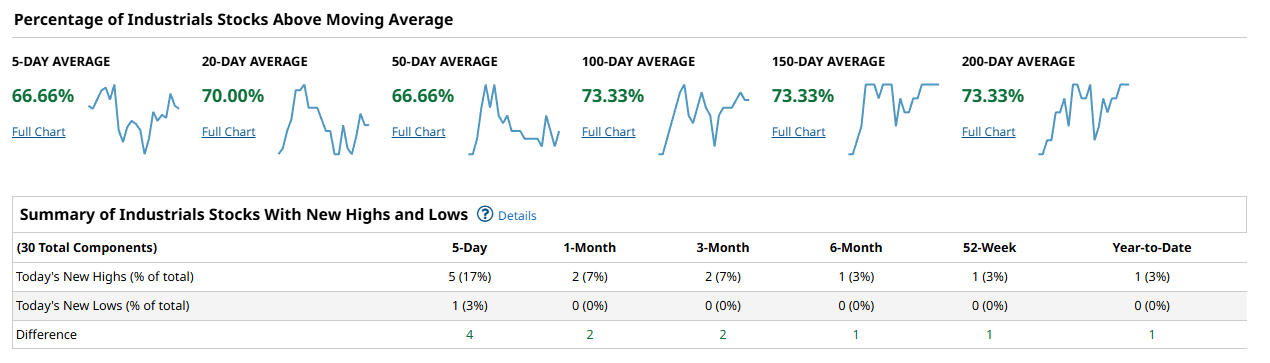
Over in the Dow Industrials, things look as stable as ever. Two-thirds of the index is above the 5-day average, and nearly three-quarters of its 30 stocks are sitting above all longer-duration moving averages from 100 to 200 days. The high/low spread remains modest but positive. Given its limited component count, this kind of uniform participation is noteworthy. It’s not often the Dow quietly shows such consensus strength, and this suggests resilience in cyclical and value names.
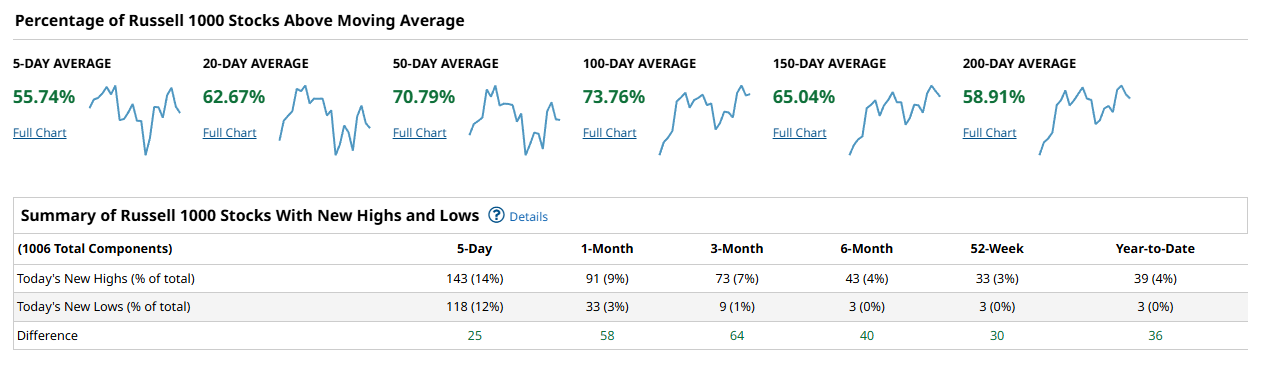
The broader Russell 1000—which often acts as a litmus test for whether rallies are broad-based or top-heavy—continues to deliver. Just under 56% of the index is above its 5-day average, and longer lookbacks show a consistent upward slope: 63% above the 20-day, nearly 71% above the 50-day, and close to 74% above the 100-day. Even the 200-day sits near 59%, confirming that this strength isn’t narrowly concentrated in megacaps. With 143 new highs versus 118 new lows in the last 5 days and a net monthly high/low spread of +58, the Russell confirms that this market is still being bought across sectors and sizes.
Zooming out, the VL Indices Market Score remains firmly in bullish territory. Yes, it edged down slightly this week, but only due to some near-term breathers—primarily in Nasdaq and Russell components on the 5-day and 20-day fronts. There’s been no breakdown in structure, no rush to defensives, and no surge in new lows. The longer-term trend participation and internals continue to support a bullish base.
We’re still in a market with wide participation and supportive internals. Leadership is rotating but not disappearing. Strength is being tested, not rejected. And based on the breadth metrics from all major indices, this still looks like a market that wants higher ground—even if it pauses here for a moment to catch its breath.
US Investor Sentiment Report
Insider Trading
Insider trading occurs when a company’s leaders or major shareholders trade stock based on non-public information. Tracking these trades can reveal insider expectations about the company’s future. For example, large purchases before an earnings report or drug trial results might indicate confidence in upcoming good news.
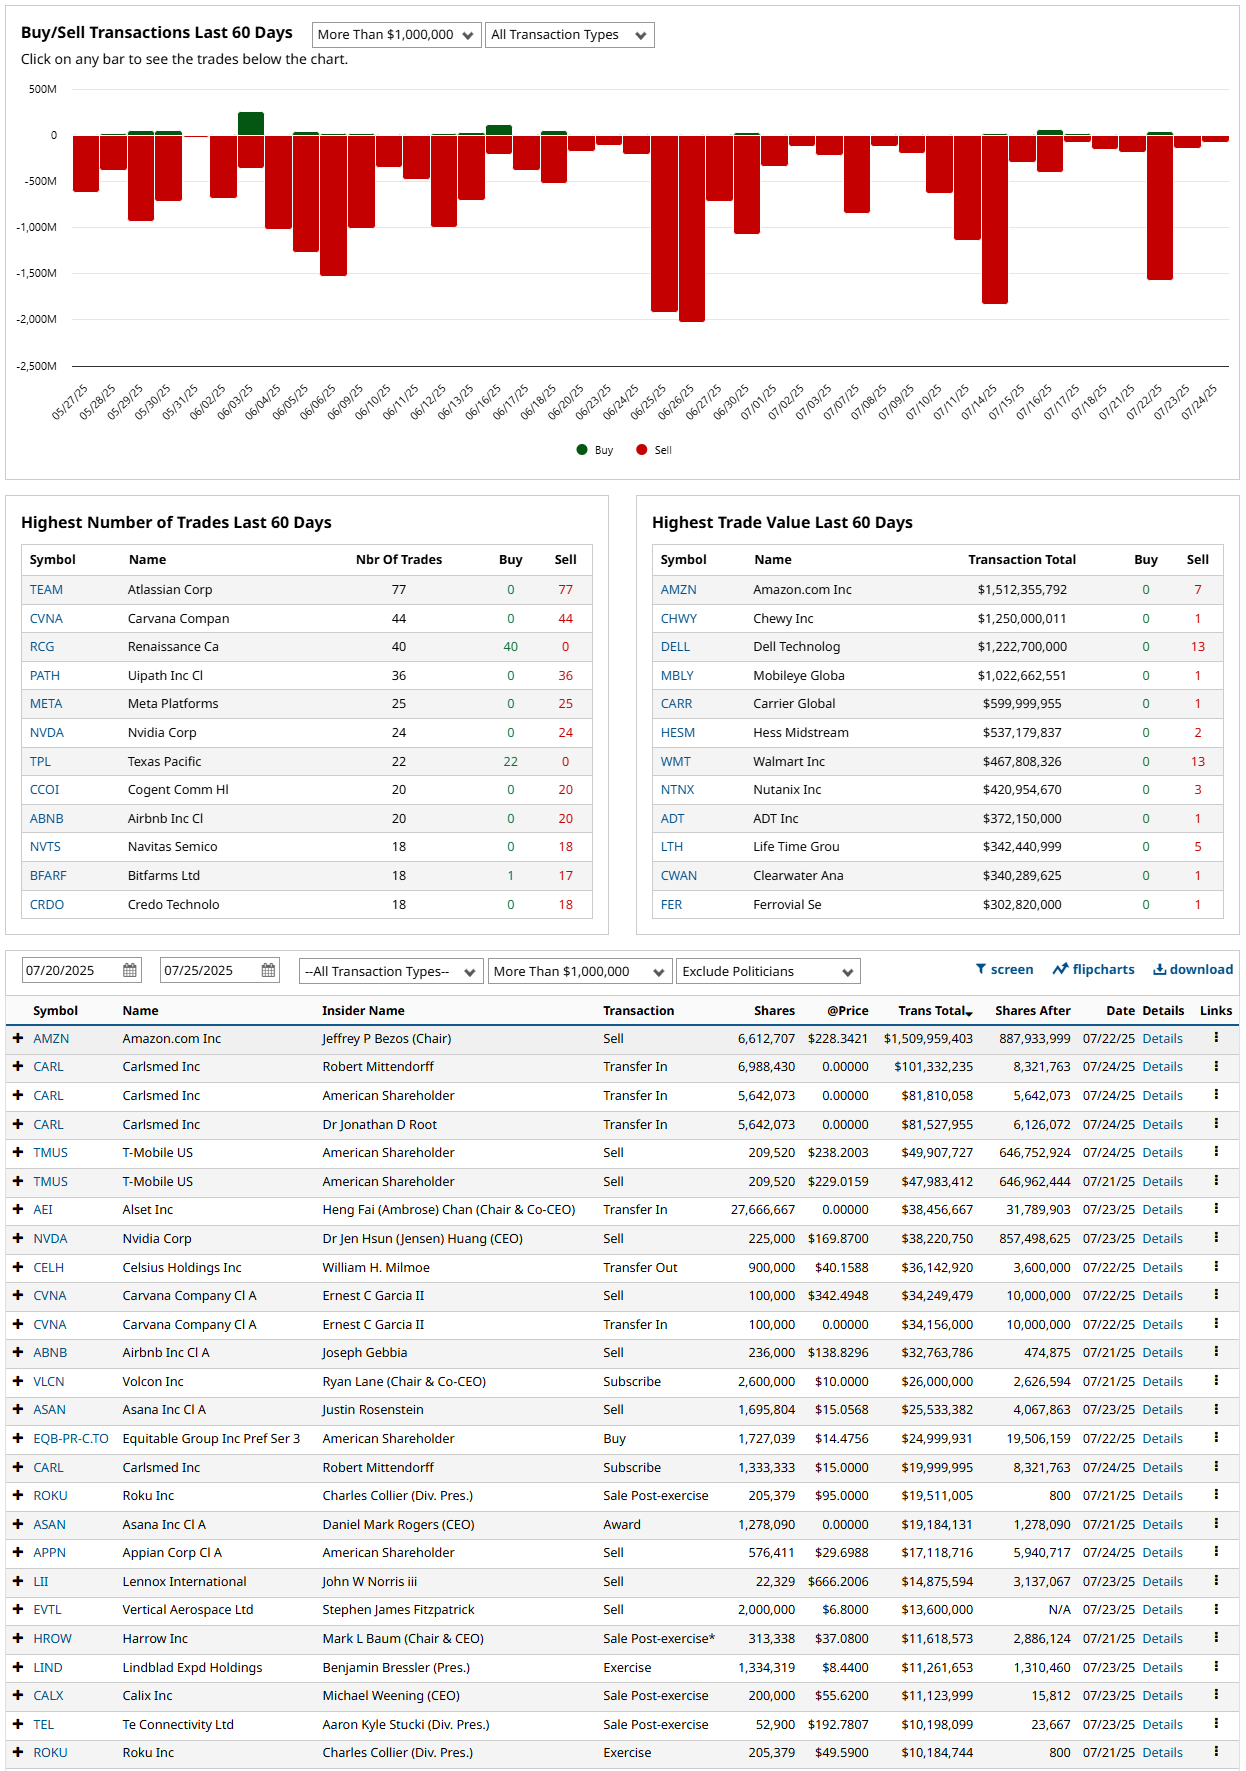
Insider activity continues to skew heavily bearish. Over the past 60 days, nearly all high-value trades have been sales, with names like Amazon, Chewy, and Dell Technologies showing multi-million dollar liquidations. Atlassian alone recorded 77 sells. Despite a few large buys and transfers (notably in Cars.com and Nvidia), the overall tone suggests insiders are locking in gains — a cautionary signal at these levels.
%Bull-Bear Spread
The %Bull-Bear Spread measures the gap between bullish and bearish investor sentiment, often from surveys like AAII. It’s a contrarian indicator—extreme optimism may signal a coming pullback, while extreme pessimism can hint at a potential rally. Large positive or negative spreads often mark market turning points.
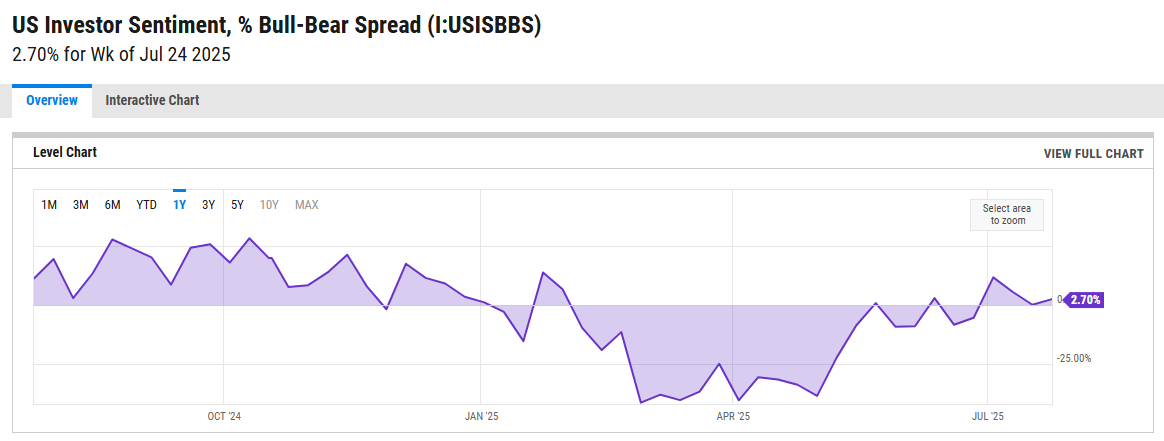
The AAII Bull-Bear spread ticked up to 2.7% this week — a modest positive reading, but still hovering near neutral. Sentiment has steadily recovered from extreme bearishness in April, though the current level doesn’t reflect exuberance. Investors remain cautious, suggesting there’s room for positioning to shift more bullish if price strength continues.
NAAIM Exposure Index
The NAAIM Exposure Index (National Association of Active Investment Managers Exposure Index) measures the average exposure to U.S. equity markets as reported by its member firms. These are typically active money managers who provide their equity exposure levels weekly. The index offers insight into how much these managers are investing in equities at any given time, ranging from being fully short (-100%) to leveraged long (up to +200%).
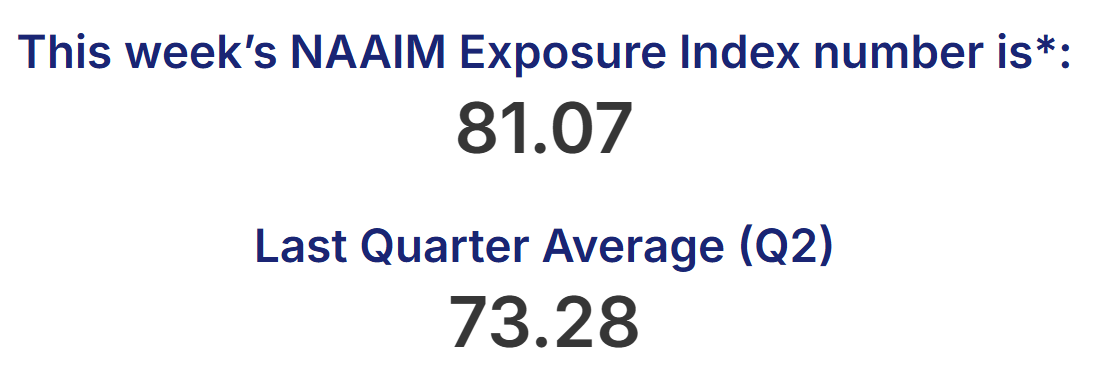
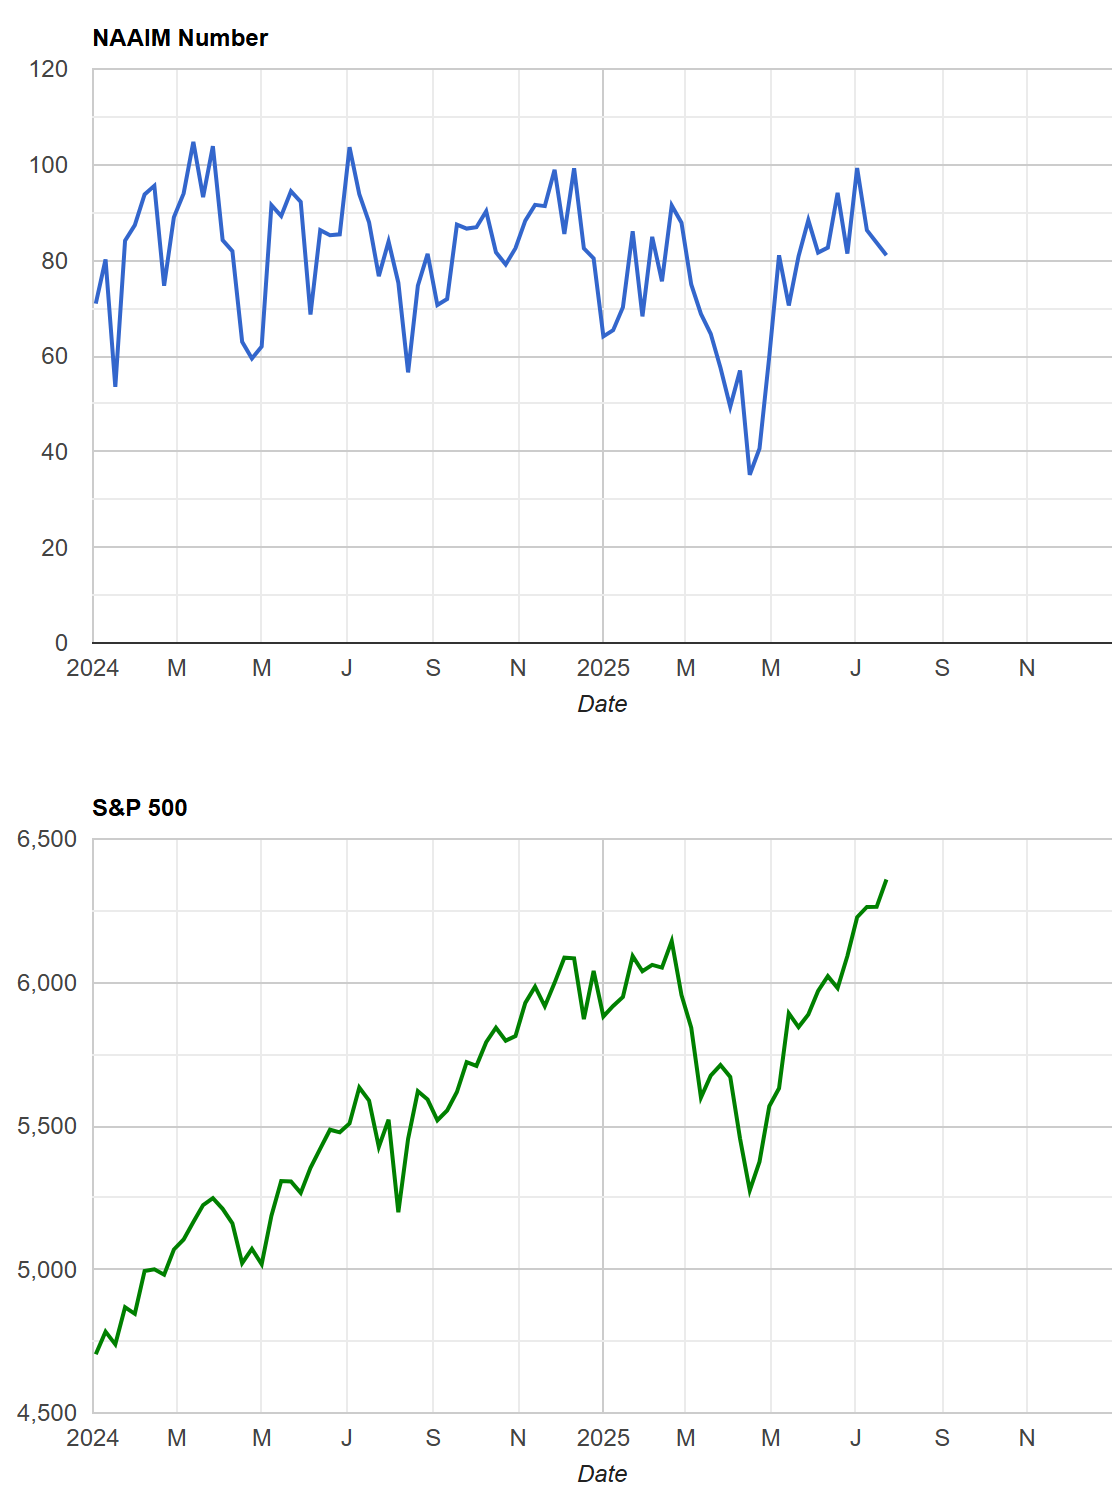
Active manager exposure, as measured by the NAAIM index, remains elevated — currently in the low 80s — after a sharp recovery from the sub-50 levels seen in April. That rebound closely mirrors the S&P’s trajectory, reinforcing the idea that managers are chasing performance as markets reclaim highs. There’s no sign of capitulation here; exposure is healthy, but not euphoric.
CBOE Total Put/Call Ratio
CBOE's total put/call ratio includes index options and equity options. It's a popular indicator for market sentiment. A high put/call ratio suggests that the market is overly bearish and stocks might rebound. A low put/call ratio suggests that market exuberance could result in a sharp fall.
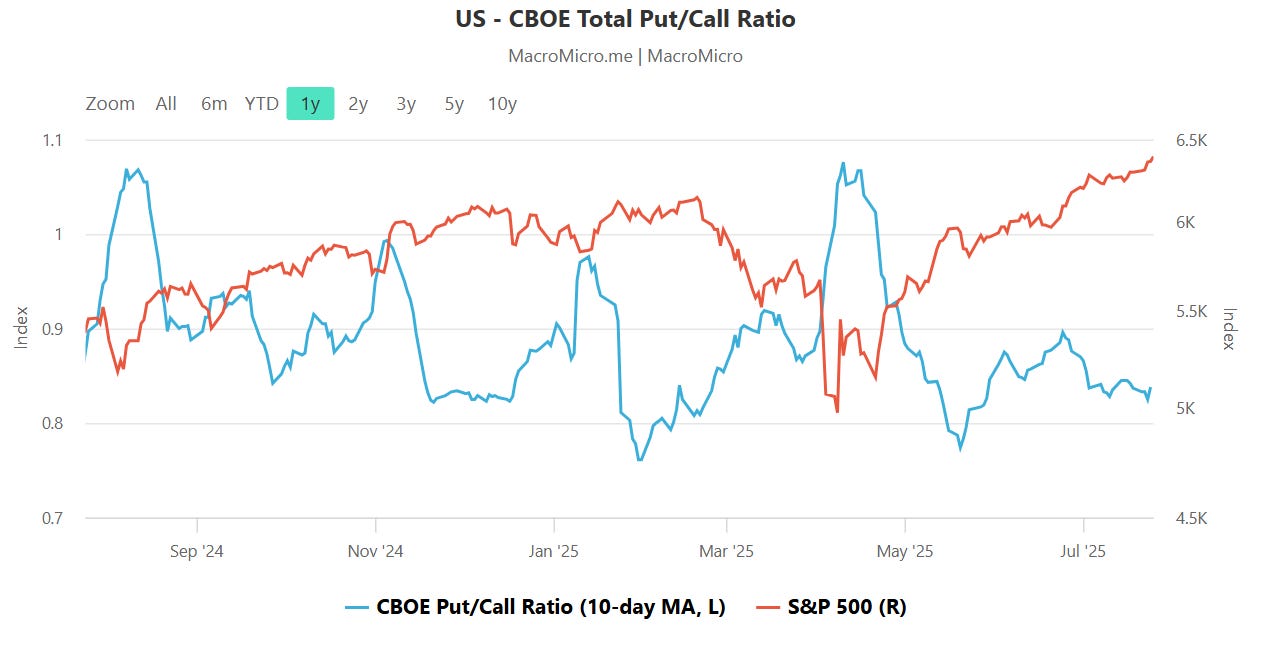
The CBOE total put/call ratio remains muted, holding near the lower end of its 12-month range. This suggests a relatively complacent options market—traders aren't aggressively hedging, and there's little fear priced in. Historically, these low readings have often coincided with market tops or brief pauses in uptrends, but context matters. For now, it supports the broader risk-on tone.
Equity vs Bond Volatility
The Merrill Lynch Option Volatility Estimate [MOVE] Index from BofAML and the CBOE Volatility Index [VIX] respectively represent market volatility of U.S. Treasury futures and the S&P 500 index. They typically move in tandem but when they diverge, an opportunity can emerge from one having to “catch-up” to the other.
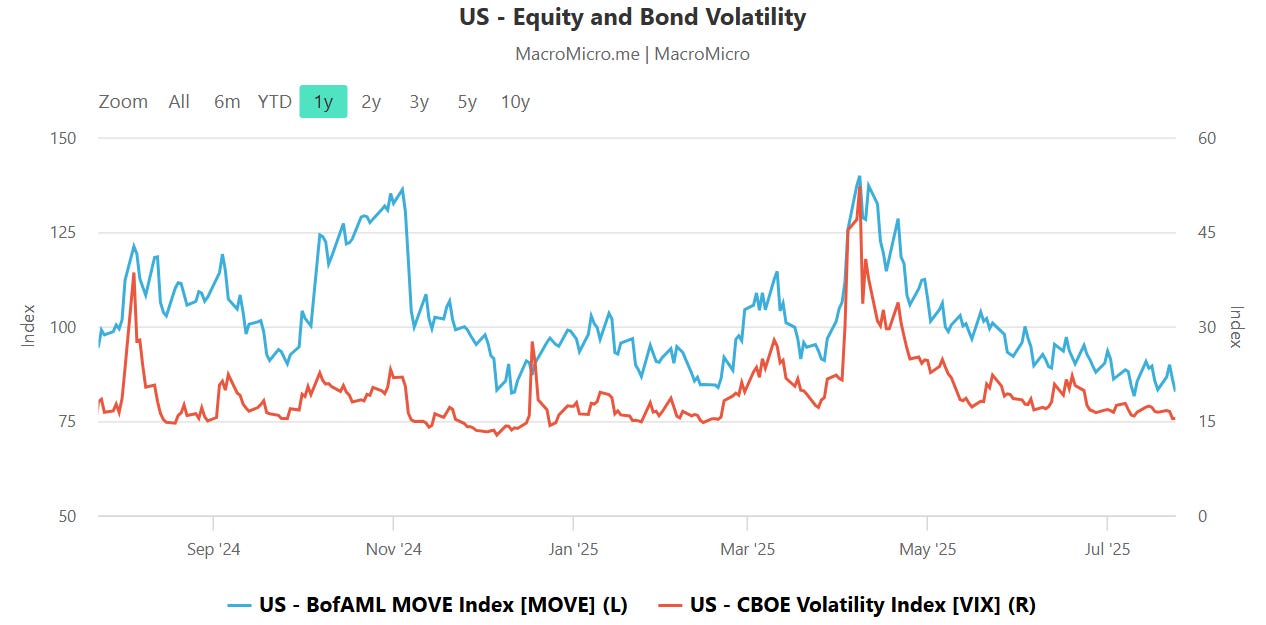
Equity volatility, as measured by the VIX, remains pinned near multi-year lows, while bond market volatility (MOVE Index) continues to hold a clear premium. This persistent divergence suggests equity markets are still pricing in a relatively benign outlook despite ongoing macro uncertainty reflected in fixed income. Until that gap narrows—either through a rise in VIX or a fall in MOVE—it's fair to say equity traders are skating confidently on what remains a fragile surface underneath.
CNN Fear & Greed Constituent Data Points & Composite Index
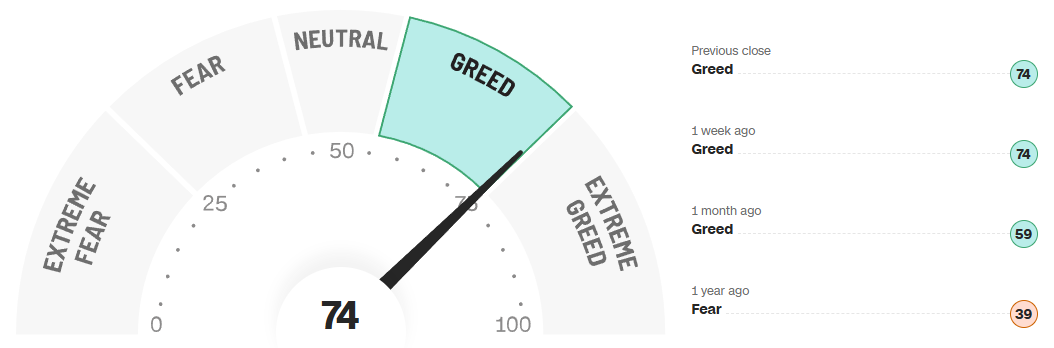
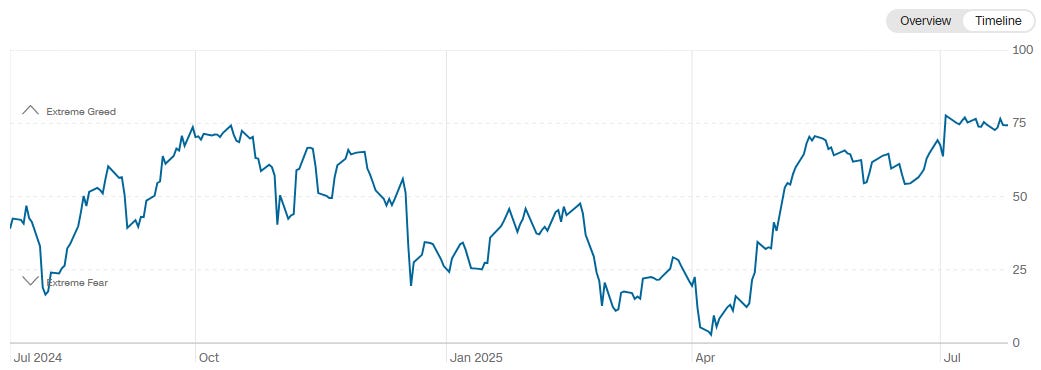
Investor sentiment has firmly landed in the "Greed" zone, with the CNN Fear & Greed Index holding at 74 for the second consecutive week. That level reflects a notable shift from just a month ago, when the index read 59, and a stark contrast to the 39 recorded this time last year — then firmly in “Fear” territory.
Looking at the time-series chart, the progression from "Extreme Fear" in early April to "Greed" by mid-summer has been both rapid and sustained. This steep climb mirrors the broader market’s surge off its spring lows, confirming that investor psychology has flipped from defensive to optimistic in a relatively short span.
While we’re not yet in the “Extreme Greed” danger zone, the current levels suggest a more complacent market, where upside expectations are becoming consensus. Historically, this environment doesn’t always precede a top — but it does imply thinner margins for error, especially if catalysts disappoint or positioning becomes too one-sided.
In context, the Fear & Greed gauge reinforces the broader picture: investors are leaning into risk, but we’re approaching levels where sentiment may begin to work against further gains if momentum falters.
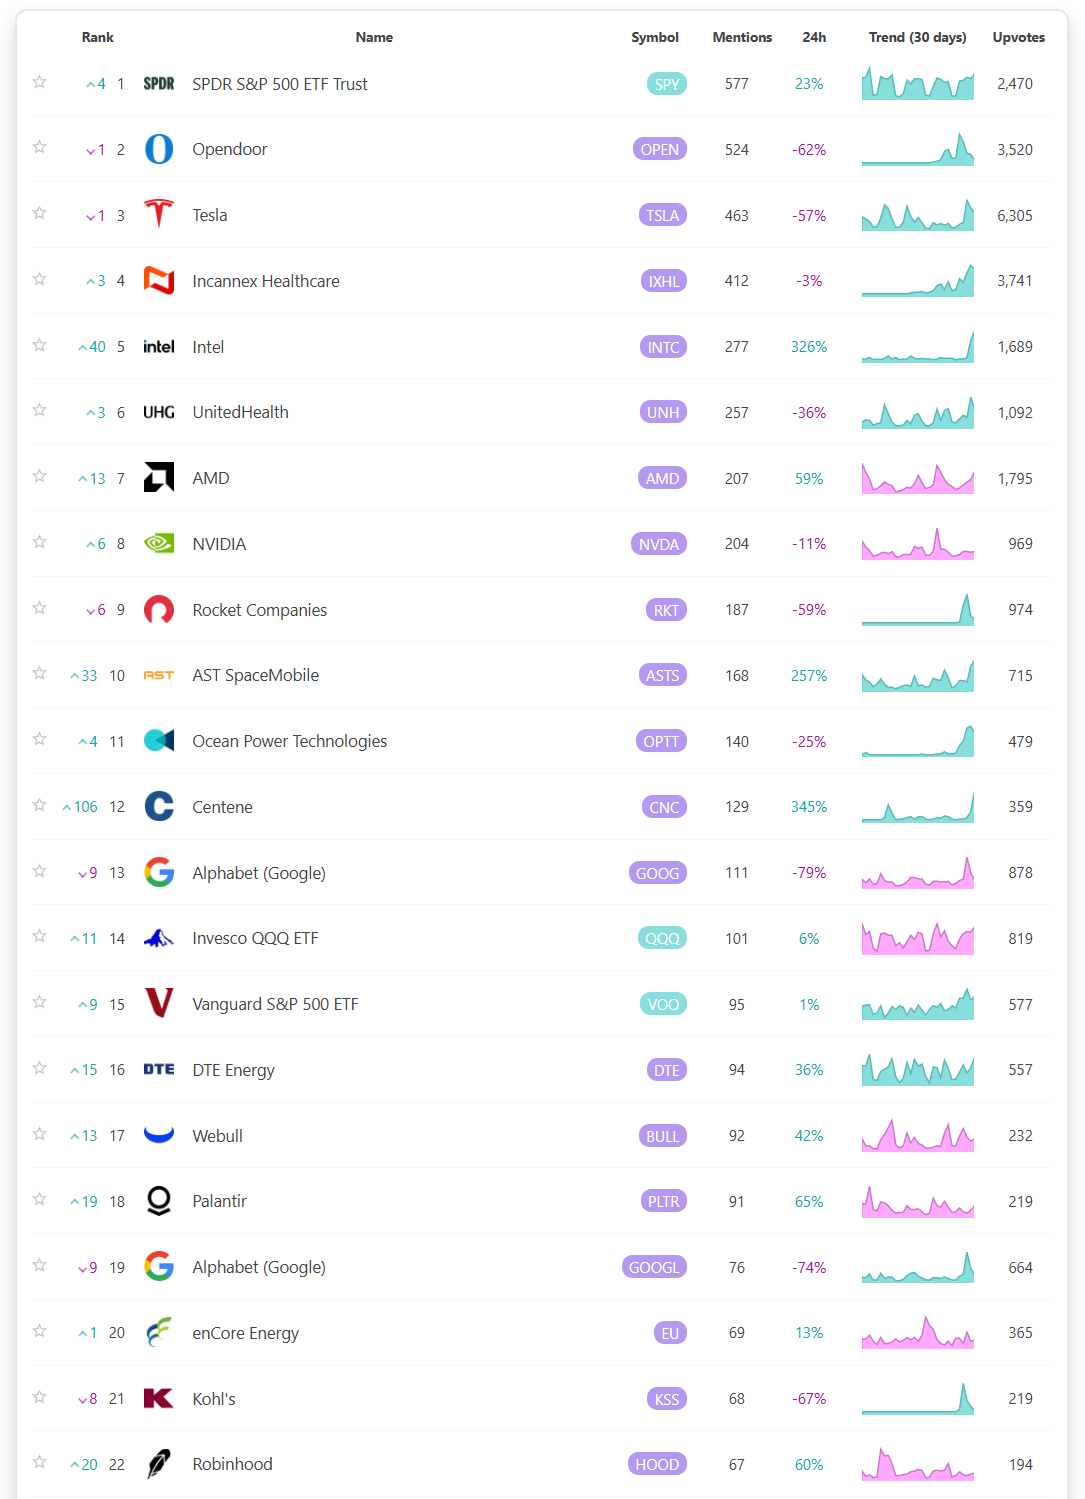
Social Media Favs
Social sentiment offers a real-time view of investor mood, often revealing market shifts before traditional indicators. It can signal momentum changes, spot emerging trends, and gauge retail investor impact—especially in high-volatility names. Tracking sentiment around events or earnings provides actionable insights, and when layered with quantitative models, can enhance predictive accuracy and risk management. Sustained sentiment trends often mirror broader market cycles, making this data a valuable tool for both short-term trades and long-term positioning.
Institutional S/R Levels for Major Indices
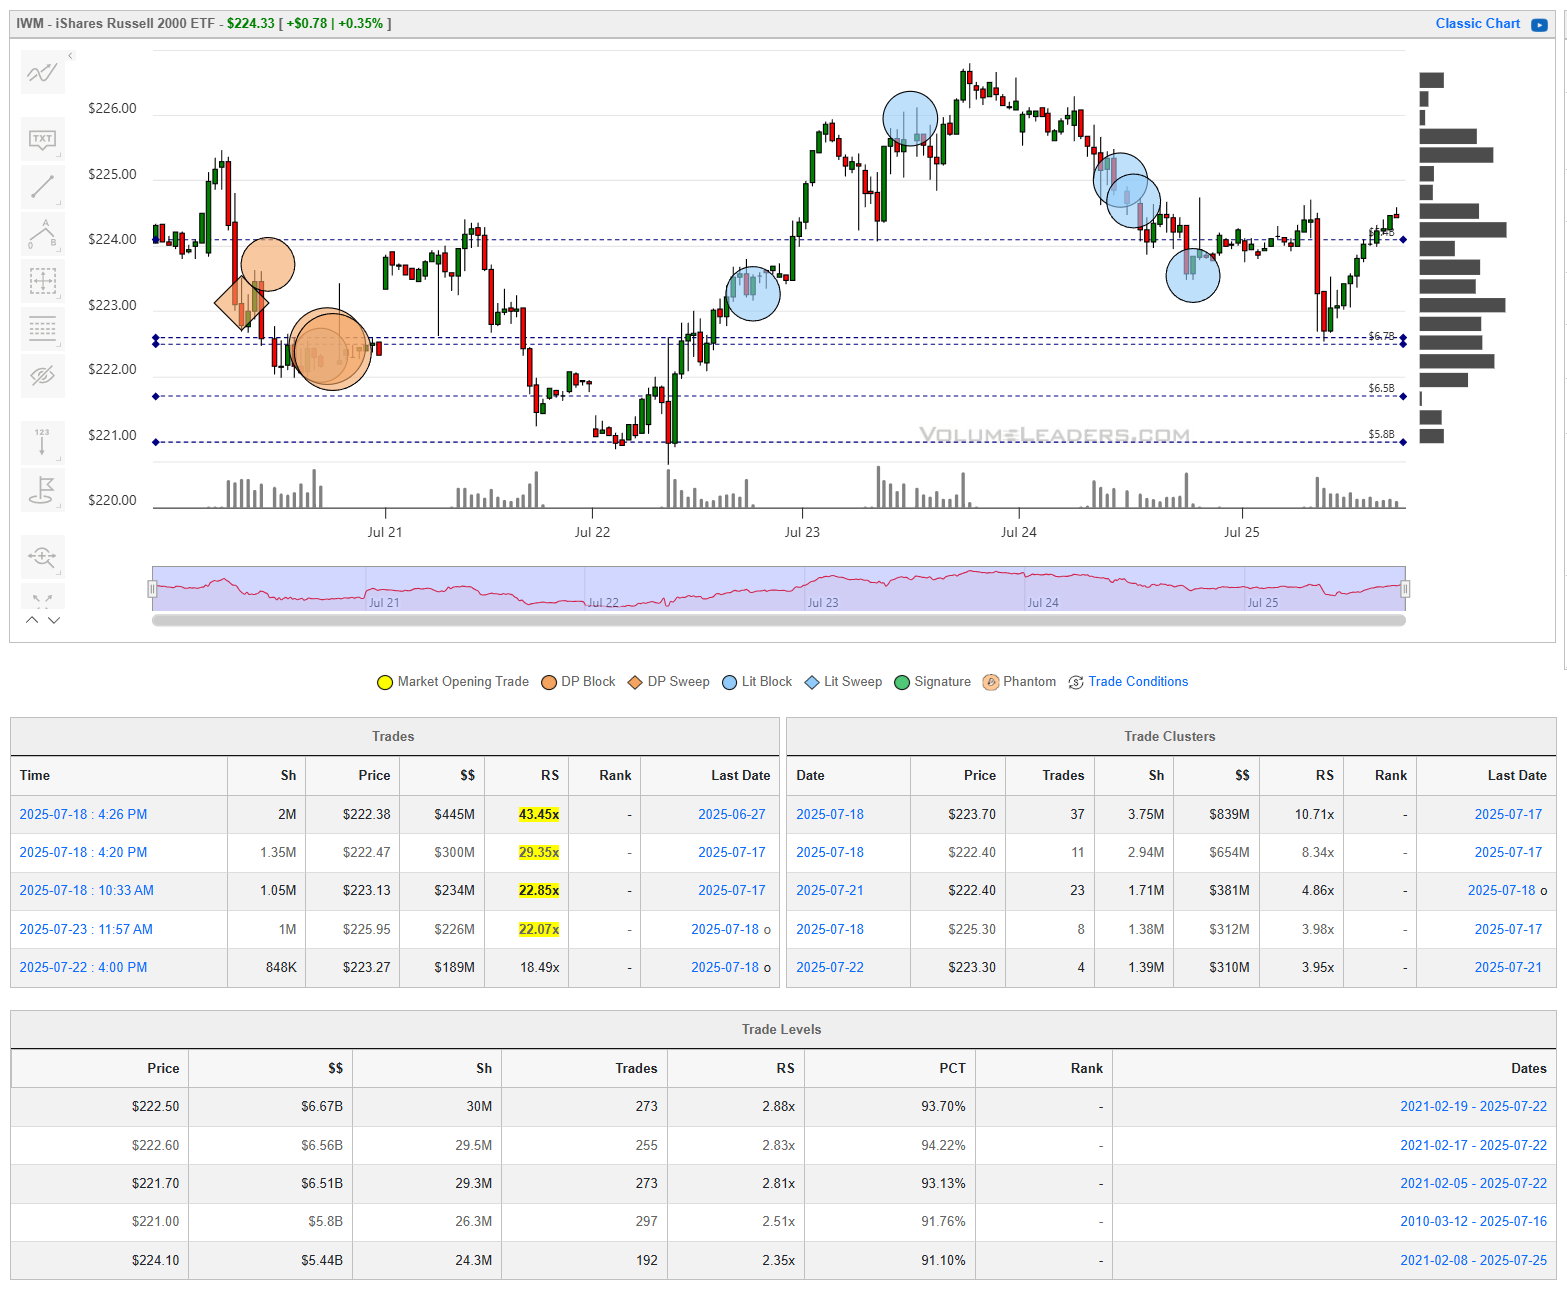
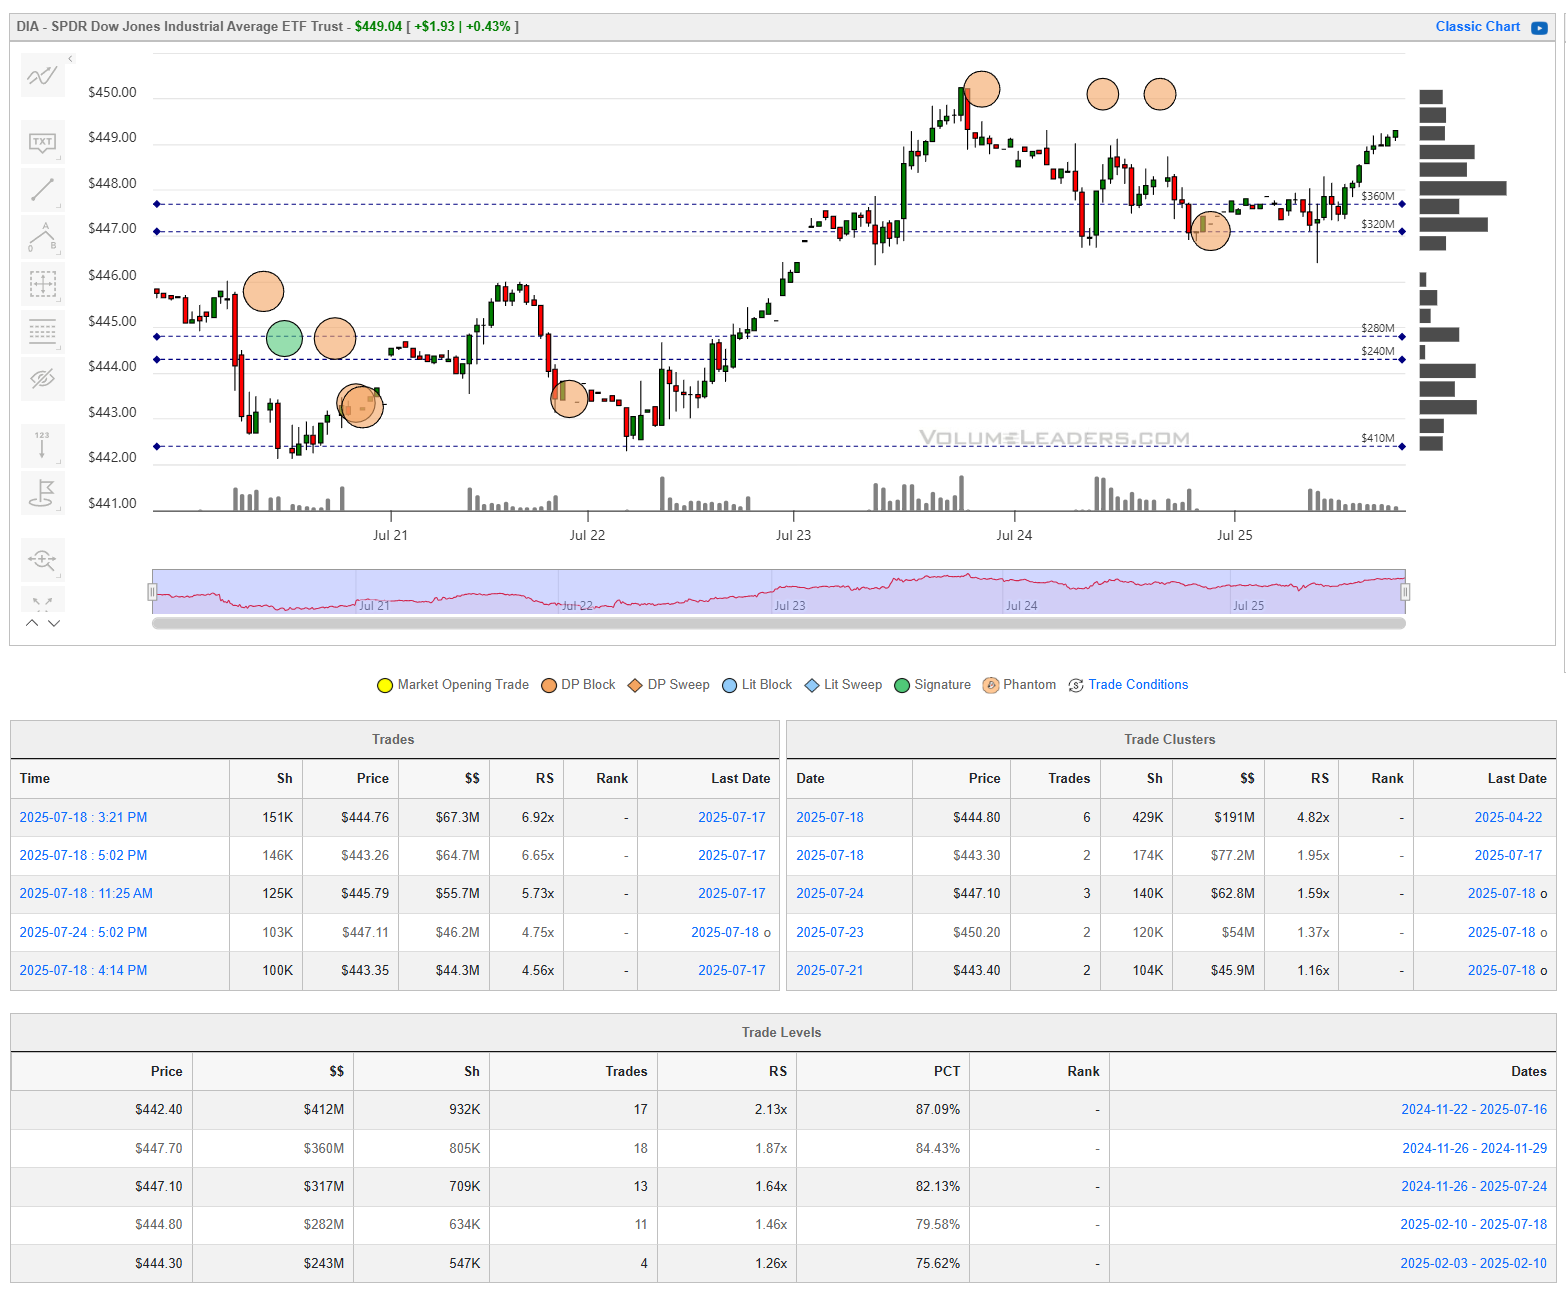
When you’re a large institutional player, your primary goal is to find liquidity - places to do a ton of business with the least amount of slippage possible. VolumeLeaders.com automatically identifies and visually plots the exact spots where institutions are doing business and where they are likely to return for more. It’s one of the primary reasons “support” and “resistance” concepts work and truly one of the reasons “price has memory” - take a look at the dashed lines in the images below that the platform plots for you automatically; these are the areas institutions constantly revisit to do more business.
Levels from the VolumeLeaders.com platform can help you formulate trades theses about:
Where to add or take profit
Where to de-risk or hedge
What strikes to target for options
Where to expect support or resistance
And this is just a small sample; there are countless ways to leverage this information into trades that express your views on the market. The platform covers thousands of tickers on multiple timeframes to accommodate all types of traders.
SPY
QQQ
IWM
DIA
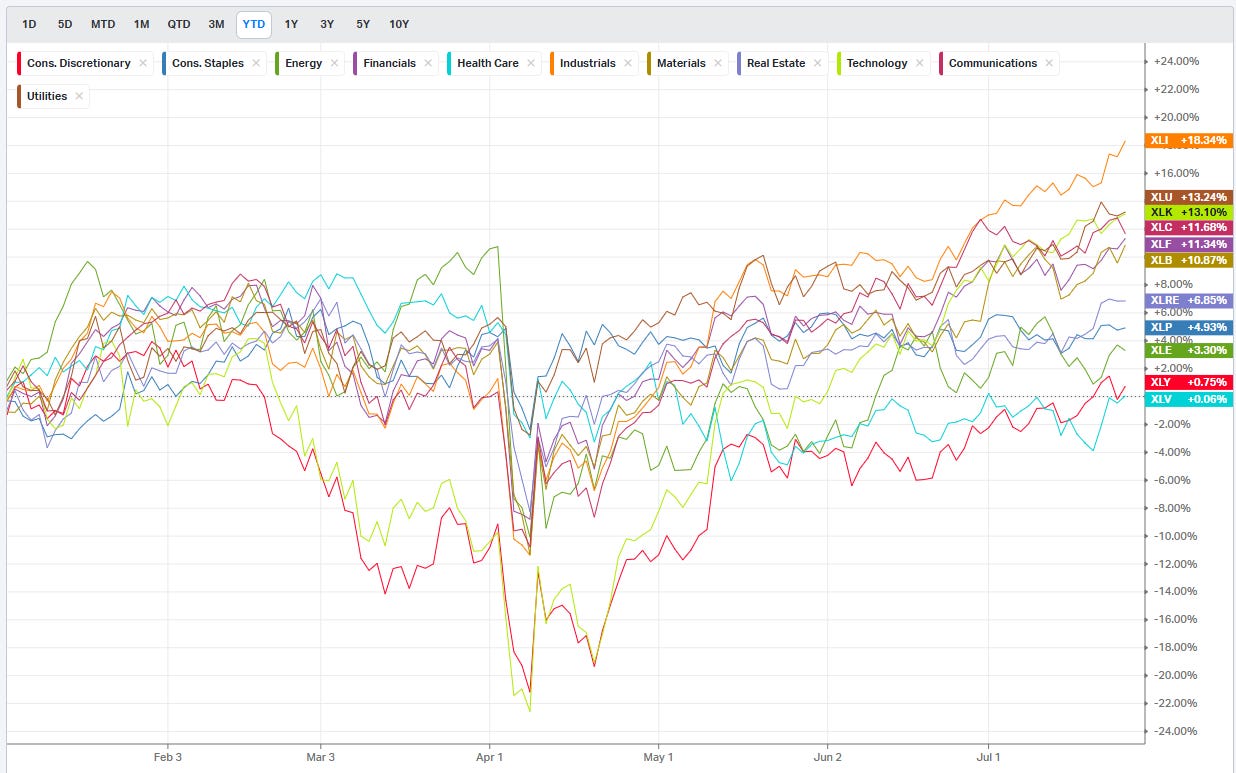
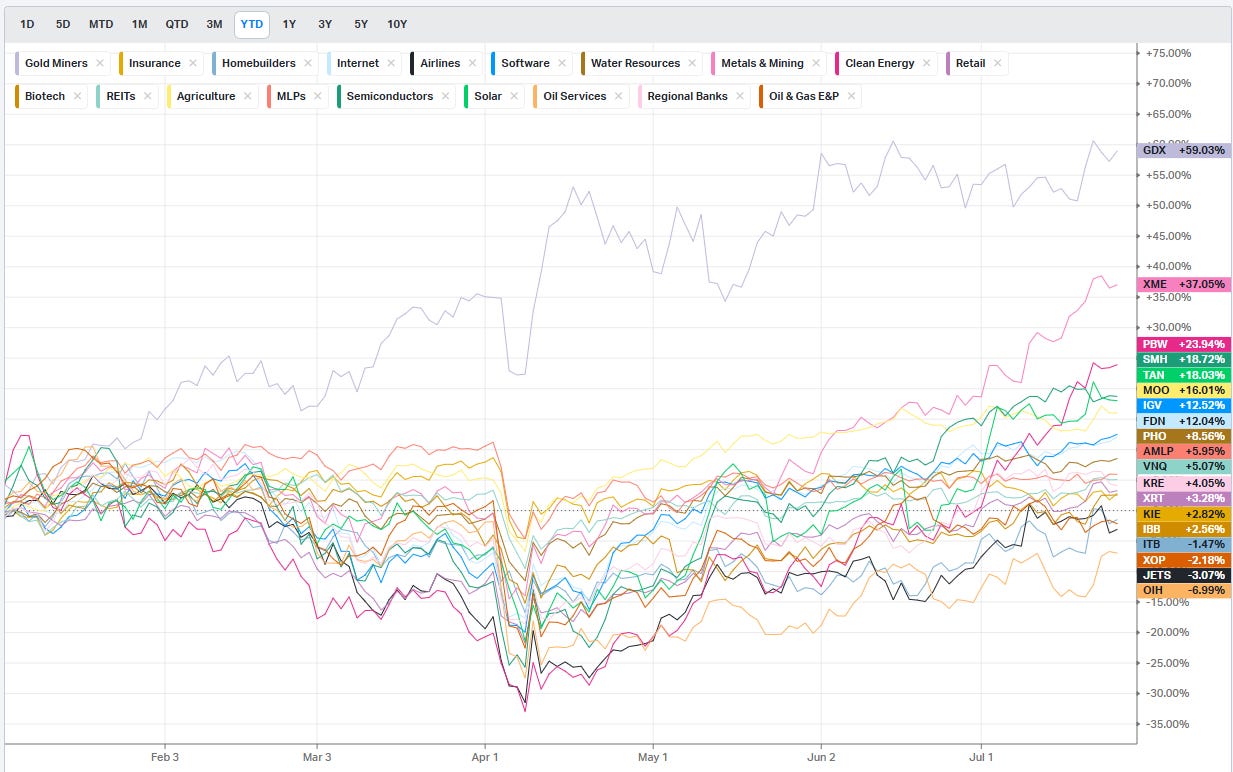
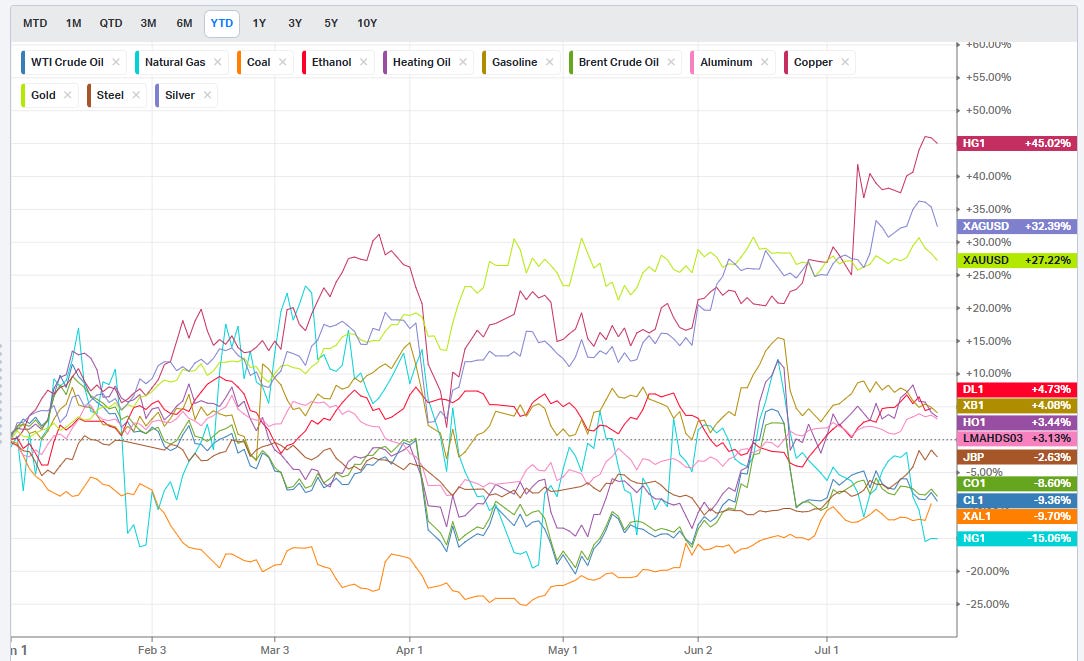
Summary Of Thematic Performance YTD
VolumeLeaders.com offers a robust set of pre-built thematic filters, allowing you to instantly explore specific market segments. These performance snapshots are provided purely for context and inspiration—think about zeroing in on the leaders and laggards within the strongest and weakest sectors, for example.
S&P By Sector
S&P By Industry
Commodities: Energy & Metals
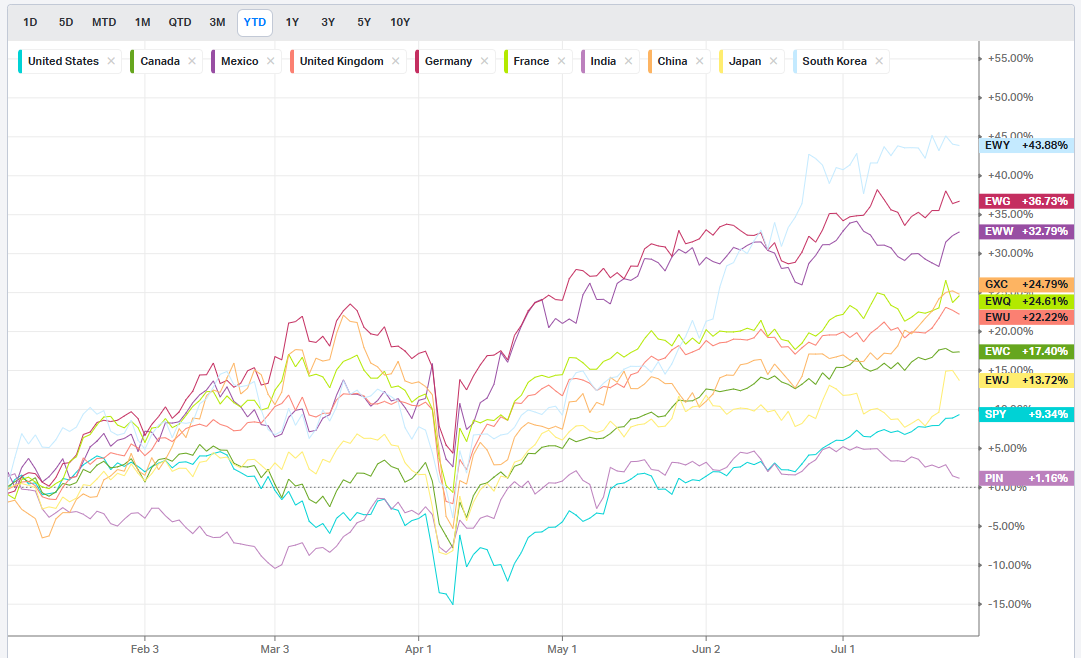
Country ETFs
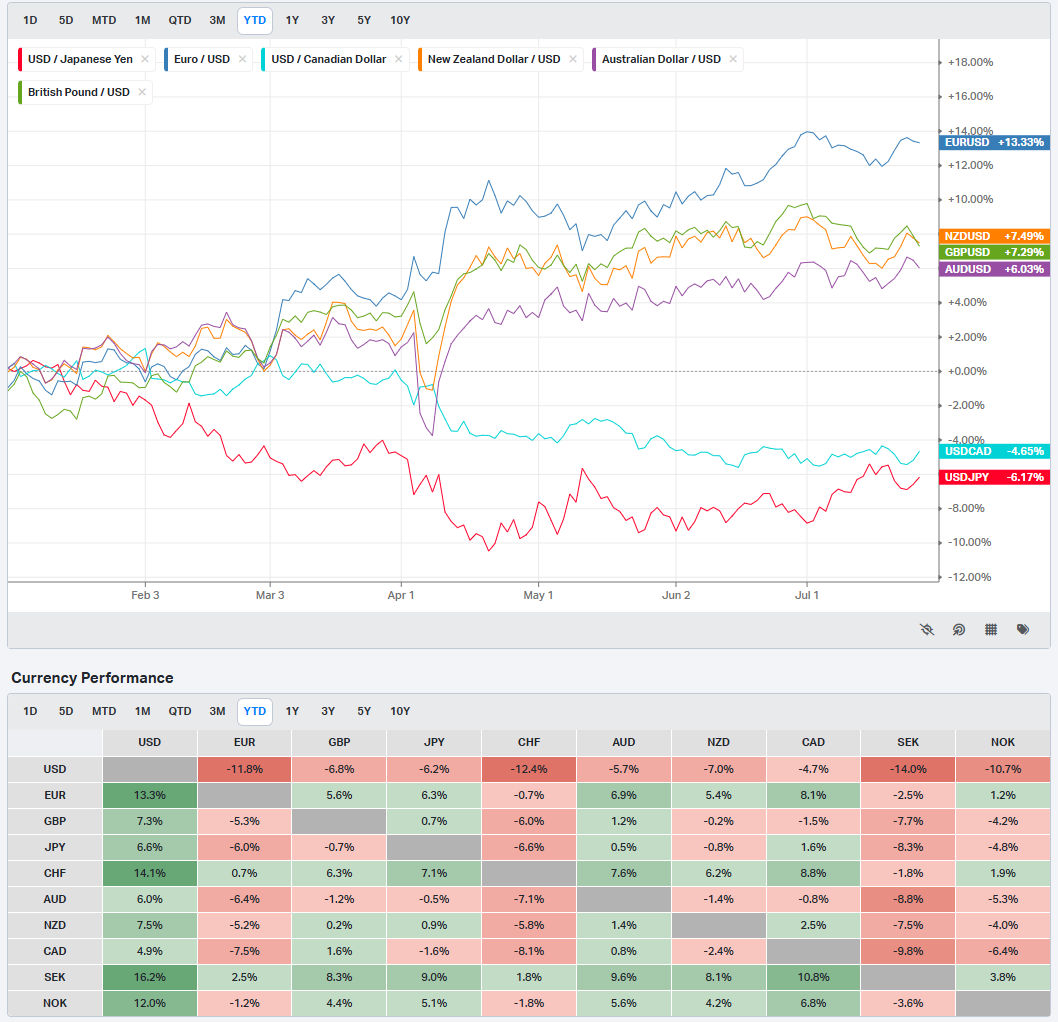
Currencies/Major FX Crosses
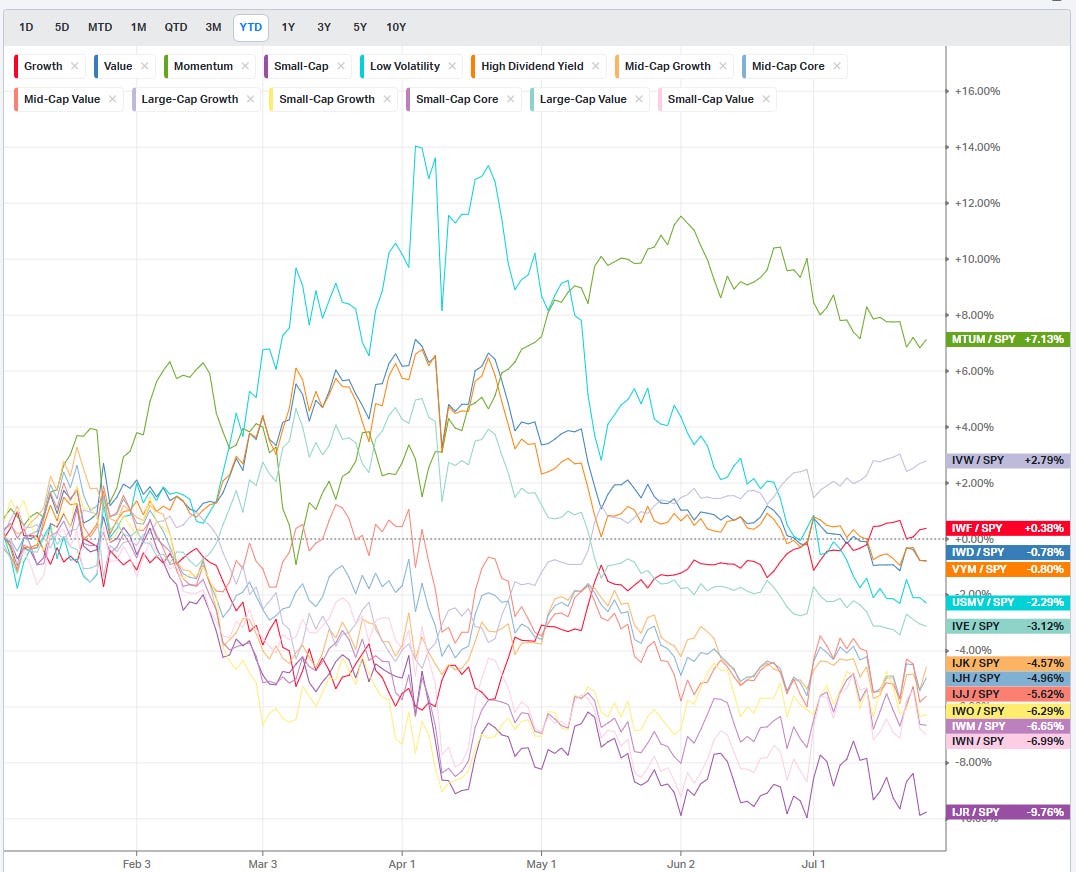
Factors: Style vs Size-vs-Value
Events On Deck This Week
Here are key events happening this week that have the potential to cause outsized moves in the market or heightened short-term volatility.
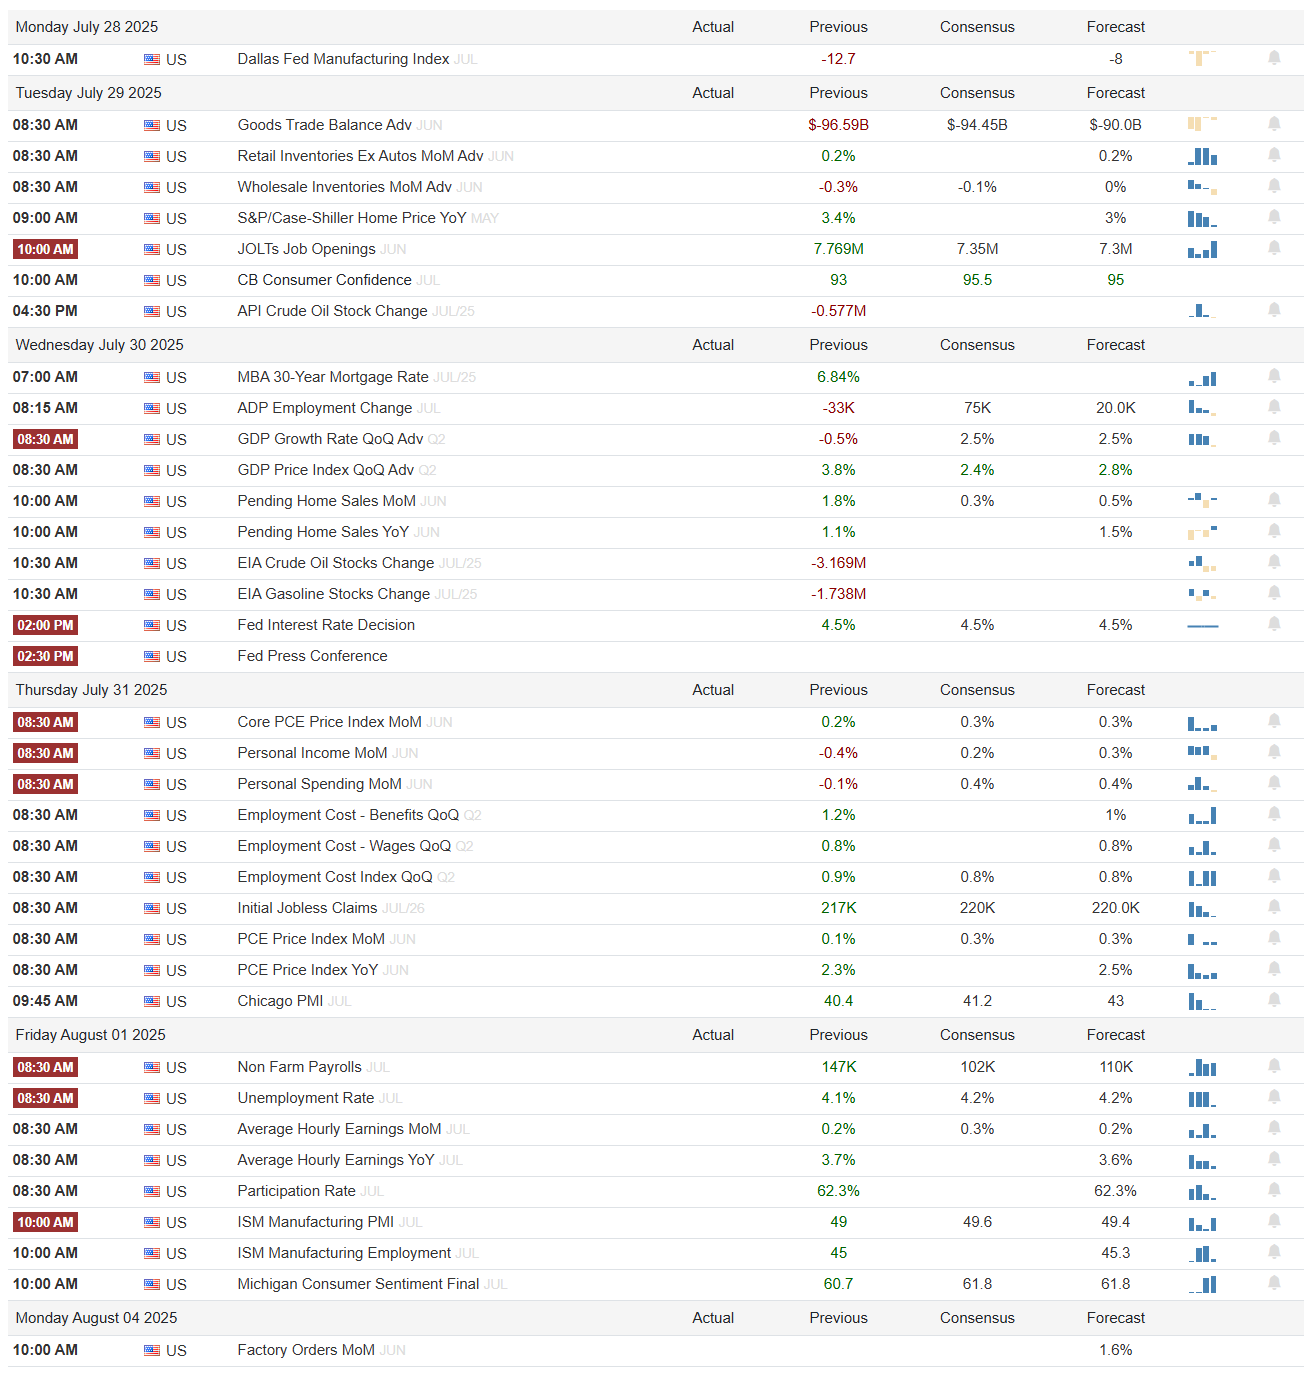
Econ Events By Day of Week
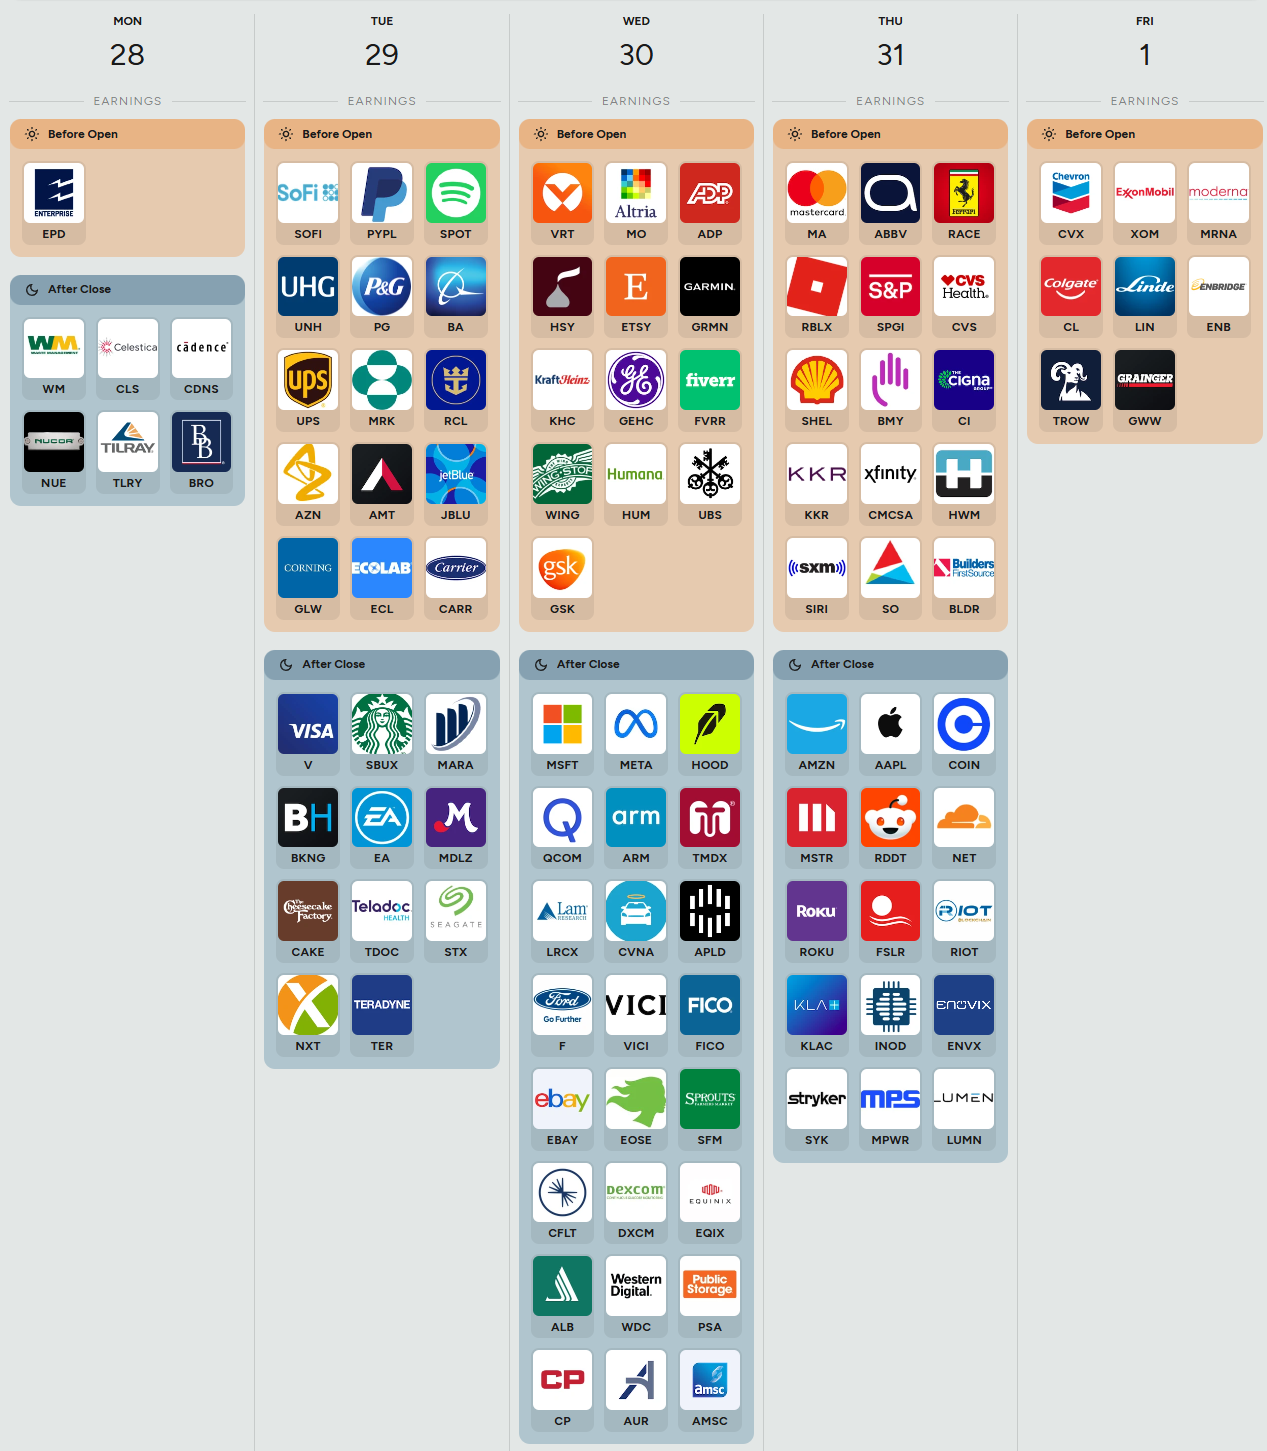
Anticipated Earnings By Day of Week

Market Intelligence Report
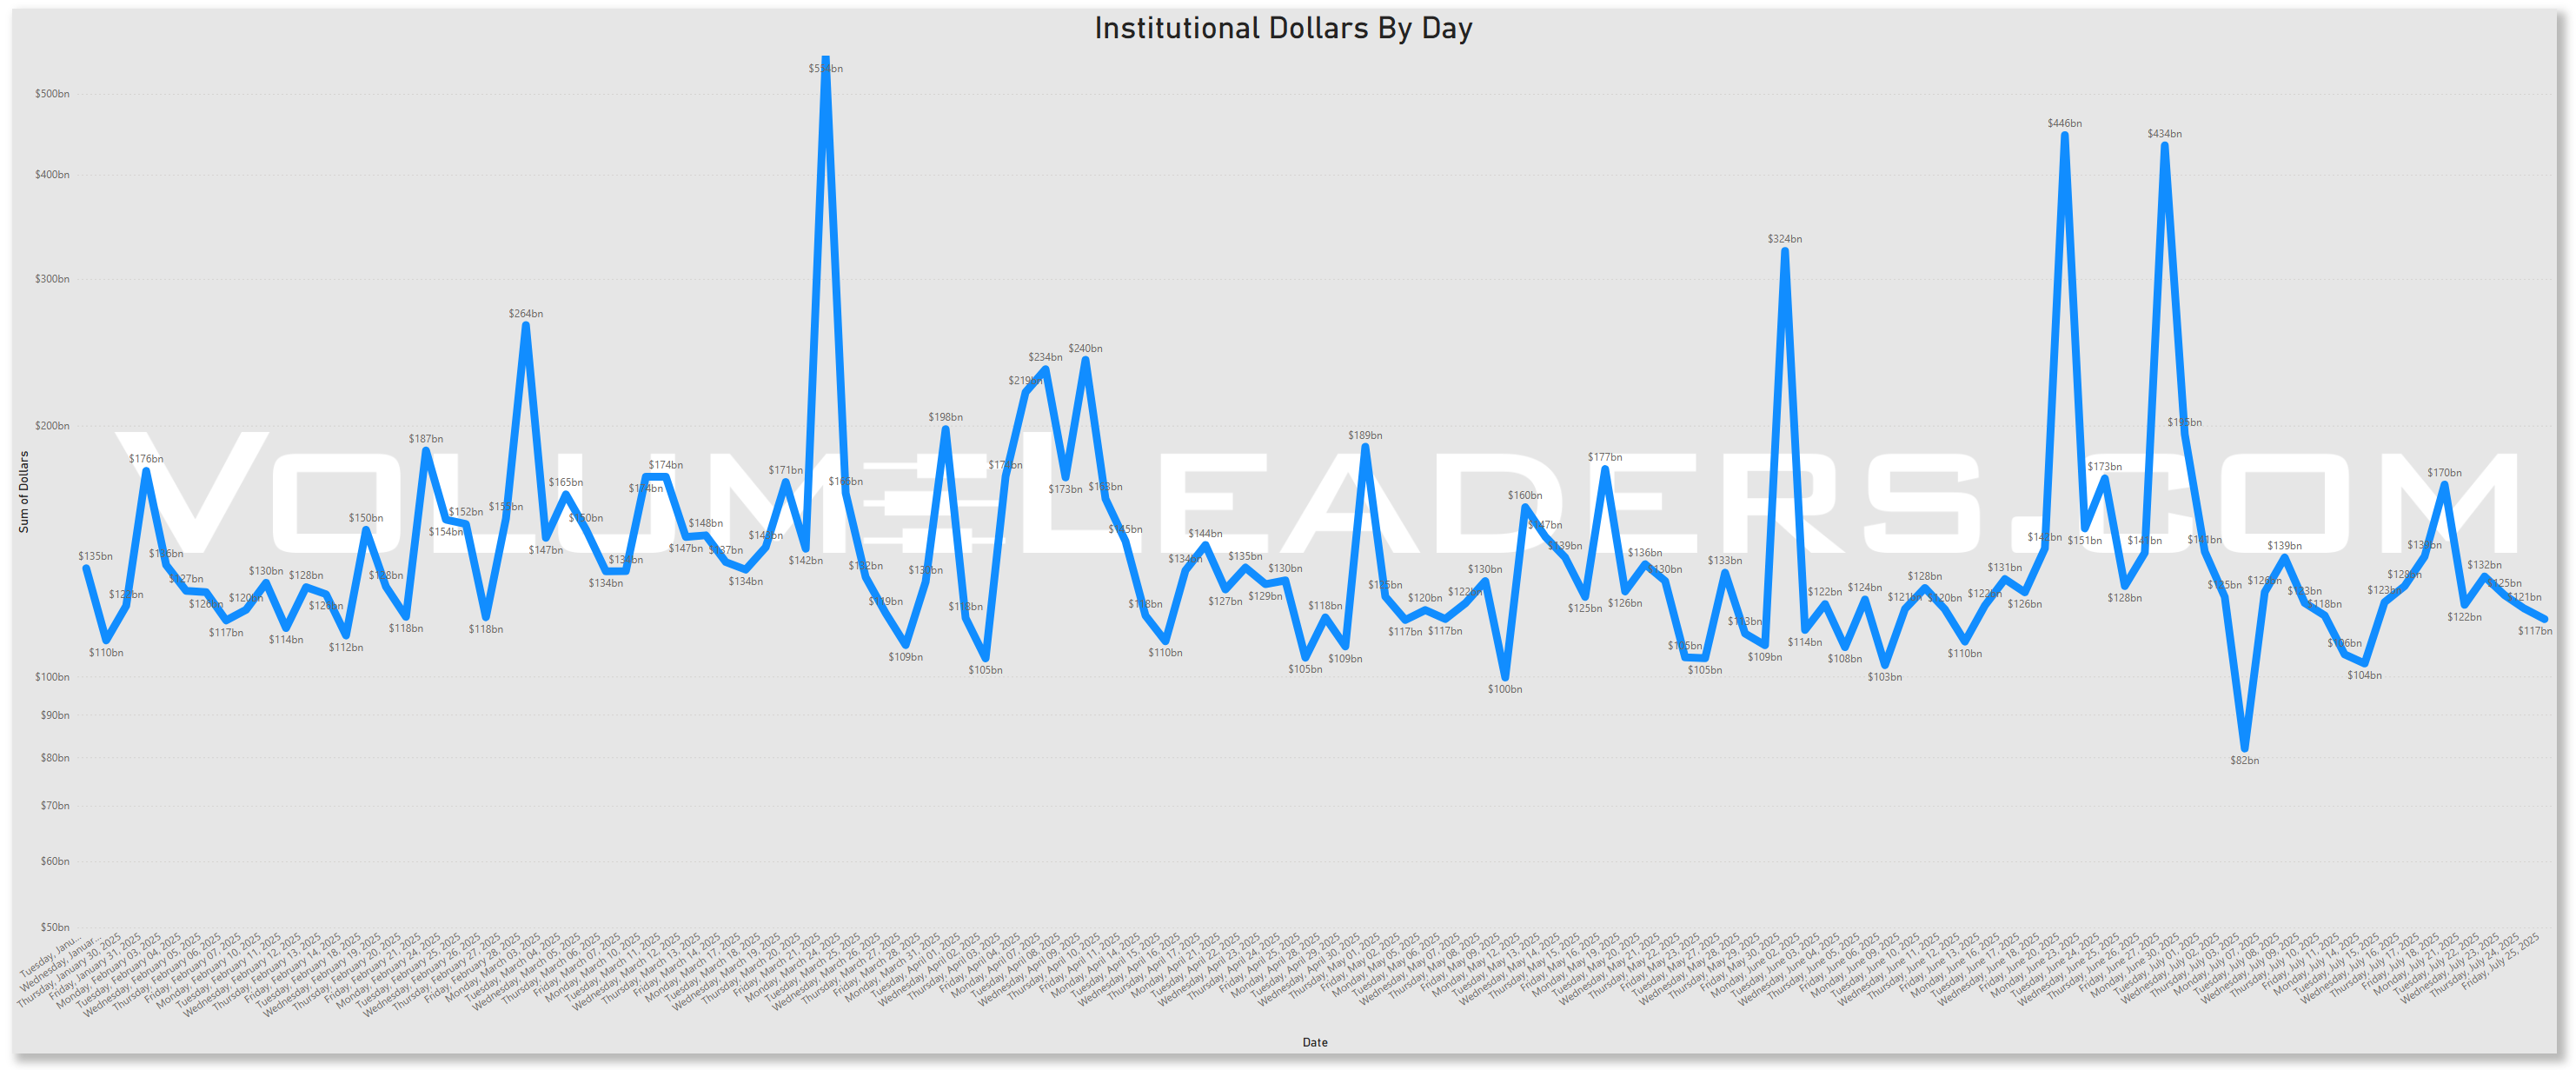
As we head into the final stretch of July, institutional dollar flow is showing measured consistency rather than urgency. With earnings season in full swing and end-of-month/beginning-of-month (EOM/BOM) flows approaching next week, this week’s positioning appears deliberate — but not aggressive.
Let’s take a closer look at what the tape is telling us.
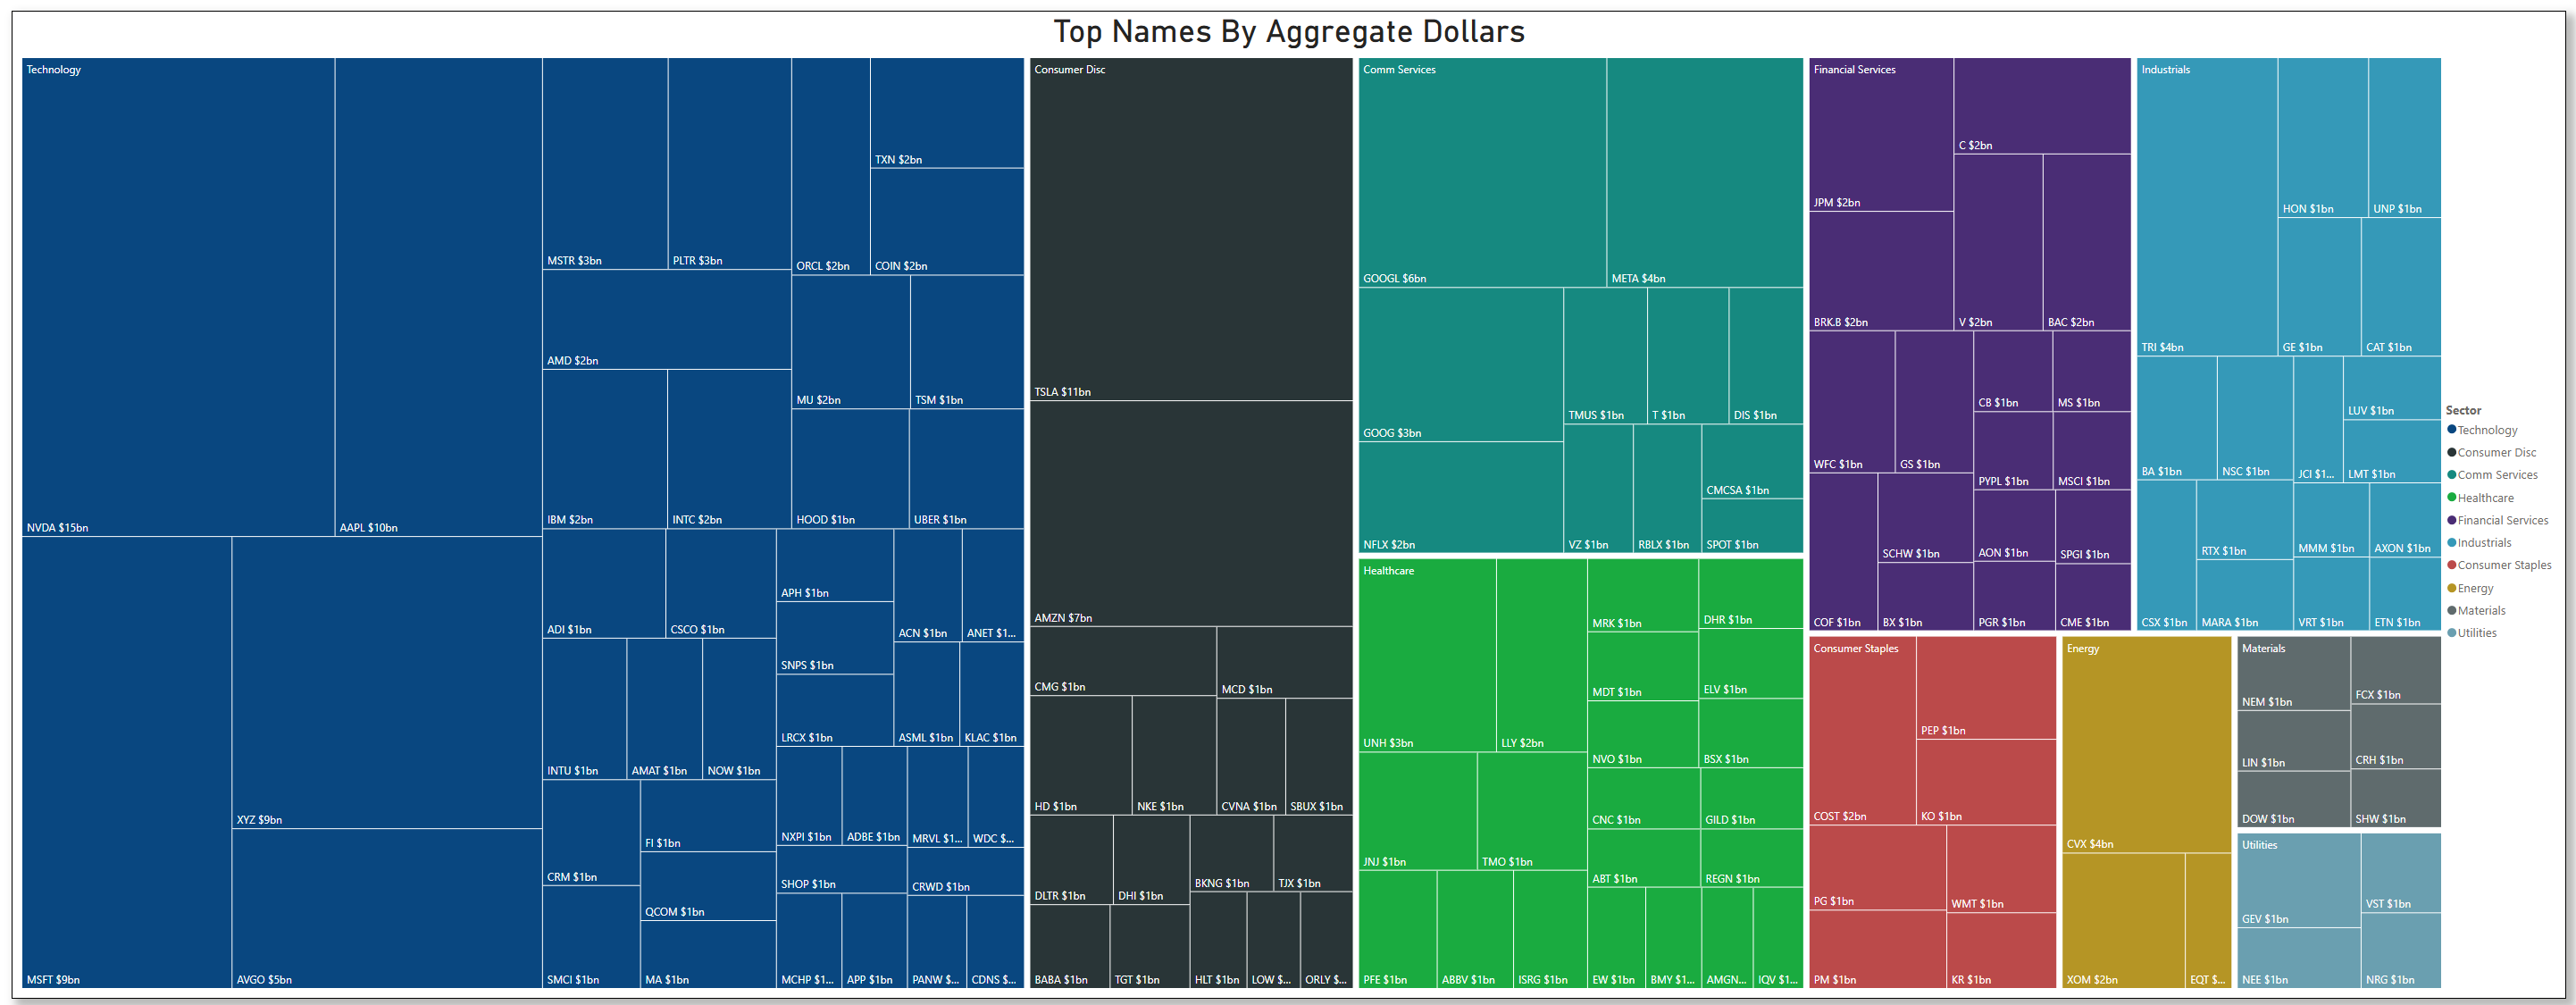
Sector-Level Flows: No Panic, No Euphoria
Daily institutional dollar flows across equity sectors have remained well within historical norms — neither collapsing nor surging.
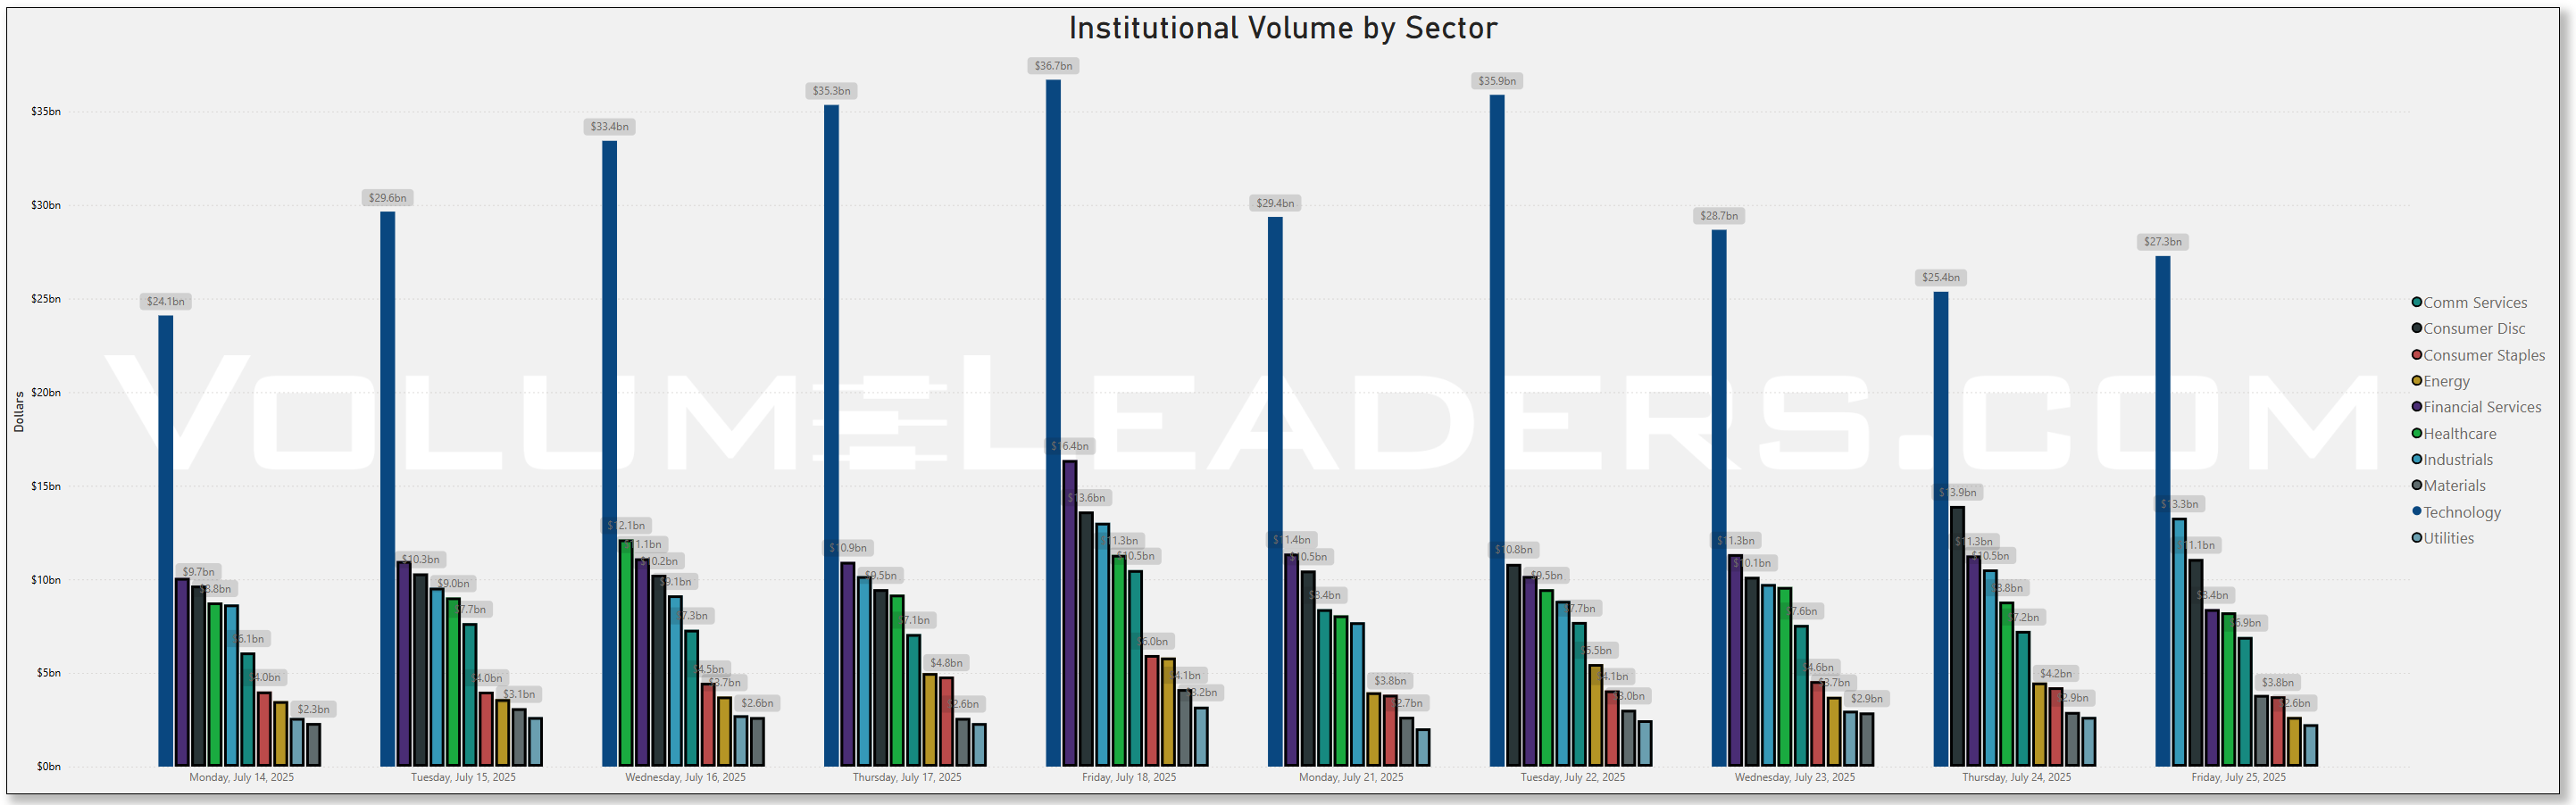
Technology, Financial Services, Consumer Discretionary, and Industrial consistently led equity flows this week.
Notably, there’s been no significant rotation out of any particular sector. Materials, Industrials, and Healthcare remained fairly stable throughout the week.
If anything, this flow behavior suggests a wait-and-see posture, likely tied to macro earnings reactions and positioning ahead of month-end portfolio balancing.
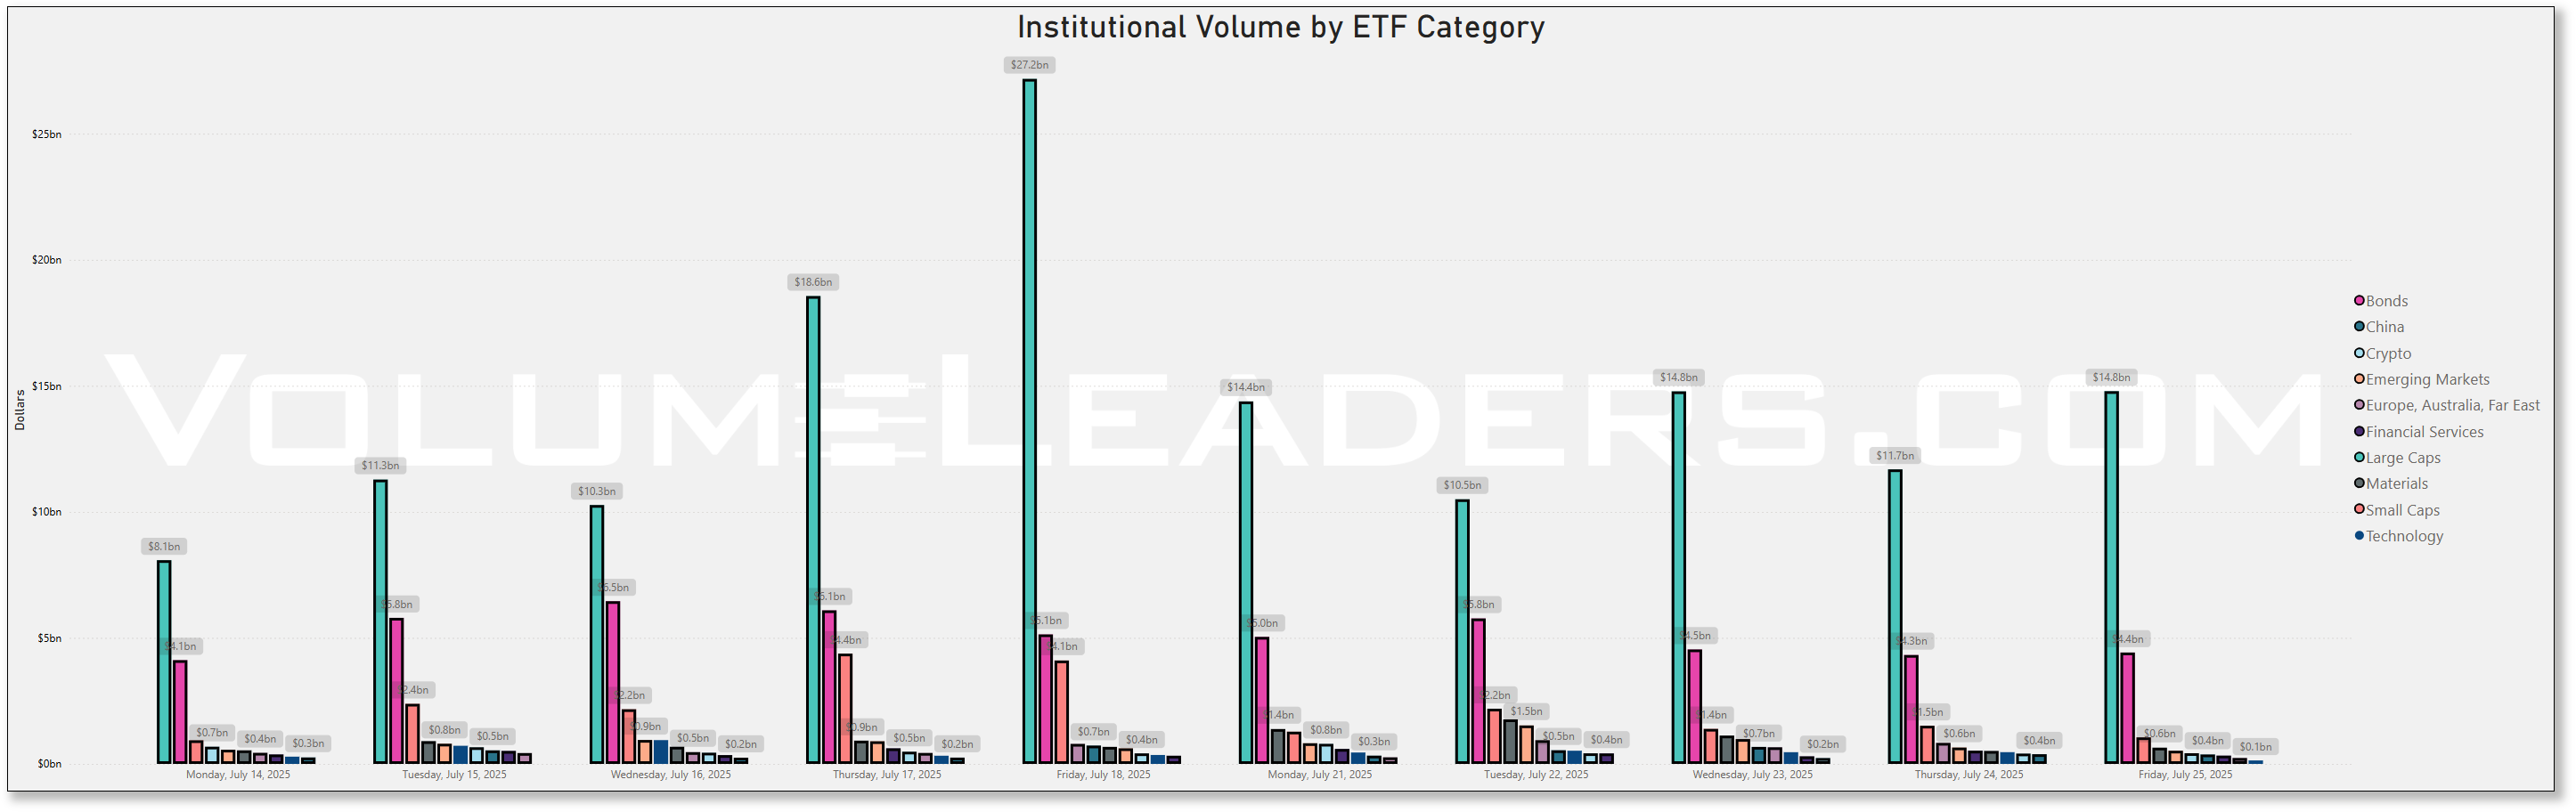
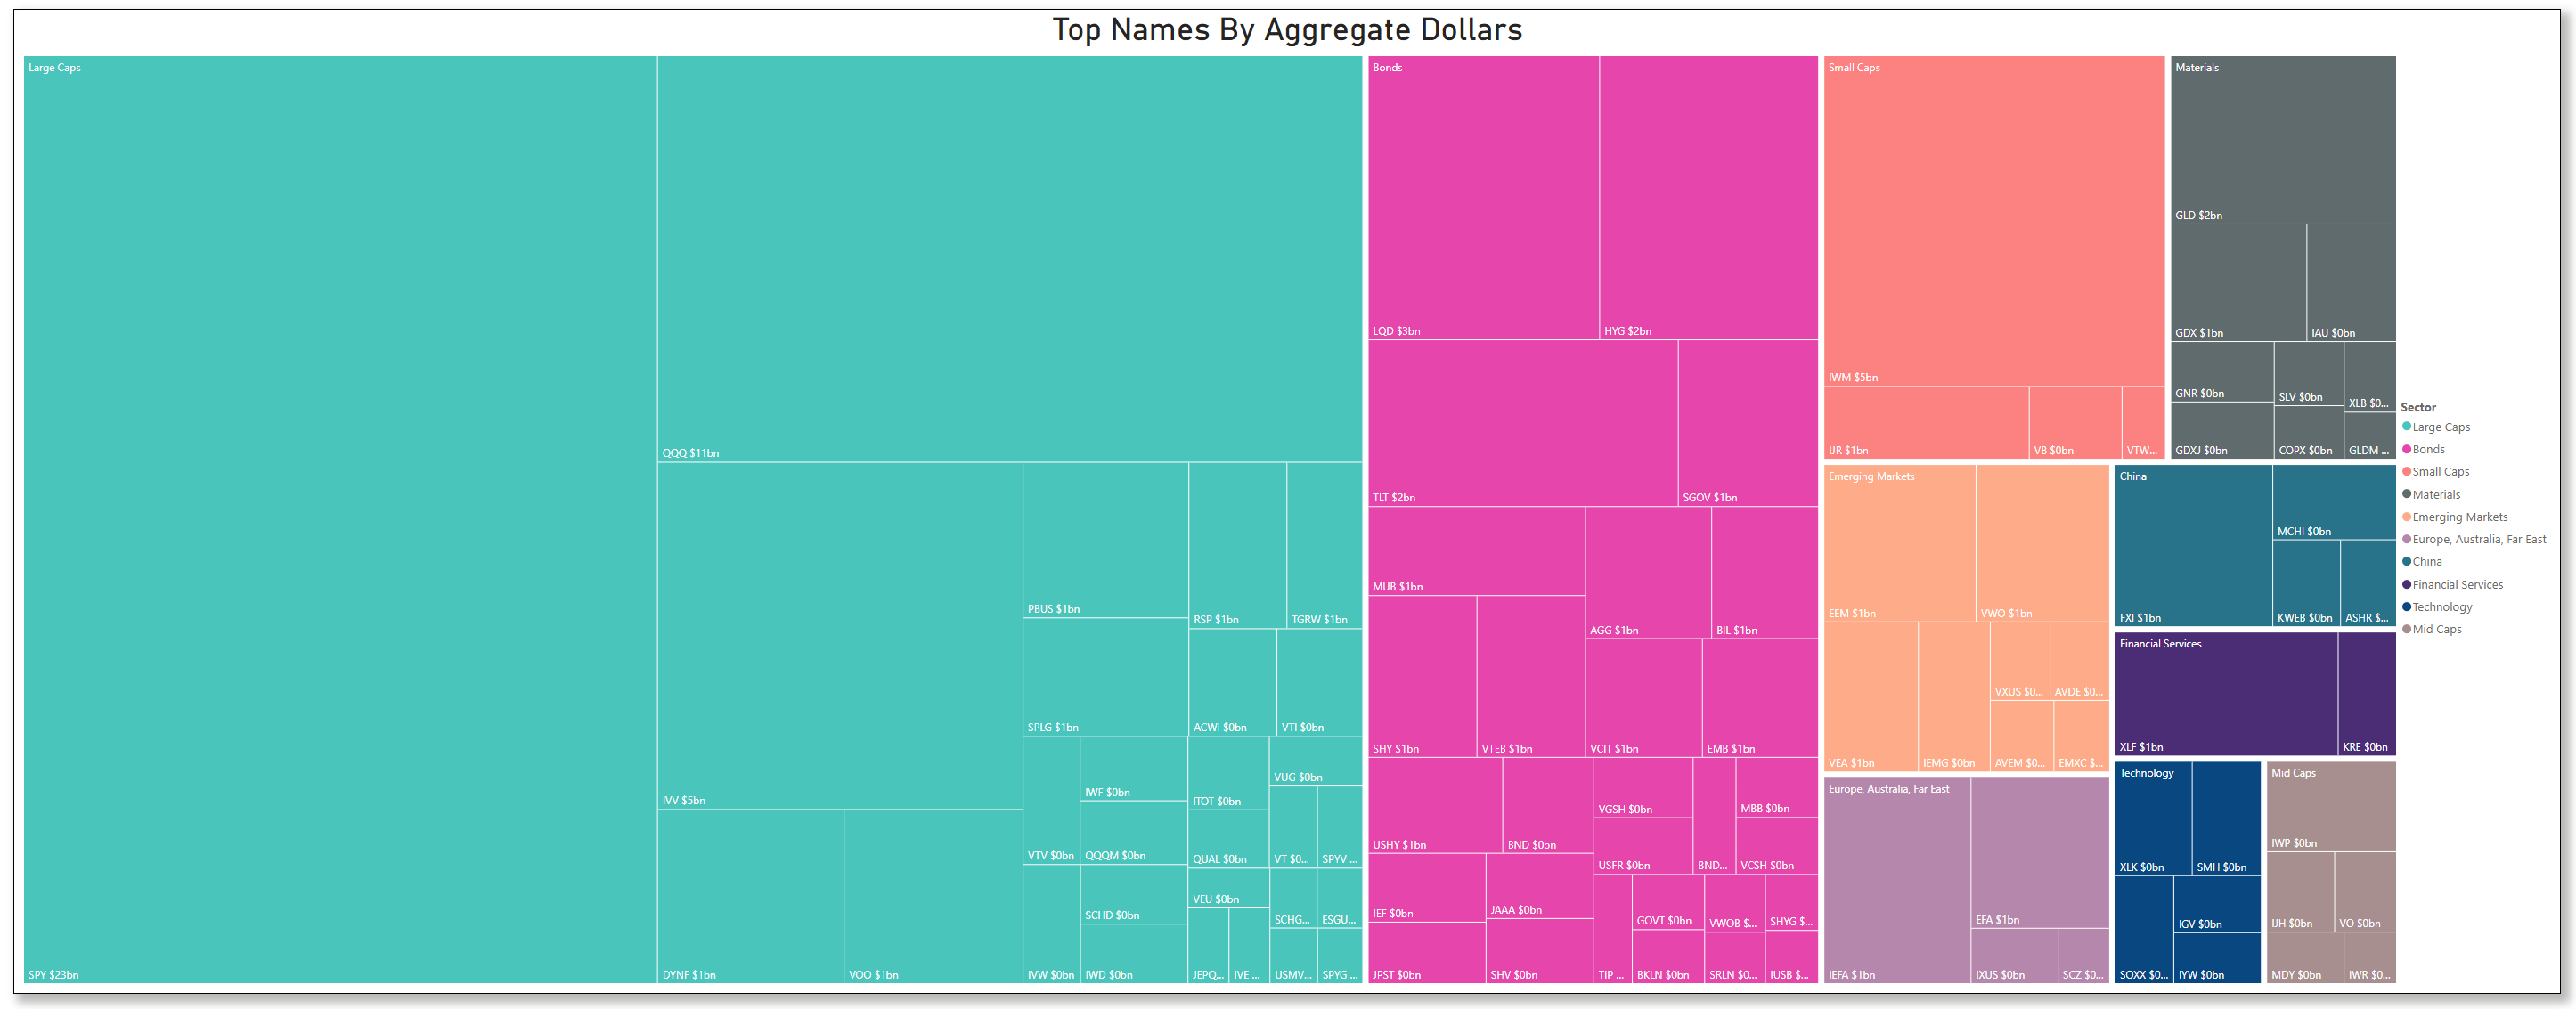
There’s no sign here of a dramatic risk-off unwind or a broad institutional chase higher. The tape is balanced — suggesting ongoing positioning, not allocation whiplash. On the ETF-side of things, after Large Caps and Bonds, Small Cap ETFs held down the number 3 spot all week:
Dark Pool Activity: Concentrated Notional Flow in a Few Megacaps
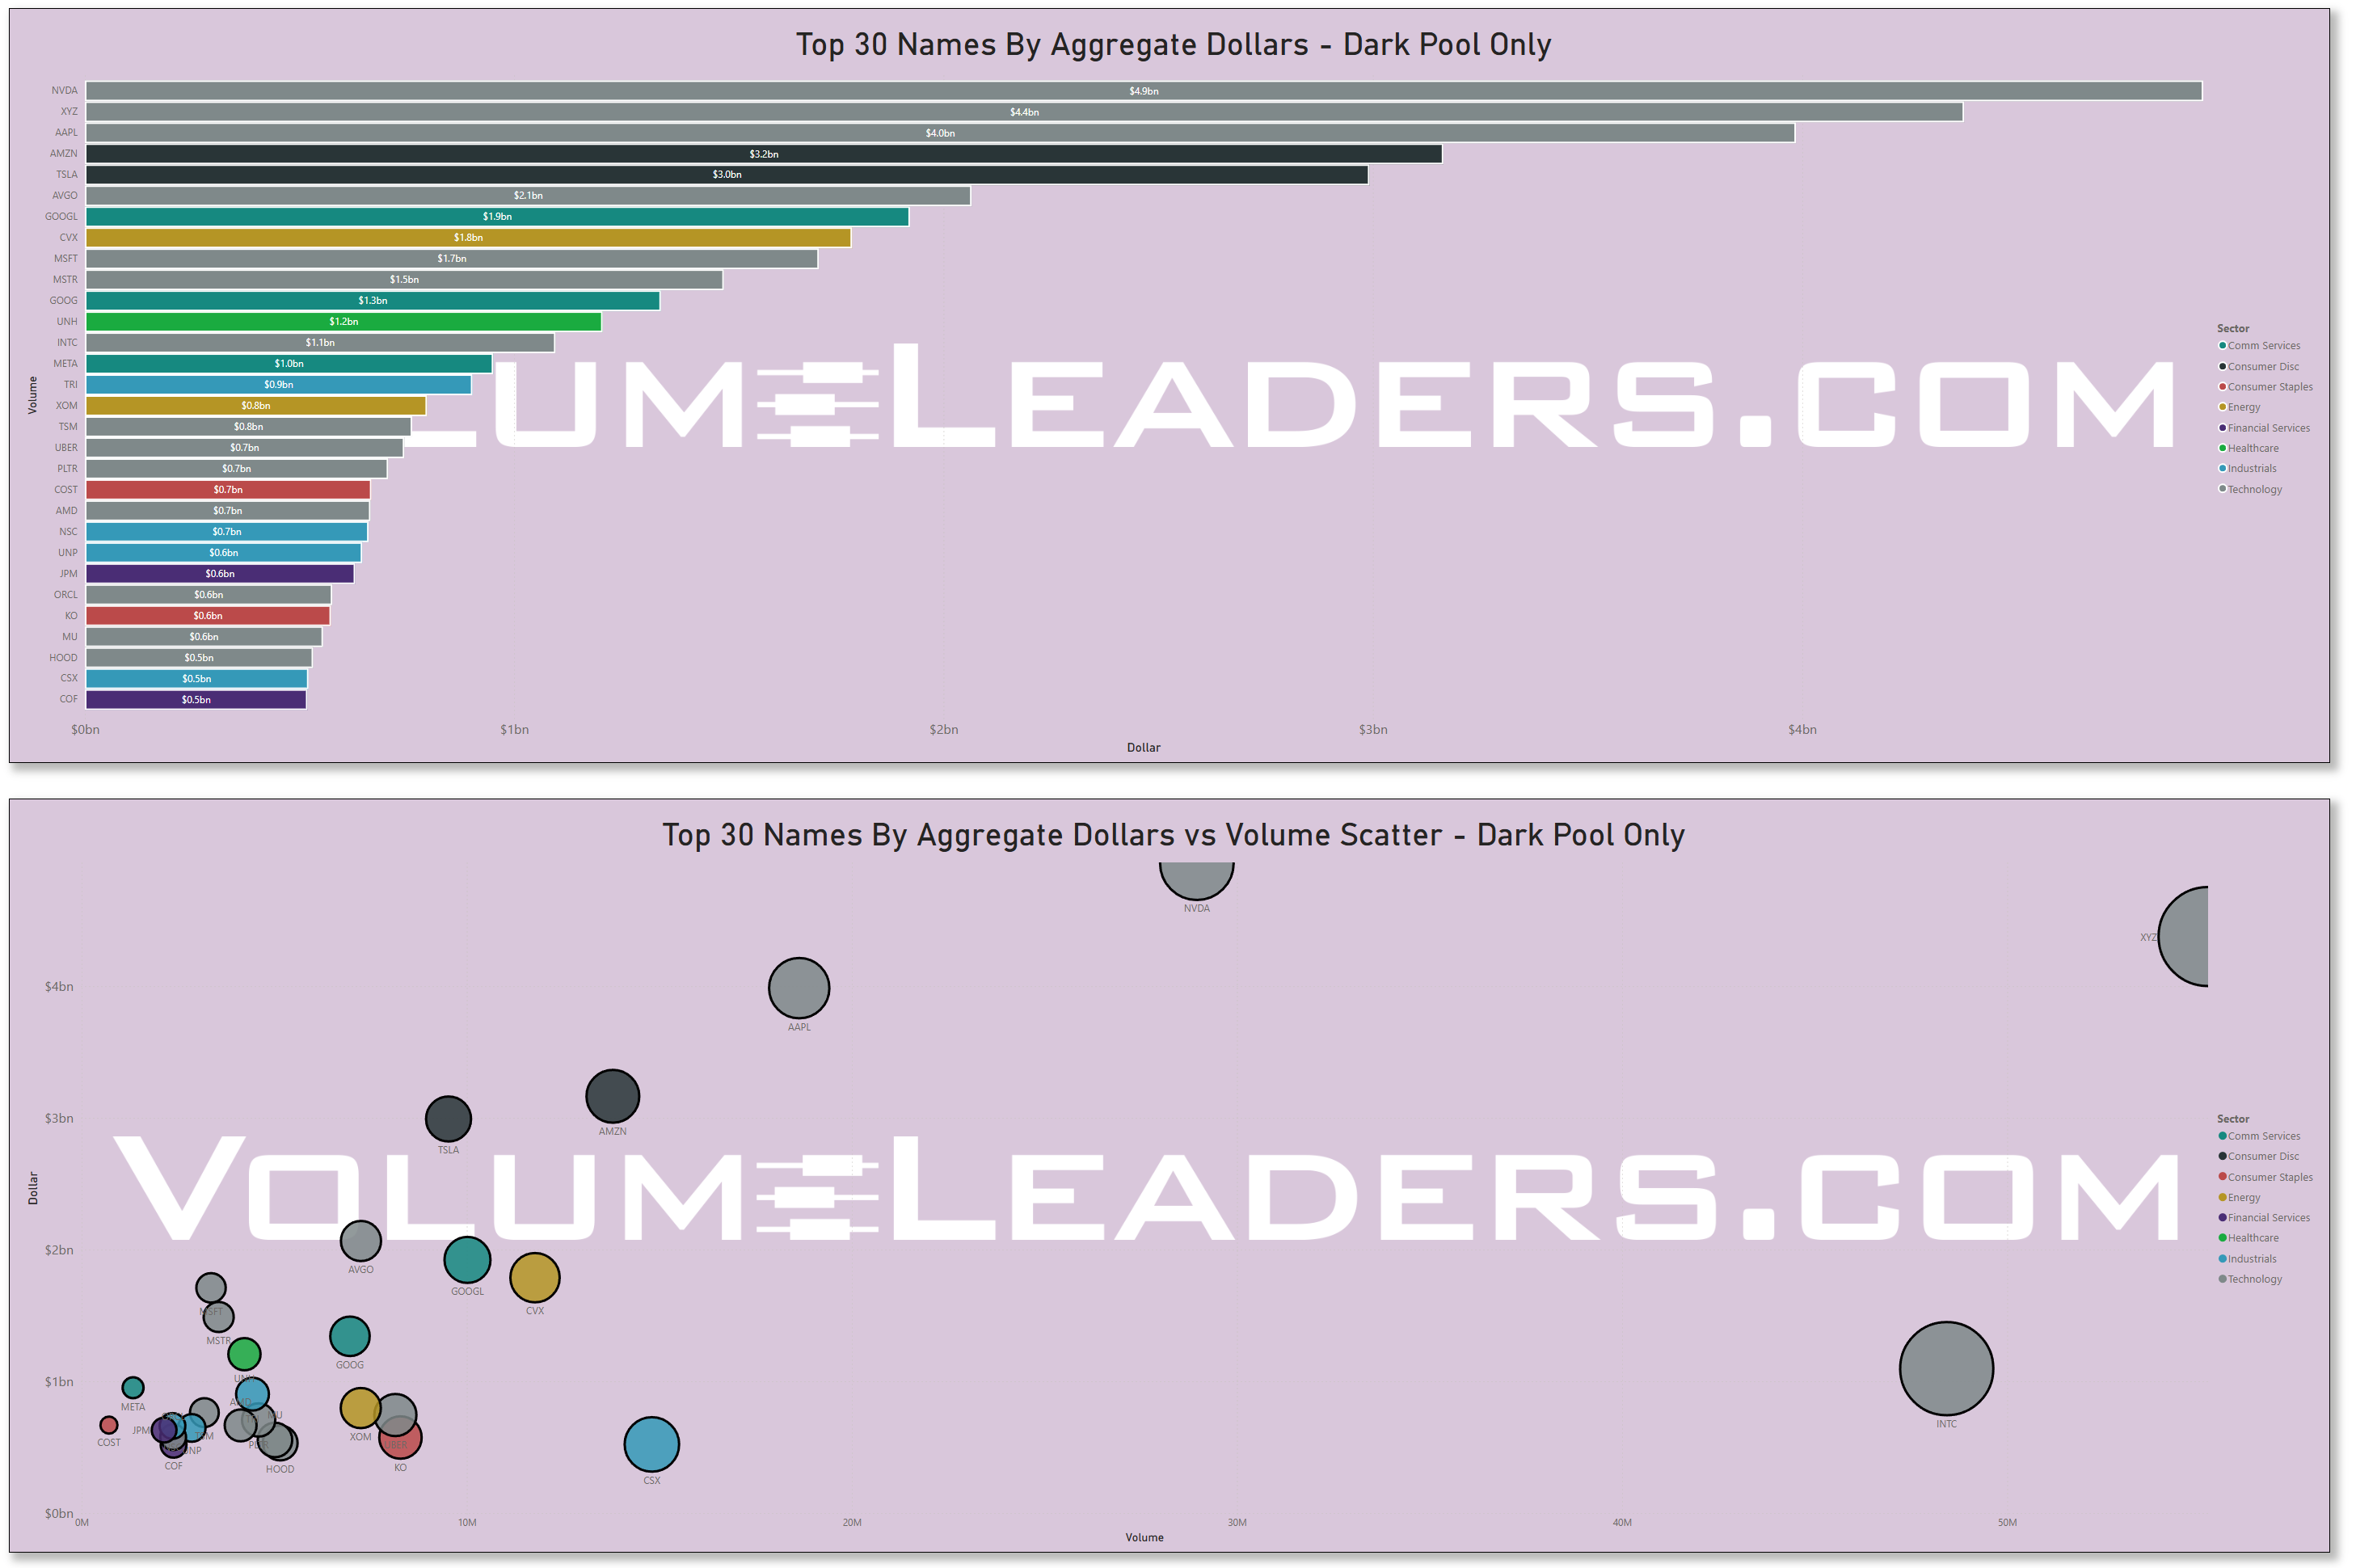
Turning to the dark pool side of the market — where institutions often transact away from lit exchanges — we see a clear concentration of notional flow in a few familiar names:
NVIDIA ($NVDA) leads with over $4.9B in dark pool flow this week.
AAPL, TSLA, and AMZN follow with flows ranging from $3B–$4B.
These flows are heavily concentrated, with the top 10 names representing the lion’s share of total dark pool dollars.
From the scatter plot, these same names also reflect large bubble sizes and relatively high dollar-per-volume ratios — confirming that position sizes are large relative to their traded volume.
INTC and XYZ are a couple of new names joining the ranks of weekly regulars. XYZ may be related to Cathie Woods’ decision to trim-up positions in Block as well as several crypto positions for a strategic repositioning in BMNR. INTC’s new CEO Lip-Bu Tan announced plans to sell off its networking unit amidst vast restructuring for the troubled chip-maker.
Sweeps: Tactical Positioning in Tesla, Nvidia, Uber
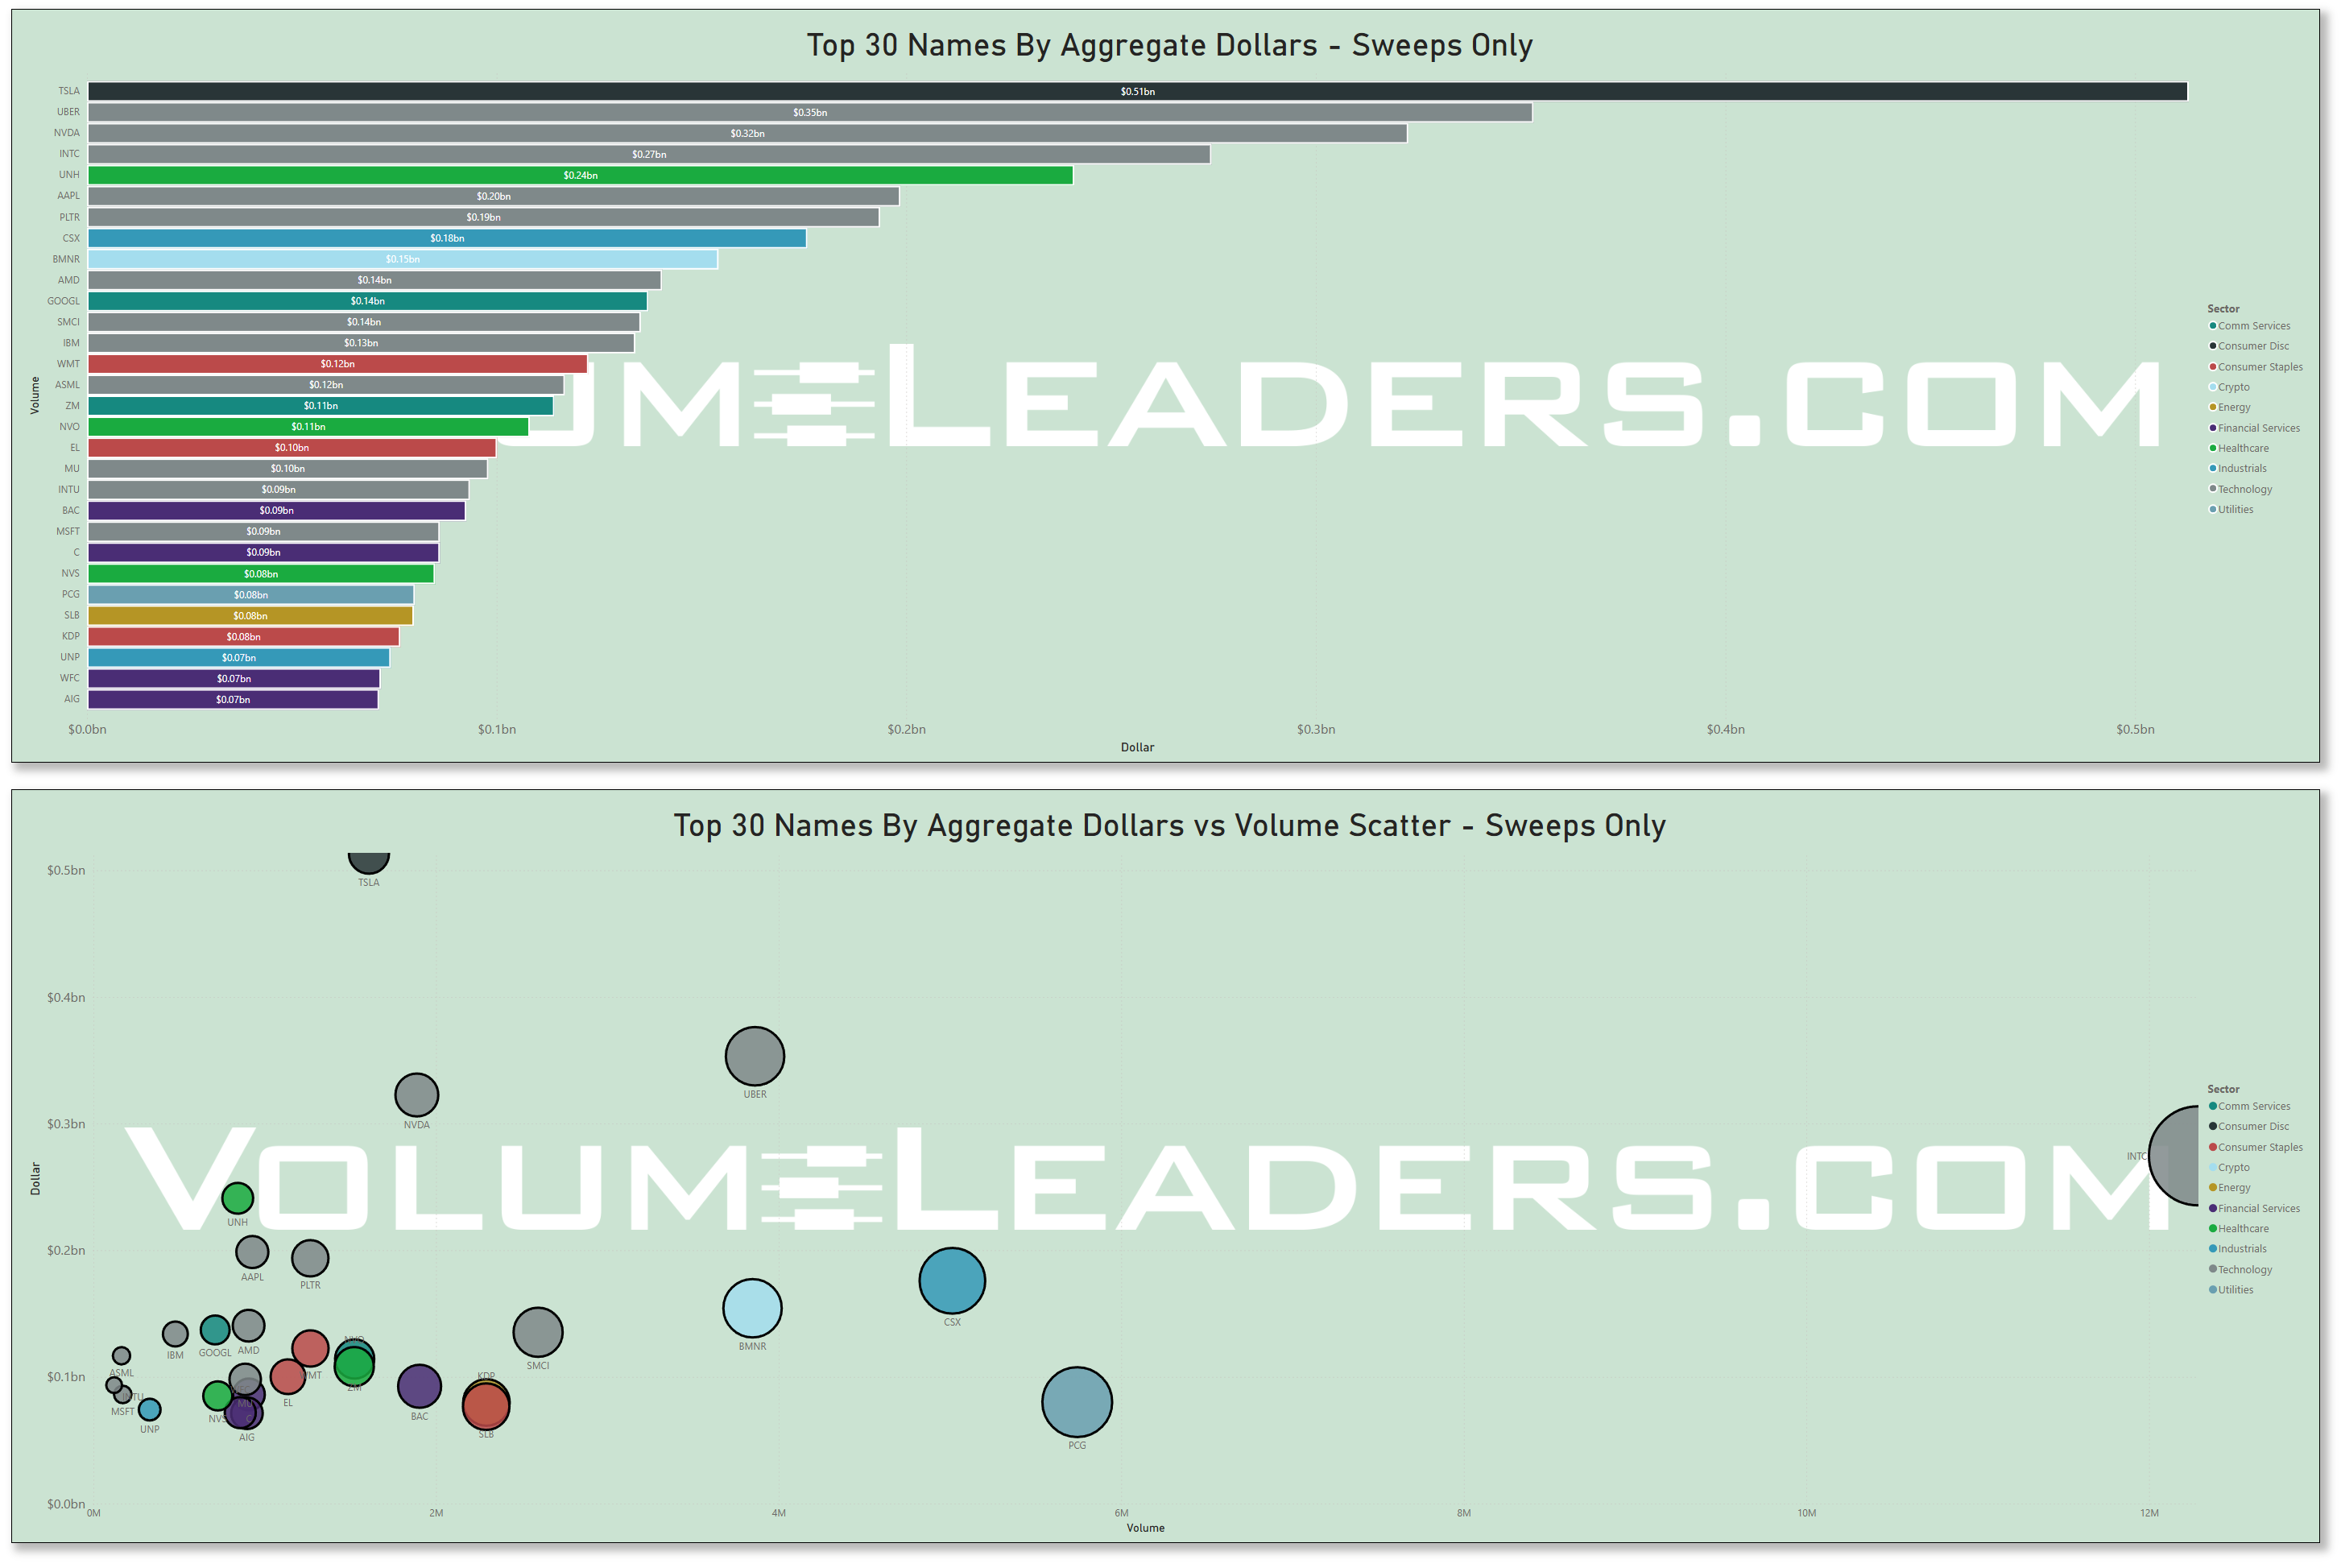
Sweep orders — which prioritize speed and execution across multiple exchanges — offer a window into tactical intent.
TSLA led all sweep activity with nearly $0.5B in sweep dollar volume; they reported a second straight quarter sales miss earlier in the week.
NVDA, AAPL, and UBER also saw significant sweep participation.
Other names like CVX, GOOG, and META round out the top 10.
In contrast to dark pool activity, which tends to reflect strategic sizing, sweep activity is generally more tactical — suggesting institutions are making time-sensitive bets in a specific subset of names. The distribution here is wider, with more mid-cap and cyclical names showing up (e.g., SMCI, CNC, PGC), pointing to broader participation at the edges of the market. UNH, which is still reeling from a slew of bad news, casually made a #5 appearance this week.
Notably, many of these names overlap with those found in the dark pool data, indicating multi-modal positioning — both passive and aggressive — in the same stocks.
Context & Outlook
We’re in the second half of July, and this week’s positioning activity reflects three key contextual backdrops:
Earnings Season:
Investors are absorbing results and guidance before making wholesale adjustments. Flow is steady but not impulsive, suggesting an openness to pivot post-earnings if needed.Month-End Rebalancing:
With EOM/BOM flows due next week, there may be some purposeful holding back. Large allocators often wait for performance data and volatility signals before executing bigger rebalance trades.Megacap Gravity:
NVDA, AAPL, TSLA, AMZN — the same cohort continues to attract the bulk of institutional attention. This likely reflects their liquidity, relevance in earnings season, and weight in key indices.
Takeaways
No directional conviction shift yet: The aggregate flow data shows stability, not a rotation or risk-off panic. It’s more tactical than thematic — for now.
Positioning is active, and broad
Prepare for next week: With earnings in full swing and end-of-month flows coming, the relatively calm surface could give way to sharper adjustments soon.
Final Note:
This week’s tape was informative not for its extremes, but for its restraint. Institutions are engaged but not broadly reactive. The next move likely hinges on macro catalysts, earnings reactions, and allocation decisions at month-end.
Individual Names with Institutional Interest
VolumeLeaders tracks several proprietary signals designed to spotlight names drawing significant institutional interest. Below, we’ve surfaced the latest results and analyzed them in aggregate to highlight emergent themes. If any of the sectors, narratives, or positioning trends resonate, the names mentioned here offer a strong starting point for deeper research and watchlist consideration in the days ahead.
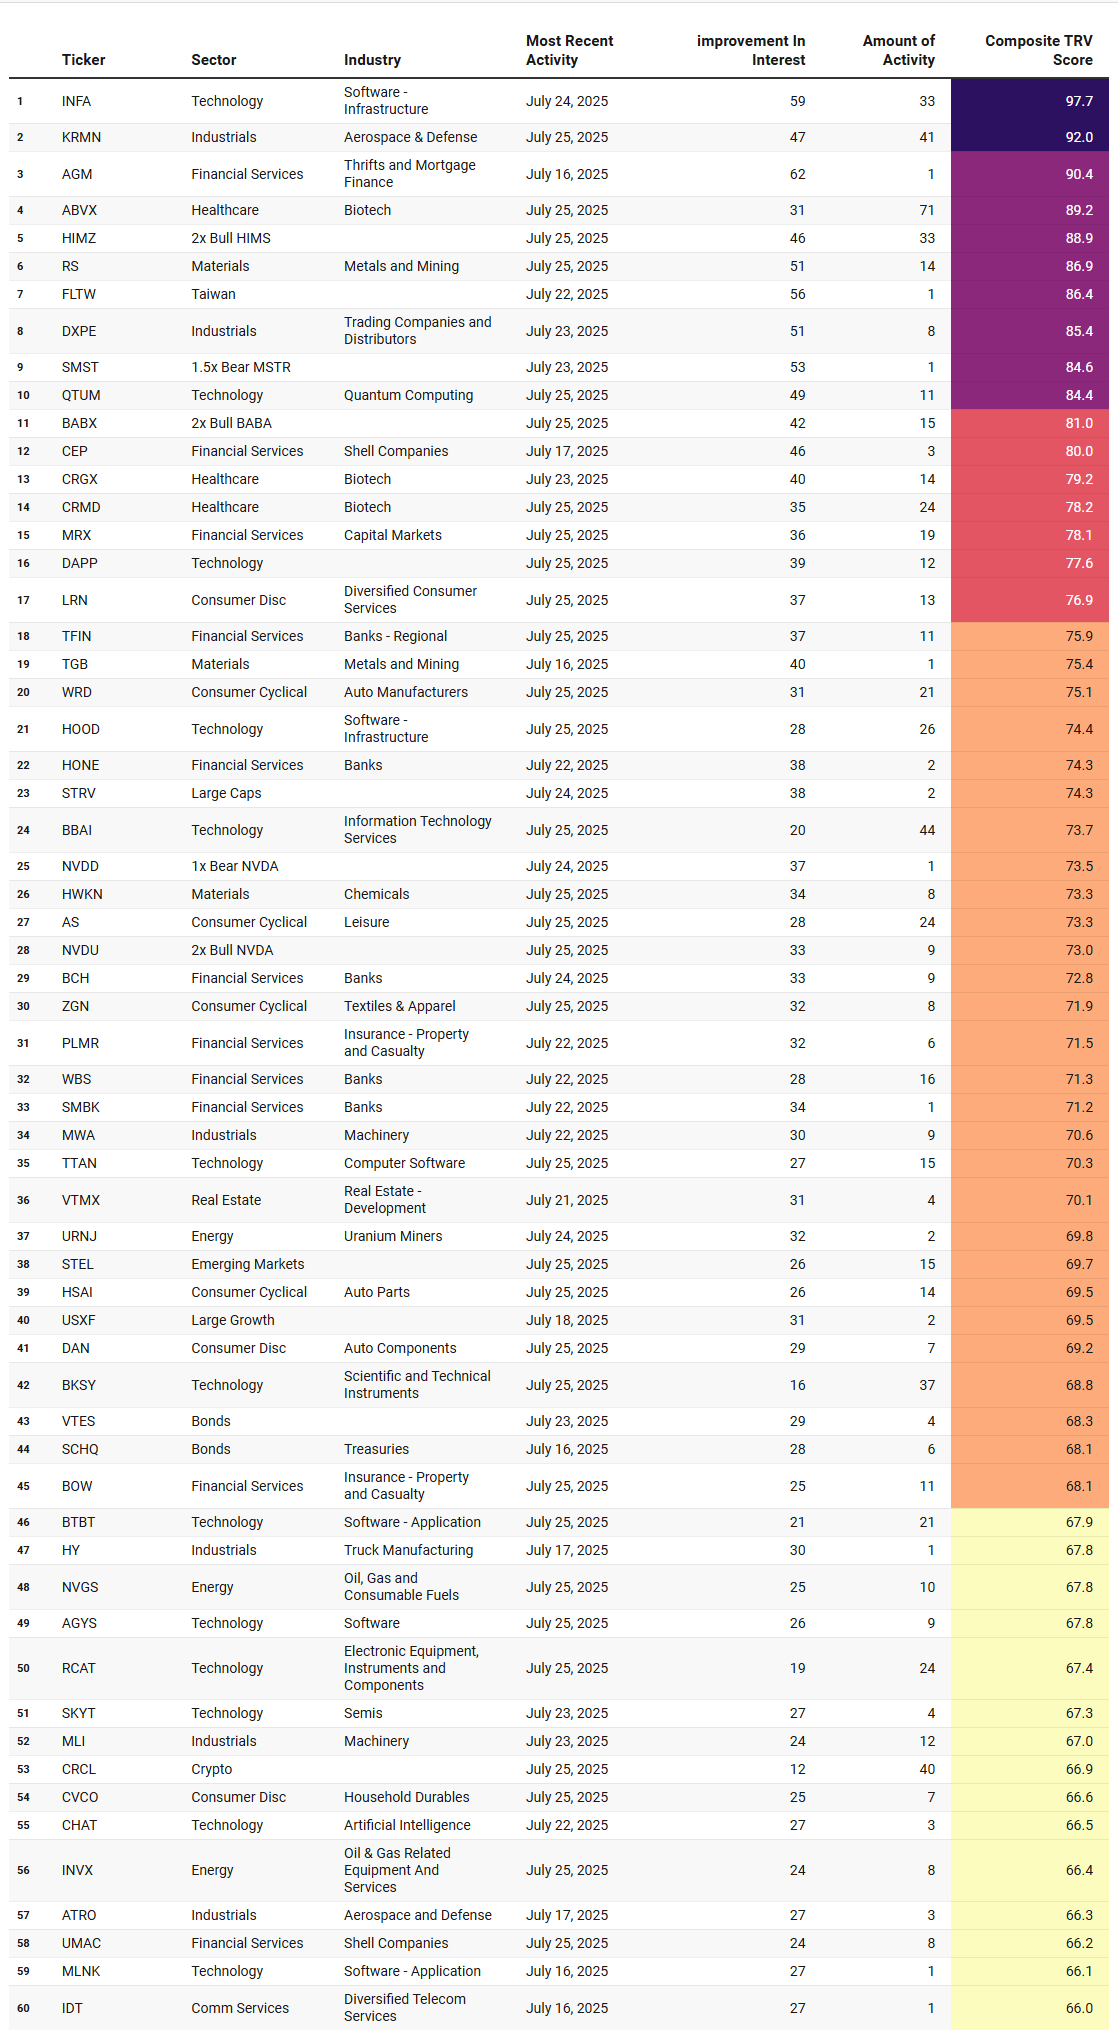
Trade Rank Velocity (TRV)
TRV is a proprietary metrics that measures the recent acceleration or deceleration in institutional trading activity for a given stock by comparing its average trade rank over the past few days to its average in recent weeks. A sharp improvement in TRV typically reflects a notable shift in positioning, often accompanied by sustained trade activity, suggesting institutions are actively engaging with the name and that intensity of activity is rising. This often precludes meaningful price or narrative shifts. Traders should use VL’s charting tools to investigate the nature of the trades—price, size, and context—before making any decisions.
Emergent Themes from the TRV Watchlist
If you’re wondering what kinds of names institutions are leaning into right now, the latest Trade Rank Velocity (TRV) data offers some pretty clear signals — and it’s not what you might expect in a cautious, late-July market.
At the top of the list, one thing is unmistakable: tech is back in favor, especially the kind of tech that’s speculative, thematic, and high beta. From software infrastructure plays like INFA and HOOD, to names in quantum computing (QTUM), AI (CHAT), and even leveraged tech instruments like 2x Bull NVDA and 2x Bull BABA — the top of the leaderboard is dominated by exposure that either needs a narrative to work or reacts sharply when one emerges.
Biotech is also seeing a quiet resurgence. ABVX, CRGX, and CRMD are all showing strong TRV scores this week, and the pattern is familiar — relatively low-liquidity names with significant upside optionality if the underlying catalyst materializes. These kinds of trades tend to show up early in a positioning cycle. Institutions don’t move size all at once in biotech — they accumulate incrementally, often in the background. The presence of multiple biotech names in the upper third of the list is a subtle but important signal that risk appetite may be rotating into more speculative corners of the market.
Another notable theme: leveraged products are back on desks. We’re seeing activity in directional tickers like HIMZ (2x Bull HIMX), SMST (1.5x Bear MSTR), NVDU (2x Bull NVDA), and NVDD (1x Bear NVDA). That’s not typically a passive allocation. This kind of exposure often represents short-term tactical positioning — usually centered around earnings season, macro catalysts, or sector-level breakouts. Whether it’s conviction or hedging is difficult to say from this alone — but what’s clear is that institutions are re-engaging with volatility.
Meanwhile, materials and metals/mining exposure continues to quietly build. RS, TGB, and Taiwan-focused FLTW all show strong improvement in interest, despite the broader sector not being a standout in the daily dollar flow data. It suggests a theme with persistent positioning — the bullish trade here is a bet that hard assets may play a larger role in portfolios if inflation expectations re-accelerate or global manufacturing begins to reflate.
Financials also make a solid showing — regional banks, capital markets, even shell companies — but what’s interesting here is the consistency, not the magnitude. Most financial names fall in the 70–78 TRV range, meaning institutions are active, but not chasing. That’s often how a rotation quietly builds: spread across tickers, spread across days, without creating obvious spikes in flow or price.
So what do we make of this week’s TRV leaderboard?
It’s tactical. Selective. Opportunistic. Institutions don’t appear to be rotating wholesale into any one sector, but they are definitely starting to lean into themes that could develop as earnings play out and month-end flows kick in. That includes speculative tech, biotech, leveraged products, and metals. It's a “test the waters” kind of week — the kind of positioning that often sets the tone for the weeks to come.
And with July wrapping up, BOM flows on deck, and volatility likely to rise as more earnings roll in — this kind of early positioning may prove to be the tell.
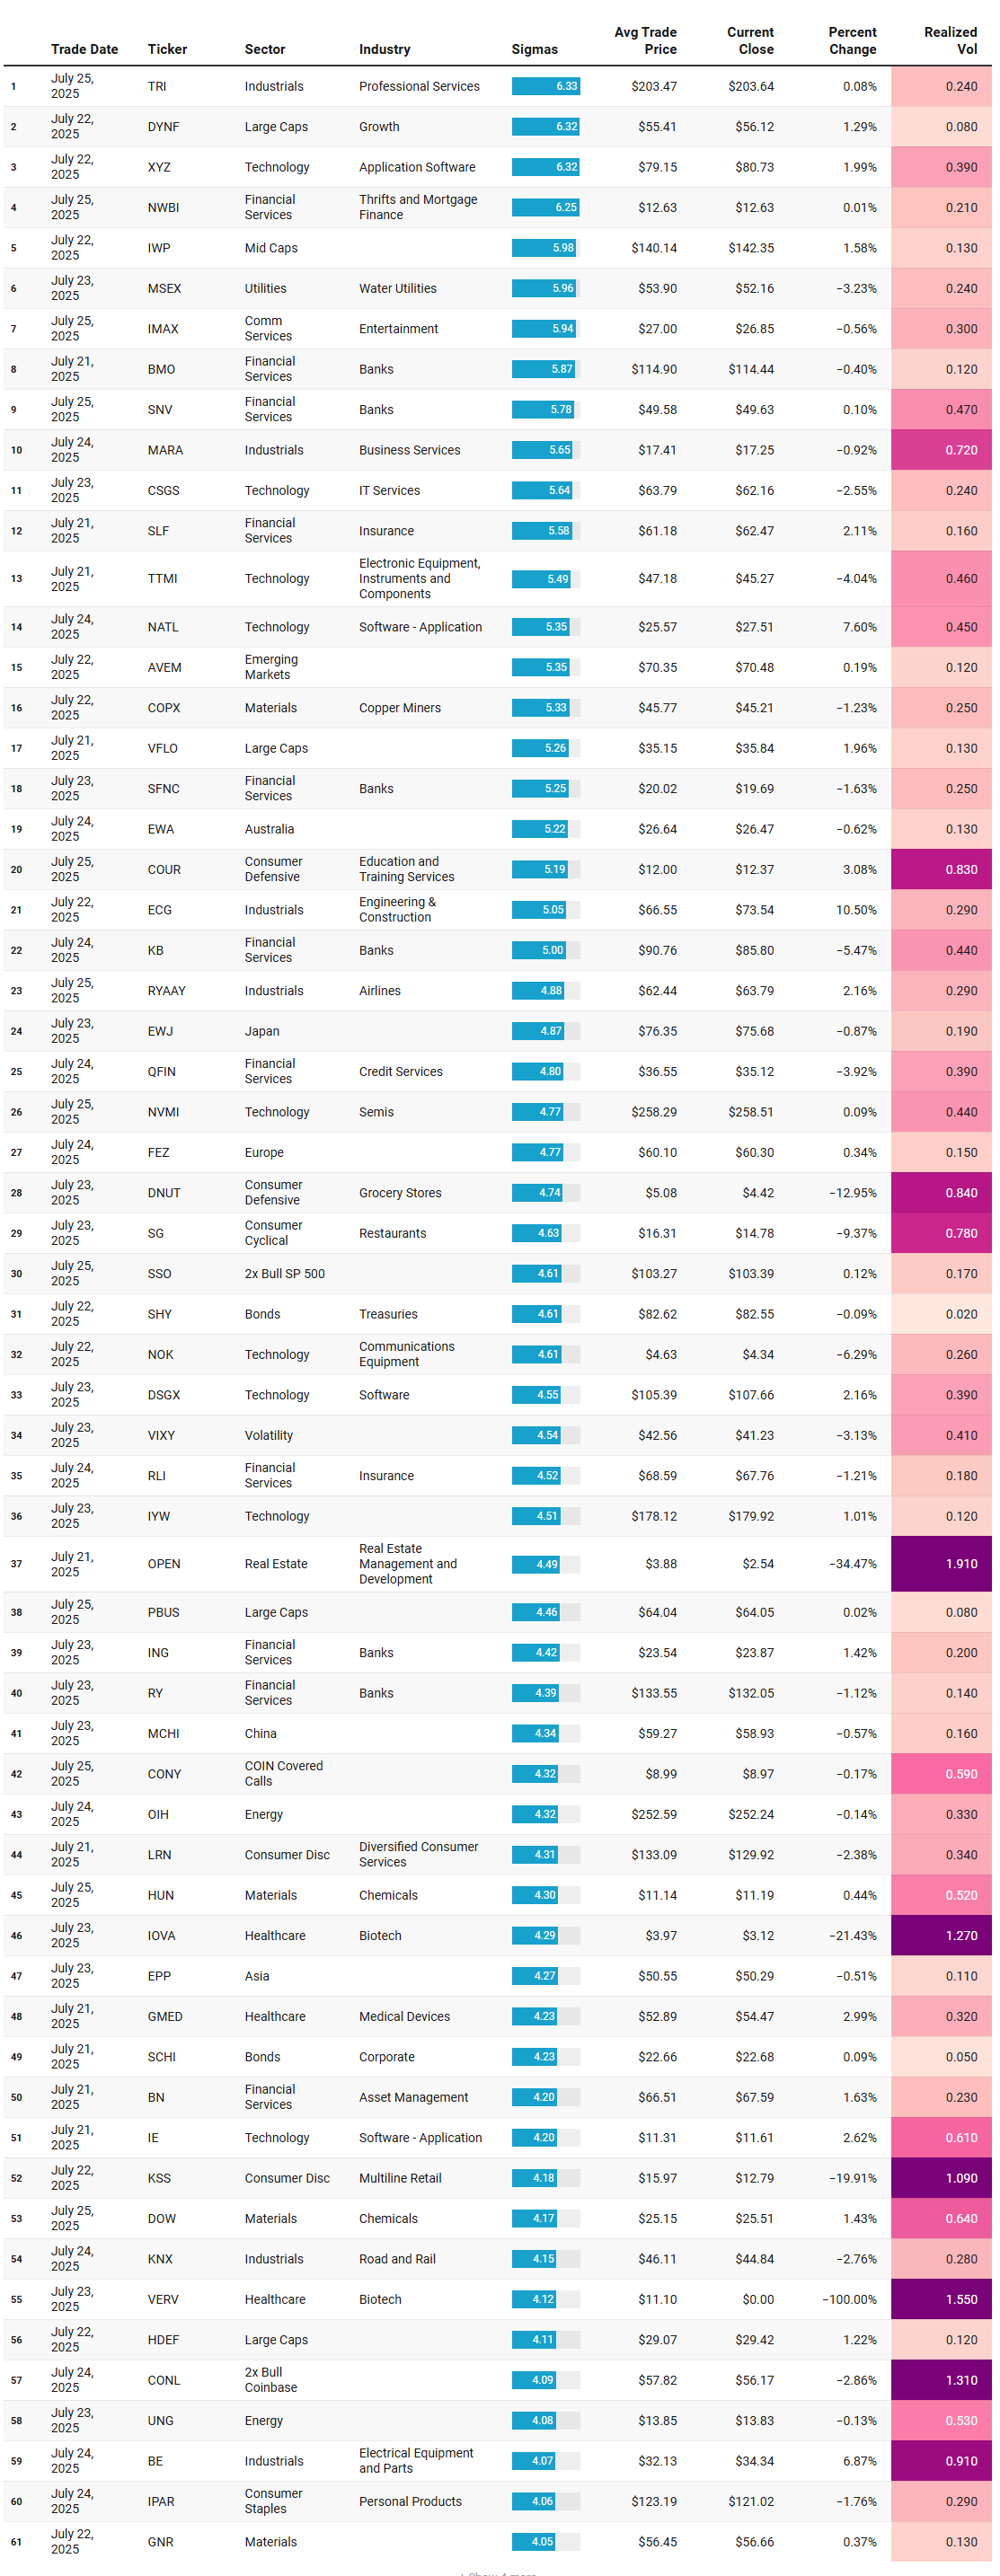
Institutional Outliers (IO)
Institutional Outliers is a proprietary metric designed to spotlight trades that significantly exceed a stock’s recent institutional activity—specifically in terms of dollar volume. By comparing current trade size against each security's recent normalized history, the metric flags outlier events that may indicate sudden institutional interest but may be missed because the activity doesn’t raise any flags/alerts when comparing the activity against the ticker’s entire history. For example, it’s conceivable that a ticker today receives the largest trade it has had in the last 6 months but the trade is unranked and would therefore be missed by current alerts built off Trade Ranks. Use “Realized Vol” to identify tickers with large price displacement and to size your risk appropriately.
Emergent Themes from the Institutional Outliers Watchlist
If you scanned the tape this week, you may have noticed something interesting: the biggest outliers weren’t driven by broad market trends — they were local explosions. We’re talking about sharp dislocations in individual names, not slow-grinding breakouts.
Several tickers posted huge moves relative to their norms, with sigma readings north of 4 and realized vol spiking. These weren’t just quiet moves either — names like OPEN, IOVA, and DNUT saw outsized pops and drops, VERV came in on the back of Lilly’s completed acquisition but in many cases, the magnitude of the move seemed disproportionate to the news, suggesting illiquidity or one-sided positioning might be amplifying reactions.
There’s also a dense cluster of regional banks and credit-sensitive financials lighting up with unusual flow — BMO, NWBI, QFIN, ING, and others — possibly a reaction to rate expectations or early signs of stress under the hood.
Meanwhile, the biotech casino continues to deliver names routinely charting in the top percentile of realized volatility for those that have the stomach and the reflexes. The volatility in names like VERV and IOVA was brutal…
On the macro side, several regional ETFs — Japan, Europe, Asia, and emerging markets — showed unusual movement. That’s paired with activity in Treasuries (SHY), volatility proxies (VIXY), and coin-linked ETFs (CONY/CONL). It feels like investors are starting to probe around the edges, rotating into plays that don’t require directional conviction on US equities. That may be a signal of growing indecision under the surface or widening participation...we’ll see in coming sessions.
Lastly, consumer discretionary names — especially the smaller and more speculative ones like KSS, DNUT, and SG — got hit hard. These are the kinds of stocks you want to see holding up if the consumer is still strong. Their breakdown suggests we may be entering the either the “earnings miss and guide lower” or meme-mania portion of the cycle for retail.
So while the S&P continues to levitate, the underlying action tells a more complicated story — one of rotation, fragmentation, and increasing idiosyncrasy. Thematically, we’re seeing:
High-volatility reversals, not clean trend breakouts
Financials and biotech showing potential stress
Macro product rotation gaining steam
Consumer names struggling under pressure
Markets may be calm on the surface, but there’s plenty of turmoil brewing in a few different corners.
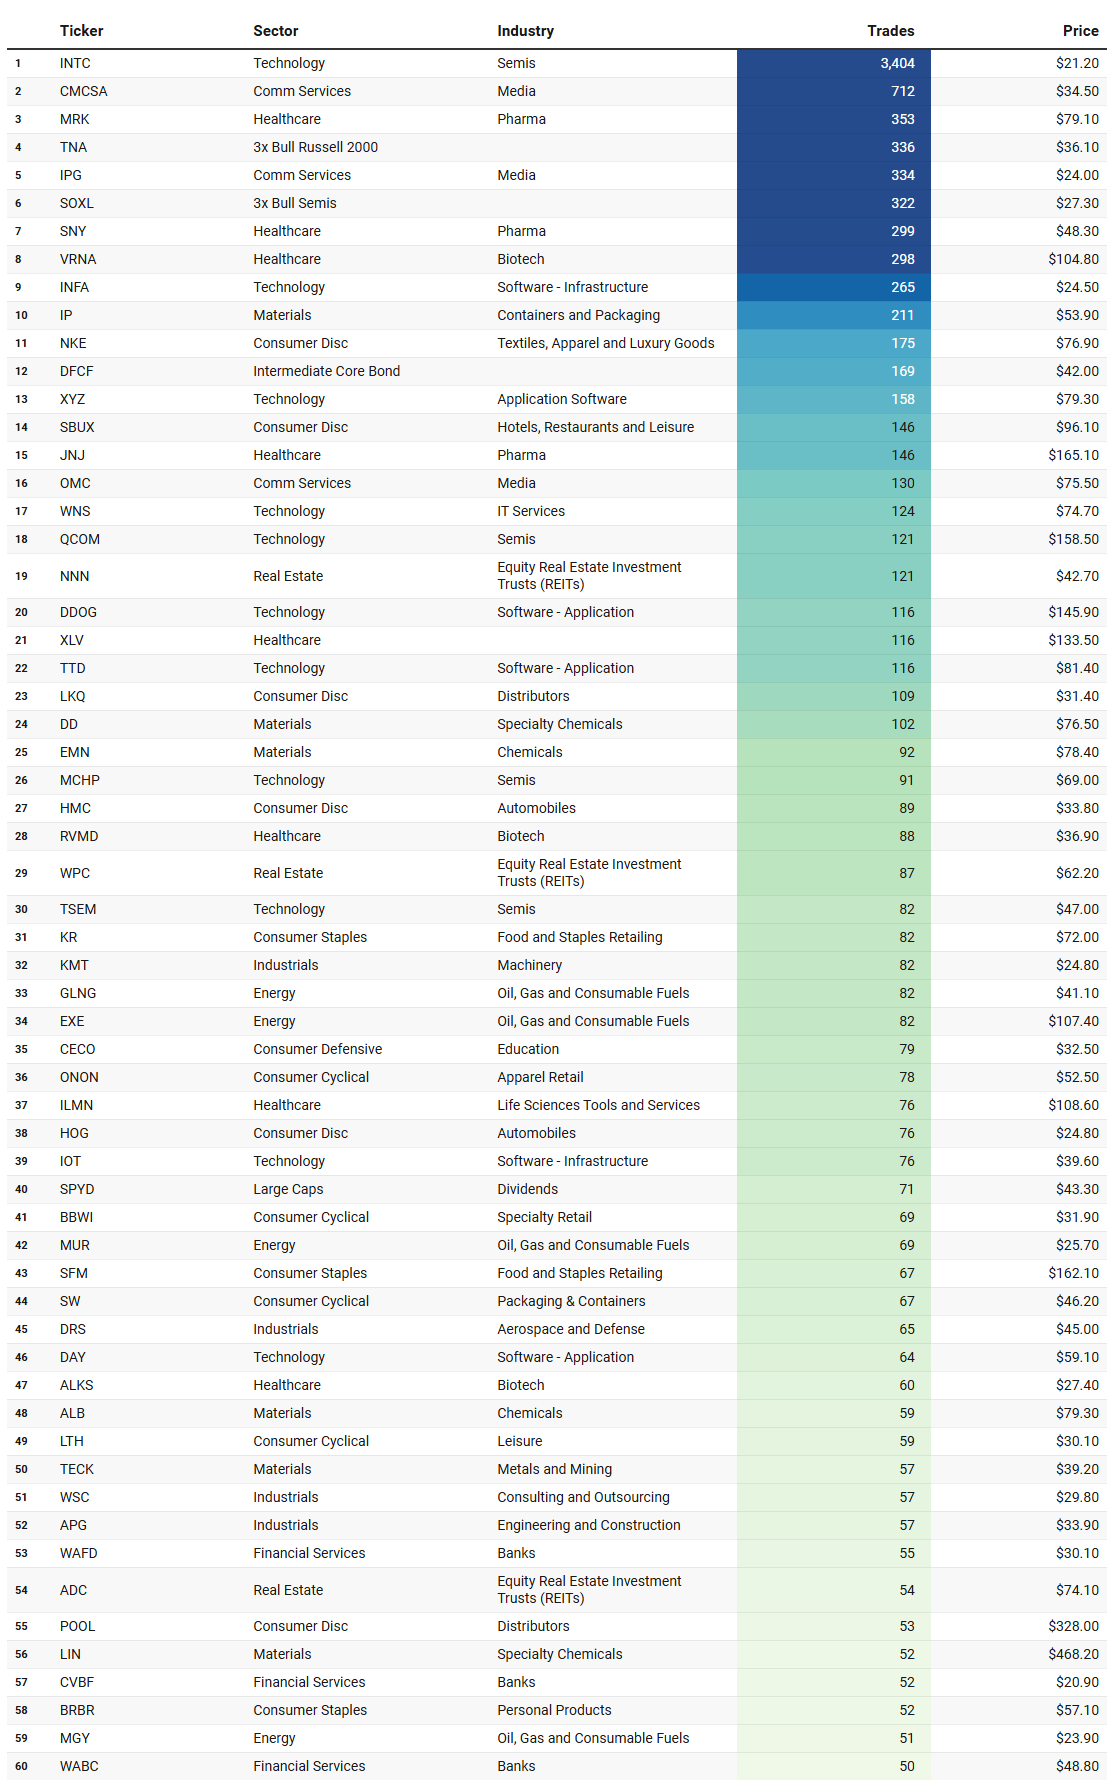
Institutional Liquidity Runs
These are the most frequently traded #1-Ranked Levels in VL. Trades occurring at the highest volume price in a ticker’s history are significant because they represent institutional engagement at a key price memory level—where the market once found consensus. These areas act as liquidity hubs, enabling large players to transact efficiently, and often signal a reassessment of fair value. This activity may precede major moves, mark equilibrium zones, or reflect broader portfolio shifts, making these price levels important to watch even without yet knowing how price will resolve.
Emergent Themes from the Institutional Liquidity Runs Watchlist
Looking at the tickers that interacted with their historically most significant volume levels this week, a few clear themes begin to emerge. The technology sector, particularly semiconductors and software infrastructure, saw outsized representation. Names like Intel, Qualcomm, Microchip, and several software players suggest institutions are focused on tech leadership—whether reassessing fair value, managing positions, or preparing for future moves.
Healthcare was another dominant presence, spanning large-cap pharma like Merck and Johnson & Johnson to smaller biotech names. This may reflect a rotation into defensives or a broader reevaluation of healthcare exposure ahead of earnings or policy updates.
Cyclicals and commodity-sensitive names also showed up in force. Energy tickers like GLNG and MUR, materials names such as Dow, Eastman Chemical, and Albemarle, and industrials from machinery to engineering and aerospace suggest institutions may be positioning around inflation, infrastructure spending, or a shift in global demand narratives.
Consumer discretionary names were scattered across apparel, autos, and leisure—with SBUX, ONON, HOG, and LTH all showing interaction—perhaps indicating a mixed or uncertain view on consumer strength. Meanwhile, the presence of several REITs and bank stocks could reflect rate-sensitive positioning tied to expectations around interest rate policy.
Altogether, this week’s activity appears broad-based, spanning nearly every sector, but with concentrated attention in tech, healthcare, and materials. The common thread seems to be institutions re-engaging at meaningful historical levels—likely reevaluating their positions as macro narratives evolve and markets enter a new phase of price discovery.
Thank you for being part of our community and for dedicating your time to this edition. Your insights and engagement drive everything we do, and we’re honored to share this space with such committed, thoughtful readers. Here’s to a week filled with clear opportunities and strong performance. Wishing you many bags 💰💰💰
—VolumeLeaders