Market Momentum: Your Weekly Financial Forecast & Market Prep
Issue 52 / What to expect July 07, 2025 thru July 11, 2025

NOTE: This weekly periodical is too large for Substack to deliver in its entirety via email - you will only see a portion of this great content if you read from your email client. Click the header/title at the top to read the full article!

In This Issue
[Free For Everyone]
Weekly Market-On-Close Report: All the macro moves, market drivers, and must-know narratives—covered in less than five minutes.
Weekly Benchmark Breakdown: Our weekly intelligence report on major indices cuts through the index-level noise to uncover participation, momentum, and structural integrity and tell you whether markets are rising on solid ground or skating on thin breadth. This is where bull markets prove themselves—or quietly start to unravel.
The Latest Investor Sentiment Readings: Track the emotional pulse of the market with our curated dashboard of sentiment indicators. From fear-fueled flight to euphoric overreach, this week's readings reveal whether investors are cautiously creeping in—or stampeding toward the exits.
Institutional Support & Resistance Levels For Major Indices: Exactly where to look for support and resistance this coming week in SPY, QQQ, IWM & DIA
Normalized Performance By Thematics YTD: Which corners of the markets are beating benchmarks, which are overlooked and which ones are over-crowded!
Key Econ Events & Earnings On-Deck For This Coming Week
[Only For Subs]
This Week’s Institutional Activity In Equities: Track the real money. This section breaks down where institutions are placing their bets—and pulling their chips. You'll get a sector-by-sector view of equity flows, highlighting the most active names attracting large-scale buying or selling. We go beyond the headlines and into the tape, surfacing the week’s most notable block trades and sweep orders, both on lit exchanges and hidden dark pools. Whether you're following momentum or fading crowded trades, this is your map to where size is moving and why it matters.
Institutional Activity By Day (rolling 6-months)
Institutional Activity By Sector By Week (rolling 6-months)
This Week’s Institutional Activity In ETFs: Follow the flows that shape the market. This section uncovers where institutions are deploying capital across the ETF landscape, broken down by sector and fund. We highlight the largest block trades and aggressive sweeps—both visible on lit exchanges and hidden in dark pools—to reveal how the smart money is positioning. Whether they’re rotating risk, hedging exposure, or scaling into themes, this is your lens into the ETF vehicles driving institutional intent.
Statistical Analysis and Insights From This Week’s Top Prints: we run the numbers on the most significant institutional trades of the week—those outsized prints that stand apart from the noise. Through statistical analysis and pattern recognition, we decode what these moves may signal about future price action. Whether it's the start of accumulation, a stealthy unwind, or a shift in market regime, this is where data meets intent. These are the trades that matter—and the stories they may be telling.

Weekly Market-On-Close Report
Markets Rally to Fresh Records as Economic Data Supports Growth Narrative
Executive Summary
Financial markets concluded a momentous week with major indices reaching new all-time highs, driven by better-than-expected employment data and significant legislative progress on Capitol Hill. The S&P 500 advanced 1.7% for the week, while smaller-cap indices outperformed with gains exceeding 3%. The week's developments underscore a resilient economic backdrop, though headwinds from policy uncertainty and evolving trade dynamics continue to shape market sentiment.
Equity Market Performance: Broad-Based Strength Emerges
Major Index Movements
The equity market's performance this week reflected a notable shift toward broader market participation. While the S&P 500 Index climbed 0.83% on Thursday alone, bringing its weekly gain to 1.7%, the most striking development was the outperformance of smaller-capitalization stocks. The Russell 2000 Index surged 3.52% for the week, while the S&P MidCap 400 gained 2.85%, both significantly outpacing their large-cap counterparts.
This rotation toward smaller companies suggests investors are increasingly willing to venture beyond the safety of mega-cap technology stocks that have dominated performance in recent years. The Russell 2000's move into positive territory for the year marks a significant milestone, indicating that the market's foundation is broadening beyond its traditional leadership.
The Dow Jones Industrial Average's 2.30% weekly advance, combined with the Nasdaq Composite's continued march to record highs, demonstrates the market's ability to maintain momentum across different sectors and investment styles. This broad-based strength provides a more sustainable foundation for continued market advancement than the narrow leadership that has characterized much of the recent bull market.
Sector Analysis and Leadership Rotation
The week's sector performance revealed a continued evolution in market leadership. Technology stocks maintained their prominence, particularly benefiting from regulatory developments regarding export restrictions to China. Software companies experienced notable rallies after the Trump administration lifted certain export license requirements for chip design software sales, providing relief to companies like Synopsys and Cadence Design, which both gained over 4%.

The semiconductor sector demonstrated particular strength, with Intel leading the charge with a 2.4% rally. This performance occurred despite ongoing concerns about global demand, as evidenced by ASML's modest decline following reports of Samsung Electronics slowing construction on a Texas chip facility. The sector's resilience in the face of mixed news suggests underlying confidence in the long-term growth prospects for chip manufacturers.

Financial services stocks continued their recent outperformance, advancing more than 1% and extending a trend that has seen the sector benefit from expectations of sustained higher interest rates. The yield curve's continued inversion, with the 10-year Treasury yield rising to 4.346%, supports the sector's net interest margin outlook while higher rates enhance the attractiveness of financial services stocks relative to other dividend-paying sectors.
Utilities emerged as an unexpected leader, driven by companies with exposure to artificial intelligence infrastructure demand. The sector's strength also reflected a relief rally among renewable energy companies, as the final language in the reconciliation bill proved less restrictive than initially feared. This development highlights the market's sensitivity to policy developments and the premium placed on regulatory clarity.
Individual Stock Highlights
Several individual stocks captured attention with significant moves tied to specific catalysts. Datadog soared over 14% following S&P's announcement that it would replace Juniper Networks in the S&P 500 Index, effective July 9. This index inclusion represents both a validation of the company's growth trajectory and a technical catalyst as index funds adjust their holdings.
Olo's surge of more than 13% came on news that private equity firm Thoma Bravo agreed to acquire the restaurant software provider for $10.25 per share in cash. This transaction continues the trend of private equity firms targeting technology companies with strong cash flows and defensible market positions, particularly in the software-as-a-service sector.

FedEx's modest 0.8% gain followed a double upgrade from BNP Paribas Exane, which cited the stock's oversold condition and expectations for continued outperformance relative to competitor UPS. This assessment reflects the ongoing competitive dynamics within the logistics sector and the market's focus on operational efficiency metrics.
Economic Data: Resilience Amid Moderation
Employment Market Strength
The week's economic data painted a picture of continued labor market resilience, despite signs of moderation from previous peaks. The Bureau of Labor Statistics reported that the U.S. economy added 147,000 jobs in June, exceeding economist expectations and representing a solid pace of employment growth. This figure came as a welcome surprise following Wednesday's concerning ADP employment report, which showed a 33,000 decline in private sector payrolls—the first contraction since March 2023.

The divergence between the ADP and BLS reports highlights the challenges in accurately assessing real-time labor market conditions. However, the official employment report's strength suggests that the underlying employment picture remains more robust than some private sector indicators suggest. The unemployment rate's decline to 4.1% from 4.2% provides additional evidence of labor market tightness, though this remains elevated from the cycle low of 3.4% reached in April 2023.
Wage growth continued its moderating trend, with average hourly earnings rising 0.2% month-over-month and 3.7% year-over-year. This deceleration from May's 0.4% monthly gain and 3.9% annual rate suggests that inflationary pressures from the labor market may be easing, potentially providing the Federal Reserve with more flexibility in its policy considerations.
The composition of employment growth reveals important nuances. Government employment, particularly at the state and local level including public education, accounted for approximately half of the month's job gains. Private sector employment growth of 74,000 represents the slowest pace since October, indicating that private businesses remain cautious about expansion despite overall economic strength.
Manufacturing and Services Divergence
The Institute for Supply Management's manufacturing purchasing managers' index remained in contraction territory at 49.0% for the fourth consecutive month, though this represented an improvement from May's 48.5% reading. The continued manufacturing weakness reflects ongoing challenges from trade policy uncertainty and shifts in global supply chains, though the modest improvement suggests conditions may be stabilizing.

In contrast, the services sector returned to expansion after May's brief contraction, with the ISM Services PMI reaching 50.8%. This rebound was driven by improvements in business activity and new orders, indicating that the services sector's fundamentals remain sound despite periodic volatility. The sector's resilience is particularly significant given its dominant role in the U.S. economy.
The services sector's price index, while moderating slightly to 67.5% from 68.7%, remained at elevated levels that suggest continued inflationary pressures. This reading marks the second-highest level since November 2022 and indicates that service providers continue to face cost pressures that they are passing along to consumers.
Trade and Manufacturing Indicators
Factory orders provided a mixed picture of manufacturing demand. The 8.2% month-over-month increase in May factory orders represented a significant rebound from the previous month's revised 3.9% decline, meeting market expectations and suggesting that manufacturing demand remains cyclical rather than structurally impaired.
However, when excluding transportation equipment, factory orders rose only 0.2%, indicating that the headline strength was concentrated in volatile categories rather than representing broad-based manufacturing strength. This distinction is important for understanding the underlying health of the manufacturing sector.
The trade deficit widened to $71.5 billion in May, slightly exceeding expectations of $71.0 billion. The increase from April's revised $60.3 billion deficit reflects the ongoing challenge of balancing domestic demand with international competitiveness. Export declines of 4.0% month-over-month, combined with import declines of just 0.1%, suggest that domestic demand remains relatively strong while external demand faces headwinds.
Policy Developments: Legislative Marathon and Trade Dynamics
Congressional Action and Fiscal Implications
The week's most significant policy development was the passage of the Republican reconciliation bill, which navigated both chambers of Congress through a series of historic procedural marathons. The Senate's 27-hour voting session and the House's record-breaking seven-hour vote demonstrate the contentious nature of the legislation while highlighting the narrow margins that define current political dynamics.

The Congressional Budget Office's assessment that the bill will add $3.3 trillion to federal budget deficits over the next decade represents a substantial fiscal expansion that will have significant implications for financial markets. This deficit spending will require increased Treasury issuance, potentially putting upward pressure on long-term interest rates even as the Federal Reserve considers policy easing.
The legislation's inclusion of a $5 trillion debt ceiling increase effectively removes this potential source of market volatility through 2027, providing important certainty for financial markets. The elimination of near-term debt ceiling concerns allows investors to focus on fundamental economic and corporate developments rather than political brinksmanship.
The bill's various tax provisions, including extensions of the 2017 tax cuts and new breaks for tips, overtime pay, and seniors, represent significant fiscal stimulus that could support economic growth in 2026 and beyond. However, the long-term sustainability of these measures remains a concern, particularly given the projected impact on federal deficits.
Trade Policy Evolution
Trade policy developments continued to evolve throughout the week, with the July 9 deadline for implementing reciprocal tariffs approaching rapidly. The Trump administration's announcement of a trade agreement with Vietnam represents a significant de-escalation from initial tariff proposals, reducing rates from 46% to 20% for Vietnamese goods and 40% for goods shipped through Vietnam but originating elsewhere.

This Vietnam agreement follows a pattern of trade policy moderation that has seen effective tariff rates decline from potential peaks of over 25% to approximately 15% currently. The European Union's efforts to reach an agreement in principle by the July 9 deadline, as expressed by Commission President Ursula von der Leyen, suggest that further de-escalation remains possible.
However, the administration's indication that Japan is unlikely to reach a trade agreement and will face tariffs of 30-35% demonstrates that trade policy remains a significant source of uncertainty. The selective nature of these negotiations creates an environment where individual countries and sectors face very different outlooks depending on their negotiating success.
Federal Reserve Policy Considerations
The Federal Reserve's policy stance remained unchanged this week, but market expectations for near-term easing diminished significantly following the strong employment report. Federal funds futures now price only a 5% probability of a rate cut at the July 29-30 Federal Open Market Committee meeting, down from 23% earlier in the week.
This shift in expectations reflects the challenge facing Federal Reserve officials as they navigate competing pressures from trade policy uncertainty and economic resilience. Atlanta Fed President Bostic's call for unchanged monetary policy due to tariff uncertainty and a resilient economy exemplifies the cautious approach likely to characterize Fed communications in the coming months.

The yield curve's continued inversion, with short-term rates exceeding long-term rates, reflects the market's assessment that current policy remains restrictive. However, Treasury Secretary Scott Bessent's criticism of the Fed's rate-setting process, noting that the 2-year Treasury yield of 3.76% fell below the federal funds rate target range, illustrates the political pressures facing monetary policymakers.
Fixed Income Markets: Yields Rise on Growth Optimism
Treasury Market Dynamics
The Treasury market experienced notable volatility this week, with yields rising across the curve following the stronger-than-expected employment report. The 10-year Treasury yield increased by 6.9 basis points to 4.346%, while the 2-year yield rose approximately 10 basis points as markets reduced expectations for near-term Federal Reserve easing.
The yield curve's response to the employment data demonstrates the market's sensitivity to economic data that might influence Federal Reserve policy timing. The steepening move, with longer-term yields rising more than shorter-term rates, suggests that investors are beginning to price in a more sustained period of economic growth that could delay the Fed's easing cycle.
The 10-year breakeven inflation expectations rate rose 2.6 basis points to a two-week high of 2.339%, indicating that investors are becoming more concerned about inflation risks. This development reflects the potential for tariff-related price pressures to emerge in the second half of the year as companies work through existing inventory buffers.
European government bond yields moved in the opposite direction, with the 10-year German bund yield falling 4.9 basis points to 2.615% and the 10-year UK gilt yield declining 7.1 basis points to 4.542%. This divergence reflects different economic and policy trajectories between the U.S. and Europe, with European Central Bank easing expectations remaining more aggressive than those for the Federal Reserve.
Corporate Credit Markets
Investment-grade corporate bonds posted positive returns despite the rise in Treasury yields, benefiting from a light week of new issuance and strong investor demand. All new issues during the week were oversubscribed, indicating healthy appetite for corporate credit despite concerns about the economic outlook.
High-yield bonds also generated positive returns, with traders noting firm market sentiment supported by equity market strength and generally favorable macroeconomic conditions. The correlation between high-yield bond performance and equity markets remained strong, reflecting the risk-on sentiment that characterized the week's trading.
The active issuance calendar ahead of the Independence Day holiday suggests that corporate issuers remain opportunistic about market conditions. Companies' willingness to access capital markets at current levels indicates confidence in their business prospects and financing needs for the remainder of the year.
International Markets: Global Divergence Continues
European Market Performance
European equity markets posted modest gains during the week, with the Euro Stoxx 50 advancing 0.46%. This performance, while positive, lagged significantly behind U.S. market gains, continuing a pattern of relative underperformance that has characterized much of 2025.

The European Central Bank's more aggressive easing stance, with swap markets pricing 6% odds of a 25 basis point rate cut at the July 24 policy meeting, reflects the different economic conditions facing the eurozone. Slower growth and more subdued inflation pressures provide European policymakers with greater flexibility to ease monetary policy.
However, the potential for U.S. tariffs to impact European exports remains a significant concern for the region's economic prospects. The ongoing trade negotiations between the U.S. and EU will be crucial in determining whether European markets can maintain their recent relative stability.
Asian Market Developments
Asian markets showed mixed performance, with China's Shanghai Composite gaining 0.18% and Japan's Nikkei Stock 225 advancing 0.06%. These modest gains reflect the cautious sentiment prevailing in the region as investors await clarity on trade policy developments.
The lifting of U.S. export license requirements for chip design software sales to China provided specific relief to technology companies with Chinese exposure. This development suggests that trade policy may become more nuanced and sector-specific rather than broadly punitive, which could benefit companies with significant Asian operations.
Japan's continued challenges with currency weakness and the Bank of Japan's ultra-accommodative policy stance create a complex environment for Japanese equities. The potential for 30-35% tariffs on Japanese goods, as suggested by the Trump administration, represents a significant headwind for the market's prospects.
Outlook and Investment Implications
Economic Growth Trajectory
The economic data and policy developments this week support a narrative of continued growth, albeit at a more moderate pace than in recent years. The resilience of the labor market, combined with fiscal stimulus from the reconciliation bill, suggests that the economy can maintain positive momentum through the second half of 2025.

However, the potential for tariff-related inflation to emerge as companies work through existing inventories remains a key risk. The timing and magnitude of these price pressures will be crucial in determining both consumer spending patterns and Federal Reserve policy responses.
The manufacturing sector's continued weakness, while concerning, appears to be stabilizing rather than deteriorating further. The services sector's return to expansion provides confidence that the dominant portion of the economy remains healthy, though wage and price pressures in this sector bear watching.
Federal Reserve Policy Path
The Federal Reserve's policy trajectory appears increasingly data-dependent, with the central bank likely to maintain its current restrictive stance until clear evidence emerges of either slowing growth or declining inflation pressures. The strong employment report effectively removes the possibility of rate cuts in the near term, pushing expectations for easing into the fall.
The challenge for Fed officials will be balancing the need to support growth if trade policy impacts become more pronounced while maintaining credibility on inflation control. The yield curve's continued inversion suggests that current policy remains restrictive, but the strength of recent economic data provides little urgency for policy changes.
Market Positioning and Sector Allocation
The week's broad-based equity market strength suggests that investors should maintain diversified exposure across market capitalizations and sectors. The outperformance of smaller-cap stocks indicates that opportunities exist beyond the mega-cap technology companies that have dominated recent performance.
The financial services sector's continued strength, supported by the prospect of sustainably higher interest rates, makes it an attractive area for investment. However, investors should remain mindful of the sector's sensitivity to economic cycles and credit quality concerns.
Technology stocks, while facing some headwinds from trade policy uncertainty, continue to benefit from structural growth trends and regulatory clarity in key areas. The semiconductor sector's resilience despite mixed fundamental news suggests that long-term growth prospects remain intact.
Fixed Income Strategy
The fixed income market's response to this week's economic data reinforces the view that yields are likely to remain in a 4.0-4.5% range for the 10-year Treasury. The combination of economic resilience and fiscal expansion creates conflicting pressures that should keep yields rangebound.
For investors, the seven- to ten-year maturity range continues to offer attractive risk-adjusted returns, providing duration exposure without the full impact of long-term deficit concerns. Investment-grade corporate bonds remain attractive given their yield advantage over Treasuries and the generally healthy corporate credit environment.
High-yield bonds, while performing well in the current environment, face risks from both rising Treasury yields and potential economic softening later in the year. Investors should remain selective in this sector, focusing on companies with strong balance sheets and defensive business models.
Conclusion: Navigating Opportunities Amid Uncertainty
This week's market action demonstrates the complex interplay between economic resilience, policy uncertainty, and investor sentiment that characterizes the current environment. The achievement of new record highs across major indices, combined with broadening market participation, suggests that the foundation for continued market advancement remains solid.
However, the challenges ahead are significant. Trade policy uncertainty, fiscal sustainability concerns, and the Federal Reserve's policy path all represent potential sources of volatility. The key for investors will be maintaining flexibility while positioning for the most likely scenarios of continued economic growth and gradual policy normalization.
The week's developments reinforce the importance of diversification across asset classes, market capitalizations, and geographic regions. While U.S. markets continue to demonstrate leadership, the global nature of modern economies means that developments abroad can have significant impacts on domestic markets.
As we move into the second half of 2025, the market's ability to digest ongoing policy changes while maintaining focus on fundamental economic and corporate developments will be crucial. The broad-based nature of this week's gains provides confidence that the market's foundation remains strong, but investors must remain vigilant for signs of changing conditions that could require tactical adjustments to their portfolios.
The coming weeks will bring important developments on trade policy, earnings season, and economic data that will help clarify the trajectory for both the economy and financial markets. Investors who remain disciplined, diversified, and attentive to emerging trends will be best positioned to navigate the opportunities and challenges that lie ahead.


Weekly Benchmark Breakdown
S&P 500 Index

The S&P 500 ($SPX) closed the week at 6,279.35, gaining +0.83% and marking a new all-time high of 6,284.65. Momentum has not only persisted but accelerated, with internal participation metrics now firmly in bullish extremes.
Breadth & Participation
80.31% of S&P 500 components are above their 20-day moving average, with 79.52% above their 5-day average – a sign of very short-term and near-term momentum alignment.
Participation remains robust across all timeframes:
50-day: 78.52%
100-day: 71.96%
150-day: 65.40%
200-day: 61.23%
These elevated breadth levels suggest strong internal confirmation of price strength. There's no sign of narrow leadership or fragility in the rally.
New Highs vs. New Lows
232 stocks (46%) hit new 5-day highs vs. just 25 new lows (5%), for a net differential of +207.
The bullish skew continues across longer timeframes:
1-month differential: +171
3-month: +143
6-month: +61
52-week: +37
This consistent expansion of highs over lows supports the thesis that this rally is not exhausted or overly dependent on a few names.
Technical Context
With the index tagging fresh record highs and internals reaching overbought conditions, there may be short-term consolidation risk. However, there’s little evidence of deterioration or negative divergence in breadth or highs/lows – typically early warnings of trend exhaustion.
Verdict
The S&P 500 is firing on all cylinders – new highs in price, leadership across sectors, and broad participation across all timeframes. While short-term cooling is possible due to elevated readings, the index remains in a strong technical position and the undercurrent remains net bullish.
Dow Jones Index

The Dow Jones Industrial Average continues its steady ascent, gaining +0.77% on the week and closing within striking distance of a new all-time closing high. The move is underpinned by exceptionally strong participation across all timeframes, suggesting widespread institutional accumulation rather than a narrow, top-heavy rally.
Breadth & Participation
Participation metrics are at bullish extremes:
93.33% of Dow components are above their 5-day and 20-day moving averages
86.66% above the 50-day
80.00% above the 100-day
73.33% above the 150-day
70.00% above the 200-day
This is a textbook case of synchronized momentum across short-, intermediate-, and long-term timeframes. Such breadth rarely occurs by accident and is usually seen during healthy, durable uptrends.
New Highs vs. New Lows
13 stocks (43%) made new 5-day highs vs. just 1 new low (3%), yielding a net differential of +12
This bullish tilt persists across longer lookbacks:
1-month differential: +9
3-month: +9
6-month: +5
52-week: +4
Even with a smaller index of 30 names, the steady stream of new highs—coupled with no new lows across any major timeframe—reinforces that the Dow’s strength is not superficial.
Technical Context
With price pushing into overhead resistance near its 52-week high, some near-term consolidation is possible. However, the absence of negative divergence in participation or in the highs/lows data suggests that pullbacks would likely be shallow and rotational rather than structural.
Verdict
The Dow Jones is showing textbook bullish behavior—rising price, broad internal strength, and no signs of distribution. The long-term posture is firmly constructive. Any dips should be viewed through a buy-the-pullback lens unless internal breadth metrics begin to meaningfully deteriorate.
NASDAQ 100 Index

The Nasdaq 100 extended its relentless rally, gaining nearly 1% on the week and setting fresh all-time highs. While tech leadership has long carried the index, this week’s action showed broadening strength across components—an encouraging sign for sustainability.
Breadth & Participation
Participation surged and now reflects broad-based strength:
86.13% of components are above their 20-day moving average
79.20% above the 5-day
83.16% above the 50-day
80.19% above the 100-day
73.26% above the 150-day
75.24% above the 200-day
These metrics paint a picture of deeply embedded momentum across all timeframes, with both short-term and longer-term breadth well above key thresholds. It’s not just the mega caps pulling weight—this is structural strength.
New Highs vs. New Lows
41 stocks (41%) hit new 5-day highs versus 6 new lows (6%), for a net differential of +35
Momentum remains bullish across extended lookbacks:
1-month differential: +32
3-month: +26
6-month: +14
52-week: +8
While the 5-day burst has cooled slightly from recent extremes, longer-term highs continue to outpace lows, which remain near zero across all windows.
Technical Context
With price pushing into uncharted territory and internals confirming the move, the Nasdaq 100 appears technically sound. While some consolidation may emerge after the breakout, breadth and leadership support the continuation thesis. No material divergence is evident.
Verdict
The Nasdaq 100 is not just hitting new highs—it’s doing so with an expanding base of support beneath it. Breadth is firing across all cylinders, suggesting any short-term pullback would likely serve as a buying opportunity rather than a signal of exhaustion. The index remains one of the strongest technically in the market.
Russel 1000

The Russell 1000 extended its march to new highs, closing just shy of its record and continuing a strong multi-week stretch of broad-based participation. With over 80% of constituents above their short-term moving averages, momentum continues to build beneath the surface.
Breadth & Participation
Participation metrics surged this week, reflecting widespread strength:
81.71% of constituents are above their 20-day average
81.22% above the 5-day
79.84% above the 50-day
74.20% above the 100-day
64.03% above the 150-day
60.77% above the 200-day
This marks a meaningful improvement across both short- and long-term timeframes, signaling that the rally is not confined to a handful of leaders—it is being driven by systemic participation across the index.
New Highs vs. New Lows
The strength in internals is further confirmed by the surge in new highs:
519 stocks (51%) hit 5-day highs this week, versus just 38 new lows (4%), for a net +481 differential
The trend extends across longer windows:
1-month differential: +387
3-month: +297
6-month: +118
52-week: +70
Notably, new lows remain extremely muted across all lookbacks, underscoring how rare breakdowns have become in this environment.
Technical Context
The Russell 1000 is riding a wave of institutional demand and improving macro breadth. There’s no evidence of fragility, deterioration, or narrowing leadership. Even the more cyclical and value-oriented components have begun to join the move, broadening the strength base even further.
Verdict
The Russell 1000’s breakout is underpinned by a surge in participation and new highs across nearly every timeframe. With breadth confirming price and very few signs of deterioration, the backdrop remains strongly bullish. Any short-term pause would be healthy, not threatening.
Major Indices Insights & Summary
Market breadth not only held firm this week—it expanded. All four major indices registered continued improvement in both short- and longer-term internal metrics, with the S&P 500, Nasdaq 100, and Russell 1000 tagging fresh all-time highs. The internal confirmation behind the price action has rarely looked stronger, with new highs expanding across timeframes and short-term momentum surging across the board.
S&P 500 – Firing on All Cylinders
The S&P 500 ended the week at 6,279.35, gaining +0.83% and closing just shy of a new all-time high at 6,284.65. Beneath the hood, internals continue to scream strength:
79.52% of stocks are above their 5-day average
80.31% above the 20-day
Breadth remains strong even further out: 71.96% (100D), 65.40% (150D), 61.23% (200D)
The highs/lows table shows +207 net new highs on a 5-day basis, with similarly strong differentials across 1-month (+171), 3-month (+143), and 6-month (+61).
Interpretation: This is not a top-heavy drift—it’s a powerful, broad-based advance supported by robust participation across timeframes and sectors.
Nasdaq 100 – Tech and Breadth in Sync
The Nasdaq 100 ($IUXX) surged +0.99% to close at 22,866.97, tagging a new all-time high of 22,896.01.
Participation is impressive:
86.13% above the 20-day
83.16% above the 50-day
Long-term readings solid: 80.19% (100D), 73.26% (150D), 75.24% (200D)
High/low spread on the week: +35, with positive differentials across all timeframes.
Interpretation: Tech strength remains the backbone of the market, but it’s not just mega-caps. Broad participation within the index reflects expanding risk appetite and cyclical participation in growth.
Dow Jones – Back From the Dead
The Dow Jones ($DOWI) tacked on +0.77% to close at 44,828.53, just a hair below its 52-week high of 45,073.63.
Participation metrics were outstanding:
93.33% of components above both 5-day and 20-day averages
Intermediate-term participation remains strong: 86.66% (50D), 80.00% (100D), 73.33% (150D), 70.00% (200D)
The Dow saw +12 net new highs on the week (5-day), with strength across all horizons.
Interpretation: This was a stealth breadth breakout. Quiet but undeniable improvement, signaling rotational support from more conservative areas of the market.
Russell 1000 – The Silent Leader
The Russell 1000 ($IWB) gained +0.81% to 343.73 and tagged a fresh 52-week high of 344.22.
Participation metrics were uniformly strong:
81.22% above the 5-day
81.71% above the 20-day
Breadth strong all the way out: 74.20% (100D), 64.03% (150D), 60.77% (200D)
It posted 519 new 5-day highs (51%) versus just 38 new lows (4%), for a whopping +481 net differential. 1-month net new highs: +387, 3-month: +297
Interpretation: The Russell 1000 continues to quietly lead the internal advance. This is one of the clearest signs that breadth is not just healthy—it’s dominant.
Key Takeaways
All four indices posted new 5-day highs, and the majority tagged or approached new all-time highs.
Short-term breadth readings (5-day & 20-day) are elevated across the board, with some of the highest participation levels of the year.
New highs dominate across all indices, with extreme net positive readings in the S&P 500 and Russell 1000.
Intermediate- and long-term moving average breadth has improved further, solidifying the structural foundation behind the rally.
Dow and Russell 1000 participation has surged, confirming this is no longer a narrow rally.
VL Indices Market Score: 83 / 100 ( +10 WoW )
Short-Term Breadth Surge
S&P: 79.52% (5D), 80.31% (20D)
NASDAQ: 79.20% (5D), 86.13% (20D)
DOW: 93.33% (5D and 20D)
IWB: 81.22% (5D), 81.71% (20D)
+15-point adjustment for near-term momentum and strength.
Explosion in Net New Highs
S&P: +207
NASDAQ: +35
DOW: +12
IWB: +481
+8-point adjustment for overwhelming net new high dominance.
Long-Term Breadth Consistency
All indices above 60% on 100D and above 60% or rising on 200D
S&P: 61.23%, IWB: 60.77%, DOW: 70%, NASDAQ: 75.24% (200D)
+5-point adjustment for solid structural internals.
Cross-Index Confirmation
Dow & Russell 1000 showing strong catch-up moves
Index rotation is healthy and leadership is broad
+5-point rotation bonus for cross-index breadth alignment.
Risk Discount Adjustment
Macro risks remain (inflation, rates, geopolitical risk)
Leadership still relatively concentrated in growth-heavy areas
-10-point discount for macro overhangs and potential fragility under stress.
Conclusion
This is one of the strongest technical weeks for market internals in recent memory. Participation is surging, net highs are exploding, and all four indices are aligned in direction and structure. While macro risks remain, the internals paint a clear picture: the rally is not just healthy—it’s gaining strength.
Verdict: Stay constructive. The market's engine is not only running—it’s firing on all cylinders.
US Investor Sentiment Report
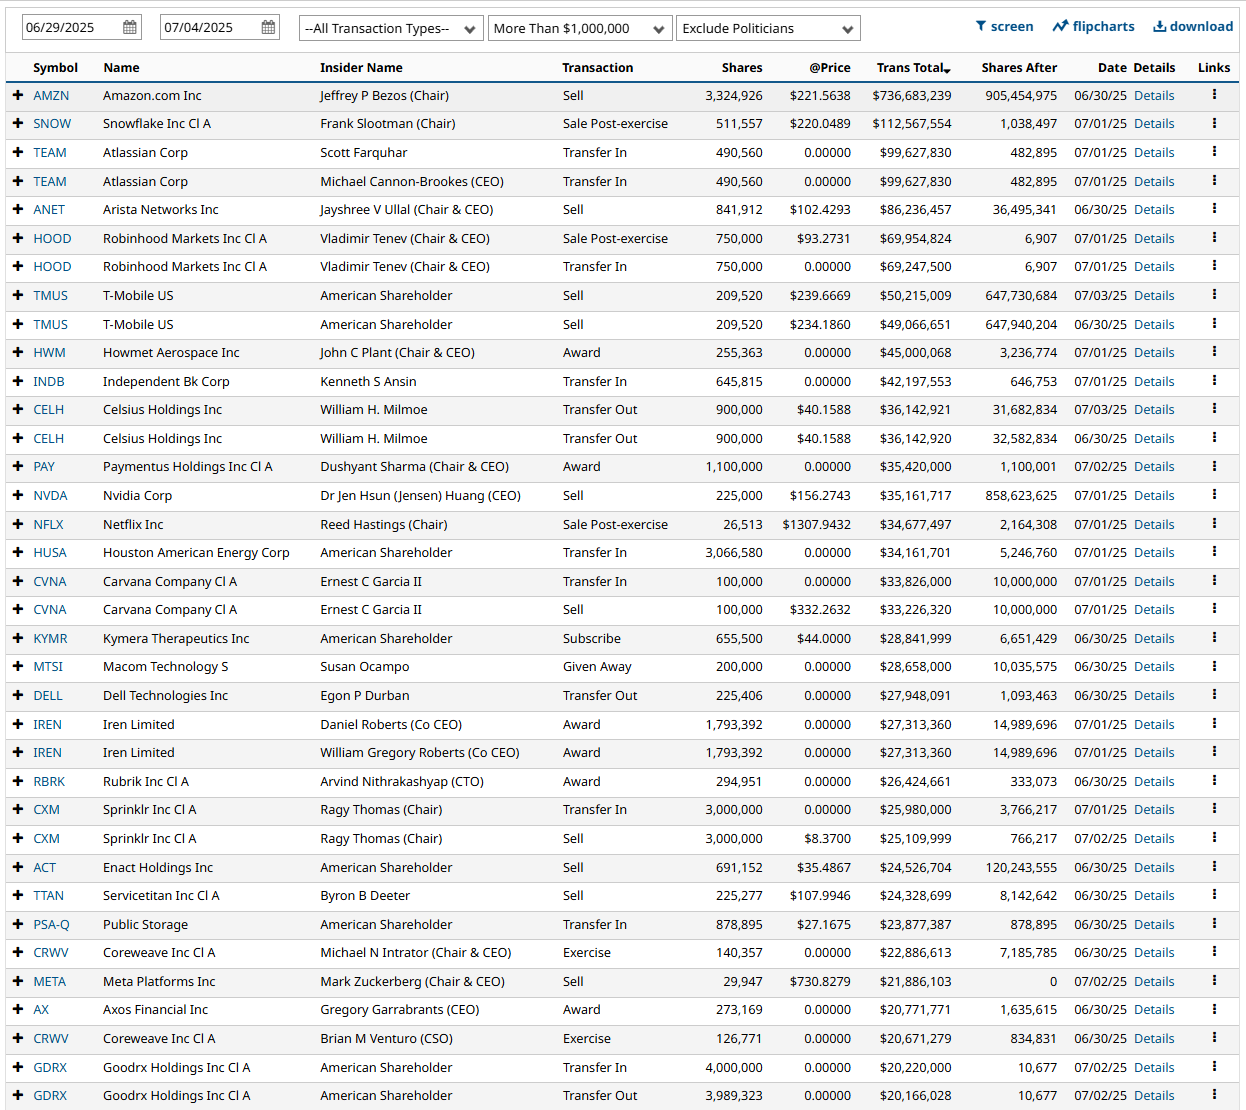
Insider Trading
Insider trading occurs when a company’s leaders or major shareholders trade stock based on non-public information. Tracking these trades can reveal insider expectations about the company’s future. For example, large purchases before an earnings report or drug trial results might indicate confidence in upcoming good news.

%Bull-Bear Spread
The %Bull-Bear Spread chart is a sentiment indicator that shows the difference between the percentage of bullish and bearish investors, often derived from surveys or sentiment data, such as the AAII (American Association of Individual Investors) sentiment survey. This spread tells investors about the prevailing mood in the market and can provide insights into market extremes and potential turning points.
Bullish or Bearish Sentiment:
When the spread is positive, it means more investors are bullish than bearish, indicating optimism about the market’s direction.
A negative spread indicates more bearish sentiment, meaning more investors expect the market to decline.
Contrarian Indicator:
The %Bull-Bear Spread is often used as a contrarian indicator. For example, extremely high levels of bullish sentiment might suggest that the market is overly optimistic and could be due for a correction.
Similarly, when bearish sentiment is extremely high, it might indicate that the market is overly pessimistic, and a rally could be on the horizon.
Market Extremes and Reversals:
Historically, extreme values of the spread (both positive and negative) can signal turning points in the market. A very high positive spread can signal market exuberance, while a very low or negative spread may indicate fear or capitulation.


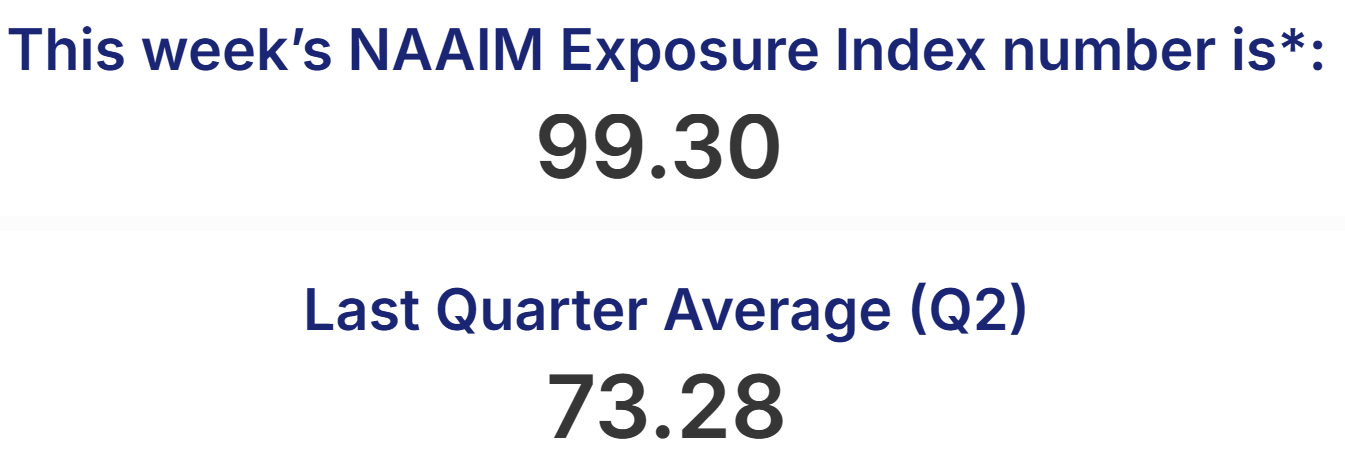
NAAIM Exposure Index
The NAAIM Exposure Index (National Association of Active Investment Managers Exposure Index) measures the average exposure to U.S. equity markets as reported by its member firms. These are typically active money managers who provide their equity exposure levels weekly. The index offers insight into how much these managers are investing in equities at any given time, ranging from being fully short (-100%) to leveraged long (up to +200%).


CBOE Total Put/Call Ratio
CBOE's total put/call ratio includes index options and equity options. It's a popular indicator for market sentiment. A high put/call ratio suggests that the market is overly bearish and stocks might rebound. A low put/call ratio suggests that market exuberance could result in a sharp fall.

Equity vs Bond Volatility
The Merrill Lynch Option Volatility Estimate [MOVE] Index from BofAML and the CBOE Volatility Index [VIX] respectively represent market volatility of U.S. Treasury futures and the S&P 500 index. They typically move in tandem but when they diverge, an opportunity can emerge from one having to “catch-up” to the other.

CNN Fear & Greed Constituent Data Points & Composite Index


Social Media Favs
Analyzing social sentiment can provide valuable insights for investment strategies by offering a pulse on public perception, mood, and market sentiment that traditional financial indicators might not capture. Here’s how social sentiment analysis can enhance investment decisions:
Market Momentum: Positive or negative social sentiment can signal impending momentum shifts. When public opinion on a stock, sector, or asset class changes sharply, it can create buying or selling pressure, especially if that sentiment becomes widespread.
Early Detection of Trends: Social sentiment data can help investors spot trends before they show up in technical or fundamental data. For example, increased positive chatter around a particular company or sector might indicate growing interest or excitement, which could lead to price appreciation.
Gauge Retail Investor Impact: With the rise of retail investor platforms, collective sentiment on social media can lead to significant price movements (e.g., meme stocks). Understanding how retail investors view certain stocks can help in identifying high-volatility opportunities.
Event Reaction Monitoring: Social sentiment can provide real-time reactions to news events, product releases, or earnings reports. Investors can use this information to gauge market reaction quickly and adjust their strategies accordingly.
Complementing Quantitative Models: By adding a social sentiment layer to quantitative models, investors can enhance predictions. For example, a model that tracks historical price and volume data might perform even better when factoring in sentiment trends as a measure of market psychology.
Risk Management: Negative sentiment spikes can be a signal of potential downturns or increased volatility. By monitoring sentiment, investors might avoid or hedge against investments in companies experiencing a public relations crisis or facing negative perceptions.
Long-Term Sentiment Trends: Sustained sentiment trends, whether positive or negative, often mirror longer-term market cycles. Tracking sentiment trends over time can help identify shifts in investor psychology that could affect longer-term investments or sector rotations.
For these reasons, sentiment analysis, when combined with other tools, can provide a comprehensive view of both immediate market reactions and underlying investor attitudes, helping investors position themselves strategically across various time frames. Here are the most mentioned/discussed tickers on Reddit from some of the most active Subreddits for trading:

Institutional S/R Levels for Major Indices
When you’re a large institutional player, your primary goal is to find liquidity - places to do a ton of business with the least amount of slippage possible. VolumeLeaders.com automatically identifies and visually plots the exact spots where institutions are doing business and where they are likely to return for more. It’s one of the primary reasons “support” and “resistance” concepts work and truly one of the reasons “price has memory” - take a look at the dashed lines in the images below that the platform plots for you automatically; these are the areas institutions constantly revisit to do more business.
Levels from the VolumeLeaders.com platform can help you formulate trades theses about:
Where to add or take profit
Where to de-risk or hedge
What strikes to target for options
Where to expect support or resistance
And this is just a small sample; there are countless ways to leverage this information into trades that express your views on the market. The platform covers thousands of tickers on multiple timeframes to accommodate all types of traders.
SPY

QQQ
IWM

DIA
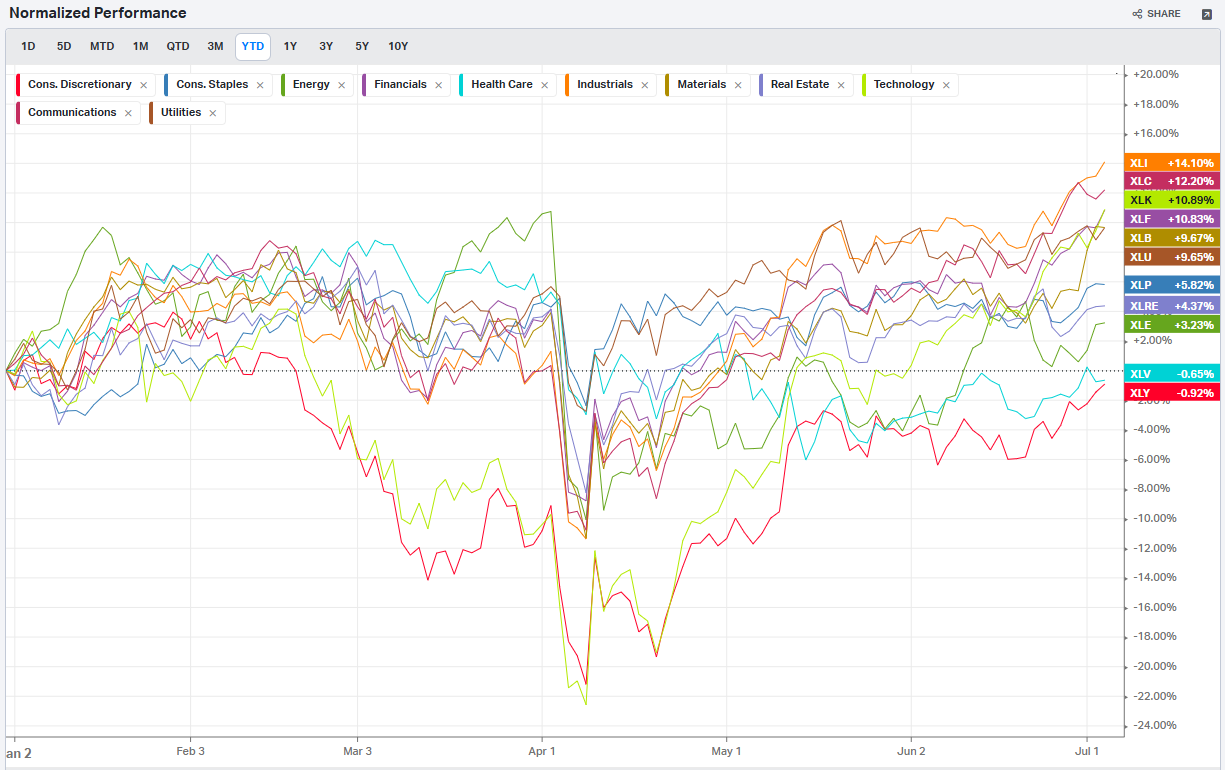
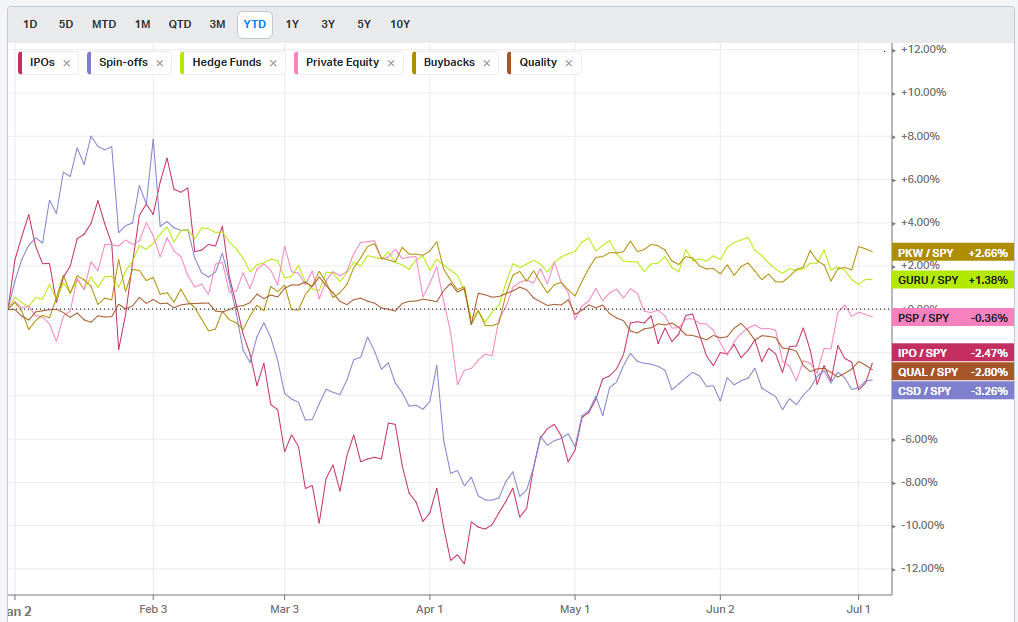
Summary Of Thematic Performance YTD
VolumeLeaders.com offers a robust set of pre-built thematic filters, allowing you to instantly explore specific market segments. These performance snapshots are provided purely for context and inspiration—think about zeroing in on the leaders and laggards within the strongest and weakest sectors, for example.
S&P By Sector
S&P By Industry

Commodities: Energy

Commodities: Metals

Commodities: Agriculture

Country ETFs

Currencies

Global Yields

Factors: Style

Factors: Size vs Value

Factors: Qualitative
Events On Deck This Week
Here are key events happening this week that have the potential to cause outsized moves in the market or heightened short-term volatility.
Econ Events By Day of Week

Anticipated Earnings By Day of Week


Market Intelligence Report
Introduction
Market Concentration and Scale
The dataset encompasses 700 institutional trades totaling $32.8 billion in transaction value represents historically light capital deployment in the week leading up to July 4th. If you review “Institutional Dollars By Day” below, it’s clear that June had 2 key liquidity events that institutions used to pull-forward most of their activity and get most of their positioning done in; on a rolling basis, this week represents the least amount of institutional activity we’ve seen in over a year. Technology sector dominance is unmistakable, accounting for $13.0 billion across 135 trades with an average relative size of 14.36x normal volumes.
Large Individual Positioning
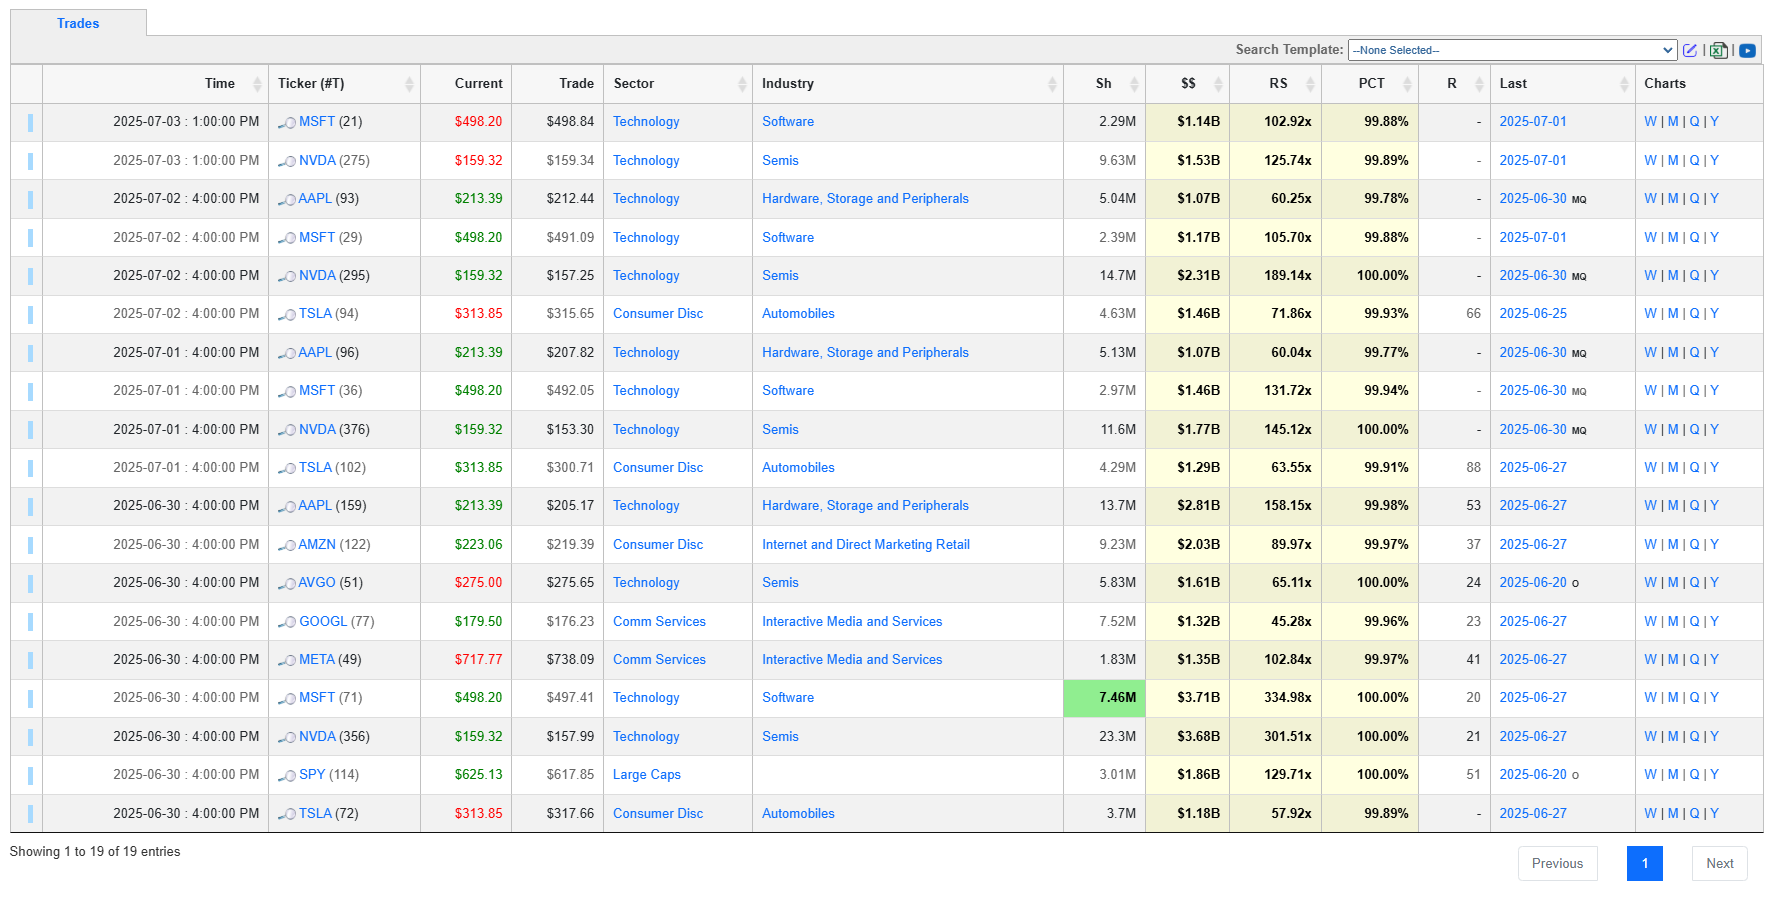
Two mega-cap positions stand out with exceptional magnitude in the week’s data. Microsoft (MSFT) recorded a $3.7 billion institutional position with a remarkable 335x relative size at rank 20, occurring as the stock reached its all-time high of $499.30 on June 27th. Microsoft's stock surged 24% in June 2025, driven by robust Q3 FY25 earnings and AI advancements, with analysts raising price targets to $605 from $540.
Similarly, NVIDIA (NVDA) captured $3.7 billion in institutional attention with 302x relative size at rank 21. NVIDIA recently became the world's most valuable company with a market cap approaching $4 trillion, maintaining 92% market share in data center GPUs despite competition from AMD and Intel. This positioning coincides with the company's GPU market share expansion and continued AI infrastructure demand.

Sector Positioning Dynamics
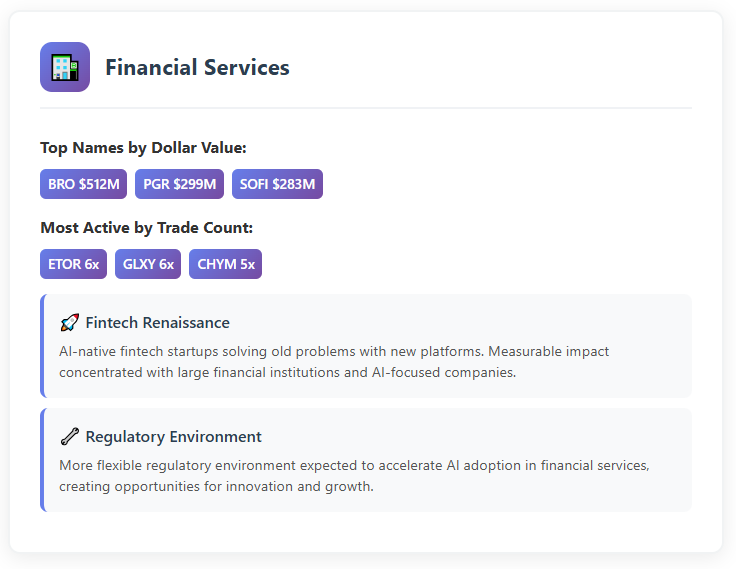
The data reveals compelling sector rotation patterns. Technology's $13.0 billion represents 40% of total activity, followed by Industrials ($3.7B), and Large Cap ETFs ($3.2B). Financial Services captured $2.9 billion across 92 trades, while Communications Services concentrated $2.5 billion in just 14 trades - indicating selective, high-conviction positioning in specific communications names like Alphabet (GOOGL) with its $1.3 billion position.
Notable Outlier Positions
JHX (Materials) appeared in 17 separate trades with ranks ranging from 1 to 25, totaling $664 million on the heels of news indicating they’ve completed their acquisition of AZEK which in turn emerged as a fascinating outlier with the highest individual trade rank of 1, representing a 281x relative size position worth $849 million. AZEK manufactures sustainable outdoor living products including decking and railing systems, operating primarily in the fast-growing outdoor living market through residential and commercial segments.

Palantir Technologies (PLTR) recorded $934 million in positioning with 249x relative size, while several ETF products showed exceptional activity: SPLG (Large Caps) totaled $1.3 billion across two trades, and UPRO (3x Bull S&P 500) registered 131x relative size positioning.
Risk and Leverage Indicators
The presence of substantial leveraged ETF positioning deserves attention. UPRO (3x Bull S&P 500), SOXL (3x Bull Semiconductors), and various sector-specific leveraged instruments suggest institutions are either hedging existing positions or expressing amplified directional views on market segments.
ETF Flow Implications
Large Cap ETF positioning totaling $3.2 billion across 33 trades reveals institutional preference for broad market exposure alongside individual stock selection. The concentration in SPLG, ITOT, and QQQM suggests institutions are maintaining market beta exposure while executing specific sector and individual equity strategies.
Crypto Still Going
The cryptocurrency exposure through Circle Internet (CRCL) with $412 million across six trades indicates institutional crypto positioning continues. Right now, institutions have painted very clear areas where they like doing business:

Data Deep-Dive

Institutional Ideas Worth Watching
A curated list of tickers surfacing on institutional radars—backed by data, momentum, and volume signatures that suggest real positioning. These are setups worth keeping an eye on.


Note: JHX+AZEK and RDFN+RKT are the results of M&A activity. AS prints at a time of heavy consolidation after essentially doubling-up off the April lows:


HWM, a quiet name that’s been doing nothing but going parabolic since 2020. Is volume telling us it’s finally ready to consolidate some longs or are institutions still ok chasing price up here?
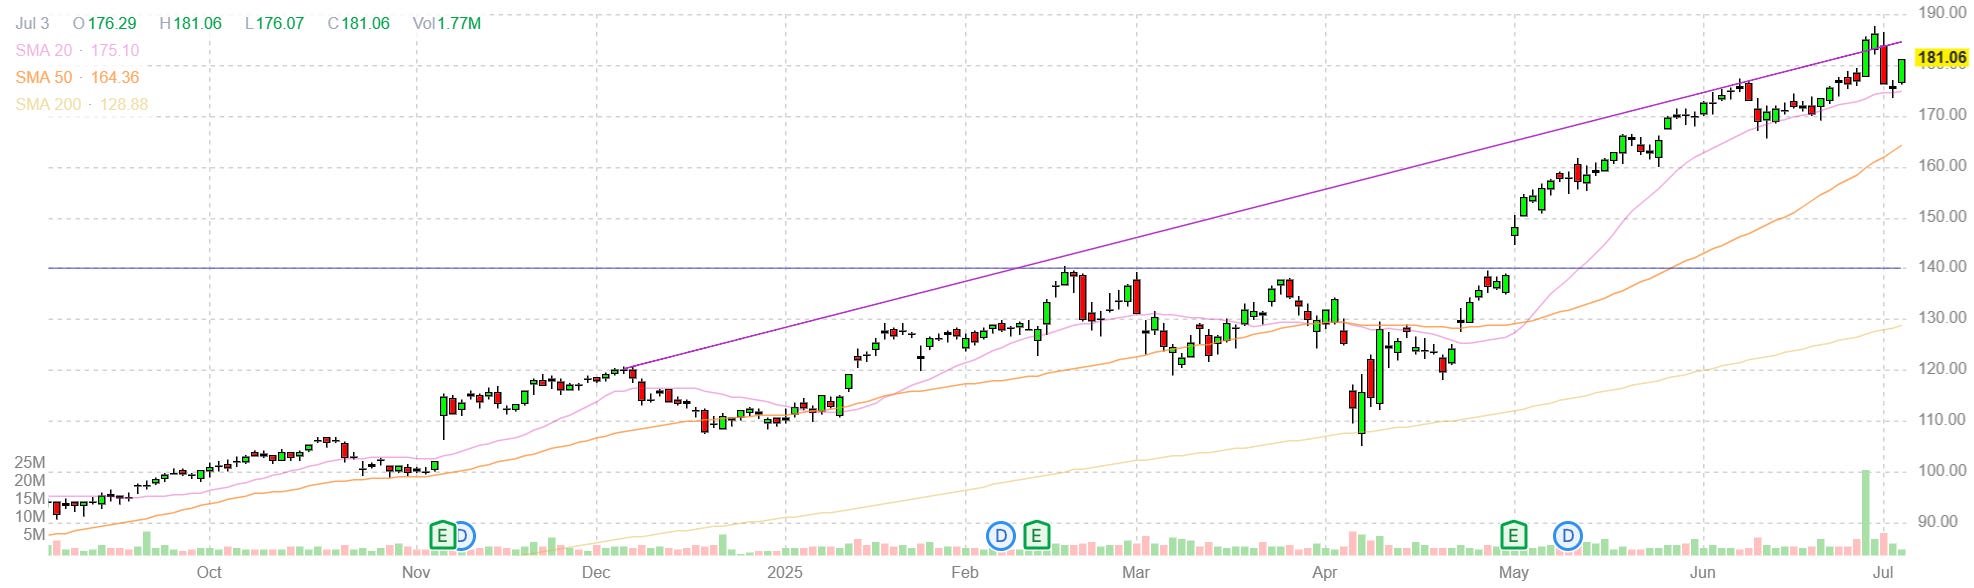
SOFI showing acceleration into new yearly highs. The name is still ~$10 off its ATHs. Watch for bulls to defend $18 and turn it into a pivot to attack higher prices:


CAH once again finds support at the 20 DMA in a constructive uptrend:

JHX’s cash-and-stock acquisition of AZEK appears to be a well-received catalyst as price attempts a look above this trading channel; price has been constructive in the run-up to the news event:


Where all of the above data in the Market Intelligence Report focuses on analyzing the top-ranked institutional flow, everything below looks at all institutional flow from this week to present the following findings.
Rolling 90-Day Dollars By Day
This chart shows institutional activity by dollars by day on a rolling 1-year basis. From a theoretical standpoint, examining a chart of daily institutional dollar activity over the course of a year can offer several insights and possible inferences, though all should be approached with caution since the data alone may not prove causality or confirm underlying reasons. Some potential takeaways include:
Event-Driven Behavior:
Sharp, singular spikes on certain days might correlate with major market-moving events. These could include central bank policy announcements, significant geopolitical news, sudden macroeconomic data releases (like employment reports or GDP data), earnings seasons for large-cap companies, or unexpected shocks (e.g., mergers, acquisitions, regulatory changes).Liquidity Dynamics:
Institutions often concentrate large trades on days with higher expected liquidity. For instance, heightened activity might coincide with index reconstitutions, option expiration dates, or the days leading up to or following a major index rebalance, when large amounts of capital shift hands simultaneously.Risk Management and Hedging Activity:
Institutions may significantly adjust their exposures on days that are critical from a risk management perspective. Large spikes can occur if hedge funds, pension funds, or asset managers are rolling over futures contracts, initiating or closing out large hedges, or reacting to volatility triggers.Market Sentiment Indicators:
While the data is purely transactional, the sheer volume of institutional involvement on certain days might indirectly hint at changing sentiment or strategic shifts.
In essence, a chart like this can lead you to hypothesize that institutional trading volumes are not constant or random but rather influenced by a mix of predictable calendar effects, major market events, liquidity considerations, risk management decisions, and strategic allocation shifts.

Top Institutional Order Flow By Sector By Week For The Past 90-Days


Top Institutional Order Flow In Equities
These are incredibly important charts to watch as they contains lots of nuanced suggestions at a thematic level. Watch these charts closely week-to-week to stay informed about where institutional money is flowing, adjust your strategies based on momentum, align your portfolio with macroeconomic and market trends, and manage risks more effectively by avoiding sectors losing institutional favor.
Sector Rotation Insights: The chart highlights which sectors are attracting institutional activity and which are losing favor. Institutions often lead market trends, so tracking shifts in their focus can indicate sector rotations.
Sentiment Analysis: The level of institutional activity reflects confidence in specific sectors. Rising activity in traditionally defensive sectors (e.g., healthcare, utilities) may indicate caution, while a surge in growth sectors (e.g., technology, consumer discretionary) could suggest optimism.
Emerging Trends: Sudden spikes in a previously overlooked sector, like industrials or consumer staples, might hint at emerging opportunities or structural shifts.
Macro Themes: Changes in sector activity often align with broader macroeconomic themes like inflation, interest rates, or geopolitical events. For instance:
Increased activity in energy might indicate concerns about oil supply or rising prices.
Growth in technology could align with innovations or favorable policies.
Risk Management: Declining institutional activity in a sector might signal weakening fundamentals or heightened risks.
Spotting Overcrowding: Excessive activity in a single sector over multiple weeks may suggest overcrowding, which could lead to heightened volatility if institutions begin to exit.


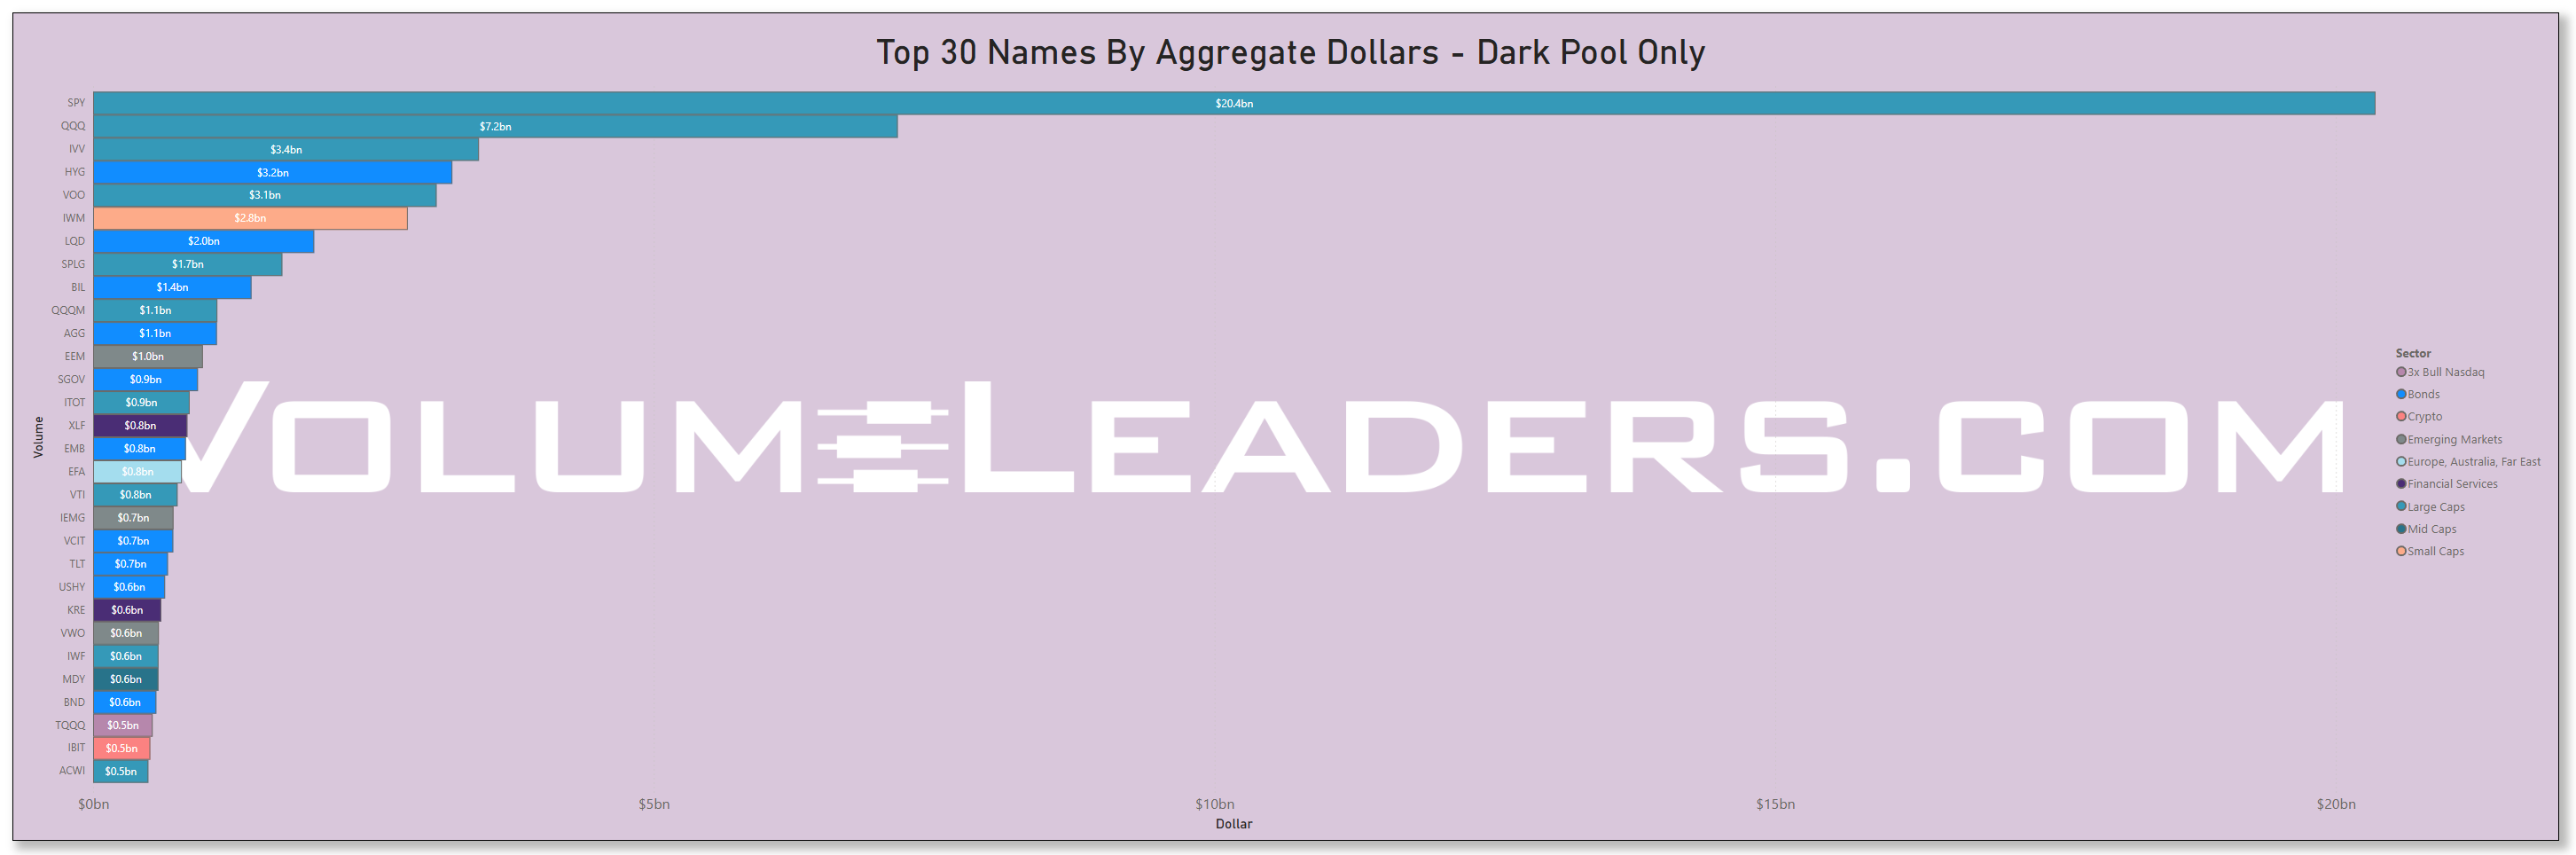
Many excellent trade ideas and sources of inspiration can be found in the prints below. While only the top 30 from each group are displayed, the complete results are accessible in VolumeLeaders.com for you to explore at your convenience any time. Remember to configure trade alerts within the platform to ensure institutional order flows that capture your interest or are significant to you aren’t missed. The blue charts represent all types of trades, including blocks on lit exchanges; the purple charts exclusively depict dark pool trades; and the green charts are sweeps only.


Top Institutional Order Flow In ETFs


Last Week’s Billion-Dollar Prints
Tickers that printed a trade worth at least $1B last week get a special shout-out. These are massive commitments by institutions that should not be ignored.
Thank you for being part of our community and for dedicating your time to this edition. Your insights and engagement drive everything we do, and we’re honored to share this space with such committed, thoughtful readers. Here’s to a week filled with clear opportunities and strong performance. Wishing you many bags 💰💰💰
—VolumeLeaders