Market Momentum: Your Weekly Financial Forecast & Market Prep
Issue 51 / What to expect June 30, 2025 thru July 4, 2025

NOTE: This weekly periodical is too large for Substack to deliver in its entirety via email - you will only see a portion of this great content if you read from your email client. Click the header/title at the top to read the full article!

In This Issue
[Free For Everyone]
Weekly Market-On-Close Report: All the macro moves, market drivers, and must-know narratives—covered in less than five minutes.
Weekly Benchmark Breakdown: Our weekly intelligence report on major indices cuts through the index-level noise to uncover participation, momentum, and structural integrity and tell you whether markets are rising on solid ground or skating on thin breadth. This is where bull markets prove themselves—or quietly start to unravel.
The Latest Investor Sentiment Readings: Track the emotional pulse of the market with our curated dashboard of sentiment indicators. From fear-fueled flight to euphoric overreach, this week's readings reveal whether investors are cautiously creeping in—or stampeding toward the exits.
Institutional Support & Resistance Levels For Major Indices: Exactly where to look for support and resistance this coming week in SPY, QQQ, IWM & DIA
Normalized Performance By Thematics YTD: Which corners of the markets are beating benchmarks, which are overlooked and which ones are over-crowded!
Key Econ Events & Earnings On-Deck For This Coming Week
[Only For Subs]
This Week’s Institutional Activity In Equities: Track the real money. This section breaks down where institutions are placing their bets—and pulling their chips. You'll get a sector-by-sector view of equity flows, highlighting the most active names attracting large-scale buying or selling. We go beyond the headlines and into the tape, surfacing the week’s most notable block trades and sweep orders, both on lit exchanges and hidden dark pools. Whether you're following momentum or fading crowded trades, this is your map to where size is moving and why it matters.
Institutional Activity By Day (rolling 6-months)
Institutional Activity By Sector By Week (rolling 6-months)
This Week’s Institutional Activity In ETFs: Follow the flows that shape the market. This section uncovers where institutions are deploying capital across the ETF landscape, broken down by sector and fund. We highlight the largest block trades and aggressive sweeps—both visible on lit exchanges and hidden in dark pools—to reveal how the smart money is positioning. Whether they’re rotating risk, hedging exposure, or scaling into themes, this is your lens into the ETF vehicles driving institutional intent.
Statistical Analysis and Insights From This Week’s Top Prints: we run the numbers on the most significant institutional trades of the week—those outsized prints that stand apart from the noise. Through statistical analysis and pattern recognition, we decode what these moves may signal about future price action. Whether it's the start of accumulation, a stealthy unwind, or a shift in market regime, this is where data meets intent. These are the trades that matter—and the stories they may be telling.

Weekly Market-On-Close Report
Markets Reach New Peaks as Geopolitical Tensions Cool and Fed Signals Dovish Shift
The final week of June delivered a powerful conclusion to the second quarter, with major U.S. equity indices surging to fresh all-time highs as investors embraced a confluence of favorable developments. The S&P 500 Index climbed 3.44% for the week, while the technology-heavy Nasdaq Composite advanced 4.25%, both closing at record levels. The Dow Jones Industrial Average, though not achieving new peaks, posted solid gains exceeding 2.5% alongside mid-cap and small-cap benchmarks.
This remarkable performance represented the strongest weekly showing for the S&P 500 since May's initial China trade framework announcement, underscoring how rapidly market sentiment can shift when multiple catalysts align favorably. The rally's breadth and intensity suggested more than mere technical momentum—it reflected a fundamental reassessment of near-term risks and opportunities across asset classes.
Geopolitical De-escalation Sparks Energy Market Reversal
The week's most dramatic narrative began over the weekend when the United States launched targeted airstrikes against three Iranian nuclear enrichment facilities. This unexpected military action, occurring amid ongoing Israel-Iran tensions that had been escalating since mid-June, initially sent shockwaves through global markets as investors braced for potential retaliation and regional destabilization.
Energy markets bore the immediate brunt of geopolitical anxiety, with ICE Brent crude oil briefly surging above $80 per barrel as traders priced in supply disruption risks. The critical Strait of Hormuz, through which approximately 20% of global oil consumption flows, remained a focal point of concern given Iran's historical threats to disrupt this vital shipping lane during periods of heightened tension.

However, Iran's measured response proved far less escalatory than many had feared. While Iranian forces did launch missiles targeting a U.S. military installation in Qatar, these projectiles were successfully intercepted with no casualties or material damage reported. More significantly, Iran refrained from targeting oil infrastructure or threatening the Strait of Hormuz, signaling a deliberate effort to contain the conflict's scope.
This restrained response triggered a dramatic reversal in energy markets that continued throughout the week. U.S. WTI crude oil, which had surged over 20% during June to reach $75 per barrel, plummeted approximately 13% to settle around $65. European natural gas prices experienced an even more pronounced decline, with Dutch TTF contracts falling 20% as Middle East risk premiums were rapidly unwound.
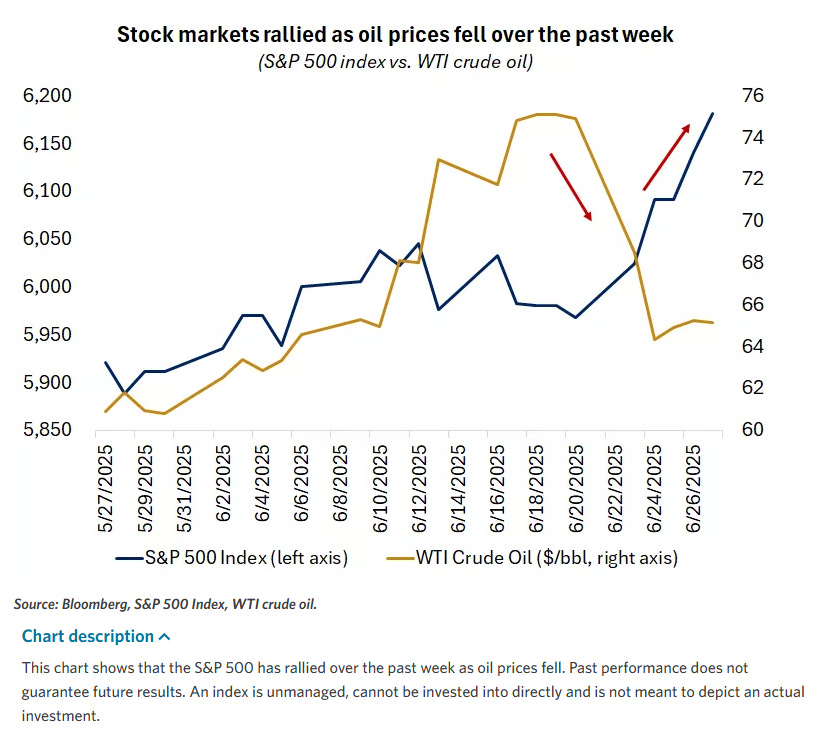
The energy sector's sharp reversal had cascading effects across broader markets. Lower oil prices not only provided immediate relief for consumers entering the peak summer driving season but also alleviated inflationary pressures that had been weighing on Federal Reserve policy deliberations. This dual benefit—reduced input costs for businesses and diminished inflation concerns—helped fuel the week's equity rally while supporting Treasury bond prices.
Federal Reserve Policy Pivot Gains Momentum
Concurrent with geopolitical de-escalation, Federal Reserve officials began articulating a more dovish stance that significantly influenced market dynamics. The central bank's June 17-18 meeting had already outlined the possibility of two rate cuts during 2025 in its updated dot plot projections, but subsequent commentary from key policymakers suggested this timeline might prove conservative.

Fed Governor Christopher Waller emerged as a particularly influential voice, indicating his support for a potential rate cut as early as July—a notably more aggressive timeline than many market participants had anticipated. Governor Michelle Bowman, whose name has been circulated as a potential successor to Chair Jerome Powell, echoed similar sentiments, lending additional credibility to the dovish narrative.
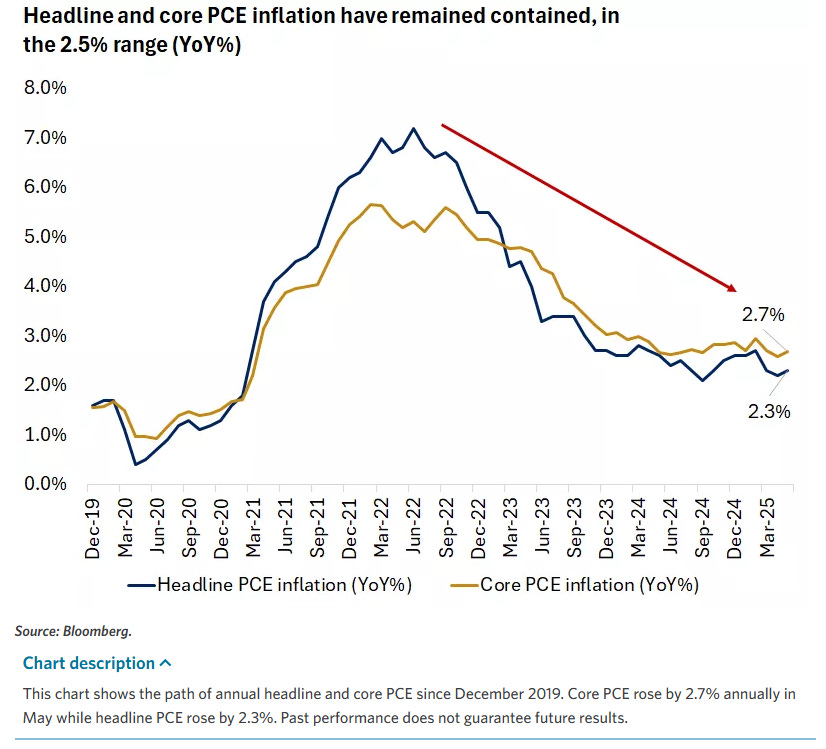
These perspectives gained further support from recent economic data that painted a picture of moderating growth alongside contained inflationary pressures. The Bureau of Economic Analysis' personal consumption expenditures (PCE) price index—the Fed's preferred inflation gauge—showed a modest uptick in May but remained within acceptable parameters. Core PCE, excluding volatile food and energy components, rose 0.2% month-over-month and 2.7% year-over-year, only slightly above consensus expectations.
More telling were the consumption and income figures that accompanied the inflation data. Personal spending unexpectedly declined 0.1% in May, while personal income fell 0.5%—the largest monthly decrease in over three and a half years. These developments suggested that consumers were beginning to feel the cumulative effects of higher interest rates and elevated living costs, potentially providing the economic cooling that Fed officials have been seeking.
The University of Michigan's consumer sentiment survey added another dovish data point, with inflation expectations for the year ahead plummeting from 6.6% in May to 5.0% in June. Survey director noted that "fears about the potential impact of tariffs on future inflation softened somewhat," indicating that trade policy concerns, while still present, were no longer dominating consumer psychology to the same extent.
Federal funds futures markets responded to this shifting landscape by increasing the probability of a July rate cut from 14.5% at the previous week's close to approximately 19% by Friday afternoon. More broadly, markets now price in two to three rate cuts by year-end, a more aggressive easing cycle than many had anticipated just weeks earlier.
Technology Sector Leads Charge to New Highs
The week's equity rally was particularly pronounced in growth-oriented sectors, with technology companies spearheading the advance to new records. The ICE Semiconductor Index surged over 5% for the week, extending its year-to-date gains to more than 10% and highlighting the sector's resilience despite ongoing China trade tensions and export restriction concerns.

NVIDIA Corporation emerged as a standout performer, reaching fresh all-time highs as artificial intelligence momentum continued to build across multiple fronts. The company benefited from positive earnings results at memory chip manufacturer Micron Technology, which reported better-than-expected results and provided encouraging commentary about AI-driven demand trends. Additionally, CEO Jensen Huang's recent discussions about robotics applications for AI technology helped fuel investor enthusiasm about expanding addressable markets.
The semiconductor rally extended well beyond individual company stories, reflecting broader institutional confidence in the sector's long-term growth trajectory. Despite periodic concerns about China market access and export restrictions, major technology companies have largely demonstrated their ability to navigate regulatory challenges while maintaining robust revenue and earnings growth. First-quarter earnings season had provided validation of this resilience, with most major tech firms not only meeting but exceeding both revenue and profit expectations.
Industrial companies with artificial intelligence infrastructure exposure also participated in the technology-driven rally, gaining over 3% for the week. This performance reflected growing recognition that AI deployment requires substantial physical infrastructure investments, from data centers to specialized manufacturing equipment, creating opportunities across multiple sectors beyond pure-play technology names.
The communication services sector, home to many large technology companies, similarly outperformed, benefiting from renewed investor confidence in digital advertising markets and cloud computing demand. Consumer discretionary stocks also participated in the growth rally, as lower interest rate expectations boosted valuations for companies sensitive to borrowing costs and consumer spending patterns.
Financial Sector Gains Momentum on Regulatory Relief
Banking and financial services companies emerged as another leadership group during the week's rally, advancing over 3% as a combination of factors aligned favorably for the sector. Capital markets-focused firms particularly benefited from improved market conditions and higher trading volumes associated with the equity rally.
A significant catalyst for bank stocks came from regulatory developments that could materially impact capital requirements. The Federal Reserve proposed reducing the enhanced supplementary leverage ratio (SLR) from its current 5% level to between 3.5% and 4.5%, with the specific requirement varying based on individual institutions' risk profiles. This proposal, now open for public comment over the typical 30-60 day period, represents a key policy objective of the current administration aimed at increasing demand for Treasury securities.

The SLR modification could prove particularly beneficial for globally systemically important banks (GSIBs), potentially freeing substantial capital from their balance sheets for more productive uses. This regulatory relief comes at a time when banks are generally well-capitalized but facing margin pressure from the interest rate environment and economic uncertainty.
Payment processing companies also rebounded during the week after facing recent pressure related to stablecoin regulatory concerns. The sector's recovery reflected both the broader risk-on sentiment and growing confidence that digital payment adoption trends remain intact despite periodic regulatory headwinds.
Credit markets provided additional support for financial sector performance, with corporate bond spreads remaining stable despite the week's significant moves in equity markets. High-yield credit spreads actually tightened modestly as declining Treasury yields provided technical support, while investment-grade spreads held steady, indicating continued confidence in corporate credit quality.

Trade Policy Developments Create Mixed Signals
International trade developments provided both support and occasional volatility throughout the week, illustrating the ongoing importance of policy uncertainty in market dynamics. The administration announced completion of a trade understanding with China that had been initially reached during Geneva negotiations in May, including Chinese commitments to deliver rare earth materials and review export controls on critical items.

Commerce Secretary Howard Lutnick provided additional details, indicating that the United States would cancel certain restrictive measures against China in exchange for these commitments. China's Commerce Ministry confirmed the agreement and stated its intention to review and approve eligible applications for controlled item exports, suggesting genuine progress in reducing trade tensions between the world's two largest economies.
Beyond the China agreement, Lutnick indicated that the White House had "imminent plans" to reach agreements with ten major trading partners ahead of a July 9 deadline for reciprocal tariffs. This timeline, while aggressive, offered hope for broader trade normalization that could reduce business uncertainty and support global economic growth.

The Treasury Department simultaneously announced a multilateral agreement with G-7 countries addressing digital taxation issues. Under this framework, U.S. companies would be excluded from certain taxes imposed by other countries in exchange for removing "revenge tax" provisions from President Trump's domestic tax legislation. This development helped ease concerns about escalating tax disputes that could complicate international business operations.
However, trade optimism received a significant setback late in the week when President Trump announced an immediate end to trade negotiations with Canada over its digital services tax. The administration's frustration with Canadian Prime Minister Mark Carney's refusal to eliminate this tax, which affects major U.S. technology companies, led to threats of new tariffs within the following week.

This development highlighted the fragile nature of trade progress and reminded investors that policy reversals remain possible even when negotiations appear to be proceeding constructively. Canadian dollar weakness following the announcement demonstrated how quickly currency markets can respond to trade policy shifts, while U.S. equity markets experienced modest volatility as investors reassessed the broader implications.
Economic Data Presents Mixed Growth Picture
The week's economic releases painted a nuanced picture of U.S. economic conditions, with indicators suggesting continued expansion alongside emerging signs of moderation in consumer activity. S&P Global's flash purchasing managers' indices for June showed business activity maintaining growth momentum, though at a slightly slower pace than the previous month.
The composite PMI reading of 52.8 represented a modest decline from May's 53.0 level while remaining comfortably above the 50 threshold that separates expansion from contraction. Manufacturing showed particular strength, with output rising for the first time since February and employment growing at the fastest rate in twelve months. However, this apparent strength came with caveats, as inventory accumulation continued at near three-year highs—a development attributed to tariff-related stockpiling that complicates economic analysis.

Services sector activity remained robust but decelerated slightly, with costs continuing to rise at concerning rates. The overall increase in input costs reached the second-highest level since early 2023, with tariff impacts widely cited as a primary driver. This cost pressure suggests that inflationary concerns, while moderating, have not been entirely resolved.
Labor market indicators continued to signal stability, with initial jobless claims declining and remaining below expectations. However, continuing claims moved higher and exceeded forecasts, suggesting that while layoffs remain limited, job-finding may be becoming more challenging for those already unemployed.
Housing market data reinforced themes of subdued activity amid affordability challenges. Existing home sales rose marginally and beat expectations but remained near historically low levels for May readings. New home sales declined sharply, falling 13.7% from April to the lowest level since October, while pending home sales provided a modest bright spot with year-over-year growth.

Durable goods orders delivered a significant positive surprise, surging 16.4% in May—the highest pace in eleven years. However, this headline figure was heavily influenced by commercial aircraft bookings, which can be volatile. More importantly, orders excluding defense and aircraft—a proxy for business investment—rebounded 1.7% after April's decline, suggesting that corporate capital spending remains reasonably healthy.
International Markets Participate in Risk-On Rally
Global equity markets generally participated in the week's positive momentum, though performance varied by region and local factors. European markets benefited significantly from declining natural gas prices, with the STOXX 600 rising 1% to test key moving average resistance levels. German markets led European performance with the DAX advancing 3%, supported by the 50-day moving average and moving back toward all-time highs.

Construction, automotive, and travel/leisure sectors drove European outperformance, benefiting from reduced energy costs and improved economic sentiment. The region's increased defense spending commitments for NATO—targeting 5% of GDP with Germany specifically planning to increase defense expenditures by 70% through 2029—provided additional support for relevant sectors.
Asian markets showed more mixed performance despite generally positive sentiment. Japan emerged as a standout performer, advancing approximately 5% and potentially breaking out of a trading range despite yen strengthening against the dollar. Chinese markets participated modestly in the rally, with both Shanghai and Hong Kong indices posting gains supported by positive trade developments, particularly regarding rare earth materials agreements.
South Korea's market performance highlighted the complexity of international investment flows. While the market posted gains, it lagged regional peers following MSCI's decision not to add the country to its Developed Market indices—a disappointment that had been driving recent optimism and performance.
Emerging markets more broadly benefited from the combination of reduced geopolitical tensions, lower commodity costs, and improved risk sentiment. However, performance remained uneven as local factors continued to influence individual country outcomes.
Commodity Markets Reflect Shifting Risk Dynamics
Commodity markets experienced significant volatility as geopolitical tensions first escalated then subsided, creating dramatic price swings that highlighted these markets' sensitivity to supply disruption risks. Energy commodities bore the brunt of these moves, with oil prices experiencing extreme volatility Monday before settling into a more sustained decline as Middle East tensions cooled.
Beyond the immediate geopolitical impacts, energy markets also reflected changing demand dynamics as economic growth concerns began to temper consumption expectations. Natural gas markets proved particularly volatile, with European prices declining sharply as winter supply concerns receded and Middle East risk premiums unwound.
Metals markets presented a more mixed picture, with precious metals declining as safe-haven demand diminished. Gold slipped 3% for the week, falling below the 50-day moving average that had provided significant support throughout the year. This technical breakdown suggested that investor appetite for traditional inflation hedges was waning as both geopolitical and monetary policy risks appeared to be moderating.
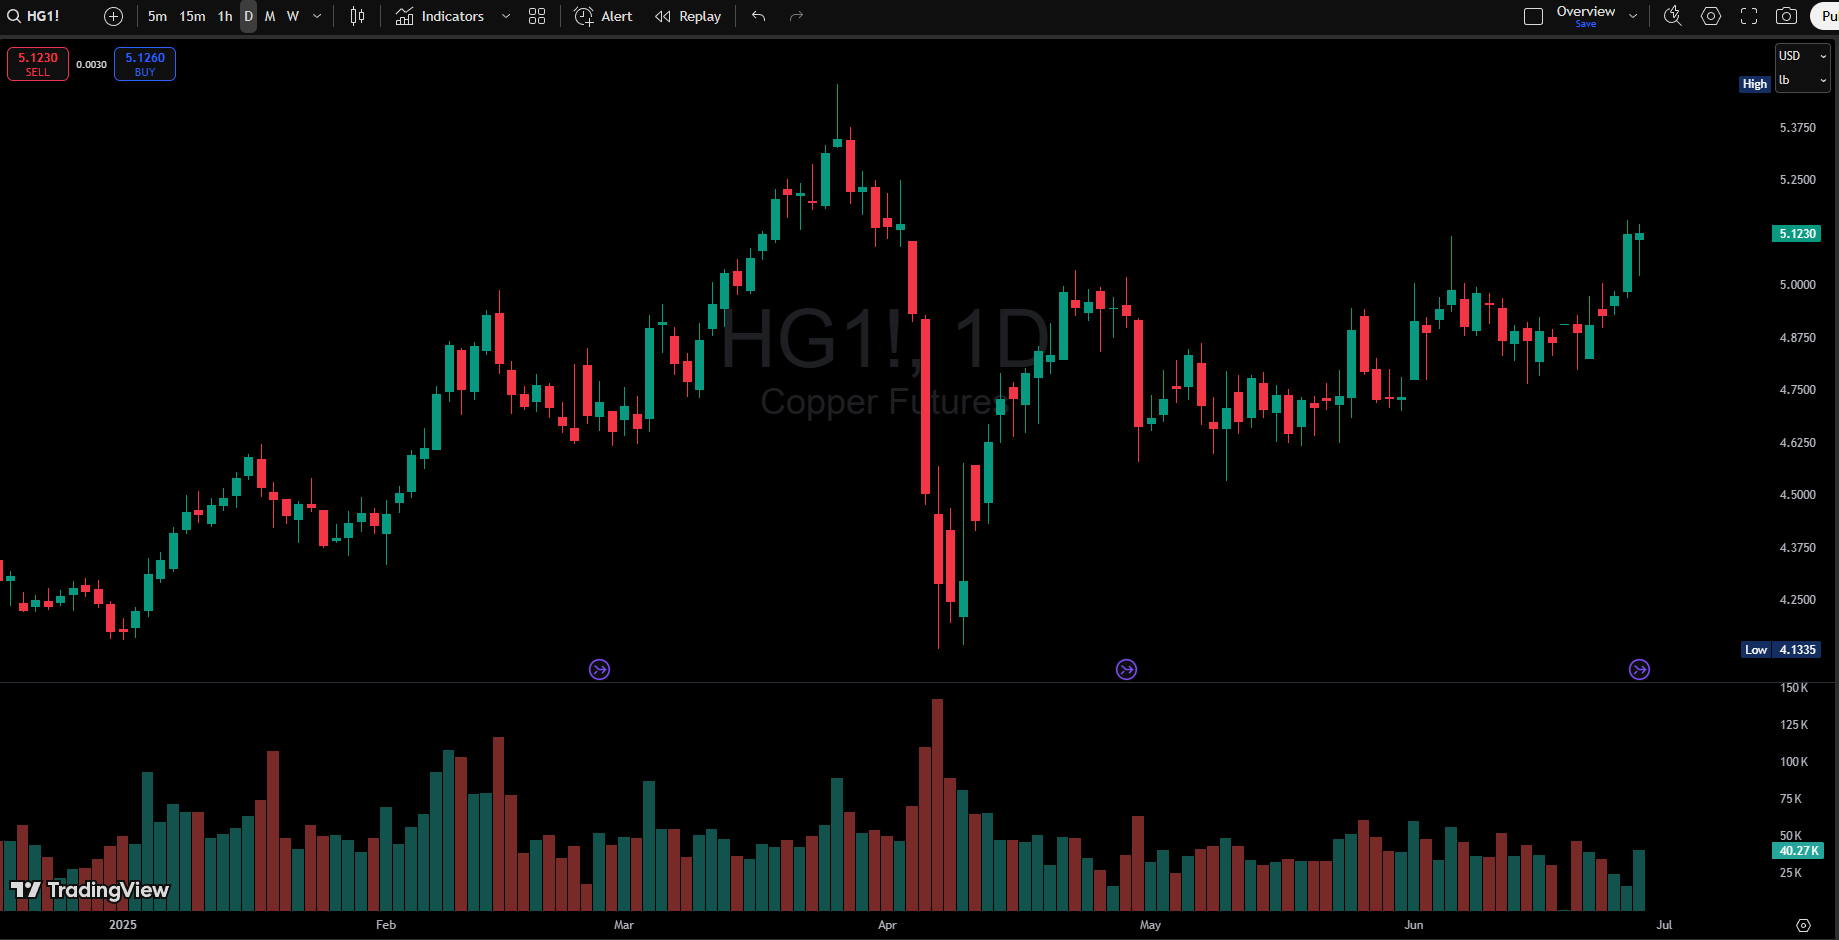
Copper provided a notable exception, advancing 6% as traders focused on supply and demand fundamentals while potentially positioning ahead of possible U.S. tariffs. President Trump's February executive order calling for an investigation into copper trade practices, with results due within 270 days, has created uncertainty about future trade policy that may be influencing positioning decisions.
Agricultural commodities generally declined, with wheat falling approximately 9% on higher production estimates. Corn extended its downtrend since mid-April, reaching its lowest levels since October as favorable growing conditions and adequate supply projections weighed on prices.
Currency Markets Signal Shifting Global Dynamics
Foreign exchange markets reflected the week's changing risk dynamics and monetary policy expectations, with the U.S. Dollar Index declining below 97 for the first time since late February 2022. This dollar weakness occurred despite relatively strong U.S. economic data, suggesting that shifting Federal Reserve policy expectations were the primary driver.
The euro's strength proved particularly notable, trading above $1.17 for the first time since October 2021. This move reflected not only dollar weakness but also improved sentiment toward European assets as energy costs declined and economic indicators showed resilience.
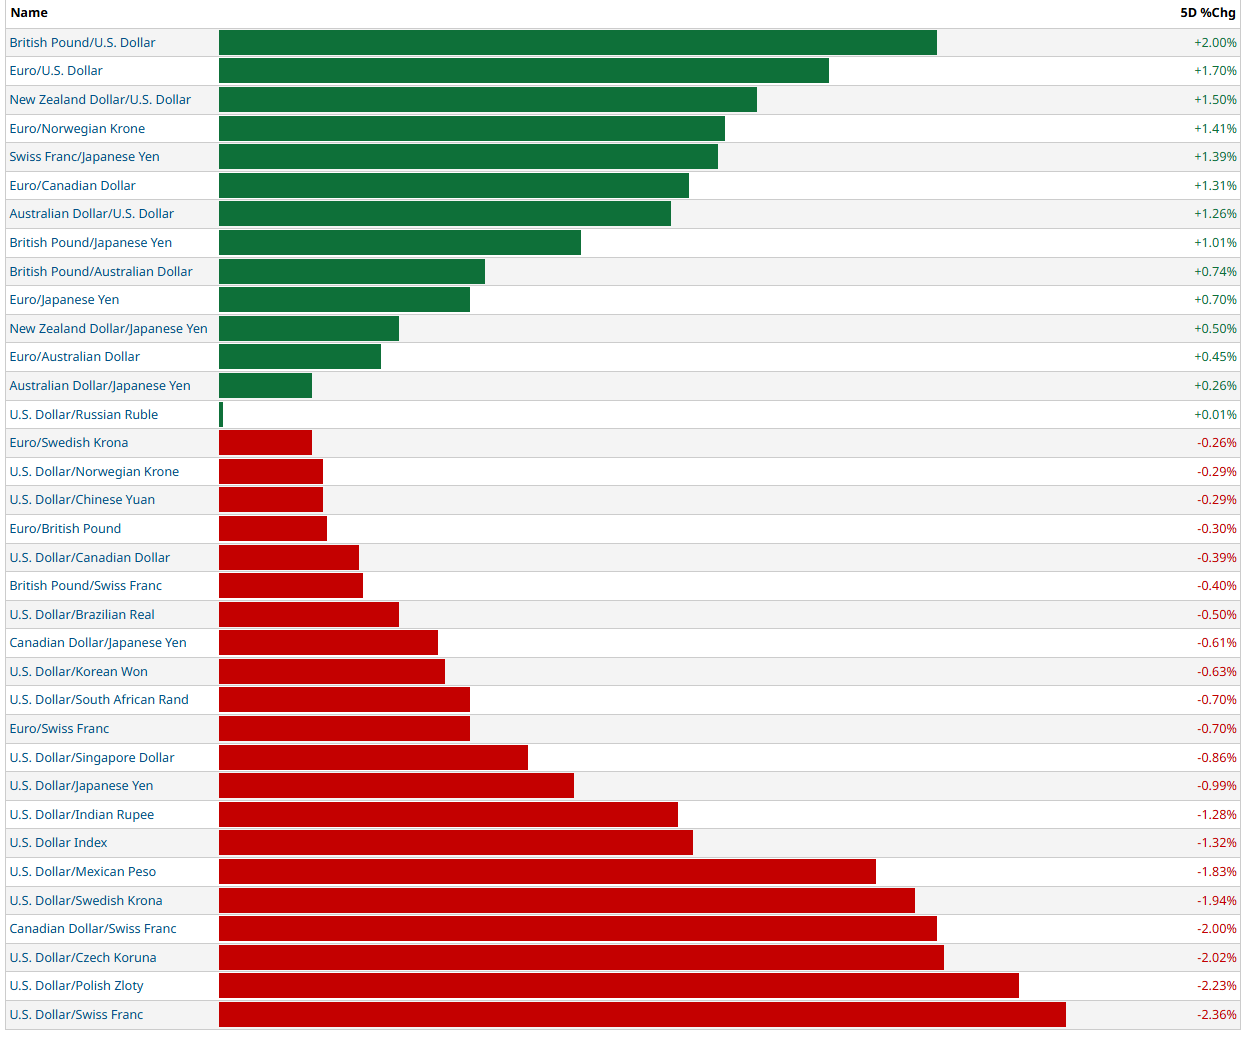
The Japanese yen experienced renewed strength after weakening the previous week, trading near ¥142 per dollar—close to its strongest recent levels from late April. This yen strength occurred despite the Bank of Japan's continued accommodative stance, highlighting how global risk sentiment and carry trade dynamics continue to influence the currency.
The Canadian dollar's sharp decline following President Trump's announcement about ending trade negotiations illustrated how quickly currency markets can respond to policy developments. This volatility served as a reminder that trade tensions remain a significant risk factor for currency markets, particularly for countries with substantial U.S. trade relationships.

Bitcoin's 3% weekly gain reflected the broader risk-on sentiment and growing institutional acceptance of digital assets. The cryptocurrency's performance suggested that it continues to trade more like a risk asset than a safe haven, responding positively to improved market sentiment and lower interest rate expectations.
Fixed Income Markets Navigate Multiple Crosscurrents
Treasury markets experienced significant moves as yields declined across the curve in response to multiple factors. The pullback in oil prices helped remove some inflation concerns, while Federal Reserve officials' increasingly dovish commentary provided additional support for bond prices.
The yield curve experienced notable steepening, with two-year Treasury yields falling 16 basis points as rate cut expectations increased. Longer-term yields also declined but by smaller amounts, reflecting continued concerns about fiscal policy and long-term inflation expectations.

Corporate credit markets remained relatively stable despite the significant moves in government bond yields. Investment-grade credit spreads held steady, while high-yield spreads actually tightened modestly as declining Treasury yields provided technical support. This stability suggested continued confidence in corporate credit quality despite economic uncertainty.
The proposed changes to the supplementary leverage ratio for banks provided additional support for Treasury markets, as the policy aims to increase demand for government securities. This regulatory development, while still in the comment period, offered the prospect of structural improvement in Treasury market liquidity and demand.
Russell Reconstitution Adds Technical Support
The annual Russell index reconstitution, transitioning to semi-annual frequency, provided additional technical support for equity markets during the week. Closing auction volumes on the New York Stock Exchange exceeded 2 billion shares for the second consecutive week, indicating substantial institutional portfolio rebalancing activity.
This technical factor helped support market performance, particularly for smaller-capitalization stocks that often experience heightened volatility during reconstitution periods. The Russell 2000 Index notably traded above its 200-day moving average for the first time since February, though it closed just below this technically significant level.
The reconstitution effects highlighted the ongoing importance of passive investment flows in market dynamics. As index funds continue to grow in size and influence, these periodic rebalancing events create concentrated trading activity that can amplify underlying market trends.
Looking Ahead: Key Catalysts and Considerations
As markets enter a shortened holiday week, several significant catalysts loom that could influence near-term performance. The Senate's expected weekend vote on comprehensive tax legislation represents a major policy milestone that could affect corporate earnings and economic growth prospects.
The July 9 trade negotiation deadline, while potentially extendable for countries negotiating in "good faith," remains a key focus for investors monitoring policy developments. The administration's handling of these negotiations could significantly influence market sentiment and business confidence.
Next week's employment report will prove crucial in shaping Federal Reserve policy expectations, particularly given the increased market focus on potential July rate cut possibilities. Economic data releases including ISM manufacturing and services surveys will provide additional insights into business conditions and inflationary pressures.
European Central Bank commentary at the Sintra conference may offer perspectives on global monetary policy coordination, while China's official PMI releases could influence sentiment toward international growth prospects.
The combination of shortened trading schedules, holiday-related lower volumes, and significant pending policy decisions creates a complex backdrop for market navigation. While momentum appears positive in the near term, the convergence of multiple potential catalysts suggests that volatility could return quickly if developments disappoint expectations.
Investment Implications and Strategic Considerations
The week's developments reinforced several key investment themes that have been developing throughout 2025. The technology sector's continued leadership, despite periodic concerns about valuations and China exposure, suggests that artificial intelligence and digital transformation trends remain powerful drivers of corporate performance and investor sentiment.

Financial sector performance improvement, supported by potential regulatory relief and improved capital markets conditions, indicates that previous concerns about net interest margin pressure and credit quality may have been overdone. The sector's relative value characteristics, combined with improving fundamental prospects, suggest continued institutional interest.
The energy sector's underperformance, while related to specific geopolitical developments, also reflects broader concerns about demand growth and transition risks. Investors appear increasingly focused on renewable energy infrastructure and efficiency technologies rather than traditional hydrocarbon assets.
International diversification themes received mixed signals, with developed market exposure offering both opportunities and risks depending on specific regional dynamics. Emerging market exposure continues to require careful country and sector selection given varying policy environments and economic trajectories.
Fixed income positioning becomes increasingly complex as Federal Reserve policy expectations shift more rapidly than many had anticipated. The potential for multiple rate cuts, while positive for bond prices, also raises questions about economic growth sustainability and long-term inflation control.
Currency hedging decisions for international investments require careful consideration given the dollar's renewed weakness and potential for continued volatility based on trade and monetary policy developments.
Navigating an Evolving Landscape
The final week of June provided a compelling conclusion to the second quarter while setting the stage for what promises to be an eventful summer period. The convergence of geopolitical de-escalation, shifting monetary policy expectations, and continued technological innovation created conditions for significant market advances across multiple asset classes.
However, the week also highlighted the continued importance of policy uncertainty in driving market volatility. Trade negotiations, Federal Reserve decisions, and regulatory developments all demonstrated their power to influence investor sentiment and asset prices rapidly and materially.
As markets enter the traditionally more volatile summer months, the combination of strong technical momentum and multiple pending catalysts creates both opportunities and risks for investors. The key to successful navigation appears to lie in maintaining flexibility while focusing on long-term structural trends that transcend short-term policy uncertainties.
The achievement of new all-time highs in major equity indices, while encouraging, also raises questions about valuation sustainability and the potential for increased volatility as markets advance into less familiar territory. Careful attention to risk management and diversification principles becomes increasingly important as market conditions continue to evolve rapidly.
Looking forward, the intersection of technological innovation, monetary policy normalization, and international trade relationships will likely continue to drive market performance. Investors who can successfully navigate these complex dynamics while maintaining discipline around valuation and risk management principles appear best positioned for continued success in this challenging but potentially rewarding environment.


Weekly Benchmark Breakdown
S&P 500 Index

The S&P 500 climbed to another all-time high this week, closing at 6,173.07 and tacking on +32.05 points (+0.52%) for the day. Intraday, the index notched a fresh record at 6,187.68, continuing a streak of higher highs that now characterizes much of this summer rally.
But the headline number tells only part of the story. Under the surface, the internals paint a picture of a market not just levitating on the backs of a few mega caps, but one experiencing remarkably strong and broad participation.
Participation: Strong Across All Horizons
Nearly 66% of S&P 500 components are trading above their 20-day moving average. The number rises further on a medium-term basis, with 70.17% above their 50-day, and remains robust on long-term gauges: over 59% of stocks are above their 100-day average, 55% above the 150-day, and 51% above the 200-day.
This kind of multi-timeframe confirmation is rare. It suggests strength that is not isolated or concentrated, but endemic across sectors and market capitalizations. In short: it’s not just the index making new highs — a large portion of its underlying constituents are, too.
New Highs Surge, New Lows Diminish
Breadth is perhaps best captured in the sheer number of new highs registered across the index:
Over the past five days, 226 S&P 500 stocks (45% of the index) printed new 5-day highs.
Only 48 stocks (10%) registered new 5-day lows.
That’s a net breadth difference of +178, the strongest showing in recent memory.
The leadership trend holds across longer timeframes as well: net new highs over the 1-month and 3-month periods stood at +119 and +90, respectively — clear signs of persistent upside leadership.
This kind of broad-based internal expansion historically correlates with market resilience. It signals a healthy rotation and expanding opportunity set rather than an overbought regime being led by a narrow group of names.
What It Means
Despite concerns around stretched valuations, low volatility, and potential policy surprises later this year, the internal condition of the S&P 500 remains exceptionally strong.
Markets can always correct — and surprises happen. But from a structural standpoint, this isn’t the kind of environment typically associated with imminent breakdowns. The weight of evidence points toward continuation, not reversal.
Bottom Line
As of now, the S&P 500 isn’t just breaking records. It’s doing so with conviction. From short-term momentum to long-term positioning, the index is backed by a broad base of advancing constituents. That doesn’t eliminate risk — but it does significantly tilt the probabilities in favor of dip buyers, trend followers, and allocators looking to stay with strength.
We’ll be watching closely for any signs of deterioration — but this week, the internals say “bullish.”
Dow Jones Index

The Dow Jones Industrial Average ($DOWI) continues to build a quietly impressive case beneath the radar. While mega-cap tech and growth names have dominated headlines, it’s the industrials that are quietly stealing the show this week.
Underneath the surface, the Dow’s breadth profile is remarkably strong — even more robust than its broader market peers.
Participation at Multi-Month Highs
Across every major moving average, the participation rate of industrial components is solidly bullish:
A stunning 76.66% of Dow components are trading above their 5-day moving average.
66.66% are above their 20-day.
Medium- and longer-term signals remain healthy too, with over 60% of components trading above their 150- and 200-day averages.
These are not just elevated numbers — they are cohesive across timeframes, signaling a deeply synchronized market advance within the 30-stock index.
New Highs Far Outweigh Lows
The momentum becomes even more apparent when looking at new highs and lows:
Over the past 5 days, 60% of Dow stocks (18 out of 30) made fresh new highs.
Only 1 stock printed a new low.
This results in a net breadth reading of +17, which is extraordinarily strong for a price-weighted index with such few components.
The leadership persists across longer lookbacks as well. On a one-month horizon, 10 stocks are at new highs with zero new lows. This kind of clean internal breadth is rare — and meaningful.
What This Tells Us
The Dow isn’t the flashiest index. But when it leads — and leads this broadly — it’s often a signal of underlying economic strength. Industrials are economically sensitive, and the internal health here suggests confidence in real-world demand, capital investment, and stability.
Moreover, this is not just a rotation into defense. It’s rotational breadth, with leadership spilling beyond tech and into legacy bellwethers — a trend that often precedes cyclical upturns.
Bottom Line
The Dow Jones may not be setting new records as dramatically as the S&P 500 or Nasdaq, but its internals are flashing green. With broad participation, rising momentum across timeframes, and near-zero signs of distress, this week marks one of the healthiest internal readings for the index in recent memory.
For investors tracking rotation, breadth, or risk-on cues beyond tech, the industrials are marching confidently forward — and they’re bringing the Dow with them.
NASDAQ 100 Index

The Nasdaq 100 continued its upward grind last week, notching another record high as megacaps powered the index into fresh territory. But this time, it’s not just the usual suspects — the rally is being confirmed more broadly beneath the surface.
Breadth Reawakens Across Timeframes
One of the biggest criticisms of this bull run has been the narrow leadership, with just a handful of tech giants dragging indexes higher. This week’s data challenges that narrative.
69.3% of Nasdaq 100 stocks are now trading above both their 5-day and 20-day moving averages — a sign of widespread short-term participation.
Impressively, 73.26% are above their 50-day average, and over 66% are holding above their 150- and 200-day averages.
Even on a longer horizon, 68.31% are above their 100-day average — up sharply from prior weeks.
This level of synchronization across timeframes is rare in the Nasdaq 100, especially when new highs are being set. It points to bullish momentum expanding beyond the index heavyweights, which is exactly what longer-term bulls want to see.
New Highs Dominating Lows
New high/lows data confirms the strength:
56 names (55%) made new 5-day highs, compared to just 6 names hitting new lows.
The net breadth difference of +50 is the best reading we’ve seen in weeks.
This trend holds across all timeframes — including 1-month, 3-month, and even 6-month lookbacks — with positive net readings across the board.
This sort of participation typically precedes trend continuation, not reversal.
What This Means
The Nasdaq 100 is known for sharp rallies, but also for being top-heavy. What we’re seeing now is a refreshing change — broad internal strength, sector-wide participation, and durable price action supporting the index’s all-time highs.
The implication? While valuations remain a concern for some, the current price action isn’t just hype-driven. There’s real institutional support flowing into the second and third tier of the Nasdaq.
Bottom Line
The Nasdaq’s new highs are being earned, not gifted. With participation metrics at multi-month peaks and new highs swamping new lows, this week’s internals offer one of the clearest signals of risk-on behavior from tech-heavy growth investors we’ve seen all year.
This isn’t a top — it’s a base-building breakout, now backed by a broad chorus of confirmation.
Russel 1000

The Russell 1000 quietly delivered one of the most impressive internal confirmations of the market rally this week — and it did so without the fanfare of mega-cap tech. While the S&P and Nasdaq continue to grab headlines, it’s the Russell 1000 that tells us whether the rally has legs or is just floating on fumes. This week, the verdict is clear: this is real participation.
Healthy Breadth Across All Timeframes
Nearly 70% of the 1001 stocks in the Russell 1000 are trading above their 5-day and 20-day moving averages, with over 70.52% also above the 50-day. Short- and medium-term breadth is not only strong — it’s strengthening.
Longer-term metrics are also catching up:
60.73% of components are above their 100-day moving average.
More than half (52.64%) are above their 150-day, and nearly 50% have reclaimed their 200-day trend.
These are not readings you get in a narrow market. This is broad, cross-sector accumulation.
New Highs Dominate in a Big Way
In the past week alone:
477 stocks (48%) printed new 5-day highs — nearly half the entire index.
Just 83 names hit new lows.
The net difference of +394 is one of the highest we've seen in months.
The trend persists across all timeframes — 1-month, 3-month, 6-month, and even 52-week high/lows all show strong net positive readings, indicating this isn’t just a short-term bounce. It’s sustained leadership emerging in size.
What It Means
Unlike the Nasdaq 100 or S&P 500 — both of which can be swayed by a small number of mega-cap names — the Russell 1000 provides a more democratized look at U.S. equities. And right now, that broader swath of companies is participating in, confirming, and amplifying the rally.
It’s also worth noting that the Russell 1000 covers the top 1000 largest U.S. companies by market cap — so it bridges both the mega-cap and large-cap universe, offering a more complete picture than the S&P 500 alone.
Bottom Line
This week’s Russell 1000 internals show a rally that is healthy, widespread, and likely to continue. There are few signs of overextension, and momentum is clearly with the bulls.
If you’re looking for breadth-confirmed strength in the market — it’s not just at the top anymore. The middle is marching in too.
Major Indices Insights & Summary
Market internals rebounded meaningfully this week across all four major indices, suggesting that last week’s weakness was likely a short-term reset rather than the start of broader deterioration. Importantly, the gains in price were matched — and in some cases led — by broad participation underneath the surface.
S&P 500 – New Highs, New Legs
The S&P 500 closed the week just shy of a fresh all-time high at 6,173, and the internals tell a story of resurgent participation:
65.8% of components are above their 5-day average — nearly double last week’s reading.
Over 70% of stocks are now above their 50-day average, reflecting renewed intermediate-term momentum.
The net new highs vs. lows for the week came in at +178, a staggering surge from the prior reading of -8.
Interpretation: This is not just price drifting higher — it’s a coordinated advance across sectors. Tech leadership persists, but this week marked broader alignment under the hood.
Nasdaq 100 – Tech Reasserts Itself
After showing relative fragility last week, the Nasdaq 100 roared back with 69–73% of components above short- and medium-term moving averages. Internals were strong across the board:
50 net new highs (5-day) vs. just 6 new lows.
Even long-term breadth metrics (200-day) improved to 66.33%, indicating renewed structural strength.
Interpretation: Growth and mega-cap tech remain in control, but the breadth of participation within the Nasdaq suggests that this is not just a narrow rally led by the usual suspects. Smaller tech names are starting to show up again.
Dow Jones Industrial Average – Quiet, But Firming
The Dow had been the weakest of the four indices last week, but it showed signs of stabilization:
5-day and 20-day breadth surged to 76.66% and 66.66%, respectively.
Net new highs across all timeframes improved, with a 5-day net of +17, up from a flat reading the week prior.
However, longer-term breadth remains rangebound around 60%, indicating that the Dow remains more defensive and lagging relative to other indices.
Interpretation: Encouraging uptick in near-term momentum, but leadership is still lacking. Still, the move hints at rotational support rather than abandonment.
Russell 1000 – The Real Story This Week
The most impressive shift came from the Russell 1000, which posted an explosive breadth surge:
69.73% of stocks are now above the 5-day, and 70.52% above the 50-day.
394 more new highs than lows on a 5-day basis — a decisive reversal from last week’s -26 reading.
Participation improved across every single timeframe from 1-month to 1-year.
Interpretation: This is real confirmation that the rally is widening. The Russell 1000 bridges the mega-cap and broader large-cap universe — and now both sides are participating. This kind of breadth is rare and often precedes sustained upside moves.
Key Takeaways
All four indices saw significant improvements in short- and medium-term breadth.
The S&P 500 and Nasdaq 100 regained leadership, but the most notable strength came from the Russell 1000, suggesting a rally that is broadening out meaningfully.
The Dow’s uptick hints at sector rotation and improving resilience.
Net new highs surged across the board — a clear signal that momentum is not just intact, but accelerating.
Conclusion: This was a broad-based rally underpinned by improving internals. Breadth confirms price, and this week’s data gives bulls renewed confidence that the uptrend is not just surviving — it's strengthening.
VL Indices Market Score: 73 / 100 ( +26 WoW )
1. Breadth Thrust Across the Board
All four indices saw major improvements in their 5-day and 20-day breadth readings.
S&P 500: 5-day breadth surged to 65.8%, from 33.8% last week.
Nasdaq 100: Rebounded to 69.3% of components above 5-day average vs. just 24.75% last week.
Russell 1000: Jumped to 69.7% from 43.5%.
Dow: Flipped sharply positive with 76.6% of components above the 5-day.
This widespread short-term momentum warrants a +20 point adjustment.
2. Expansion in New Highs
Net new highs across all indices show sustained demand:
S&P: +178
Nasdaq: +50
Russell 1000: +394
Dow: +17
These are strongly bullish participation figures and reflect improving structure beyond just price action.
+6 point adjustment for breadth expansion at the highs.
3. Longer-Term Averages Moving Up
The percentage of stocks above the 100-day and 200-day moving averages is now consistently above 50% in all indices.
SPX: 59% (100D), 51% (200D)
NDX: 68% (100D), 66% (200D)
RUI: 61% (100D), 50% (200D)
DOW: 56% (100D), 56% (200D)
This is a healthy sign of intermediate-term structural integrity.
+5 point boost for sustained improvement across longer-term metrics.
4. Rotational Support from Dow and Russell
Dow internals flipped bullish for the first time in weeks.
Russell 1000 — a broader large-cap universe — led all indices in net new highs and breadth recovery.
Interpretation: This is no longer a top-heavy rally. Participation has broadened meaningfully, which deserves credit.
+5 point positive rotation bonus.
5. Valuation & Macro Risk Offsets
While internals are strong, macro data remains mixed and large-cap growth continues to dominate relative to cyclicals, suggesting some risk of fragility beneath the surface if macro shocks emerge.
-10 point discount for external and thematic fragilities (e.g., elevated positioning, narrow leadership still in place).
US Investor Sentiment Report
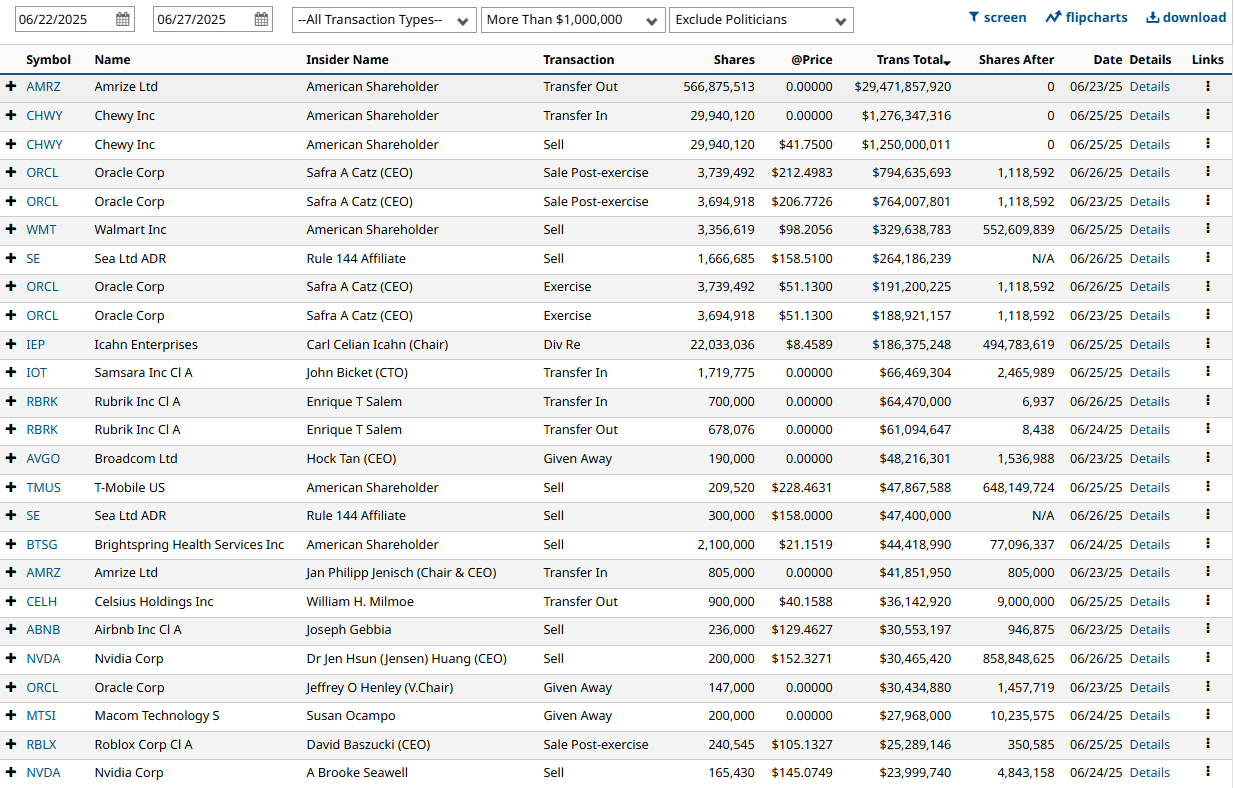
Insider Trading
Insider trading occurs when a company’s leaders or major shareholders trade stock based on non-public information. Tracking these trades can reveal insider expectations about the company’s future. For example, large purchases before an earnings report or drug trial results might indicate confidence in upcoming good news.

%Bull-Bear Spread
The %Bull-Bear Spread chart is a sentiment indicator that shows the difference between the percentage of bullish and bearish investors, often derived from surveys or sentiment data, such as the AAII (American Association of Individual Investors) sentiment survey. This spread tells investors about the prevailing mood in the market and can provide insights into market extremes and potential turning points.
Bullish or Bearish Sentiment:
When the spread is positive, it means more investors are bullish than bearish, indicating optimism about the market’s direction.
A negative spread indicates more bearish sentiment, meaning more investors expect the market to decline.
Contrarian Indicator:
The %Bull-Bear Spread is often used as a contrarian indicator. For example, extremely high levels of bullish sentiment might suggest that the market is overly optimistic and could be due for a correction.
Similarly, when bearish sentiment is extremely high, it might indicate that the market is overly pessimistic, and a rally could be on the horizon.
Market Extremes and Reversals:
Historically, extreme values of the spread (both positive and negative) can signal turning points in the market. A very high positive spread can signal market exuberance, while a very low or negative spread may indicate fear or capitulation.


NAAIM Exposure Index
The NAAIM Exposure Index (National Association of Active Investment Managers Exposure Index) measures the average exposure to U.S. equity markets as reported by its member firms. These are typically active money managers who provide their equity exposure levels weekly. The index offers insight into how much these managers are investing in equities at any given time, ranging from being fully short (-100%) to leveraged long (up to +200%).


CBOE Total Put/Call Ratio
CBOE's total put/call ratio includes index options and equity options. It's a popular indicator for market sentiment. A high put/call ratio suggests that the market is overly bearish and stocks might rebound. A low put/call ratio suggests that market exuberance could result in a sharp fall.


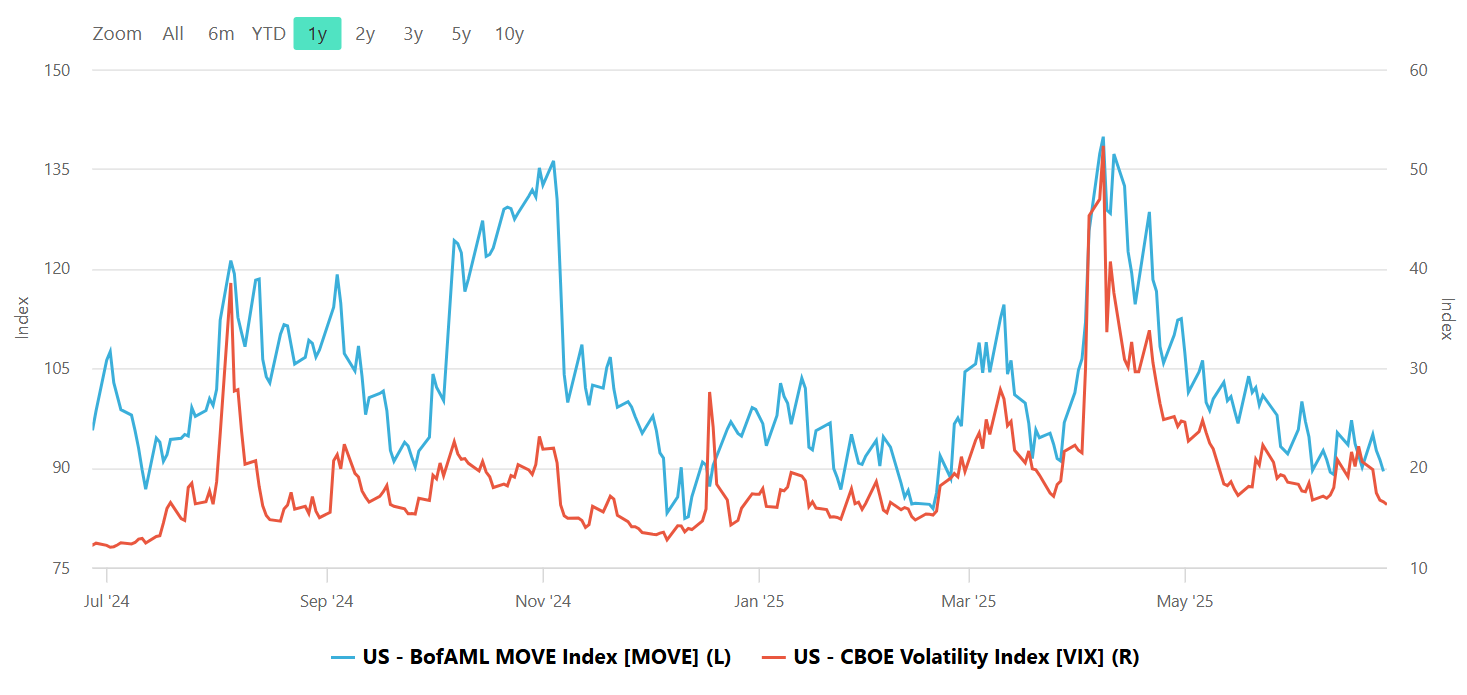
Equity vs Bond Volatility
The Merrill Lynch Option Volatility Estimate [MOVE] Index from BofAML and the CBOE Volatility Index [VIX] respectively represent market volatility of U.S. Treasury futures and the S&P 500 index. They typically move in tandem but when they diverge, an opportunity can emerge from one having to “catch-up” to the other.

CNN Fear & Greed Constituent Data Points & Composite Index


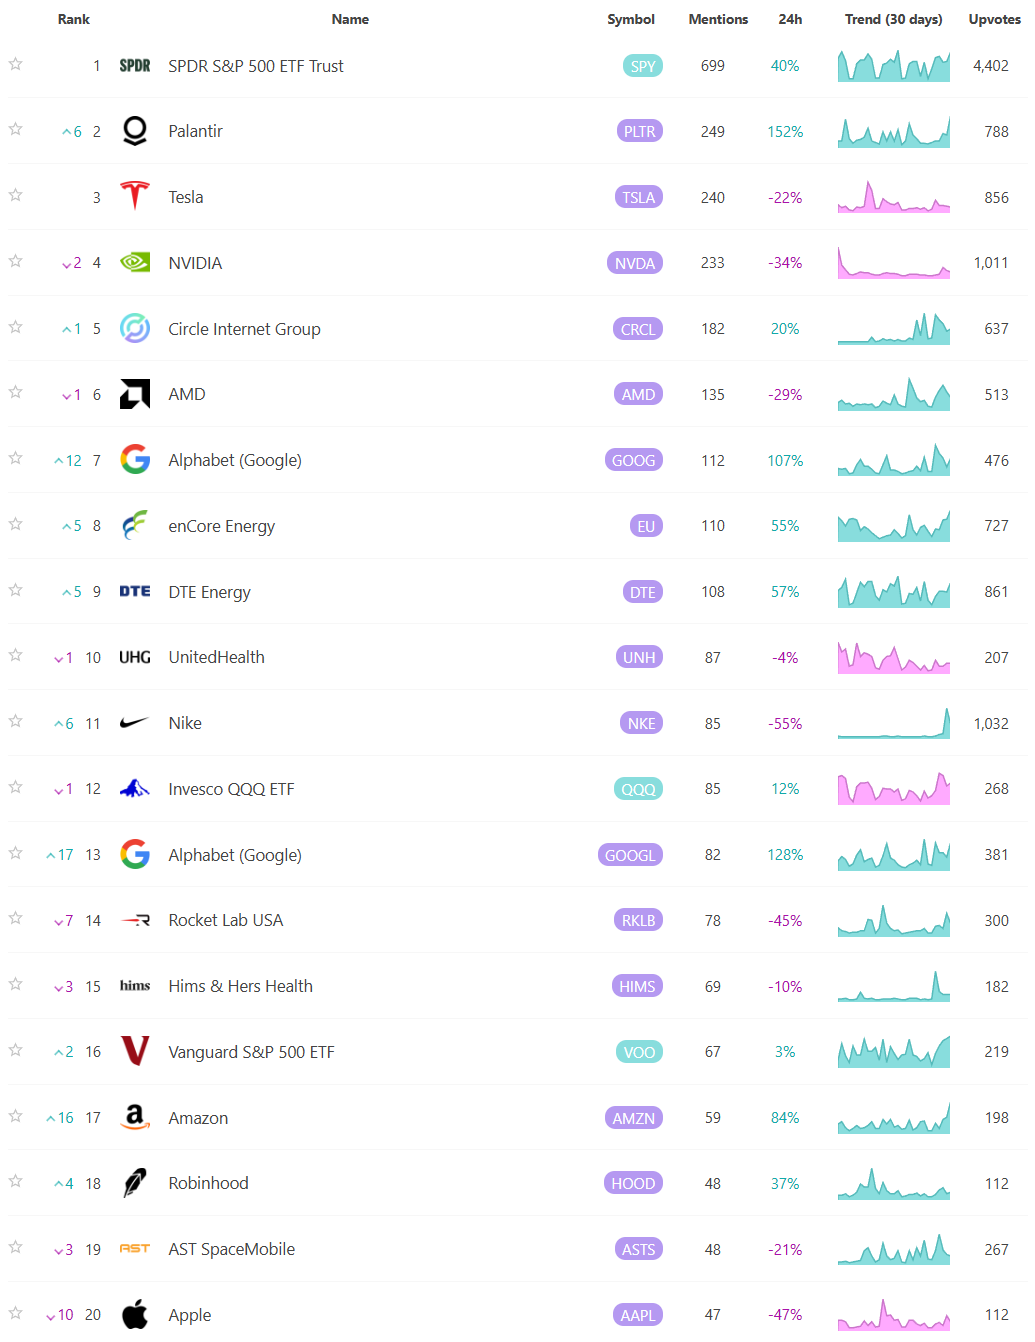
Social Media Favs
Analyzing social sentiment can provide valuable insights for investment strategies by offering a pulse on public perception, mood, and market sentiment that traditional financial indicators might not capture. Here’s how social sentiment analysis can enhance investment decisions:
Market Momentum: Positive or negative social sentiment can signal impending momentum shifts. When public opinion on a stock, sector, or asset class changes sharply, it can create buying or selling pressure, especially if that sentiment becomes widespread.
Early Detection of Trends: Social sentiment data can help investors spot trends before they show up in technical or fundamental data. For example, increased positive chatter around a particular company or sector might indicate growing interest or excitement, which could lead to price appreciation.
Gauge Retail Investor Impact: With the rise of retail investor platforms, collective sentiment on social media can lead to significant price movements (e.g., meme stocks). Understanding how retail investors view certain stocks can help in identifying high-volatility opportunities.
Event Reaction Monitoring: Social sentiment can provide real-time reactions to news events, product releases, or earnings reports. Investors can use this information to gauge market reaction quickly and adjust their strategies accordingly.
Complementing Quantitative Models: By adding a social sentiment layer to quantitative models, investors can enhance predictions. For example, a model that tracks historical price and volume data might perform even better when factoring in sentiment trends as a measure of market psychology.
Risk Management: Negative sentiment spikes can be a signal of potential downturns or increased volatility. By monitoring sentiment, investors might avoid or hedge against investments in companies experiencing a public relations crisis or facing negative perceptions.
Long-Term Sentiment Trends: Sustained sentiment trends, whether positive or negative, often mirror longer-term market cycles. Tracking sentiment trends over time can help identify shifts in investor psychology that could affect longer-term investments or sector rotations.
For these reasons, sentiment analysis, when combined with other tools, can provide a comprehensive view of both immediate market reactions and underlying investor attitudes, helping investors position themselves strategically across various time frames. Here are the most mentioned/discussed tickers on Reddit from some of the most active Subreddits for trading:
Institutional S/R Levels for Major Indices
When you’re a large institutional player, your primary goal is to find liquidity - places to do a ton of business with the least amount of slippage possible. VolumeLeaders.com automatically identifies and visually plots the exact spots where institutions are doing business and where they are likely to return for more. It’s one of the primary reasons “support” and “resistance” concepts work and truly one of the reasons “price has memory” - take a look at the dashed lines in the images below that the platform plots for you automatically; these are the areas institutions constantly revisit to do more business.
Levels from the VolumeLeaders.com platform can help you formulate trades theses about:
Where to add or take profit
Where to de-risk or hedge
What strikes to target for options
Where to expect support or resistance
And this is just a small sample; there are countless ways to leverage this information into trades that express your views on the market. The platform covers thousands of tickers on multiple timeframes to accommodate all types of traders.
SPY
QQQ

IWM
DIA
Summary Of Thematic Performance YTD
VolumeLeaders.com offers a robust set of pre-built thematic filters, allowing you to instantly explore specific market segments. These performance snapshots are provided purely for context and inspiration—think about zeroing in on the leaders and laggards within the strongest and weakest sectors, for example.
S&P By Sector

S&P By Industry

Commodities: Energy

Commodities: Metals

Commodities: Agriculture

Country ETFs

Currencies

Global Yields

Factors: Style

Factors: Size vs Value

Factors: Qualitative

Events On Deck This Week
Here are key events happening this week that have the potential to cause outsized moves in the market or heightened short-term volatility.
Econ Events By Day of Week

Anticipated Earnings By Day of Week


Market Intelligence Report
This week’s top-ranked institutional trade data reveals highly concentrated capital allocation across Technology, Industrials, Healthcare, and select leveraged ETFs. The volume and rank characteristics suggest purposeful activity that deviates materially from baseline flows. Our scoring framework analyzes each trade on five axes, producing a composite score that highlights priority names for institutional attention.
Notably, several of these trades represent the largest prints on record for their respective tickers, with a material percentage having no comparable trade seen in years.
Top Mega-Money Moves
The following trades earned the highest Multi-Factor Trade Significance Scores, reflecting extreme dollar size, anomalous flow velocity, and favorable follow-through in price.
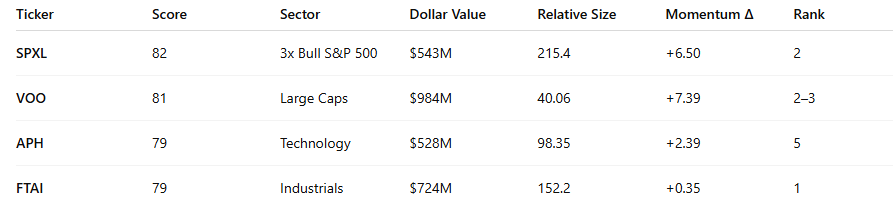
These trades were not only large in absolute size, but also displayed price appreciation after execution, suggesting that market participants may be validating the flow direction via momentum.
Scoring Breakdown (Max 100):
Trades scoring >75: 14
Trades scoring >65: 52
Sectors scoring >55: 6 sectors
These high-score trades and sectors consistently align with directional price follow-through, heavy volume, and trade magnitude rankings, validating the framework’s ability to isolate institutional activity.
Sector Intelligence
Scored by multi-factor significance (dollar flow, avg. size, high-rank % frequency, trade density, and momentum), the following sectors topped institutional focus:
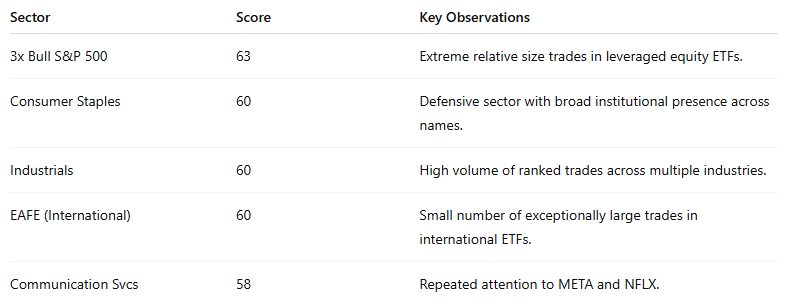
These sectors showed a blend of speculative and defensive capital flows, with Industrials and Consumer Staples serving as core allocations and leveraged ETFs suggesting directional conviction.
Industry Intelligence
Select industries emerged as targets for capital concentration:
Software – Application: Consistent high-ranking trades in APP 0.00%↑ and COIN 0.00%↑ .
Biotech: KNSA 0.00%↑ , RVMD 0.00%↑ , and ACAD 0.00%↑ reflect institutional interest in healthcare innovation and FDA-driven catalysts.
Auto Components: STRT 0.00%↑ and MOD 0.00%↑ featured high relative size trades, suggesting tactical positioning in the supply chain recovery narrative.
These industries are either event-driven (biotech) or cyclical (auto, software), indicating an expectation for directional movement or repricing.
Bull vs Bear Sentiment Analysis
An analysis of leveraged ETFs suggests strong bullish posturing:
Bull ETFs (e.g., SPXL, TQQQ, SOXL): $1.39B+ in flows; extremely high relative sizes (100x+).
Bear ETFs (e.g., SPXS, SQQQ): ~$291M total flow.
Bull:Bear Flow Ratio = 4.8 : 1
While flow direction cannot be definitively known, this ratio suggests greater institutional exposure to long or risk-on scenarios than hedging or downside speculation.
Rank Analysis
Rank 1 trades (largest ever for the ticker): ~30% of all trades.
No prior similar trade found: 68% of Rank 1 trades had no “Size Last Seen” date—suggesting fresh positioning or new institutional initiation.
Rank 2–3 trades: Frequently clustered in megacap ETFs (VOO, SPY), reinforcing existing exposure.
This rank skew implies more institutional confidence in expanding into new names or reasserting dominance in existing ones.
Statistical Distributions
Dollar Value: 90th percentile exceeds $250M. Median value ~ $12M.
Relative Size: 25% of trades are >15x average, with many exceeding 100x.
Momentum (Price Δ): The top quartile of trades showed positive movement > $2/share from the trade price.
These are not passive executions. These are market-impactful trades with follow-through and significance.
Ticker Clustering Insights
Without formal clustering algorithms applied, three intuitive groups emerged:
Liquidity-heavy macro vehicles: SPXL, VOO, TQQQ.
Event-driven biotech: RVMD, KNSA, ACAD.
Small-to-mid cap infrastructure & industrial plays: FTAI, APG, MOD.
These groupings reflect both macro exposure management and single-name thematic opportunities.
Institutional Ideas Worth Watching
A curated list of tickers surfacing on institutional radars—backed by data, momentum, and volume signatures that suggest real positioning. These are setups worth keeping an eye on.


🚨 Major Flow Event: June 27th
Massive institutional acceleration across all sectors on June 27th
This represents 80% of the total 5-day flow concentrated in a single day
Huge institutional positioning event amidst EoQ rebal to obfuscate flows
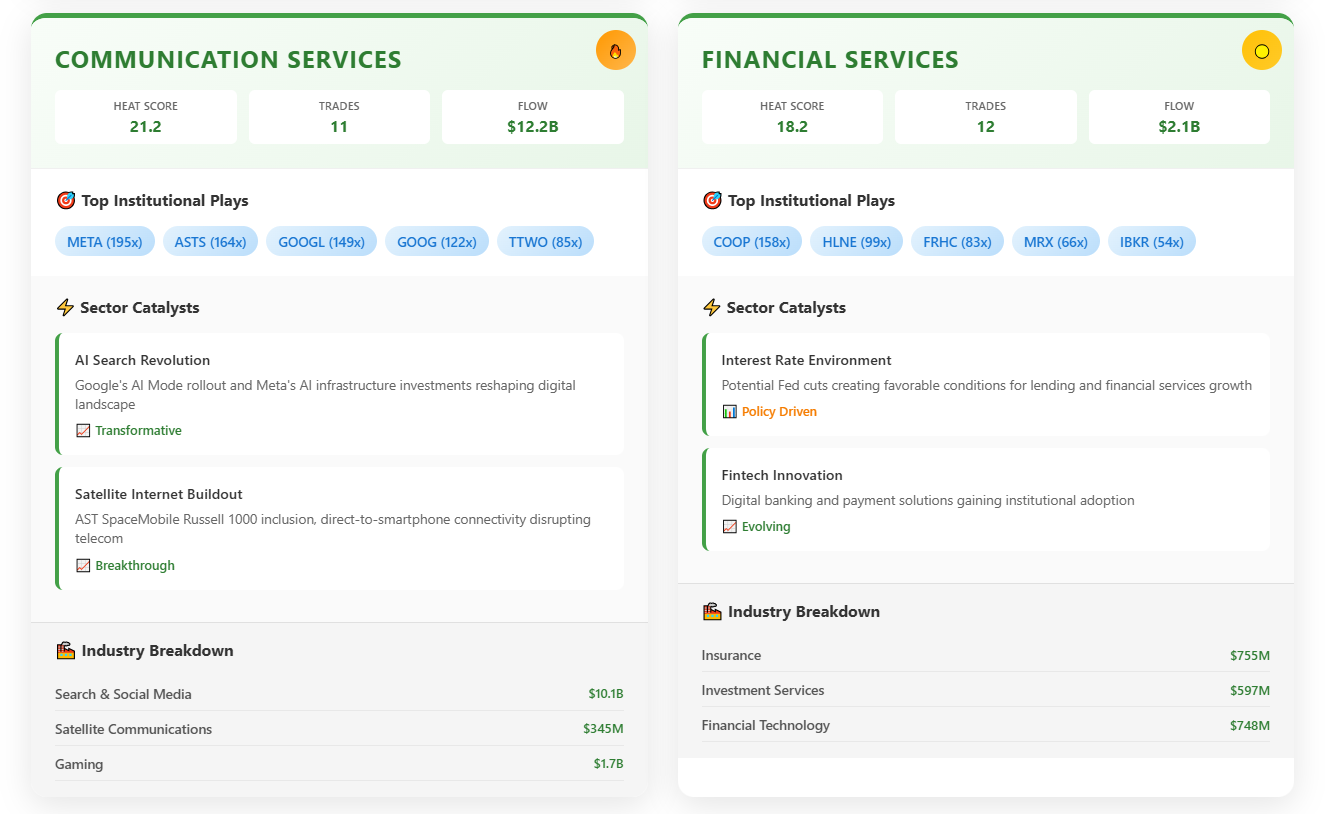
💥 Sector Momentum Changes (June 26 → 27):
Technology: +3,050% ($1.0B → $31.5B)
Driven by PLTR, NVDA, MSFT mega flows
AI infrastructure theme dominating
Communication Services: +63,000% ($0.02B → $12.6B)
GOOGL, META AI investments surging
Search/social platforms positioning for AI future
Healthcare: +4,500% ($0.2B → $9.2B)
Broad-based biotech accumulation
FDA catalyst positioning
Consumer Discretionary: +930% ($0.7B → $7.2B)
Amazon Prime Day momentum building
Consumer tech acceleration
Industrials: +1,150% ($0.4B → $5.0B)
Space & defense themes accelerating
Infrastructure spending flow

Massive Concentration in Low Activity (0-8x): 597 stocks (52%) show normal trading patterns
Moderate Activity (8-16x): 264 stocks (23%) - typical earnings or sector rotation activity
High Activity (16-50x): 221 stocks (19%) - significant but not extreme events
Extreme Activity (>50x): Only 71 stocks (6%) - major news events, breakouts, or unusual conditions
🎯 Key Sector Insights:
Technology (253 stocks): Dominates across all ranges, especially visible in extreme activity
Healthcare (268 stocks): Largest sector, heavy presence in normal and moderate activity
Industrials/Financial: Strong presence in normal ranges, fewer extreme events
Utilities/Real Estate: Minimal extreme activity, as expected for stable sectors


🔥 Heat-Based Sector Ranking: Technology leads with a heat score of 36.6, followed by Healthcare (27.2) and Industrials (23.0)
📊 Multi-Dimensional Analysis: Each sector shows trade count, total dollar flow, and top institutional positions
⚡ Catalyst Integration: Real sector themes like AI infrastructure boom, FDA approval waves, and space economy expansion
🏭 Industry Breakdown: Detailed sub-sector analysis showing where the money is flowing within each sector
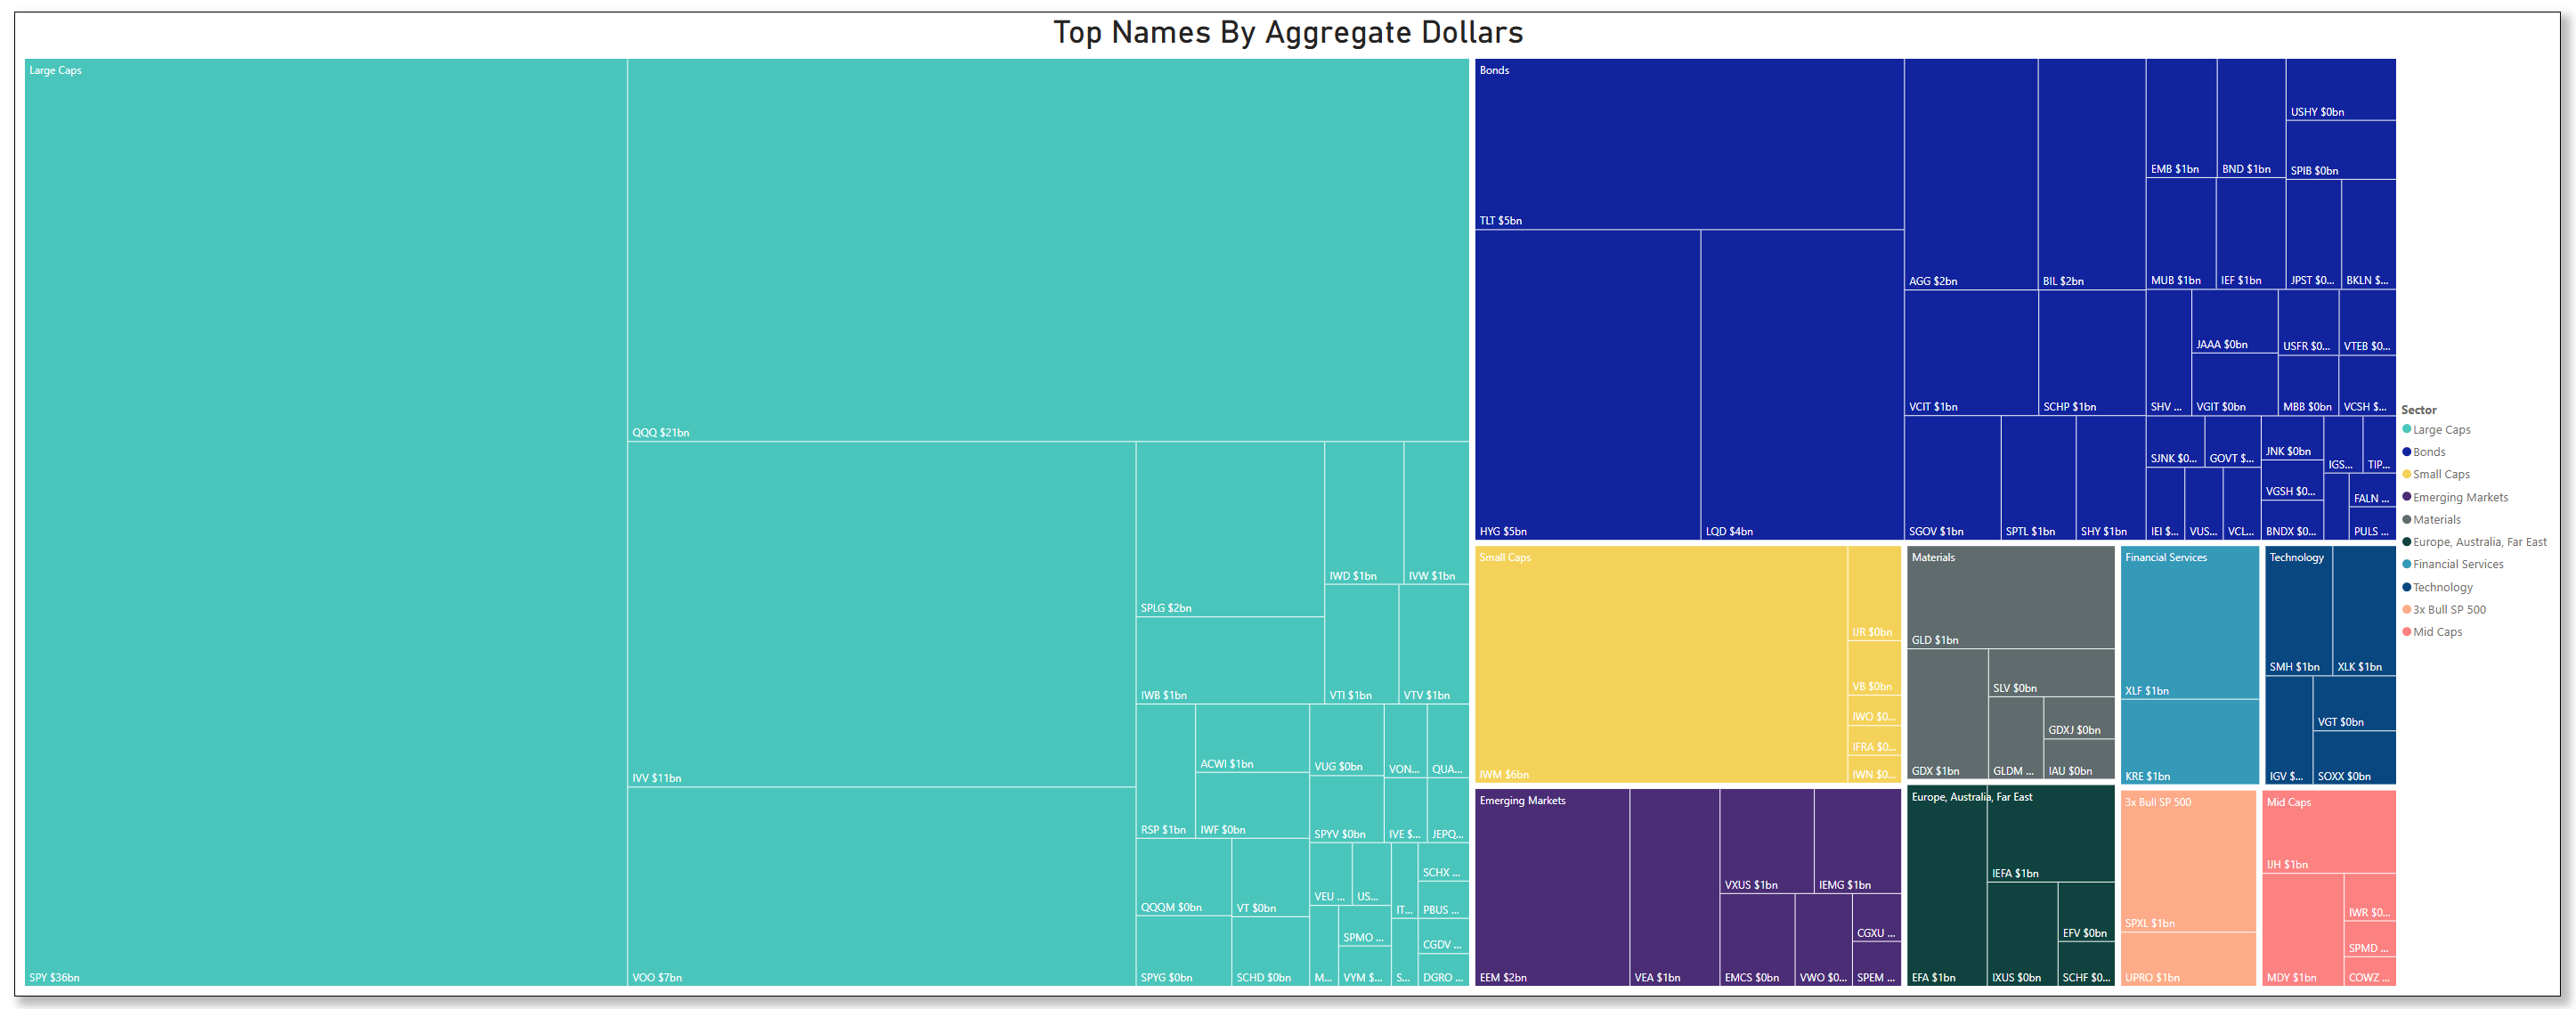
Major Investment Themes Identified:
AI Infrastructure Dominance - Technology sector seeing $32B institutional flow
Healthcare Renaissance - Biotech companies positioned ahead of FDA catalysts
New Space Economy - Aerospace & defense benefiting from commercialization
Communication Evolution - Search/social platforms investing in AI transformation
Cross-Sector Intelligence:
The visualization reveals institutional capital is rotating toward growth themes rather than traditional value sectors, with AI being the dominant cross-sector catalyst driving investment decisions.
Where all of the above data in the Market Intelligence Report focuses on analyzing the top-ranked institutional flow, everything below looks at all institutional flow from this week to present the following findings.
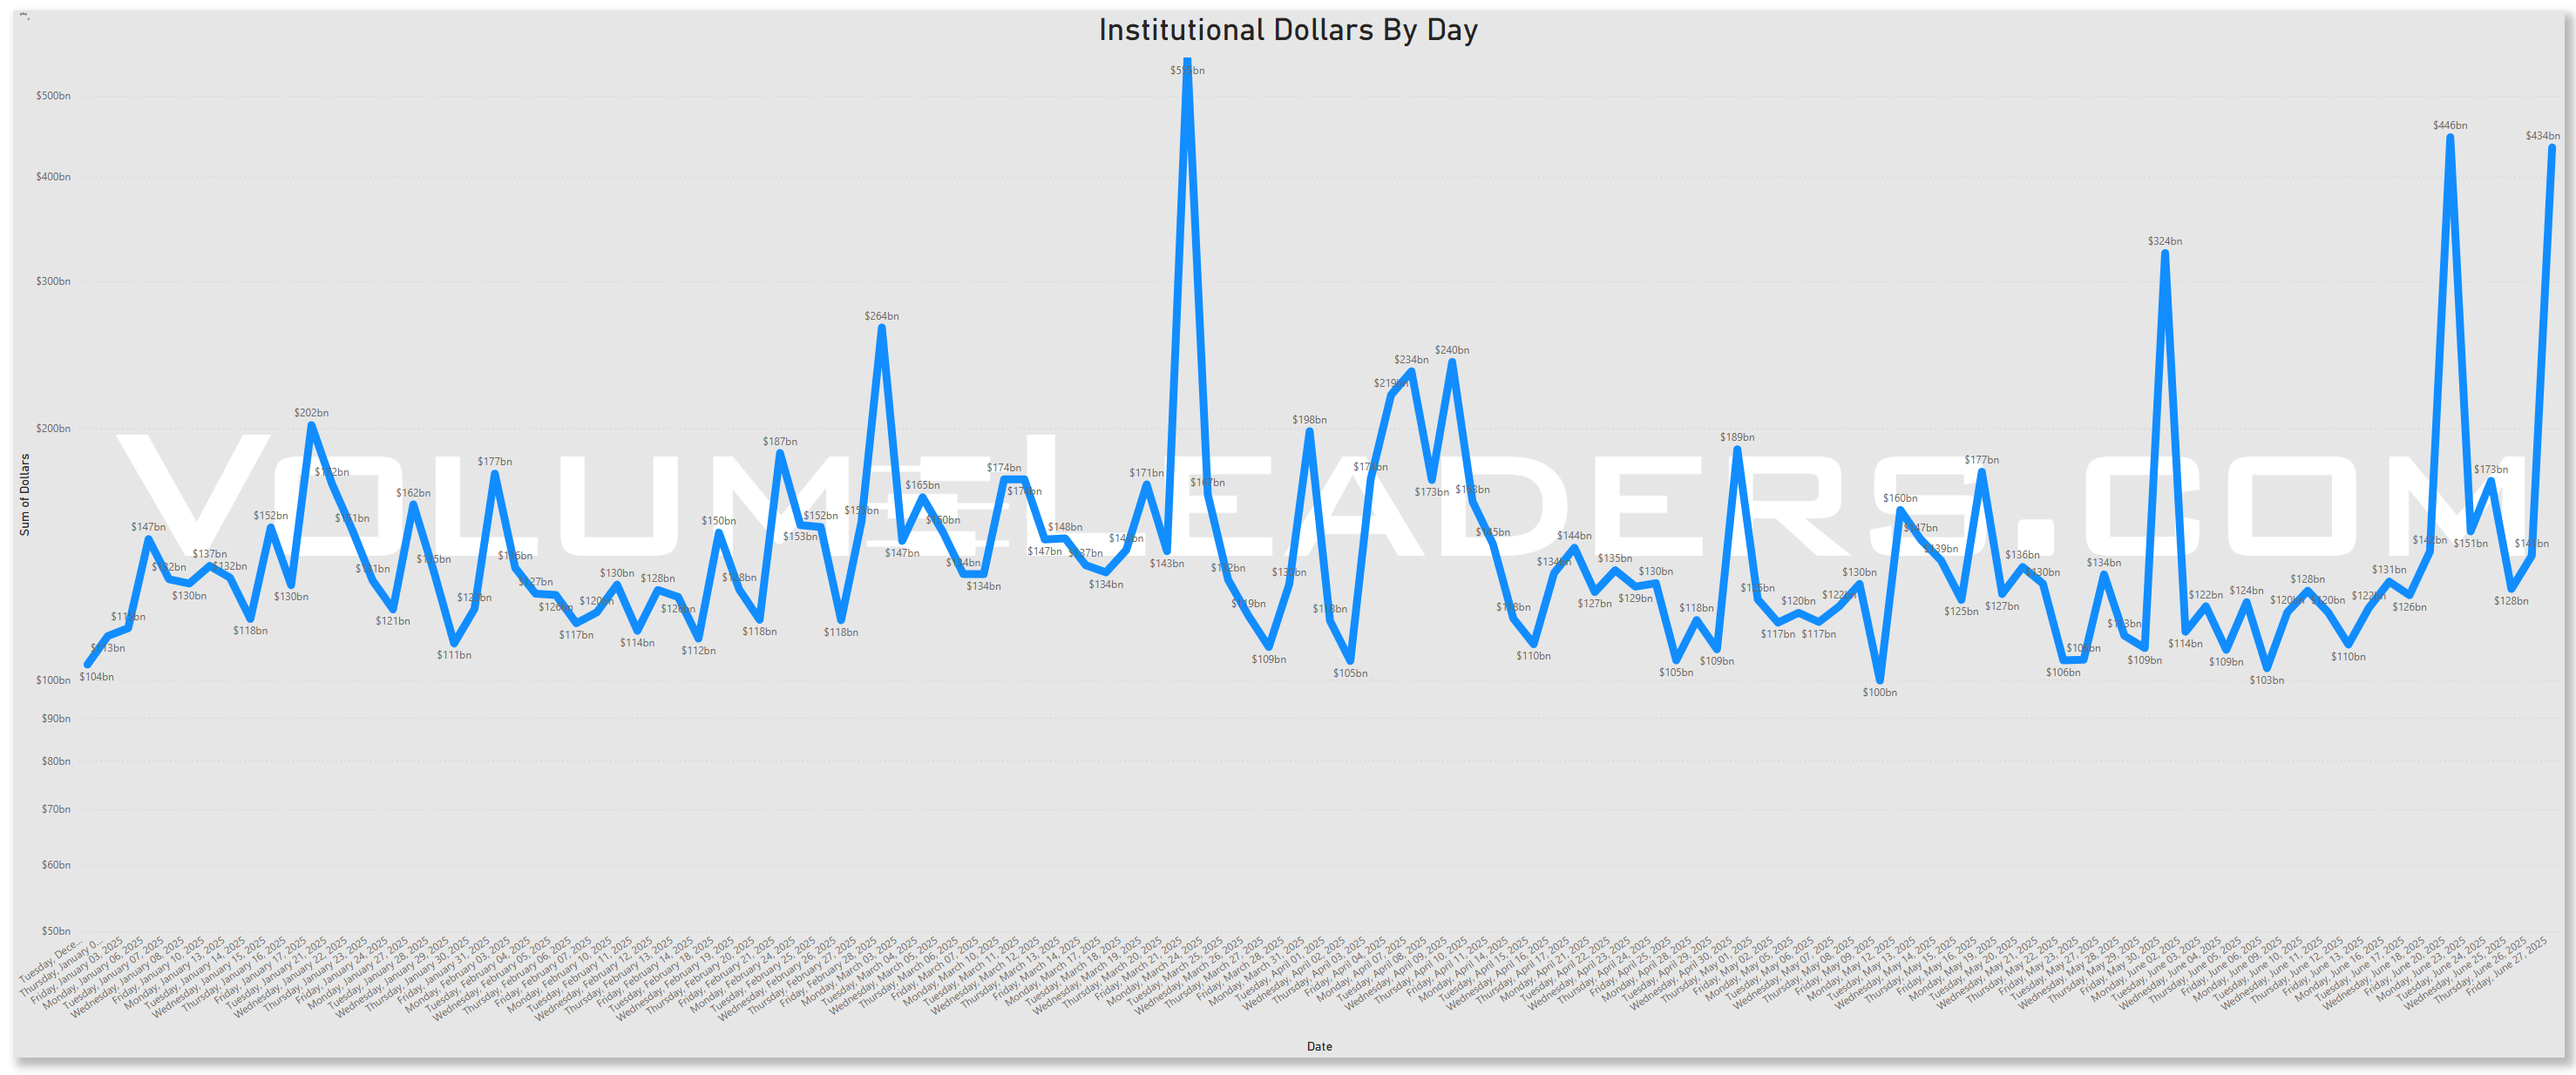
Rolling 90-Day Dollars By Day
This chart shows institutional activity by dollars by day on a rolling 1-year basis. From a theoretical standpoint, examining a chart of daily institutional dollar activity over the course of a year can offer several insights and possible inferences, though all should be approached with caution since the data alone may not prove causality or confirm underlying reasons. Some potential takeaways include:
Event-Driven Behavior:
Sharp, singular spikes on certain days might correlate with major market-moving events. These could include central bank policy announcements, significant geopolitical news, sudden macroeconomic data releases (like employment reports or GDP data), earnings seasons for large-cap companies, or unexpected shocks (e.g., mergers, acquisitions, regulatory changes).Liquidity Dynamics:
Institutions often concentrate large trades on days with higher expected liquidity. For instance, heightened activity might coincide with index reconstitutions, option expiration dates, or the days leading up to or following a major index rebalance, when large amounts of capital shift hands simultaneously.Risk Management and Hedging Activity:
Institutions may significantly adjust their exposures on days that are critical from a risk management perspective. Large spikes can occur if hedge funds, pension funds, or asset managers are rolling over futures contracts, initiating or closing out large hedges, or reacting to volatility triggers.Market Sentiment Indicators:
While the data is purely transactional, the sheer volume of institutional involvement on certain days might indirectly hint at changing sentiment or strategic shifts.
In essence, a chart like this can lead you to hypothesize that institutional trading volumes are not constant or random but rather influenced by a mix of predictable calendar effects, major market events, liquidity considerations, risk management decisions, and strategic allocation shifts.
Top Institutional Order Flow By Sector By Week For The Past 90-Days


Top Institutional Order Flow In Equities
These are incredibly important charts to watch as they contains lots of nuanced suggestions at a thematic level. Watch these charts closely week-to-week to stay informed about where institutional money is flowing, adjust your strategies based on momentum, align your portfolio with macroeconomic and market trends, and manage risks more effectively by avoiding sectors losing institutional favor.
Sector Rotation Insights: The chart highlights which sectors are attracting institutional activity and which are losing favor. Institutions often lead market trends, so tracking shifts in their focus can indicate sector rotations.
Sentiment Analysis: The level of institutional activity reflects confidence in specific sectors. Rising activity in traditionally defensive sectors (e.g., healthcare, utilities) may indicate caution, while a surge in growth sectors (e.g., technology, consumer discretionary) could suggest optimism.
Emerging Trends: Sudden spikes in a previously overlooked sector, like industrials or consumer staples, might hint at emerging opportunities or structural shifts.
Macro Themes: Changes in sector activity often align with broader macroeconomic themes like inflation, interest rates, or geopolitical events. For instance:
Increased activity in energy might indicate concerns about oil supply or rising prices.
Growth in technology could align with innovations or favorable policies.
Risk Management: Declining institutional activity in a sector might signal weakening fundamentals or heightened risks.
Spotting Overcrowding: Excessive activity in a single sector over multiple weeks may suggest overcrowding, which could lead to heightened volatility if institutions begin to exit.


Many excellent trade ideas and sources of inspiration can be found in the prints below. While only the top 30 from each group are displayed, the complete results are accessible in VolumeLeaders.com for you to explore at your convenience any time. Remember to configure trade alerts within the platform to ensure institutional order flows that capture your interest or are significant to you aren’t missed. The blue charts represent all types of trades, including blocks on lit exchanges; the purple charts exclusively depict dark pool trades; and the green charts are sweeps only.


Top Institutional Order Flow In ETFs


Last Week’s Billion-Dollar Prints
Tickers that printed a trade worth at least $1B last week get a special shout-out. These are massive commitments by institutions that should not be ignored.

Thank you for being part of our community and for dedicating your time to this edition. Your insights and engagement drive everything we do, and we’re honored to share this space with such committed, thoughtful readers. Here’s to a week filled with clear opportunities and strong performance. Wishing you many bags 💰💰💰
—VolumeLeaders