Market Momentum: Your Weekly Financial Forecast & Market Prep
Issue 50 / What to expect June 23, 2025 thru June 27, 2025

NOTE: This weekly periodical is too large for Substack to deliver in its entirety via email - you will only see a portion of this great content if you read from your email client. Click the header/title at the top to read the full article!

In This Issue
[Free For Everyone]
Weekly Market-On-Close Report: All the macro moves, market drivers, and must-know narratives—covered in less than five minutes.
Weekly Benchmark Breakdown: Our weekly intelligence report on major indices cuts through the index-level noise to uncover participation, momentum, and structural integrity and tell you whether markets are rising on solid ground or skating on thin breadth. This is where bull markets prove themselves—or quietly start to unravel.
The Latest Investor Sentiment Readings: Track the emotional pulse of the market with our curated dashboard of sentiment indicators. From fear-fueled flight to euphoric overreach, this week's readings reveal whether investors are cautiously creeping in—or stampeding toward the exits.
VL Special Coverage Report: Market Regimes: Reading the Market’s Mood and Trading Accordingly
Institutional Support & Resistance Levels For Major Indices: Exactly where to look for support and resistance this coming week in SPY, QQQ, IWM & DIA
Normalized Performance By Thematics YTD: Which corners of the markets are beating benchmarks, which are overlooked and which ones are over-crowded!
Key Econ Events & Earnings On-Deck For This Coming Week
[Only For Subs]
This Week’s Institutional Activity In Equities: Track the real money. This section breaks down where institutions are placing their bets—and pulling their chips. You'll get a sector-by-sector view of equity flows, highlighting the most active names attracting large-scale buying or selling. We go beyond the headlines and into the tape, surfacing the week’s most notable block trades and sweep orders, both on lit exchanges and hidden dark pools. Whether you're following momentum or fading crowded trades, this is your map to where size is moving and why it matters.
Institutional Activity By Day (rolling 6-months)
Institutional Activity By Sector By Week (rolling 6-months)
This Week’s Institutional Activity In ETFs: Follow the flows that shape the market. This section uncovers where institutions are deploying capital across the ETF landscape, broken down by sector and fund. We highlight the largest block trades and aggressive sweeps—both visible on lit exchanges and hidden in dark pools—to reveal how the smart money is positioning. Whether they’re rotating risk, hedging exposure, or scaling into themes, this is your lens into the ETF vehicles driving institutional intent.
Statistical Analysis and Insights From This Week’s Top Prints: we run the numbers on the most significant institutional trades of the week—those outsized prints that stand apart from the noise. Through statistical analysis and pattern recognition, we decode what these moves may signal about future price action. Whether it's the start of accumulation, a stealthy unwind, or a shift in market regime, this is where data meets intent. These are the trades that matter—and the stories they may be telling.

Weekly Market-On-Close Report
Markets Navigate Geopolitical Turbulence as Fed Maintains Steady Course
Financial markets exhibited remarkable resilience this week despite escalating Middle Eastern tensions, as investors balanced geopolitical uncertainty against continued economic stability and Federal Reserve policy clarity. While equity indices closed mixed, the measured response across asset classes demonstrated market maturity in processing complex, overlapping risks. The Federal Reserve's decision to hold rates steady for the fourth consecutive meeting provided an anchor of stability, even as policymakers acknowledged the challenging backdrop of trade tensions, fiscal policy shifts, and international conflicts.
Federal Reserve Policy: Patience Amid Uncertainty
The June FOMC Decision
The Federal Open Market Committee's unanimous decision to maintain the federal funds rate at 4.25%-4.5% represented more than just monetary policy continuity—it reflected a sophisticated balancing act between competing economic forces. Chairman Jerome Powell's post-meeting commentary emphasized the Fed's commitment to data-dependent decision-making while acknowledging the elevated uncertainty surrounding tariff impacts, geopolitical developments, and their potential economic ramifications.
The central bank's Summary of Economic Projections revealed a nuanced shift in expectations. While officials maintained their projection of two rate cuts for 2025, the underlying assumptions showed increased caution. Inflation forecasts were revised upward to 3.1% from the previous 2.8% estimate, reflecting anticipated tariff-driven price pressures. Simultaneously, GDP growth projections were modestly reduced, suggesting policymakers expect some economic moderation as various policy uncertainties work through the system.
Market Reaction and Policy Implications
The market's muted response to the Fed announcement—with the S&P 500 trading in less than a 1% range and Treasury yields ending essentially unchanged—validated the central bank's communication strategy. This stability reflected successful expectation management, with market participants largely aligned with the Fed's cautious approach.

However, beneath this surface calm lies a growing internal debate among policymakers. The dot plot revealed a notable division: seven officials anticipate no rate cuts this year, while eight still expect two reductions. This split underscores the complexity of current economic conditions and suggests future policy decisions may be more contentious than the unanimous June vote implies.

Federal Reserve Governor Christopher Waller's Friday morning comments added an interesting dimension to the policy discussion. His suggestion that rate cuts could begin as early as July, coupled with his dismissive stance on tariff-related inflation concerns, highlighted the ongoing internal deliberations. Waller's perspective that "increases in tariffs this year are likely to push up prices and weigh on economic activity" but won't constitute a "big problem" reflects a more dovish interpretation of current conditions.
The Tariff Conundrum
The Federal Reserve faces an unprecedented challenge in assessing tariff impacts on monetary policy. Current trade restrictions have elevated the average effective tariff rate to approximately 15%—the highest level since 1936—creating significant analytical complexity. Powell's acknowledgment that "someone has to pay" for these costs, while admitting uncertainty about consumer pass-through rates, illustrates the difficulty of incorporating trade policy into traditional monetary frameworks.
The Fed's revised inflation projections specifically account for expected tariff-driven price increases, particularly as companies exhaust pre-tariff inventory levels and implement previously announced price adjustments. This represents a shift from the limited inflation impact observed thus far, where many companies absorbed costs or relied on existing inventory to maintain pricing stability.
Equity Market Performance: Resilience Amid Volatility
Index Performance and Sector Rotation
Equity markets demonstrated notable resilience throughout the week, with major indices finishing mixed despite significant geopolitical and economic crosscurrents. The S&P 500's modest decline of 0.22% masked considerable intraday volatility, while the Dow Jones Industrial Average managed a slight gain of 0.08%. The Nasdaq 100's 0.43% decline reflected continued pressure on technology stocks, particularly semiconductor companies.

Small and mid-cap indices provided the week's bright spot, outperforming their large-cap counterparts and suggesting investor appetite for domestic-focused companies potentially less exposed to international trade tensions. This performance differential signals a subtle but meaningful shift in risk preferences, with investors seeking exposure to companies with greater control over their operating environments.
Technology Sector Pressures
The semiconductor industry bore particular pressure following reports that U.S. officials were considering revoking waivers for allies operating chip manufacturing facilities in China. This development sent ripples through the technology sector, with industry leaders including Lam Research, KLA Corp, Applied Materials, Intel, Qualcomm, and Broadcom all posting significant declines.
The "Magnificent Seven" technology stocks, which have driven much of the market's recent performance, experienced a challenging week. Alphabet led declines with a drop exceeding 3%, while Meta Platforms, Nvidia, Amazon, and Microsoft all posted losses. Notably, Apple bucked this trend with gains exceeding 2%, demonstrating the increasingly differentiated performance within this previously cohesive group.
This divergence within technology leadership reflects evolving investor perceptions about regulatory risks, competitive positioning, and growth sustainability. The semiconductor sector's vulnerability to trade policy changes has become particularly apparent, with investors reassessing valuations based on potential supply chain disruptions and market access limitations.
Individual Stock Movements
Corporate earnings and guidance continued to drive individual stock performance, with several notable winners and losers emerging from the week's results. Kroger led S&P 500 gainers with a surge exceeding 9% following better-than-expected first-quarter adjusted earnings per share of $1.49 versus consensus estimates of $1.45. This outperformance highlighted the continued strength in essential retail sectors.
CarMax also posted strong gains of more than 6% after reporting first-quarter net sales of $7.55 billion, surpassing expectations of $7.52 billion. The used car retailer's performance suggested continued consumer demand in the automotive sector, despite broader economic uncertainties.
The week's most dramatic individual stock movement came from GMS Inc, which surged more than 24% following reports that Home Depot had made an acquisition offer for the company. This development potentially initiated a bidding war with QXO Inc, which had previously submitted a $5 billion offer, demonstrating continued merger and acquisition activity in the construction materials sector.
On the negative side, Accenture led S&P 500 decliners with a drop exceeding 6% after lowering its full-year operating margin forecast. The consulting firm's revised guidance reflected broader pressures on professional services companies navigating uncertain client spending environments.
Fixed Income Markets: Safe Haven Dynamics
Treasury Market Performance
U.S. Treasury markets provided their traditional safe-haven function during the week's geopolitical tensions, with yields declining across most maturities. The 10-year Treasury yield fell 1.6 basis points to 4.375%, reflecting increased demand for government securities amid Middle Eastern uncertainties.
The Treasury market's response pattern revealed interesting dynamics in investor risk assessment. Initial declines in bond prices occurred following President Trump's diplomatic overtures regarding Iran's nuclear program, suggesting reduced safe-haven demand. However, subsequent developments and continued regional tensions restored Treasury appeal, with prices recovering and moving higher by week's end.
September 10-year Treasury note futures closed up 6 ticks, benefiting from multiple supportive factors including weaker-than-expected Philadelphia Fed business outlook data and Governor Waller's dovish commentary about potential July rate cuts. The combination of economic data disappointments and geopolitical uncertainties created a favorable environment for government bond performance.
Corporate Credit Markets
Investment-grade corporate bonds advanced alongside Treasuries, with new issuance generally oversubscribed despite the unsettled macroeconomic environment. This robust demand suggests continued investor appetite for quality credit exposure, particularly given attractive yield levels compared to recent years.
High-yield bond markets experienced somewhat softer sentiment, according to trading desk reports, as equity market volatility created some uncertainty about credit quality prospects. However, the issuance calendar remained active, with companies seeking to access markets ahead of the Juneteenth holiday and potential summer volatility.
The credit market's performance differential between investment-grade and high-yield securities reflected typical risk-adjustment patterns during periods of uncertainty. Investors gravitated toward higher-quality issuers while maintaining more cautious stances on credits with greater sensitivity to economic fluctuations.
International Market Dynamics
European Markets
European equity markets generally underperformed their U.S. counterparts, with the Euro Stoxx 50 managing a modest 0.70% gain while most major regional indices posted declines for the second consecutive week. The mixed performance reflected ongoing concerns about energy price impacts from Middle Eastern tensions, with natural gas prices surging 8% during the week.
Central bank activity dominated European financial news, with multiple institutions adjusting monetary policy. The Bank of England maintained its current policy stance, while the Norges Bank, Swiss National Bank, and Riksbank all implemented rate cuts. This divergent approach highlighted the varying economic conditions across European economies and their different policy requirements.

Reports suggesting European leaders' openness to accepting a 10% tariff rate from the United States added another dimension to market considerations. This potential compromise could reduce trade tension uncertainty while still representing a significant policy shift with economic implications for transatlantic commerce.
Asian Market Performance
Asian markets exhibited mixed performance, with Japan posting modest gains while Chinese markets declined. South Korea emerged as a standout performer, continuing its strong momentum with gains of 4% for the week. This outperformance reflected ongoing optimism about potential market-friendly reforms and possible future inclusion as a developed market by MSCI.
The Bank of Japan's decision to slow its bond purchase tapering to ¥200 billion from the current ¥400 billion next year demonstrated continued accommodative policy support. This adjustment aimed to mitigate bond market volatility while maintaining the central bank's gradual policy normalization trajectory.

China's Shanghai Composite and Hong Kong markets both posted declines, reflecting continued investor caution about the Chinese economy despite some better-than-feared recent economic data. The subdued performance suggested ongoing concerns about domestic growth prospects and international trade relationships.
Geopolitical Risk Assessment
Middle Eastern Tensions
The escalation of Israeli-Iranian hostilities entered its eighth day by week's end, with no clear signs of resolution. Israel's strikes against Iran's nuclear and missile production facilities, coupled with Iran's warnings about potential retaliation, created a complex risk environment for global markets.
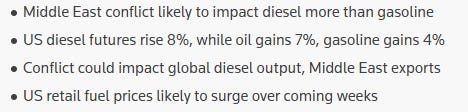
Despite the severity of the conflict, market reactions remained relatively measured compared to historical precedents. Oil prices did advance, with Brent crude gaining 4% for the week on top of the previous week's 12% increase. However, broader market disruptions were limited, suggesting either investor confidence in containment or effective risk management strategies.

The strategic importance of the Strait of Hormuz remained a key concern, with the waterway handling approximately 20% of global daily crude shipments. While Iran had not yet moved to close this vital passage, reports of signal jamming affecting approximately 1,000 vessels daily demonstrated the potential for indirect disruption. A collision between two tankers near the strait, attributed to navigation signal interference, illustrated these emerging risks.

U.S. Policy Response
President Trump's announcement of a two-week decision timeline regarding potential U.S. military involvement added another layer of uncertainty to the situation. His statement acknowledging a "substantial chance of negotiations" provided some market reassurance, suggesting diplomatic options remained viable.
The president's early departure from G7 meetings to address Middle Eastern developments demonstrated the priority level assigned to the crisis. This shift potentially impacted the timing of other international negotiations, including trade discussions that were expected during the summit.
Economic Data Analysis
Consumer Spending Patterns
May retail sales data revealed complex consumer spending dynamics, with headline figures showing a 0.9% decline following April's 0.1% drop. However, this surface weakness primarily reflected a steep decline in automobile sales, which had surged in March ahead of the Trump administration's 25% automotive tariff implementation in early April.
The more telling metric—control group sales, which feed directly into GDP calculations and exclude volatile categories—rebounded with a 0.4% increase in May. This improvement, driven by increases in sporting goods and furniture purchases, suggested underlying consumer demand remained stable despite headline volatility.
The retail sales pattern illustrated the complex ways trade policy impacts economic data, with pre-tariff buying surges followed by natural corrections creating misleading short-term trends. This dynamic complicates Federal Reserve analysis and underscores the challenges of incorporating trade policy effects into economic forecasting.
Housing Market Weakness
Housing market indicators painted a concerning picture of sector health, with multiple metrics pointing to continued weakness. The National Association of Home Builders' Housing Market Index fell to 32 in June, down two points from May and marking the lowest reading since December 2022. Readings below 50 indicate negative builder sentiment about current and near-term market conditions.

May housing starts provided even more dramatic evidence of sector struggles, falling 9.8% to a seasonally adjusted annual rate of 1.26 million—the lowest level since May 2020. Building permits also declined to 1.393 million, suggesting continued weakness ahead as these typically lead actual construction activity.
NAHB Chairman Buddy Hughes attributed the deterioration to "elevated mortgage rates and tariff and economic uncertainty," highlighting how multiple policy factors combine to suppress housing demand. With 30-year fixed mortgage rates recently at 6.81%—despite being a four-week low—financing costs remain substantially elevated compared to recent historical norms.
Manufacturing Sector Indicators
Regional Federal Reserve manufacturing surveys provided mixed signals about industrial sector health. The Empire State Manufacturing Survey disappointed with results below expectations, driven primarily by declines in current conditions, new orders, and shipments. However, six-month forward expectations jumped dramatically to 21.2 from -2, suggesting businesses anticipate improved conditions ahead.

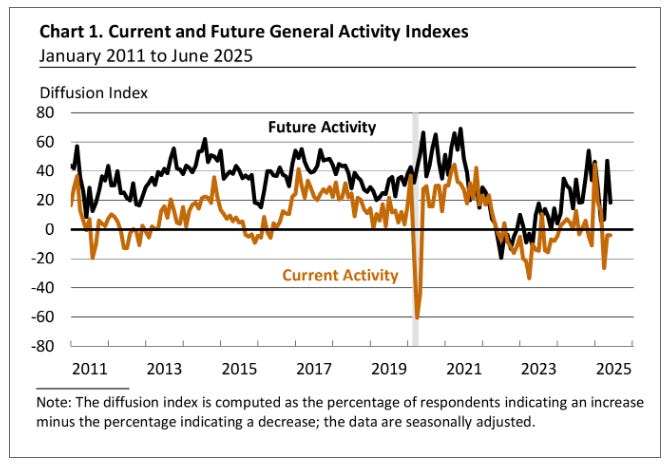
Conversely, the Philadelphia Fed Manufacturing Index remained unchanged at -4, slightly below consensus expectations of -1. More concerning, the six-month expectations component fell significantly from 47.2 to 18.3, with new orders expectations dropping from 49.7 to 22.1. This divergence between regional surveys highlighted the uneven nature of current manufacturing conditions.
May industrial production declined 0.2%, missing consensus expectations of 0.1% growth. While most durable consumer goods categories showed growth—including automotive, home electronics, and appliances—energy production fell sharply by 3.2%. Capacity utilization declined to 77.4%, indicating continued slack in industrial capacity.
Commodity Markets: Energy in Focus
Oil Market Dynamics
Energy markets dominated commodity performance, with crude oil posting its third consecutive week of gains. Brent crude's 4% weekly advance, following the previous week's 12% surge, brought prices briefly to $79 per barrel before Friday's pullback. The Department of Energy's report of an 11.5 million barrel crude oil inventory draw provided additional supply-side support.

Natural gas markets experienced even more dramatic moves, with both European and U.S. prices posting strong gains. Israel's precautionary shutdown of its Leviathan field for security purposes contributed to supply concerns, while broader regional tensions supported forward price curves.

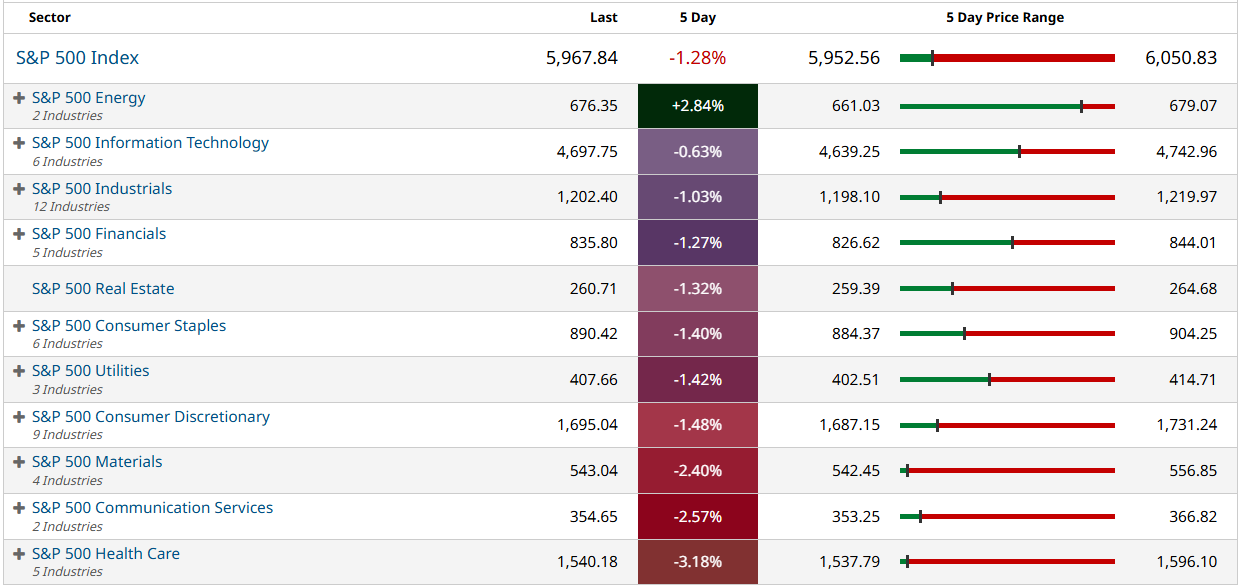
The energy sector's outperformance in equity markets reflected these commodity price movements, though gains moderated from the previous week's more dramatic advances. Energy company stocks benefited from improved margin prospects while also facing questions about potential supply chain disruptions and operational risks in volatile regions.
Metals and Agricultural Commodities
Precious metals markets showed mixed performance despite increased geopolitical uncertainty. Gold failed to sustain moves above $3,450 for the third time in two months, suggesting technical resistance at these elevated levels despite fundamental support from safe-haven demand. Silver consolidated around $36.50, while platinum posted weekly gains before retreating 4% on Friday.
Agricultural commodities exhibited varied performance, with corn continuing its downtrend since mid-April despite broader commodity strength. This divergence reflected crop-specific supply and demand dynamics that remained largely separate from geopolitical influences affecting energy and metals markets.
The metals sector's performance highlighted the complex relationship between geopolitical risk and commodity prices. While precious metals typically benefit from uncertainty, technical factors and profit-taking can override fundamental support, particularly at elevated price levels.
Currency Markets: Dollar Dynamics
Dollar Performance
The U.S. Dollar Index posted a modest weekly decline, continuing its recent softening trend after breaking below the 98 level. However, the dollar's performance varied significantly across currency pairs, gaining against the yen and Swiss franc while weakening versus the euro, which briefly traded above $1.16.
This mixed dollar performance reflected competing influences on currency markets. Safe-haven demand supported the dollar against some currencies, while expectations of Federal Reserve rate cuts and concerns about U.S. fiscal policy created headwinds against others. The euro's strength suggested improved European economic sentiment or reduced concerns about regional banking sector stress.
Dollar-yen dynamics remained particularly interesting, with the dollar strengthening for five of the past six days against the Japanese currency. This pattern occurred despite the Bank of Japan's dovish policy adjustments and suggested continued interest rate differential advantages for dollar-denominated assets.
Cryptocurrency and Digital Assets
Bitcoin and Digital Asset Performance
Bitcoin experienced a relatively quiet week by cryptocurrency standards, with prices declining 2% to approximately $103,000. The 50-day moving average at $100,700 provided technical support, while the asset briefly dropped outside its previous week's trading range before recovering.
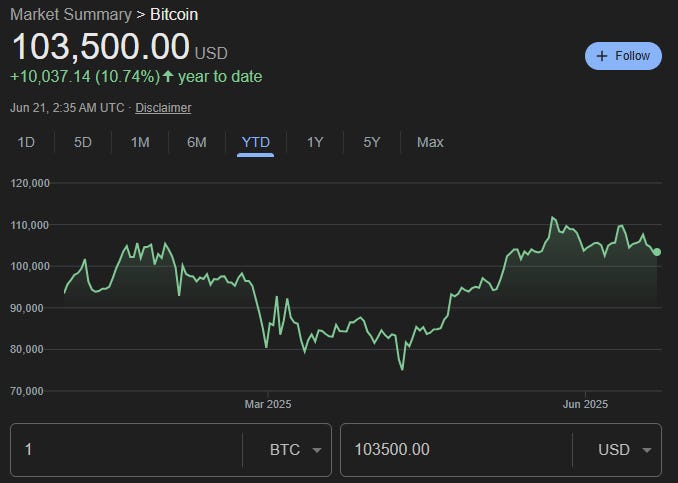
The Senate's passage of the GENIUS Act, establishing clear regulatory frameworks for stablecoins, represented a significant policy development for the digital asset sector. While this legislation didn't immediately impact Bitcoin prices, it provided greater regulatory clarity that could support broader institutional adoption over time.
Circle Internet Group continued its post-IPO surge with gains exceeding 20%, building on the previous Wednesday's 34% advance following the stablecoin legislation passage. This outperformance highlighted the potential benefits of regulatory clarity for specific digital asset business models.
JPMorgan's announcement of a partnership with Coinbase to create a new digital currency called JPMD demonstrated continued institutional interest in blockchain-based financial solutions. Coinbase shares responded positively with gains exceeding 25%, while traditional payment processors faced pressure from the expanding digital payment ecosystem.

Sector Analysis: Divergent Performance Themes
Financial Services Recovery
Financial sector stocks bounced back after the previous week's declines, benefiting from stable interest rate expectations and positive regulatory developments in the digital asset space. The sector's recovery reflected investor confidence in the sustainability of current interest rate levels and their positive impact on bank profitability.
The passage of stablecoin legislation provided particular support for financial firms with cryptocurrency exposure or partnerships. Traditional banks began positioning themselves to benefit from regulated digital asset adoption, while payment processors faced competitive pressures from evolving cryptocurrency payment systems.
Regional banks showed resilience despite ongoing concerns about commercial real estate exposure and deposit pressures. The stable interest rate environment provided some relief from margin pressure concerns, while economic data suggested continued albeit moderate loan demand.
Healthcare Sector Challenges
Healthcare emerged as the week's worst-performing sector, declining nearly 3% amid continued pressure on pharmaceutical and biotechnology companies. Political developments, including changes to CDC advisory committee membership, created additional uncertainty about vaccine and regulatory policies.
Biotechnology companies faced specific challenges, with Sarepta Therapeutics declining more than 3% following a second death associated with its Elevidys DMD gene therapy treatment. These safety concerns highlighted the ongoing risks in biotechnology investment and the importance of clinical trial outcomes for sector performance.
Traditional pharmaceutical companies also struggled, reflecting broader concerns about potential policy changes affecting drug pricing and regulatory approval processes. The sector's underperformance contrasted sharply with its typical defensive characteristics during periods of market uncertainty.
Communication Services Weakness
The communication services sector posted a 2% decline, with Alphabet accounting for much of the weakness following its significant single-day drop. However, performance within the sector showed considerable variation, with telecom and cable companies declining while other media stocks traded positively.
The sector's mixed performance reflected different exposure levels to regulatory, competitive, and technological pressures. Traditional telecommunications companies faced continued challenges from changing consumer preferences and technology shifts, while content and media companies navigated evolving distribution models and advertising markets.
Technical Analysis and Market Structure
Index Technical Patterns
The S&P 500's ability to maintain trading ranges near the 6,000 level throughout the week demonstrated important technical resilience. Despite various fundamental pressures, the index avoided any significant technical breakdowns, suggesting underlying market structure remained sound.
Friday's triple witching expiration and quarterly index rebalancing created additional technical factors affecting market behavior. The NYSE's closing auction exceeded 2 billion shares, reflecting significant institutional rebalancing activity that may have temporarily suppressed volatility.
Options hedging activity associated with expiration may have contributed to the week's relatively tight trading ranges. With these positions rolling off, market participants anticipated potential volatility expansion in the coming week as natural price discovery mechanisms resume normal function.
Volatility Patterns
Market volatility remained surprisingly contained given the breadth of fundamental uncertainties affecting asset prices. This compression likely reflected several factors, including options-related hedging, institutional risk management practices, and possibly market maker inventory management strategies.
The contained volatility pattern contrasted with historical precedents during similar geopolitical and monetary policy uncertainty periods. This divergence suggested either improved market structure resilience or potential volatility compression that could resolve with more dramatic price movements in subsequent periods.
Economic Outlook and Forward Indicators
Growth Trajectory Assessment
Despite first-quarter GDP contraction of 0.2%, economic indicators suggested a strong second-quarter rebound potential. The Atlanta Fed's real-time GDP estimate pointing to 3.4% second-quarter growth reflected expectations that tariff-driven import surges would reverse, providing a natural growth stimulus.

Averaging the two quarters would yield approximately 1.6% growth for the first half of 2025—a "good enough" pace according to many analysts, particularly given the elevated uncertainty environment. This moderate growth trajectory aligned with Federal Reserve expectations of continued but slower expansion.
The labor market remained a key economic support pillar, with weekly jobless claims at 245,000 showing continued strength. Continuing claims also declined, suggesting job market resilience despite broader economic uncertainties. Consumer confidence measures improved modestly but hadn't yet established clear upward trends.
Inflation Dynamics
Core Personal Consumption Expenditures, the Federal Reserve's preferred inflation gauge, reached four-year lows in April with May data expected to show 2.6%. However, this benign recent performance masked building pressures from tariff implementation and potential service sector inflation persistence.
The Federal Reserve's upward revision of 2025 inflation forecasts to 3.1% from 2.8% specifically acknowledged expected tariff-driven price increases. As companies exhaust pre-tariff inventory levels and implement previously announced price adjustments, consumer price pressures were expected to become more apparent in subsequent months.

Services inflation remained a particular concern, with this sector less directly affected by goods-focused trade policies but potentially more sensitive to labor market tightness and wage pressures. The interaction between goods and services inflation presented complex analytical challenges for monetary policymakers.
Investment Strategy Implications
Portfolio Positioning Considerations
Market developments suggested several strategic positioning themes for investment portfolios. Diversification remained crucial given the multiple, overlapping uncertainty sources affecting different asset classes and geographic regions. International equity exposure offered potential value, particularly with many investors remaining underweight relative to global benchmarks.
Within U.S. markets, the broadening of market leadership beyond technology giants created opportunities in previously overlooked sectors. Financials and healthcare, despite recent healthcare weakness, offered potential value for investors willing to navigate sector-specific challenges.
The steepening yield curve expectation, with long-term rates potentially declining more slowly than short-term rates even during Federal Reserve easing cycles, suggested tactical fixed-income positioning opportunities. Investment-grade bonds with seven to ten-year maturities appeared attractive relative to longer-duration alternatives.
Risk Management Framework
Current market conditions demanded sophisticated risk management approaches that accounted for multiple, potentially correlated risk sources. Geopolitical tensions, trade policy uncertainty, and monetary policy transitions created a complex risk environment requiring careful portfolio stress testing.
Traditional safe-haven assets showed some effectiveness during the week's tensions, with Treasury bonds and certain currencies providing portfolio protection. However, the limited nature of market disruptions suggested either effective risk management or potential complacency that could be tested by more severe developments.
Currency hedging strategies gained importance given the dollar's mixed performance and potential for significant moves based on Federal Reserve policy evolution or geopolitical developments. International investors faced particular challenges in managing multi-currency exposure amid uncertain policy environments.
Conclusion: Navigating Uncertainty with Measured Optimism
The week's market performance demonstrated remarkable resilience in the face of significant fundamental uncertainties. Equity markets' mixed but stable performance, combined with measured responses in fixed-income and currency markets, suggested investor confidence in the underlying economic structure despite surface-level disruptions.
The Federal Reserve's patient approach to monetary policy provided an important anchor for market expectations, even as internal policy debates reflected the genuine complexity of current economic conditions. The central bank's focus on data-dependent decision-making, while acknowledging elevated uncertainty, offered a framework for market participants to assess future policy evolution.
Geopolitical tensions in the Middle East remained a wildcard factor with potential for significant market impact. However, the measured market response to initial developments suggested either effective risk management or potentially dangerous complacency. Continued monitoring of these developments remained essential for investment decision-making.
Looking ahead, several key themes emerged from the week's developments. The ongoing tension between economic resilience and policy uncertainty seemed likely to persist, creating both opportunities and risks for active portfolio management. The broadening of market leadership beyond technology giants suggested a potentially healthier foundation for sustained market advances.
International diversification appeared increasingly attractive given the U.S. market's elevated valuations and concentration risks. European and emerging market equities offered potential value, though they came with their own political and economic uncertainties requiring careful analysis.

The week's events reinforced the importance of maintaining flexible, well-diversified investment approaches capable of adapting to rapidly changing conditions. While market resilience was encouraging, the multiple sources of uncertainty suggested that future volatility remained likely, creating both risks and opportunities for prepared investors.
Ultimately, the market's ability to process complex, overlapping risks while maintaining reasonable stability demonstrated the sophistication of modern financial markets. However, this stability should not breed complacency, as the fundamental uncertainties driving current conditions remained largely unresolved and capable of producing more dramatic market responses as they evolve.


Weekly Benchmark Breakdown
S&P 500 Index

The S&P 500 ($SPX) posted a mild decline of -0.22% on the week, closing at 5,967.57 after briefly trading above 6,018. Despite the modest move in price, underlying internals showed mixed-to-softening breadth, with signs of internal consolidation replacing the prior week's strength.
Breadth metrics weakened modestly from the prior week’s rebound levels:
40.15% of stocks closed above the 5-day moving average (vs. 24.80% prior)
44.33% above the 20-day MA (vs. 38.29%)
62.42% above the 50-day MA (vs. 69.44%)
Longer-term metrics (100-, 150-, and 200-day) showed slight weakening, but remain neutral to constructive overall
New high/low dynamics softened:
5-day new highs totaled 109 stocks (22% of the index)
5-day new lows rose to 127 stocks (25%)
Net new highs: -18, a reversal from the previous week’s +58 print
Despite the drop in net highs, the 1-month to YTD high/low spreads remain comfortably positive, suggesting no deeper structural deterioration yet.
While the S&P 500 held near highs, internal momentum paused. Breadth narrowed modestly and leadership thinned, though the majority of the index remains in an uptrend on longer timeframes. This may represent a rotation-based digestion rather than the start of a broader correction, but continued slippage in breadth will need to be monitored closely.
The base case remains constructive as long as support around 5,920–5,940 holds and breadth stabilizes.
Dow Jones Index
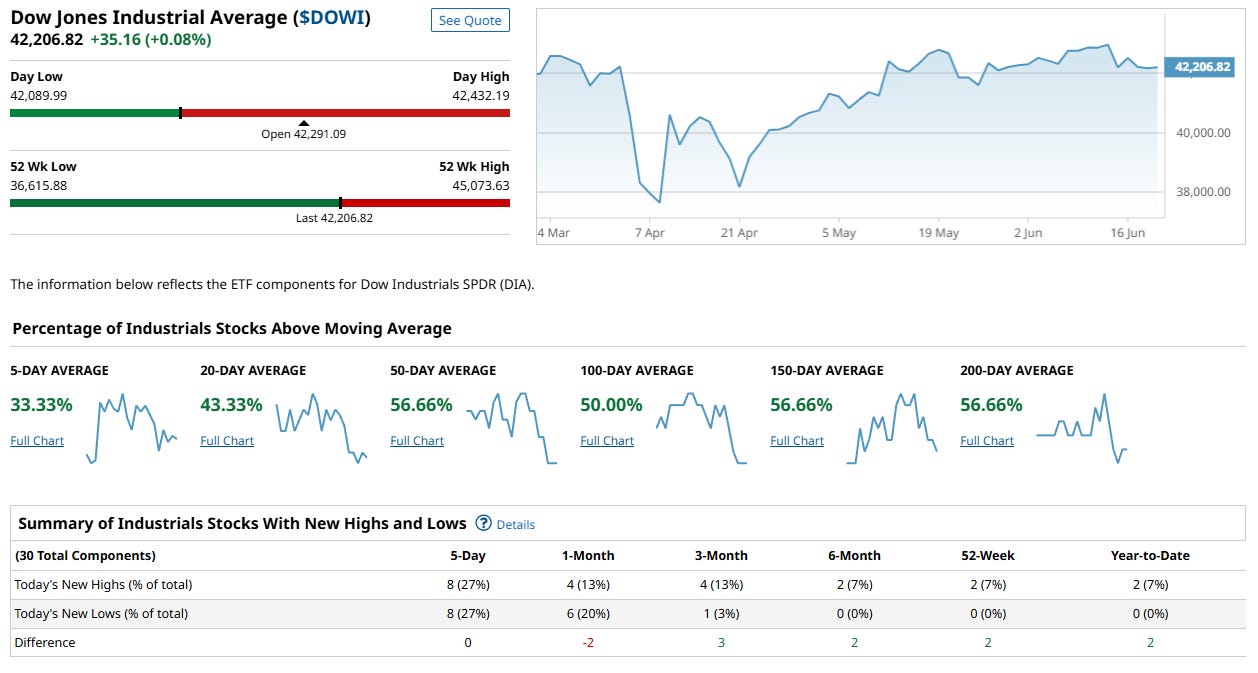
The Dow Jones Industrial Average ($DOWI) closed nearly flat on the week at 42,206.82, up just +0.08%. While the price action was muted, internal dynamics painted a more revealing picture of a bifurcated tape and stalled momentum.
Breadth remained soft, with only one-third of Dow components above short-term averages:
33.33% of stocks are above the 5-day MA
43.33% above the 20-day
Intermediate and longer-term metrics (50-, 100-, 150-, 200-day) held steady near ~56–57%, suggesting broader support across timeframes despite near-term pullback
New high/low analysis revealed a balanced but stagnant structure:
5-day highs and lows were evenly split at 8 each (27%)
1-month net difference fell slightly negative (-2), though medium- to long-term spreads (3- to 12-month) stayed modestly positive
The Dow is holding its ground, but shows signs of waning leadership. The near-term stall in momentum and lack of net new highs suggests buyers are pausing, though a majority of components remain in longer-term uptrends. Stability in the 42,000–42,200 zone is critical going forward. A decisive move will likely require stronger sector participation and a broader push in breadth.
NASDAQ 100 Index
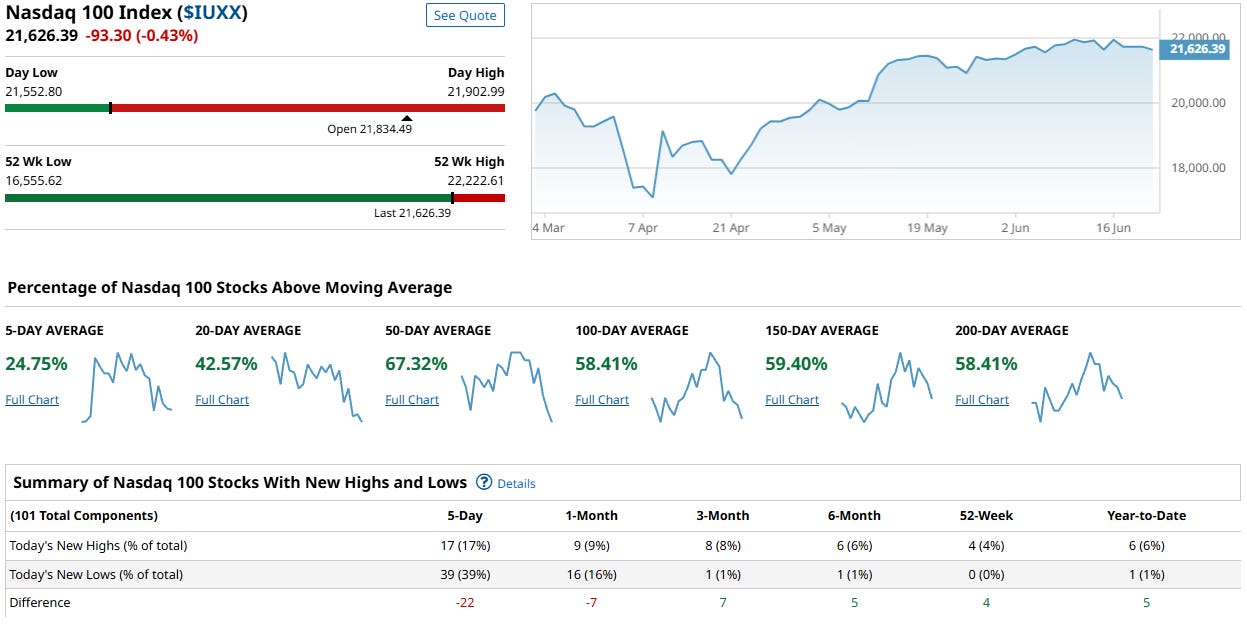
The Nasdaq 100 ($IUX) ended the week at 21,626.39, down -0.43%. While the index remains near all-time highs, the internal structure showed signs of broad softening, especially in short-term participation and breadth.
Breadth erosion intensified:
Only 24.75% of Nasdaq 100 stocks are above their 5-day moving average
20-day MA participation slipped to 42.57%, reinforcing the idea that the recent pullback has been widely felt
Still, 50- to 200-day participation remains strong (all above 58%), indicating healthy longer-term momentum
New highs and lows were skewed negatively this week:
17 new highs vs. 39 new lows (difference of -22)
Net new highs were also negative over the 1-month period (-7)
However, 3- to 12-month high/low spreads improved, hinting that the weakness is contained to recent action rather than structural deterioration
The Nasdaq remains near peak levels, but internal conditions reflect fatigue. Breadth contraction and a widening gap between short-term highs and lows signal that leadership is narrowing and risk appetite is weakening at the margins. A period of digestion or rotation appears underway, and further gains will require renewed participation across a broader set of constituents.
Russel 1000
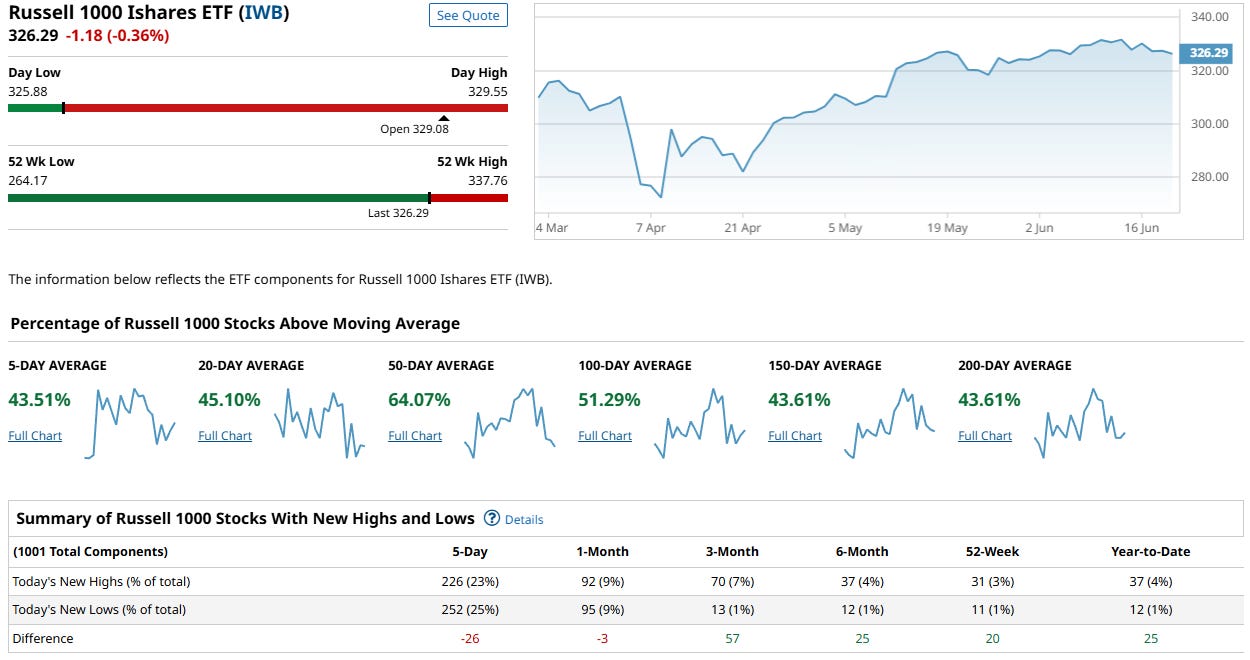
The Russell 1000 ($IWB) closed the week at 326.29, down -0.36%, retreating modestly from recent highs but maintaining a constructive price posture. However, internal breadth metrics offered mixed messages, with near-term weakness offset by longer-term stability.
Mixed breadth signals:
Near-term participation is lackluster: only 43.51% of stocks are above their 5-day MA
Participation improves along longer timeframes: 64.07% (50-day), 51.29% (100-day)
150- and 200-day moving average participation has pulled back to just 43.61%, matching the 5-day reading — suggesting rotation or distribution beneath the surface
High/low breadth offered more encouraging signs:
While the 5-day net high/low spread was -26 (226 new highs vs. 252 new lows), medium- and longer-term metrics are solidly positive
The 3-month spread stands at +57, 6-month at +25, and YTD at +25 — indicative of strength across timeframes despite weekly volatility
The Russell 1000 is demonstrating a digestion phase following a strong rally. While short-term momentum has waned and breadth narrowed, the deeper structure remains intact. The persistence of longer-term net highs suggests healthy undercurrents, but market strength is less convincing at the surface. Traders may need to brace for more choppy consolidation unless broader participation improves.
Major Indices Insights & Summary
1. Narrow Participation and Softening Breadth
Across the major indices, short-term breadth weakened meaningfully this week. The percentage of stocks above their 5-day moving average dropped sharply:
Nasdaq 100: 24.75%
Russell 1000: 43.51%
S&P 500: 40.15%
Dow Industrials: 33.33%
Despite indices trading just off all-time highs, the underlying participation thinned considerably, particularly in the Nasdaq where the breadth deterioration is most acute. This divergence between index levels and component participation suggests a market increasingly reliant on a shrinking leadership cohort.
2. Mid- and Long-Term Structure Still Constructive
Longer-term breadth measures (50-day to 200-day MAs) remain stable overall:
SPX: 62.42% above 50-day, 44.93% above 200-day
NDX: 67.32% above 50-day, 58.41% above 200-day
RUI: 64.07% above 50-day, 43.61% above 200-day
DJI: 56.66% flat across 50- to 200-day MAs
These figures reflect that, while participation is weakening at the margins, the broader uptrend remains intact. A pullback or rotation is underway rather than a structural breakdown.
3. Mixed High/Low Signals Across Timeframes
The net new high/low figures over 5 days were negative in all indices except the Dow:
SPX: -18
NDX: -22
RUI: -26
DJI: 0
However, on a 3-month and 6-month basis, all four indices showed net positive highs, with the Russell 1000 and S&P 500 particularly strong. This reaffirms a longer-term healthy bias, but recent weakness may reflect short-term exhaustion or sector rotation.
4. Index Price Positioning Near Highs
All indices remain in strong technical territory:
Nasdaq 100 closed ~2.7% below its 52-week high
S&P 500 sits ~2.9% below its high
Russell 1000 and Dow are each within ~3.3% of their peaks
Despite the softness in internals, index price levels have not broken down. The trend remains upward, though near-term corrective pressure is increasing.
5. Under the Surface: Divergences Suggest Rotation
The Nasdaq’s weaker breadth, especially relative to the Russell 1000 and S&P 500, may signal a leadership transition underway. The Dow’s flat net highs and balanced MA participation point to consolidation, not breakdown. The Russell's stronger long-term net highs imply continued leadership in value, cyclicals, or mid-cap growth.
Summary
This week was marked by notable short-term deterioration in breadth, even as price levels remained elevated. Markets appear to be entering a digestion or rotation phase. The broader technical structure remains bullish, but the growing reliance on fewer leaders introduces fragility. Watch for either a breadth rebound or a pullback toward support as the likely resolution in the near term.
VL Indices Market Score: 47 / 100 ( -5 WoW )
1. Breadth Deterioration (Score: 10/25)
Short-term participation sharply declined:
NDX 5-day MA breadth fell to 24.75%
SPX and RUI both below 45% in the 5-day and 20-day windows
Net 5-day highs vs. lows were negative in 3 of 4 indices
Despite stable longer-term breadth, the short-term erosion reflects waning participation, reducing the score in this category.
2. Trend Integrity (Score: 15/25)
Major indices remain just off all-time highs:
SPX and NDX within ~3% of 52-week highs
RUI and DJI still near peak levels
Longer moving average participation (50–200-day) remains stable
Price structure and trend health are intact, but softening momentum suggests a possible near-term topping or pause.
3. High/Low Leadership (Score: 7/20)
Net new highs are negative in 3 indices over the 5-day period
Longer-term highs (3-month and 6-month) remain positive, especially in RUI and SPX
The improvement at longer horizons is encouraging but offset by current deterioration
4. Relative Strength & Rotation (Score: 10/20)
Nasdaq shows growing relative weakness in breadth vs. other indices
Russell 1000 holds up better in intermediate-term highs and lows
Rotation appears underway from growth to broader market exposure, but it’s early
5. Volatility & Fragility Risk (Score: 5/10)
The divergence between index levels and participation elevates fragility risk
Narrow leadership in NDX heightens the chance of a shallow correction or fast rotation if leading names falter
This week’s drop in the VL Score reflects a loss of internal momentum even as broader trends stay intact. The score suggests a neutral-to-cautiously-bullish regime, where continued leadership thinning and short-term breadth erosion demand attention. A bounce in participation—or a deeper correction—will likely resolve the current tension in the coming weeks.
US Investor Sentiment Report
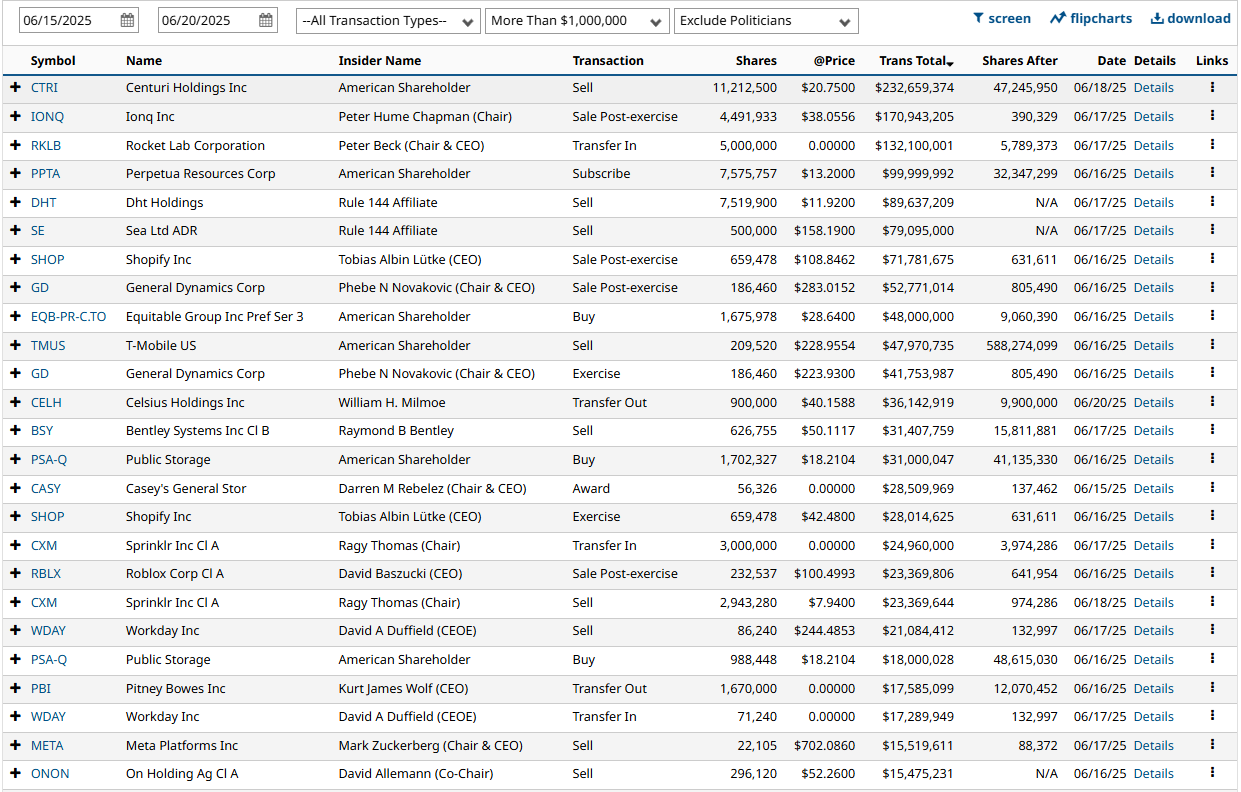
Insider Trading
Insider trading occurs when a company’s leaders or major shareholders trade stock based on non-public information. Tracking these trades can reveal insider expectations about the company’s future. For example, large purchases before an earnings report or drug trial results might indicate confidence in upcoming good news.

%Bull-Bear Spread
The %Bull-Bear Spread chart is a sentiment indicator that shows the difference between the percentage of bullish and bearish investors, often derived from surveys or sentiment data, such as the AAII (American Association of Individual Investors) sentiment survey. This spread tells investors about the prevailing mood in the market and can provide insights into market extremes and potential turning points.
Bullish or Bearish Sentiment:
When the spread is positive, it means more investors are bullish than bearish, indicating optimism about the market’s direction.
A negative spread indicates more bearish sentiment, meaning more investors expect the market to decline.
Contrarian Indicator:
The %Bull-Bear Spread is often used as a contrarian indicator. For example, extremely high levels of bullish sentiment might suggest that the market is overly optimistic and could be due for a correction.
Similarly, when bearish sentiment is extremely high, it might indicate that the market is overly pessimistic, and a rally could be on the horizon.
Market Extremes and Reversals:
Historically, extreme values of the spread (both positive and negative) can signal turning points in the market. A very high positive spread can signal market exuberance, while a very low or negative spread may indicate fear or capitulation.

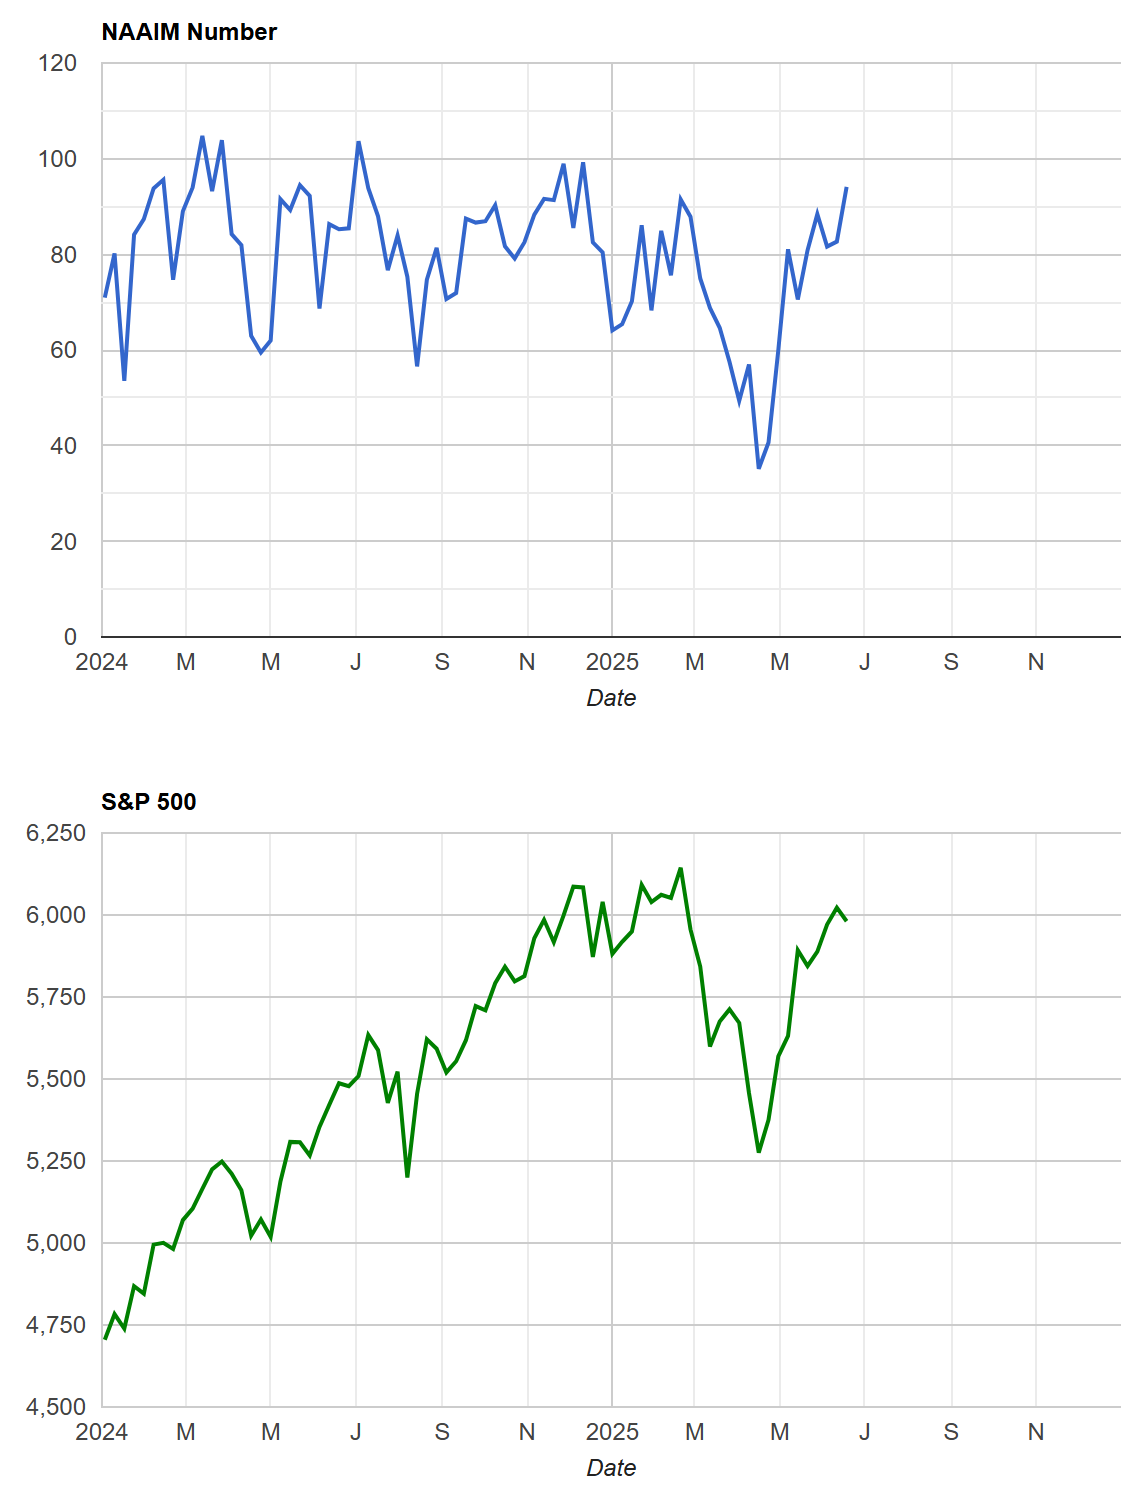
NAAIM Exposure Index
The NAAIM Exposure Index (National Association of Active Investment Managers Exposure Index) measures the average exposure to U.S. equity markets as reported by its member firms. These are typically active money managers who provide their equity exposure levels weekly. The index offers insight into how much these managers are investing in equities at any given time, ranging from being fully short (-100%) to leveraged long (up to +200%).


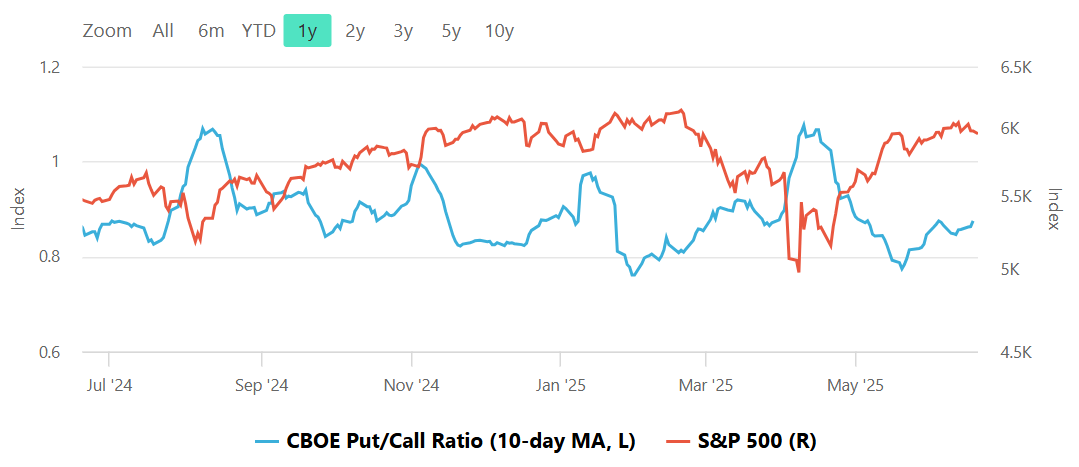
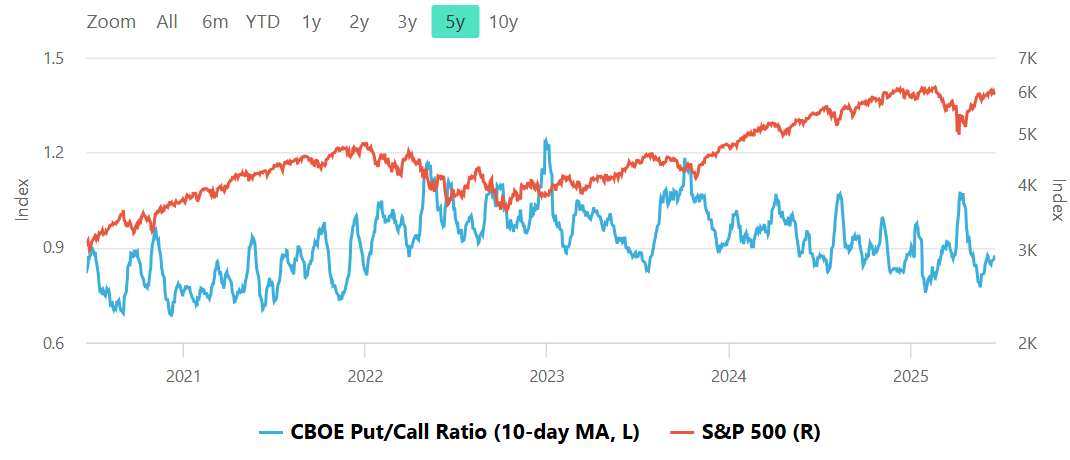
CBOE Total Put/Call Ratio
CBOE's total put/call ratio includes index options and equity options. It's a popular indicator for market sentiment. A high put/call ratio suggests that the market is overly bearish and stocks might rebound. A low put/call ratio suggests that market exuberance could result in a sharp fall.
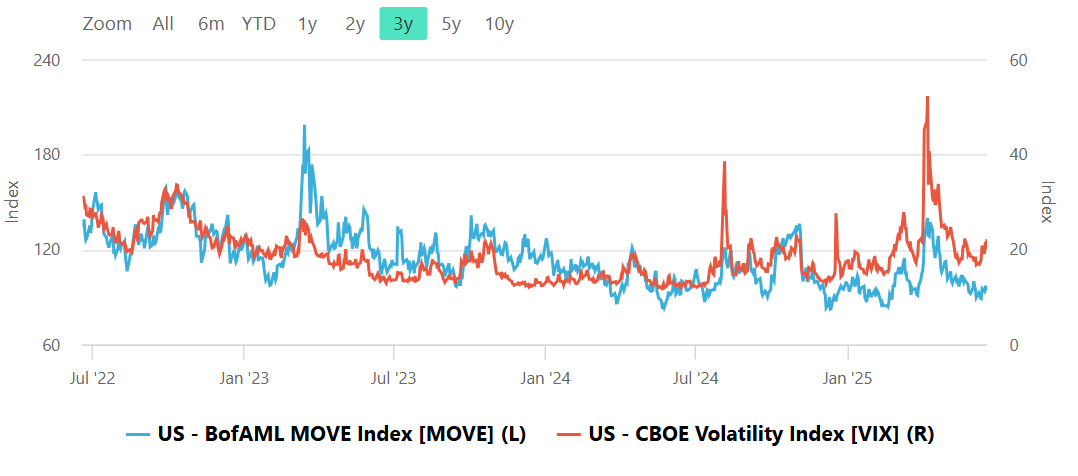
Equity vs Bond Volatility
The Merrill Lynch Option Volatility Estimate [MOVE] Index from BofAML and the CBOE Volatility Index [VIX] respectively represent market volatility of U.S. Treasury futures and the S&P 500 index. They typically move in tandem but when they diverge, an opportunity can emerge from one having to “catch-up” to the other.

CNN Fear & Greed Constituent Data Points & Composite Index


Social Media Favs
Analyzing social sentiment can provide valuable insights for investment strategies by offering a pulse on public perception, mood, and market sentiment that traditional financial indicators might not capture. Here’s how social sentiment analysis can enhance investment decisions:
Market Momentum: Positive or negative social sentiment can signal impending momentum shifts. When public opinion on a stock, sector, or asset class changes sharply, it can create buying or selling pressure, especially if that sentiment becomes widespread.
Early Detection of Trends: Social sentiment data can help investors spot trends before they show up in technical or fundamental data. For example, increased positive chatter around a particular company or sector might indicate growing interest or excitement, which could lead to price appreciation.
Gauge Retail Investor Impact: With the rise of retail investor platforms, collective sentiment on social media can lead to significant price movements (e.g., meme stocks). Understanding how retail investors view certain stocks can help in identifying high-volatility opportunities.
Event Reaction Monitoring: Social sentiment can provide real-time reactions to news events, product releases, or earnings reports. Investors can use this information to gauge market reaction quickly and adjust their strategies accordingly.
Complementing Quantitative Models: By adding a social sentiment layer to quantitative models, investors can enhance predictions. For example, a model that tracks historical price and volume data might perform even better when factoring in sentiment trends as a measure of market psychology.
Risk Management: Negative sentiment spikes can be a signal of potential downturns or increased volatility. By monitoring sentiment, investors might avoid or hedge against investments in companies experiencing a public relations crisis or facing negative perceptions.
Long-Term Sentiment Trends: Sustained sentiment trends, whether positive or negative, often mirror longer-term market cycles. Tracking sentiment trends over time can help identify shifts in investor psychology that could affect longer-term investments or sector rotations.
For these reasons, sentiment analysis, when combined with other tools, can provide a comprehensive view of both immediate market reactions and underlying investor attitudes, helping investors position themselves strategically across various time frames. Here are the most mentioned/discussed tickers on Reddit from some of the most active Subreddits for trading:


Special Coverage Report
Market Regimes: Reading the Market’s Mood and Trading Accordingly
Title: Market Regimes: Reading the Market’s Mood and Trading Accordingly
I. Introduction: Why Market Regimes Matter
Imagine walking into a casino and placing all your money on red—only to discover you're not playing roulette, you're at a poker table. That’s what it feels like trading without understanding the market regime. Markets aren’t random. They shift. They cycle. They oscillate between moods. And if you don’t learn to read those moods, you’ll find yourself applying the right strategy in the wrong environment—a common but costly error.

Market regimes are essentially the market's dominant environment: bullish, bearish, sideways, volatile, calm, euphoric, fearful. Each regime influences the behavior of traders, the performance of strategies, and the reliability of technical and fundamental signals. The key to sustainable trading isn't just having a great system; it's knowing when to use it. This article aims to explore how to identify market regimes as they form, which tools and techniques are most effective for adapting to shifting environments, what strategies align best with each regime, and how to protect your capital during transitions.
II. Anatomy of a Market Regime
A market regime is not defined by a single metric or signal but rather by a confluence of behaviors and characteristics. Price structure plays a central role: are we seeing higher highs and higher lows suggestive of a bull trend, or lower highs and lower lows indicative of a bear phase? Is the market trapped in a tight range, or exhibiting wide price swings? Beyond price, volatility adds another layer of insight. Rising volatility often marks inflection points, while low volatility can denote stability or the calm before the storm.
Market participation also matters. A rally driven by a handful of mega-caps tells a different story than one supported by broad sector strength. Liquidity conditions, influenced by central bank actions, interest rates, and credit availability, further shape market dynamics. And overarching it all are macroeconomic conditions: inflation trends, GDP growth, employment figures, and geopolitical events.

Timeframes further complicate the picture. A stock or index might appear bullish on a monthly chart while undergoing a correction on a weekly timeframe and consolidating on an intraday basis. Fractal awareness—the ability to understand and contextualize multiple timeframes—is key to accurate regime recognition.

Institutional flows often anchor and solidify regimes. When large funds begin rotating capital between sectors, de-risking portfolios, or leveraging into growth, their moves set the tone for broader market behavior. Recognizing these patterns can give traders a critical edge.
III. Detecting Regime Changes in Real Time
Anticipating when a regime is about to change can be as valuable as recognizing the current one. Several methods exist to help traders spot these shifts as they unfold. On the technical side, moving average crossovers provide a foundational tool. When shorter-term averages cross above or below longer-term ones, they can signal the start or end of a trend. Divergences in market breadth, such as rising indices accompanied by declining participation, often hint at underlying weakness and a potential change in direction.
Volatility patterns offer another lens. Markets tend to exhibit volatility clustering, meaning that calm periods are followed by more calm, and chaotic periods beget more chaos. Sudden spikes in measures like the VIX or in average true range (ATR) often herald a new regime. Failed breakouts—those that initially move strongly beyond resistance or support only to reverse—can serve as early indicators that the prevailing trend is losing strength.
Quantitative methods also aid in this process. Hidden Markov Models (HMM) can statistically infer underlying states based on observed market behavior. Rolling Sharpe ratios, when declining, may suggest deteriorating reward-to-risk dynamics. Changes in asset correlations—such as equity and bond markets moving in tandem when they typically diverge—can also indicate a shift.

Sentiment and positioning data provide yet another layer of insight. Tools like the AAII sentiment survey, put/call ratios, or the NAAIM exposure index quantify crowd psychology. Meanwhile, Commitments of Traders (COT) reports shed light on how large commercial and non-commercial entities are positioned. Dark pool volume trends can offer clues about institutional activity behind the scenes. Together, these tools allow for a multi-faceted approach to regime detection.
IV. Market Regime Typology
Market regimes tend to fall into a handful of common archetypes. The bullish trending regime is characterized by consistent price appreciation, higher highs and lows, and sector rotation among risk-on areas like tech or consumer discretionary. Trend-following strategies tend to perform well in these periods, particularly those that employ breakout entries or momentum overlays. The bullish phase is also marked by declining volatility and tightening credit spreads, reinforcing risk appetite.
Conversely, bearish regimes display persistent declines, lower highs and lows, and a shift in leadership toward defensive sectors such as utilities or consumer staples. Volatility usually rises, and sentiment turns cautious or outright fearful. Here, short-selling rallies, allocating to volatility instruments, or moving to cash can be prudent.

Some periods are defined not by clear direction but by mean-reversion. These range-bound regimes see repeated failures to break out or break down, creating choppy trading environments. Oscillators like stochastics or Bollinger Bands become more useful, and options traders may favor theta-positive strategies.
Finally, transition regimes often emerge with a burst of volatility and no clear trend. These are the most dangerous periods for traders, as whipsaws and false signals abound. Patience, smaller position sizes, and an emphasis on capital preservation are critical in these times.
V. Protecting Capital During Regime Transitions
Regime transitions are perilous not because they are inherently more volatile, but because they represent change—and traders, like all humans, are wired to prefer consistency. The strategy that worked yesterday may suddenly falter, and without clear signals, traders often overreact or freeze.
Protecting capital in these moments starts with humility. Recognizing that uncertainty is high, traders should reduce position size and tighten risk parameters. Trailing stops help preserve gains when the environment begins to shift. Monitoring market leadership is also important; when top-performing stocks begin to falter, it may indicate a broader change.
Volatility indicators such as the VIX or ATR can act as early warnings, and their spikes should prompt a reassessment of exposure. Hedging becomes more relevant, whether through inverse ETFs, protective puts, or volatility-linked instruments. And above all, holding cash is not a sign of weakness but of discipline. Sometimes, the best trade is no trade.
VI. Aligning Strategy With Regime
Adapting to the prevailing regime is what separates professional traders from hobbyists. Each environment rewards a different approach, and knowing which tool to use is critical.
In trending bullish markets, momentum-based systems thrive. These might use moving averages to confirm trends or relative strength to identify leaders. In bearish phases, strategies pivot toward capital protection, using short setups or instruments that benefit from volatility. Sideways markets demand a shift to mean-reversion, where tools like VWAP or RSI play a greater role. During volatile transitions, traders must adopt an adaptive mindset, prioritizing risk management over profit maximization.

Position sizing should also reflect the regime. Volatility-adjusted sizing, using tools like ATR, ensures that risk remains constant even as price behavior changes. Some traders blend multiple models and activate them based on predefined regime criteria. Performance expectations from your strategies, your indicators and your trading personality must also be realigned; what works in a bull run may not in a sideways grind.
VII. Common Mistakes Traders Make Across Regimes
One of the most frequent errors traders make is applying a single strategy across all market environments. While consistency in process is good, rigidity in application is not. Traders often overtrade in uncertain regimes, mistaking volatility for opportunity. They might size positions based on past performance, not current risk, and misinterpret random fluctuations as meaningful signals.
Emotional biases compound the issue. A strategy that recently worked becomes a psychological anchor, leading traders to force trades or hold on too long. Confirmation bias and overconfidence further erode discipline. Great traders avoid these pitfalls by constantly reassessing their strategy's fit within the current regime.
VIII. Practical Tools & Routines for Regime Awareness
Maintaining awareness of the market regime requires structure. Traders benefit from a daily dashboard that includes trend direction, market breadth, volatility measures, and sector rotation. A weekly checklist helps identify whether leadership is strengthening or weakening, whether volatility is expanding or contracting, and whether sentiment is supportive or deteriorating.
Mental models can reinforce discipline. Questions like "Am I trading the market I see or the market I want?" or "What risk does this regime imply?" prompt thoughtful decision-making. Journaling performance relative to regime conditions can reveal which strategies perform best in which environments, helping traders refine their edge.
IX. Conclusion: Build Regime Awareness Into Your DNA
Understanding market regimes isn't a bonus skill—it's a core competency. It's what allows traders to survive volatility, avoid overconfidence, and profit when conditions align. The market is not static; it evolves. The strategies that work today may not work tomorrow, and the only way to endure is to adapt.
By developing the tools, routines, and mindset to recognize and respond to regime changes, traders equip themselves with a true edge. In a game where capital flows to those who best understand the rules, regime awareness is one of the most powerful rules of all.
Clarity sharpens with consistency. For further reading, here are some books that can help deepen your understanding of market regimes:
Popular & Practical Books
"Stage Analysis: Technical Strategies for Trading Stocks" by Stan Weinstein
This cult classic introduces a four-stage market framework: Accumulation, Uptrend, Distribution, and Downtrend. It's beloved by swing traders for its clear rules and regime-based logic using weekly charts and moving averages."Adaptive Markets" by Andrew W. Lo
Lo challenges the Efficient Market Hypothesis with the idea that markets evolve like biological systems. Excellent for understanding why regimes shift and how human behavior plays a central role."Trading in the Zone" by Mark Douglas
While not about regimes per se, it reinforces the mindset required to recognize and adapt to changing environments."Quantitative Trading" by Ernest Chan
A pragmatic look at how to test and build strategies that adapt to regime changes, including volatility-based filters and risk management tactics."Dynamic Asset Allocation" by James Picerno
Focuses on macro regime awareness and using data like yield spreads, inflation, and momentum to inform tactical asset allocation."Market Wizards" by Jack D. Schwager
A compilation of interviews where many of the world’s top traders describe how adapting to market conditions is key to their longevity and success.
Institutional S/R Levels for Major Indices
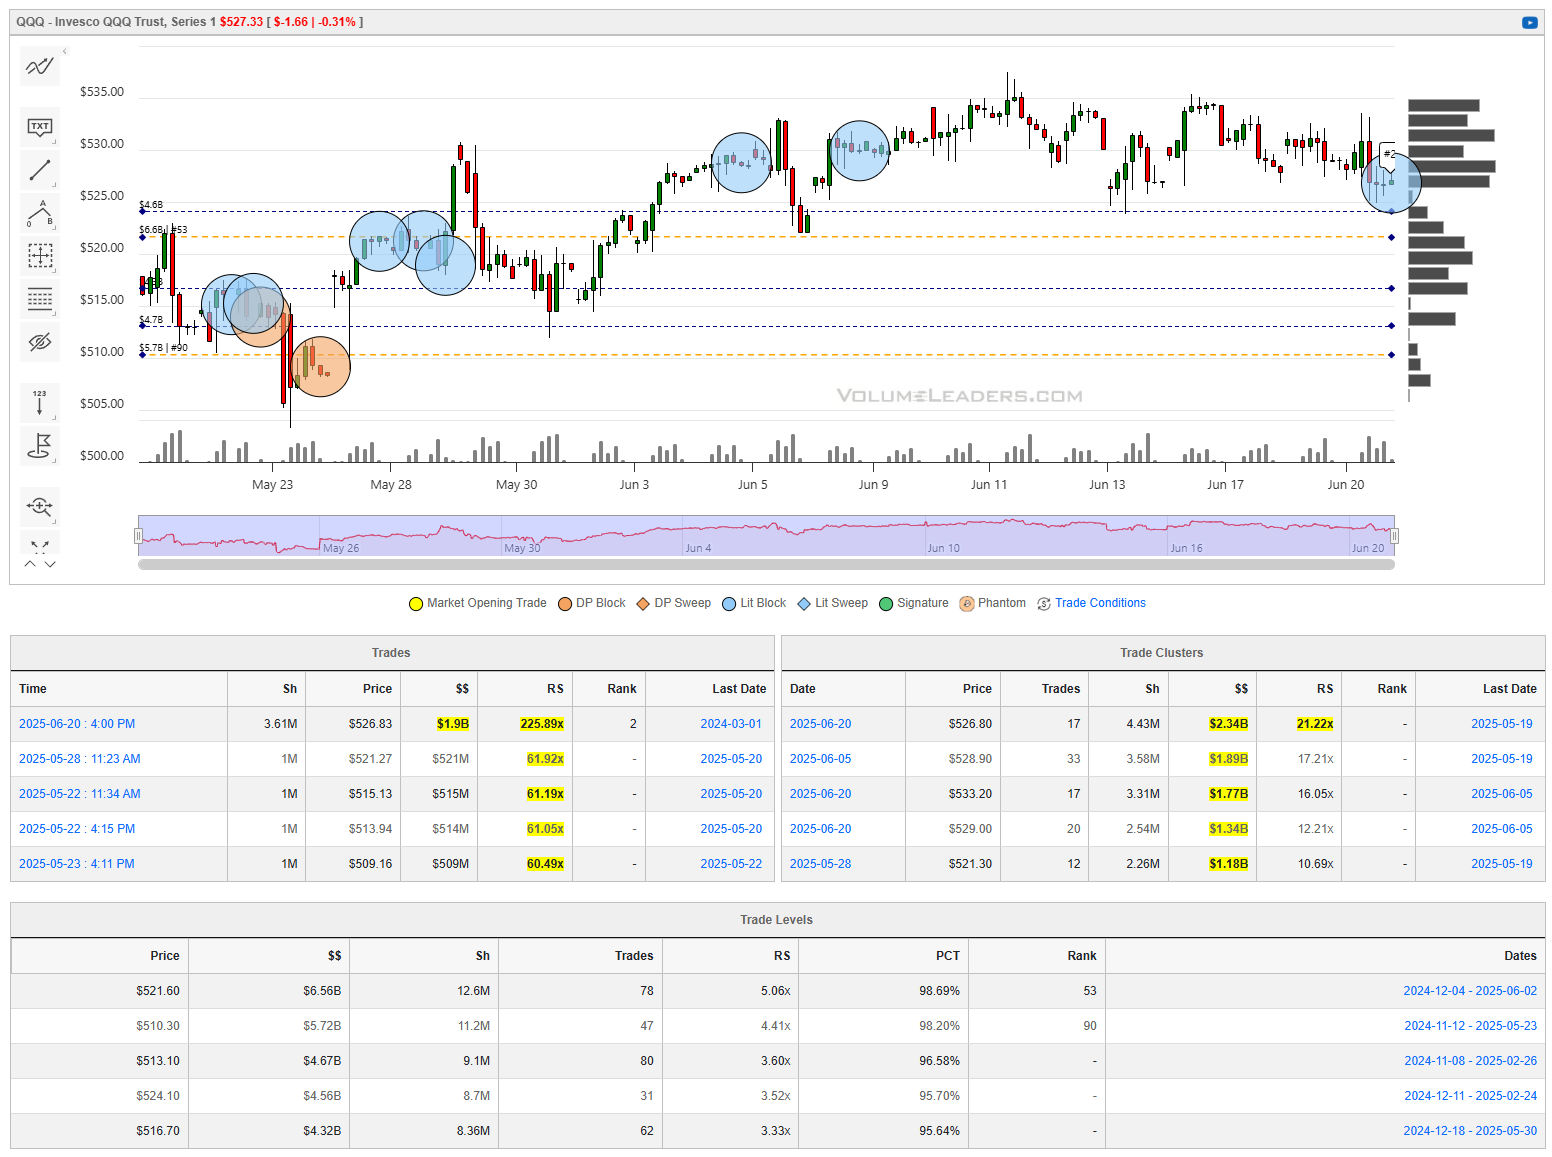
When you’re a large institutional player, your primary goal is to find liquidity - places to do a ton of business with the least amount of slippage possible. VolumeLeaders.com automatically identifies and visually plots the exact spots where institutions are doing business and where they are likely to return for more. It’s one of the primary reasons “support” and “resistance” concepts work and truly one of the reasons “price has memory” - take a look at the dashed lines in the images below that the platform plots for you automatically; these are the areas institutions constantly revisit to do more business.
Levels from the VolumeLeaders.com platform can help you formulate trades theses about:
Where to add or take profit
Where to de-risk or hedge
What strikes to target for options
Where to expect support or resistance
And this is just a small sample; there are countless ways to leverage this information into trades that express your views on the market. The platform covers thousands of tickers on multiple timeframes to accommodate all types of traders.
SPY

QQQ
IWM
DIA

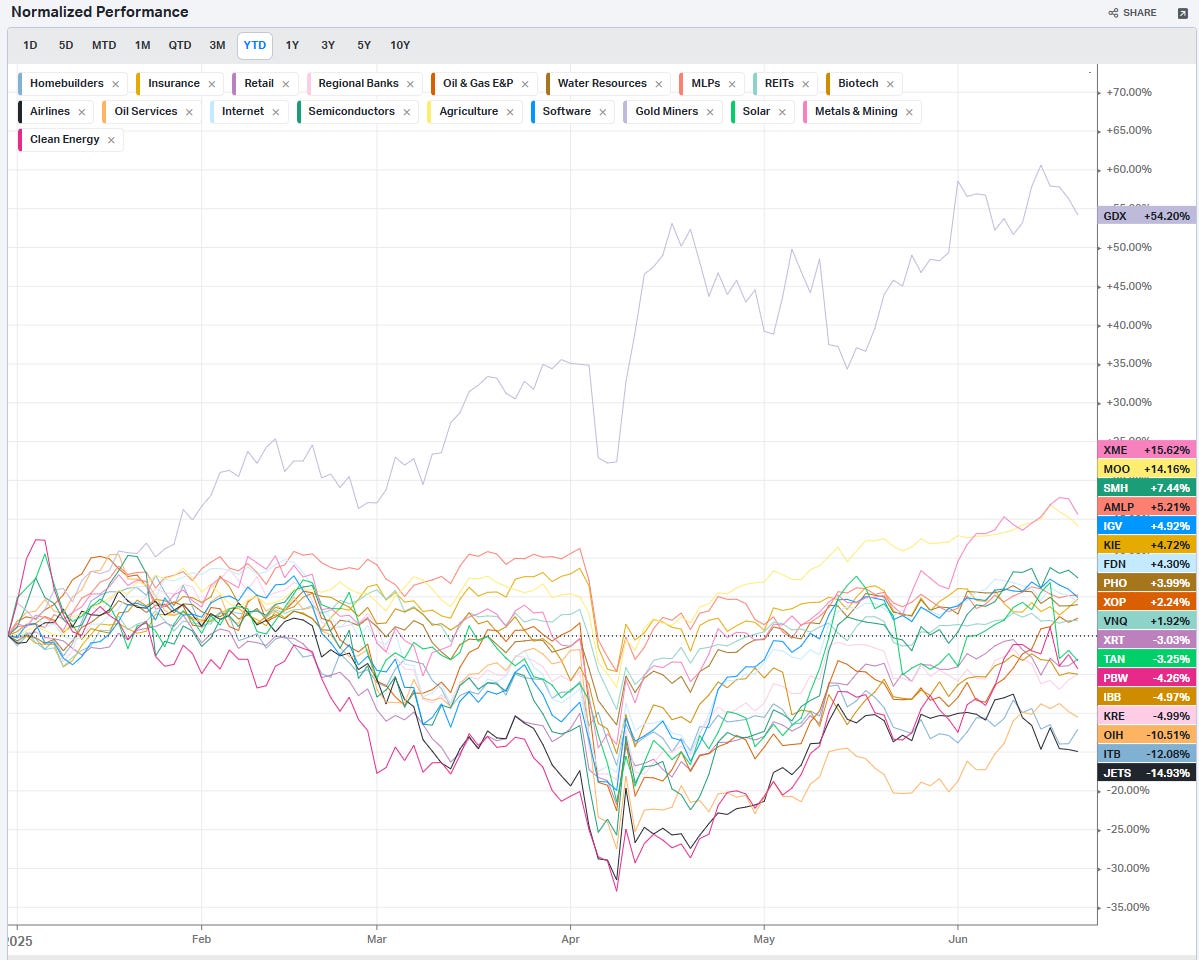
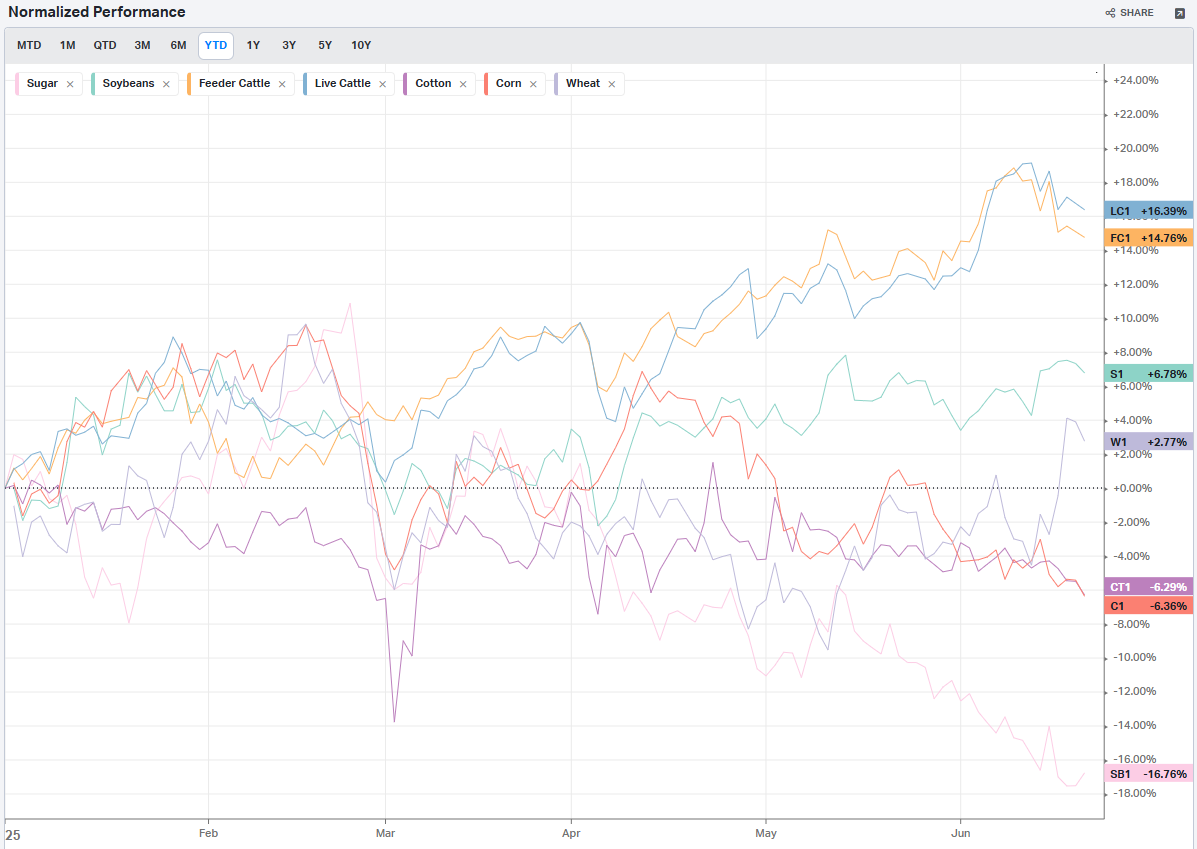
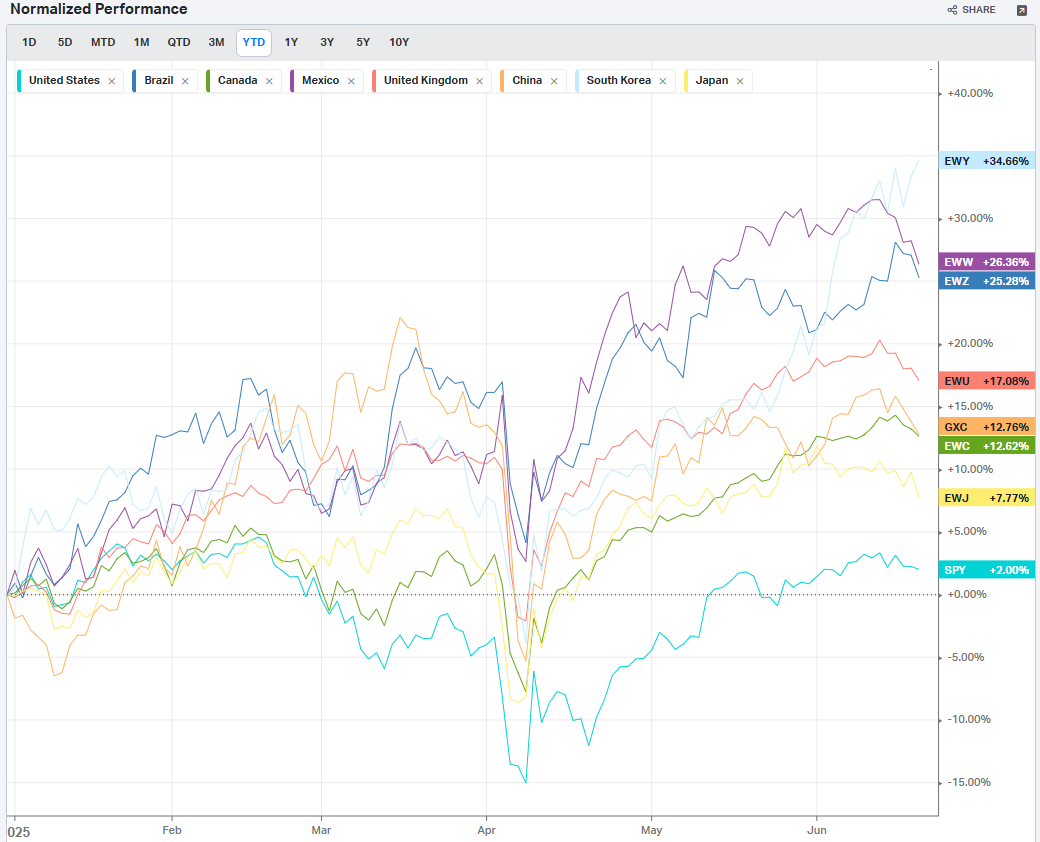
Summary Of Thematic Performance YTD
VolumeLeaders.com offers a robust set of pre-built thematic filters, allowing you to instantly explore specific market segments. These performance snapshots are provided purely for context and inspiration—think about zeroing in on the leaders and laggards within the strongest and weakest sectors, for example.
S&P By Sector

S&P By Industry
Commodities: Energy

Commodities: Metals

Commodities: Agriculture
Country ETFs
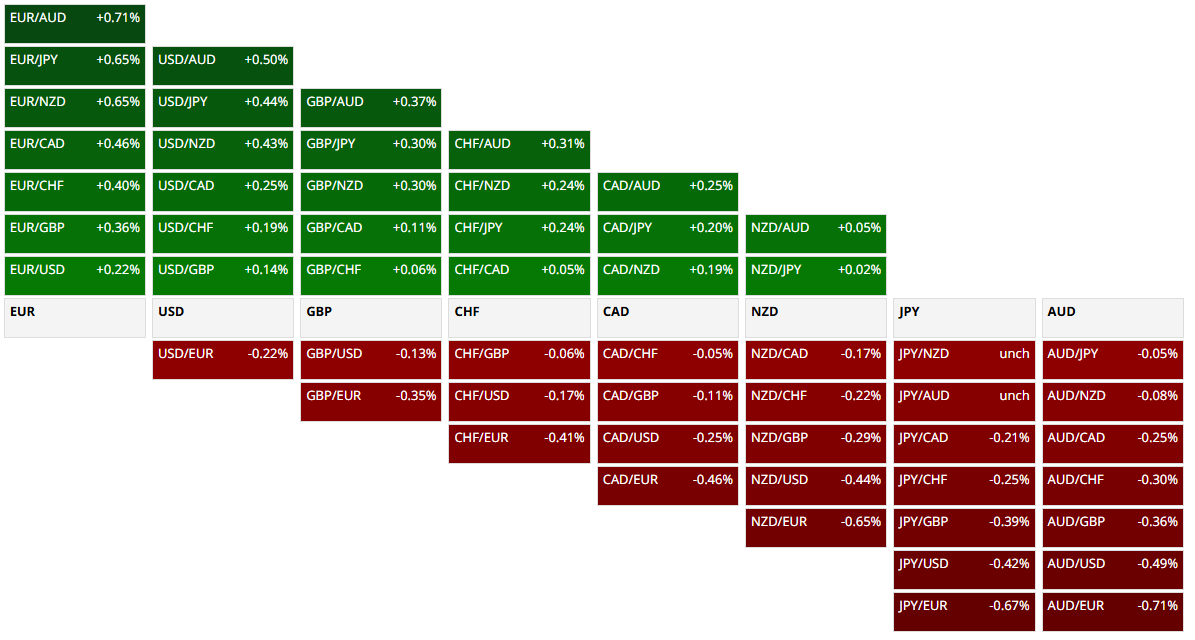
Currencies

Global Yields

Factors: Style
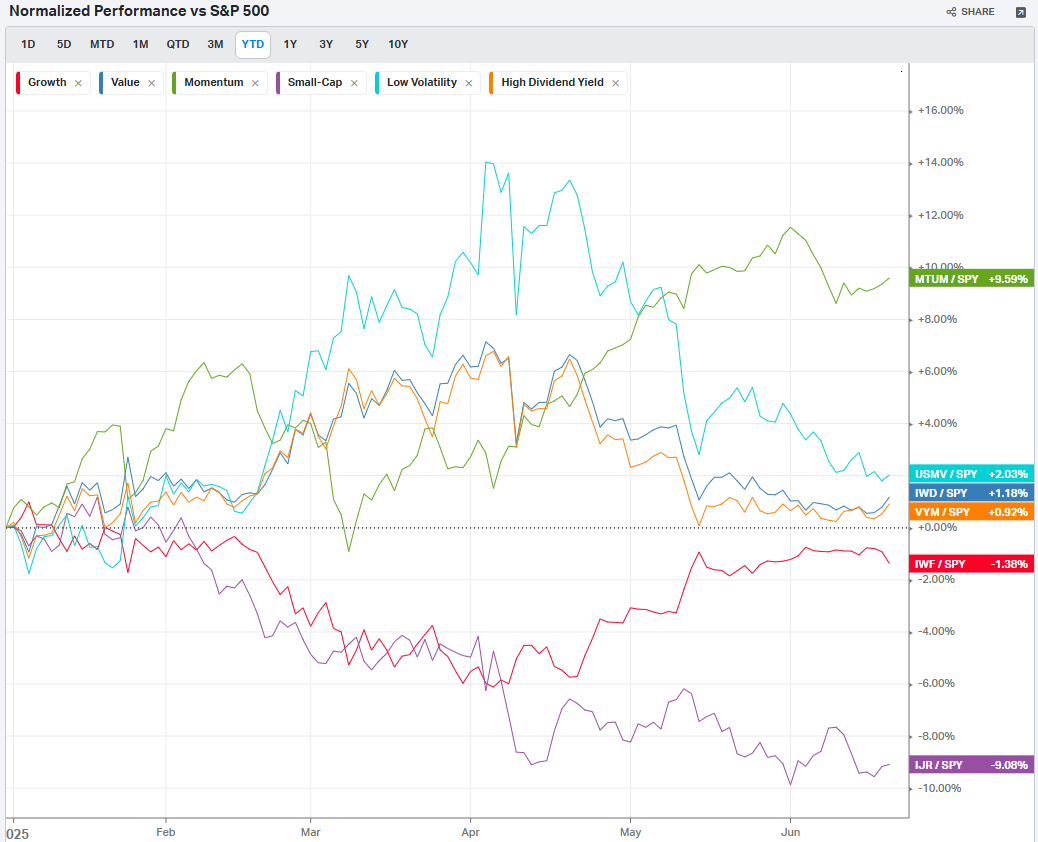
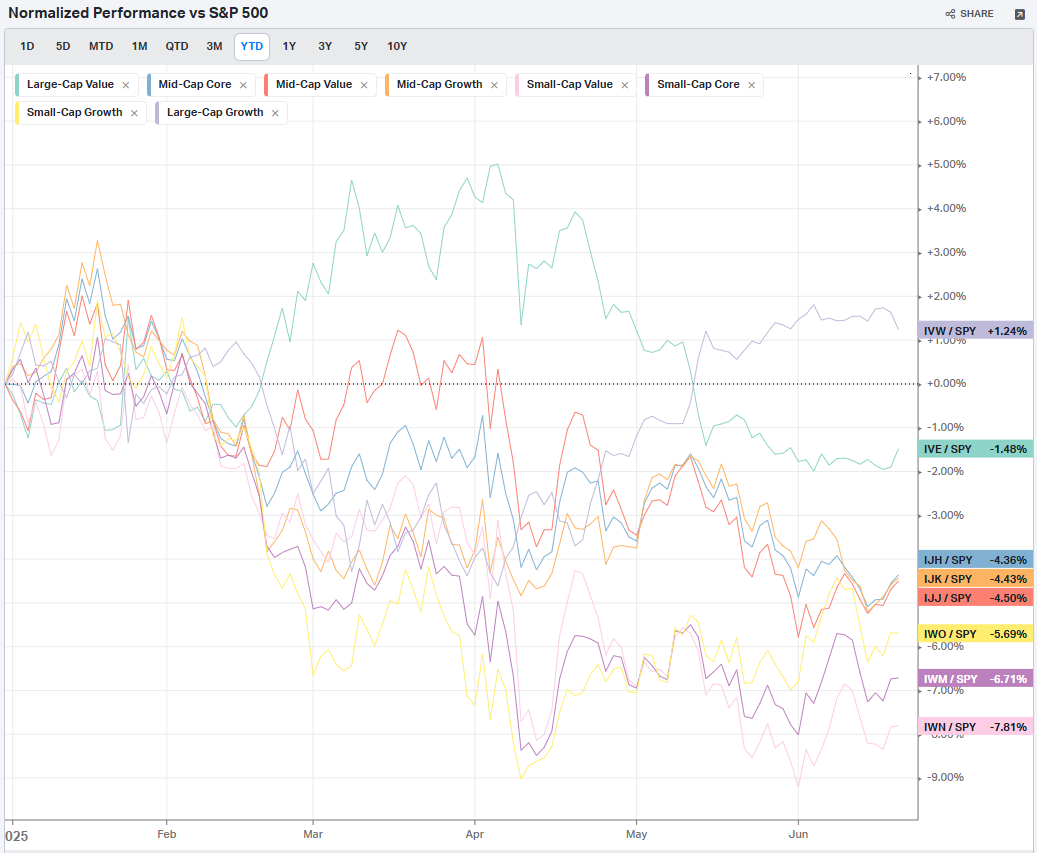
Factors: Size vs Value
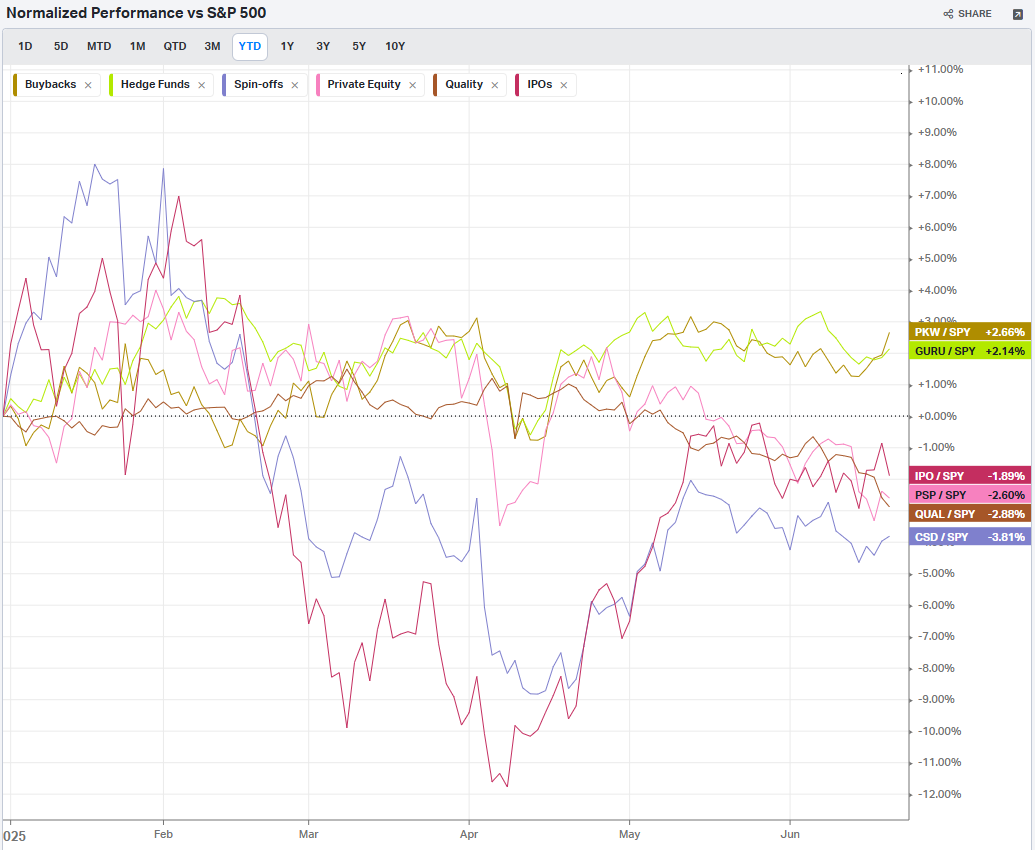
Factors: Qualitative
Events On Deck This Week
Here are key events happening this week that have the potential to cause outsized moves in the market or heightened short-term volatility.
Econ Events By Day of Week

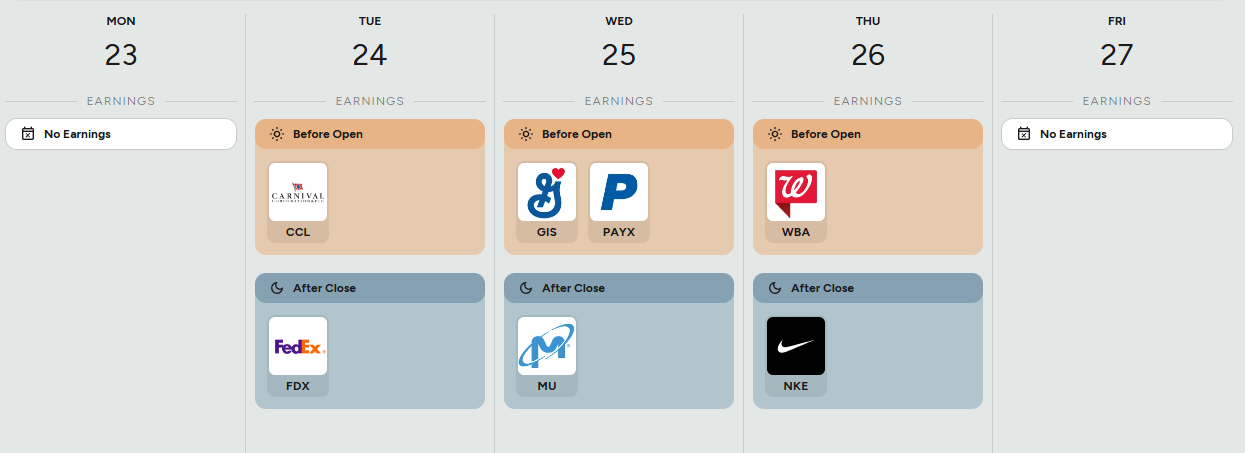
Anticipated Earnings By Day of Week

Aggregate Institutional Order Flow Summary
Rolling 90-Day Dollars By Day
This chart shows institutional activity by dollars by day on a rolling 1-year basis. From a theoretical standpoint, examining a chart of daily institutional dollar activity over the course of a year can offer several insights and possible inferences, though all should be approached with caution since the data alone may not prove causality or confirm underlying reasons. Some potential takeaways include:
Event-Driven Behavior:
Sharp, singular spikes on certain days might correlate with major market-moving events. These could include central bank policy announcements, significant geopolitical news, sudden macroeconomic data releases (like employment reports or GDP data), earnings seasons for large-cap companies, or unexpected shocks (e.g., mergers, acquisitions, regulatory changes).Liquidity Dynamics:
Institutions often concentrate large trades on days with higher expected liquidity. For instance, heightened activity might coincide with index reconstitutions, option expiration dates, or the days leading up to or following a major index rebalance, when large amounts of capital shift hands simultaneously.Risk Management and Hedging Activity:
Institutions may significantly adjust their exposures on days that are critical from a risk management perspective. Large spikes can occur if hedge funds, pension funds, or asset managers are rolling over futures contracts, initiating or closing out large hedges, or reacting to volatility triggers.Market Sentiment Indicators:
While the data is purely transactional, the sheer volume of institutional involvement on certain days might indirectly hint at changing sentiment or strategic shifts.
In essence, a chart like this can lead you to hypothesize that institutional trading volumes are not constant or random but rather influenced by a mix of predictable calendar effects, major market events, liquidity considerations, risk management decisions, and strategic allocation shifts.

Top Institutional Order Flow By Sector By Week For The Past 90-Days
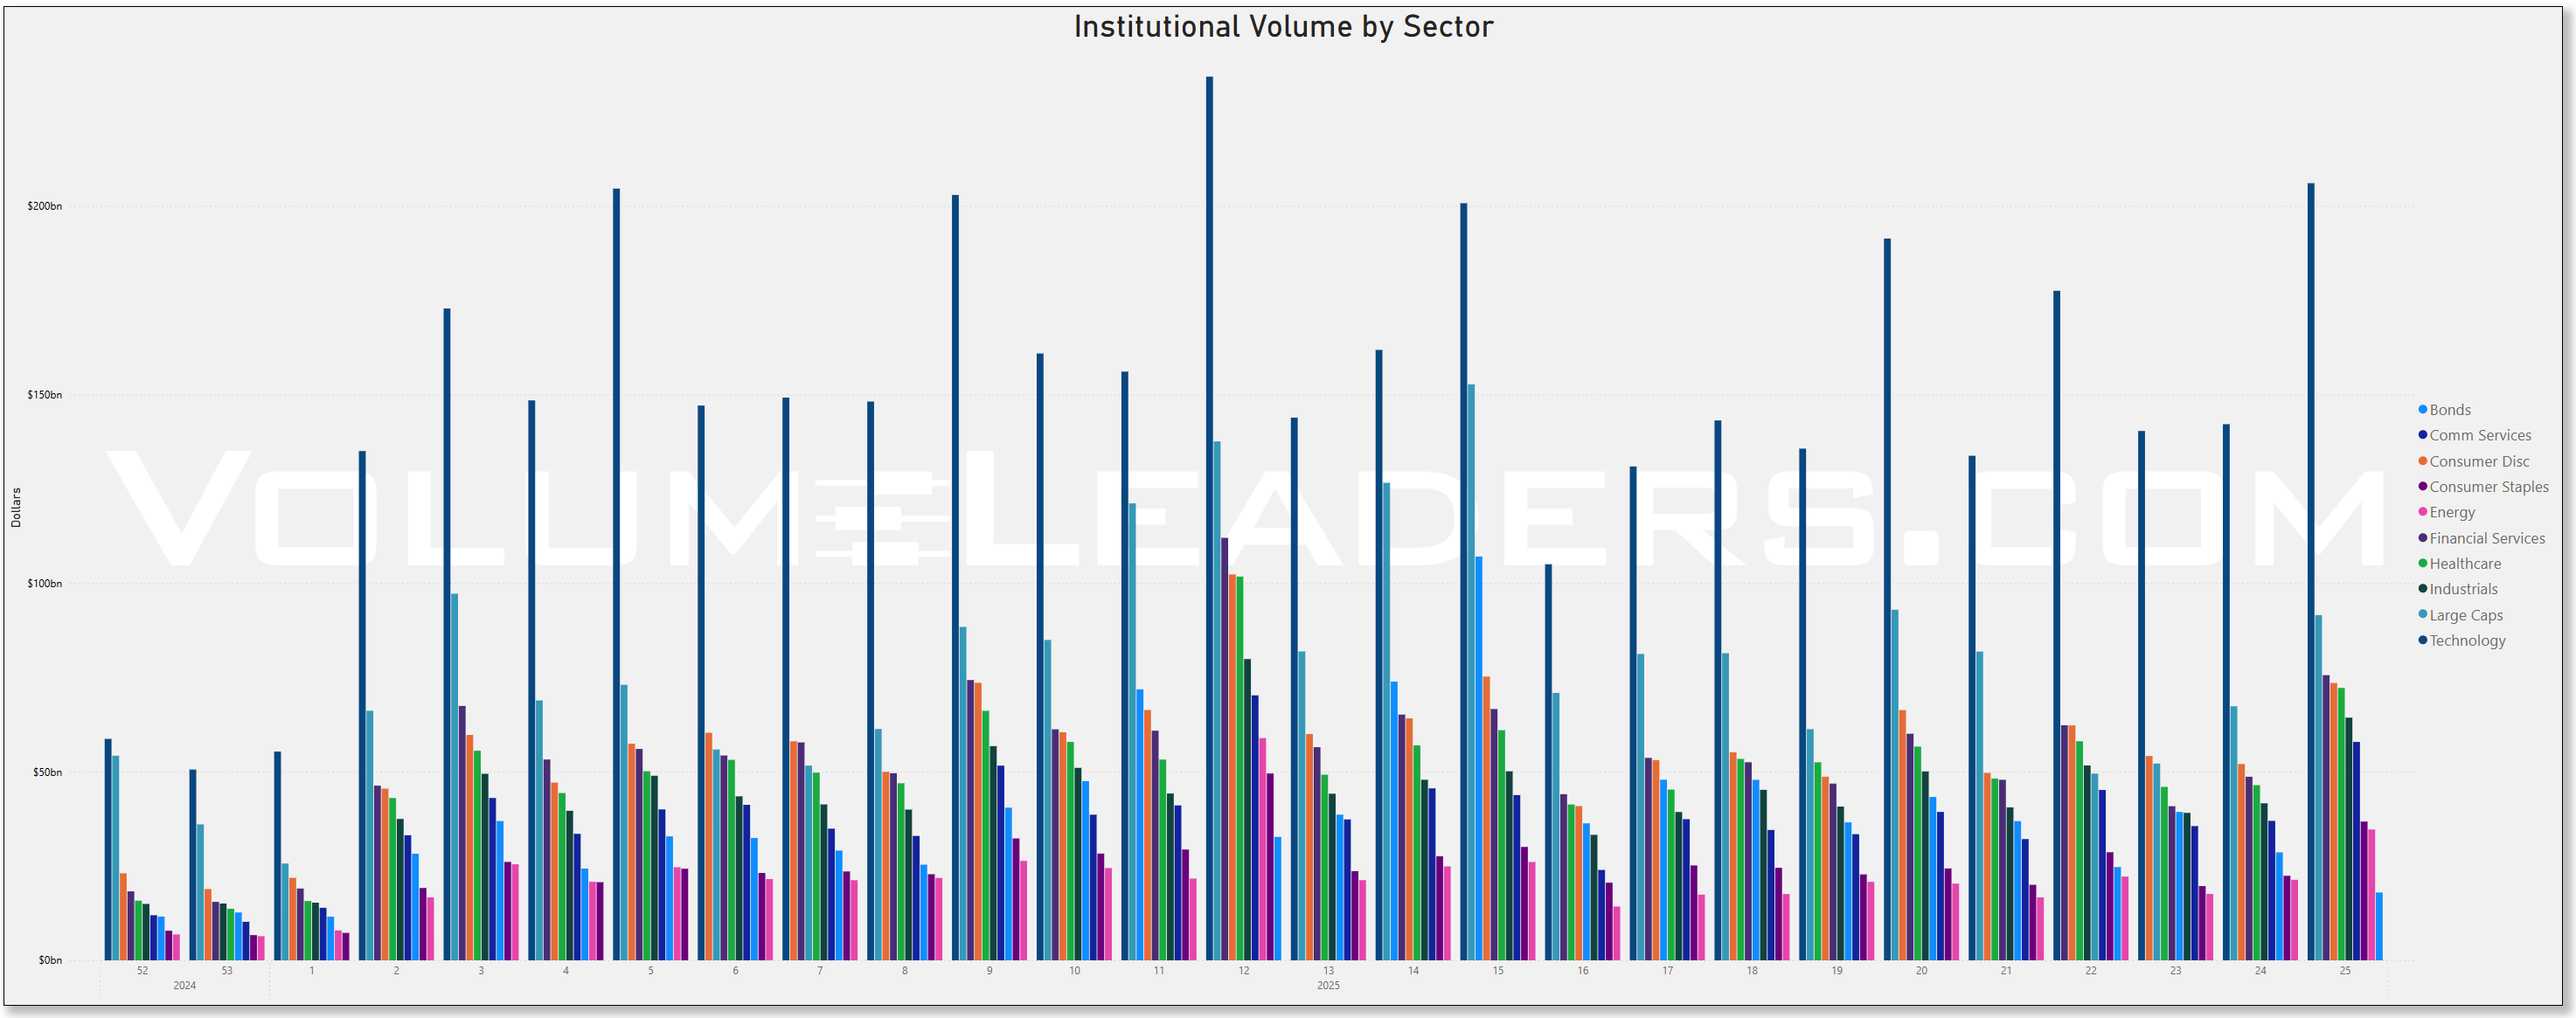

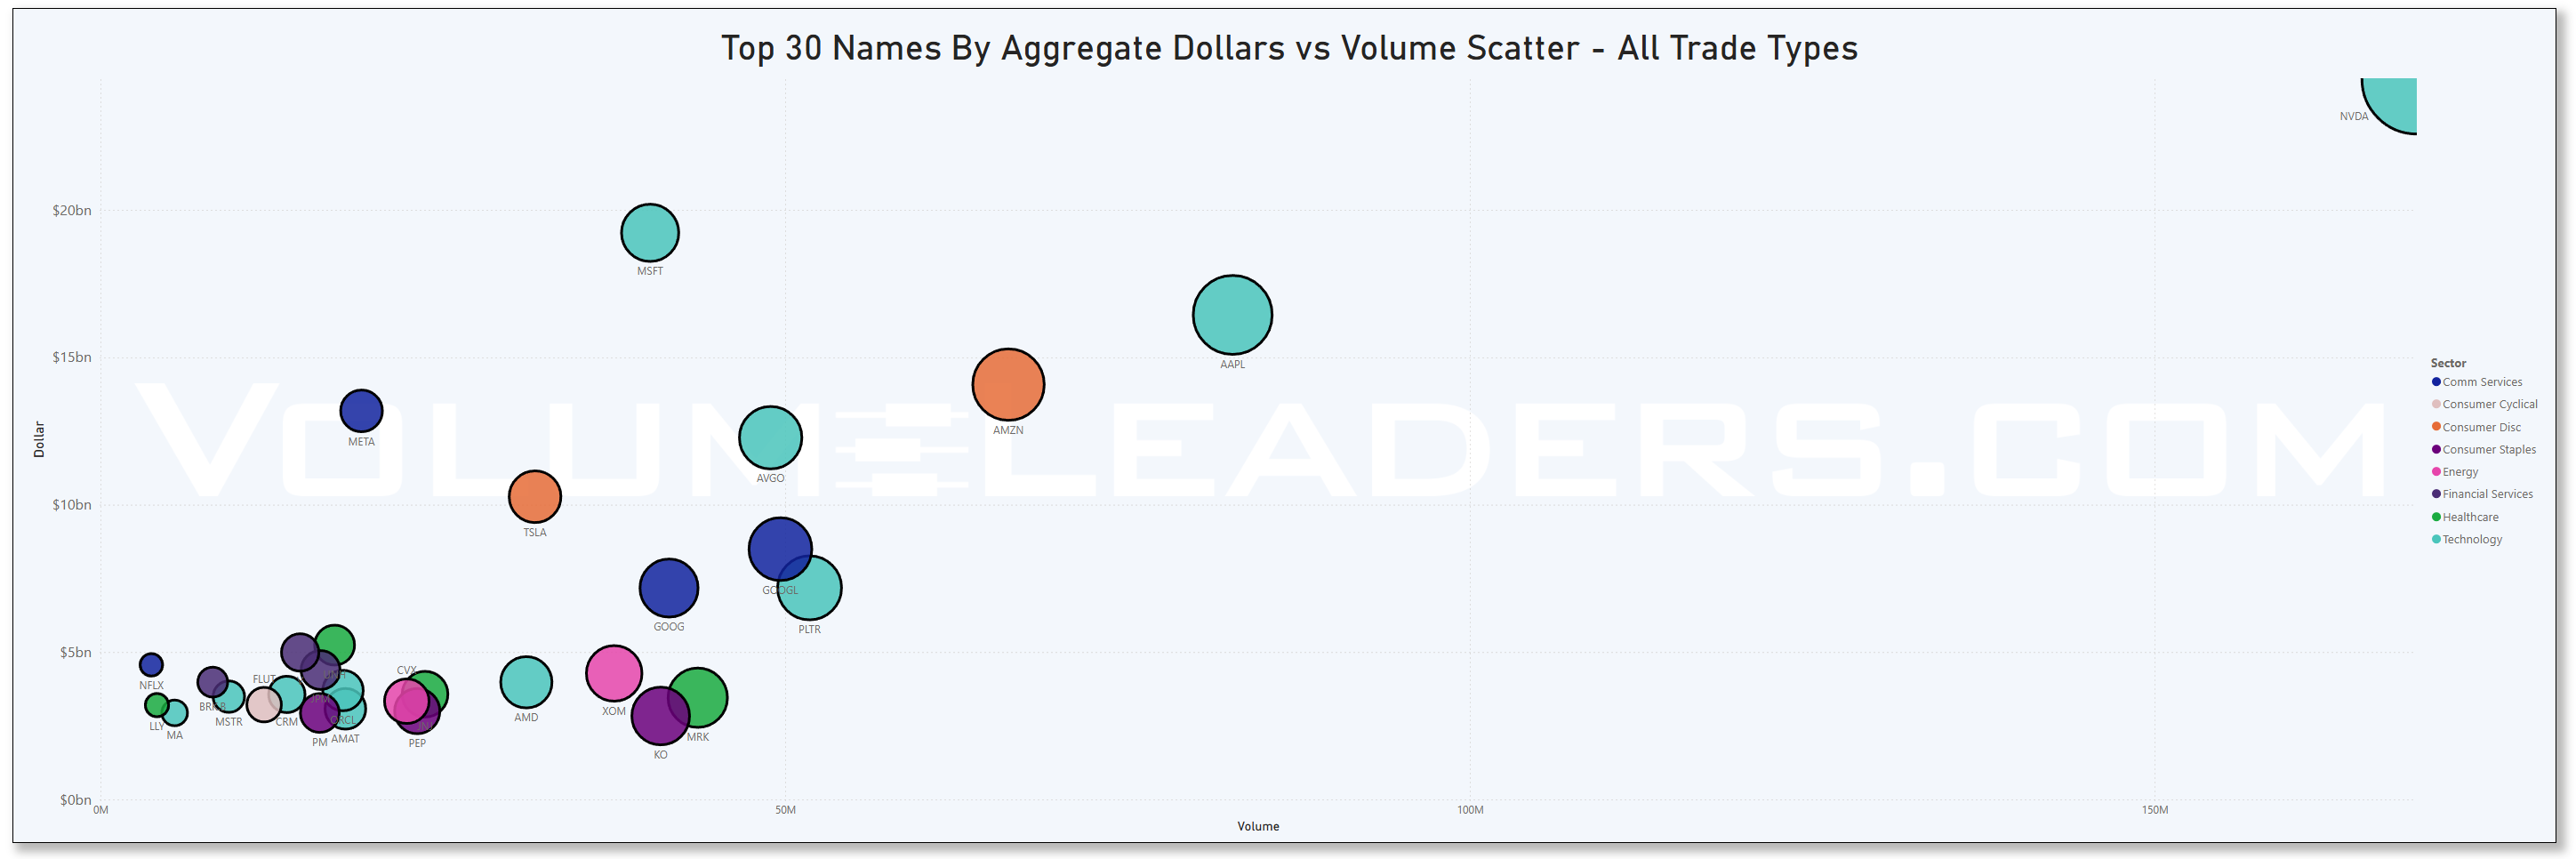
Top Institutional Order Flow In Equities
These are incredibly important charts to watch as they contains lots of nuanced suggestions at a thematic level. Watch these charts closely week-to-week to stay informed about where institutional money is flowing, adjust your strategies based on momentum, align your portfolio with macroeconomic and market trends, and manage risks more effectively by avoiding sectors losing institutional favor.
Sector Rotation Insights: The chart highlights which sectors are attracting institutional activity and which are losing favor. Institutions often lead market trends, so tracking shifts in their focus can indicate sector rotations.
Sentiment Analysis: The level of institutional activity reflects confidence in specific sectors. Rising activity in traditionally defensive sectors (e.g., healthcare, utilities) may indicate caution, while a surge in growth sectors (e.g., technology, consumer discretionary) could suggest optimism.
Emerging Trends: Sudden spikes in a previously overlooked sector, like industrials or consumer staples, might hint at emerging opportunities or structural shifts.
Macro Themes: Changes in sector activity often align with broader macroeconomic themes like inflation, interest rates, or geopolitical events. For instance:
Increased activity in energy might indicate concerns about oil supply or rising prices.
Growth in technology could align with innovations or favorable policies.
Risk Management: Declining institutional activity in a sector might signal weakening fundamentals or heightened risks.
Spotting Overcrowding: Excessive activity in a single sector over multiple weeks may suggest overcrowding, which could lead to heightened volatility if institutions begin to exit.

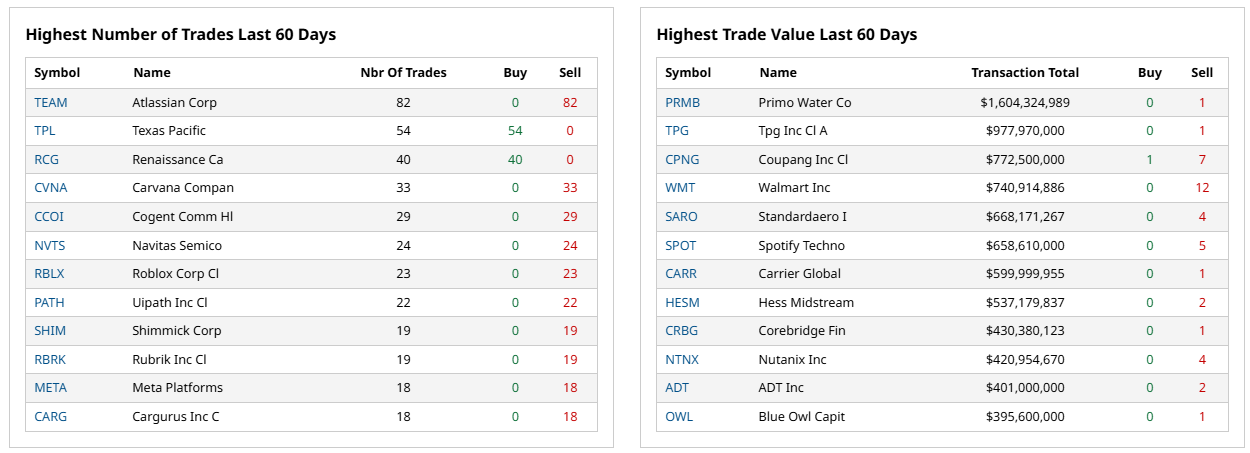
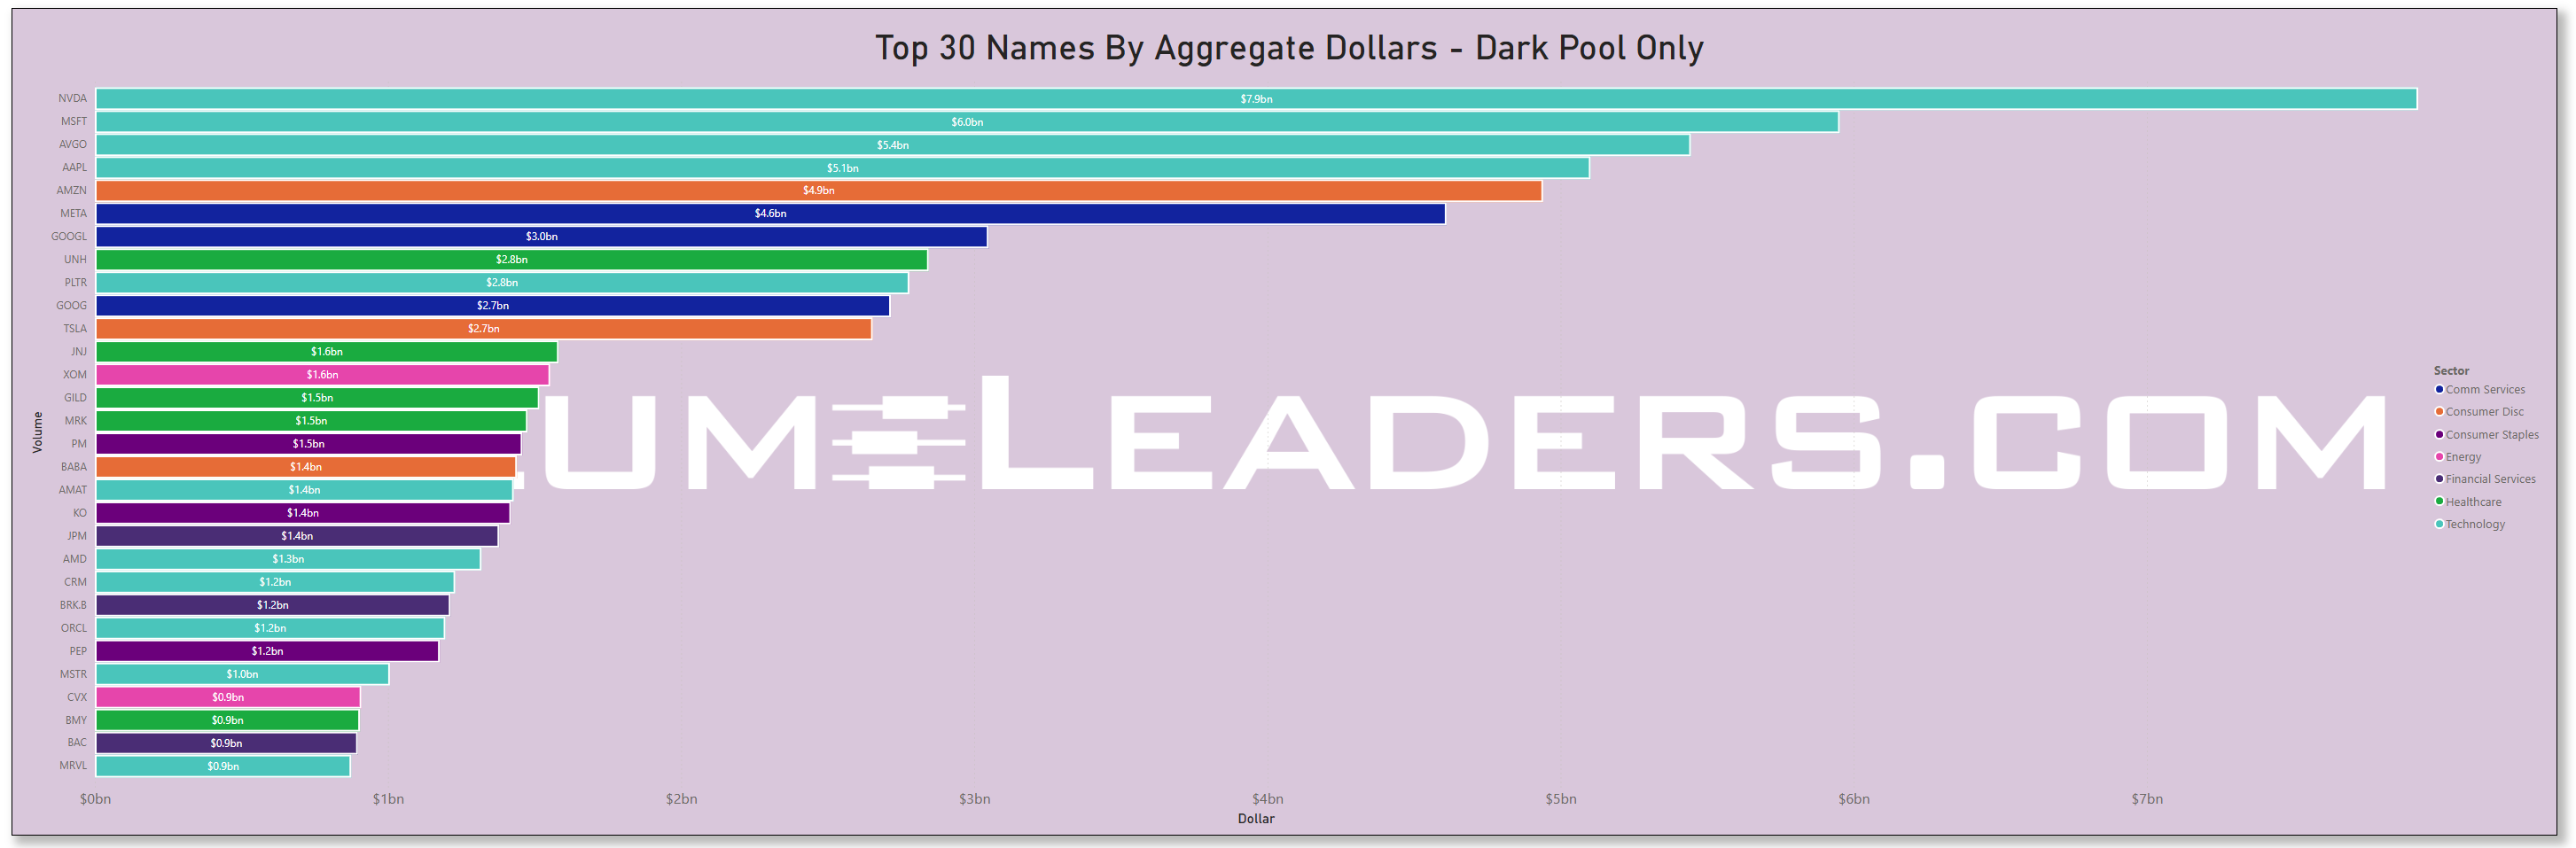
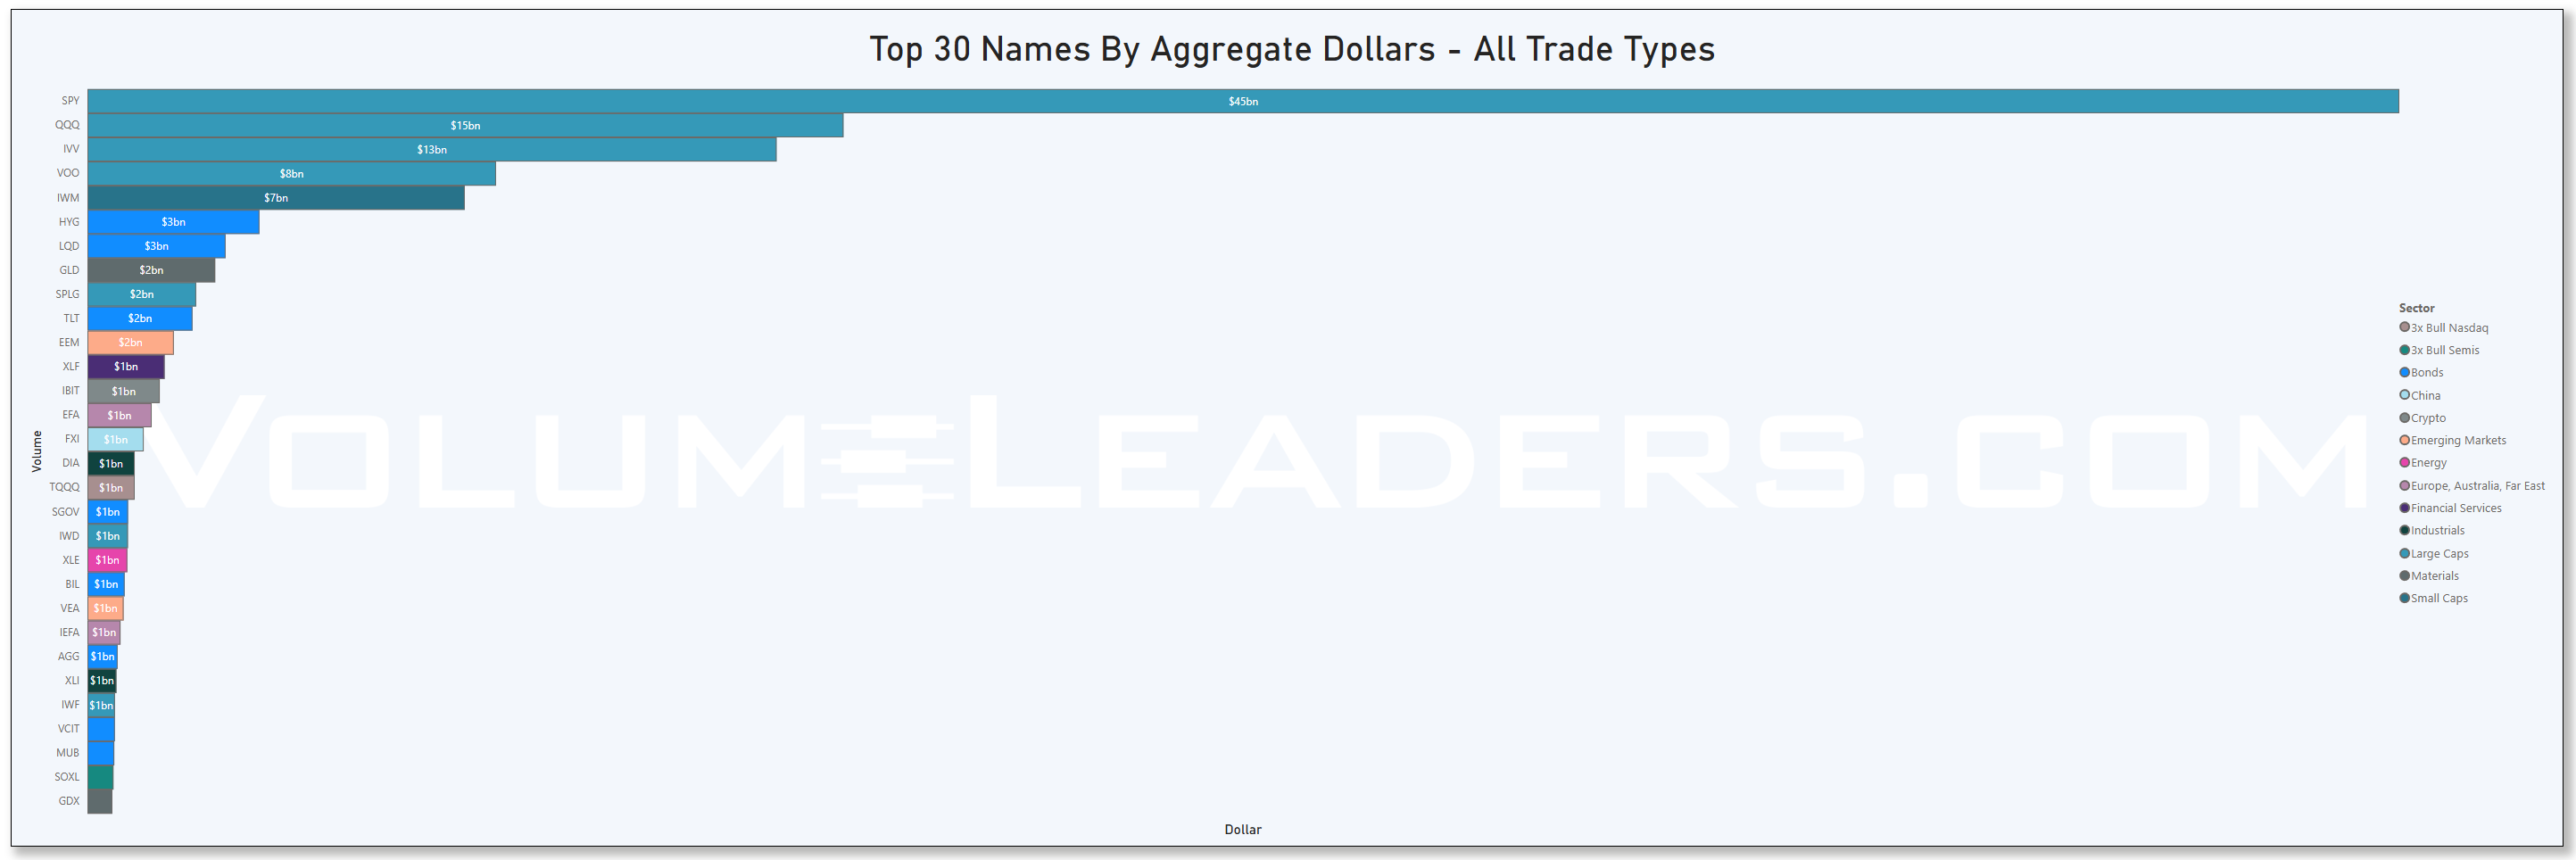
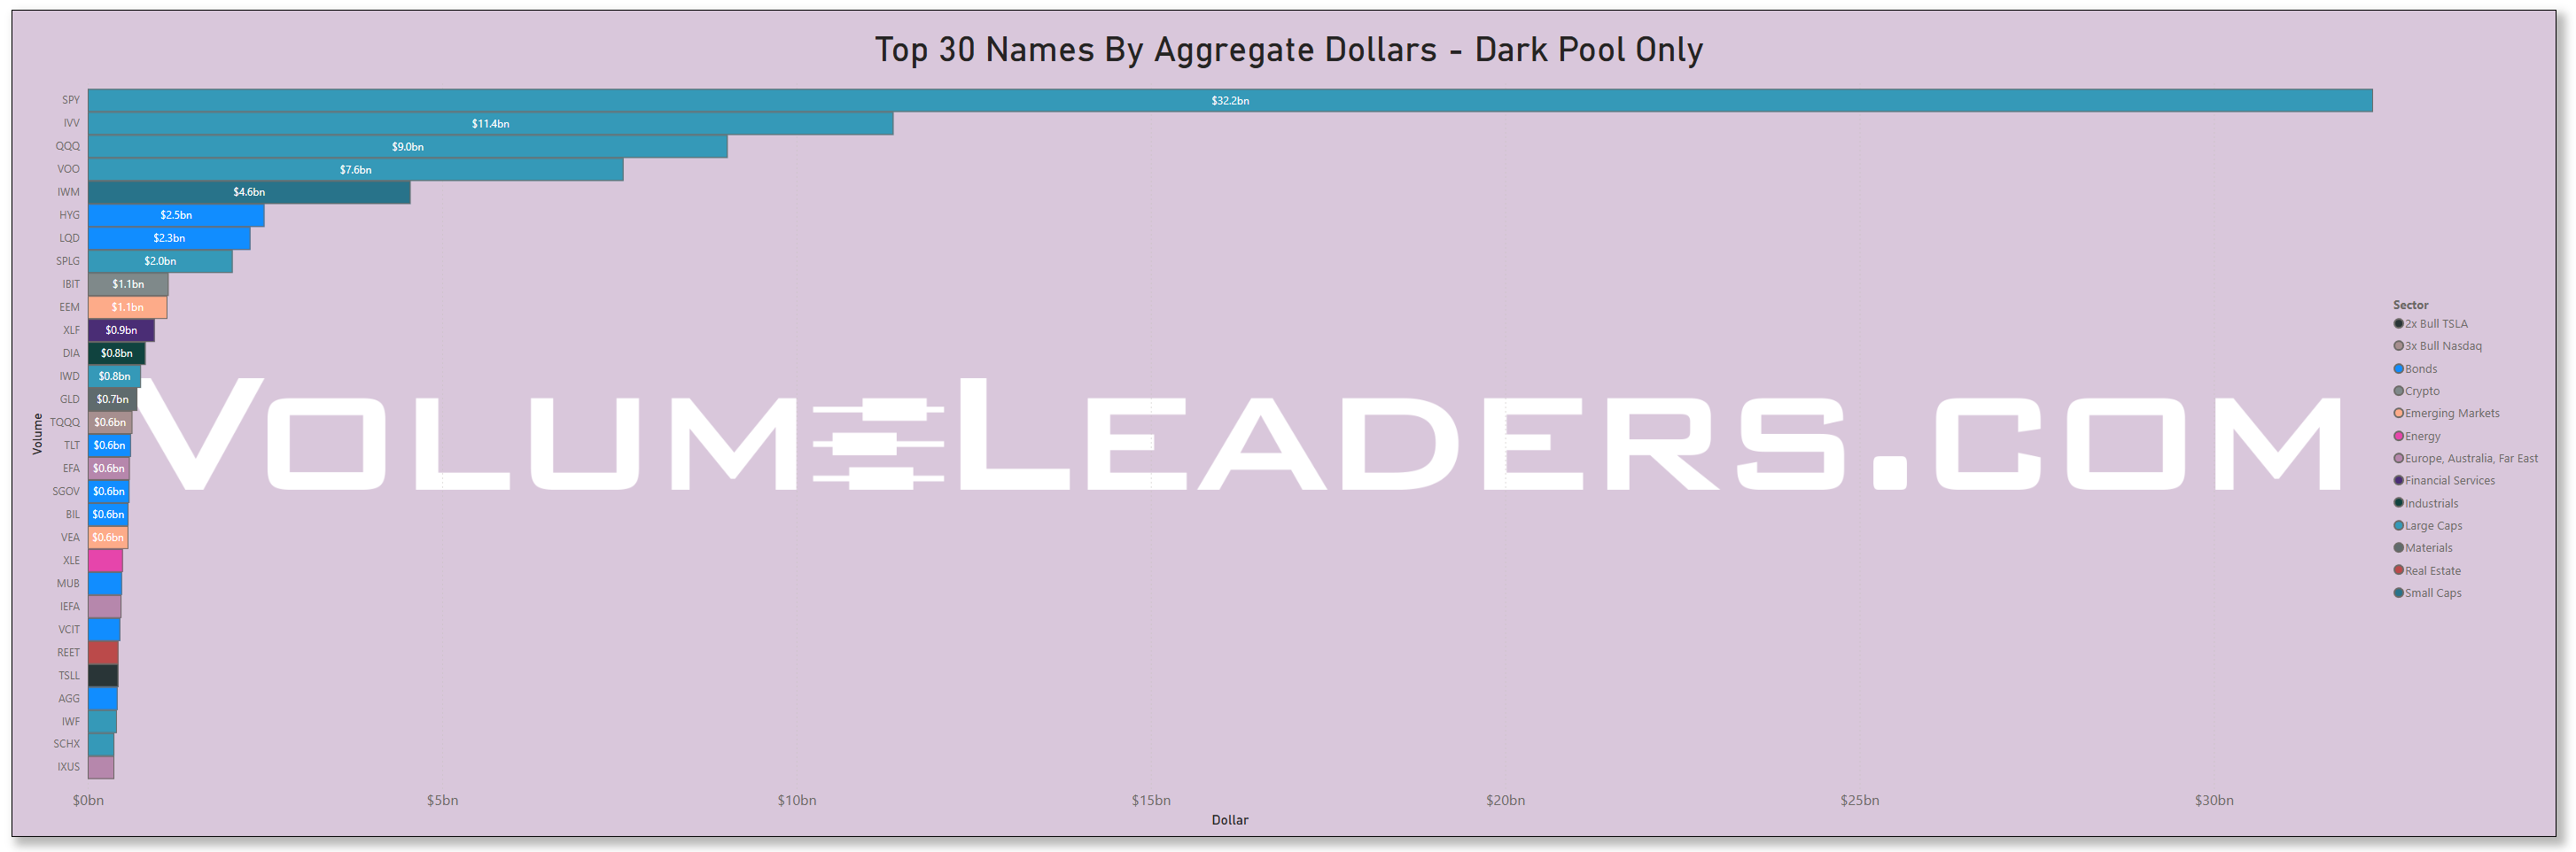
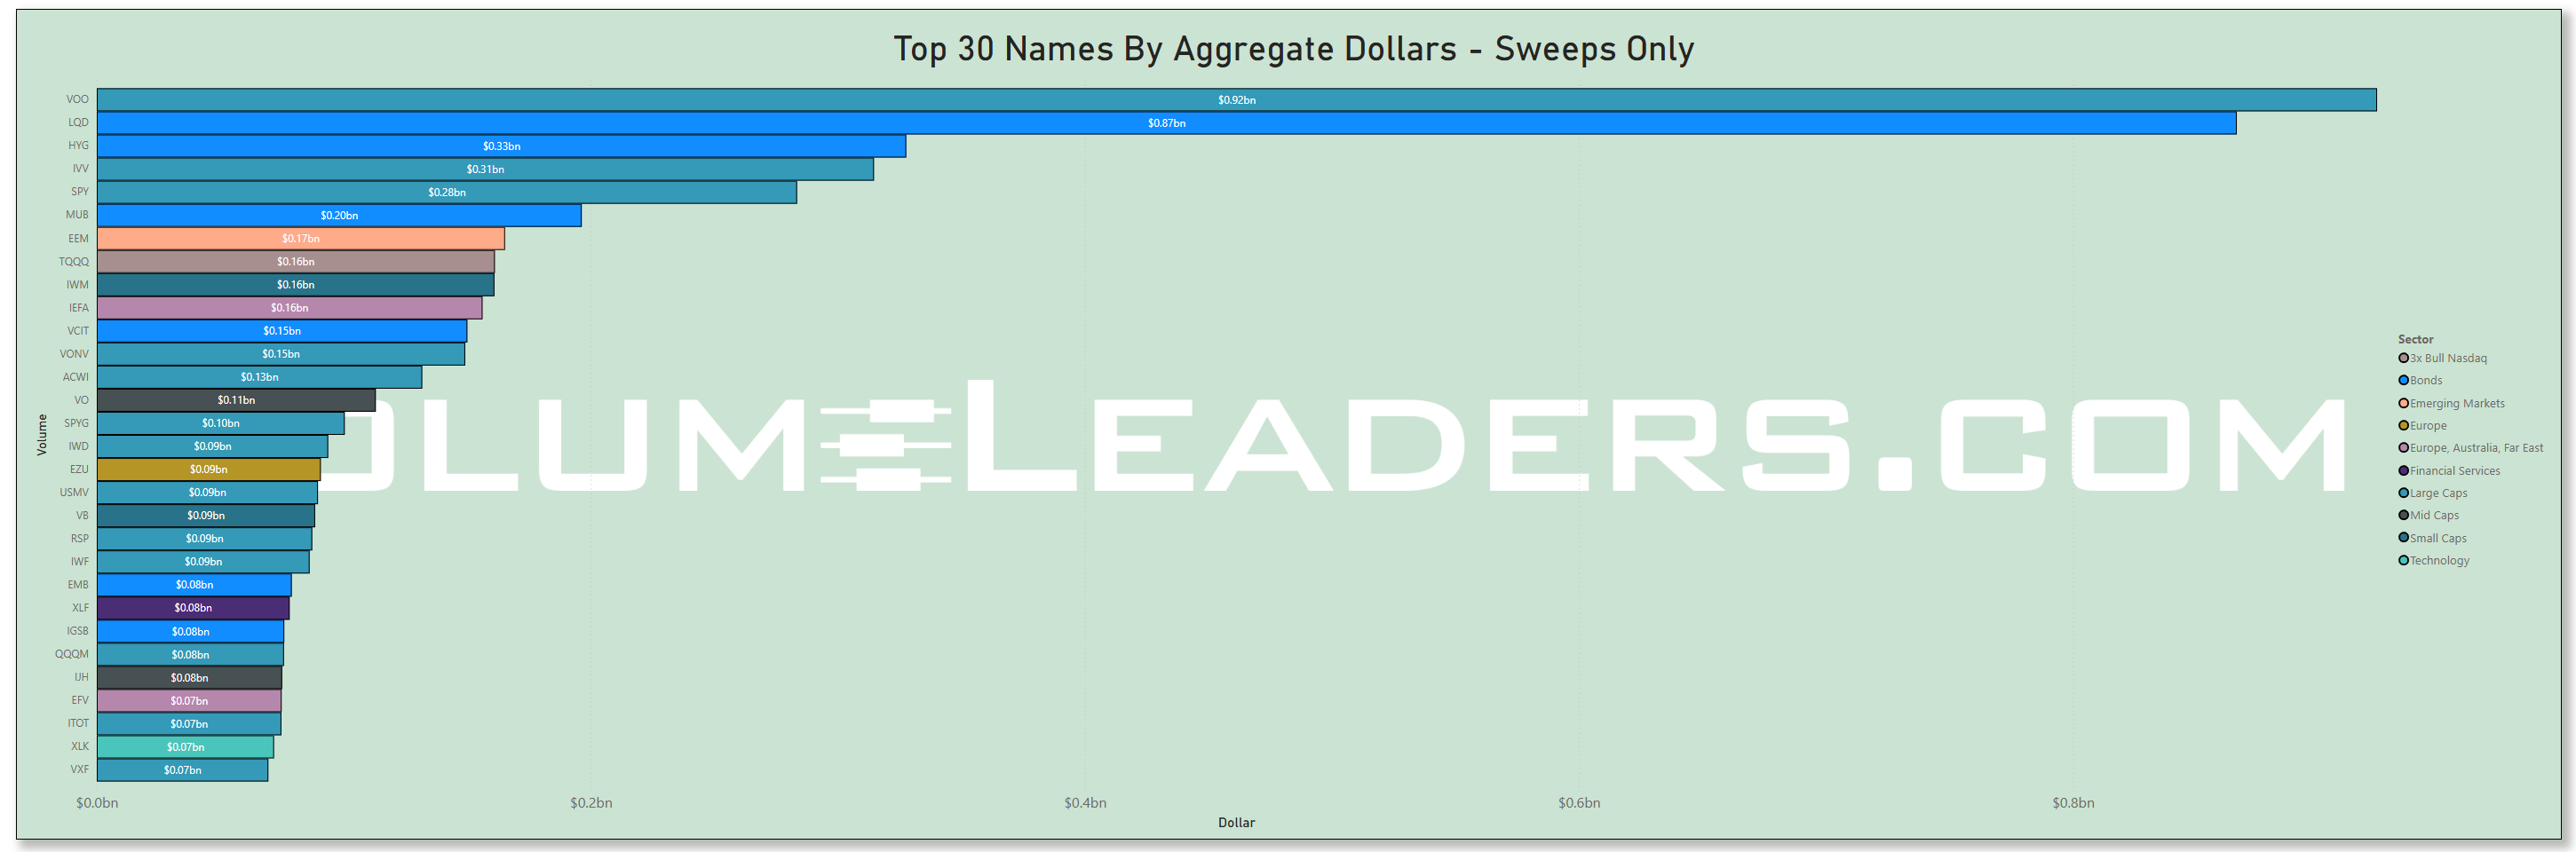
Many excellent trade ideas and sources of inspiration can be found in the prints below. While only the top 30 from each group are displayed, the complete results are accessible in VolumeLeaders.com for you to explore at your convenience any time. Remember to configure trade alerts within the platform to ensure institutional order flows that capture your interest or are significant to you aren’t missed. The blue charts represent all types of trades, including blocks on lit exchanges; the purple charts exclusively depict dark pool trades; and the green charts are sweeps only.


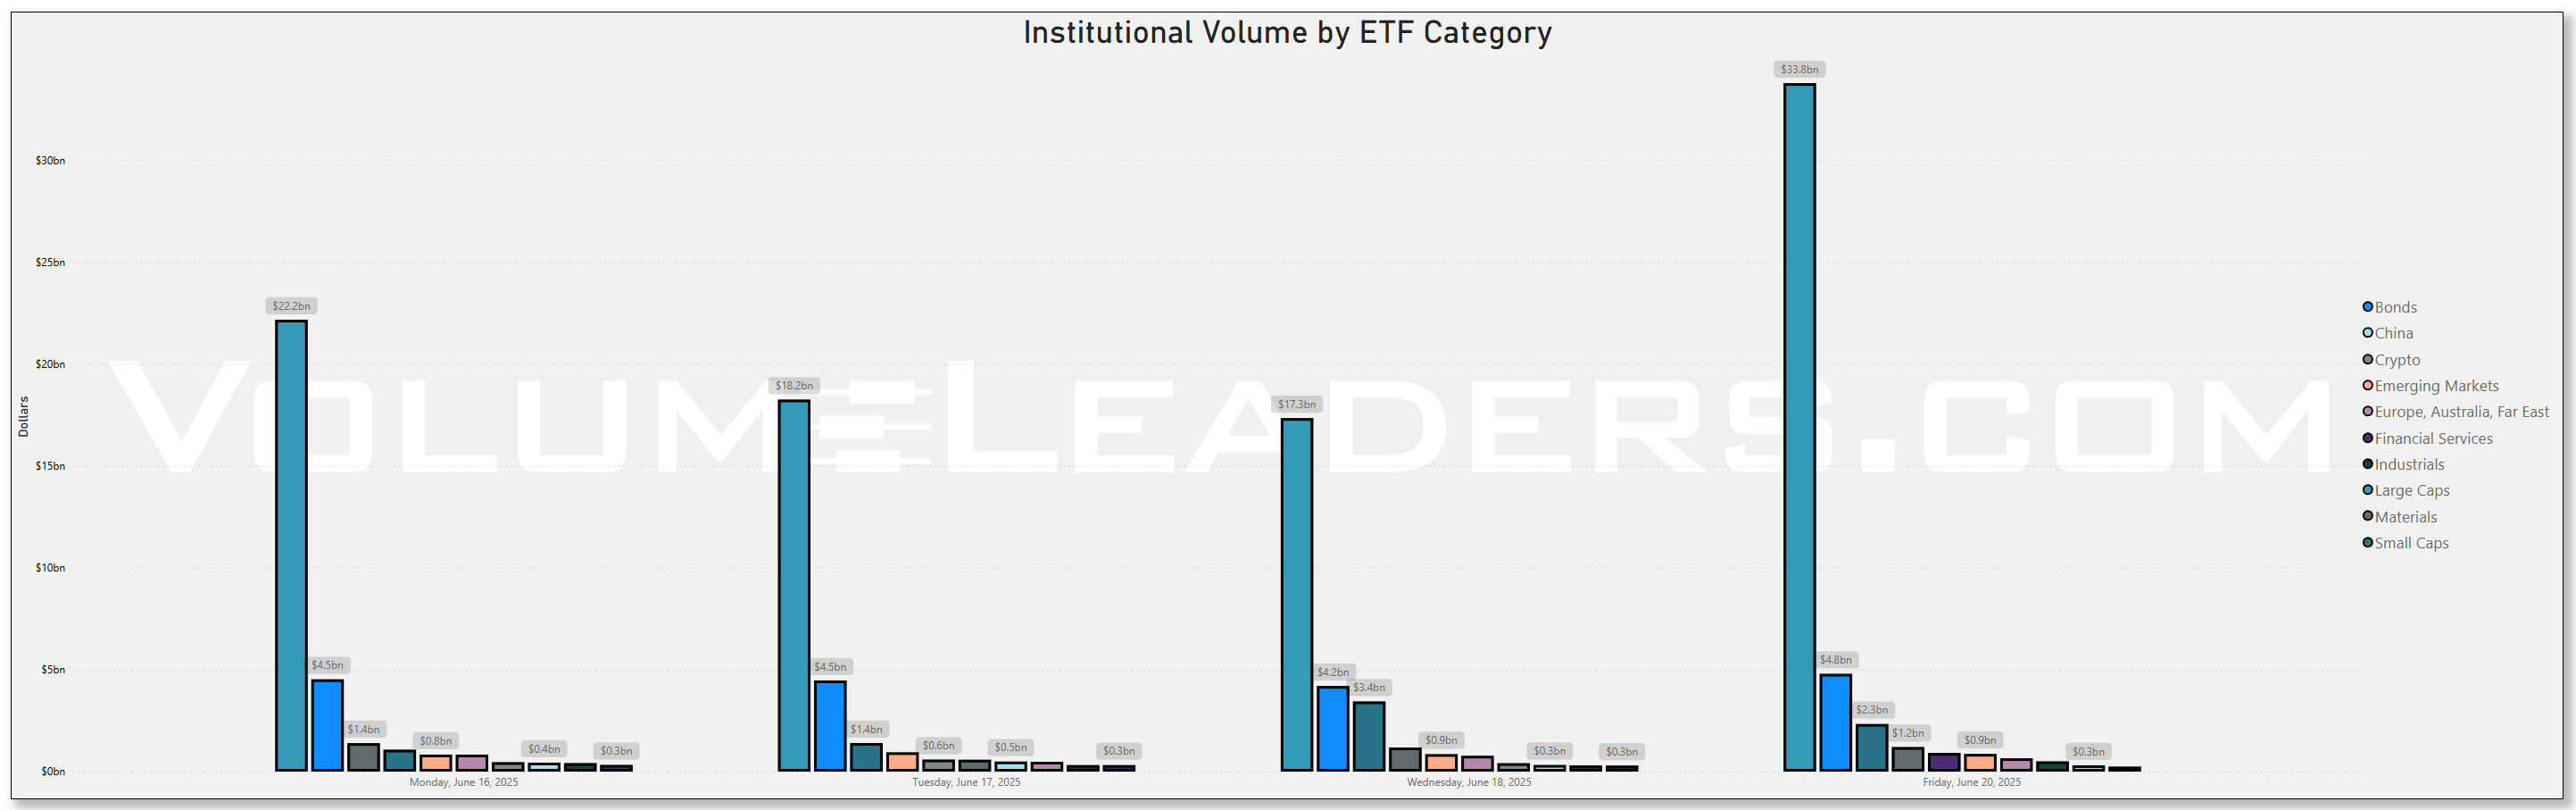
Top Institutional Order Flow In ETFs


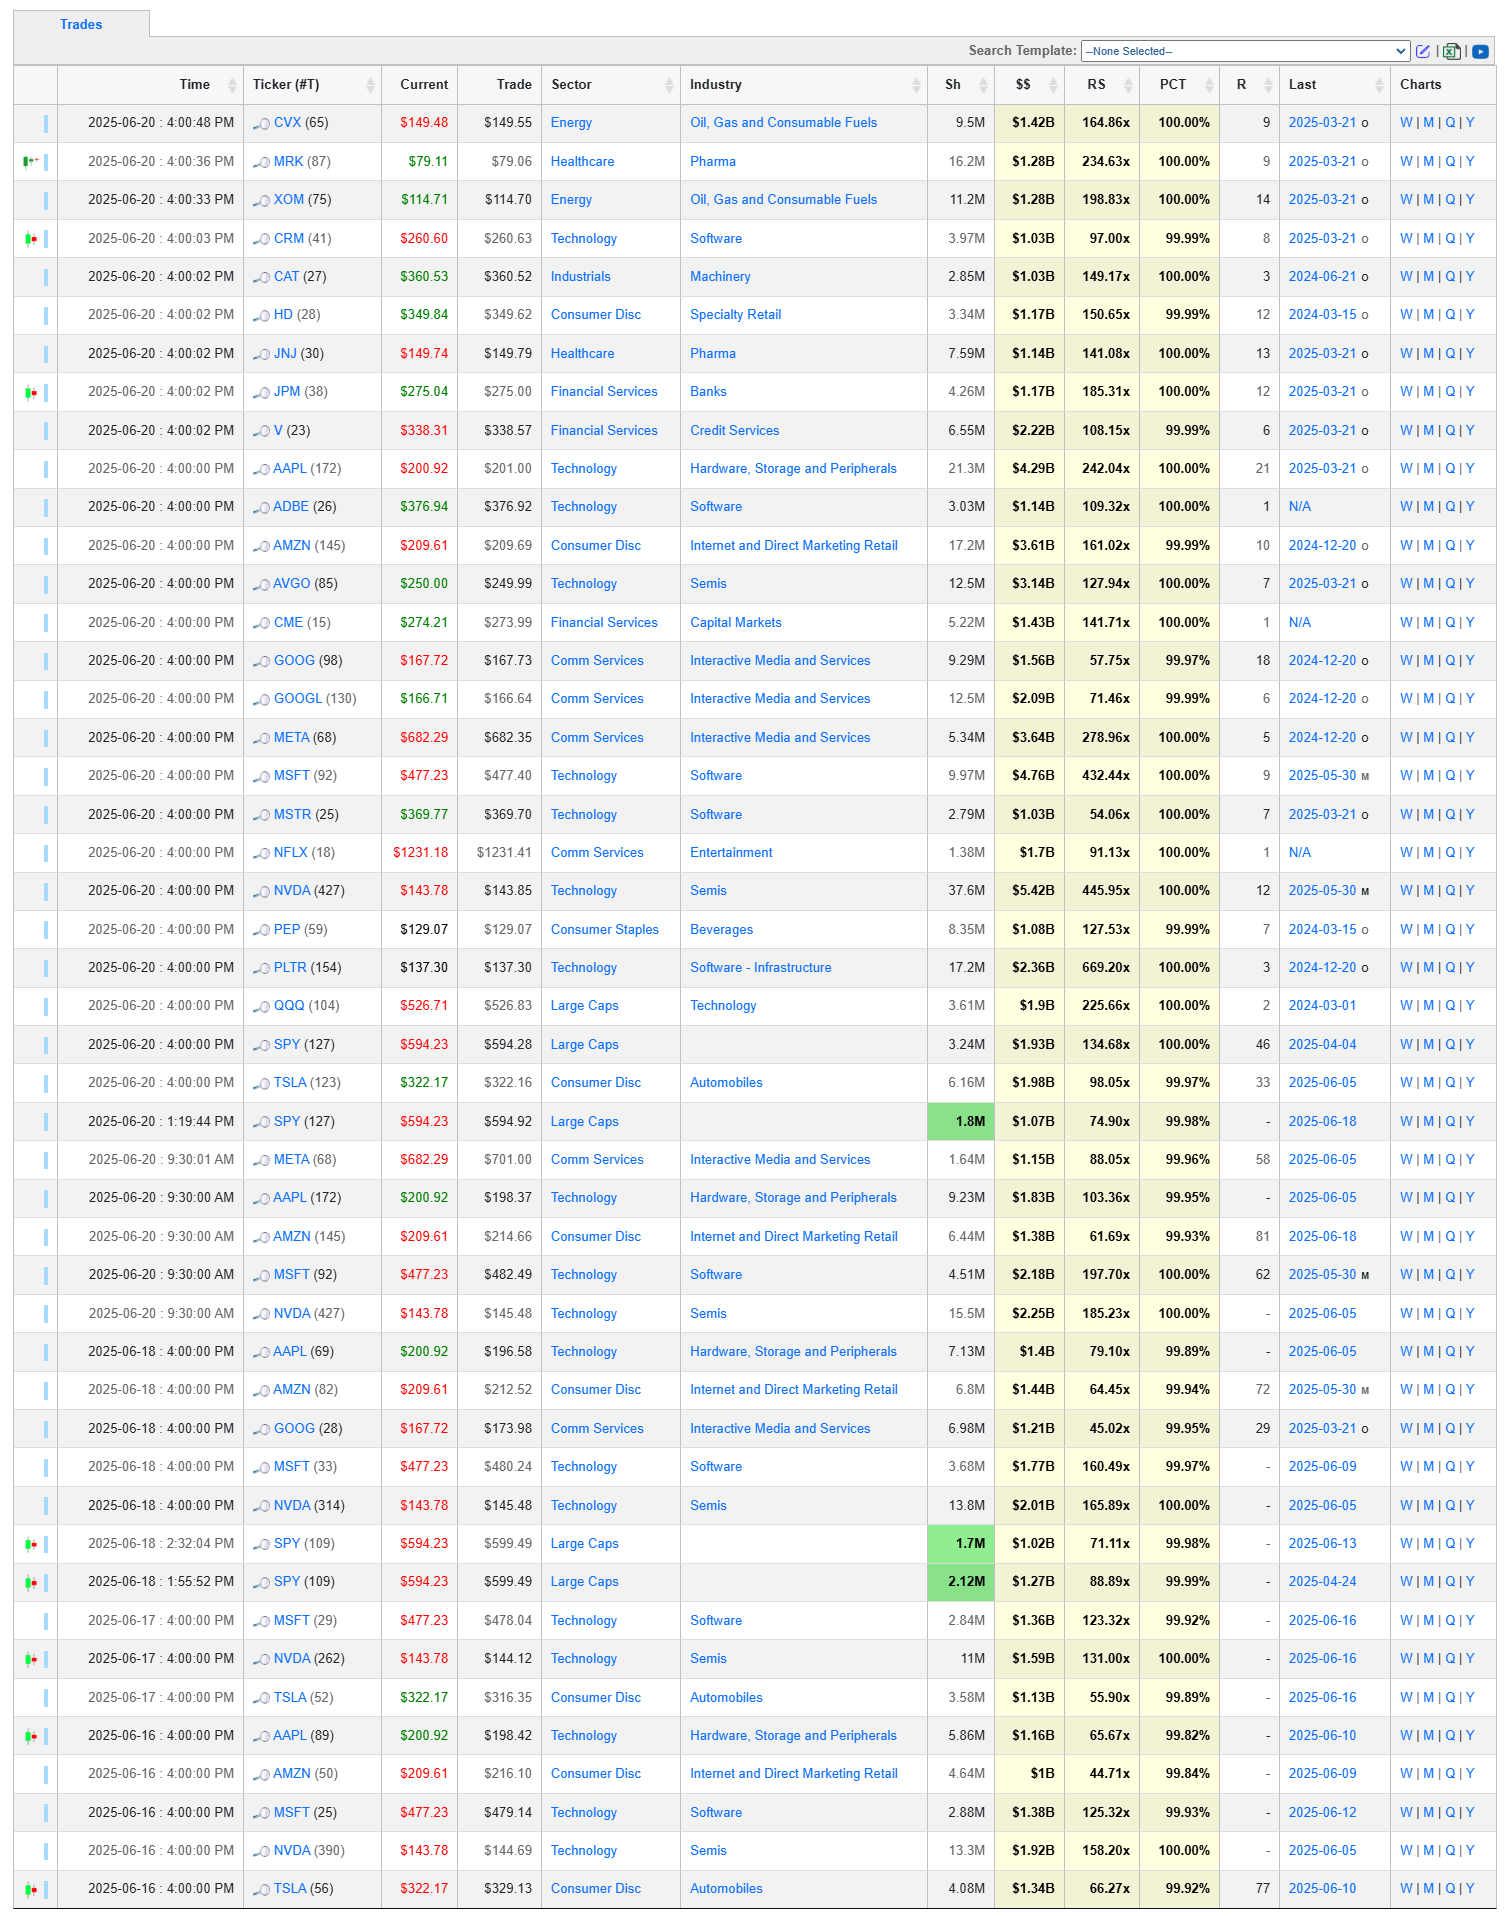
Last Week’s Billion-Dollar Prints
Tickers that printed a trade worth at least $1B last week get a special shout-out. These are massive commitments by institutions that should not be ignored.
This Week’s Top-Ranked Institutional Order Flow Summary
Where to Hide $211.8B In Capital Deployment?
When Wall Street's Titans Place Their Bets
The institutional trading data from this week reveals a fascinating confluence of strategic positioning, heightened concentration, and emerging sector rotations that collectively paint a picture of Wall Street's most sophisticated investors making calculated bets on the future. With $211.8 billion deployed across 1,242 top-ranked institutional positions, this dataset captures the market's most influential players commitments to significant capital convictions.
The data reveals three compelling narratives: the extraordinary dominance of artificial intelligence plays, a pronounced shift toward defensive positioning amid geopolitical uncertainty, and the emergence of previously dormant sectors experiencing renewed institutional interest after years of neglect.
The Palantir Phenomenon: When Conviction Meets Controversy
Leading this institutional parade is Palantir Technologies (PLTR) with a staggering relative size of 669.2x - a number that defies conventional positioning metrics. This positioning comes as Palantir stock has surged 83% year-to-date following escalating Middle East tensions and expanded defense contracts, with the Pentagon increasing Palantir's Maven Smart System contract ceiling from $480 million to $1.275 billion.
However, this extraordinary institutional conviction arrives amid growing debate about sustainability. Analysis suggests that while institutions remain net buyers of Palantir stock, there has been a significant slowdown in buying activity, with both buying and selling trends converging - potentially signaling further selling on the horizon. The $2.36 billion institutional position represents either prescient positioning ahead of a defense technology supercycle or dangerous concentration in an overvalued narrative.
Technology's Institutional Stranglehold
The Technology sector commands $59.0 billion of institutional capital across 236 positions - representing 28% of total deployment. This concentration reflects broader institutional recognition that the "Magnificent 7" currently represent over 31% of U.S. equity portfolios, with Apple, Microsoft and Nvidia now each larger by market cap than every country in the world MSCI All-Country World Index except the U.S. and Japan.
NVIDIA (NVDA) demonstrates this institutional consensus with a relative size of 445.95x and $5.4 billion in positioning. Despite recent challenges including a $4.5 billion charge related to H20 export restrictions to China, NVIDIA reported Q1 revenue of $44.1 billion, up 69% year-over-year. The institutional positioning suggests confidence that the top four U.S. AI spenders (Amazon, Microsoft, Google, and Meta) have plans to deploy over $315 billion of capex this year, most of which is slated for expanding AI infrastructure.
Financial Services: The Smart Money's Defensive Play
With $22.3 billion deployed across 154 positions, Financial Services represents the second-largest sector allocation. Bank of America (BAC) leads with a relative size of 350.59x, while Progressive (PGR) shows unusual institutional conviction with a relative size of 146.79x at rank 2 positioning.
This positioning aligns with broader institutional recognition that financials have been riding strong post-election momentum, giving them a potential tailwind into the back half of 2025. The concentration in traditional banking alongside insurance suggests institutions are positioning for rising interest rates and improved net interest margins.
The Renaissance of Forgotten Sectors
Perhaps most intriguing are the 43 positions representing companies not seen in institutional portfolios since 2022 or earlier. Live Nation (LYV) returns with a relative size of 125.6x after last being seen in December 2019, while AngloGold Ashanti (AU) emerges with a relative size of 89.87x after being absent since March 2019. These revivals suggest institutional recognition of fundamental value in previously overlooked assets or anticipation of sector-specific catalysts.
Statistical Deep Dive: Patterns in the Data
Concentration and Risk Analysis
The data reveals extreme concentration among institutional holdings:
Top 10 positions by relative size account for $26.9 billion in deployment
Technology sector dominance: 236 positions totaling $59.0B (28% of total capital)
Mega-cap concentration: 25 positions exceed $1 billion in institutional deployment
Geographic clustering: Strong U.S. domestic focus amid trade policy uncertainty and an oft-overlooked dollar adding complexity to the puzzle
Timing and Execution Patterns
Institutional execution timing reveals strategic considerations:
After Hours (6 PM-6 AM): 402 trades, $68.2B total value, 42.1x average relative size
Mid Day (10 AM-2 PM): 321 trades, $52.1B total value, 37.8x average relative size
Afternoon (2-6 PM): 301 trades, $48.9B total value, 31.2x average relative size
Early Morning (6-10 AM): 218 trades, $42.6B total value, 29.8x average relative size
The preference for after-hours execution suggests institutions prioritizing market impact minimization over immediate liquidity.
Rank-Size Correlation Analysis
The correlation coefficient between institutional rank and relative size is -0.67, confirming that lower ranks (larger positions) correlate strongly with higher relative impact. This validates the ranking methodology while highlighting positions where institutions deviate from typical size-rank relationships.
Price-Impact Efficiency Leaders
Analyzing relative size per dollar of share price reveals the most "efficient" institutional bets:
GRAB (Grab Holdings): $4.49 price, 65.51 relative size = 14.59 efficiency
DNN (Denison Mines): $1.73 price, 23.19 relative size = 13.40 efficiency
F (Ford Motor): $10.60 price, 136.09 relative size = 12.84 efficiency
What This Reveals:
The efficiency leaders are lower-priced stocks where institutions can achieve high relative impact per dollar of share price
The most efficient plays are in traditional sectors (automotive, mining, ride-sharing) rather than high-flying tech
Sector Rotation Signals
Materials Sector Renaissance
The Materials sector shows 61 trades totaling $7.7 billion with an elevated average relative size of 34.84x. Notable positions include:
Corteva (CTVA): Rank 1, relative size 86.06, $459.7M
CF Industries (CF): Rank 1, relative size 122.51, $526.1M
Arconic (ATI): Rank 4, relative size 139.64, $333.2M
This positioning suggests institutional anticipation of commodity dynamics making a splash soon, perhaps as part of supply chain reshoring.
Healthcare Defensive Positioning
Healthcare's $21.6 billion across 143 positions reflects defensive positioning amid policy uncertainty. Abbott Labs (ABT) demonstrates unusual conviction with rank 4 positioning and relative size of 116.14x, while HCA Healthcare (HCA) shows rank 2 conviction with relative size 107.58x.
Energy Sector Contrarian Bets
Energy positioning totals $10.6 billion across 75 trades, with institutions split on energy price direction for 2025. ExxonMobil (XOM) leads with relative size 198.83x and $1.28 billion deployment, suggesting institutional confidence in traditional energy amid renewable transition uncertainty and Middle East conflict.
Cryptocurrency and Digital Asset Integration
The emergence of 9 crypto-related positions totaling $1.7 billion with an average relative size of 60.38x signals institutional acceptance of digital assets as portfolio diversifiers, all on back of recent policy updates around stablecoins. Circle (CRCL) leads with rank 1 positioning and relative size 86.69, suggesting institutional confidence in stablecoin infrastructure.
Private Market Spillovers and Illiquidity Premiums
Several positions suggest institutional pursuit of private market-like returns in public markets:
Quantum computing plays: IONQ (rank 1, relative size 90.8)
Space economy bets: ASTS (rank 1, relative size 62.37)
Infrastructure proxies: ETR (rank 5, relative size 64.0)
These positions likely reflect tactical institutional positioning.
Geopolitical Hedging Strategies
The data reveals institutional positioning for various geopolitical scenarios:
Trade War Defensive Positioning
Domestic-focused industrials: Caterpillar (CAT) with relative size 149.17x
Reshoring beneficiaries: Amphenol (APH) with multiple positions
Currency hedges: Gold-adjacent plays through materials sector overweighting, miners and closely-related precious metals
Defense Technology Thesis
Palantir's massive positioning reflects government contract expansion
Aerospace exposure: Multiple positions in defense contractors
Cybersecurity allocation: CrowdStrike and related security infrastructure
Critical Inflection Points and Forward Indicators
Institutional Consensus Breaks
Several tickers show multiple institutional positions, indicating consensus plays:
APH (Amphenol): 3 separate positions totaling $1.4B
SCCO (Southern Copper): 2 positions totaling $433.8M
META (Meta): Multiple large positions exceeding $3.6B
These consensus positions represent either exceptional conviction or dangerous groupthink.
Contrarian Positioning Signals
High-conviction positions in traditionally cyclical sectors suggest contrarian institutional thinking:
Materials overweighting amid recession fears
Financial services concentration during rate uncertainty
Energy positioning despite ESG pressures
The lack of Bear leverage may represent complacency
NuScale Power (SMR)
Institutional surge: ~78% owned by institutions, with $333 M in inflows over 24 months
Recent placement: SMR appears in the top-25 roster with a large relative-size trade, consistent with recent institutional enthusiasm.
Catalysts: SMR shares surged ~19% in a single day in late May, largely driven by regulatory and project updates
Sector tailwinds: Regulatory approval for NRC-certified SMRs, global energy themes, and UK/US government backing—like Rolls‑Royce's SMR plan (target deployment by 2032) and Holtec’s US projects highlight global institutional interest
Global momentum: Renewed nuclear interest is gaining institutional backing. Cameco, BWX Technologies, and others stand to benefit from global reactor outlook
SMR ecosystem: Startups including TerraPower, Oklo, and Holtec have recently raised ~$1–2B collectively, aimed at low-carbon data center integration
Policy backdrop: US Senate legislation is proposing long-term tax credits for nuclear, and Trump-era licensing reform is reigniting investor appetite
Market Structure Implications
Liquidity Concentration Risk
With $59.0 billion concentrated in Technology and significant positioning in mega-cap names, institutional herding risk appears elevated. Historical precedent suggests such concentration can amplify volatility during sector rotations.
Forward-Looking Catalysts
Immediate (Next 30 Days)
Federal Reserve policy decisions affecting Financial Services positioning
Q2 earnings validation of Technology sector concentration
Geopolitical developments impacting Defense Technology thesis
Medium-term (3-6 Months)
Trade policy clarification affecting Materials and Industrial positioning
AI infrastructure spending validation supporting Technology concentration
Energy price resolution determining sector allocation sustainability
Conclusion: An Evolving Institutional Playbook
This $211.8 billion institutional deployment represents more than capital allocation - it reveals the evolving playbook of sophisticated investors navigating an increasingly complex global landscape. The data suggests institutions are simultaneously pursuing AI-driven growth, defensive positioning against geopolitical uncertainty, and contrarian bets on undervalued sectors.
The extreme concentration in Technology, while profitable in recent years, appears to be reaching levels that concern even the institutions creating it. The emergence of "forgotten" sectors and defensive positioning in Financial Services suggests smart money is quietly preparing for a potential regime change.
Most critically, the data reveals institutional recognition that traditional diversification models require updating. The integration of crypto assets, pursuit of private market-like returns in public vehicles, and concentration in specialized technology infrastructure all point to a fundamental evolution in institutional investment strategy.
I hope this analysis provides some potential ideas of where the most sophisticated investors are placing their bets - and perhaps more importantly, where they're not. In an environment where institutional assets under management continue to grow, following these capital flows may offer the clearest signal of where markets are heading next.
The question now is whether their collective wisdom will prove prescient or whether their concentration will become their weakness as markets evolve beyond their current positioning assumptions.
Thank you for being part of our community and for dedicating your time to this edition. Your insights and engagement drive everything we do, and we’re honored to share this space with such committed, thoughtful readers. Here’s to a week filled with clear opportunities and strong performance. Wishing you many bags 💰💰💰
—VolumeLeaders