

Market Momentum: Your Weekly Financial Forecast & Market Prep
Issue 49 / What to expect June 16, 2025 thru June 20, 2025

NOTE: This weekly periodical is too large for Substack to deliver in its entirety via email - you will only see a portion of this great content if you read from your email client. Click the header/title at the top to read the full article!

In This Issue
[Free For Everyone]
Weekly Market-On-Close Report: All the macro moves, market drivers, and must-know narratives—covered in less than five minutes.
Weekly Benchmark Breakdown: Our weekly intelligence report on major indices cuts through the index-level noise to uncover participation, momentum, and structural integrity and tell you whether markets are rising on solid ground or skating on thin breadth. This is where bull markets prove themselves—or quietly start to unravel.
The Latest Investor Sentiment Readings: Track the emotional pulse of the market with our curated dashboard of sentiment indicators. From fear-fueled flight to euphoric overreach, this week's readings reveal whether investors are cautiously creeping in—or stampeding toward the exits.
VL Special Coverage Report: Seeing the Full Picture: How Bank of America Uses 20 Valuation Metrics to Evaluate Equity Worth
Institutional Support & Resistance Levels For Major Indices: Exactly where to look for support and resistance this coming week in SPY, QQQ, IWM & DIA
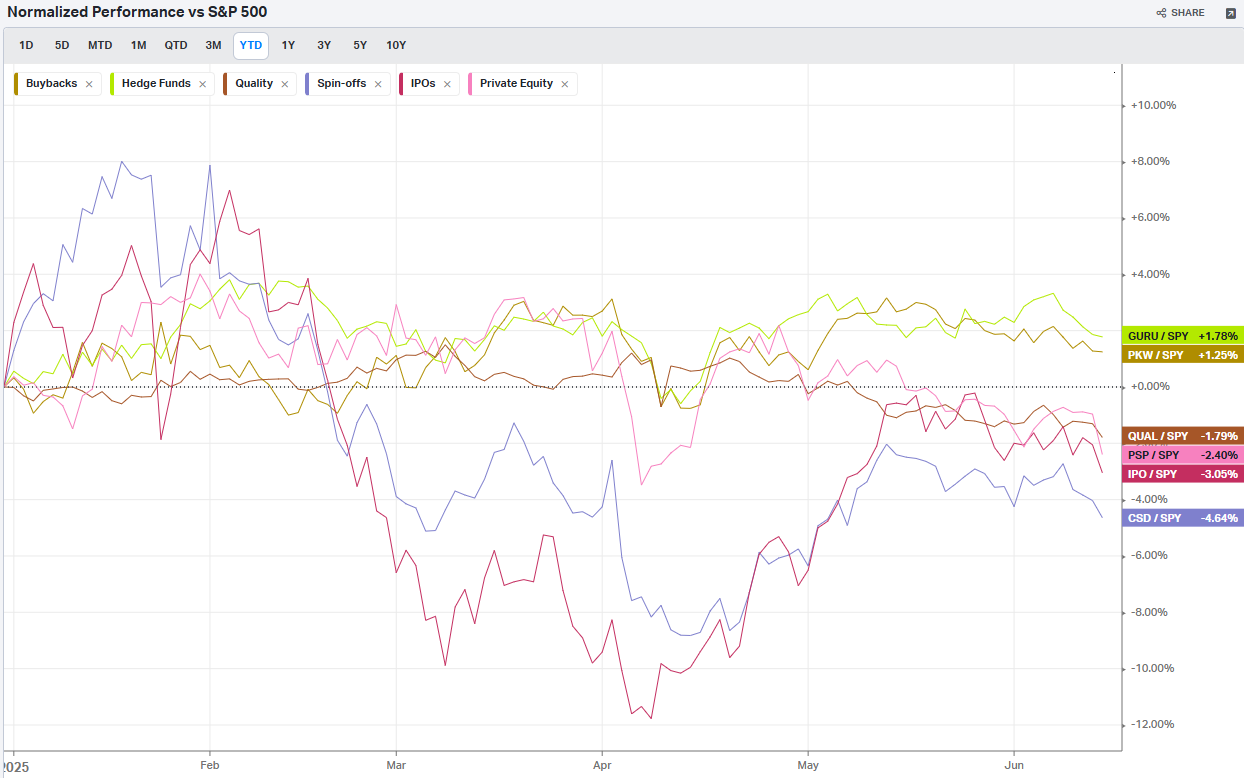
Normalized Performance By Thematics YTD: Which corners of the markets are beating benchmarks, which are overlooked and which ones are over-crowded!
Key Econ Events & Earnings On-Deck For This Coming Week
[Only For Subs]
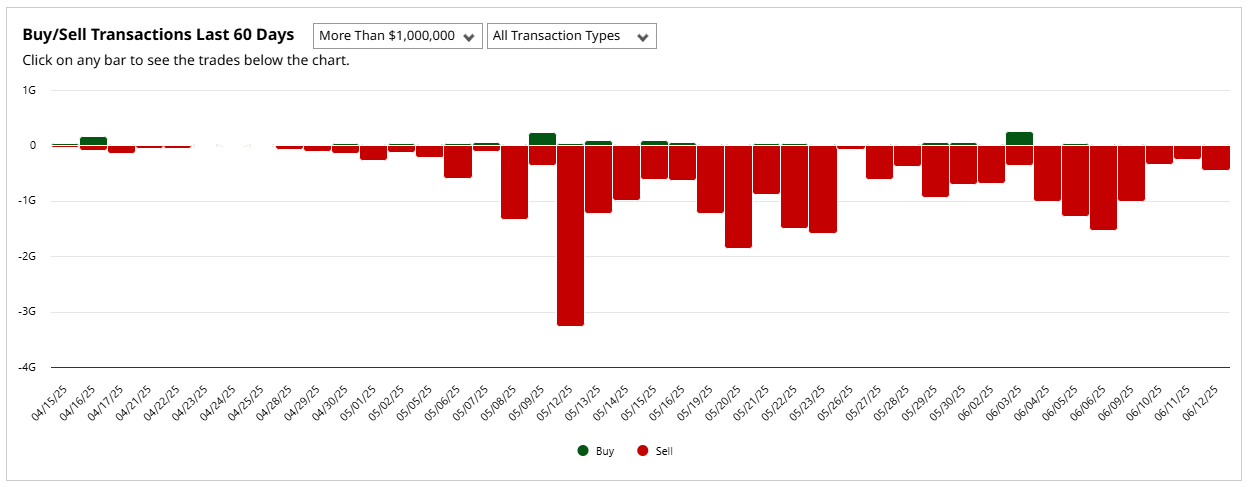
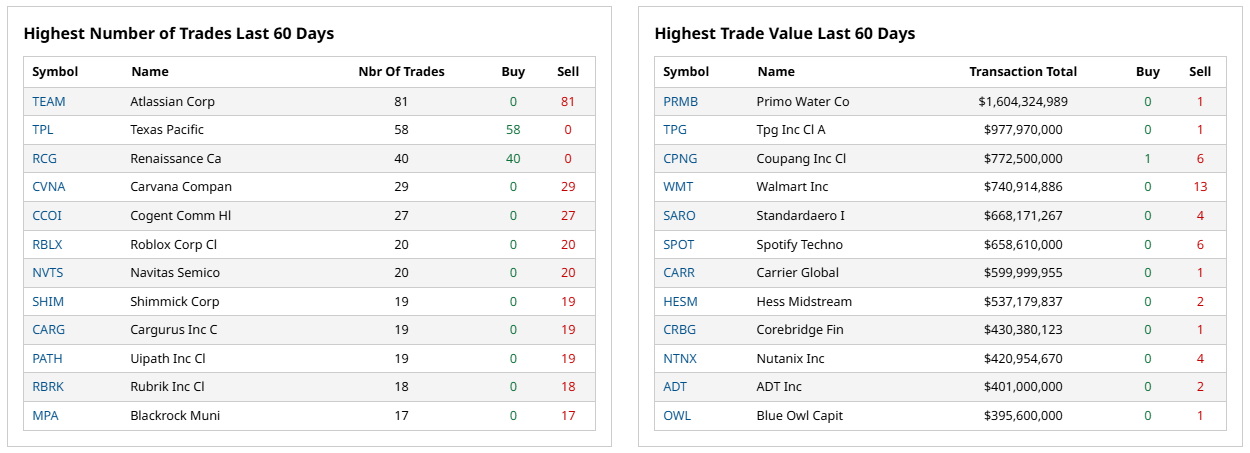
This Week’s Institutional Activity In Equities: Track the real money. This section breaks down where institutions are placing their bets—and pulling their chips. You'll get a sector-by-sector view of equity flows, highlighting the most active names attracting large-scale buying or selling. We go beyond the headlines and into the tape, surfacing the week’s most notable block trades and sweep orders, both on lit exchanges and hidden dark pools. Whether you're following momentum or fading crowded trades, this is your map to where size is moving and why it matters.
Institutional Activity By Day (rolling 6-months)
Institutional Activity By Sector By Week (rolling 6-months)
This Week’s Institutional Activity In ETFs: Follow the flows that shape the market. This section uncovers where institutions are deploying capital across the ETF landscape, broken down by sector and fund. We highlight the largest block trades and aggressive sweeps—both visible on lit exchanges and hidden in dark pools—to reveal how the smart money is positioning. Whether they’re rotating risk, hedging exposure, or scaling into themes, this is your lens into the ETF vehicles driving institutional intent.
Statistical Analysis and Insights From This Week’s Top Prints: we run the numbers on the most significant institutional trades of the week—those outsized prints that stand apart from the noise. Through statistical analysis and pattern recognition, we decode what these moves may signal about future price action. Whether it's the start of accumulation, a stealthy unwind, or a shift in market regime, this is where data meets intent. These are the trades that matter—and the stories they may be telling.

Weekly Market-On-Close Report
Geopolitical Tensions Drive Volatility Amid Economic Resilience
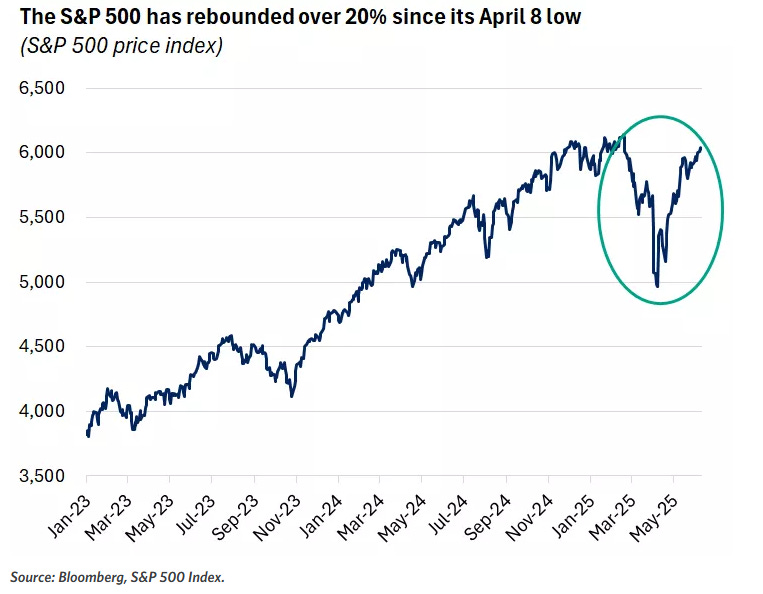
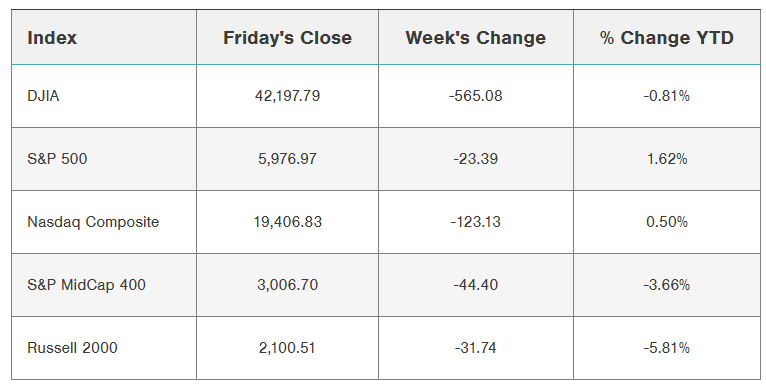
Financial markets concluded the trading week under significant pressure as escalating Middle Eastern tensions overshadowed otherwise constructive economic fundamentals. Major equity indices posted meaningful declines on Friday, with the S&P 500 retreating 1.13%, the Dow Jones Industrial Average declining 1.79%, and the Nasdaq 100 falling 1.29%. The selloff was precipitated by Israeli military operations targeting Iranian nuclear infrastructure, prompting a classic risk-off response across asset classes and commodity markets.

Despite geopolitical headwinds, underlying economic indicators continued to demonstrate resilience. Consumer price inflation moderated below expectations in May, consumer sentiment registered its first improvement in six months, and preliminary trade framework discussions between the United States and China yielded encouraging developments. These crosscurrents highlight the complex dynamics facing investors as they navigate between solid fundamental conditions and heightened geopolitical uncertainty.
Market Performance and Index Analysis
Equity Market Dynamics
The week's trading patterns exemplified the market's sensitivity to geopolitical developments, with indices exhibiting strength through Thursday before deteriorating sharply on Friday. The S&P 500's 1.13% decline brought weekly performance into negative territory despite earlier gains, while futures contracts for June E-mini S&P (ESM25) fell 1.06%, indicating continued pressure in extended trading sessions.
Mid-cap and small-cap segments faced more pronounced headwinds, with the S&P MidCap 400 declining 1.46% and the Russell 2000 dropping 1.49%. This differential performance reflects the market's preference for large-cap stability during periods of uncertainty, as smaller companies typically exhibit higher volatility sensitivity to macro developments.
The Nasdaq 100's 1.29% retreat, while significant, demonstrated relative resilience compared to broader market indices. However, June E-mini Nasdaq futures (NQM25) extended losses to 1.20%, suggesting continued technology sector pressure into the following session.
International Market Performance
Global equity markets mirrored domestic weakness, with European indices posting comparable declines. The Euro Stoxx 50 closed down 1.31%, reflecting similar risk-off sentiment across developed markets. Asian markets also participated in the broader selloff, with China's Shanghai Composite declining 0.75% and Japan's Nikkei Stock 225 falling 0.89%.
The synchronized global equity decline underscores the interconnected nature of modern financial markets and the rapid transmission of geopolitical risk across international boundaries. The relative magnitude of losses suggests that while regional factors play a role, global risk appetite remains the dominant driver of cross-border equity flows.
Geopolitical Catalyst Analysis
Middle East Conflict Escalation
The primary market catalyst emerged from Israeli military operations targeting approximately 100 Iranian facilities, including nuclear infrastructure and ballistic missile programs. The strikes, which reportedly eliminated senior Iranian military commanders and nuclear scientists, represented a significant escalation in regional tensions that had been simmering for months.
Iran's retaliatory response, launching dozens of ballistic missiles into Israeli territory, virtually guaranteed continued military engagement and elevated the conflict to a new phase of intensity. Israeli Prime Minister Netanyahu's commitment to continue strikes "for as many days as it takes to remove this threat" signals a prolonged period of regional instability.

The conflict's market implications extend beyond immediate risk-off sentiment. President Trump's characterization of the situation as requiring Iran to make a nuclear deal "before it is too late," coupled with warnings of "even more brutal" future attacks, introduces additional policy uncertainty. While the administration emphasized non-involvement in the military strikes, the potential for expanded U.S. engagement remains if Iran attempts to block the Strait of Hormuz or attacks American assets in the region.
Commodity Market Response
Oil markets experienced dramatic volatility, with crude prices surging over 7% on Friday to reach four-month highs near $73 per barrel. The weekly gain of nearly 12% reflects market concerns about potential supply disruptions through critical shipping channels, particularly the Strait of Hormuz, through which approximately 20% of global oil supplies transit.

The energy market response highlights the continued strategic importance of Middle Eastern production capacity despite increased U.S. domestic output. While America has achieved net petroleum exporter status, global price dynamics remain sensitive to supply disruption risks in the region.
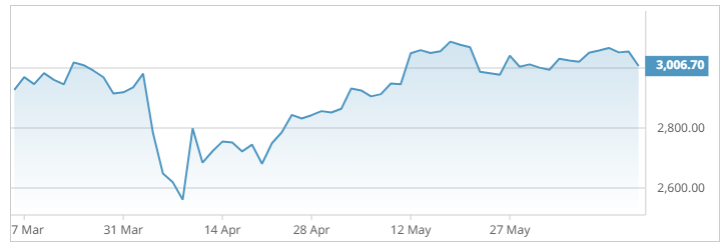
Gold markets demonstrated their traditional safe-haven characteristics, with precious metals advancing 1.50% as investors sought refuge from geopolitical uncertainty. The rally brought gold to new record highs near $3,450 per ounce, eclipsing previous peaks established in late April and early May. The metal's performance, up from approximately $2,600 at year-end, reflects both geopolitical premium and broader monetary policy considerations.
Economic Fundamentals Assessment
Inflation Dynamics
Despite geopolitical turmoil, domestic inflation metrics delivered encouraging signals for monetary policy normalization. The Bureau of Labor Statistics reported May Consumer Price Index growth of just 0.1% month-over-month, significantly below consensus expectations of 0.3% and down from April's 0.2% reading.
Annual headline inflation registered 2.4%, modestly above April's four-year low of 2.3% but below forecasted 2.5%. More importantly, core CPI excluding volatile food and energy components remained stable at 2.8% year-over-year, slightly below anticipated 2.9% and demonstrating continued disinflationary momentum in services sectors.
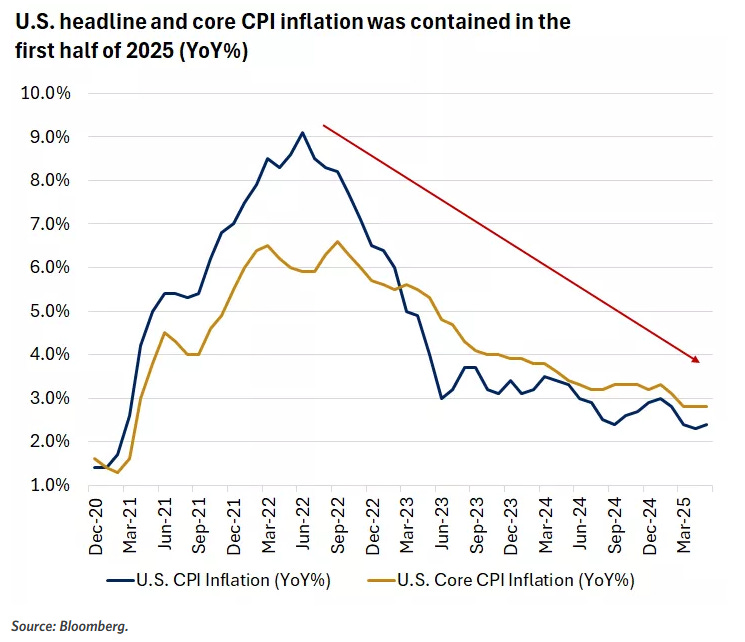
Producer price inflation at the wholesale level similarly undershot expectations, rising only 0.1% monthly after April's modest decline. This reading, below consensus forecasts of 0.2%, suggests that tariff impacts thus far have been more contained than many market participants anticipated, possibly due to inventory build-ahead strategies by importers.
The inflation data's significance extends beyond immediate monetary policy implications. The moderation occurs against a backdrop of elevated tariff uncertainty, suggesting that supply chain adaptations and inventory management strategies may be effectively mitigating some inflationary pressures from trade policy changes.
Consumer Sentiment Recovery
Consumer confidence metrics provided additional evidence of economic resilience, with the University of Michigan's preliminary June Consumer Sentiment Index surging to 60.5 from May's 52.2 reading. The 8.3-point improvement represented the first positive movement in six months and significantly exceeded consensus expectations of 53.6.
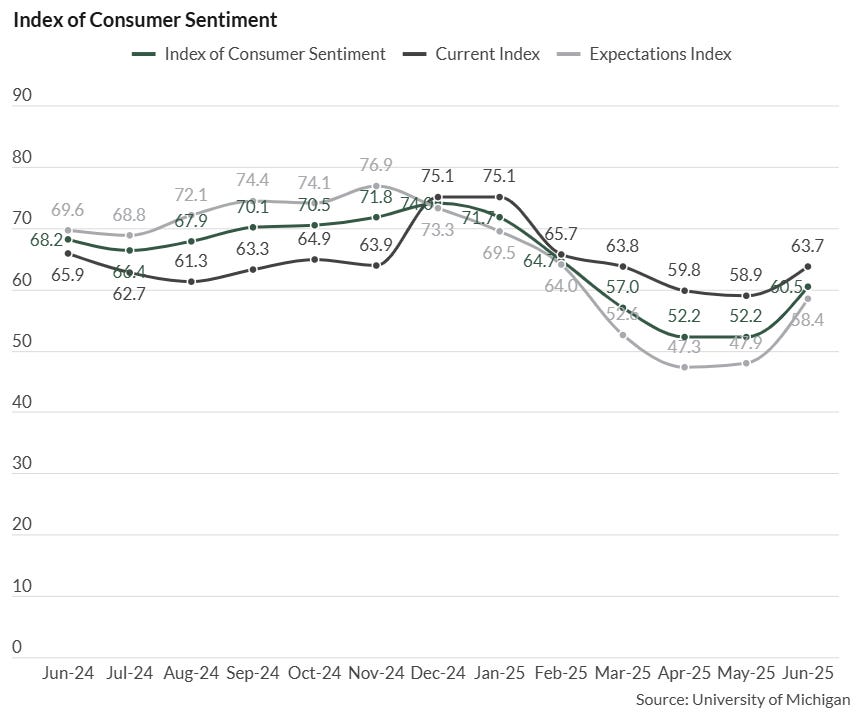
Perhaps more significantly, one-year inflation expectations plummeted to 5.1% from May's elevated 6.6% level, a decline substantially larger than forecasted retreat to 6.4%. Five-to-ten-year inflation expectations moderated slightly to 4.1% from 4.2%, aligning with market projections and suggesting longer-term price stability expectations remain anchored.
According to survey analysis, consumers appear to have "settled somewhat from the shock of the extremely high tariffs announced in April and the policy volatility seen in the weeks that followed." This adaptation suggests that while initial tariff announcements created significant uncertainty, households are beginning to adjust expectations as policy implementation details emerge.
Labor Market Dynamics
The employment landscape continues demonstrating remarkable stability despite broader economic uncertainties. Current unemployment rates hover near 4.2%, substantially below the long-term historical average of approximately 5.5%, indicating continued labor market tightness.
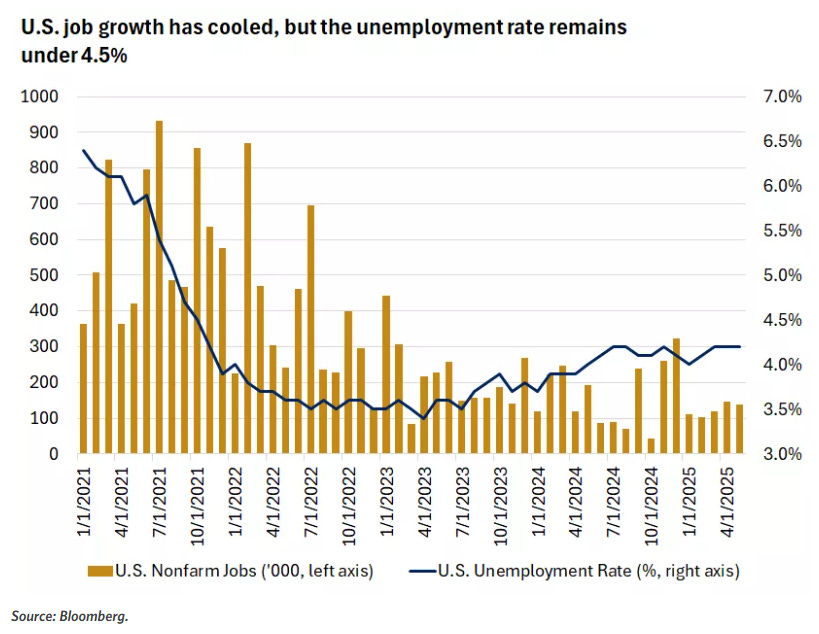
The current environment can be characterized as featuring "low hiring but also low firing," as corporations prioritize talent retention amid uncertain business conditions. This dynamic supports wage growth, with increases of approximately 3.9% continuing to outpace inflation rates, providing consumers with positive real wage gains.
This wage-inflation differential represents a critical support mechanism for consumer spending patterns. Historical analysis suggests that consumers demonstrate greatest spending confidence when employment security coincides with real wage growth, both conditions currently present in the domestic economy.
GDP Growth Trajectory
Economic growth metrics continue exceeding trend rates despite first-quarter softness attributed primarily to inventory accumulation patterns. Second-quarter GDP tracking estimates suggest growth rates may exceed 3%, driven by household consumption projections of approximately 1.7% annually.
The consumption resilience appears particularly noteworthy given persistent weak consumer sentiment readings prior to recent improvements. This divergence between sentiment and actual spending behavior suggests that objective economic conditions may be providing sufficient support for discretionary expenditures despite subjective uncertainty.
Trade Policy Developments
China-United States Framework Progress
Bilateral trade discussions yielded meaningful progress during the week, with both American and Chinese officials reporting establishment of a preliminary trading framework. The proposed structure includes significant tariff modifications, with Chinese export levies potentially declining from current 145% levels to 55%, comprising reciprocal 10% tariffs, 20% fentanyl-related penalties, and existing 25% China-specific duties.
Conversely, tariffs on American exports to China would be maintained at 10% levels under the framework. Beyond tariff adjustments, the agreement addresses critical non-tariff barriers, particularly concerning Chinese rare-earth mineral exports essential for American manufacturing operations.
China has agreed to temporarily restore rare-earth export licenses to U.S. manufacturers for six-month periods, while America will ease restrictions on Chinese jet engine components and related aerospace parts. While representing constructive progress, the preliminary nature of these arrangements requires presidential approval from both nations before implementation.
Multilateral Trade Timeline Considerations
The July 9 deadline for the conclusion of the 90-day tariff pause on non-Chinese trading partners approaches rapidly, creating additional policy uncertainty. Treasury Secretary Bessent's recent comments suggest potential deadline extensions for partners demonstrating "good faith" in ongoing negotiations, acknowledging the complex timeline requirements for comprehensive trade agreement development.
Current elevated 10% tariff rates on these partners during the pause period continue imposing economic costs, though substantially below the higher rates initially contemplated. The administration's apparent flexibility on timing suggests recognition that sustainable trade agreements require adequate development time rather than artificial deadline pressures.
United Kingdom Trade Agreement Progress
Bilateral discussions with the United Kingdom yielded encouraging developments, with Prime Minister Starmer indicating removal of remaining obstacles to finalizing a comprehensive trade agreement. The potential conclusion of U.S.-UK trade negotiations represents a significant diplomatic achievement and could provide a template for broader multilateral engagement.
Federal Reserve Policy Implications
Interest Rate Environment
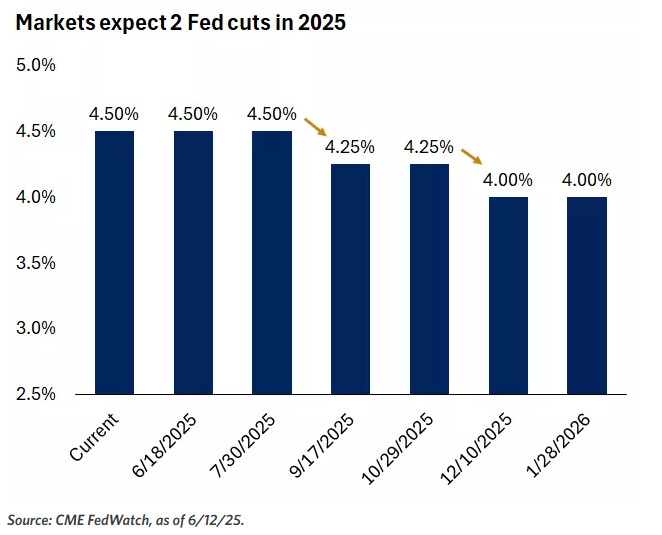
Current federal funds rates of 4.25%-4.5% maintain significant elevation above prevailing inflation rates of 2.5%-3.5%, providing the Federal Reserve considerable accommodation flexibility should economic conditions warrant intervention. Futures markets are discounting minimal 3% probability of 25 basis point reduction at the June 17-18 Federal Open Market Committee meeting, suggesting near-term policy stability expectations.
However, market pricing implies expectations for one to two rate cuts during 2025's second half, contingent upon economic data evolution and trade policy clarity. The Fed's current wait-and-see posture reflects prudent assessment of competing inflationary and deflationary forces, particularly given ongoing tariff uncertainty and geopolitical developments.
Fixed Income Market Dynamics
Treasury markets experienced meaningful volatility throughout the week, with September 10-year notes (ZNU25) declining 14.5 ticks on Friday. The 10-year yield advanced 5.1 basis points to 4.411%, primarily reflecting inflationary concerns from energy price increases rather than fundamental monetary policy shifts.
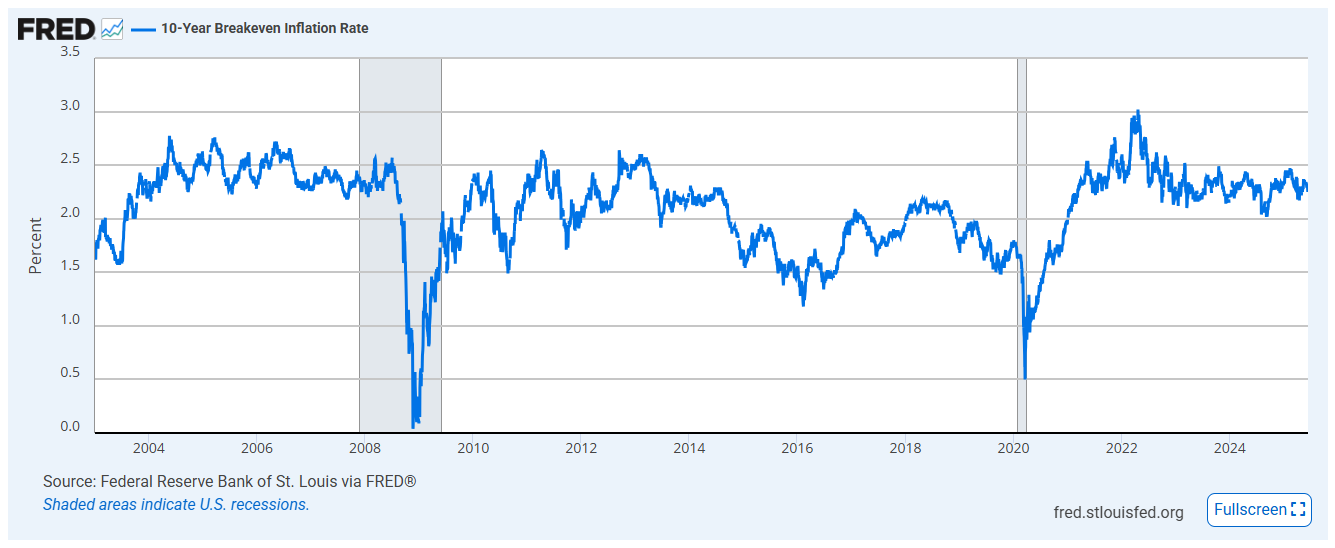
Ten-year breakeven inflation expectations rose 2.2 basis points to 2.291%, recovering from early week five-week lows and suggesting market recognition of potential commodity-driven price pressures. Notably, Treasuries failed to generate meaningful safe-haven demand despite geopolitical tensions, indicating investor focus on inflation implications rather than flight-to-quality dynamics.
European government bond yields demonstrated similar patterns, with German 10-year bund yields advancing 5.8 basis points to 2.535% and UK gilt yields rising 7.3 basis points to 4.550%. Swap markets are pricing 11% probability of 25 basis point European Central Bank rate reduction at the July 24 policy meeting.
A successful 30-year Treasury auction during the week generated stronger-than-expected demand, with yields of 4.84% coming below Wednesday's 4.91% closing level. This outcome helped alleviate recent concerns about diminished Treasury market attractiveness and potential financing difficulties for government operations.
Sector-Specific Performance Analysis
Energy Sector Leadership
Geopolitical tensions provided significant tailwinds for energy sector equities, with major integrated oil companies posting notable gains. Exxon Mobil ( XOM 0.00%↑ ) advanced 2.1% while Chevron ( CVX 0.00%↑ ) gained 0.7%, reflecting both higher commodity prices and expectations for improved operational margins.

The sector's outperformance extends beyond immediate price benefits, as sustained higher oil prices improve the economics of domestic production operations and enhance cash flow generation capabilities for capital allocation and shareholder returns.
Defense Contractor Rally
Military escalation in the Middle East drove substantial gains across defense industry stocks, with major contractors experiencing significant premium expansion. Lockheed Martin ( LMT 0.00%↑ ) surged 3.7%, Northrop Grumman ( NOC 0.00%↑ ) gained 4.0%, and RTX Corporation ( RTX 0.00%↑ ) advanced 3.6%.
The defense sector rally reflects both immediate procurement expectations and longer-term geopolitical tension implications for military spending priorities. Sustained regional conflict could drive enhanced defense budget allocations and accelerated equipment replacement cycles.
Travel and Hospitality Pressure
Tourism-related equities faced significant headwinds from conflict escalation, as extended Middle Eastern warfare could substantially impact international travel patterns. Booking Holdings ( BKNG 0.00%↑ ), Expedia Group ( EXPE 0.00%↑ ), Hilton Worldwide Holdings ( HLT 0.00%↑), and Marriott International (MAR 0.00%↑) all posted losses averaging approximately 3%.
The sector's vulnerability extends beyond direct regional exposure, as heightened security concerns and elevated energy costs can depress broader travel demand patterns and reduce discretionary spending on leisure activities.
Airline Industry Challenges
Commercial aviation stocks experienced particularly acute pressure from dual headwinds of elevated fuel costs and weakening pricing power. Higher oil prices directly impact operational expenses, while recent inflation data showing airfares declining 2.7% month-over-month for the fourth consecutive month suggests limited ability to pass through cost increases.
American Airlines Group ( AAL 0.00%↑ ) and United Airlines Holdings (UAL 0.00%↑) declined over 4%, while Delta Air Lines ( DAL 0.00%↑ ) fell 3.8% and Southwest Airlines ( LUV 0.00%↑ ) dropped 2.7%. The sector's performance reflects the challenging operational environment of squeezed margins from both input cost inflation and pricing pressure.
Technology Sector Divergence
The Magnificent 7 technology stocks demonstrated mixed performance amid broader risk-off sentiment, with Tesla ( TSLA 0.00%↑ ) managing a 2% gain while most peers posted losses. Nvidia ( NVDA 0.00%↑ ) led declines with a 2.1% drop, while Apple ( AAPL 0.00%↑ ) and Meta Platforms ( META 0.00%↑ ) each lost over 1%.
Tesla's outperformance may reflect its relative insulation from immediate geopolitical impacts and continued investor confidence in electric vehicle market penetration. Conversely, semiconductor and technology hardware companies face greater supply chain vulnerability from international tensions.
Financial Services Disruption
Payment processing companies faced unique pressures from reports of major retailers investigating stablecoin adoption to bypass traditional credit card transaction fees. Visa ( V 0.00%↑ ) and Mastercard ( MA 0.00%↑ ) both declined over 4% on Wall Street Journal reports that Amazon and Walmart are exploring alternative payment mechanisms.

This development represents a potentially transformative threat to traditional payment processing business models, as cryptocurrency-based transactions could significantly reduce merchant processing costs while maintaining transaction security and efficiency.
Individual Equity Highlights
Industrial Sector Developments
US Steel ( X 0.00%↑ ) declined 2.6% following reports that Nippon Steel's planned acquisition may face delays if management freedom requirements are not adequately addressed. The transaction's uncertainty reflects broader concerns about foreign acquisition approvals in strategic industrial sectors.

Boeing ( BA 0.00%↑ ) continued facing headwinds from the aftermath of the Indian 787 Dreamliner crash that resulted in over 240 fatalities. The stock fell nearly 2% on Friday, adding to Thursday's 5.14% decline as safety concerns continue impacting the aerospace manufacturer's reputation and order flow.
Technology Earnings Impact
Adobe ( ADBE 0.00%↑ ) experienced over 5% decline despite reporting second-quarter results that exceeded analyst expectations. The negative reaction reflects persistent investor concerns about artificial intelligence's potential impact on Adobe's creative software revenue streams, despite management's attempts to address competitive positioning.
The Adobe reaction exemplifies broader market concerns about AI disruption across traditional software sectors, with investors requiring increasingly compelling evidence of competitive moat sustainability against rapidly evolving technological capabilities.
Consumer Discretionary Adjustments
McDonald's ( MCD 0.00%↑ ) declined 0.4% following Argus Research's downgrade from buy to hold rating. The adjustment reflects analyst concerns about sustained consumer discretionary spending patterns amid economic uncertainty and potential margin pressure from operational cost inflation.
Market Outlook and Investment Implications
Volatility Expectations
The convergence of geopolitical tensions, trade policy uncertainty, and evolving monetary policy conditions suggests continued elevated volatility levels in the near term. Historical analysis indicates that geopolitical tensions typically generate short-lived market impacts, though commodity price effects can persist longer.
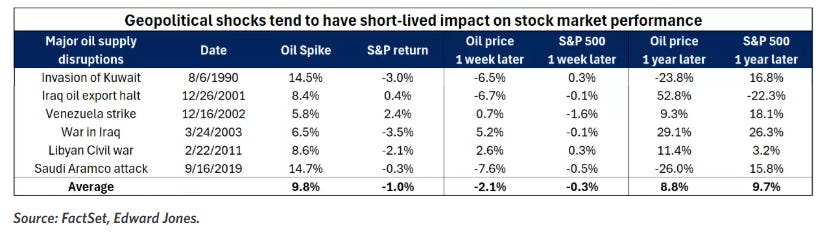
The current environment's complexity, combining multiple uncertainty sources, may extend typical volatility duration patterns. Investors should anticipate continued choppy market conditions until greater clarity emerges regarding Middle Eastern conflict resolution and trade policy implementation.
Sectoral Positioning Considerations
Current market dynamics favor defensive positioning with selective growth exposure. Energy and defense sectors appear well-positioned for continued geopolitical tension environments, while travel and transportation sectors face sustained headwinds from both conflict and elevated commodity costs.
Technology sector performance likely depends on geopolitical development trajectories, with semiconductor and hardware companies facing greater supply chain vulnerability than software and services providers. Financial services companies may benefit from potential interest rate stability but face headwinds from payment processing disruption risks.
Fixed Income Strategy Implications
Treasury positioning requires balancing safe-haven demand against inflation risk considerations. While geopolitical tensions typically support government bond demand, elevated commodity prices and potential supply chain disruption could maintain inflation pressure and limit bond rally potential.
Corporate credit markets may experience differentiated performance based on sector exposure to geopolitical and commodity price risks. Energy sector credit should benefit from improved cash flow generation, while transportation and consumer discretionary credits may face margin pressure.
International Exposure Assessment
Global market integration suggests that U.S. investors cannot entirely insulate portfolios from international developments through domestic positioning alone. However, American market relative insulation from direct trade and energy dependencies provides some defensive characteristics compared to international alternatives.
Emerging market exposure requires careful consideration of individual country geopolitical alignments and commodity dependencies. Markets with significant Middle Eastern exposure or energy import dependencies may face sustained pressure until conflict resolution.
Economic Policy Monitoring
Fiscal Policy Developments
Congressional tax policy discussions continue progressing toward July 4 deadlines, with Senate negotiations focusing primarily on Tax Cuts and Jobs Act extensions rather than dramatically stimulative new measures. While the impact may be largely status quo maintenance, potential accelerated capital expenditure deductions and deregulation measures could provide modest economic support.
The fiscal policy impact timing suggests greater influence during 2026 as provisions take effect, rather than immediate economic acceleration. This timing may prove beneficial by providing economic support if current growth momentum moderates naturally through normal cyclical patterns.
Regulatory Environment Evolution
Potential deregulation across multiple sectors could provide medium-term economic support through reduced compliance costs and enhanced operational flexibility. Financial services, energy, and healthcare sectors appear most likely to benefit from regulatory streamlining initiatives.
However, the implementation timeline and scope of regulatory changes remain uncertain, requiring careful monitoring of administrative actions and congressional support for broader deregulatory initiatives.
Risk Assessment and Scenario Analysis
Upside Scenario Considerations
Optimistic outcomes could emerge from successful Middle Eastern conflict de-escalation, comprehensive U.S.-China trade agreement conclusion, and continued economic resilience despite external pressures. Such developments could drive meaningful equity market recovery and commodity price normalization.
Federal Reserve rate reduction implementation could provide additional market support, particularly for interest-sensitive sectors including real estate, utilities, and growth-oriented technology companies. Combined with fiscal policy support, this monetary accommodation could extend the current economic expansion cycle.
Downside Risk Evaluation
Adverse scenarios include sustained Middle Eastern conflict escalation, potential U.S. military involvement, and significant commodity price increases driving renewed inflation pressure. Such developments could force Federal Reserve policy reconsideration and potentially trigger economic growth deceleration.
Trade policy negotiations failure and return to elevated tariff levels could create sustained inflationary pressure while simultaneously reducing economic growth through higher consumer costs and business investment uncertainty.
Base Case Projection
The most probable outcome involves continued near-term volatility with gradual resolution of current uncertainty sources over the coming quarters. Economic fundamentals appear sufficiently robust to withstand moderate external pressures, while policy flexibility remains available for more severe scenarios.
Markets likely continue experiencing elevated volatility until geopolitical and trade policy clarity improves, with selective sector outperformance based on individual exposure to prevailing uncertainty sources.
Conclusion and Strategic Recommendations
Current market conditions reflect the complex interaction between solid underlying economic fundamentals and elevated external uncertainty from geopolitical and trade policy sources. While near-term volatility appears likely to persist, the domestic economy's resilience provides a foundation for eventual market stabilization.
Investors should maintain diversified positioning with tactical adjustments for current uncertainty sources. Energy and defense sector exposure provides geopolitical tension hedging, while maintaining technology and healthcare allocations captures longer-term growth potential.
Fixed income positioning should balance safe-haven benefits against inflation risk considerations, with intermediate-duration Treasuries potentially offering optimal risk-adjusted returns in the current environment. Corporate credit requires careful sector selection based on individual vulnerability to prevailing risk factors.
The market's response to this week's developments demonstrates continued sensitivity to external shocks despite improving fundamental conditions. This dynamic suggests that patient, diversified investment approaches with tactical flexibility will likely outperform more concentrated strategies during the current uncertainty period.
As clarity emerges regarding trade policy implementation and geopolitical developments, markets should eventually reflect underlying economic strength and corporate earnings growth potential. Until such clarity arrives, maintaining defensive positioning with selective growth exposure appears prudent for navigating the complex current environment.

Weekly Benchmark Breakdown
S&P 500 Index
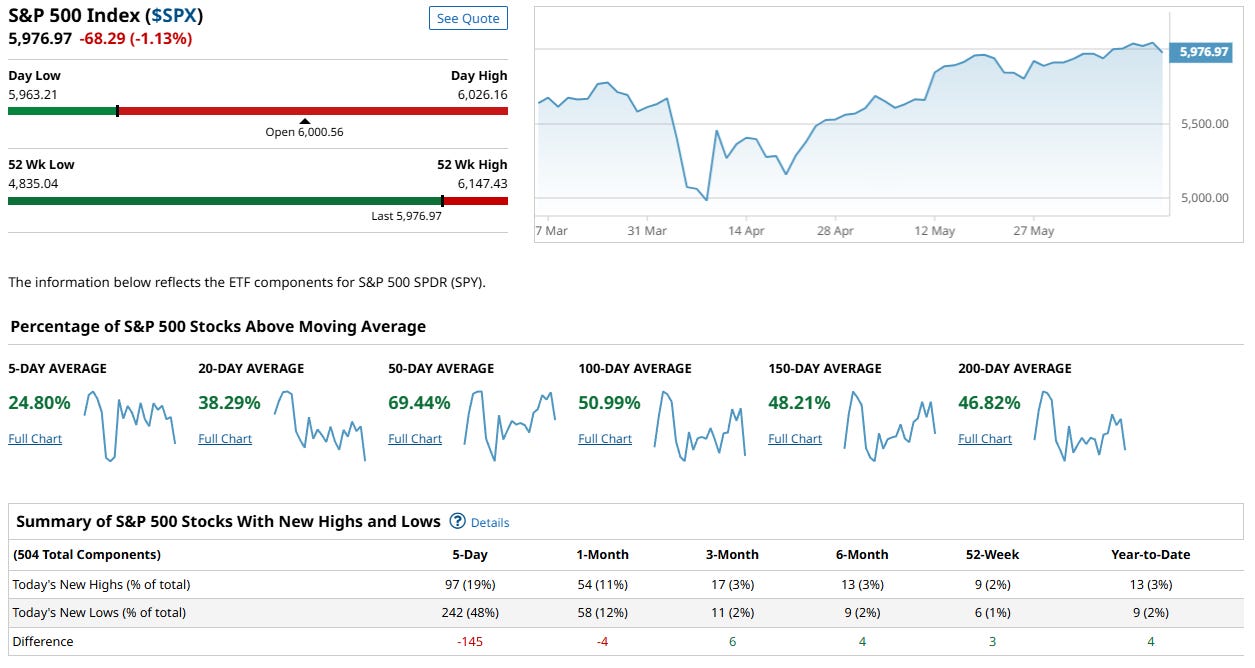
The S&P 500 closed at 5,976.97, down -1.13% on the week—marking a modest pullback from recent highs. However, under the surface, the picture reveals a sharper deterioration in internal breadth than the index-level move alone would suggest. The rally’s foundation has clearly weakened this week, as short-term momentum collapsed and new lows sharply outpaced new highs.
Breadth Metrics: Significant Short-Term Deterioration
Short-term momentum has broken down:
Just 24.80% of components are above the 5-day moving average—down from over 70% last week.
Only 38.29% remain above the 20-day MA.
Intermediate trend remains somewhat intact:
69.44% of components still above 50-day MA, but this is now likely at risk if weakness persists.
Longer-term trend alignment is showing initial cracks:
100-day MA: 50.99%
150-day MA: 48.21%
200-day MA: 46.82%
The index remains technically long-term healthy, but deterioration is creeping into intermediate and long-term structures.
New Highs vs. New Lows: Bearish Reversal
97 new 5-day highs (19%), versus 242 new lows (48%) → net -145.
The most negative breadth print in weeks—this is a clear reversal of bullish leadership.
New lows dominate even out to 1-month and beyond:
1-month net: -4
3-month net: +6 (still positive, but fading)
6-month, 52-week, YTD also beginning to tilt toward neutral.
Interpretation
The S&P 500 breadth structure has sharply deteriorated. The short-term reversal in momentum and the large surge in new lows signal that the rally has lost steam—at least for now. Intermediate trend breadth (50-day MA) remains strong but will likely weaken quickly if downside pressure persists.
At the same time, longer-term structures are still intact, but leadership is no longer broad-based. Institutional activity appears to be rotating out of weaker names, causing a bifurcated market beneath the surface.
Conclusion
This was a breadth breakdown week for the S&P 500. Short-term momentum has collapsed, and leadership is now decisively skewed to the downside. While long-term trend structures have not yet broken, they are vulnerable if current weakness deepens.
Unless short-term breadth rebounds quickly, the market risks transitioning into a corrective phase. For now, the tape favors caution and selectivity, with defensive positioning warranted until participation improves. This is no longer a "fully confirmed rally" — breadth has flipped to fragile and vulnerable.
Dow Jones Index
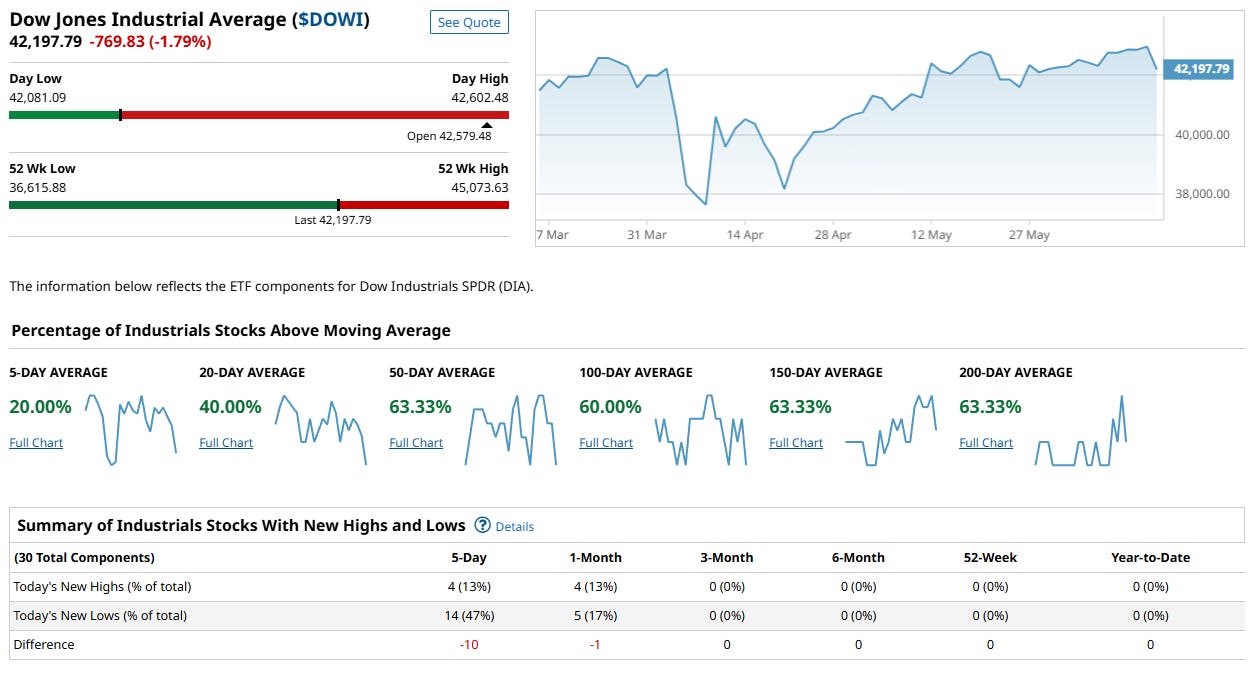
The Dow Jones Industrial Average closed at 42,197.79, down -1.79% on the week, marking a sharp reversal after weeks of steady grinding higher. Internally, the picture has clearly deteriorated at the short- and intermediate-term levels, though long-term structure remains relatively stable for now.
Breadth Metrics: Short-Term Breakdown, Long-Term Still Holding
Short-term momentum has weakened materially:
Just 20.00% of components are above their 5-day moving average.
40.00% remain above the 20-day MA—both readings sharply lower from recent highs.
Intermediate-term trend holding for now:
63.33% of components are still above the 50-day MA—resilient, but vulnerable if selling persists.
Long-term structure remains strong:
100-day MA: 60.00%
150-day MA: 63.33%
200-day MA: 63.33%
Long-term participation is still healthy, though leadership is thinning at the edges.
New Highs vs. New Lows: Weakening Leadership
4 new 5-day highs (13%), versus 14 new lows (47%) → net -10.
Leadership is clearly thinning:
1-month net: -1
No 3-month, 6-month, 52-week, or YTD new highs reported this week.
New low count is not overwhelming, but the absence of new highs is a yellow flag.
Interpretation
The Dow’s internals this week reflect a clear loss of momentum and growing internal fragility. While the longer-term structure (100-, 150-, 200-day MAs) remains intact, the collapse in short-term momentum and the negative new high/new low spread signals that buyers have stepped aside, at least for now.
Leadership is becoming narrow, and downside pressure is picking up. The fact that long-term breadth is holding means this is not yet a major breakdown, but the index is vulnerable to further pullback if short-term breadth does not stabilize soon.
Conclusion
The Dow is moving into a short-term corrective phase after a very strong prior run. The deterioration in 5-day and 20-day breadth, coupled with thinning leadership, points to fading upside momentum. The long-term trend remains technically sound, but unless participation rebounds in the coming week, further weakness is likely.
For now, this is a market to approach with caution—selectivity and risk management take priority until we see breadth stabilization and a new wave of leadership emerge.
NASDAQ 100 Index
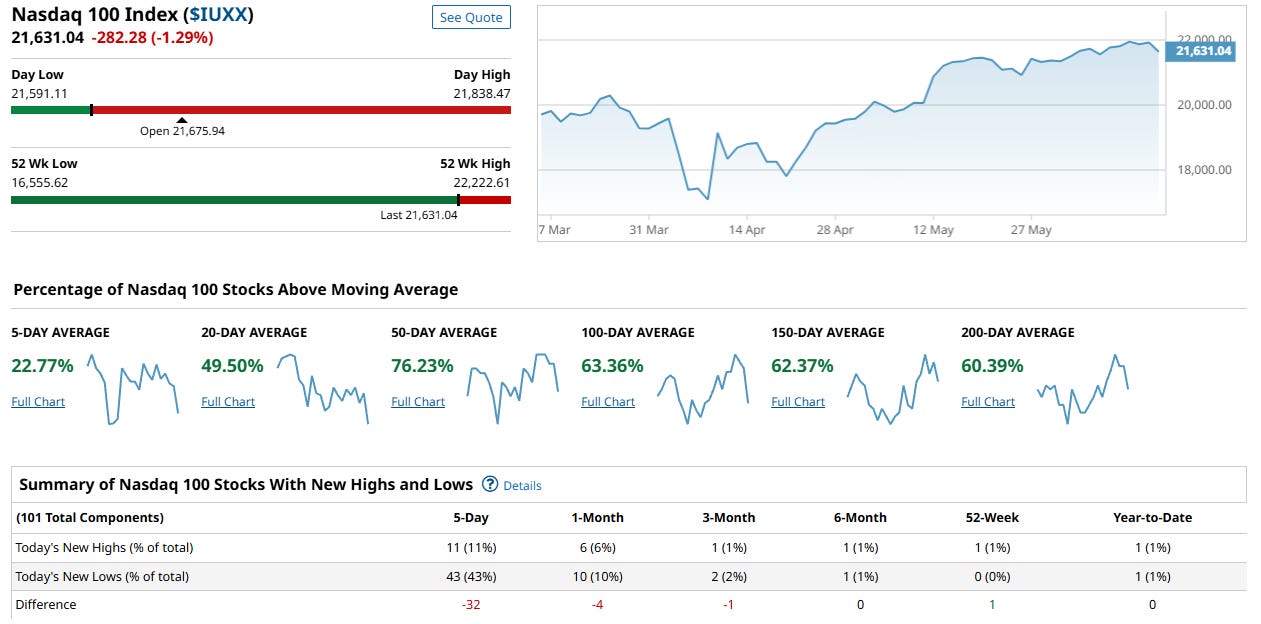
The Nasdaq 100 closed at 21,631.04, down -1.29% on the week—a meaningful pullback from recent highs. The index is still within striking distance of its 52-week high, but breadth has materially deteriorated under the surface, with notable short-term weakness and declining leadership.
Breadth Metrics: Short-Term Weakness Emerging
Short-term momentum has broken down sharply:
Only 22.77% of components remain above their 5-day moving average—down from the 70–80% zone seen in recent weeks.
49.50% remain above their 20-day MA—a major drop from prior strength.
Intermediate-term trend holding for now:
76.23% of components still above 50-day MA—off highs, but still providing a cushion.
Long-term structure remains healthy but at risk:
100-day MA: 63.36%
150-day MA: 62.37%
200-day MA: 60.39%
These long-term readings indicate the uptrend remains intact, but short-term breadth is flashing caution.
New Highs vs. New Lows: Clear Deterioration in Leadership
11 new 5-day highs (11%), versus 43 new lows (43%) → net -32.
Breadth deterioration is also showing at longer timeframes:
1-month net: -4
3-month net: -1
6-month, 52-week, YTD: flat
Leadership has thinned dramatically, and weakness is broadening across components.
Interpretation
The Nasdaq 100 is showing a classic short-term breadth breakdown after a strong run. While long-term trend structure remains technically sound, short- and intermediate-term participation has weakened materially.
This is a rotation and risk-management phase, not a structural breakdown—yet. However, the combination of falling short-term breadth and a negative new high/new low spread indicates that buyers have stepped aside temporarily, leaving the index vulnerable to further mean reversion.
Conclusion
The Nasdaq 100 has entered a short-term corrective phase, with breadth now signaling caution. While the longer-term uptrend is still intact, the current deterioration in participation and leadership suggests a period of consolidation or deeper pullback may be required to reset internals.
For now, this is a market where selectivity is key—focus on relative strength names, manage risk, and watch for signs of breadth stabilization before re-engaging aggressively. Short-term caution is warranted until momentum and leadership rebuild.
Russel 1000
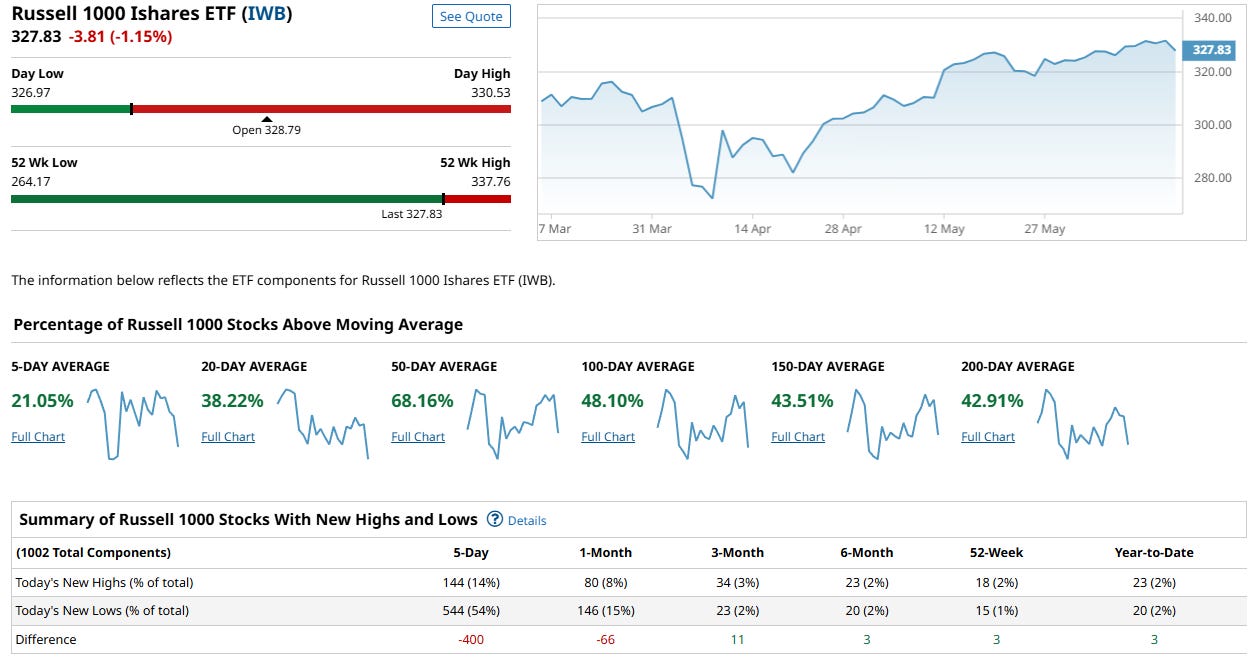
The Russell 1000 closed at 327.83, down -1.15% on the week, showing a sharp pullback from its recent strong run. Underneath the surface, market breadth has deteriorated significantly, with short-term momentum collapsing and new lows now dominating across nearly all timeframes.
Breadth Metrics: Momentum Cracking Hard
Short-term momentum has broken down sharply:
Only 21.05% of components are above their 5-day moving average—a complete reversal from the >75% zone seen just two weeks ago.
38.22% remain above the 20-day MA—also a steep drop.
Intermediate-term participation weakening:
68.16% still above 50-day MA—but this is now vulnerable given the sharp deterioration in short-term momentum.
Longer-term structure slipping:
100-day MA: 48.10%
150-day MA: 43.51%
200-day MA: 42.91%
The long-term trend structure is moving back below the key 50% participation threshold—a risk factor going forward.
New Highs vs. New Lows: Negative Breadth Dominates
144 new 5-day highs (14%), versus 544 new lows (54%) → net -400 — the worst breadth print of the four major indices this week.
Longer-term net new highs/lows remain negative:
1-month net: -66
3-month net: +11 (barely positive, at risk of flipping)
6-month, 52-week, YTD: flat
The sheer scale of 544 new lows is a clear sign that selling is widespread across the index.
Interpretation
The Russell 1000 has shifted into a broad internal correction. Short-term breadth and leadership have completely collapsed, and the dominance of new lows across nearly all windows signals institutional rotation out of weaker names.
The fact that the 50-day MA still holds at 68% is somewhat supportive, but given the magnitude of short-term deterioration, this cushion may erode quickly if downside momentum persists. The trend of the past few weeks—catch-up rally in breadth and new highs—has now been decisively reversed.
Conclusion
The Russell 1000 is now the weakest of the four major indices in internal structure this week. The combination of collapsing short-term momentum, overwhelming new lows, and falling long-term participation is a clear warning flag.
This is a market in active correction beneath the surface, and risk management is warranted until we see breadth stabilize and downside leadership abate. Expect further mean reversion and potential leadership rotation in coming sessions—defensive positioning is favored until participation rebuilds.
Major Indices Insights & Summary
Market internals across all four major U.S. indices have meaningfully deteriorated this week, shifting from broad-based strength to a fragile state dominated by short-term momentum collapse and an overwhelming surge in new lows. While prices remain elevated near recent highs, breadth tells a sharply different story: buyers have stepped aside, and defensive selling is gaining traction.
The deterioration is broad:
The S&P 500 saw its 5-day breadth plunge to 24.8%, with new lows outpacing new highs by -145—a sharp reversal from prior strength.
The Dow Jones breadth also collapsed, with only 20% of components above the 5-day MA and new highs vs. lows net -10.
The Nasdaq 100, while technically the strongest long-term, also saw short-term breadth collapse to 22.8%, with new lows outpacing highs by -32.
The Russell 1000 posted the most dramatic internal damage, with 544 new lows vs. 144 new highs (-400), and just 21% of components above the 5-day MA—the most severe breakdown among the major indices.
Longer-term structures (150- and 200-day MAs) remain intact across the board for now, but are increasingly vulnerable if selling continues. This is not a healthy tape beneath the surface, despite relatively small price pullbacks in the indices.
Bottom line: The rally’s internal foundation has cracked. Without a swift and decisive breadth rebound, the risk of a deeper corrective phase is now front and center.
VL Indices Market Score: 52 / 100 ( -38 WoW )
Our Market Score plunged this week as internal momentum flipped negative across all major indices. While long-term structures are still technically intact, short-term deterioration and the surge in new lows argue for caution.
1. Leadership Has Vanished
S&P 500: +97 highs vs. 242 lows → net -145
Dow Jones: +4 highs vs. 14 lows → net -10
Nasdaq 100: +11 highs vs. 43 lows → net -32
Russell 1000: +144 highs vs. 544 lows → net -400
Buyers are no longer in control. Leadership is retreating across all timeframes.
2. Participation Collapse Across the Board
5-day % of stocks above MA:
S&P 500: 24.8%
Dow Jones: 20.0%
Nasdaq 100: 22.8%
Russell 1000: 21.0%
20-day % of stocks above MA:
S&P 500: 38.3%
Dow Jones: 40.0%
Nasdaq 100: 49.5%
Russell 1000: 38.2%
Momentum is breaking down at a rapid pace. The rotation out of previously strong participation is swift and decisive.
3. Long-Term Structures Still Intact (For Now)
S&P 500: ~48–50% above 150/200 MA
Dow Jones: ~63% above 150/200 MA
Nasdaq 100: ~60–62% above 150/200 MA
Russell 1000: ~43–42% above 150/200 MA
This remains the last line of defense. If these long-term readings begin to fall meaningfully in the coming week, the risk of a more prolonged correction rises sharply.
4. Market Tone Has Shifted
Unlike prior weeks, where dips were shallow and quickly bought, this week’s action signals distribution rather than orderly rotation. Short-term breadth collapse and broad new low expansion are classic markers of institutional risk-off behavior.
This does not yet constitute a structural bear phase—but the internal shift is undeniable. Defensive positioning and risk management are now warranted.
5. Conclusion
The market has entered a fragile and vulnerable state. Breadth is deteriorating across all major indices, leadership has vanished, and the internal momentum that supported the prior rally has decisively reversed.
Unless we see a sharp rebound in breadth participation and leadership in the next 1–2 weeks, the risk of an intermediate-term correction grows substantially. We downgrade our outlook from confirmed rally to corrective risk-on alert — watch breadth metrics closely in the days ahead.
US Investor Sentiment Report
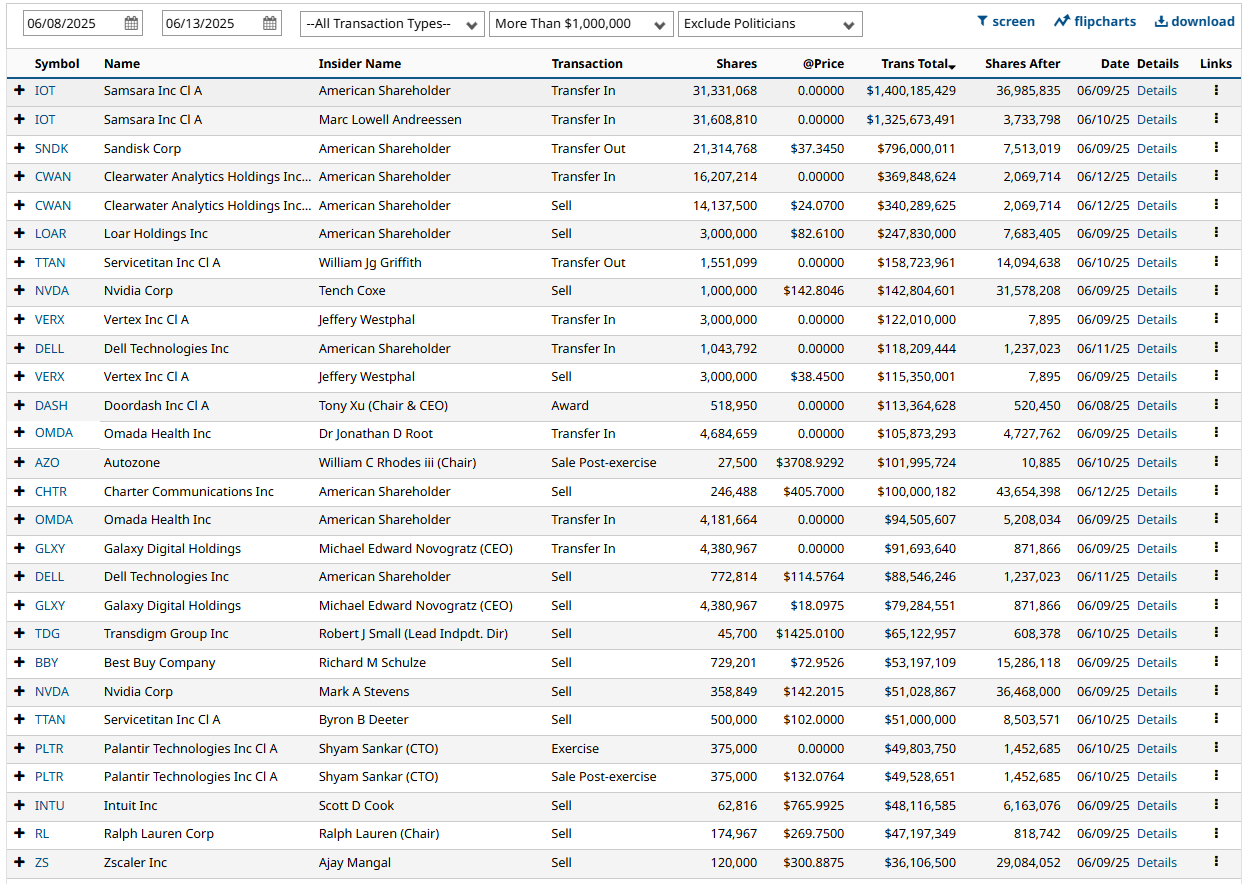
Insider Trading
Insider trading occurs when a company’s leaders or major shareholders trade stock based on non-public information. Tracking these trades can reveal insider expectations about the company’s future. For example, large purchases before an earnings report or drug trial results might indicate confidence in upcoming good news.
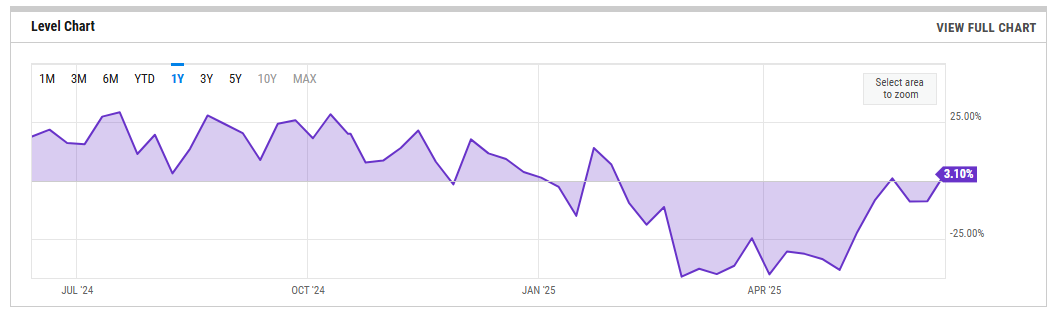
%Bull-Bear Spread
The %Bull-Bear Spread chart is a sentiment indicator that shows the difference between the percentage of bullish and bearish investors, often derived from surveys or sentiment data, such as the AAII (American Association of Individual Investors) sentiment survey. This spread tells investors about the prevailing mood in the market and can provide insights into market extremes and potential turning points.
Bullish or Bearish Sentiment:
When the spread is positive, it means more investors are bullish than bearish, indicating optimism about the market’s direction.
A negative spread indicates more bearish sentiment, meaning more investors expect the market to decline.
Contrarian Indicator:
The %Bull-Bear Spread is often used as a contrarian indicator. For example, extremely high levels of bullish sentiment might suggest that the market is overly optimistic and could be due for a correction.
Similarly, when bearish sentiment is extremely high, it might indicate that the market is overly pessimistic, and a rally could be on the horizon.
Market Extremes and Reversals:
Historically, extreme values of the spread (both positive and negative) can signal turning points in the market. A very high positive spread can signal market exuberance, while a very low or negative spread may indicate fear or capitulation.
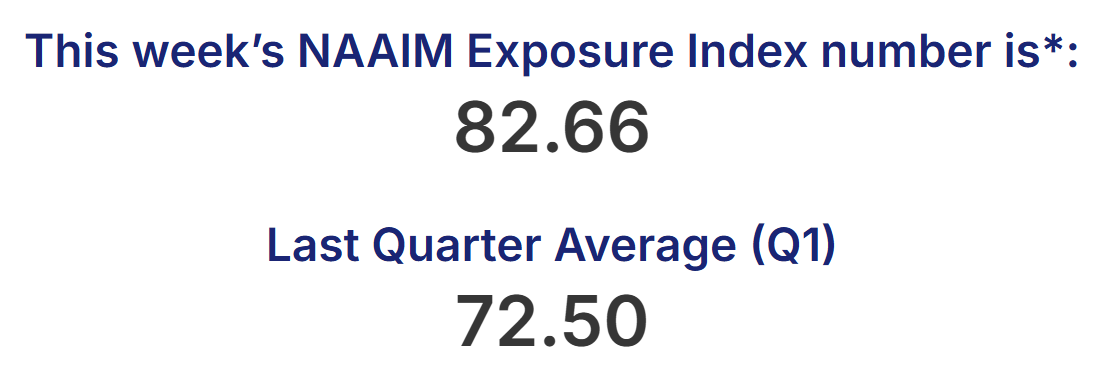
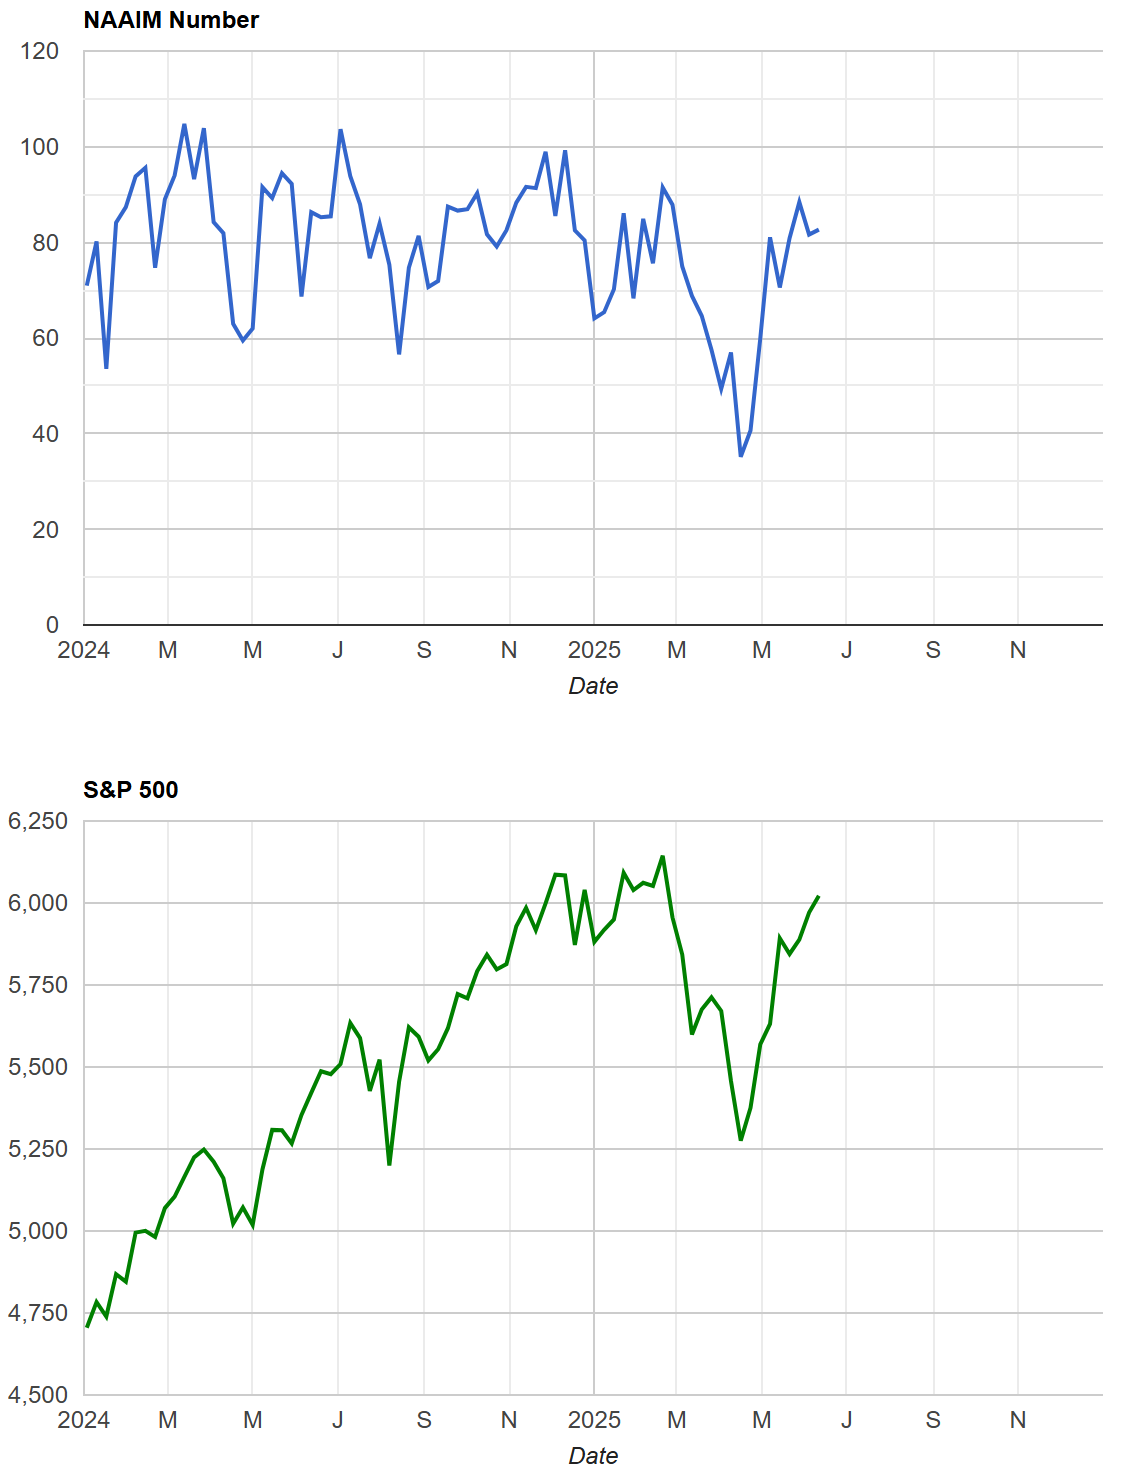
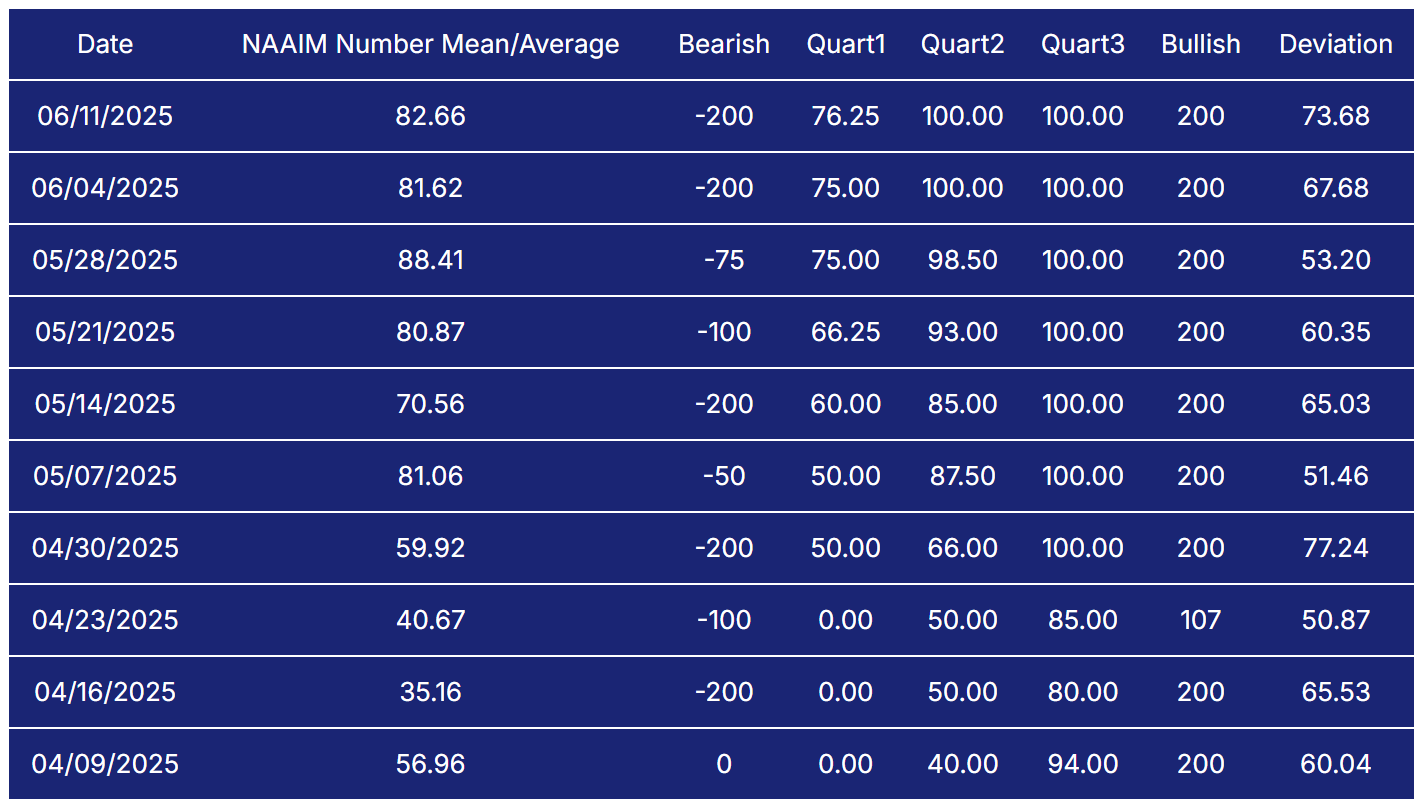
NAAIM Exposure Index
The NAAIM Exposure Index (National Association of Active Investment Managers Exposure Index) measures the average exposure to U.S. equity markets as reported by its member firms. These are typically active money managers who provide their equity exposure levels weekly. The index offers insight into how much these managers are investing in equities at any given time, ranging from being fully short (-100%) to leveraged long (up to +200%).
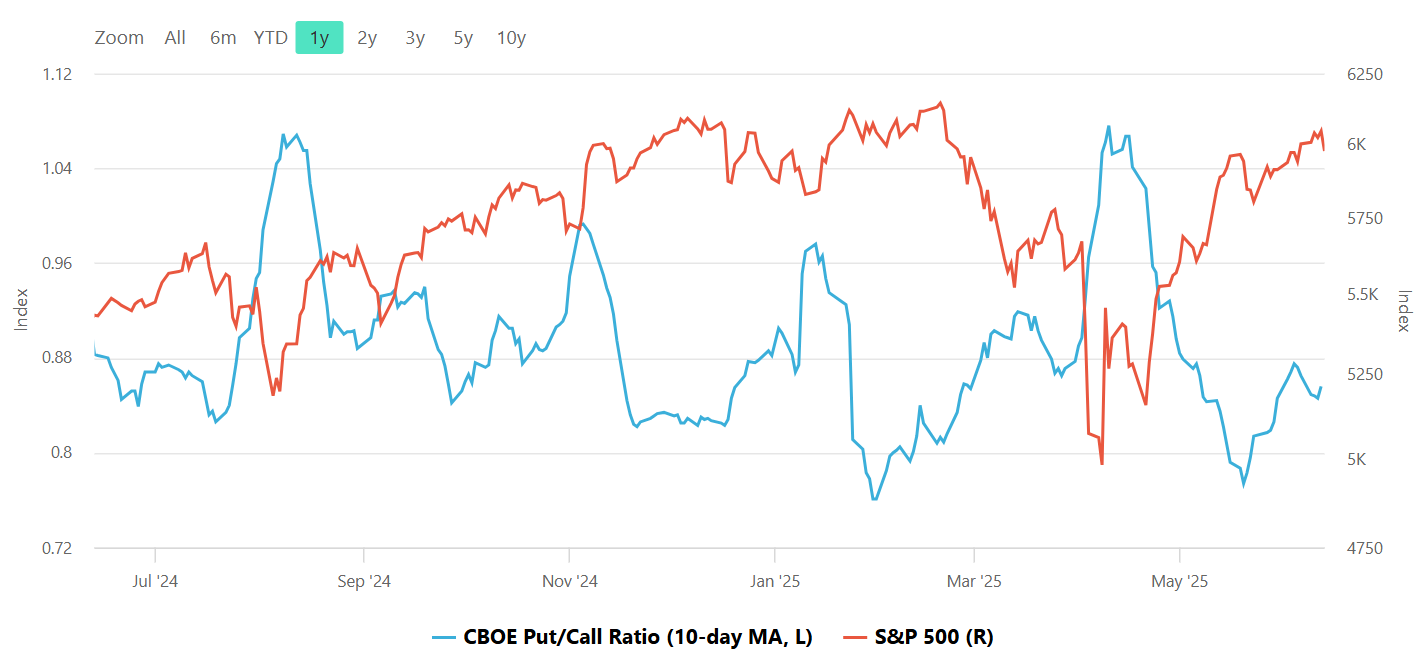
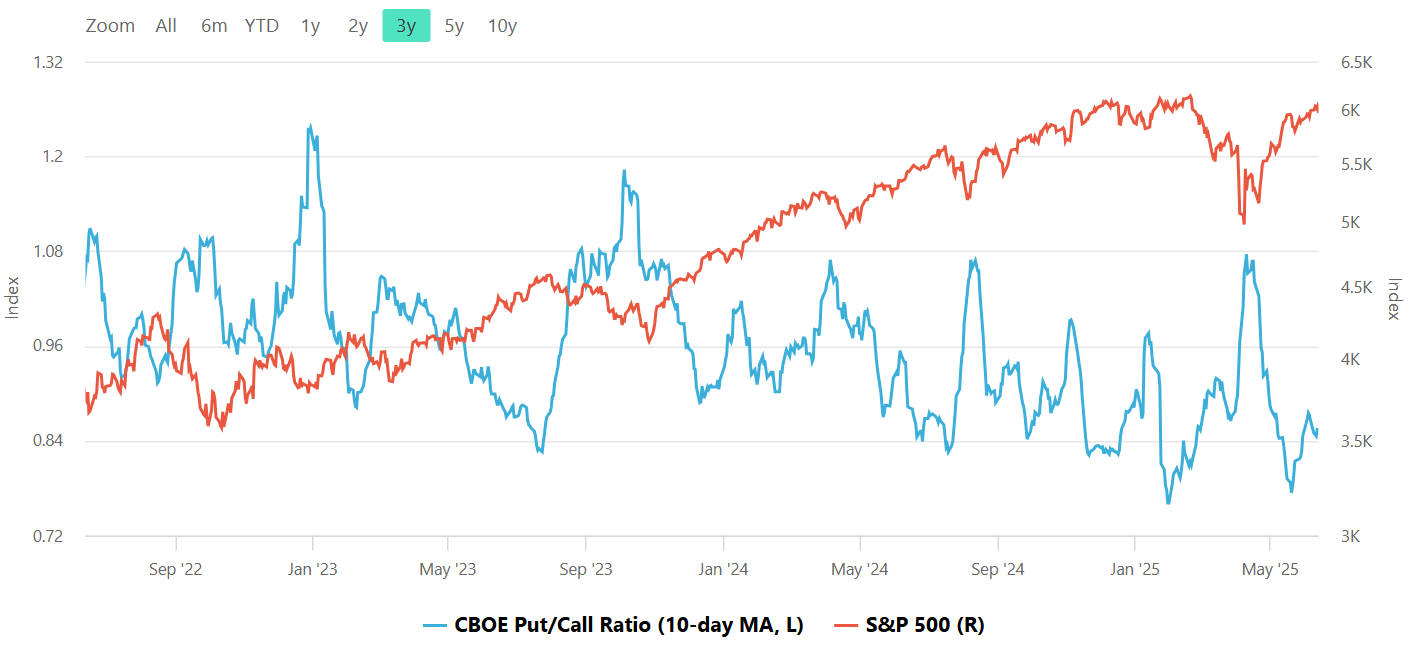
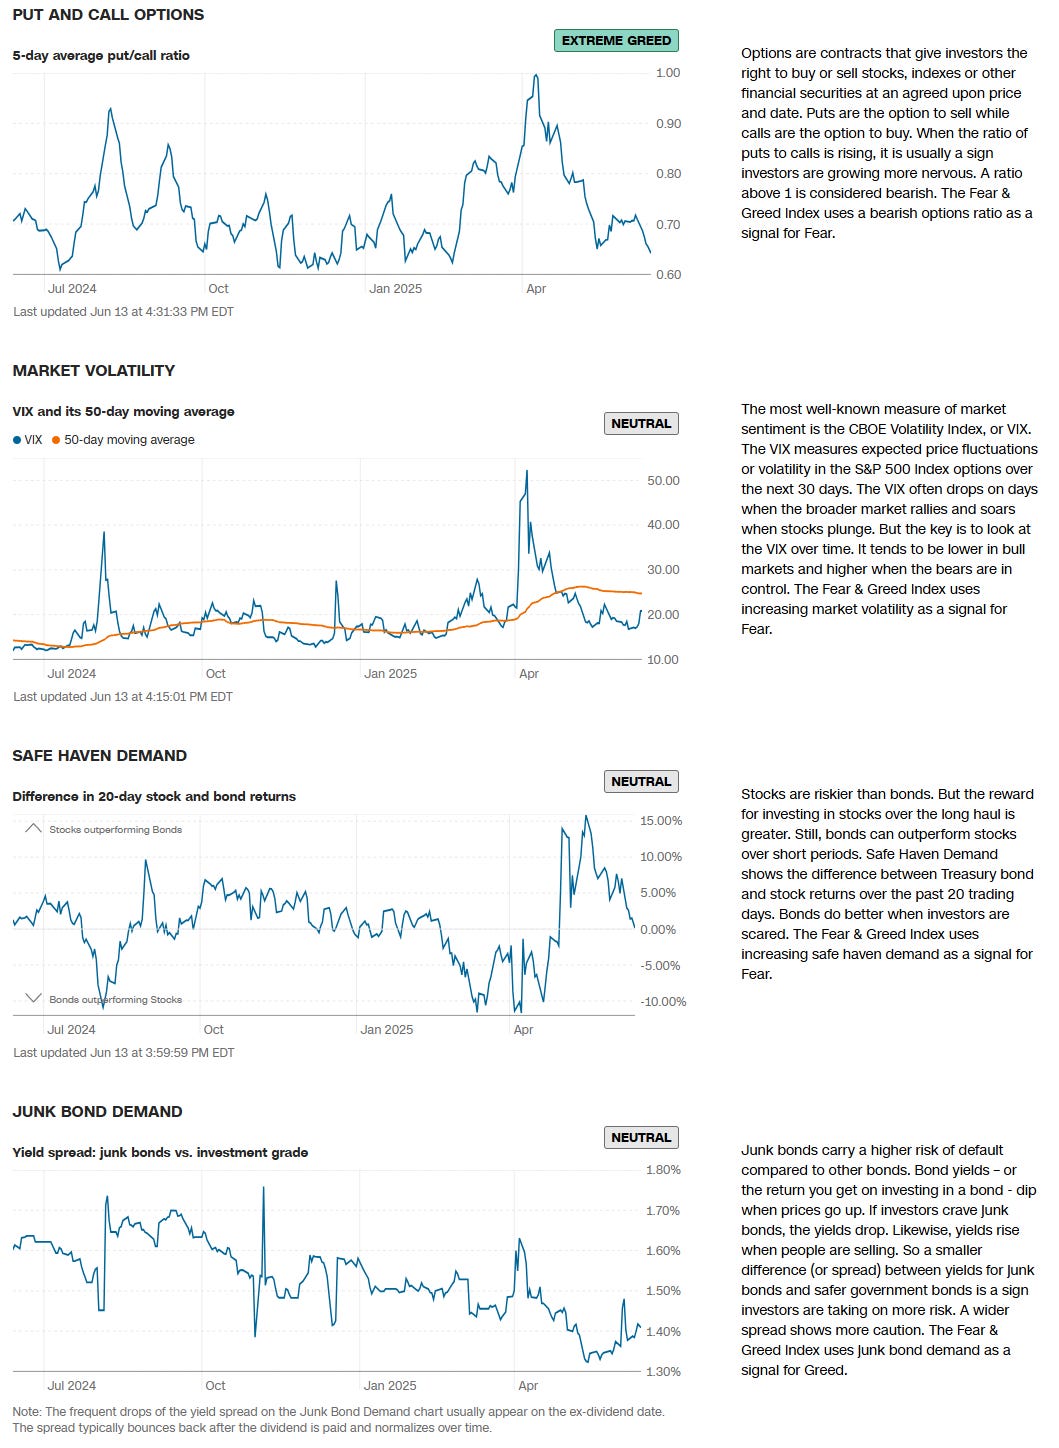
CBOE Total Put/Call Ratio
CBOE's total put/call ratio includes index options and equity options. It's a popular indicator for market sentiment. A high put/call ratio suggests that the market is overly bearish and stocks might rebound. A low put/call ratio suggests that market exuberance could result in a sharp fall.
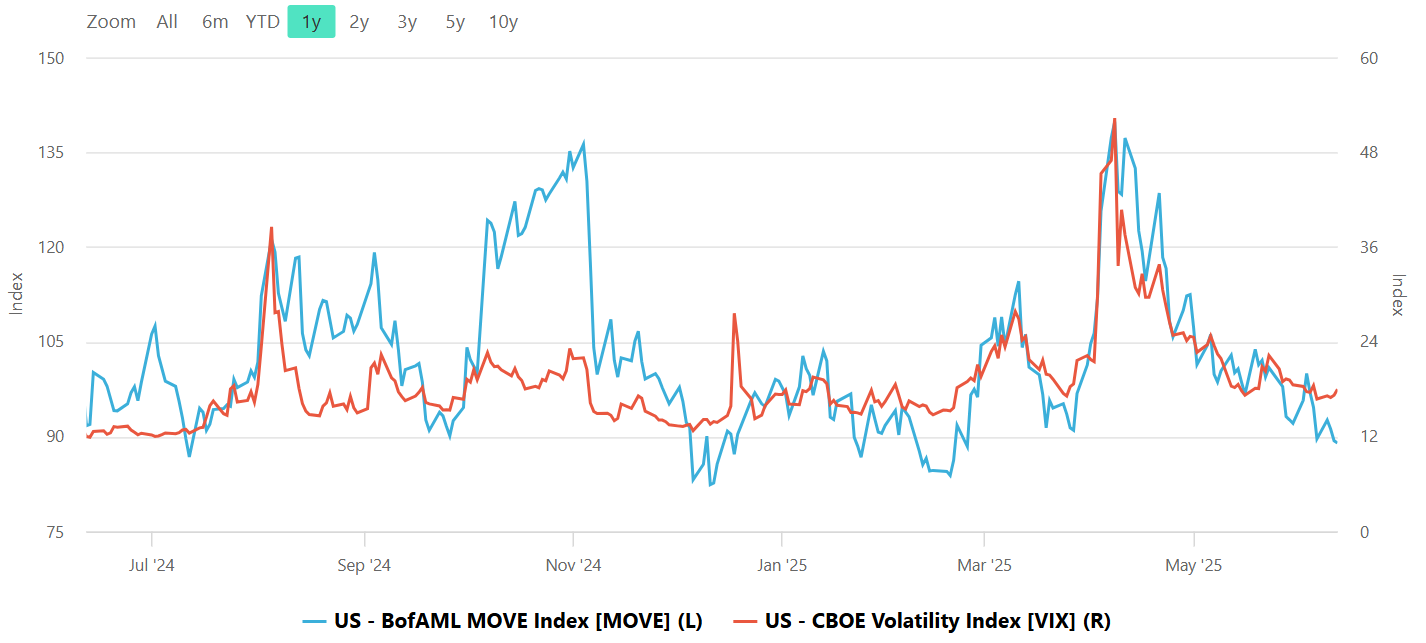
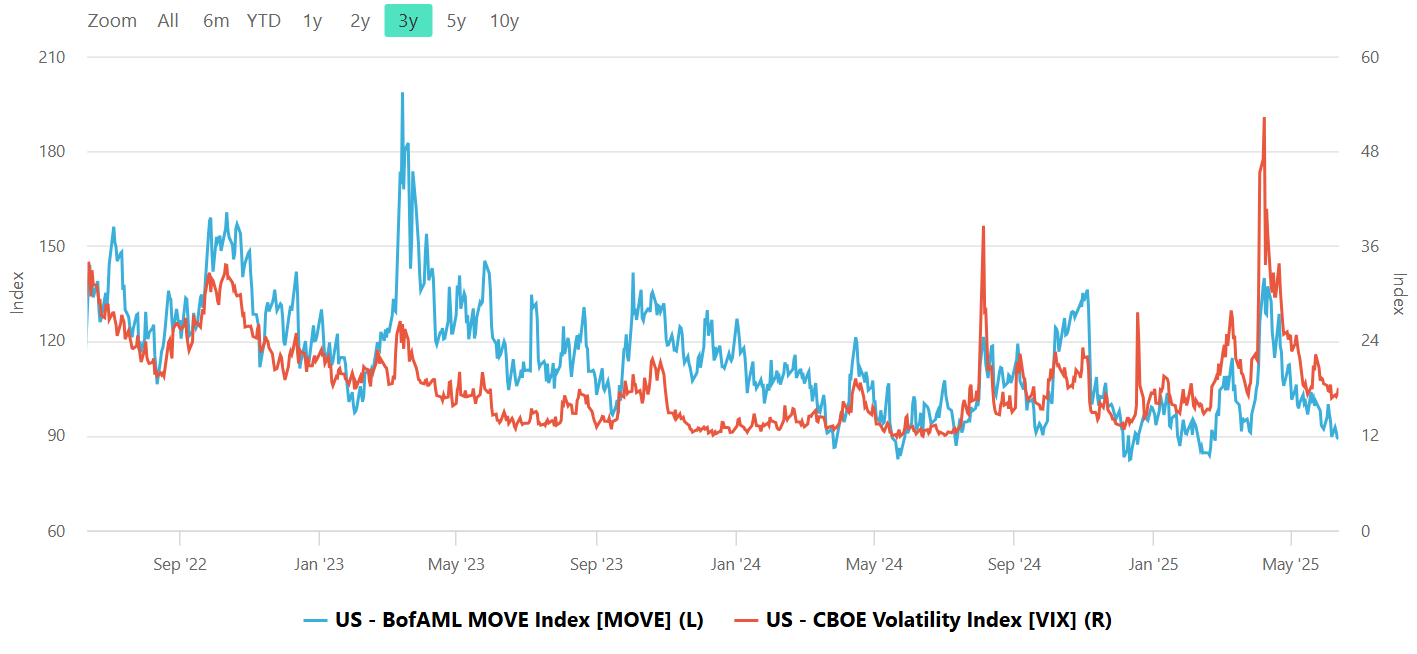
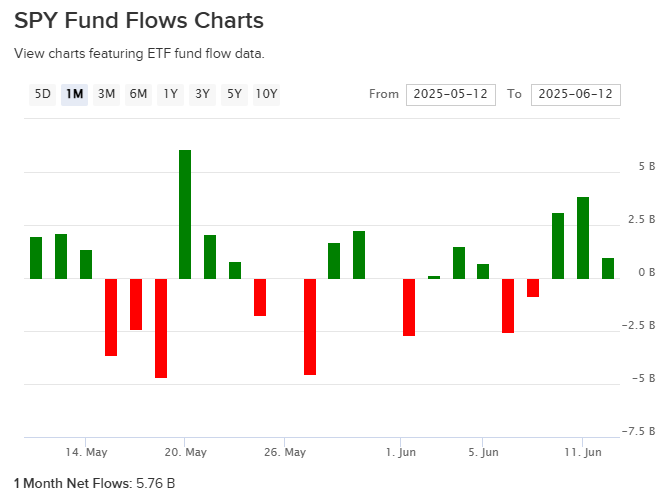
Equity vs Bond Volatility
The Merrill Lynch Option Volatility Estimate [MOVE] Index from BofAML and the CBOE Volatility Index [VIX] respectively represent market volatility of U.S. Treasury futures and the S&P 500 index. They typically move in tandem but when they diverge, an opportunity can emerge from one having to “catch-up” to the other.
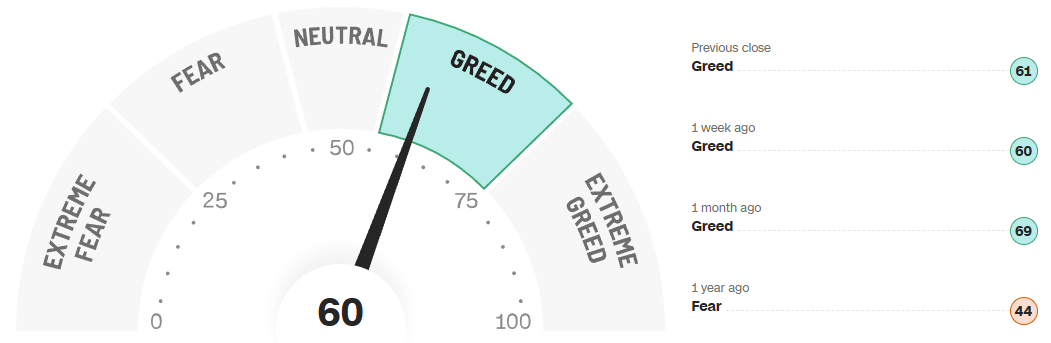
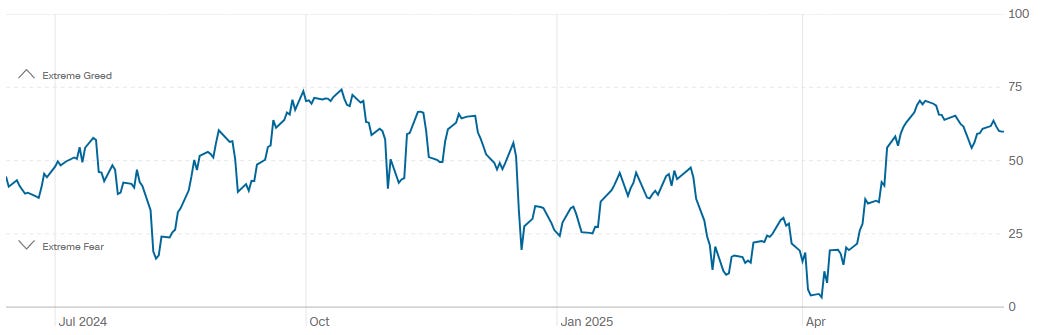
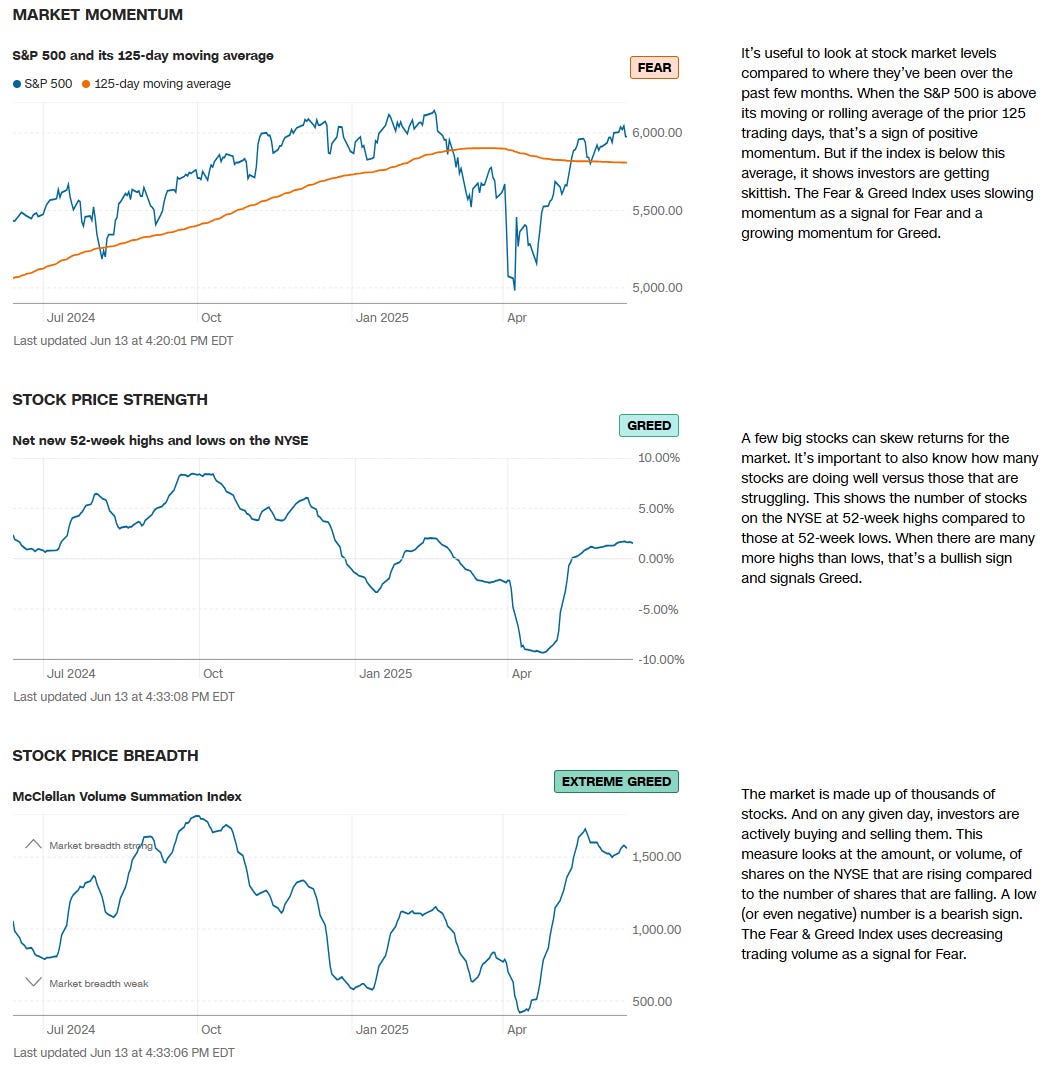
CNN Fear & Greed Constituent Data Points & Composite Index
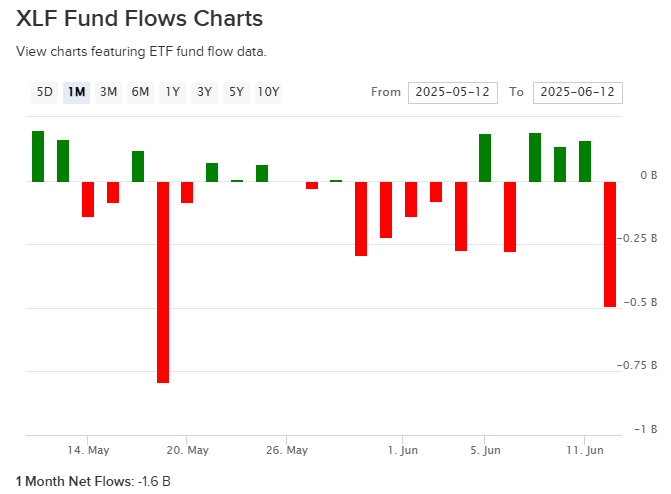
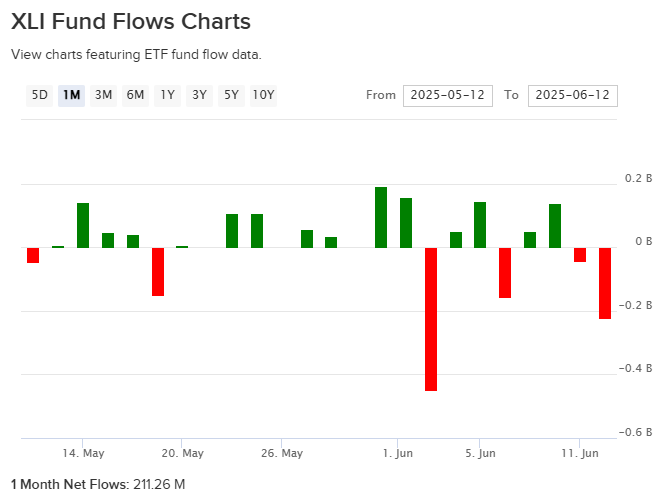
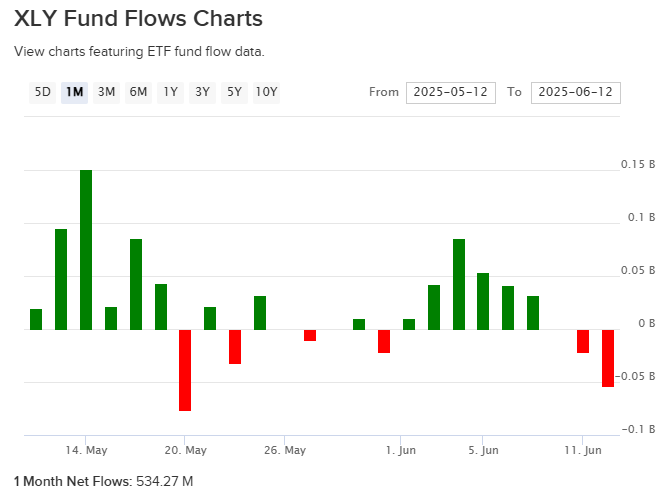
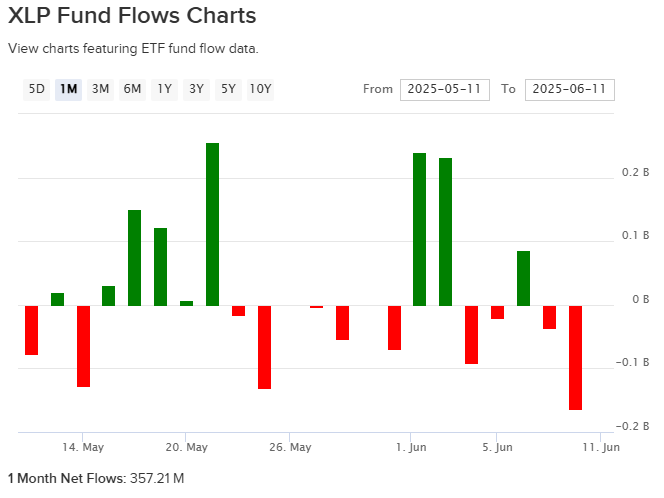
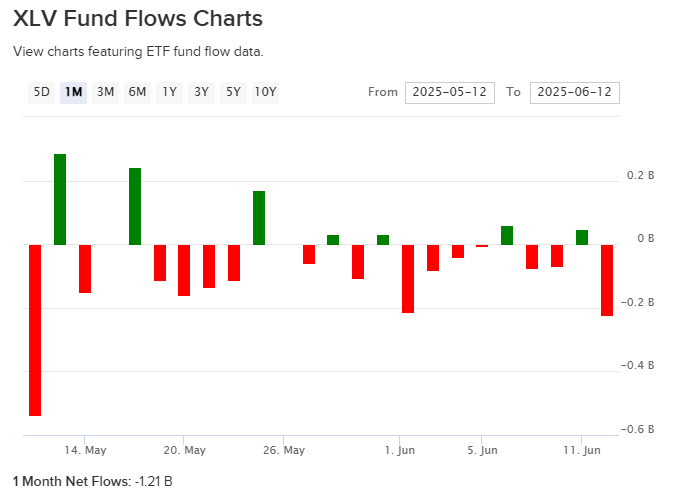
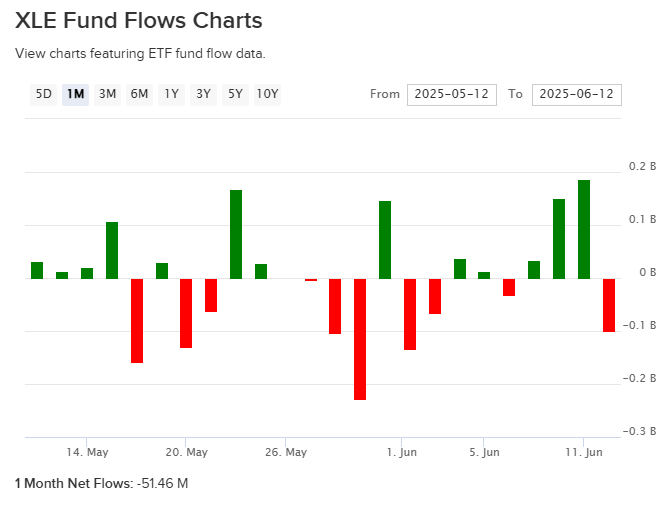
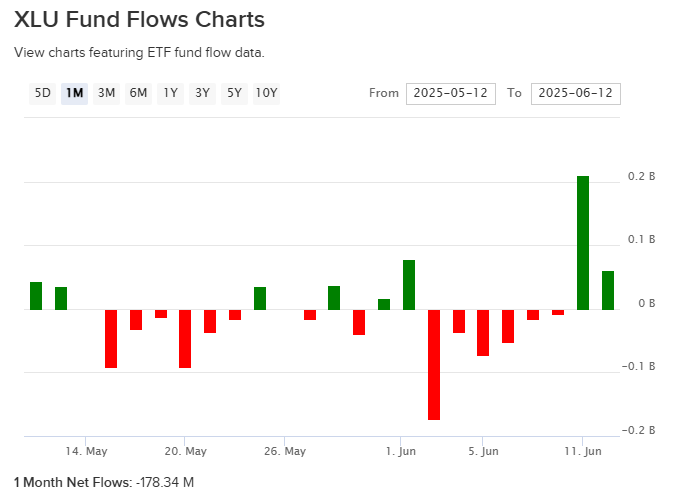
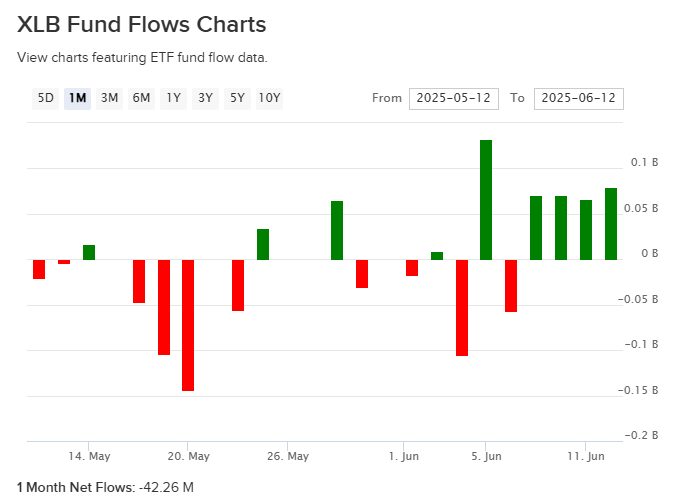
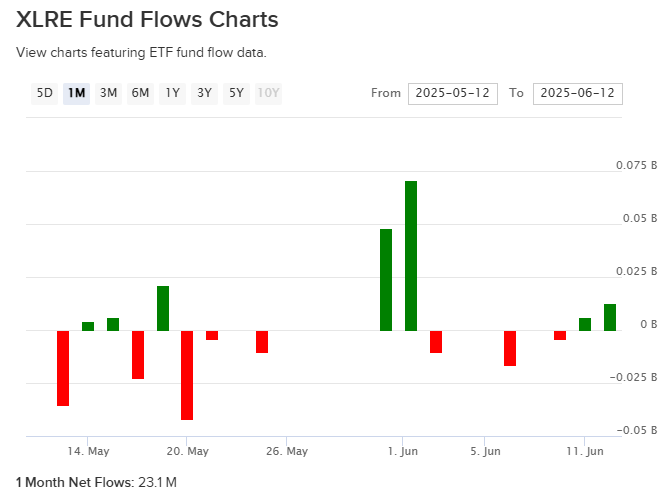
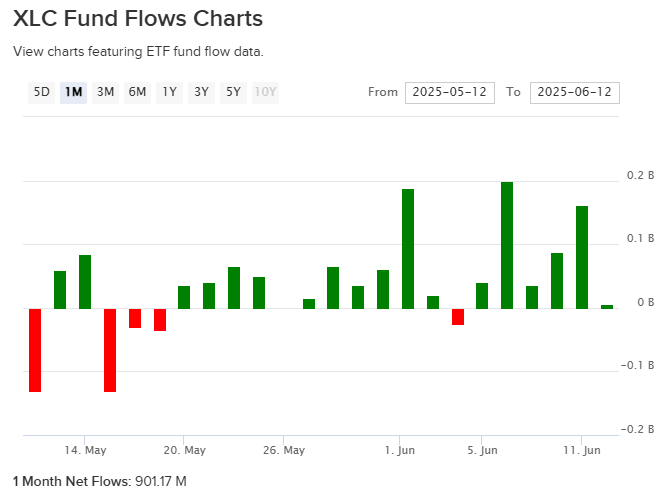
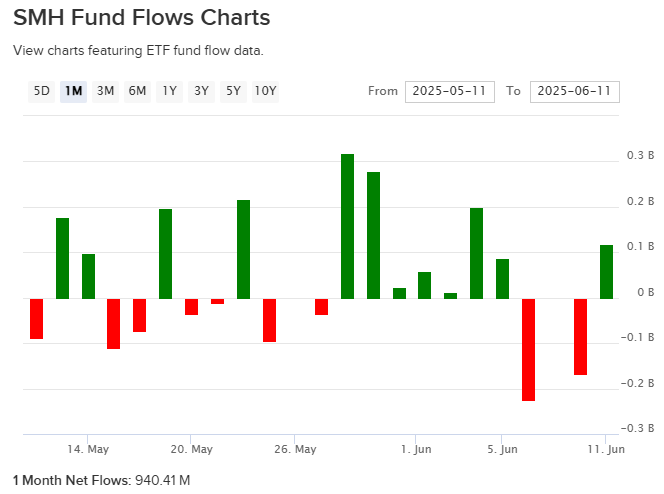
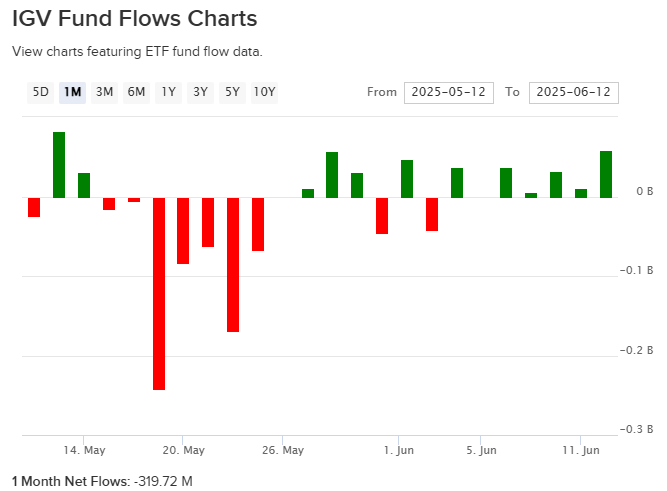
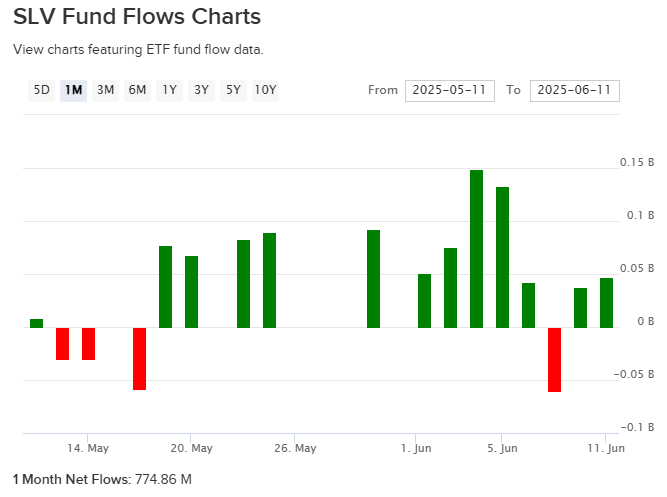
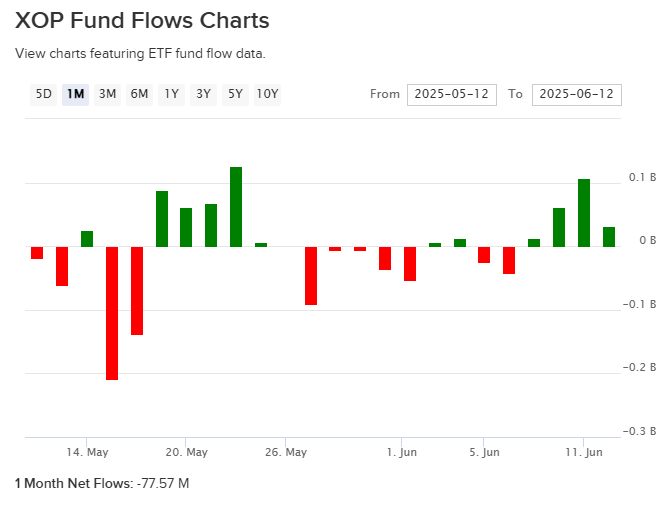
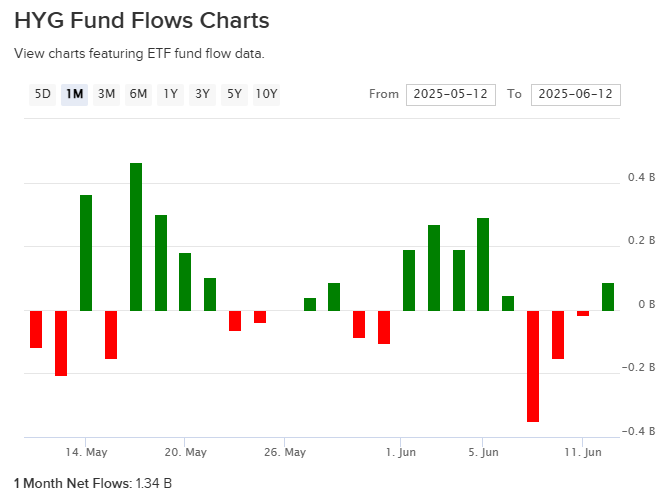
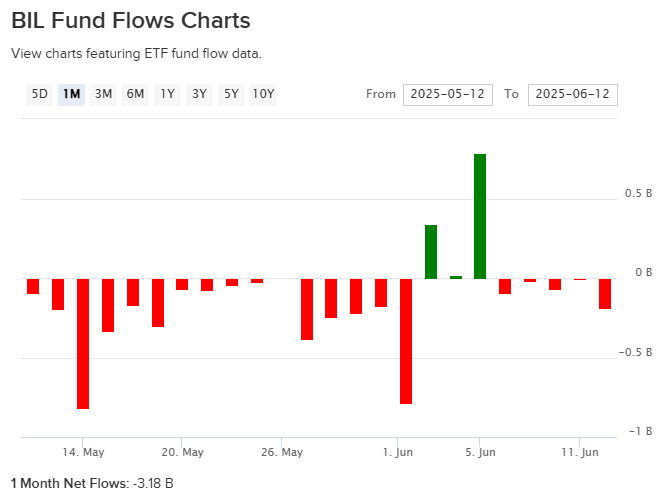
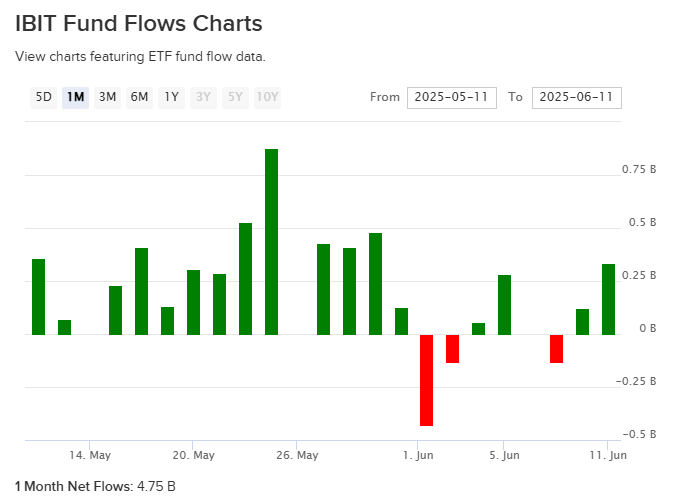
Fund Flows Snapshot
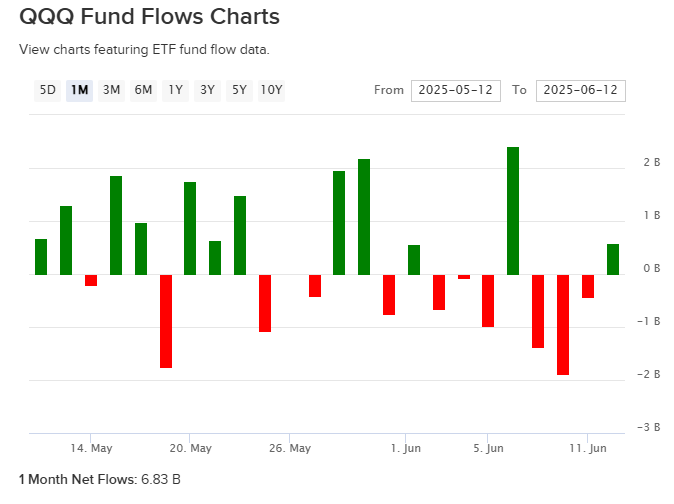
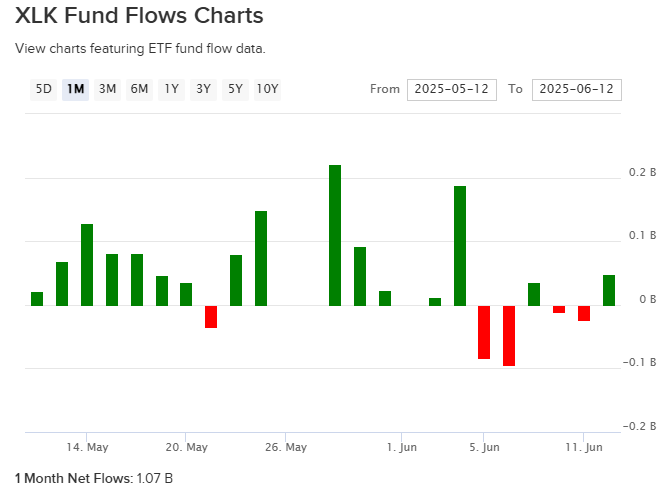
How to Read Fund Flows
Fund flows track the net movement of money into or out of ETFs over a given time period. Positive flows mean investors are adding money to that ETF; negative flows mean they are pulling money out. Fund flows provide insight into where capital is moving, which sectors or themes are being favored, and how market participants are positioning themselves.
Why Fund Flows Matter
Flows often tell us what’s happening beneath the surface of price action:
When flows align with a trend, they can confirm its strength.
When flows diverge from price (price rising but outflows), they can signal potential exhaustion or false moves.
Tracking sector rotation via flows helps identify where institutional money is moving — often ahead of retail.
Flows into defensive assets (utilities, staples, gold) can warn of rising risk aversion, while inflows into growth sectors or high-yield credit signal a more risk-on environment.
How to Use This Section
When reviewing the 1-month trailing fund flows:
Look for which sectors/themes are seeing inflows vs outflows — rotation can often precede price leadership.
Watch for flows into safe-haven assets — growing fear or hedging activity.
Pay attention to flow divergences — if flows contradict recent price moves, it may signal changing market dynamics.
Use flow trends as a lens for market risk appetite — is capital positioning for expansion, protection, or reversal?
What to Look For
Strong inflows → Sector/theme gaining institutional sponsorship — potential leadership emerging.
Consistent outflows → Sector/theme falling out of favor — headwind to price.
Sudden flow reversals → Shifts in market regime or sentiment — time to investigate.
Flows into defensive sectors + out of cyclicals → Broad de-risking underway.
Flows into growth & cyclicals → Confidence in the market’s forward outlook.
Bottom line: Fund flows give you an edge in tracking where the market is positioning next — often before it shows up in price.
This section helps you see what’s moving behind the scenes so you can align your trades and investments accordingly.
Pro Tips
When flows go into cyclical sectors + out of defensives → risk-on.
When flows go into defensives + credit ETFs + gold → risk-off or caution.
When flow divergence happens (e.g. price rising but XLF or XLI flows negative) → be alert for reversals.
When flows surge into money market funds → risk aversion peaking → contrarian bullish if combined with price washout.
When flows chase hot sectors late in a rally (high trailing flows in XLK, XLY, SMH after extended runs) → watch for potential crowding and reversal risk.
When broad market flows (SPY, QQQ) are flat or negative but sector flows are positive → market is entering a stock-picker’s tape — be selective, not broad beta.
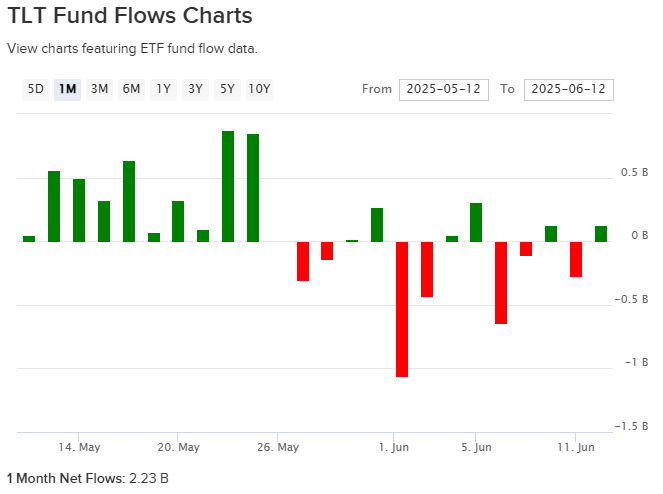
When flows move sharply into bond proxies (XLU, XLRE, XLP) → rate expectations shifting → monitor yields and Fed signals.
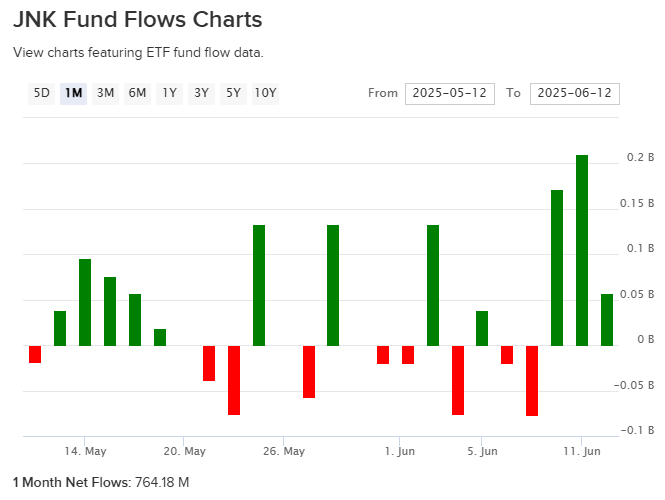
When HYG / JNK flows flip strongly negative → rising credit stress → equities vulnerable to volatility spike.
When flows into small caps (IWM) surge after underperformance → reflation expectations building → often signals early phase of macro turn.
When global ETF flows (EEM, EFA) sharply diverge from US flows → macro capital rotation underway — useful for FX and commodities positioning.
Core S&P 500 Sector ETFs
Popular Thematic / Subsector ETFs to Watch
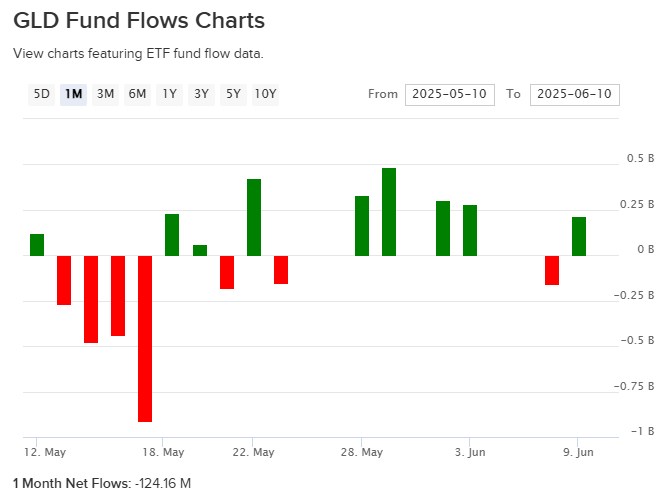
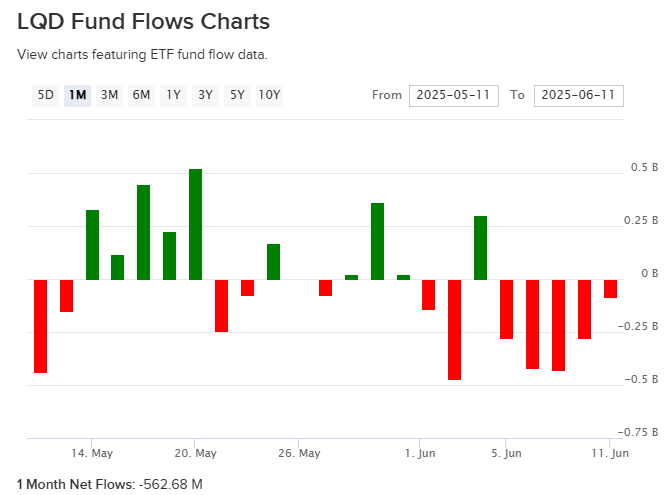
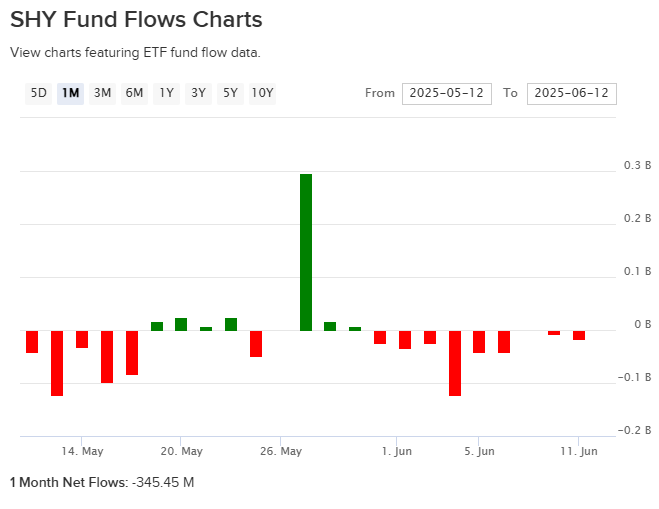
Fixed Income / Credit ETFs
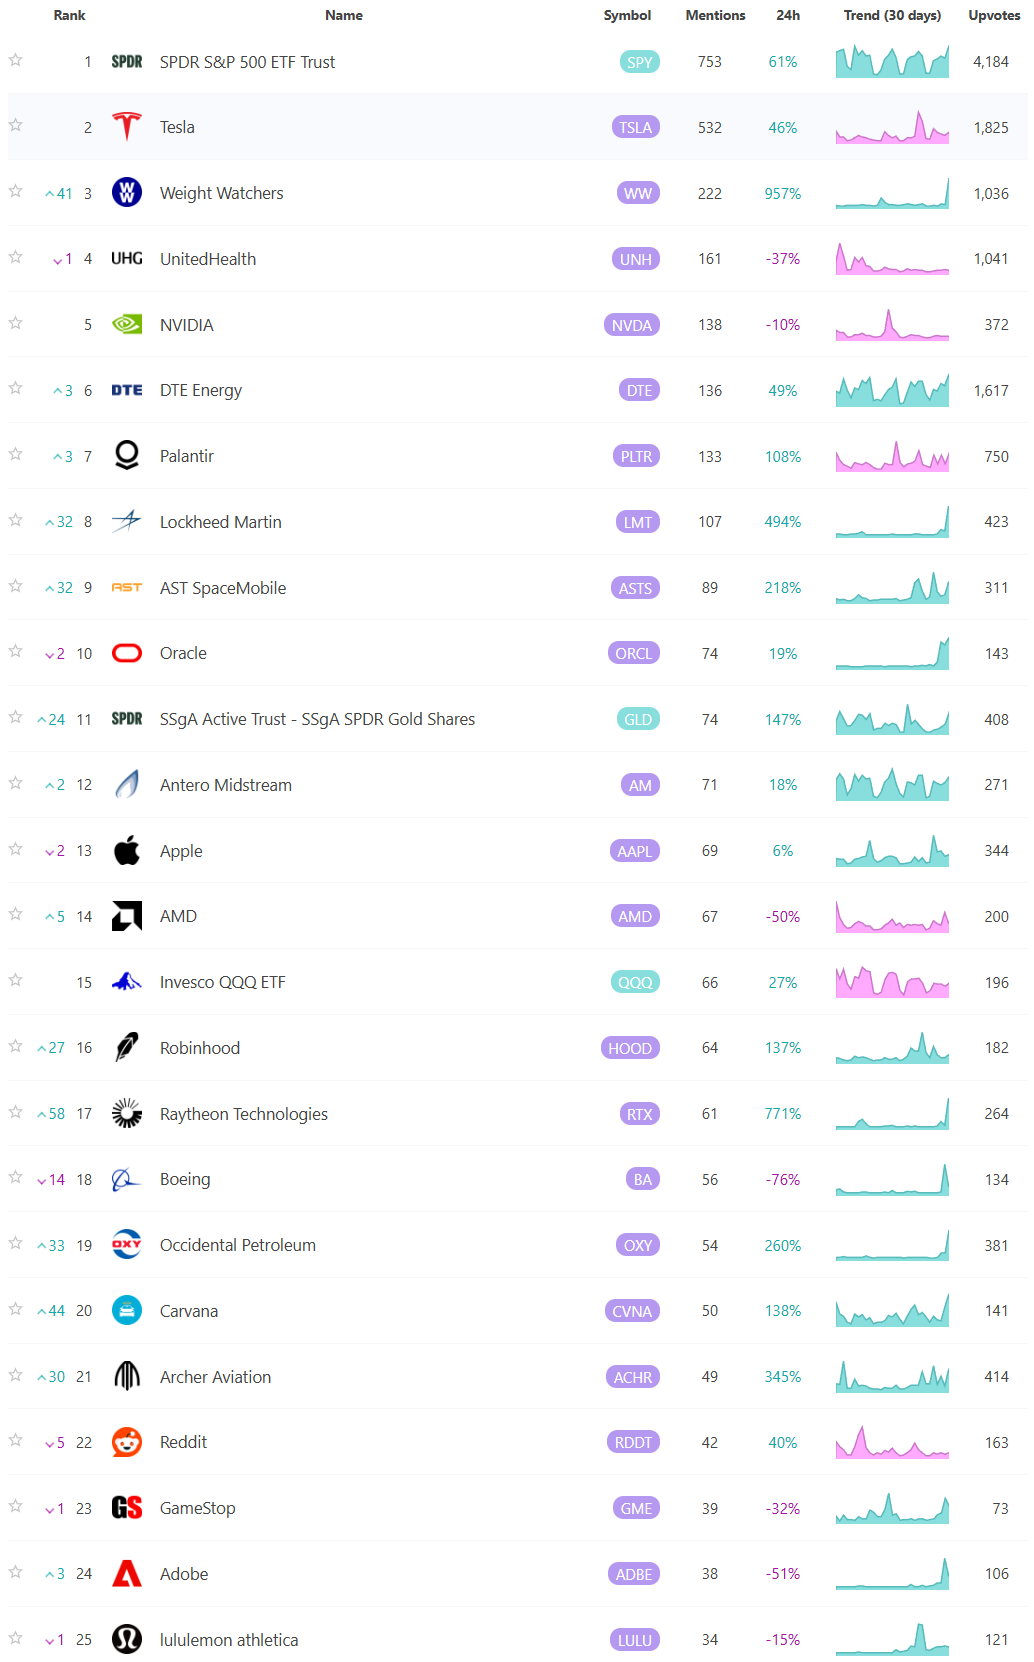
Social Media Favs
Analyzing social sentiment can provide valuable insights for investment strategies by offering a pulse on public perception, mood, and market sentiment that traditional financial indicators might not capture. Here’s how social sentiment analysis can enhance investment decisions:
Market Momentum: Positive or negative social sentiment can signal impending momentum shifts. When public opinion on a stock, sector, or asset class changes sharply, it can create buying or selling pressure, especially if that sentiment becomes widespread.
Early Detection of Trends: Social sentiment data can help investors spot trends before they show up in technical or fundamental data. For example, increased positive chatter around a particular company or sector might indicate growing interest or excitement, which could lead to price appreciation.
Gauge Retail Investor Impact: With the rise of retail investor platforms, collective sentiment on social media can lead to significant price movements (e.g., meme stocks). Understanding how retail investors view certain stocks can help in identifying high-volatility opportunities.
Event Reaction Monitoring: Social sentiment can provide real-time reactions to news events, product releases, or earnings reports. Investors can use this information to gauge market reaction quickly and adjust their strategies accordingly.
Complementing Quantitative Models: By adding a social sentiment layer to quantitative models, investors can enhance predictions. For example, a model that tracks historical price and volume data might perform even better when factoring in sentiment trends as a measure of market psychology.
Risk Management: Negative sentiment spikes can be a signal of potential downturns or increased volatility. By monitoring sentiment, investors might avoid or hedge against investments in companies experiencing a public relations crisis or facing negative perceptions.
Long-Term Sentiment Trends: Sustained sentiment trends, whether positive or negative, often mirror longer-term market cycles. Tracking sentiment trends over time can help identify shifts in investor psychology that could affect longer-term investments or sector rotations.
For these reasons, sentiment analysis, when combined with other tools, can provide a comprehensive view of both immediate market reactions and underlying investor attitudes, helping investors position themselves strategically across various time frames. Here are the most mentioned/discussed tickers on Reddit from some of the most active Subreddits for trading:

Special Coverage Report
Seeing the Full Picture: How Bank of America Uses 20 Valuation Metrics to Evaluate Equity Worth
I. The Myth of the One True Metric
In the chaotic chorus of modern markets, there is an enduring temptation to distill investment decisions into a single, elegant number. For decades, the Price-to-Earnings ratio (P/E) has been the go-to shortcut for investors of all stripes — from portfolio managers to the weekend warrior managing a Roth IRA between coffee breaks. It’s a comforting figure: easy to calculate, easy to compare, easy to misinterpret.
But Bank of America, one of the largest and most influential financial institutions in the world, rejects that simplicity. Behind the curtain of its research desks and global strategy teams lies a valuation engine that runs not on a single signal but on a chorus of 20 distinct valuation metrics. These range from traditional ratios like P/B and EV/EBITDA to more nuanced indicators of cash flow, profitability, and capital structure. Together, they form a comprehensive mosaic — a layered approach that resists the allure of shortcuts and embraces complexity.
This is not merely an academic exercise or a tool of redundancy. BoA’s analysts believe valuation is too important — and too subtle — to leave in the hands of a single metric. By evaluating assets across multiple financial lenses, they are able to detect inconsistencies, identify traps, and more accurately value opportunity amid noise. This report explores how and why that 20-metric framework was built — and why it matters more than ever in today’s fractured markets.
II. The Philosophy Behind the 20-Metric Framework
To understand the why of this approach, we must first grapple with the core philosophical idea underpinning BoA’s strategy: valuation is probabilistic, not deterministic. There is no single formula that guarantees value. Rather, value exists in the interplay of expectations, fundamentals, capital structure, cash flow dynamics, and market sentiment. It is revealed over time — often only in hindsight — and is constantly distorted by narratives, liquidity, and macroeconomic regimes.
BoA’s 20-metric framework is built to see through that distortion. It exists to triangulate — to confirm or contradict the signals that any one metric might flash. For example, a low P/E might suggest a bargain, but if that company is hemorrhaging cash or weighed down by debt, the true value may be far less than the earnings multiple implies.
This mosaic approach also reflects sectoral nuance. What counts as a high P/B ratio for a bank may be par for the course for a biotech firm. Similarly, capital-intensive industries may look unattractive on net margin but shine on EBITDA or asset turnover. The 20-metric framework accounts for these divergences. It doesn't seek universal truth — it seeks contextual clarity.
III. Price-Based and Earnings Metrics: The Old Standbys
Let’s begin with the most familiar territory: price-based and earnings-based metrics. These include:
P/E Ratio (Trailing 12 Months)
Forward P/E
PEG Ratio (Price/Earnings-to-Growth)
Price to Book (P/B)
Price to Sales (P/S)
These are what most investors would recognize from a finance textbook or brokerage dashboard. They provide a surface-level view of what you’re paying for an asset, relative to what it’s earning, owning, or selling.
But surface-level does not mean irrelevant. BoA still relies heavily on these traditional metrics, particularly for screening large universes of stocks. P/E and Forward P/E are used to identify outliers, detect regime shifts, and quickly scan sectoral valuation dispersion. PEG adds a growth dimension to the equation — often helping analysts determine whether a high P/E is justified.
Price to Book (P/B) shines especially in asset-heavy sectors — like financials and industrials — where tangible equity plays a significant role in valuation. Meanwhile, P/S is often a go-to when earnings are negative or distorted, as in early-stage tech or healthcare plays.
These five metrics are the starting point in the 20-metric ensemble, but never the endpoint. They are the front door — inviting but incomplete.
IV. The Rise of Cash Flow and Enterprise Value Metrics
Valuation evolves with the market, and nowhere is that clearer than in the growing dominance of cash flow and EV-based metrics. These include:
Price to Free Cash Flow (P/FCF)
EV/EBITDA
EV/EBIT
EV/Sales
EV/Free Cash Flow
Why the pivot? In short: cash doesn’t lie.
Earnings can be manipulated through accounting assumptions, but cash flow reveals operational health. BoA leans heavily on P/FCF to assess whether a company is generating real value that can be reinvested or returned to shareholders. This is especially important in mature industries, where earnings growth may be modest but cash generation is strong.
Enterprise Value (EV) introduces a broader lens. It accounts not just for market cap but also for debt and cash — the entire capital structure. That’s where EV/EBITDA and EV/EBIT come in. These metrics allow for cross-company comparisons regardless of leverage levels, a critical distinction in industries like telecom, energy, and utilities where debt is a structural feature.
EV/Sales is particularly useful when a company has negative earnings but strong revenue momentum — common in high-growth tech. And EV/FCF is the holy grail for many analysts, combining the breadth of enterprise value with the purity of free cash flow.
BoA’s analysts often consider these metrics to be "truth-tellers" in an otherwise noisy environment. They cut through GAAP smoke and mirror games and expose what the business is really worth to an acquirer or long-term investor.
V. Profitability & Quality Metrics: Cutting Through the Noise
Not all valuation is about price. Some of it is about what the business does with its resources. This brings us to the profitability and quality cluster:
Earnings Yield
Operating Margin
Net Profit Margin
Return on Equity (ROE)
Return on Assets (ROA)
Return on Invested Capital (ROIC)
These metrics help BoA distinguish between cheap and good. A low P/E stock may seem like a value buy — until you realize the company earns just a sliver of profit on every dollar of revenue. In contrast, a high-margin, high-ROIC business with strong returns on capital might be a far better long-term investment even if it appears expensive on traditional metrics.
ROE and ROIC, in particular, are signals of a business’s ability to reinvest profitably. They are key indicators in BoA’s quality-factor screens and often guide the team’s thinking when constructing durability-focused portfolios.
Margins (operating and net) help isolate cost control and pricing power — key traits in an inflationary or recessionary environment. Earnings yield, the inverse of P/E, is often used as a relative value tool in asset allocation decisions — especially when comparing equities to bonds.
VI. Growth Metrics: The Path Forward
Valuation, in isolation, is meaningless without growth. A company trading at 50x earnings might still be cheap if those earnings are about to triple. That’s why BoA factors in:
Earnings Growth Rate (3- or 5-year CAGR)
Revenue Growth Rate
Growth metrics are notoriously volatile — subject to macro conditions, management changes, or secular disruption — but BoA uses them to contextualize multiples. A PEG ratio (P/E to Growth) under 1 might indicate that growth is underappreciated. Conversely, a high-growth stock with decelerating revenue should raise red flags.
The bank’s analysts cross-reference growth expectations with valuation and profitability. A high-growth name that also generates FCF and high ROIC? That’s gold. A fast grower burning cash and taking on debt? Tread carefully.
Growth is also central to thematic investing. Whether it’s AI, green energy, or semiconductors, BoA’s strategists use historical and forecasted CAGR data to filter and prioritize among peers.
VII. Risk & Balance Sheet Strength
No valuation framework is complete without a serious look at financial risk. BoA tracks:
Debt to Equity Ratio
Interest Coverage Ratio
These help the bank assess whether a company’s capital structure is sustainable — especially in rising rate environments or periods of credit tightening. Debt/Equity flags over-leveraged firms vulnerable to refinancing risk. Interest coverage gauges how comfortably a company can service its obligations.
These metrics also inform dividend sustainability and M&A potential. A low-leverage firm with strong coverage ratios might be a safer play in defensive rotations. Conversely, a highly leveraged company might be a risky — but high-reward — turnaround candidate.
BoA doesn’t use these metrics just to avoid downside. They’re also used to identify opportunities during dislocation — when credit fears overshoot the fundamentals.
VIII. How These Metrics Interact: Building a Composite View
The real power of BoA’s valuation model lies not in the metrics themselves, but in how they interact.
For example:
A stock with a low Forward P/E but negative FCF and deteriorating margins? That’s a value trap.
A stock with high EV/EBITDA but massive revenue growth and improving ROIC? That might be a misunderstood growth story.
BoA’s analysts weigh these factors depending on sector, stage of the business cycle, and macro regime. The bank rarely gives equal importance to all 20 metrics. Instead, they use them to tell a cohesive story — and to check whether that story holds up under multiple lenses.
It’s a bit like flying a plane with multiple instruments. You wouldn’t want to rely on just your altimeter. You need airspeed, direction, fuel level, and wind readings. The same goes for valuation.
IX. The Quant Layer: Scorecards, Factor Models & Screening
BoA doesn’t stop at interpretation. These metrics feed into quantitative models, scorecards, and ranking systems. The bank runs factor-based screens, where these metrics are weighted and scored to build custom portfolios.
Value Factors: P/E, P/B, EV/EBITDA
Quality Factors: ROE, ROIC, margins
Growth Factors: Earnings/revenue CAGR
Risk Factors: Debt ratios, interest coverage
This systematic layer powers smart beta products, sector rotation strategies, and risk overlays. It also forms the basis for tactical research notes sent to institutional clients — especially in volatile markets.
These screens can also flag stocks that may be poised to re-rate — either upward due to improving fundamentals or downward due to deteriorating quality.
X. Closing Thoughts: Seeing Like a Research Desk
If this all sounds exhaustive, that’s because it is. BoA’s 20-metric framework isn’t just about being thorough — it’s about being conviction-driven in a world addicted to noise.
In a time when headlines, sentiment shifts, and AI-generated news cycles can move billions in minutes, valuation discipline is more critical than ever. The point isn’t to be perfect — it's to be less wrong, more often.
Investors can’t always predict the future. But by using a wide lens, they can better understand the present — and make more grounded assumptions about what comes next. Whether you’re an institutional allocator or an individual stock picker, the lesson is clear: trust no single signal.
A stock, like a person, is too complex to judge on one dimension.
Institutional S/R Levels for Major Indices
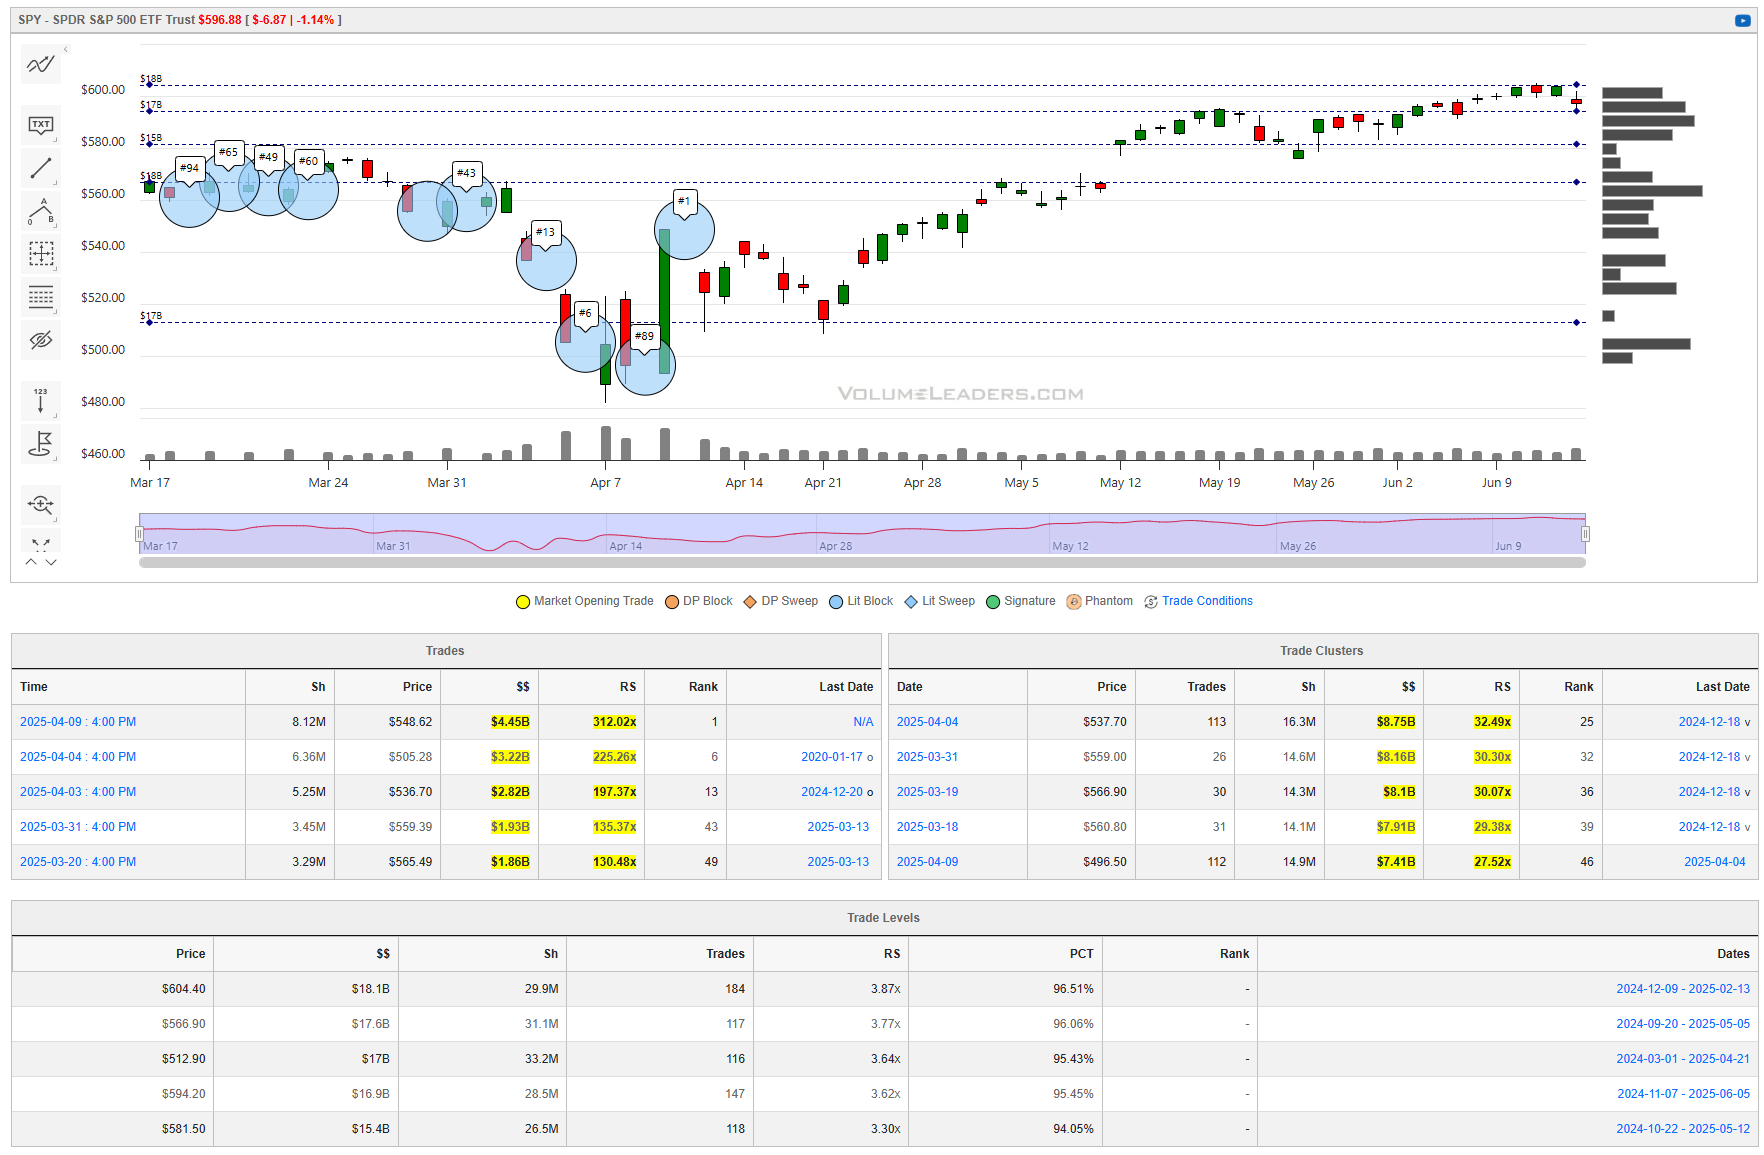
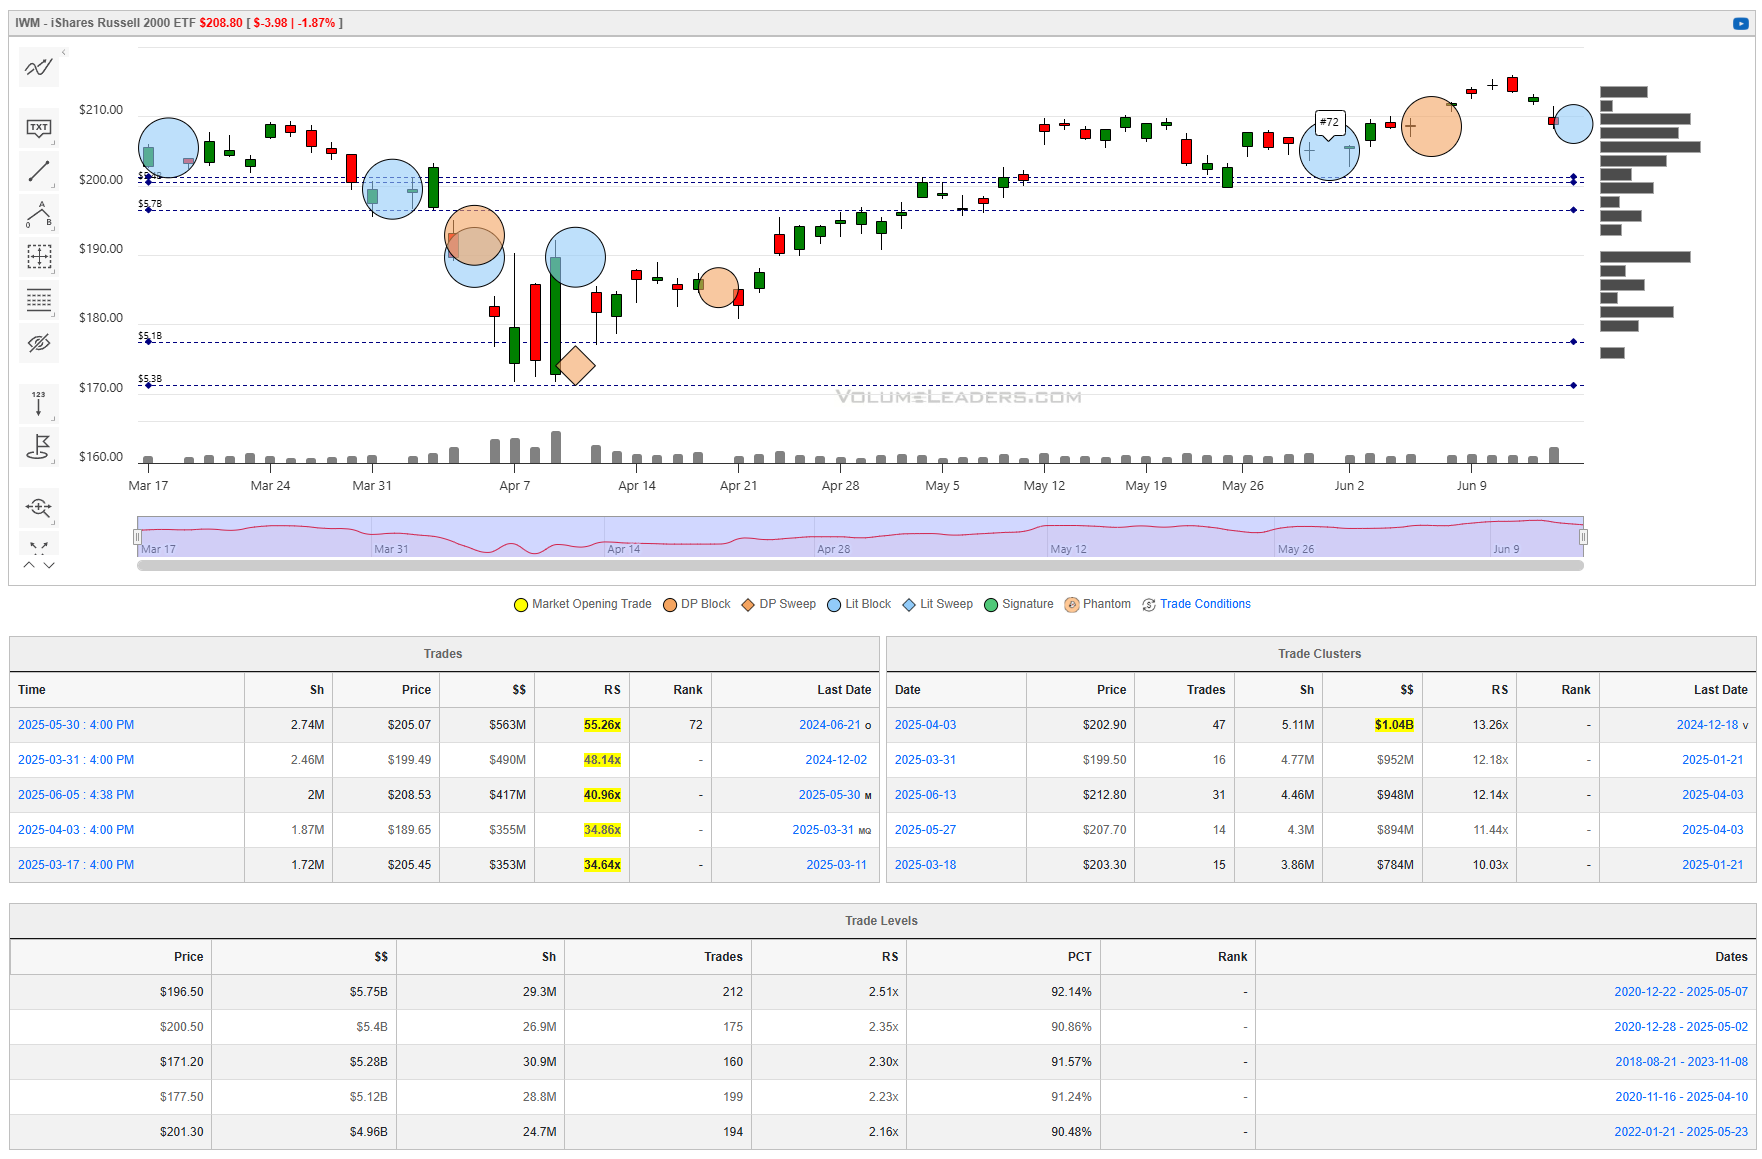
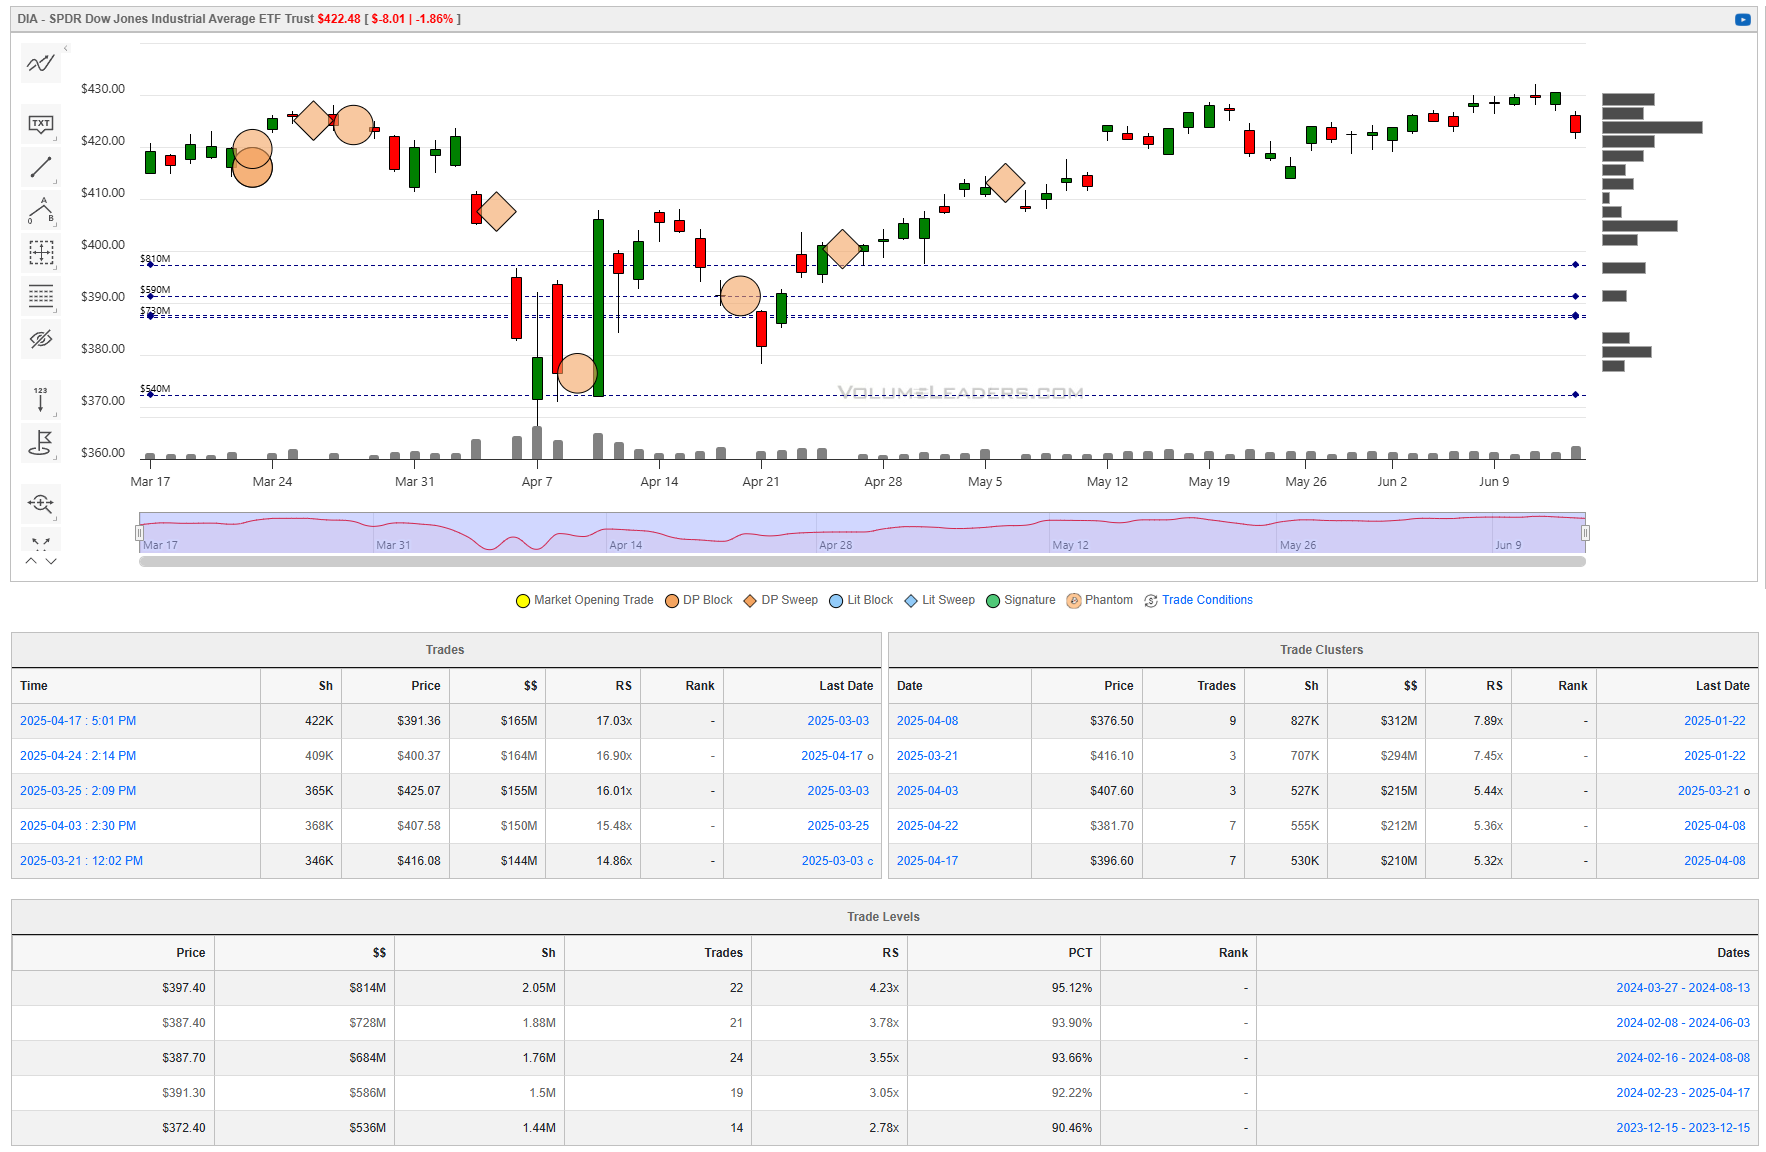
When you’re a large institutional player, your primary goal is to find liquidity - places to do a ton of business with the least amount of slippage possible. VolumeLeaders.com automatically identifies and visually plots the exact spots where institutions are doing business and where they are likely to return for more. It’s one of the primary reasons “support” and “resistance” concepts work and truly one of the reasons “price has memory” - take a look at the dashed lines in the images below that the platform plots for you automatically; these are the areas institutions constantly revisit to do more business.
Levels from the VolumeLeaders.com platform can help you formulate trades theses about:
Where to add or take profit
Where to de-risk or hedge
What strikes to target for options
Where to expect support or resistance
And this is just a small sample; there are countless ways to leverage this information into trades that express your views on the market. The platform covers thousands of tickers on multiple timeframes to accommodate all types of traders.
SPY
QQQ
IWM
DIA
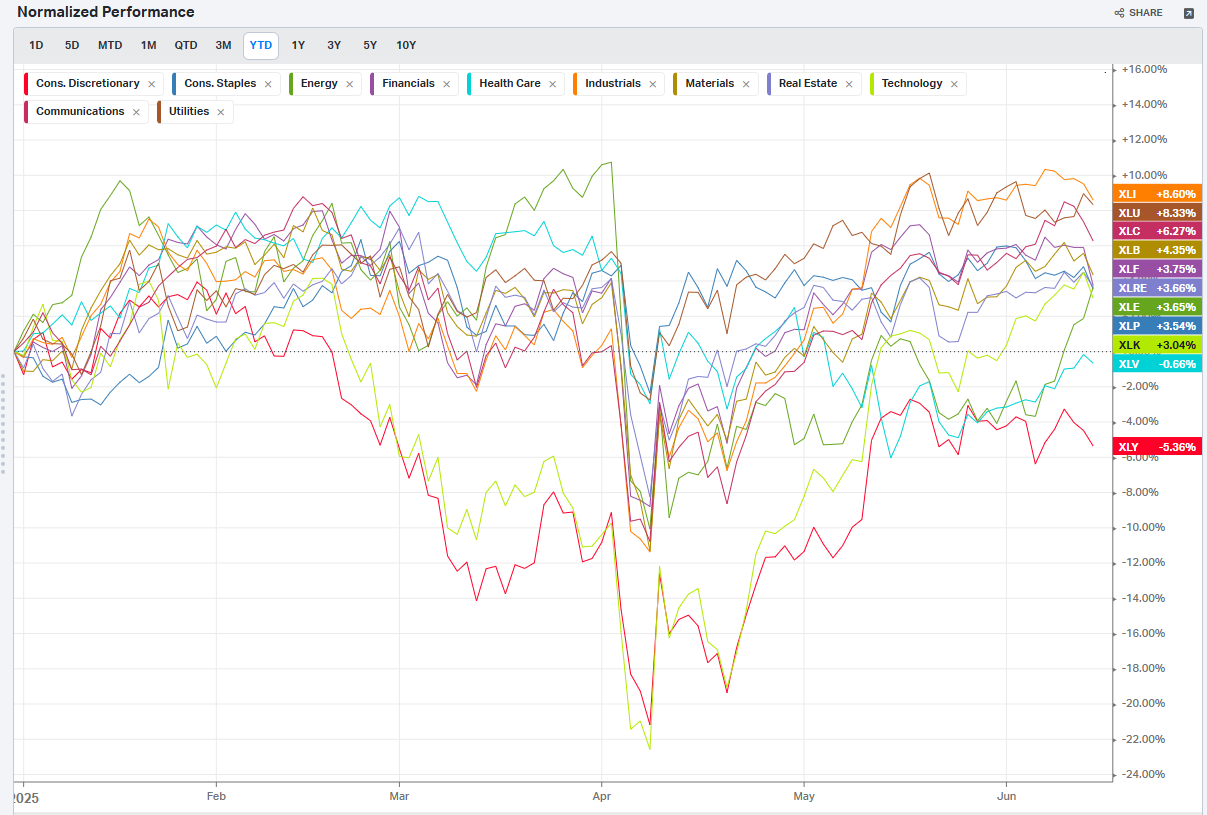
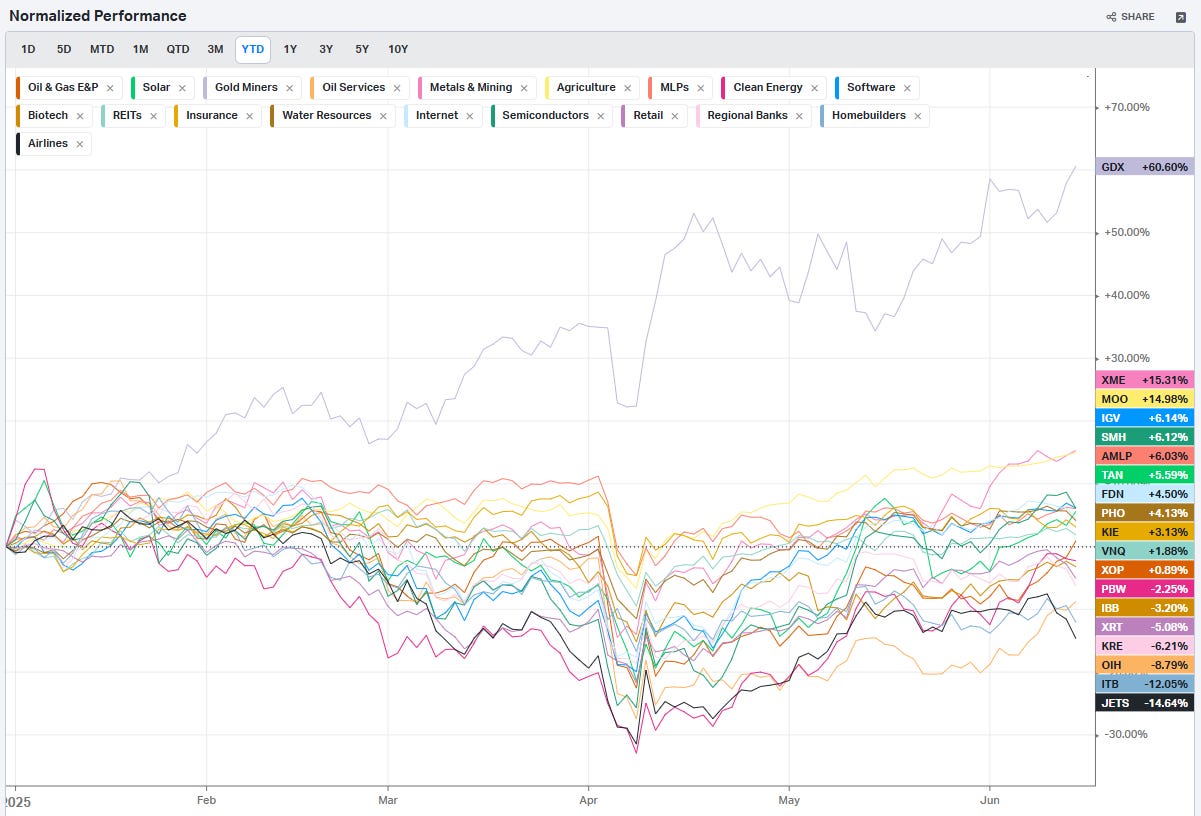
Summary Of Thematic Performance YTD
VolumeLeaders.com offers a robust set of pre-built thematic filters, allowing you to instantly explore specific market segments. These performance snapshots are provided purely for context and inspiration—think about zeroing in on the leaders and laggards within the strongest and weakest sectors, for example.
S&P By Sector
S&P By Industry
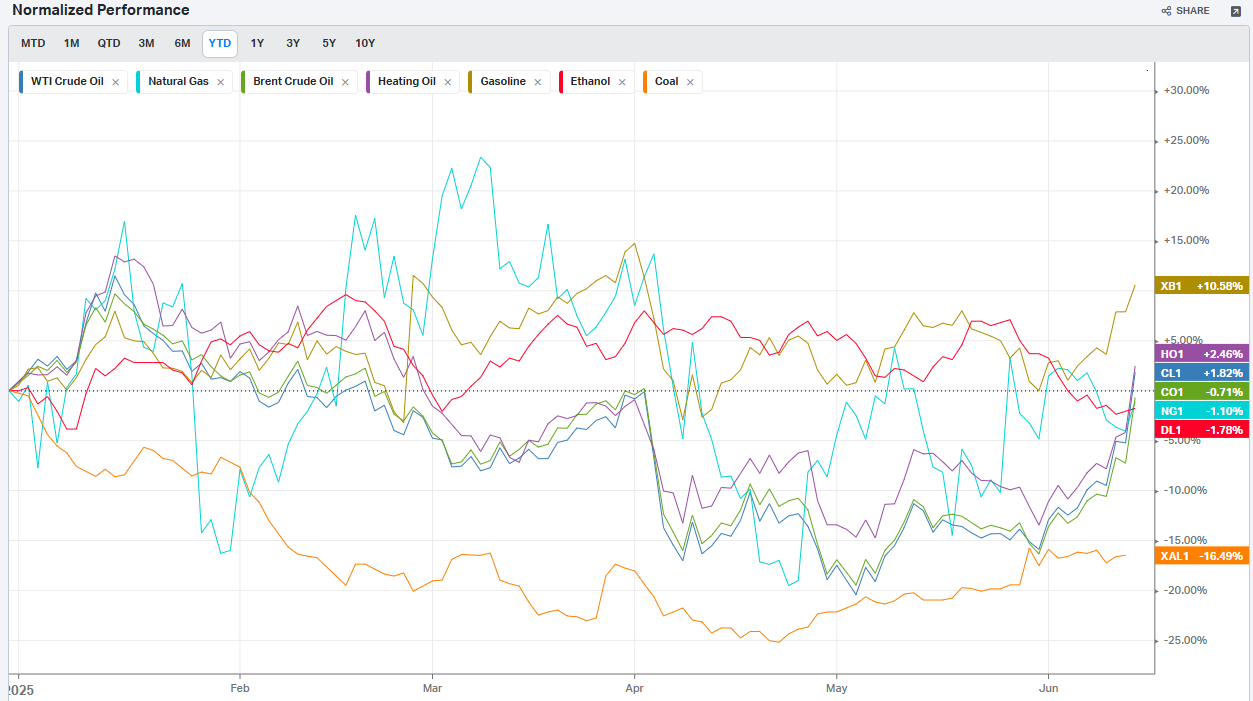
Commodities: Energy
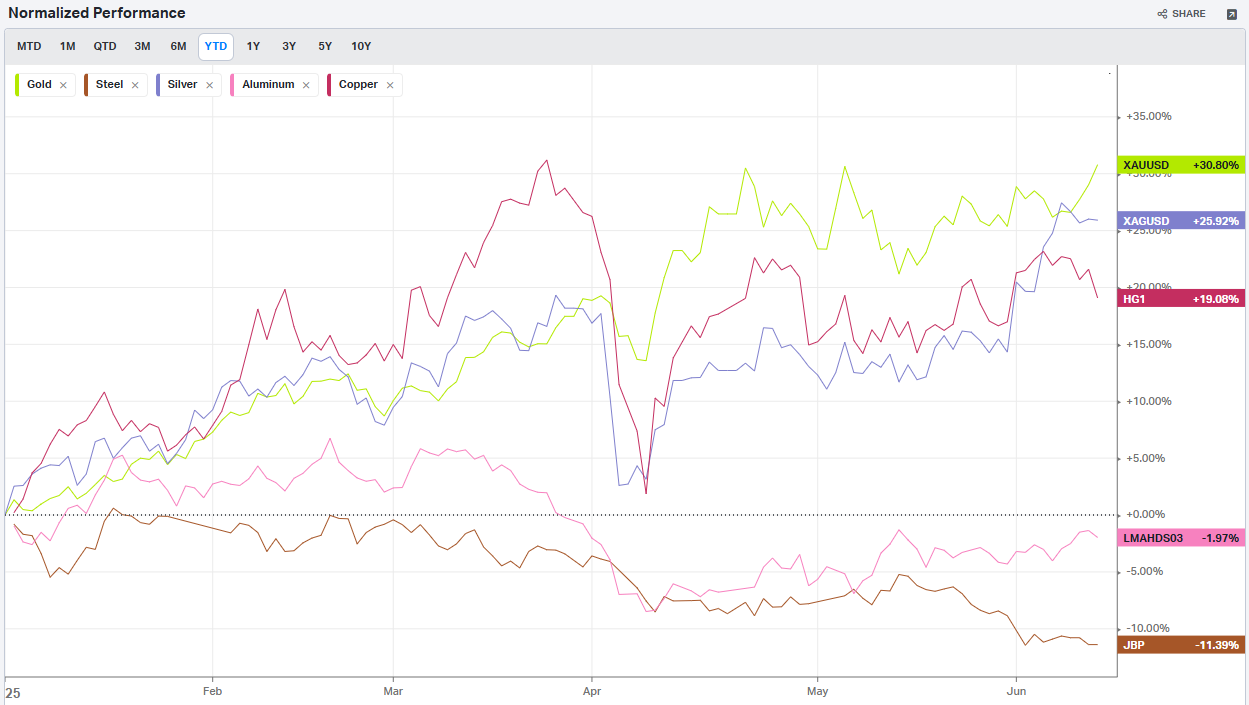
Commodities: Metals
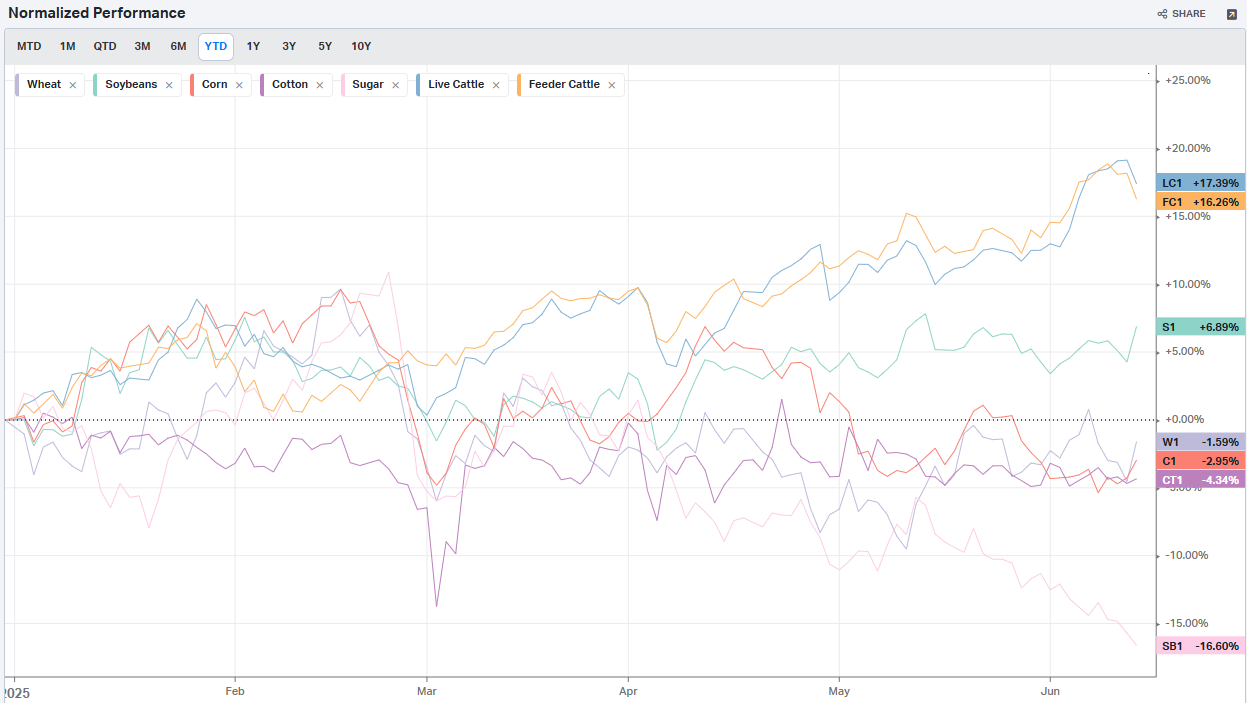
Commodities: Agriculture
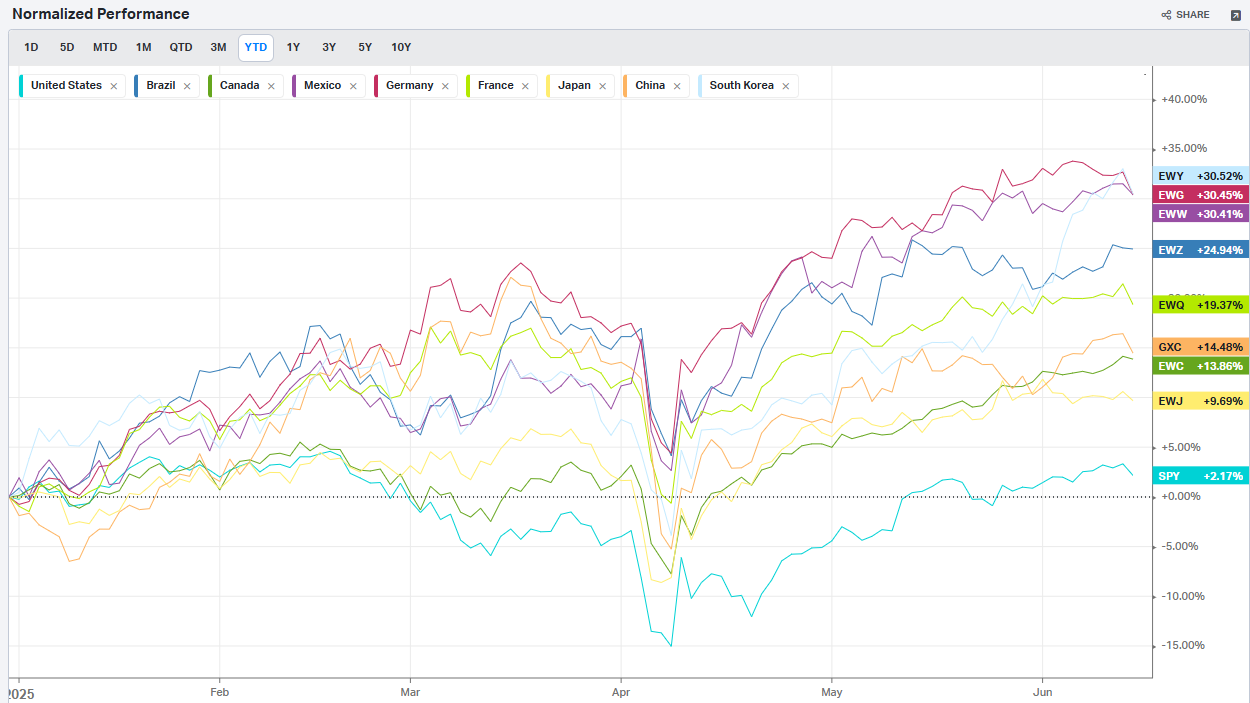
Country ETFs
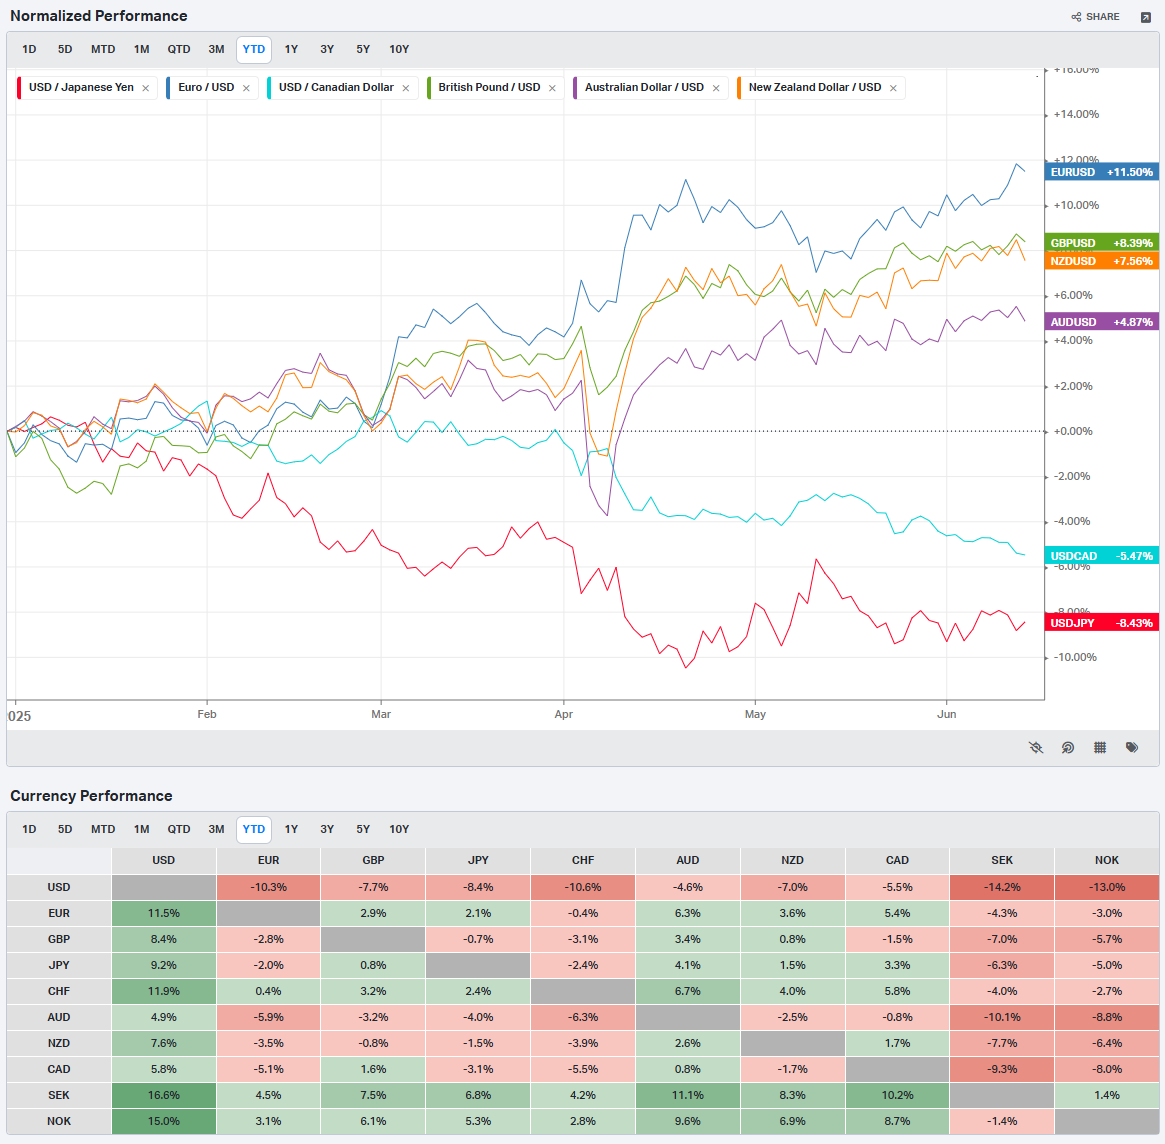
Currencies
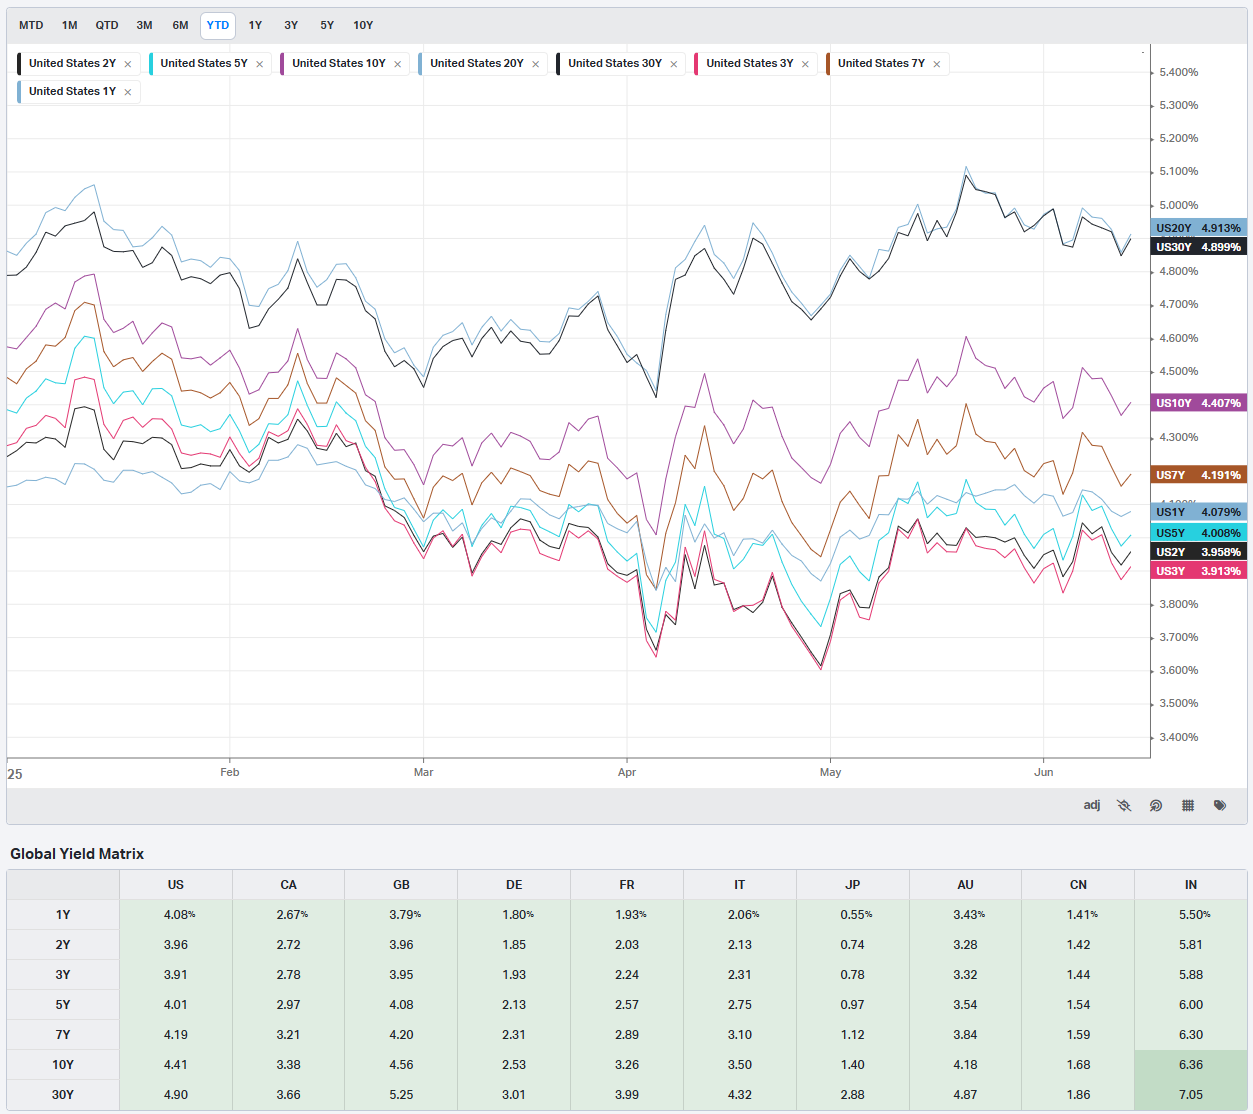
Global Yields
Factors: Style
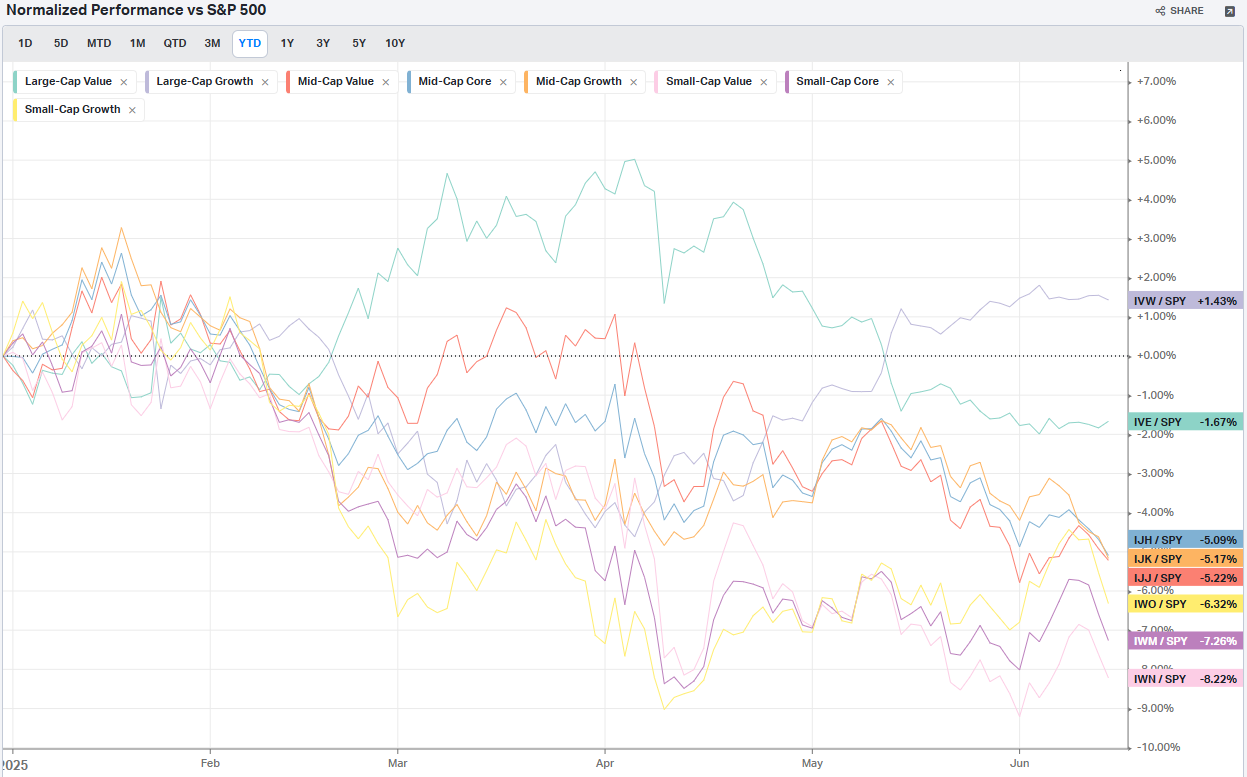
Factors: Size vs Value
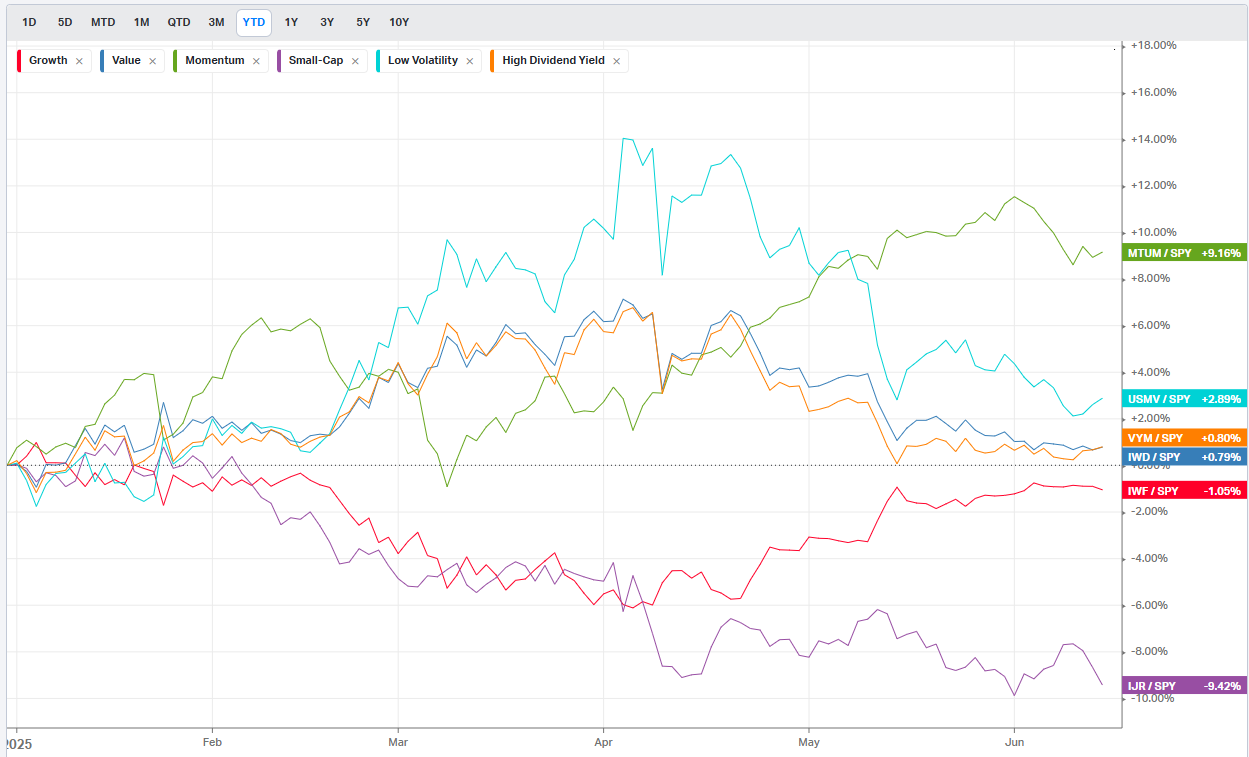
Factors: Qualitative
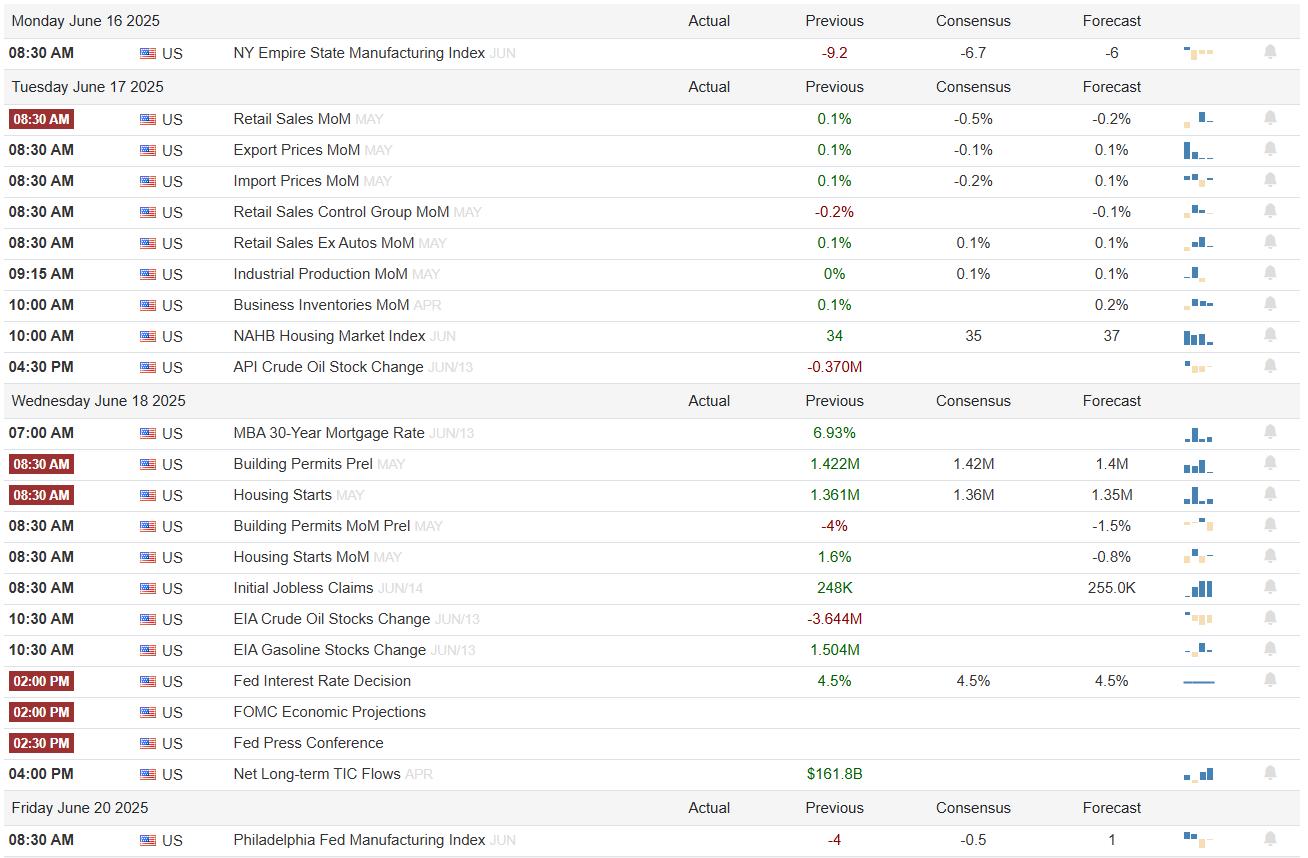
Events On Deck This Week
Here are key events happening this week that have the potential to cause outsized moves in the market or heightened short-term volatility.
Econ Events By Day of Week
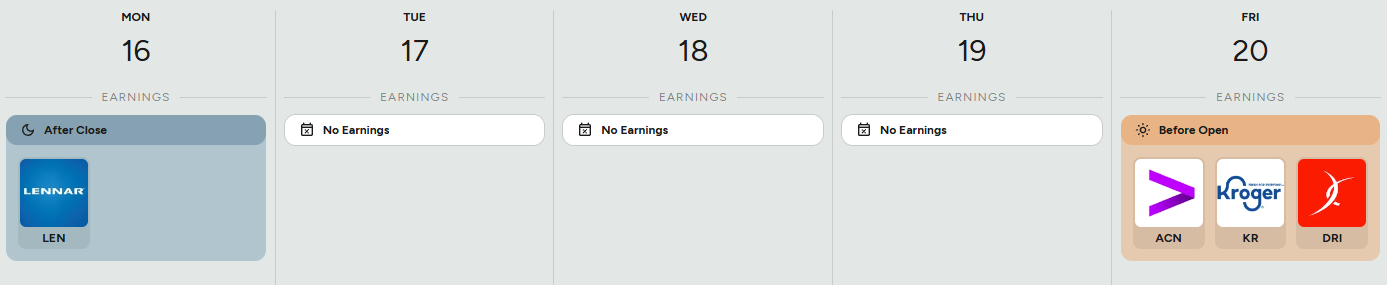
Anticipated Earnings By Day of Week

Market Intelligence Report
Top-Ranked Institutional Order Flow Analysis
Analysis of this week’s 614 Top-25 Ranked Institutional Trades
This comprehensive analysis of 614 institutional trades representing $21.4 billion in capital deployment reveals concentration in specific themes that institutional investors are positioning for aggressively. The data exposes three dominant investment narratives occurring simultaneously: continued nuclear renaissance positioning mentioned a couple of weeks ago, cybersecurity infrastructure acceleration, and unprecedented defensive large-cap concentration with aggressive sizing parameters.
Critical Market Intelligence:
Nuclear Energy Revolution: OKLO commands $263.6 million across 6 trades with 85.05 relative size ratio, coinciding with Air Force pilot agreements and $400 million secondary offering led by Goldman Sachs
Cryptocurrency Infrastructure Maturation: CRCL (Circle) receives $460.7 million institutional backing following explosive 168% IPO debut, with ProShares and Bitwise racing to file ETFs within days
Defensive Positioning at Scale: SPLG exhibits unprecedented 199.89 relative size ratio with $1.2 billion positioning—the largest institutional large-cap bet in dataset history
Cybersecurity Infrastructure Surge: RBRK commanding $369.4 million following Q1 2026 earnings that prompted analyst upgrades including Wells Fargo raising targets from $80 to $125
Bull/Bear Sentiment: 5.93:1 ratio favoring bullish positioning ($221M vs $37M), signaling continued institutional optimism despite geopolitical uncertainties.
Nuclear Energy: The Ultimate Contrarian Convergence Play
OKLO: $263.6 Million Strategic Positioning Ahead of Regulatory Catalysts
Oklo emerges as the ultimate institutional conviction play with $263.6 million deployed across six separate trades, achieving an extraordinary 85.05 relative size ratio that ranks among the dataset's highest institutional positioning levels. This concentration occurs precisely as multiple catalysts converge:

Regulatory Advancement Timeline: The company moves closer to nuclear power deals with the US Air Force, with the Defense Logistics Agency issuing a notice of intent to award a power purchase agreement for a pilot reactor at Eielson Air Force Base in Alaska. The positioning coincides with Trump's directive for the NRC to issue licenses within 18 months, creating defined catalyst timelines that institutions appear to be positioning ahead of.
Capital Markets Validation: Oklo's $400 million secondary offering led by Goldman Sachs, BofA Securities, Citigroup, and JPMorgan Chase signals institutional appetite for nuclear infrastructure exposure at precisely the moment when regulatory pathways are accelerating.
AI-Nuclear Infrastructure Nexus: Sam Altman's strategic resignation as Oklo chairman specifically to facilitate supply discussions between OpenAI and the nuclear startup underscores the AI-energy convergence that institutions appear to be anticipating. The institutional concentration in OKLO coinciding with these developments suggests informed positioning for the intersection of artificial intelligence energy demands and clean baseload power generation.
The nuclear positioning extends beyond individual securities through concentrated exposure to leveraged nuclear positions, suggesting a multi-layered institutional approach to sector acceleration potential.
Cryptocurrency Infrastructure: Post-IPO Institutional Adoption Acceleration
CRCL: $460.7 Million Deployment Following Market Structure Breakthrough
Circle Internet Group represents the most compelling cryptocurrency infrastructure play in the dataset, with $460.7 million deployed across 14 separate institutional trades following the company's explosive NYSE debut. The stablecoin issuer's shares more than doubled in their debut, with the stock opening at $69 and reaching as high as $103.75 before closing at $83.23, representing a 168% gain from the $31 IPO price.
Institutional Validation Cascade: Within days of the IPO, ProShares and Bitwise filed for exchange-traded funds tied to CRCL shares, with the ProShares Ultra CRCL ETF seeking 2x leveraged exposure and the Bitwise CRCL Option Income Strategy ETF applying covered call strategies. The immediate ETF filing activity demonstrates institutional recognition of stablecoin infrastructure as foundational financial market utility.
International Capital Convergence: Japan-based SBI Holdings announced a $50 million investment in Circle, highlighting institutional faith in stablecoins and their role in mainstream crypto adoption. Combined with Cathie Wood's ARK Investment Management purchasing over 3 million shares for its flagship ARKK ETF, making Circle one of its top 10 holdings, the positioning suggests institutional consensus around cryptocurrency market structure evolution.
The 54.8 relative size ratio indicates substantial institutional conviction in stablecoin infrastructure as traditional finance integration accelerates beyond speculative positioning toward utility infrastructure investment.
Cybersecurity Infrastructure: Post-Earnings Momentum with Strategic Depth
RBRK: $369.4 Million Following Exceptional Q1 Performance
Rubrik's institutional positioning reaches $369.4 million across multiple trades following Q1 2026 earnings that significantly exceeded expectations, positioning the company at the intersection of cybersecurity and AI infrastructure. The earnings prompted widespread analyst upgrades, including Wells Fargo raising their price target from $80 to $125, Wedbush increasing to $120 from $80, and KeyBanc raising to $113 from $98.
Zero Trust Data Security Platform Expansion: Rubrik's integration with Google Agentspace for secure AI data management and the company's expansion of AMD EPYC processor deployment across cloud platforms positions the company at the convergence of AI infrastructure and cybersecurity—two themes receiving substantial institutional attention.

Enterprise Infrastructure Positioning: The relative size metric of 53.12 for RBRK suggests institutions are significantly overweighting cybersecurity infrastructure relative to historical allocations. This positioning appears prescient given escalating geopolitical tensions and increasing enterprise IT security spending priorities.
The cybersecurity positioning extends to complementary data storage infrastructure through Seagate Technology (STX) receiving $143.2 million with 55.24 relative size and Western Digital (WDC) garnering $123.7 million with 36.76 relative size, suggesting comprehensive institutional exposure to data protection ecosystems.
Large-Cap Concentration: Defensive Positioning with Unprecedented Sizing
SPLG: $1.224 Billion with Historic 199.89 Relative Size Ratio
The most extraordinary institutional positioning appears in SPLG (SPDR Portfolio S&P 500 ETF), with $1.224 billion deployed across multiple trades and an unprecedented 199.89 relative size ratio—the highest concentration in the entire dataset. This positioning represents the largest relative institutional large-cap bet in recent history.
Defensive Strategy with Aggressive Implementation: The positioning coincides with Bank of America's analysis showing the S&P 500 expensive on all 20 valuation metrics, yet strategists maintaining bullish outlooks due to structural advantages including energy independence, dollar reserve status, and technology sector leadership. SPLG's ultra-low cost structure makes it optimal for institutions seeking core large-cap exposure without fee drag.
Multi-Scenario Portfolio Construction: The concentration in SPLG alongside significant positioning in bond ETFs (VCSH with $751 million and 126.07 relative size) suggests institutional barbell portfolio construction for both offensive and defensive scenarios. This approach indicates sophisticated positioning for multiple market outcomes while maintaining maximum position sizing flexibility.
Combined with VOO positioning totaling $2.751 billion, total large-cap ETF institutional deployment exceeds $4 billion, representing unprecedented institutional preference for low-cost, broad market exposure during uncertain periods.
Precious Metals: Inflation Hedge with Geopolitical Premium Integration
Materials Sector: $1.502 Billion with 34.3% Top-5 Rank Concentration
The materials sector demonstrates the highest top-5 rank concentration at 34.3%, indicating exceptional institutional conviction. Royal Gold (RGLD) commands $221.4 million with a 59.94 relative size ratio, while Agnico Eagle Mines (AEM) receives $205.7 million with an 84.21 relative size ratio.

The precious metals concentration occurs as gold reaches new record highs near $3,450 per ounce amid Middle Eastern tensions and inflation concerns. The relative size metrics suggest institutions are making their largest precious metals bets in years, potentially anticipating sustained commodity price elevation beyond current levels while providing comprehensive geopolitical uncertainty hedging.
Technology Hardware: AI Infrastructure and Supply Chain Resilience
Data Storage Infrastructure Theme: $390 Million Concentrated Deployment
Technology sector positioning reveals institutional focus on infrastructure components rather than consumer applications. The $390 million combined positioning in Seagate Technology (STX) and Western Digital (WDC) with high relative size ratios aligns with AI workload requirements and enterprise data protection needs.
This storage infrastructure theme intersects with cybersecurity positioning through companies like Rubrik, suggesting institutions are building comprehensive exposure to data protection and management ecosystems rather than single-point solutions. The positioning indicates institutional recognition of integrated data infrastructure requirements for AI deployment at enterprise scale.
Bull vs Bear Sentiment: Overwhelming Institutional Optimism
5.93:1 Ratio Signals Extraordinary Conviction
The bull vs bear analysis reveals unprecedented institutional optimism with a 5.93:1 ratio favoring bullish positions:
Bull Positions: $221 million across 57 trades
Bear Positions: $37 million across 13 trades
This ratio significantly exceeds historical norms and suggests institutional positioning for continued market advancement despite geopolitical and economic uncertainties. The stark disparity indicates institutional confidence in market structure resilience and potential for continued advancement rather than defensive positioning.
Leveraged Positioning Breakdown:
Multiple 2x Bull positions across technology names (NVDA, AMD, AVGO)
Cryptocurrency bull positioning (Bitcoin, Ethereum)
Sector-specific bull bets spanning multiple themes
The limited bear positioning primarily focuses on tactical technology shorts rather than broad defensive strategies, suggesting institutions view current uncertainties as opportunities rather than systemic risks.
Statistical Distributions: Concentration Signals
Trade Size Distribution:
Median Trade: $7.81 million
90th Percentile: $116.7 million
Maximum Position: $960.65 million (VOO)
The right-skewed distribution reveals significant concentration in mega-trades, with 10% of positions exceeding $116.7 million, indicating institutional preference for large, liquid positions with maximum impact potential.
Relative Size Intensity:
Median Relative Size: 3.48
90th Percentile: 46.35
Maximum: 199.89 (SPLG unprecedented sizing)
Twenty-six trades exceed 50 relative size (4.2% of total), representing $6.869 billion in high-conviction capital deployment—32% of total institutional capital concentrated in ultra-high conviction positions.
Multi-Factor Trade Significance: Institutional Conviction Hierarchy
Top-Tier Institutional Positioning (85+ Scores)
Tier 1 Maximum Conviction:
SPLG (89.0 Score): $1.224B, 199.89 RelSize, Rank 1, Multiple Trades
OKLO (84.6 Score): $263.6M, 85.05 RelSize, Rank 1, 6 Trades
Tier 2 High Conviction (75-84 Scores): 3. CRCL (79.8 Score): $460.7M, 54.8 RelSize, Rank 2, 14 Trades 4. EEMA (78.8 Score): $762.1M, 38.1 RelSize, Rank 1, 6 Trades 5. CHYM (78.1 Score): $176.1M, 32.9 RelSize, Rank 1, 25 Trades
The multi-factor analysis confirms institutional concentration in defensive large-cap plays, nuclear infrastructure, and cryptocurrency market structure themes with unprecedented sizing parameters.
Sector Multi-Factor Rankings
Large Caps (60.8): Maximum dollar and relative size scores
Materials (55.2): Exceptional rank concentration and solid deployment
Bonds (53.3): Strong relative size and defensive characteristics
Technology (52.8): Broad engagement with selective high-conviction plays
Clustering Analysis: High-Conviction Theme Convergence
Ultra-High Conviction Cluster (RelSize > 50)
Twenty-six trades exceed 50 relative size, representing $6.869 billion in capital:
Large Caps: $4.2B (SPLG and VOO mega-positioning)
Technology: $890M (cybersecurity and infrastructure focus)
Utilities: $264M (nuclear energy concentration)
Materials: $427M (precious metals positioning)
This clustering represents institutional positioning intensity unprecedented in recent periods, suggesting conviction levels typically preceding major market developments.
Multiple Trade Accumulation Patterns
Sustained Institutional Building:
CHYM: 25 trades ($176.1M) - Financial services consolidation
CRCL: 14 trades ($460.7M) - Cryptocurrency infrastructure
TTAN: 9 trades ($207.7M) - Technology infrastructure

The accumulation patterns suggest institutional conviction building over time rather than single large block deployment, indicating sustained strategic positioning across multiple execution periods.
Investment Implications: Structural Transition Positioning
Primary Convergence Themes
Nuclear-AI Infrastructure Nexus: The combination of OKLO's $263.6 million positioning with AI infrastructure investments suggests institutions anticipate significant energy demand from artificial intelligence workloads, creating sustained demand for clean baseload power generation. The regulatory advancement timeline creates defined catalyst windows for potential asymmetric returns.
Cryptocurrency Market Structure Evolution: CRCL's $460.7 million institutional backing and immediate ETF product development indicates institutional recognition of stablecoin infrastructure as foundational financial utility rather than speculative positioning. The theme suggests cryptocurrency integration into traditional financial systems reaching institutional adoption inflection.
Defensive Positioning with Growth Overlays: SPLG's unprecedented 199.89 relative size ratio combined with nuclear, crypto, and cybersecurity exposure suggests institutional portfolio construction for multiple scenarios while maintaining aggressive position sizing in high-conviction areas.
Comprehensive Risk Management Integration: Precious metals positioning alongside energy and defense exposure indicates sophisticated geopolitical risk hedging beyond traditional safe-haven allocation models, suggesting institutional preparation for sustained uncertainty periods.
Sector Rotation and Timing Signals
Technology Infrastructure Prioritization: Institutional concentration in cybersecurity (RBRK), data storage (STX, WDC), and quantum computing (RGTI) over consumer applications suggests positioning for technological infrastructure buildout supporting AI deployment at enterprise scale.
Materials as Strategic Hedge: The 34.3% top-5 rank concentration in materials (highest among sectors) with high relative size ratios suggests institutional positioning for inflation protection and supply chain security beyond traditional commodity allocation approaches.
Financial Services Evolution: Positioning in specialized financial services (insurance brokerage, crypto infrastructure) rather than traditional banking suggests institutional preference for operational leverage and structural market change beneficiaries.
Risk Assessment: Concentration and Opportunity Analysis
Unprecedented Positioning Intensity
The relative size metrics reveal institutional position sizing beyond historical norms:
SPLG at 199.89: Largest relative large-cap positioning in dataset
VCSH at 126.07: Maximum institutional bond positioning relative to history
Multiple positions above 80: Nuclear, materials, and crypto infrastructure
These metrics suggest institutional conviction levels that typically precede either major market advances or potential concentration risk in specific themes.
Catalyst Timeline Convergence
Defined Regulatory Windows:
Nuclear licensing decisions (18-month NRC timeline)
Stablecoin legislation progress
AI infrastructure deployment acceleration
Geopolitical resolution timelines
The convergence of multiple catalyst timelines with unprecedented institutional positioning suggests major market developments anticipated within 12-18 month periods.
Actionable Intelligence for Investors
Strategic Portfolio Positioning
Nuclear Energy Infrastructure: OKLO's institutional backing coinciding with regulatory advancement and military agreements suggests asymmetric risk/reward with defined catalyst timelines. The positioning indicates institutional conviction in nuclear renaissance acceleration beyond current market pricing.
Cryptocurrency Infrastructure Maturation: CRCL's post-IPO institutional adoption and immediate ETF development suggests stablecoin infrastructure reaching institutional utility status. The positioning indicates cryptocurrency market structure evolution beyond speculative phases toward foundational financial infrastructure.
Cybersecurity-AI Integration: RBRK's positioning following earnings excellence and AI integration partnerships suggests institutional recognition of cybersecurity as AI infrastructure requirement rather than standalone solution. The theme indicates convergence of multiple technology infrastructure needs.
Defensive Strategies with Offensive Execution: SPLG's unprecedented relative sizing suggests institutional preparation for volatility while maintaining equity exposure through low-cost, broad market access. The approach indicates sophisticated multi-scenario positioning.
Risk Management Framework
Concentration Monitoring: The unprecedented relative size ratios across multiple themes suggest institutional position sizing beyond historical norms, requiring careful monitoring of concentration risk versus conviction opportunity balance.
Catalyst Timing: The convergence of regulatory, technological, and market structure catalysts with institutional positioning suggests potential for accelerated developments within defined timeframes, creating both opportunity and timing risk considerations.
Market Structure Evolution: The institutional positioning patterns suggest major structural transitions occurring simultaneously across energy, technology, and financial markets, potentially amplifying returns for correctly positioned assets while creating significant risks for incorrectly positioned portfolios.
Conclusion: Smart Money Positioning for Multiple Structural Transitions
This comprehensive analysis of 614 institutional trades representing $21.4 billion reveals sophisticated positioning for multiple structural market transitions occurring simultaneously. The large relative sizing across nuclear energy, cryptocurrency infrastructure, cybersecurity, and defensive large-cap strategies indicates noteworthy institutional conviction levels.
Key Strategic Conclusions:
The convergence of AI infrastructure needs, geopolitical uncertainty, regulatory advancement, and technological innovation creates a unique environment where multiple investment themes intersect. The institutional positioning data suggests these convergences are actively being monetized by the market's most informed participants through the reported sizing.
Forward-Looking Implications: The institutional concentration in defensive strategies with aggressive growth theme overlays suggests sophisticated preparation for both volatility and advancement scenarios. The positioning indicates institutional confidence in structural transition outcomes in specific themes while maintaining flexibility for multiple market development paths.
The institutional trading patterns reveal major structural transitions beyond traditional cyclical market movements, potentially offering early signals for emerging asymmetric risk/reward opportunities in correctly identified convergence themes while highlighting concentration risks for incorrectly positioned strategies.
Aggregate Institutional Order Flow Summary
Here’s a more comprehensive look, beyond the top-ranked trades of the week, at aggregate institutional positioning.
Rolling 90-Day Dollars By Day
This chart shows institutional activity by dollars by day on a rolling 1-year basis. From a theoretical standpoint, examining a chart of daily institutional dollar activity over the course of a year can offer several insights and possible inferences, though all should be approached with caution since the data alone may not prove causality or confirm underlying reasons. Some potential takeaways include:
Event-Driven Behavior:
Sharp, singular spikes on certain days might correlate with major market-moving events. These could include central bank policy announcements, significant geopolitical news, sudden macroeconomic data releases (like employment reports or GDP data), earnings seasons for large-cap companies, or unexpected shocks (e.g., mergers, acquisitions, regulatory changes).Liquidity Dynamics:
Institutions often concentrate large trades on days with higher expected liquidity. For instance, heightened activity might coincide with index reconstitutions, option expiration dates, or the days leading up to or following a major index rebalance, when large amounts of capital shift hands simultaneously.Risk Management and Hedging Activity:
Institutions may significantly adjust their exposures on days that are critical from a risk management perspective. Large spikes can occur if hedge funds, pension funds, or asset managers are rolling over futures contracts, initiating or closing out large hedges, or reacting to volatility triggers.Market Sentiment Indicators:
While the data is purely transactional, the sheer volume of institutional involvement on certain days might indirectly hint at changing sentiment or strategic shifts.
In essence, a chart like this can lead you to hypothesize that institutional trading volumes are not constant or random but rather influenced by a mix of predictable calendar effects, major market events, liquidity considerations, risk management decisions, and strategic allocation shifts.
Top Institutional Order Flow By Sector By Week For The Past 90-Days
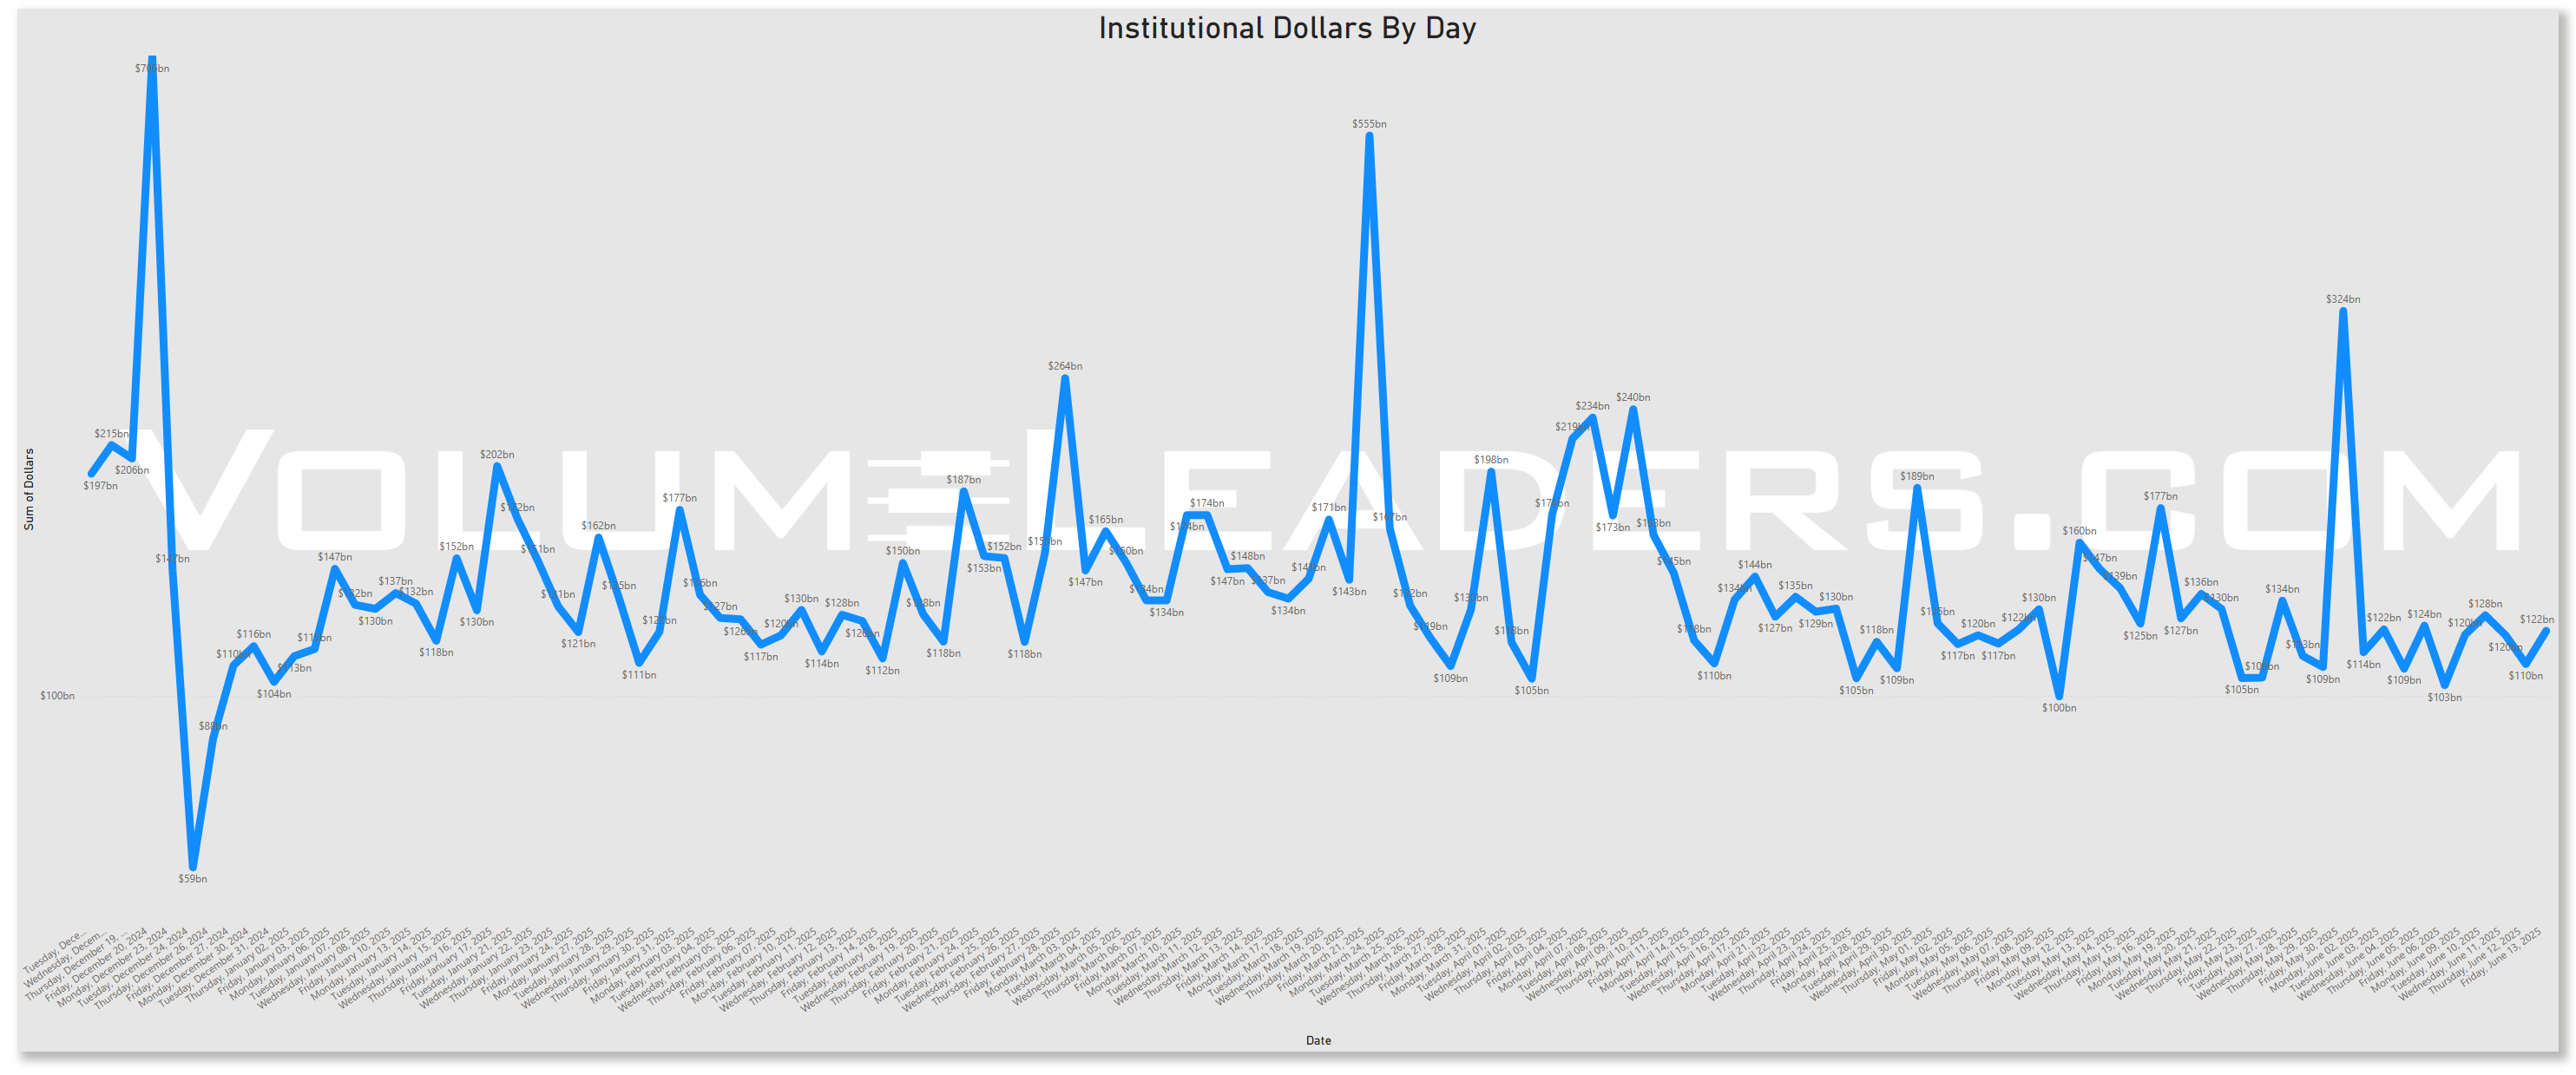
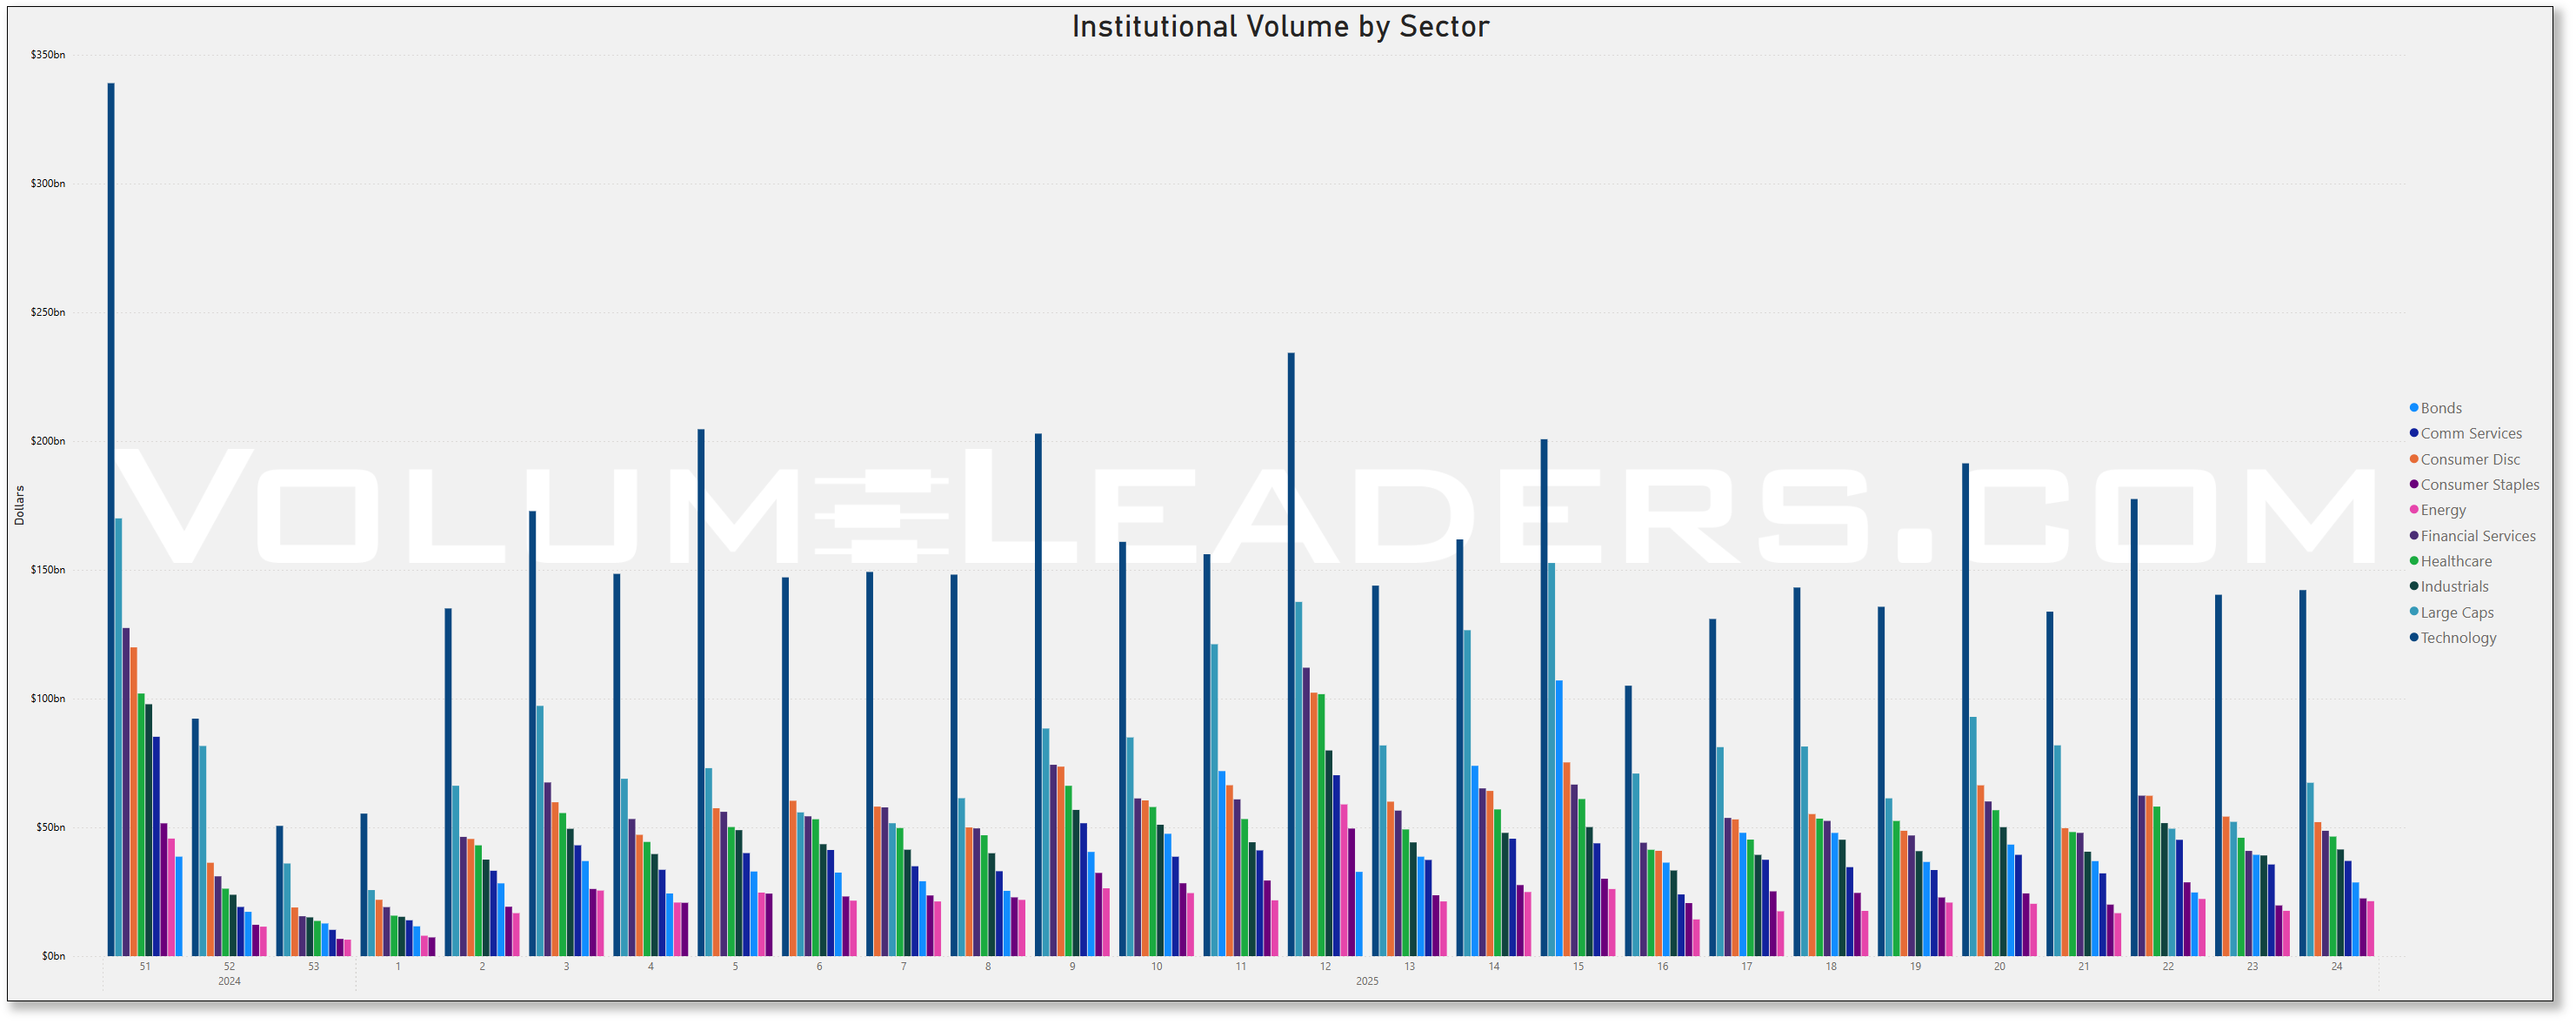
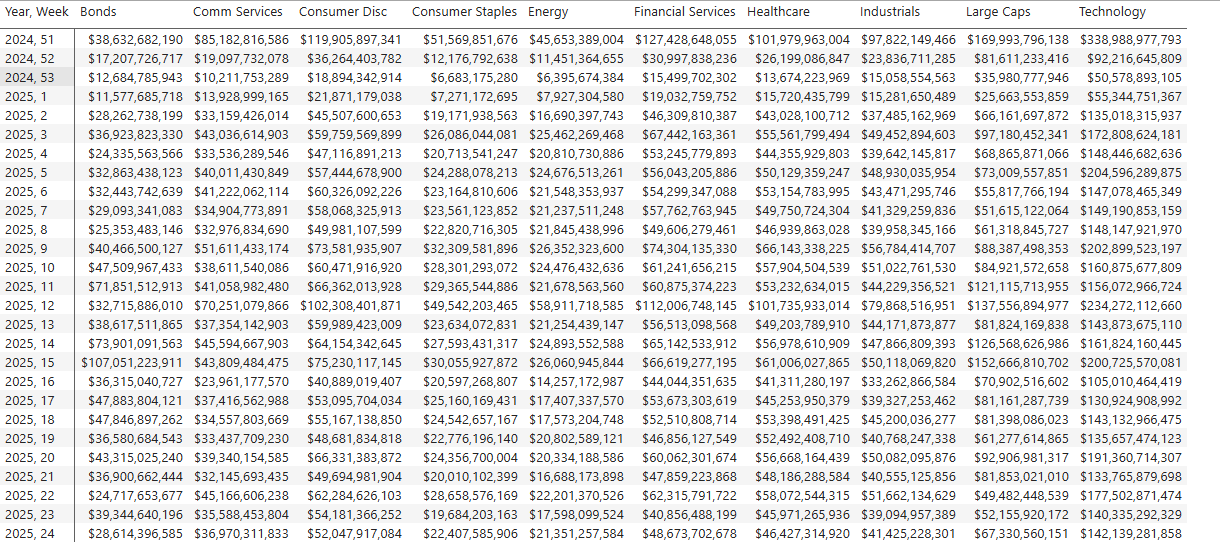
Top Institutional Order Flow In Equities
These are incredibly important charts to watch as they contains lots of nuanced suggestions at a thematic level. Watch these charts closely week-to-week to stay informed about where institutional money is flowing, adjust your strategies based on momentum, align your portfolio with macroeconomic and market trends, and manage risks more effectively by avoiding sectors losing institutional favor.
Sector Rotation Insights: The chart highlights which sectors are attracting institutional activity and which are losing favor. Institutions often lead market trends, so tracking shifts in their focus can indicate sector rotations.
Sentiment Analysis: The level of institutional activity reflects confidence in specific sectors. Rising activity in traditionally defensive sectors (e.g., healthcare, utilities) may indicate caution, while a surge in growth sectors (e.g., technology, consumer discretionary) could suggest optimism.
Emerging Trends: Sudden spikes in a previously overlooked sector, like industrials or consumer staples, might hint at emerging opportunities or structural shifts.
Macro Themes: Changes in sector activity often align with broader macroeconomic themes like inflation, interest rates, or geopolitical events. For instance:
Increased activity in energy might indicate concerns about oil supply or rising prices.
Growth in technology could align with innovations or favorable policies.
Risk Management: Declining institutional activity in a sector might signal weakening fundamentals or heightened risks.
Spotting Overcrowding: Excessive activity in a single sector over multiple weeks may suggest overcrowding, which could lead to heightened volatility if institutions begin to exit.
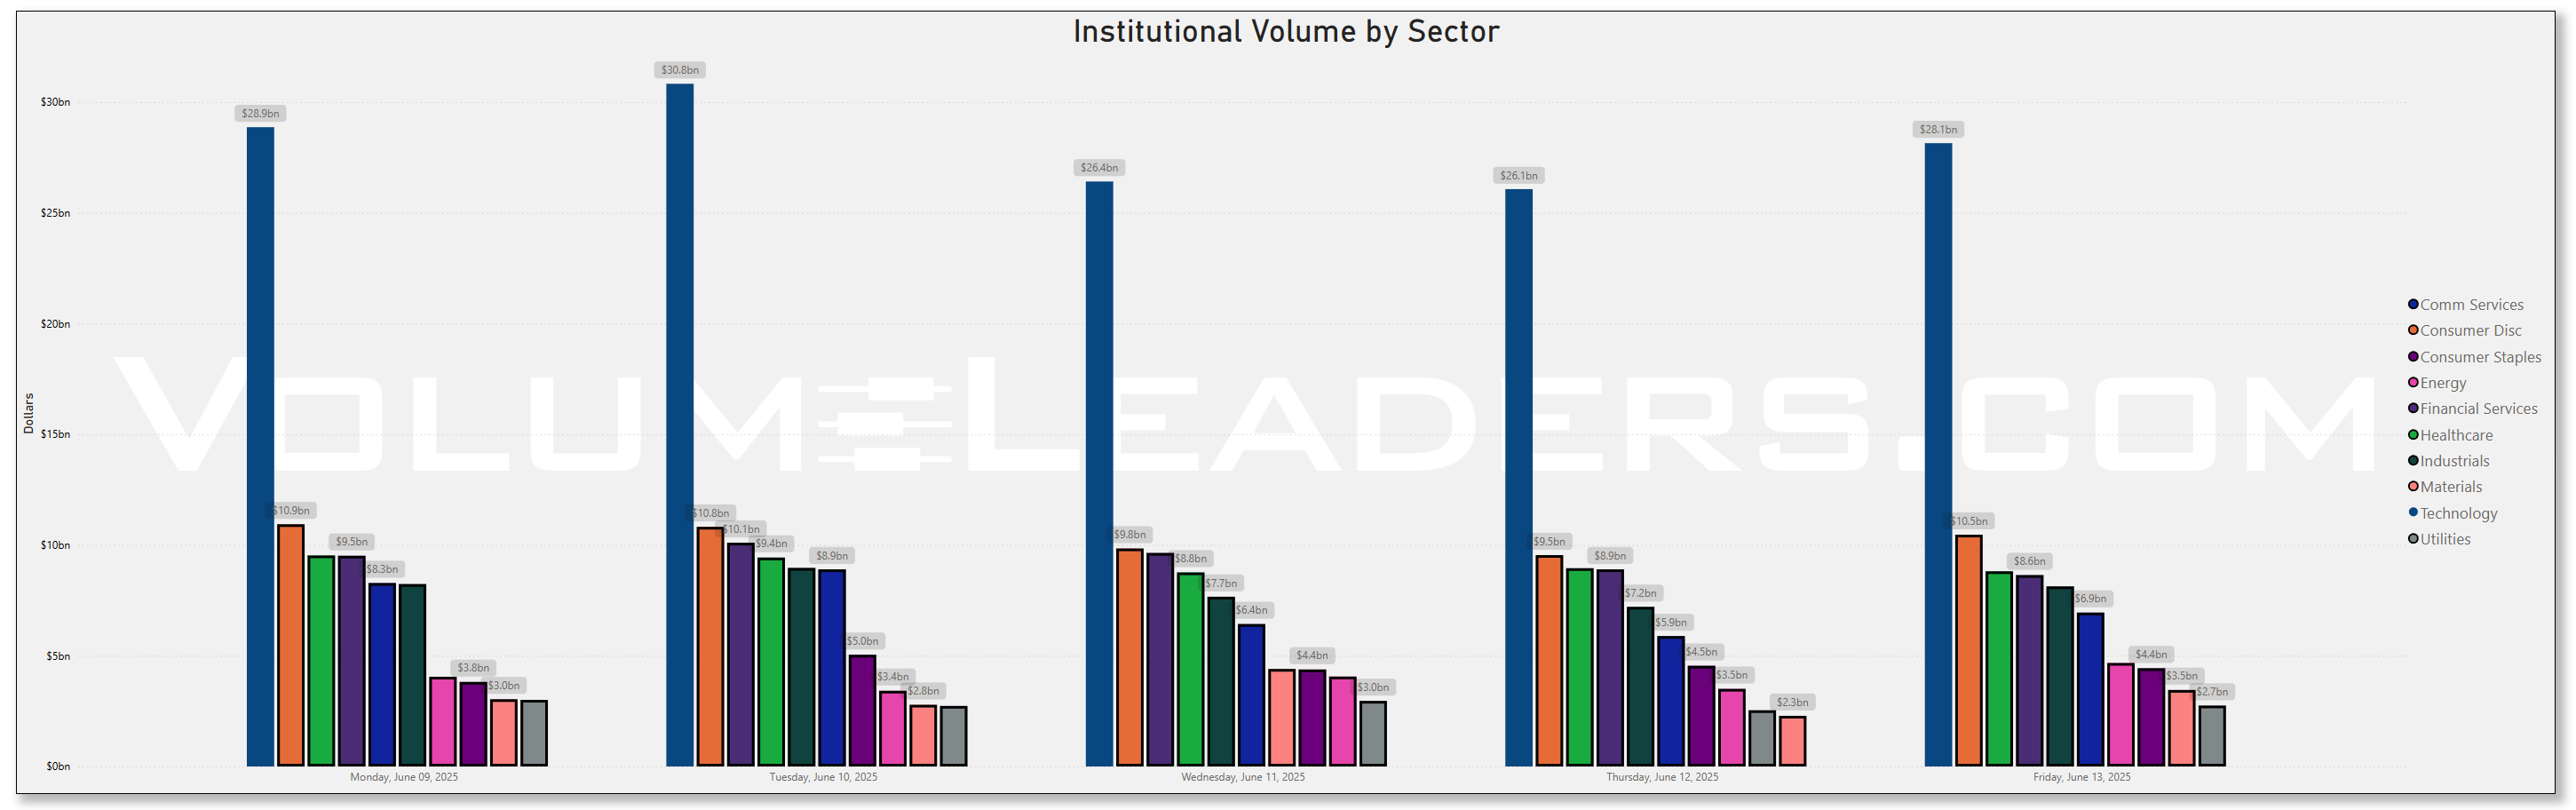
Overview
Institutional order flow remained concentrated throughout the week, with clear leadership in Communication Services and Consumer Discretionary. Defensive sectors such as Utilities and Materials continued to see the least engagement, indicating a risk-on posture among institutional participants.
Weekly Sector Totals (Approximate)
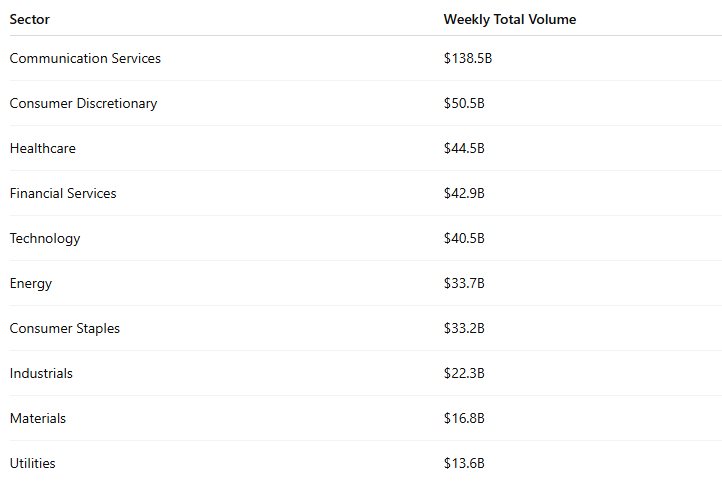
Sector Commentary
Communication Services
This sector saw dominant inflows each day, with daily volumes ranging from $26.4B to $30.9B. Totaling $138.5B for the week, it far outpaced all other sectors. The consistent strength likely reflects concentrated institutional positioning in mega-cap names and thematic bets related to AI, digital infrastructure, or media monetization.
Consumer Discretionary
With a weekly total of $50.5B, this sector maintained a firm second position. Daily flows remained stable around the $10B mark, signaling ongoing confidence in the consumer and select high-beta growth names. Friday's pickup suggests continued institutional interest heading into the following week.
Healthcare and Financial Services
Healthcare ($44.5B) and Financials ($42.9B) posted stable daily flows, consistently ranking in the middle of the sector pack. Their relative steadiness may reflect a balanced institutional appetite for defensible earnings and interest rate sensitivity.
Technology
Technology drew $40.5B in total flows, trailing Healthcare and Financials. While still strong, it did not show leadership this week. The sector’s positioning may reflect cautious optimism or rotation into other growth areas.
Energy and Consumer Staples
Both sectors showed mid-tier flows in the $33B range. Activity was strongest early in the week, with a drop-off into mid-week followed by a mild recovery on Friday. This pattern suggests tactical participation rather than strong conviction.
Industrials, Materials, and Utilities
These sectors saw the least activity, with Industrials at $22.3B, Materials at $16.8B, and Utilities at $13.6B. The persistent underweight suggests a lack of rotation into traditional defensive or value sectors. Institutions appear to be avoiding low-growth, low-volatility exposures at this stage of the market cycle.
Market Implications
Positioning remains concentrated in growth-oriented sectors, with Communication Services drawing outsized flows throughout the week.
Defensive sectors are underrepresented, pointing to low institutional concern over near-term volatility or macro deterioration.
Lack of rotation suggests that institutions are not repositioning portfolios materially but are reinforcing existing high-conviction exposures.
Technology’s relative underperformance within the growth complex should be monitored for signs of either reacceleration or broader de-risking.
Many excellent trade ideas and sources of inspiration can be found in the prints below. While only the top 30 from each group are displayed, the complete results are accessible in VolumeLeaders.com for you to explore at your convenience any time. Remember to configure trade alerts within the platform to ensure institutional order flows that capture your interest or are significant to you aren’t missed. The blue charts represent all types of trades, including blocks on lit exchanges; the purple charts exclusively depict dark pool trades; and the green charts are sweeps only.
Institutional Positioning by Name
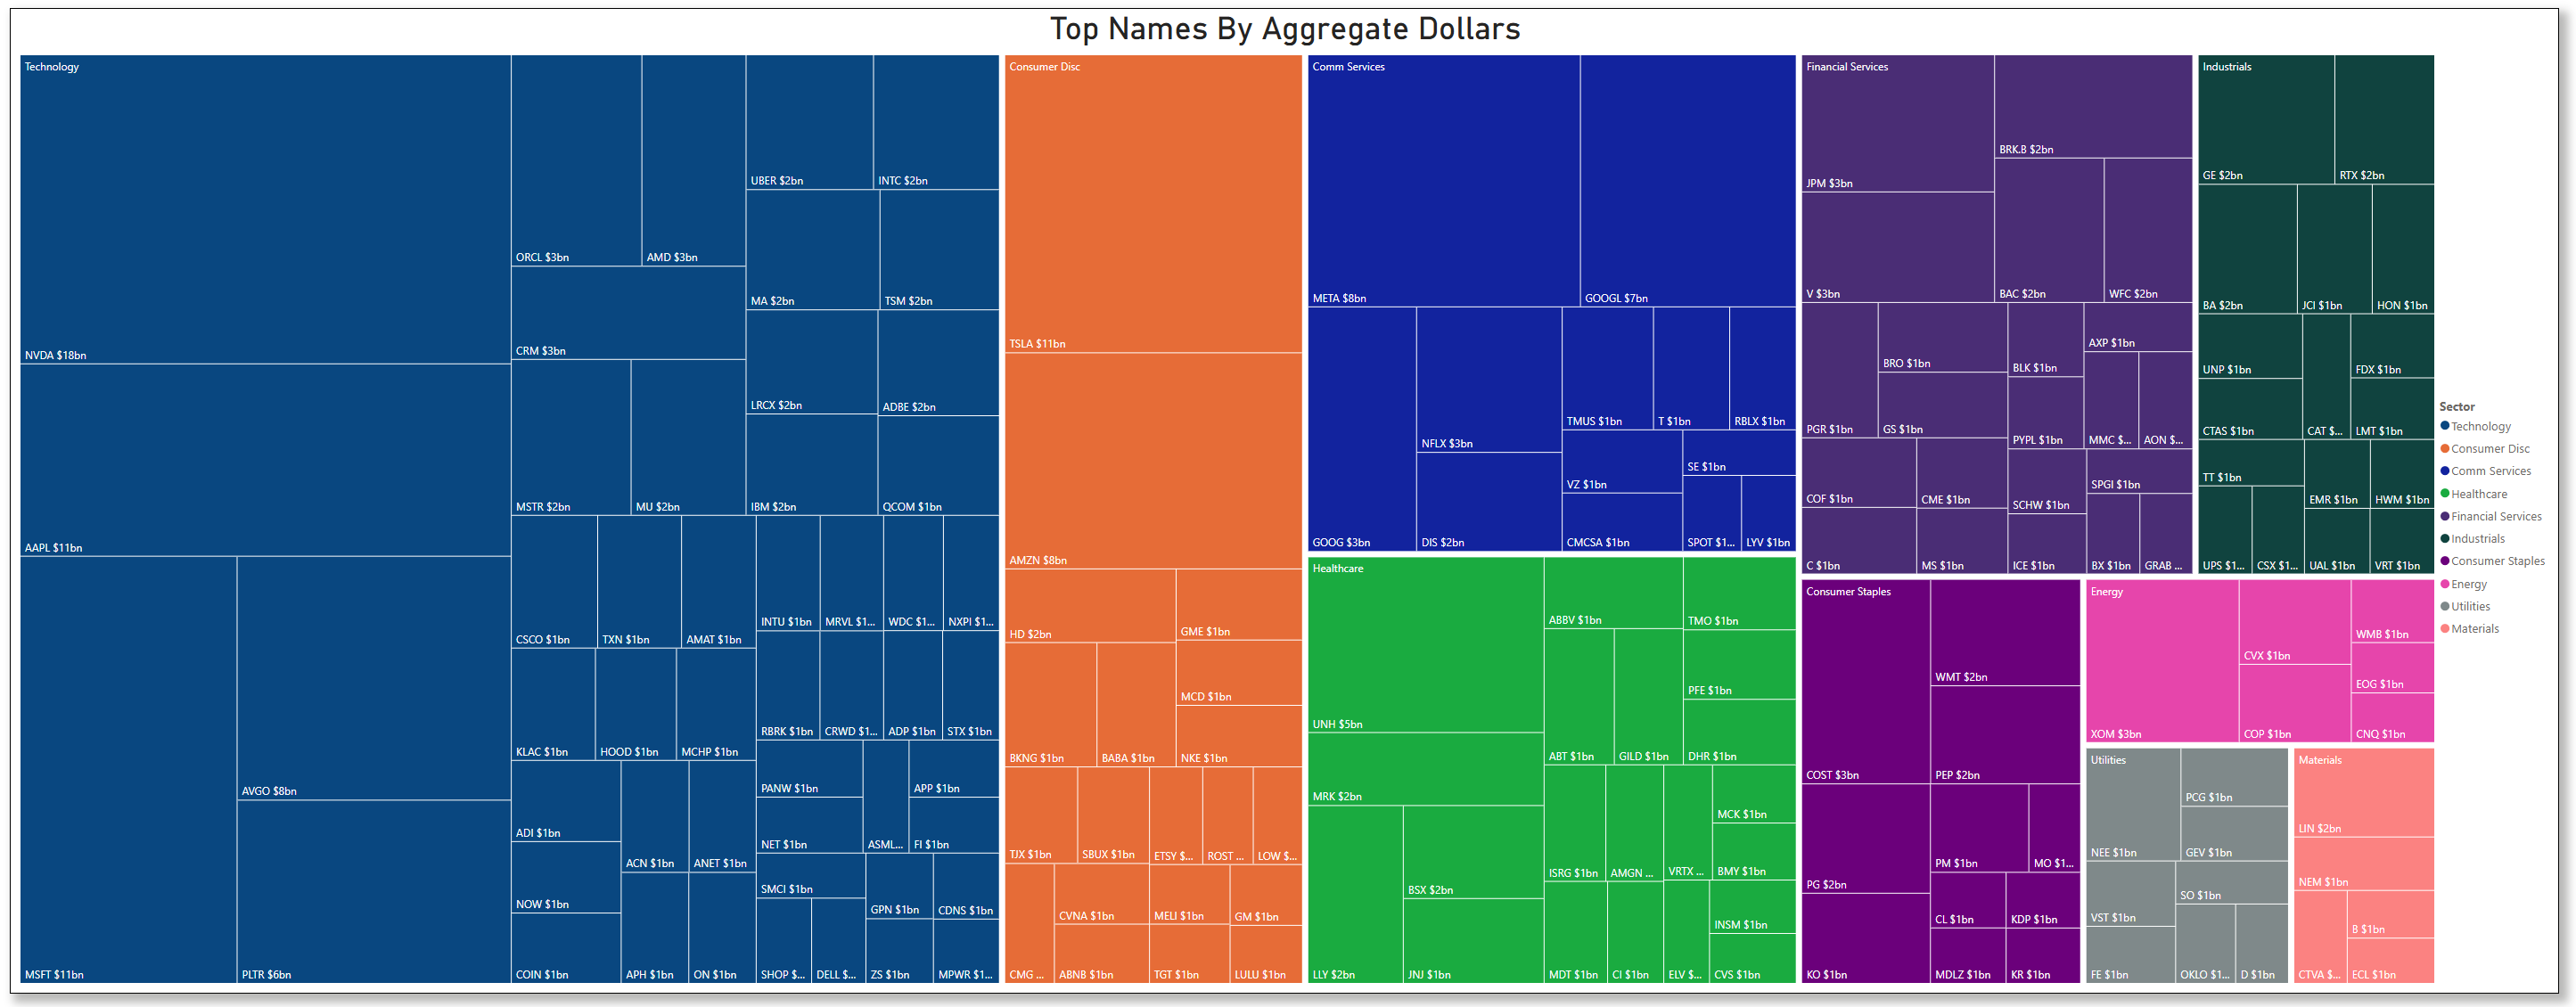
Concentration Within Technology
The Technology sector, despite not ranking at the top in total sector flows this week, features exceptionally concentrated trades in large-cap leaders:
NVIDIA ($18B), Apple ($11B), Microsoft ($11B), and Broadcom ($8B) are the top four tech names, together representing nearly half of all Technology sector flows.
A meaningful cluster of $1–$3B trades is spread across over 30 tickers, suggesting both core positioning in large caps and selective exposure to semis (AMD, TSM, AVGO, QCOM), software (ORCL, CRM, ADBE), and AI-related names (PLTR, SMCI, MSTR).
Takeaway: Institutions are not broadly distributing across the sector, but are doubling down on the highest-liquidity, high-conviction names in AI, infrastructure, and cloud.
High-Conviction Plays in Consumer Discretionary
Tesla ($11B) and Amazon ($8B) are clear institutional favorites, followed by Home Depot ($2B), with a long tail of $1B positions in discretionary retail and services (e.g., GME, MCD, NKE, LULU, SBUX).
The top-heavy skew indicates that most of the flow is driven by just a handful of names with high beta and thematic appeal.
Communication Services: Mega-Cap Focus
The sector’s strength appears almost entirely due to mega-cap concentration:
Meta ($8B), Google Class A ($7B), and Google Class C ($3B) dominate flows.
Supporting flows are distributed among Netflix, Disney, Roblox, and Telcos (TMUS, VZ).
Interpretation: Institutions are using this sector primarily to express views on digital ad recovery, streaming profitability, and large-scale infrastructure plays.
Financials: Diversified Allocation
The Financials sector displays a more even distribution, with top names like JPMorgan ($3B), Visa ($3B), and Berkshire Hathaway ($2B) alongside regional banks and asset managers such as Schwab, BlackRock, AXP, and SPGI.
This broad distribution suggests sector-wide positioning, likely in response to rate expectations or earnings resilience rather than a single thematic driver.
Healthcare: Balanced Exposure
While UnitedHealth ($3B) and Merck ($2B) lead flows, most other top names in this sector received $1B allocations (e.g., ABBV, PFE, GILD, AMGN).
Interpretation: Institutions are positioning in healthcare for defensive earnings quality, not for breakout momentum.
Industrials, Energy, and Defensive Sectors: Wide but Shallow
These sectors (Industrials, Energy, Consumer Staples, Utilities, Materials) show:
A broad spread of $1B to $2B names, but none of the standout megacap-sized positions seen in Tech or Comm Services.
For example, GE ($2B), RTX ($2B), CVX ($1B), and WMT ($2B) are top names, but flows are generally low and fragmented.
Interpretation: These sectors are being modestly accumulated, possibly as risk control overlays rather than alpha generators.
Strategic Implications
Mega-cap dominance remains the primary driver of institutional order flow. The largest trades are clustered in high-liquidity, high-profile stocks, particularly within Technology and Communication Services.
AI, semiconductor infrastructure, and digital platforms are receiving the most concentrated bets, with NVDA and META leading by a wide margin.
Defensive sectors are not receiving concentrated capital, but there is enough dispersion to suggest measured exposure for portfolio balancing — not thematic conviction.
Investors should watch the sustainability of leadership in these high-conviction names, as any rotation away from them may signal a broader shift in institutional sentiment.
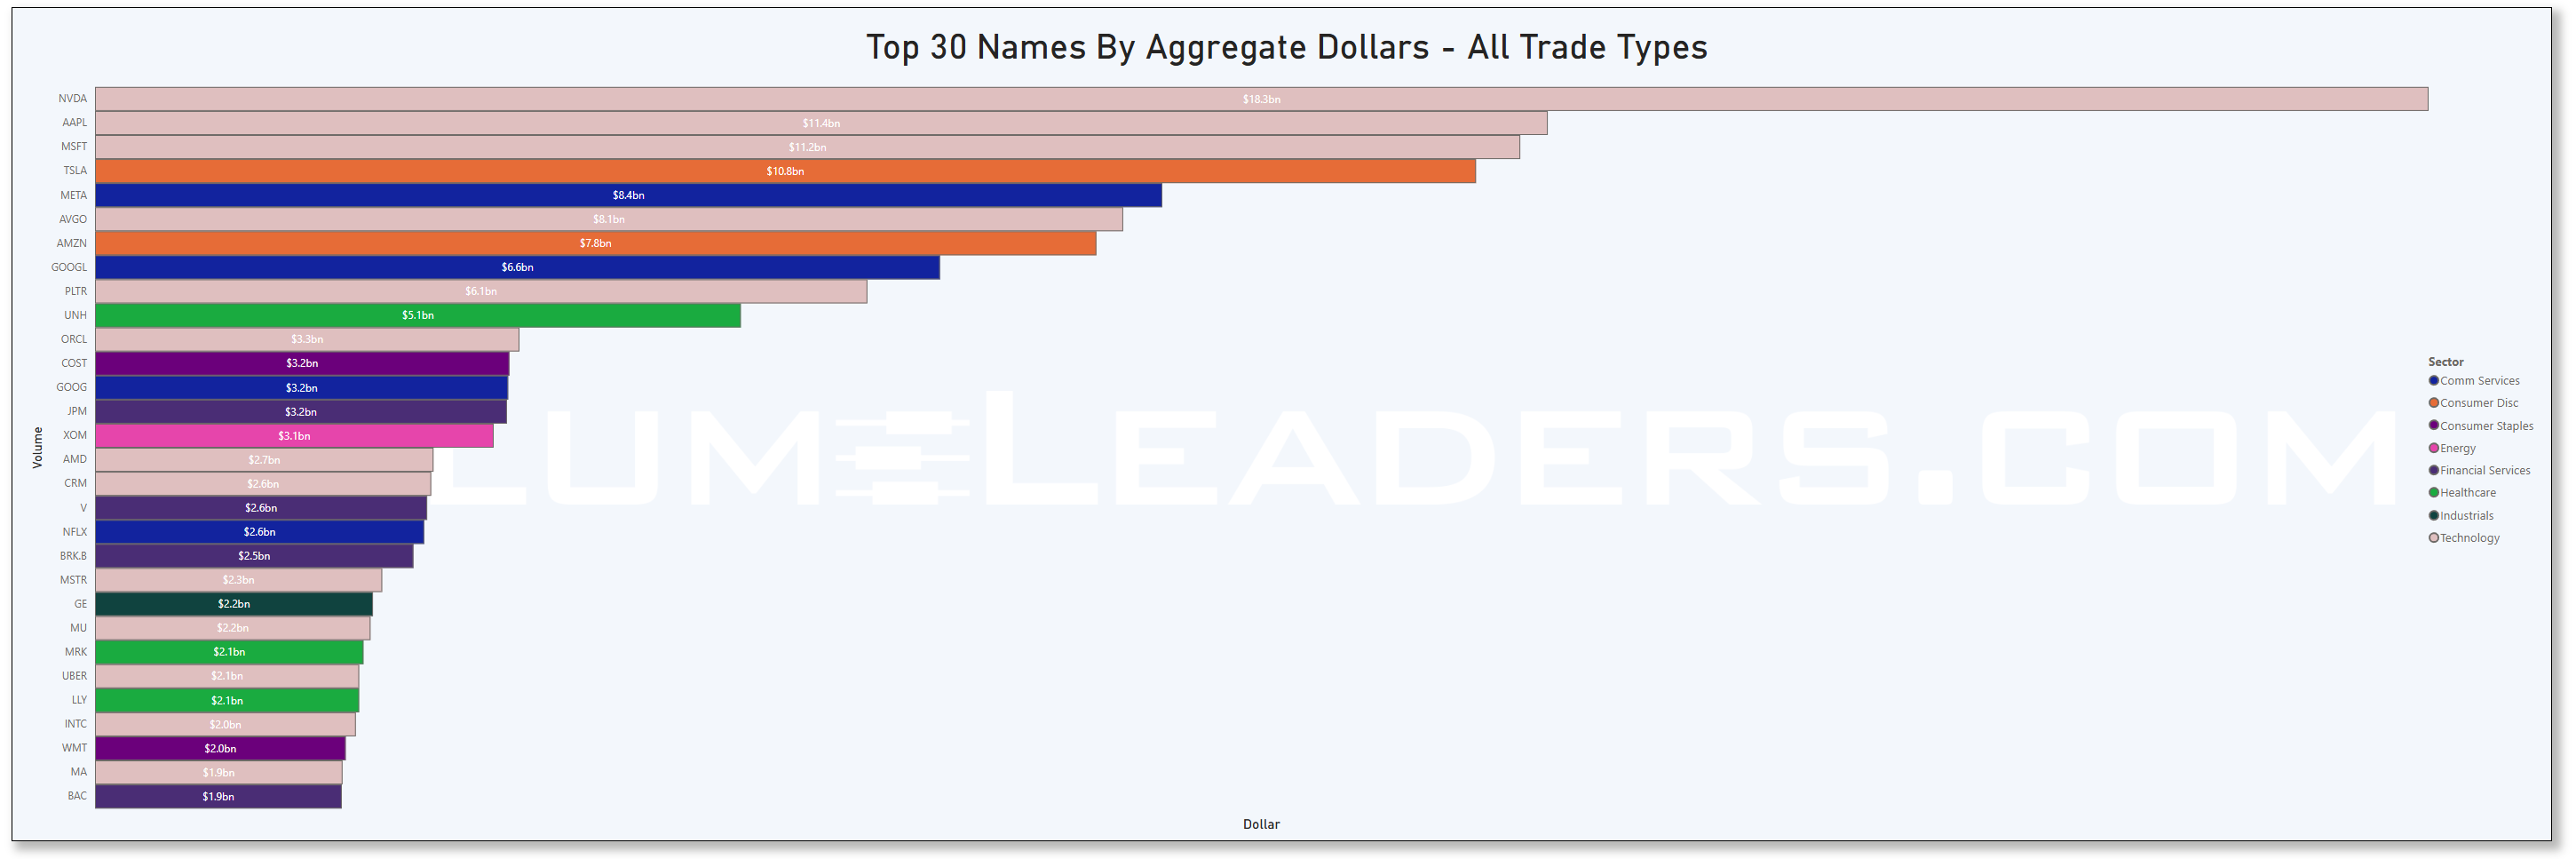
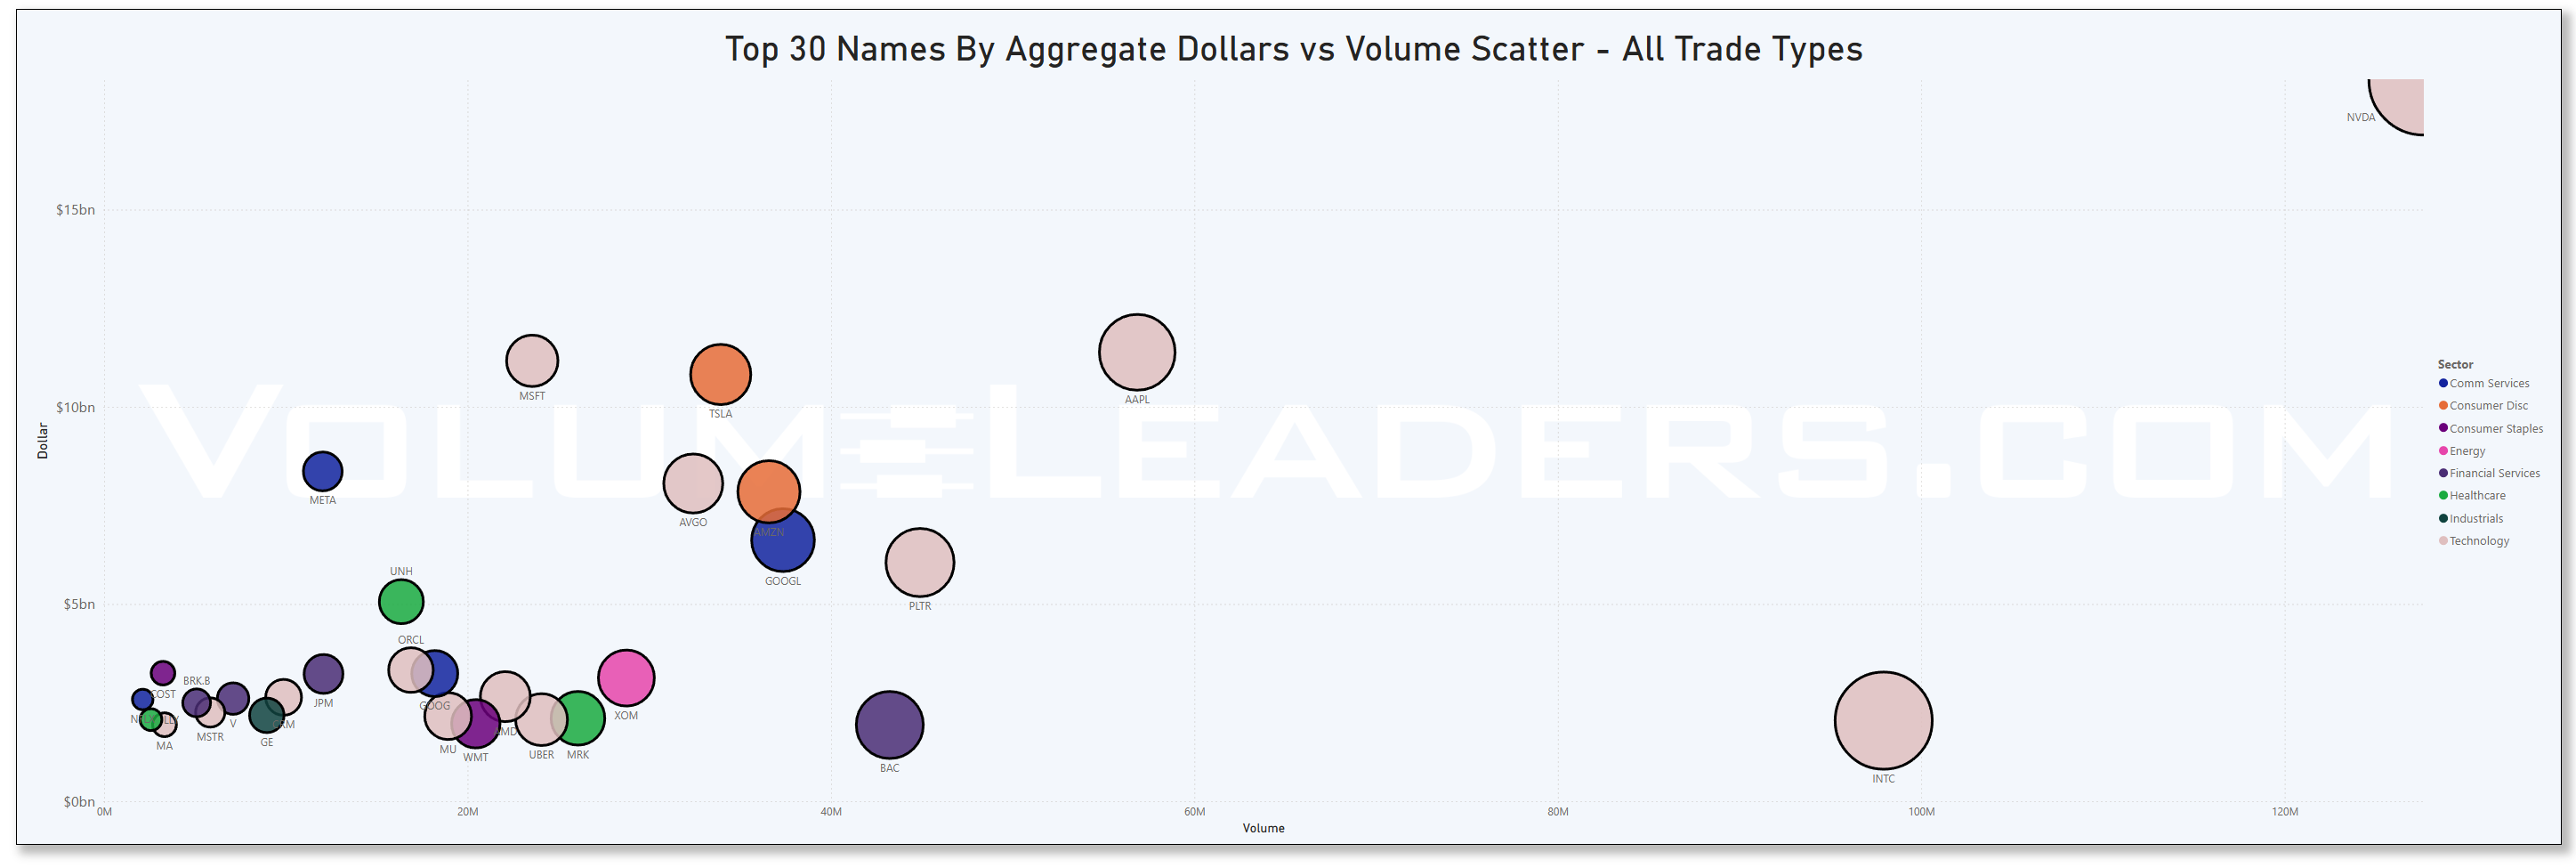
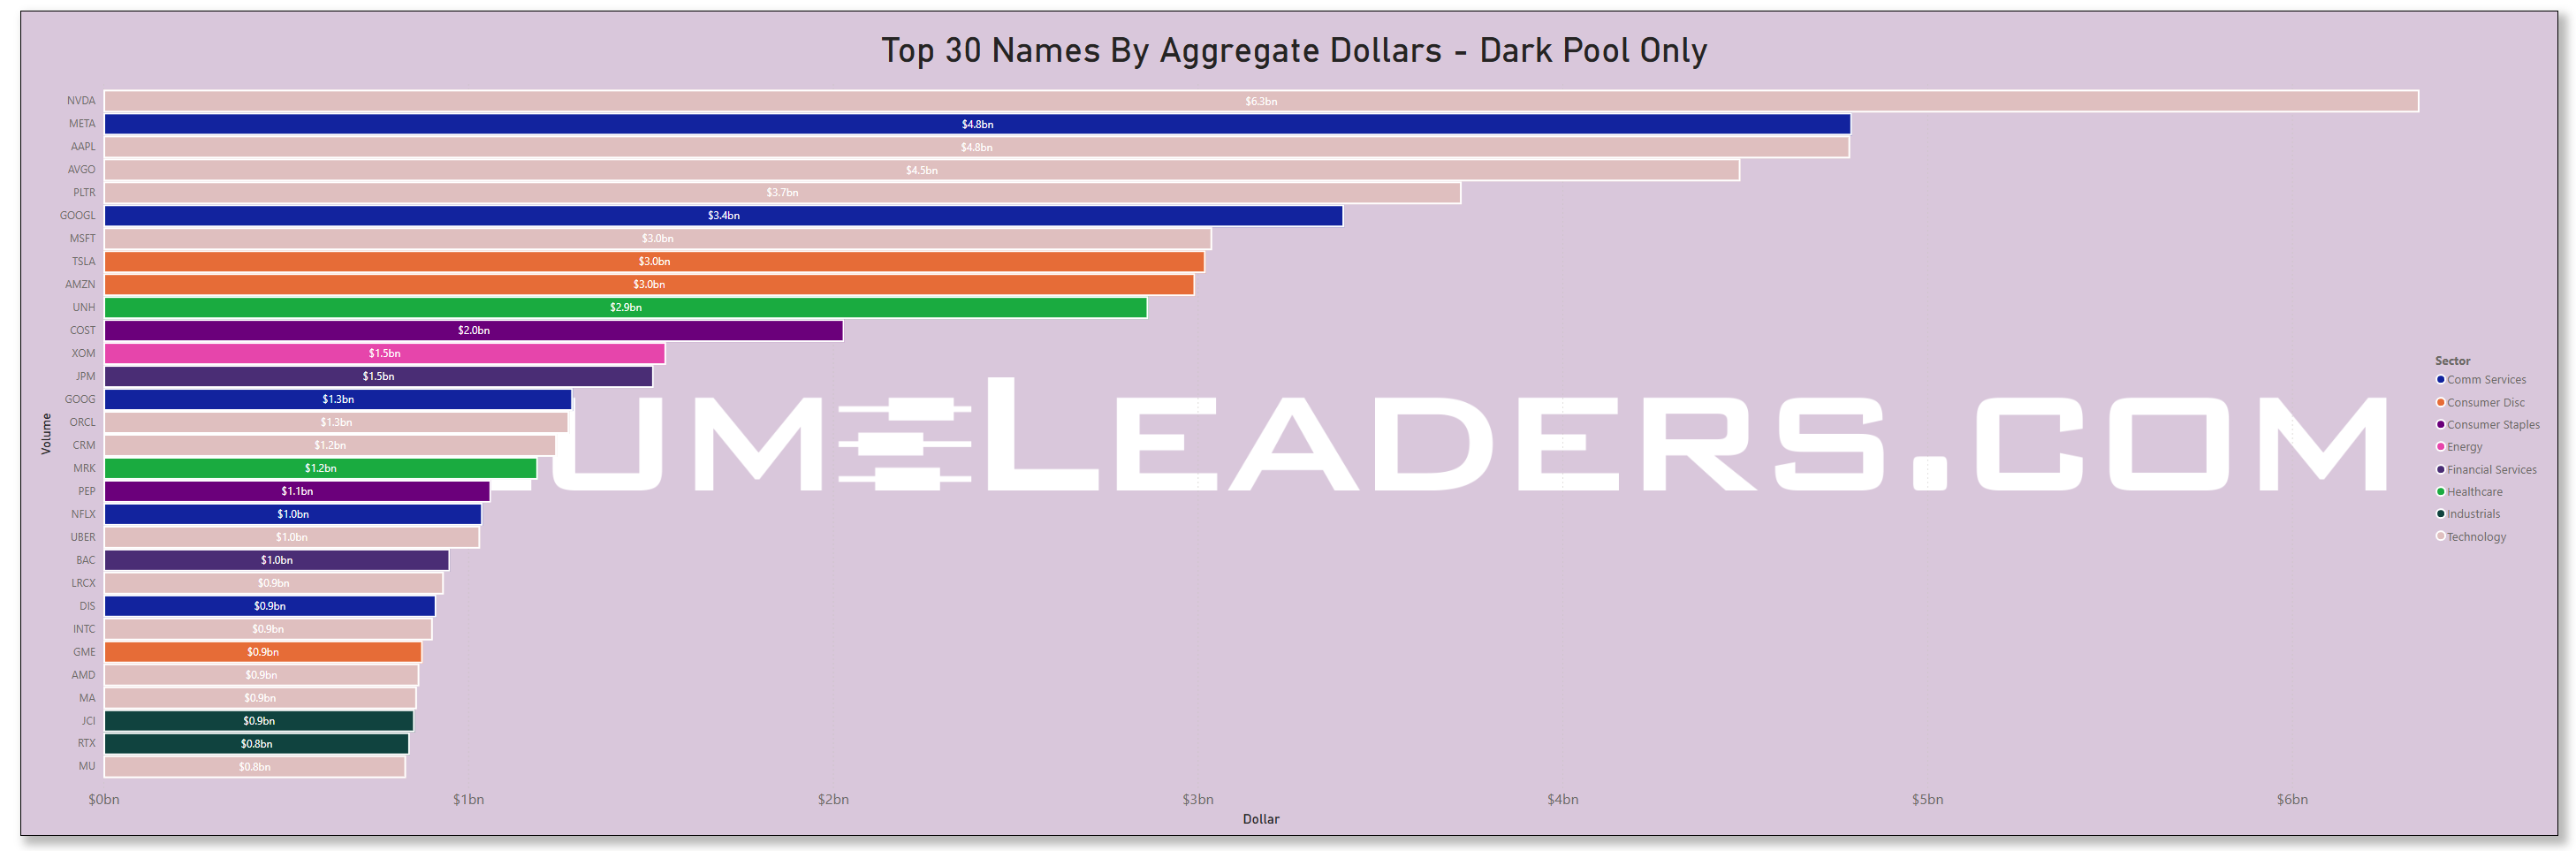
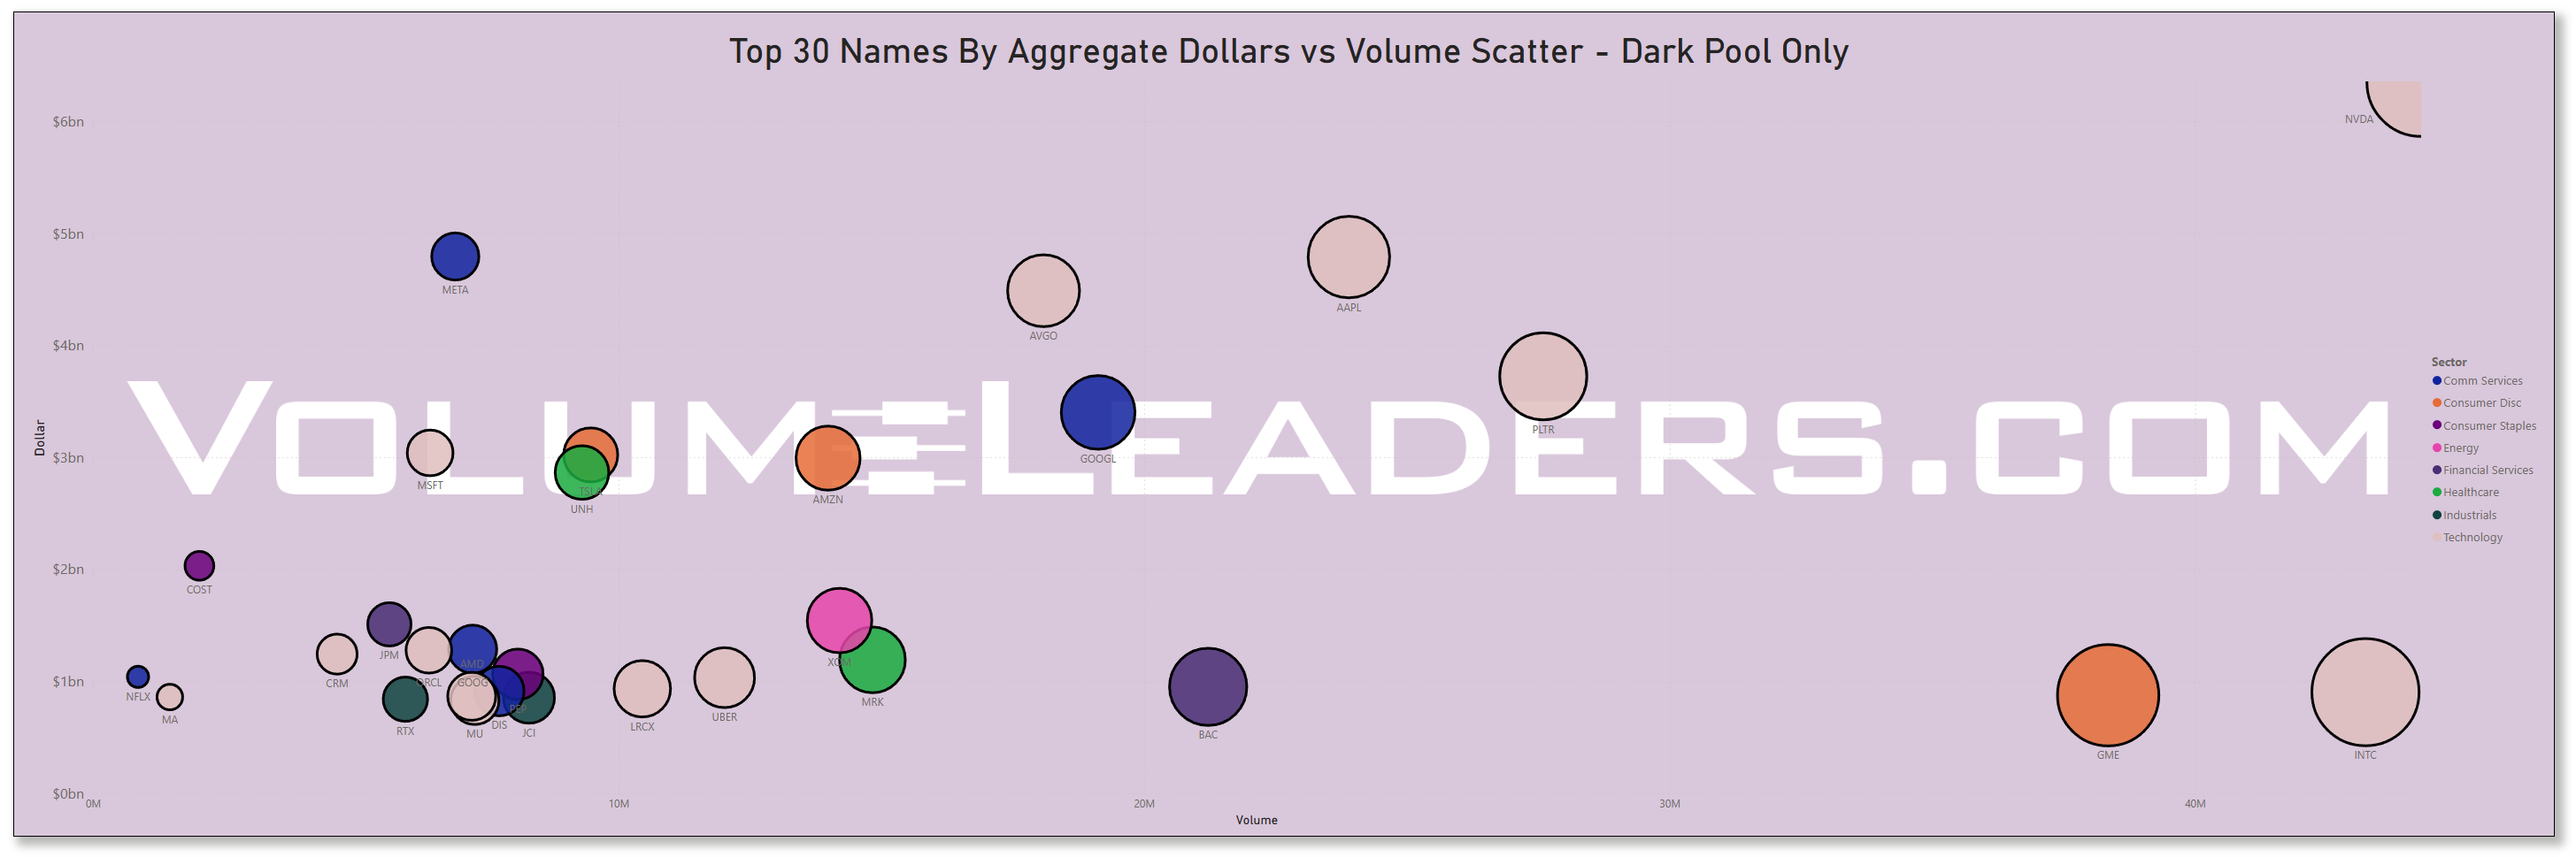
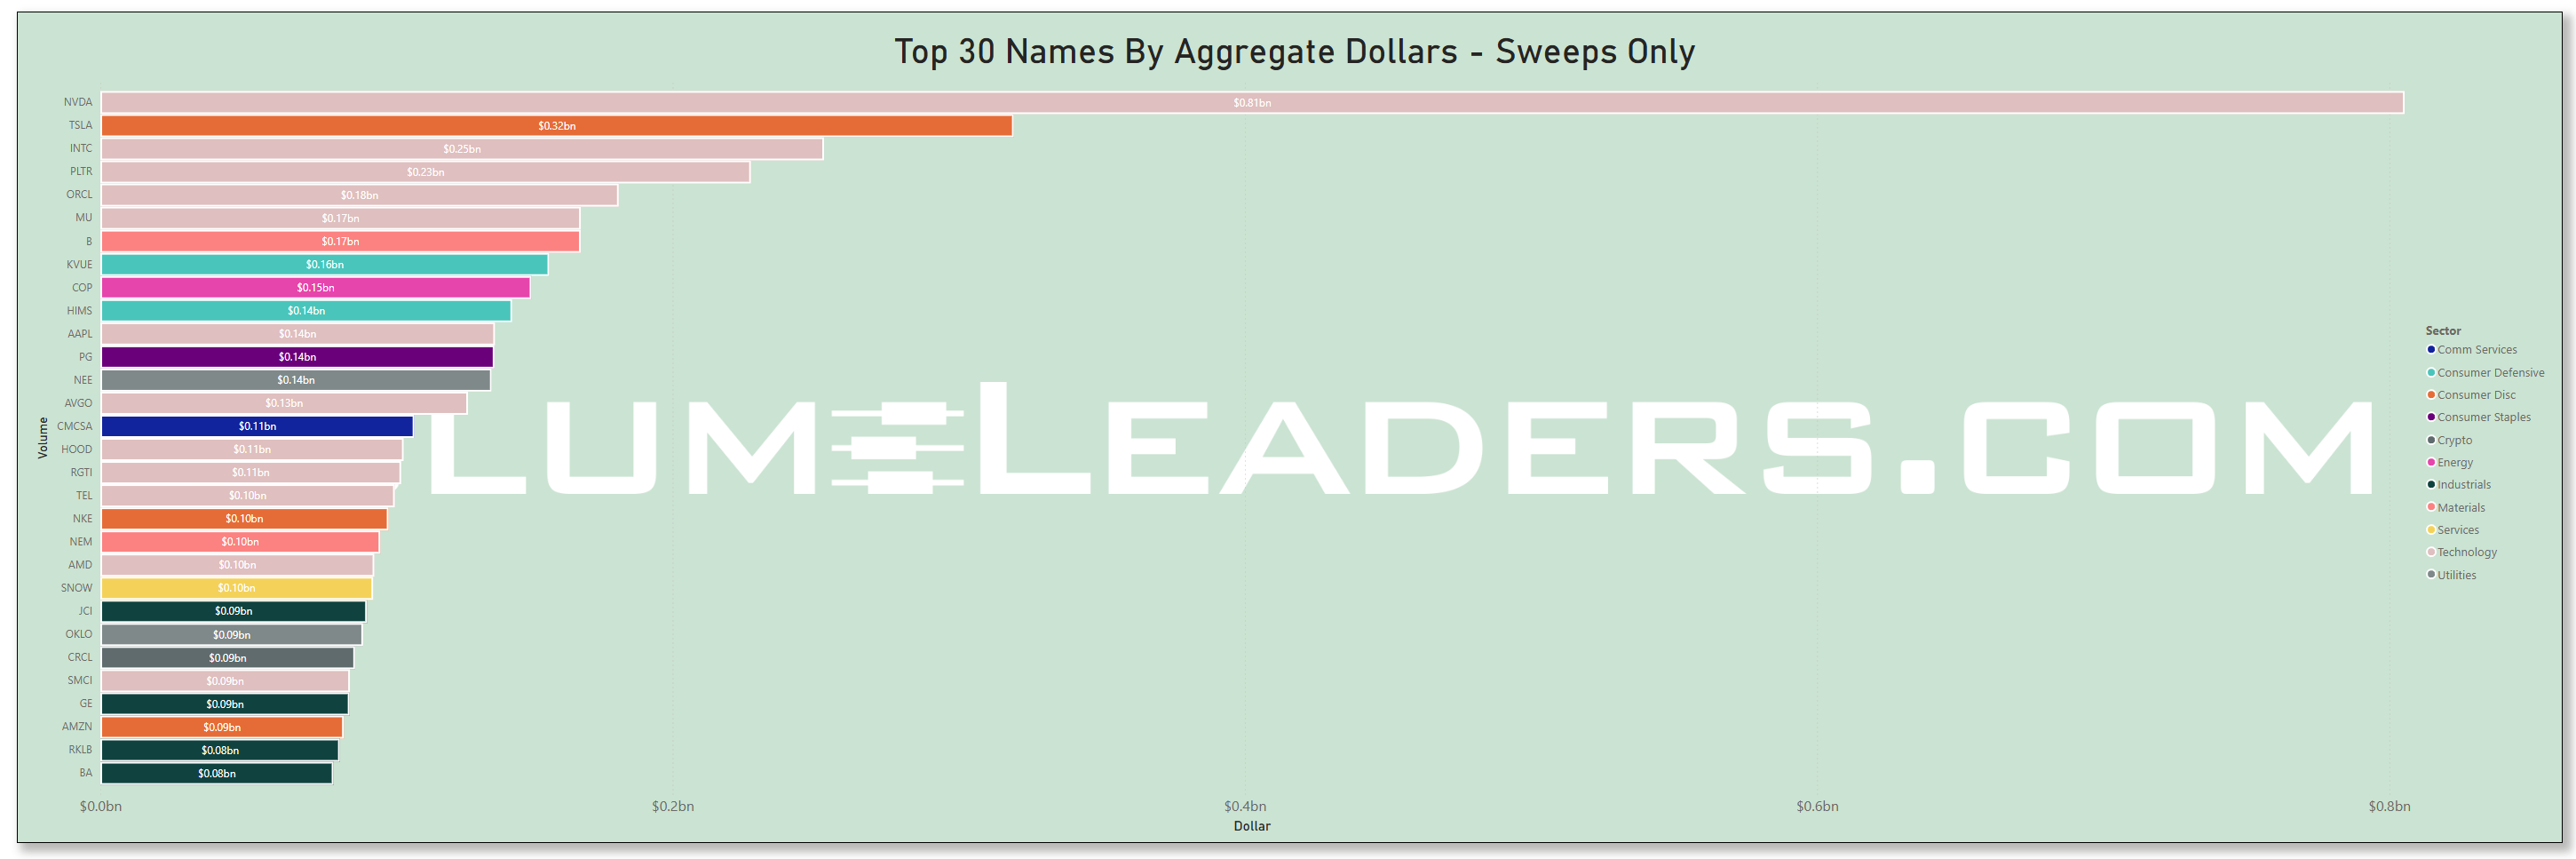
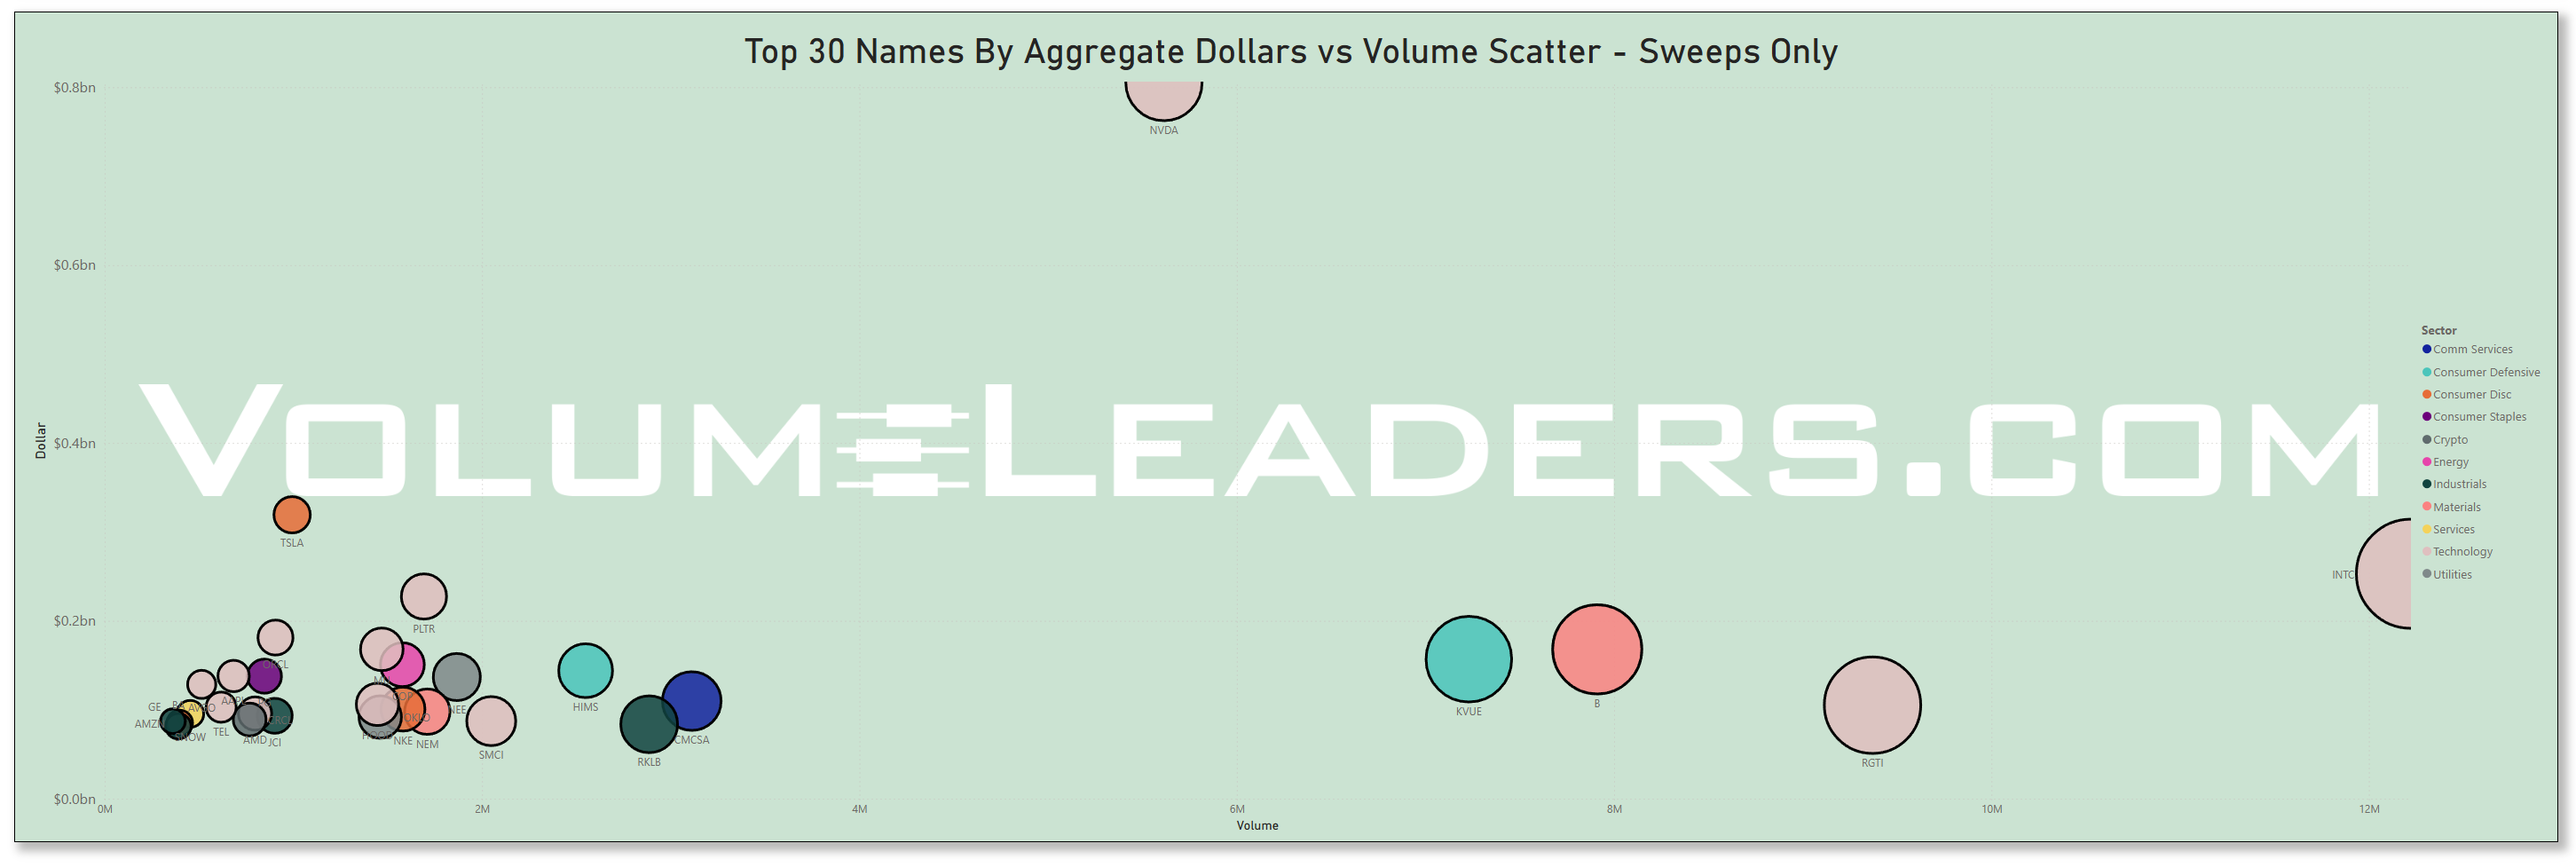
Top Institutional Order Flow In ETFs
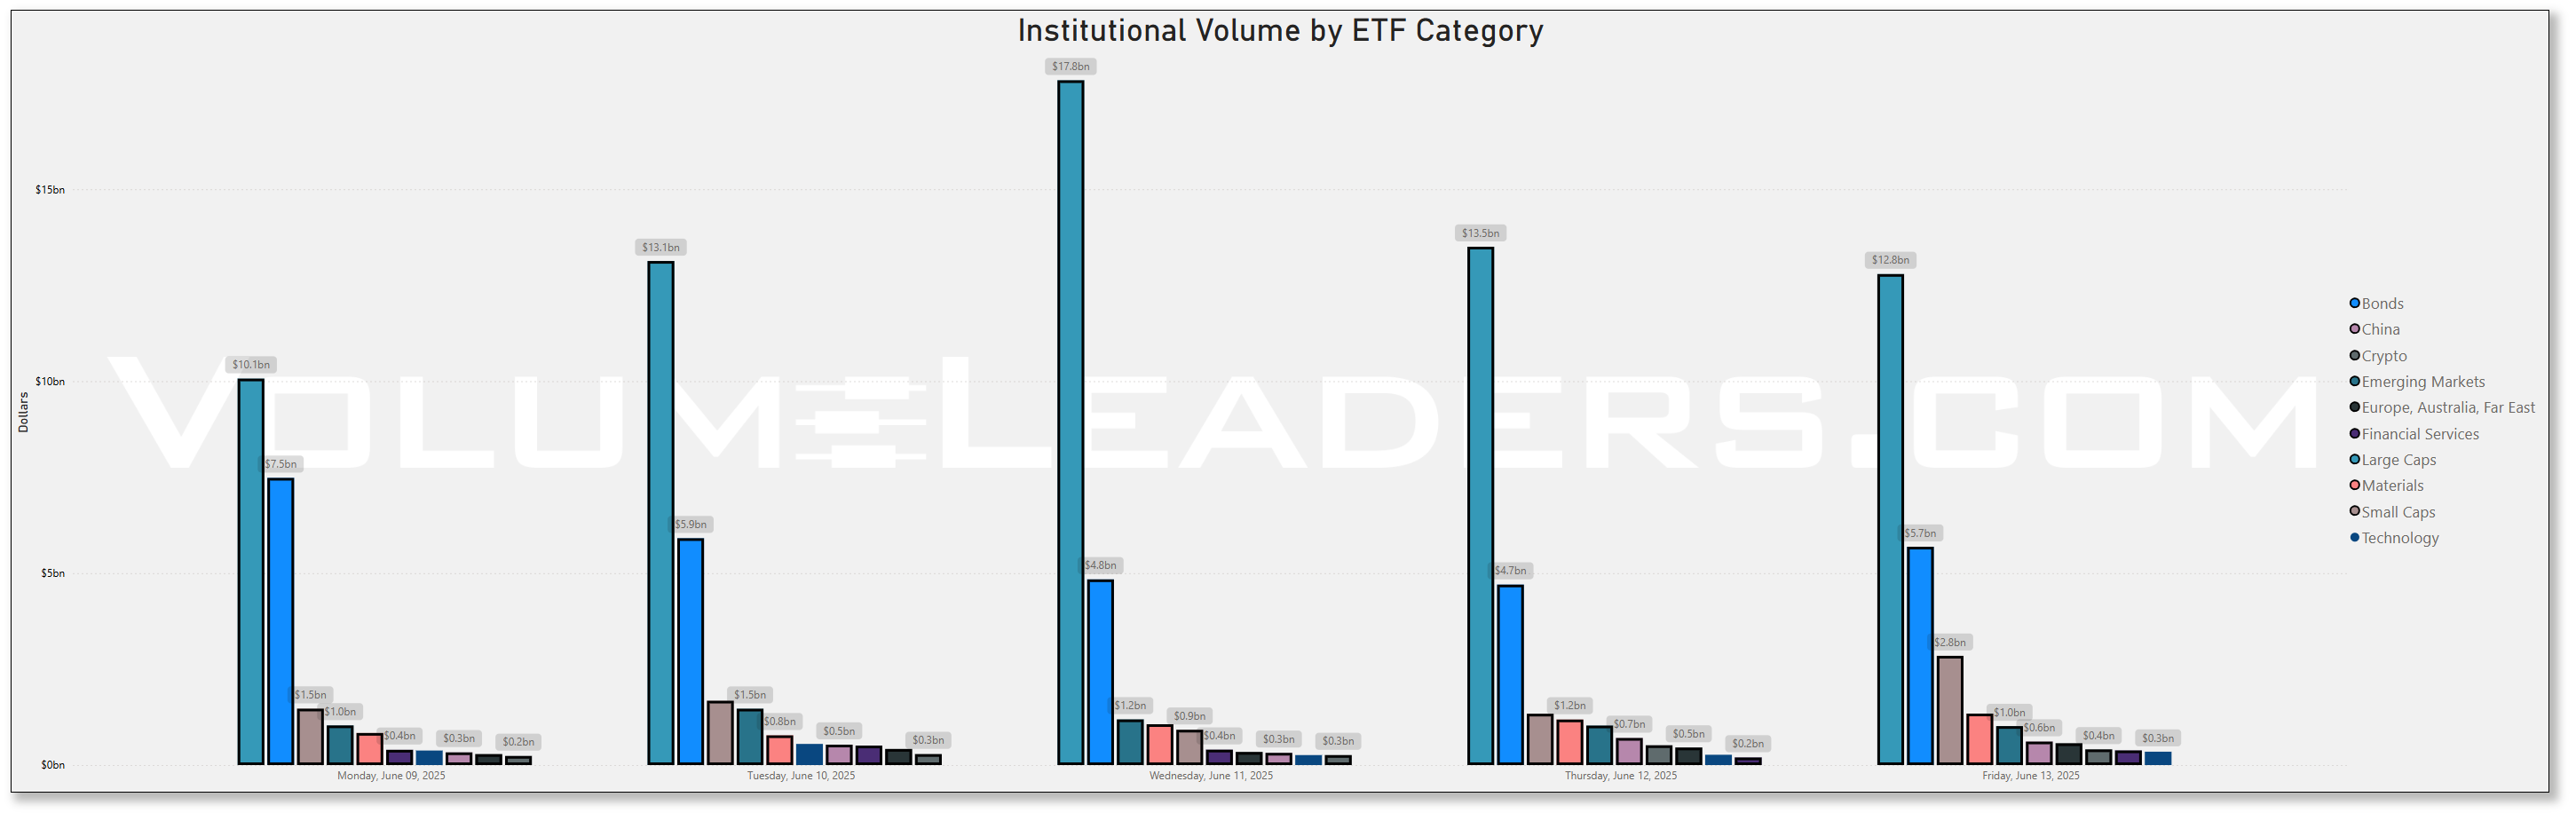
Institutional ETF Allocation – Weekly Overview
Primary Observation: Large-Cap Dominance
Large Cap ETFs received overwhelming institutional volume every day, ranging from $25.5B to $37.4B per day, totaling over $164 billion for the week.
This level of concentration reflects:
Broad market exposure demand (likely via SPY, QQQ, VTI).
High institutional liquidity needs.
Confidence in market breadth or index-level momentum.
Weekly Trends by Category (in billions)
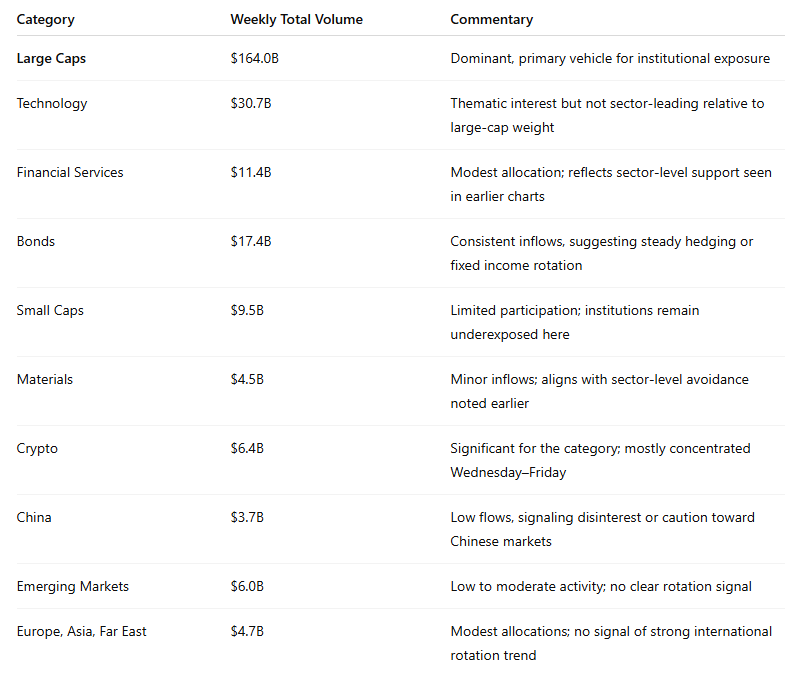
Key Interpretations
1. Index Overlays Take Precedence
The dominance of large-cap ETFs suggests institutions are using broad market instruments as primary trading or positioning vehicles, not rotating meaningfully into smaller cap or thematic categories.
The gap between Large Cap and all other categories reflects a high-conviction bet on broad equity exposure, not a diversified thematic allocation strategy.
2. Sector-Level Confirmation
Flows into Technology ETFs (~$30.7B) reinforce earlier observations: strong participation, but not the sector with highest absolute dollar flow.
Financial Services and Materials show up here at levels consistent with their underlying equity flows — supportive, but not leadership.
3. Limited Appetite for Risk-Off or Non-US Plays
Bond flows are steady (~$3–$4B/day), suggesting base-level hedging or duration rebalancing, not a flight to safety.
Emerging markets and China remain underweighted, with flows below $1.5B per day — implying minimal institutional reallocation toward global risk-on regions.
Europe/Asia/International ETFs remain on the sidelines.
4. Noteworthy Crypto Inflows Mid-Week
Crypto ETF flows accelerated mid-week, peaking on Wednesday–Friday. Totaling $6.4B for the week, this is significant relative to historical norms.
Suggests speculative participation or front-running around a crypto event or breakout.
Strategic Implications
Market positioning remains heavily index-centric, with institutions committing significant capital to large-cap ETFs rather than expressing high-conviction rotation into small caps, emerging markets, or bonds.
Thematic interest is isolated, primarily in Technology and Crypto, but still a secondary priority compared to general market exposure.
Risk appetite appears intact, with only modest bond inflows and no signs of significant hedging or global flight to safety.
Analysts should monitor whether Crypto and Small Caps continue to see higher flow momentum in coming weeks, potentially signaling a shift in appetite toward more speculative or growth-levered areas.
ETF-Level Flow Concentration
1. Institutional Flow is Hyper-Concentrated in a Few Large-Cap ETFs
The overwhelming majority of dollar flow went into large-cap index products:
SPY: $20B
VOO: $18B
IVV: $13B
These three S&P 500-tracking ETFs alone represent over $50B in aggregate volume — more than the entire total of many other categories combined.
Additional flows went into QQQ ($7B), QQQM, VTI, IWV, and similar total-market or growth-oriented ETFs.
Implication: Institutions are deploying capital at scale using high-liquidity, index-linked vehicles — signaling a macro-level positioning rather than micro-level rotation.
2. Bond ETF Flows Are Broad but Shallow
Fixed income flows are spread across dozens of instruments, with top allocations in:
LQD and HYG ($3B each) – corporate credit exposure.
TLT ($2B) – duration-sensitive U.S. Treasuries.
Most other bond ETFs (AGG, BIL, VTEB, JPST, MUB) registered $0.5B–$1B each.
Implication: Fixed income allocation is tactical and diversified — consistent with hedging, rate positioning, or cash-parking rather than directional conviction.
3. Minimal Flows into Small Caps and Thematic Sectors
IWM and IJR (small-cap proxies) saw just $0.5B–$1B, despite the broader market rally.
Sector/thematic ETFs (Materials, Financials, Technology) are represented almost exclusively by $500M-or-less flows, with SMH, XLF, and KRE showing minor activity.
Implication: Institutions are not aggressively rotating into smaller or higher beta segments, even within thematic winners.
4. Gold and Commodities Are Not in Favor
Materials-related ETFs such as GLD ($2B), GDX ($1B), SLV, and IAU saw modest flows but remain secondary in aggregate allocation.
No signs of large-scale hedging via precious metals or commodity baskets.
Implication: Institutions are not expressing risk-off behavior or inflation hedging via metals.
5. Emerging Markets See Moderate Interest
Notable allocations in:
EEM ($2B)
IEMG ($1B)
VEA, VWO, EMXC, and others (~$0.5B–$1B)
Spread across both broad EM indices and ex-China products.
Implication: Moderate EM engagement, potentially driven by valuation dispersion or currency plays — but not indicative of a major shift in global exposure.
6. Crypto Exposure Concentrated in IBIT
IBIT: $1B in flows; most other crypto-related ETFs (e.g., BITO, GBTC, ETH-linked names) are not prominently featured.
Implication: Institutional interest is selectively funneled through trusted vehicles (likely IBIT/BlackRock) — pointing to early-stage accumulation rather than broad adoption.
Strategic Interpretation
Institutional positioning is overwhelmingly index-driven — not based on aggressive rotation, sector bets, or international diversification.
The ETF trade is functioning as a liquidity deployment mechanism, not as a granular factor or thematic allocation strategy.
Risk appetite remains high, but very concentrated. The lack of broad sector or size diversification leaves markets vulnerable to sudden sentiment shifts tied to large-cap tech or index-based exposure.
Bond flows reflect preparation, not panic — allocations are wide but measured, suggesting a balancing act rather than flight to safety.
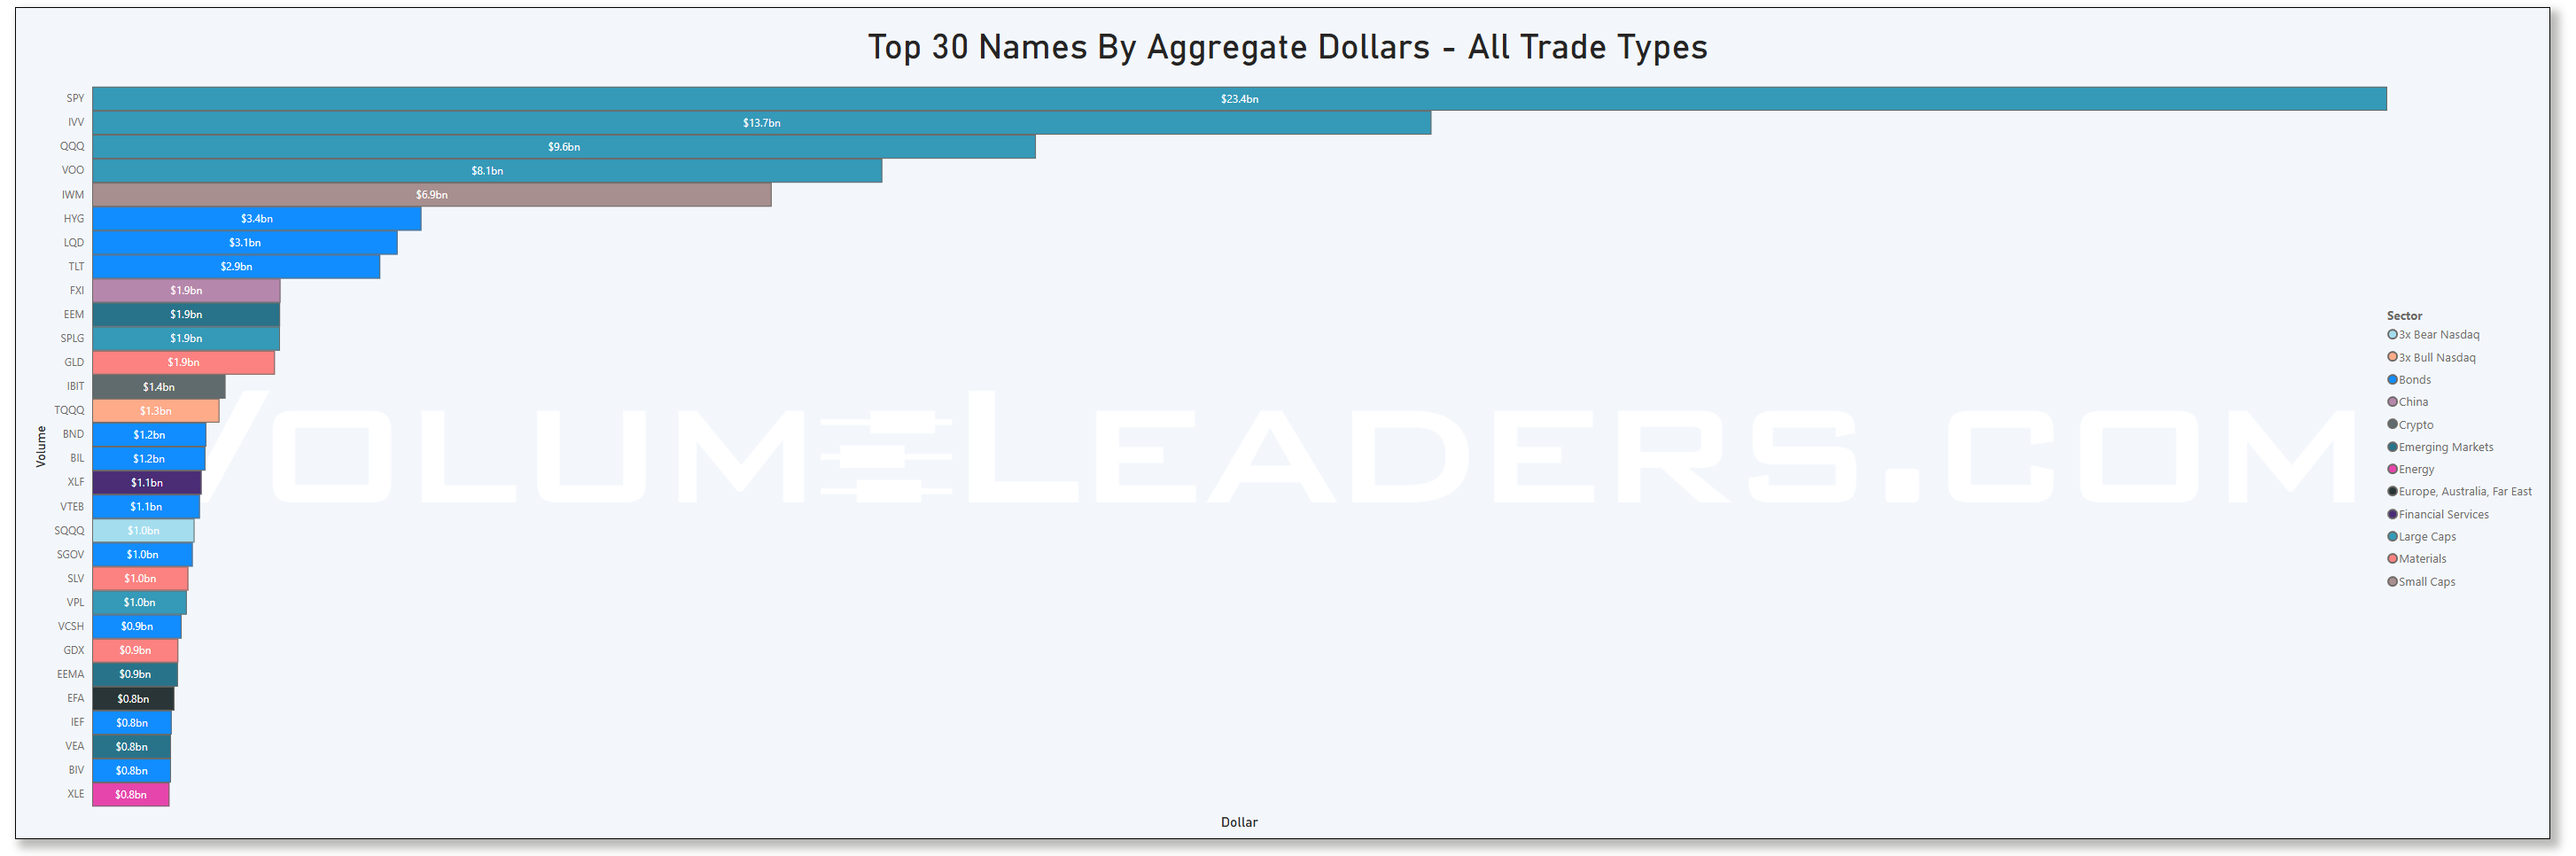
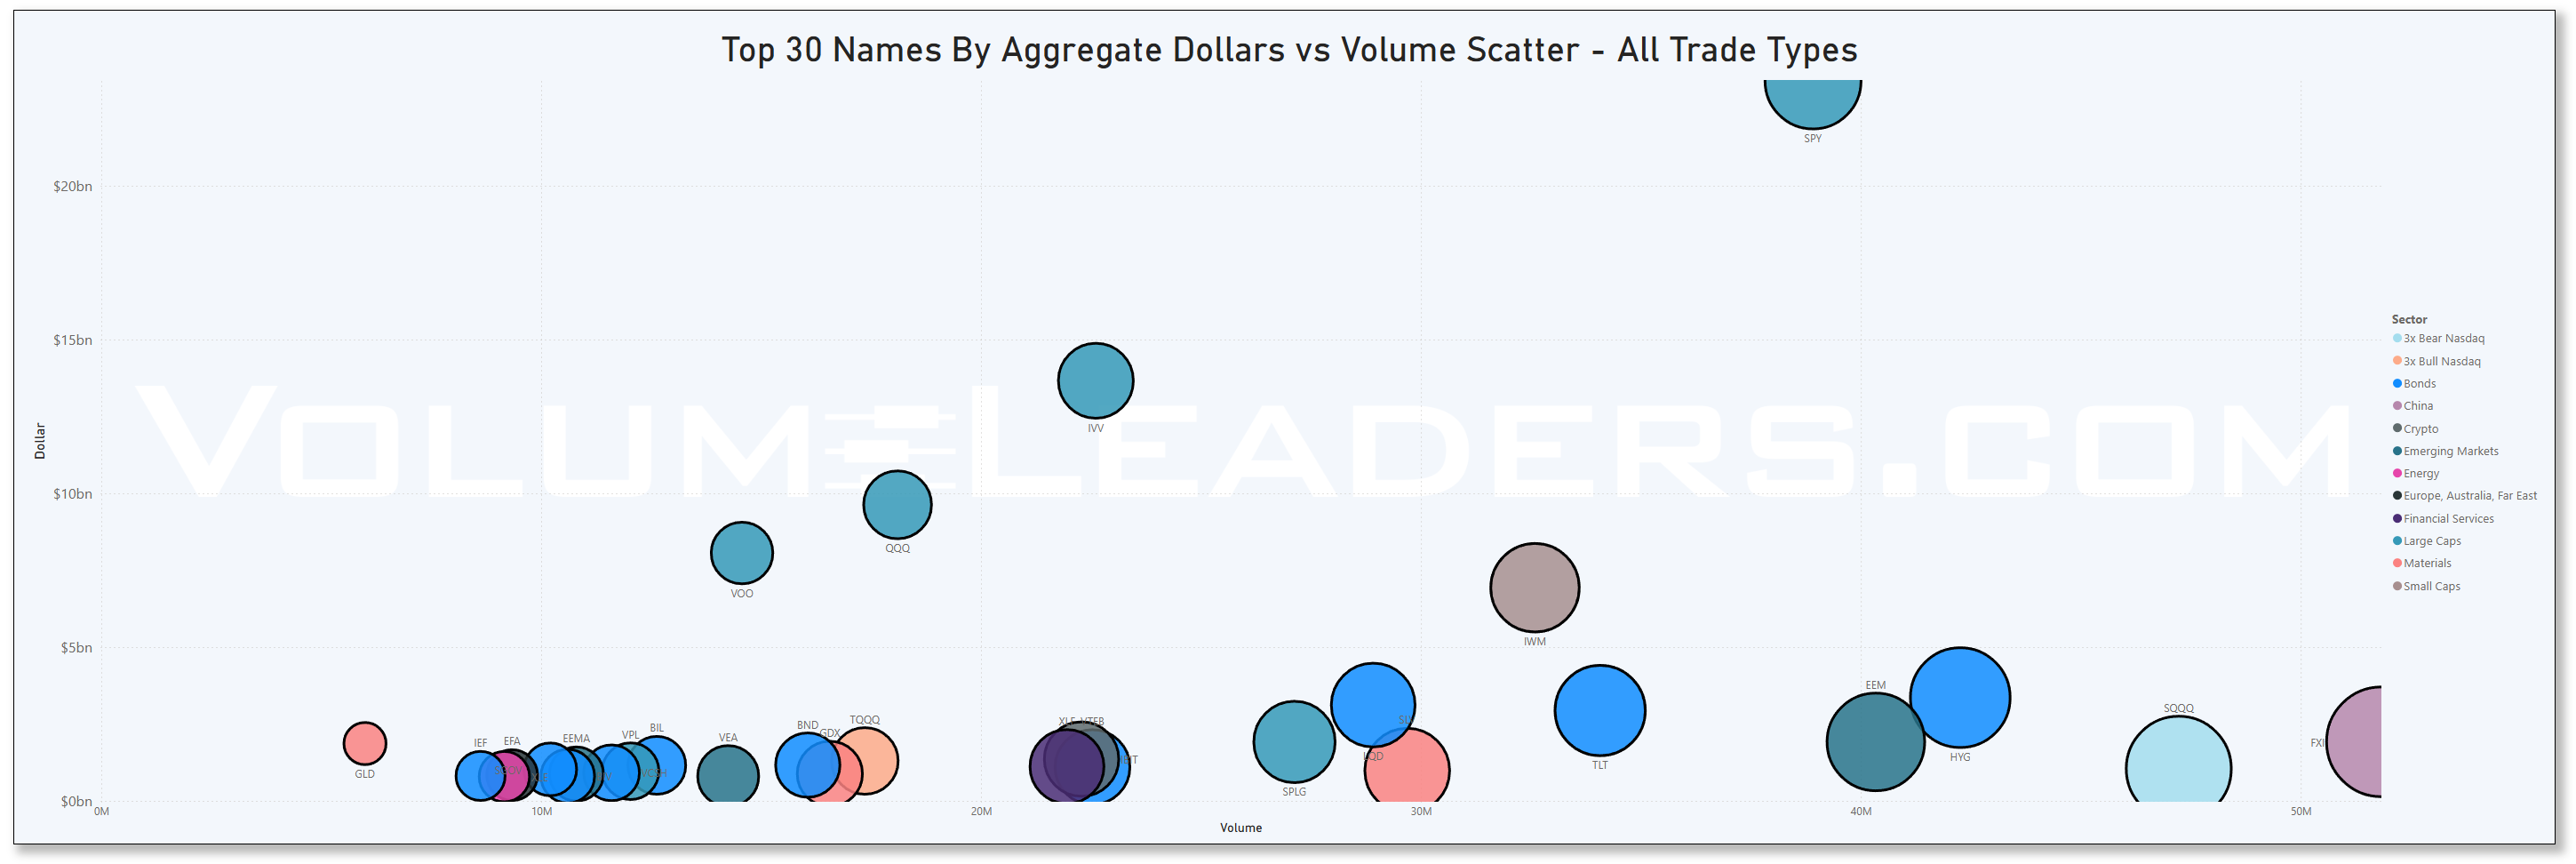
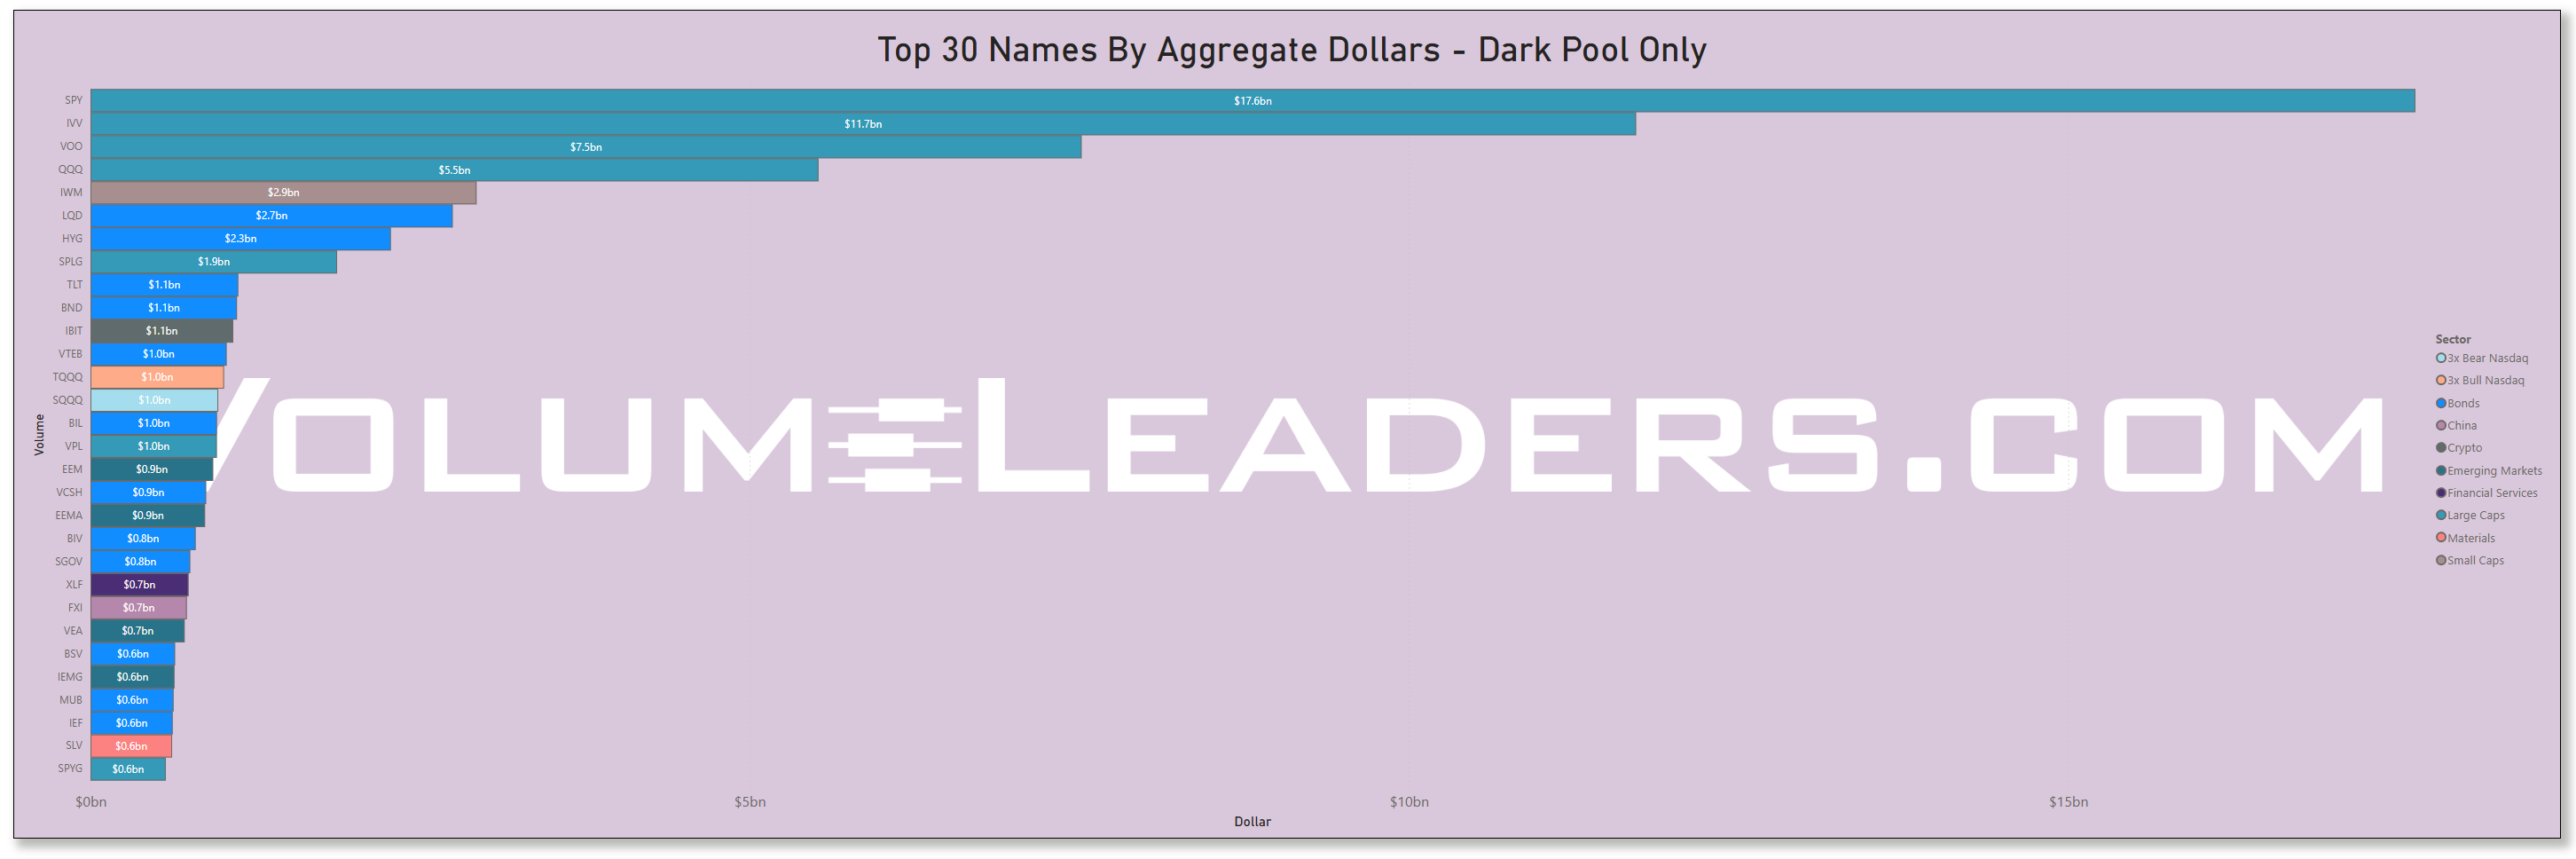
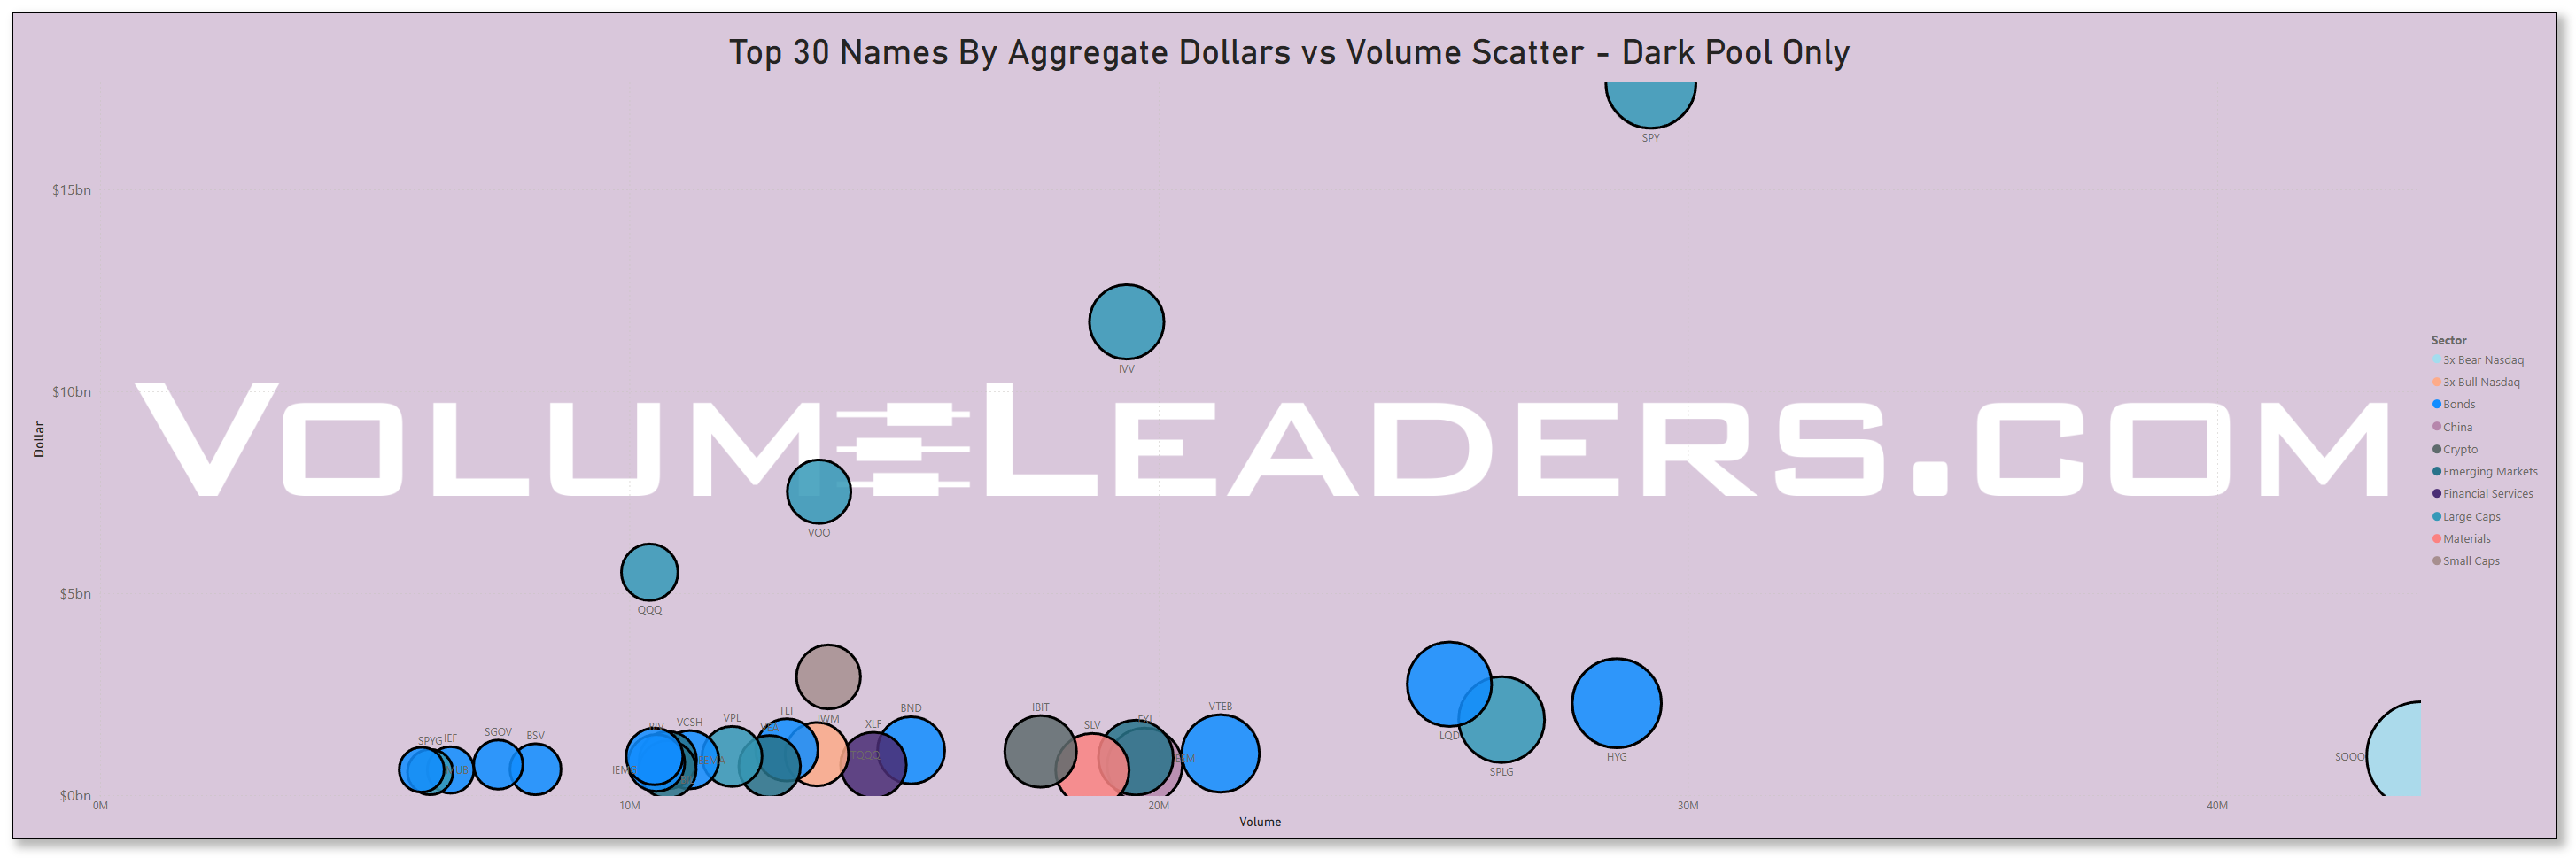
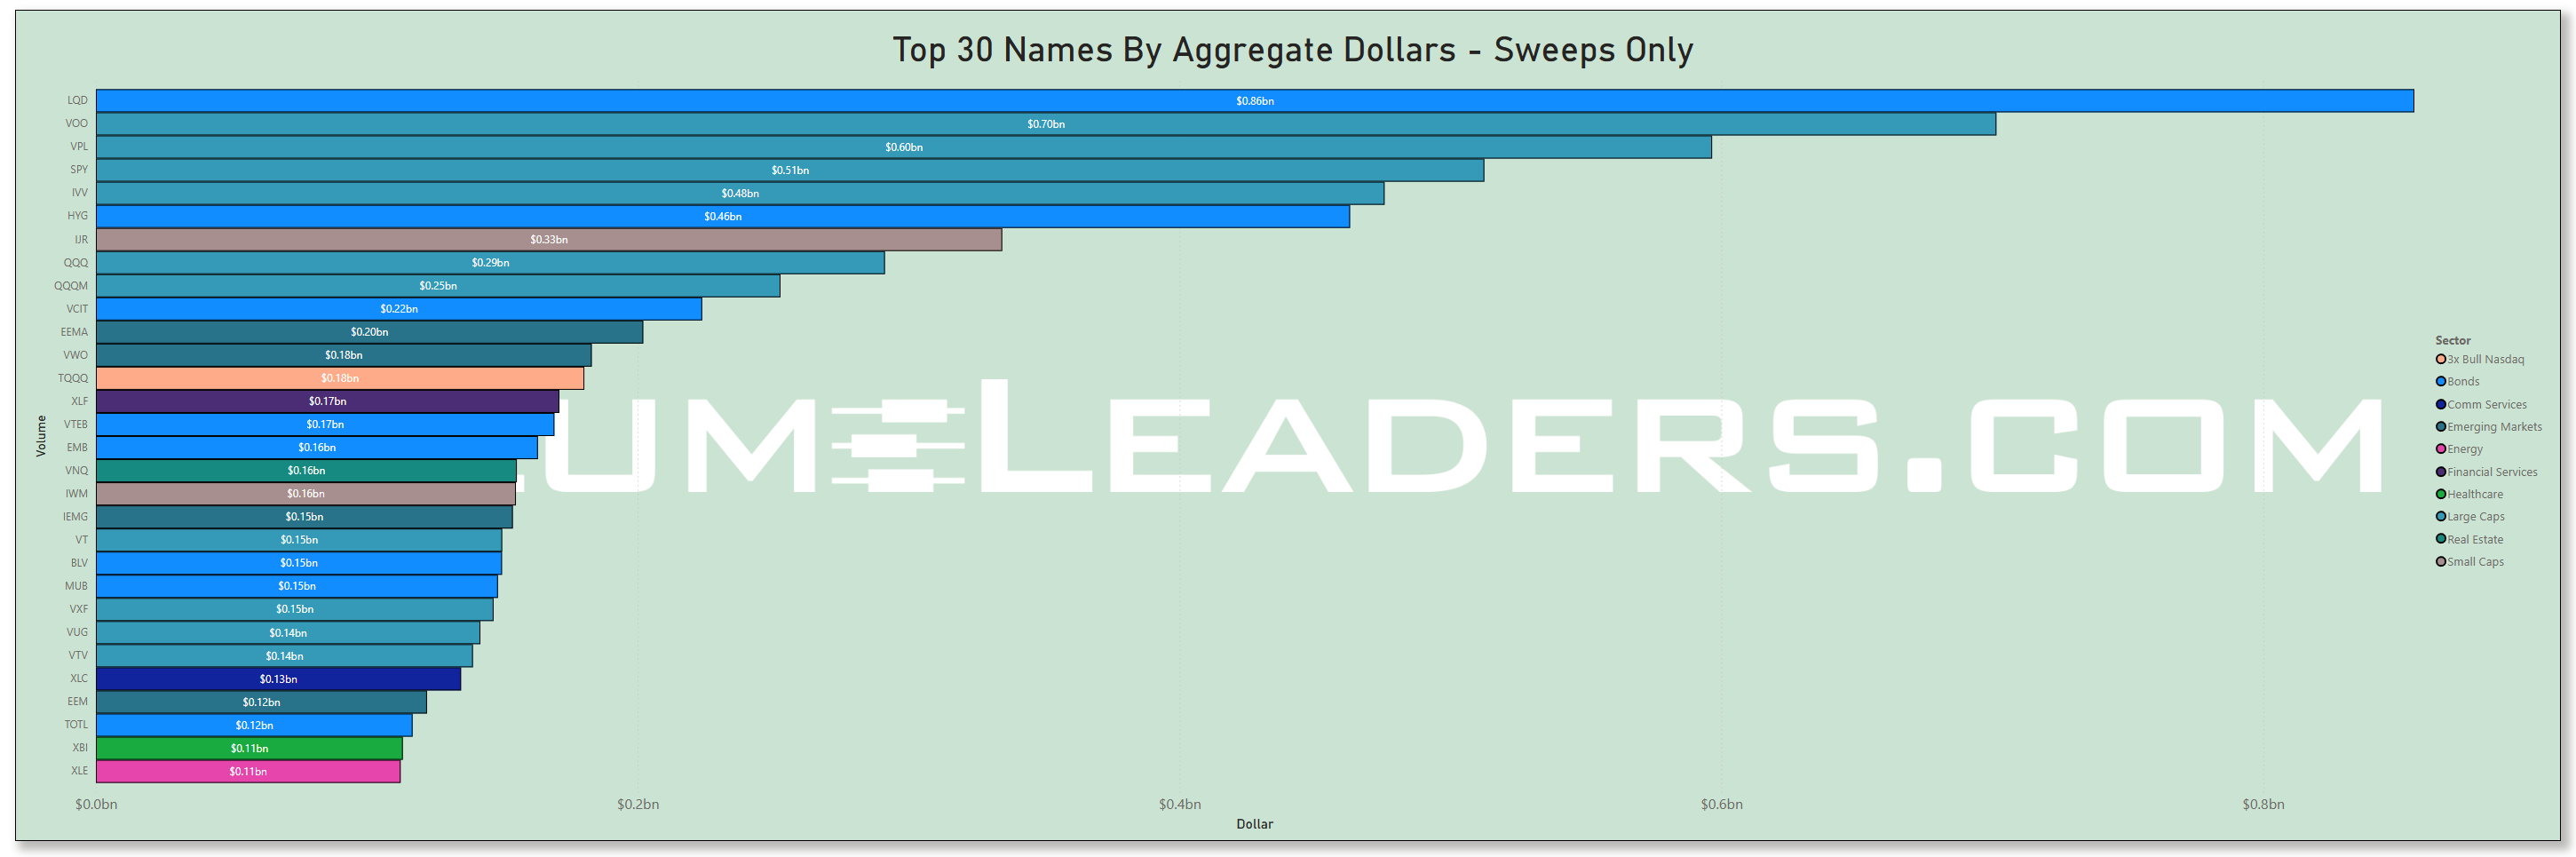
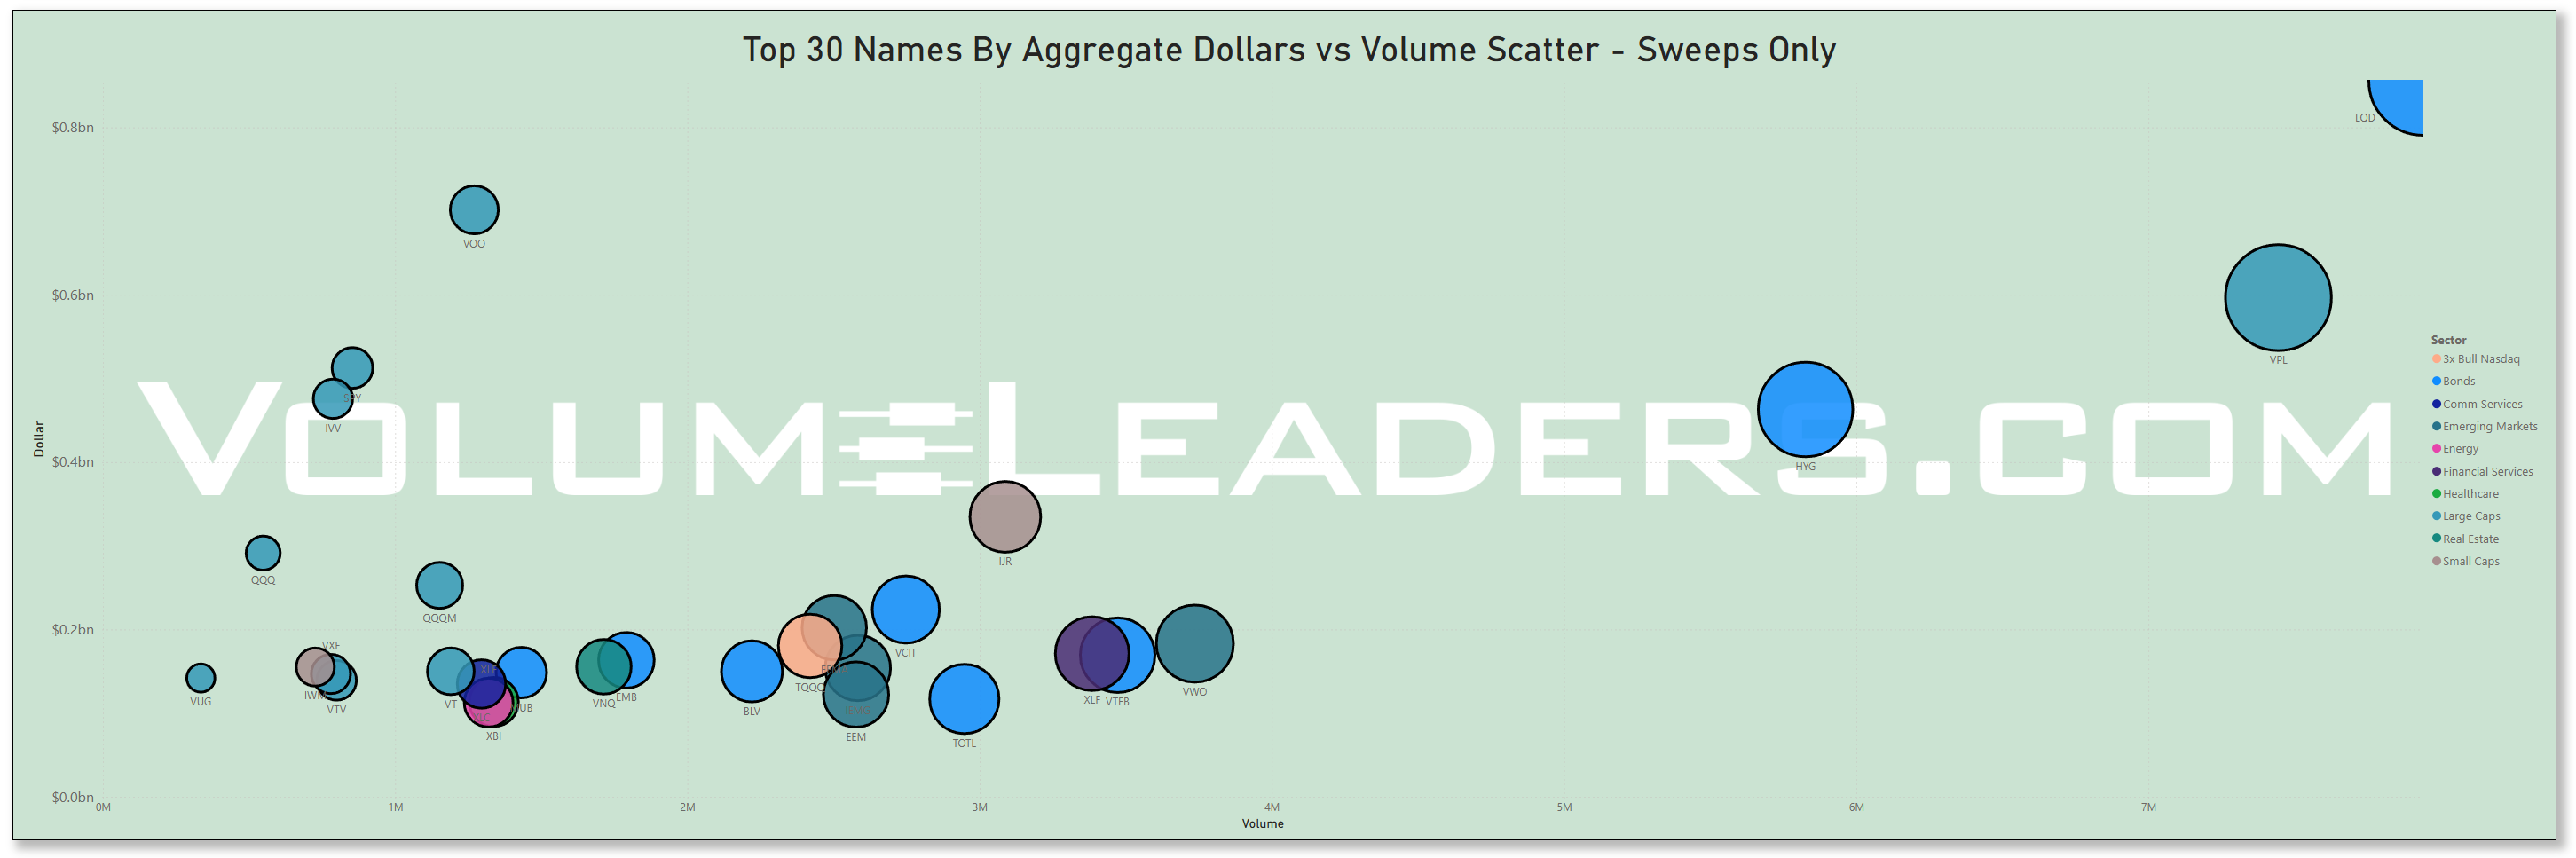
Last Week’s Billion-Dollar Prints
Tickers that printed a trade worth at least $1B last week get a special shout-out. These are massive commitments by institutions that should not be ignored.
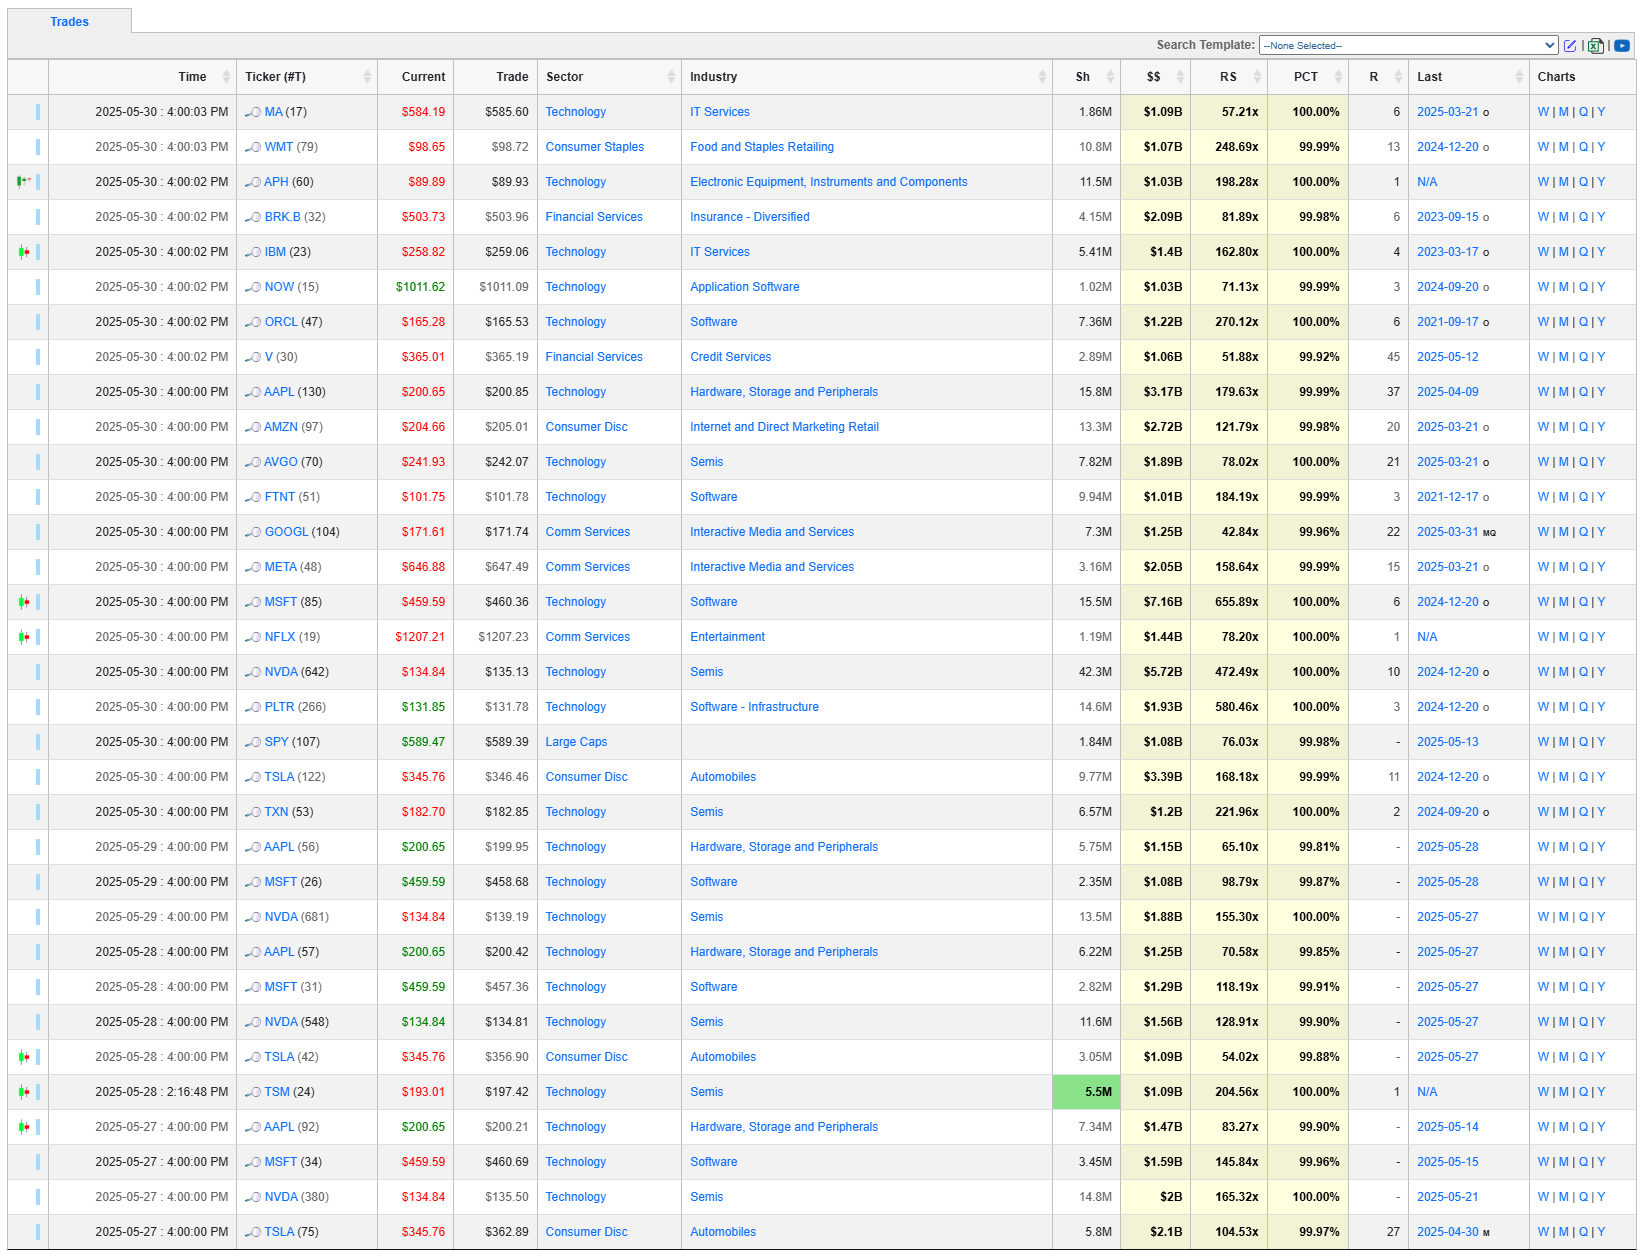
Thank you for being part of our community and for dedicating your time to this edition. Your insights and engagement drive everything we do, and we’re honored to share this space with such committed, thoughtful readers. Here’s to a week filled with clear opportunities and strong performance. Wishing you many bags 💰💰💰
—Volume Leaders