Market Momentum: Your Weekly Financial Forecast & Market Prep
Issue 48 / What to expect June 09, 2025 thru June 13, 2025

NOTE: This weekly periodical is too large for Substack to deliver in its entirety via email - you will only see a portion of this great content if you read from your email client. Click the header/title at the top to read the full article!

In This Issue
[Free For Everyone]
Weekly Market-On-Close Report: All the macro moves, market drivers, and must-know narratives—covered in less than five minutes.
Weekly Benchmark Breakdown: Our weekly intelligence report on major indices cuts through the index-level noise to uncover participation, momentum, and structural integrity and tell you whether markets are rising on solid ground or skating on thin breadth. This is where bull markets prove themselves—or quietly start to unravel.
The Latest Investor Sentiment Readings: Track the emotional pulse of the market with our curated dashboard of sentiment indicators. From fear-fueled flight to euphoric overreach, this week's readings reveal whether investors are cautiously creeping in—or stampeding toward the exits.
VL Special Coverage Report: How to Read Fund Flows Like a Pro
Institutional Support & Resistance Levels For Major Indices: Exactly where to look for support and resistance this coming week in SPY, QQQ, IWM & DIA
Normalized Performance By Thematics YTD: Which corners of the markets are beating benchmarks, which are overlooked and which ones are over-crowded!
Key Econ Events & Earnings On-Deck For This Coming Week
[Only For Subs]
This Week’s Institutional Activity In Equities: Track the real money. This section breaks down where institutions are placing their bets—and pulling their chips. You'll get a sector-by-sector view of equity flows, highlighting the most active names attracting large-scale buying or selling. We go beyond the headlines and into the tape, surfacing the week’s most notable block trades and sweep orders, both on lit exchanges and hidden dark pools. Whether you're following momentum or fading crowded trades, this is your map to where size is moving and why it matters.
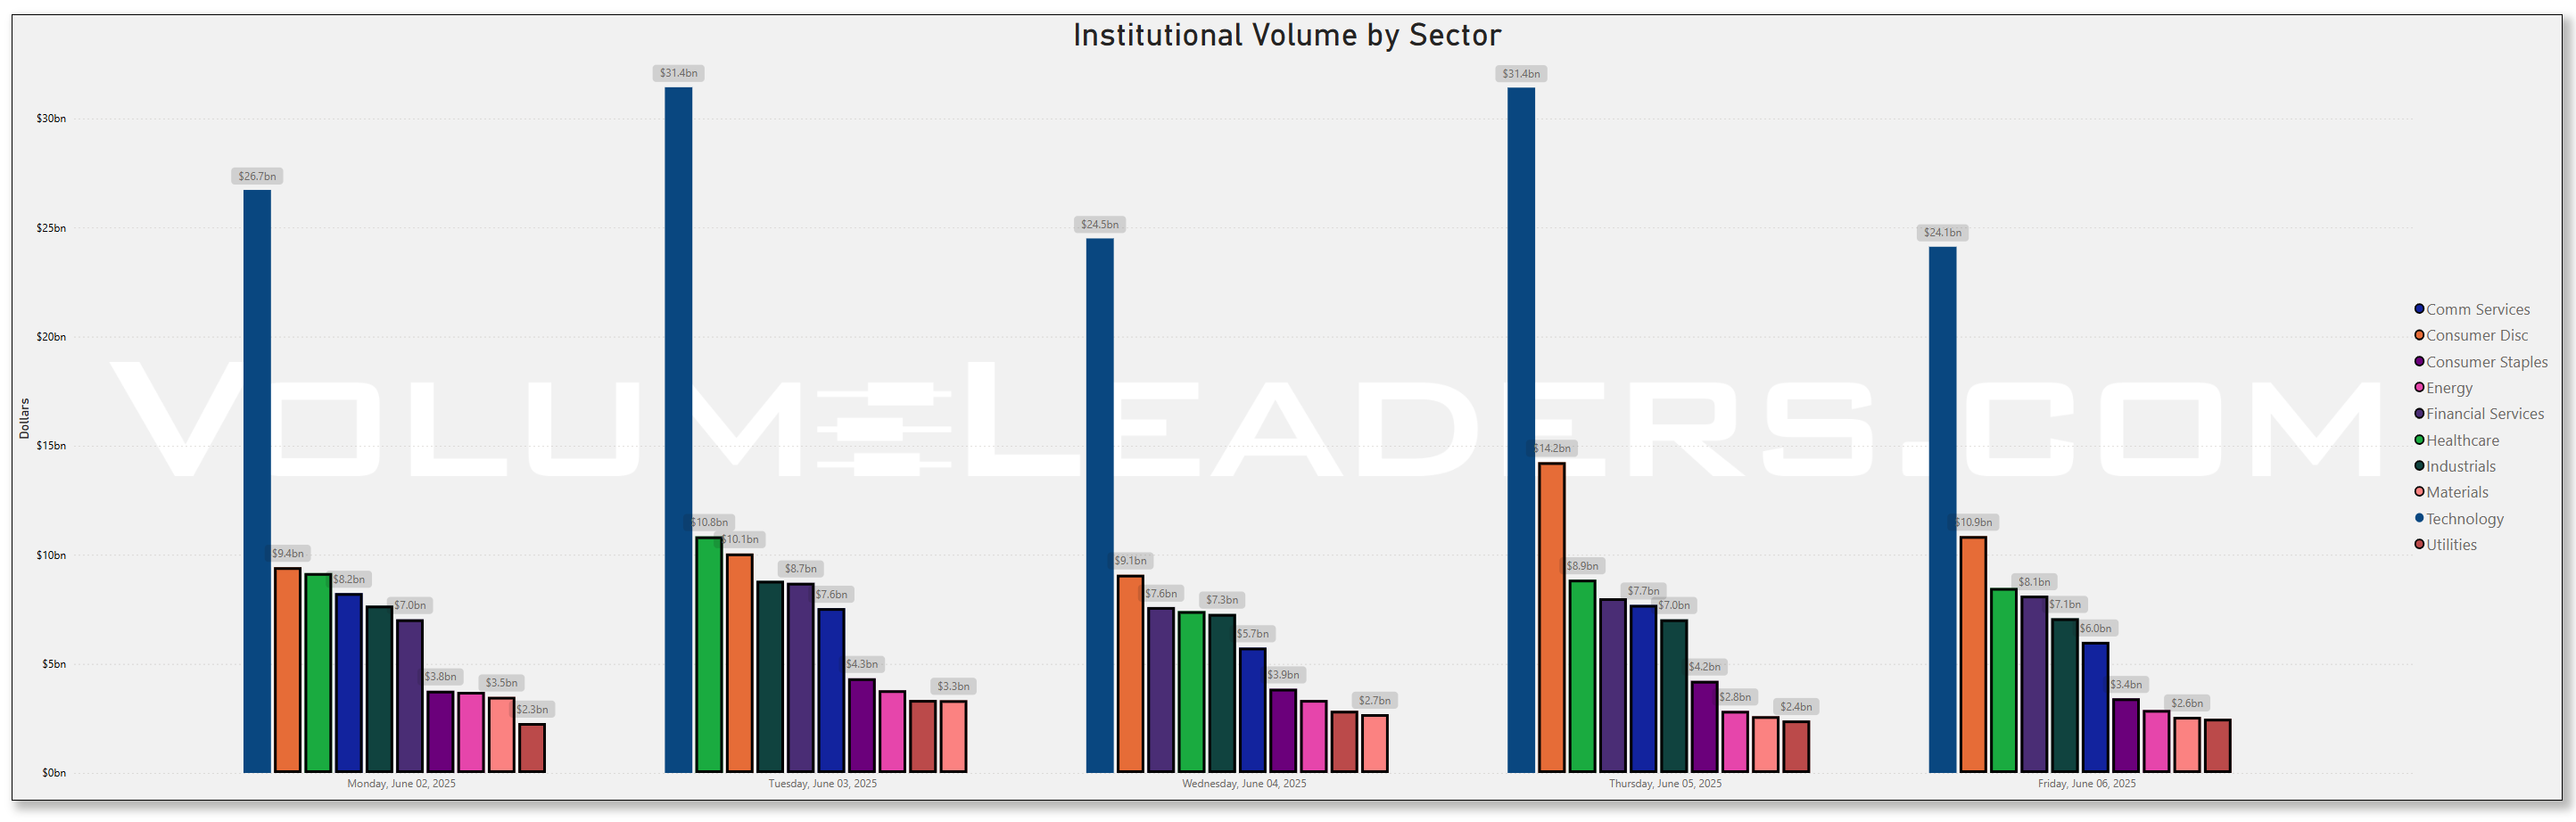
Institutional Activity By Day (rolling 6-months)
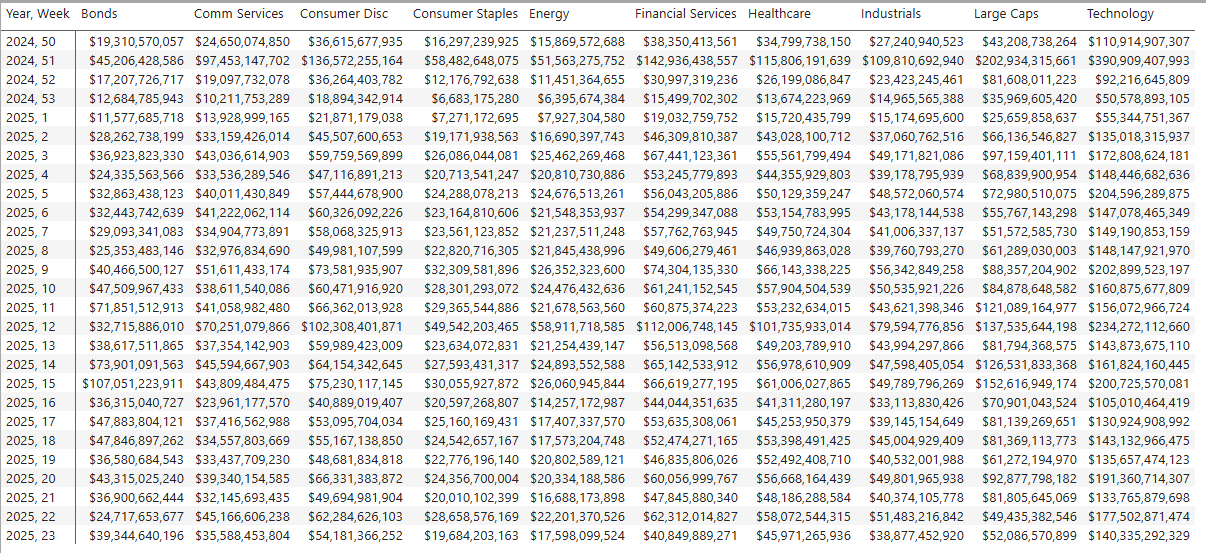
Institutional Activity By Sector By Week (rolling 6-months)
This Week’s Institutional Activity In ETFs: Follow the flows that shape the market. This section uncovers where institutions are deploying capital across the ETF landscape, broken down by sector and fund. We highlight the largest block trades and aggressive sweeps—both visible on lit exchanges and hidden in dark pools—to reveal how the smart money is positioning. Whether they’re rotating risk, hedging exposure, or scaling into themes, this is your lens into the ETF vehicles driving institutional intent.
Statistical Analysis and Insights From This Week’s Top Prints: we run the numbers on the most significant institutional trades of the week—those outsized prints that stand apart from the noise. Through statistical analysis and pattern recognition, we decode what these moves may signal about future price action. Whether it's the start of accumulation, a stealthy unwind, or a shift in market regime, this is where data meets intent. These are the trades that matter—and the stories they may be telling.

Weekly Market-On-Close Report
Recovery Gains Momentum Amid Employment Strength
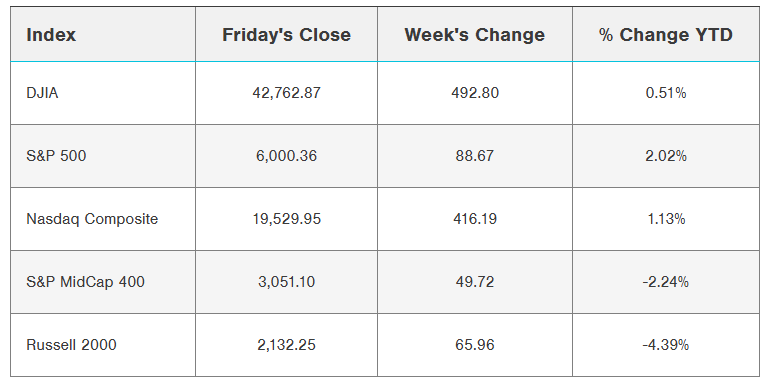
Financial markets demonstrated remarkable resilience during the trading week, with major indices posting their second consecutive week of gains despite navigating a complex landscape of trade tensions, employment data, and corporate earnings developments. The S&P 500 Index closed Friday at a 3½-month high, gaining 1.03%, while the Dow Jones Industrial Average reached a 3-month peak with a 1.05% advance. The technology-heavy Nasdaq 100 Index contributed to the broad-based rally with a 0.99% increase.
The week's momentum culminated in Friday's robust session, driven primarily by stronger-than-anticipated employment figures that alleviated mounting concerns about economic deceleration. Concurrently, renewed diplomatic engagement between the United States and China provided additional market support, with President Trump announcing that bilateral trade negotiations would resume Monday in London.
Market Performance Overview
Equity Index Performance
The week's trading patterns reflected a market grappling with multiple crosscurrents before finding its footing. Major indices experienced volatility early in the week as trade tensions resurfaced, but managed to recover and maintain upward trajectory through Friday's close.
The S&P 500's advance to multi-month highs represents a significant technical achievement, though the index remains approximately 3% below its record peak established nearly four months prior. This positioning suggests markets are gradually rebuilding confidence while maintaining a measured approach to risk-taking.
Small-capitalization stocks demonstrated particularly strong performance, with the Russell 2000 Index leading major benchmarks with a 3.19% weekly gain. This outperformance versus large-cap peers signals potential broadening of market leadership beyond mega-cap technology names that have dominated recent performance.
The Nasdaq Composite's 2.18% weekly advance and the Dow Jones Industrial Average's 1.17% gain contributed to a positive year-to-date performance across all major indices, marking a notable shift from earlier periods of market uncertainty.
International Market Performance
Global equity markets provided supportive backdrop for domestic performance. The Euro Stoxx 50 closed 0.36% higher, while China's Shanghai Composite reached a 2-week high with a modest 0.04% gain. Japan's Nikkei Stock 225 contributed to the positive international sentiment with a 0.50% advance.
This coordinated global performance suggests that the factors driving domestic market strength—including trade developments and economic resilience—are resonating across international markets as well.
Employment Market Dynamics
May Nonfarm Payrolls Report
Friday's employment report served as the week's pivotal catalyst, providing evidence that labor market conditions remain healthier than many analysts had anticipated. The Bureau of Labor Statistics reported that nonfarm payrolls increased by 139,000 positions in May, exceeding consensus expectations of 126,000 and demonstrating continued job creation momentum.
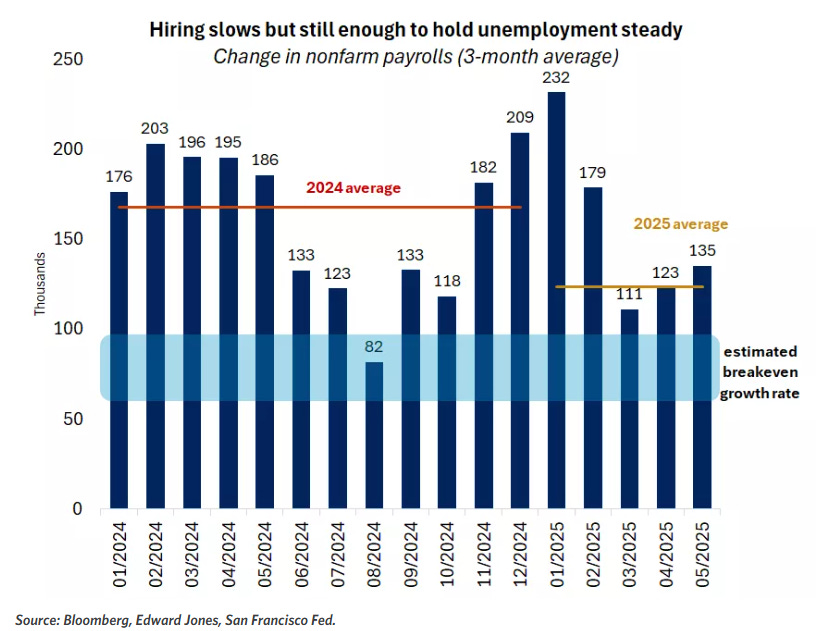
However, the report contained mixed signals that merit careful analysis. April's initially reported gain of 177,000 jobs was revised downward to 147,000, representing a significant adjustment that partially offset May's positive surprise. This revision pattern has become a recurring theme, with job gains for the previous two months experiencing sizable downward adjustments.
The unemployment rate remained steady at 4.2%, matching economist projections and maintaining the narrow 4.0% to 4.2% range that has characterized the labor market since May 2024. This stability suggests that while job creation has moderated from previous peaks, the labor market is not deteriorating rapidly.
Wage Growth and Labor Costs
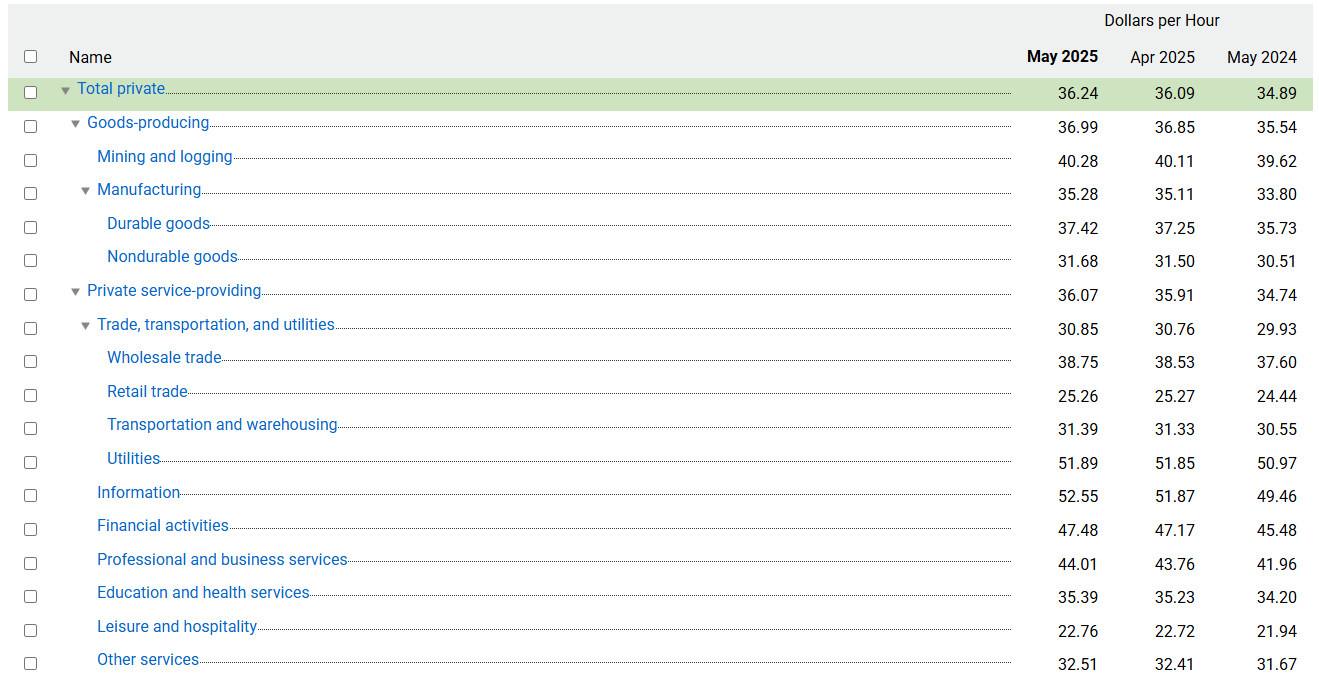
Average hourly earnings provided one of the report's most significant developments, rising 0.4% month-over-month and 3.9% year-over-year. These figures exceeded expectations of 0.3% monthly growth and 3.7% annual growth, indicating that wage pressures remain elevated despite broader economic moderation.
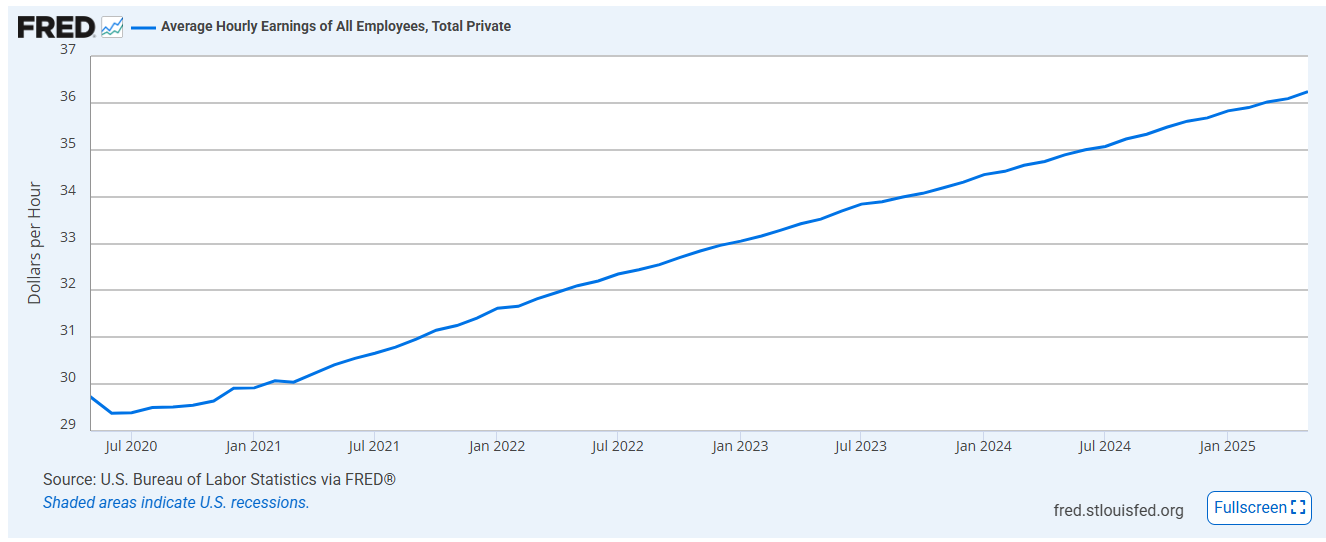
The stronger wage growth carries dual implications for market participants. While rising wages support consumer spending capacity—a critical component of economic growth—they also contribute to persistent inflationary pressures and can compress corporate profit margins.
Labor force participation presented a concerning development, declining to 62.4% from April's 62.6% reading. This reduction may reflect the impact of tighter immigration policies implemented by the current administration, potentially constraining labor supply growth.
Sector-Specific Employment Trends
Healthcare emerged as the primary driver of job creation, contributing 62,000 new positions to May's total. The leisure and hospitality sector provided additional support with 48,000 new jobs, suggesting that consumer-facing industries continue to expand despite broader economic uncertainties.
Manufacturing employment declined by 8,000 positions, potentially reflecting the early impact of tariff policies on industrial activity. Federal government employment experienced its largest monthly decline since 2020, falling by 22,000 positions as the new administration implements workforce reductions.
Alternative Employment Indicators
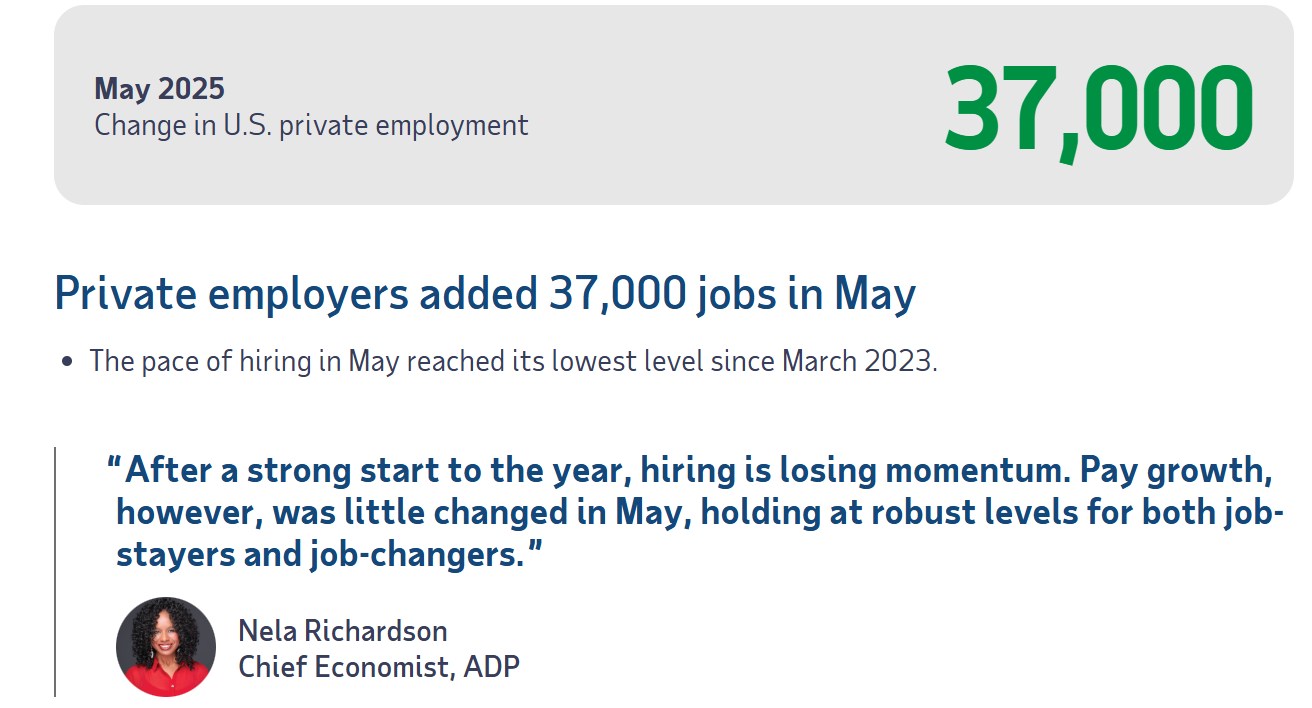
The week's employment picture was complicated by conflicting signals from private sector data. ADP's private payroll report indicated only 37,000 new positions in May, representing the lowest reading since March 2023 and falling well short of the Bureau of Labor Statistics' figures.
Initial jobless claims for the week ended May 31 rose by 8,000 to 247,000, reaching the highest level since October and suggesting some softening in labor demand. However, the Labor Department's Job Openings and Labor Turnover Survey (JOLTS) showed both job openings and hiring increasing in April, indicating continued resilience in labor demand through the early implementation of global tariff policies.
Economic Data and Business Activity
Manufacturing Sector Performance
The Institute for Supply Management's Manufacturing Purchasing Managers' Index delivered disappointing results, registering 48.5% for May—the third consecutive month of contractionary readings below 50%. This figure fell short of the expected 49.5% and represented the lowest reading since November.
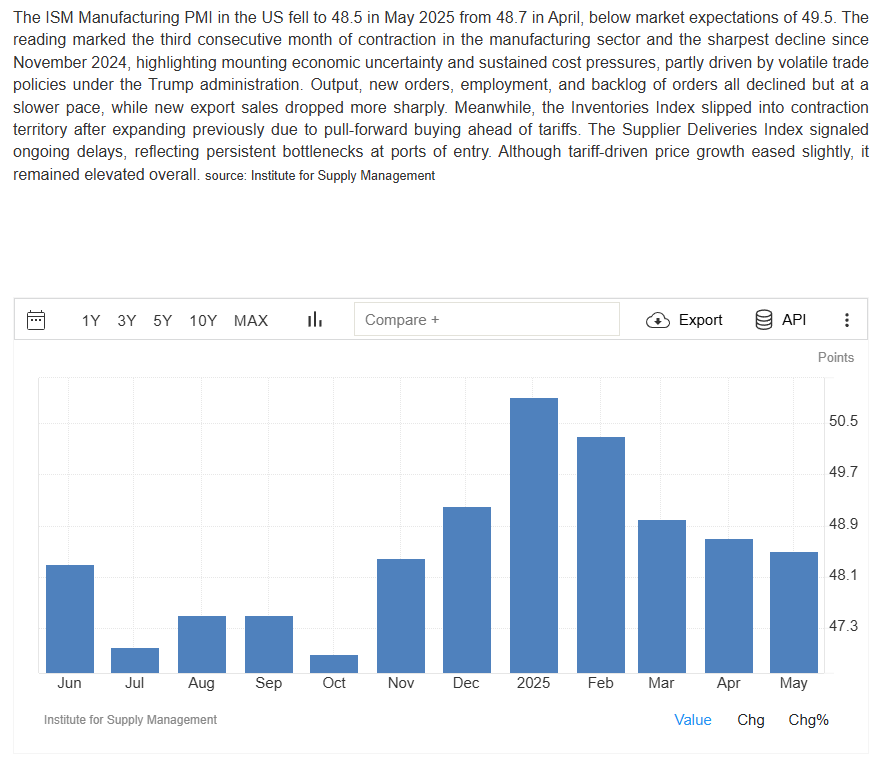
The manufacturing sector's struggles appear increasingly linked to trade policy impacts. The ISM report's imports component plunged 7.2 percentage points to 39.9%, with the survey committee explicitly citing reduced demand and tariff pricing effects as contributing factors.
Price pressures within manufacturing remained elevated, with the prices index staying in expansion territory near levels last seen in June 2022. This dynamic suggests that tariff costs are being passed through the supply chain, potentially contributing to broader inflationary pressures.
Services Sector Developments
The services sector, which represents the largest portion of the U.S. economy, provided additional cause for concern with its first contractionary reading in 11 months. The ISM Services PMI registered 49.9% in May, just below the 50% threshold that separates expansion from contraction.
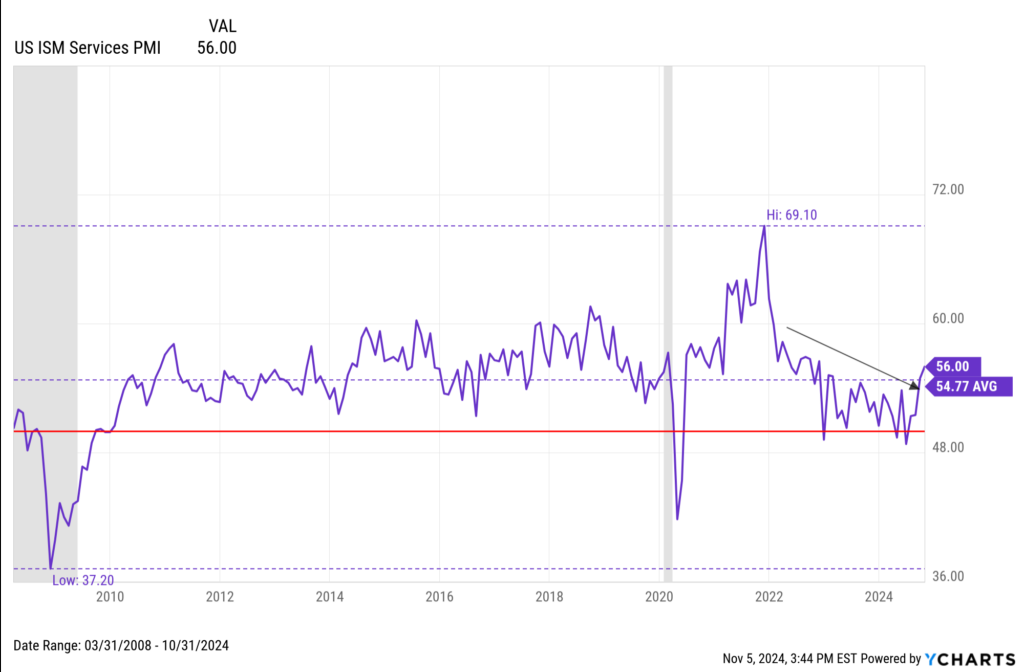
New orders within the services sector fell sharply, declining 5.9 percentage points from 52.3% to 46.4%. This deterioration suggests that demand conditions may be weakening more broadly across the economy, beyond just manufacturing activities.
The services price index reached its highest level since November 2022, indicating that inflationary pressures are not confined to goods-producing sectors. Employment within services provided a bright spot, returning to expansion after two months of contraction.
Consumer Credit and Spending Indicators
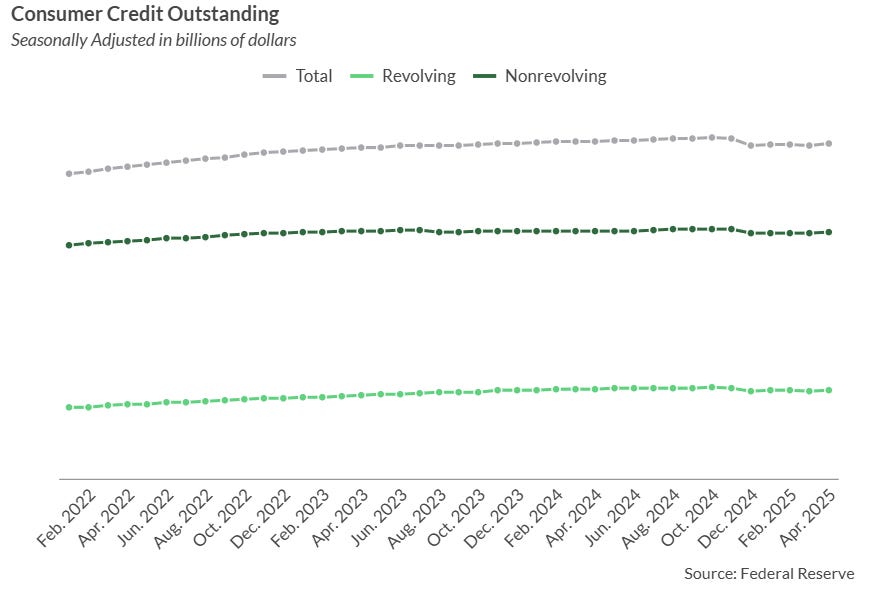
April consumer credit data provided evidence of continued consumer financial activity, with credit expansion of $17.873 billion reaching a 4-month high. This figure significantly exceeded expectations of $10.000 billion, suggesting that consumers remain willing and able to access credit for spending purposes.

The robust credit growth may reflect several factors, including confidence in employment prospects, the need to finance purchases ahead of potential tariff-related price increases, or simply normal seasonal patterns. Regardless of the underlying drivers, continued credit expansion supports the consumer spending outlook.
Trade Policy and International Relations
U.S.-China Trade Developments
Trade policy remained a central market theme throughout the week, with developments providing both volatility and eventual relief. Early in the week, renewed tensions between the U.S. and China created market uncertainty, but Thursday's productive phone call between President Trump and President Xi Jinping helped stabilize investor sentiment.
President Trump characterized the conversation as reaching "a very positive conclusion for both countries," though specific details of any agreements or understandings were not disclosed. The announcement that U.S. and Chinese negotiators would resume formal trade talks Monday in London provided concrete evidence of diplomatic re-engagement.

Tariff Timeline and Market Implications
Several critical deadlines loom over the summer months that could significantly impact market conditions. The July 9 expiration of the 90-day pause on "reciprocal" tariff rates and the August 12 end of China's 90-day pause represent potential catalysts for renewed volatility.
Recent court decisions have added complexity to the trade policy landscape, with legal challenges to President Trump's authority to impose reciprocal tariffs affecting approximately two-thirds of proposed tariff increases. These legal developments create additional uncertainty about the ultimate scope and timing of trade policy implementation.
New sectoral investigations targeting pharmaceutical and semiconductor industries are currently underway, potentially expanding the breadth of trade restrictions beyond current levels. The complexity of these bilateral negotiations and the multiple moving pieces suggest that self-imposed deadlines may require extension to allow sufficient time for comprehensive agreements.
Federal Reserve Policy and Interest Rate Outlook
Current Rate Expectations
The employment report's stronger-than-expected results significantly impacted Federal Reserve policy expectations, with markets now pricing zero probability of a 25 basis point rate cut at the June 17-18 Federal Open Market Committee meeting. This represents a dramatic shift from two months earlier when bond markets were fully pricing in a June rate cut.
Interest rate futures markets indicate that most investors now expect two quarter-point rate cuts by year-end, with the first reduction not anticipated until September. This timeline reflects the Federal Reserve's stated preference for additional economic clarity before adjusting policy.
Fed Official Communications
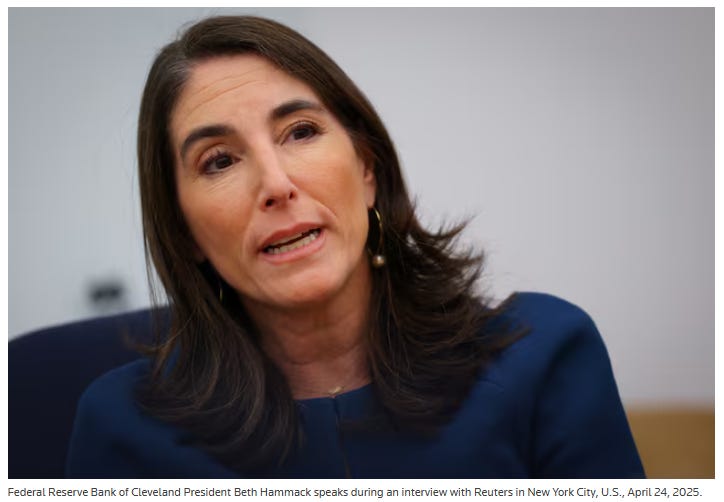
Federal Reserve officials provided mixed signals regarding future policy direction during the week. Cleveland Fed President Hammack adopted a cautious stance, stating that she would "rather wait for further clarity on the economic impact of a variety of policy changes before adjusting interest rates" and emphasized that "now is not a good time to be preemptive."
Philadelphia Fed President Harker offered a more specific timeline for potential policy adjustments, indicating that "in the second half of the year, if things resolve themselves, and we start to see more clarity, and we continue to see inflation coming down to 2%, I could definitely see a rate cut in the offing."
The divergence in Fed official views reflects the challenging policy environment created by trade uncertainties, fiscal policy changes, and evolving economic conditions. The central bank appears committed to maintaining flexibility while avoiding premature policy adjustments.
Economic Growth and Inflation Outlook
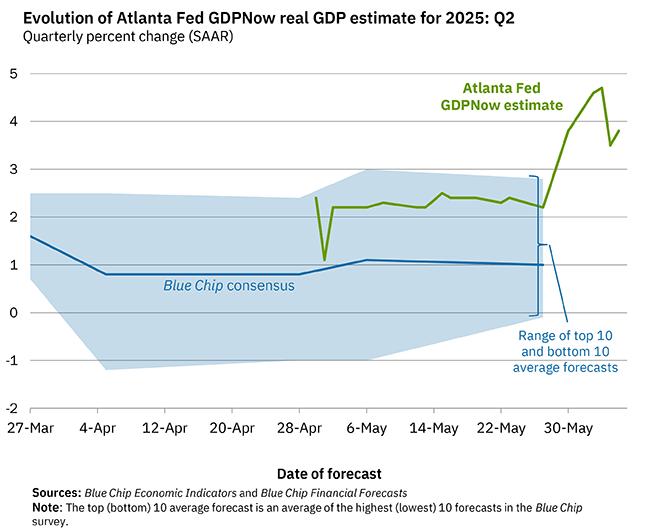
The Atlanta Fed's GDP model currently projects 3.8% growth for the second quarter, suggesting continued economic momentum despite trade headwinds. The Fed's preferred inflation measure recently hit a four-year low, providing some room for policy accommodation if economic conditions warrant.
However, the combination of tariff-related price pressures and wage growth acceleration could complicate the inflation outlook. Fed officials appear to be taking a wait-and-see approach, allowing economic data to guide policy decisions rather than committing to predetermined adjustment schedules.
Bond Market Analysis
Treasury Yield Movements
The Treasury market experienced significant volatility during the week, ultimately settling higher across most maturity sectors following Friday's employment report. September 10-year Treasury note futures (ZNU25) closed down 28.5 ticks, while the 10-year note yield rose 11.9 basis points to 4.510%.
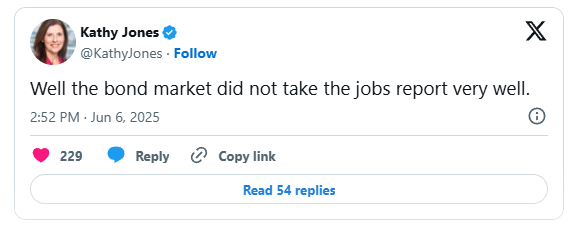
The yield increase represented a reversal from earlier week patterns, when Treasury notes had initially posted modest gains on carryover strength from European bond market rallies. The employment report's hawkish implications quickly overwhelmed these supportive factors.
Treasury notes reached a 1-week low on Friday, with the 10-year yield touching a 1-week high of 4.512%. This movement reflects market recognition that stronger employment data reduces the likelihood of near-term Federal Reserve rate cuts.
International Bond Market Developments
European government bond yields presented a mixed picture during the week. German 10-year bund yields fell 0.7 basis points to 2.576%, while UK 10-year gilt yields rose 2.8 basis points to 4.644%.
The divergence in European yields reflects varying economic conditions and policy expectations across regions. German yields benefited from economic data showing upward revisions to Eurozone Q1 GDP growth, while UK yields faced pressure from domestic inflation concerns.
Credit Market Performance
Investment-grade corporate bonds outperformed government securities during the week, with new issuance meeting strong demand from investors. Municipal bonds weakened slightly amid heavy new issuance, though traders noted that new deals were generally well absorbed by the market.
The corporate bond market's relative strength suggests continued investor confidence in credit quality and corporate earning capacity. This performance differential between corporate and government bonds often signals healthy risk appetite among institutional investors.
Sector Analysis and Stock Performance
Technology Sector Leadership
Information technology stocks provided significant leadership during the week's rally, benefiting from renewed optimism surrounding artificial intelligence applications and continued corporate investment in AI infrastructure. The sector's outperformance helped drive broader market gains.
Semiconductor companies delivered particularly strong results, with Marvell Technology ( MRVL 0.00%↑ ) closing up more than 4%. Additional semiconductor names including Analog Devices ( ADI 0.00%↑ ), Micron Technology ( MU 0.00%↑ ), and ARM Holdings ( ARM 0.00%↑ ) gained more than 2%, while Applied Materials ( AMAT 0.00%↑ ), Lam Research ( LRCX 0.00%↑ ), KLA Corp ( KLAC 0.00%↑ ), and others advanced more than 1%.
The "Magnificent Seven" technology stocks contributed meaningfully to overall market performance. Alphabet ( GOOGL 0.00%↑ ) closed up more than 3%, Amazon.com ( AMZN 0.00%↑ ) gained more than 2%, and Apple ( AAPL 0.00%↑ ), Nvidia ( NVDA 0.00%↑ ), and Meta Platforms ( META 0.00%↑ ) each advanced more than 1%. Microsoft ( MSFT 0.00%↑ ) provided additional support with a 0.58% gain.
Energy Sector Momentum
Energy stocks and related service providers benefited from a more than 6% surge in WTI crude oil prices, which reached 1½-month highs during the week. This commodity strength translated directly into equity performance across the energy complex.
APA Corp ( APA 0.00%↑ ) led energy gains with an advance of more than 3%. Major integrated oil companies including Chevron ( CVX 0.00%↑ ) and Exxon Mobil ( XOM 0.00%↑ ) gained more than 2%, while service providers Halliburton ( HAL 0.00%↑ ), Baker Hughes ( BKR 0.00%↑ ), and Schlumberger ( SLB 0.00%↑ ) participated in the sector's strength.
The energy sector's performance reflects both technical factors in crude oil markets and potential optimism about reduced trade tensions that could support global economic growth and energy demand.
Individual Stock Developments
Tesla ( TSLA 0.00%↑ ) provided one of the week's most dramatic individual stock stories, recovering more than 3% on Friday after plunging 14% on Thursday. The initial decline followed a public dispute between CEO Elon Musk and President Trump, with Musk criticizing the President's tax bill and Trump proposing to end government contracts and subsidies for Musk's companies.

The Friday recovery came after Musk signaled willingness to reduce tensions, demonstrating the market's sensitivity to political and policy uncertainties affecting individual companies.
QXO Inc ( QXO 0.00%↑ ) delivered exceptional performance with a gain of more than 13% after Wolfe Research initiated coverage with an outperform recommendation and $44 price target. Quanex Building Products ( NX 0.00%↑ ) advanced more than 10% following Q2 net sales of $452.5 million that exceeded consensus expectations of $439.3 million.
Sarepta Therapeutics ( SRPT 0.00%↑ ) gained more than 9% after Scotiabank upgraded the stock to sector outperform with an $80 price target, demonstrating continued investor interest in biotechnology opportunities.
Notable Underperformers
Several high-profile companies faced significant challenges during the week. Lululemon Athletica ( LULU 0.00%↑ ) led S&P 500 and Nasdaq 100 declines with a drop of more than 19% after reducing its full-year earnings per share estimate to $14.58-$14.78 from a previous range of $14.95-$15.15.

DocuSign ( DOCU 0.00%↑ ) fell more than 18% after reporting Q1 billings of $739.6 million, below consensus expectations of $746.4 billion, and reducing its full-year billings forecast. Vera Therapeutics (VERA) declined more than 25% after Japanese competitor Otsuka reported superior trial results for kidney disease treatment.
ServiceTitan ( TTAN 0.00%↑ ) dropped more than 6% following a Q1 loss per share of 51 cents, wider than the consensus expectation of 37 cents. Mosaic (MOS) fell more than 4% after cutting its Q2 phosphates sales volume forecast well below consensus expectations.
Broadcom ( AVGO 0.00%↑ ) declined more than 4% despite reporting better-than-expected Q2 earnings, as analysts questioned whether the company's future guidance was strong enough to support recent stock strength.
Market Volatility and Risk Assessment
Volatility Index Trends
The Cboe Volatility Index continued its recent decline, falling for the eighth week out of the past nine to close Friday at 16.8, down from 18.6 the previous week. This level represents a substantial decrease from the recent peak of 52.3 reached on April 8, indicating significant improvement in investor risk sentiment.
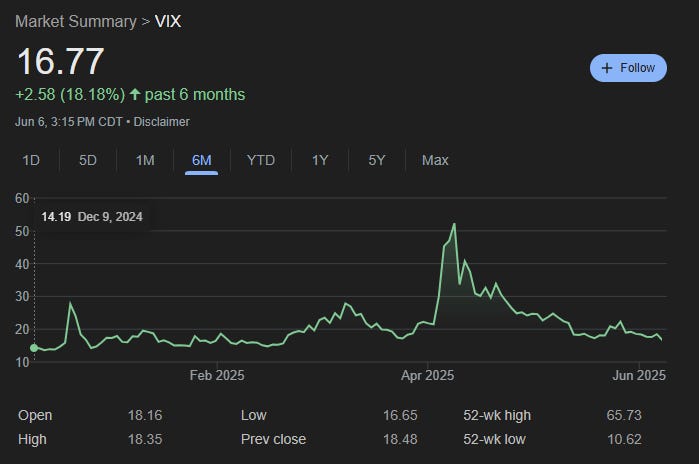
The sustained decline in volatility expectations suggests that markets have largely absorbed the initial shock of trade policy changes and are focusing on fundamental economic conditions rather than policy uncertainty.
Sector Rotation Patterns
Despite the broad market's positive performance, defensive sectors demonstrated relative weakness. Consumer staples and utilities stocks within the S&P 500 finished in negative territory for the week, declining 1.5% and 1.0% respectively—representing the worst performance among the index's 11 sectors.
This underperformance of traditionally defensive sectors during a market rally suggests that investors are showing increased risk appetite and confidence in economic growth prospects. The rotation away from defensive positions often signals improving market sentiment.
Small-Cap Relative Performance
Small-capitalization stocks' significant outperformance during the week, with the Russell 2000 gaining 3.2% versus 1.6% for large-cap indices, indicates potential broadening of market leadership. However, small-caps continued to lag larger stocks on a year-to-date basis, suggesting that this relative strength may represent catch-up performance rather than a sustained trend reversal.
International Economic Developments
European Economic Data
Eurozone economic indicators presented a mixed but generally supportive picture. Q1 GDP was revised higher to 0.6% quarter-over-quarter and 1.5% year-over-year, exceeding expectations of 0.4% and 1.2% respectively. This upward revision suggests greater economic resilience than initially estimated.
However, April retail sales rose only 0.1% month-over-month, weaker than expectations of 0.2%, indicating that consumer spending momentum may be moderating. German industrial production fell 1.4% month-over-month in April, also weaker than the expected 1.0% decline.
European Central Bank Policy
ECB Governing Council member Stournaras provided guidance on future policy direction, stating that "the bar for another ECB rate cut is high, in July and beyond." He suggested that the ECB should pause its interest rate reduction cycle to assess recent economic shocks, particularly those related to trade developments.

Interest rate swaps are currently pricing a 27% probability of a 25 basis point rate cut by the ECB at the July 24 policy meeting, indicating that markets expect a cautious approach from European policymakers.
Commodity Markets
Crude Oil Performance
WTI crude oil delivered one of the week's strongest commodity performances, surging more than 6% to reach its highest price in six weeks. This advance offset modest price declines experienced over the previous two weeks and provided significant support for energy-related equity sectors.
The oil price rally appears to reflect a combination of factors, including optimism about U.S.-China trade dialogue that could support global economic growth and energy demand, along with potential supply considerations.
Precious Metals and Cryptocurrency
Gold experienced a relatively uneventful week, closing in positive territory while trading within its established range. The precious metal's sideways action suggests that investors are neither aggressively seeking safe-haven assets nor abandoning defensive positions entirely.
Bitcoin and other cryptocurrencies faced headwinds during the week, with bitcoin declining more than 1% as it pulled back from the new all-time high of just under $120,000 established two weeks prior. The cryptocurrency's retreat may reflect profit-taking after recent gains or uncertainty about regulatory developments.
Corporate Earnings and Business Developments
Q1 Earnings Season Conclusion
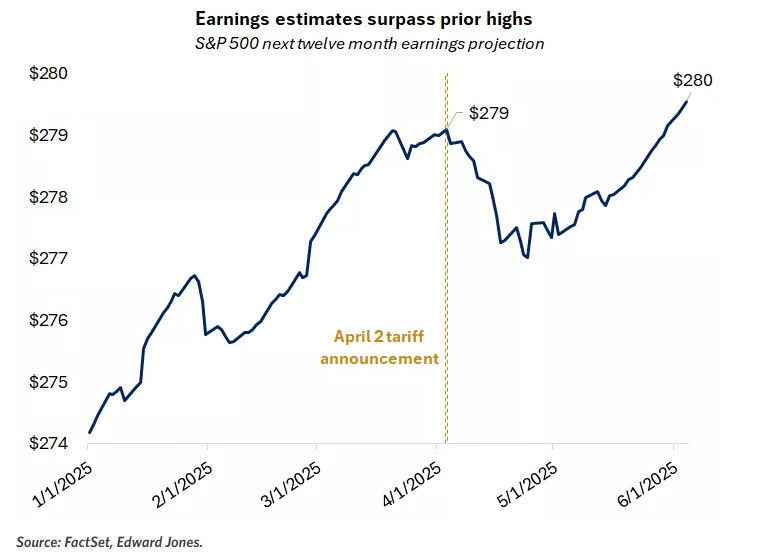
The first quarter earnings season concluded with S&P 500 companies delivering solid results, achieving 12.5% year-over-year profit growth—marking the third quarter of double-digit growth in the past four. While earnings growth estimates for 2025 have been revised down from 14% to 8.5%, the 2026 outlook remains steady at previous levels.
The forward 12-month earnings estimate recently reached a new high, providing fundamental support for rising equity valuations. This earnings strength suggests that while valuations have contributed to recent market gains, fundamental improvements have also played an important supporting role.
Sector-Specific Earnings Performance
Growth sectors dominated earnings performance, with information technology, communication services, and consumer discretionary together accounting for over 50% of S&P 500 market capitalization. Technology earnings grew 20%, communication services surged 33%, and consumer discretionary rose 8%.
These results helped restore investor confidence in growth-oriented sectors that had temporarily fallen out of favor earlier in the year. The strong performance also highlighted robust corporate spending on artificial intelligence applications, contributing to NVIDIA's reclaim of the title of world's most valuable company.
AI Investment Trends
Corporate earnings reports continued to highlight significant artificial intelligence investment, with companies across multiple sectors reporting increased AI-related capital expenditure and operational initiatives. Meta Platforms' announcement of a 20-year contract with Constellation Energy to power its AI operations exemplified the scale of infrastructure investment being undertaken.
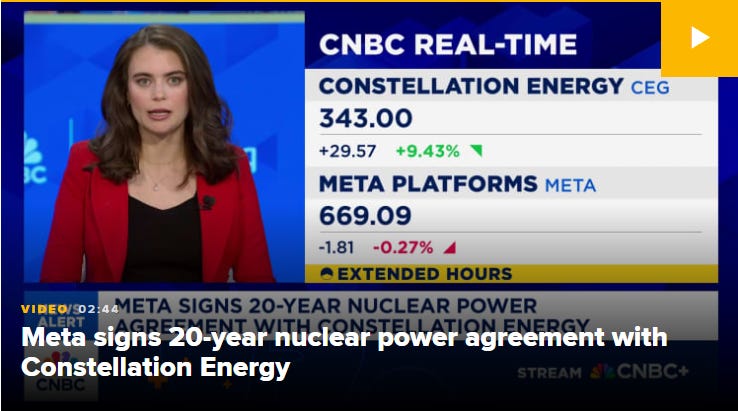
This sustained AI investment theme provides fundamental support for technology sector valuations and suggests that the artificial intelligence trend has moved beyond speculative interest to concrete business implementation.
Looking Ahead: Key Catalysts and Risks
Economic Data Calendar
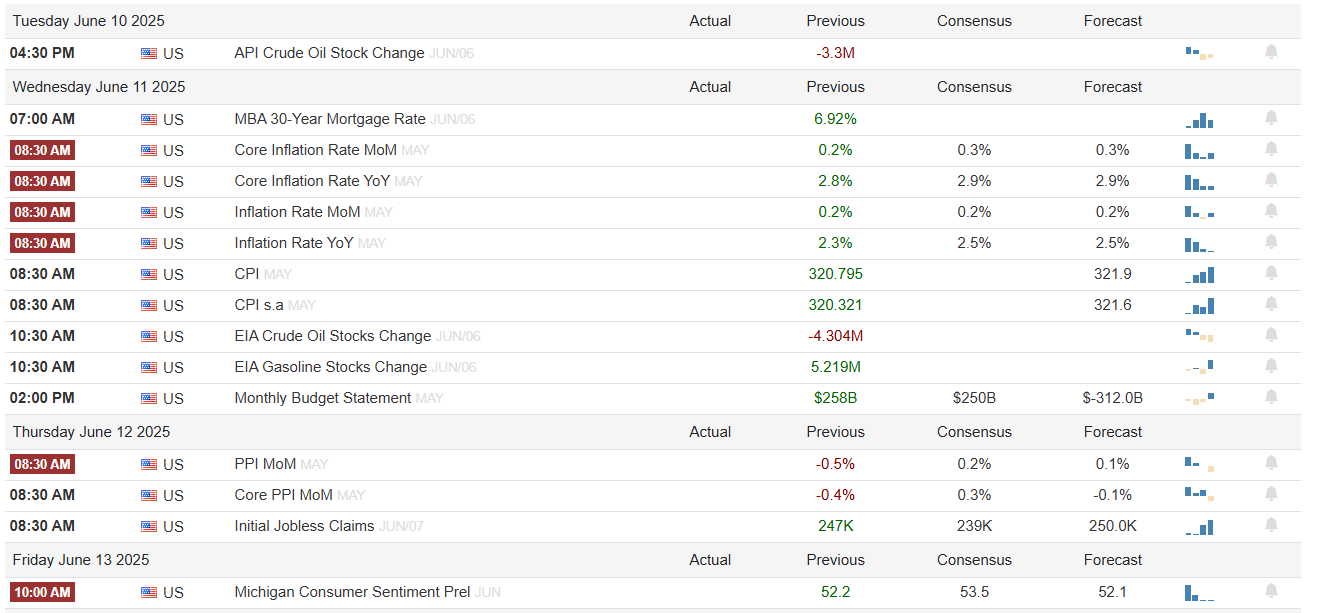
The upcoming week features several important economic releases that could influence market direction. Wednesday's Consumer Price Index report will provide crucial insight into whether recent inflation moderation trends continued through May despite elevated tariffs and global trade tensions.
Last month's CPI report showed an annual rate of 2.3% in April, down from 2.4% in March. Core inflation, excluding volatile energy and food prices, remained unchanged at 2.8%. Any significant deviation from expected trends could influence Federal Reserve policy expectations and market pricing.
Corporate Events
Apple's annual Worldwide Developers Conference approaches with heightened investor interest in the company's artificial intelligence strategy. Following what analysts termed a disappointing debut for Apple Intelligence and delays in planned AI enhancements to Siri, investors seek clarity on how Apple plans to reassert itself in AI competition.

Bloomberg reports suggest Apple may allow third-party developers to use its AI models, though analysts note that competitors currently offer developers superior features. The conference outcomes could significantly influence sentiment toward Apple and broader technology sector AI investments.
Trade Policy Deadlines
Multiple trade-related deadlines during the summer months represent potential volatility catalysts. The July 9 expiration of reciprocal tariff pauses and August 12 end of China's 90-day pause could reignite market uncertainty if diplomatic progress proves insufficient.
Ongoing sectoral investigations in pharmaceuticals and semiconductors add additional complexity to the trade landscape. The multiple moving pieces and legal challenges to tariff authority suggest that deadline extensions may be necessary to accommodate comprehensive negotiations.
Fiscal Policy Developments
The House of Representatives' passage of the reconciliation bill by a narrow margin has moved the legislation to the Senate, where debate about deficit implications has intensified. The bill includes debt ceiling provisions, adding urgency to reach agreement before the Treasury's projected mid-July cash exhaustion date.
Treasury Secretary Bessent's call for Congressional action by mid-July creates pressure for Republicans to quickly agree on a comprehensive tax and spending package. The fiscal policy outcomes could significantly influence market sentiment and economic growth prospects.
Conclusion
The week's market performance demonstrated remarkable resilience in the face of multiple crosscurrents, with equity indices posting their second consecutive week of gains while reaching multi-month highs. The combination of better-than-expected employment data, renewed U.S.-China diplomatic engagement, and strong corporate earnings provided sufficient positive momentum to overcome early-week trade tensions and individual corporate controversies.
The employment report's indication that labor market conditions remain healthier than many feared helped alleviate concerns about economic deceleration. While the data contained mixed signals, including downward revisions to prior months and declining labor force participation, the overall message supported continued economic expansion at a measured pace.
Federal Reserve policy expectations have adjusted to reflect the stronger employment data, with markets now pricing minimal probability of near-term rate cuts. This shift reflects the central bank's stated preference for additional economic clarity before adjusting policy, particularly given ongoing trade and fiscal policy uncertainties.
Looking ahead, markets face a potentially eventful summer period with multiple catalysts capable of influencing direction. Trade policy deadlines, Federal Reserve meetings, fiscal policy debates, and key economic data releases all represent potential inflection points for market sentiment.
The current environment suggests that while fundamental economic conditions remain supportive, policy uncertainties continue to create potential for increased volatility. Investors appear to be balancing confidence in corporate earnings growth and economic resilience against caution regarding policy implementation and international trade developments.
The week's performance reinforced themes of market adaptability and fundamental strength, but also highlighted the ongoing importance of policy clarity and international cooperation in sustaining investor confidence. As summer approaches, the intersection of domestic policy implementation and international diplomatic progress will likely play crucial roles in determining whether current market momentum can be sustained.

Weekly Benchmark Breakdown
S&P 500 Index
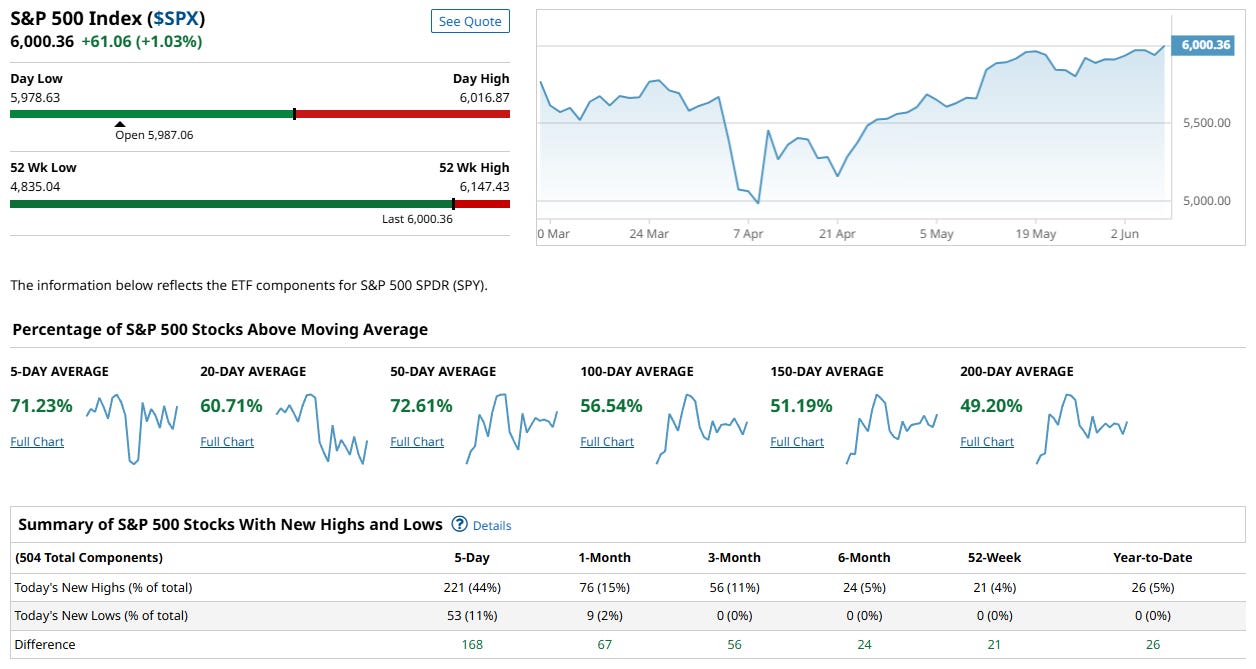
The S&P 500 closed at 6,000.36, up +1.03% on the week and printing a fresh psychological milestone. But more importantly, internal market breadth is fully confirming this advance—with a robust expansion of participation across both short- and longer-term timeframes.
Breadth Metrics: Fully Supportive of the Rally
Short-term momentum remains excellent, with 71.23% of components above their 5-day moving average.
Intermediate-term structure is broad and healthy:
60.71% above 20-day MA
72.61% above 50-day MA
This signals sustained buyer engagement across the majority of the index.
Longer-term trend alignment is improving steadily:
56.54% above 100-day MA
51.19% above 150-day MA
49.20% above 200-day MA
These levels suggest the market’s foundation is broadening, with more and more stocks transitioning into full long-term uptrends.
New Highs vs. New Lows: Strong Bullish Confirmation
221 new 5-day highs (44%), versus 53 new lows (11%) → net +168.
The positive skew is dominant across all timeframes, from 1-month to YTD.
No new 6-month, 52-week, or YTD lows were recorded—showing total absence of downside leadership and a very healthy internal tone.
Conclusion
This is one of the strongest breadth readings for the S&P 500 we’ve seen in recent weeks. Not only is the index itself breaking through key levels, but the advance is:
broad-based
internally confirmed
participation is growing, not narrowing
The market is not being driven by a narrow group of megacaps—breadth is expanding from the bottom up.
The S&P 500 rally is currently on solid structural footing. Breadth trends remain synchronized across short-, intermediate-, and long-term windows. The widespread new highs suggest there is still significant momentum in the system. Pullbacks remain likely to be bought, and the probability of a durable summer rally is increasing as the breadth base deepens.
In short: this is a bull market doing what bull markets do when healthy—broadening participation and confirming price.
Dow Jones Index
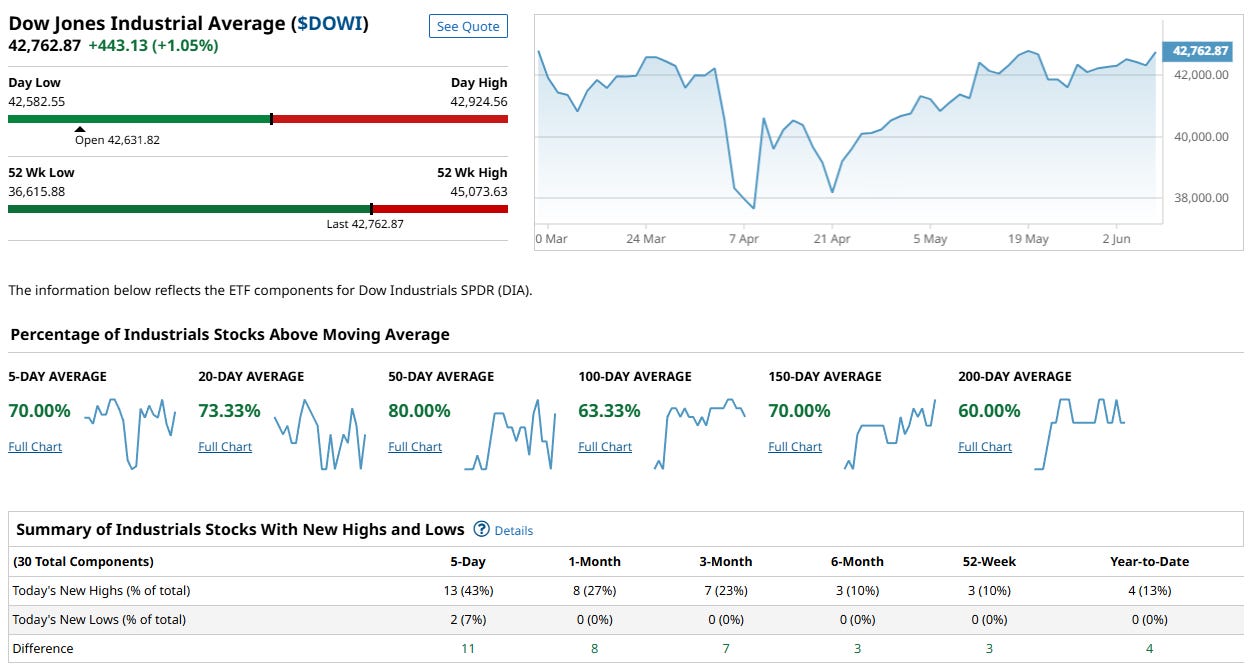
The Dow Jones Industrial Average closed at 42,762.87, up +1.05% on the week and moving steadily toward its 52-week high. Under the surface, breadth remains very healthy and well-aligned—suggesting this move is broad-based and structurally sound.
Breadth Metrics: Fully Supportive and Synchronized
Short-term momentum is strong, with 70.00% of components above their 5-day moving average.
Intermediate-term participation remains excellent:
73.33% above 20-day MA
80.00% above 50-day MA
The majority of Dow components are trending higher across tactical and medium-term windows, reinforcing the strength of the index.
Long-term structure is firmly positive:
63.33% above 100-day MA
70.00% above 150-day MA
60.00% above 200-day MA
This indicates that the uptrend is deeply rooted across timeframes and not the result of short-term momentum alone.
New Highs vs. New Lows: Positive Leadership Confirmed
13 new 5-day highs (43%), versus 2 new lows (7%) → net +11.
Positive new high vs. new low spreads are observed across all timeframes (1-month through YTD).
The absence of any new lows beyond the 5-day window highlights the internal stability of the index.
Conclusion
The Dow continues to exhibit one of the healthiest breadth profiles among major U.S. indices. Participation is widespread, long-term trends are aligned, and downside pressure remains extremely light. This is a textbook example of a well-supported, sustainable uptrend.
The Dow’s rally remains fully confirmed by internals. The combination of strong short-term momentum, excellent intermediate-term participation, and robust long-term trend alignment points to a market with significant internal strength. Barring an external shock, the index appears poised for continued leadership and remains a model of durable bullish structure in this environment.
NASDAQ 100 Index
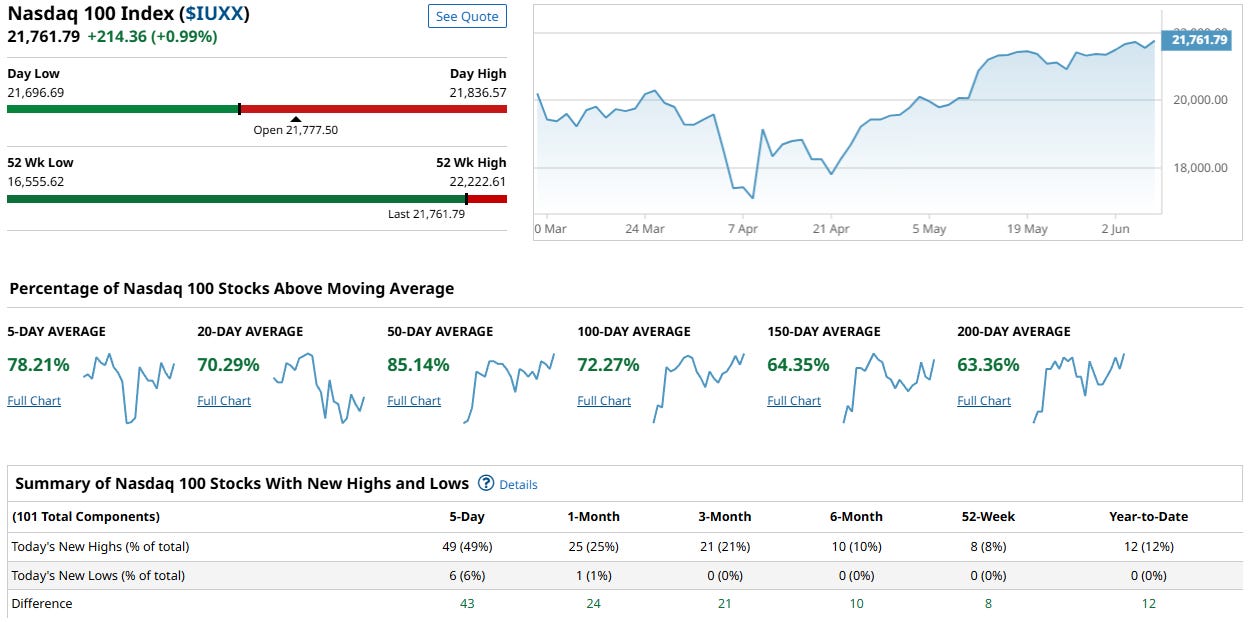
The Nasdaq 100 closed at 21,761.79, up +0.99% on the week, just shy of its 52-week high. Beneath the surface, breadth remains extremely strong and continues to broaden, confirming the ongoing advance and indicating robust institutional demand.
Breadth Metrics: Outstanding Across All Timeframes
Short-term momentum is very strong, with 78.21% of components above their 5-day moving average.
Intermediate-term participation is excellent:
70.29% above 20-day MA
85.14% above 50-day MA
The high level of participation in the 50-day window is particularly noteworthy, signaling deep trend persistence and commitment.
Long-term trend alignment is highly supportive:
72.27% above 100-day MA
64.35% above 150-day MA
63.36% above 200-day MA
These numbers reflect a fully synchronized long-term uptrend across the majority of the index.
New Highs vs. New Lows: Strong Leadership
49 new 5-day highs (49%), versus 6 new lows (6%) → net +43.
Positive leadership is confirmed across all timeframes, with a very healthy breadth of new highs:
1-month: +24
3-month: +21
6-month: +10
52-week: +8
Year-to-date: +12
The low level of new lows across all windows signals that weak hands have been largely cleared.
Conclusion
The Nasdaq 100 continues to lead the market in both price and breadth. Participation is deep, multi-timeframe alignment is strong, and leadership (new highs) is broad-based—not concentrated in a narrow set of names. This is a textbook example of a healthy, sustainable uptrend.
The Nasdaq 100 is in an exceptionally strong technical position. The rally is broad, confirmed by internals, and showing no material signs of deterioration. With breadth fully supportive across short-, intermediate-, and long-term windows, the index remains well-positioned for further upside. Pullbacks, if they occur, are likely to be met with strong demand, making this one of the most attractive structural setups among major U.S. indices.
Russel 1000
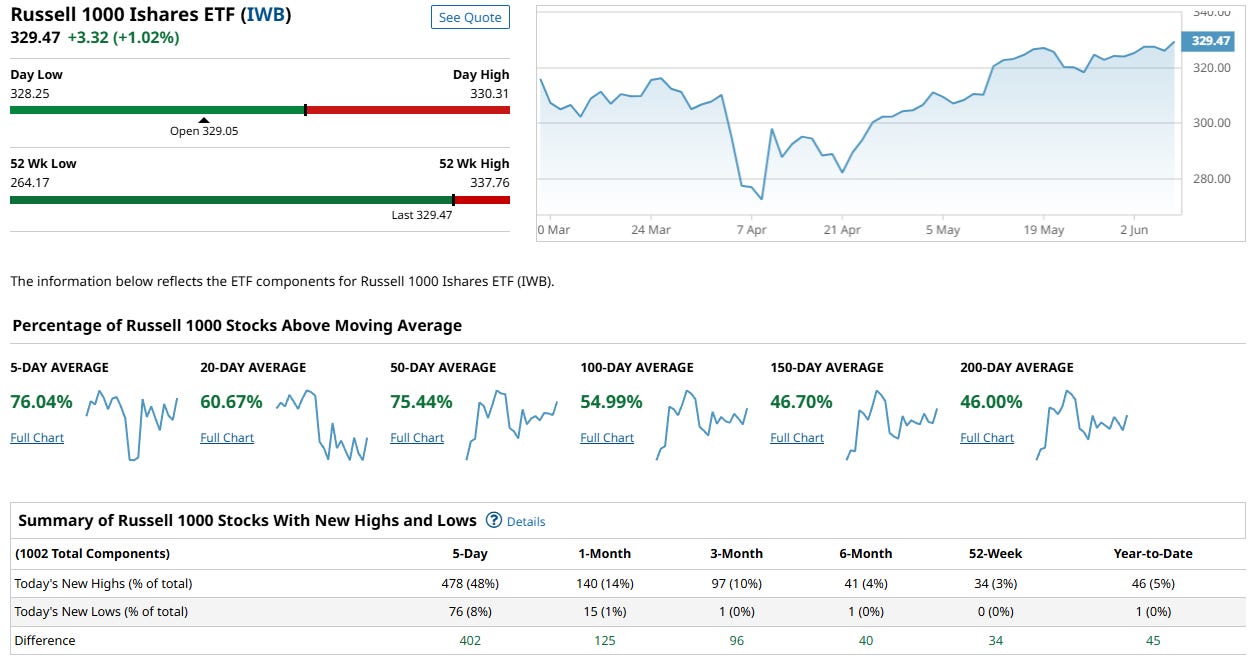
The Russell 1000 closed at 329.47, up +1.02% on the week and steadily approaching its 52-week high. Importantly, the rally is now being supported by broadening internal participation—a significant improvement from recent weeks and a very healthy sign for large- and mid-cap equities.
Breadth Metrics: Strong Short-Term and Improving Intermediate
Short-term momentum is very strong, with 76.04% of components above their 5-day moving average.
Intermediate-term participation is solid and broadening:
60.67% above 20-day MA
75.44% above 50-day MA
This reflects widespread buying and trend continuation across the index.
Long-term structure is improving, but still a work in progress:
54.99% above 100-day MA
46.70% above 150-day MA
46.00% above 200-day MA
While participation is still below 50% at the longest horizons, these levels have risen materially in recent weeks, showing a healthy rotation into longer-term leadership.
New Highs vs. New Lows: Leadership Expanding Sharply
478 new 5-day highs (48%), versus 76 new lows (8%) → net +402.
Leadership strength is confirmed across all timeframes:
1-month: +125
3-month: +96
6-month: +40
52-week: +34
Year-to-date: +45
The surge in multi-timeframe new highs highlights that the rally is no longer narrow—leadership is deepening and diversifying.
Conclusion
The Russell 1000 now displays the best short- and intermediate-term breadth profile it has shown in several months. While the long-term participation still has room to catch up, the powerful expansion in new highs and the broadening participation at the 50-day and 100-day levels suggest that a durable, sustainable phase of the rally is underway.
The Russell 1000 rally is firmly back on solid footing. The broad-based surge in new highs, improving participation across all windows, and increasingly constructive long-term trend alignment position the index for continued strength and further upside. The days of narrow leadership and fragility in this index appear to be fading fast, replaced by healthy and expanding participation—a very bullish backdrop for large- and mid-cap equities.
Major Indices Insights & Summary
Market internals across all four major U.S. indices continued to improve this week, with the rally now entering a phase of broad-based strength and leadership expansion. Breadth momentum remains elevated, and new highs have expanded decisively across timeframes. Long-term trend alignment continues to improve steadily, especially in the Russell 1000, which is now catching up to its peers.
Participation is no longer narrowly concentrated, and buying interest is spreading deeper into the market. The S&P 500, Dow Jones, and Nasdaq 100 all show highly synchronized strength across short-, intermediate-, and long-term trend windows, while the Russell 1000 has staged a breakout week in new highs and participation breadth.
Across all indices, weak hands are being cleared, downside leadership is nearly nonexistent, and the rally is supported by both strong demand and structural integrity. This market has transitioned from recovery mode to one of confirmed strength.
VL Indices Market Score: 90 / 100 (+8 WoW)
Internal strength advanced again this week. The market is now in a position of confirmed broad-based uptrend, with synchronized participation across all major indices and timeframes. New highs continue to expand across the board, and long-term structures are steadily improving.
1. Leadership is Deepening and Broadening
S&P 500: 221 new 5-day highs (44%) — highest in weeks, clear sign of broad participation.
Russell 1000: 478 new 5-day highs (48%) — breakout breadth, strongest leadership surge among the four indices.
Nasdaq 100: 49 new 5-day highs (49%) — leadership remains robust and broad-based.
Dow Jones: 13 new 5-day highs (43%) — maintaining steady leadership.
Net new highs across all four indices confirm buyers are in control.
2. Participation Now Supports the Trend
S&P 500: 71.2% above 5-day MA, 60.7% above 20-day, 72.6% above 50-day
Dow Jones: 70.0% above 5-day MA, 73.3% above 20-day, 80.0% above 50-day
Nasdaq 100: 78.2% above 5-day MA, 70.3% above 20-day, 85.1% above 50-day
Russell 1000: 76.0% above 5-day MA, 60.7% above 20-day, 75.4% above 50-day
Momentum breadth remains excellent and well-aligned across indices, supporting trend continuation.
3. Long-Term Foundations Strengthening
S&P 500: 51.2% above 150-day MA, 49.2% above 200-day MA
Dow Jones: 70.0% above 150-day MA, 60.0% above 200-day MA
Nasdaq 100: 64.4% above 150-day MA, 63.4% above 200-day MA
Russell 1000: 46.7% above 150-day MA, 46.0% above 200-day MA — improving fast
The market is building a solid foundation of sustained uptrend participation across timeframes.
4. Weak Hands Cleared, Downside Pressure Minimal
S&P 500: Only 11% new lows (53 stocks), despite 44% new highs — clean leadership profile.
Russell 1000: Only 8% new lows (76 stocks) vs 48% new highs — very strong net breadth.
Nasdaq 100: Only 6 new lows (6%) vs 49 new highs (49%) — healthy.
Dow Jones: Only 2 new lows (7%) vs 13 new highs (43%) — rock-solid.
Downside pressure is absent — breadth has fully transitioned to offensive leadership.
5. Conclusion
The U.S. equity rally has entered a new phase of broad-based strength and leadership expansion. Breadth is not only improving — it is leading. Multiple indices are now trading with fully synchronized participation across timeframes, and long-term trend structures are steadily strengthening.
The market is no longer climbing the proverbial wall of worry — it is now backed by institutional demand and internal confirmation. Pullbacks remain likely to be shallow and bought, and the probability of further trend continuation remains high.
US Investor Sentiment Report
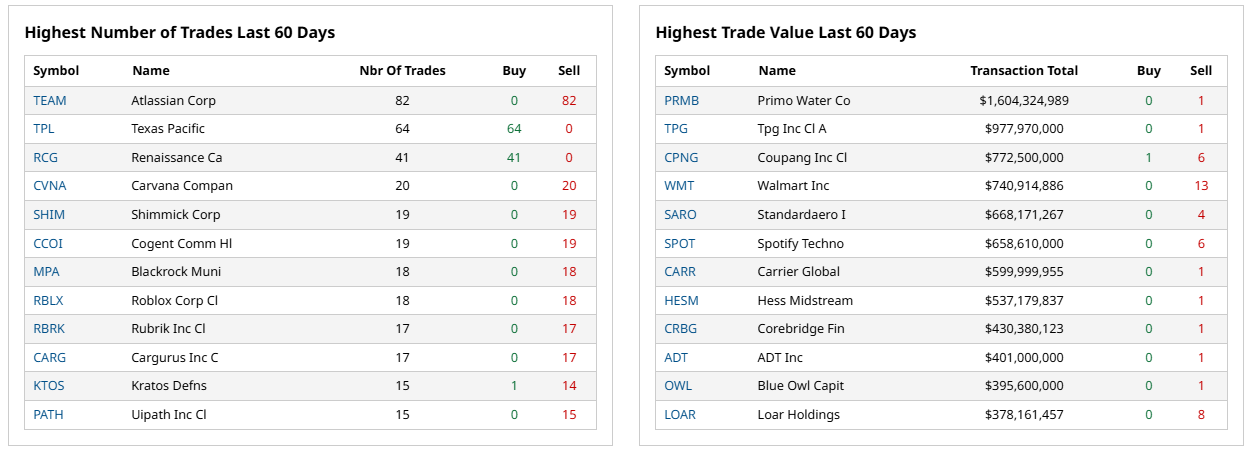
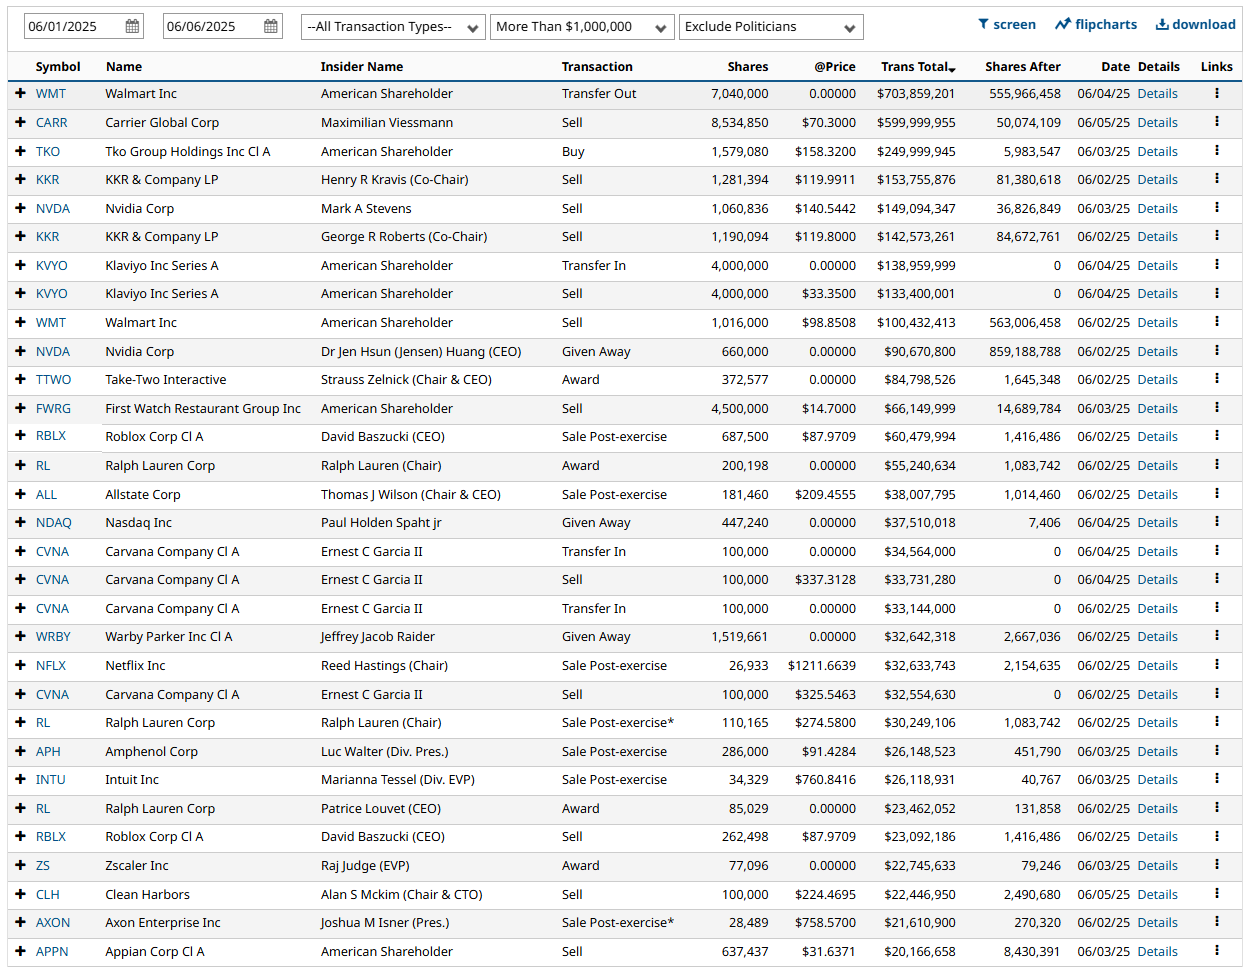
Insider Trading
Insider trading occurs when a company’s leaders or major shareholders trade stock based on non-public information. Tracking these trades can reveal insider expectations about the company’s future. For example, large purchases before an earnings report or drug trial results might indicate confidence in upcoming good news.
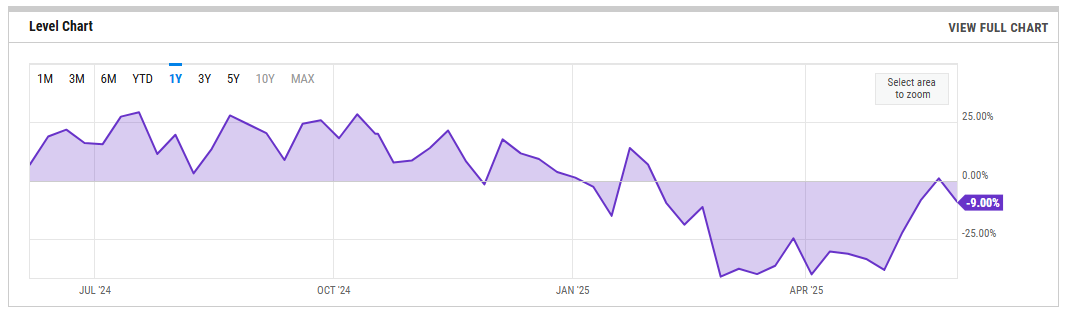
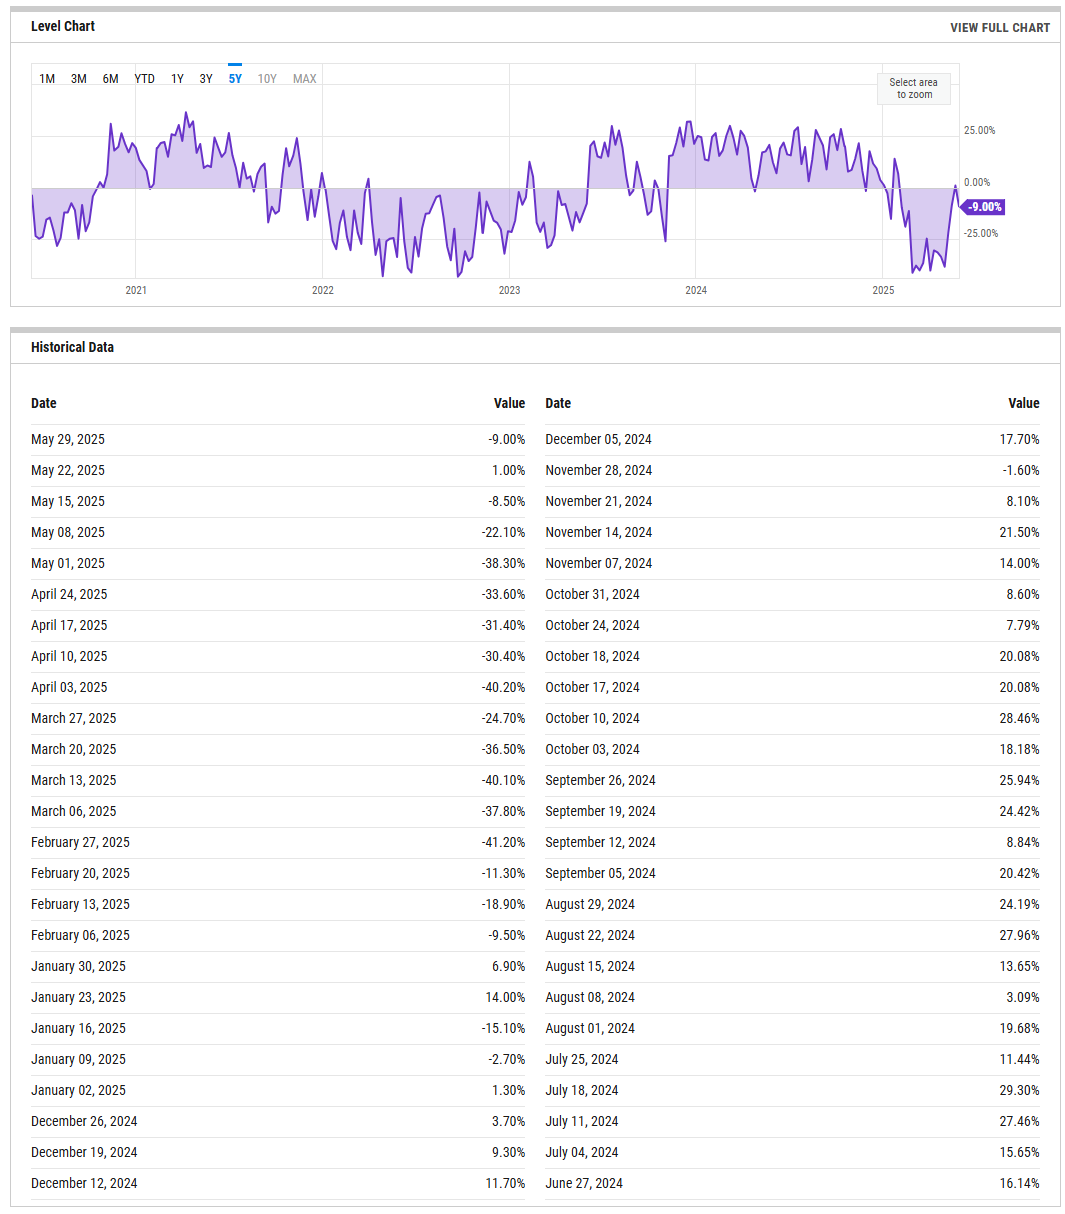
%Bull-Bear Spread
The %Bull-Bear Spread chart is a sentiment indicator that shows the difference between the percentage of bullish and bearish investors, often derived from surveys or sentiment data, such as the AAII (American Association of Individual Investors) sentiment survey. This spread tells investors about the prevailing mood in the market and can provide insights into market extremes and potential turning points.
Bullish or Bearish Sentiment:
When the spread is positive, it means more investors are bullish than bearish, indicating optimism about the market’s direction.
A negative spread indicates more bearish sentiment, meaning more investors expect the market to decline.
Contrarian Indicator:
The %Bull-Bear Spread is often used as a contrarian indicator. For example, extremely high levels of bullish sentiment might suggest that the market is overly optimistic and could be due for a correction.
Similarly, when bearish sentiment is extremely high, it might indicate that the market is overly pessimistic, and a rally could be on the horizon.
Market Extremes and Reversals:
Historically, extreme values of the spread (both positive and negative) can signal turning points in the market. A very high positive spread can signal market exuberance, while a very low or negative spread may indicate fear or capitulation.
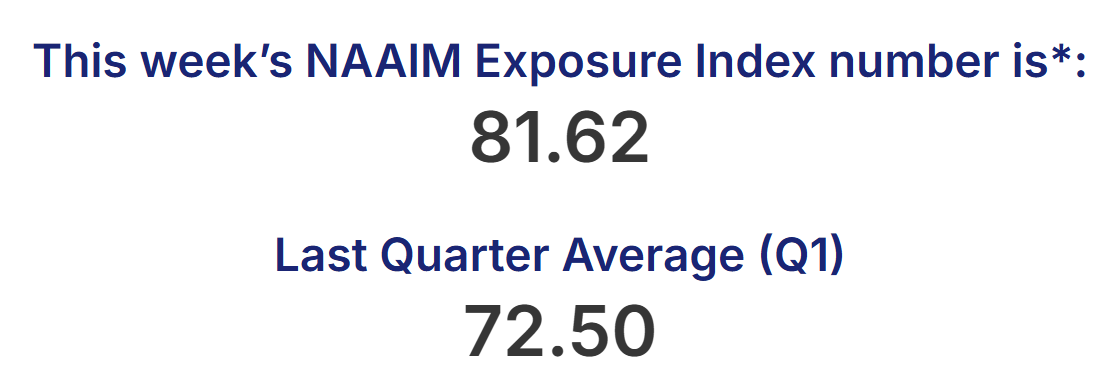
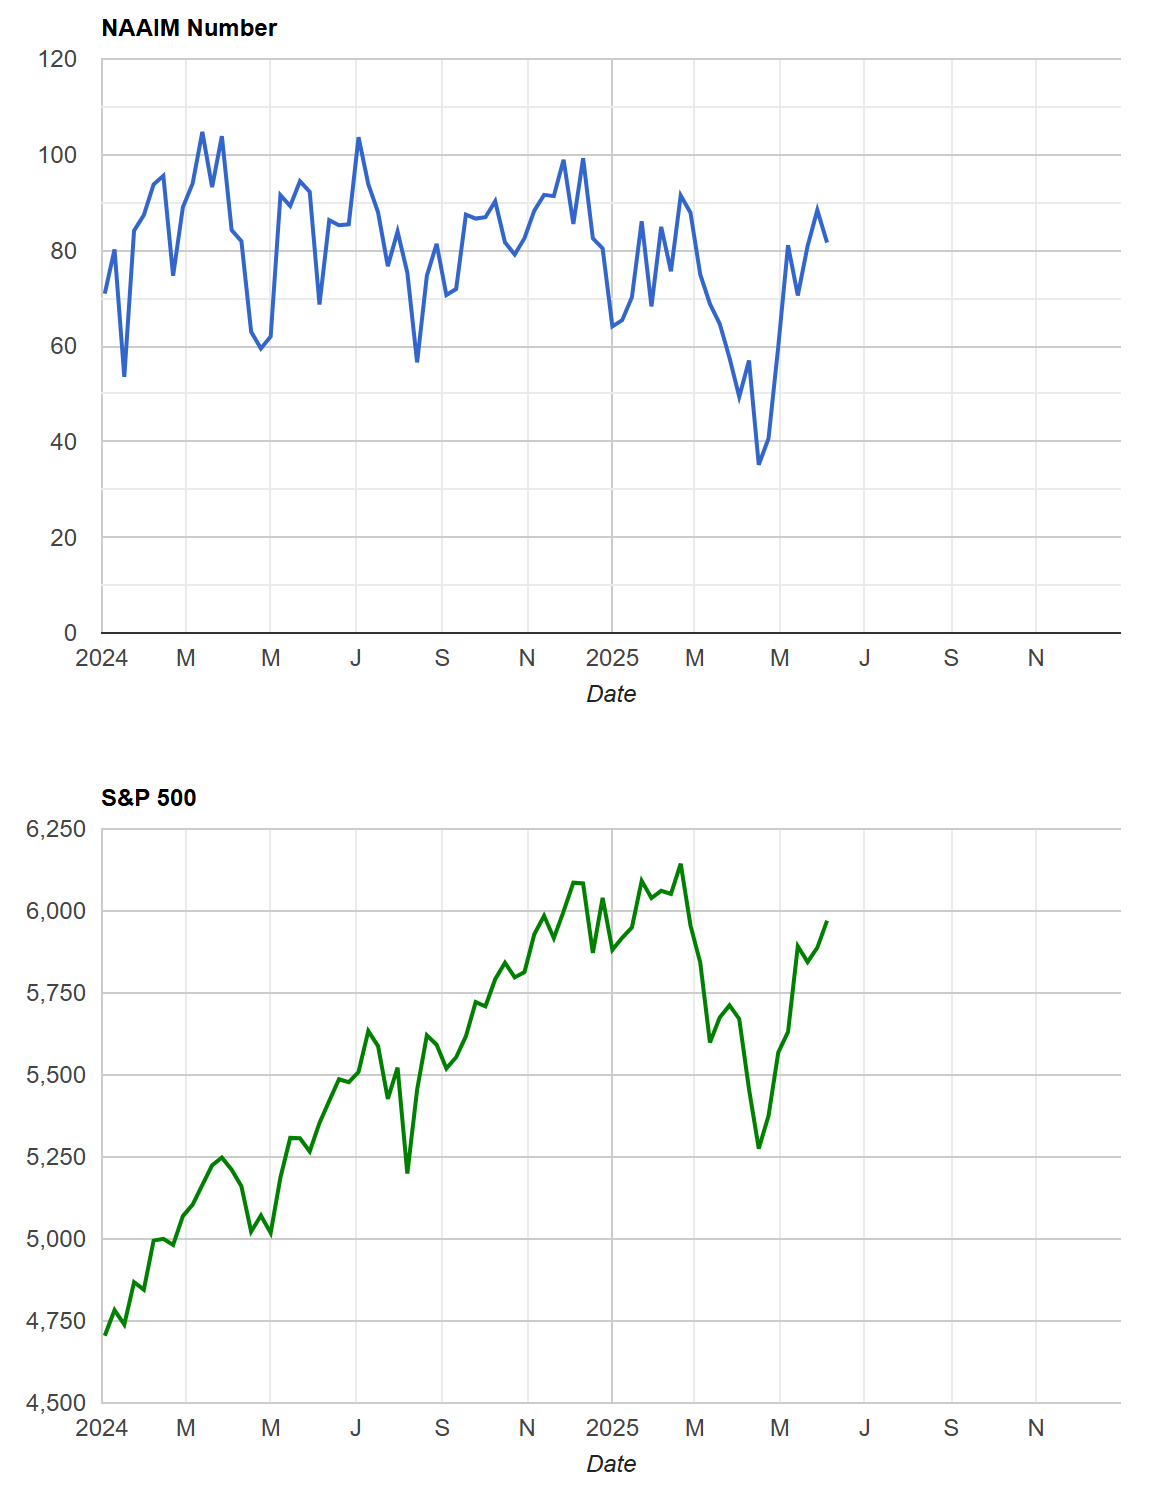
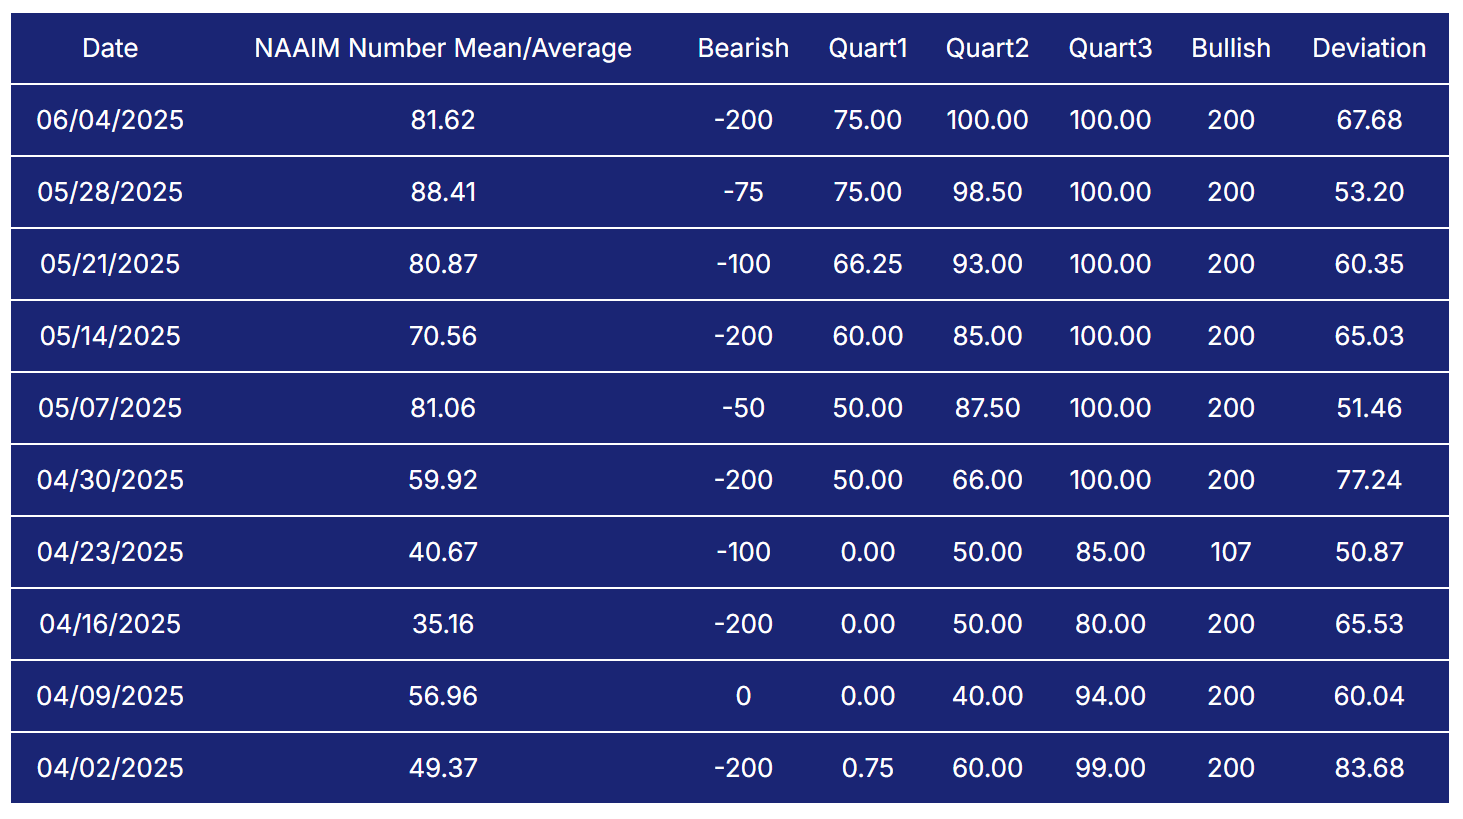
NAAIM Exposure Index
The NAAIM Exposure Index (National Association of Active Investment Managers Exposure Index) measures the average exposure to U.S. equity markets as reported by its member firms. These are typically active money managers who provide their equity exposure levels weekly. The index offers insight into how much these managers are investing in equities at any given time, ranging from being fully short (-100%) to leveraged long (up to +200%).
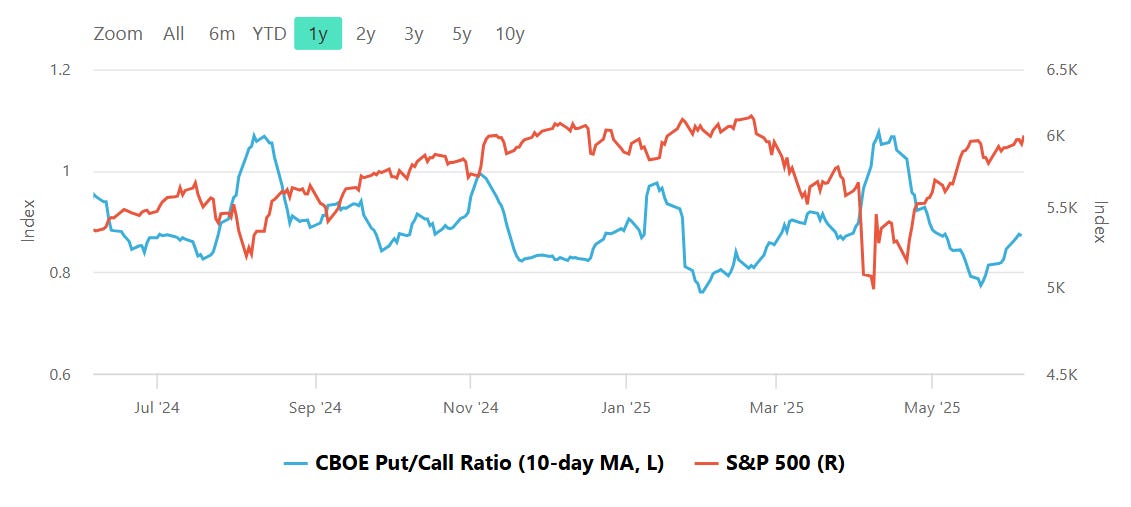
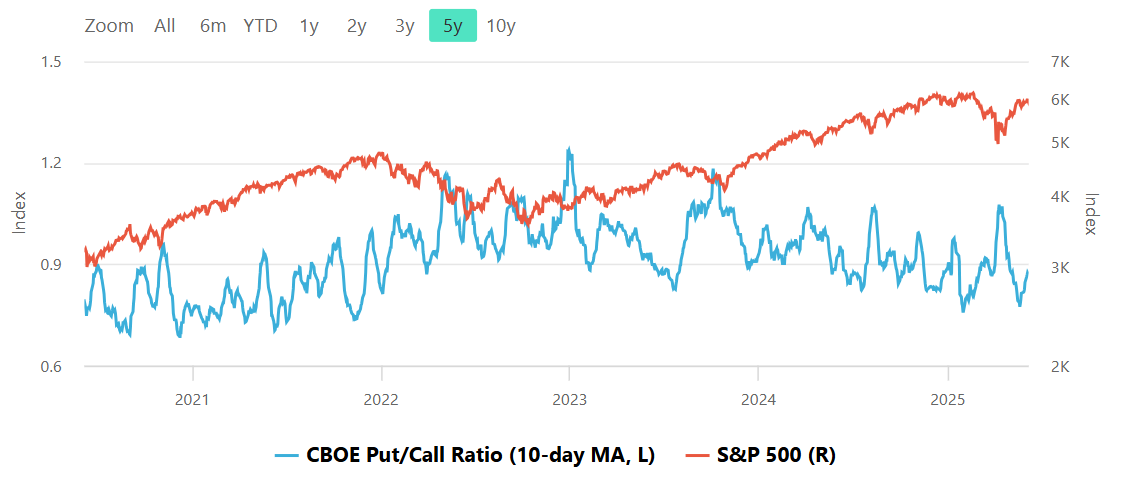
CBOE Total Put/Call Ratio
CBOE's total put/call ratio includes index options and equity options. It's a popular indicator for market sentiment. A high put/call ratio suggests that the market is overly bearish and stocks might rebound. A low put/call ratio suggests that market exuberance could result in a sharp fall.
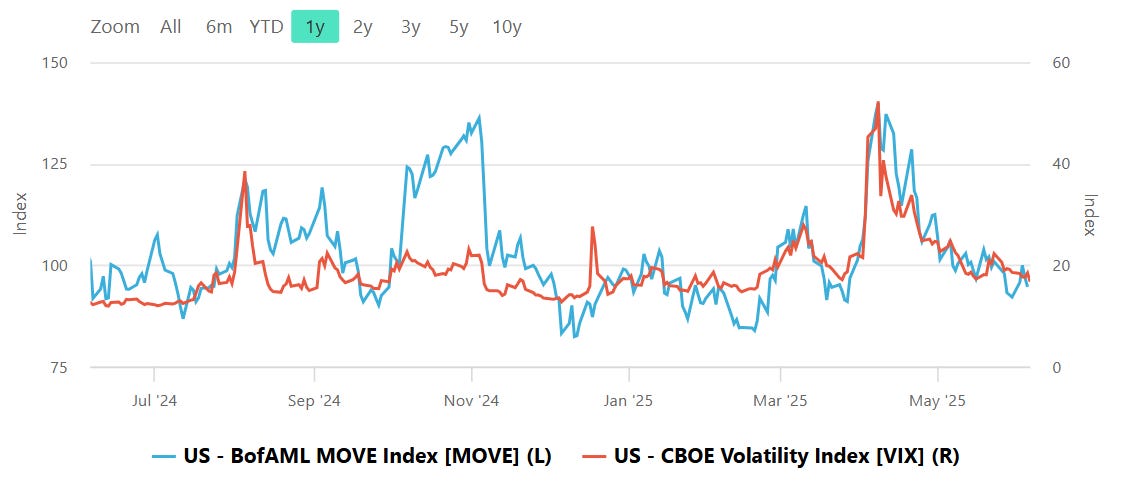
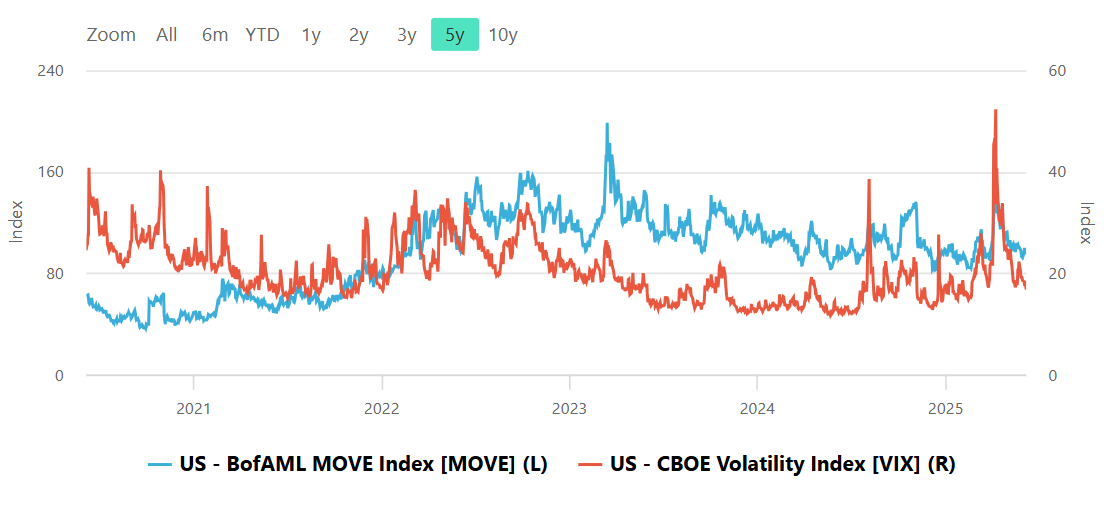
Equity vs Bond Volatility
The Merrill Lynch Option Volatility Estimate [MOVE] Index from BofAML and the CBOE Volatility Index [VIX] respectively represent market volatility of U.S. Treasury futures and the S&P 500 index. They typically move in tandem but when they diverge, an opportunity can emerge from one having to “catch-up” to the other.
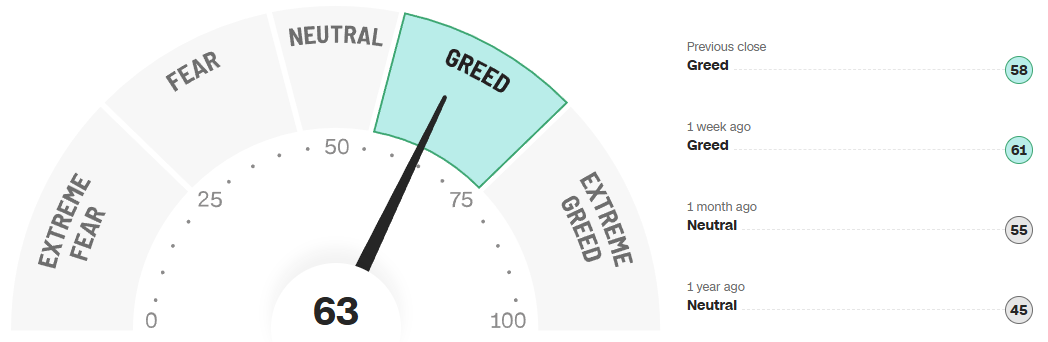
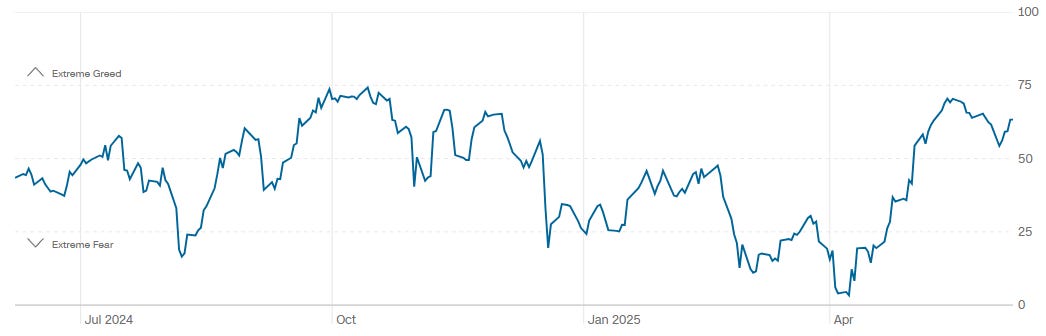
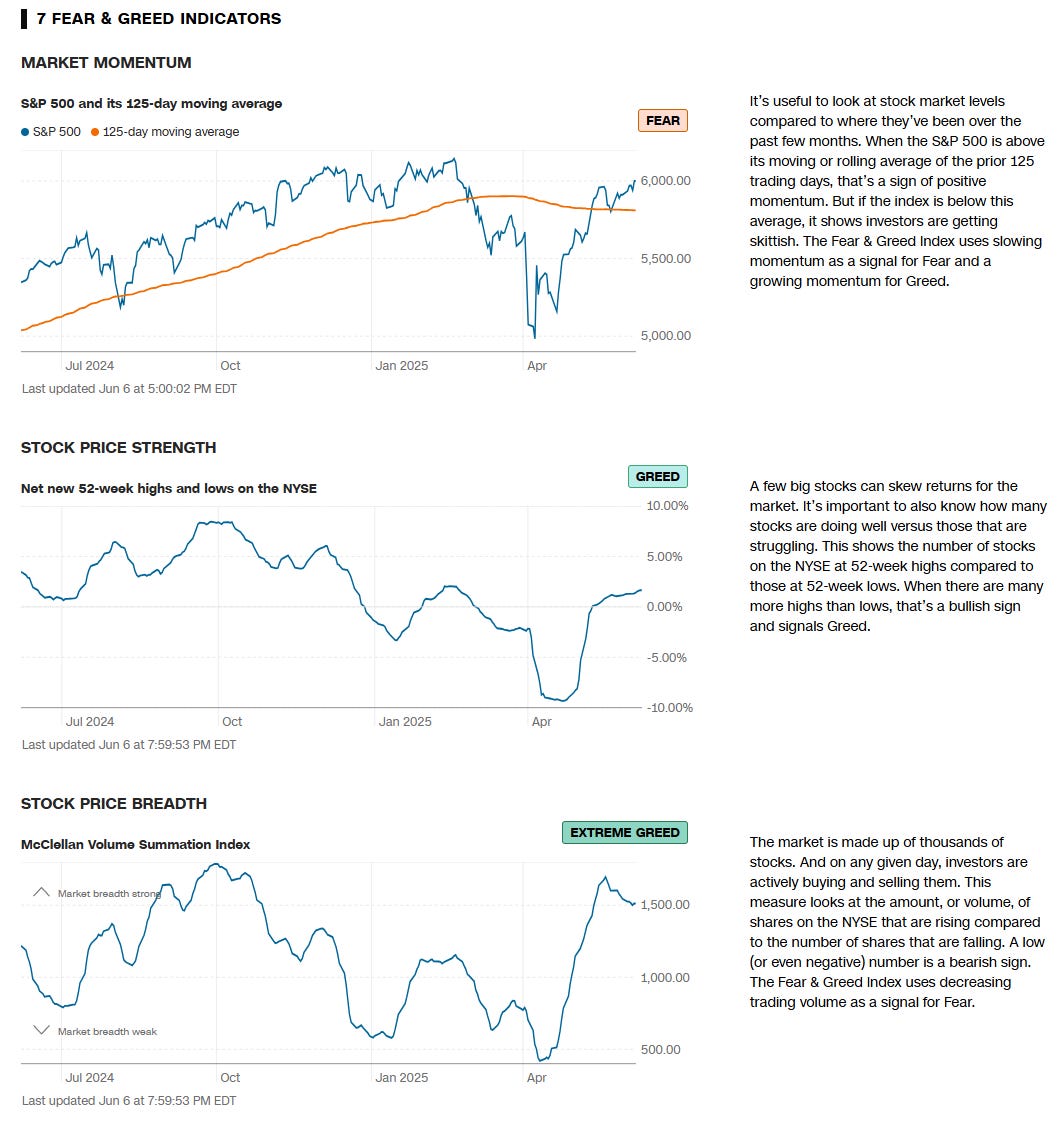
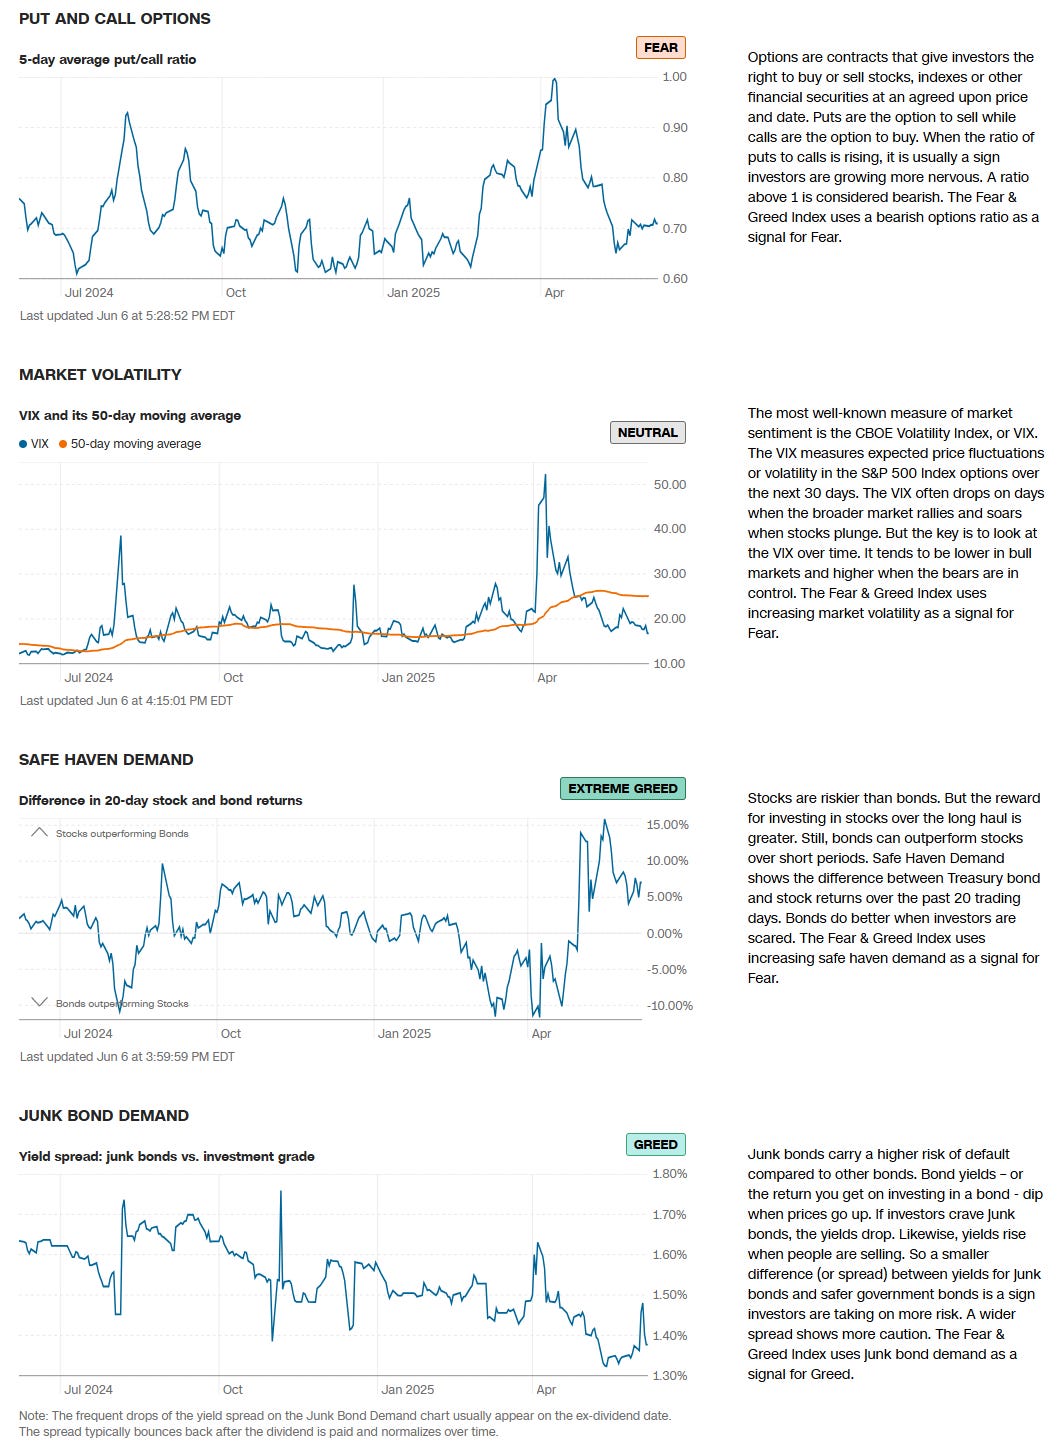
CNN Fear & Greed Constituent Data Points & Composite Index
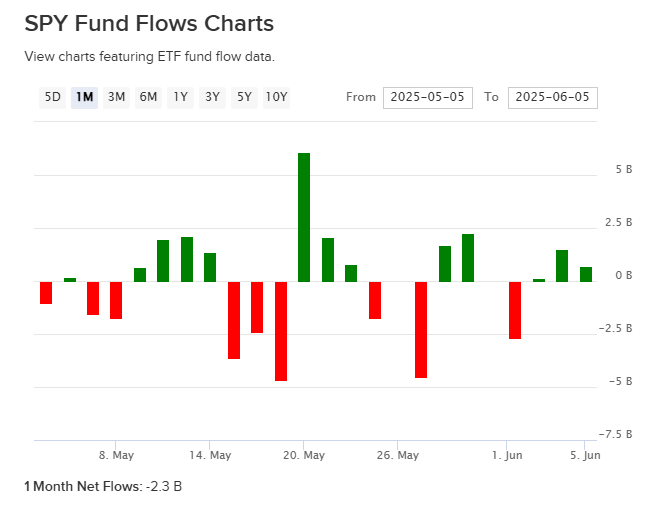
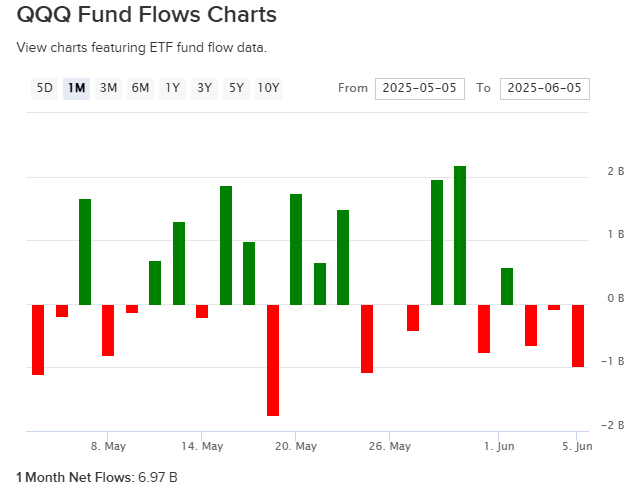
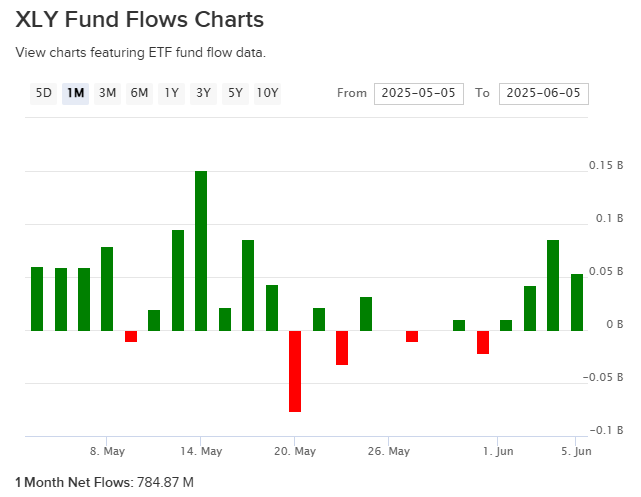
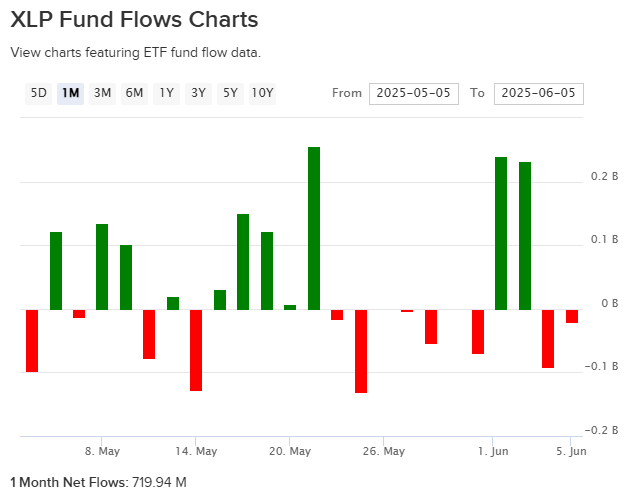
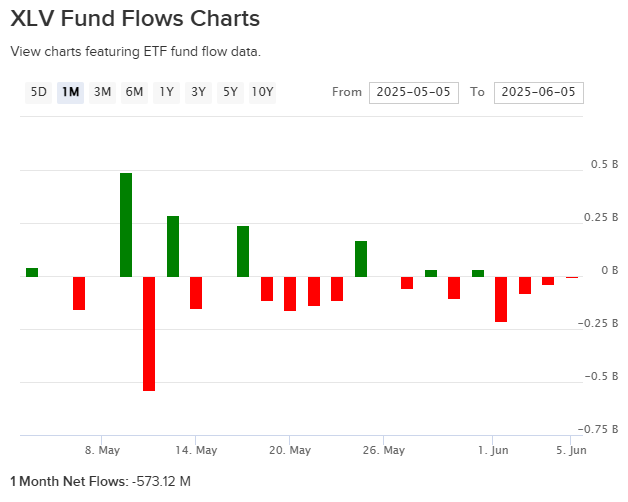
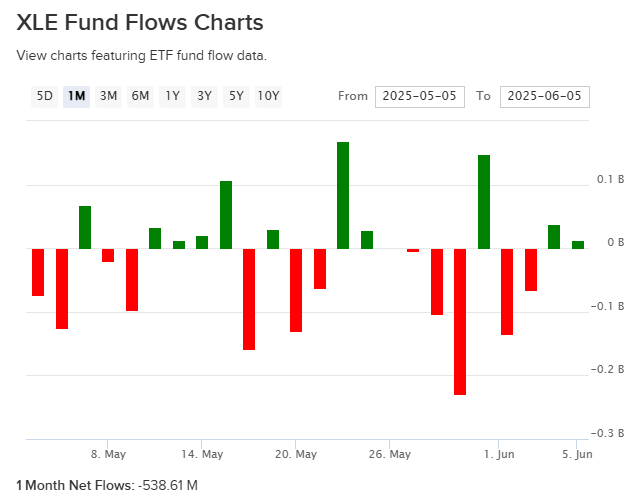
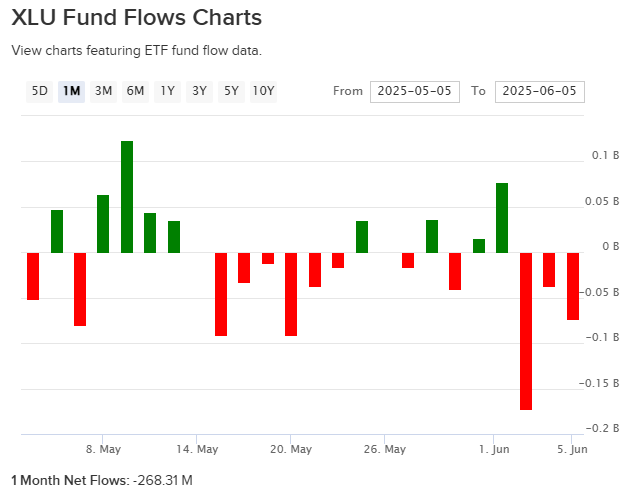
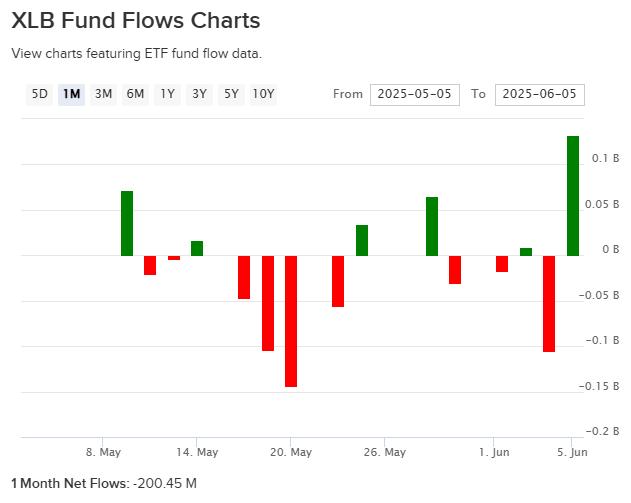
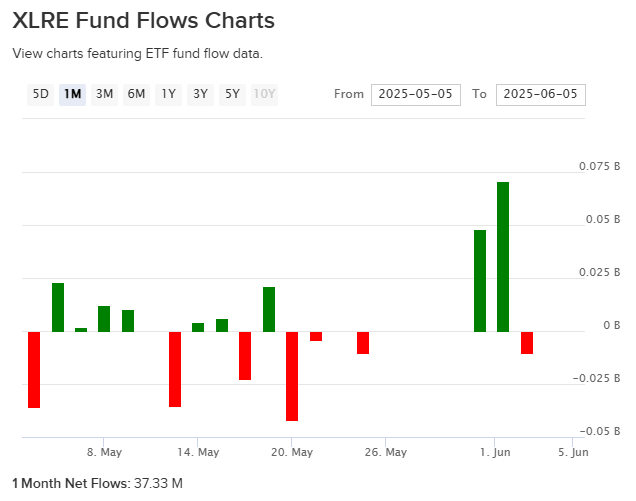
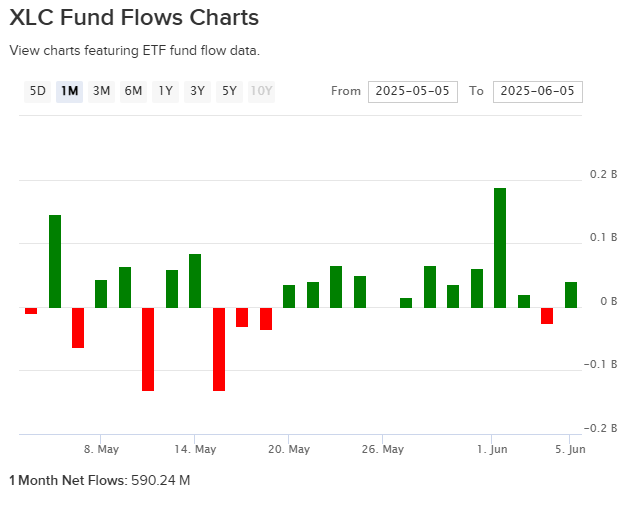
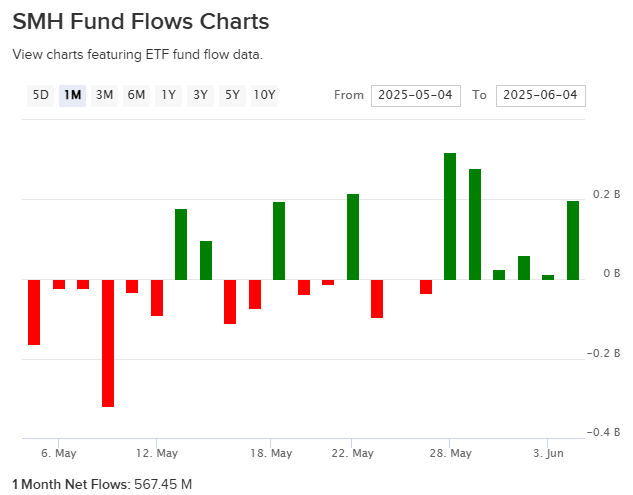
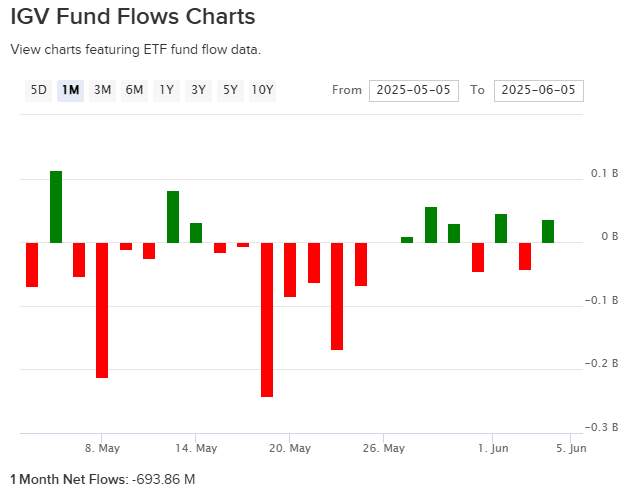
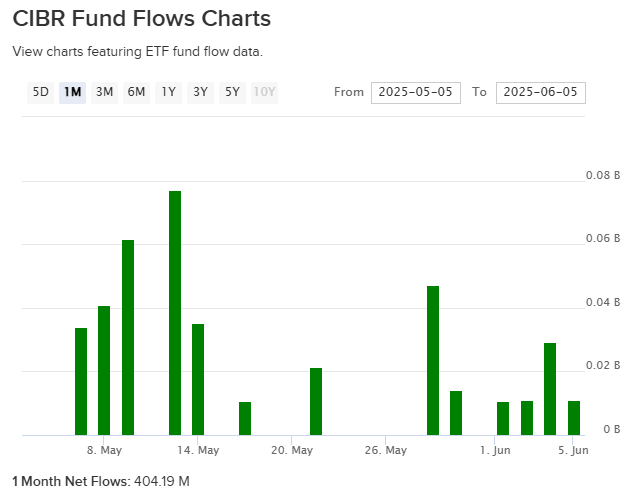
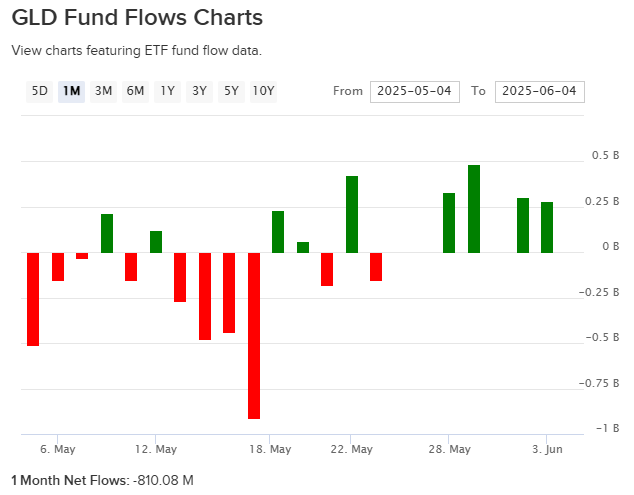
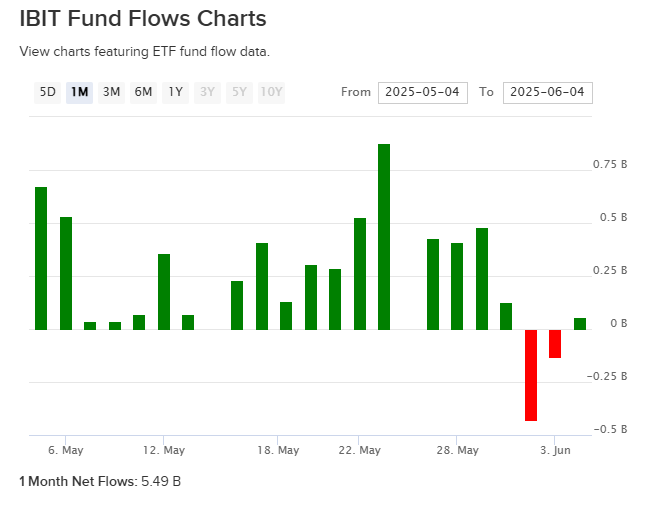
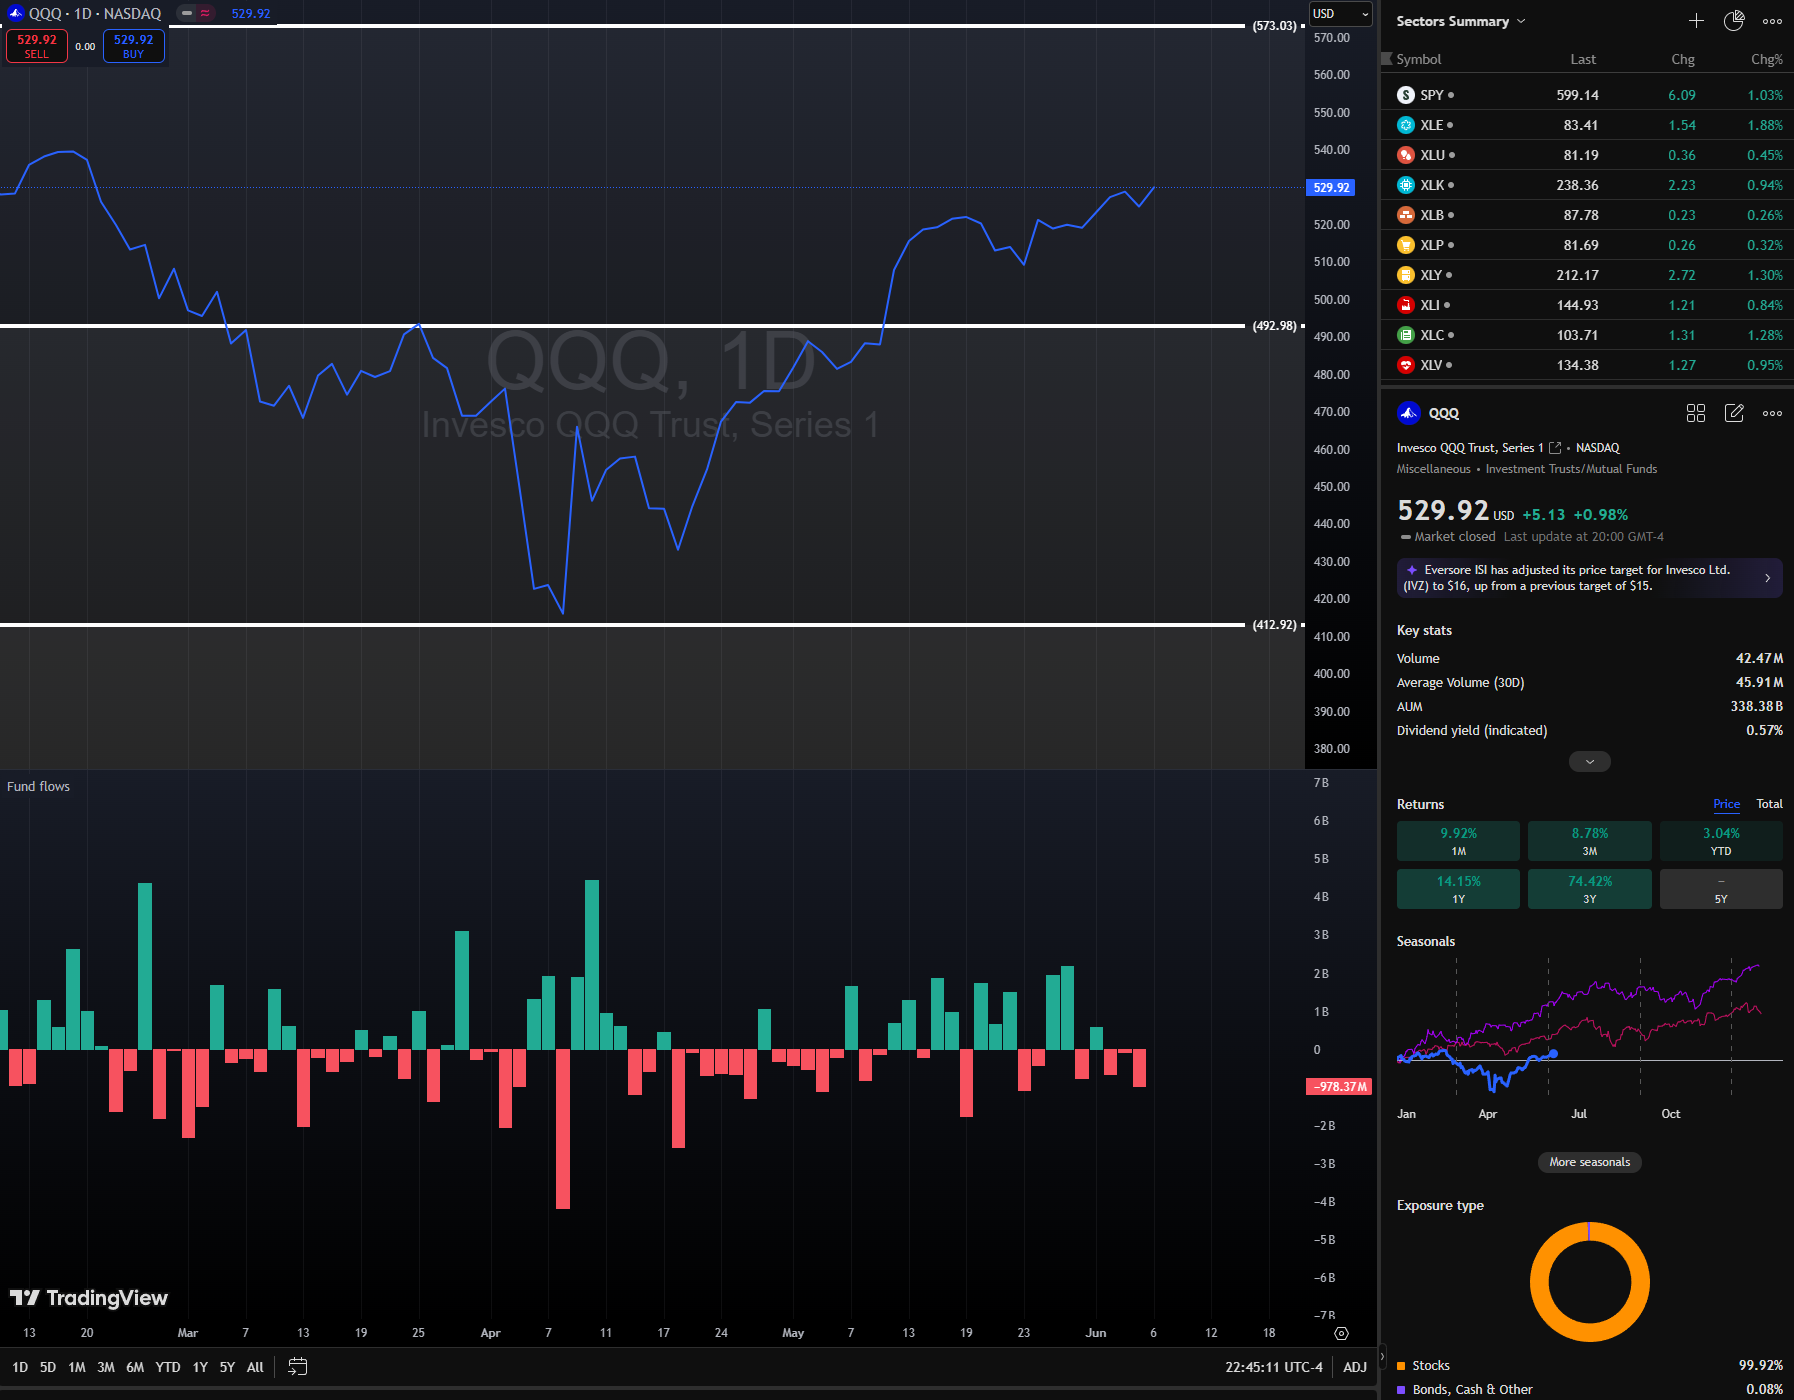
Fund Flows Snapshot
How to Read Fund Flows
Fund flows track the net movement of money into or out of ETFs over a given time period. Positive flows mean investors are adding money to that ETF; negative flows mean they are pulling money out. Fund flows provide insight into where capital is moving, which sectors or themes are being favored, and how market participants are positioning themselves.
Why Fund Flows Matter
Flows often tell us what’s happening beneath the surface of price action:
When flows align with a trend, they can confirm its strength.
When flows diverge from price (price rising but outflows), they can signal potential exhaustion or false moves.
Tracking sector rotation via flows helps identify where institutional money is moving — often ahead of retail.
Flows into defensive assets (utilities, staples, gold) can warn of rising risk aversion, while inflows into growth sectors or high-yield credit signal a more risk-on environment.
How to Use This Section
When reviewing the 1-month trailing fund flows:
Look for which sectors/themes are seeing inflows vs outflows — rotation can often precede price leadership.
Watch for flows into safe-haven assets — growing fear or hedging activity.
Pay attention to flow divergences — if flows contradict recent price moves, it may signal changing market dynamics.
Use flow trends as a lens for market risk appetite — is capital positioning for expansion, protection, or reversal?
What to Look For
Strong inflows → Sector/theme gaining institutional sponsorship — potential leadership emerging.
Consistent outflows → Sector/theme falling out of favor — headwind to price.
Sudden flow reversals → Shifts in market regime or sentiment — time to investigate.
Flows into defensive sectors + out of cyclicals → Broad de-risking underway.
Flows into growth & cyclicals → Confidence in the market’s forward outlook.
Bottom line: Fund flows give you an edge in tracking where the market is positioning next — often before it shows up in price.
This section helps you see what’s moving behind the scenes so you can align your trades and investments accordingly.
Pro Tips
When flows go into cyclical sectors + out of defensives → risk-on.
When flows go into defensives + credit ETFs + gold → risk-off or caution.
When flow divergence happens (e.g. price rising but XLF or XLI flows negative) → be alert for reversals.
When flows surge into money market funds → risk aversion peaking → contrarian bullish if combined with price washout.
When flows chase hot sectors late in a rally (high trailing flows in XLK, XLY, SMH after extended runs) → watch for potential crowding and reversal risk.
When broad market flows (SPY, QQQ) are flat or negative but sector flows are positive → market is entering a stock-picker’s tape — be selective, not broad beta.
When flows move sharply into bond proxies (XLU, XLRE, XLP) → rate expectations shifting → monitor yields and Fed signals.
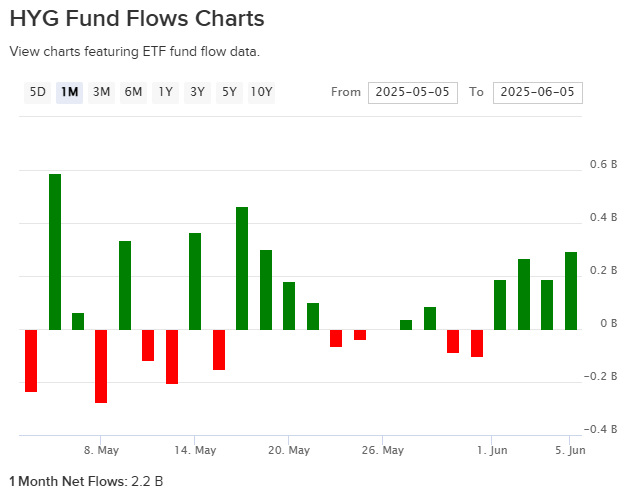
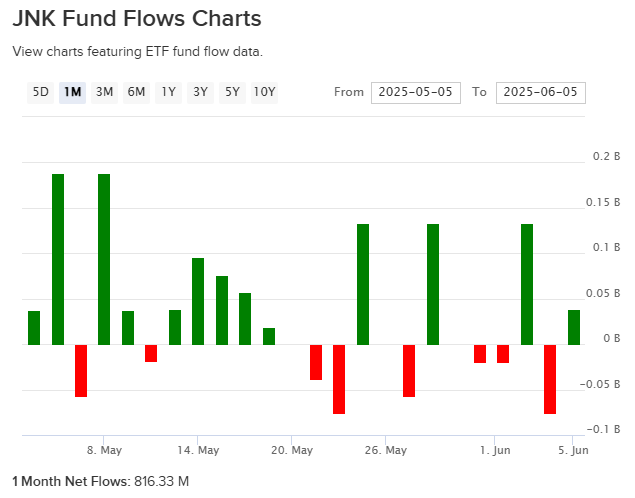
When HYG / JNK flows flip strongly negative → rising credit stress → equities vulnerable to volatility spike.
When flows into small caps (IWM) surge after underperformance → reflation expectations building → often signals early phase of macro turn.
When global ETF flows (EEM, EFA) sharply diverge from US flows → macro capital rotation underway — useful for FX and commodities positioning.
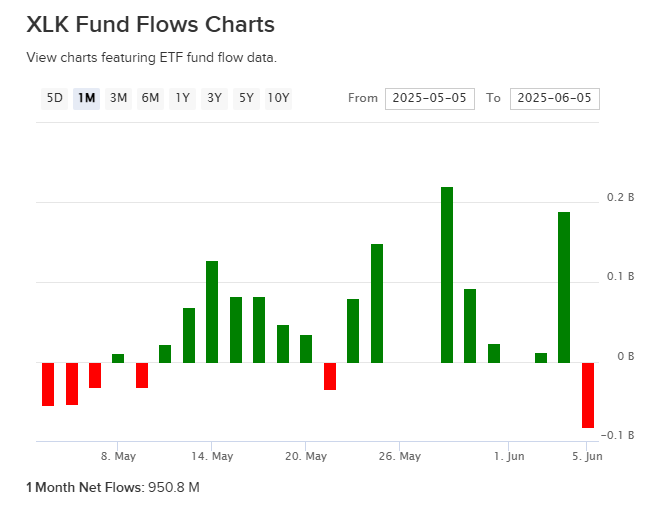
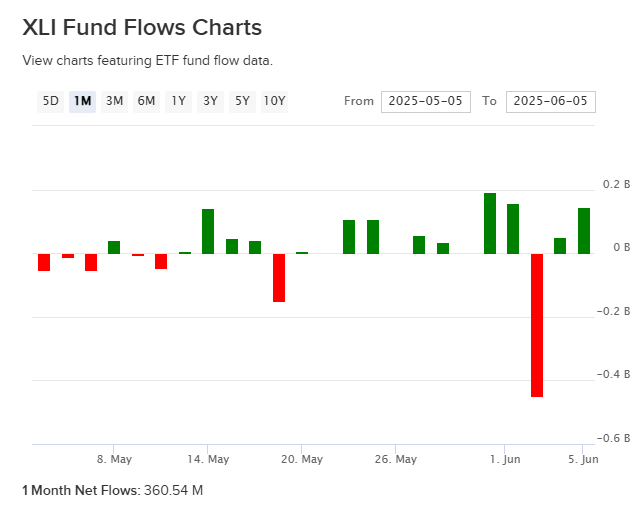
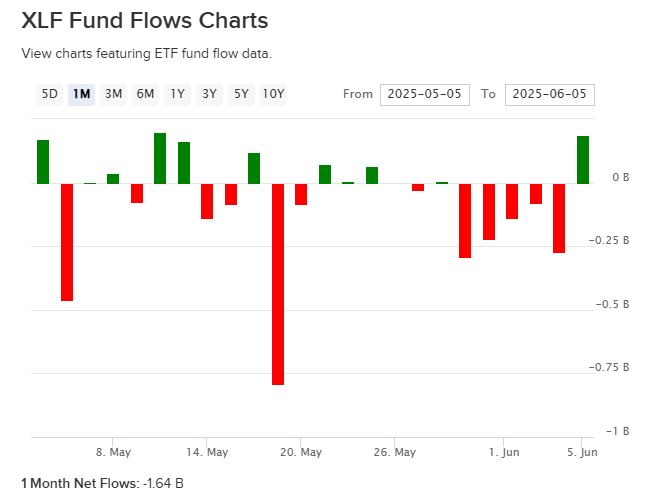
Core S&P 500 Sector ETFs
Popular Thematic / Subsector ETFs to Watch
Fixed Income / Credit ETFs
Social Media Favs
Analyzing social sentiment can provide valuable insights for investment strategies by offering a pulse on public perception, mood, and market sentiment that traditional financial indicators might not capture. Here’s how social sentiment analysis can enhance investment decisions:
Market Momentum: Positive or negative social sentiment can signal impending momentum shifts. When public opinion on a stock, sector, or asset class changes sharply, it can create buying or selling pressure, especially if that sentiment becomes widespread.
Early Detection of Trends: Social sentiment data can help investors spot trends before they show up in technical or fundamental data. For example, increased positive chatter around a particular company or sector might indicate growing interest or excitement, which could lead to price appreciation.
Gauge Retail Investor Impact: With the rise of retail investor platforms, collective sentiment on social media can lead to significant price movements (e.g., meme stocks). Understanding how retail investors view certain stocks can help in identifying high-volatility opportunities.
Event Reaction Monitoring: Social sentiment can provide real-time reactions to news events, product releases, or earnings reports. Investors can use this information to gauge market reaction quickly and adjust their strategies accordingly.
Complementing Quantitative Models: By adding a social sentiment layer to quantitative models, investors can enhance predictions. For example, a model that tracks historical price and volume data might perform even better when factoring in sentiment trends as a measure of market psychology.
Risk Management: Negative sentiment spikes can be a signal of potential downturns or increased volatility. By monitoring sentiment, investors might avoid or hedge against investments in companies experiencing a public relations crisis or facing negative perceptions.
Long-Term Sentiment Trends: Sustained sentiment trends, whether positive or negative, often mirror longer-term market cycles. Tracking sentiment trends over time can help identify shifts in investor psychology that could affect longer-term investments or sector rotations.
For these reasons, sentiment analysis, when combined with other tools, can provide a comprehensive view of both immediate market reactions and underlying investor attitudes, helping investors position themselves strategically across various time frames. Here are the most mentioned/discussed tickers on Reddit from some of the most active Subreddits for trading:


Special Coverage Report
How to Read Fund Flows Like a Pro
A practical guide to using ETF and fund flow data to track market rotation, risk appetite, and institutional positioning.
Introduction
Most traders focus almost exclusively on price and charts. But professional investors understand that price is only the surface. Beneath every move, every trend, every breakout or breakdown, lies one fundamental force: capital movement.
Where is money flowing to? Where is it fleeing from? How are the institutions, the big allocators of capital, quietly repositioning long before it’s visible to the crowd? The answers to these questions live in an often-overlooked data set: fund flows.
When used well, fund flows give you deep insight into the market’s internal state — what’s being bid, what’s being sold, where the crowd is crowding, and when sentiment is turning. They are a powerful context tool, helping you interpret whether a trend is real or false, whether leadership is broad or narrow, and whether big money is moving into or out of risk.
This Special Report will show you exactly how to use fund flows like a professional — not just as data points, but as part of a sophisticated framework for understanding markets.
Understanding Fund Flows
At its core, a fund flow is simple: it measures how much money is moving into or out of an investment fund. If investors are buying shares of a fund, its net flow is positive — new money is entering. If they are redeeming shares, its net flow is negative — money is leaving.
But this simple measure tells us an enormous amount about market positioning. When capital moves decisively into certain sectors, factors, asset classes, or regions, it leaves a footprint. That footprint often appears well before it fully expresses in price.
The most valuable flows to track include ETF flows, which are fast-moving and favored by institutions; mutual fund flows, which are slower but reveal retail positioning; and money market fund flows, which are a powerful barometer of fear and risk aversion.
You can find these data sets in several places. ETFdb.com offers an excellent free database of ETF flows, updated daily and weekly. ICI.org provides weekly updates on mutual fund and money market fund flows. Paid services like EPFR Global offer deeper data, but much of it is summarized in Bloomberg and Financial Times articles.
How Professionals Interpret Flows
Flows are powerful, but they require careful interpretation. Professionals do not react to every blip in flow data. Instead, they look for trends — sustained movement of capital that confirms or contradicts price behavior.
The first and simplest principle is confirmation versus divergence. If price is rising and fund flows into that sector or asset class are also rising, the move is confirmed — capital is supporting the price action. If price is rising but fund flows are negative or drying up, the move is suspect — often driven by short covering or mechanical buying, not true demand.
Note: ETF fund flow data reflects primary market creations and redemptions, not secondary market trading volume. Shorting activity can influence ETF price and volume, but unless it triggers creations or redemptions, it does not directly affect reported fund flows.
Flows also reveal sector rotation — one of the most important drivers of market leadership. Institutions rotate capital between sectors as macro conditions evolve. Flows into cyclical sectors like financials, industrials, and consumer discretionary typically indicate risk-on positioning and economic optimism. Flows into defensive sectors like healthcare, utilities, and staples often signal rising caution. Tracking these rotations helps traders position ahead of leadership shifts.
More broadly, fund flows serve as a risk-on/risk-off gauge. Flows into equities, high-yield bonds, and cyclical sectors suggest growing risk appetite. Flows into Treasuries, money market funds, and gold suggest risk aversion. Watching these patterns week to week provides essential context for sizing trades and managing exposure.
Flows also offer insight into macro shifts. Large inflows into long-dated Treasuries often signal rising recession fears or a collapse in growth expectations. Surging flows into small caps may indicate growing confidence in domestic growth. Outflows from emerging markets often reflect rising global stress or a strengthening US dollar.
Finally, flows can serve as a powerful contrarian tool. When retail panic drives massive outflows from equities and into money markets, professionals often begin buying. Conversely, when hot sectors attract enormous inflows late in a rally, professionals often prepare for reversals. The crowd often buys tops and sells bottoms — and flow extremes can help you fade these moves.
What to Track
Not all fund flows are equally useful. Professionals focus on a core set of instruments that provide the clearest signals.
Among sectors, the SPDR S&P 500 sector ETFs — XLK (technology), XLF (financials), XLY (consumer discretionary), XLI (industrials), XLV (healthcare), XLU (utilities), XLP (consumer staples), XLE (energy), XLRE (real estate), XLB (materials), and XLC (communications) — provide an excellent view of where institutional money is rotating.
Among indices, the big four — SPY (S&P 500), QQQ (Nasdaq 100), IWM (Russell 2000), and DIA (Dow 30) — show the broad risk-on/risk-off balance in equities.
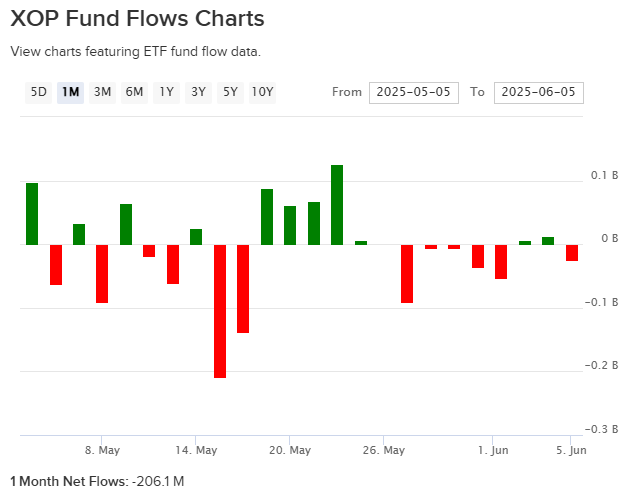
Thematic and high-beta ETFs like SMH (semiconductors), IGV (software), CIBR/HACK (cybersecurity), SKYY (cloud), URNM/URA (uranium), and ITA/PPA (defense) reveal where speculative capital is moving.
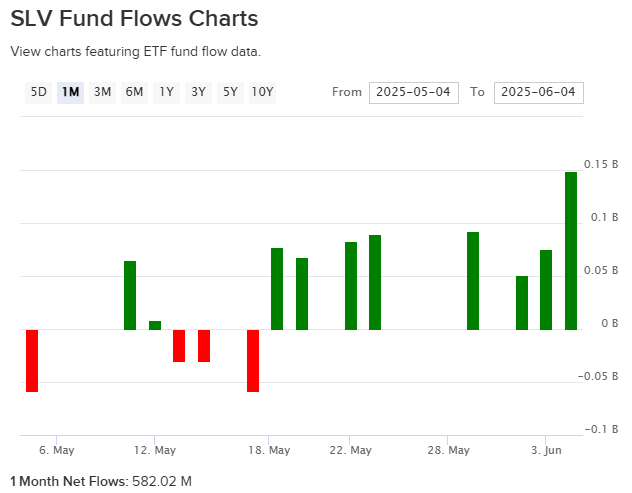
Commodities ETFs — GLD and SLV — reflect safe-haven demand and inflation expectations.
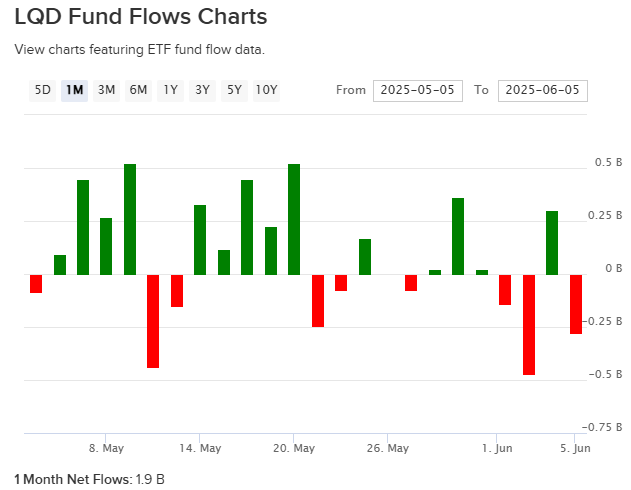
Credit ETFs — HYG, JNK (high yield), and LQD (investment grade) — provide early warning of credit stress, which often precedes equity volatility.
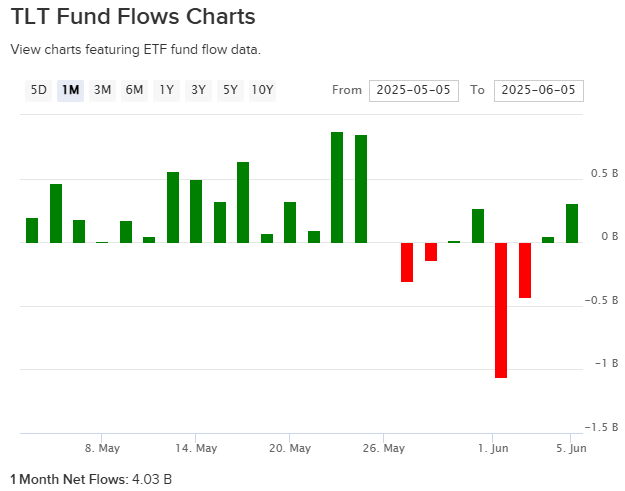
Treasury ETFs — TLT and IEF — reveal macro positioning around rates and growth expectations.
Global equity flows — into EFA (developed markets) and EEM (emerging markets) — provide clues about global capital rotation and risk appetite.
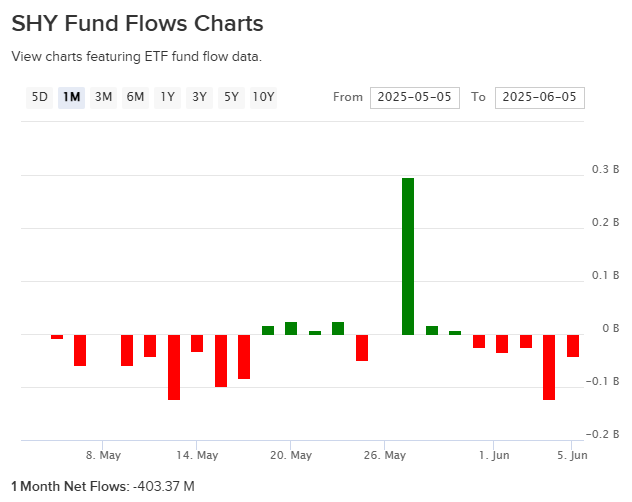
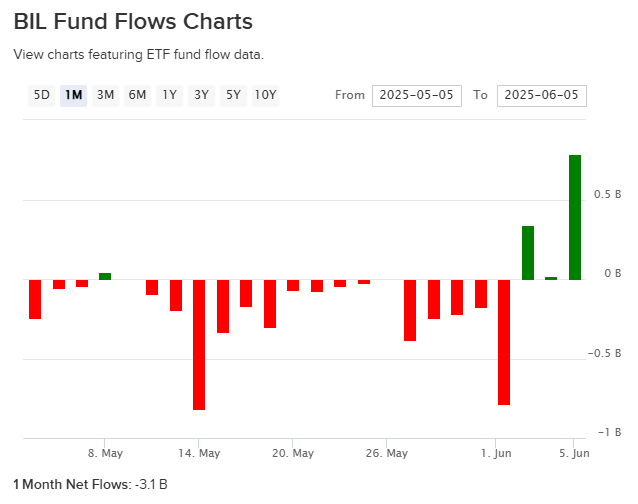
Finally, money market fund flows, available from ICI.org, are one of the purest fear gauges in the market. Surging flows into money markets often mark panic and washout conditions — key moments for contrarian positioning.
Building a Fund Flow Dashboard
Professionals typically monitor flows weekly, building a dashboard that tracks sector rotation, risk appetite, macro positioning, and global capital movement.
A simple spreadsheet or chart can track trailing 1-week and 1-month flows for key ETFs and fund categories. The goal is not to react to every tick, but to observe sustained trends and emerging divergences. Use this worksheet to establish a market narrative and trading bias that you can align your trades with throughout the week.
Flows are most powerful when combined with other market internals — breadth, institutional positioning, options data, and insider activity. Together, these elements provide a comprehensive view of market dynamics.
For free data, ETFdb.com and ICI.org are excellent starting points. Paid services like EPFR and SentimenTrader offer more advanced flow dashboards, but much of the essential signal is available for free if you know where to look.
Common Pitfalls
The most common mistake in using fund flows is overreacting to noise. Daily flows can be erratic; weekly and monthly trends matter far more.
Another frequent error is overinterpreting single-week extremes. A huge inflow or outflow in one week, absent a sustained trend, may simply reflect a mechanical rebalance or a short-lived event.
Context also matters. Flows around month-end, quarter-end, options expiration, or major index rebalances can be distorted. Professionals adjust their interpretation accordingly.
Finally, it is critical to remember that flows are a context tool, not a timing signal. They help frame your bias, manage your exposure, and identify where the smart money is moving — but they should not be used in isolation to pick tops or bottoms.
Conclusion
Fund flows reveal the deep currents that move markets. They tell you where money is going, where it is fleeing, and where crowding or fear is building — often long before these dynamics are visible in price alone.
By adding flow analysis to your market process, you gain an edge. You understand not just what is happening, but why. You can position ahead of leadership shifts, avoid crowded trades, and lean against panic when opportunity is greatest.
Start simple: track flows weekly. Build your dashboard. Combine flow data with breadth, positioning, and sentiment. Over time, you will develop an intuitive feel for how capital is moving — and that understanding will make you a far more informed and effective trader because you’ll then be aligning your daily trades with bias established from analyzing broader weekly flows and institutional positioning.
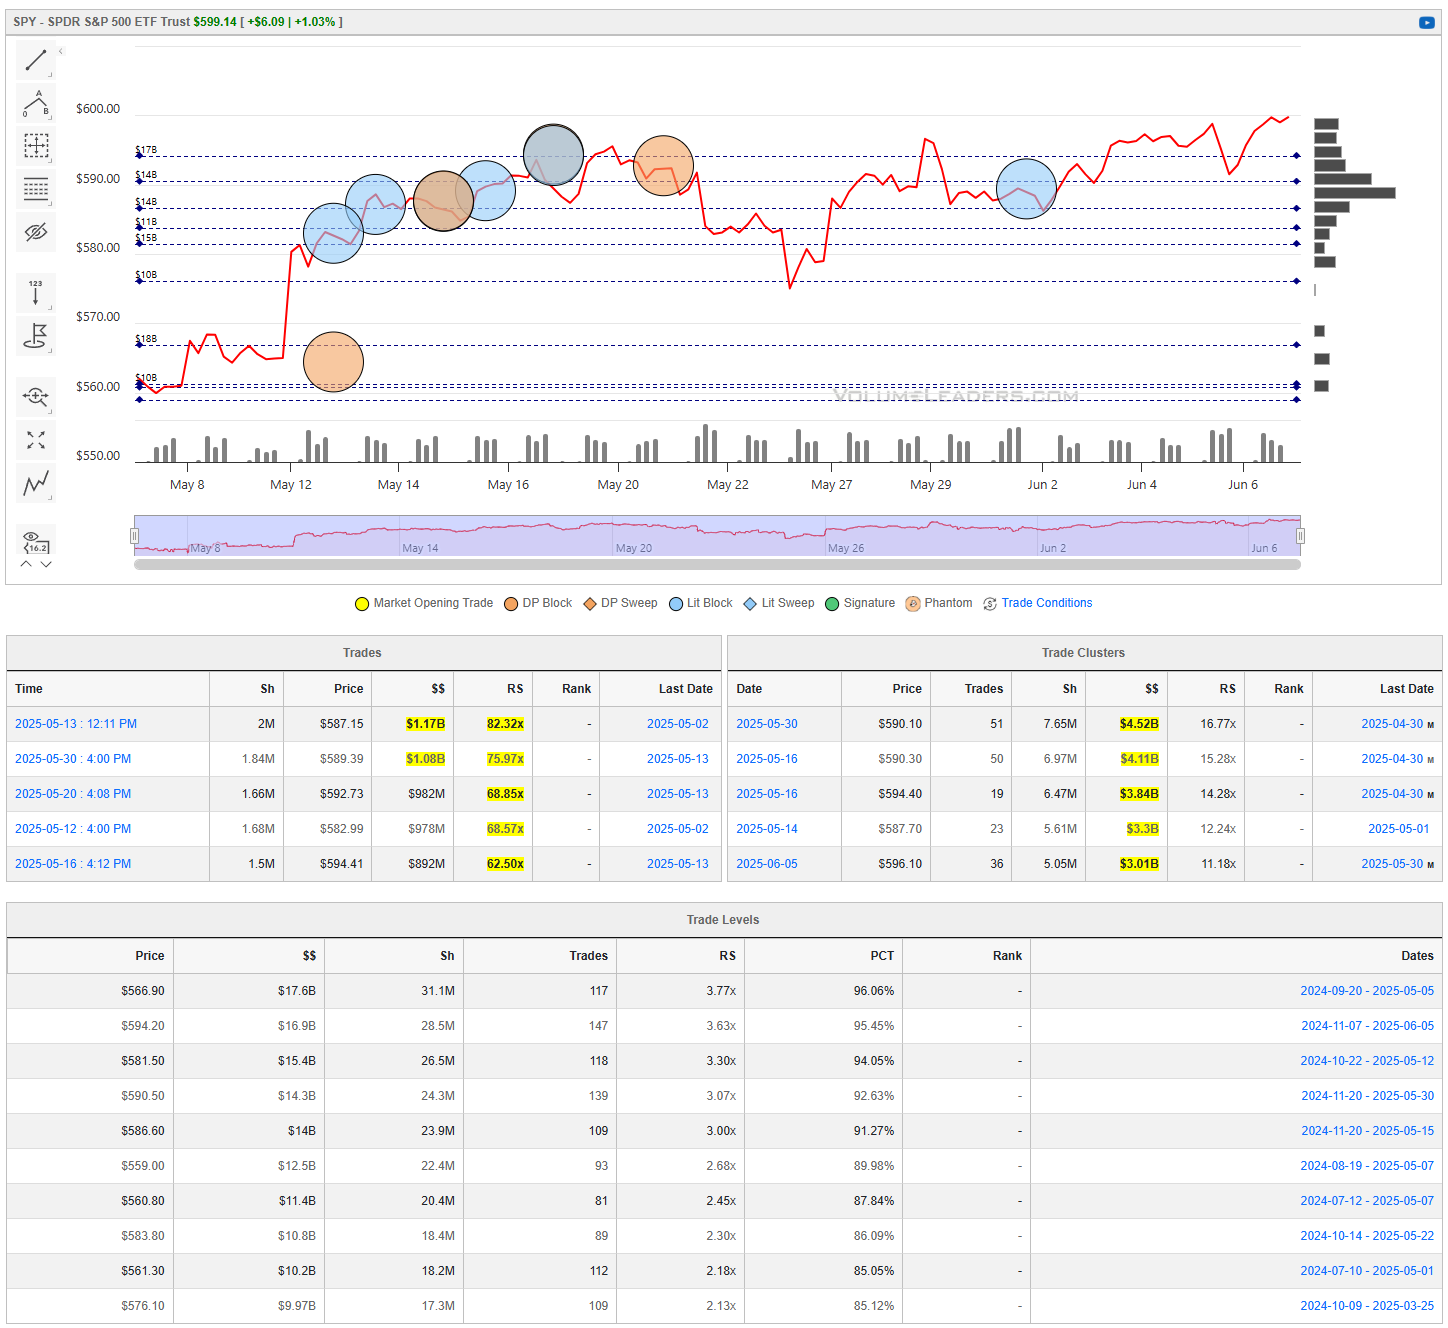
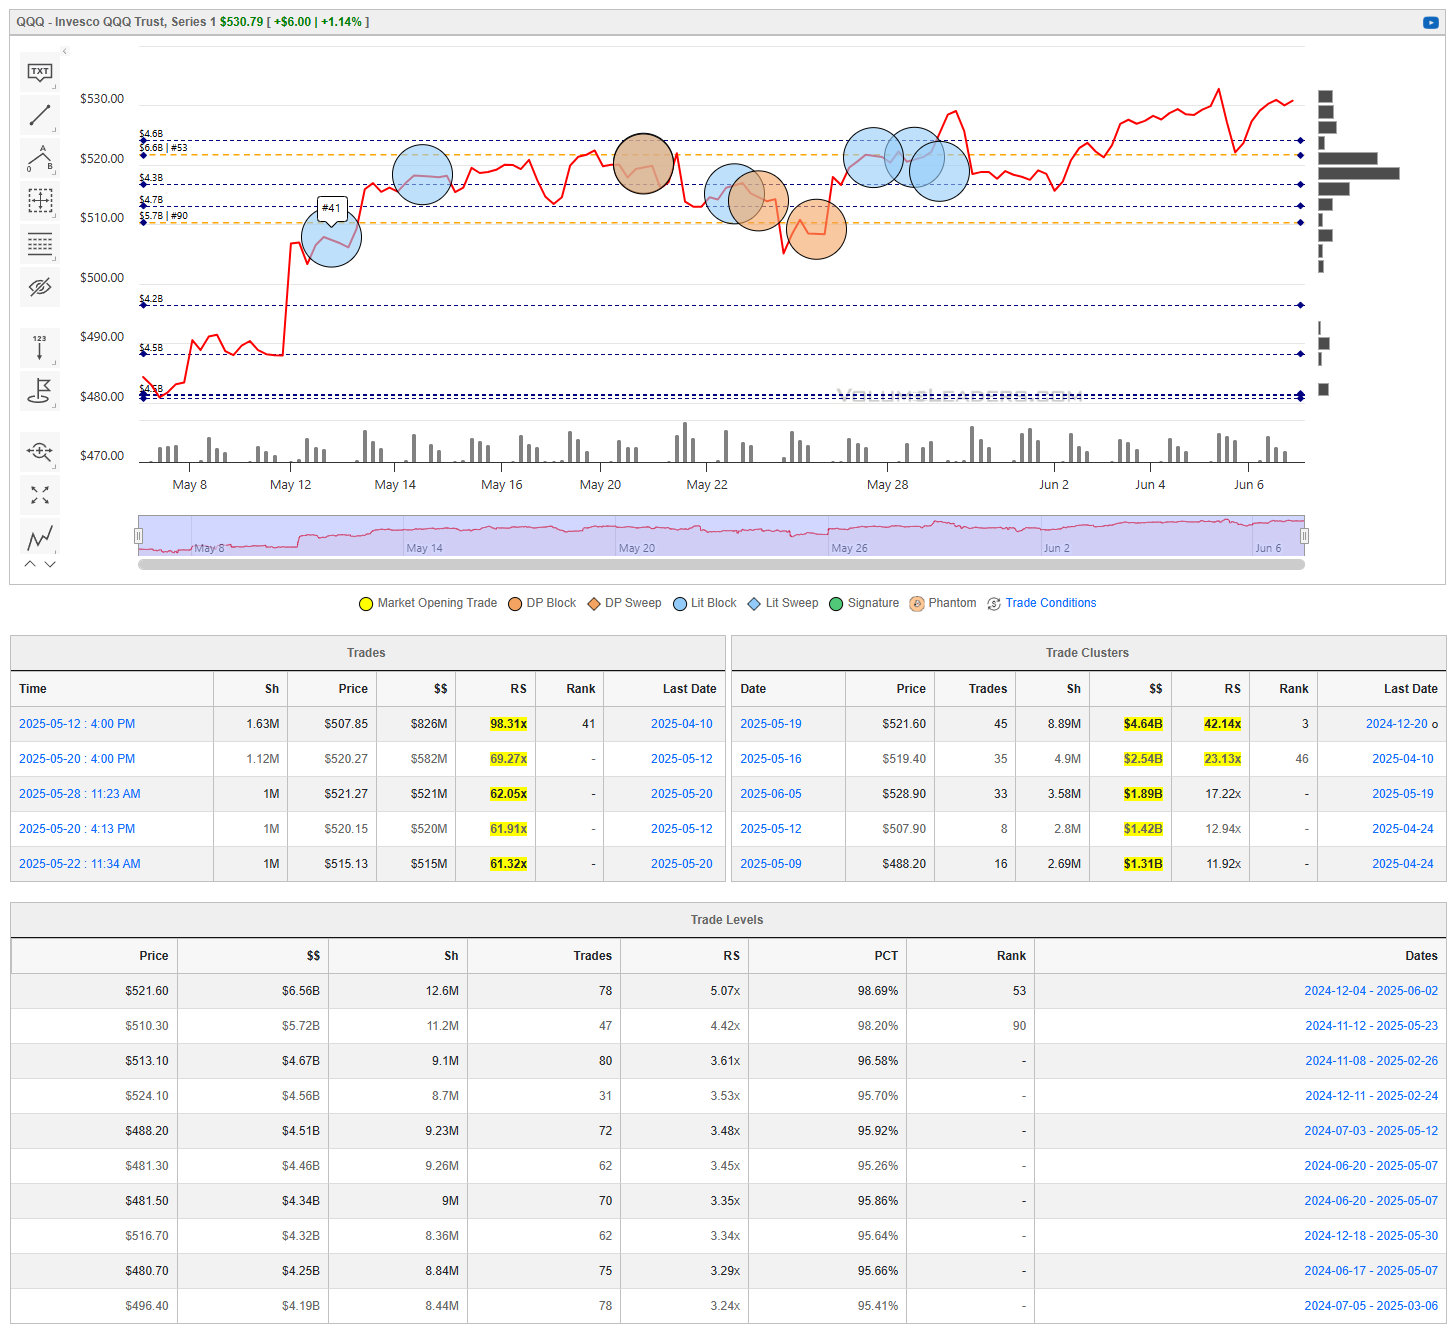
Institutional S/R Levels for Major Indices
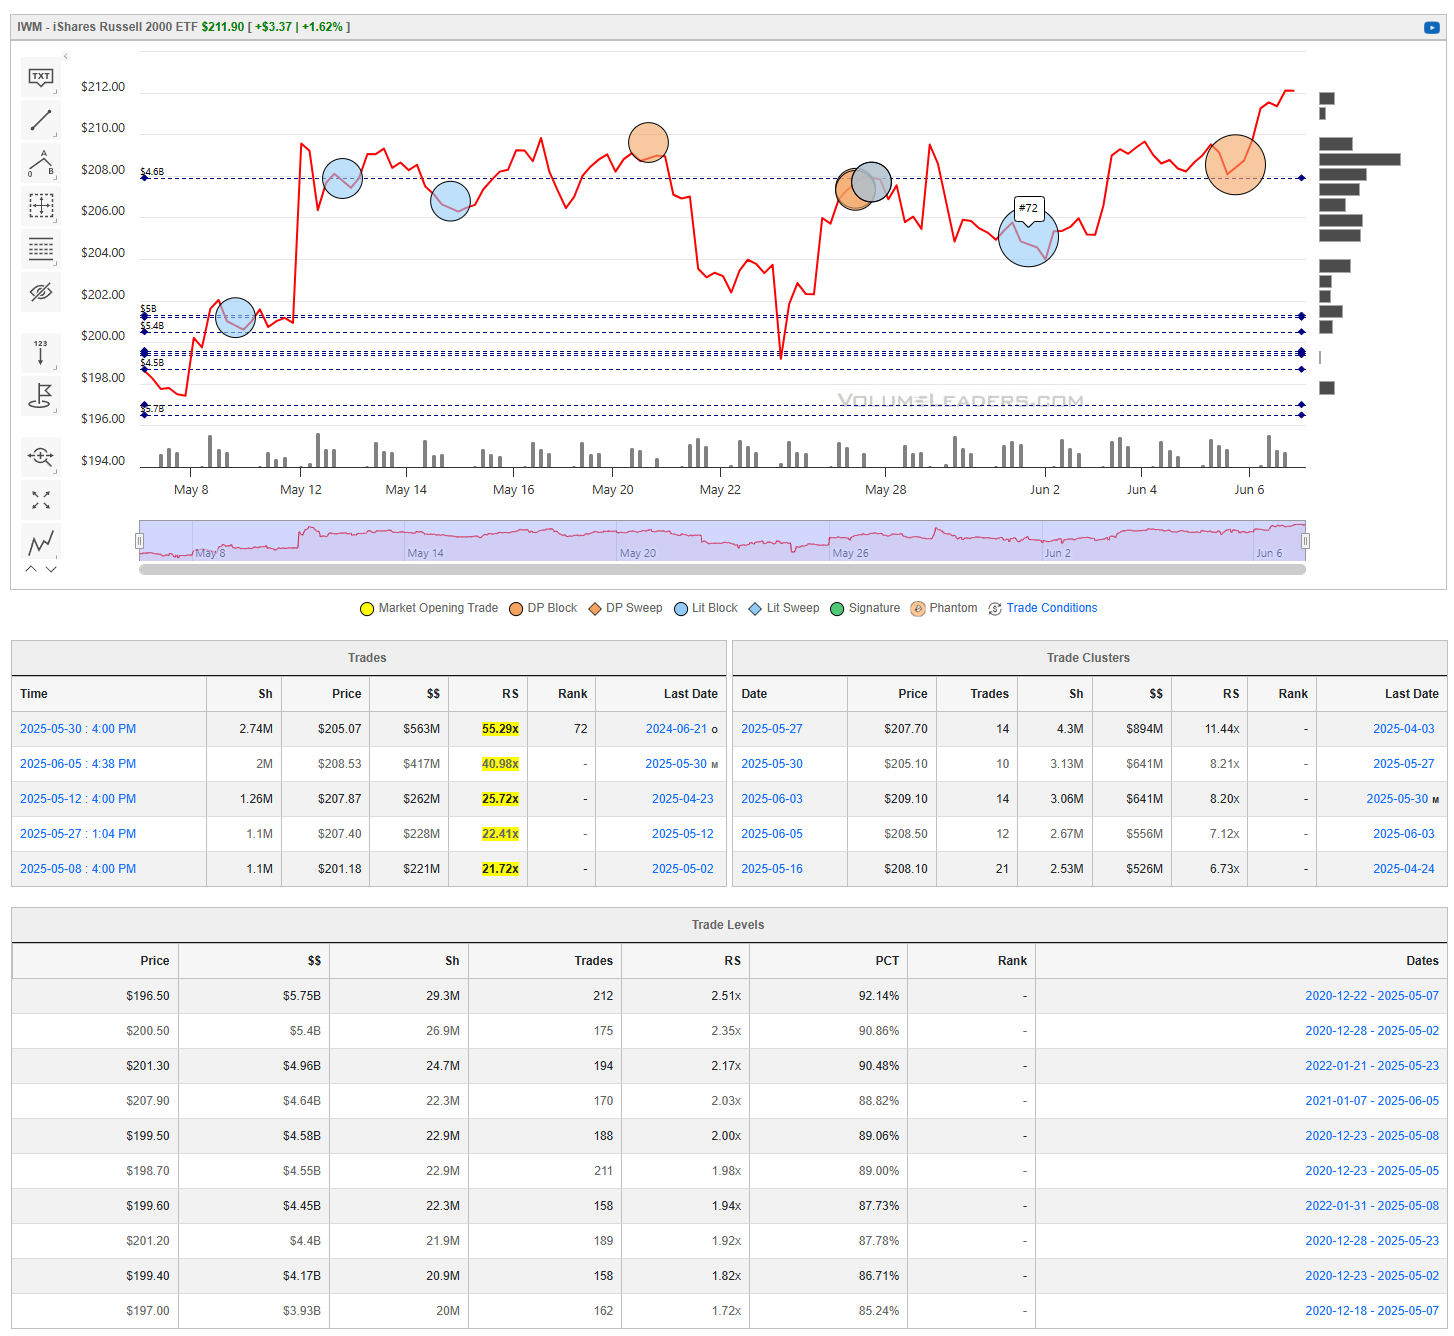
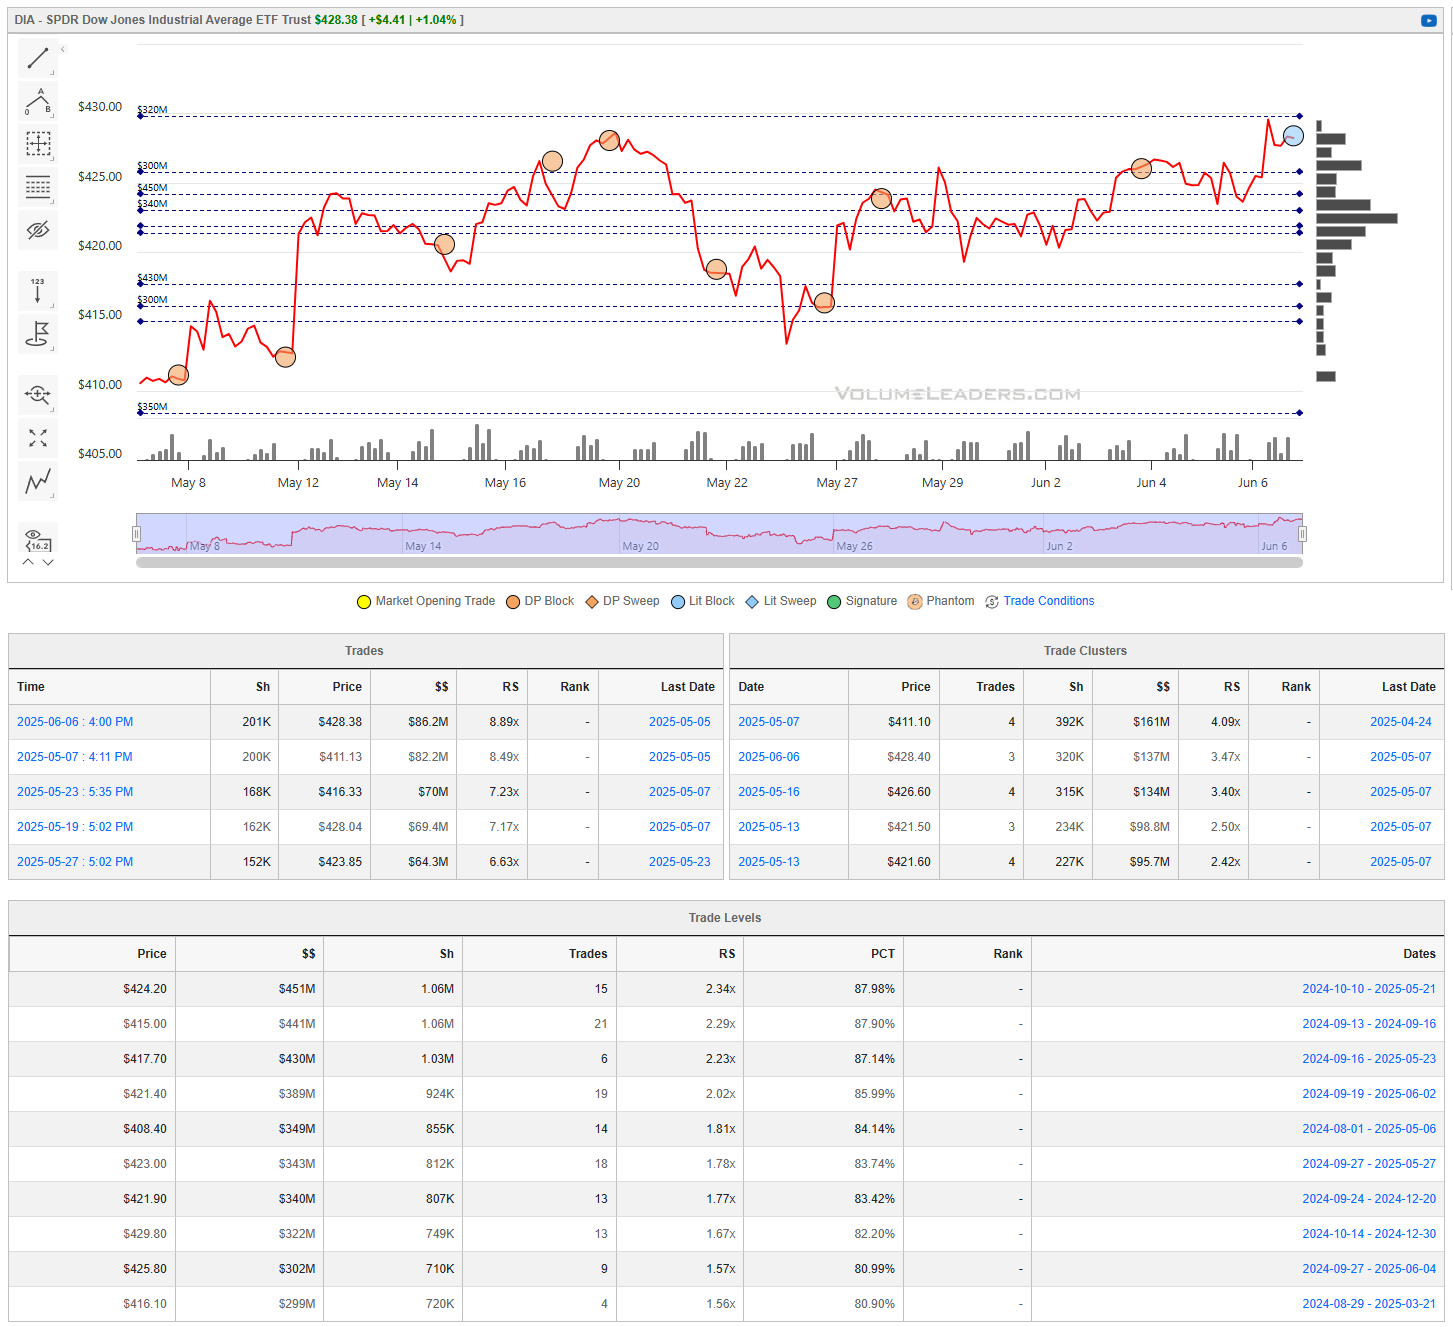
When you’re a large institutional player, your primary goal is to find liquidity - places to do a ton of business with the least amount of slippage possible. VolumeLeaders.com automatically identifies and visually plots the exact spots where institutions are doing business and where they are likely to return for more. It’s one of the primary reasons “support” and “resistance” concepts work and truly one of the reasons “price has memory” - take a look at the dashed lines in the images below that the platform plots for you automatically; these are the areas institutions constantly revisit to do more business.
Levels from the VolumeLeaders.com platform can help you formulate trades theses about:
Where to add or take profit
Where to de-risk or hedge
What strikes to target for options
Where to expect support or resistance
And this is just a small sample; there are countless ways to leverage this information into trades that express your views on the market. The platform covers thousands of tickers on multiple timeframes to accommodate all types of traders.
SPY
QQQ
IWM
DIA
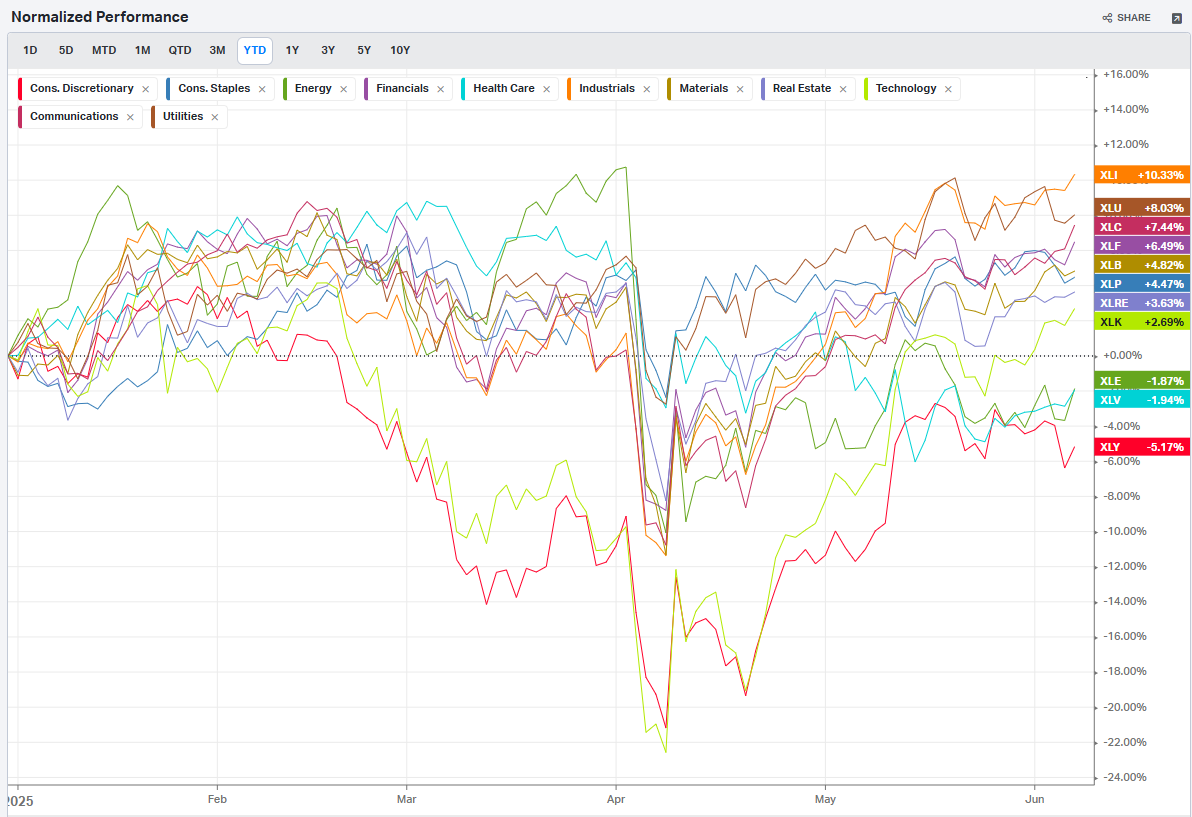
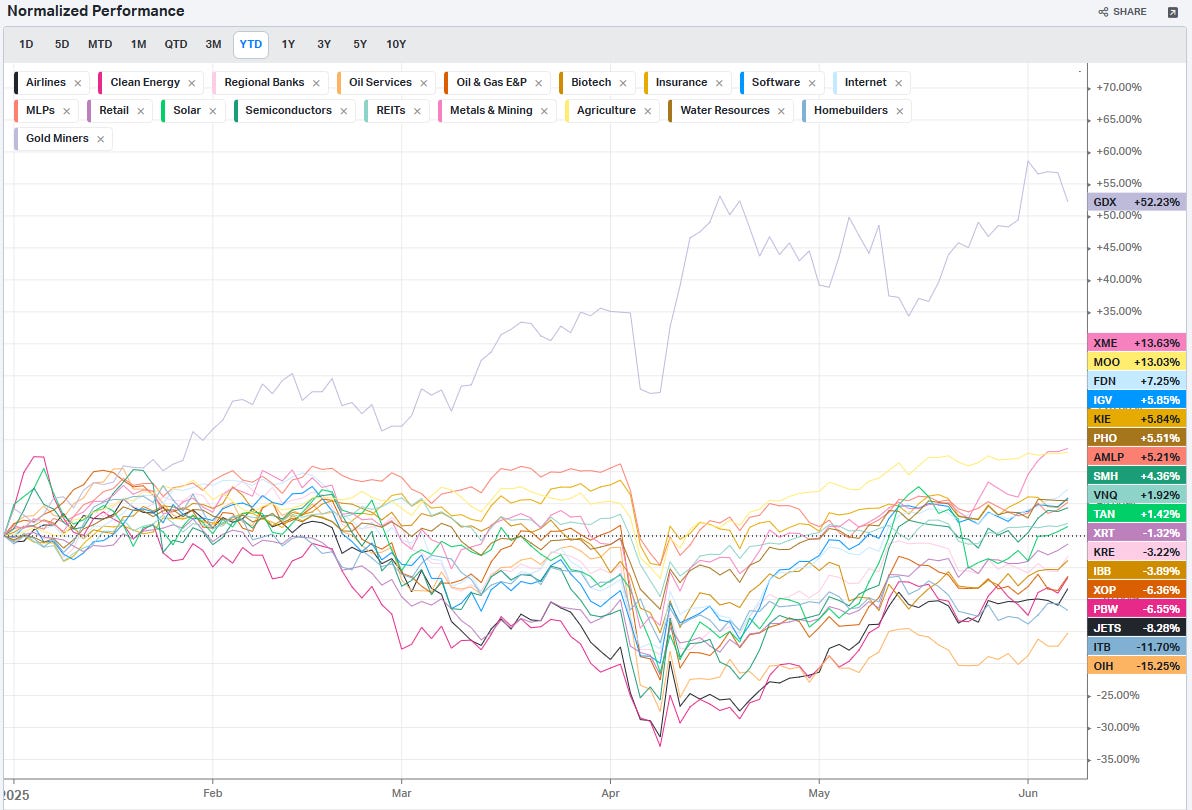
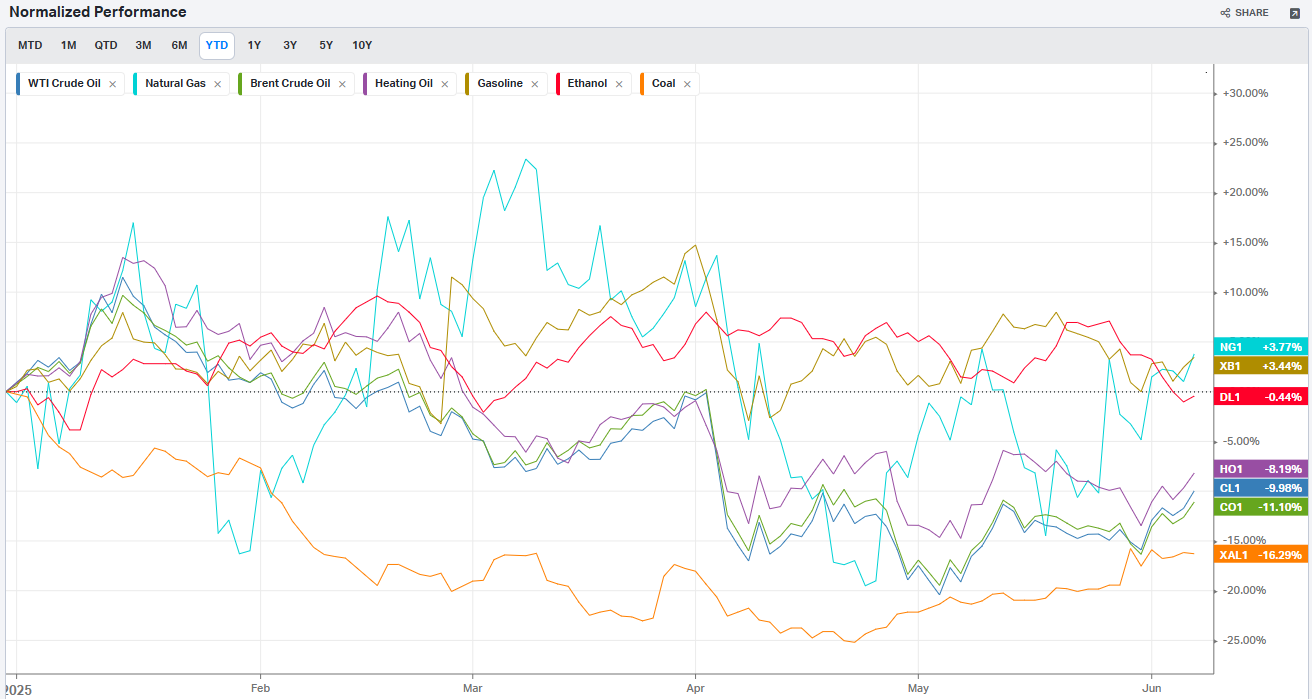
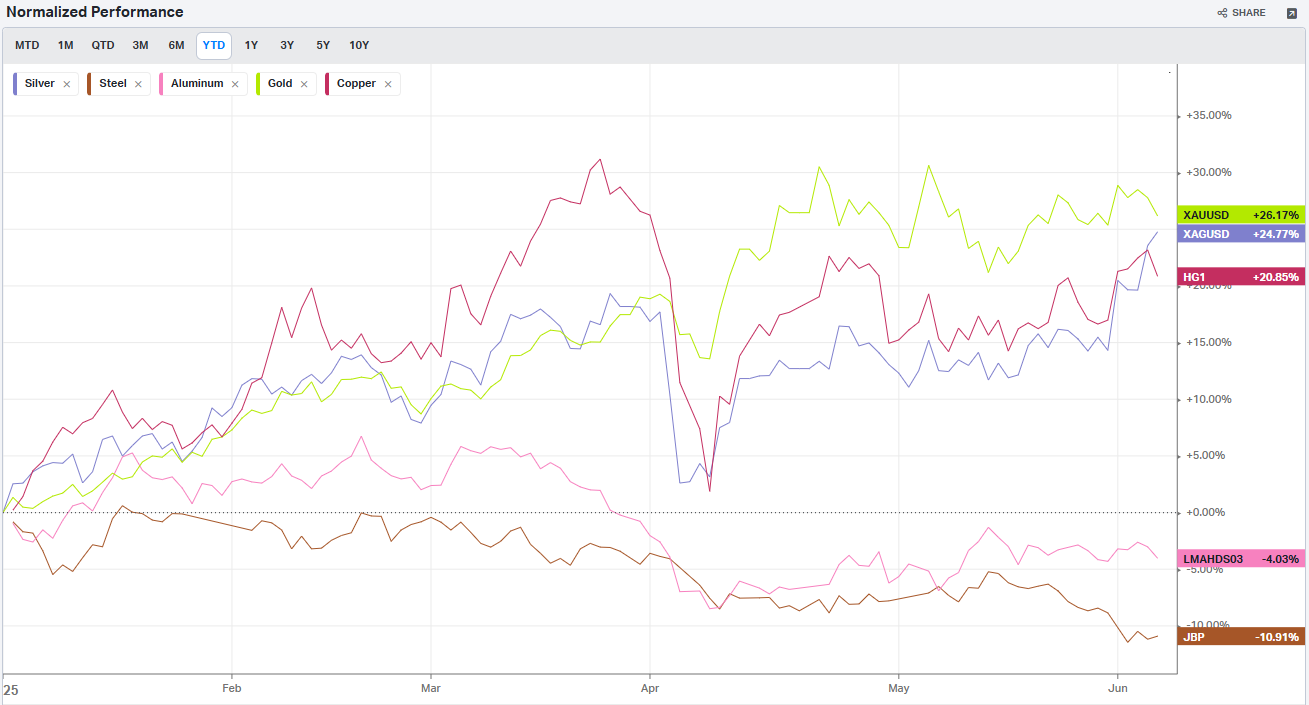
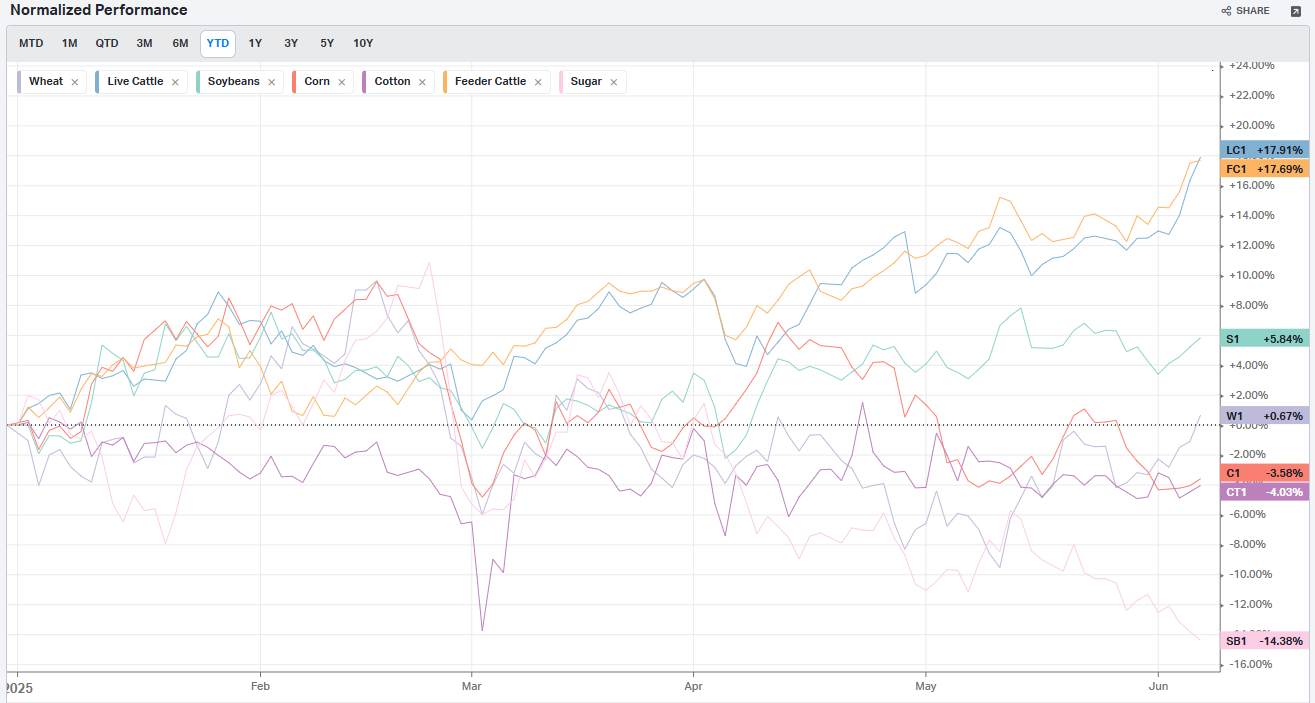
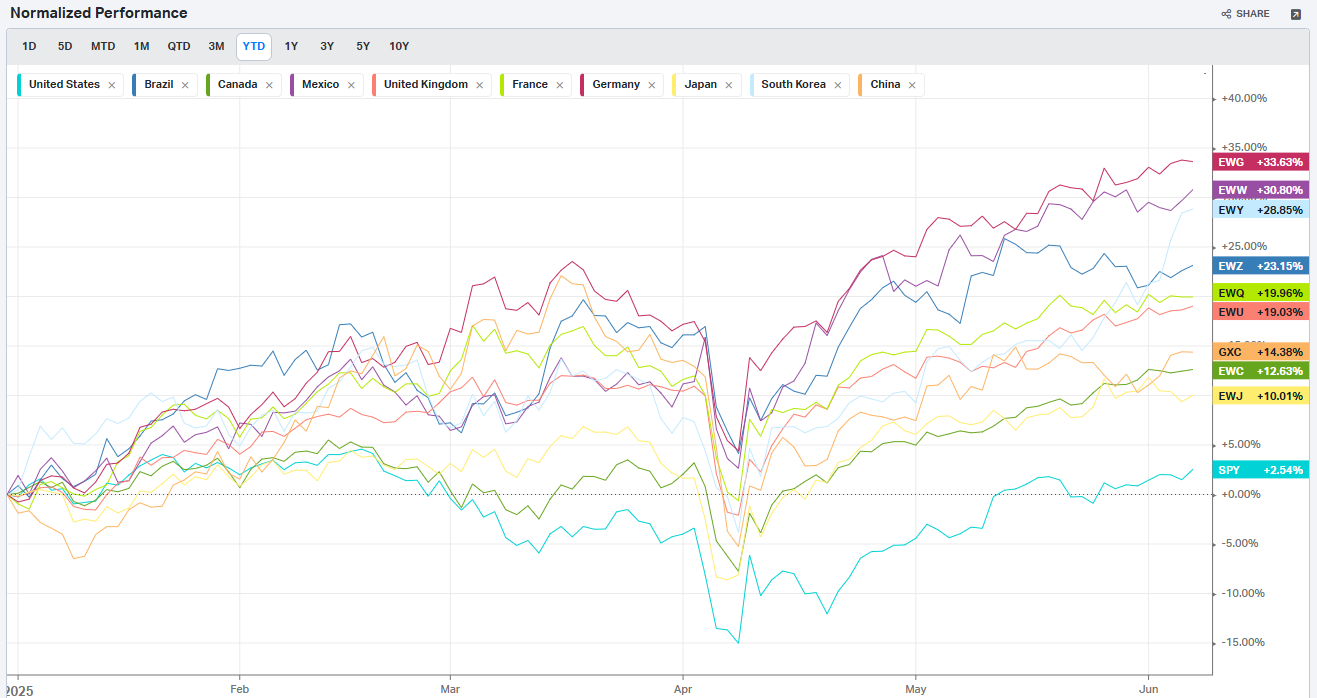
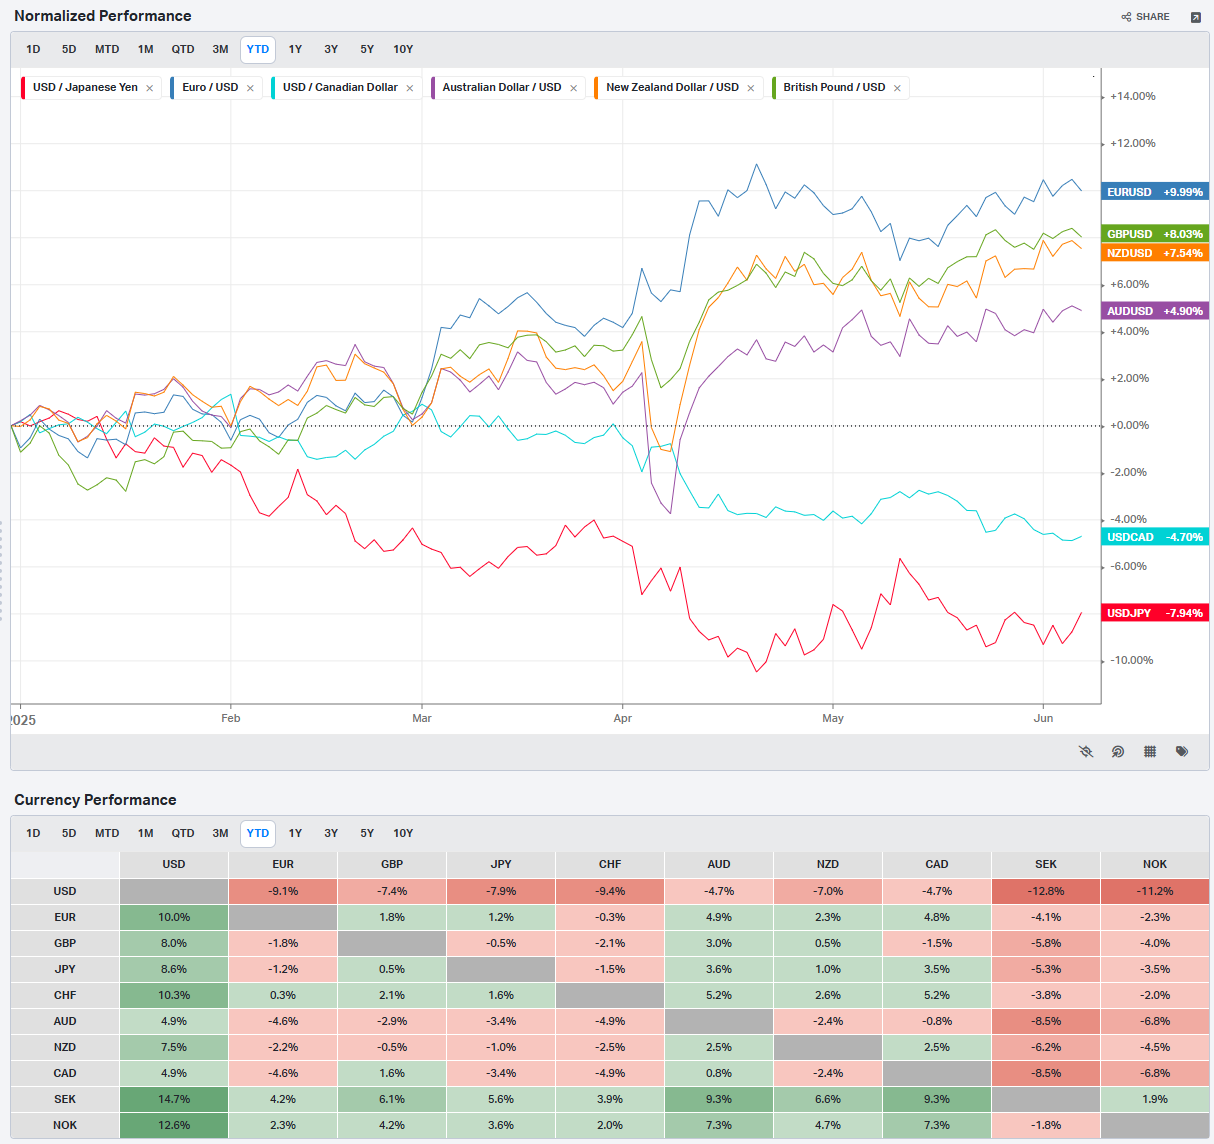
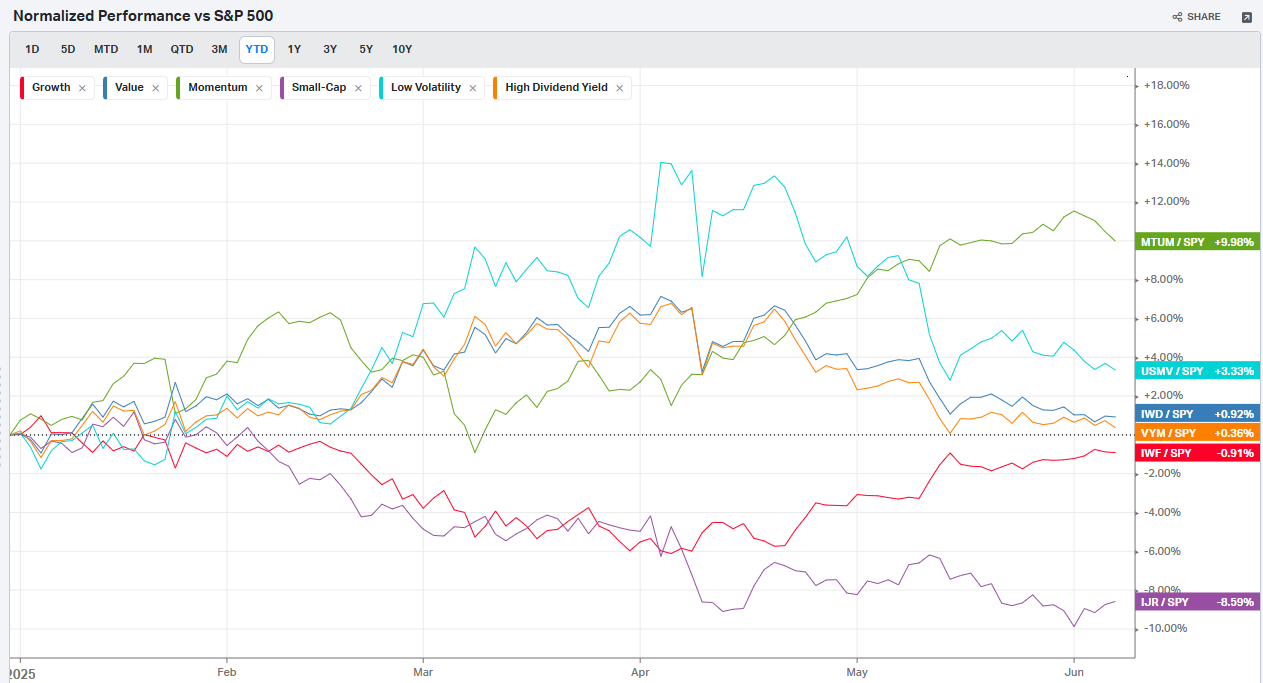
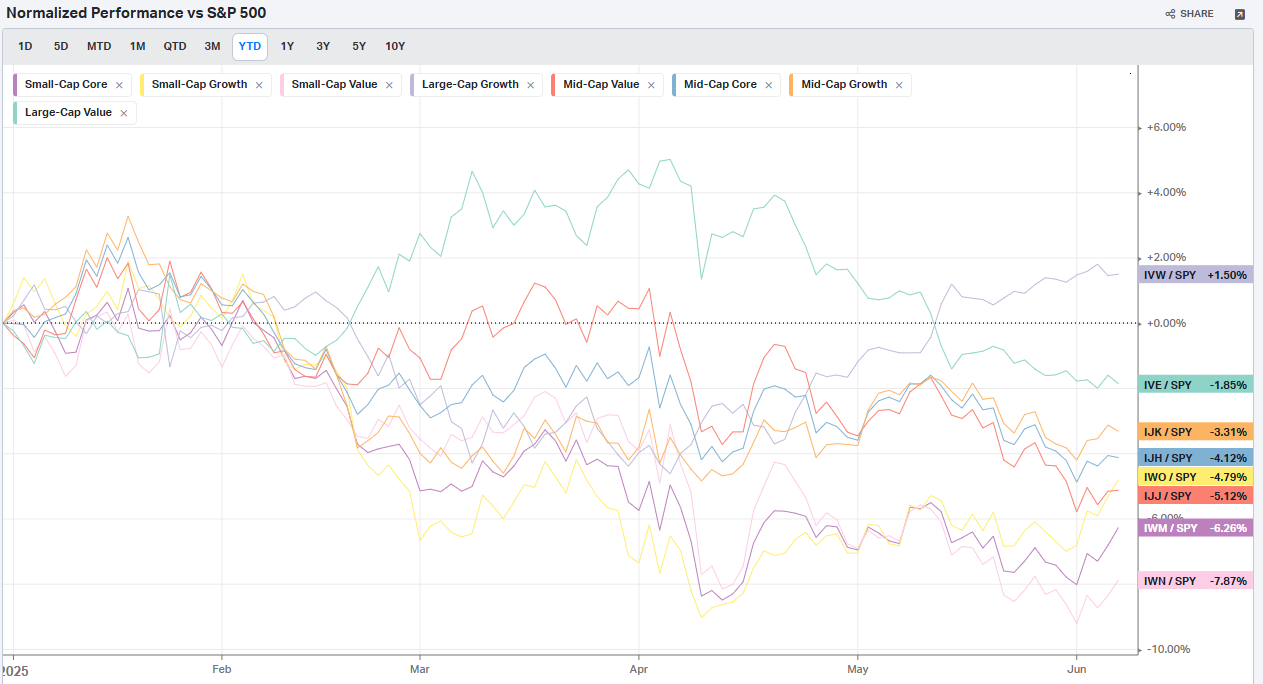
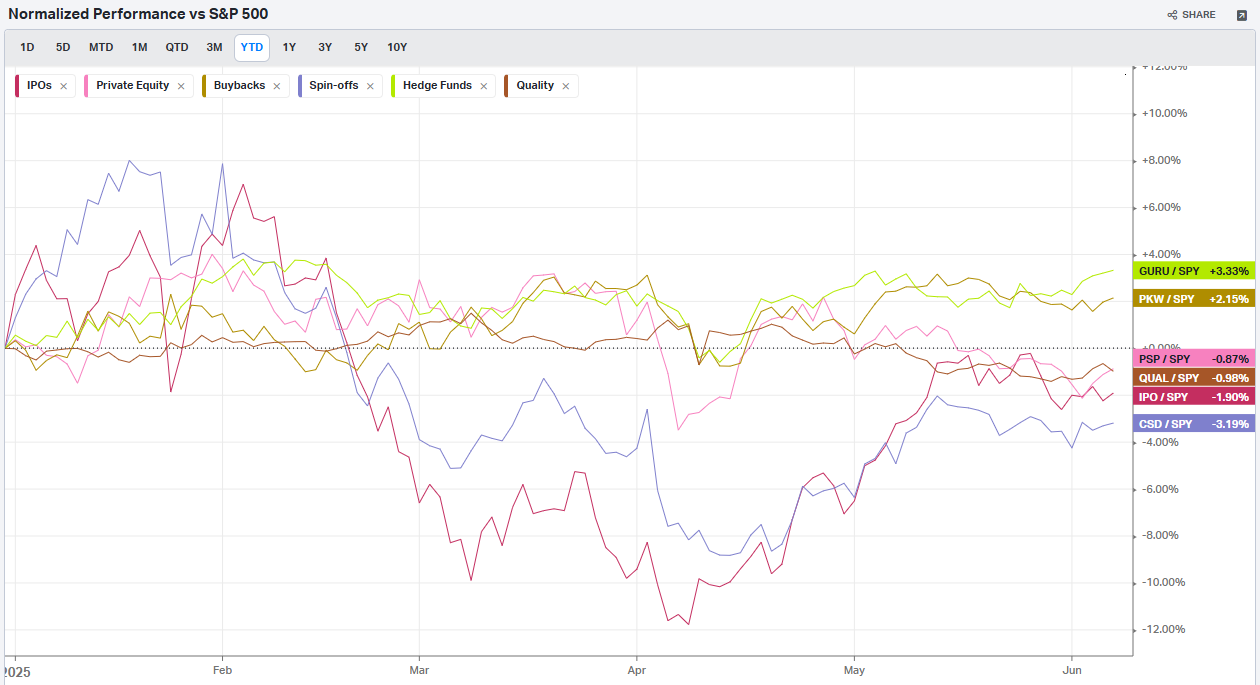
Summary Of Thematic Performance YTD
VolumeLeaders.com offers a robust set of pre-built thematic filters, allowing you to instantly explore specific market segments. These performance snapshots are provided purely for context and inspiration—think about zeroing in on the leaders and laggards within the strongest and weakest sectors, for example.
S&P By Sector
S&P By Industry
Commodities: Energy
Commodities: Metals
Commodities: Agriculture
Country ETFs
Currencies
Global Yields
Factors: Style
Factors: Size vs Value
Factors: Qualitative
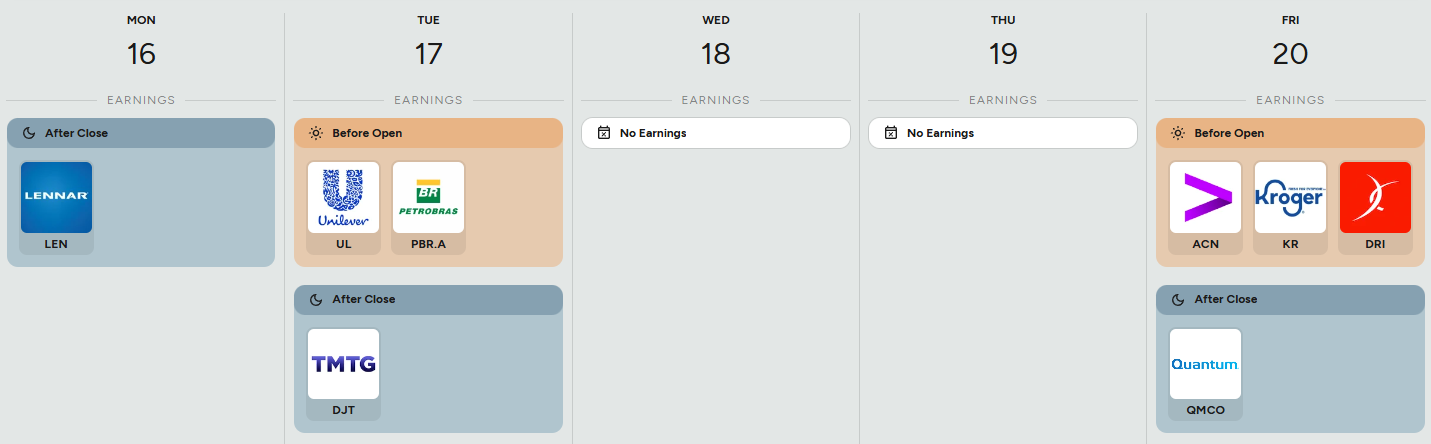
Events On Deck This Week
Here are key events happening this week that have the potential to cause outsized moves in the market or heightened short-term volatility.
Econ Events By Day of Week
Anticipated Earnings By Day of Week

Market Intelligence Report
Institutional Trades Signal Potential Market Shifts
This week's institutional trading data reveals 530 significant trades with combined exposure exceeding $8.7 billion, featuring unusually large position sizes across diverse asset classes. Some trades reached 224x normal size, suggesting either major conviction plays or significant risk management activities.
EXTREME MAGNITUDE POSITIONING
The 200x+ Anomalies
SPXL 0.00%↑ (3x Leveraged S&P 500): 224x normal size, $550M
When institutions push a 3x leveraged ETF to 224 times its normal trading size, they're either making an extraordinarily bold bet on market acceleration or desperately hedging existing positions. The sheer magnitude suggests this isn't routine portfolio management—either someone sees massive upside ahead or needs urgent exposure adjustment. Given that leveraged ETFs are designed for short-term tactical moves, this extreme positioning raises questions about whether institutions are positioning for an imminent catalyst or managing significant portfolio stress.
VXUS 0.00%↑ (Emerging Markets): 185x normal size, $554M
A 185x normal trade in emerging markets exposure tells a fascinating story of either opportunistic international diversification or something more concerning. While this could represent smart money rotating away from expensive U.S. markets toward cheaper international opportunities, it's equally plausible this reflects forced selling pressure from institutional redemptions or risk-off positioning. The timing amid U.S. political uncertainties makes both narratives compelling.
TSLA 0.00%↑ (Tesla): 164x normal size, $3.3 billion
Tesla's massive institutional activity is particularly intriguing given the recent "$150 billion in market value wiped out" from the Trump-Musk public feud. This $3.3 billion in unusual institutional flow could represent contrarian positioning by institutions who see the political drama as temporary noise, or it might reflect major holders cutting their losses after the dramatic selloff. The 164x normal size suggests this wasn't gradual accumulation or distribution—something triggered urgent institutional action.

The Bond Fortress Question
AGG 0.00%↑ (Core U.S. Bonds): 98x normal size, $790M
The massive AGG positioning comes as "The iShares Core U.S. Aggregate Bond ETF (AGG)…has taken in $12.4 billion of inflows this year", fitting a broader rotation into fixed income. But 98x normal size goes beyond typical rotation patterns. This suggests institutions are either positioning aggressively for the rate cuts that historically deliver 6.5% bond returns in the following year, or they're building defensive positions because they're genuinely worried about what's coming for risk assets.
VCLT 0.00%↑ (Corporate Bonds): 77x normal size, $495M
Corporate bond positioning at 77x normal size sits at the intersection of income generation and credit risk. While institutions might be chasing yield in a potentially falling rate environment, they're also taking on corporate credit exposure just as economic uncertainties mount. The magnitude suggests this goes beyond yield-chasing into either genuine conviction about corporate credit quality or sophisticated credit spread positioning.
SECTOR CAPITAL ALLOCATION PATTERNS
Consumer Discretionary's $3.7 Billion Question
Tesla dominates this sector's flows, but the concentration raises important questions about whether institutions see consumer strength ahead or are managing existing discretionary exposure. Consumer discretionary typically leads both market rallies and declines, so this level of institutional activity could signal either confidence in consumer resilience or preparation for a consumption slowdown.
Technology's $2.3 Billion Bet
Notable positions include GRND 0.00%↑ (Software Application) at 5x normal size and SHOP 0.00%↑ commanding $247M in institutional interest. Technology continues attracting institutional capital, but at current valuations, every large tech position becomes a statement about either continued innovation premiums or profit-taking opportunities. The institutional activity could reflect AI and digital transformation conviction or represent sophisticated rotation within technology subsectors.

The Large Cap Double-Down
SPLG 0.00%↑ appearing twice in extreme trades (161x and 104x normal) suggests institutions are either dramatically increasing broad market exposure or conducting significant index-related activities. Large cap positioning typically represents either risk-on confidence in market leadership or defensive rotation into established quality names. The repeated extreme activity in the same ETF points to either massive conviction or complex institutional rebalancing needs.
Fixed Income's $1.5 Billion Migration
The substantial rotation into bond instruments aligns with broader institutional trends but raises questions about timing and motivation. While positioning ahead of rate cuts makes strategic sense, the magnitude could also reflect genuine concern about equity market sustainability. Fixed income flows often precede rather than follow market stress.
INDIVIDUAL POSITION INSIGHTS
Volatility and Speculation Signals
VYLD 0.00%↑ (Volatility): Rank #1 trade, $862K represents institutional positioning for increased market volatility, but whether this reflects opportunity seeking or portfolio insurance remains unclear. Volatility positioning could indicate either tactical opportunities in market disruption or defensive hedging against anticipated instability.
CRCL 0.00%↑ (Crypto): $314M institutional allocation continues the mainstream institutional crypto adoption story, though $314M in institutional crypto exposure could equally represent momentum-driven allocation or fundamental long-term positioning. Crypto institutional flows often reflect either genuine adoption milestones or speculative late-cycle behavior.

Materials and Industrial Positioning
X 0.00%↑ (U.S. Steel): 93x normal size and AGI 0.00%↑ (Metals & Mining): 12x normal size, $24.4M suggest institutional positioning around materials and industrial themes. This could reflect infrastructure optimism and supply chain reshoring trends, or it might represent late-cycle positioning in sectors that historically peak ahead of economic slowdowns. Materials positioning often signals either early-cycle optimism or late-cycle speculation.
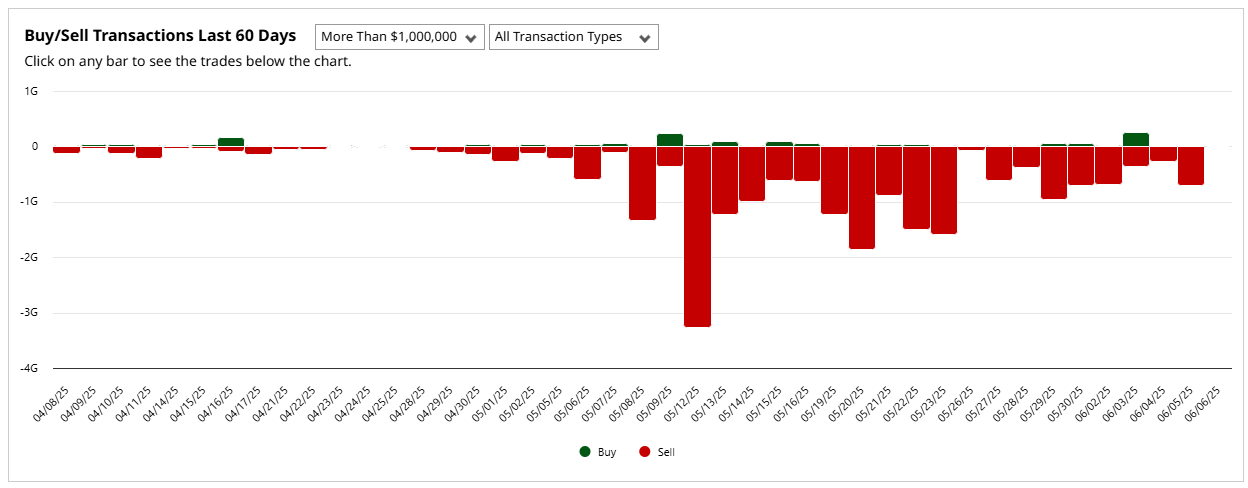
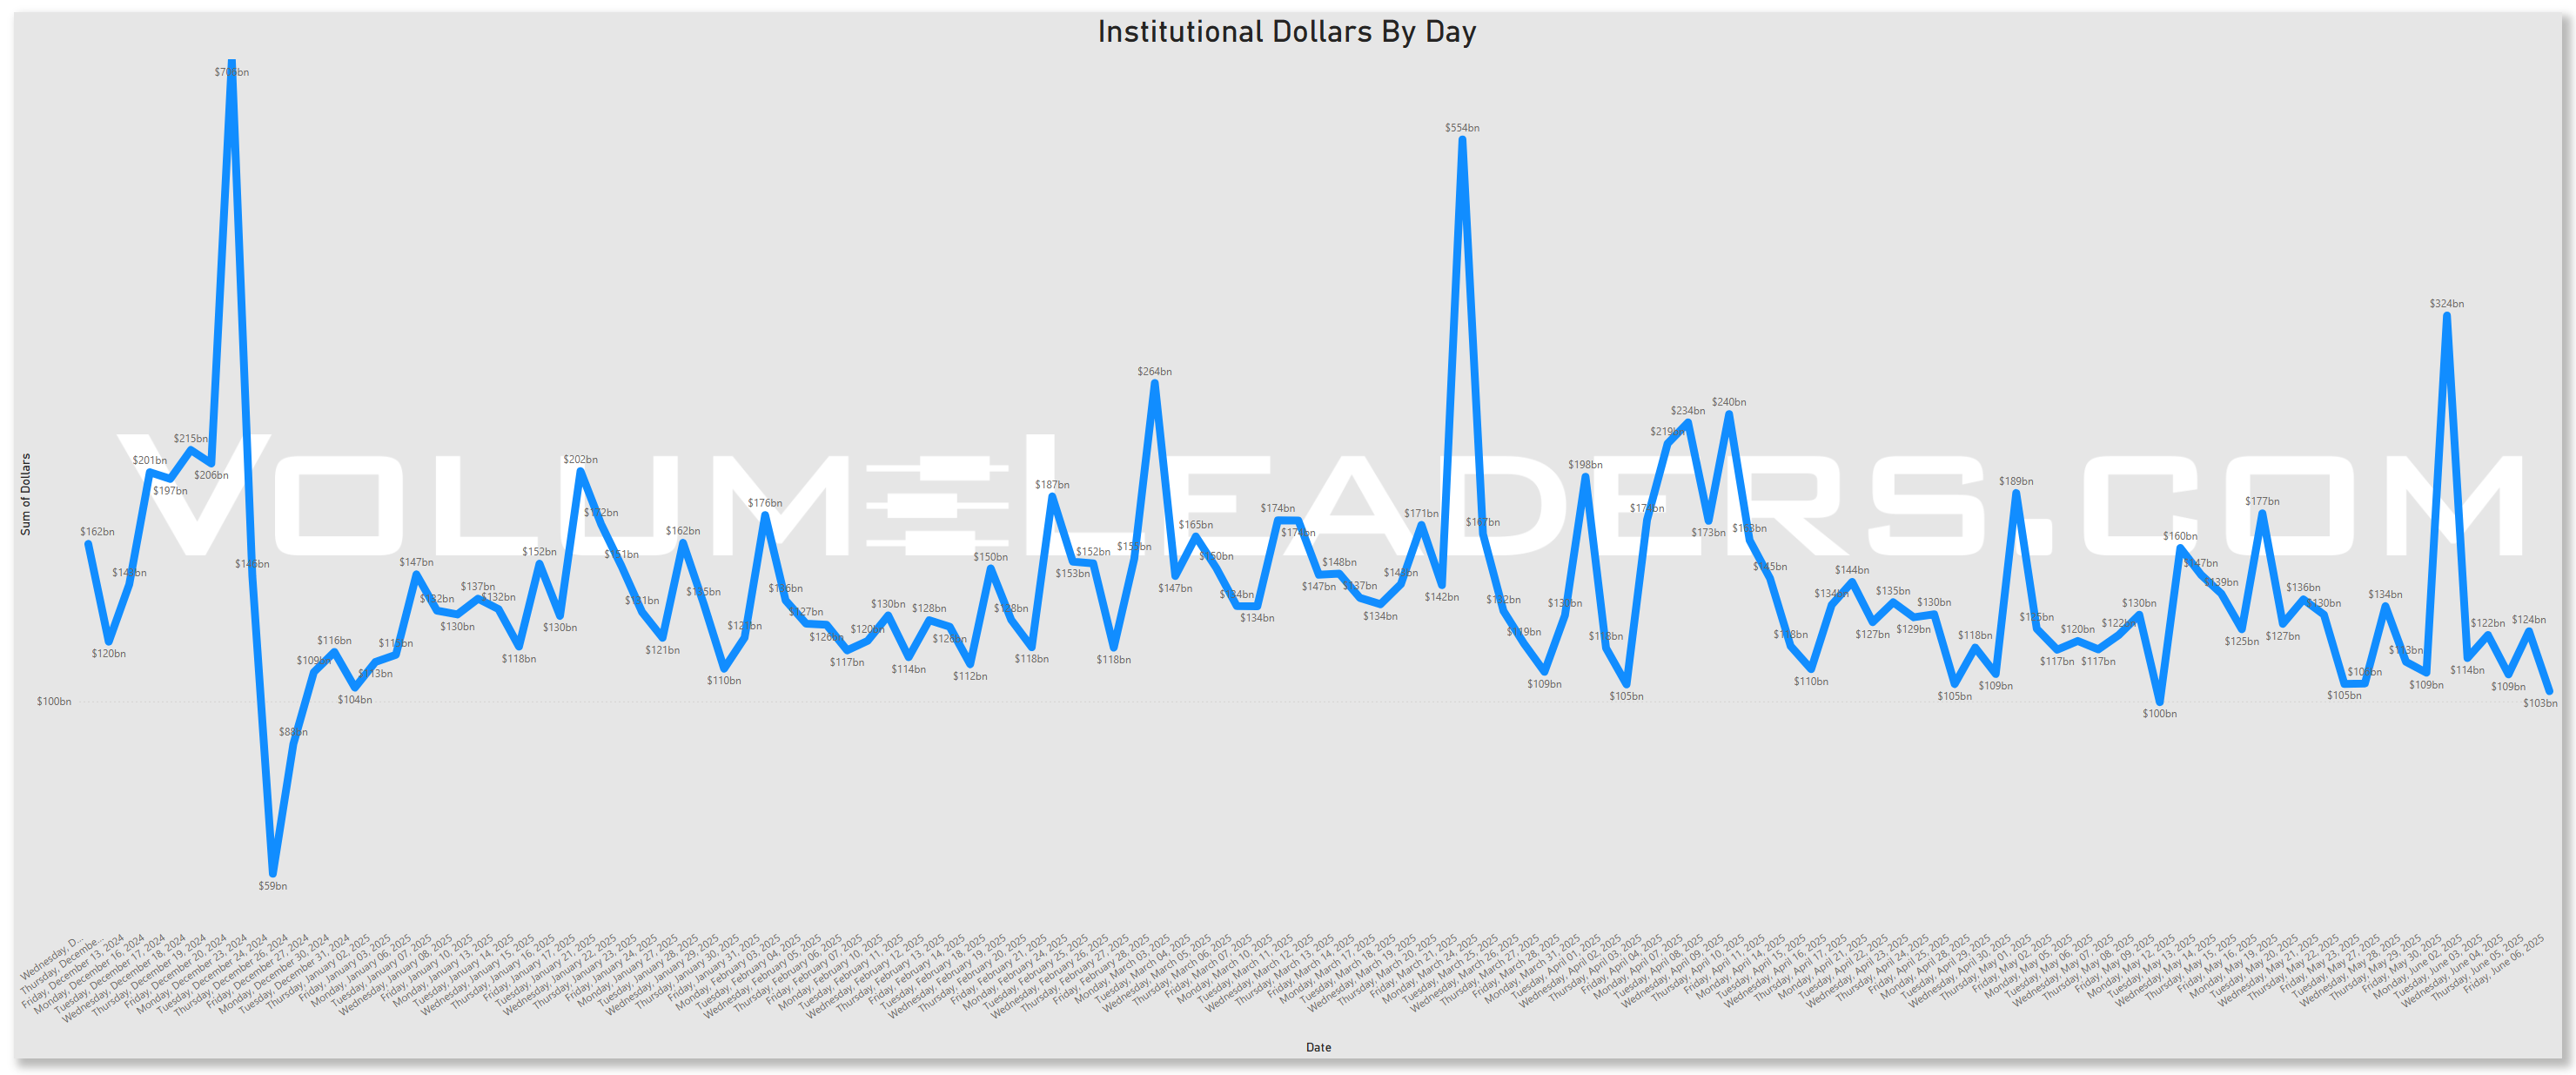
Rolling 90-Day Dollars By Day
This chart shows institutional activity by dollars by day on a rolling 1-year basis. From a theoretical standpoint, examining a chart of daily institutional dollar activity over the course of a year can offer several insights and possible inferences, though all should be approached with caution since the data alone may not prove causality or confirm underlying reasons. Some potential takeaways include:
Event-Driven Behavior:
Sharp, singular spikes on certain days might correlate with major market-moving events. These could include central bank policy announcements, significant geopolitical news, sudden macroeconomic data releases (like employment reports or GDP data), earnings seasons for large-cap companies, or unexpected shocks (e.g., mergers, acquisitions, regulatory changes).Liquidity Dynamics:
Institutions often concentrate large trades on days with higher expected liquidity. For instance, heightened activity might coincide with index reconstitutions, option expiration dates, or the days leading up to or following a major index rebalance, when large amounts of capital shift hands simultaneously.Risk Management and Hedging Activity:
Institutions may significantly adjust their exposures on days that are critical from a risk management perspective. Large spikes can occur if hedge funds, pension funds, or asset managers are rolling over futures contracts, initiating or closing out large hedges, or reacting to volatility triggers.Market Sentiment Indicators:
While the data is purely transactional, the sheer volume of institutional involvement on certain days might indirectly hint at changing sentiment or strategic shifts.
In essence, a chart like this can lead you to hypothesize that institutional trading volumes are not constant or random but rather influenced by a mix of predictable calendar effects, major market events, liquidity considerations, risk management decisions, and strategic allocation shifts.
Top Institutional Order Flow By Sector By Week For The Past 90-Days
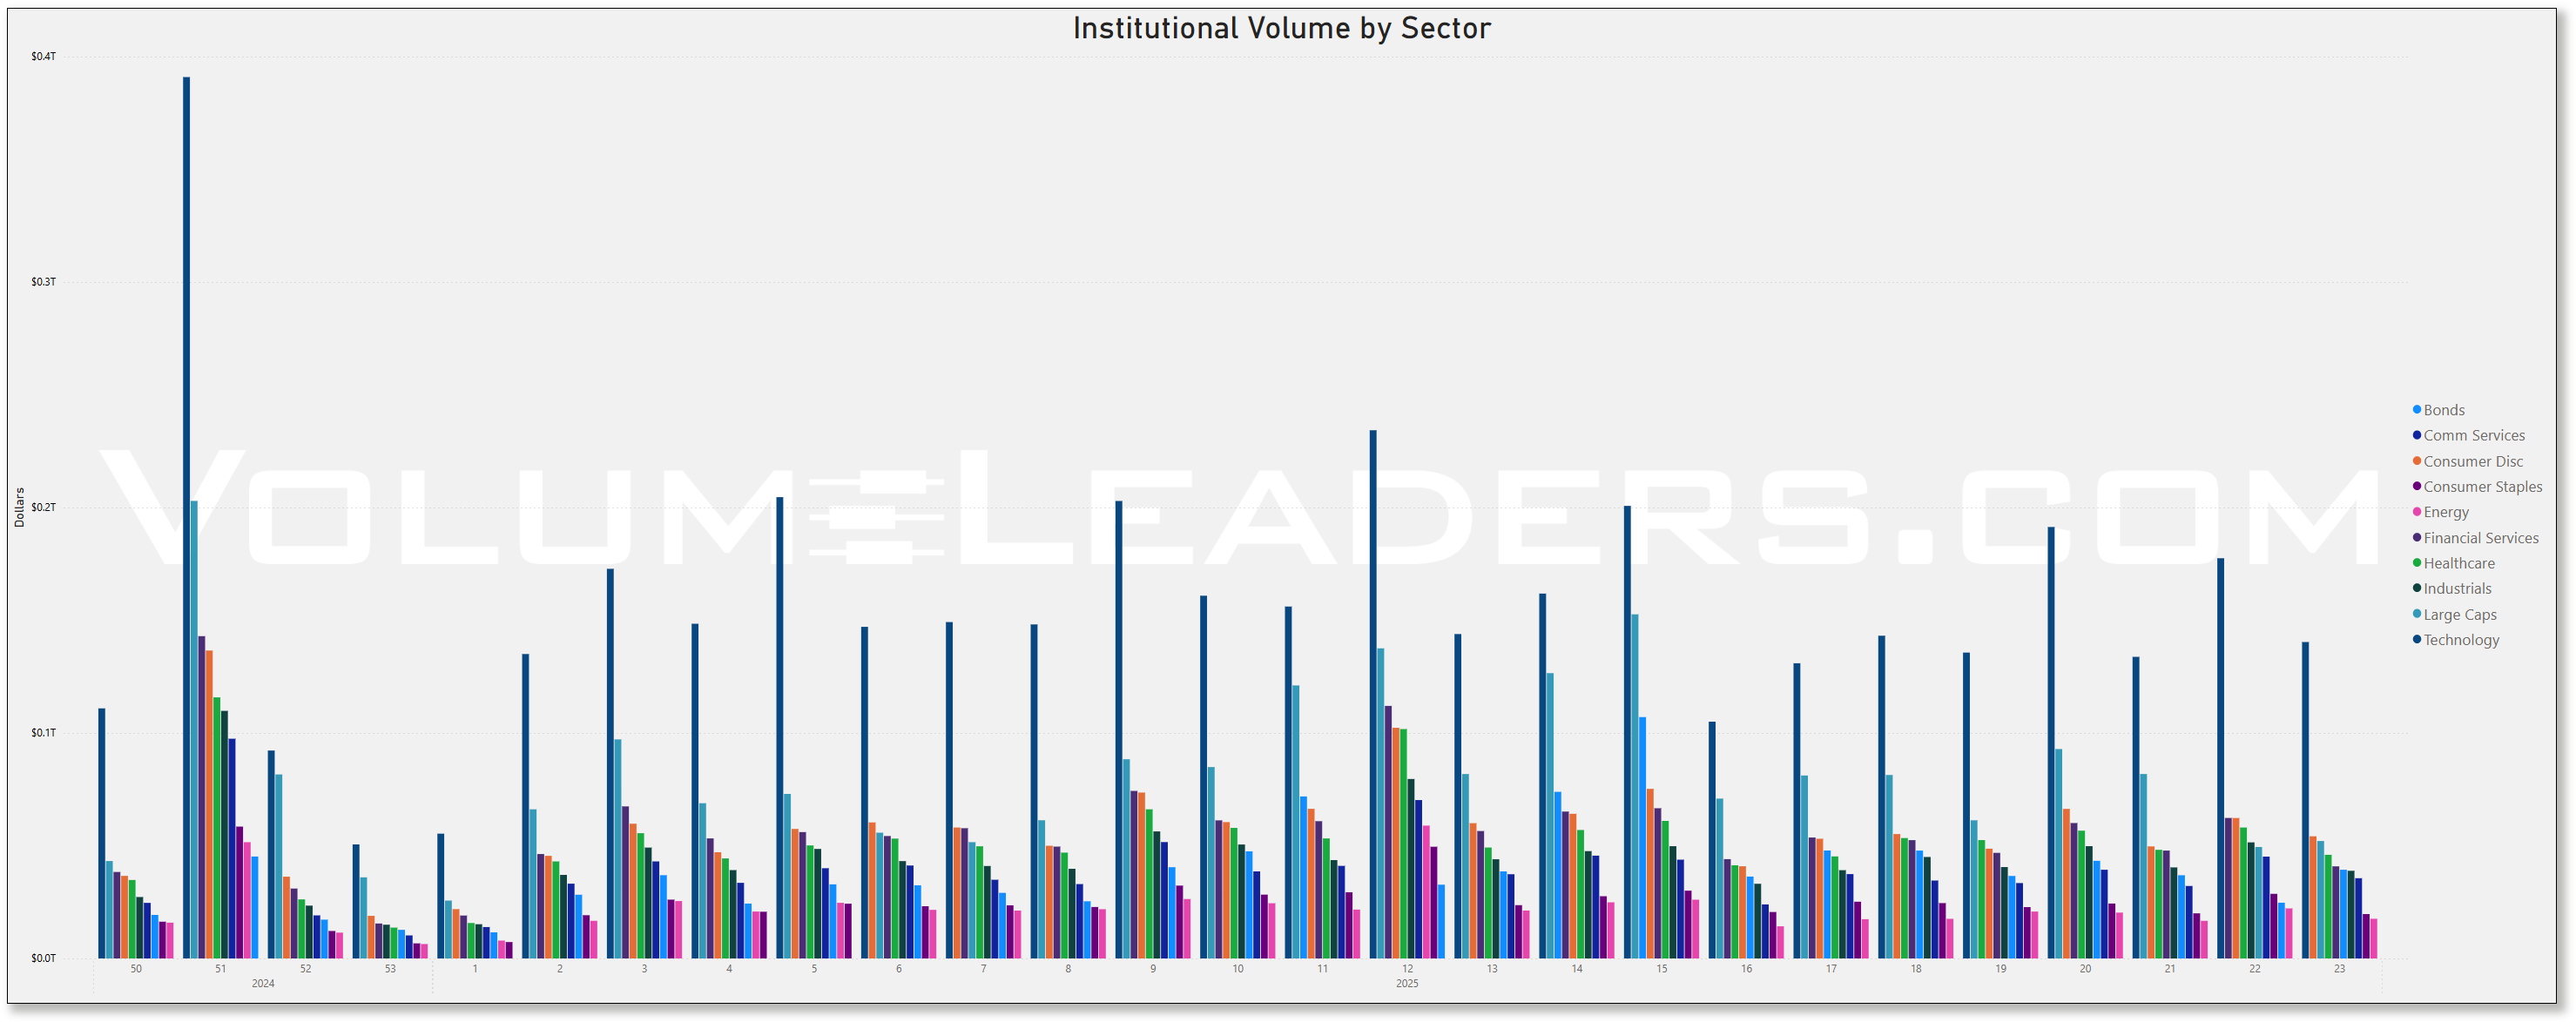
Top Institutional Order Flow In Equities
These are incredibly important charts to watch as they contains lots of nuanced suggestions at a thematic level. Watch these charts closely week-to-week to stay informed about where institutional money is flowing, adjust your strategies based on momentum, align your portfolio with macroeconomic and market trends, and manage risks more effectively by avoiding sectors losing institutional favor.
Sector Rotation Insights: The chart highlights which sectors are attracting institutional activity and which are losing favor. Institutions often lead market trends, so tracking shifts in their focus can indicate sector rotations.
Sentiment Analysis: The level of institutional activity reflects confidence in specific sectors. Rising activity in traditionally defensive sectors (e.g., healthcare, utilities) may indicate caution, while a surge in growth sectors (e.g., technology, consumer discretionary) could suggest optimism.
Emerging Trends: Sudden spikes in a previously overlooked sector, like industrials or consumer staples, might hint at emerging opportunities or structural shifts.
Macro Themes: Changes in sector activity often align with broader macroeconomic themes like inflation, interest rates, or geopolitical events. For instance:
Increased activity in energy might indicate concerns about oil supply or rising prices.
Growth in technology could align with innovations or favorable policies.
Risk Management: Declining institutional activity in a sector might signal weakening fundamentals or heightened risks.
Spotting Overcrowding: Excessive activity in a single sector over multiple weeks may suggest overcrowding, which could lead to heightened volatility if institutions begin to exit.
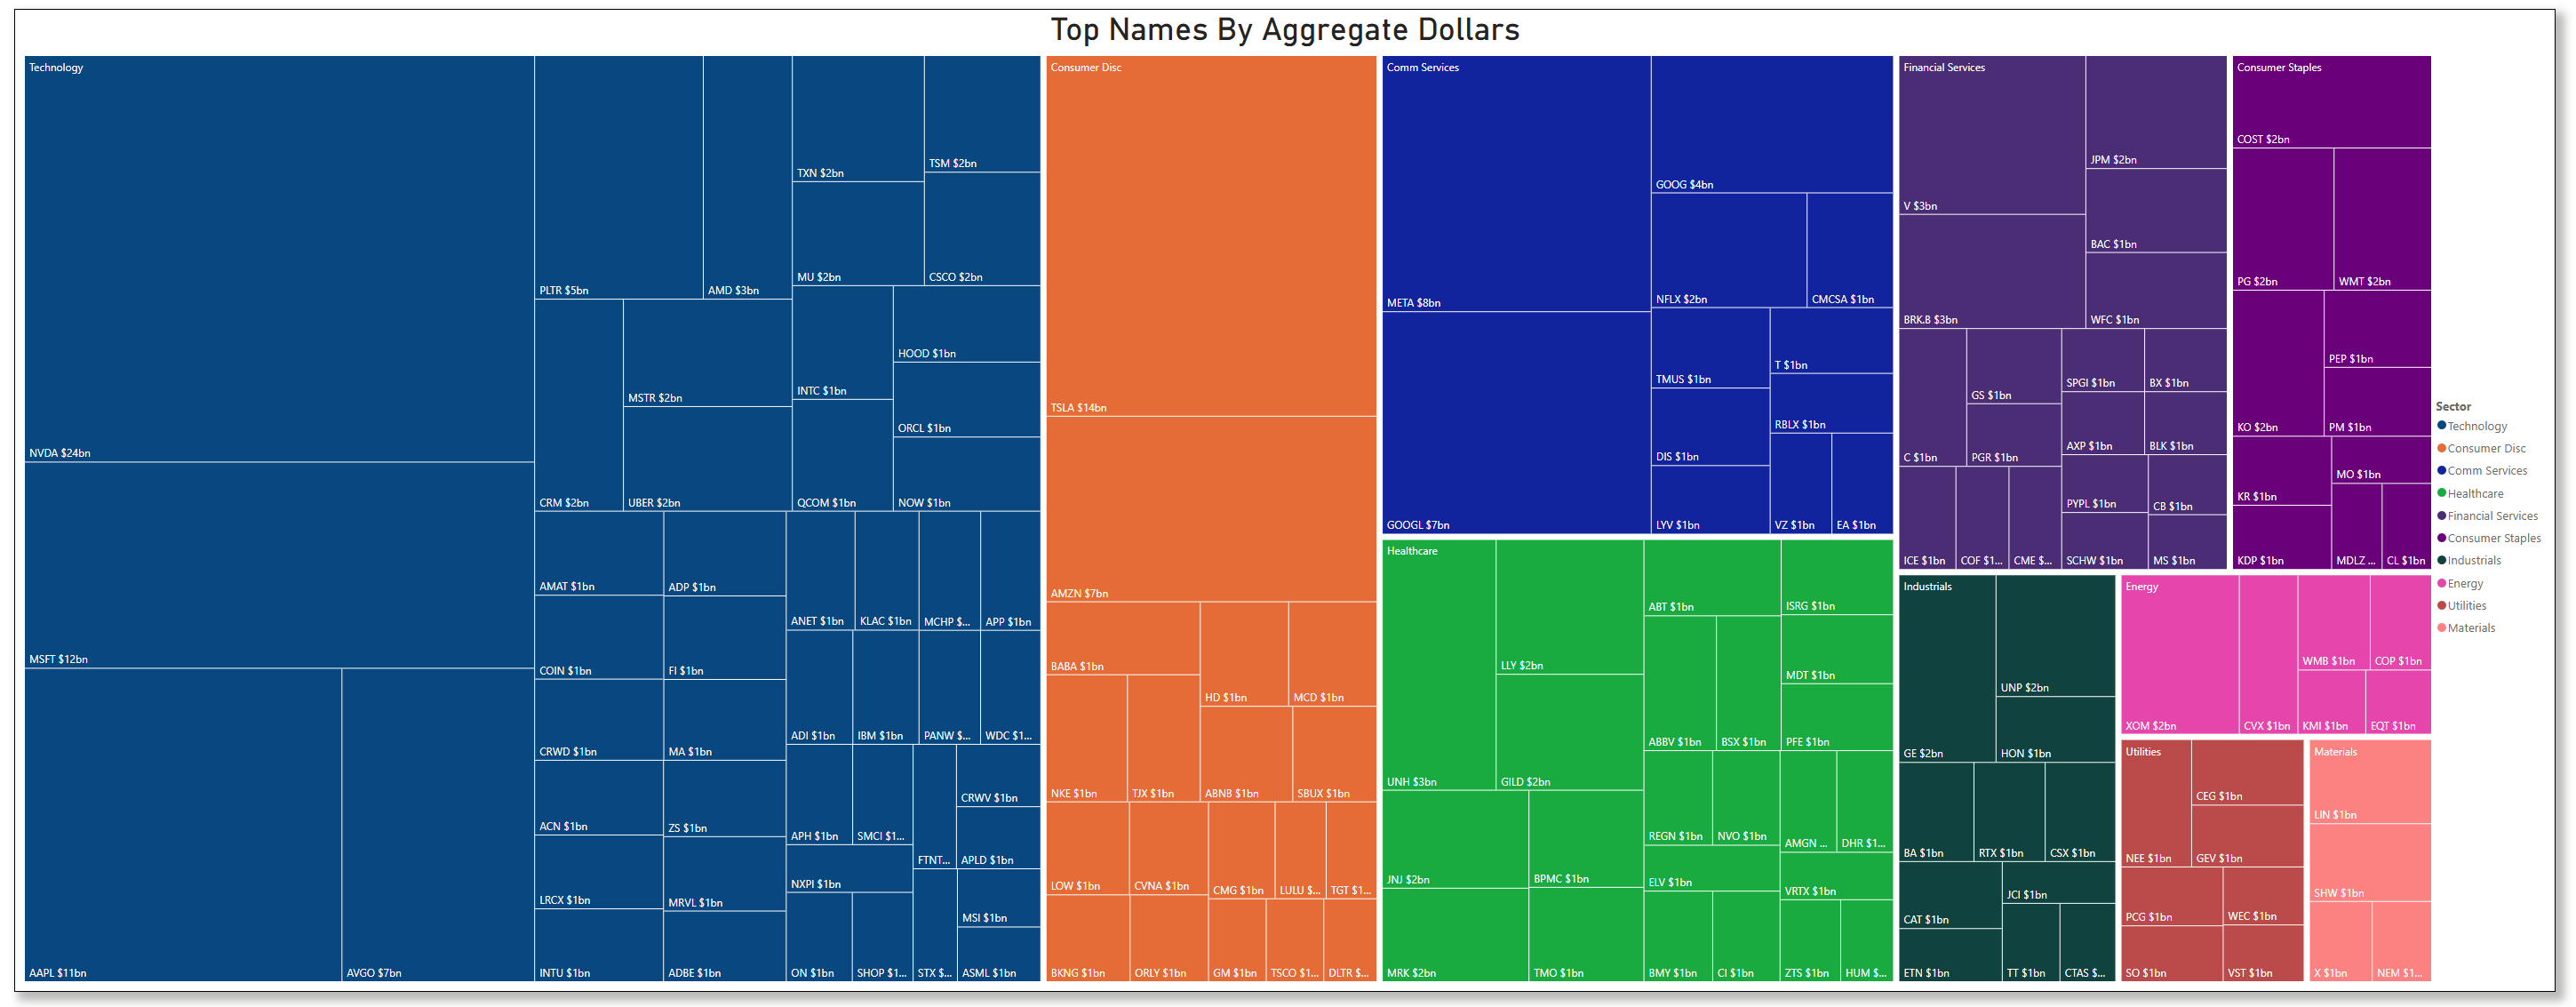
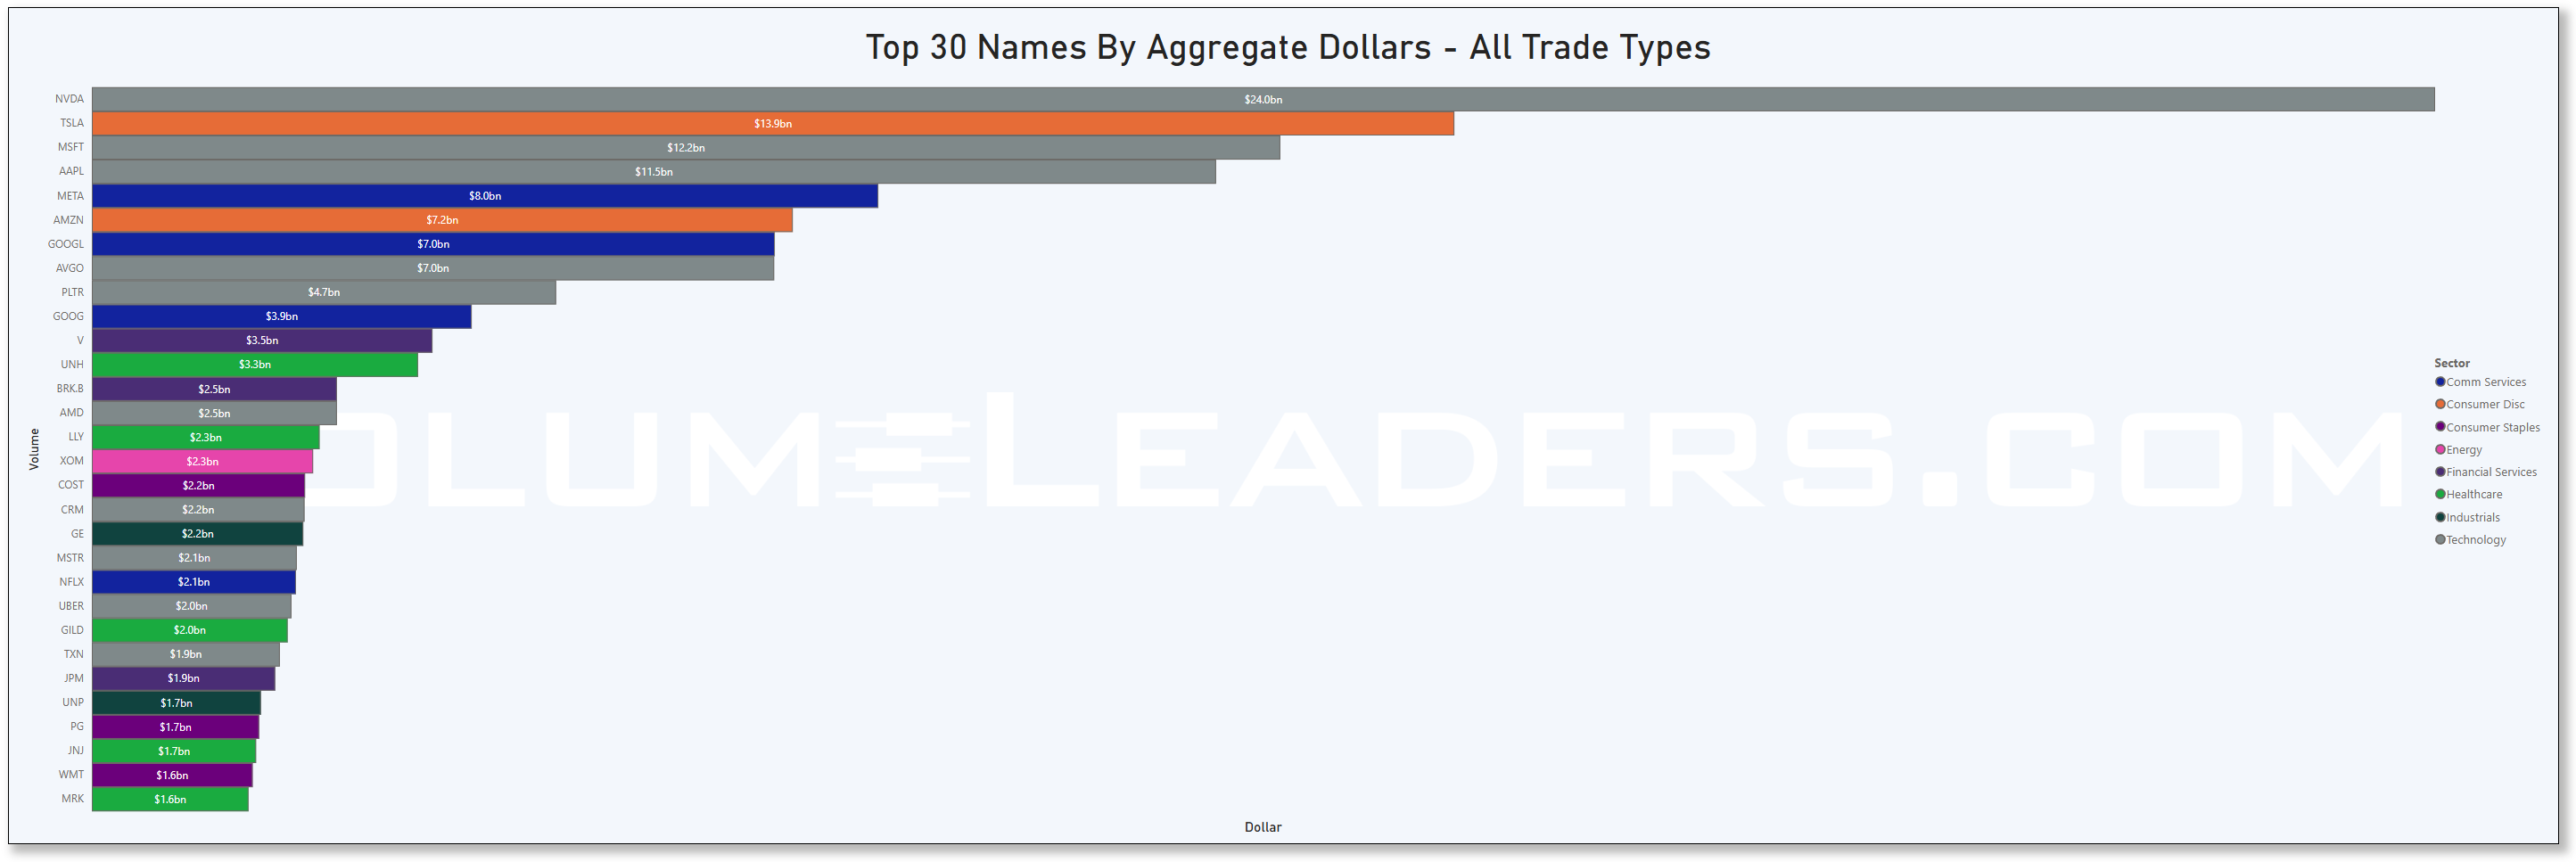
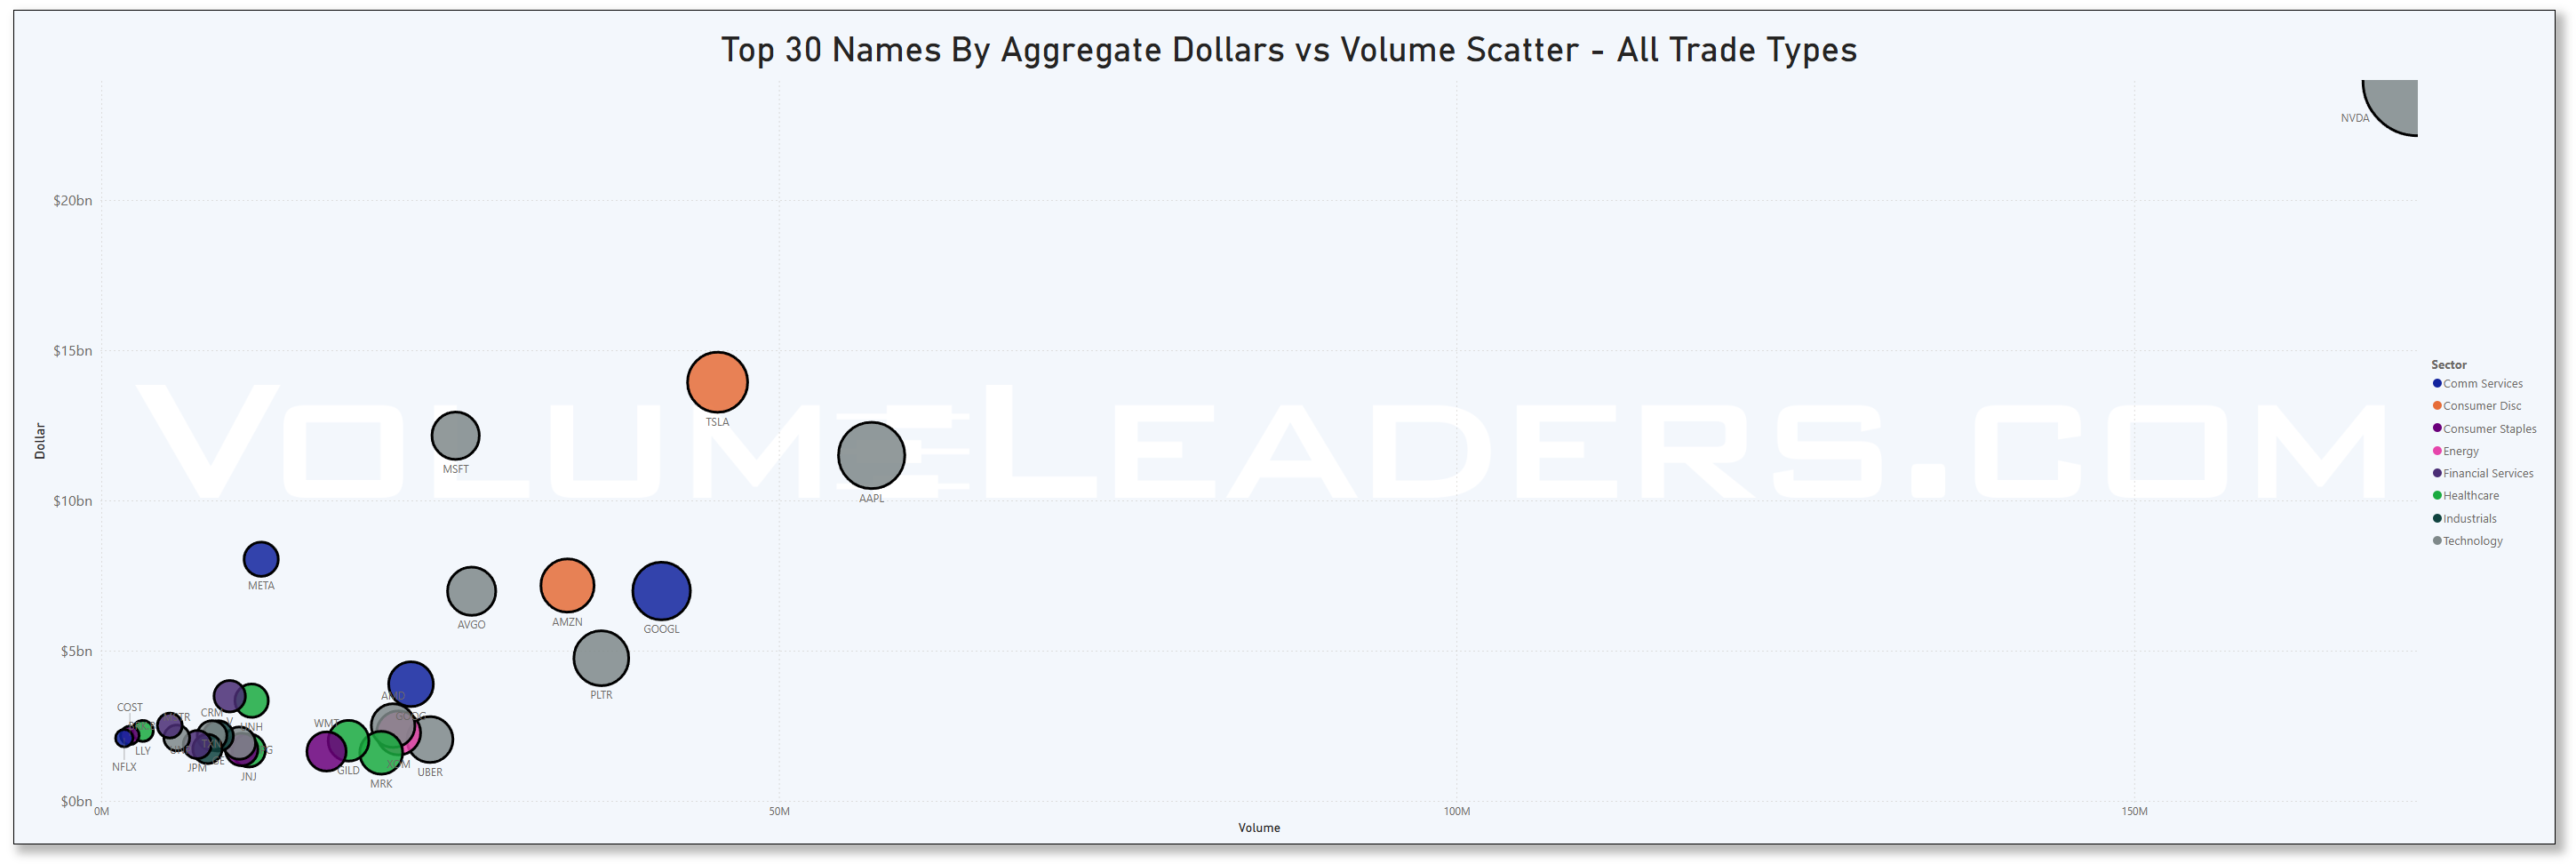
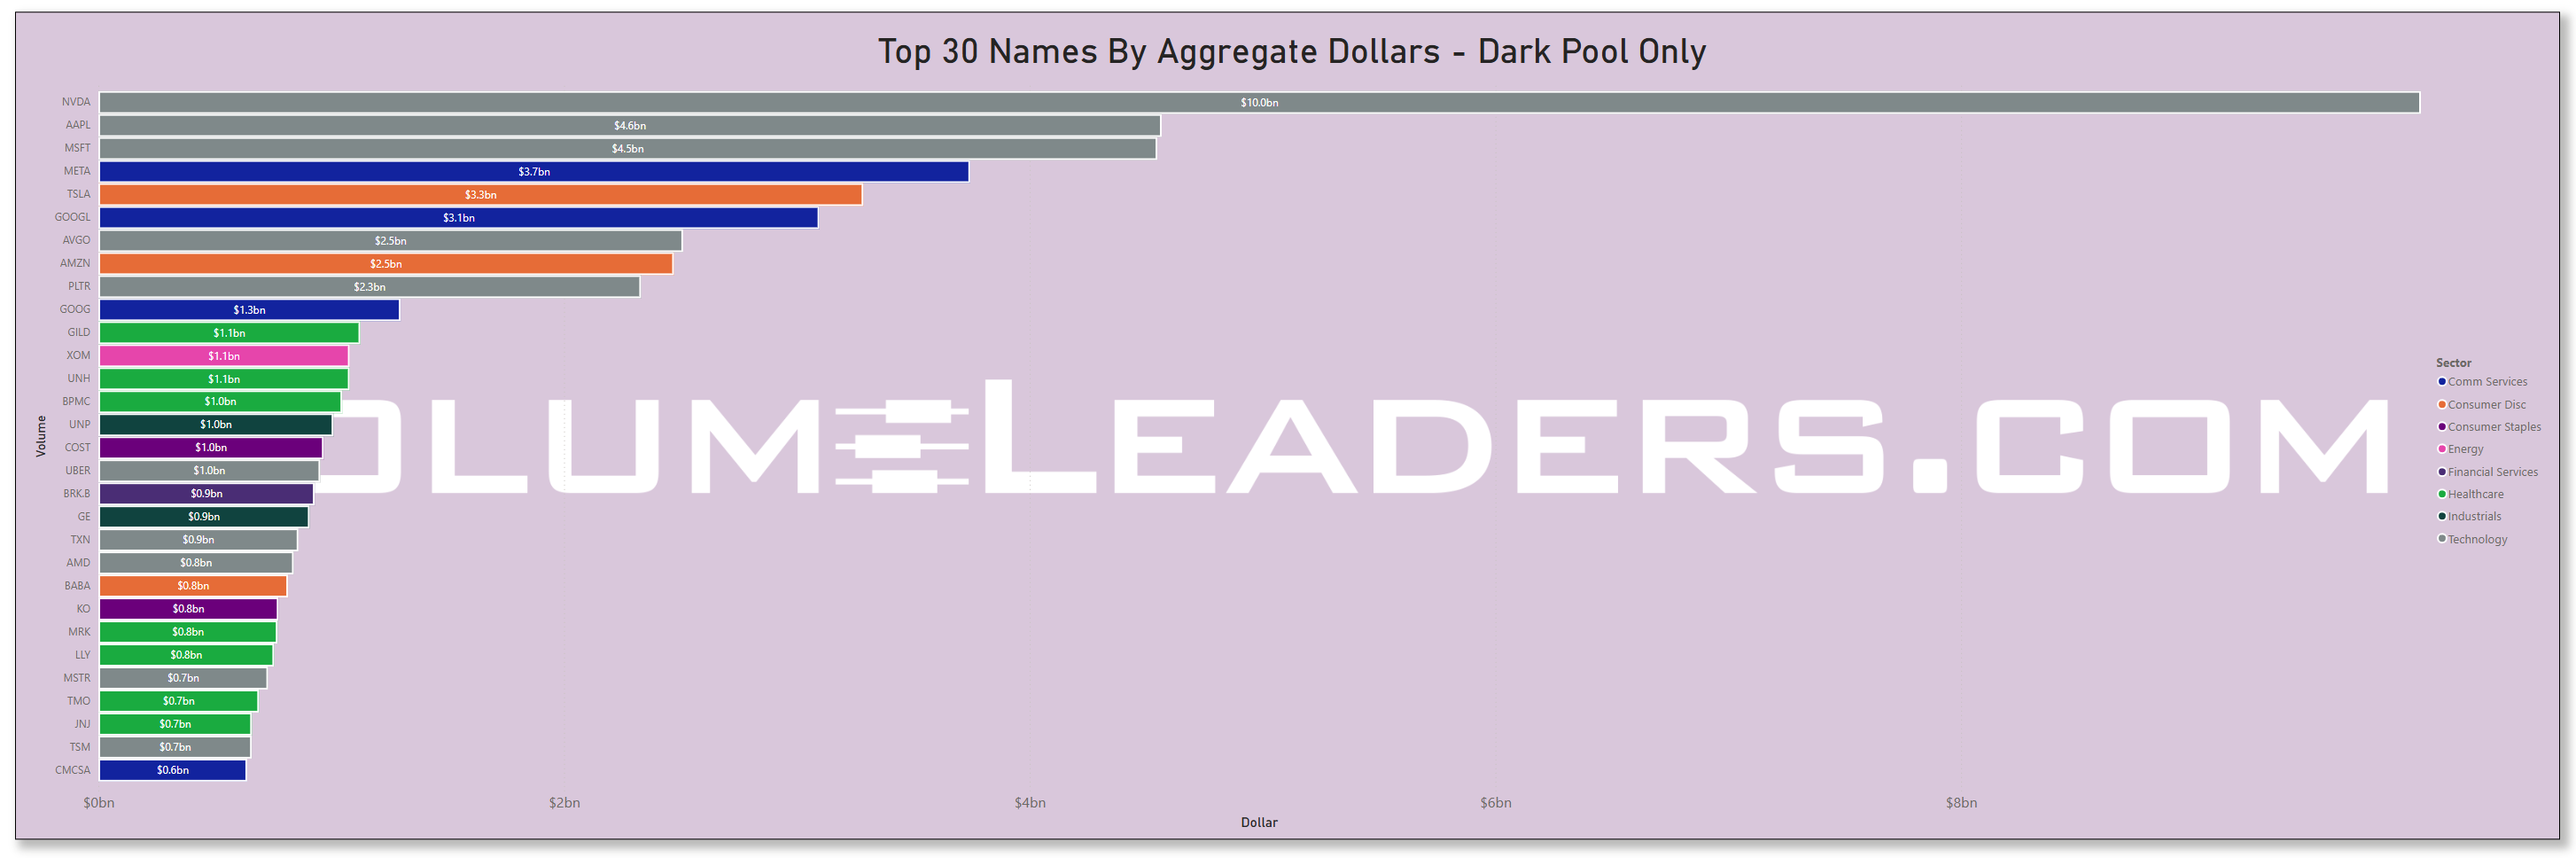
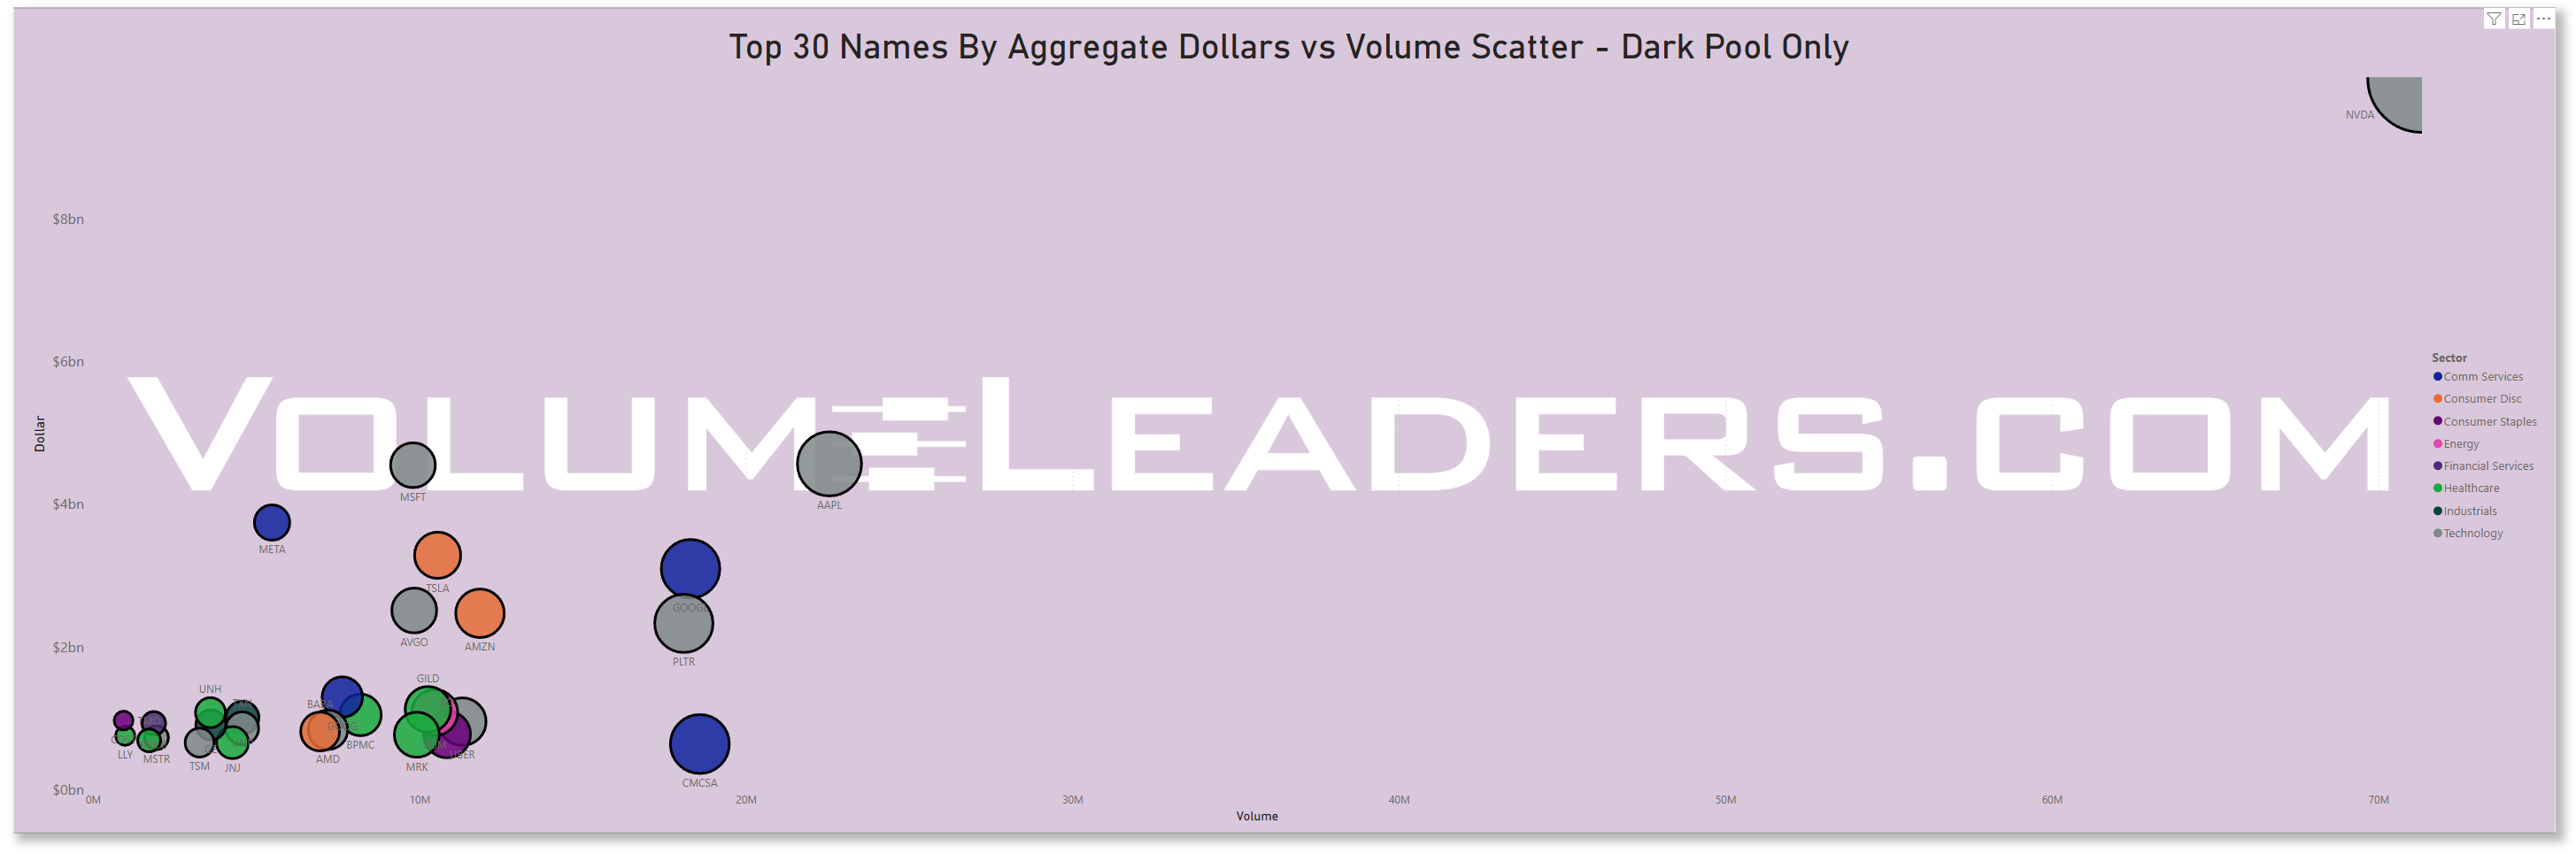
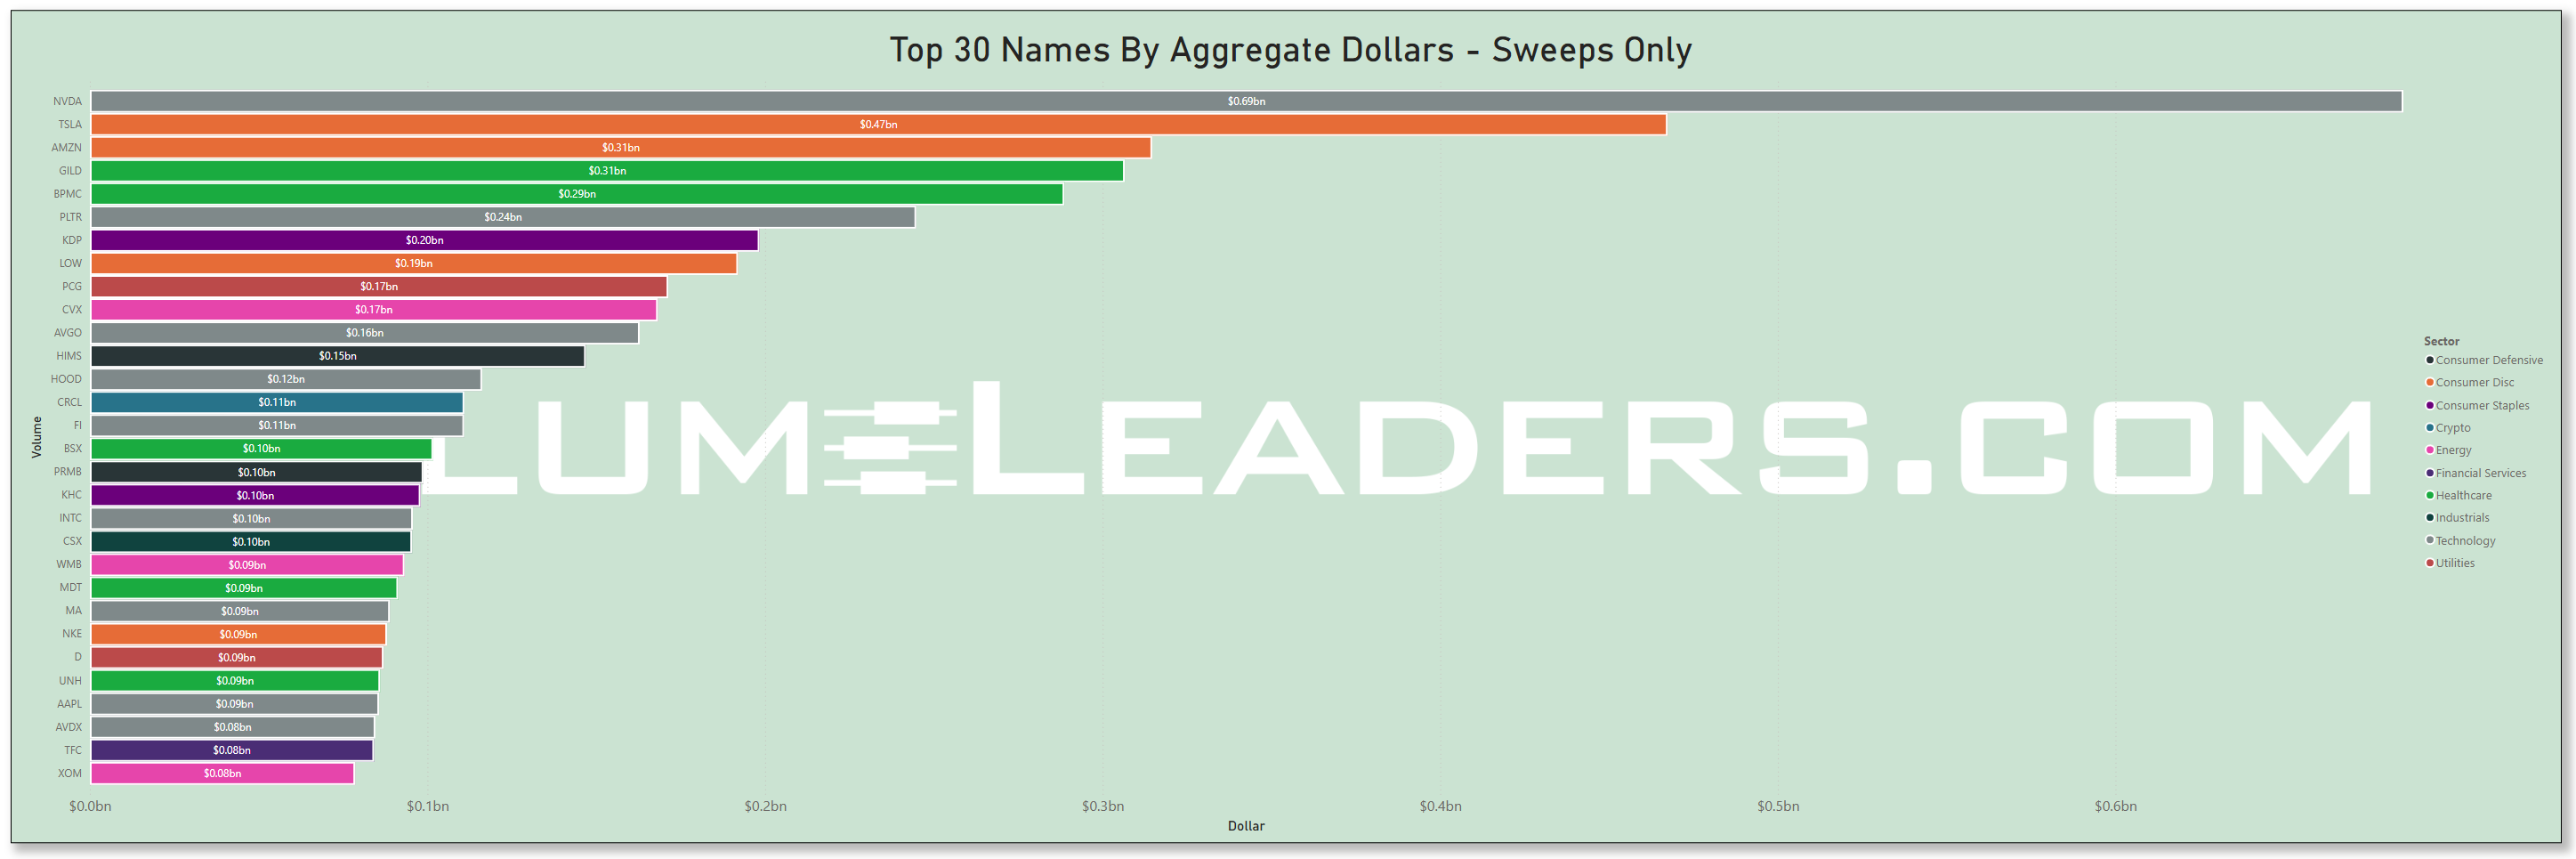
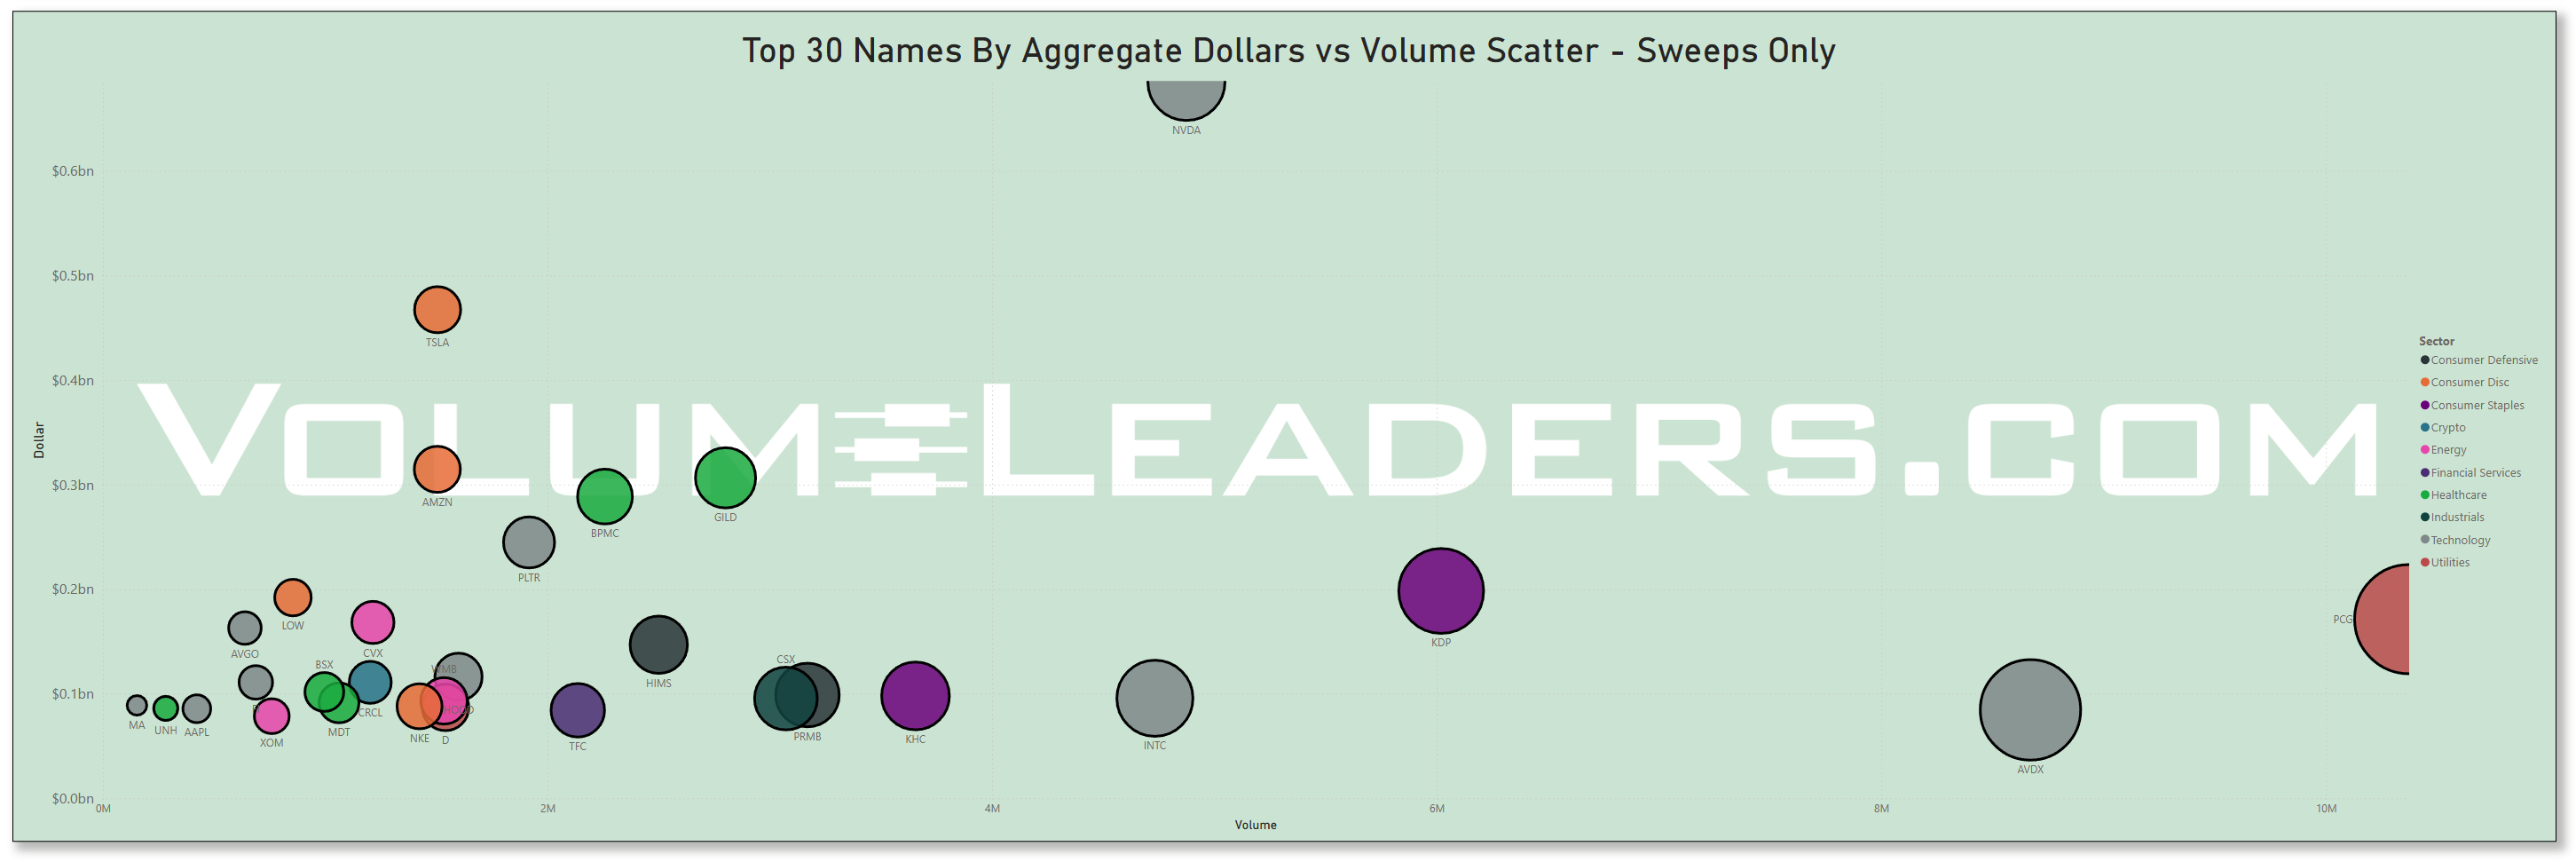
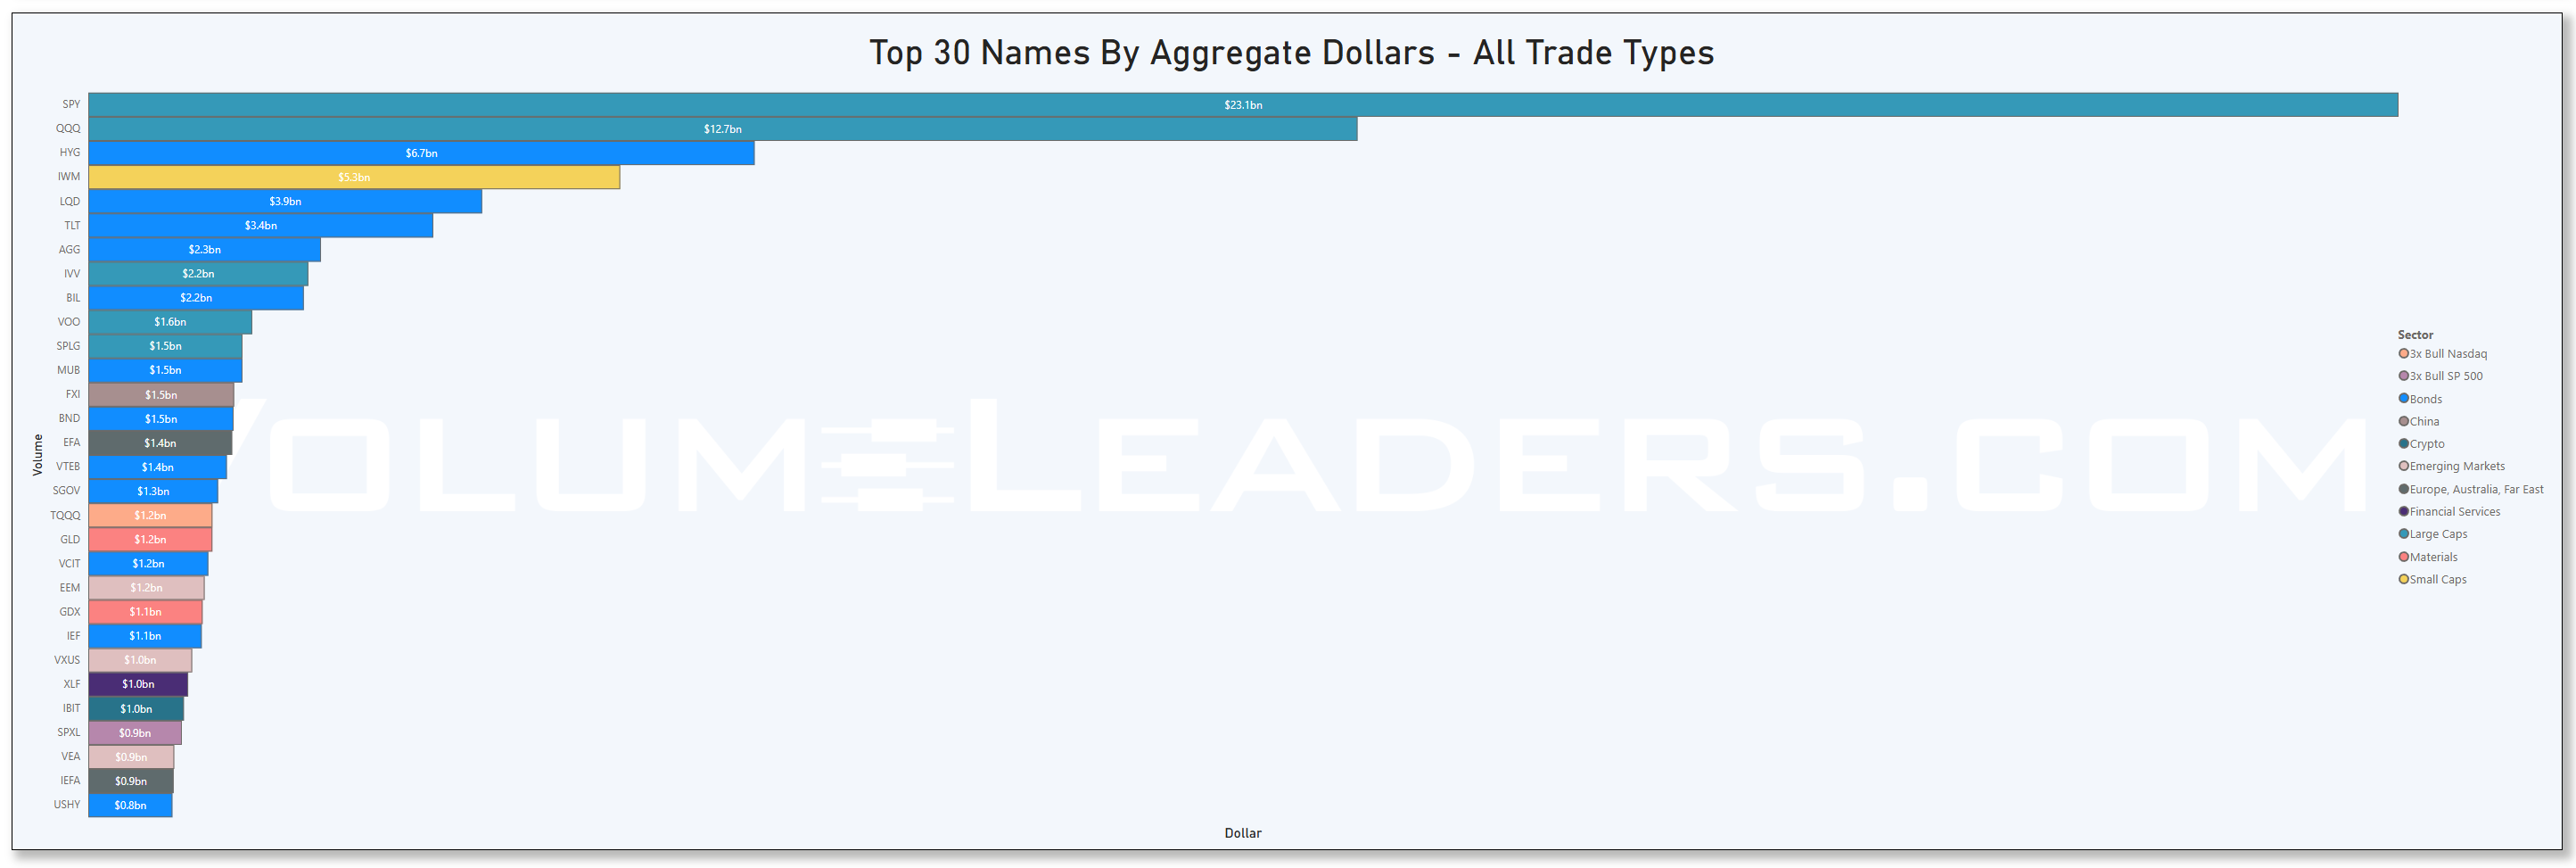
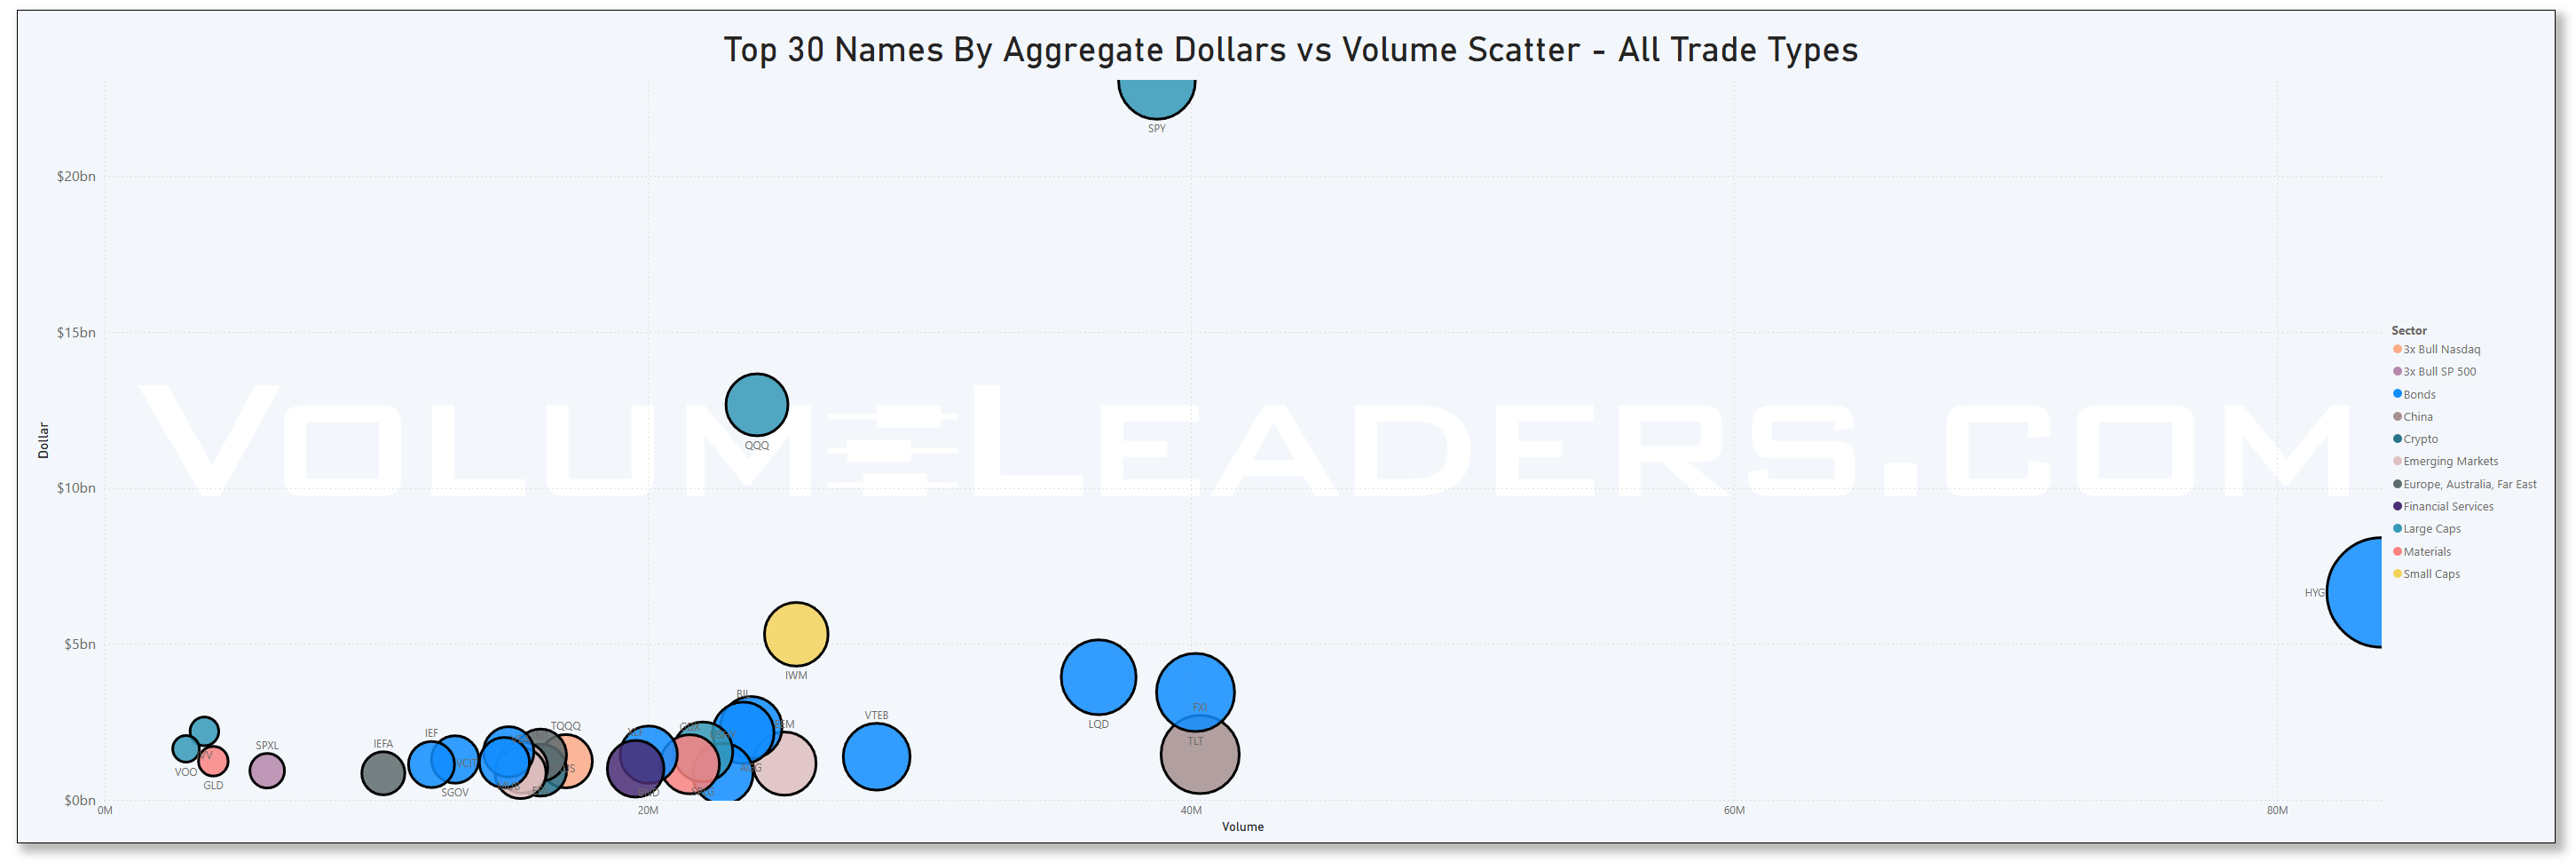
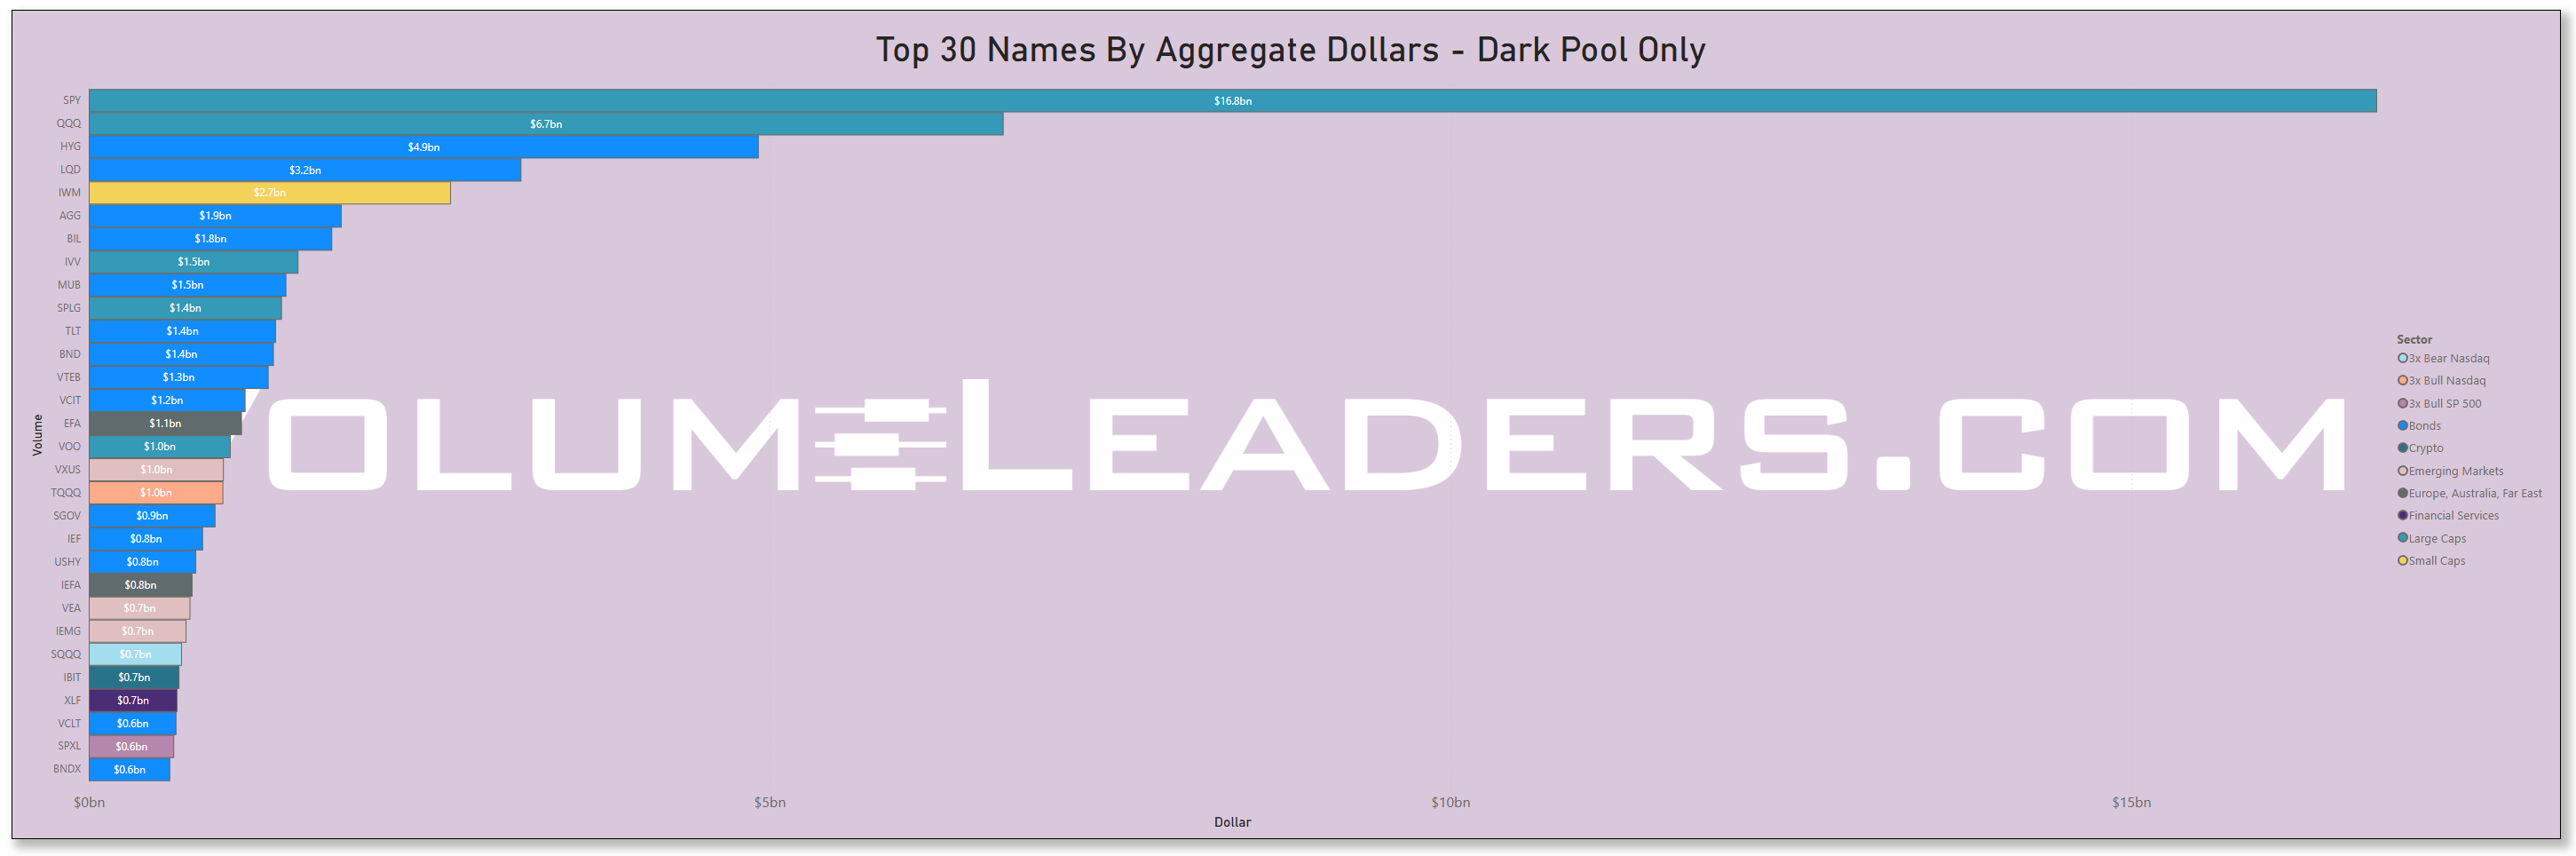
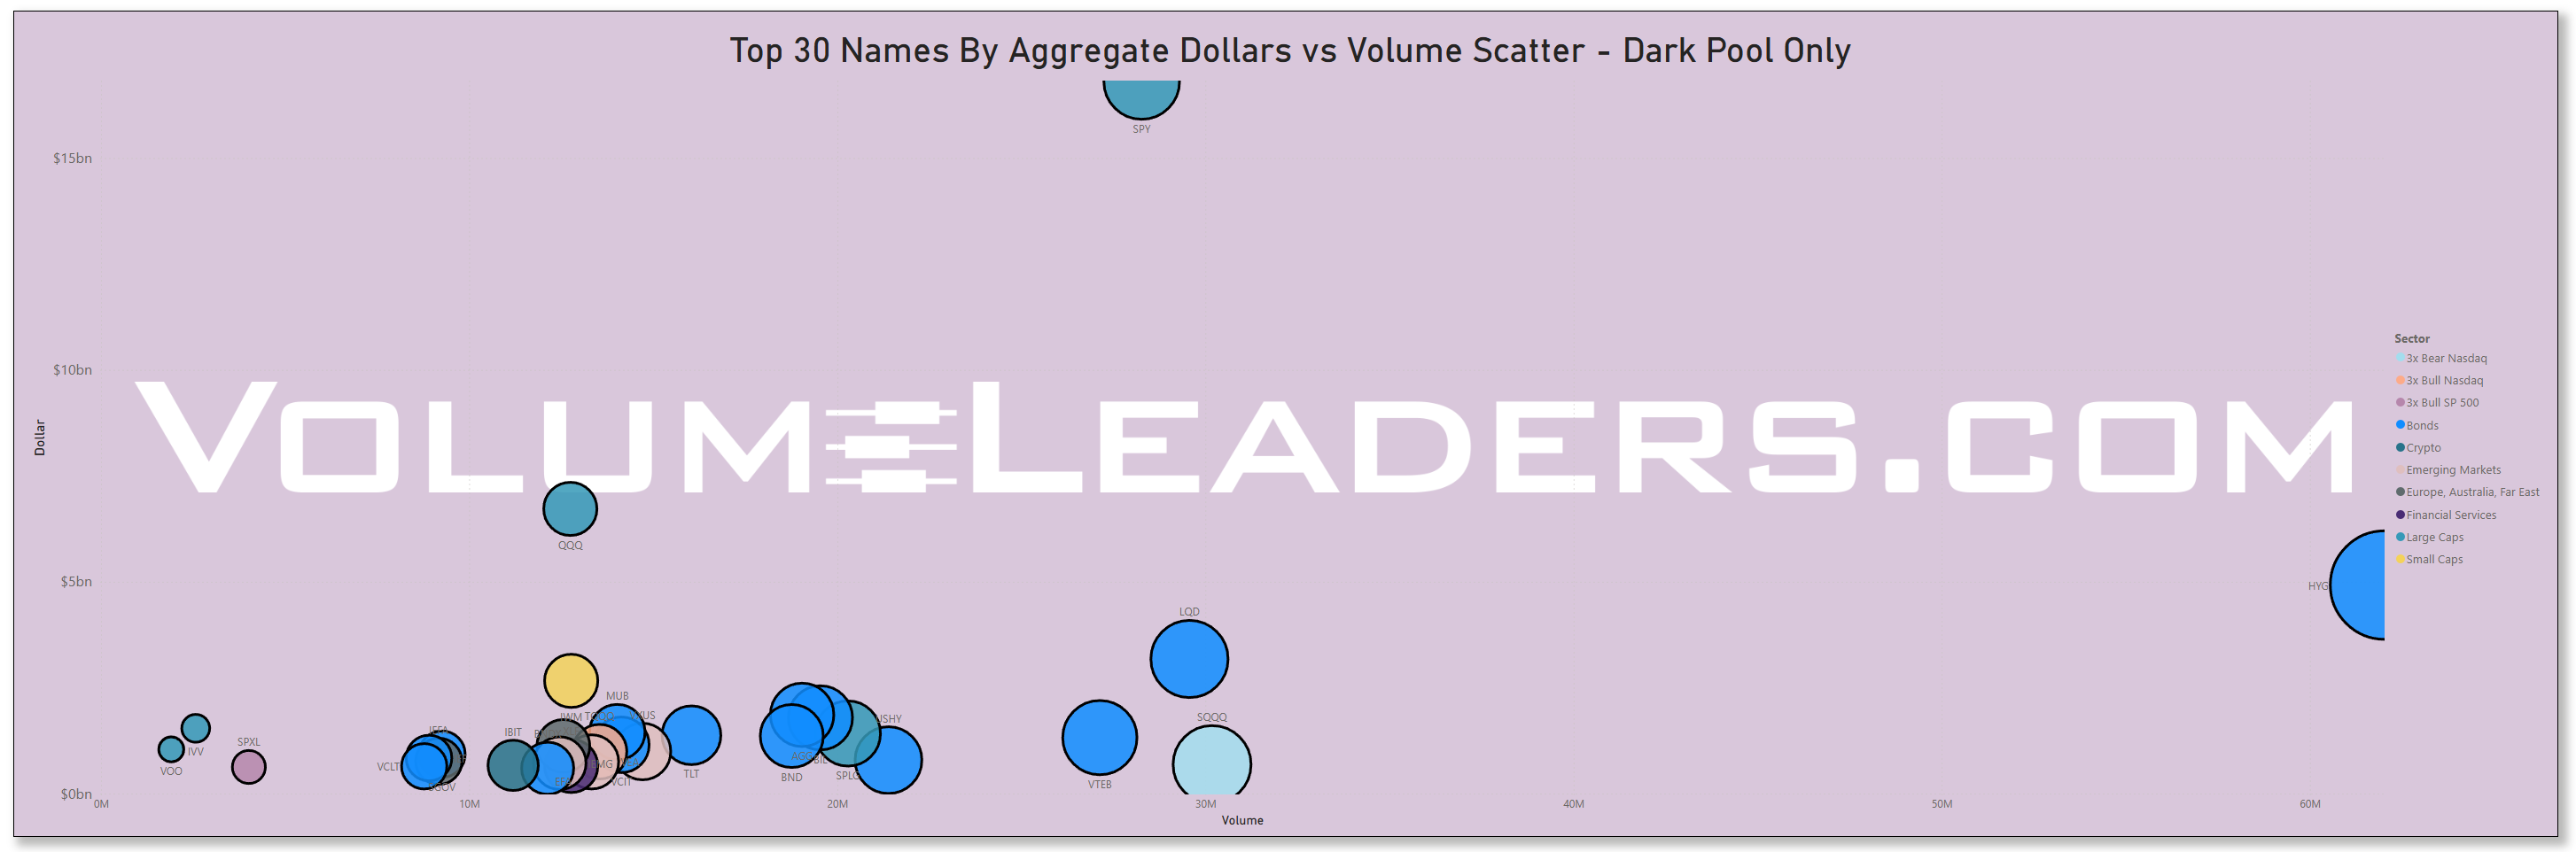
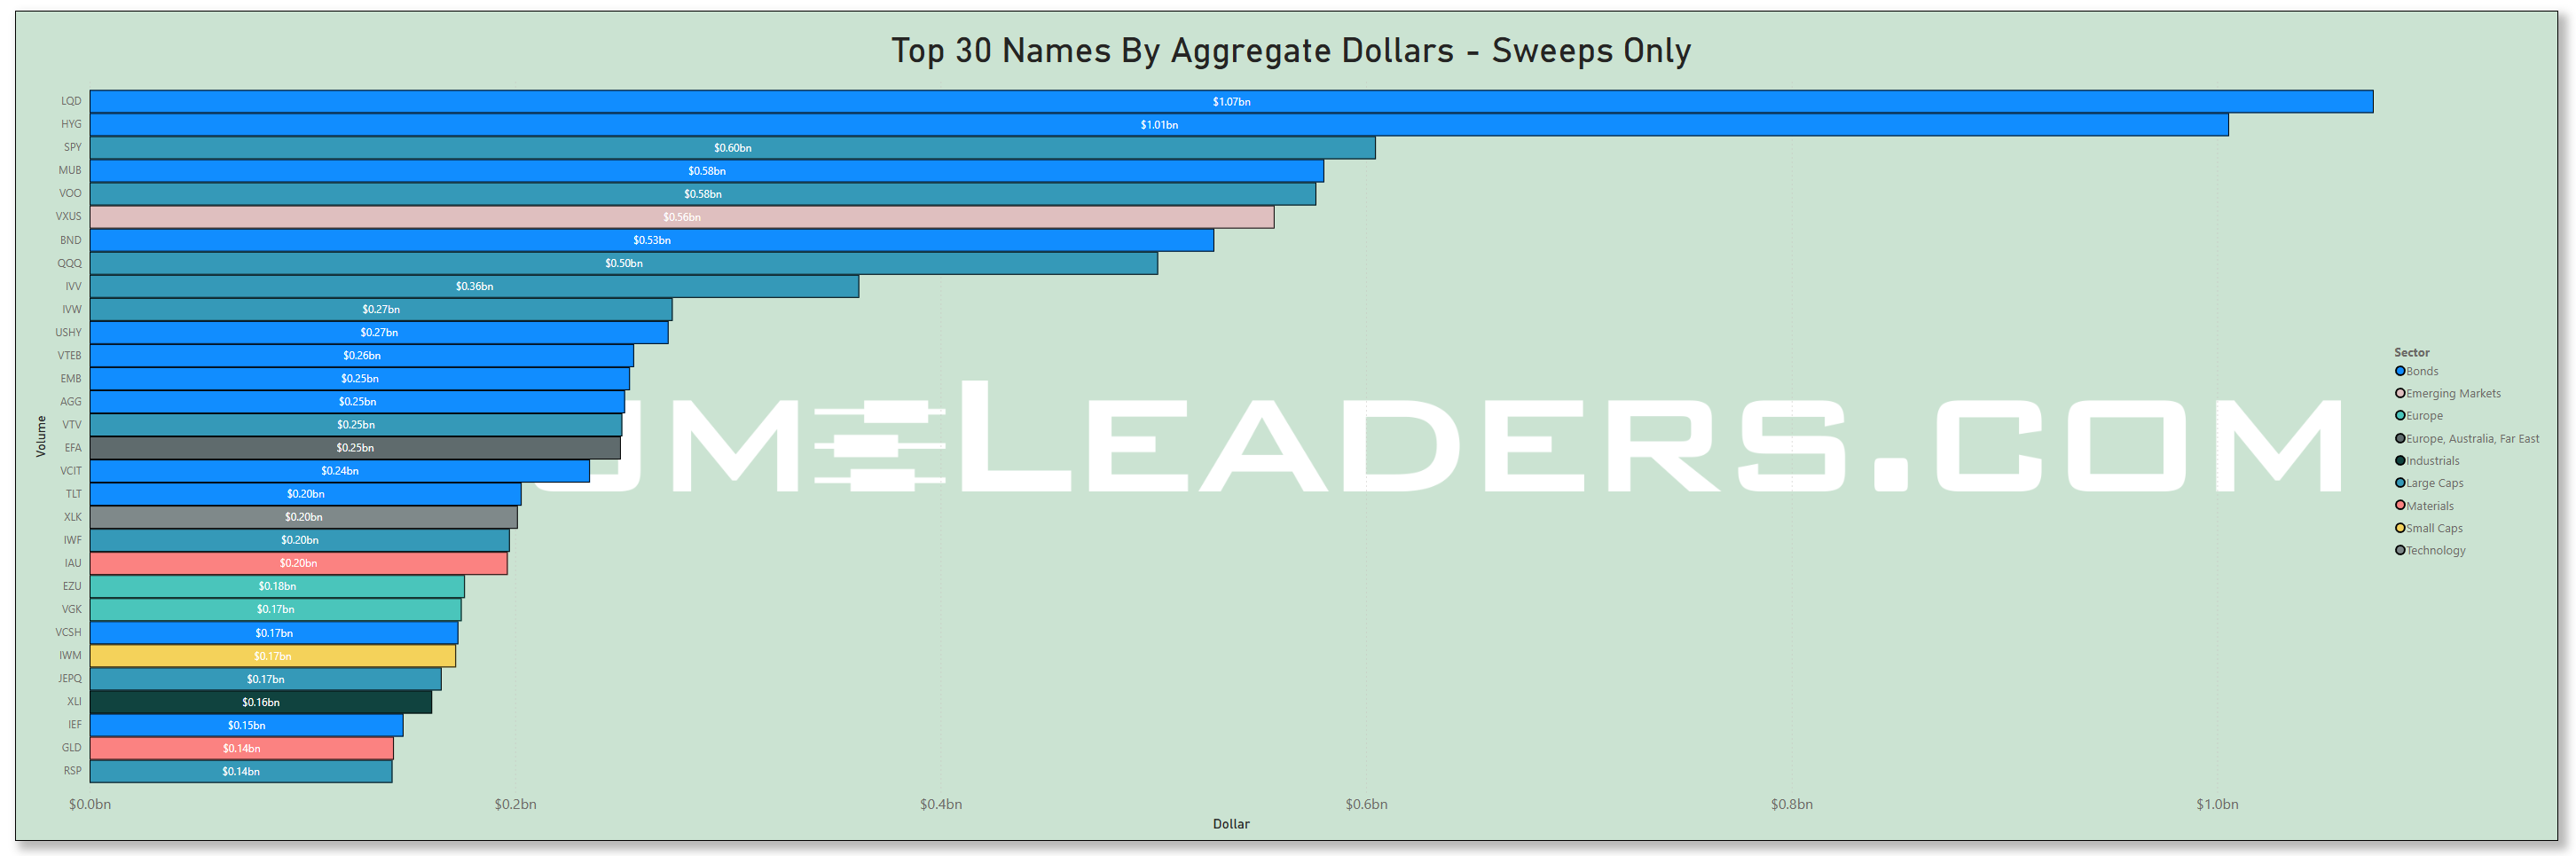
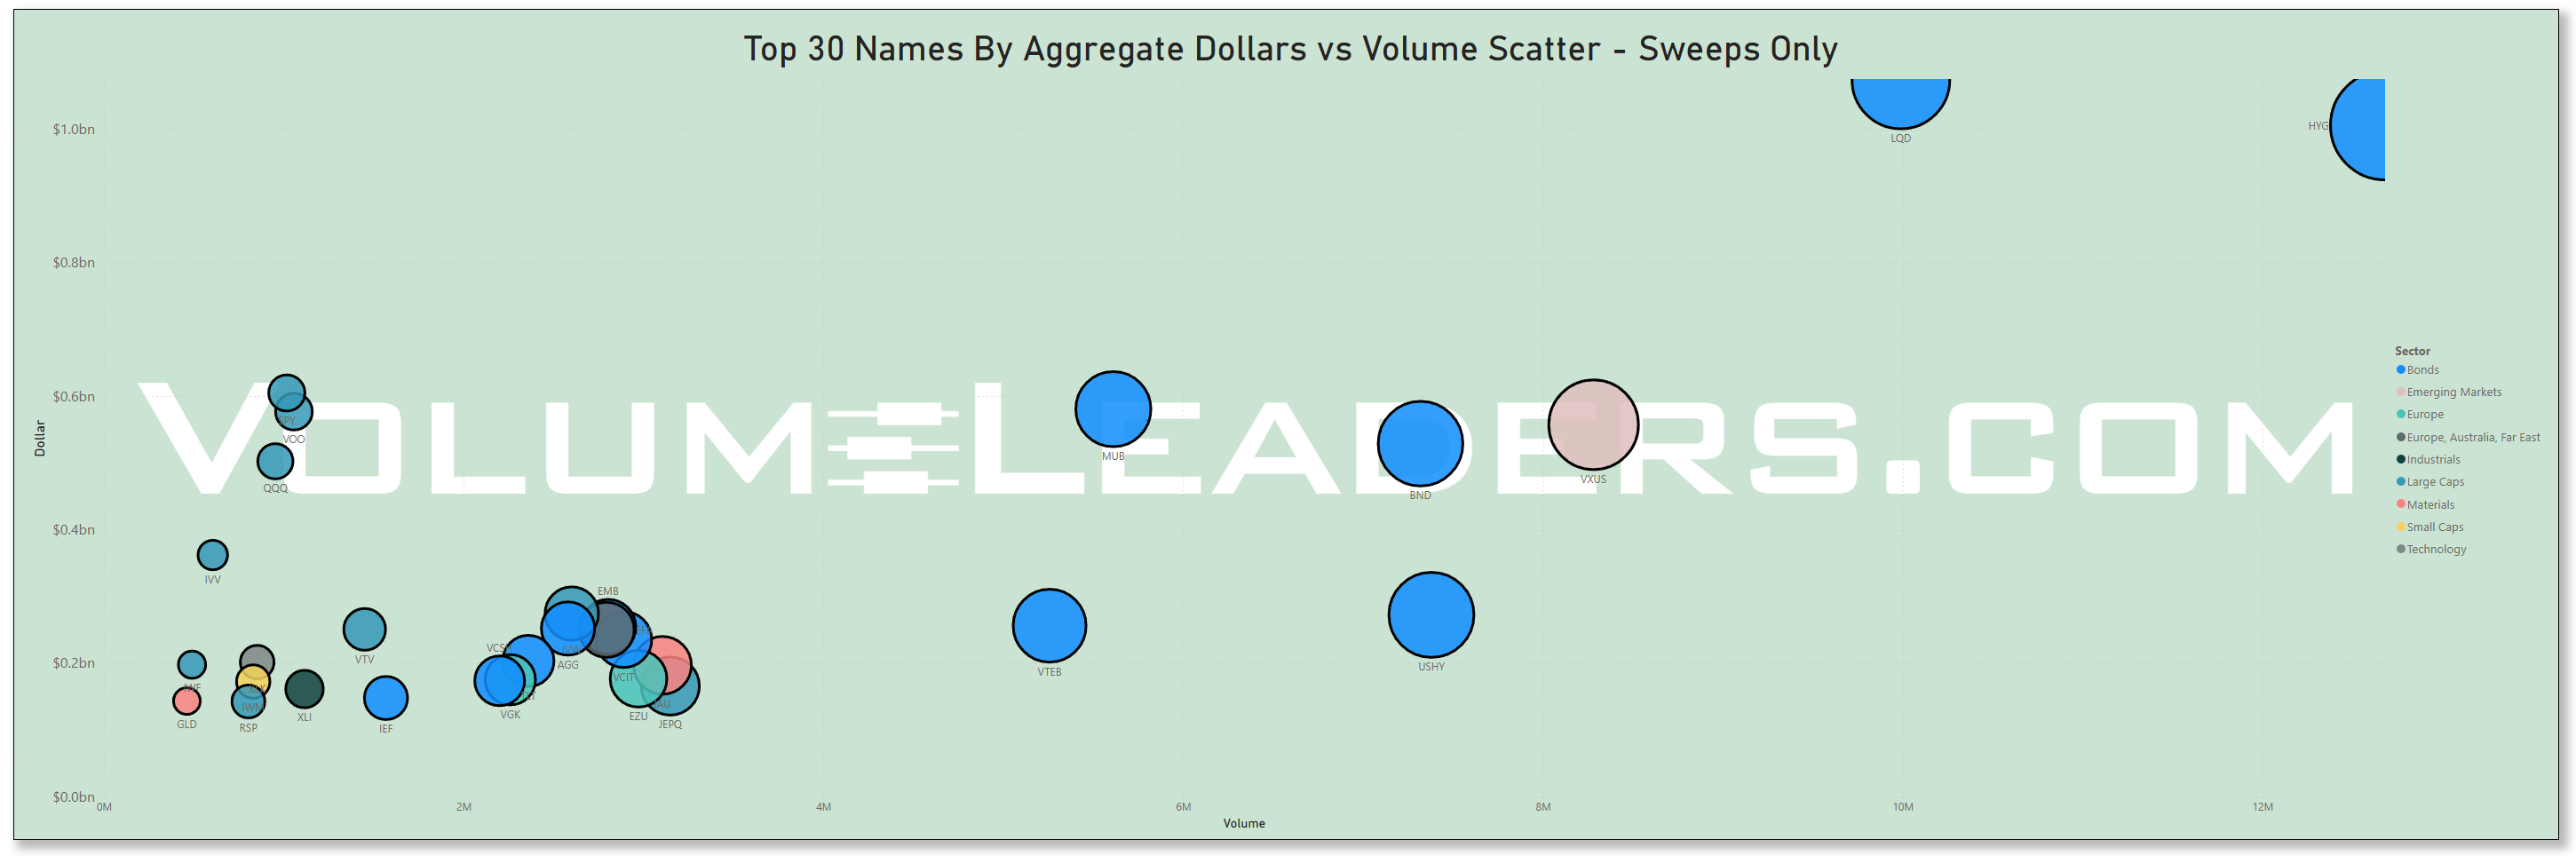
Many excellent trade ideas and sources of inspiration can be found in the prints below. While only the top 30 from each group are displayed, the complete results are accessible in VolumeLeaders.com for you to explore at your convenience any time. Remember to configure trade alerts within the platform to ensure institutional order flows that capture your interest or are significant to you aren’t missed. The blue charts represent all types of trades, including blocks on lit exchanges; the purple charts exclusively depict dark pool trades; and the green charts are sweeps only.
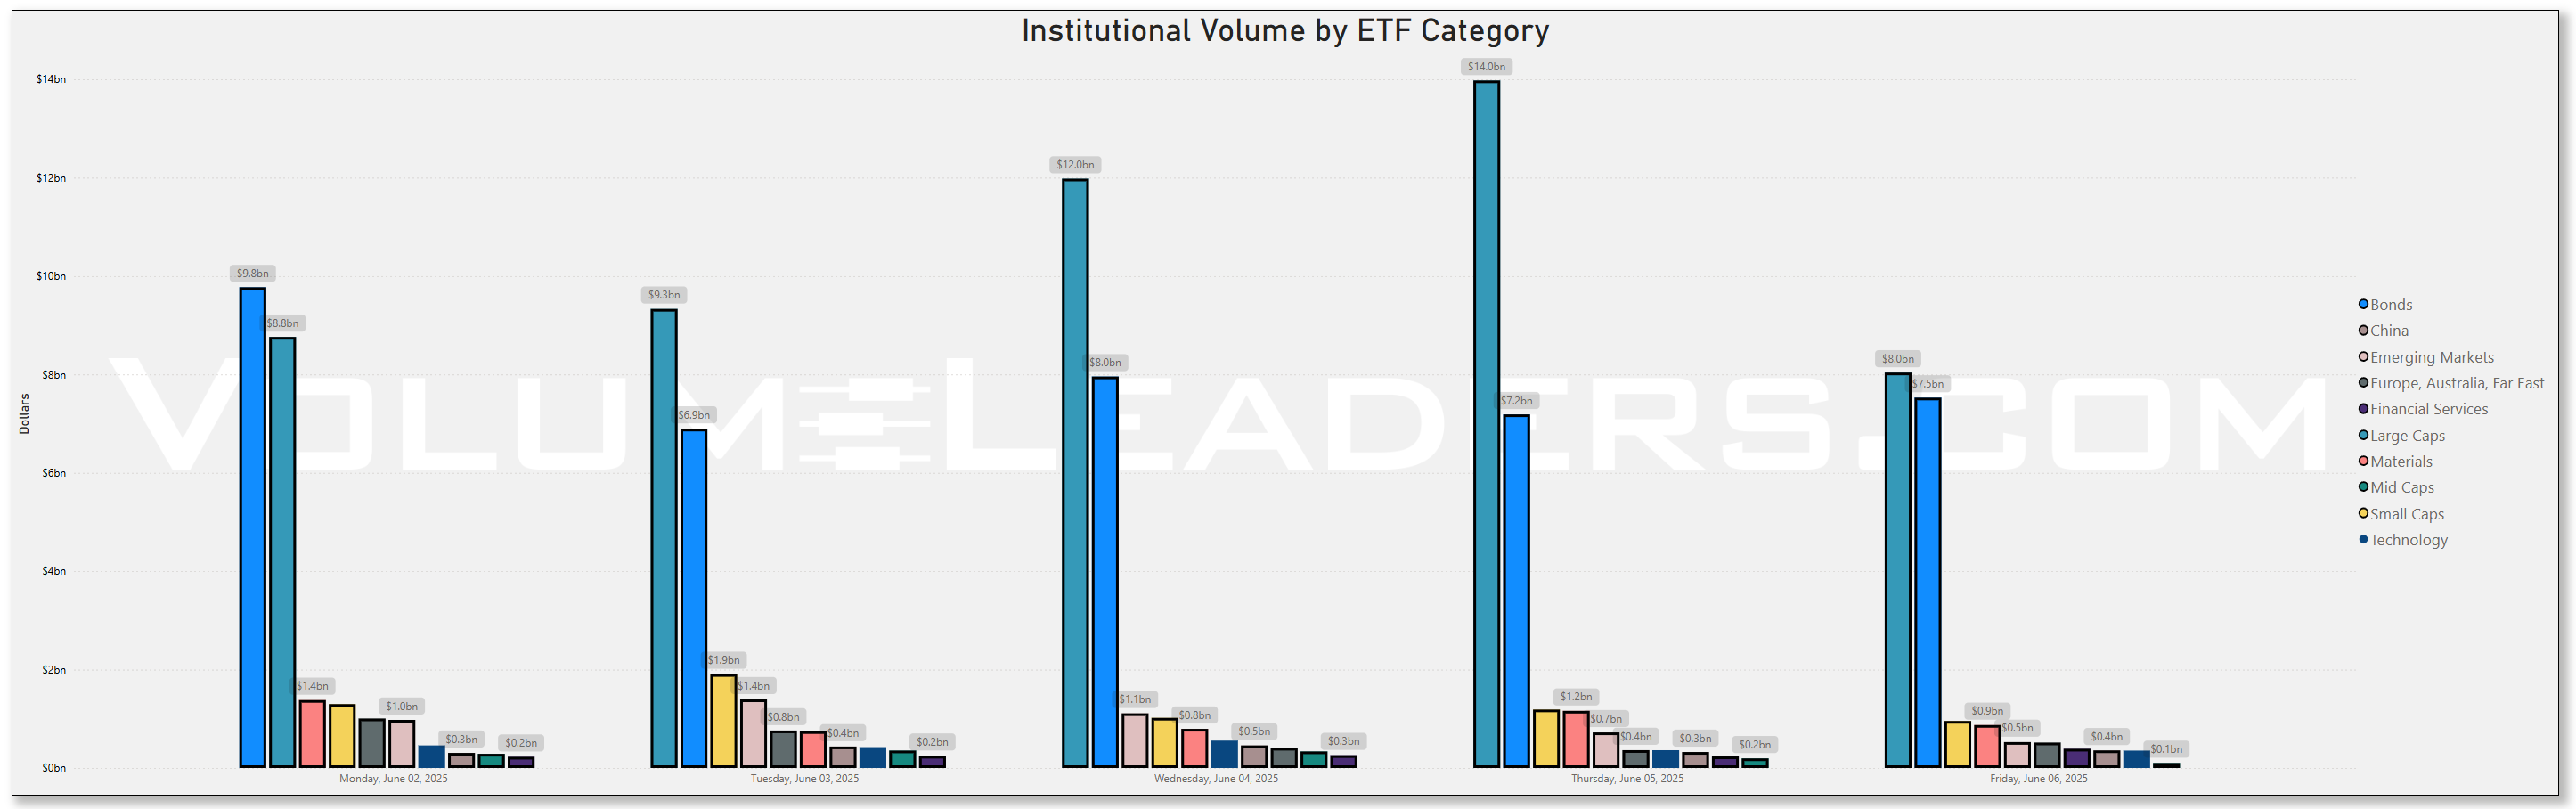
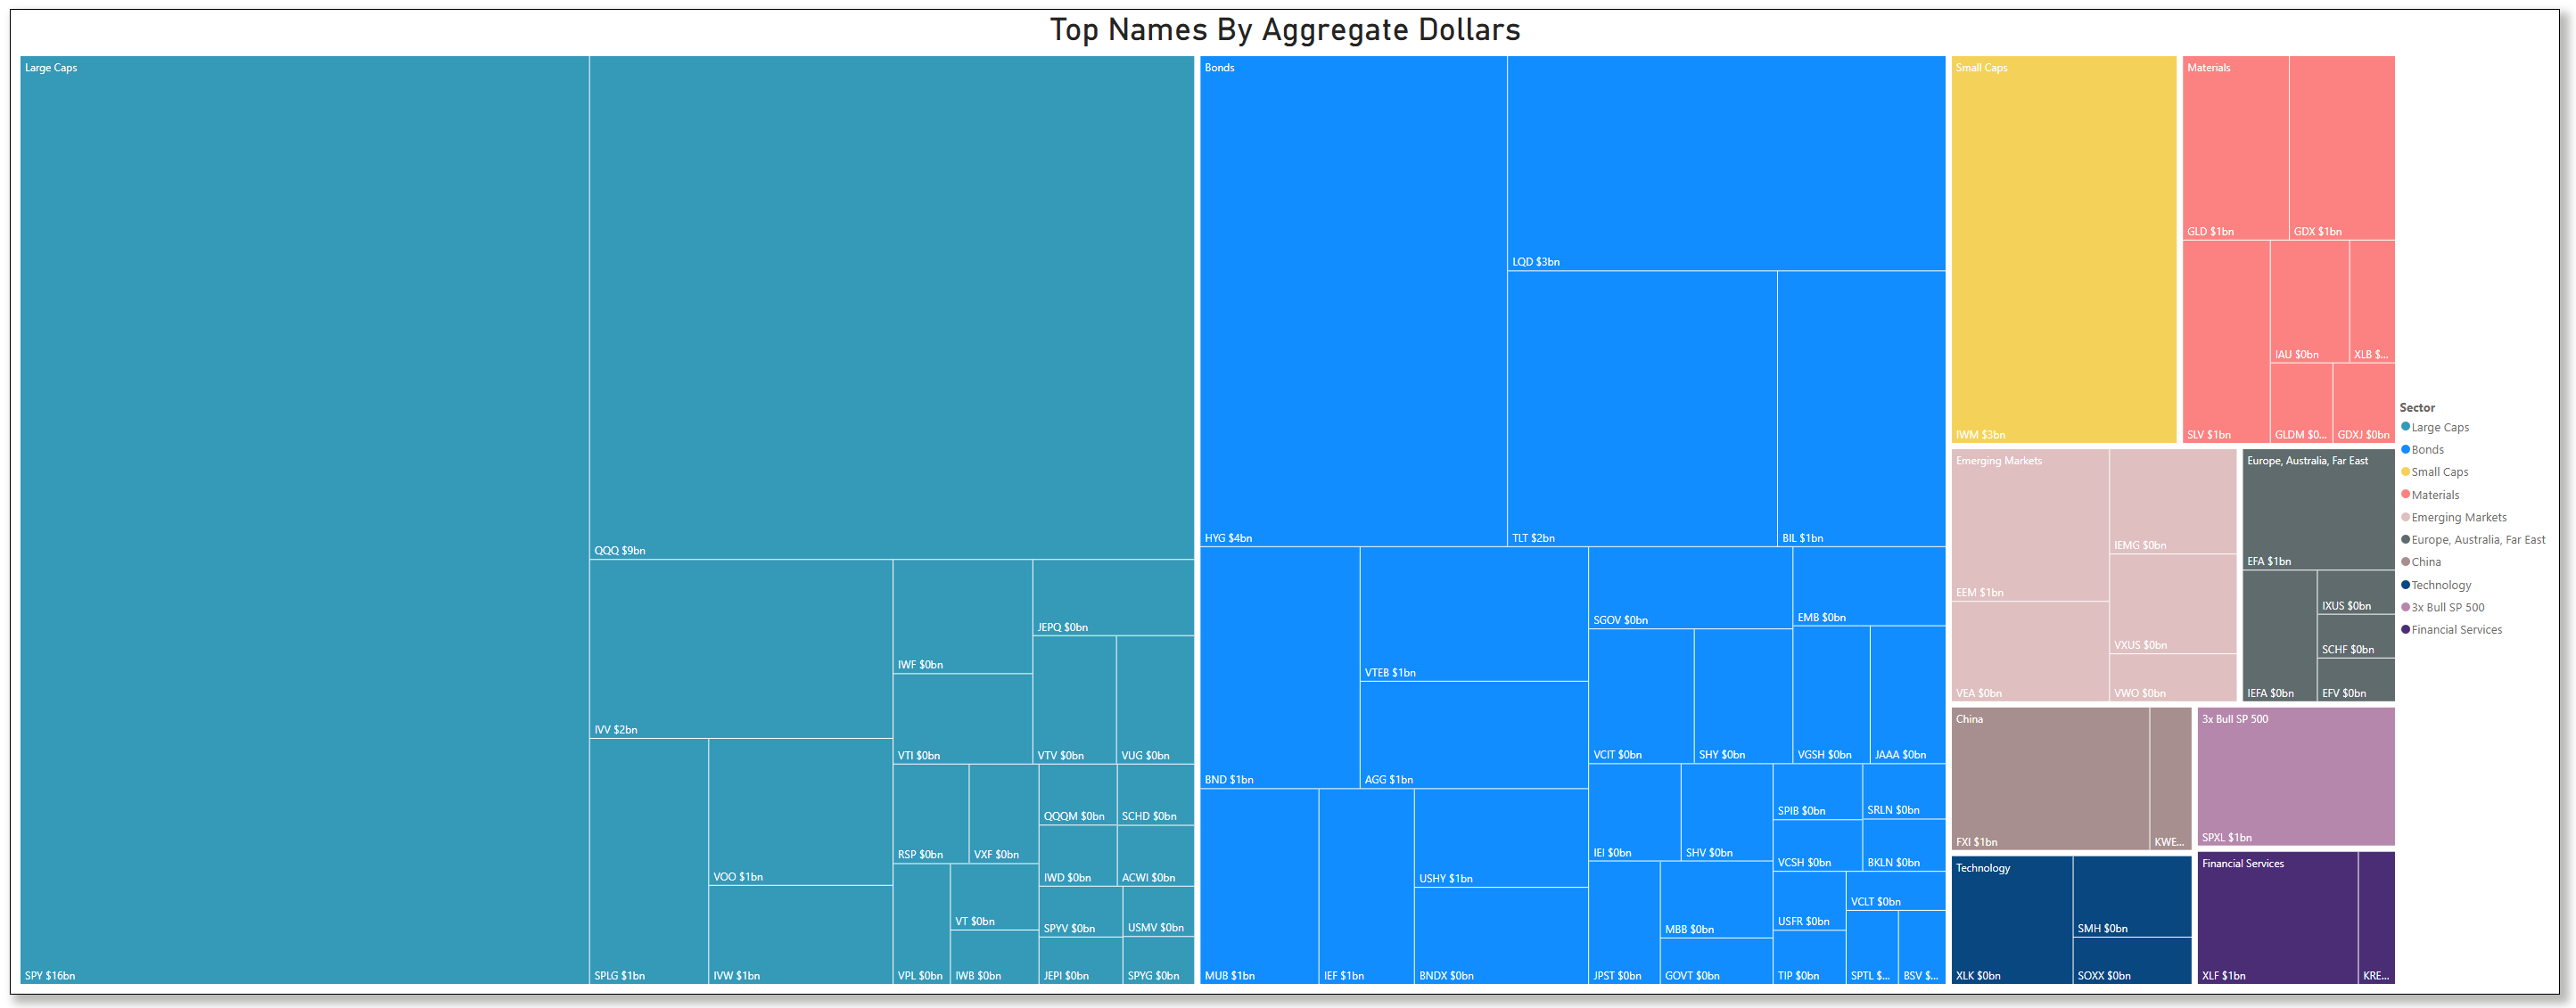
Top Institutional Order Flow In ETFs
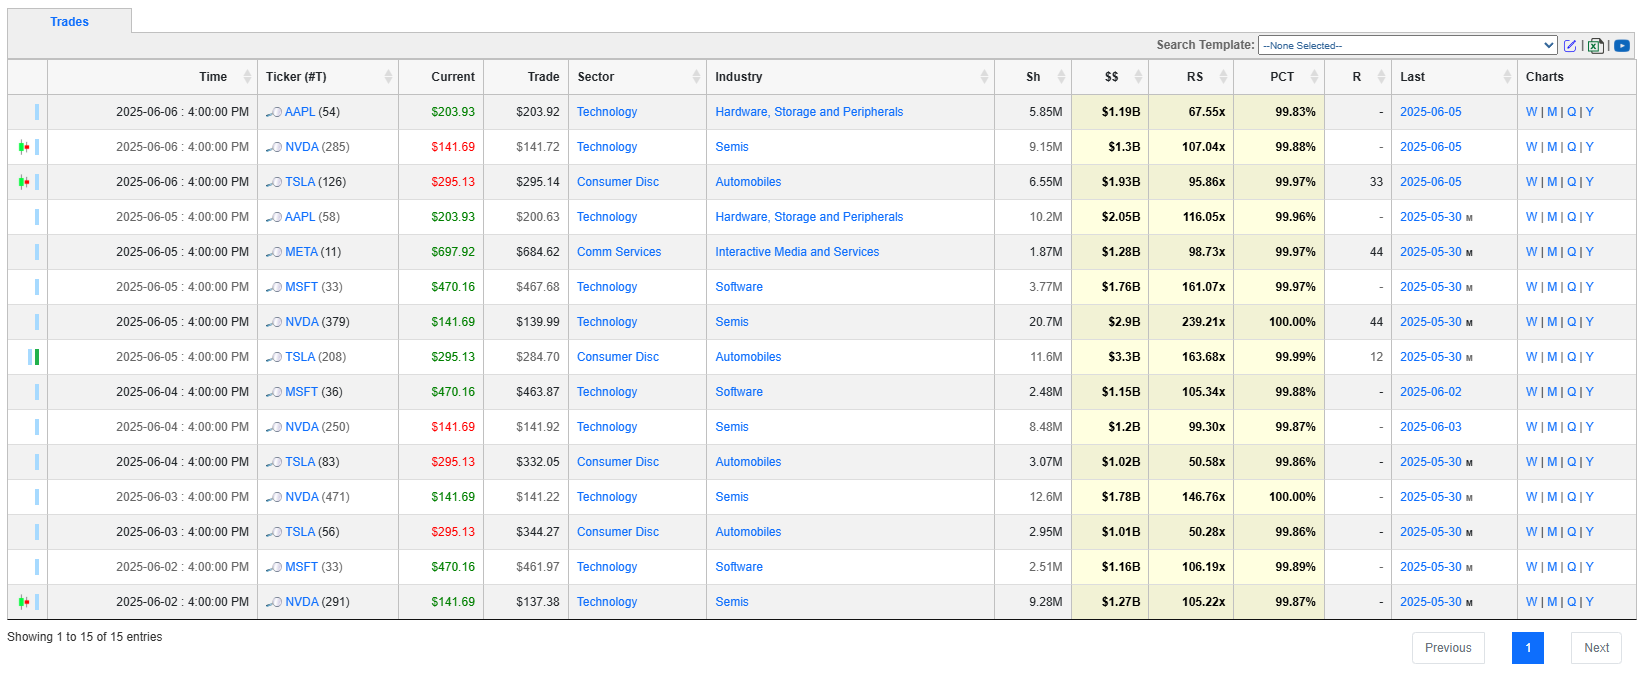
Last Week’s Billion-Dollar Prints
These are the trades that matter. Any ticker that saw a single print worth $1 billion or more last week earns a spot here. Such massive trades reflect the conviction of major institutional players — hedge funds, pension funds, sovereign wealth, or corporate buybacks — and often precede meaningful directional moves. Watch these names closely.
Comprehensive Analysis of Institutional Trades: Key Patterns & Insights
This analysis examines 530 significant institutional trades representing $17.36 billion in capital allocation across the week of June 2-6, 2025. The data reveals extraordinary positioning patterns with some trades reaching 224x normal size, indicating either major strategic repositioning or significant risk management activities. Key findings include overwhelming bullish sentiment (68.7:1 Bull/Bear ratio), concentrated extreme positioning in leveraged instruments, and fresh institutional activity patterns with 91.3% of trades showing recent similar-size precedents.
Critical Context: CRCL (Circle) emerged as the top-scoring ticker following its massive NYSE IPO debut, where the stablecoin issuer "priced its initial public offering at $31 per share late Wednesday" and "soared 168% in NYSE debut," representing a landmark moment for institutional crypto adoption.
Top Mega-Money Moves
The Trillion-Dollar Tesla Question
TSLA: $3.3 billion at 163.7x normal size (Rank 12)
Tesla's institutional positioning represents the largest dollar allocation in the dataset, occurring precisely during the company's dramatic political tensions. The 163.7x normal size suggests this transcends routine portfolio management—institutions are either making contrarian bets on political drama resolution or conducting major position adjustments following the "$150 billion in market value wiped out" from Trump-Musk tensions.
The Leverage Amplification Strategy
SPXL: $550.2 million at 223.9x normal size (Rank 1)
The most extreme relative size positioning in the entire dataset comes from institutions pushing 3x leveraged S&P 500 exposure to unprecedented levels. This 223.9x normal size indicates either extraordinary conviction about near-term market direction or sophisticated hedging strategies requiring amplified exposure.
The International Arbitrage Play
VXUS: $554 million at 185.1x normal size (Rank 1)
Emerging markets positioning at 185.1x normal represents one of the most unusual international allocation patterns observed. This could reflect either strategic diversification away from U.S. political uncertainties or indicate forced institutional rebalancing due to external pressures.
The Double-Strike Large Cap Positioning
SPLG: $1.04 billion combined (160.8x and 103.8x normal size)
The same large-cap ETF appearing twice among extreme outliers with combined flows exceeding $1 billion suggests coordinated institutional strategy rather than coincidental activity. This pattern indicates either systematic large-cap accumulation or complex index-related institutional requirements.
Multi-Factor Trade Significance
Methodology Validation
The multi-factor scoring system successfully identifies the most institutionally significant positions by combining:
Dollar Value (0-25 points): Absolute capital allocation importance
Relative Size (0-25 points): Unusual positioning magnitude
Rank (0-20 points): Institutional priority assessment
Multiple Trades (0-15 points): Sustained institutional interest
Price Momentum (0-15 points): Market timing considerations
Top Ticker Significance Insights
The scoring reveals institutions prioritize cryptocurrency adoption (CRCL), technology infrastructure positioning, and entertainment sector opportunities, suggesting a balanced approach between growth themes and tactical opportunities.
Multi-Factor Sector Significance Rankings
3x Bull SP 500: 75 points (Dollar: 22 + Size: 25 + High Rank: 25 + Count: 0 + Momentum: 3)
Leveraged bull positioning dominates sector significance through extreme relative sizing, despite limited trade count. The perfect high-rank score indicates institutions view these positions as top priorities.Mid Caps: 69 points (Dollar: 19 + Size: 24 + High Rank: 25 + Count: 0 + Momentum: 1)
Mid-cap exposure shows similar extreme positioning patterns with maximum high-rank concentration, suggesting institutions see asymmetric opportunities in this market segment.Technology: 65 points (Dollar: 24 + Size: 18 + High Rank: 4 + Count: 15 + Momentum: 4)
Technology leads in dollar allocation and trade count diversity, indicating broad-based institutional interest across multiple technology subsectors rather than concentrated bets.Crypto: 59 points with 10.77% average price momentum
Cryptocurrency sector significance receives major boost from Circle's IPO success, where "Circle (CRCL) rose as high as $103 on its first day of trading" after pricing "far above this week's expected range," validating institutional crypto adoption trends.
Industry Intelligence
Top Industry Concentrations by Dollar Value
Automobiles: $3.34 billion (35.2x average relative size)
Tesla's dominance creates this industry concentration, but the 35.2x average relative size across automotive trades suggests industry-wide institutional repositioning rather than isolated Tesla activity.Information Technology Services: $502.2 million (8.2x average, 15 trades)
Broad technology services positioning with moderate relative sizes but high trade count indicates systematic institutional allocation across IT infrastructure and services companies.Software Infrastructure: $483 million (10.6x average, 17 trades)
Software infrastructure shows balanced positioning with both significant dollar allocation and diversified trade count, suggesting institutional confidence in software platform businesses.Biotech: $427.1 million (5.8x average, 22 trades)
Biotechnology demonstrates the highest trade diversification with 22 separate positions, indicating institutional strategies focused on portfolio breadth rather than concentrated bets.Corporate Bonds: $505.7 million (40.9x average, 2 trades)
Fixed income positioning shows extreme relative sizing in corporate credit, suggesting either yield-seeking behavior or defensive positioning ahead of anticipated market volatility.
Bull vs Bear Sentiment Analysis
Overwhelming Bullish Institutional Sentiment
Bull ETF Allocation: $807.8 million across 56 trades
Bear ETF Allocation: $11.8 million across 7 trades
Sentiment Ratio: 68.7:1 favoring bullish positioning
The 68.7:1 Bull/Bear ratio represents extraordinary institutional optimism, but the concentration in leveraged instruments suggests this confidence comes with appetite for amplified exposure rather than conservative positioning. Key bullish positions include SPXL ($550.2M), with smaller allocations across technology and sector-specific leveraged products.
The minimal bear positioning ($11.8M total) indicates either genuine institutional confidence in market direction or suggests defensive strategies are being implemented through other instruments not captured in traditional bear ETFs.
Rank Analysis
Rank Distribution Patterns
Ranks 1-5: 110 trades (20.8%) - Top priority institutional positions
Ranks 6-15: 254 trades (47.9%) - Secondary strategic positioning
Ranks 16-25: 166 trades (31.3%) - Tactical or opportunistic allocations
Statistical Distributions
Dollar Value Distribution
Under $10M: 383 trades (72.3%)
$10M-$50M: 121 trades (22.8%)
$50M-$100M: 20 trades (3.8%)
Over $100M: 26 trades (4.9%)
The concentration in smaller dollar allocations (72.3% under $10M) suggests most institutional activity involves tactical positioning rather than major strategic reallocation.
Relative Size Distribution
Under 2x: 132 trades (24.9%)
2x-5x: 167 trades (31.5%)
5x-20x: 213 trades (40.2%)
Over 20x: 18 trades (3.4%)
The 40.2% concentration in 5x-20x relative size indicates most institutional trades represent meaningful but not extreme positioning adjustments.
Price Momentum Analysis
Average price momentum of 2.1% across all trades, with cryptocurrency showing strongest momentum (10.77%) and bonds showing slight negative momentum (-0.06%), reflecting sector-specific institutional timing and market dynamics.
Ticker Clustering Analysis
Top Multi-Factor Significance Scores
CRCL (Circle): 98 points
Circle achieves top significance through its historic IPO debut, becoming "one of the few pure-play crypto companies to list in the U.S." with institutional validation of stablecoin business models.CRWV: 90 points
APLD: 87 points

CNK (Cinemark): 84 points
MSTY: 82 points
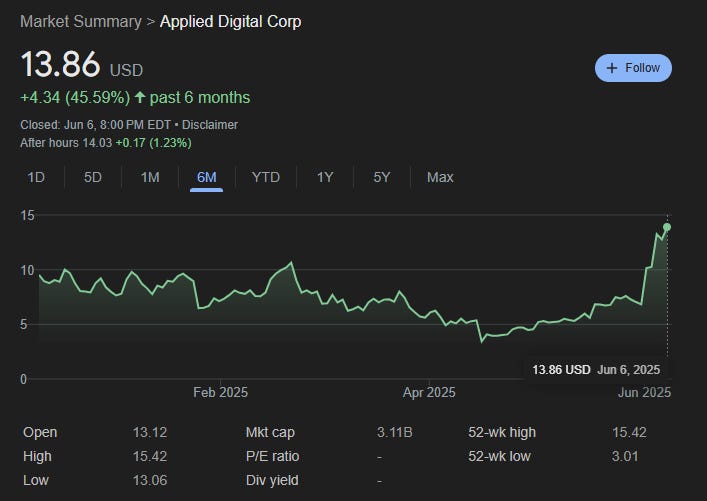
The diversity among top-scoring tickers—from cryptocurrency (CRCL) to entertainment (CNK) to technology services—indicates institutions are pursuing opportunities across multiple sectors rather than concentrated themes.
Multiple Trade Concentration
Notable tickers with multiple institutional trades include systematic positioning in technology infrastructure and financial services, suggesting these sectors receive sustained rather than episodic institutional attention.
Similar Size Last Seen Patterns
Recent Activity Concentration
91.3% of trades (484 out of 530) show recent similar-size activity patterns, indicating this week's institutional positioning builds on recent precedents rather than representing entirely new strategies.
Key Recent Activity Dates
May 30, 2025: 84 tickers (15.8% of dataset)
June 2, 2025: 31 tickers
June 3, 2025: 26 tickers
March 21, 2025: 25 tickers
June 5, 2025: 21 tickers
The concentration around May 30 suggests a significant institutional repositioning event, with continued activity through early June indicating sustained strategic adjustments rather than isolated trading. Take a look at last week’s newsletter for a refresher on just how large of a positioning-event EOM turned out to be!
Fresh Positioning Analysis
The 9.7% of trades without recent similar-size precedents represent genuinely new institutional strategies, concentrated in emerging opportunities like the Circle IPO and specific technology infrastructure plays.
Actionable Intelligence for Investors
Strategic Positioning Insights
Leverage Appetite Signals: The unprecedented 223.9x positioning in SPXL suggests institutions expect significant near-term market movements requiring amplified exposure.
International Diversification Acceleration: 185.1x positioning in emerging markets (VXUS) indicates institutions are rapidly adjusting geographic allocation, potentially ahead of domestic political or economic developments.
Crypto Institutional Validation: Circle's IPO success, where "Cathie Wood's ARK Investment Management has indicated interest in purchasing up to $150 million of the shares," represents further mainstream institutional validation of cryptocurrency infrastructure businesses.
Risk Management Considerations
Extreme Positioning Vulnerability: The 18 trades exceeding 50x normal size create concentration risk if market conditions change rapidly.
Leverage Amplification Risk: Heavy institutional positioning in 3x leveraged instruments amplifies both upside potential and downside vulnerability.
Political Sensitivity: Tesla's massive positioning during political tensions highlights how external events can impact large institutional allocations. Watch TSLA closely on Monday to see if this was just a tree-shake or if we investors continue de-risking and putting some distance between them and potential backlash.
Market Timing Implications
Recent Activity Acceleration: The 91.3% of trades showing recent similar patterns suggests institutional positioning is accelerating rather than stabilizing.
Sector Rotation Evidence: Balanced positioning across technology, financial services, and international markets indicates institutions are positioning for multiple scenarios rather than single themes.
Defensive-Offensive Balance: Simultaneous positioning in bonds ($1.5B) and leveraged equities ($807.8M) suggests institutions are implementing barbell strategies for uncertain environments.
Conclusion
The institutional trading data reveals a fascinating contradiction: overwhelming bullish sentiment (68.7:1 Bull/Bear ratio) combined with extreme positioning magnitudes (224x normal size) suggests institutions are making bold directional bets while simultaneously managing significant uncertainties. The combination of Tesla's $3.3 billion positioning amid political drama, large leveraged ETF activity, and Circle's successful IPO validation indicates institutions are navigating a complex environment requiring both conviction and risk management.
The 91.3% of trades showing recent similar-size patterns suggests this institutional positioning represents acceleration of existing trends and continuations of prior positions rather than entirely new strategies. However, the extreme relative sizes (18 trades over 50x normal) indicate institutions are implementing these strategies with unusual urgency or conviction.
For investors, the key insight is that institutional behavior suggests preparation for significant market movements—either through opportunity capture (leveraged bull positioning) or risk management (international diversification). If there is one thematic we’ve seen consistently this year, it’s that diversification has paid and many feel forced to participate but aren’t ready to abandon downside protection due to the persistence of market risks from multiple angles.
Thank you for being part of our community and for dedicating your time to this edition. Your insights and engagement drive everything we do, and we’re honored to share this space with such committed, thoughtful readers. Here’s to a week filled with clear opportunities and strong performance. Wishing you many bags 💰💰💰
—VolumeLeaders