Market Momentum: Your Weekly Financial Forecast & Market Prep
Issue 47 / What to expect June 02, 2025 thru June 06, 2025

NOTE: This weekly periodical is too large for Substack to deliver in its entirety via email - you will only see a portion of this great content if you read from your email client. Click the header/title at the top to read the full article!

In This Issue
[Free For Everyone]
Weekly Market-On-Close Report: All the macro moves, market drivers, and must-know narratives—covered in less than five minutes.
Weekly Benchmark Breakdown: Our weekly intelligence report on major indices cuts through the index-level noise to uncover participation, momentum, and structural integrity and tell you whether markets are rising on solid ground or skating on thin breadth. This is where bull markets prove themselves—or quietly start to unravel.
The Latest Investor Sentiment Readings: Track the emotional pulse of the market with our curated dashboard of sentiment indicators. From fear-fueled flight to euphoric overreach, this week's readings reveal whether investors are cautiously creeping in—or stampeding toward the exits.
VL Special Coverage Report: America's Nuclear Renaissance: Why the Smart Money Is Going Atomic
Institutional Support & Resistance Levels For Major Indices: Exactly where to look for support and resistance this coming week in SPY, QQQ, IWM & DIA
Normalized Performance By Thematics YTD: Which corners of the markets are beating benchmarks, which are overlooked and which ones are over-crowded!
Key Econ Events & Earnings On-Deck For This Coming Week
[Only For Subs]
This Week’s Institutional Activity In Equities: Track the real money. This section breaks down where institutions are placing their bets—and pulling their chips. You'll get a sector-by-sector view of equity flows, highlighting the most active names attracting large-scale buying or selling. We go beyond the headlines and into the tape, surfacing the week’s most notable block trades and sweep orders, both on lit exchanges and hidden dark pools. Whether you're following momentum or fading crowded trades, this is your map to where size is moving and why it matters.
Institutional Activity By Day (rolling 6-months)
Institutional Activity By Sector By Week (rolling 6-months)
This Week’s Institutional Activity In ETFs: Follow the flows that shape the market. This section uncovers where institutions are deploying capital across the ETF landscape, broken down by sector and fund. We highlight the largest block trades and aggressive sweeps—both visible on lit exchanges and hidden in dark pools—to reveal how the smart money is positioning. Whether they’re rotating risk, hedging exposure, or scaling into themes, this is your lens into the ETF vehicles driving institutional intent.
Statistical Analysis and Insights From This Week’s Top Prints: we run the numbers on the most significant institutional trades of the week—those outsized prints that stand apart from the noise. Through statistical analysis and pattern recognition, we decode what these moves may signal about future price action. Whether it's the start of accumulation, a stealthy unwind, or a shift in market regime, this is where data meets intent. These are the trades that matter—and the stories they may be telling.

Weekly Market-On-Close Report
The financial markets concluded another eventful week with a complex tapestry of outcomes that defied simple categorization. While major indices managed to eke out modest gains, the underlying dynamics revealed a market grappling with fundamental tensions between corporate resilience and geopolitical uncertainty. This intricate dance between optimism and caution has created a fascinating environment for investors, one where traditional patterns are being challenged and new narratives are emerging.
The Broad Market Landscape: Mixed Signals and Subtle Movements
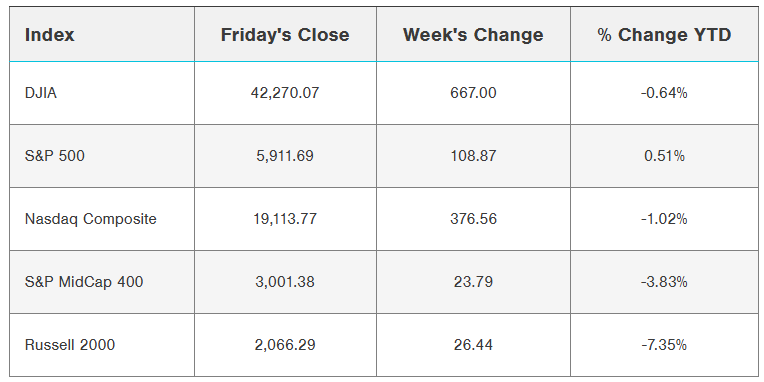
Major equity benchmarks displayed the kind of nuanced performance that often characterizes markets in transition. The flagship S&P 500 index managed a marginal decline of just 0.01%, essentially treading water in a week filled with significant developments. This near-flat performance masks the considerable volatility that occurred beneath the surface, as investors processed a steady stream of earnings announcements, policy developments, and economic indicators.
The Dow Jones Industrial Average demonstrated slightly more resilience, advancing 0.13% as blue-chip stocks found favor among investors seeking stability amid uncertainty. Meanwhile, the technology-heavy Nasdaq 100 experienced a modest pullback of 0.11%, reflecting some profit-taking in high-growth sectors that have been market leaders throughout much of the year.
Futures markets provided additional insight into investor sentiment, with June E-mini S&P contracts trading 0.10% lower and June E-mini Nasdaq futures declining 0.16%. These moves suggest that market participants are adopting a cautious stance as they look toward the upcoming weeks, anticipating potential volatility from ongoing policy developments and earnings announcements.
The week's trading action was particularly notable for its intraday swings, as markets opened under pressure before recovering ground in afternoon sessions. This pattern of early weakness followed by late-session strength has become increasingly common, suggesting that institutional investors may be using market dips as buying opportunities while remaining selective about their timing.
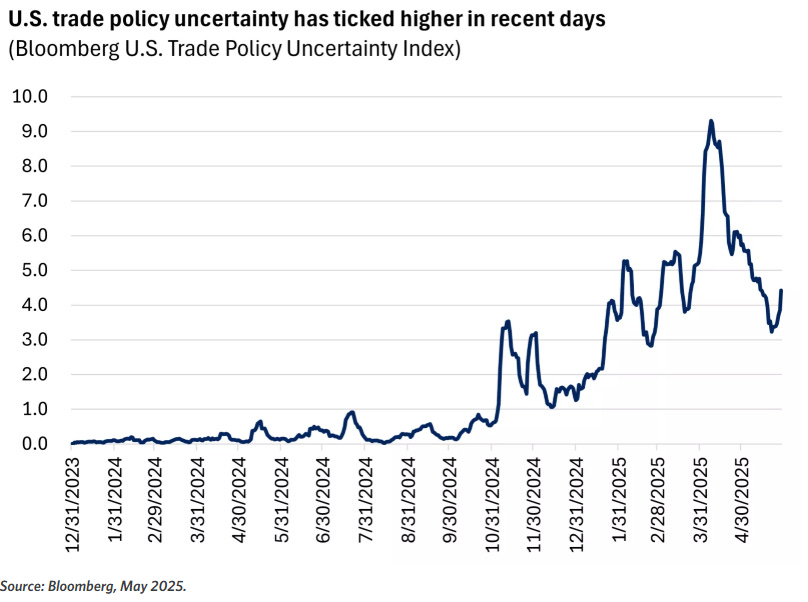
Trade Policy Uncertainty: The Dominant Market Theme
Perhaps no single factor influenced market sentiment more profoundly than the evolving landscape of international trade policy. The week began with significant developments in US-China relations, as Treasury Secretary Bessent acknowledged that bilateral trade discussions had reached an impasse. His characterization of talks as "a bit stalled" immediately captured market attention, as investors recognized the potential implications for global supply chains and economic growth.

The situation became more complex when President Trump publicly accused China of violating previous agreements regarding tariff modifications. This accusation, combined with statements from US Trade Representative Greer highlighting China's alleged delays in approving export licenses for rare-earth materials, created an atmosphere of heightened tension that weighed on market sentiment throughout the early part of the week.
However, markets demonstrated their characteristic resilience when President Trump subsequently expressed confidence that trade issues could be resolved through direct dialogue with Chinese leadership. His suggestion that a conversation with President Xi could lead to a breakthrough provided enough hope to support a recovery in equity prices, illustrating how sensitive markets have become to even subtle shifts in trade rhetoric.
The broader implications of these trade developments extend far beyond immediate market movements. Companies across various sectors are being forced to reassess their supply chain strategies, inventory management practices, and pricing models. This ongoing adjustment process is creating both challenges and opportunities, as businesses work to navigate an increasingly complex international environment.
Corporate Earnings: A Story of Resilience and Adaptation
The first quarter earnings season provided a compelling counterpoint to trade-related uncertainties, with corporate America demonstrating remarkable adaptability in the face of challenging conditions. More than 90% of S&P 500 companies have now reported their quarterly results, with an impressive 77% exceeding analyst expectations. This beat rate represents the highest percentage since the second quarter of 2024, suggesting that management teams have successfully navigated the complex operating environment.
Particularly striking was the actual earnings growth rate of 13.1%, which significantly exceeded the modest 6.6% growth that analysts had anticipated at the beginning of the reporting season. This substantial outperformance indicates that companies have found ways to maintain profitability despite various headwinds, including inflationary pressures, supply chain disruptions, and regulatory uncertainties.
The technology sector emerged as a particular bright spot, with several high-profile companies delivering results that exceeded even optimistic expectations. Artificial intelligence companies, in particular, demonstrated the continued strength of demand for their products and services, validating the substantial investments that have been made in this rapidly evolving field.
However, forward-looking guidance has been more measured, with full-year 2025 corporate profit projections for the S&P 500 now expected to rise 9.4%. While this represents solid growth by historical standards, it marks a downward revision from the 12.5% increase that analysts had projected in early January. This adjustment reflects the realistic assessment that companies are making about the potential impact of ongoing policy uncertainties on their business prospects.
Economic Indicators: Inflation Progress and Consumer Dynamics
The week brought several important economic data releases that provided valuable insights into the underlying health of the US economy. April personal spending data showed a moderate 0.2% monthly increase, precisely in line with economist expectations. This measured pace of consumption growth suggests that consumers are maintaining their spending patterns while exercising appropriate caution given the uncertain economic environment.
More encouraging was the substantial 0.8% increase in personal income during April, which far exceeded the 0.3% gain that analysts had anticipated. This represented the largest monthly increase in personal income in 15 months, providing consumers with additional financial resources that could support future spending activities. The strength in income growth may reflect various factors, including wage increases, bonus payments, and government transfer adjustments.
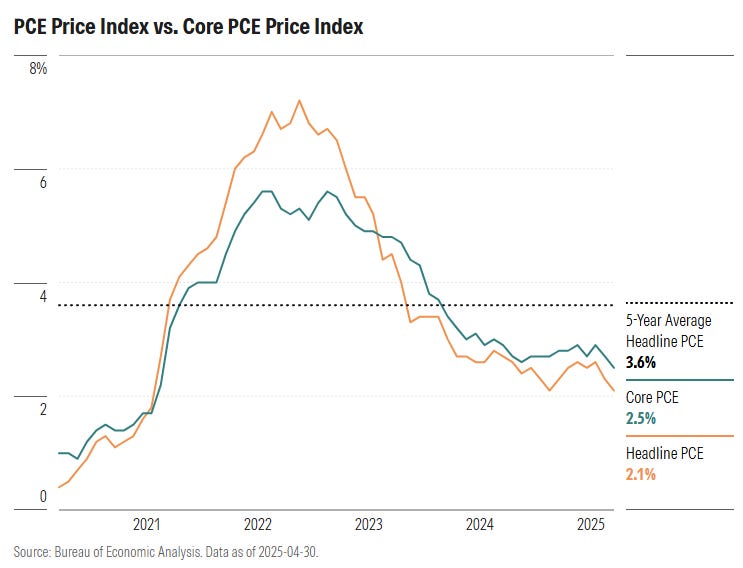
From a monetary policy perspective, the most significant development was the continued moderation in inflation pressures. The core Personal Consumption Expenditures price index, widely regarded as the Federal Reserve's preferred inflation measure, rose just 0.1% monthly and 2.5% annually. The year-over-year reading marked the smallest increase in more than four years, representing meaningful progress toward the Federal Reserve's 2% inflation target.
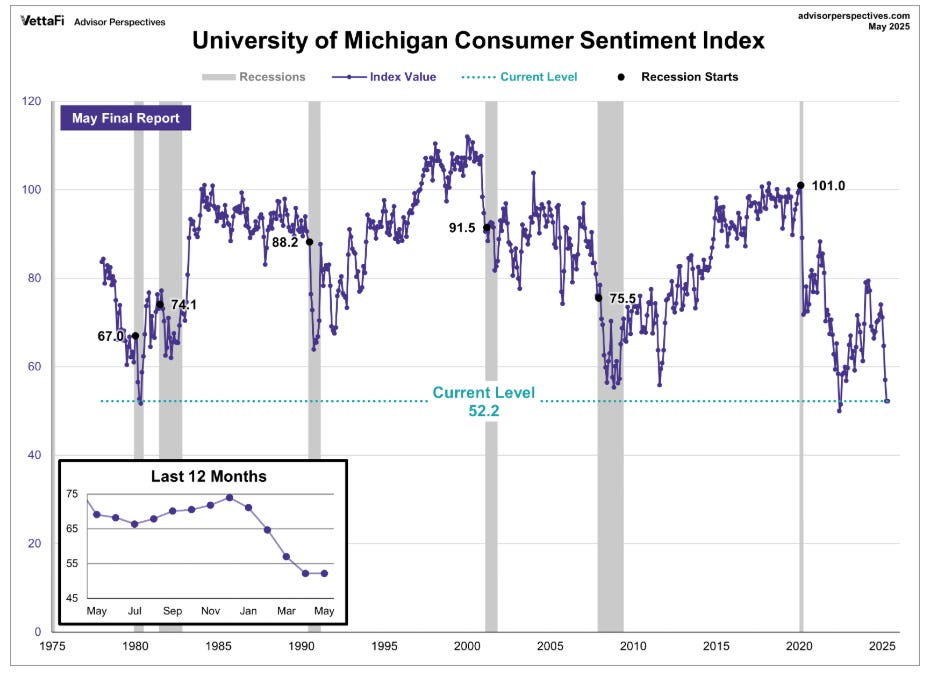
Consumer sentiment data provided additional context for understanding the economic landscape. The University of Michigan's consumer sentiment index was revised upward to 52.2, though this reading remains historically low. More encouraging were the downward revisions to inflation expectations, with one-year expectations falling to 6.6% from a previously reported 7.3%, and five-to-ten-year expectations declining to 4.2%. These adjustments suggest that consumers may be gaining confidence that inflationary pressures will continue to moderate over time.
Regional economic data was more mixed, with the Chicago Purchasing Managers' Index unexpectedly declining to 40.5, well below the 45.0 reading that economists had anticipated. This weakness in manufacturing activity highlights the challenges that certain sectors continue to face, particularly those with significant exposure to global supply chains and trade relationships.
Federal Reserve Policy Implications: A Measured Approach
The week's economic developments had important implications for Federal Reserve policy considerations. Comments from Dallas Federal Reserve President Logan provided insight into the central bank's current thinking, as she suggested that it might be "quite some time" before officials have sufficient clarity about economic conditions to adjust interest rates. This patient approach reflects the Fed's recognition that policy decisions must account for the complex interplay of factors currently influencing the economy.
Market-based measures of Federal Reserve policy expectations showed minimal probability of rate cuts in the near term, with just a 5% chance of a 25 basis point reduction at the upcoming June meeting. This assessment aligns with the Fed's apparent preference for maintaining current policy settings while gathering additional economic data and monitoring the effects of various policy initiatives.
The central bank's cautious stance appears well-founded given the multiple sources of economic uncertainty currently present. Trade policy developments, inflation dynamics, labor market conditions, and global economic trends all contribute to a complex decision-making environment that argues for measured responses rather than aggressive policy adjustments.
International Market Developments: Global Headwinds
Overseas markets reflected similar themes of uncertainty and caution, with most major indices posting modest declines. The Euro Stoxx 50 fell 0.08%, while China's Shanghai Composite dropped 0.47% and Japan's Nikkei declined 1.22%. These moves suggest that the challenges facing US markets are part of broader global dynamics rather than purely domestic concerns.
European economic data was mixed, with some indicators showing resilience while others pointed to potential weakness. German retail sales unexpectedly fell 1.1% monthly, representing the largest decline in more than 18 months and raising questions about consumer spending patterns in Europe's largest economy.

However, German inflation data showed continued progress toward central bank targets, with consumer prices rising 0.2% monthly and 2.1% annually. This measured pace of price increases provides the European Central Bank with flexibility in its policy deliberations, though market expectations continue to anticipate a rate reduction at the upcoming June meeting.
Individual Stock Performances: Winners and Losers
The week featured several standout individual stock performances that illustrated the diverse factors influencing equity valuations. Beauty retailer Ulta Beauty emerged as the top performer in the S&P 500, surging more than 11% after delivering first-quarter earnings per share of $6.70, well above the $5.80 consensus estimate. The company also raised its 2026 earnings forecast, demonstrating confidence in its strategic direction and market position.
Technology companies also featured prominently among the week's winners. Zscaler gained more than 9% after reporting third-quarter revenue that exceeded expectations and raising its full-year revenue guidance. Similarly, Unity Software jumped more than 9% following an analyst upgrade that highlighted improved prospects for the gaming technology company.
Palantir Technologies attracted significant attention, rising more than 7% on reports that the Trump administration plans to expand the use of the company's technology platform across multiple government agencies. This development underscores the growing importance of data analytics and artificial intelligence in government operations.
On the negative side, several companies faced significant headwinds. Regeneron Pharmaceuticals experienced the largest decline in major indices, falling more than 19% after disappointing late-stage trial results for an experimental drug developed in partnership with Sanofi. This setback highlights the inherent risks in pharmaceutical development and the market's sensitivity to clinical trial outcomes.
The semiconductor sector faced particular pressure, with multiple companies posting significant declines. Marvell Technology led the sector lower, falling more than 5% after providing gross margin guidance that fell slightly short of analyst expectations. The weakness spread throughout the chip industry, affecting companies ranging from established players like Intel and AMD to specialized firms focused on specific market segments.
Retail companies also faced challenges, with The Gap falling more than 20% after warning about the potential impact of current tariff levels on earnings. The company's guidance highlighted the real-world effects that trade policy is having on businesses with significant international supply chains.
Fixed Income Markets: Safe Haven Demand
Government bond markets provided a counterpoint to equity volatility, with investors seeking the relative safety and stability of high-quality debt instruments. Ten-year Treasury notes gained ground, with yields falling to 4.420%, representing a three-week low. This movement reflected both safe-haven demand amid trade tensions and positive sentiment following encouraging inflation data.
The bond market's performance illustrated the complex dynamics currently at play in financial markets. While equity investors grappled with mixed corporate earnings and policy uncertainties, fixed-income markets found support from both flight-to-quality flows and expectations that inflation pressures may continue to moderate.
European government bonds followed similar patterns, with German bund yields falling to 2.500% and UK gilt yields declining modestly to 4.647%. These movements suggest that global investors are maintaining a risk-averse stance while remaining optimistic about long-term inflation prospects.
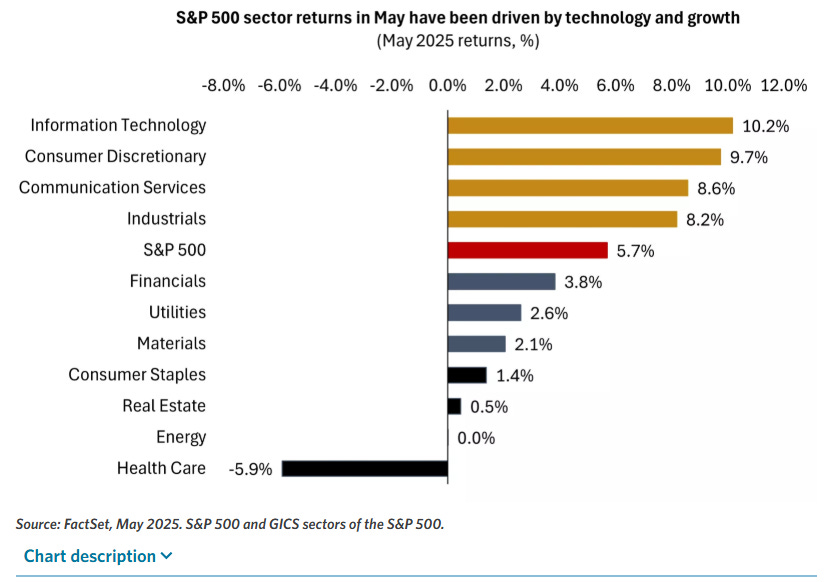
Sector Analysis: Technology Leadership and Cyclical Challenges
The week's sector performance revealed important insights about investor preferences and economic expectations. Technology and growth-oriented sectors continued to demonstrate relative strength, benefiting from strong earnings reports and optimistic long-term prospects for artificial intelligence and digital transformation initiatives.
Healthcare technology companies particularly benefited from positive sentiment, as investors recognized the sector's potential for continued innovation and growth. The strong performance of companies like Dexcom, which received positive analyst coverage initiation, highlighted the market's appetite for businesses with clear competitive advantages and addressable market opportunities.
Conversely, more cyclically sensitive sectors faced headwinds as investors weighed the potential impact of trade policy uncertainties on economic growth. Manufacturing companies, particularly those with significant international exposure, experienced pressure as markets assessed the potential implications of ongoing trade tensions.
The energy sector presented a mixed picture, with companies navigating complex dynamics related to commodity prices, regulatory policies, and global demand patterns. While some firms benefited from favorable supply-demand dynamics, others faced challenges related to policy uncertainties and shifting energy transition trends.
Looking Forward: Key Themes and Considerations
As markets prepare for the coming weeks, several key themes are likely to continue influencing investor sentiment and asset prices. Trade policy developments remain paramount, with market participants closely monitoring any signs of progress in US-China negotiations or changes in the broader international trade environment.
Corporate earnings season will continue to provide important insights into business conditions and management expectations. While first-quarter results have been encouraging, investors will be particularly focused on forward-looking guidance and commentary about operating conditions and strategic priorities.
Economic data releases will maintain their importance, particularly measures of inflation, employment, and consumer spending. The Federal Reserve's policy deliberations will depend heavily on these indicators, making them crucial inputs for investor decision-making processes.
International developments also warrant attention, as global economic conditions and policy decisions in major economies can significantly influence US market performance. European economic data, Chinese policy initiatives, and developments in other major economies all have the potential to create ripple effects in US markets.
Technical Market Analysis: Support and Resistance Levels
From a technical perspective, major indices have demonstrated resilience while navigating complex fundamental challenges. The S&P 500's ability to maintain levels above key moving averages has provided comfort to technically-oriented investors, though some measures of market breadth have shown signs of deterioration in earlier parts of this month before rebounding this week.
Momentum indicators have also shown some moderation, with the Relative Strength Index falling from elevated levels. While these technical developments don't necessarily signal an immediate reversal in market trends, they do suggest that investors should remain vigilant about potential changes in market dynamics.
Investment Implications and Strategic Considerations
The current market environment presents both opportunities and challenges for investors across different time horizons and risk preferences. The combination of solid corporate earnings, moderating inflation, and policy uncertainties creates a complex backdrop that requires careful navigation.
For long-term investors, the fundamental health of corporate America appears solid, with companies demonstrating their ability to adapt to challenging conditions while maintaining profitability. The continued strength of technology and innovation-focused businesses suggests that secular growth themes remain intact despite cyclical headwinds.
However, the elevated level of policy uncertainty argues for maintaining appropriate diversification and avoiding excessive concentration in any single sector or theme. The week's performance highlighted how quickly sentiment can shift based on policy developments, making risk management particularly important in the current environment.
Balancing Optimism and Caution
The week's market performance encapsulated many of the themes that have defined 2025's investment landscape. Corporate resilience has provided a foundation for market stability, while policy uncertainties have created periodic volatility and investor unease. This combination has produced a market environment that rewards careful analysis and thoughtful positioning while punishing excessive speculation or complacency.
As we look ahead, the ability of markets to navigate these competing forces will likely depend on several key factors. Progress in international trade negotiations could provide significant upside potential, while continued corporate adaptation and earnings growth should support fundamental valuations. At the same time, any escalation in policy uncertainties or disappointing economic data could create additional challenges.
The week's developments reinforce the importance of maintaining a balanced perspective that acknowledges both the strengths and vulnerabilities present in current market conditions. While there are certainly reasons for optimism about corporate prospects and economic fundamentals, the elevated level of uncertainty argues for prudent risk management and careful attention to evolving conditions.
Ultimately, successful navigation of current market conditions will require investors to remain flexible and responsive to changing circumstances while maintaining focus on long-term investment objectives. The week's mixed but generally positive outcomes suggest that markets retain their underlying resilience, even as they continue to grapple with complex and evolving challenges.
In this environment, the premium on quality research, careful analysis, and disciplined execution has never been higher. Investors who can successfully balance the competing demands of opportunity recognition and risk management are likely to be best positioned for success in the weeks and months ahead.

Weekly Benchmark Breakdown
S&P 500 Index
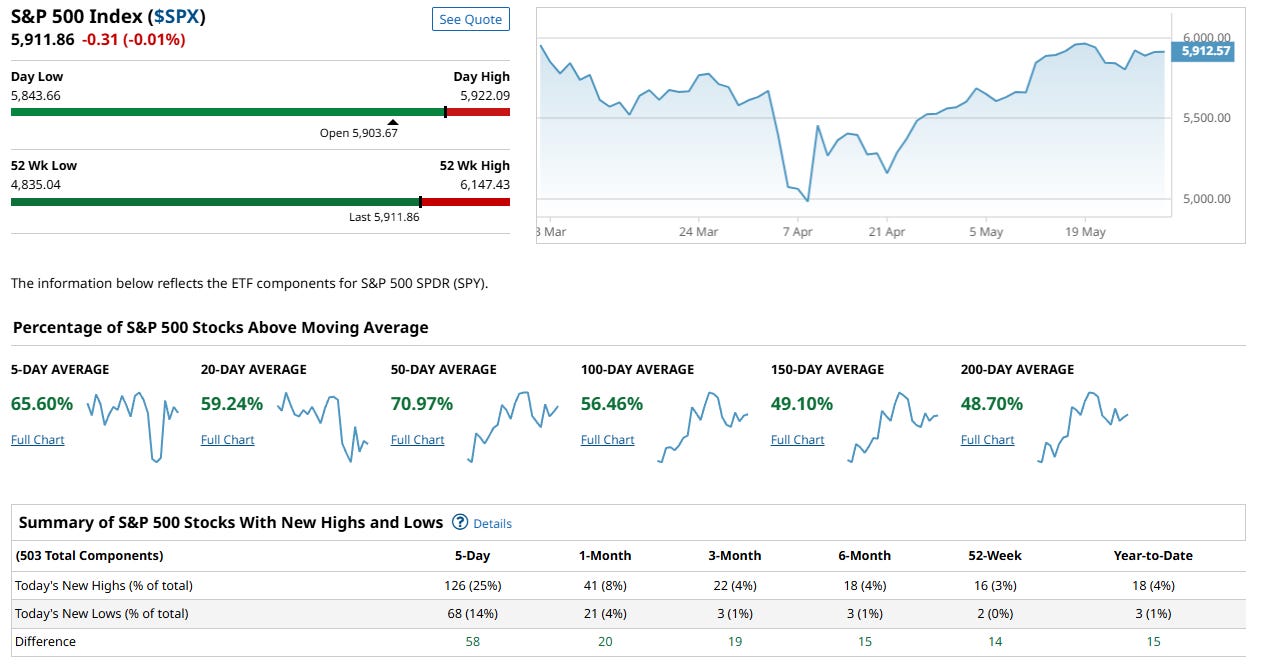
The S&P 500 ($SPX) continues to trade near all-time highs at 5,911.86, but now, unlike in previous weeks, internal breadth is catching up with price—a healthy and constructive development that validates the rally’s durability.
Key Takeaways
Short-Term Momentum Surging:
A strong 65.6% of stocks are above their 5-day moving average, indicating widespread participation in the near-term advance.Intermediate-Term Participation Solid:
59.2% of stocks are above their 20-day MA
70.97% are above their 50-day MA
This reinforces the idea that the rally is not narrowly led but instead broad-based and sustained across multiple timeframes.
Long-Term Trend Strengthening:
While still not above the 50% threshold, long-term breadth is improving, with:56.5% above 100-day MA
49.1% above 150-day MA
48.7% above 200-day MA
This suggests that the majority of stocks are either in or approaching long-term uptrends—a notable shift from the deterioration seen two weeks ago.
New Highs vs. New Lows – Bullish Turnaround
126 stocks (25%) hit new 5-day highs vs. 68 stocks (14%) hitting new lows.
The net positive differential of +58 is a clear reversal from last week’s deterioration, confirming the rally’s internal strength.
Importantly, the improvement is visible across all timeframes—1-month, 3-month, 6-month, and YTD—pointing to durability and momentum rather than a short-term pop.
Conclusion
This is the healthiest breadth snapshot for the S&P 500 in weeks. The rally is no longer being carried by a few megacaps; the internals now reflect broad institutional conviction and synchronized trend alignment across short- and intermediate-term windows, with long-term structures improving rapidly.
The bull is no longer limping—it’s striding forward with backup. This breadth confirmation provides “permission” for higher highs and suggests dips are likely to be bought, not sold. Unless there's a sudden deterioration, the technical setup supports a continued grind higher.
Dow Jones Index
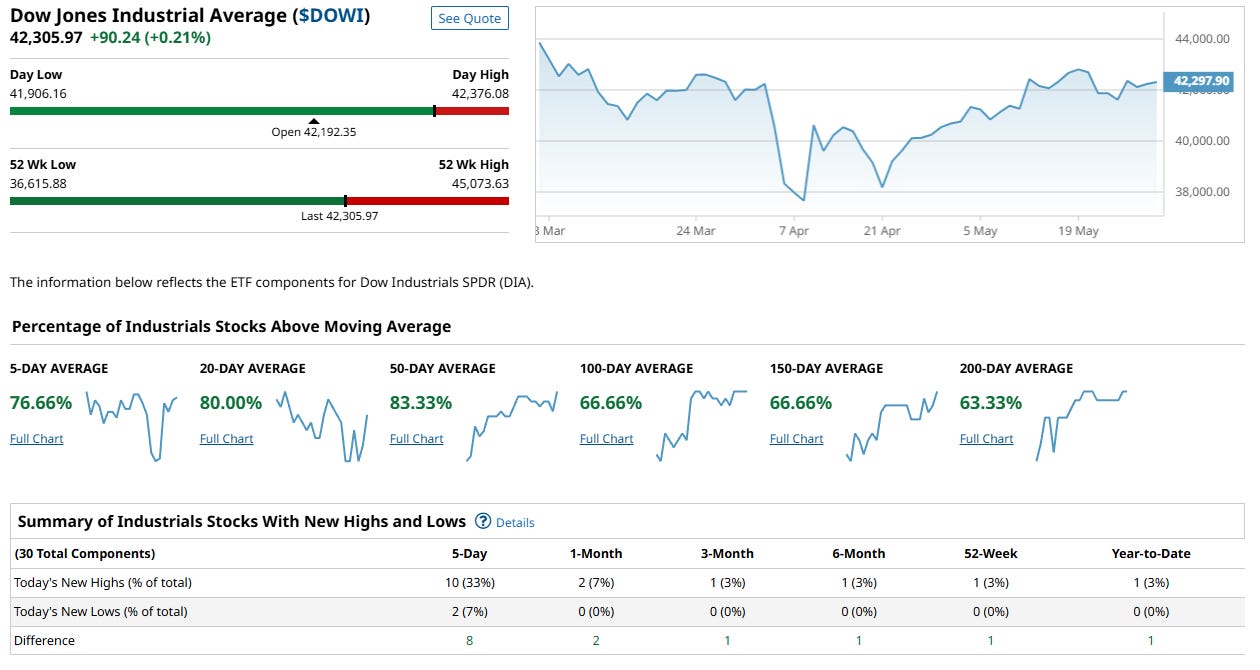
The Dow Jones Industrial Average closed at 42,305.97, up +0.21% on the day and continuing to hover near recent highs. Beneath the surface, market internals reveal impressive breadth strength and a well-balanced uptrend, suggesting this advance is not only intact but also broadly supported.
Breadth Momentum: Strong Across the Board
Short-term strength is notable, with 76.66% of components above their 5-day moving average, showing active participation in the latest push higher.
Intermediate-term metrics are even stronger, with:
80.00% above the 20-day MA
83.33% above the 50-day MA
These numbers reflect a resilient and well-supported rally that extends beyond headline price action.
Long-Term Structure: Bullish and Aligned
A clear majority of Dow components are also trading above their:
100-day MA (66.66%)
150-day MA (66.66%)
200-day MA (63.33%)
This cross-timeframe alignment suggests that the uptrend is sustainable, and not just a tactical bounce. Longer-term investors are seeing broad participation as well.
New Highs vs. New Lows: Constructive and Confirming
Over the past 5 days, 10 stocks (33%) have made new highs, while only 2 (7%) have made new lows, a healthy net difference of +8.
New high counts also show modest breadth across timeframes (1-month, 3-month, 6-month, YTD), though the breakout strength remains concentrated.
Conclusion
The Dow is showing some of the healthiest internals among major indices, with consistently strong participation across all moving average windows and a positive, if modest, new high–new low spread. These conditions suggest that the current price level is well-supported by internal market dynamics, and the index is structurally positioned to absorb short-term volatility while continuing to grind higher.
This is the definition of a broad and durable uptrend, supported by rotation and widespread sector participation.
NASDAQ 100 Index
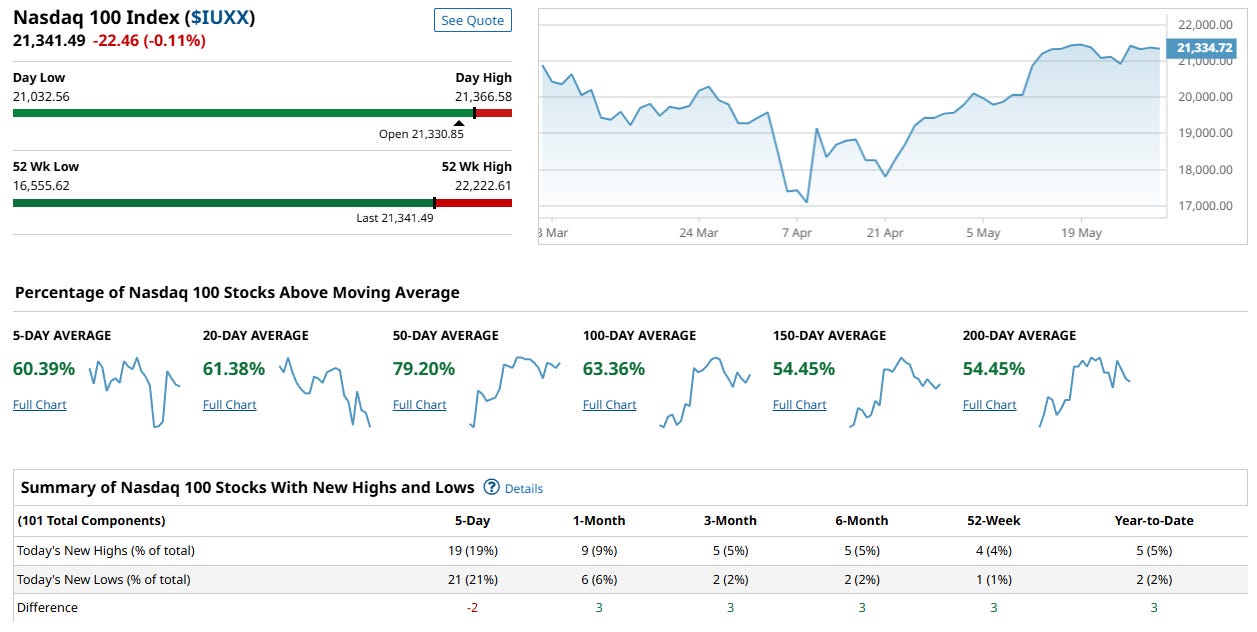
The Nasdaq 100 closed at 21,341.49, down slightly by -0.11%, but remains near its all-time highs. Underneath the modest dip, market internals remain broadly supportive—though some short-term indecision is starting to appear, particularly in the breadth of leadership.
Breadth Metrics: Still Strong and Synchronized
Short- and Intermediate-Term:
60.4% of stocks are above the 5-day MA
61.4% above the 20-day MA
79.2% above the 50-day MA
This is a healthy profile, showing broad participation and trend strength across multiple timeframes.
Long-Term Trend Alignment Holding:
63.4% above the 100-day MA
54.5% above the 150-day MA
54.5% above the 200-day MA
These levels indicate the majority of Nasdaq 100 components remain in long-term uptrends, with decent consistency across deeper lookbacks.
New Highs vs. New Lows: Neutral-to-Cautious
5-day new highs: 19 stocks (19%)
5-day new lows: 21 stocks (21%)
Net difference: -2
This slight negative spread reflects rotational choppiness, not a breakdown. It shows that while many stocks are still participating in the uptrend, fresh breakouts are no longer clearly leading, and some names are starting to fade at the edges.
Interpretation
The Nasdaq 100 remains technically healthy, with broad support across all major trend horizons. However, the recent dip in new highs relative to new lows suggests the rally may be entering a digestion phase. This isn’t bearish by itself, but it does suggest the next leg higher will require either renewed leadership or a broadening out of breakout activity.
Conclusion
This is a consolidating but still constructive tape for the Nasdaq 100. The breadth is there, the long-term structure is intact, and participation remains high. But the lack of decisive leadership among individual components signals that upside may be slower or more selective in the short term. A watchful stance is appropriate—strength remains, but momentum needs to reassert itself.
Russel 1000
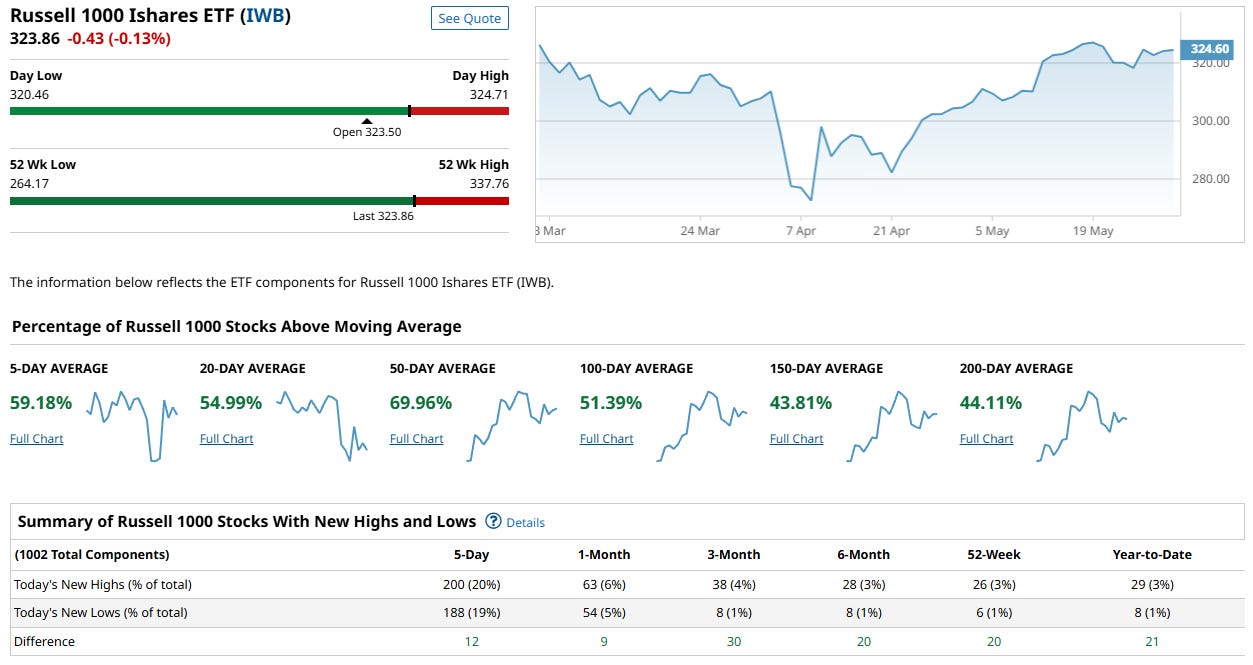
The Russell 1000 closed at 323.86, down -0.13% on the day, yet the broader market internals remain constructive. The index continues to consolidate just below all-time highs, and while not as robust as the Dow or Nasdaq in trend alignment, the breadth picture has improved meaningfully over recent sessions.
Participation Across Timeframes: Rebuilding Strength
Short-term momentum is respectable, with 59.2% of components above their 5-day moving average.
Intermediate-term breadth is supportive:
54.9% above the 20-day MA
69.96% above the 50-day MA
This reflects a solid middle ground—not overheated, not deteriorating—indicative of a market under accumulation, even if it’s not breaking out aggressively.
Longer-term structure remains mixed:
51.4% above the 100-day MA
43.8% above the 150-day MA
44.1% above the 200-day MA
These numbers suggest the long-term trend is healing, but not yet fully confirmed across the broader index.
New Highs vs. New Lows: Improvement Confirmed
5-day new highs: 200 stocks (20%)
5-day new lows: 188 stocks (19%)
Net difference: +12
While the margin is narrow, this is a notable shift from recent weeks, when new lows dramatically outpaced new highs. The Russell 1000 now shows positive net breadth across all key timeframes—1-month, 3-month, 6-month, 52-week, and YTD.
Interpretation
This is a stabilizing and strengthening tape. While the Russell 1000 doesn’t exhibit the cleanest long-term trend alignment yet, the breadth improvements and pickup in new highs suggest that capital is returning to a wider range of large and mid-cap stocks—not just concentrated leadership names.
The backdrop favors continued rotation and accumulation, particularly if longer-term participation continues to improve.
Conclusion
The Russell 1000 reflects a market that is on firmer footing than a few weeks ago. Short- and intermediate-term strength is clearly in place, and long-term breadth metrics are gradually recovering. With breadth now net positive and trend participation expanding, this index is positioned to support further upside—provided the recent improvements hold.
Major Indices Insights & Summary
Market internals across all four major U.S. indices have staged a notable rebound, reversing last week’s deterioration and signaling renewed strength beneath surface-level price action. Breadth metrics have improved significantly, short-term momentum has reaccelerated, and new highs are once again outpacing new lows in key indices. The S&P 500 and Dow Jones now show the strongest structural improvements, while Nasdaq 100 maintains trend leadership and Russell 1000 begins to stabilize after previous damage.
The S&P 500 saw its 5-day breadth surge to 65.6% and now boasts over 70% of stocks above the 50-day MA. New highs (126) now outpace new lows (68), a positive net difference of +58. The Dow Jones presents the cleanest picture, with over 80% of components above the 20- and 50-day MAs and 66–67% above long-term averages—paired with a strong new high count (33% of stocks) and no deterioration at the lows. The Nasdaq 100 remains in a healthy technical position despite short-term leadership rotation, with the majority of components still in uptrends across all moving average horizons. The Russell 1000, while still trailing in long-term alignment, showed a sharp internal improvement with 200 new highs vs. 188 lows and a strengthening base above key intermediate trend levels.
In short, breadth is broadening again, new highs are returning, and multiple timeframes are beginning to realign. This week’s internals mark a shift from fragility to resilience and reacceleration.
Our Indices Market Score: 82 / 100 (+35 WoW)
Following last week’s shakeout, market internals have re-strengthened materially. The rally is no longer narrowly led and shows growing alignment across timeframes and sectors. Here’s why confidence has returned:
1. Breadth Breakout Reconfirmed
Participation surged across the board:
S&P 500: 65.6% above 5-day MA, 59% above 20-day, 71% above 50-day
Dow Jones: 76.7% above 5-day MA, 80% above 20-day, 83.3% above 50-day
Nasdaq 100: 60.4% above 5-day MA, 61.4% above 20-day, 79.2% above 50-day
Russell 1000: 59.2% above 5-day MA, 55% above 20-day, 70% above 50-day
This indicates a healthy reset in momentum and broad-based buying interest.
2. New Highs Reassert Control
New highs outpaced new lows across three of the four indices:
S&P 500: +58 net (126 highs vs 68 lows)
Dow Jones: +8 net (10 highs vs 2 lows)
Russell 1000: +12 net (200 highs vs 188 lows)
Nasdaq 100: minor setback (-2 net), but still showing 19% of stocks at 5-day highs
The return of positive net breadth shows buyers are back in control.
3. Multi-Timeframe Structure Realigning
The percentage of stocks above longer-term moving averages has improved:
S&P 500: Now nearly 50% above both 150- and 200-day MAs
Dow Jones: Over 63% of stocks above 200-day MA
Nasdaq 100: Over 54% above both 150- and 200-day MAs
Russell 1000: Still lagging slightly (44%), but directionally improving
This re-synchronization across timeframes restores a critical pillar of sustained uptrends.
4. Internals Now Confirm Price
Unlike last week’s divergence, this week’s rising prices are now confirmed by internal strength. The rebound in short- and intermediate-term breadth, along with fresh new highs, signals underlying accumulation, not just passive index drift. This internal confirmation gives the rally permission to continue, and increases the probability that pullbacks will be shallow and bought.
5. Conclusion
Last week’s fragility has been replaced by renewed strength and improving breadth. With multiple indices showing synchronized participation, positive net highs, and stable long-term structures, this rally is regaining its footing. Risks remain, but the market is once again trading with internal support—and that’s a bullish development.
FOREX
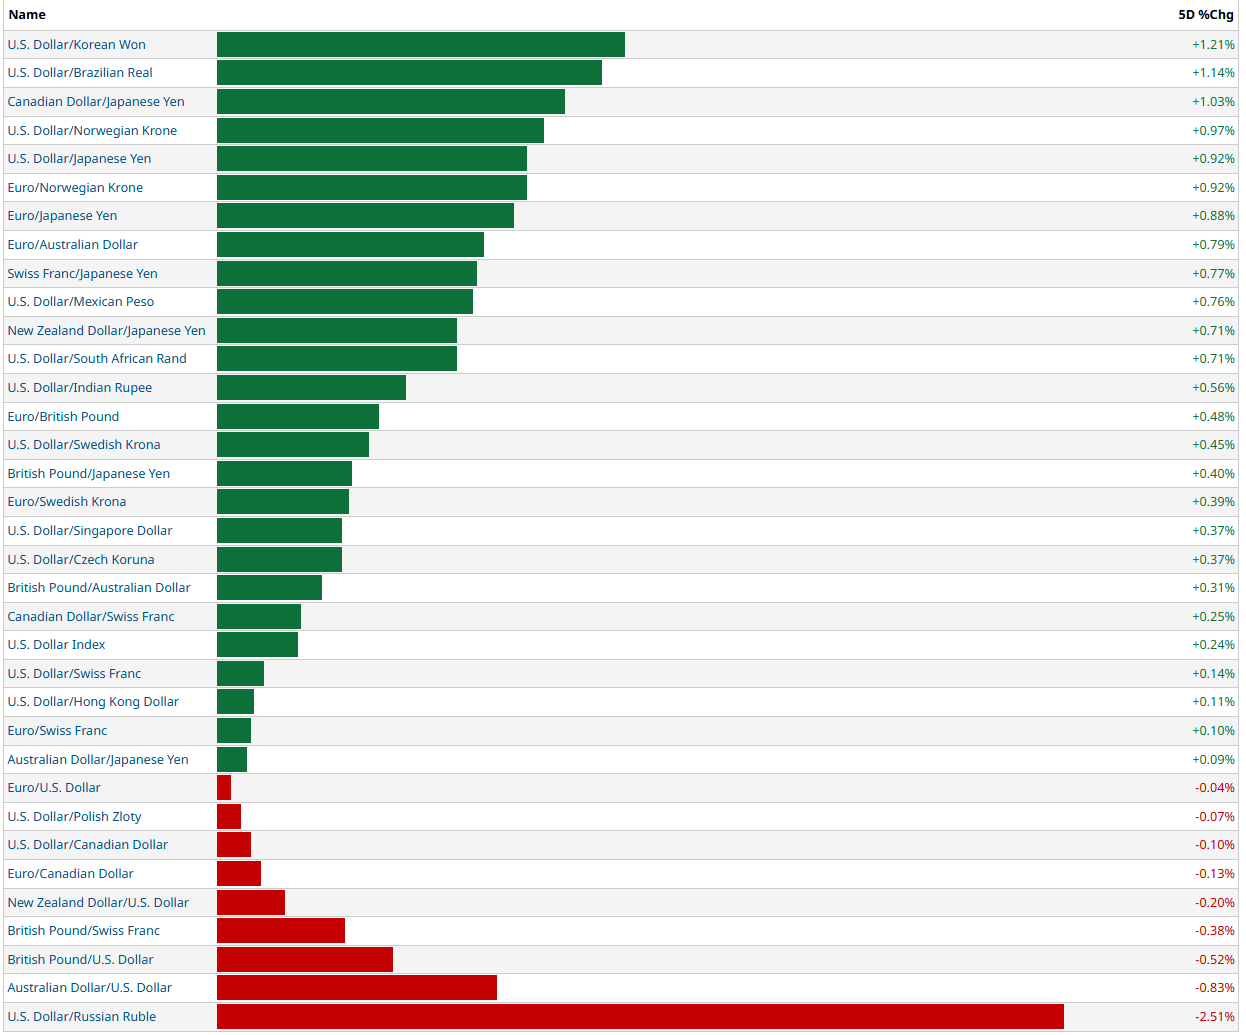
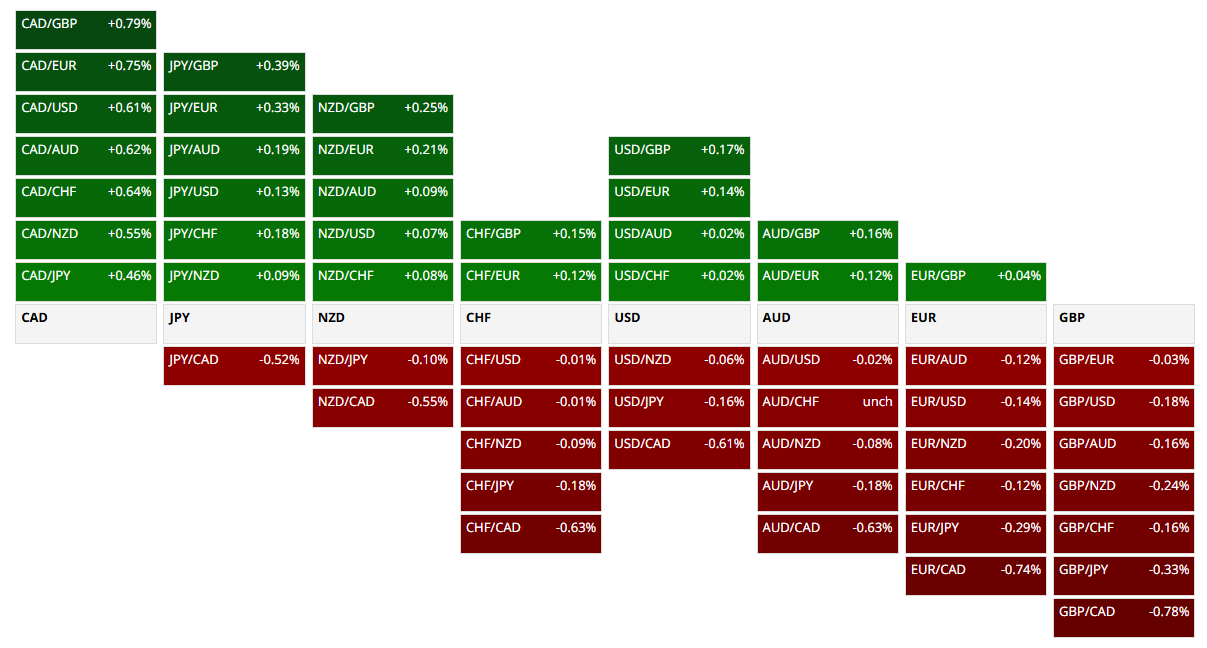
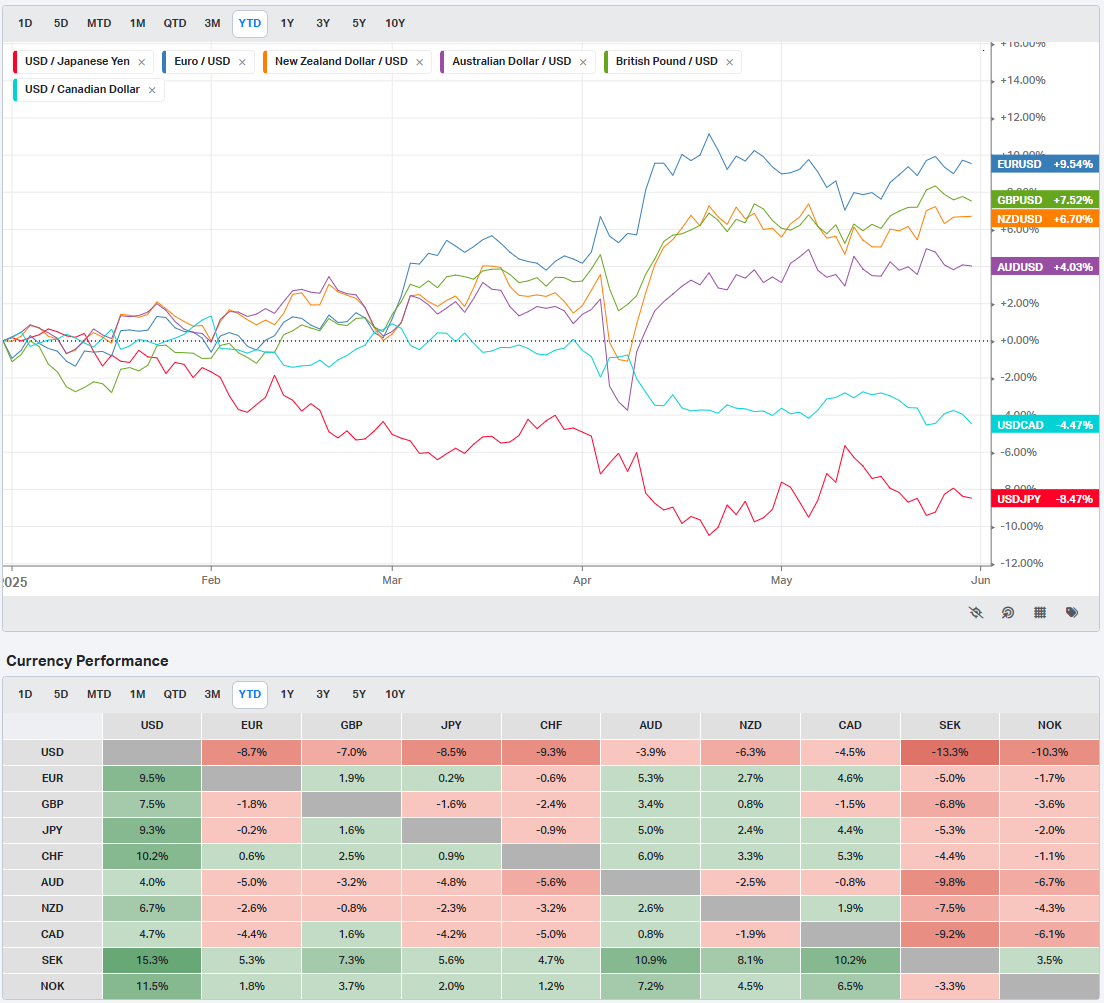
The past week in foreign exchange markets shows a broad-based resurgence in U.S. dollar strength, with the greenback advancing against the majority of global currencies. Out of the 35 currency pairs shown, the U.S. dollar gained ground in over 75% of them, highlighting a return to USD dominance—in contrast to the prior week's weakness.
Key Observations
U.S. Dollar Strength Resurfaces
The USD led gains against high-beta and emerging market currencies, including:
Korean Won (+1.21%)
Brazilian Real (+1.14%)
Japanese Yen (multiple pairs +0.92% to +1.03%)
Norwegian Krone (+0.97%)
Mexican Peso (+0.76%)
These moves reflect a strong risk-off or neutral shift in tone, with flows moving back into the safety and yield advantage of the dollar.
Commodity FX Mostly Weaker
Notably, AUD/USD (-0.83%) and NZD/USD (-0.20%) both declined, pointing to some pressure on growth- and commodity-sensitive currencies.
CAD was mixed, gaining against JPY but losing slightly versus USD.
Isolated USD Weakness
The U.S. dollar lost ground significantly only against the Russian Ruble (-2.51%), likely due to localized geopolitical or commodity-driven factors.
Modest losses were seen vs. AUD, GBP, and EUR in spot pairs like AUD/USD (-0.83%), GBP/USD (-0.52%), and EUR/USD (-0.04%), but these were exceptions in an otherwise dollar-dominant tape.
Broader Interpretation
The broad USD strength indicates a likely shift in rate expectations, risk sentiment, or positioning unwind in global FX markets.
Strength against JPY, KRW, and EM FX reflects a more cautious global macro environment or relative U.S. outperformance.
Crosses like USD/JPY, USD/KRW, and USD/BRL serve as barometers of risk appetite—and their sharp rallies hint at increased hedging or capital repatriation flows.
Conclusion
This was a cleanly pro-dollar week in FX markets. The USD regained its footing across nearly every major region, including Asia, Latin America, and Europe. While commodity currencies and EM FX suffered, the broader message is one of renewed global demand for dollar exposure—potentially tied to relative growth strength, defensive flows, or central bank divergence.
Unless reversed, this renewed dollar strength could pressure global risk assets and may spill over into commodities and equities in the near term.
US Investor Sentiment
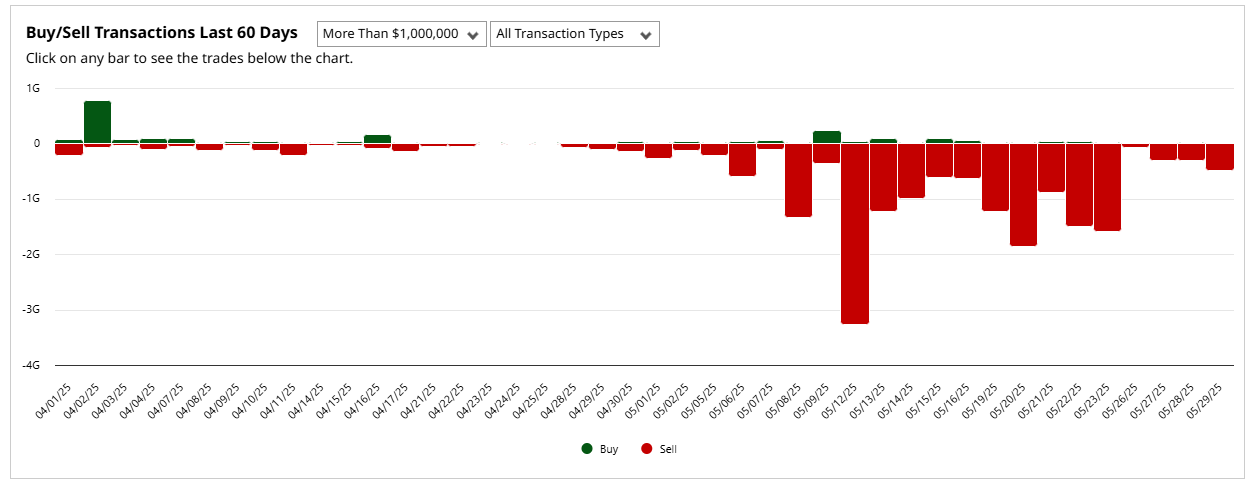
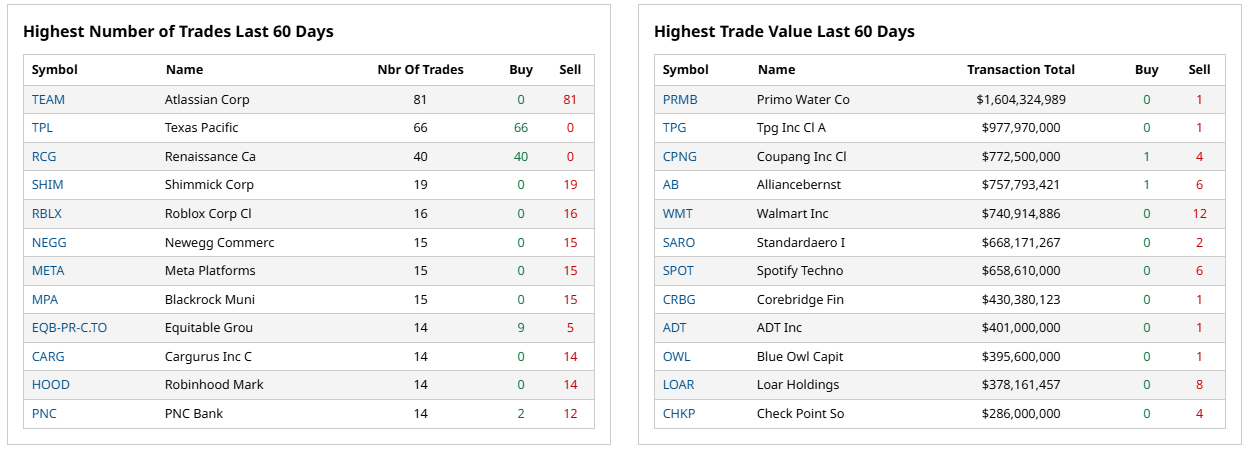
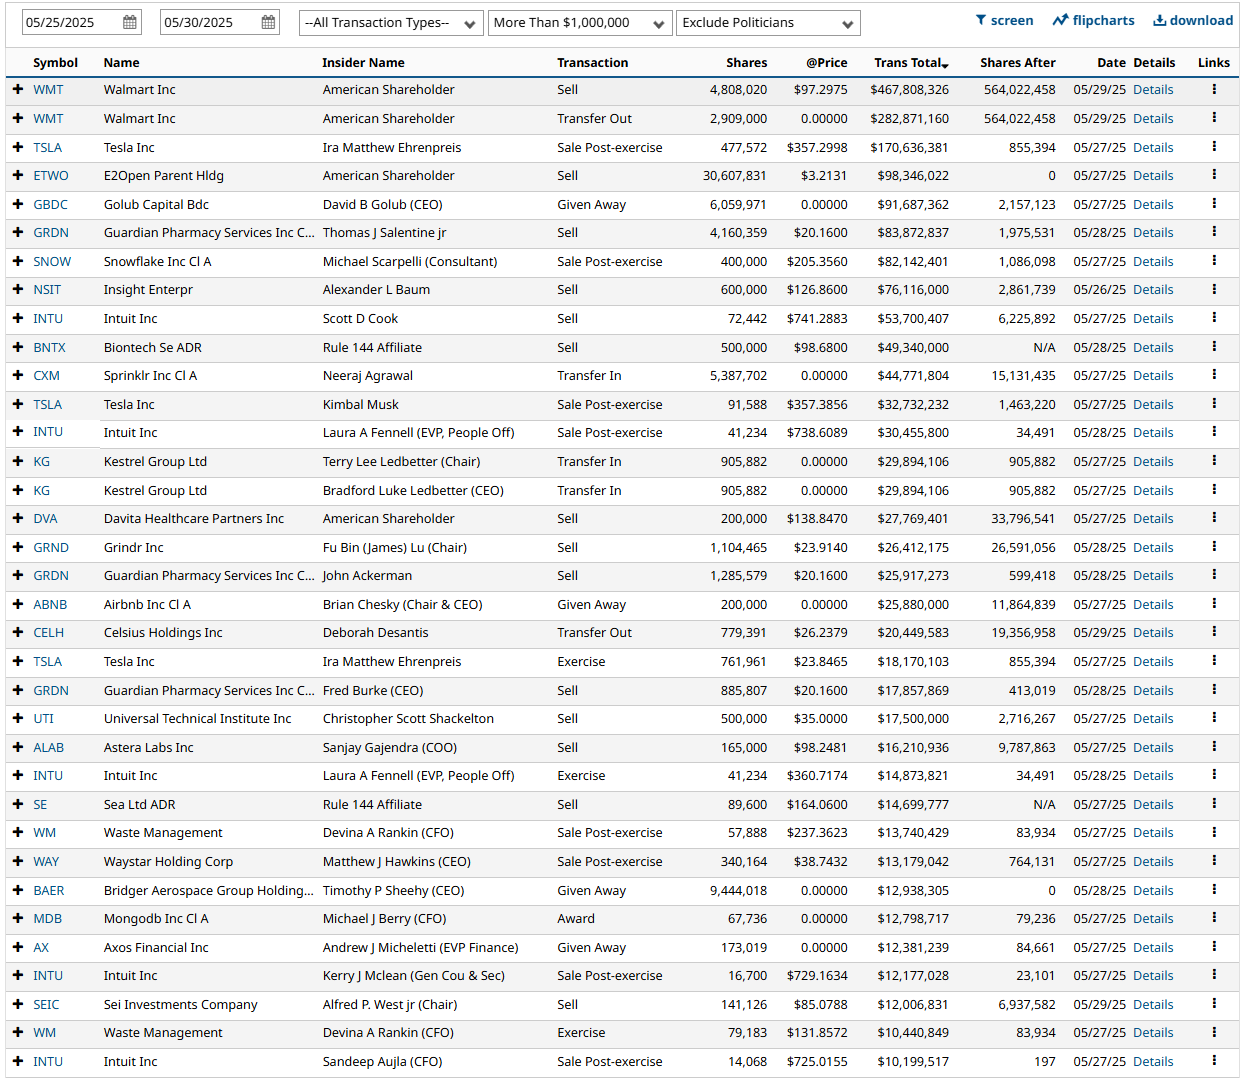
Insider Trading
Insider trading occurs when a company’s leaders or major shareholders trade stock based on non-public information. Tracking these trades can reveal insider expectations about the company’s future. For example, large purchases before an earnings report or drug trial results might indicate confidence in upcoming good news.
%Bull-Bear Spread
The %Bull-Bear Spread chart is a sentiment indicator that shows the difference between the percentage of bullish and bearish investors, often derived from surveys or sentiment data, such as the AAII (American Association of Individual Investors) sentiment survey. This spread tells investors about the prevailing mood in the market and can provide insights into market extremes and potential turning points.
Bullish or Bearish Sentiment:
When the spread is positive, it means more investors are bullish than bearish, indicating optimism about the market’s direction.
A negative spread indicates more bearish sentiment, meaning more investors expect the market to decline.
Contrarian Indicator:
The %Bull-Bear Spread is often used as a contrarian indicator. For example, extremely high levels of bullish sentiment might suggest that the market is overly optimistic and could be due for a correction.
Similarly, when bearish sentiment is extremely high, it might indicate that the market is overly pessimistic, and a rally could be on the horizon.
Market Extremes and Reversals:
Historically, extreme values of the spread (both positive and negative) can signal turning points in the market. A very high positive spread can signal market exuberance, while a very low or negative spread may indicate fear or capitulation.
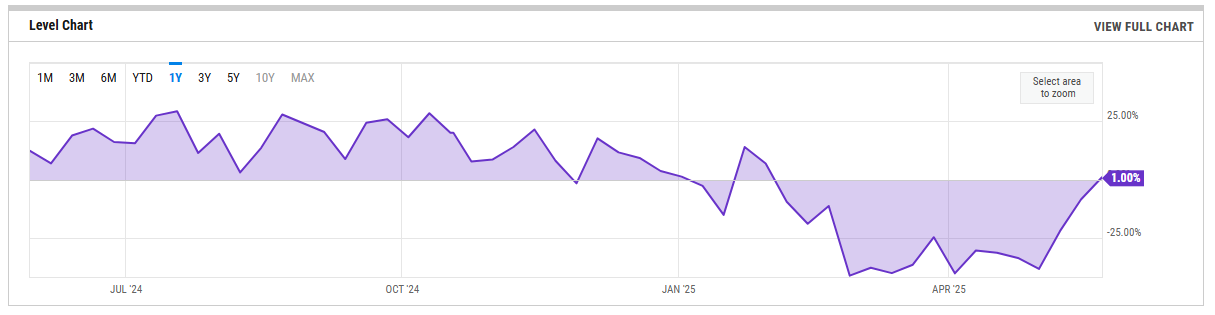
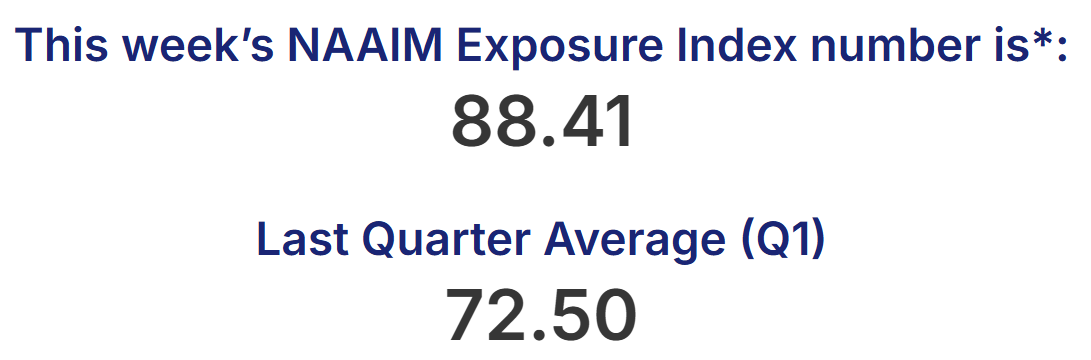
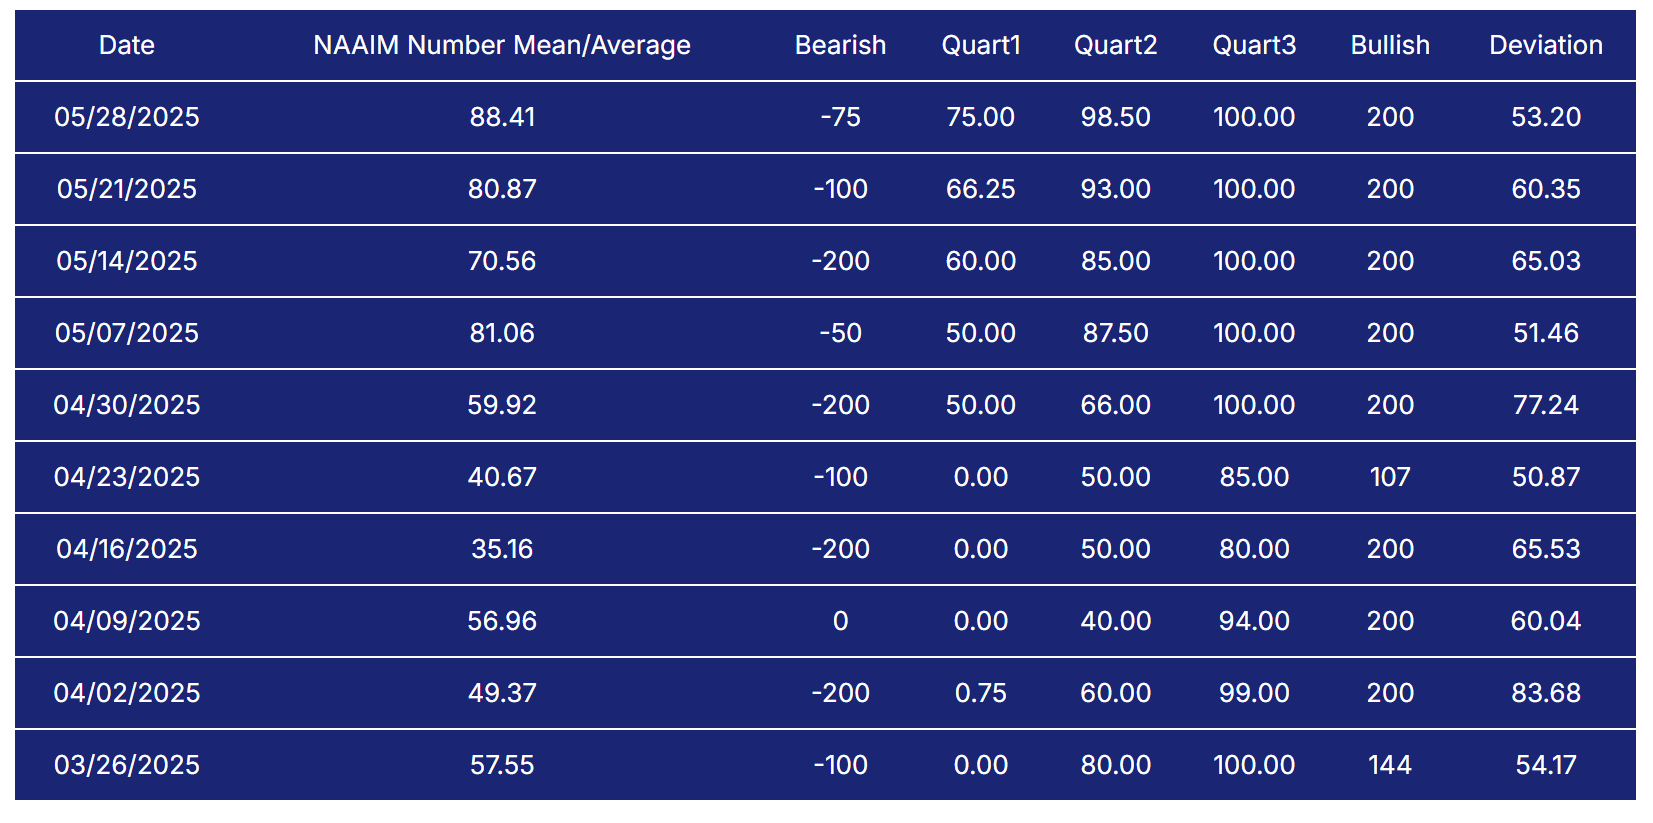
NAAIM Exposure Index
The NAAIM Exposure Index (National Association of Active Investment Managers Exposure Index) measures the average exposure to U.S. equity markets as reported by its member firms. These are typically active money managers who provide their equity exposure levels weekly. The index offers insight into how much these managers are investing in equities at any given time, ranging from being fully short (-100%) to leveraged long (up to +200%).
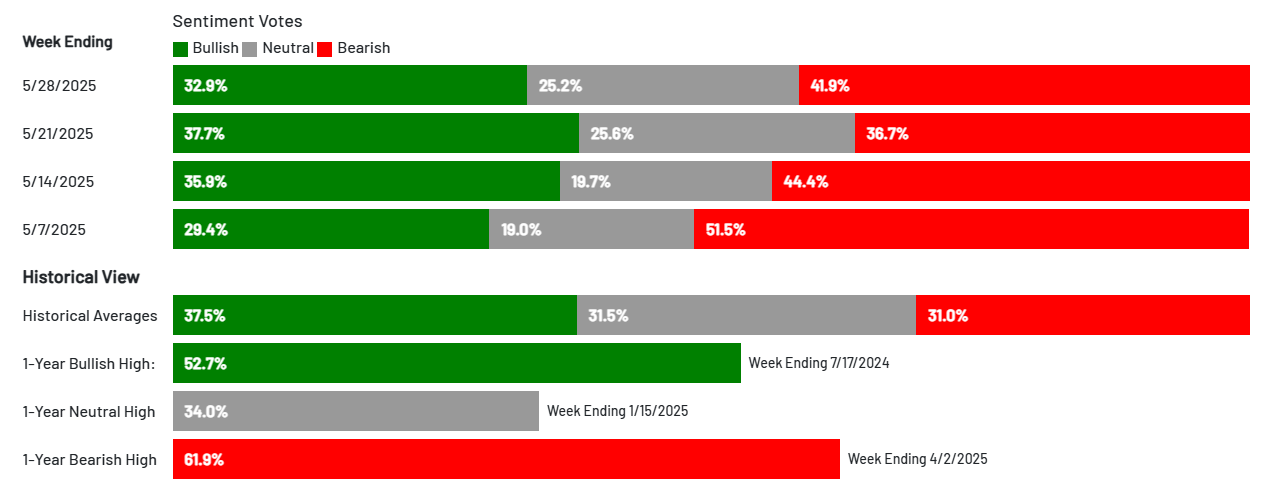
AAII Investor Sentiment Survey
The AAII Investor Sentiment Survey is a weekly survey conducted by the American Association of Individual Investors (AAII) to gauge the mood of individual investors regarding the direction of the stock market over the next six months. It provides insights into whether investors are feeling bullish (expecting the market to rise), bearish (expecting the market to fall), or neutral (expecting the market to stay about the same).
Key Points:
Bullish Sentiment: Reflects the percentage of investors who believe the stock market will rise in the next six months.
Bearish Sentiment: Represents those who expect a decline.
Neutral Sentiment: Reflects investors who anticipate little to no market movement.
The survey is widely followed as a contrarian indicator, meaning that extreme levels of bullishness or bearishness can sometimes signal market turning points. For example, when a large number of investors are overly optimistic (high bullish sentiment), it could suggest a market top, while excessive pessimism (high bearish sentiment) may indicate a market bottom is near.
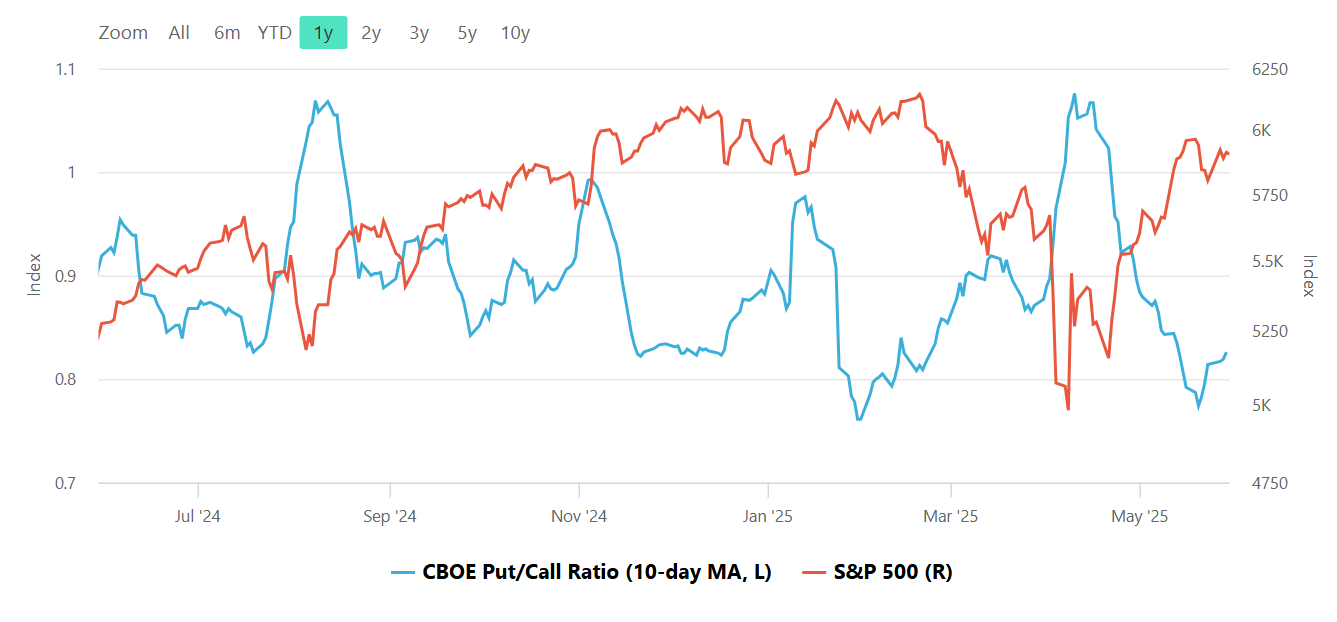
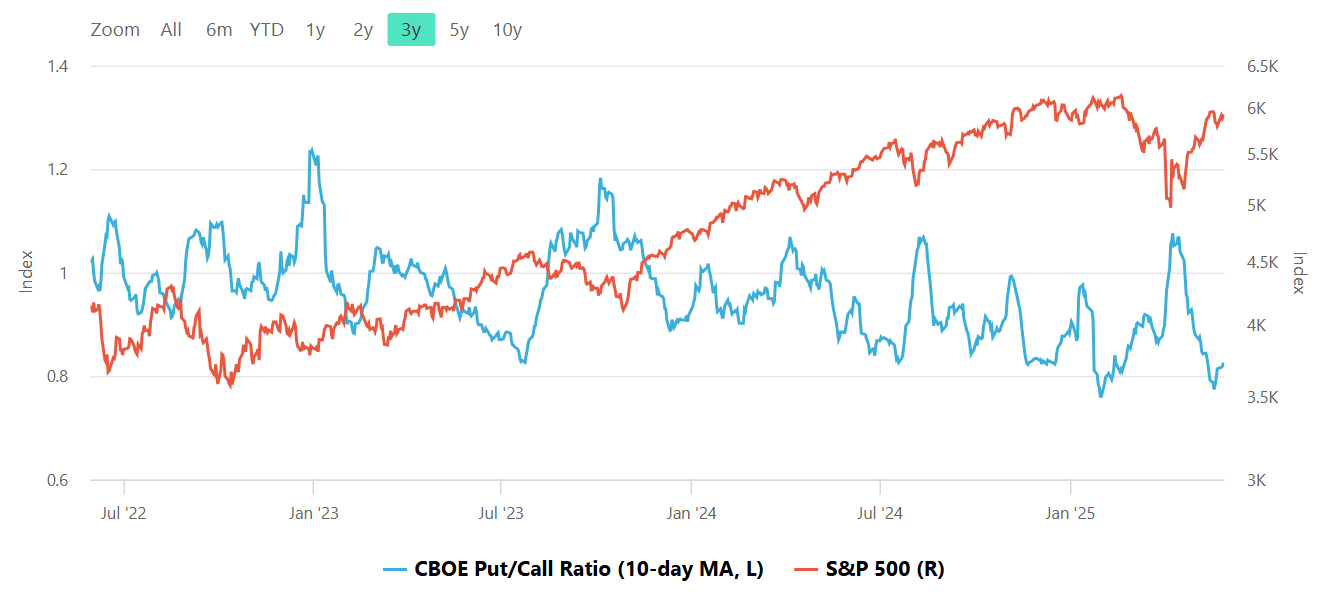
CBOE Total Put/Call Ratio
CBOE's total put/call ratio includes index options and equity options. It's a popular indicator for market sentiment. A high put/call ratio suggests that the market is overly bearish and stocks might rebound. A low put/call ratio suggests that market exuberance could result in a sharp fall.
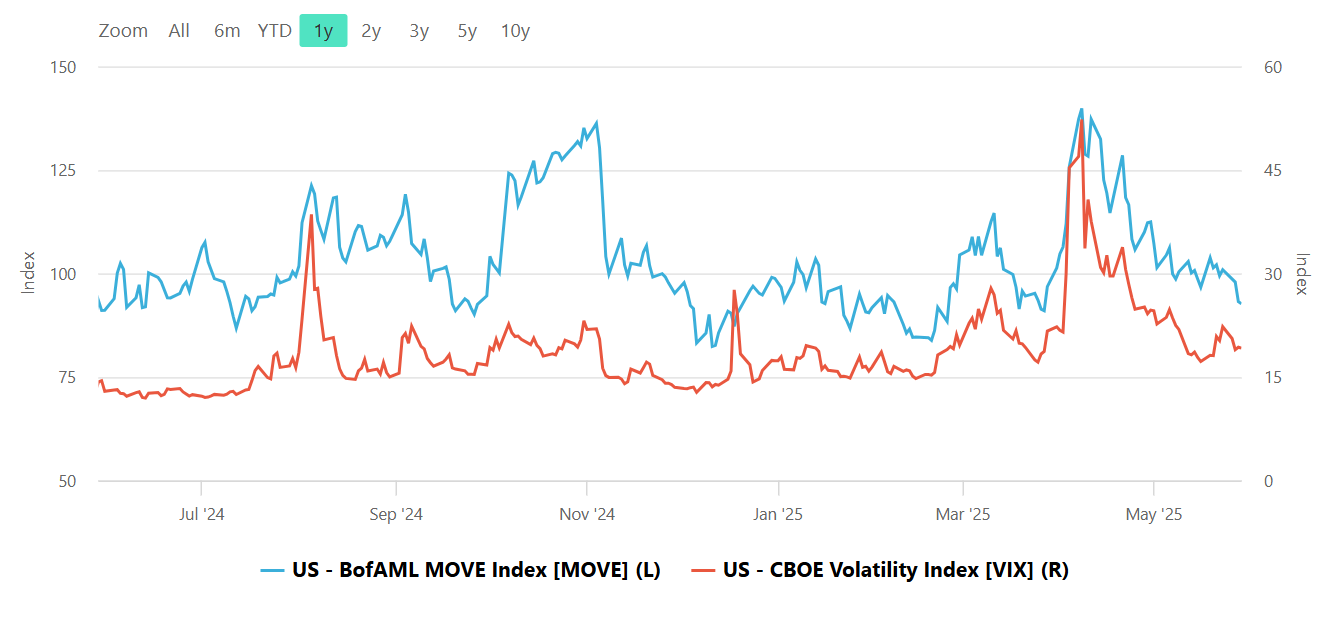
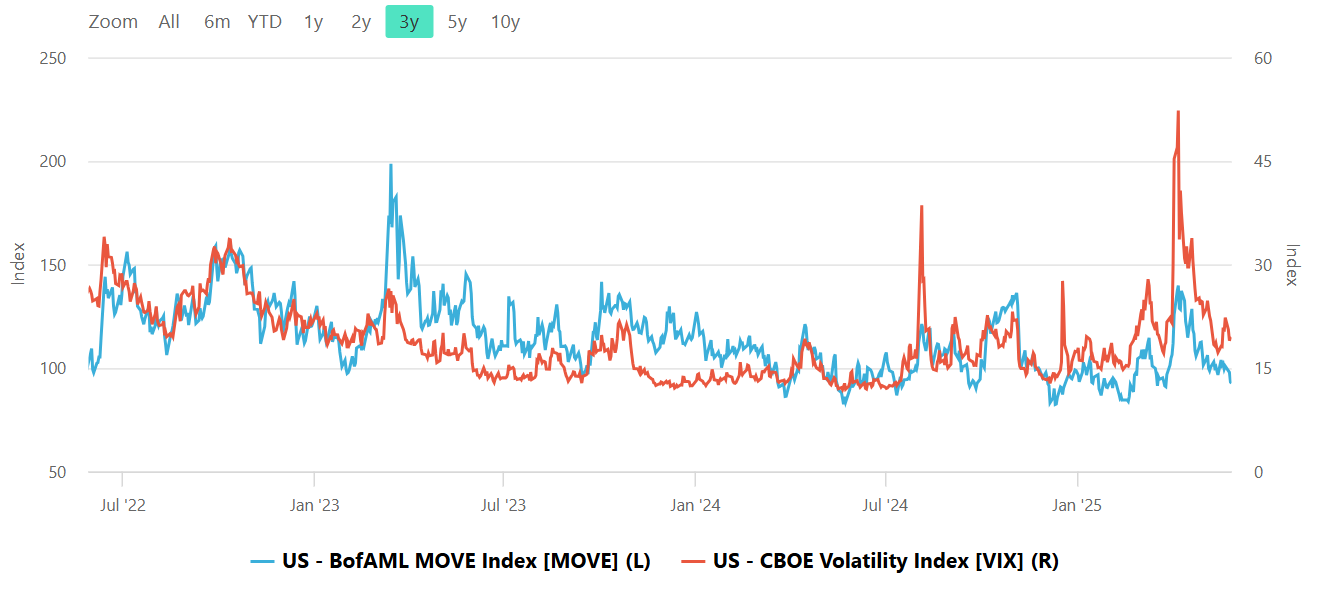
Equity vs Bond Volatility
The Merrill Lynch Option Volatility Estimate [MOVE] Index from BofAML and the CBOE Volatility Index [VIX] respectively represent market volatility of U.S. Treasury futures and the S&P 500 index. They typically move in tandem but when they diverge, an opportunity can emerge from one having to “catch-up” to the other.
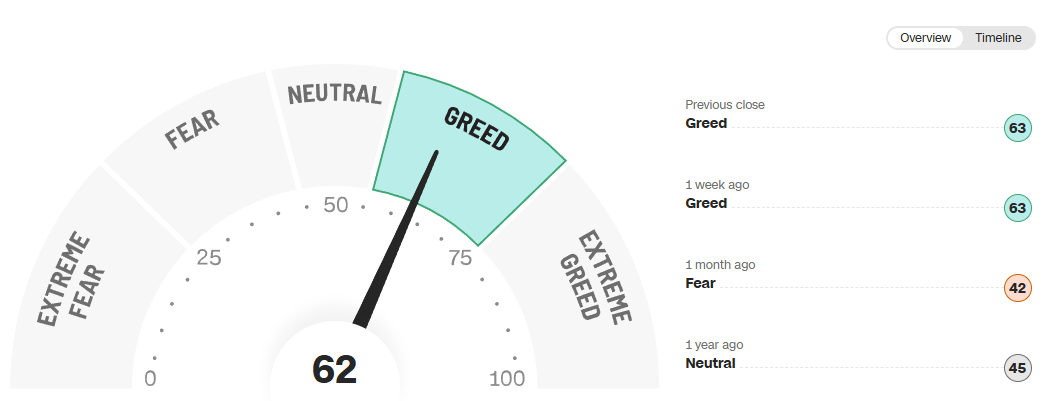
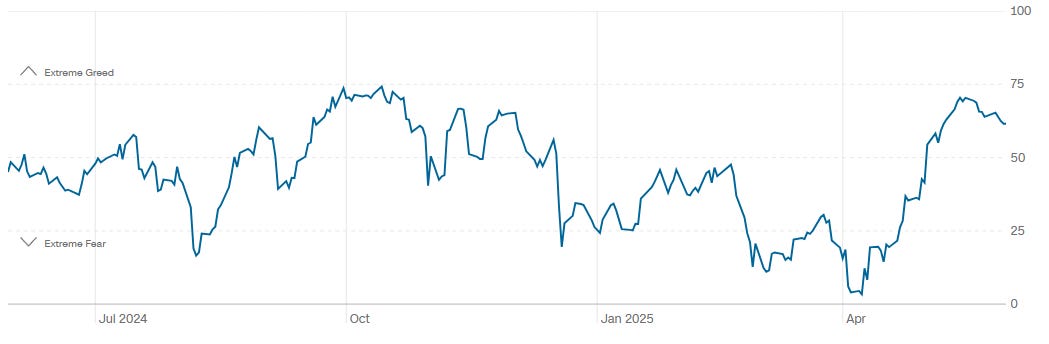
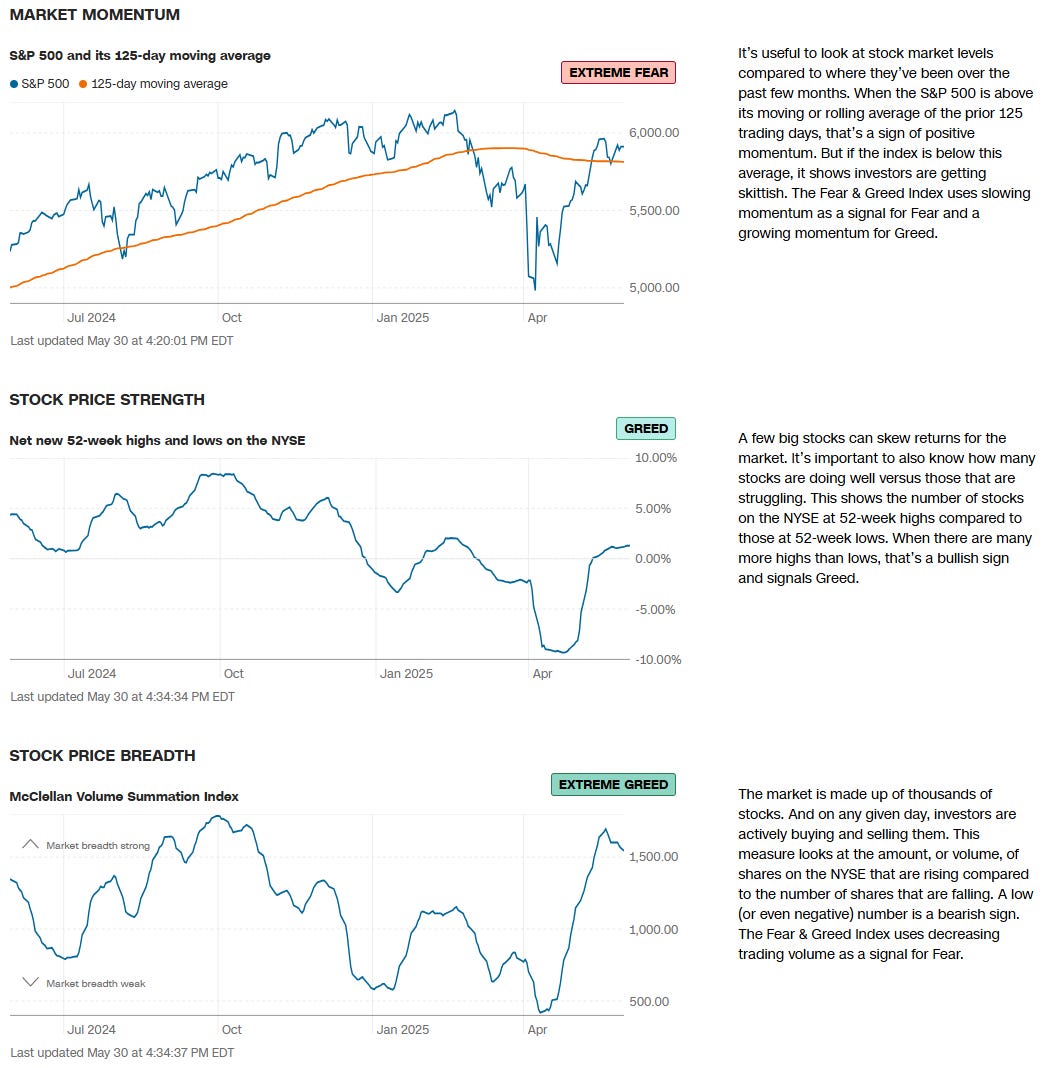
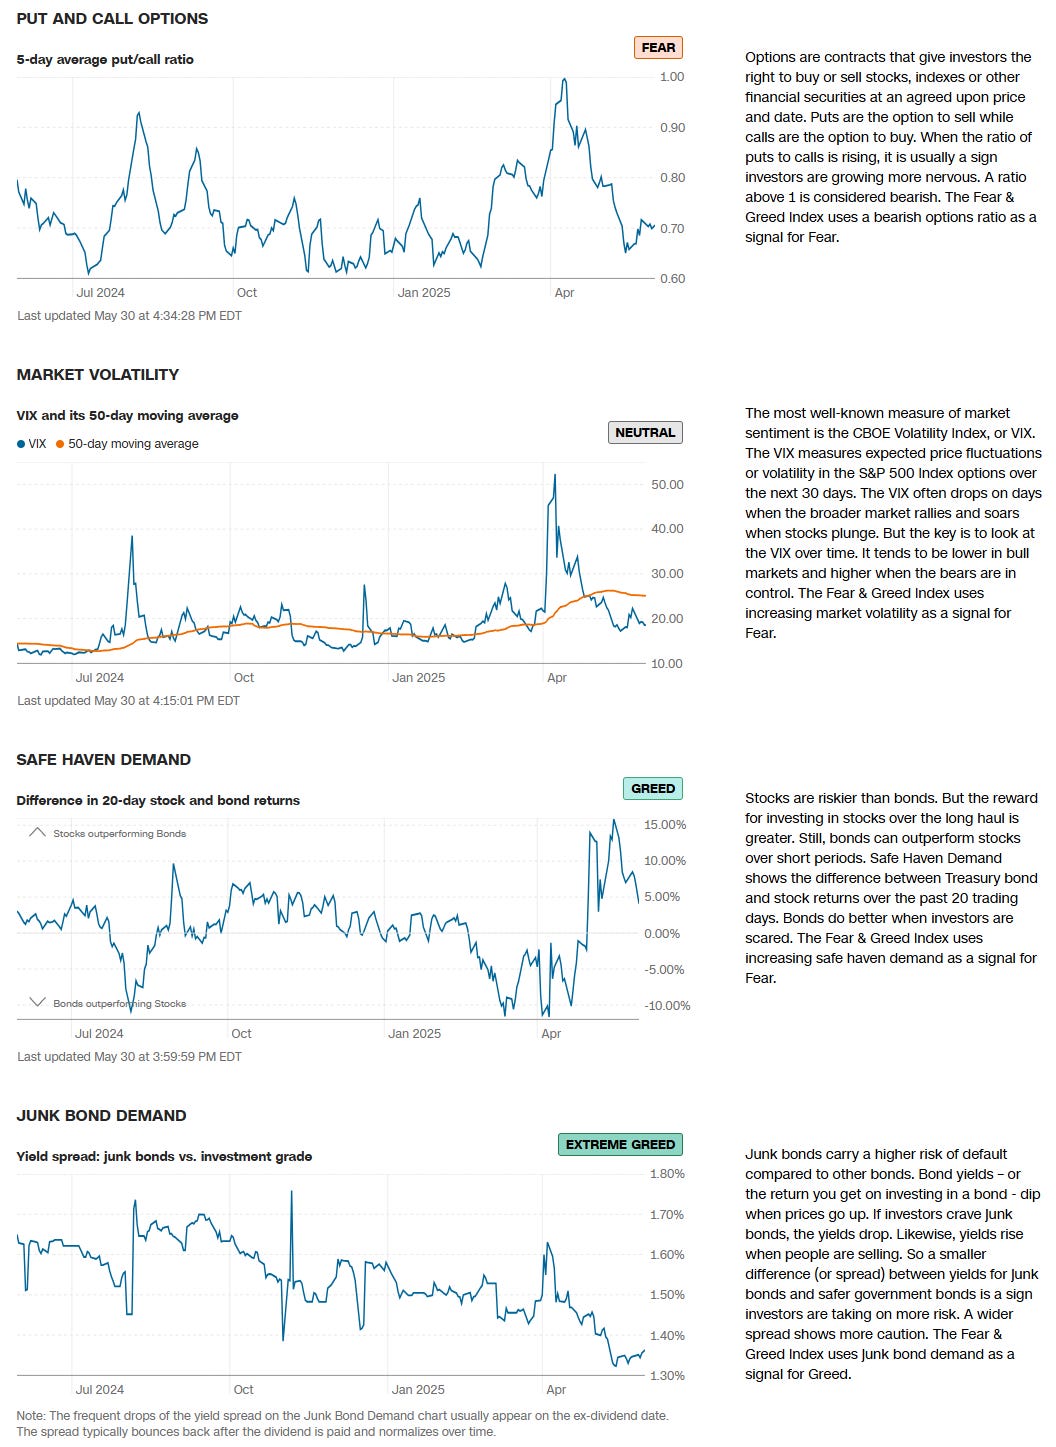
CNN Fear & Greed Constituent Data Points & Composite Index
Social Media Favs
Analyzing social sentiment can provide valuable insights for investment strategies by offering a pulse on public perception, mood, and market sentiment that traditional financial indicators might not capture. Here’s how social sentiment analysis can enhance investment decisions:
Market Momentum: Positive or negative social sentiment can signal impending momentum shifts. When public opinion on a stock, sector, or asset class changes sharply, it can create buying or selling pressure, especially if that sentiment becomes widespread.
Early Detection of Trends: Social sentiment data can help investors spot trends before they show up in technical or fundamental data. For example, increased positive chatter around a particular company or sector might indicate growing interest or excitement, which could lead to price appreciation.
Gauge Retail Investor Impact: With the rise of retail investor platforms, collective sentiment on social media can lead to significant price movements (e.g., meme stocks). Understanding how retail investors view certain stocks can help in identifying high-volatility opportunities.
Event Reaction Monitoring: Social sentiment can provide real-time reactions to news events, product releases, or earnings reports. Investors can use this information to gauge market reaction quickly and adjust their strategies accordingly.
Complementing Quantitative Models: By adding a social sentiment layer to quantitative models, investors can enhance predictions. For example, a model that tracks historical price and volume data might perform even better when factoring in sentiment trends as a measure of market psychology.
Risk Management: Negative sentiment spikes can be a signal of potential downturns or increased volatility. By monitoring sentiment, investors might avoid or hedge against investments in companies experiencing a public relations crisis or facing negative perceptions.
Long-Term Sentiment Trends: Sustained sentiment trends, whether positive or negative, often mirror longer-term market cycles. Tracking sentiment trends over time can help identify shifts in investor psychology that could affect longer-term investments or sector rotations.
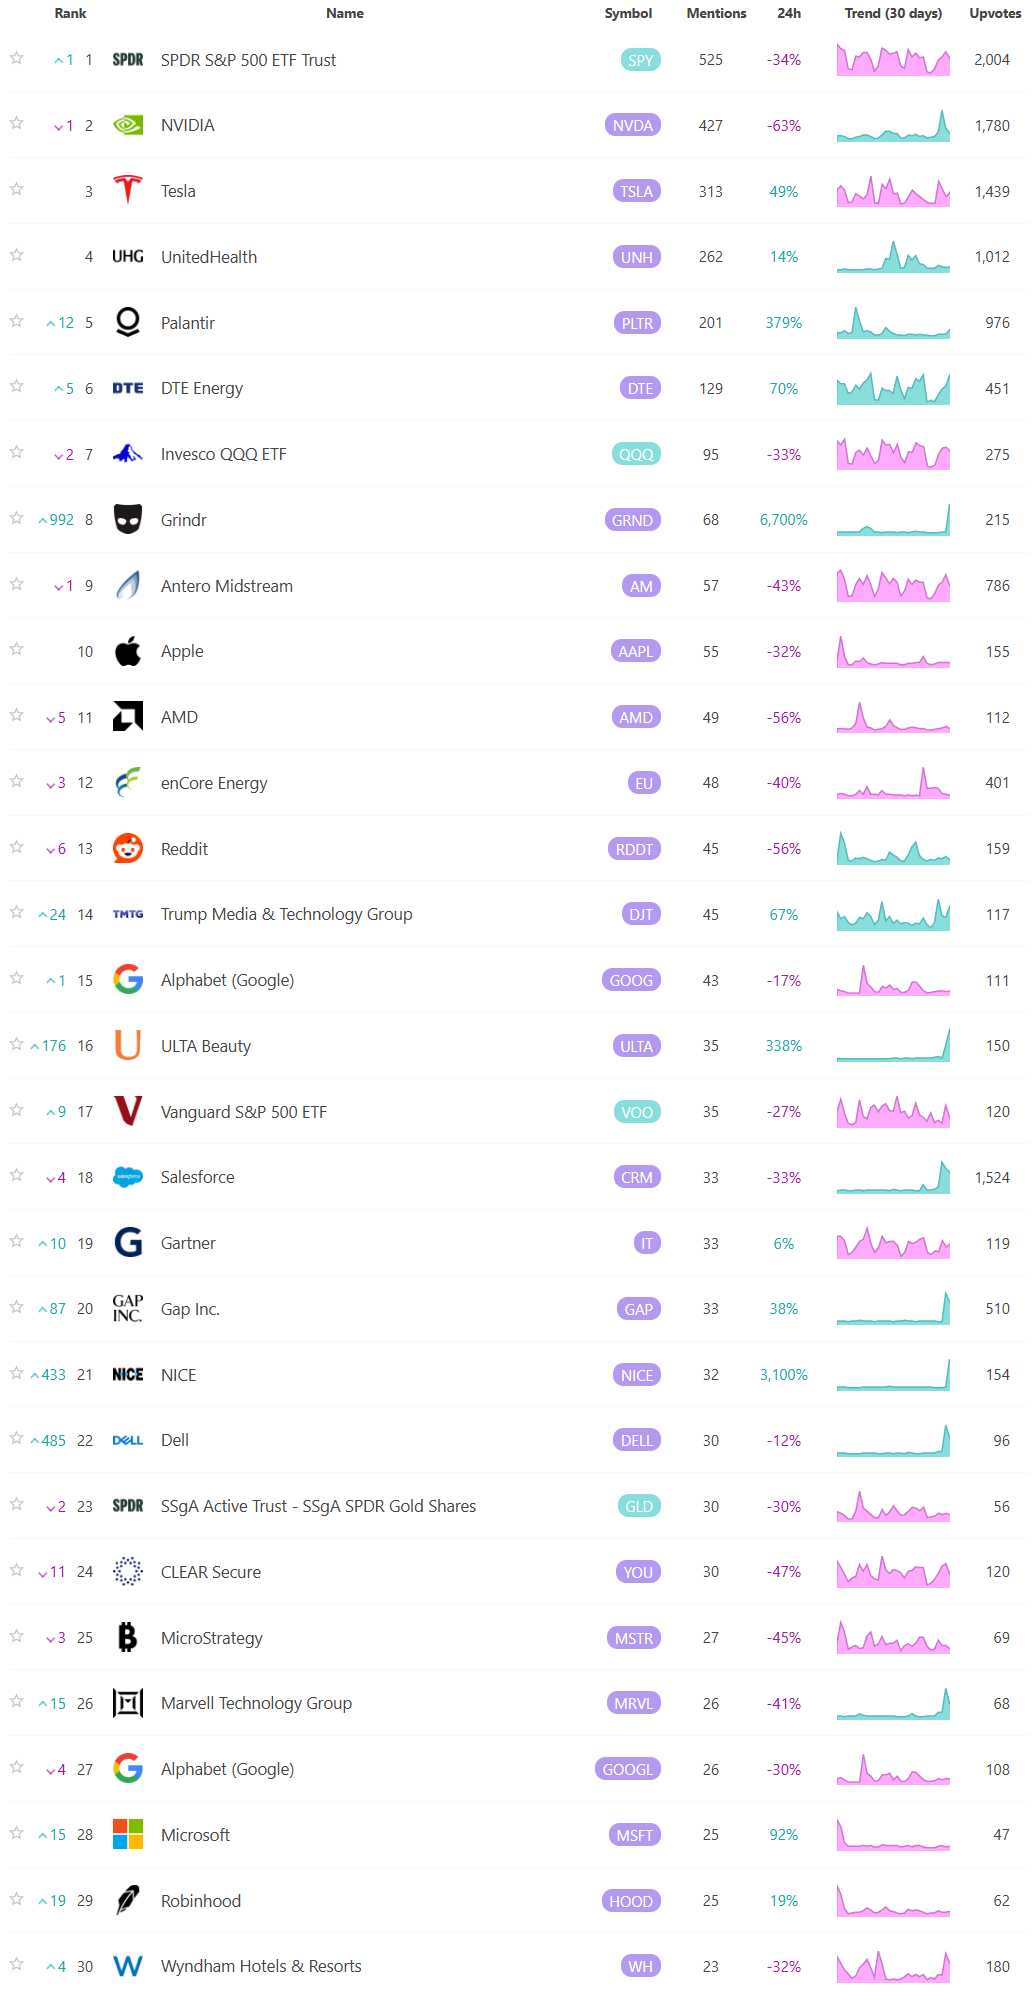
For these reasons, sentiment analysis, when combined with other tools, can provide a comprehensive view of both immediate market reactions and underlying investor attitudes, helping investors position themselves strategically across various time frames. Here are the most mentioned/discussed tickers on Reddit from some of the most active Subreddits for trading:

Special Coverage Report
America's Nuclear Renaissance: Why the Smart Money Is Going Atomic
The Nuclear Reawakening
Over the past few decades, nuclear energy has vacillated between visionary promise and controversial pariah. But in 2025, a dramatic policy shift under President Trump has breathed new life into what was once considered a stagnating sector. Four executive orders—targeting regulatory streamlining, technological advancement, domestic fuel independence, and aggressive expansion goals—have catalyzed renewed investor interest and national conversation.
This week we cover why nuclear energy is back in the spotlight, the short- and long-term implications of recent policy decisions, the companies leading innovation across various nuclear sub-themes, the risks that could derail this momentum, and how both retail and institutional investors can position for what may be a generational opportunity.
Context and Catalysts
The turning point for America’s nuclear sector came in May 2025 when President Trump unveiled a suite of executive orders designed to reorient the country’s energy priorities. These directives set ambitious targets, including quadrupling current nuclear output to 400 gigawatts by 2050, and established accelerated approval timelines for new reactors—18 months for first-time licenses, and just 12 months for renewals. Perhaps most notably, the administration offered full-throated support for Small Modular Reactors (SMRs) and microreactors, framing them as indispensable for national security and the power demands of AI infrastructure. The policy package also included aggressive moves to fortify the domestic uranium supply chain, following the 2024 ban on Russian uranium imports.
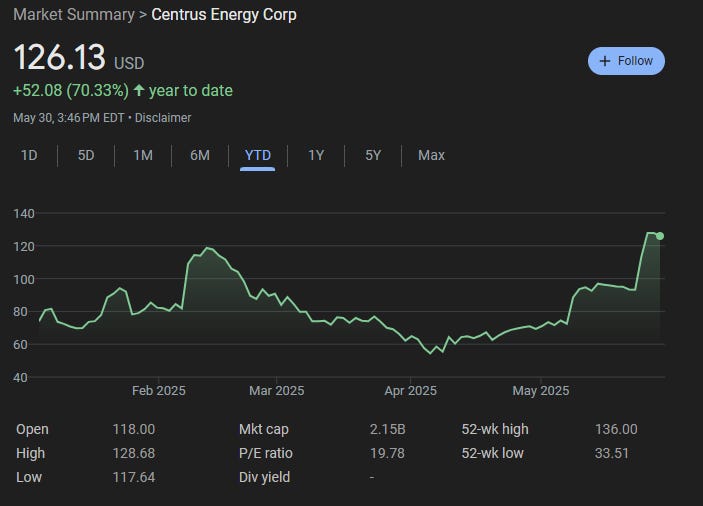
Market reactions were swift and telling. Companies like Oklo, a pioneer in microreactors, surged over 10% immediately after the announcement and continued to outperform throughout the quarter. NuScale Power, the first firm to receive U.S. regulatory approval for an SMR design, rallied 15%. Meanwhile, uranium suppliers like Centrus Energy and Cameco Corp. saw their shares approach multi-year highs. While these early gains are partly driven by momentum traders and thematic ETF inflows, they also reflect growing investor confidence that nuclear energy may finally be entering a new golden age.
The Landscape of Nuclear Innovation
To understand where opportunity lies, it’s important to dissect the nuclear sector into its constituent parts, each offering unique risk-return profiles and growth trajectories.
The first and perhaps most exciting segment involves the developers of Small Modular Reactors and other advanced nuclear technologies. These firms are pursuing radically safer, smaller, and more scalable reactor designs. Oklo, NuScale, and BWX Technologies lead the pack among public names, while private companies like X-Energy, Kairos Power, Holtec, and Ultra Safe Nuclear Corp. are gaining traction with federal grants and defense contracts. GE-Hitachi, a joint venture housed within General Electric, is also building momentum with its BWRX-300 reactor, designed to reduce construction and operational costs.

Meanwhile, the upstream portion of the nuclear ecosystem—uranium mining and fuel enrichment—has emerged as a bottleneck and, by extension, an investment opportunity. Centrus Energy, the only U.S.-owned uranium enricher, is a direct beneficiary of federal efforts to localize supply. Cameco, Uranium Energy Corp., Energy Fuels Inc., and NexGen Energy represent a diverse set of fuel producers with global footprints, many of which are already locking in long-term supply contracts.
Further downstream, utilities and power generation companies stand to benefit from increased demand for stable baseload energy and potential incentives to modernize or expand their nuclear capacity. Players such as Exelon, Dominion Energy, Duke Energy, NextEra Energy, Southern Company, Vistra, and Constellation Energy operate large-scale nuclear facilities or have the balance sheet to develop new ones. These companies, often viewed as conservative yield plays, may find themselves at the center of a major structural tailwind.
Short-Term Momentum (2025–2027)
In the near term, several forces are converging to sustain nuclear’s upward trajectory. Chief among them is regulatory acceleration. The Nuclear Regulatory Commission’s new mandates to process licenses within 12 to 18 months dramatically improve the commercial viability of SMR startups. Companies like NuScale and Oklo, already far along in the approval process, stand to benefit immensely. BWX Technologies, known for its work on nuclear propulsion and advanced fuels, is another contender poised to secure lucrative government and commercial contracts.
The uranium market is another area of rapid change. With Russian uranium imports now banned and secondary supply chains under pressure, U.S. and Canadian suppliers are experiencing renewed demand. Centrus Energy’s position as the only domestic enricher makes it a keystone of energy independence policy. Cameco and Uranium Energy Corp. are similarly positioned to gain from rising prices and contract flow, especially as utilities scramble to lock in reliable sources of fuel.
Additionally, new customer verticals are emerging. The military and major tech firms are exploring microreactor deployment to support remote operations and AI-powered data centers. These small, modular solutions offer the reliability and energy density traditional generators cannot match, making companies like USNC and X-Energy increasingly relevant.
Long-Term Potential (2027–2040 and Beyond)
Over the long term, nuclear energy may become an essential pillar of grid decarbonization efforts. Unlike wind and solar, which are intermittent and require significant storage capacity, nuclear provides consistent baseload power. This makes it a powerful complement to renewables in a decarbonized grid. Utilities like Southern Company, Constellation Energy, and Duke Energy, already operating nuclear assets, are in a prime position to expand further.
Another promising horizon is international deployment. If the United States can maintain technological leadership in SMRs, it could become a major exporter to developing nations in Asia, Africa, and Eastern Europe. Countries with growing energy needs but limited space or infrastructure for traditional reactors may find American-designed SMRs particularly appealing. GE-Hitachi, NuScale, and Oklo could be first movers in what could become a multi-decade export boom.

Fuel sovereignty is also likely to become a more prominent narrative. The push to not only mine but also enrich and recycle nuclear fuel domestically offers sustained upside for Centrus and potentially for new players. We may even see a wave of vertical integration as mining companies seek to expand into enrichment and fabrication.
Threats to the Narrative
Despite all the momentum, the nuclear renaissance is far from guaranteed. Several risks loom large and could derail the theme before it reaches maturity.
A change in political leadership could halt or reverse progress. A future administration with different energy priorities may abandon aggressive nuclear expansion, reinstate burdensome regulatory timelines, or redirect funding toward other energy sources. Even without a political reversal, entrenched resistance from regulatory bodies like the NRC or legal challenges from environmental groups could delay projects or spike costs.
Safety concerns remain another major headwind. A single accident, even if minor, could sour public opinion and send investors fleeing. The memory of Fukushima is still fresh, and trust in nuclear safety is tenuous at best.

Economically, nuclear has always struggled with cost overruns. SMRs promise cost reduction, but they have yet to prove themselves at scale. If early projects like NuScale or Oklo run into budgetary disasters, the entire investment narrative could suffer.
Technological disruptions also pose a threat. Advances in battery storage or breakthroughs in fusion or hydrogen could reduce the long-term need for nuclear, particularly if they offer similar baseload characteristics with fewer political or social drawbacks.
Finally, public perception and ESG-related pressures continue to be a challenge. Despite nuclear being one of the cleanest energy sources in terms of emissions, many institutional investors still exclude it from green portfolios. That stance may evolve, but progress remains slow.
Investor Positioning
For those looking to capitalize on the nuclear revival, a tiered portfolio strategy may be appropriate.
Investors with high risk tolerance might focus on innovation leaders and smaller uranium producers. These include Oklo, NuScale, Centrus, Uranium Energy Corp., and Energy Fuels Inc.—names that offer significant upside but are subject to volatility and execution risk.
Balanced portfolios may want a mix of fuel suppliers like Cameco and NexGen Energy alongside engineering firms like BWX Technologies and utilities like Vistra and Constellation Energy. These companies are well-positioned to grow with the sector but are less exposed to binary regulatory or technology risks.
Conservative investors or income-focused portfolios might favor established utilities. Exelon, Southern Company, Dominion, NextEra Energy, and Duke offer stable cash flows, dividends, and embedded optionality in their existing or planned nuclear operations.
Ultimately, diversification across sub-themes—reactors, fuel, utilities—provides the best hedge against individual failure while maintaining exposure to the broader trend.
A Rare Second Chance
The history of nuclear energy is one of missed potential, but that narrative is undergoing rapid revision. With supportive federal policy, rising energy demands from AI and electrification, and real technological progress in reactor design, the stage is set for a renaissance. For the first time in decades, the question isn’t whether nuclear energy has a future—it’s how quickly it can scale.
Investors willing to look past the sector’s scars may find themselves well rewarded. As always, timing, selectivity, and patience will be key. But if this is truly the dawn of nuclear’s second act, those who get in early could be buying into one of the most durable energy stories of the 21st century.
Regular updates will follow, including deep dives on ticker-specific developments, uranium pricing dynamics, and emerging global partnerships. Subscribe to stay ahead of the curve.
Disclosure: This post is for informational purposes only and does not constitute investment advice. The author may hold positions in some of the securities mentioned.
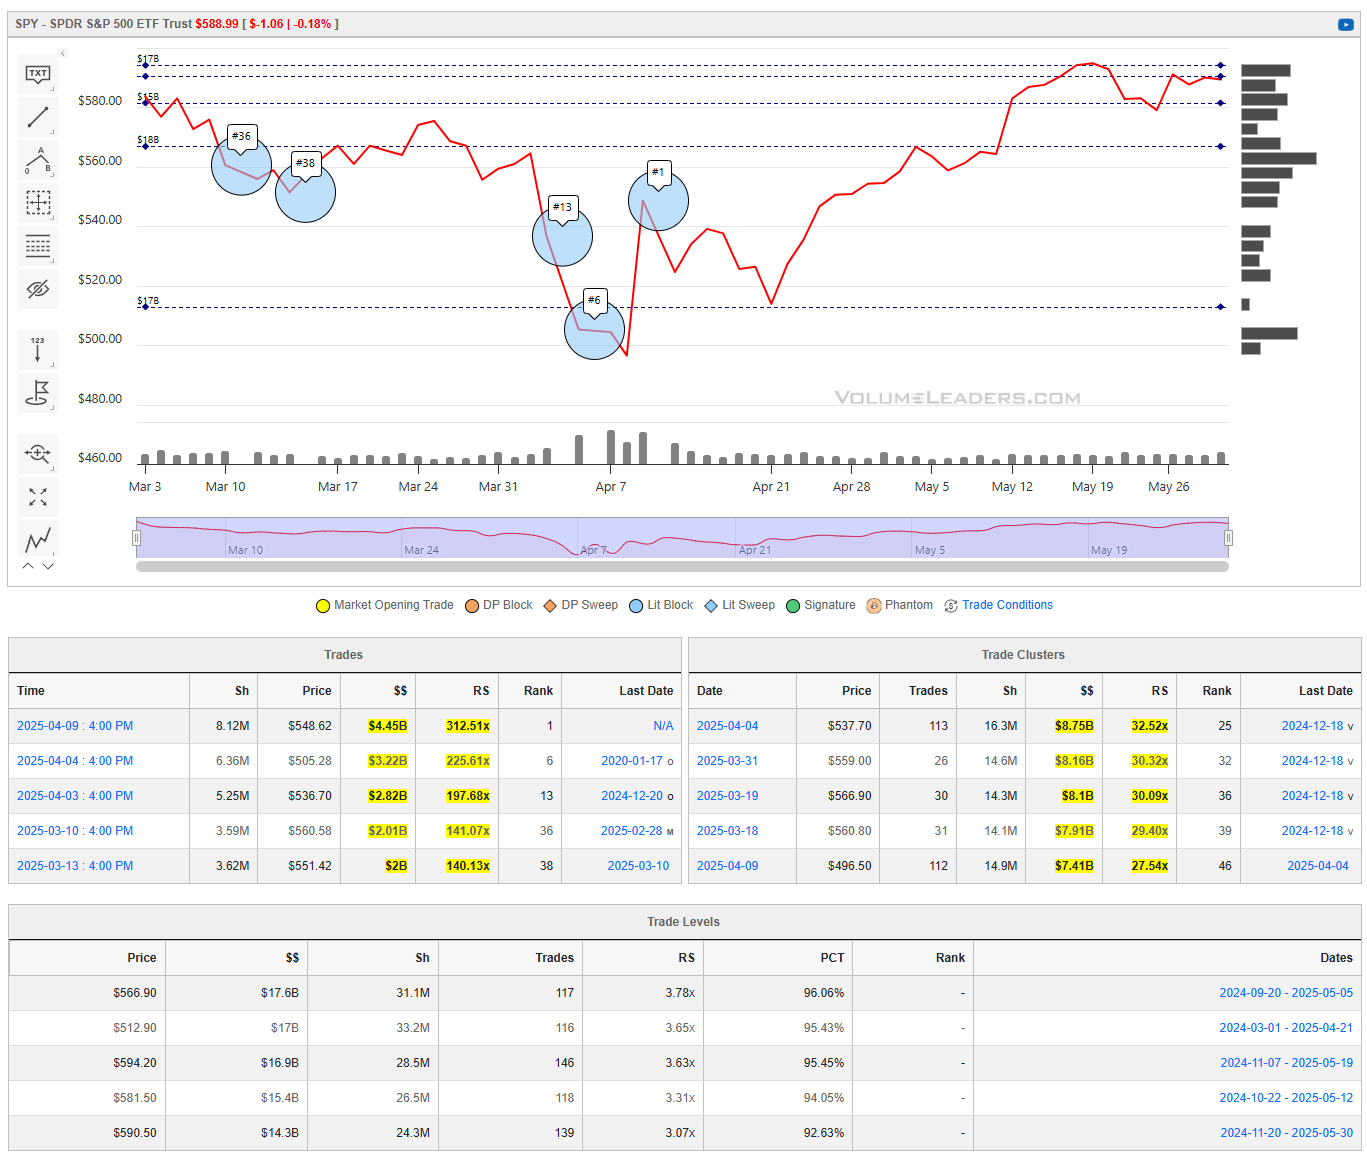
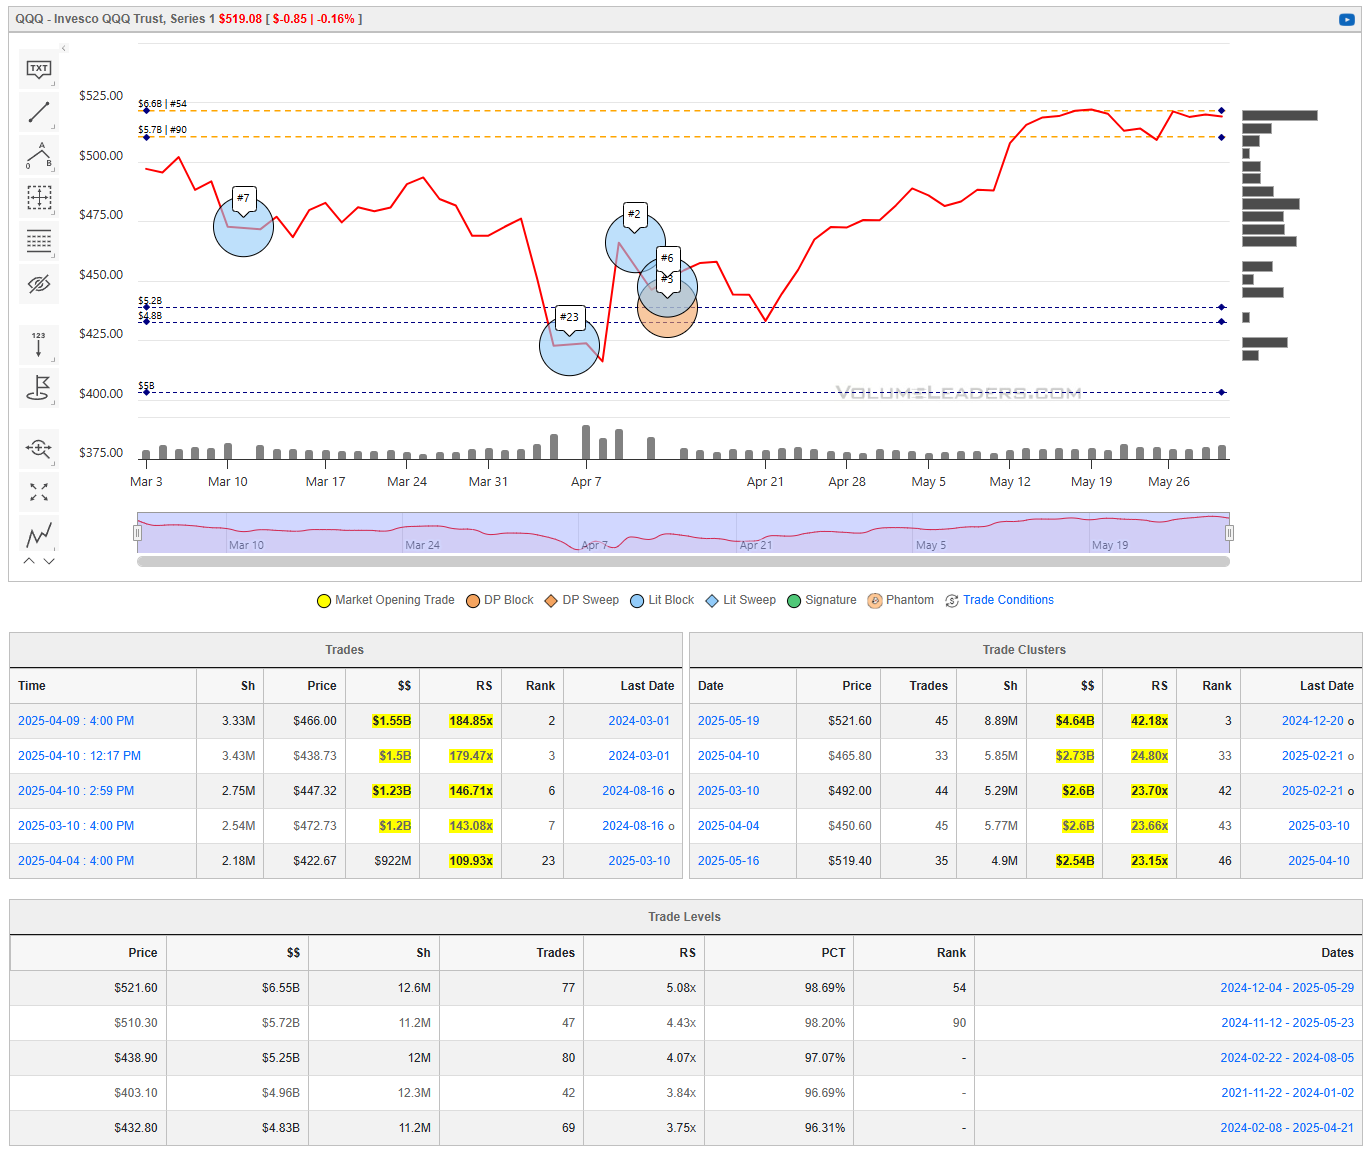
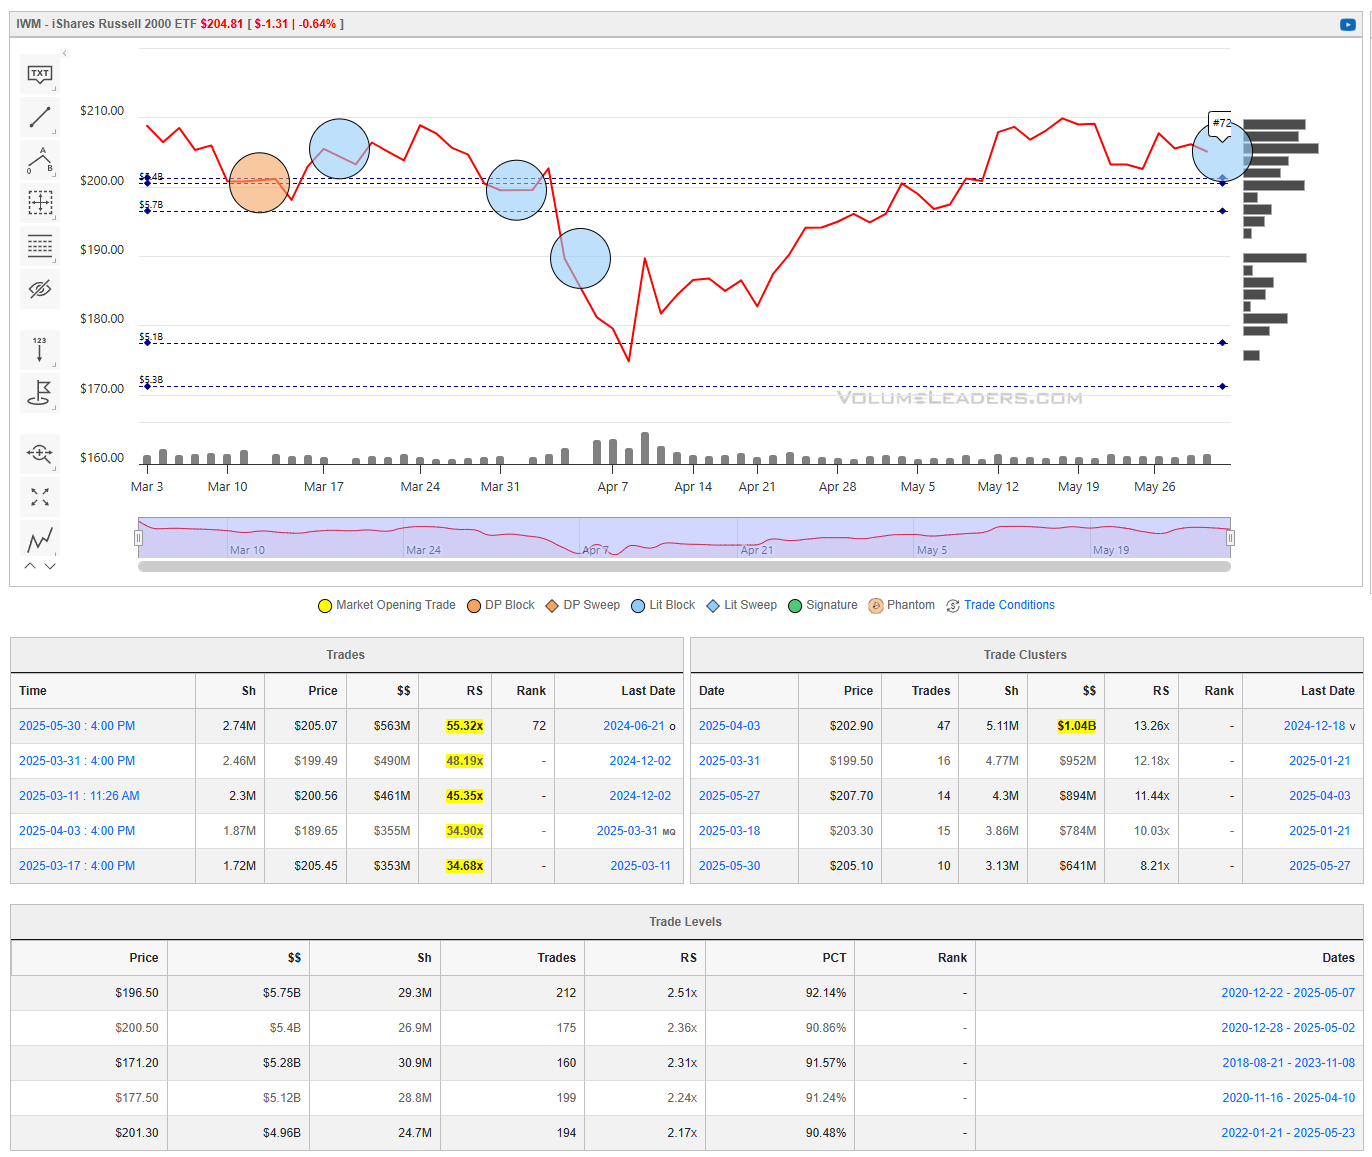
Institutional S/R Levels for Major Indices
When you’re a large institutional player, your primary goal is to find liquidity - places to do a ton of business with the least amount of slippage possible. VolumeLeaders.com automatically identifies and visually plots the exact spots where institutions are doing business and where they are likely to return for more. It’s one of the primary reasons “support” and “resistance” concepts work and truly one of the reasons “price has memory” - take a look at the dashed lines in the images below that the platform plots for you automatically; these are the areas institutions constantly revisit to do more business.
Levels from the VolumeLeaders.com platform can help you formulate trades theses about:
Where to add or take profit
Where to de-risk or hedge
What strikes to target for options
Where to expect support or resistance
And this is just a small sample; there are countless ways to leverage this information into trades that express your views on the market. The platform covers thousands of tickers on multiple timeframes to accommodate all types of traders.
SPY
QQQ
IWM
DIA
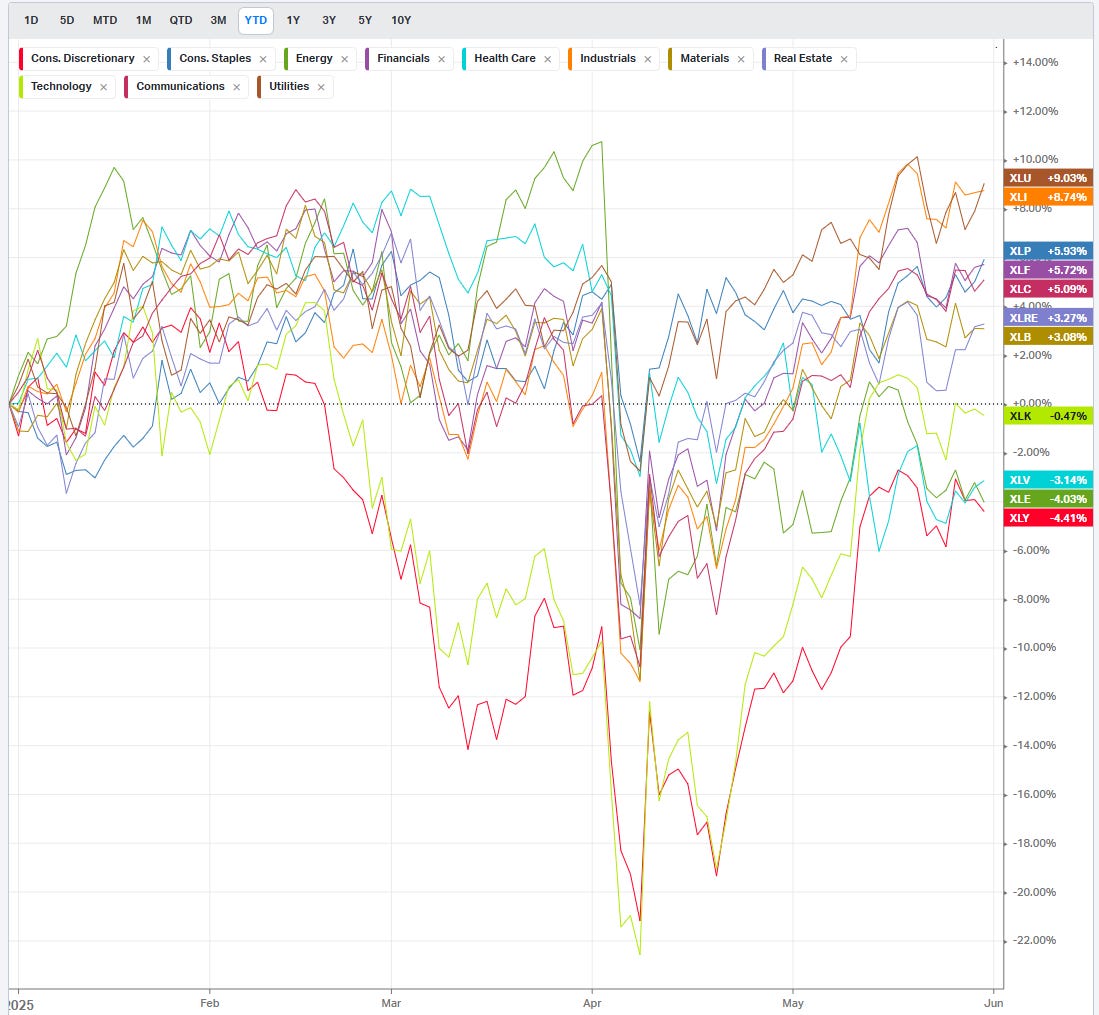
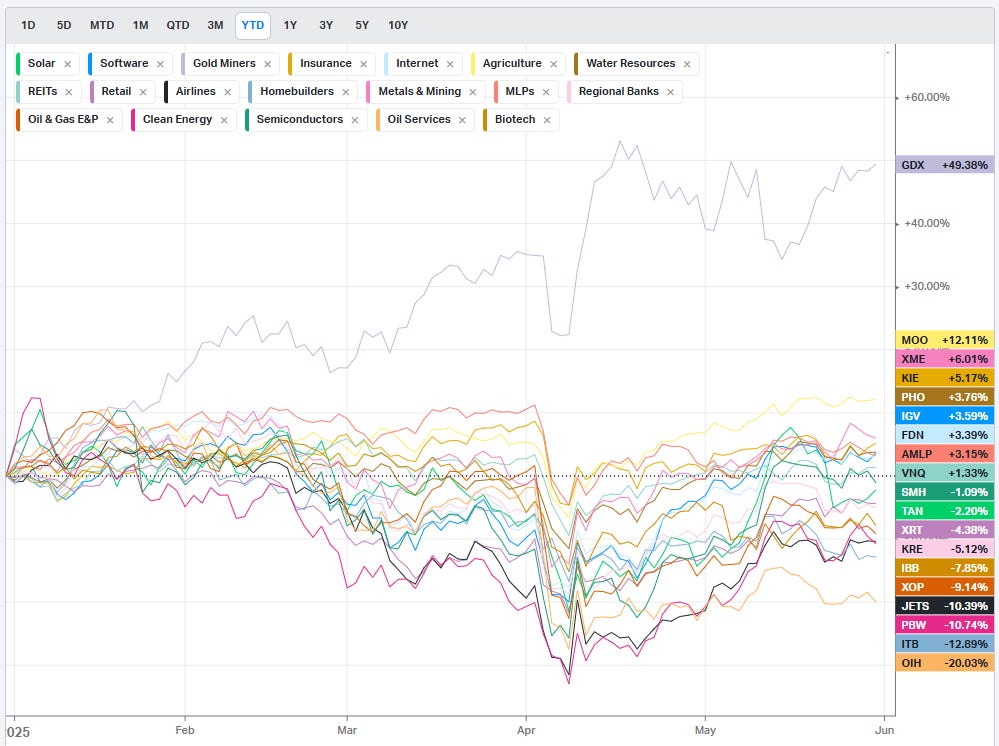
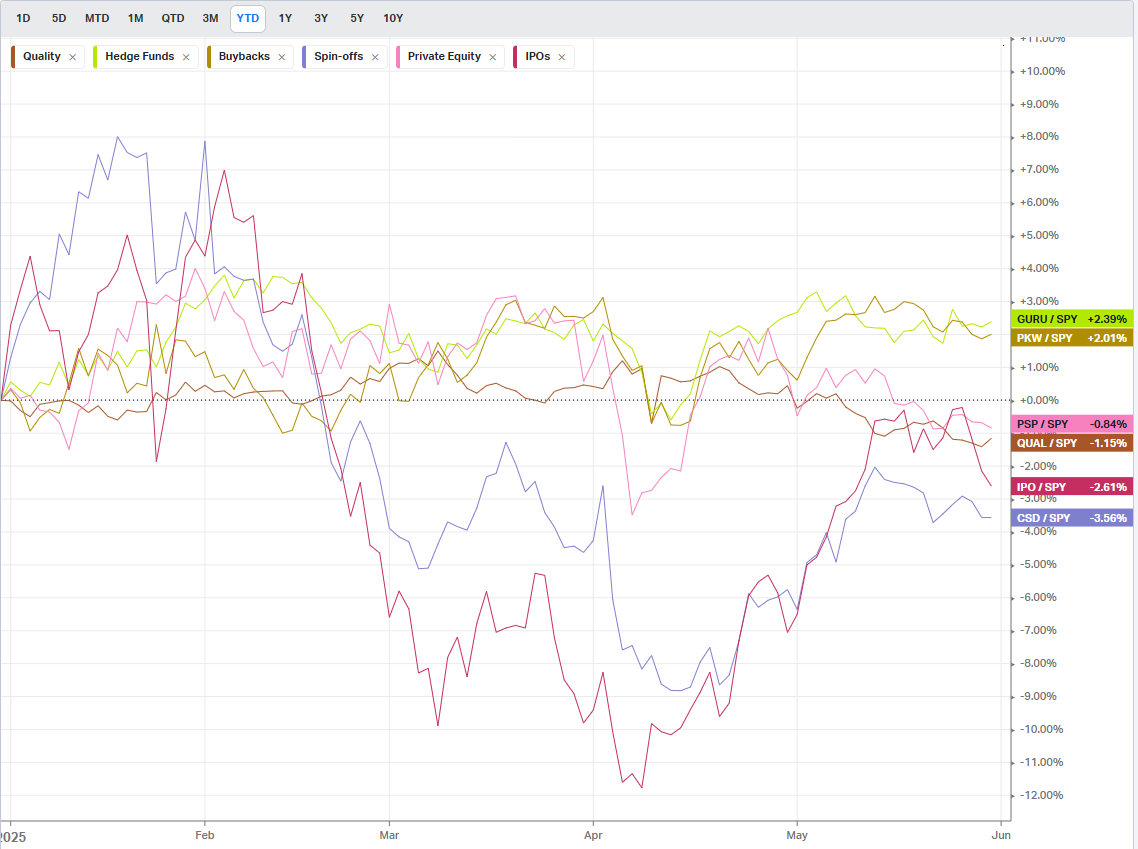
Summary Of Thematic Performance YTD
VolumeLeaders.com offers a robust set of pre-built thematic filters, allowing you to instantly explore specific market segments. These performance snapshots are provided purely for context and inspiration—think about zeroing in on the leaders and laggards within the strongest and weakest sectors, for example.
S&P By Sector
S&P By Industry
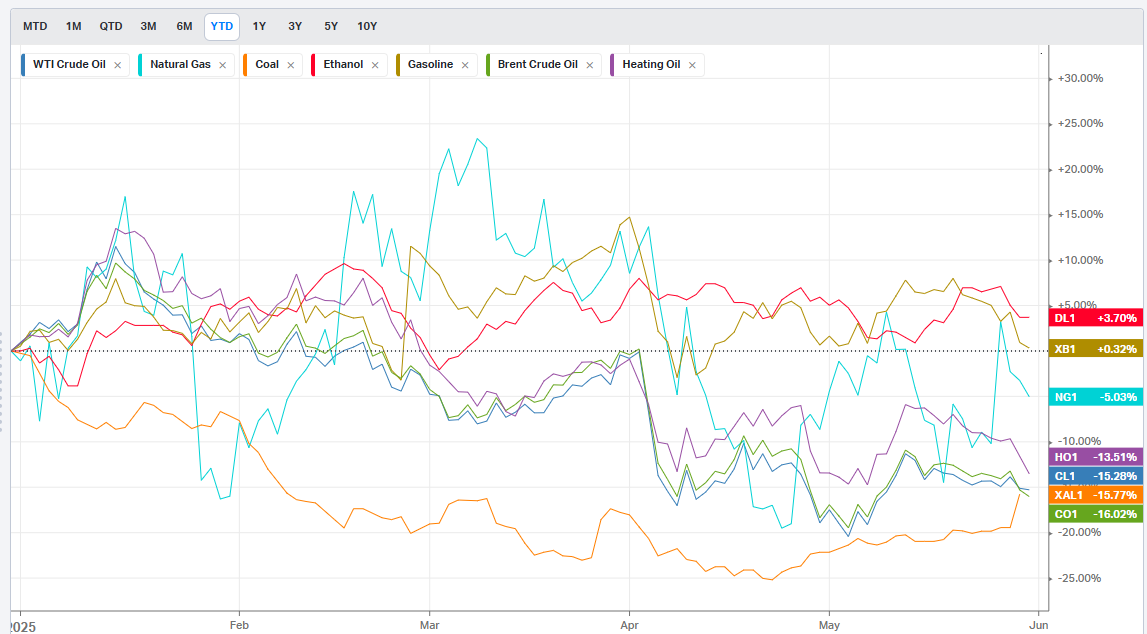
Commodities: Energy
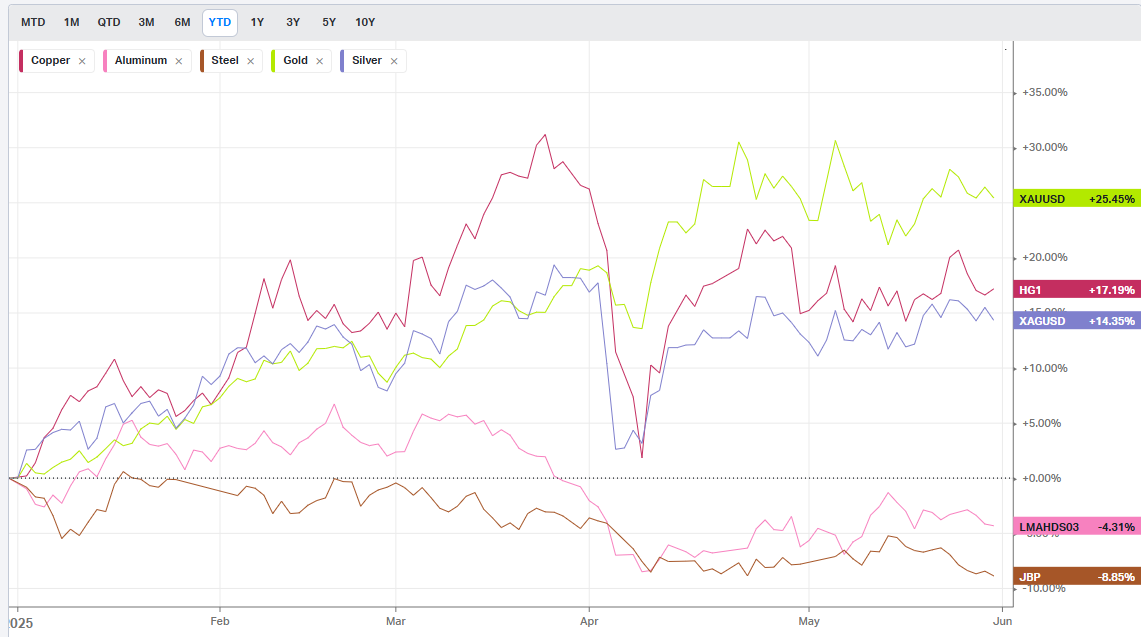
Commodities: Metals
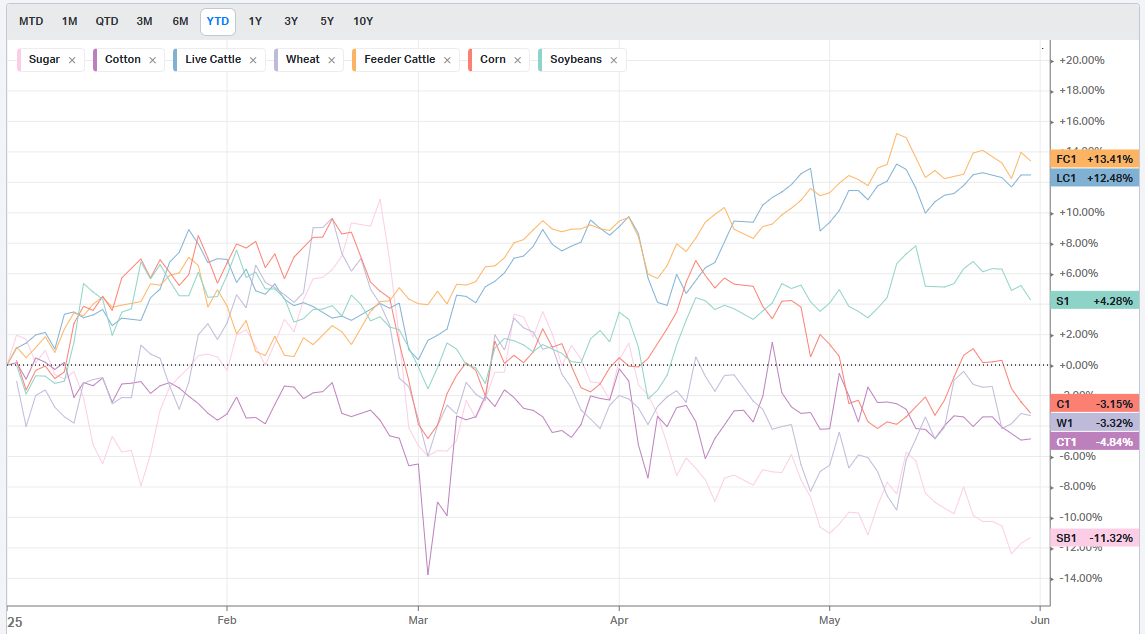
Commodities: Agriculture
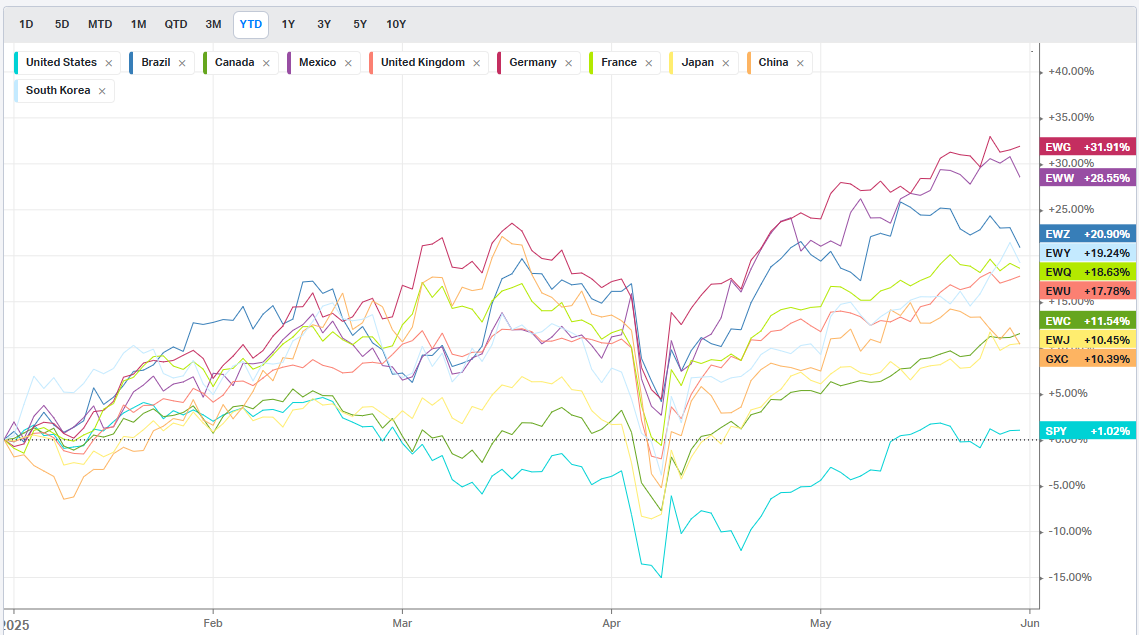
Country ETFs
Currencies
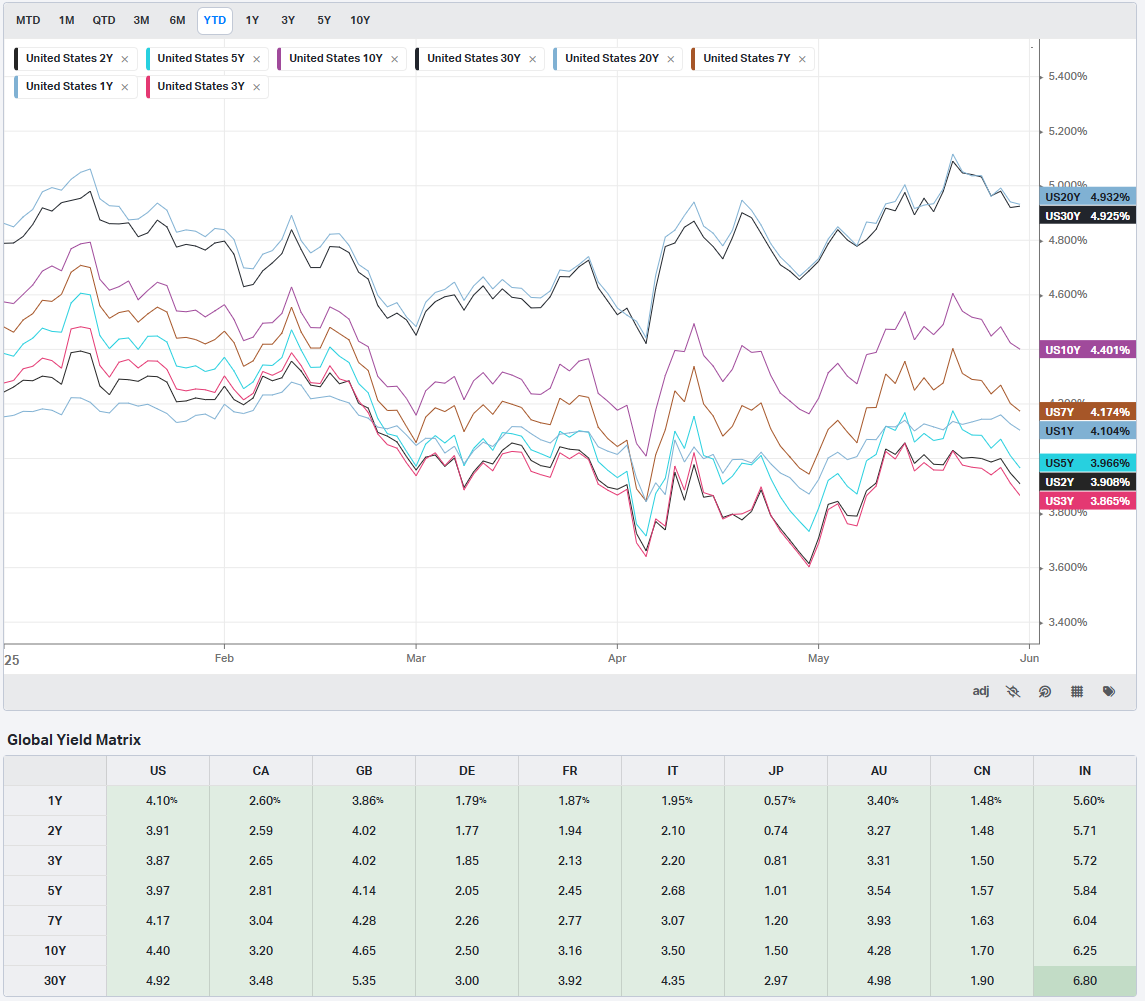
Global Yields
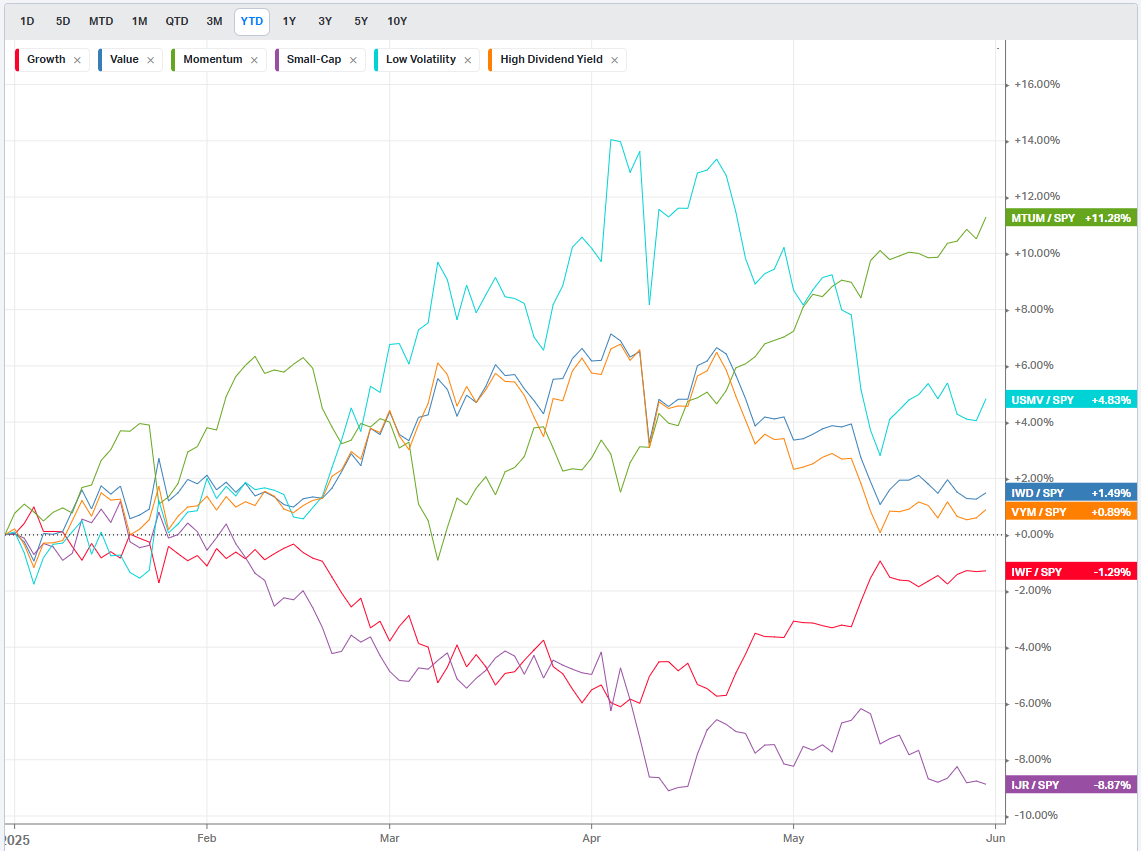
Factors: Style
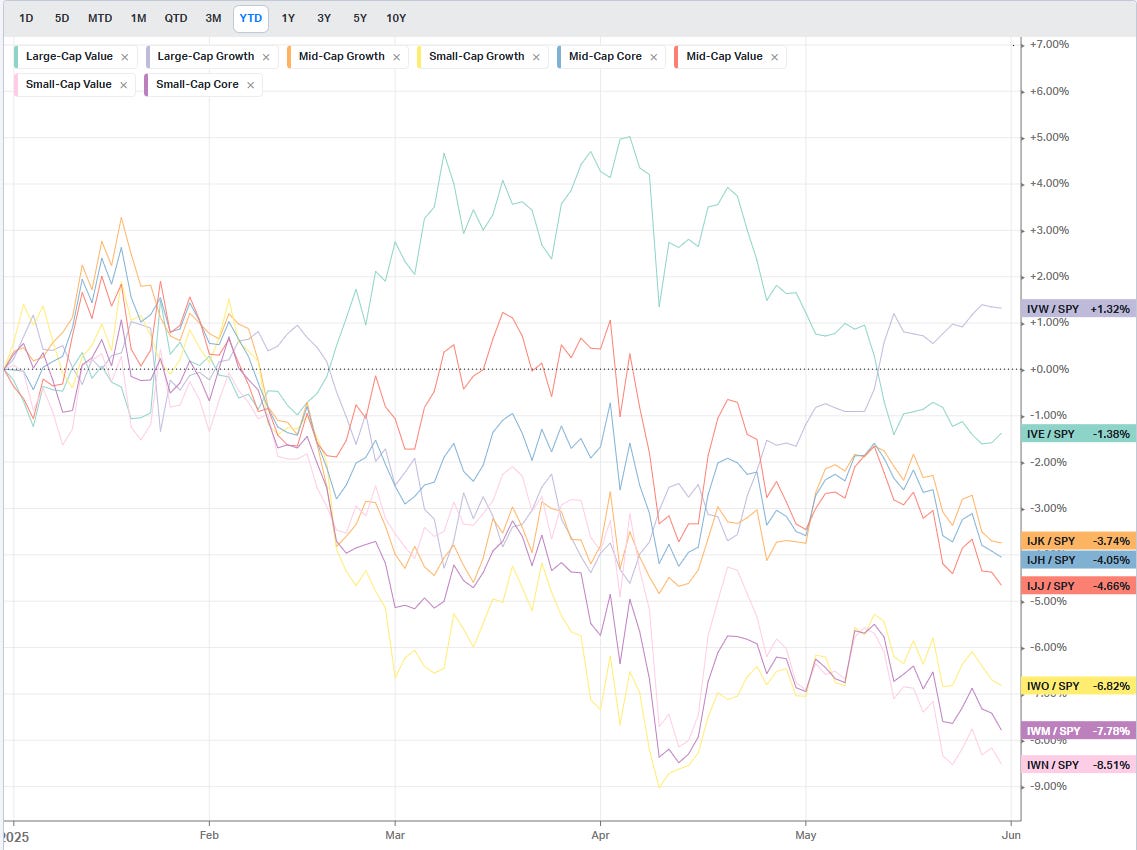
Factors: Size vs Value
Factors: Qualitative
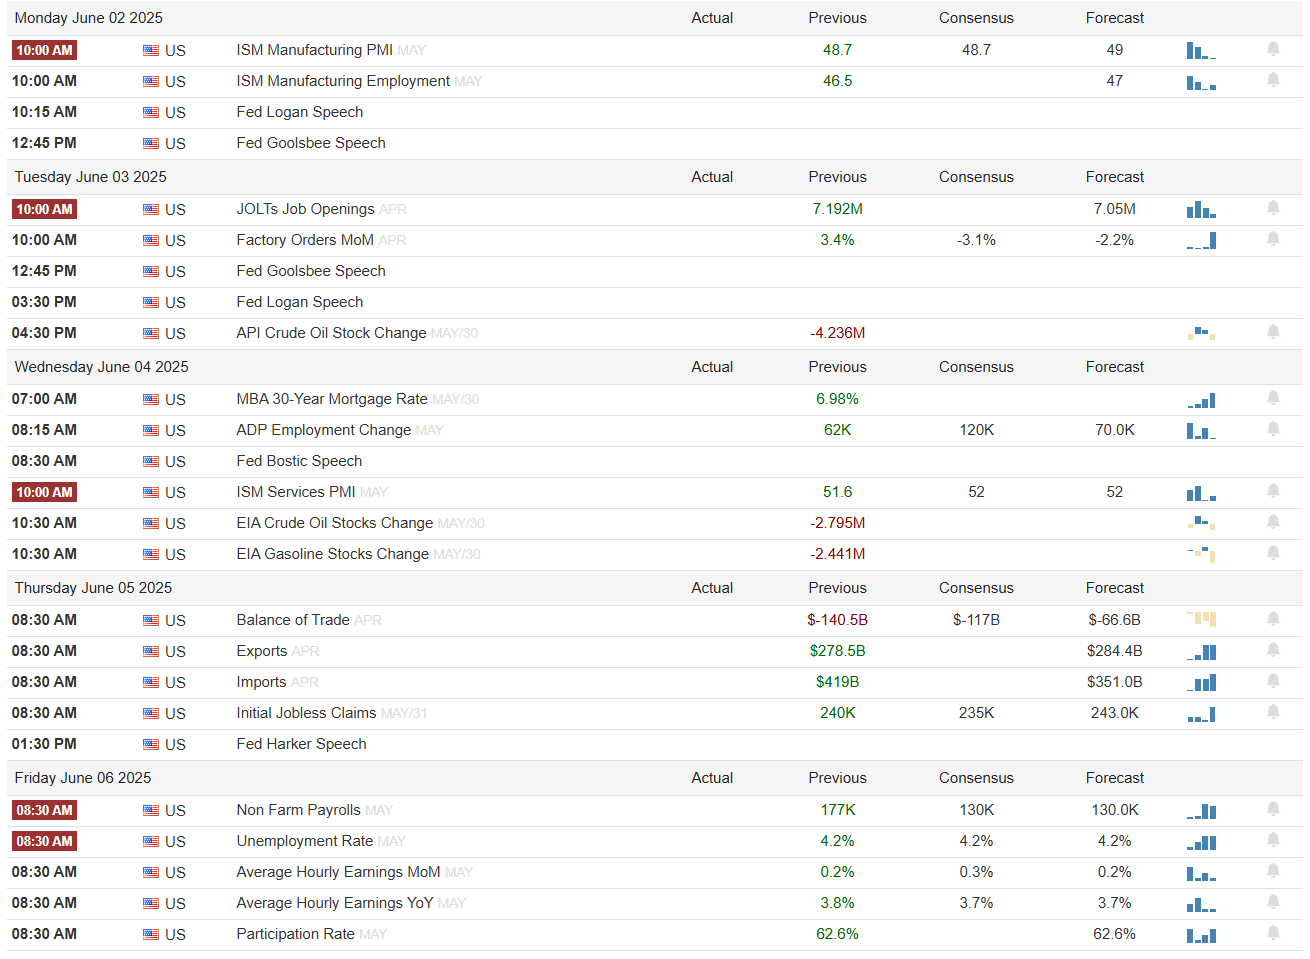
Events On Deck This Week
Here are key events happening this week that have the potential to cause outsized moves in the market or heightened short-term volatility.
Econ Events By Day of Week
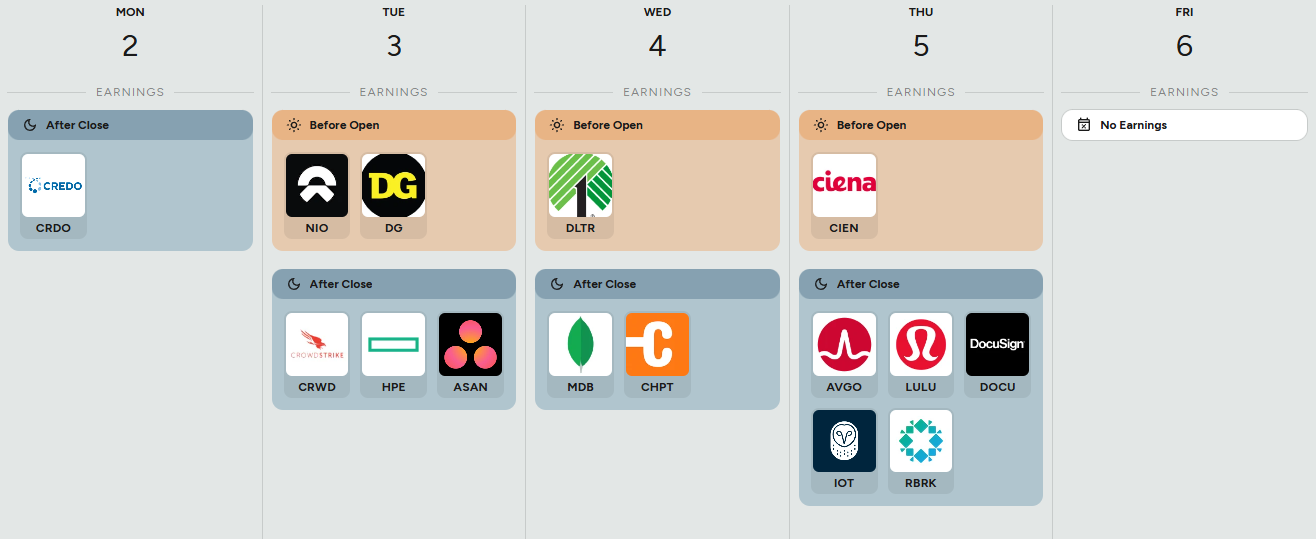
Anticipated Earnings By Day of Week

Market Intelligence Report
Summary
This comprehensive analysis of 942 institutional trades reveals unprecedented capital deployment totaling $135.76 billion, with sophisticated positioning across multiple sectors and asset classes. The data demonstrates institutional conviction at historic levels, with an average trade size of $144.1 million—significantly above normal parameters.
Key Findings:
19 trades exceed $1 billion, indicating extraordinary institutional confidence
Technology sector dominance with $48.9 billion in institutional capital (36% of total volume)
Bull/Bear sentiment ratio of 83.45:1 shows overwhelming institutional optimism
52 rank-1 positions totaling $15.7 billion represent the largest institutional commitments per security
Nuclear energy emergence as a strategic institutional theme, led by OKLO's multiple high-ranking positions
Analysis Highlights:
📊 Scale & Scope:
942 institutional trades totaling $135.76 billion
Average trade size of $144.1 million (3.2x typical institutional average)
19 trades exceed $1 billion, representing unprecedented institutional conviction
Multi-Factor Trade Significance Leaders:
MSFT: 71.5 score (massive $7.16B position, 655.89x relative size)
NVDA: 55.5 score (continued AI infrastructure dominance)
PLTR: 53.4 score (billionaire hedge fund rotation play)
QBTS: 43.4 score (quantum computing institutional cluster)
OKLO: 42.6 score (nuclear energy AI data center theme)
Bull vs Bear Sentiment:
Bull ETF trades: $1.697 billion across 42 positions
Bear ETF trades: $20.3 million across 10 positions
Bull/Bear Ratio: 83.45:1 (extreme institutional optimism)
Key Insights:
OKLO nuclear energy stock has surged over 100% this month on AI data center power demand, with landmark 12-gigawatt Switch partnership and Trump administration nuclear development support
Technology sector captures 36% of all institutional capital ($48.9B)
52 rank-1 positions totaling $15.7B represent significant institutional conviction bets
"Resurrection" pattern shows $3.7B returning to stocks dormant since 2021
The analysis reveals institutions are making tremendous infrastructure bets on AI, quantum computing, and nuclear energy rather than defensive positioning, with the coordination and scale to suggest an investment thematic that has legs, not just a quick money-grab - take a look at the Rolling 90-Day Dollars By Day chart and you’ll immediately see the scale of the positioning from this week.
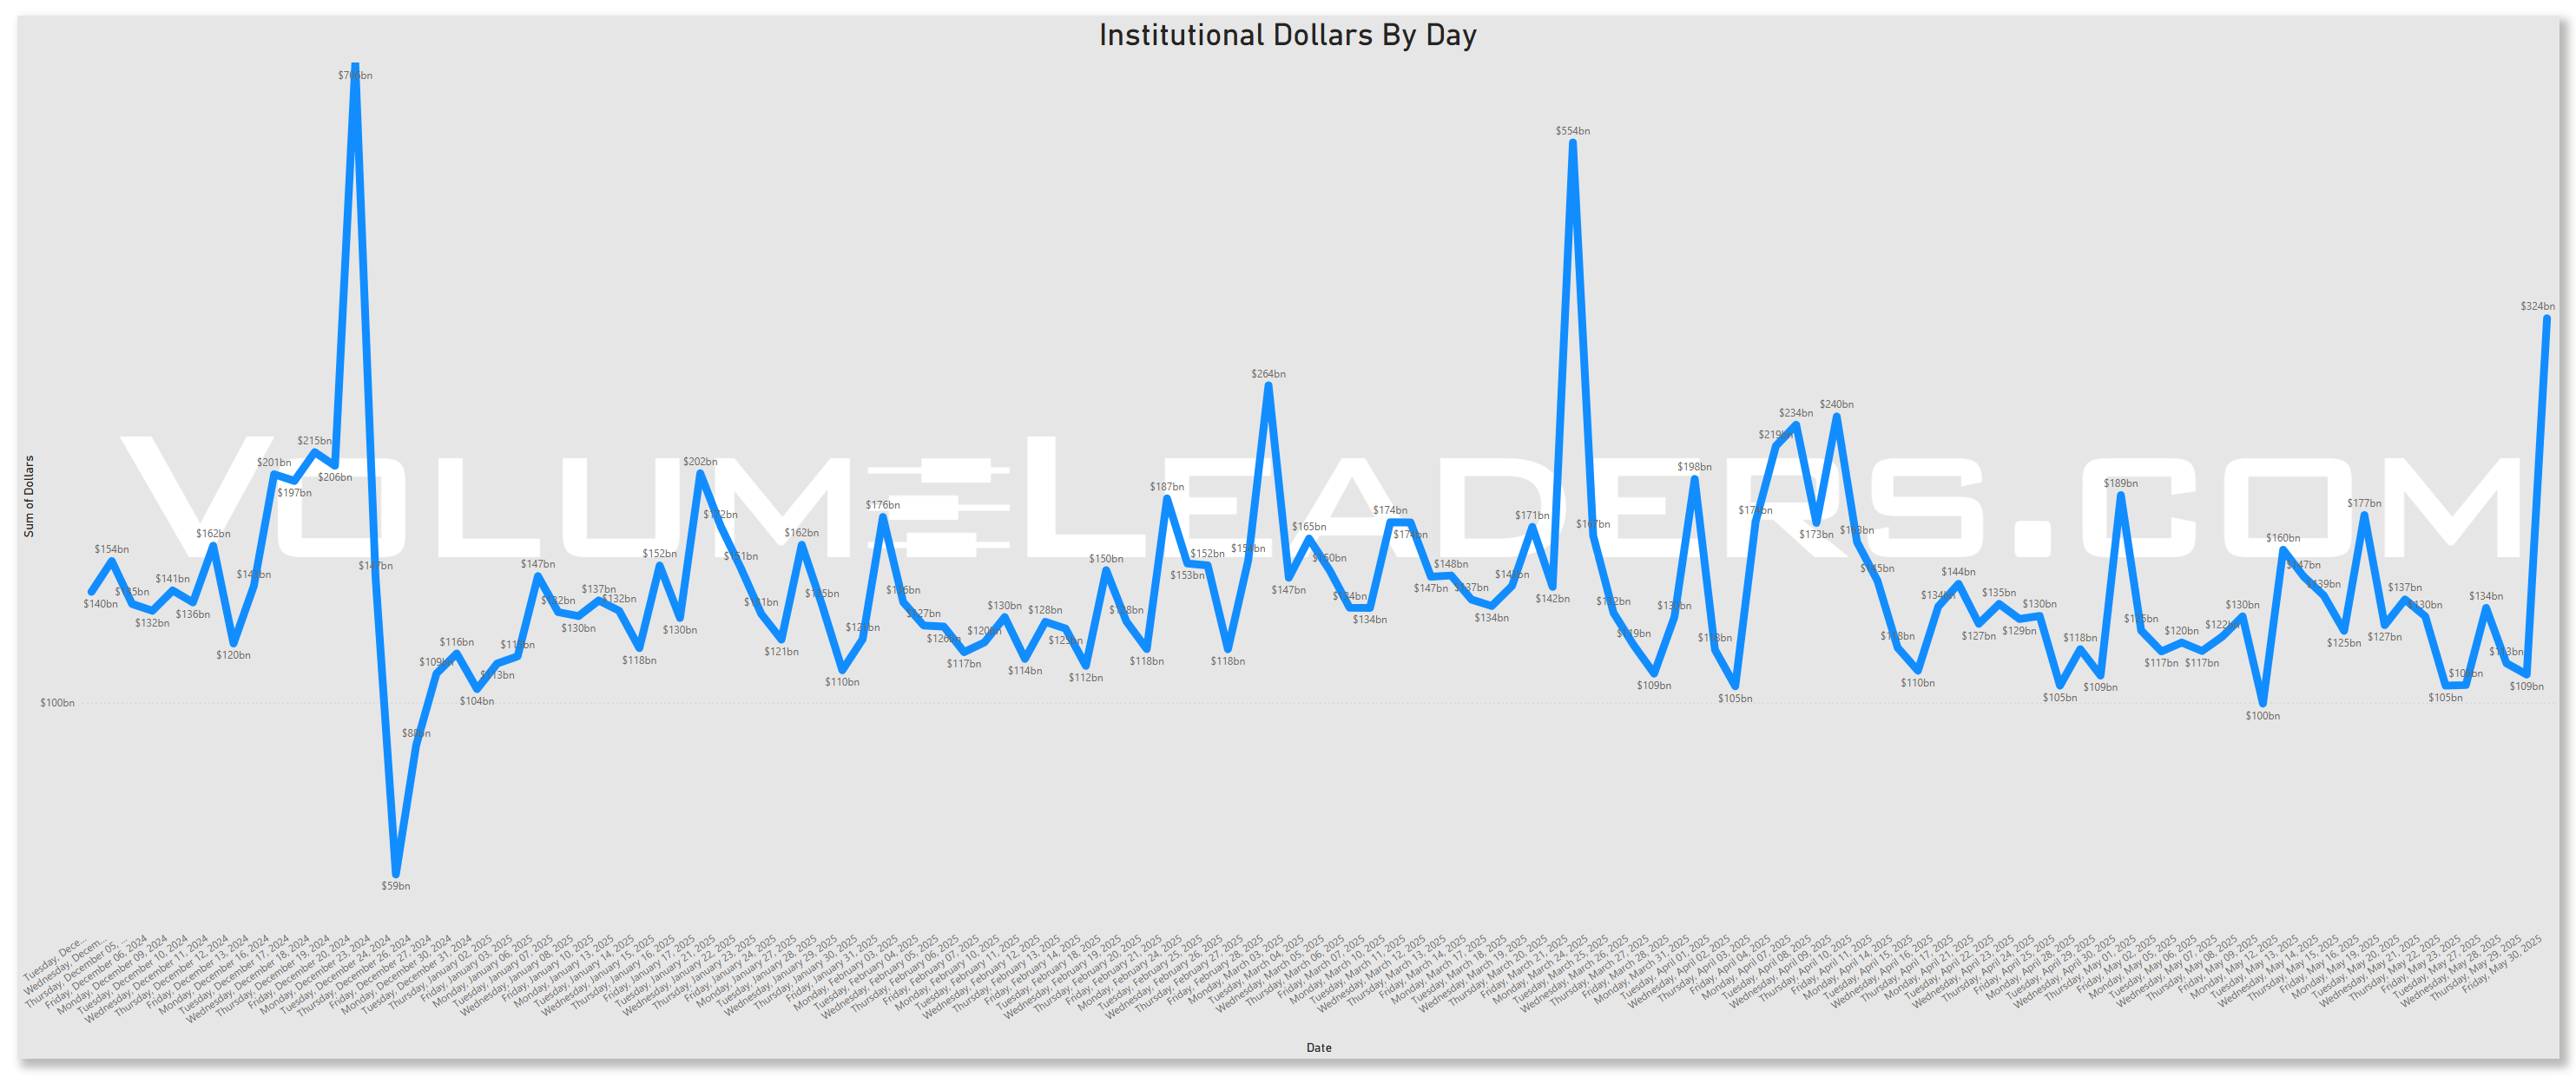
Rolling 90-Day Dollars By Day
This chart shows institutional activity by dollars by day on a rolling 1-year basis. From a theoretical standpoint, examining a chart of daily institutional dollar activity over the course of a year can offer several insights and possible inferences, though all should be approached with caution since the data alone may not prove causality or confirm underlying reasons. Some potential takeaways include:
Event-Driven Behavior:
Sharp, singular spikes on certain days might correlate with major market-moving events. These could include central bank policy announcements, significant geopolitical news, sudden macroeconomic data releases (like employment reports or GDP data), earnings seasons for large-cap companies, or unexpected shocks (e.g., mergers, acquisitions, regulatory changes).Liquidity Dynamics:
Institutions often concentrate large trades on days with higher expected liquidity. For instance, heightened activity might coincide with index reconstitutions, option expiration dates, or the days leading up to or following a major index rebalance, when large amounts of capital shift hands simultaneously.Risk Management and Hedging Activity:
Institutions may significantly adjust their exposures on days that are critical from a risk management perspective. Large spikes can occur if hedge funds, pension funds, or asset managers are rolling over futures contracts, initiating or closing out large hedges, or reacting to volatility triggers.Market Sentiment Indicators:
While the data is purely transactional, the sheer volume of institutional involvement on certain days might indirectly hint at changing sentiment or strategic shifts.
In essence, a chart like this can lead you to hypothesize that institutional trading volumes are not constant or random but rather influenced by a mix of predictable calendar effects, major market events, liquidity considerations, risk management decisions, and strategic allocation shifts.
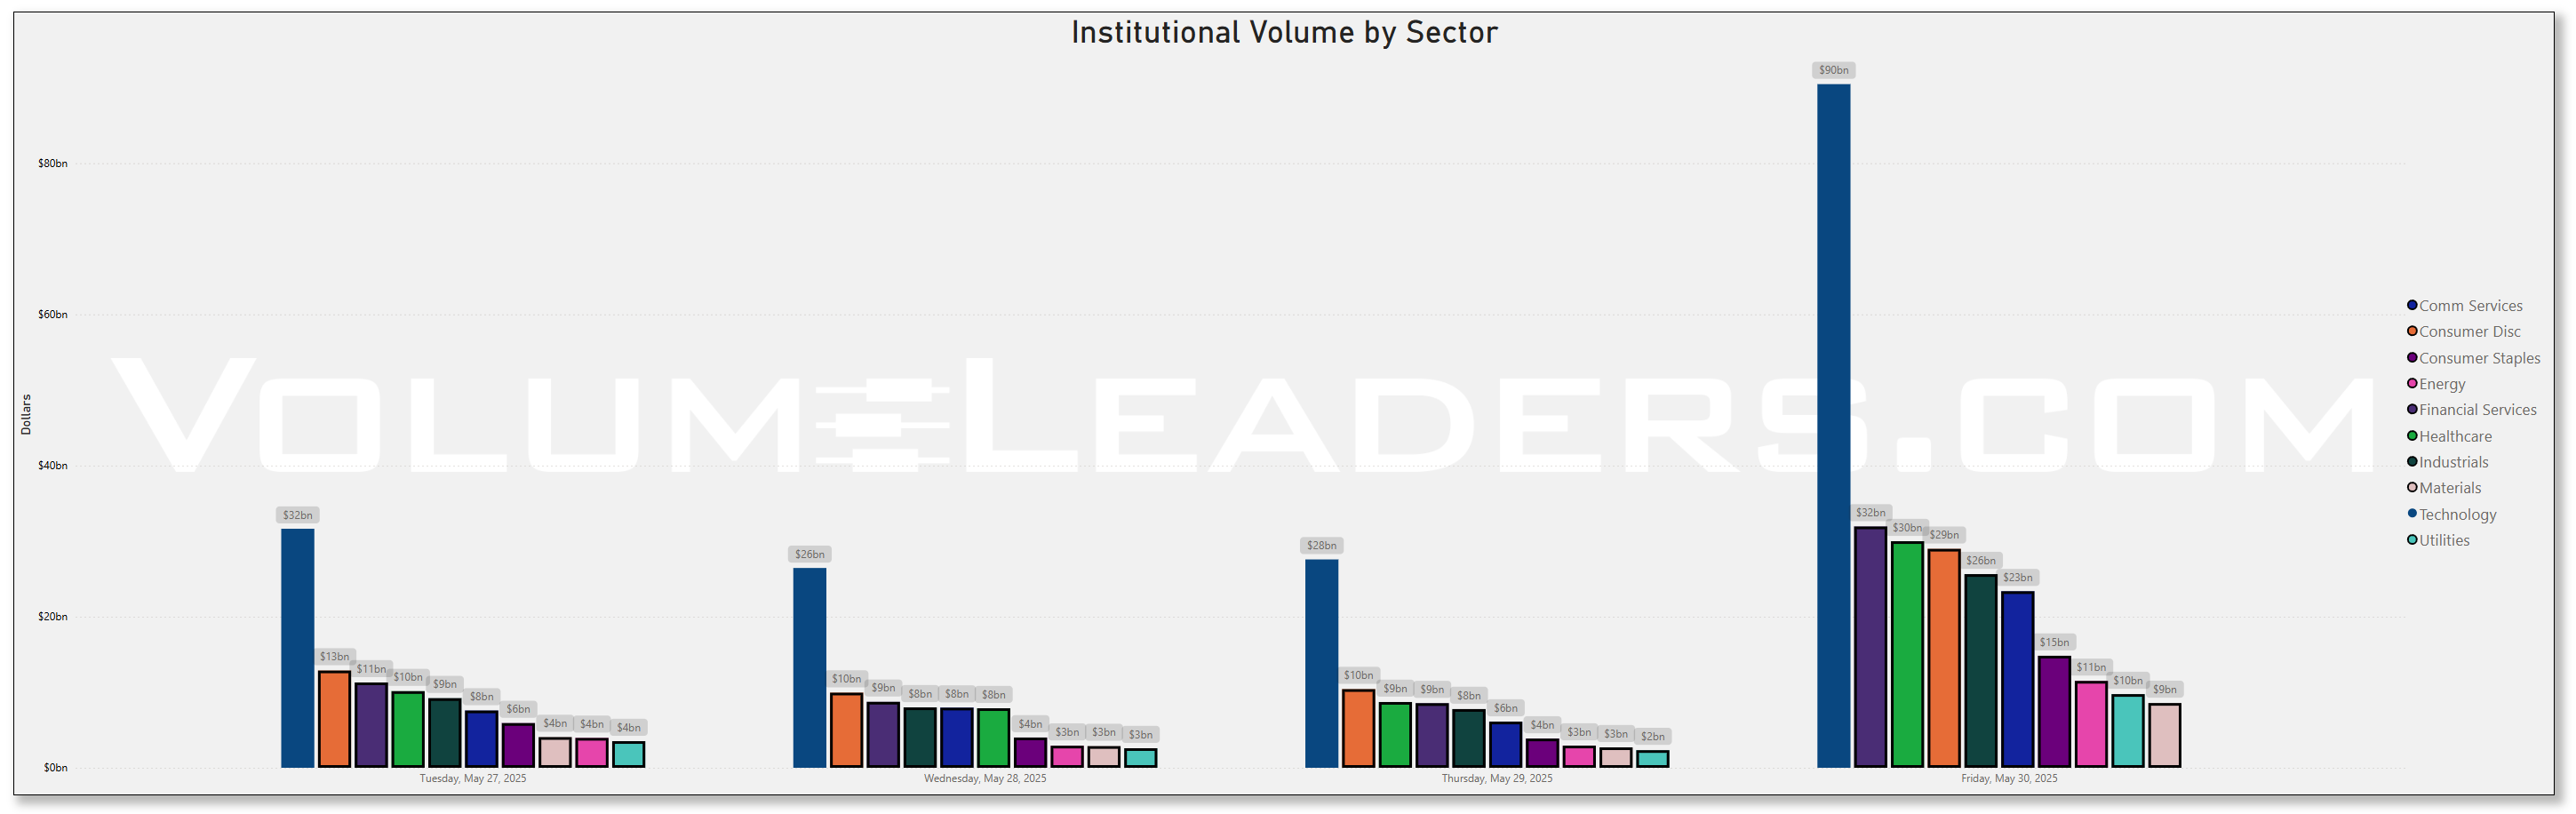
Top Institutional Order Flow By Sector By Week For The Past 90-Days
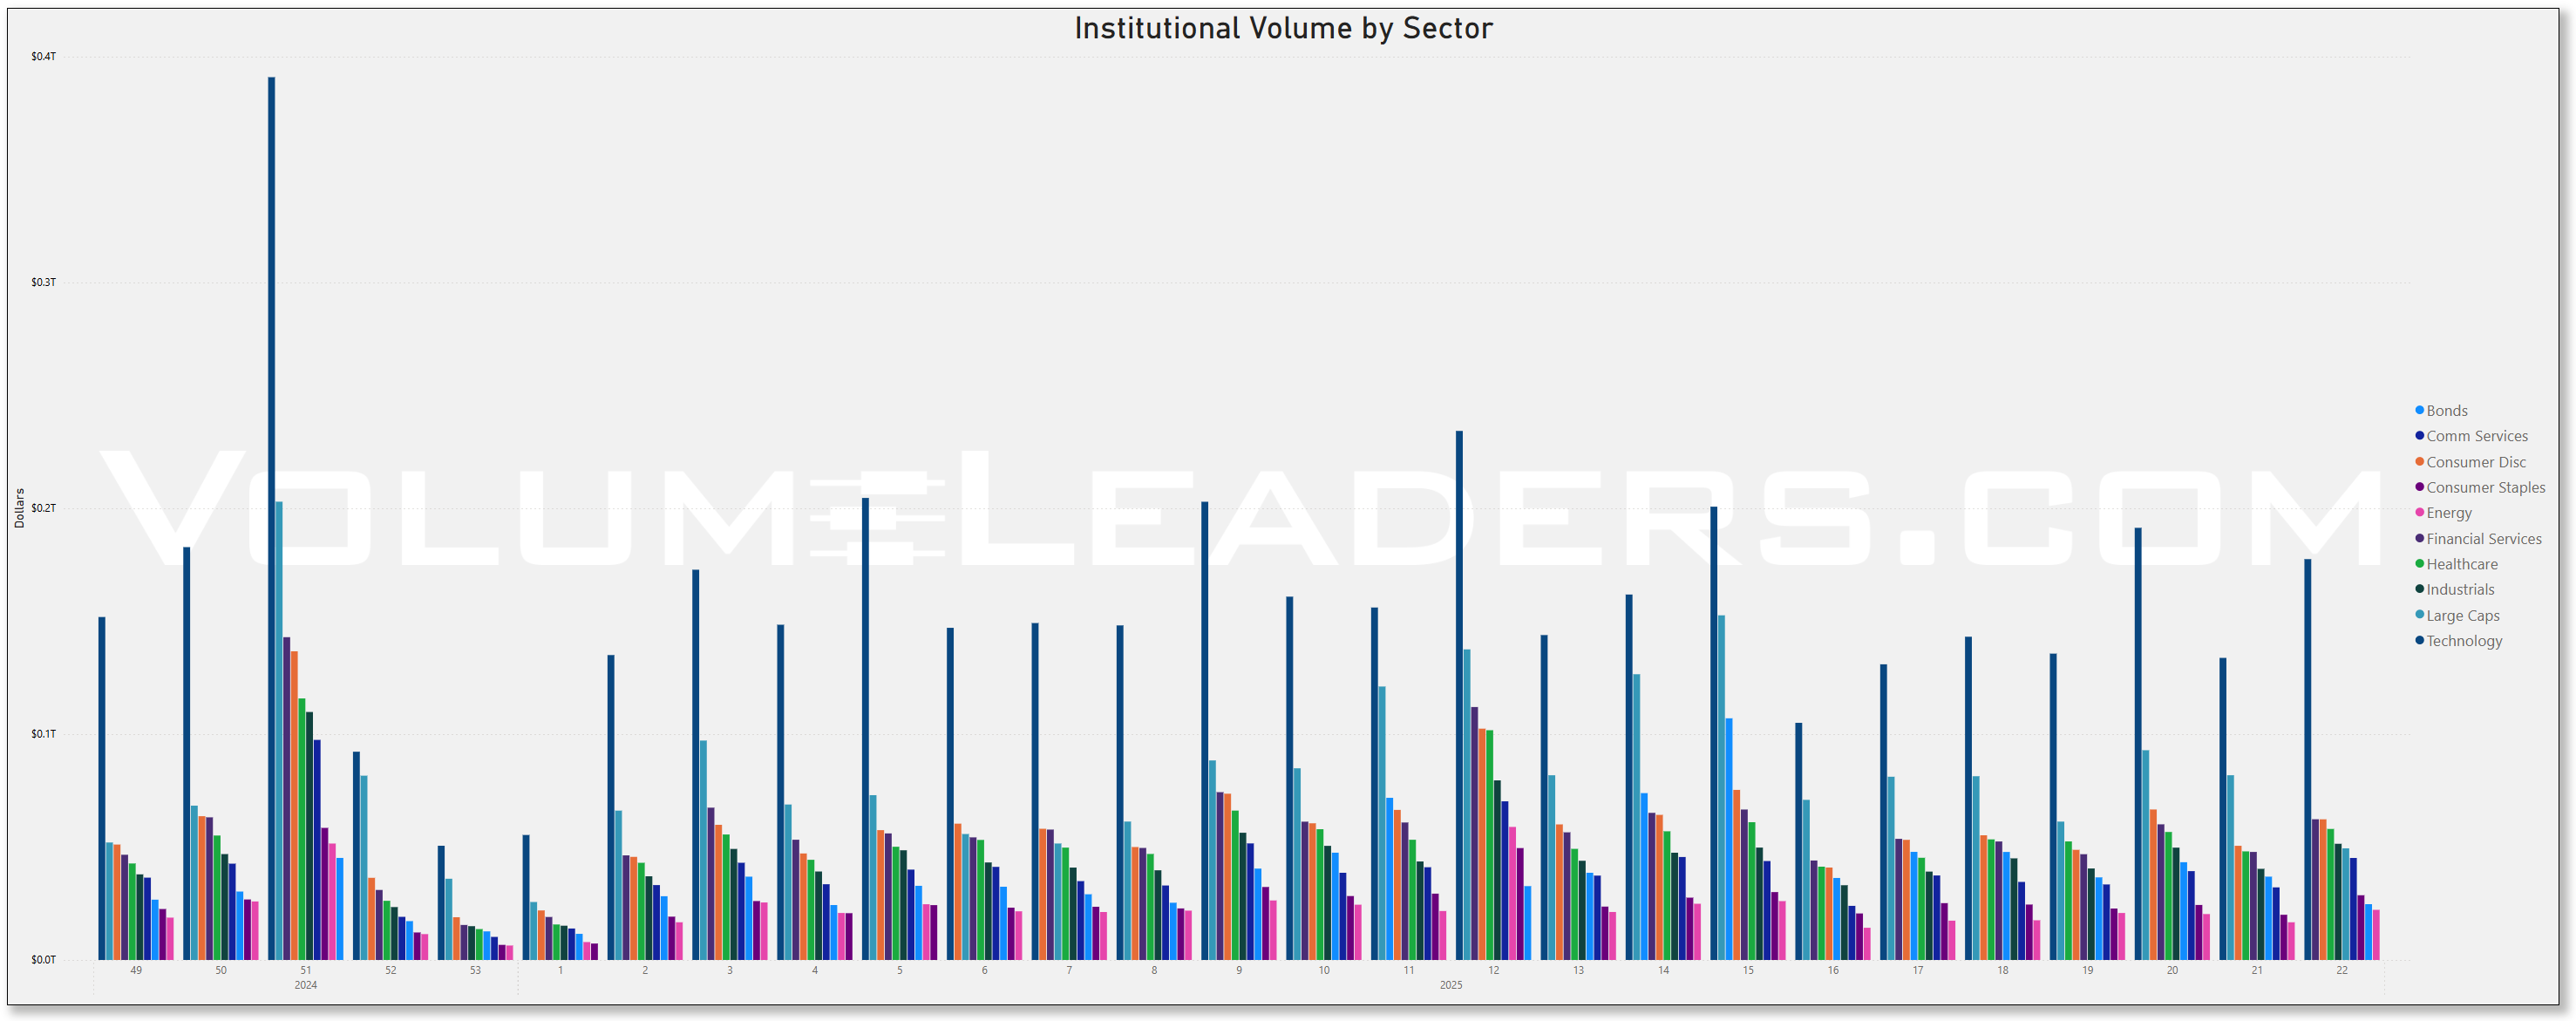
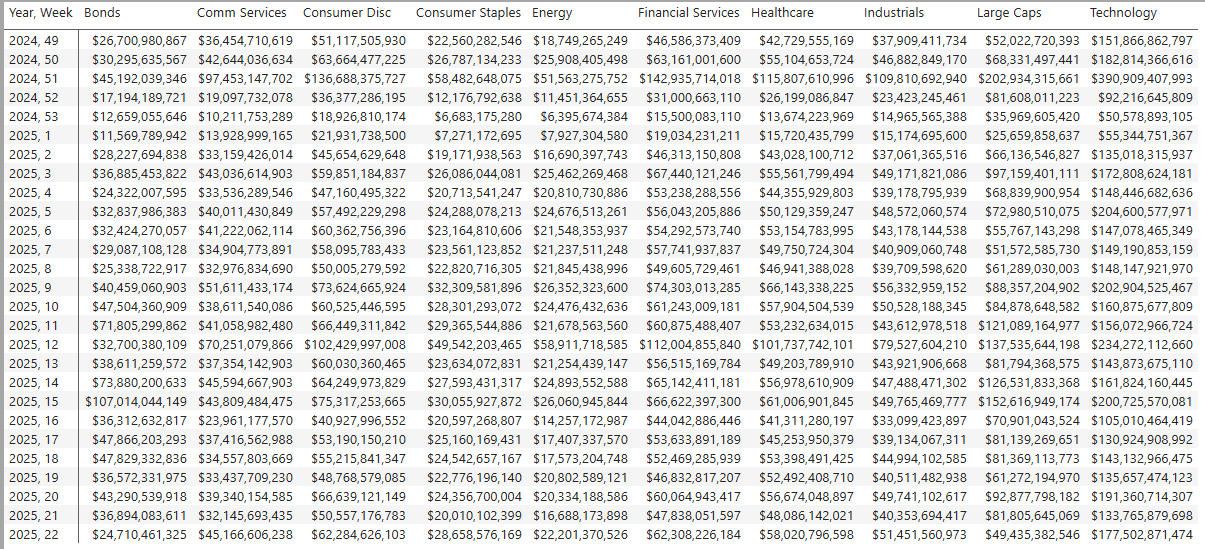
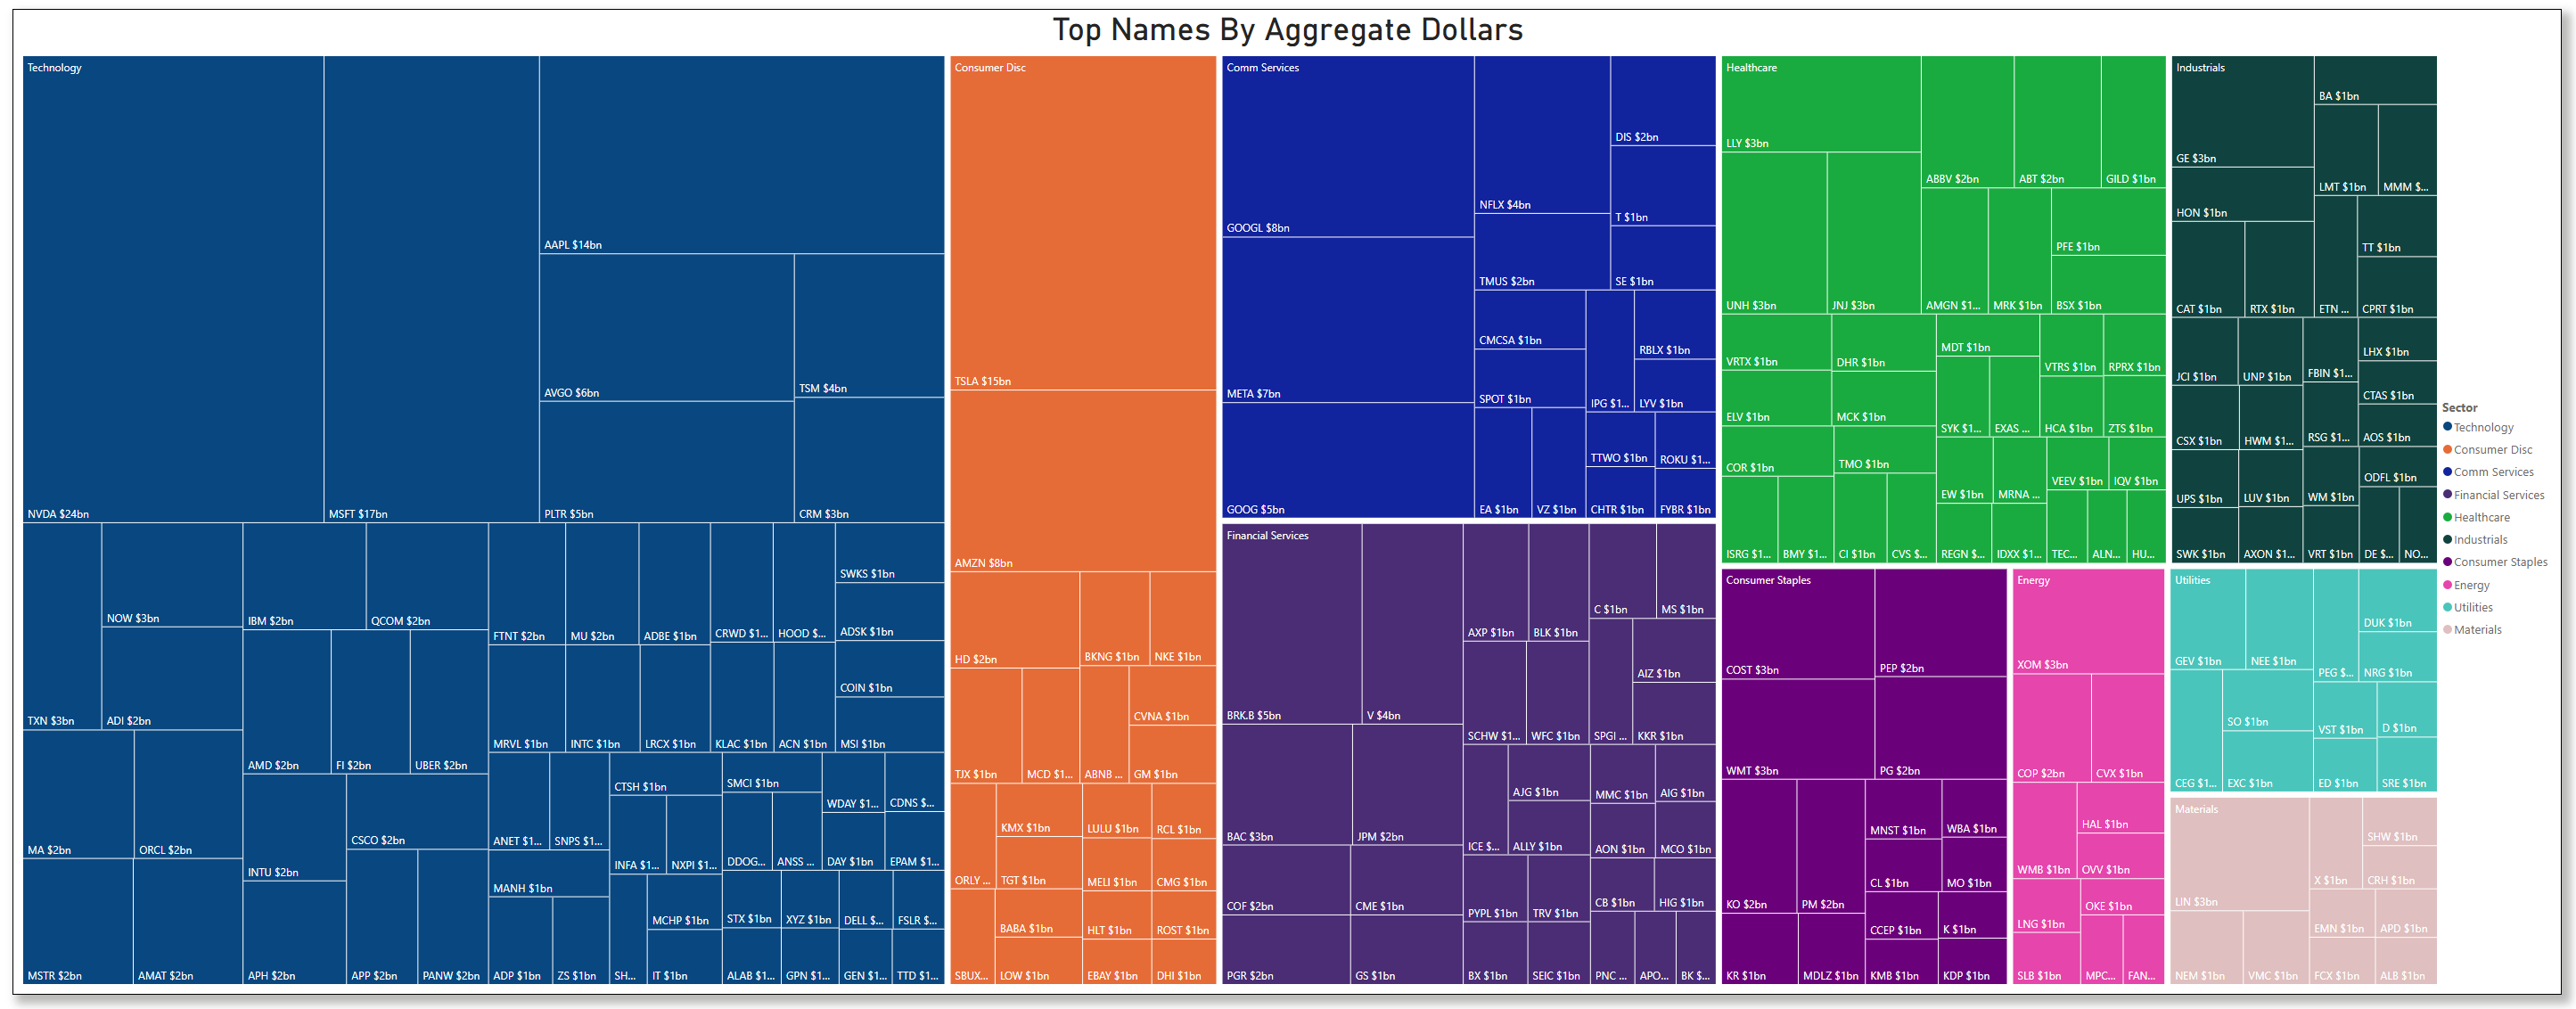
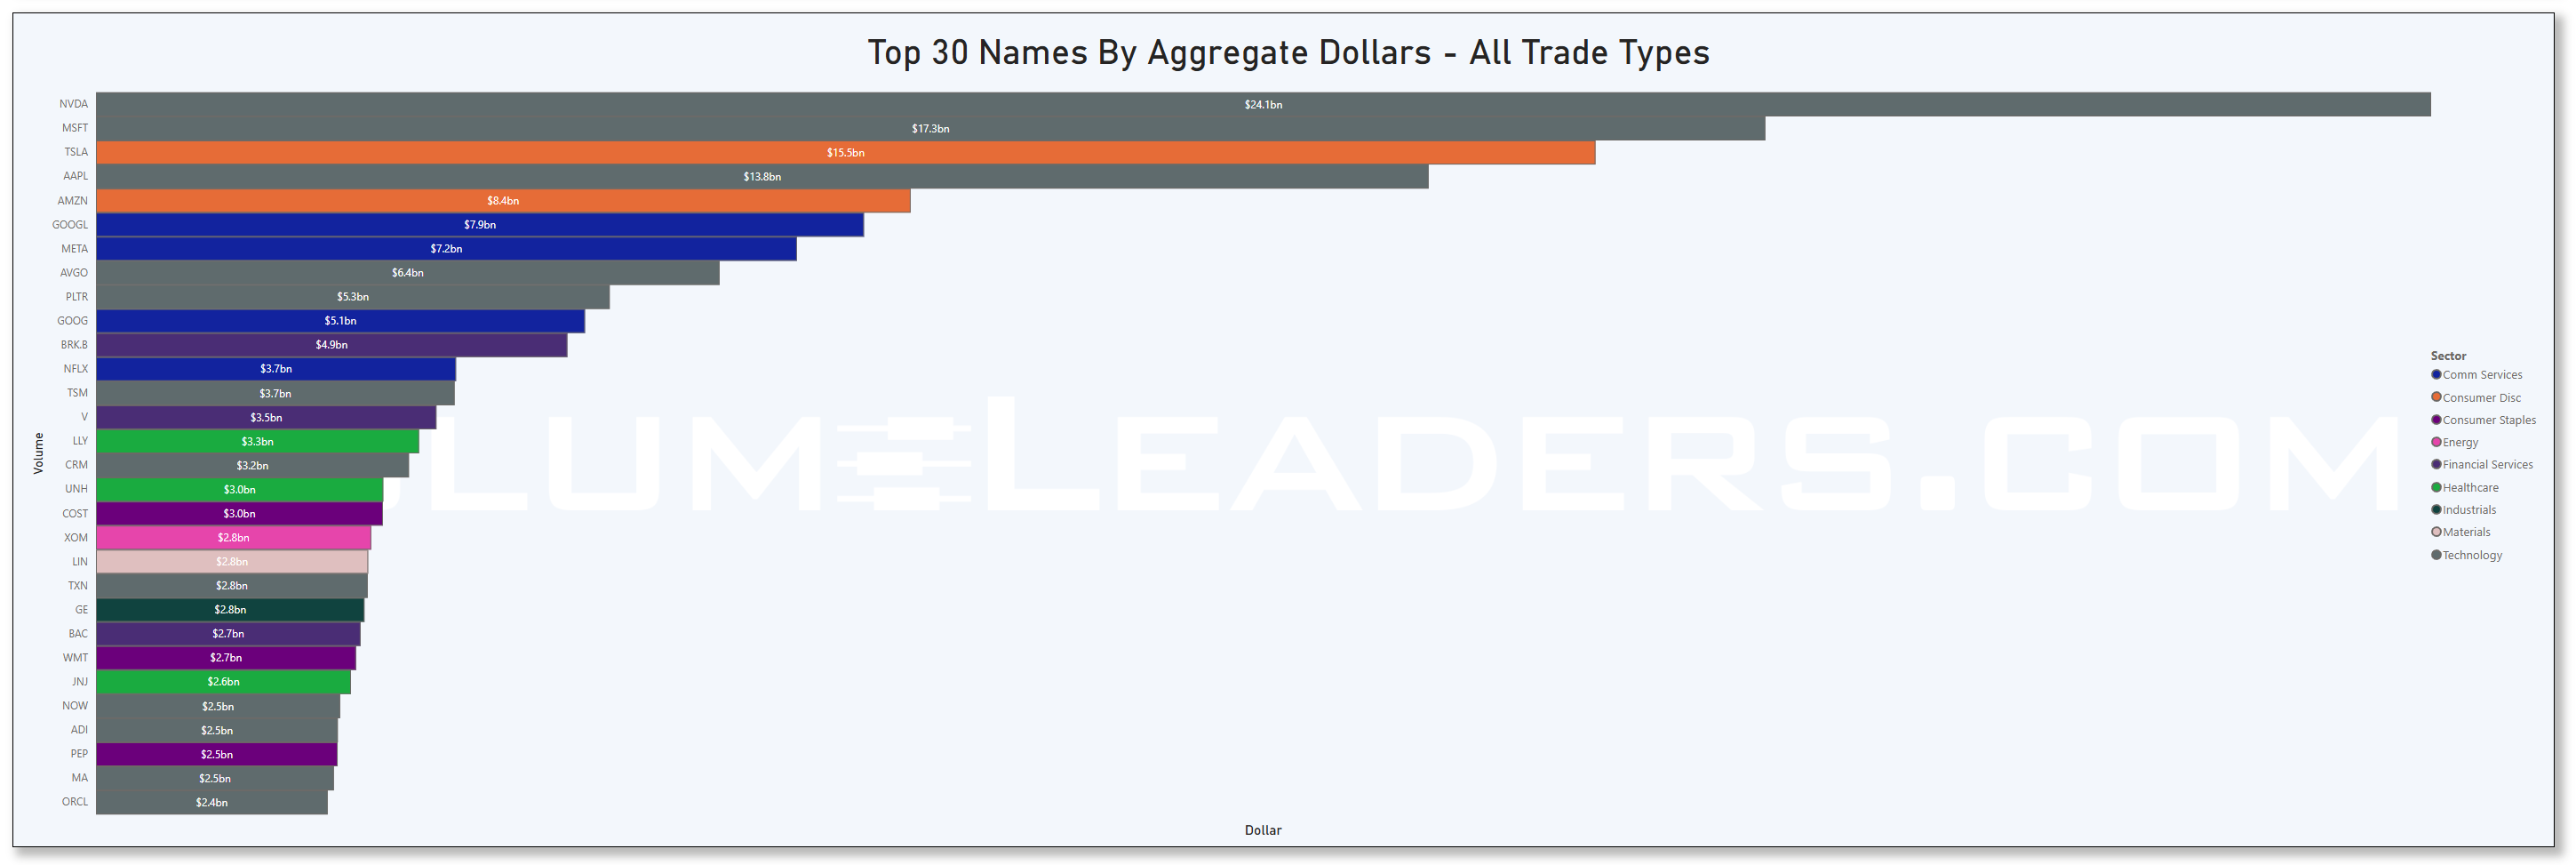
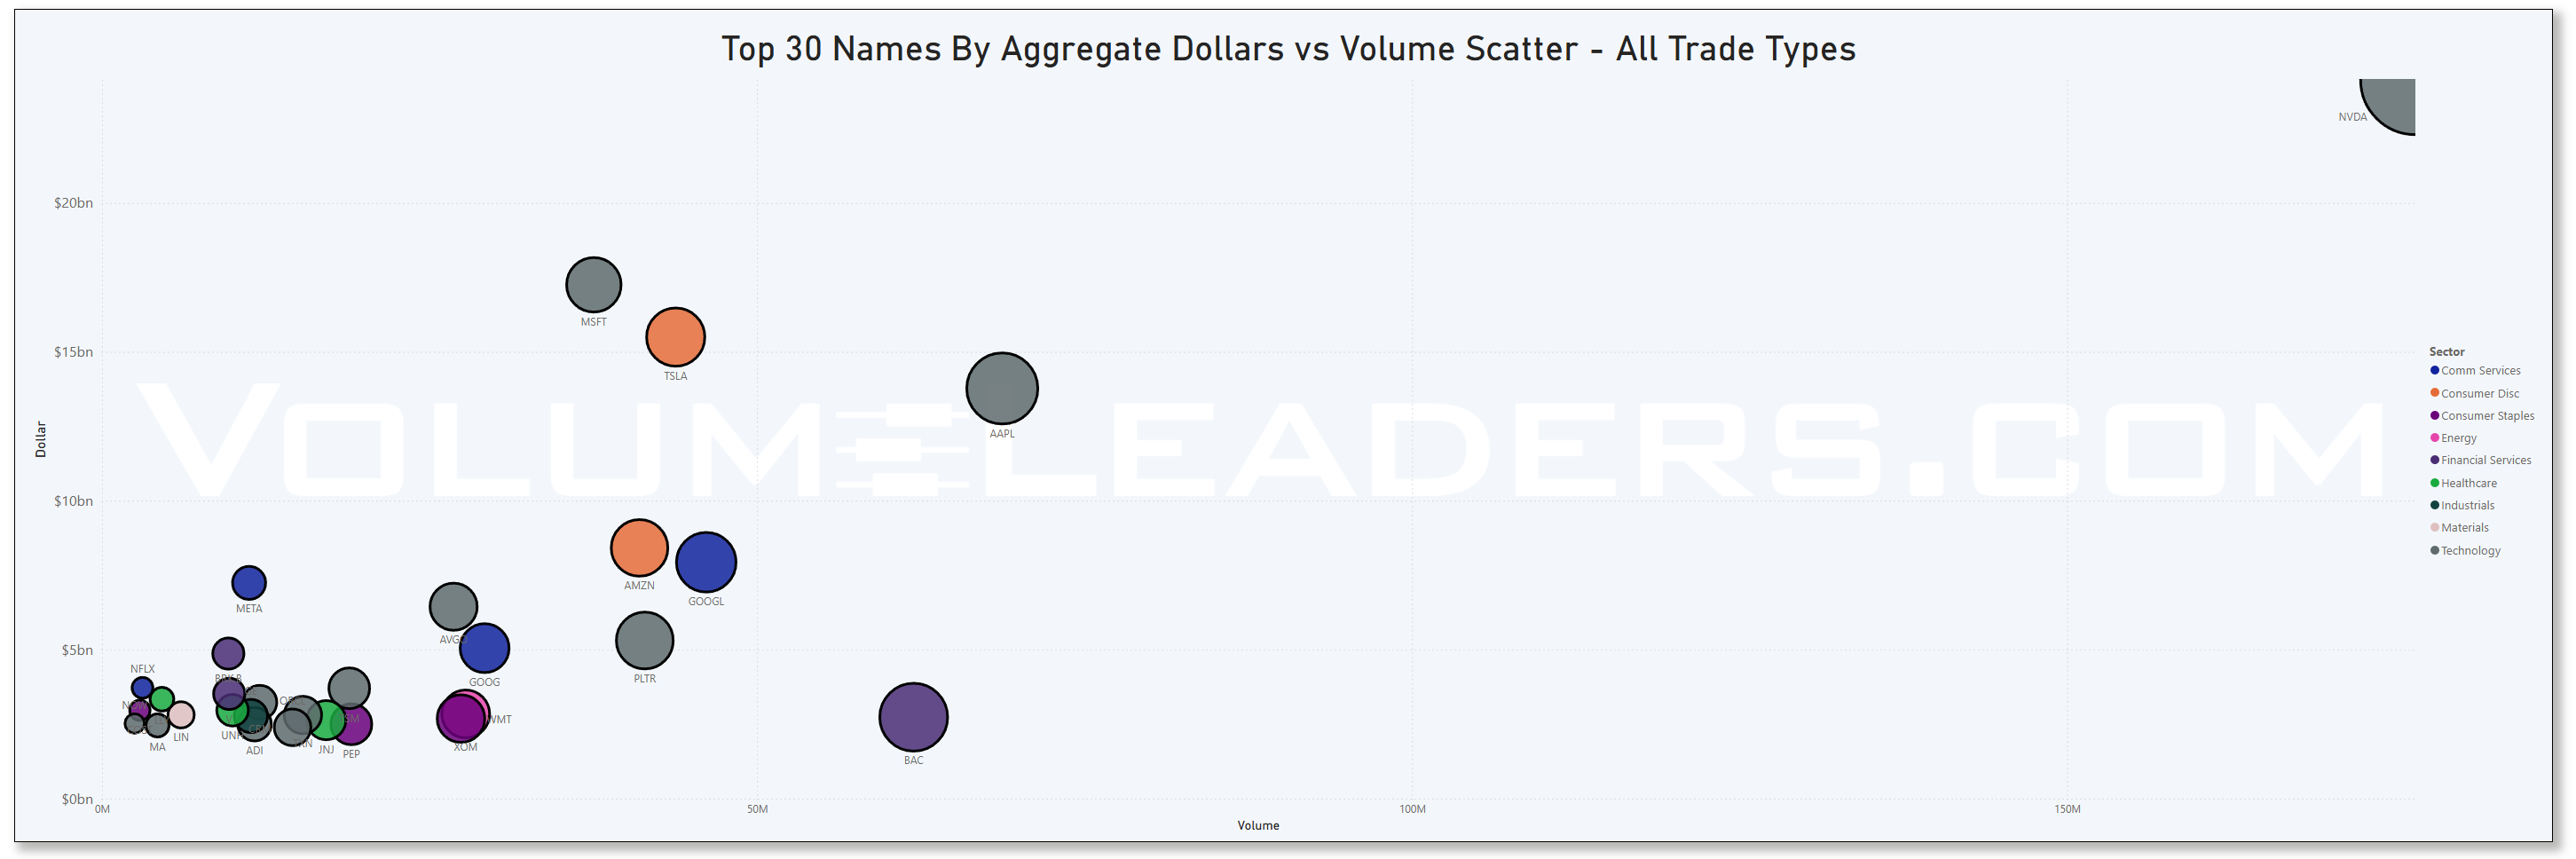
Top Institutional Order Flow In Equities
These are incredibly important charts to watch as they contains lots of nuanced suggestions at a thematic level. Watch these charts closely week-to-week to stay informed about where institutional money is flowing, adjust your strategies based on momentum, align your portfolio with macroeconomic and market trends, and manage risks more effectively by avoiding sectors losing institutional favor.
Sector Rotation Insights: The chart highlights which sectors are attracting institutional activity and which are losing favor. Institutions often lead market trends, so tracking shifts in their focus can indicate sector rotations.
Sentiment Analysis: The level of institutional activity reflects confidence in specific sectors. Rising activity in traditionally defensive sectors (e.g., healthcare, utilities) may indicate caution, while a surge in growth sectors (e.g., technology, consumer discretionary) could suggest optimism.
Emerging Trends: Sudden spikes in a previously overlooked sector, like industrials or consumer staples, might hint at emerging opportunities or structural shifts.
Macro Themes: Changes in sector activity often align with broader macroeconomic themes like inflation, interest rates, or geopolitical events. For instance:
Increased activity in energy might indicate concerns about oil supply or rising prices.
Growth in technology could align with innovations or favorable policies.
Risk Management: Declining institutional activity in a sector might signal weakening fundamentals or heightened risks.
Spotting Overcrowding: Excessive activity in a single sector over multiple weeks may suggest overcrowding, which could lead to heightened volatility if institutions begin to exit.
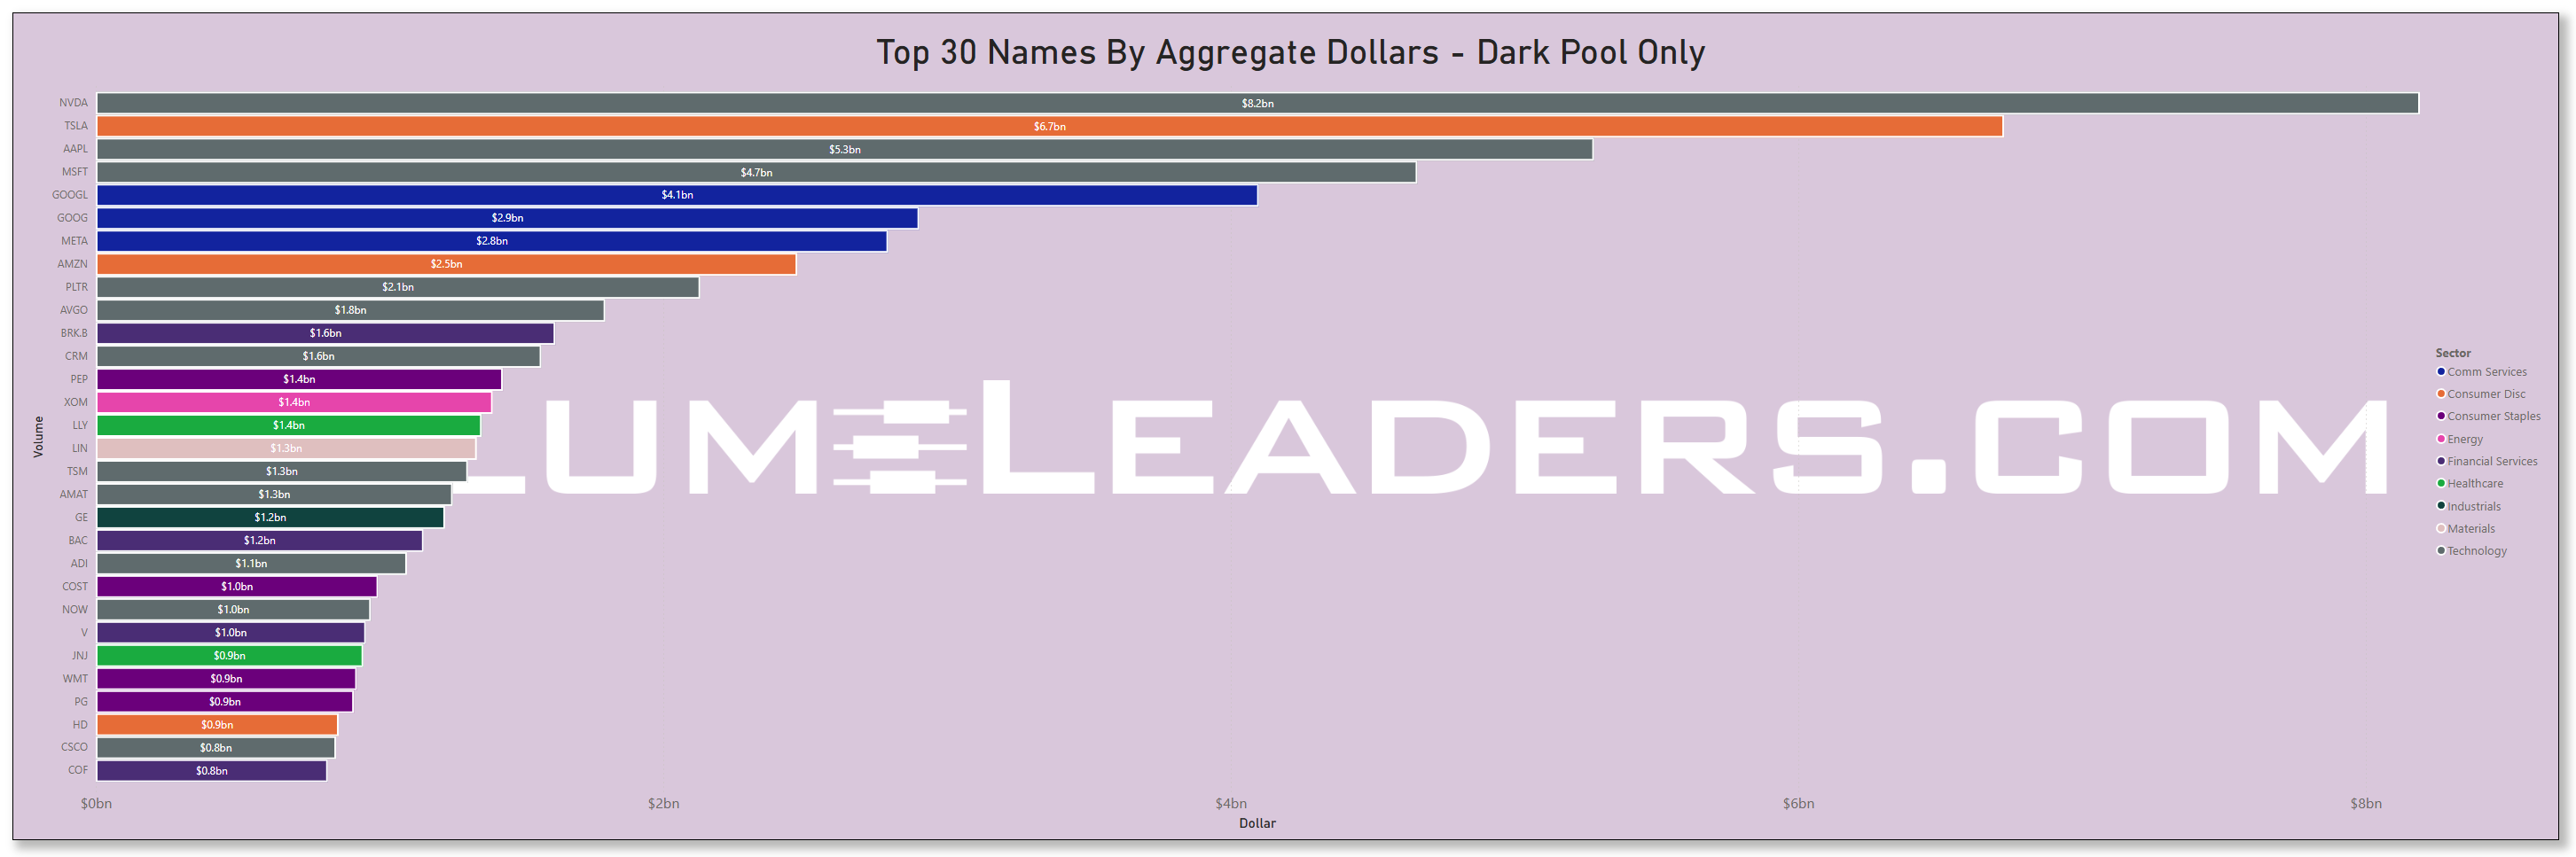
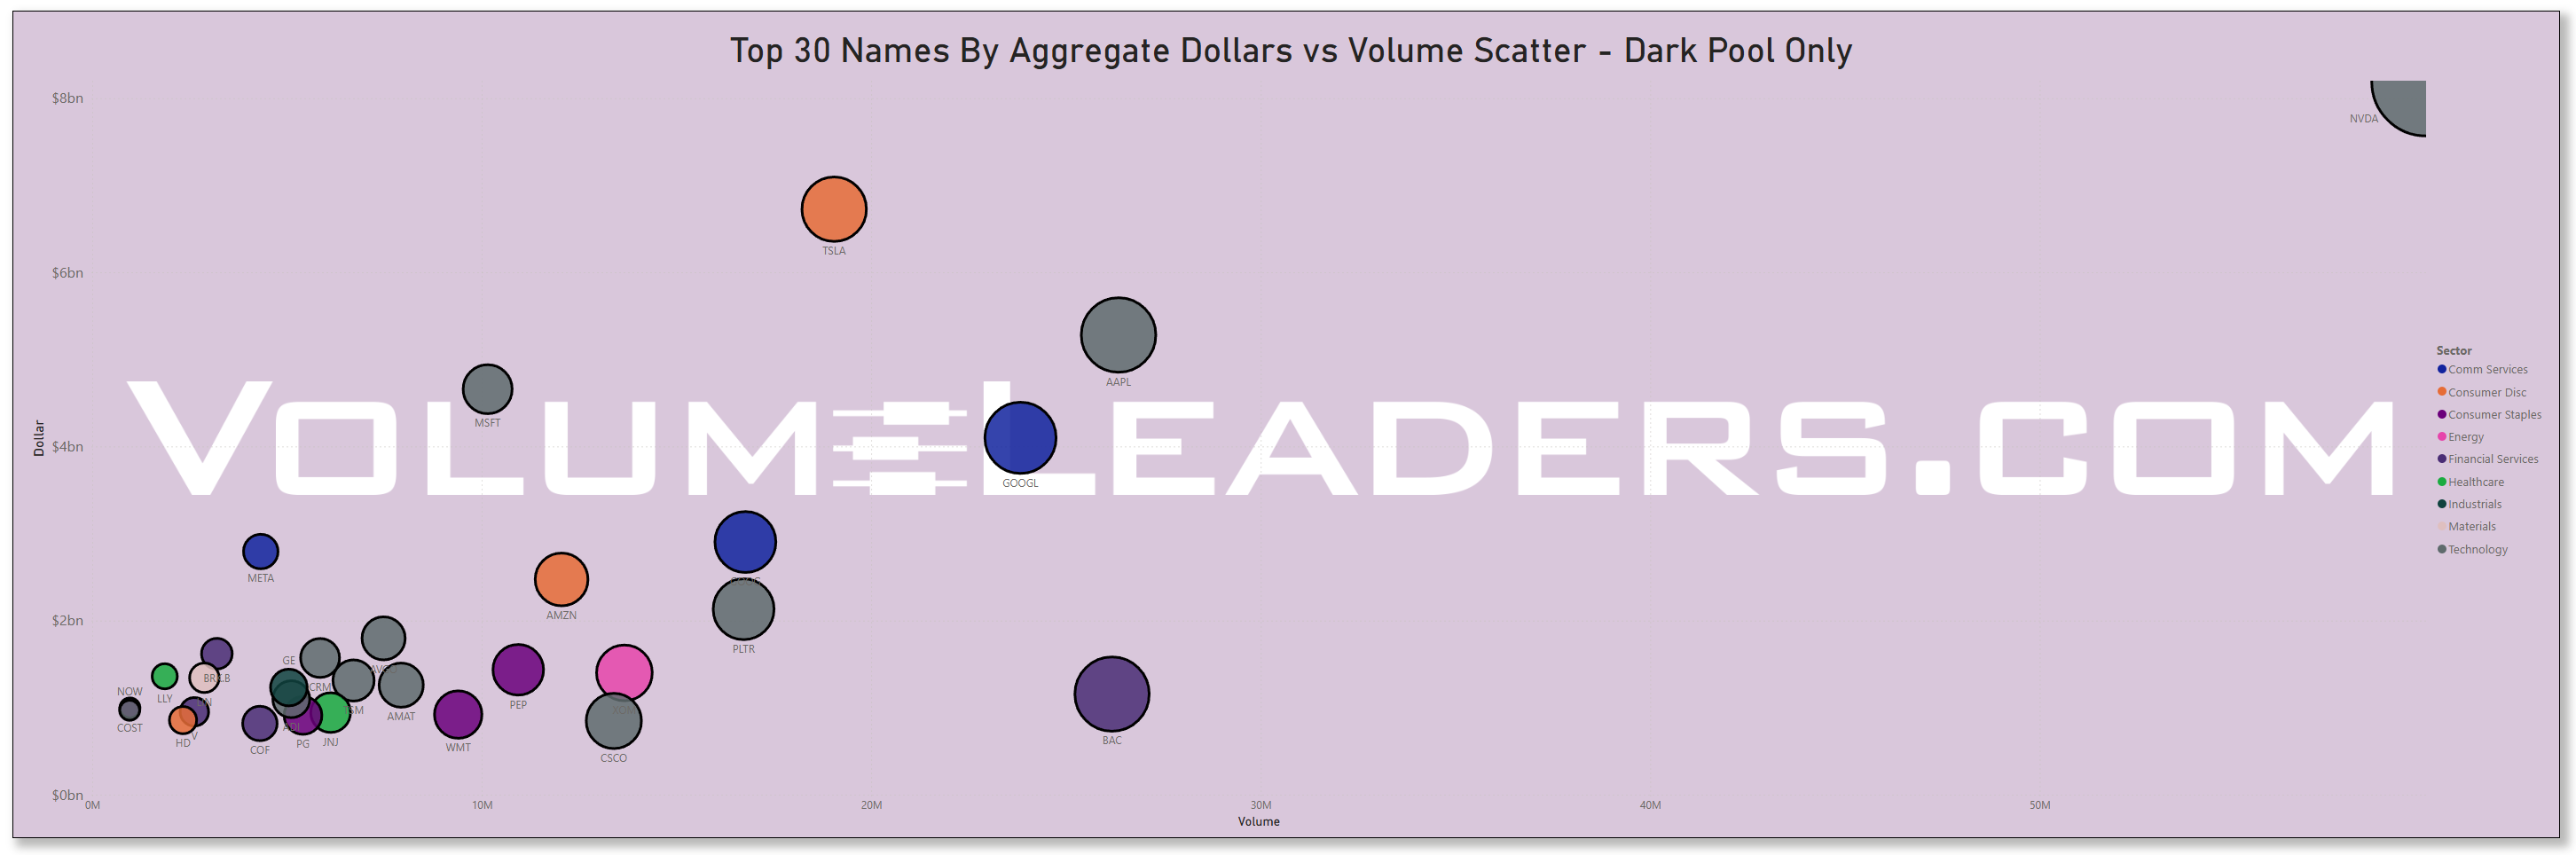
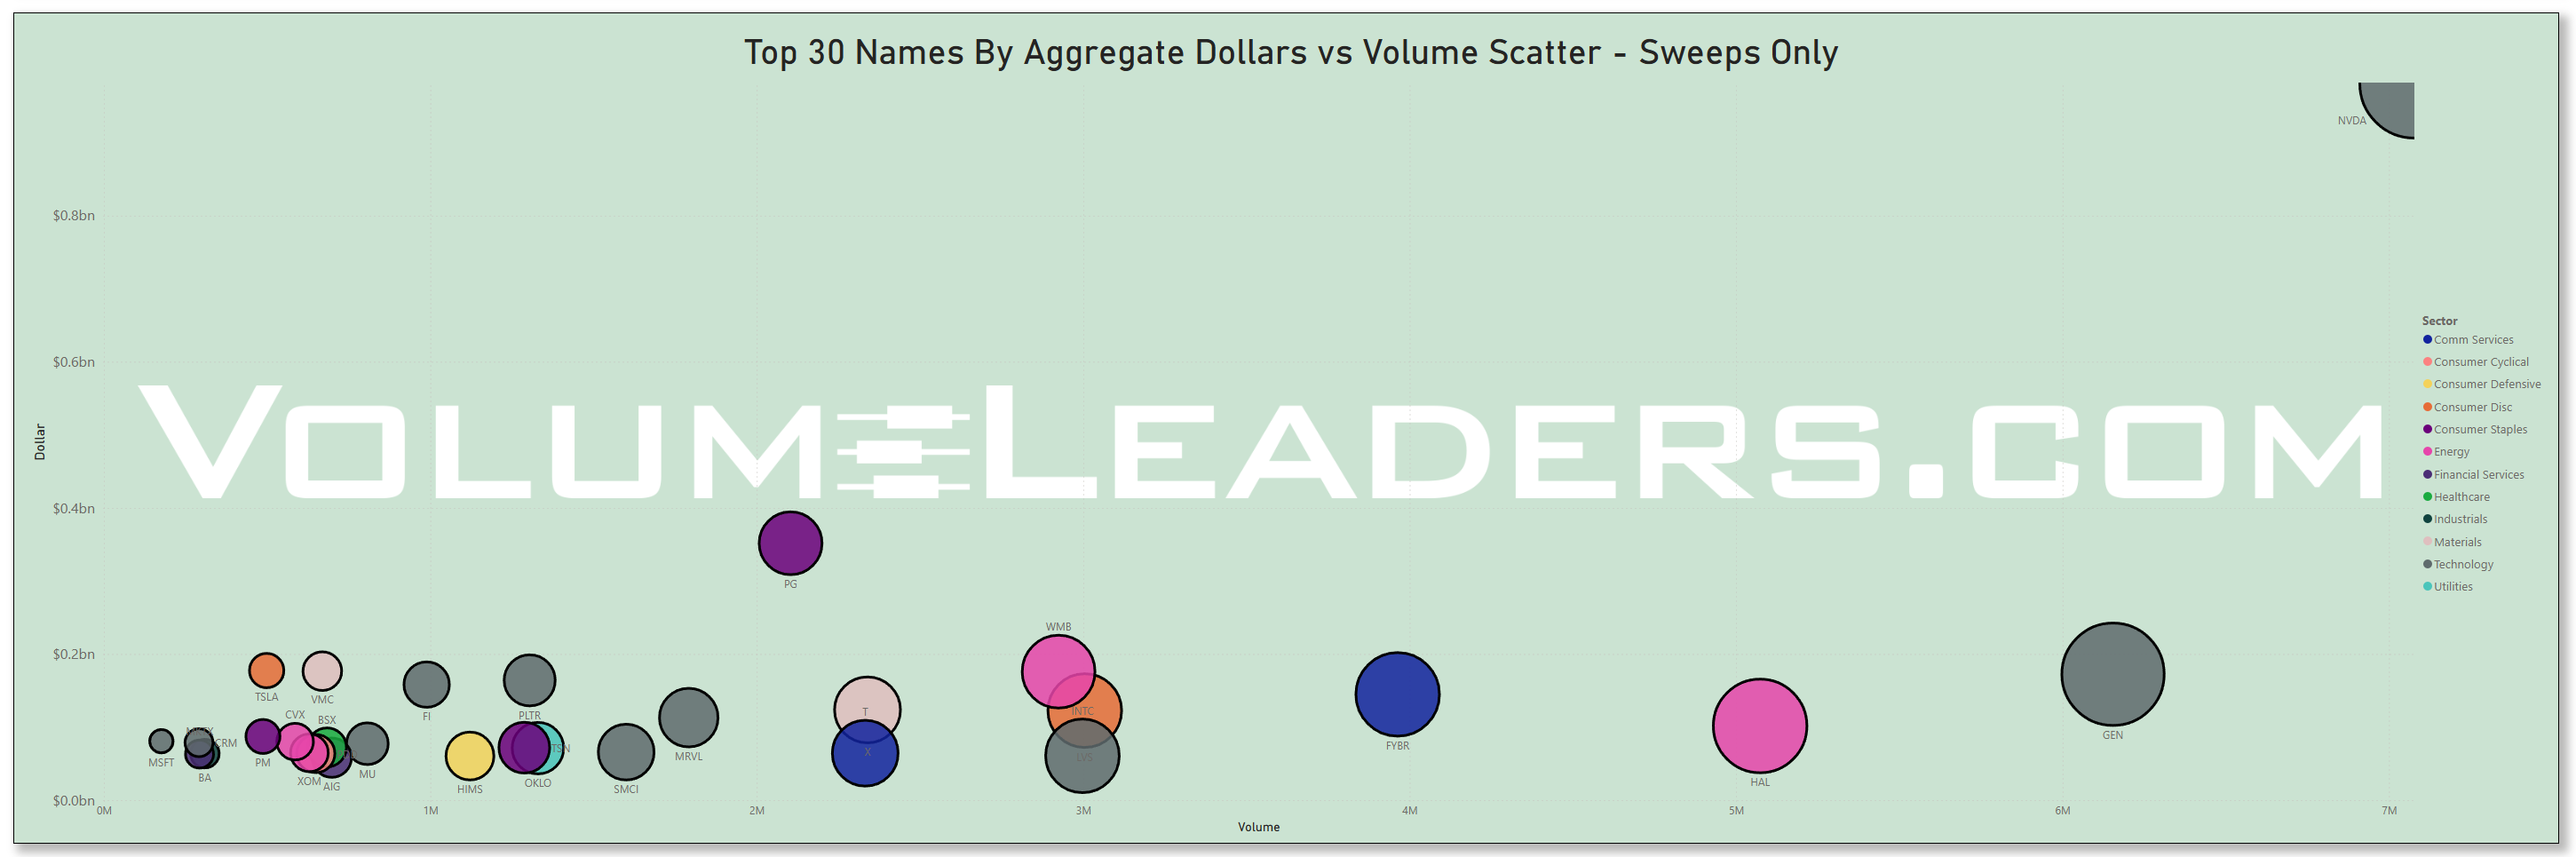
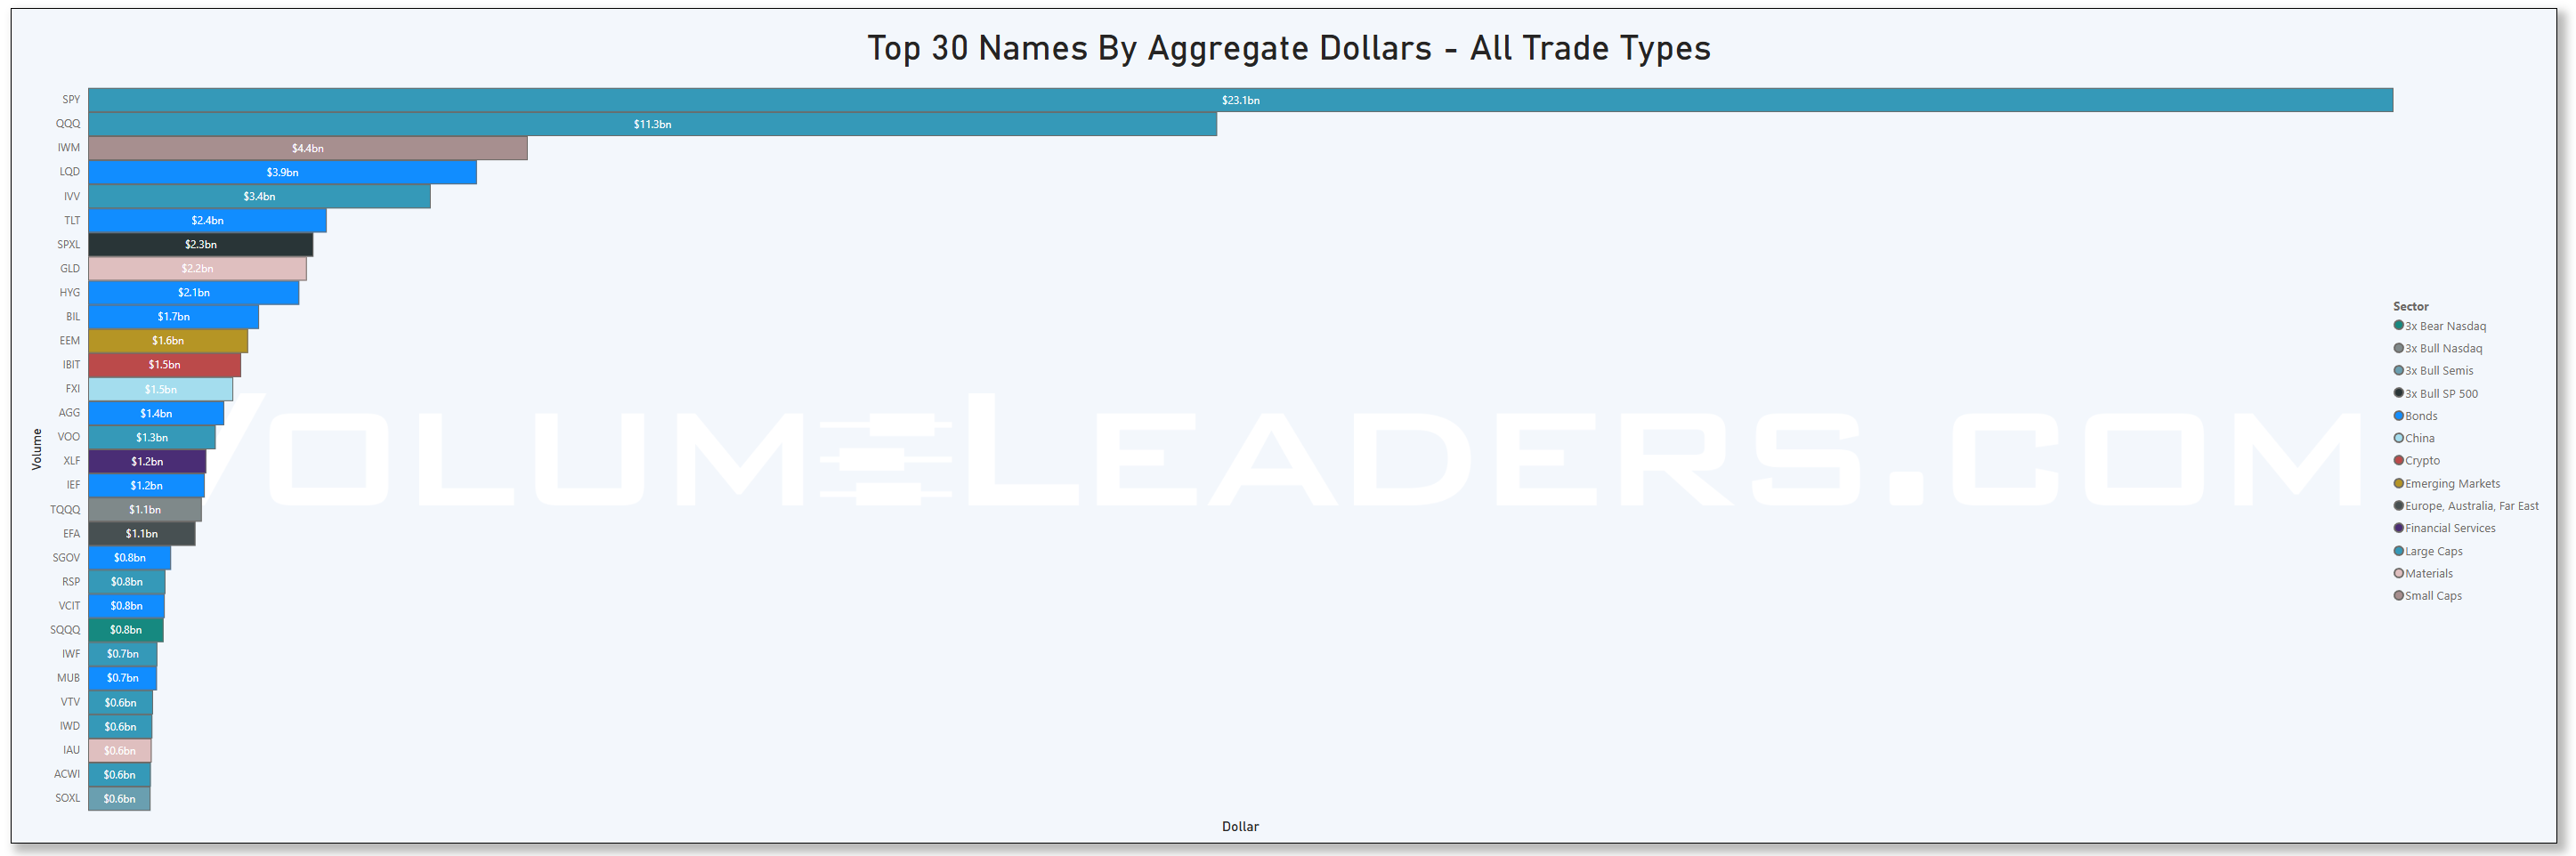
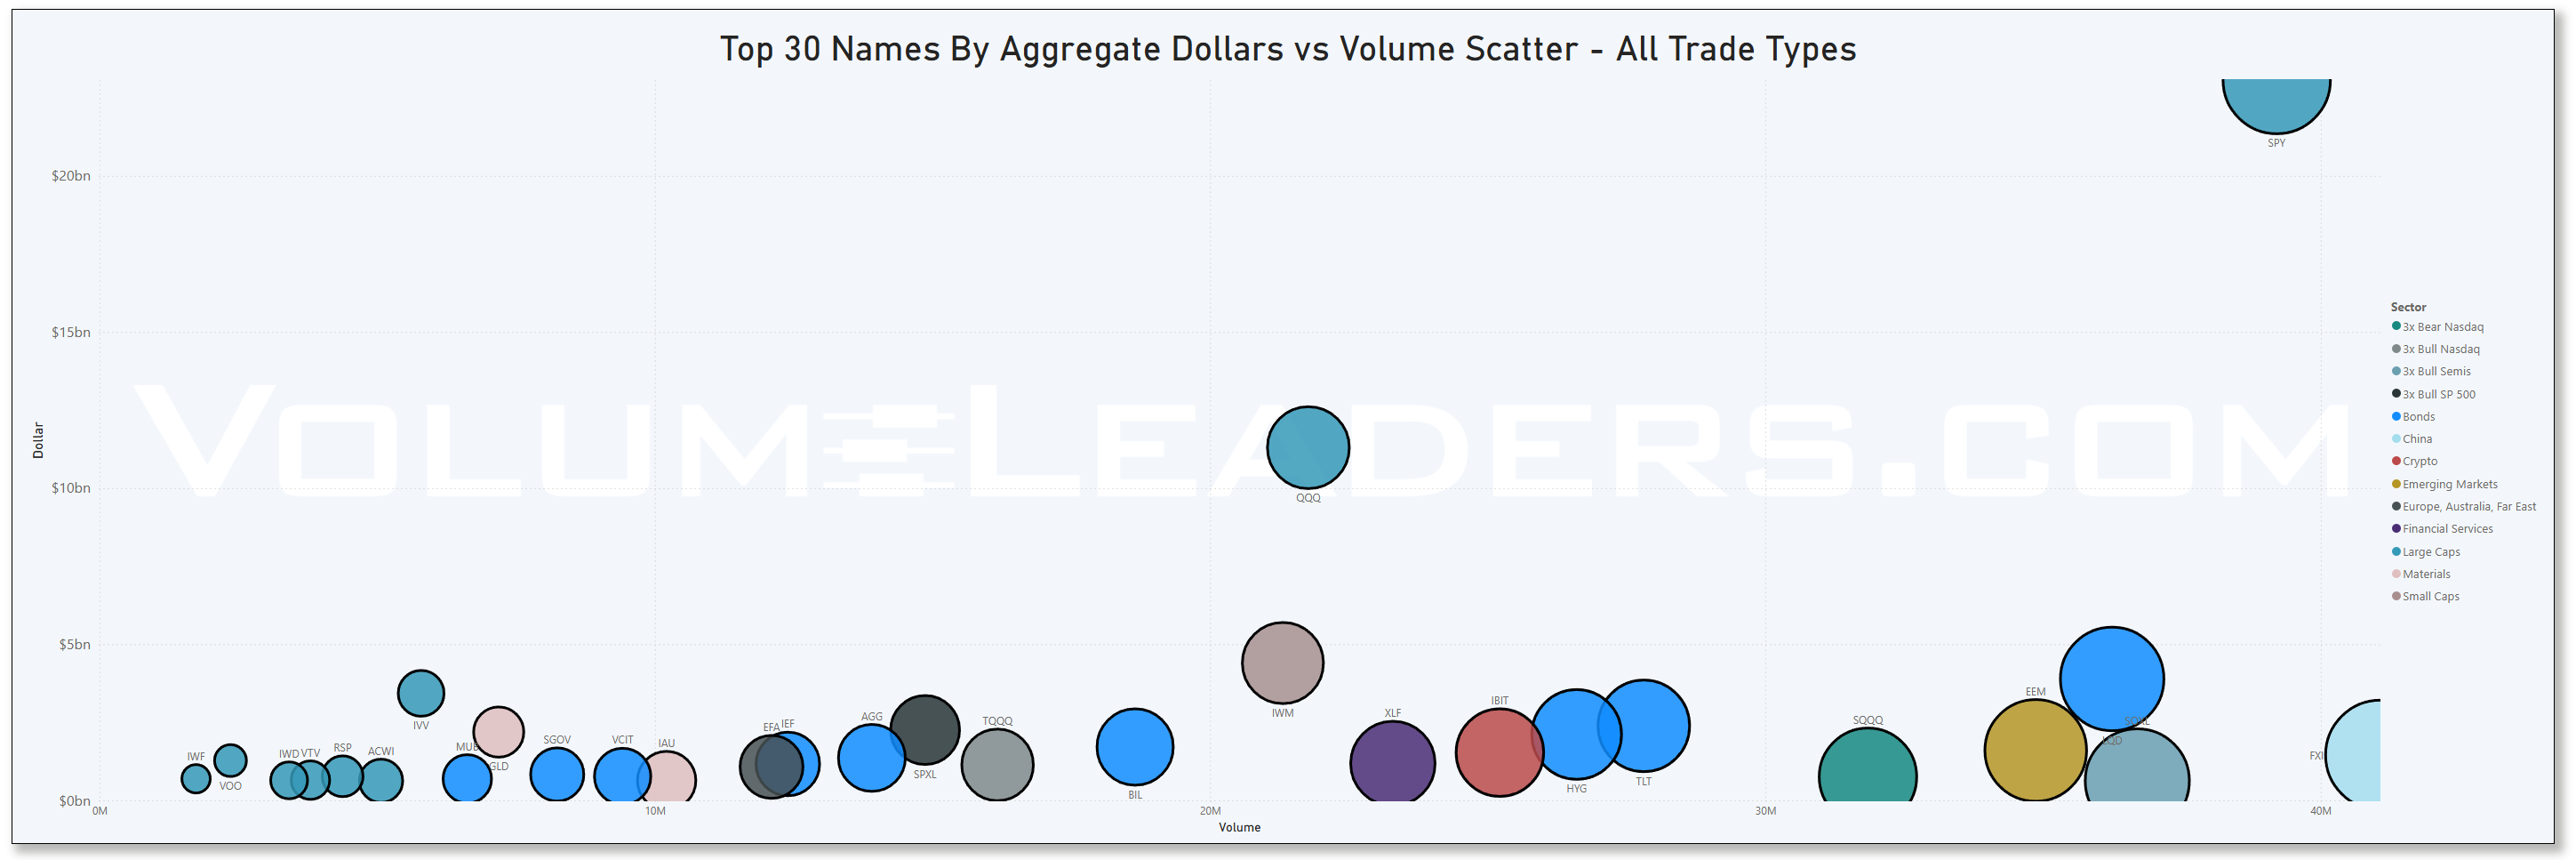
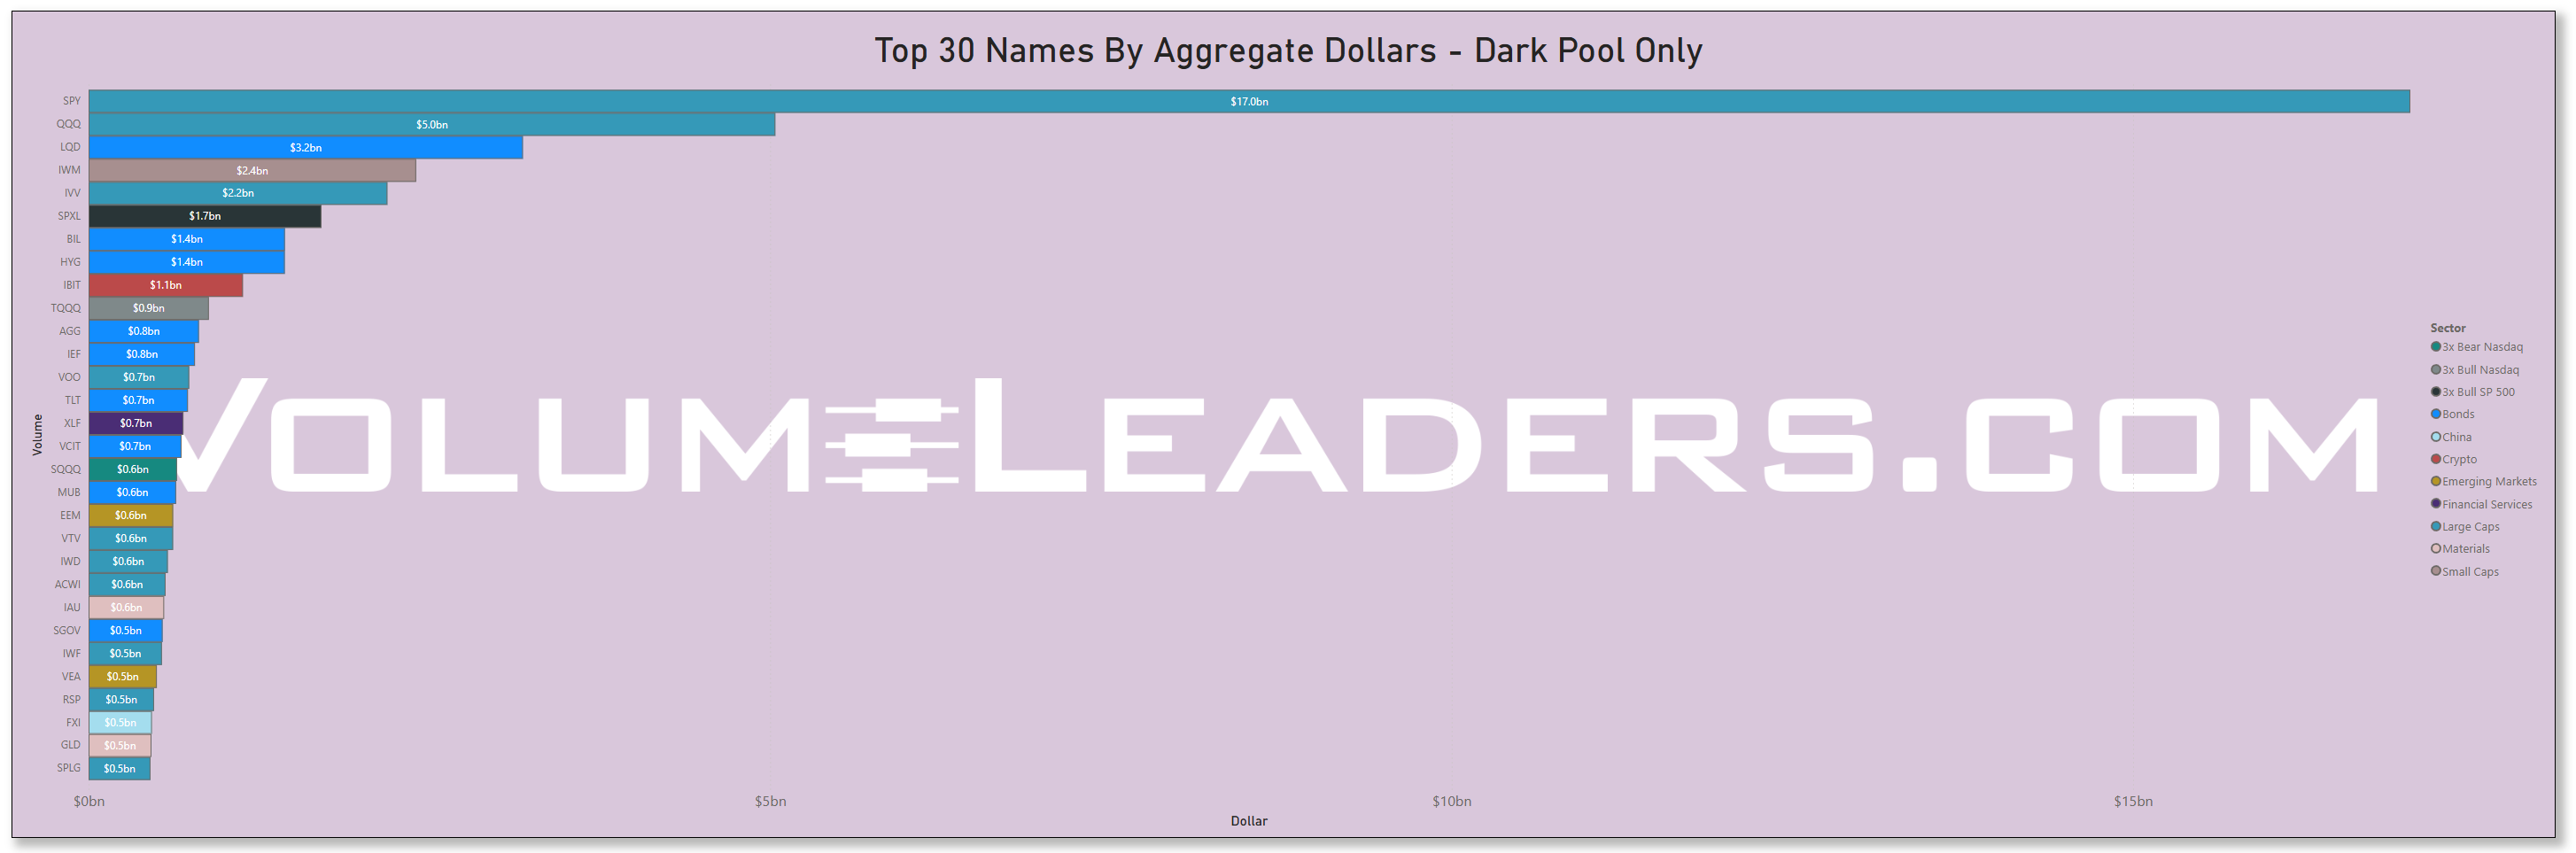
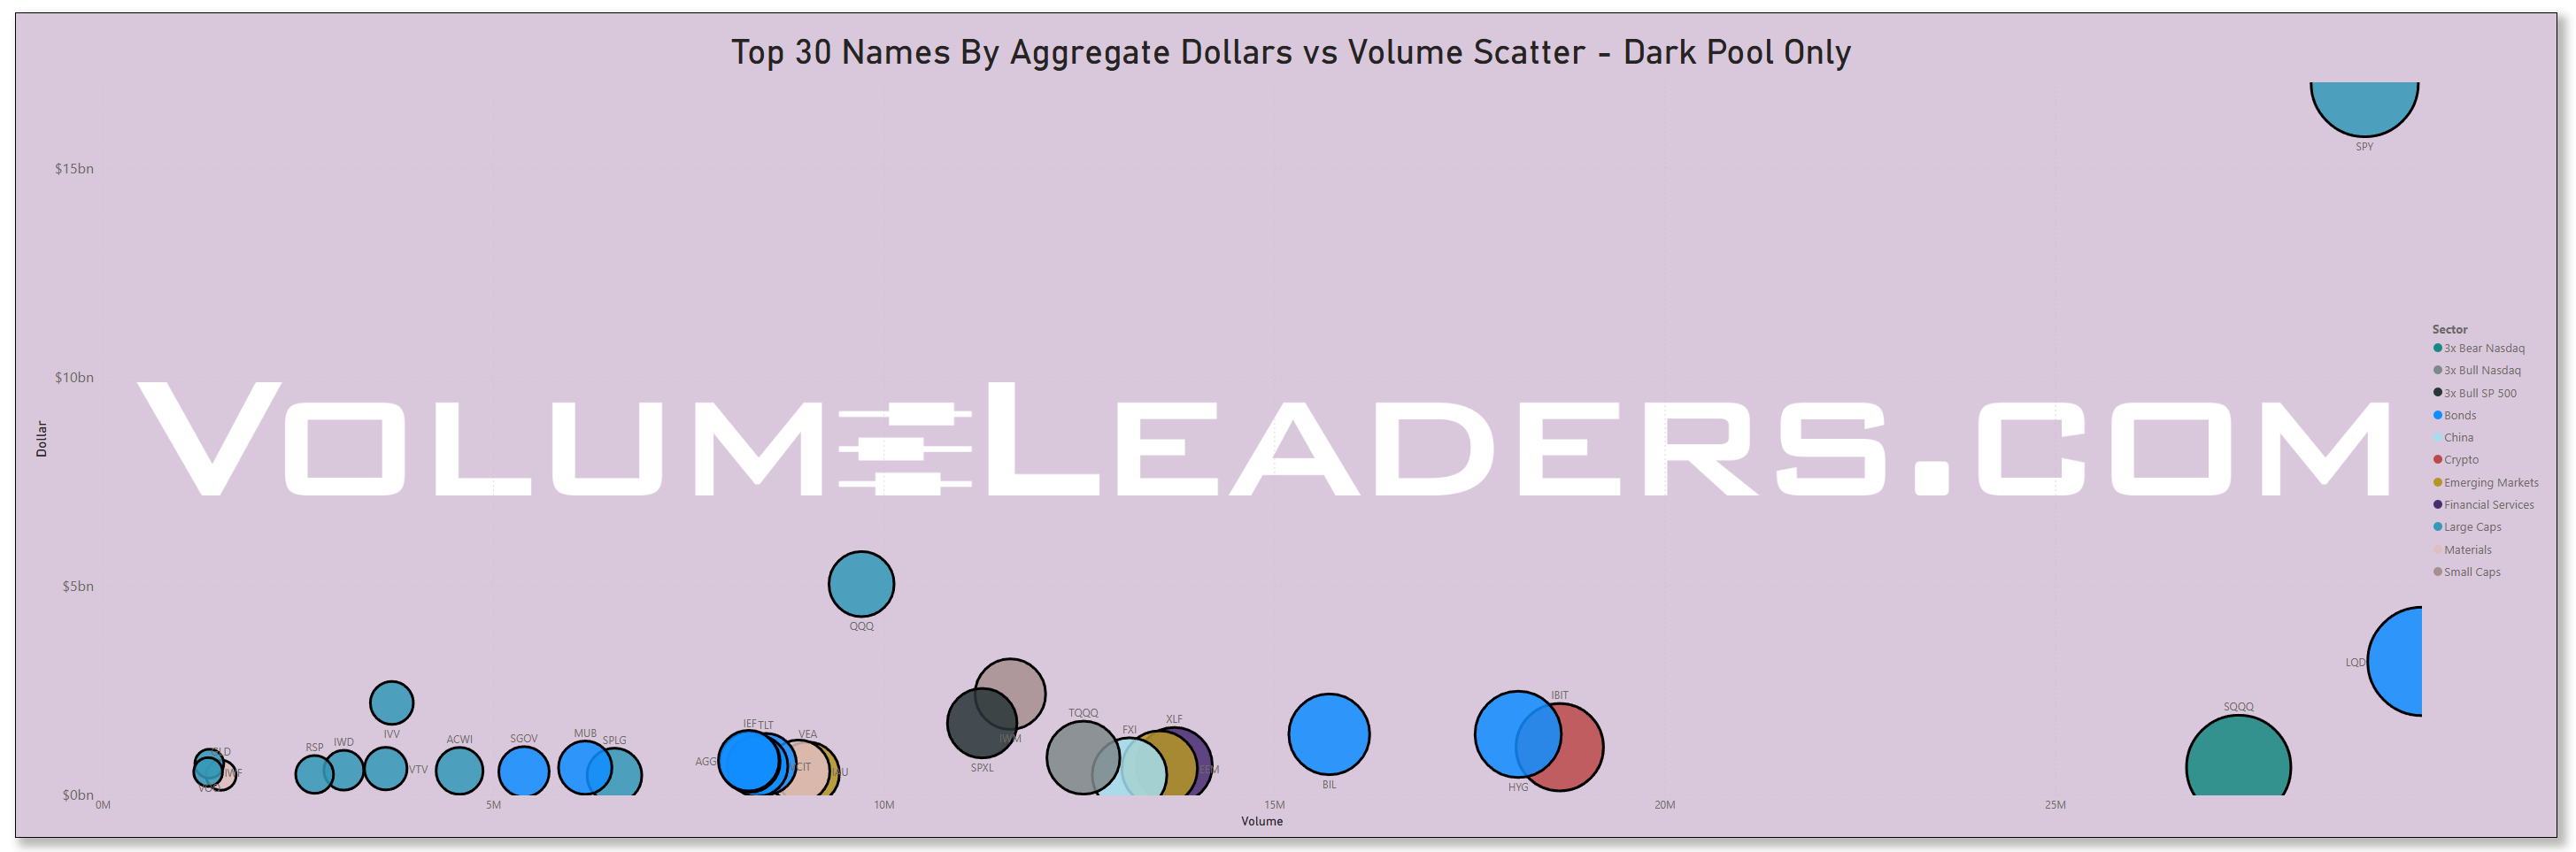
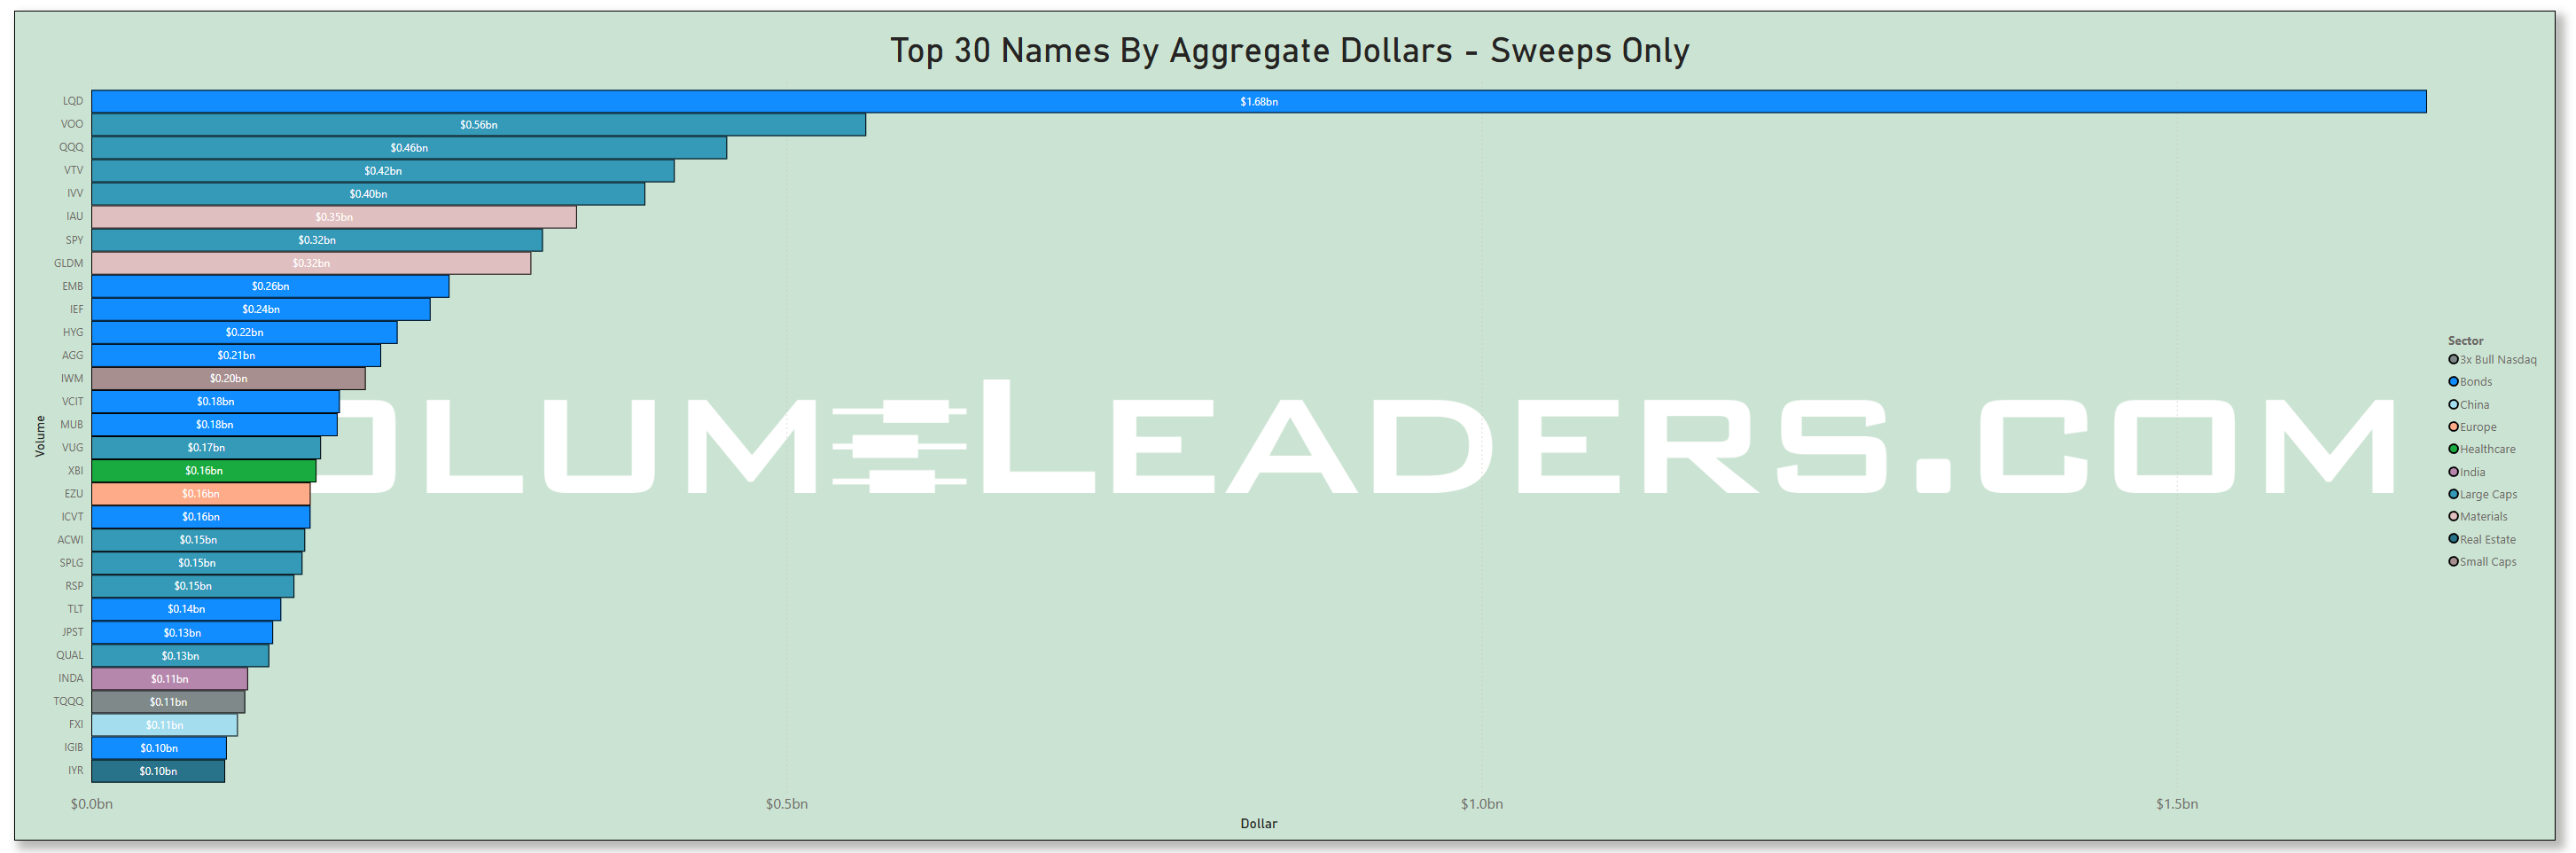
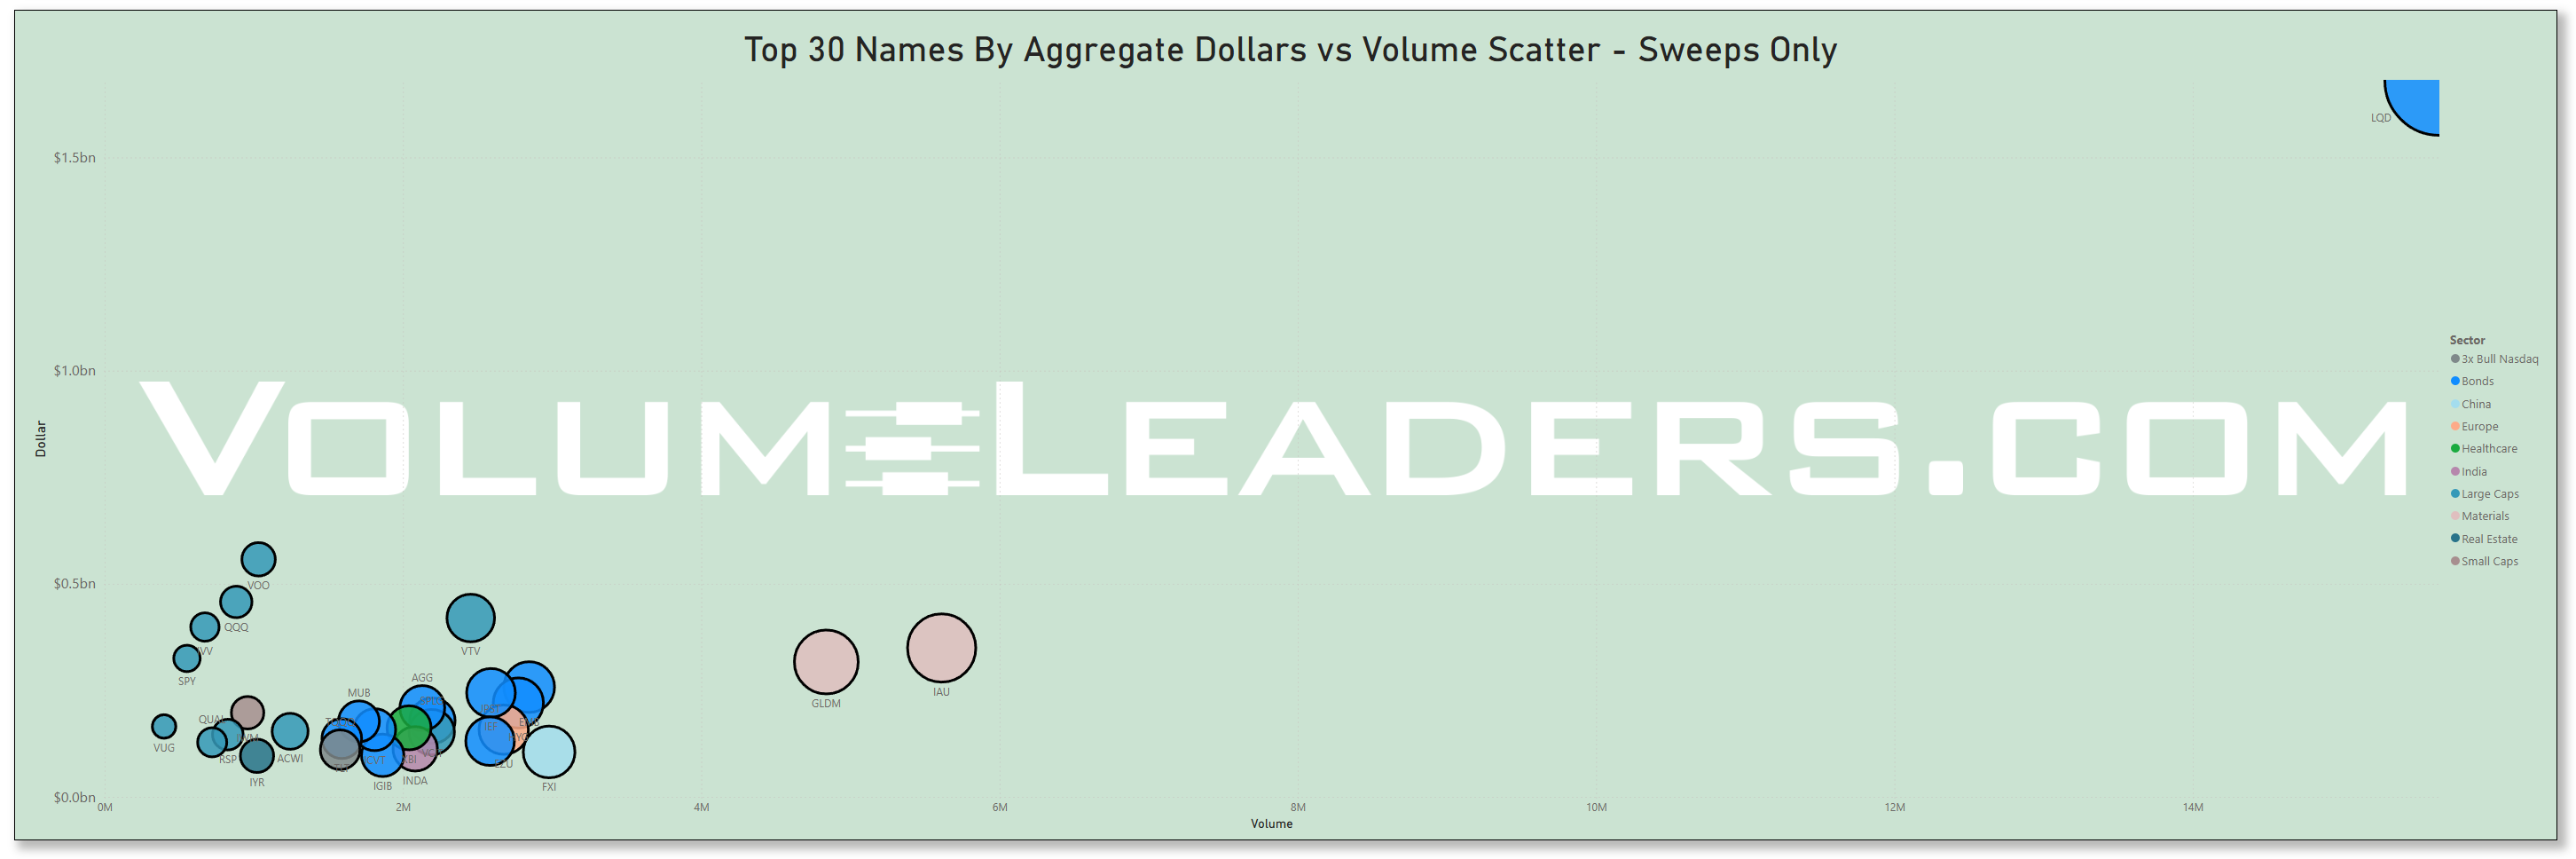
Many excellent trade ideas and sources of inspiration can be found in the prints below. While only the top 30 from each group are displayed, the complete results are accessible in VolumeLeaders.com for you to explore at your convenience any time. Remember to configure trade alerts within the platform to ensure institutional order flows that capture your interest or are significant to you aren’t missed. The blue charts represent all types of trades, including blocks on lit exchanges; the purple charts exclusively depict dark pool trades; and the green charts are sweeps only.
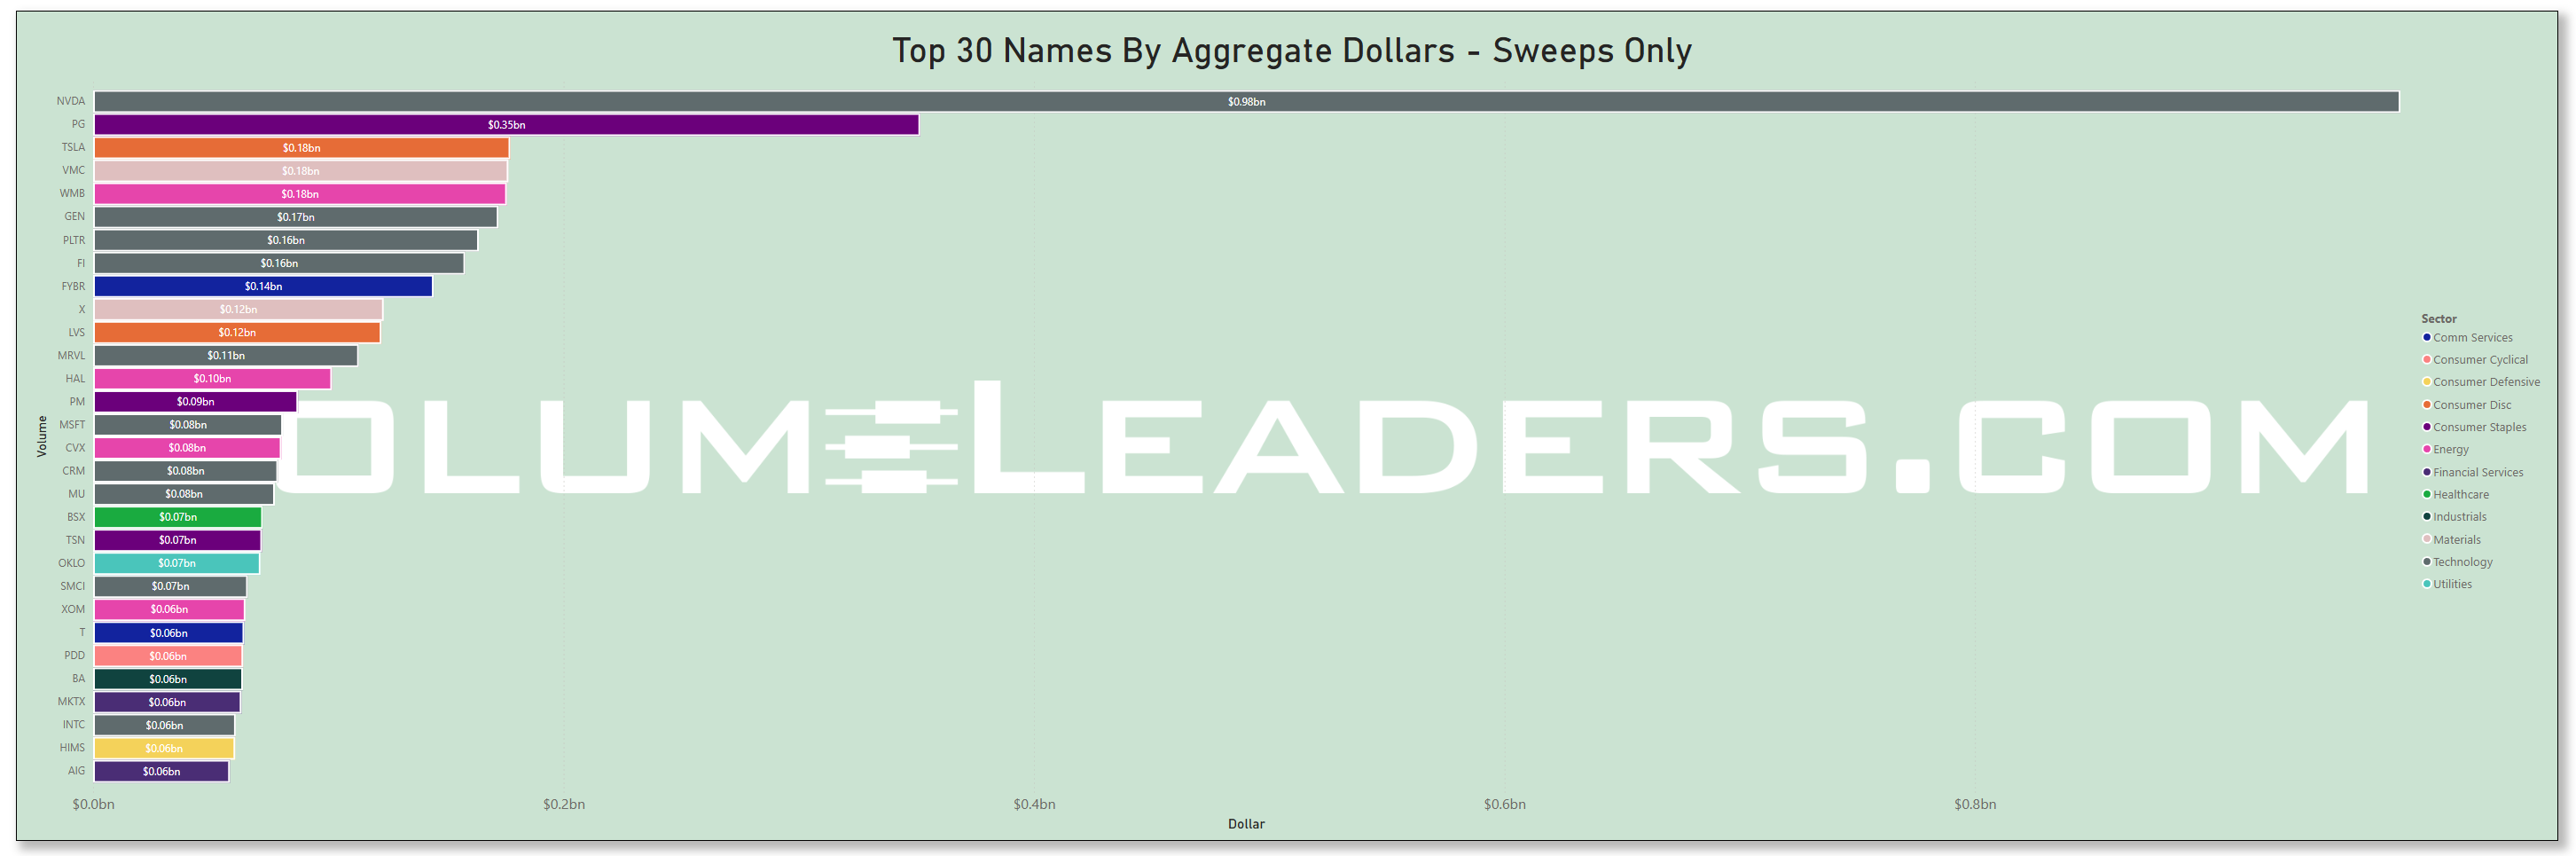
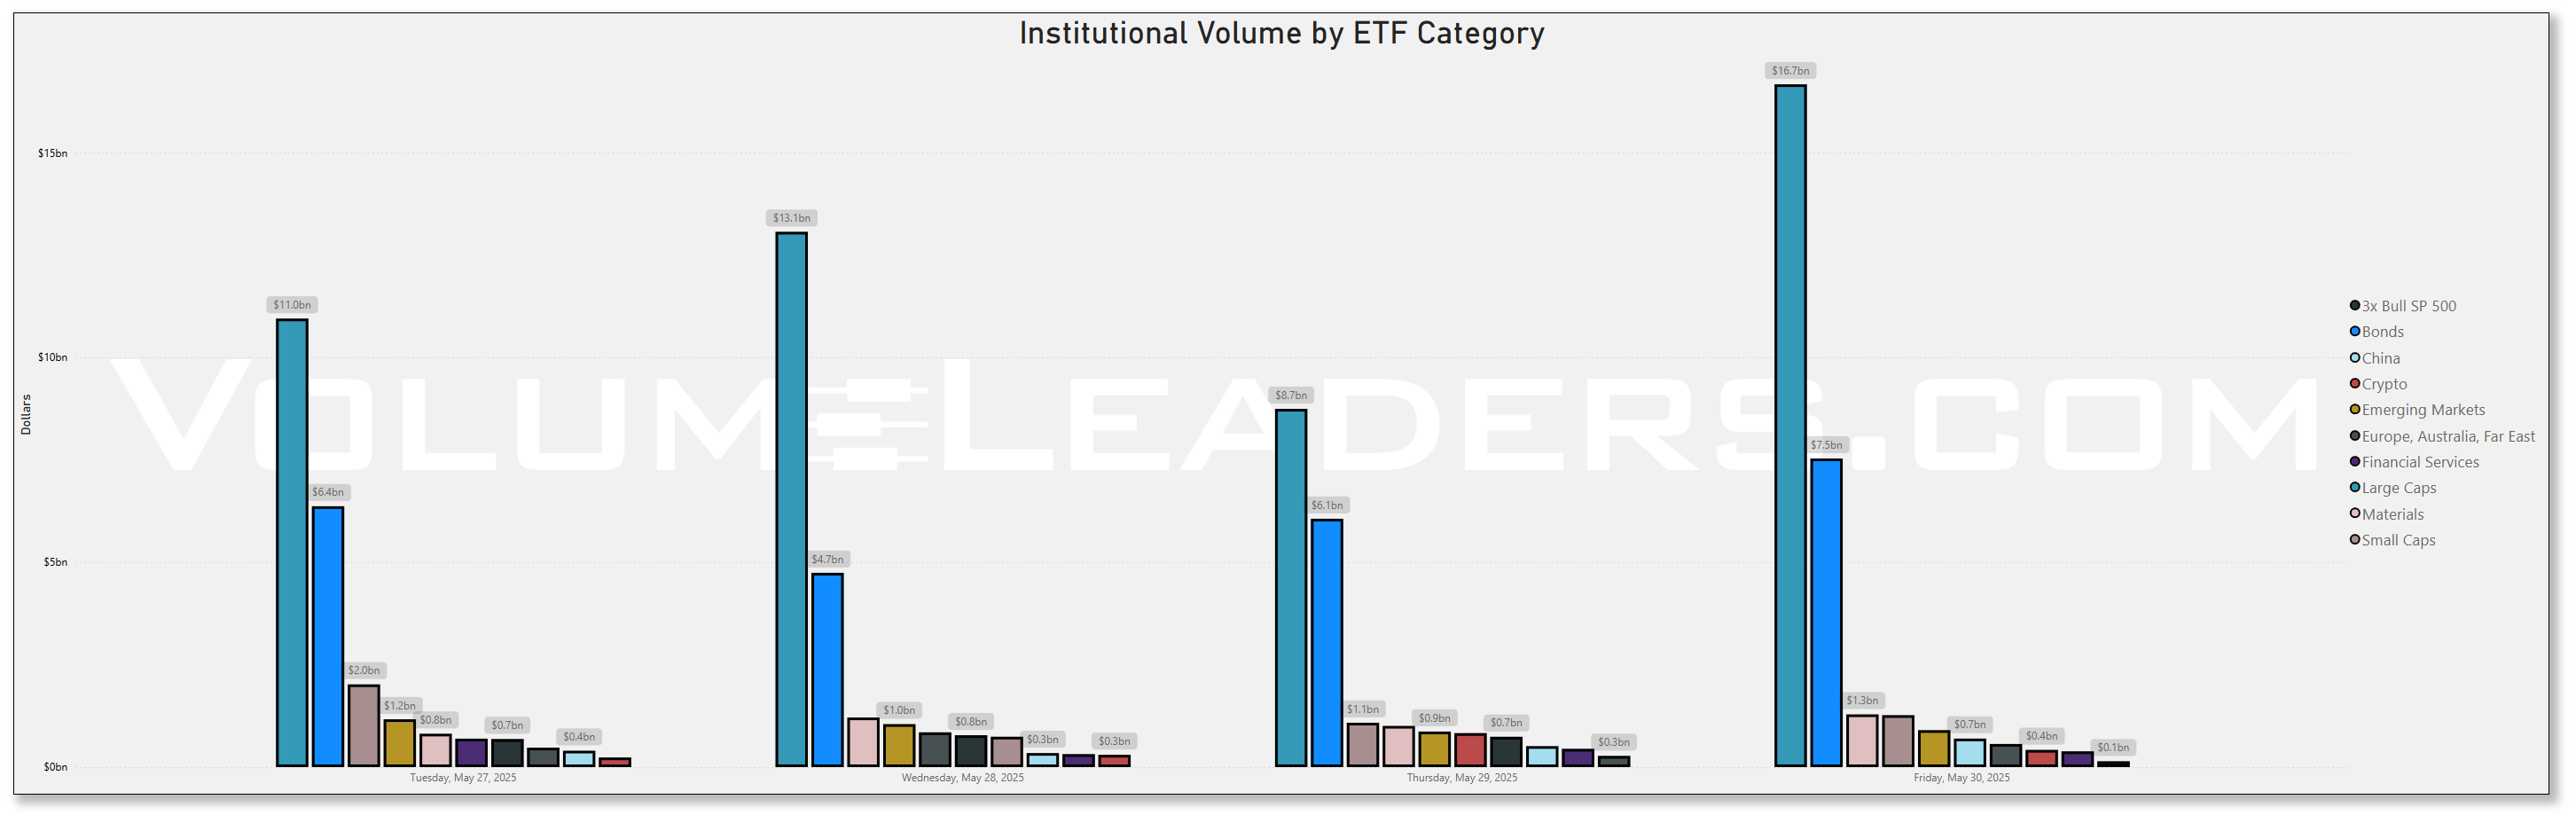
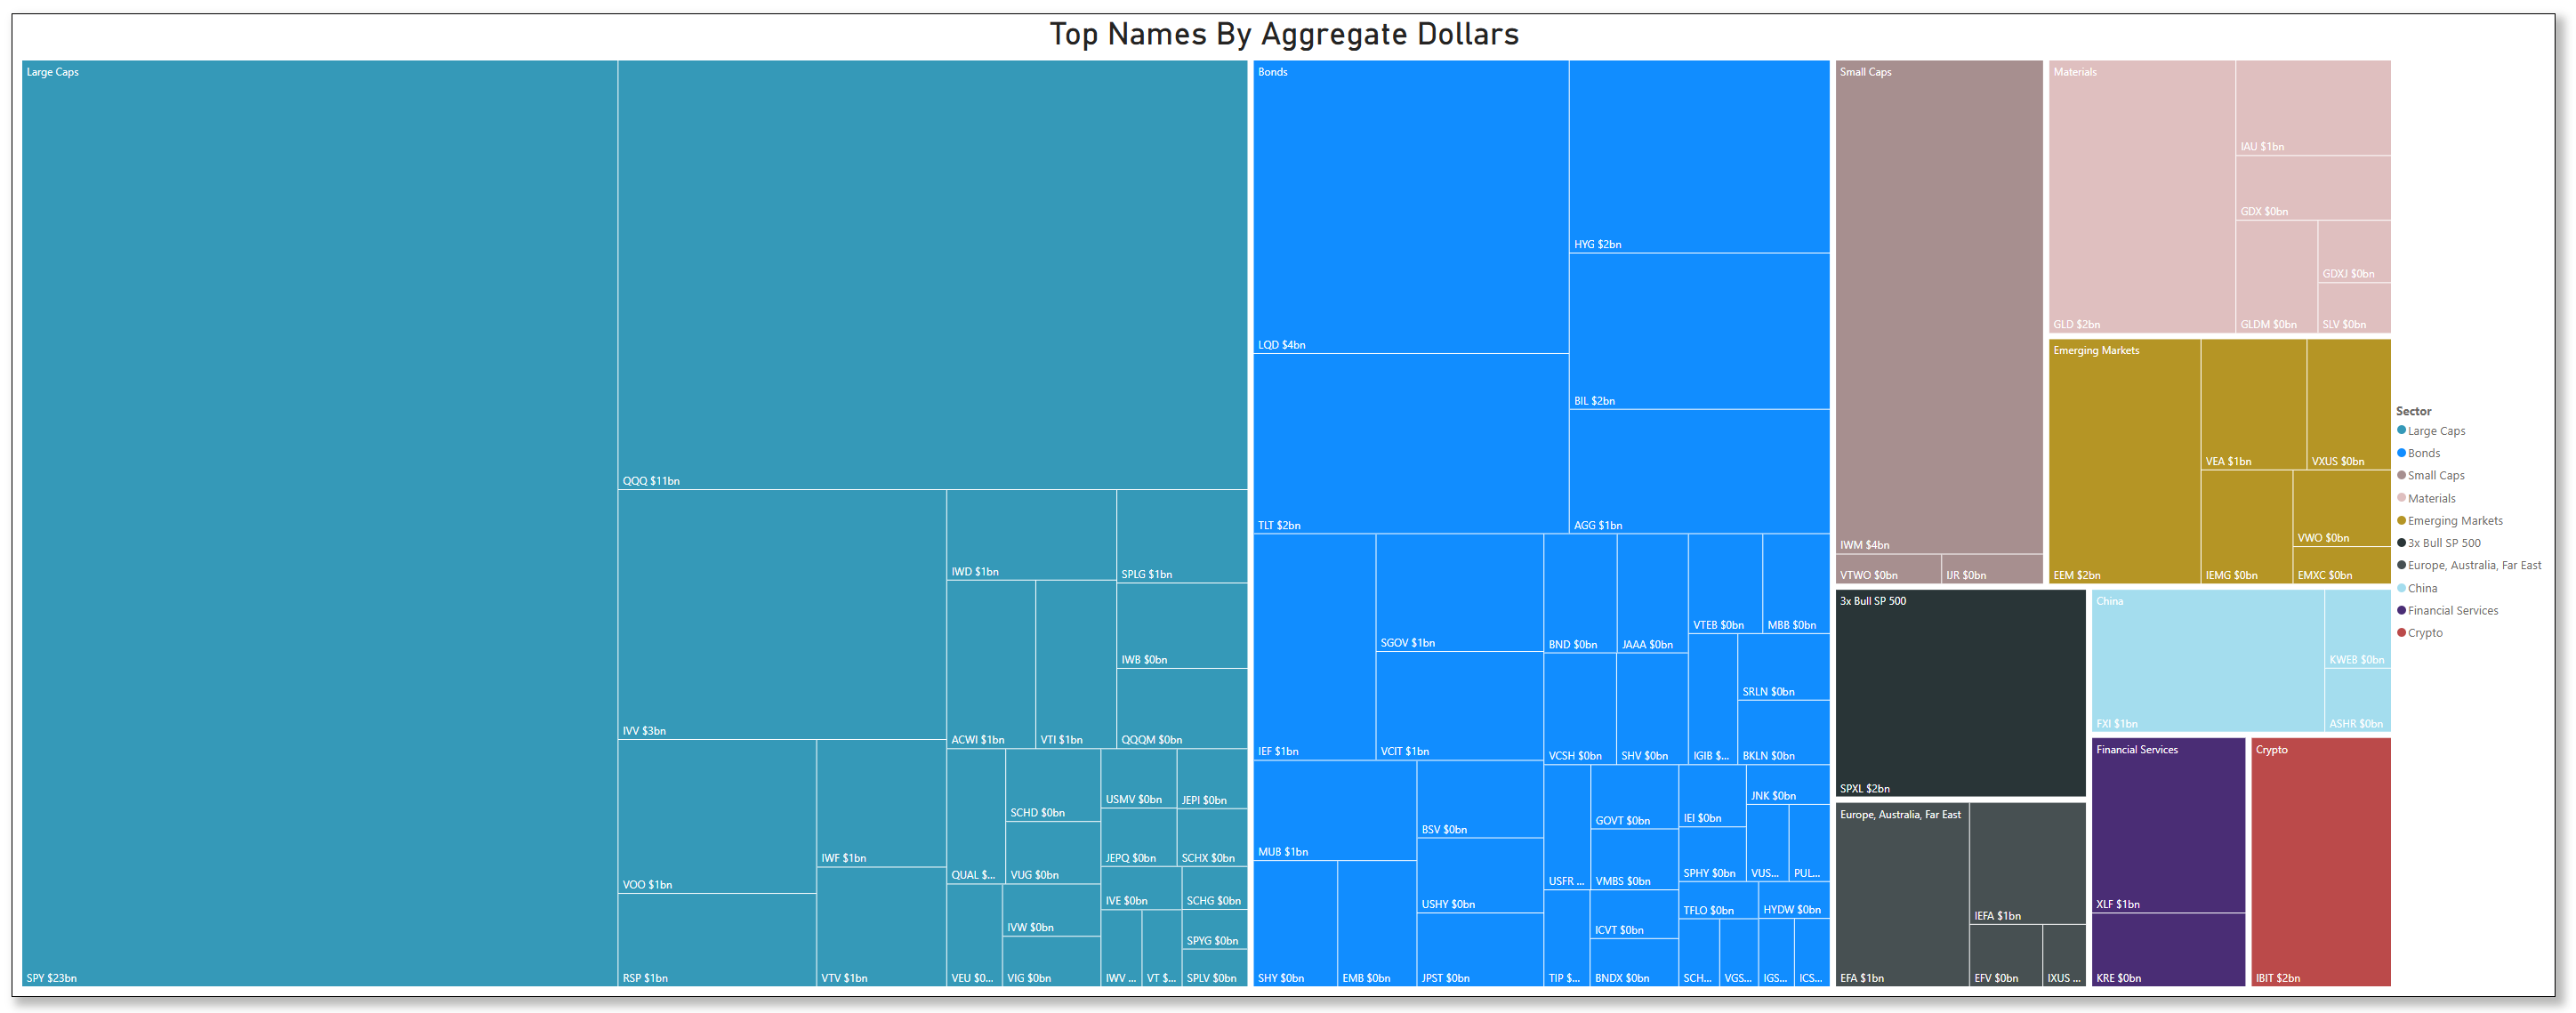
Top Institutional Order Flow In ETFs
Last Week’s Billion-Dollar Prints
Tickers that printed a trade worth at least $1B last week get a special shout-out. These are massive commitments by institutions that should not be ignored.
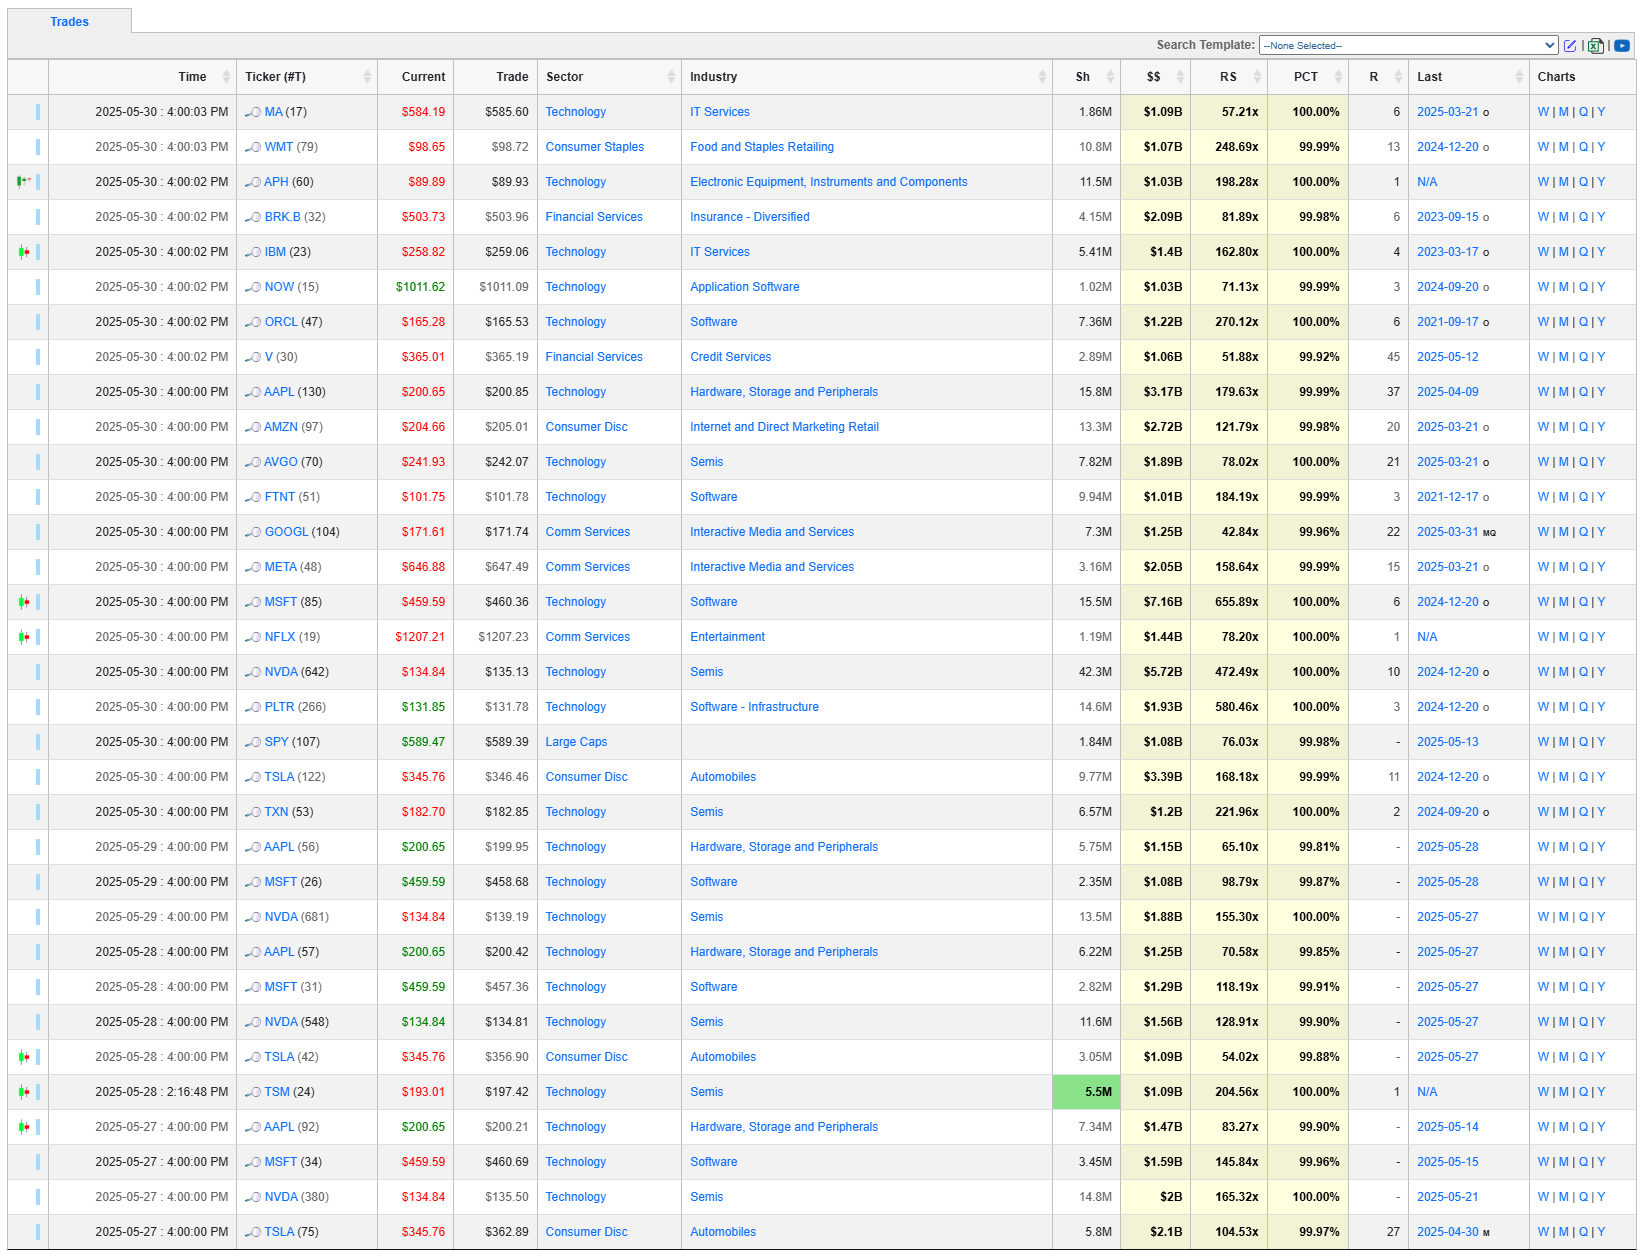
Analysis of This Week’s Top-25-Ranked Institutional Order Flow: Key Patterns & Insights
The Trillion-Dollar Technology Thesis
Microsoft ( MSFT 0.00%↑ ) leads institutional positioning with a $7.16 billion trade showing 655.89x relative size—the most extreme institutional positioning in the dataset. This represents the largest institutional commitment to any single security since December 2024.
NVIDIA ( NVDA 0.00%↑ ) follows with $5.72 billion at 472.49x relative size, confirming sustained institutional belief in AI infrastructure despite recent market volatility.

Palantir ( PLTR 0.00%↑ ) emerges as a surprising institutional favorite with $1.93 billion showing 580.46x relative size. The company has surged 64% in 2025, with billionaire hedge funds Millennium Management and Citadel quadrupling positions while trimming NVIDIA stakes—signaling strategic rotation within AI winners.
The Resurrection Plays
Oracle ( ORCL 0.00%↑ ): $1.22 billion position marks first institutional activity of this magnitude since September 2021, with 270.12x relative size suggesting institutions view enterprise AI adoption as reaching critical mass.
Fortinet ( FTNT 0.00%↑ ): $1.01 billion dormant since December 2021, indicating cybersecurity's return to institutional favor with 184.19x relative size.
Communication Services Concentration
Netflix ( NFLX 0.00%↑ ): $1.44 billion rank-1 position signals institutional confidence in streaming leadership Meta ( META 0.00%↑ ): $2.05 billion with 158.64x relative size shows sustained social media investment Google ( GOOGL 0.00%↑ ): $1.25 billion position despite rank-22 classification indicates value opportunity perception
Sector Intelligence
Technology Sector: The Institutional Fortress
179 trades totaling $48.9 billion (36% of all institutional capital)
Average relative size of 43.1x indicates exceptional institutional conviction
27.9% high-rank percentage demonstrates quality positioning across the sector
Multi-Factor Score: 57.1 (highest among all sectors)
Strategic Implications: Technology's dominance suggests institutions view current market conditions as an opportunity, particularly in AI, quantum computing, and enterprise software.
Financial Services: The Stealth Move
107 trades totaling $13.9 billion
Berkshire Hathaway (BRK.B): $2.09 billion position shows Buffett-level institutional confidence
Bank of America: 389.48x relative size represents most extreme banking sector positioning
Emerging Themes: Nuclear and Quantum
Nuclear Energy Renaissance: OKLO appears in multiple high-ranking positions, reflecting institutional recognition of AI data center power demands. The company has surged over 100% this month, with Trump administration executive orders supporting nuclear development and a landmark 20-year, 12-gigawatt agreement with Switch data centers.

Quantum Computing Cluster: Multiple quantum stocks ( QBTS 0.00%↑ , IONQ 0.00%↑ , QUBT 0.00%↑ , RGTI 0.00%↑ ) show coordinated institutional positioning, suggesting institutions are positioning ahead of commercial quantum breakthroughs or news.
Industry Intelligence
Top 15 Industries by Institutional Capital Deployment
Software - Application (31 trades, $11.0B total value, 4 Rank-1 positions)
Semiconductors (24 trades, $9.8B total value, 1 Rank-1 position)
Internet Content & Information (8 trades, $9.2B total value, 1 Rank-1 position)
Oil, Gas & Consumable Fuels (26 trades, $3.2B total value, 1 Rank-1 position)
Banks - Diversified (13 trades, $2.8B total value, 0 Rank-1 positions)
Industry Clustering Analysis: The concentration in software applications and semiconductors reinforces the AI infrastructure thesis, while traditional energy positioning suggests institutions are hedging against commodity cycle turns.
Bull vs Bear Sentiment Analysis
Overwhelming Institutional Optimism
Bull ETF Trades: 42 positions worth $1.697 billion
Bear ETF Trades: 10 positions worth $20.3 million
Bull/Bear Ratio: 83.45:1
This extreme ratio indicates institutions are positioning for significant market advancement rather than defensive scenarios. The concentration in leveraged bull ETFs (3x Bull SP 500 leading with highest multi-factor score of 56.0) suggests institutions expect sustained momentum.
Key Bull Positions:
SPXL 0.00%↑ (3x Bull SP 500): 3 trades totaling $1.53 billion
Multiple TSLA 0.00%↑ Bull instruments: Leveraged exposure to Tesla acceleration
NVDA 0.00%↑ Bull positions: Amplified AI infrastructure plays
Rank Analysis
The Elite Rank-1 Club: $15.7 Billion in Prime Positioning
52 Rank-1 trades represent absolutely stunning institutional positioning in each respective security, totaling $15.7 billion. This concentration indicates institutions are making maximum-conviction bets rather than incremental adjustments.

Notable Rank-1 Positions:
Netflix ( NFLX 0.00%↑ ): $1.44 billion - streaming dominance play
Taiwan Semiconductor ( TSM 0.00%↑ ): $1.09 billion - AI chip manufacturing leadership
Abbott Labs ( ABT 0.00%↑ ): $999.5 million - healthcare infrastructure
Amphenol ( APH 0.00%↑ ): $1.03 billion - connectivity solutions for AI hardware
Rank Distribution Analysis:
Ranks 1-5 concentration: 204 trades (21.6% of total) command 34.5% of total dollar volume
Average trade size by rank: Rank-1 ($302.4M), Rank-2 ($198.4M), Rank-3 ($251.4M)
Statistical Distributions
Dollar Value Distribution
Total Volume: $135.76 billion across 942 trades
Average Trade Size: $144.1 million (3.2x typical institutional average)
Median Trade Size: $25.0 million
Billion-Dollar Trades: 19 positions (2.0% of trades, 41.3% of total value)
Relative Size Analysis
Average Relative Size: 26.9x normal institutional activity
Median Relative Size: 9.66x
Extreme Outliers: 49 trades exceed 100x relative size
Ultra-Extreme: 15 trades exceed 200x relative size
Statistical Significance: The high concentration of extreme relative sizes indicates this is not routine portfolio rebalancing but strategic repositioning ahead of anticipated market shifts.
Ticker Clustering Analysis
Multiple Trade Significance
114 tickers show multiple institutional trades, indicating sustained institutional attention rather than isolated positioning.
Top Multiple-Trade Clusters:
SPXL 0.00%↑ : 3 trades, $1.53B total - broad market amplification strategy
Taiwan Semiconductor ( TSM 0.00%↑ ): 2 trades, $1.51B - semiconductor supply chain positioning
General Electric ( GE 0.00%↑ ): 2 trades, $1.42B - industrial renaissance play
AppLovin ( APP 0.00%↑ ): 2 trades, $981.5M - mobile advertising infrastructure
Skyworks Solutions ( SWKS 0.00%↑ ): 2 trades, $742.1M - connectivity chip specialization

Clustering Implications: The concentration in technology infrastructure companies (semiconductors, connectivity, mobile platforms) reinforces the AI-driven transformation thesis across multiple market layers.
Similar Size Last Seen Patterns
Temporal Distribution Analysis
2025 (This year): 642 trades, $58.7B (43.3% of total value)
2024 (Last year): 160 trades, $44.4B (32.7% of total value)
2021 (3+ years ago): 16 trades, $3.7B - "resurrection" positions
No Previous Data: 57 trades, $15.8B - entirely new institutional interest
The 2021 Resurrection Pattern
Sixteen trades showing first institutional activity since 2021 total $3.7 billion, representing strategic re-entry into previously abandoned positions. These "resurrection" trades often signal fundamental business model improvements or sector rotation opportunities.
Key Resurrection Plays:
Oracle: $1.22B (enterprise AI transformation)
Fortinet: $1.01B (cybersecurity resurgence)
EPAM Systems: $374M (digital transformation services)
Multi-Factor Trade Significance
Ticker Rankings (Top 10)
MSFT: 71.5 (Dollar: 25, RelSize: 25, Rank: 14, Multiple: 0)
NVDA: 55.5 (Dollar: 20, RelSize: 18, Rank: 10, Multiple: 0)
PLTR: 53.4 (Dollar: 6.7, RelSize: 22.1, Rank: 17, Multiple: 0)
SPXL: 48.9 (Dollar: 5.4, RelSize: 8, Rank: 18, Multiple: 10)
QBTS: 43.4 (Dollar: 0.8, RelSize: 1.1, Rank: 19, Multiple: 15)
OKLO: 42.6 (Dollar: 0.5, RelSize: 0.6, Rank: 19, Multiple: 15)
LIF: 42.5 (Dollar: 0.5, RelSize: 0.5, Rank: 19, Multiple: 15)
TSM: 42.2 (Dollar: 5.3, RelSize: 5.4, Rank: 19, Multiple: 5)
GE: 40.6 (Dollar: 5, RelSize: 9.1, Rank: 14, Multiple: 5)
IBIT: 41.5 (Dollar: 2.1, RelSize: 12.9, Rank: 19, Multiple: 0)
Sector Rankings (Top 5)
Technology: 57.1 (Dollar: 25, RelSize: 5.1, HighRank: 7)
3x Bull SP 500: 56.0 (Dollar: 0.8, RelSize: 25, HighRank: 25)
Financial Services: 29.6 (Dollar: 7.1, RelSize: 3.2, HighRank: 5.4)
Industrials: 29.5 (Dollar: 6.3, RelSize: 2.4, HighRank: 4.4)
Healthcare: 27.1 (Dollar: 5.8, RelSize: 2.6, HighRank: 5.7)
Methodology Note: Scores combine dollar value (0-25), relative size (0-25), rank quality (0-20), multiple trades (0-15), and momentum factors (0-15) for comprehensive significance assessment.
Actionable Intelligence for Investors
Primary Investment Themes Identified
1. AI Infrastructure Supremacy Institutions are making generational bets on AI infrastructure, from chipmakers (NVDA, TSM) to software platforms (MSFT, PLTR) to enterprise adoption (ORCL). The scale and coordination suggest this trend has years, not quarters, remaining.

2. Nuclear Energy Renaissance OKLO's multiple high-ranking positions reflect institutional recognition that AI data centers require baseload power solutions. With Trump administration support and major data center partnerships, nuclear represents an emerging institutional theme.
3. Quantum Computing Pre-Positioning Coordinated positioning across QBTS, IONQ, QUBT, and RGTI suggests institutions are positioning ahead of quantum commercial viability, despite recent sector volatility.
4. Financial Sector Revival Bank of America's extreme 389.48x relative size and Berkshire Hathaway's $2.09B position suggest institutions anticipate interest rate environment changes favoring financial sector performance.
5. Leveraged Market Acceleration The 83.45:1 bull/bear ratio and concentration in 3x leveraged ETFs indicates institutions expect sustained market momentum, not defensive positioning.
Risk Considerations
Concentration Risk: The extreme concentration in technology (36% of total volume) creates sector-specific vulnerability.
Relative Size Extremes: 15 trades exceeding 200x relative size suggest institutional positioning may be ahead of fundamental support. Additionally, even if the context is bullish, the trades merely represent positioning so it’s CRITICAL to watch the price levels to stay on the right side of the institutional trade.
Leverage Exposure: Heavy institutional usage of leveraged ETFs amplifies both opportunity and risk in volatile market conditions.
Strategic Positioning Recommendations
For Growth-Oriented Investors: Focus on AI infrastructure plays (MSFT, NVDA, PLTR) and emerging themes (OKLO, QBTS) where institutional conviction is highest.
For Value-Oriented Investors: Consider "resurrection" plays (ORCL, FTNT) where institutional interest returns after multi-year absence.
For Defensive Positioning: Monitor financial sector and healthcare accumulation as potential rotation destinations if technology momentum slows.
Conclusion
This institutional trading data represents one of the most significant capital deployment episodes in recent market history. The combination of extreme trade sizes, huge relative positioning, and coordinated sector concentration suggests institutions are positioning for fundamental market structure changes rather than cyclical adjustments.
The convergence of AI infrastructure investment, nuclear energy emergence, quantum computing pre-positioning, and leveraged market acceleration strategies indicates institutions expect sustained technological transformation with significant market implications.
The data suggests we are witnessing institutional capitalism's largest technological infrastructure bet since the end of Q1. The scope, scale, and coordination indicate this is just the beginning of a pretty sizable institutional positioning cycle.
Thank you for being part of our community and for dedicating your time to this edition. Your insights and engagement drive everything we do, and we’re honored to share this space with such committed, thoughtful readers. Here’s to a week filled with clear opportunities and strong performance. Wishing you many bags 💰💰💰
—Volumeleaders