Market Momentum: Your Weekly Financial Forecast & Market Prep
Issue 46 / What to expect May 26, 2025 thru May 30, 2025
In This Issue
[Free For Everyone]
Market-On-Close: All of last week’s market-moving news and macro context in under 5 minutes
The Latest Investor Sentiment Readings
Institutional Support & Resistance Levels For Major Indices: Exactly where to look for support and resistance this coming week in SPY, QQQ, IWM & DIA
Normalized Performance By Thematics YTD (Sector, Industry, Factor, Energy, Metals, Currencies, and more): which corners of the markets are beating benchmarks, which ones are overlooked and which ones are over-crowded
Key Econ Events and Earnings On-Deck For This Week
[Only For Subs]
Institutional Activity By Day (rolling 6-months)
Institutional Activity By Sector By Week (rolling 6-months)
This Week’s Institutional Activity In Equities: Institutional order flow broken down by sector and names in equities. Includes the largest sweeps and blocks on lit exchanges and hidden dark pools.
This Week’s Institutional Activity In ETFs: Institutional order flow broken down by sector and names for ETFs. Includes the largest sweeps and blocks on lit exchanges and hidden dark pools.
Statistical Analysis and Insights From This Week’s Top Prints: a deep dive into what the latest positioning data might be telling us of things to come

Market-On-Close
Market Turbulence Returns as Fiscal Fears and Trade Tensions Reshape Investment Landscape
The financial markets experienced a dramatic shift in sentiment this week, as investors grappled with a confluence of factors that collectively signaled a potential turning point in the current market cycle. What began as concerns over America's fiscal trajectory quickly morphed into a broader reassessment of risk, culminating in renewed trade tensions that sent shockwaves through global markets.
A Week of Reckoning for U.S. Markets
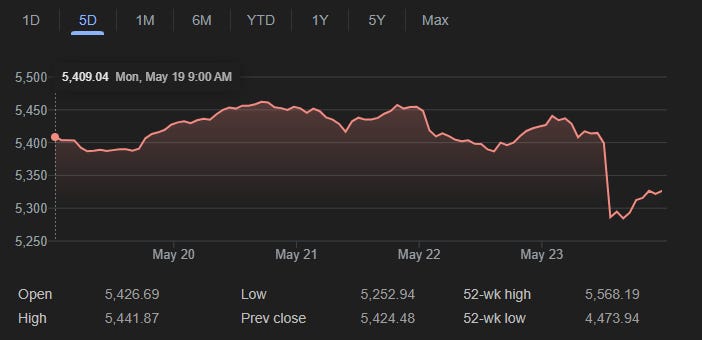
Major American equity indices bore the brunt of investor anxiety, with broad-based selling pressure emerging across all major benchmarks. The S&P 500 retreated 0.67% by Friday's close, while the Dow Jones Industrial Average shed 0.61%, and the technology-heavy Nasdaq 100 declined 0.93%. These moves pushed both the S&P 500 and Dow to two-week lows, while the Nasdaq touched its lowest level in a week and a half.
The selling momentum extended into futures markets, where June E-mini S&P futures dropped 0.77% and June E-mini Nasdaq futures fell 1.09%, suggesting continued pressure heading into the following week. What made this decline particularly noteworthy was its broad-based nature, affecting everything from large-cap stalwarts to smaller growth companies, indicating a fundamental shift in risk appetite rather than sector-specific concerns.
Small and mid-cap indices, often viewed as barometers of domestic economic confidence, fared even worse than their large-cap counterparts. This divergence suggested that investors were becoming increasingly cautious about companies with greater exposure to U.S. economic conditions and potential policy changes.
The Credit Rating Catalyst
The week's volatility can be traced back to a significant development that had been anticipated but nonetheless sent ripples through the financial system: Moody's Investors Service completed the trilogy of major credit rating downgrades for U.S. sovereign debt. Following similar actions by Standard & Poor's in 2011 and Fitch in 2023, Moody's stripped the United States of its final AAA credit rating, citing persistent concerns about the nation's fiscal trajectory and mounting debt burden.
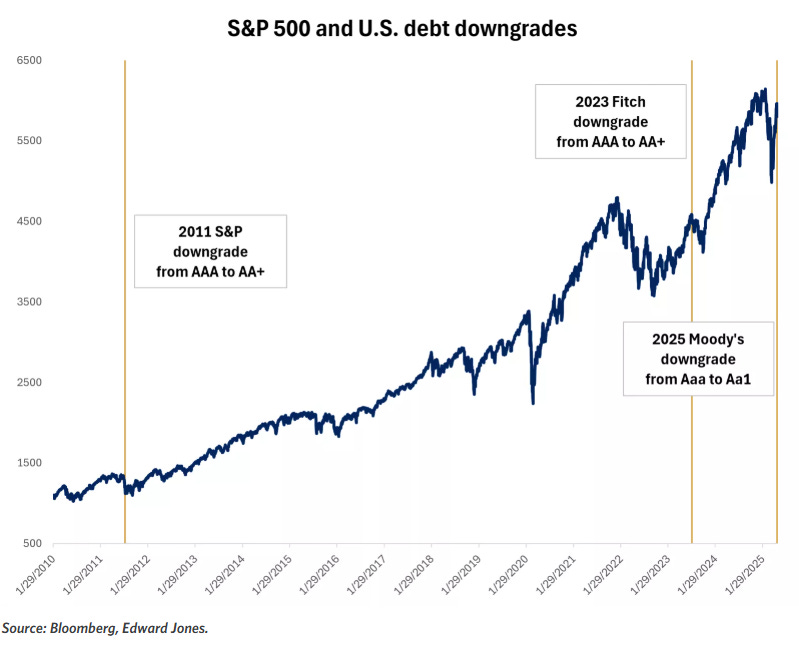
The timing of this downgrade proved particularly impactful, coming at a moment when markets were already grappling with uncertainties surrounding fiscal policy and government spending. Unlike the dramatic market reaction that followed S&P's 2011 downgrade, however, this move was largely anticipated, having been telegraphed by Moody's negative watch status since November 2023.
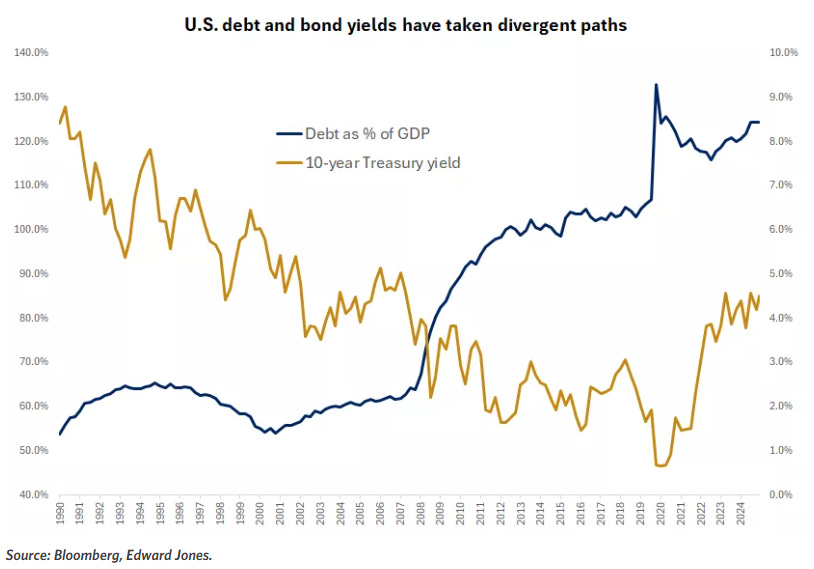
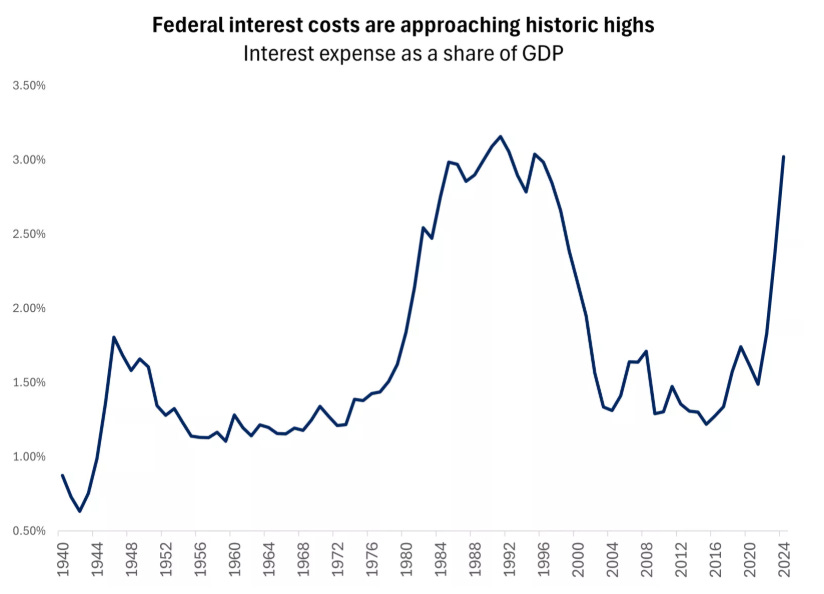
The rating agency's rationale centered on what it characterized as a lack of meaningful progress across multiple administrations and congressional sessions in addressing structural fiscal imbalances. With interest costs consuming an ever-larger portion of federal spending and the debt-to-GDP ratio projected to reach unprecedented levels, Moody's concluded that the risks had finally outweighed the benefits of maintaining the premium rating.
Importantly, the downgrade aligned U.S. debt with the ratings already assigned by the other major agencies, meaning that major bond index providers had already moved Treasury securities to their double-A categories. This technical detail helped limit the immediate forced selling that might have occurred if passive funds tracking these indices had suddenly needed to divest their holdings.
Legislative Momentum Adds Fuel to Fiscal Concerns
The credit rating downgrade gained additional significance as it coincided with legislative developments on Capitol Hill. The House of Representatives passed a comprehensive tax bill by the narrowest possible margin—a single vote—setting up what promises to be contentious negotiations in the Senate.
The legislation, officially dubbed the reconciliation bill but colloquially referred to as the "One Big Beautiful Bill," represents an ambitious attempt to extend expiring tax provisions while introducing new ones. The package includes extensions of the 2017 tax cuts alongside campaign promises such as tax exemptions for tips and overtime pay, enhanced benefits for seniors, and an increase in the state and local tax deduction cap from $10,000 to $40,000 for households earning under $500,000.
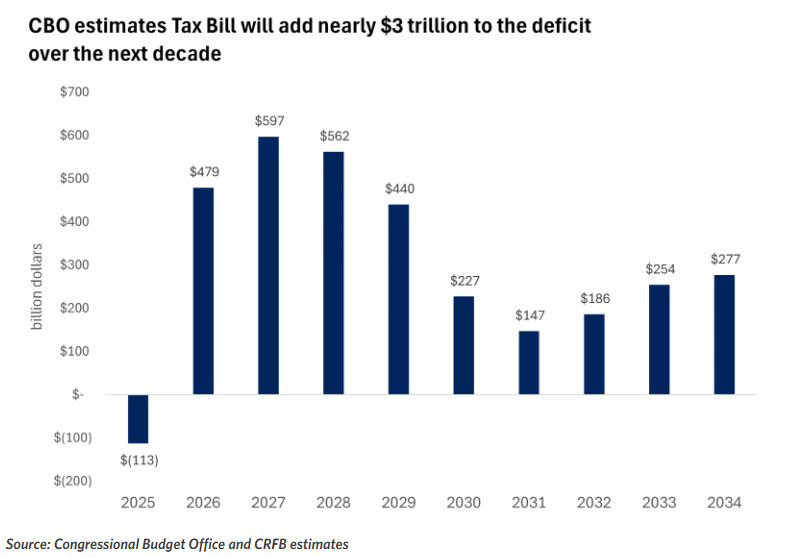
Congressional Budget Office estimates suggest the legislation could add nearly $3 trillion to the federal deficit over the next decade, with the impact front-loaded in the initial years. The bill's structure—featuring immediate tax relief coupled with deferred spending reductions—could push the deficit to approximately 7% of GDP within the next two years.
This fiscal arithmetic presented investors with a complex calculus. While the additional stimulus could provide near-term economic support, potentially boosting corporate earnings and consumer spending, the long-term implications for debt sustainability raised questions about future borrowing costs and monetary policy flexibility.
Bond Markets Sound the Alarm
Perhaps nowhere was the week's anxiety more evident than in the Treasury market, where yields surged across the maturity spectrum in what many interpreted as a warning shot from bond vigilantes. The 10-year Treasury yield climbed above 4.5%, while the 30-year bond yield crossed the psychologically significant 5% threshold for the first time since 2007.
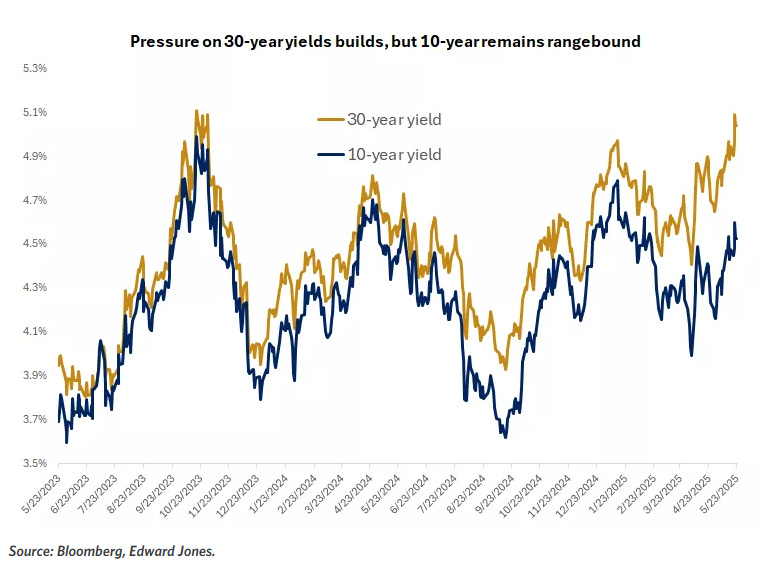
This movement in longer-term rates was particularly telling, as it suggested investors were demanding higher compensation for the perceived risks of holding U.S. government debt over extended periods. The yield curve steepening reflected growing concerns about the government's future borrowing needs and the potential for fiscal dominance—a scenario where debt service costs begin to constrain monetary policy options.
A weak auction of 20-year Treasury bonds mid-week served as a concrete manifestation of these concerns. The auction's poor reception, characterized by weak demand and higher-than-expected yields, sent immediate shockwaves through both bond and equity markets. It marked a stark contrast to the consistently strong demand for Treasury securities that had characterized much of the post-pandemic period.
The global nature of the bond selloff provided some context for the U.S. experience. Japanese 30-year bond yields hit record highs, while German, British, and Australian long-term rates also came under pressure. This synchronized move suggested that concerns about fiscal sustainability and inflationary pressures were not confined to the United States, though America's situation remained particularly acute given the scale of its projected deficits.
Trade Tensions Return to Center Stage
Just as markets appeared to be finding some stability amid the fiscal concerns, a familiar source of volatility reemerged: trade policy. President Trump's announcement of potential 50% tariffs on European Union goods, effective June 1st, caught markets off guard and reminded investors that trade negotiations remained fragile despite recent positive developments.

The President's characterization of EU trade discussions as "going nowhere" and his stated lack of interest in reaching a deal marked a significant escalation in rhetoric. This development was particularly jarring given the recent 90-day pause on certain tariffs that had provided markets with a sense of relief and contributed to the strong rally from April lows.
The trade tensions took on additional specificity with threats directed at individual companies. Apple found itself in the crosshairs with warnings of 25% tariffs on iPhones unless the company moved production to the United States. The threat extended to other device manufacturers, including Samsung Electronics, creating uncertainty for the entire consumer technology sector.

Apple's stock price reaction—falling more than 3% on Friday—demonstrated the immediate market impact of these policy pronouncements. The decline in Apple shares had outsized effects on major indices given the company's significant weighting in market-cap-weighted benchmarks.
Sector Rotation Reflects Changing Dynamics
The week's market action revealed interesting patterns in sector performance that provided insights into investor thinking. The semiconductor industry, which had been a major beneficiary of artificial intelligence enthusiasm and reshoring trends, found itself under particular pressure as trade concerns resurfaced.
Major chip stocks experienced broad-based declines, with Microchip Technology leading the retreat with a drop exceeding 3%. The selling extended across the semiconductor ecosystem, affecting everything from equipment manufacturers like Applied Materials and Lam Research to chip designers like Qualcomm and Nvidia. This weakness reflected concerns that renewed trade tensions could disrupt the complex global supply chains that characterize the semiconductor industry.
The technology sector's vulnerability became particularly apparent as investors reassessed the sustainability of valuations that had been predicated on continued globalization and stable trade relationships. Companies with significant international exposure or complex supply chains found themselves particularly vulnerable to the shifting narrative.
Conversely, certain sectors benefited from the changing dynamics. Nuclear power stocks surged on reports that the administration planned to streamline regulatory processes for new reactor approvals. Centrus Energy and NuScale Power posted gains exceeding 18%, while established players like Constellation Energy and Vistra also advanced.

Gold mining companies found favor as investors sought traditional safe havens amid the uncertainty. The precious metal's price advance to two-week highs lifted mining stocks, with Gold Fields, AngloGold Ashanti, and Newmont all posting solid gains.
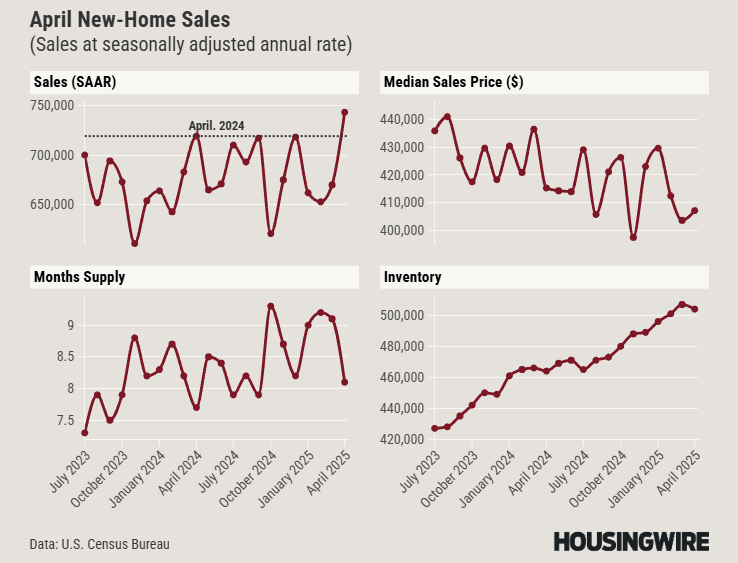
Economic Data Provides Mixed Signals
Amid the policy-driven volatility, economic data releases offered a complex picture of underlying economic conditions. The housing market provided perhaps the most surprising development, with new home sales jumping to a three-year high in April, rising 10.9% month-over-month to reach an annualized pace of 743,000 units.
This strength in new home sales stood in stark contrast to the existing home sales market, which hit its lowest April level since 2009. The divergence suggested that builders were finding ways to attract buyers despite elevated mortgage rates, possibly through pricing strategies or incentives that weren't available in the resale market.
The housing data's implications extended beyond the sector itself, as residential construction and related industries represent significant portions of economic activity. Strong new home sales suggested continued confidence among builders and buyers, despite the challenging interest rate environment.
Business activity surveys provided additional complexity to the economic picture. After hitting a 16-month low in April, business activity rebounded sharply in May according to purchasing managers' surveys. Both services and manufacturing sectors showed improvement, with readings well above the expansion threshold of 50.
However, the details within these surveys revealed concerning undercurrents. Price pressures accelerated to their fastest pace since August 2022, with respondents overwhelmingly attributing the increases to tariff-related costs. Export orders declined while supply chain delays intensified, suggesting that trade uncertainties were already beginning to impact business operations.
Corporate Earnings Paint a Resilient Picture
Against the backdrop of macro uncertainty, corporate earnings continued to demonstrate remarkable resilience. With nearly 90% of S&P 500 companies having reported first-quarter results, 77% exceeded analyst estimates—the highest beat rate since the second quarter of 2024.
Perhaps more impressive was the magnitude of earnings growth, which reached 13.1% year-over-year, substantially exceeding the 6.6% growth rate that analysts had projected at the beginning of the earnings season. This outperformance suggested that companies were successfully navigating the challenging environment through operational efficiency, pricing power, or both.
The earnings strength provided an important counterpoint to the week's market volatility, reminding investors that underlying business fundamentals remained solid despite the macro headwinds. Full-year earnings growth projections for the S&P 500 stood at 9.4%, though this represented a downward revision from the 12.5% growth rate anticipated at the beginning of the year.
Individual company results highlighted both the opportunities and challenges present in the current environment. Intuit emerged as a standout performer, reporting third-quarter revenue of $7.75 billion against expectations of $7.56 billion. The financial software company's ability to raise its full-year revenue forecast to $18.72-18.76 billion from a previous range of $18.16-18.35 billion demonstrated the continued demand for digital financial services.
Conversely, several companies faced challenges that reflected broader economic pressures. Deckers Outdoor plummeted more than 19% after providing disappointing guidance, while Workday fell over 12% despite meeting expectations, as investors expressed concern about the company's ability to monetize its artificial intelligence investments.
Federal Reserve Policy Implications
The week's developments had significant implications for Federal Reserve policy expectations, as investors recalibrated their assumptions about the central bank's likely path forward. Rising bond yields and renewed inflationary pressures from potential tariffs complicated the Fed's dual mandate of price stability and full employment.
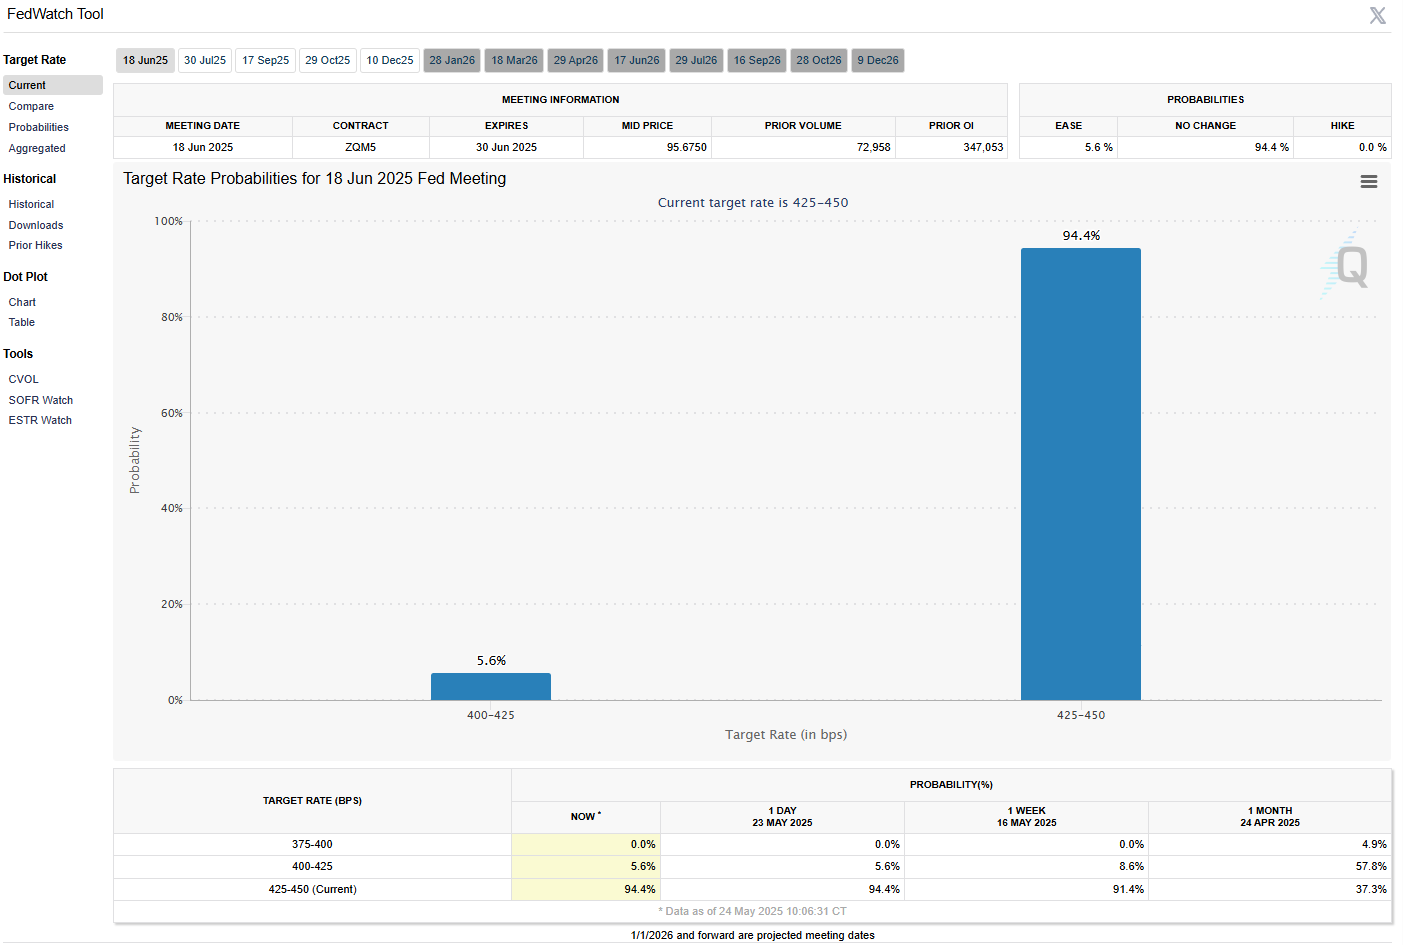
Market-based measures of Fed policy expectations shifted notably during the week, with the probability of a 25 basis point rate cut at the June 17-18 Federal Open Market Committee meeting falling to just 2%. This represented a significant change from earlier expectations and reflected the market's assessment that fiscal stimulus and trade tensions could reignite inflationary pressures.
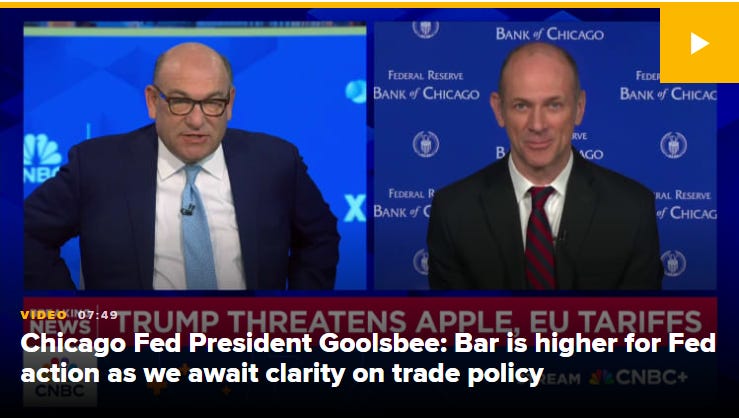
Comments from Chicago Federal Reserve President Austan Goolsbee added to the uncertainty, as he characterized the renewed tariff threats as "really scary" for businesses while maintaining that rate cuts remained possible over a 10-16 month time horizon. This nuanced position reflected the Fed's challenging position of needing to balance multiple, potentially conflicting economic forces.
The European Central Bank provided a contrast to the Fed's cautious stance, with officials signaling continued commitment to monetary easing. ECB Governing Council members suggested that a June rate cut remained highly likely, with market pricing reflecting 99% odds of a 25 basis point reduction at the June 5th policy meeting.
International Market Reactions
Global markets reflected the interconnected nature of modern finance, with international indices showing mixed but generally negative reactions to the week's developments. European markets faced particular pressure given the specific tariff threats directed at the European Union.
The Euro Stoxx 50 tumbled to a two-week low, closing down 1.81% as investors grappled with the implications of potential 50% tariffs on EU goods. The sharp decline reflected concerns about European export competitiveness and the potential for retaliatory measures that could escalate into a broader trade conflict.
Asian markets showed more resilience, though still faced headwinds. China's Shanghai Composite fell 0.94% to a week-and-a-half low, while Japan's Nikkei Stock 225 managed a modest 0.47% gain. The divergent performance reflected varying degrees of exposure to U.S. trade policies and different domestic economic conditions.
European government bond yields declined in contrast to their U.S. counterparts, with German 10-year yields falling 7.6 basis points to 2.567% and UK 10-year gilt yields dropping 7.0 basis points to 4.681%. This divergence suggested that European bonds were benefiting from safe-haven flows and expectations of continued monetary accommodation from the ECB.
Cryptocurrency and Alternative Assets
The week's traditional market volatility coincided with significant developments in cryptocurrency markets, where Bitcoin achieved a new all-time high above $111,000. This milestone represented the first new peak for the leading cryptocurrency since January, suggesting that digital assets were attracting investors seeking alternatives to traditional financial instruments.
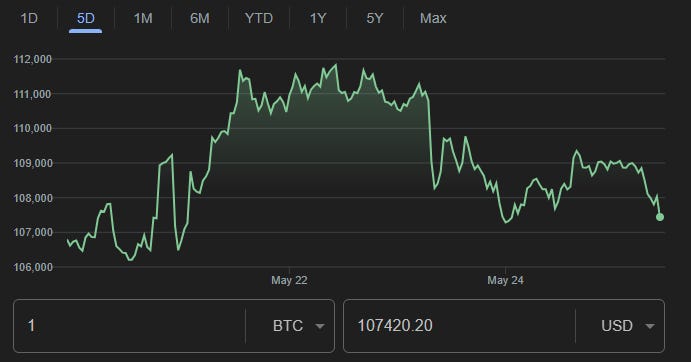
The cryptocurrency rally occurred despite—or perhaps because of—the uncertainty in traditional markets, reinforcing the narrative that digital assets can serve as portfolio diversifiers during periods of conventional market stress. The timing of Bitcoin's achievement suggested that some investors viewed cryptocurrency as a hedge against fiscal irresponsibility and currency debasement concerns.
Gold also attracted renewed interest, jumping to two-week highs as investors sought traditional safe-haven assets. While the precious metal continued to trade within its recent range, the upward movement reflected its enduring appeal during periods of geopolitical and fiscal uncertainty.
Looking Forward: Key Factors to Monitor
As markets head into the Memorial Day holiday week, several key factors emerge as critical monitoring points for investors. The Senate's handling of the tax reconciliation bill will provide important signals about the ultimate shape of fiscal policy and its potential economic impact.
Trade negotiations remain perhaps the most immediate source of market-moving news, with the July expiration of the 90-day tariff pause creating a definitive timeline for resolution or escalation. The coincidental timing of trade deadlines with debt ceiling negotiations adds another layer of complexity to an already challenging policy environment.
Federal Reserve communications will be scrutinized for signals about how policymakers are weighing competing economic forces. The central bank's ability to maintain credibility while navigating between fiscal pressures and price stability concerns will be crucial for market confidence.
International developments, particularly European responses to tariff threats and Chinese economic data, will provide important context for global growth prospects and trade relationships.
Technical and Strategic Considerations
From a technical perspective, the week's action represented a significant test of the strong rally that had characterized markets since the April 8th lows. The S&P 500's nearly 20% advance from those lows had pushed many traditional valuation metrics to elevated levels, making markets vulnerable to any shift in fundamental conditions.
The fact that both the S&P 500 and Dow Jones Industrial Average fell back into negative territory for the year served as a reminder of how quickly market sentiment can shift. However, historical analysis of similar rally patterns suggests that strong advances like those seen since April are often followed by continued positive returns, though the path forward may be more volatile.
The breadth of the week's decline, affecting everything from large-cap technology stocks to small-cap domestic companies, suggested that investors were engaging in broad-based risk reduction rather than sector-specific repositioning. This pattern often precedes either capitulation selling or stabilization, depending on whether fundamental concerns prove justified.
Investment Implications and Strategy
The week's developments highlighted the importance of several key investment principles in navigating uncertain markets. Diversification across asset classes, geographies, and sectors proved its value as different areas of the market responded differently to various news flows.
The bond market's behavior reinforced the potential attractiveness of intermediate-term fixed income investments, particularly for investors who had been maintaining elevated cash positions. While long-term bonds faced pressure from fiscal concerns, intermediate maturities offered potentially attractive risk-adjusted returns.
Dollar-cost averaging strategies gained renewed relevance as market volatility increased, allowing investors to take advantage of price swings without attempting to time market movements perfectly. This approach proved particularly valuable given the week's dramatic intraday swings and conflicting news flows.
The importance of maintaining focus on long-term objectives while remaining flexible in tactical approaches became apparent as markets grappled with rapidly changing conditions. Investors who could distinguish between temporary volatility and fundamental shifts in market conditions were better positioned to make appropriate portfolio adjustments.
Conclusion: A Pivotal Moment for Markets
This week marked a potential inflection point for financial markets, as the confluence of fiscal concerns, trade tensions, and monetary policy uncertainty created a more challenging environment for investors. The Moody's downgrade, while largely expected, served as a catalyst for broader concerns about America's fiscal trajectory and its implications for asset prices.
The return of trade tensions reminded markets that policy uncertainty remains a significant factor in investment decisions, capable of quickly reversing periods of optimism and risk-taking. The specific nature of the threats—targeting both broad trading relationships and individual companies—demonstrated the unpredictable nature of policy-driven market moves.
Perhaps most importantly, the week's events highlighted the interconnected nature of fiscal policy, monetary policy, and trade relationships in shaping market outcomes. Investors will need to monitor these relationships carefully as they evolve, recognizing that changes in one area can have cascading effects across multiple asset classes and geographies.
As markets enter the traditionally quieter summer period, the foundations for future performance are being established through current policy decisions and market reactions. The ability of various market participants—from individual investors to institutional portfolio managers—to adapt to this evolving environment will likely determine investment success in the months ahead.
The week's developments serve as a reminder that while markets can appear calm and predictable for extended periods, the underlying forces that drive asset prices are constantly shifting. Successful investing requires not just an understanding of current conditions, but an awareness of how those conditions might change and an investment approach that can adapt accordingly.
Looking ahead, the key will be distinguishing between temporary volatility driven by headline risks and more fundamental shifts in economic and market conditions. This week's events provided examples of both, and investors' ability to make these distinctions will be crucial for navigating the complex environment that appears to be emerging.
Range, Breadth, New Highs & Lows By Index
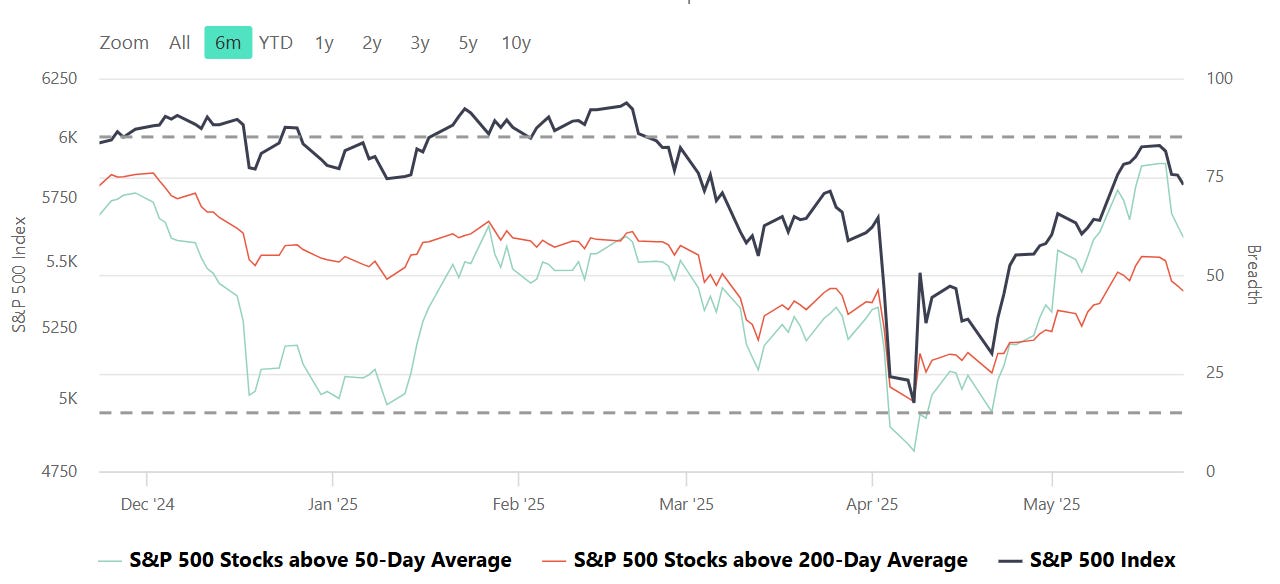
S&P 500 Index
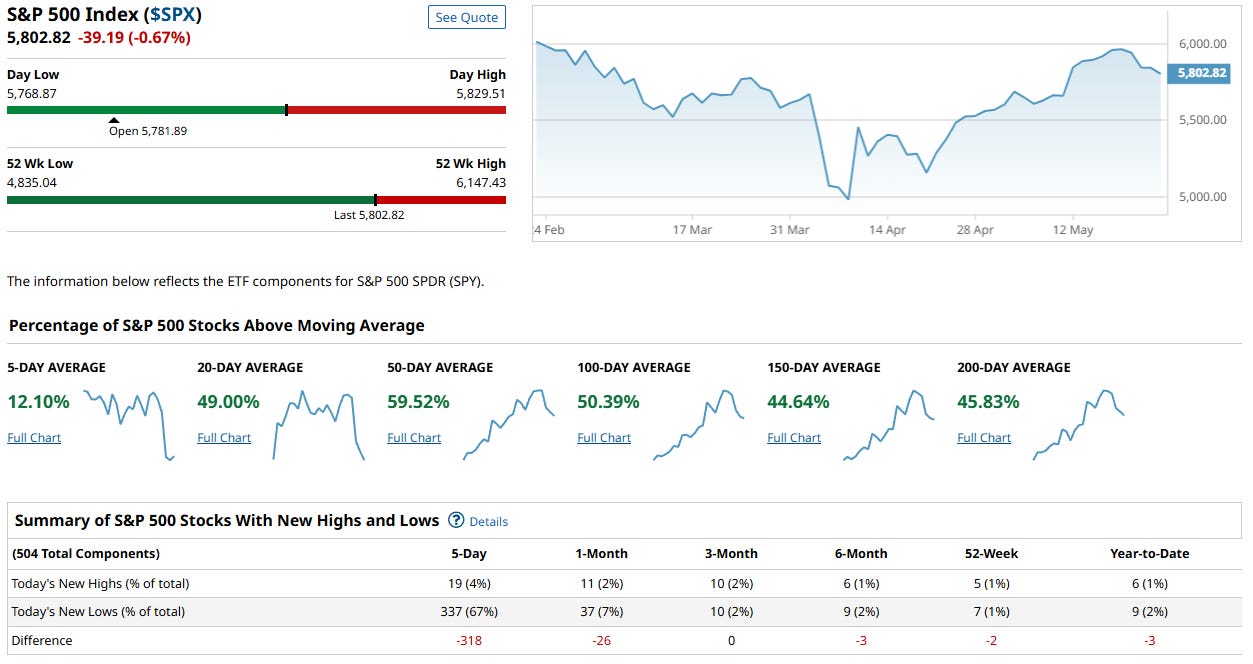
Despite the S&P 500 index ($SPX) hovering near 5,800, breadth data suggests a weakening internal structure beneath the surface. The index is down 0.67% on the day, and although it remains well above its 52-week low, participation is notably thinning:
Short-term breadth is deteriorating: Only 12.1% of S&P 500 components are above their 5-day moving average, signaling poor short-term momentum.
Intermediate-term metrics remain moderately supportive, with around half of stocks above their 50- and 100-day averages (59.5% and 50.4%, respectively).
Longer-term trends are mixed: Just 44.6% and 45.8% of stocks remain above their 150- and 200-day averages, respectively, indicating a fragile foundation for sustained bullish moves.
New Highs vs. New Lows is a major red flag:
In the past 5 days, 337 stocks (67%) made new lows, while only 19 (4%) hit new highs—a net difference of -318, showing widespread deterioration and elevated selling pressure.
Takeaway: While the index level itself appears relatively healthy, the underlying participation is weak. This kind of negative divergence between price and breadth can be a warning sign of an impending broader pullback or increased volatility. Caution is warranted unless breadth improves markedly.
Dow Jones Index
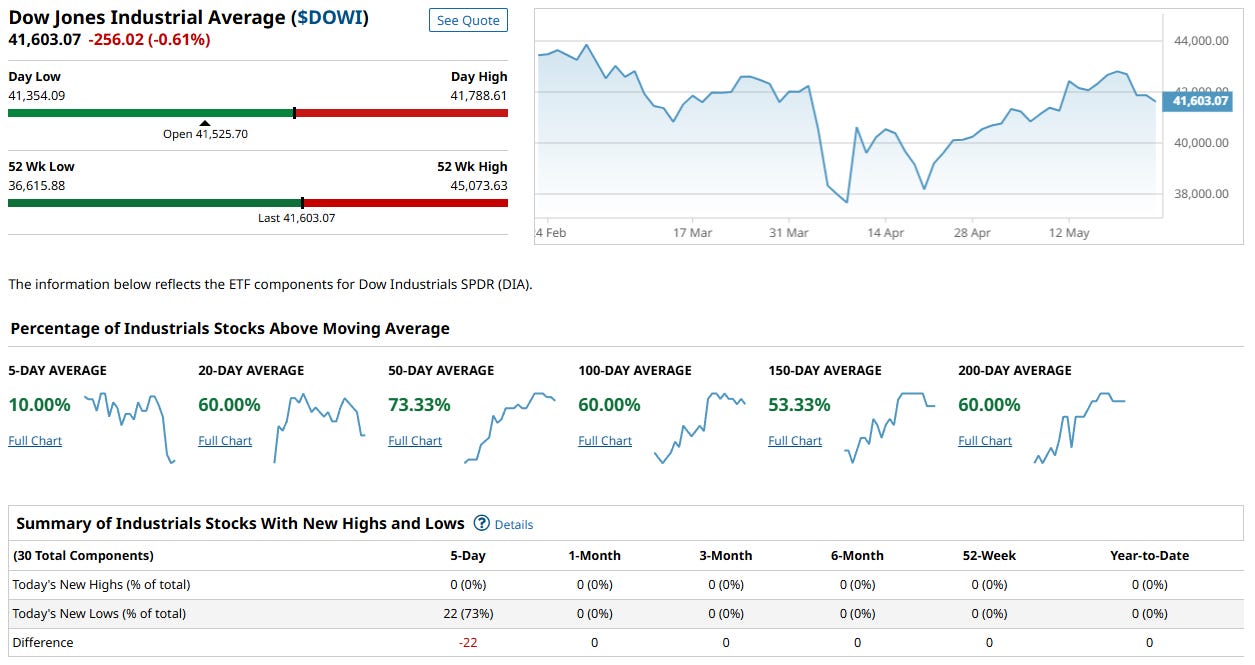
The Dow Jones closed at 41,603.07, down -0.61% on the day. While the index itself is still holding relatively steady and well above its 52-week low, market internals tell a mixed story with recent signs of strain:
Short-term weakness is apparent, with just 10% of components above their 5-day moving average—suggesting poor near-term momentum and waning participation.
Intermediate to long-term structure looks healthier, with:
73.3% above the 50-day,
60% above the 100-day and 200-day,
53.3% above the 150-day moving average.
This signals a market still broadly in an uptrend, albeit with recent turbulence.
Breadth deterioration is evident:
0 new highs and 22 new lows (73%) in just the past 5 days—a sharp imbalance and a sign that most Dow components are under pressure despite the index level being relatively elevated.
Takeaway: The Dow may appear resilient on the surface, but under the hood, short-term weakness is spreading fast. Longer-term participation remains decent for now, but the lack of new highs and surge in new lows suggests caution. A further deterioration in medium- and long-term averages could tip this market from stable to vulnerable.
NASDAQ 100 Index
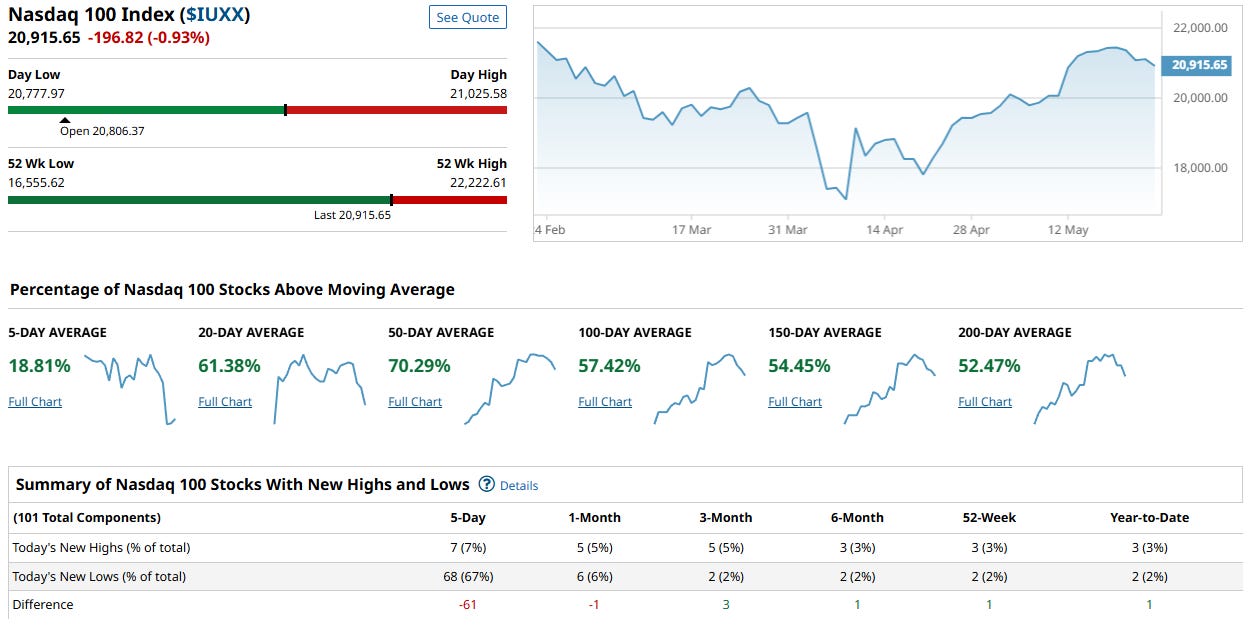
The Nasdaq 100 closed at 20,915.65, down -0.93% on the day—marking the weakest session among the major indices. Despite trading near all-time highs, internal breadth shows signs of short-term fragility amid broader structural strength:
Short-term weakness is evident: only 18.8% of components are above their 5-day moving average.
Intermediate- and long-term breadth is still strong:
70.3% are above the 50-day,
57.4% above the 100-day,
54.5% and 52.5% above the 150- and 200-day averages, respectively.
These levels reflect a majority of components still in uptrends despite recent volatility.
New Highs vs. New Lows highlights a notable disconnect:
Just 7 stocks (7%) made new highs in the last 5 days,
While 68 stocks (67%) hit new lows—a net -61 difference.
The 5-day new low count exceeds any other time frame, pointing to intensifying short-term distribution.
Takeaway: The Nasdaq 100 remains technically robust over longer timeframes, but cracks are forming under the surface. The growing number of new lows despite proximity to record highs reflects sectoral weakness and narrowing leadership—signs that the rally may be losing steam unless breadth improves. Elevated caution is warranted.
Russel 1000
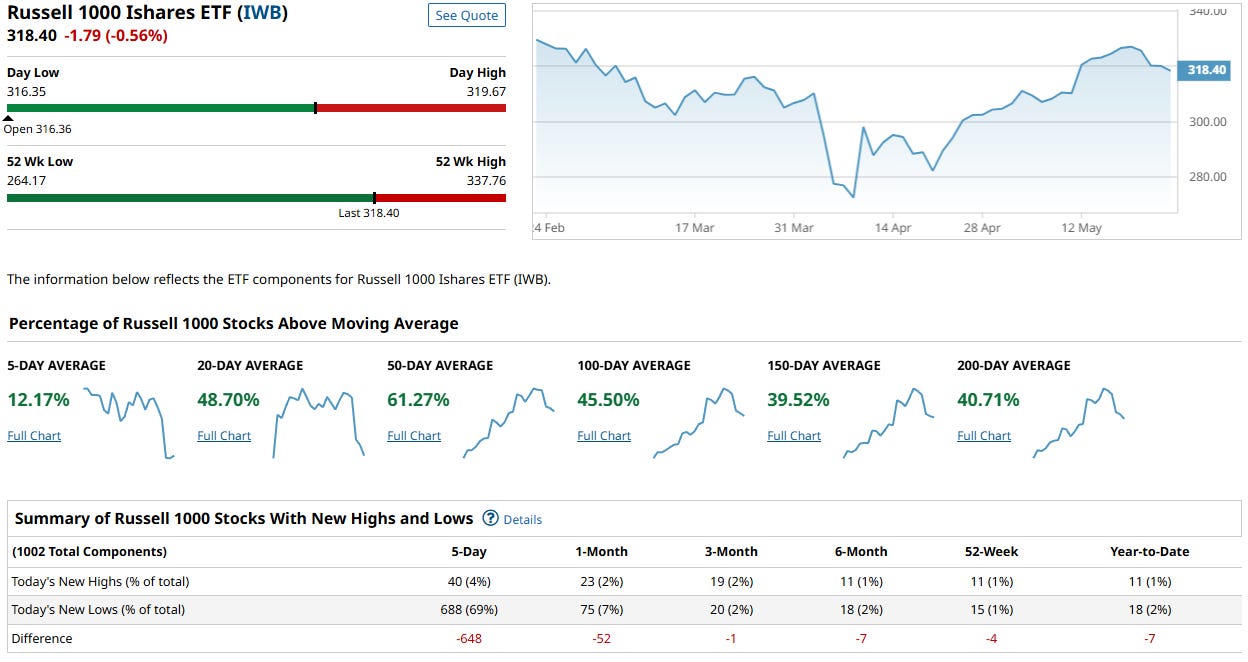
The Russell 1000, representing large- and mid-cap U.S. equities, closed at 318.40, down -0.56% on the day. While the price remains near recent highs, market internals suggest broad deterioration and a concerning lack of participation:
Short-term momentum is weak, with only 12.17% of stocks above their 5-day moving average.
Intermediate-term breadth is mixed, with:
48.7% above the 20-day,
61.3% above the 50-day.
Longer-term structure is breaking down:
Only 45.5%, 39.5%, and 40.7% of stocks are above their 100-, 150-, and 200-day averages, respectively.
This suggests that the rally is built on an increasingly narrow base.
The most concerning signal is the breadth of new lows:
688 out of 1002 stocks (69%) made new lows in the past 5 days, versus only 40 new highs (4%).
This nets a difference of -648—an extremely bearish internal signal.
The weakness is not just isolated to the 5-day window; negative net new lows also persist across every major time frame.
Takeaway: While the index price appears stable, the Russell 1000 is showing signs of internal breakdown. The sharp skew toward new lows and weak participation across all durations point to broad-based selling pressure, with leadership confined to a shrinking number of names. This kind of divergence historically precedes market pullbacks or increased volatility unless promptly reversed.
🧠 Insights Summary
Market internals across all major U.S. indices have meaningfully deteriorated this week, revealing weakening participation beneath surface-level index strength. Despite prices hovering near recent highs, breadth metrics tell a different story: short-term momentum has collapsed, and new lows are significantly outpacing new highs across the board. The most severe internal damage is observed in the Russell 1000 (net -648) and S&P 500 (net -318), while even the more resilient Nasdaq 100 and Dow Jones posted lopsided new-low readings.
The S&P 500 and Russell 1000—both broad-market proxies—now show fewer than half of their constituents above the 100-day, 150-day, and 200-day moving averages. The Dow Jones, although still technically healthier on a longer-term basis, saw 73% of its components hit new 5-day lows. The Nasdaq 100 remains the relative leader in trend alignment, but even it is showing short-term cracks with only 18.8% of components above the 5-day moving average.
In short, price strength is becoming increasingly narrow, with a shrinking set of stocks propping up the indices—a fragile and unsustainable condition unless breadth improves soon.
📈 Our Indices Market Score: 47 / 100 (−36 WoW)
The market has sharply declined from last week’s strength and now sits in a precarious spot marked by narrow leadership, deteriorating breadth, and negative internal momentum. Here’s why our confidence has fallen:
1. Breadth Breakdown Confirmed
Short-term participation has collapsed: only 10–18% of stocks in each index are above their 5-day moving averages. More alarmingly, new 5-day lows vastly outnumber new highs in all four indices:
S&P 500: 337 lows vs 19 highs
Russell 1000: 688 lows vs 40 highs
Nasdaq 100: 68 lows vs 7 highs
Dow: 22 lows, 0 highs
This is classic distribution behavior—a bearish internal regime shift.
2. Leadership Has Narrowed Significantly
Whereas last week saw broad-based participation, this week shows sharp reversion to narrow leadership. The Russell 1000’s -648 net new lows reveal wholesale weakness across sectors. The Dow and S&P 500 are also showing signs of institutional rotation out of previously supportive areas, with longer-term trend alignment now in jeopardy for the majority of constituents.
3. Multi-Timeframe Disagreement
The market is now disjointed across timeframes. While some indices (notably Nasdaq 100) still retain relatively high 50- and 100-day breadth, the 150- and 200-day averages have fallen below 50% in the S&P, Russell, and Nasdaq. This misalignment removes a key pillar of bull market durability and reintroduces risk of failed rallies.
4. Price Outruns Internals
The indices are masking internal weakness. While headline prices appear healthy, breadth deterioration and surging new lows suggest the rally is no longer underpinned by broad participation. Without internal confirmation, this makes any further upside vulnerable and pullbacks less likely to be bought—at least in the short term.
5. Suggestive Institutional Positioning
Extreme hedging activity: The single largest unusual trade was SH 0.00%↑ (S&P bear) at $49.1M with 46.1x relative size - an enormous hedge position
Higher average relative sizes: Bear trades average 3.15 relative size vs bulls at 2.76, suggesting more urgent/defensive positioning
Quality of bear bets: Large positions in high-quality bear instruments (SH, SPXU 0.00%↑ ) rather than just speculative plays
SQQQ dominance: 174 trades totaling $507M in SQQQ 0.00%↑ (3x Nasdaq bear) shows serious tech sector hedging
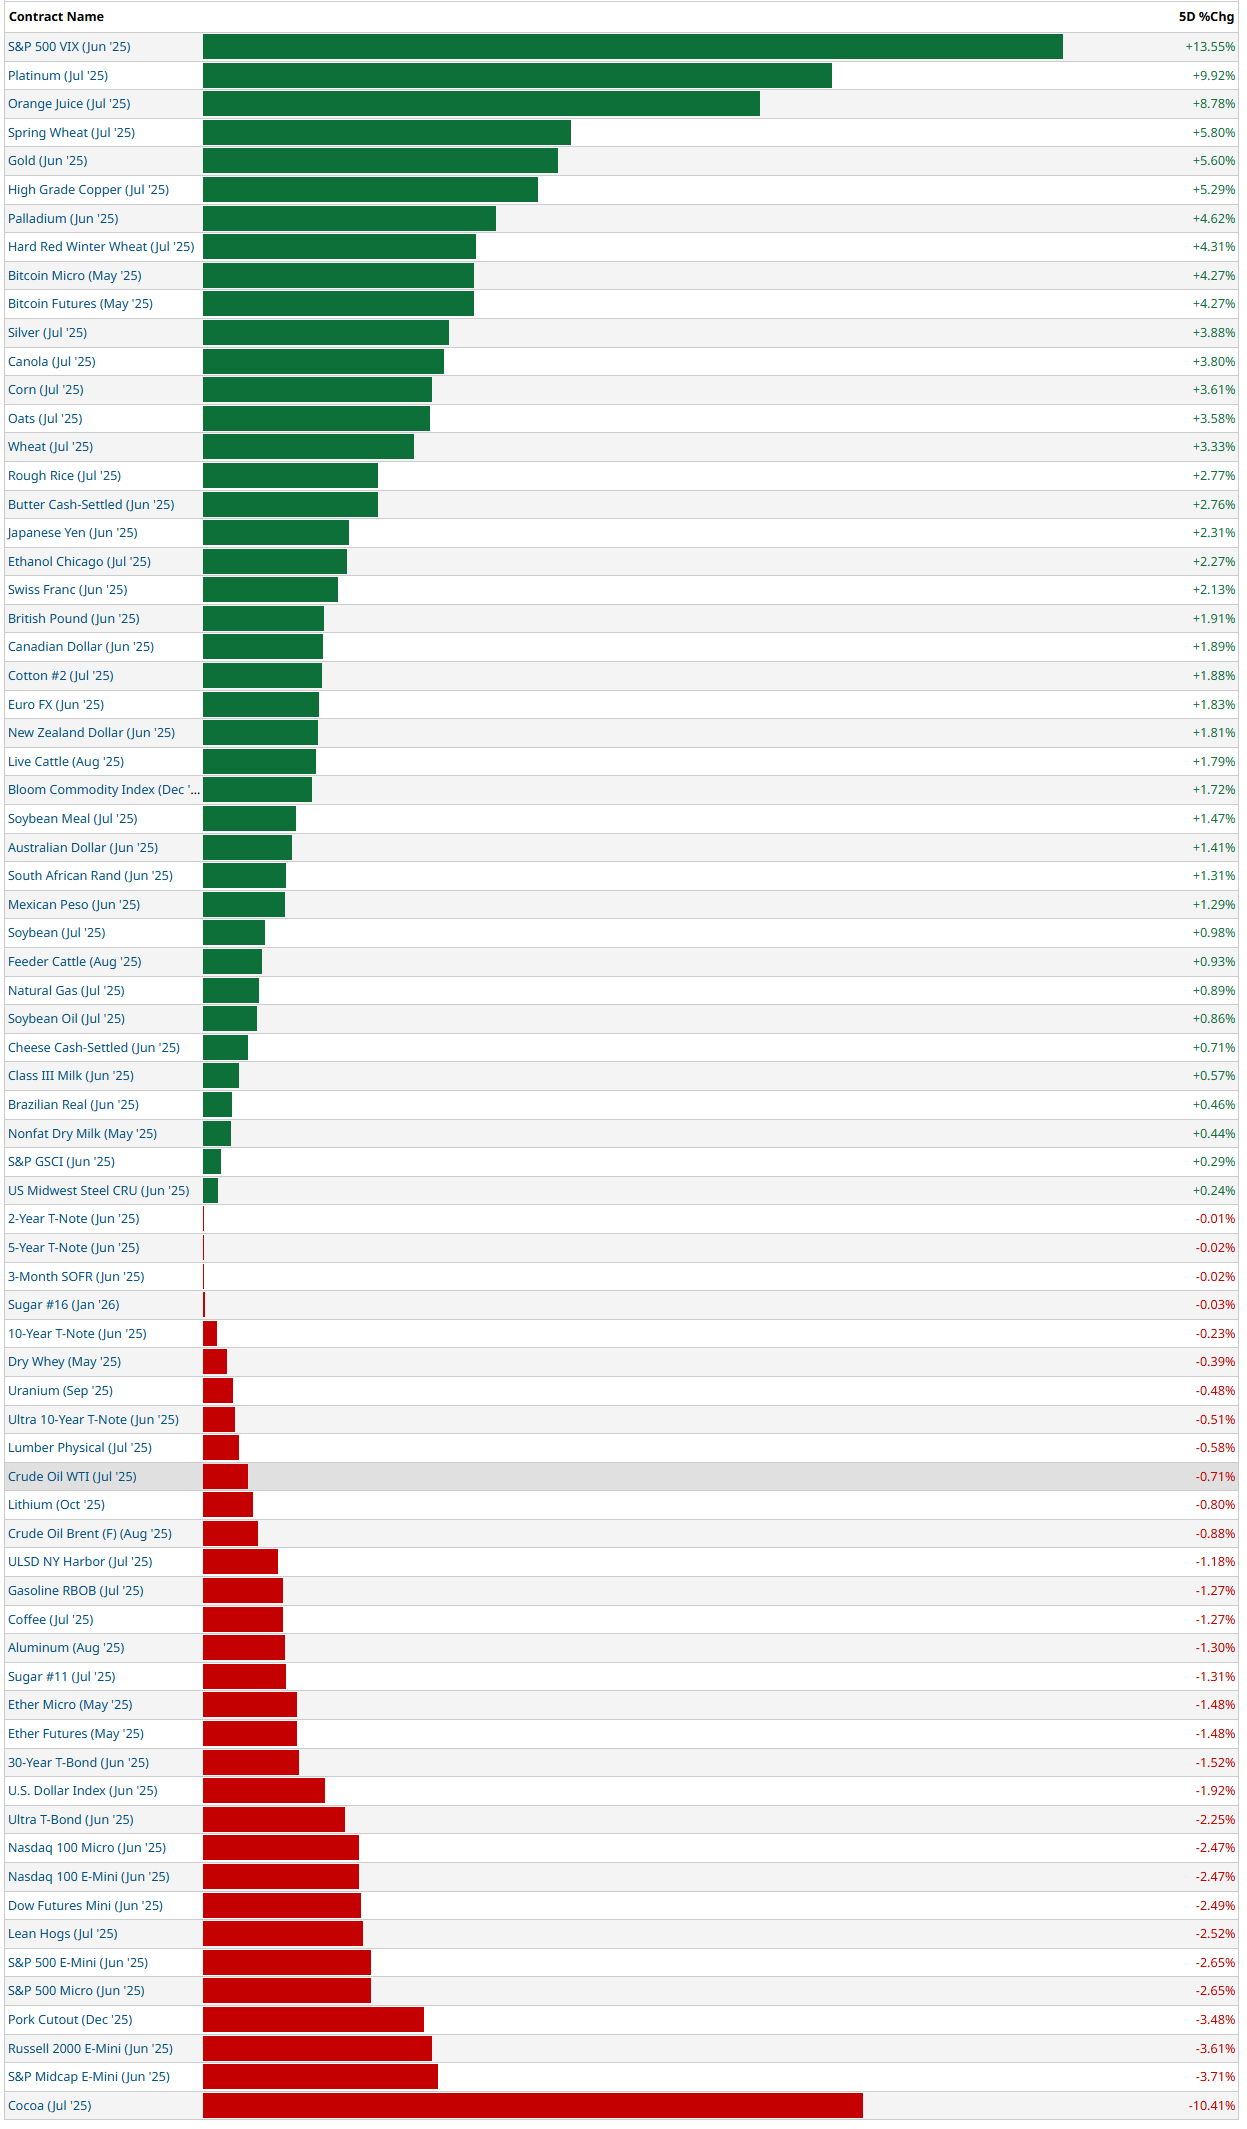
5-Day Futures Performance Leaders
FOREX
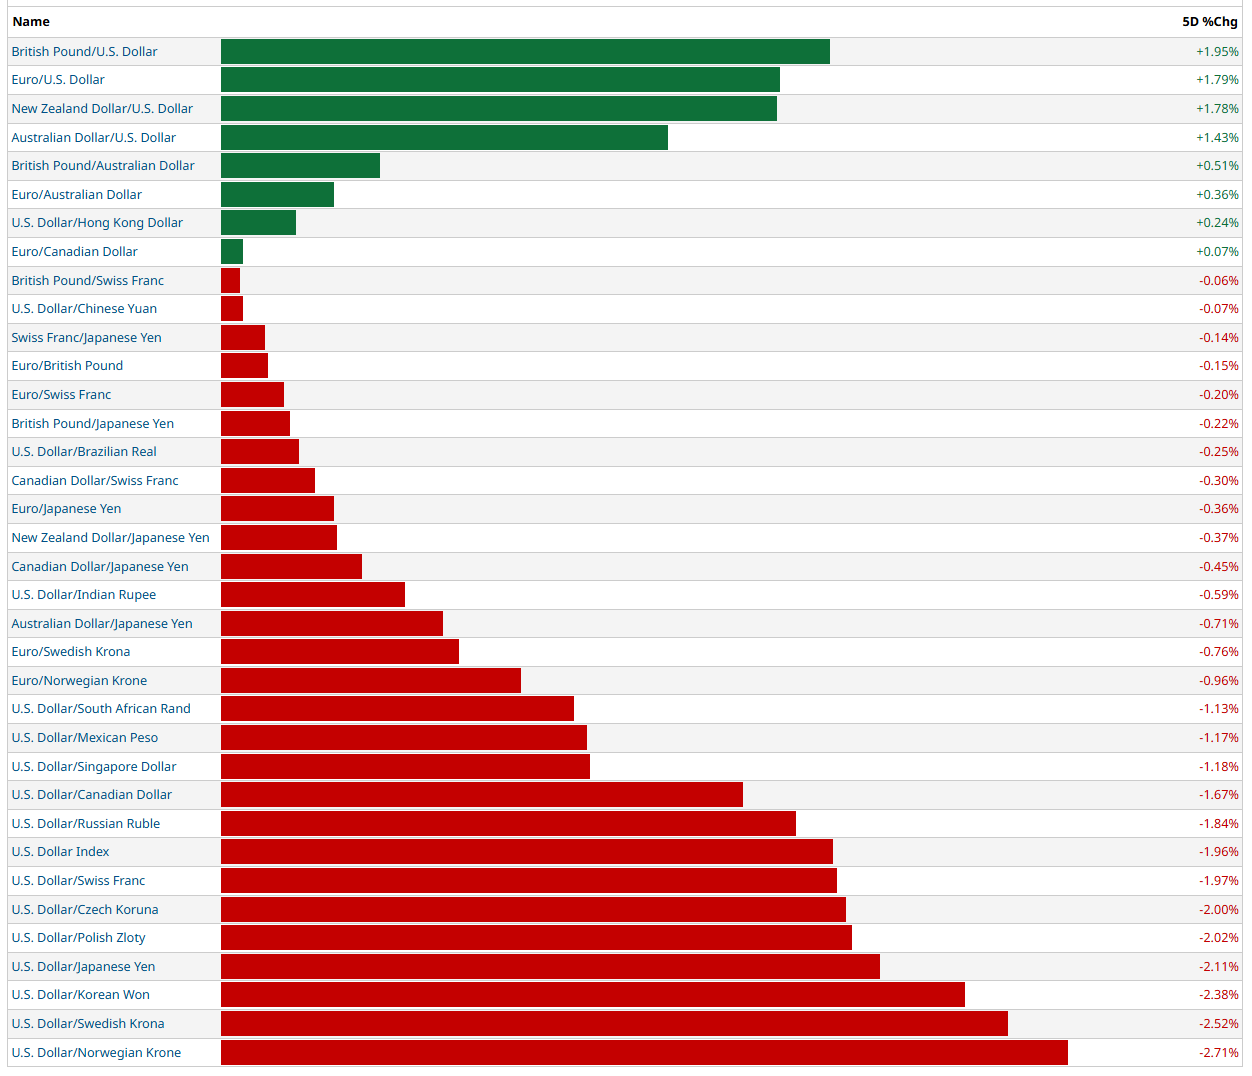
The U.S. dollar broadly weakened this week across global currency markets, with the losses especially pronounced against risk-sensitive and high-beta currencies. The FX tape is sending a clear message: risk appetite is alive, and global capital is flowing into non-dollar assets.
🔻 USD Under Pressure
The USD is the weakest major currency on the board, with significant losses against 75% of tracked pairs.
Largest drawdowns came against:
Norwegian Krone (USD/NOK -2.71%)
Korean Won (-2.38%)
Japanese Yen (-2.11%)
Polish Zloty (-2.11%)
Swiss Franc (-1.97%)
This indicates broad de-risking of USD exposure, likely driven by cooling inflation expectations, softening U.S. data, or a potential pivot in Fed tone. In particular, emerging market currencies and commodity-tied FX are gaining ground, a classic sign of reflationary optimism or carry trade re-engagement.
🟢 Top Gainers vs USD
GBP/USD (+1.95%), EUR/USD (+1.79%), NZD/USD (+1.78%), and AUD/USD (+1.43%) lead the pack.
This strength in European and Oceania currencies points to broad-based global demand and renewed cyclical rotation.
The GBP is particularly strong, also rallying across other crosses like GBP/JPY and GBP/CHF, implying monetary policy divergence or better-than-expected UK macro data.
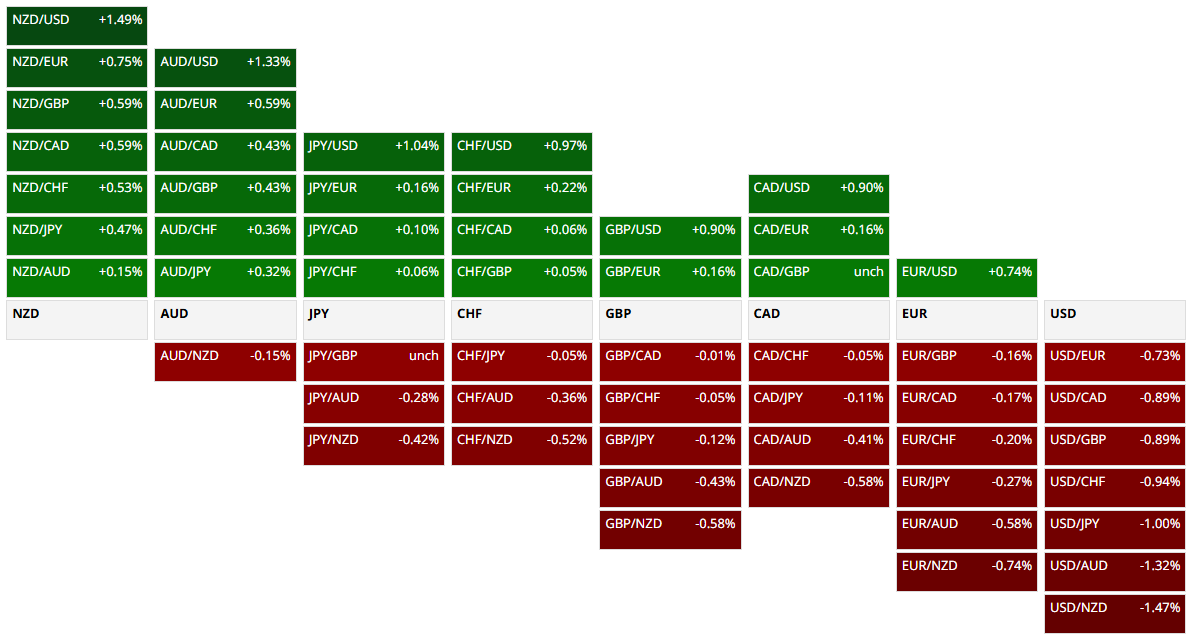
⚖️ Cross-Currency Trends
Most USD crosses weakened, even against currencies typically viewed as safe havens, like CHF and JPY.
Commodity currencies (AUD, NZD, NOK) are outperforming across the board, suggesting renewed appetite for risk-on trades.
The Euro is firm but not dominant, gaining against USD and CHF, but slightly down versus GBP—implying relative stability, not leadership.
🧭 Interpretation & Outlook
The USD's broad retreat suggests markets are increasingly confident in the global growth outlook and are betting on a weaker Fed posture going forward.
The strength in high-beta and EM FX reinforces the view that capital is rotating into perceived value and risk-on regions.
However, USD weakness has reached oversold levels in some pairs, so a short-term bounce or consolidation is possible—but the macro backdrop now favors diversified, non-dollar positioning.
This is a pro-risk, anti-dollar tape. Whether driven by macro fundamentals, central bank divergence, or renewed carry trade interest, the signal is consistent: the dollar has lost its bid, and capital is looking for opportunity elsewhere. If this trend continues, it could further fuel global equity strength and commodity inflation in the weeks ahead.
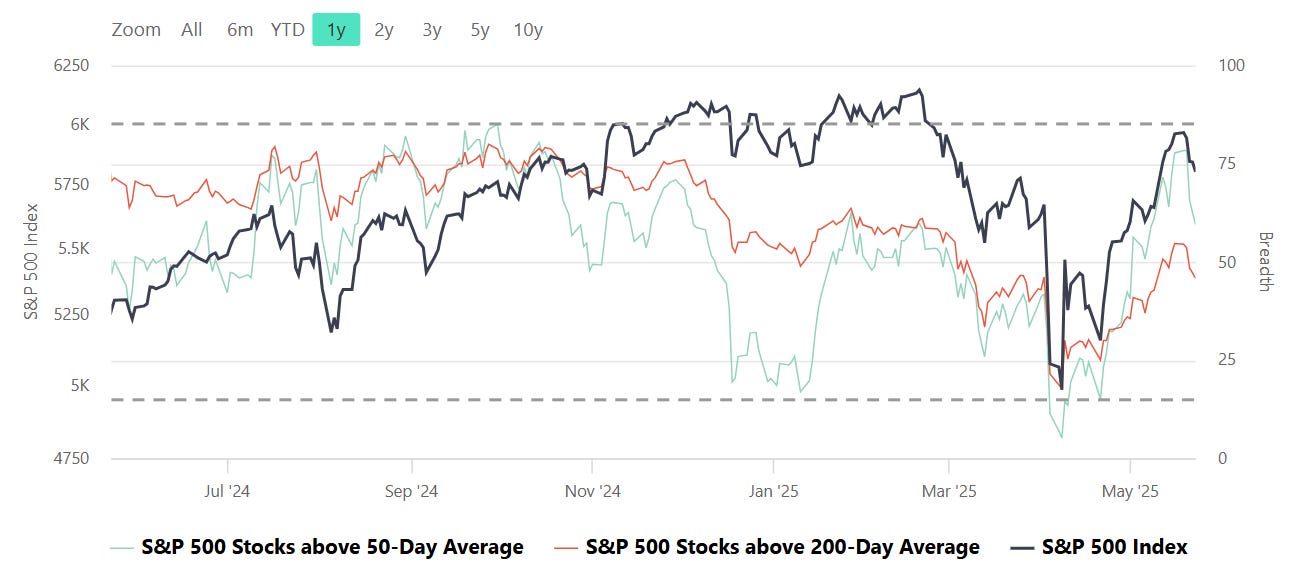
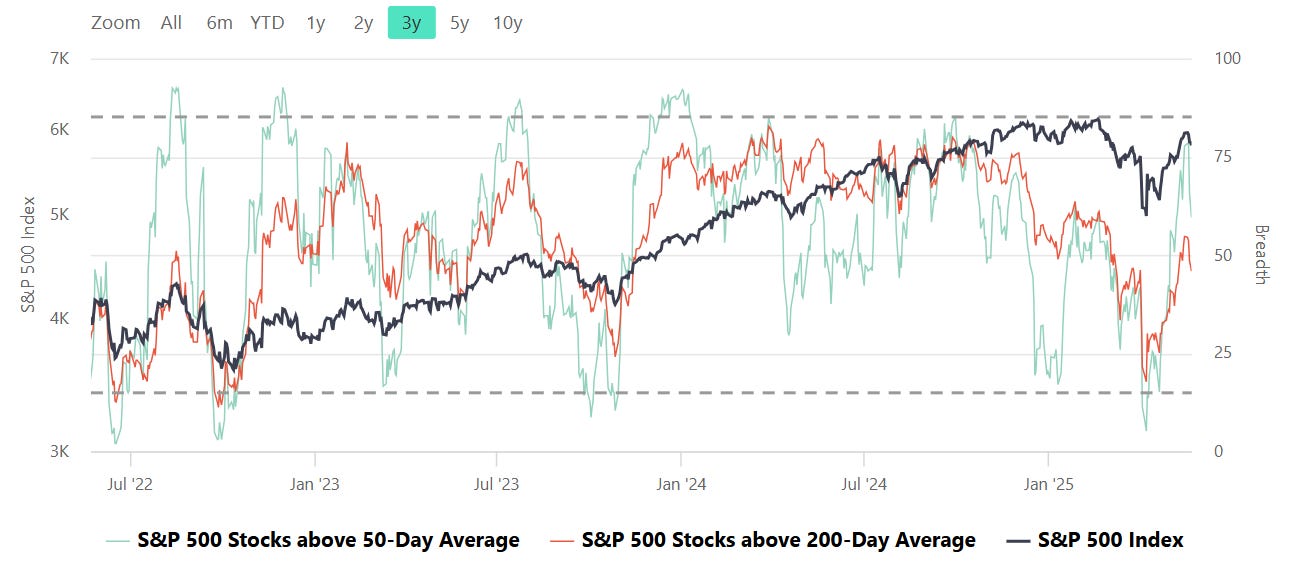
S&P Breadth
Breadth, in the context of stock market analysis, refers to the measure of how many stocks in a given index (such as the S&P 500) are participating in a trend, such as advancing or declining relative to a certain moving average (e.g., 50-day or 200-day).
Market Strength Assessment:
Breadth provides insight into whether a market rally or decline is broad-based or driven by only a few large-cap stocks. A rally supported by a high percentage of stocks above their 50-day or 200-day averages is generally considered healthier and more sustainable.
Early Warning Signals:
Divergences between breadth indicators and the index price can signal potential reversals. For example:
If the index is rising, but the number of stocks above their moving averages is declining, it may indicate weakening underlying strength and potential for a pullback.
Conversely, if breadth improves while the index remains flat or declines, it may suggest accumulating strength for a future rally.
Trend Confirmation:
Breadth indicators can confirm trends. For instance, a strong majority of stocks above their moving averages signals robust market momentum, providing confidence in the prevailing trend.
Identifying Overbought or Oversold Conditions:
Extremely high or low breadth readings can signal overbought or oversold conditions, which might lead to mean reversion. For example:
If nearly all stocks are above their 50-day or 200-day averages, it may suggest overbought conditions.
Conversely, extremely low levels indicate oversold conditions and potential for a bounce.
Breadth and Timing Investments:
Entry Points:
When breadth improves (e.g., more stocks move above their 50-day or 200-day moving averages) after a market pullback, it can indicate a good time to start building positions as the broader market is regaining strength.
Exit Points:
Breadth deterioration during a rally may suggest it’s time to reduce exposure, especially if only a small number of stocks are driving index gains. This is often a warning sign of an impending correction.
Volatility and Risk Management:
Weak breadth in volatile markets may prompt caution or defensive positioning. Conversely, improving breadth can justify taking on more risk during uptrends.
CME Fedwatch
What is the likelihood that the Fed will change the Federal target rate at upcoming FOMC meetings, according to interest rate traders? Use CME FedWatch to track the probabilities of changes to the Fed rate, as implied by 30-Day Fed Funds futures prices.

US Investor Sentiment
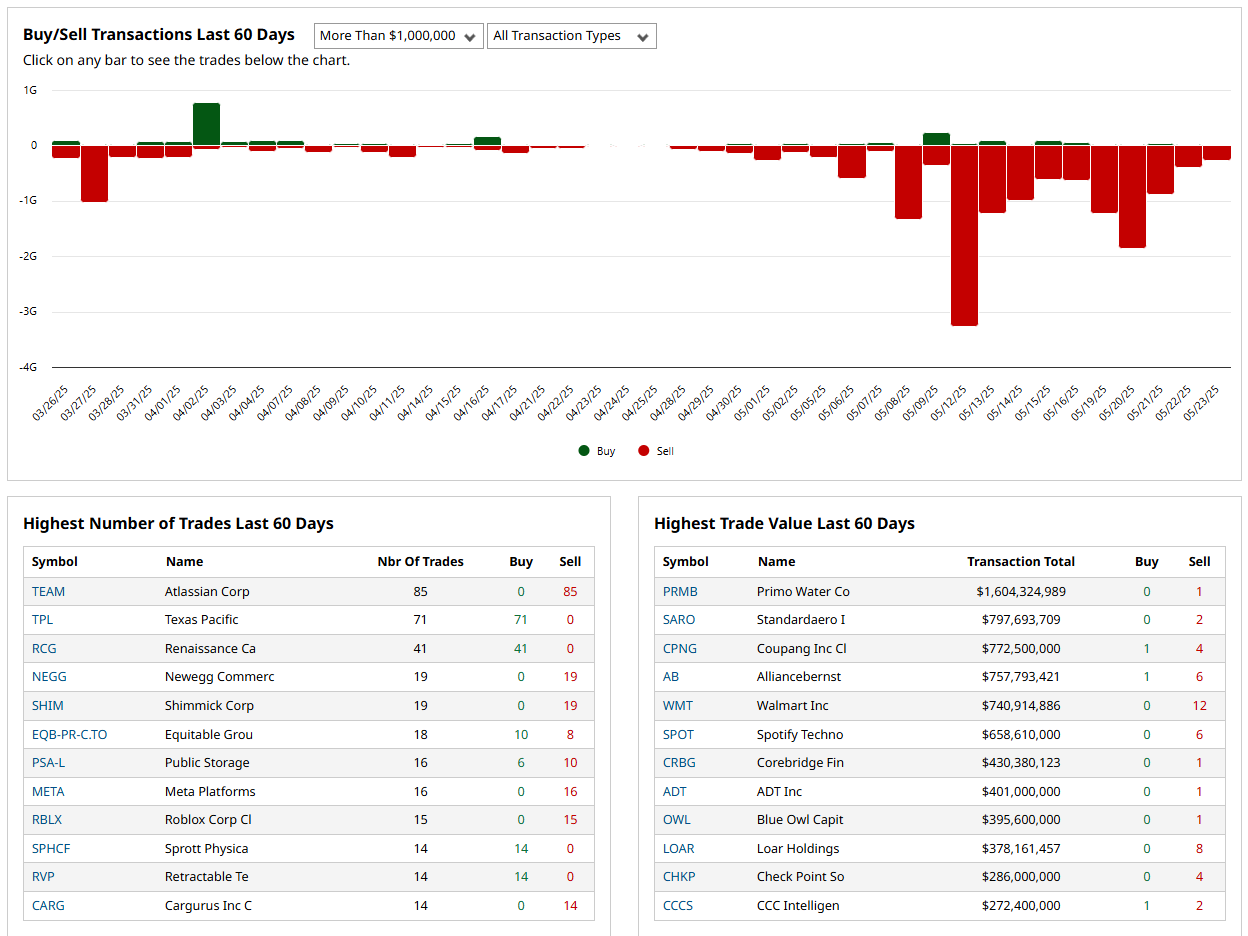
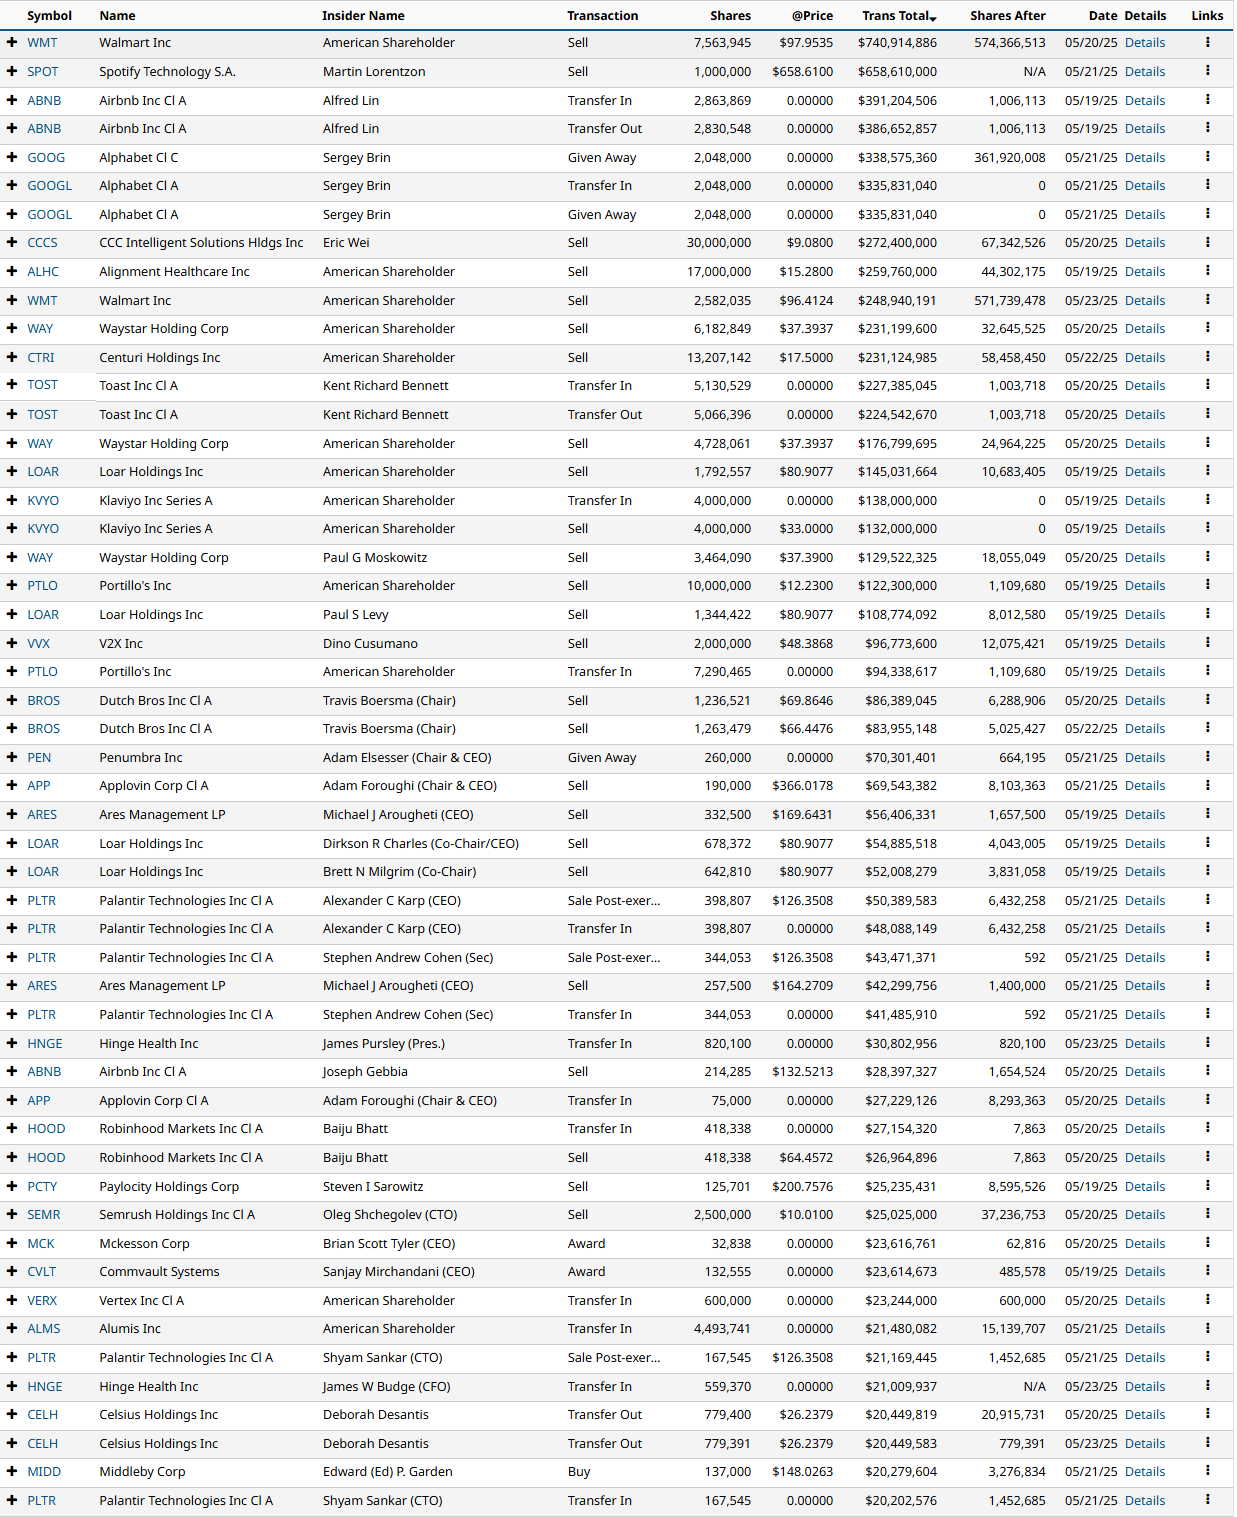
Insider Trading
Insider trading occurs when a company’s leaders or major shareholders trade stock based on non-public information. Tracking these trades can reveal insider expectations about the company’s future. For example, large purchases before an earnings report or drug trial results might indicate confidence in upcoming good news.
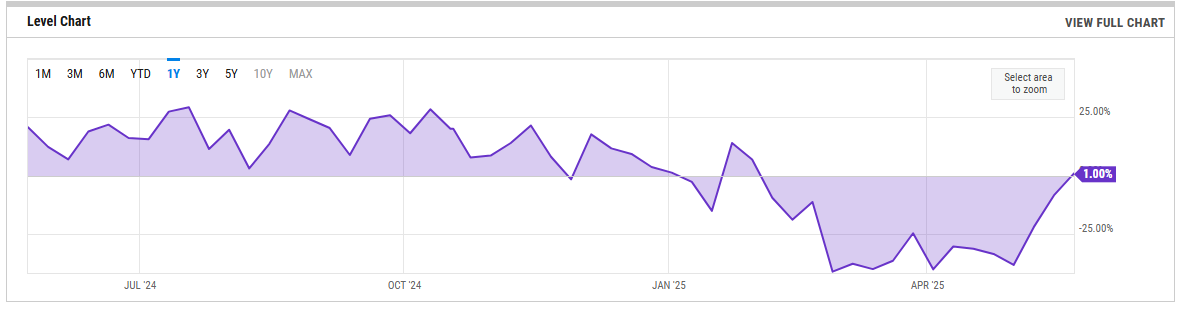
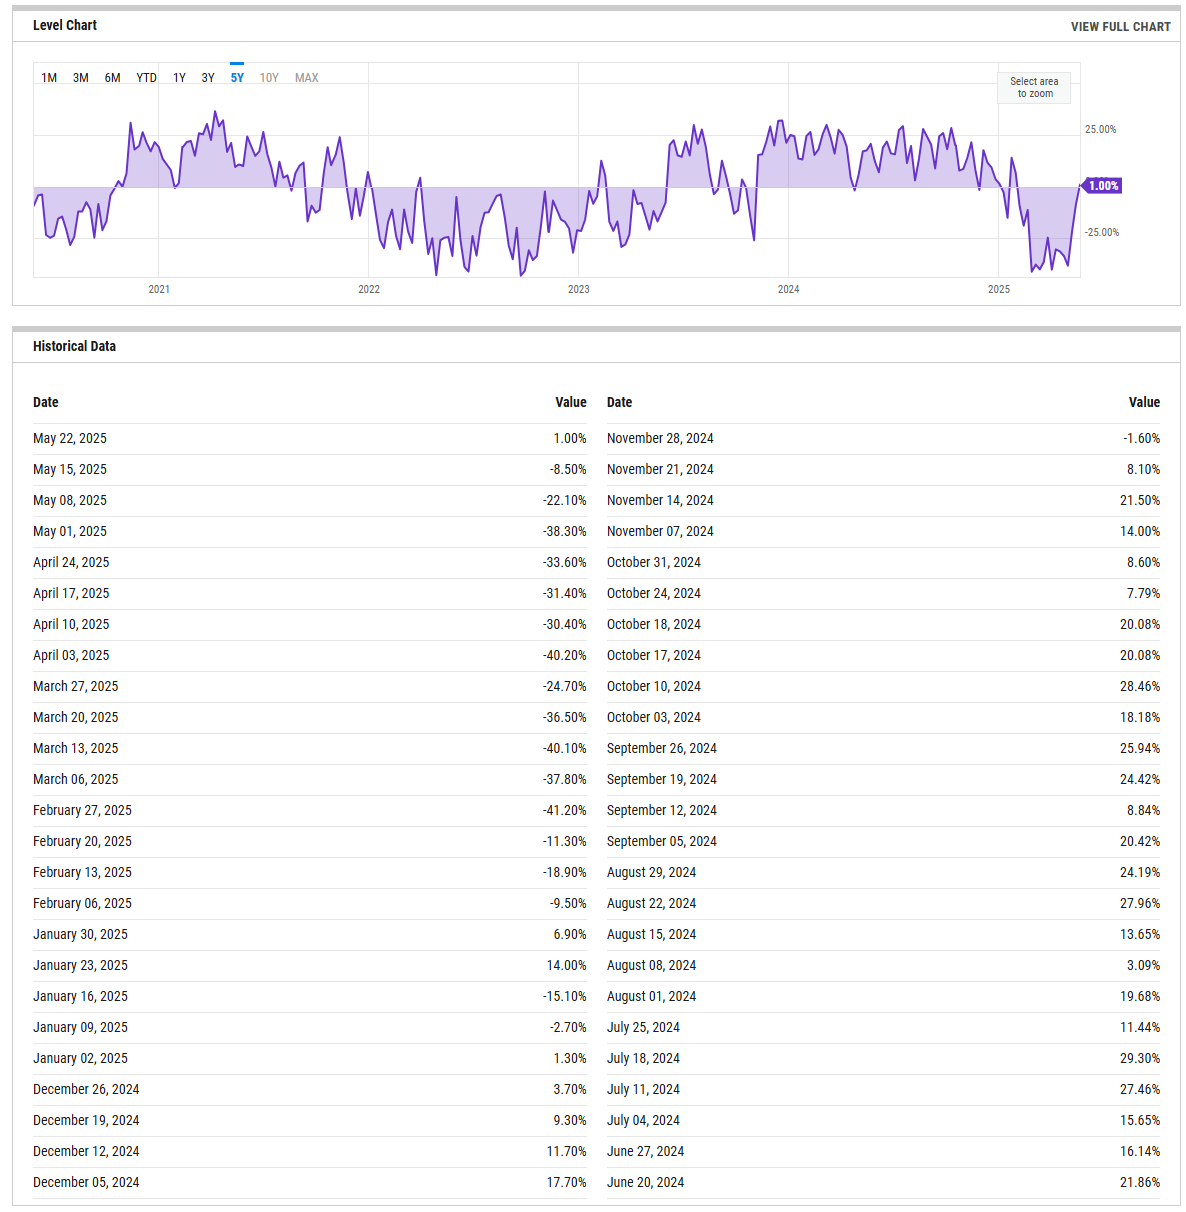
%Bull-Bear Spread
The %Bull-Bear Spread chart is a sentiment indicator that shows the difference between the percentage of bullish and bearish investors, often derived from surveys or sentiment data, such as the AAII (American Association of Individual Investors) sentiment survey. This spread tells investors about the prevailing mood in the market and can provide insights into market extremes and potential turning points.
Bullish or Bearish Sentiment:
When the spread is positive, it means more investors are bullish than bearish, indicating optimism about the market’s direction.
A negative spread indicates more bearish sentiment, meaning more investors expect the market to decline.
Contrarian Indicator:
The %Bull-Bear Spread is often used as a contrarian indicator. For example, extremely high levels of bullish sentiment might suggest that the market is overly optimistic and could be due for a correction.
Similarly, when bearish sentiment is extremely high, it might indicate that the market is overly pessimistic, and a rally could be on the horizon.
Market Extremes and Reversals:
Historically, extreme values of the spread (both positive and negative) can signal turning points in the market. A very high positive spread can signal market exuberance, while a very low or negative spread may indicate fear or capitulation.
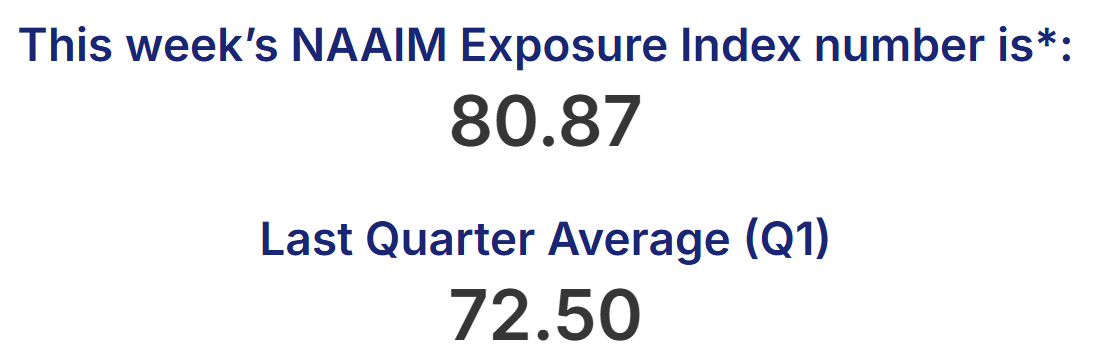
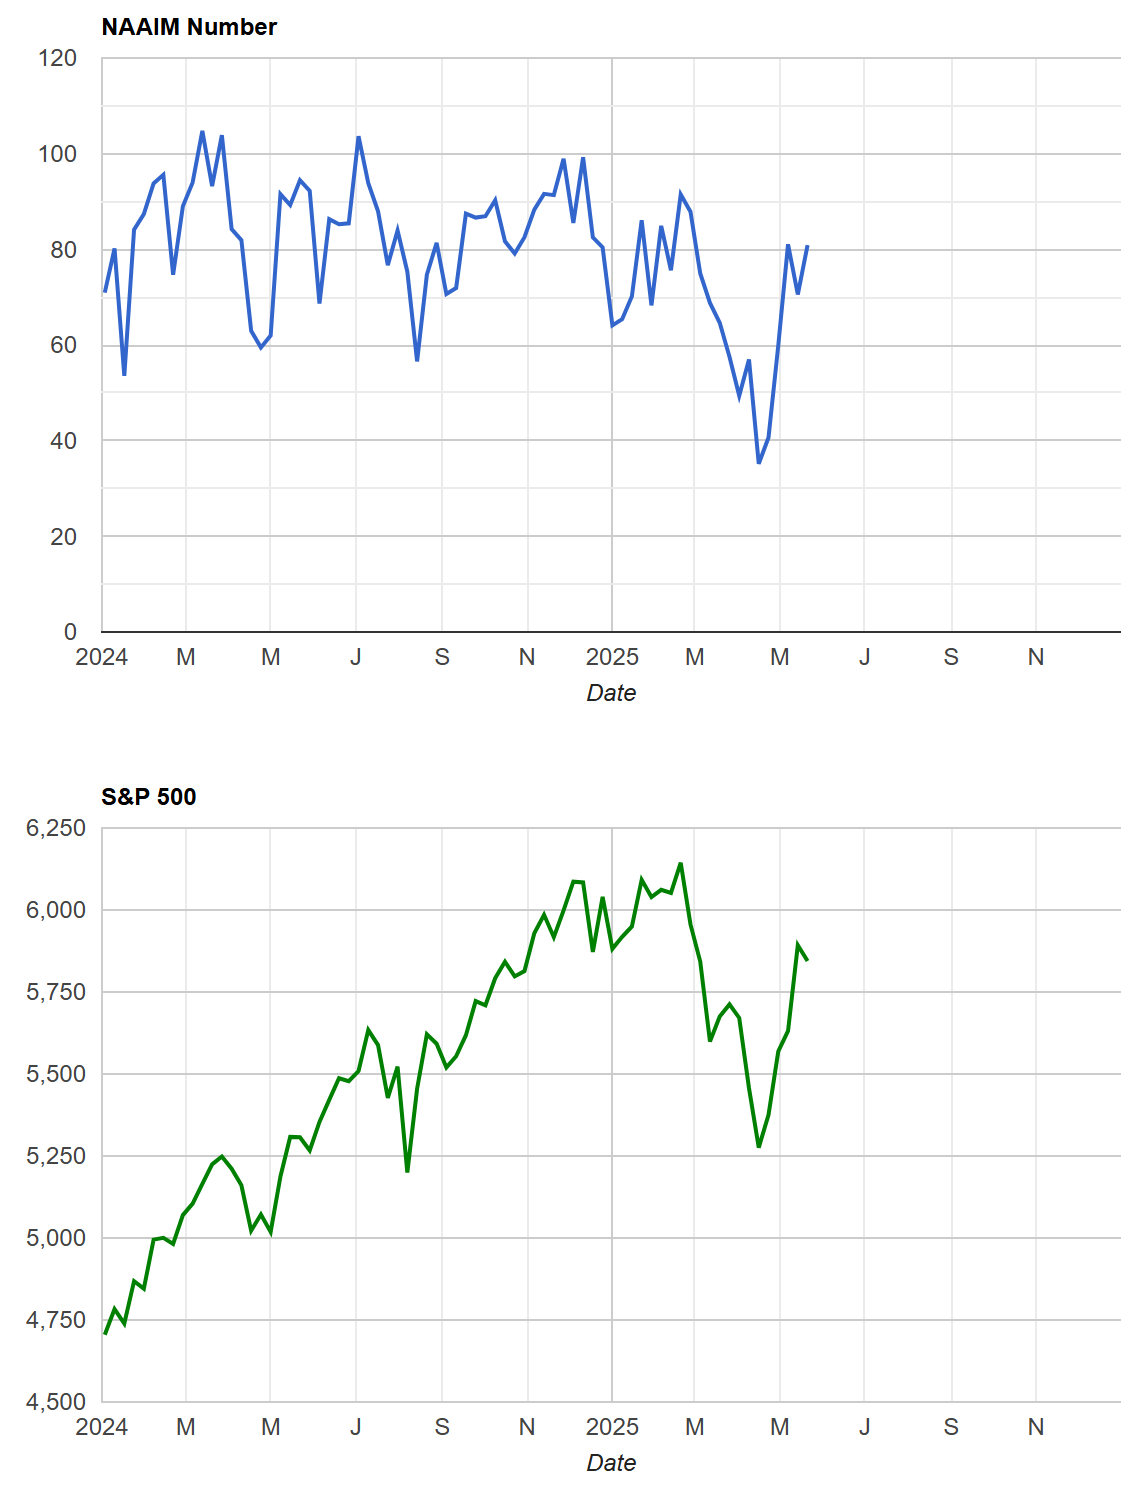
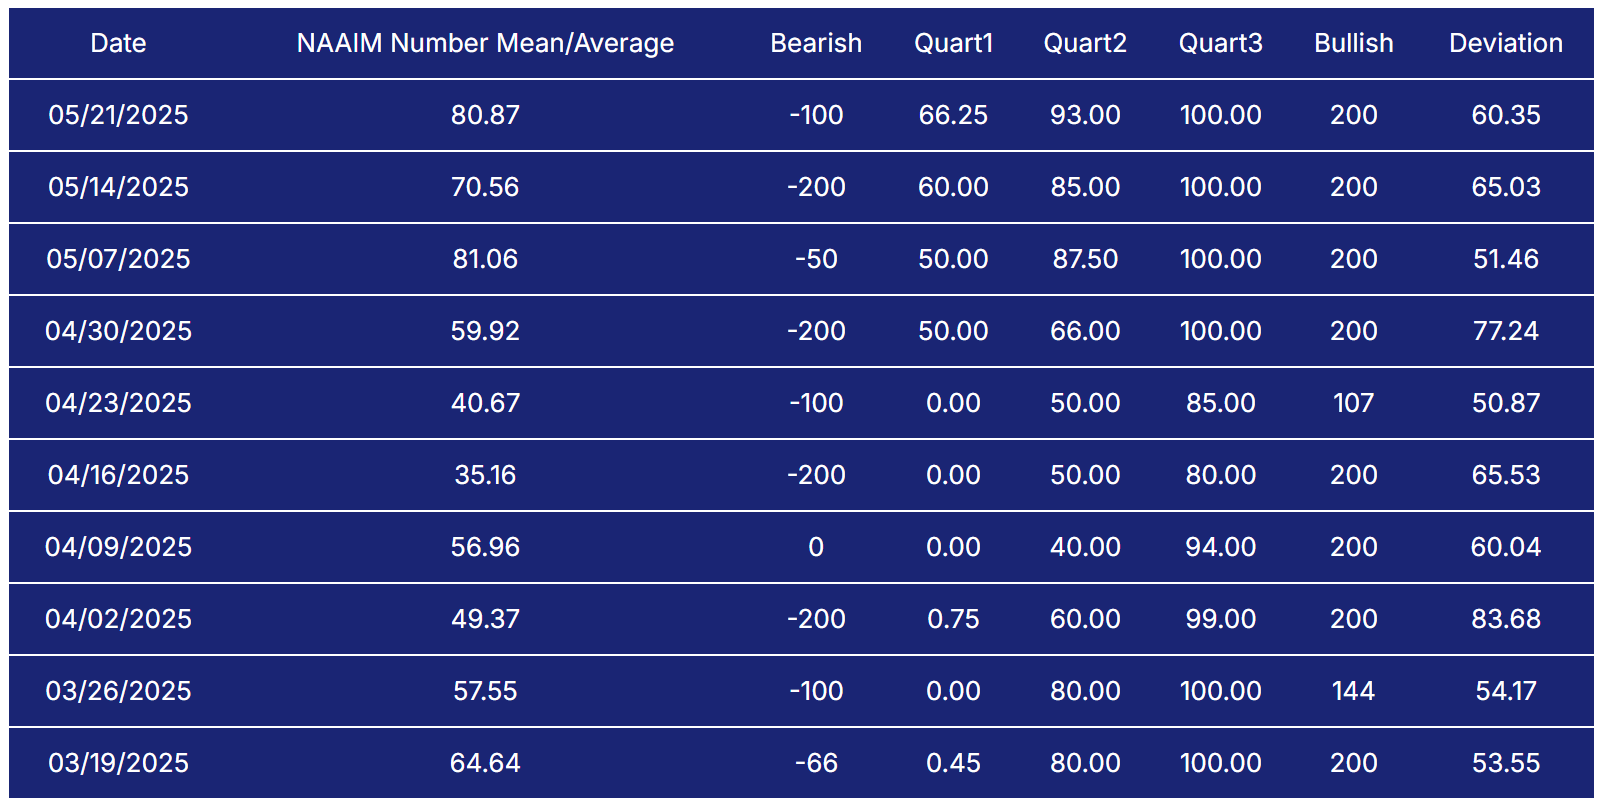
NAAIM Exposure Index
The NAAIM Exposure Index (National Association of Active Investment Managers Exposure Index) measures the average exposure to U.S. equity markets as reported by its member firms. These are typically active money managers who provide their equity exposure levels weekly. The index offers insight into how much these managers are investing in equities at any given time, ranging from being fully short (-100%) to leveraged long (up to +200%).
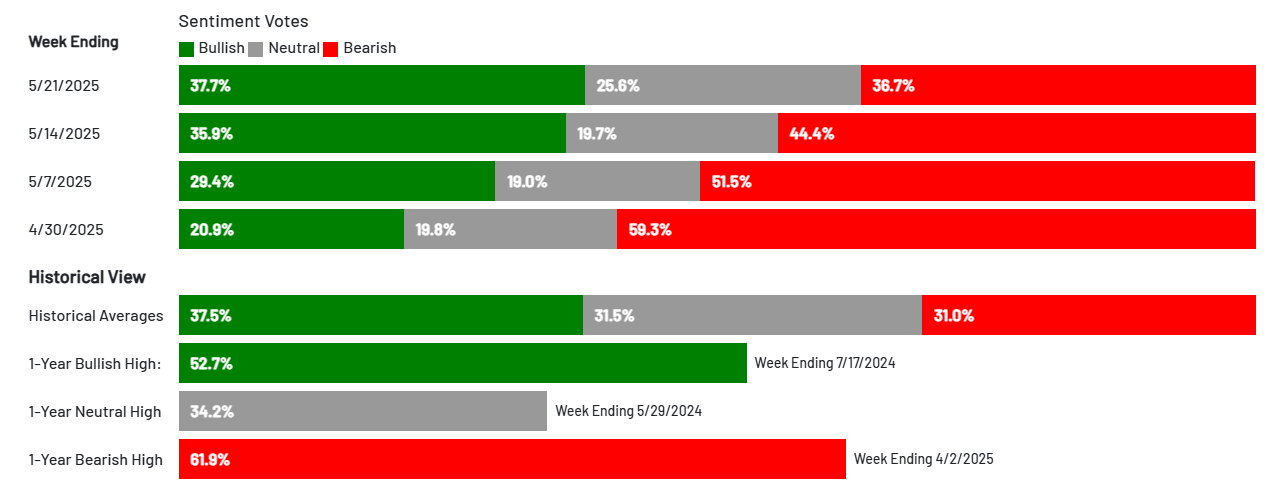
AAII Investor Sentiment Survey
The AAII Investor Sentiment Survey is a weekly survey conducted by the American Association of Individual Investors (AAII) to gauge the mood of individual investors regarding the direction of the stock market over the next six months. It provides insights into whether investors are feeling bullish (expecting the market to rise), bearish (expecting the market to fall), or neutral (expecting the market to stay about the same).
Key Points:
Bullish Sentiment: Reflects the percentage of investors who believe the stock market will rise in the next six months.
Bearish Sentiment: Represents those who expect a decline.
Neutral Sentiment: Reflects investors who anticipate little to no market movement.
The survey is widely followed as a contrarian indicator, meaning that extreme levels of bullishness or bearishness can sometimes signal market turning points. For example, when a large number of investors are overly optimistic (high bullish sentiment), it could suggest a market top, while excessive pessimism (high bearish sentiment) may indicate a market bottom is near.
SPX Put/Call Ratio
The SPX Put/Call Ratio is an indicator that is used to gauge market sentiment. This is calculated as the ratio between trading S&P 500 put options and S&P call options. A high put/call ratio can indicate fear in the markets, while a low ratio indicates confidence. For example, in 2015, the Put-Call ratio was as high as 3.77 because of market fears stemming from various global economic issues like a GDP growth slowdown in China and a Greek debt default.
CBOE Equity Put/Call Ratio
The CBOE (Chicago Board Options Exchange) equity put/call ratio is a sentiment indicator used by traders and analysts to gauge market sentiment and potential shifts in investor behavior. It is calculated by dividing the volume of put options by the volume of call options on equities. Here’s what it reveals and how it is generally interpreted:
High Put/Call Ratio: When the put/call ratio is high (above 1.0), it suggests that there is more demand for put options than call options. This typically reflects a more bearish sentiment, as investors may be hedging against potential declines or expecting the market to fall.
Low Put/Call Ratio: Conversely, a low put/call ratio (below 0.7) indicates a higher volume of call options compared to puts, reflecting bullish sentiment. Investors may be expecting upward momentum and are positioning themselves to profit from price gains
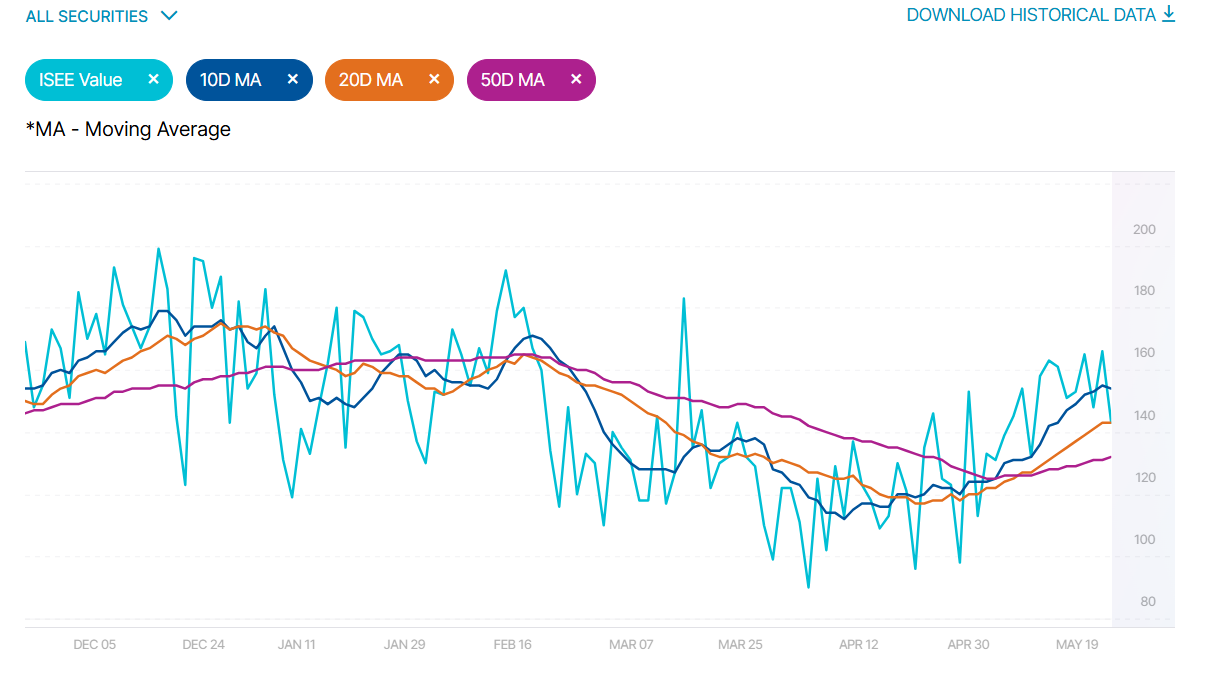
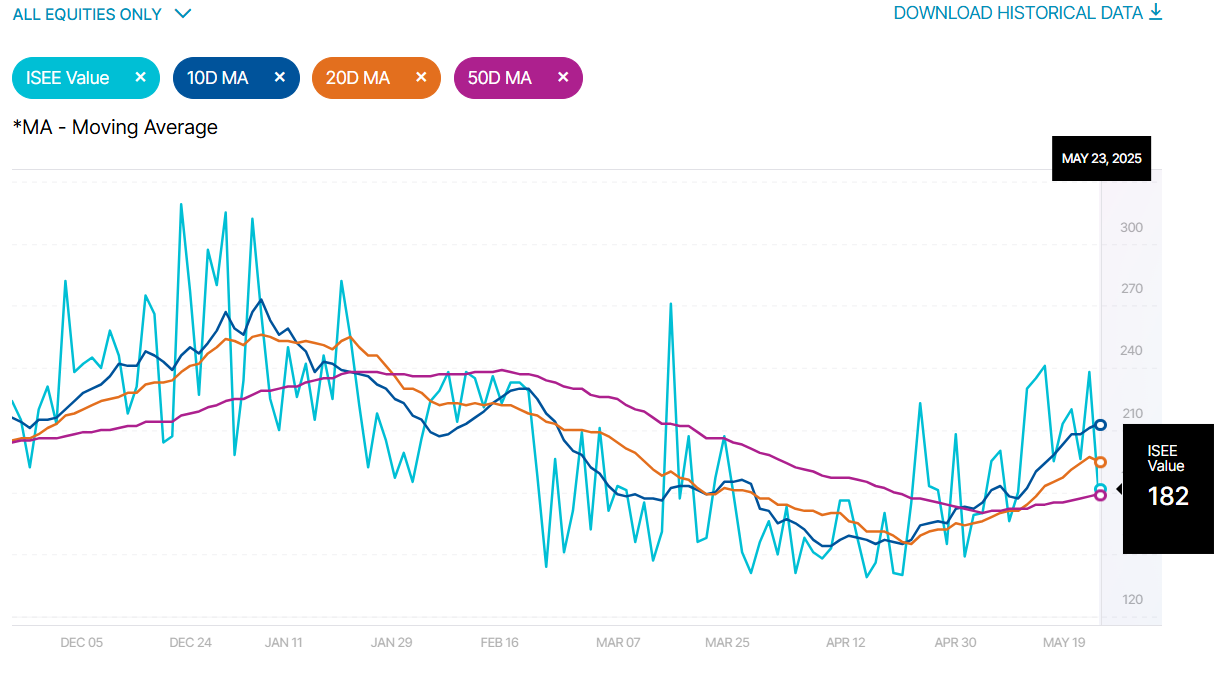
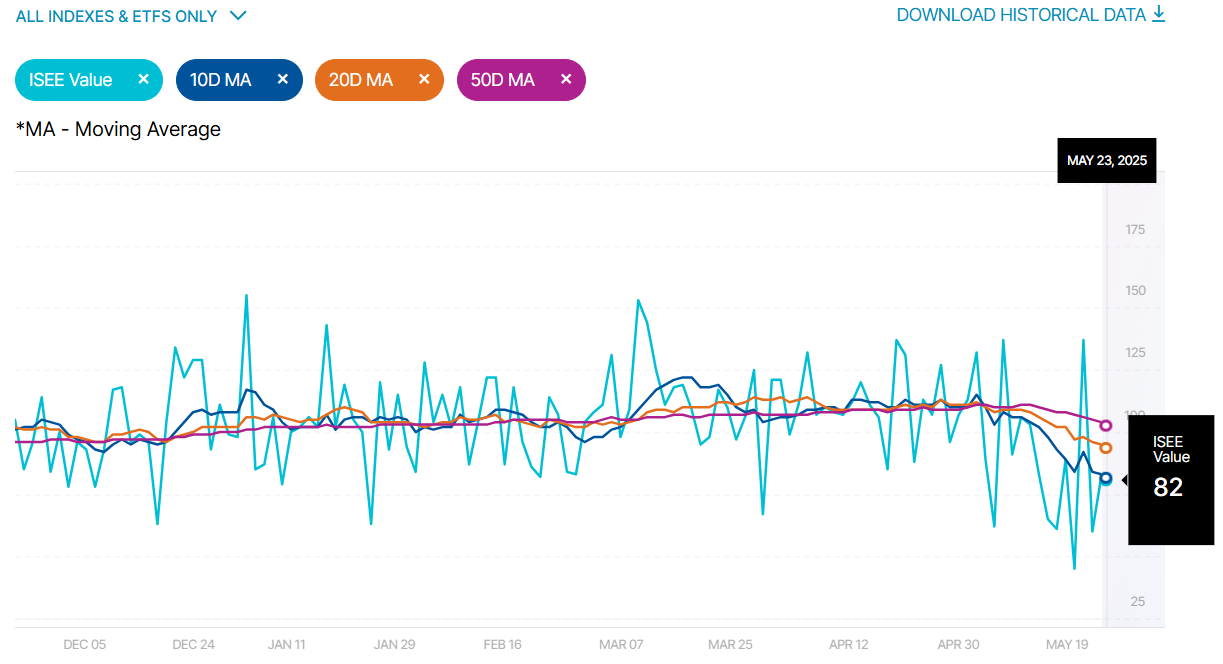
ISEE Sentiment Index
The ISEE (International Securities Exchange Sentiment) Index is a measure of investor sentiment derived from options trading. Unlike traditional put/call ratios, the ISEE Index focuses only on opening long customer transactions and is adjusted to remove market-maker and firm trades, providing a purer sentiment reading.
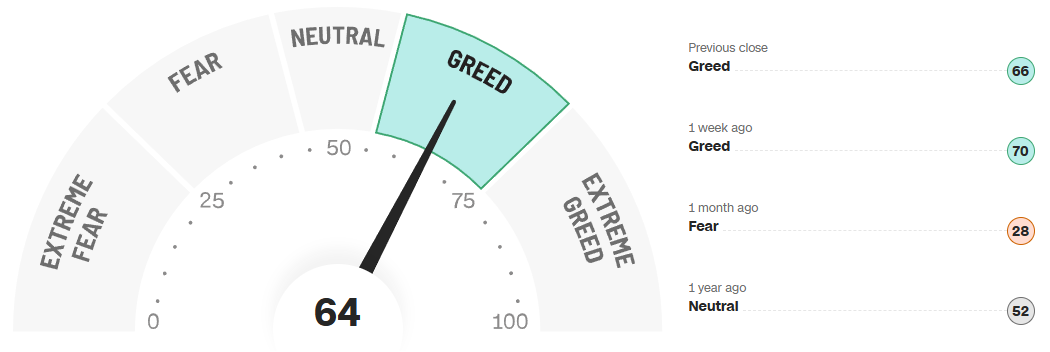
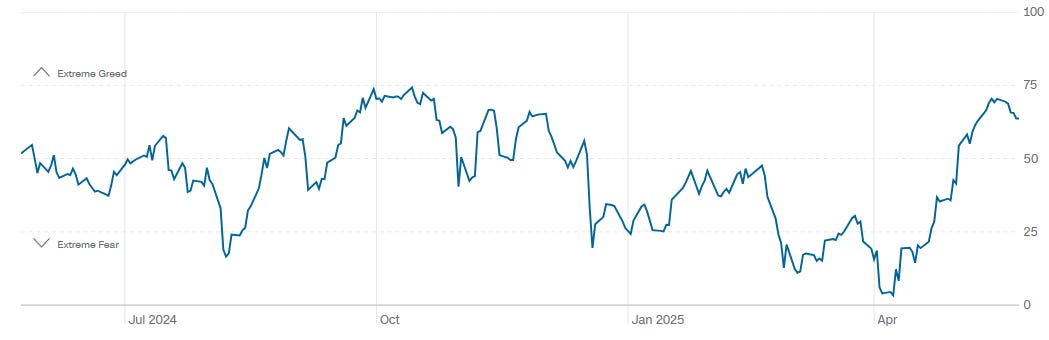
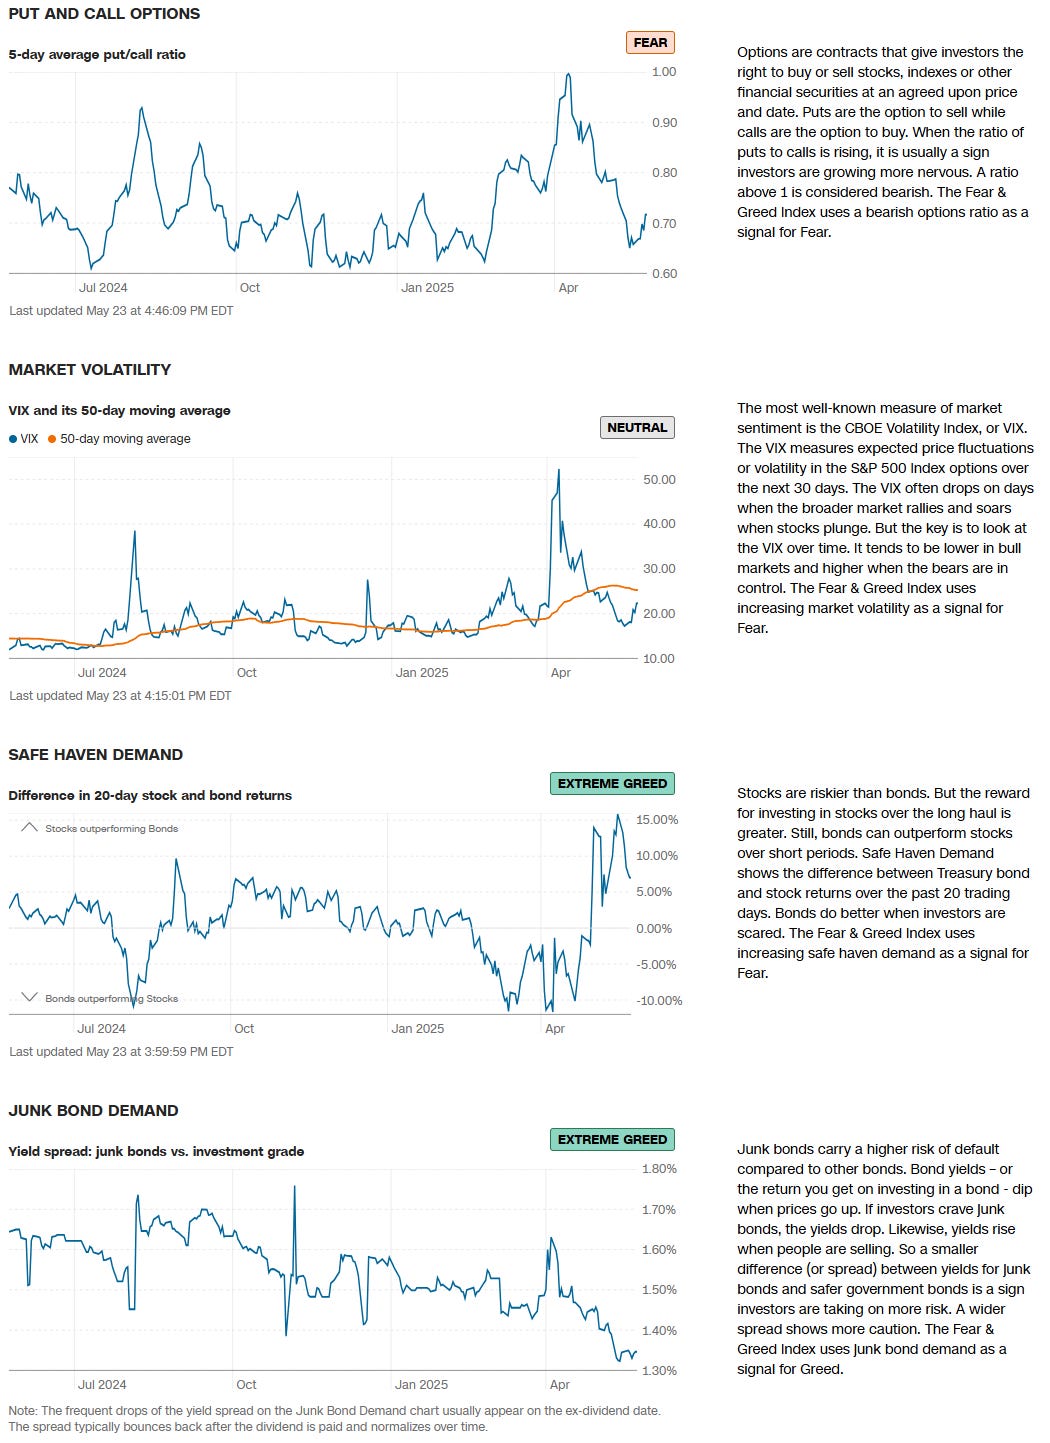
CNN Fear & Greed Constituent Data Points & Composite Index
Social Media Favs
Analyzing social sentiment can provide valuable insights for investment strategies by offering a pulse on public perception, mood, and market sentiment that traditional financial indicators might not capture. Here’s how social sentiment analysis can enhance investment decisions:
Market Momentum: Positive or negative social sentiment can signal impending momentum shifts. When public opinion on a stock, sector, or asset class changes sharply, it can create buying or selling pressure, especially if that sentiment becomes widespread.
Early Detection of Trends: Social sentiment data can help investors spot trends before they show up in technical or fundamental data. For example, increased positive chatter around a particular company or sector might indicate growing interest or excitement, which could lead to price appreciation.
Gauge Retail Investor Impact: With the rise of retail investor platforms, collective sentiment on social media can lead to significant price movements (e.g., meme stocks). Understanding how retail investors view certain stocks can help in identifying high-volatility opportunities.
Event Reaction Monitoring: Social sentiment can provide real-time reactions to news events, product releases, or earnings reports. Investors can use this information to gauge market reaction quickly and adjust their strategies accordingly.
Complementing Quantitative Models: By adding a social sentiment layer to quantitative models, investors can enhance predictions. For example, a model that tracks historical price and volume data might perform even better when factoring in sentiment trends as a measure of market psychology.
Risk Management: Negative sentiment spikes can be a signal of potential downturns or increased volatility. By monitoring sentiment, investors might avoid or hedge against investments in companies experiencing a public relations crisis or facing negative perceptions.
Long-Term Sentiment Trends: Sustained sentiment trends, whether positive or negative, often mirror longer-term market cycles. Tracking sentiment trends over time can help identify shifts in investor psychology that could affect longer-term investments or sector rotations.
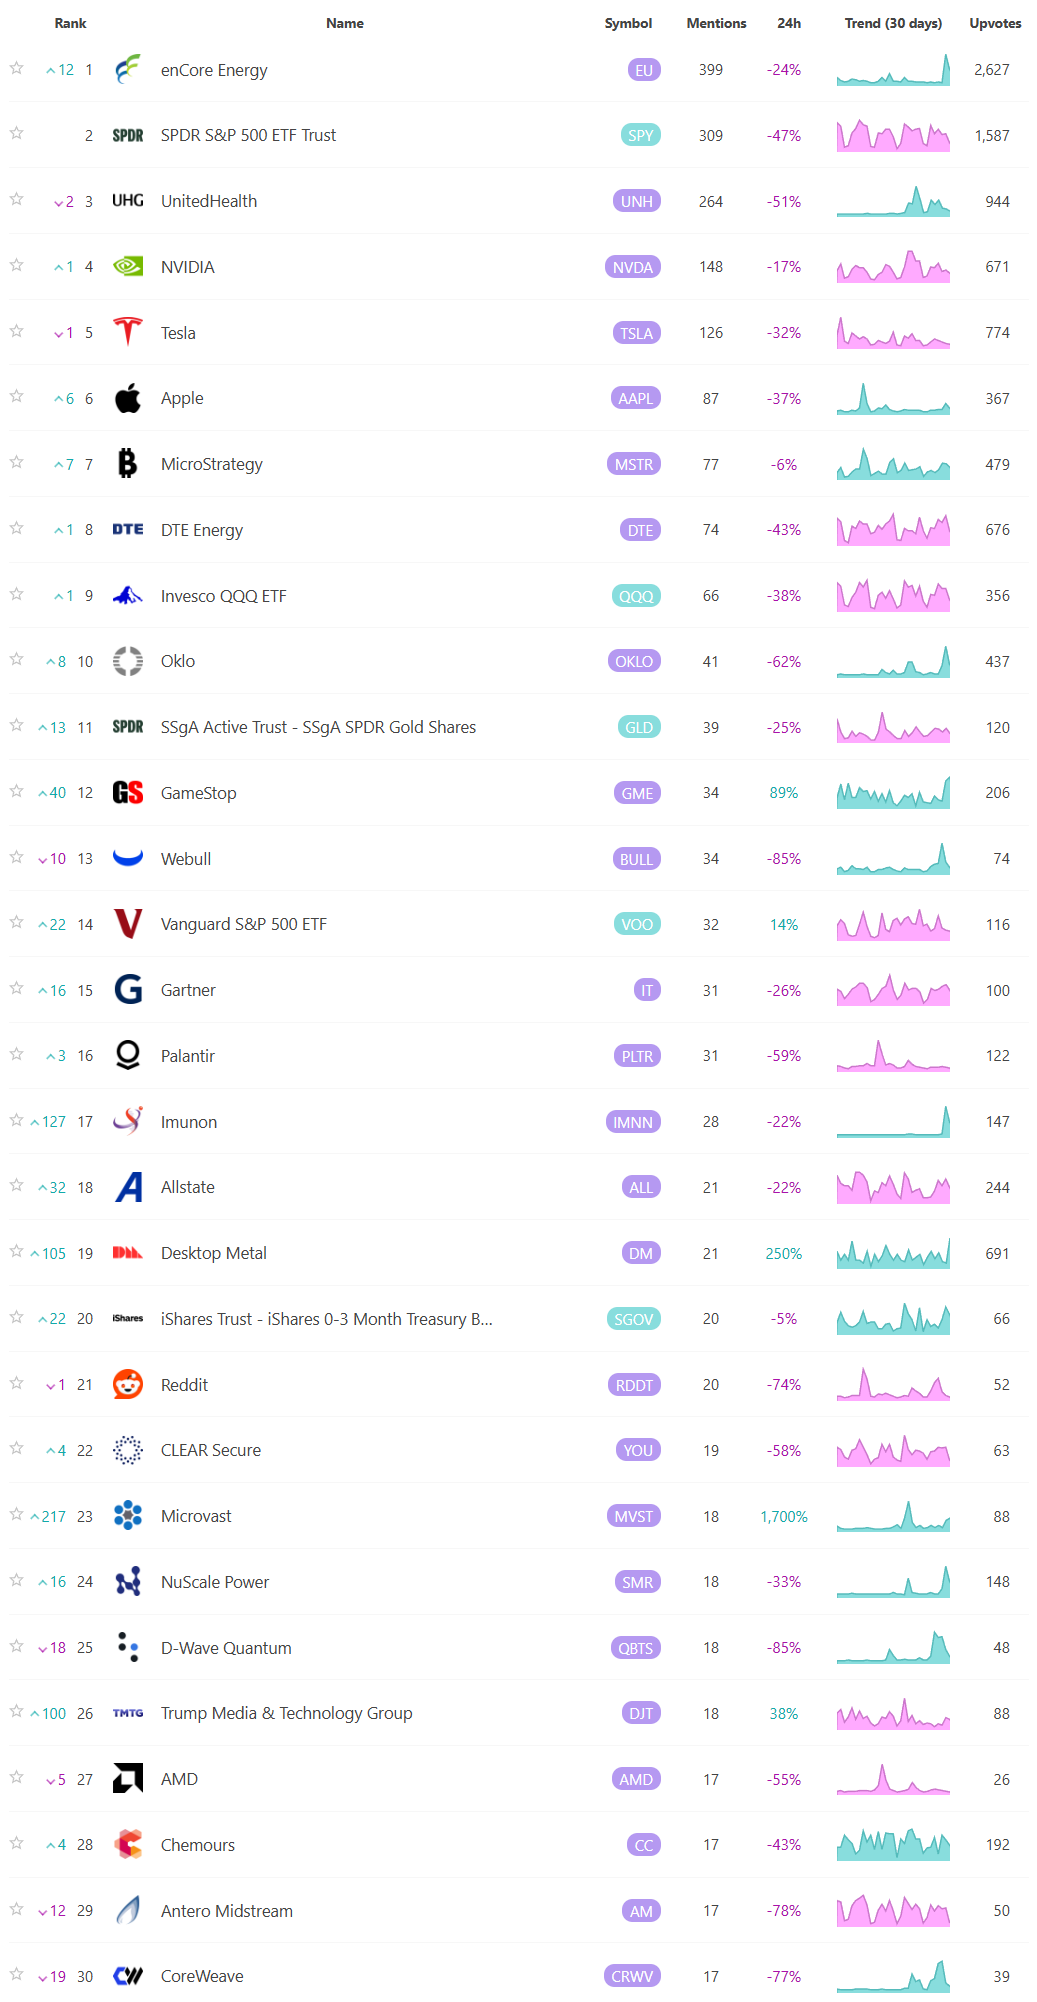
For these reasons, sentiment analysis, when combined with other tools, can provide a comprehensive view of both immediate market reactions and underlying investor attitudes, helping investors position themselves strategically across various time frames. Here are the most mentioned/discussed tickers on Reddit from some of the most active Subreddits for trading:
Institutional S/R Levels for Major Indices
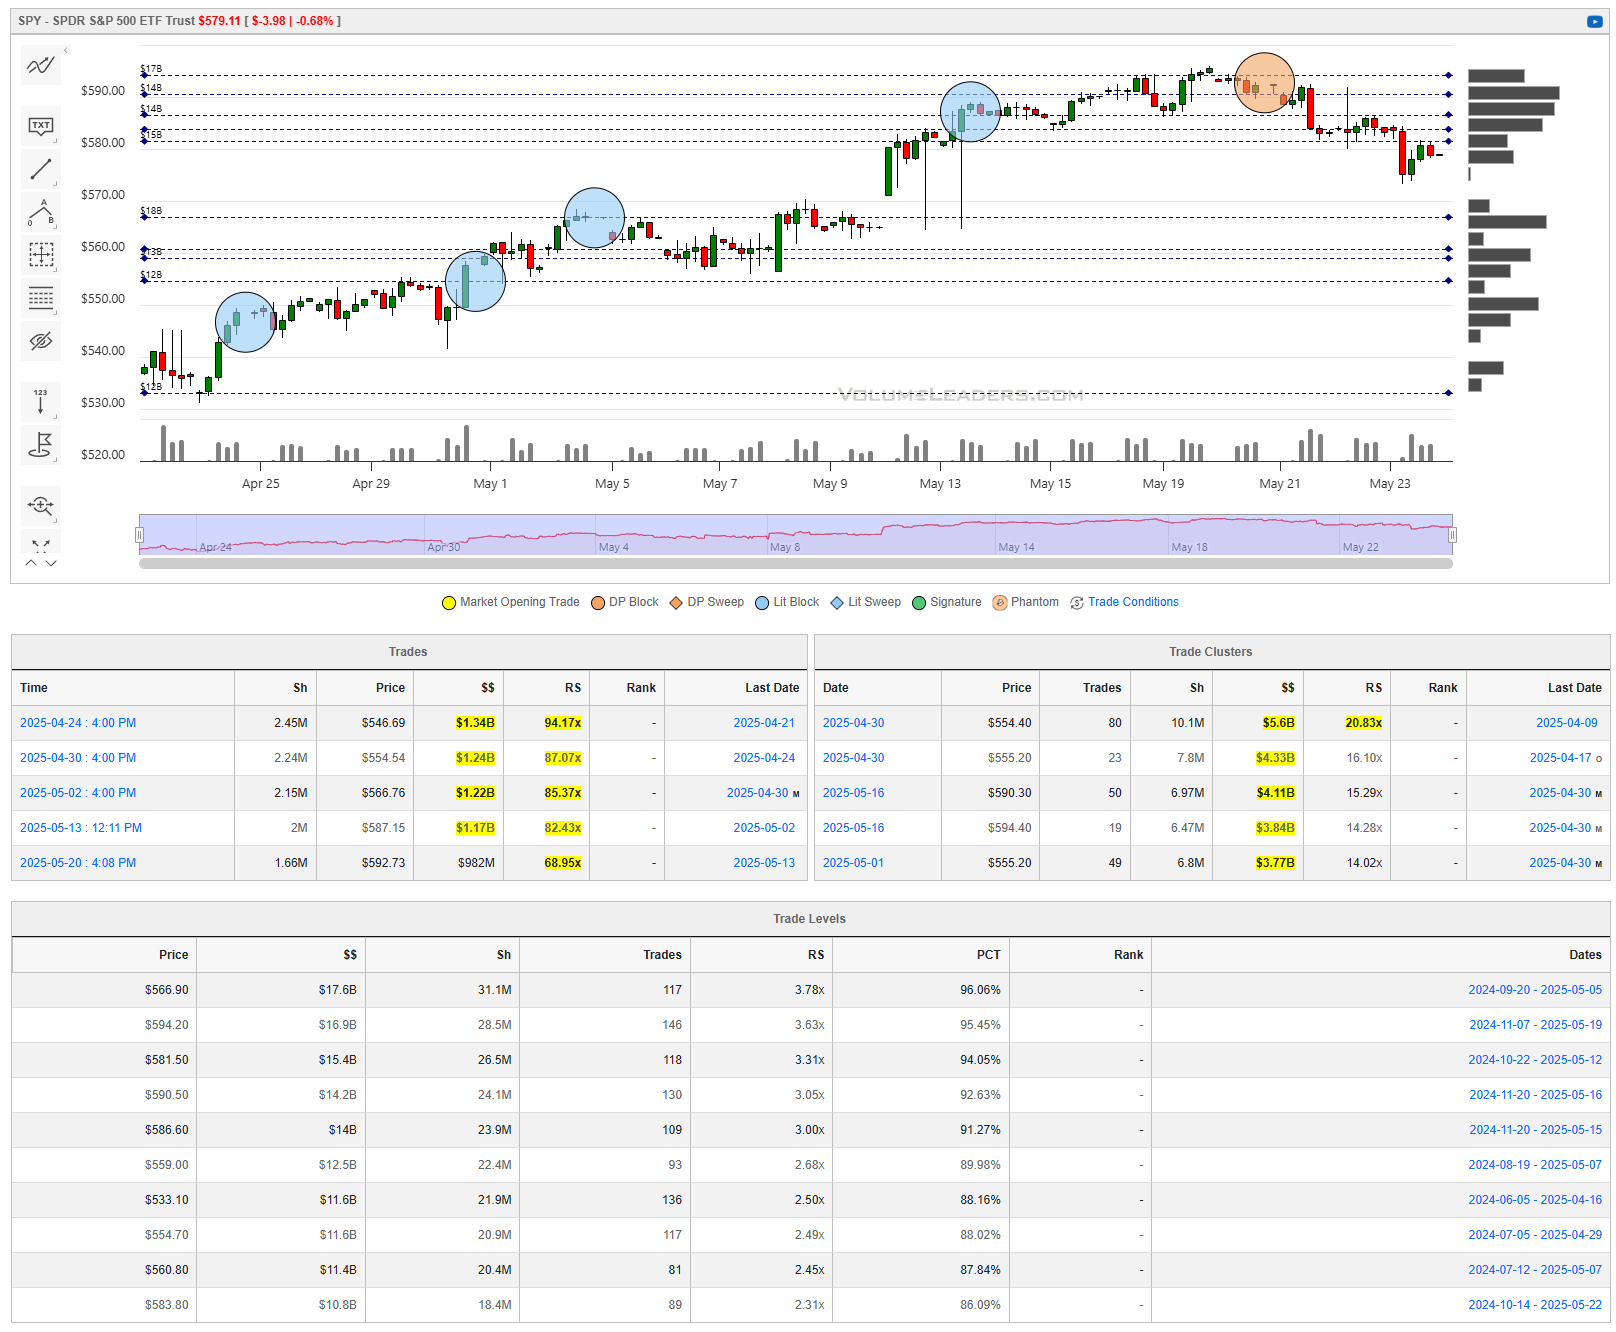
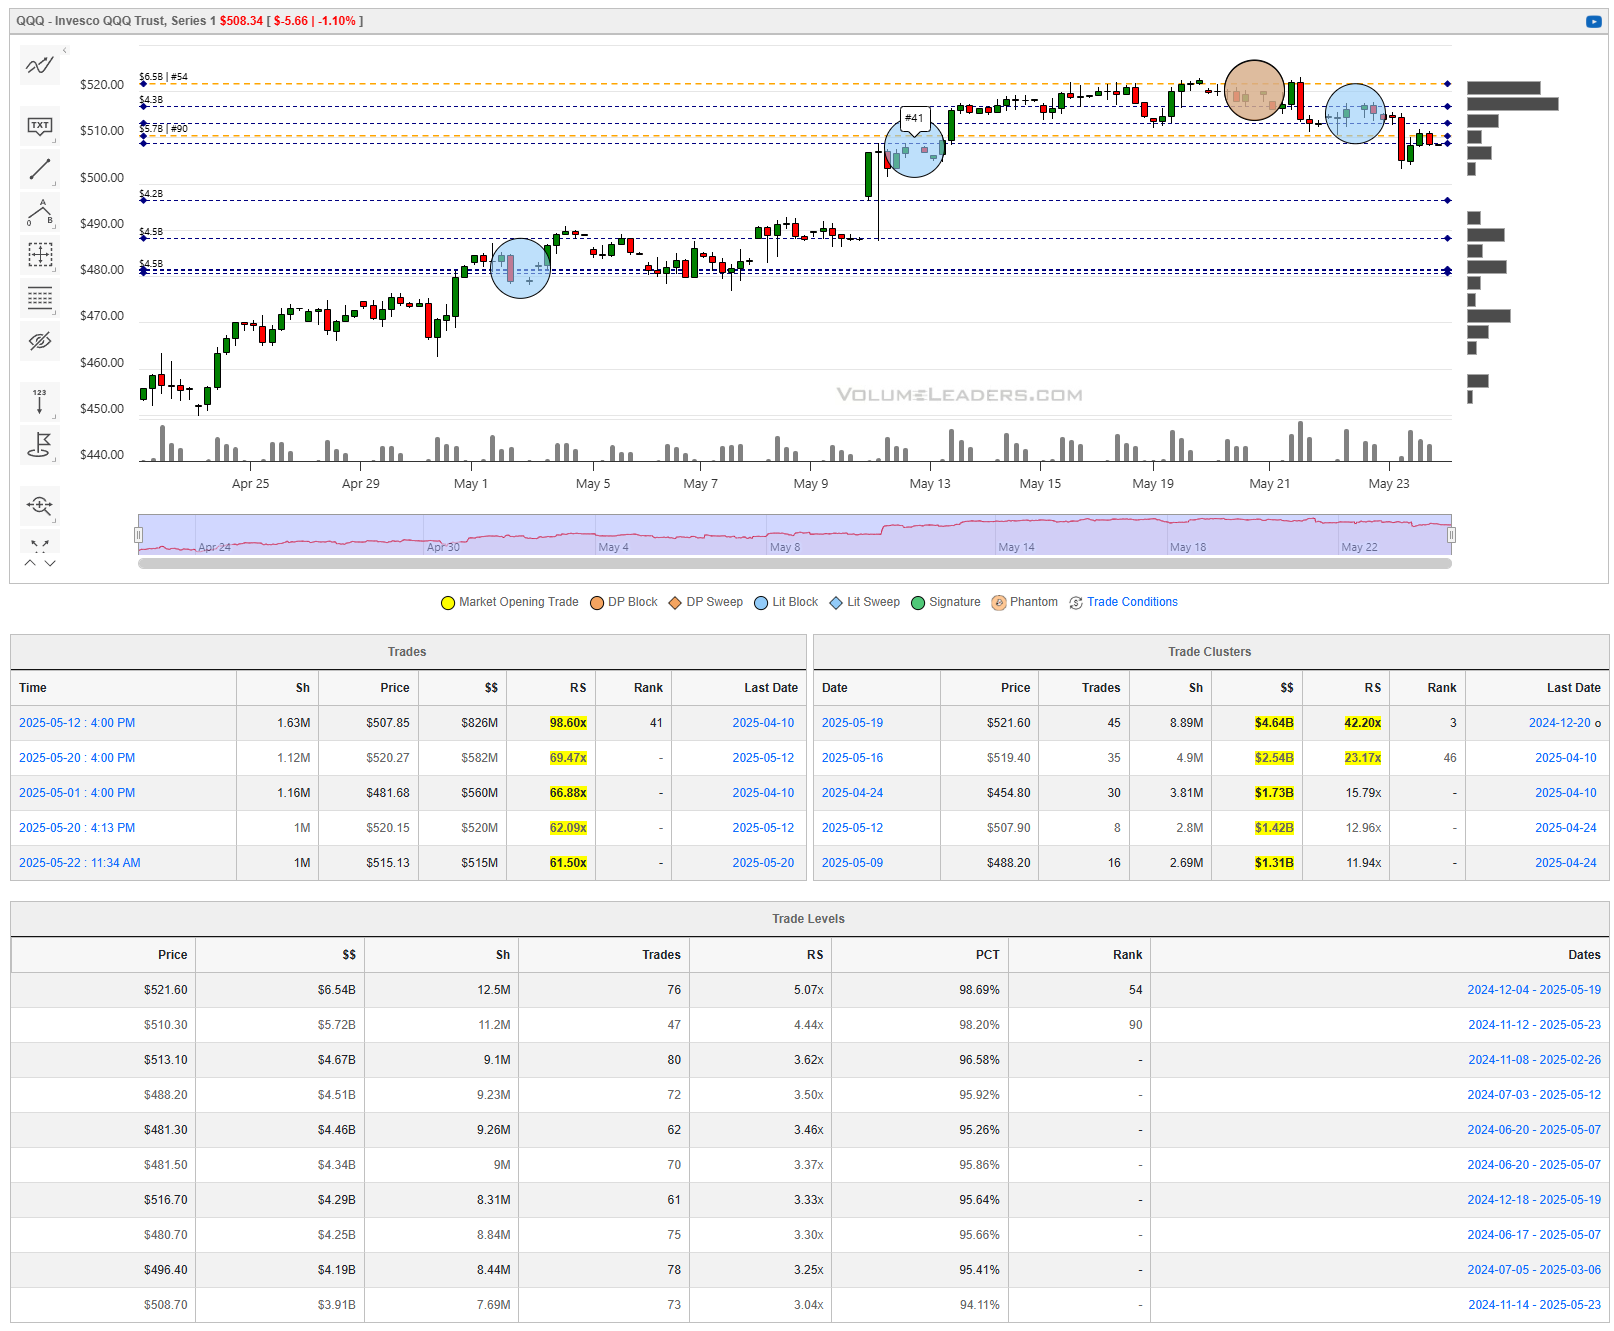
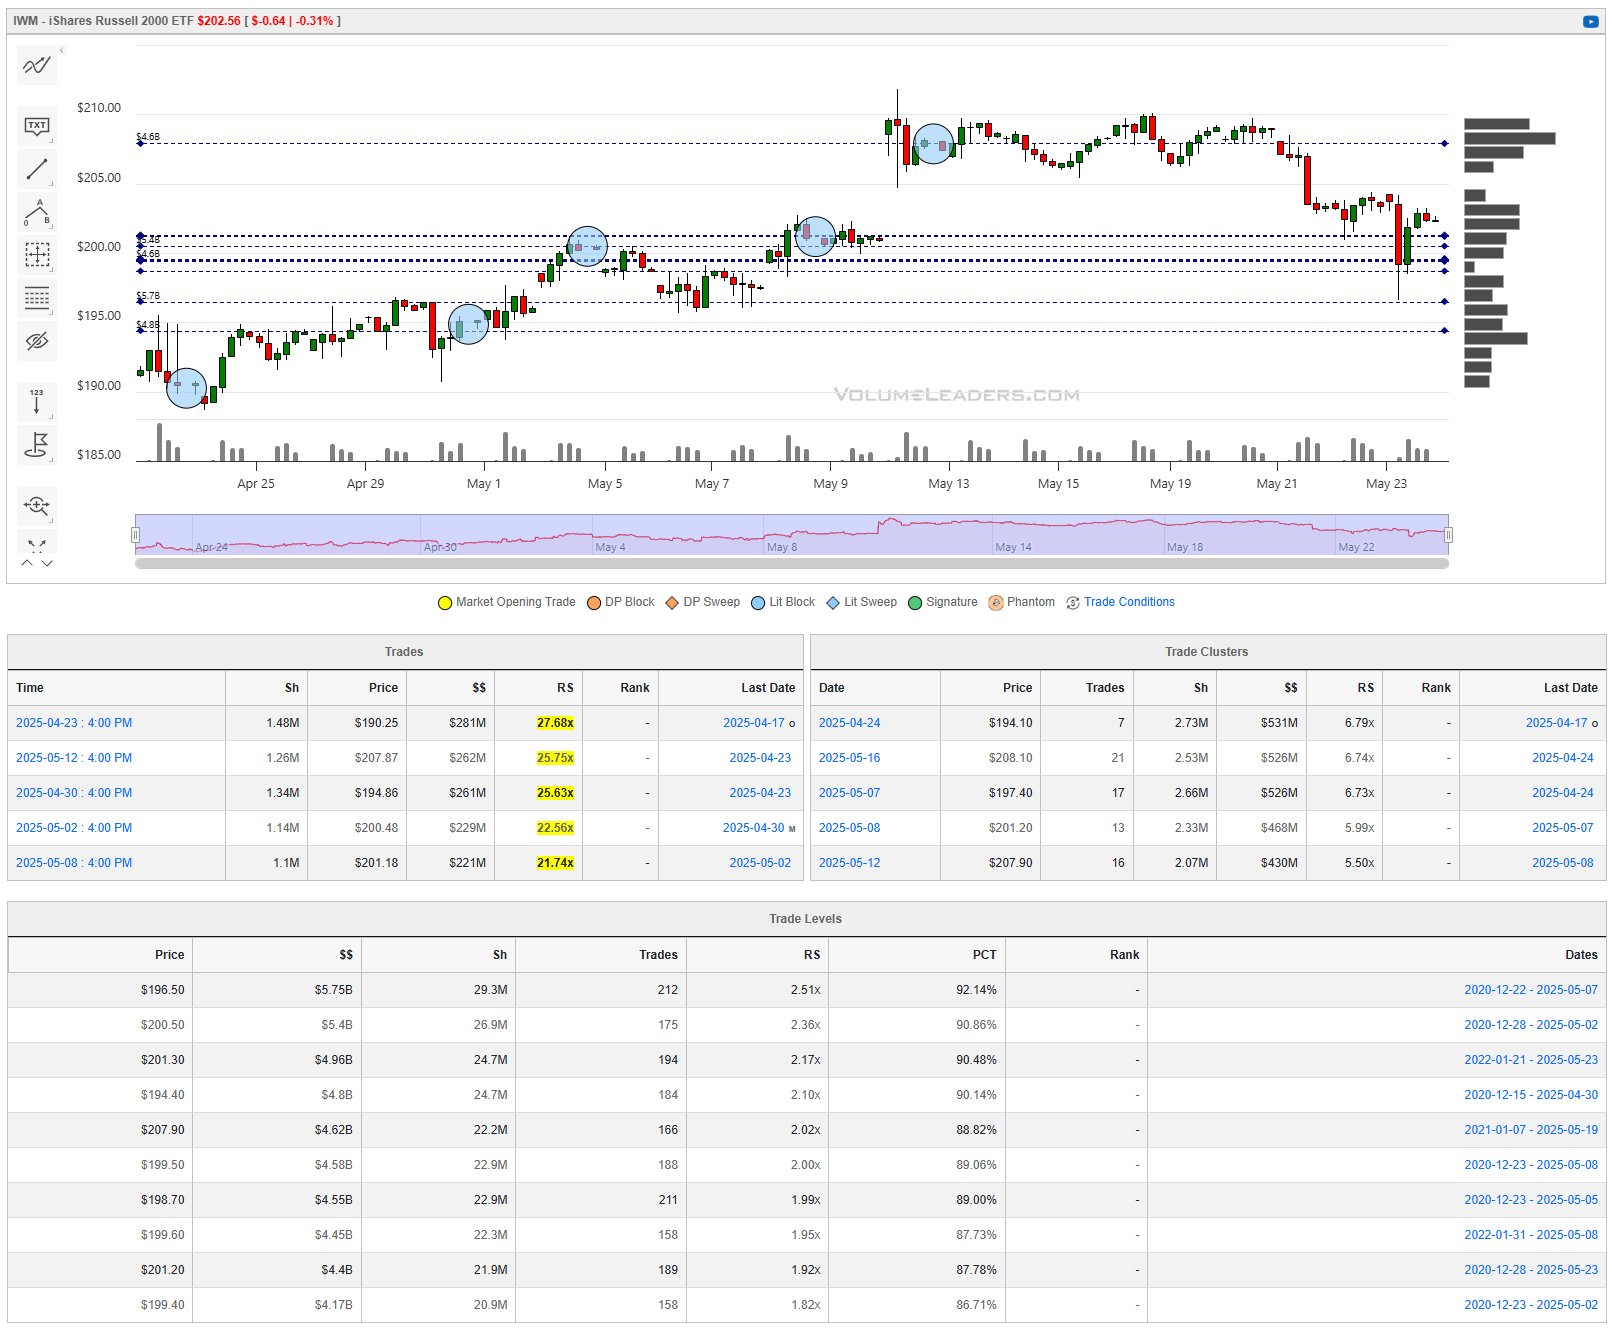
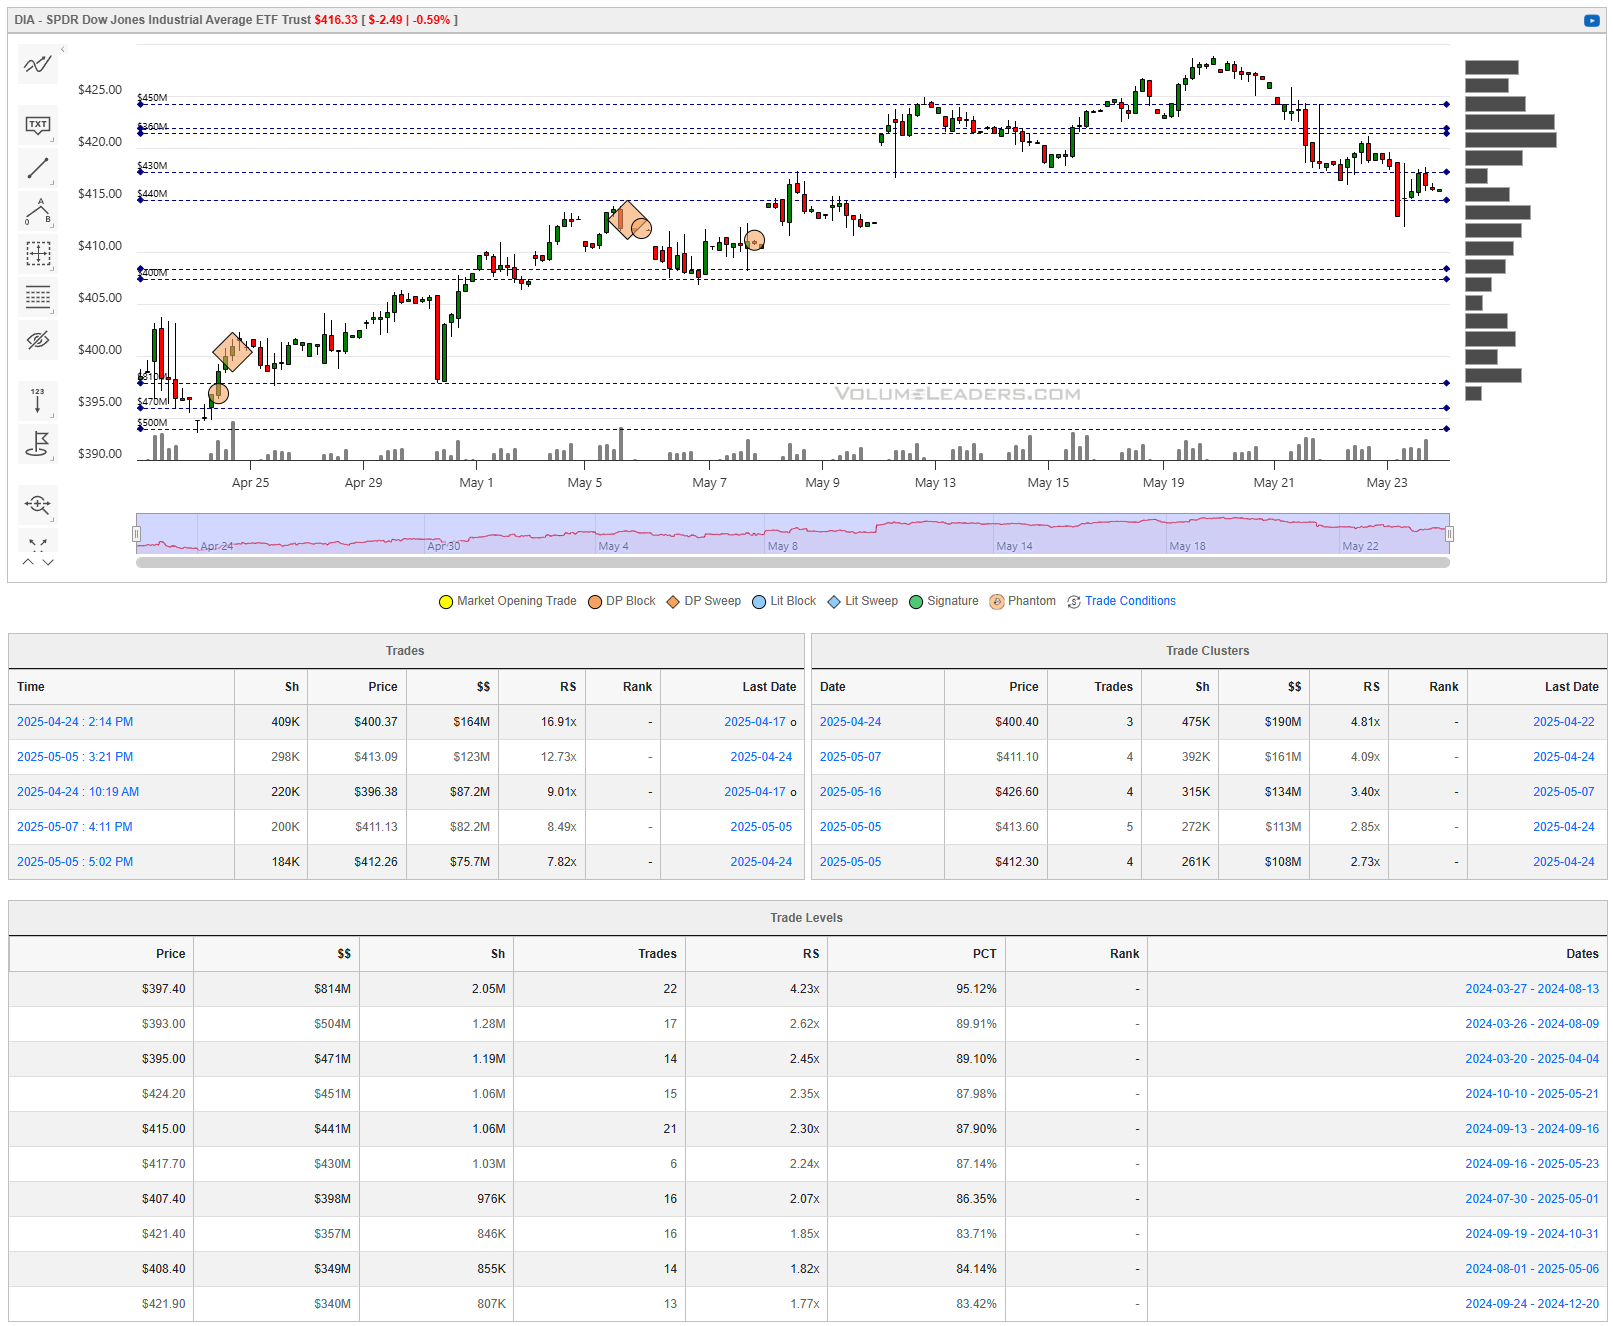
When you’re a large institutional player, your primary goal is to find liquidity - places to do a ton of business with the least amount of slippage possible. VolumeLeaders.com automatically identifies and visually plots the exact spots where institutions are doing business and where they are likely to return for more. It’s one of the primary reasons “support” and “resistance” concepts work and truly one of the reasons “price has memory” - take a look at the dashed lines in the images below that the platform plots for you automatically; these are the areas institutions constantly revisit to do more business.
Levels from the VolumeLeaders.com platform can help you formulate trades theses about:
Where to add or take profit
Where to de-risk or hedge
What strikes to target for options
Where to expect support or resistance
And this is just a small sample; there are countless ways to leverage this information into trades that express your views on the market. The platform covers thousands of tickers on multiple timeframes to accommodate all types of traders.
SPY
QQQ
IWM
DIA
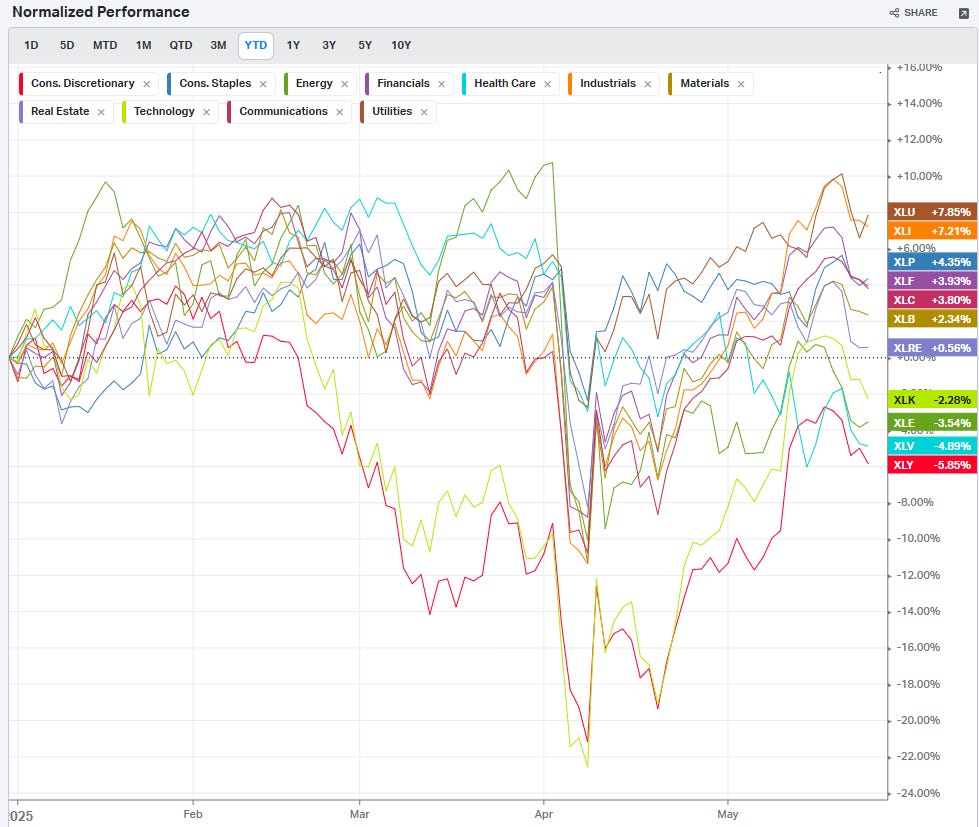
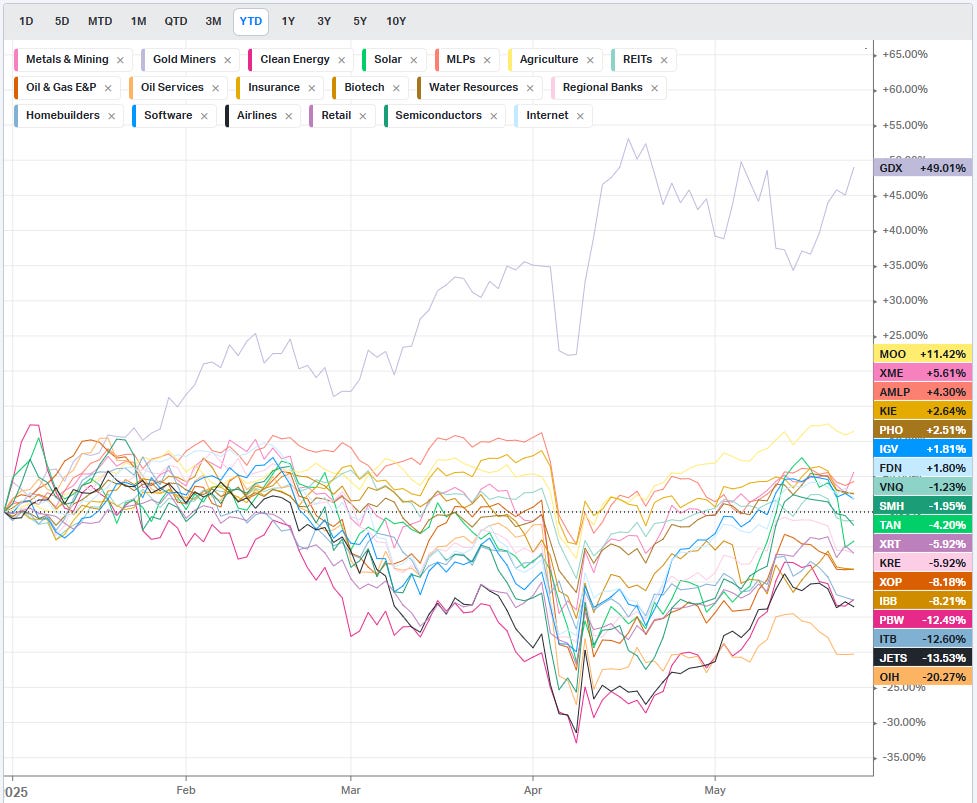
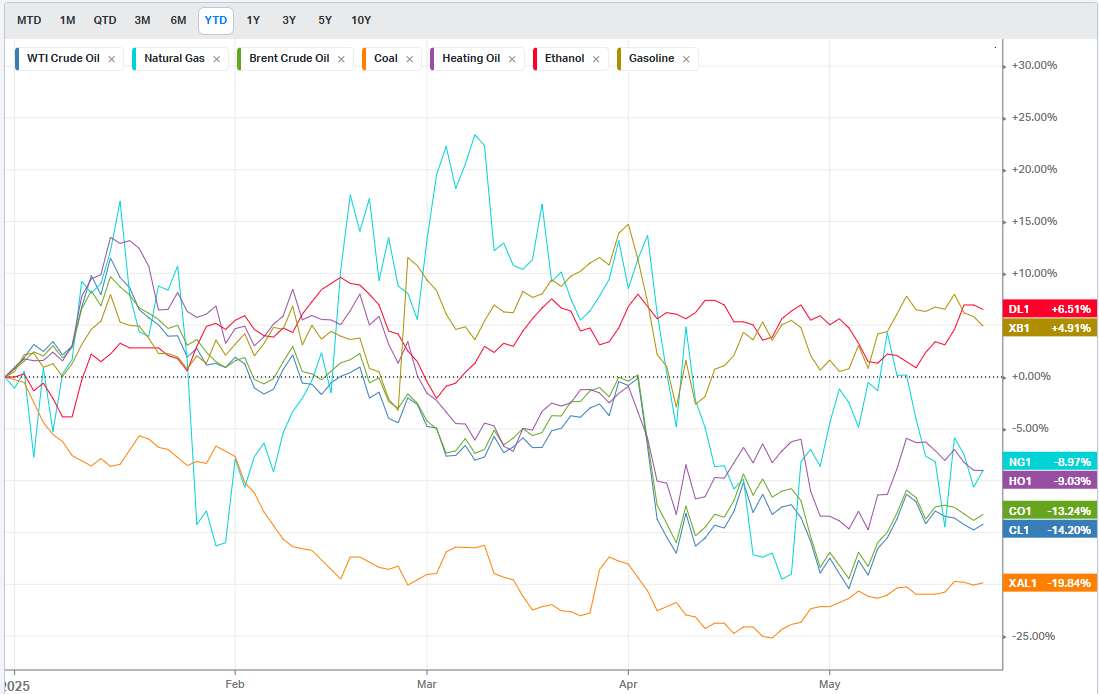
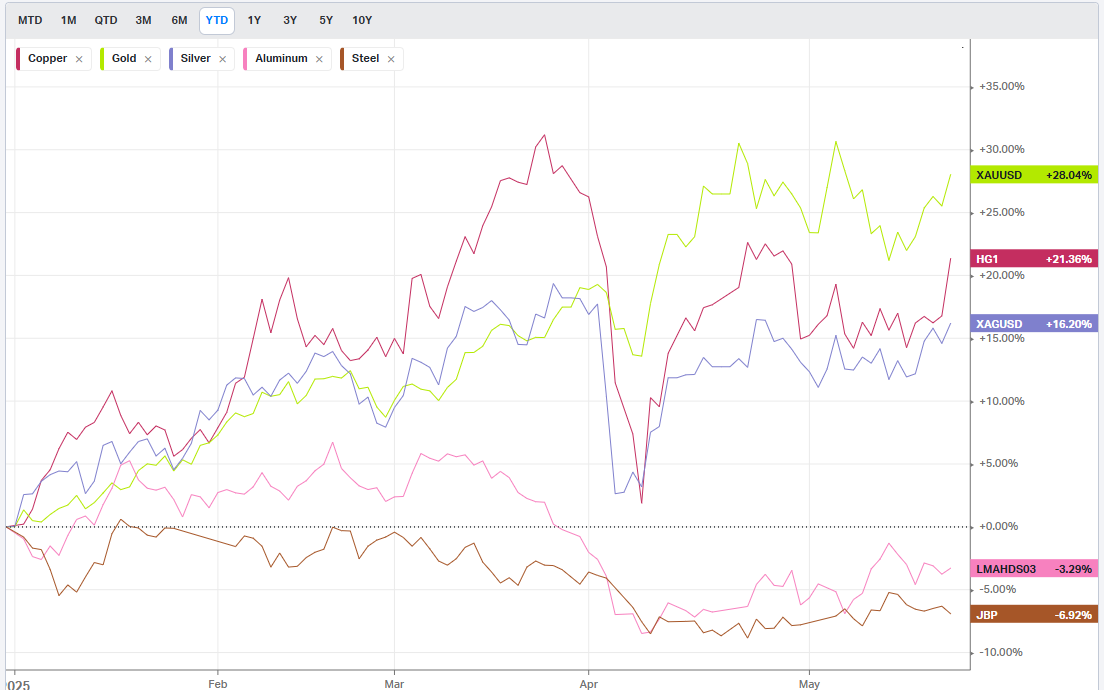
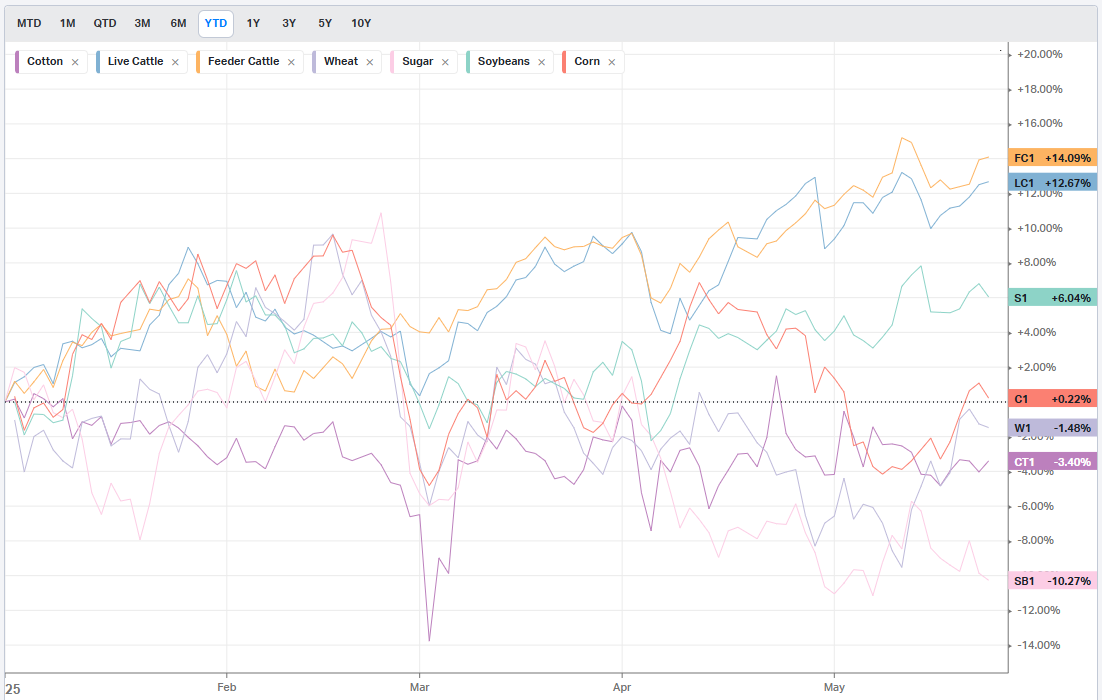
Summary Of Thematic Performance YTD
VolumeLeaders.com offers a robust set of pre-built thematic filters, allowing you to instantly explore specific market segments. These performance snapshots are provided purely for context and inspiration—think about zeroing in on the leaders and laggards within the strongest and weakest sectors, for example.
S&P By Sector
S&P By Industry
Commodities: Energy
Commodities: Metals
Commodities: Agriculture
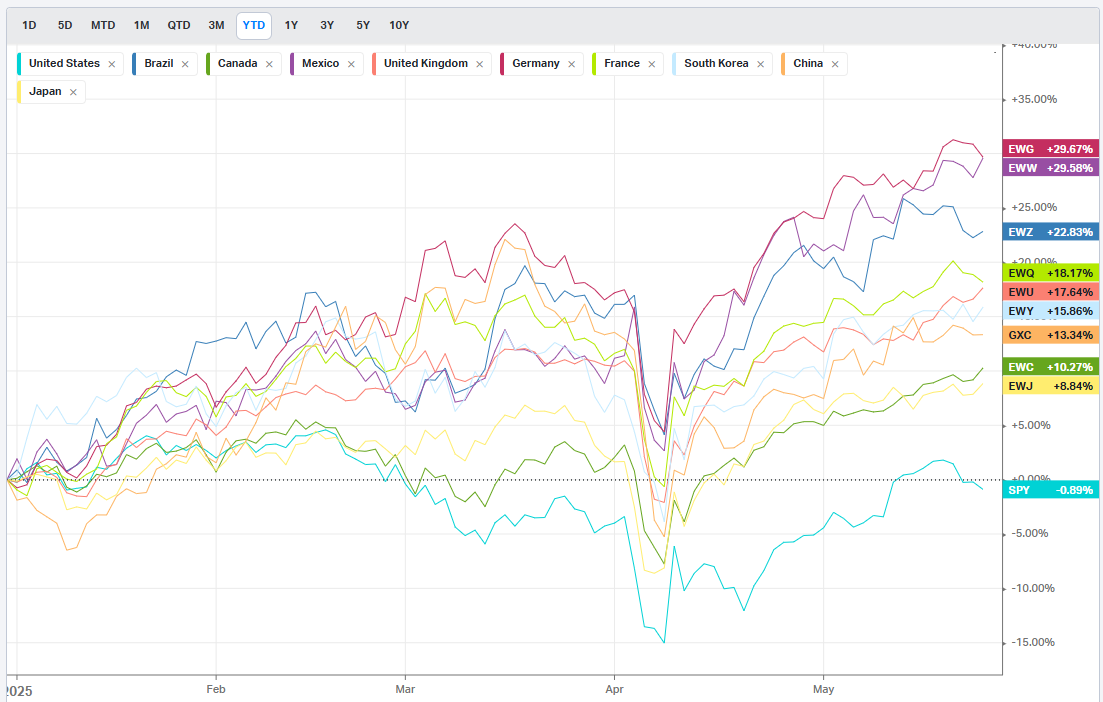
Country ETFs
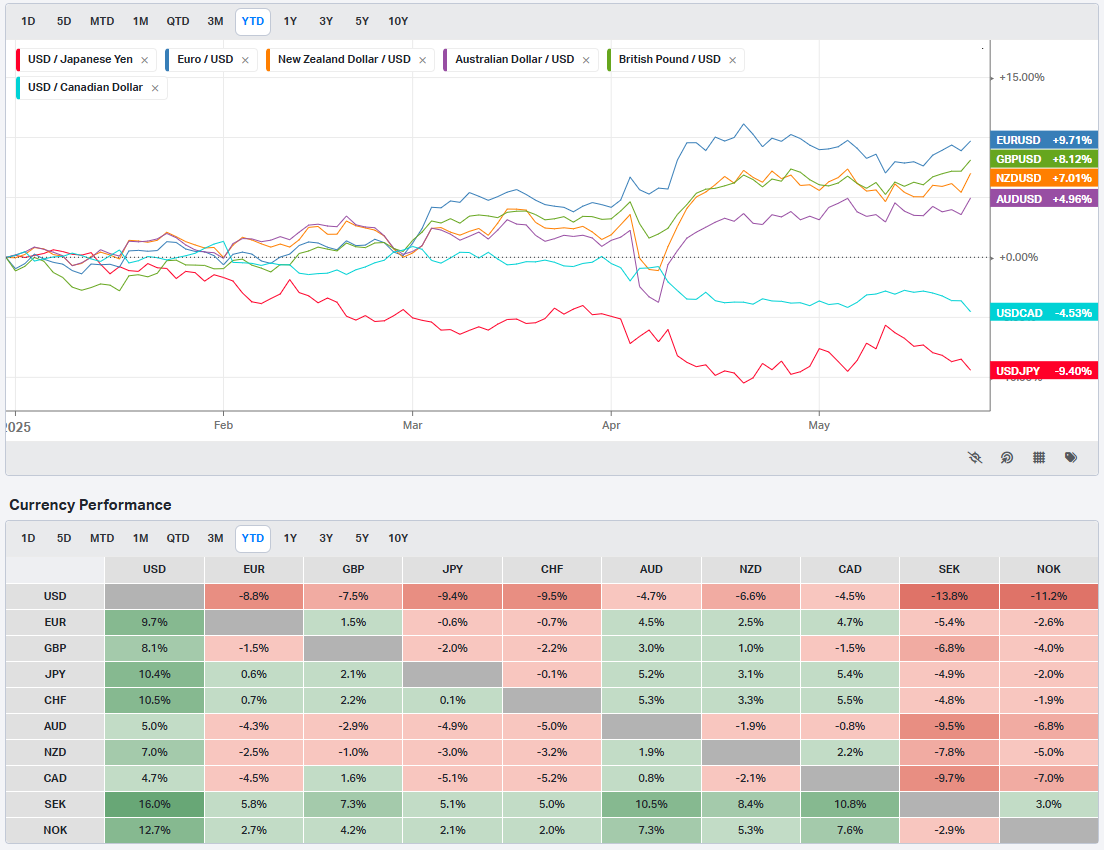
Currencies
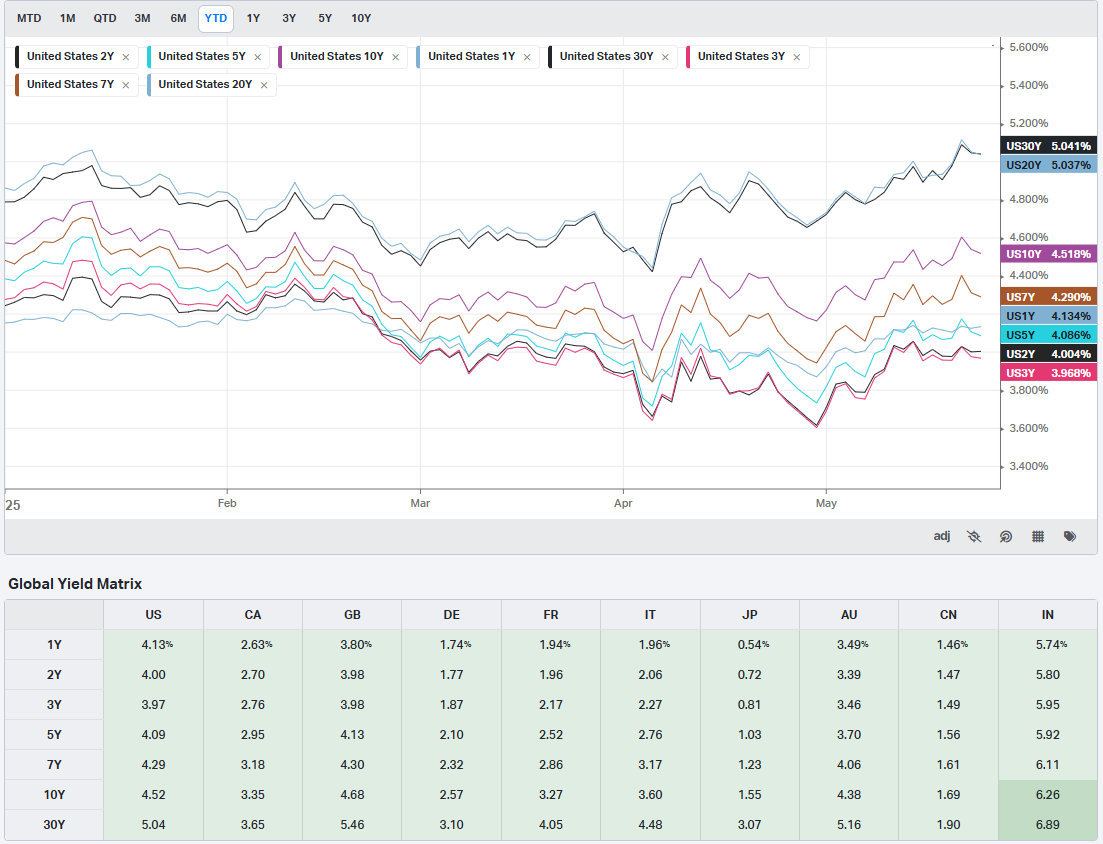
Global Yields
Factors: Style
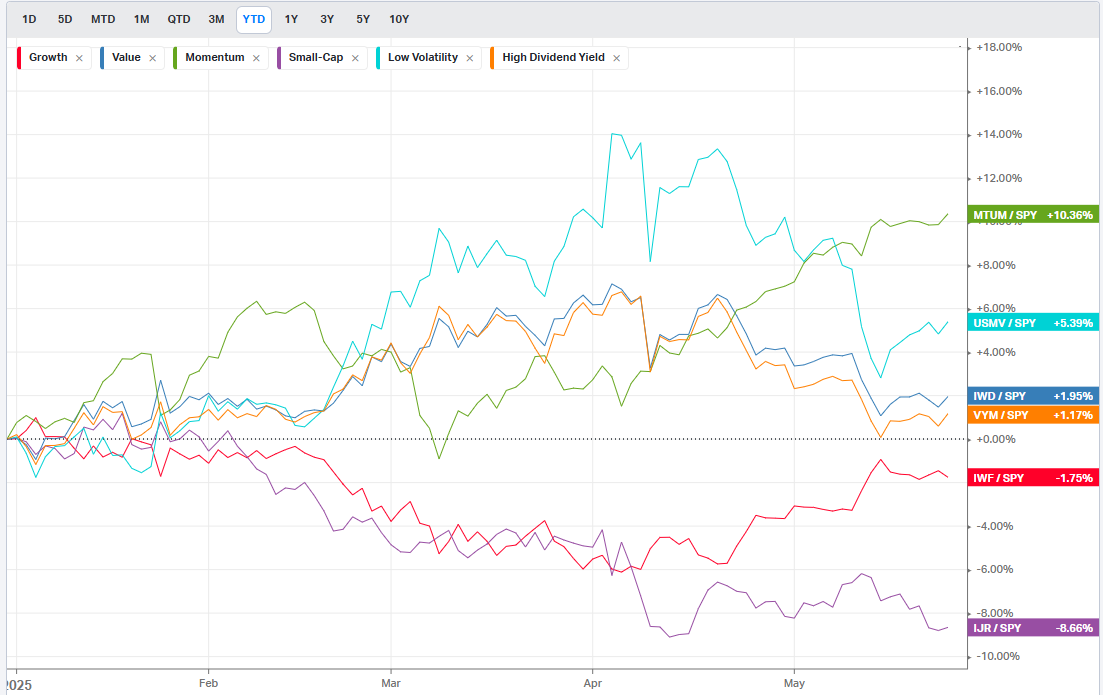
Factors: Size vs Value
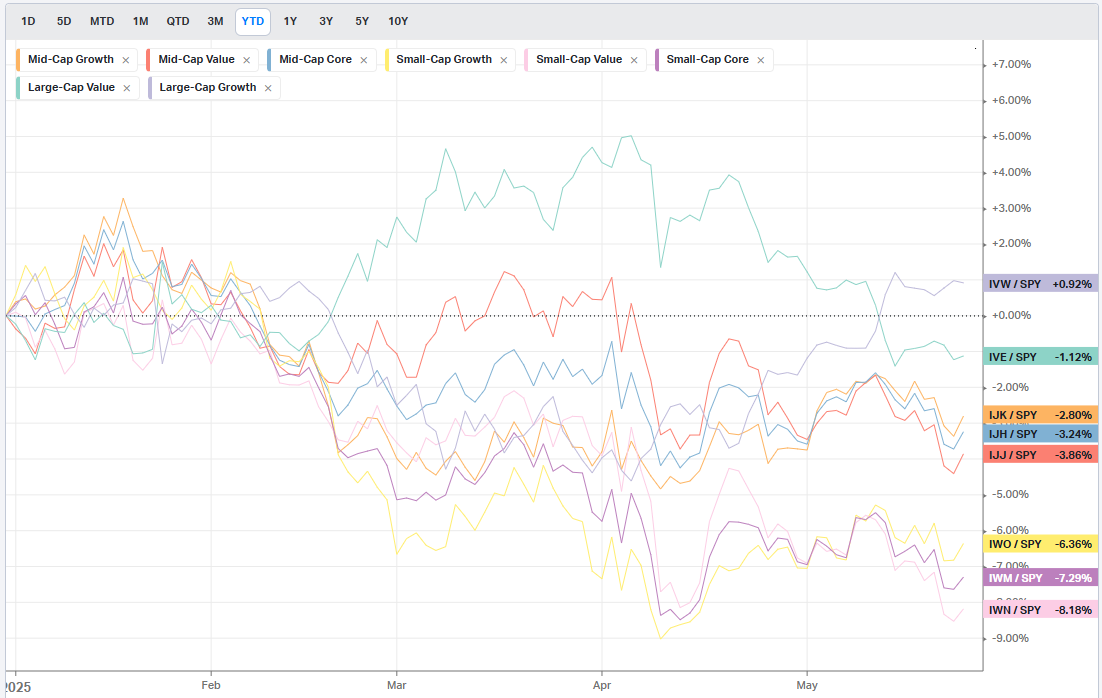
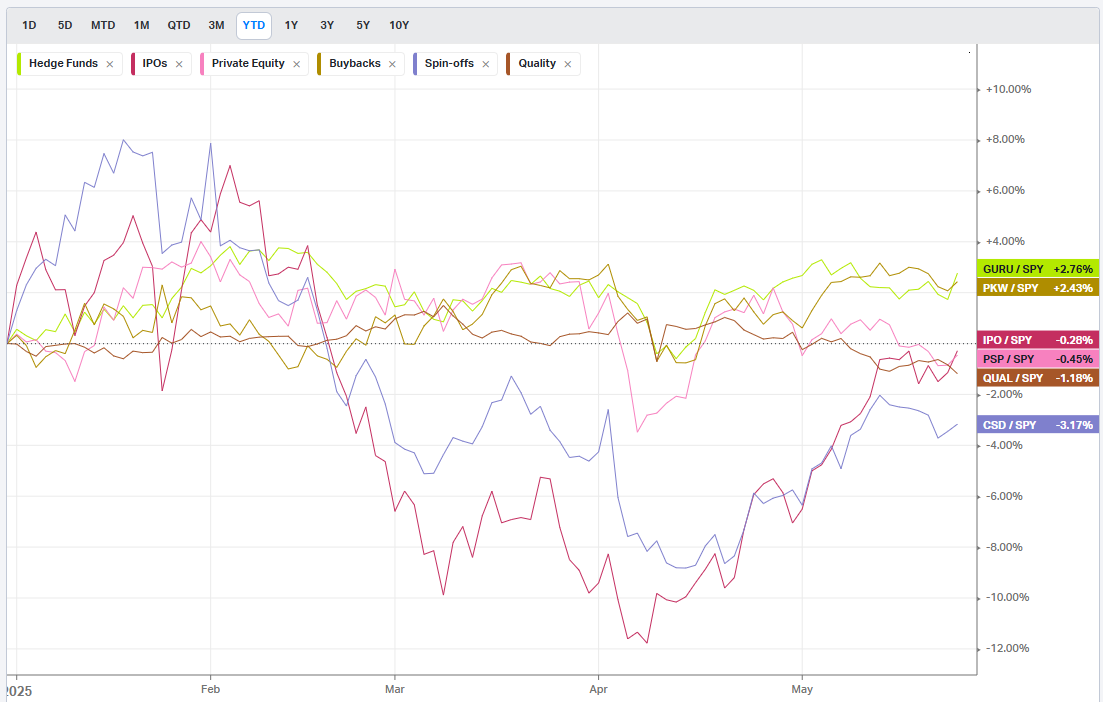
Factors: Qualitative
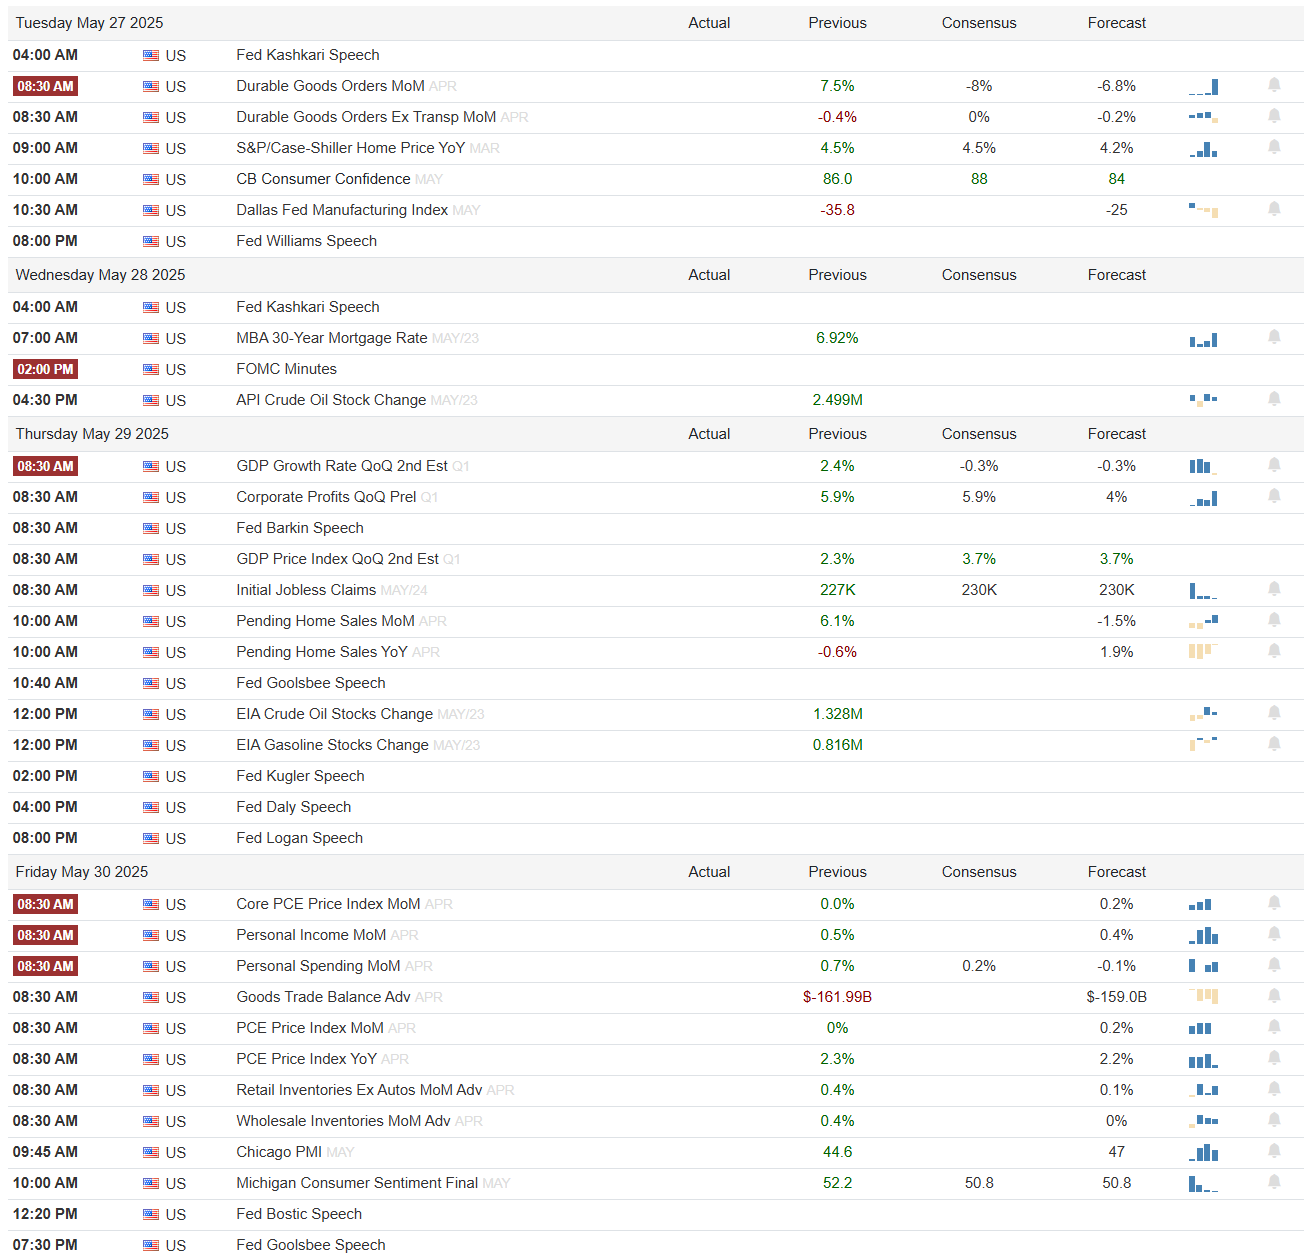
Events On Deck This Week
Here are key events happening this week that have the potential to cause outsized moves in the market or heightened short-term volatility.
Econ Events By Day of Week
Anticipated Earnings By Day of Week


Institutional Order Flow Intelligence Report
🎯 Critical Findings
MASSIVE INTERNATIONAL REPOSITIONING: The data reveals significant institutional activity with IAGG showing 261x normal volume and $1.6B in trades, signaling major USD hedging or anticipation of international rate cuts.
MULTI-FACTOR SIGNIFICANCE LEADERS:
IAGG 0.00%↑ (85.5 pts) - International bond mega-positioning
THRO 0.00%↑ (84.9 pts) - Core equity rotation with 21 trades
IBIT 0.00%↑ (82.0 pts) - Bitcoin corporate treasury acceleration
BULL/BEAR SENTIMENT: Strong 6.85:1 ratio favoring bull positions, but sophisticated hedging in TSLA 0.00%↑ and NVDA 0.00%↑ suggests risk management around momentum names.
📊 Statistical Insights
Total Volume: $28B across 611 trades (307 unique tickers)
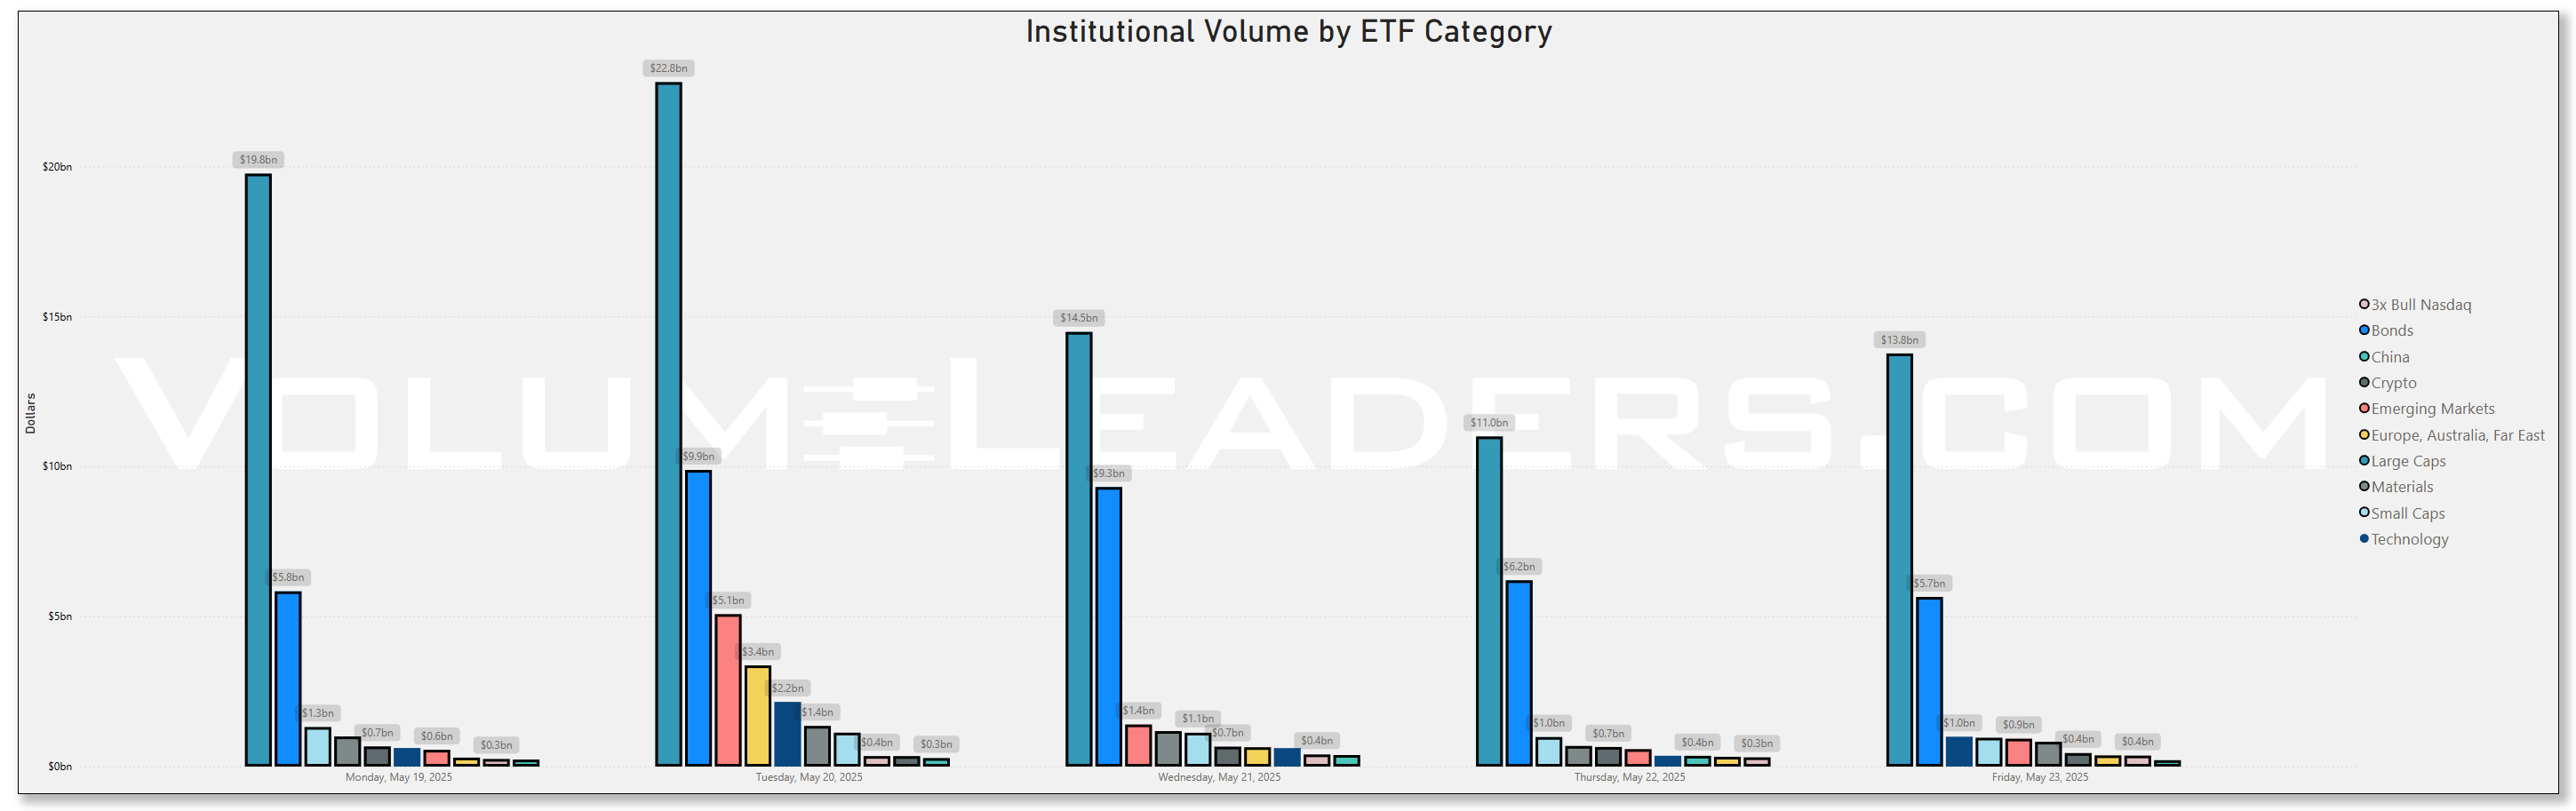
Peak Day: May 20 with $13.8B (49% of weekly volume)
Extreme Activity: 15 trades showing 100x+ normal volume
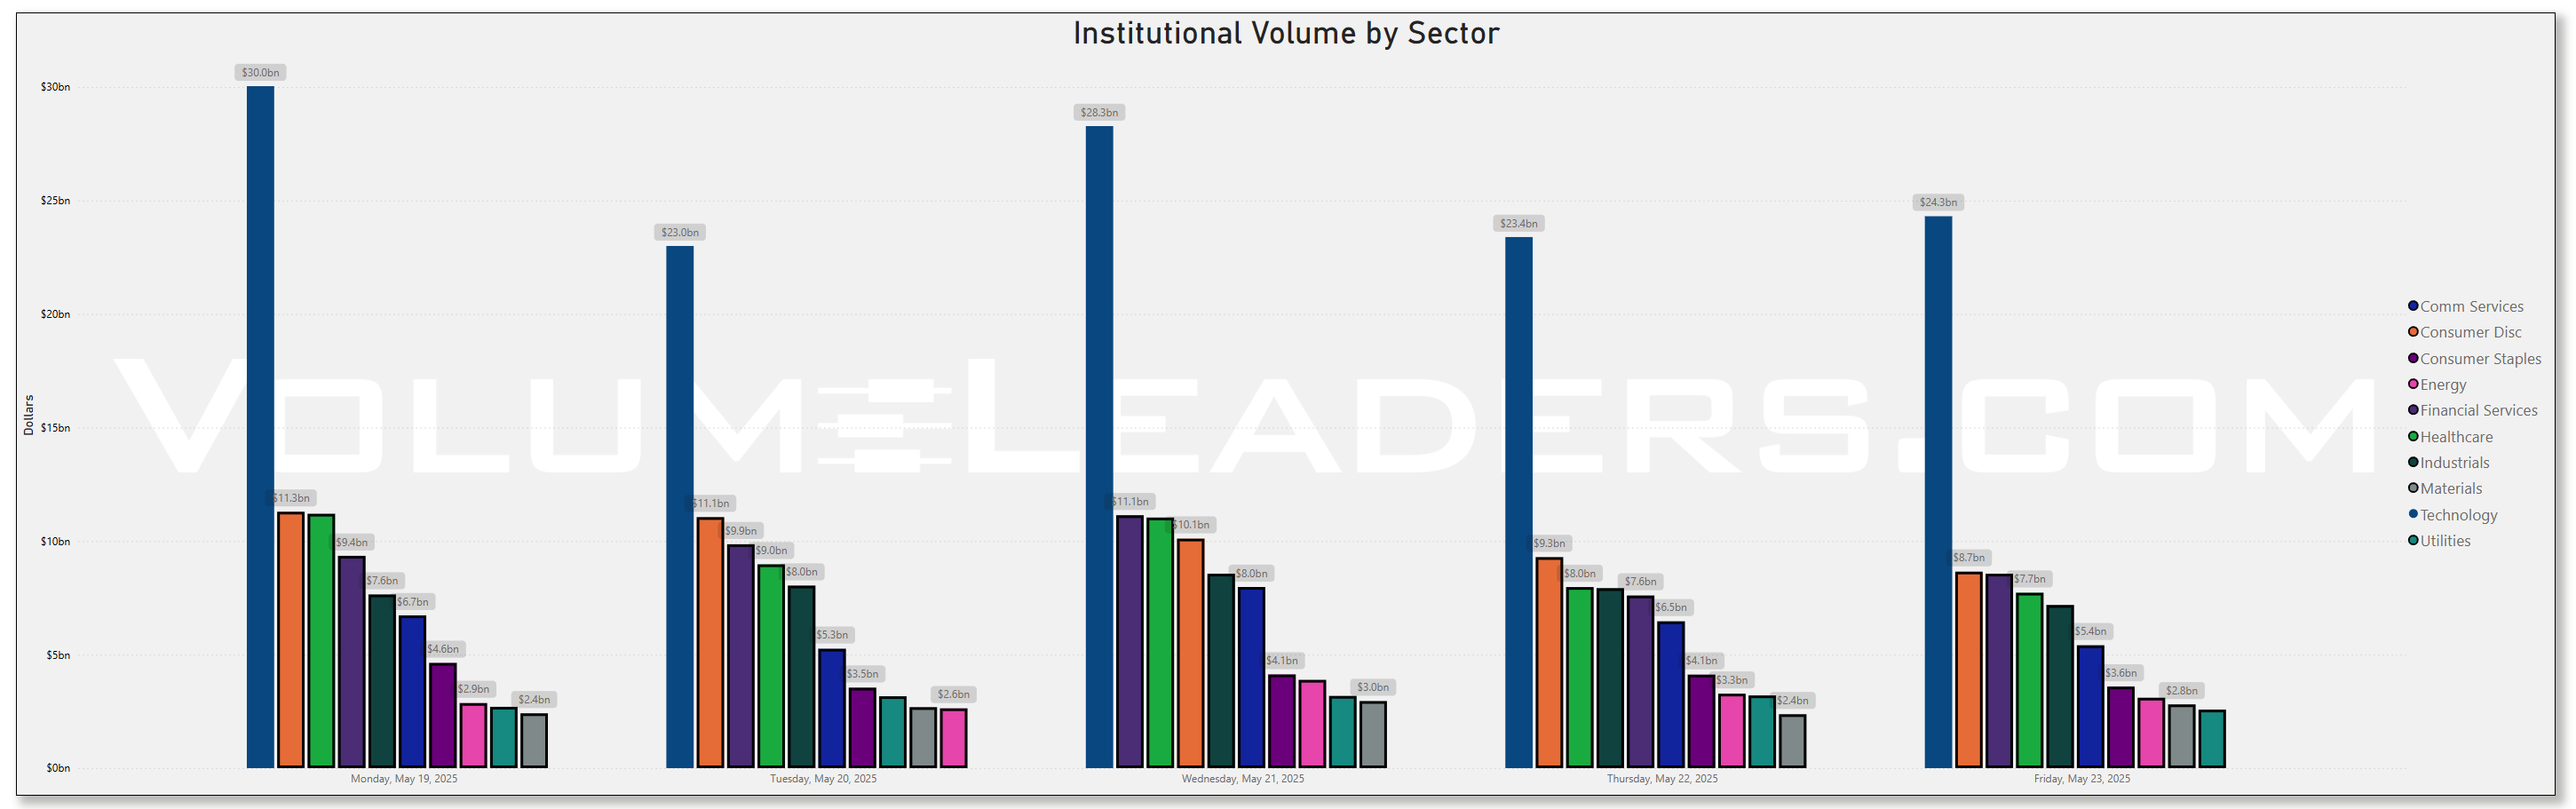
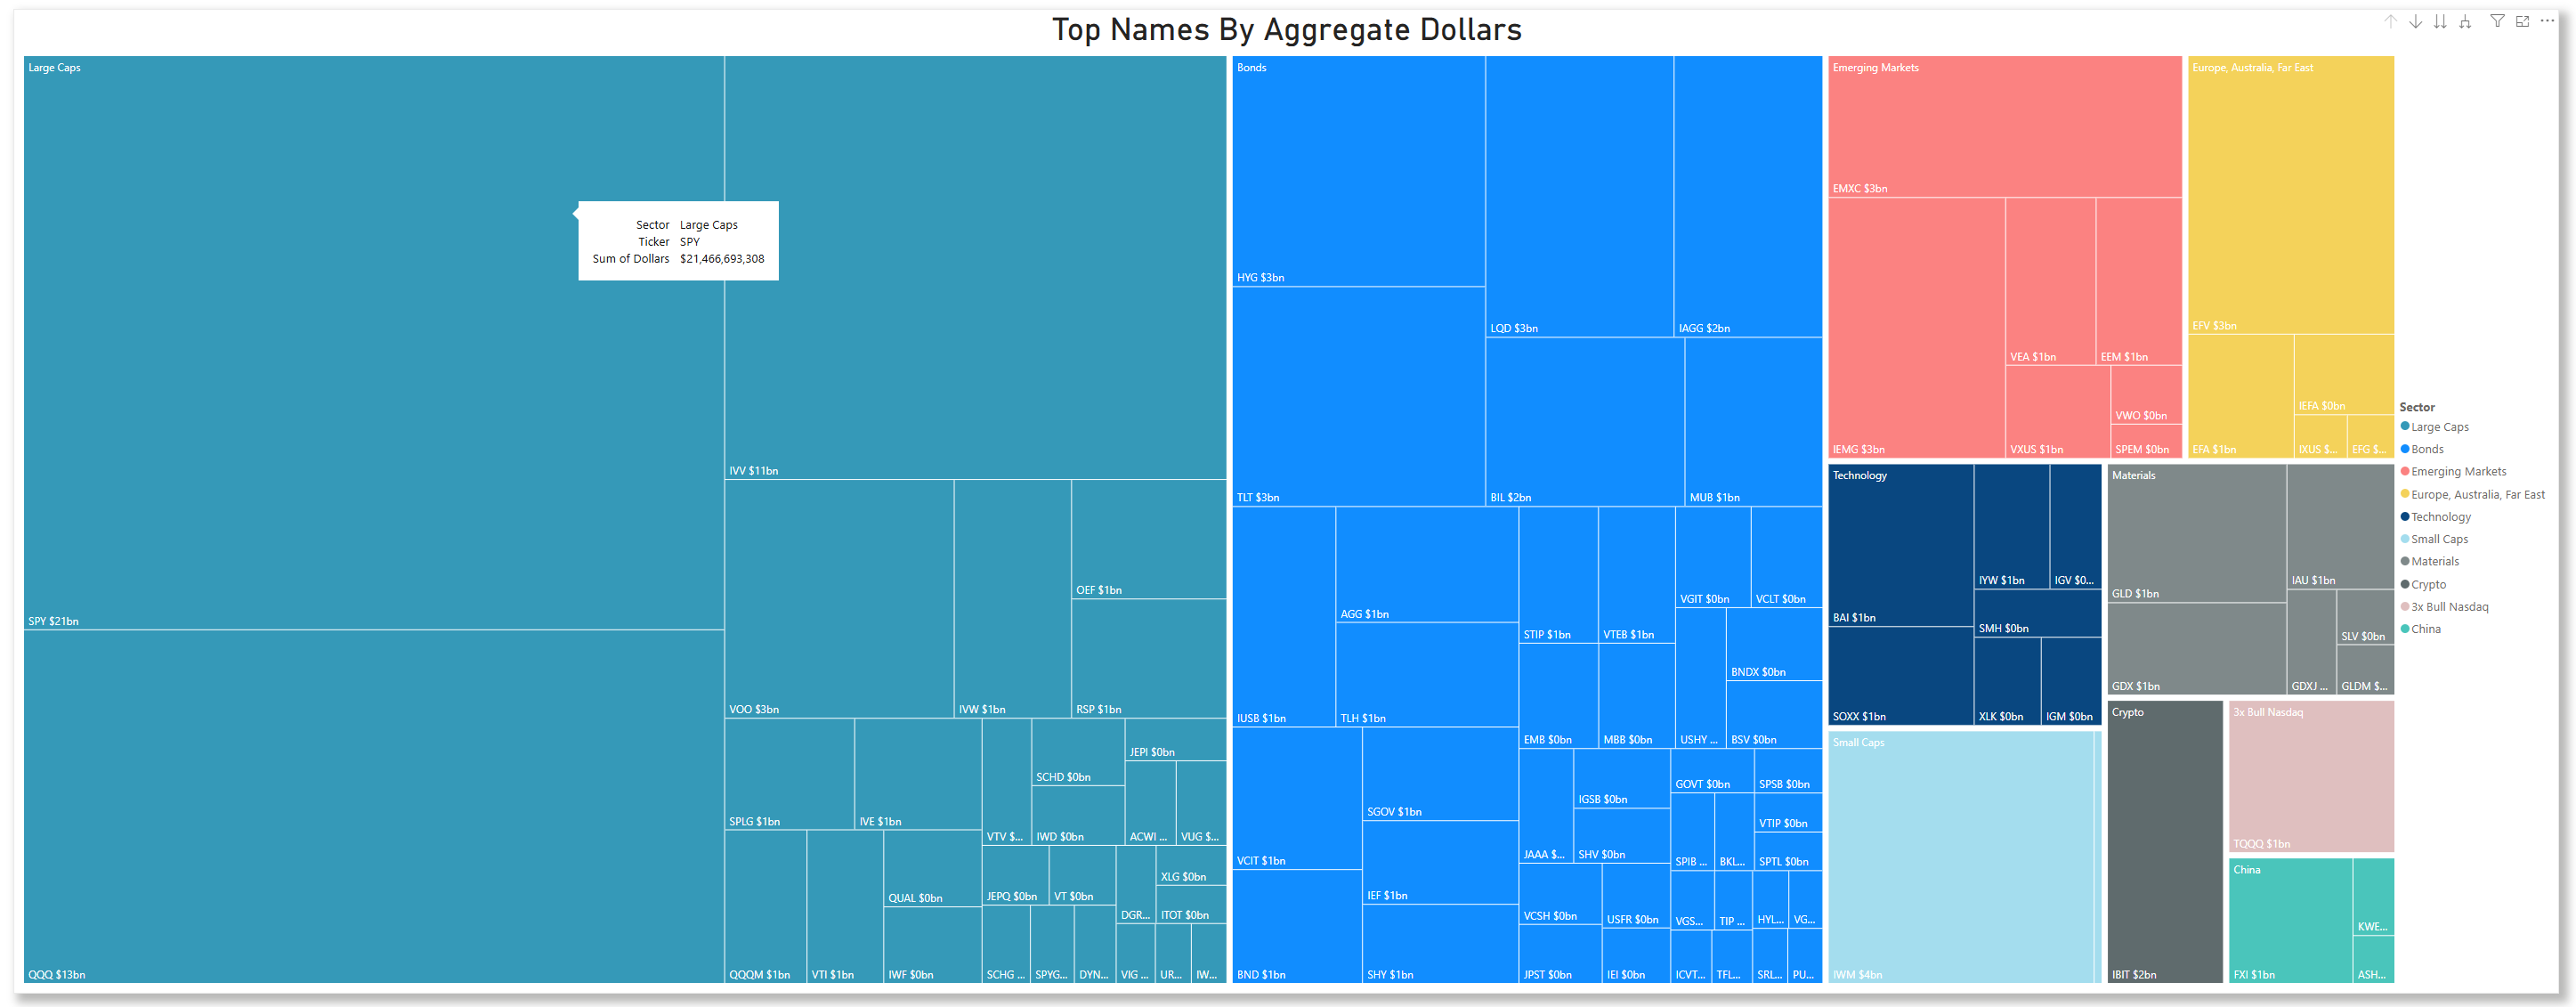
Sector Leaders: Technology ($4.5B), Bonds ($3.8B), Healthcare ($2.9B)
🚨 Key Actionable Intelligence
Immediate Catalysts:
JWN privatization completed on the 20th at $24.25/share. A buyer group composed of the Nordstrom family (forming Norse Holdings) and the Mexican retail group, El Puerto de Liverpool.UNH institutional accumulation despite -36% YTD decline
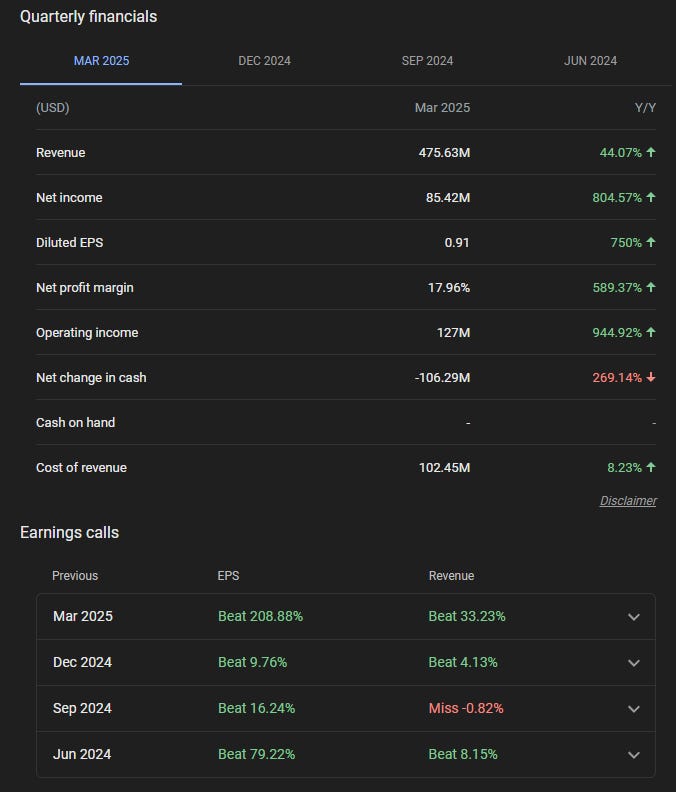
PEGA validation following 44% revenue growth. Pega is a platform for workflow automation and generative AI-powered decisioning for businesses.

Strategic Themes:
International diversification via European ETFs
Healthcare contrarian plays on regulatory resolution
AI infrastructure validation in enterprise platforms
Retail consolidation wave following M&A success
The analysis reveals institutions are positioning for major macroeconomic shifts, with particular focus on Fed/ECB policy divergence, sector rotation from growth to value, and geographic rebalancing away from USD dominance. See below for full details.
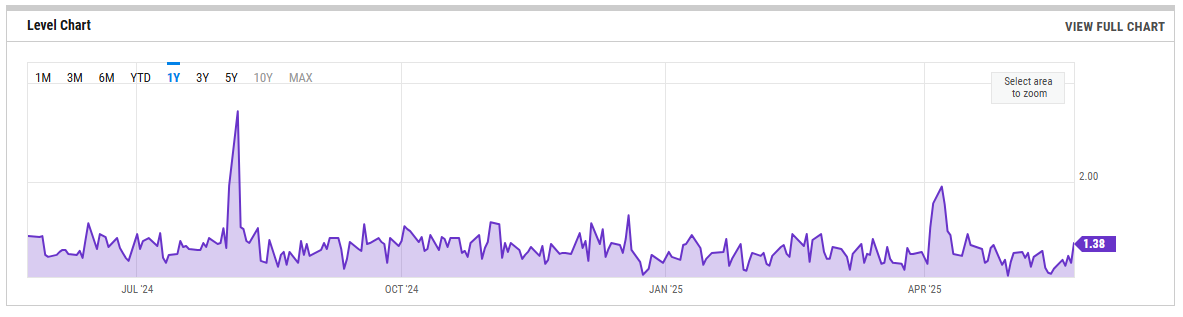
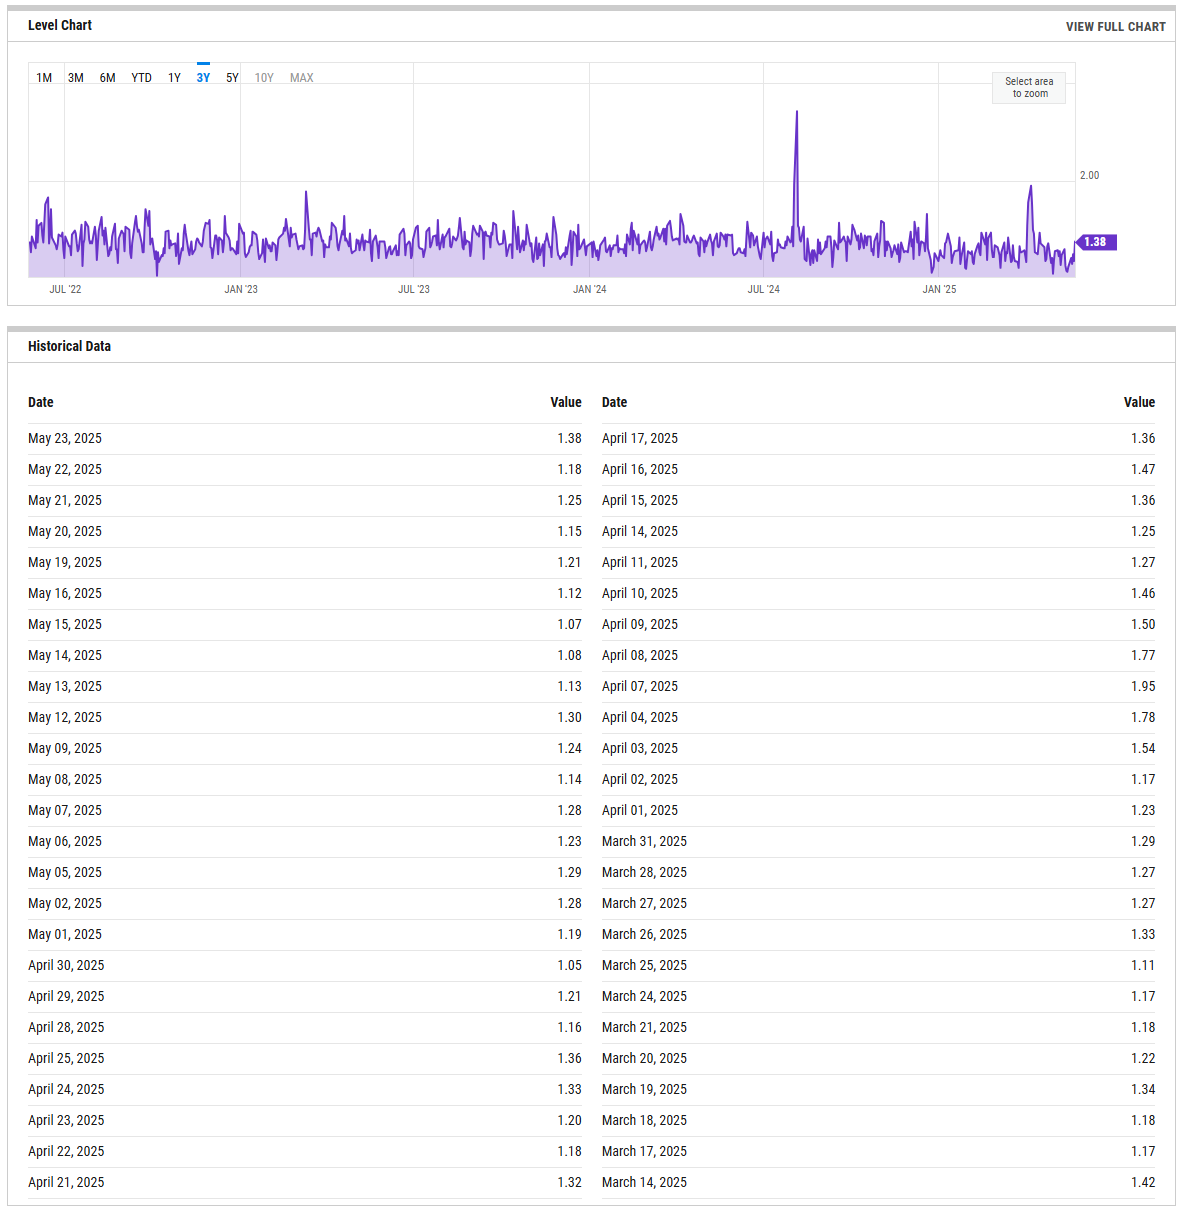
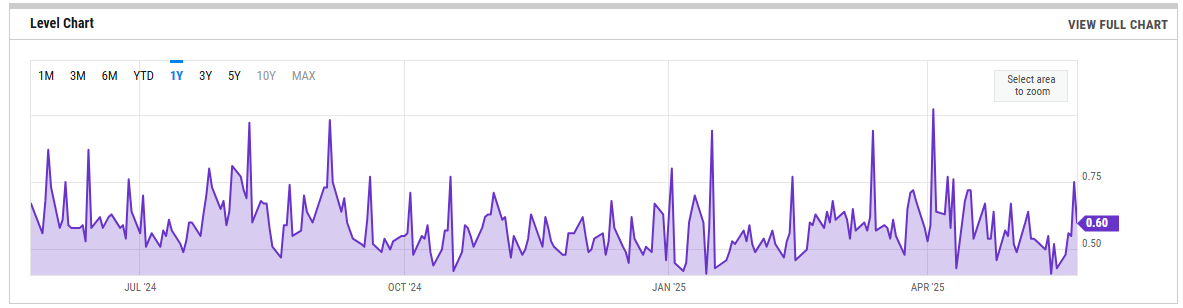
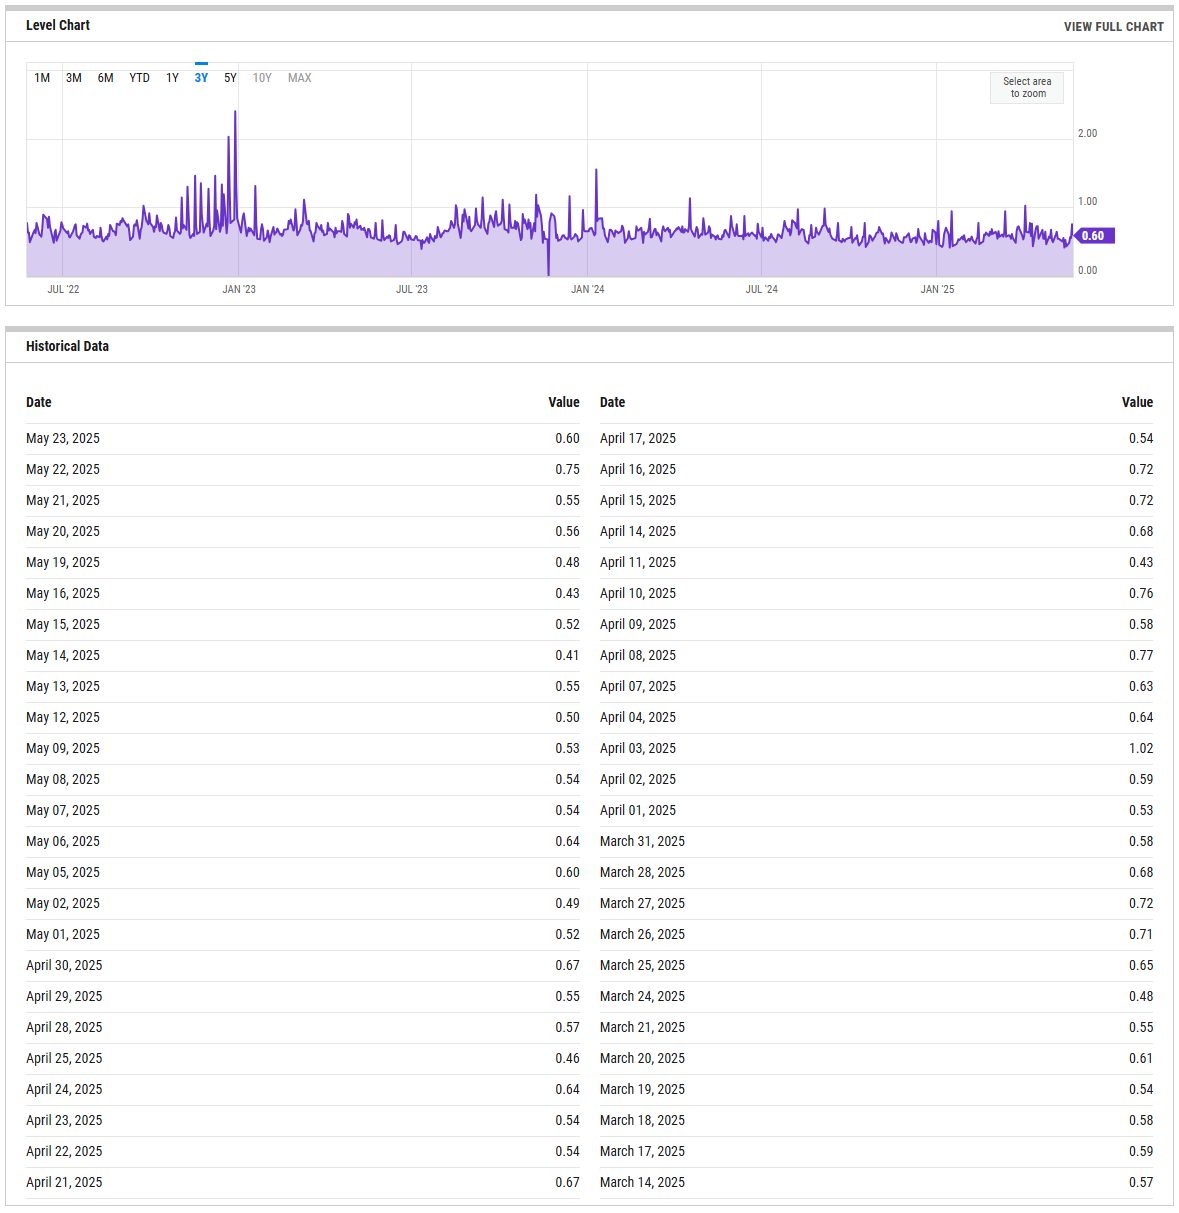
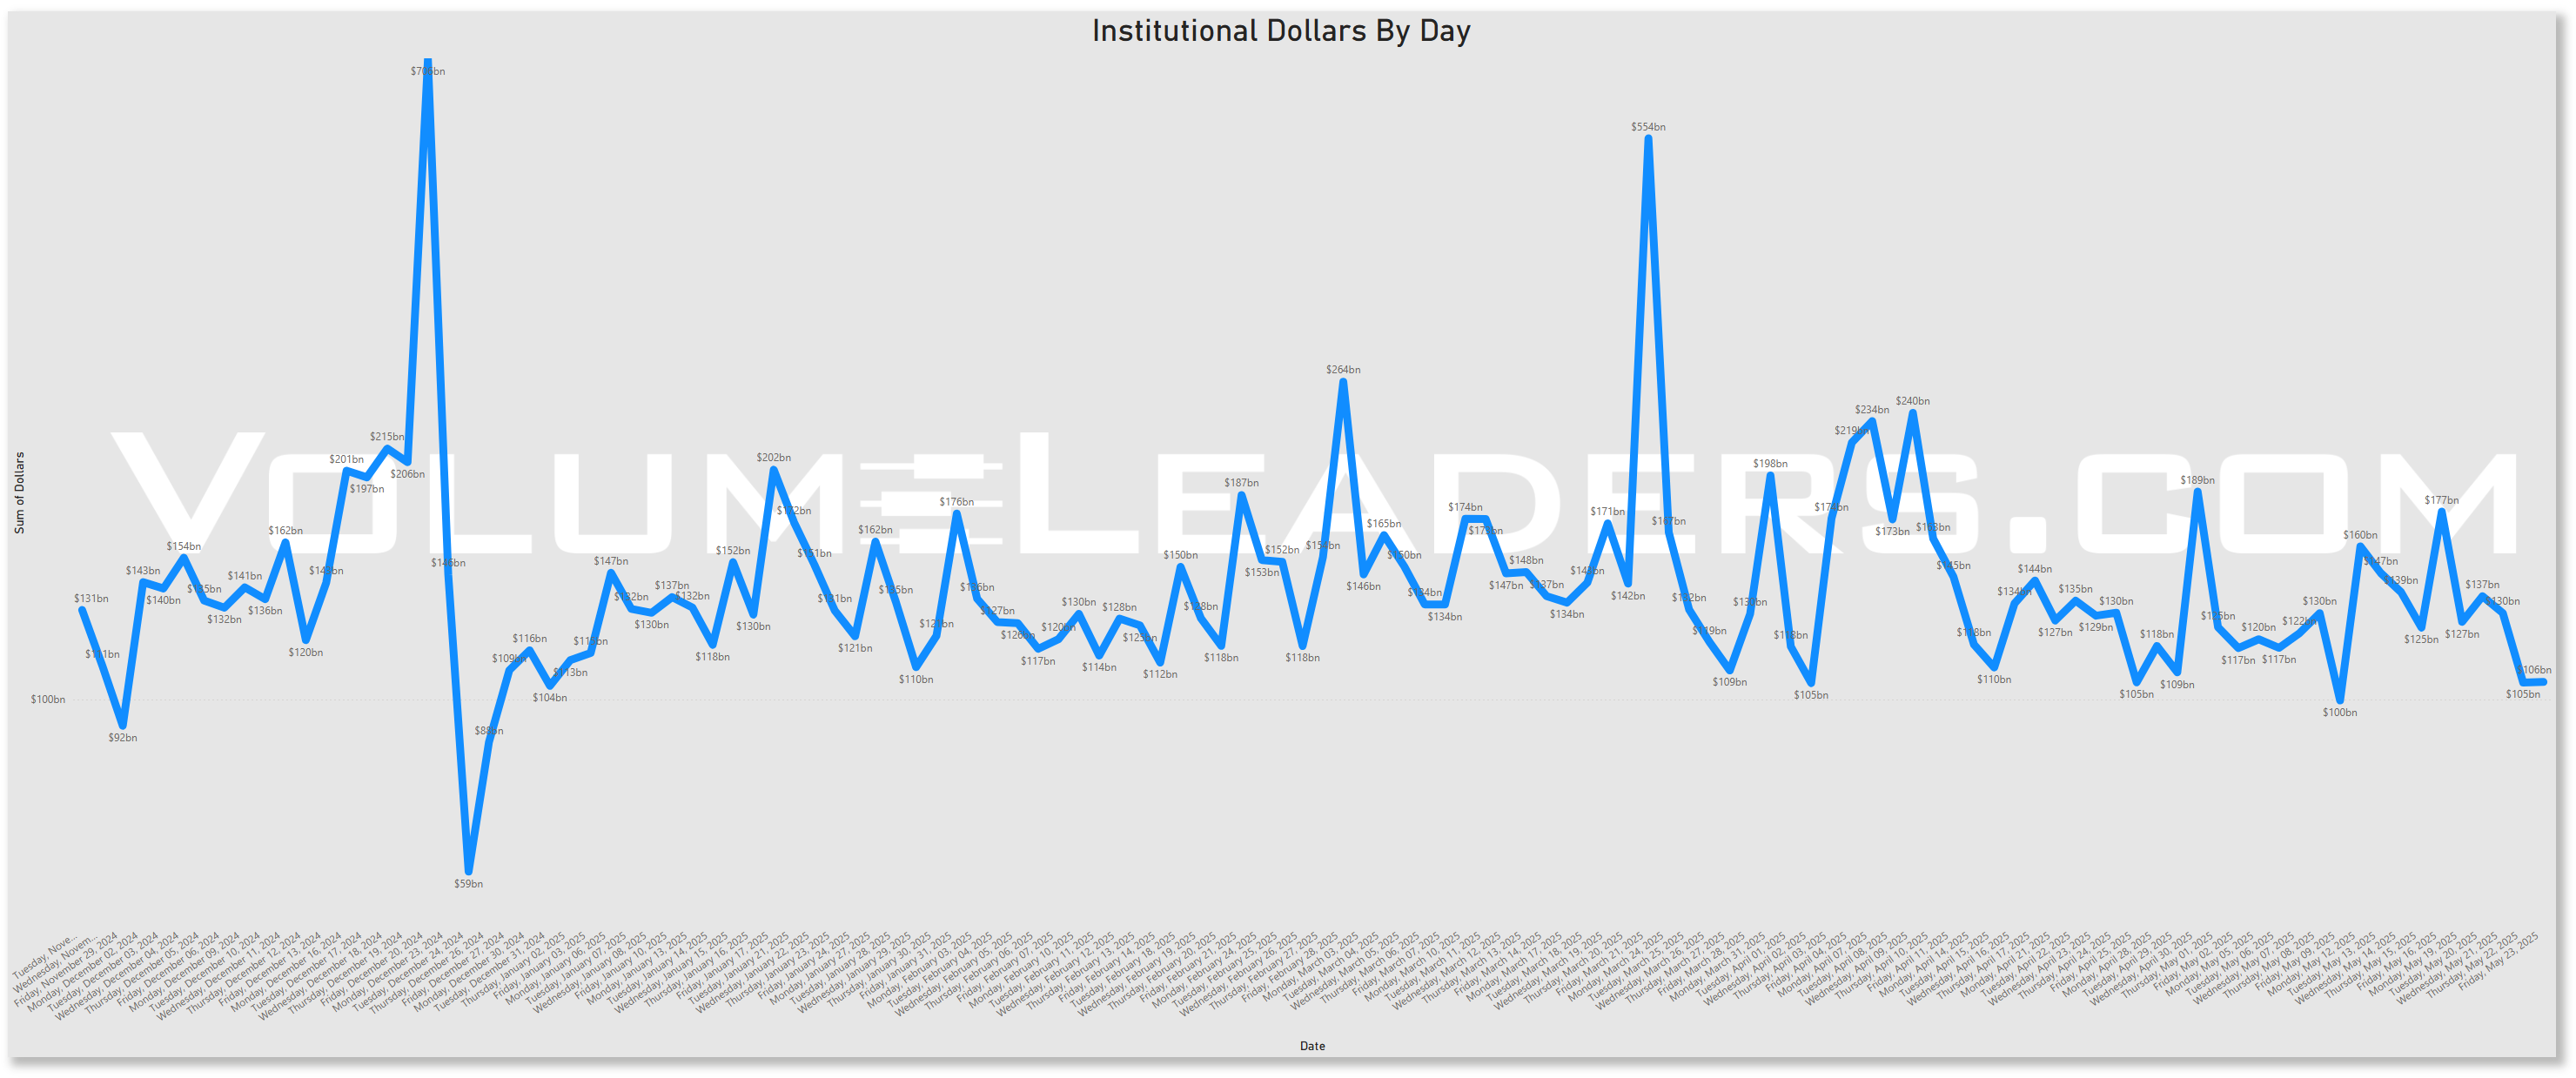
Rolling 90-Day Dollars By Day
This chart shows institutional activity by dollars by day on a rolling 1-year basis. From a theoretical standpoint, examining a chart of daily institutional dollar activity over the course of a year can offer several insights and possible inferences, though all should be approached with caution since the data alone may not prove causality or confirm underlying reasons. Some potential takeaways include:
Event-Driven Behavior:
Sharp, singular spikes on certain days might correlate with major market-moving events. These could include central bank policy announcements, significant geopolitical news, sudden macroeconomic data releases (like employment reports or GDP data), earnings seasons for large-cap companies, or unexpected shocks (e.g., mergers, acquisitions, regulatory changes).Liquidity Dynamics:
Institutions often concentrate large trades on days with higher expected liquidity. For instance, heightened activity might coincide with index reconstitutions, option expiration dates, or the days leading up to or following a major index rebalance, when large amounts of capital shift hands simultaneously.Risk Management and Hedging Activity:
Institutions may significantly adjust their exposures on days that are critical from a risk management perspective. Large spikes can occur if hedge funds, pension funds, or asset managers are rolling over futures contracts, initiating or closing out large hedges, or reacting to volatility triggers.Market Sentiment Indicators:
While the data is purely transactional, the sheer volume of institutional involvement on certain days might indirectly hint at changing sentiment or strategic shifts.
In essence, a chart like this can lead you to hypothesize that institutional trading volumes are not constant or random but rather influenced by a mix of predictable calendar effects, major market events, liquidity considerations, risk management decisions, and strategic allocation shifts.
Top Institutional Order Flow By Sector By Week For The Past 90-Days
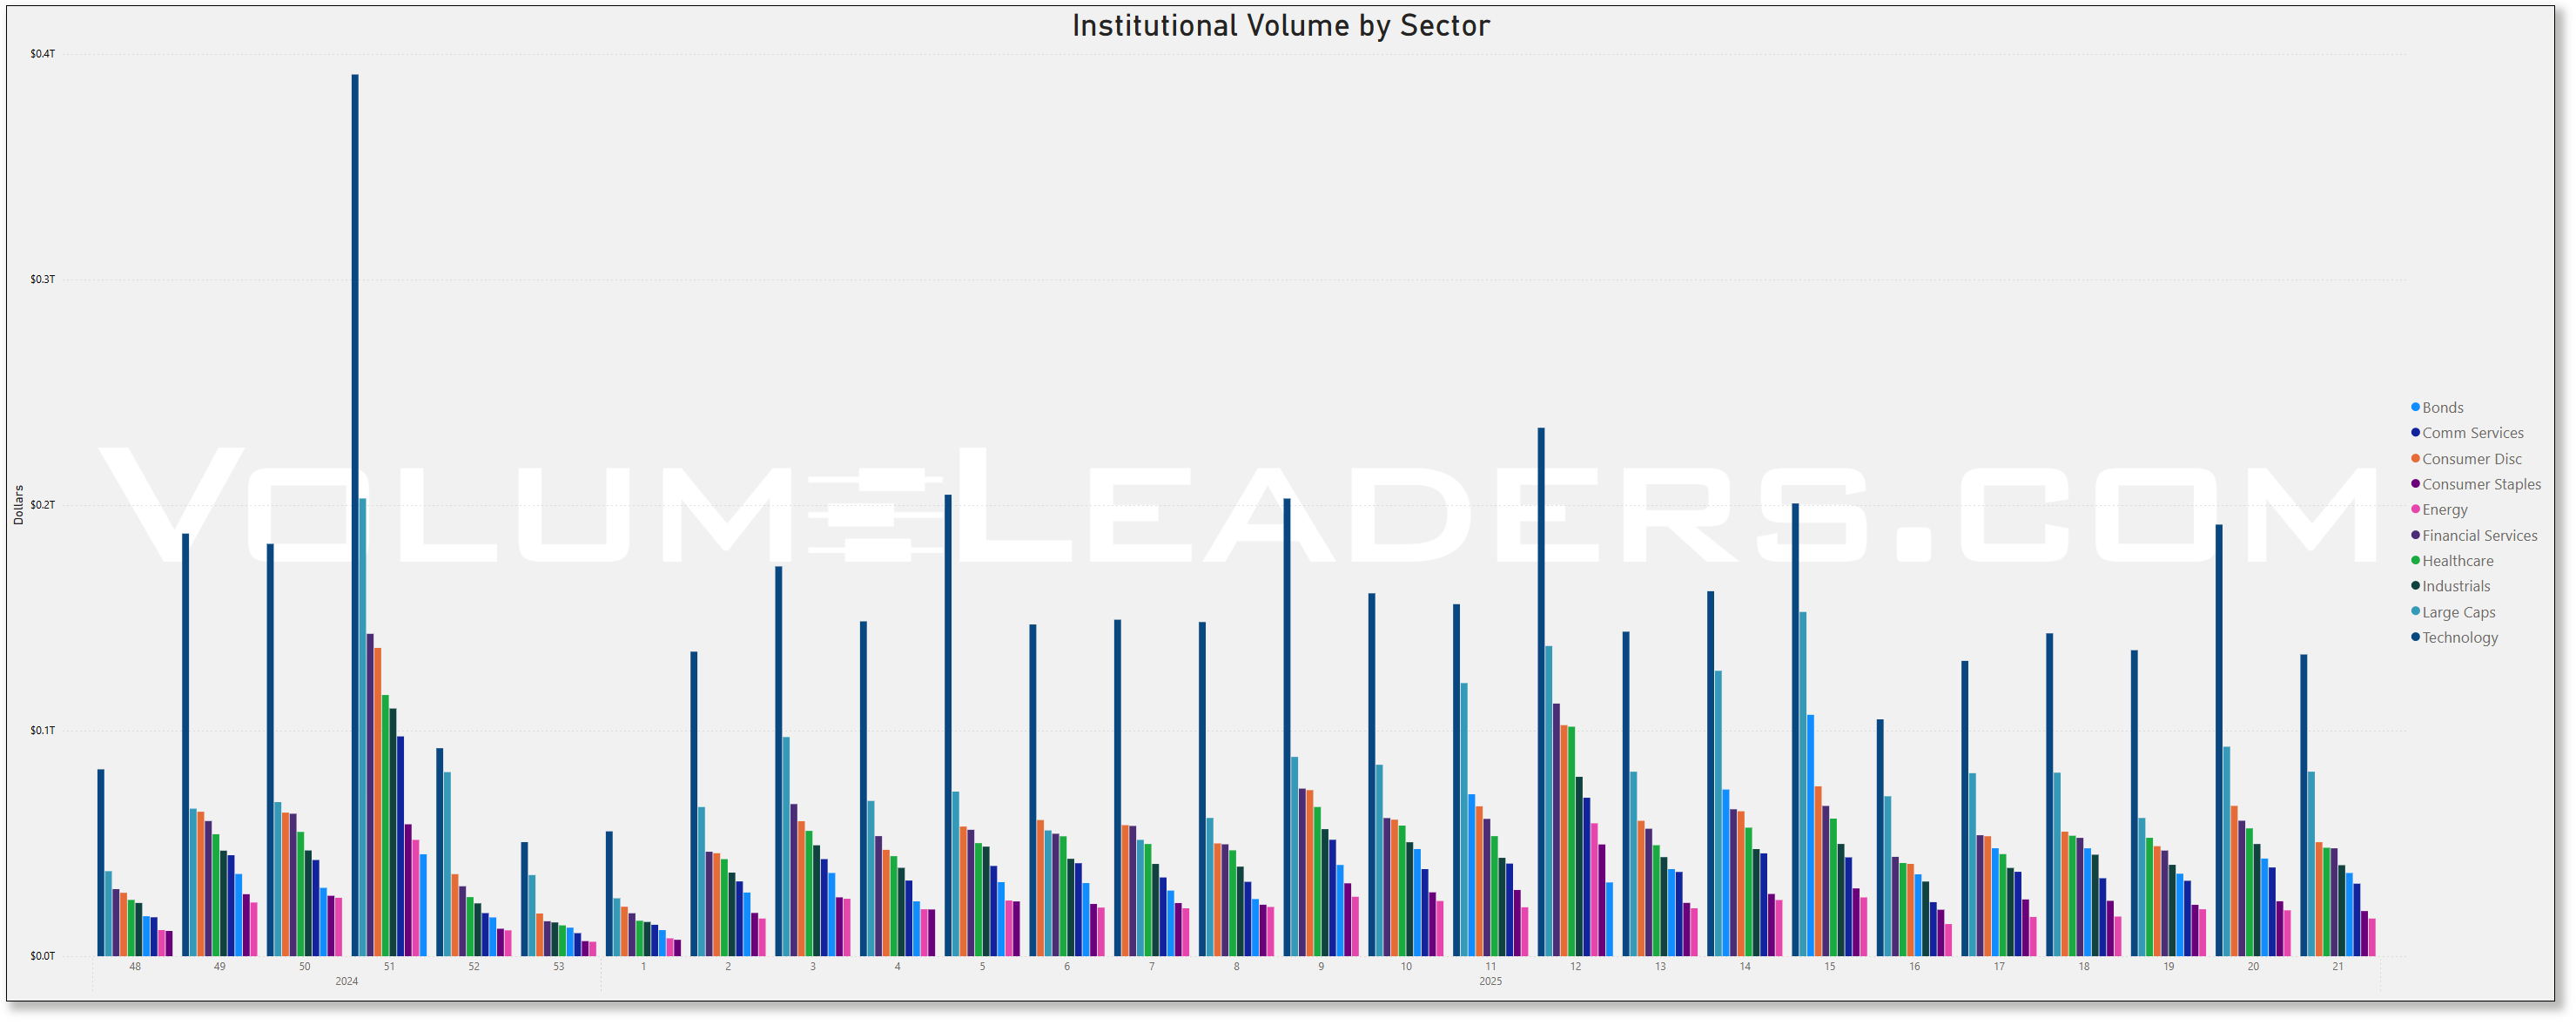
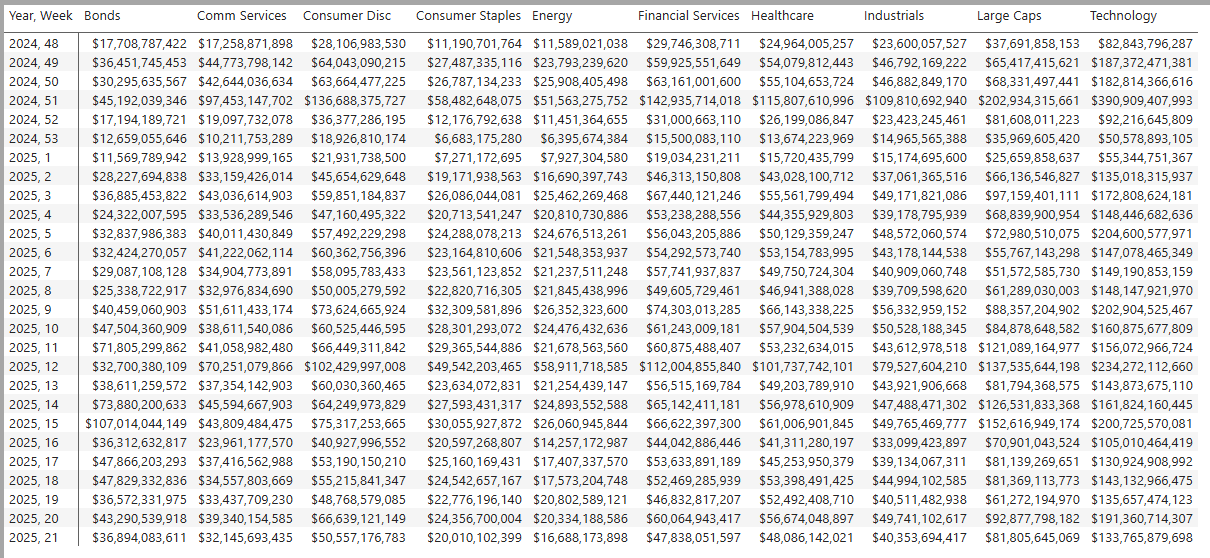
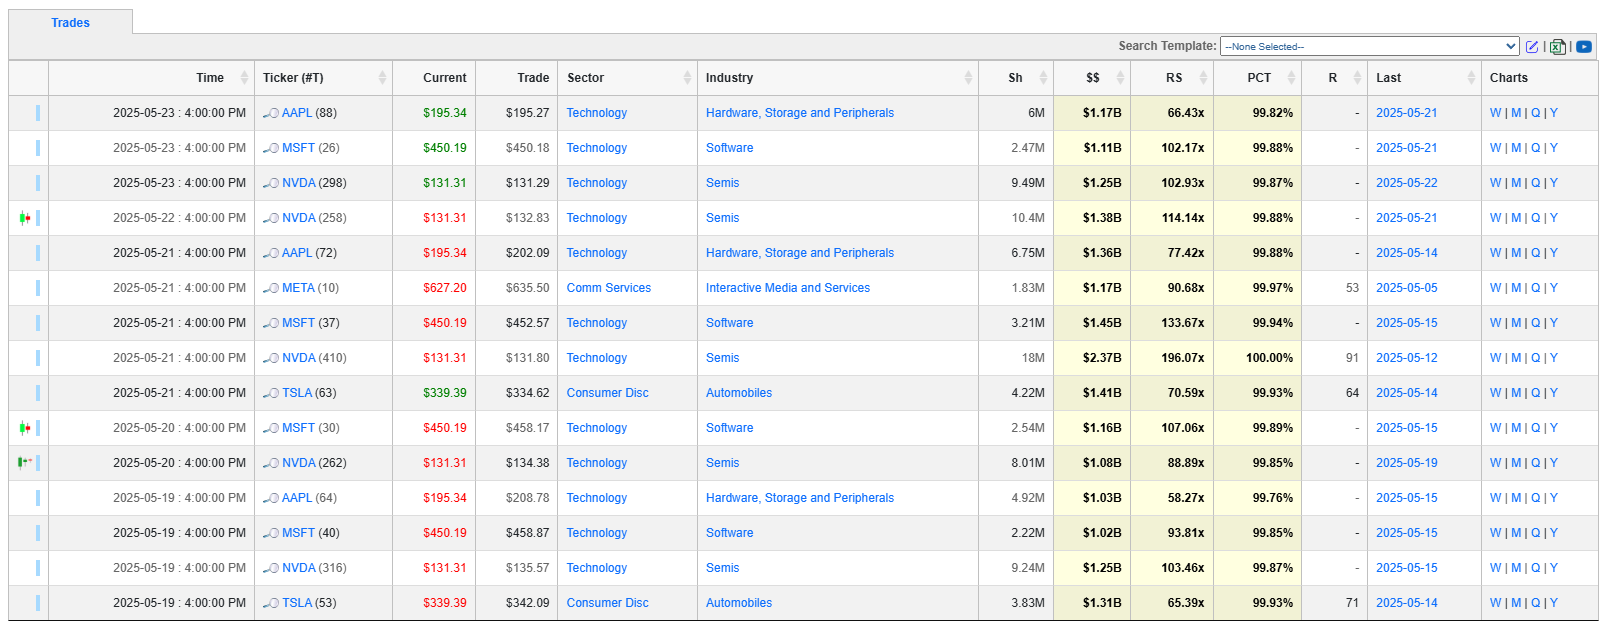
Top Institutional Order Flow In Equities
These are incredibly important charts to watch as they contains lots of nuanced suggestions at a thematic level. Watch these charts closely week-to-week to stay informed about where institutional money is flowing, adjust your strategies based on momentum, align your portfolio with macroeconomic and market trends, and manage risks more effectively by avoiding sectors losing institutional favor.
Sector Rotation Insights: The chart highlights which sectors are attracting institutional activity and which are losing favor. Institutions often lead market trends, so tracking shifts in their focus can indicate sector rotations.
Sentiment Analysis: The level of institutional activity reflects confidence in specific sectors. Rising activity in traditionally defensive sectors (e.g., healthcare, utilities) may indicate caution, while a surge in growth sectors (e.g., technology, consumer discretionary) could suggest optimism.
Emerging Trends: Sudden spikes in a previously overlooked sector, like industrials or consumer staples, might hint at emerging opportunities or structural shifts.
Macro Themes: Changes in sector activity often align with broader macroeconomic themes like inflation, interest rates, or geopolitical events. For instance:
Increased activity in energy might indicate concerns about oil supply or rising prices.
Growth in technology could align with innovations or favorable policies.
Risk Management: Declining institutional activity in a sector might signal weakening fundamentals or heightened risks.
Spotting Overcrowding: Excessive activity in a single sector over multiple weeks may suggest overcrowding, which could lead to heightened volatility if institutions begin to exit.

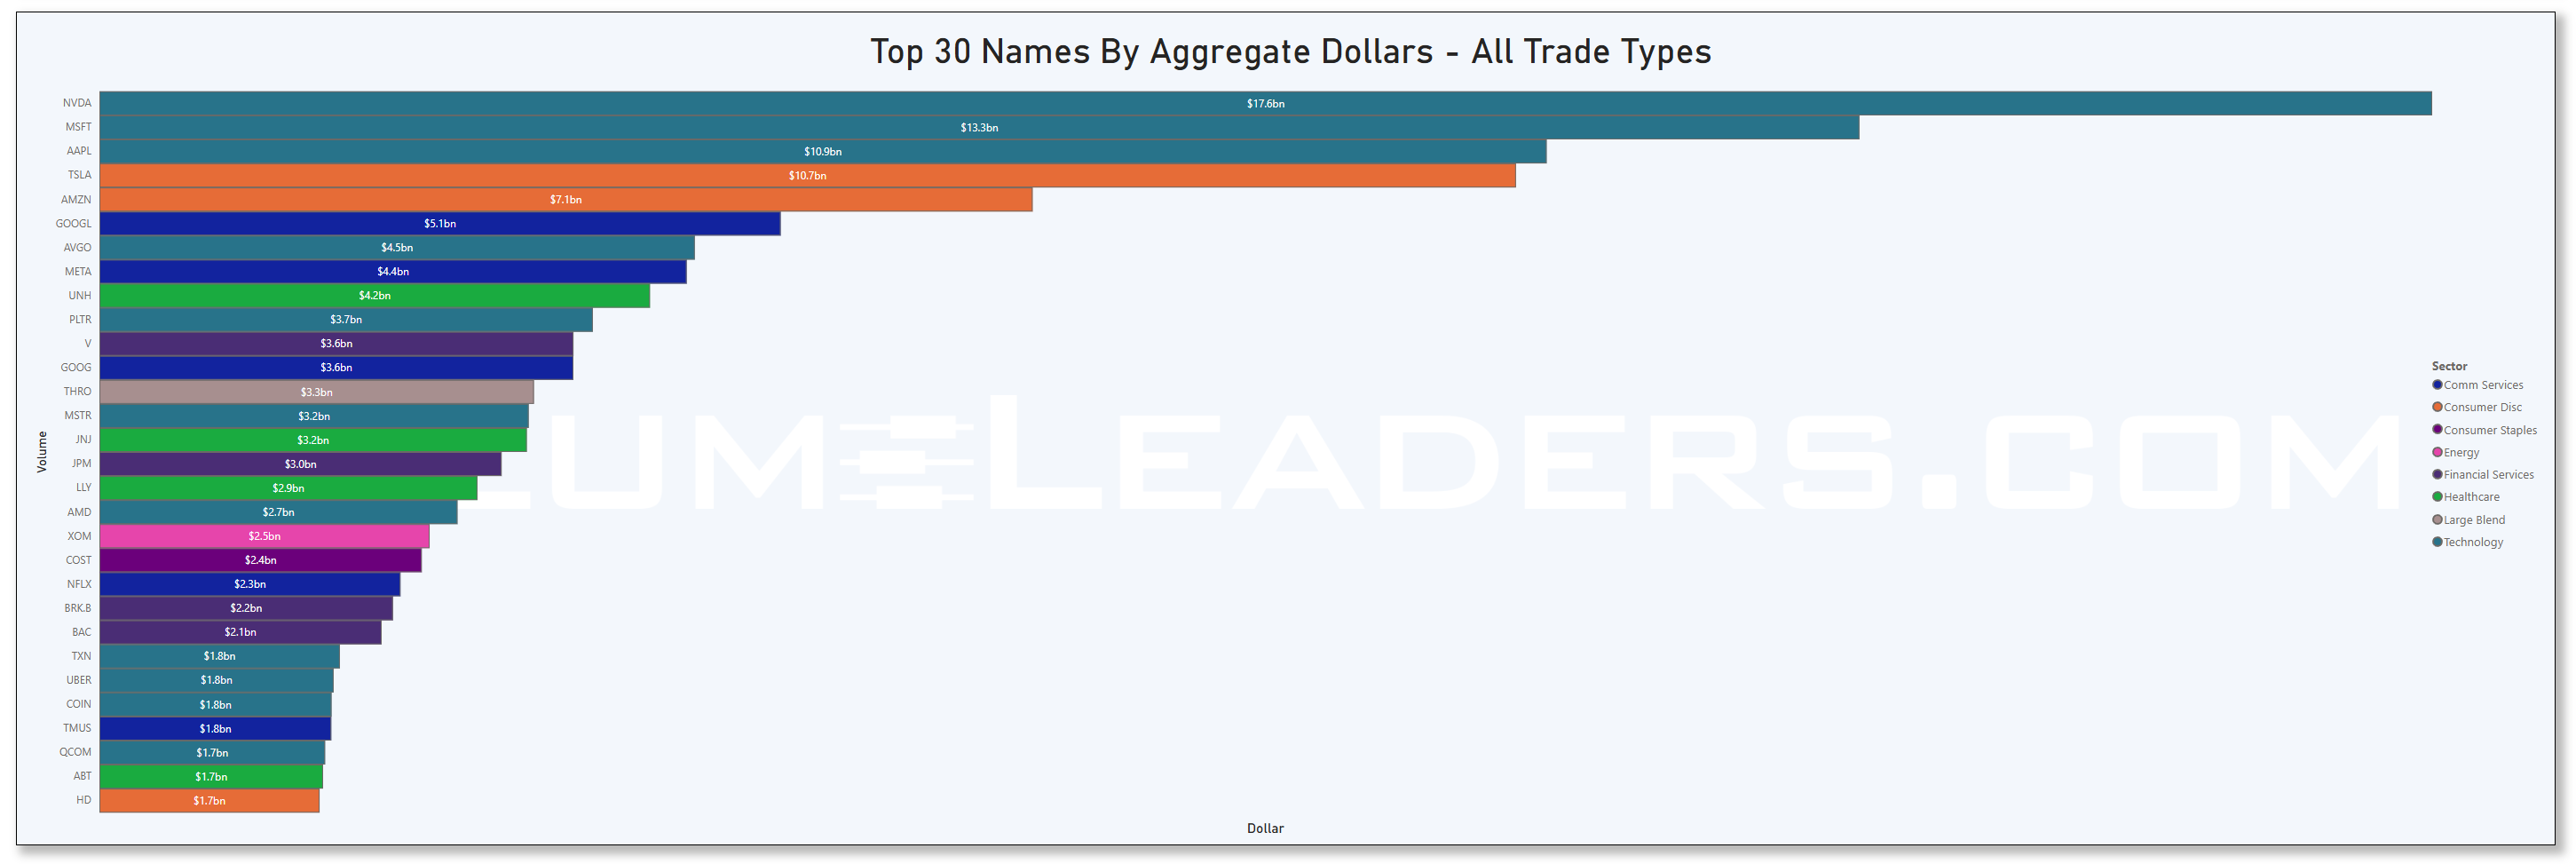
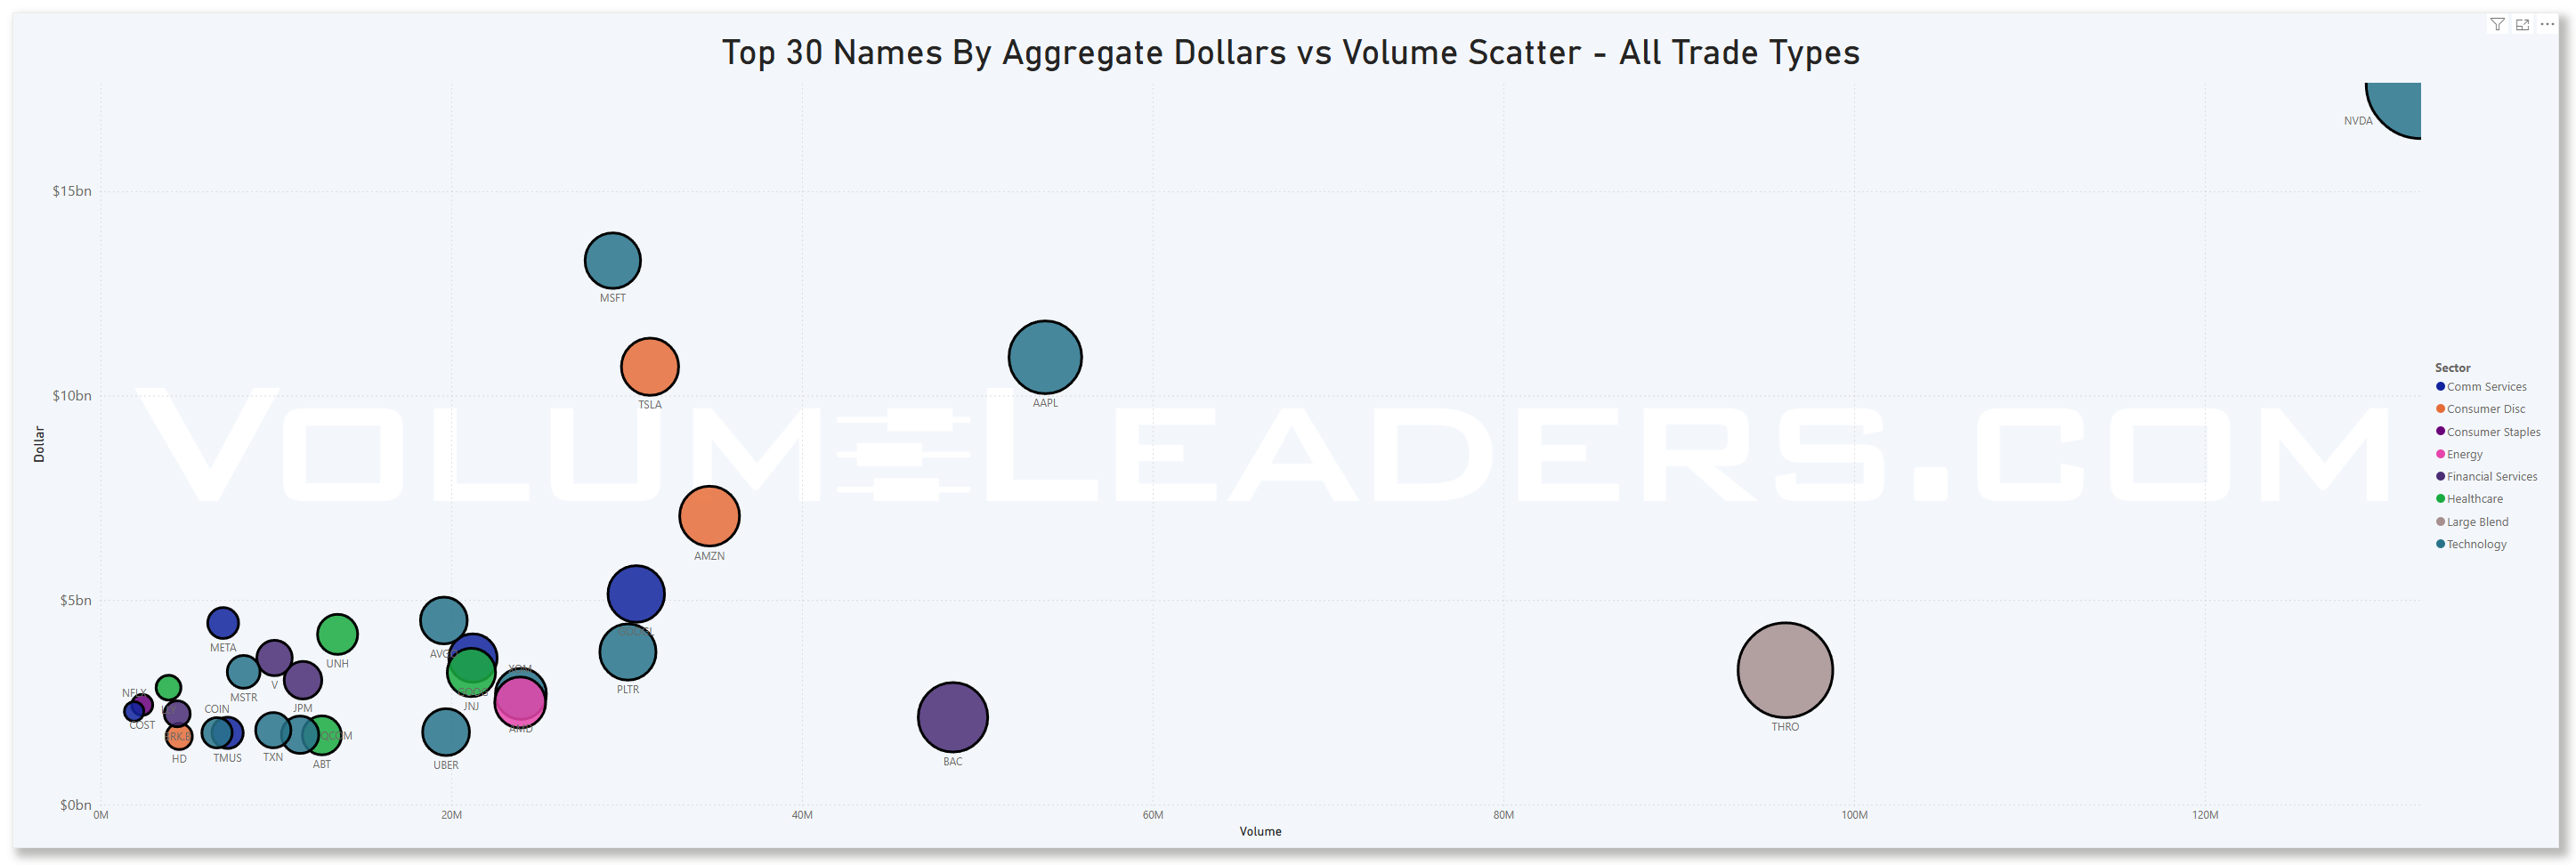
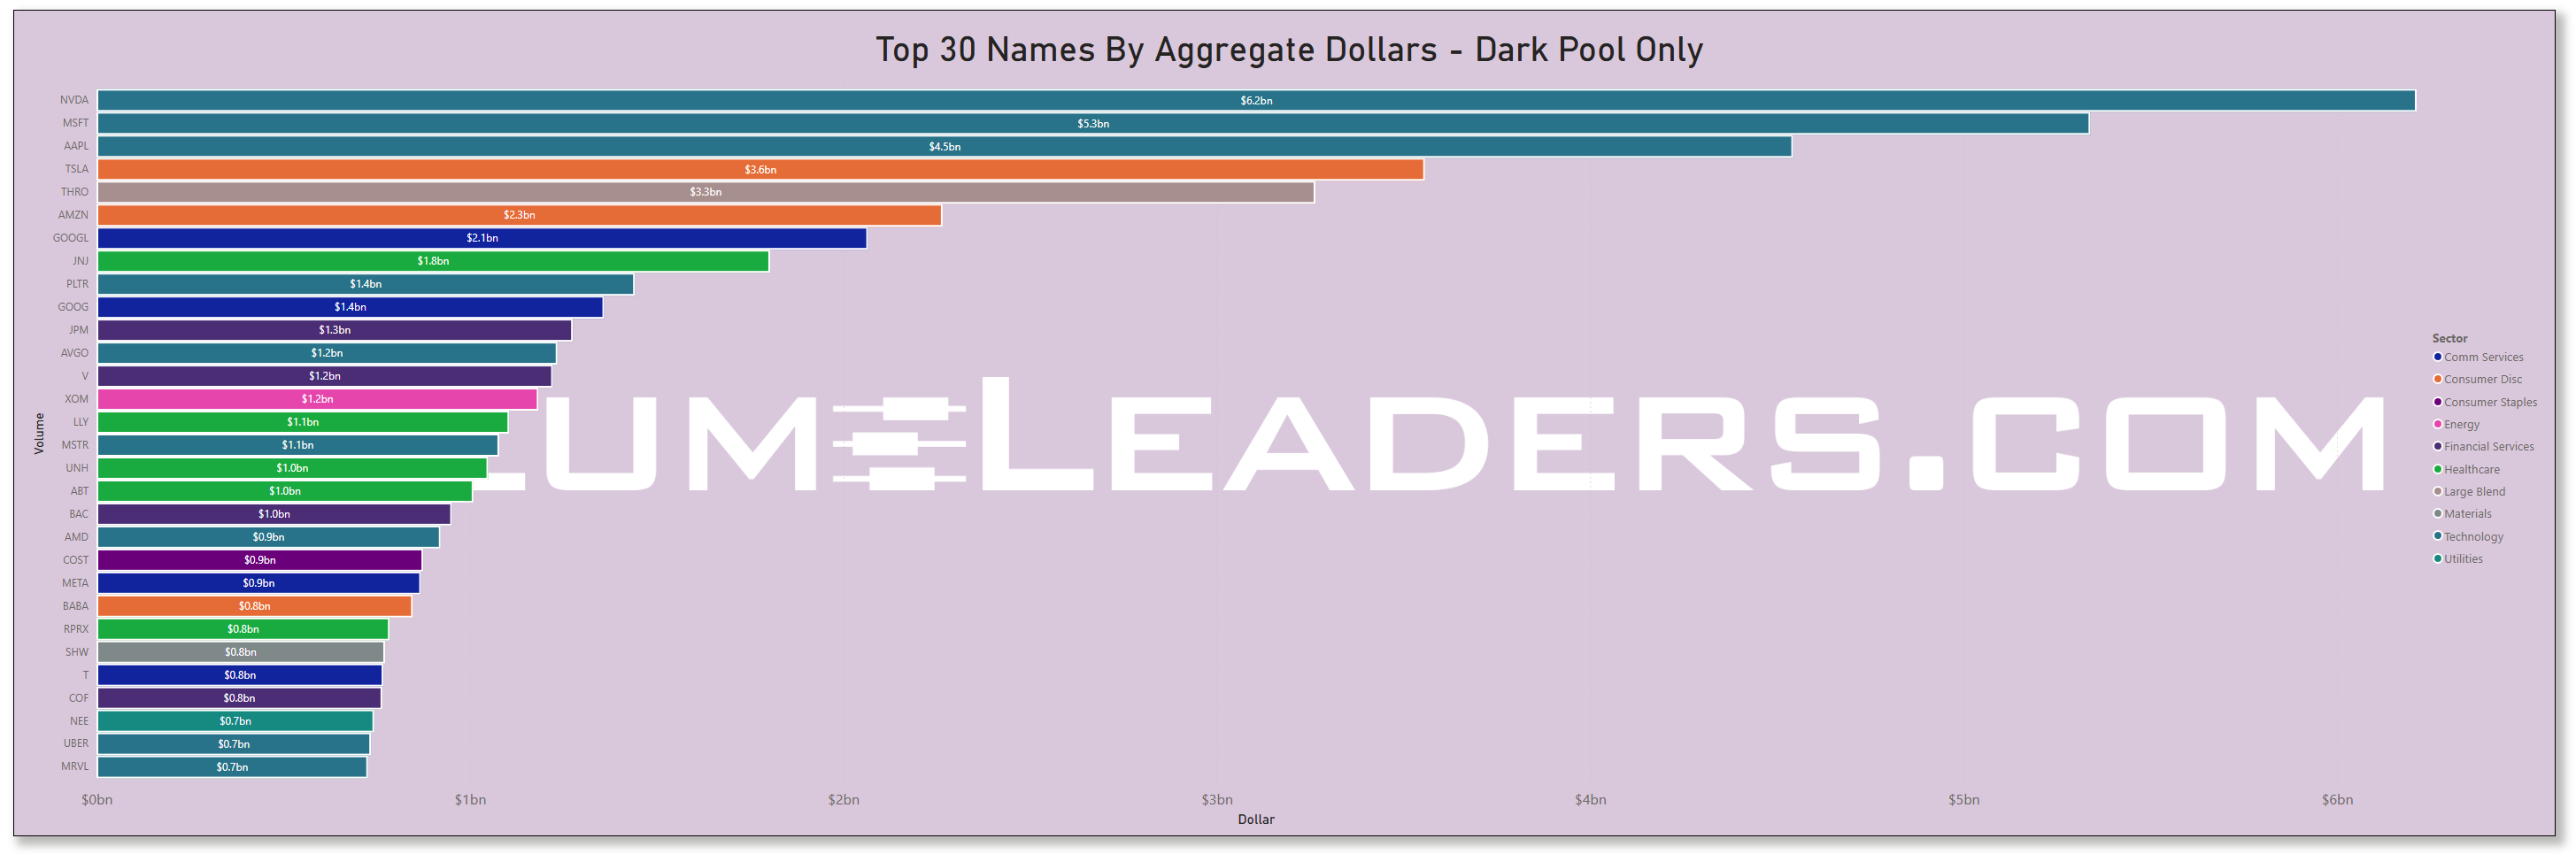
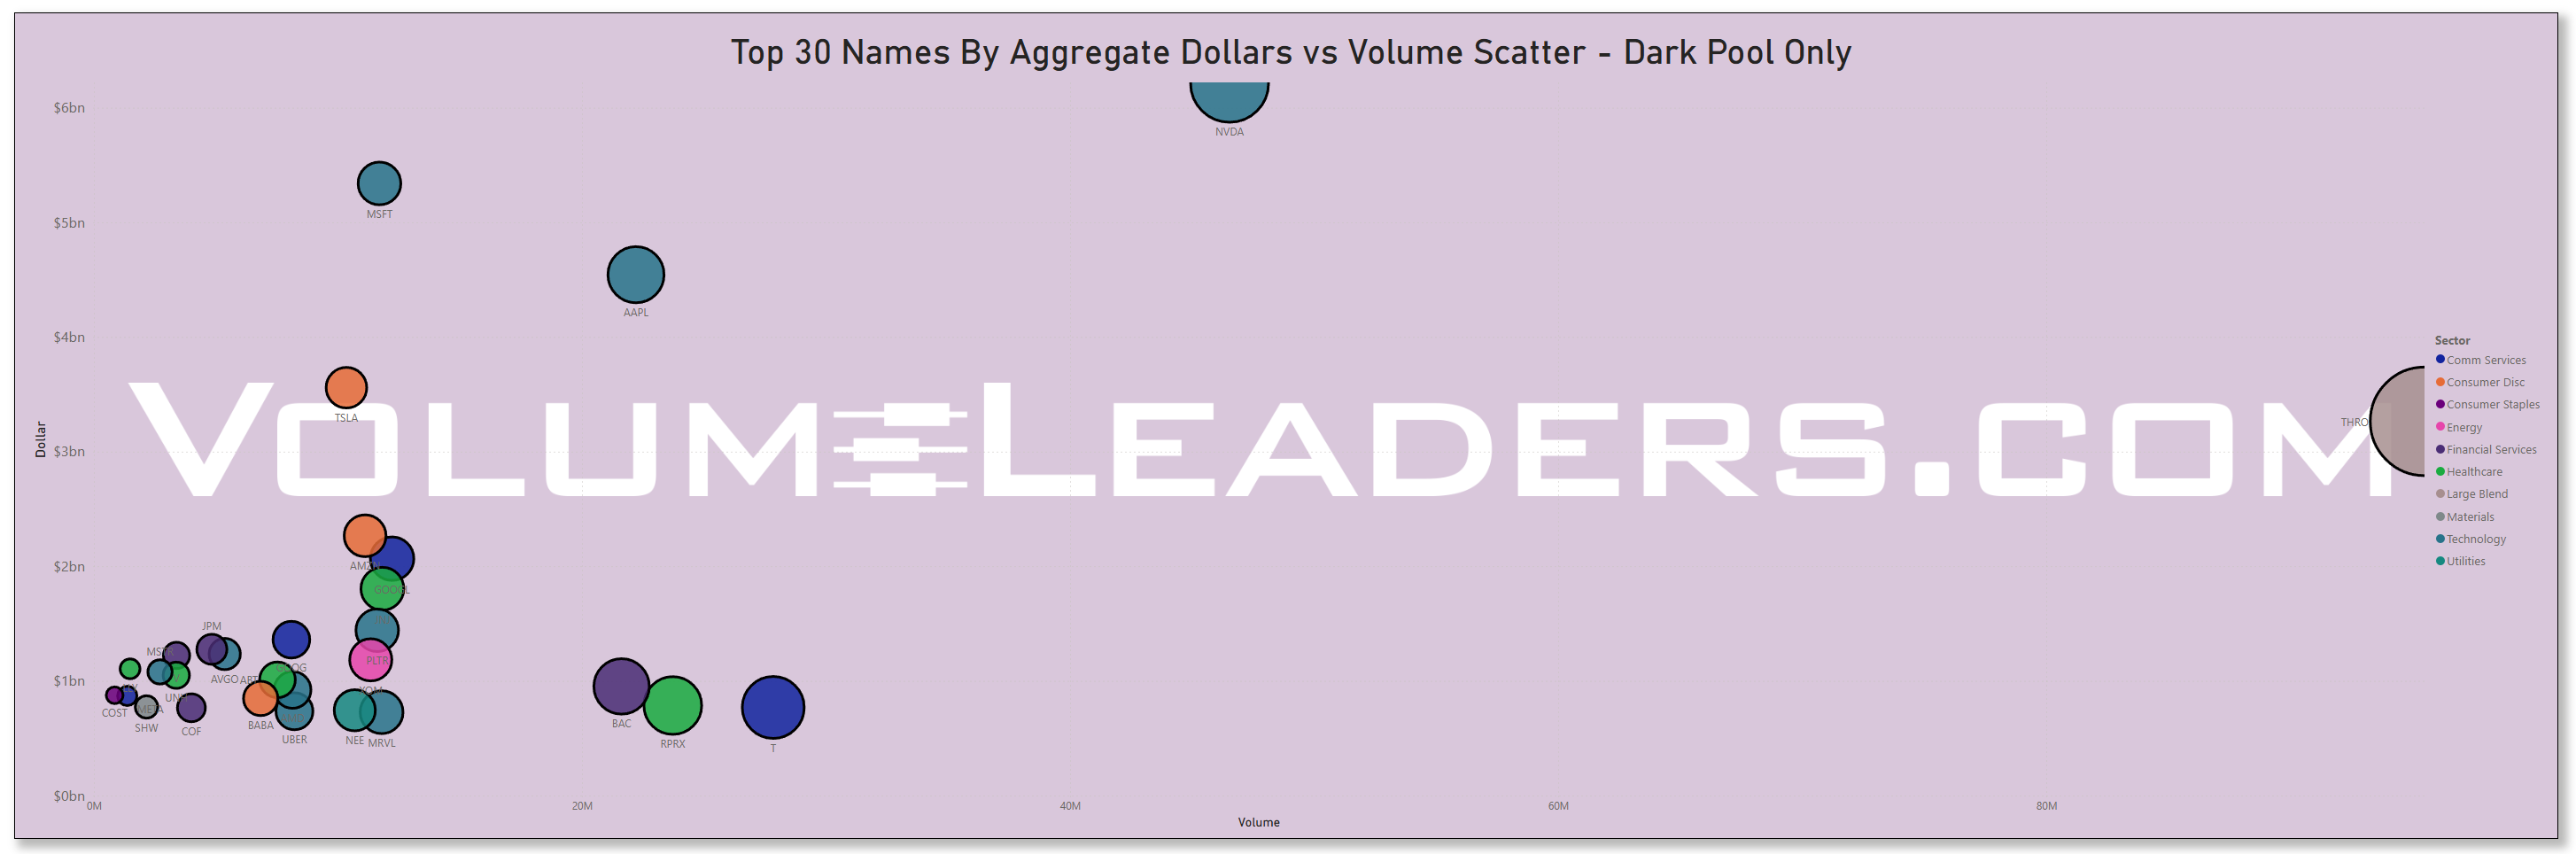
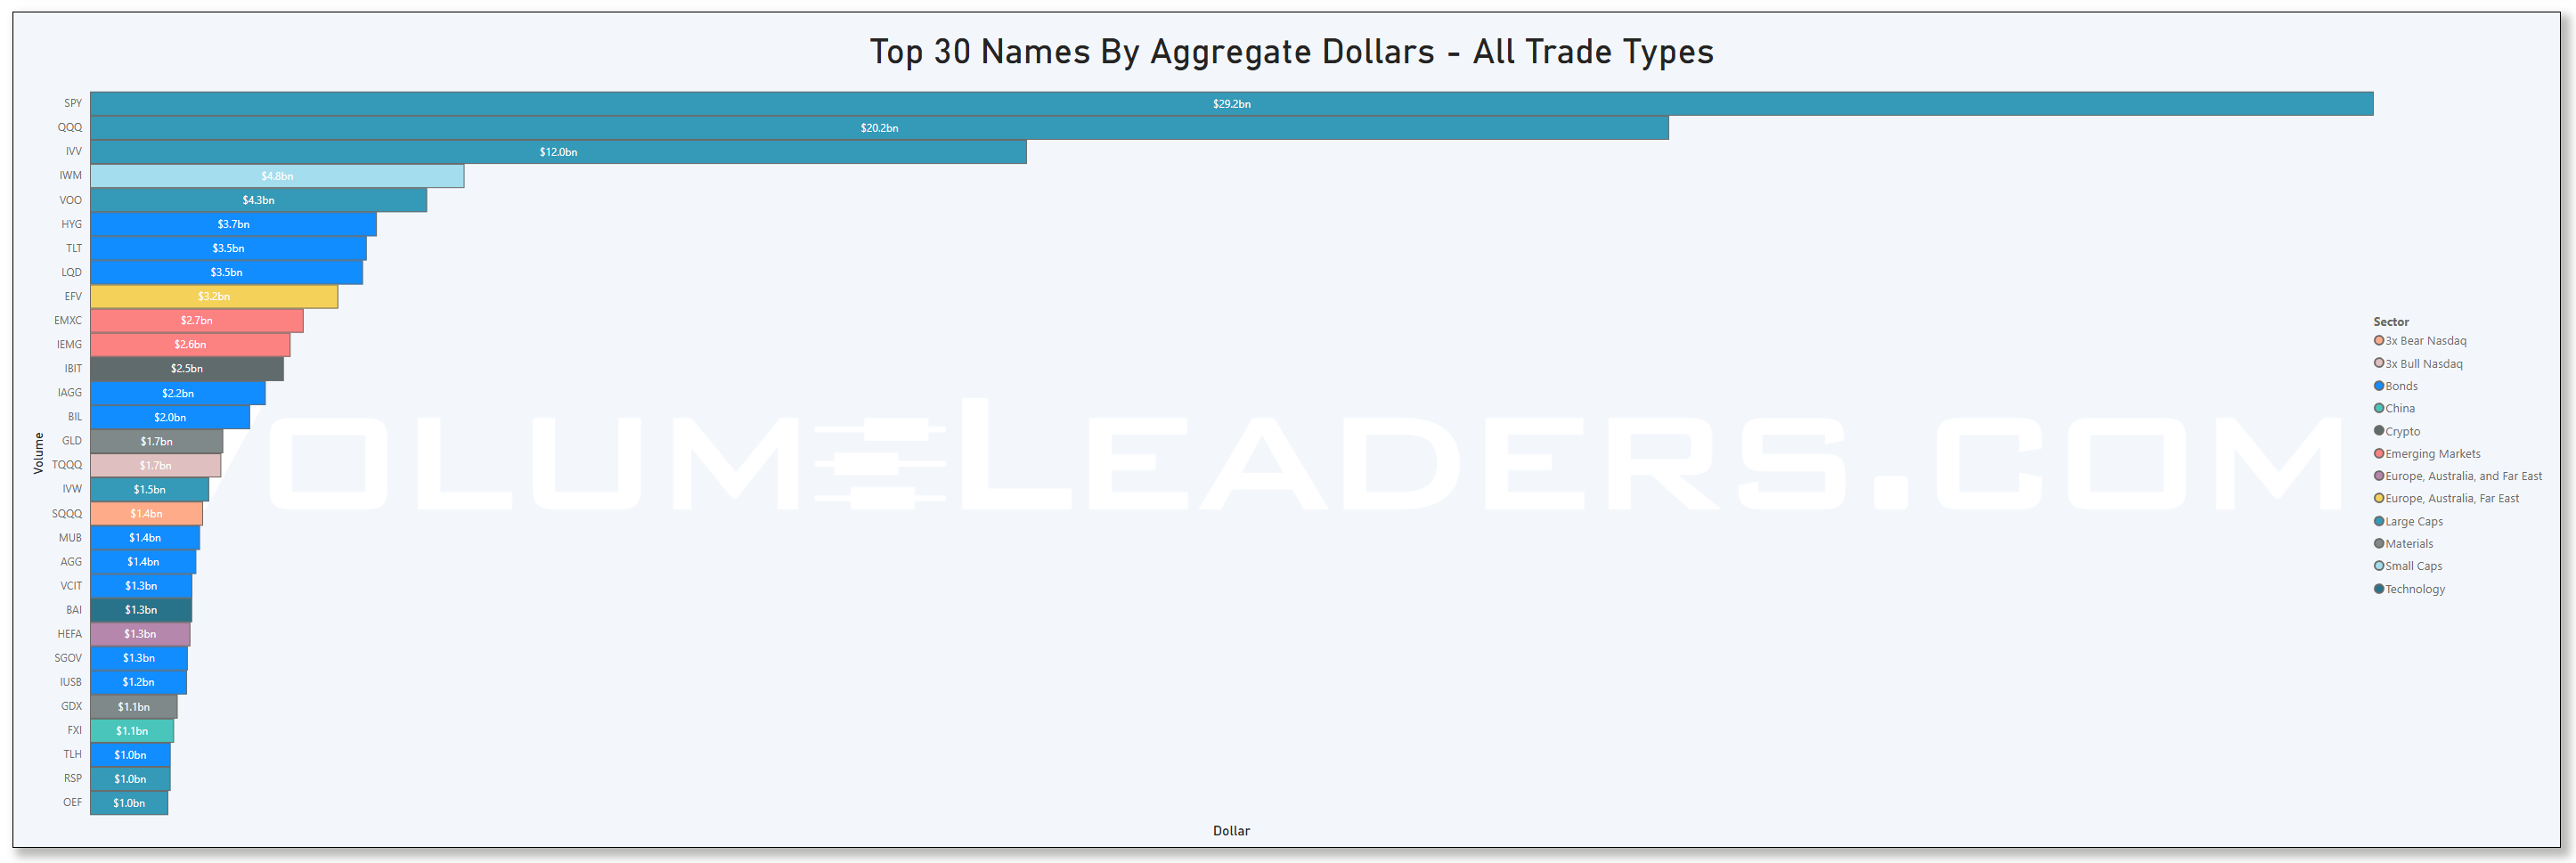
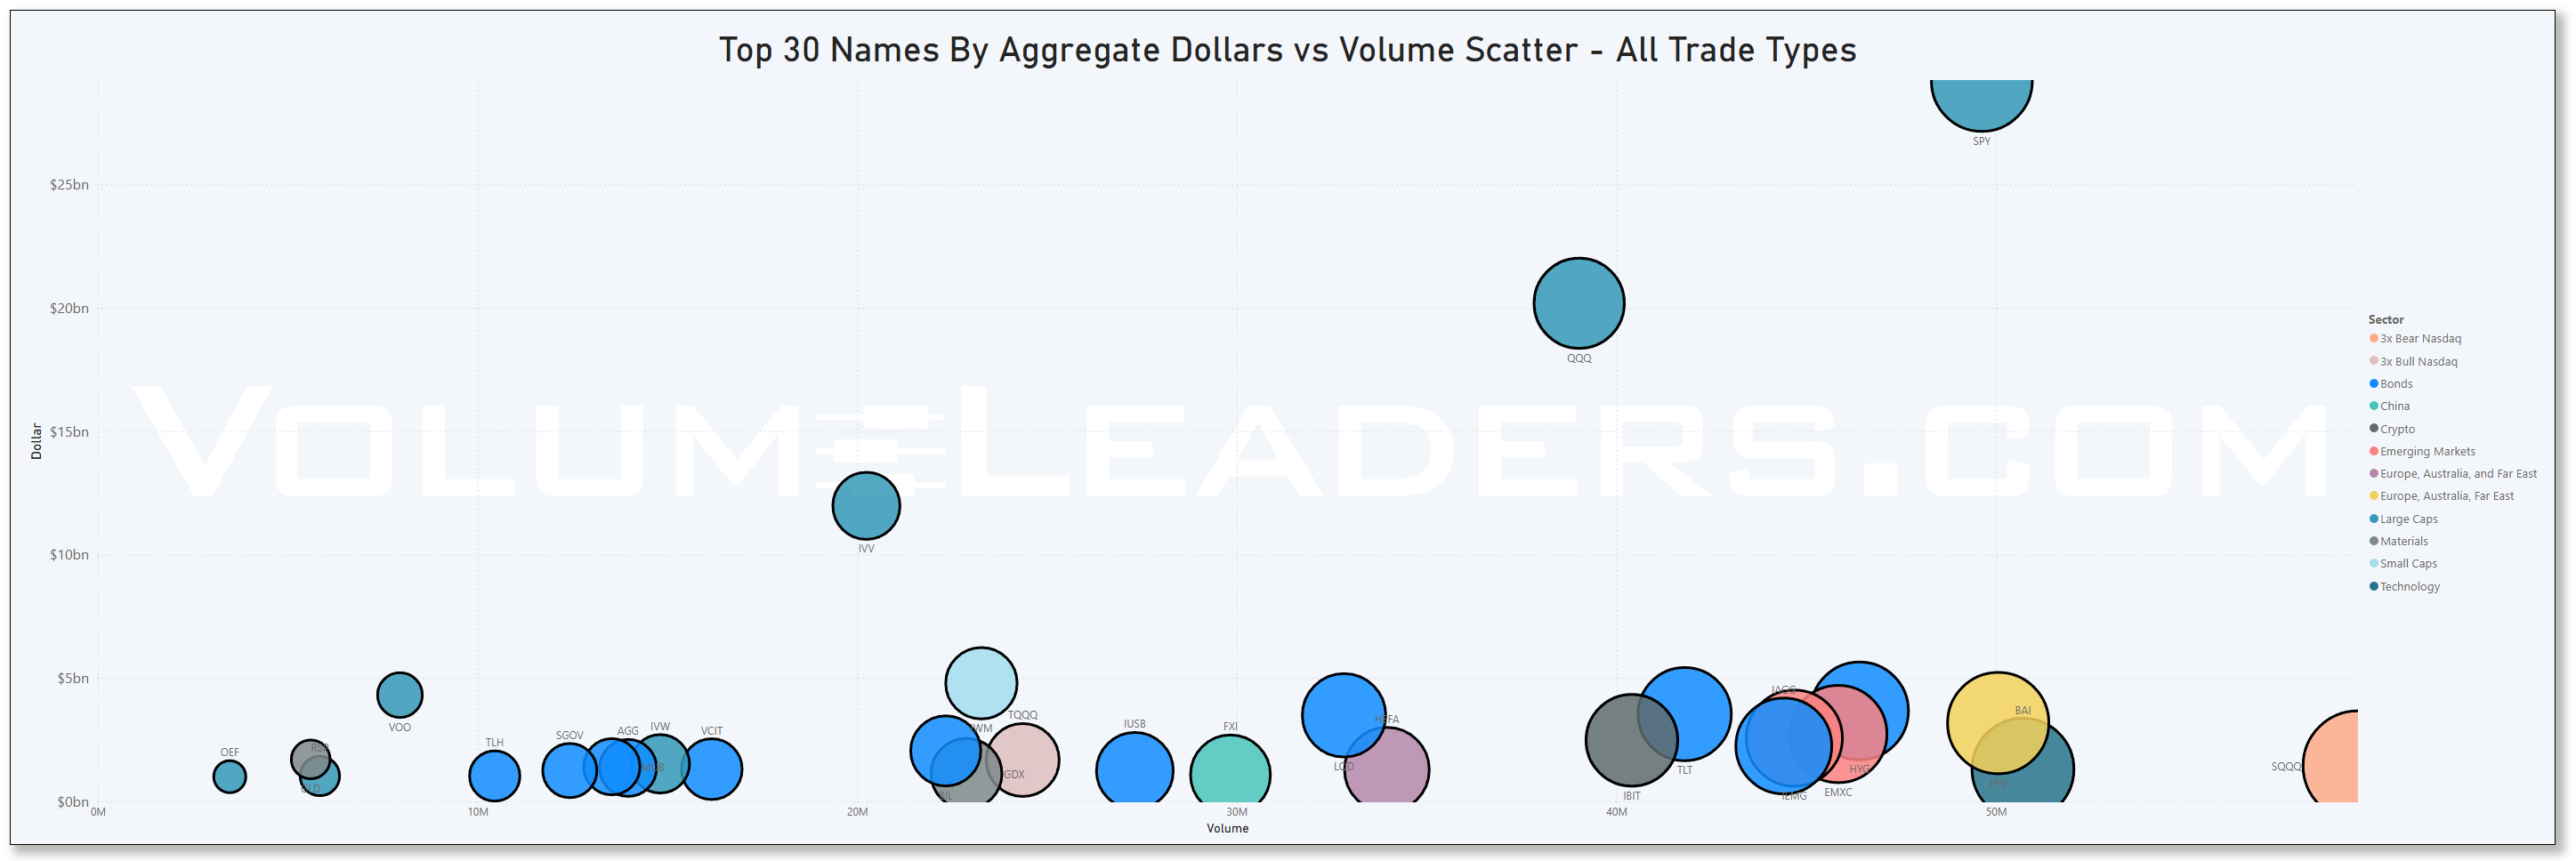
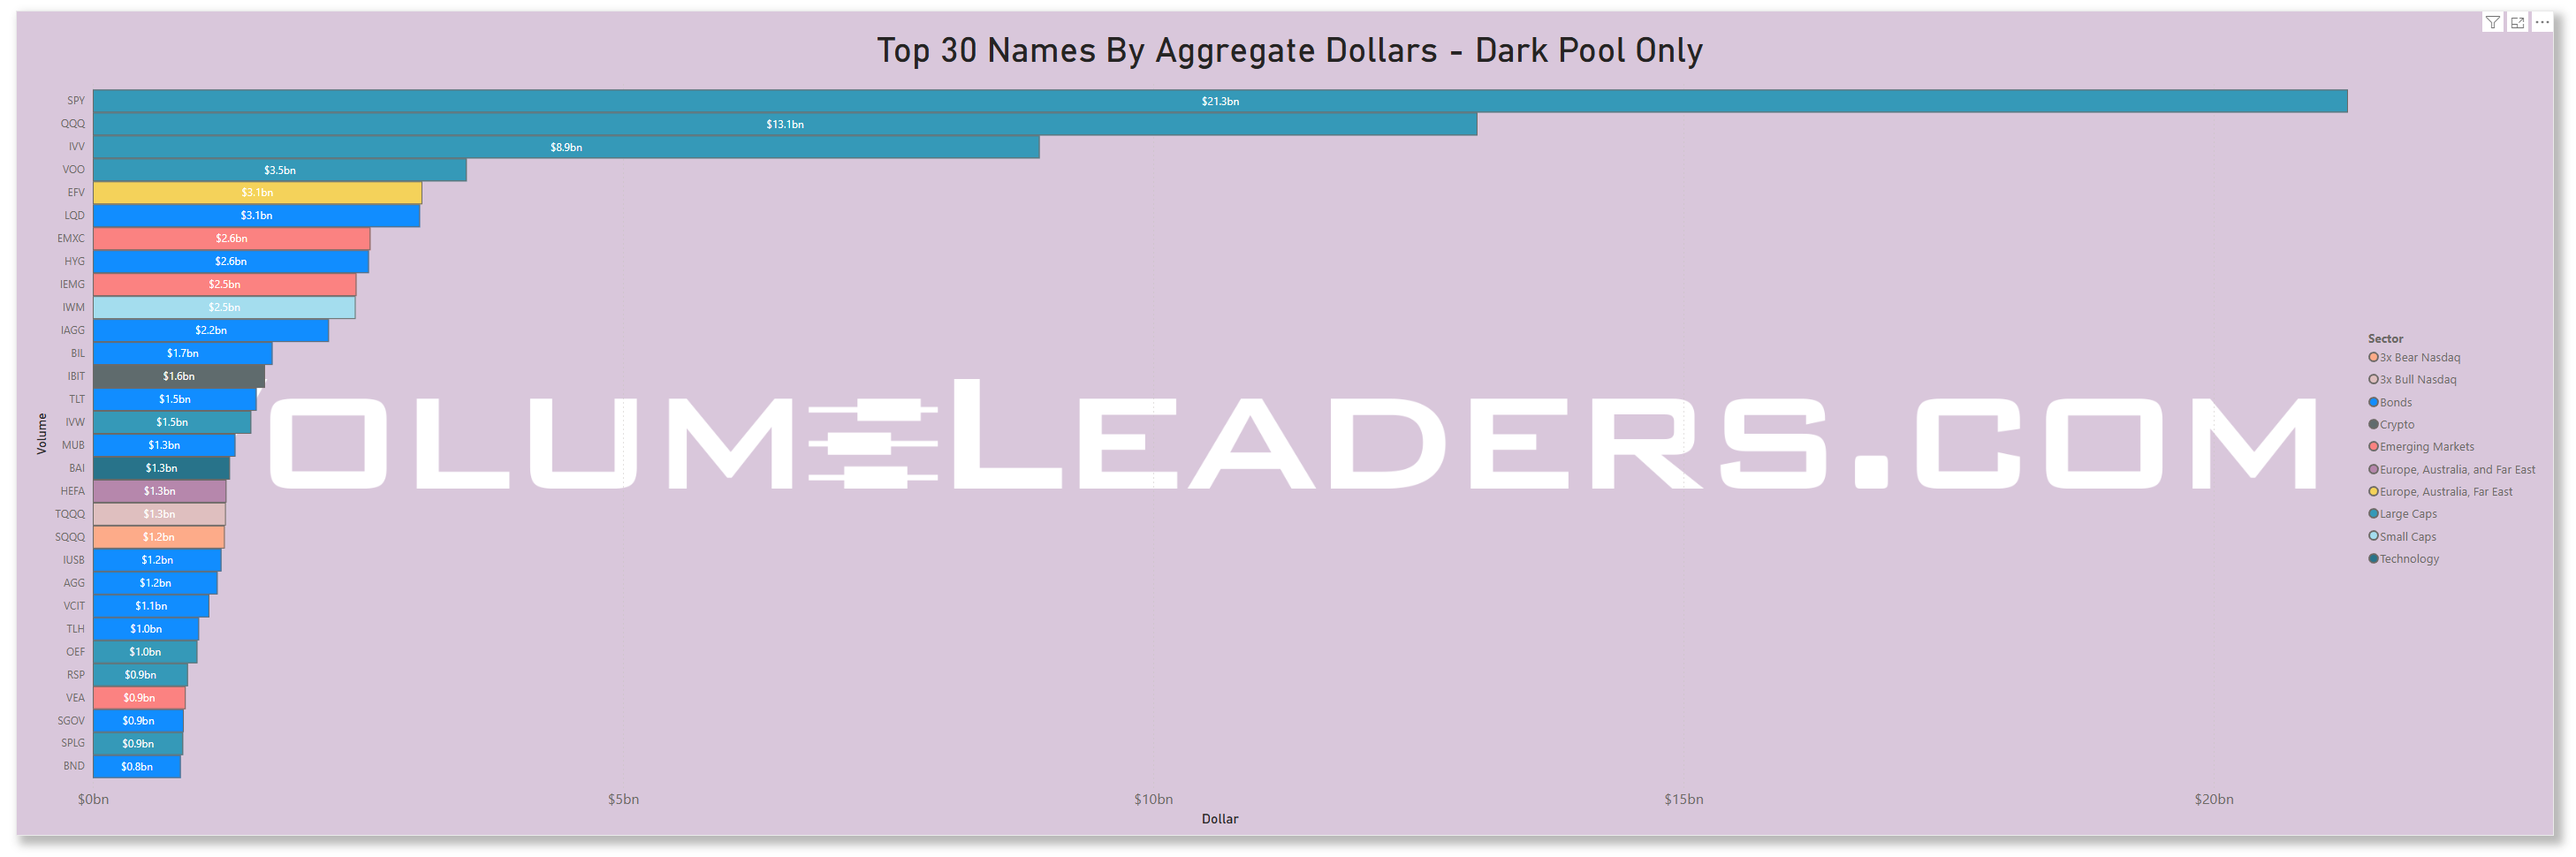
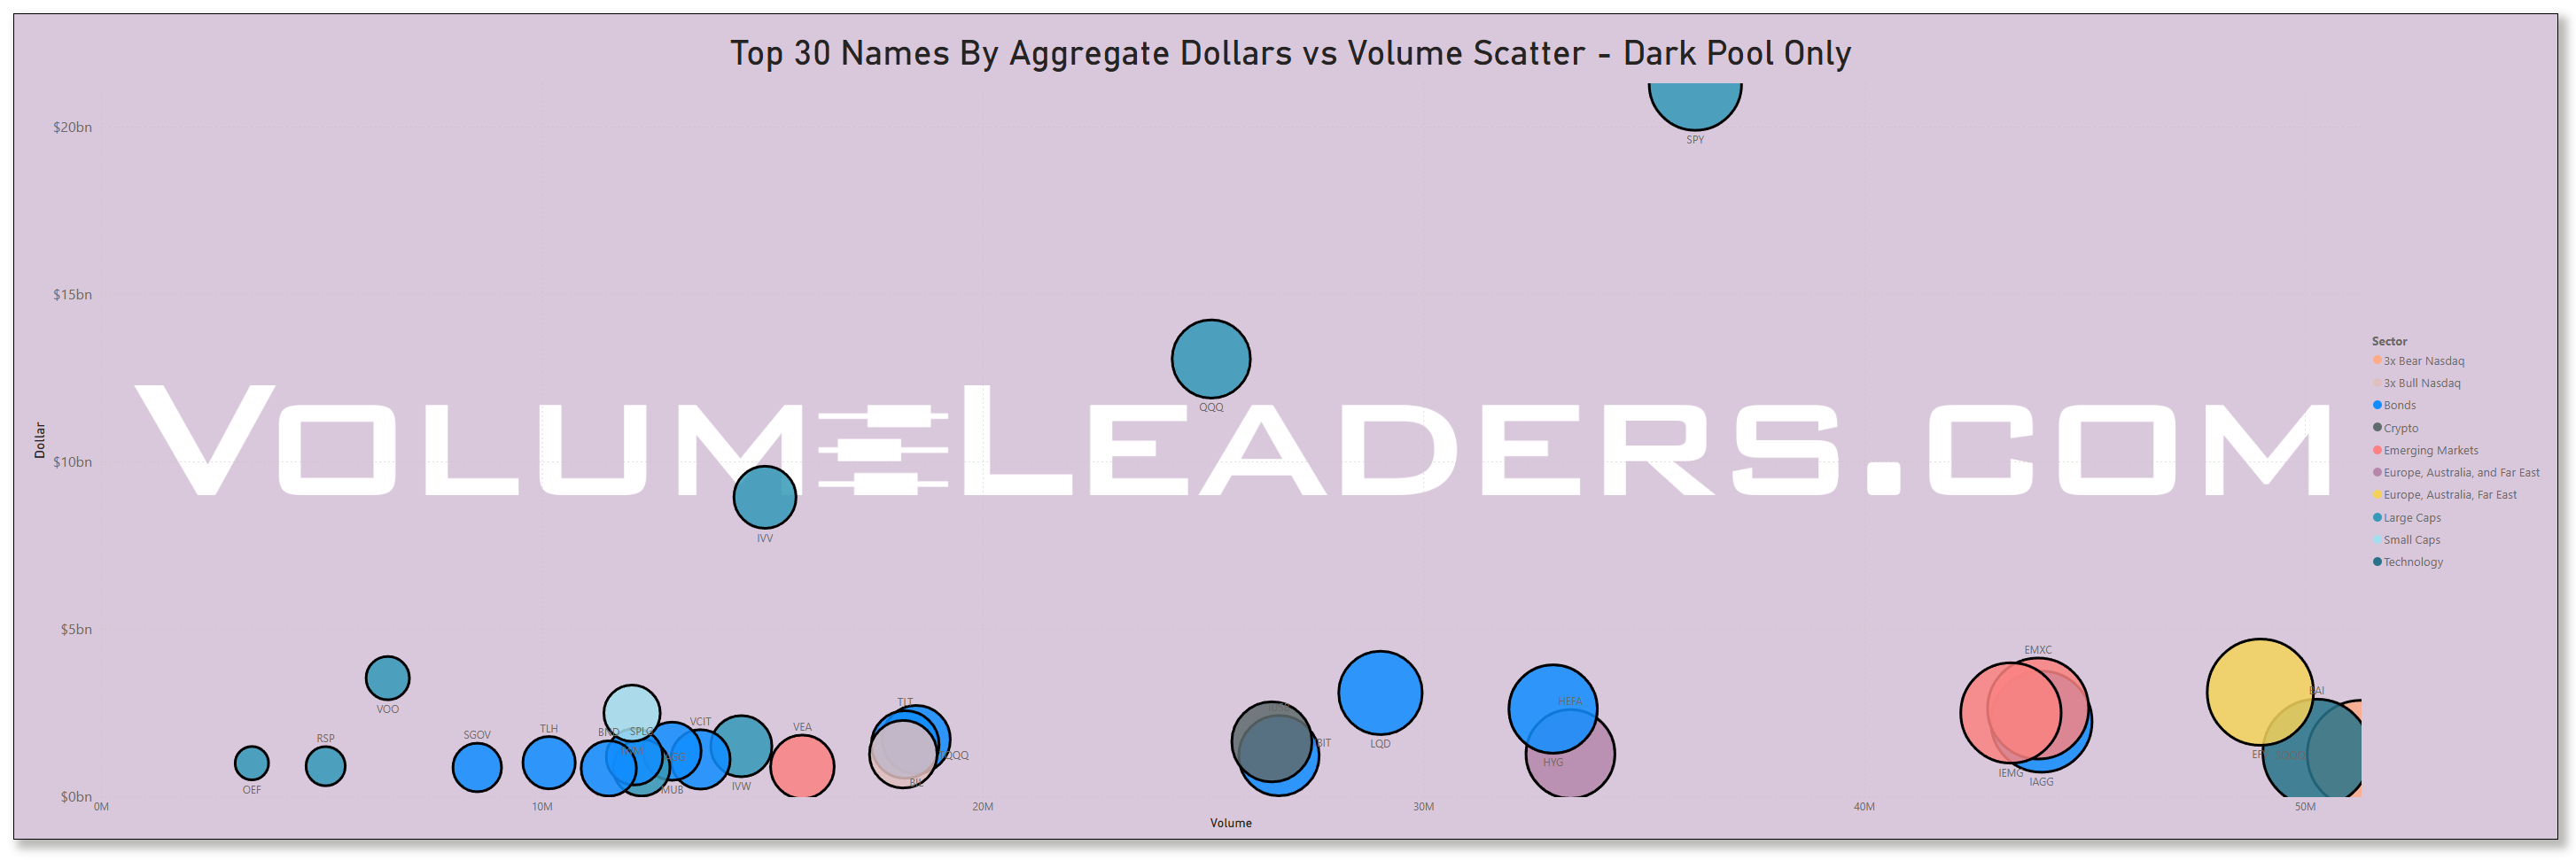
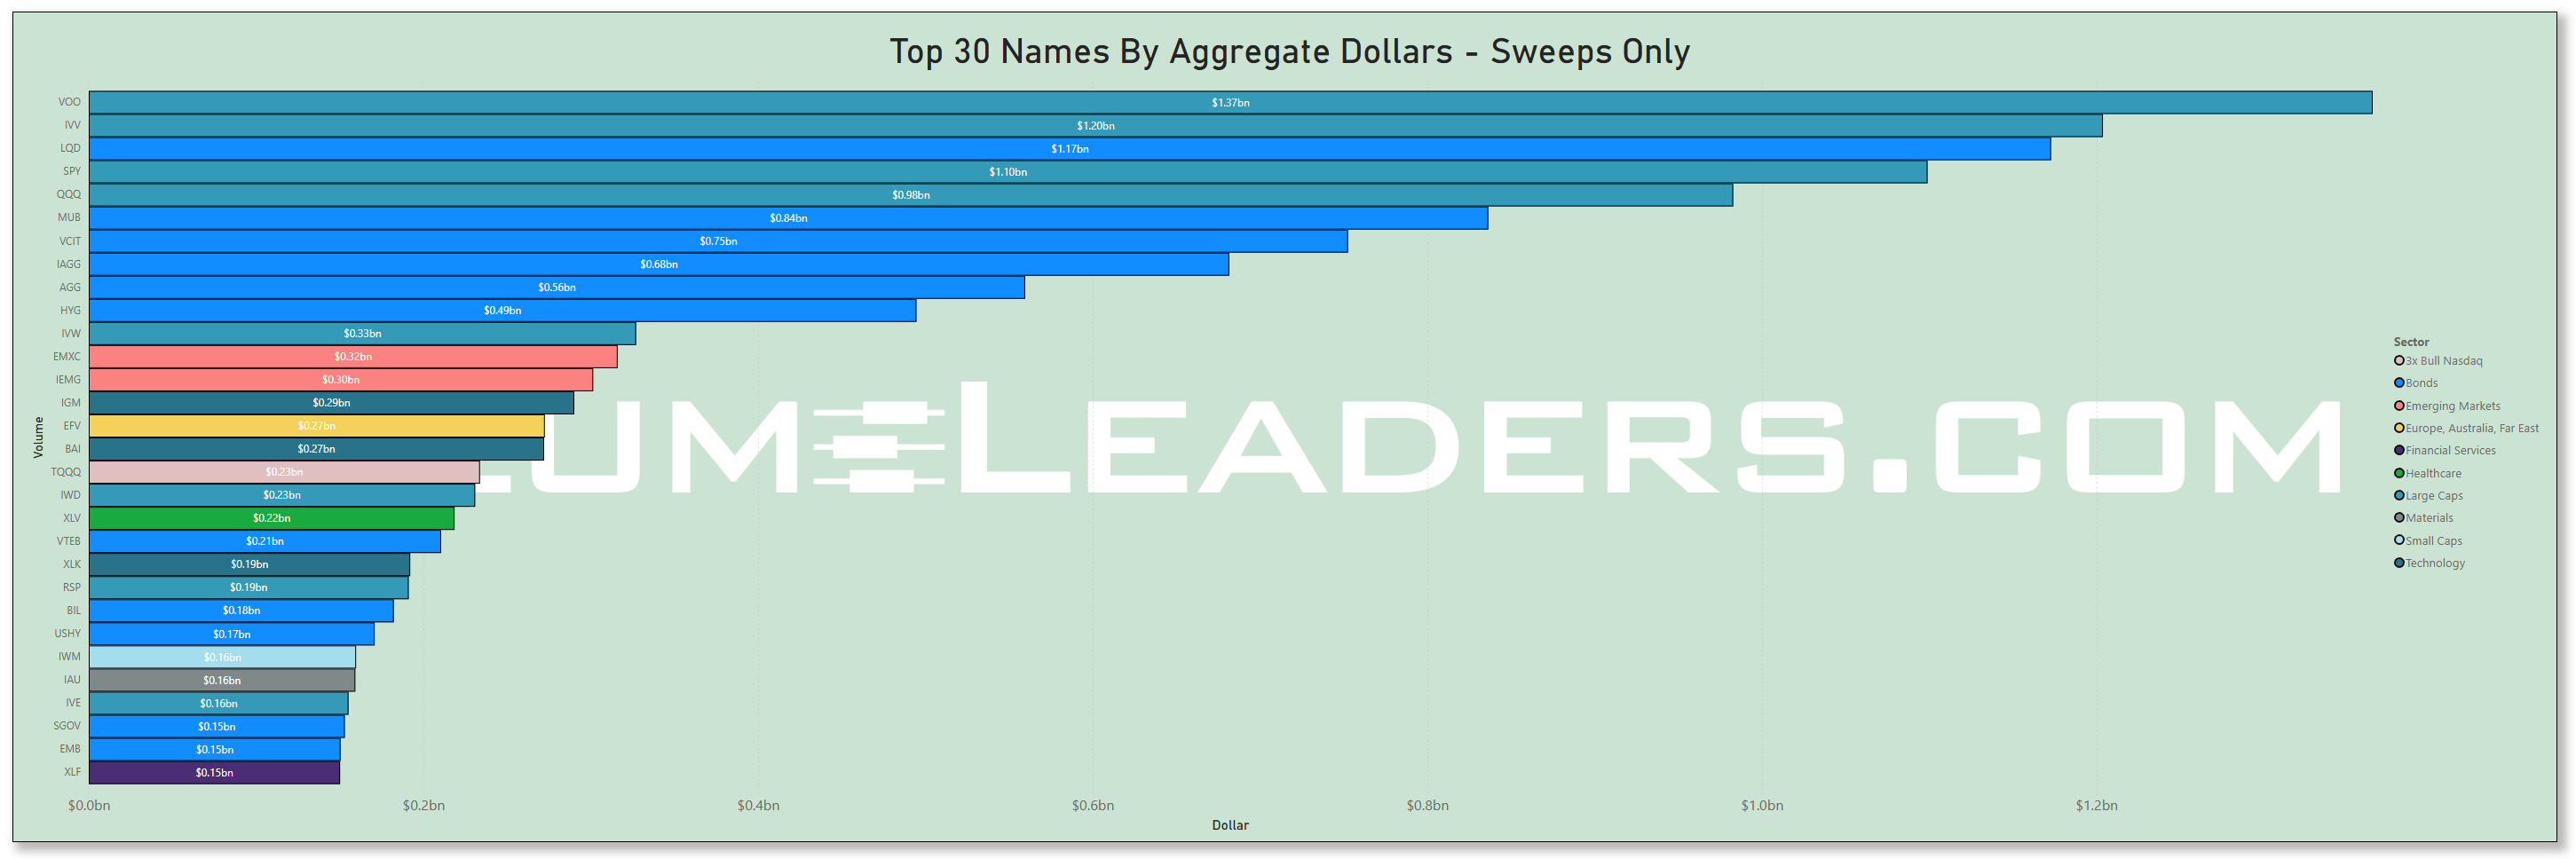
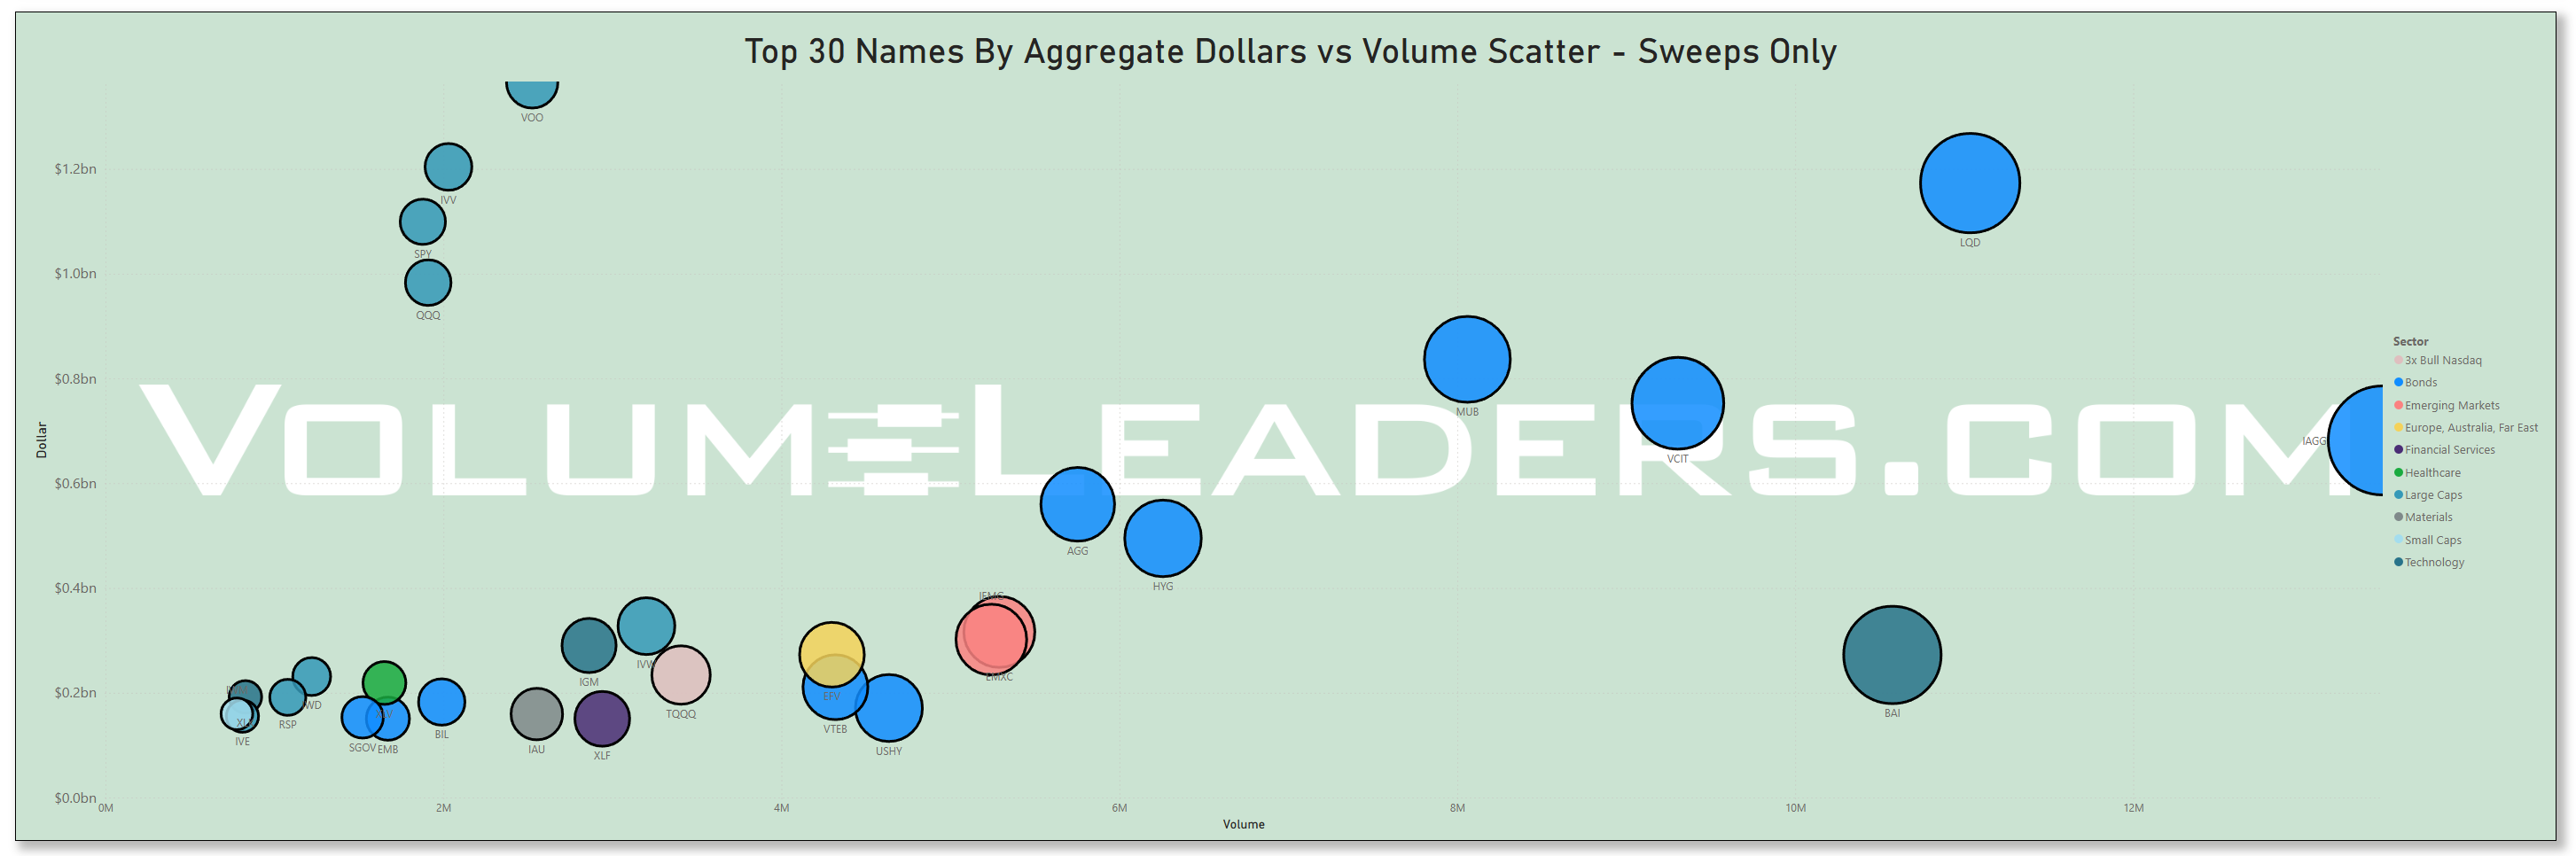
Many excellent trade ideas and sources of inspiration can be found in the prints below. While only the top 30 from each group are displayed, the complete results are accessible in VolumeLeaders.com for you to explore at your convenience any time. Remember to configure trade alerts within the platform to ensure institutional order flows that capture your interest or are significant to you aren’t missed. The blue charts represent all types of trades, including blocks on lit exchanges; the purple charts exclusively depict dark pool trades; and the green charts are sweeps only.
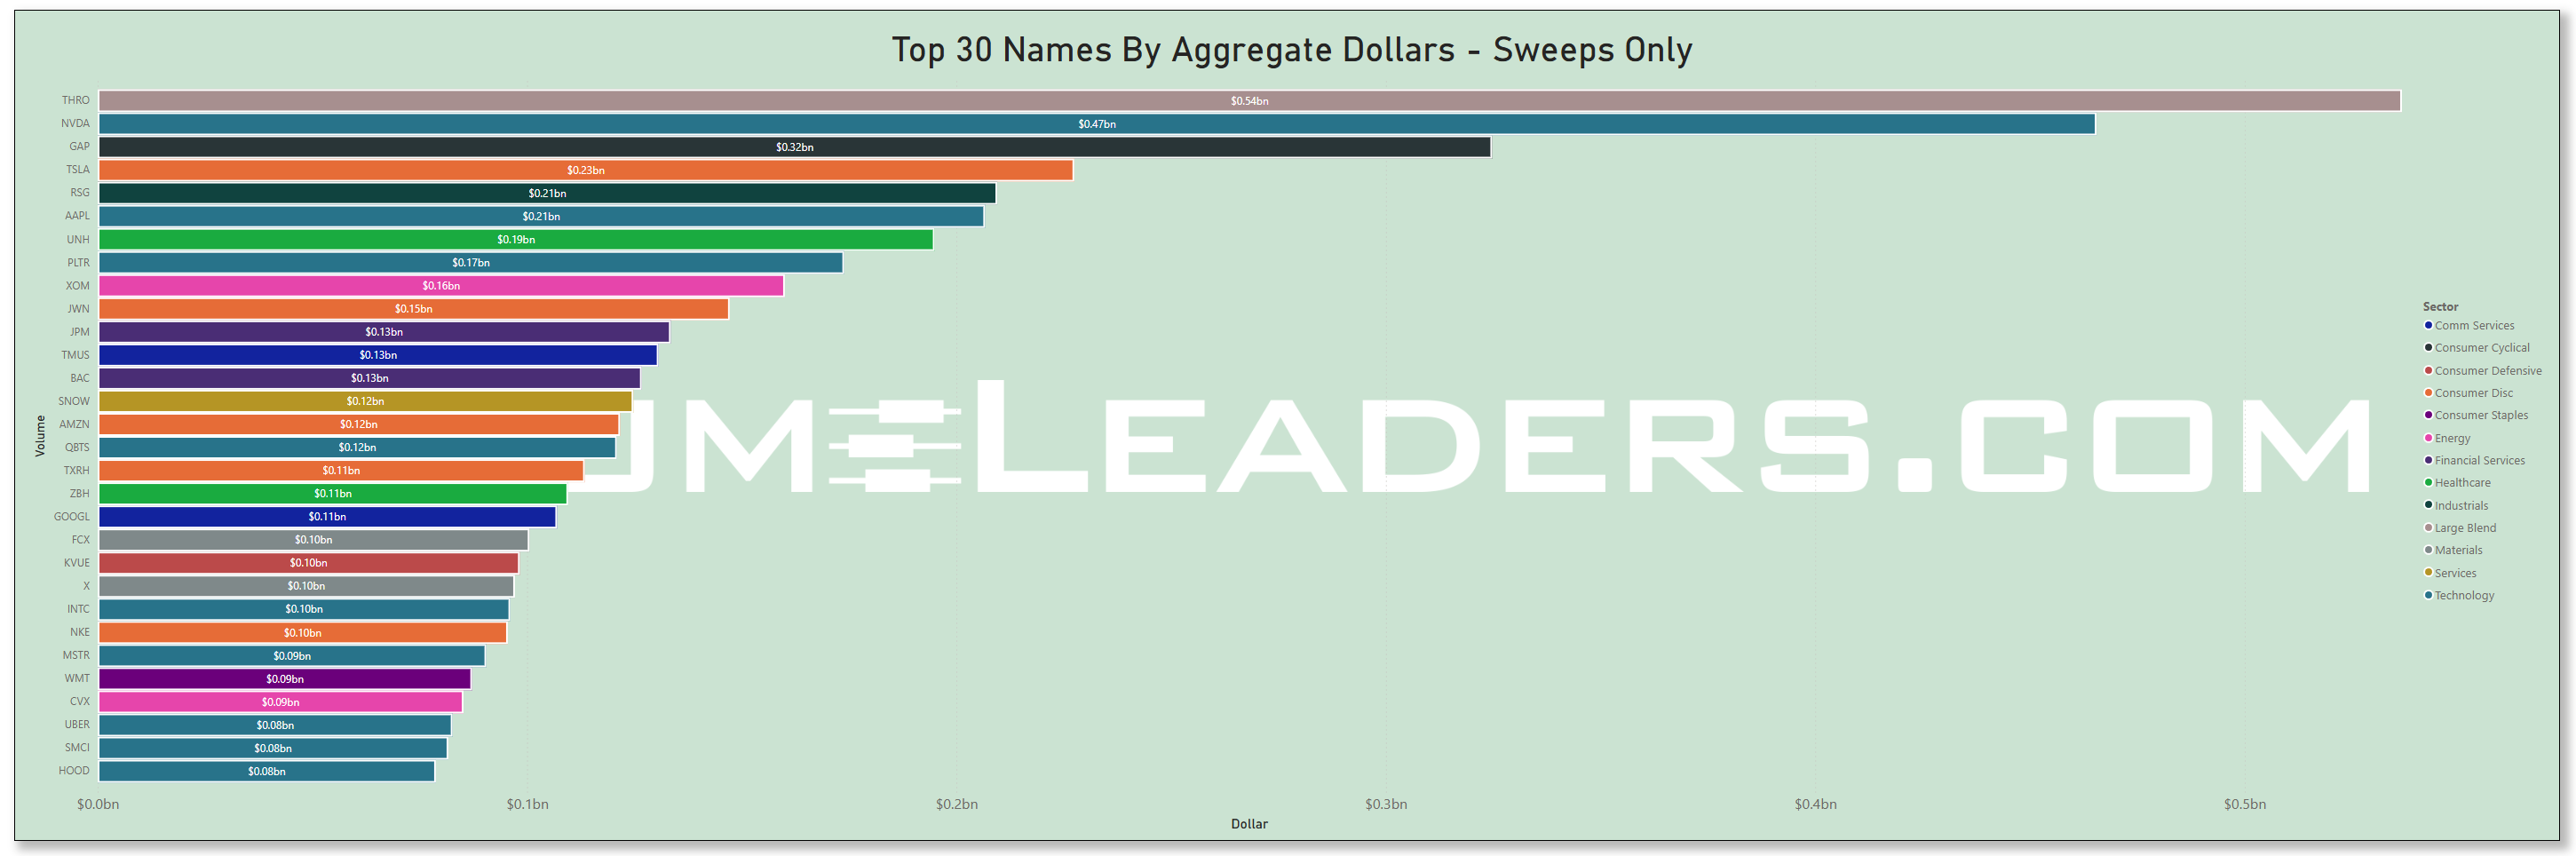
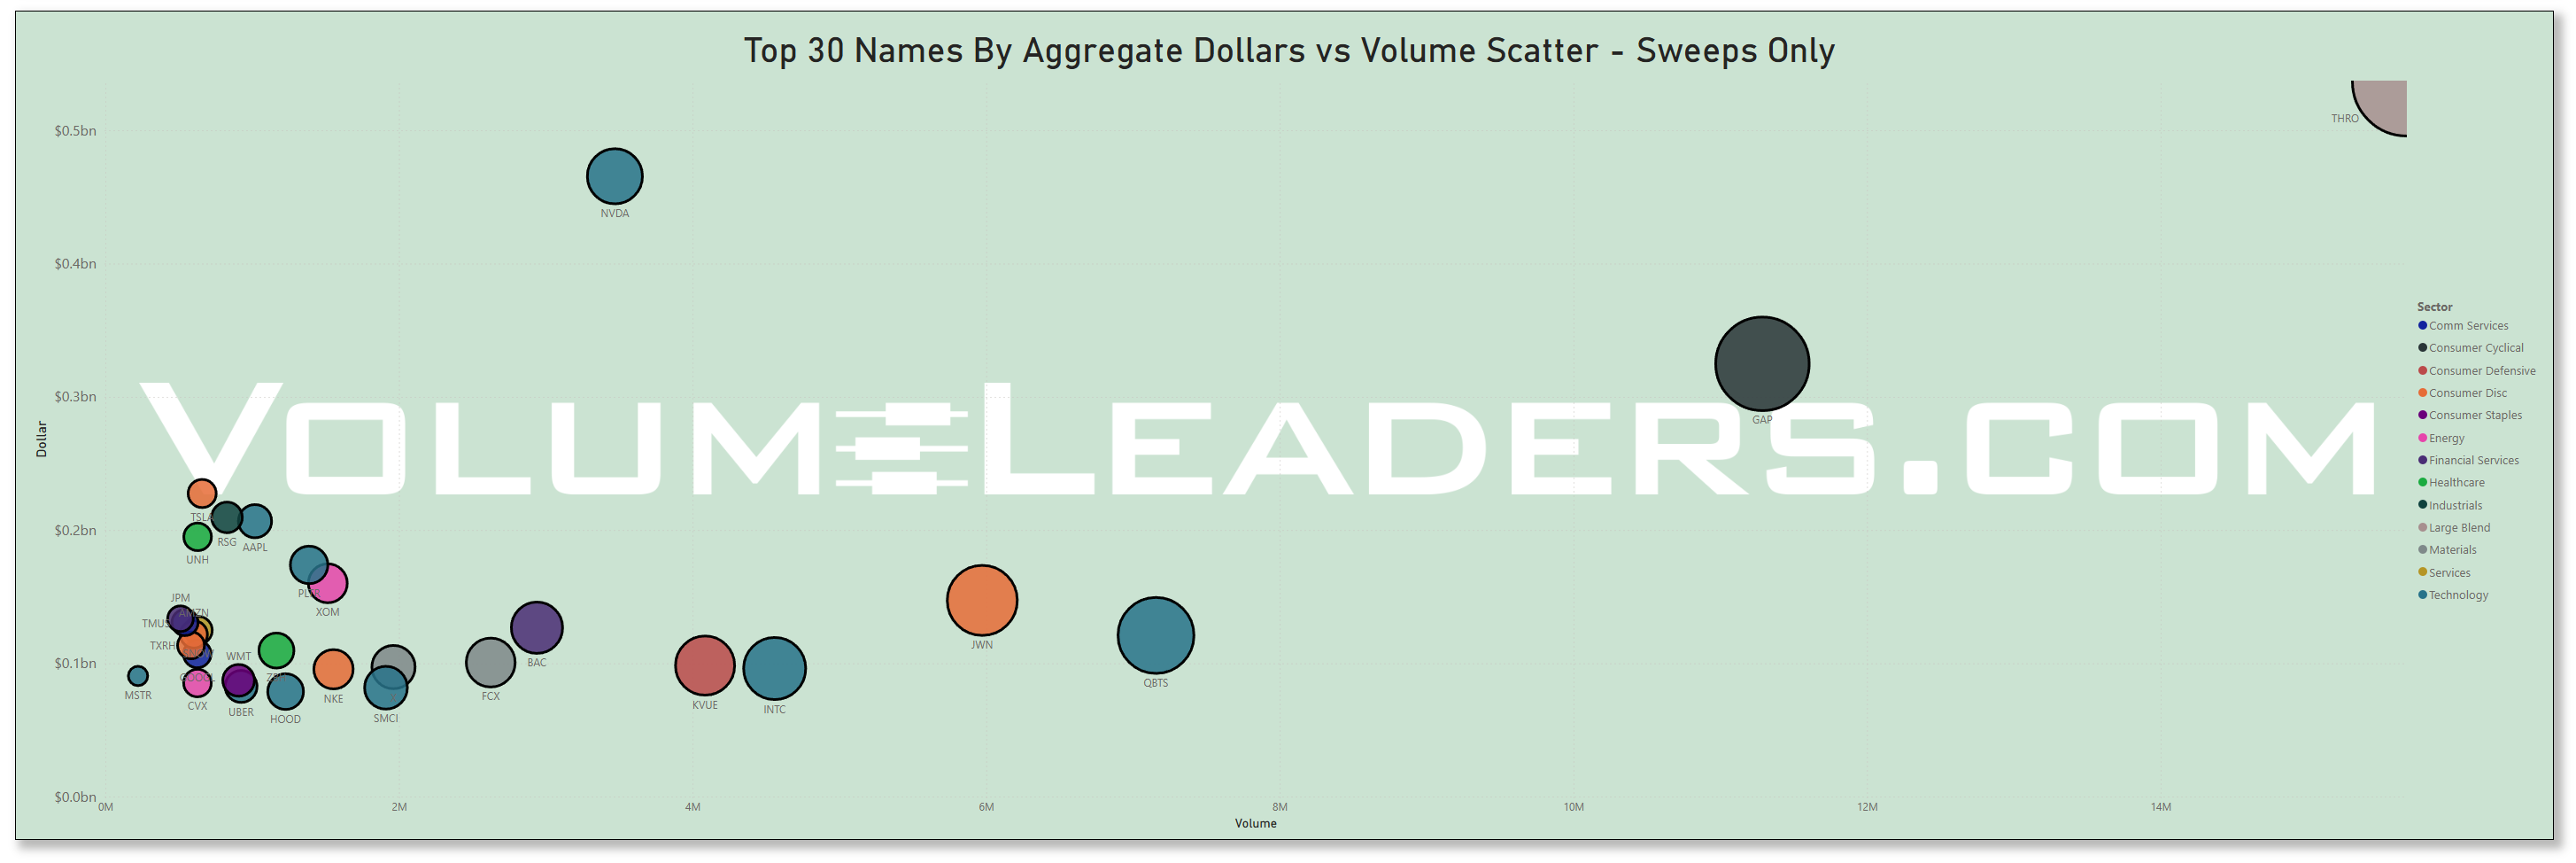
Top Institutional Order Flow In ETFs
Last Week’s Billion-Dollar Prints
Tickers that printed a trade worth at least $1B last week get a special shout-out. These are massive commitments by institutions that should not be ignored.
Analysis of This Week’s Top-25-Ranked Institutional Order Flow: Key Patterns & Insights
Executive Summary
Total Market Activity: $28.0 billion across 611 institutional trades
Period: May 19-23, 2025
Unique Tickers: 307 securities
Average Trade Size: $45.8 million
Peak Activity Day: May 20 with $13.8 billion (49% of weekly volume), when indices were broadly at their respective weekly highs
🎯 Key Findings
EXPLOSIVE INTERNATIONAL REPOSITIONING: Institutions deployed $1.6 billion into European markets with up to 261x normal activity in bond ETFs, signaling massive USD hedging or anticipation of international rate cuts.
CONTRARIAN HEALTHCARE PLAYS: $766M UnitedHealth position while stock trades at -36% YTD suggests institutional "blood in the streets" accumulation ahead of potential resolution.
AI ACCELERATION CONFIRMED: Pegasystems saw 119x normal volume coinciding with 44% revenue growth, validating institutional AI transformation thesis.
🚀 Top Mega-Money Moves
Tier 1: Billion-Dollar Institutional Statements
Tier 2: High-Conviction Specialized Plays
HEFA 0.00%↑ (Europe ETF): $513.8M at 162x normal - European monetary policy anticipation
AGG 0.00%↑ (US Bonds): $498.7M at 62x normal - Rate cut positioning
OEF 0.00%↑ (Large Caps): $467.7M at 73.7x normal - Quality growth allocation
BAI 0.00%↑ (Technology): $463.7M at 55x normal - AI infrastructure build-out
IUSB 0.00%↑ (Int'l Bonds): $456.3M at 134.8x normal - Global fixed income diversification
📊 Sector Intelligence
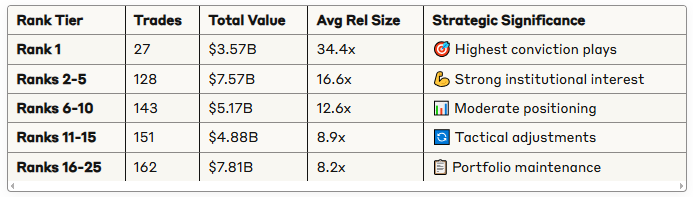
Sector Significance Rankings (Multi-Factor Score 0-100)
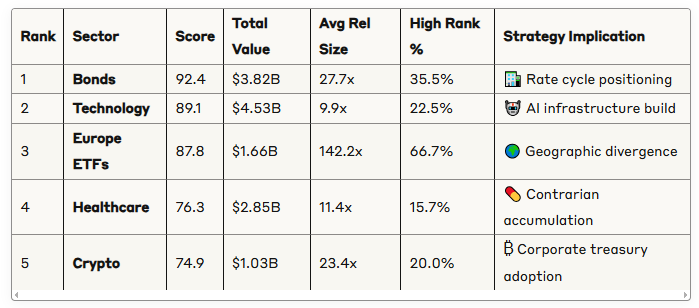
Sector Strategic Insights
🏦 Bonds (31 trades, $3.82B)
261x normal activity in IAGG suggests major currency hedging
International bond focus indicates dollar weakness anticipation
Rate cut expectations driving fixed income rotation
🤖 Technology (102 trades, $4.53B)
AI pure-plays showing 100x+ activity (PEGA, BAI)
Infrastructure build-out continuing despite high valuations
Institutional confidence in AI transformation timeline
🌍 International (Europe/Emerging)
182x normal volume in European ETFs
$2.6B total international exposure suggests major geographic rebalancing
Anticipation of Fed/ECB policy divergence
🏭 Industry Intelligence
Top Industries by Institutional Commitment
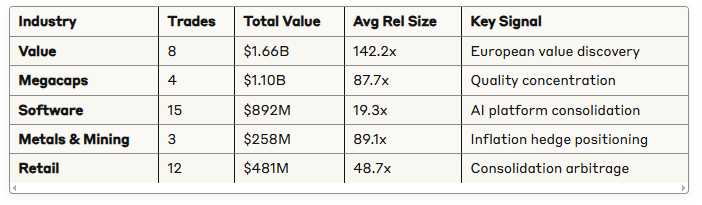
Emerging Industry Themes
🛒 Retail Consolidation: JWN 0.00%↑ showing 148x activity amid $6.25B privatization
⚡ AI Software Platforms: PEGA's 119x volume validates enterprise AI adoption acceleration
🏗️ Infrastructure Metals: Gold ETF ( IAU 0.00%↑ ) at 157x normal suggests continued interest in hedging against inflation/currency risks
🐂🐻 Bull vs Bear Sentiment Analysis
Leveraged ETF Positioning Summary
Bull Trades: 54 positions, $129.9M total value
Bear Trades: 10 positions, $19.0M total value
Bull/Bear Ratio: 6.85:1 - Strong bullish institutional sentiment
Bull Trade Breakdown by Theme
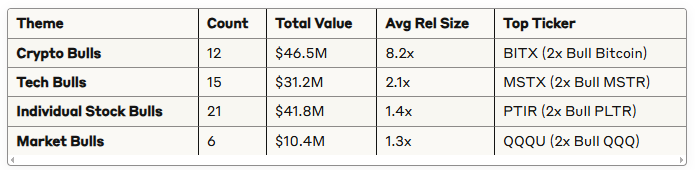
Bear Trade Breakdown
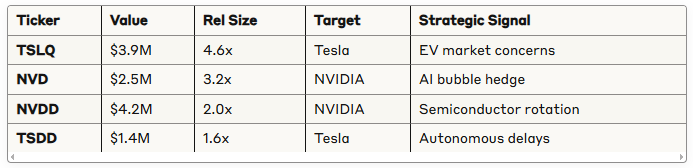
Sentiment Analysis
The 6.85:1 bull/bear ratio indicates strong institutional optimism, but the presence of NVIDIA and Tesla hedges suggests sophisticated risk management around high-momentum names as breadth retreats this week.
📈 Rank Analysis
Rank Distribution Patterns
Rank 1 Mega-Conviction Analysis
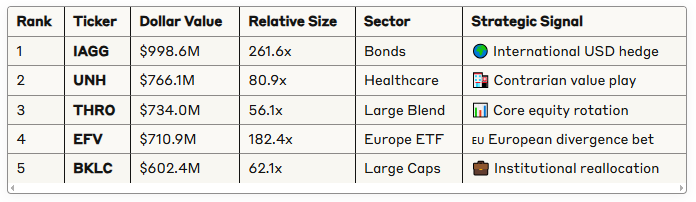
Top Rank 1 Positions by Significance:
IAGG 0.00%↑ - $999M (Bonds): International currency hedge
THRO 0.00%↑ - $734M (Large Blend): Core equity reallocation
HEFA 0.00%↑ - $514M (Europe): Geographic diversification
BAI 0.00%↑ - $464M (Technology): AI infrastructure
PEGA 0.00%↑ - $314M (Technology): Enterprise AI platform
📊 Statistical Distributions
Dollar Value Distribution
Median Trade: $8.3M
Mean Trade: $45.8M
Standard Deviation: $127.3M
95th Percentile: $156.8M
Distribution Characteristics: Highly right-skewed with 15 trades >$300M representing 58% of total dollar volume, indicating institutional "go big or go home" mentality on key themes.
Relative Size Distribution
Mean Relative Size: 11.8x
Median: 3.2x
Maximum: 261.6x (IAGG)
90th Percentile: 24.7x
Activity Buckets:
1-5x Normal: 342 trades (56%) - Routine positioning
5-25x Normal: 189 trades (31%) - Elevated interest
25-100x Normal: 65 trades (11%) - High conviction
100x+ Normal: 15 trades (2%) - Extreme positioning
🎯 Ticker Clustering Analysis
Multi-Factor Trade Significance Rankings (0-100 Scale)
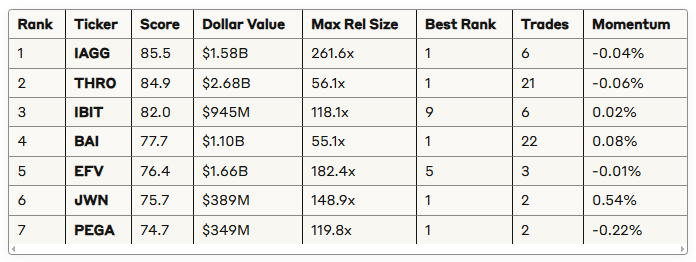
Clustering Insights
🏆 Tier 1 (80+ Points): Mega-Conviction Plays
International bonds (IAGG) and European equity (EFV) dominance
Core equity rotation (THRO) with massive scale
Crypto corporate adoption (IBIT) acceleration
⭐ Tier 2 (70-79 Points): High-Significance Themes
Technology infrastructure + AI (BAI, PEGA)
Retail consolidation (JWN), watch for more M&A activity
Specialized sector rotation plays
🕒 Similar Size Last Seen Patterns
Historical Activity Timeline Analysis
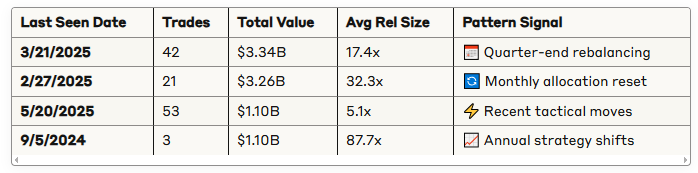
Pattern Recognition
Quarterly Rebalancing (3/21/2025): 42 trades worth $3.3B suggest major portfolio rebalancing at Q1 end, with many positions now being doubled down on.
Recent Acceleration (5/19-5/22): 76 trades worth $1.85B with 8.1x average relative size indicates institutions are rapidly implementing new positioning as macro conditions shift.
Historical Echo Patterns: Trades with similar sizes last seen 6-9 months ago suggest institutions are returning to previously successful strategies.
💡 Multi-Factor Trade Significance
Scoring Methodology
For Individual Tickers (100-point scale):
Dollar Value (0-25): Based on $1B+ threshold for maximum points
Relative Size (0-25): Based on 100x+ activity for maximum points
Rank (0-20): Better rank = higher score (Rank 1 = 20 points)
Multiple Trades (0-15): Bonus for sustained institutional interest
Price Momentum (0-15): Absolute value of price movement
For Sectors (100-point scale):
Dollar Value (0-25): Based on $5B+ threshold
Relative Size (0-25): Based on 50x+ average activity
High Rank % (0-25): Percentage of trades in Ranks 1-5
Trade Count (0-15): Volume of institutional interest
Price Movement (0-10): Sector momentum indicators
Top Significance Insights
85.5-Point IAGG: Perfect storm of massive scale ($1.6B), extreme activity (261x), top ranking, and multiple institutions participating.
84.9-Point THRO: Sustained institutional positioning (21 trades) of core equity exposure with significant scale.
82.0-Point IBIT: Bitcoin corporate treasury adoption accelerating with 118x normal activity despite mid-tier ranking.
🎯 Actionable Intelligence for Investors
🚨 High-Conviction Institutional Themes
1. International Diversification Acceleration
Action: Watch European ETFs (EFV, HEFA) and international bonds (IAGG)
Catalyst: Fed/ECB policy divergence expectations
Timeline: 3-6 months as rate cycles diverge
2. Healthcare Contrarian Opportunity
Action: Monitor UNH for entry points as institutional accumulation continues
Catalyst: Resolution of DOJ investigation or management stability
Risk: Regulatory overhang remains significant
3. AI Infrastructure Validation
Action: Focus on enterprise AI platforms (PEGA) showing revenue acceleration
Catalyst: Q3 2025 product launches and adoption metrics
Supporting Data: 44% revenue growth coinciding with institutional buying
4. Retail Consolidation Wave
Action: Monitor M&A arbitrage opportunities in retail sector
Catalyst: JWN privatization success encouraging additional takeouts
Sector: Department stores and specialty retail chains
⚠️ Risk Management Signals
Tech Hedging Activity: NVIDIA and Tesla bear positions suggest institutions are hedging momentum names despite overall bullish stance.
Currency Hedge Urgency: 261x activity in international bonds suggests institutions expect significant USD moves.
Sector Rotation Acceleration: Massive bond and international positioning indicates potential equity market leadership change.
📈 Portfolio Positioning Recommendations
Immediate (1-4 weeks):
Monitor department store and specialty retail chains for M&A arbitrage opps
Consider international bond exposure via IAGG
Watch for UNH stabilization signals
Medium-term (1-3 months):
European equity exposure ahead of policy divergence
AI infrastructure plays with validated revenue growth, stick to names with healthy balance sheets
Gold/inflation hedges remain prudent
Long-term (3-6 months):
Healthcare sector recovery plays
Continued crypto corporate adoption
Potential retail consolidation beneficiaries
🎯 Conclusion
This week's institutional trading data reveals a strategic inflection point where smart money is aggressively repositioning for major macroeconomic shifts. The combination of 261x normal bond ETF activity, $766M contrarian healthcare bets, and 119x AI platform accumulation suggests institutions see significant opportunities emerging from current market dislocations.
Key Strategic Shifts Identified:
Geographic Rebalancing: $2.6B related to international markets
Sector Rotation: From growth to value and domestic to international
Risk Management: Selective hedging of momentum names
Theme Validation: AI transformation and crypto adoption continuing
Critical Success Factors:
Timing: Institutions are positioning ahead of anticipated policy divergences
Scale: $28B in weekly activity represents conviction
Diversification: 307 unique tickers is not the most diverse weekly set we’ve seen but is decent and suggests post-OPEX tactical repositioning
The data suggests investors should prepare for increased volatility as these institutional positions unfold, with particular attention to currency movements, sector rotation, and geographic rebalancing themes that are driving this level of institutional activity.
Thank you for being part of our community and for dedicating your time to this edition. Your insights and engagement drive everything we do, and we’re honored to share this space with such committed, thoughtful readers. Here’s to a week filled with clear opportunities and strong performance. Wishing you many bags 💰💰💰
—Volumeleaders