Market Momentum: Your Weekly Financial Forecast & Market Prep
Issue 45 / What to expect May 19, 2025 thru May 23, 2025
In This Issue
[Free For Everyone]
Market-On-Close: All of last week’s market-moving news and macro context in under 5 minutes
The Latest Investor Sentiment Readings
Institutional Support & Resistance Levels For Major Indices: Exactly where to look for support and resistance this coming week in SPY, QQQ, IWM & DIA
Special Coverage Report: Projecting S&P 500 Valuations: A Guide to Determining Current Fair Value
Normalized Performance By Thematics YTD (Sector, Industry, Factor, Energy, Metals, Currencies, and more): which corners of the markets are beating benchmarks, which ones are overlooked and which ones are over-crowded
Key Econ Events and Earnings On-Deck For This Week
[Only For Subs]
Institutional Activity By Day (rolling 6-months)
Institutional Activity By Sector By Week (rolling 6-months)
This Week’s Institutional Activity In Equities: Institutional order flow broken down by sector and names in equities. Includes the largest sweeps and blocks on lit exchanges and hidden dark pools.
This Week’s Institutional Activity In ETFs: Institutional order flow broken down by sector and names for ETFs. Includes the largest sweeps and blocks on lit exchanges and hidden dark pools.
Statistical Analysis and Insights From This Week’s Top Prints: a deep dive into what the latest positioning data might be telling us of things to come

Market-On-Close
Financial Markets Weekly Review: Trade Tensions Ease and Markets Rally
Executive Summary
The financial markets experienced a significant rebound this week, with major indices posting their strongest weekly gains in months. This remarkable turnaround was primarily driven by the de-escalation of trade tensions between the United States and China, following productive negotiations in Switzerland. The two economic powerhouses agreed to substantially reduce tariffs during a 90-day period while working toward a longer-term agreement. Additionally, favorable inflation data and strategic policy shifts in the technology sector contributed to the positive market sentiment. Despite these encouraging developments, underlying concerns about consumer confidence, retail spending patterns, and the potential long-term impact of trade policies continue to warrant careful consideration for investors navigating this complex landscape.

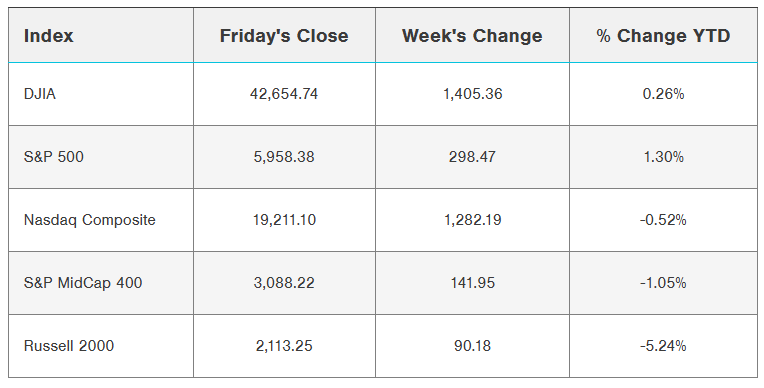
Market Performance Overview
Equity markets rallied strongly throughout the week, with technology stocks leading the charge. The Nasdaq Composite demonstrated exceptional strength, surging 7.15% as investors responded favorably to the easing of trade restrictions, particularly those related to artificial intelligence chips. The S&P 500 advanced 5.27%, successfully returning to positive territory for 2025 and recording its best weekly performance in months. Meanwhile, the Dow Jones Industrial Average gained 3.41%, reaching a six-week high.
Friday's session continued the week's positive momentum, with the S&P 500 climbing 0.70% to reach a 2¼-month high. The Dow Jones Industrials rose 0.78%, marking a 1½-month high, while the Nasdaq 100 added 0.43%. This upward trajectory was further supported by reports that the United States and European Union had broken an impasse in tariff negotiations, reinforcing the theme of improving international trade relations.
Smaller-cap indices also performed well, with the S&P MidCap 400 and Russell 2000 registering their sixth consecutive week of gains. This broader market participation suggests increasing investor confidence beyond the large-cap segment.
Trade Relations: A Pivotal Turning Point
The week's defining development emerged from the Switzerland trade talks between U.S. and Chinese officials. After escalating tensions throughout April, which had seen tariffs spike to prohibitive levels of 145% from the U.S. and 125% from China, negotiators reached a significant breakthrough. Both nations agreed to substantially reduce these rates—to 30% and 10%, respectively—for a 90-day cooling-off period while pursuing more comprehensive trade discussions.
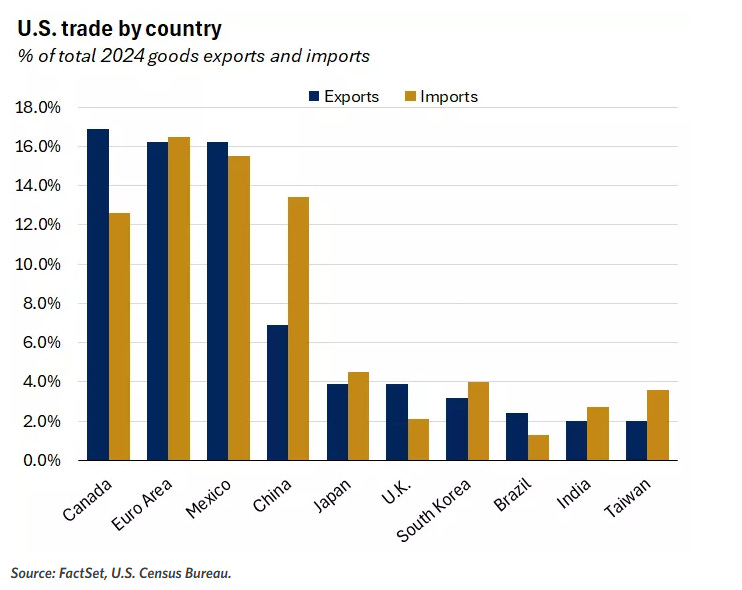
This temporary truce holds particular significance given China's prominence as a U.S. trading partner, accounting for approximately 13% of U.S. imports and receiving about 7% of U.S. exports. By comparison, the previously announced agreement with the United Kingdom affected a much smaller trade relationship, with the UK representing only 2% of U.S. imports and 4% of exports.
In a separate but equally important development, the Biden administration announced plans to ease trade restrictions related to artificial intelligence chips. This policy shift enabled major technology companies to explore new international agreements, as evidenced by the announced deal between NVIDIA and Saudi Arabia. These developments particularly energized the technology sector and contributed to its market outperformance.
While these breakthroughs have reduced immediate concerns, market participants remain cognizant that trade negotiations will likely extend over several months, with the 90-day tariff suspension set to expire in early July. Bloomberg reported Friday that the Trump administration plans to establish tariff rates for U.S. trading partners within the next two to three weeks, suggesting that trade policy will remain a focal point for market sentiment in the near term.
Economic Indicators: Mixed Signals
Inflation Shows Signs of Moderation
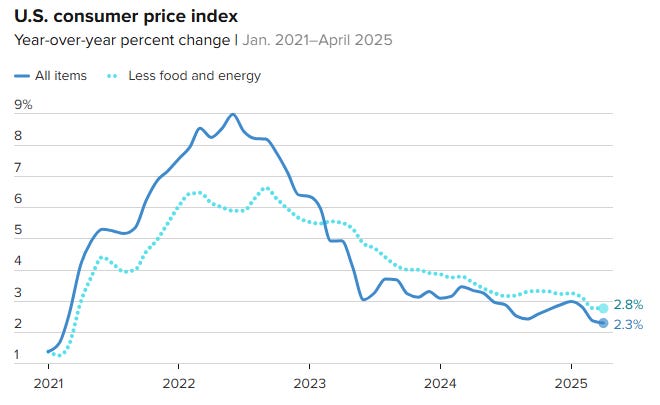
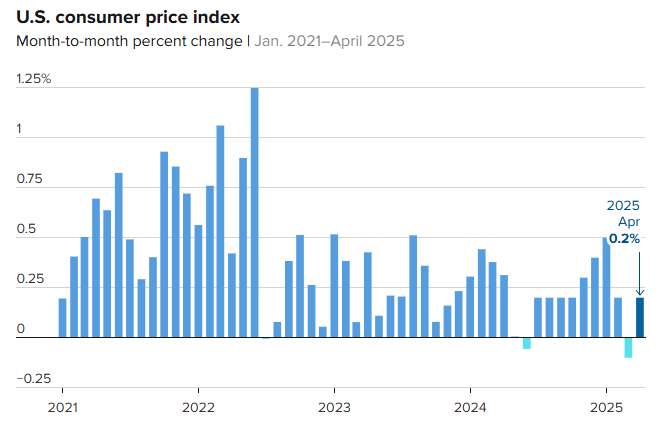
The week delivered encouraging news on the inflation front, with data suggesting continued moderation in price pressures. The Consumer Price Index (CPI) for April increased by just 0.2% month-over-month, with shelter costs accounting for the majority of the increase. On a year-over-year basis, headline CPI rose 2.3%, down from March's 2.4% and representing the smallest annual increase since February 2021. Core CPI, which excludes volatile food and energy components, increased 0.2% for the month and 2.8% annually, holding relatively steady compared to the previous month's readings.
Producer price data provided even more reassuring evidence of easing inflationary pressures. The Producer Price Index (PPI) unexpectedly declined by 0.5% in April, significantly below the consensus forecast for a 0.2% increase. Core PPI similarly dropped by 0.4%. On an annual basis, headline PPI registered a 2.4% increase, while core PPI rose 3.1%, both lower than March figures. These readings suggest that wholesale inflation is moderating, potentially indicating a favorable trend for consumer prices in the months ahead.
However, one contradictory signal emerged from import price data released Friday. The April import price index excluding petroleum rose 0.4%, exceeding expectations of 0.1% and marking the largest monthly increase in nearly a year. This metric bears watching as it could reflect early impacts of trade policy shifts.
Perhaps most concerning were the University of Michigan's inflation expectations indicators for May, which showed consumer expectations for the year ahead jumping to a 43-year high of 7.3%, up significantly from April's 6.5%. Similarly, the 5-10 year inflation expectations rose to a 34-year high of 4.6%. These elevated expectations, if they persist, could complicate the Federal Reserve's policy decisions.
Consumer Sentiment and Spending Patterns
Consumer sentiment indicators presented a more challenging picture. The University of Michigan's preliminary May consumer sentiment index fell unexpectedly to 50.8, a nearly three-year low and well below the consensus forecast for an increase to 53.4. This marks the fifth consecutive monthly decline, with the index now approximately 30% below its January levels.
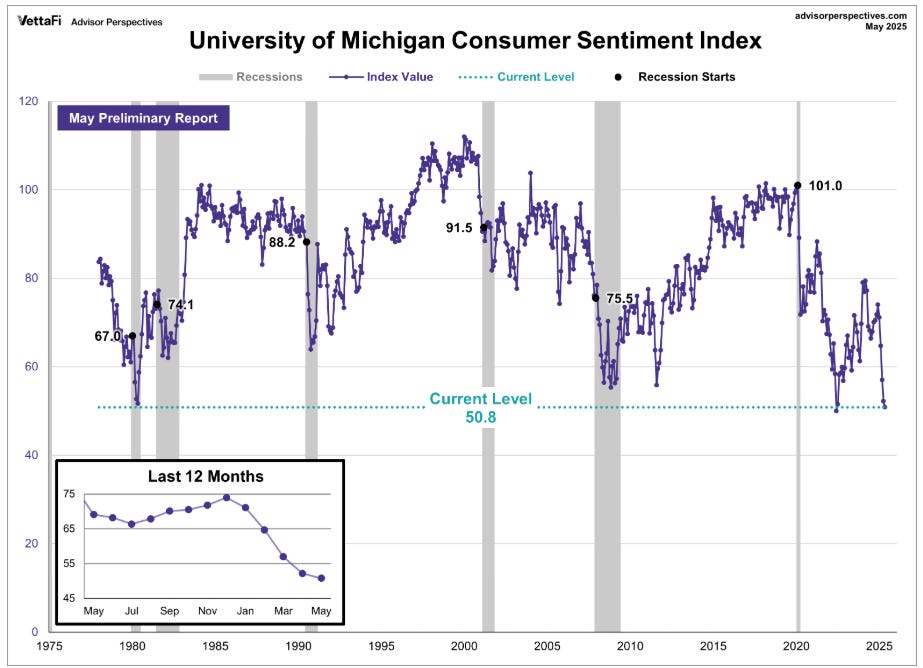
Survey director Joanne Hsu noted that "tariffs were spontaneously mentioned by nearly three-quarters of consumers, up from almost 60% in April; uncertainty over trade policy continues to dominate consumers' thinking about the economy." This suggests that despite the recent positive developments, trade concerns continue to weigh heavily on consumer psychology.
Retail sales data reflected this cautious consumer outlook, with April sales increasing just 0.1%, below expectations of 0.3% growth. While March figures were revised upward from 1.4% to an impressive 1.7%, the retail sales control group—which excludes volatile categories like gasoline, motor vehicles, and building materials—actually contracted by 0.2% in April. The deceleration in spending could indicate that consumers front-loaded purchases in March ahead of anticipated tariff increases, followed by a natural pullback in April.
Nevertheless, retail sales remain 5.1% higher than a year ago, suggesting underlying resilience in consumer spending despite the recent moderation. This strength is supported by solid household balance sheets, rising wages, and relatively stable labor market conditions.
Housing and Employment
The housing market showed signs of weakness in April. Housing starts rose 1.6% month-over-month to an annualized rate of 1.361 million units, slightly below expectations of 1.364 million.
More concerning was the 4.7% decline in building permits—a forward-looking indicator of construction activity—to 1.412 million units, well below the forecasted 1.450 million.
Labor market indicators remained relatively stable. Initial jobless claims registered at 229,000, in line with expectations and consistent with recent trends. Continuing claims also held steady, suggesting the employment situation has not deteriorated significantly despite the broader economic uncertainties.
Federal Reserve Outlook
The mixed economic data has reinforced market expectations that the Federal Reserve will maintain its current policy stance in the near term while closely monitoring developments in trade policy, inflation, and economic growth.
Atlanta Fed President Bostic offered modest support for markets with his comments on Friday, indicating that he expects the U.S. economy to slow this year but avoid recession. He projected "one rate cut this year" amid economic uncertainty, acknowledging that tariffs could exert upward pressure on inflation.

Federal Reserve Chair Powell reiterated the Fed's commitment to its 2% inflation target and emphasized the importance of keeping longer-term inflation expectations anchored. The market is currently pricing in only a 9% probability of a 25-basis-point rate cut at the June 17-18 FOMC meeting, suggesting investors anticipate the Fed will maintain its cautious approach in the near term.
The prevailing view among market participants is that while rate cuts remain a possibility later in 2025, the Federal Reserve is likely to defer any policy easing until it gains greater clarity on the impact of trade policies and their effect on inflation and economic growth.
Corporate Earnings and Sector Performance
The first-quarter earnings season is winding down, with over 80% of S&P 500 companies having reported results. The outcome has been remarkably positive, with 77% of companies exceeding analyst expectations—the highest proportion since the second quarter of 2024. Earnings growth for Q1 has reached 13.1%, substantially outpacing the 6.6% growth anticipated before the reporting period began.
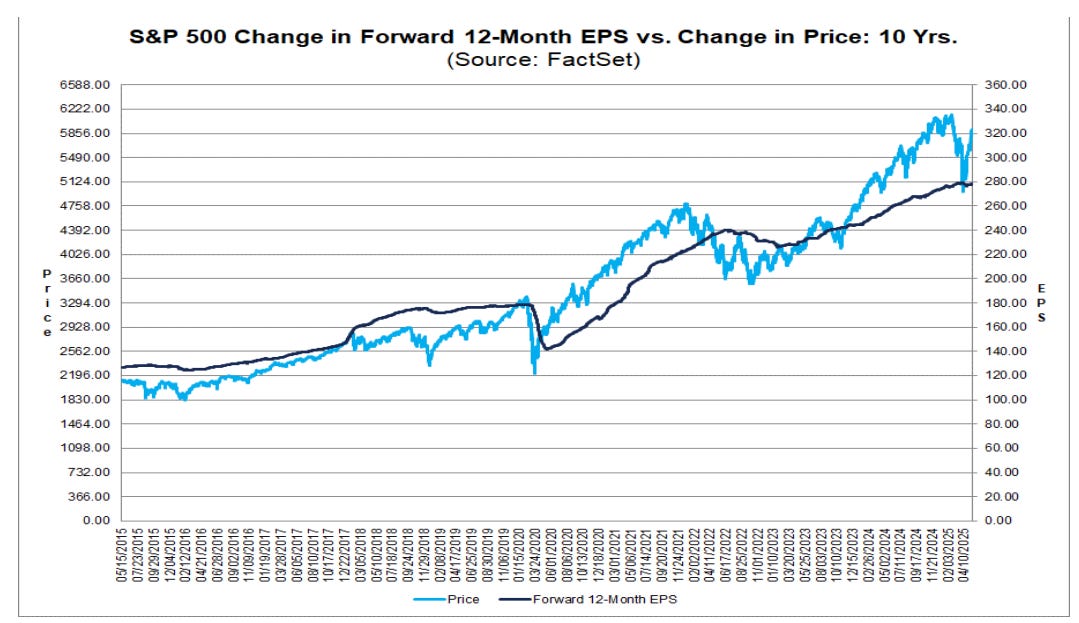
However, full-year profit projections have been tempered, with S&P 500 corporate earnings now expected to rise 9.4% in 2025, down from the 12.5% forecast in early January. This adjustment likely reflects increased uncertainty surrounding trade policies and their potential impact on corporate profitability.
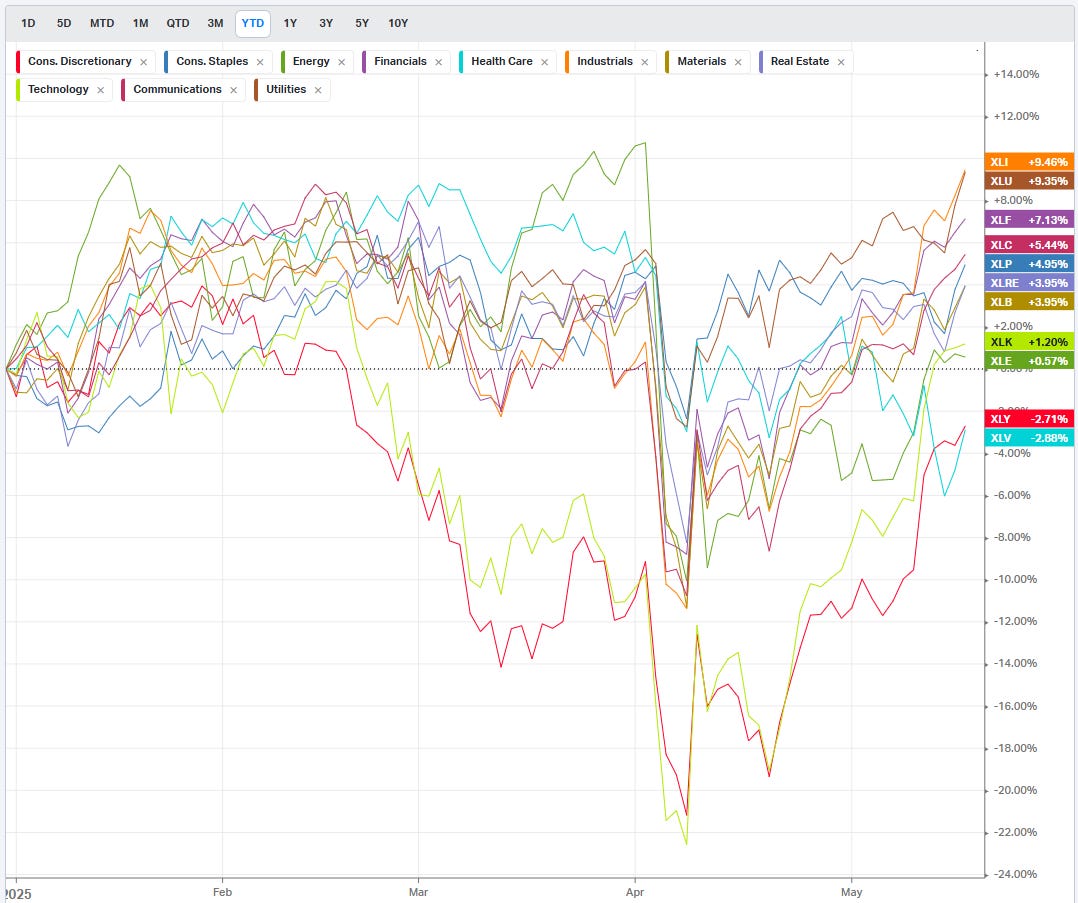
Sector performance this week reflected the shift in market sentiment. Early in the week, information technology, communication services, and consumer discretionary sectors led the rally, buoyed by the positive developments in trade policy. However, as the week progressed, defensive sectors such as utilities and consumer staples gained momentum, suggesting investors were hedging against potential volatility.
Several notable individual stock movements captured attention:
UnitedHealth Group surged more than 5% on Friday, leading gains in the S&P 500 as pharmaceutical stocks and health insurance companies rallied.
Moderna advanced over 5%, while Humana gained more than 4%.
Applied Materials declined more than 5%, weighing on chip stocks, after reporting Q2 net sales of $7.10 billion, below the consensus estimate of $7.13 billion.
CoreWeave jumped more than 22% after regulatory filings revealed that Nvidia had increased its stake in the company to 7% from 5.2%.
Archer Aviation rose more than 9% after being selected as the "Official Air Taxi Provider" for the 2028 LA Olympic and Paralympic Games.
Adobe gained more than 3%, leading advances in the Nasdaq 100, after Jeffries suggested that the company's price increase on Creative Cloud software plans made its 2025 revenue forecast appear "conservative."
Globant SA plummeted more than 23% after reporting disappointing Q1 revenue and cutting its full-year forecast.
Fixed Income Markets
Bond markets presented a mixed picture throughout the week. Treasury yields fluctuated in response to economic data releases but generally trended higher until Friday, when the 10-year Treasury yield fell 0.4 basis points to 4.428%. June 10-year T-notes closed up 2.5 ticks on Friday, finding support from the weaker-than-expected housing starts and consumer sentiment data.
European government bonds performed well, with the 10-year German bund yield decreasing 3.2 basis points to 2.590% and the 10-year UK gilt yield falling 1.1 basis points to 4.649%.
Investment-grade and high-yield corporate bonds outperformed Treasuries, benefiting from the risk-on market environment. New bond issuances were met with solid demand, reflecting improved investor confidence. Municipal bonds also outperformed Treasuries, though they faced some pressure late in the week from Treasury market weakness and a heavy issuance calendar.
ECB Governing Council member Kazaks provided insight into European monetary policy, suggesting that interest rate cuts are approaching their endpoint as "we are relatively close to the terminal rate already" if inflation returns to the 2% target this year as expected. Market participants are pricing in a 91% probability of a 25-basis-point rate cut by the ECB at its June 5 policy meeting.

Global Market Perspective
International markets displayed varied performance on Friday. The Euro Stoxx 50 reached a seven-week high, closing up 0.29%. Asian markets were less buoyant, with China's Shanghai Composite declining 0.40% and Japan's Nikkei Stock 225 finishing unchanged.
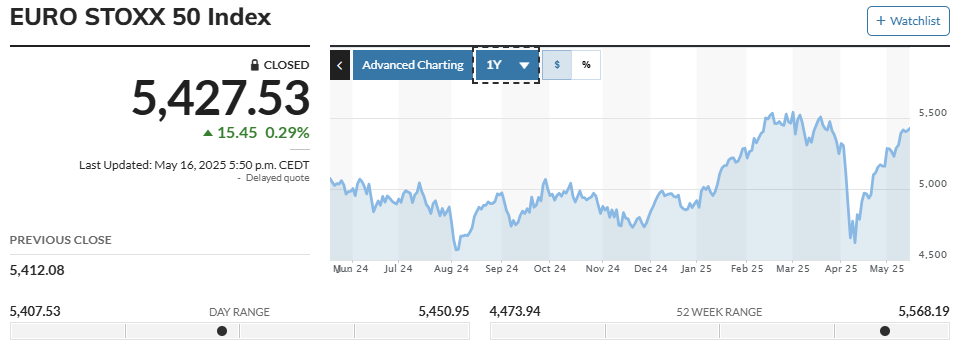
The contrasting performance highlights the different regional impacts of evolving trade policies and economic conditions. European markets benefited from progress in U.S.-EU trade negotiations, while Chinese markets remained more cautious despite the temporary tariff reduction agreement with the United States.
Investment Implications and Strategy
For investors navigating this complex environment, several strategic considerations emerge:
Volatility Management: Despite the impressive market recovery, with U.S. large-cap stocks rebounding from a nearly 19% decline in mid-April to positive territory for 2025, periods of volatility are likely to persist as trade negotiations continue and tax policy discussions intensify ahead of the year-end expiration of the 2017 Tax Cuts and Jobs Act.
Diversification Benefits: Globally diversified portfolios have demonstrated their value during this period of market turbulence, with international stocks and bonds providing a smoother path compared to U.S. equities alone.
Asset Allocation Preferences: Given the relative strength of the U.S. economy and the quality of its corporate sector, an overweight position in U.S. large- and mid-cap stocks appears warranted, while maintaining exposure to international markets for diversification benefits.
Fixed Income Strategy: Within bond allocations, intermediate- and long-term bonds may offer attractive opportunities, particularly as the 10-year Treasury yield approaches the upper end of its expected 4%-4.5% range for 2025.
Sector Positioning: Technology and healthcare sectors demonstrated resilience this week, while defensive sectors gained momentum as the week progressed. A balanced approach across growth-oriented and defensive sectors may help navigate potential market volatility.
Risk Management: Regular portfolio rebalancing remains essential to maintain alignment with long-term investment objectives while capitalizing on market dislocations.
The temporary reduction in tariffs between the U.S. and China has alleviated worst-case recessionary scenarios, but investors should remain prepared for potential challenges as trade policies evolve and their impact on inflation and economic growth becomes clearer.
Looking Ahead
As the market enters next week, several key developments bear watching:
Trade Policy Developments: Any updates on the timing or structure of permanent tariff rates could significantly impact market sentiment.
Consumer Behavior: Following the weaker-than-expected retail sales data and declining consumer sentiment, indicators of consumer spending will be closely monitored for signs of either resilience or further weakness.
Inflation Trajectory: With mixed signals from recent inflation reports and concerning inflation expectations data, upcoming price indicators will be scrutinized for evidence of either continued moderation or renewed pressure.
Corporate Commentary: As the earnings season concludes, management guidance and commentary on the potential impact of trade policies on profit margins and growth projections will provide valuable insights.
Federal Reserve Communication: Any shifts in tone from Fed officials regarding the inflation outlook or policy path could influence market expectations for interest rate movements later in the year.
While the immediate market outlook has brightened considerably following the de-escalation of trade tensions, investors should remain vigilant to potential shifts in policy, economic conditions, and market sentiment. The path forward is likely to include both opportunities and challenges as the global economy adapts to evolving trade relationships and policy frameworks.
Range, Breadth, New Highs & Lows By Index
S&P 500 Index
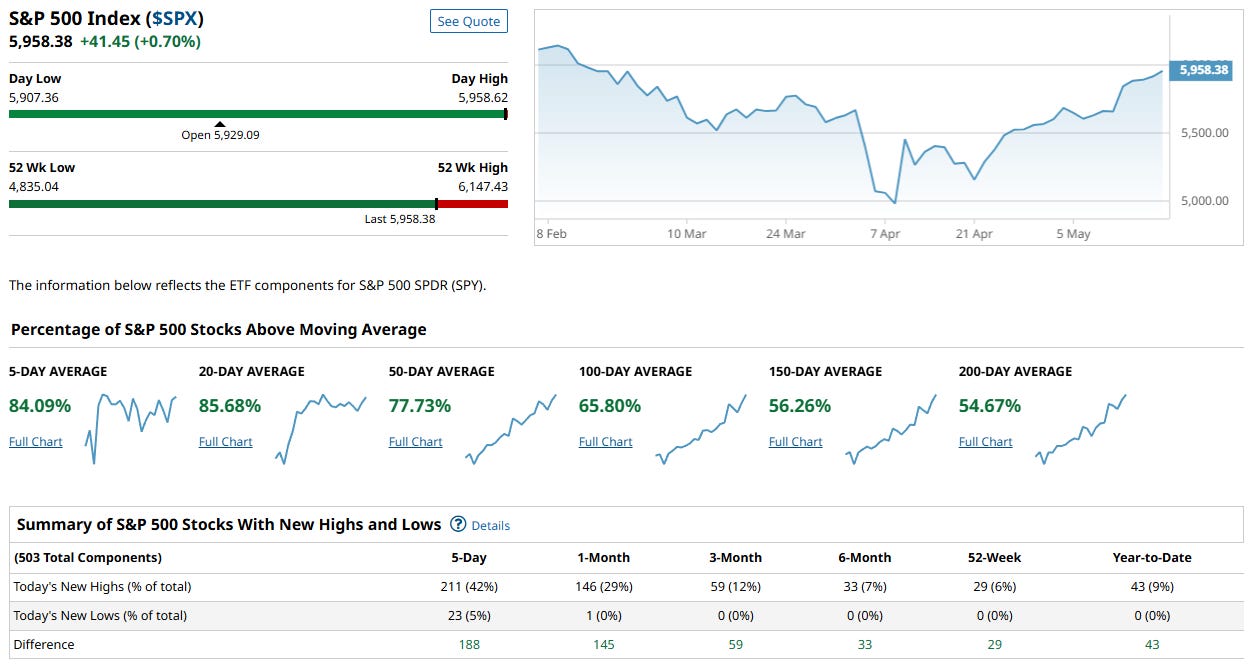
The S&P 500 is showing robust internal strength and broad market participation. Closing at 5,958.38 (+0.70%), it sits near its recent highs and just below the 52-week high of 6,147.43—signaling momentum toward a potential breakout.
Key Takeaways:
Breadth is Surging:
84.09% of S&P 500 stocks are above their 5-day moving average.
85.68% are above their 20-day MA.
Even longer-term metrics are catching up: 200-day average breadth is now at 54.67%, and steadily rising.
New Highs Dominate:
211 stocks (42%) hit new 5-day highs vs. just 23 (5%) making new lows—a difference of 188, showing strong internal leadership.Momentum Across All Timeframes:
From short-term to long-term averages, participation is increasing—an indication that more stocks are joining the rally rather than just a few mega caps driving the index.Technical Positioning:
The index is pressing into the upper bounds of its range. With this degree of participation, any breakout from here would be considered healthier and more sustainable than earlier attempts.
Summary:
This is a textbook example of a market with improving breadth and strengthening trend structure. The combination of high percentage readings across all moving averages and a dominant new-high/new-low spread suggests bullish control. Unless macro or external catalysts derail momentum, the S&P 500 appears poised for continuation higher.
Dow Jones Index
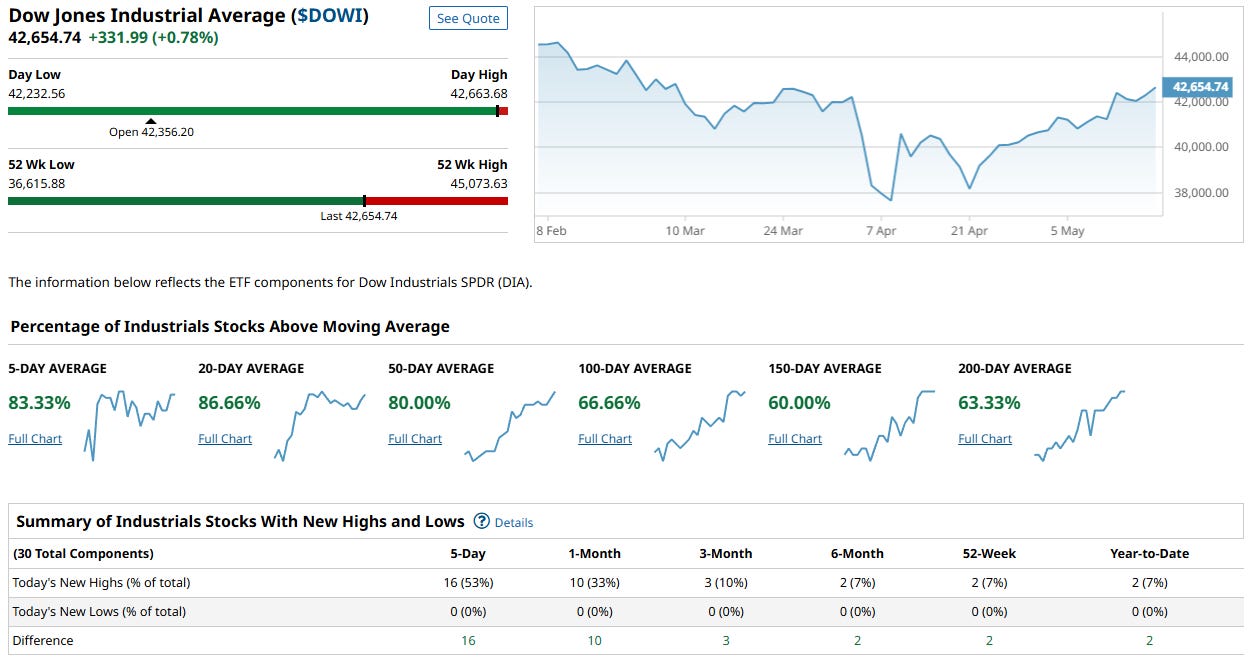
Closing at 42,654.74 (+0.78%), the Dow continues its strong upward trajectory, now just a few percent shy of its 52-week high. What sets this move apart is the impressive internal confirmation across all timeframes.
Key Takeaways:
Broad Participation Across All Timeframes:
86.66% of Dow components are above their 20-day moving average.
80.00% are above the 50-day MA.
63.33% are above the 200-day MA — the highest long-term breadth reading in months.
Short-Term Momentum is Exceptional:
83.33% above 5-day MA.
16 out of 30 stocks (53%) hit new 5-day highs.
Zero new lows, signaling no internal drag.
Improving Long-Term Trend Quality:
Over 60% of stocks are now aligned with their 150- and 200-day averages.
This is a notable shift from earlier in the year when long-term breadth was flat or deteriorating.
Summary:
The Dow isn’t just drifting higher—it’s surging with unanimity. Breadth readings across all major moving averages show that bullish participation is widespread, not concentrated. With no components hitting new lows and more than half making fresh 5-day highs, this is a market backed by conviction. As long as internals remain this strong, the path of least resistance appears to be higher, potentially retesting or breaking through the 52-week highs in the near term.
NASDAQ 100 Index
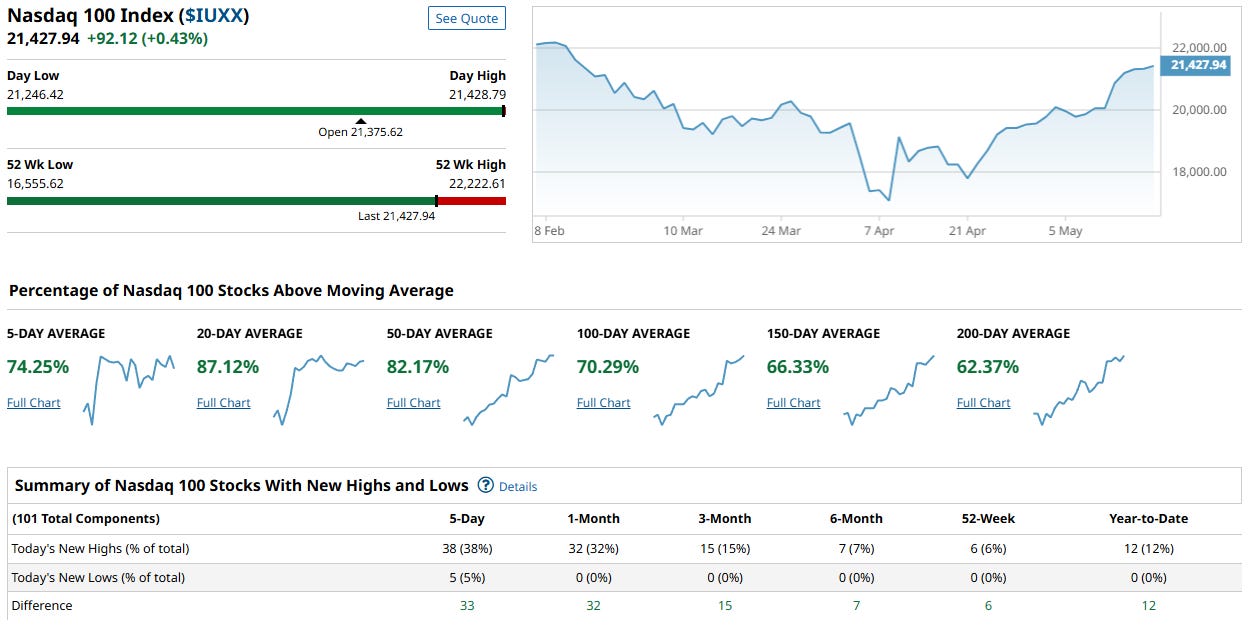
The Nasdaq 100 continues to power higher, closing at 21,427.94 (+0.43%), just beneath its 52-week high of 22,222.61. The rally is not only price-driven—it’s underpinned by solid, broad-based internal strength across short-, intermediate-, and long-term measures.
Key Takeaways:
Strong Breadth Across Timeframes:
87.12% of Nasdaq 100 stocks are above their 20-day MA.
82.17% are above their 50-day.
Longer-term structure is solidifying, with 62.37% above the 200-day MA—indicating deeper market alignment with the uptrend.
Short-Term Momentum Healthy:
74.25% of components are above their 5-day MA.
38 stocks (38%) printed new 5-day highs, compared to only 5 new lows—a positive breadth differential of +33.
Improving Long-Term Leadership:
Over two-thirds of components are now above the 100- and 150-day moving averages.
New highs span multiple timeframes, including 52-week highs, which suggests sustained institutional participation.
Summary:
The Nasdaq 100 is not just rising—it's rising with increasing participation and structural integrity. Breadth is strong, with over 80% of components aligned in the short- and intermediate-term, while longer-term moving averages are catching up quickly. With minimal new lows and a positive momentum skew, the market looks positioned for further upside. Continued strength in breadth confirms that this rally is more than just a handful of tech giants—there’s deeper buying interest building under the surface.
Russel 1000
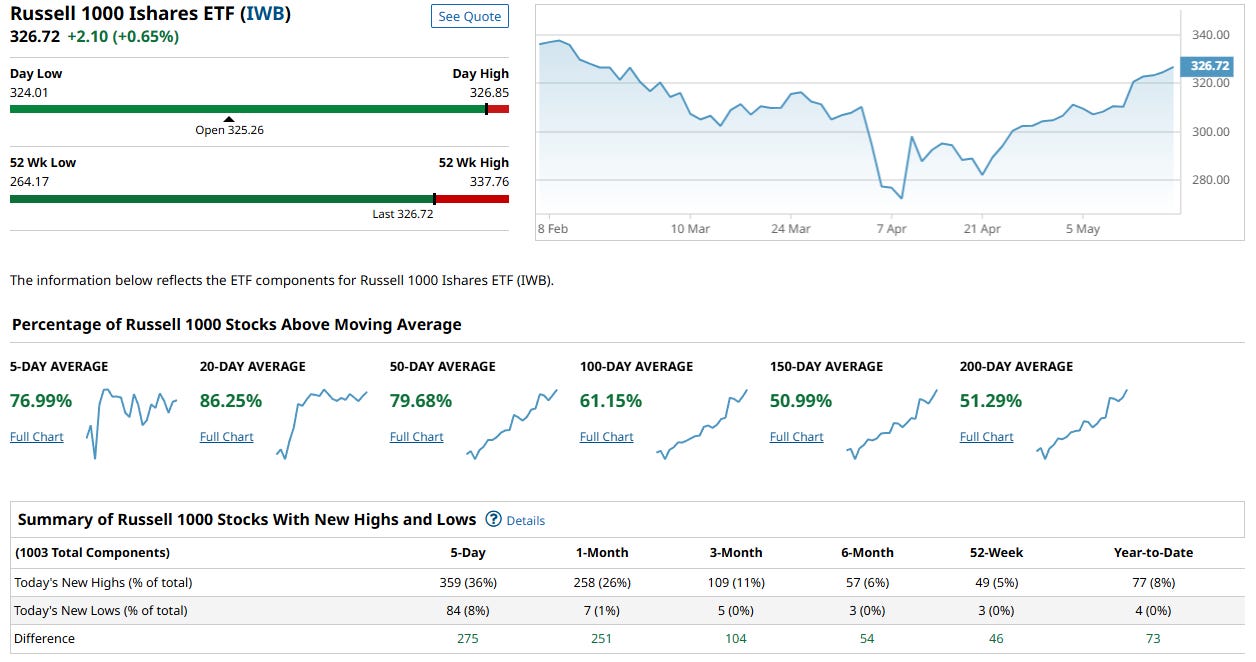
The Russell 1000 ETF ($IWB) closed at 326.72 (+0.65%), continuing its push toward the 52-week high of 337.76. Beneath the surface, participation is broad and strengthening, with healthy contributions from a wide range of constituents—not just the mega caps.
Key Takeaways:
Widespread Breadth Across Timeframes:
86.25% of stocks are above their 20-day MA.
79.68% are above their 50-day MA.
Even longer-term measures are firming up: 51.29% of components are now above their 200-day MA.
Robust Short-Term Momentum:
76.99% of stocks are above their 5-day MA.
359 stocks (36%) made new 5-day highs, vs. only 84 new lows — a breadth spread of +275.
Long-Term Participation Climbing:
More than half of constituents are back above both the 150- and 200-day averages.
This expansion in long-term breadth confirms the rally is gaining durability.
Summary:
The Russell 1000 is showing broad-based, sustainable strength with improving participation across all timeframes. Short-term momentum is strong, and new highs are accelerating, but what’s even more encouraging is the growing number of names reclaiming their longer-term trendlines. With over 250 more new highs than new lows over the last five days, this rally has depth. The index appears to be marching steadily toward a test of its 52-week high—and with internals this strong, it may well surpass it.
Overall Indices Assessment
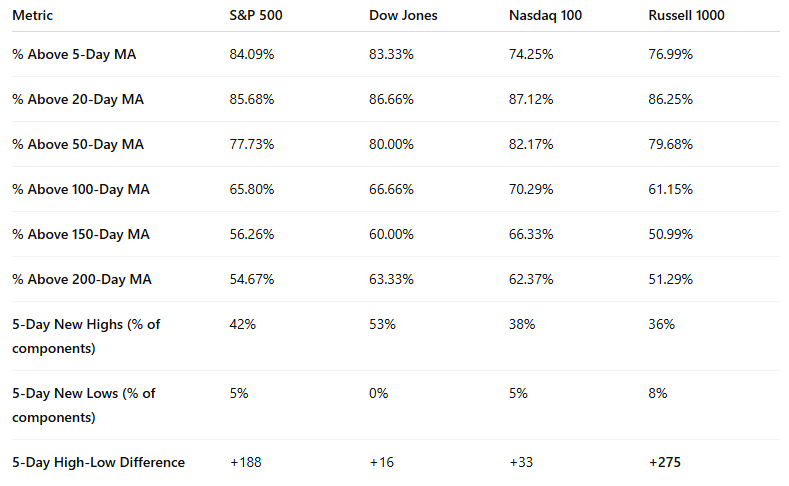
🧠 Insights Summary
Market internals across all major U.S. indices are strong and continue to improve, with particularly robust participation in the Dow Jones and Russell 1000, the latter showing the widest breadth differential (+275) thanks to its diverse composition. The S&P 500 remains healthy and near highs, backed by strength in over 85% of its components across short- and medium-term moving averages. The Nasdaq 100 is also firmly bullish, with over 70% of stocks above their 100-day MAs and breadth leadership within tech and growth sectors. Notably, long-term trend alignment (150/200-day MAs) is now in majority territory for all indices, suggesting the rally has legs and broader institutional conviction. In short, this is no longer a narrow advance—the bull is broadening.
📈 Our Indices Market Score: 83 / 100 (+15 WoW)
The market has clearly advanced from last week’s recovery phase into a position of broad-based strength and growing durability. Here’s why our confidence has improved:
1. Breadth Breakout Confirmed
Across all four major indices, participation has surged. Over 85% of stocks in the S&P 500, Dow, Nasdaq 100, and Russell 1000 are above their 20-day moving averages. Even more impressively, the percentage of stocks above their 200-day MAs has climbed above 50% across the board—a critical threshold indicating that the majority of names are now in long-term uptrends.
2. Leadership is No Longer Narrow
Last week’s concern—that the rally was carried by a handful of mega caps—has significantly diminished. The Russell 1000 shows the widest new high–new low spread (+275) and improving long-term metrics, while the Dow now has over 63% of its components above their 200-day MA. This suggests rotation into broader sectors and more diversified participation.
3. Multi-Timeframe Alignment
We’re seeing alignment across short-, intermediate-, and long-term trend structure. Momentum is no longer just “short-term hot”—it’s sustaining across the 50-, 100-, and even 150-day lookbacks. This kind of synchronization is what defines sustained bull phases, not just tactical bounces.
4. Internal Confirmation Over Price Alone
Breadth metrics and new high counts suggest that the move higher is not being led by price alone—it is being confirmed and driven by real demand under the surface. This gives the rally “permission” to continue and makes pullbacks more likely to be bought.
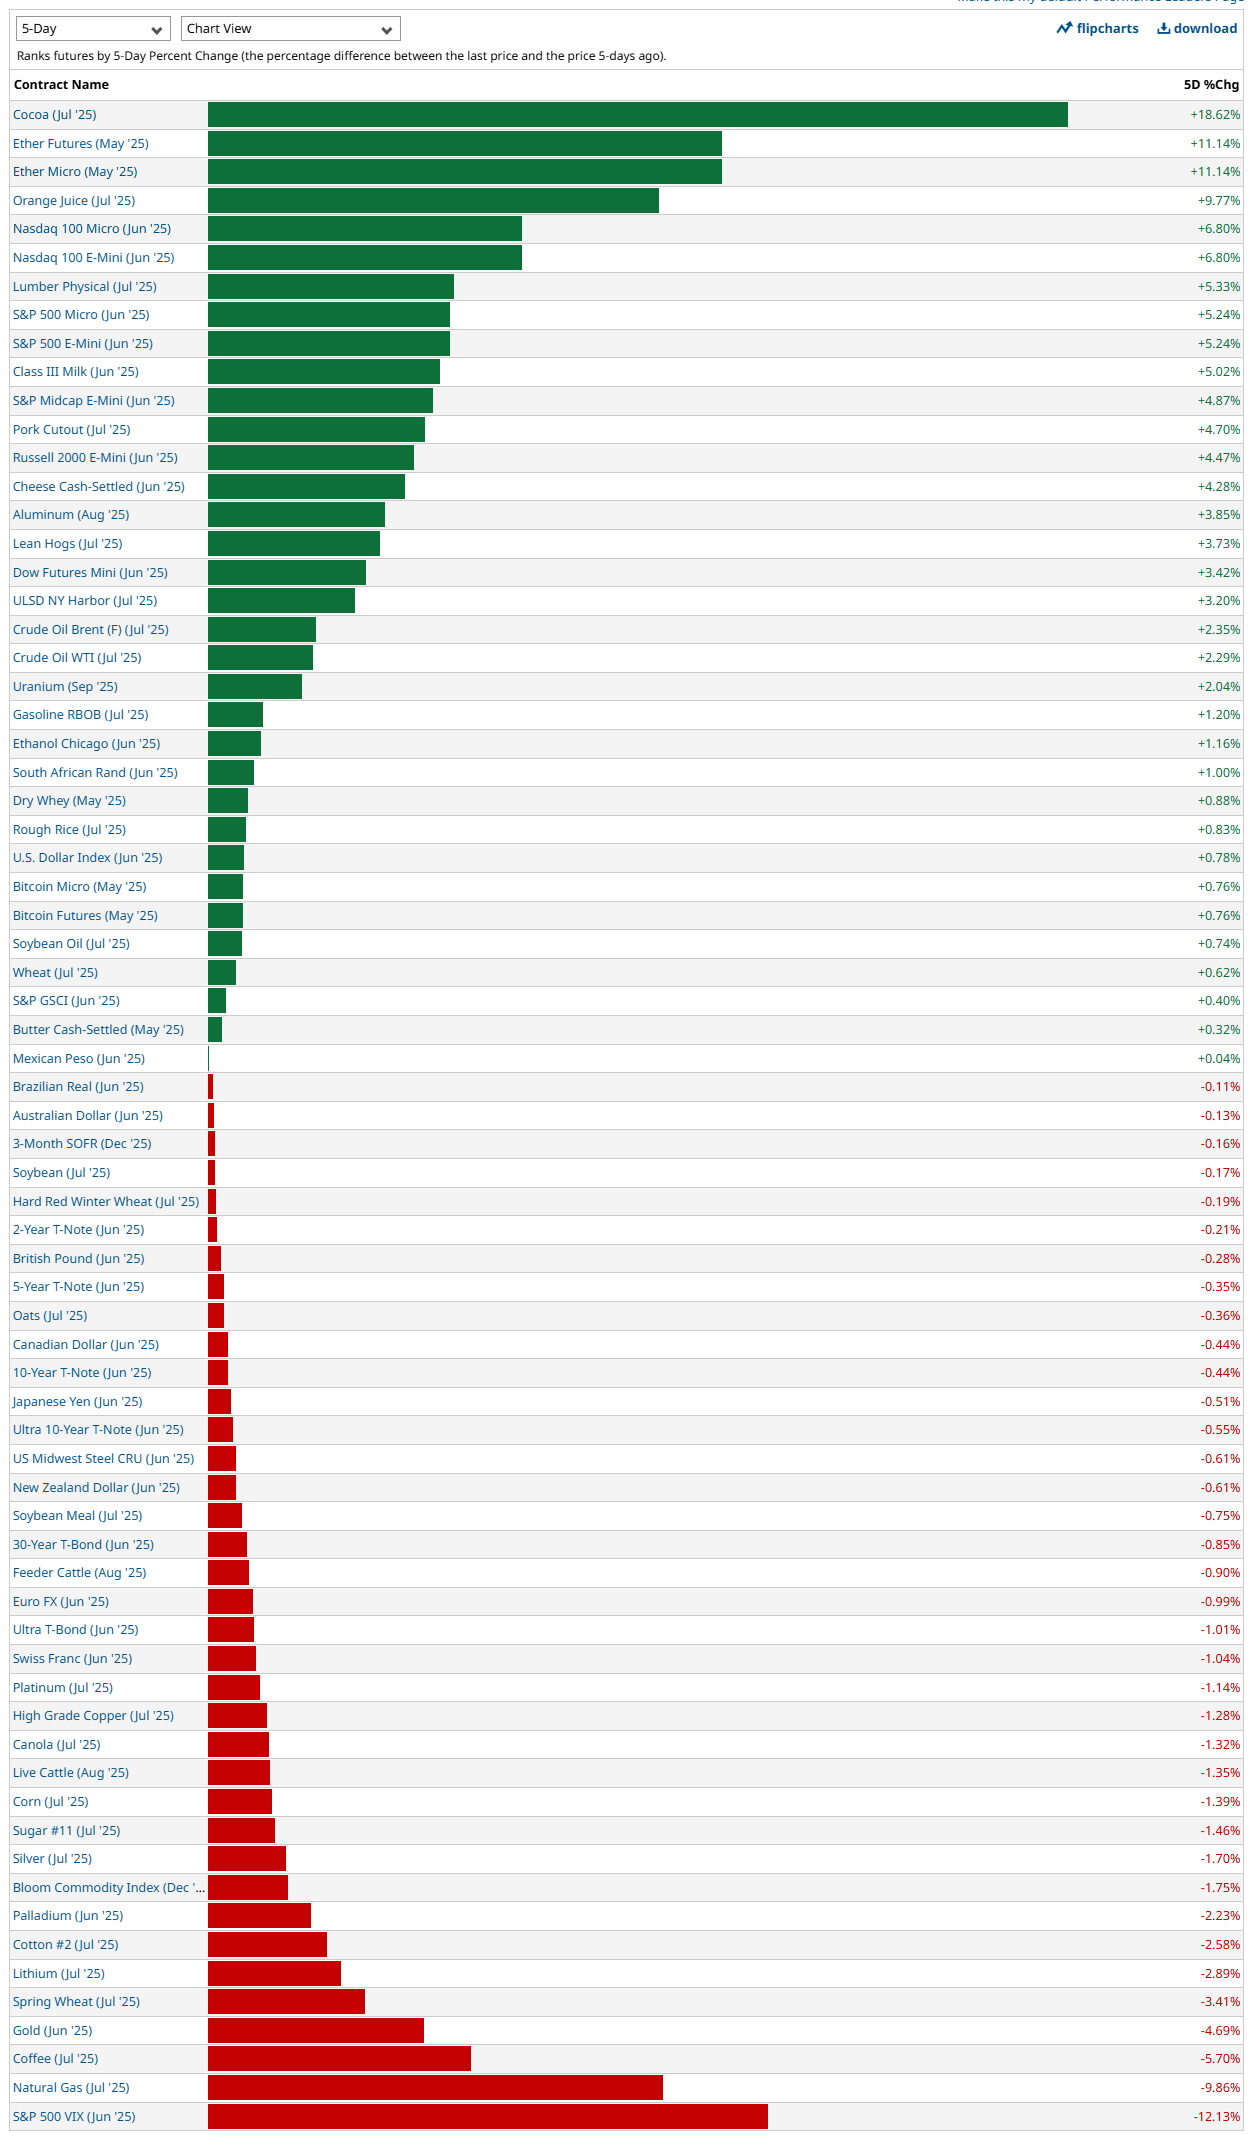
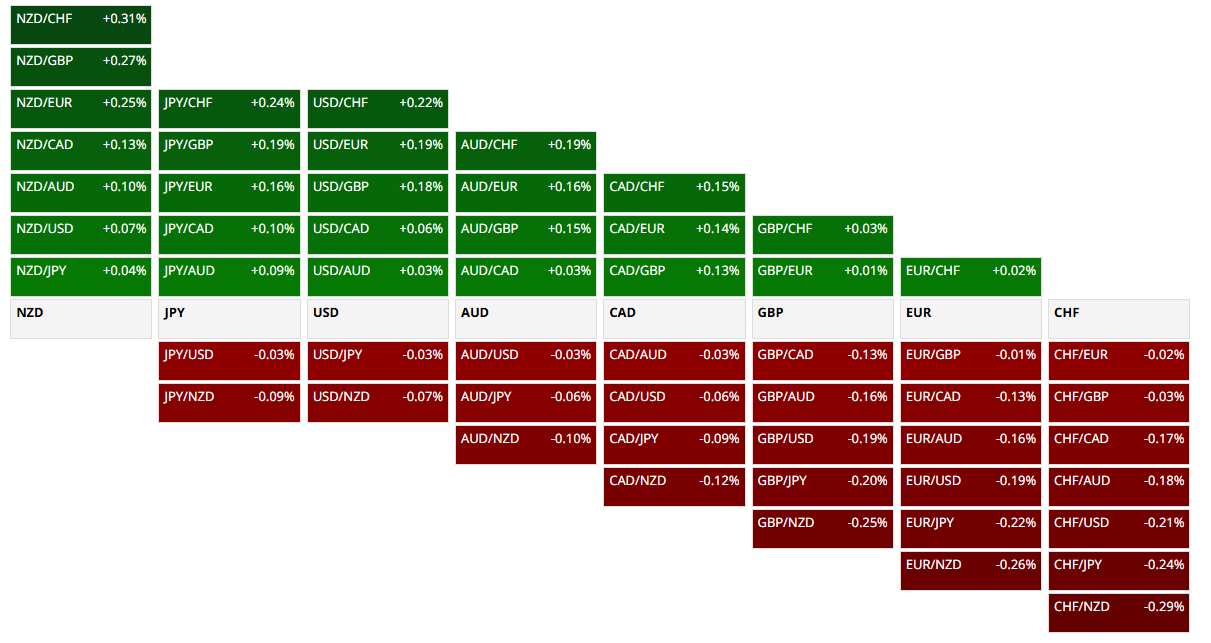
5-Day Futures Performance Leaders
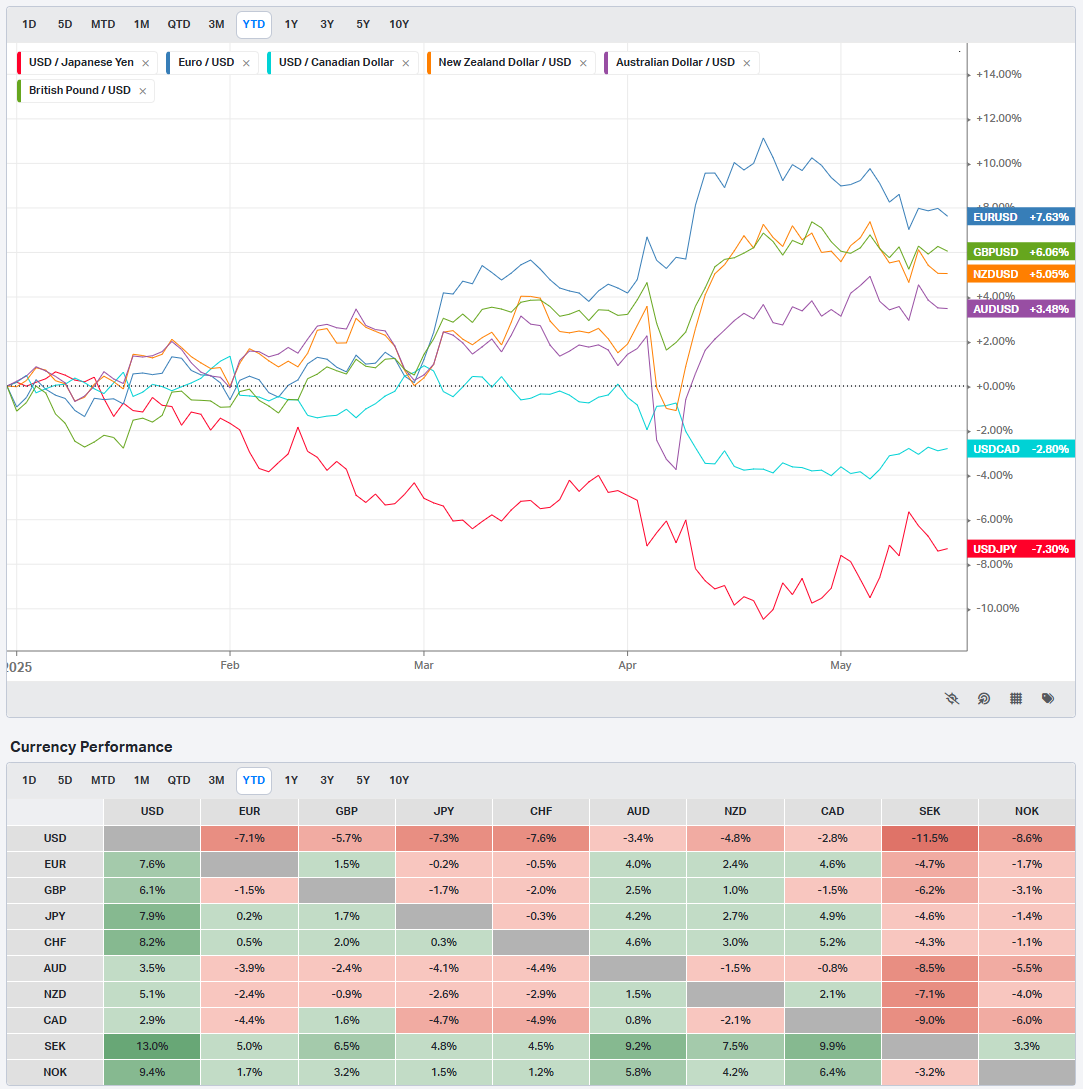
FOREX
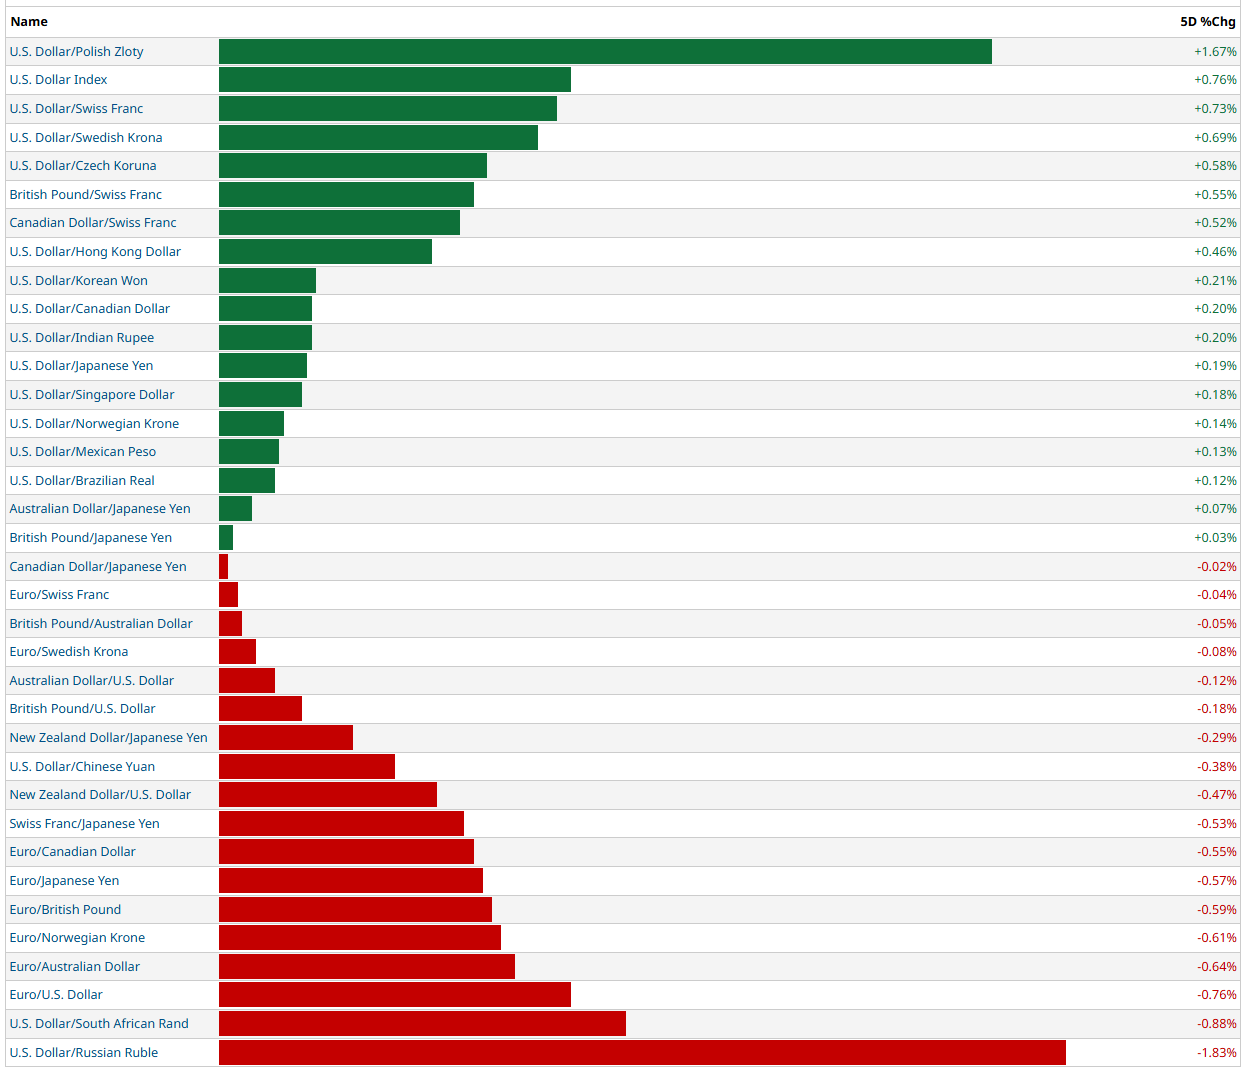
Key Takeaways:
USD Broadly Strong — But Not Uniformly So
The U.S. Dollar posted solid gains against a wide swath of currencies, especially in Central and Eastern Europe, with standout strength versus the Polish Zloty (+1.67%), Swiss Franc (+0.73%), and Swedish Krona (+0.69%). The U.S. Dollar Index itself is up +0.76%, confirming that this is a generalized dollar strength move—though with plenty of nuance.Strength Centered in European and Safe-Haven FX
The biggest USD gains came against traditional risk-off or peripheral European currencies, suggesting investors may be rotating toward USD amid relative policy or macro uncertainty in those regions. Gains against the Swiss Franc, Krona, and Zloty support this narrative.Asia and Commodity FX Mixed
The Dollar held modest strength against the Korean Won, Indian Rupee, and Japanese Yen, but showed relative weakness against high-beta commodity currencies like the Australian Dollar (AUD) and South African Rand (ZAR). The AUD/USD fell -0.64%, and USD/ZAR dropped sharply by -1.83%, suggesting risk-on behavior or local tailwinds in those economies.DXY Strength Masking EMFX Divergence
While broad USD strength is the theme, EMFX is not uniformly weak. The Rand and Ruble notably strengthened against the dollar, signaling regional flows, commodity strength, or idiosyncratic factors.EUR and GBP Under Pressure
The Euro and British Pound both weakened against the dollar and other crosses (e.g., EUR/USD -0.76%, GBP/USD -0.88%), pointing to relative underperformance of European assets, potentially linked to economic stagnation or rate differentials.
Insights Summary
The Dollar is asserting itself again—but this isn’t a panic-driven surge. It’s more of a rotation into USD strength via European and low-volatility currencies, while risk-on pairs like AUD, ZAR, and BRL show relative resilience. The divergence suggests that investors are positioning for continued U.S. economic outperformance or a hawkish Fed, but not fleeing risk entirely. Expect continued dollar strength if macro uncertainty persists, though rotation within EM and commodity FX may offer selective long opportunities.
Our FX Market Bias Score: 72/100 (+9 WoW)
The forex market has shifted from cautious dollar strength to a more assertive and rotational USD outperformance, especially against European and safe-haven currencies. While not a runaway dollar rally, the alignment of DXY strength (+0.76%) with regional USD dominance reflects a broader, more confident USD environment, lifting our score from 63 to 72.
1. Broader Dollar Strength Confirmed
Last week, USD gains were modest and selective. This week, the Dollar is gaining against a majority of developed market currencies, particularly the Polish Zloty, Swiss Franc, and Euro. The U.S. Dollar Index rising +0.76% reflects a more cohesive trend, not just isolated pair moves.
2. Risk Appetite Still Intact
Despite USD strength, we’re not seeing a full risk-off flight. Currencies like the South African Rand (+1.83% vs. USD) and Australian Dollar (mixed) are holding ground or even gaining. This suggests a “USD carry trade rotation” environment rather than a fear-driven demand for dollars.
3. Clear Regional Divergences
The Dollar is not rising against everything. EMFX and some commodity pairs are firm, while Europe is the primary source of weakness. That kind of rotation provides opportunities for selective long-USD exposure, rather than all-out dollar buying.
Why Not Higher Than 72?
Lack of USD Strength vs. Risk/Commodity FX like ZAR, AUD, and BRL shows hesitation.
The sharp drop in USD/ZAR (-1.83%) and USD/RUB (-1.83%) suggests regional capital flows or commodity strength are pushing against USD dominance.
No panic in safe havens (JPY, CHF) confirms this is not a macro flight to safety.
Summary:
The U.S. Dollar is on firmer footing this week, supported by broad gains and strong divergence against European and low-yield currencies. However, selective EM and high-beta FX strength prevents this from being a full-spectrum dollar bull market. The score reflects a constructive USD outlook with room for tactical plays, especially in cross-currency setups where USD isn’t the denominator.
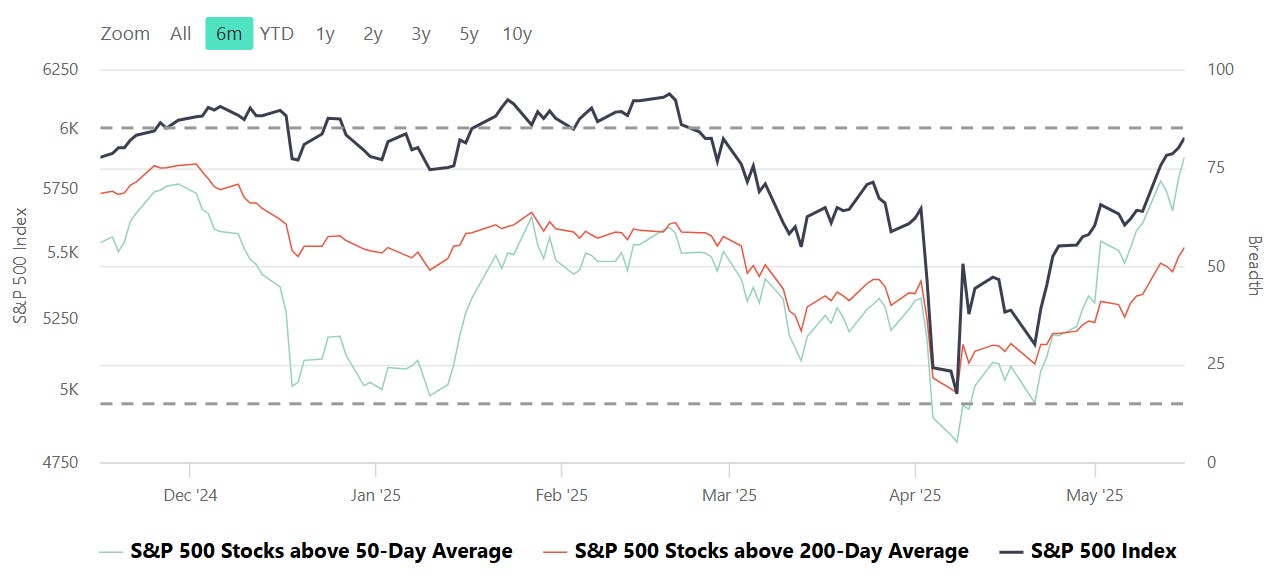
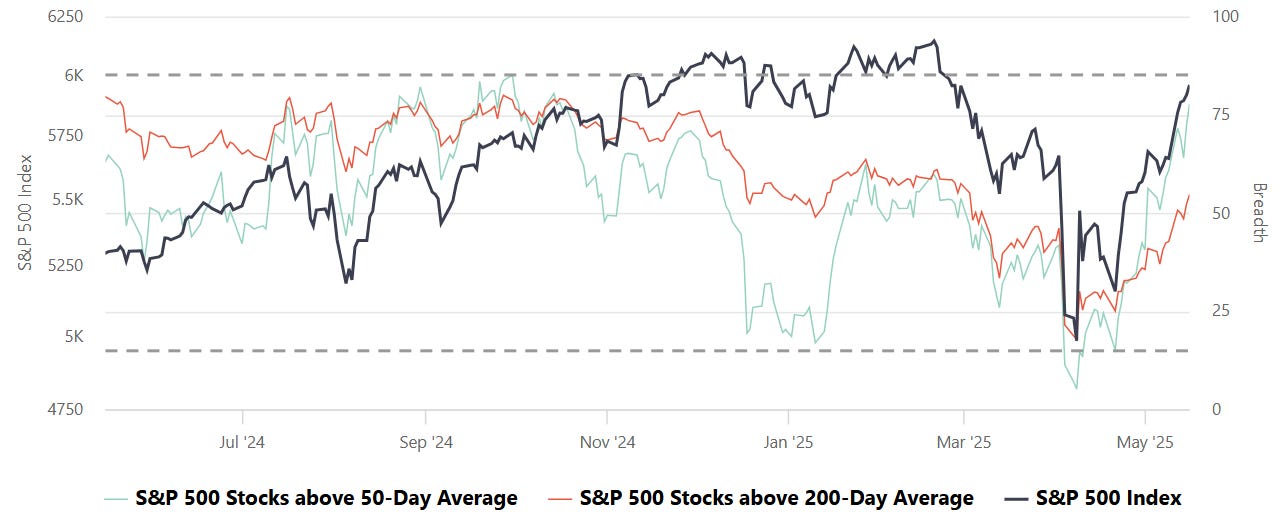
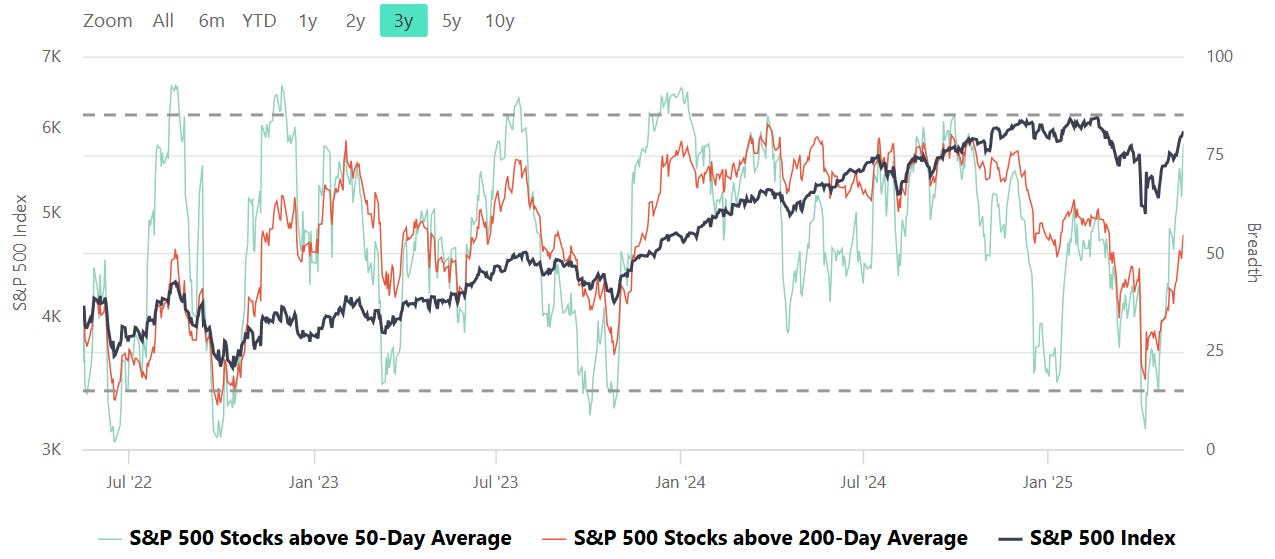
S&P Breadth
Breadth, in the context of stock market analysis, refers to the measure of how many stocks in a given index (such as the S&P 500) are participating in a trend, such as advancing or declining relative to a certain moving average (e.g., 50-day or 200-day).
Market Strength Assessment:
Breadth provides insight into whether a market rally or decline is broad-based or driven by only a few large-cap stocks. A rally supported by a high percentage of stocks above their 50-day or 200-day averages is generally considered healthier and more sustainable.
Early Warning Signals:
Divergences between breadth indicators and the index price can signal potential reversals. For example:
If the index is rising, but the number of stocks above their moving averages is declining, it may indicate weakening underlying strength and potential for a pullback.
Conversely, if breadth improves while the index remains flat or declines, it may suggest accumulating strength for a future rally.
Trend Confirmation:
Breadth indicators can confirm trends. For instance, a strong majority of stocks above their moving averages signals robust market momentum, providing confidence in the prevailing trend.
Identifying Overbought or Oversold Conditions:
Extremely high or low breadth readings can signal overbought or oversold conditions, which might lead to mean reversion. For example:
If nearly all stocks are above their 50-day or 200-day averages, it may suggest overbought conditions.
Conversely, extremely low levels indicate oversold conditions and potential for a bounce.
Breadth and Timing Investments:
Entry Points:
When breadth improves (e.g., more stocks move above their 50-day or 200-day moving averages) after a market pullback, it can indicate a good time to start building positions as the broader market is regaining strength.
Exit Points:
Breadth deterioration during a rally may suggest it’s time to reduce exposure, especially if only a small number of stocks are driving index gains. This is often a warning sign of an impending correction.
Volatility and Risk Management:
Weak breadth in volatile markets may prompt caution or defensive positioning. Conversely, improving breadth can justify taking on more risk during uptrends.
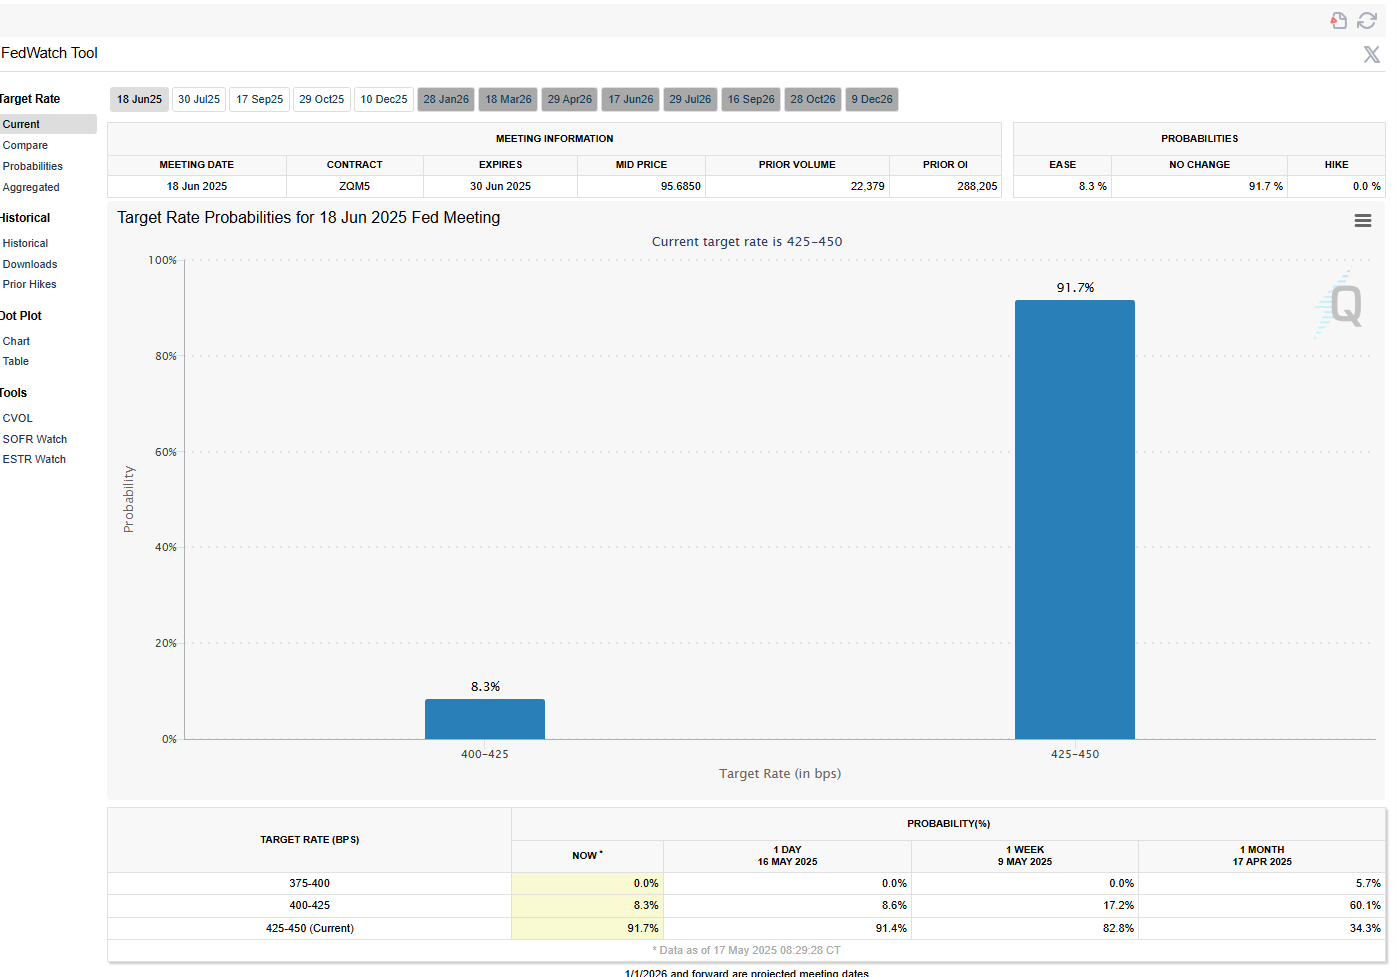
CME Fedwatch
What is the likelihood that the Fed will change the Federal target rate at upcoming FOMC meetings, according to interest rate traders? Use CME FedWatch to track the probabilities of changes to the Fed rate, as implied by 30-Day Fed Funds futures prices.

US Investor Sentiment
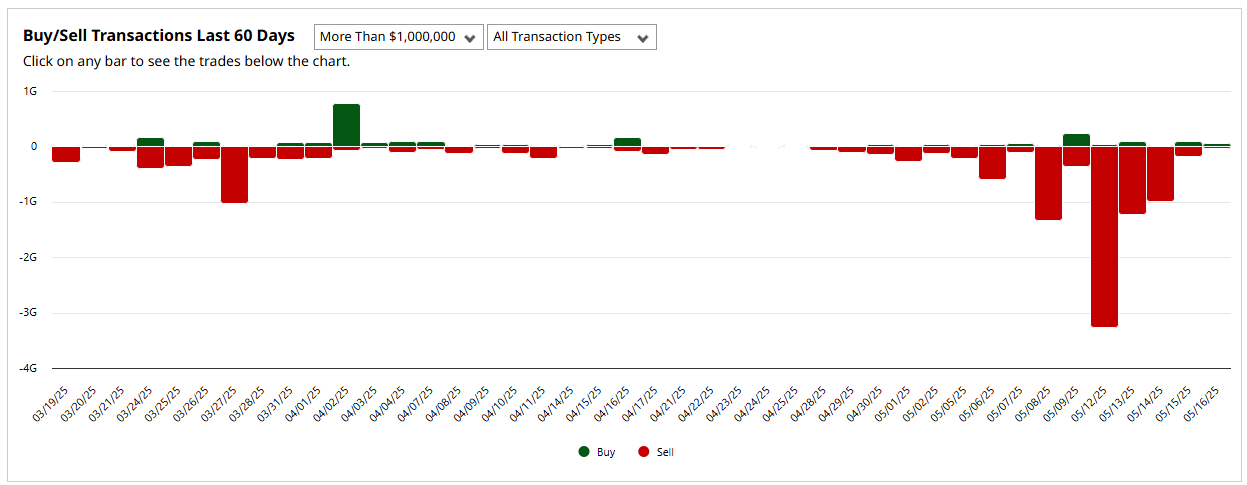
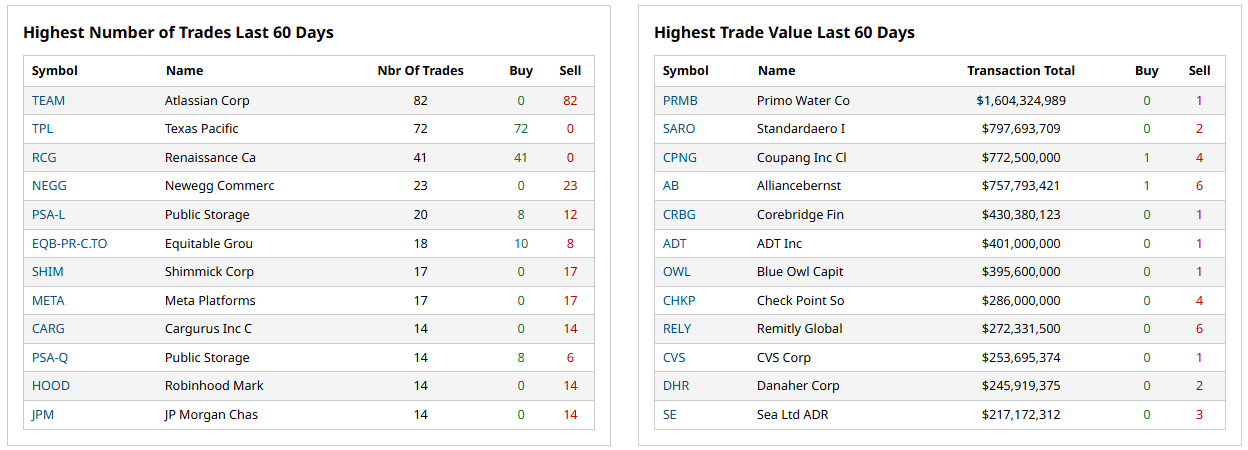
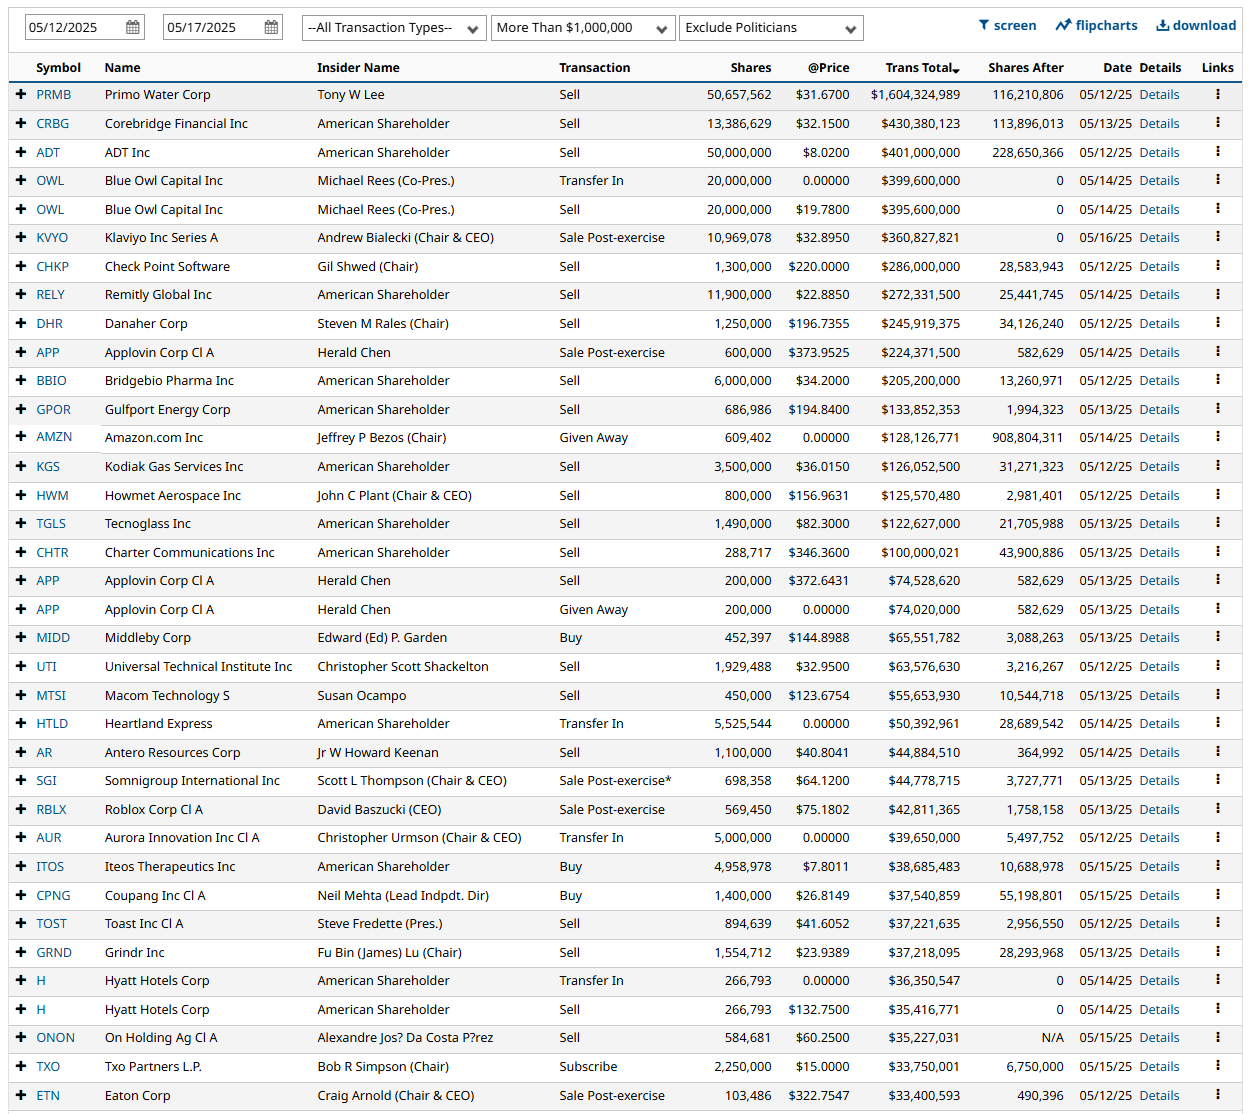
Insider Trading
Insider trading occurs when a company’s leaders or major shareholders trade stock based on non-public information. Tracking these trades can reveal insider expectations about the company’s future. For example, large purchases before an earnings report or drug trial results might indicate confidence in upcoming good news.
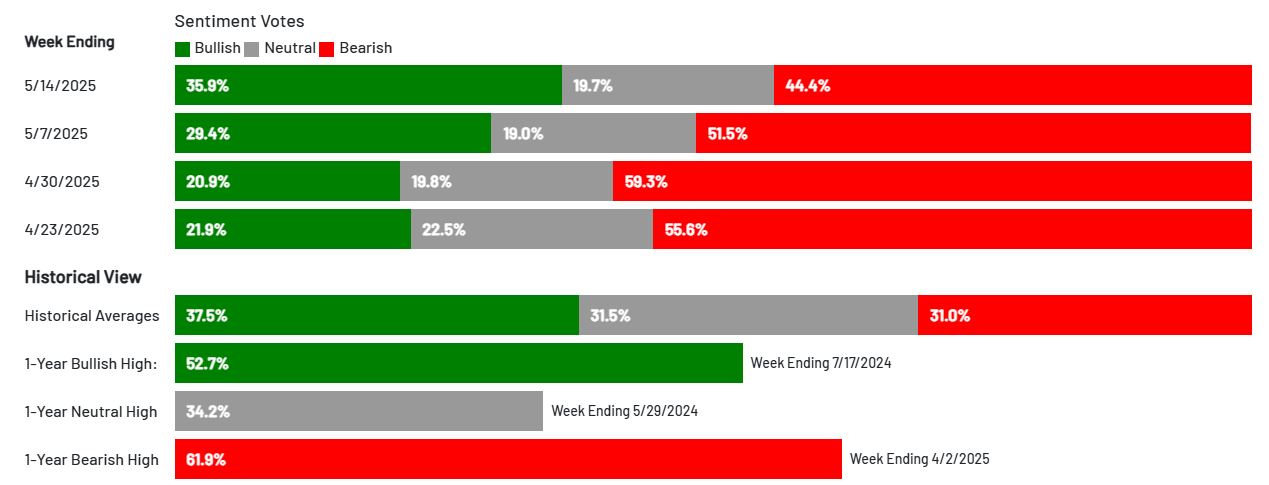
%Bull-Bear Spread
The %Bull-Bear Spread chart is a sentiment indicator that shows the difference between the percentage of bullish and bearish investors, often derived from surveys or sentiment data, such as the AAII (American Association of Individual Investors) sentiment survey. This spread tells investors about the prevailing mood in the market and can provide insights into market extremes and potential turning points.
Bullish or Bearish Sentiment:
When the spread is positive, it means more investors are bullish than bearish, indicating optimism about the market’s direction.
A negative spread indicates more bearish sentiment, meaning more investors expect the market to decline.
Contrarian Indicator:
The %Bull-Bear Spread is often used as a contrarian indicator. For example, extremely high levels of bullish sentiment might suggest that the market is overly optimistic and could be due for a correction.
Similarly, when bearish sentiment is extremely high, it might indicate that the market is overly pessimistic, and a rally could be on the horizon.
Market Extremes and Reversals:
Historically, extreme values of the spread (both positive and negative) can signal turning points in the market. A very high positive spread can signal market exuberance, while a very low or negative spread may indicate fear or capitulation.
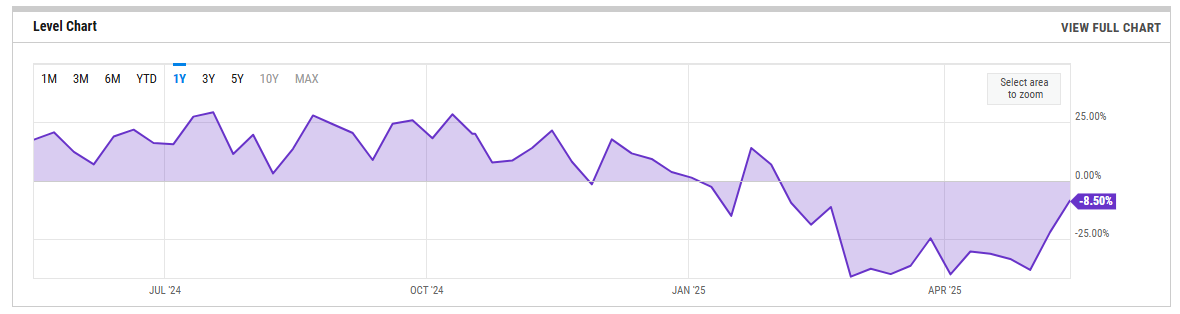
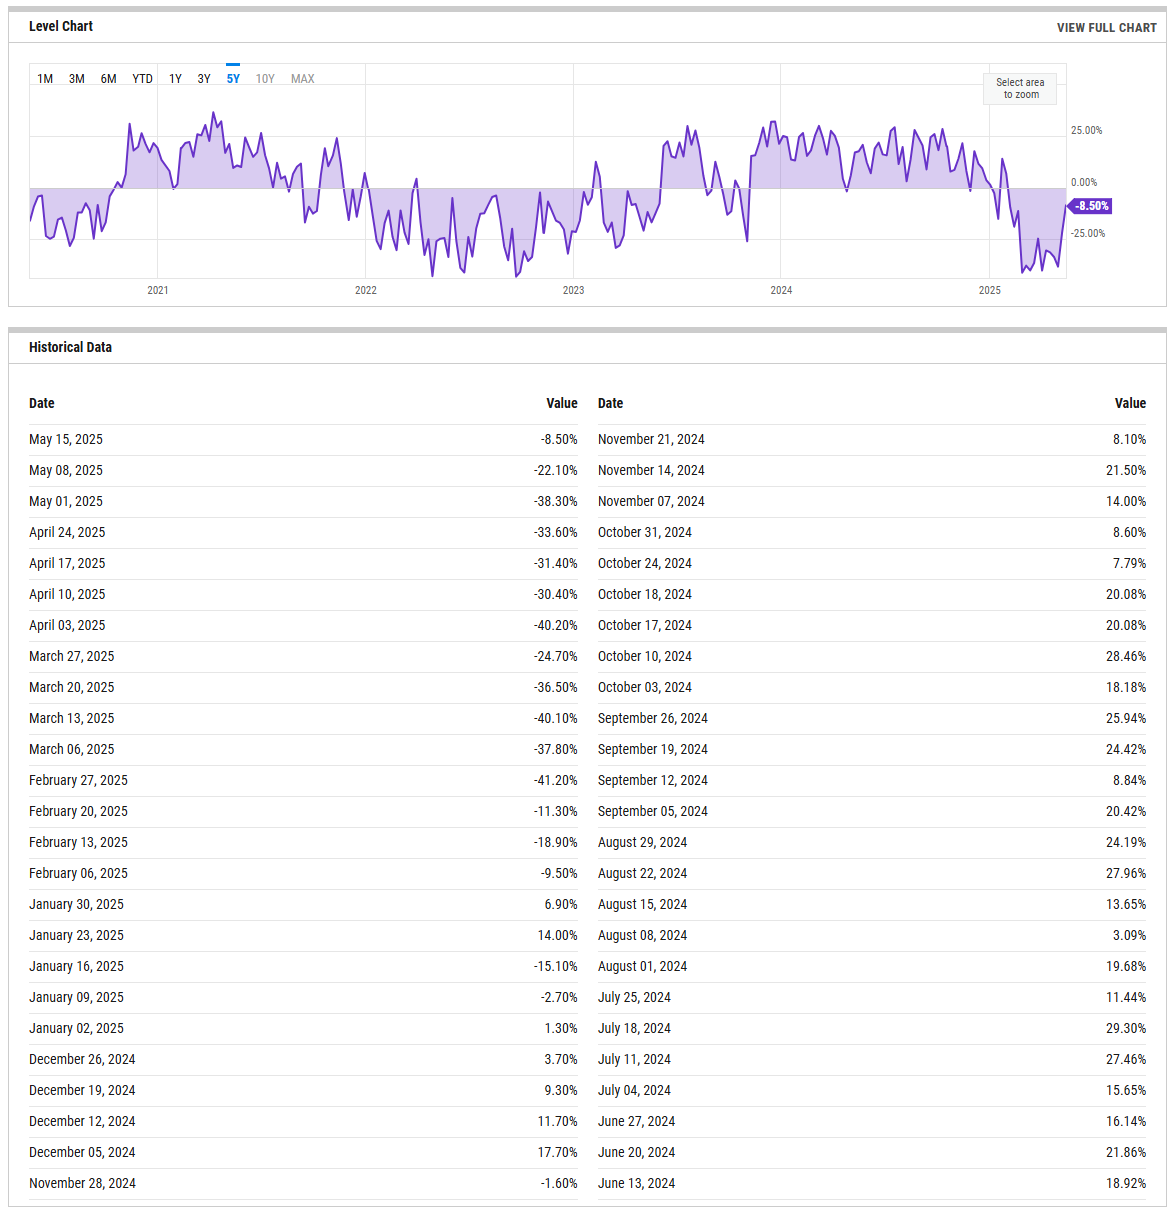
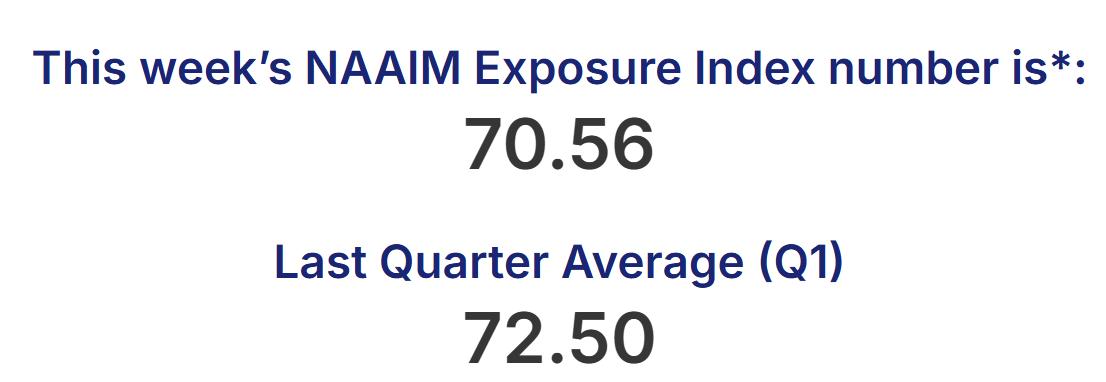
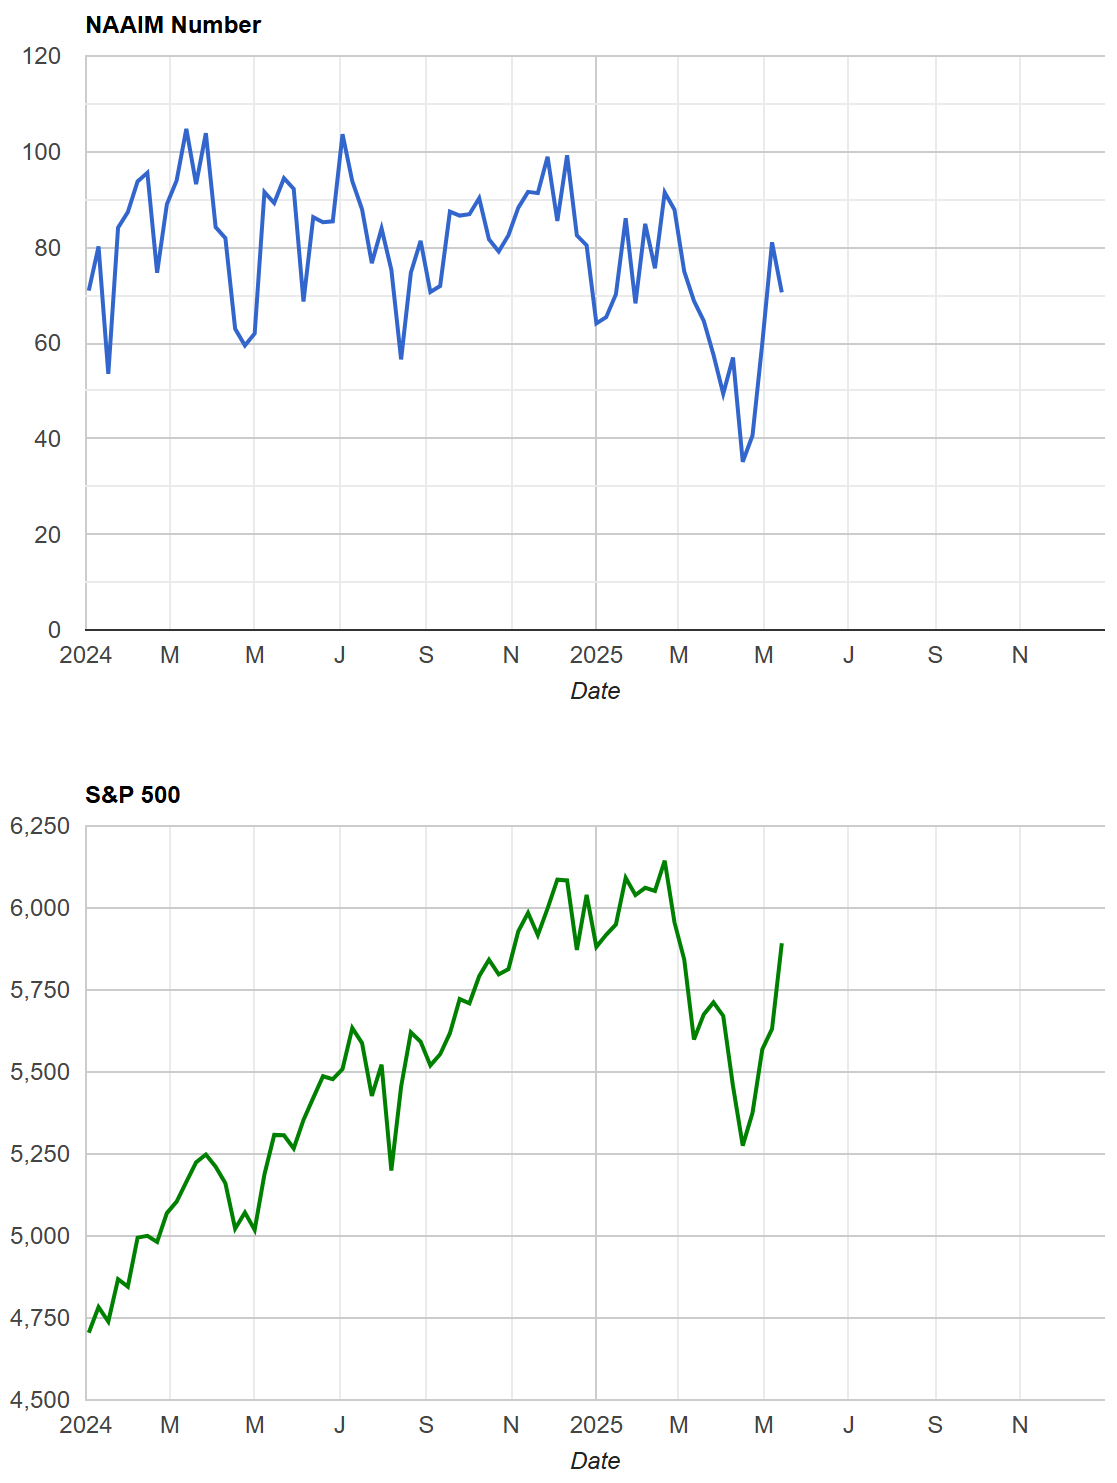
NAAIM Exposure Index
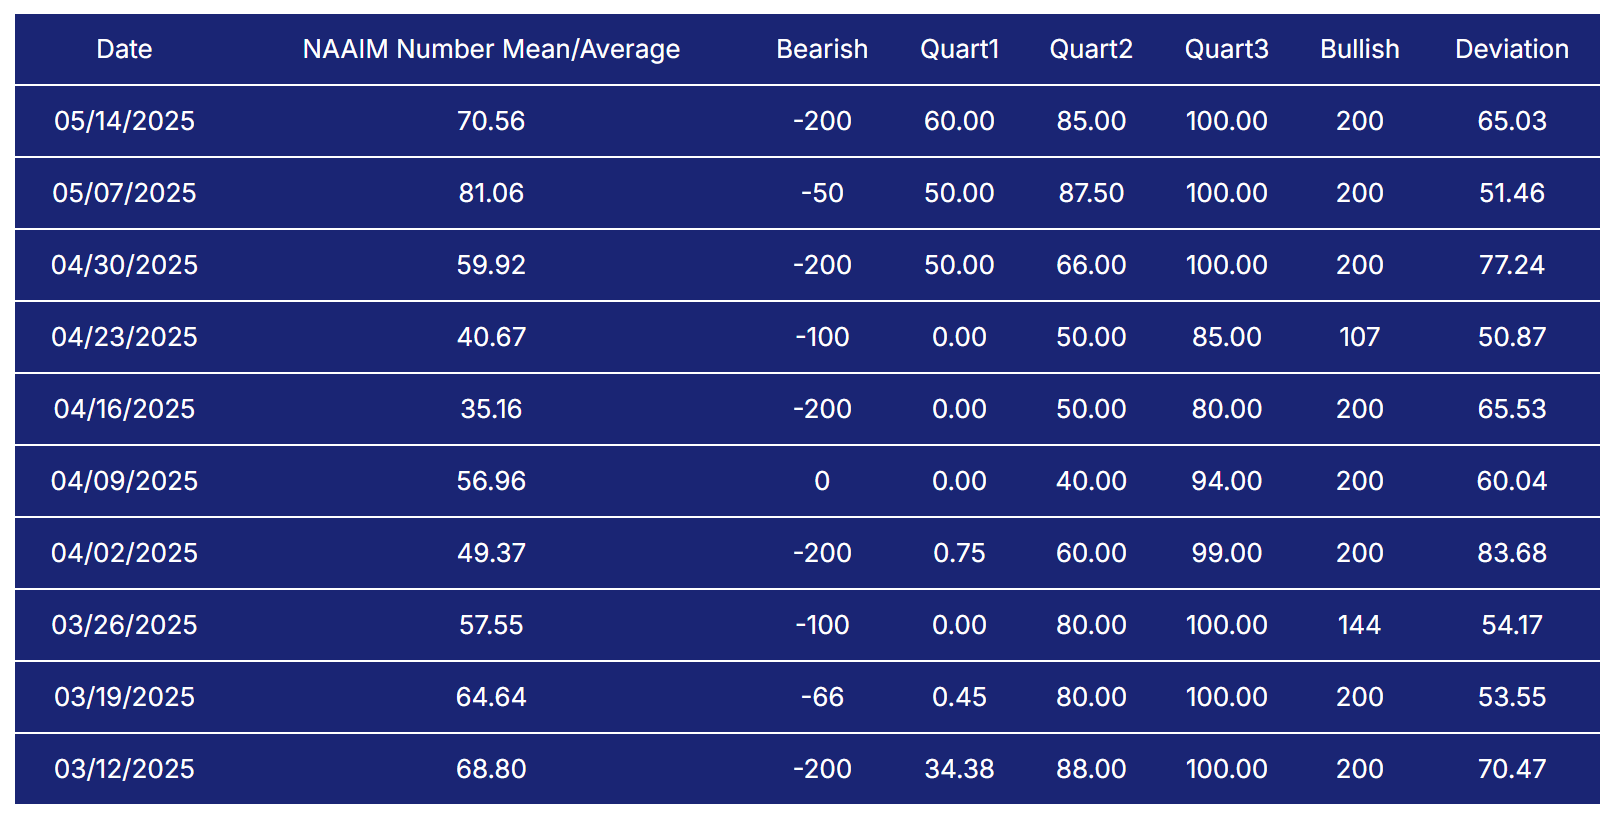
The NAAIM Exposure Index (National Association of Active Investment Managers Exposure Index) measures the average exposure to U.S. equity markets as reported by its member firms. These are typically active money managers who provide their equity exposure levels weekly. The index offers insight into how much these managers are investing in equities at any given time, ranging from being fully short (-100%) to leveraged long (up to +200%).
AAII Investor Sentiment Survey
The AAII Investor Sentiment Survey is a weekly survey conducted by the American Association of Individual Investors (AAII) to gauge the mood of individual investors regarding the direction of the stock market over the next six months. It provides insights into whether investors are feeling bullish (expecting the market to rise), bearish (expecting the market to fall), or neutral (expecting the market to stay about the same).
Key Points:
Bullish Sentiment: Reflects the percentage of investors who believe the stock market will rise in the next six months.
Bearish Sentiment: Represents those who expect a decline.
Neutral Sentiment: Reflects investors who anticipate little to no market movement.
The survey is widely followed as a contrarian indicator, meaning that extreme levels of bullishness or bearishness can sometimes signal market turning points. For example, when a large number of investors are overly optimistic (high bullish sentiment), it could suggest a market top, while excessive pessimism (high bearish sentiment) may indicate a market bottom is near.
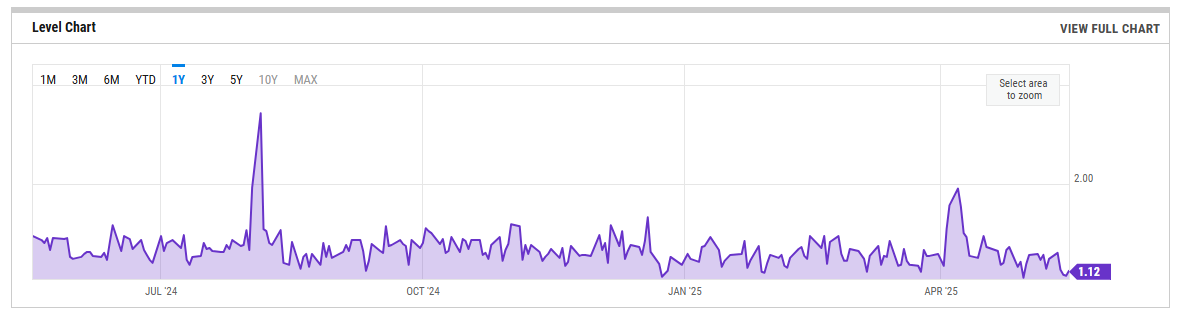
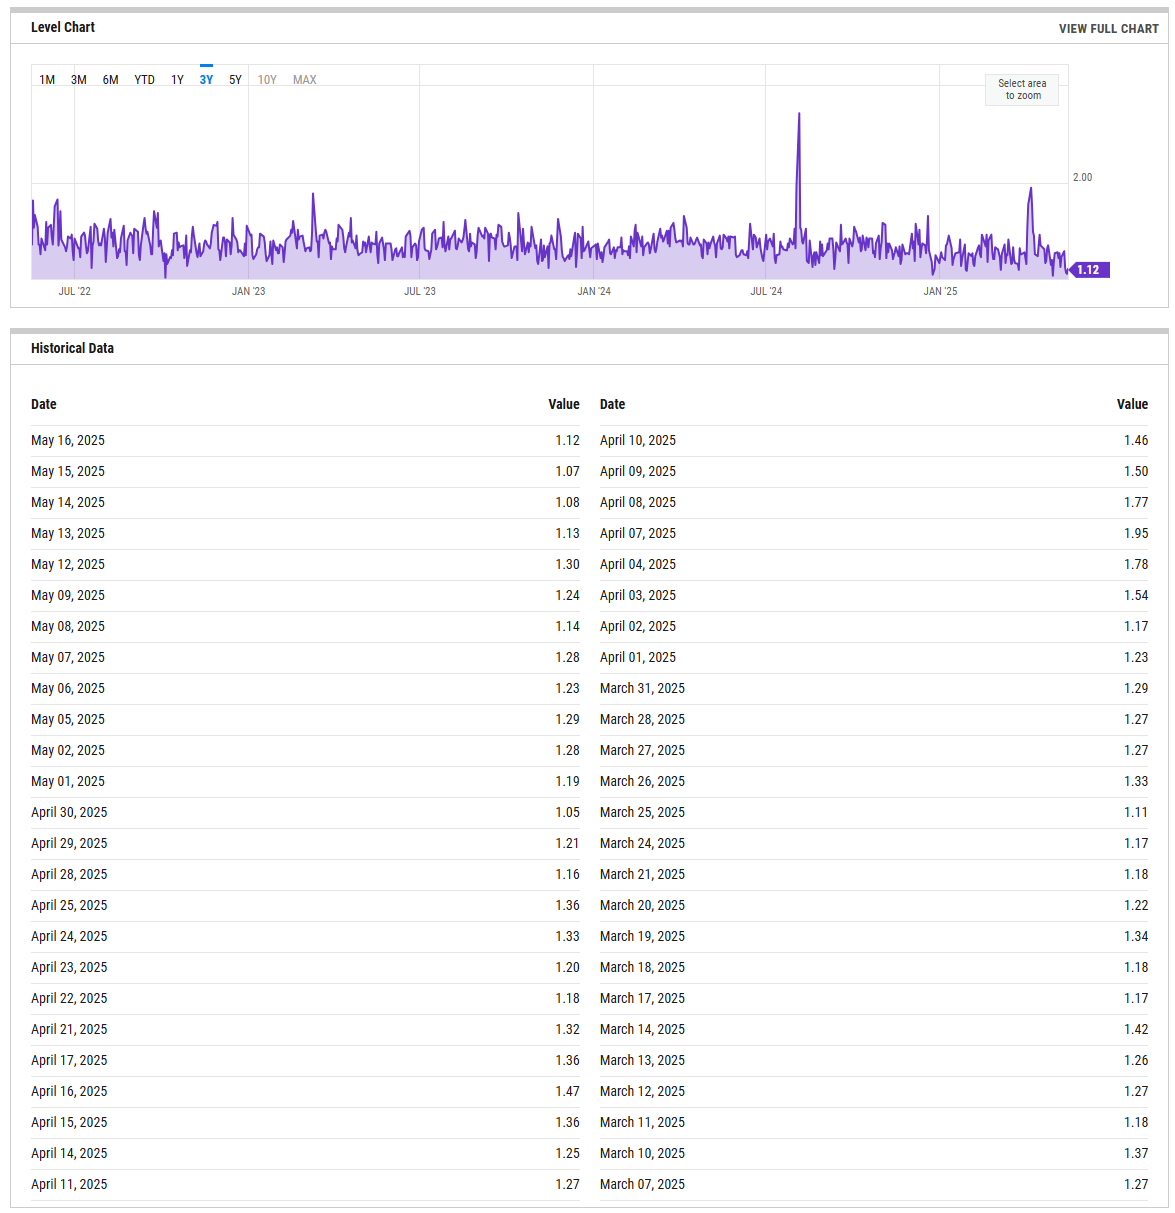
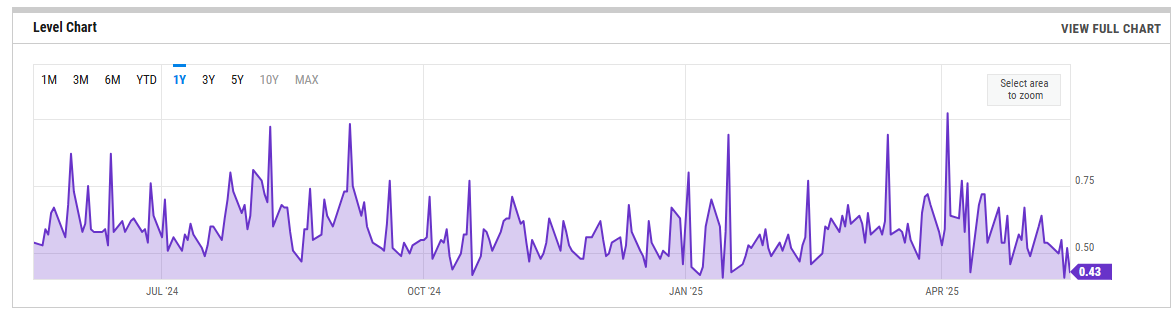
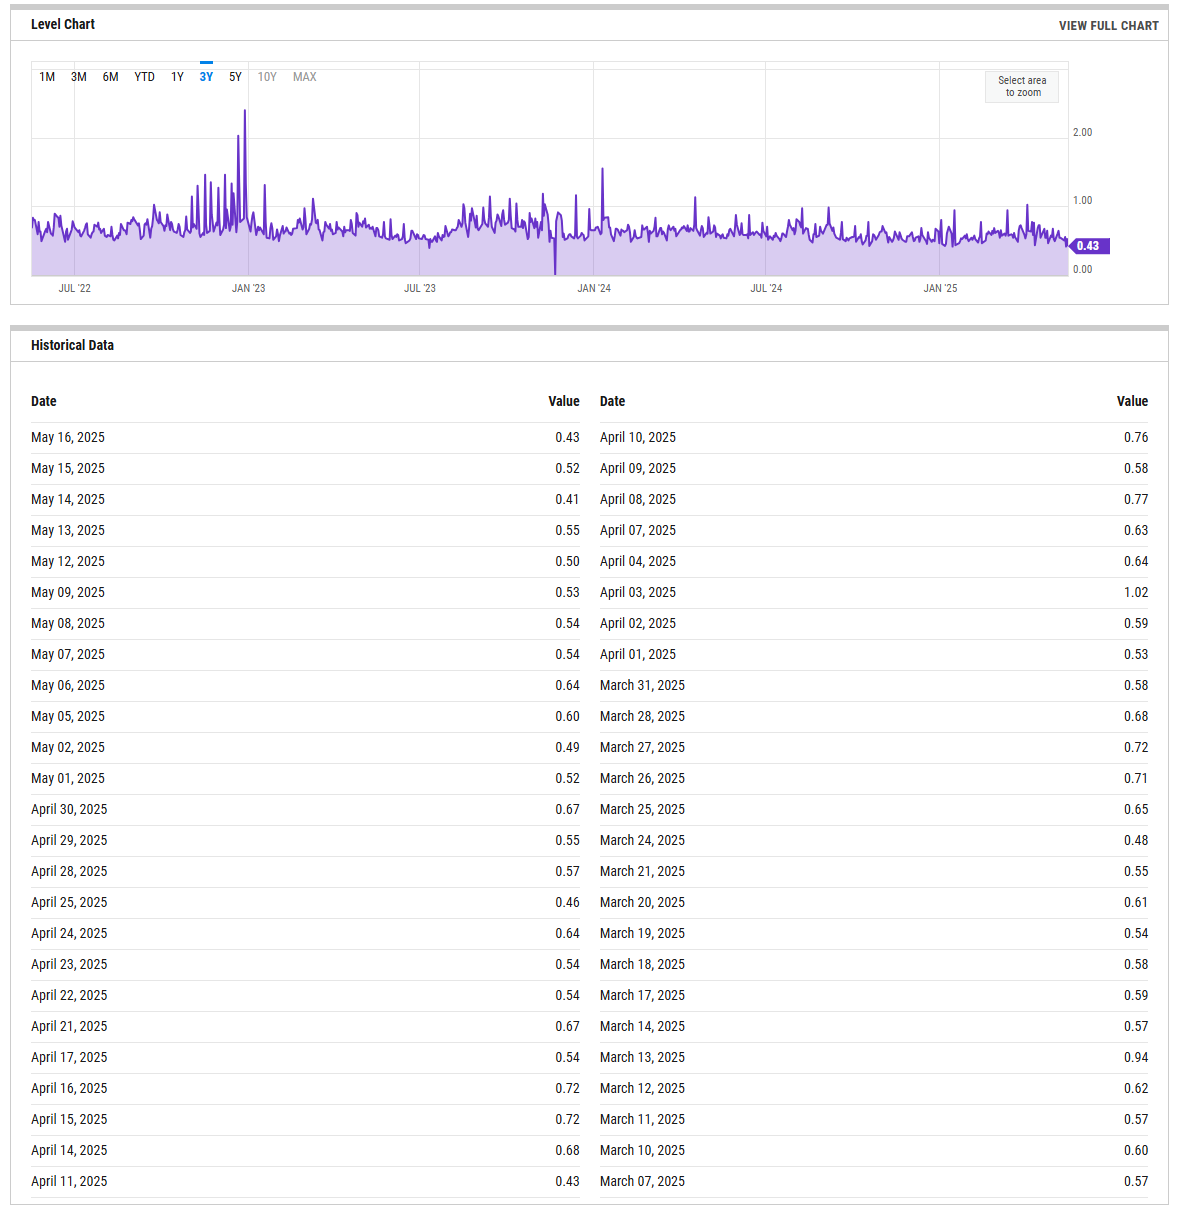
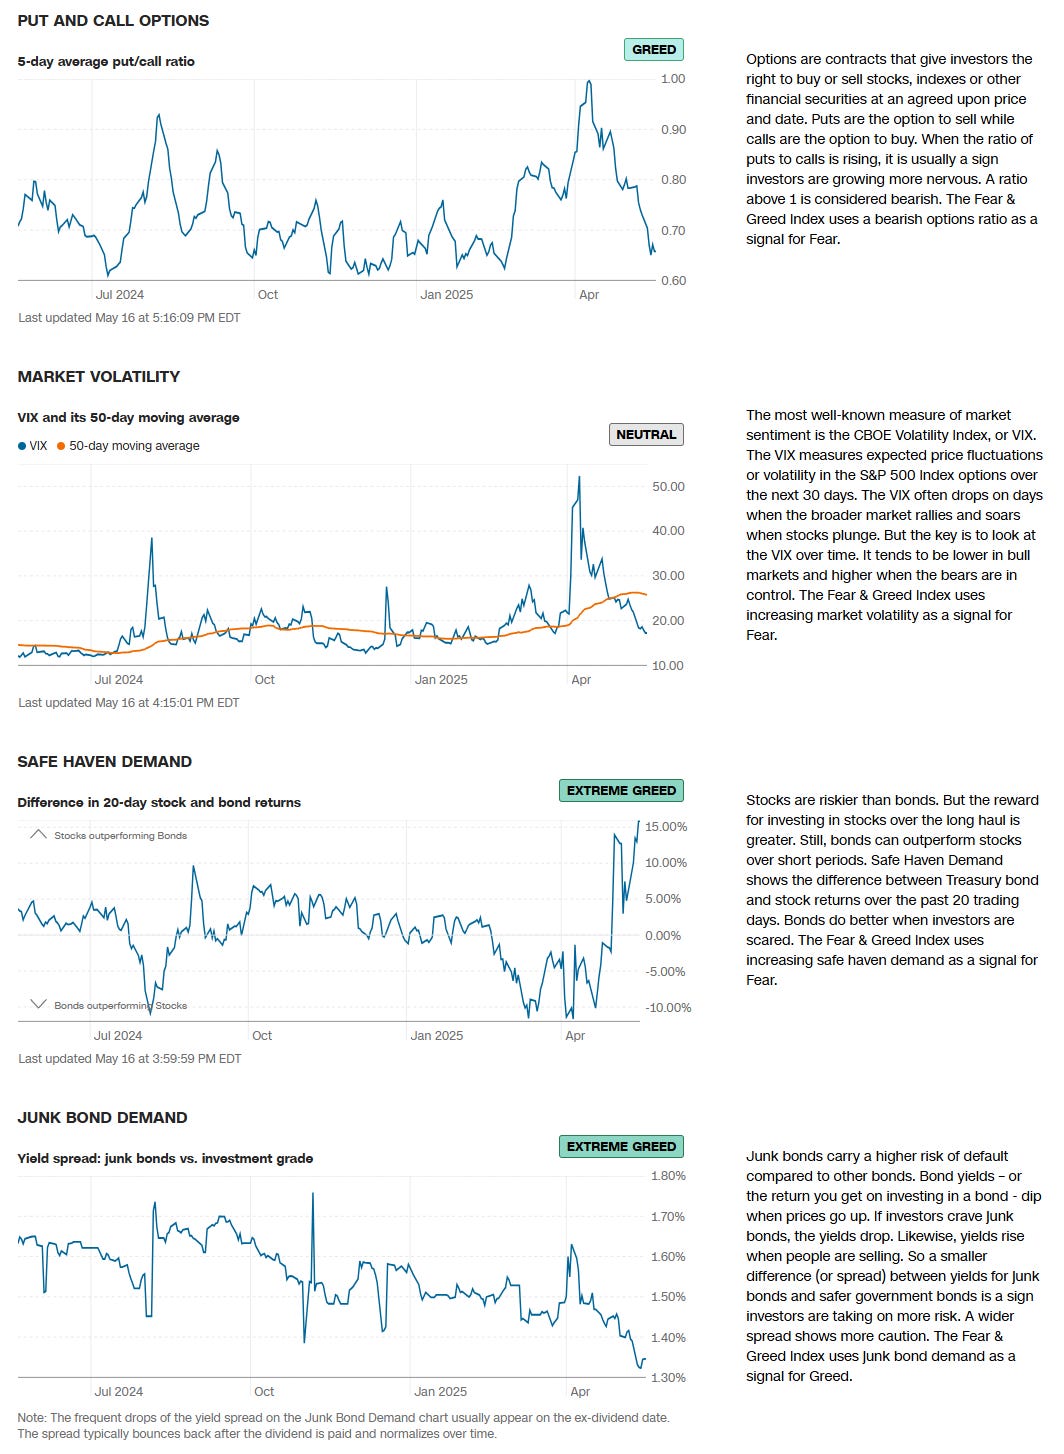
SPX Put/Call Ratio
The SPX Put/Call Ratio is an indicator that is used to gauge market sentiment. This is calculated as the ratio between trading S&P 500 put options and S&P call options. A high put/call ratio can indicate fear in the markets, while a low ratio indicates confidence. For example, in 2015, the Put-Call ratio was as high as 3.77 because of market fears stemming from various global economic issues like a GDP growth slowdown in China and a Greek debt default.
CBOE Equity Put/Call Ratio
The CBOE (Chicago Board Options Exchange) equity put/call ratio is a sentiment indicator used by traders and analysts to gauge market sentiment and potential shifts in investor behavior. It is calculated by dividing the volume of put options by the volume of call options on equities. Here’s what it reveals and how it is generally interpreted:
High Put/Call Ratio: When the put/call ratio is high (above 1.0), it suggests that there is more demand for put options than call options. This typically reflects a more bearish sentiment, as investors may be hedging against potential declines or expecting the market to fall.
Low Put/Call Ratio: Conversely, a low put/call ratio (below 0.7) indicates a higher volume of call options compared to puts, reflecting bullish sentiment. Investors may be expecting upward momentum and are positioning themselves to profit from price gains
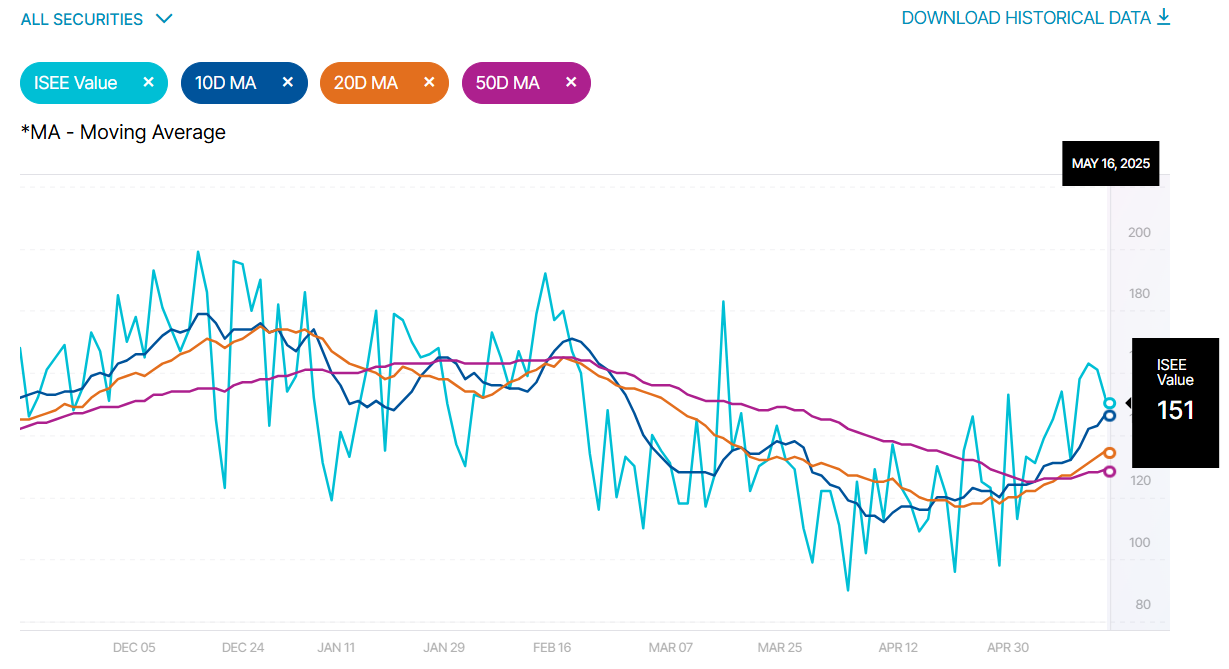
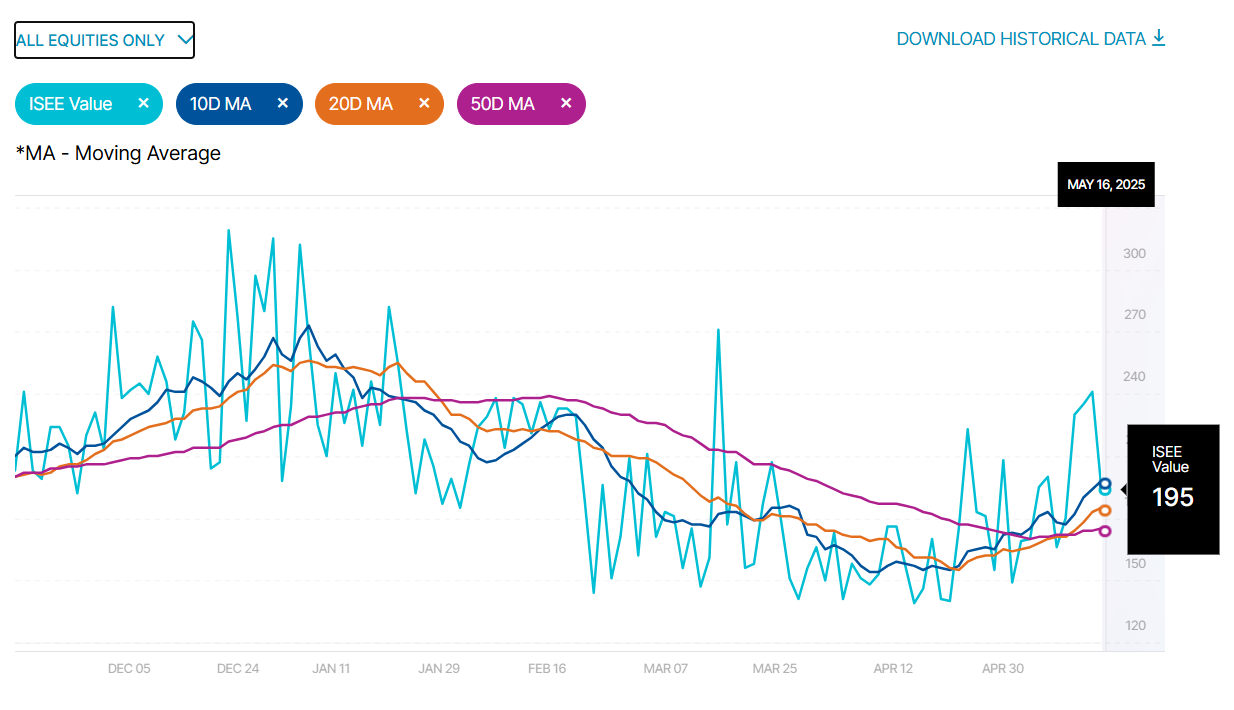
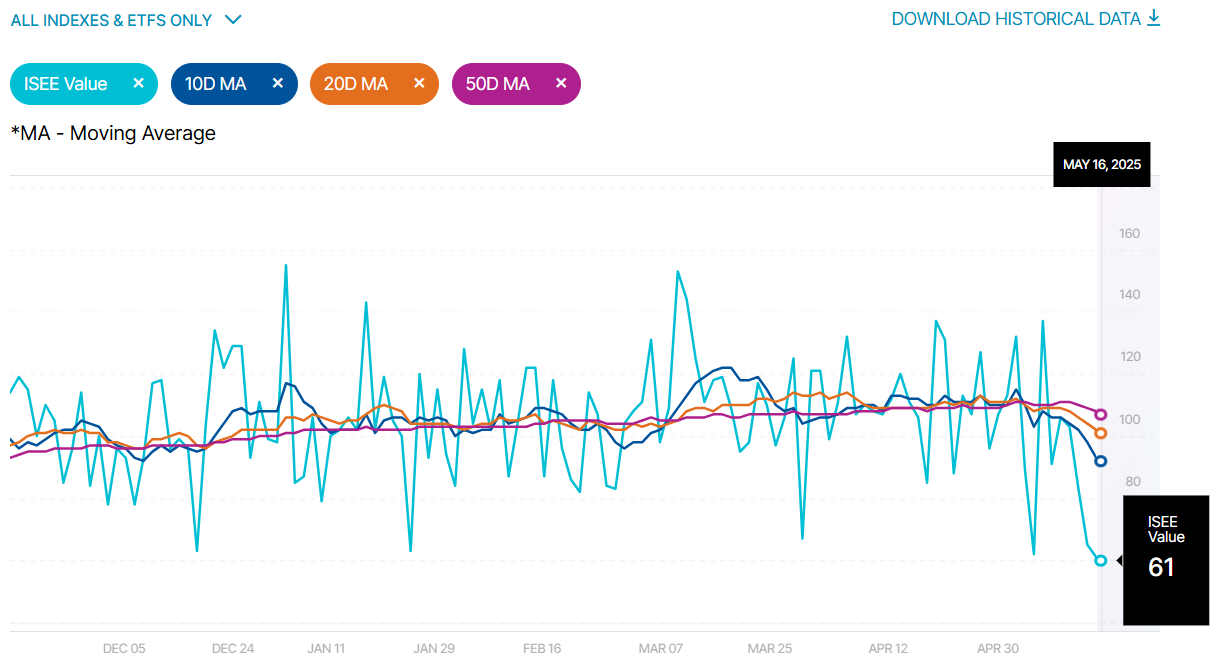
ISEE Sentiment Index
The ISEE (International Securities Exchange Sentiment) Index is a measure of investor sentiment derived from options trading. Unlike traditional put/call ratios, the ISEE Index focuses only on opening long customer transactions and is adjusted to remove market-maker and firm trades, providing a purer sentiment reading.
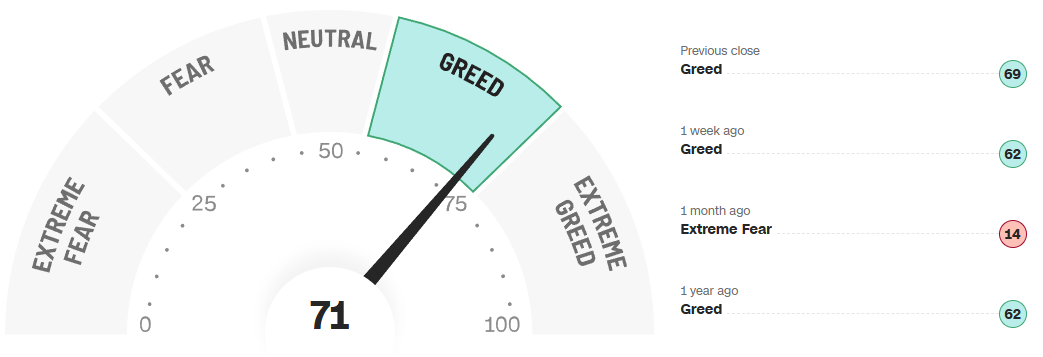
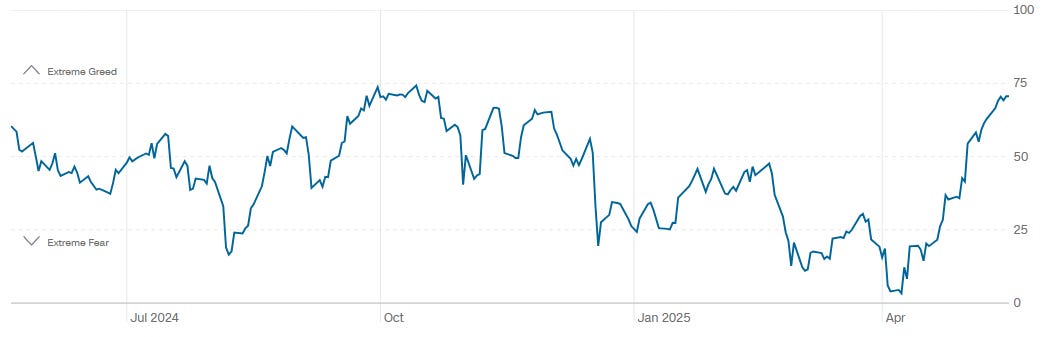
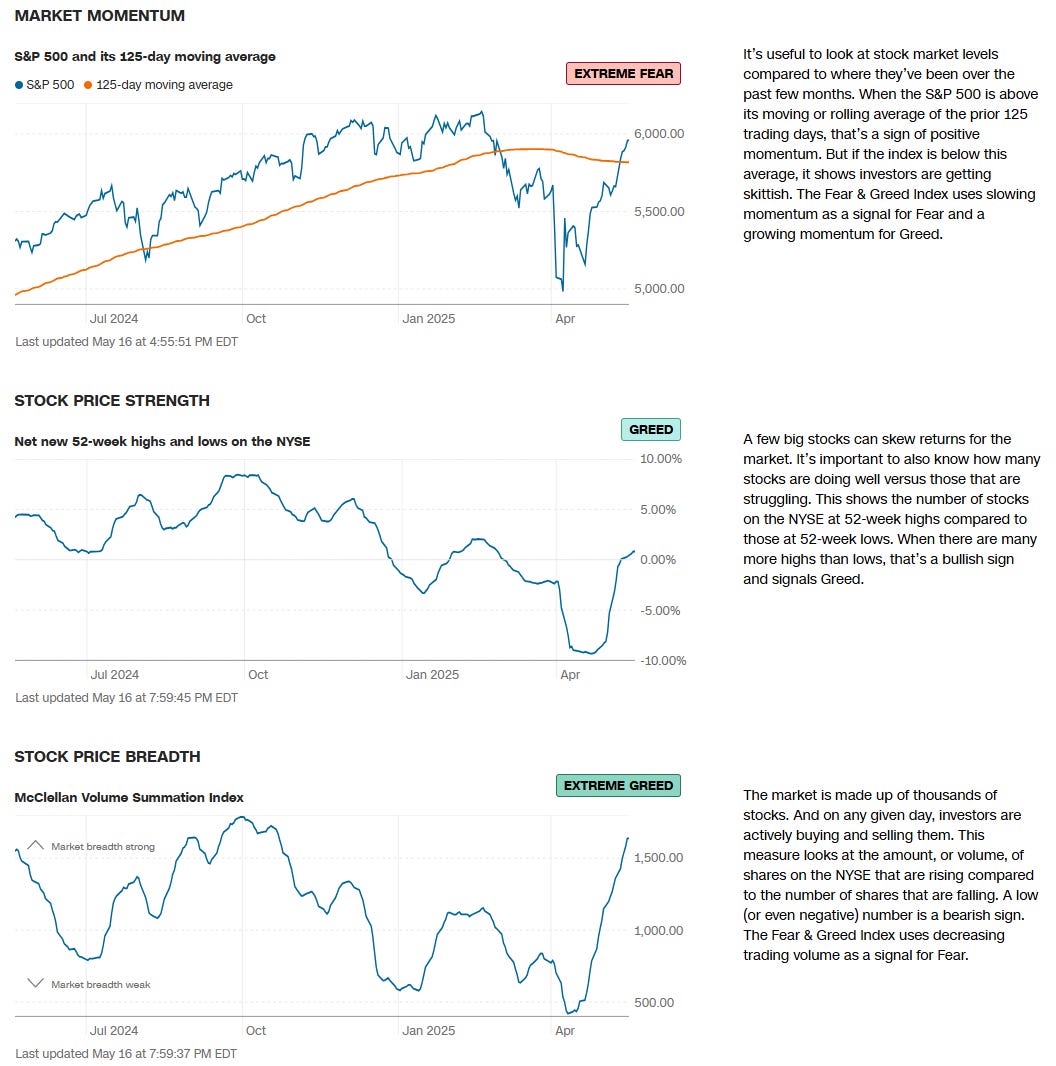
CNN Fear & Greed Constituent Data Points & Composite Index
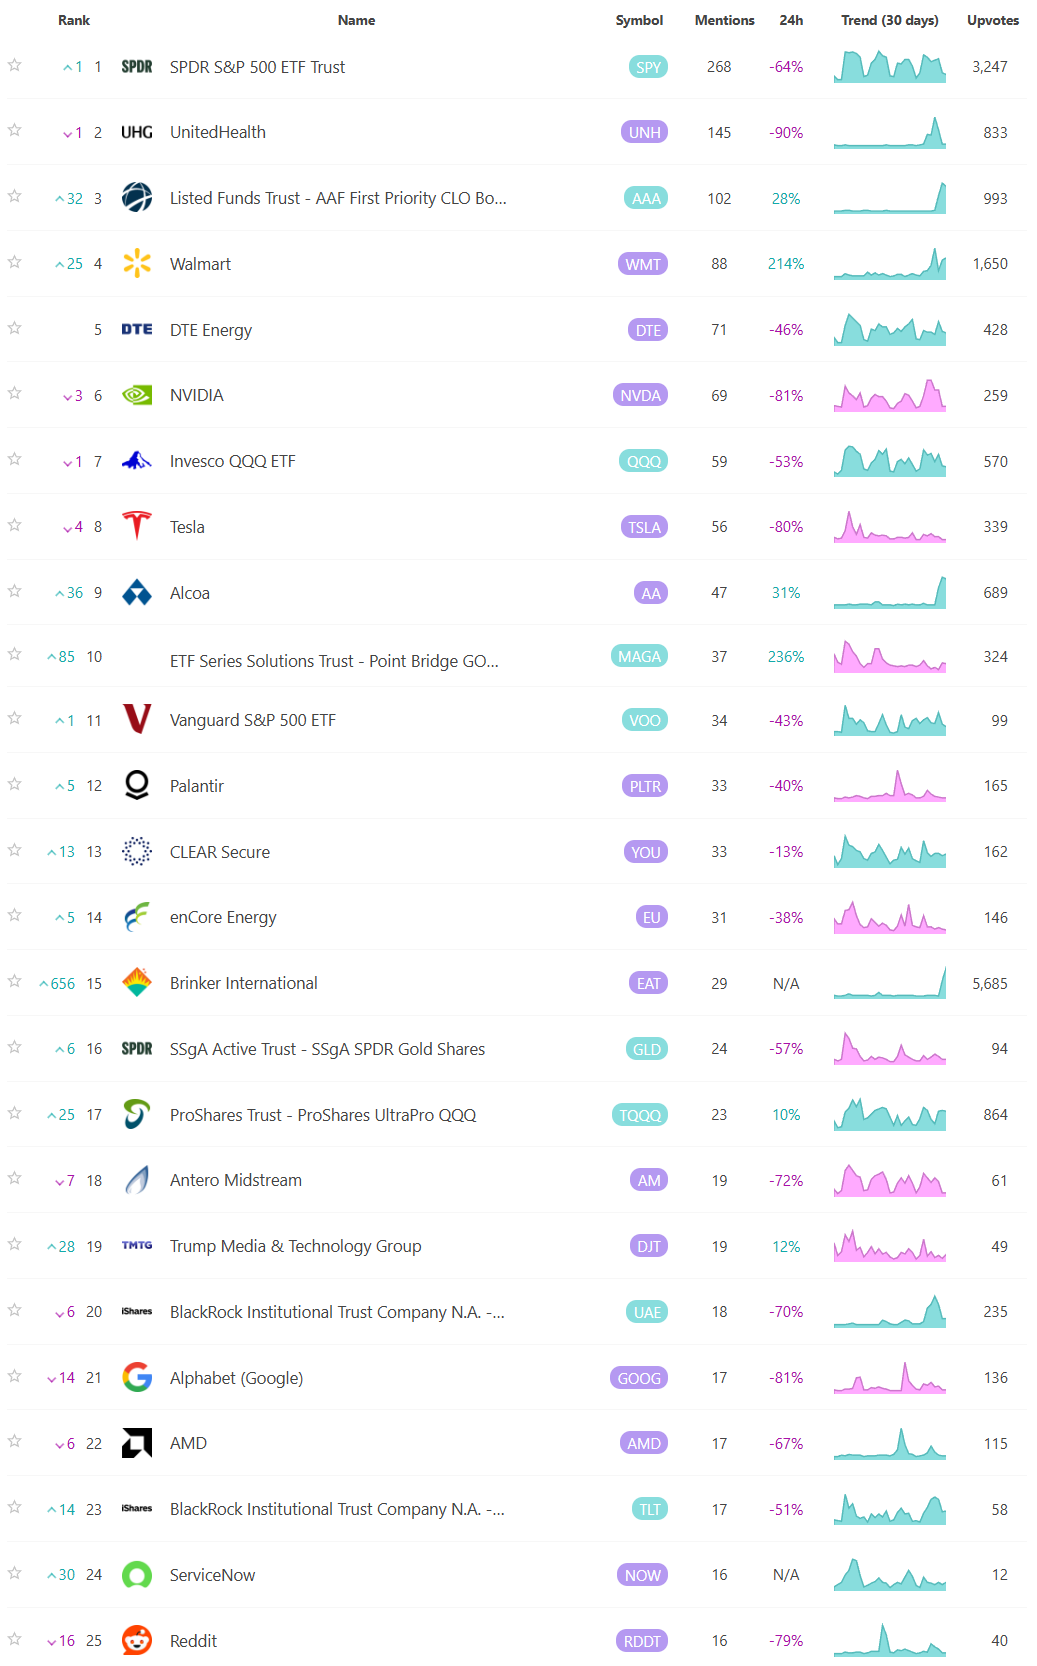
Social Media Favs
Analyzing social sentiment can provide valuable insights for investment strategies by offering a pulse on public perception, mood, and market sentiment that traditional financial indicators might not capture. Here’s how social sentiment analysis can enhance investment decisions:
Market Momentum: Positive or negative social sentiment can signal impending momentum shifts. When public opinion on a stock, sector, or asset class changes sharply, it can create buying or selling pressure, especially if that sentiment becomes widespread.
Early Detection of Trends: Social sentiment data can help investors spot trends before they show up in technical or fundamental data. For example, increased positive chatter around a particular company or sector might indicate growing interest or excitement, which could lead to price appreciation.
Gauge Retail Investor Impact: With the rise of retail investor platforms, collective sentiment on social media can lead to significant price movements (e.g., meme stocks). Understanding how retail investors view certain stocks can help in identifying high-volatility opportunities.
Event Reaction Monitoring: Social sentiment can provide real-time reactions to news events, product releases, or earnings reports. Investors can use this information to gauge market reaction quickly and adjust their strategies accordingly.
Complementing Quantitative Models: By adding a social sentiment layer to quantitative models, investors can enhance predictions. For example, a model that tracks historical price and volume data might perform even better when factoring in sentiment trends as a measure of market psychology.
Risk Management: Negative sentiment spikes can be a signal of potential downturns or increased volatility. By monitoring sentiment, investors might avoid or hedge against investments in companies experiencing a public relations crisis or facing negative perceptions.
Long-Term Sentiment Trends: Sustained sentiment trends, whether positive or negative, often mirror longer-term market cycles. Tracking sentiment trends over time can help identify shifts in investor psychology that could affect longer-term investments or sector rotations.
For these reasons, sentiment analysis, when combined with other tools, can provide a comprehensive view of both immediate market reactions and underlying investor attitudes, helping investors position themselves strategically across various time frames. Here are the most mentioned/discussed tickers on Reddit from some of the most active Subreddits for trading:
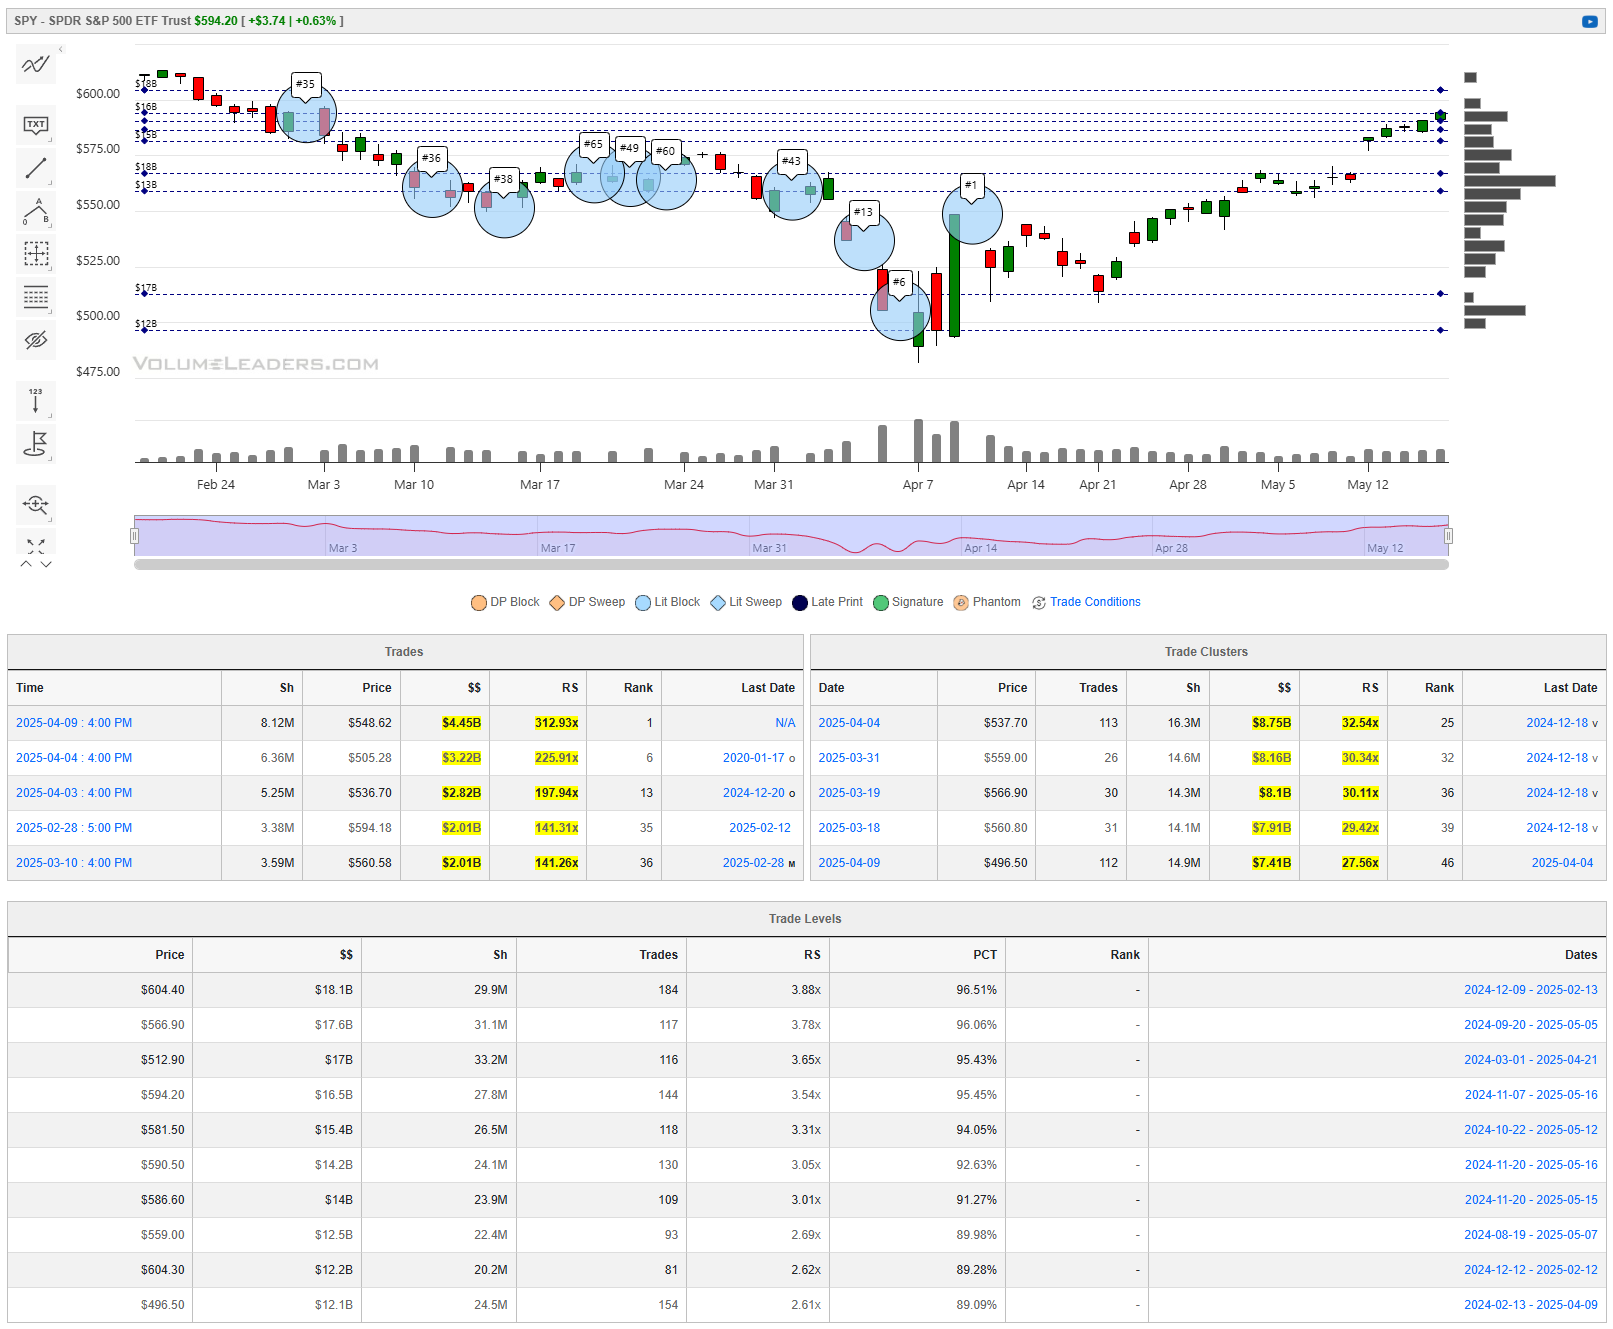
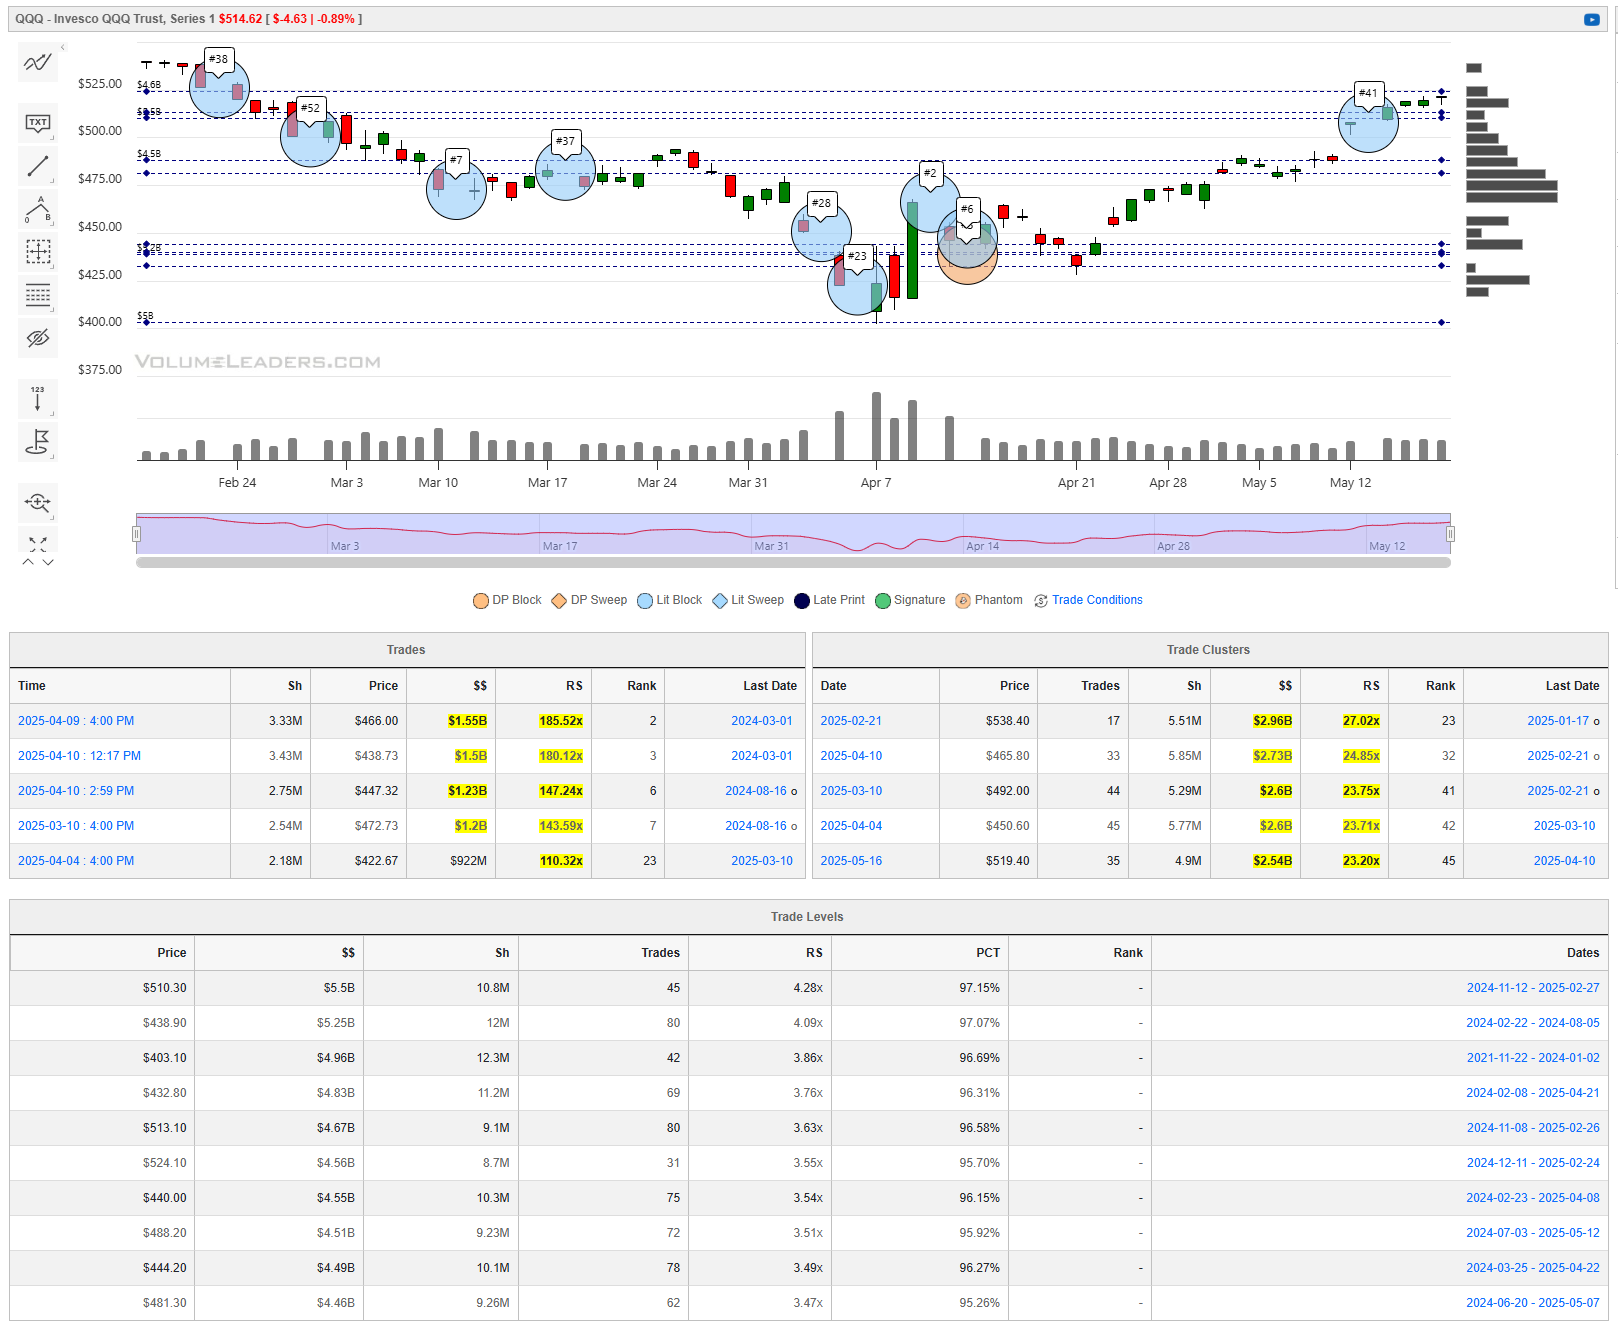
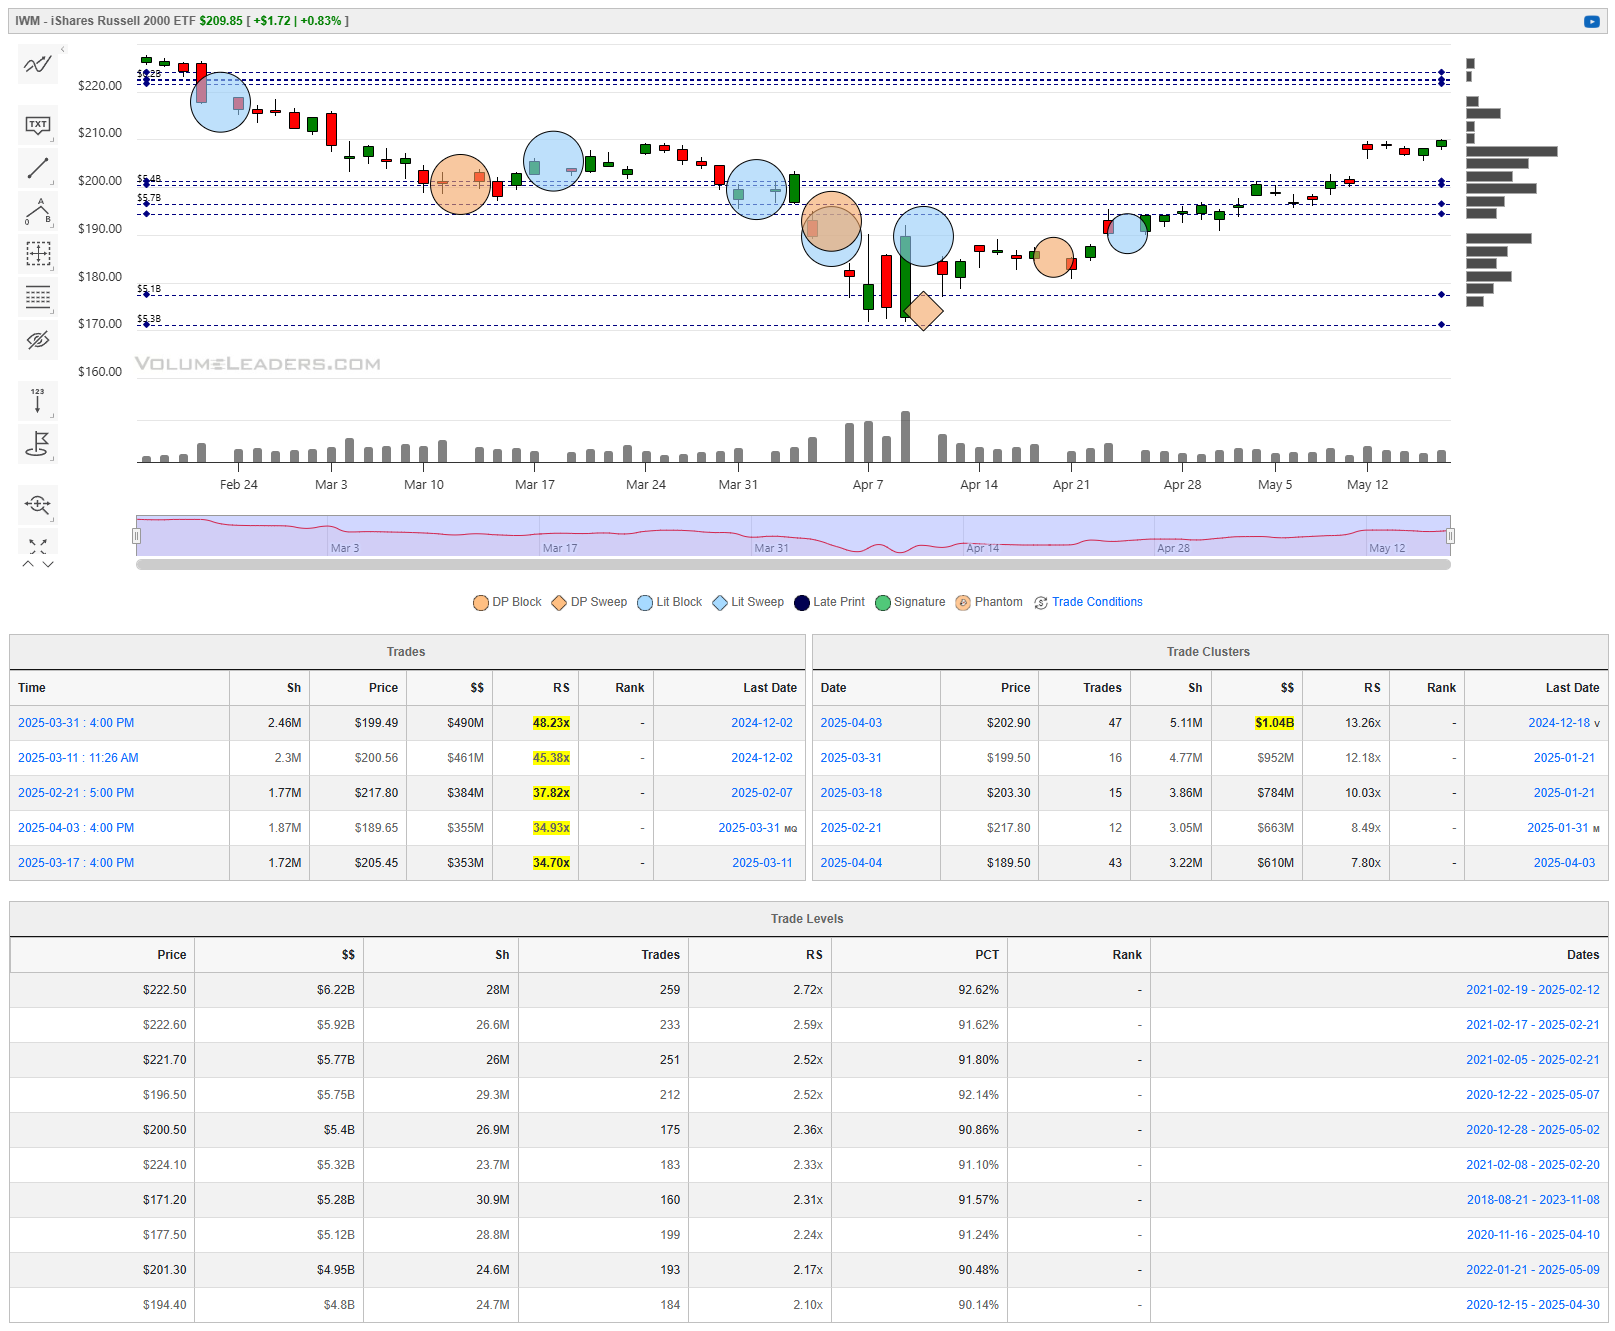
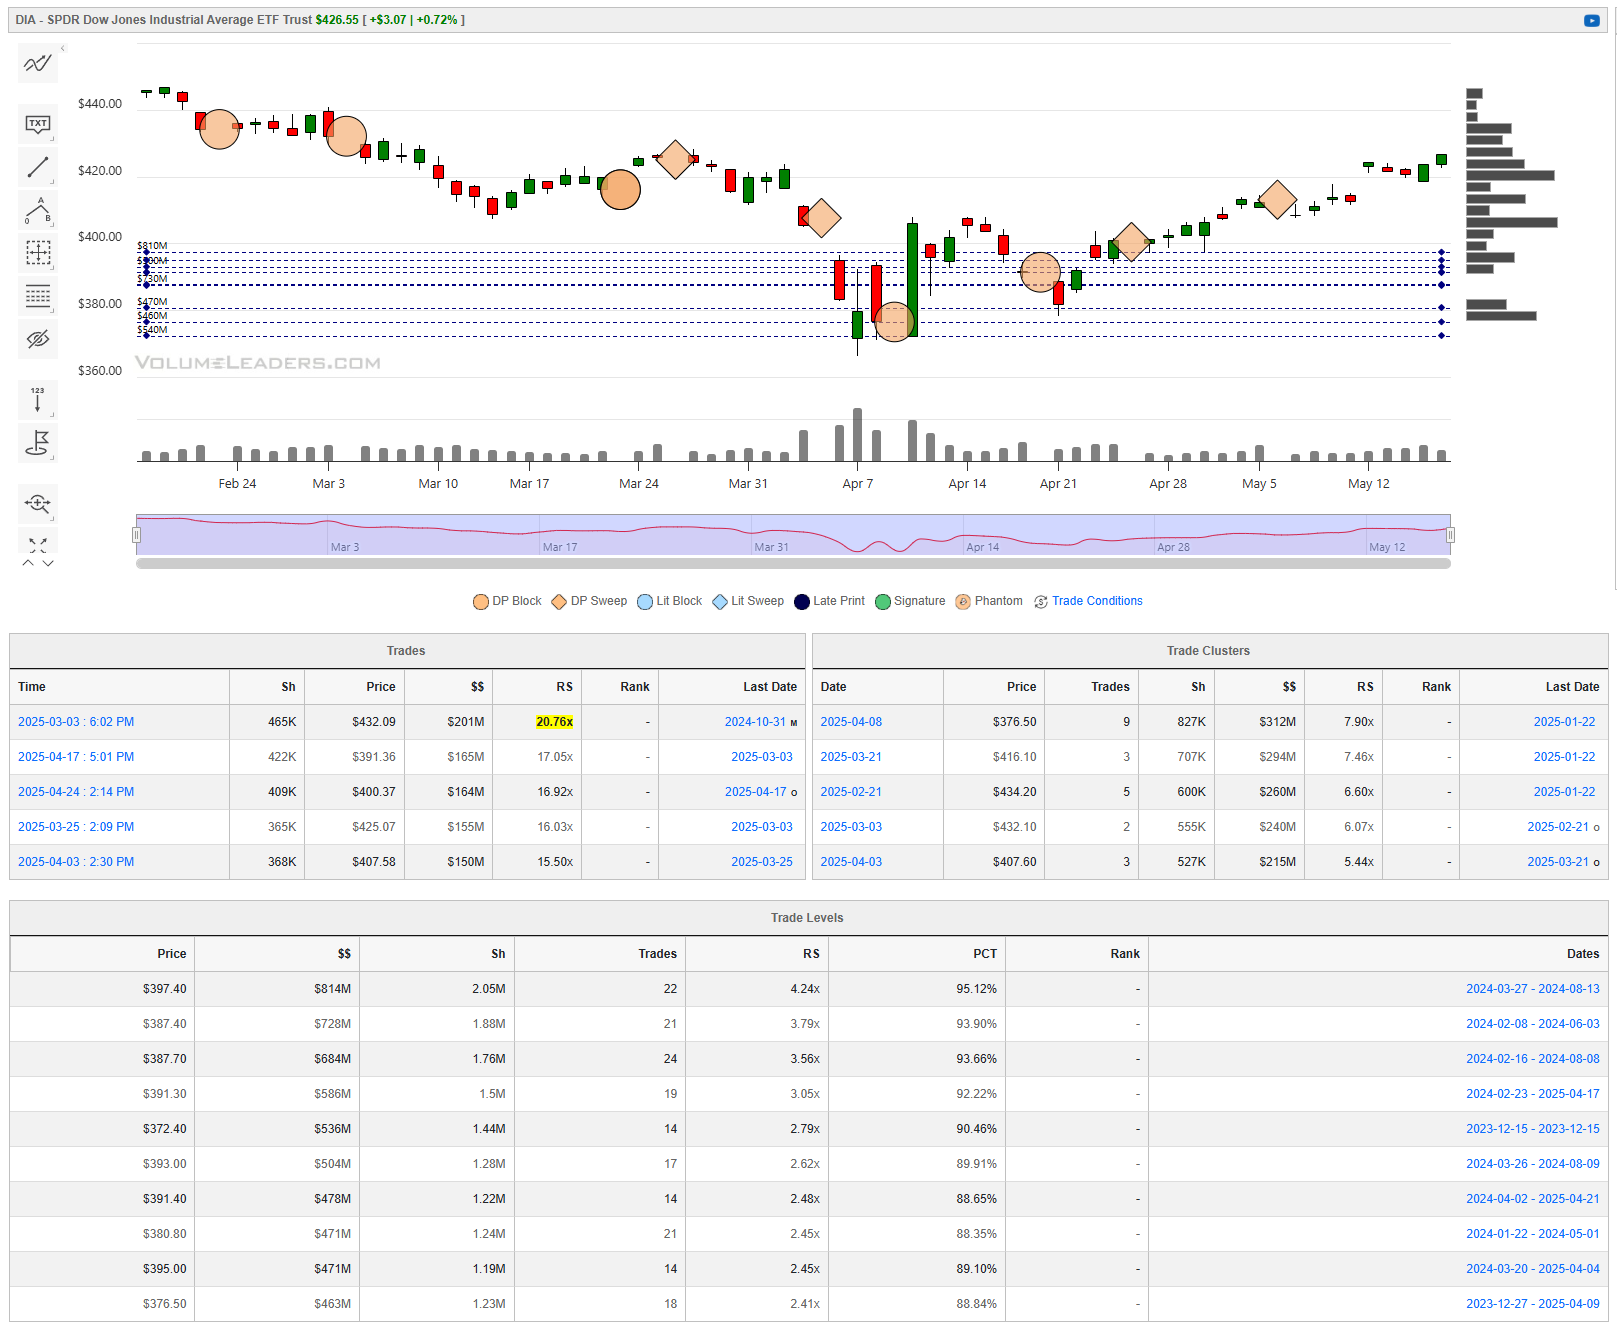
Institutional S/R Levels for Major Indices
When you’re a large institutional player, your primary goal is to find liquidity - places to do a ton of business with the least amount of slippage possible. VolumeLeaders.com automatically identifies and visually plots the exact spots where institutions are doing business and where they are likely to return for more. It’s one of the primary reasons “support” and “resistance” concepts work and truly one of the reasons “price has memory” - take a look at the dashed lines in the images below that the platform plots for you automatically; these are the areas institutions constantly revisit to do more business.
Levels from the VolumeLeaders.com platform can help you formulate trades theses about:
Where to add or take profit
Where to de-risk or hedge
What strikes to target for options
Where to expect support or resistance
And this is just a small sample; there are countless ways to leverage this information into trades that express your views on the market. The platform covers thousands of tickers on multiple timeframes to accommodate all types of traders.
SPY
QQQ
IWM
DIA
Special Coverage
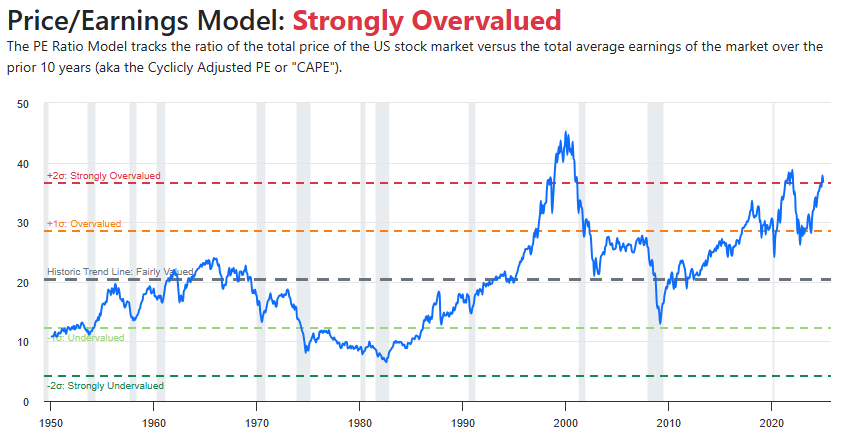
Projecting S&P 500 Valuations: A Guide to Determining Current Fair Value
In a market environment that is increasingly driven by momentum, emotion, and macro uncertainty, the role of valuation as a grounding force cannot be overstated. Though markets can defy logic in the short run, the gravitational pull of intrinsic value continues to exert its influence over time. This is especially true for the S&P 500—a benchmark index that not only reflects the health of corporate America but also serves as a proxy for global equity sentiment. Understanding how to estimate the fair value of the S&P 500, and how to project it using data-driven, historically grounded models, is critical for investors seeking to allocate capital prudently, manage risk effectively, and stay anchored in volatile conditions.
The pursuit of fair value is less about achieving perfect precision and more about constructing a defensible framework—one that blends macro awareness, fundamental analysis, and statistical discipline. Here we explore that pursuit in depth, providing a narrative walkthrough of the most widely used valuation methods, the key macroeconomic levers that affect them, and a blueprint for synthesizing multiple models into a cohesive projection for today’s market.
Foundations of Valuation: Anchoring Expectations
At its most fundamental level, valuation answers a simple question: What is the present value of future corporate earnings? When we apply this question to the S&P 500, however, the simplicity ends. The index is not a single company, but a composite of 500 firms from diverse industries, each with unique growth profiles, capital structures, and macro sensitivities. Nevertheless, a few constants allow us to ground valuation analysis: earnings power, valuation multiples, and discount rates.
Corporate earnings are the starting point. Analysts commonly use forward earnings estimates—typically 12-month forecasts aggregated from Wall Street consensus—because markets tend to discount the future, not the past. These forward earnings serve as the "E" in the widely cited price-to-earnings (P/E) ratio, which in turn gives us a shorthand for how expensive or cheap the market is relative to expectations.
But earnings alone do not tell the full story. Valuation multiples expand or contract based on a range of factors including interest rates, inflation expectations, and investor risk appetite. When interest rates are low and economic growth appears stable, investors are willing to pay more for each dollar of earnings, and multiples rise. When uncertainty or inflation dominate headlines, multiples compress. The rate at which investors discount future cash flows—commonly anchored to the 10-year Treasury yield plus a risk premium—is the mathematical underpinning of this dynamic.
Exploring the Major Models
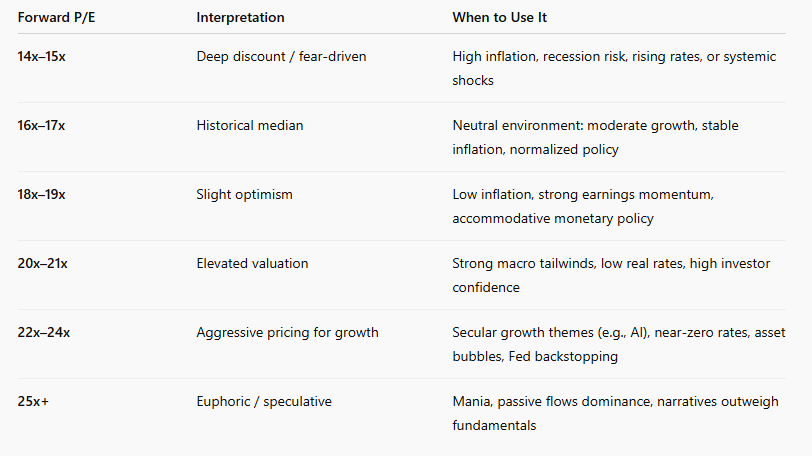
Among the most practical approaches to valuing the S&P 500 is the forward P/E model. This method is as straightforward as it is widely used: multiply the consensus forward EPS by an assumed fair multiple. For instance, if forward EPS is projected at $250 and we deem 17x earnings a fair multiple based on historical norms, then the fair value estimate lands at 4,250. Simplicity is its strength, but also its weakness. The P/E multiple is a moving target, shaped by shifting macro conditions and investor psychology.
The Fed Model attempts to add more rigor by comparing the S&P 500’s earnings yield (the inverse of the P/E ratio) to the yield on 10-year Treasury bonds. The logic is that both represent potential returns on investment—one risky, one risk-free. If the equity yield exceeds the bond yield, stocks are considered undervalued. Critics argue this model ignores the equity risk premium and oversimplifies investor behavior, but it remains popular, especially among allocators looking for a macro signal.
A more nuanced approach is offered by the Gordon Growth Model (GGM), which applies discounted cash flow logic at the index level. Here, the present value of expected dividends or earnings is calculated by dividing them by the difference between a discount rate and expected long-term growth. While theoretically sound, the GGM is highly sensitive to small changes in growth and rate assumptions, making it best used as a conceptual anchor rather than a precision tool.
The Shiller CAPE ratio, created by Nobel laureate Robert Shiller, seeks to smooth out the cyclicality of earnings by using a 10-year inflation-adjusted average. This helps avoid being misled by temporarily inflated or depressed earnings. However, CAPE is often criticized for being too slow to reflect structural changes in profitability or corporate tax policy.
Then there is the Yardeni Model, a more flexible alternative that adjusts the Fed Model by incorporating long-term earnings growth expectations and corporate bond yields. It offers a middle ground between simplicity and nuance, but like all models, it depends on assumptions that are themselves volatile.
The Macro Overlay
Valuation does not exist in a vacuum. It is deeply influenced by the macroeconomic environment. Inflation, in particular, has an outsized impact. Persistent inflation erodes the present value of future earnings, forcing a downward revision of fair value. Similarly, the Federal Reserve’s policy stance shapes both interest rates and the availability of capital, thereby influencing discount rates and investor risk appetite.
Earnings momentum and revisions also play a pivotal role. A valuation framework is only as good as its input assumptions, and forward earnings can change rapidly during earnings season, or in response to economic data and geopolitical shocks. The sectoral composition of the index matters as well. The S&P 500 is heavily tilted toward tech and communication services. These companies tend to reinvest rather than pay dividends, and their earnings often justify higher multiples due to scalability and margin expansion potential. Models like the Gordon Growth Model, which rely on dividend inputs, may understate the value of such growth-oriented components.
Interpreting Market Signals
Professional investors complement long-term valuation models with real-time indicators that reflect market sentiment and institutional positioning. The equity risk premium (ERP), for instance, helps measure whether investors are being adequately compensated for bearing equity risk. A rising ERP may indicate undervaluation, while a low or negative ERP suggests complacency.
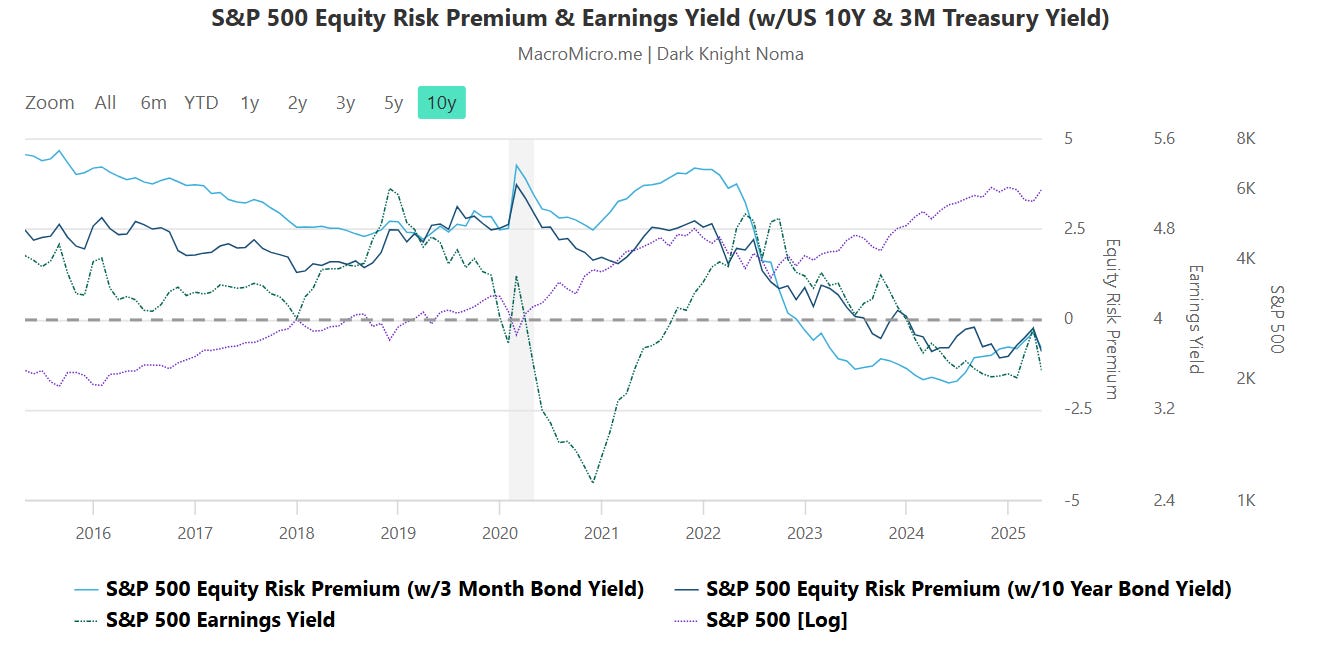
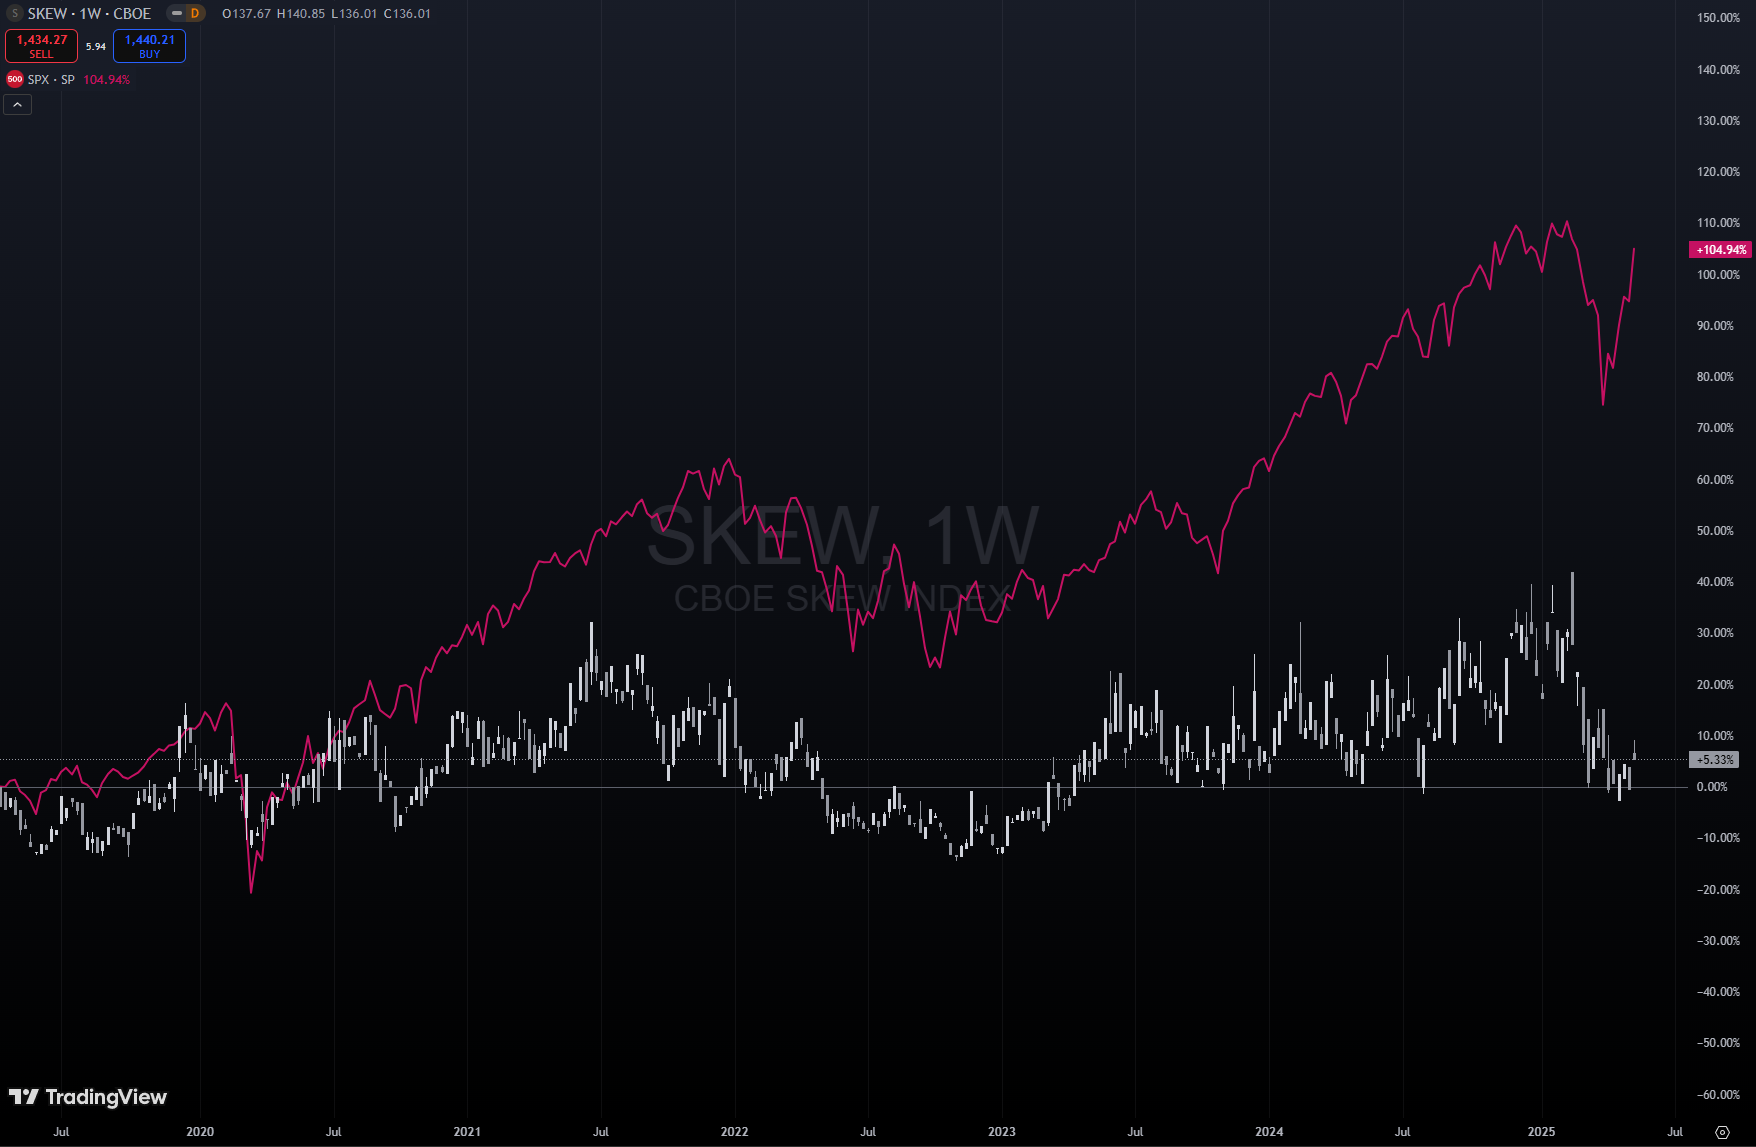
Implied volatility and options skew are also informative. If out-of-the-money puts are significantly more expensive than calls, it can signal hedging behavior or downside fear. Breadth indicators, such as the percentage of S&P 500 constituents trading above their 200-day moving average, help validate whether price moves are supported by broad participation or driven by a handful of megacaps.
Building a Composite Framework
No single valuation model offers a complete view. A robust approach involves blending multiple perspectives to triangulate fair value. One way to do this is to assign weights to 3–5 models based on the current macro regime. In periods of monetary easing and low inflation, forward P/E and Fed Model estimates might carry more weight. During turbulent or high-rate environments, models like Shiller CAPE or Yardeni may provide a more conservative anchor.
Each model provides a range of estimates rather than a fixed target. By compiling low, mid, and high estimates, one can define a valuation band that helps assess whether current market pricing reflects optimism, pessimism, or equilibrium. When prices push above the high end of the band, it may suggest froth. When they sink below the low end, it could signal opportunity.
A Live Walkthrough
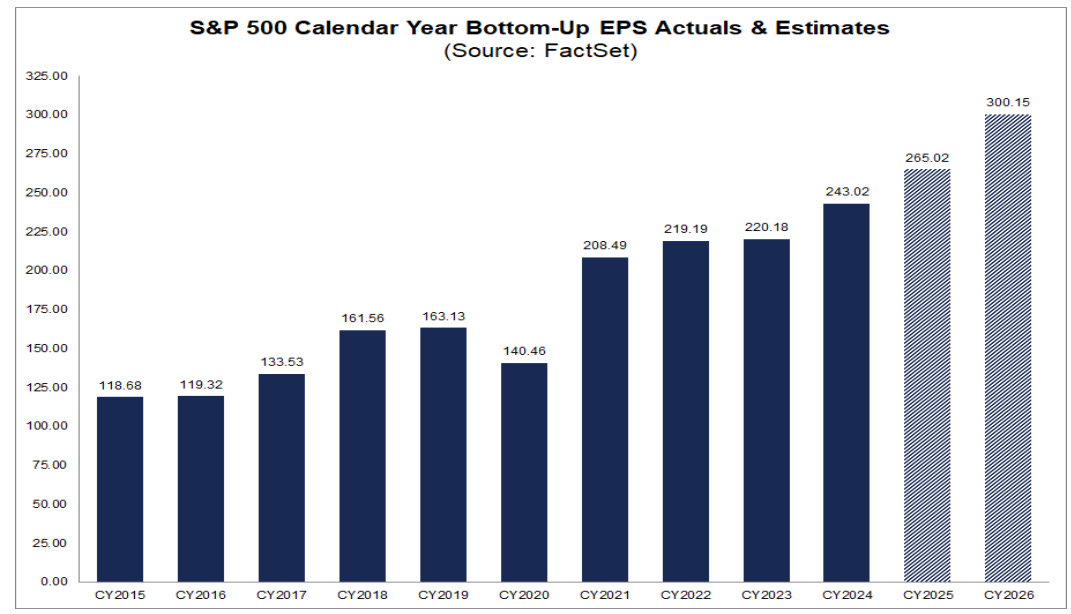
Let’s put this into practice. Suppose forward 12-month EPS for the S&P 500 is $250. The 10-year Treasury yield is 4.4%. Long-term earnings growth is projected at 4.5%. Using a variety of models:
Forward P/E Model (using 17x): Fair value = 4,250
Fed Model: Fair value = $250 / 0.044 = 5,681
Gordon Growth Model: Fair value = ($250 × 1.045) / (0.076 - 0.045) = 8,419
Yardeni Model: Fair value = $250 / (0.054 - 0.10 × 0.045) = 5,732
With the S&P 500 trading at approximately 5,300, we observe that it sits near the midpoint of this range, slightly above long-term norms but within the bounds justified by growth and rate assumptions. In such an environment, one might argue for a cautiously constructive stance, while watching for signs that the growth assumptions embedded in current pricing are vulnerable to revision.
Additional Valuation Models to Explore
1. Tobin’s Q Ratio Market value of assets vs. replacement cost. High Q ratios can signal overvaluation relative to economic fundamentals.
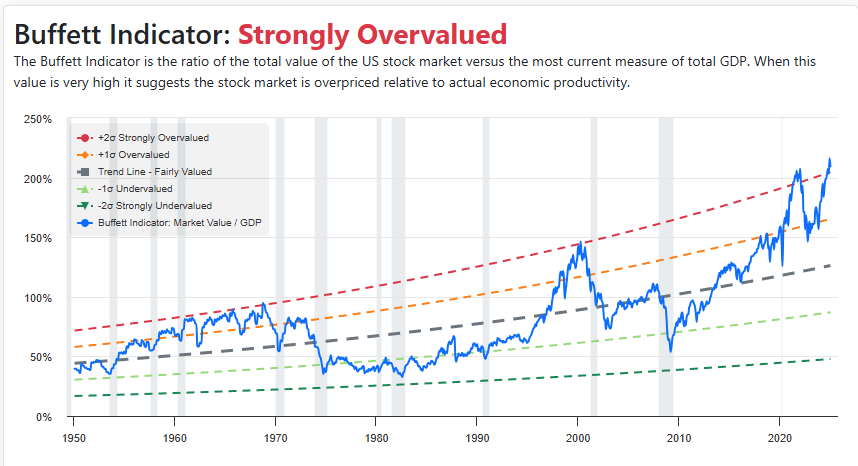
2. Buffett Indicator (Market Cap to GDP) Used by Warren Buffett to gauge whether equities are overextended relative to economic output.
3. Price-to-Sales (P/S) Ratio Helpful when earnings are depressed or manipulated. Particularly relevant for growth stocks.
4. PEG Ratio Price-to-Earnings relative to growth rate. PEG < 1.0 suggests undervaluation.
5. H-Model Two-stage growth variation of the Gordon Growth Model. Captures transition from high to stable growth.
6. Residual Income Model Focuses on economic profit, or value created beyond the required return on equity.
7. Multi-Stage Dividend Discount Model Ideal for dividend-paying companies with different growth phases.
8. Economic Value Added (EVA) Measures true value creation by subtracting cost of capital from operating profits.
9. Implied Equity Risk Premium Models Reverse-engineer ERP from market prices. Highlights investor expectations.
10. Inflation-Adjusted Valuation Models Incorporate real variables to neutralize inflation distortion in earnings and yields.
Whether you’re a fundamental investor, a quant, or a macro trader, understanding and experimenting with these alternative models can enhance your ability to see value where others may only see price.
Final Thoughts
Valuation is not a crystal ball; it is a lens. Used properly, it sharpens focus and tempers bias. It gives investors a framework for weighing risk and reward, assessing opportunity, and managing expectations. By blending models, contextualizing with macro inputs, and remaining intellectually honest about uncertainty, investors can use valuation not just as a tool for forecasting but as a discipline for navigating markets that often defy simple logic.
Markets will continue to be shaped by narratives, liquidity, and emotion. But in the long arc of investing, value remains the gravity to which prices ultimately return. Understanding how to estimate that value is not just an analytical exercise—it’s an essential edge.
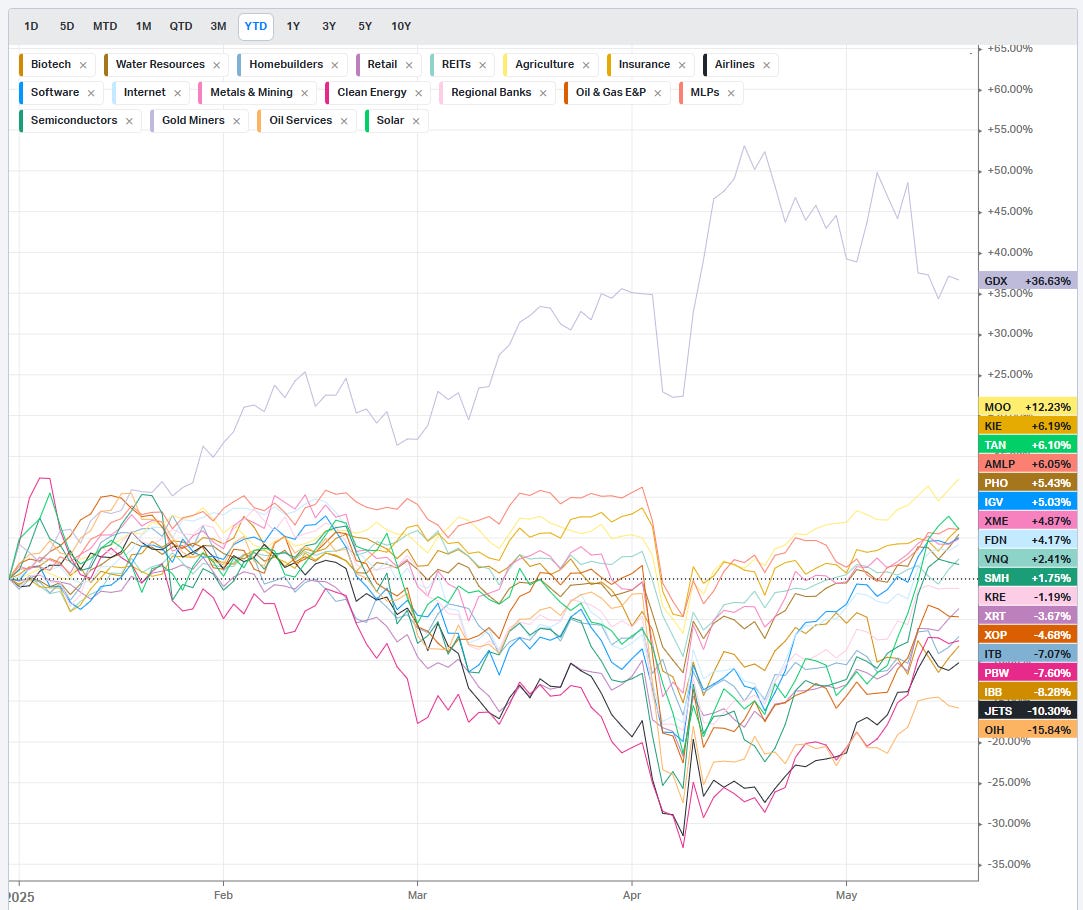
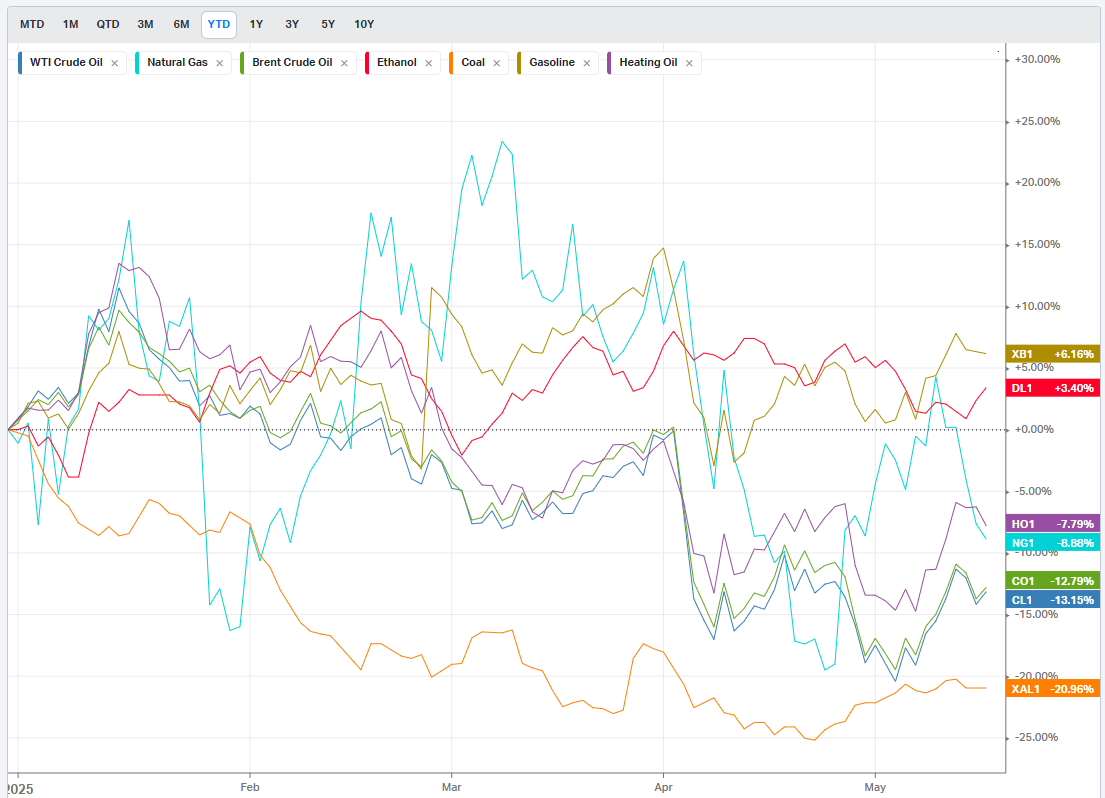
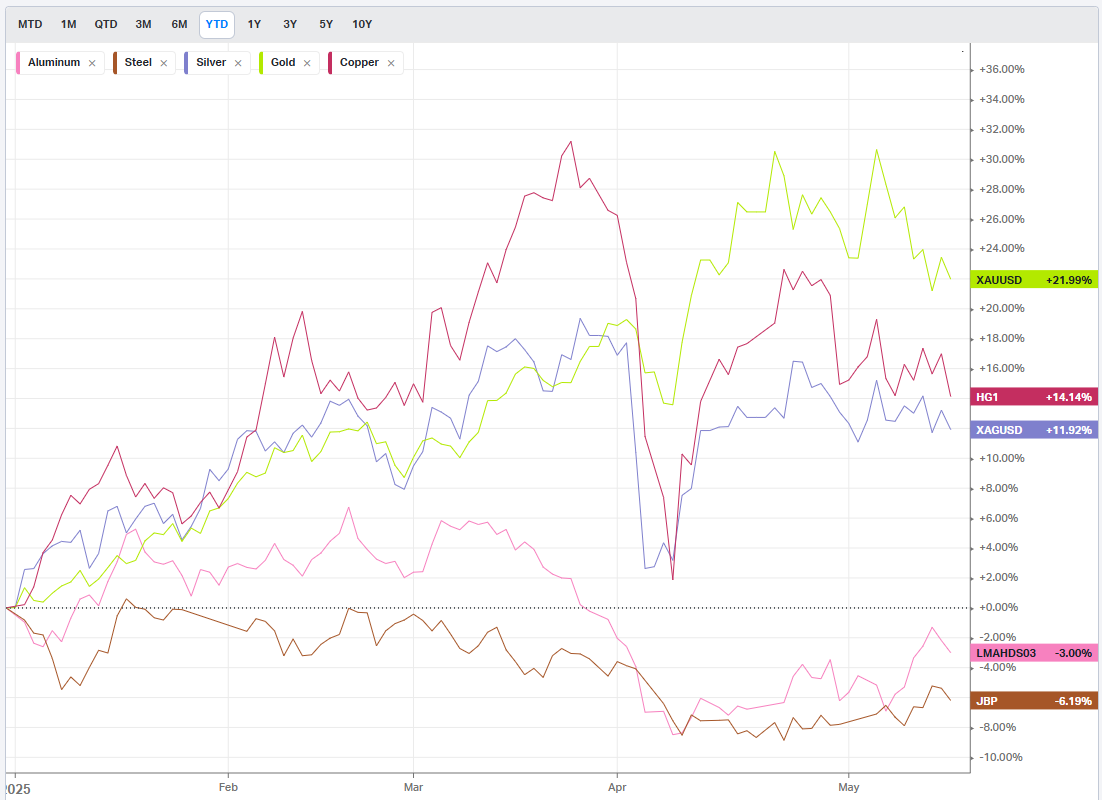
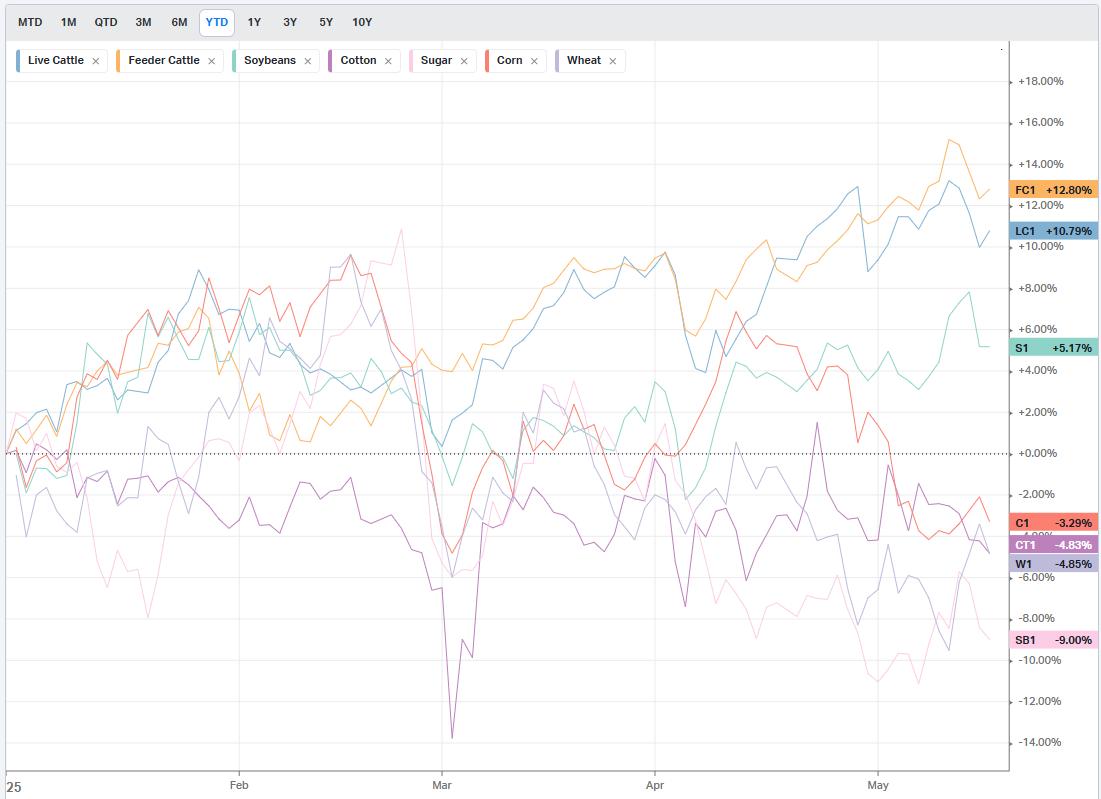
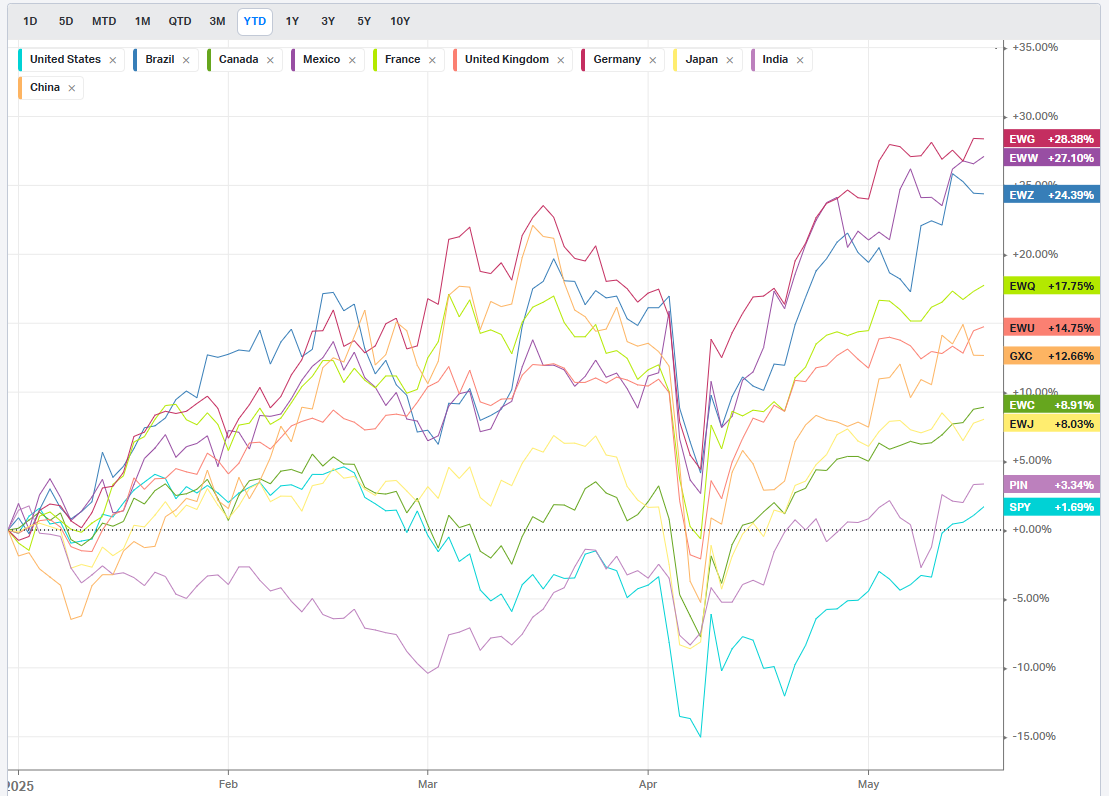
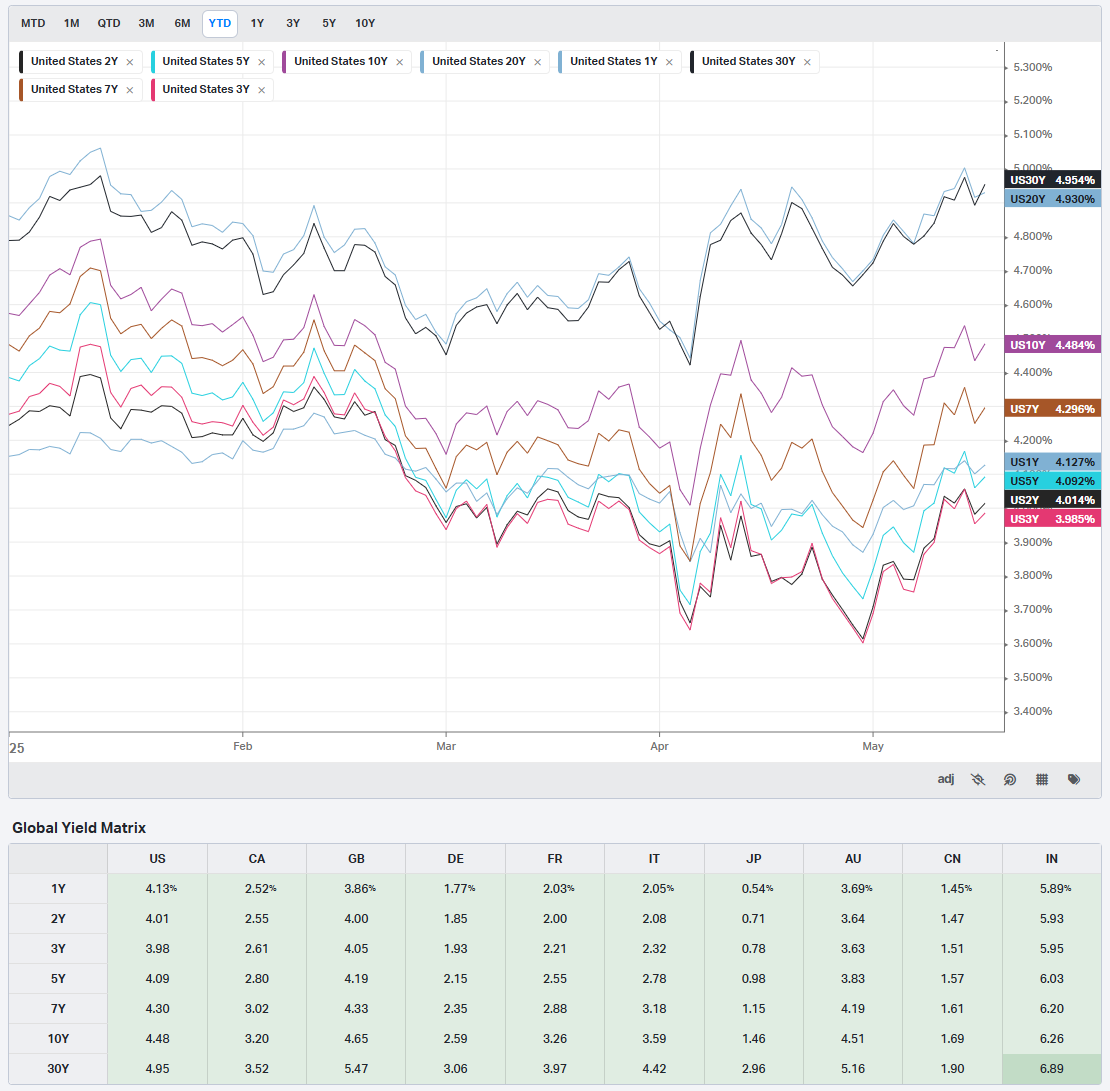
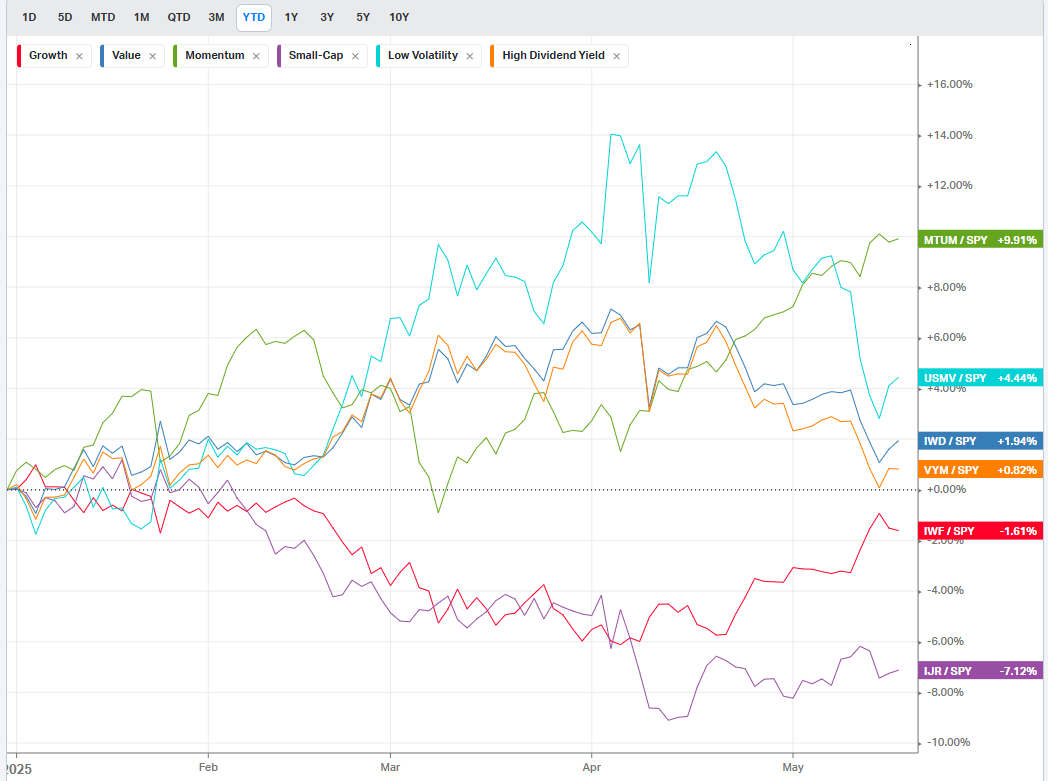
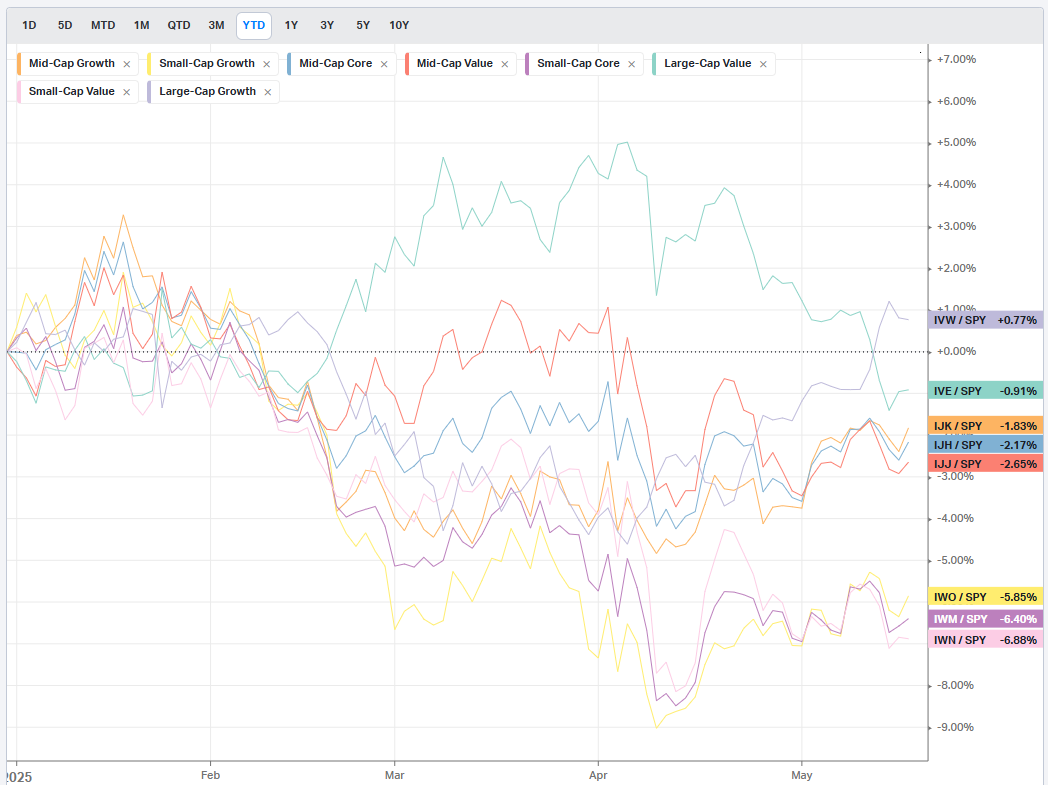
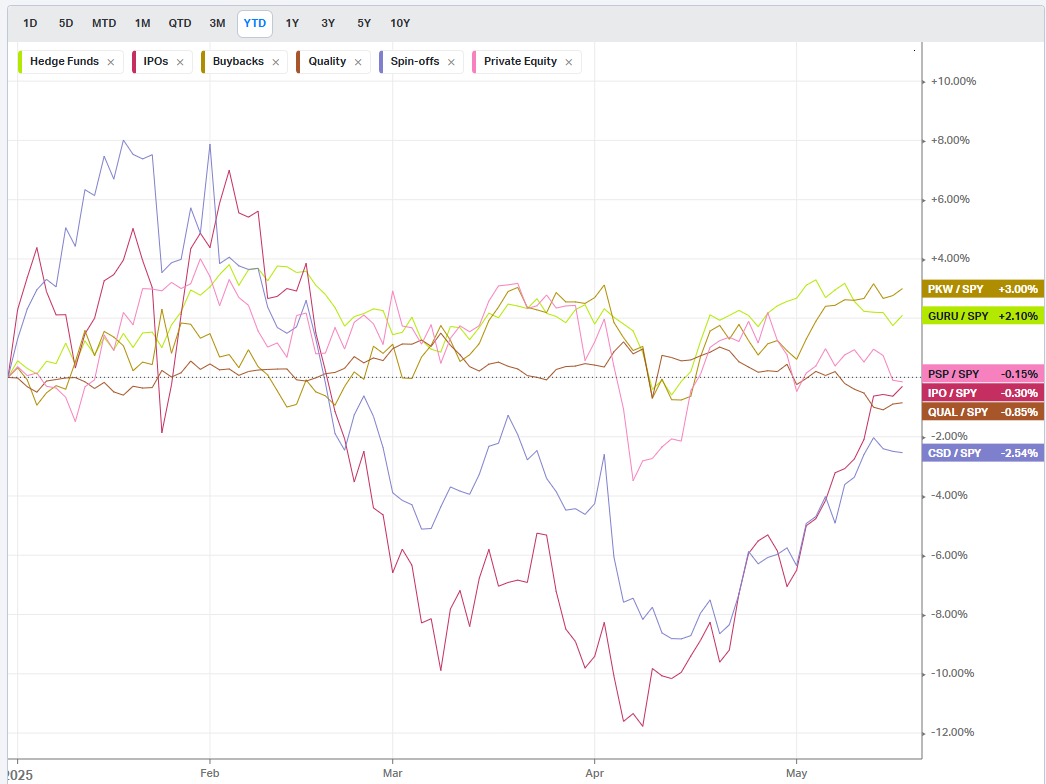
Summary Of Thematic Performance YTD
VolumeLeaders.com offers a robust set of pre-built thematic filters, allowing you to instantly explore specific market segments. These performance snapshots are provided purely for context and inspiration—think about zeroing in on the leaders and laggards within the strongest and weakest sectors, for example.
S&P By Sector
S&P By Industry
Commodities: Energy
Commodities: Metals
Commodities: Agriculture
Country ETFs
Currencies
Global Yields
Factors: Style
Factors: Size vs Value
Factors: Qualitative
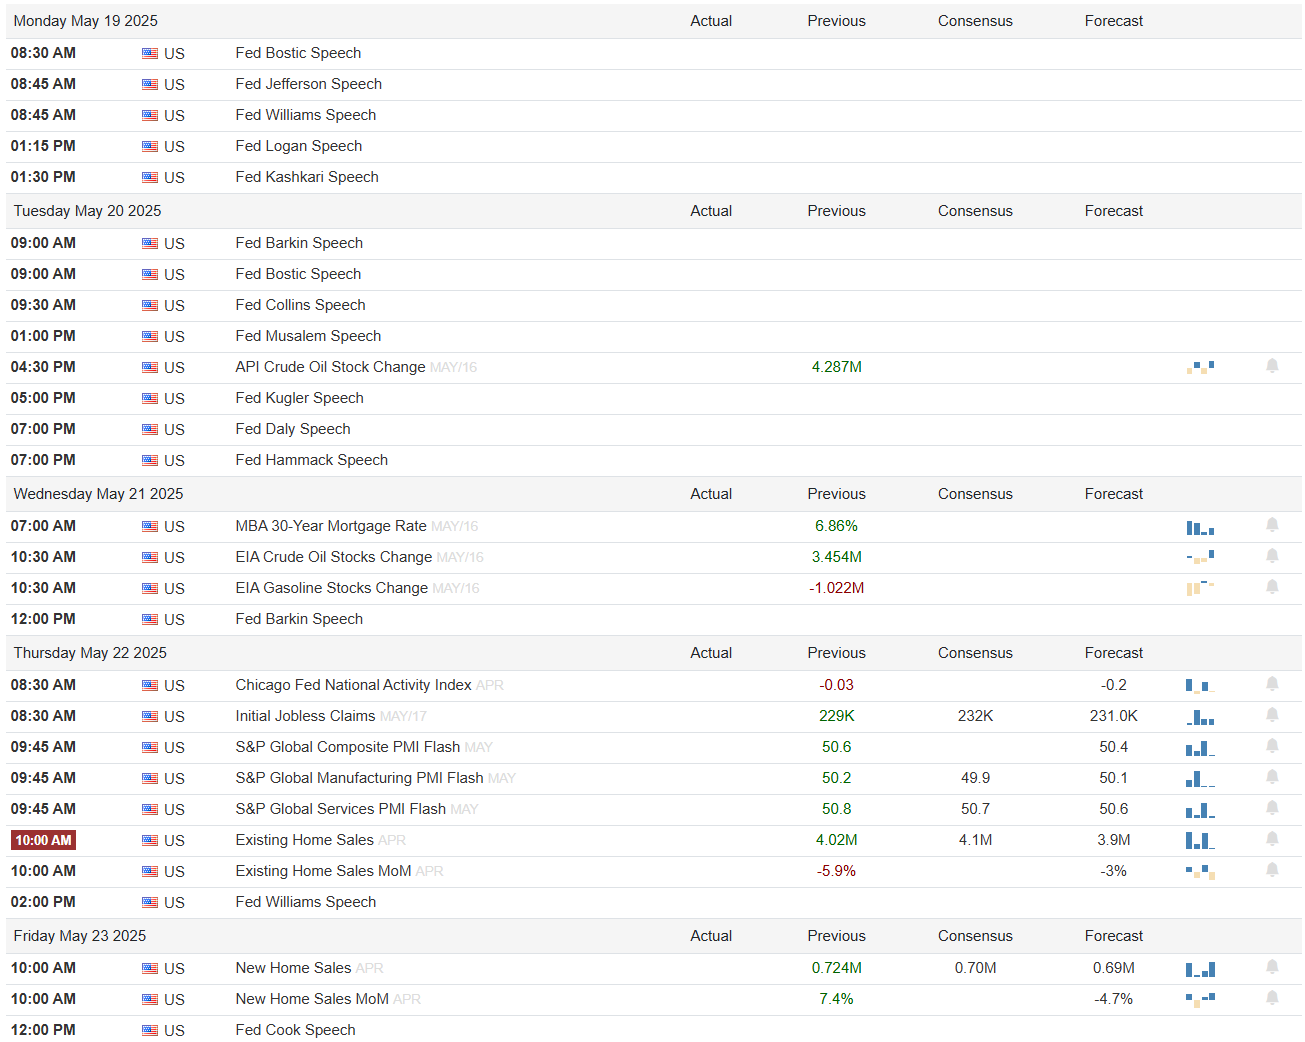
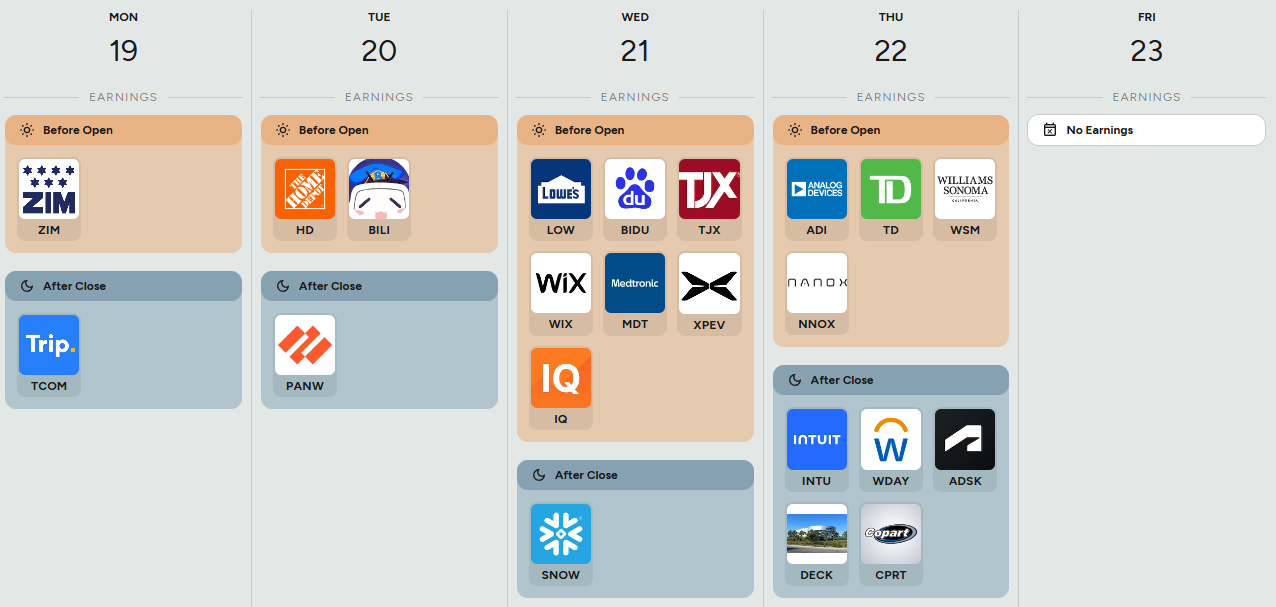
Events On Deck This Week
Here are key events happening this week that have the potential to cause outsized moves in the market or heightened short-term volatility.
Econ Events By Day of Week
Anticipated Earnings By Day of Week

Institutional Order Flow
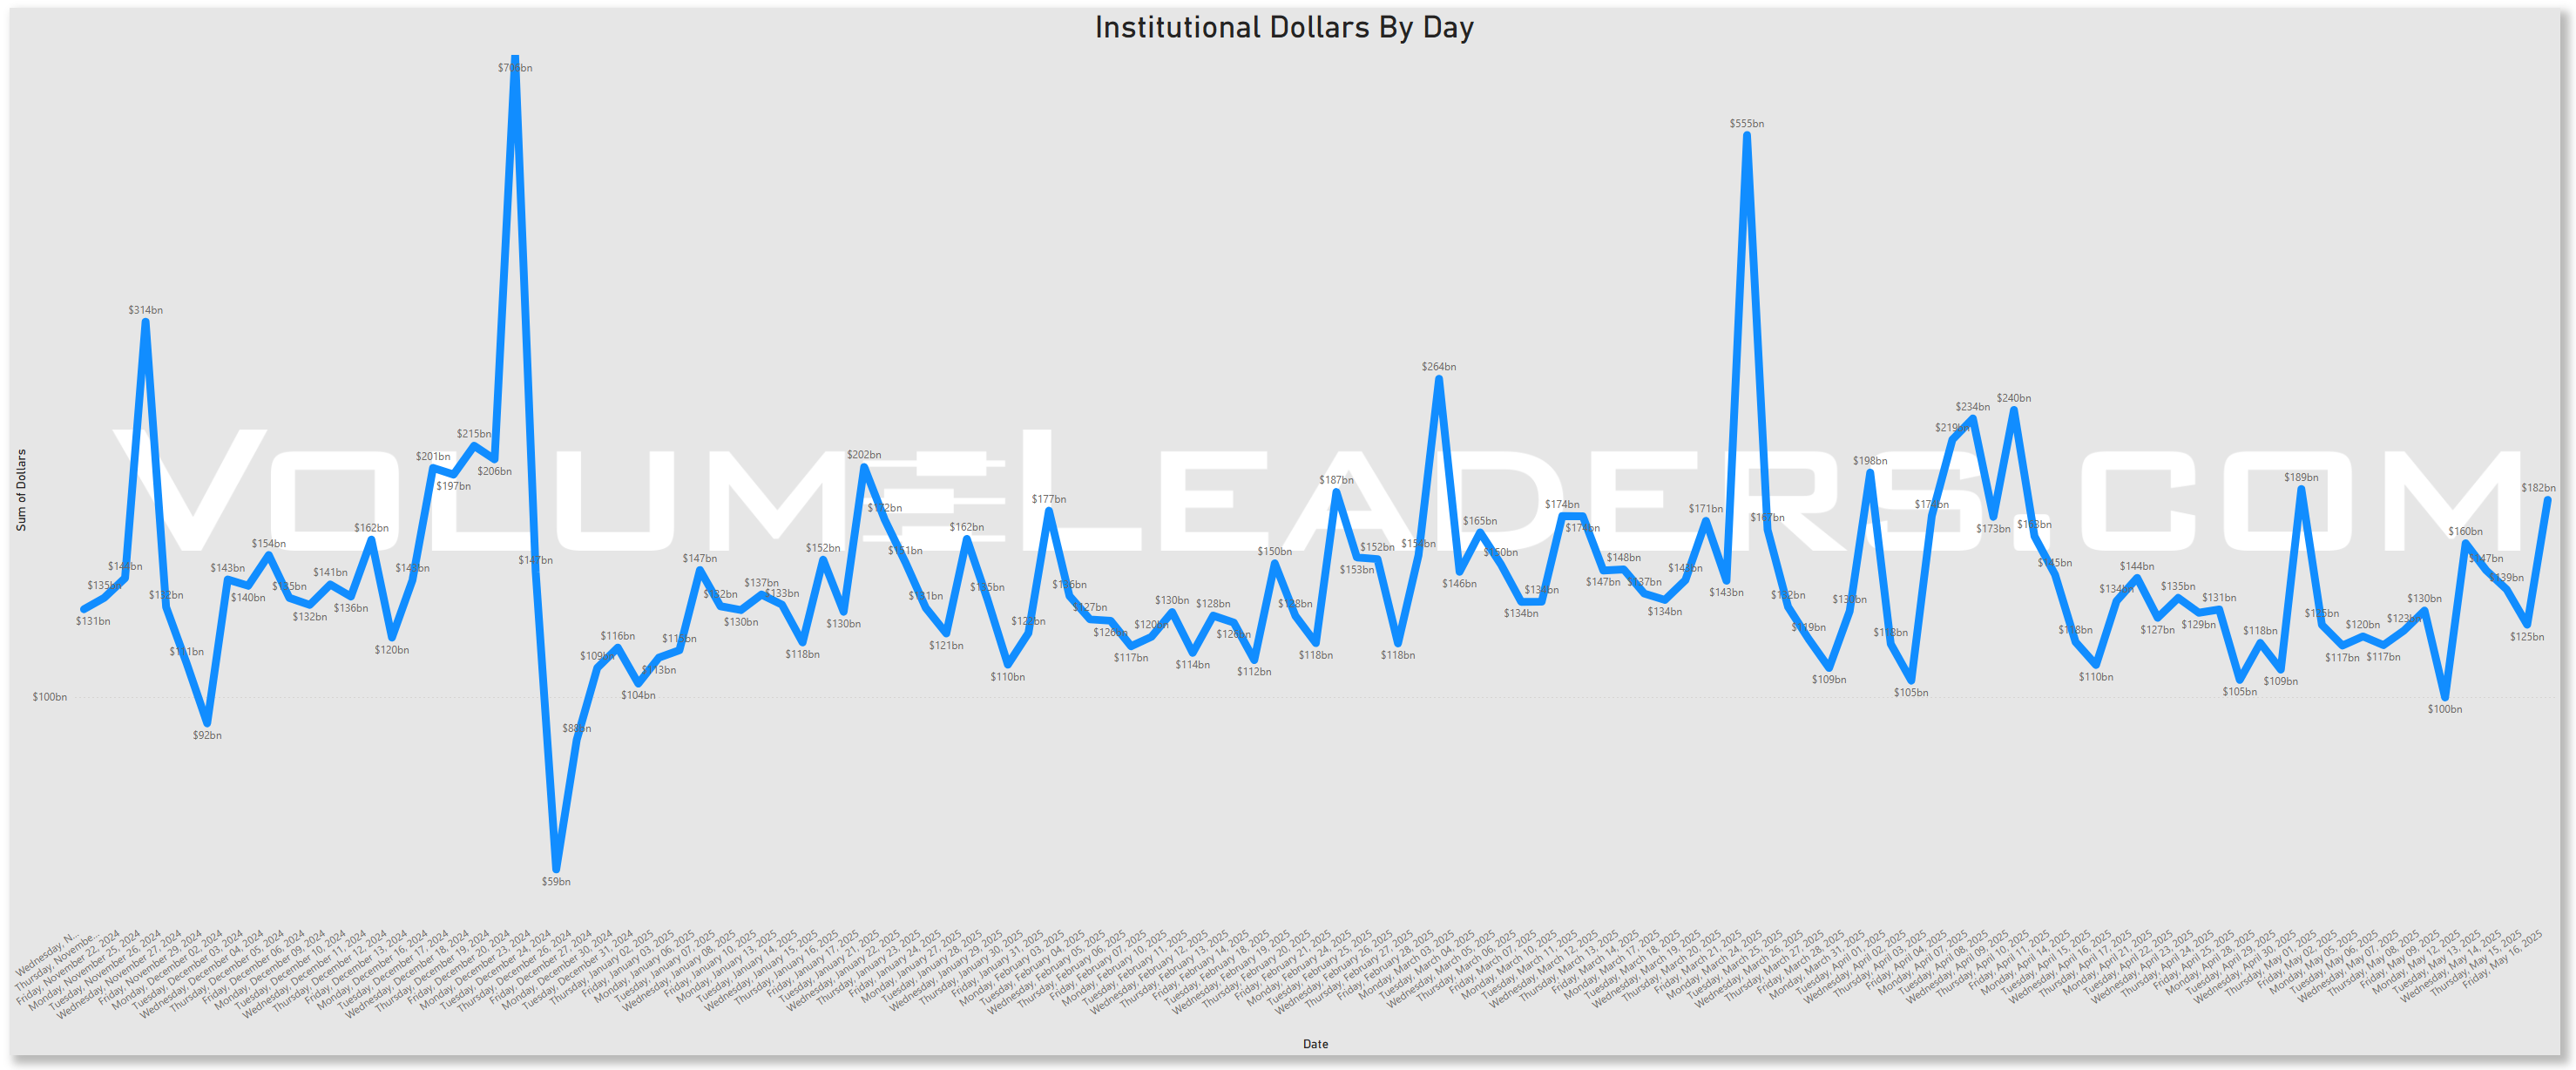
Rolling 90-Day Dollars By Day
This chart shows institutional activity by dollars by day on a rolling 1-year basis. From a theoretical standpoint, examining a chart of daily institutional dollar activity over the course of a year can offer several insights and possible inferences, though all should be approached with caution since the data alone may not prove causality or confirm underlying reasons. Some potential takeaways include:
Event-Driven Behavior:
Sharp, singular spikes on certain days might correlate with major market-moving events. These could include central bank policy announcements, significant geopolitical news, sudden macroeconomic data releases (like employment reports or GDP data), earnings seasons for large-cap companies, or unexpected shocks (e.g., mergers, acquisitions, regulatory changes).Liquidity Dynamics:
Institutions often concentrate large trades on days with higher expected liquidity. For instance, heightened activity might coincide with index reconstitutions, option expiration dates, or the days leading up to or following a major index rebalance, when large amounts of capital shift hands simultaneously.Risk Management and Hedging Activity:
Institutions may significantly adjust their exposures on days that are critical from a risk management perspective. Large spikes can occur if hedge funds, pension funds, or asset managers are rolling over futures contracts, initiating or closing out large hedges, or reacting to volatility triggers.Market Sentiment Indicators:
While the data is purely transactional, the sheer volume of institutional involvement on certain days might indirectly hint at changing sentiment or strategic shifts.
In essence, a chart like this can lead you to hypothesize that institutional trading volumes are not constant or random but rather influenced by a mix of predictable calendar effects, major market events, liquidity considerations, risk management decisions, and strategic allocation shifts.
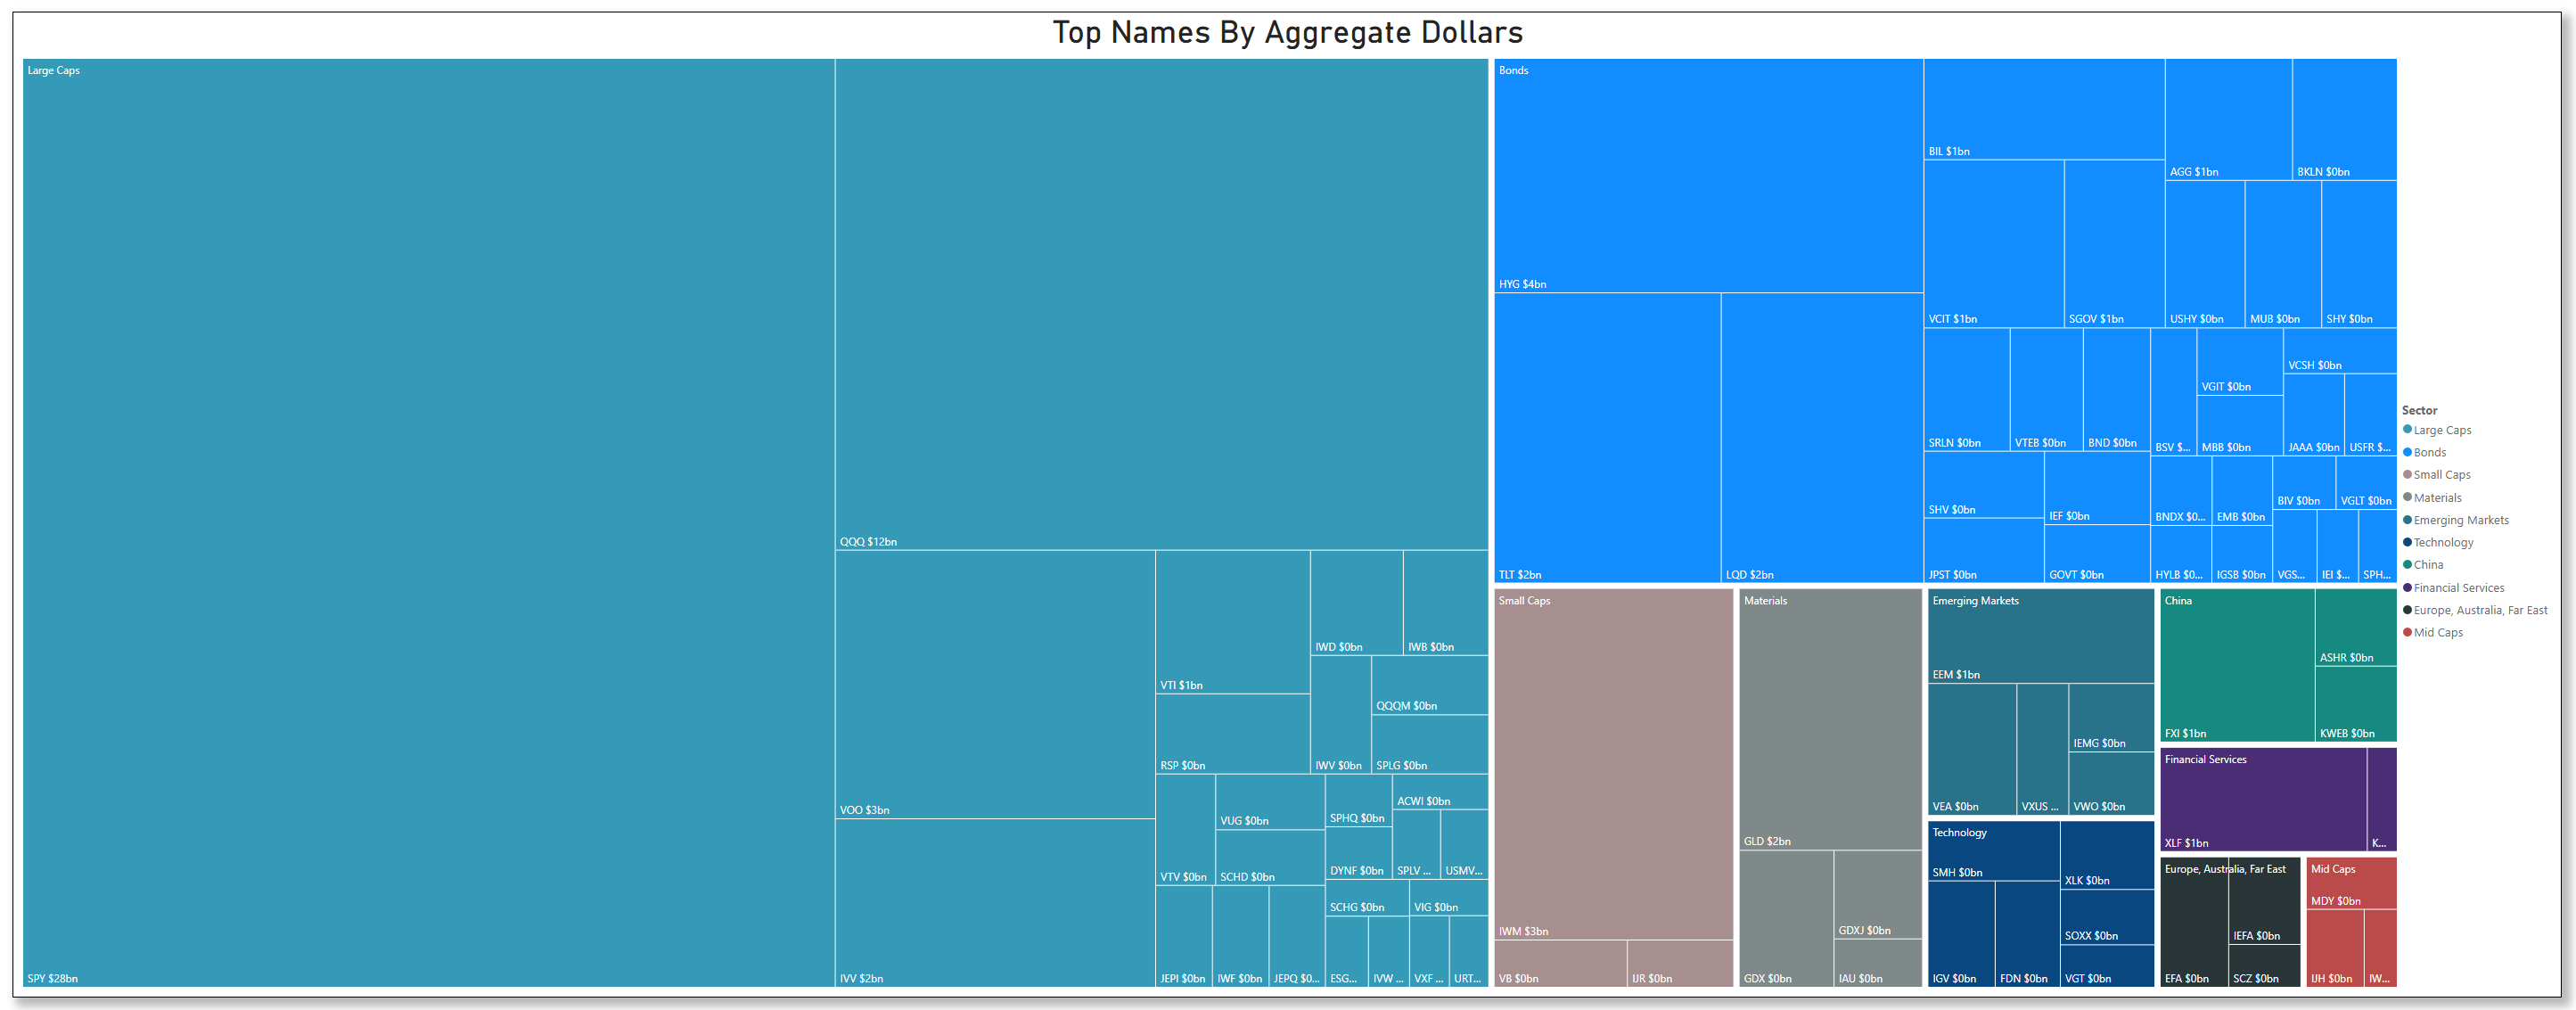
Top Institutional Order Flow By Sector By Week For The Past 90-Days
Top Institutional Order Flow In Equities
These are incredibly important charts to watch as they contains lots of nuanced suggestions at a thematic level. Watch these charts closely week-to-week to stay informed about where institutional money is flowing, adjust your strategies based on momentum, align your portfolio with macroeconomic and market trends, and manage risks more effectively by avoiding sectors losing institutional favor.
Sector Rotation Insights: The chart highlights which sectors are attracting institutional activity and which are losing favor. Institutions often lead market trends, so tracking shifts in their focus can indicate sector rotations.
Sentiment Analysis: The level of institutional activity reflects confidence in specific sectors. Rising activity in traditionally defensive sectors (e.g., healthcare, utilities) may indicate caution, while a surge in growth sectors (e.g., technology, consumer discretionary) could suggest optimism.
Emerging Trends: Sudden spikes in a previously overlooked sector, like industrials or consumer staples, might hint at emerging opportunities or structural shifts.
Macro Themes: Changes in sector activity often align with broader macroeconomic themes like inflation, interest rates, or geopolitical events. For instance:
Increased activity in energy might indicate concerns about oil supply or rising prices.
Growth in technology could align with innovations or favorable policies.
Risk Management: Declining institutional activity in a sector might signal weakening fundamentals or heightened risks.
Spotting Overcrowding: Excessive activity in a single sector over multiple weeks may suggest overcrowding, which could lead to heightened volatility if institutions begin to exit.
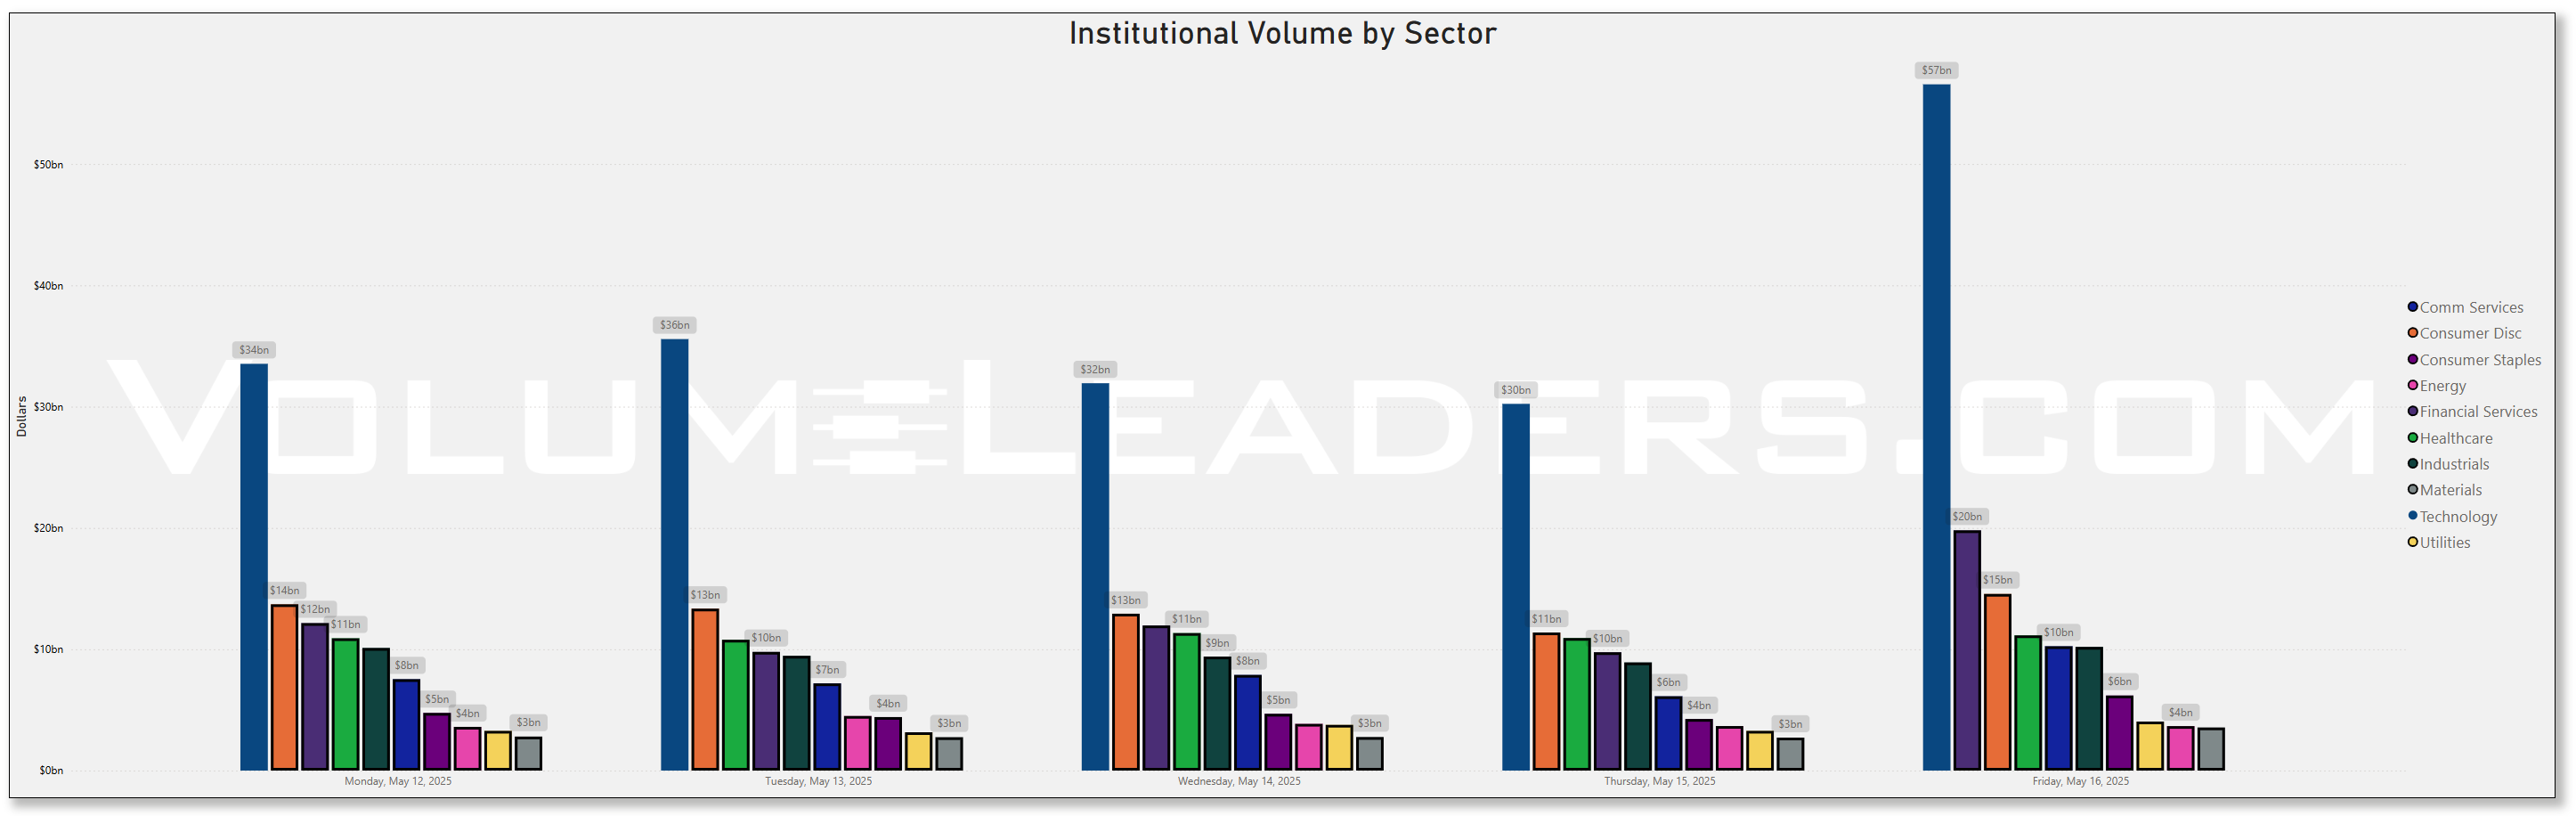
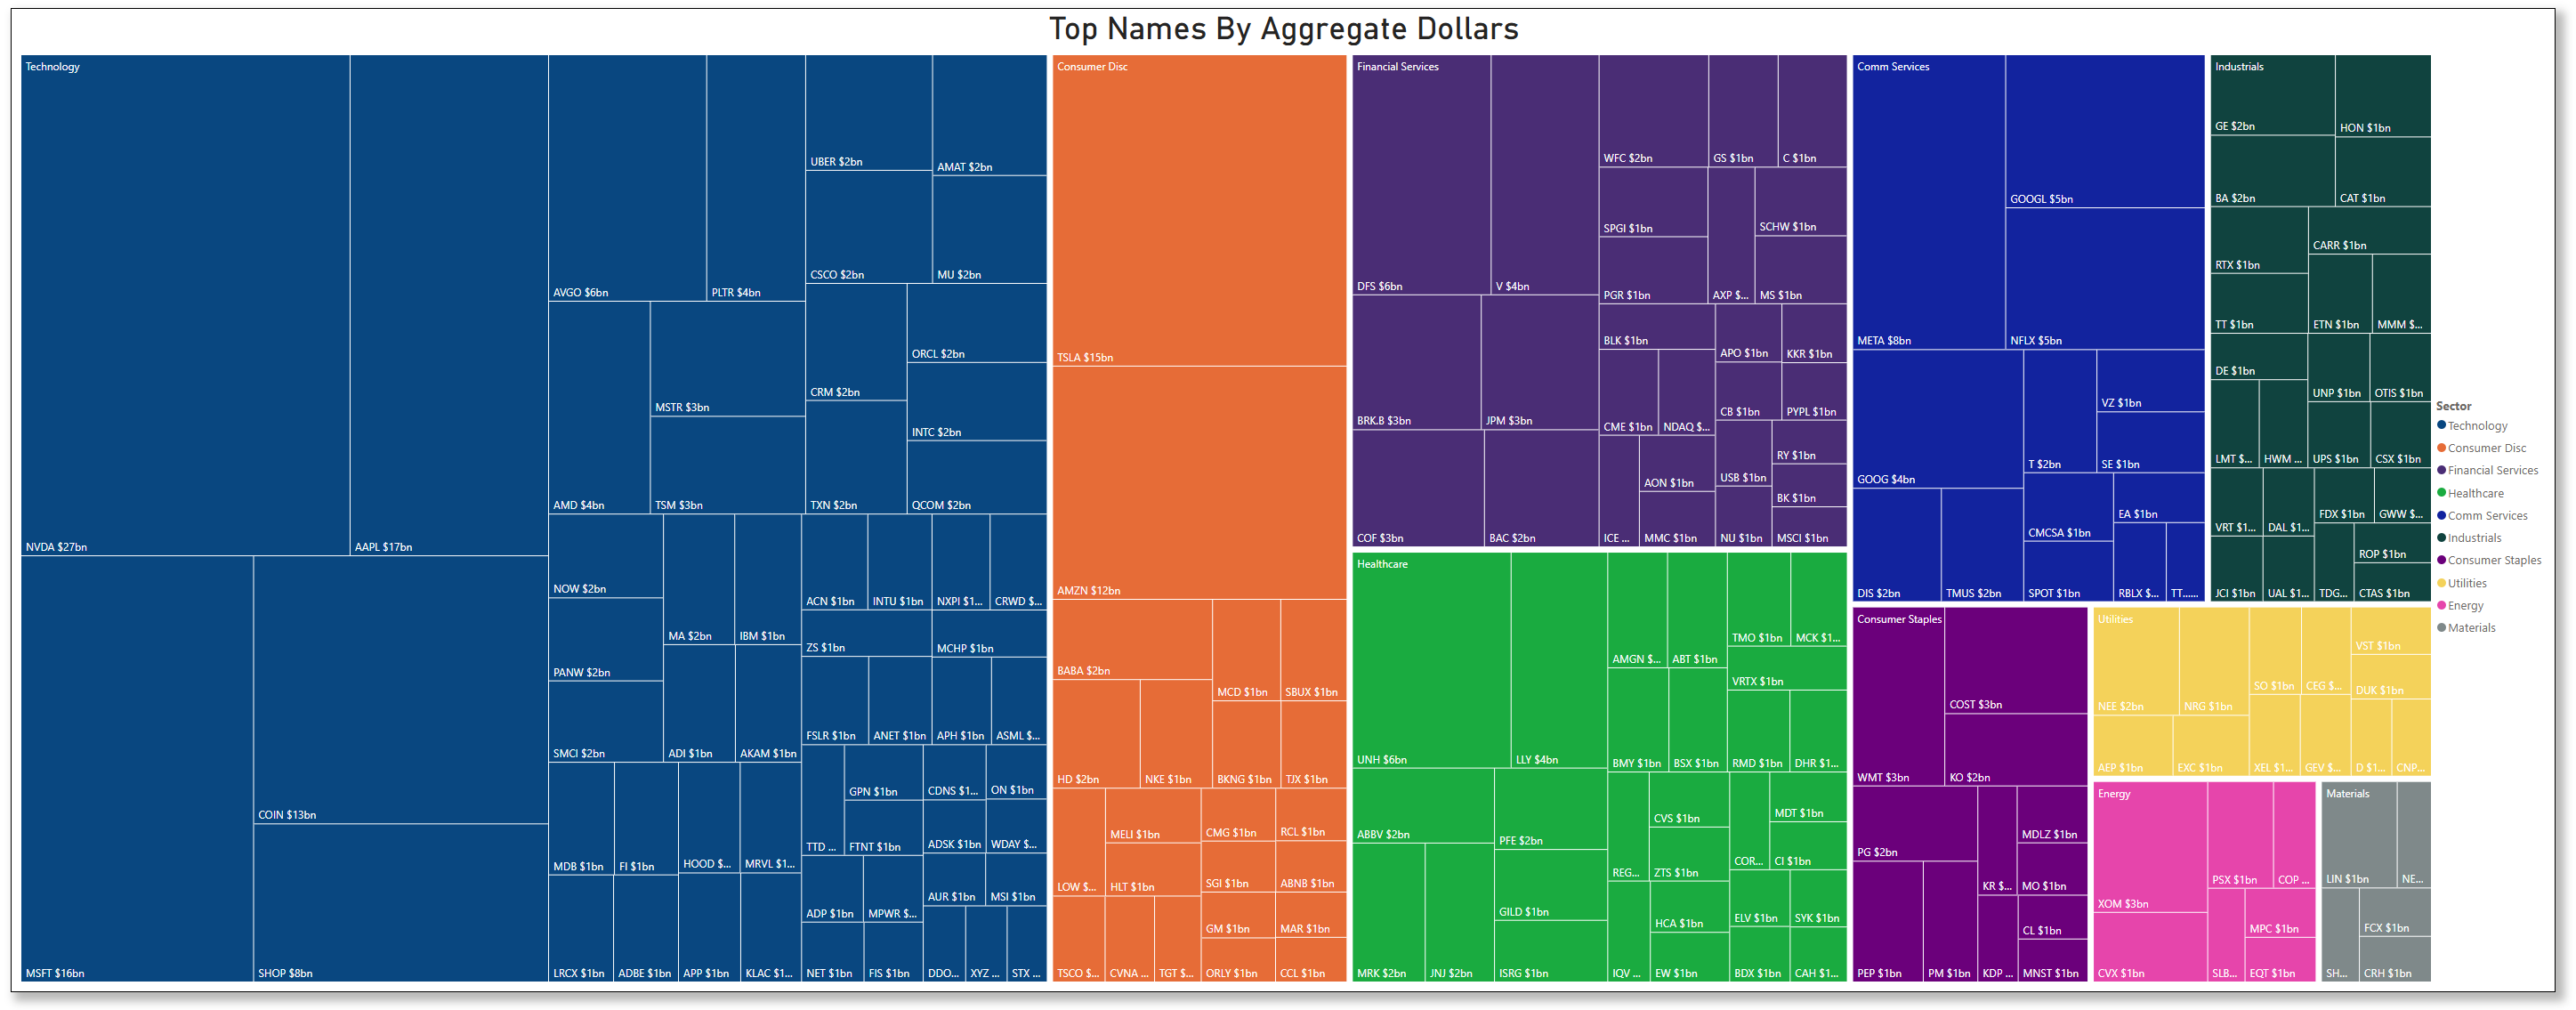
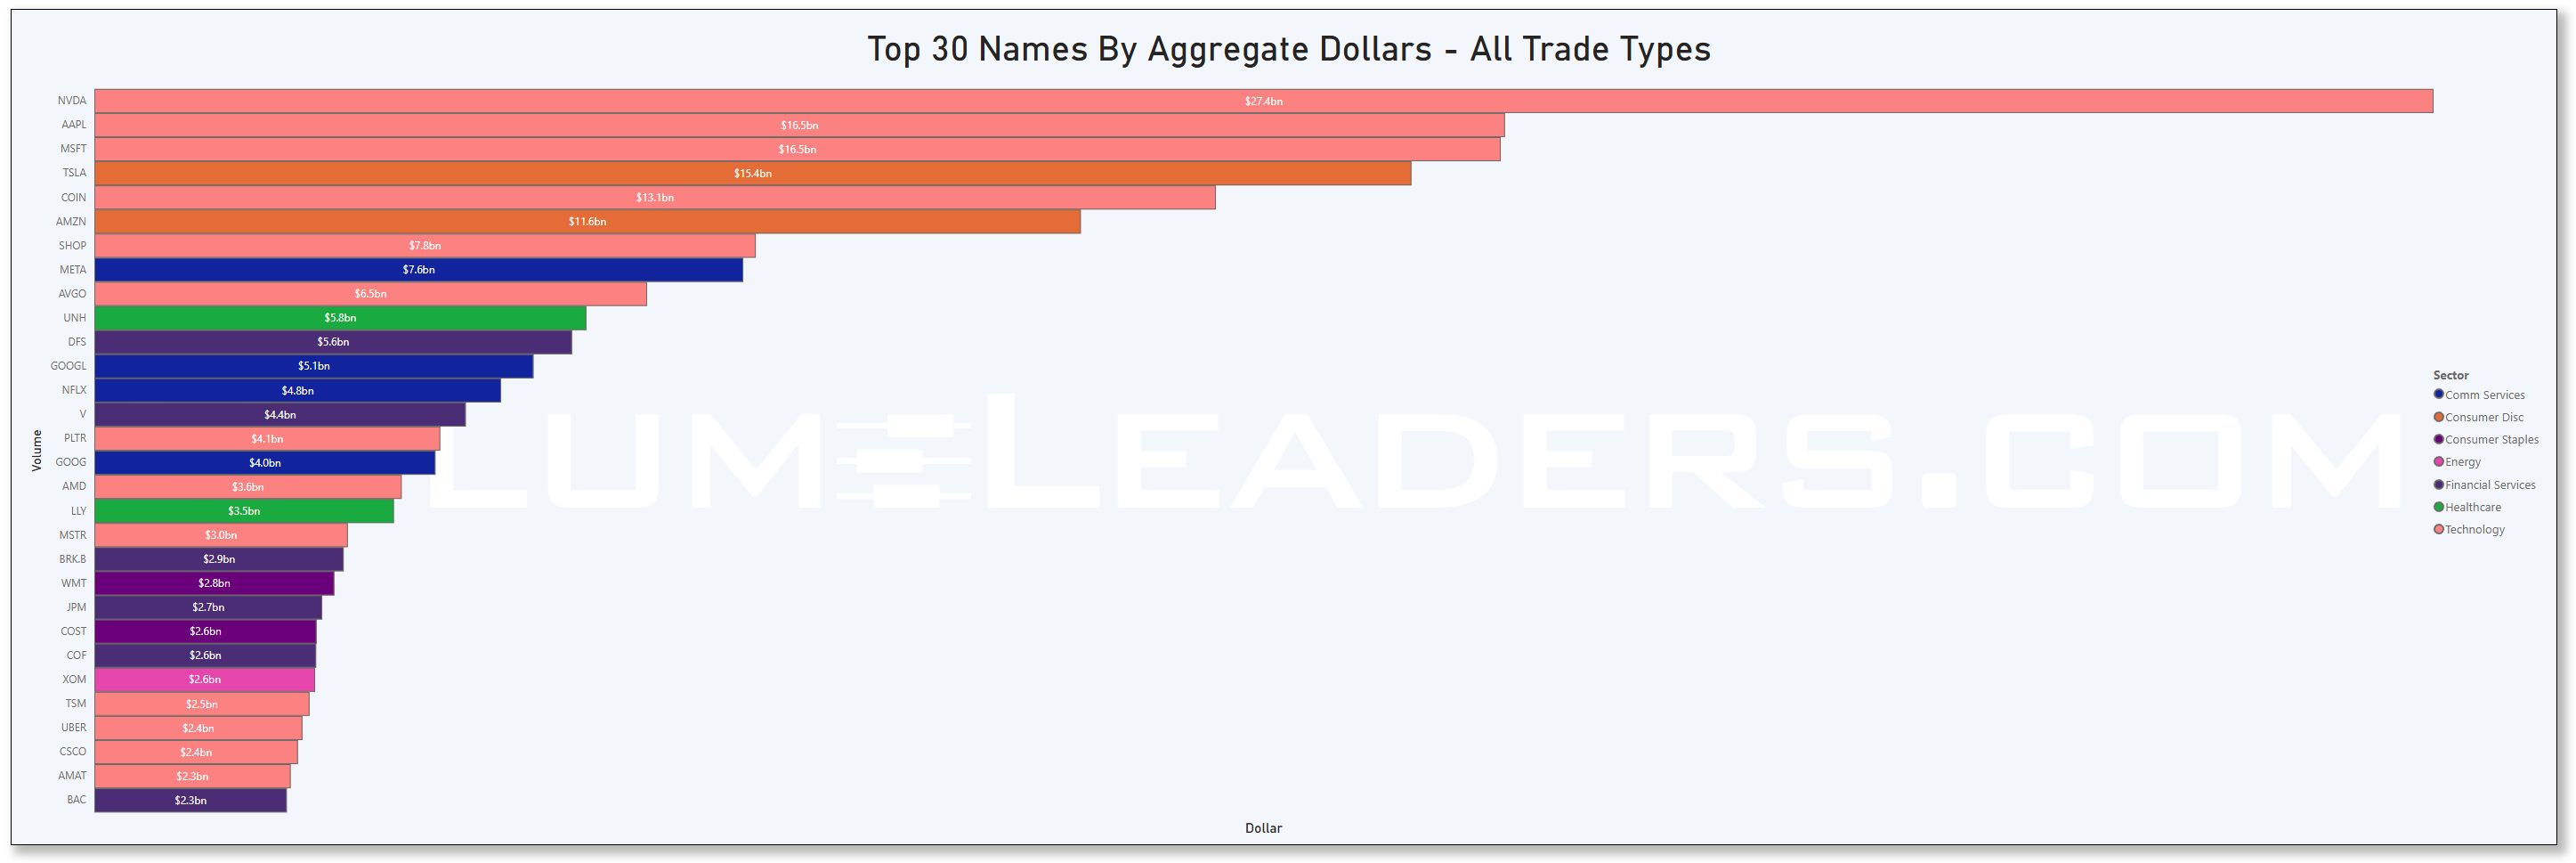
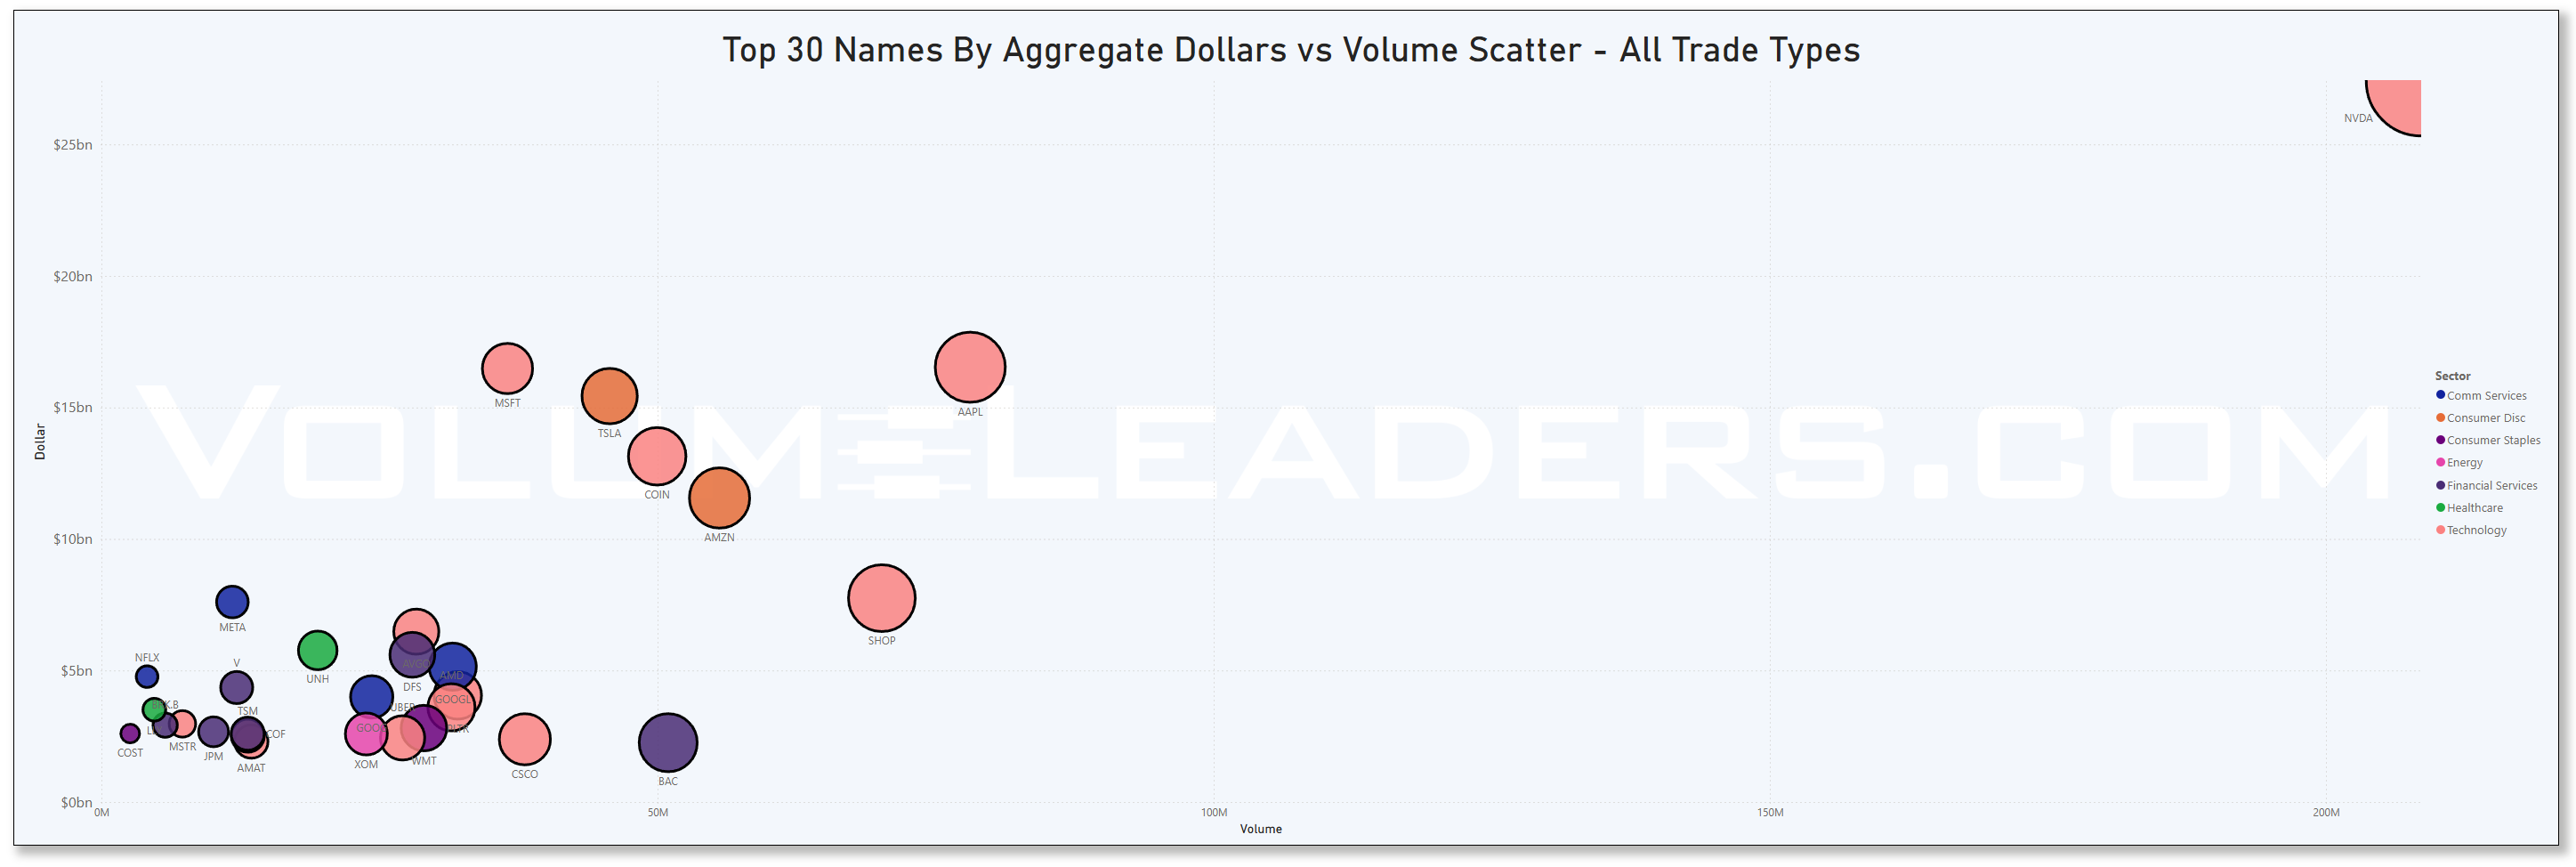
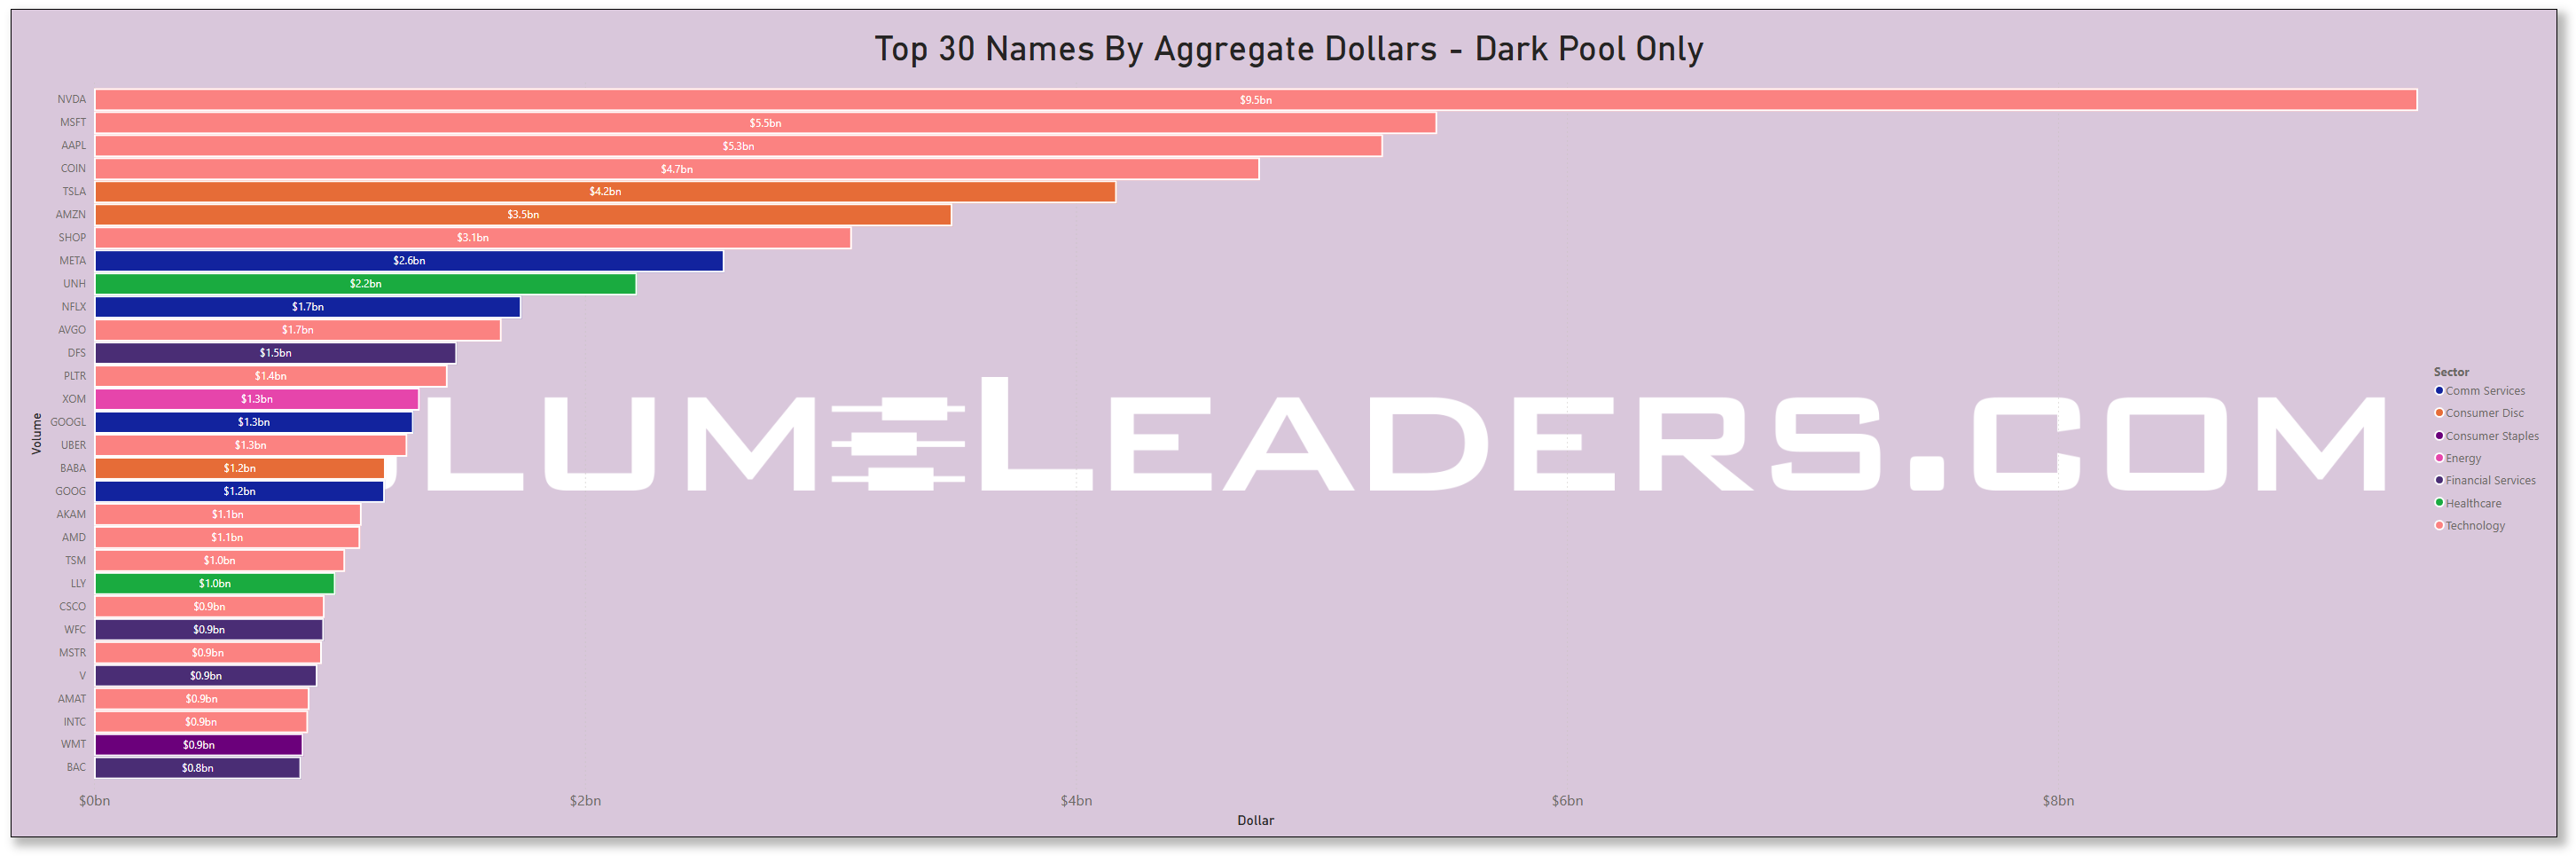
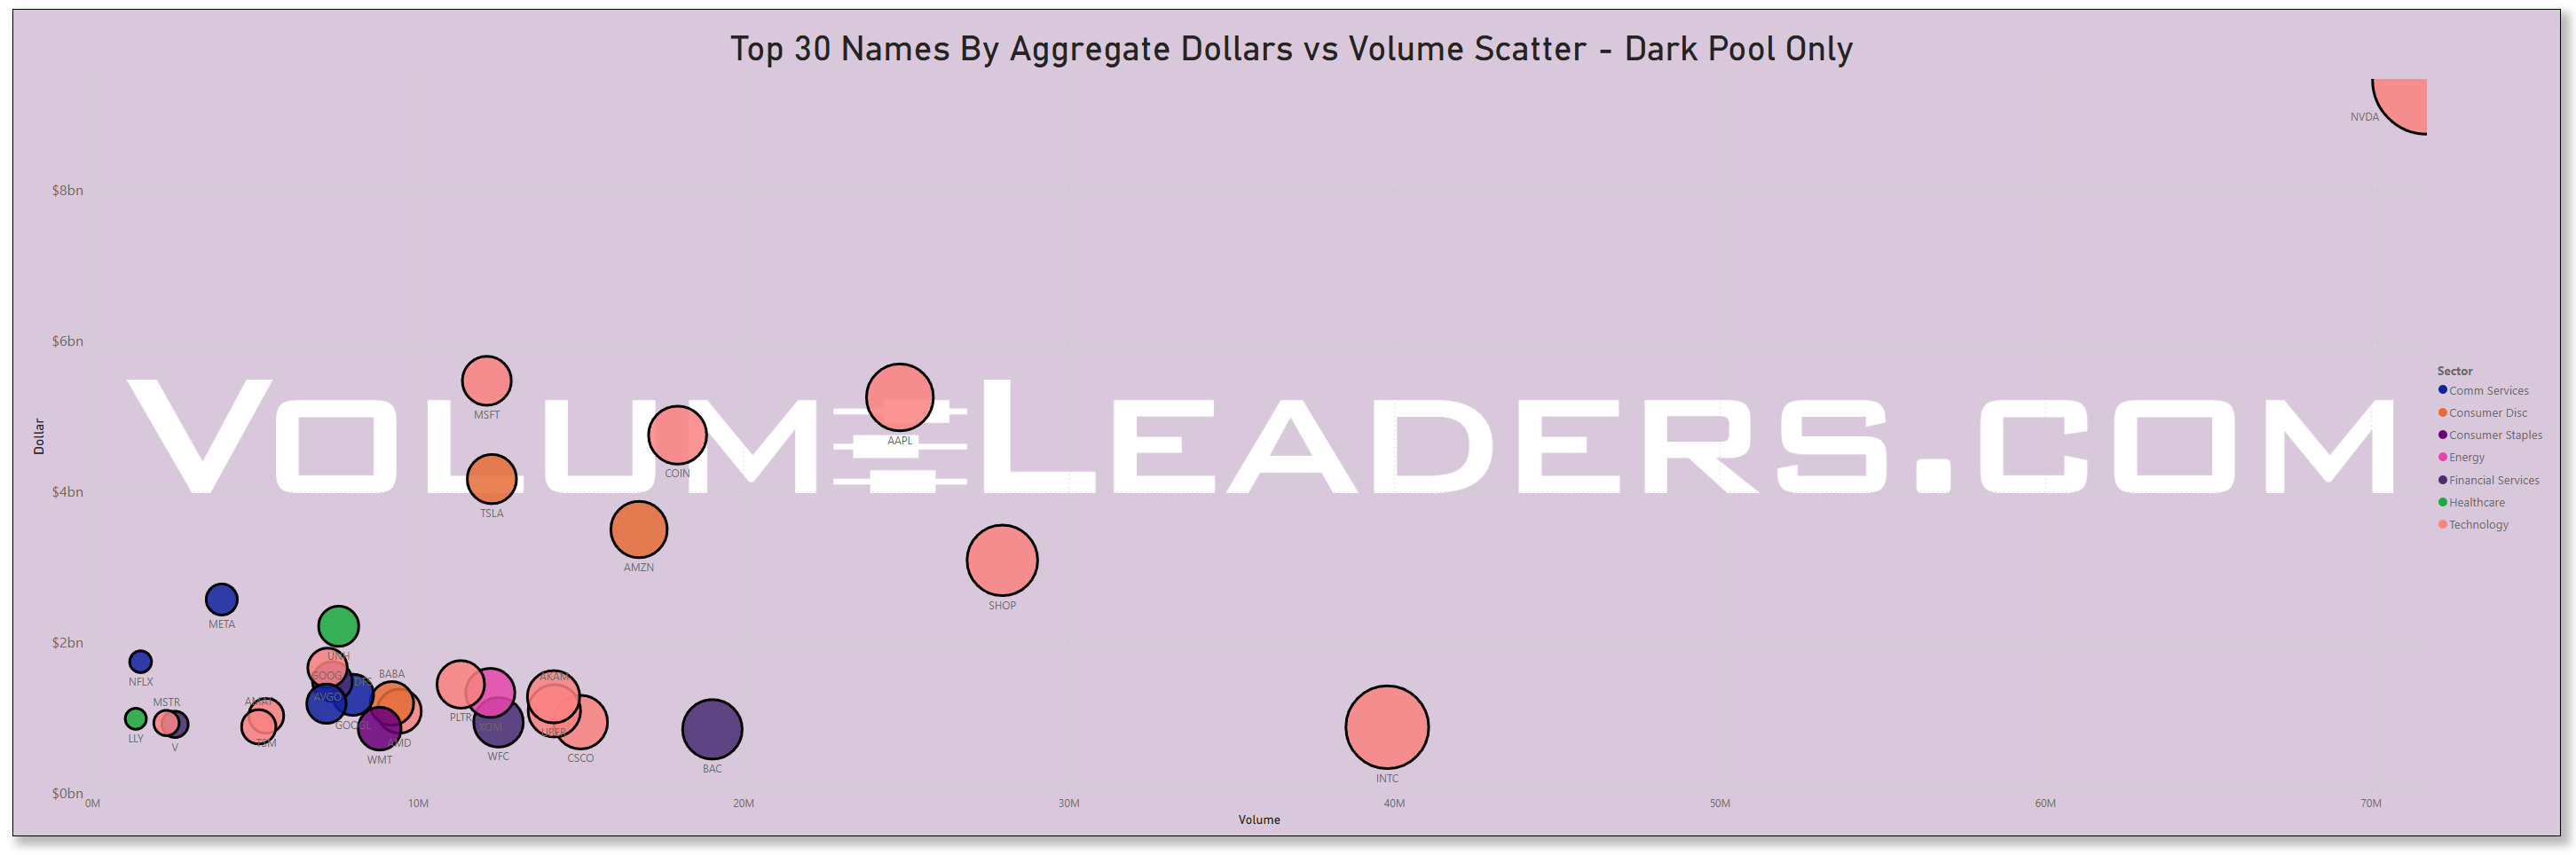
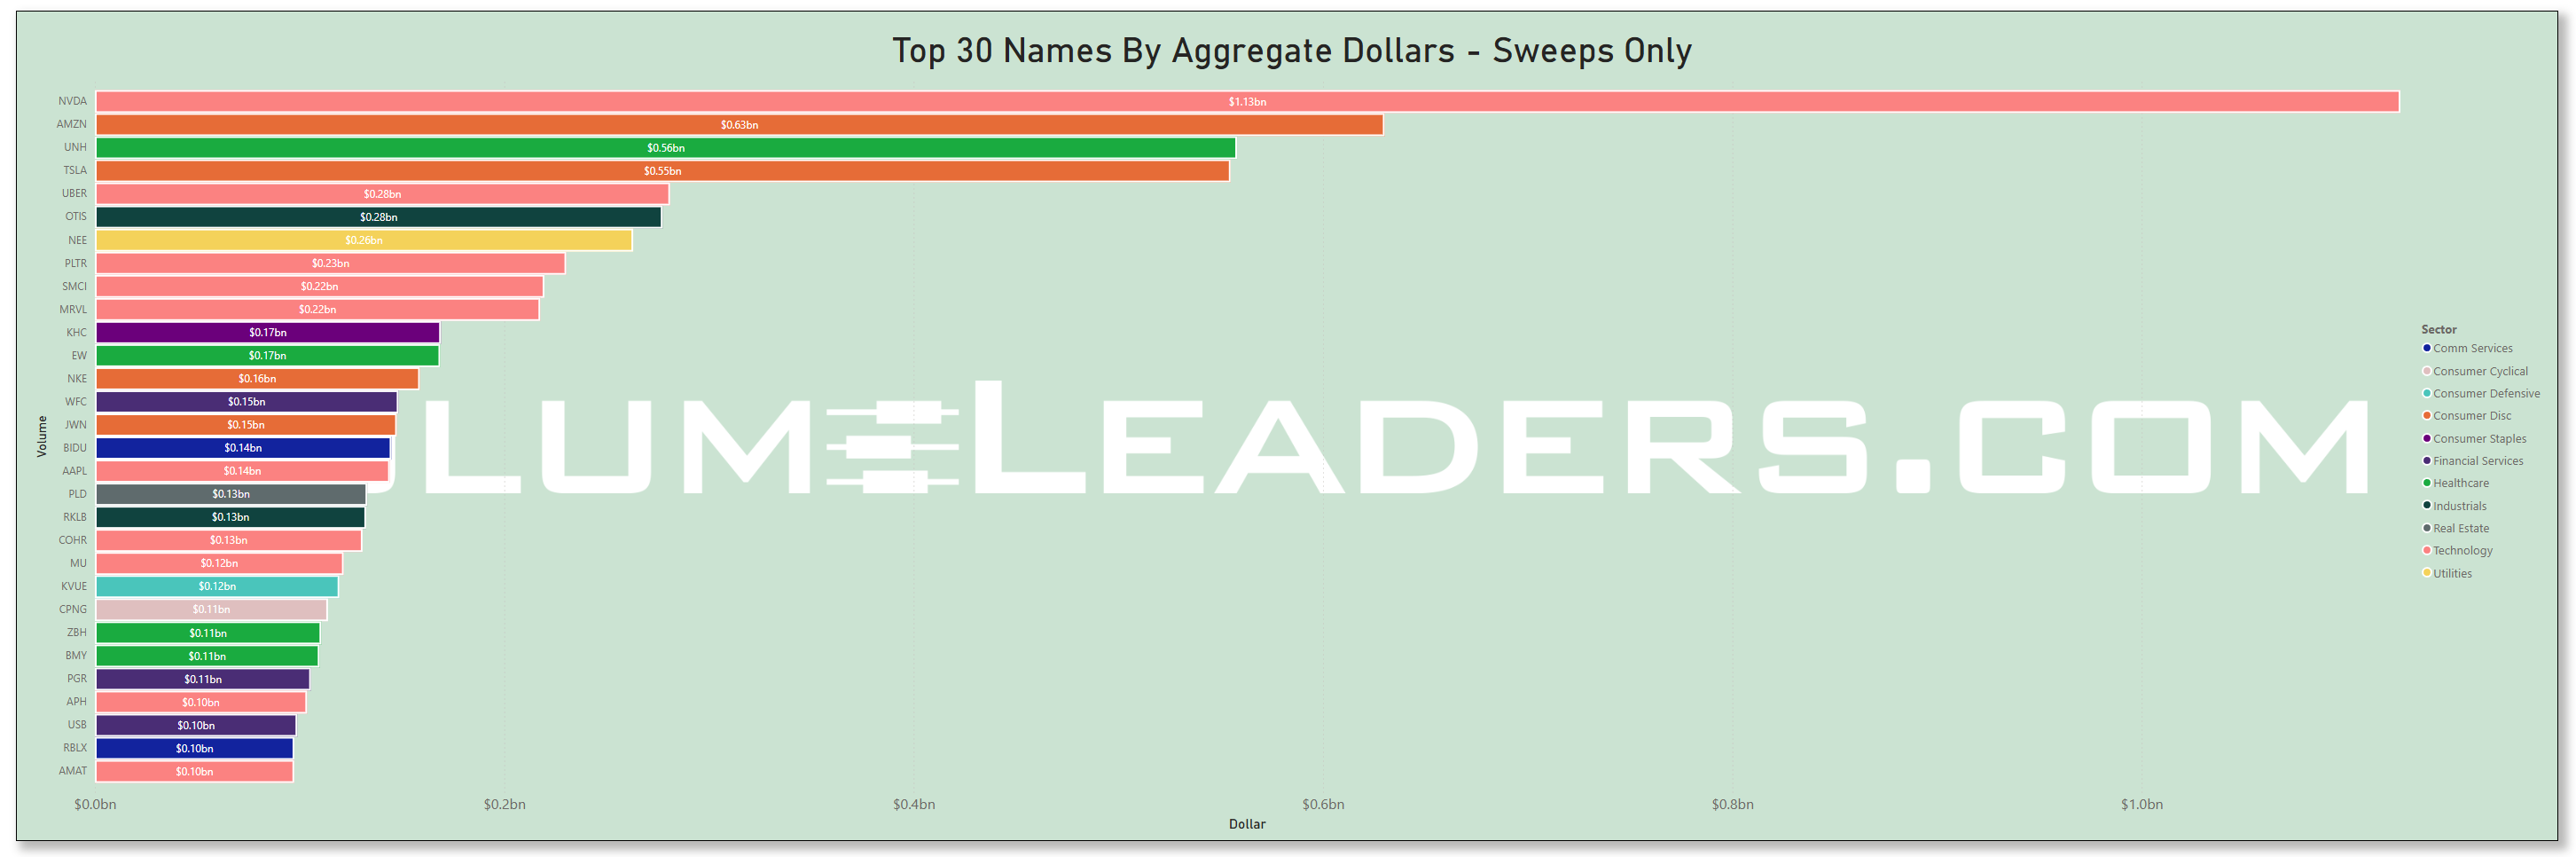
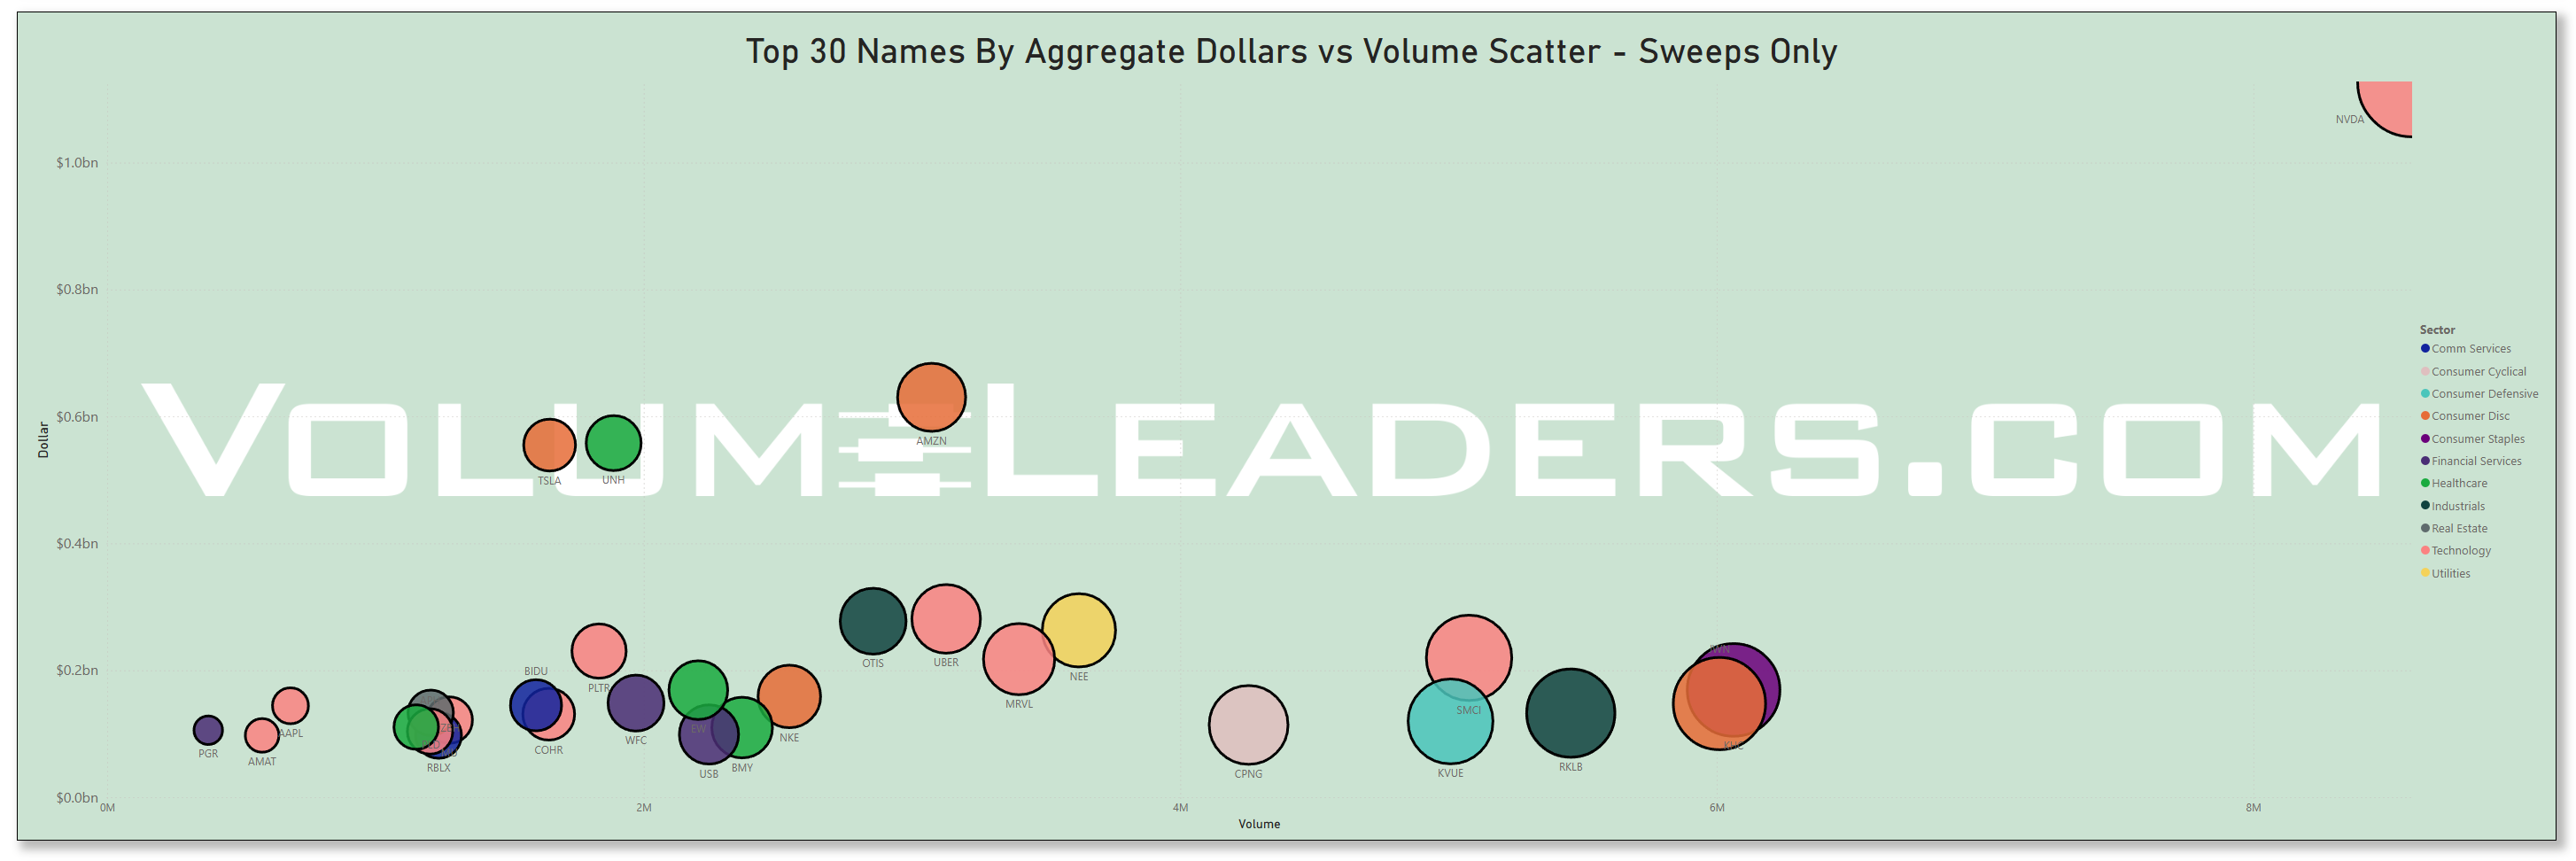
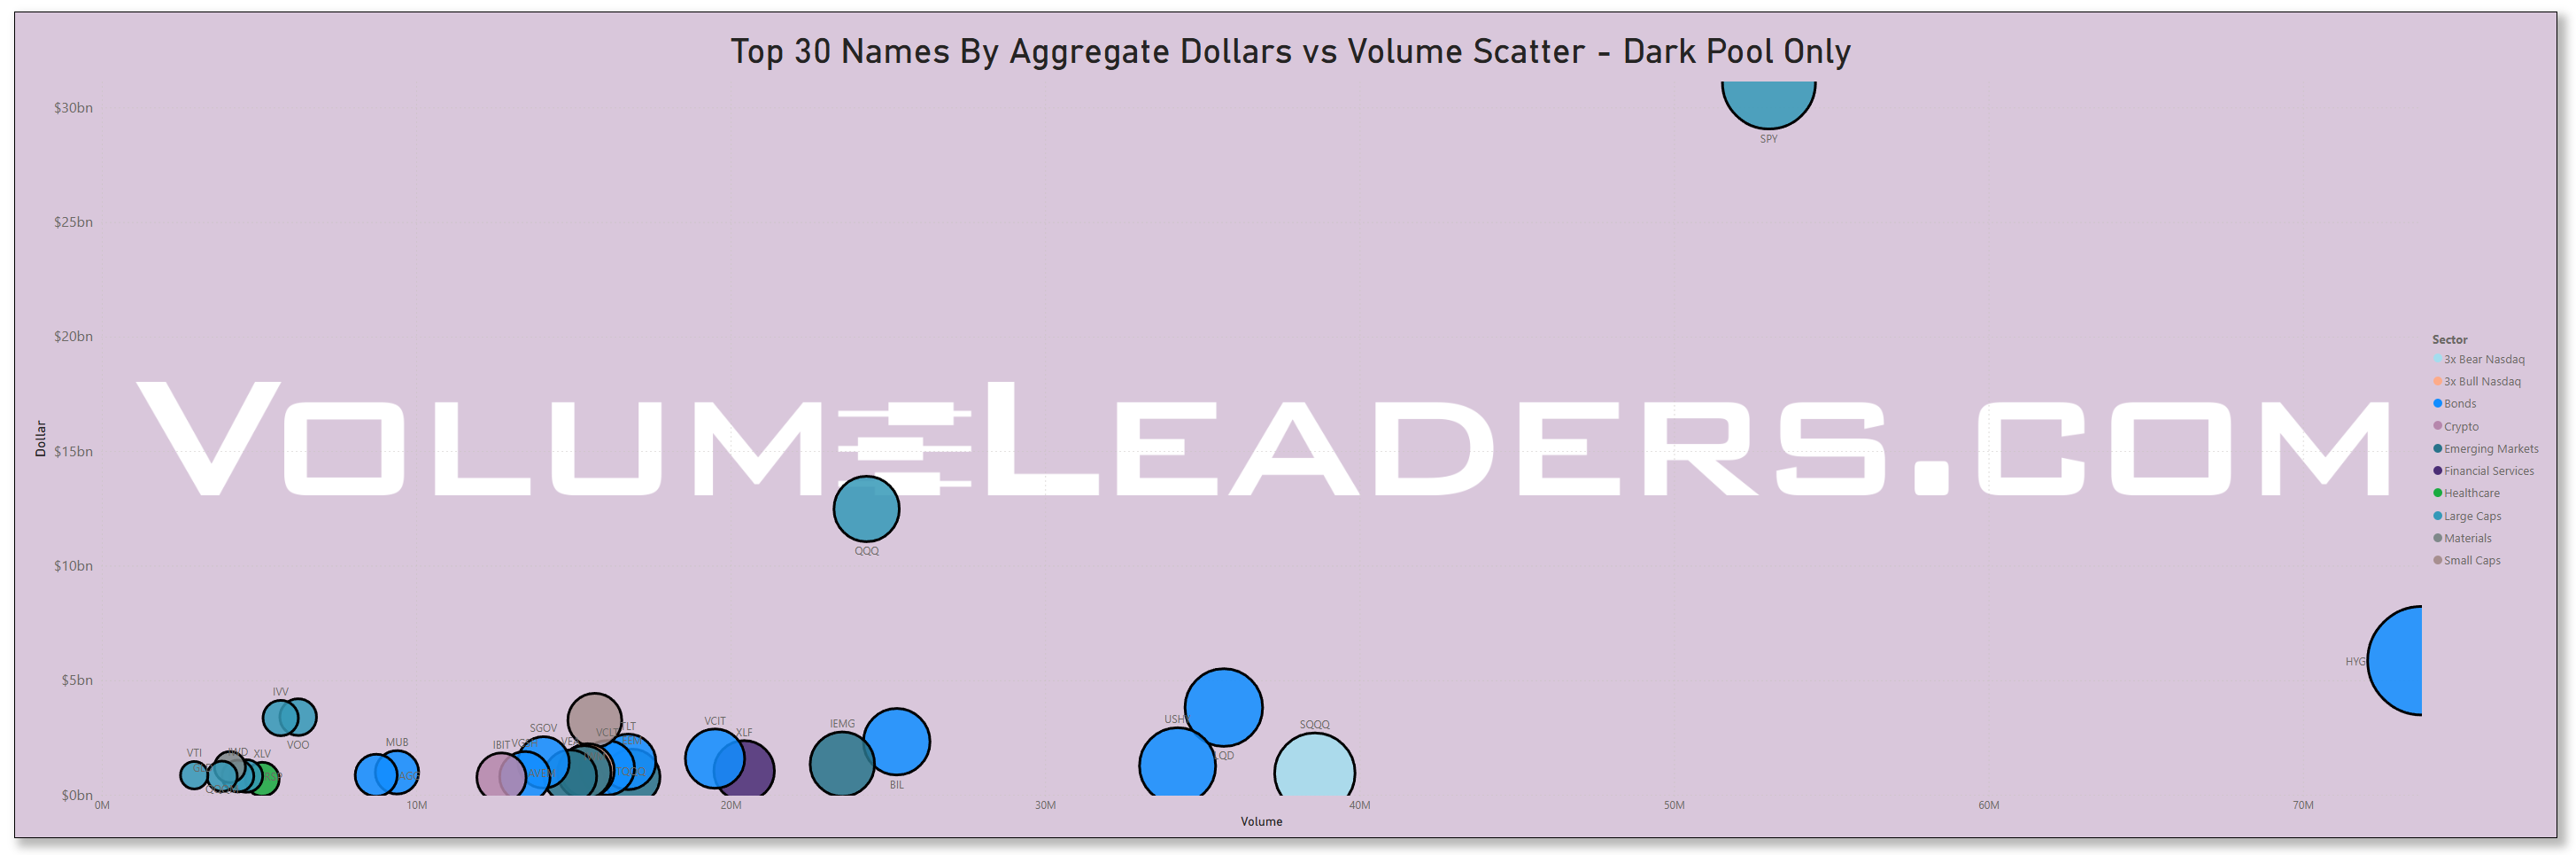
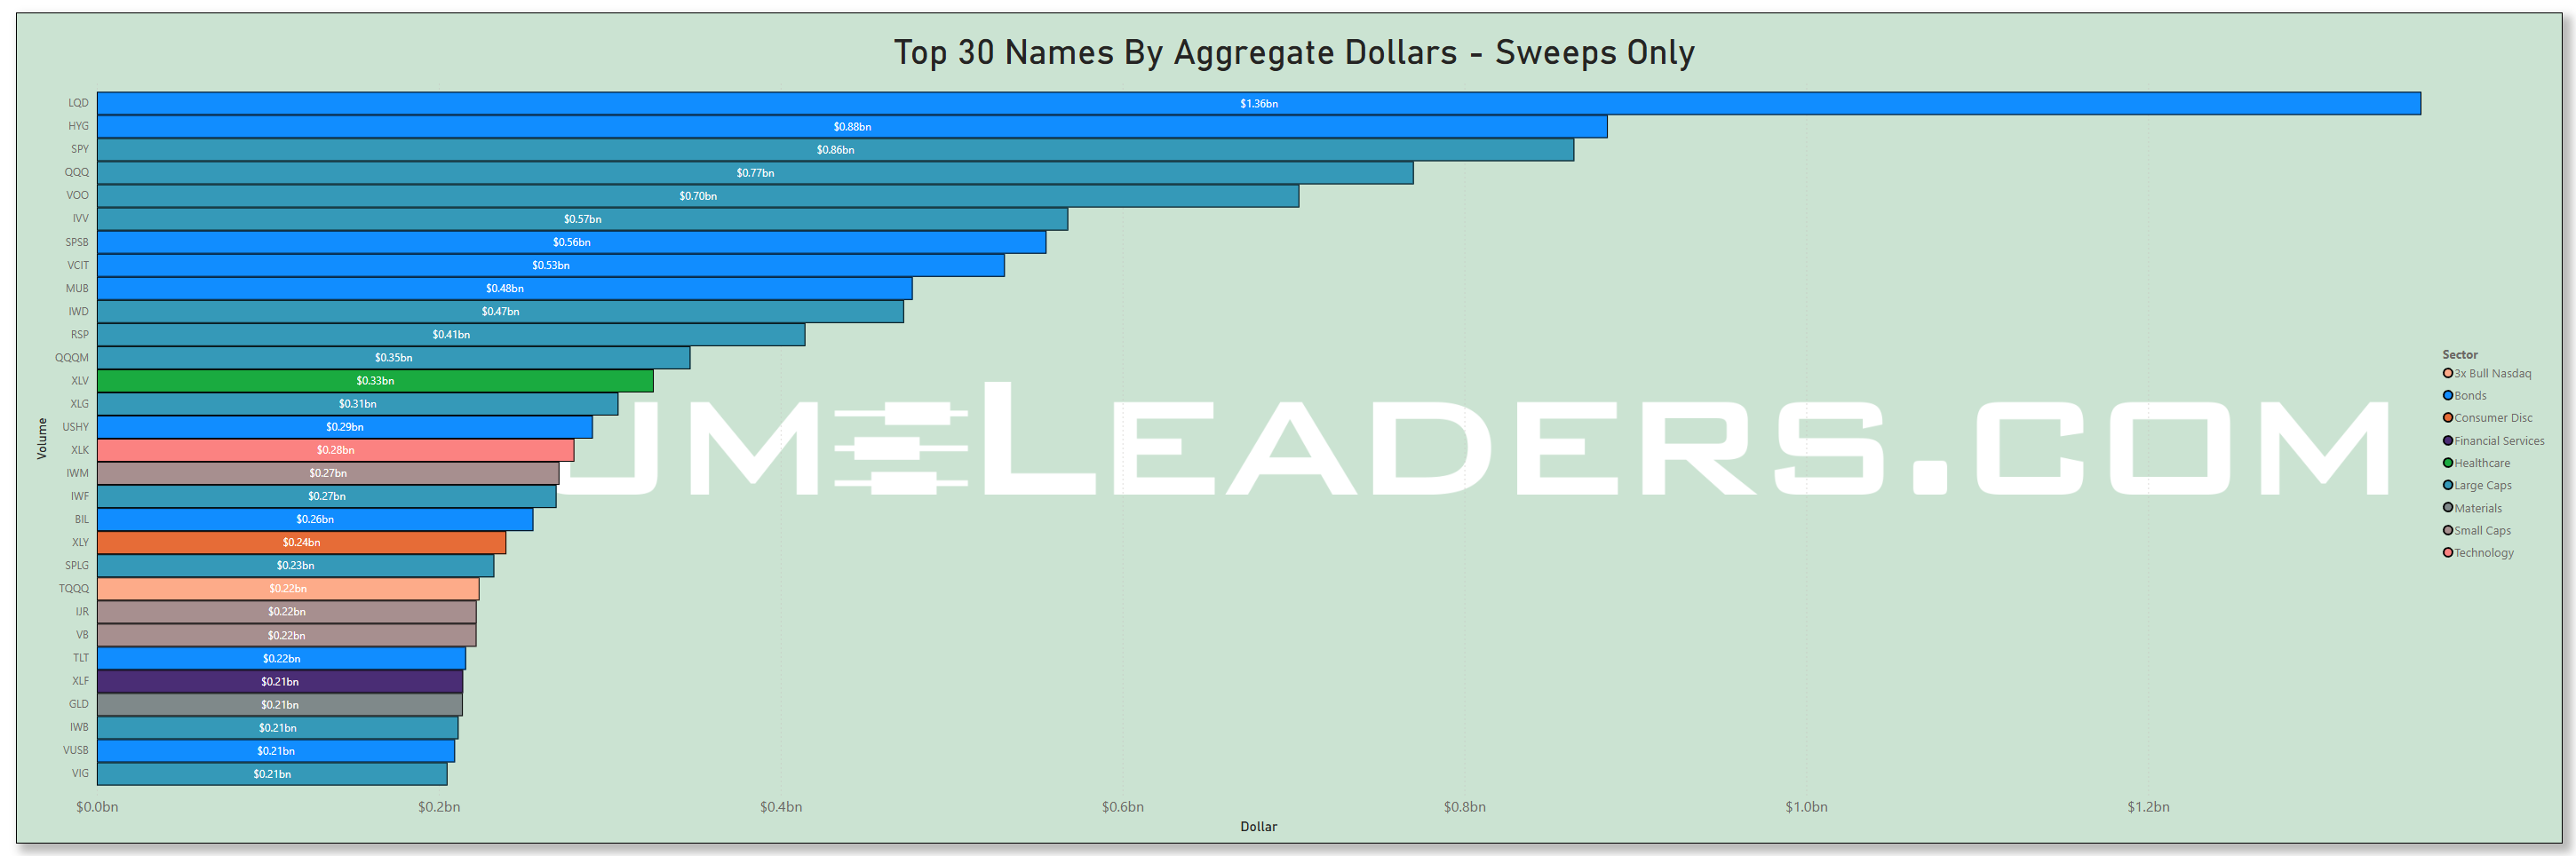
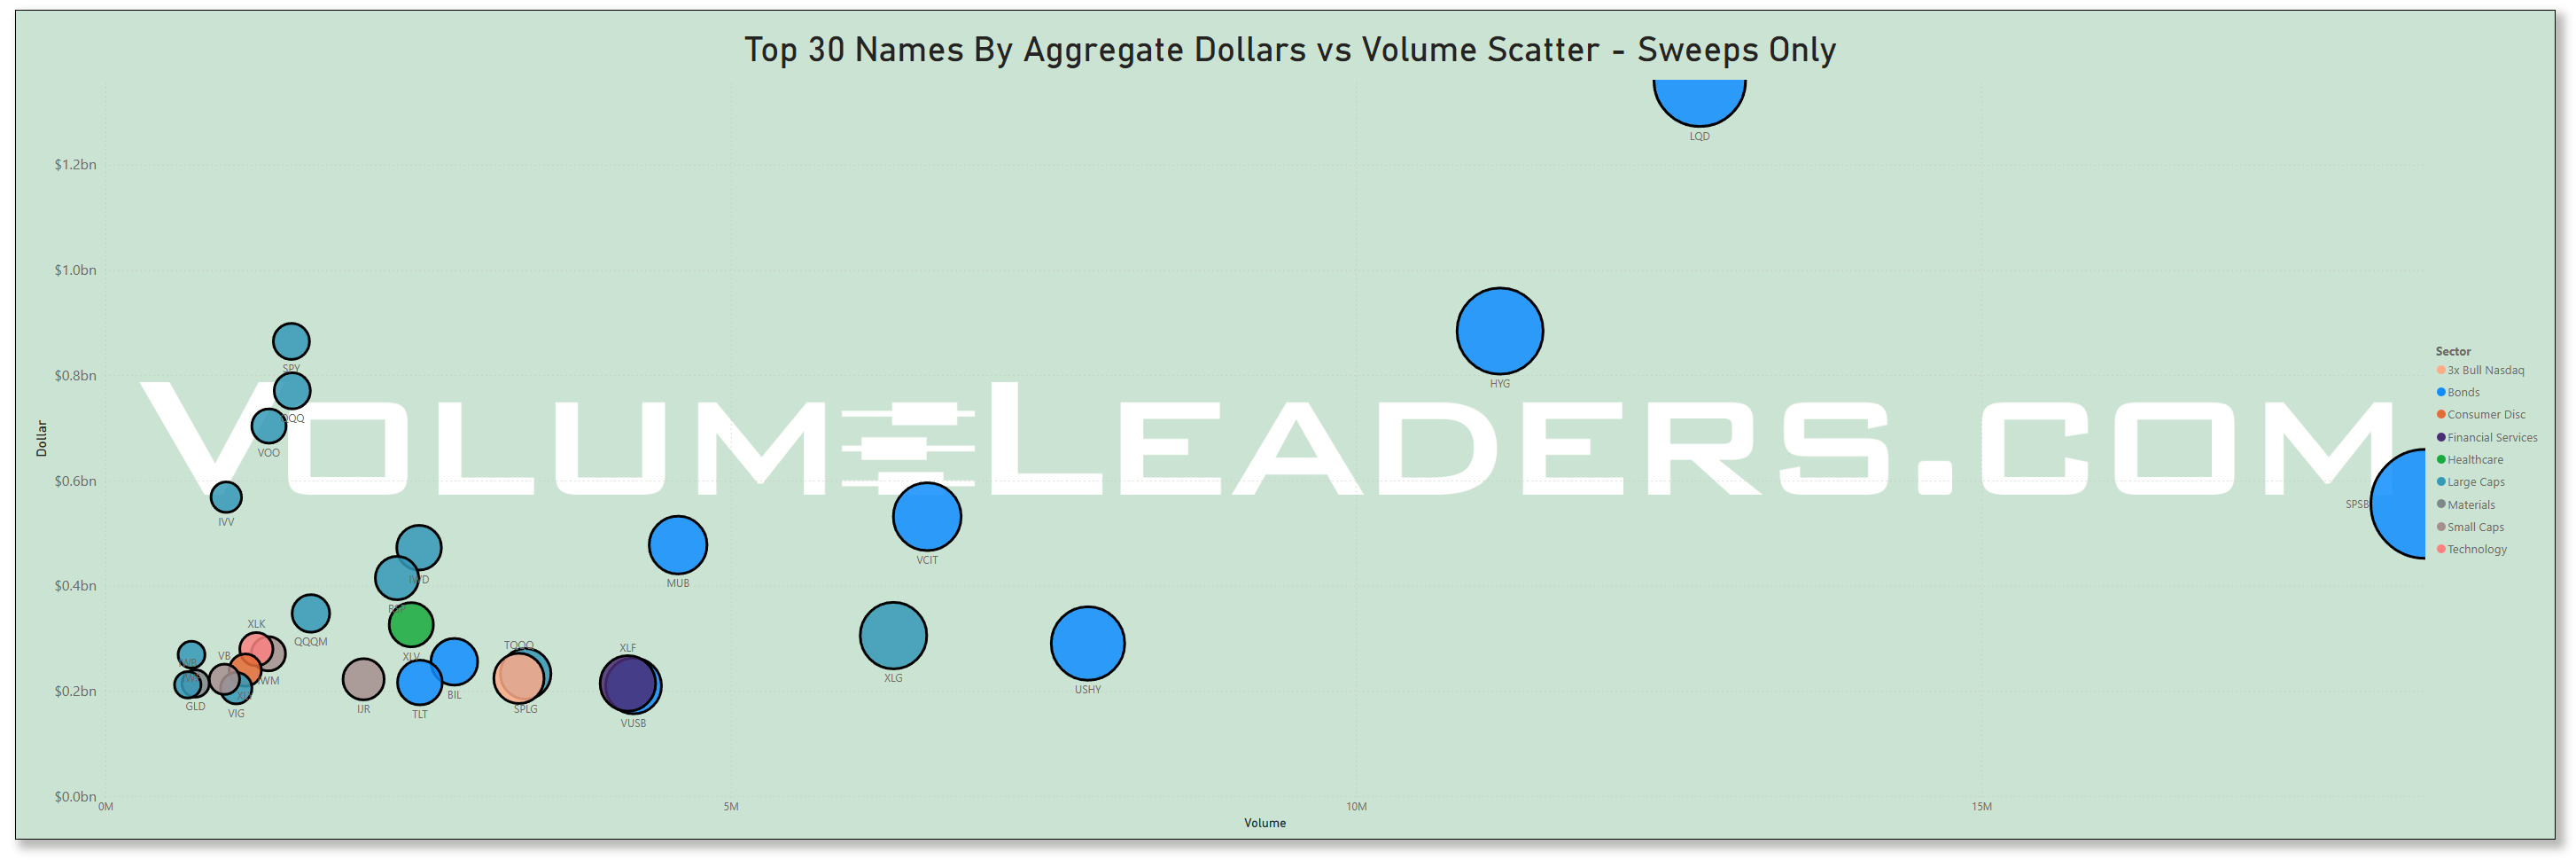
Many excellent trade ideas and sources of inspiration can be found in the prints below. While only the top 30 from each group are displayed, the complete results are accessible in VolumeLeaders.com for you to explore at your convenience any time. Remember to configure trade alerts within the platform to ensure institutional order flows that capture your interest or are significant to you aren’t missed. The blue charts represent all types of trades, including blocks on lit exchanges; the purple charts exclusively depict dark pool trades; and the green charts are sweeps only.
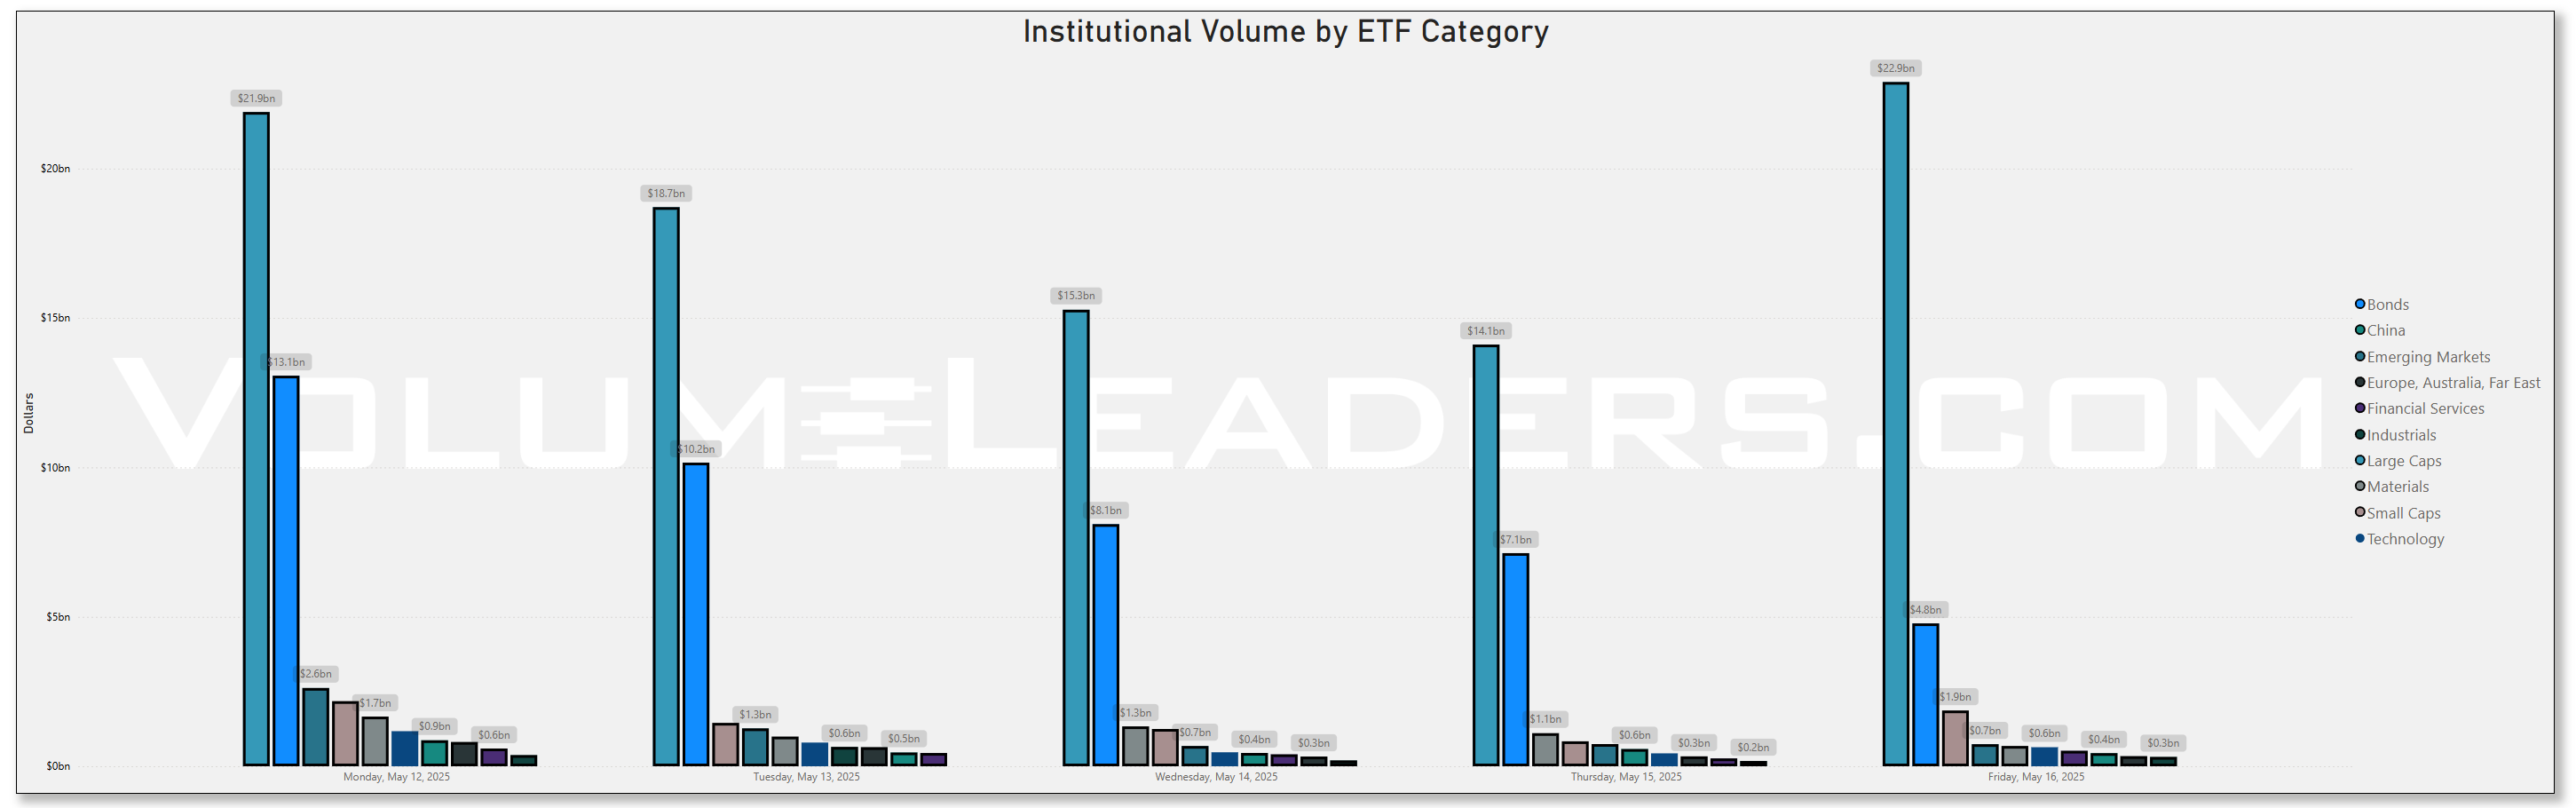
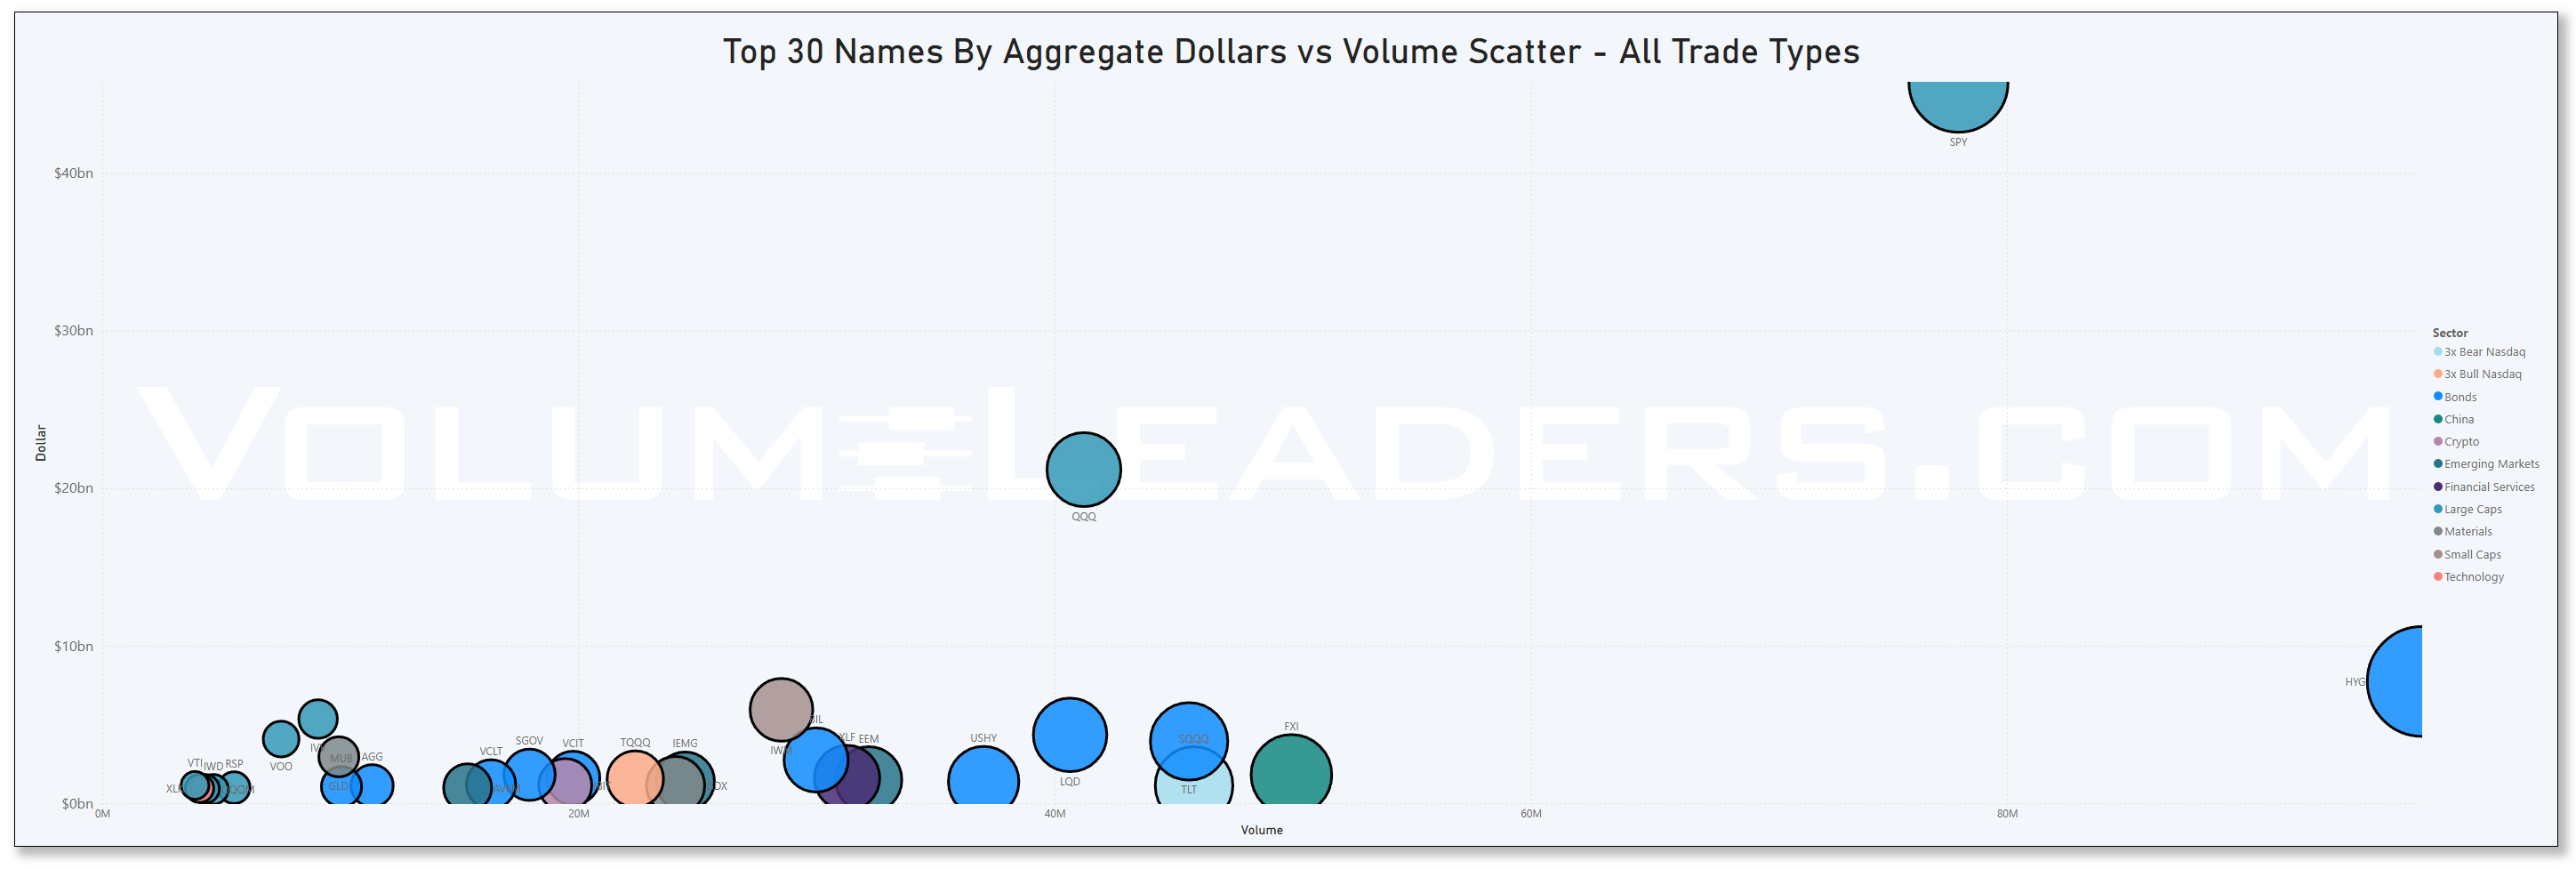
Top Institutional Order Flow In ETFs
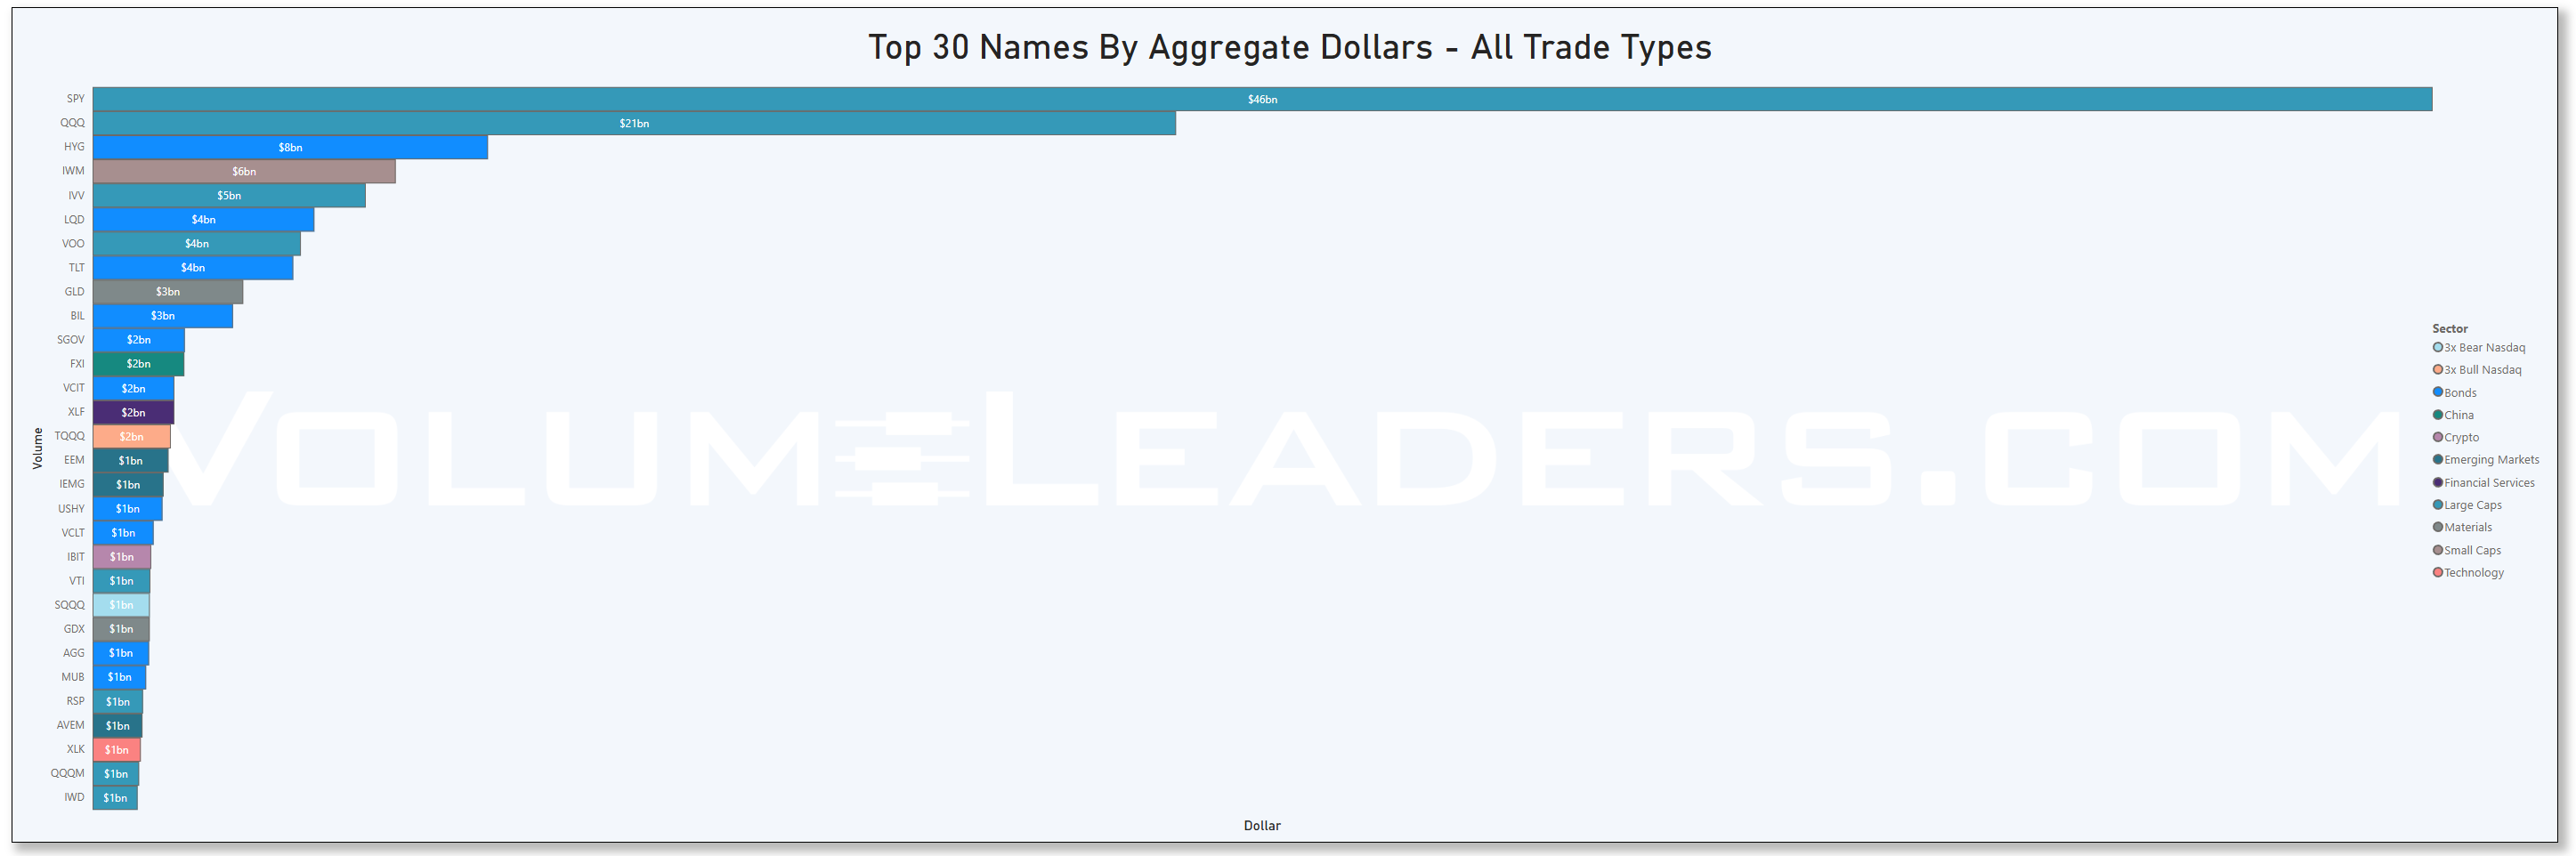
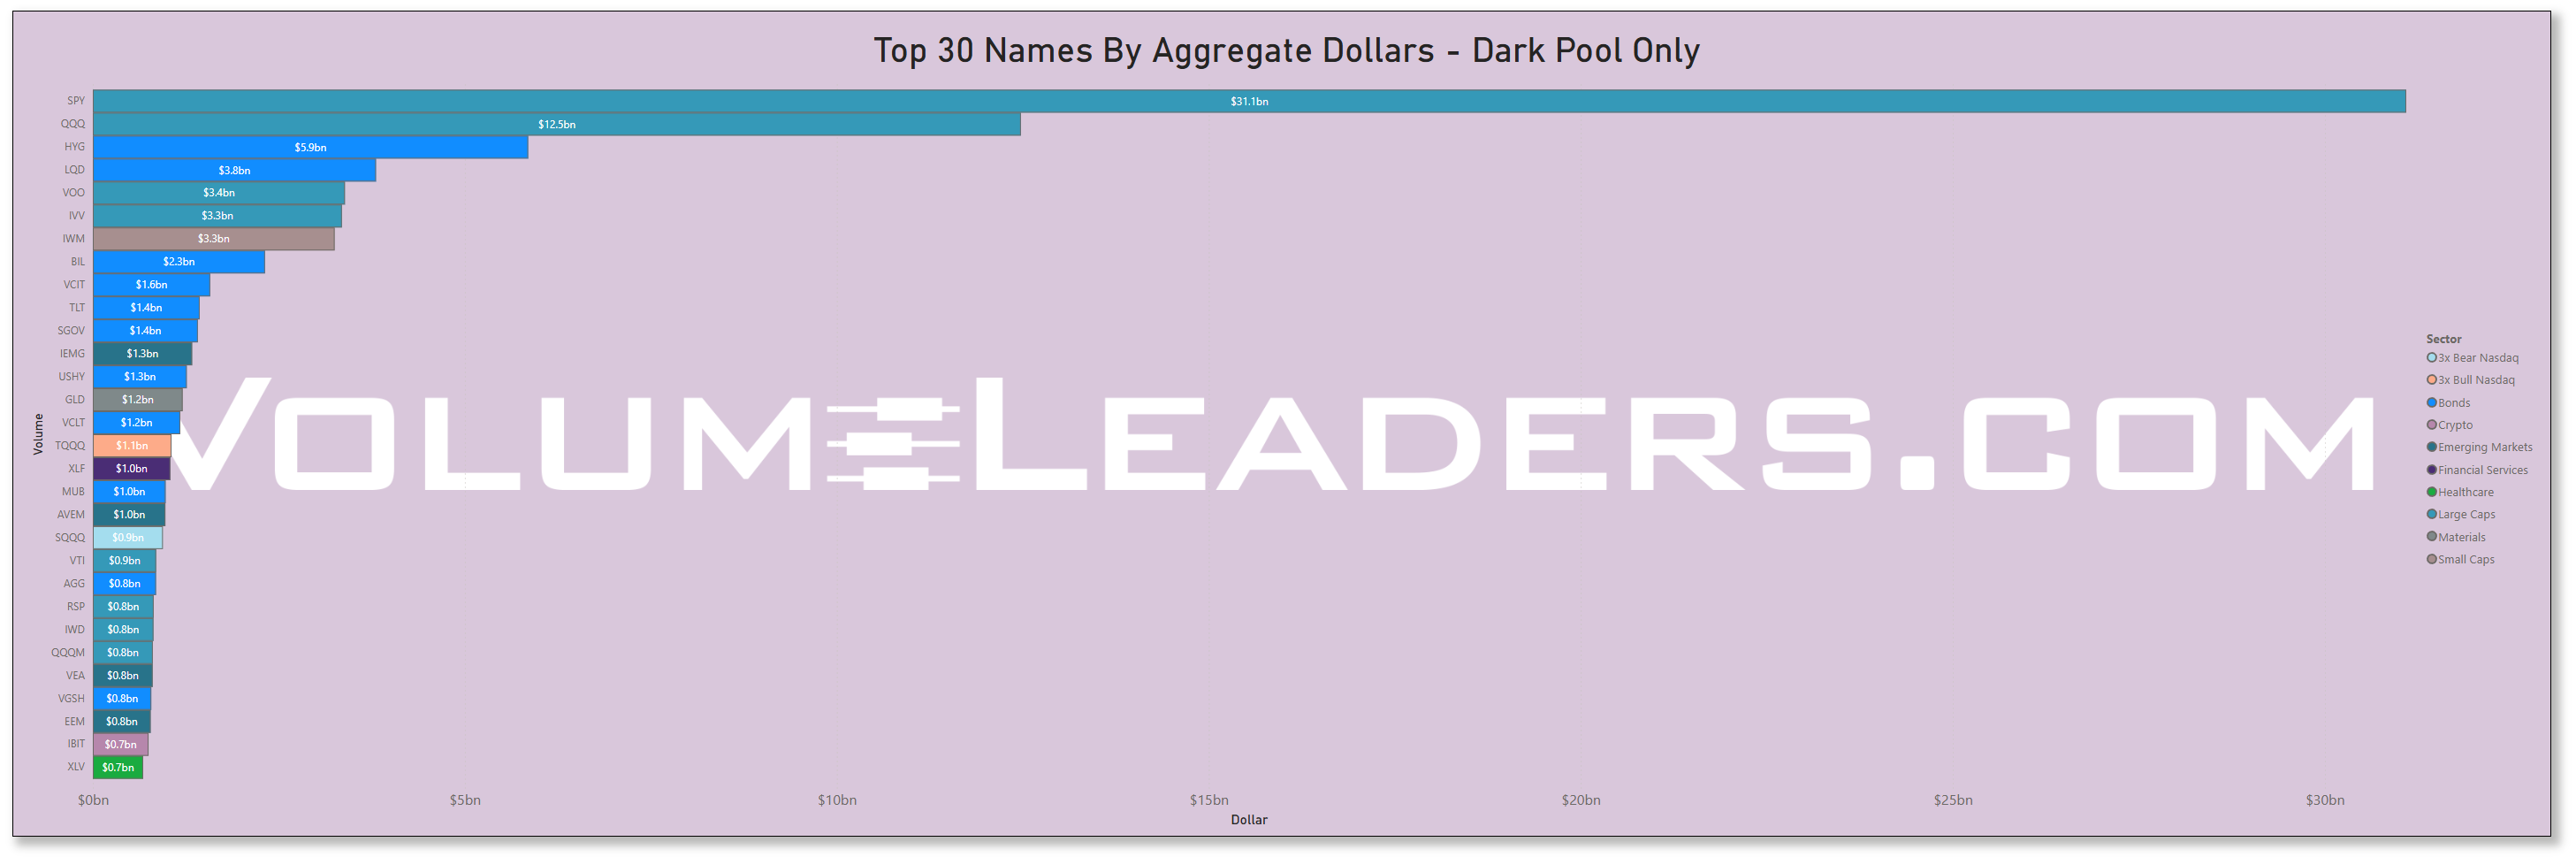
Last Week’s Billion-Dollar Prints
Tickers that printed a trade worth at least $1B last week get a special shout-out. These are massive commitments by institutions that should not be ignored.
Analysis of This Week’s Top-25-Ranked Institutional Order Flow
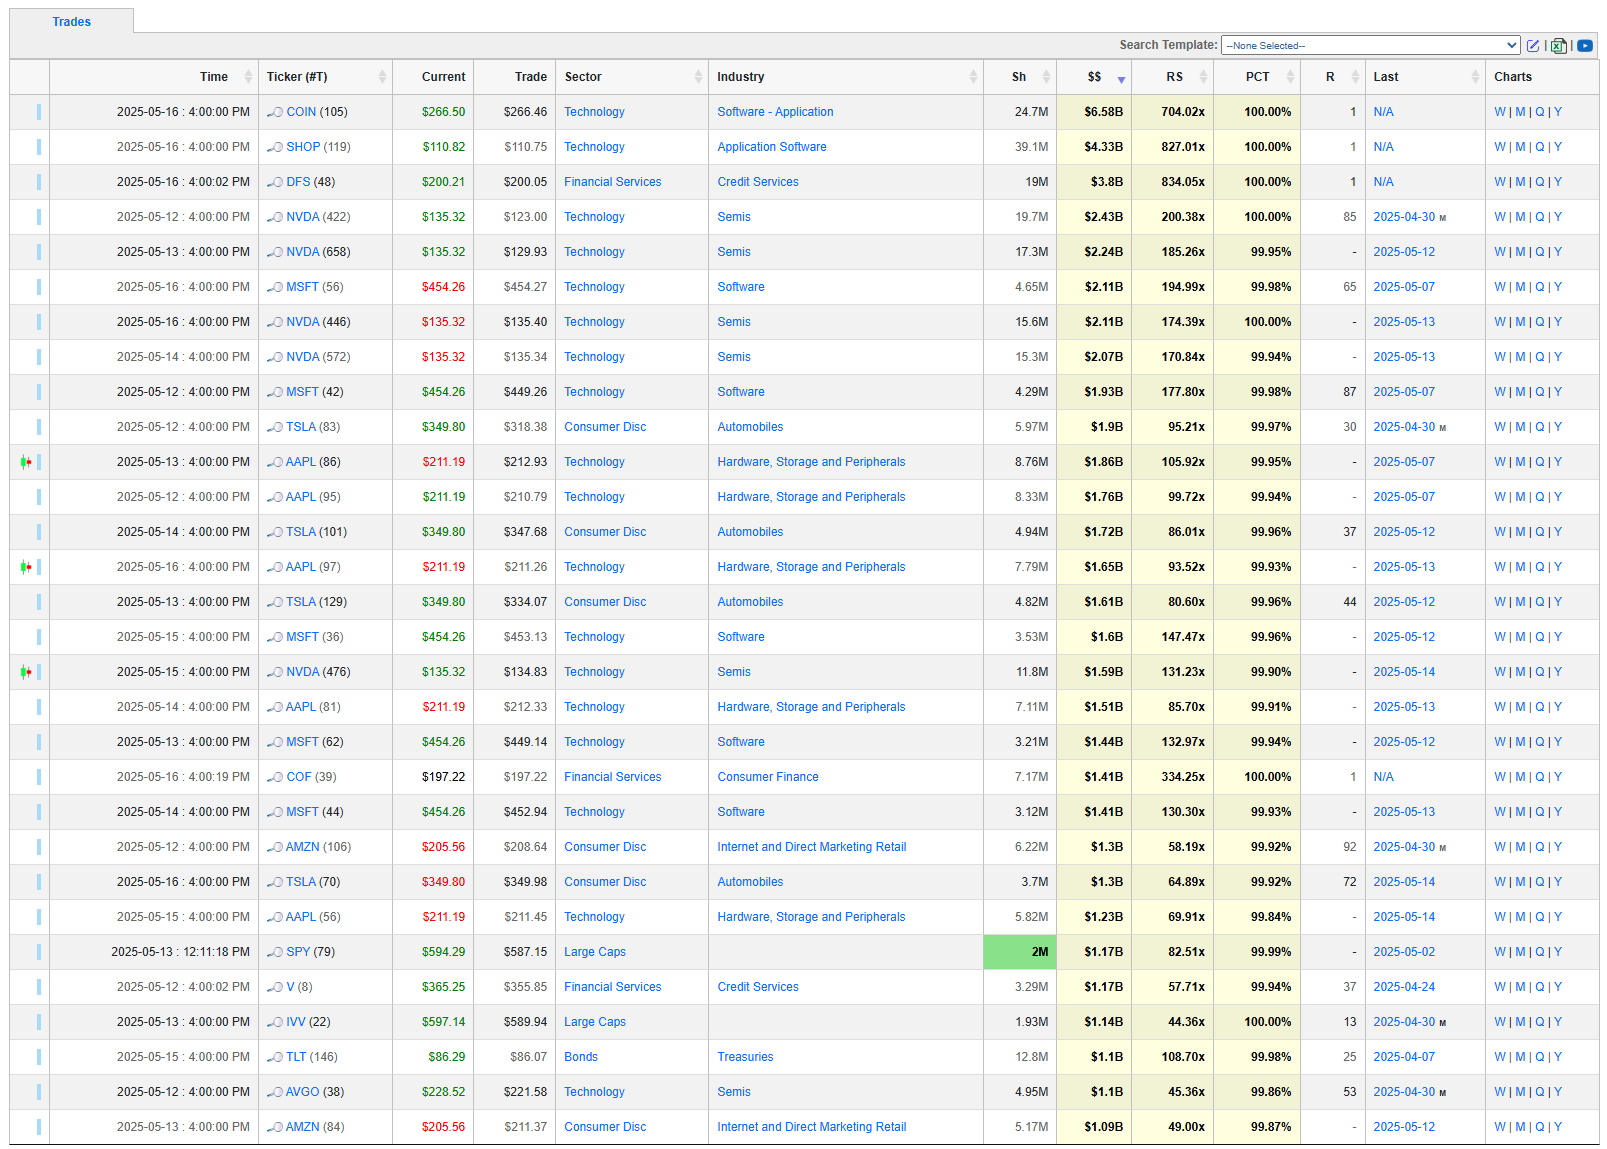
This comprehensive analysis examines institutional trading activity from the VolumeLeaders.com dataset containing 707 top-25-ranked trades across 399 unique tickers. The data reveals several significant patterns:
Unprecedented financial sector activity driven by the imminent Capital One-Discover merger (closing May 18, 2025), with DFS recording the single highest relative size trade (834x normal volume) worth $3.8 billion
Massive technology sector positioning with the highest concentration of institutional activity (111 trades across 56 tickers), led by Coinbase ($6.6B) and Shopify ($4.3B) trades
Extremely bullish sentiment with a Bull/Bear ETF ratio of 10.4:1 by trade count and 4.6:1 by dollar value, indicating strong institutional optimism
Credit services and consumer finance industries showing the strongest institutional interest relative to historical norms, pointing to expectations of rising consumer spending and credit expansion
Multiple high-rank trades clustering in specific tickers like ETOR, HIMZ, GRYP, SHOP, and COIN, suggesting an imminent move.
The Multi-Factor Trade Significance analysis identified COIN, SHOP, and DFS as the most significant institutional positions, combining exceptional dollar value, relative size, rank importance, and multiple trade patterns.
Top Mega-Money Moves
The analysis reveals extraordinary institutional trading activity, with several standout transactions:
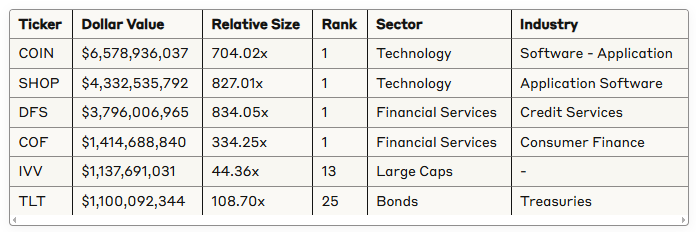
The most striking observation is the concentration of mega-trades in finance and technology, with the top three trades exceeding $14.7 billion combined. The DFS trade is particularly notable given the imminent Capital One acquisition closing on May 18, 2025, representing institutional positioning ahead of this significant consolidation event.
Multiple high-ranked trades in COIN and SHOP have appeared after news that both will be joining the S&P500 and NASDAQ 100, respectively, on May 19th. COIN appears four times in the top 15 trades by dollar value, and SHOP appears three times.
Sector Intelligence
The sector analysis reveals clear institutional preferences and emerging trends:
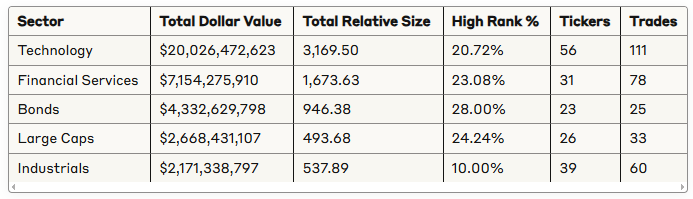
Technology dominates both in total dollar value and relative size, with a staggering $20 billion in institutional capital deployment, significantly outpacing all other sectors. Financial Services shows the second highest institutional interest, largely driven by the DFS and COF trades linked to the upcoming merger.
The Bond sector's high rank percentage (28%) is notable, suggesting increased institutional interest in fixed income despite the current interest rate environment. This could indicate positioning for anticipated rate changes or economic uncertainty.
Emerging Markets shows the highest average relative size per trade (54.88x), indicating outsized institutional positioning relative to normal volume in this area, despite fewer overall trades.
Industry Intelligence
Drilling down to industry level reveals even more targeted institutional positioning:
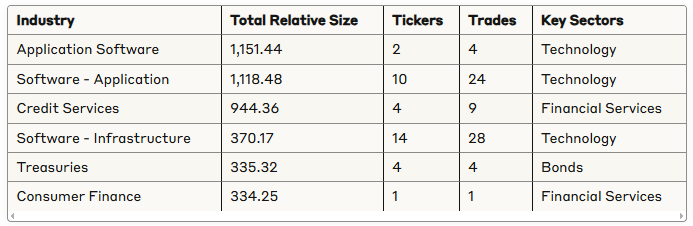
The remarkable concentration in software-related industries—with Application Software, Software Application, and Software Infrastructure collectively accounting for over 2,600 in relative size—indicates extraordinary institutional conviction in the software space.
The Credit Services industry (which includes DFS) ranks third in total relative size despite having only 9 trades, demonstrating the significance of the Capital One-Discover merger in driving institutional positioning. This trend extends to Consumer Finance (COF), creating a clear financial services theme in the data.
The narrowly focused institutional activity in Application Software (just 2 tickers but 1,151 in relative size) versus the more diversified positioning in Software Infrastructure (14 tickers) suggests more targeted conviction in specific application software companies.
Bull vs Bear Sentiment Analysis
Institutional sentiment analysis using bull/bear ETF positioning reveals overwhelmingly bullish sentiment:
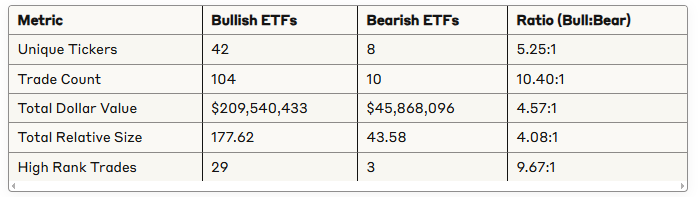
The composite Bull/Bear Sentiment Score calculates to 129.57/100, indicating Extremely Bullish institutional sentiment. The most telling metric is the 10.4:1 ratio in trade count, showing institutional investors are making ten bullish ETF trades for every bearish ETF trade.
The high-rank ratio of 9.67:1 is particularly significant, as it indicates that bullish ETF trades are nearly 10 times more likely to be high-priority institutional positions (ranks 1-5) compared to bearish trades.
Rank Analysis
Rank distribution analysis reveals significant patterns in institutional prioritization:
Rank 1 trades (the highest priority institutional positions) comprise 8.3% of all trades but represent 41.2% of total dollar value
Ranks 1-5 (high-priority positions) account for 25.6% of trades but represent 68.7% of total dollar value
Ranks 20-25 (lower priority positions) comprise 18.2% of trades but only 5.3% of total dollar value
The concentration of dollar value in top-ranked trades indicates that institutions are deploying their largest capital to their highest-conviction ideas. The average dollar value of a Rank 1 trade is approximately $837 million, compared to just $68 million for a Rank 25 trade.
Financial Services shows the highest percentage of Rank 1 trades at 7.7%, followed by Technology at 4.5%, suggesting these sectors contain the highest-conviction institutional positioning.
Statistical Distributions
Analysis of dollar value and relative size distributions reveals:
Dollar Value Distribution:
Small trades (<$5M): 43.0% of all trades
Medium trades ($5M-$50M): 38.5% of all trades
Large trades ($50M-$500M): 16.1% of all trades
Mega trades (>$500M): 2.4% of all trades
Relative Size Distribution:
Small relative size (<5x): 57.0% of all trades
Medium relative size (5x-50x): 38.6% of all trades
Large relative size (50x-500x): 4.0% of all trades
Extreme relative size (>500x): 0.4% of all trades
The distribution patterns show a classic power law, with a high concentration of dollar value in a small number of mega-trades. The three trades with extreme relative size (>500x) are DFS, SHOP, and COIN—all exceptional institutional movements tied to major market developments.
Ticker Clustering Analysis
Examining tickers by sector-industry clusters reveals significant institutional focus areas:
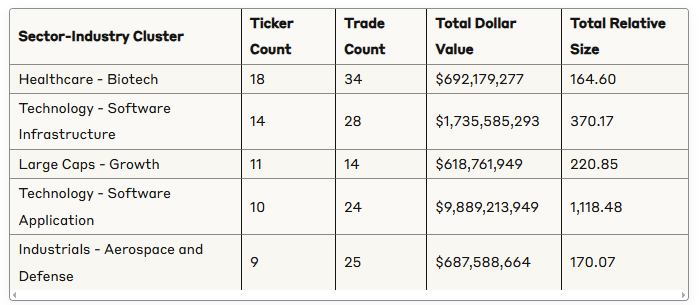
The strongest institutional positioning relative to the number of tickers is in Technology - Software Application, where just 10 tickers account for nearly $10 billion in institutional capital deployment and over 1,118 in relative size.
Healthcare - Biotech shows broad but less intense institutional interest with 18 tickers but only 164.60 in total relative size, suggesting more diversified and less concentrated positioning.
The Industrials - Aerospace and Defense cluster shows consistent institutional interest across 9 tickers with 25 trades, indicating steady accumulation rather than exceptional positioning.
Similar Size Last Seen Patterns
Analysis of the "Date Similar Size Last Seen" field reveals:
21.4% of trades represent institutional positioning at scales not seen in over 6 months
12.2% of trades show positioning at scales not seen in over 1 year
2.8% of trades indicate positioning at unprecedented levels (null value in "Date Similar Size Last Seen")
Notable trades with no previous similar size (indicating potentially unprecedented institutional positioning) include:
DFS (Financial Services): $3.8B, 834.05x, Rank 1
SHOP (Technology): $4.3B, 827.01x, Rank 1
COIN (Technology): $6.6B, 704.02x, Rank 1
COF (Financial Services): $1.4B, 334.25x, Rank 1
The concentration of unprecedented positioning in Financial Services and Technology sectors reinforces the significance of these areas in current institutional trading activity.
Multi-Factor Trade Significance
The Multi-Factor Trade Significance analysis combines dollar value, relative size, rank, multiple trades, and price momentum factors to identify the most important institutional positions:
Top Tickers by Multi-Factor Significance:
COIN (85.18/100): Leading with exceptional dollar value and high momentum
SHOP (77.96/100): Highest relative size and strong dollar value
DFS (66.05/100): Outstanding relative size and significant dollar value
AVEM (39.36/100): Strong multi-trade pattern and good overall metrics
COF (36.22/100): Excellent rank and good relative size
Top Sectors by Multi-Factor Significance:
Technology (74.66/100): Dominant in dollar value, relative size, and trade count
Financial Services (41.80/100): Strong across all metrics
Developed Markets (35.84/100): Perfect high rank percentage
Bonds (29.18/100): Solid high rank percentage and good price momentum
2x Bull MSTR (26.84/100): Perfect high rank percentage but lower in other metrics
The Multi-Factor analysis confirms the exceptional importance of the COIN, SHOP, and DFS trades, which score significantly higher than all other institutional positions when considering all factors together.
Actionable Intelligence for Investors
Based on this comprehensive analysis, several actionable insights emerge:
Financial Services Focus: The extraordinary positioning in DFS and COF ahead of the May 18th merger closing suggests continued institutional interest in financial consolidation plays. Other credit services and consumer finance companies may see similar institutional interest.
Software Application Premium: The concentrated institutional positioning in Application Software suggests expectations for significant outperformance in this specific industry vertical, making it a key area for investor attention.
Crypto Infrastructure Conviction: The inclusion of COIN in a major index could be suggesting a potentially significant shift in institutional acceptance of digital assets.
Bonds as a Defensive Position: The high rank percentage for Bond sector trades suggests defensive positioning alongside bullish sentiment, indicating institutions may be hedging their bets despite overall optimism.
Extremely Bullish ETF Positioning: The 10.4:1 bull/bear ETF ratio by trade count provides a clear indicator of institutional sentiment, suggesting investors should maintain net long positioning while being selective in sector allocation.
Conclusion
This comprehensive analysis of institutional trading activity reveals unprecedented positioning in Financial Services and Technology sectors, with the upcoming Capital One-Discover merger driving exceptional DFS and COF activity. The extraordinary concentration in software-related industries indicates strong institutional conviction in these areas.
The Multi-Factor Trade Significance analysis identifies COIN, SHOP, and DFS as the most important institutional trades, combining exceptional dollar value, relative size, rank importance, and multiple trade patterns. The bull/bear ETF ratio of 10.4:1 confirms extremely bullish institutional sentiment.
Thank you for being part of our community and for dedicating your time to this edition. Your insights and engagement drive everything we do, and we’re honored to share this space with such committed, thoughtful readers. Here’s to a week filled with clear opportunities and strong performance. Wishing you many bags 💰💰💰
—VolumeLeaders