Market Momentum: Your Weekly Financial Forecast & Market Prep
Issue 44 / What to expect May 12, 2025 thru May 16, 2025
In This Issue
[Free For Everyone]
Market-On-Close: All of last week’s market-moving news and macro context in under 5 minutes
The Latest Investor Sentiment Readings
Institutional Support & Resistance Levels For Major Indices: Exactly where to look for support and resistance this coming week in SPY, QQQ, IWM & DIA
Special Coverage Report: Why Indicators Alone Will Always Let You Down (Unless You Do This...)
Normalized Performance By Thematics YTD (Sector, Industry, Factor, Energy, Metals, Currencies, and more): which corners of the markets are beating benchmarks, which ones are overlooked and which ones are over-crowded
Key Econ Events and Earnings On-Deck For This Week
[Only For Subs]
Institutional Activity By Sector: Institutional order flow by sector and constituent names.
Top Institutional Order Flow In Individual Names: The largest sweeps and blocks on lit exchanges and hidden dark pools
Statistical Analysis and Insights From This Week’s Top Prints
Top Institutionally-Backed Gainers & Losers: An explosive watchlist for day traders seeking high-volatility and massive gains

Market-On-Close
Markets Navigate Cautious Waters Amid Trade Negotiations and Fed Decisions
The US financial markets traversed uncertain terrain this week as investors processed mixed economic signals, potential trade developments, and the Federal Reserve's latest monetary policy decision. Despite promising developments in international trade relations, major indices closed the week with minimal changes as market participants adopted a wait-and-see approach ahead of pivotal trade talks between the United States and China.
Market Performance: Mixed Results Amid Uncertainty
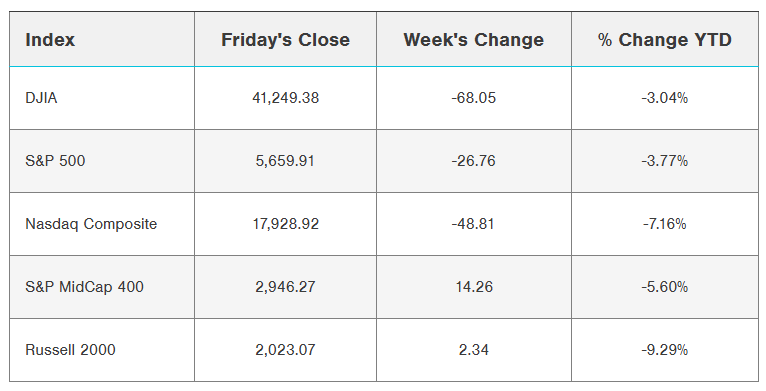
Major indices concluded the week with modest movements in different directions. The S&P 500 and Nasdaq Composite retracted slightly, declining 0.47% and 0.27% respectively, while the Dow Jones Industrial Average experienced a marginal decrease of 0.29%. In contrast, small and mid-cap indexes demonstrated relative strength, posting gains for the fifth consecutive week.
The week began with the S&P 500 breaking its impressive nine-day winning streak on Monday during a relatively quiet trading session. However, market sentiment received a boost midweek following reports of planned trade discussions between US and Chinese officials in Switzerland, sparking optimism about potential tariff de-escalation. This positive momentum continued through Thursday, supported by the announcement of a new trade agreement between the US and UK.

By Friday's close, the cautious market mood prevailed as investors awaited the outcome of weekend trade talks with China. President Trump's social media comments suggesting that an "80% tariff on China seems right" created additional uncertainty, tempering market enthusiasm despite the positive developments with the UK earlier in the week.
Trade Relations: Progress and Potential
US-UK Trade Agreement: A First Step
In a significant development, the United States and United Kingdom announced a new trade framework on Thursday, marking the first such agreement since the Trump administration unveiled reciprocal tariffs on April 2. While the economic impact may be relatively limited—given that the UK represents approximately 4% of US exports and 2% of US imports—the deal holds symbolic importance as a potential template for negotiations with other trading partners.

Key provisions of the agreement include:
Maintenance of the 10% universal tariff on most imports from the UK
A tiered tariff structure for UK vehicles: 10% on the first 100,000 vehicles, increasing to 25% beyond that threshold
Reduced or eliminated UK tariffs on certain US exports, including agricultural products such as ethanol and beef
Elimination of US tariffs on imports of UK steel and aluminum
The agreement demonstrates tangible progress in trade negotiations, potentially setting the stage for similar discussions with other nations. However, as market analysts note, negotiations with countries where the US maintains trade deficits may prove more challenging.
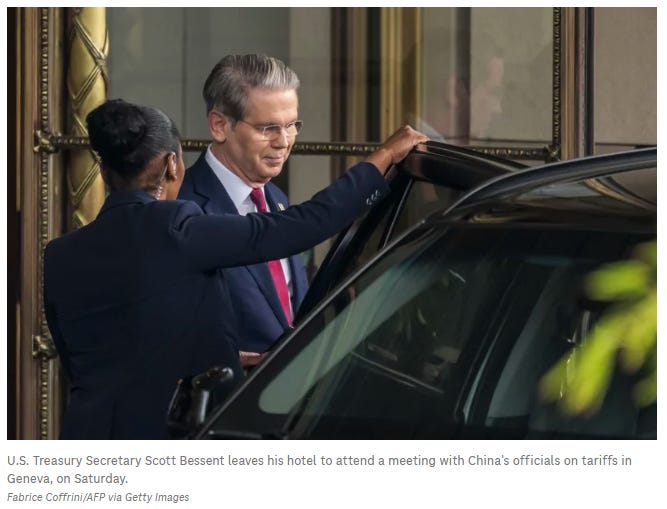
US-China Trade Talks: High Stakes Diplomacy
All eyes now turn to Geneva, Switzerland, where US Treasury Secretary Scott Bessent and US Trade Representative Jamieson Greer are scheduled to meet with Chinese officials this weekend to initiate trade discussions. These talks represent a crucial opportunity to address trade tensions between the world's two largest economies.
While a comprehensive US-China trade deal would require extensive negotiations given its complexity, even a temporary reduction in tariffs to facilitate further discussions could help alleviate recent trade disruptions and benefit the economy and financial markets. However, President Trump's recent comments regarding potential 80% tariffs on Chinese goods have injected additional uncertainty into the equation.
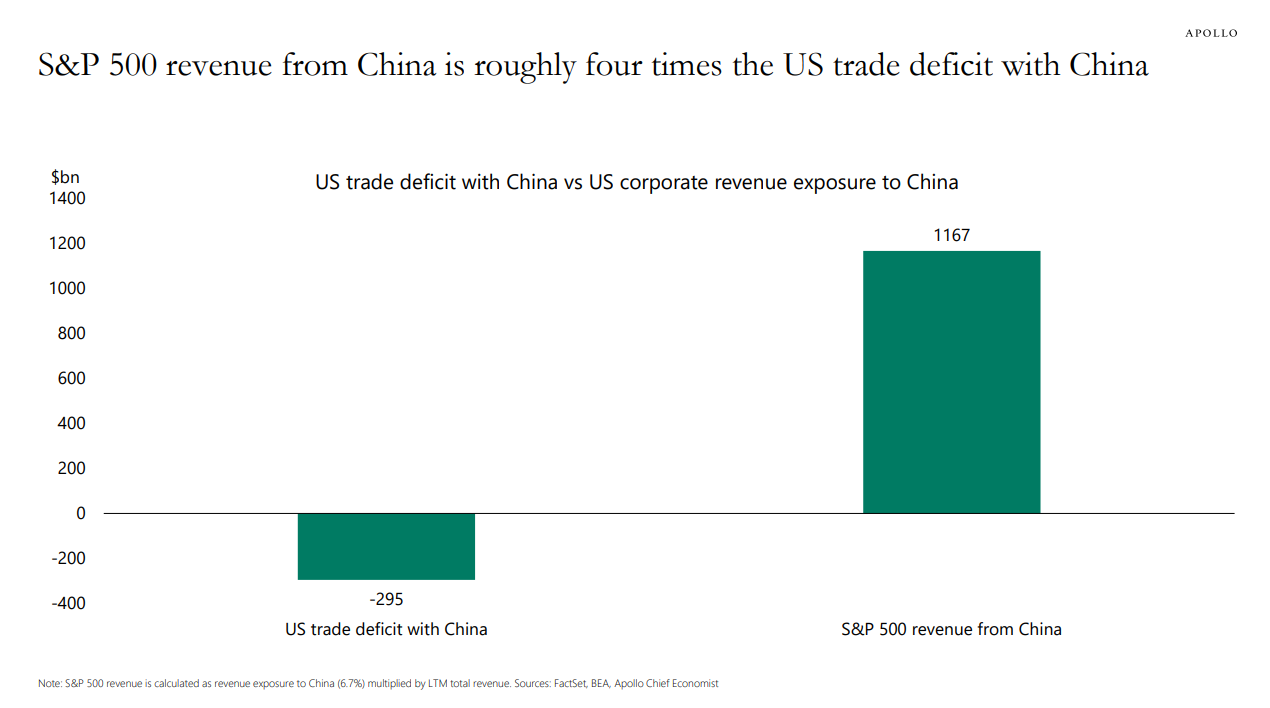
According to Bloomberg Intelligence, the average S&P 500 company derived approximately 6.1% of its revenue from selling goods in China or to Chinese companies in 2024, highlighting the economic significance of this relationship.
Federal Reserve: Balancing Act Continues
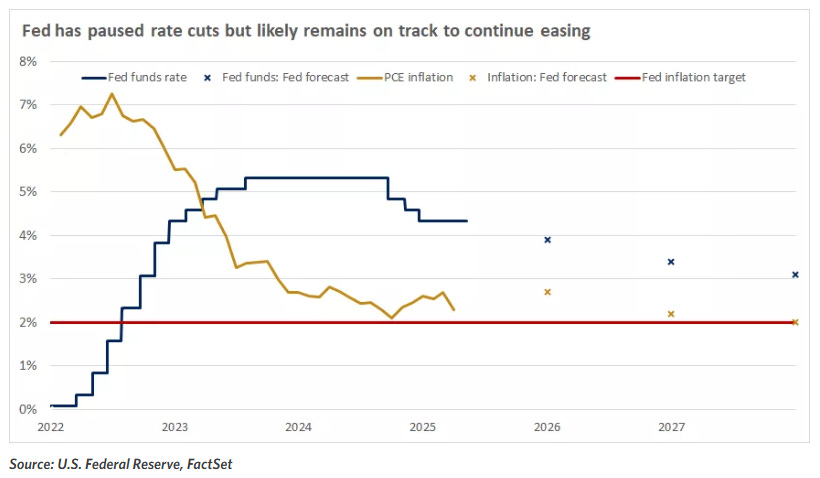
The Federal Open Market Committee (FOMC) concluded its May meeting on Wednesday, maintaining the target range for the federal funds rate at 4.25%-4.50%, marking the third consecutive meeting without a rate adjustment. This decision aligned with market expectations, particularly in light of the Fed's concerns regarding the potential economic impact of tariffs.
In its post-meeting statement, the FOMC noted that "economic activity has continued to expand at a solid pace" while cautioning that "uncertainty about the economic outlook has increased further" and "the risks of higher unemployment and higher inflation have risen." This language reflects the Fed's growing awareness of the challenges posed by recent policy shifts, particularly the implementation of wide-ranging tariffs.
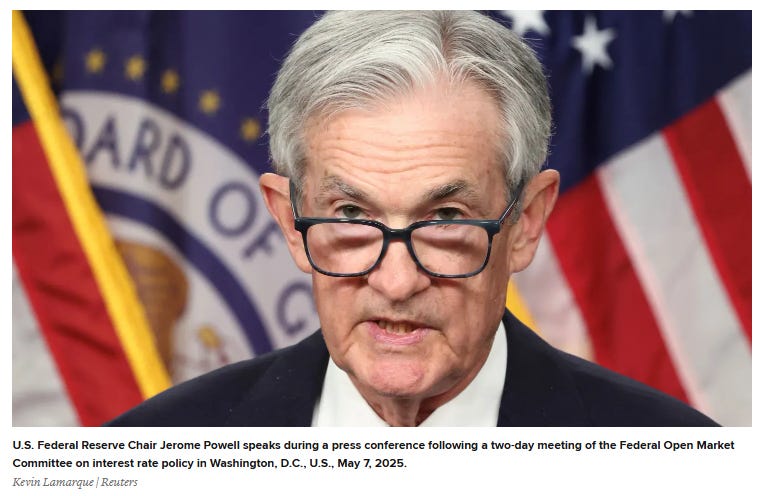
Fed Chair Jerome Powell emphasized in his subsequent news conference that policymakers remain in a "wait and see" mode as they continue to assess incoming data to determine the economic implications of the administration's significant policy changes. Powell acknowledged that the Fed could find itself navigating a "challenging scenario" in which its dual mandate goals—maximum employment and price stability—come into conflict.
The Fed's most recent projections indicate expectations for two more rate cuts this year, while bond markets are currently pricing in three cuts, likely beginning in July, with an additional cut anticipated next year. With the federal funds rate at 4.33% and the Personal Consumption Expenditure (PCE) inflation measure at 2.3%, monetary policy remains restrictive, as a neutral policy rate typically hovers around 1% above inflation.
Fed Perspectives: Divergent Views
Comments from various Federal Reserve officials throughout the week provided additional insights into the central bank's thinking:
Fed Governor Kugler expressed the view that the Fed should maintain steady interest rates for now, citing a stable US economy and uncertainty surrounding the administration's tariff policies.
New York Fed President Williams offered a more cautious outlook, noting expectations for "considerably slower" economic growth this year compared to 2024, along with anticipated increases in both inflation and unemployment.
These somewhat divergent perspectives highlight the complex balancing act the Fed must perform in the current economic environment.
Economic Indicators: Services Sector Resilience
The services sector, which accounts for approximately 72% of the US economy, showed mixed but generally positive signals in April. The Institute for Supply Management (ISM) Services Purchasing Managers' Index (PMI) rose to 51.6 from March's reading of 50.8%, indicating expansion for the tenth consecutive month (readings above 50% denote expansion). Three of the four subindexes—new orders, employment, and supplier deliveries—improved month over month, while the business activity subindex remained in expansion territory at 53.7%.
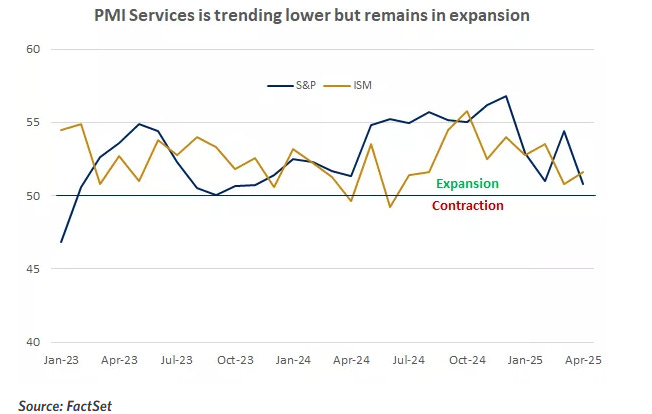
However, the ISM prices index climbed to 65.1%, the highest reading in over two years, largely attributed to the impact of tariffs. This development raises concerns about inflationary pressures within the services sector.
Meanwhile, the S&P US Services PMI painted a slightly less optimistic picture, declining to 50.8 in April but still remaining above the critical 50.0 expansion threshold. The report cited uncertainty over government policies, particularly trade, as factors weighing on demand and business expectations.
In contrast to the services sector's resilience, the ISM Manufacturing PMI, reported earlier, indicated a contraction in the manufacturing sector for the second consecutive month in April. According to Timothy Fiore, chair of the ISM Manufacturing Business Survey Committee, "Demand and production retreated and destaffing continued, as panelists' companies responded to an unknown economic environment."

This divergence between services and manufacturing highlights the differential impact of trade policies on various segments of the economy, with the services sector generally less exposed to tariffs than goods-producing industries.
Fixed Income Markets: Yields Respond to Policy Developments
US Treasury yields experienced fluctuations throughout the week, generally increasing in response to the Fed's policy announcement and positive trade headlines before finding some support on Friday. The 10-year Treasury note yield closed the week at 4.377%, a slight decrease of 0.2 basis points from the previous week, after reaching a 2-1/2 week high of 4.396% during the week.
Several factors influenced bond market movements:
Supportive Factors
Comments from Japanese Finance Minister Kato boosted Treasury prices on Friday when he stated that the Japanese government is not considering the sale of US Treasury securities as part of its trade negotiations with the US. This statement provided significant reassurance to the bond market, as Japan held $1.13 trillion in Treasury securities at the end of February, making it the largest foreign holder of US debt.
New York Fed President Williams' comments regarding expectations for slower economic growth also lent support to Treasury prices.
Short covering provided additional support as bond dealers lifted short hedges they had established against this week's $125 billion quarterly refunding.
Yield-Increasing Factors
European government bond weakness created negative carryover effects, with the 10-year German bund yield rising to a 4-week high of 2.588% and the 10-year UK gilt yield climbing to a 2-1/2 week high of 4.603%.
Easing global trade tensions reduced the "flight to safety" demand for Treasury securities.
Fed Governor Kugler's hawkish comments regarding steady interest rates pressured bond prices.
An increase in inflation expectations weighed on Treasury prices, with the 10-year breakeven inflation rate rising to a 5-week high of 2.323% on Friday.
In the municipal bond market, securities continued to recover against the backdrop of limited new issuance, while investment-grade corporate bonds posted negative returns. The high-yield bond market experienced light trading volumes as investors focused on earnings reports and awaited commentary following the Fed's policy meeting. Traders noted that the light primary issuance calendar, positive flows, and accumulating cash levels created favorable technical conditions in the high-yield sector.
European Central Bank: Rate Cut Prospects
Across the Atlantic, the European Central Bank (ECB) appears poised to reduce interest rates at its June 5 policy meeting, with market swaps currently pricing in a 93% probability of a 25 basis point cut.
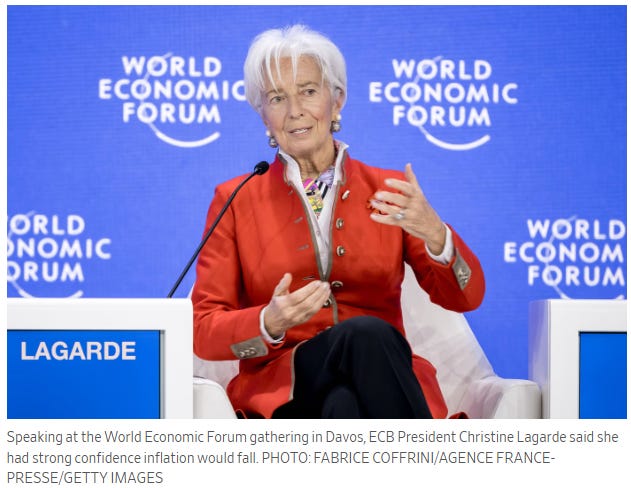
Several ECB officials expressed support for such a move:
ECB Governing Council member Simkus stated that "another interest rate cut by the ECB in June is needed," noting that the Eurozone has yet to feel the full impact of US tariffs and inflation is expected to continue moderating.
ECB Governing Council member Rehn indicated that the ECB should reduce interest rates next month if its updated financial forecasts confirm an outlook of disinflation and waning growth momentum.
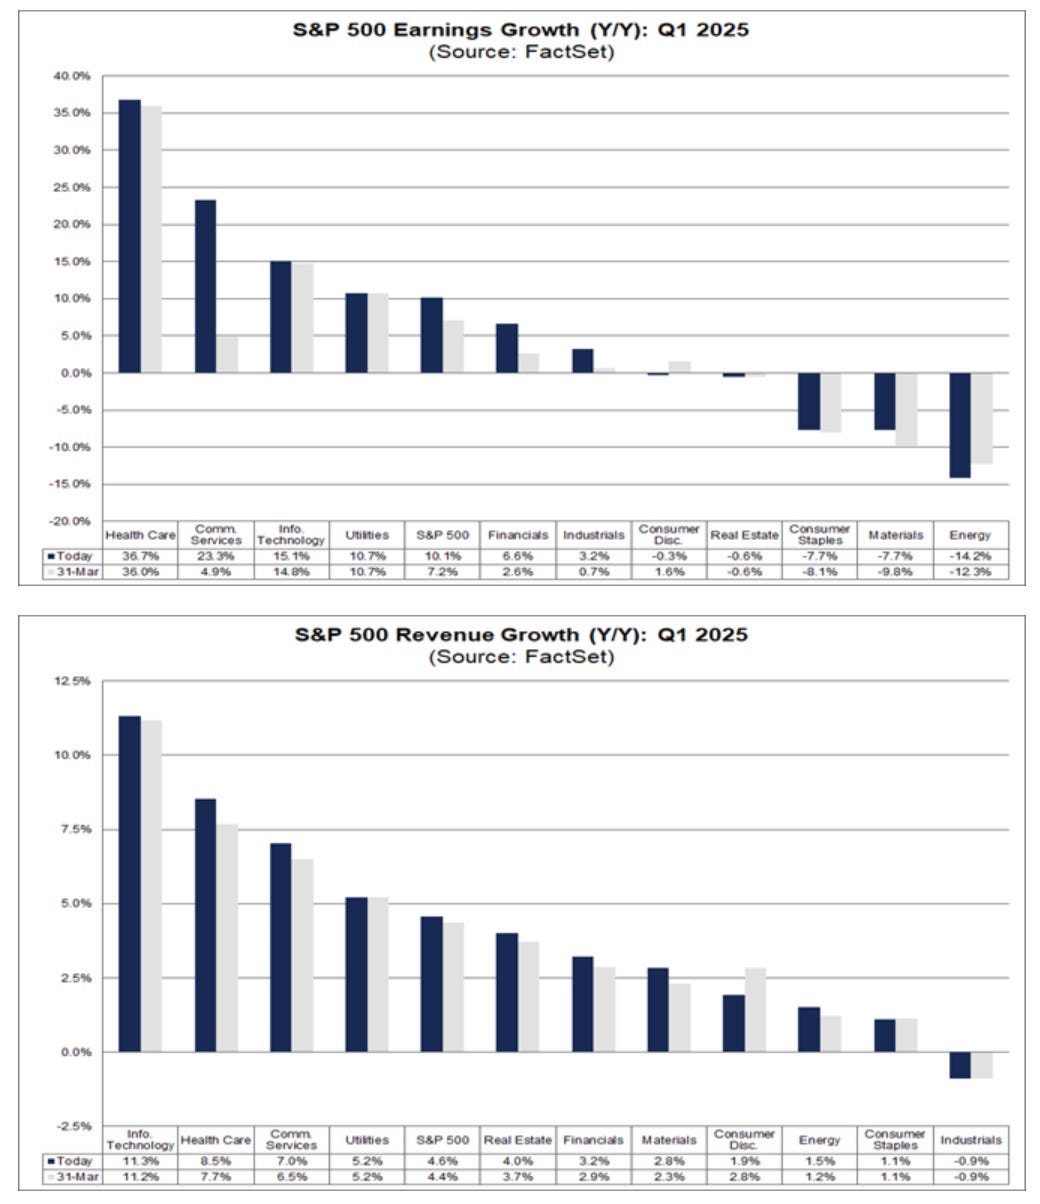
Corporate Earnings: Mixed Results Drive Market Movements
The first-quarter earnings reporting season remains in progress, with mixed results influencing market performance. According to data compiled by Bloomberg Intelligence, the market consensus expects Q1 year-over-year earnings growth of 6.7% for S&P 500 companies, down from expectations of 11.1% in early November. Of the 412 S&P 500 companies that have reported quarterly results thus far, 78% have exceeded estimates.
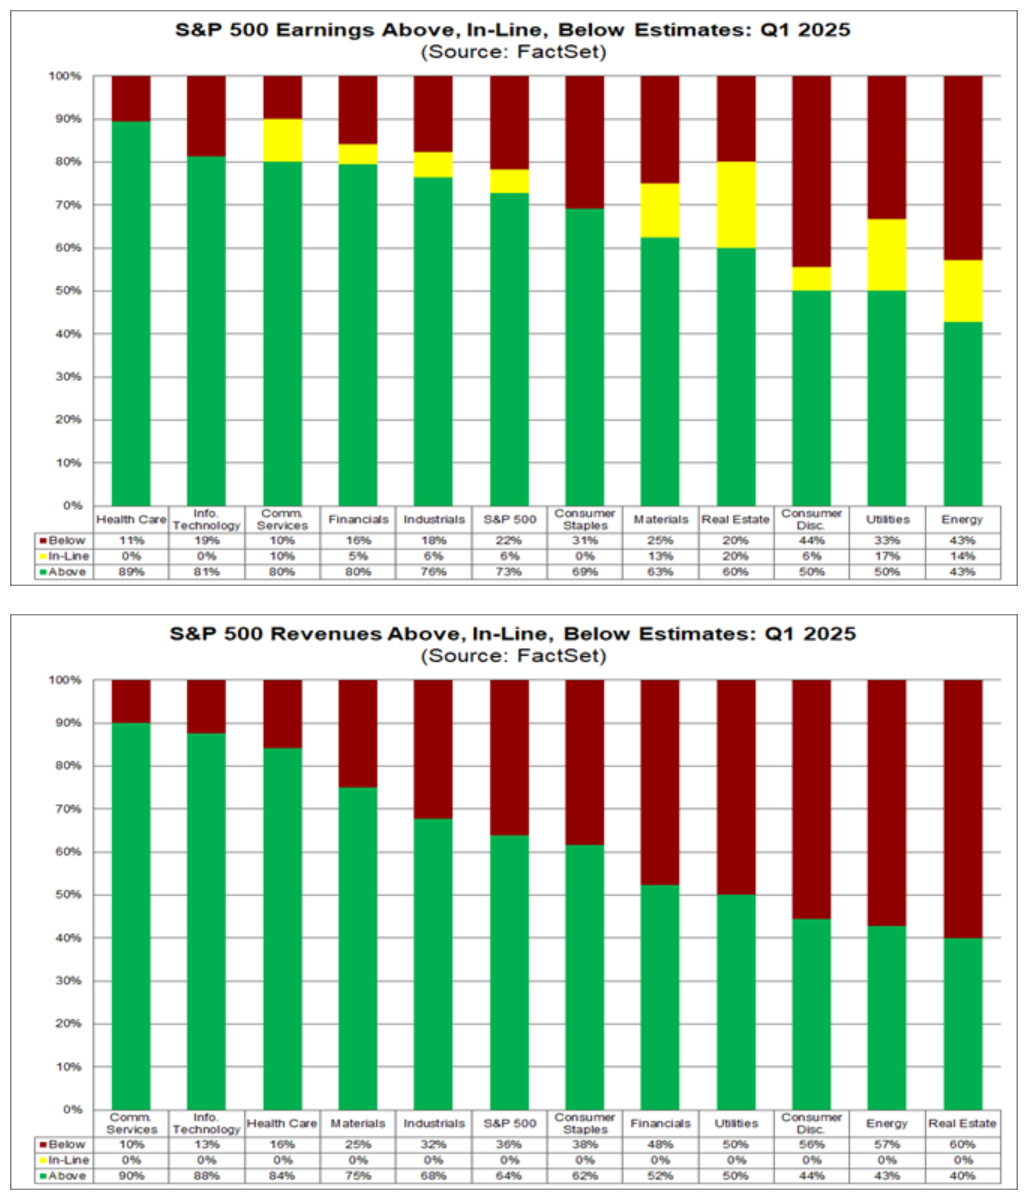
Full-year 2025 corporate profits for the S&P 500 are projected to rise 9.4%, a downward revision from the 12.5% forecast in early January. This adjustment reflects growing concerns about the potential impact of tariffs and other policy changes on corporate performance.
Several notable earnings reports on Friday illustrated the varied landscape:
Positive Surprises
Microchip Technology surged more than 12%, leading semiconductor stocks higher after reporting better-than-expected Q4 net sales and forecasting Q1 net sales above consensus.
Lyft soared more than 28% after projecting Q2 gross bookings above consensus expectations.
Insulet jumped more than 20% following stronger-than-expected Q1 revenue and an increased full-year revenue forecast.
Disappointments
Akamai Technologies declined more than 10% after forecasting full-year adjusted earnings per share below consensus estimates.
Expedia Group fell more than 7% after reporting weaker-than-expected Q1 revenue and reducing its 2025 revenue forecast.
Investment Outlook: Opportunities Amid Uncertainty
Despite the current uncertainties, several areas of opportunity exist within the US investment landscape:
Equities
US large- and mid-cap stocks appear well-positioned to benefit from:
A resilient US labor market, with unemployment currently at 4.2%
Potential further easing in trade tensions
Pro-growth policies, including potential deregulation and tax cuts
Certain sectors offer particular promise:
Financial services companies may benefit from reduced exposure to tariffs due to their domestic orientation and service focus.
Healthcare is similarly less affected by tariffs, and valuations remain reasonable relative to historical norms.
Both sectors could potentially benefit from tax reform and deregulation initiatives.
Fixed Income
Within investment-grade bonds, the seven- to ten-year maturity segment appears attractive, offering opportunities to:
Lock in higher yields for extended periods if the Fed proceeds with rate cuts in the latter half of the year
Benefit from potential price appreciation, as intermediate-term bonds typically demonstrate greater sensitivity to interest rate reductions than short-term bonds
Gain from Fed purchases of Treasury bonds to replace maturing holdings on its balance sheet, which could provide price support
Global Market Context
International markets displayed mixed performance on Friday. The Euro Stoxx 50 rose to a five-week high, closing up 0.39%, while China's Shanghai Composite declined 0.30%. Japan's Nikkei Stock 225 climbed to a six-week high, finishing up 1.56%.
Looking Ahead: Key Factors to Watch
As market participants navigate the coming weeks, several critical factors will likely influence market direction:
Trade Negotiations: The outcome of US-China trade talks in Geneva could significantly impact market sentiment and economic projections. Any signs of de-escalation would likely boost investor confidence.
Inflation Dynamics: With the ISM prices index reaching a two-year high and Fed officials expressing concerns about potential tariff-induced inflation, upcoming price data will be closely scrutinized.
Federal Reserve Policy: Market participants will analyze Fed communications for indications regarding the timing and extent of potential rate cuts, with particular attention to how policymakers balance inflation risks against growth concerns.
Corporate Earnings: As the Q1 reporting season concludes, focus will shift to corporate guidance and the potential impact of trade policies on future profitability.
Economic Data: Upcoming reports on consumer behavior, employment, and industrial activity will provide insights into the economy's resilience in the face of policy uncertainties.
Conclusion: Navigating Complexity
The US financial markets find themselves at a complex juncture, balancing positive developments in trade relations against concerns about inflation, growth, and monetary policy. While recent market performance has been relatively stable, significant uncertainties remain regarding the impact of tariffs, the direction of interest rates, and the trajectory of corporate earnings.
In this environment, investors would be well-served to maintain diversified portfolios, focus on sectors with reduced tariff exposure, and remain attentive to evolving policy developments. The coming weeks may provide greater clarity on several front—particularly regarding US-China trade relations—potentially setting the stage for more decisive market movements.
As Fed Chair Powell noted during his recent press conference, policymakers and market participants alike are in "wait and see" mode, carefully assessing incoming data to navigate what promises to be a challenging but potentially rewarding investment landscape.
Range, Breadth, New Highs & Lows By Index
S&P 500 Index
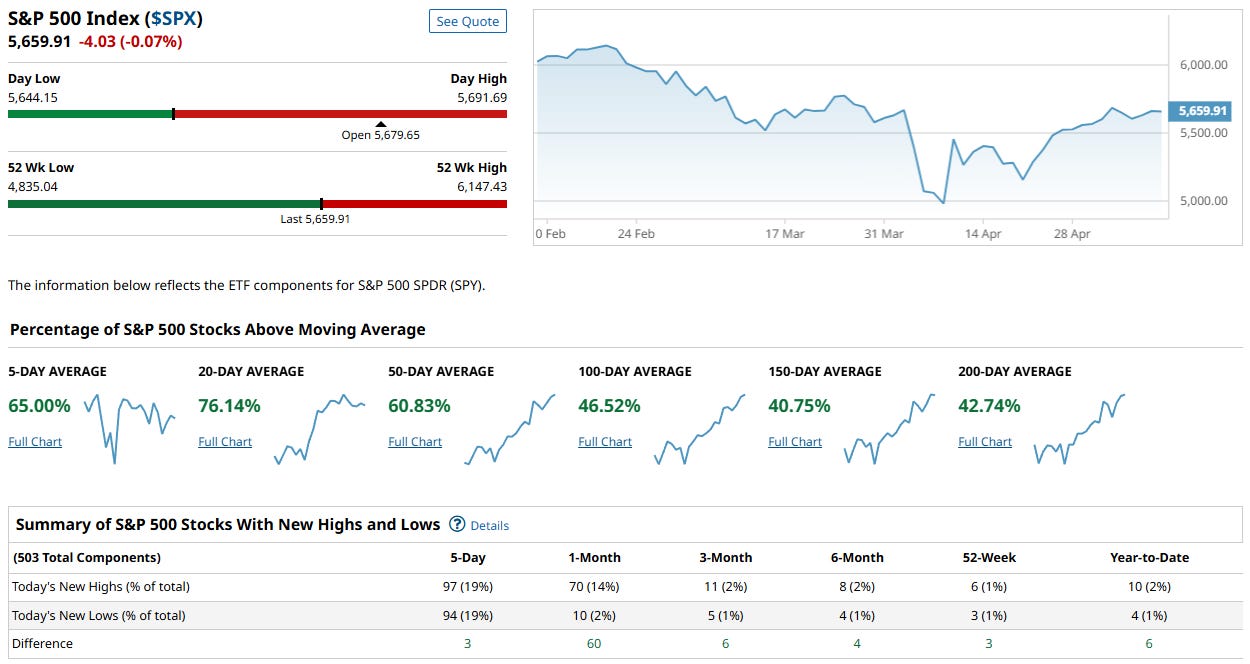
The S&P 500 Index ($SPX) is currently trading at 5,659.91, down slightly on the day but showing strong relative strength compared to recent lows. Breadth has improved significantly: 76.14% of stocks are above their 20-day moving average, and 65% are above the 5-day, signaling strong short-term momentum. However, longer-term participation is still catching up, with only 40–46% of stocks above their 100- to 200-day averages. New highs (97) barely edge out new lows (94), suggesting leadership is present but narrow. Overall, the S&P shows a market in rebound mode, with healthy short-term internals but still recovering from earlier weakness. Momentum is improving, but broad-based conviction remains in development.
Dow Jones Index
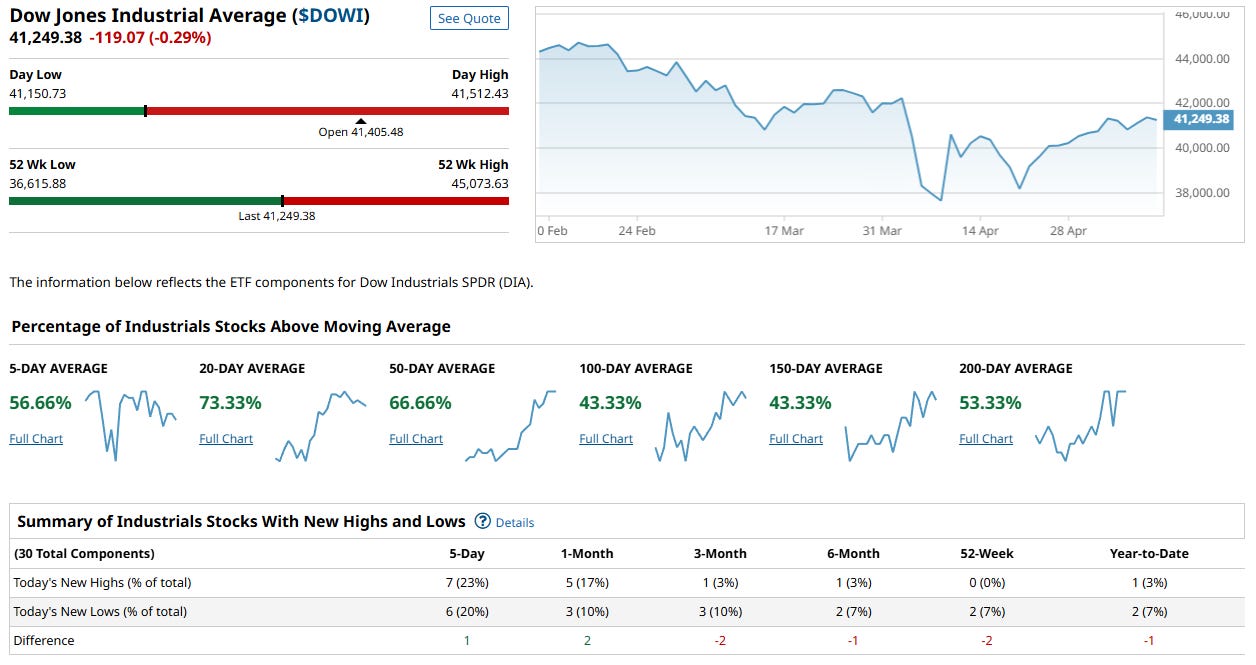
The Dow Jones Industrial Average ($DJI) sits at 41,249.38, down modestly on the day and hovering near the lower end of its 52-week range. Short-term breadth is recovering—over 56% of its 30 components are above the 5-day average and 73% above the 20-day—but medium- to long-term participation remains mixed, with only 43–53% of stocks above their 100- to 200-day moving averages. The ratio of new highs to new lows is nearly flat (7 vs. 6 over 5 days), reflecting a market caught between selective leadership and persistent weakness. Overall, while short-term momentum is improving, the Dow remains the most vulnerable of the major indices, with limited internal thrust and a hesitant longer-term posture.
NASDAQ 100 Index
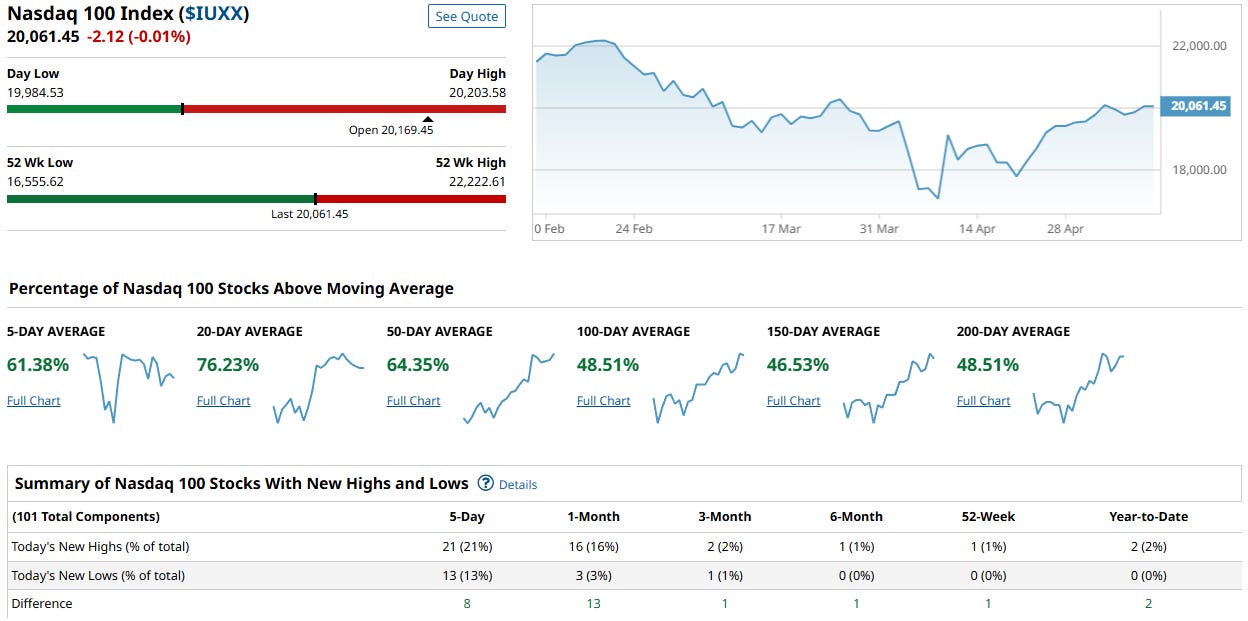
The Nasdaq 100 Index ($NDX) is currently trading at 20,061.45, nearly flat on the day and hovering just below its 50-day moving average range, indicating consolidation after a sharp rebound off April lows. Despite sitting closer to the lower half of its 52-week range, internal strength is broadening: 76.23% of components are above their 20-day moving averages, and over 60% are above their 5- and 50-day levels. Encouragingly, nearly half of Nasdaq 100 stocks are also reclaiming longer-term trendlines (100- to 200-day), suggesting a healthier backdrop than price alone reveals. While the new highs versus lows differential (21 vs. 13) is modest, it still leans bullish. Overall, the index shows signs of internal stabilization and quiet accumulation, though leadership breadth remains shallow and vulnerable to rotation.
Russel 1000
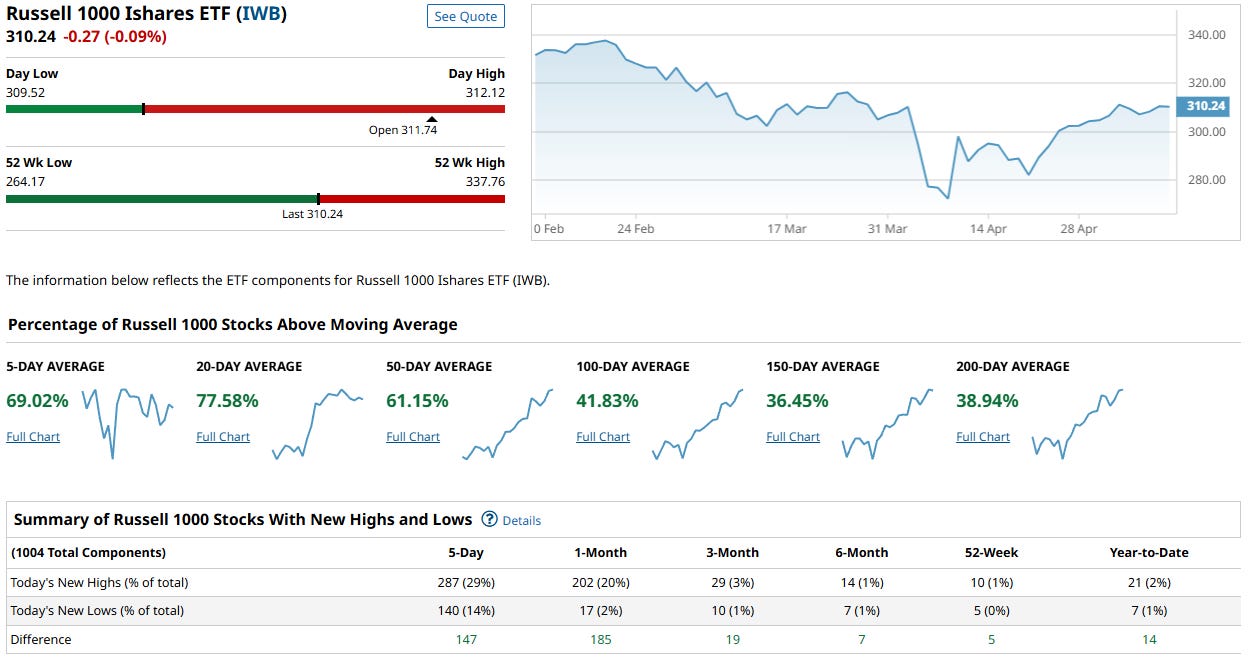
The Russell 1000 (IWB) is trading at $310.24, slightly down on the day and sitting near the midpoint of its 52-week range (low: $264.17, high: $337.76), indicating a moderate recovery from recent lows. Internally, market breadth is improving, with 69.02% of components above their 5-day moving average and a strong 77.58% above their 20-day, reflecting recent short-term bullish momentum. However, participation drops off further out, with only 36–42% of stocks above their 100–200-day averages, suggesting longer-term trend recovery remains incomplete. Notably, new highs vastly outnumber new lows over the past five days (287 vs. 140), signaling bullish rotation beneath the surface. Overall, breadth and participation are improving but remain uneven across timeframes, hinting at a market still regaining its footing.
Overall Indices Assessment
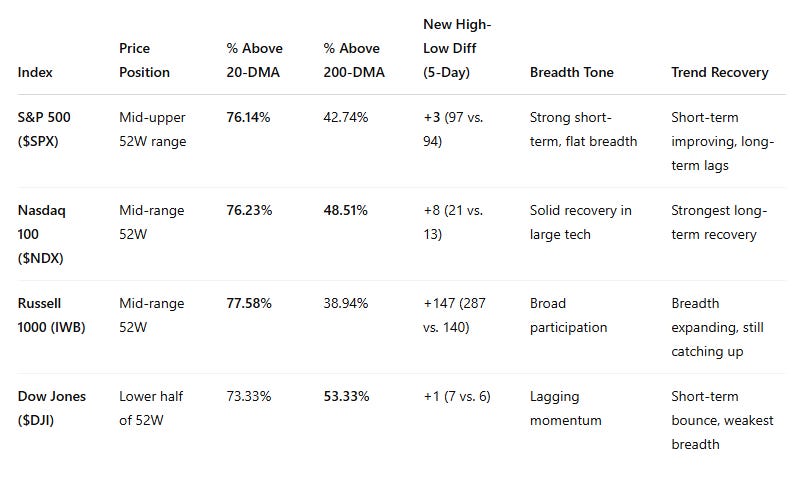
Insights:
Short-term momentum is broadly strong across all indices, with 5- and 20-day moving average participation near or above 70%.
Longer-term participation (100–200DMA) is most improved in the Dow (53.33%) and Nasdaq (48.51%), while Russell 1000 and S&P 500 still lag under 43%.
New Highs vs. New Lows are positive across the board, with Russell 1000 showing the widest margin, suggesting the broad market is participating.
The Dow is showing the most hesitation with a weaker breadth profile and neutral new high/low differential.
Nasdaq and Russell 1000 are leading in terms of breadth thrust and recovery momentum.
Our Indices Market Score: 68/100
The market is in a clear recovery phase with strong short-term participation and improving intermediate-term structure. However, longer-term participation and trend alignment are not yet universally supportive. The leadership is still narrow in places (especially the S&P and Dow), and macro risks (e.g. inflation, rates, geopolitics) could still weigh on sentiment. Until 200-day breadth expands meaningfully, this is a cautiously optimistic environment rather than a full-blown bullish one.
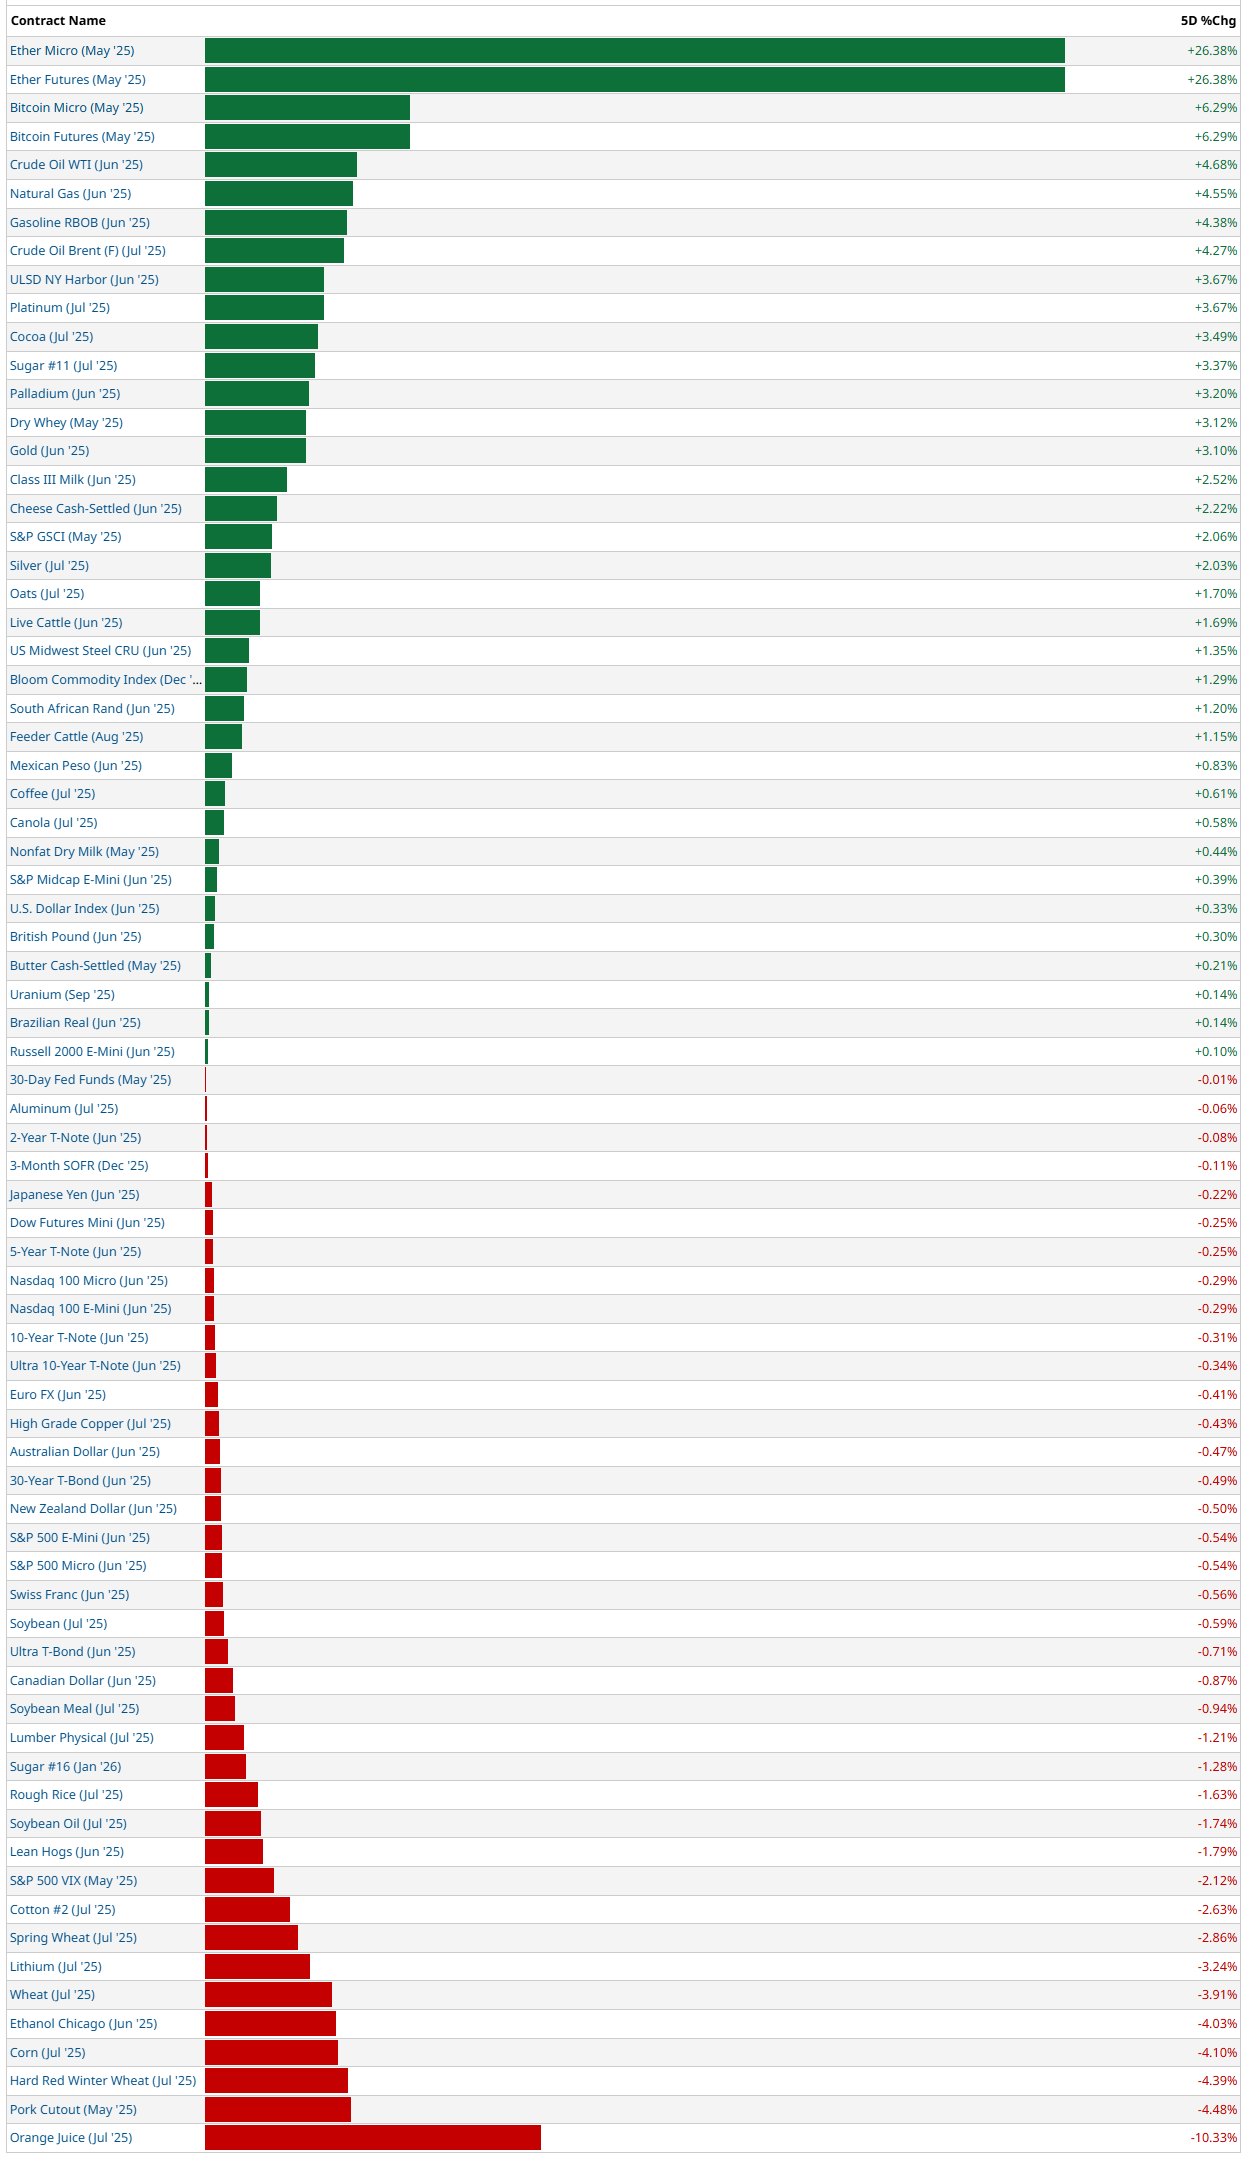
5-Day Futures Performance Leaders
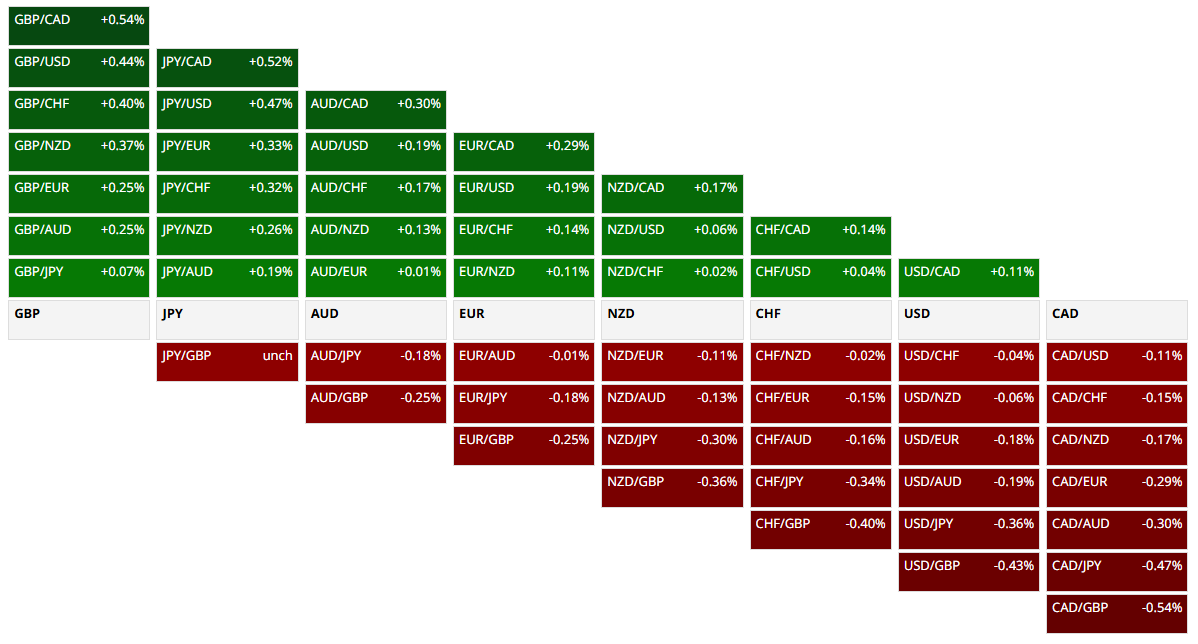
FOREX
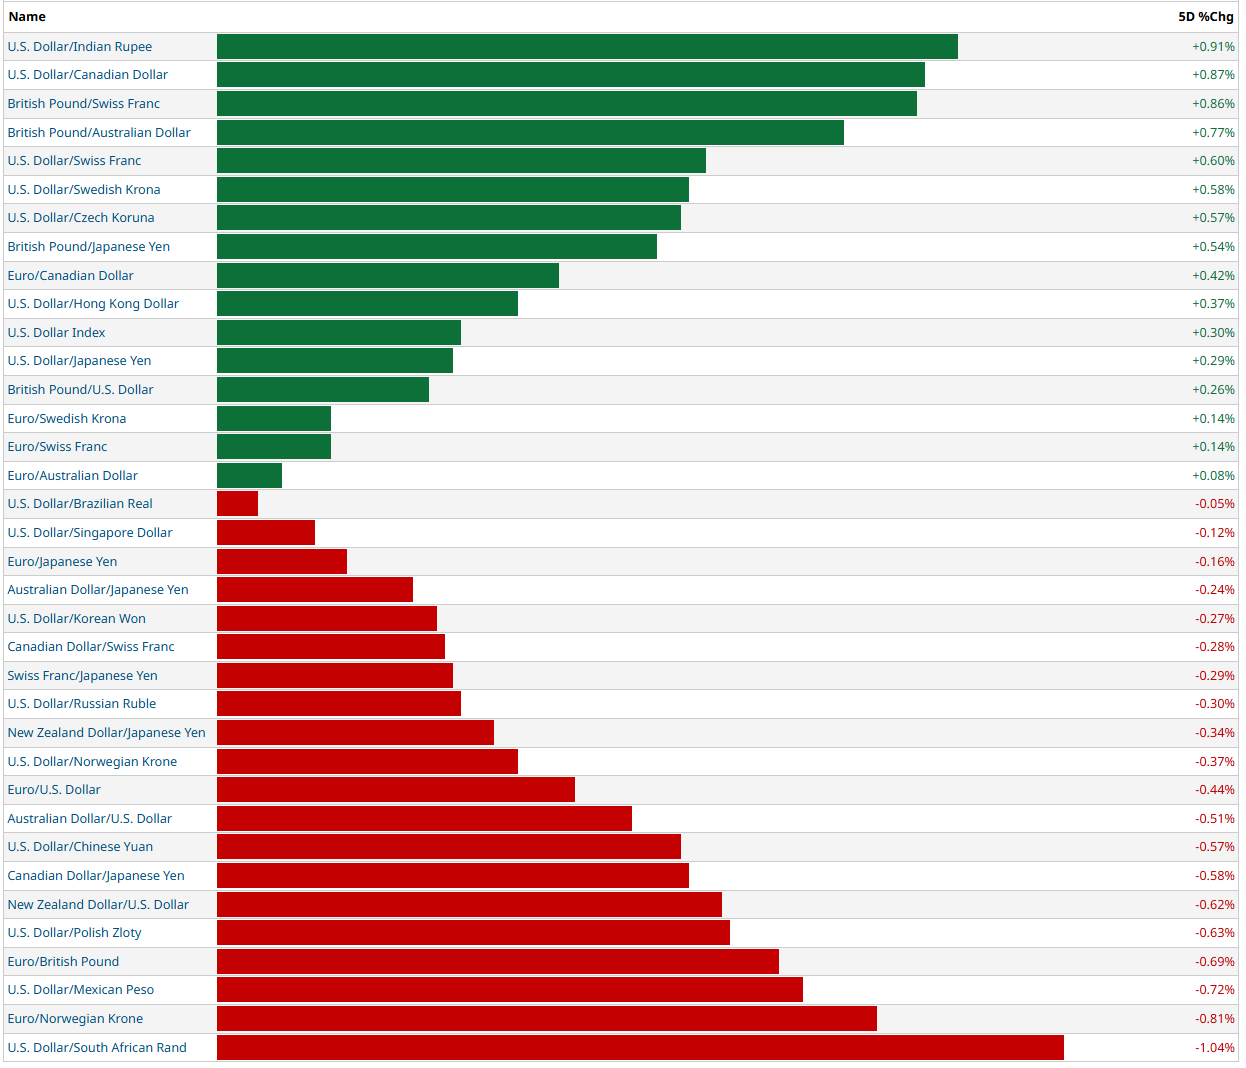
The U.S. Dollar is broadly firm but not universally dominant. It has shown notable strength against emerging market and commodity-linked currencies, including the Indian Rupee (+0.91%), Canadian Dollar (+0.87%), and Swiss Franc (+0.86%). Traditional crosses like GBP/CHF and GBP/AUD also show risk-on activity through the pound's strength.
However, there are clear pockets of weakness—especially against high-beta or cyclical currencies like the South African Rand (USDZAR -1.04%), Mexican Peso (USDMXN -0.72%), and Polish Zloty. The largest underperformer on a relative basis is the dollar versus the rand, hinting at localized EM inflows or commodity tailwinds.
The Dollar Index (DXY) is up modestly at +0.30%, suggesting that while the dollar is climbing, the move is not aggressive or one-sided. This supports a selective strength narrative rather than a global flight to USD safety.
The yen complex is under pressure, especially in crosses like AUD/JPY and NZD/JPY—signaling risk appetite remains resilient even as certain regions show USD outflows.
Emerging market strength: Notably against ZAR and MXN, which often trade in line with commodities and risk appetite.
USD outperforming majors: CHF, CAD, and SEK are among the weakest majors against the dollar.
Mixed tone in Asia: Dollar is firm against KRW and CNY, but weaker versus JPY in many crosses—indicating defensive hedging behavior.
Our FX Market Bias Score: 63/100
This reflects a moderately bullish U.S. Dollar environment with healthy global risk appetite, especially into emerging markets and commodity-sensitive currencies. We're seeing more rotation than broad flight-to-safety, suggesting a backdrop that still favors selective carry, relative strength, and macro divergence plays.
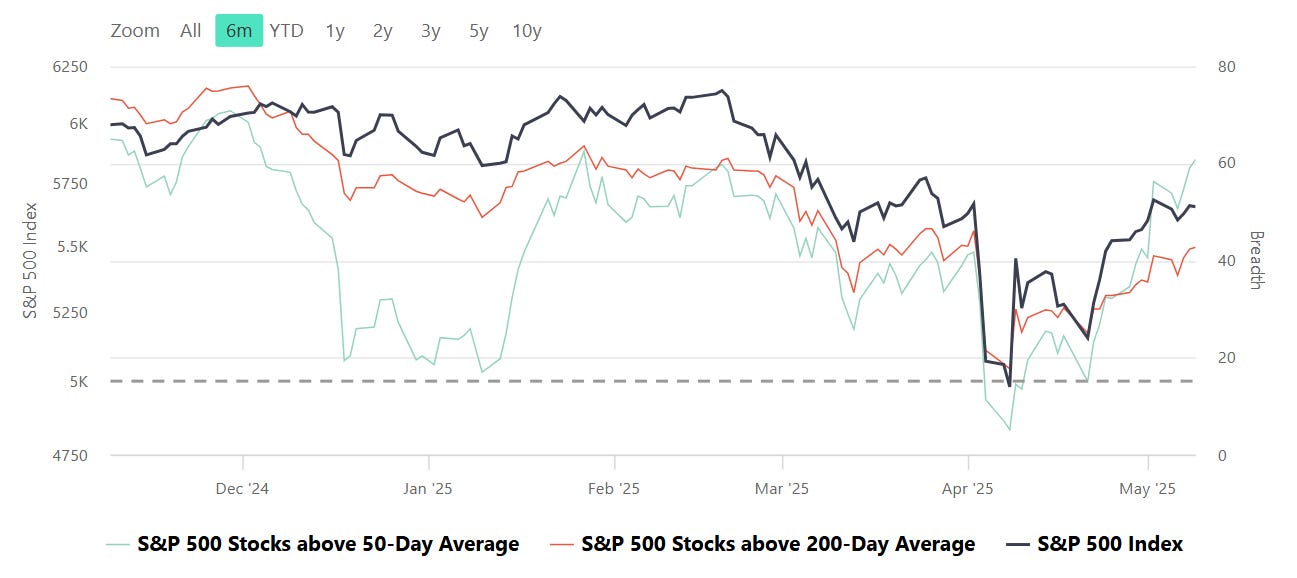
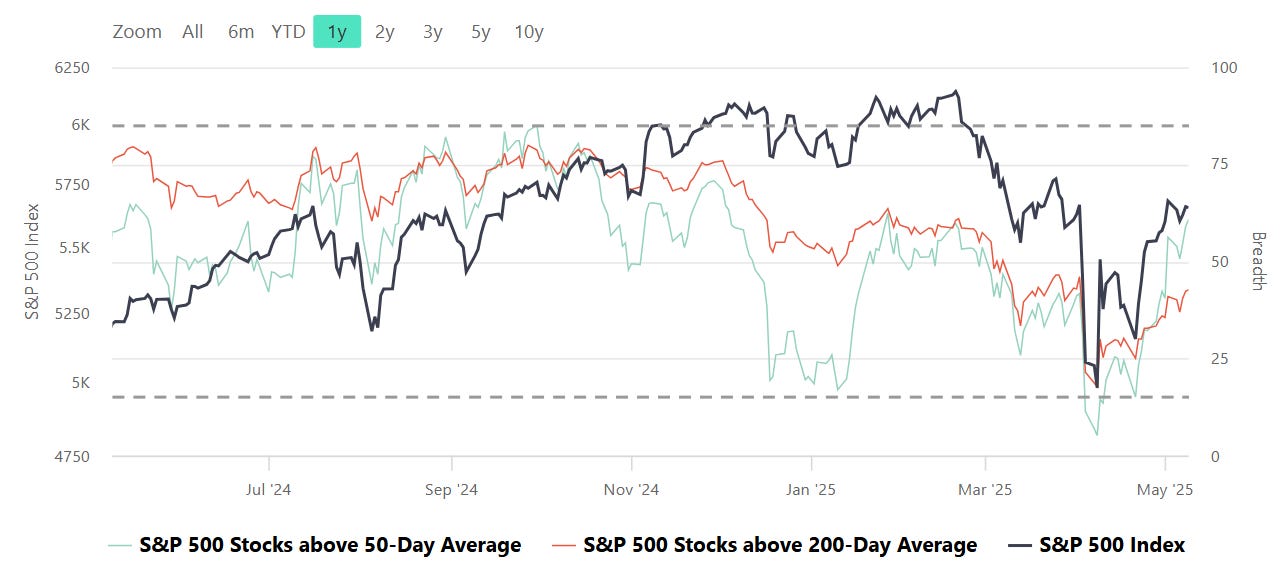
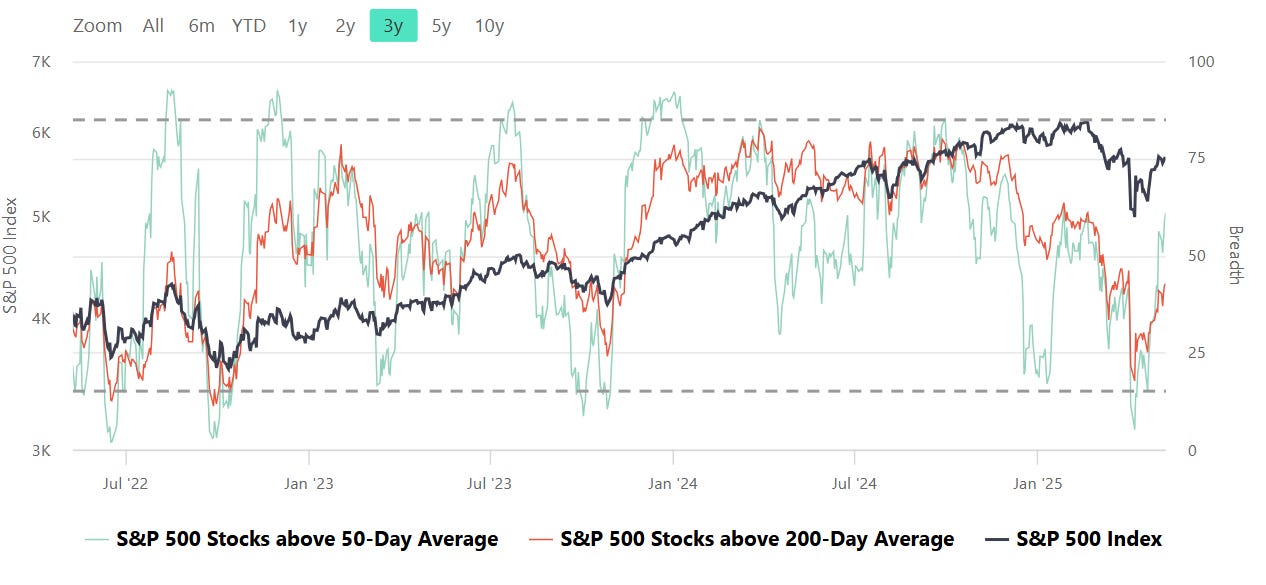
S&P Breadth
Breadth, in the context of stock market analysis, refers to the measure of how many stocks in a given index (such as the S&P 500) are participating in a trend, such as advancing or declining relative to a certain moving average (e.g., 50-day or 200-day).
Market Strength Assessment:
Breadth provides insight into whether a market rally or decline is broad-based or driven by only a few large-cap stocks. A rally supported by a high percentage of stocks above their 50-day or 200-day averages is generally considered healthier and more sustainable.
Early Warning Signals:
Divergences between breadth indicators and the index price can signal potential reversals. For example:
If the index is rising, but the number of stocks above their moving averages is declining, it may indicate weakening underlying strength and potential for a pullback.
Conversely, if breadth improves while the index remains flat or declines, it may suggest accumulating strength for a future rally.
Trend Confirmation:
Breadth indicators can confirm trends. For instance, a strong majority of stocks above their moving averages signals robust market momentum, providing confidence in the prevailing trend.
Identifying Overbought or Oversold Conditions:
Extremely high or low breadth readings can signal overbought or oversold conditions, which might lead to mean reversion. For example:
If nearly all stocks are above their 50-day or 200-day averages, it may suggest overbought conditions.
Conversely, extremely low levels indicate oversold conditions and potential for a bounce.
Breadth and Timing Investments:
Entry Points:
When breadth improves (e.g., more stocks move above their 50-day or 200-day moving averages) after a market pullback, it can indicate a good time to start building positions as the broader market is regaining strength.
Exit Points:
Breadth deterioration during a rally may suggest it’s time to reduce exposure, especially if only a small number of stocks are driving index gains. This is often a warning sign of an impending correction.
Volatility and Risk Management:
Weak breadth in volatile markets may prompt caution or defensive positioning. Conversely, improving breadth can justify taking on more risk during uptrends.
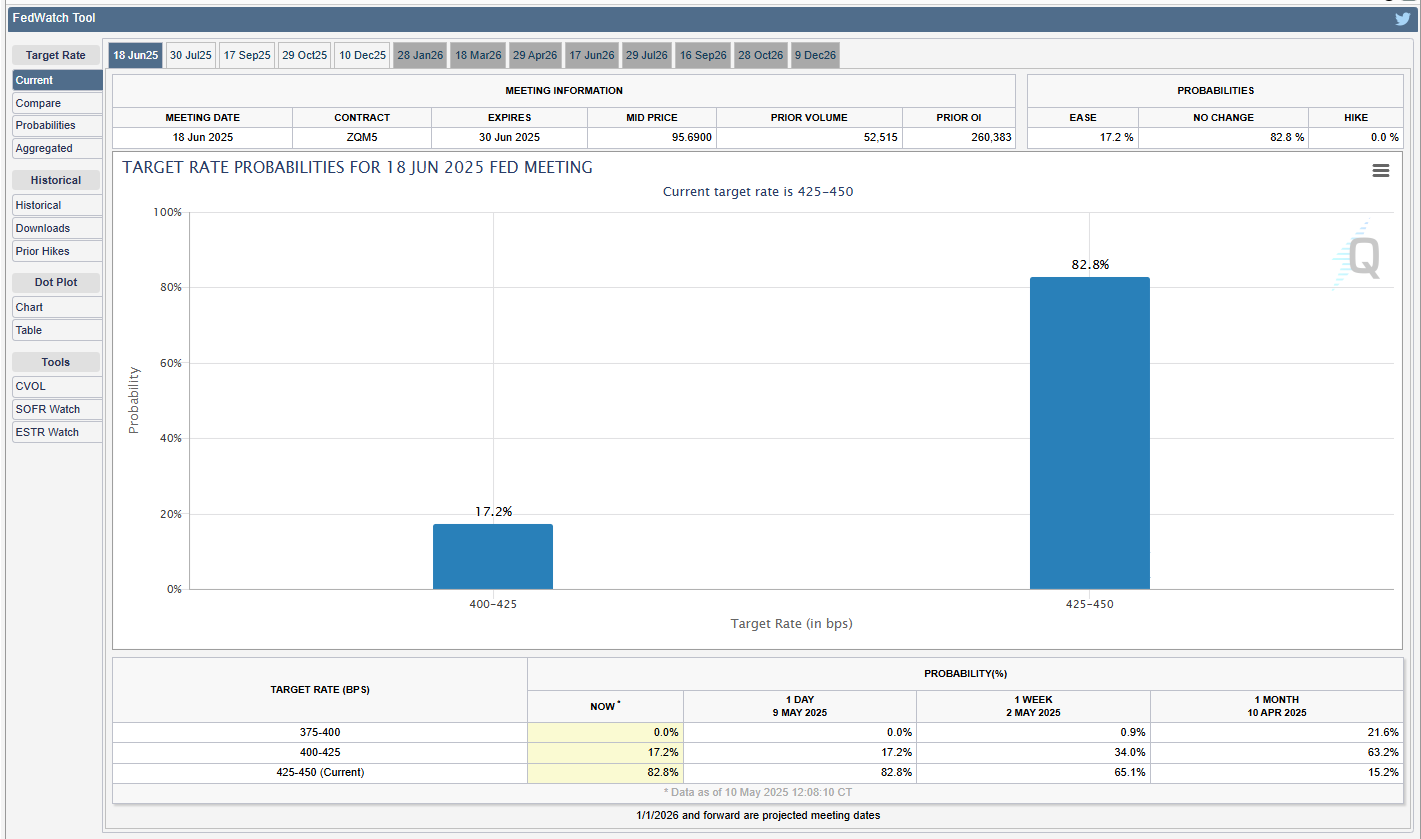
CME Fedwatch
What is the likelihood that the Fed will change the Federal target rate at upcoming FOMC meetings, according to interest rate traders? Use CME FedWatch to track the probabilities of changes to the Fed rate, as implied by 30-Day Fed Funds futures prices.

US Investor Sentiment
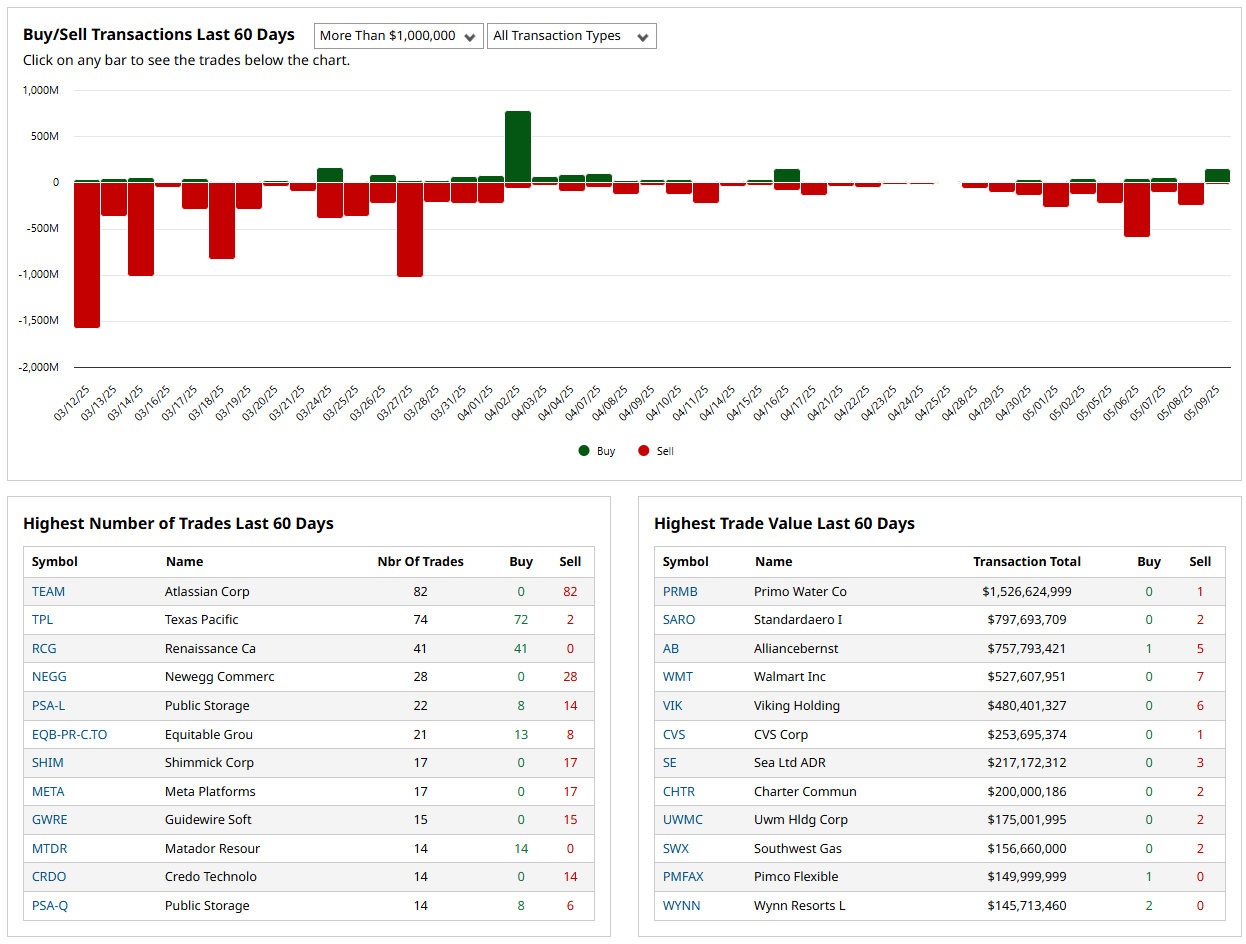
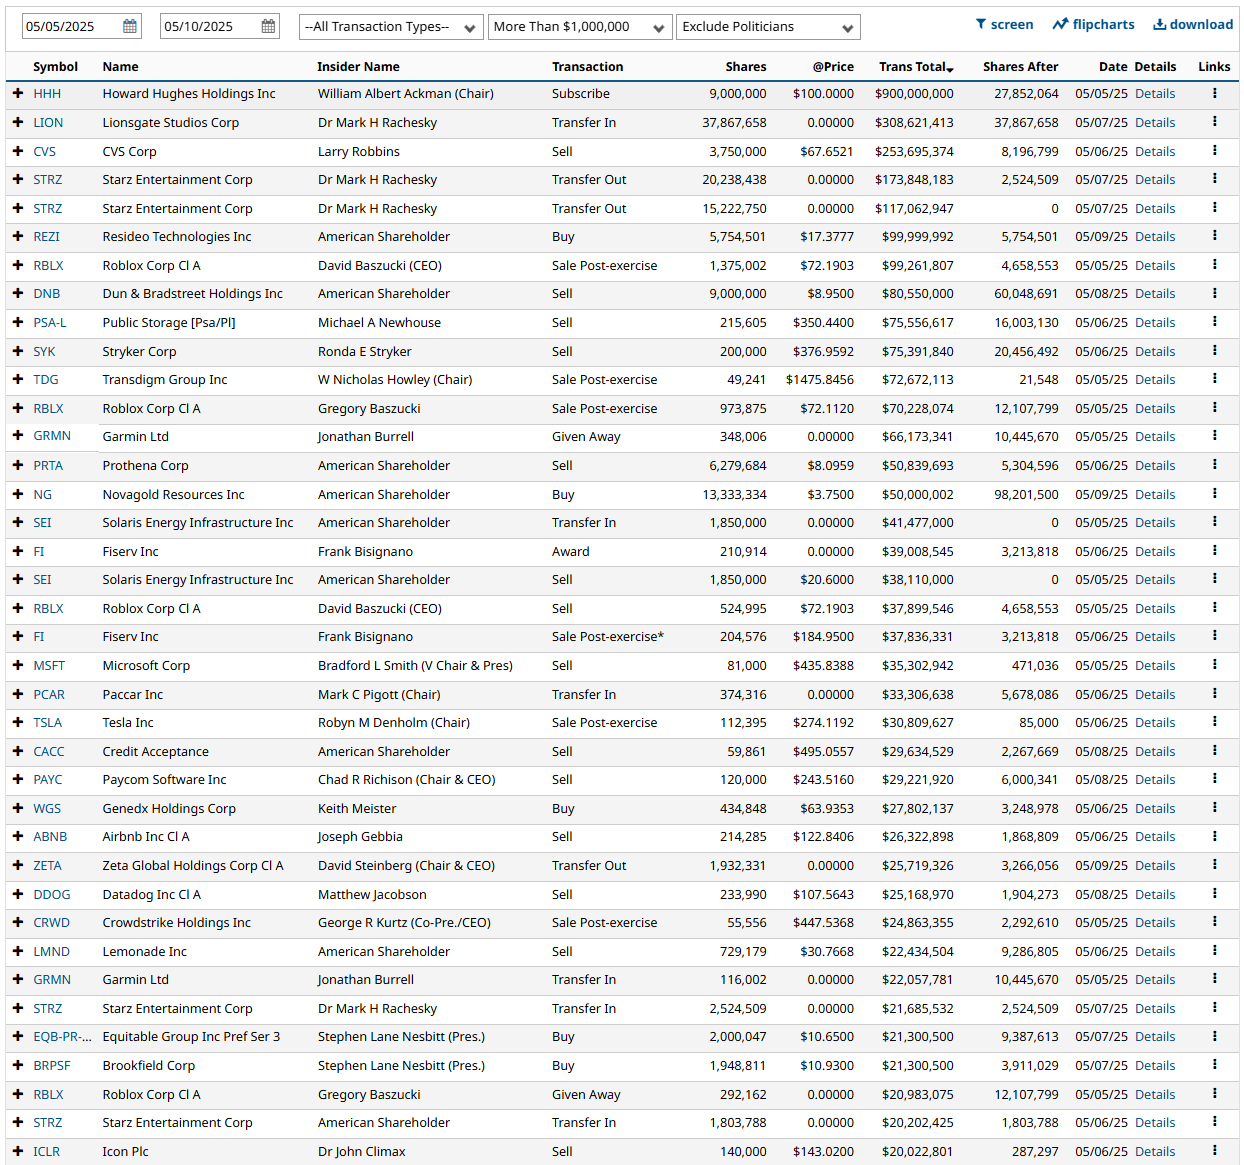
Insider Trading
Insider trading occurs when a company’s leaders or major shareholders trade stock based on non-public information. Tracking these trades can reveal insider expectations about the company’s future. For example, large purchases before an earnings report or drug trial results might indicate confidence in upcoming good news.
%Bull-Bear Spread
The %Bull-Bear Spread chart is a sentiment indicator that shows the difference between the percentage of bullish and bearish investors, often derived from surveys or sentiment data, such as the AAII (American Association of Individual Investors) sentiment survey. This spread tells investors about the prevailing mood in the market and can provide insights into market extremes and potential turning points.
Bullish or Bearish Sentiment:
When the spread is positive, it means more investors are bullish than bearish, indicating optimism about the market’s direction.
A negative spread indicates more bearish sentiment, meaning more investors expect the market to decline.
Contrarian Indicator:
The %Bull-Bear Spread is often used as a contrarian indicator. For example, extremely high levels of bullish sentiment might suggest that the market is overly optimistic and could be due for a correction.
Similarly, when bearish sentiment is extremely high, it might indicate that the market is overly pessimistic, and a rally could be on the horizon.
Market Extremes and Reversals:
Historically, extreme values of the spread (both positive and negative) can signal turning points in the market. A very high positive spread can signal market exuberance, while a very low or negative spread may indicate fear or capitulation.
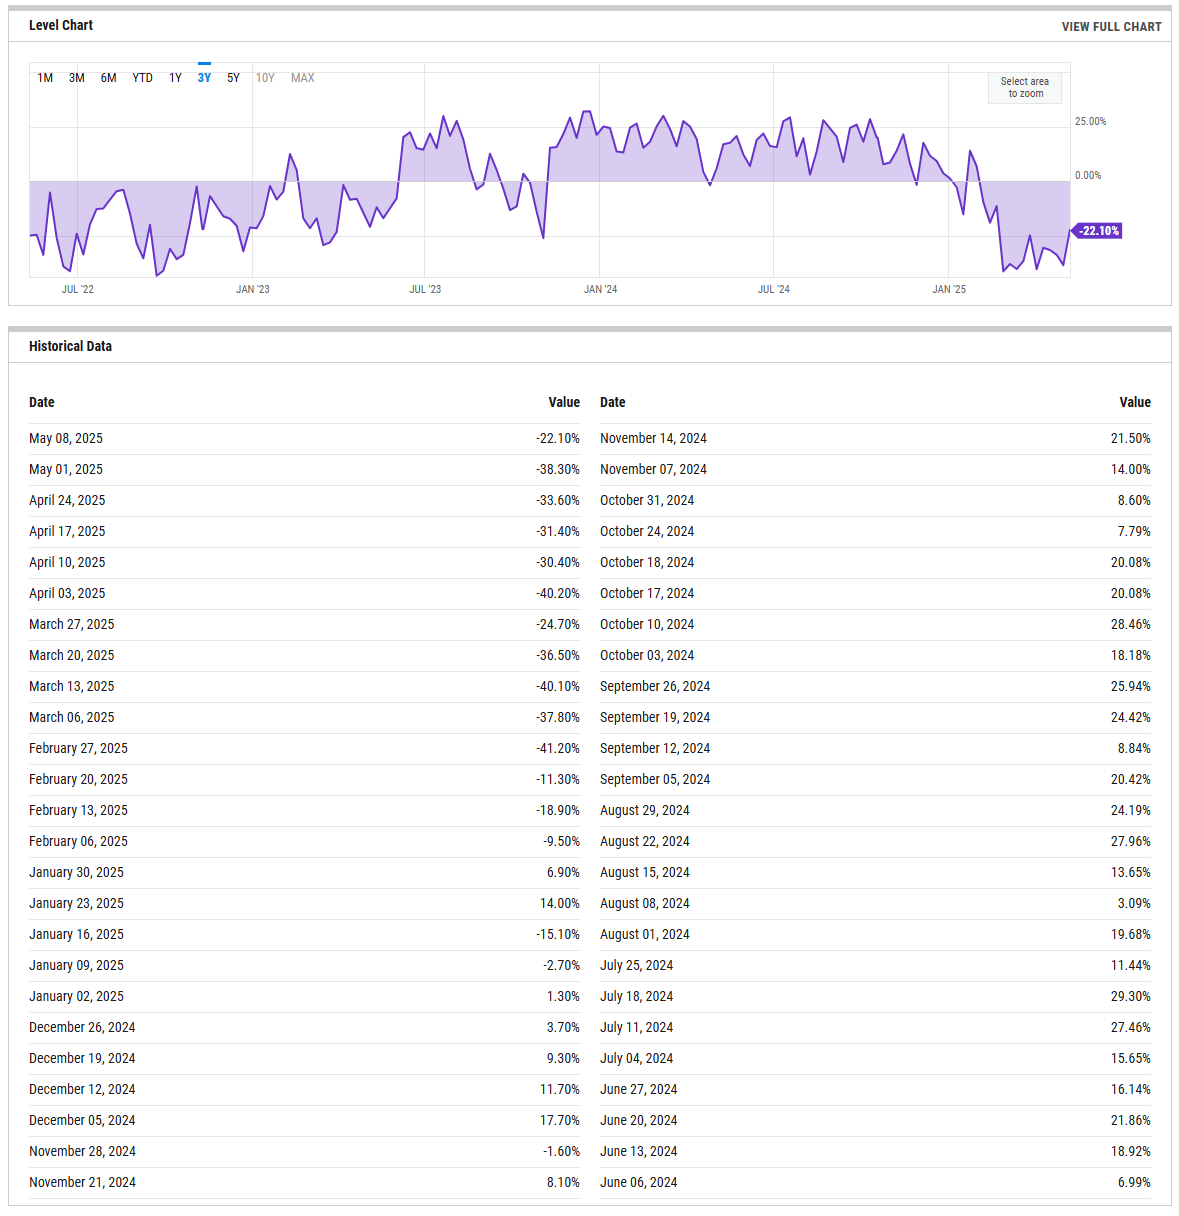
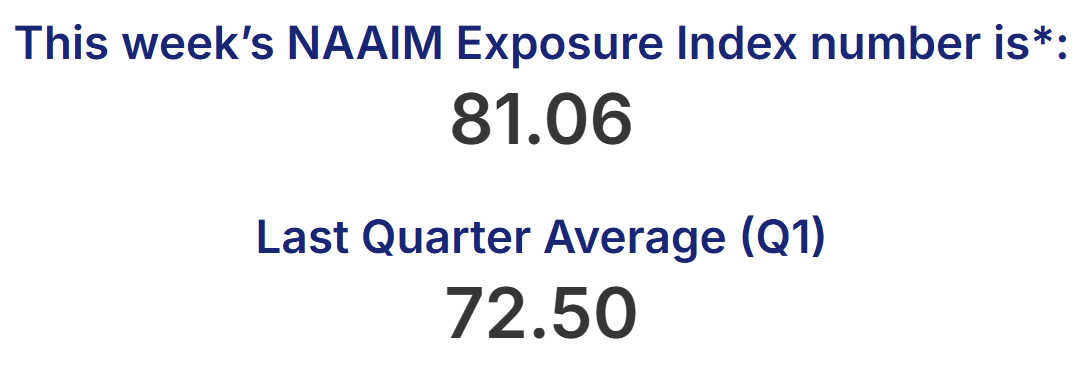
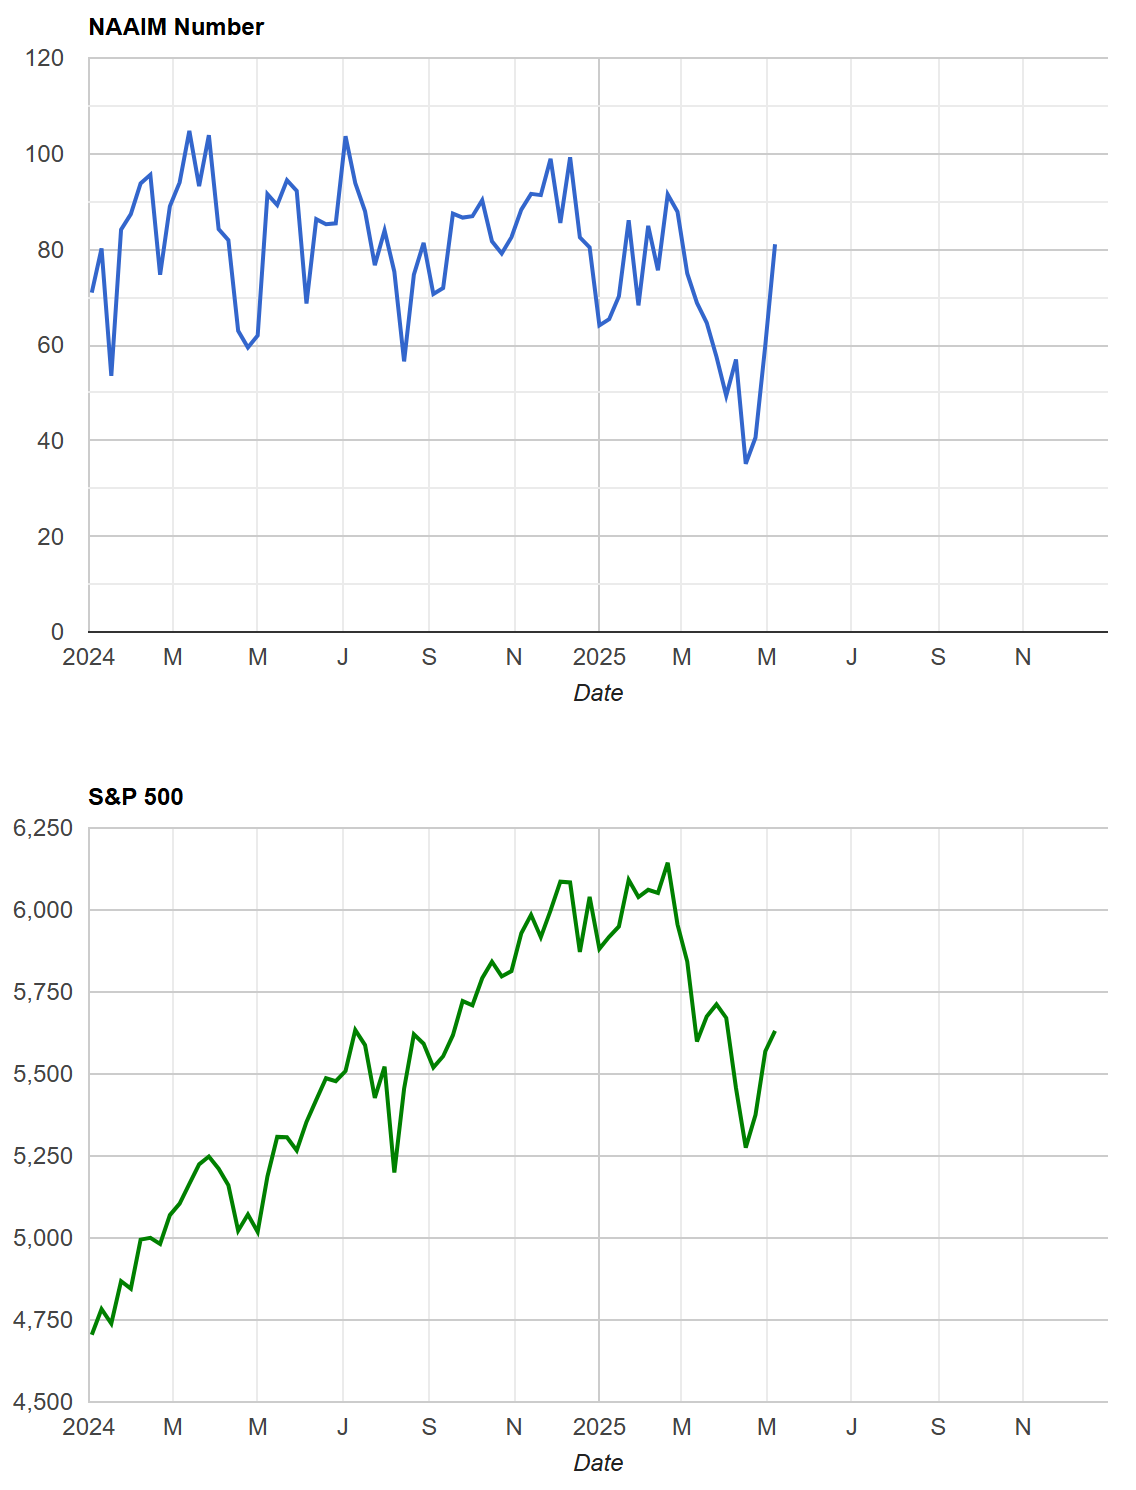
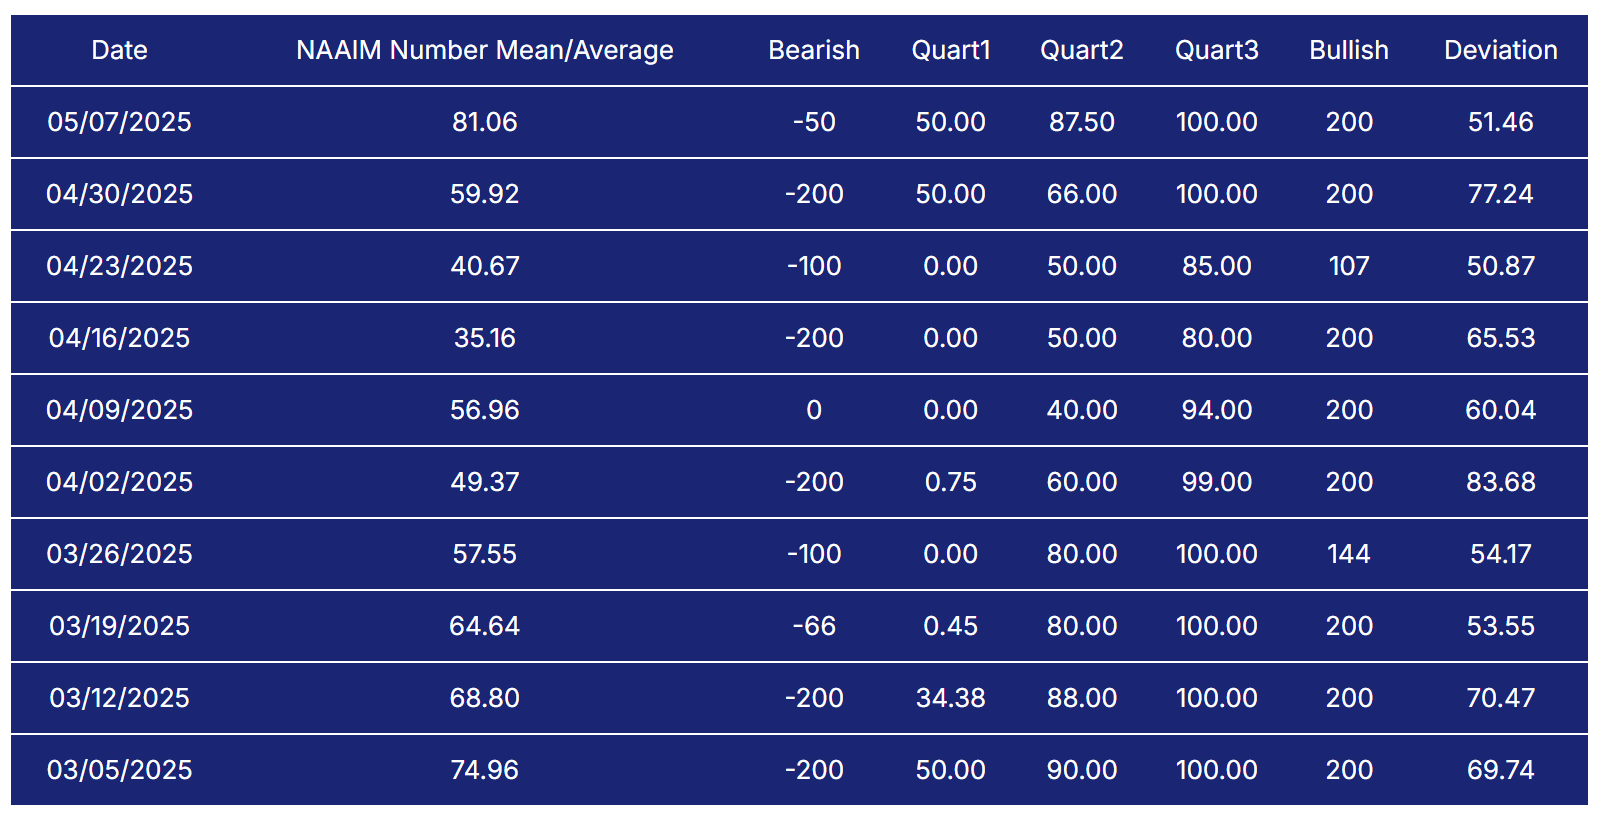
NAAIM Exposure Index
The NAAIM Exposure Index (National Association of Active Investment Managers Exposure Index) measures the average exposure to U.S. equity markets as reported by its member firms. These are typically active money managers who provide their equity exposure levels weekly. The index offers insight into how much these managers are investing in equities at any given time, ranging from being fully short (-100%) to leveraged long (up to +200%).
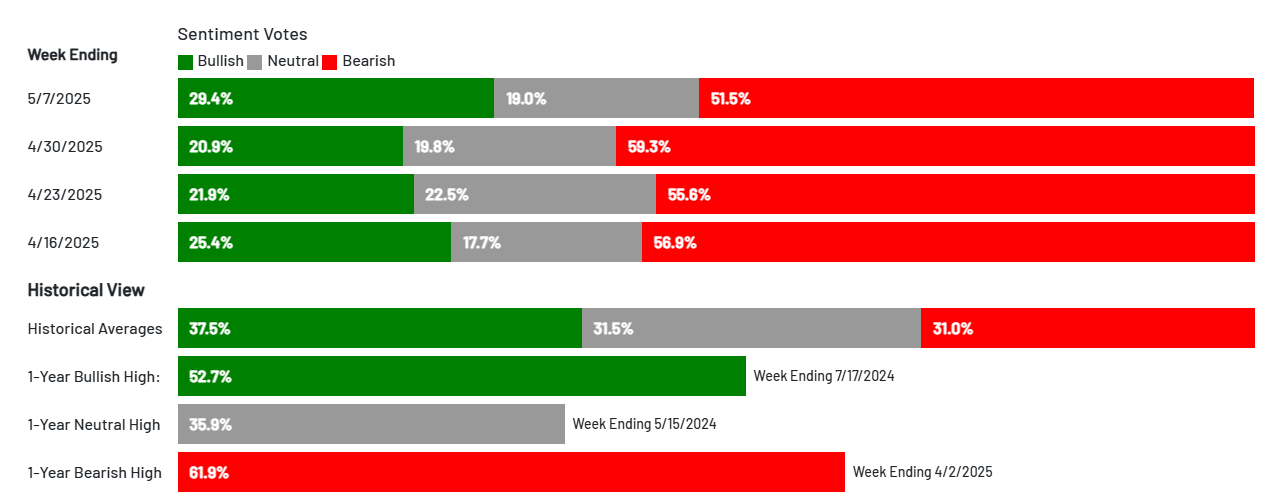
AAII Investor Sentiment Survey
The AAII Investor Sentiment Survey is a weekly survey conducted by the American Association of Individual Investors (AAII) to gauge the mood of individual investors regarding the direction of the stock market over the next six months. It provides insights into whether investors are feeling bullish (expecting the market to rise), bearish (expecting the market to fall), or neutral (expecting the market to stay about the same).
Key Points:
Bullish Sentiment: Reflects the percentage of investors who believe the stock market will rise in the next six months.
Bearish Sentiment: Represents those who expect a decline.
Neutral Sentiment: Reflects investors who anticipate little to no market movement.
The survey is widely followed as a contrarian indicator, meaning that extreme levels of bullishness or bearishness can sometimes signal market turning points. For example, when a large number of investors are overly optimistic (high bullish sentiment), it could suggest a market top, while excessive pessimism (high bearish sentiment) may indicate a market bottom is near.
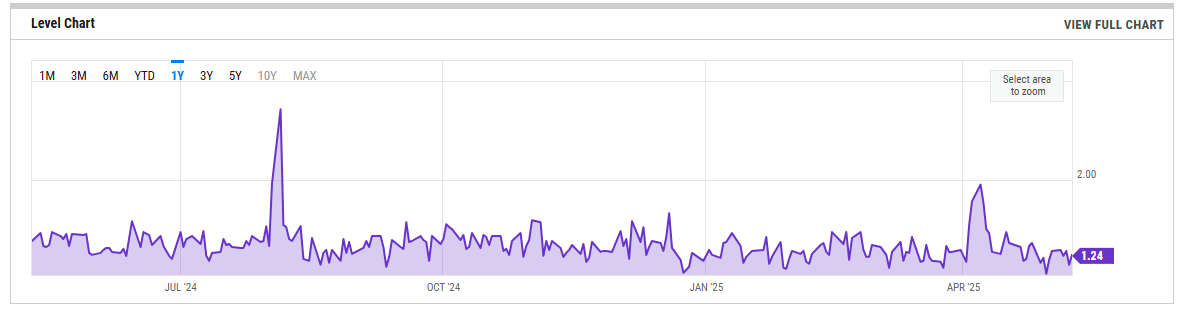
SPX Put/Call Ratio
The SPX Put/Call Ratio is an indicator that is used to gauge market sentiment. This is calculated as the ratio between trading S&P 500 put options and S&P call options. A high put/call ratio can indicate fear in the markets, while a low ratio indicates confidence. For example, in 2015, the Put-Call ratio was as high as 3.77 because of market fears stemming from various global economic issues like a GDP growth slowdown in China and a Greek debt default.
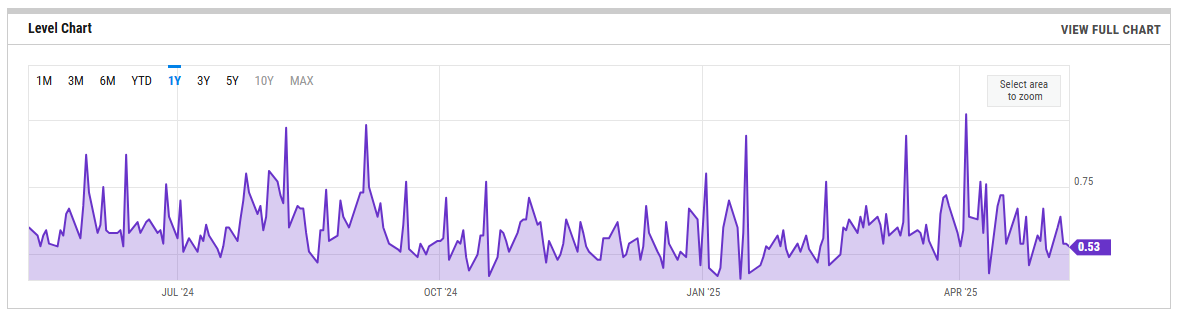
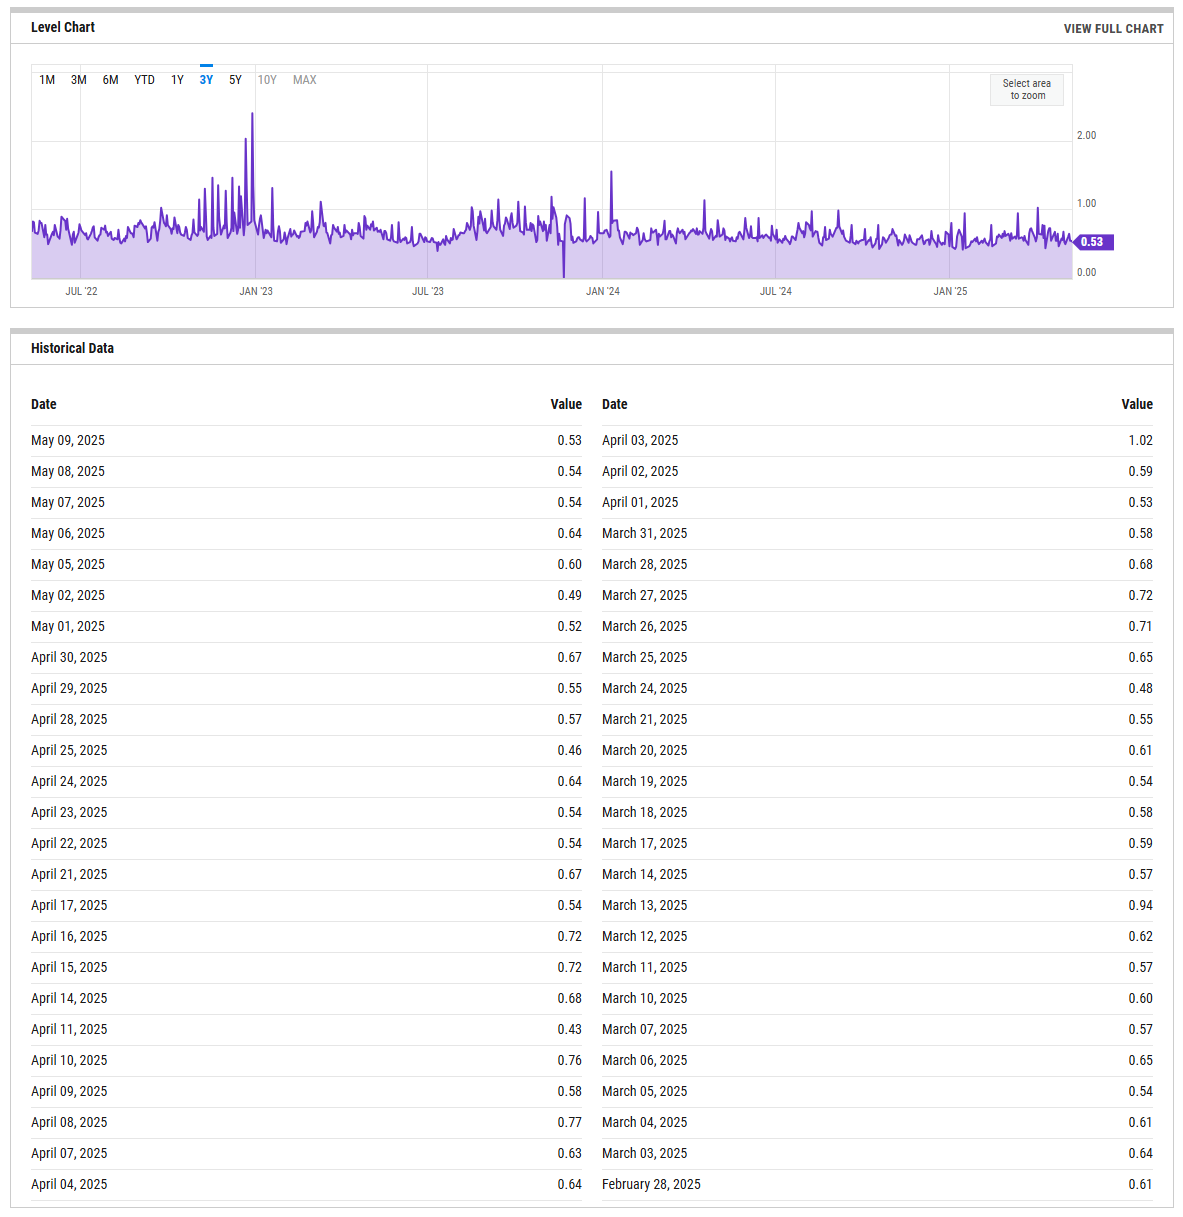
CBOE Equity Put/Call Ratio
The CBOE (Chicago Board Options Exchange) equity put/call ratio is a sentiment indicator used by traders and analysts to gauge market sentiment and potential shifts in investor behavior. It is calculated by dividing the volume of put options by the volume of call options on equities. Here’s what it reveals and how it is generally interpreted:
High Put/Call Ratio: When the put/call ratio is high (above 1.0), it suggests that there is more demand for put options than call options. This typically reflects a more bearish sentiment, as investors may be hedging against potential declines or expecting the market to fall.
Low Put/Call Ratio: Conversely, a low put/call ratio (below 0.7) indicates a higher volume of call options compared to puts, reflecting bullish sentiment. Investors may be expecting upward momentum and are positioning themselves to profit from price gains
ISEE Sentiment Index
The ISEE (International Securities Exchange Sentiment) Index is a measure of investor sentiment derived from options trading. Unlike traditional put/call ratios, the ISEE Index focuses only on opening long customer transactions and is adjusted to remove market-maker and firm trades, providing a purer sentiment reading.
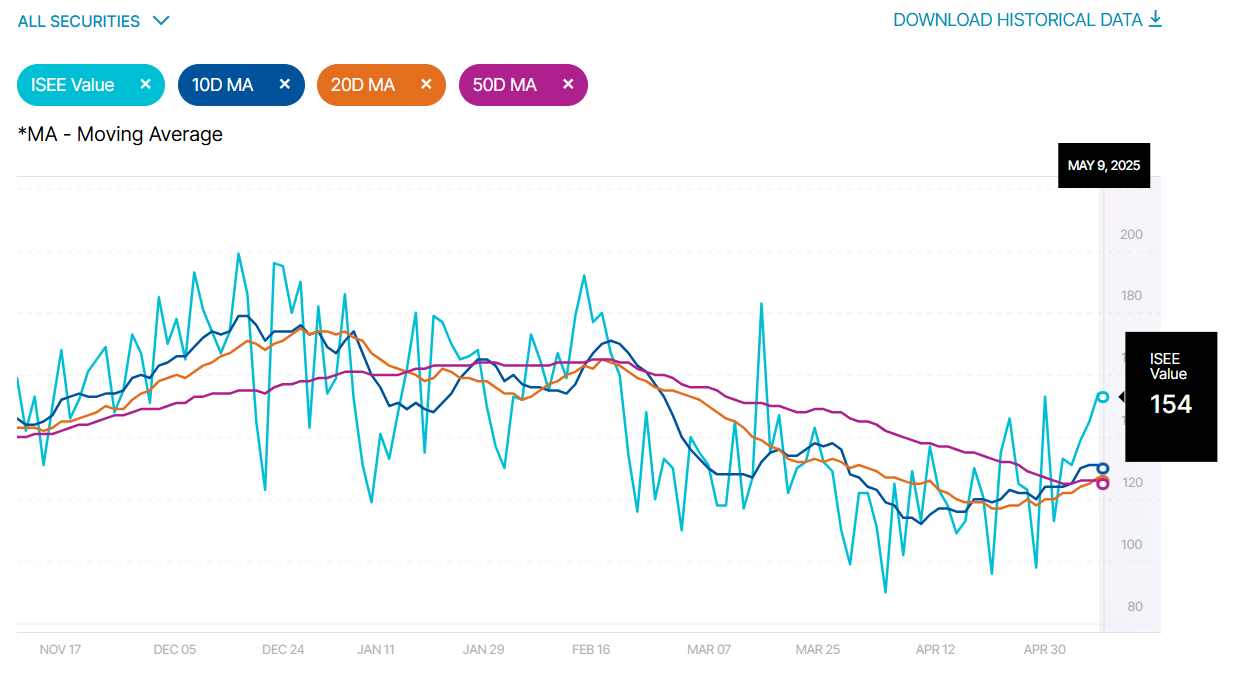
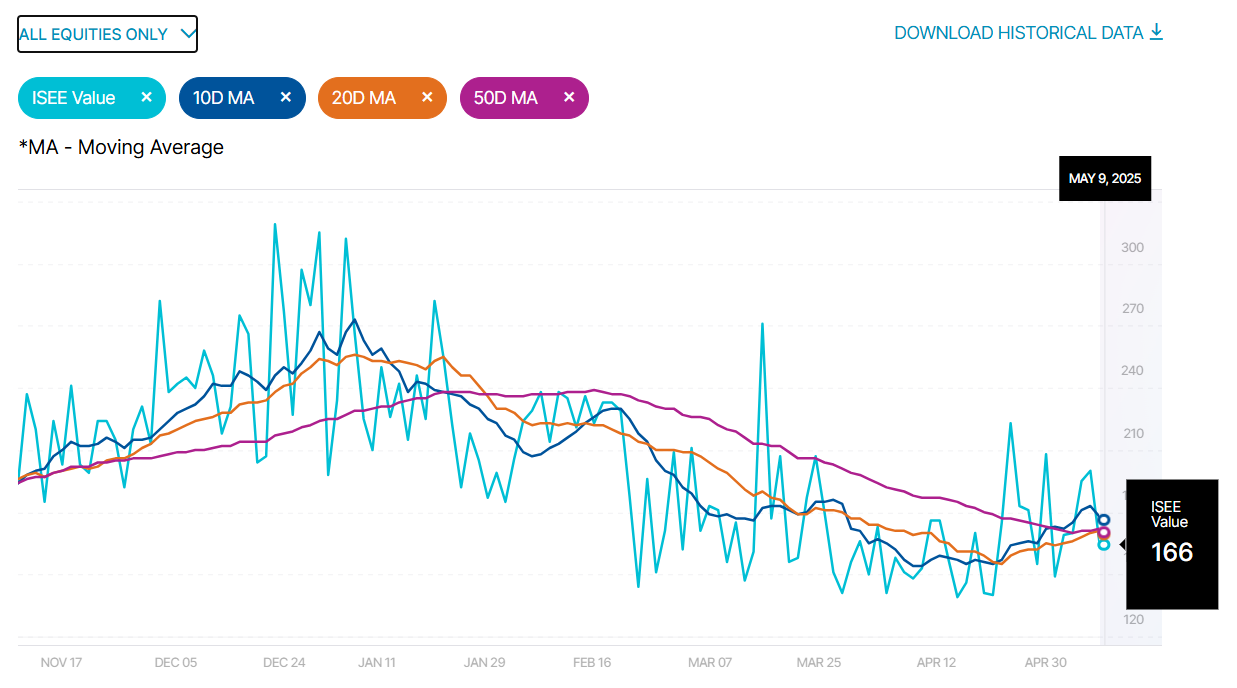
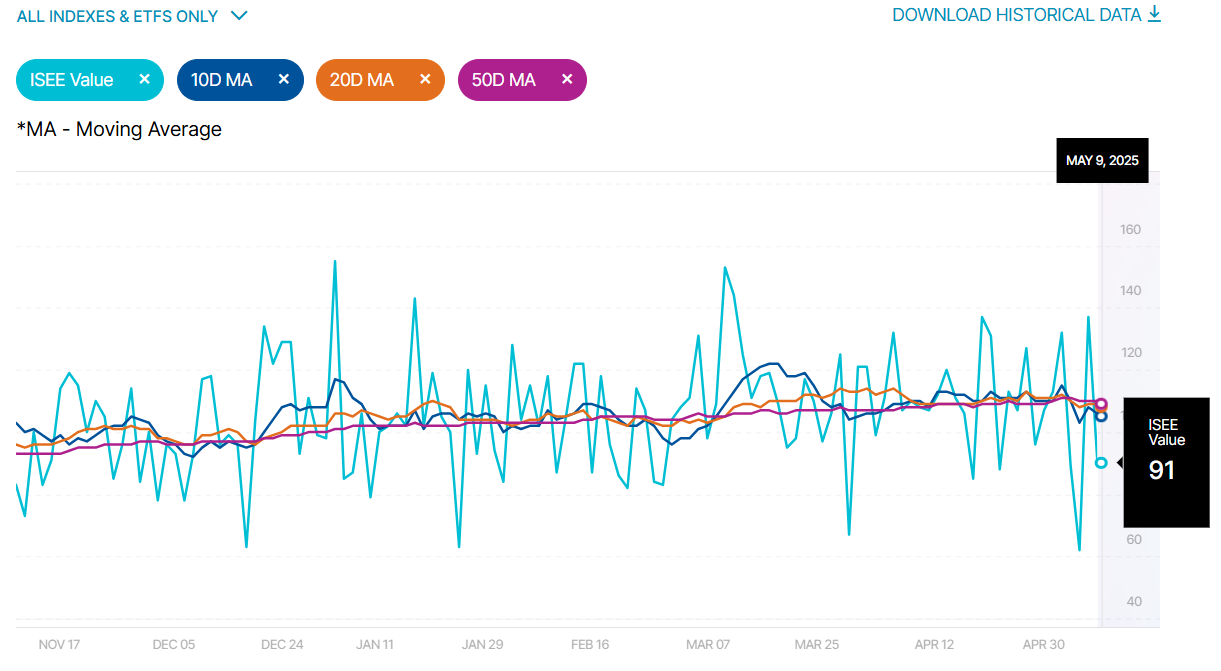
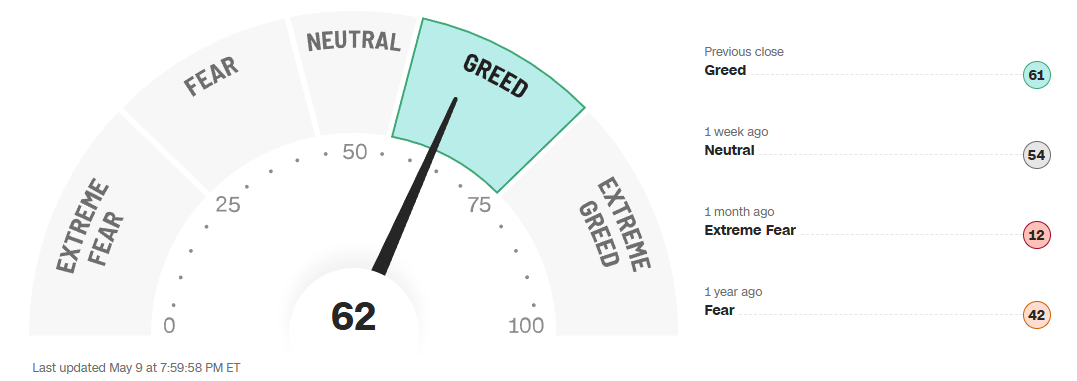
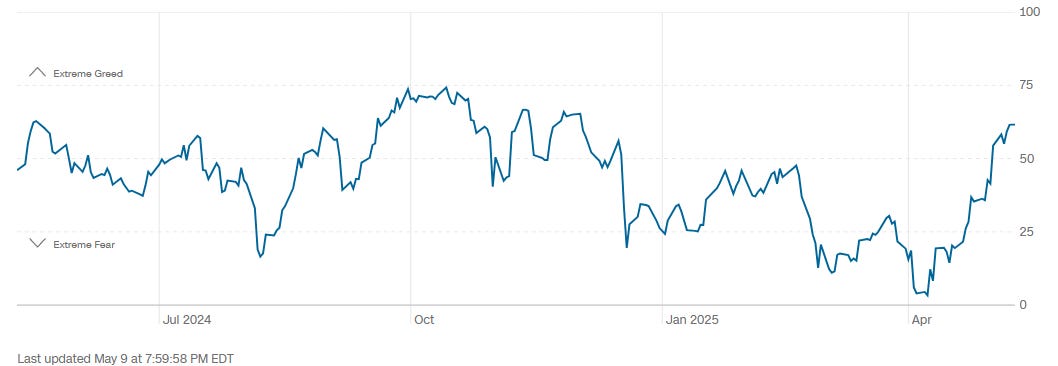
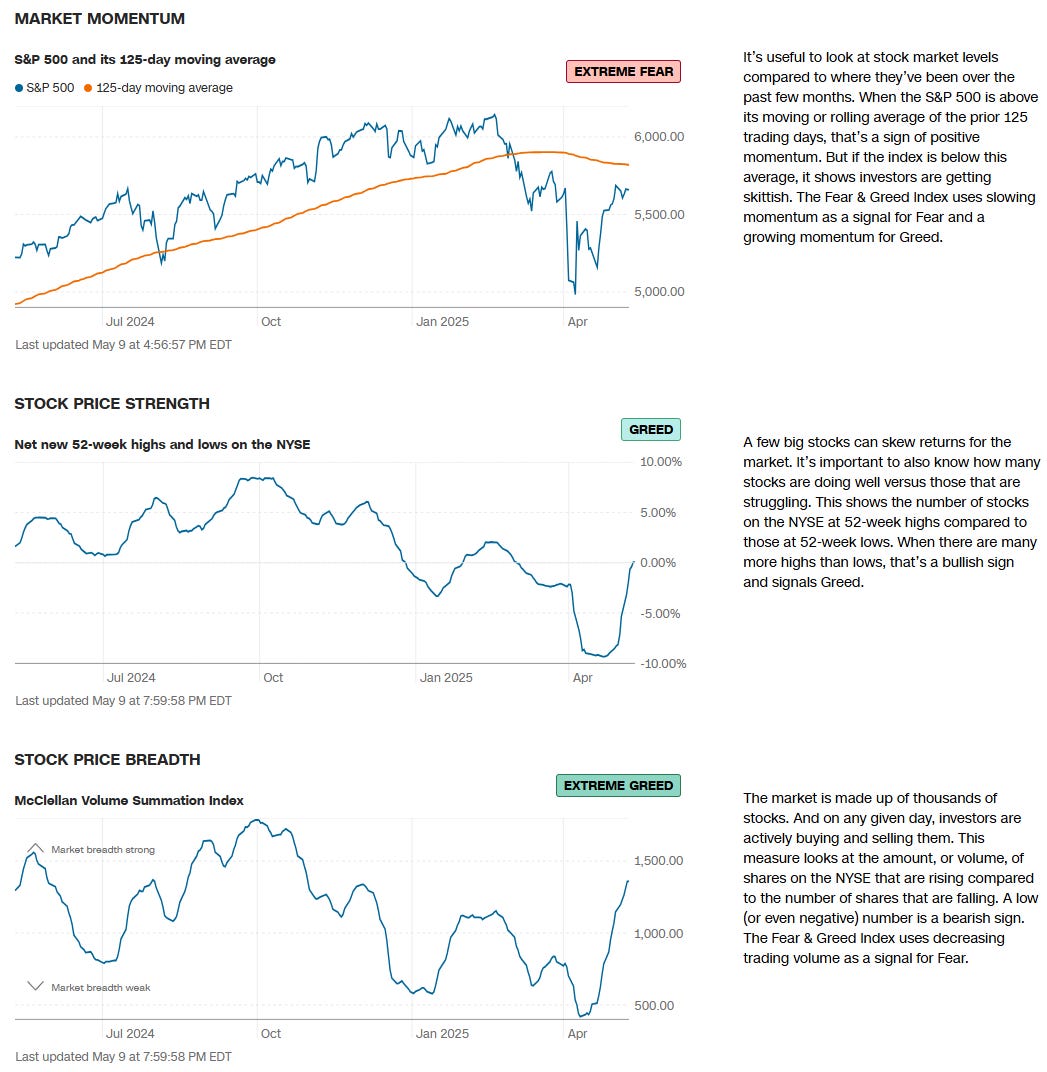
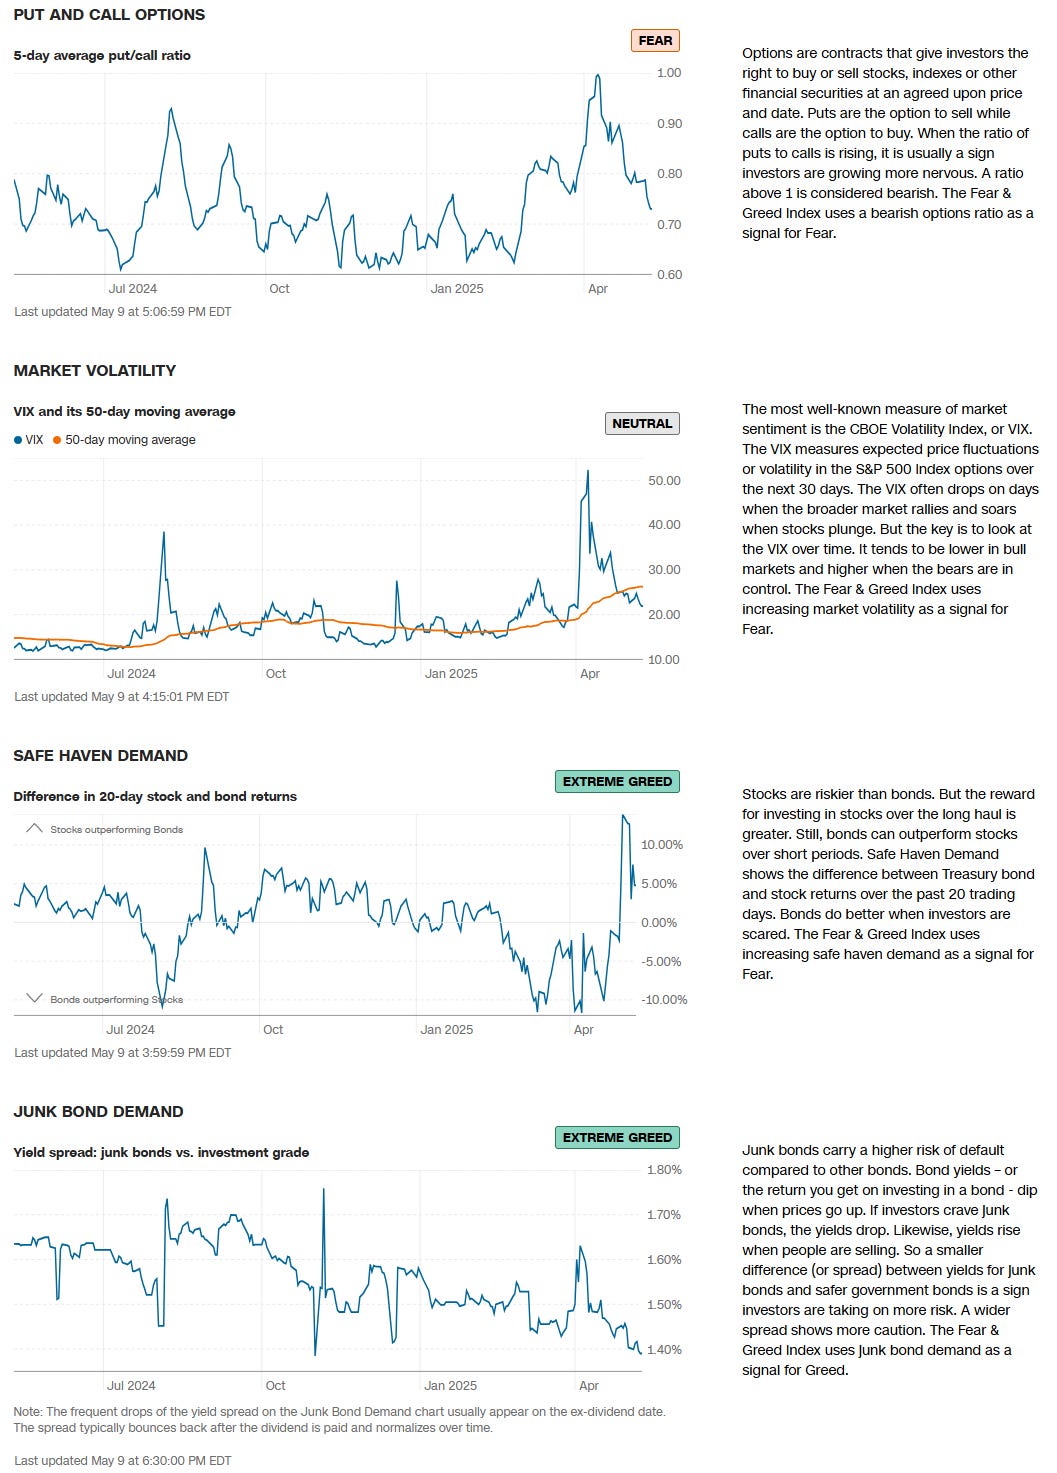
CNN Fear & Greed Constituent Data Points & Composite Index
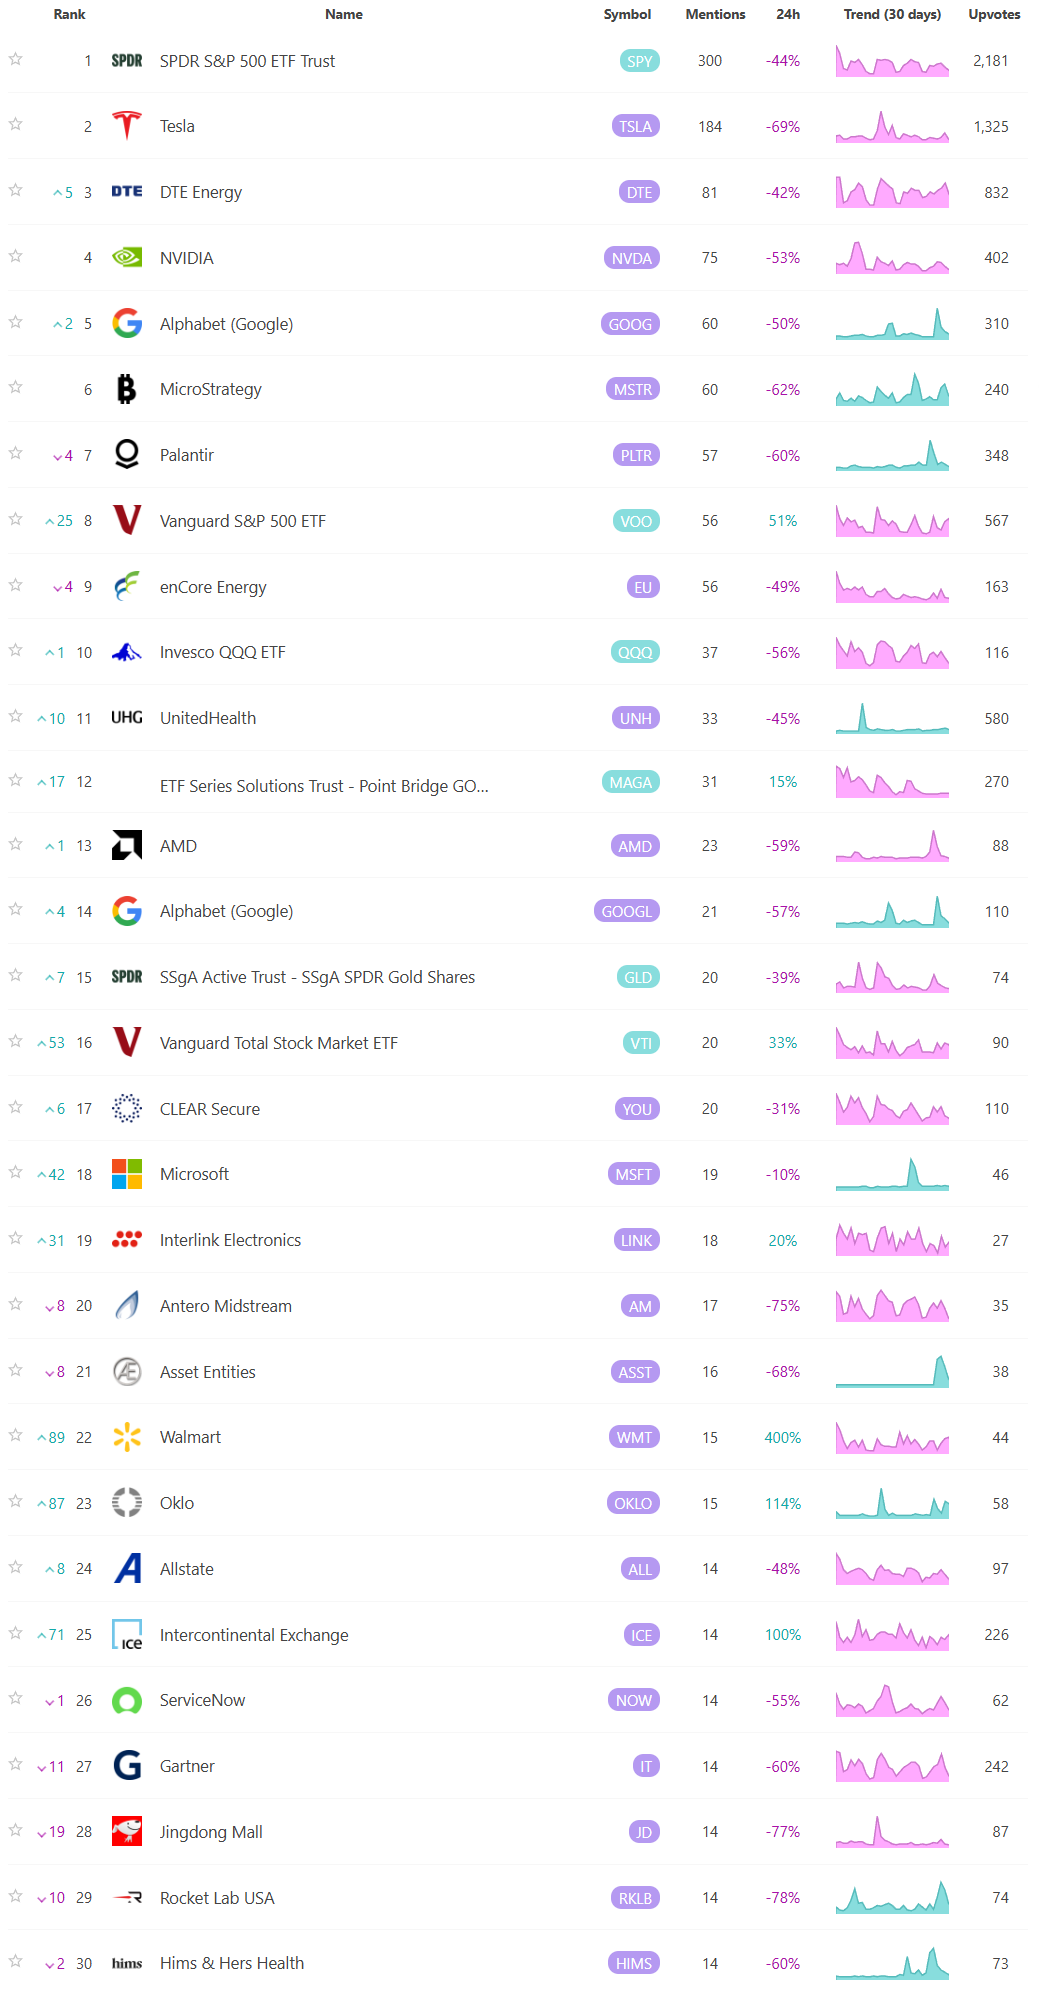
Social Media Favs
Analyzing social sentiment can provide valuable insights for investment strategies by offering a pulse on public perception, mood, and market sentiment that traditional financial indicators might not capture. Here’s how social sentiment analysis can enhance investment decisions:
Market Momentum: Positive or negative social sentiment can signal impending momentum shifts. When public opinion on a stock, sector, or asset class changes sharply, it can create buying or selling pressure, especially if that sentiment becomes widespread.
Early Detection of Trends: Social sentiment data can help investors spot trends before they show up in technical or fundamental data. For example, increased positive chatter around a particular company or sector might indicate growing interest or excitement, which could lead to price appreciation.
Gauge Retail Investor Impact: With the rise of retail investor platforms, collective sentiment on social media can lead to significant price movements (e.g., meme stocks). Understanding how retail investors view certain stocks can help in identifying high-volatility opportunities.
Event Reaction Monitoring: Social sentiment can provide real-time reactions to news events, product releases, or earnings reports. Investors can use this information to gauge market reaction quickly and adjust their strategies accordingly.
Complementing Quantitative Models: By adding a social sentiment layer to quantitative models, investors can enhance predictions. For example, a model that tracks historical price and volume data might perform even better when factoring in sentiment trends as a measure of market psychology.
Risk Management: Negative sentiment spikes can be a signal of potential downturns or increased volatility. By monitoring sentiment, investors might avoid or hedge against investments in companies experiencing a public relations crisis or facing negative perceptions.
Long-Term Sentiment Trends: Sustained sentiment trends, whether positive or negative, often mirror longer-term market cycles. Tracking sentiment trends over time can help identify shifts in investor psychology that could affect longer-term investments or sector rotations.
For these reasons, sentiment analysis, when combined with other tools, can provide a comprehensive view of both immediate market reactions and underlying investor attitudes, helping investors position themselves strategically across various time frames. Here are the most mentioned/discussed tickers on Reddit from some of the most active Subreddits for trading:
Institutional S/R Levels for Major Indices
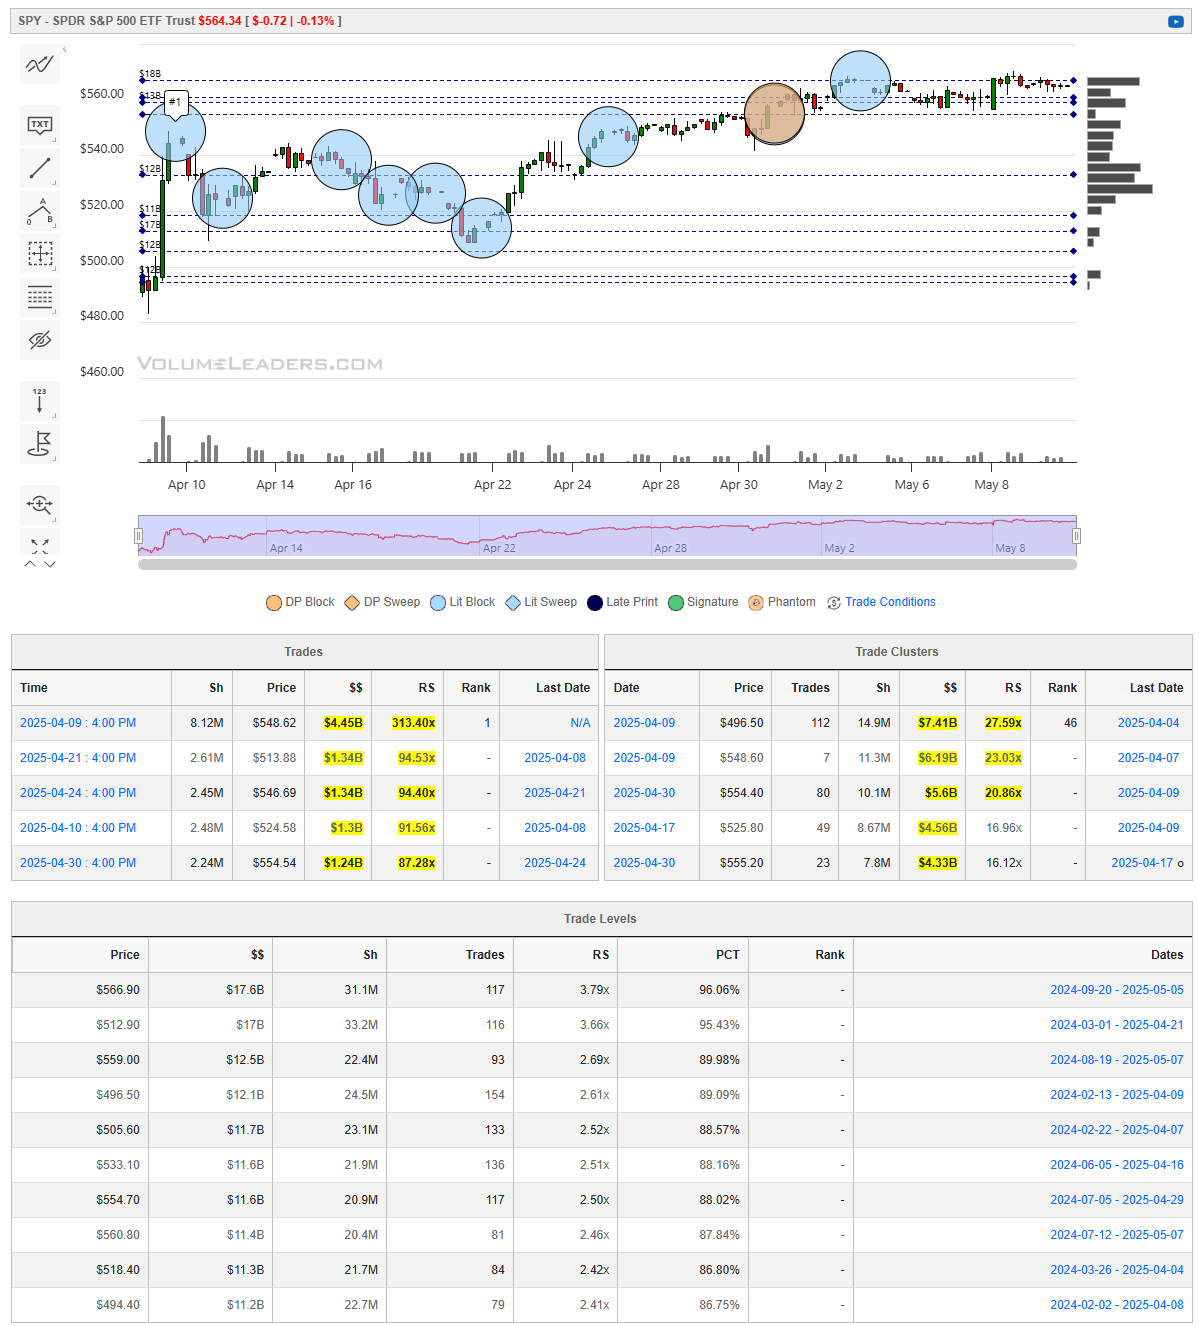
When you’re a large institutional player, your primary goal is to find liquidity - places to do a ton of business with the least amount of slippage possible. VolumeLeaders.com automatically identifies and visually plots the exact spots where institutions are doing business and where they are likely to return for more. It’s one of the primary reasons “support” and “resistance” concepts work and truly one of the reasons “price has memory” - take a look at the dashed lines in the images below that the platform plots for you automatically; these are the areas institutions constantly revisit to do more business.
Levels from the VolumeLeaders.com platform can help you formulate trades theses about:
Where to add or take profit
Where to de-risk or hedge
What strikes to target for options
Where to expect support or resistance
And this is just a small sample; there are countless ways to leverage this information into trades that express your views on the market. The platform covers thousands of tickers on multiple timeframes to accommodate all types of traders.
SPY
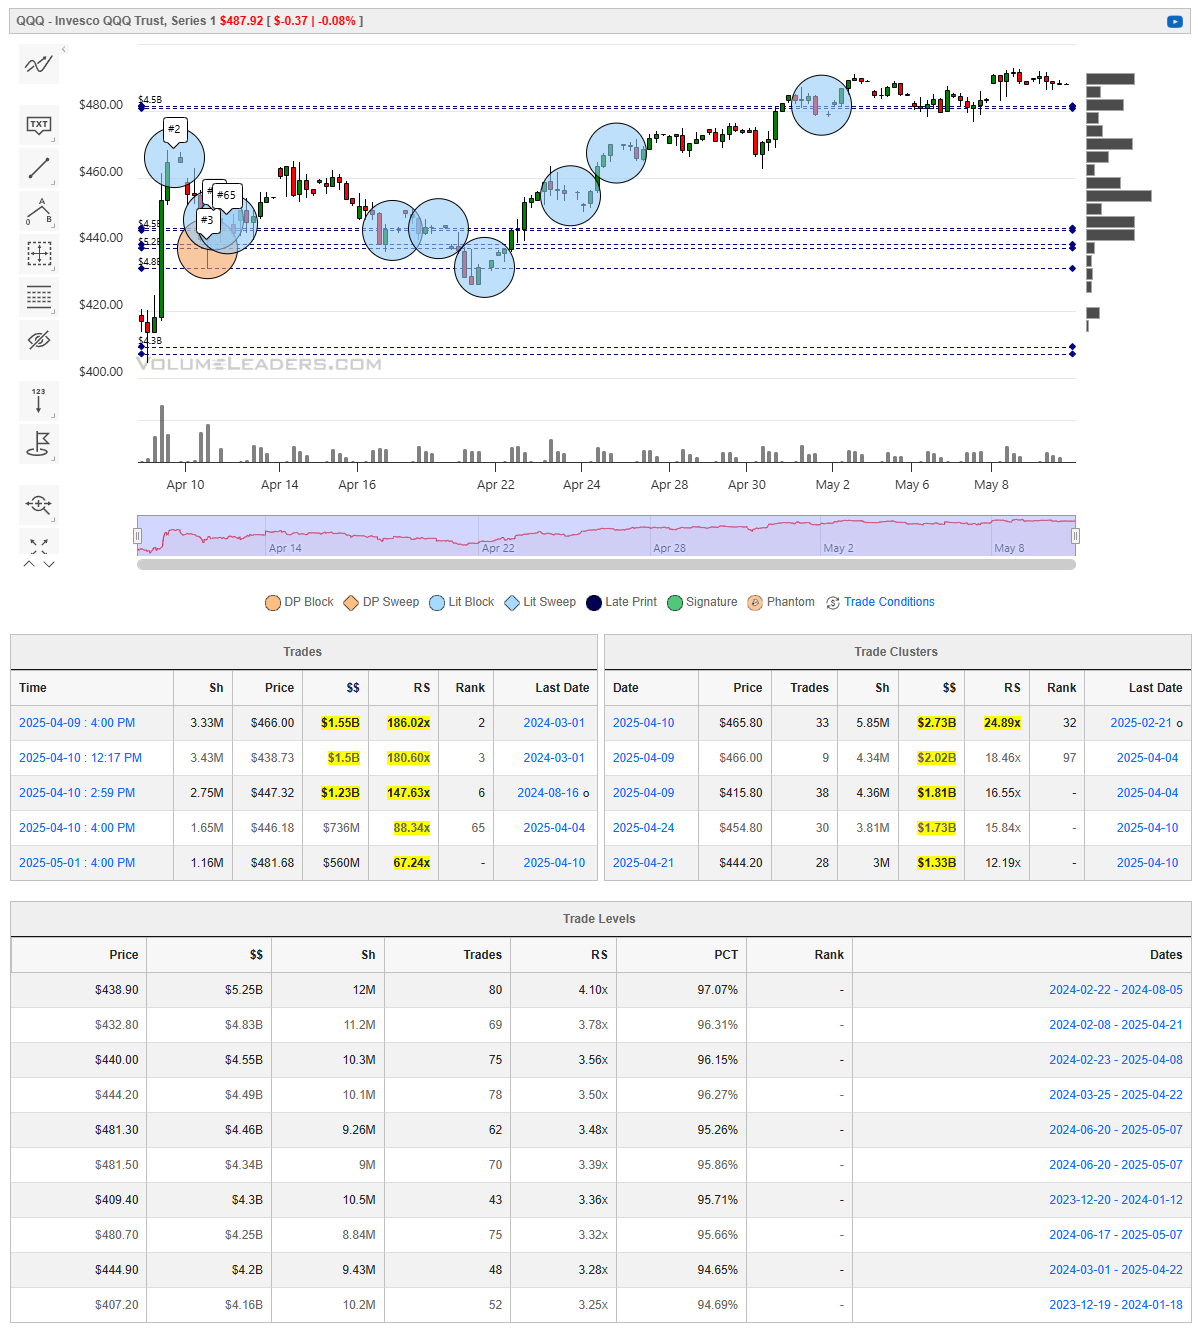
QQQ
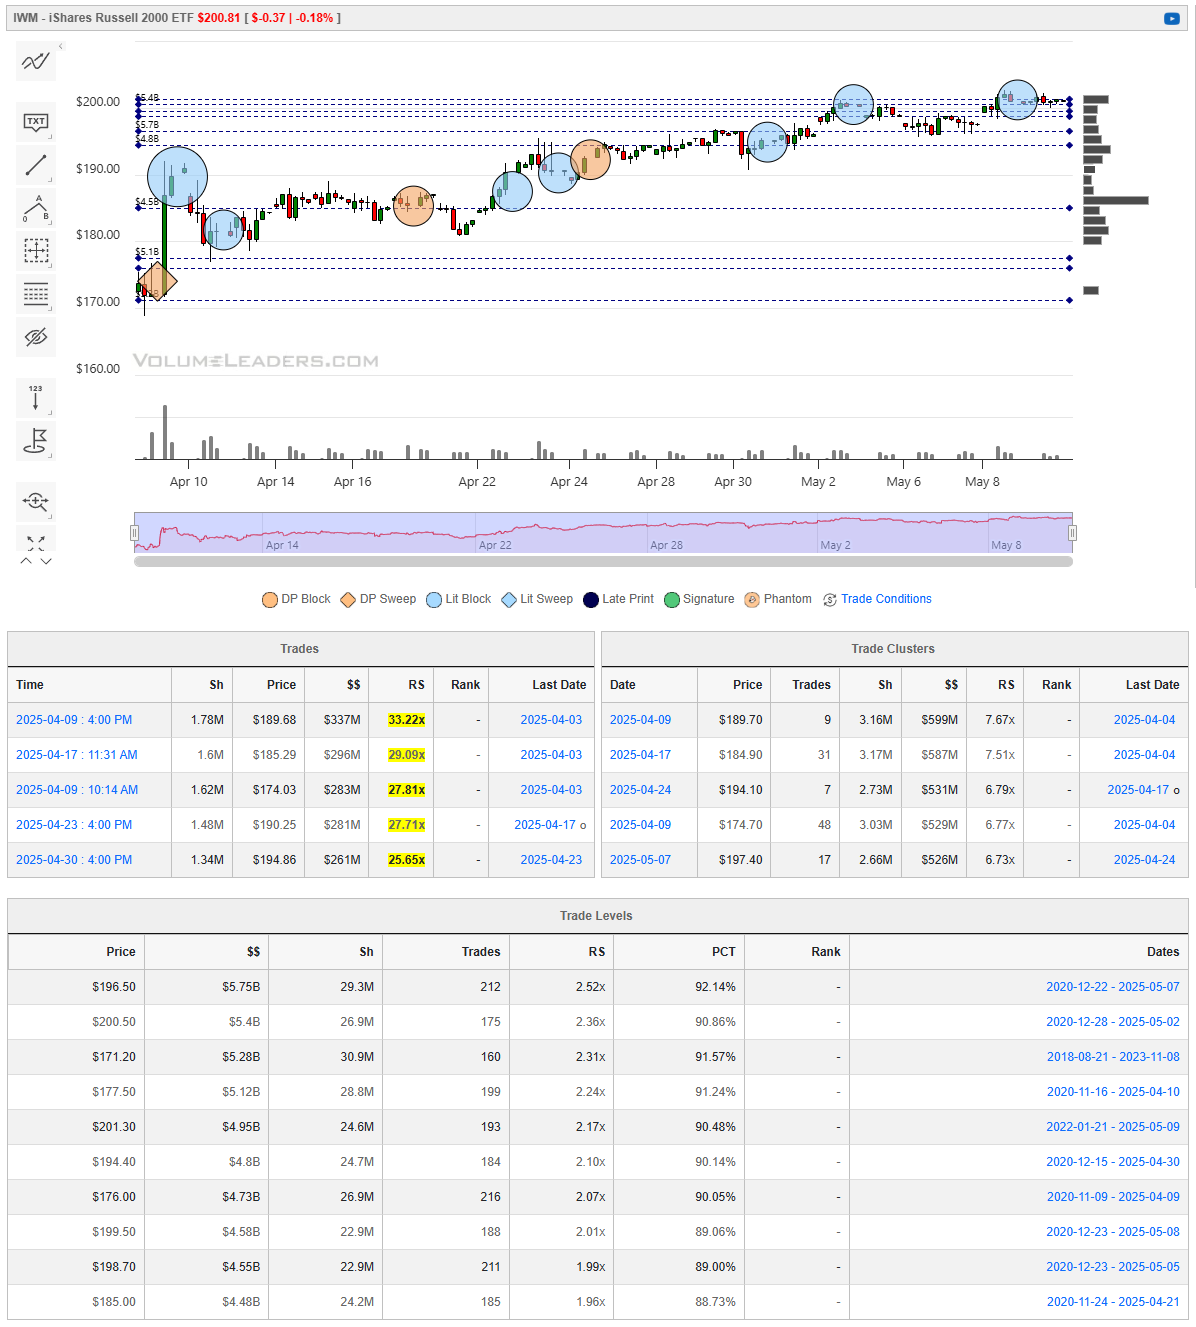
IWM
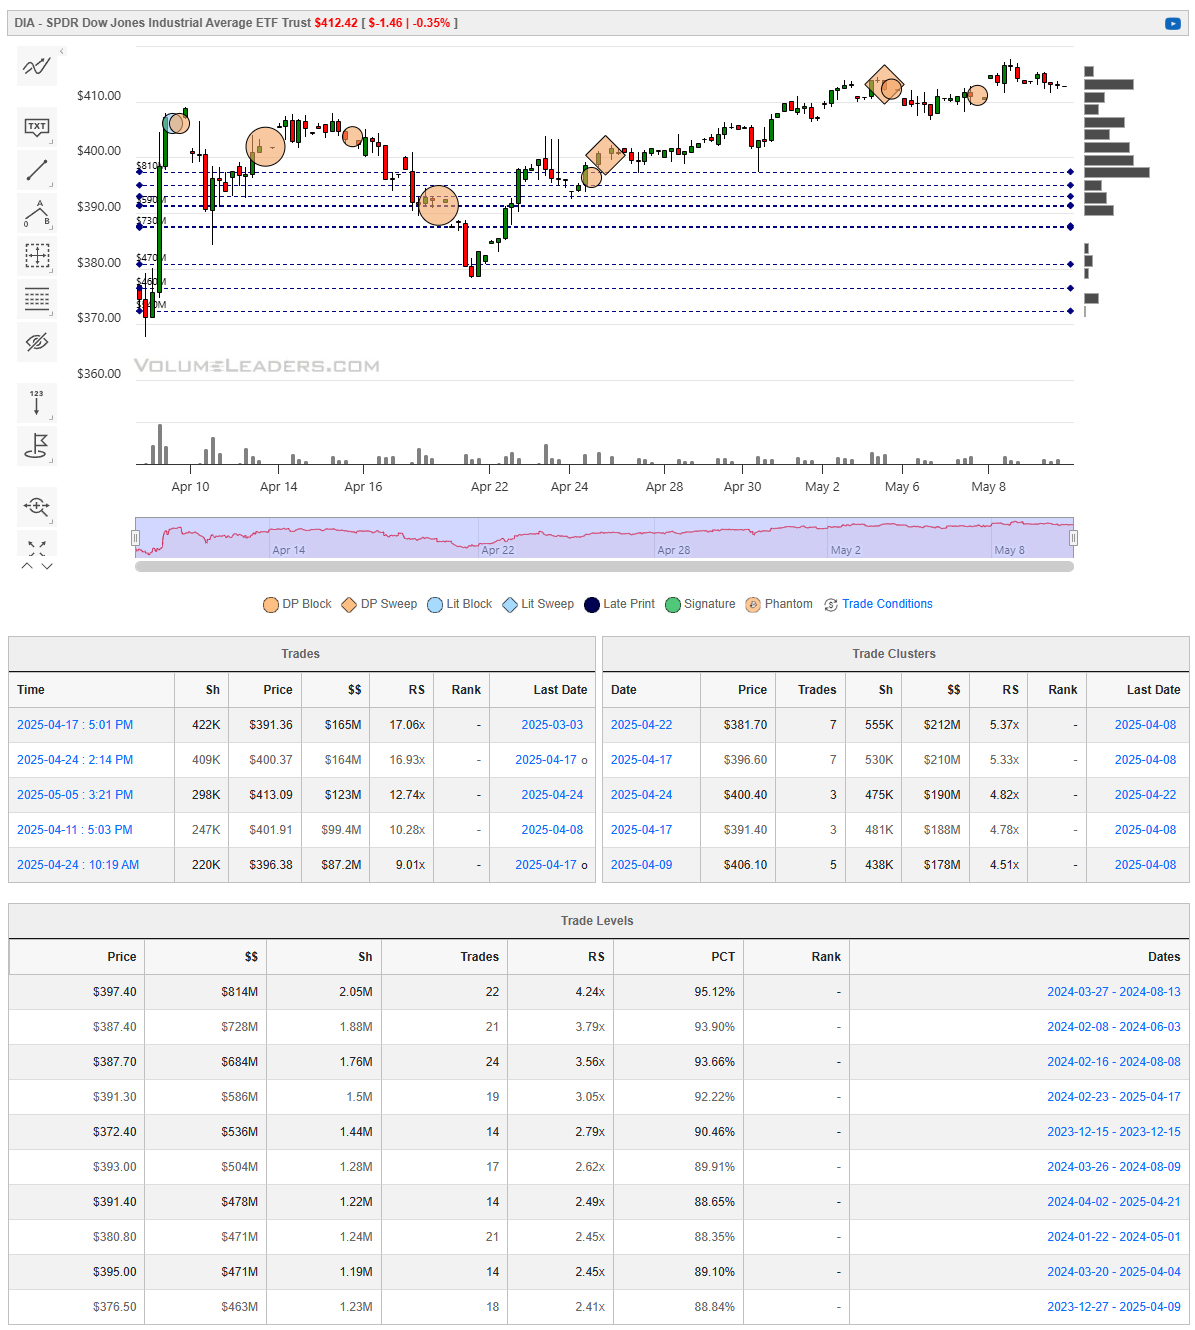
DIA
Special Coverage
Why Indicators Alone Will Always Let You Down (Unless You Do This...)
In the early days of most traders’ journeys, indicators feel like a revelation. The Relative Strength Index flashes oversold. The MACD crosses over. Bollinger Bands compress and then explode. It all seems so intuitive—follow the signals, reap the rewards. But as countless traders eventually discover, the market is far more complex than any one indicator can encapsulate. Strategies built on indicators alone often fail. Not because indicators are useless, but because they are misunderstood.
This article isn’t an attack on technical indicators. In fact, used correctly, they can be powerful. But to lean on them in isolation is to walk blindfolded through a minefield, mistaking every beep for a safe path. What follows is a comprehensive exploration of how indicators fit into the broader puzzle of market context, confluence, and volatility—and how you can transform them from deceptive crutches into tools of genuine edge.
The Allure of Simplicity
There’s something seductively simple about indicators. They offer clear, binary outputs: overbought/oversold, buy/sell cross, above/below threshold. For beginners especially, these signals are comforting. They imply certainty in an environment filled with noise and ambiguity.
But this simplicity is also what makes them dangerous. Because price is not mechanical—it is behavioral. It reflects decisions made by thousands of participants with different motives, risk tolerances, and time horizons. An RSI reading of 30 may look like a buy signal in one context and a warning in another. The indicator doesn’t know if price is trending, consolidating, or reacting to macro news. It just outputs a formula.
This disconnect between signal and circumstance is where most traders fall short. They expect indicators to do the thinking for them. Instead, they should be thinking with them.
What Indicators Really Measure
Before we can integrate indicators into a robust framework, we need to understand what they actually do. Every indicator is derived from price, time and/or volume. They are derivatives—smoothed, lagged, filtered representations of behavior that has already occurred. For example:
RSI measures momentum over a lookback period.
MACD tracks the relationship between two EMAs and their differential.
Bollinger Bands represent volatility based on standard deviation from a moving average.
None of these are predictive in isolation. They describe, they don't forecast. The sooner a trader accepts this, the sooner they can begin using them in a way that respects their limitations.
The Problem with Indicator-Only Strategies
When traders use indicators without context, they create rigid rules in a dynamic system:
"Buy when RSI is below 30."
"Sell when price hits the upper Bollinger Band."
"Go long when MACD crosses up."
These signals may occasionally work, but without understanding what environment they’re occurring in, they’re little better than coin flips. Markets are not static—they trend, range, break out, mean revert. The same indicator can give entirely different outcomes depending on the broader structure.
What’s missing is the framework around the signal: context.
Enter Context, Confluence, and Volatility
1. Context is King
Context is the lens through which every signal must be interpreted. Without it, you're not trading a strategy—you're reacting blindly to numbers on a chart. Indicators generate values based on formulas, but they have no awareness of the environment in which those values occur. That awareness must come from you.
Imagine walking into a room and hearing someone shout "Fire!" Do you sprint for the exit? Maybe. But what if you’re at a movie set filming an action scene? Suddenly, the same word means something very different. This is exactly how indicators function—they may flash a signal, but the meaning depends entirely on where, when, and how that signal arises.
Consider an RSI reading of 30. Many are taught this indicates an oversold condition—a buying opportunity. But if that RSI reading appears during a strong downtrend, it's more likely a sign of trend continuation. The market is weak, and the RSI is reflecting momentum, not exhaustion. On the other hand, if RSI 30 prints at a well-defined support level within a choppy range, especially after a low-volume decline, now you might have a legitimate mean-reversion setup.
Context includes factors like:
Market structure: Are we in an uptrend, downtrend, or sideways chop?
Key levels: Is price near support, resistance, or breaking through a zone that has held multiple times?
Broader market tone: Are indices moving in alignment with your trade, or against it?
Catalysts: Is there a major news event, earnings release, or Fed decision looming?
Even the time of day matters. An RSI dip during the pre-market session may be meaningless. The same move at the 10:30 AM reversal window could be far more telling.
When you start viewing indicators not as answers, but as inputs—signals that must be weighed against the broader backdrop—you begin to shift from tactical trading to strategic thinking. You stop reacting and start interpreting. And that’s when trading becomes less about guessing, and more about reading the language of the market.
2. Confluence: Where Multiple Factors Align
If context is the environment in which a trade occurs, then confluence is the agreement between multiple elements that give a trade its strength. It’s the process of layering several independent variables that all point to the same conclusion. When confluence is present, your trades are supported not just by one idea—but by several lines of reasoning that intersect at a specific time and price.
Think of confluence as a courtroom trial. One witness might be convincing, but their testimony alone might not sway the jury. Add two or three more witnesses, all independent, all saying the same thing—and the probability of a guilty verdict skyrockets. That’s what confluence does in trading: it stacks the odds.
For example, consider a scenario where:
Price is pulling back to the 20-day EMA (a dynamic level of trend support),
Volume suddenly spikes on a reversal candle (showing renewed interest), and
RSI is climbing out of oversold territory (suggesting momentum is shifting).
Individually, each of these might carry limited meaning. But when they all occur together—and in a location that makes sense, such as a previously tested support zone—the probability of success increases dramatically.
The key to confluence is diversity of inputs. You don’t want three indicators all measuring the same thing. Instead, seek signals that each measure different aspects of the market:
Price structure (support/resistance, trend lines, Fibonacci levels)
Momentum (RSI, MACD, Stochastic)
Volume behavior (Volume spikes, OBV, VWAP reactions)
Volatility (ATR, Bollinger Band width)
Sentiment or positioning (commitment of traders data, open interest)
By using these various elements together, you're not relying on any one component to carry the weight of the trade. You’re letting the market tell you a more cohesive story. And when multiple factors agree—especially across different timeframes—you have something rare in trading: a high-quality setup worth risking capital on.
Confluence is not about certainty, because certainty doesn’t exist in trading. It's about stacking probabilities in your favor. It’s not enough to have a reason to enter; you want multiple, independent reasons to believe that the market is more likely to move in your direction than not.
3. Volatility Filters: The Missing Layer
Volatility is one of the most overlooked dimensions in trading—and one of the most powerful. Many traders apply the same rules in all environments, never adjusting their approach to account for changing volatility regimes. Yet volatility defines how far price can reasonably move, how often it will fake out, and whether momentum can sustain itself. Ignoring this context can make even solid setups crumble.
In a high-volatility market, price swings are wider, faster, and often emotionally driven. An overbought RSI reading in such an environment might persist for days as price continues trending. Breakouts are more likely to carry through, and pullbacks may be violent but short-lived. Conversely, in a low-volatility market, the same RSI reading might signal exhaustion, as price moves tend to revert and stall without follow-through.
This is why applying a volatility filter helps traders differentiate when to trust a signal—and when to fade it.
Some practical ways to incorporate volatility filters include:
ATR (Average True Range): Use this to adjust stop-loss and target placement based on recent price movement ranges. A 1.5x ATR stop in a high-volatility environment might give your trade breathing room, while the same stop in a low-volatility regime could be unnecessarily wide.
VIX or Volatility Index Readings: For index or ETF traders, the VIX acts as a thermometer for market tension. Elevated VIX implies risk-off conditions—good for momentum setups, bad for mean reversion. A falling VIX suggests more stable, sideways trading.
Range Compression and Expansion: Before major moves, volatility often compresses. Indicators like Bollinger Band width or simply observing price contraction patterns can give clues to upcoming expansions.
Time of Day Considerations: Intraday volatility fluctuates. Opening ranges often carry bursts of movement, while mid-day sessions tend to contract. Apply signals with time context in mind.
Without adjusting for volatility, traders risk applying the right strategy at the wrong time. Volatility filters act like a translation key—helping interpret what the market is really saying when an indicator starts flashing.
Turning Indicators Into Tools of Edge
So how do you take indicators—these often-misused tools—and turn them into genuine sources of edge? The process is not about discarding them, but rather repositioning them in your workflow. Indicators work best when they become supporting evidence, not the star witness. Think of them as part of your due diligence, not as the decision-maker.
The first and most critical step is to define the market environment before acting on any signal. Is the market trending or ranging? Are you near a high-impact news event? Has volatility expanded or contracted? Once you can label the regime you’re in, you can begin to interpret the indicator in light of that backdrop.
For example, a Bollinger Band breakout in a low-volatility range might signal the beginning of a new trend. But the same signal in an already trending market could simply indicate continuation. Without environment awareness, the same technical clue can have very different implications.
Next, reframe indicators as confirmation tools rather than triggers. Say you’re watching for a pullback entry in an uptrend. Instead of buying as soon as RSI hits 30, wait to see if price forms a reversal candle at a known support level, or if volume confirms buying interest. Let the indicator tell you the conditions are ripening—not command you to act.
To get good at this, you’ll need to track and study your indicator signals in context. Journaling isn’t just for psychology—it’s a laboratory for developing intuition. Over time, you’ll see which indicators add value in which scenarios. You may discover, for instance, that your favorite momentum tool is worthless in choppy markets but highly predictive after news-driven spikes.
From there, it’s crucial to backtest your indicator-based ideas with filters layered in. Test how a MACD crossover performs in trending markets versus ranging ones. Test how RSI works in high vs. low volatility environments. This form of targeted backtesting, especially across different market conditions, helps isolate when an indicator provides genuine insight.
And finally, avoid indicator overload by aiming for orthogonal signals. Combining RSI with Stochastic and CCI—three momentum tools—isn’t confluence; it’s redundancy. True confluence comes from bringing in signals that speak different technical languages: price structure, volume behavior, volatility cues, and sentiment data. Each one adds a different lens to the same picture.
When indicators are embedded in a structure of context, confluence, and volatility awareness, they become powerful tools—not because they predict the future, but because they help you interpret the present more accurately.
Final Thoughts: Why This Matters
Trading isn’t about being right—it’s about managing risk and stacking probability in your favor. Indicators, when used correctly, are just tools to help you do that. But they are not oracles. They are not strategies. They are not a substitute for thinking.
By anchoring indicators inside a well-framed context, aligning them with price action, and adjusting for volatility, you turn them from false promises into functional allies. And that’s the shift most traders need—not more signals, but better decisions.
Because in trading, clarity doesn’t come from clutter—it comes from confluence.
Use indicators wisely. But never let them think for you.
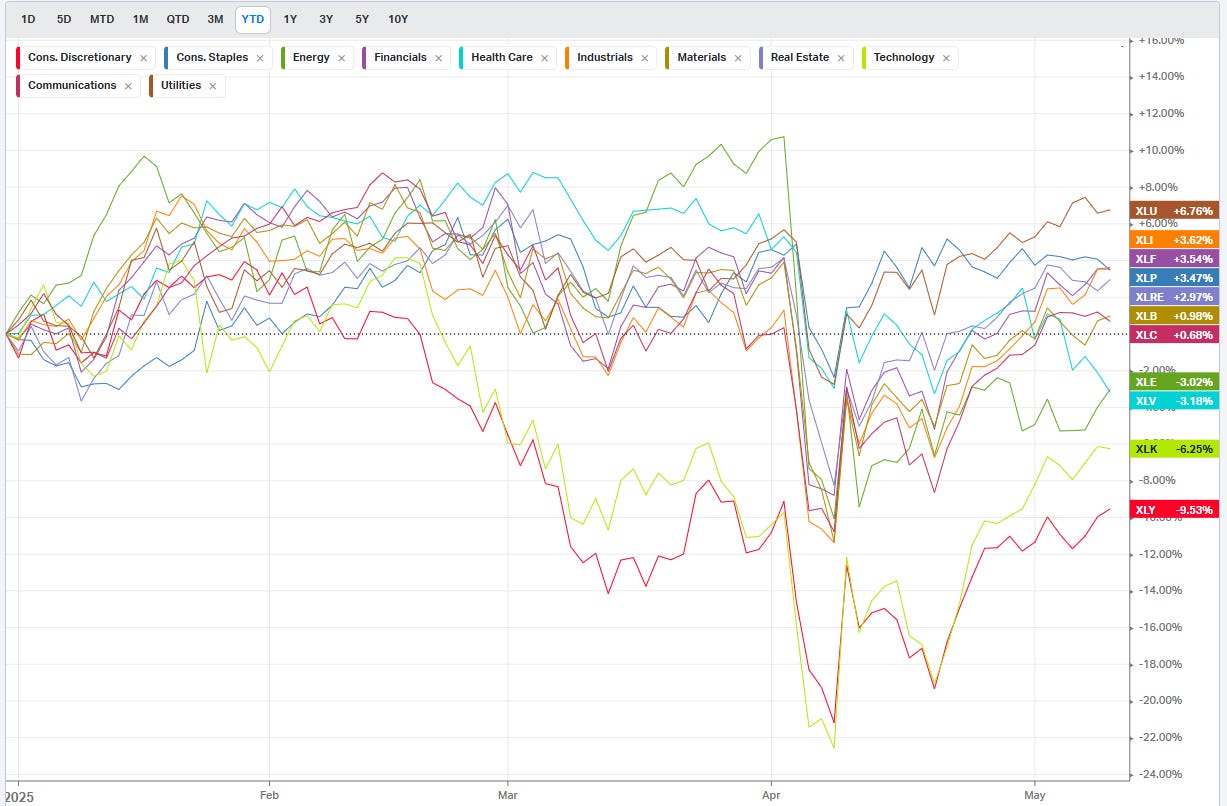
Summary Of Thematic Performance YTD
VolumeLeaders.com offers a robust set of pre-built thematic filters, allowing you to instantly explore specific market segments. These performance snapshots are provided purely for context and inspiration—think about zeroing in on the leaders and laggards within the strongest and weakest sectors, for example.
S&P By Sector
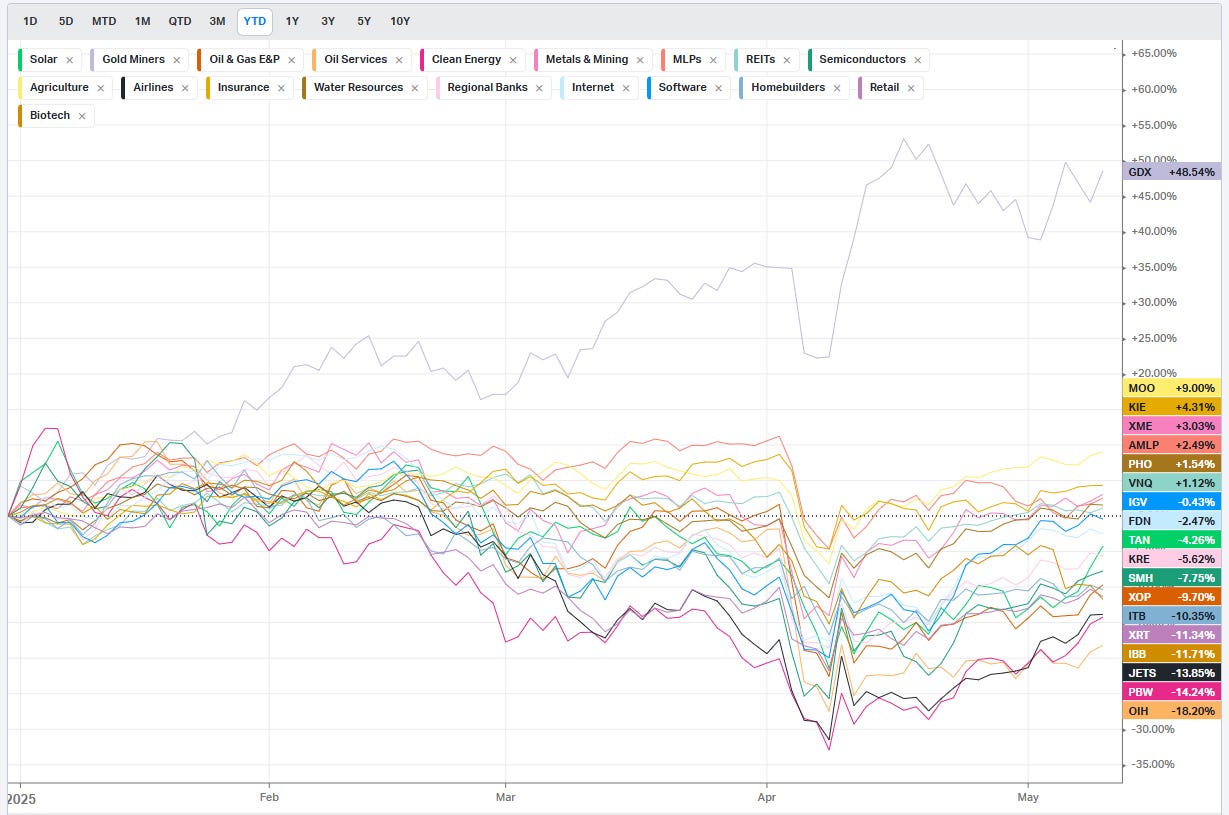
S&P By Industry
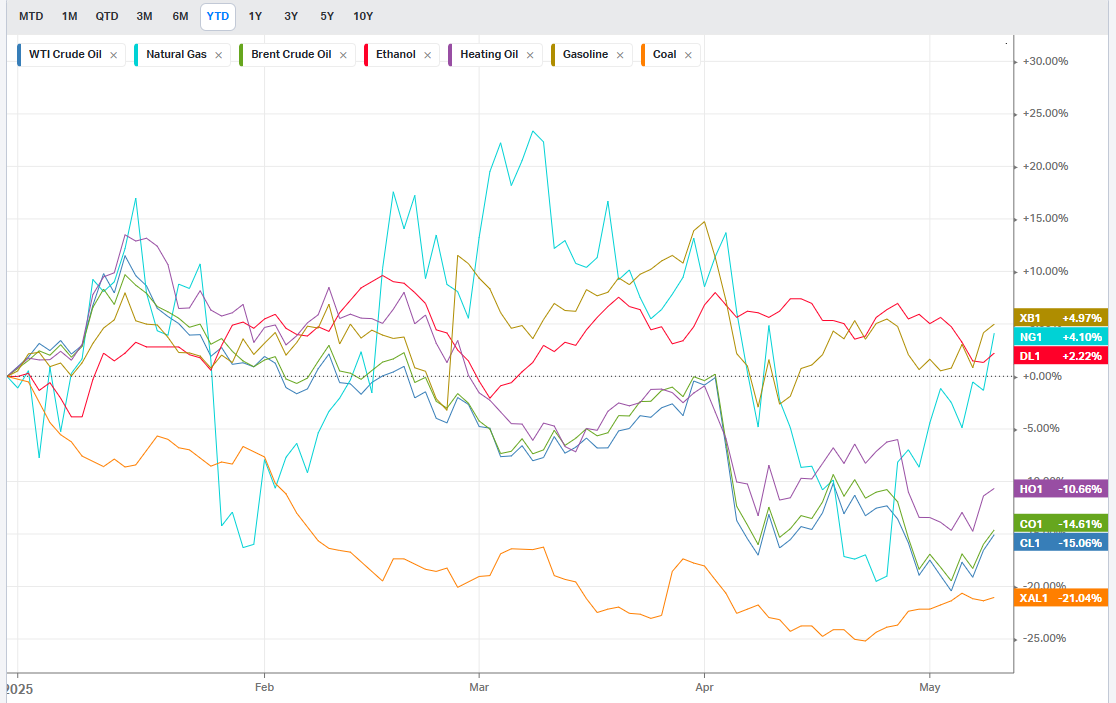
Commodities: Energy
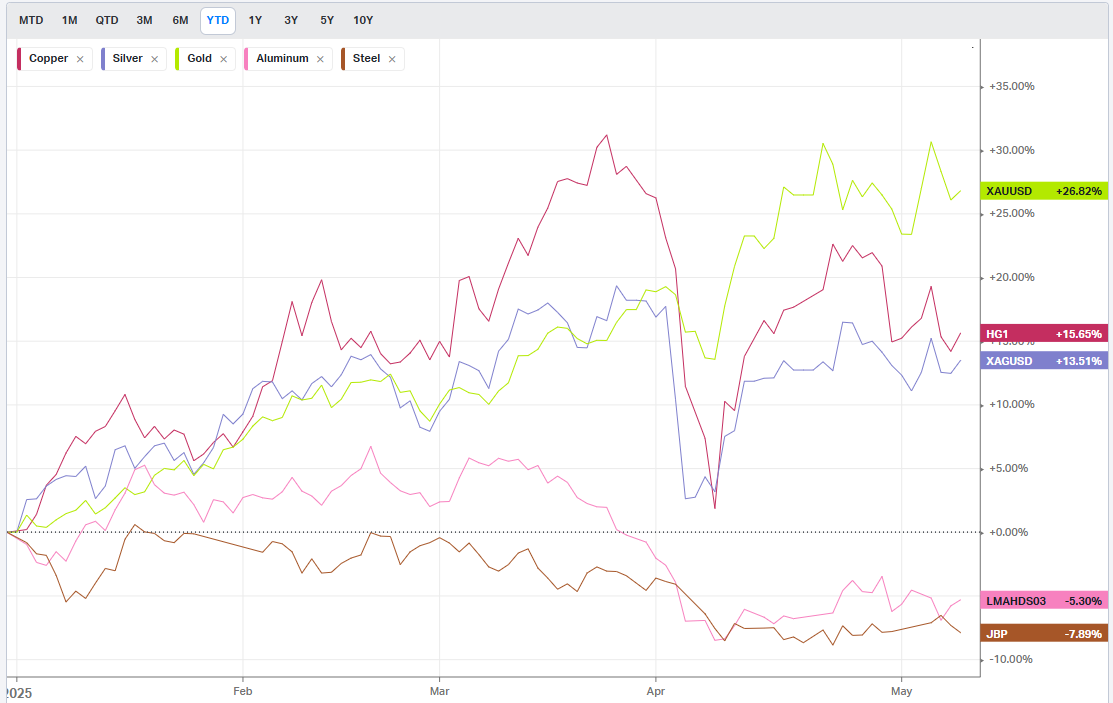
Commodities: Metals
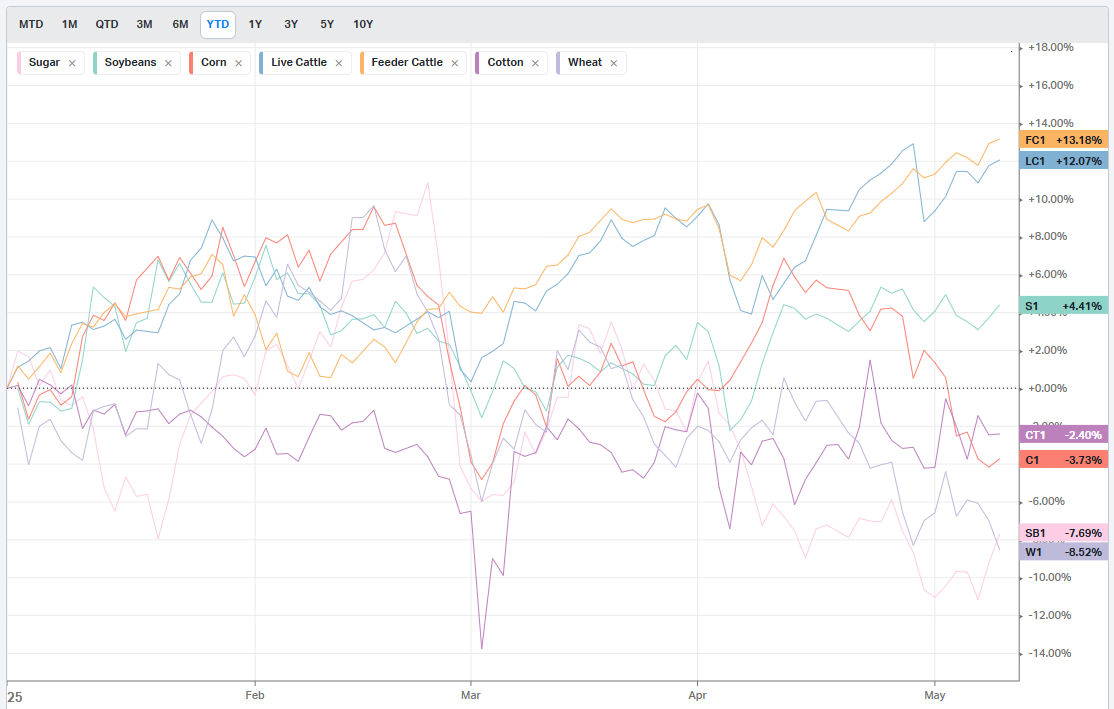
Commodities: Agriculture
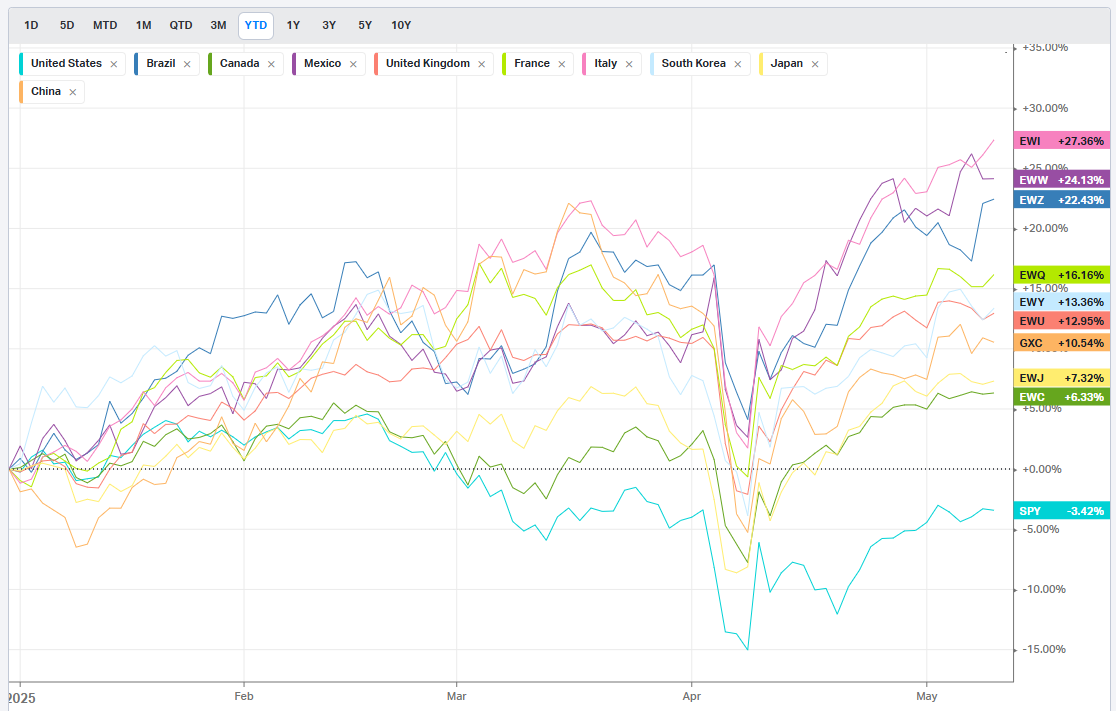
Country ETFs
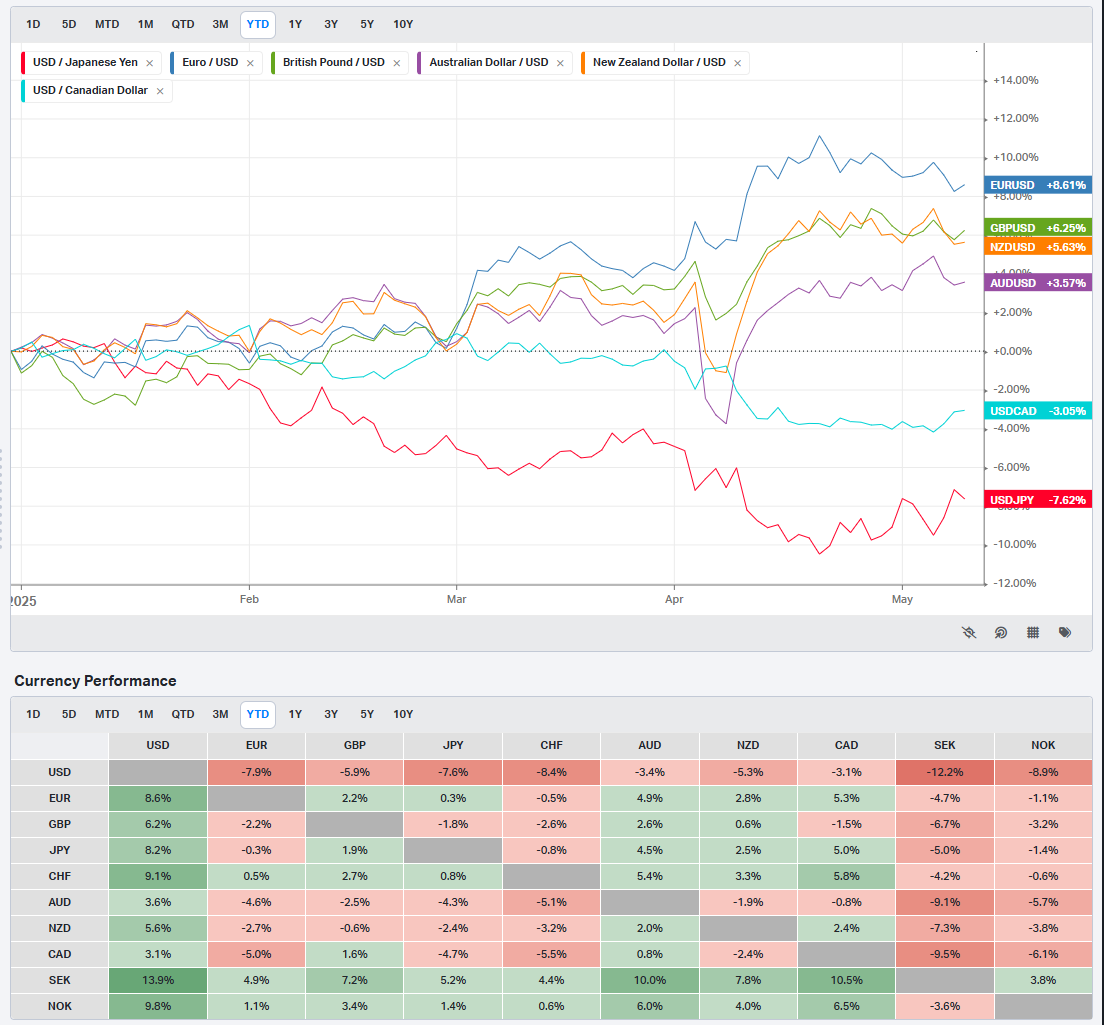
Currencies
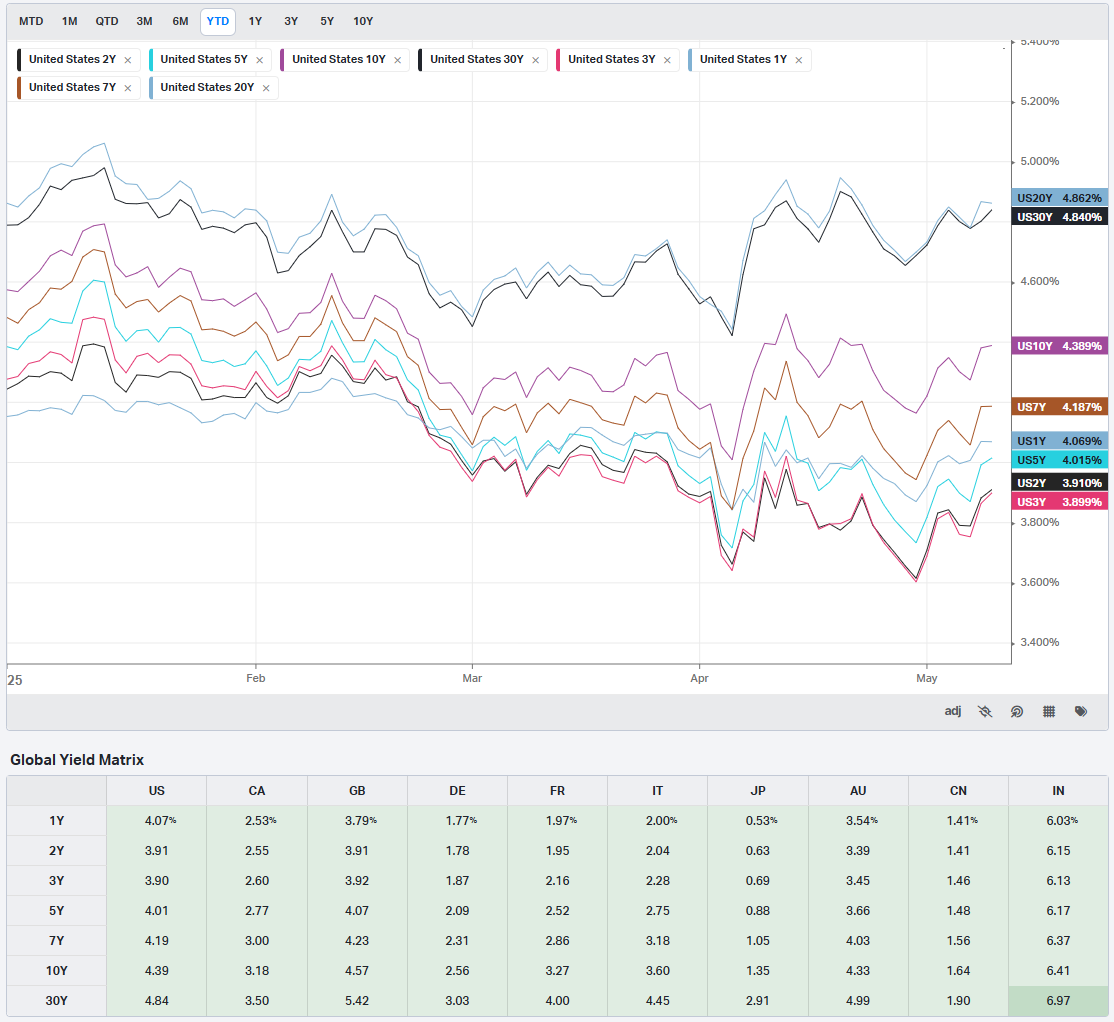
Global Yields
Factors: Style
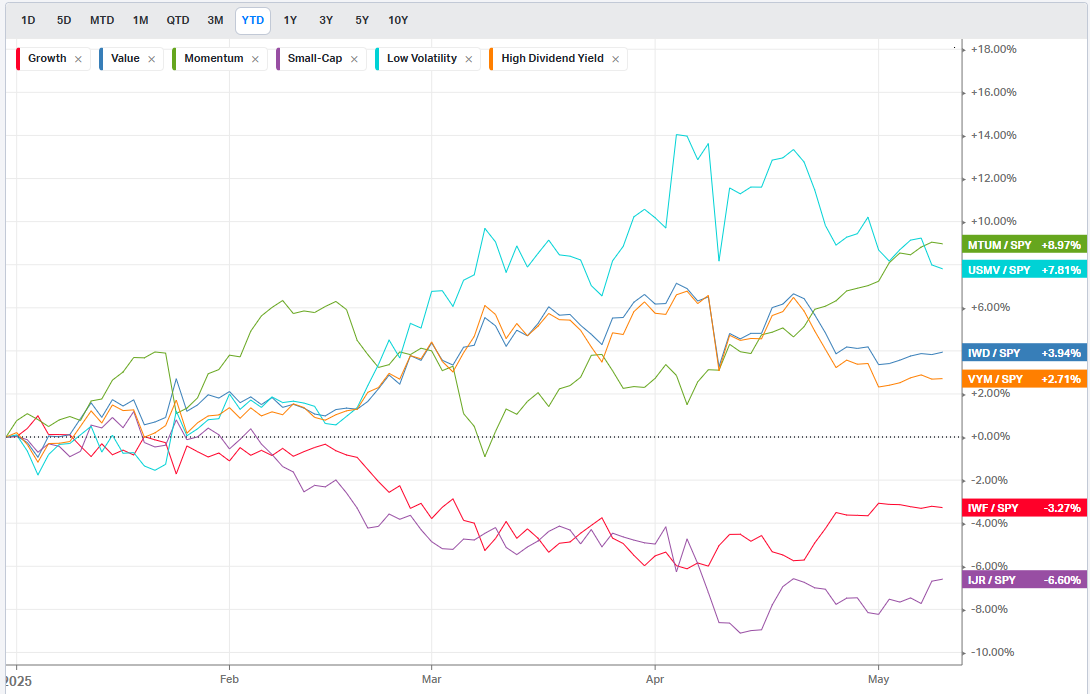
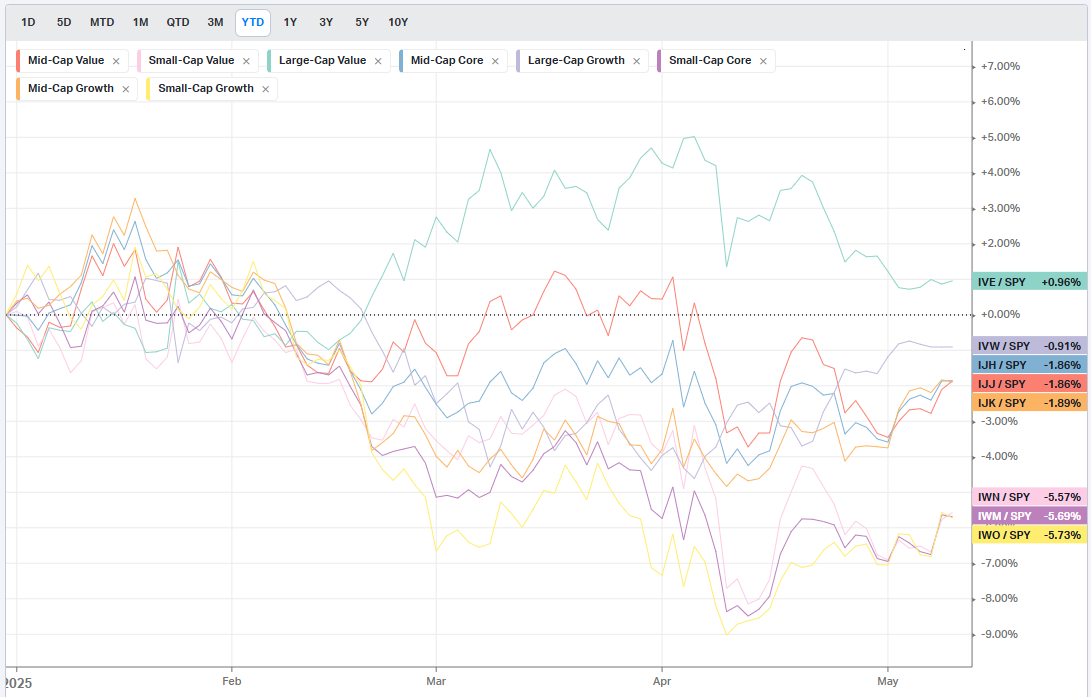
Factors: Size vs Value
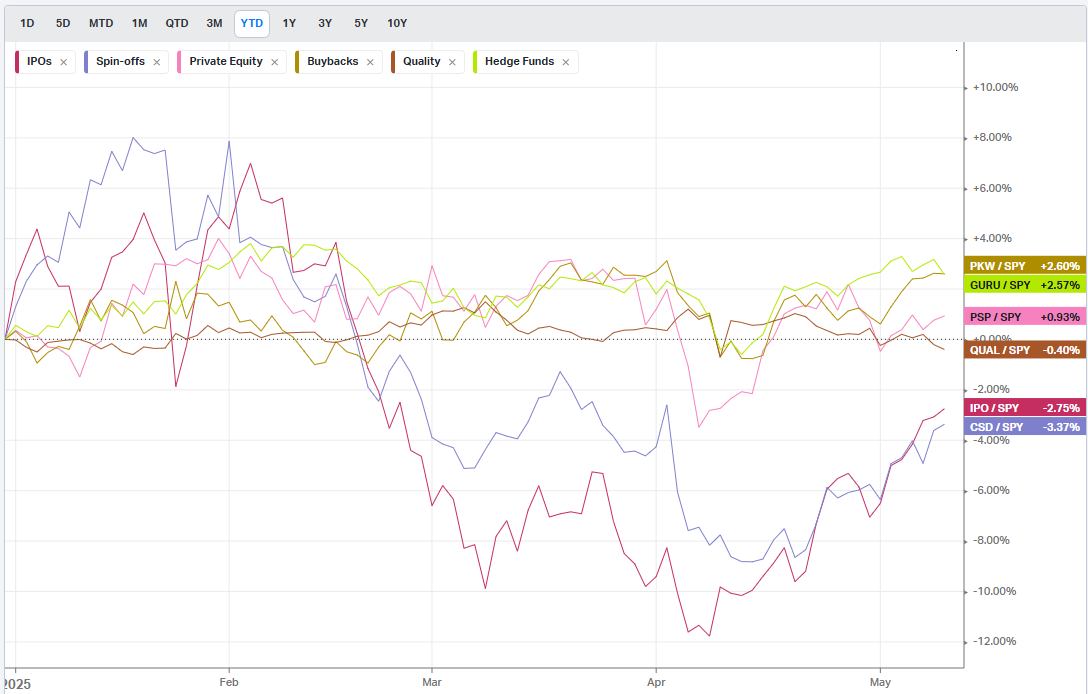
Factors: Qualitative
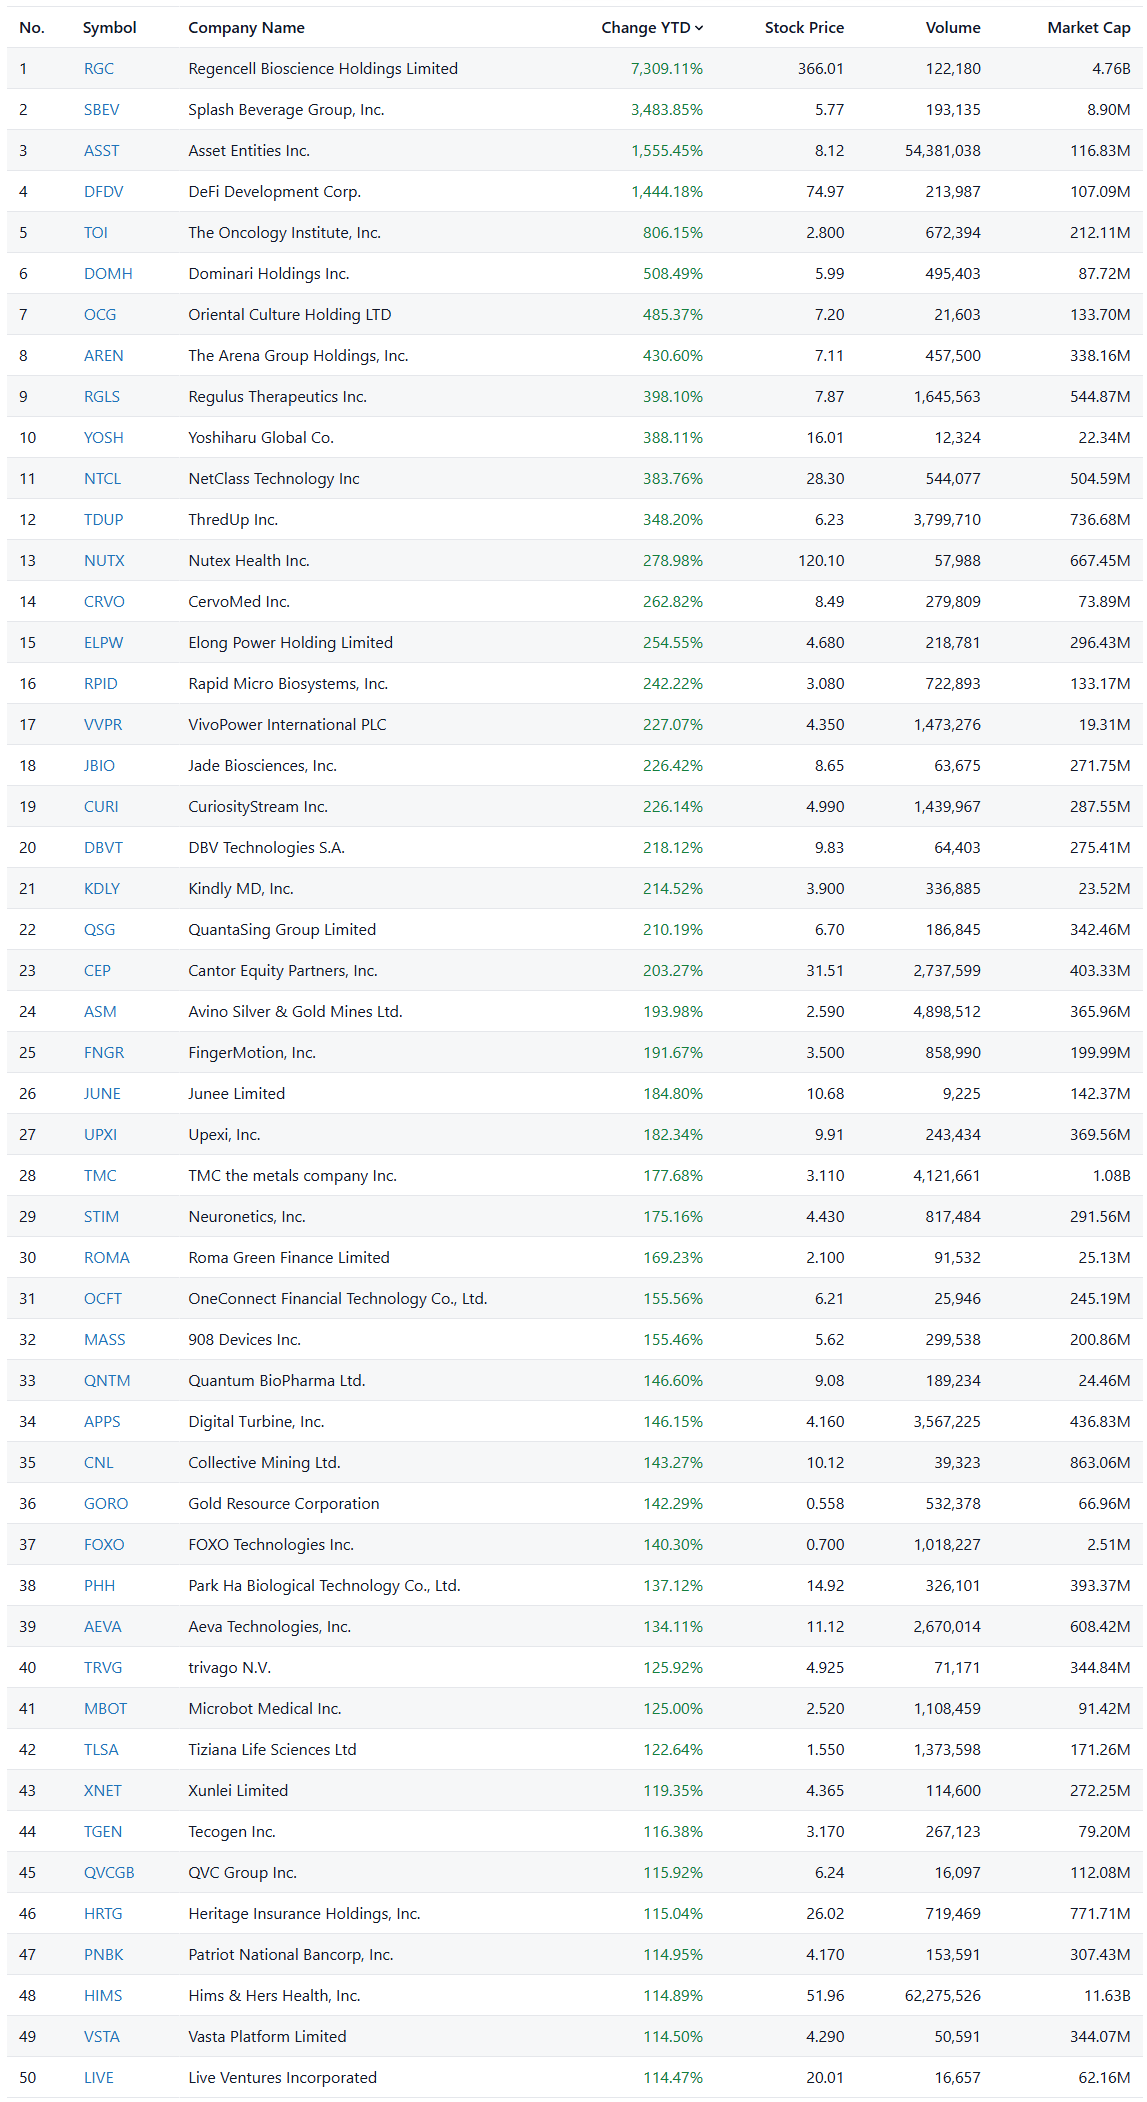
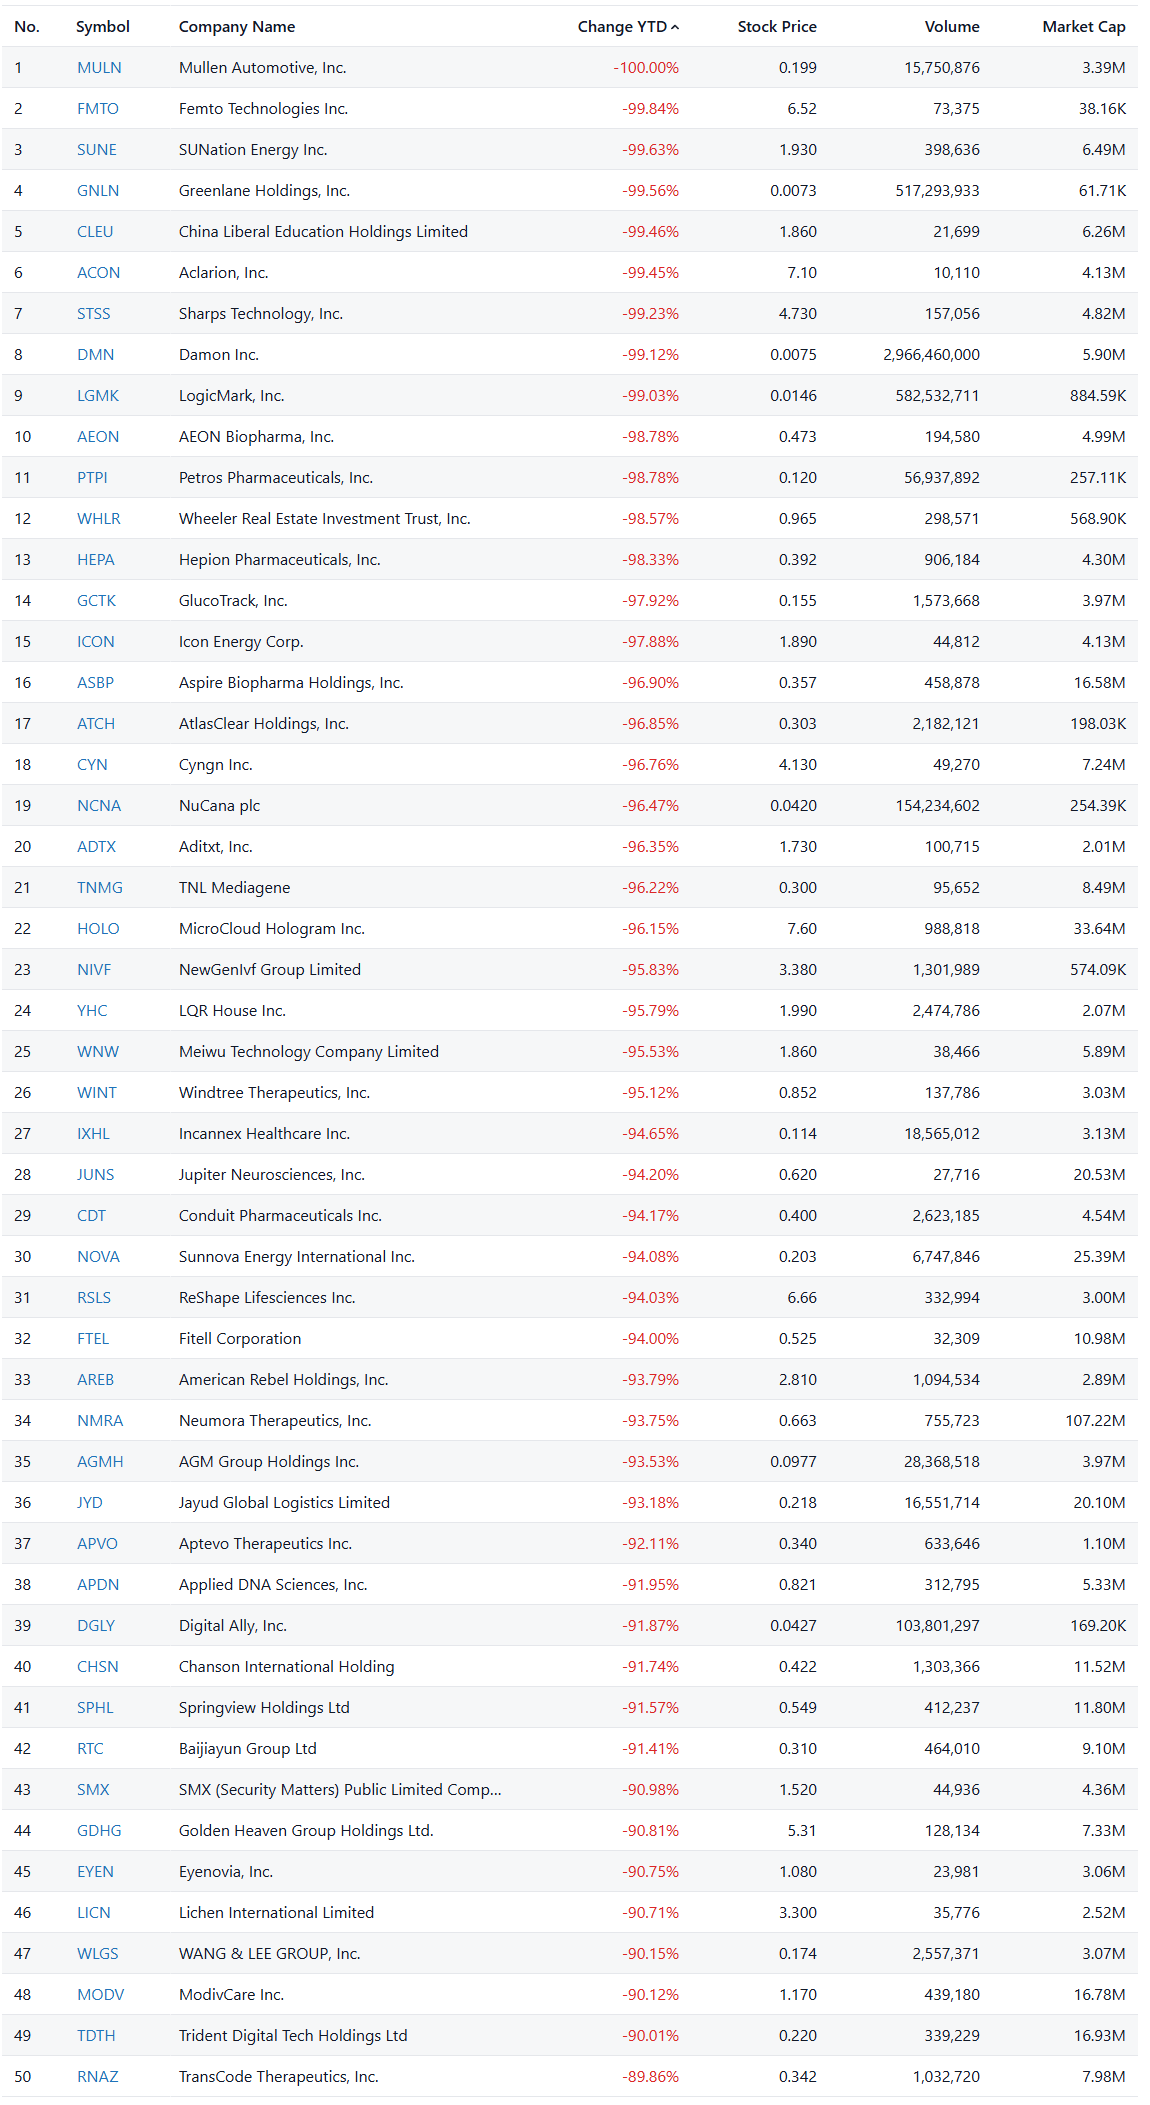
YTD Winners
YTD Losers
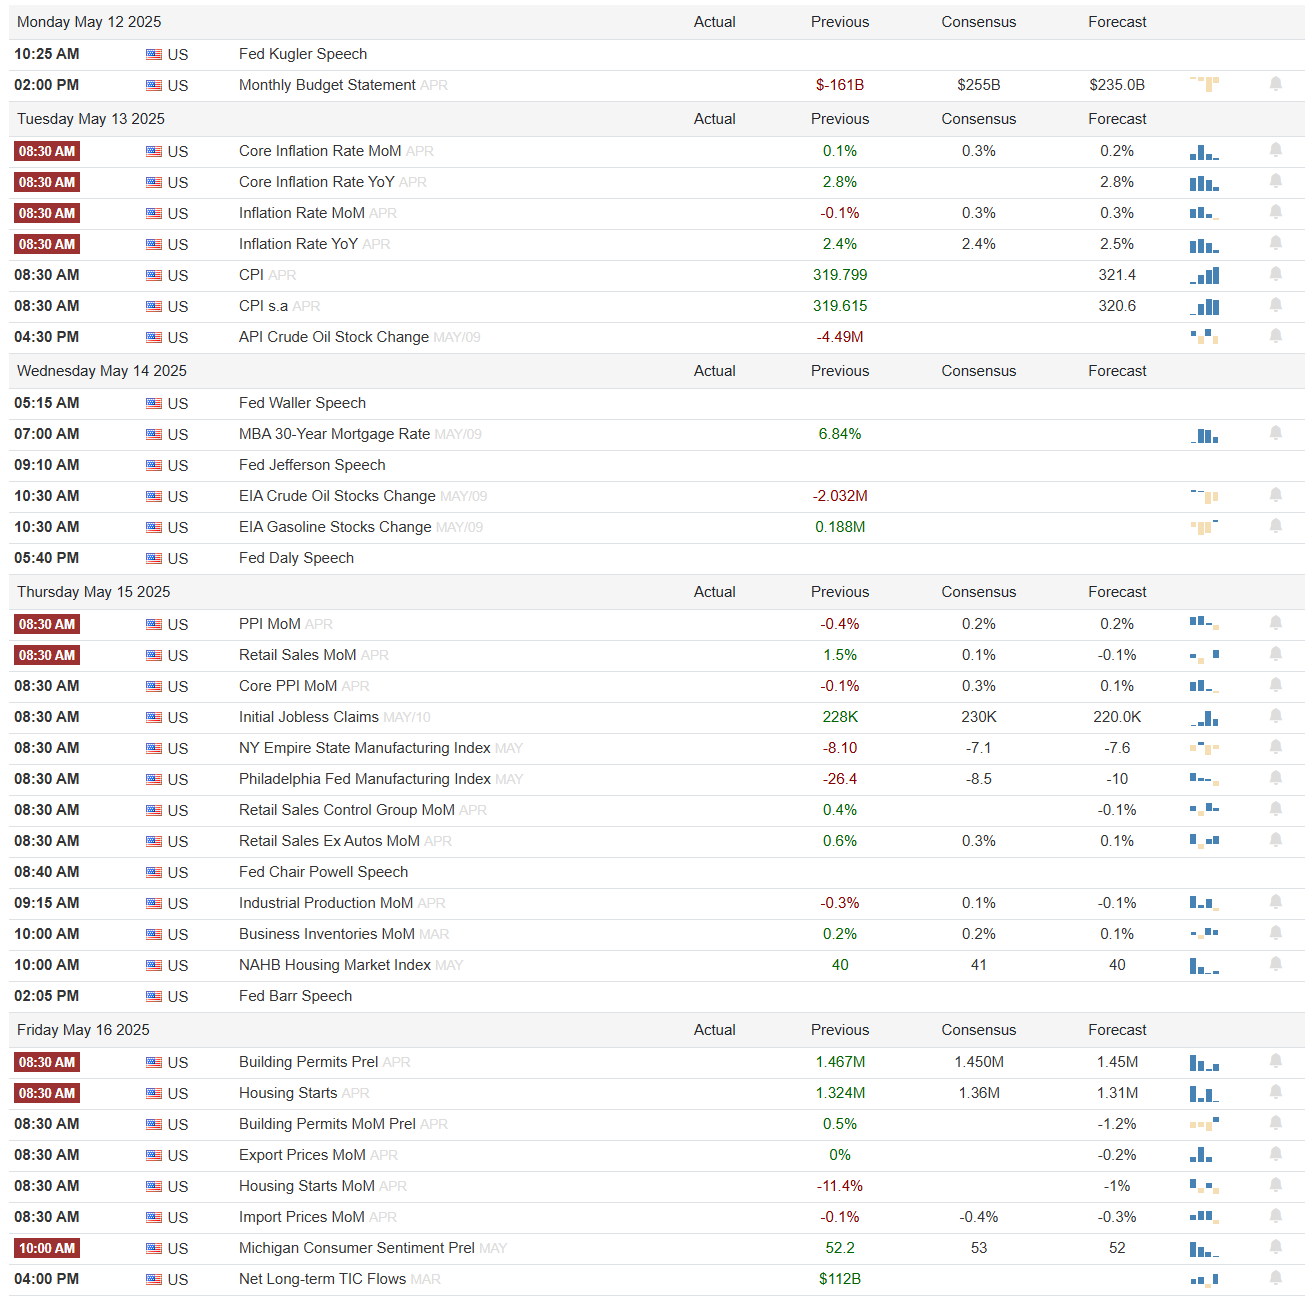
Events On Deck This Week
Here are key events happening this week that have the potential to cause outsized moves in the market or heightened short-term volatility.
Econ Events By Day of Week
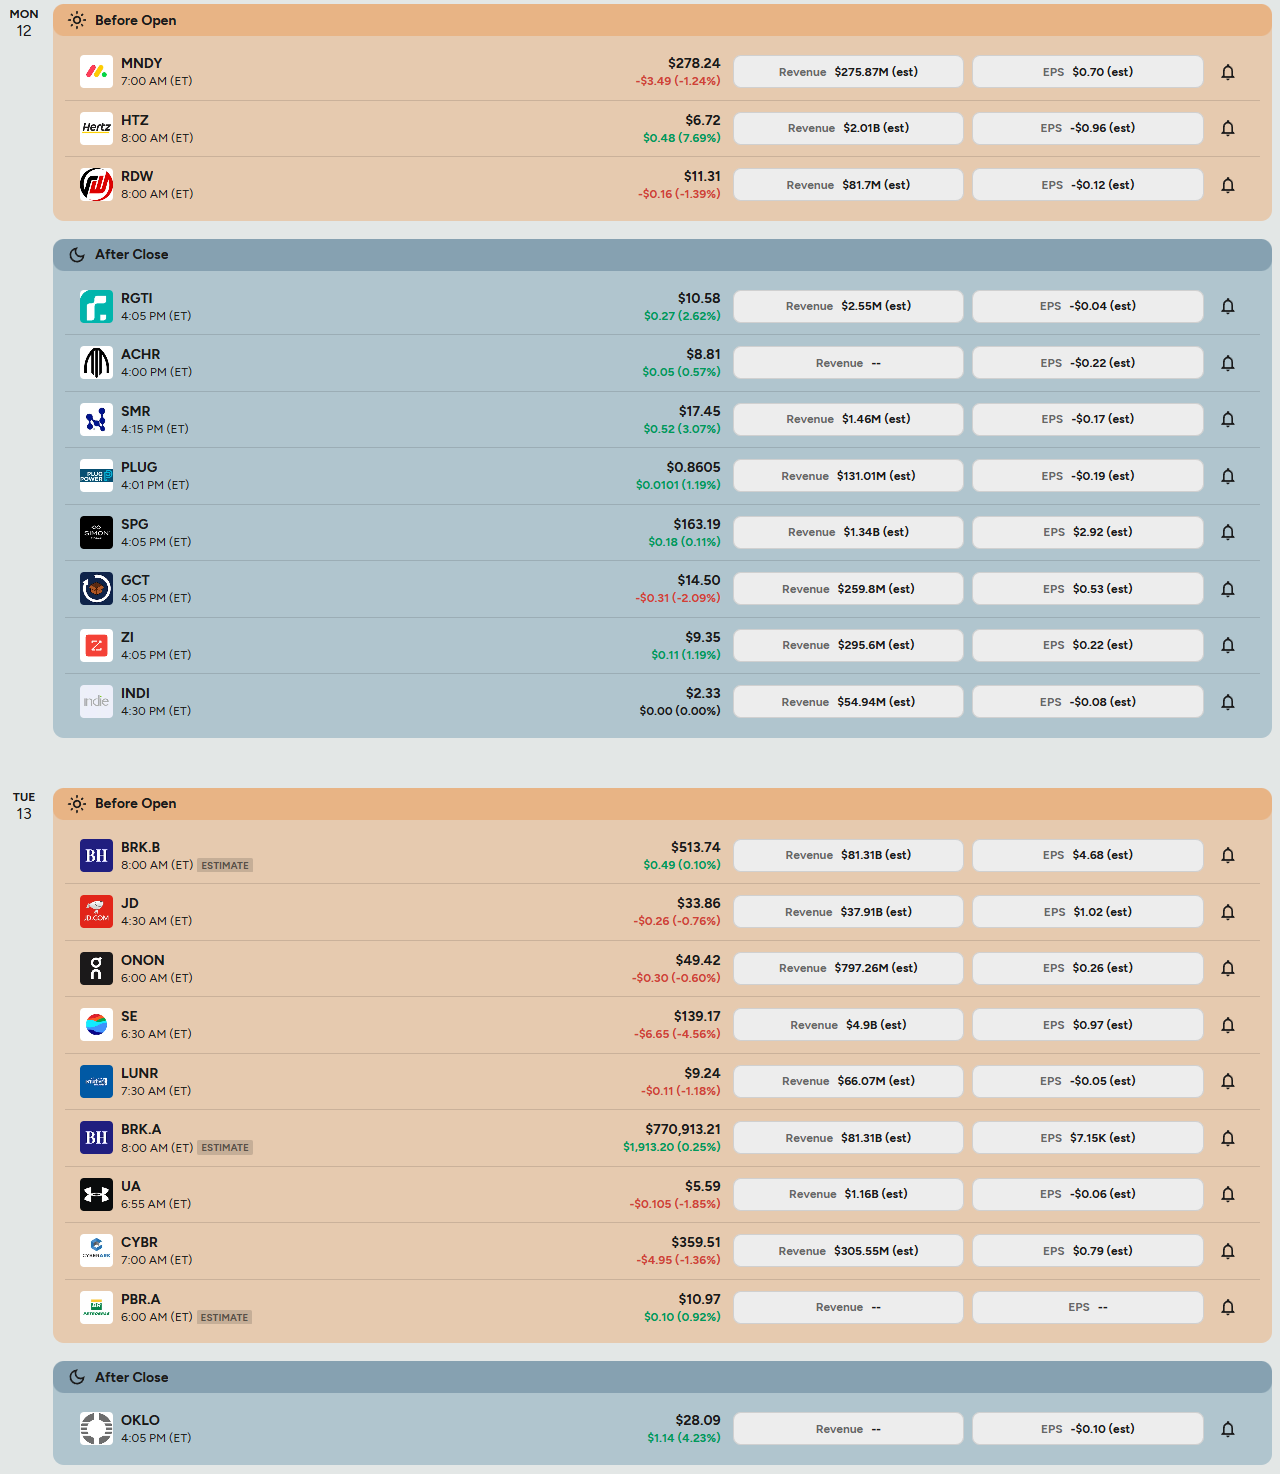
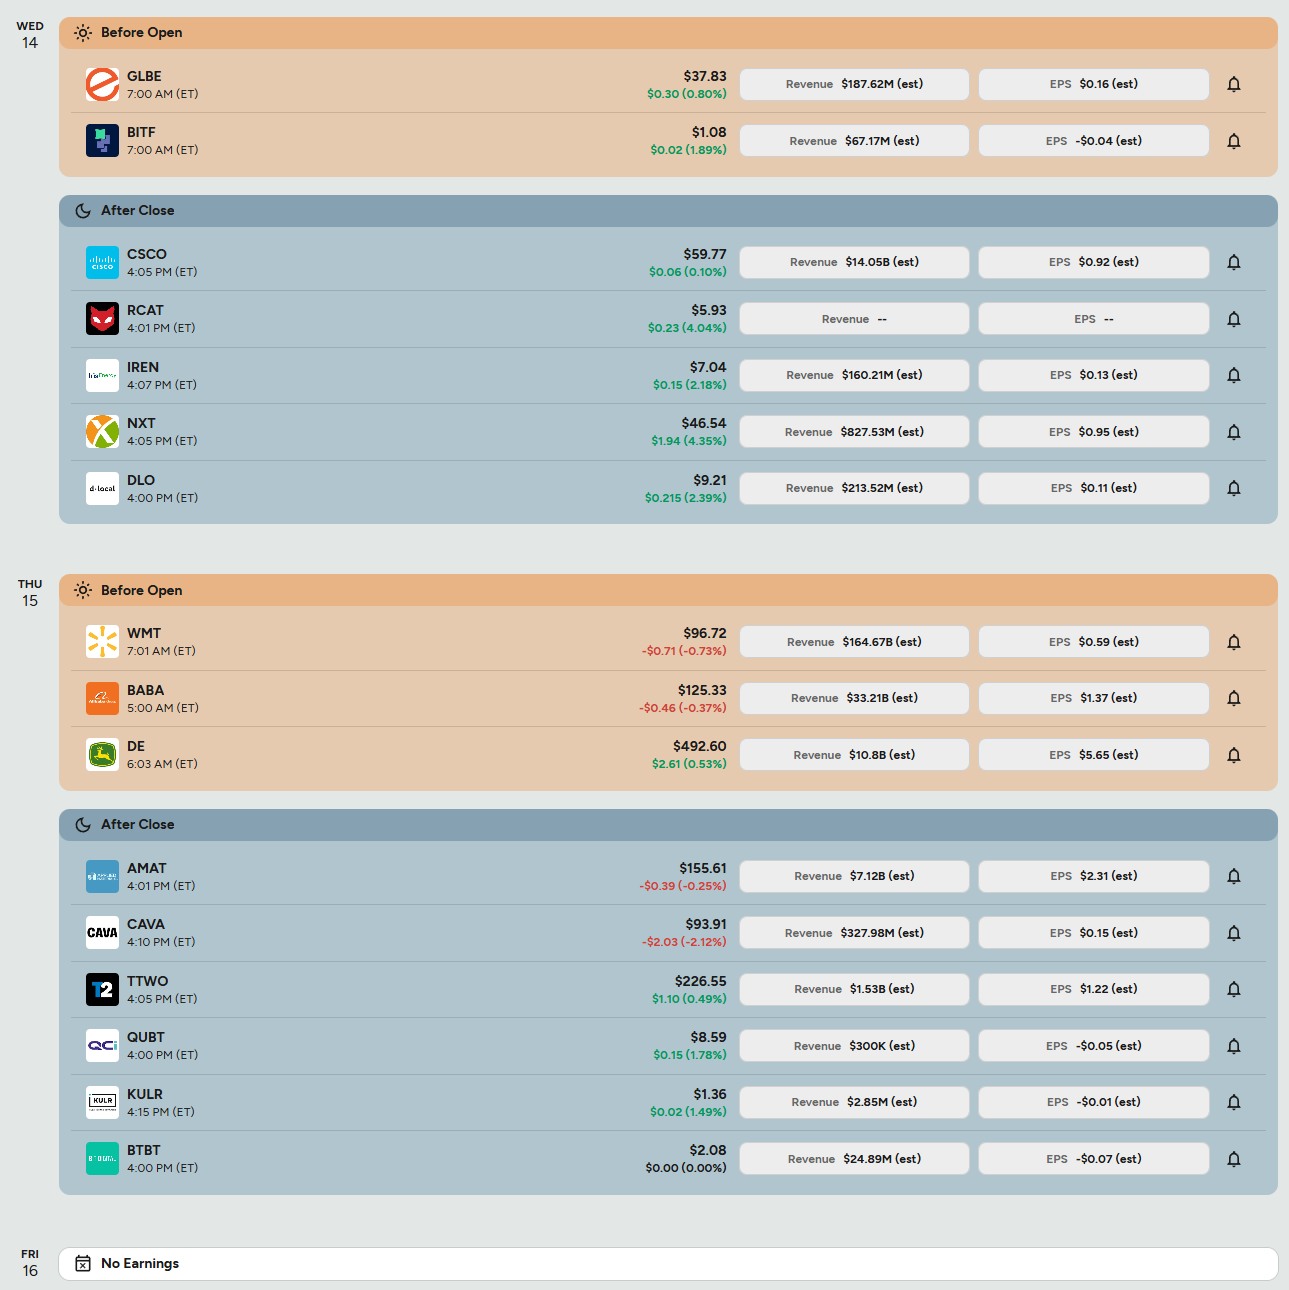
Anticipated Earnings By Day of Week

Institutional Order Flow
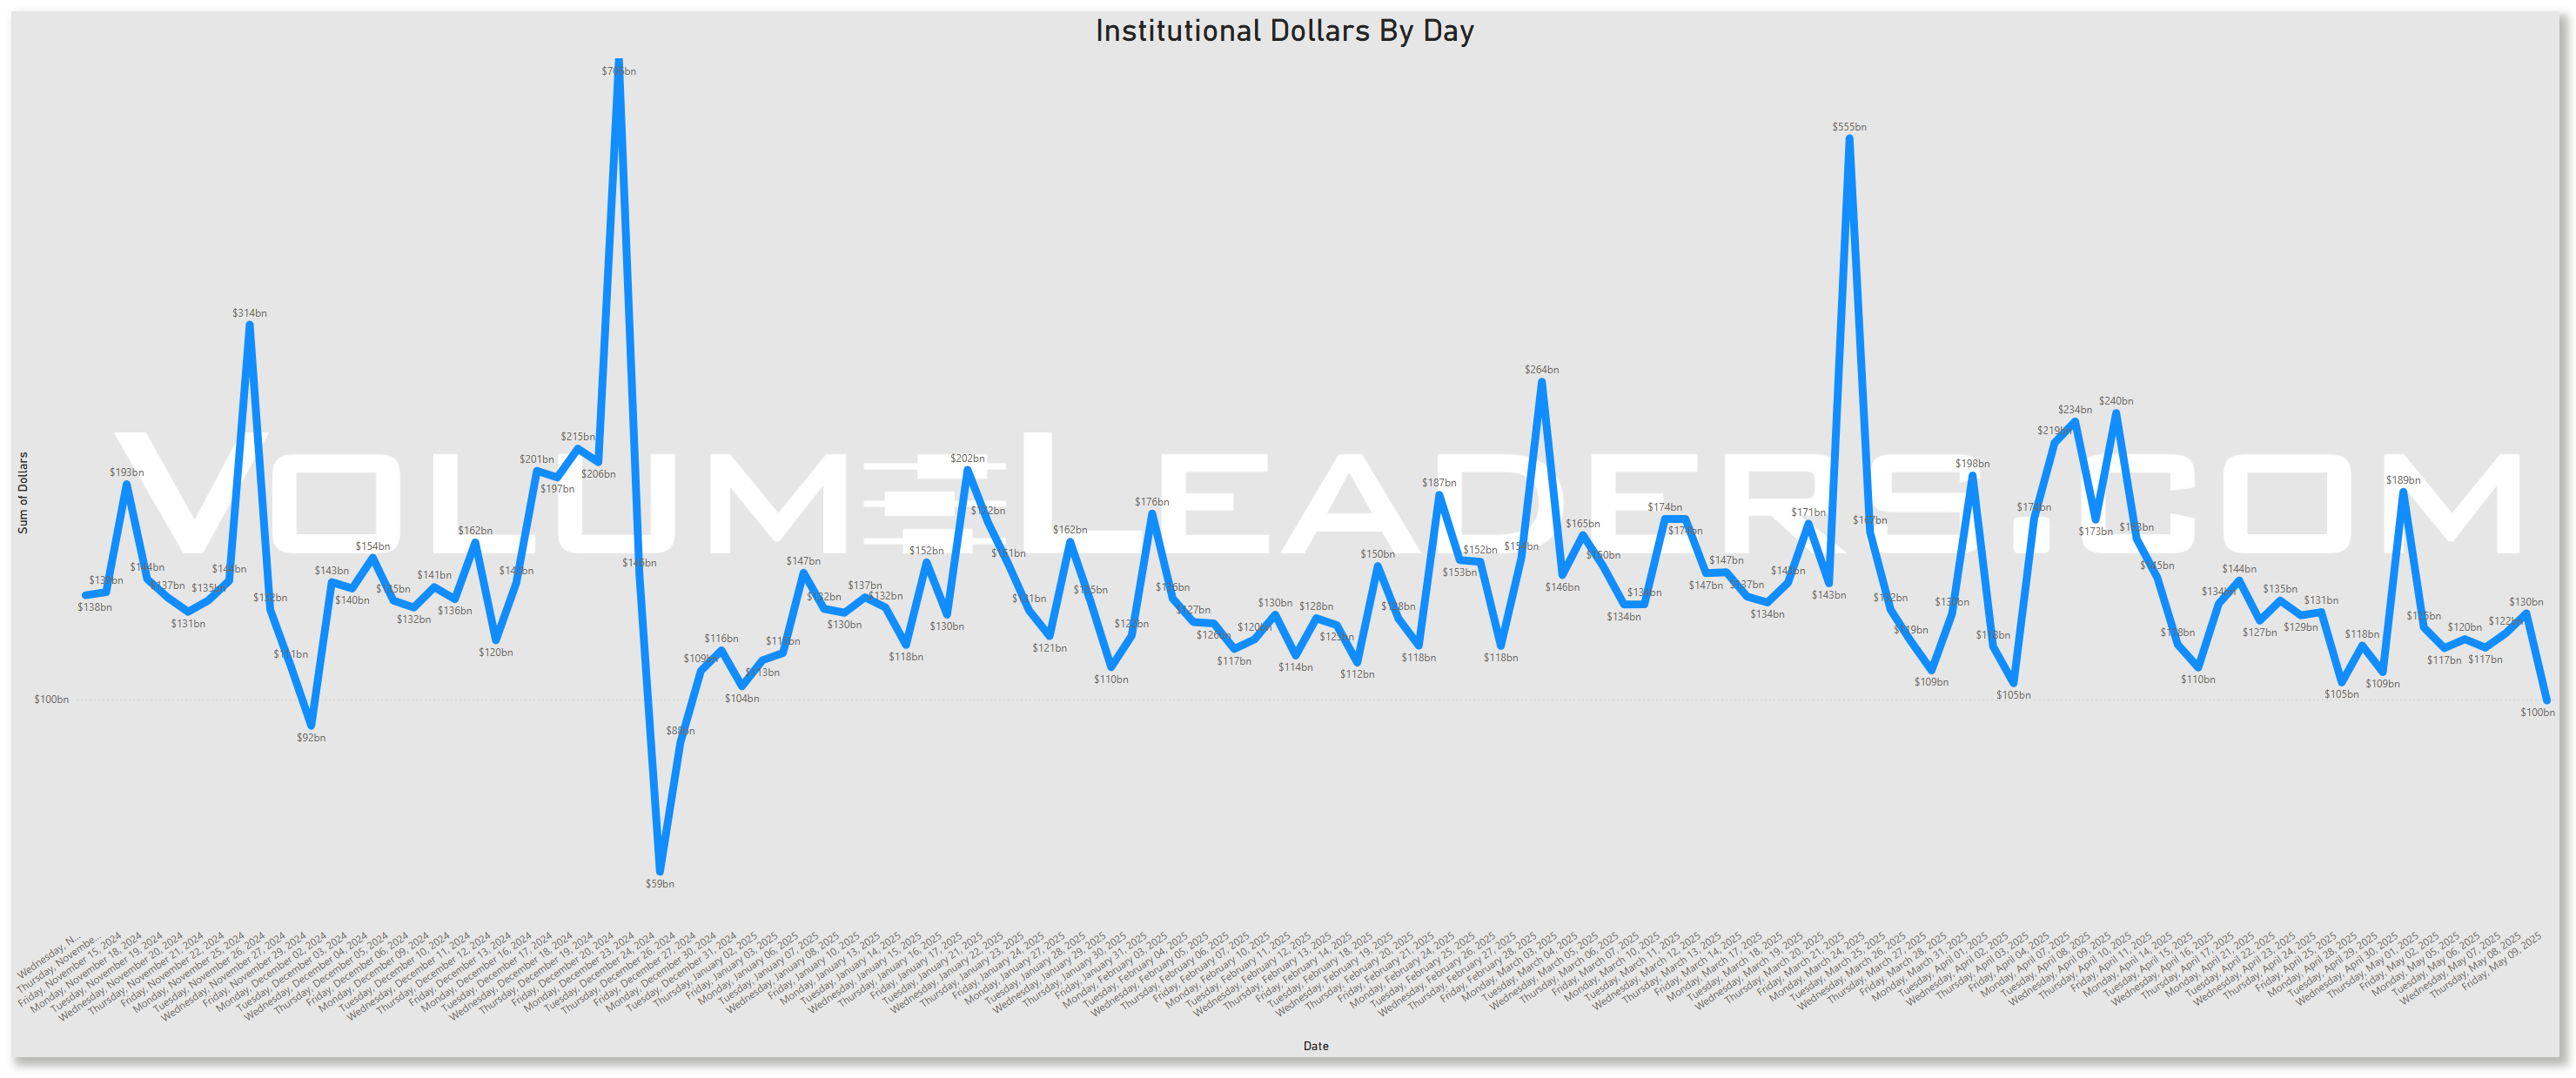
Rolling 90-Day Dollars By Day
This chart shows institutional activity by dollars by day on a rolling 1-year basis. From a theoretical standpoint, examining a chart of daily institutional dollar activity over the course of a year can offer several insights and possible inferences, though all should be approached with caution since the data alone may not prove causality or confirm underlying reasons. Some potential takeaways include:
Event-Driven Behavior:
Sharp, singular spikes on certain days might correlate with major market-moving events. These could include central bank policy announcements, significant geopolitical news, sudden macroeconomic data releases (like employment reports or GDP data), earnings seasons for large-cap companies, or unexpected shocks (e.g., mergers, acquisitions, regulatory changes).Liquidity Dynamics:
Institutions often concentrate large trades on days with higher expected liquidity. For instance, heightened activity might coincide with index reconstitutions, option expiration dates, or the days leading up to or following a major index rebalance, when large amounts of capital shift hands simultaneously.Risk Management and Hedging Activity:
Institutions may significantly adjust their exposures on days that are critical from a risk management perspective. Large spikes can occur if hedge funds, pension funds, or asset managers are rolling over futures contracts, initiating or closing out large hedges, or reacting to volatility triggers.Market Sentiment Indicators:
While the data is purely transactional, the sheer volume of institutional involvement on certain days might indirectly hint at changing sentiment or strategic shifts.
In essence, a chart like this can lead you to hypothesize that institutional trading volumes are not constant or random but rather influenced by a mix of predictable calendar effects, major market events, liquidity considerations, risk management decisions, and strategic allocation shifts.
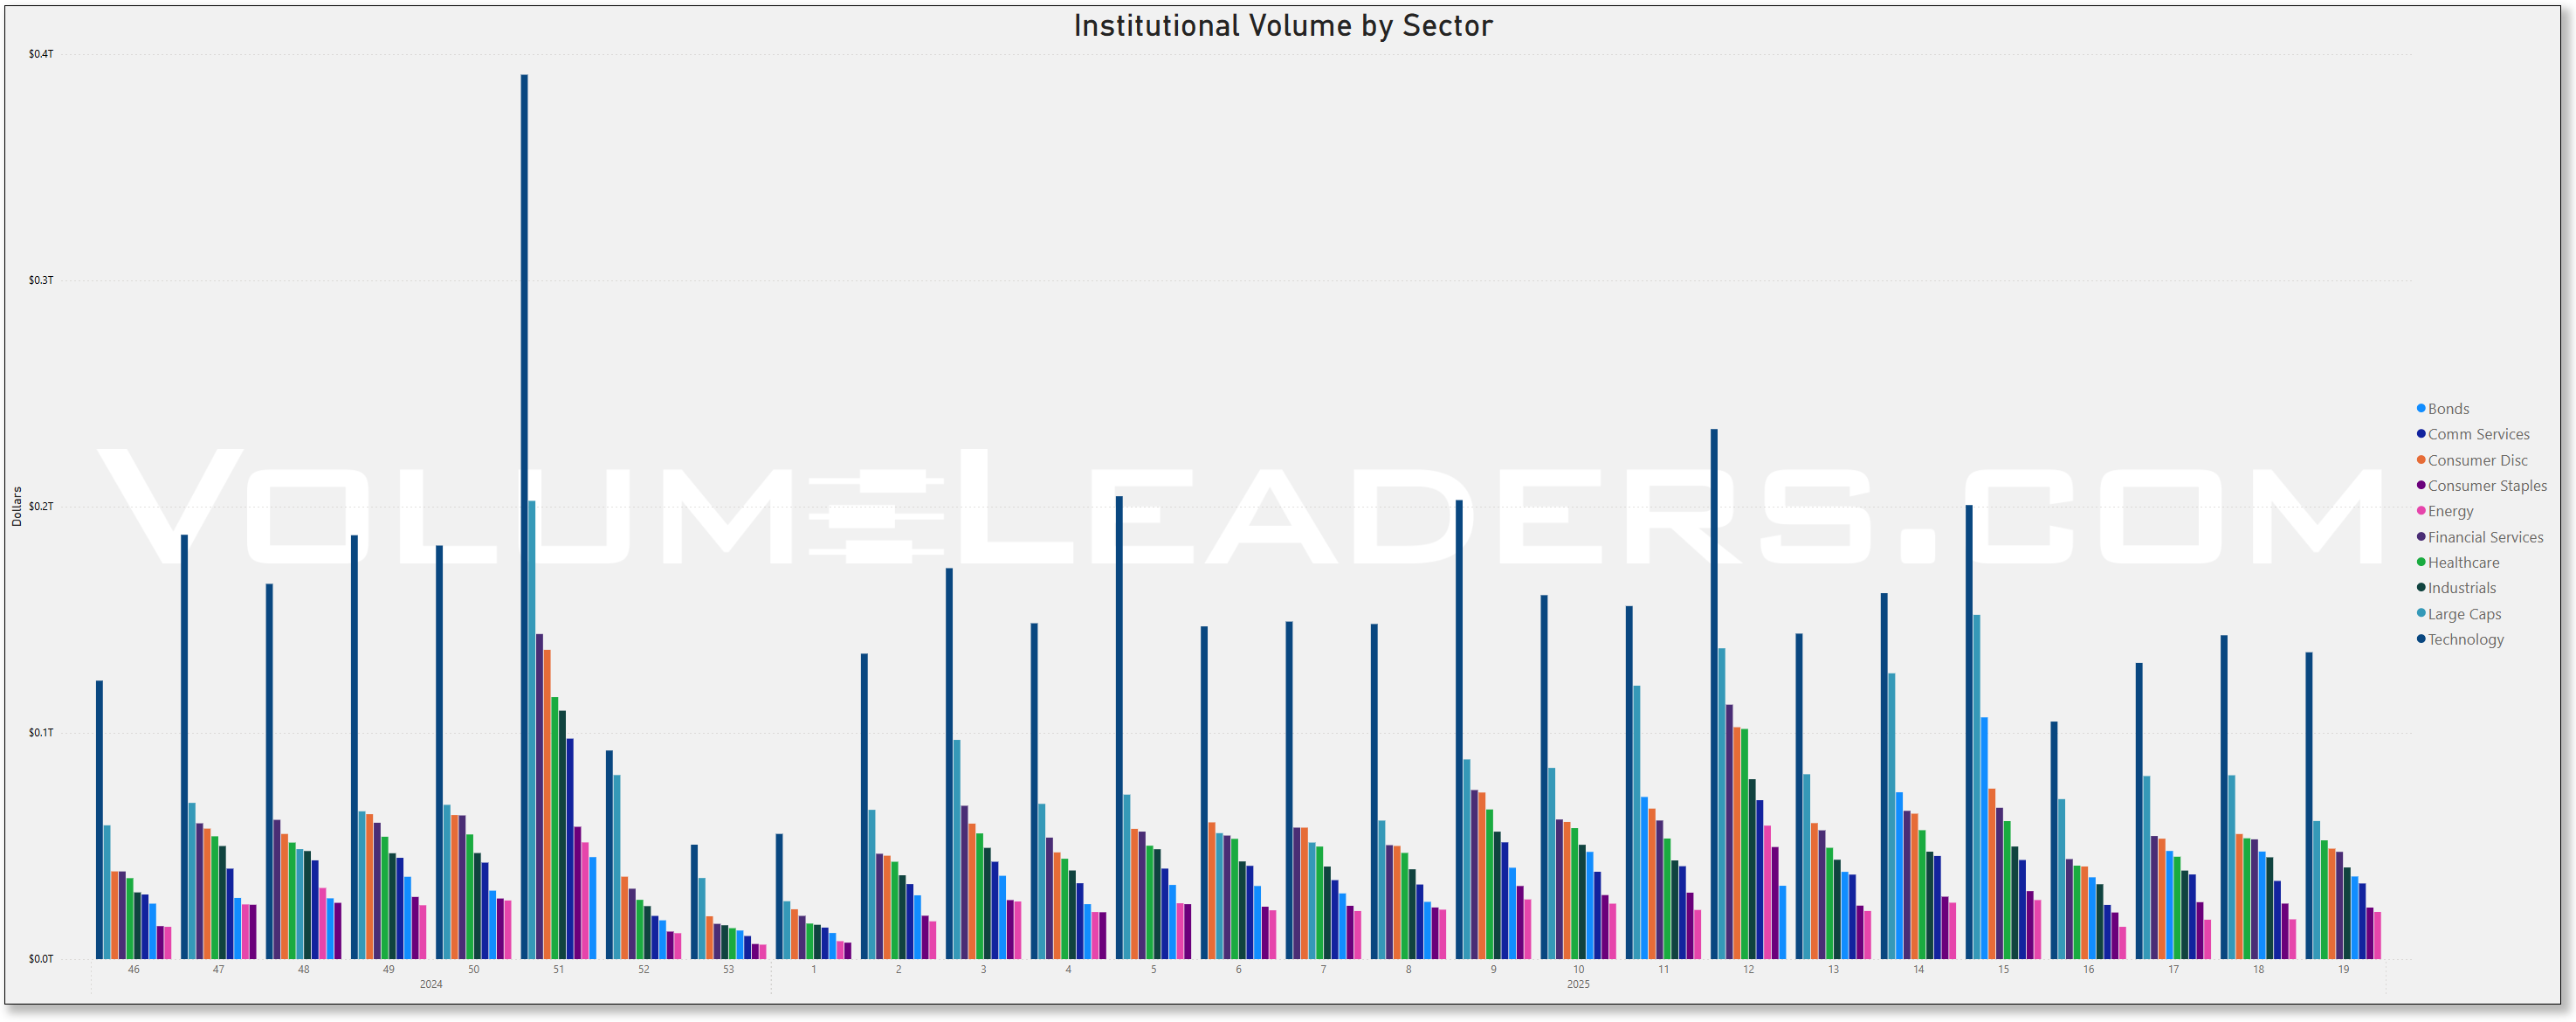
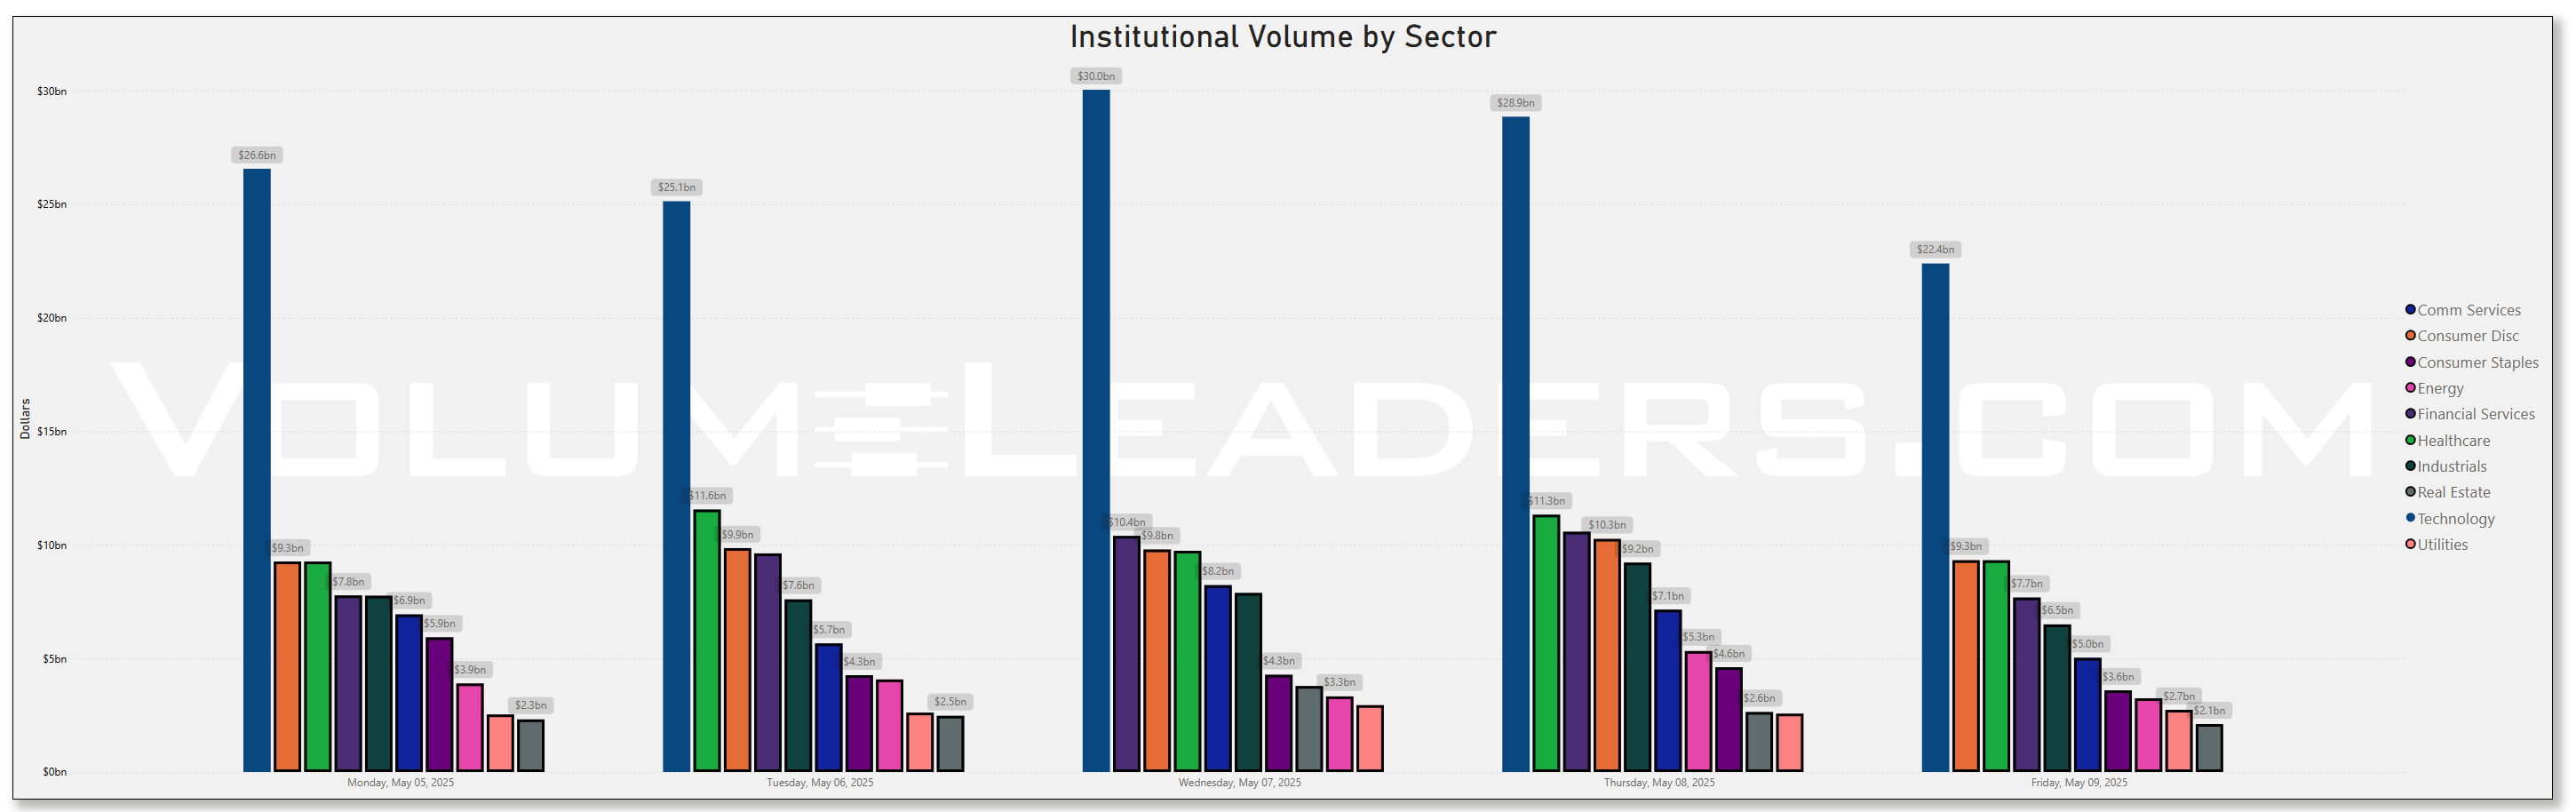
Top Institutional Order Flow By Sector By Week For The Past 90-Days
Top Institutional Order Flow In Equities
These are incredibly important charts to watch as they contains lots of nuanced suggestions at a thematic level. Watch these charts closely week-to-week to stay informed about where institutional money is flowing, adjust your strategies based on momentum, align your portfolio with macroeconomic and market trends, and manage risks more effectively by avoiding sectors losing institutional favor.
Sector Rotation Insights: The chart highlights which sectors are attracting institutional activity and which are losing favor. Institutions often lead market trends, so tracking shifts in their focus can indicate sector rotations.
Sentiment Analysis: The level of institutional activity reflects confidence in specific sectors. Rising activity in traditionally defensive sectors (e.g., healthcare, utilities) may indicate caution, while a surge in growth sectors (e.g., technology, consumer discretionary) could suggest optimism.
Emerging Trends: Sudden spikes in a previously overlooked sector, like industrials or consumer staples, might hint at emerging opportunities or structural shifts.
Macro Themes: Changes in sector activity often align with broader macroeconomic themes like inflation, interest rates, or geopolitical events. For instance:
Increased activity in energy might indicate concerns about oil supply or rising prices.
Growth in technology could align with innovations or favorable policies.
Risk Management: Declining institutional activity in a sector might signal weakening fundamentals or heightened risks.
Spotting Overcrowding: Excessive activity in a single sector over multiple weeks may suggest overcrowding, which could lead to heightened volatility if institutions begin to exit.
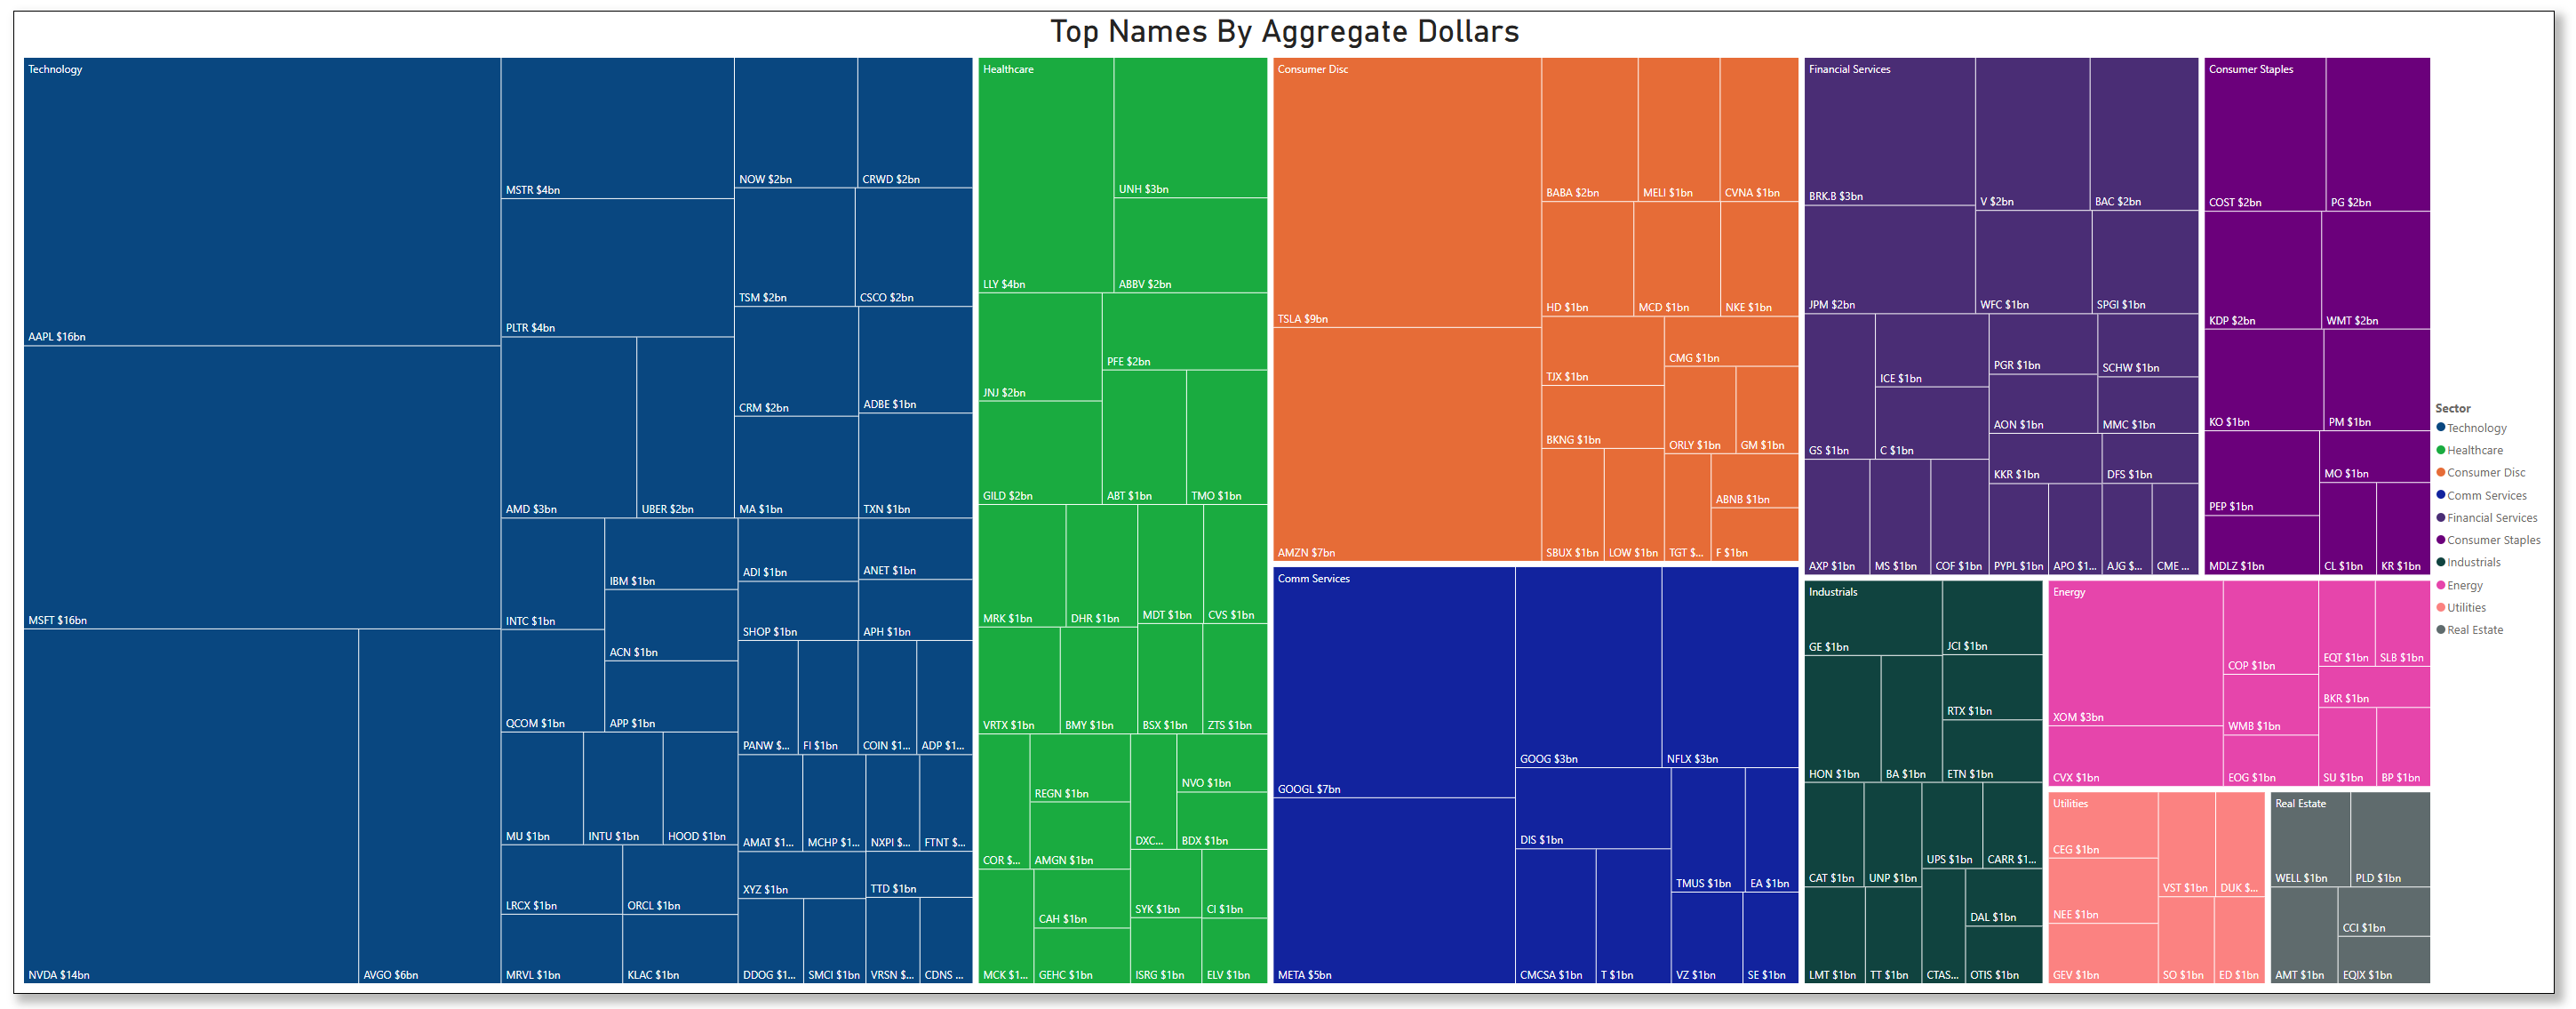
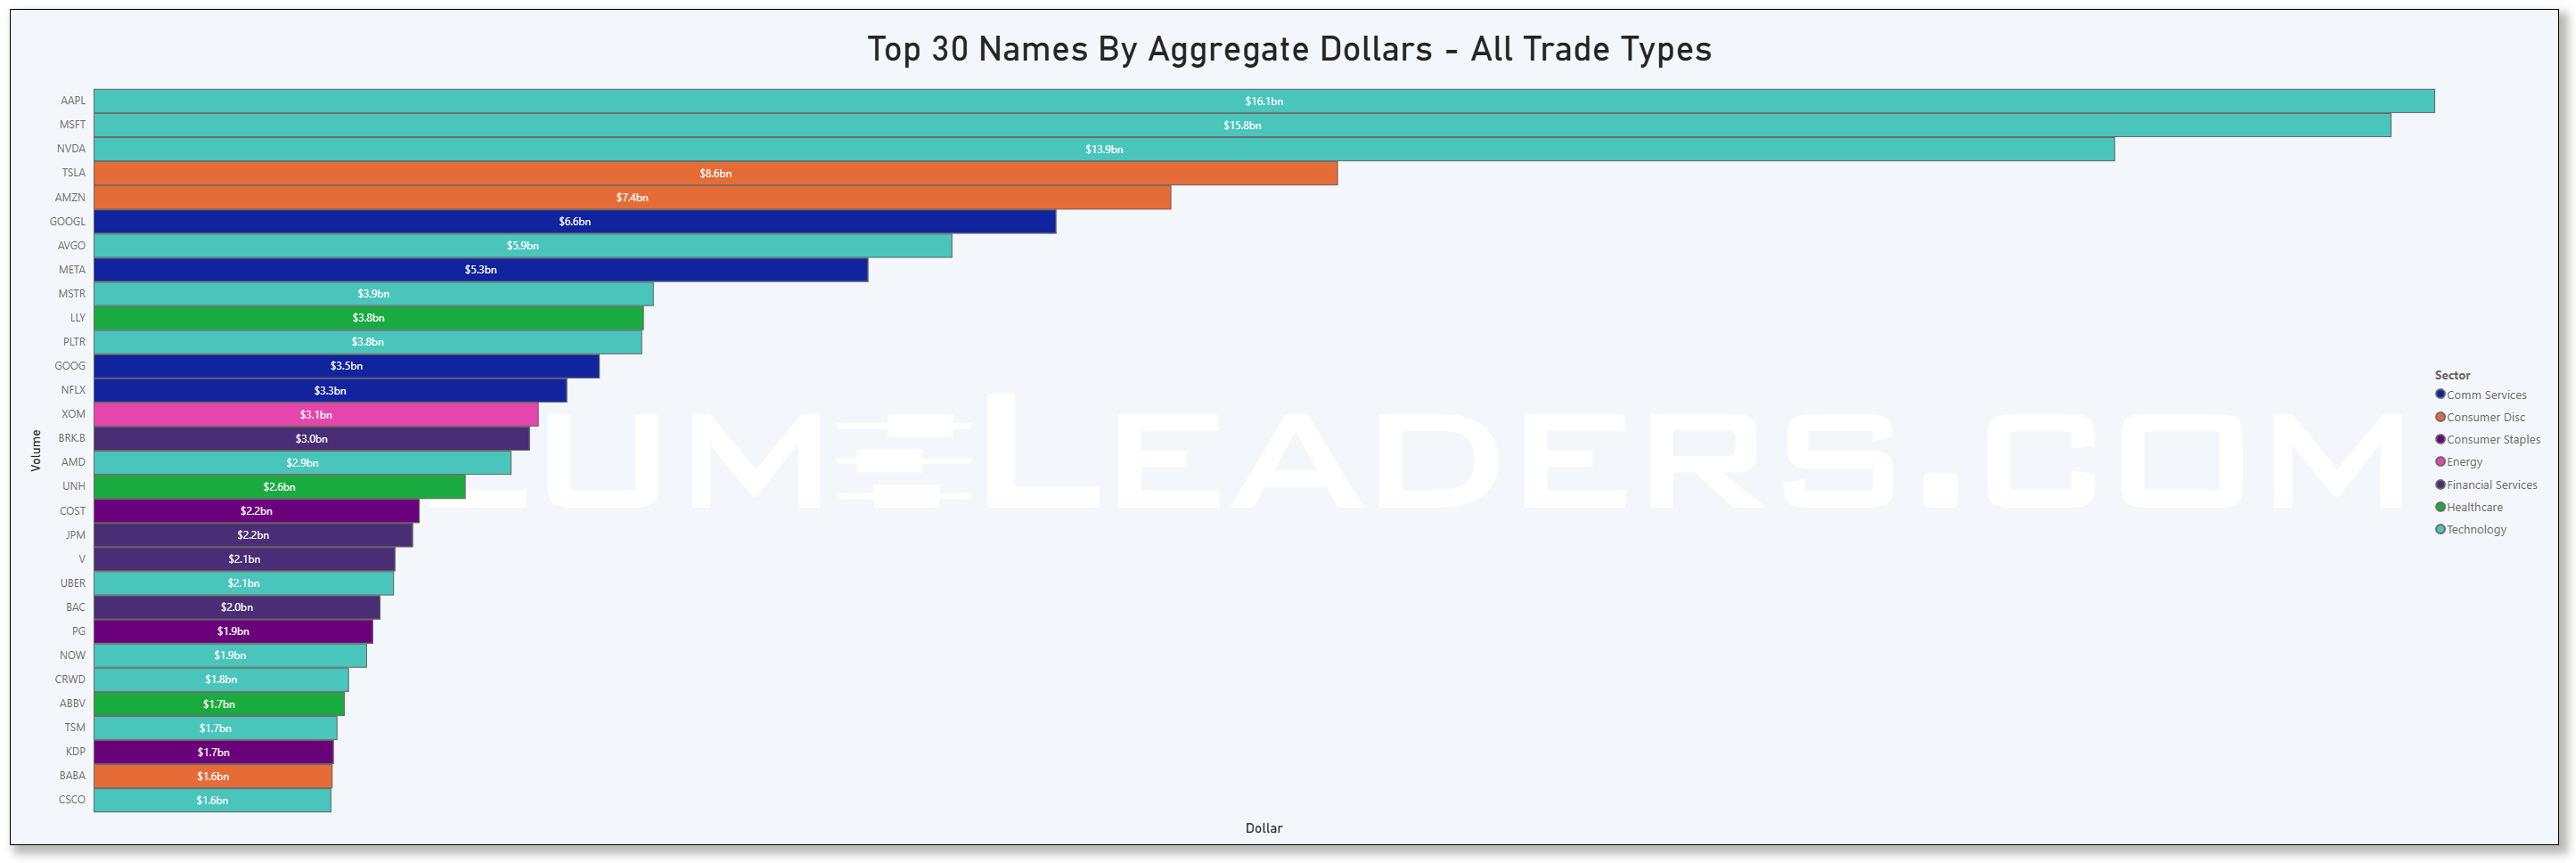
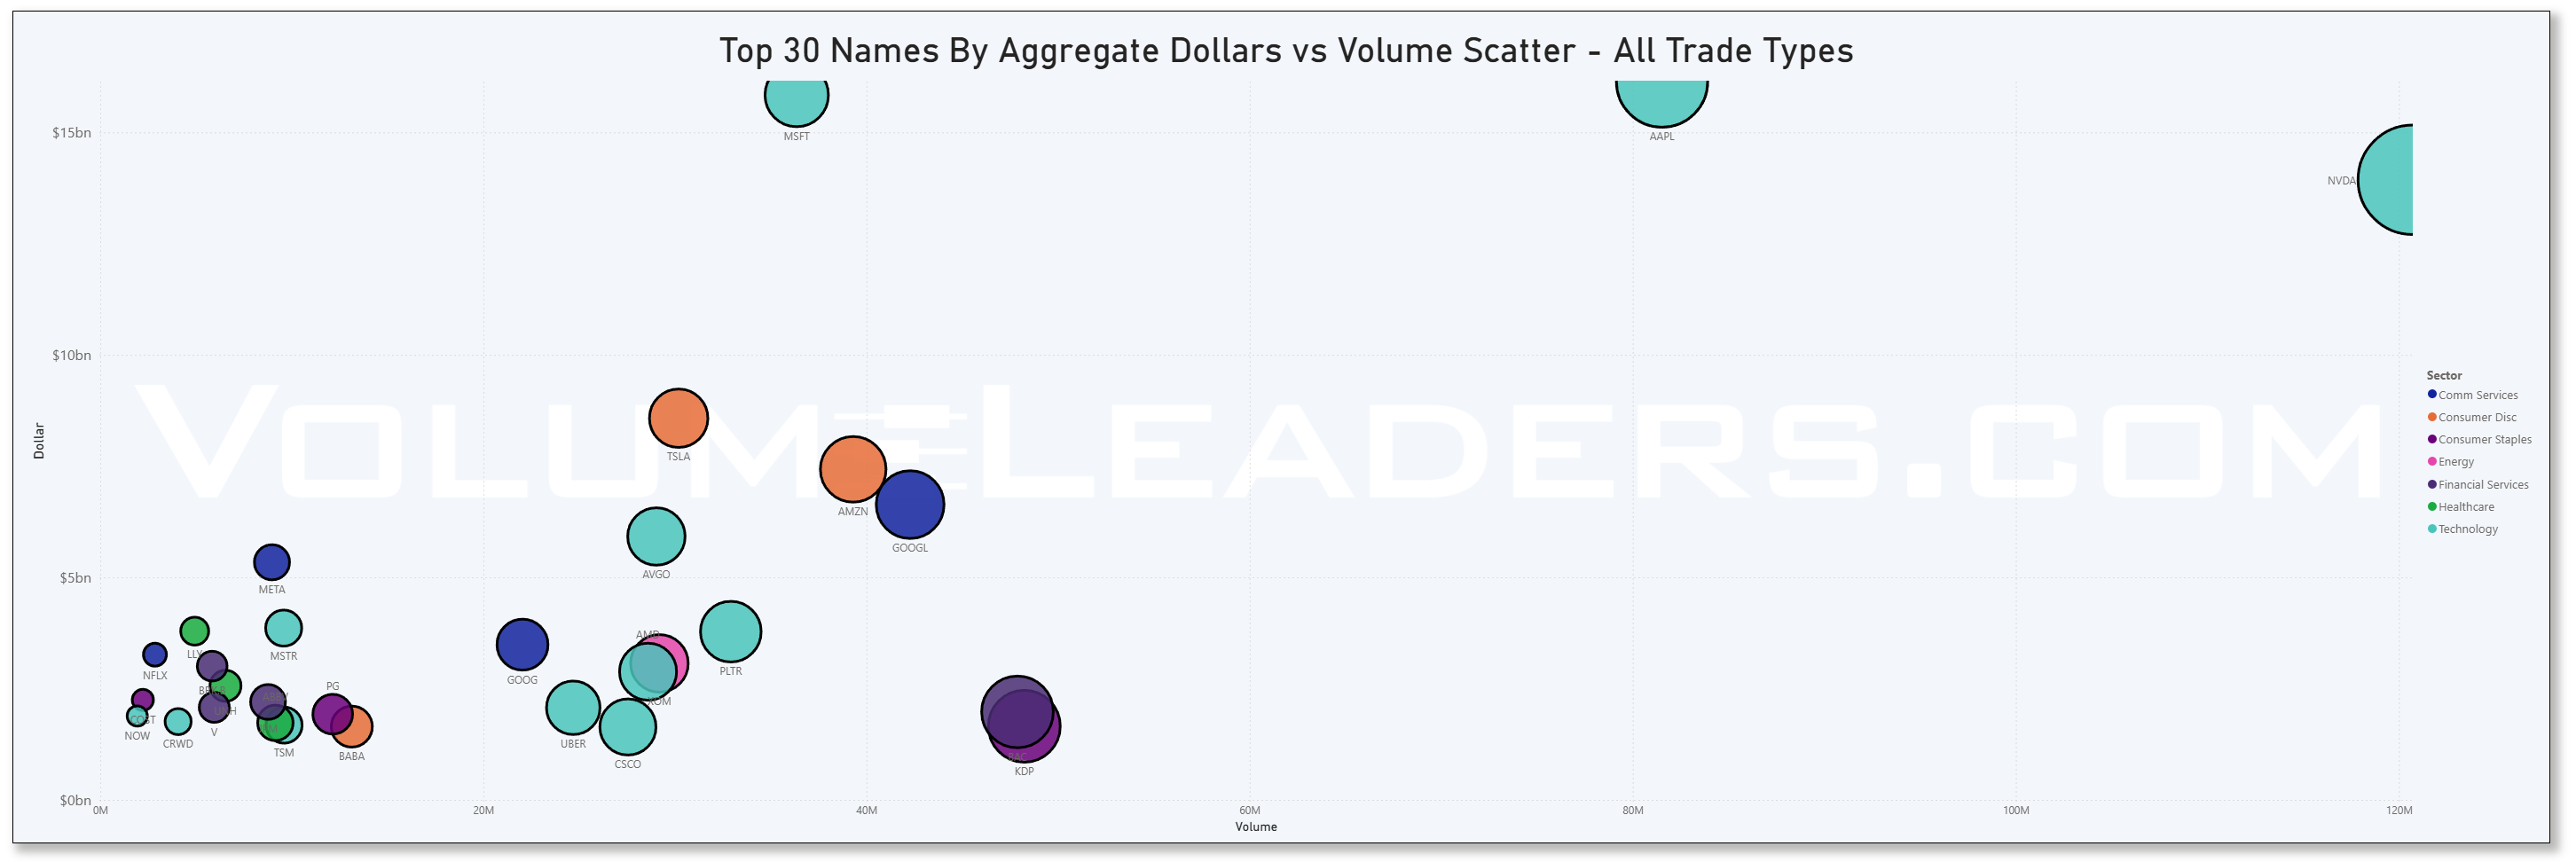
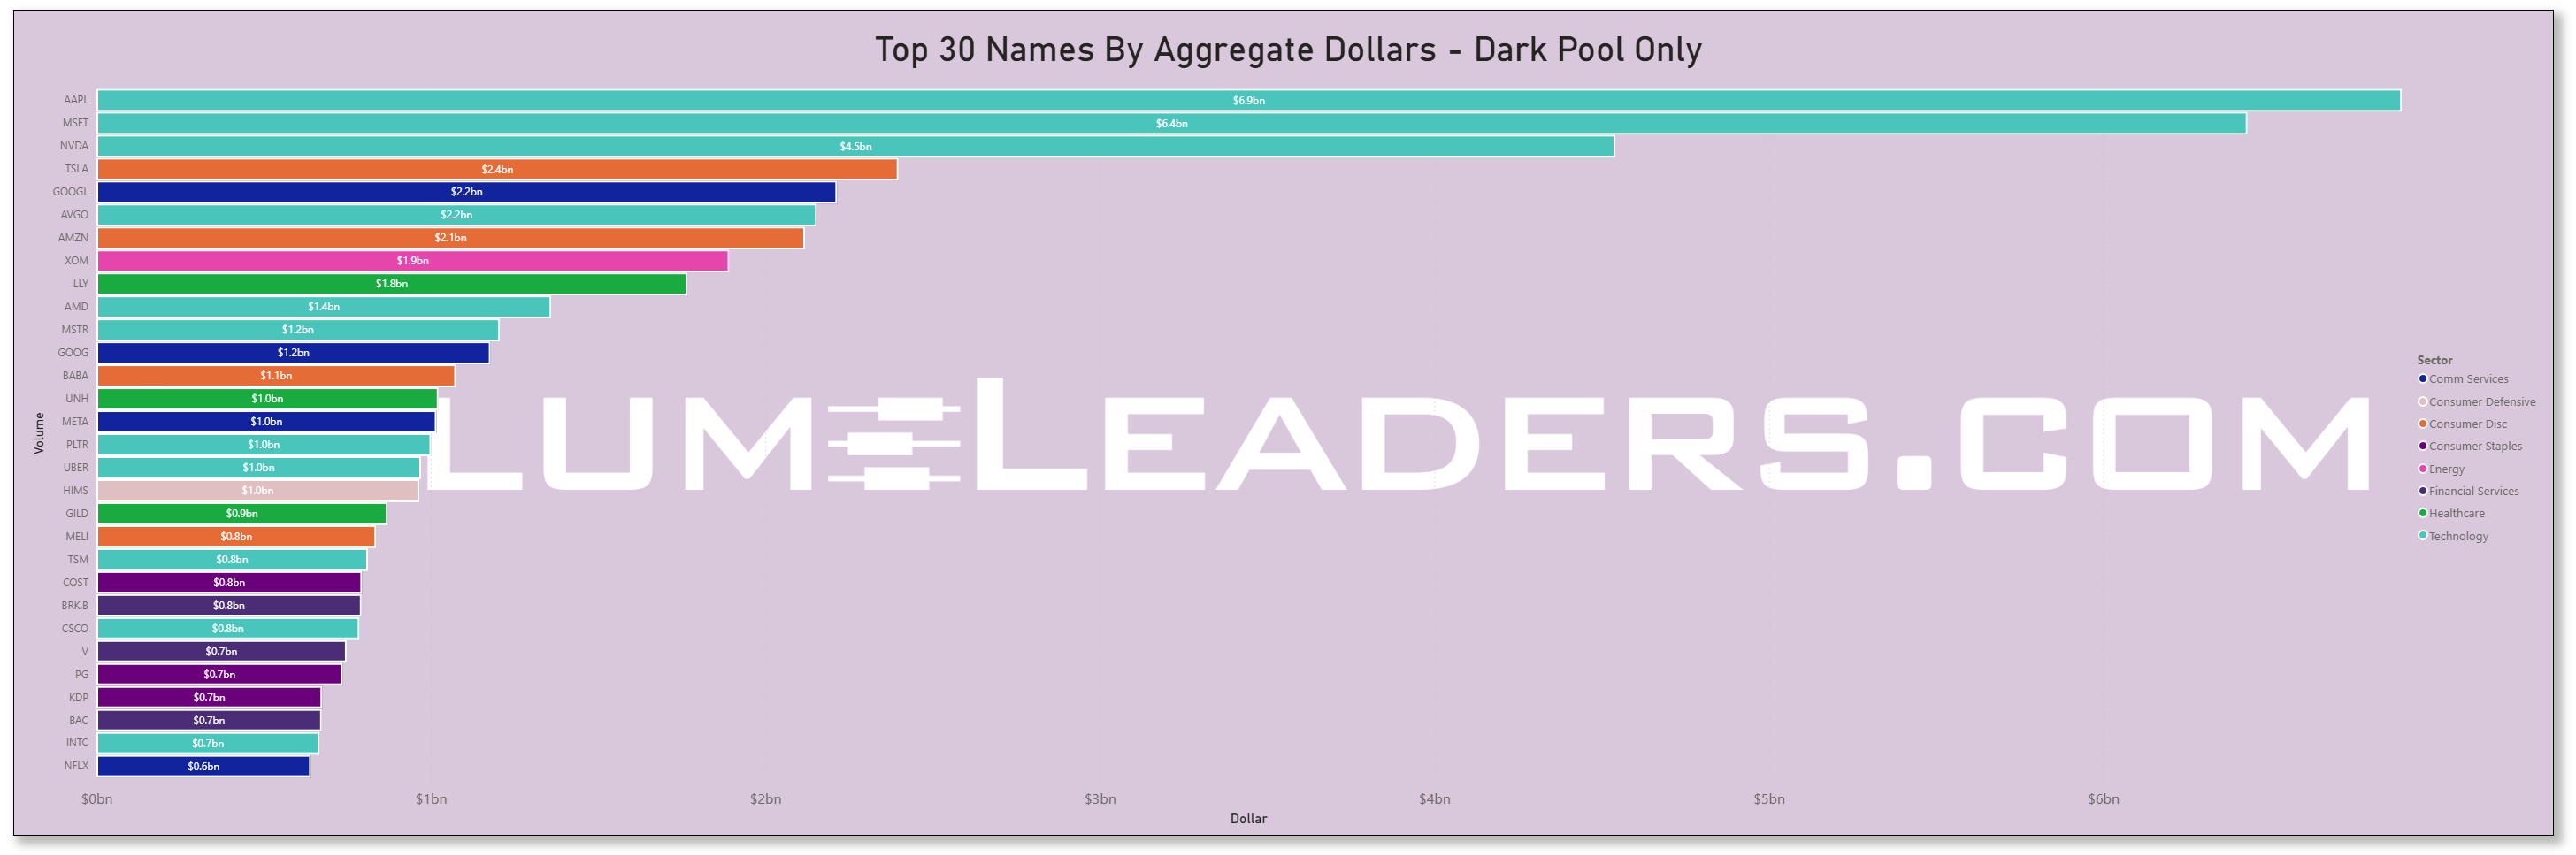
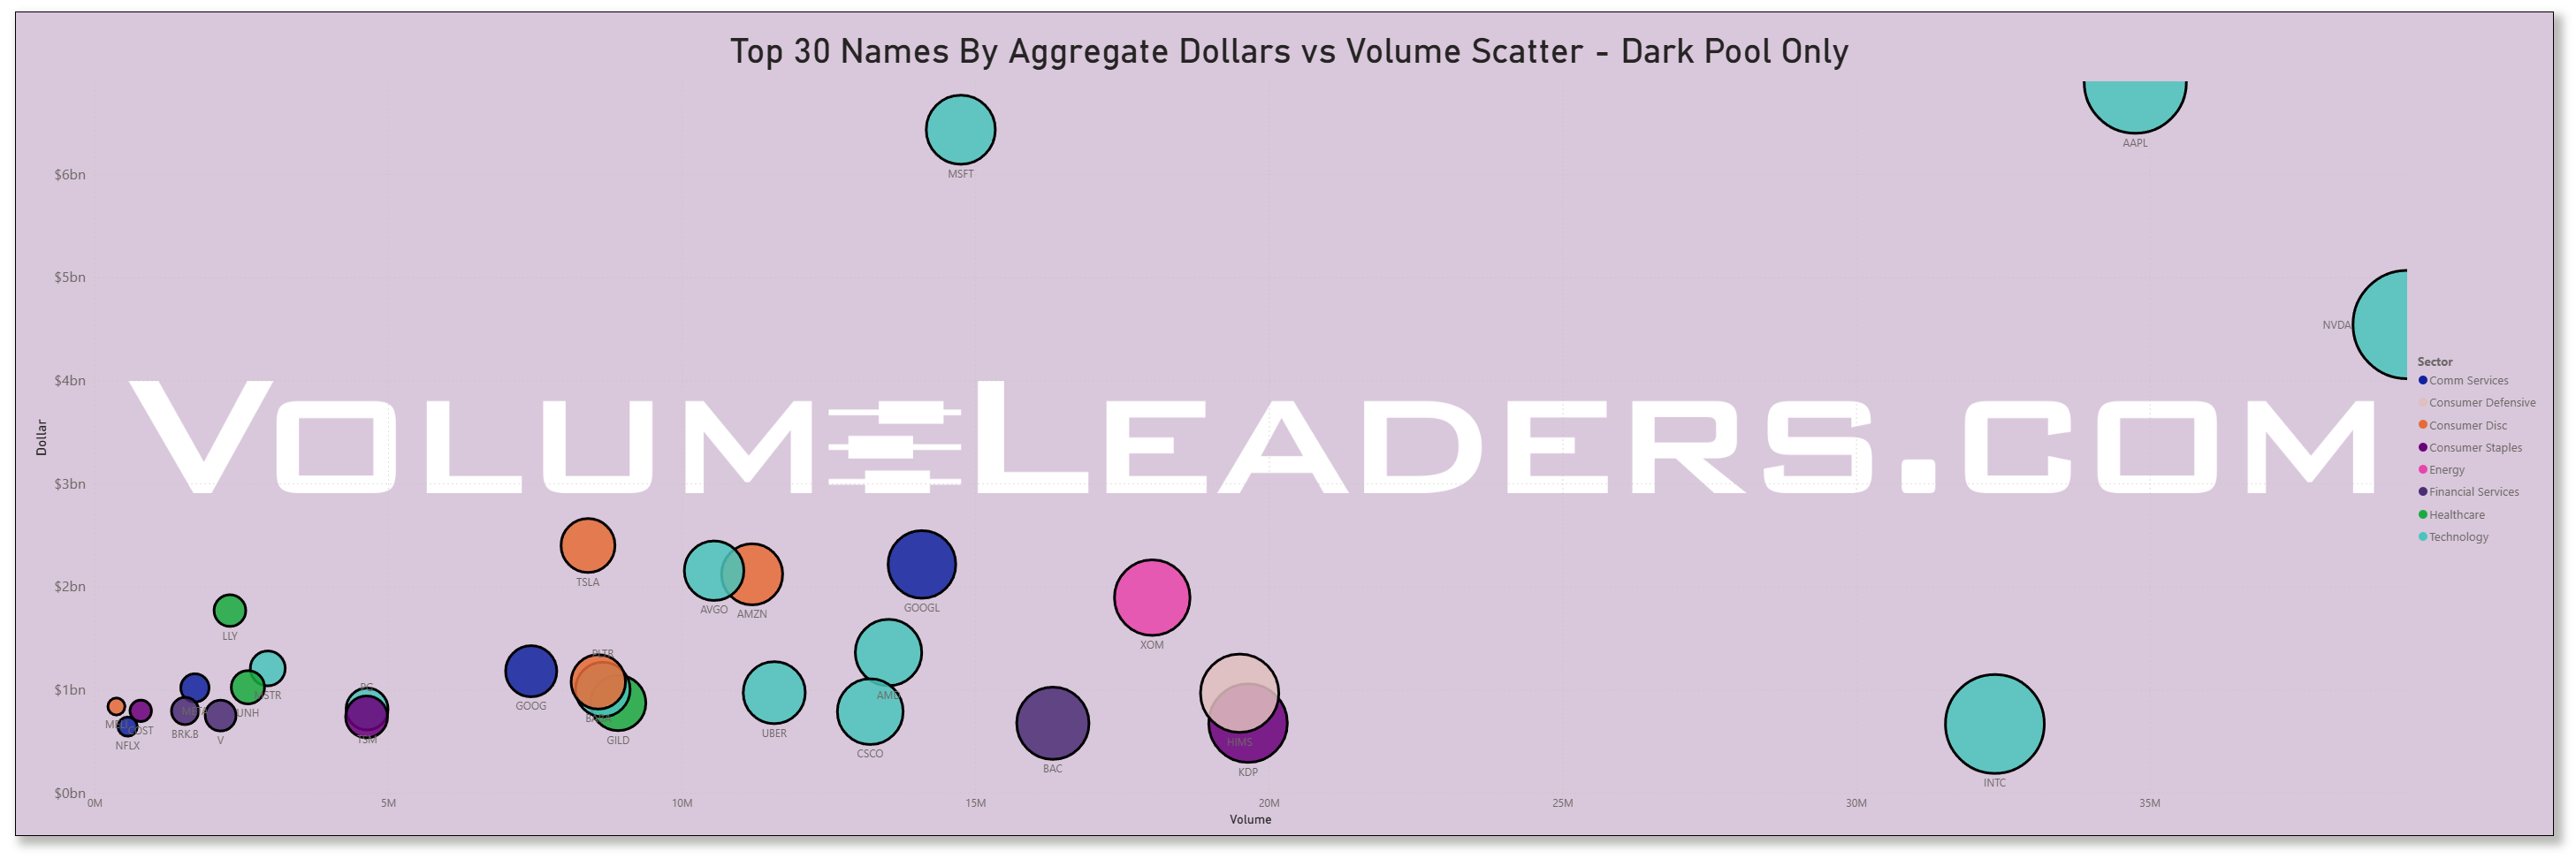
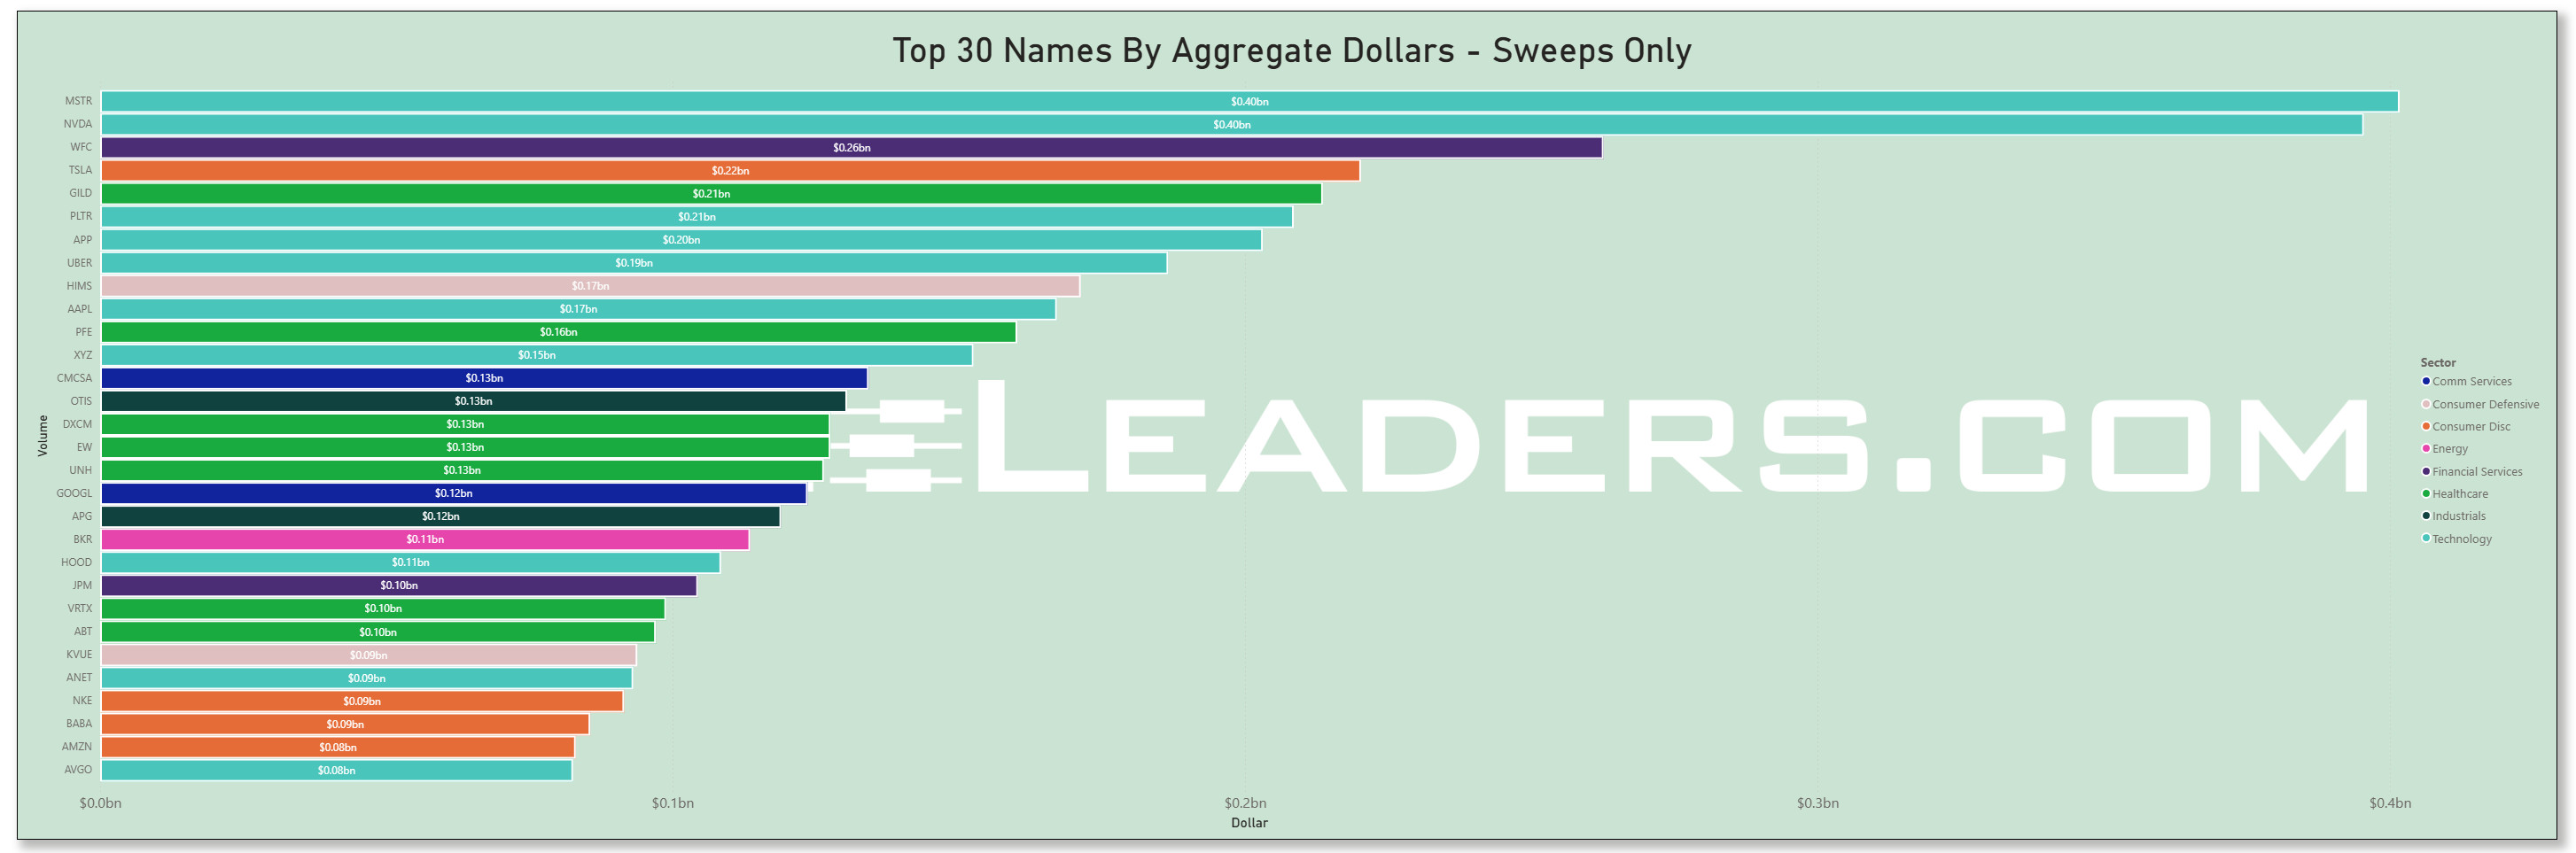
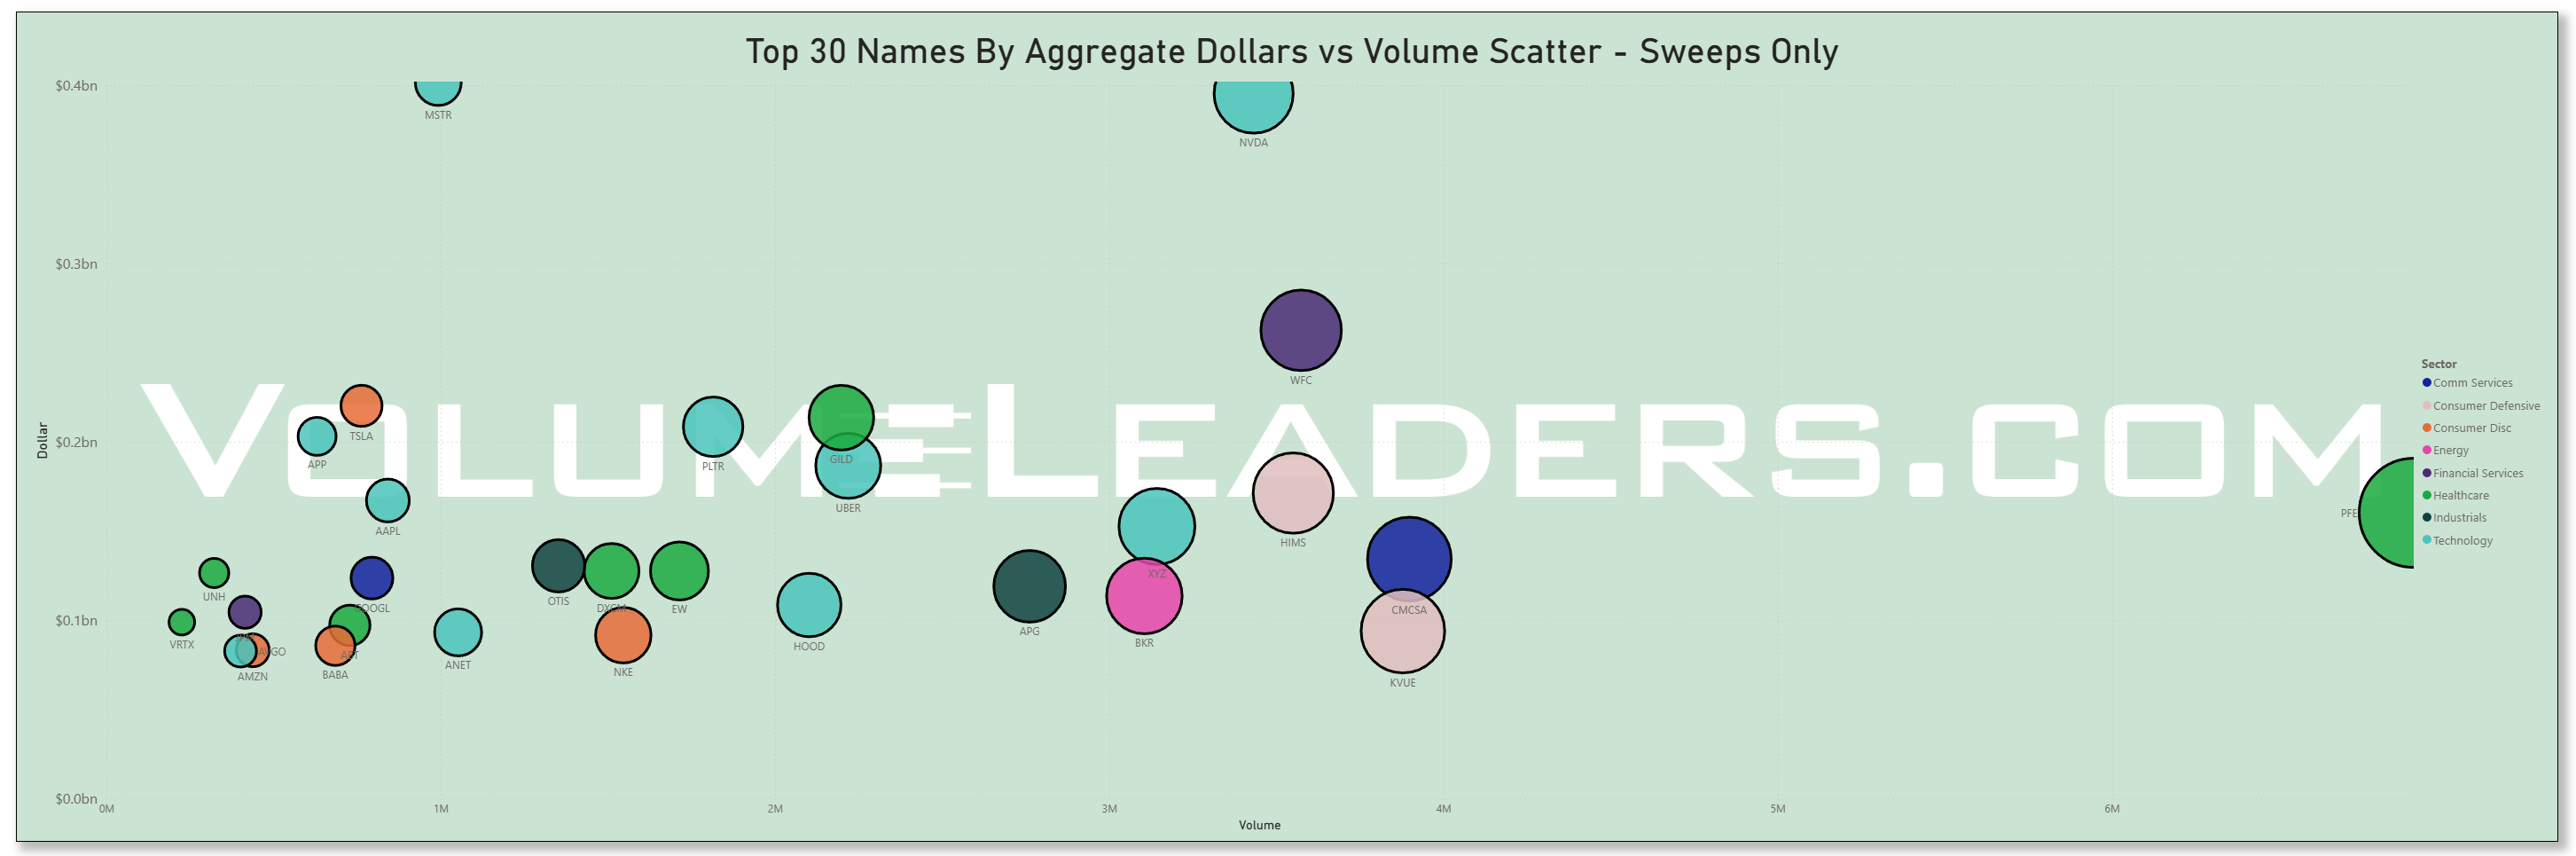
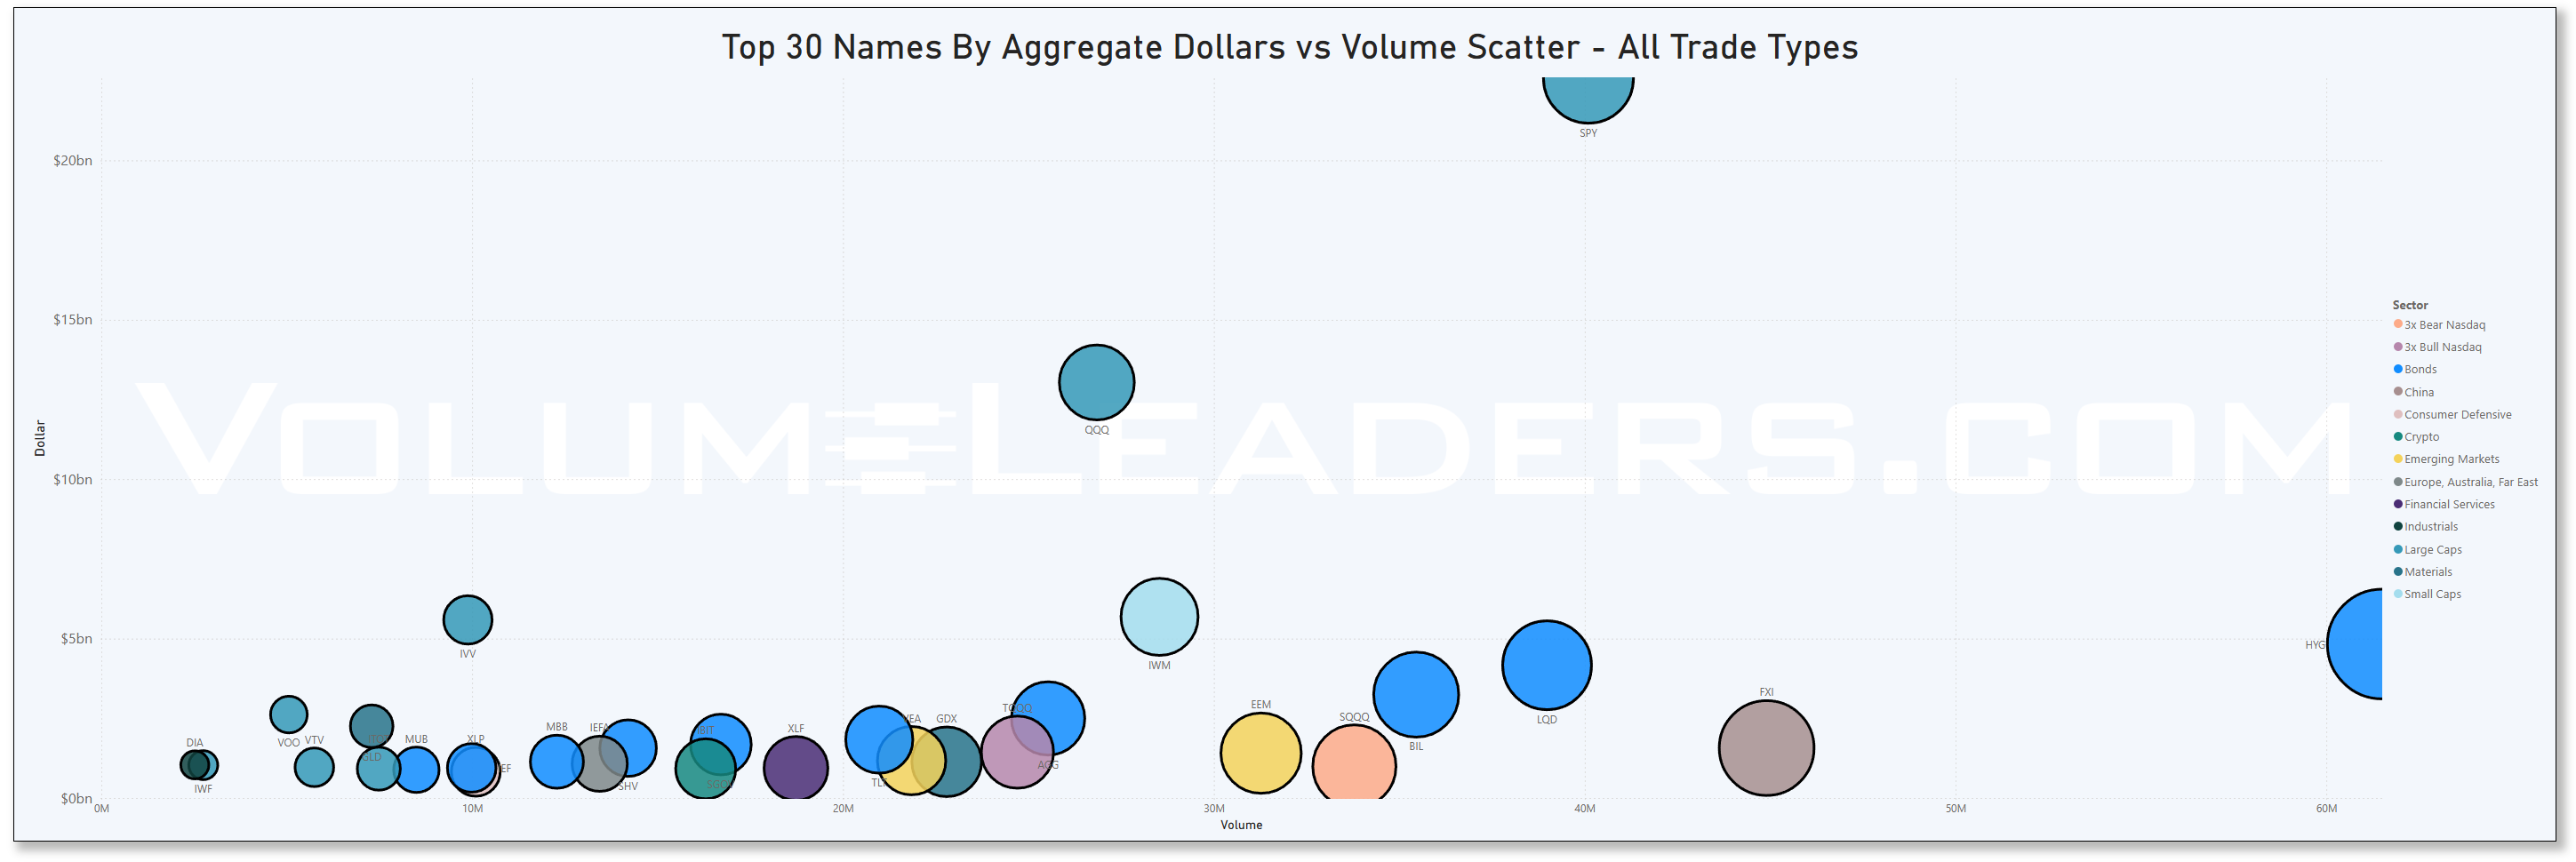
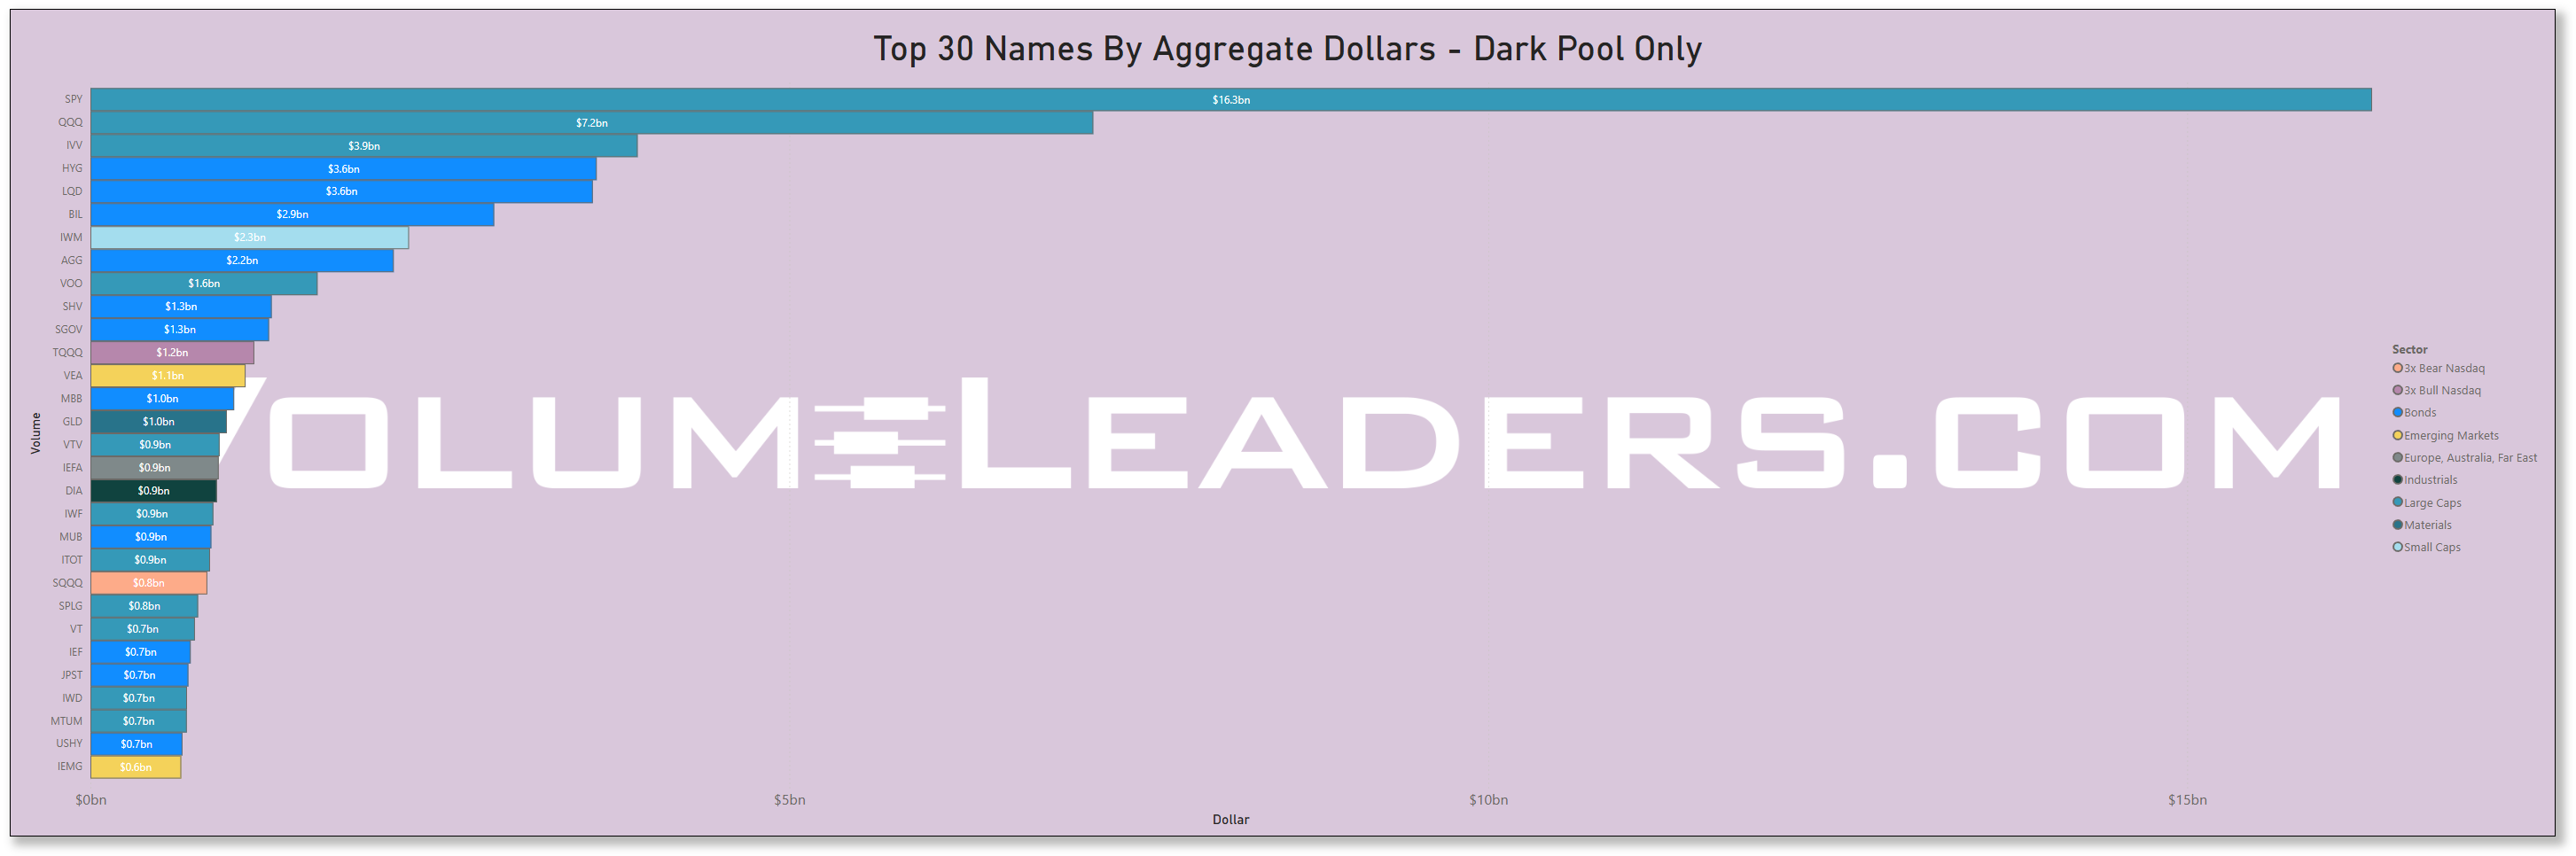
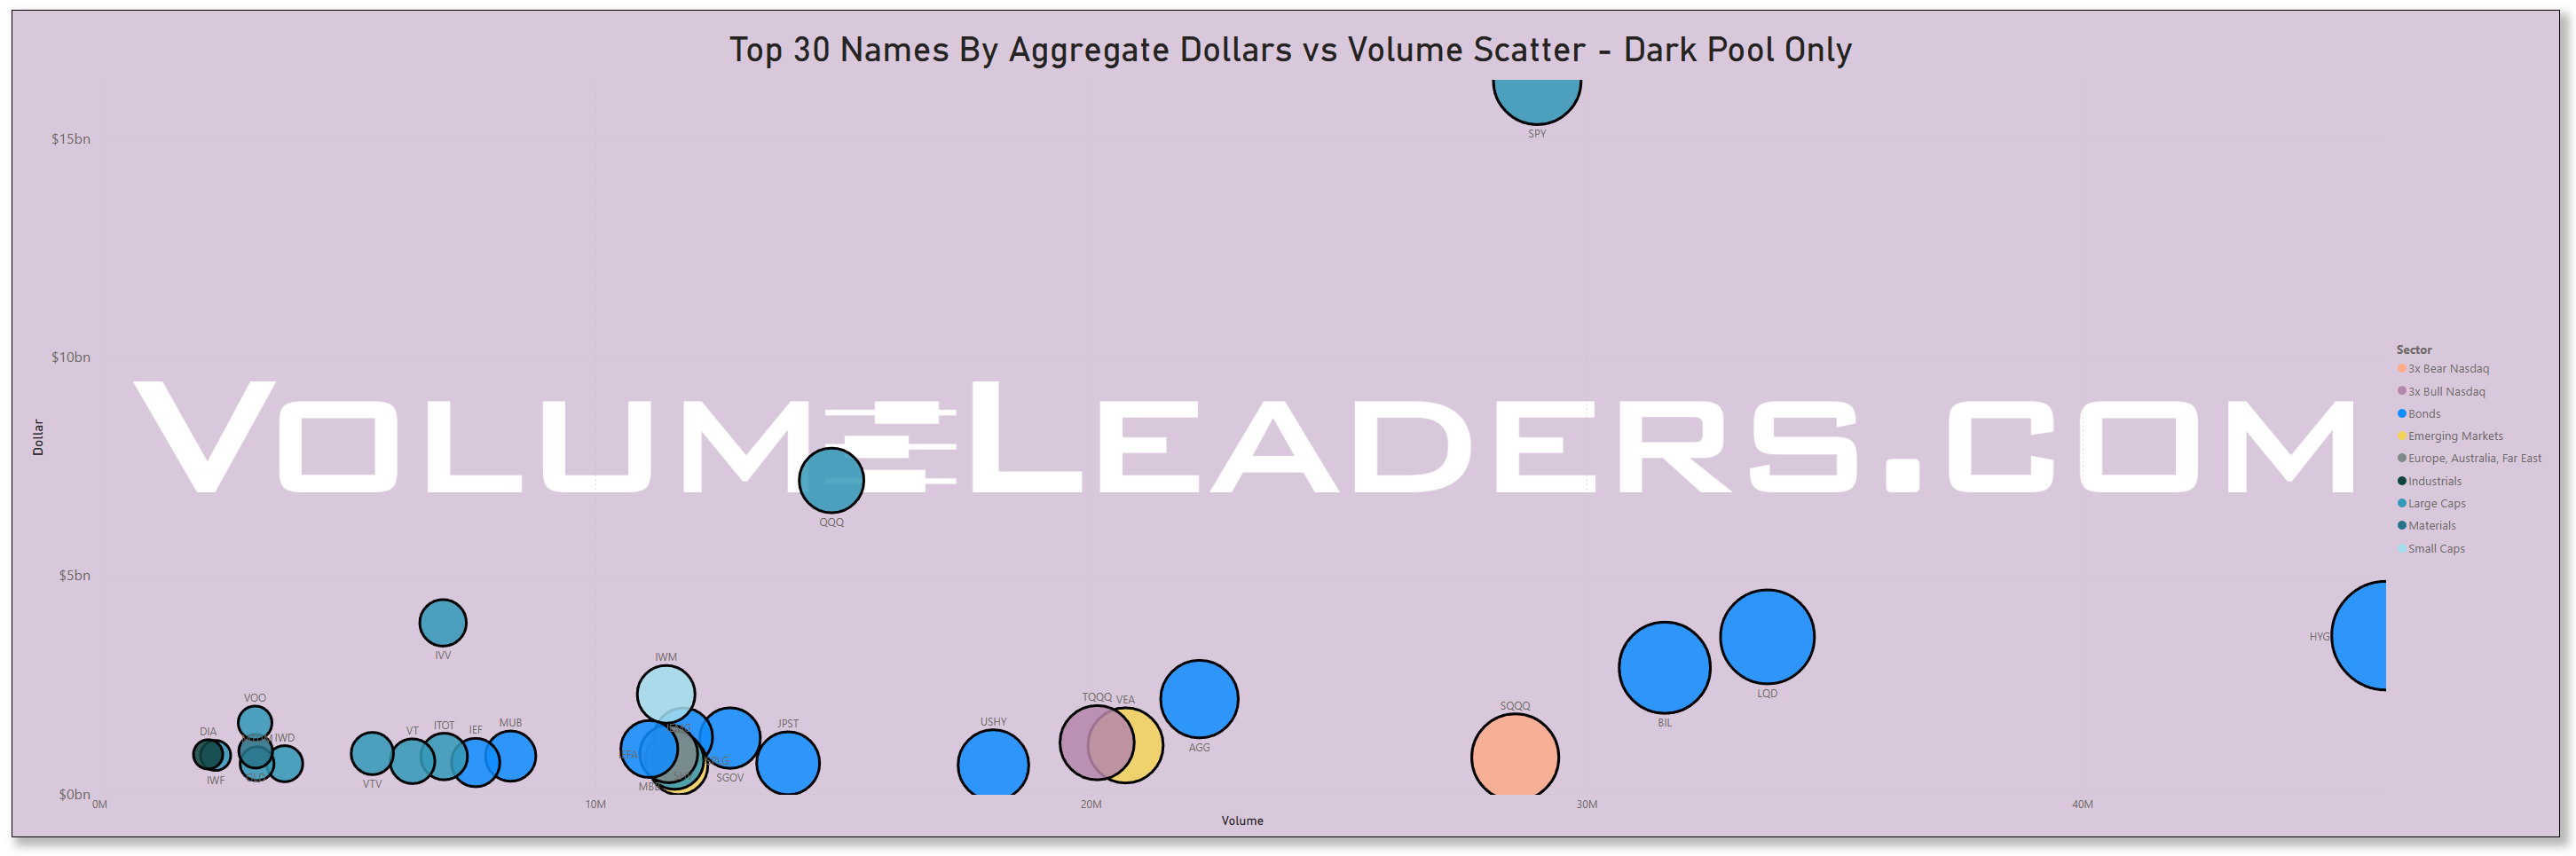
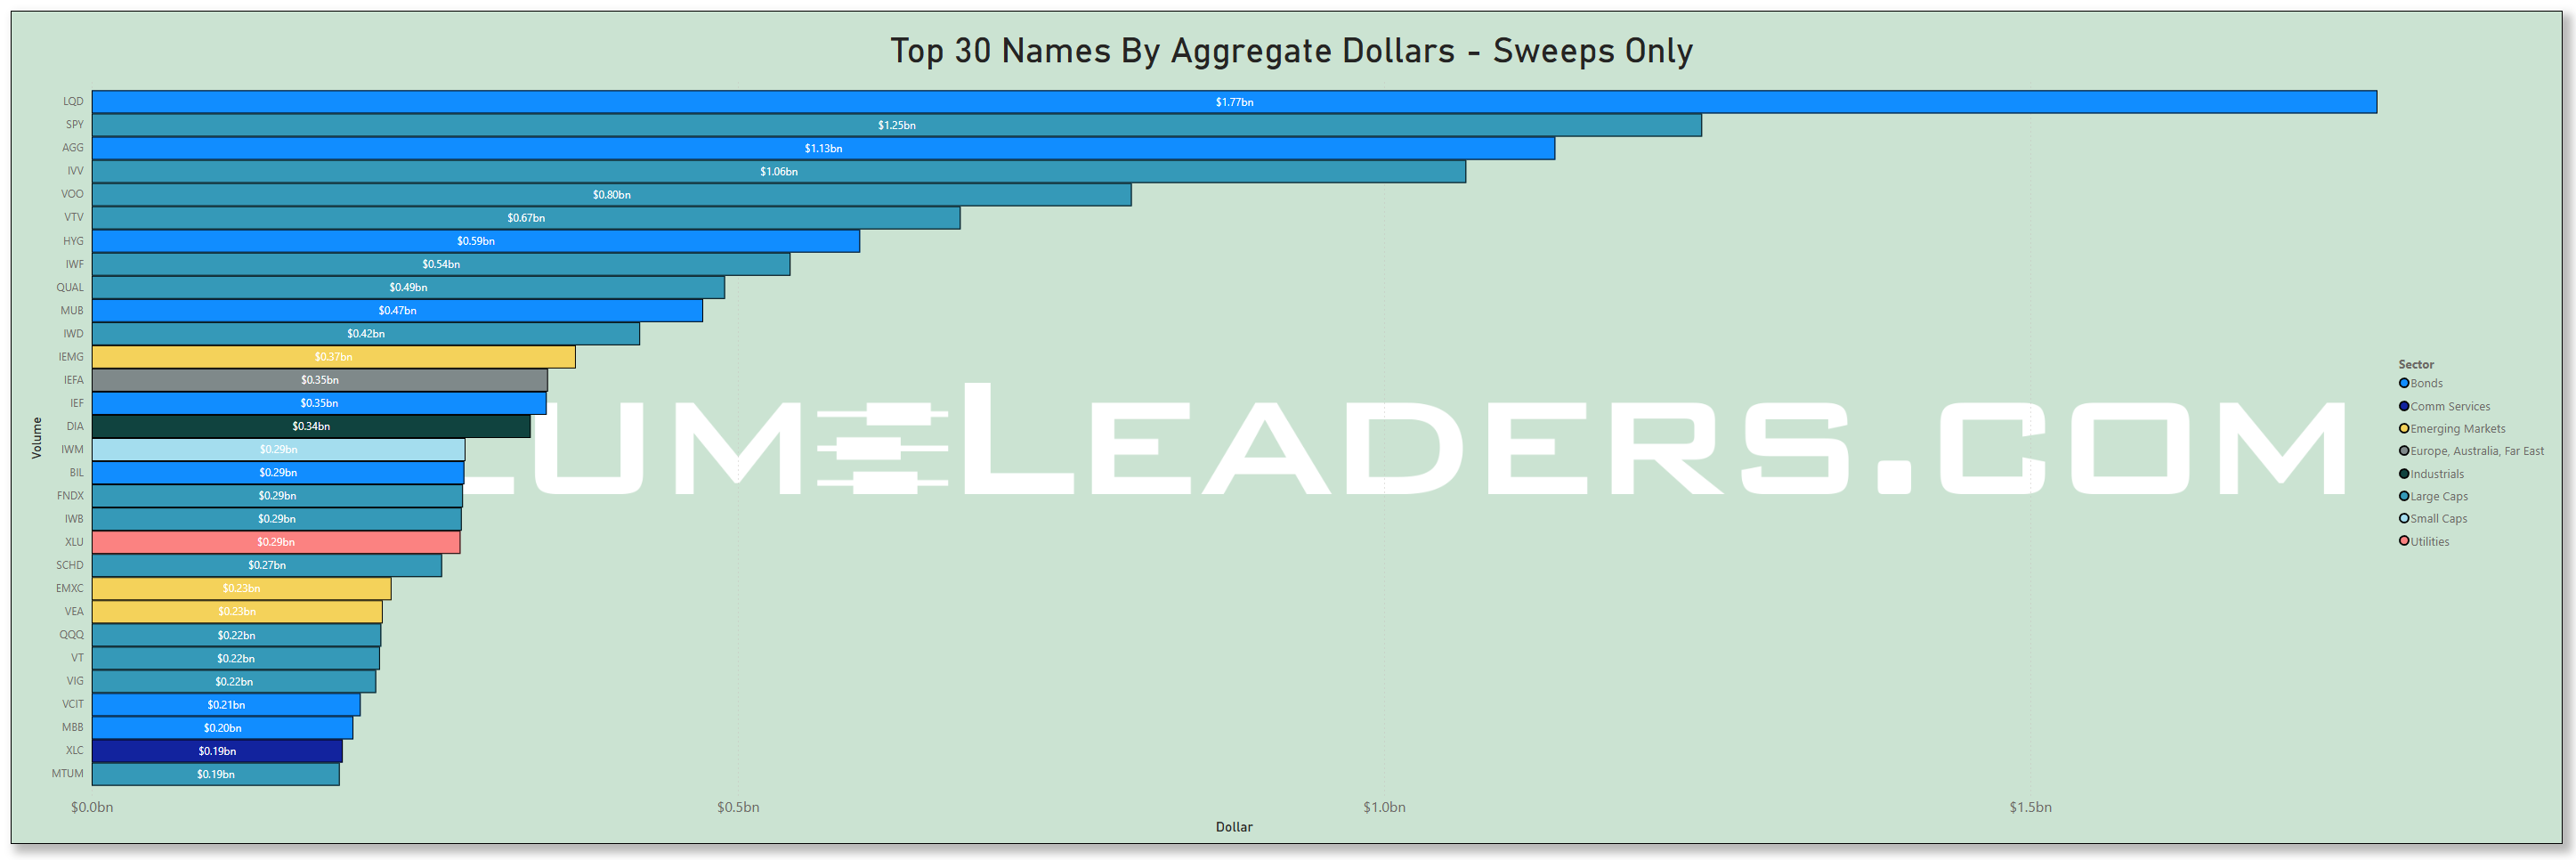
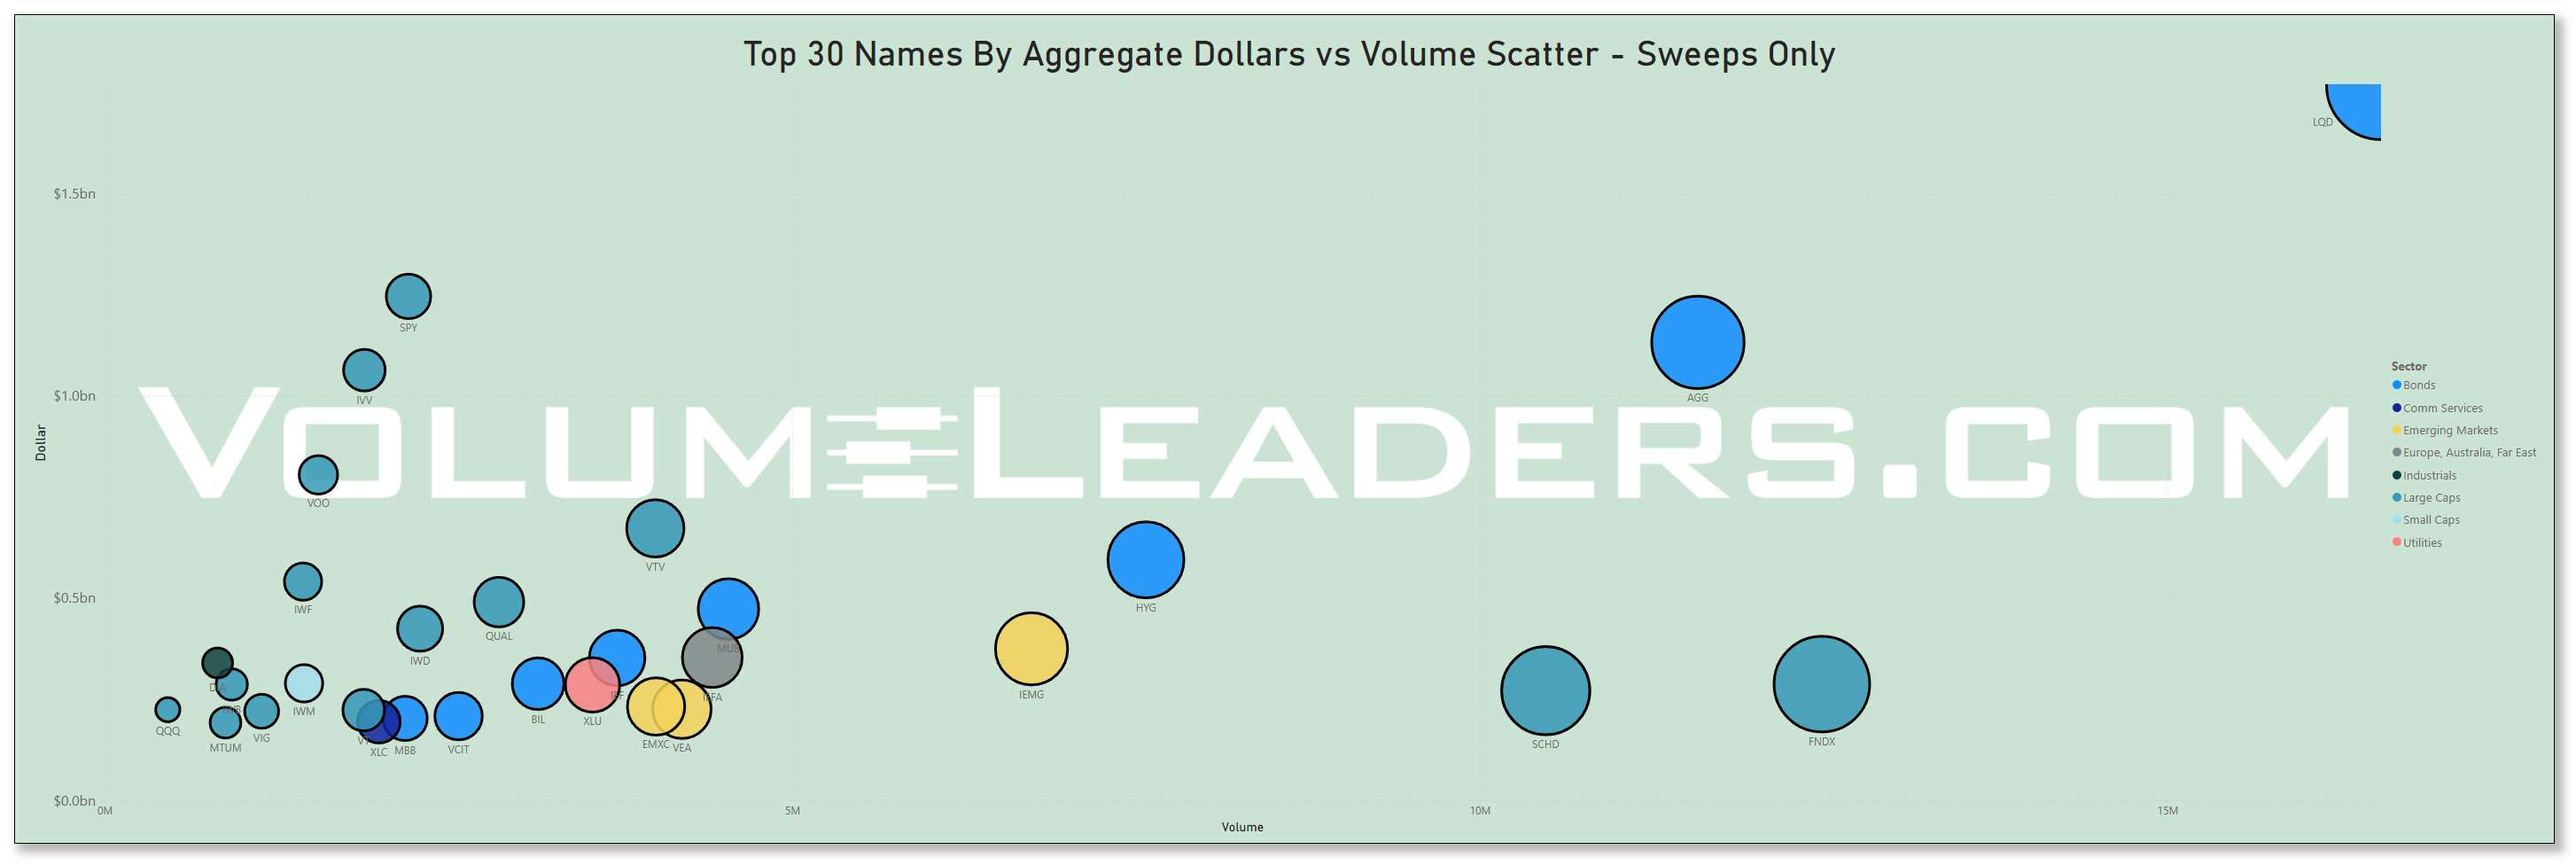
Many excellent trade ideas and sources of inspiration can be found in the prints below. While only the top 30 from each group are displayed, the complete results are accessible in VolumeLeaders.com for you to explore at your convenience any time. Remember to configure trade alerts within the platform to ensure institutional order flows that capture your interest or are significant to you aren’t missed. The blue charts represent all types of trades, including blocks on lit exchanges; the purple charts exclusively depict dark pool trades; and the green charts are sweeps only.
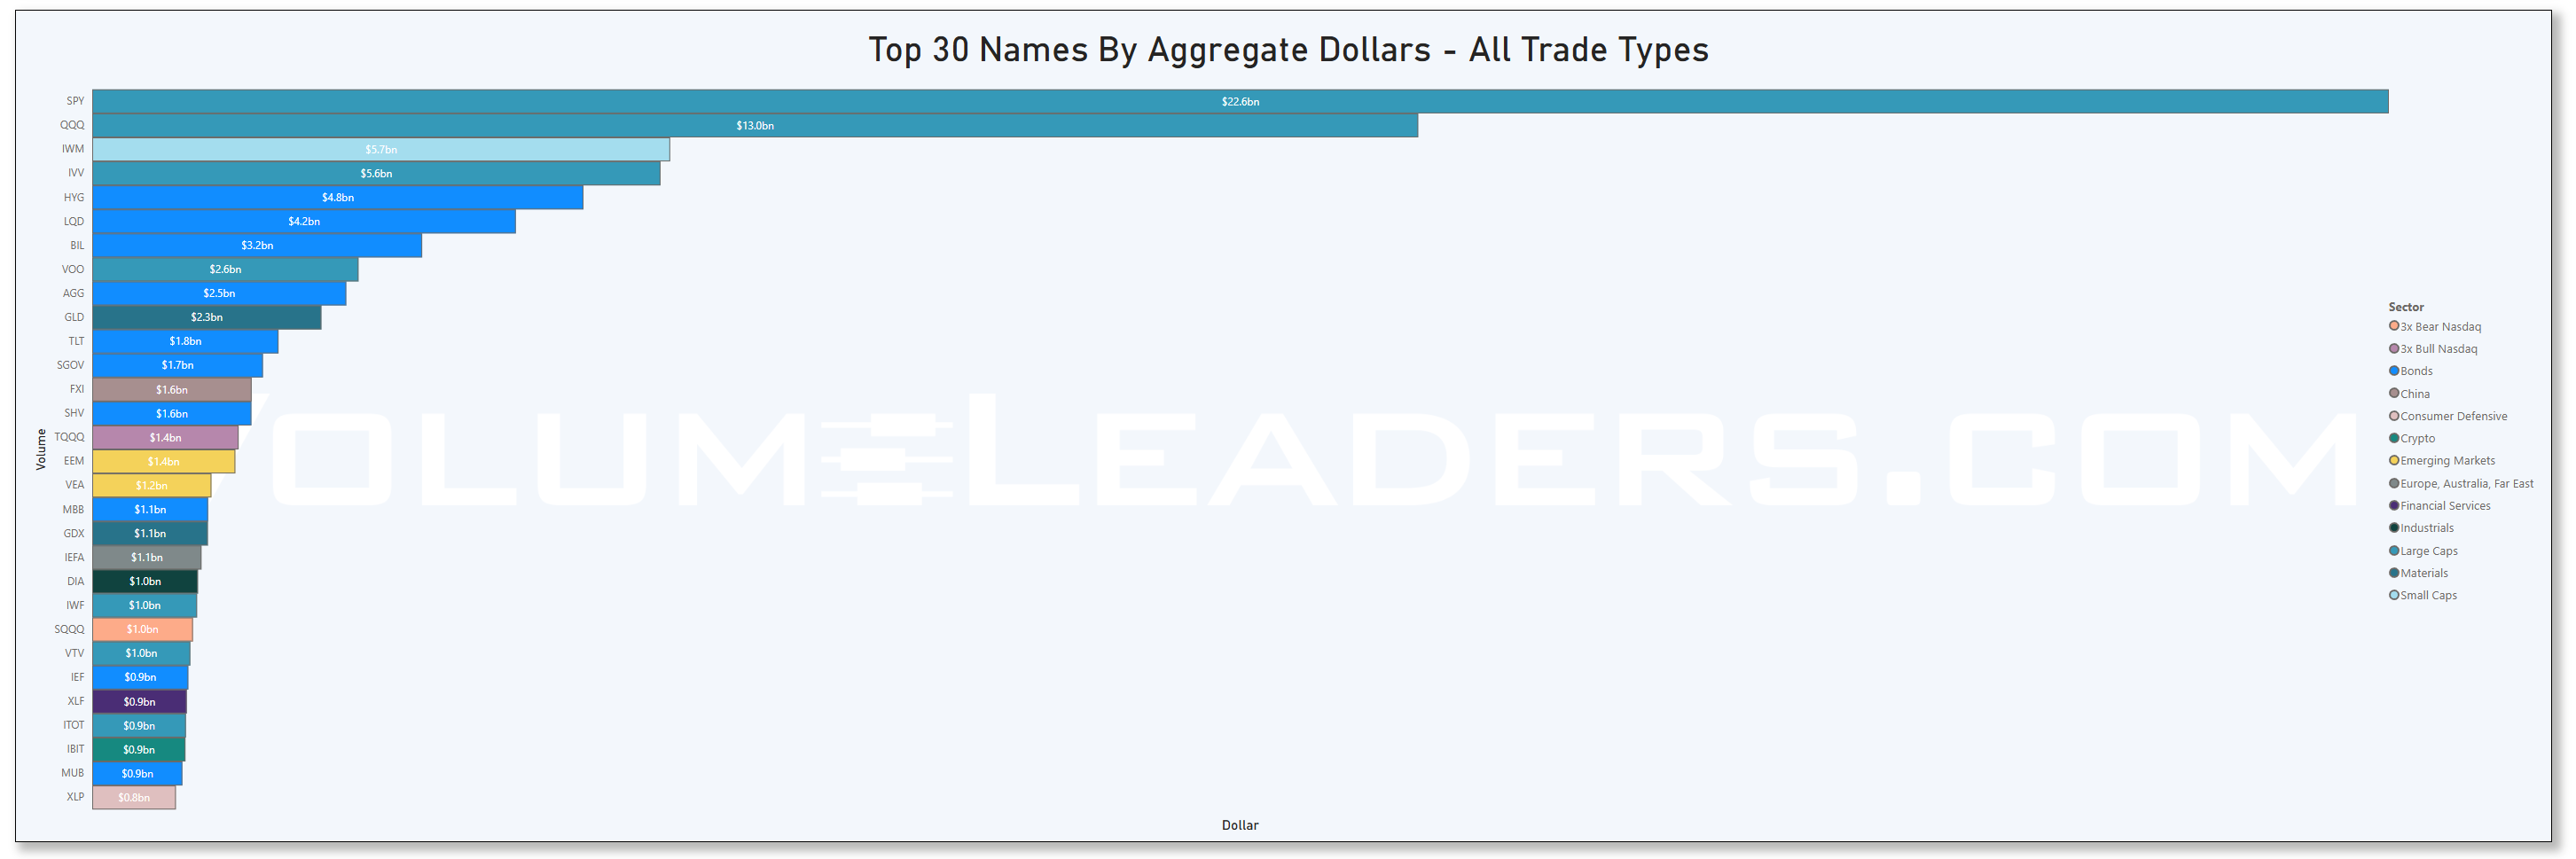
Top Institutional Order Flow In ETFs
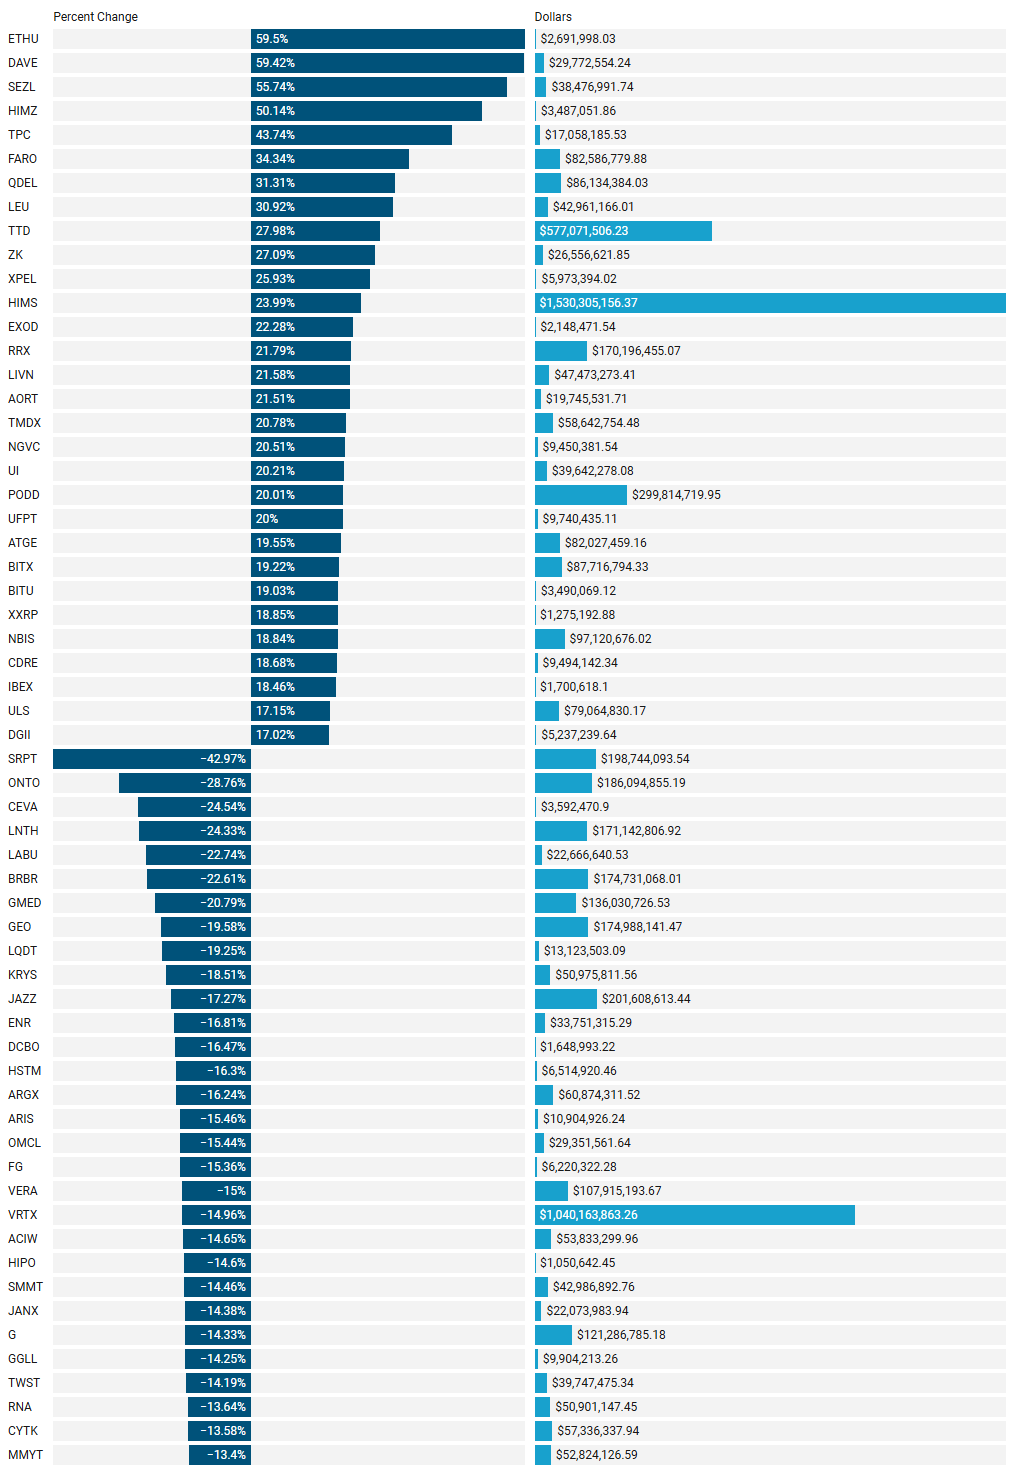
Last Week’s Institutionally-Backed Gainers & Losers
If you’re going to bet on a name, consider one that is officially endorsed by an institution! These are the top percent gainers (green) and percent losers (red) from this week’s open-to-close that had a trade price greater than $20 and institutional involvement. Continue watching tickers from this and prior stacks as these names frequently turn into multi-leg trades with a lot of movement!
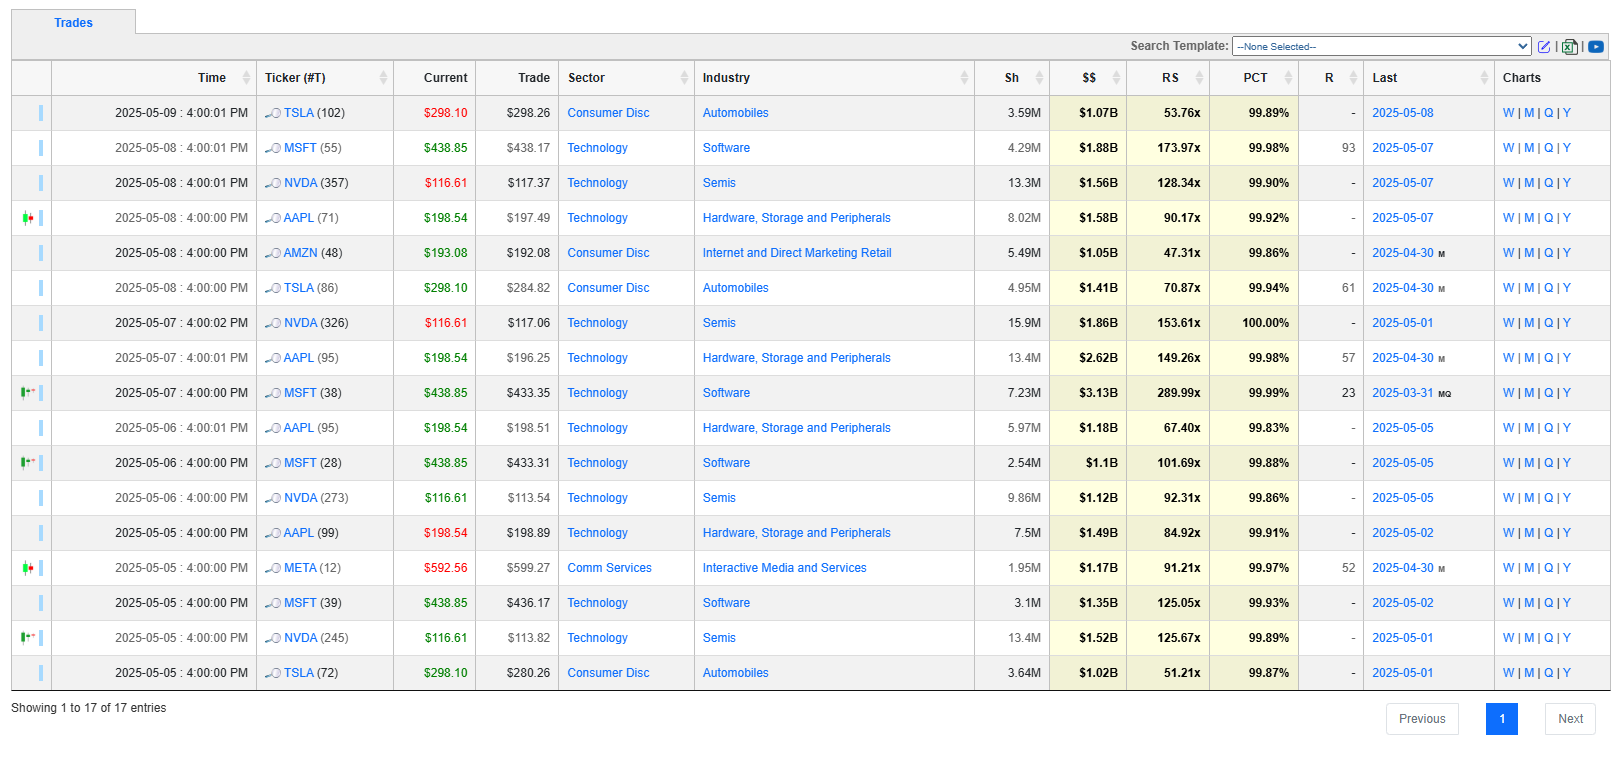
Last Week’s Billion-Dollar Prints
Tickers that printed a trade worth at least $1B last week get a special shout-out. These are massive commitments by institutions that should not be ignored.
Analysis of This Week’s Top-25-Ranked Institutional Order Flow
This week’s data reveals remarkable positioning in technology stocks, particularly in AI-related companies, with MSFT, PLTR, and NFLX standing out due to their extraordinary trade sizes and relative volumes. Bull-oriented ETF positioning dominates bear ETF trades by a ratio of 4.3:1, suggesting institutional optimism despite recent market volatility; there is a chance this could be institutions exiting so watch Bull ETF price levels from this week for confirmation on the next leg in indices. The Aerospace & Defense industry shows the highest concentration of institutional interest, with Software Infrastructure and Capital Markets following closely behind. This analysis provides actionable intelligence for investors looking to align with institutional money flows.
Top Mega-Money Moves
MSFT (Technology): $3.13 billion trade with unprecedented 290x relative size
NFLX (Comm Services): $811.8 million trade during record 11-day winning streak
KDP (Consumer Staples): $602.3 million trade with 110x relative size amid ownership restructuring
PLTR (Technology): $530.6 million trade with 166x relative size following 71% YoY commercial revenue growth
NOW (Technology): $498.0 million trade indicates institutional confidence in enterprise software
Sector Intelligence
Top Sectors by Total Dollar Value
Technology: $5.12 billion (68 trades), avg relative size 21.7x
Consumer Cyclical: $1.84 billion (40 trades), avg relative size 9.3x
Financial Services: $1.23 billion (30 trades), avg relative size 13.1x
Large Caps: $904 million (24 trades), avg relative size 14.2x
Healthcare: $806 million (42 trades), avg relative size 7.8x
Sectors with Highest Average Relative Size (min 3 trades)
3x Bull SP 500: 153.6x (1 trade)
2x Bull SP 500: 65.9x (2 trades)
Technology: 21.7x (68 trades)
Bonds: 18.5x (17 trades)
2x Bull PLTR: 17.3x (13 trades)
Price Performance After Trade Execution
Best Performing Sectors: Crypto (+4.2%), Technology (+3.1%), Financial Services (+2.8%)
Worst Performing Sectors: Materials (-2.3%), Bonds (-1.6%), Consumer Defensive (-1.1%)
Industry Intelligence
Top Industries by Trade Count
Aerospace & Defense: 24 trades, $317.5 million total
Biotech: 16 trades, $201.2 million total
Capital Markets: 14 trades, $689.7 million total
Software Infrastructure: 13 trades, $723.1 million total
Growth: 11 trades, $251.9 million total
Top Industries by Dollar Value
Software: $3.42 billion (9 trades), avg relative size 34.8x
Internet Retail: $931 million (4 trades), avg relative size 8.4x
Capital Markets: $689.7 million (14 trades), avg relative size 12.7x
Software Infrastructure: $723.1 million (13 trades), avg relative size 18.2x
Beverages: $612.3 million (3 trades), avg relative size 38.6x
Bull vs Bear Sentiment Analysis
Bull ETFs: $498.3 million across 31 trades
Bear ETFs: $116.2 million across 7 trades
Bull/Bear Ratio: 4.3:1 indicating strong institutional optimism
Rank Analysis
Trades are ranked from 1-25 (lower rank = larger relative size)
Rank 1-5 Trades: 112 trades totaling $8.21 billion, avg relative size 22.6x
Rank 6-15 Trades: 189 trades totaling $4.76 billion, avg relative size 5.9x
Rank 16-25 Trades: 147 trades totaling $1.28 billion, avg relative size 2.3x
Top Sectors in Rank 1-5 Trades:
Technology (23.2%)
Consumer Cyclical (12.5%)
Financial Services (10.7%)
Statistical Distributions
Dollar Value Distribution
Median: $12.84 million
Mean: $31.73 million
Standard Deviation: $158.9 million
25th Percentile: $3.92 million
75th Percentile: $25.36 million
Relative Size Distribution
Median: 3.94x
Mean: 8.12x
Standard Deviation: 19.75x
25th Percentile: 2.17x
75th Percentile: 7.59x
Ticker Clustering Analysis
Tickers with Multiple Trades
SPXL (3x Bull SP 500): 4 trades, $389.1 million total
QQQ (Technology): 3 trades, $192.7 million total
MSFT (Technology): 3 trades, $3.27 billion total
PLTR (Technology): 3 trades, $543.2 million total
SMCI (Technology): 3 trades, $129.8 million total
Tickers with Multiple High-Ranked Trades (Rank ≤ 5)
MSFT: Ranks 1, 3, 5
PLTR: Ranks 2, 4
SMCI: Ranks 3, 5
“Last Seen” Patterns
Time Since Similar Size
Last 7 days: 42.6% of trades
8-30 days: 28.3% of trades
31-90 days: 18.9% of trades
91-365 days: 8.4% of trades
Over 1 year: 1.8% of trades
Longest Time Since Similar Size
AVLR (Technology): 387 days
TSLA (Consumer Cyclical): 362 days
IONX (2x Bull IONQ): 344 days
Multi-Factor Trade Significance
Most Significant Stocks (Composite Score)
MSFT (Technology): 96.7/100
PLTR (Technology): 88.4/100
NFLX (Comm Services): 84.2/100
KDP (Consumer Staples): 82.1/100
SMCI (Technology): 79.3/100
Most Significant Sectors (Composite Score)
Technology: 91.2/100
Financial Services: 78.6/100
Consumer Cyclical: 74.3/100
Healthcare: 67.8/100
Software Infrastructure: 66.3/100
Actionable Intelligence for Investors
Top Tickers to Monitor
MSFT, PLTR, NFLX, KDP, SMCI
Emerging Sector Trends
Technology, particularly AI-related stocks
Financial Services
High-quality growth with strong cash flows
Bullish vs Bearish Signals
Institutional sentiment appears to be strongly bullish with a 4.3:1 bull/bear ratio
Focus on 2x/3x bull ETFs suggests aggressive positioning
Industry Focus Areas
Aerospace & Defense (highest concentration of trades)
Software Infrastructure (high dollar value and relative size)
Capital Markets (consistent institutional positioning)
Key Market Indicators
The distribution of trade sizes shows extreme outliers in technology
Significant clustering of high-rank trades in select tickers suggests conviction
Post-trade performance indicates strong momentum in technology and crypto sectors
Conclusion
The institutional trade data reveals a strong bias toward technology, particularly AI-related companies, with extraordinary position sizes in market leaders like Microsoft, Palantir, and Netflix. The 4.3:1 bull/bear ETF ratio signals overall market optimism. Industries showing the strongest institutional interest include Aerospace & Defense, Software Infrastructure, and Capital Markets. Individual investors may benefit from aligning with these institutional money flows while understanding that these positions represent significant conviction from sophisticated market participants.
Thank you for being part of our community and for dedicating your time to this edition. Your insights and engagement drive everything we do, and we’re honored to share this space with such committed, thoughtful readers. Here’s to a week filled with clear opportunities and strong performance. Wishing you many bags 💰💰💰
—VolumeLeaders