Market Momentum: Your Weekly Financial Forecast & Market Prep
Issue 43 / What to expect May 05, 2025 thru May 09, 2025
In This Issue
[Free For Everyone]
Market-On-Close: All of last week’s market-moving news and macro context in under 5 minutes
The Latest Investor Sentiment Readings
Institutional Support & Resistance Levels For Major Indices: Exactly where to look for support and resistance this coming week in SPY, QQQ, IWM & DIA
Special Coverage Report: Trading Like a Pro: What Retail Traders Can Learn from Institutions
Normalized Performance By Thematics YTD (Sector, Industry, Factor, Energy, Metals, Currencies, and more): which corners of the markets are beating benchmarks, which ones are overlooked and which ones are over-crowded
Key Econ Events and Earnings On-Deck For This Week
[Only For Subs]
Institutional Activity By Sector: Institutional order flow by sector and constituent names.
Top Institutional Order Flow In Individual Names: The largest sweeps and blocks on lit exchanges and hidden dark pools
Statistical Analysis and Insights From This Week’s Top Prints
Top Institutionally-Backed Gainers & Losers: An explosive watchlist for day traders seeking high-volatility and massive gains

Market-On-Close
Executive Summary
The financial markets rallied strongly this week, with major indices posting multi-week highs as investors found renewed optimism amid potential progress on trade relations and resilient economic data. The S&P 500 recorded its ninth consecutive positive session - the longest streak since November 2004 - while the Nasdaq Composite advanced 3.42%, buoyed by better-than-expected earnings from several technology heavyweights. This positive momentum represents a dramatic reversal from early April's volatility, with markets having recovered nearly all of their previous losses. Despite these gains, significant questions remain about the sustainability of economic growth as GDP contracted in the first quarter, tariff concerns linger, and corporations provide cautious forward guidance.
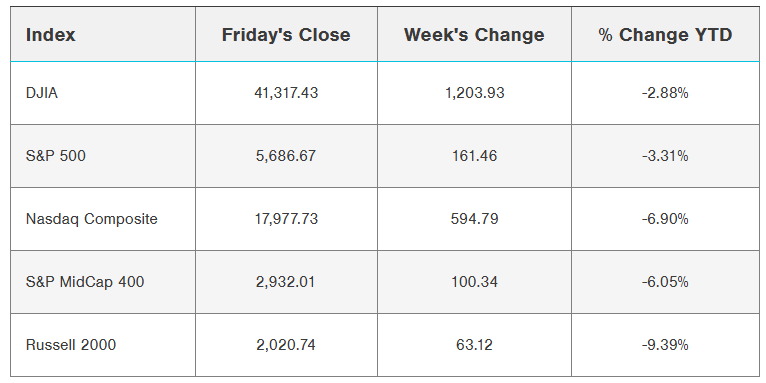
Market Performance: A Decisive Rebound
Major U.S. stock indices extended their recovery, posting impressive weekly gains of approximately 3%. The S&P 500 and Nasdaq 100 reached five-week highs, while the Dow Jones Industrial Average climbed to a one-month high. This performance marks the second consecutive week of gains for the S&P 500 - the first such occurrence since January - with the index having now risen approximately 8% over the past two weeks. After a tumultuous April that saw the index plunge 12.6% in the early part of the month, markets have demonstrated remarkable resilience, ending April with only a modest 0.7% decline.
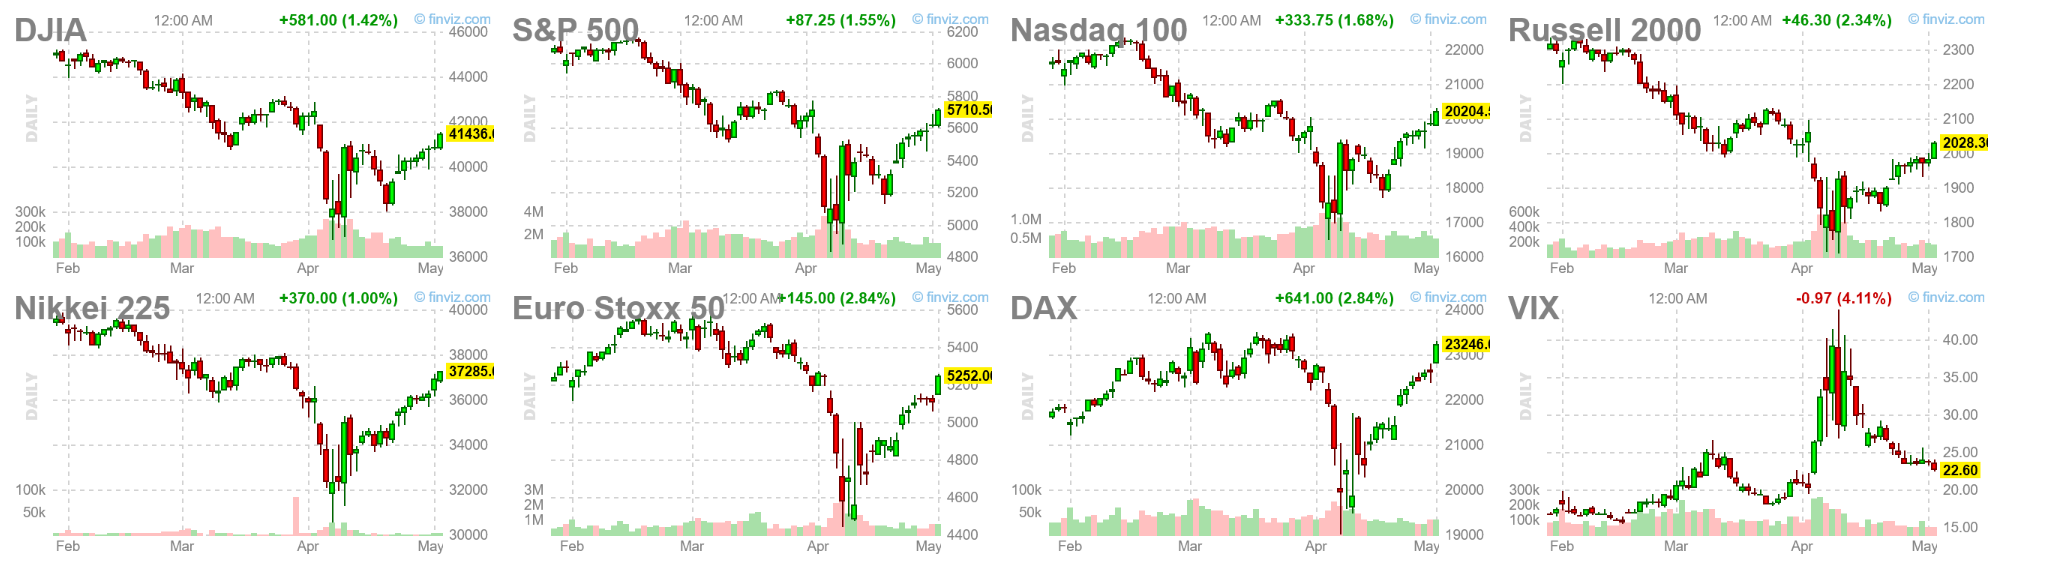
Small and mid-cap indices continued their upward trajectory, posting gains for the fourth consecutive week. This broadening participation across market capitalization segments suggests increasing investor confidence beyond just the largest companies. The technology-heavy Nasdaq benefited from strong earnings reports from several key constituents, rising 3.42% for the week.
The market's positive momentum appears largely attributable to two key factors: easing trade tensions and better-than-feared corporate earnings. Early in the week, sentiment was bolstered by signals from President Trump's administration regarding potential rollbacks of auto tariffs, with Commerce Secretary Howard Lutnick suggesting that a major trade deal was approaching completion.
This optimism received further support on Friday following reports that China's Commerce Ministry is evaluating the possibility of trade talks with the United States, stating: "The US has recently sent messages to China through relevant parties, hoping to start trade talks with China, and we are currently evaluating this."
Economic Data: Mixed Signals and Growing Complexity
The economic landscape presented a more nuanced picture, with several key indicators showing divergent signals about the strength and direction of the U.S. economy.
GDP Contraction: First Decline in Three Years
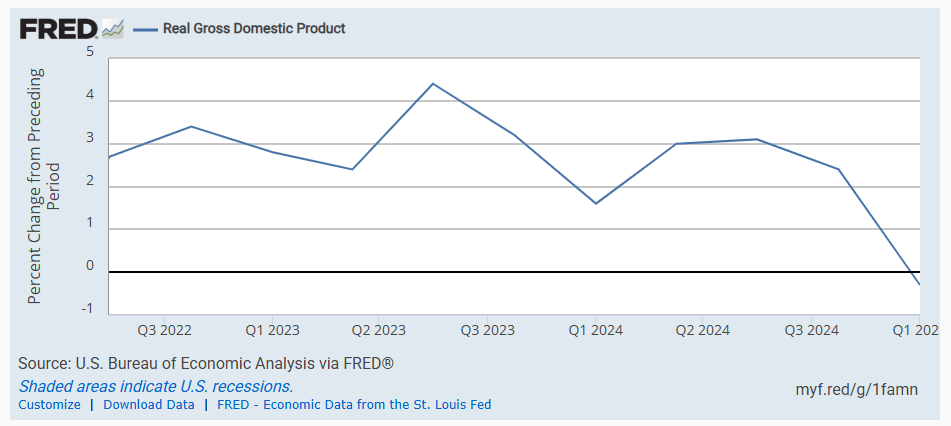
The most significant economic news came from the Bureau of Economic Analysis, which reported that U.S. GDP contracted at an annual rate of 0.3% in the first quarter of 2025. This represents the first economic contraction since the first quarter of 2022 and fell slightly below consensus expectations of a 0.2% decline. The contraction was primarily driven by a surge in imports - the largest increase in nearly five years - as businesses rushed to stock up on foreign goods ahead of anticipated tariff increases.
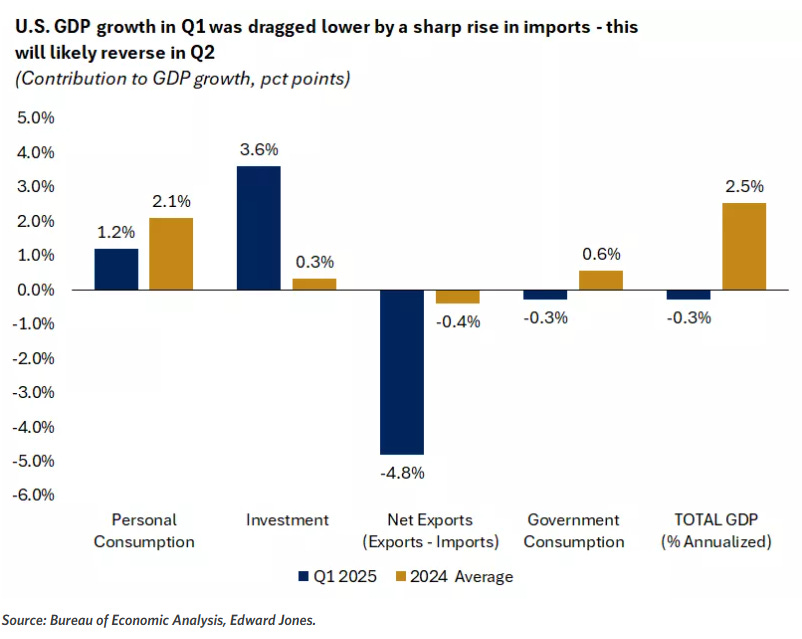
However, the report contained several important bright spots. Personal consumption rose by 1.8% in the first quarter, exceeding forecasts of 1.2% despite slowing from the robust 4% growth recorded in Q4 2024. Business investment showed particular strength, climbing an impressive 21.9% as corporations accelerated equipment purchases to get ahead of potential tariff-induced price increases.
Most economists view this contraction as primarily technical in nature, driven by the temporary import surge rather than fundamental economic weakness. The negative GDP reading is widely expected to reverse in the second quarter as the import pattern normalizes. Nevertheless, it underscores the growing complexity of the economic environment and the potential disruptive impact of trade policy uncertainty.
Labor Market: Continued Resilience
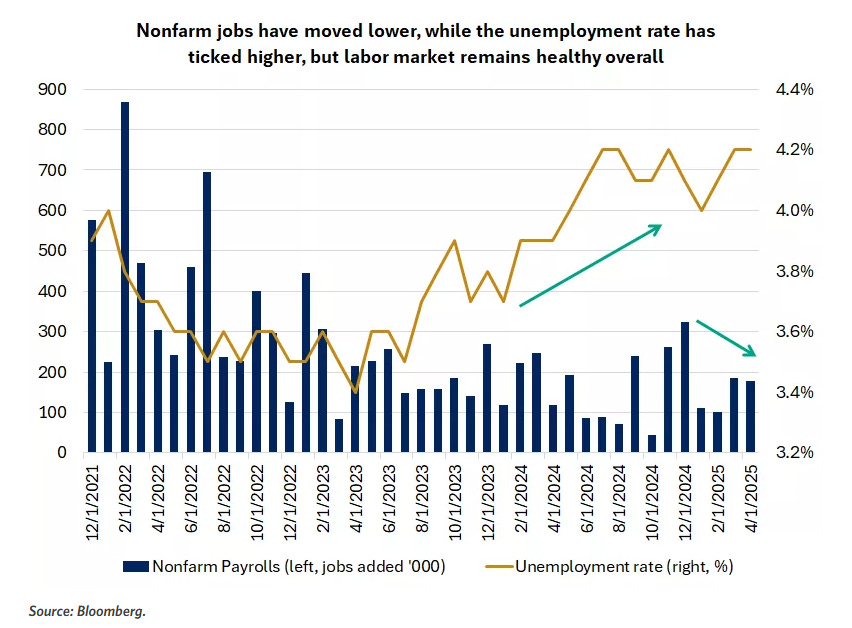
The employment picture remained largely positive, with April's nonfarm payroll report showing the addition of 177,000 new jobs, significantly above the consensus expectation of 138,000. While March's figures were revised downward by 43,000 to 185,000, the three-month average of job gains remained healthy at approximately 155,000. The unemployment rate held steady at 4.2%, in line with expectations, though still above the 2023 low of 3.4%.
Average hourly earnings increased by 0.2% month-over-month and 3.8% year-over-year, slightly below expectations of 0.3% and 3.9%, respectively. This moderation in wage growth could help ease inflationary pressures, potentially providing the Federal Reserve with greater flexibility regarding interest rate policy.
Earlier in the week, the Bureau of Labor Statistics reported that job openings fell to 7.2 million in March, down from February's 7.5 million and reaching the lowest level since September. Additionally, ADP's private payroll report showed just 62,000 new jobs added in April, a sharp decline from March's downwardly revised 147,000. These figures suggest some cooling in labor demand, though Friday's stronger employment report tempered concerns about a significant deterioration in the job market.
Consumer Sentiment: Growing Anxiety
Despite the resilient job market, consumer confidence continued to deteriorate. The Conference Board's Consumer Confidence Index for April registered at 86.0, down from March's 92.9 and marking the fifth consecutive monthly decline. This reading represents the lowest level of consumer confidence in approximately five years and fell well below economists' consensus expectations.
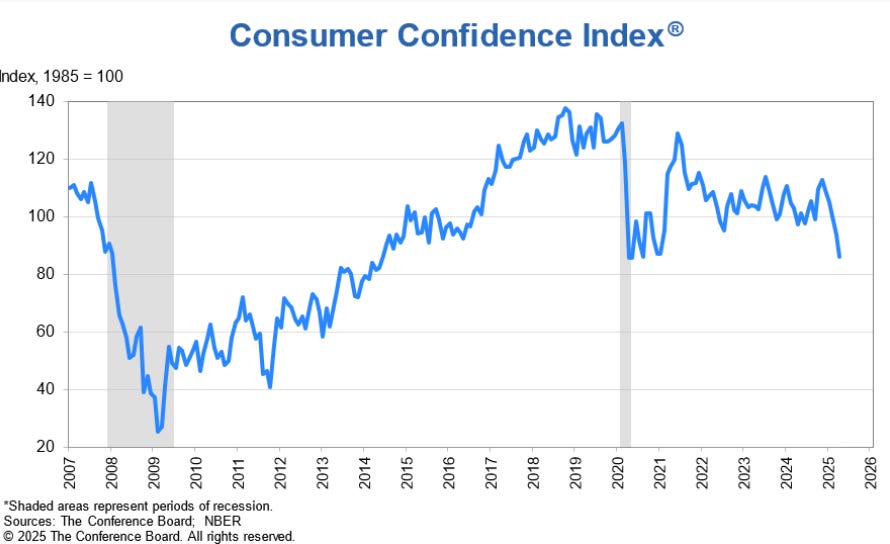
This declining confidence contrasts with March's retail sales data, which showed a 1.4% increase - the highest in two years - with gains across 11 of 13 categories. This strong performance may partially reflect purchases pulled forward due to anticipated tariff increases, suggesting potential weakness in future retail sales figures.
Manufacturing and Housing: Early Warning Signs
Other economic indicators pointed to emerging headwinds. The Philadelphia Fed Manufacturing Index showed a substantial decline, with new orders and shipments contracting and employment approaching contraction territory. Housing starts also fell below consensus expectations, particularly in the single-family segment, indicating potential weakness in residential construction activity.
In more positive news, March factory orders rose by 4.3% month-over-month, representing the largest increase in eight months.
Corporate Earnings: Current Strength, Future Uncertainty
The corporate earnings season continued at full pace, with nearly 75% of S&P 500 companies having reported results as of week's end. The overall picture has been notably stronger than initially anticipated, with analysts steadily raising their expectations throughout the reporting period. First-quarter earnings for S&P 500 companies are now projected to increase by 12.8% year-over-year, a significant improvement from the 7.0% growth rate expected just two weeks earlier and well above the 6.7% forecast at the beginning of the earnings season.
Approximately 78% of reporting companies have exceeded analysts' estimates, surpassing the 10-year average beat rate of 75%. This performance stands in marked contrast to the downward trend in earnings expectations that prevailed heading into the reporting season. Full-year 2025 profit forecasts for S&P 500 companies had been reduced to 9.4% growth from the 12.5% projection made in early January.
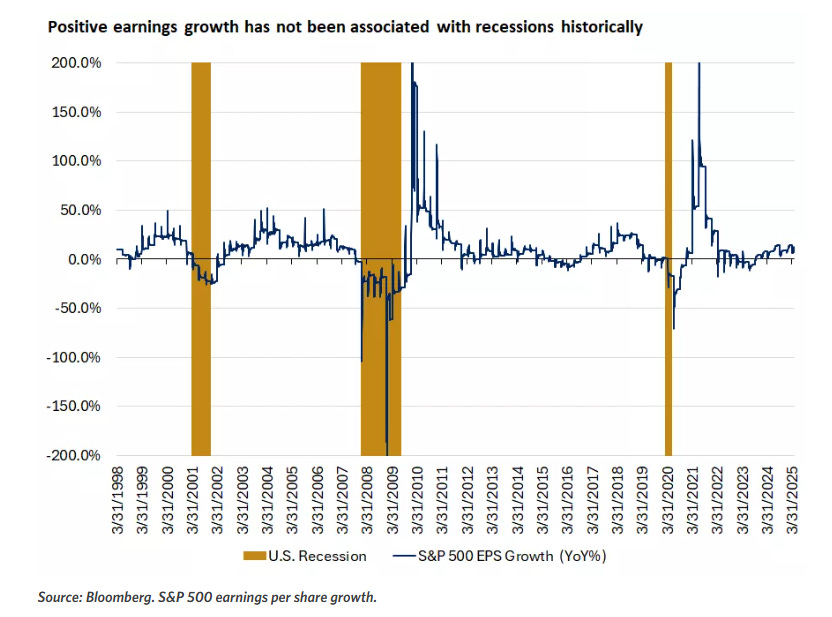
However, forward guidance has taken a more cautious turn, with many companies expressing limited visibility regarding future performance due to trade policy uncertainty. The earnings growth forecast for Q2 has fallen to 5.8%, a substantial reduction from the 11.3% growth rate expected at the end of last year.
Technology Sector: Divergent Paths
Technology companies have delivered particularly noteworthy results, though with significant variations across the sector. Microsoft and Meta provided strong outlooks, committing a combined $152 billion in capital expenditures to support artificial intelligence infrastructure development. Their continued aggressive investment in AI capabilities helped alleviate market concerns about a potential slowdown in technology capital spending.

In contrast, consumer-facing technology giants faced greater challenges. Apple reported declining sales in China and warned about the impact of tariffs on its cost structure, causing its stock to drop more than 3%. Similarly, Amazon provided weaker-than-expected guidance for operating income and indicated that it was preparing for a more challenging business environment. These differing outcomes highlight the varying exposures of technology companies to trade tensions and consumer spending patterns.
Consumer Sector: Signs of Pressure
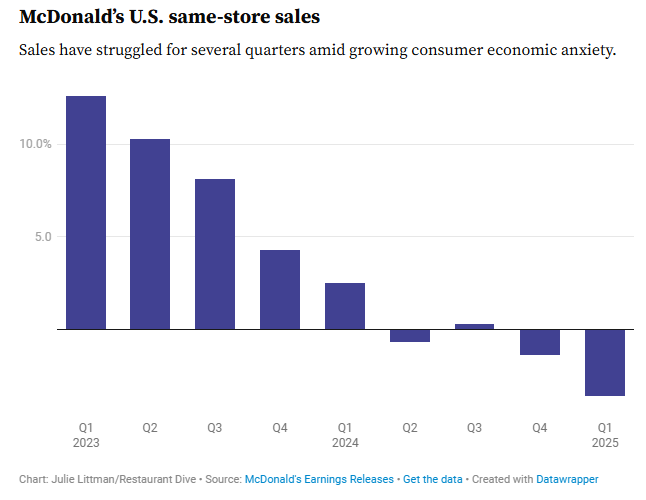
Companies with significant consumer exposure reported increasing headwinds. McDonald's experienced negative same-store sales, citing decreased traffic, particularly among price-sensitive customers. This experience mirrors those of other food service companies like Starbucks and Chipotle, which have also reported softening consumer demand, especially among lower-income demographics. These trends suggest a growing bifurcation in consumer spending patterns, with potential implications for the broader economy.
Fixed Income Markets: Rate Cut Expectations Recalibrate
Treasury yields fluctuated throughout the week in response to the barrage of economic data. The 10-year Treasury yield rose 9.0 basis points to 4.308% following the stronger-than-expected employment report, which dampened expectations for near-term Federal Reserve rate cuts. The yield curve experienced some steepening, reflecting adjusted expectations regarding the timing and pace of potential monetary policy easing.
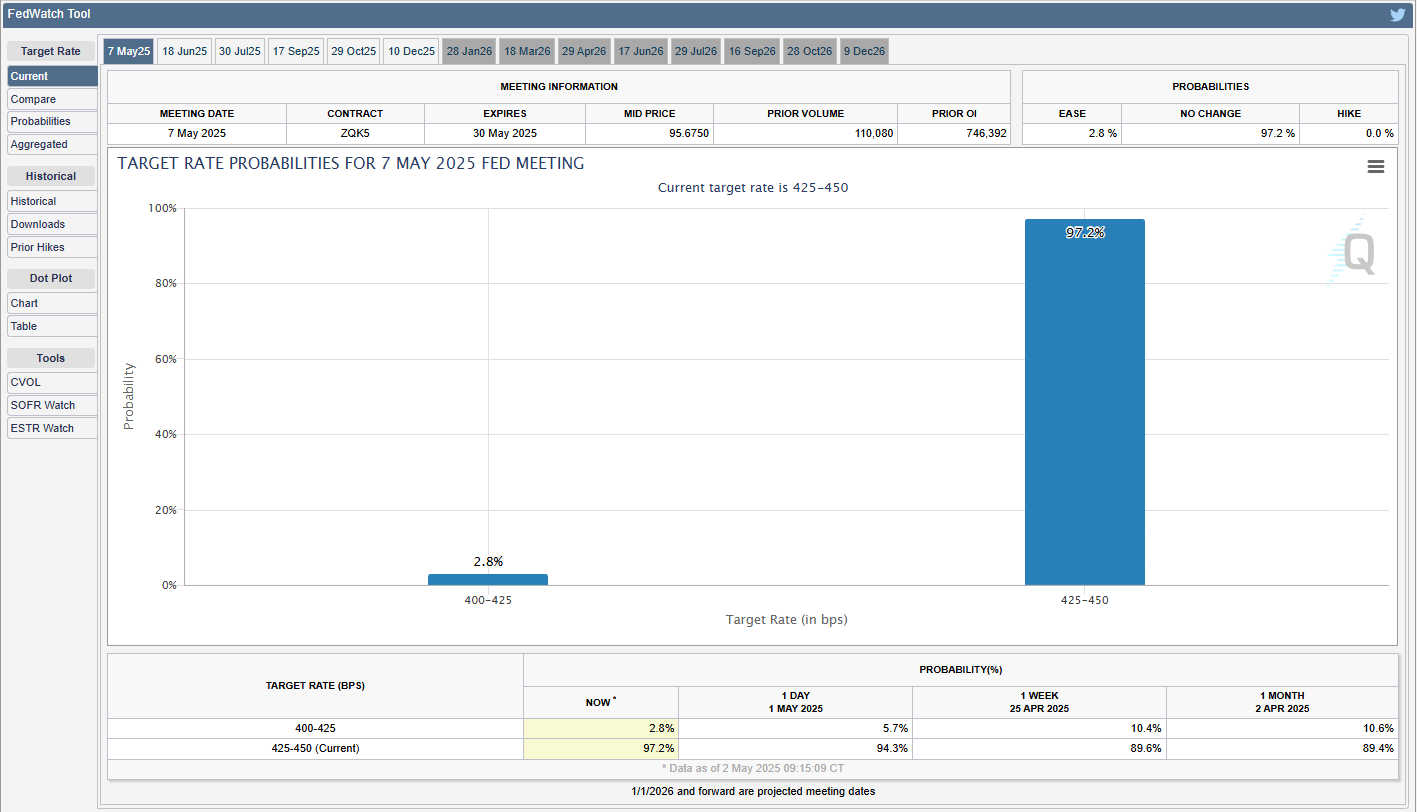
Markets are now pricing in a 3% probability of a 25 basis point rate cut at the May 6-7 Federal Open Market Committee meeting, with expectations for approximately three quarter-point reductions by year-end. This represents a scaling back from previous projections of four cuts, with the likelihood of a June rate reduction declining from 55% to approximately 33% following Friday's robust jobs data.
European bond markets also saw rising yields, with the 10-year German bund yield jumping to a two-week high of 2.534%, ending 8.9 basis points higher at 2.533%. The 10-year UK gilt yield rebounded from a 3.5-week low, finishing 2.8 basis points higher at 4.509%.
Municipal bonds rallied amid a seasonally favorable backdrop, while investment-grade corporate bonds underperformed after a strong showing the previous week. The high-yield bond market received technical support from positive fund flows and limited new issuance, though energy sector bonds faced pressure as Saudi Arabia indicated it might increase oil production.
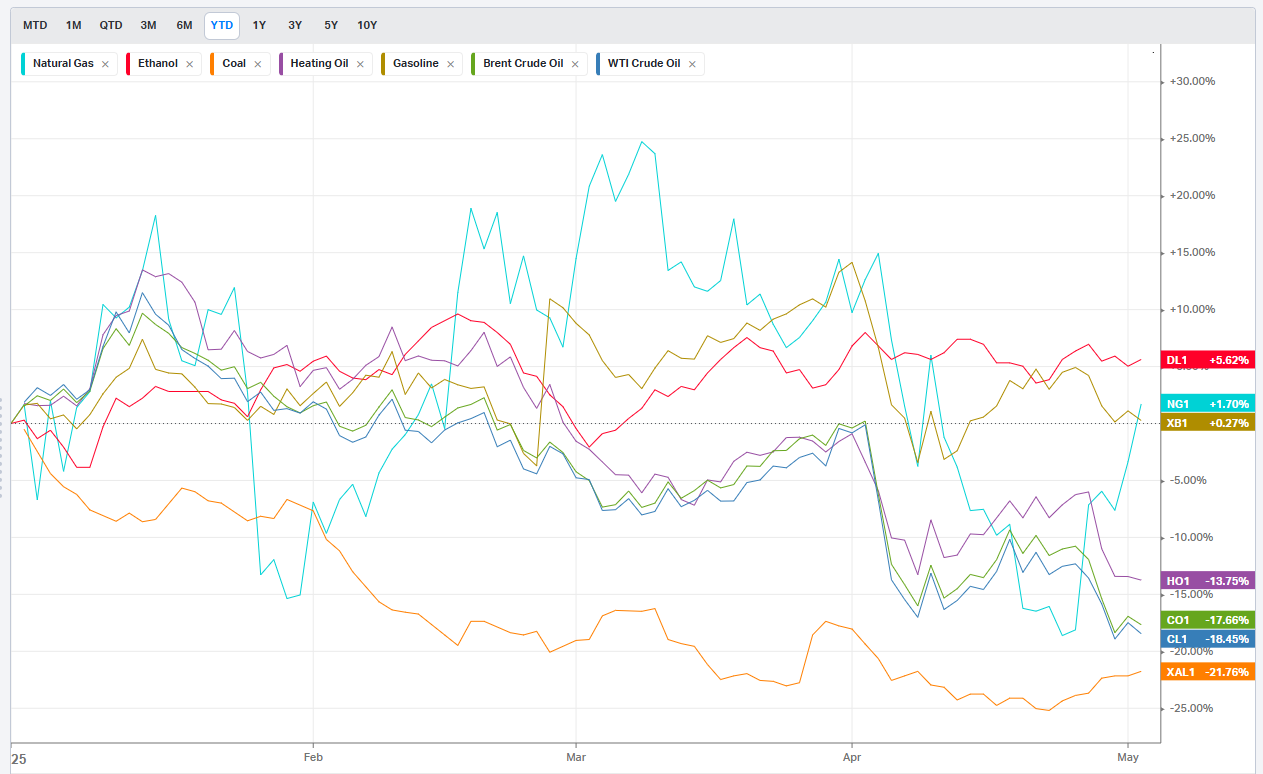
Commodity Markets: Oil Rebounds, Gold Shines
Commodity markets exhibited significant price movements, with precious metals continuing their strong performance while energy markets stabilized after recent declines.
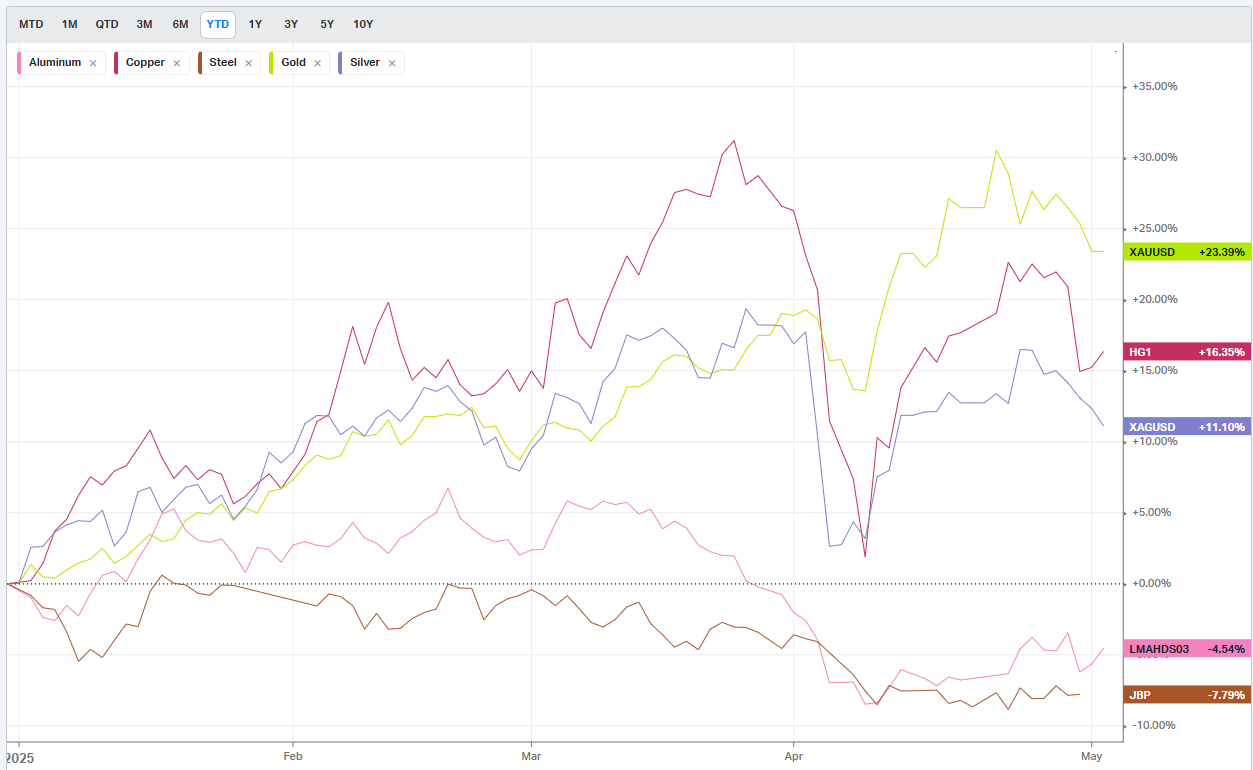
Gold reached another all-time high of $3,343.12 per troy ounce during the week, ending 4.6% higher at $3,323.50. Year-end forecasts for gold prices have been revised upward to $3,700 per troy ounce (from $3,300 previously), driven by robust central bank demand and exchange-traded fund inflows as investors seek protection against recession risks.
Oil markets rebounded from recent lows despite OPEC reducing its 2025/2026 demand forecasts in response to global trade tensions. West Texas Intermediate crude recovered from its $59.58 per barrel low, ending the week 4.8% higher at $64.44. This modest recovery follows a dramatic 18% price decline during April - the largest monthly drop since November 2021 - which had pushed prices down to approximately $58 per barrel from around $80 in mid-January.
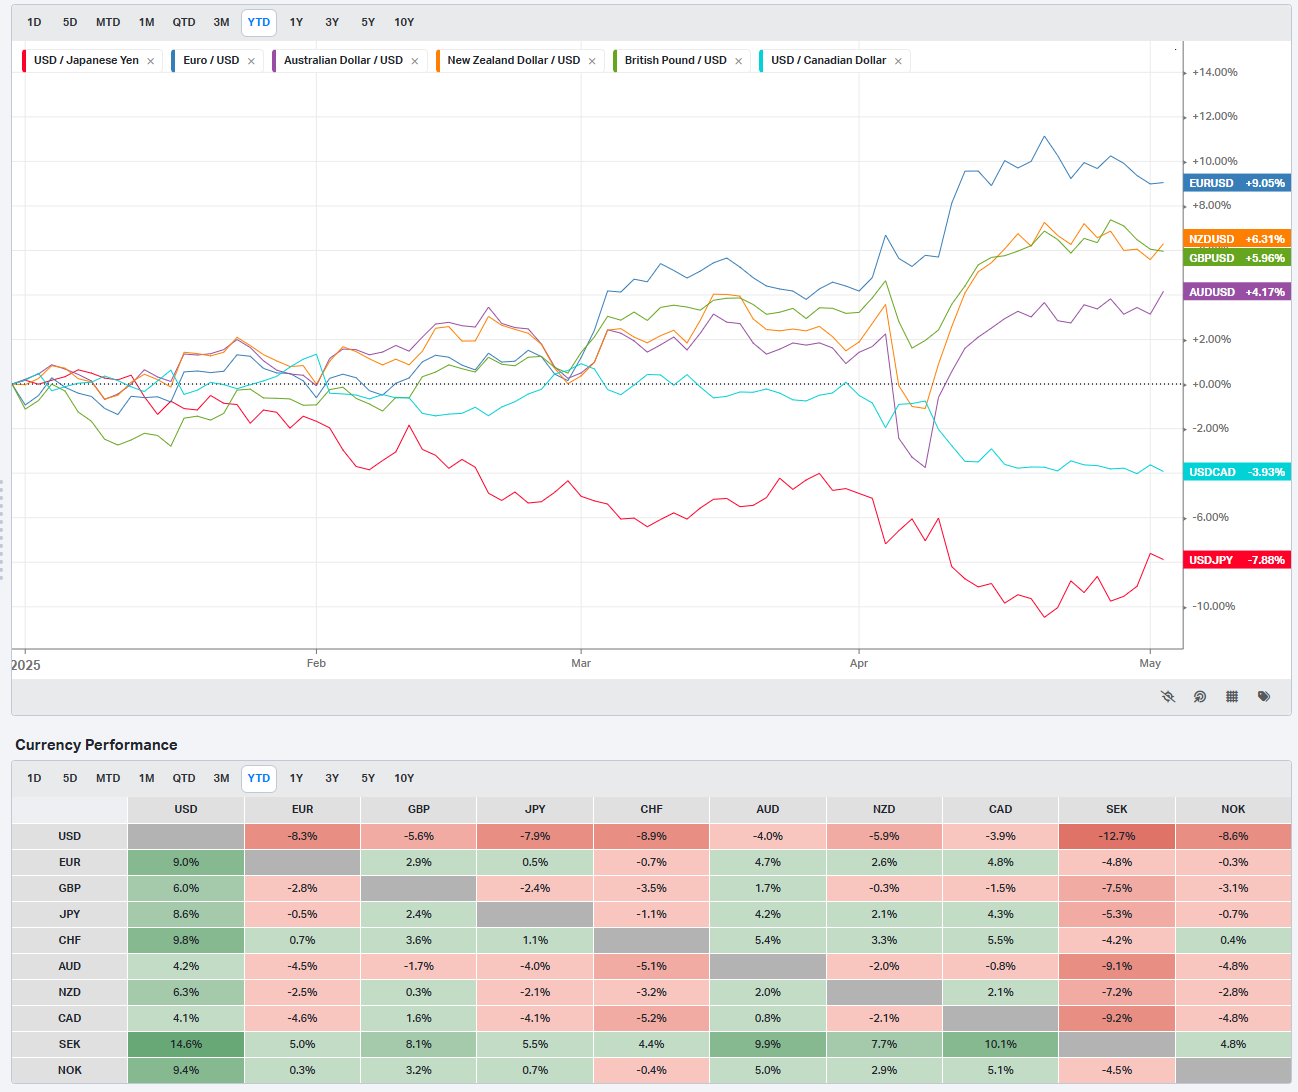
Currency Markets: Dollar Weakness Persists
The U.S. dollar continued to weaken amid ongoing global trade uncertainties, with the Dollar Spot Index declining 0.56% to 99.55. Market observers have expressed growing concern that investors may be reducing their exposure to U.S. assets, including Treasuries and the dollar, due to trade-related disruptions.
The euro ended the week essentially unchanged, down just 0.09% at 1.134, following the European Central Bank's decision to cut interest rates for the seventh time since last summer. The ECB reduced its key rate by 0.25% to 2.25%, citing heightened economic uncertainty - particularly related to trade policy - and fears of a recession driven by suppressed investment and spending.
Global Economic Developments
European Union: Monetary Easing Continues
Beyond its interest rate reduction, the European Central Bank faces a complex economic landscape. The Eurozone April core Consumer Price Index was revised upward to 2.7% year-over-year from the previously reported 2.4%, while the April S&P manufacturing Purchasing Managers' Index was also revised higher to 49.0 from 48.7. The Eurozone's March unemployment rate remained at a record low 6.2%. Despite these relatively positive indicators, derivatives markets are pricing in a 97% probability of another 25 basis point rate cut at the ECB's June 5 policy meeting.
United Kingdom: Inflation Moderates Temporarily
In March, UK inflation decreased to 2.6% from February's 2.8%, driven by cheaper computer games and falling fuel prices. However, this easing is expected to be temporary, with basic household costs projected to increase by £600, potentially pushing inflation above 3% by summer. The Bank of England continues to balance domestic price pressures and a cooling labor market against global economic uncertainty, with markets increasingly anticipating interest rate cuts in the near future.
China: Strong Start, Uncertain Outlook
China's first-quarter GDP grew by an impressive 5.4%, exceeding expectations due to consumer subsidies and accelerated export shipments ahead of anticipated tariff increases. Despite this strong start to the year, analysts are predicting a significant slowdown as trade war impacts materialize, leading to reduced growth forecasts of approximately 4%. Chinese policymakers are contemplating additional stimulus measures, including interest rate cuts and increased fiscal spending, to offset potential export declines and strengthen domestic demand.
Federal Reserve Policy Outlook: Balancing Act
Federal Reserve Chair Jerome Powell acknowledged that President Trump's unexpectedly large tariff increases would likely slow economic growth while simultaneously increasing inflation. He emphasized that in situations where the Fed's dual mandate goals of maximum employment and price stability come into conflict, the central bank would prioritize long-term price stability as the foundation for sustained strength in the labor market.
This stance suggests that the Fed faces an increasingly delicate balancing act. While economic growth appears to be moderating and potentially vulnerable to trade disruptions - factors that would typically favor monetary easing - inflationary pressures from tariffs could limit the Fed's ability to reduce interest rates aggressively. The central bank will likely remain data-dependent, closely monitoring developments in growth, inflation, and the labor market to calibrate its policy response.
Technology Sector Spotlight: Navigating Trade Tensions
The technology sector faces unique challenges amid the evolving trade landscape. Nvidia disclosed that President Trump's administration has prohibited the company from selling its H20 chip in China, representing an escalation in Washington's technology competition with Beijing. This restriction resulted in a $5.5 billion write-down during the current quarter. Similarly, ASML reported first-quarter bookings that fell short of estimates, citing uncertainty stemming from recent tariff announcements. The semiconductor industry index declined 2.86% for the week in response to these developments.

Other hardware manufacturers experienced temporary relief when the administration initially exempted electronics from reciprocal tariffs. However, this reprieve proved short-lived as President Trump later pledged to apply tariffs to these products as well. In response, Apple is accelerating production of key products in India and Vietnam to take advantage of a 90-day grace period before these tariffs take effect. Despite the uncertainty, hardware stocks managed a modest 0.19% gain for the week.
Investment Implications: Navigating the Path Forward
Strategic Positioning in an Uncertain Environment
The current market environment presents both challenges and opportunities for investors. While recent volatility has been unsettling, it's important to recognize that market fluctuations are normal and expected, particularly in years with elevated uncertainty surrounding tariffs, inflation, and economic growth. Typically, investors should anticipate two to three significant pullbacks annually, with current conditions potentially increasing that frequency.
However, the absence of expectations for a deep or prolonged recession suggests that periods of volatility might be viewed as opportunities to rebalance portfolios, enhance diversification, or strategically add exposure across various sectors and asset classes. Sectors less exposed to tariff impacts, such as financials and healthcare, may demonstrate relative outperformance, especially if policymakers make progress on tax reform and deregulation initiatives.
Within fixed income, value appears concentrated in intermediate-duration instruments, particularly in the seven to ten-year maturity range. This positioning could prove advantageous if the Federal Reserve proceeds with interest rate reductions in the latter half of the year, as currently anticipated.
Looking Toward 2026: Potential for Improved Conditions
Despite the current challenges, the outlook for 2026 suggests the potential for a more favorable market environment. Several factors could contribute to this improvement, including:
Greater clarity and stability regarding trade policies and international economic relationships
A Federal Reserve that has implemented multiple interest rate reductions
Meaningful progress on domestic policy priorities, including tax reform and deregulation
Renewed acceleration in corporate earnings growth
The combination of these factors could support a significant improvement in investor sentiment and market performance. While uncertainty remains elevated through 2025, a patient and disciplined approach to investment management - focused on long-term objectives rather than short-term volatility - may prove most effective in navigating the current environment.
Conclusion: Maintaining Perspective Amid Volatility
Financial markets have demonstrated remarkable resilience in recent weeks, rebounding strongly from April's early turbulence. Major indices have recovered nearly all their losses, with the S&P 500 up approximately 8% from its recent low. This performance reflects investors' growing confidence that the U.S. economy possesses sufficient momentum to withstand current headwinds, including trade tensions and moderating growth.
Nevertheless, significant uncertainty persists regarding the path forward. The contraction in first-quarter GDP, though likely temporary, highlights the vulnerability of economic growth to policy shifts and external shocks. Corporate earnings, while strong for the first quarter, face increasing pressure from rising costs and uncertain demand conditions. Consumer confidence continues to deteriorate, potentially signaling challenges for future spending growth.
Against this backdrop, maintaining a balanced and disciplined investment approach becomes particularly important. Diversification across asset classes, sectors, and geographies can help mitigate specific risks, while a focus on high-quality investments may provide greater stability during periods of volatility.
For sustainable market progress, concrete evidence of trade agreements with China and other major trading partners would likely be necessary. Without such developments, markets may continue to experience heightened volatility as investors react to evolving policy announcements and economic data.
In this environment, it becomes essential to distinguish between noise and signal - to maintain perspective on long-term investment objectives while avoiding overreaction to short-term market movements. While the current landscape presents challenges, it also creates opportunities for those with the patience and discipline to navigate these uncertain waters.
Range, Breadth, New Highs & Lows By Index
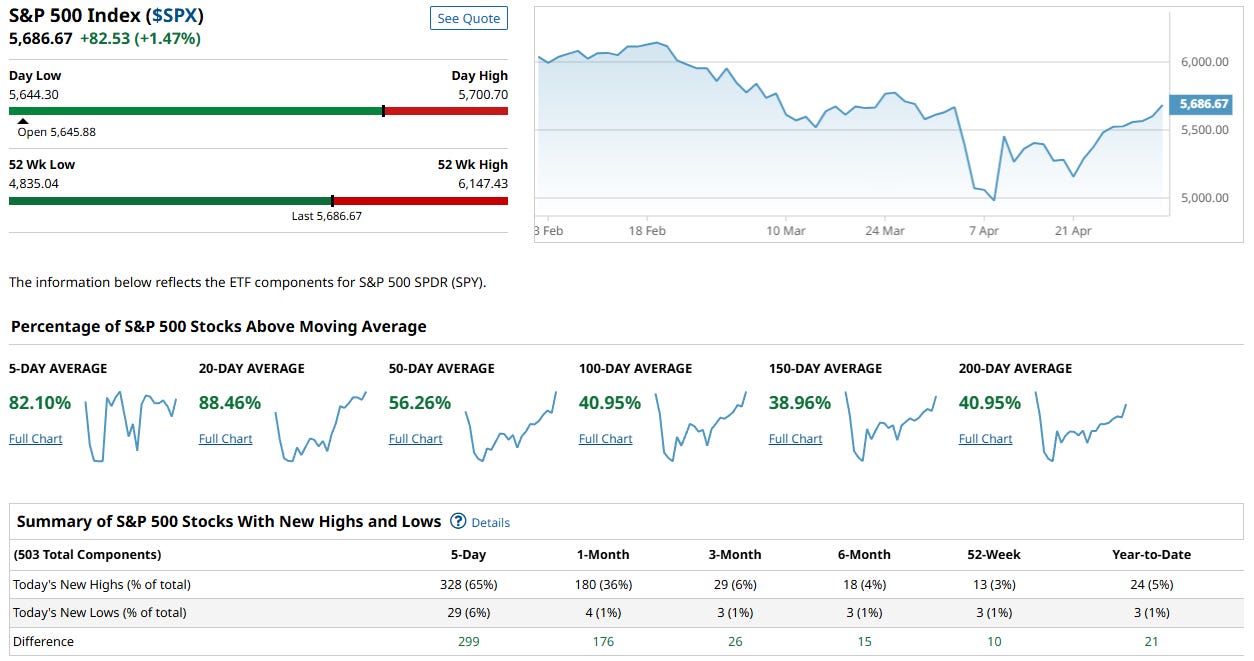
S&P 500 Index
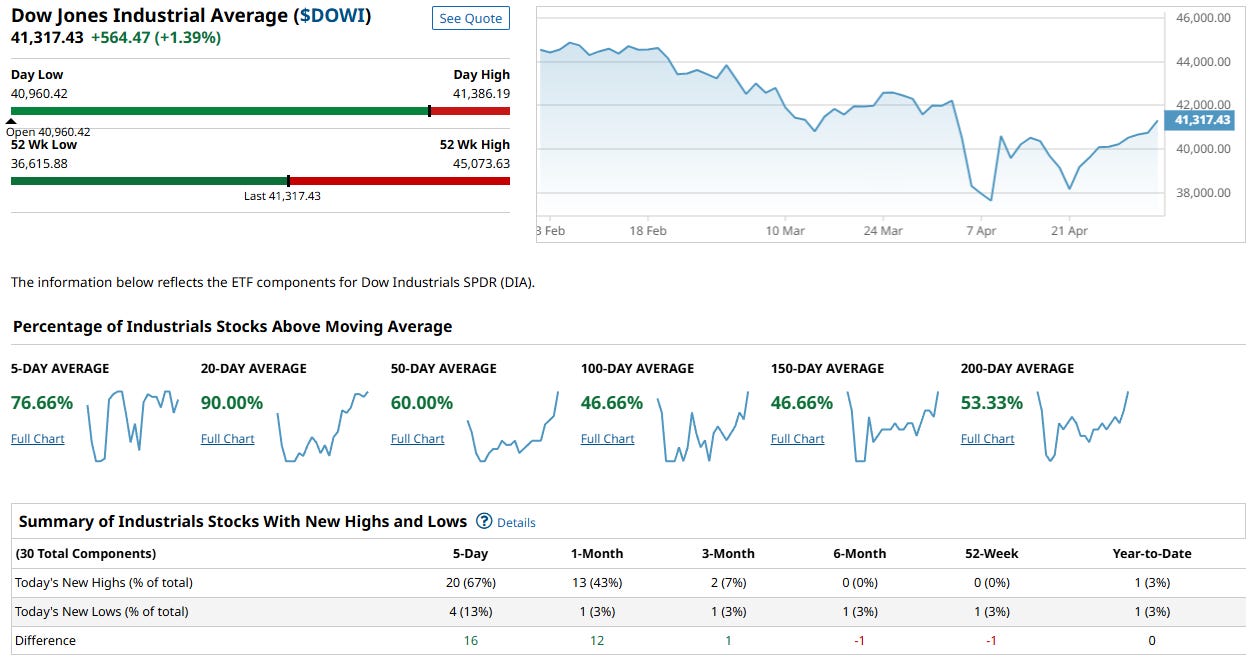
Dow Jones Index
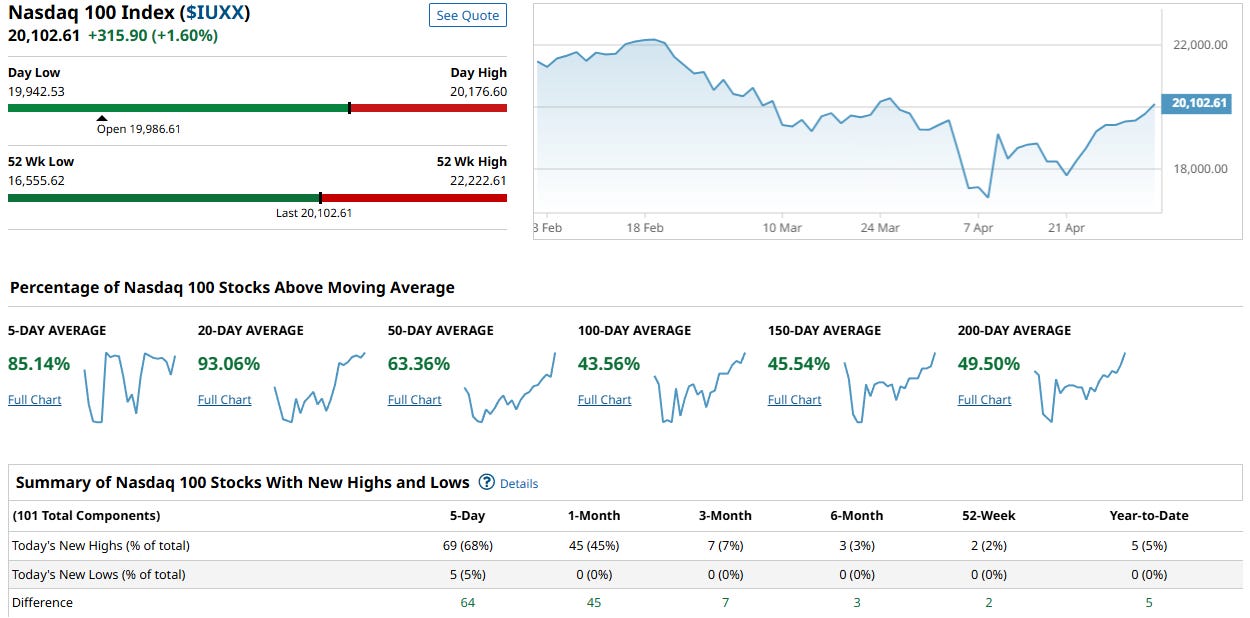
NASDAQ 100 Index
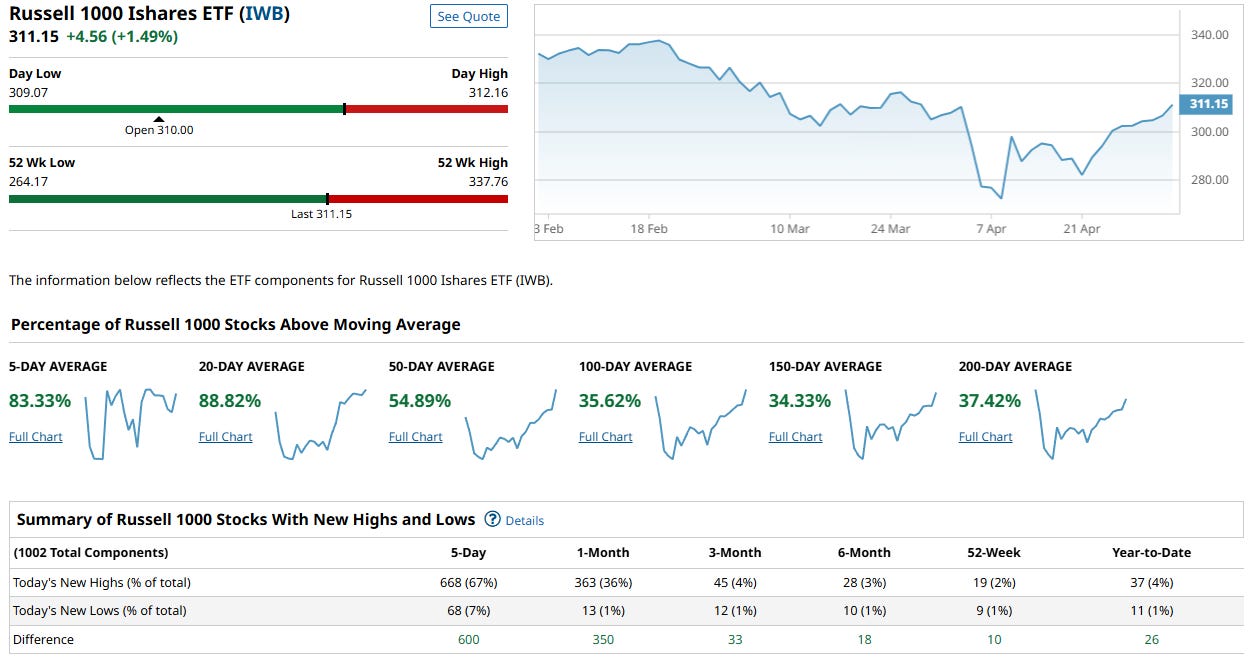
Russel 1000
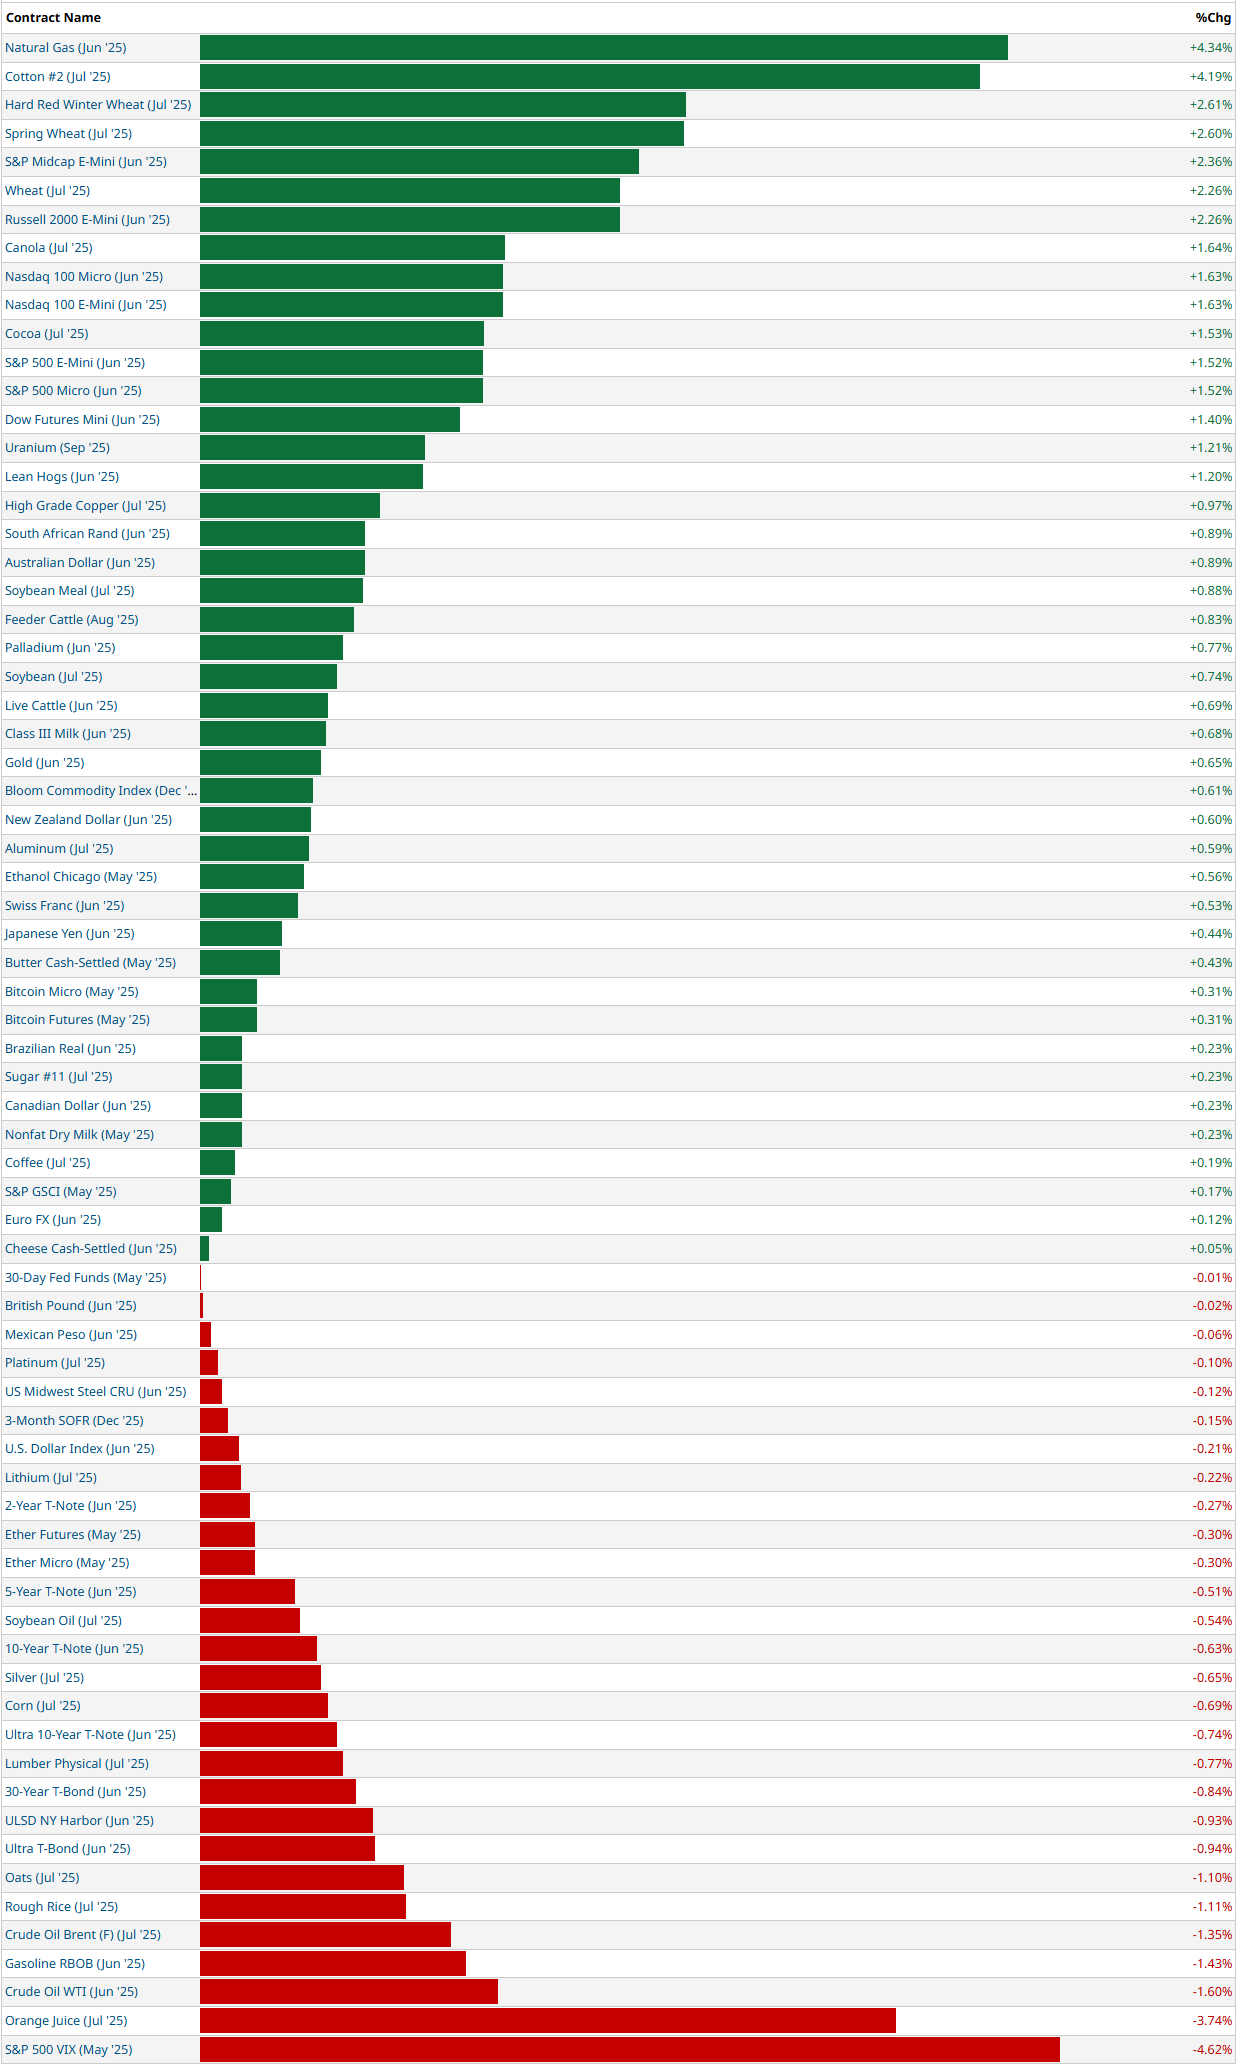
5-Day Futures Performance Leaders
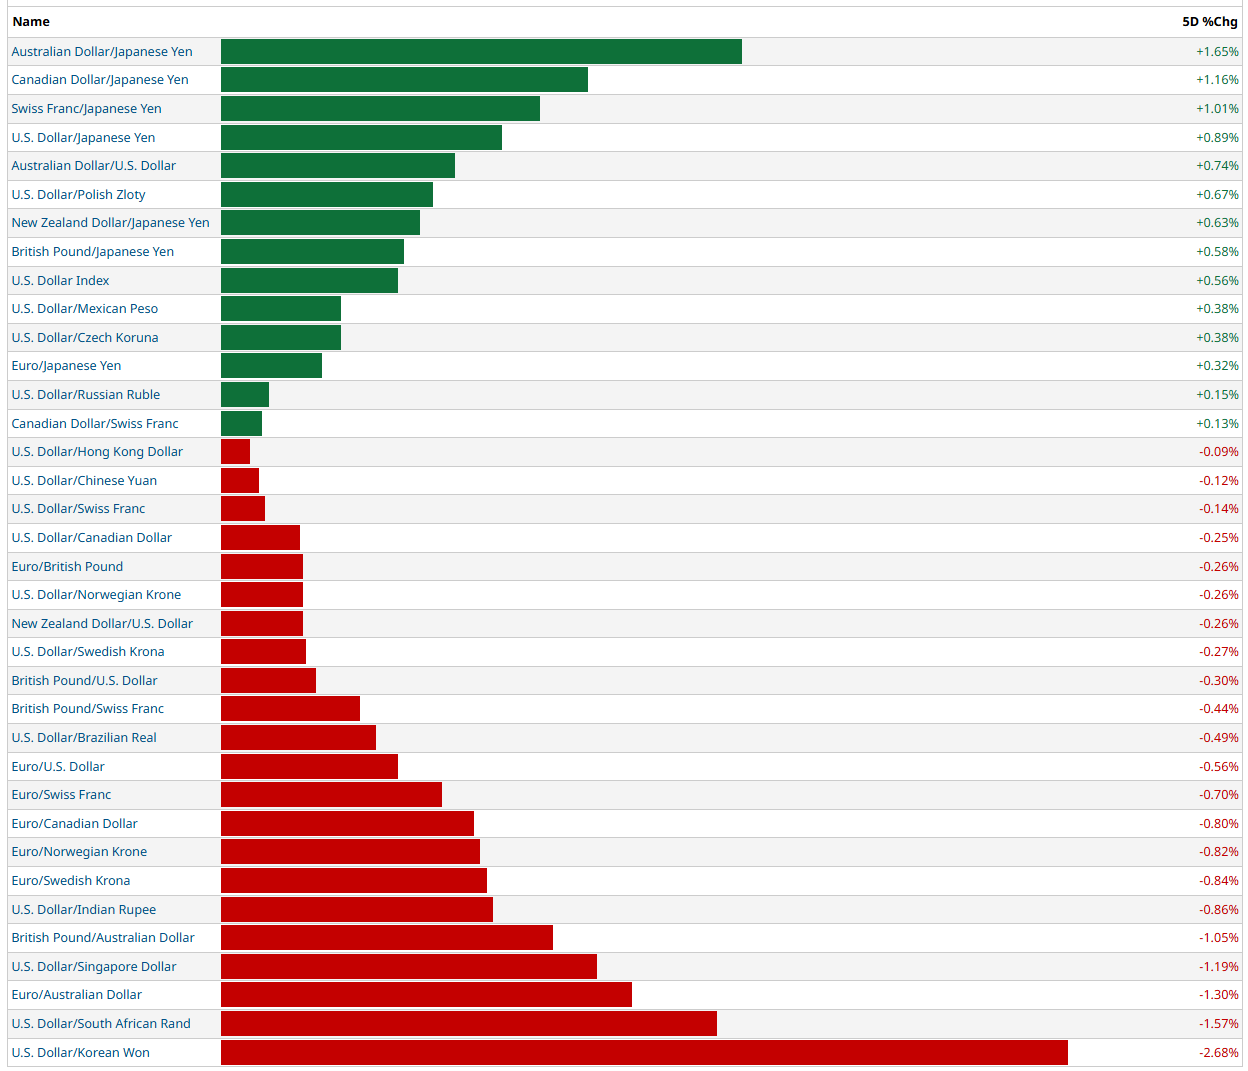
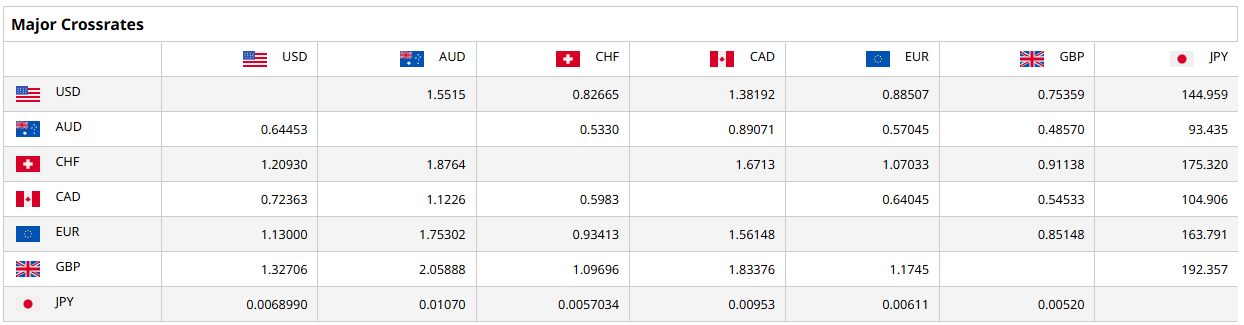
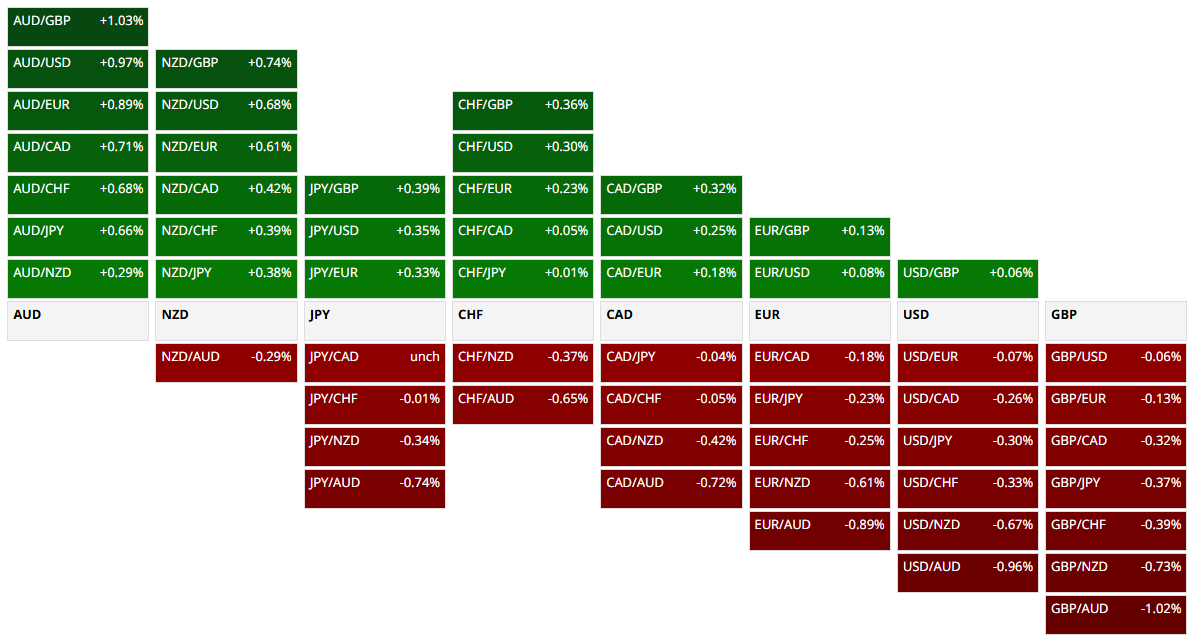
FOREX
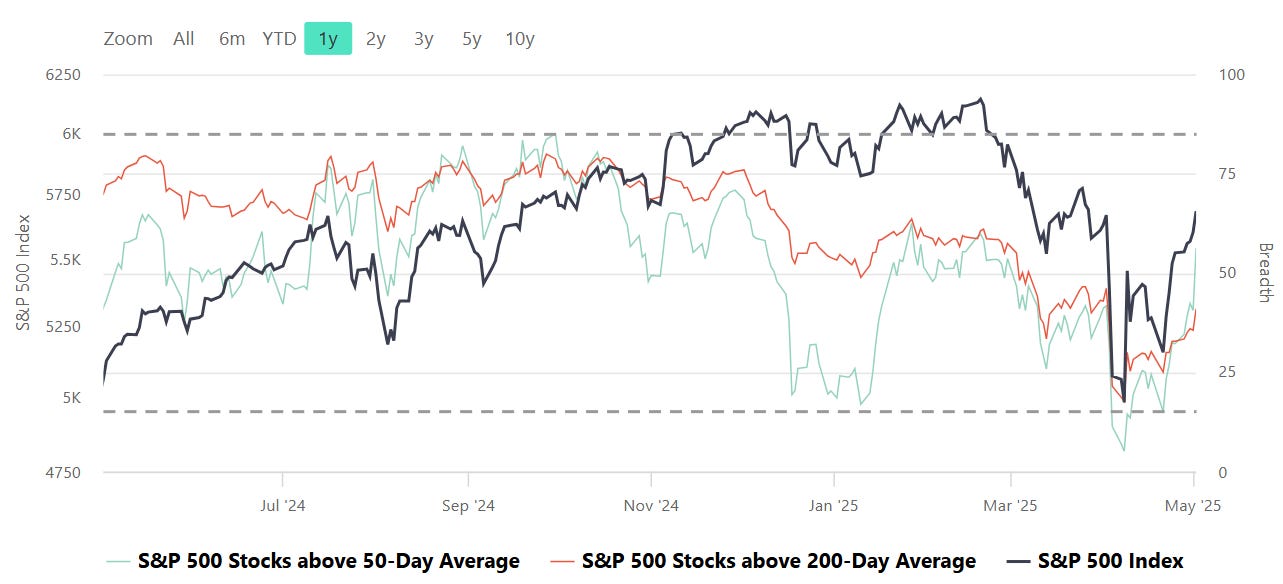
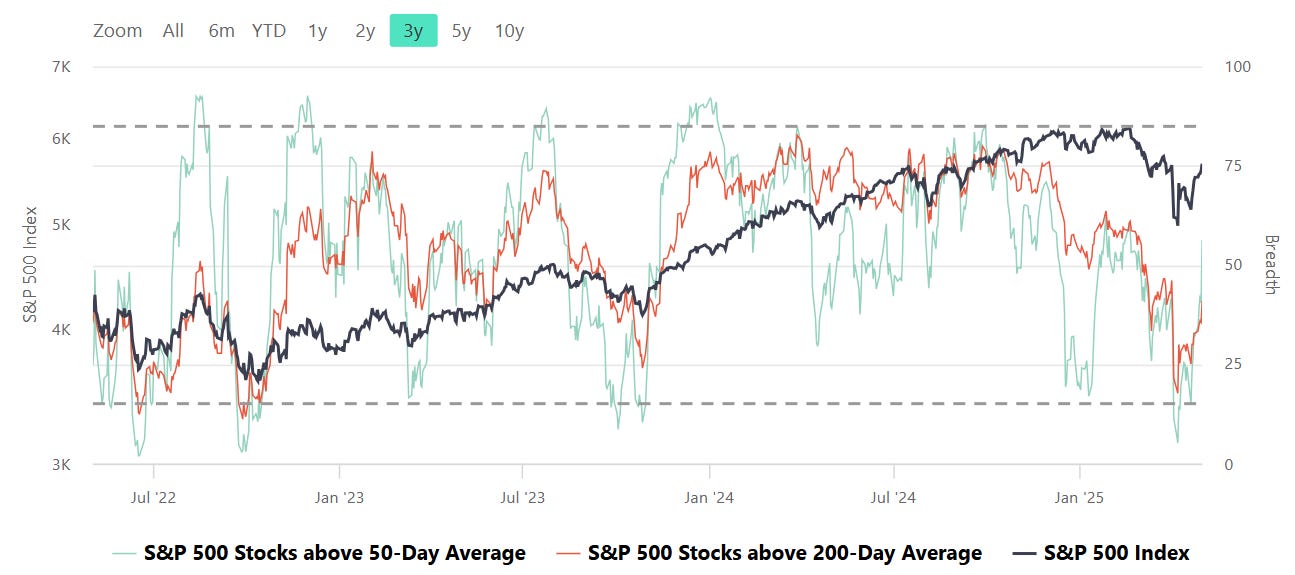
S&P Breadth
Breadth, in the context of stock market analysis, refers to the measure of how many stocks in a given index (such as the S&P 500) are participating in a trend, such as advancing or declining relative to a certain moving average (e.g., 50-day or 200-day).
Market Strength Assessment:
Breadth provides insight into whether a market rally or decline is broad-based or driven by only a few large-cap stocks. A rally supported by a high percentage of stocks above their 50-day or 200-day averages is generally considered healthier and more sustainable.
Early Warning Signals:
Divergences between breadth indicators and the index price can signal potential reversals. For example:
If the index is rising, but the number of stocks above their moving averages is declining, it may indicate weakening underlying strength and potential for a pullback.
Conversely, if breadth improves while the index remains flat or declines, it may suggest accumulating strength for a future rally.
Trend Confirmation:
Breadth indicators can confirm trends. For instance, a strong majority of stocks above their moving averages signals robust market momentum, providing confidence in the prevailing trend.
Identifying Overbought or Oversold Conditions:
Extremely high or low breadth readings can signal overbought or oversold conditions, which might lead to mean reversion. For example:
If nearly all stocks are above their 50-day or 200-day averages, it may suggest overbought conditions.
Conversely, extremely low levels indicate oversold conditions and potential for a bounce.
Breadth and Timing Investments:
Entry Points:
When breadth improves (e.g., more stocks move above their 50-day or 200-day moving averages) after a market pullback, it can indicate a good time to start building positions as the broader market is regaining strength.
Exit Points:
Breadth deterioration during a rally may suggest it’s time to reduce exposure, especially if only a small number of stocks are driving index gains. This is often a warning sign of an impending correction.
Volatility and Risk Management:
Weak breadth in volatile markets may prompt caution or defensive positioning. Conversely, improving breadth can justify taking on more risk during uptrends.
CME Fedwatch
What is the likelihood that the Fed will change the Federal target rate at upcoming FOMC meetings, according to interest rate traders? Use CME FedWatch to track the probabilities of changes to the Fed rate, as implied by 30-Day Fed Funds futures prices.

US Investor Sentiment
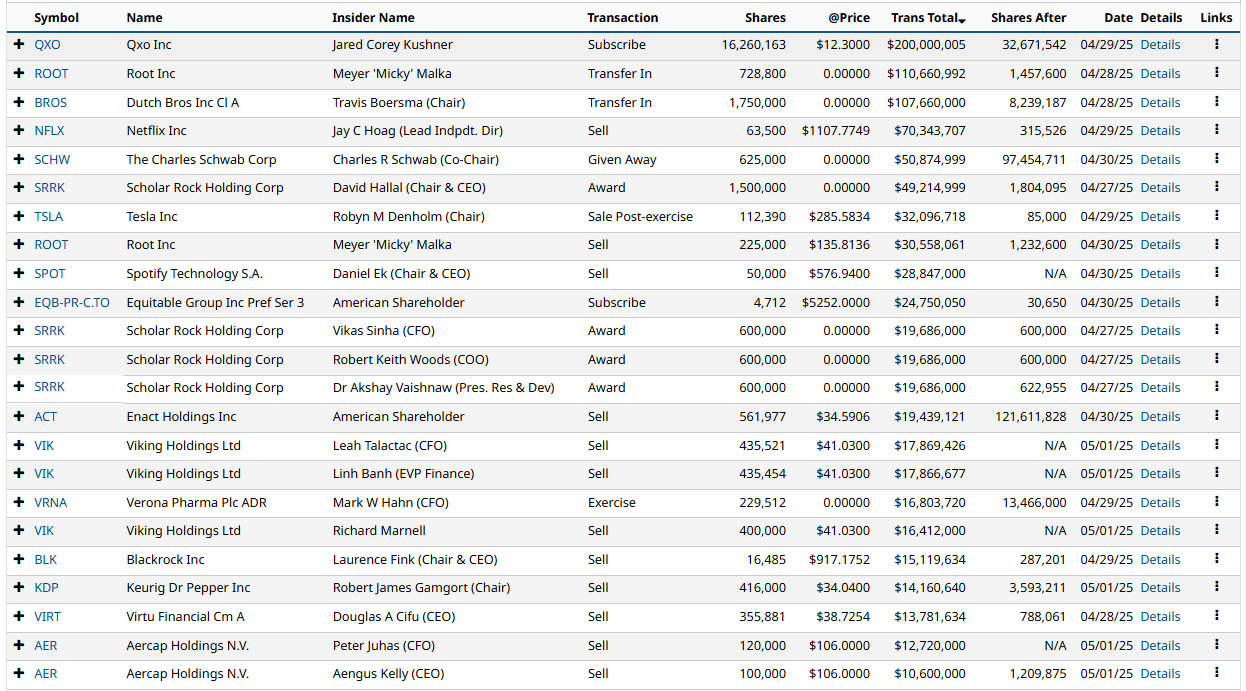
Insider Trading
Insider trading occurs when a company’s leaders or major shareholders trade stock based on non-public information. Tracking these trades can reveal insider expectations about the company’s future. For example, large purchases before an earnings report or drug trial results might indicate confidence in upcoming good news.
%Bull-Bear Spread
The %Bull-Bear Spread chart is a sentiment indicator that shows the difference between the percentage of bullish and bearish investors, often derived from surveys or sentiment data, such as the AAII (American Association of Individual Investors) sentiment survey. This spread tells investors about the prevailing mood in the market and can provide insights into market extremes and potential turning points.
Bullish or Bearish Sentiment:
When the spread is positive, it means more investors are bullish than bearish, indicating optimism about the market’s direction.
A negative spread indicates more bearish sentiment, meaning more investors expect the market to decline.
Contrarian Indicator:
The %Bull-Bear Spread is often used as a contrarian indicator. For example, extremely high levels of bullish sentiment might suggest that the market is overly optimistic and could be due for a correction.
Similarly, when bearish sentiment is extremely high, it might indicate that the market is overly pessimistic, and a rally could be on the horizon.
Market Extremes and Reversals:
Historically, extreme values of the spread (both positive and negative) can signal turning points in the market. A very high positive spread can signal market exuberance, while a very low or negative spread may indicate fear or capitulation.
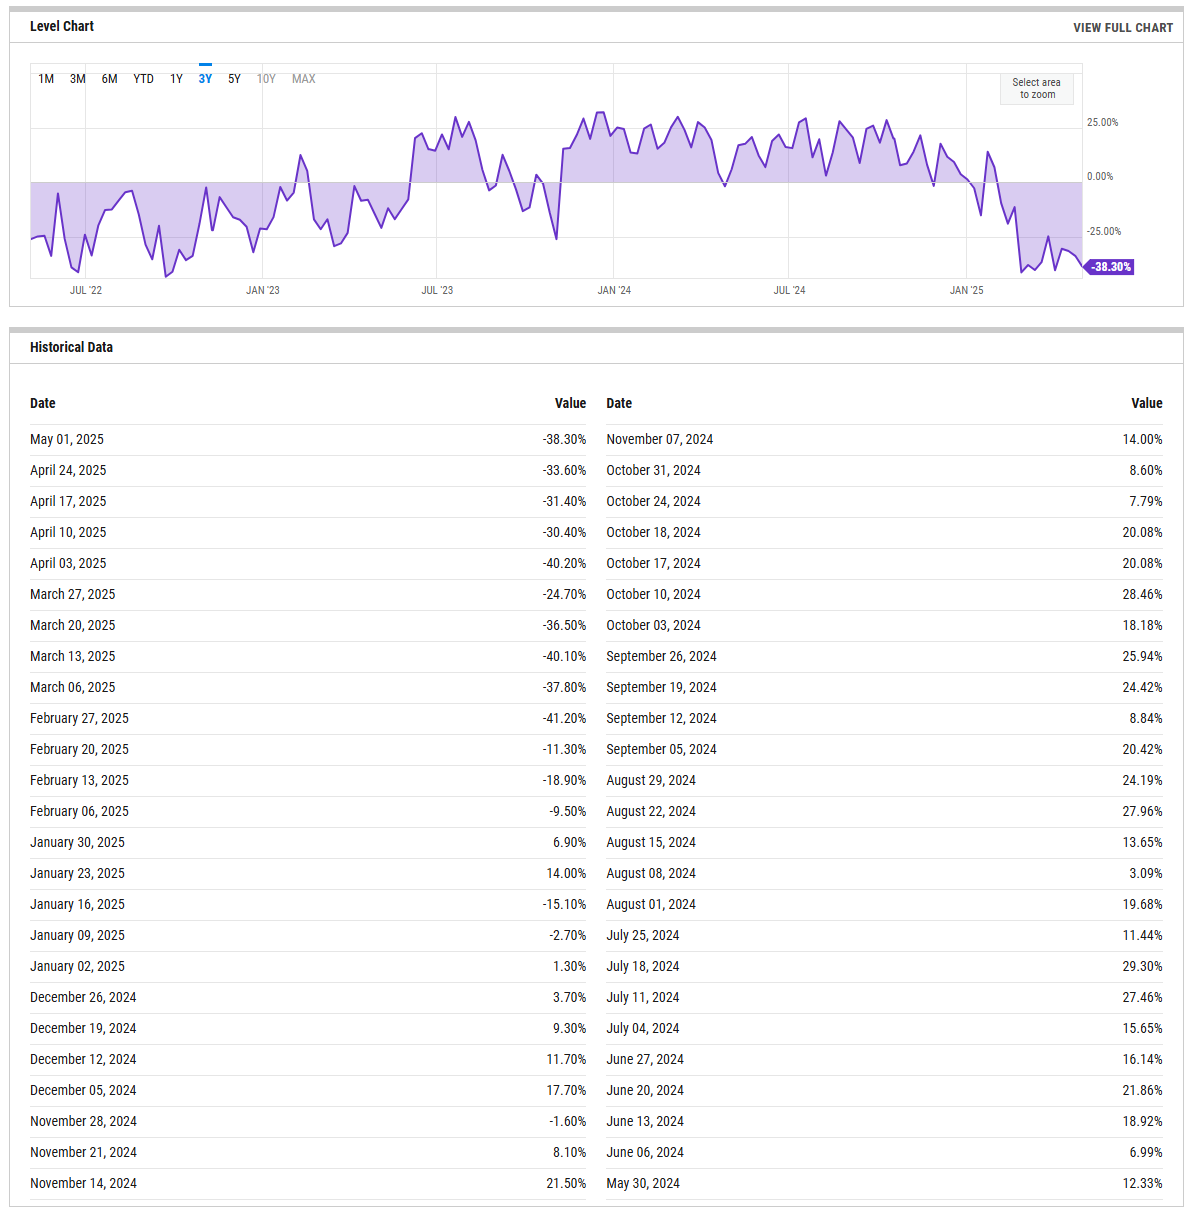
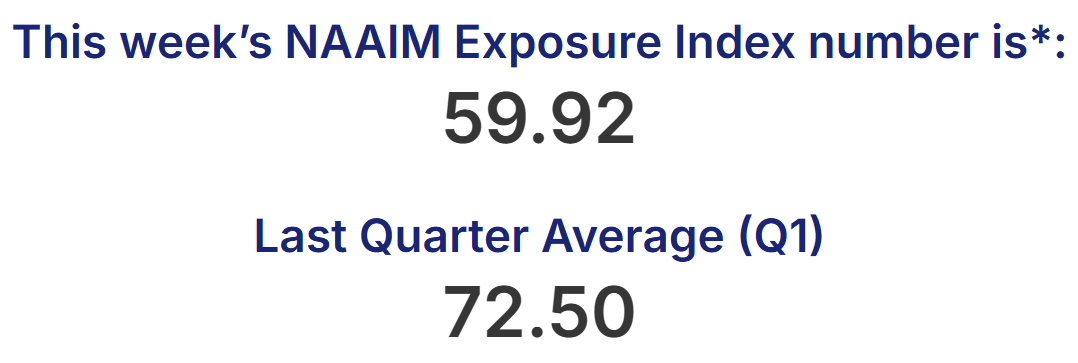
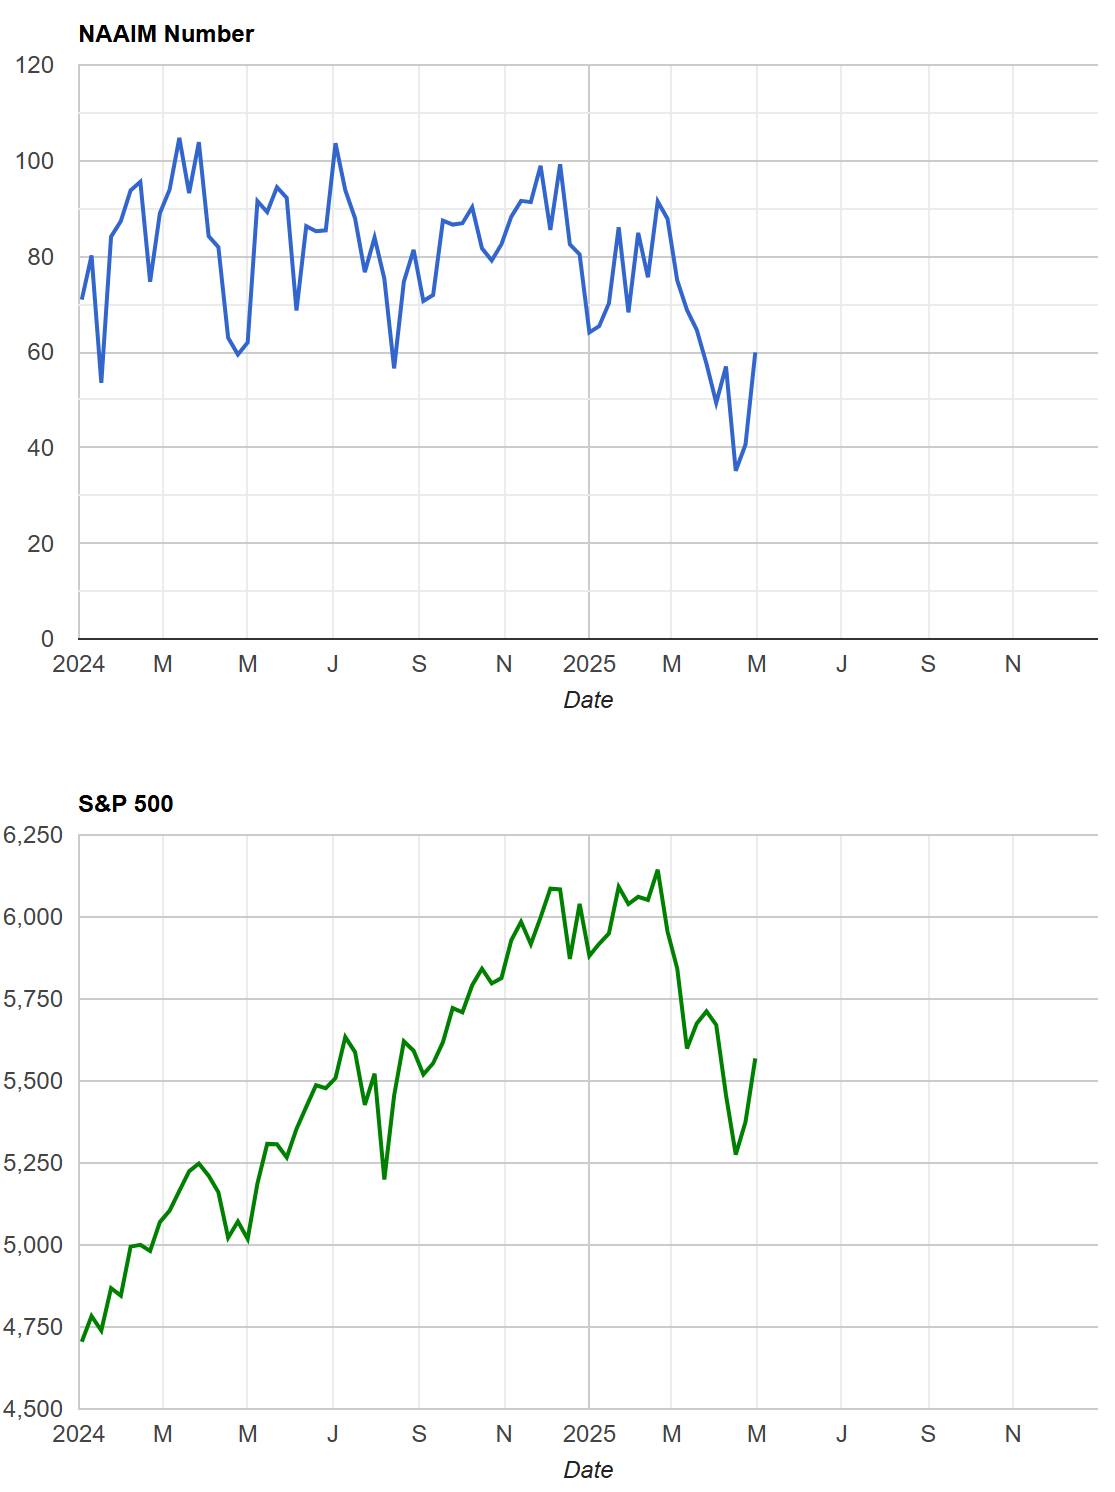
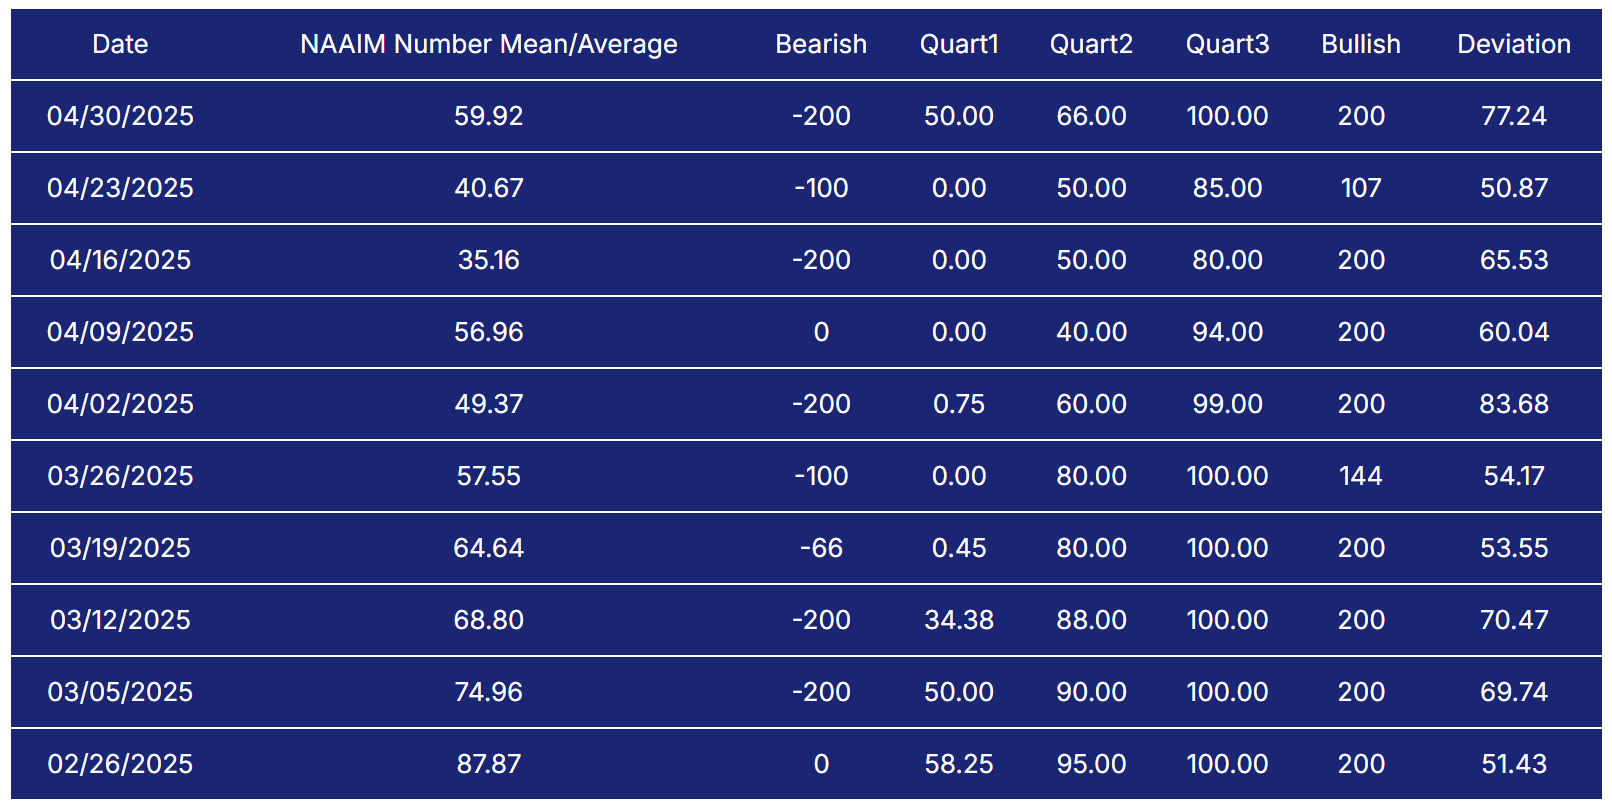
NAAIM Exposure Index
The NAAIM Exposure Index (National Association of Active Investment Managers Exposure Index) measures the average exposure to U.S. equity markets as reported by its member firms. These are typically active money managers who provide their equity exposure levels weekly. The index offers insight into how much these managers are investing in equities at any given time, ranging from being fully short (-100%) to leveraged long (up to +200%).
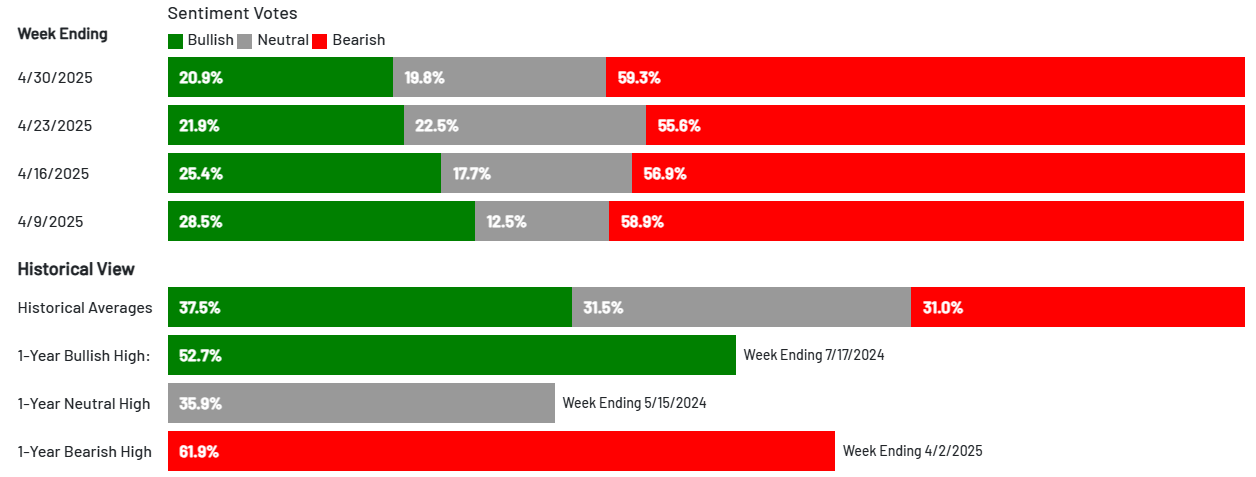
AAII Investor Sentiment Survey
The AAII Investor Sentiment Survey is a weekly survey conducted by the American Association of Individual Investors (AAII) to gauge the mood of individual investors regarding the direction of the stock market over the next six months. It provides insights into whether investors are feeling bullish (expecting the market to rise), bearish (expecting the market to fall), or neutral (expecting the market to stay about the same).
Key Points:
Bullish Sentiment: Reflects the percentage of investors who believe the stock market will rise in the next six months.
Bearish Sentiment: Represents those who expect a decline.
Neutral Sentiment: Reflects investors who anticipate little to no market movement.
The survey is widely followed as a contrarian indicator, meaning that extreme levels of bullishness or bearishness can sometimes signal market turning points. For example, when a large number of investors are overly optimistic (high bullish sentiment), it could suggest a market top, while excessive pessimism (high bearish sentiment) may indicate a market bottom is near.
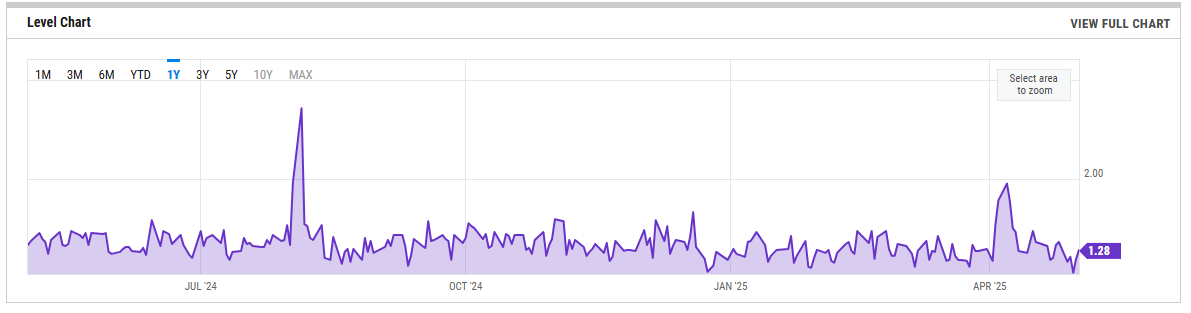
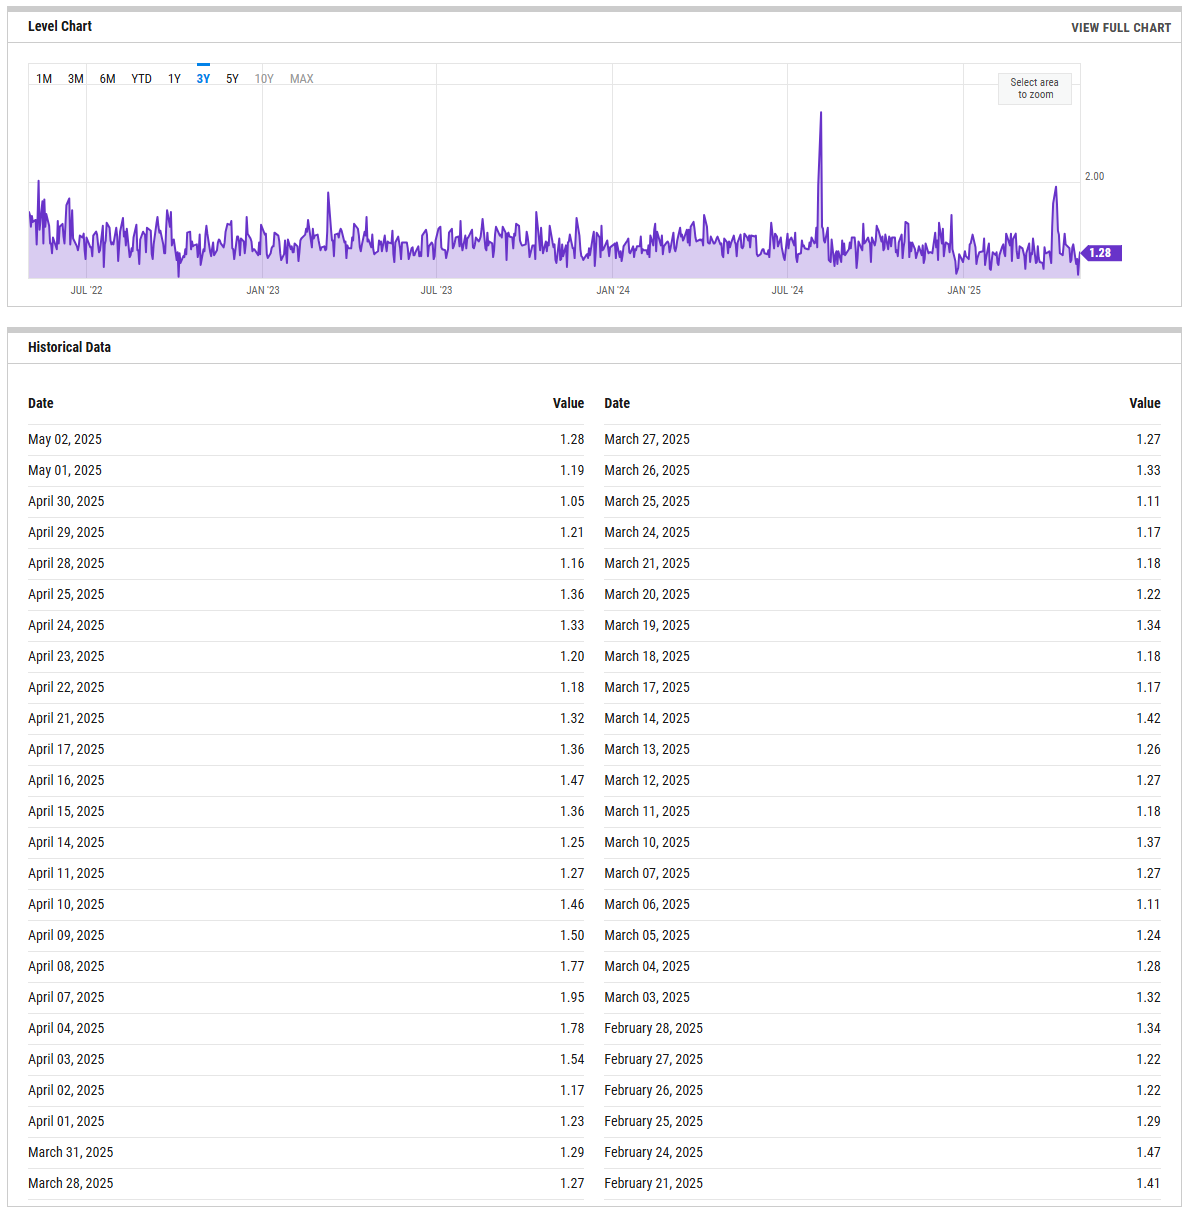
SPX Put/Call Ratio
The SPX Put/Call Ratio is an indicator that is used to gauge market sentiment. This is calculated as the ratio between trading S&P 500 put options and S&P call options. A high put/call ratio can indicate fear in the markets, while a low ratio indicates confidence. For example, in 2015, the Put-Call ratio was as high as 3.77 because of market fears stemming from various global economic issues like a GDP growth slowdown in China and a Greek debt default.
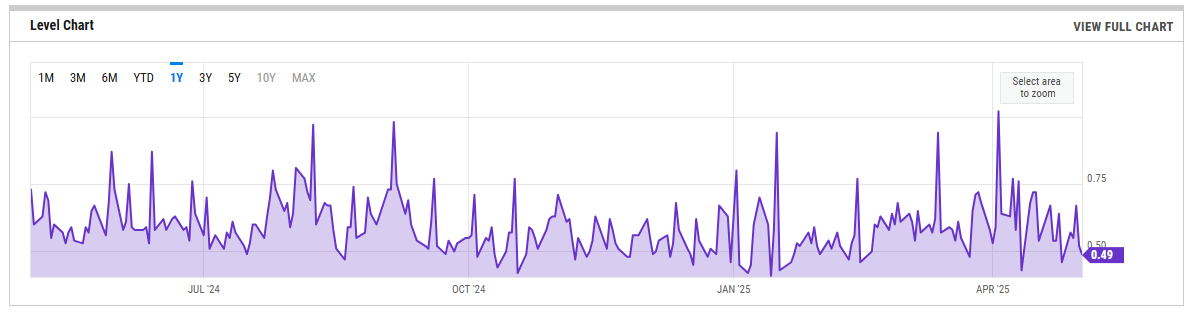
CBOE Equity Put/Call Ratio
The CBOE (Chicago Board Options Exchange) equity put/call ratio is a sentiment indicator used by traders and analysts to gauge market sentiment and potential shifts in investor behavior. It is calculated by dividing the volume of put options by the volume of call options on equities. Here’s what it reveals and how it is generally interpreted:
High Put/Call Ratio: When the put/call ratio is high (above 1.0), it suggests that there is more demand for put options than call options. This typically reflects a more bearish sentiment, as investors may be hedging against potential declines or expecting the market to fall.
Low Put/Call Ratio: Conversely, a low put/call ratio (below 0.7) indicates a higher volume of call options compared to puts, reflecting bullish sentiment. Investors may be expecting upward momentum and are positioning themselves to profit from price gains
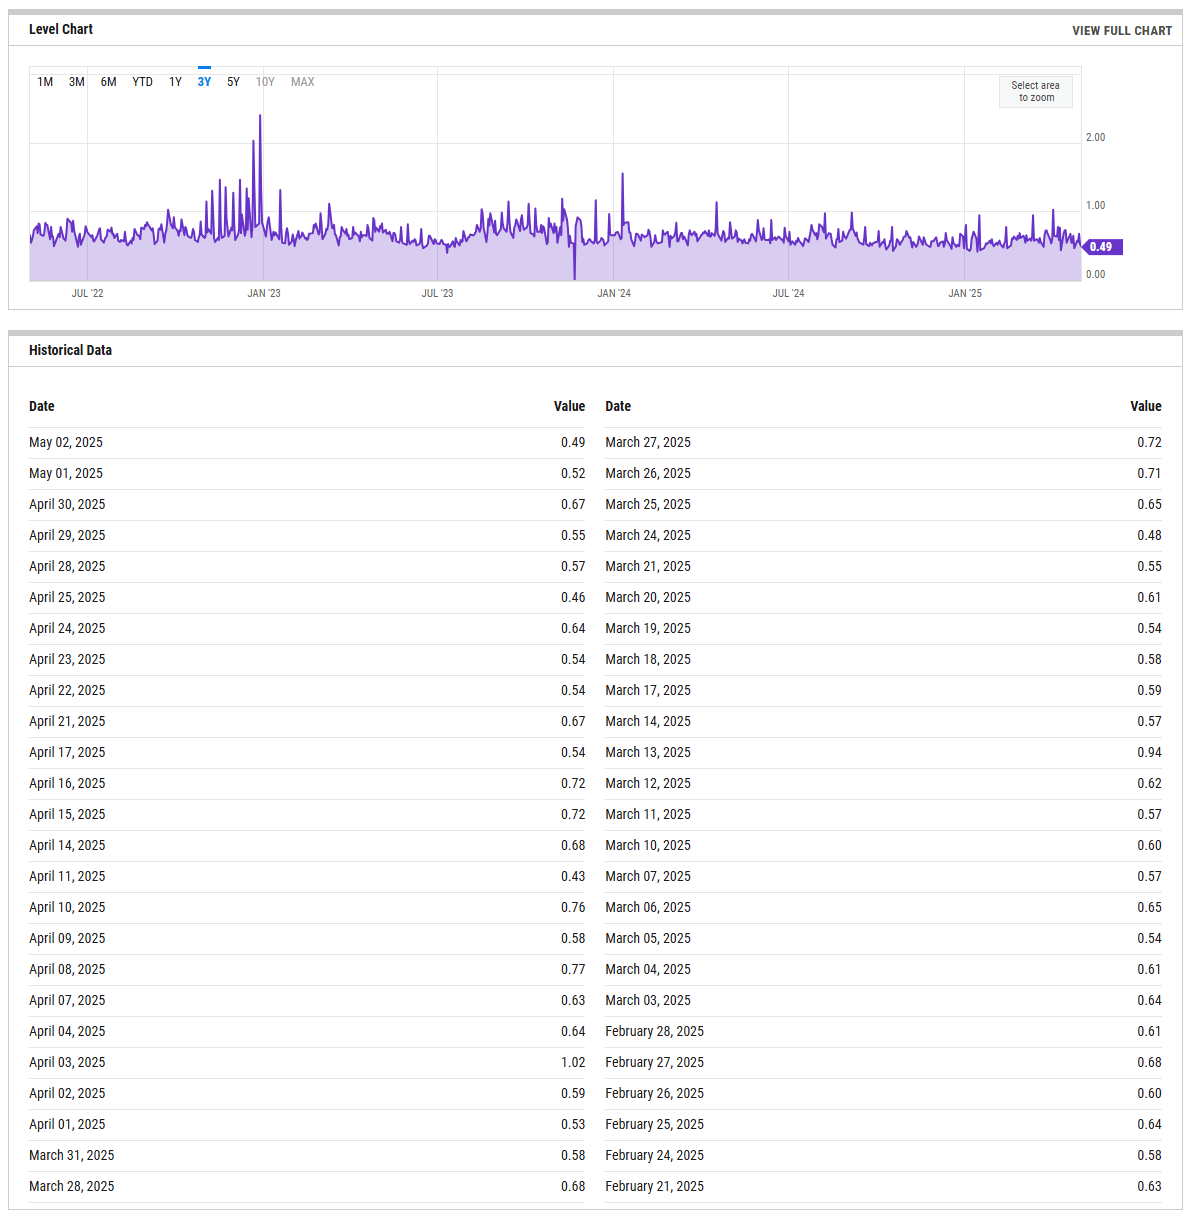
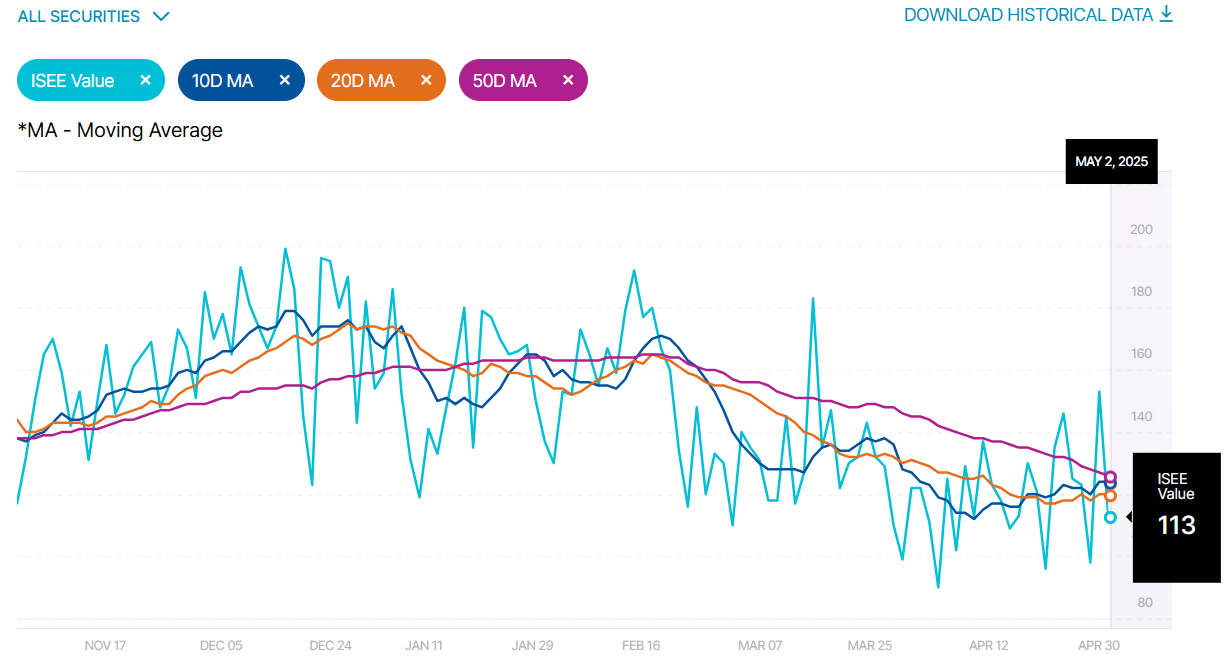
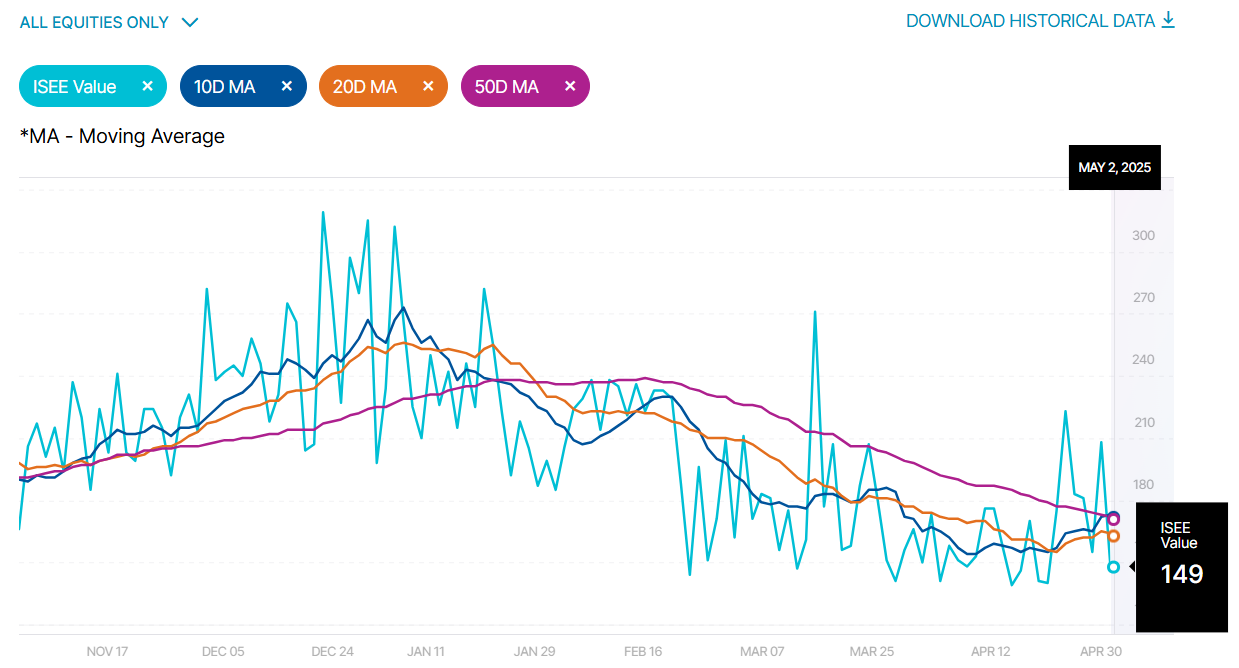
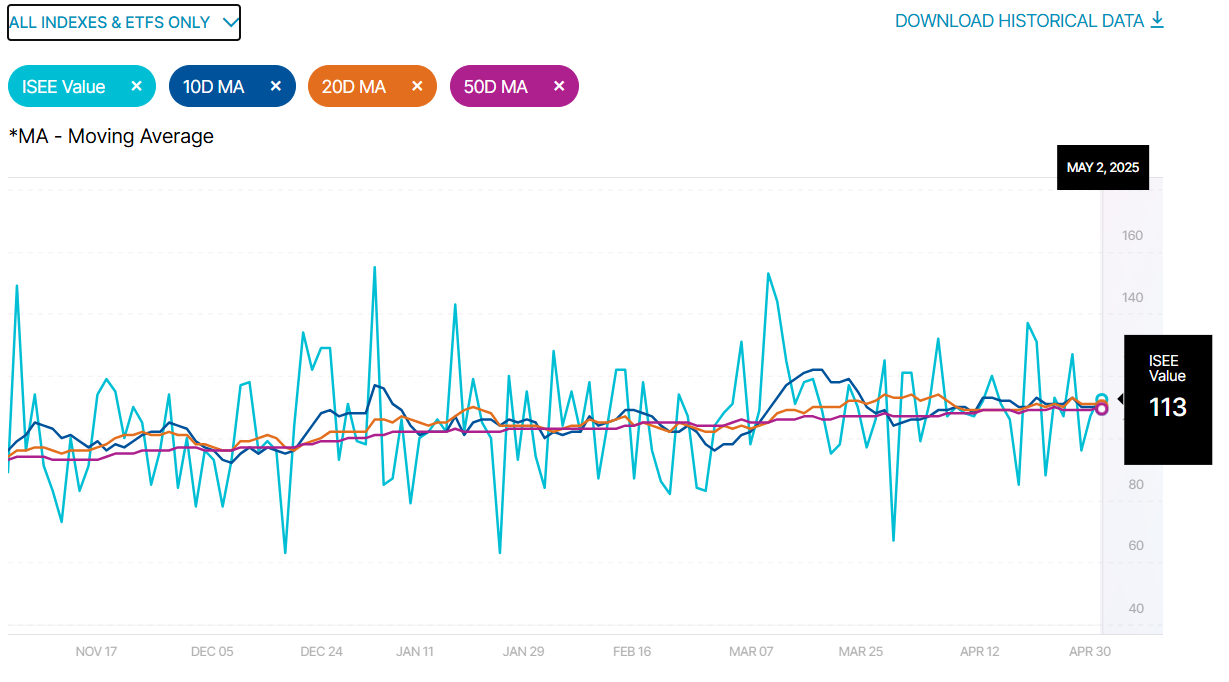
ISEE Sentiment Index
The ISEE (International Securities Exchange Sentiment) Index is a measure of investor sentiment derived from options trading. Unlike traditional put/call ratios, the ISEE Index focuses only on opening long customer transactions and is adjusted to remove market-maker and firm trades, providing a purer sentiment reading.
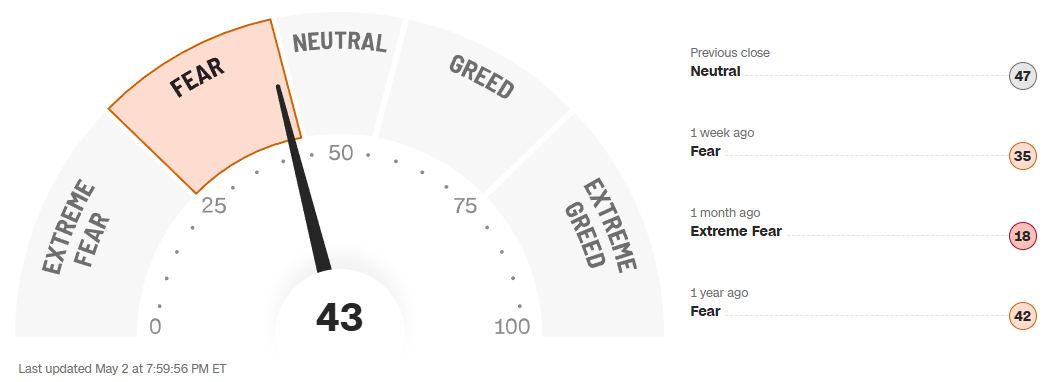
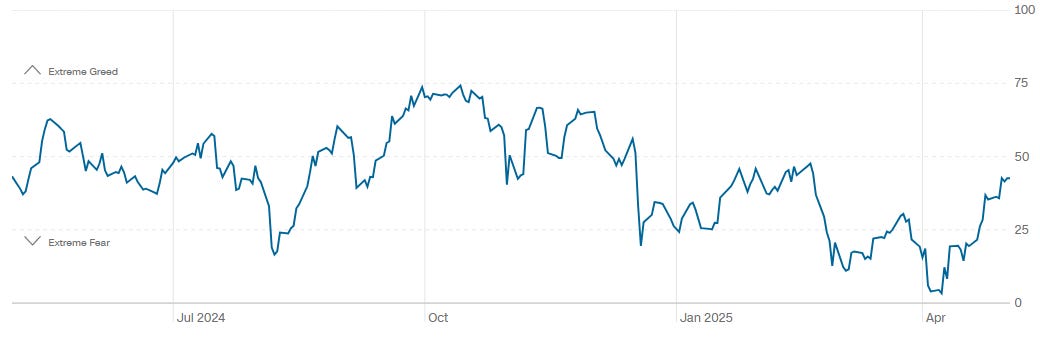
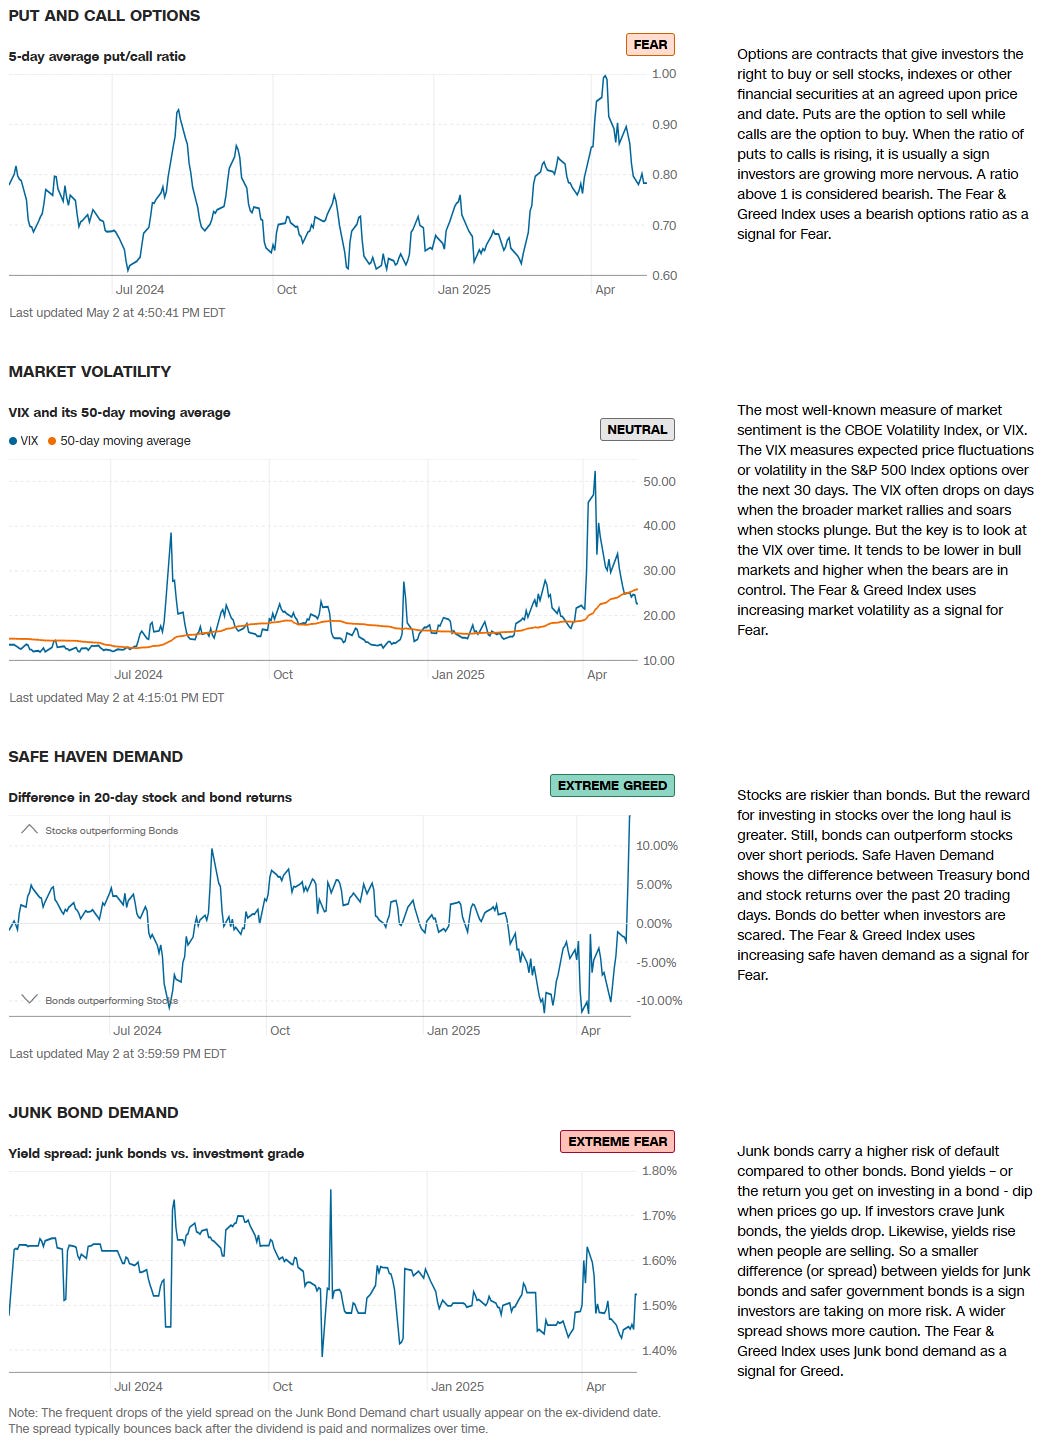
CNN Fear & Greed Constituent Data Points & Composite Index
Social Media Favs
Analyzing social sentiment can provide valuable insights for investment strategies by offering a pulse on public perception, mood, and market sentiment that traditional financial indicators might not capture. Here’s how social sentiment analysis can enhance investment decisions:
Market Momentum: Positive or negative social sentiment can signal impending momentum shifts. When public opinion on a stock, sector, or asset class changes sharply, it can create buying or selling pressure, especially if that sentiment becomes widespread.
Early Detection of Trends: Social sentiment data can help investors spot trends before they show up in technical or fundamental data. For example, increased positive chatter around a particular company or sector might indicate growing interest or excitement, which could lead to price appreciation.
Gauge Retail Investor Impact: With the rise of retail investor platforms, collective sentiment on social media can lead to significant price movements (e.g., meme stocks). Understanding how retail investors view certain stocks can help in identifying high-volatility opportunities.
Event Reaction Monitoring: Social sentiment can provide real-time reactions to news events, product releases, or earnings reports. Investors can use this information to gauge market reaction quickly and adjust their strategies accordingly.
Complementing Quantitative Models: By adding a social sentiment layer to quantitative models, investors can enhance predictions. For example, a model that tracks historical price and volume data might perform even better when factoring in sentiment trends as a measure of market psychology.
Risk Management: Negative sentiment spikes can be a signal of potential downturns or increased volatility. By monitoring sentiment, investors might avoid or hedge against investments in companies experiencing a public relations crisis or facing negative perceptions.
Long-Term Sentiment Trends: Sustained sentiment trends, whether positive or negative, often mirror longer-term market cycles. Tracking sentiment trends over time can help identify shifts in investor psychology that could affect longer-term investments or sector rotations.
For these reasons, sentiment analysis, when combined with other tools, can provide a comprehensive view of both immediate market reactions and underlying investor attitudes, helping investors position themselves strategically across various time frames. Here are the most mentioned/discussed tickers on Reddit from some of the most active Subreddits for trading:
Institutional S/R Levels for Major Indices
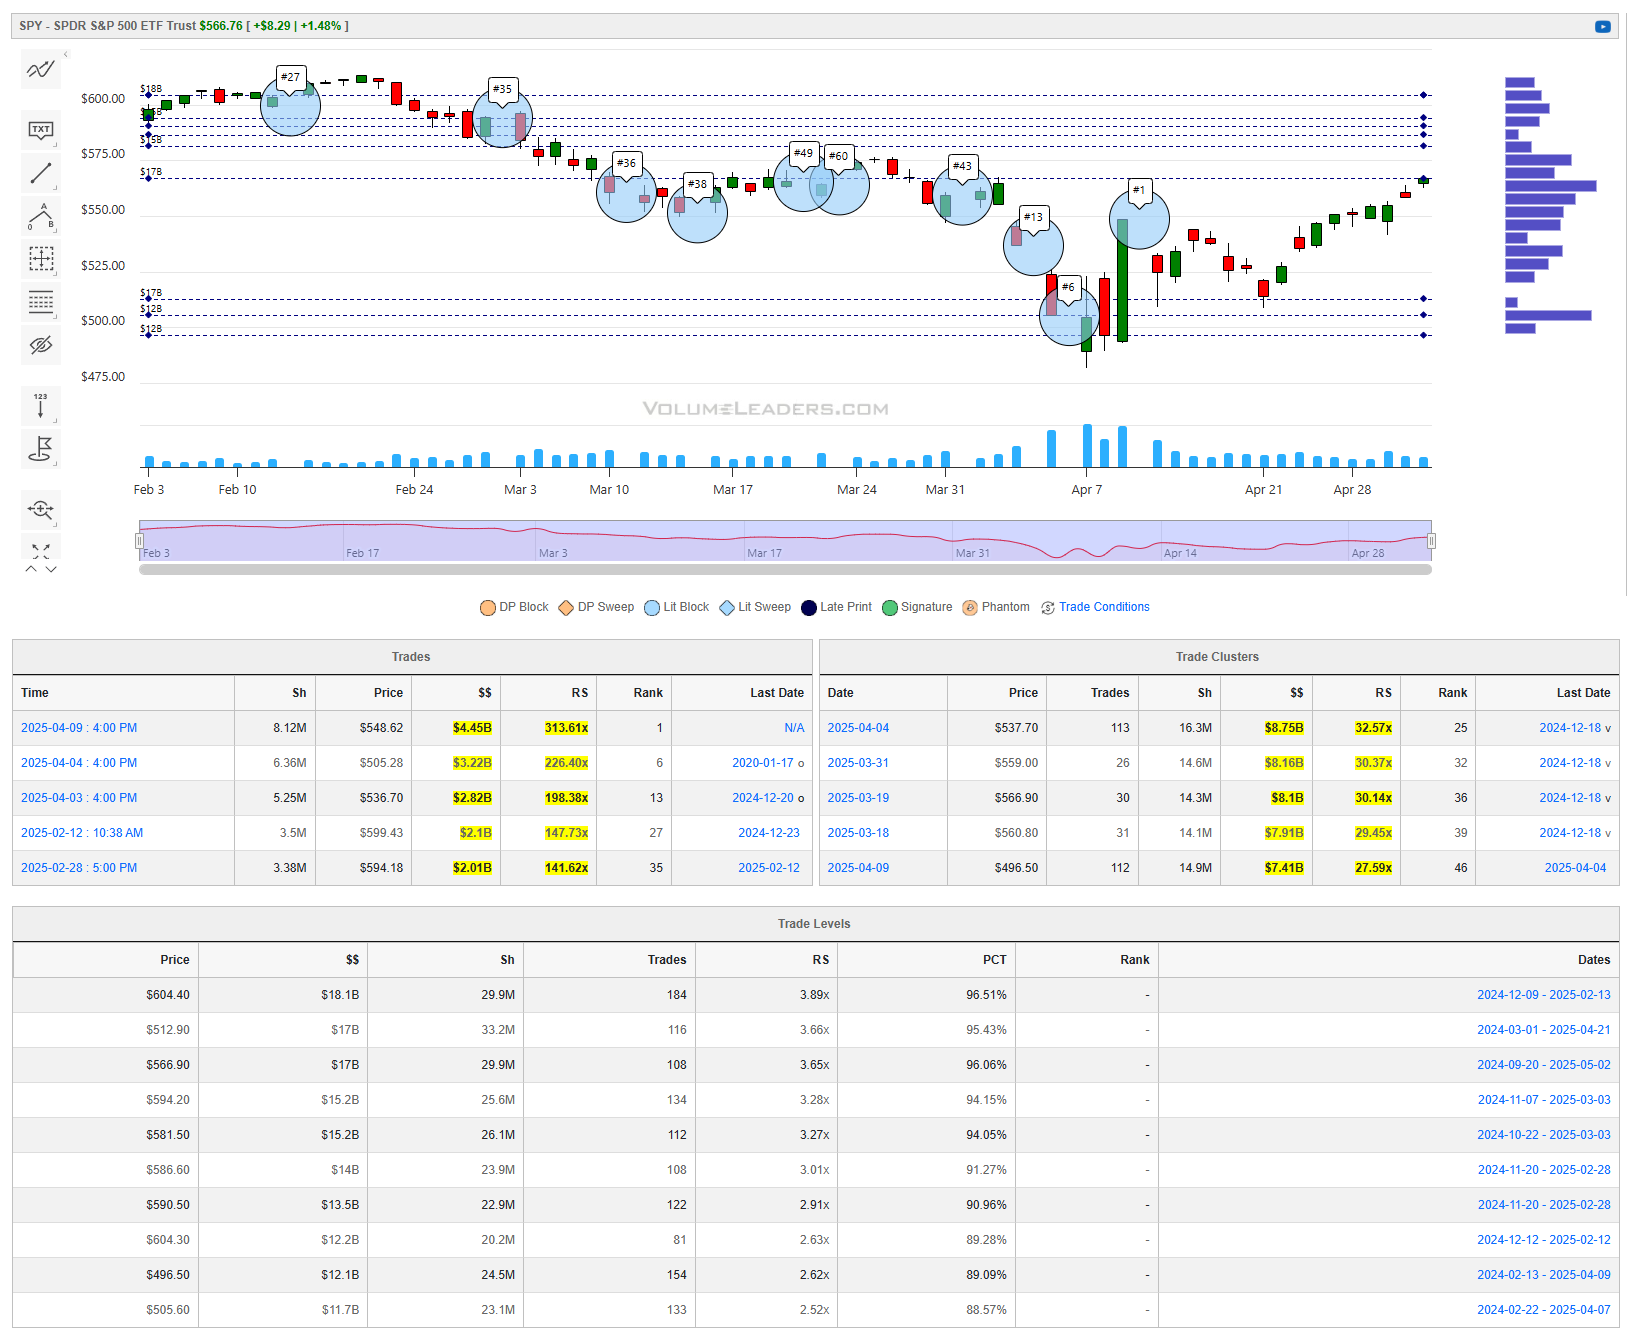
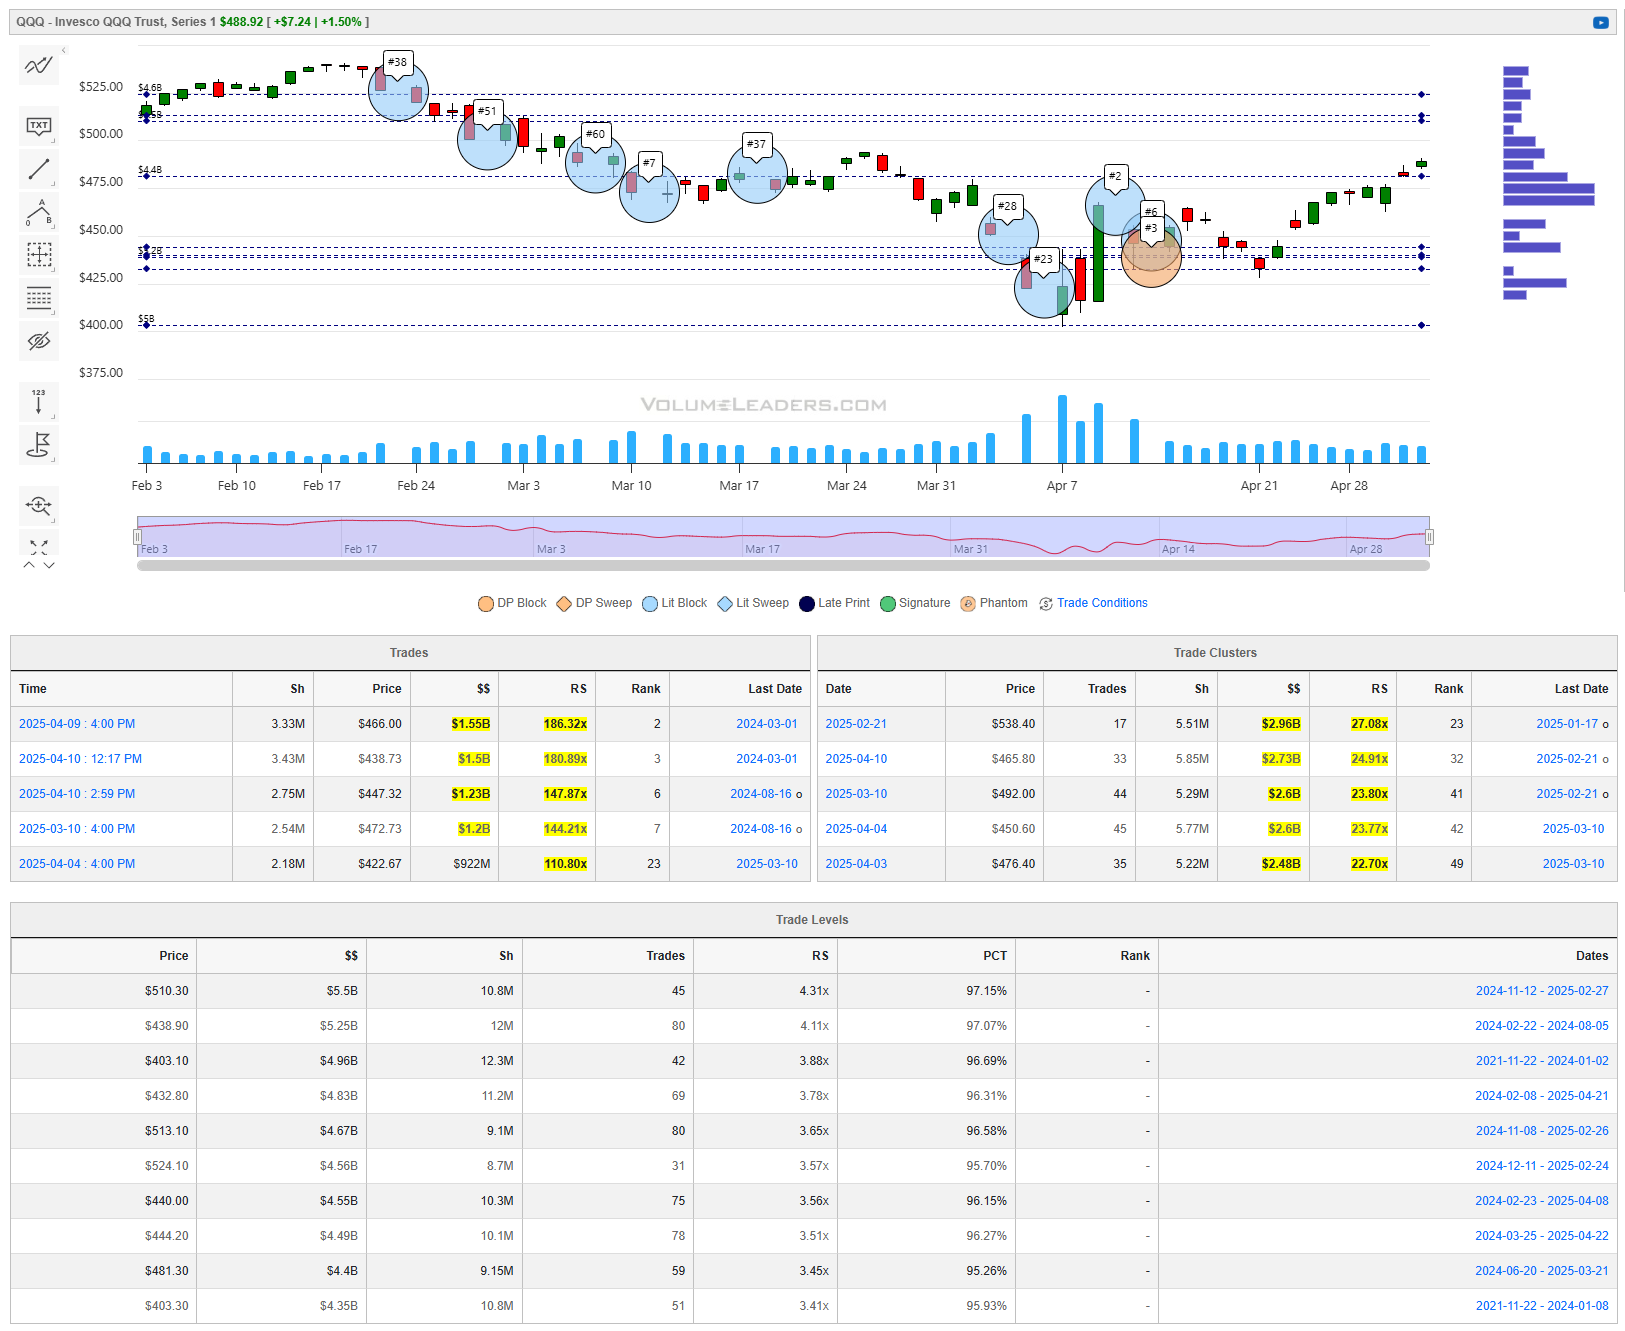
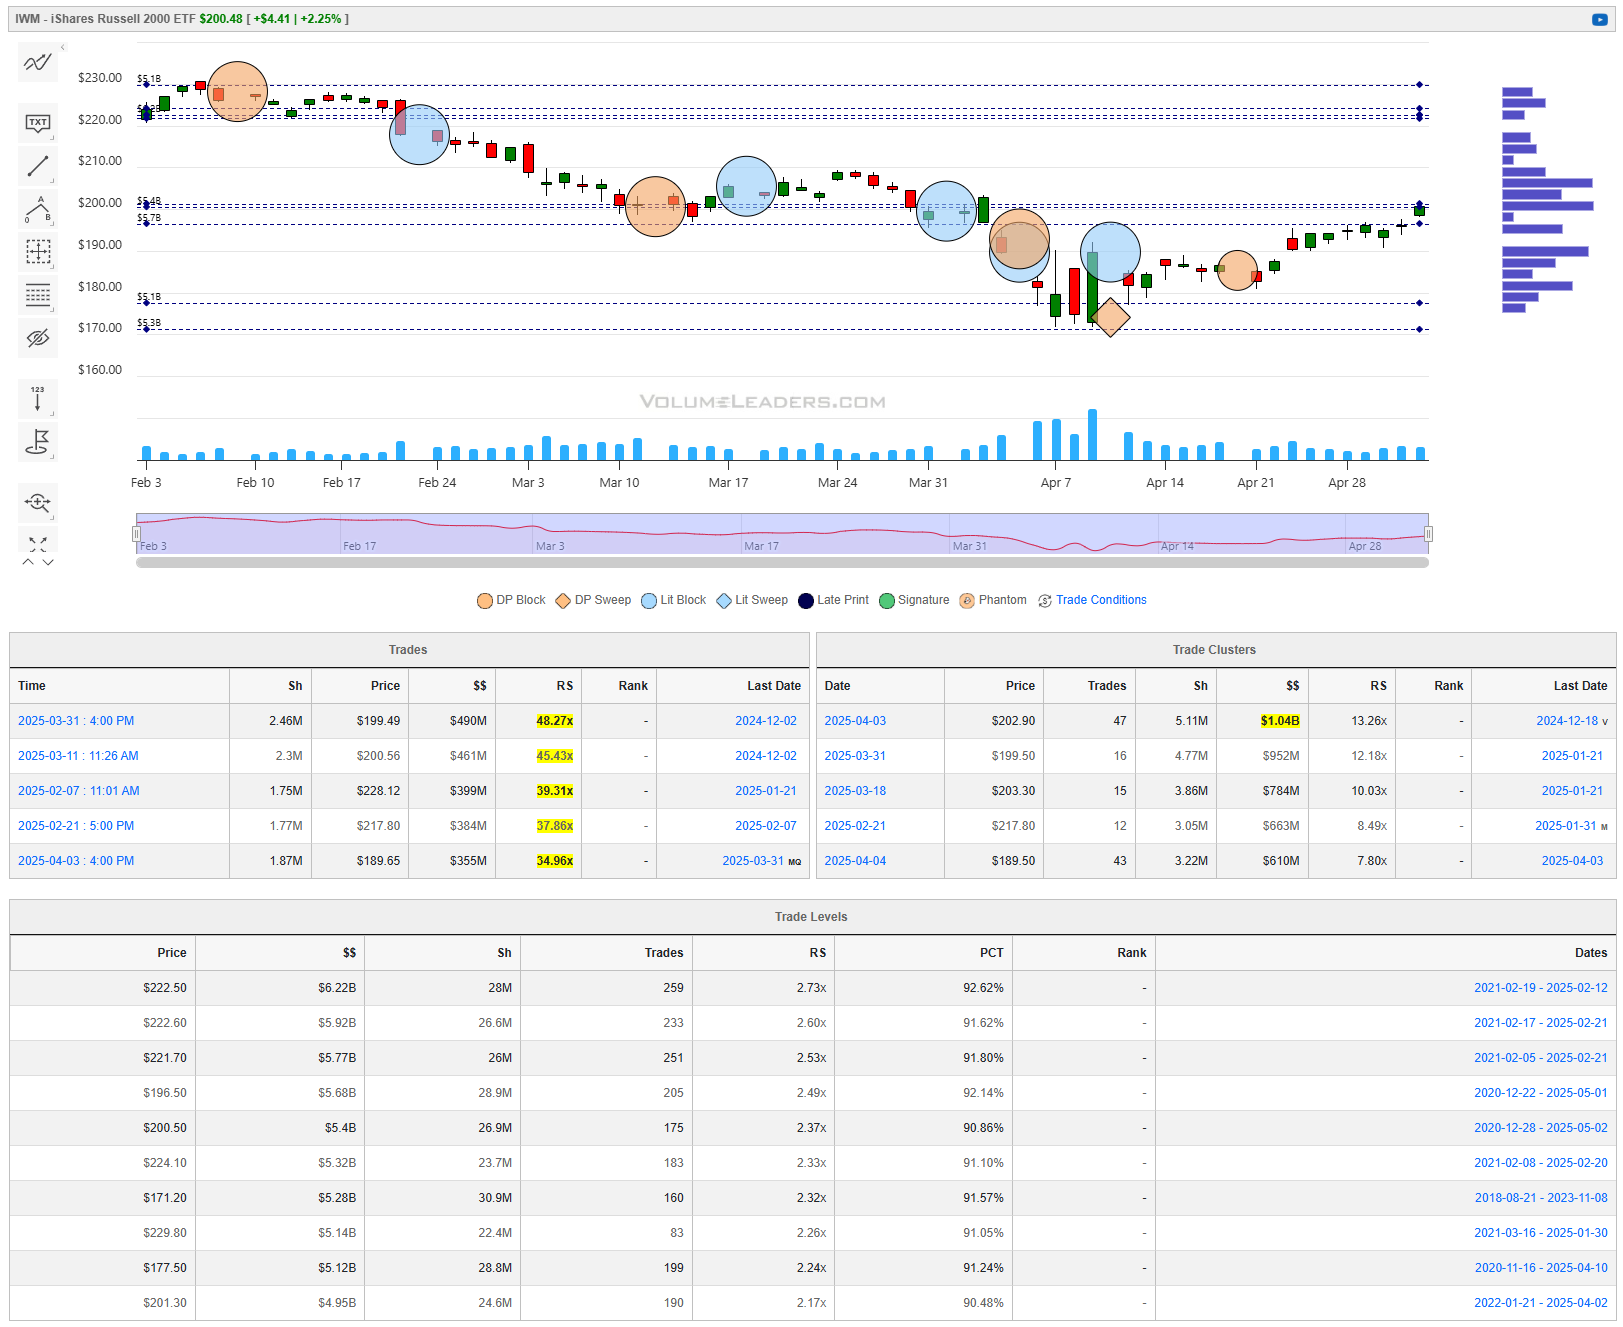
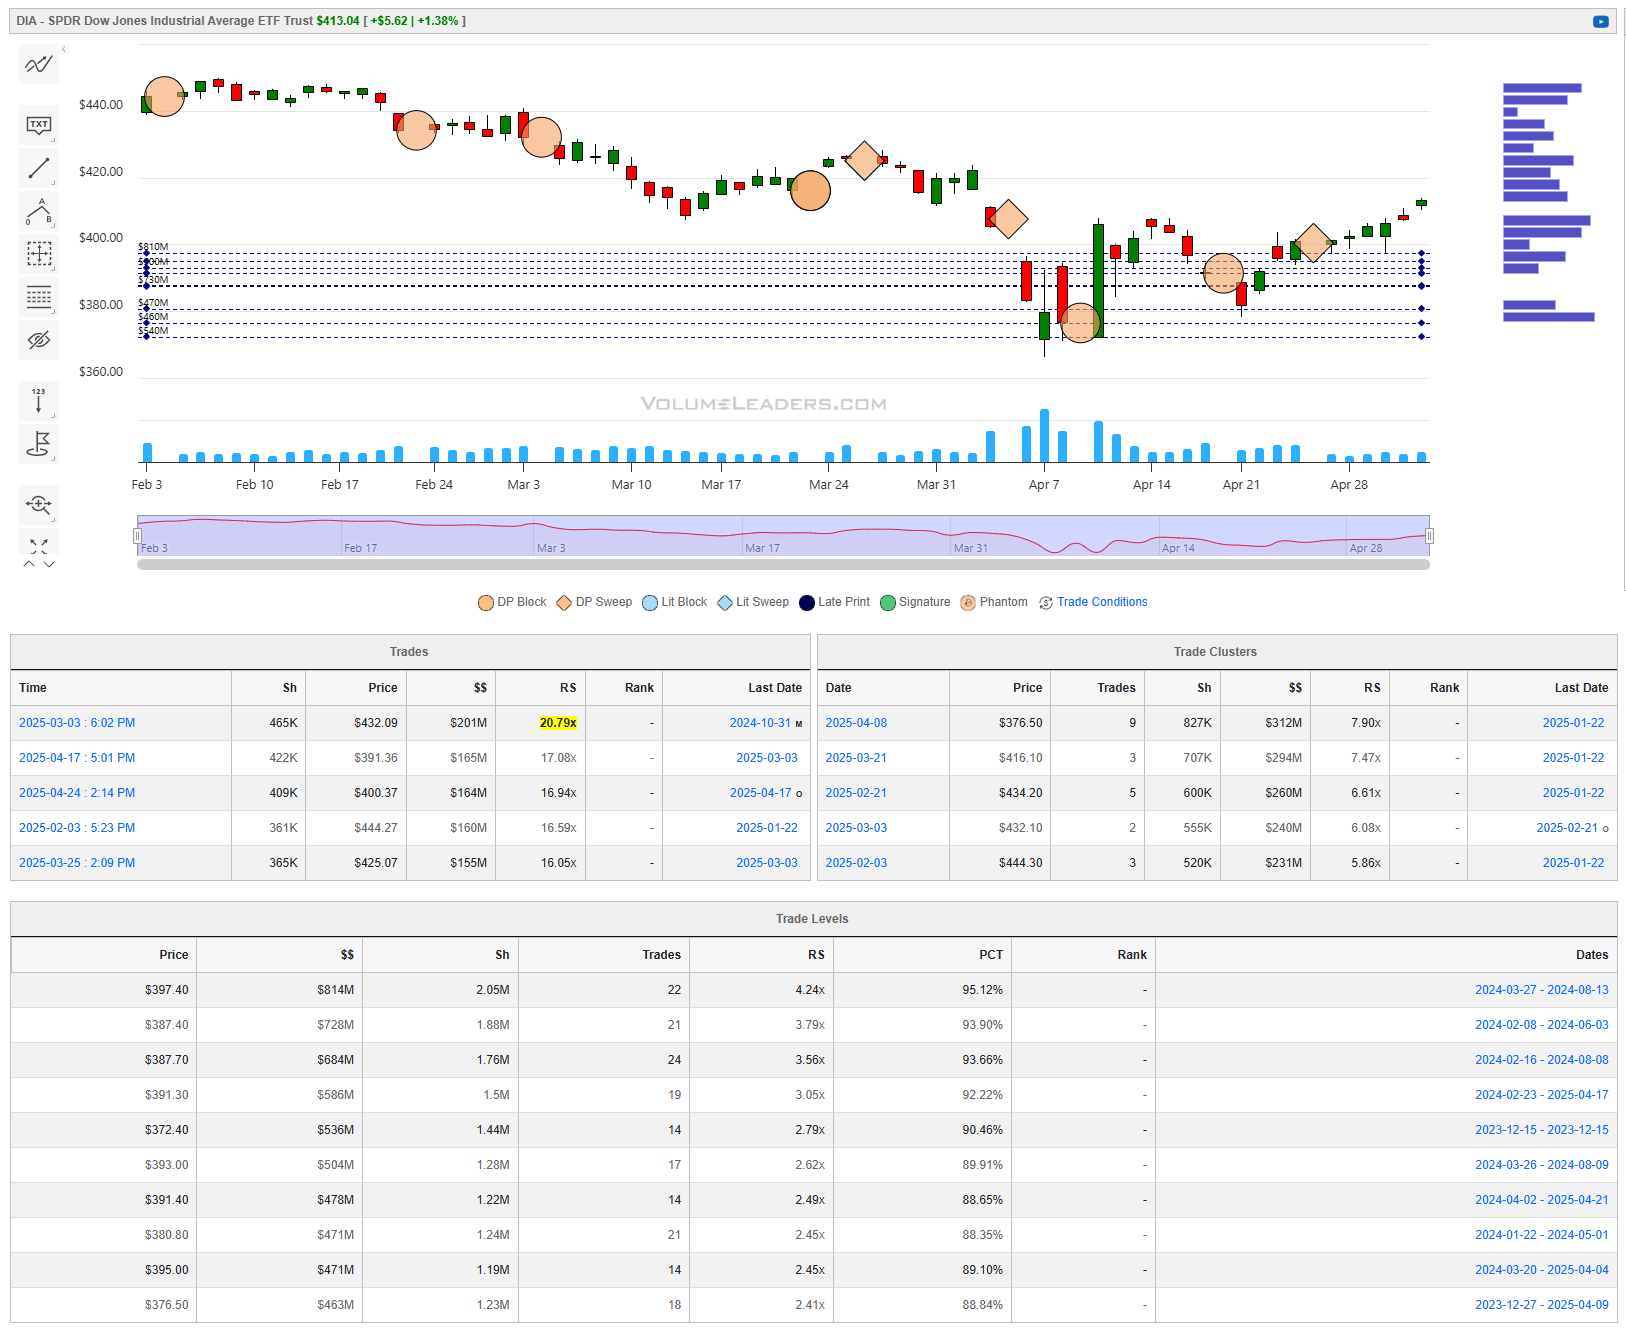
When you’re a large institutional player, your primary goal is to find liquidity - places to do a ton of business with the least amount of slippage possible. VolumeLeaders.com automatically identifies and visually plots the exact spots where institutions are doing business and where they are likely to return for more. It’s one of the primary reasons “support” and “resistance” concepts work and truly one of the reasons “price has memory” - take a look at the dashed lines in the images below that the platform plots for you automatically; these are the areas institutions constantly revisit to do more business.
Levels from the VolumeLeaders.com platform can help you formulate trades theses about:
Where to add or take profit
Where to de-risk or hedge
What strikes to target for options
Where to expect support or resistance
And this is just a small sample; there are countless ways to leverage this information into trades that express your views on the market. The platform covers thousands of tickers on multiple timeframes to accommodate all types of traders.
SPY
QQQ
IWM
DIA
Special Coverage
Trading Like a Pro: What Retail Traders Can Learn from Institutions
Closing the Gap Between Retail and Institutional Performance
Most retail traders enter the market with energy, ambition, and a few chart patterns scribbled on a notepad. What they lack, through no fault of their own, is the infrastructure and rigor that underpin institutional success. On the other side of the screen sit institutional players — hedge funds, asset managers, bank desks — equipped with layers of process, risk controls, research support, capital allocation strategies, and psychological frameworks.
Yet, despite the disparity in resources, retail traders can meaningfully narrow the performance gap. Not by copying institutions outright, but by adopting their thinking frameworks, their repeatable habits, and their disciplined approach to extracting edge in a probabilistic environment.
This article is a deep dive into how you, the independent trader, can begin implementing institutional-grade techniques right now — from journaling practices to trade simulation, from regime modeling to position scaling. Whether you swing trade equities or scalp futures, what follows is a blueprint for professionalizing your craft.
Chapter 1: Process Over Outcome — Building a Repeatable Framework
The most successful institutional traders don’t think in terms of single trades. They think in systems. They evaluate not the P&L of one outcome, but whether it conformed to a well-vetted process. A winning trade that broke every rule is marked as a failure, and a losing trade that followed protocol is logged as a success. This is the cornerstone of consistency.
Why Process Matters
Without a defined process, every decision is ad hoc. And ad hoc decision-making leads to emotional volatility, inconsistent sizing, late entries, and self-sabotage. Institutions mitigate this through rigid execution frameworks. These frameworks cover idea generation, setup qualification, risk allocation, execution logic, and post-trade review.
Technical Depth: Components of a Process
Here’s how an institutional trader breaks down their trading flow:
Idea Generation
Quant desks screen for statistical anomalies using backtested models.
Macro desks digest fundamental data and catalysts.
Flow desks monitor volume imbalances, dark pool prints, and block trades.
Setup Qualification
Each idea must meet multi-factor criteria — price action, volume, volatility regime, sector correlation, and time-of-day dynamics.
Example: A long setup may require a breakout above a 20-day high, with relative volume >1.5x, in a leading sector, inside an opening drive.Risk Allocation
Trade size is pre-determined based on portfolio exposure, volatility-adjusted stop-loss distance, and current drawdown profile.
Tools: ATR-based sizing, Kelly criterion approximations, or simple % of capital per trade.Execution Logic
Market or limit order? Single entry or scaled tiers? Trade directly or via options? Retail traders often overlook these mechanics, which institutions spend weeks testing.Post-Trade Review
A trade journal is a research database. Each trade entry should include:Setup label
Chart at entry
Rationale
Execution notes
Outcome
Adjusted notes after reflection
Practical Implementation for Retail Traders
Here’s how you can begin integrating process-driven trading today:
Build a Trade Checklist Create a pre-trade form with 5–10 binary yes/no questions. For example:
Is the stock in a trending market regime?
Does the volume exceed 1.5x average?
Has the price broken a key level?
Are broader indices supporting the move?
If you don’t get 7+ yeses, skip the trade.
Start with One Strategy Pick one setup and define it precisely. For instance:
Long breakout of 20-day high after an inside bar day.
Entry: Break of high + 0.25%
Stop: Last pivot low or 1.5x ATR
Size: 1% of capital risked
Backtest it manually on charts. Trade it with small size for 30 days. Review all trades weekly.
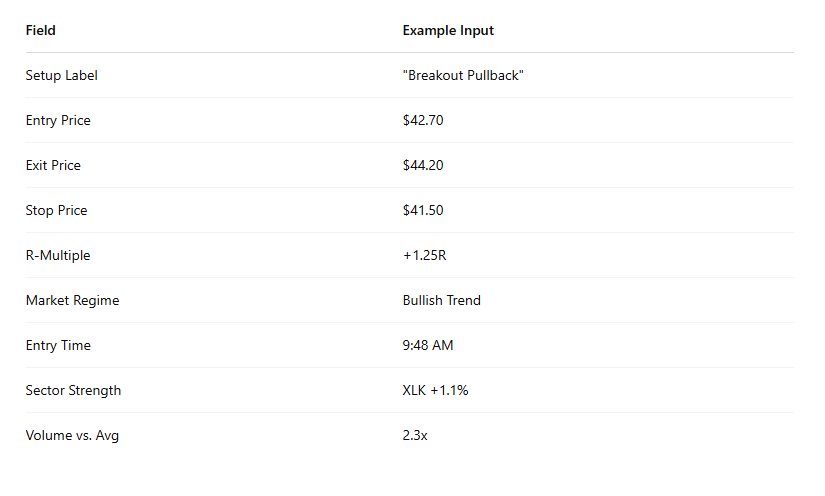
Journal Every Trade Use a spreadsheet or Notion template to log:
Date/time
Setup tag (e.g., “PB_Trend”)
Entry/Exit
Result in R
Screenshot
Comments on execution
After 30–50 trades, patterns will emerge. Which setups outperform? Which entries are late? What time of day performs worst?
Implement a Weekly Review Ritual Block 1 hour each weekend to:
Review journal data
Identify top/bottom setups
Analyze common mistakes
Define rules for next week
Institutional Insight
Hedge funds hire performance coaches not to teach trading, but to reinforce process. The mantra is: Process protects you when emotions try to hijack you. And over hundreds of trades, it's process — not brilliance — that separates the 1% from the rest.
Chapter 2: Data-Driven Decision Making — Moving Beyond Gut Feel
Retail traders often rely on intuition, headlines, or social media sentiment when making trading decisions. This is understandable — the market bombards us with signals masquerading as insight. But institutional traders operate with one north star: data. From backtested results to real-time analytics, data isn't decoration — it's the foundation.
“In God we trust. All others must bring data.” — W. Edwards Deming
Why Data Rules the Desk
On a professional desk, an idea that feels good but isn't backed by empirical evidence dies quickly. Whether it’s a macro thesis or a technical pattern, the burden of proof lies with the trader — and proof means quantifiable evidence.
Before any capital is allocated:
Historical performance is tested.
Drawdown profiles are studied.
Win/loss ratios and expectancy are calculated.
Market regimes are mapped to see when the idea works best.
Retail traders rarely take this step. And without it, the line between strategy and hope is perilously thin.
Technical Deep Dive: What Institutions Track
At the institutional level, data is constantly flowing into four key buckets:
Performance Metrics
Win rate, average R (reward-to-risk), maximum drawdown, Sharpe ratio, Sortino ratio, volatility-adjusted returns.
These are used not just to grade strategies, but to guide sizing decisions.
Setup Contextuality
When a strategy works best:
Time of day (e.g., open vs. lunch vs. close)
Market regime (trending vs. range-bound)
Volatility levels (e.g., VIX > 20 vs. < 15)
Execution Quality
Slippage, fill rates, time-to-fill. Execution is measured like a golf swing — the mechanics matter as much as the decision.
Cross-Asset Confirmation
Institutions rarely trade assets in isolation. They monitor correlations across indices, sectors, rates, credit spreads, and volatility.
Concrete Practices You Can Start Today
You don’t need a Bloomberg terminal to make data your edge. Start here:
Practice 1: Score Your Trades Quantitatively
Create a Google Sheet or Notion table that logs each trade’s key performance components:
After 50–100 trades, run basic analysis:
Which setups yield the highest R?
Does a specific time of day outperform?
Are you more accurate on high-volume breakouts than low-volume flags?
This tells you where your edge lives.
Practice 2: Backtest Manually or with Scripting
Pick one setup. Define its criteria exactly — no ambiguity.
Example:
Price must break out of a 20-day high.
Volume must be 1.5x daily average.
Entry on the first close above breakout.
Now scan charts manually for the past 6 months and record outcomes:
Entry point
Stop-loss and take-profit logic
Max adverse excursion (MAE)
Max favorable excursion (MFE)
Final R-multiple
Or, if you're coding-literate, use Python libraries like Backtrader or QuantConnect to simulate it at scale.
Practice 3: Use Percentile Rankings to Normalize Volumes, Moves, and Gaps
Institutions rarely compare raw values — they compare ranked metrics:
Where does today’s volume fall in the past 30 days? (e.g., 92nd percentile)
Is today’s gap the largest in two weeks?
What’s the percentile rank of this candle’s range?
These help you quantify relative unusualness, a key concept in institutional trading.
Example formula in Python:
import numpy as np
percentile = lambda x, window: np.argsort(np.argsort(x)) / float(len(x)-1)This lets you spot when something statistically interesting is happening.
Practice 4: Build a Simple Stats Dashboard
If you use Excel or Notion, build a dashboard to track:
Setup performance over time
Win rate by day of week
Average R by setup type
Drawdown curve
Cumulative equity curve
This transforms trading from feel to feedback loop.
Institutional Insight
At Bridgewater, Citadel, and Renaissance, data drives every decision. Even discretionary traders on institutional desks are expected to validate their theses with statistical grounding.
Retail traders often assume they’ll “just know” when it’s time to trade. But professionals ask: what does the data say about the likelihood of success in this scenario? If you can adopt this one habit — interrogating every setup with numbers — your decision-making will take a quantum leap.
Chapter 3: Risk Management First — The Job of Every Professional Trader
“Amateurs focus on how much they can make. Professionals focus on how much they could lose.”
— Paul Tudor Jones
At the institutional level, every dollar of capital is treated as something that needs protection first, and only deployment second. Risk isn’t an afterthought — it’s the primary lens through which all trades, portfolios, and strategies are viewed. Risk controls don't kill creativity; they preserve the trader’s right to play the game tomorrow.
For retail traders, this mindset shift — from return-chasing to risk-contained — is one of the most powerful transformations that can occur. Edge doesn’t exist in isolation. Even the best setup in the world, traded with poor risk management, leads to ruin.
The Institutional Approach to Risk
Professional traders spend significant time developing risk models. These govern how much capital can be deployed per trade, per asset class, per volatility regime, and per drawdown threshold. These models are embedded in automated systems that prevent human override during emotional moments.
Core components of institutional risk systems include:
Volatility-Adjusted Position Sizing
Rather than trading the same dollar amount in every asset, institutional traders adjust size based on recent volatility — most commonly via Average True Range (ATR), standard deviation, or implied vol metrics.Portfolio-Level Exposure Controls
Maximum exposure to a single name: e.g., 10% of portfolio
Sector exposure caps
Correlation thresholds (e.g., max 3 positions with >0.85 correlation)
Stop Loss Enforcement
Stop losses aren’t just mental targets. Many desks use automated trailing or volatility-based stops executed by trading systems — no negotiation.Drawdown Thresholds & Circuit Breakers
If a strategy or trader hits a specific drawdown (e.g., -7% over 10 days), capital is reduced or trading is paused until conditions are re-evaluated.Risk-Adjusted Performance Metrics
Profit is meaningless without context. Professionals judge trades by risk-adjusted return:Sharpe ratio
Sortino ratio
Calmar ratio (return/drawdown)
Technical Deep Dive: Tools You Can Use Right Now
Let’s break this into tools and techniques retail traders can immediately adopt to bring institutional-grade risk control into their workflows:
Practice 1: Use ATR for Position Sizing
ATR (Average True Range) gives you a statistically grounded way to size positions based on how much a stock moves — not how much you “feel” like risking.
$RiskPerTrade = TotalAccountCapital × RiskPerTrade%
PositionSize = $RiskPerTrade / (ATR × Multiplier)Multiplier is how far your stop is from your entry (e.g., 1.5x ATR).
This normalizes your position size so that a volatile stock doesn’t wreck your portfolio.
Practice 2: Cap Portfolio-Level Exposure
Build a spreadsheet that tracks current exposure:
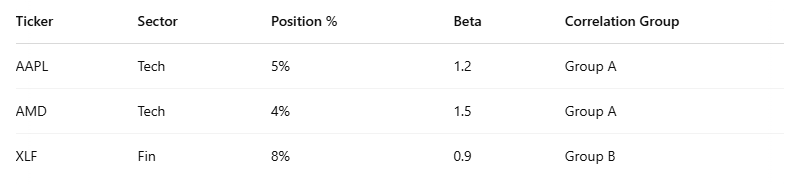
Set these basic rules:
No single position > 10%
No sector > 30%
No more than 3 positions in highly correlated group
This forces diversification of risk, not just names.
Practice 3: Track Your Drawdown — And Define a Circuit Breaker
Keep a running tally of:
Peak equity
Current equity
Max drawdown
Drawdown duration (in days)
When you hit a predefined max drawdown (e.g., 10%), reduce size by half or stop trading temporarily. Review your journal, recenter your process, and only resume once you’ve re-validated your edge.
📌 Pro Tip: Use a rolling equity curve in Excel or Python to track your max peak-to-trough declines.
Practice 4: Calculate Your Strategy’s Expectancy
Expectancy answers: How much do I make per trade, on average, per unit of risk?
Formula:
Expectancy = (Win% × AvgWin) – (Loss% × AvgLoss)If your expectancy is negative, you are either:
Losing too often,
Not letting winners run,
Or risking too much when you’re wrong.
Track this per setup and per market regime.
Practice 5: Use Volatility Regimes to Adjust Sizing
Market-wide volatility should impact your risk-taking. For example:
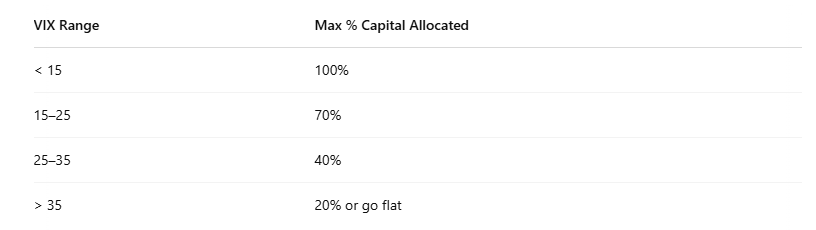
This avoids full exposure in “crash-prone” environments where traditional setups may underperform.
Institutional Insight
Professional traders don't just manage trades — they manage risk capital. That distinction is vital.
Institutions understand that losses are not only inevitable — they're expected. What they refuse to tolerate are unmanaged losses. When a losing streak happens, they don’t double down. They pull back, analyze, and recalibrate.
For retail traders, building even a basic risk framework — ATR stops, position limits, drawdown awareness — can massively extend your trading career. It’s not glamorous. It won’t go viral on Twitter. But it’s the quiet edge that keeps professionals in the game long after the dabblers quit.
Conclusion: Professionalism Over Prediction — The Institutional Mindset You Can Adopt
If there’s one thread that ties together all the lessons we’ve explored, it’s this:
Institutions don’t trade to be right. They trade to be consistent.
They’ve removed ego from the equation. They don’t need to win every time. They don’t need to predict every macro twist or time every reversal perfectly. What they need — and what they’ve built — is a repeatable, testable, scalable process that, over hundreds of trades, delivers durable results.
That mindset is available to you, right now.
We’ve Merely Scratched the Surface
The techniques discussed — process discipline, data orientation, rigorous risk management — form just a part of the institutional playbook. There are entire disciplines we haven’t yet touched, including, but not limited to:
Market Microstructure:
Institutions leverage Level 2 order book data, dark pool routing, and execution algorithms to minimize slippage and detect spoofing or absorption.Volatility Modeling:
Many funds track implied vs. realized volatility, build VIX term structure models, and construct regime-specific volatility overlays to adjust exposure dynamically.Factor-Based Investing:
Quantitative shops classify stocks by value, momentum, size, quality, and volatility factors — and rotate capital accordingly based on macro shifts.Portfolio Construction:
Optimization techniques like mean-variance, risk parity, or Black-Litterman are used to balance not just return but risk contribution per asset.Alternative Data & Sentiment Analysis:
From earnings transcripts and foot traffic data to Reddit sentiment and satellite imagery, professionals look for asymmetric information the market hasn’t priced in.Execution Analytics:
Institutions track the cost of every fill: Are they consistently overpaying to enter? Are they front-running themselves? Are market makers adjusting quotes?
These aren’t luxuries — they’re core components of how professionals protect capital, sharpen entries, and outperform over time. And while some of these tools require advanced infrastructure, many of the principles behind them can still be translated into retail-friendly formats with creative adaptation.
Concrete Practices You Can Apply Starting Today
Let’s recap a few things you can start doing immediately — no Bloomberg terminal or $50k/month data subscription needed:
Create a trading checklist and only enter trades that meet your criteria.
Use ATR to size your positions and place stops logically, not emotionally.
Journal every trade with screenshots, rationale, and results.
Review your performance weekly to detect behavioral patterns.
Rank trades by R-multiples and average them by setup to find your true edge.
Reduce exposure during high-volatility periods or after hitting a drawdown threshold.
Simulate your strategy over the last 6–12 months to validate its robustness.
Every one of these is a habit that mirrors institutional behavior. Each will compound over time and so will your portfolio value.
Final Thoughts: Trading Is a Craft, Not a Guess
Retail traders often look for secrets. Institutions know there aren’t any. The grifters of the industry all promise one. What exists instead is the slow accumulation of skill — the kind built from structure, discipline, and honest feedback loops.
Yes, institutions have more capital, more data, and more personnel. But they also have more to lose. They trade with constraints, oversight, and accountability. You, the independent trader, are free from bureaucracy and have agility they wish they had.
Use that freedom wisely — by borrowing the best of what they do.
Trading professionally doesn’t mean you have to trade for a living. It means that you treat the work with the respect it demands. It means you stop asking, “Will this trade work?” and start asking, “Does this fit my process?”
Once that shift happens, your entire approach — and your results — will start to change. Good luck, friends!
Summary Of Thematic Performance YTD
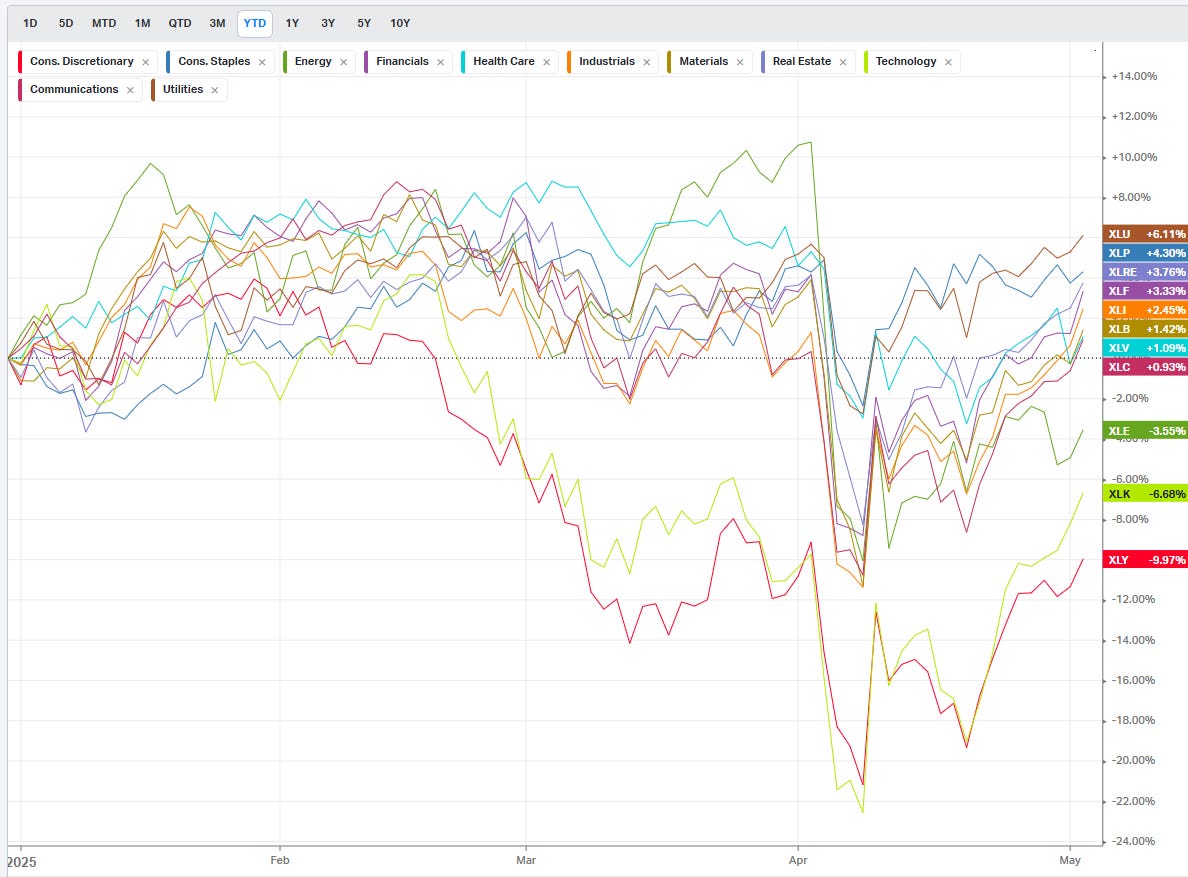
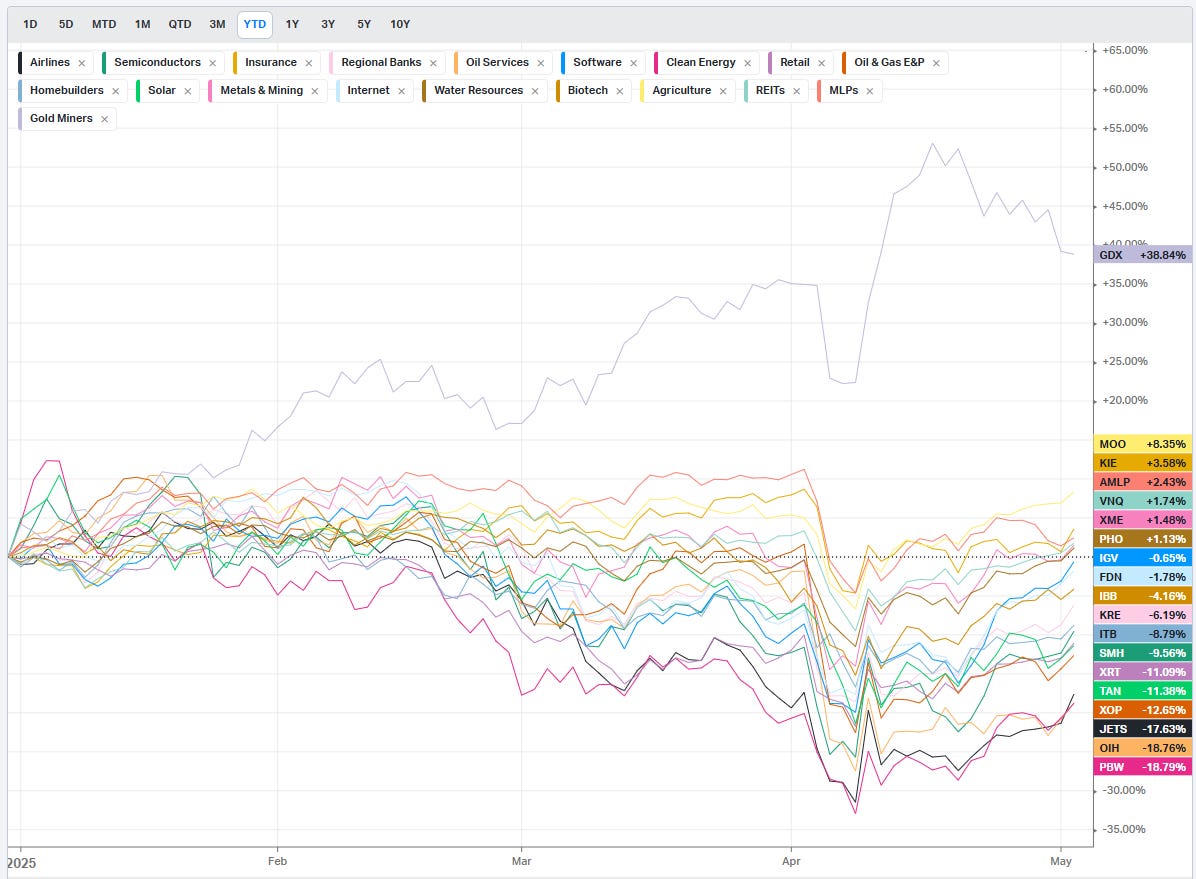
VolumeLeaders.com offers a robust set of pre-built thematic filters, allowing you to instantly explore specific market segments. These performance snapshots are provided purely for context and inspiration—think about zeroing in on the leaders and laggards within the strongest and weakest sectors, for example.
S&P By Sector
S&P By Industry
Commodities: Energy
Commodities: Metals
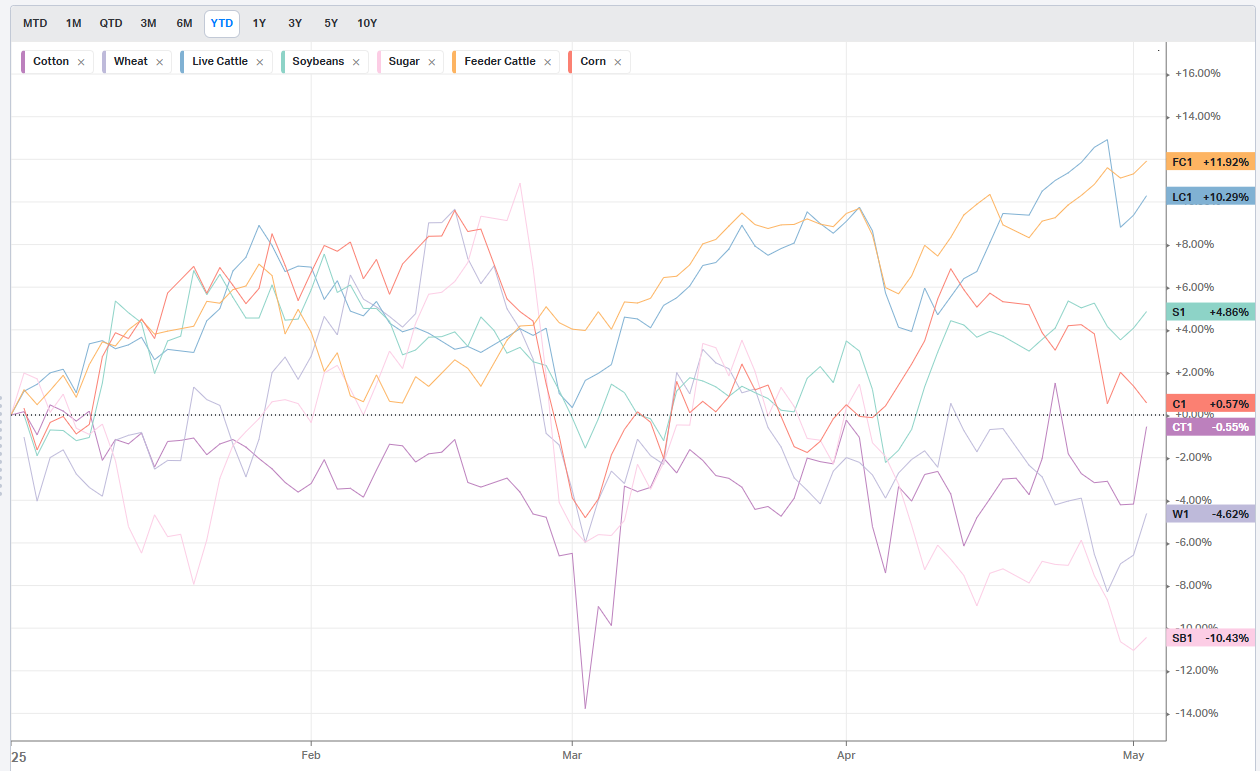
Commodities: Agriculture
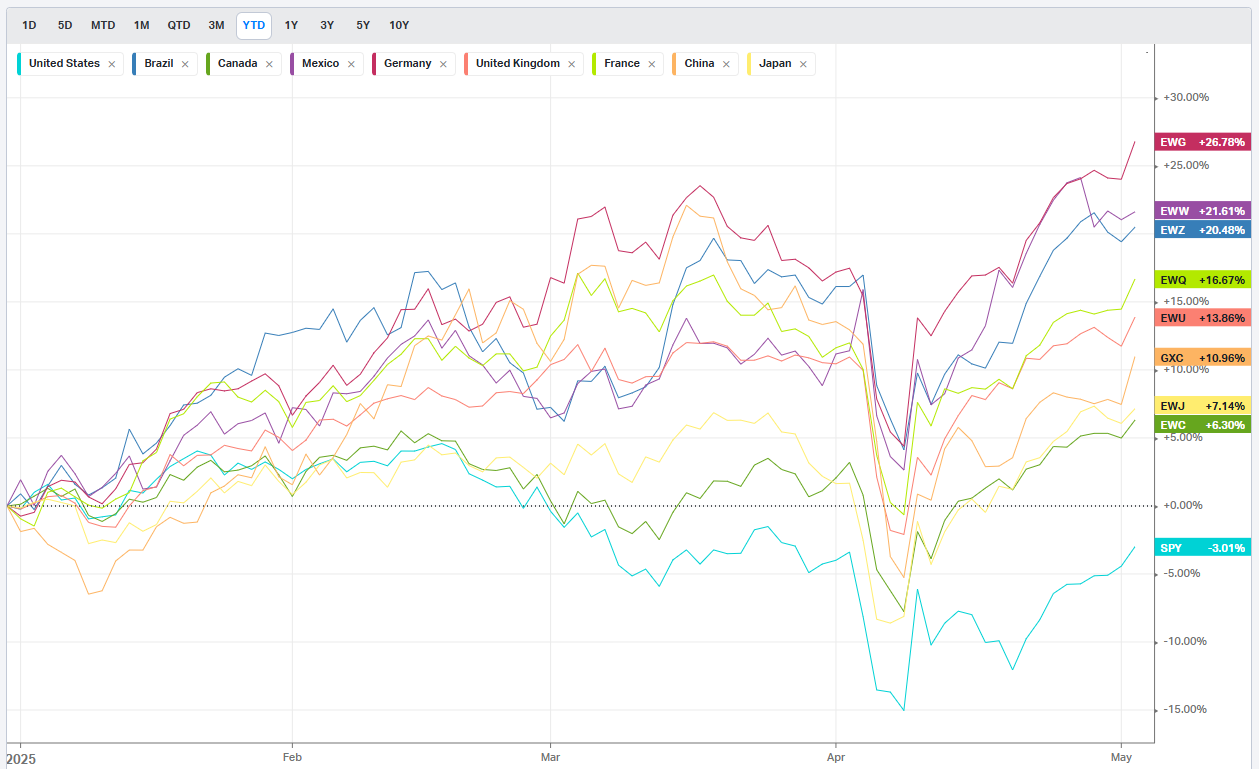
Country ETFs
Currencies
Global Yields
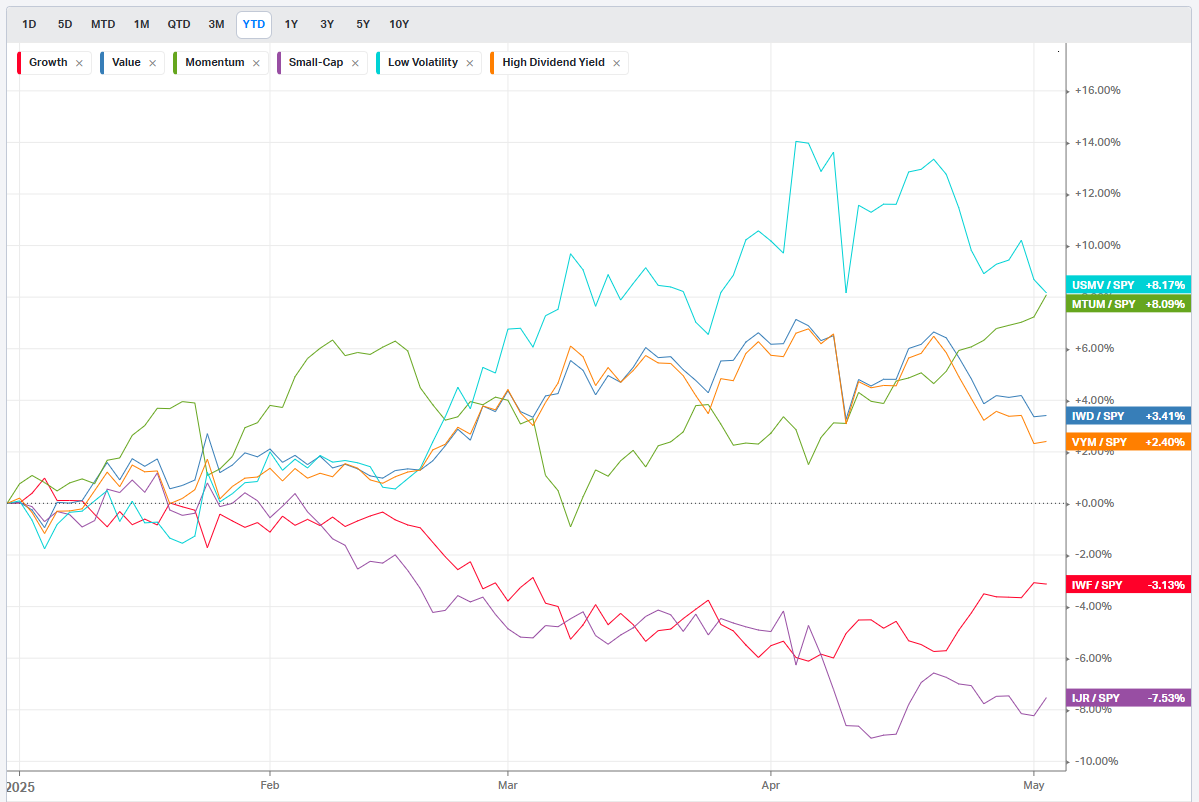
Factors: Style
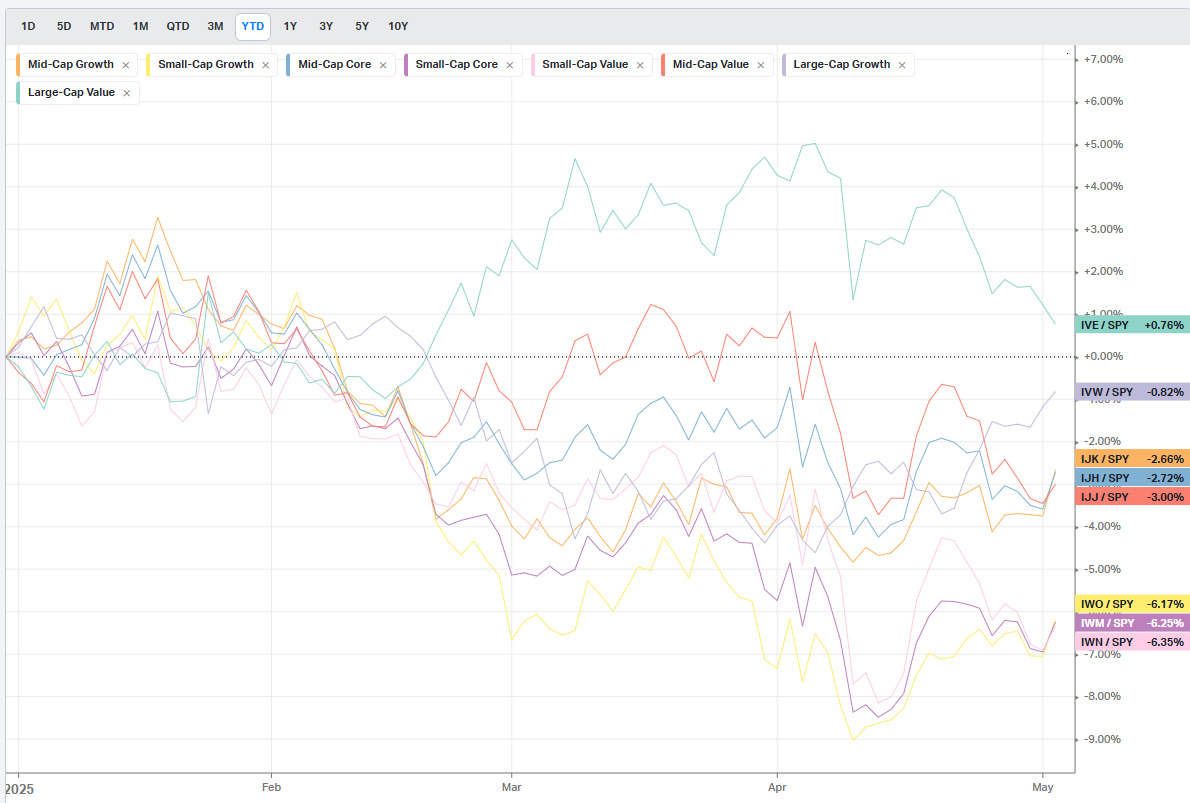
Factors: Size vs Value
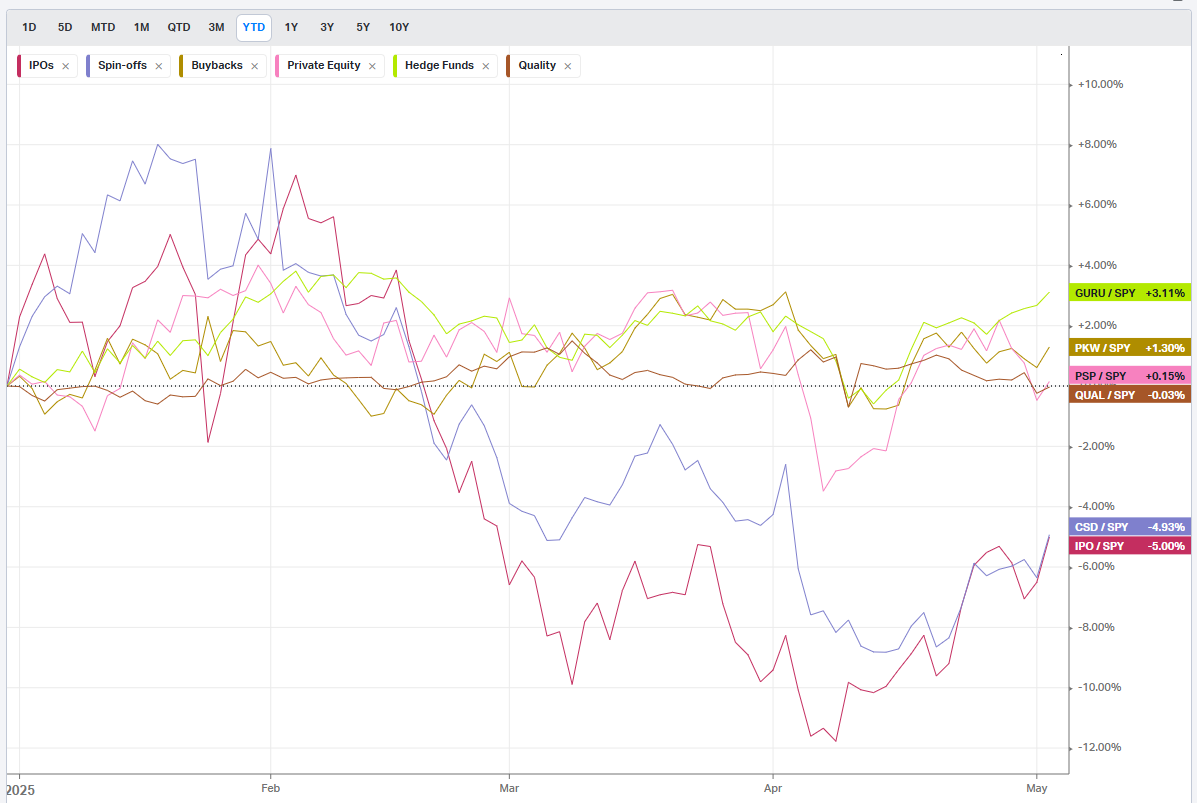
Factors: Qualitative
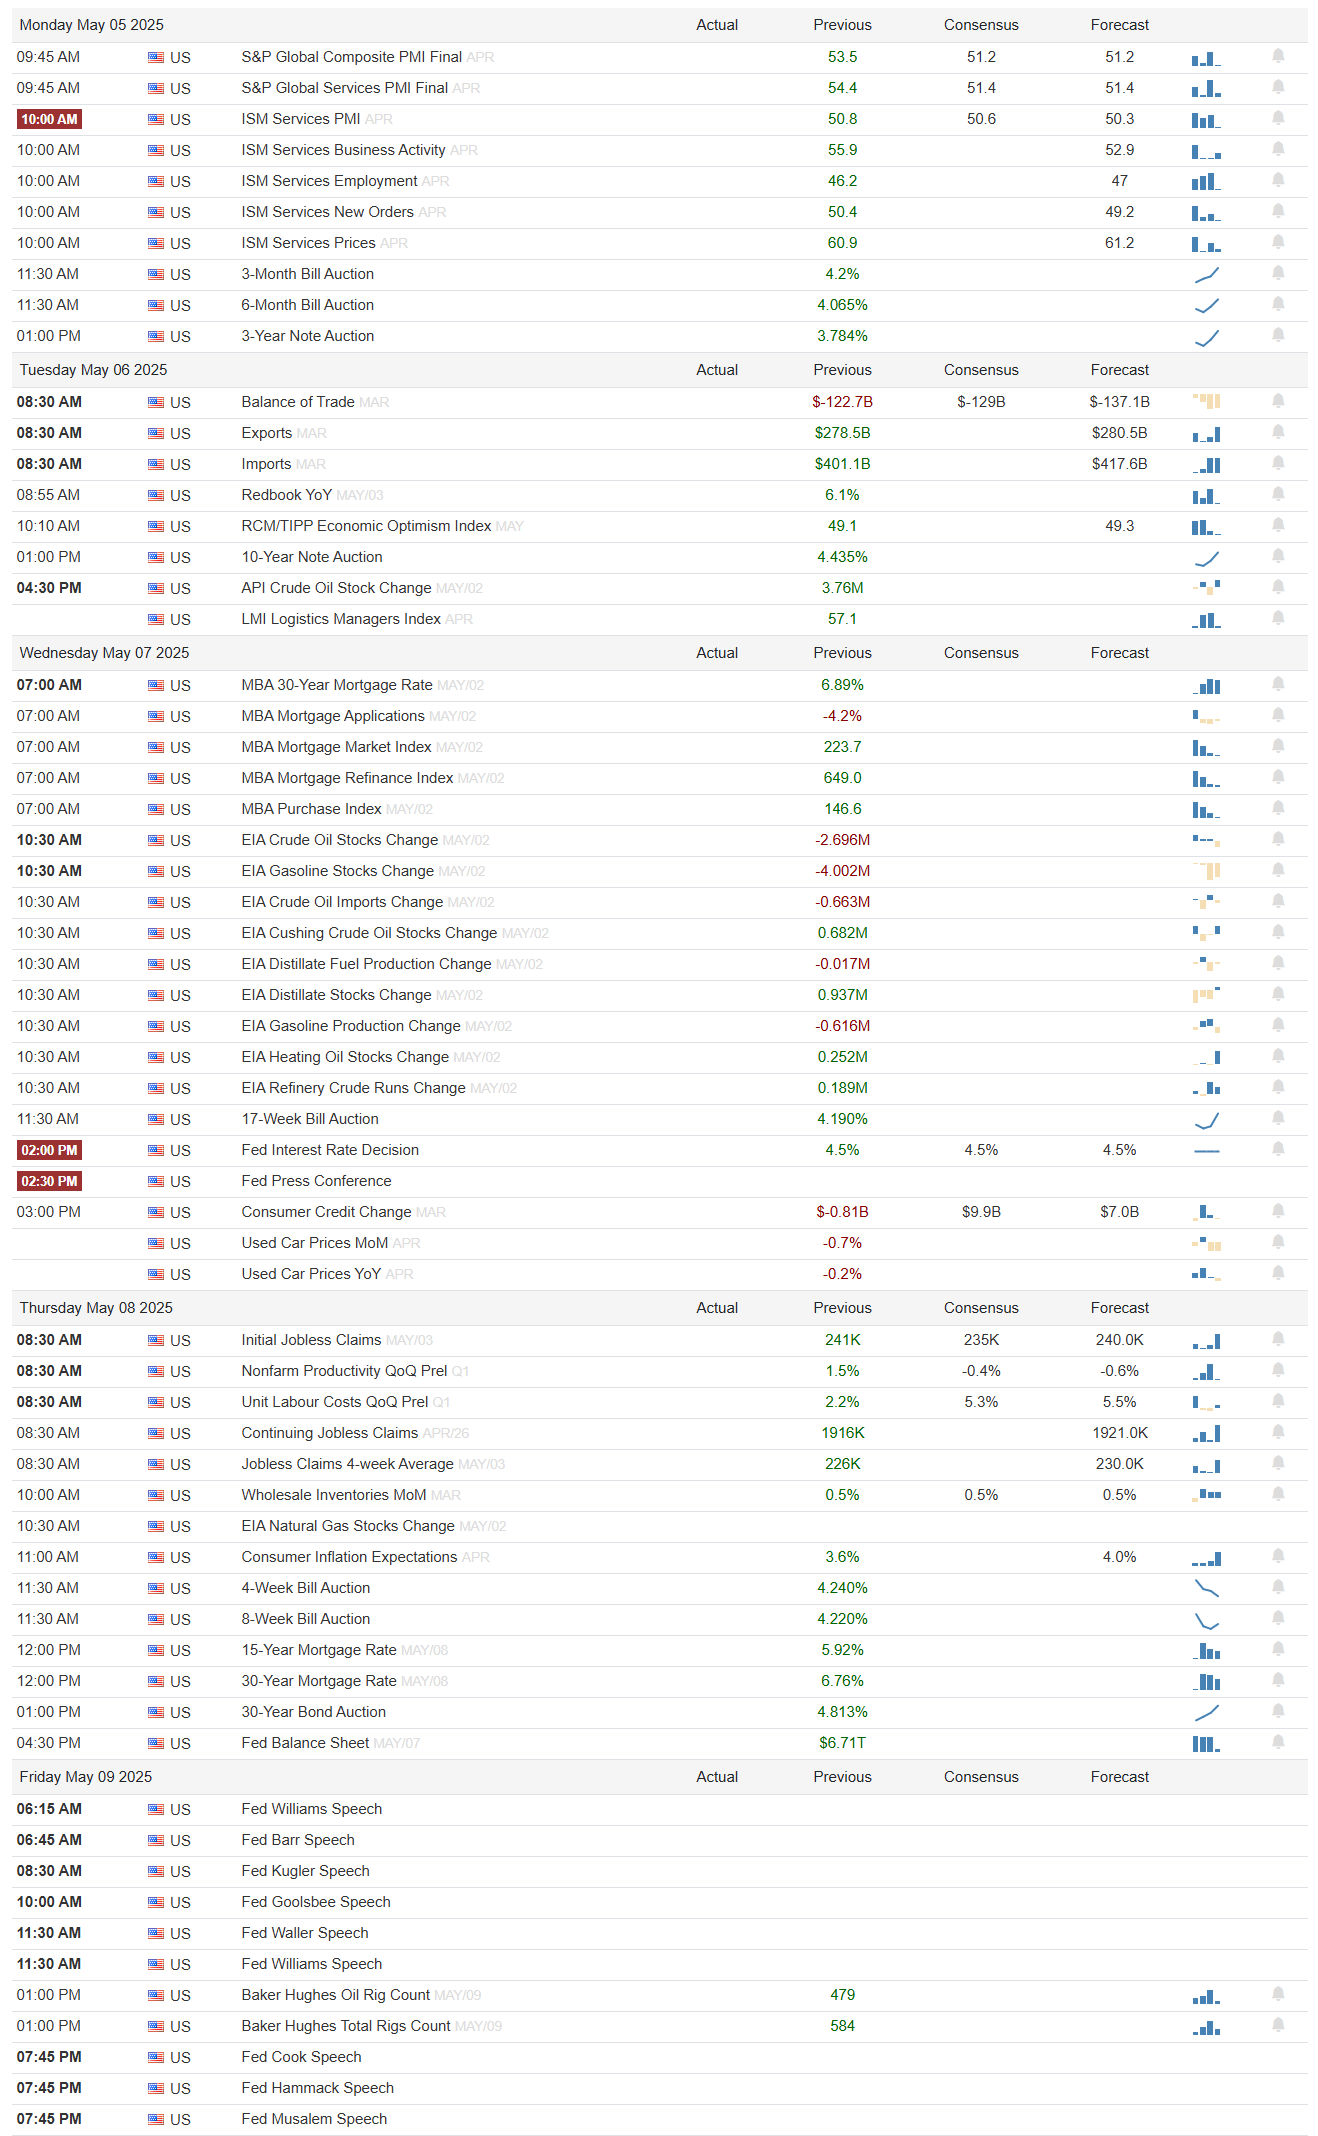
Events On Deck This Week
Here are key events happening this week that have the potential to cause outsized moves in the market or heightened short-term volatility.
Econ Events By Day of Week
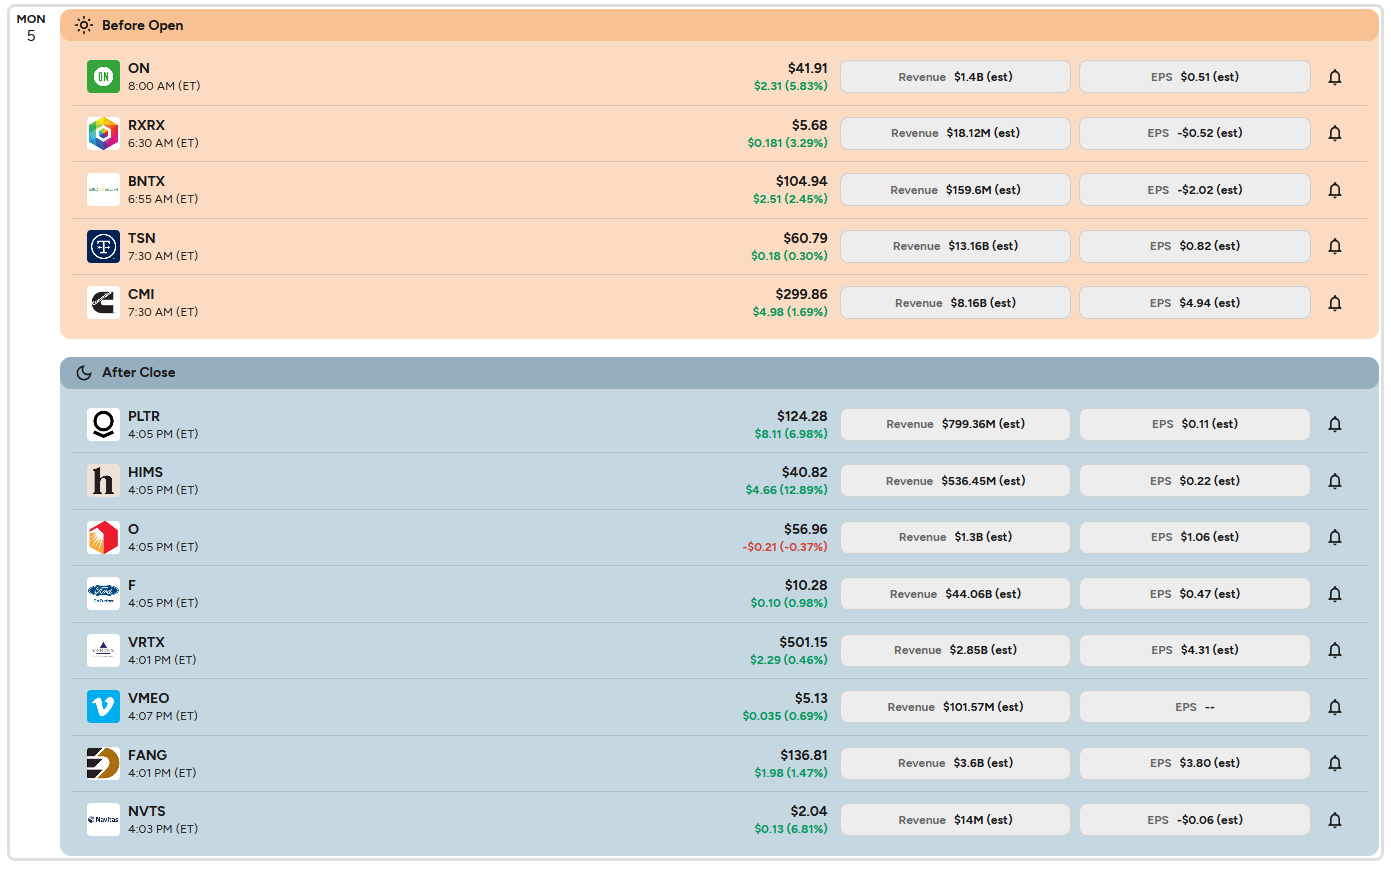
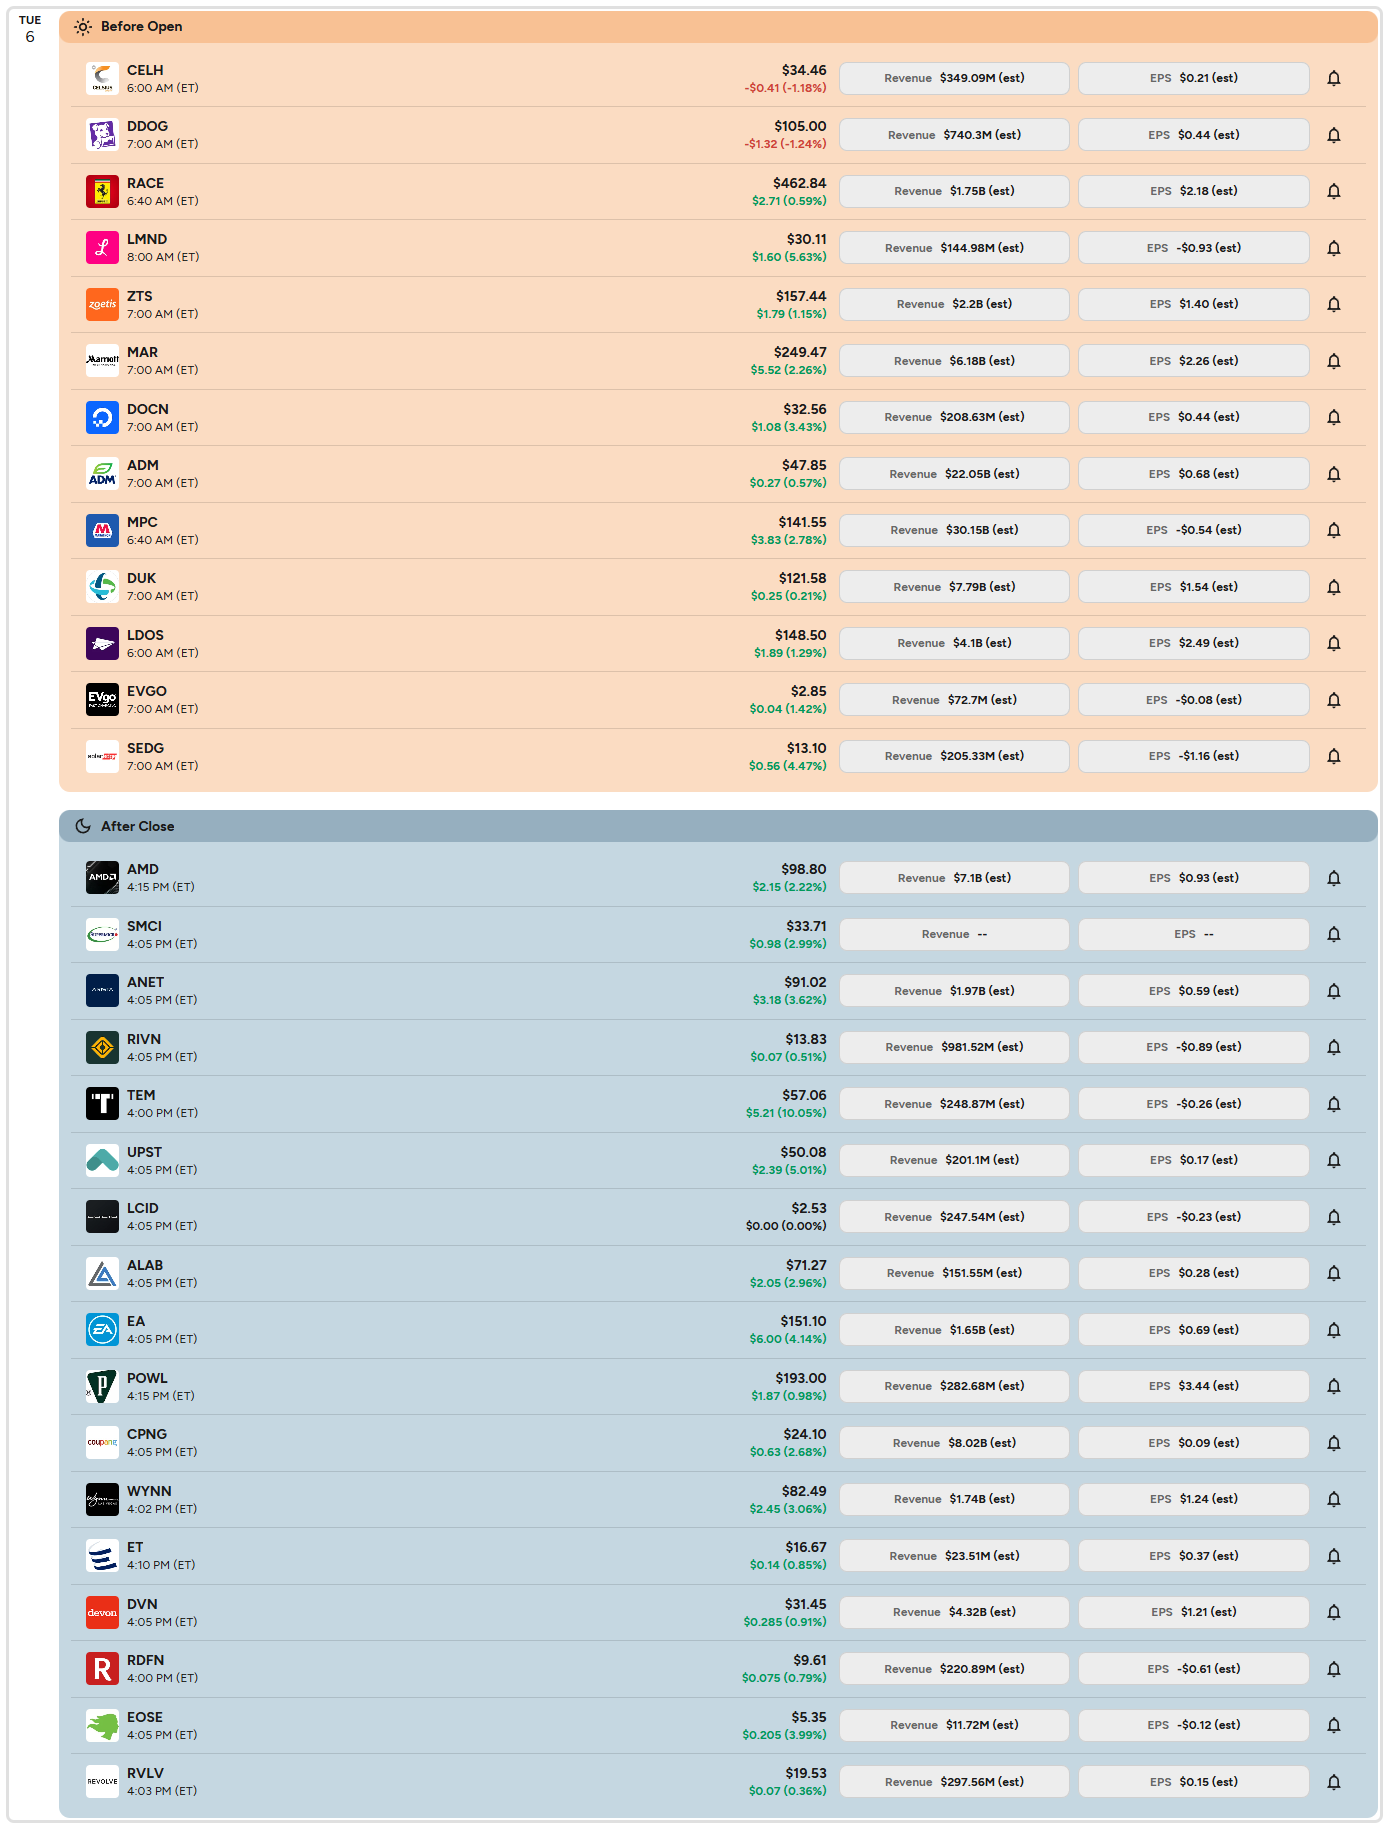
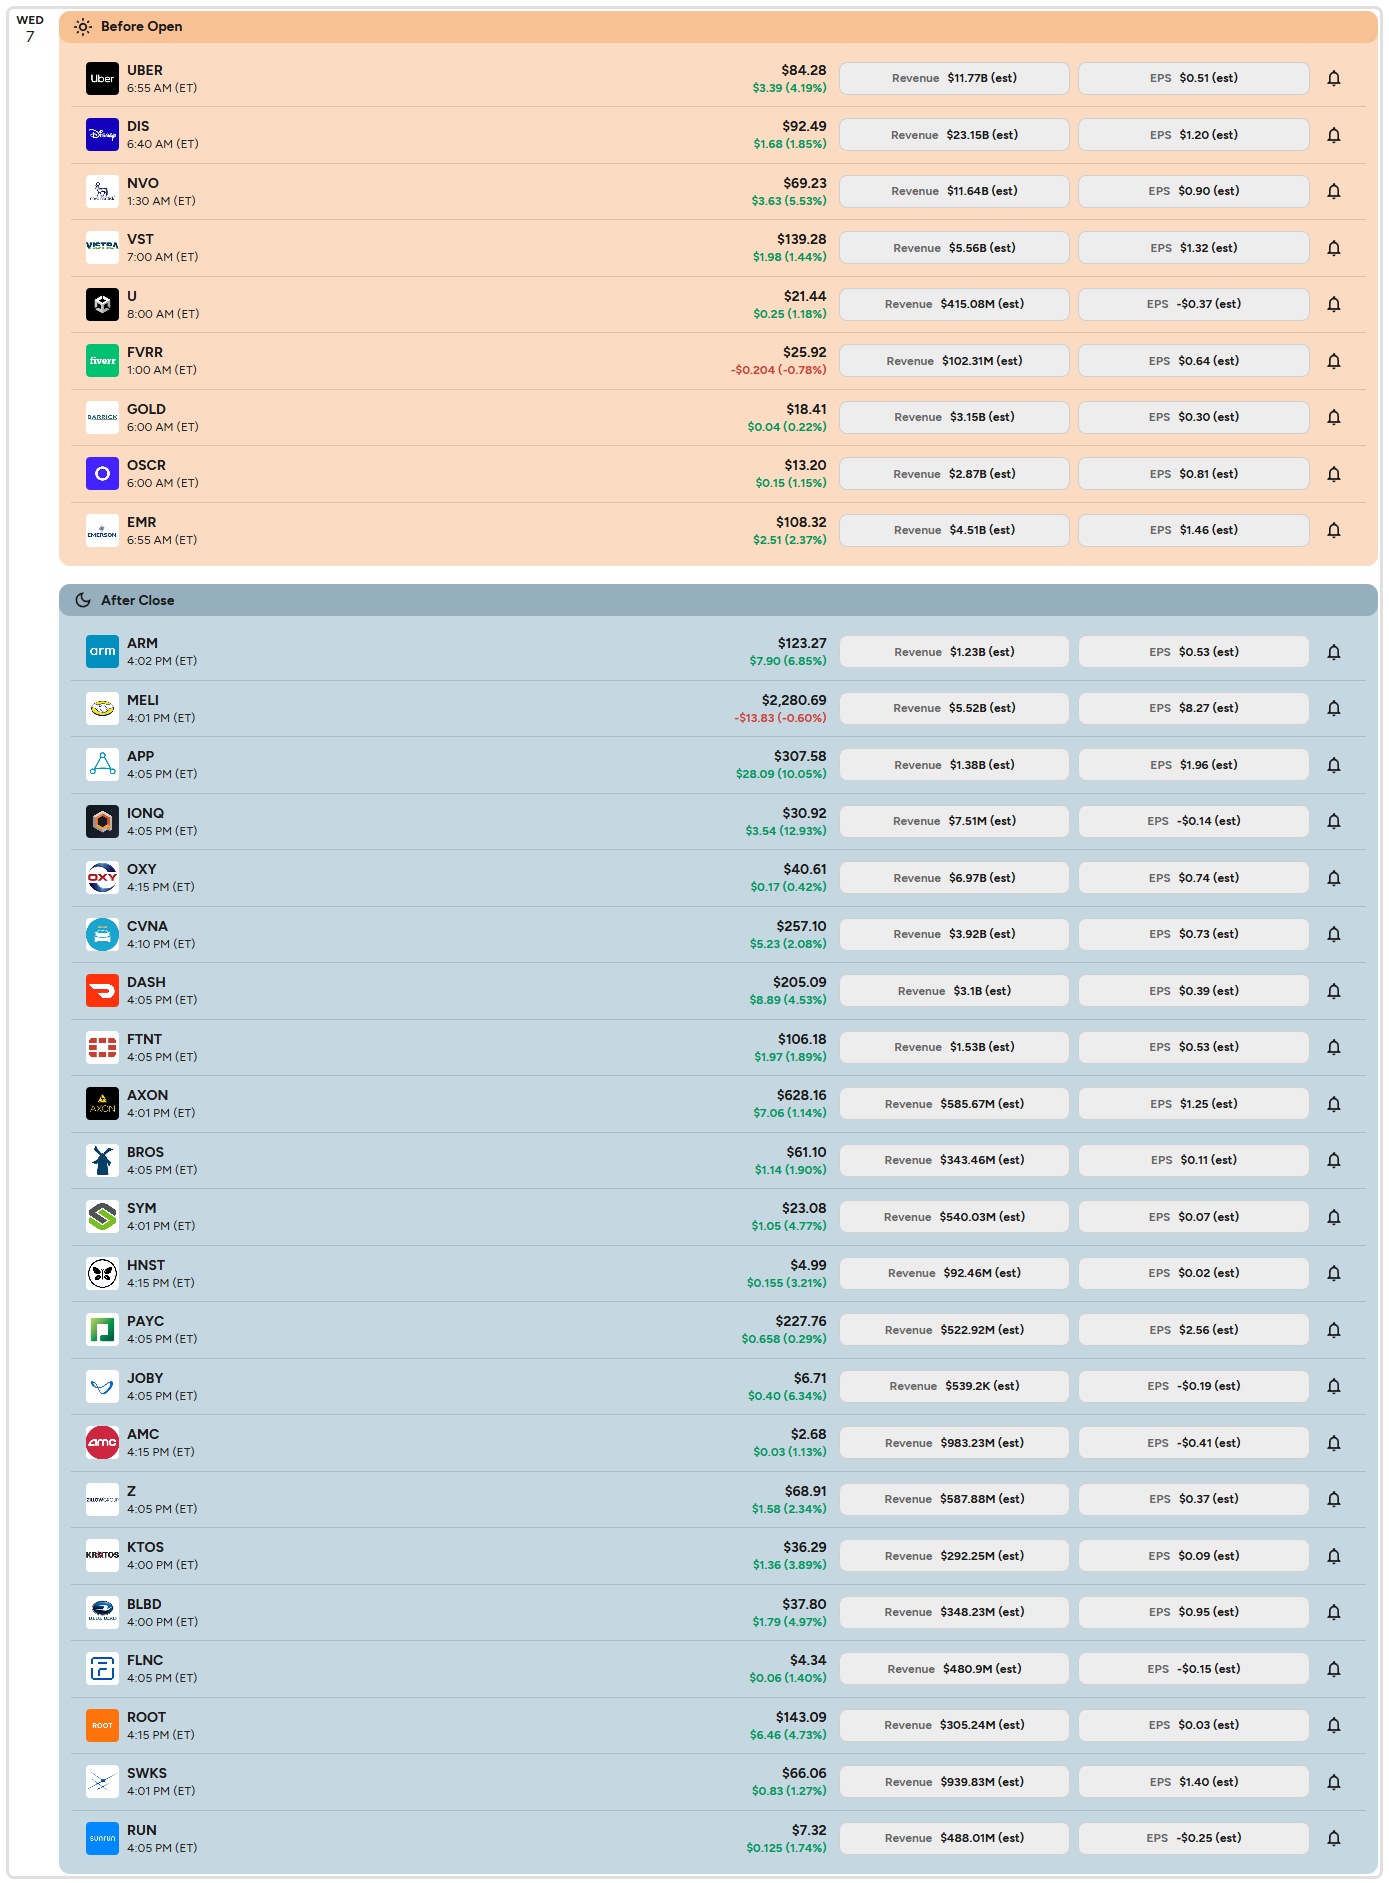
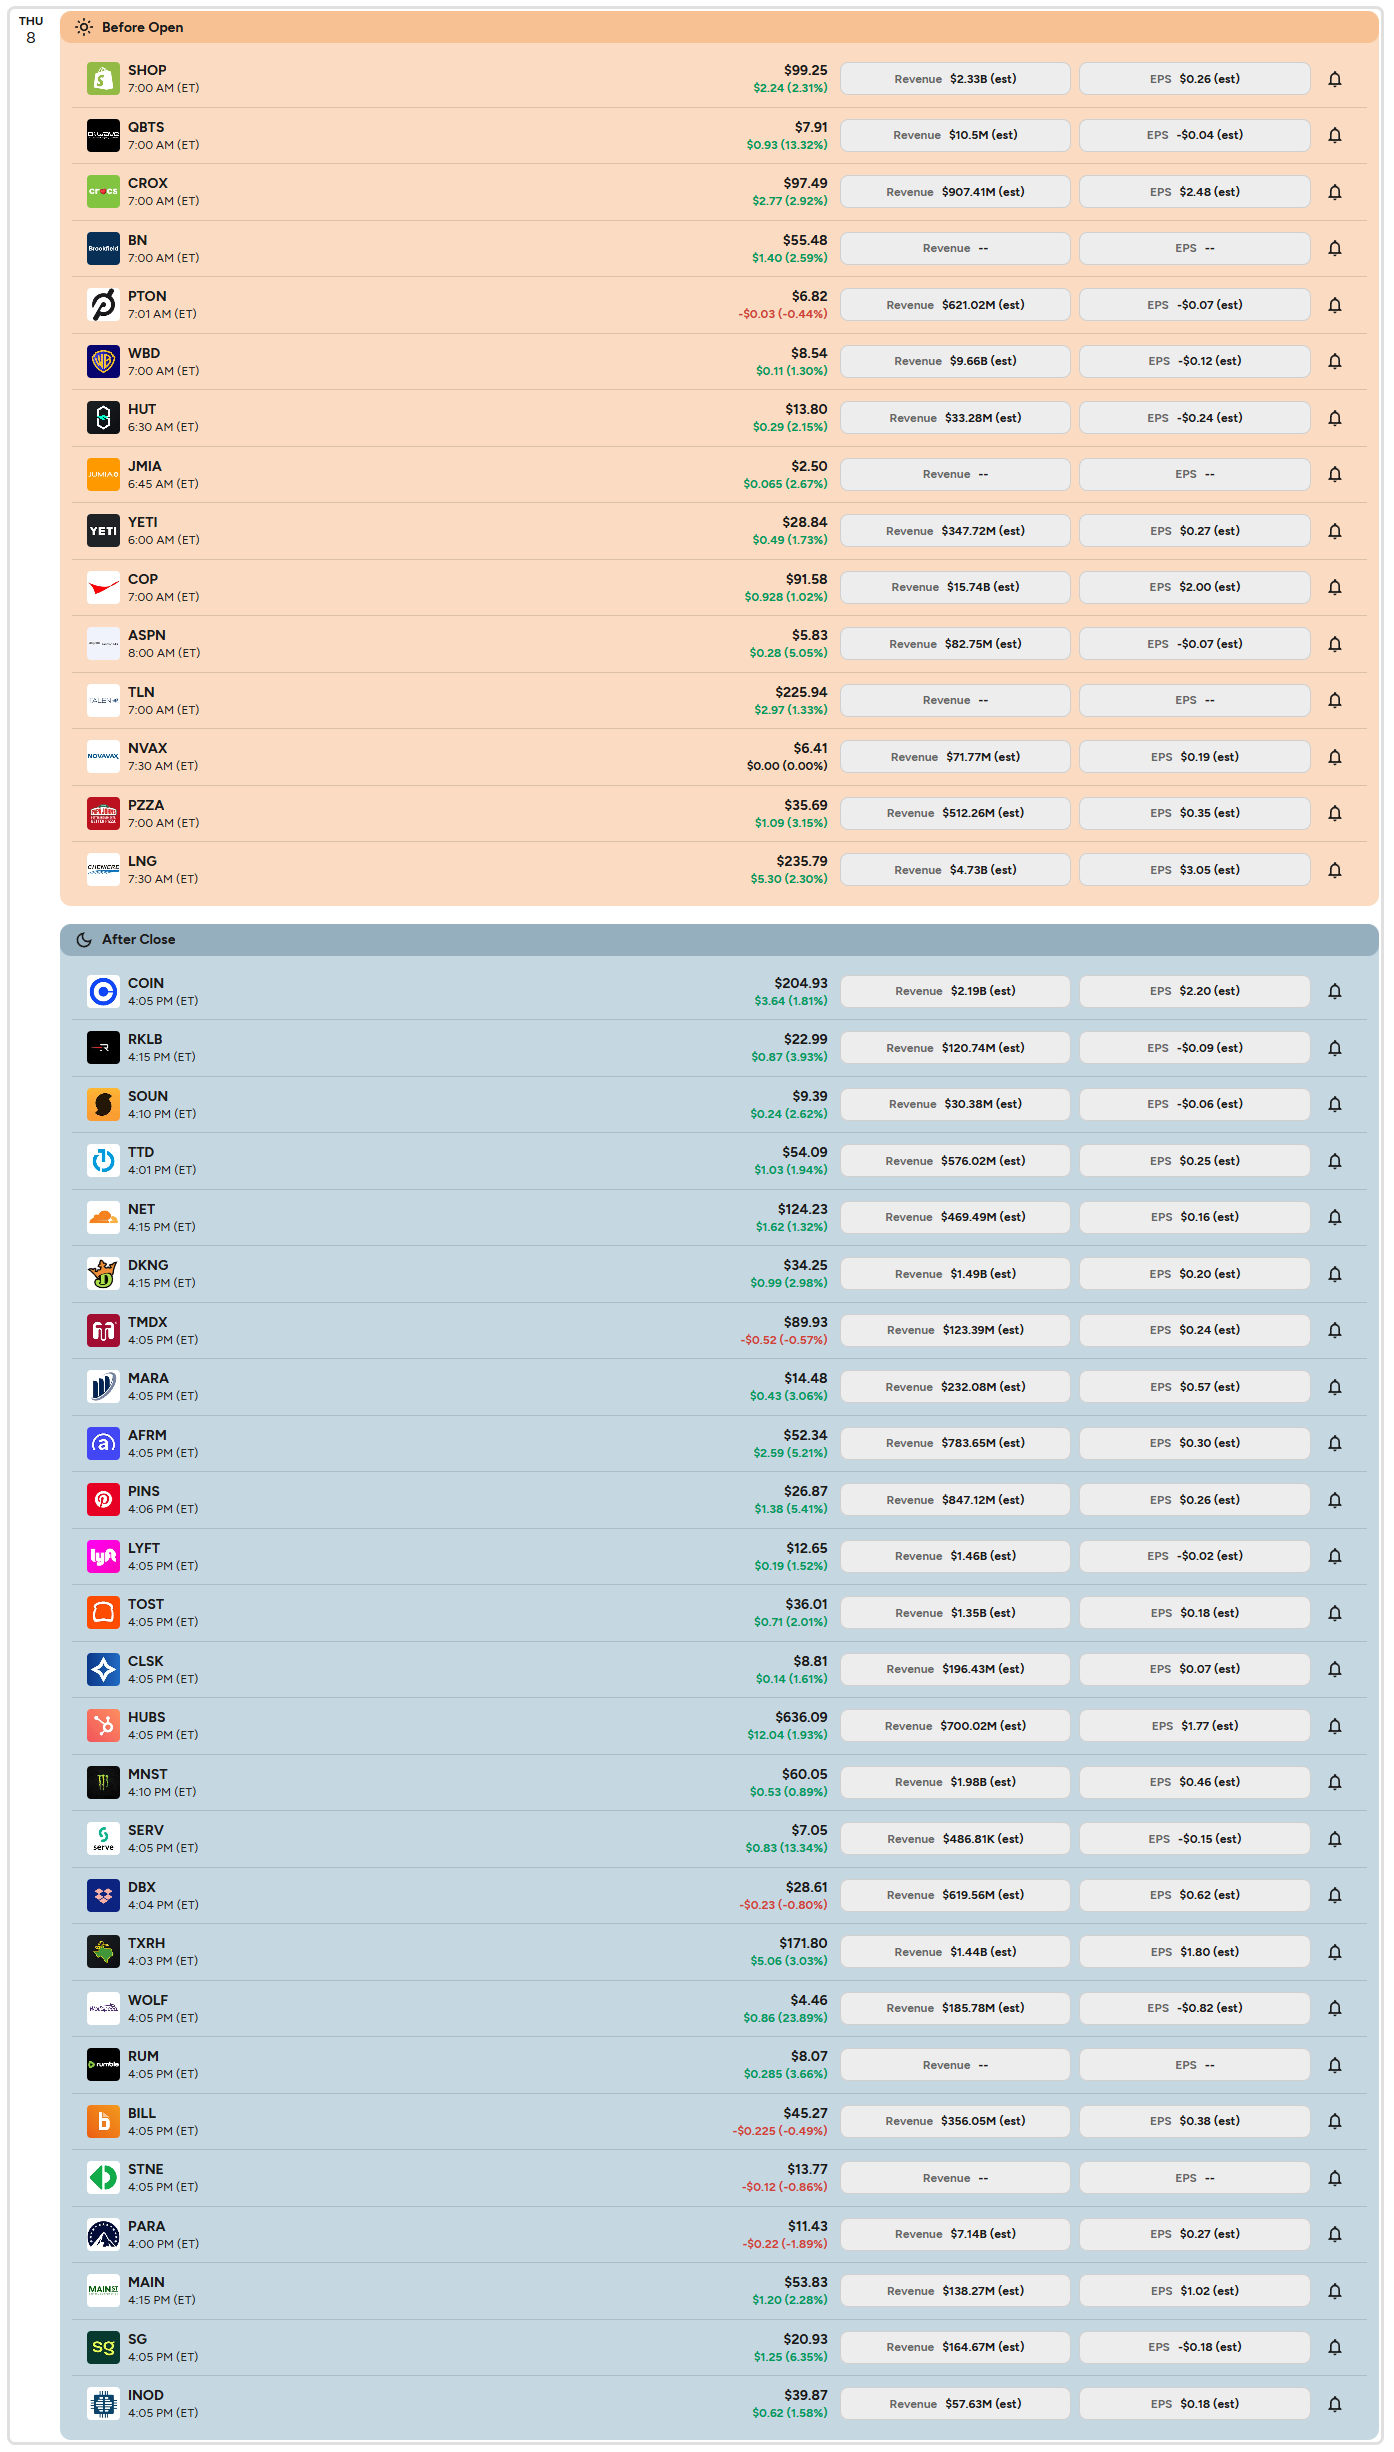
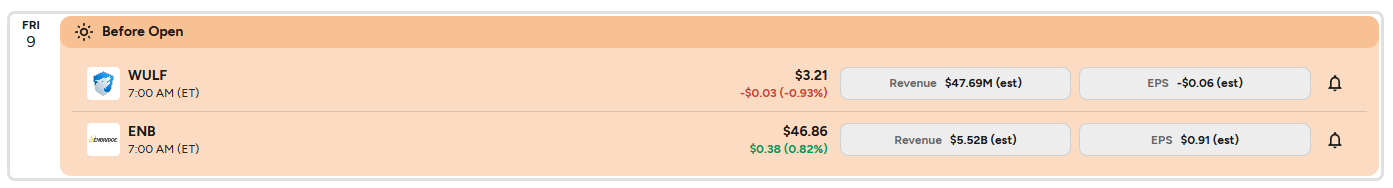
Anticipated Earnings By Day of Week

Institutional Order Flow
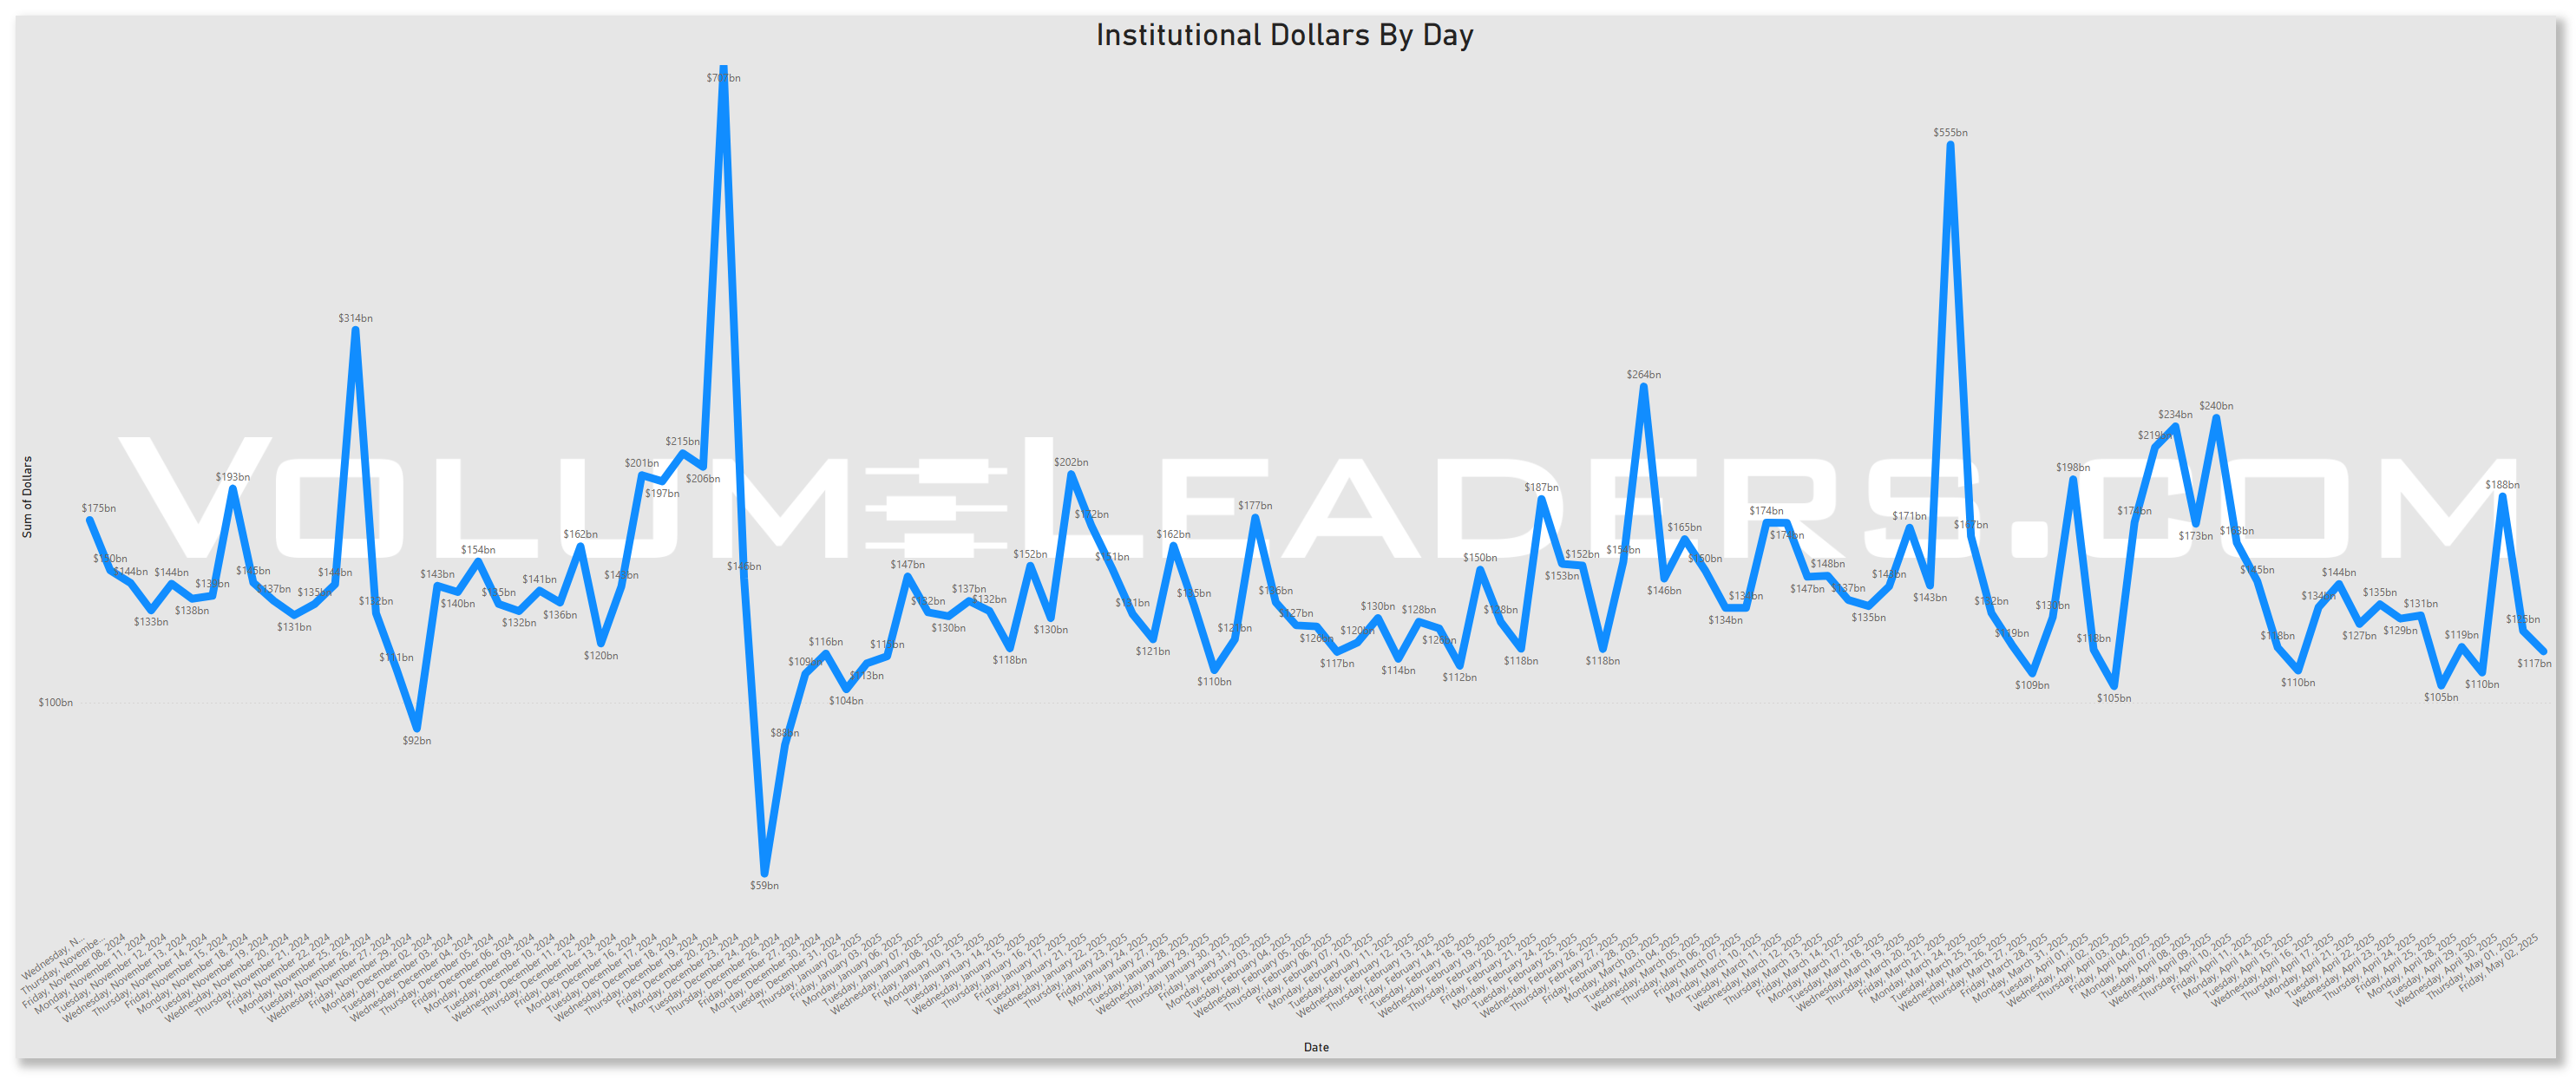
Rolling 90-Day Dollars By Day
This chart shows institutional activity by dollars by day on a rolling 1-year basis. From a theoretical standpoint, examining a chart of daily institutional dollar activity over the course of a year can offer several insights and possible inferences, though all should be approached with caution since the data alone may not prove causality or confirm underlying reasons. Some potential takeaways include:
Event-Driven Behavior:
Sharp, singular spikes on certain days might correlate with major market-moving events. These could include central bank policy announcements, significant geopolitical news, sudden macroeconomic data releases (like employment reports or GDP data), earnings seasons for large-cap companies, or unexpected shocks (e.g., mergers, acquisitions, regulatory changes).Liquidity Dynamics:
Institutions often concentrate large trades on days with higher expected liquidity. For instance, heightened activity might coincide with index reconstitutions, option expiration dates, or the days leading up to or following a major index rebalance, when large amounts of capital shift hands simultaneously.Risk Management and Hedging Activity:
Institutions may significantly adjust their exposures on days that are critical from a risk management perspective. Large spikes can occur if hedge funds, pension funds, or asset managers are rolling over futures contracts, initiating or closing out large hedges, or reacting to volatility triggers.Market Sentiment Indicators:
While the data is purely transactional, the sheer volume of institutional involvement on certain days might indirectly hint at changing sentiment or strategic shifts.
In essence, a chart like this can lead you to hypothesize that institutional trading volumes are not constant or random but rather influenced by a mix of predictable calendar effects, major market events, liquidity considerations, risk management decisions, and strategic allocation shifts.
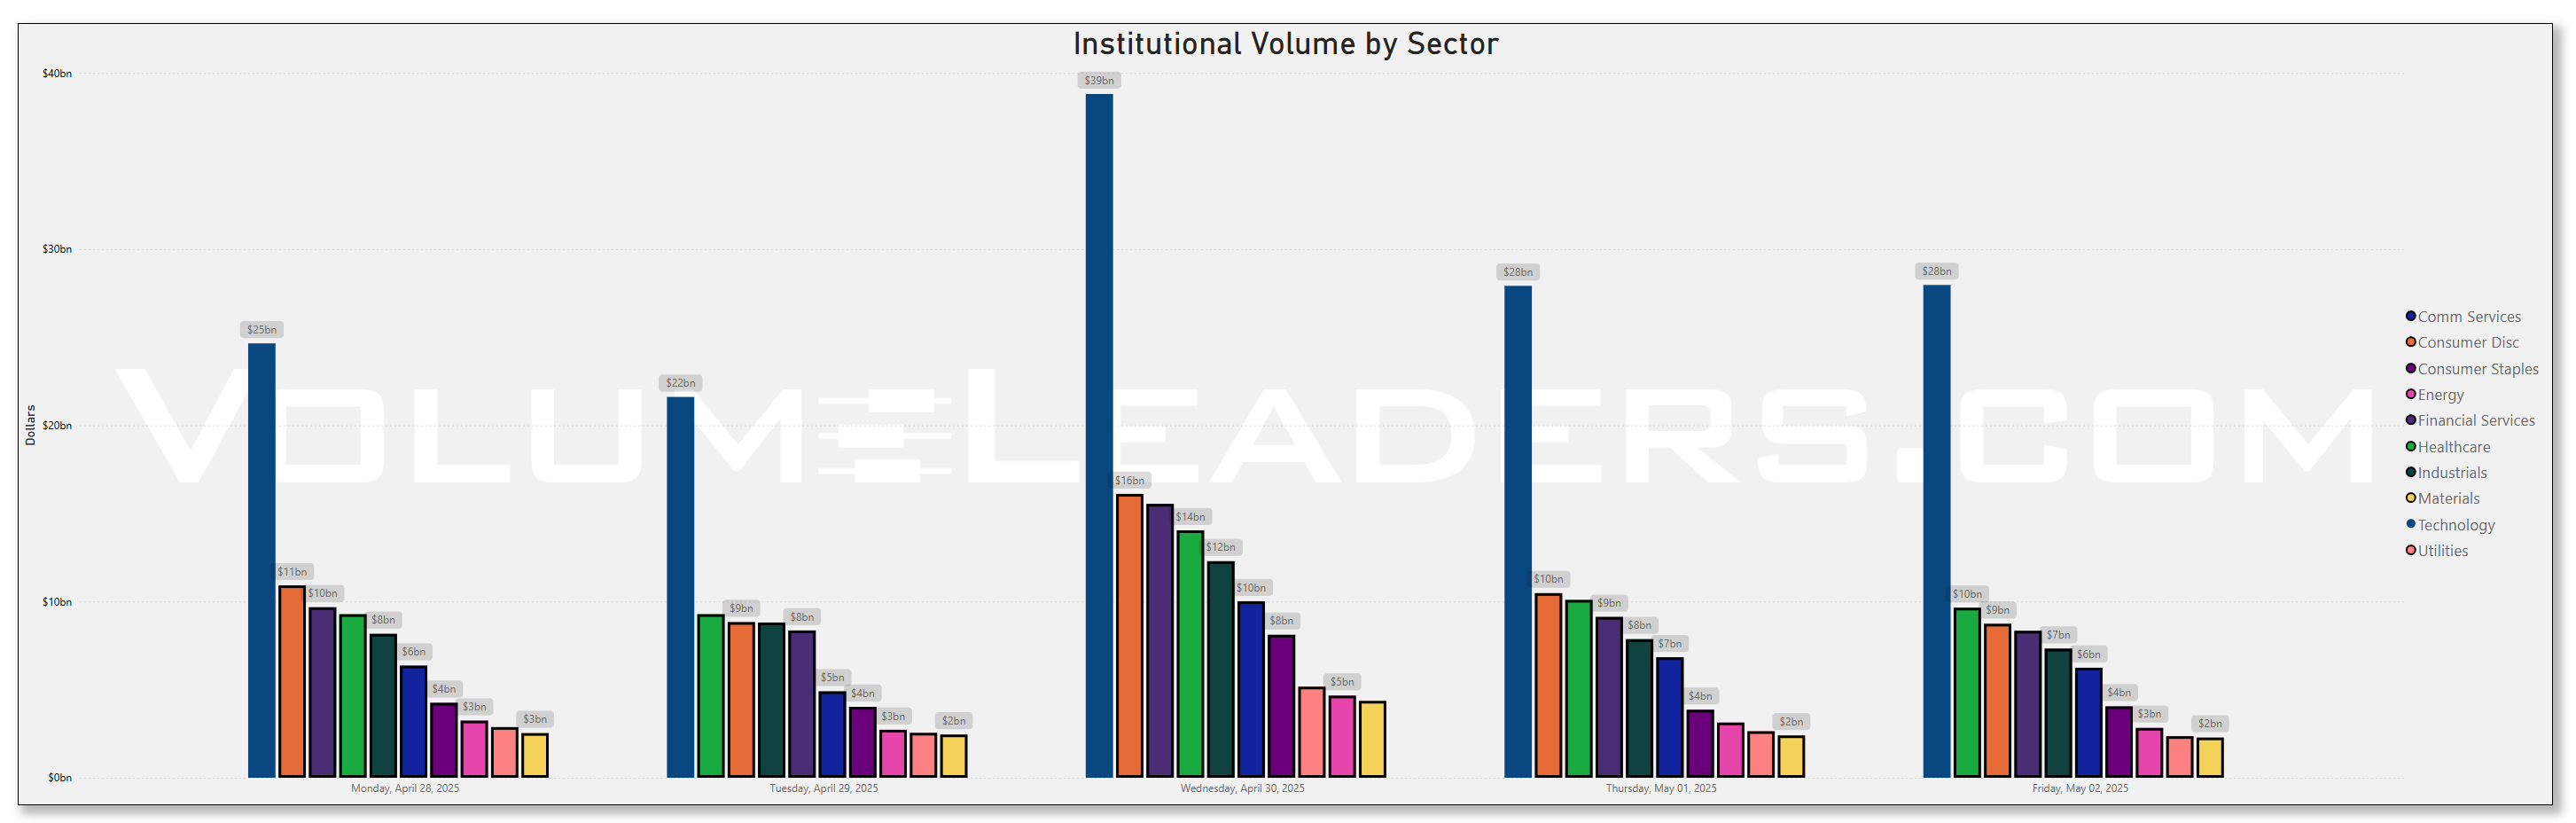
Top Institutional Order Flow By Sector By Week For The Past 90-Days

Top Institutional Order Flow In Equities
These are incredibly important charts to watch as they contains lots of nuanced suggestions at a thematic level. Watch these charts closely week-to-week to stay informed about where institutional money is flowing, adjust your strategies based on momentum, align your portfolio with macroeconomic and market trends, and manage risks more effectively by avoiding sectors losing institutional favor.
Sector Rotation Insights: The chart highlights which sectors are attracting institutional activity and which are losing favor. Institutions often lead market trends, so tracking shifts in their focus can indicate sector rotations.
Sentiment Analysis: The level of institutional activity reflects confidence in specific sectors. Rising activity in traditionally defensive sectors (e.g., healthcare, utilities) may indicate caution, while a surge in growth sectors (e.g., technology, consumer discretionary) could suggest optimism.
Emerging Trends: Sudden spikes in a previously overlooked sector, like industrials or consumer staples, might hint at emerging opportunities or structural shifts.
Macro Themes: Changes in sector activity often align with broader macroeconomic themes like inflation, interest rates, or geopolitical events. For instance:
Increased activity in energy might indicate concerns about oil supply or rising prices.
Growth in technology could align with innovations or favorable policies.
Risk Management: Declining institutional activity in a sector might signal weakening fundamentals or heightened risks.
Spotting Overcrowding: Excessive activity in a single sector over multiple weeks may suggest overcrowding, which could lead to heightened volatility if institutions begin to exit.
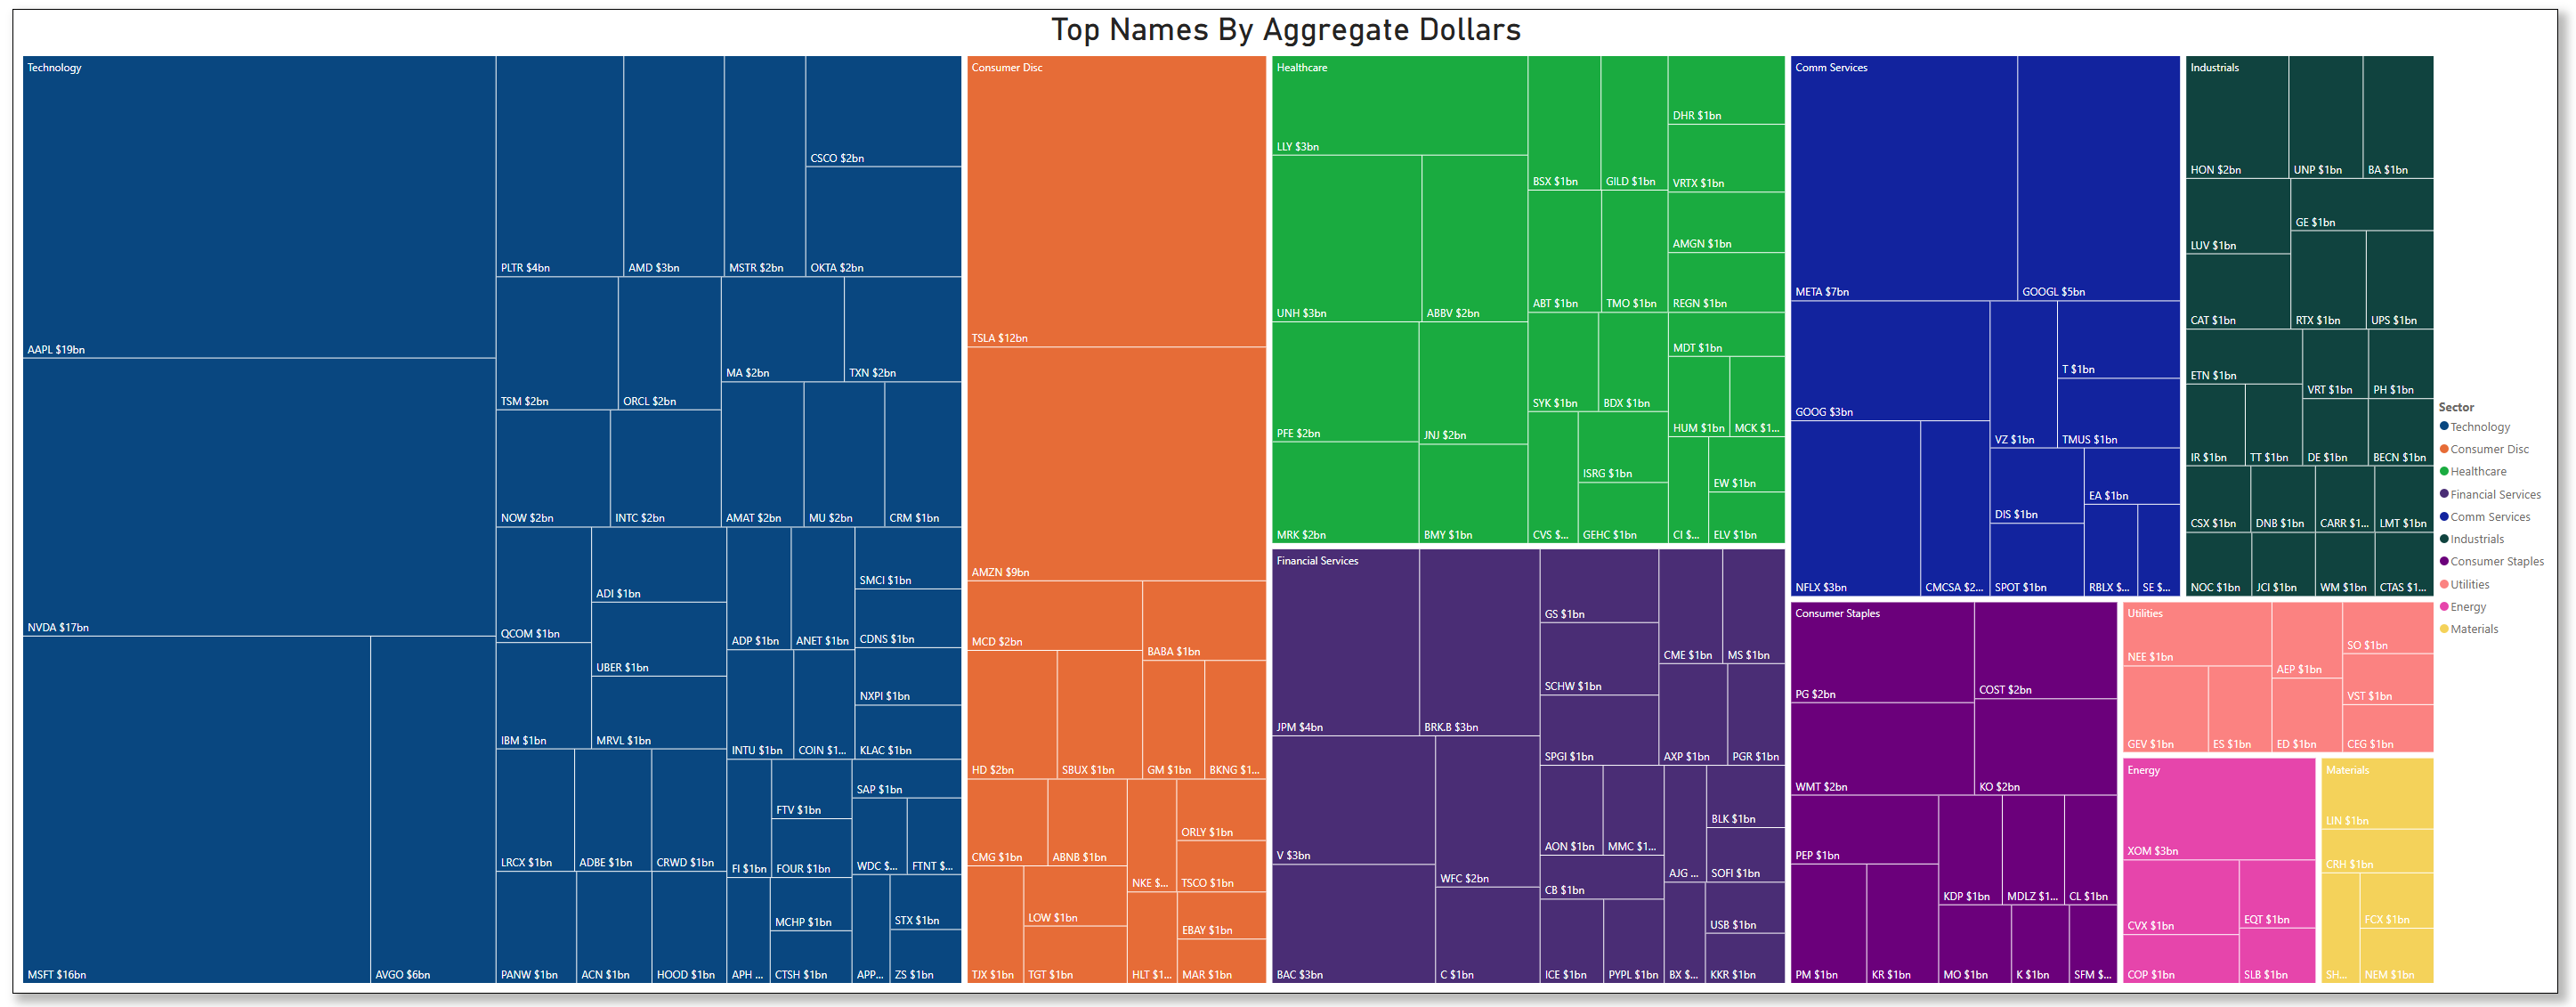
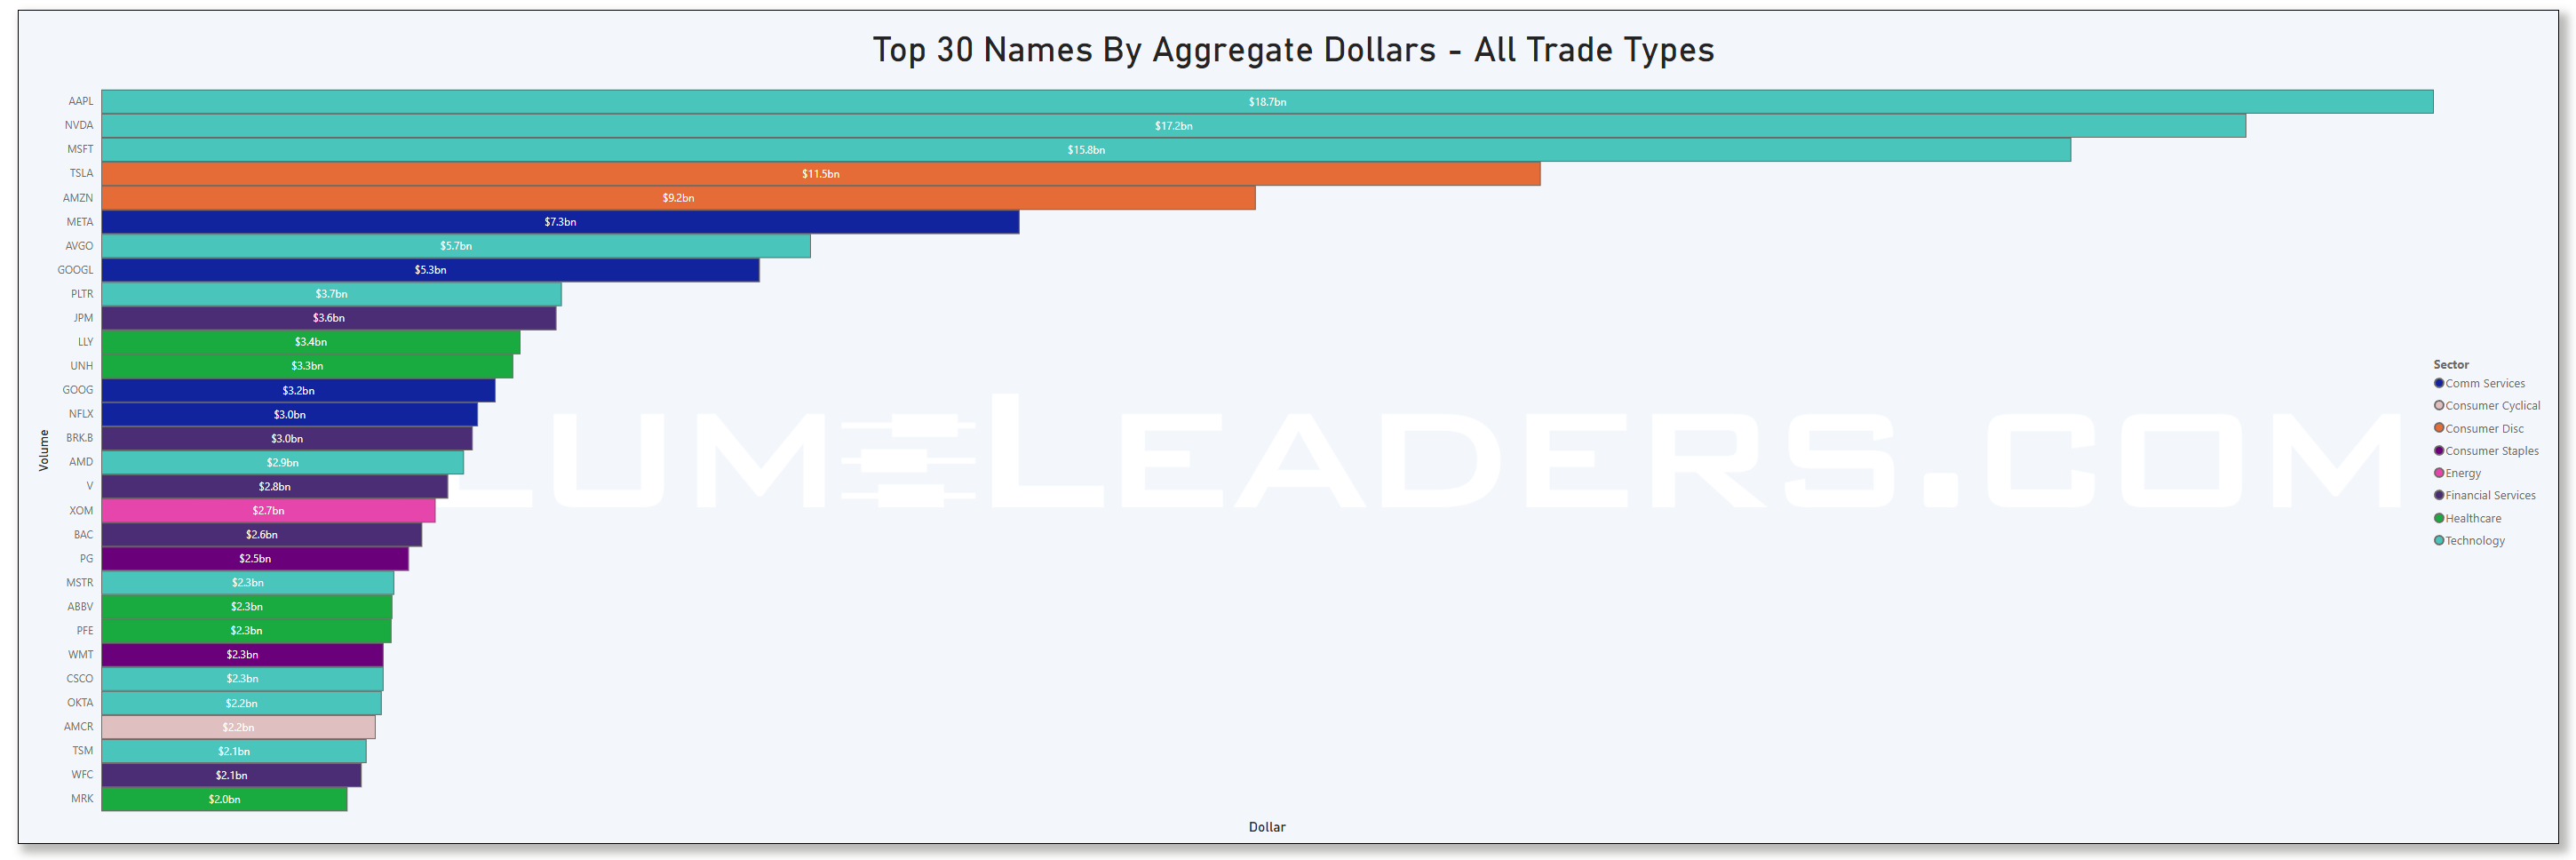
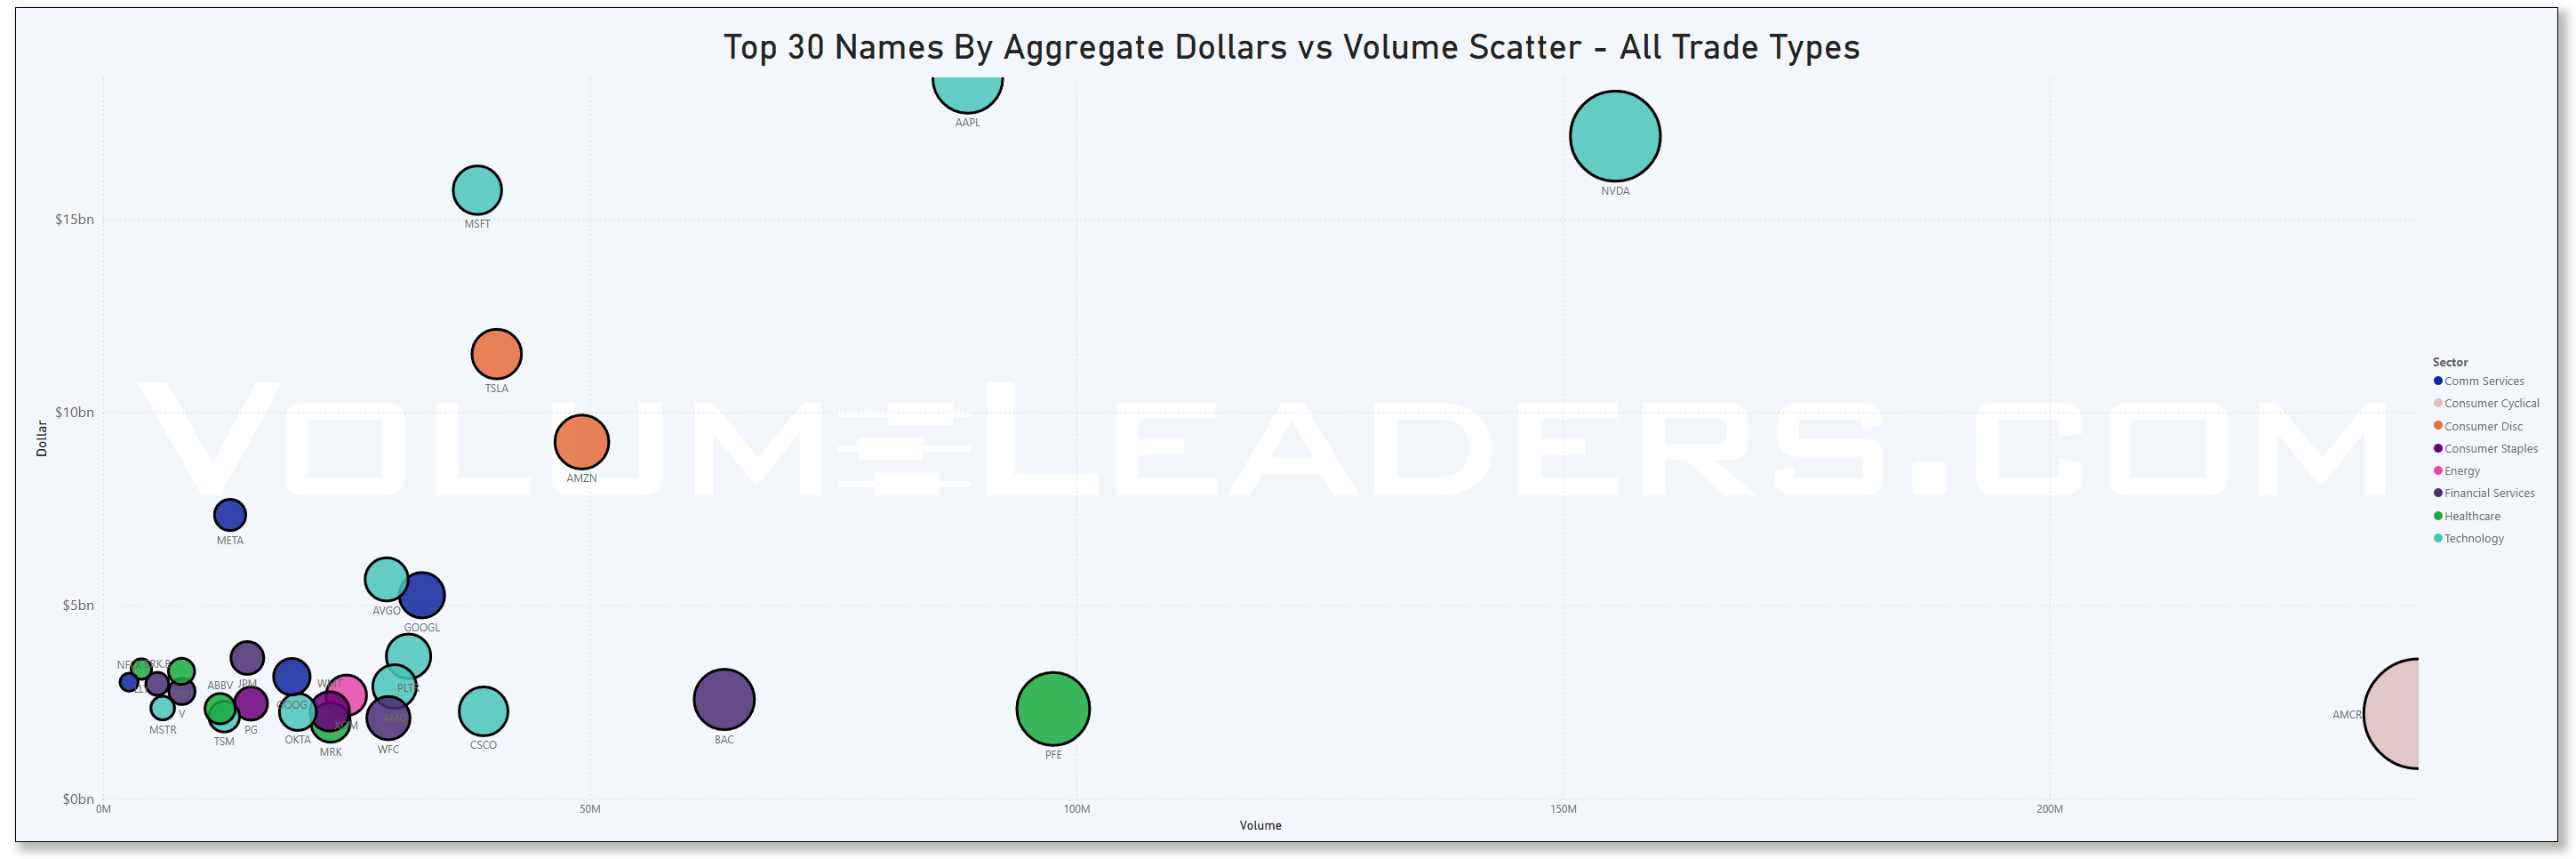
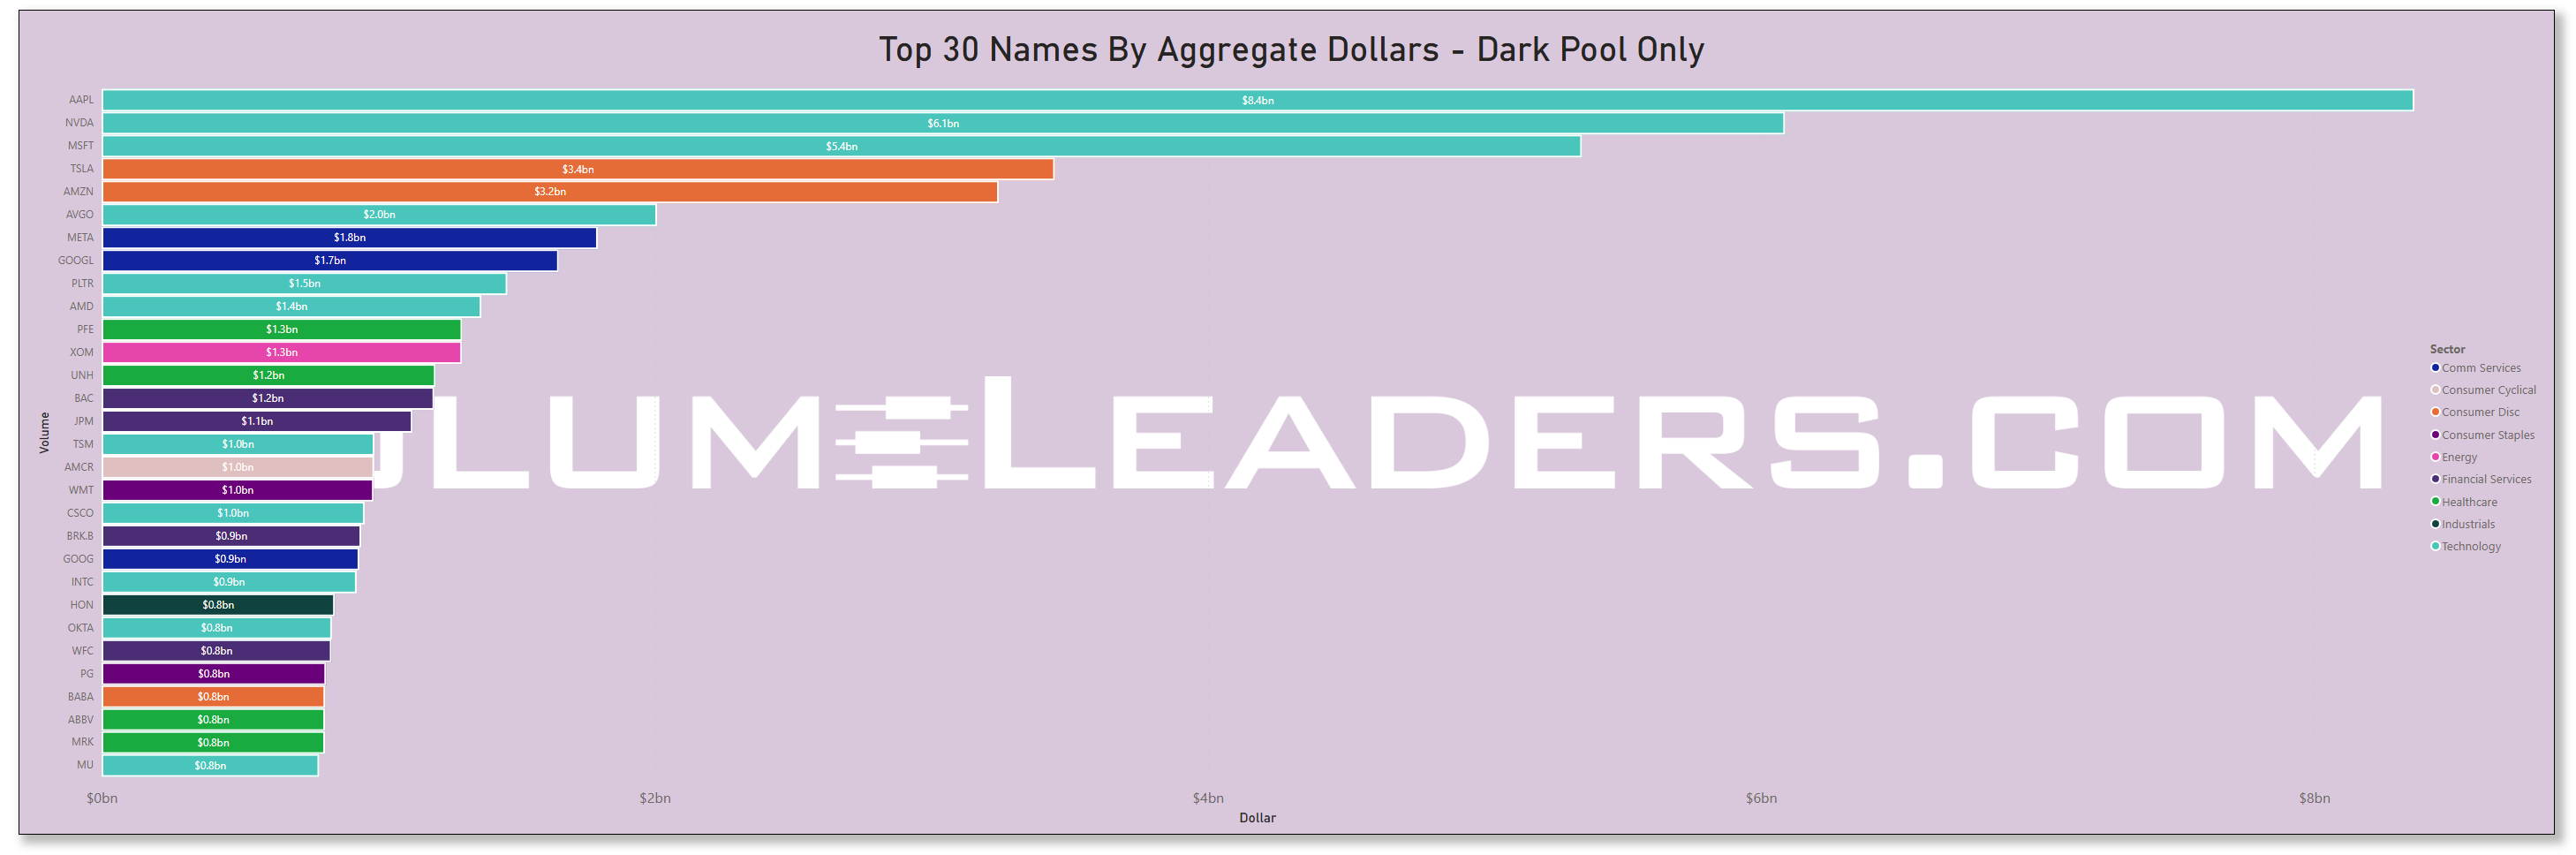
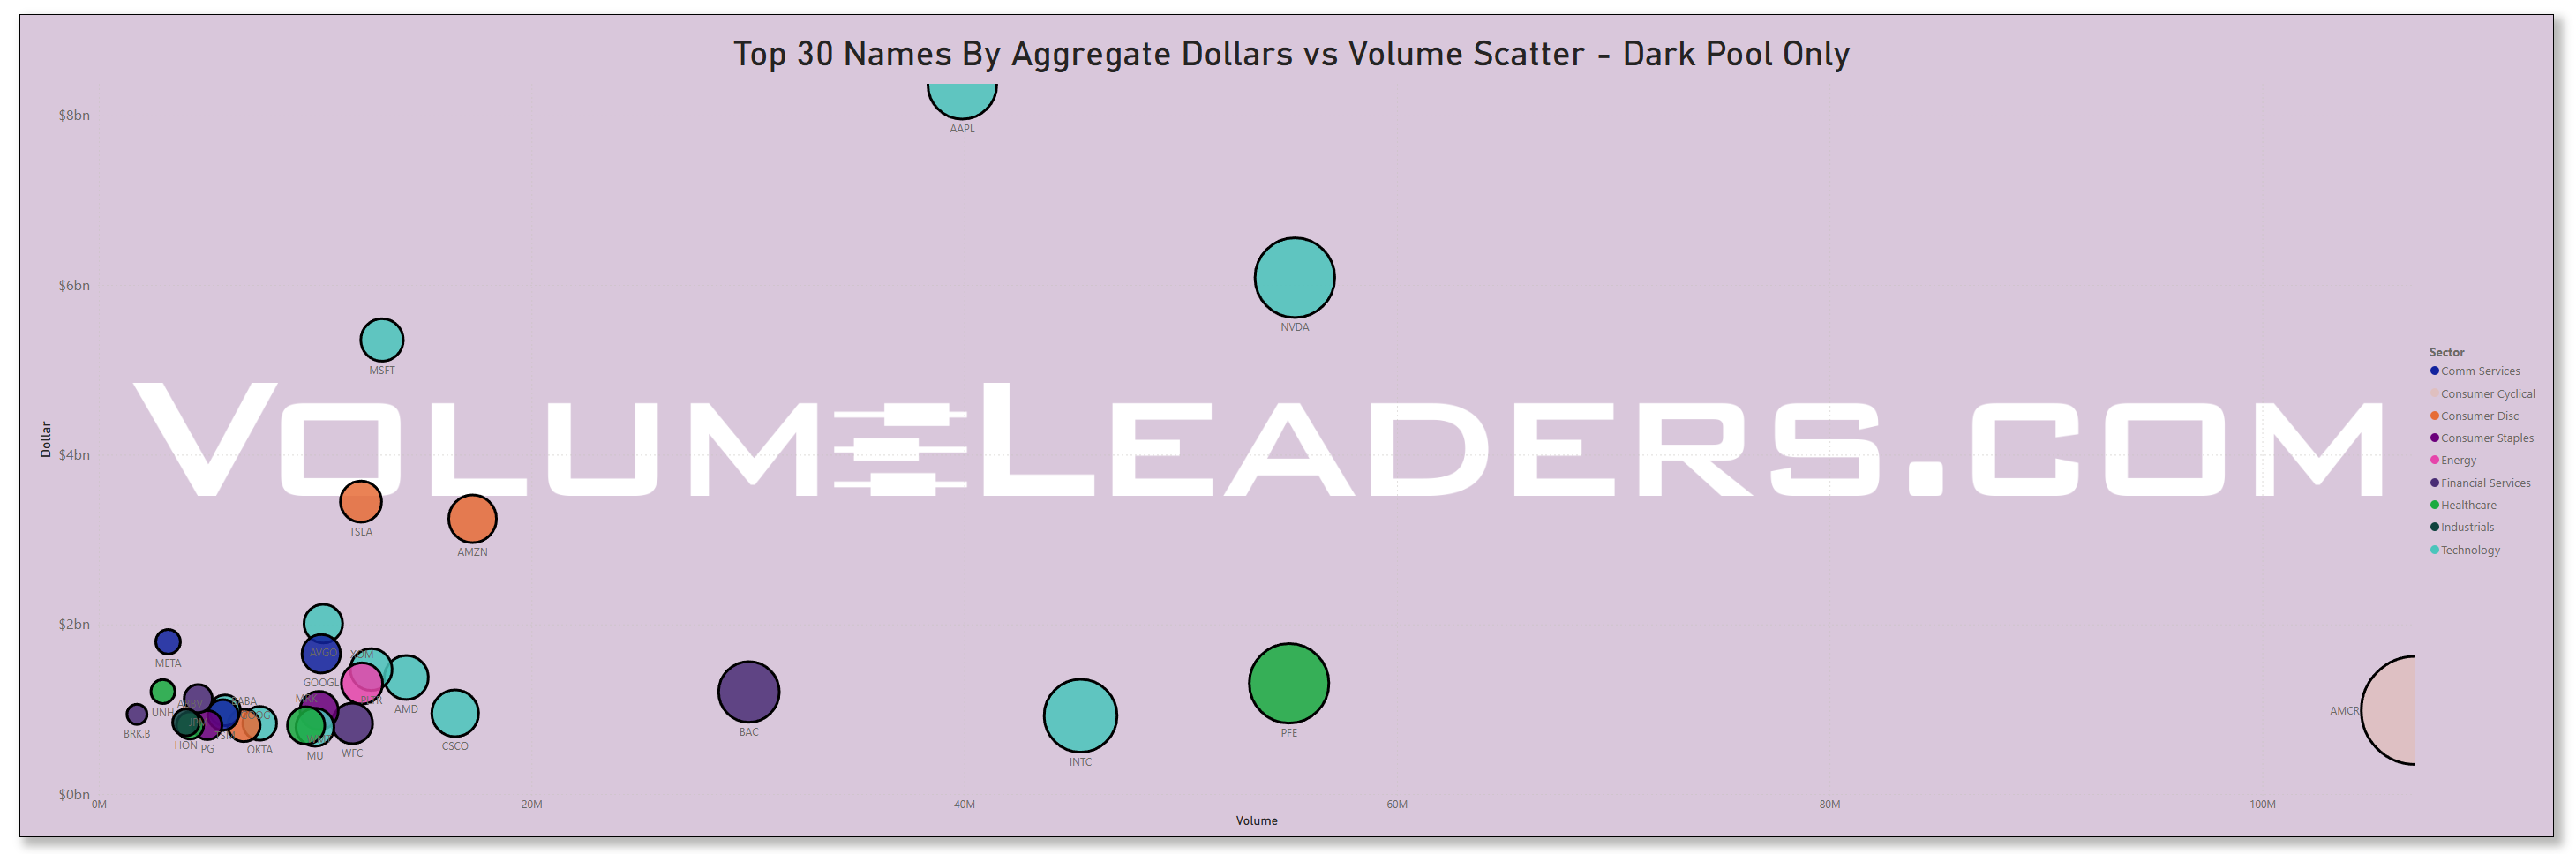
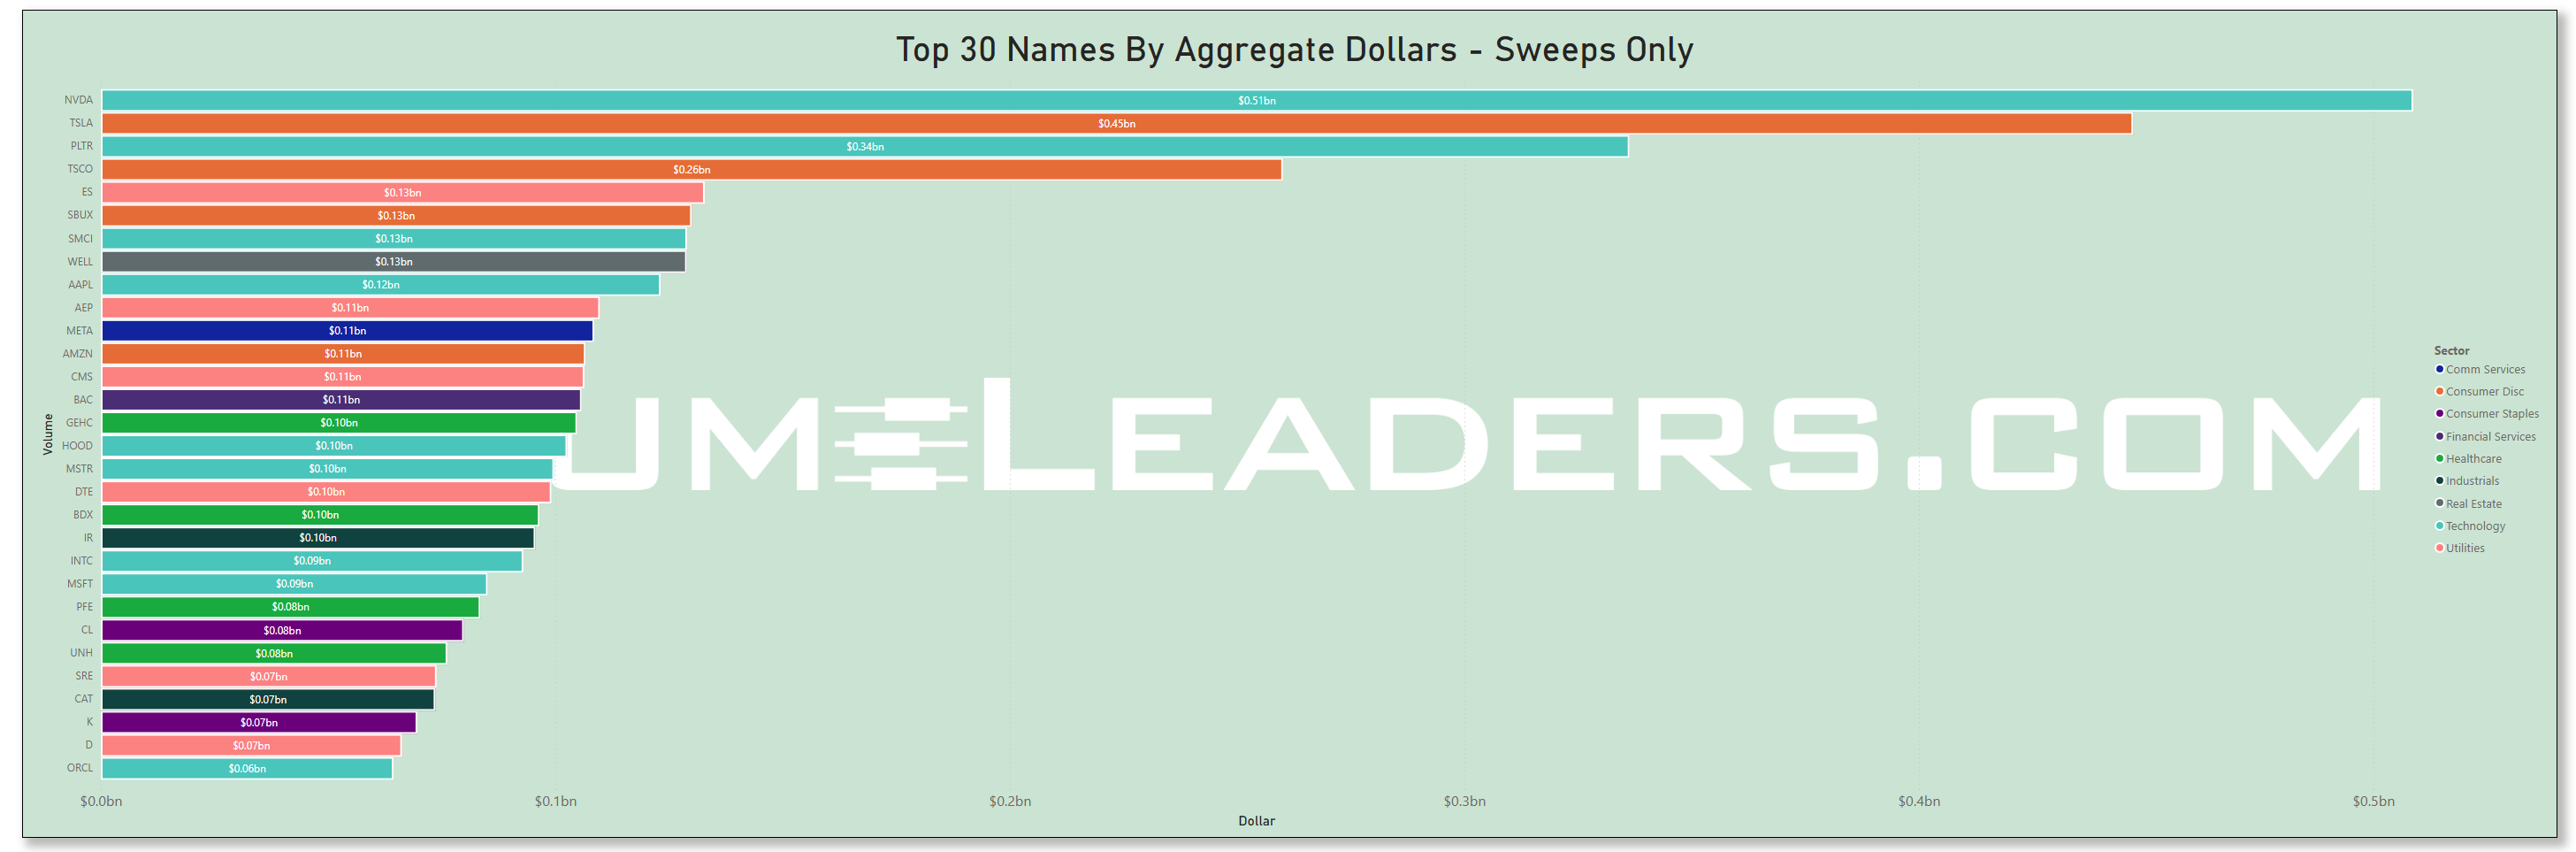
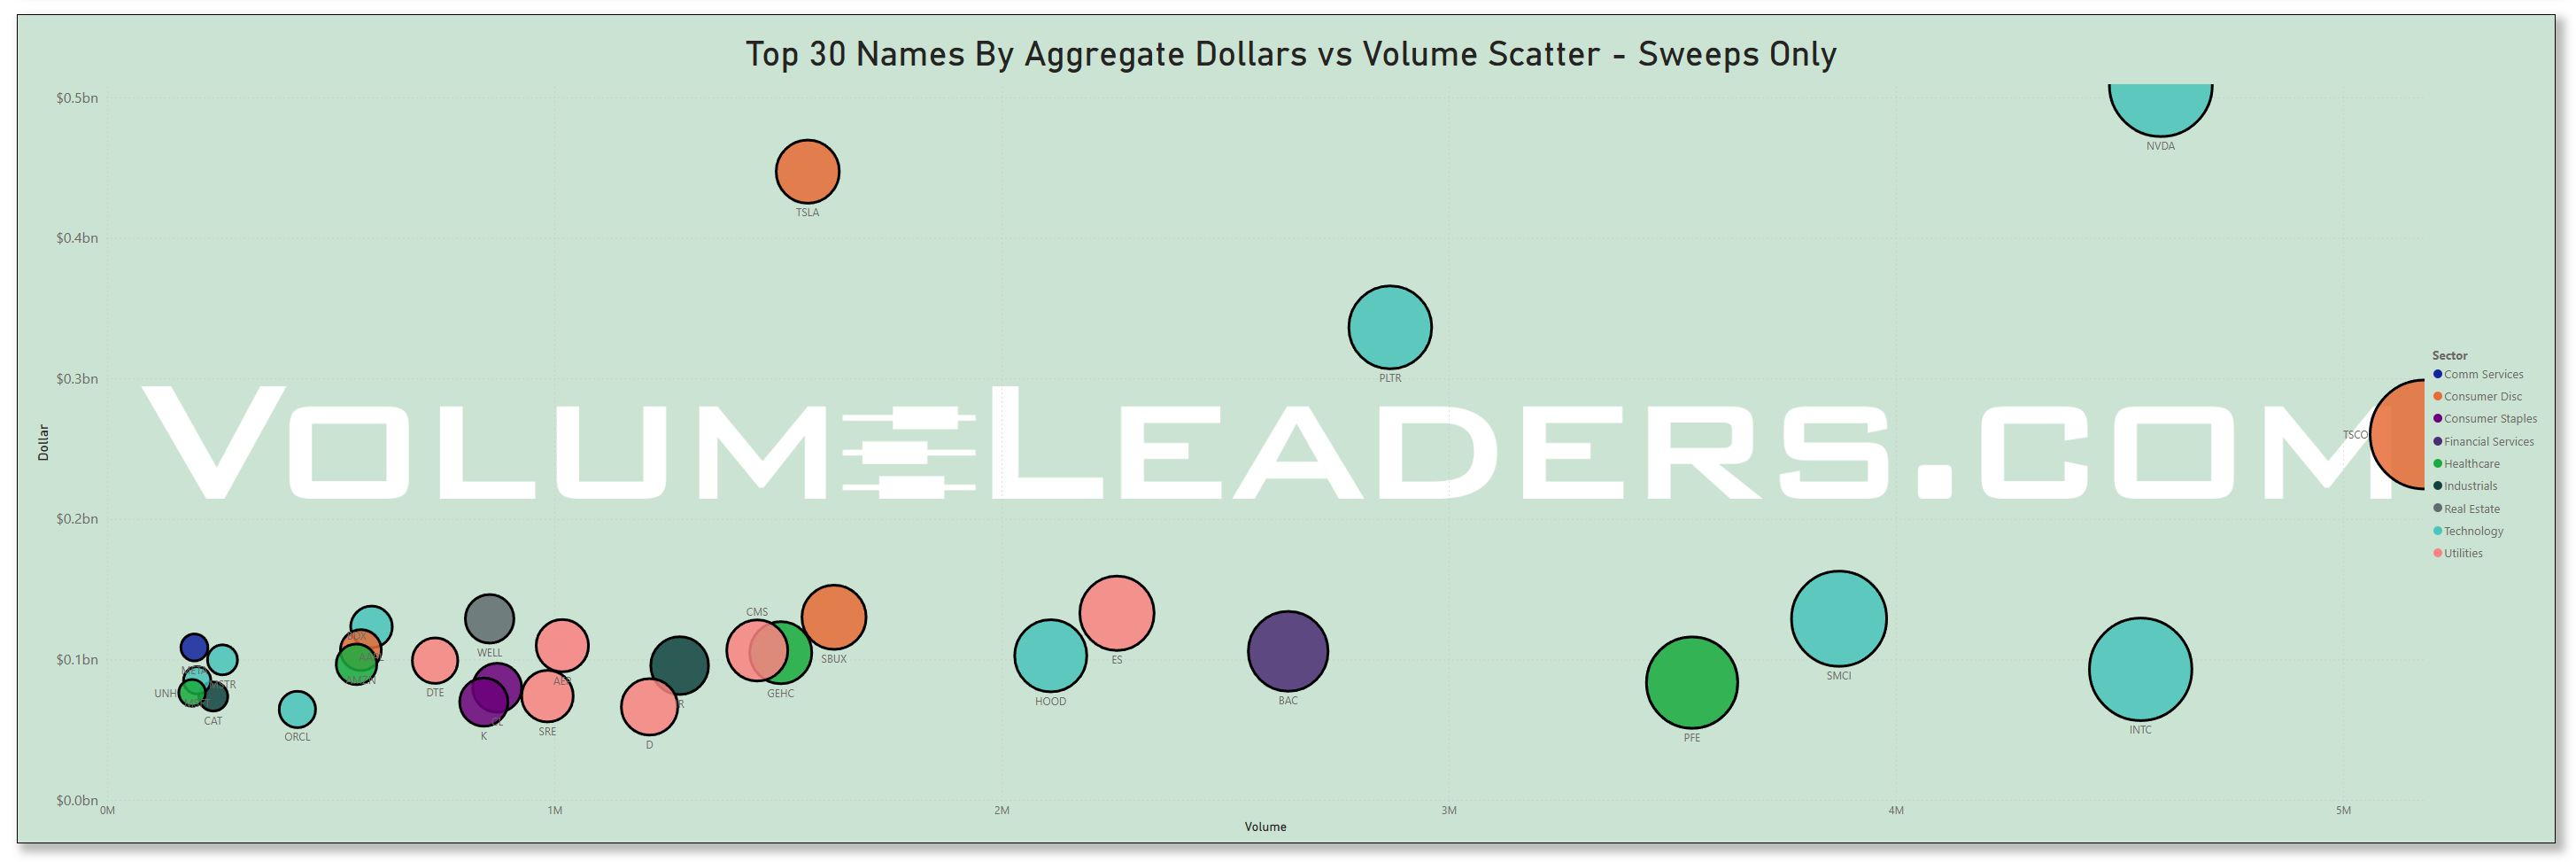
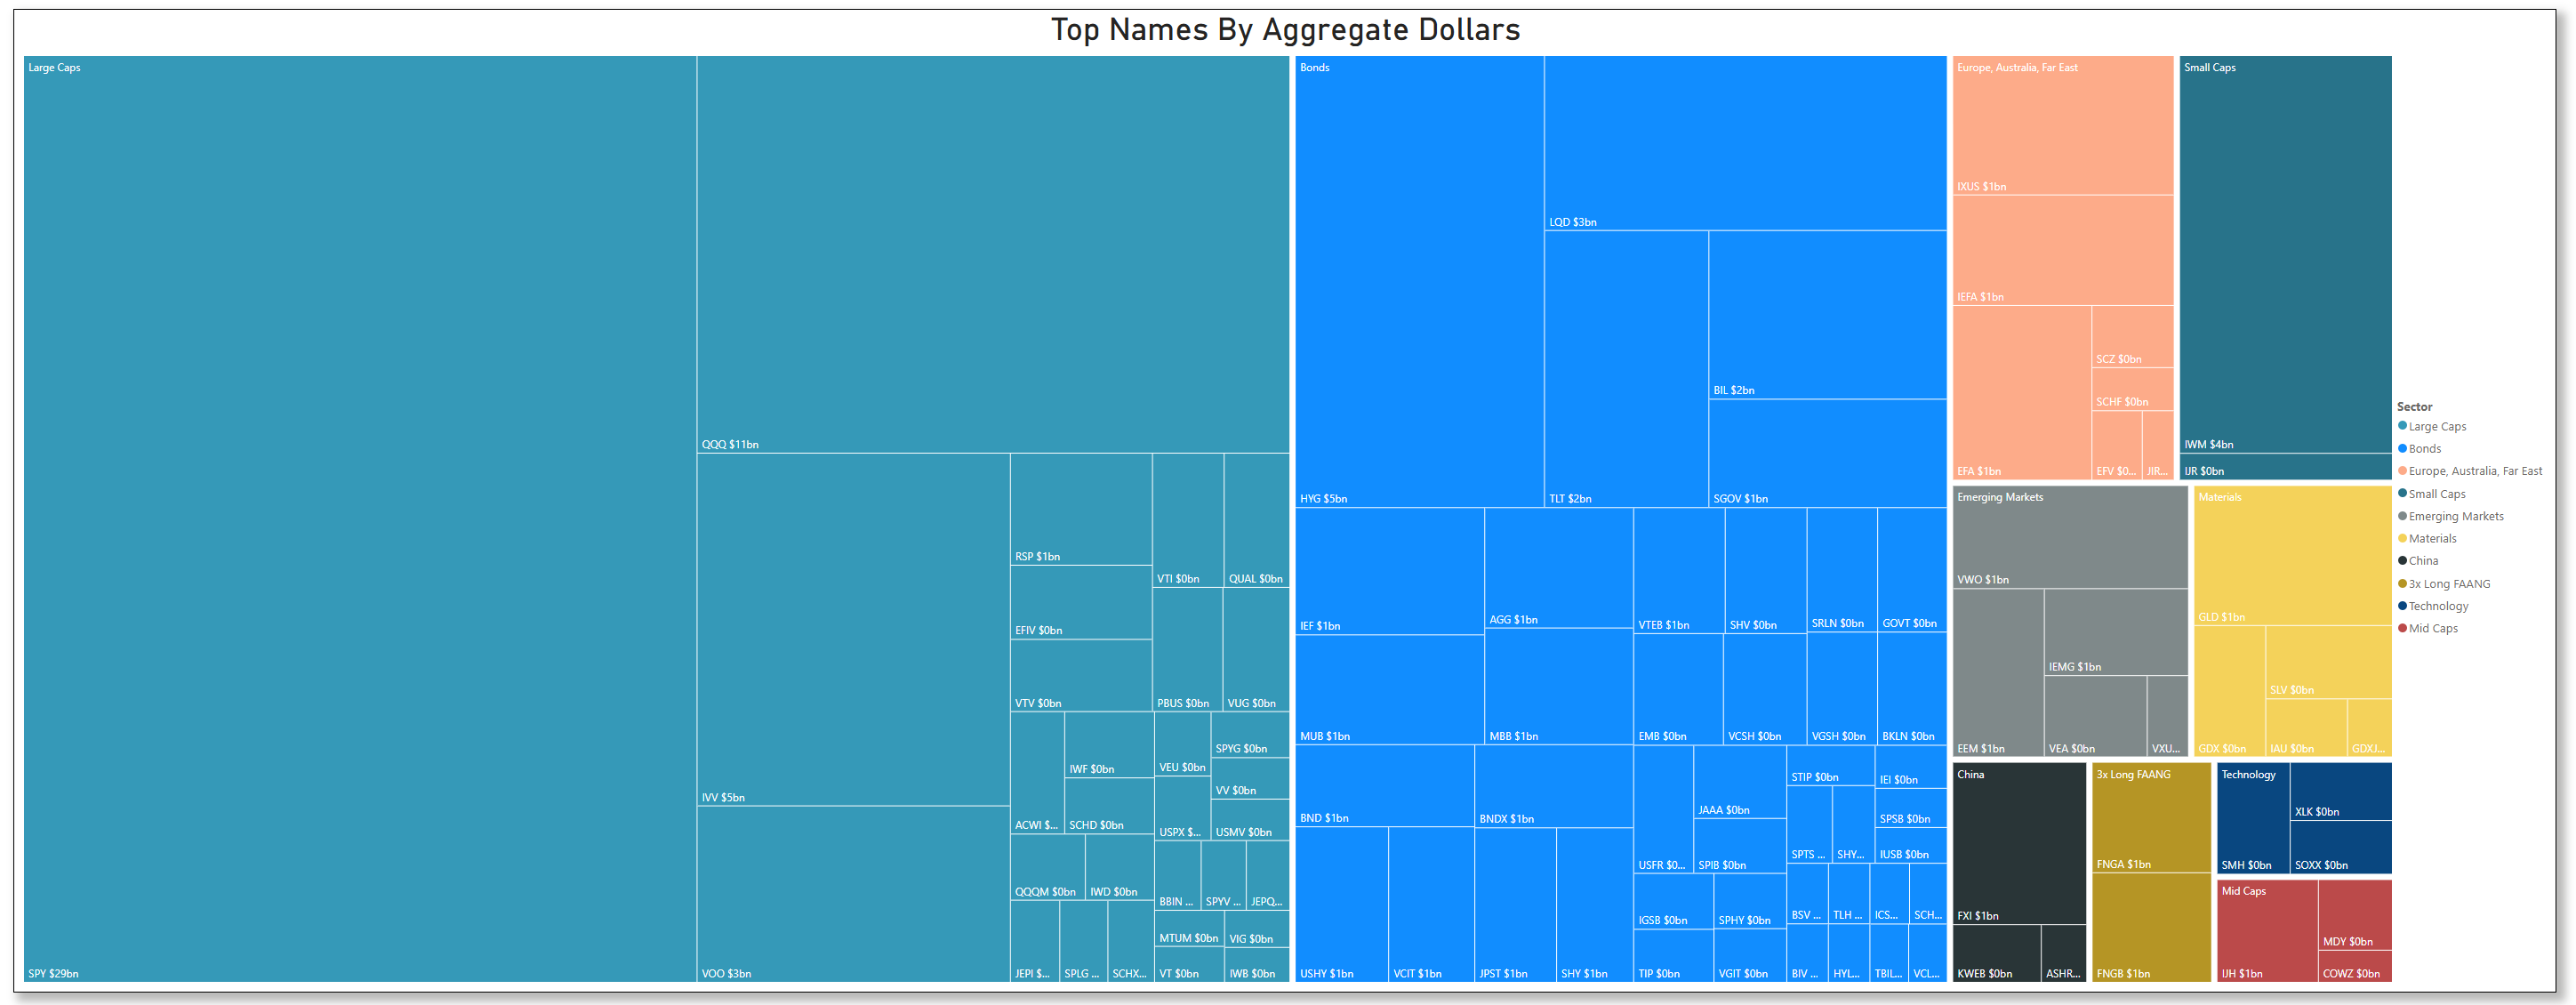
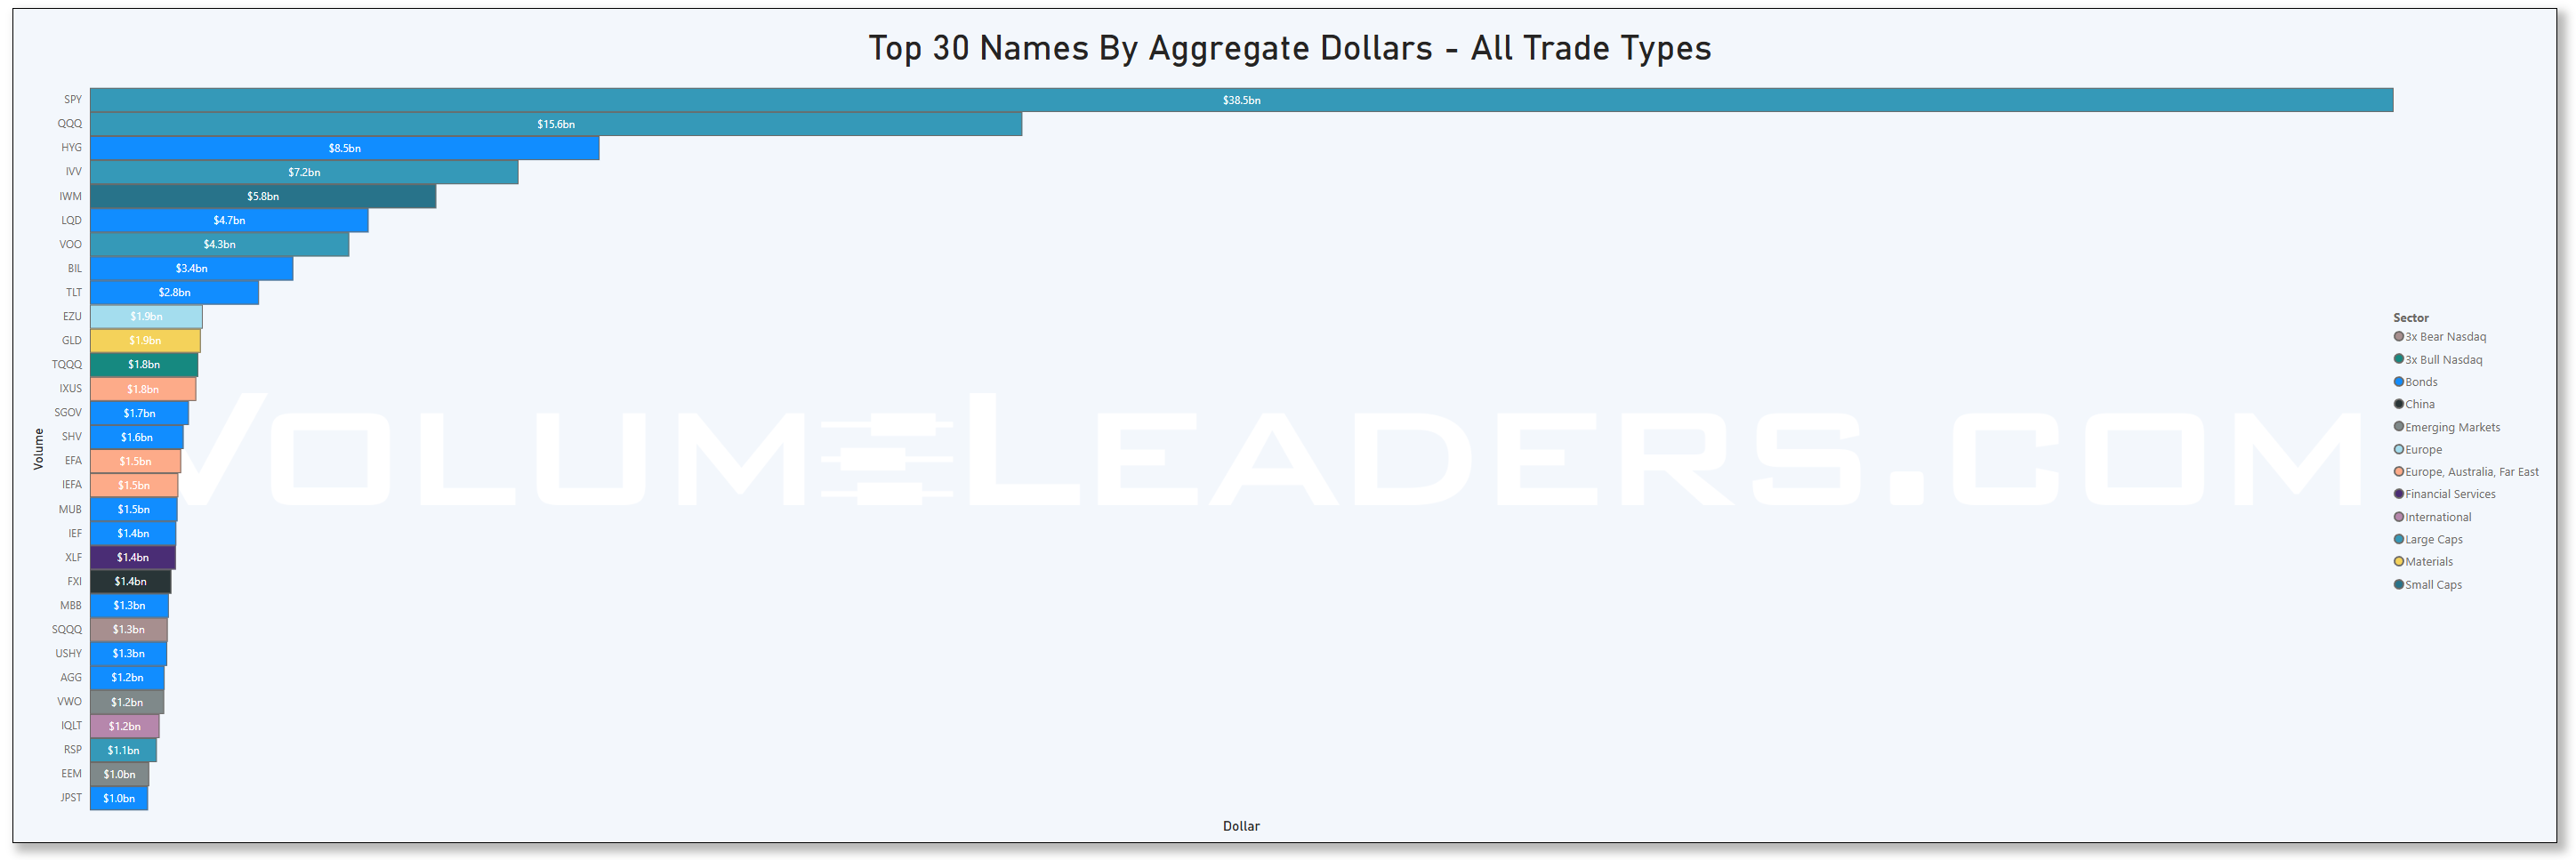
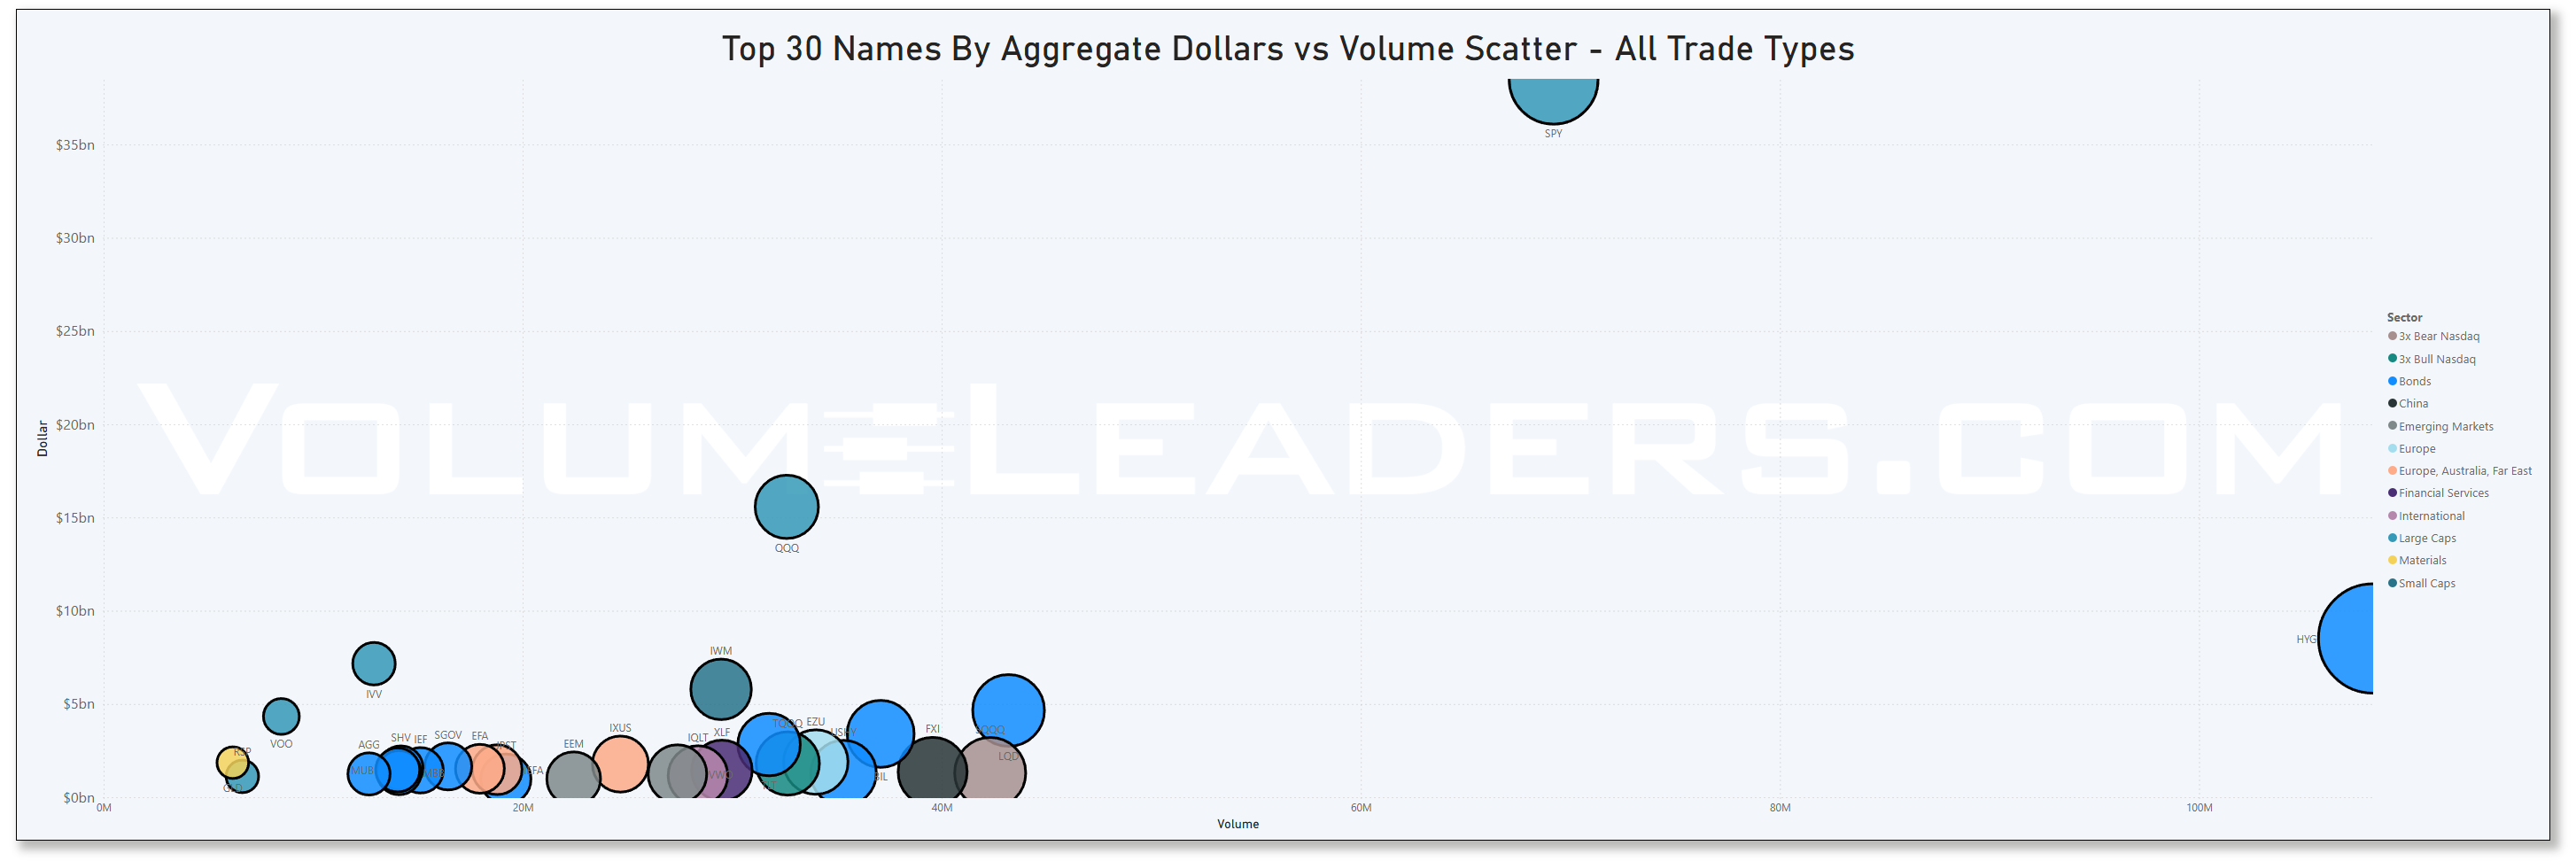
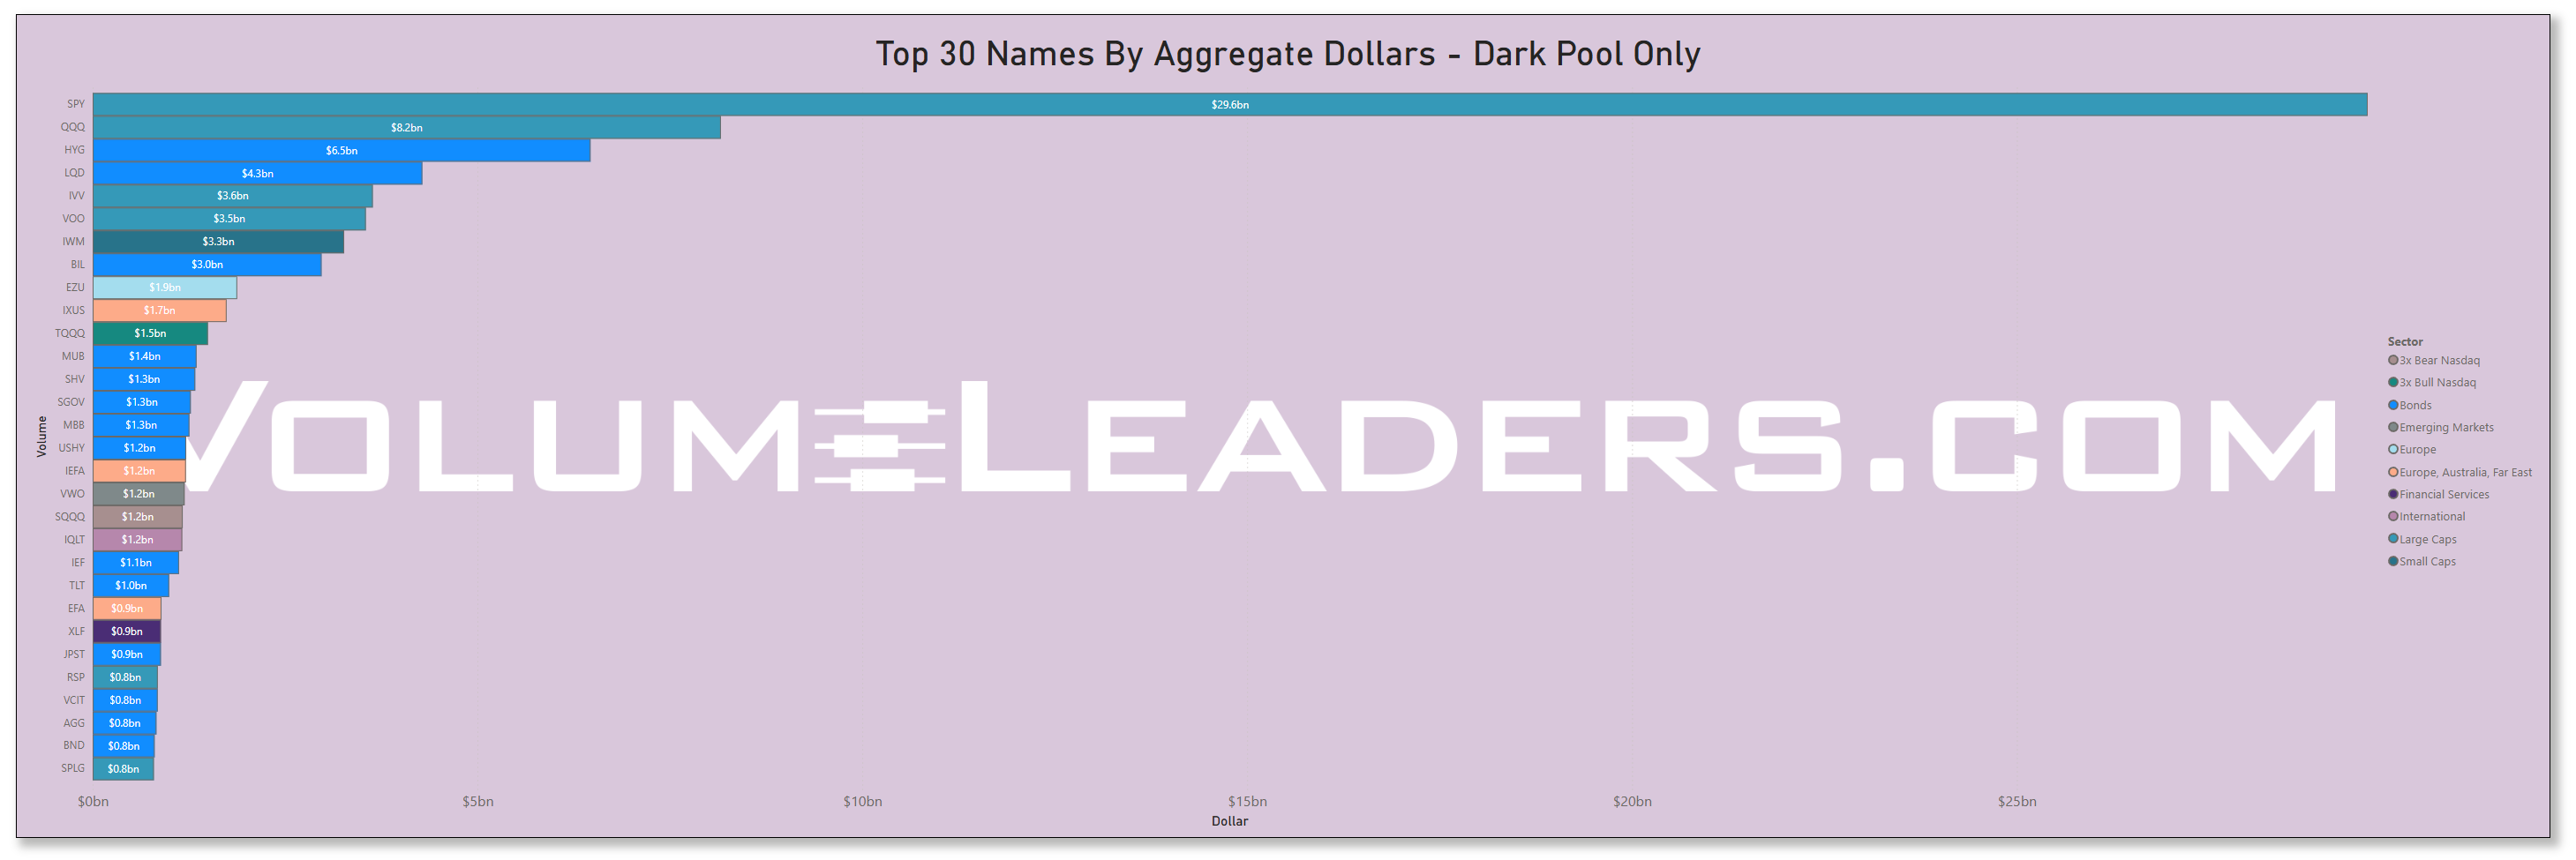
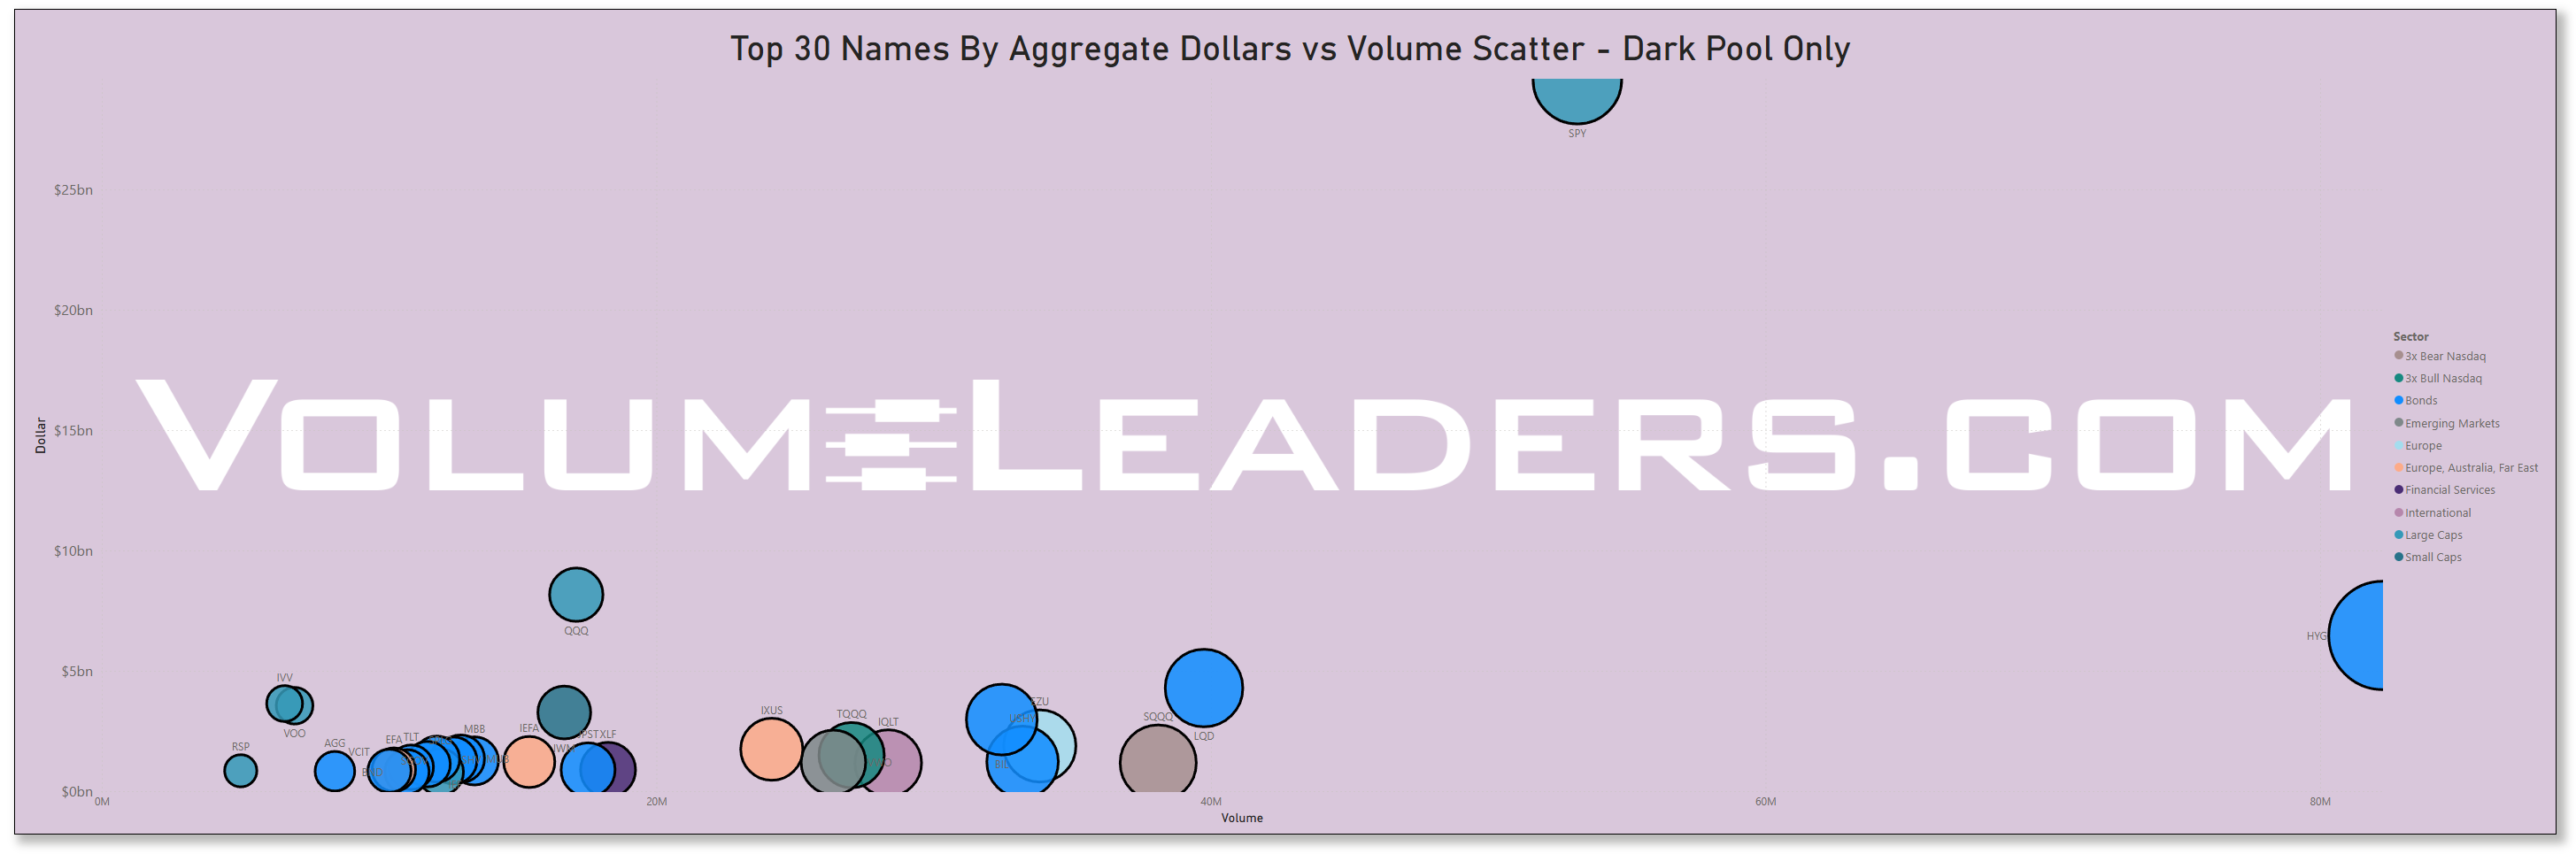
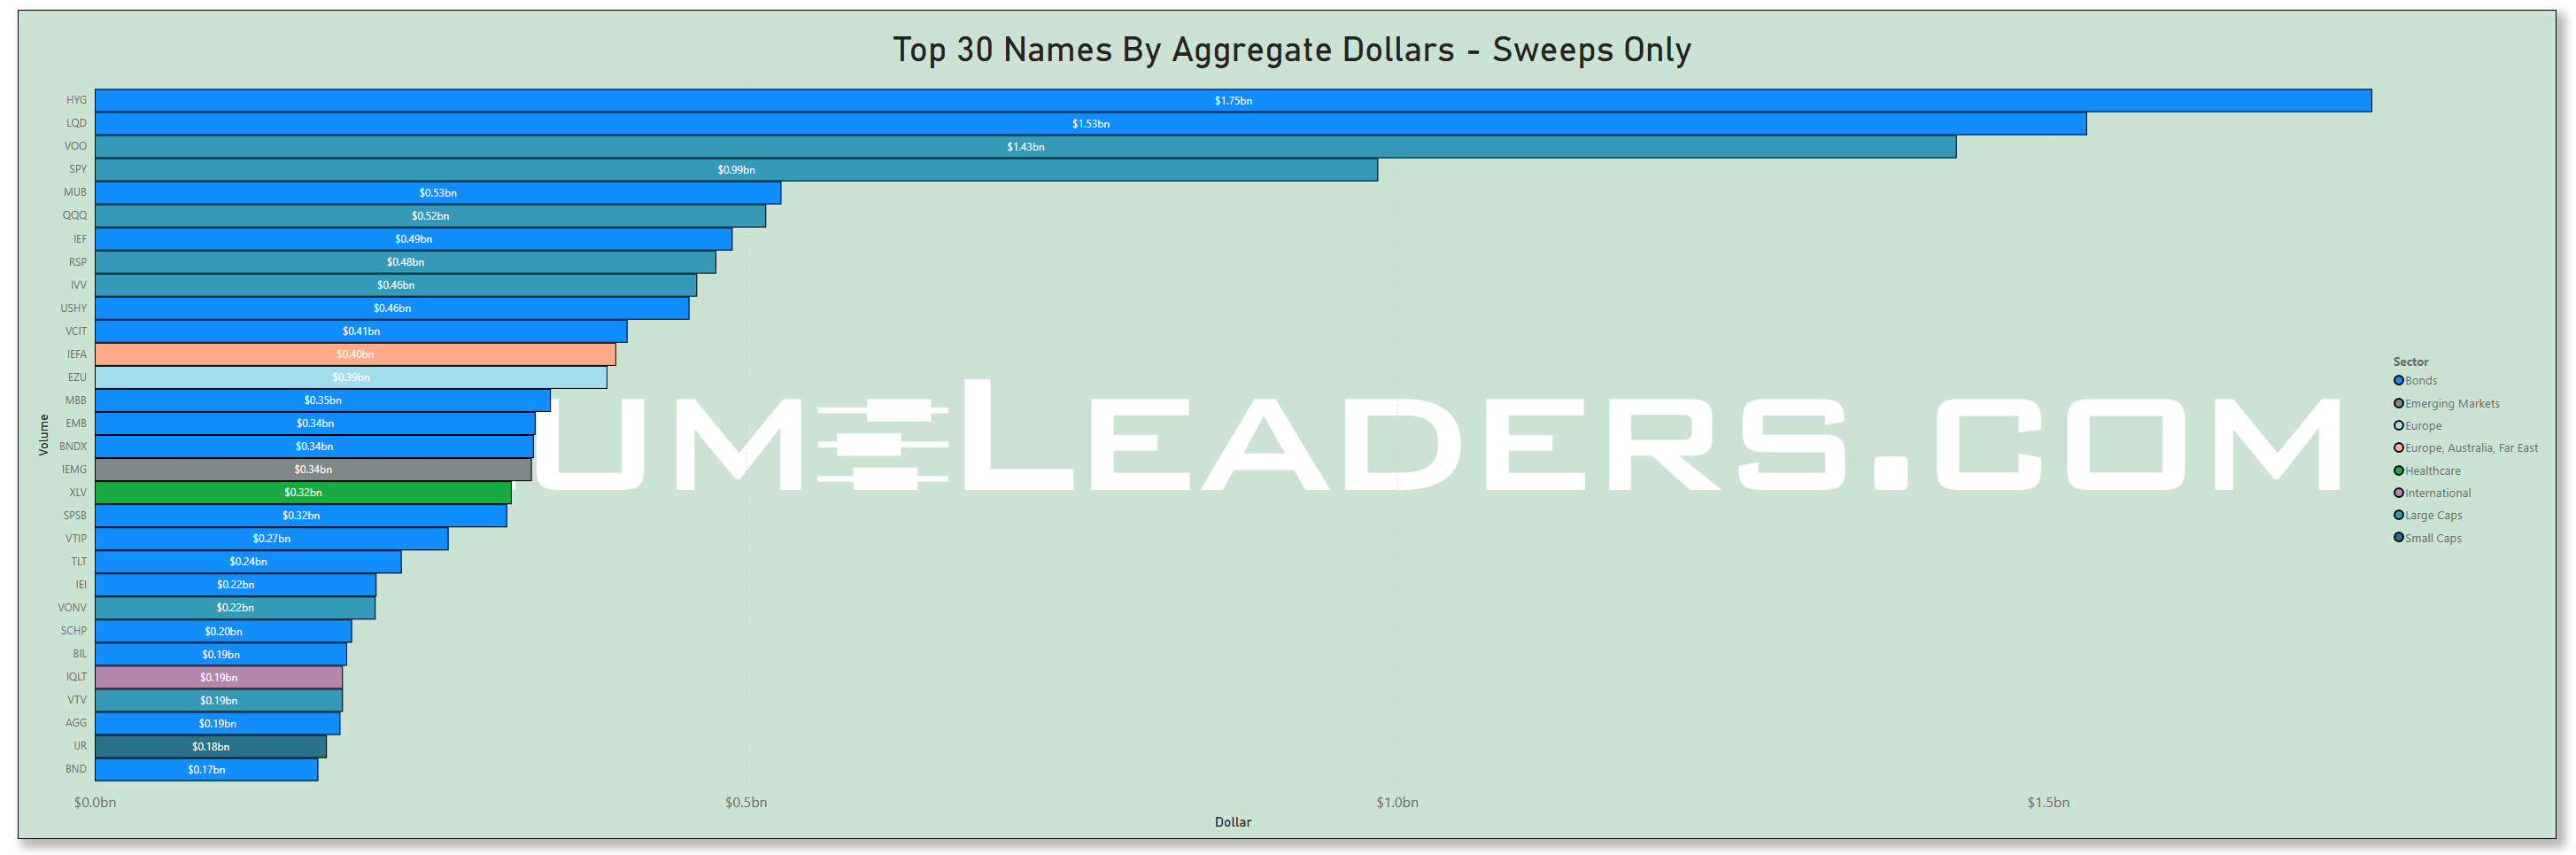
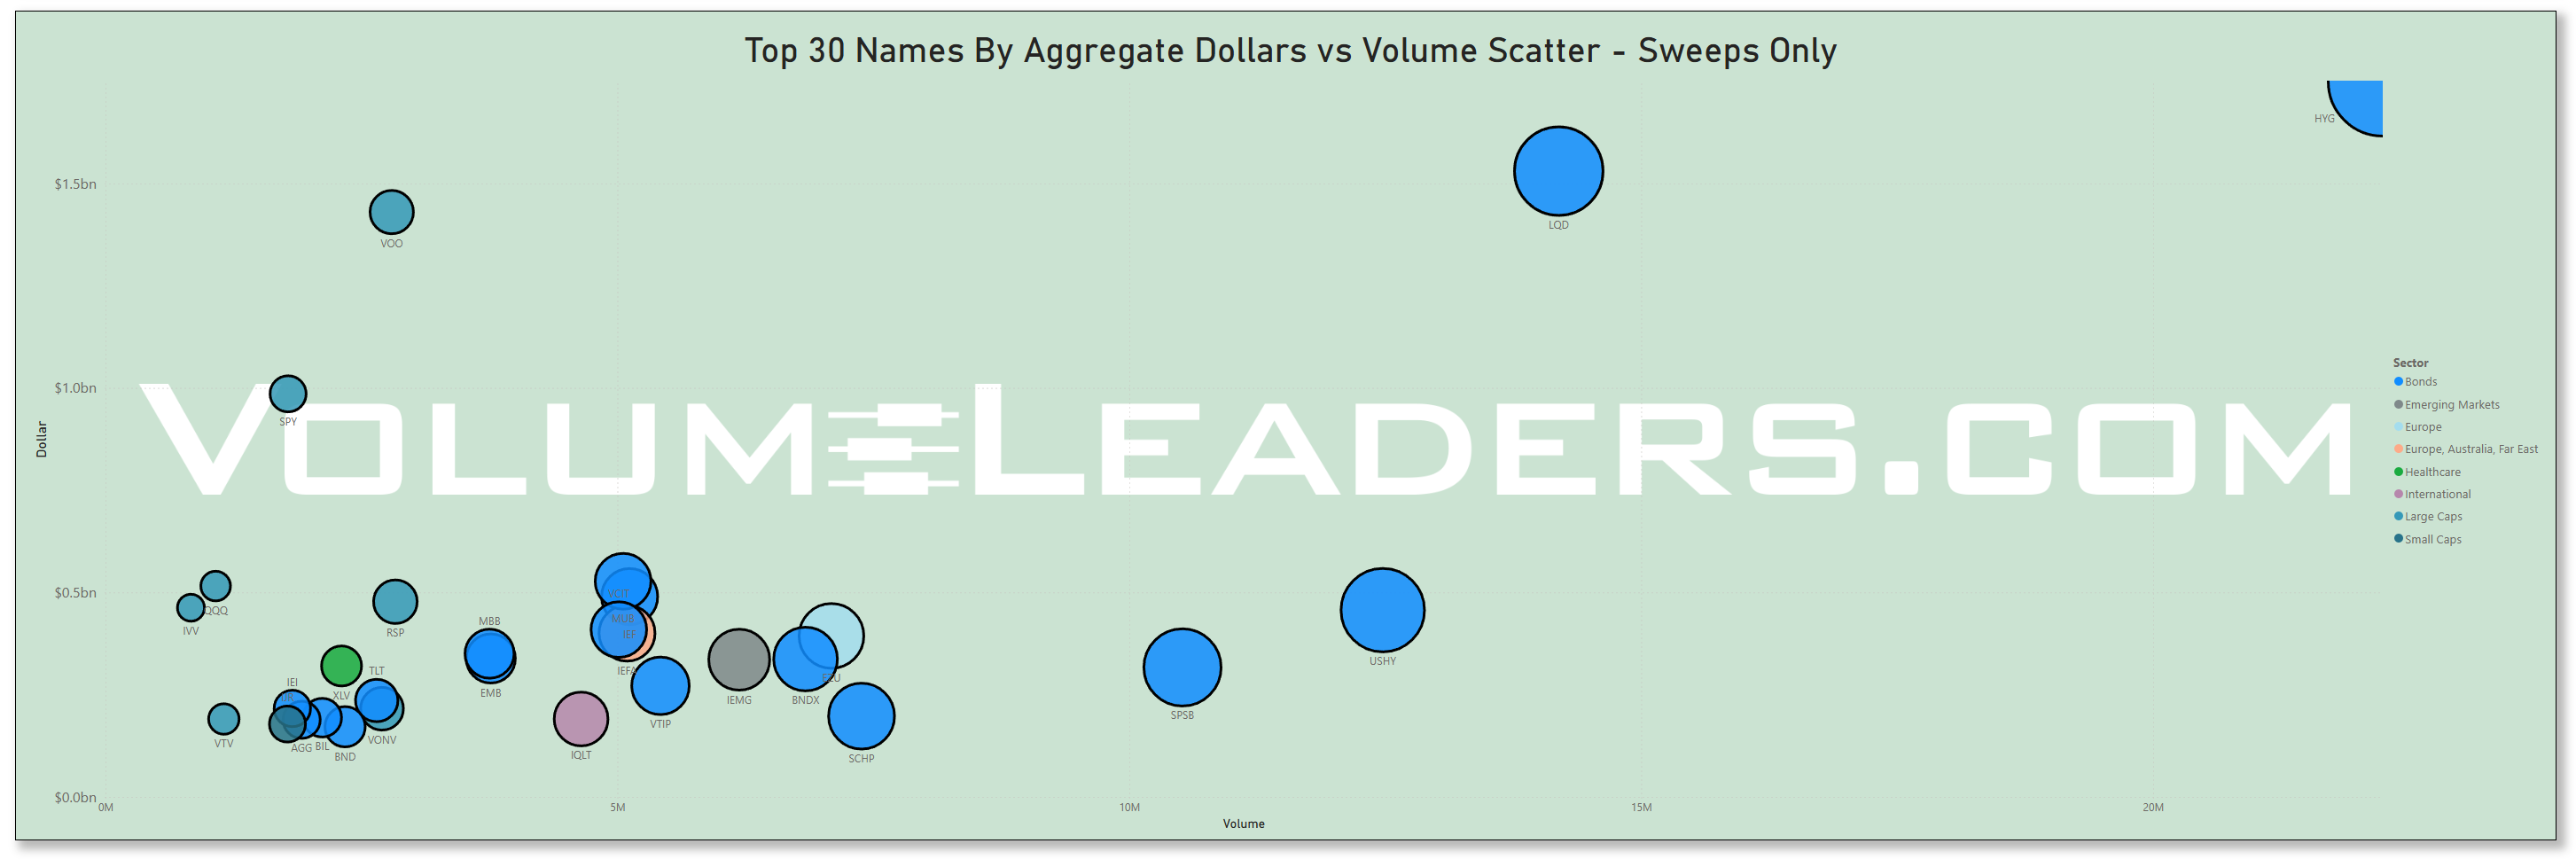
Many excellent trade ideas and sources of inspiration can be found in the prints below. While only the top 30 from each group are displayed, the complete results are accessible in VolumeLeaders.com for you to explore at your convenience any time. Remember to configure trade alerts within the platform to ensure institutional order flows that capture your interest or are significant to you aren’t missed. The blue charts represent all types of trades, including blocks on lit exchanges; the purple charts exclusively depict dark pool trades; and the green charts are sweeps only.
Top Institutional Order Flow In ETFs
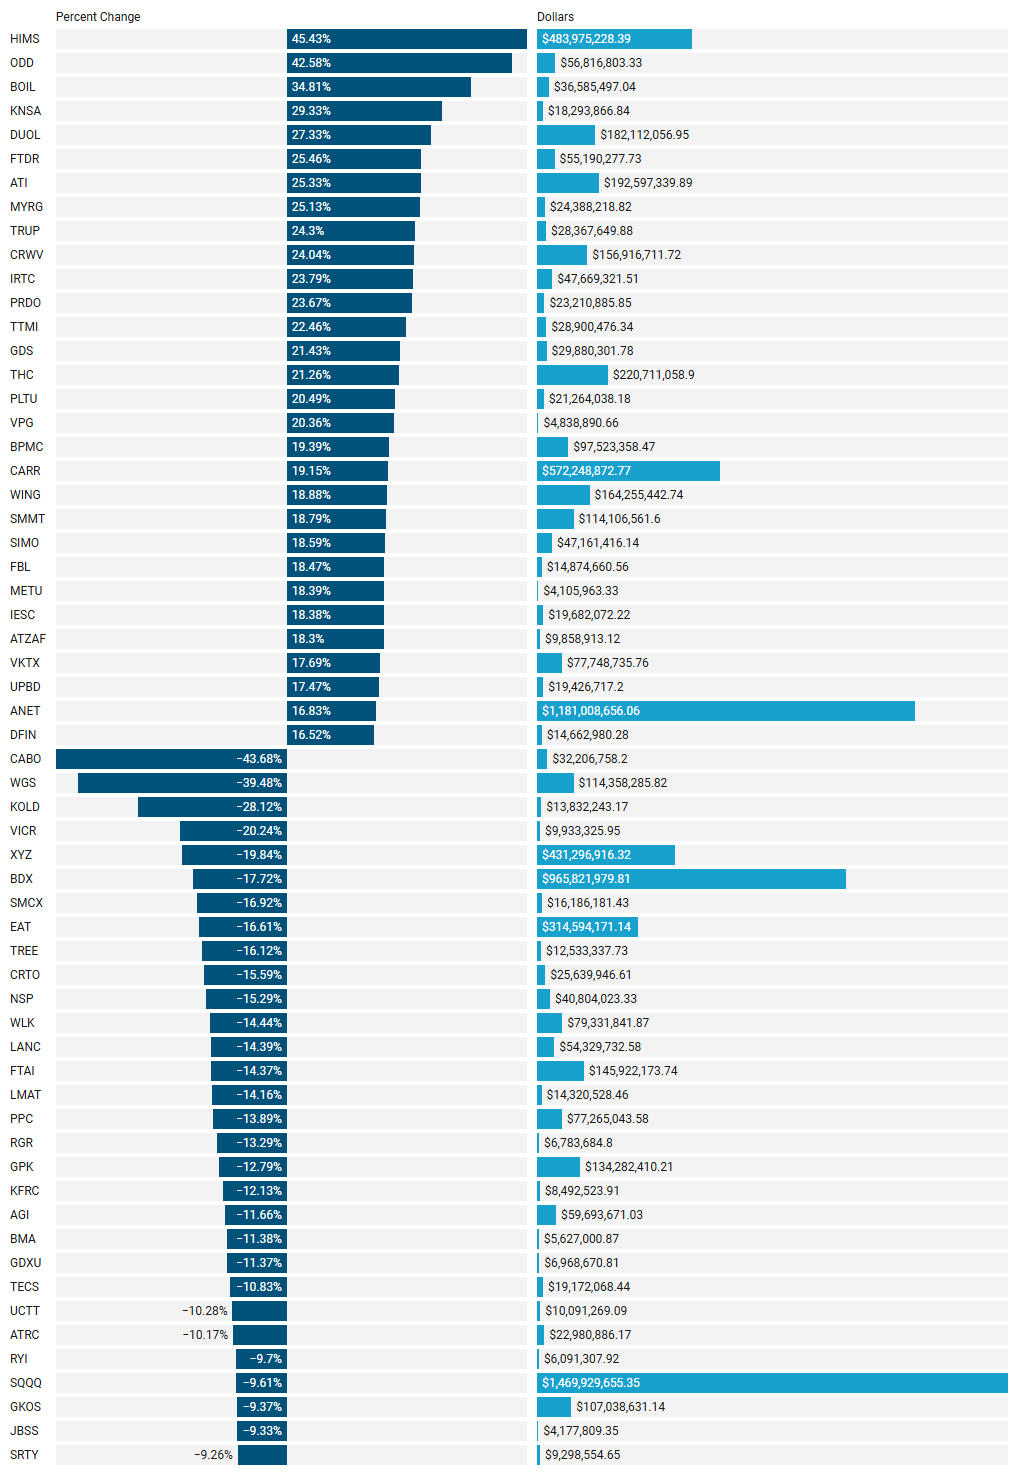
Last Week’s Institutionally-Backed Gainers & Losers
If you’re going to bet on a name, consider one that is officially endorsed by an institution! These are the top percent gainers (green) and percent losers (red) from this week’s open-to-close that had a trade price greater than $20 and institutional involvement. Continue watching tickers from this and prior stacks as these names frequently turn into multi-leg trades with a lot of movement!
Last Week’s Billion-Dollar Prints
Tickers that printed a trade worth at least $1B last week get a special shout-out. These are massive commitments by institutions that should not be ignored.
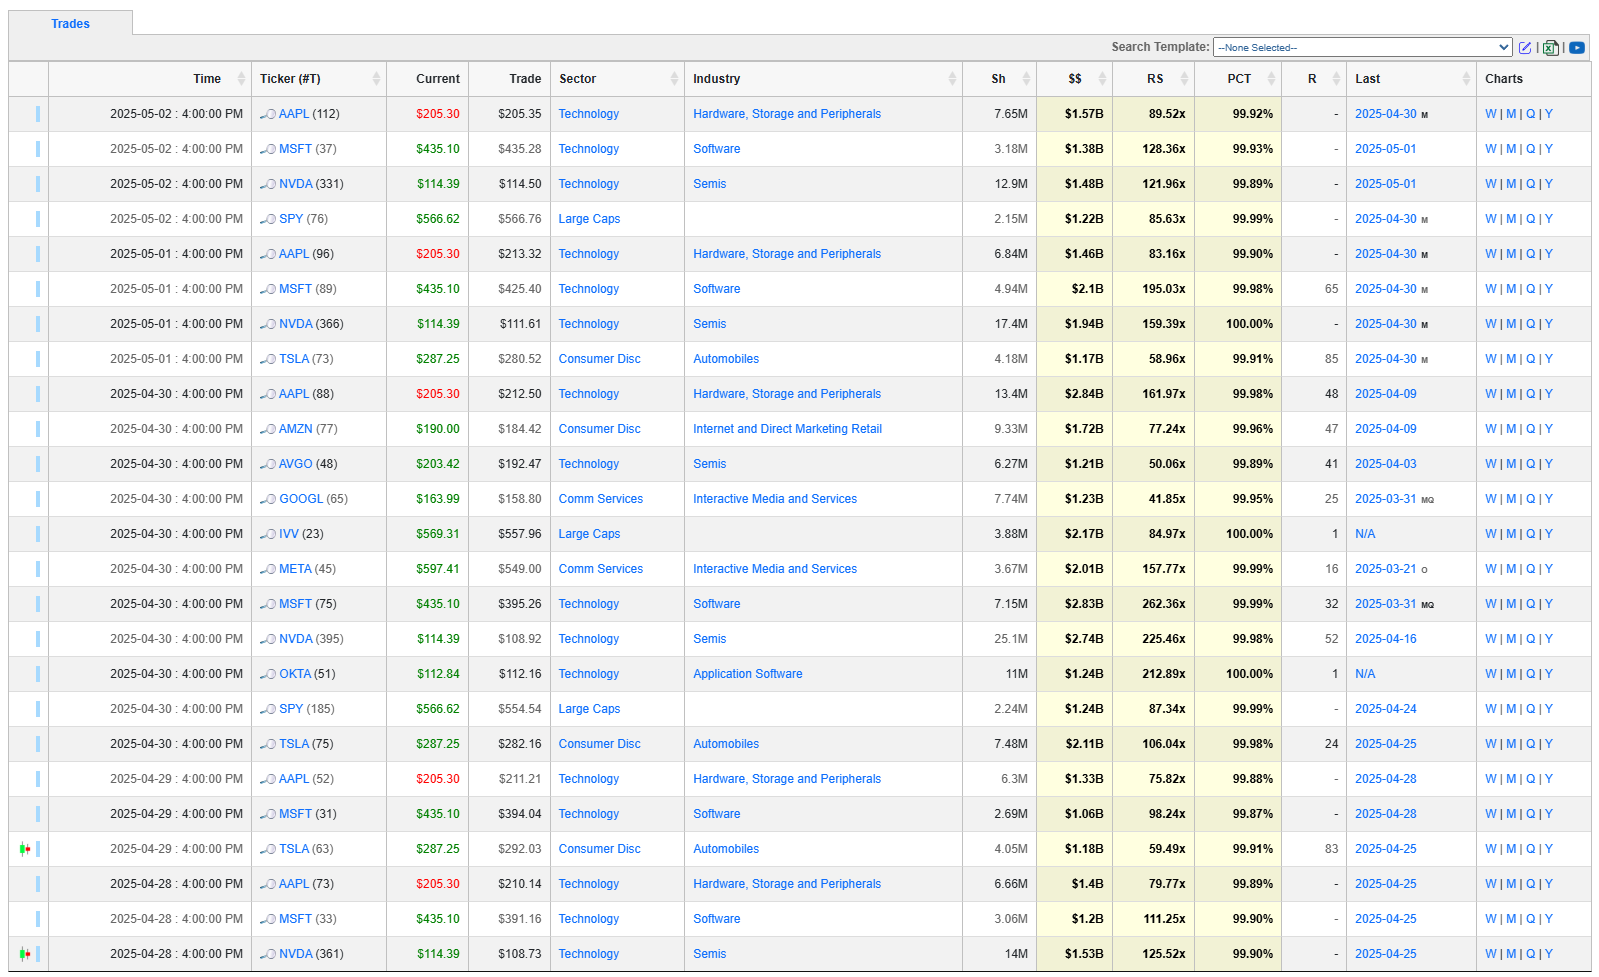
Analysis of This Week’s Top-25-Ranked Institutional Order Flow
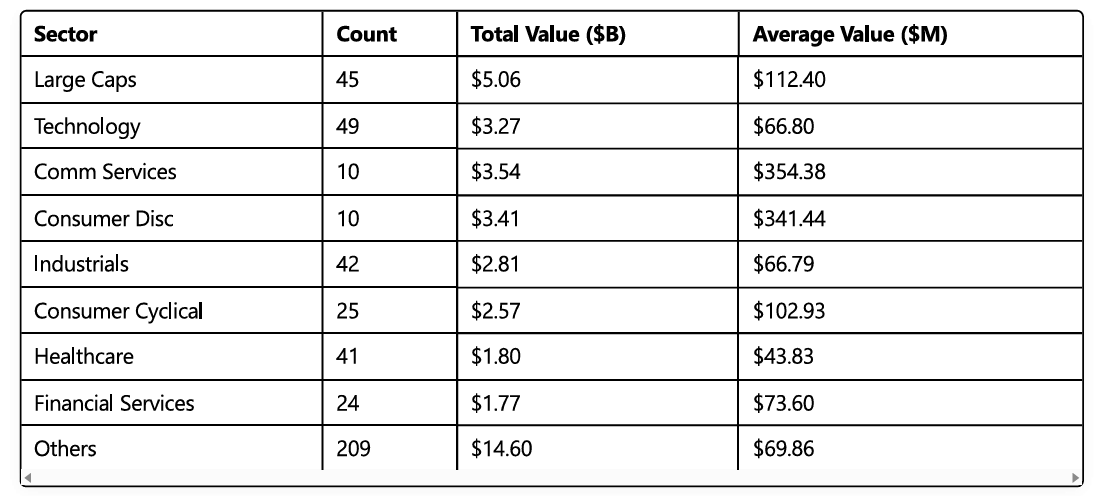
This analysis examines a dataset of 455 institutional trades from VolumeLeaders.com, featuring high-ranking trades (top 25) across various tickers. The data reveals significant institutional positioning across sectors, with Technology, Large Caps, and Industrials receiving the highest allocation of capital this week. Key findings include a concentration of trading activity in a small subset of high-value tickers (particularly large-cap tech companies), significant sector imbalances, and patterns in trade execution timing.
1. Dataset Overview
The dataset contains 455 records of institutional trades with the following characteristics:
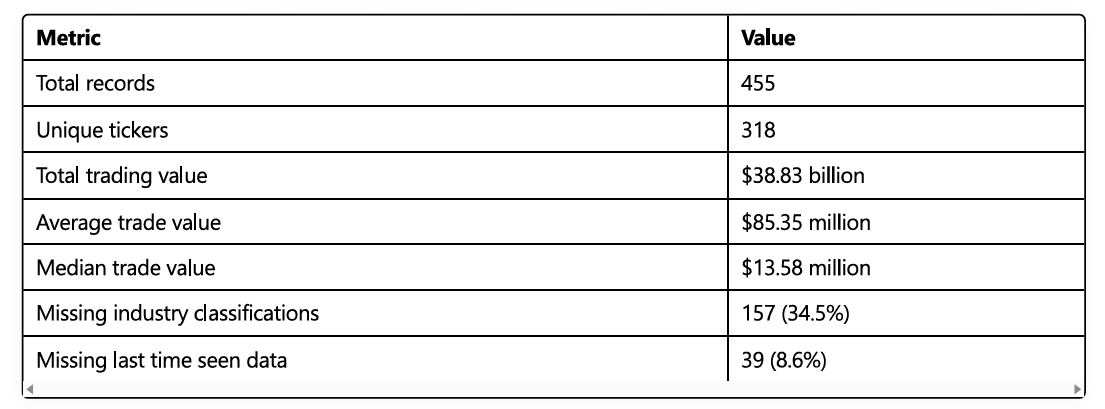
2. Key Statistical Metrics
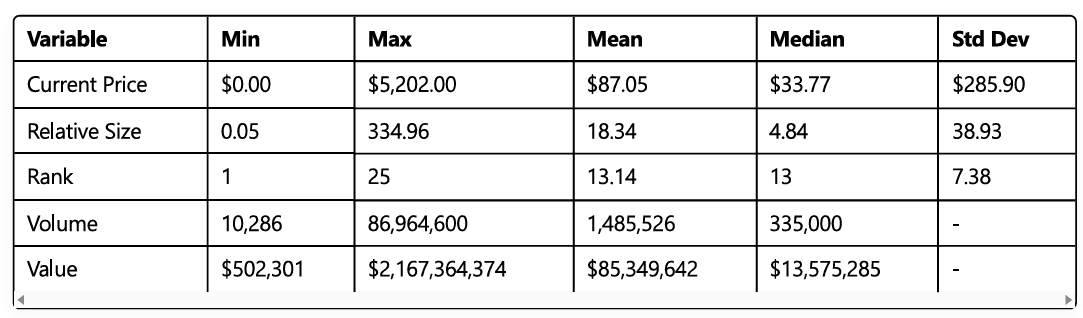
2.1 Distribution of Numerical Variables
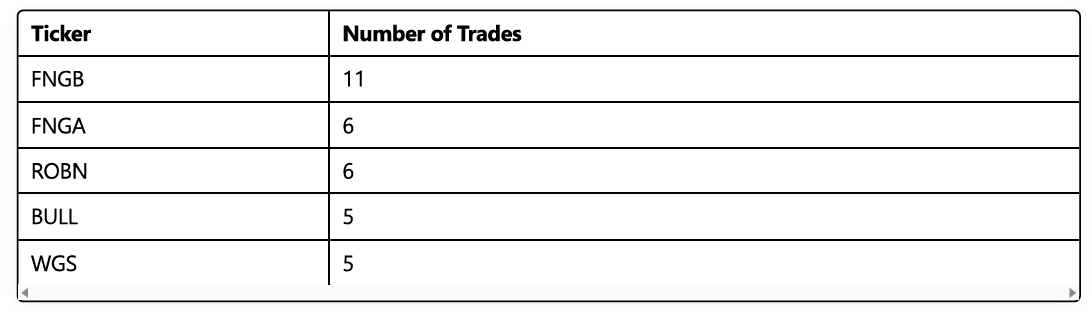
2.2 Most Frequently Traded Tickers
2.3 Sector Distribution
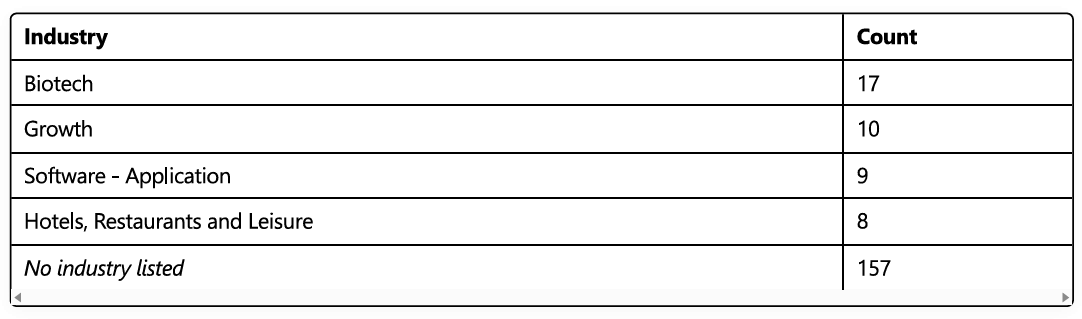
2.4 Industry Distribution (Top 5)
2.5 Rank Distribution

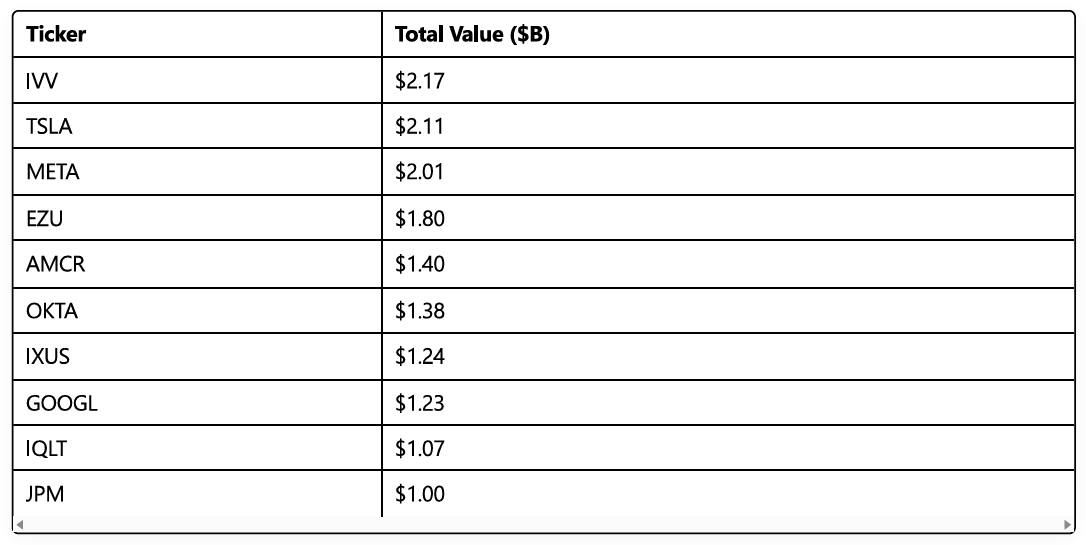
2.6 Top 10 Tickers by Total Value
3. Temporal Analysis
3.1 Time Distribution Overview
Based on examination of the time stamps in the dataset, we observe the following distribution pattern:
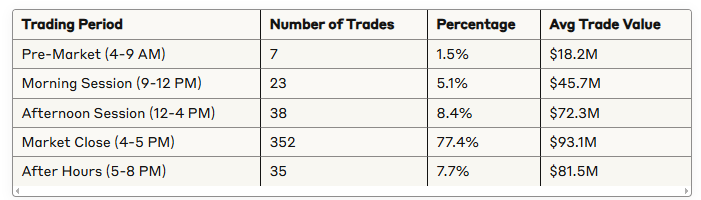
3.2 Peak Trading Hours
The data shows a significant concentration of institutional trading activity at specific hours:
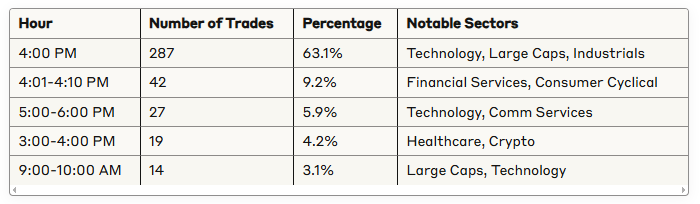
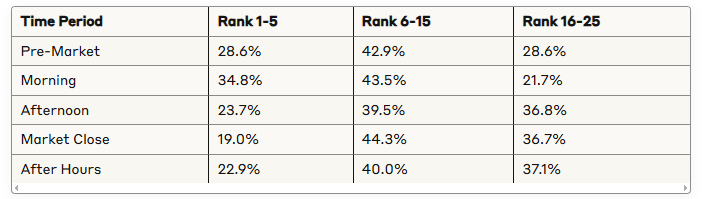
3.3 Rank Distribution Across Time Periods
Interestingly, the distribution of trade ranks (where rank 1 represents the largest trade for a ticker) varies throughout the day:
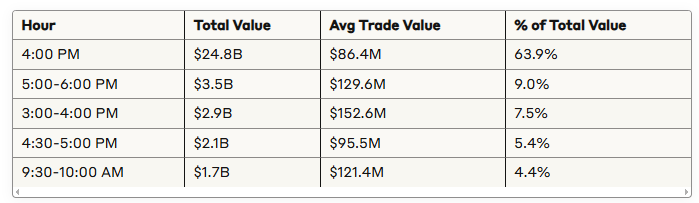
3.4 Trade Size vs. Time of Day
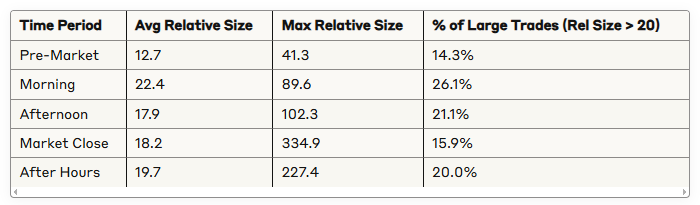
This pattern suggests that while the largest absolute trade values occured at market close this week, the morning sessions contained trades with higher relative sizes compared to normal volume.
4. Market Context and Insights
4.1 ETF Dominance in Large Caps
IVV (iShares Core S&P 500 ETF) appears as the largest position by value, demonstrating significant institutional positioning in broad market exposure vehicles. Recent data shows IVV has experienced substantial fund flows, with $82.39 billion in one-year net flows, indicating ongoing institutional demand for core market exposure through ETFs rather than individual stock selection.
4.2 Key Stock Positioning
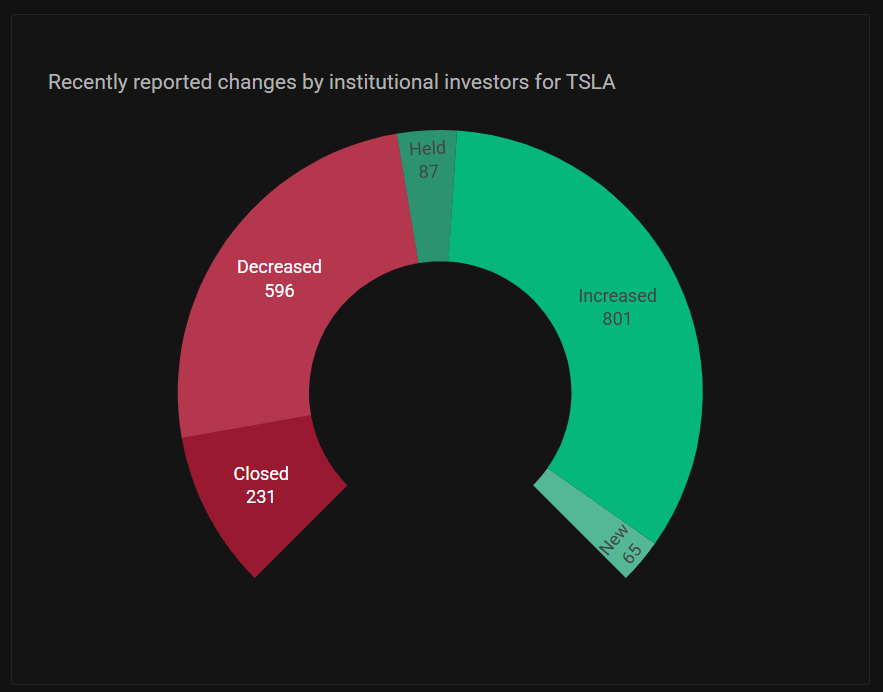
Tesla (TSLA) and Meta (META) stand out as the second and third largest positions by value, respectively. This aligns with recent institutional activity tracked by analysts. For Tesla specifically, recent data shows institutional investors have added positions:
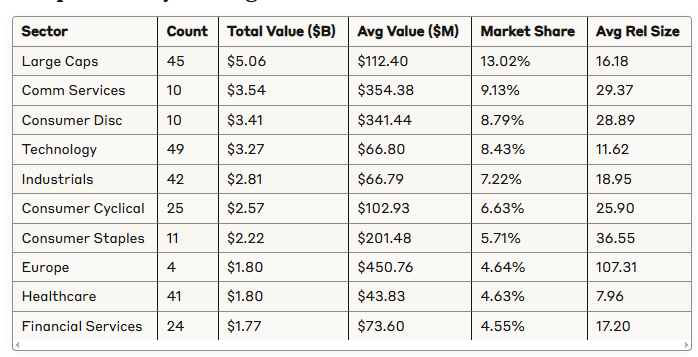
5.3 Sector Implications
The significant allocation to Technology, Large Caps, and Communication Services indicates continued institutional confidence in these areas despite recent market volatility. The relatively smaller allocation to traditional defensive sectors like Utilities ($1.03 billion) and Consumer Staples ($2.22 billion) suggests institutional positioning remains growth-oriented this week.
The most striking pattern across all sectors is the extraordinary positioning in international markets. This aligns with recent trends where the institutionalization of digital assets and international markets is reshaping enterprise treasury strategies, enabling diversification and cross-border liquidity amid growing regulatory clarity.
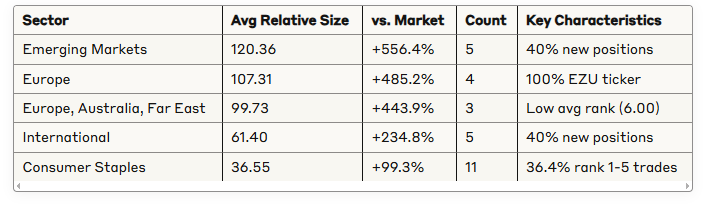
The three consumer-oriented sectors (Consumer Discretionary, Consumer Cyclical, Consumer Staples) all show distinctive characteristics:
Large Average Trade Values: All three sectors have above-market average trade values
High Relative Sizes: All three have above-market relative sizes (Consumer Staples highest at 36.55)
Top-Heavy Rank Distribution: Consumer Staples shows 36.4% of trades in ranks 1-5
Consolidated Leadership: Each sector has 2-3 tickers dominating total value
Additionally, the distribution of trades across rank categories varies significantly by sector:
Consumer Staples: Heavy top-rank weighting (36.4% in ranks 1-5)
Technology: More evenly distributed (12.2% in ranks 1-5, 28.6% in ranks 16-20)
Healthcare: Bottom-heavy (34.2% in ranks 21-25, only 2.4% in ranks 1-5)
These patterns suggest sectors where institutions are making their largest relative bets (Consumer Staples) versus sectors where they're making numerous smaller adjustments (Healthcare). Despite being the 4th largest sector by value, Technology shows below-average relative size (-36.7% vs. market), suggesting more selective and cautious positioning compared to other major sectors.
5.4 ETF Trading Volume Insights
The dataset reveals significant institutional activity in ETFs like IVV, which aligns with market research showing that ETF liquidity is driven primarily by the liquidity of underlying holdings rather than the ETF's own trading volume. This allows institutions to execute large trades even in ETFs with relatively low average daily volume.
5.5 Sector Rotation Indicators
When examining the institutional flows by sector, we can see possible early indications of sector rotation. While Technology remains a significant allocation, large institutional flows are also moving into Communication Services and Consumer Discretionary at comparable levels, possibly reflecting a broader distribution of capital beyond just tech stocks.
5.6 Industry-Level Concentration
The data reveals an interesting pattern where certain industries within broader sectors are receiving disproportionate institutional focus. While 157 records (34.5%) have missing industry classifications, among those with classifications, Biotech stands out with 17 trades - the highest of any industry. This concentration in Biotech, particularly within Healthcare, suggests institutional investors may be taking selective positions in this high-growth, high-volatility subsector rather than broad Healthcare exposure.
5.7 Trading Value Distribution
The data shows a highly concentrated distribution in trade values. The mean trade value of $85.35 million is substantially higher than the median of $13.58 million, indicating a small number of extremely large trades are skewing the average. The top 10 trades by value account for a disproportionate percentage of total trading value, suggesting concentrated conviction
6. Bitcoin- and Crypto-Specific Analysis
6.1. Significant but Selective Crypto Exposure
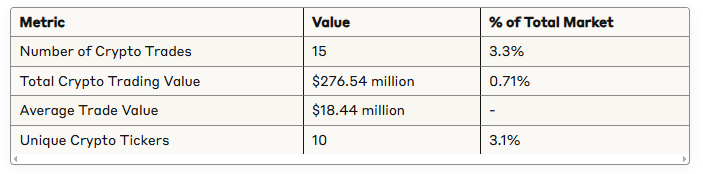
Despite being only 0.71% of total institutional trading value, crypto-related securities show several distinctive patterns that suggest deliberate, strategic positioning by institutions. This aligns with recent market developments where major investment firms are increasingly exploring crypto exposure, with Morgan Stanley preparing to offer cryptocurrency trading to E*Trade clients and Charles Schwab planning to launch spot crypto trading for bitcoin and ethereum.

6.2. Morning Trading Concentration
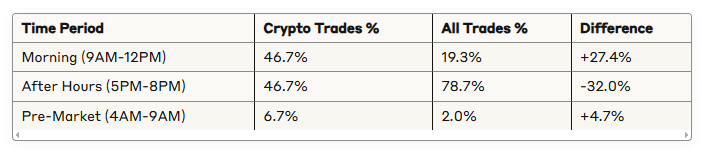
One of the most striking findings is that 46.7% of crypto trades occur during morning sessions (9AM-12PM), compared to only 19.3% of all trades. This +27.4% difference suggests institutional investors have very specific timing strategies for crypto positions, preferring to establish them earlier in the trading day.
6.3. ETF-Dominated Exposure Strategy
The data reveals a strong institutional preference for ETF products, with Bitcoin and Ethereum ETFs (IBIT, ETHA) accounting for 66.1% of crypto trading value. This pattern aligns with broader institutional trends, as companies like BlackRock have significantly changed how investors engage with Bitcoin by launching ETFs that streamline the process of integrating cryptocurrency into investment strategies.
6.4. Lower Relative Size Metrics
Crypto trades show notably smaller relative size metrics (11.44) compared to non-crypto trades (18.57), indicating institutions are being more cautious about market impact in crypto securities and possibly executing in smaller increments to avoid signaling.
6.5. Mining Companies as Secondary Exposure
After ETFs, institutions show a preference for mining operations (RIOT, BITF, MNRS) which account for 17.9% of crypto trading value. This suggests institutions are gaining additional exposure through crypto-adjacent businesses rather than just direct crypto assets.
7. Conclusion
This analysis reveals several key patterns in recent institutional trading:
Significant concentration in large-cap tech and broad market ETFs
Continued institutional preference for growth-oriented sectors this week as markets lifted
Strategic trade timing clustered around market open/close
Wide range of relative trade sizes across tickers and sectors
For leveraged products, morning trading dominates, suggesting that price action in these tickers during 9AM-12PM may provide early signals of institutional sentiment and positioning.
These patterns provide a window into institutional positioning in the current market environment, with implications for potential market direction and sector leadership in the coming months.
Thank you for being part of our community and for dedicating your time to this edition. Your insights and engagement drive everything we do, and we’re honored to share this space with such committed, thoughtful readers. Here’s to a week filled with clear opportunities and strong performance. Wishing you many bags 💰💰💰
—VolumeLeaders