Market Momentum: Your Weekly Financial Forecast & Market Prep
Issue 42 / What to expect April 28, 2025 thru May 02, 2025
In This Issue
[Free For Everyone]
Market-On-Close: All of last week’s market-moving news and macro context in under 5 minutes
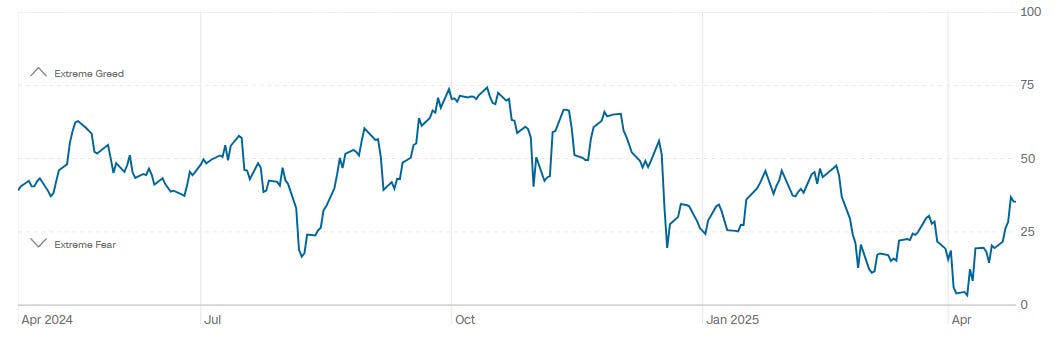
The Latest Investor Sentiment Readings
Institutional Support & Resistance Levels For Major Indices: Exactly where to look for support and resistance this coming week in SPY, QQQ, IWM & DIA
Special Coverage Report: Navigating Sector Signals in an Uncertain Market
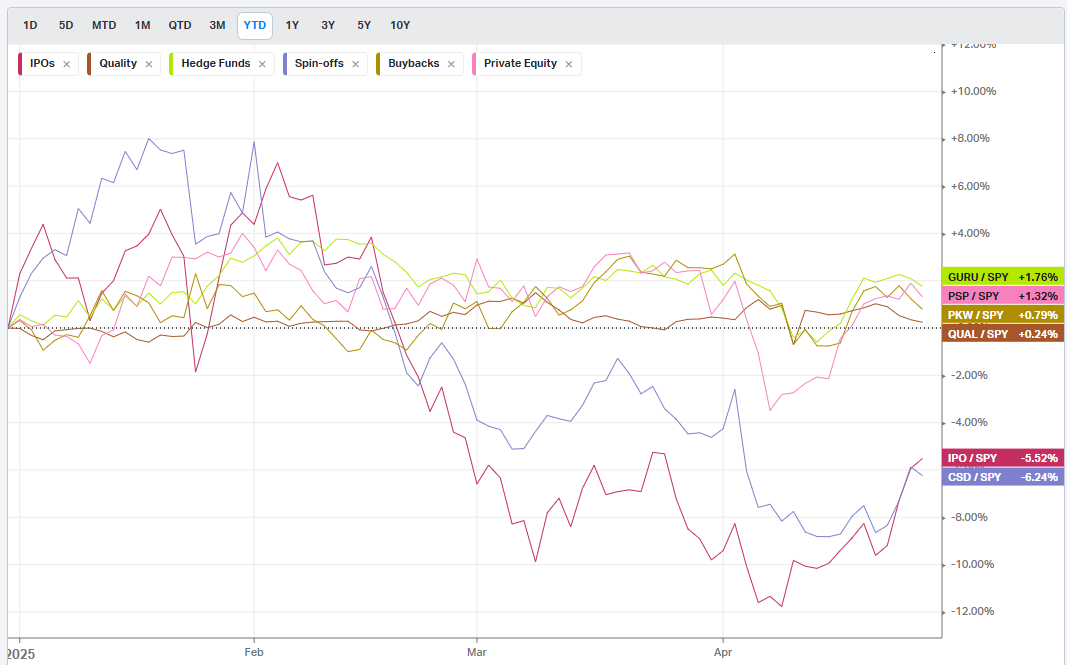
Normalized Performance By Thematics YTD (Sector, Industry, Factor, Energy, Metals, Currencies, and more): which corners of the markets are beating benchmarks, which ones are overlooked and which ones are over-crowded
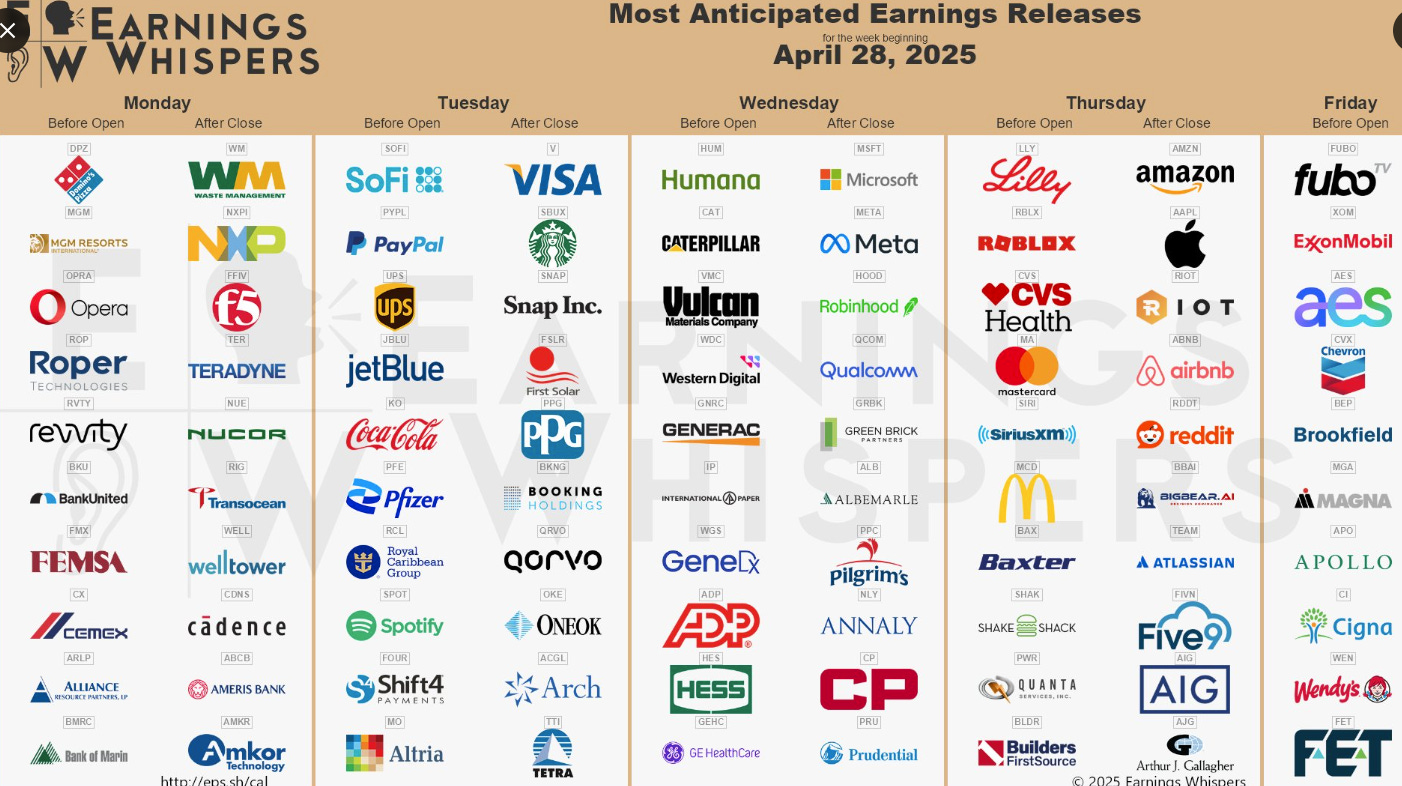
Key Econ Events and Earnings On-Deck For This Week
[Only For Subs]
Institutional Activity By Sector: Institutional order flow by sector and constituent names.
Top Institutional Order Flow In Individual Names: The largest sweeps and blocks on lit exchanges and hidden dark pools
Statistical Analysis and Insights From This Week’s Top Prints
Top Institutionally-Backed Gainers & Losers: An explosive watchlist for day traders seeking high-volatility and massive gains

Market-On-Close
Market Recalibration: Finding Equilibrium Amid Trade Tensions
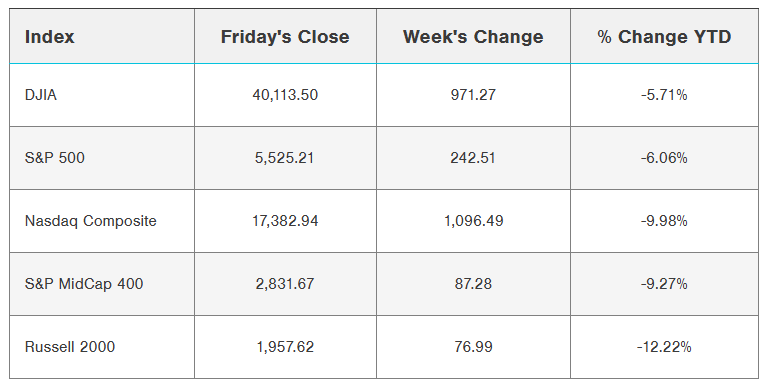
In the ebb and flow of financial markets, this past week represented a notable chapter in what has become an increasingly dramatic narrative of global economic positioning. Markets staged a measured recovery, with major indices climbing to three-week highs as investors navigated conflicting signals on international trade relations and processed a flurry of corporate earnings announcements. The week's developments revealed a financial ecosystem seeking a new equilibrium—one where trade policy, monetary expectations, and corporate performance converge in an attempt to find fair prices for indices.
The Pendulum Swing of Trade Rhetoric
The financial world has spent recent weeks absorbing the implications of historically aggressive tariff proposals. What began as a market shock has evolved into a more nuanced dialogue, with evidence suggesting we may have moved beyond peak uncertainty. The administration's initial hard-line stance appears to be softening, creating space for market participants to recalibrate expectations.

Reports emerged suggesting China might suspend its 125% tariff on select American imports, including medical equipment and industrial chemicals. This potential olive branch represents the kind of reciprocal de-escalation that markets have been awaiting. However, official messaging remains mixed. Chinese Foreign Ministry spokesman Guo Jiakun emphasized that China "isn't in negotiations with the US over tariffs," while President Trump maintained that the US would not reduce tariffs unless China offered "something substantial" in return.

This dance of diplomatic positioning has become the defining rhythm to which markets now move. The administration has signaled potential openings with other trading partners as well, with Treasury Secretary Bessent characterizing US-South Korea discussions as "very successful" and noting "significant progress" toward an agreement with India. These developments suggest that while the threat of substantial trade barriers remains, the probability of worst-case scenarios has diminished.

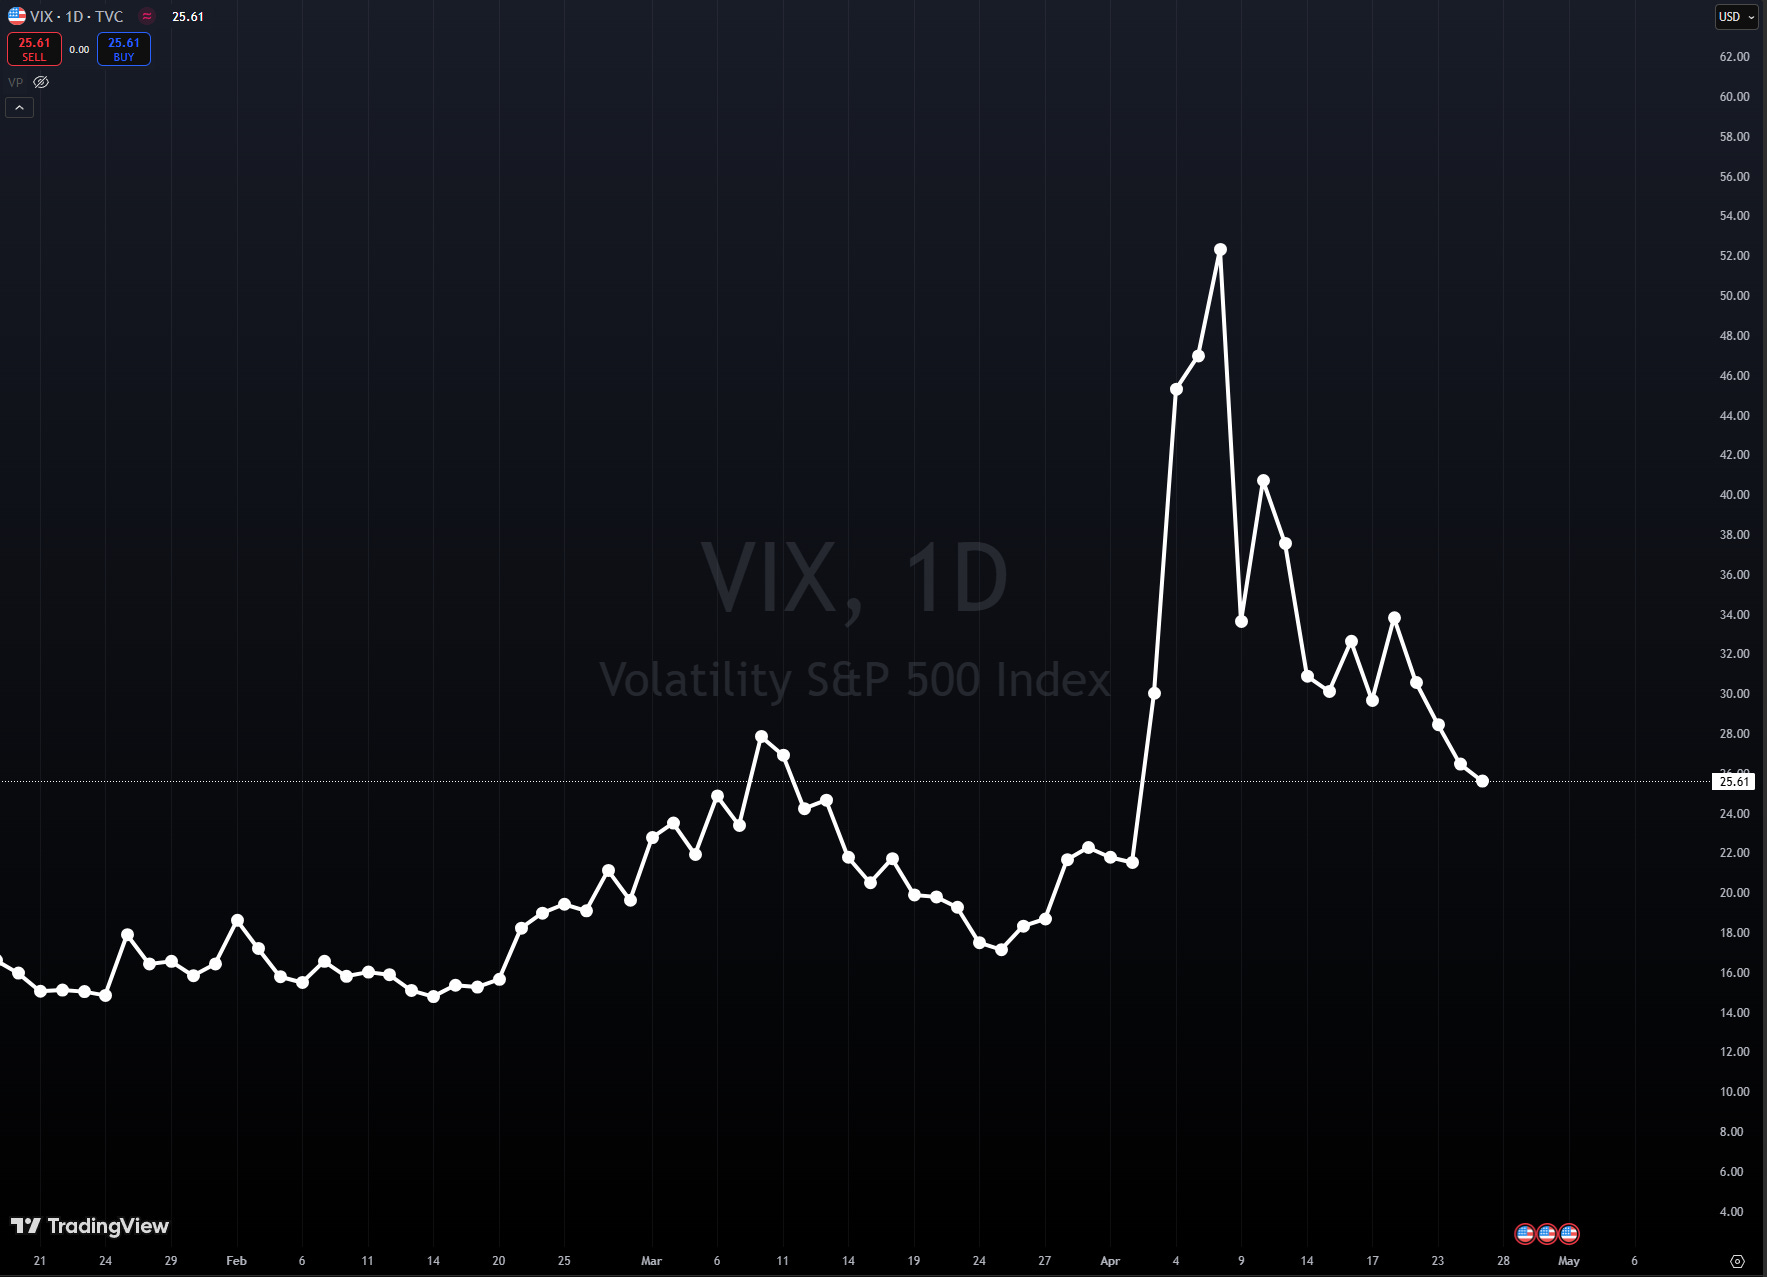
The trade policy uncertainty index, after reaching alarming heights earlier in the month, has begun to recede. This cooling of tensions has allowed volatility measures to retreat from their recent spikes, though they remain elevated relative to historical norms. The lesson emerging from these fluctuations is that headline risk in the current environment can change "faster than the weather in springtime St. Louis"—with market implications following closely behind.
Monetary Policy: Independence and Anticipation
Beyond trade concerns, markets have been processing evolving perceptions of Federal Reserve independence. After expressing frustration about the pace of interest rate cuts, President Trump stated he has "no intention of firing" Fed Chair Powell—a declaration that helped stabilize Treasury markets that had been unsettled by earlier comments challenging central bank autonomy.
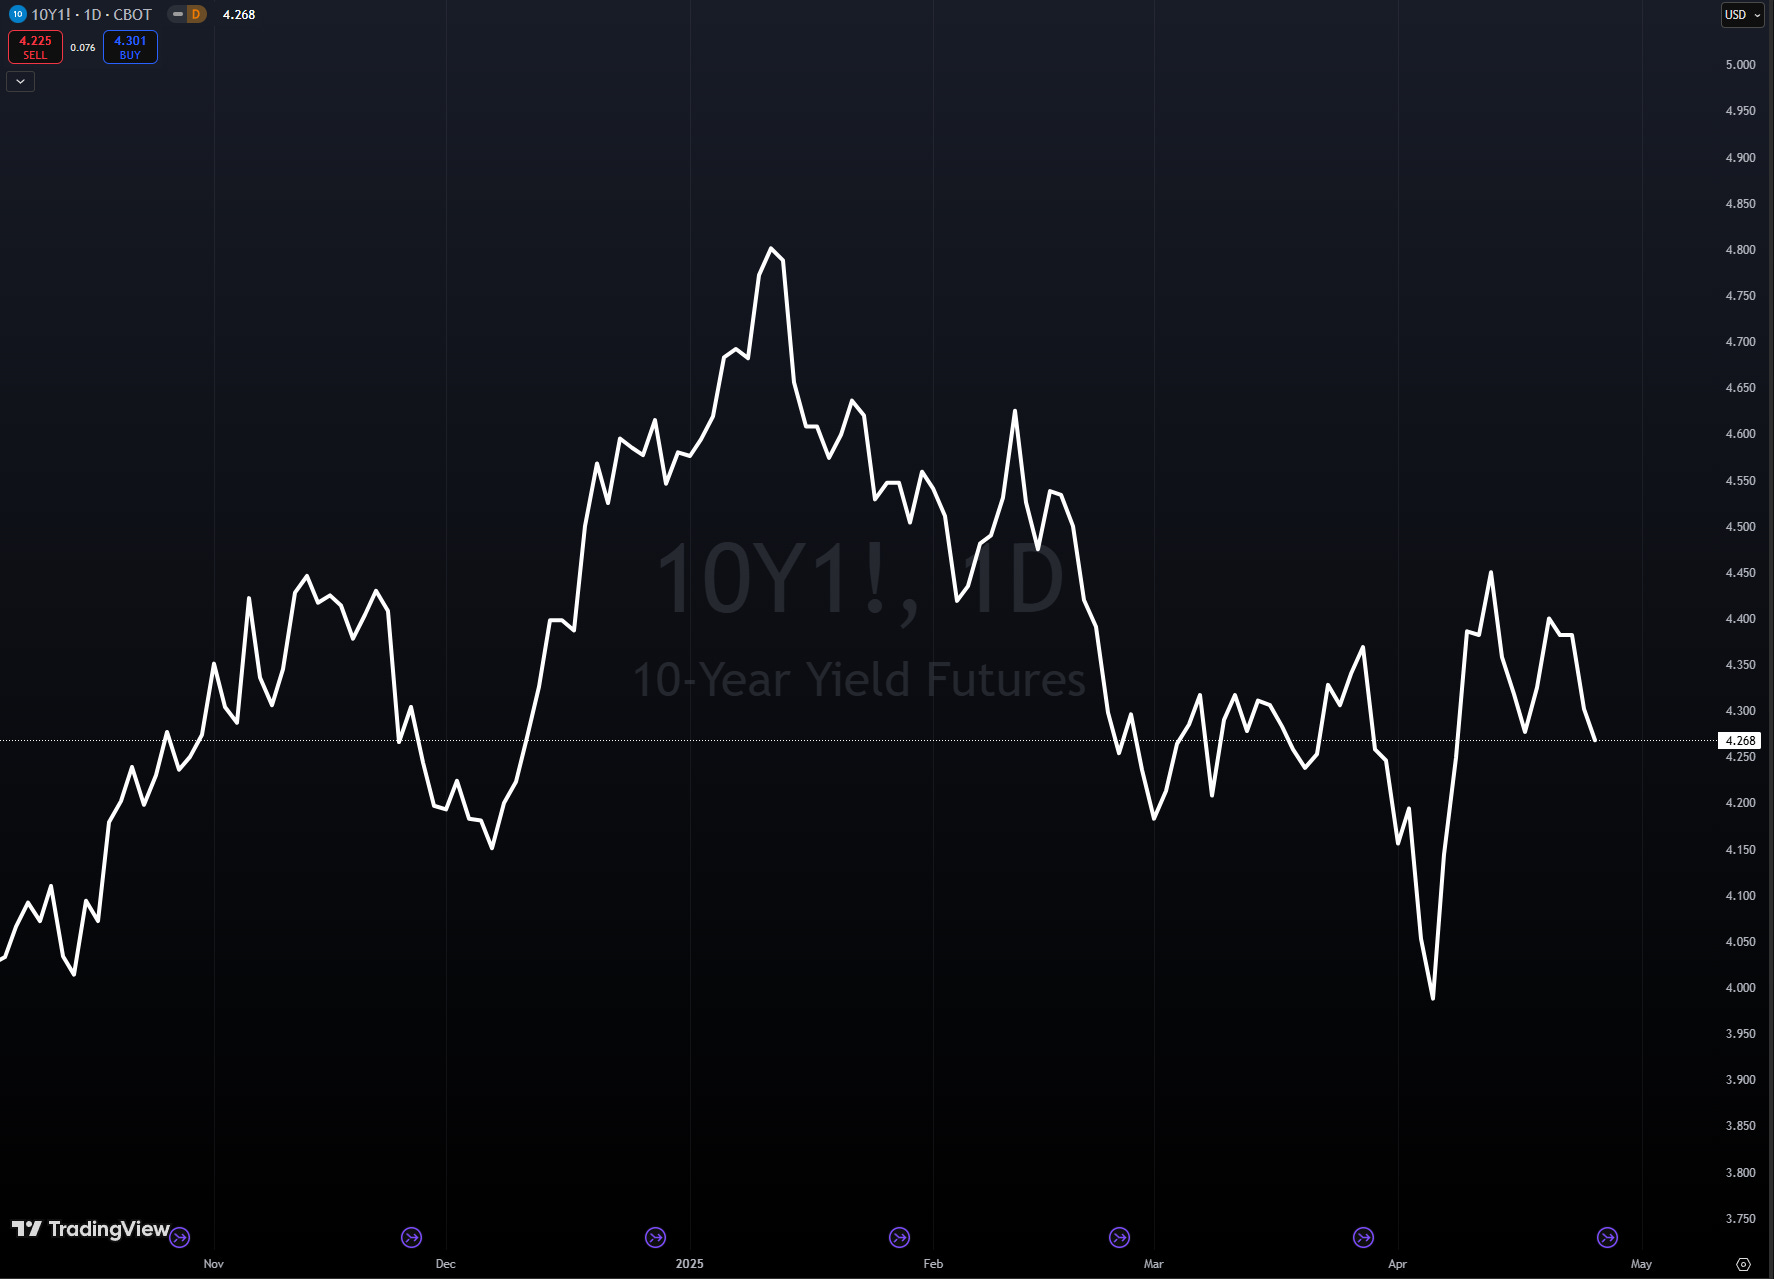
This clarification has contributed to the 10-year Treasury yield settling into the middle of the 4.0%-4.5% range that many analysts anticipate will persist through the year. T-note prices gained modest ground during the week, with the 10-year yield falling nearly 5 basis points to 4.266%.
Fed officials themselves have been carefully threading the needle between inflation vigilance and recognition of emerging economic headwinds. Cleveland Fed President Hammack suggested clear data could prompt rate cuts as early as June, while Fed Governor Waller indicated support for rate reductions if tariffs led to job losses. Chair Powell has emphasized that when faced with conflicting goals around employment and price stability, the Fed would prioritize long-term price stability as the foundation for sustained labor market health.

The prevailing expectation now incorporates a scenario where the economy slows to below-trend growth of 1.5%-1.7% as average tariff rates settle around 10%-15% rather than exceeding 20%. Under these conditions, core inflation might peak near 3.5%-4% before declining as demand moderates. Market participants are pricing in approximately 87 basis points of rate cuts by year-end, with a 71% probability of the first reduction occurring in June.
Meanwhile, the European Central Bank has already moved more aggressively, implementing its seventh rate cut since last summer by reducing rates 25 basis points to 2.25%. This action reflects heightened concern about economic uncertainty stemming from trade policy developments and recession fears driven by suppressed investment and consumer spending.
Corporate America: Earnings in Focus
With about 60% of S&P 500 companies reporting results between April 21 and May 2, corporate earnings have shared the spotlight with macroeconomic developments. Thus far, earnings season has begun on reasonably solid footing, with approximately 75% of reporting companies exceeding analyst expectations and posting positive surprises 10% greater than the ten-year average.
However, these results largely predate potential tariff impacts on sales and profitability, making forward guidance particularly significant this quarter. Some consumer-facing companies have already begun signaling caution, warning of slowing consumer spending and withdrawing full-year guidance amid macroeconomic uncertainty. Consequently, earnings growth projections for 2025 have moderated from 14% in January to 9.5% currently. More modest mid-single-digit growth appears achievable barring a deeper economic downturn.

The technology sector continues to dominate market attention, with the "Magnificent Seven" stocks rallying Friday to lift broader indices. Tesla surged more than 9%, while Nvidia climbed over 4%. Meta Platforms, Amazon, and Microsoft all gained more than 1%, while Apple advanced modestly. Alphabet rose after reporting quarterly revenue excluding traffic acquisition costs of $76.49 billion, exceeding the $75.4 billion consensus expectation.
Not all earnings narratives were positive. Intel declined more than 6% after delivering weaker-than-anticipated guidance. T-Mobile US fell over 11% following disappointing subscriber growth, and Eastman Chemical dropped more than 6% after forecasting second-quarter adjusted earnings below consensus, specifically citing "tariffs between the US and China" as a contributing factor.
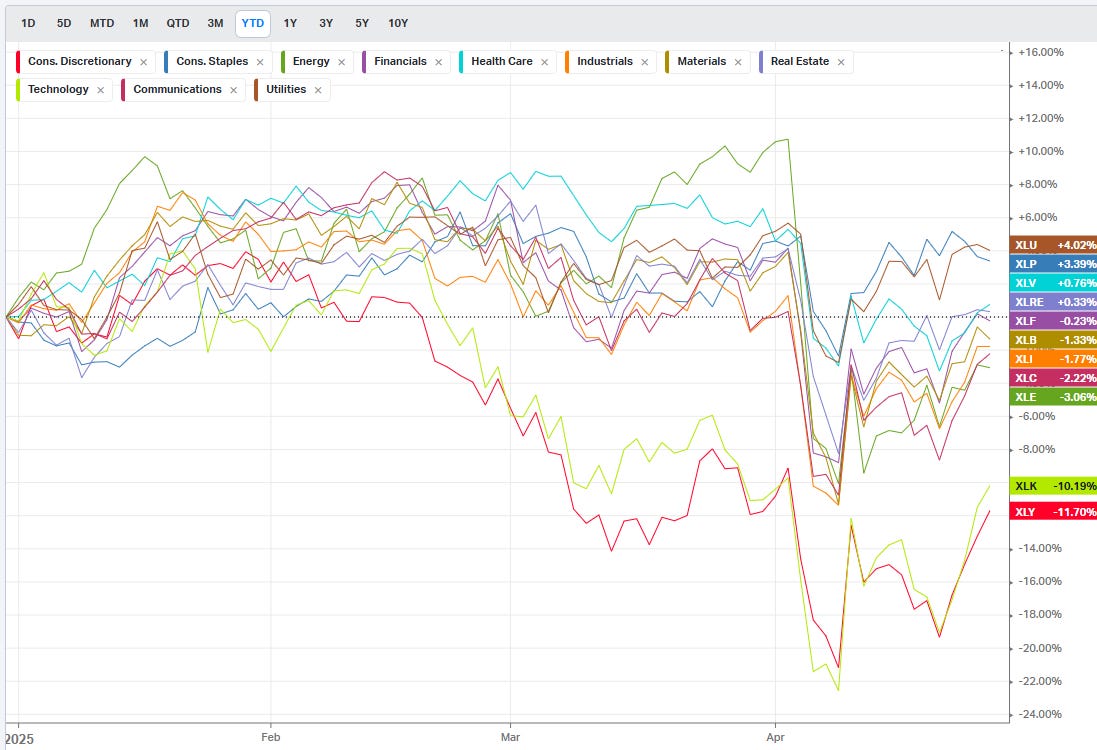
Sector performance has begun to reflect evolving views about which segments might navigate the current environment most successfully. Health care has demonstrated leadership in first-quarter earnings growth while offering both defensive characteristics and growth potential. The financial sector, despite broader market volatility, reached new relative highs compared to the S&P 500, suggesting investor recognition of its lower exposure to trade headwinds and potential benefits from tax cuts and deregulation initiatives expected later in the year.
Market Positioning: Between Extremes
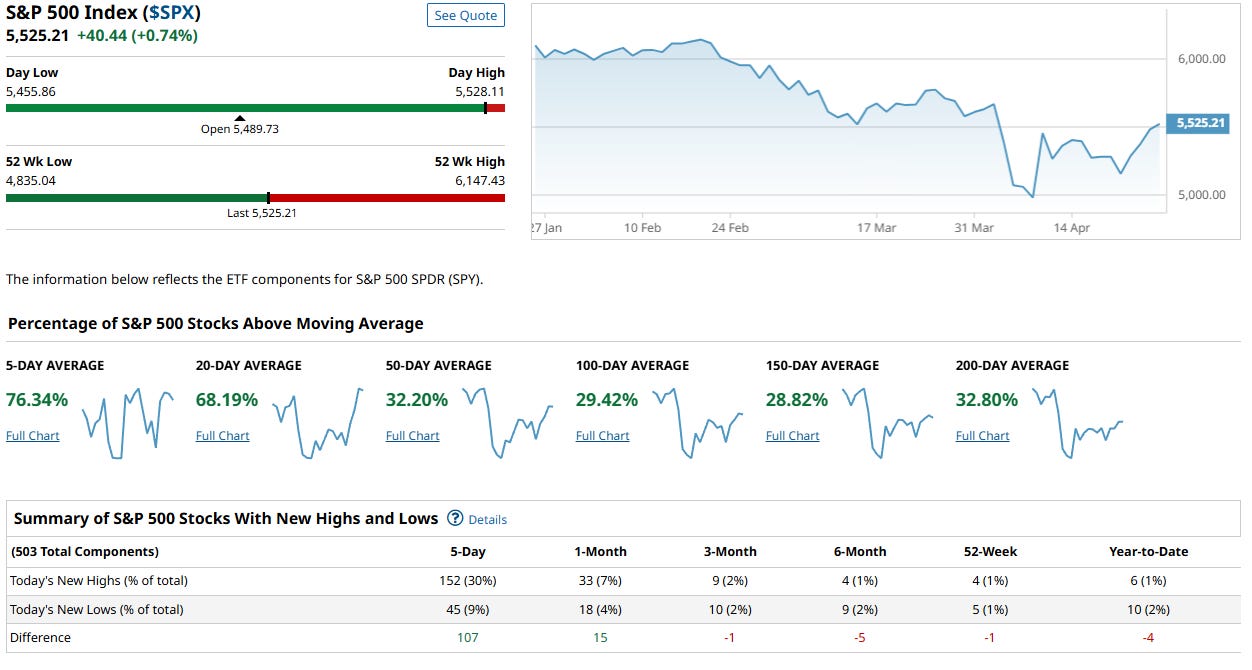
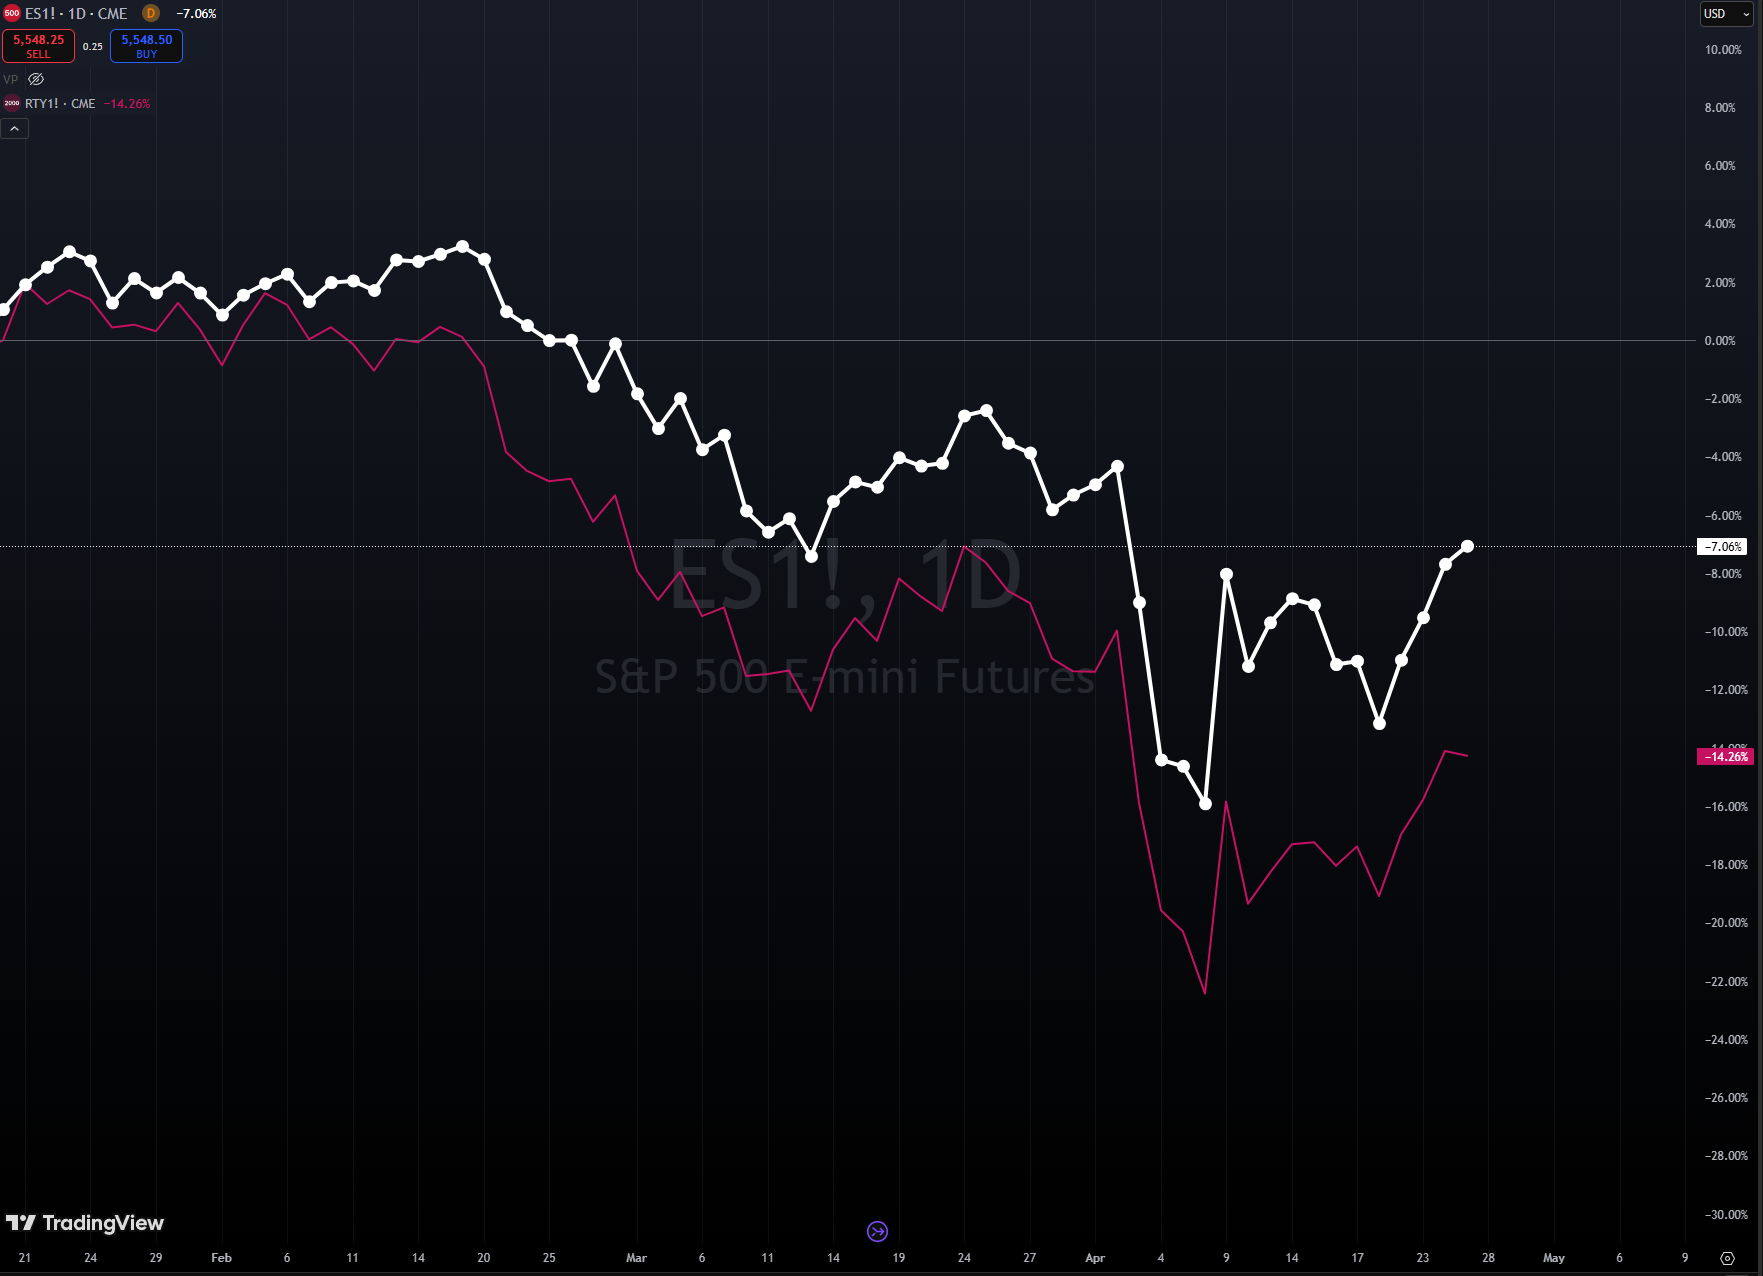
The S&P 500 has now recovered approximately 10% from its recent low but remains roughly 10% below its February peak. This middle ground positions the market at a critical inflection point—having moved away from extreme pessimism but requiring more concrete positive developments to justify further advances.
Historical patterns suggest that following significant market declines, volatility typically takes time to normalize completely. The bottoming process often involves retesting prior lows, with V-shaped recoveries being relatively uncommon without substantial monetary or fiscal intervention. Given current constraints on both fronts—with the Fed limited by persistent inflation concerns and the government facing deficit realities—a rapid return to previous highs appears unlikely.
However, conditions for a prolonged decline or deepening bear market are also absent. Unlike 2008, the economy shows few significant imbalances or excesses that might compound a slowdown. Debt service as a percentage of disposable income remains below both decade-long and long-term averages. Unemployment continues at low levels, and wage growth has exceeded inflation for 23 consecutive months. Unlike 2022, the Fed stands poised to reduce rates rather than raise them further.
The path forward largely hinges on trade developments and potential shifts toward pro-growth policy initiatives. Markets may trade within a range for some time, experiencing periodic volatility before gradually working back toward early-2025 levels. While the S&P 500 might finish the year relatively flat, diversified portfolios could fare better, as international equities have maintained or even extended their performance advantages relative to U.S. stocks.

Economic Indicators: Mixed Signals
Economic data released during the week painted a nuanced picture of the U.S. economy. The University of Michigan's April consumer sentiment index was revised upward by 1.4 points to 52.2, exceeding expectations of 50.5. One-year inflation expectations were revised lower to 6.5% from 6.7%, below the anticipated 6.8%. While these revisions offer some encouragement, the overall sentiment reading still represents an 8% decline from March, with expectations falling a dramatic 32% since January—the steepest three-month percentage drop since the 1990 recession.
S&P Global's Flash Purchasing Managers' Index revealed that U.S. business activity growth slowed to a 16-month low in April. Manufacturing activity unexpectedly increased slightly to 50.7 from March's 50.2, but services sector growth decelerated sharply, pulling the composite index down to 51.2 from 53.5. Prices charged for goods and services rose at the fastest pace in over a year, with much of the increase attributed to tariff impacts. Business expectations for the year declined to their lowest level since July 2022, although manufacturing sector optimism declined less dramatically amid "hopes of positive impacts from government policies."
Housing market data reflected persistent affordability challenges, with the National Association of Realtors reporting that sales of previously owned homes dropped 5.9% in March—the steepest monthly decline since November 2022. The seasonally adjusted annual rate of 4.02 million home sales represented the lowest March figure since 2009. NAR Chief Economist Lawrence Yun attributed this weakness to "affordability challenges associated with high mortgage rates" while noting that with mortgage delinquencies near historical lows, "the housing market is on solid footing."
Durable goods orders increased for a third consecutive month in March, rising 9.2% from February. However, this headline figure masks underlying caution, as the advance stemmed primarily from a 27% surge in transportation equipment orders—particularly a 139% jump in commercial aircraft orders as businesses rushed to place orders ahead of impending tariffs. Excluding transportation, orders were flat month-over-month, potentially reflecting business hesitation amid ongoing economic and policy uncertainty.

The Philadelphia Fed Manufacturing Index showed a substantial decline, with new orders and shipments contracting and employment approaching contraction territory. Housing starts fell below consensus expectations, particularly in single-family homes. However, March retail sales aligned with projections at 1.4%—the highest in two years—with gains in 11 of 13 categories, potentially reflecting sales pulled forward due to tariff concerns.
Outside the United States, data from China revealed first-quarter GDP growth of 5.4%, exceeding expectations due to consumer subsidies and accelerated export shipments ahead of tariff implementation. Despite this strong start, analysts project a slowdown due to trade war impacts, with growth forecasts lowered to approximately 4%. Chinese policymakers are considering stimulus measures, including interest rate reductions and expanded fiscal spending, to offset potential export declines and strengthen domestic demand.

In the United Kingdom, March retail sales excluding auto fuel unexpectedly rose 0.5% month-over-month versus expectations of a 0.5% decline. However, inflation concerns persist, with forecasts suggesting price increases could exceed 3% by summer as household bills rise.
Market Movements: A Sector View
Beyond the broad index movements, individual sectors exhibited distinct patterns reflecting their perceived vulnerability or resilience to current conditions. The technology sector demonstrated its continued market influence, with the Magnificent Seven stocks driving substantial index movement. However, beneath the surface, more telling patterns emerged.
The semiconductor industry is still under pressure amid heightened tensions between the U.S. and China in the technology sphere. Nvidia warned that the administration had prohibited the company from selling its H20 chip in China, resulting in a $5.5 billion write-down for the current quarter. ASML reported bookings below analyst estimates for the first quarter, citing uncertainty stemming from recent tariff announcements.
Hardware stocks experienced volatility following reports of potential electronics exemptions from reciprocal tariffs, though this optimism proved short-lived after subsequent declarations that tariffs would still apply to these products. Apple has reportedly accelerated production shifts to India and Vietnam to utilize a 90-day grace period before new tariffs take effect.
The financial sector demonstrated relative strength, gaining 0.54% after major banks reported first-quarter earnings that surpassed expectations. This outperformance amid broader market volatility suggests investor recognition of the sector's lower exposure to direct trade impacts and potential benefits from policy shifts later in the year.
Charter Communications emerged as a standout performer, rising more than 11% to lead gainers in both the S&P 500 and Nasdaq 100 after reporting first-quarter adjusted EBITDA of $5.80 billion, exceeding the $5.57 billion consensus. VeriSign climbed 8% following news that new domain registrations processed increased 6.3% year-over-year to 10.1 million.
On the downside, Erie Indemnity fell more than 11% to lead S&P 500 decliners after reporting quarterly earnings per share of $2.65, substantially below the $3.19 consensus. T-Mobile US dropped over 11%, leading Nasdaq 100 decliners, after reporting 495,000 new monthly mobile phone subscribers compared to analyst expectations of 507,000.
Alternative Assets: Dollar Weakness and Gold Strength
While equity markets stabilized, notable movements occurred in currency and commodity markets. The U.S. dollar weakened further amid ongoing trade tensions, with the Dollar Spot Index decreasing 0.56% to 99.55. This decline reflected growing concerns that international investors might be reducing exposure to U.S. assets, including Treasuries and the dollar itself, in response to trade policy uncertainty.
Goldman Sachs reported that foreign investors had sold $63 billion of U.S. equities since March 1, noting, "This dynamic poses a substantial risk to equity valuations because foreign investors entered 2025 with a record 18% ownership share of U.S. equities."
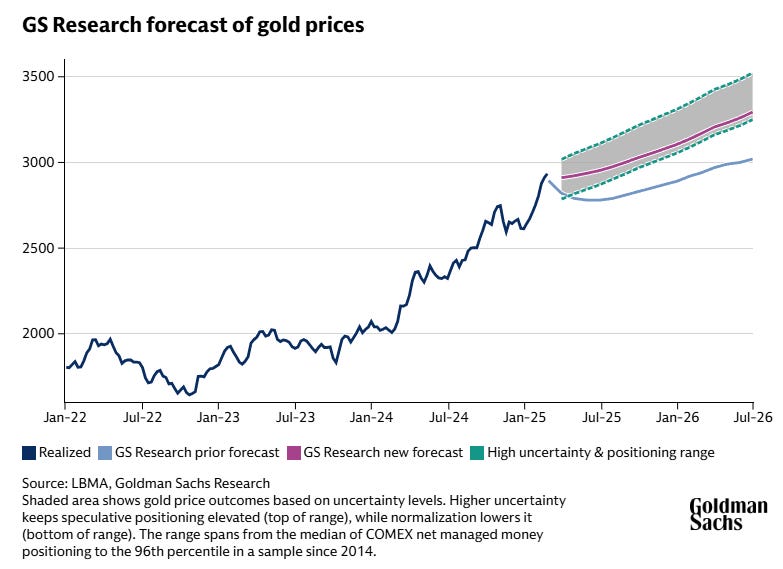
Gold, despite a small pullback, continues continues to hold the highs. Year-end forecasts for the precious metal have been revised upward to $3,700 per troy ounce from earlier projections of $3,300, reflecting strong central bank demand and exchange-traded fund inflows driven by recession concerns.
Oil markets rebounded from recent lows, with West Texas Intermediate crude climbing 4.8% to $64.44 after hitting lows of $59.58. This recovery occurred despite OPEC reducing its 2025/2026 oil demand forecasts in response to escalating trade tensions.
The Path Forward: Navigating Uncertainty
As financial markets seek to establish a new equilibrium amid evolving trade policies and economic expectations, several key themes emerge that will likely shape performance in the weeks ahead.
First, the transition from extreme pessimism to cautious optimism requires substantive developments rather than merely improved rhetoric. While peak uncertainty appears to have passed, concrete agreements with major trading partners would provide stronger foundations for sustained market advances.
Second, corporate earnings now face heightened scrutiny as investors attempt to assess tariff impacts on revenue growth and profitability. Forward guidance has taken on particular significance, with early indications suggesting prudent management teams are preparing for more challenging conditions ahead.
Third, the Federal Reserve's policy path has become increasingly contingent on how trade developments affect economic growth and inflation. Market participants now anticipate multiple rate reductions this year, with the timing and magnitude dependent on how quickly tariff effects manifest in economic data.
Fourth, international diversification may offer relative advantages as U.S. assets encounter headwinds from trade policy uncertainty. International equities have maintained their performance edge even as U.S. stocks have rebounded from recent lows.
Finally, sector selection has grown increasingly important in navigating the current environment. Health care and financials have demonstrated relative strength that may persist, while technology continues to exhibit significant influence over broader market direction despite facing specific challenges related to international trade restrictions.

The market narrative has evolved from one of crisis to one of recalibration. The extreme volatility that characterized early April has moderated, allowing for more nuanced assessment of economic conditions and corporate prospects. While substantial challenges remain, the financial markets have demonstrated remarkable adaptability in absorbing unprecedented policy shifts and establishing new frameworks for valuation and risk assessment.
As traders and investors look toward May, they face a market positioned between extremes—having moved away from panic but not yet fully embracing optimism. This middle ground may persist for some time, with periodic volatility testing resolve before a clearer direction emerges. For thoughtful market participants, this environment offers both challenges and opportunities, rewarding careful analysis and strategic positioning while punishing complacency and excessive conviction.
In the words often attributed to John Maynard Keynes, "When the facts change, I change my mind." The financial markets have demonstrated this adaptability in recent weeks, absorbing significant shifts in trade policy expectations and monetary outlook while maintaining functional liquidity and price discovery.
The central question now confronting market participants is whether the current equilibrium represents a temporary way station on a path to further deterioration or the foundation for gradual recovery. The answer will emerge not from rhetoric but from concrete developments in trade negotiations, economic data, and corporate performance in the weeks ahead. Those prepared to interpret these signals objectively, without excessive attachment to previous narratives, will be best positioned to navigate the evolving landscape successfully. We highly recommend this week’s “Special Coverage” report provided freely below; it includes market navigation markers you can use to sidestep traps and seize opportunity in this period of uncertainty.
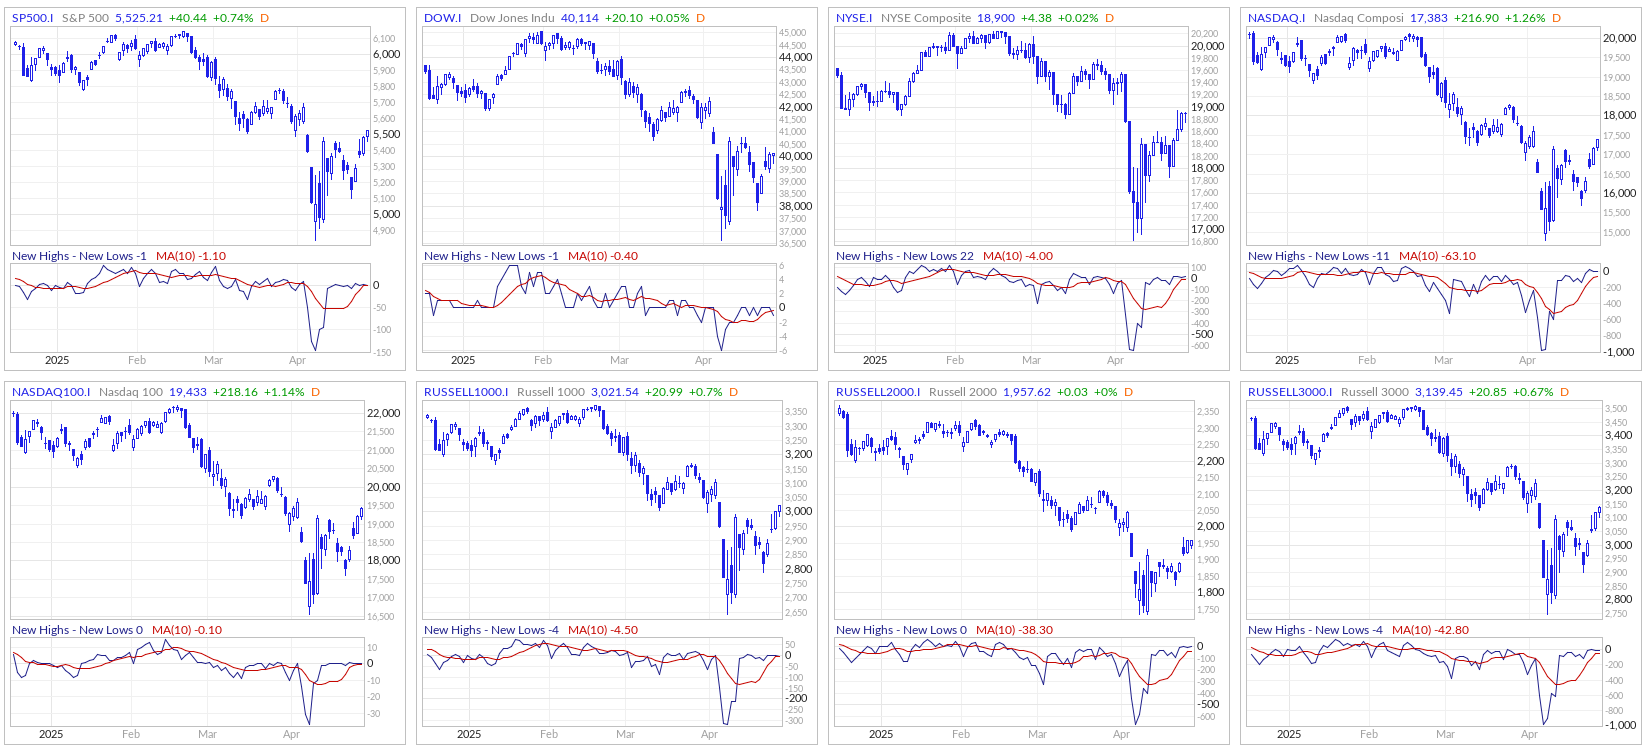
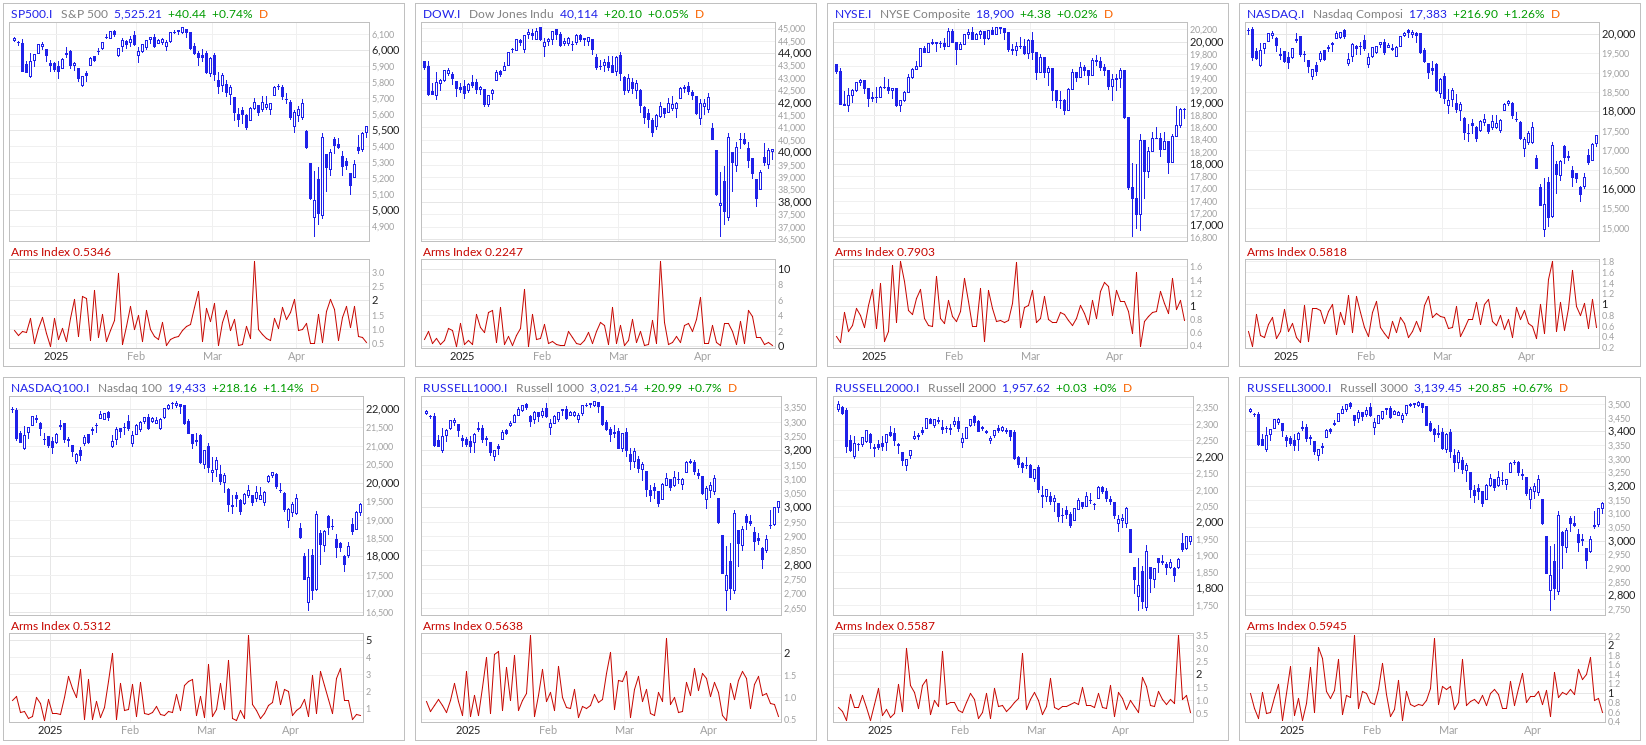
Range, Breadth, New Highs & Lows By Index
S&P 500 Index
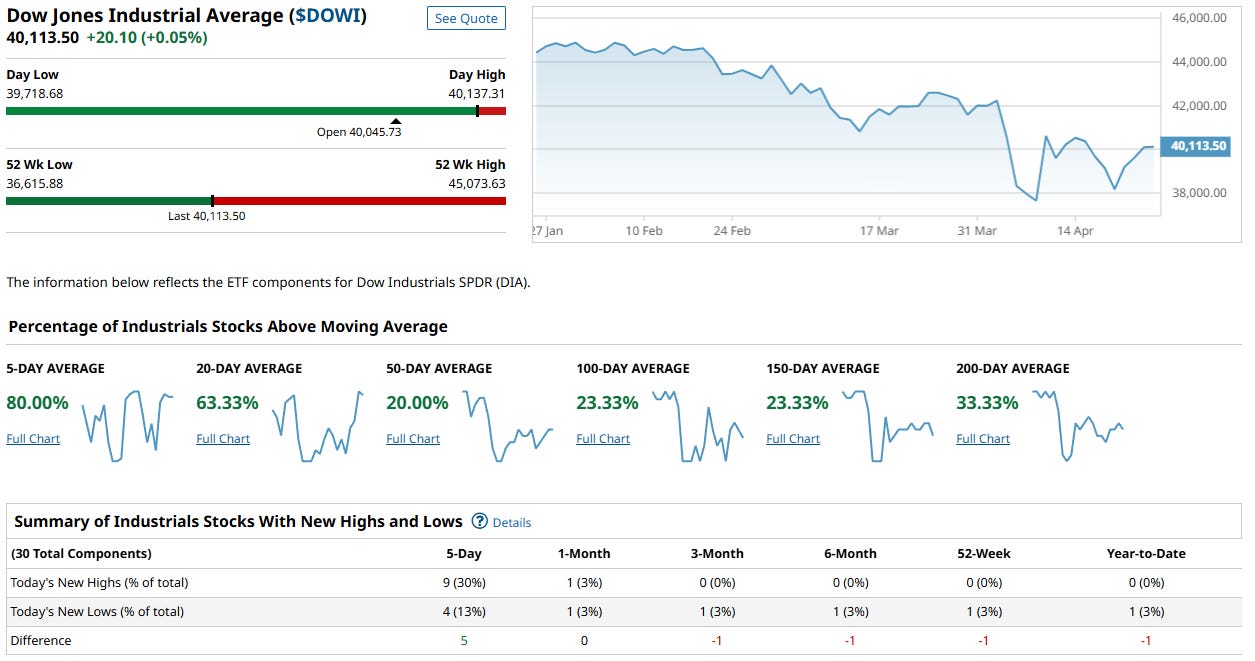
Dow Jones Index
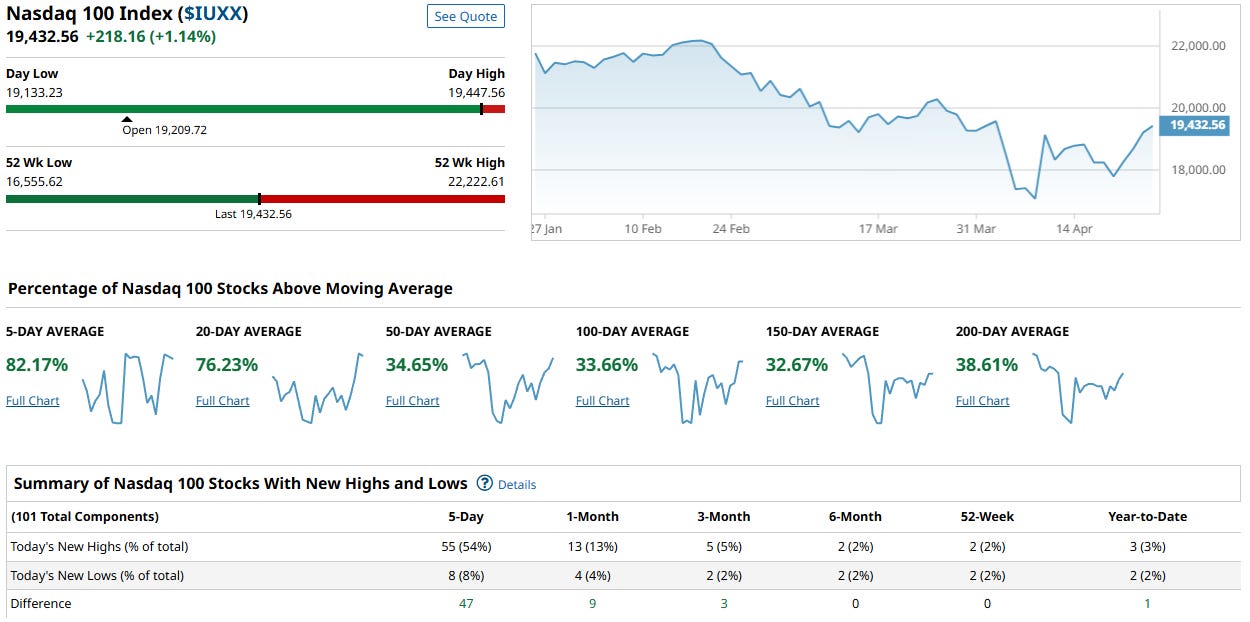
NASDAQ 100 Index
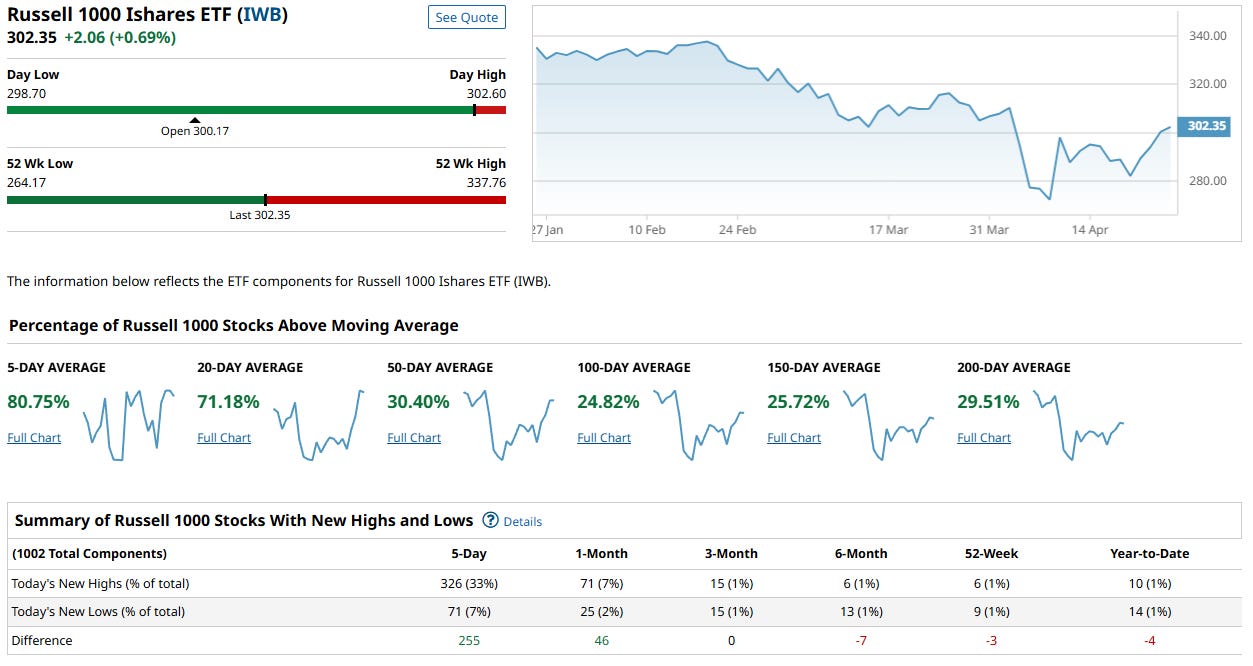
Russel 1000
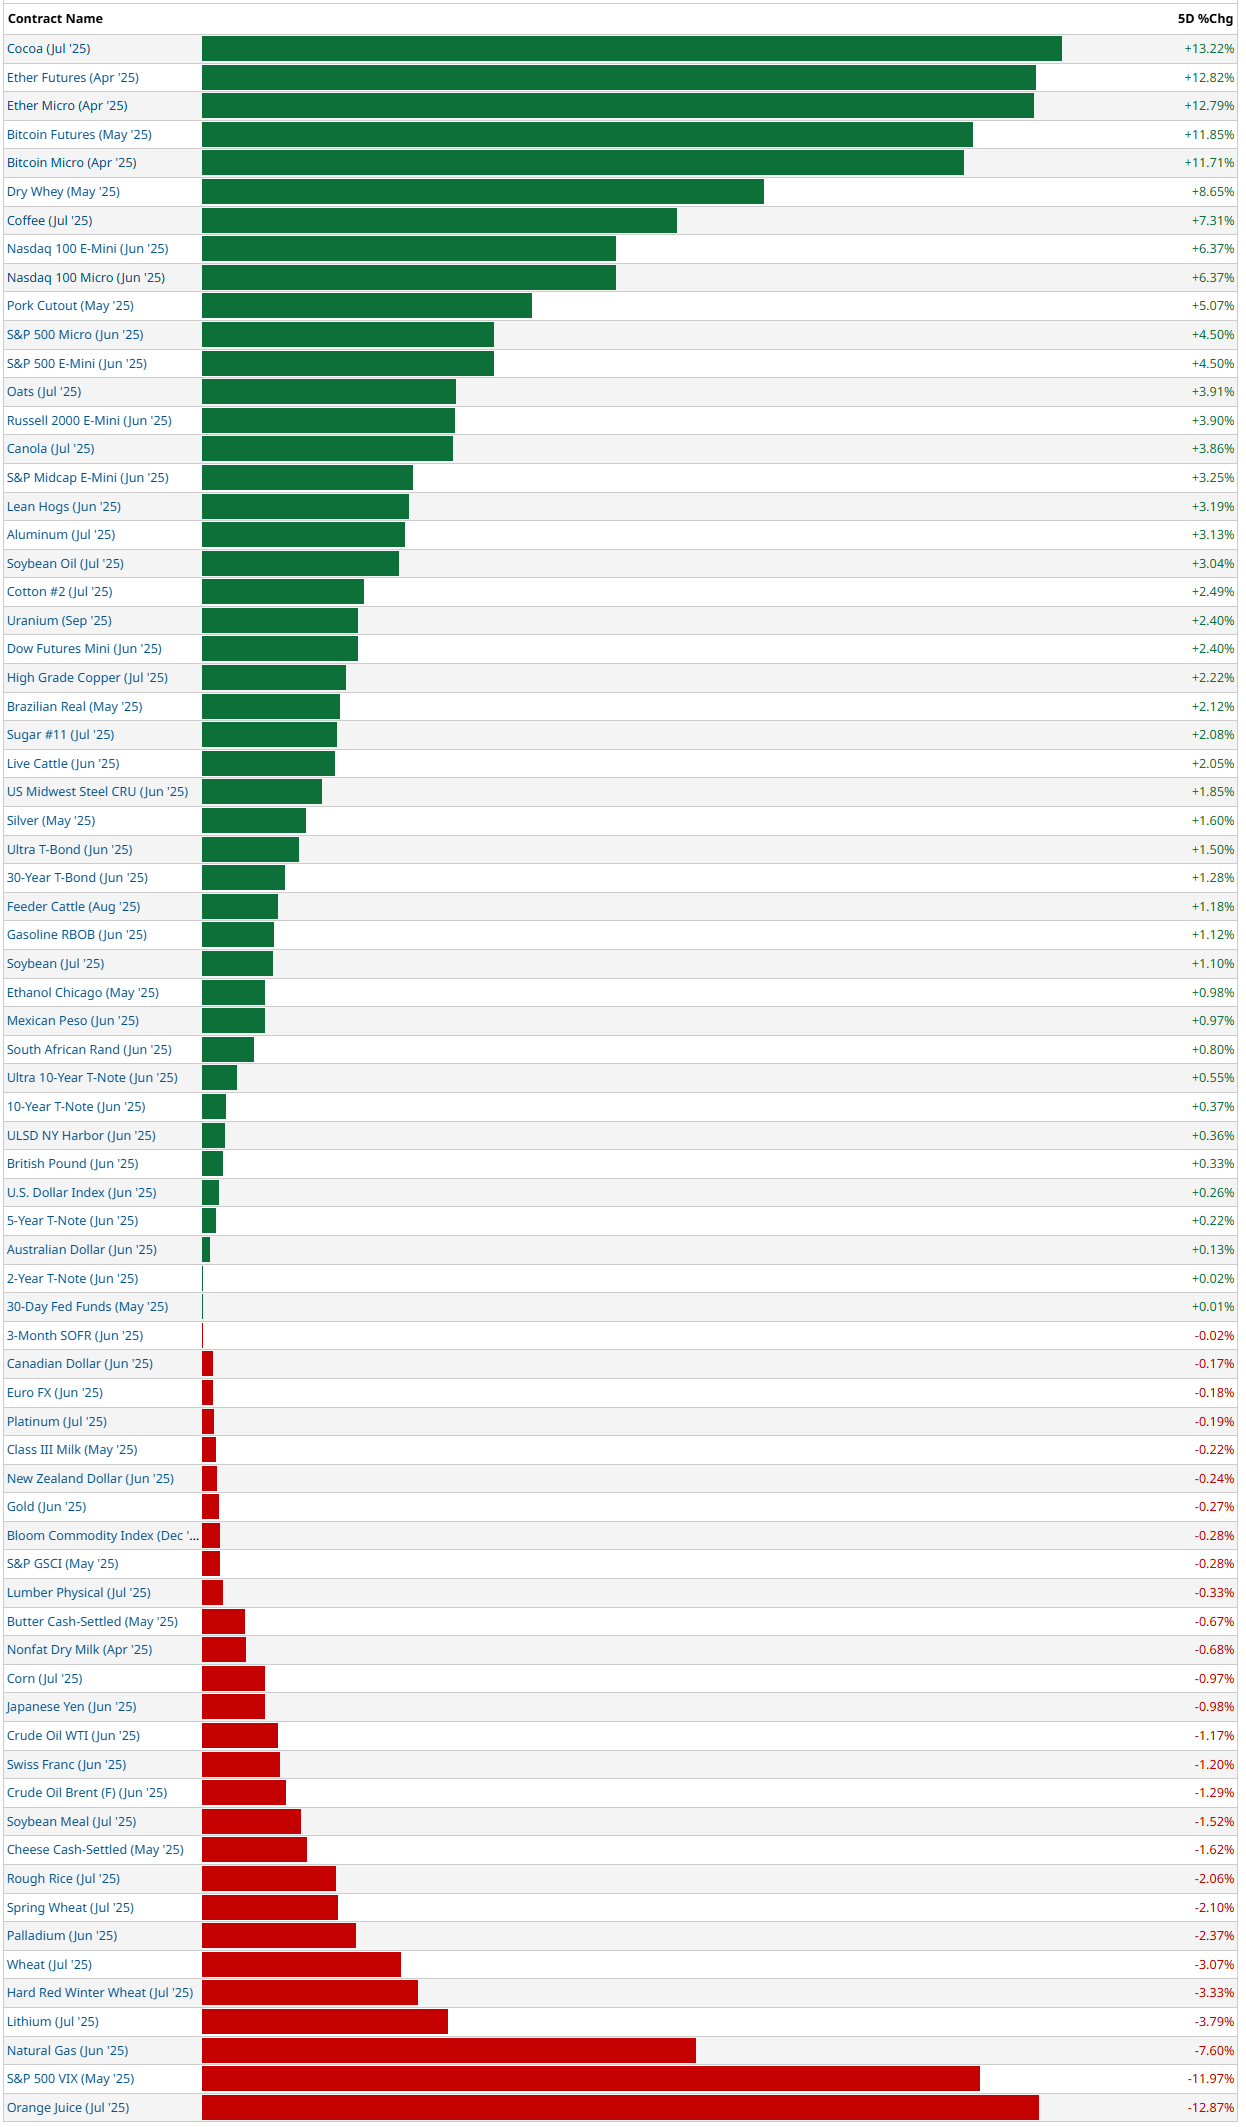
5-Day Futures Performance Leaders
New Highs - New Lows
The New Highs - New Lows indicator (NH-NL) displays the daily difference between the number of stocks reaching new 52-week highs and the number of stocks reaching new 52-week lows. The NH-NL indicator generally reaches its extreme lows slightly before a major market bottom. As the market then turns up from the major bottom, the indicator jumps up rapidly. During this period, many new stocks are making new highs because it's easy to make a new high when prices have been depressed for a long time. The NH-NL indicator oscillates around zero. If the indicator is positive, the bulls are in control. If it is negative, the bears are in control. As the cycle matures, a divergence often occurs as fewer and fewer stocks are making new highs (the indicator falls), yet the market indices continue to reach new highs. This is a classic bearish divergence that indicates that the current upward trend is weak and may reverse.
ARMS Index
The Arms Index, also known as the TRIN (Short-Term TRading INdex), was developed by Richard Arms in the 1960s. It is calculated by dividing the ratio of advancing stocks to declining stocks by the ratio of advancing volume to declining volume. Interpreting the Arms Index involves looking at its value in relation to certain thresholds. A value below "1" is considered bullish, indicating that advancing stocks and volume dominate the market. Conversely, a value above "1" is considered bearish, suggesting that declining stocks and volume are more prevalent. Extremely low values (below 0.5) or high values (above 2) are often seen as potential reversal signals.
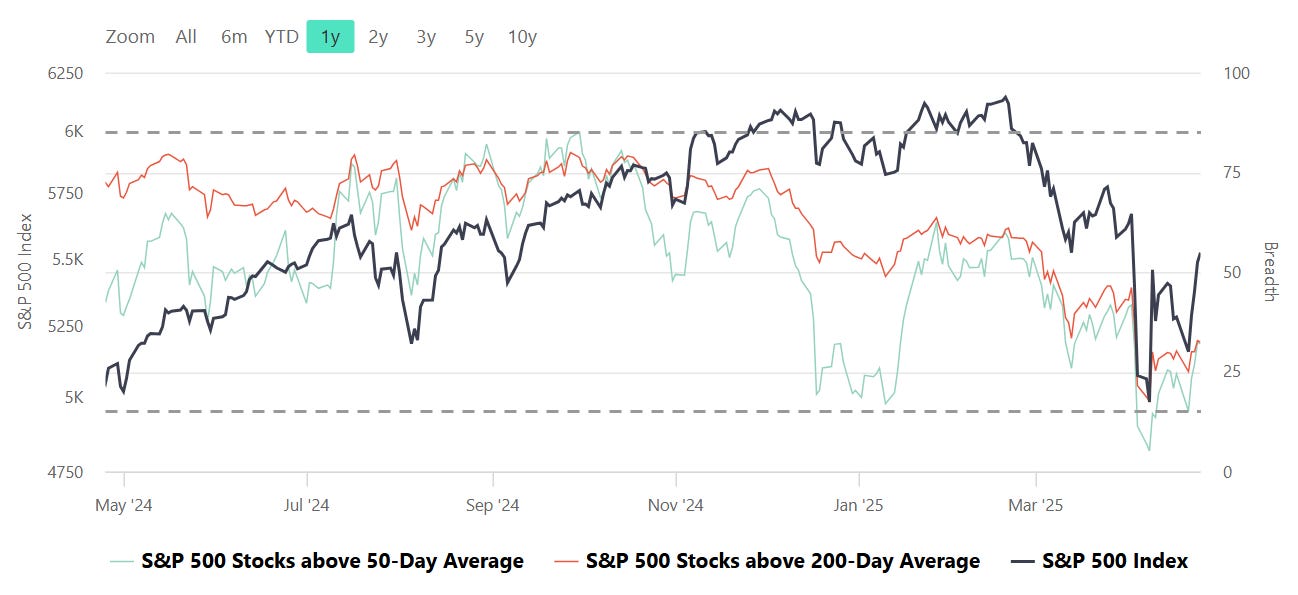
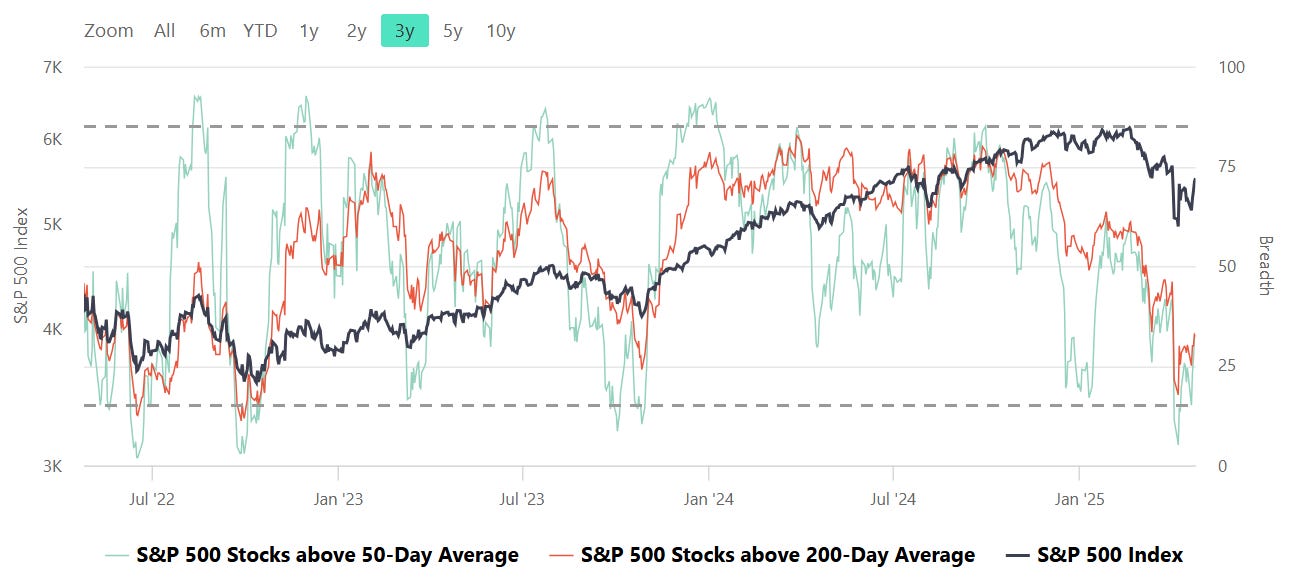
S&P Breadth
Breadth, in the context of stock market analysis, refers to the measure of how many stocks in a given index (such as the S&P 500) are participating in a trend, such as advancing or declining relative to a certain moving average (e.g., 50-day or 200-day).
Market Strength Assessment:
Breadth provides insight into whether a market rally or decline is broad-based or driven by only a few large-cap stocks. A rally supported by a high percentage of stocks above their 50-day or 200-day averages is generally considered healthier and more sustainable.
Early Warning Signals:
Divergences between breadth indicators and the index price can signal potential reversals. For example:
If the index is rising, but the number of stocks above their moving averages is declining, it may indicate weakening underlying strength and potential for a pullback.
Conversely, if breadth improves while the index remains flat or declines, it may suggest accumulating strength for a future rally.
Trend Confirmation:
Breadth indicators can confirm trends. For instance, a strong majority of stocks above their moving averages signals robust market momentum, providing confidence in the prevailing trend.
Identifying Overbought or Oversold Conditions:
Extremely high or low breadth readings can signal overbought or oversold conditions, which might lead to mean reversion. For example:
If nearly all stocks are above their 50-day or 200-day averages, it may suggest overbought conditions.
Conversely, extremely low levels indicate oversold conditions and potential for a bounce.
Breadth and Timing Investments:
Entry Points:
When breadth improves (e.g., more stocks move above their 50-day or 200-day moving averages) after a market pullback, it can indicate a good time to start building positions as the broader market is regaining strength.
Exit Points:
Breadth deterioration during a rally may suggest it’s time to reduce exposure, especially if only a small number of stocks are driving index gains. This is often a warning sign of an impending correction.
Volatility and Risk Management:
Weak breadth in volatile markets may prompt caution or defensive positioning. Conversely, improving breadth can justify taking on more risk during uptrends.
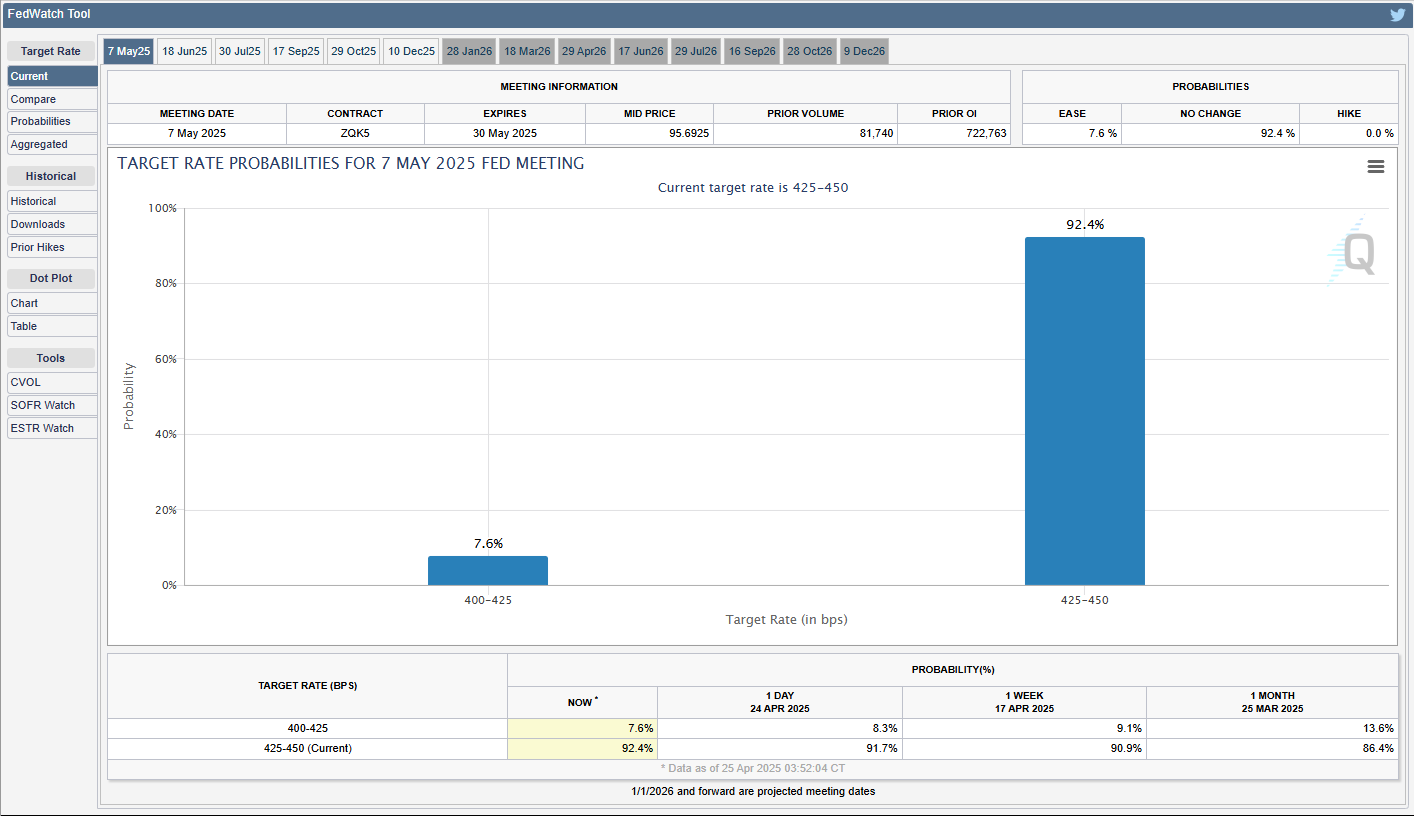
CME Fedwatch
What is the likelihood that the Fed will change the Federal target rate at upcoming FOMC meetings, according to interest rate traders? Use CME FedWatch to track the probabilities of changes to the Fed rate, as implied by 30-Day Fed Funds futures prices.

US Investor Sentiment
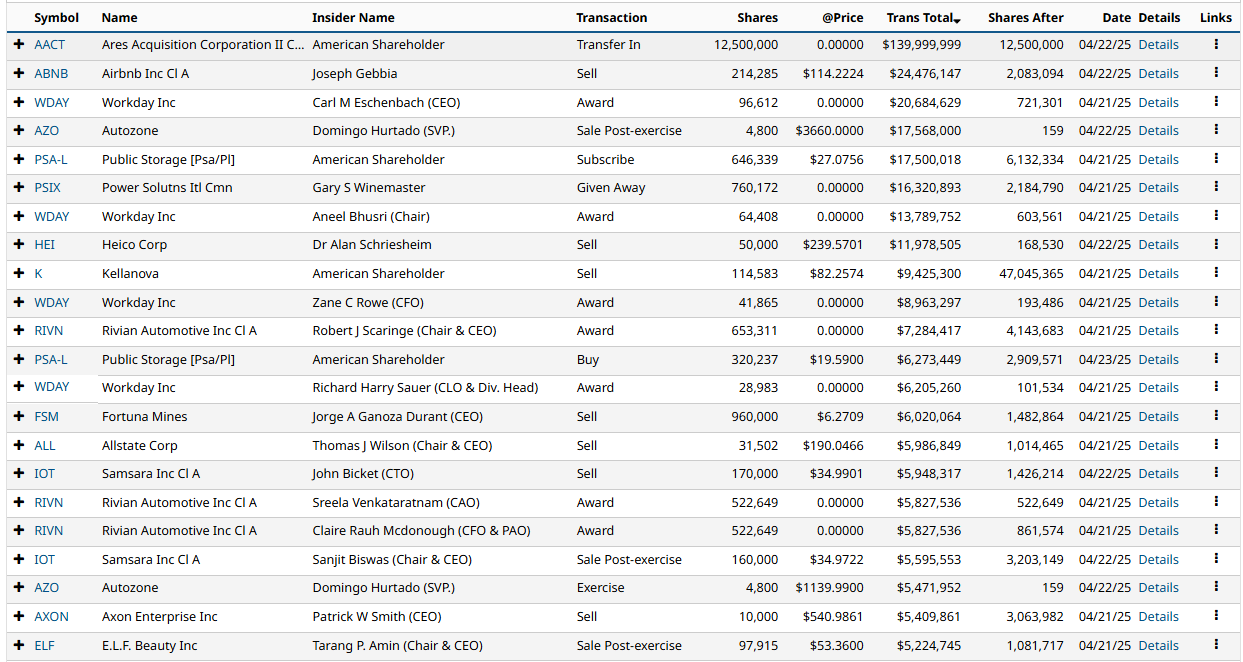
Insider Trading
Insider trading occurs when a company’s leaders or major shareholders trade stock based on non-public information. Tracking these trades can reveal insider expectations about the company’s future. For example, large purchases before an earnings report or drug trial results might indicate confidence in upcoming good news.
%Bull-Bear Spread
The %Bull-Bear Spread chart is a sentiment indicator that shows the difference between the percentage of bullish and bearish investors, often derived from surveys or sentiment data, such as the AAII (American Association of Individual Investors) sentiment survey. This spread tells investors about the prevailing mood in the market and can provide insights into market extremes and potential turning points.
Bullish or Bearish Sentiment:
When the spread is positive, it means more investors are bullish than bearish, indicating optimism about the market’s direction.
A negative spread indicates more bearish sentiment, meaning more investors expect the market to decline.
Contrarian Indicator:
The %Bull-Bear Spread is often used as a contrarian indicator. For example, extremely high levels of bullish sentiment might suggest that the market is overly optimistic and could be due for a correction.
Similarly, when bearish sentiment is extremely high, it might indicate that the market is overly pessimistic, and a rally could be on the horizon.
Market Extremes and Reversals:
Historically, extreme values of the spread (both positive and negative) can signal turning points in the market. A very high positive spread can signal market exuberance, while a very low or negative spread may indicate fear or capitulation.
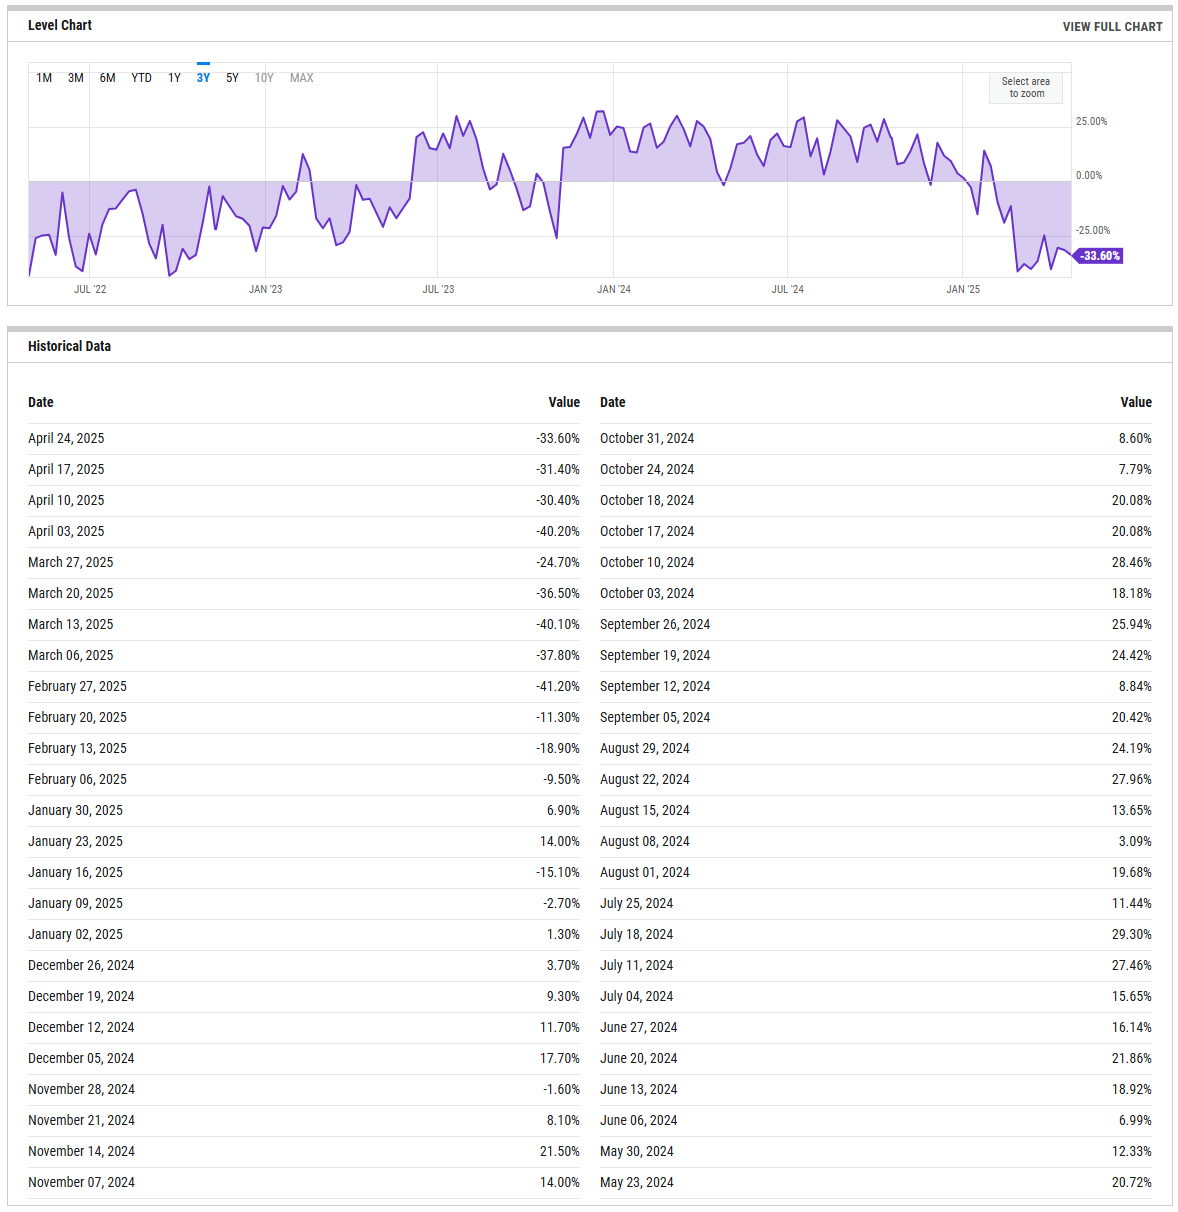
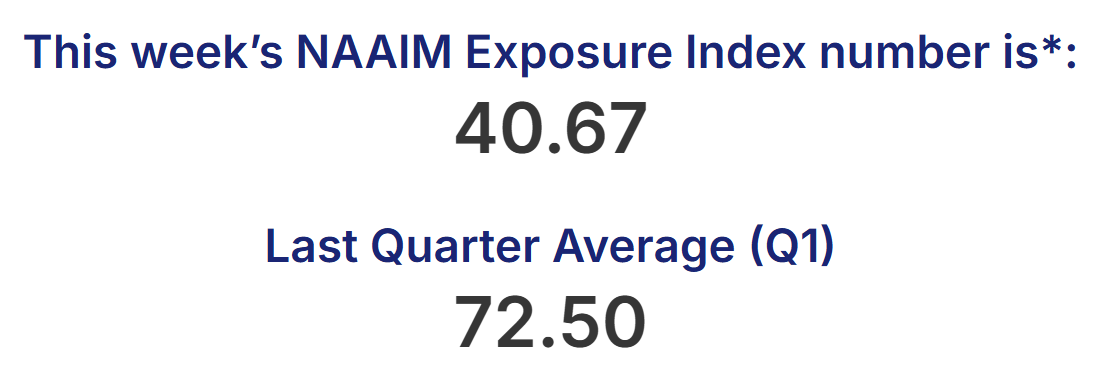
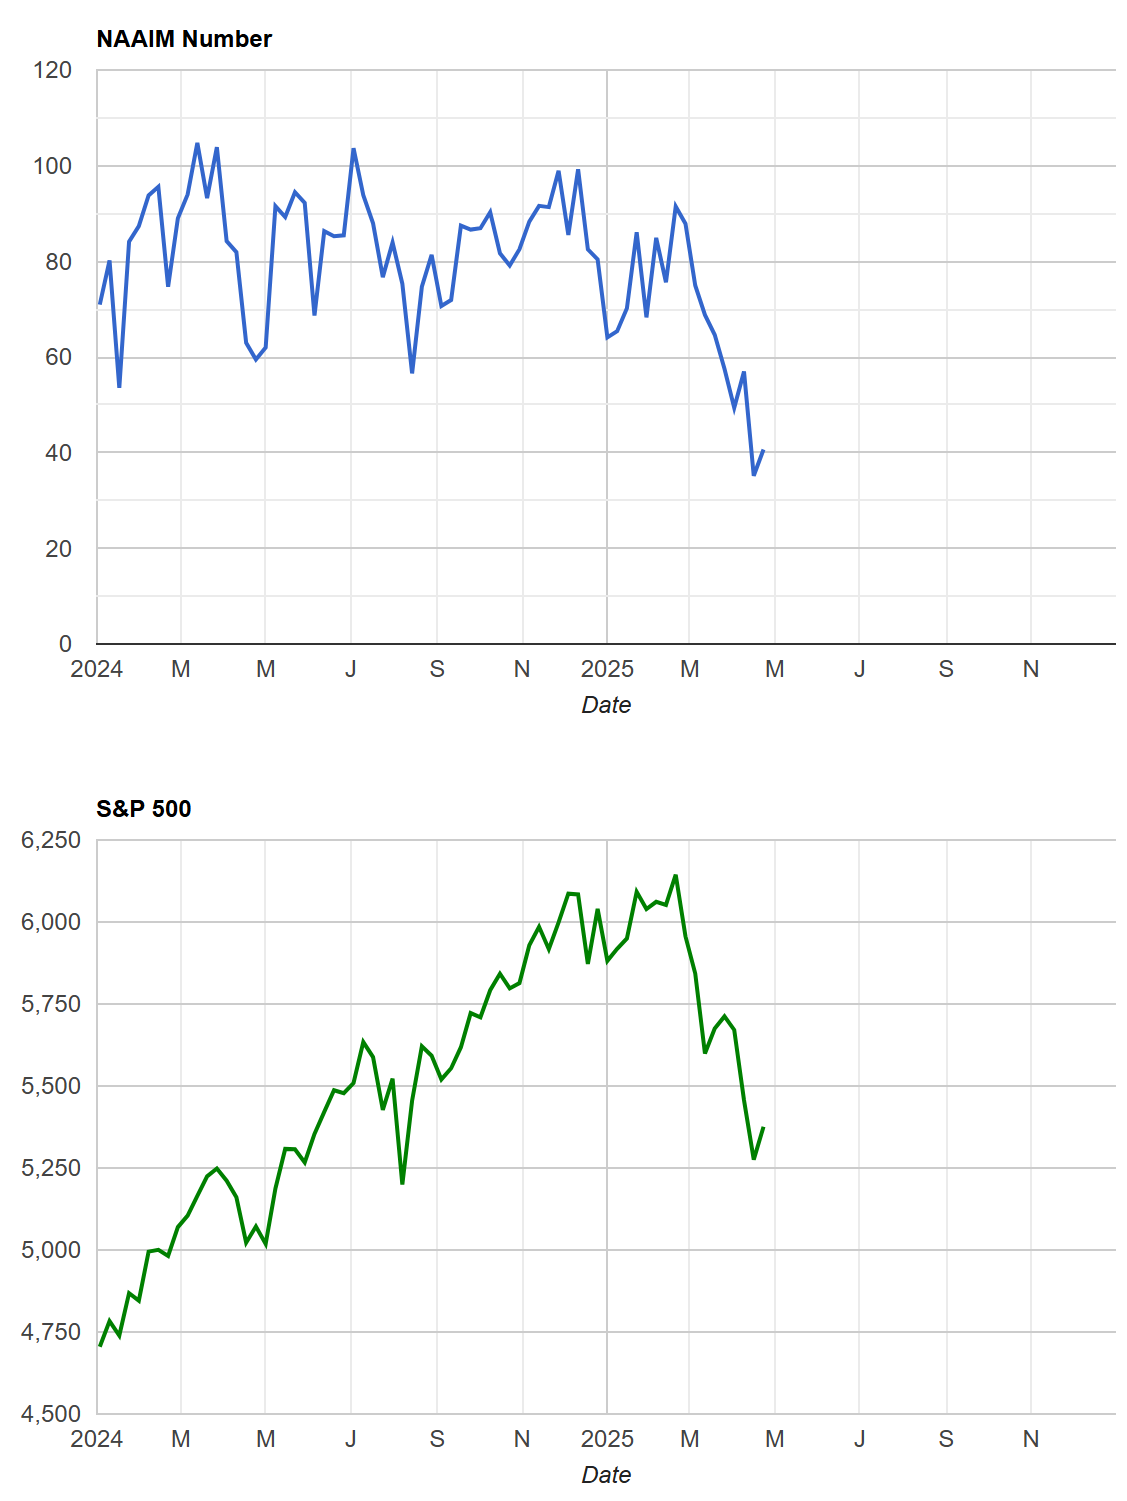
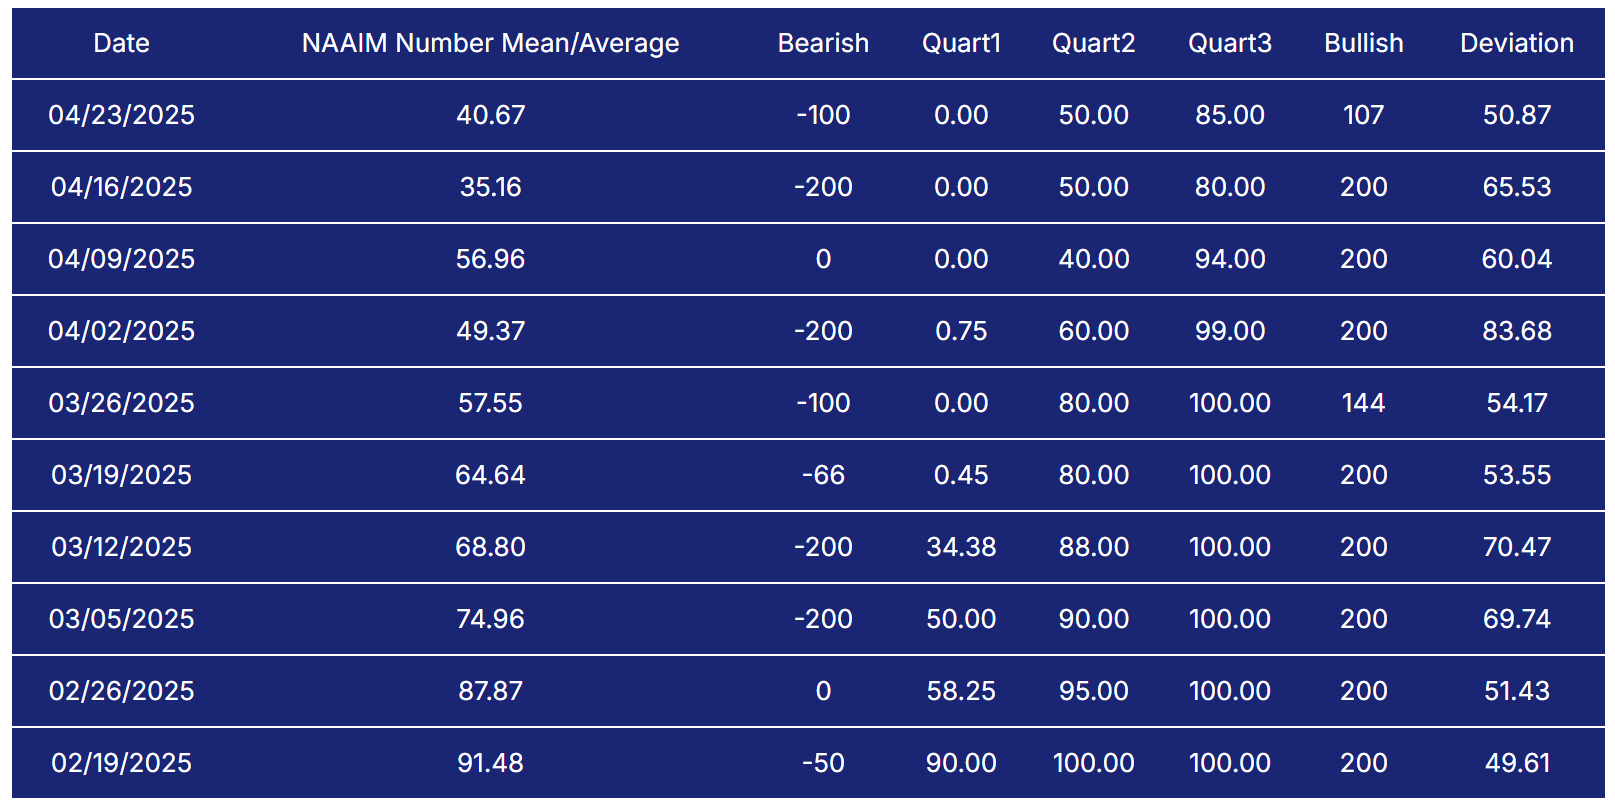
NAAIM Exposure Index
The NAAIM Exposure Index (National Association of Active Investment Managers Exposure Index) measures the average exposure to U.S. equity markets as reported by its member firms. These are typically active money managers who provide their equity exposure levels weekly. The index offers insight into how much these managers are investing in equities at any given time, ranging from being fully short (-100%) to leveraged long (up to +200%).
AAII Investor Sentiment Survey
The AAII Investor Sentiment Survey is a weekly survey conducted by the American Association of Individual Investors (AAII) to gauge the mood of individual investors regarding the direction of the stock market over the next six months. It provides insights into whether investors are feeling bullish (expecting the market to rise), bearish (expecting the market to fall), or neutral (expecting the market to stay about the same).
Key Points:
Bullish Sentiment: Reflects the percentage of investors who believe the stock market will rise in the next six months.
Bearish Sentiment: Represents those who expect a decline.
Neutral Sentiment: Reflects investors who anticipate little to no market movement.
The survey is widely followed as a contrarian indicator, meaning that extreme levels of bullishness or bearishness can sometimes signal market turning points. For example, when a large number of investors are overly optimistic (high bullish sentiment), it could suggest a market top, while excessive pessimism (high bearish sentiment) may indicate a market bottom is near.
SPX Put/Call Ratio
The SPX Put/Call Ratio is an indicator that is used to gauge market sentiment. This is calculated as the ratio between trading S&P 500 put options and S&P call options. A high put/call ratio can indicate fear in the markets, while a low ratio indicates confidence. For example, in 2015, the Put-Call ratio was as high as 3.77 because of market fears stemming from various global economic issues like a GDP growth slowdown in China and a Greek debt default.
CBOE Equity Put/Call Ratio
The CBOE (Chicago Board Options Exchange) equity put/call ratio is a sentiment indicator used by traders and analysts to gauge market sentiment and potential shifts in investor behavior. It is calculated by dividing the volume of put options by the volume of call options on equities. Here’s what it reveals and how it is generally interpreted:
High Put/Call Ratio: When the put/call ratio is high (above 1.0), it suggests that there is more demand for put options than call options. This typically reflects a more bearish sentiment, as investors may be hedging against potential declines or expecting the market to fall.
Low Put/Call Ratio: Conversely, a low put/call ratio (below 0.7) indicates a higher volume of call options compared to puts, reflecting bullish sentiment. Investors may be expecting upward momentum and are positioning themselves to profit from price gains
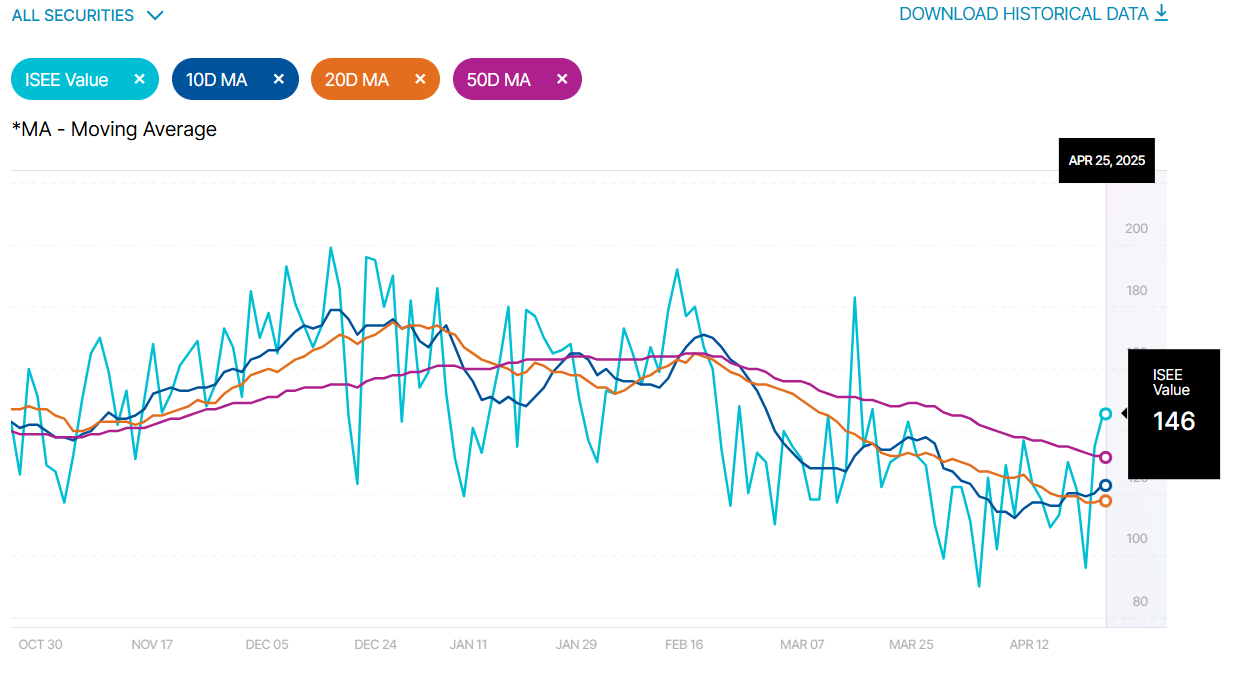
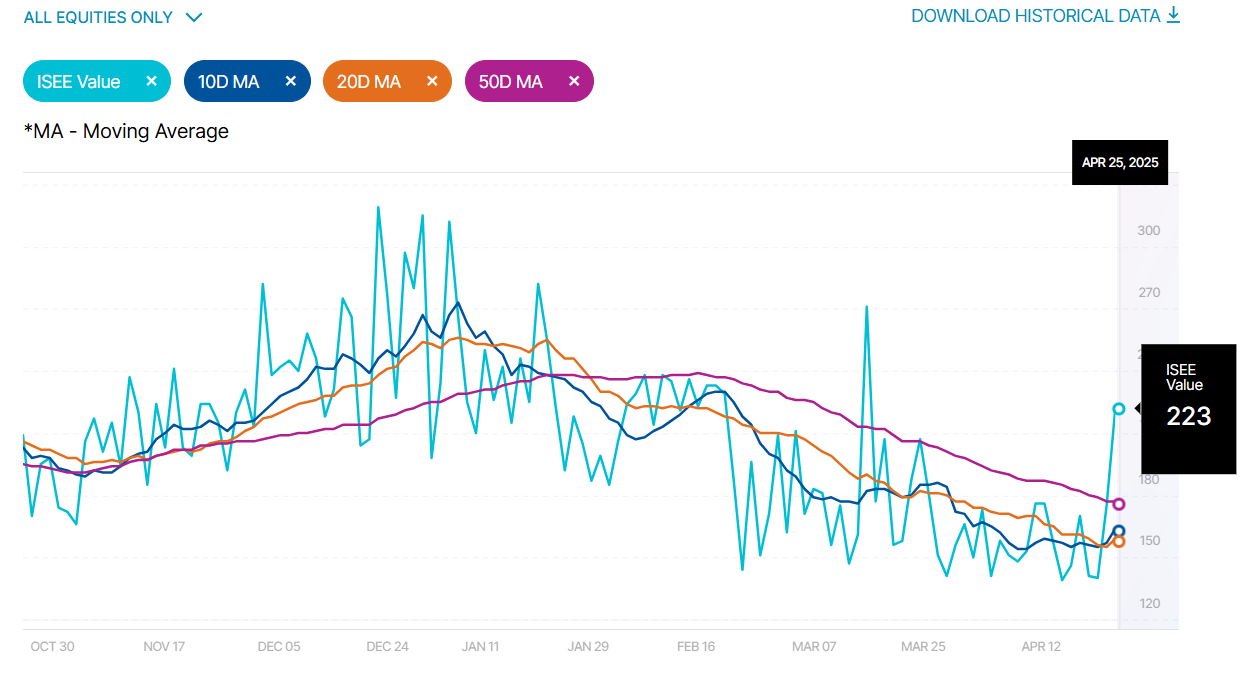
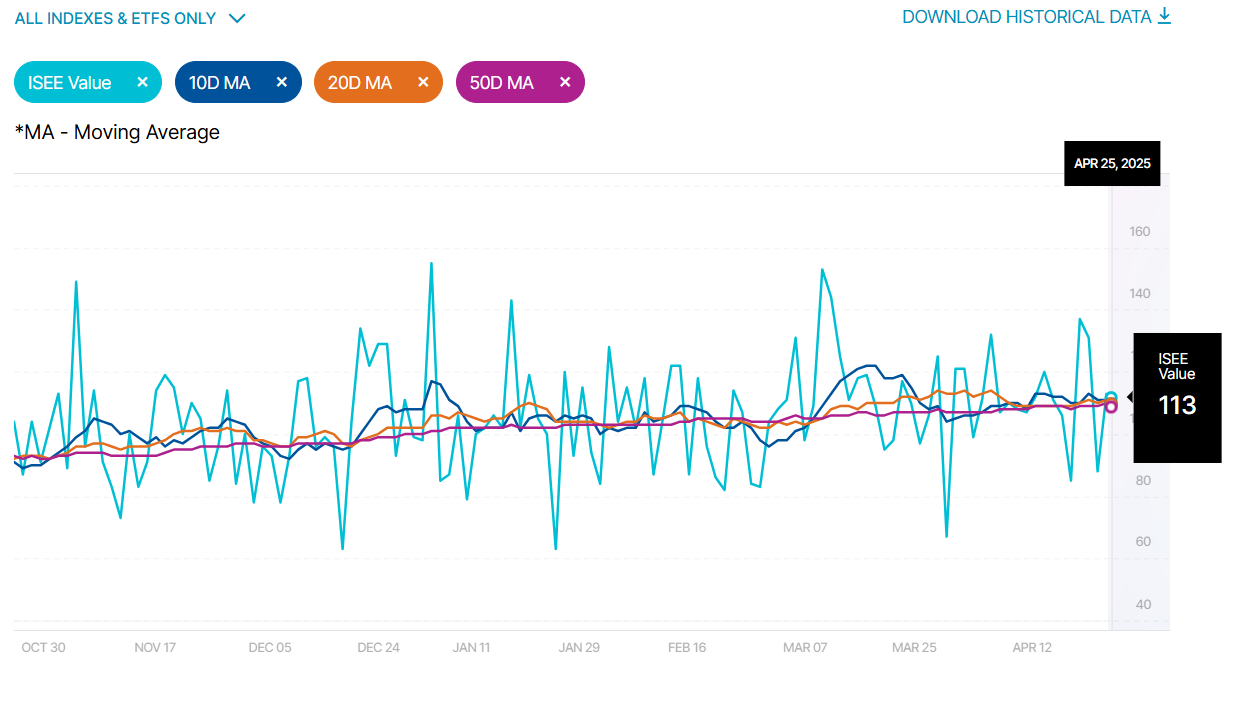
ISEE Sentiment Index
The ISEE (International Securities Exchange Sentiment) Index is a measure of investor sentiment derived from options trading. Unlike traditional put/call ratios, the ISEE Index focuses only on opening long customer transactions and is adjusted to remove market-maker and firm trades, providing a purer sentiment reading.
The ISEE Index typically ranges from 0 to 200, with readings above 100 indicating more call options being bought relative to put options, suggesting bullish sentiment. Conversely, readings below 100 suggest bearish sentiment, with more puts being purchased relative to calls.
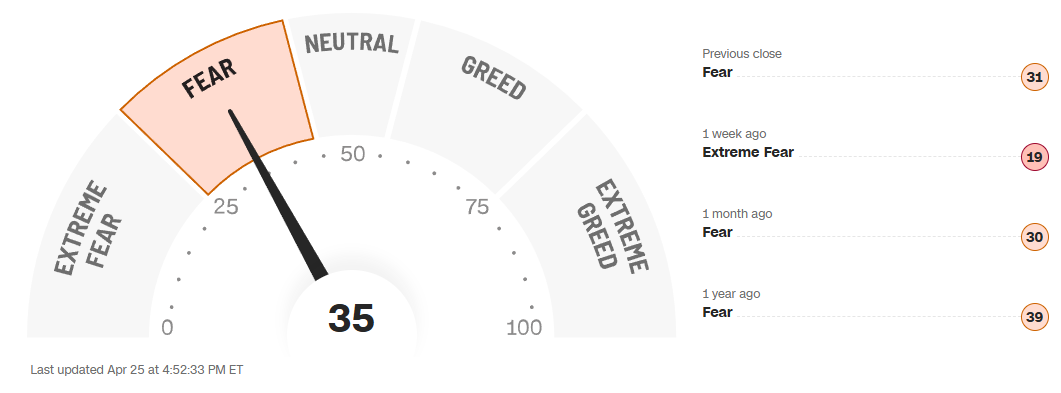
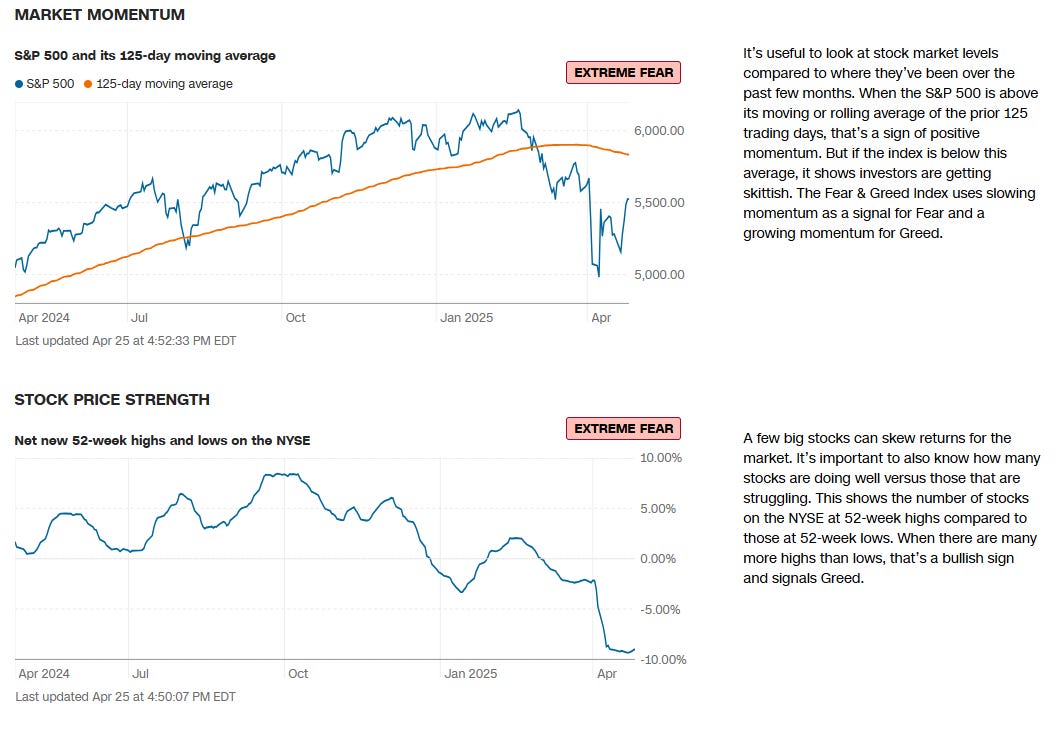
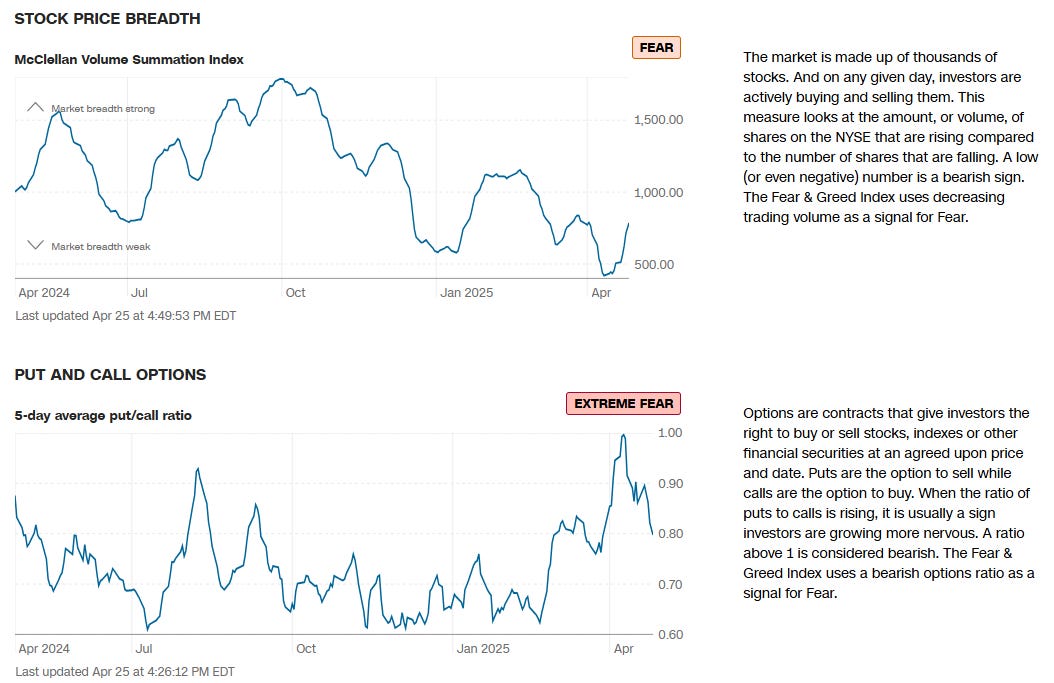
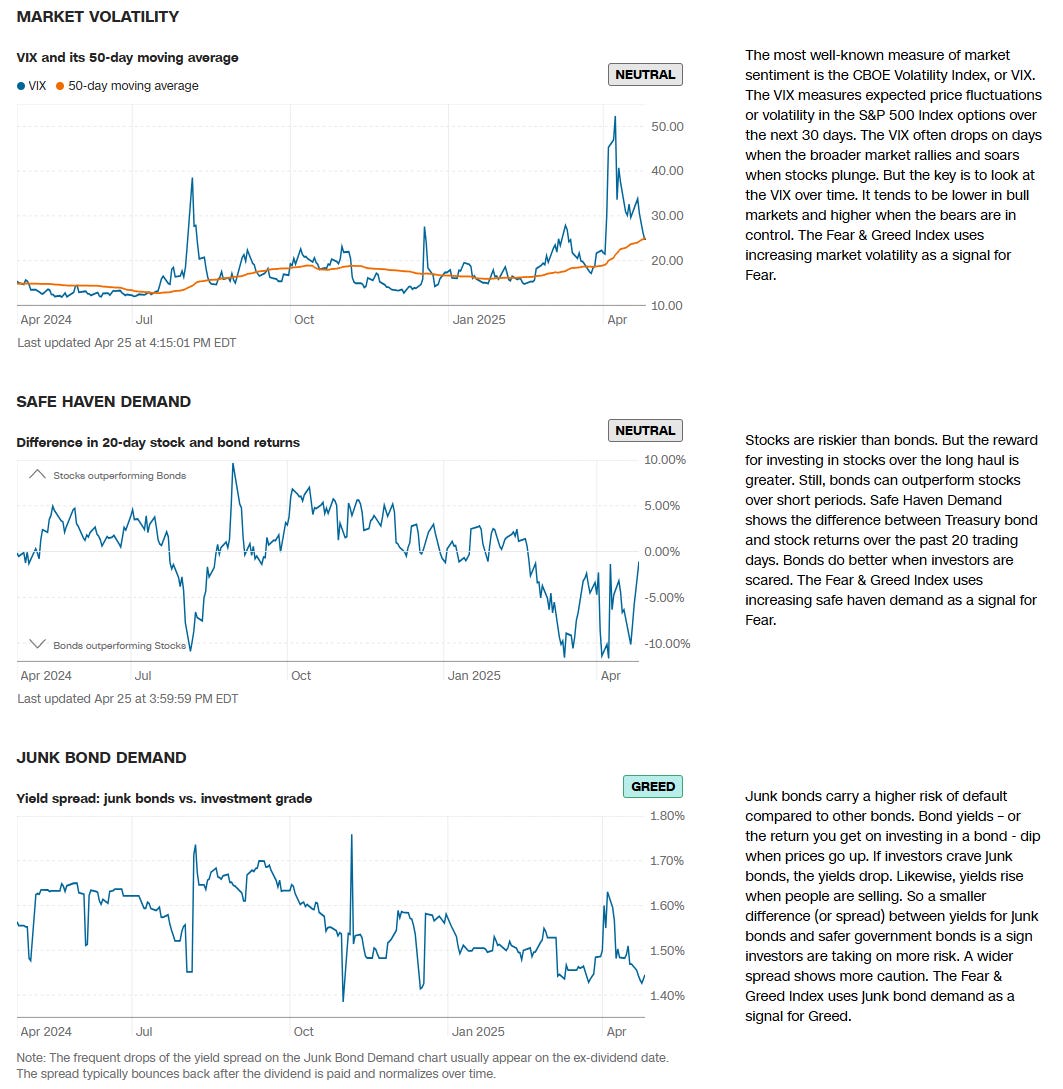
CNN Fear & Greed Constituent Data Points & Composite Index
Social Media Favs
Analyzing social sentiment can provide valuable insights for investment strategies by offering a pulse on public perception, mood, and market sentiment that traditional financial indicators might not capture. Here’s how social sentiment analysis can enhance investment decisions:
Market Momentum: Positive or negative social sentiment can signal impending momentum shifts. When public opinion on a stock, sector, or asset class changes sharply, it can create buying or selling pressure, especially if that sentiment becomes widespread.
Early Detection of Trends: Social sentiment data can help investors spot trends before they show up in technical or fundamental data. For example, increased positive chatter around a particular company or sector might indicate growing interest or excitement, which could lead to price appreciation.
Gauge Retail Investor Impact: With the rise of retail investor platforms, collective sentiment on social media can lead to significant price movements (e.g., meme stocks). Understanding how retail investors view certain stocks can help in identifying high-volatility opportunities.
Event Reaction Monitoring: Social sentiment can provide real-time reactions to news events, product releases, or earnings reports. Investors can use this information to gauge market reaction quickly and adjust their strategies accordingly.
Complementing Quantitative Models: By adding a social sentiment layer to quantitative models, investors can enhance predictions. For example, a model that tracks historical price and volume data might perform even better when factoring in sentiment trends as a measure of market psychology.
Risk Management: Negative sentiment spikes can be a signal of potential downturns or increased volatility. By monitoring sentiment, investors might avoid or hedge against investments in companies experiencing a public relations crisis or facing negative perceptions.
Long-Term Sentiment Trends: Sustained sentiment trends, whether positive or negative, often mirror longer-term market cycles. Tracking sentiment trends over time can help identify shifts in investor psychology that could affect longer-term investments or sector rotations.
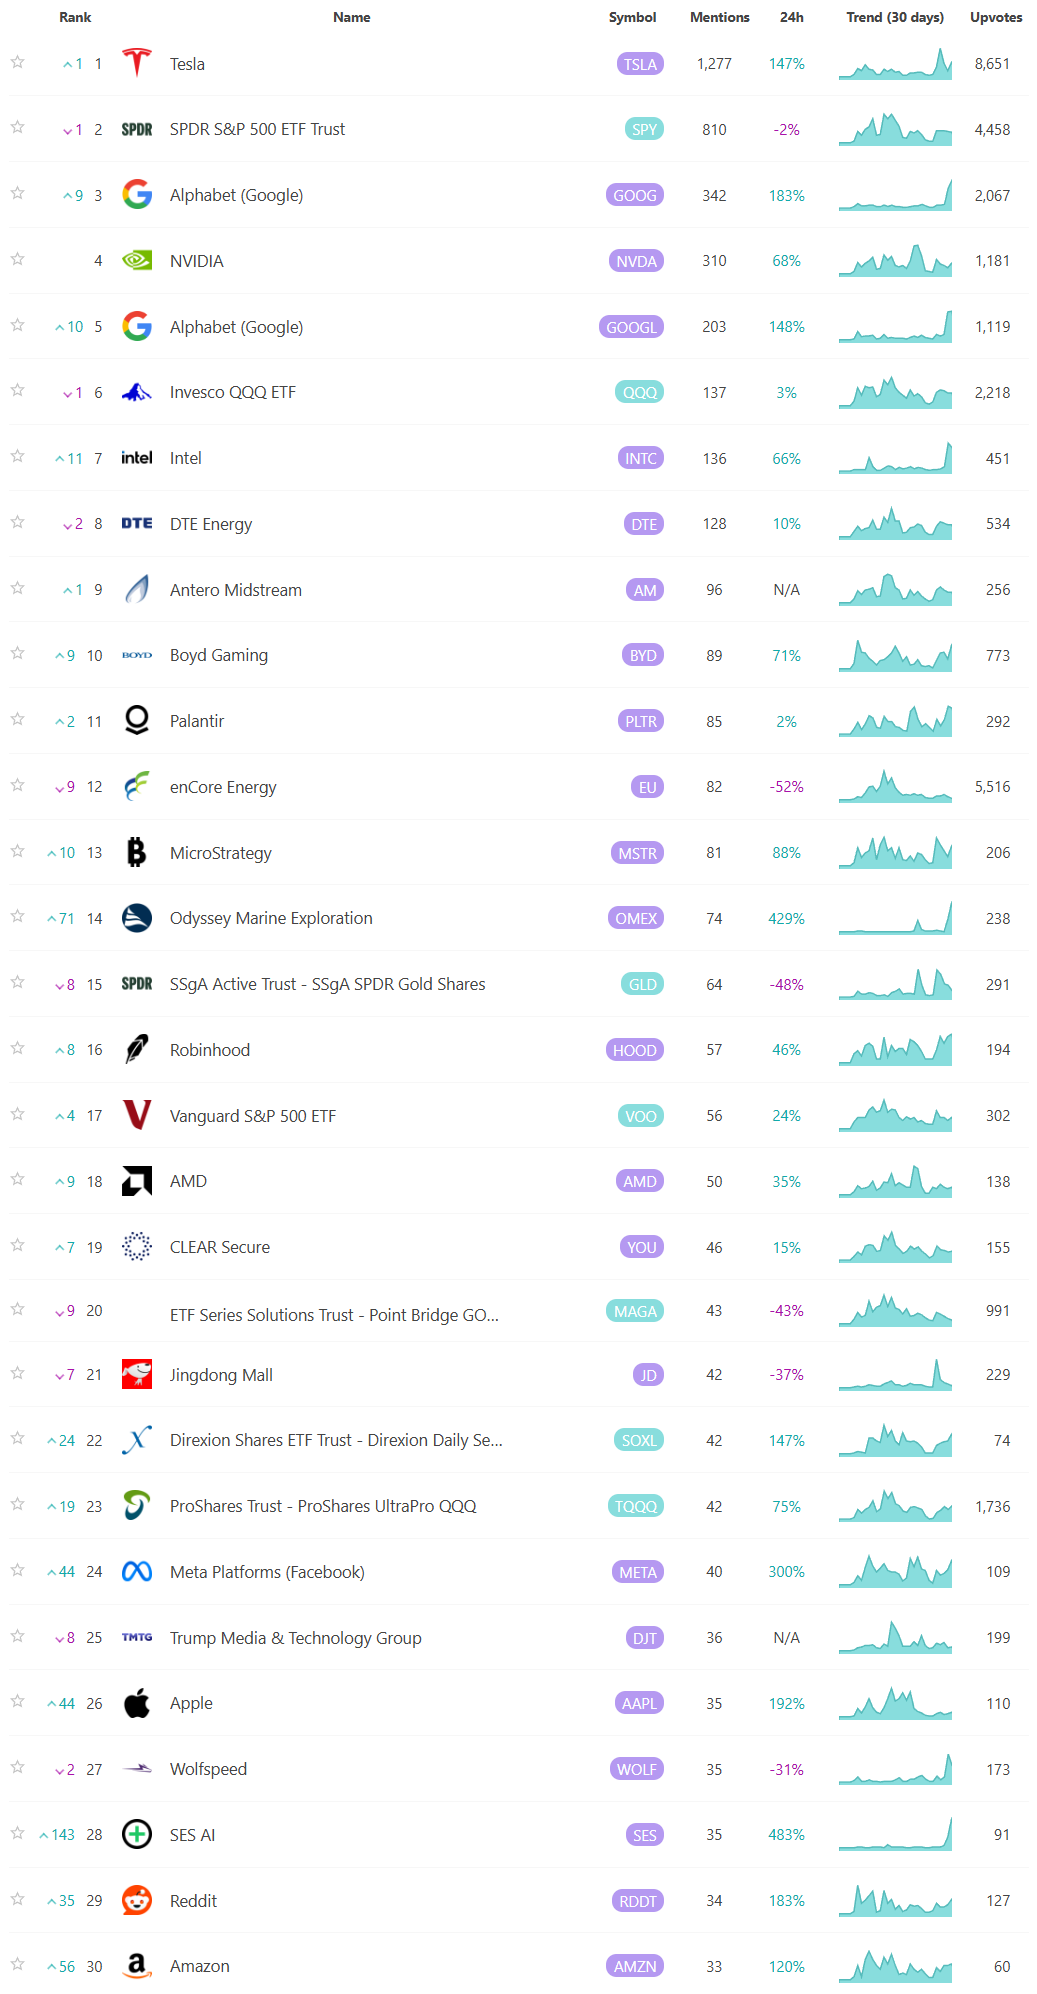
For these reasons, sentiment analysis, when combined with other tools, can provide a comprehensive view of both immediate market reactions and underlying investor attitudes, helping investors position themselves strategically across various time frames. Here are the most mentioned/discussed tickers on Reddit from some of the most active Subreddits for trading:
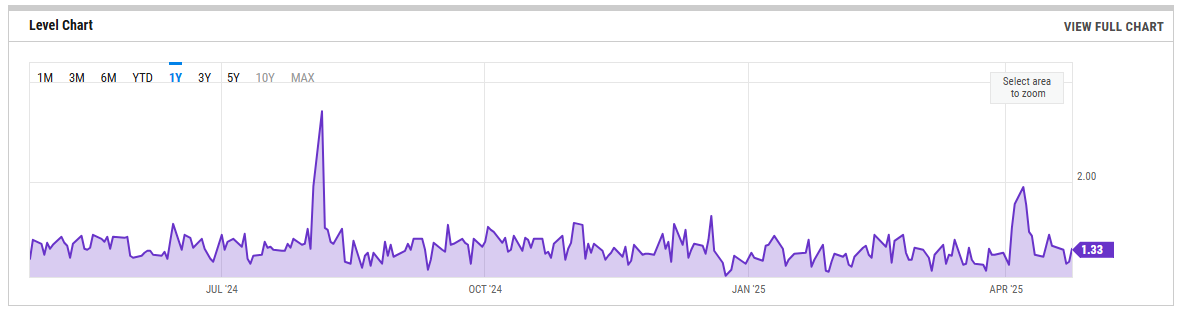
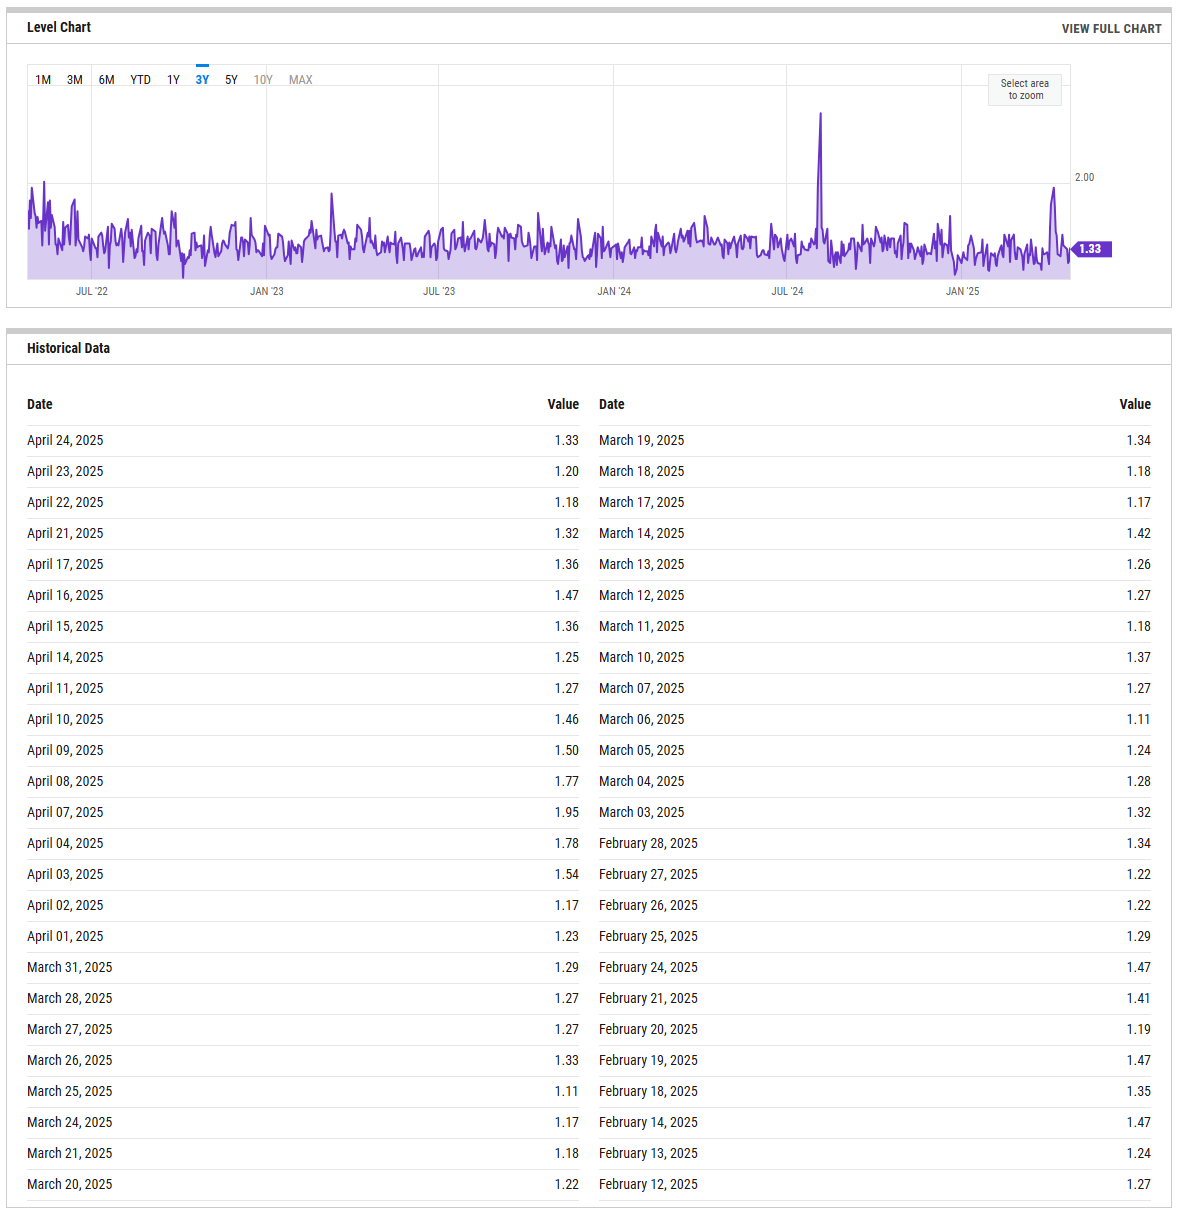
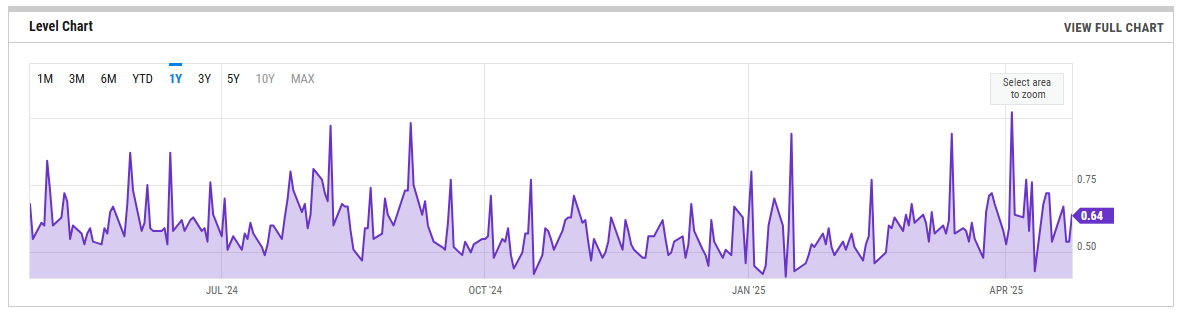
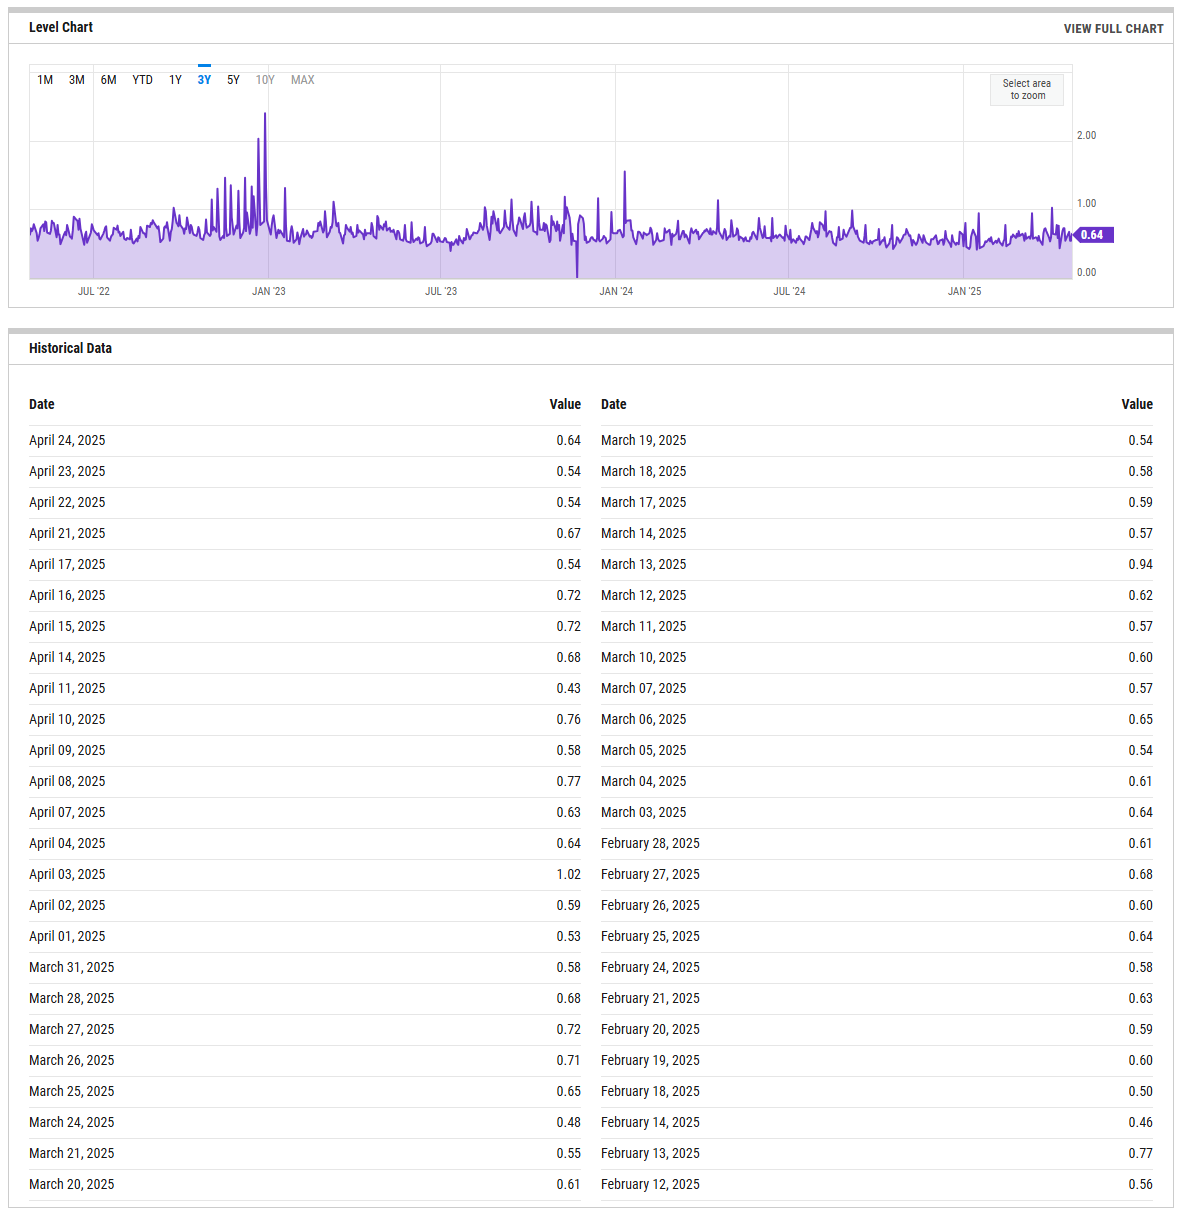
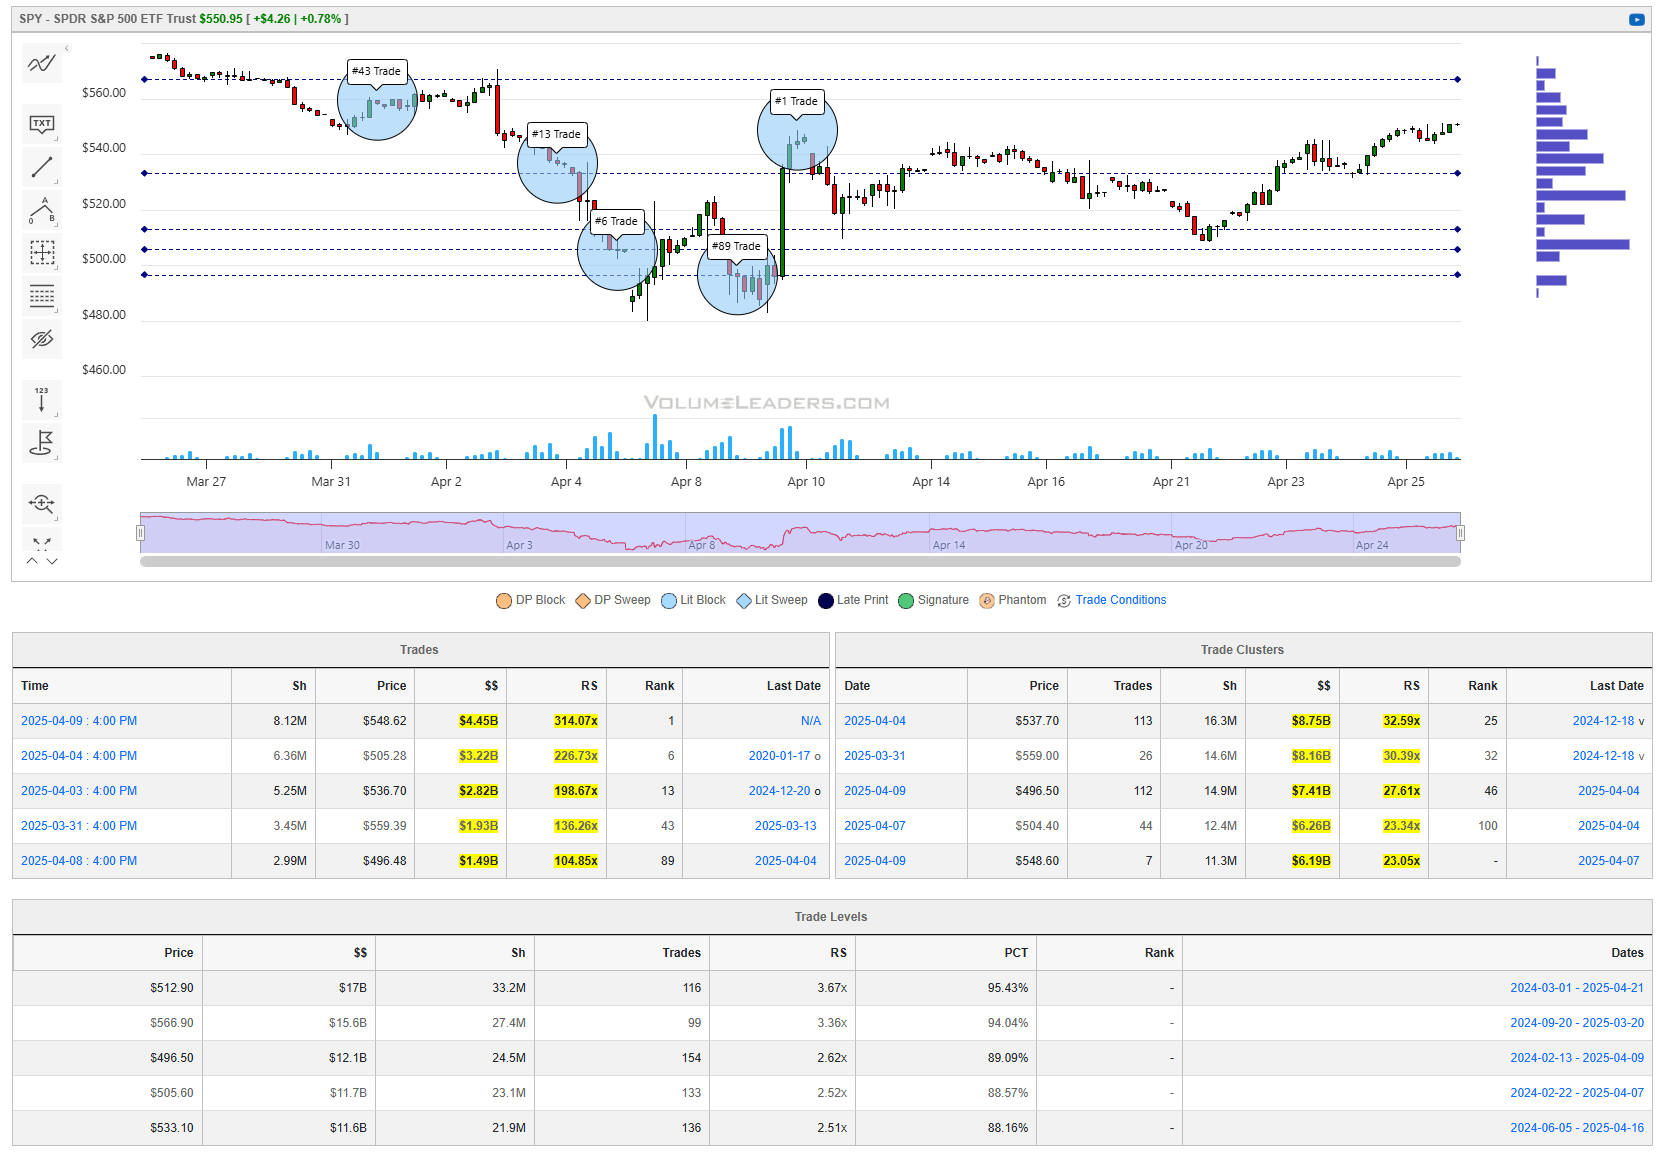
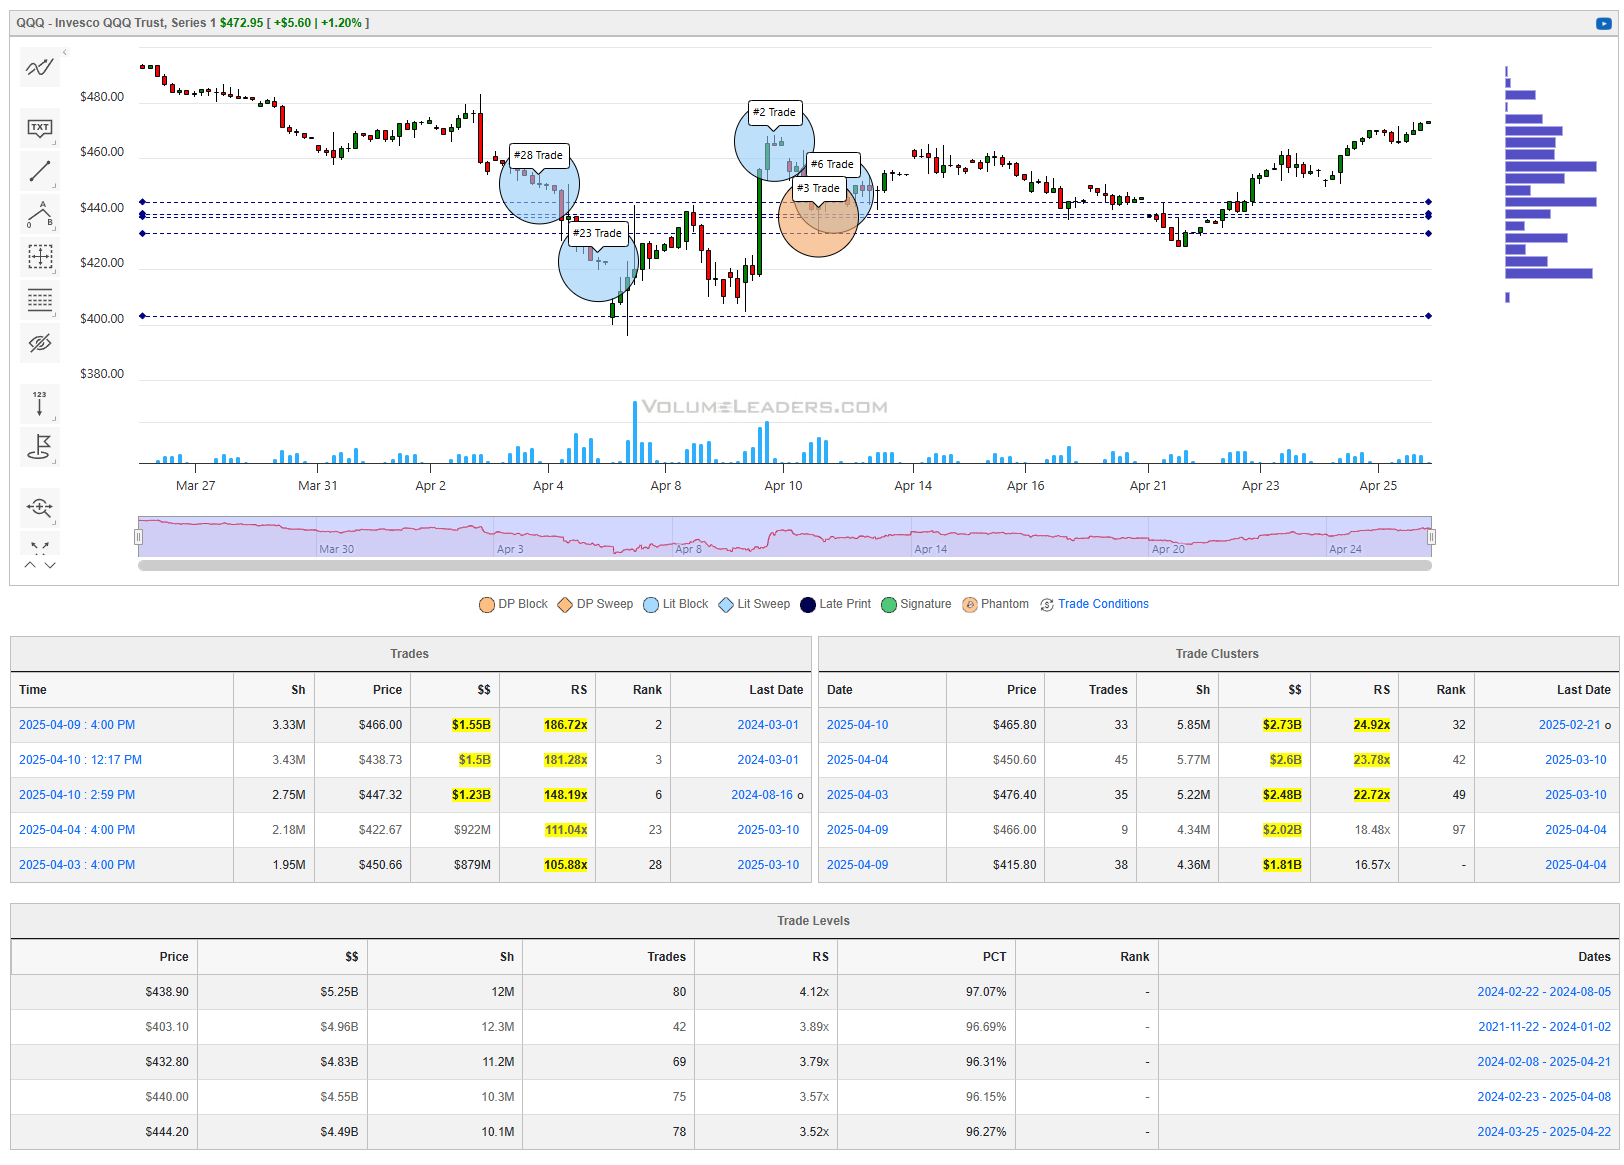
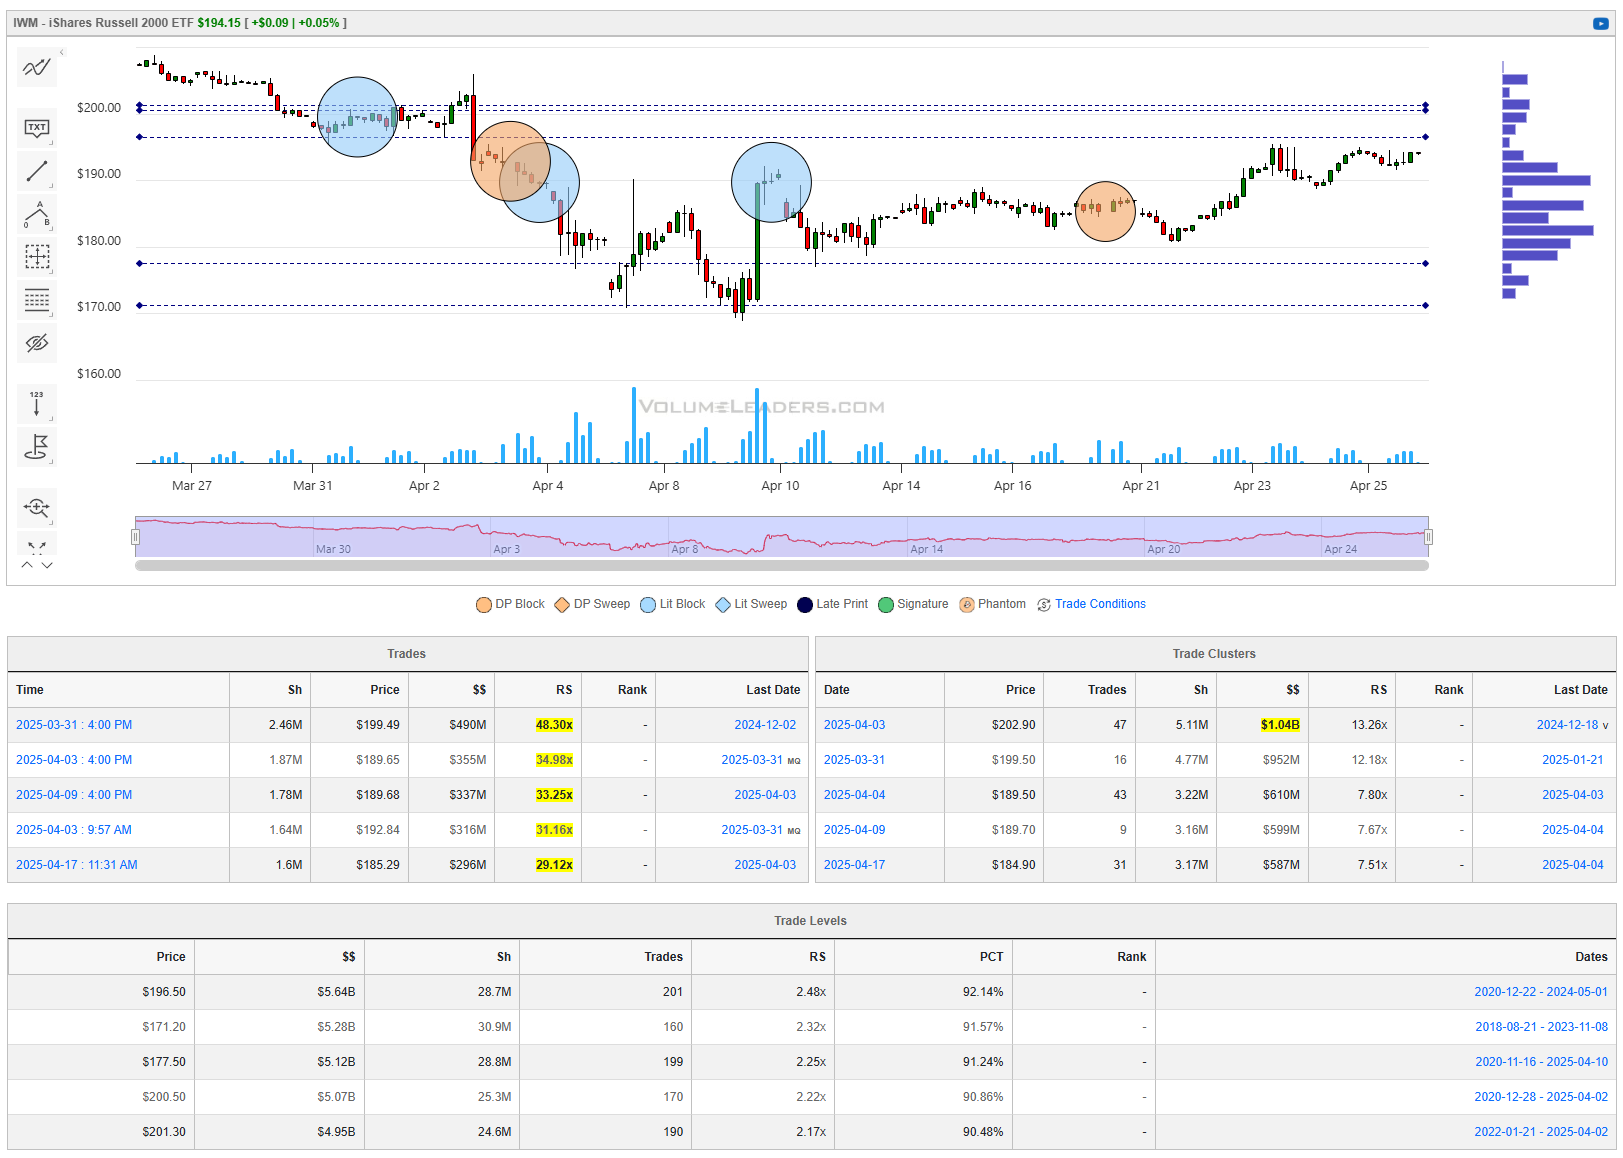
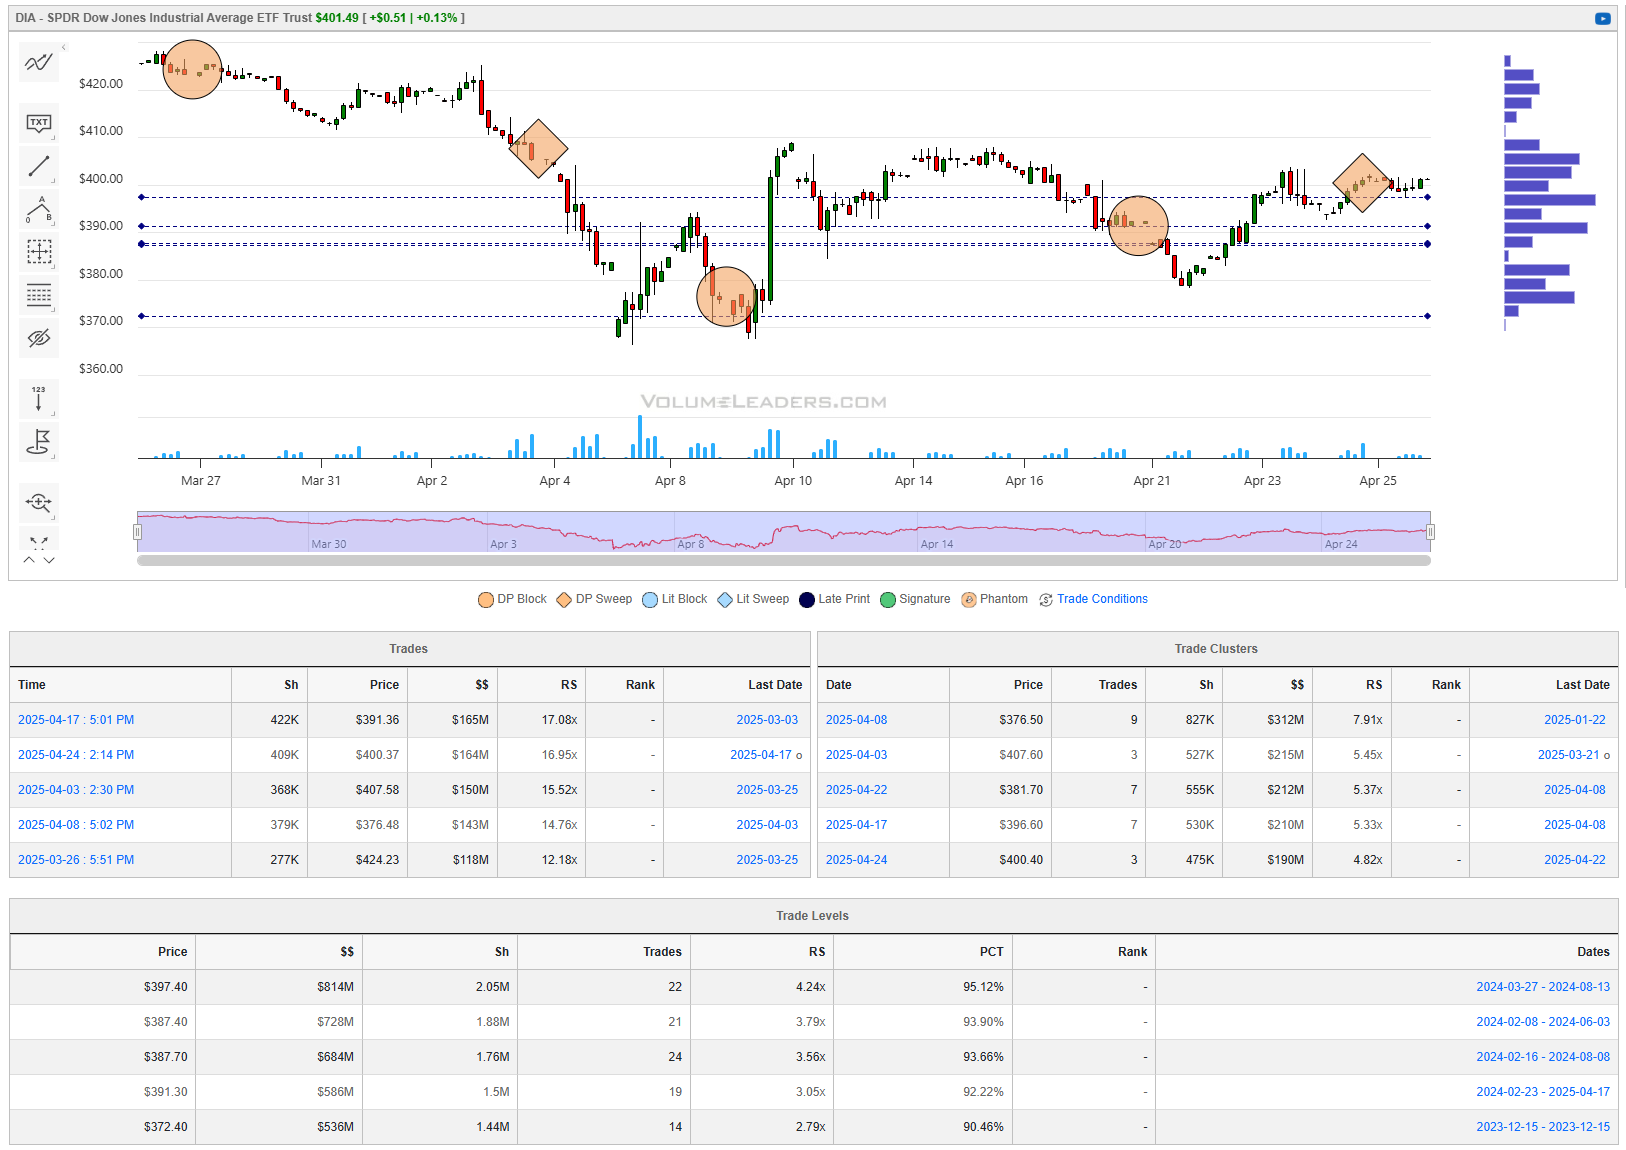
Institutional S/R Levels for Major Indices
When you’re a large institutional player, your primary goal is to find liquidity - places to do a ton of business with the least amount of slippage possible. VolumeLeaders.com automatically identifies and visually plots the exact spots where institutions are doing business and where they are likely to return for more. It’s one of the primary reasons “support” and “resistance” concepts work and truly one of the reasons “price has memory”.
Levels from the VolumeLeaders.com platform can help you formulate trades theses about:
Where to add or take profit
Where to de-risk or hedge
What strikes to target for options
Where to expect support or resistance
And this is just a small sample; there are countless ways to leverage this information into trades that express your views on the market. The platform covers thousands of tickers on multiple timeframes to accommodate all types of traders.
SPY
QQQ
IWM
DIA
Special Coverage
Navigating Sector Signals in an Uncertain Market
In late April of 2025, the U.S. equity markets find themselves at a crossroads. After a sharp sell-off precipitated by renewed tariff tensions with China and upheaval in the technology sector—most notably NVIDIA’s sudden charges arising from export restrictions on its China-bound AI chips—investors stand perched between fear and opportunity.

Beneath the surface of headline numbers lies a tapestry of sector rotations, breadth measures, and credit‑market dynamics that together constitute a living, breathing barometer of collective investor conviction. Let’s talk about the sectoral rotations that would validate a sustainable bull case or potentially provide the warning signs that herald deeper market storms. Over the coming weeks, as economic data, corporate earnings, and geopolitical developments unfold, these patterns will serve as our compass.
The Macro Crosscurrents
Tariffs have once again taken center stage in the global economic narrative. In mid-April 2025, the United States announced a significant escalation of duties on a swath of Chinese imports—ranging from advanced electronics to basic industrial goods—propelling headline rates on certain categories above 140 percent. Beijing’s retaliatory levies, in turn, tilted toward 125 percent on key U.S. exports, from soybean meal to luxury vehicles. Such tit‑for‑tat measures reverberated beyond diplomatic sniping; they seeped into boardrooms, disrupted supply chains, and ultimately cast a pall over corporate outlooks. Investors, ever attuned to profit warnings and forward guidance, sold first and asked questions later, pulling stocks lower in a synchronized global swoon.
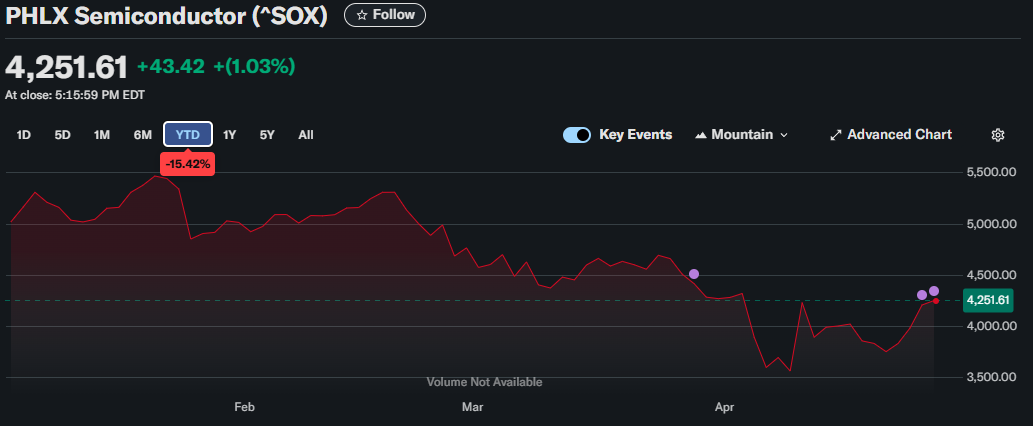
Compounding the tariff story was turbulence in the semiconductor sector. NVIDIA, the bellwether for AI‑driven growth, shocked markets by booking an estimated $5.5 billion in charges after fresh export controls barred the shipment of its new H20 chip to Chinese customers. The news marked a rare stumble for a company that, until then, had been the engine behind the Nasdaq’s relentless climb. Within hours, NVIDIA’s shares tumbled 6–7 percent, dragging down chipmakers across Asia and the United States alike. The Nasdaq 100 closed April 16 down more than 4 percent, wiping tens of billions in market capitalization off names from Micron to AMD. This episode crystallized a broader concern: technology’s golden era may be encountering a geopolitical speed bump, with unpredictable policy shifts threatening revenue streams and capital‑expenditure plans.
At the same time, Federal Reserve Chair Jerome Powell cautioned that while inflation was moderating, the full economic impact of tariffs—and the second‑round price adjustments they might trigger—remained uncertain. Without clear signs of a genuine slowdown in consumer prices, the Fed was unlikely to pivot aggressively toward rate cuts. For bond investors, this equated to a steely determination to hold yields at or near current levels; for equity traders, it translated to heightened volatility and a reluctance to commit wholeheartedly to either camp.

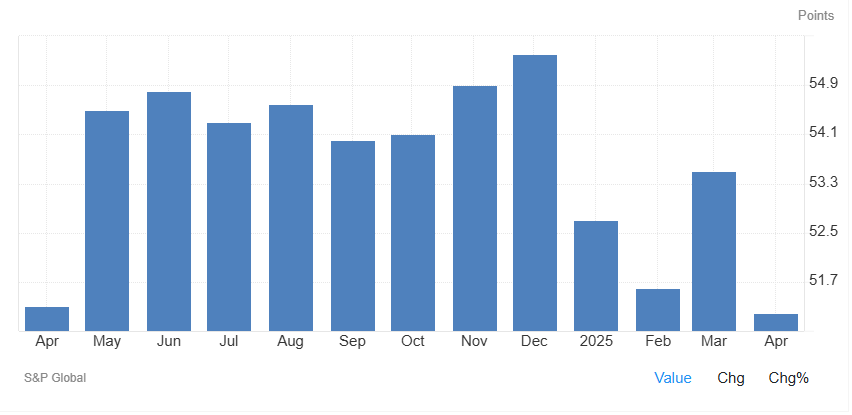
April’s flash U.S. Composite PMI fell to 51.2—its weakest in 16 months—indicates only marginal expansion as firms grappled with higher tariffs and input‑cost pressures. Meanwhile, U.S. equity futures continue trying to hold ground and invalidate any lingering concerns of a “dead cat bounce” in stocks, as erratic trade‑policy signals from Washington continue to perpetuate unease among investors. Growth remains fragile and that any long‑lasting recovery will require clearer tariff de‑escalation and stronger PMI prints.
Against this backdrop of policy friction, earnings season loomed. Analysts questioned whether corporate America could still defy rising input costs and choppy end‑demand conditions. Would cyclical names deliver upside surprises, or would defensive sectors—health care, staples, utilities—once again demonstrate their relative safety? The answers would reverberate through sector rotations, ultimately determining whether the market’s next move was up, down, or sideways. A lot of familiar names in coming days:
Sector Rotations That Signal a Bull Case
A sustainable bull market demands breadth—it is not enough for a handful of mega‑caps to rally; participation across cyclical, financial and consumer‑driven sectors is paramount. The first sign of recovery lies in the industrial complex. When the Dow Transports index decisively breaks above its recent consolidation, it confirms CEOs are ordering more equipment, cargo volumes are rising, and global trade is humming. Accompanying this should be a composite purchasing managers index (PMI) for manufacturing that edges back above 50, driven by strength in new orders and export demand.
Materials stocks serve as the next proving ground. The rebound in copper futures need to continue holding above $4.50 per pound—backed by strong demand in China and replenishment in U.S. building materials—speaks to renewed optimism in infrastructure spending and base‑metal end‑users. With miners boosting guidance and reducing hedge book discounts, the XLB 0.00%↑ sector ETF outperformance relative to the S&P 500 by 2 percent over five trading days would be a clear bullish breadcrumb.

Energy also plays a starring role. Crude oil prices should lift, reinforced by OPEC+ discipline and resilient U.S. refinery margins, pointing to an environment where energy companies can restore capital returns—dividends and buybacks—while funding new exploration. A steady rise in XLE 0.00%↑ alongside a flattening of the curve in WTI futures would suggest traders anticipate tighter balances ahead, which would embolden equity bulls.
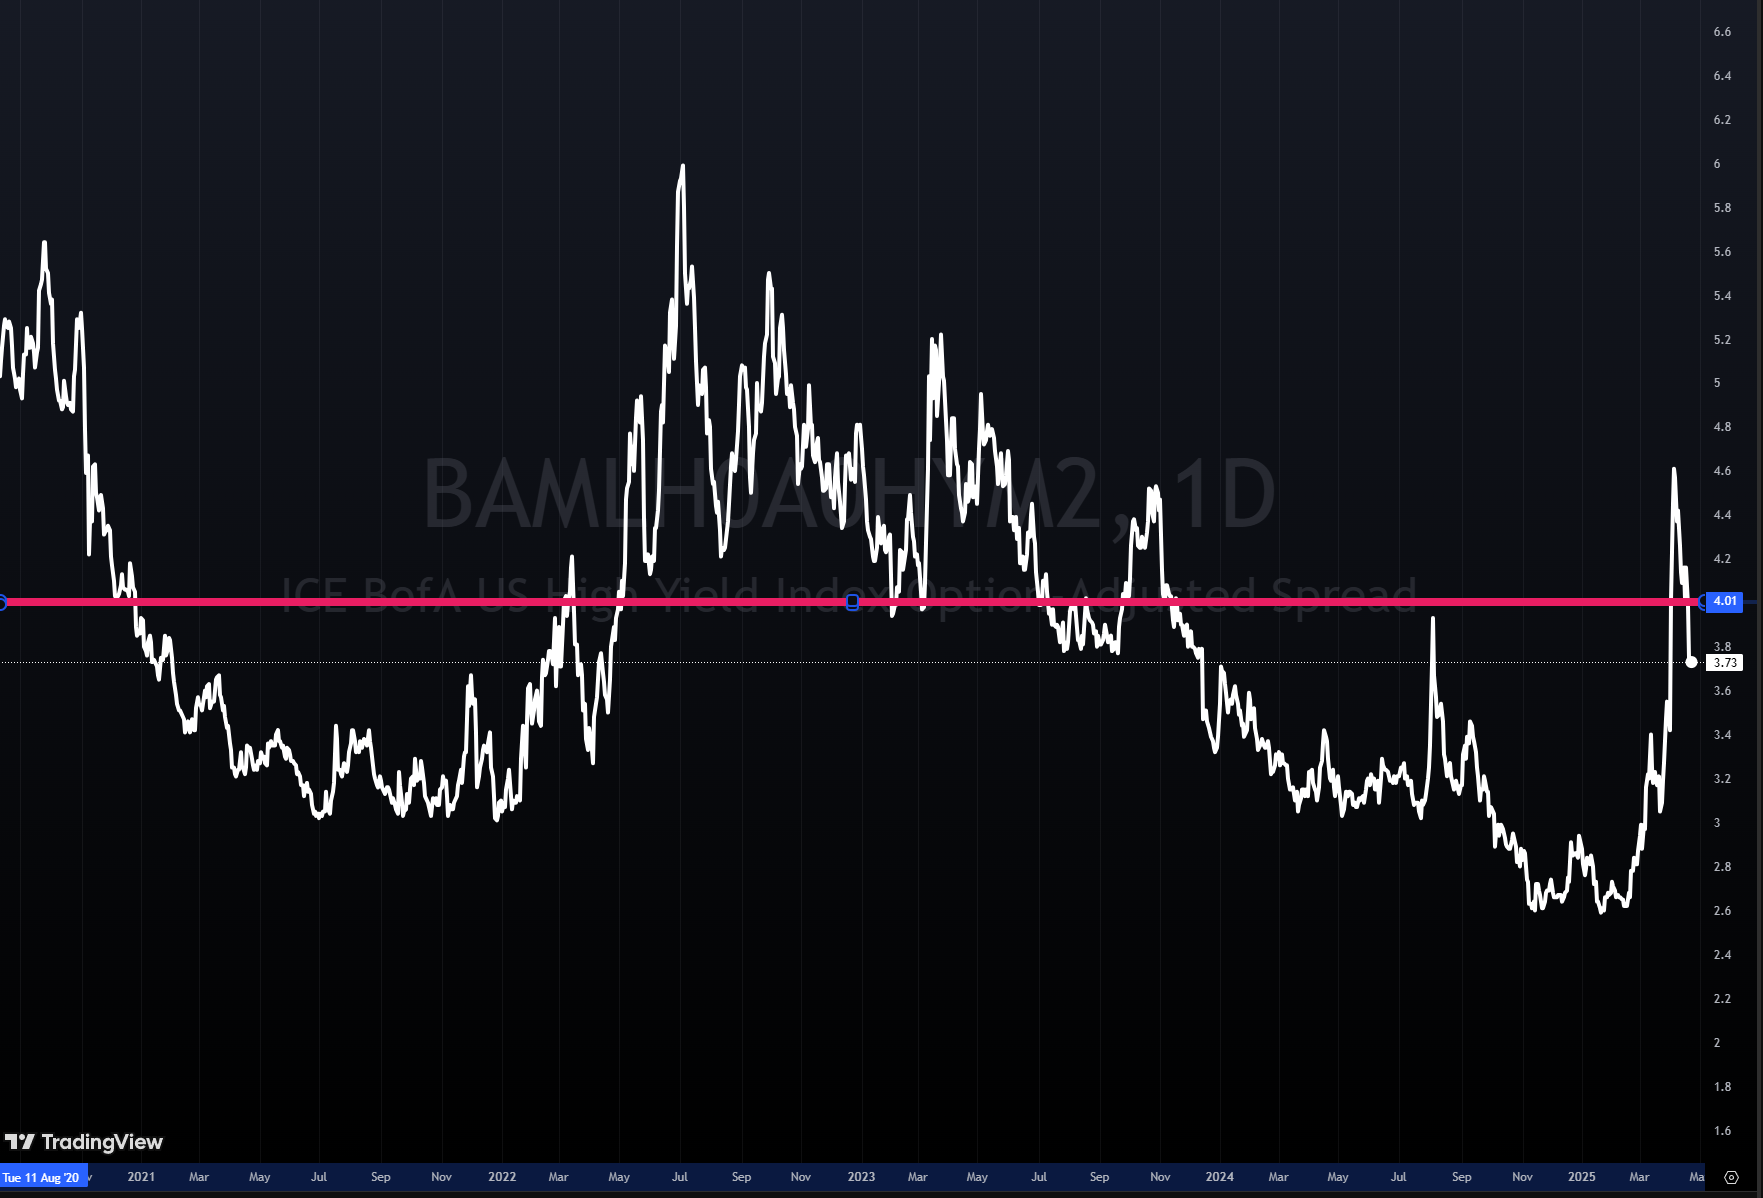
Financials provide a further litmus test. A modest steepening of the Treasury yield curve—measured by the 2s‑10s spread widening from 40 basis points back toward 60 basis points—indicates banks can widen net interest margins. As credit spreads tighten, with the ICE BofA US High Yield index retracing recent wides from 450 basis points to below 400, risk appetite for leveraged loans and noninvestment grade debt returns. This rotation into XLF and regional-bank ETFs underscores confidence that the economic cycle has not prematurely ended.
On the consumer front, discretionary names must outpace staples. A surprise uptick in retail sales—driven by robust online apparel and leisure services—concurrently with a rise in consumer‑sentiment indices above their six‑month averages would highlight that households feel safe spending on non‑essentials. Housing-related equities, from home‑improvement chains to furniture retailers, rallying in concert with a modest pullback in mortgage rates below 5 percent, indicate a lifeline for an economy still tethered to housing activity.
Perhaps most critically, technology’s rally must broaden beyond the “Magnificent Seven.” While NVIDIA and its peers might lead the narrative, mid‑cap semiconductor equipment makers—companies like KLAC 0.00%↑ and LRCX 0.00%↑ —need to confirm with upbeat capex guidance. A move in the SOX semiconductor indices into positive territory on fresh fab‑build announcements would cement tech’s role as a growth engine rather than a spectator sport confined to seven stocks.
Underlying all of these rotations, market‐breadth measures must confirm the change in regime. The NYSE advance/decline cumulative line making new highs, even as the S&P 500 tests its post‑sell‑off lows, signals that more stocks are joining the advance. The Russell 2000 outperforming the large‑cap benchmarks by 1–2 percent over a rolling week reflects a democratization of the rally—an essential condition for durable bull markets.
A cherry-on-top would be seeing insider buying start to ramp. Insider selling can happen for a number of reasons that have nothing to do with a lack of confidence or negative outlook - tax planning, exercising stock options, 10b5-1 trading plans, and many more - but insider buying quite often signals confidence in future projects/performance and perceived undervaluations.
Warning Signs and Bearish Signals
Even as bulls tout the potential for a snap‑back, several warning lights could pivot sentiment sharply back to the downside. Defensive leadership is often the first harbinger of market malaise. If health care ( XLV 0.00%↑ ) and staples ( XLP 0.00%↑ ) continue to outperform by 2–3 percent while the broader market flattens, it reveals that investors are choosing safety over growth, paying up for predictability at the expense of upside capture.
Financials rolling over represents another red flag. Banks lagging the S&P 500 by more than 2 percent suggests that net interest margins are under threat—either because the yield curve is flattening anew or because credit concerns outweigh any rate‑hike reprieve. A reversal of the 2s‑10s spread back toward zero, or an outright inversion, would echo recessionary fears, pushing XLF and broker‑dealer stocks into bear territory.
Cyclicals fading across the board—industrials, materials, energy each trailing by 1–2 percent over consecutive trading days—indicates that growth expectations are receding. Should ISM new‑orders indices slip back below 50, the myth of a “tariff‑driven acceleration” evaporates, leaving only the sting of higher input costs.
Significant underperformance in consumer discretionary is equally ominous. Retailers warning on same‑store sales, leisure stocks missing guidance, and a dip in consumer‑sentiment readings below 60 point to a retrenchment in household spending—a core pillar of U.S. GDP. When XLY 0.00%↑ lags, broad economic health is in question.
Narrowing tech breadth is perhaps the most painful of all. A disconnect where the Nasdaq is held up by just five mega‑caps while small‑ and mid‑cap tech ETFs languish suggests the rally’s heart has stopped. Any sizable capex guidance cuts—especially among foundry operators or memory‑chip makers—would confirm that the AI spending boom may be oversold.
On a more systemic level, credit and volatility stress tell the tale. High‑yield spreads widening back above 400 basis points, coupled with the VIX spiking beyond 25 and refusing to subside, reveal that fear has transcended transient shocks and embedded itself in risk‑premia. In these conditions, even neutral sectors can become collateral damage.
Finally, true capitulation often manifests in safe‑haven rallies. Treasury yields plunging—10‑year yields breaking below 3 percent—and gold pushing into recent highs underscore a fundamental loss of confidence in equities. These moves, when sustained, mark the onset of deeper corrections rather than mere tactical pullbacks.
Pathways Forward
In the weeks ahead, investors will weigh sectoral signals against real‑time data: payrolls reports, ISM surveys, Fed minutes, and corporate earnings. To make this concrete, below are our best‑estimate projections for the S&P 500 over the next one, two, and three weeks, along with percentage likelihoods and key contingencies.
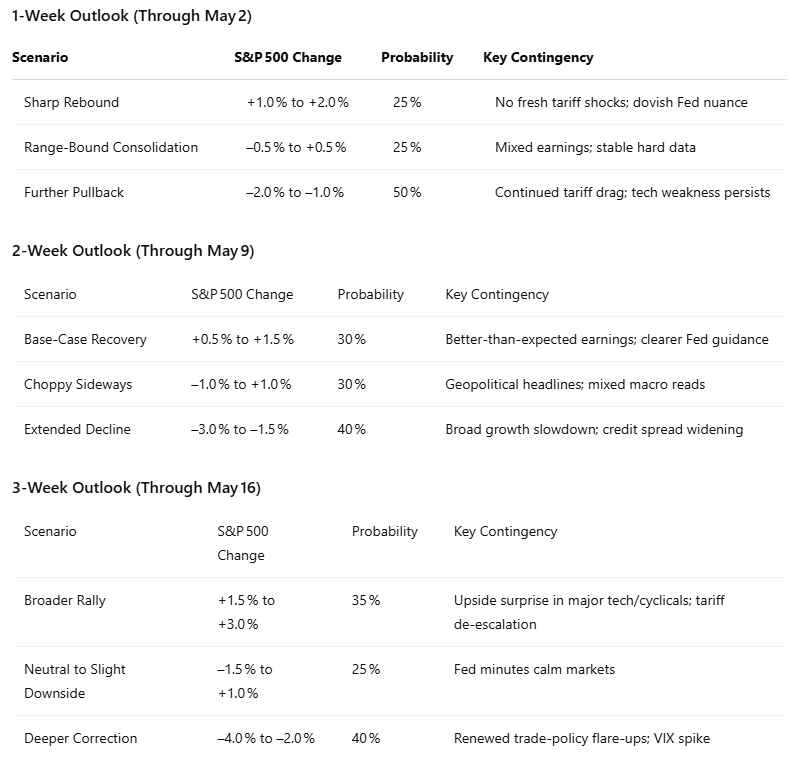
Adjusting Probabilities
Each new escalation in tariffs now carries a ~12 percent shift toward downside paths.
Conversely, a meaningful de‑escalation or trade‑talk breakthrough can shift ~12 percent probability toward bullish outcomes.
Earnings guidance surprises matter: upside guidance revisions can shift ~8 percent probability toward bullish scenarios, while downside guidance cuts can add ~8 percent weight to bearish outcomes.
Flash PMI surprises to the downside adjust further‑pullback odds upward by ~5–10 percent.
A clear Fed signal of patience or pivot can reallocate up to 8 percent probability toward bullish scenarios.
April 28–29 (Goods Trade Balance, Retail & Wholesale Inventories): Disappointing trade or inventory data could tilt downside odds by 3–5 percent if they signal inventory buildups or weak export demand.
April 30 (GDP Growth QoQ, Core PCE Price Index): A GDP advance read below 1.5 percent or core PCE above forecasts could shift ~8 percent toward bearish scenarios (growth concerns or sticky inflation).
May 1–2 (ISM Manufacturing PMI, Nonfarm Payrolls, Unemployment Rate): PMI below 50 or payrolls missing consensus by 100k+ could reallocate ~7 percent to downside paths; conversely, strong prints could boost recovery odds by ~7 percent.
May 5–6 (ISM Services PMI, Trade Balance): A services PMI under 52 might nudge 4 percent toward bearish outcomes, while a narrower trade deficit can add 3 percent to bullish cases.
May 7 (Fed Interest Rate Decision & Press Conference): This is a binary event. A dovish tilt (e.g., signaling rate cuts) could reassign up to 15 percent toward bullish paths; a neutral or hawkish stance could add 15 percent to downside scenarios.
By overlaying these event‑specific adjustments onto our existing contingency framework, market participants can react swiftly and recalibrate probabilities as fresh data arrives.
Derivation of Probability Weights
The percentage shifts assigned to each event and scenario are grounded in a combination of historical market sensitivities, volatility analysis, and expert judgment:
Historical Sensitivity Analysis: We reviewed past instances of tariff escalations/de‑escalations and tracked subsequent 1‑ to 3‑week S&P 500 moves. On average, each significant tariff change correlated with a 10–15 percent shift in downside backbone risk, justifying our ~12 percent estimate.
Earnings Guidance Impact: Analyzing S&P 500 constituent guidance revisions over the last five earnings seasons showed that cumulative upside revisions historically lifted index probabilities by roughly 6–10 percent, leading us to adopt an ~8 percent rule of thumb.
PMI & Macro Surprises: Flash PMI data surprises of ±1 standard deviation historically moved short-term index performance bands by 3–10 percent. We positioned our shifts within this empirically observed range.
Fed Communication Effects: Fed meeting leaks and post‑meeting statements typically swing market tilt by up to 15 percent in either direction, based on volatility spikes around FOMC days.
Expert Calibration: Finally, these metrics were adjusted using forward‑looking judgment—accounting for current volatility regimes, market positioning, and unique geopolitical contexts—to refine each weight.Conclusion
Markets rarely move in straight lines. They are the product of myriad actors—traders, allocators, corporations, central banks—each with their own motivations and constraints. Yet in the crosscurrents of tariffs, tech shocks, and policy signals, a clear narrative emerges through sector rotations and breadth measures. Whether the next leg is up, down, or simply sideways will hinge on which sectors take the helm. By watching those rotations—both the bullish surges and the bearish retreats—investors can navigate the uncertainty with greater conviction, positioning themselves on the right side of the market’s next decisive move.
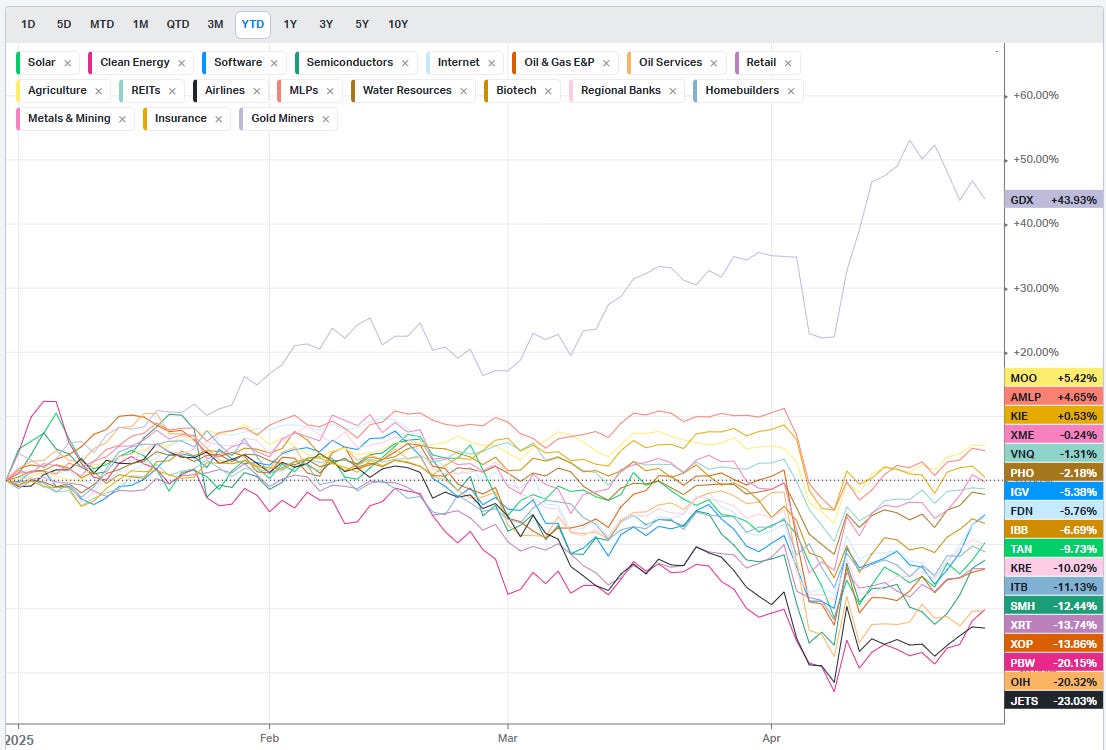
Summary Of Thematic Performance YTD
VolumeLeaders.com offers a robust set of pre-built thematic filters, allowing you to instantly explore specific market segments. These performance snapshots are provided purely for context and inspiration—think about zeroing in on the leaders and laggards within the strongest and weakest sectors, for example.
S&P By Sector
S&P By Industry
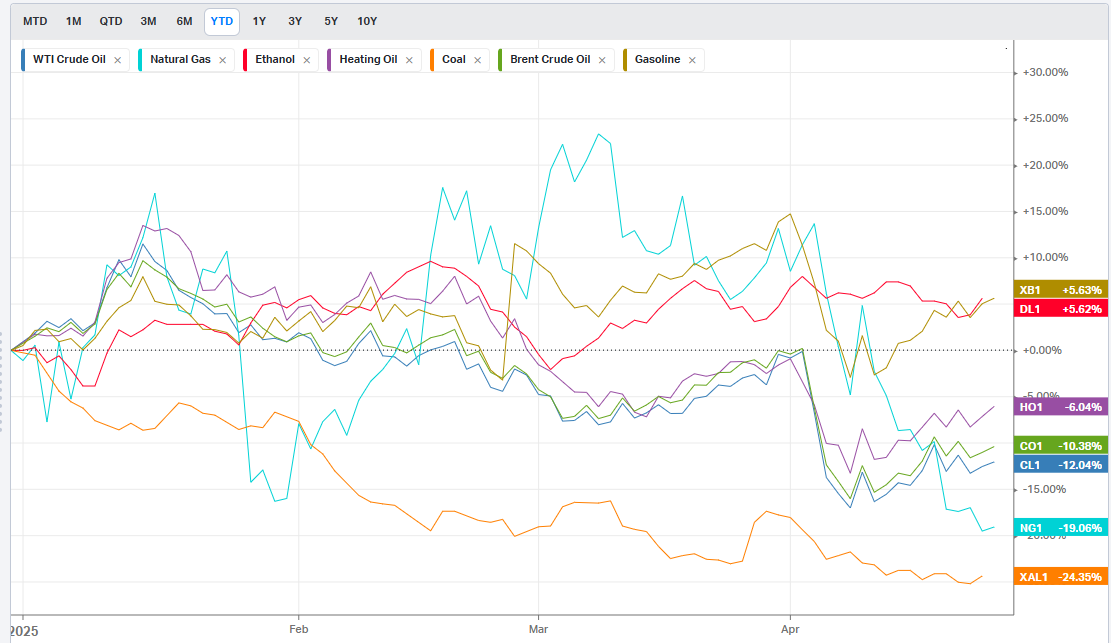
Commodities: Energy
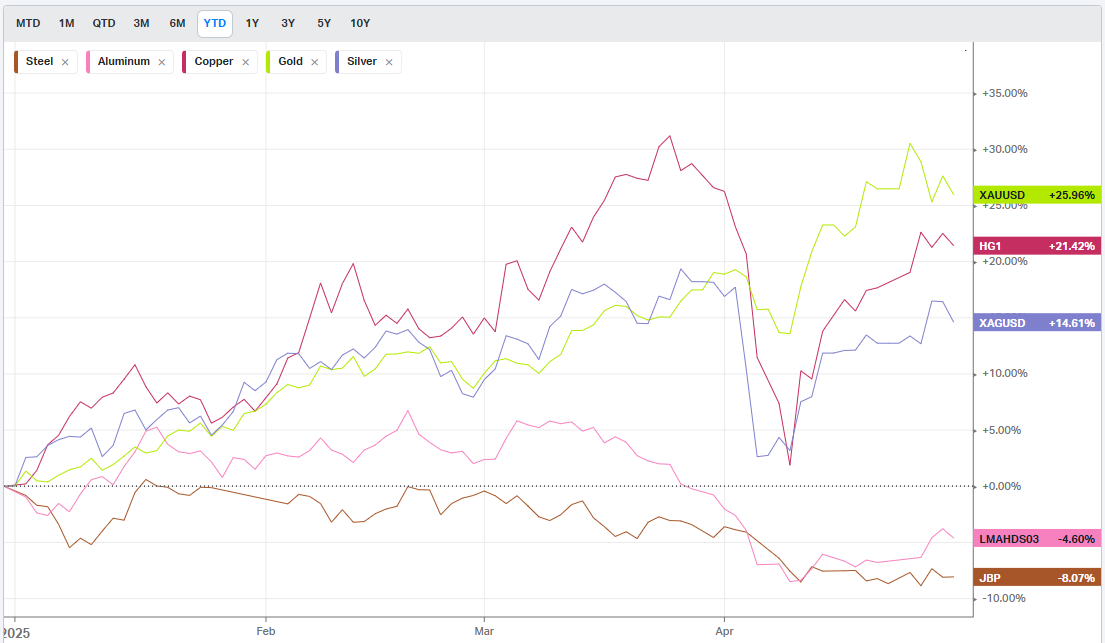
Commodities: Metals
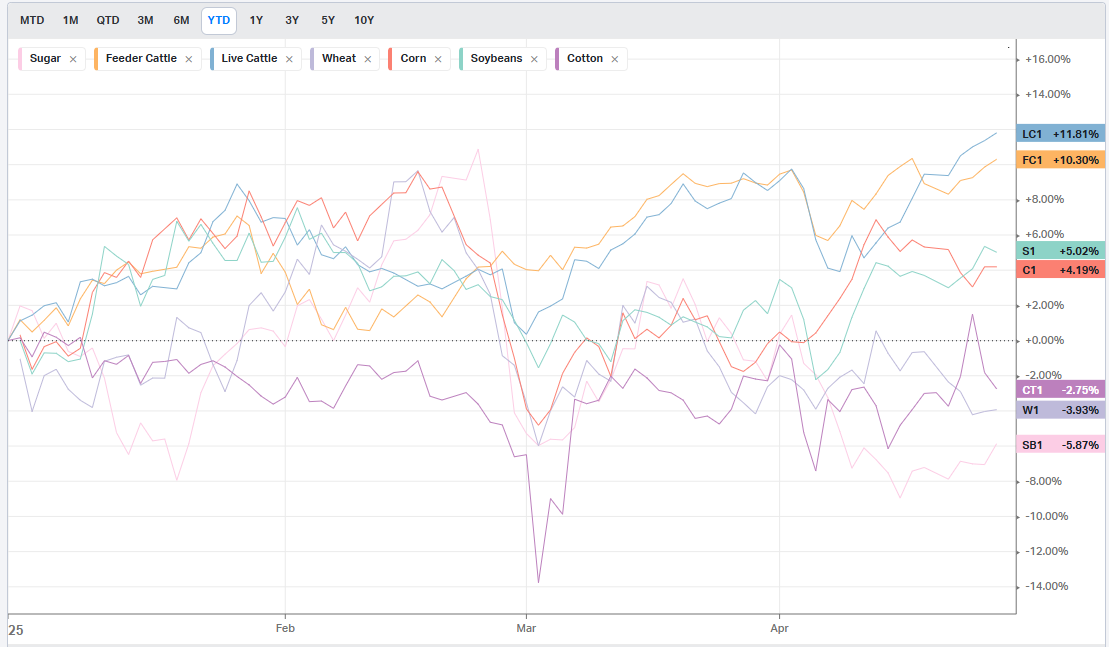
Commodities: Agriculture
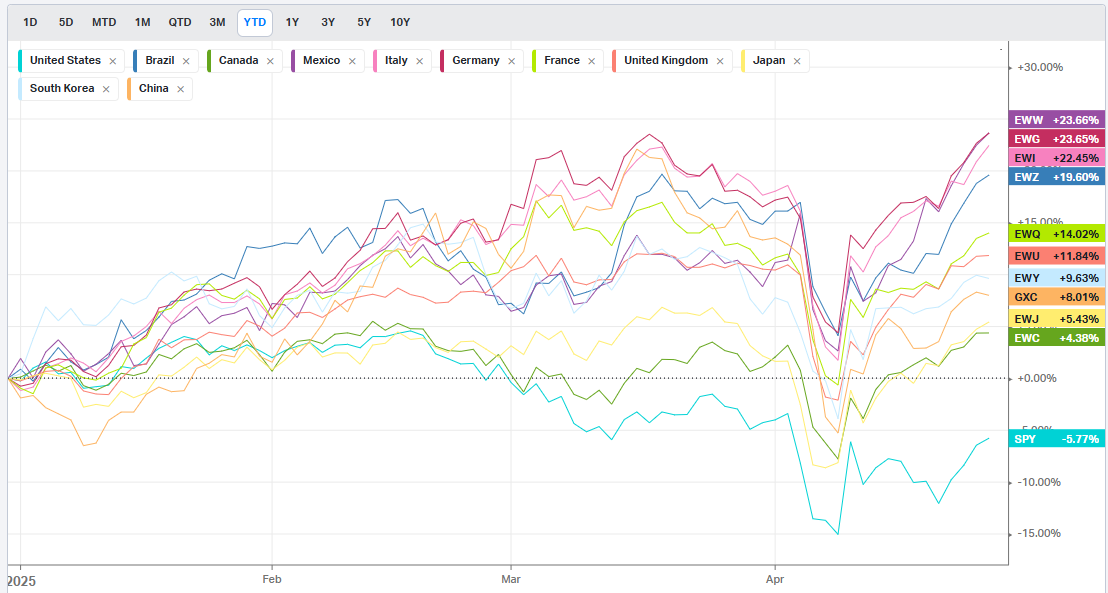
Country ETFs
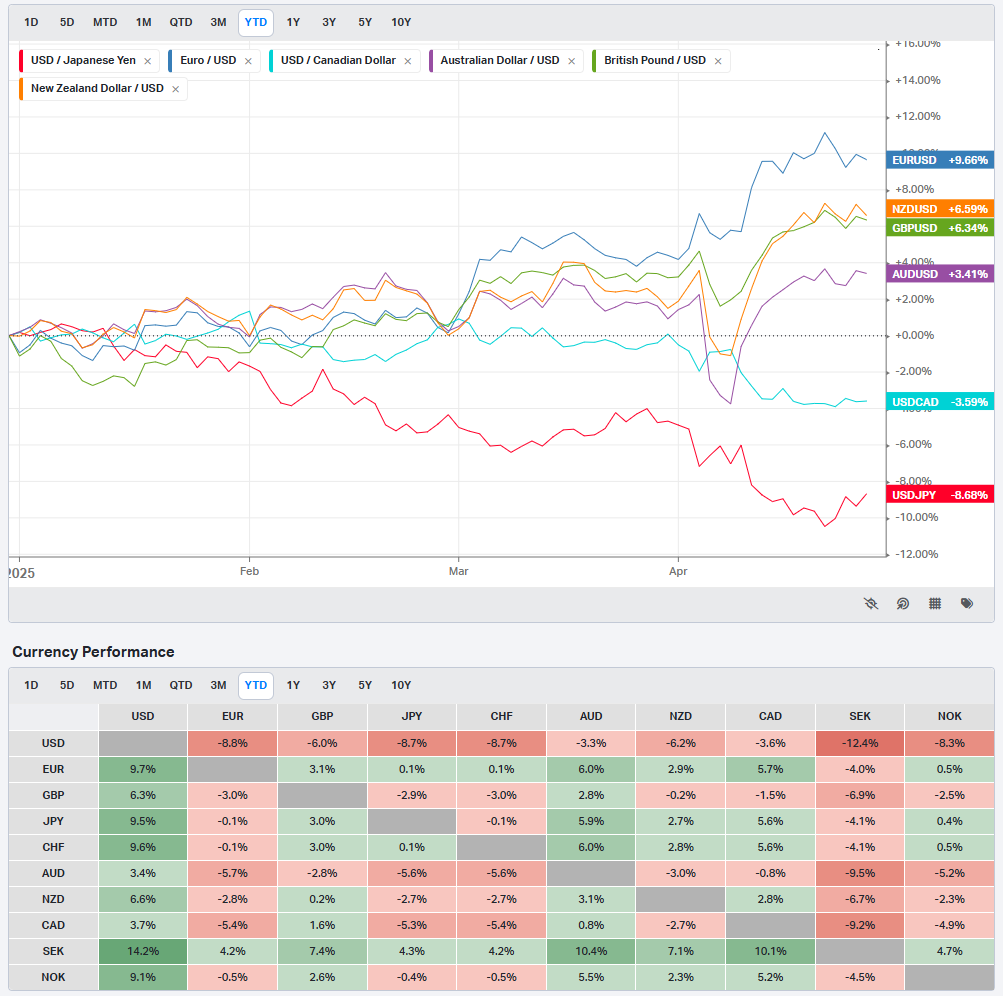
Currencies
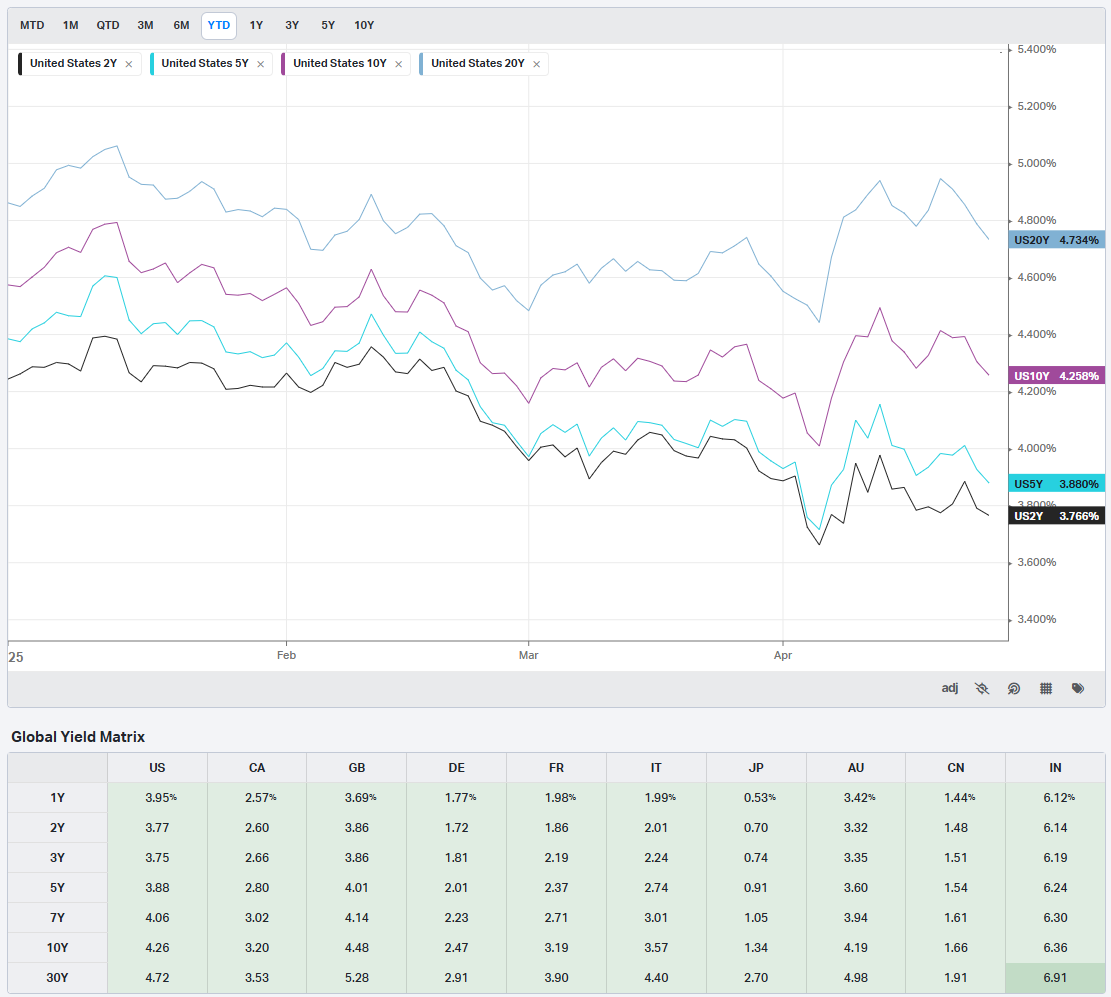
Global Yields
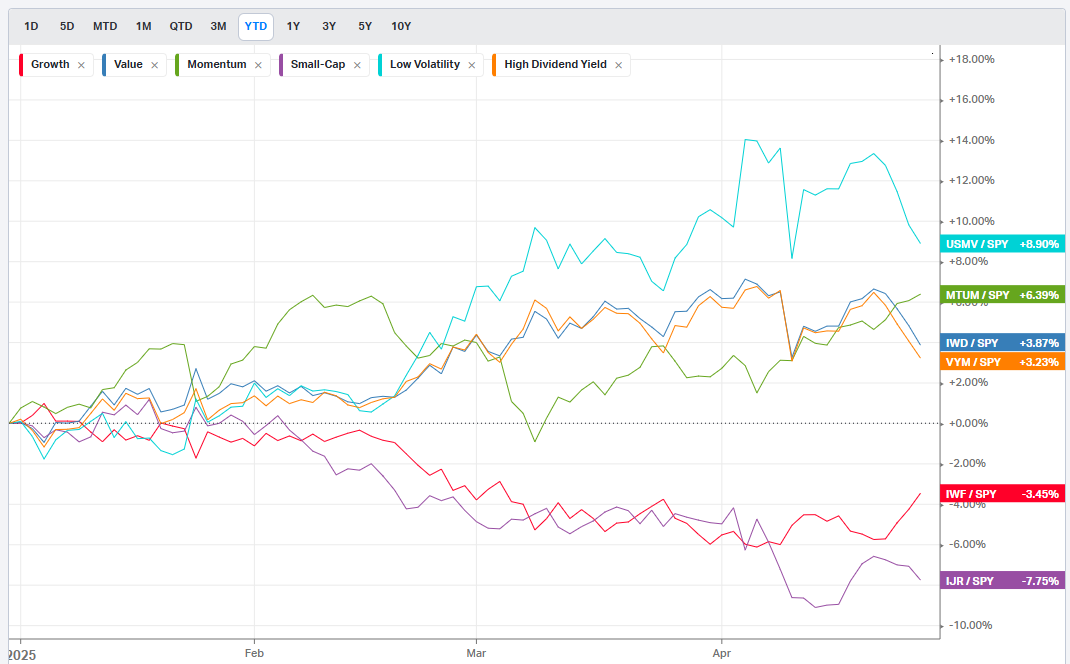
Factors: Style
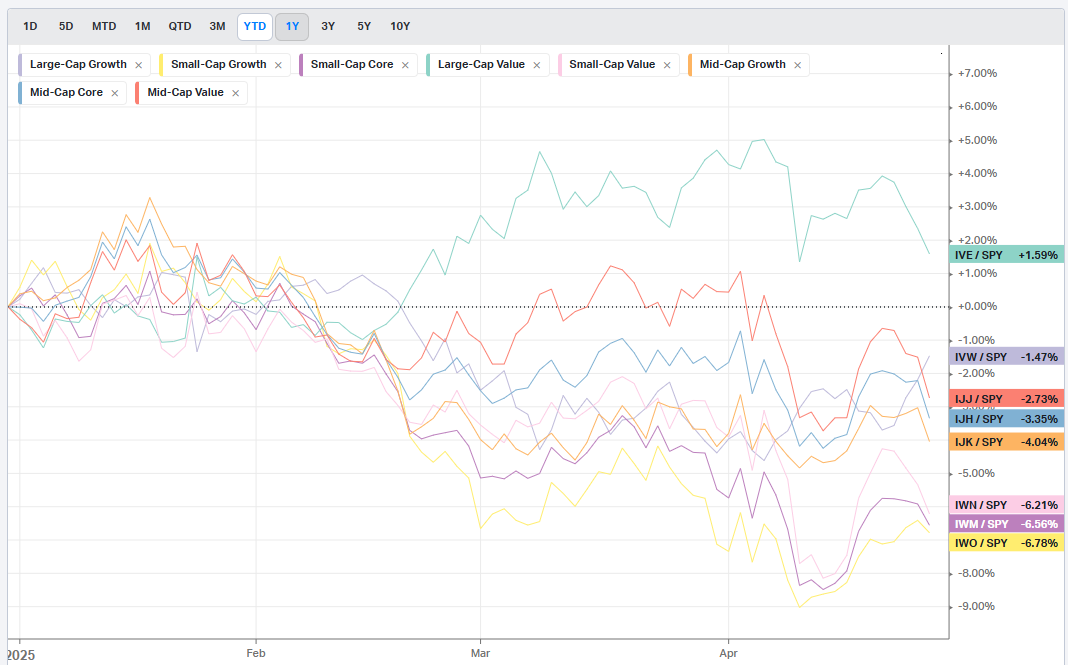
Factors: Size vs Value
Factors: Qualitative
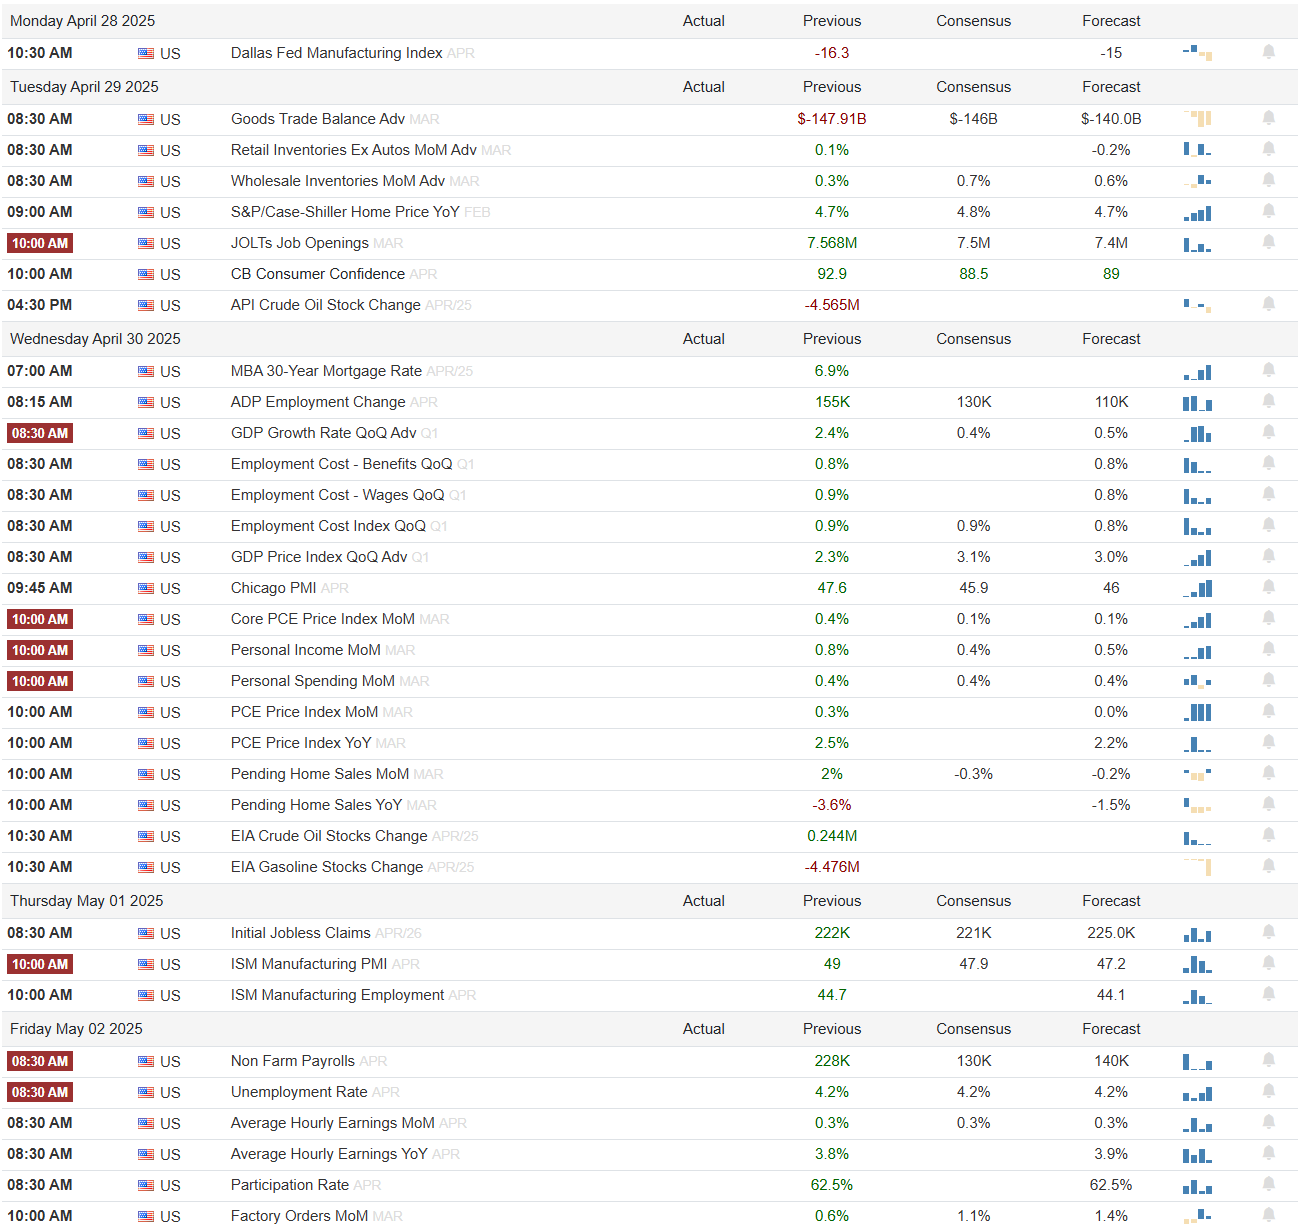
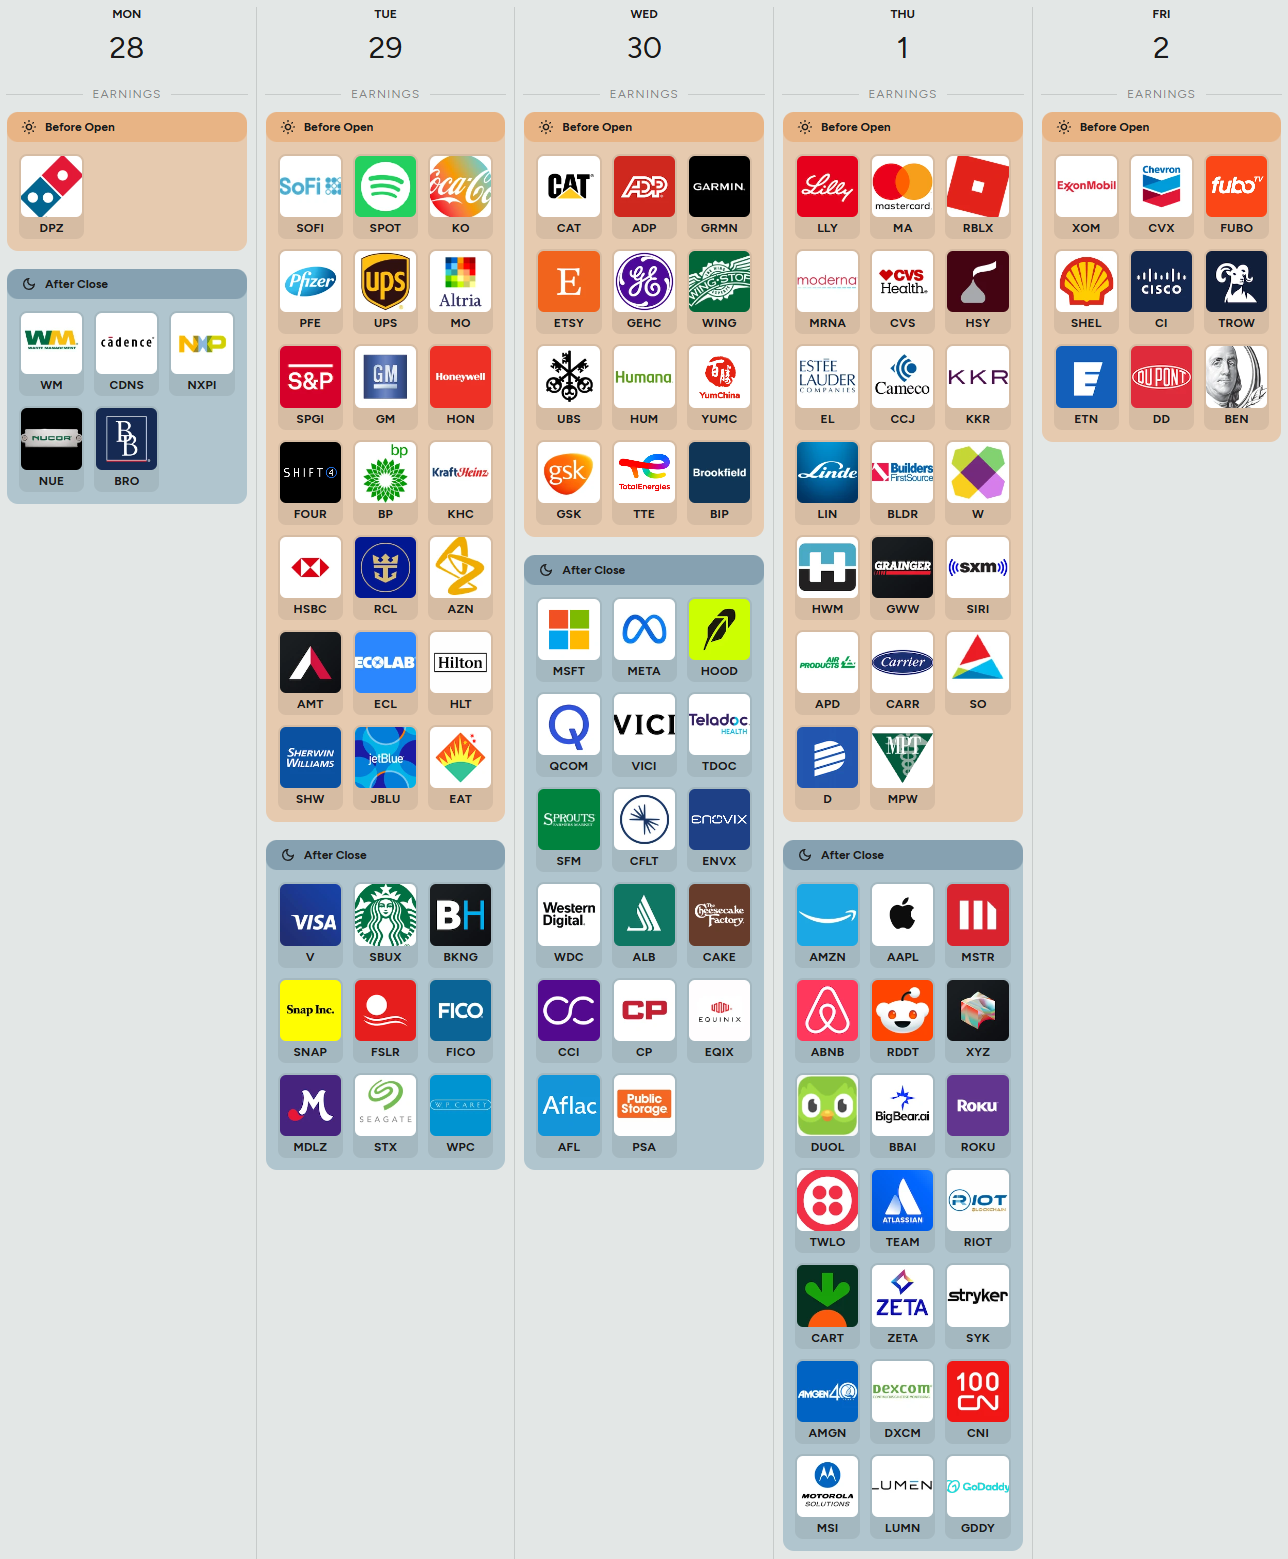
Events On Deck This Week
Here are key events happening this week that have the potential to cause outsized moves in the market or heightened short-term volatility.
Econ Events By Day of Week
Anticipated Earnings By Day of Week

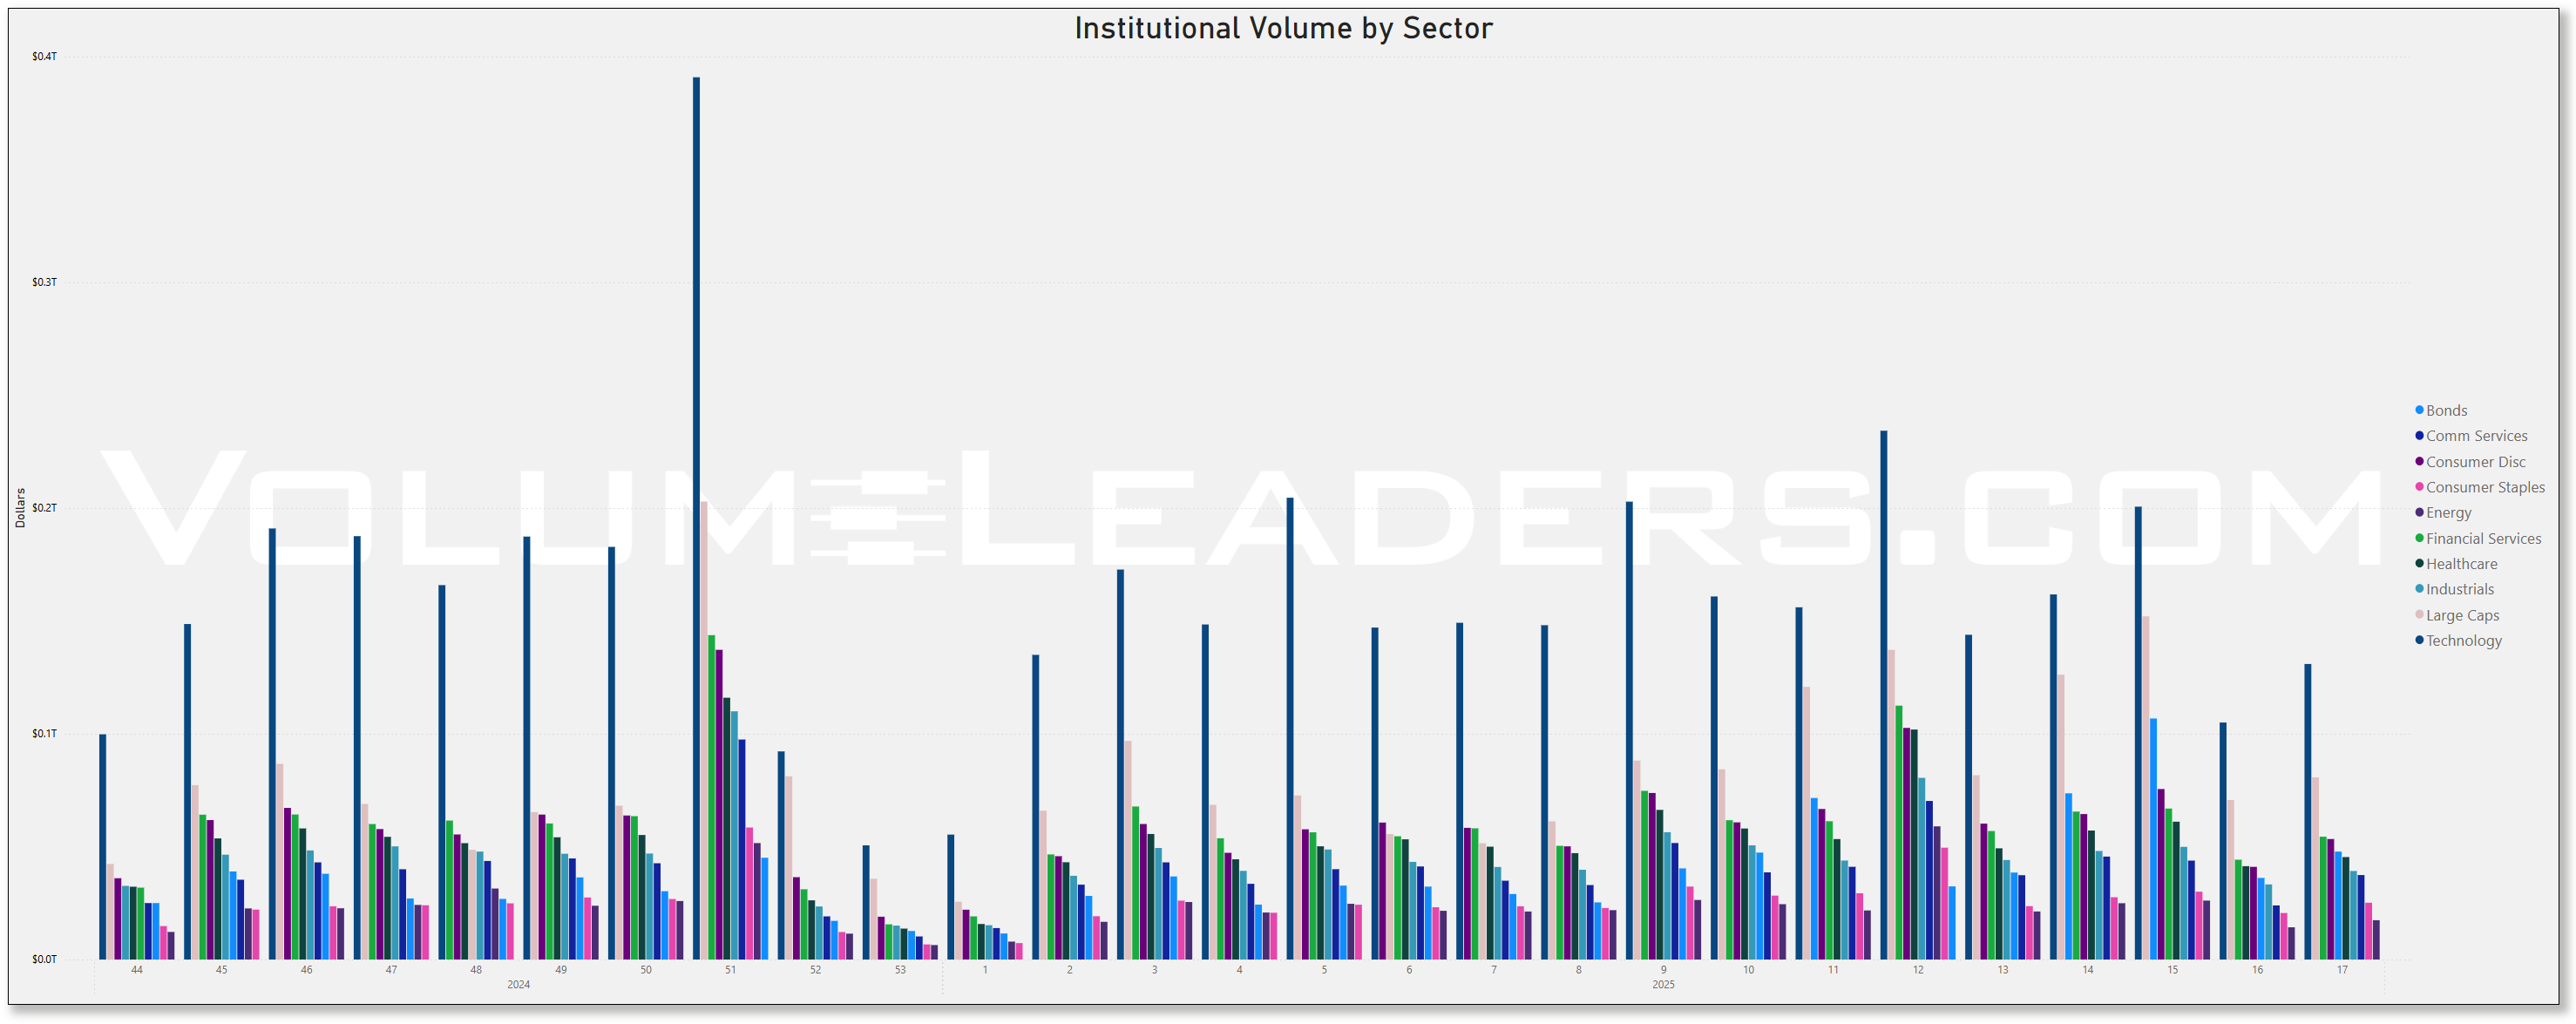
Institutional Order Flow
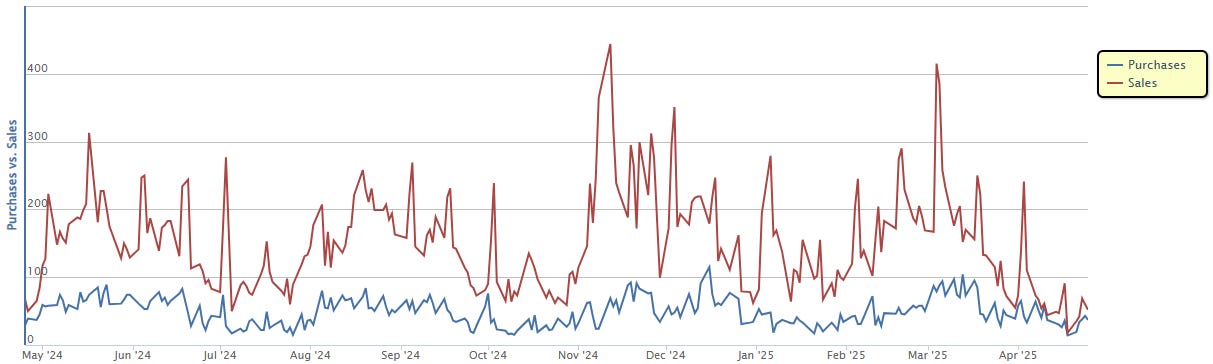
Rolling 90-Day Dollars By Day
This chart shows institutional activity by dollars by day on a rolling 1-year basis. From a theoretical standpoint, examining a chart of daily institutional dollar activity over the course of a year can offer several insights and possible inferences, though all should be approached with caution since the data alone may not prove causality or confirm underlying reasons. Some potential takeaways include:
Event-Driven Behavior:
Sharp, singular spikes on certain days might correlate with major market-moving events. These could include central bank policy announcements, significant geopolitical news, sudden macroeconomic data releases (like employment reports or GDP data), earnings seasons for large-cap companies, or unexpected shocks (e.g., mergers, acquisitions, regulatory changes).Liquidity Dynamics:
Institutions often concentrate large trades on days with higher expected liquidity. For instance, heightened activity might coincide with index reconstitutions, option expiration dates, or the days leading up to or following a major index rebalance, when large amounts of capital shift hands simultaneously.Risk Management and Hedging Activity:
Institutions may significantly adjust their exposures on days that are critical from a risk management perspective. Large spikes can occur if hedge funds, pension funds, or asset managers are rolling over futures contracts, initiating or closing out large hedges, or reacting to volatility triggers.Market Sentiment Indicators:
While the data is purely transactional, the sheer volume of institutional involvement on certain days might indirectly hint at changing sentiment or strategic shifts.
In essence, a chart like this can lead you to hypothesize that institutional trading volumes are not constant or random but rather influenced by a mix of predictable calendar effects, major market events, liquidity considerations, risk management decisions, and strategic allocation shifts.
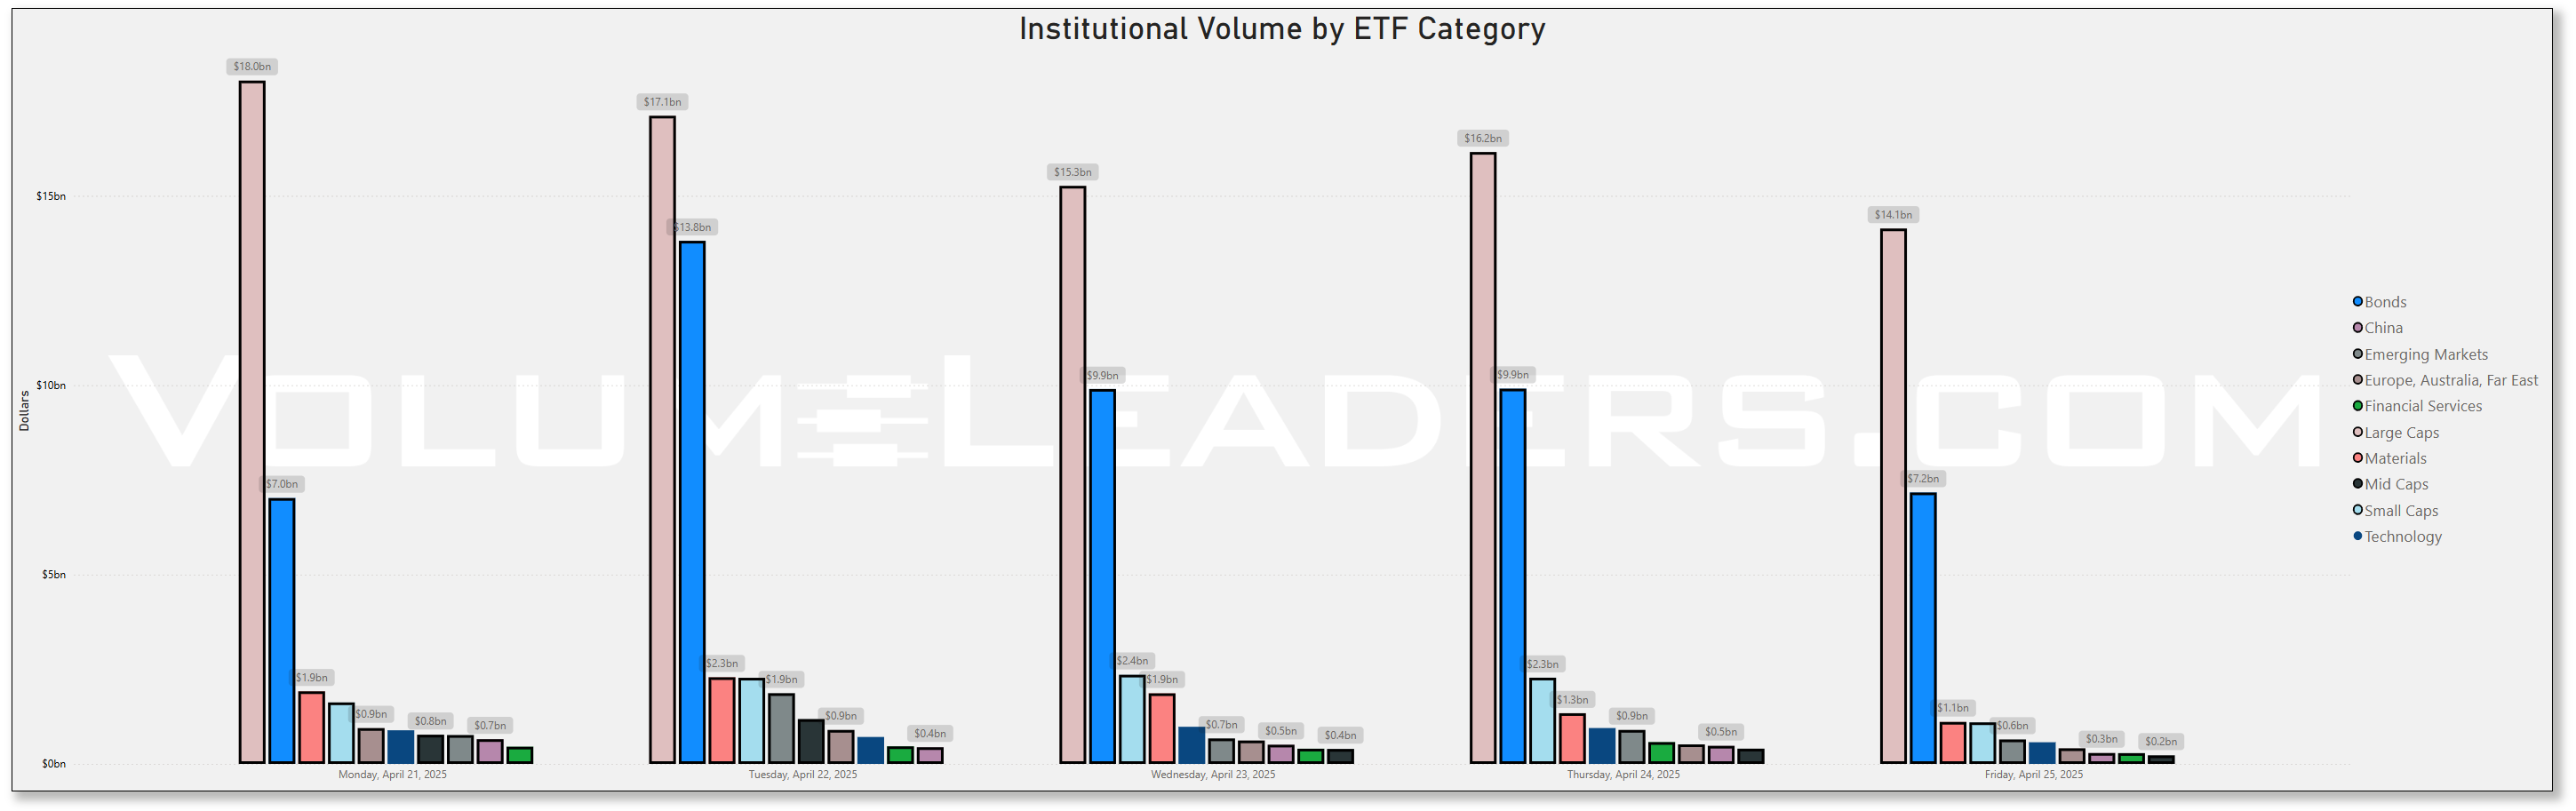
Top Institutional Order Flow By Sector By Week For The Past 90-Days
Top Institutional Order Flow In Equities
These are incredibly important charts to watch as they contains lots of nuanced suggestions at a thematic level. Watch these charts closely week-to-week to stay informed about where institutional money is flowing, adjust your strategies based on momentum, align your portfolio with macroeconomic and market trends, and manage risks more effectively by avoiding sectors losing institutional favor.
Sector Rotation Insights: The chart highlights which sectors are attracting institutional activity and which are losing favor. Institutions often lead market trends, so tracking shifts in their focus can indicate sector rotations.
Sentiment Analysis: The level of institutional activity reflects confidence in specific sectors. Rising activity in traditionally defensive sectors (e.g., healthcare, utilities) may indicate caution, while a surge in growth sectors (e.g., technology, consumer discretionary) could suggest optimism.
Emerging Trends: Sudden spikes in a previously overlooked sector, like industrials or consumer staples, might hint at emerging opportunities or structural shifts.
Macro Themes: Changes in sector activity often align with broader macroeconomic themes like inflation, interest rates, or geopolitical events. For instance:
Increased activity in energy might indicate concerns about oil supply or rising prices.
Growth in technology could align with innovations or favorable policies.
Risk Management: Declining institutional activity in a sector might signal weakening fundamentals or heightened risks.
Spotting Overcrowding: Excessive activity in a single sector over multiple weeks may suggest overcrowding, which could lead to heightened volatility if institutions begin to exit.
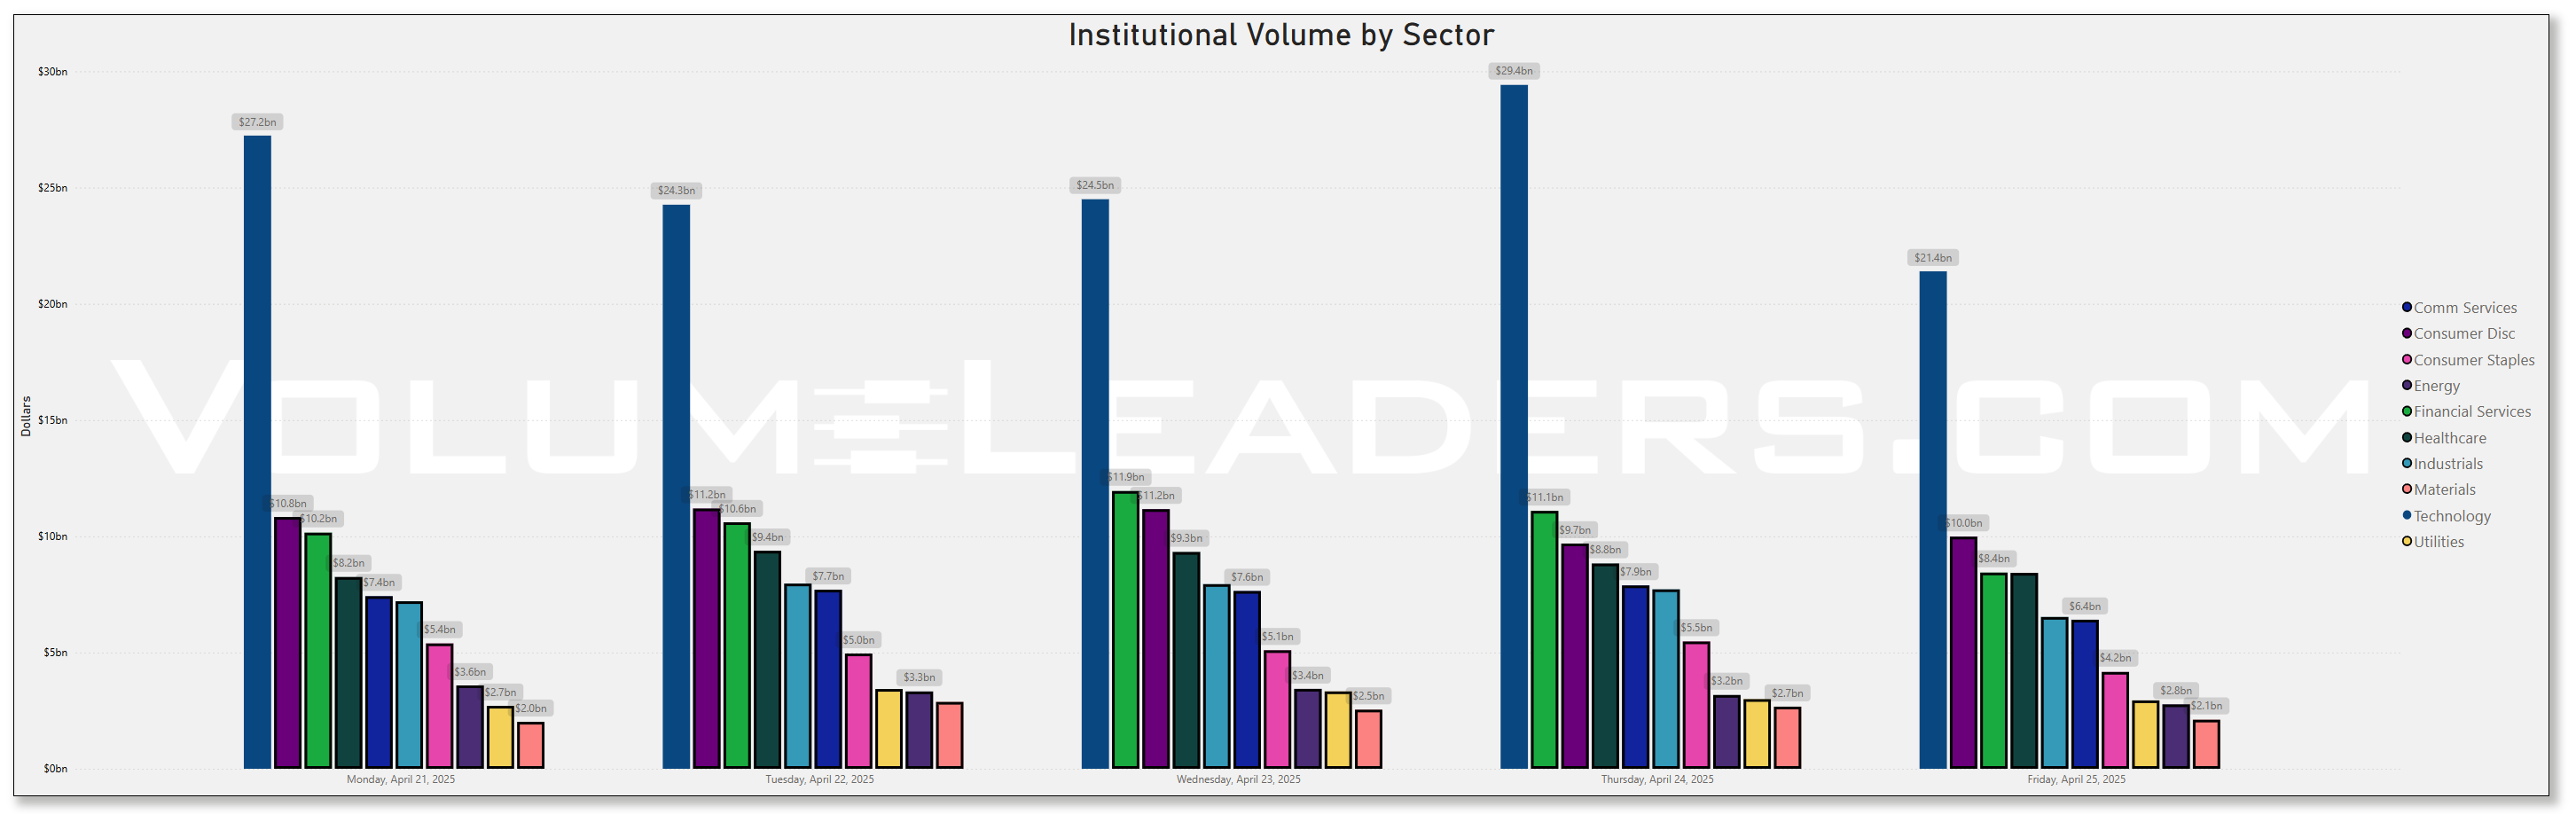
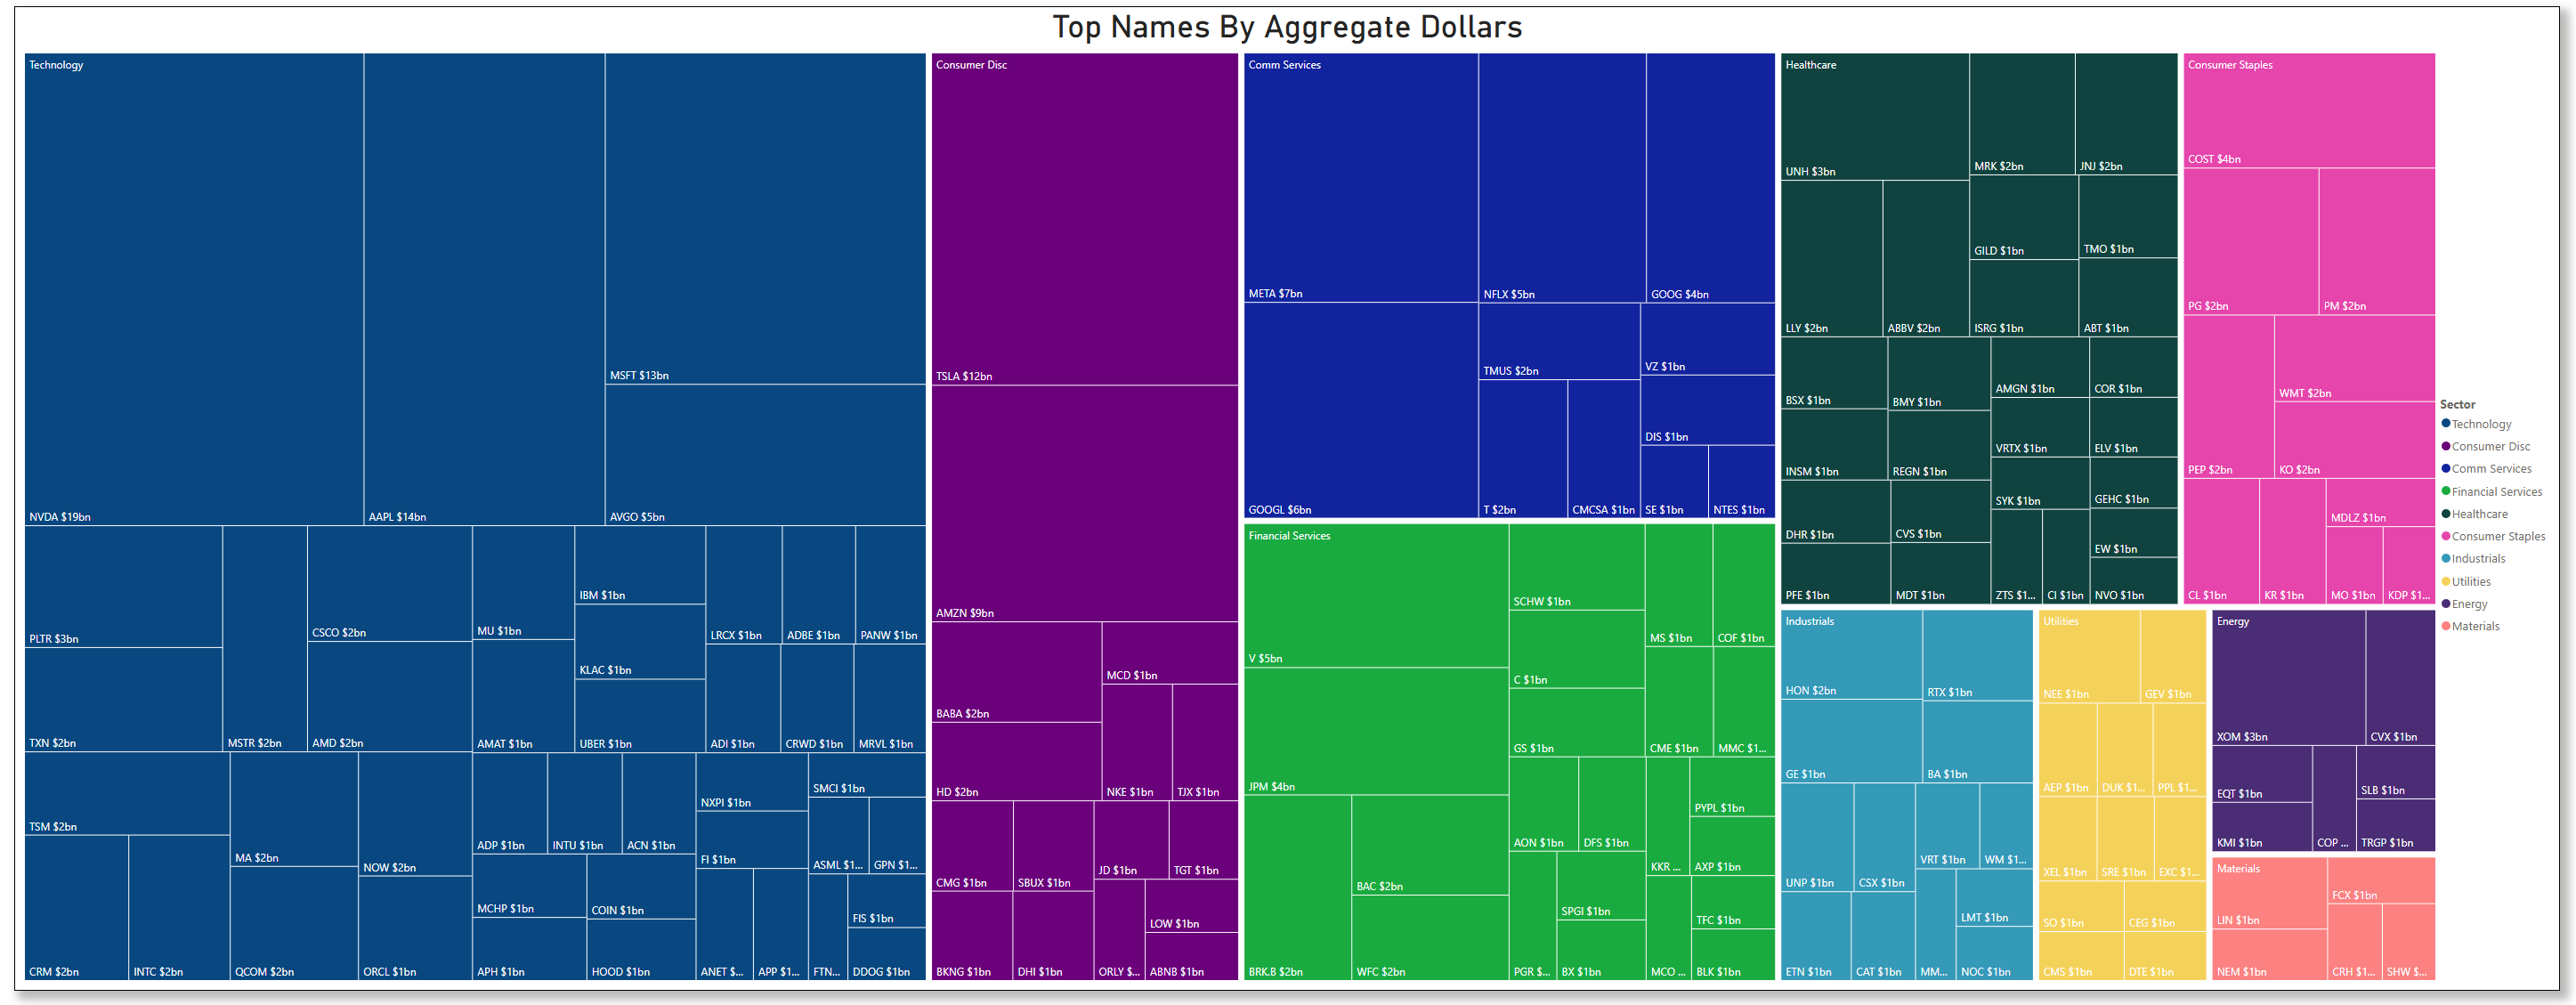
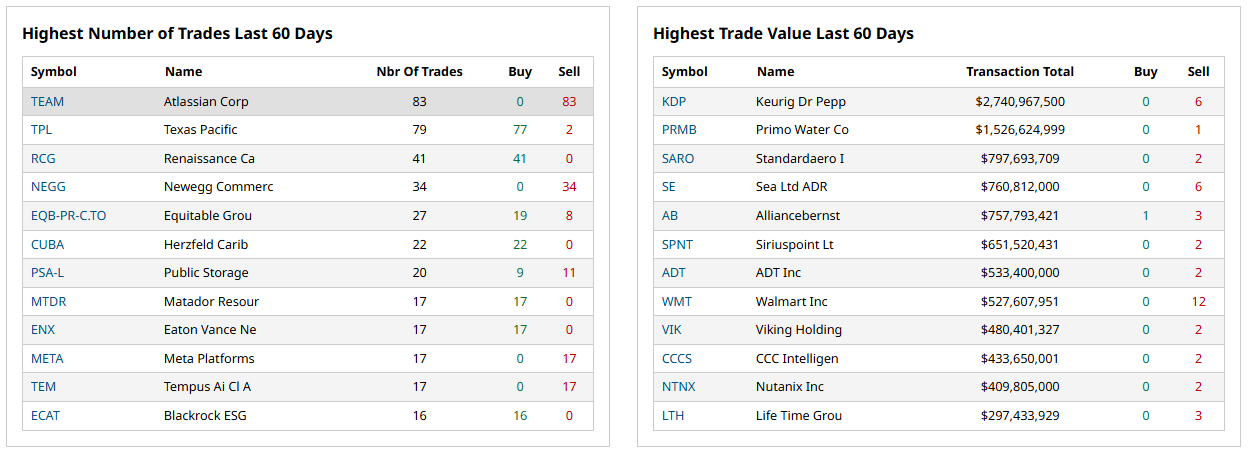
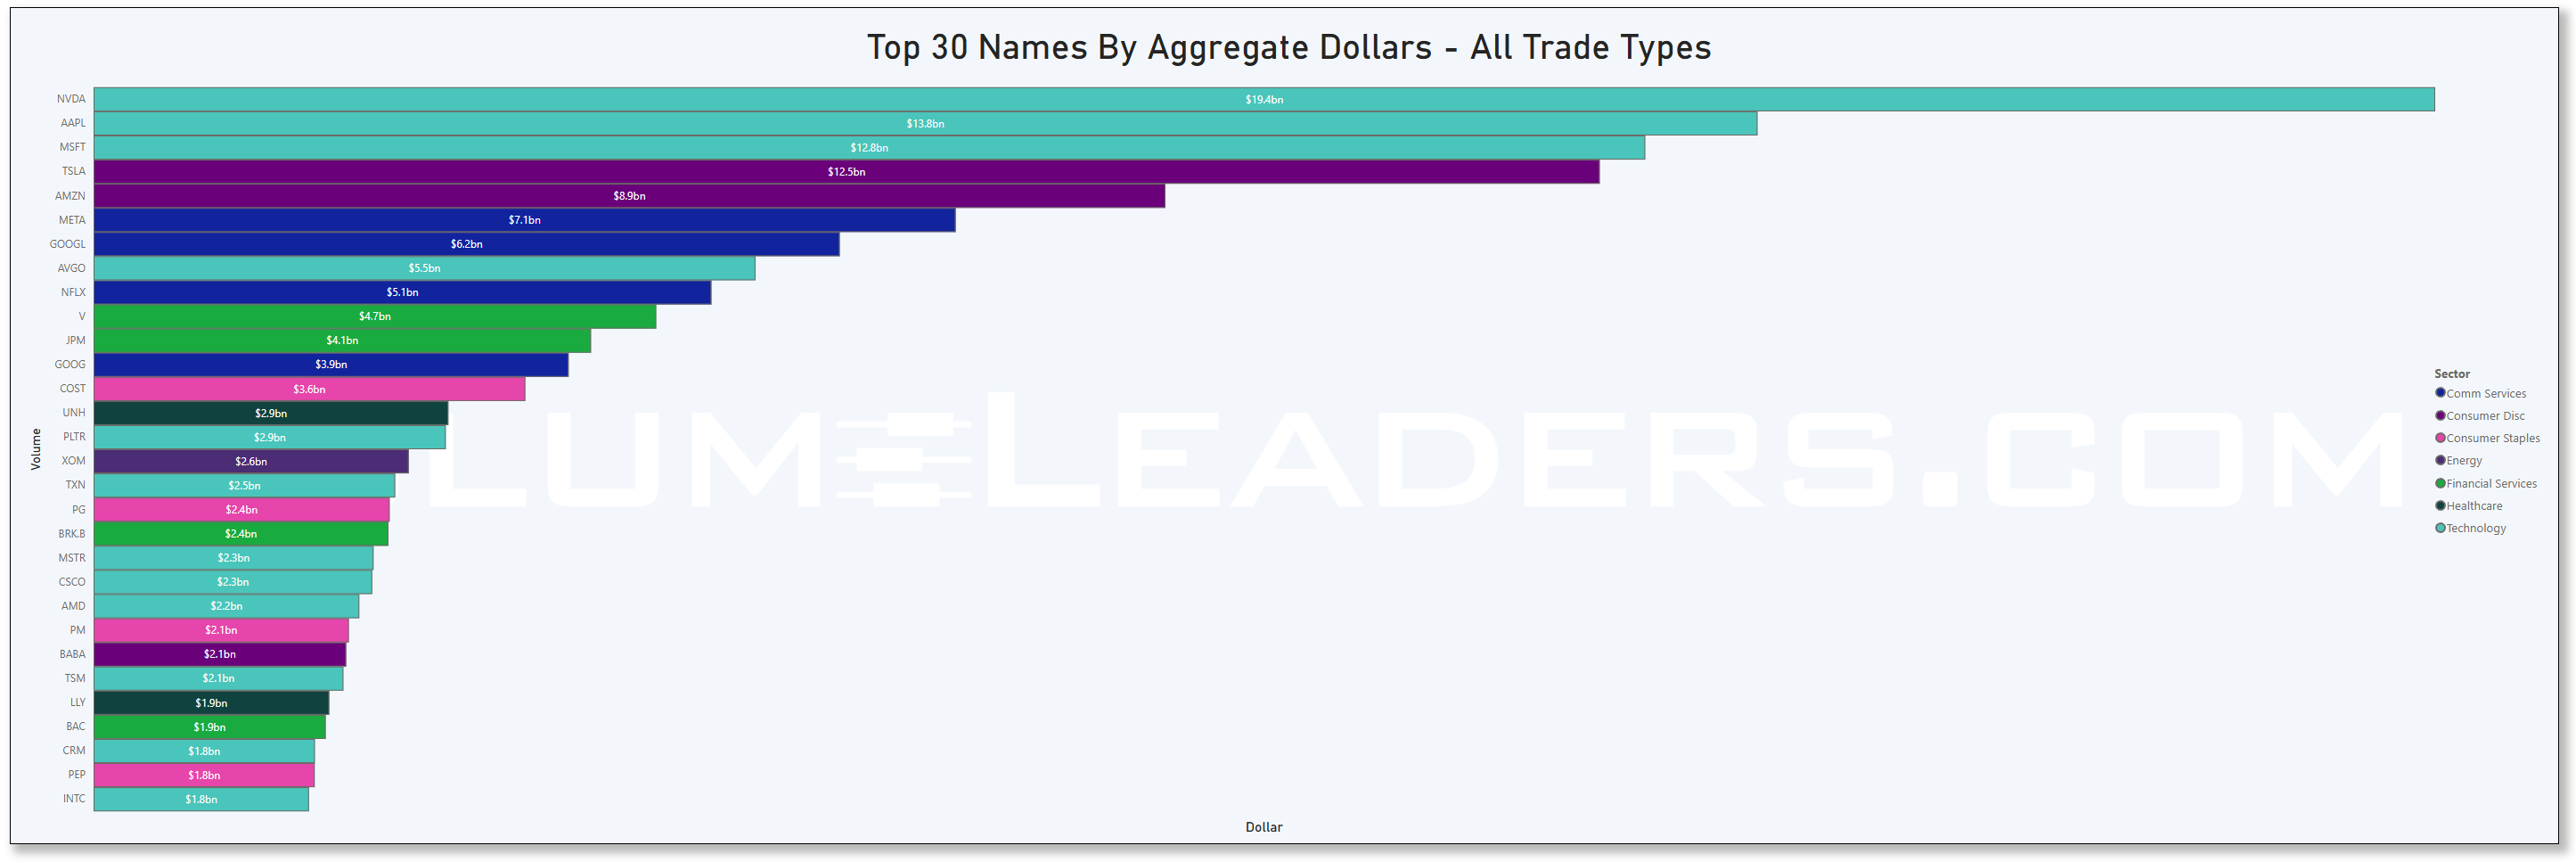
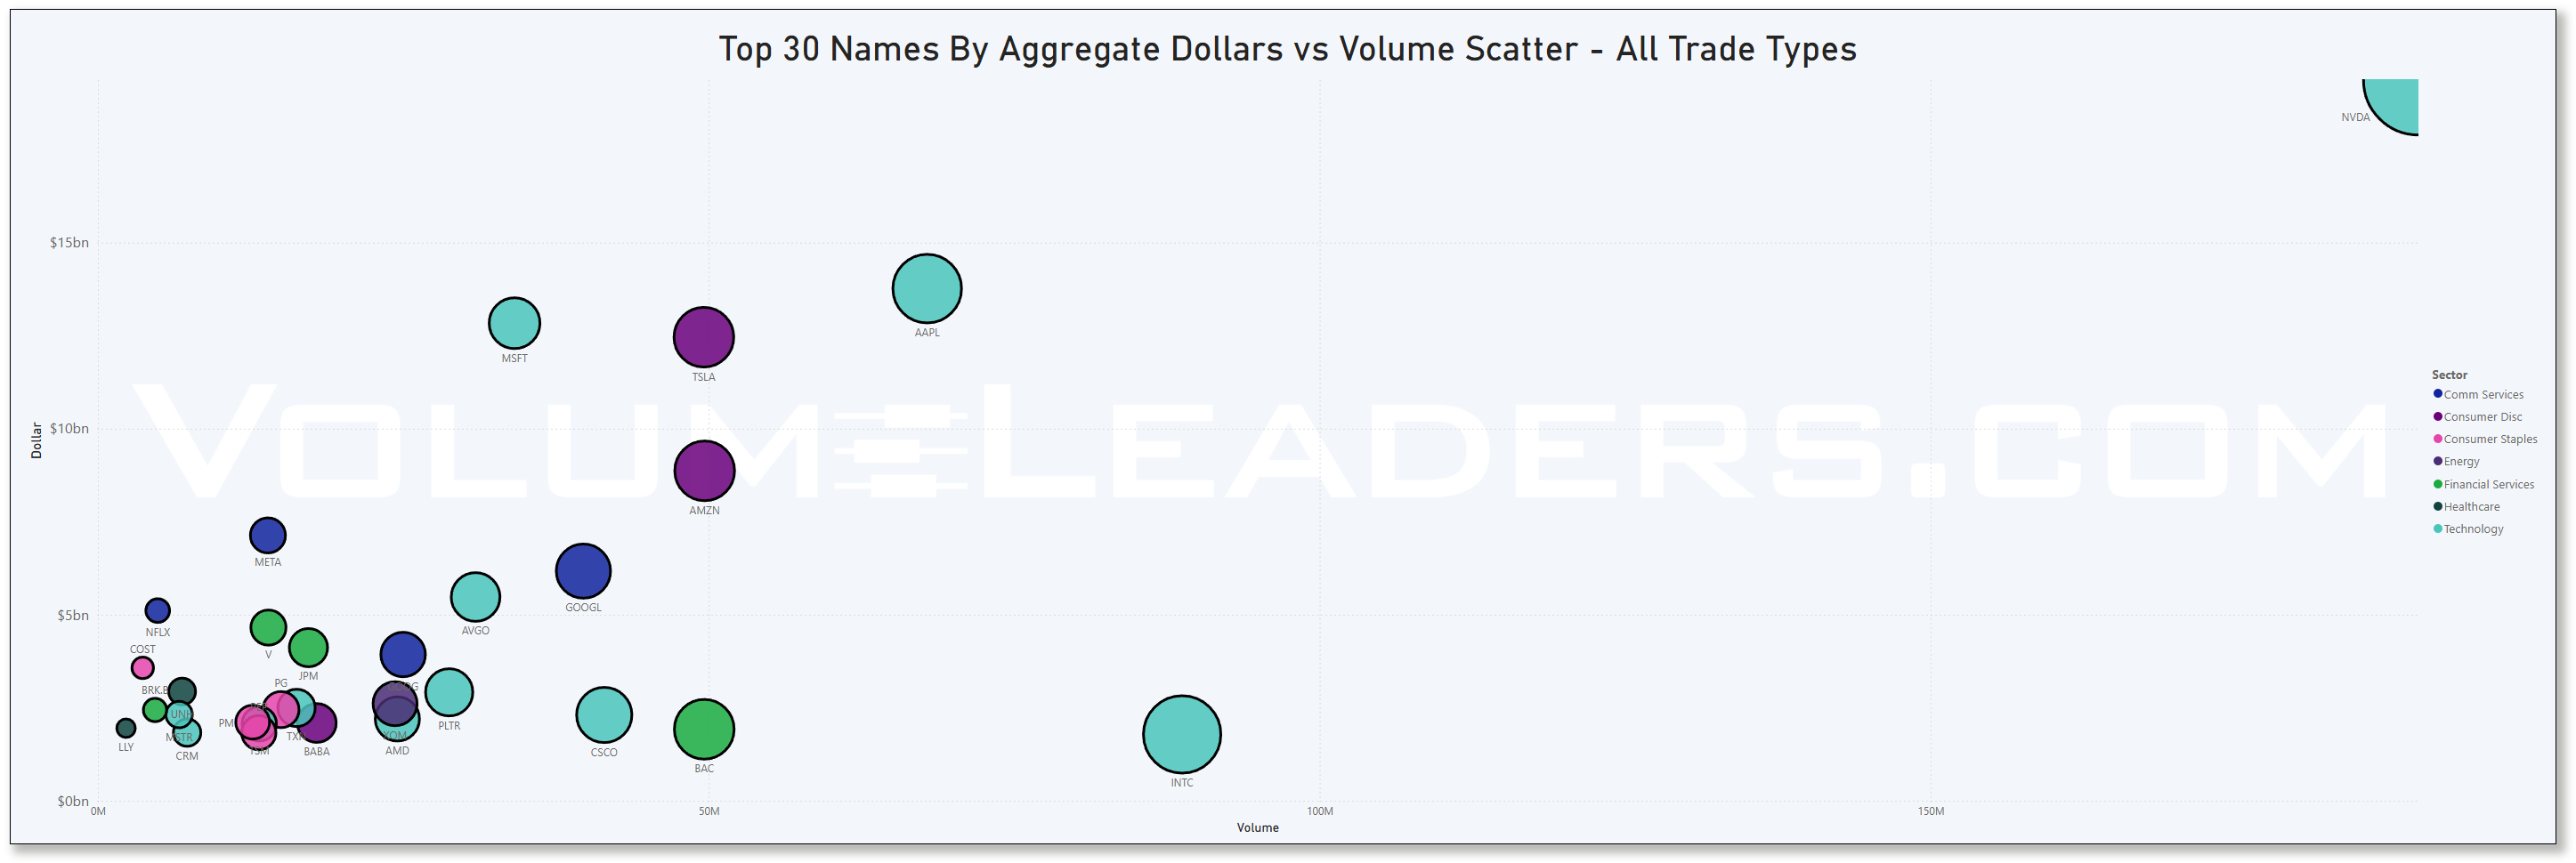
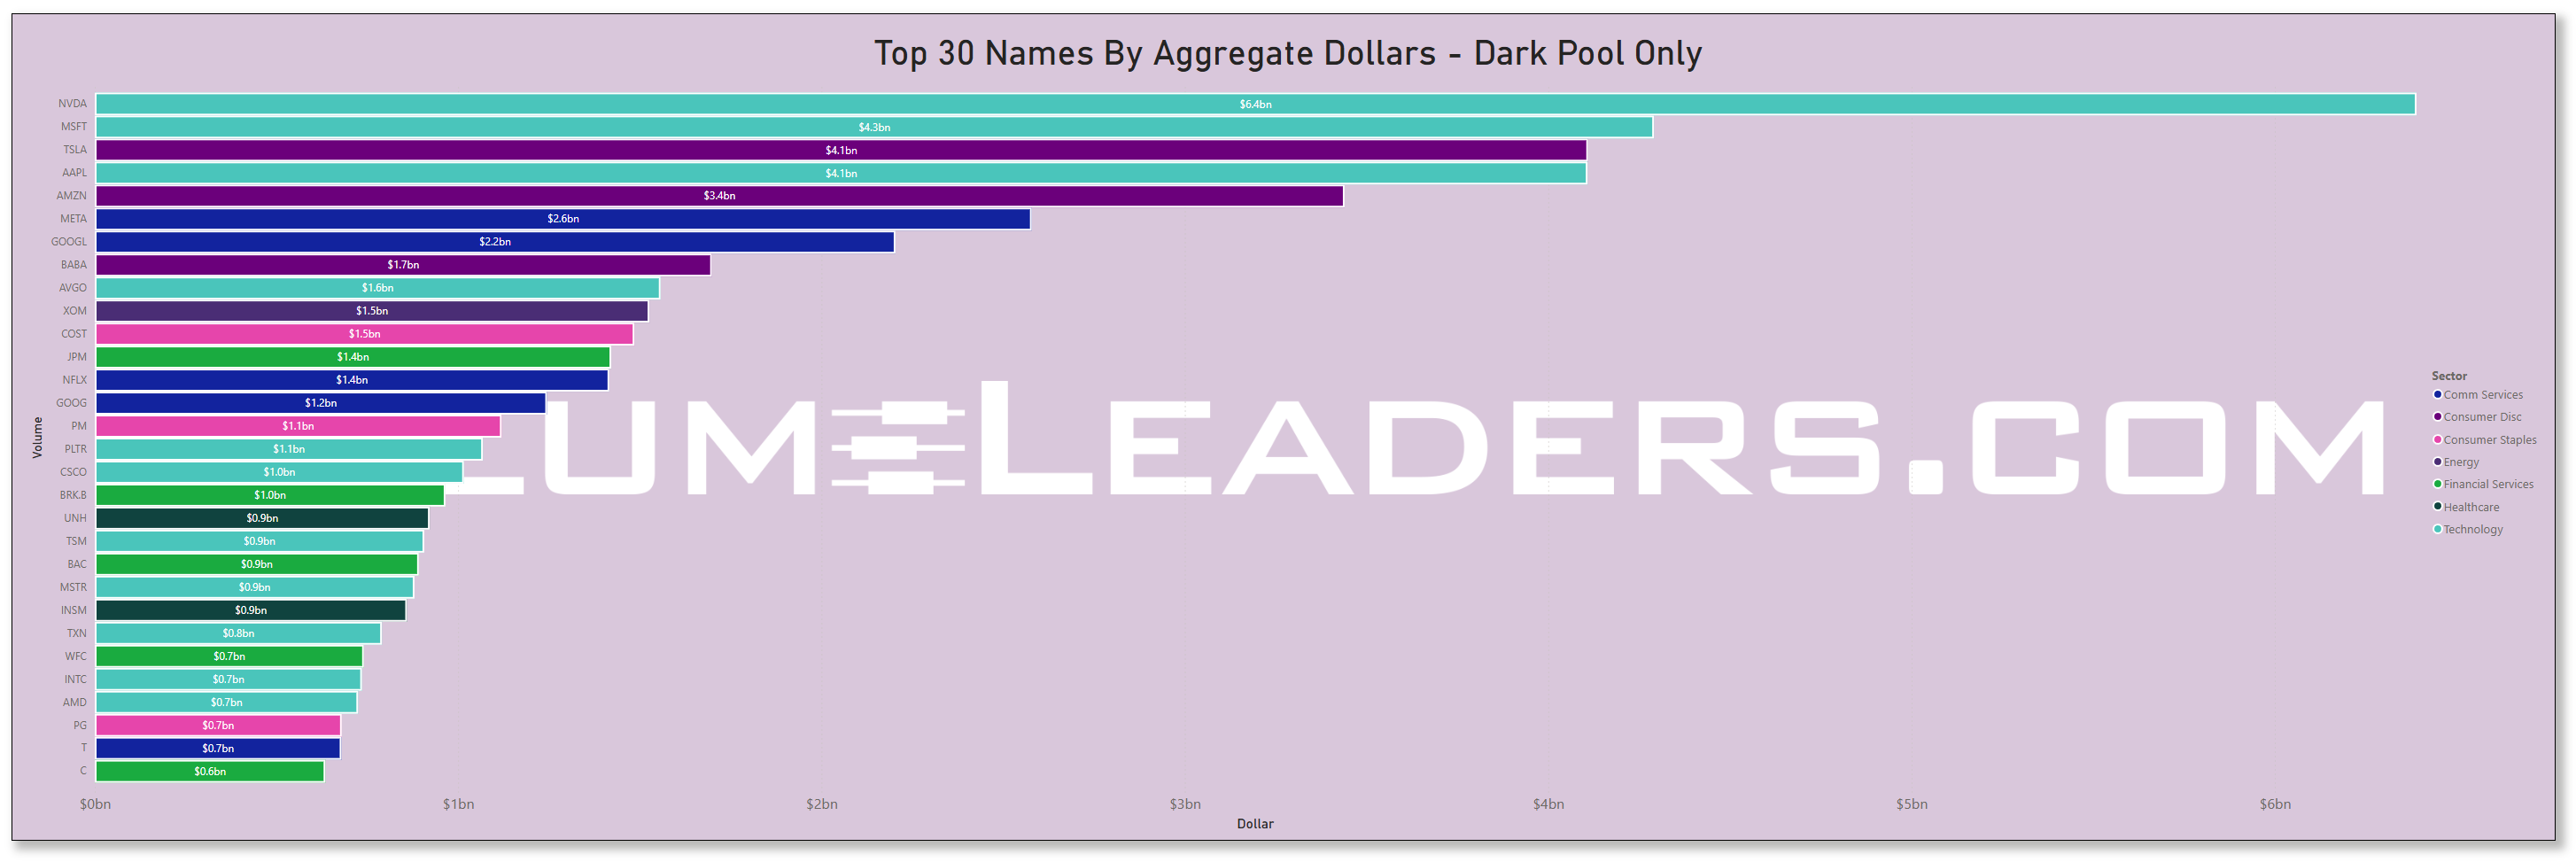
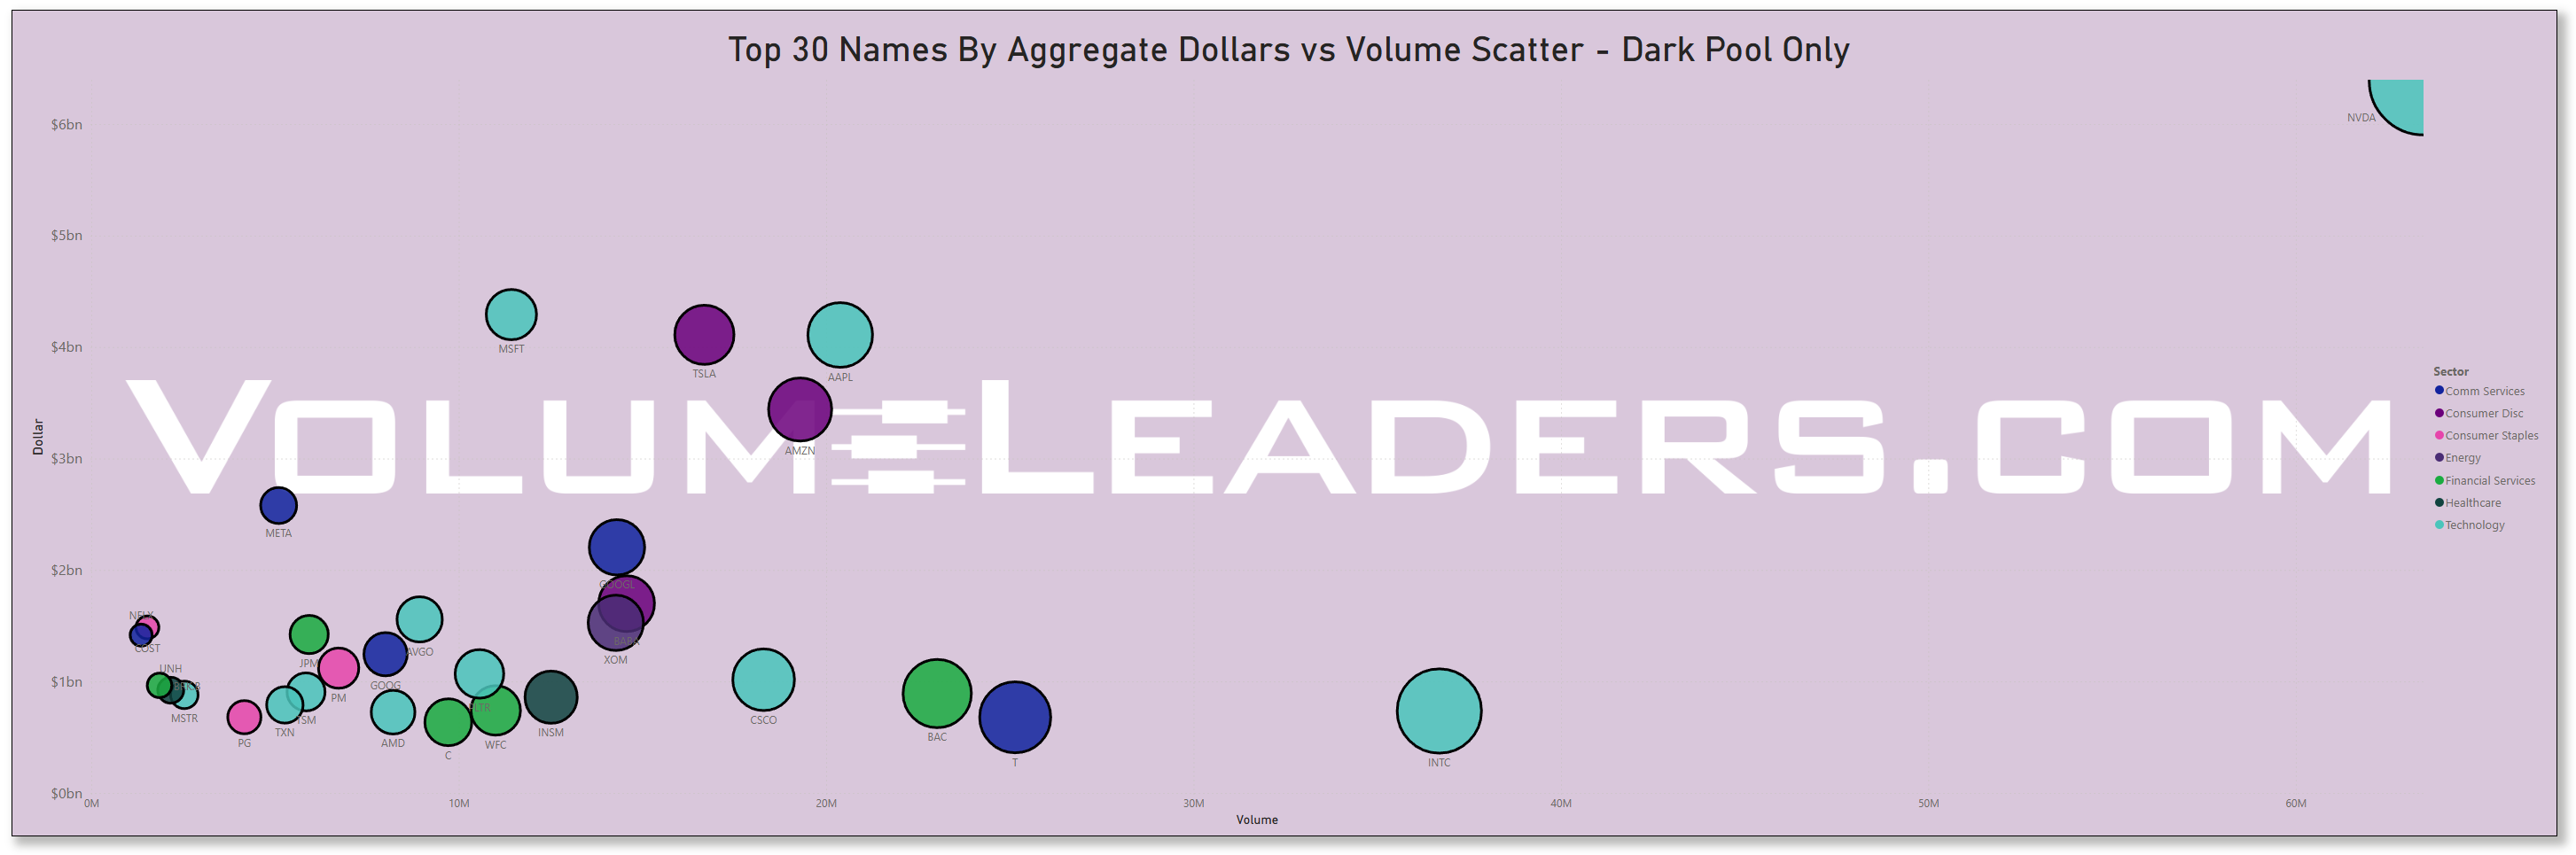
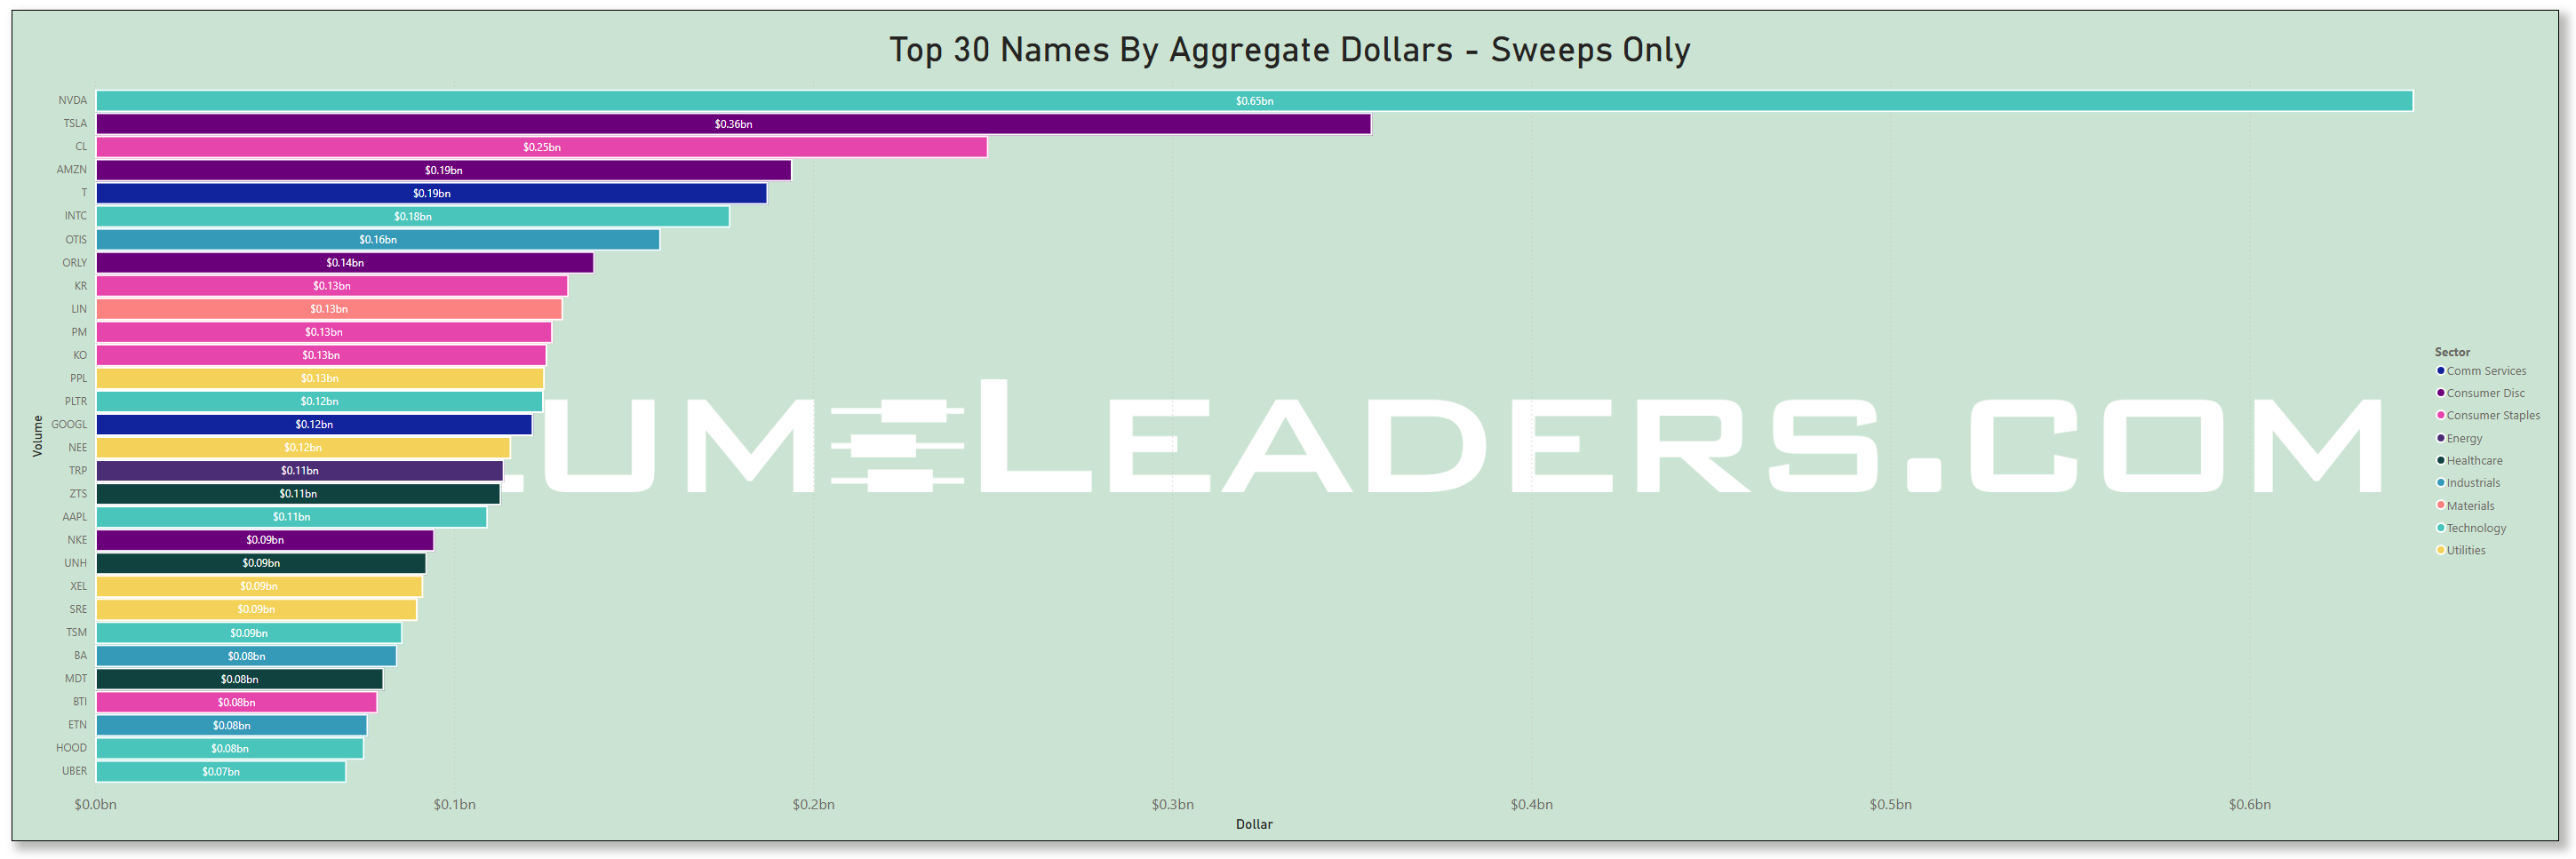
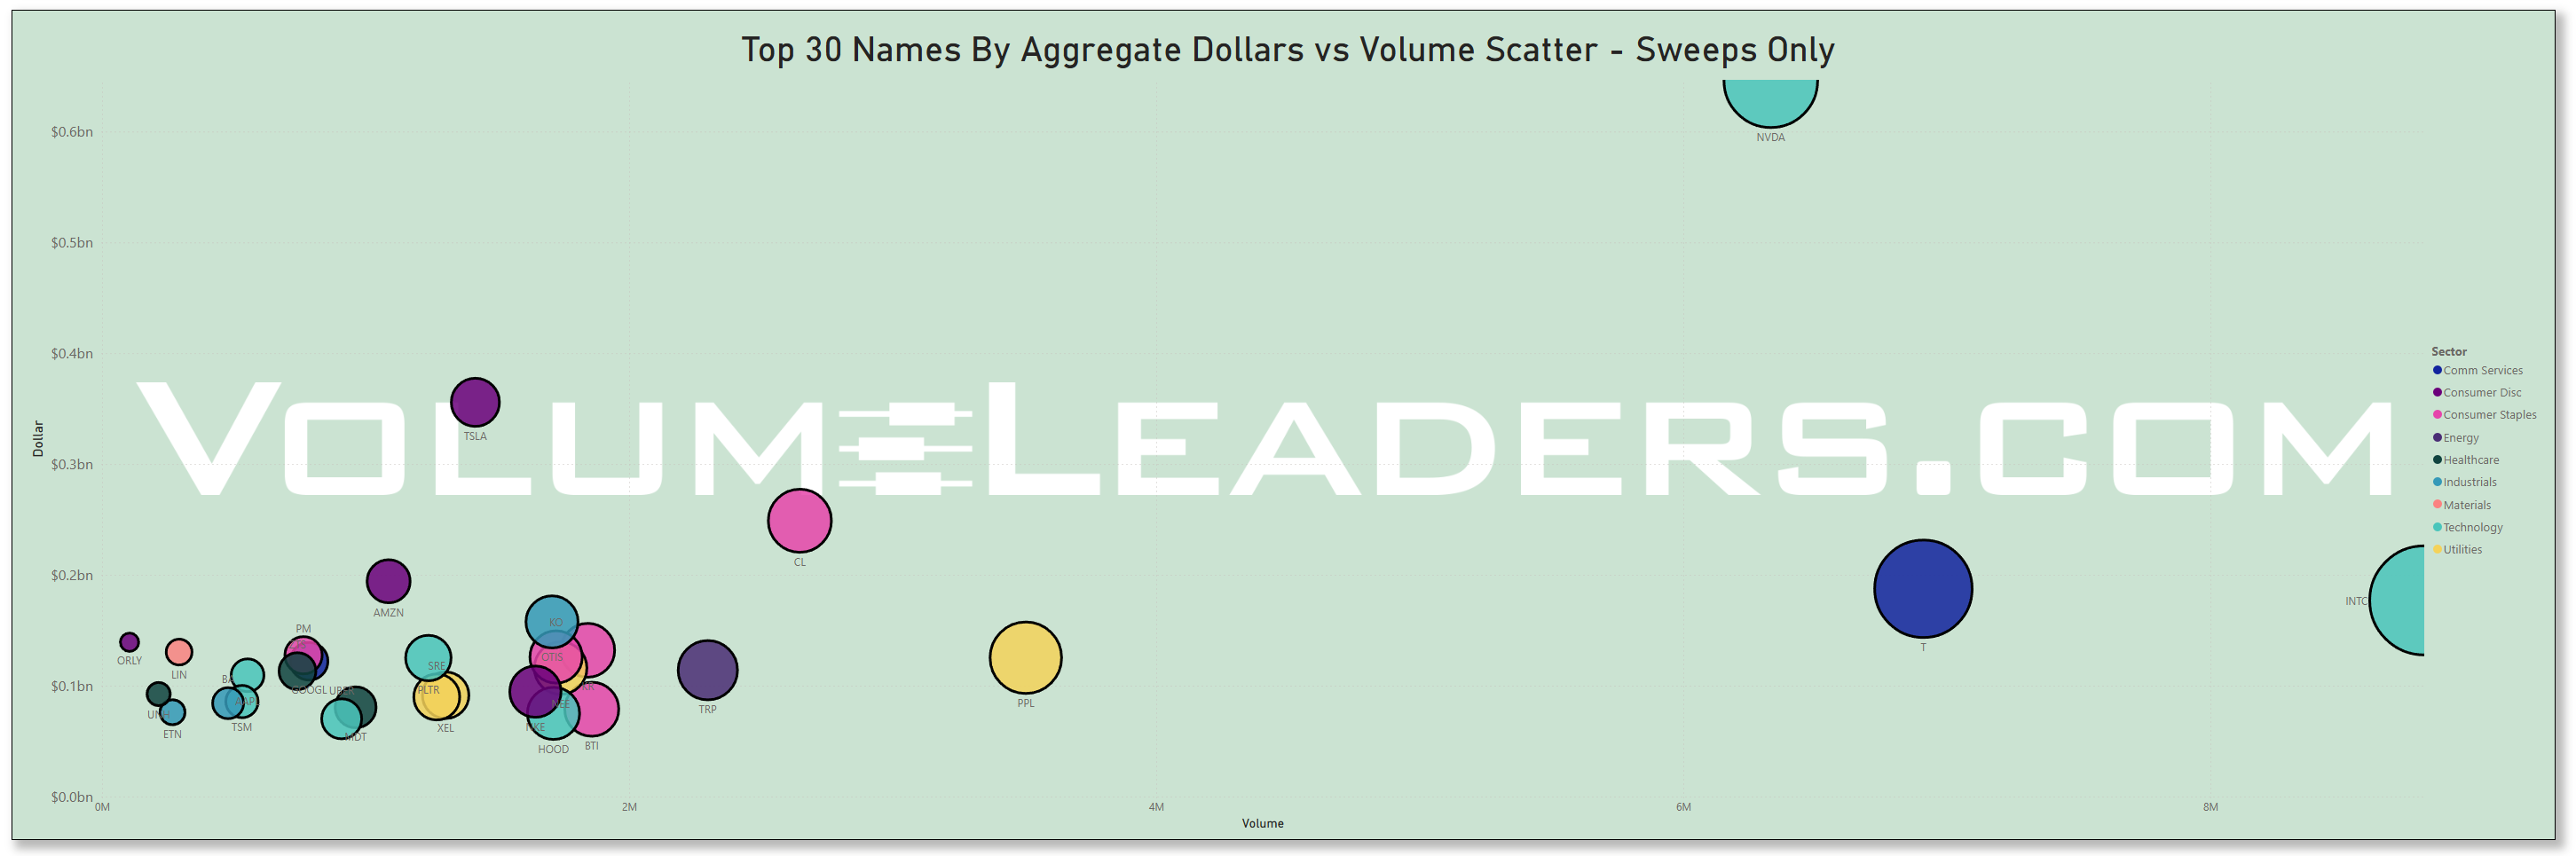
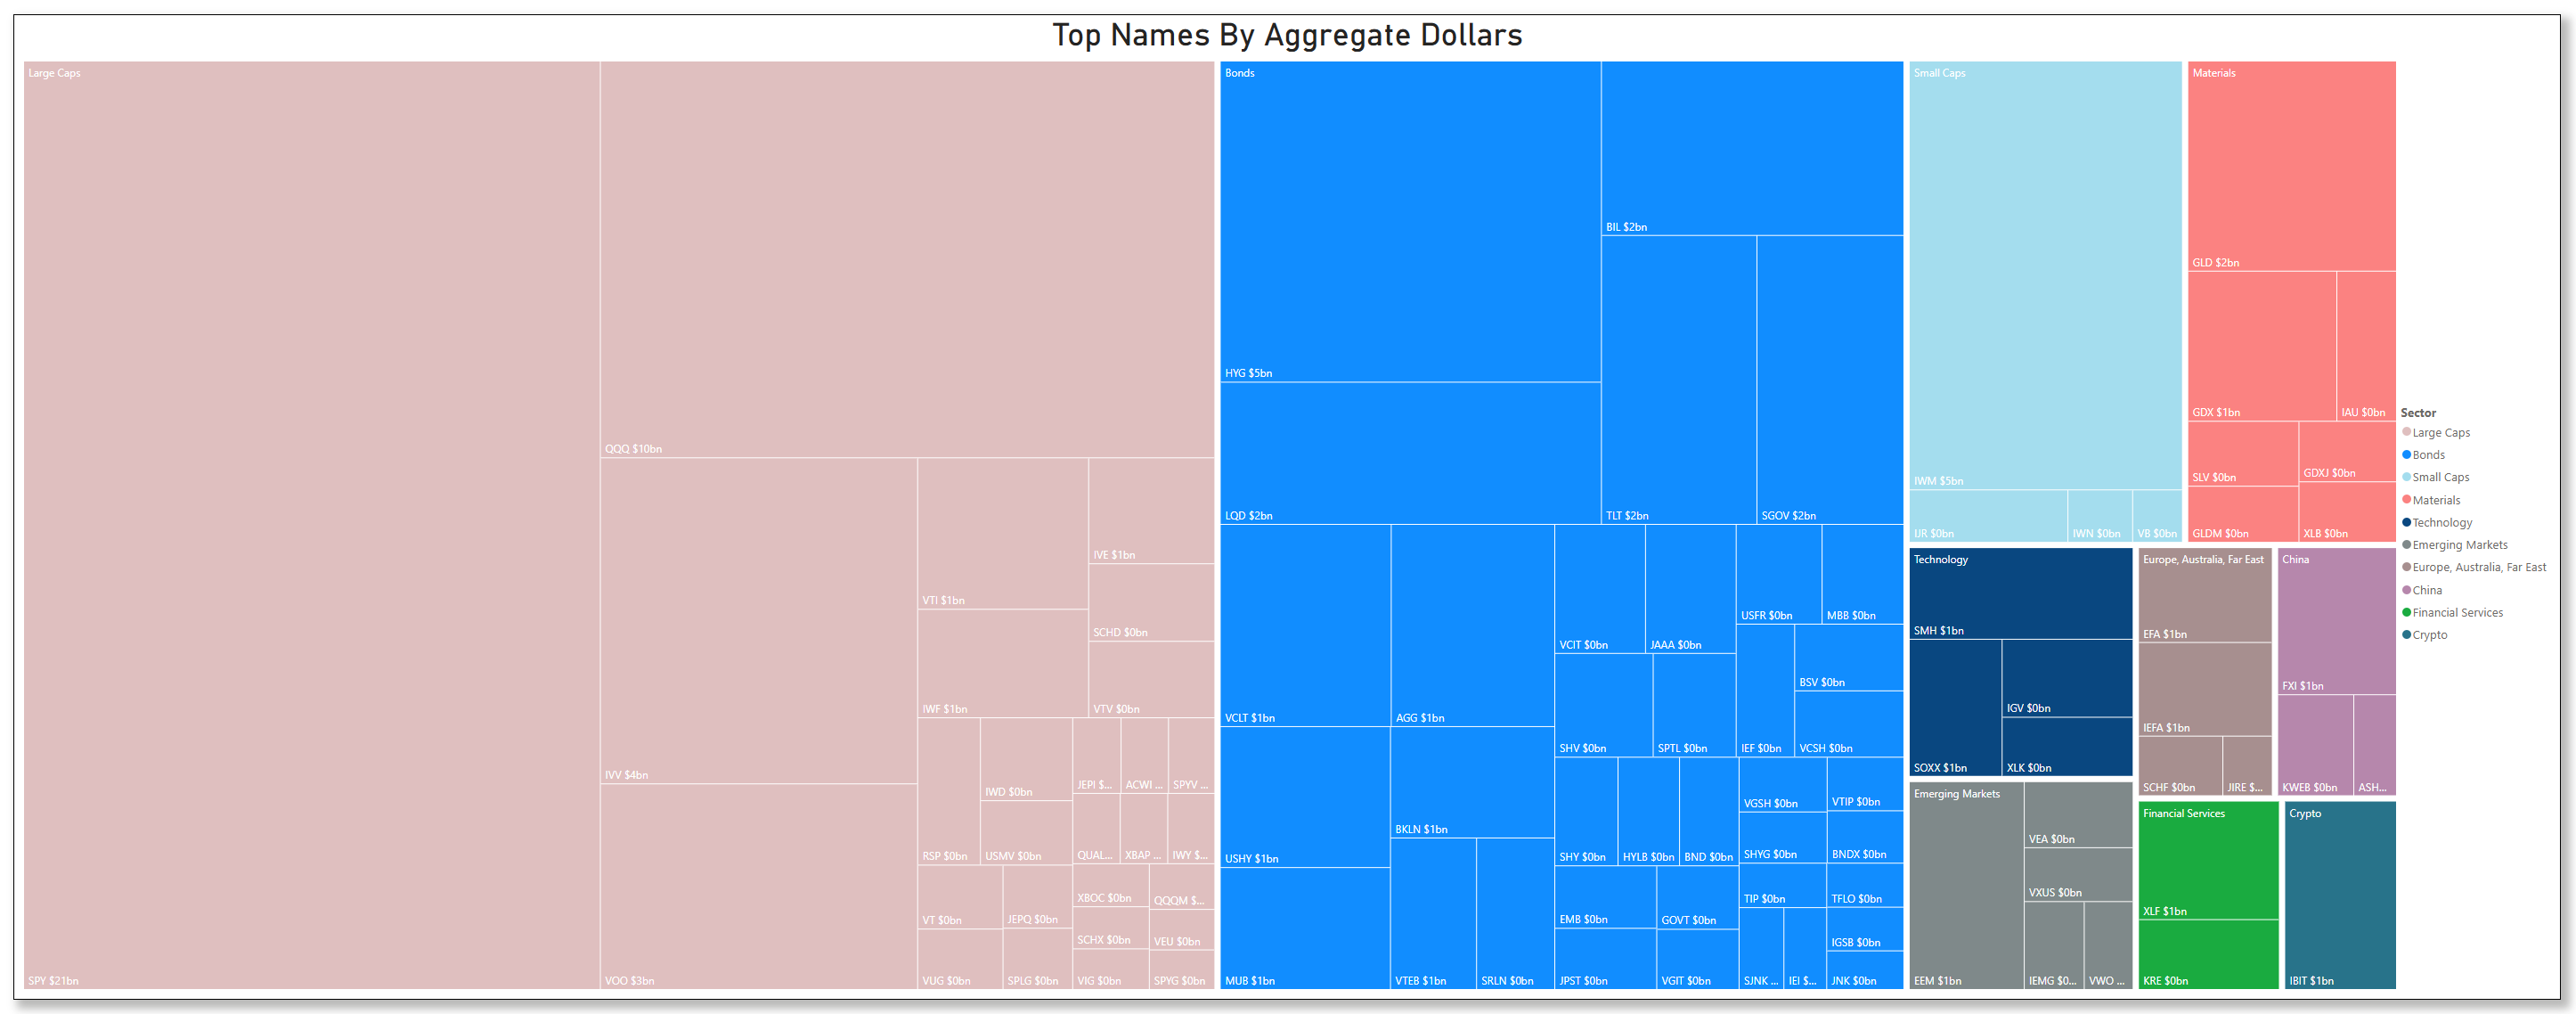
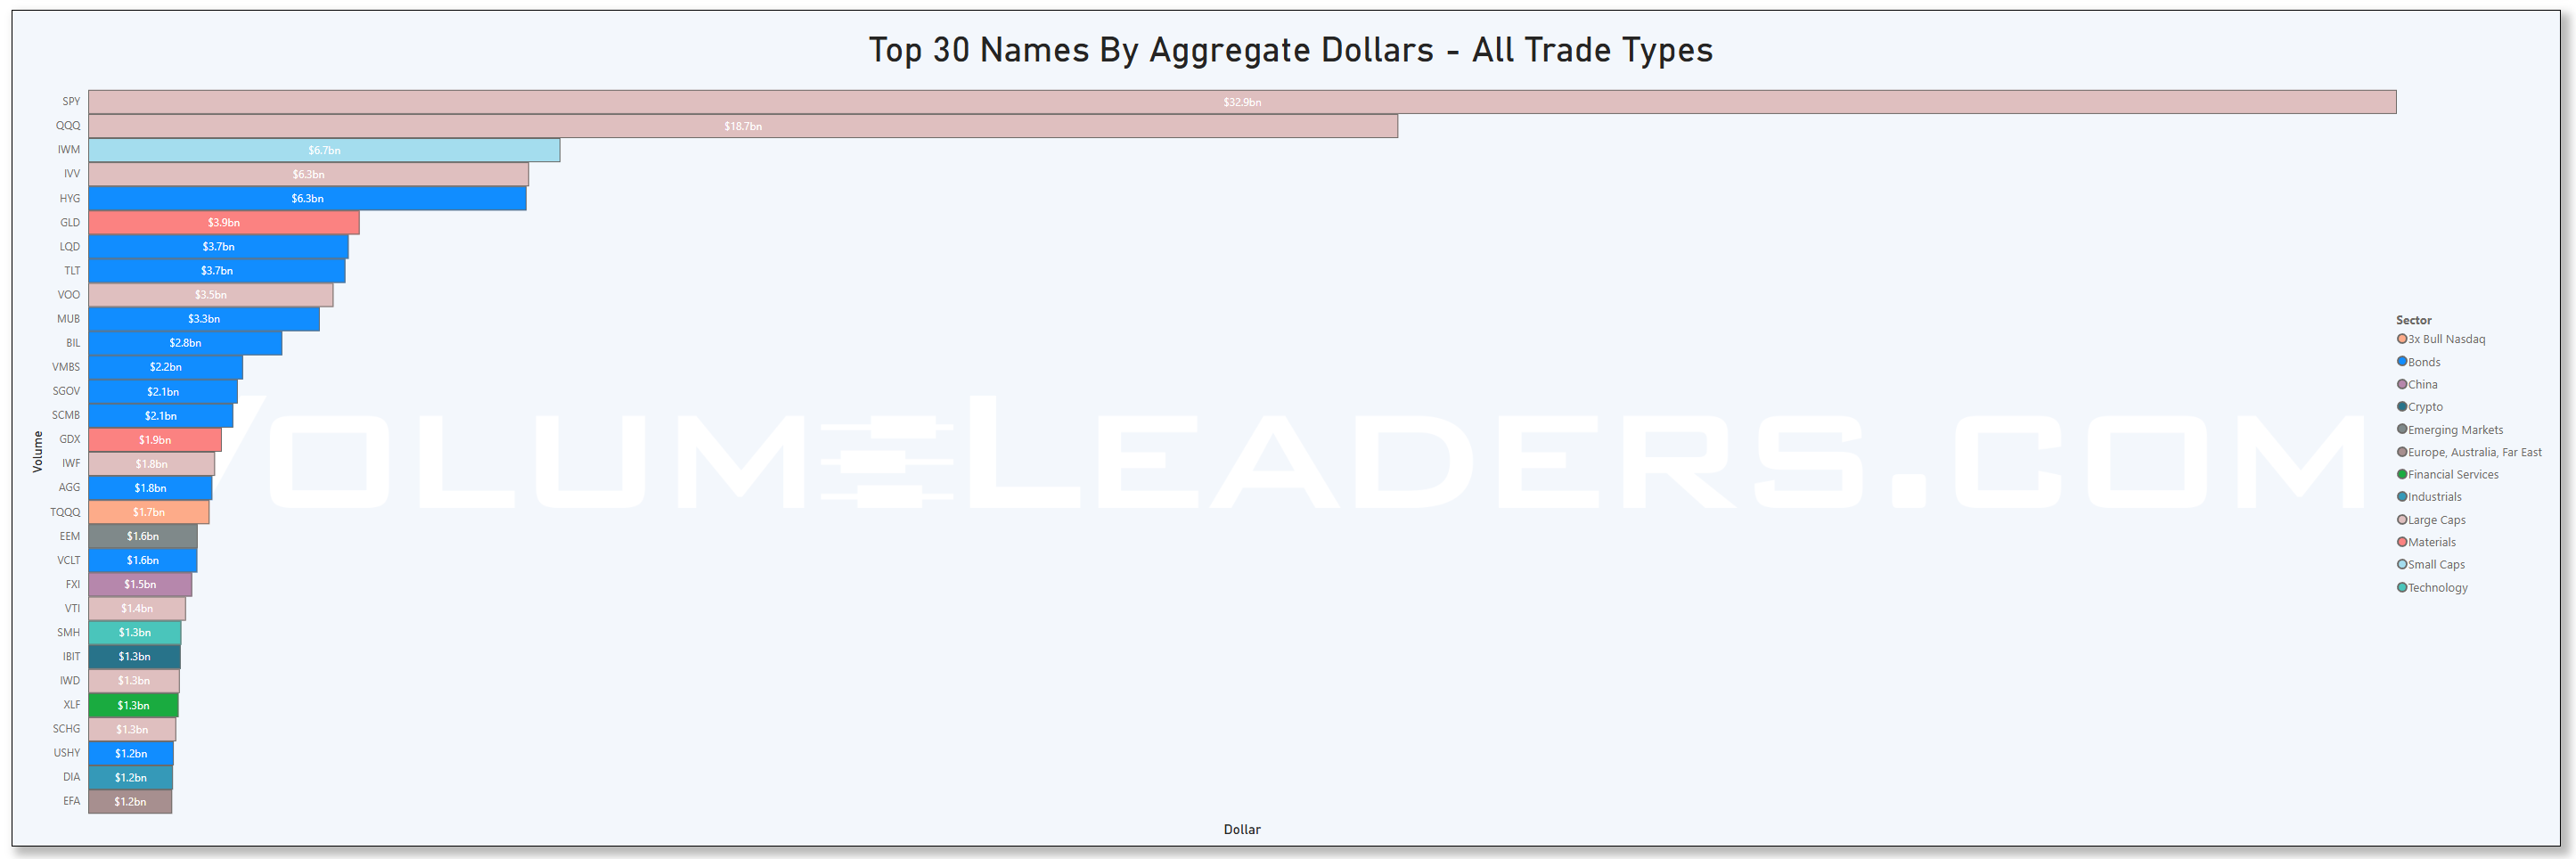
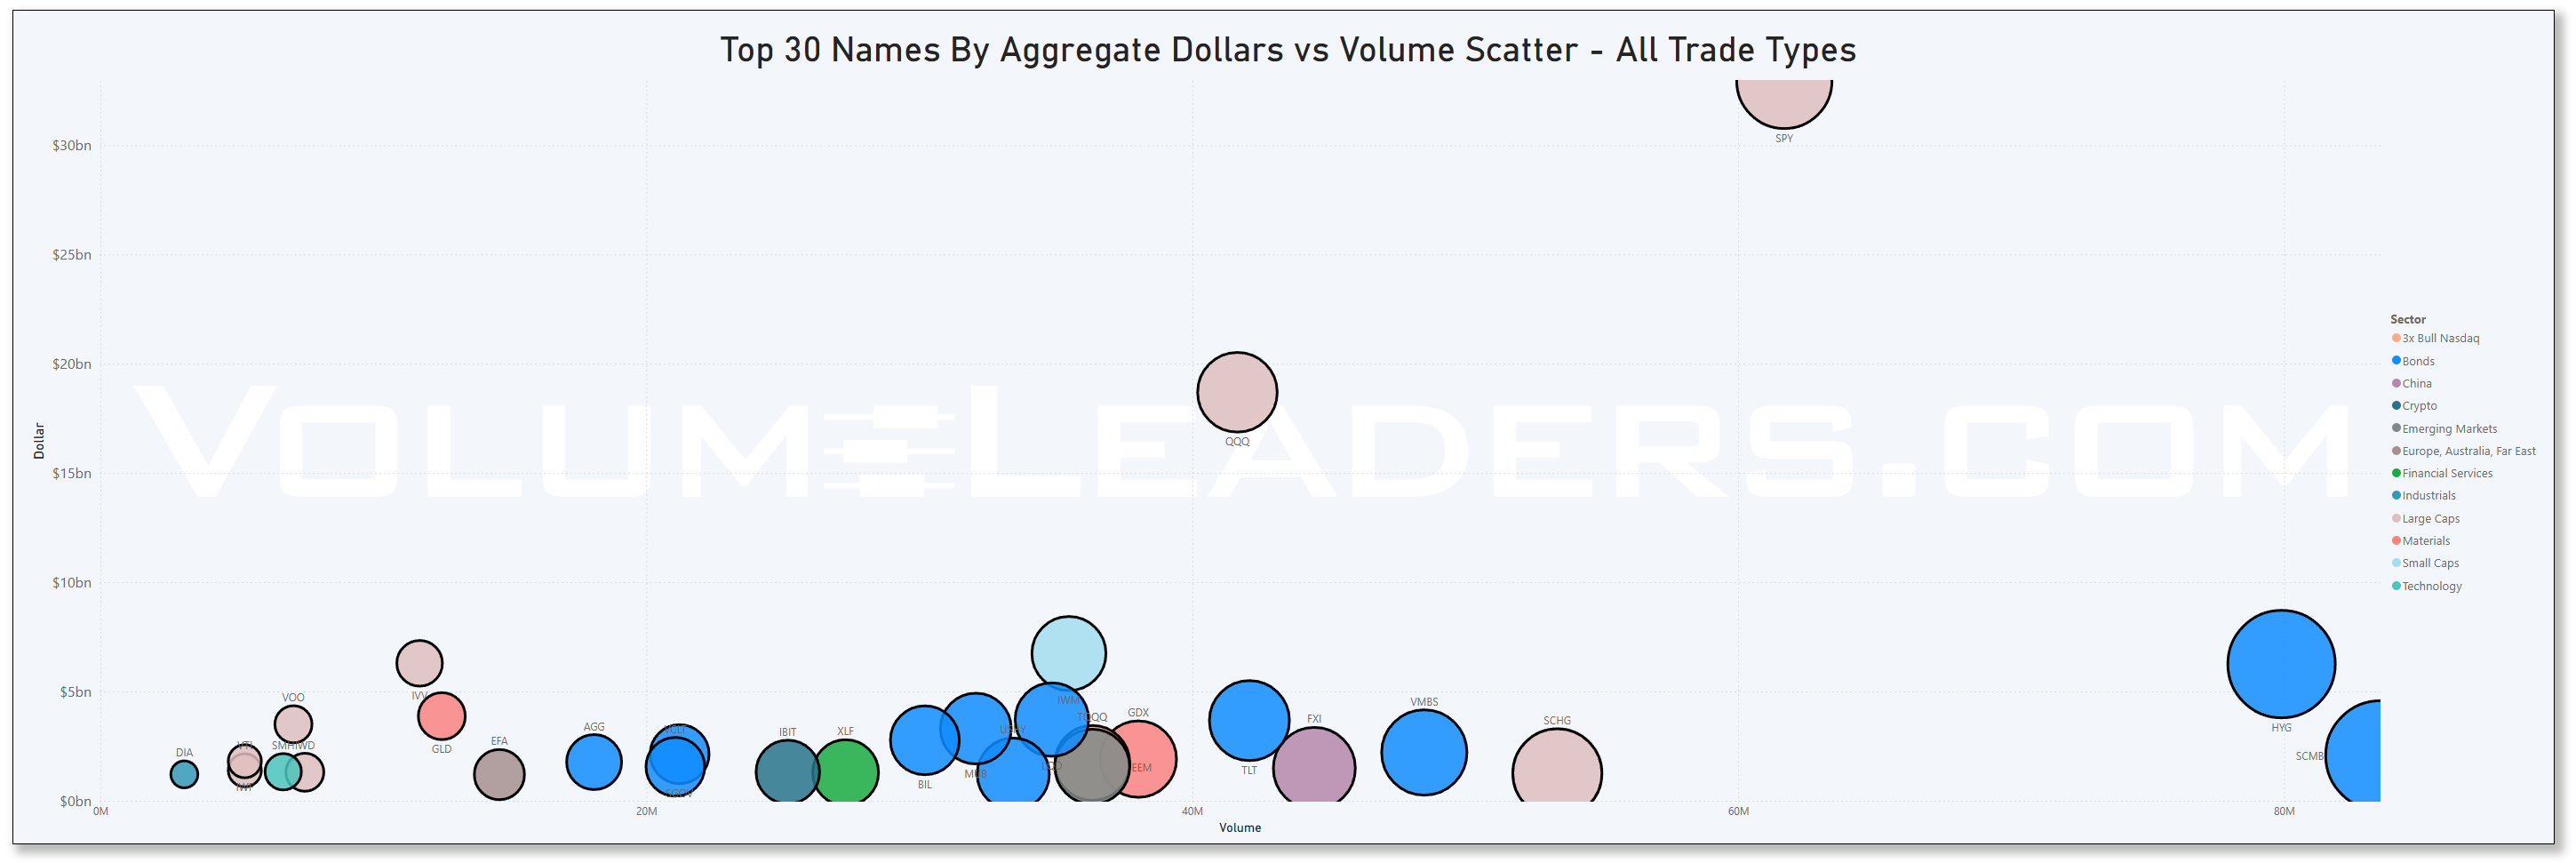
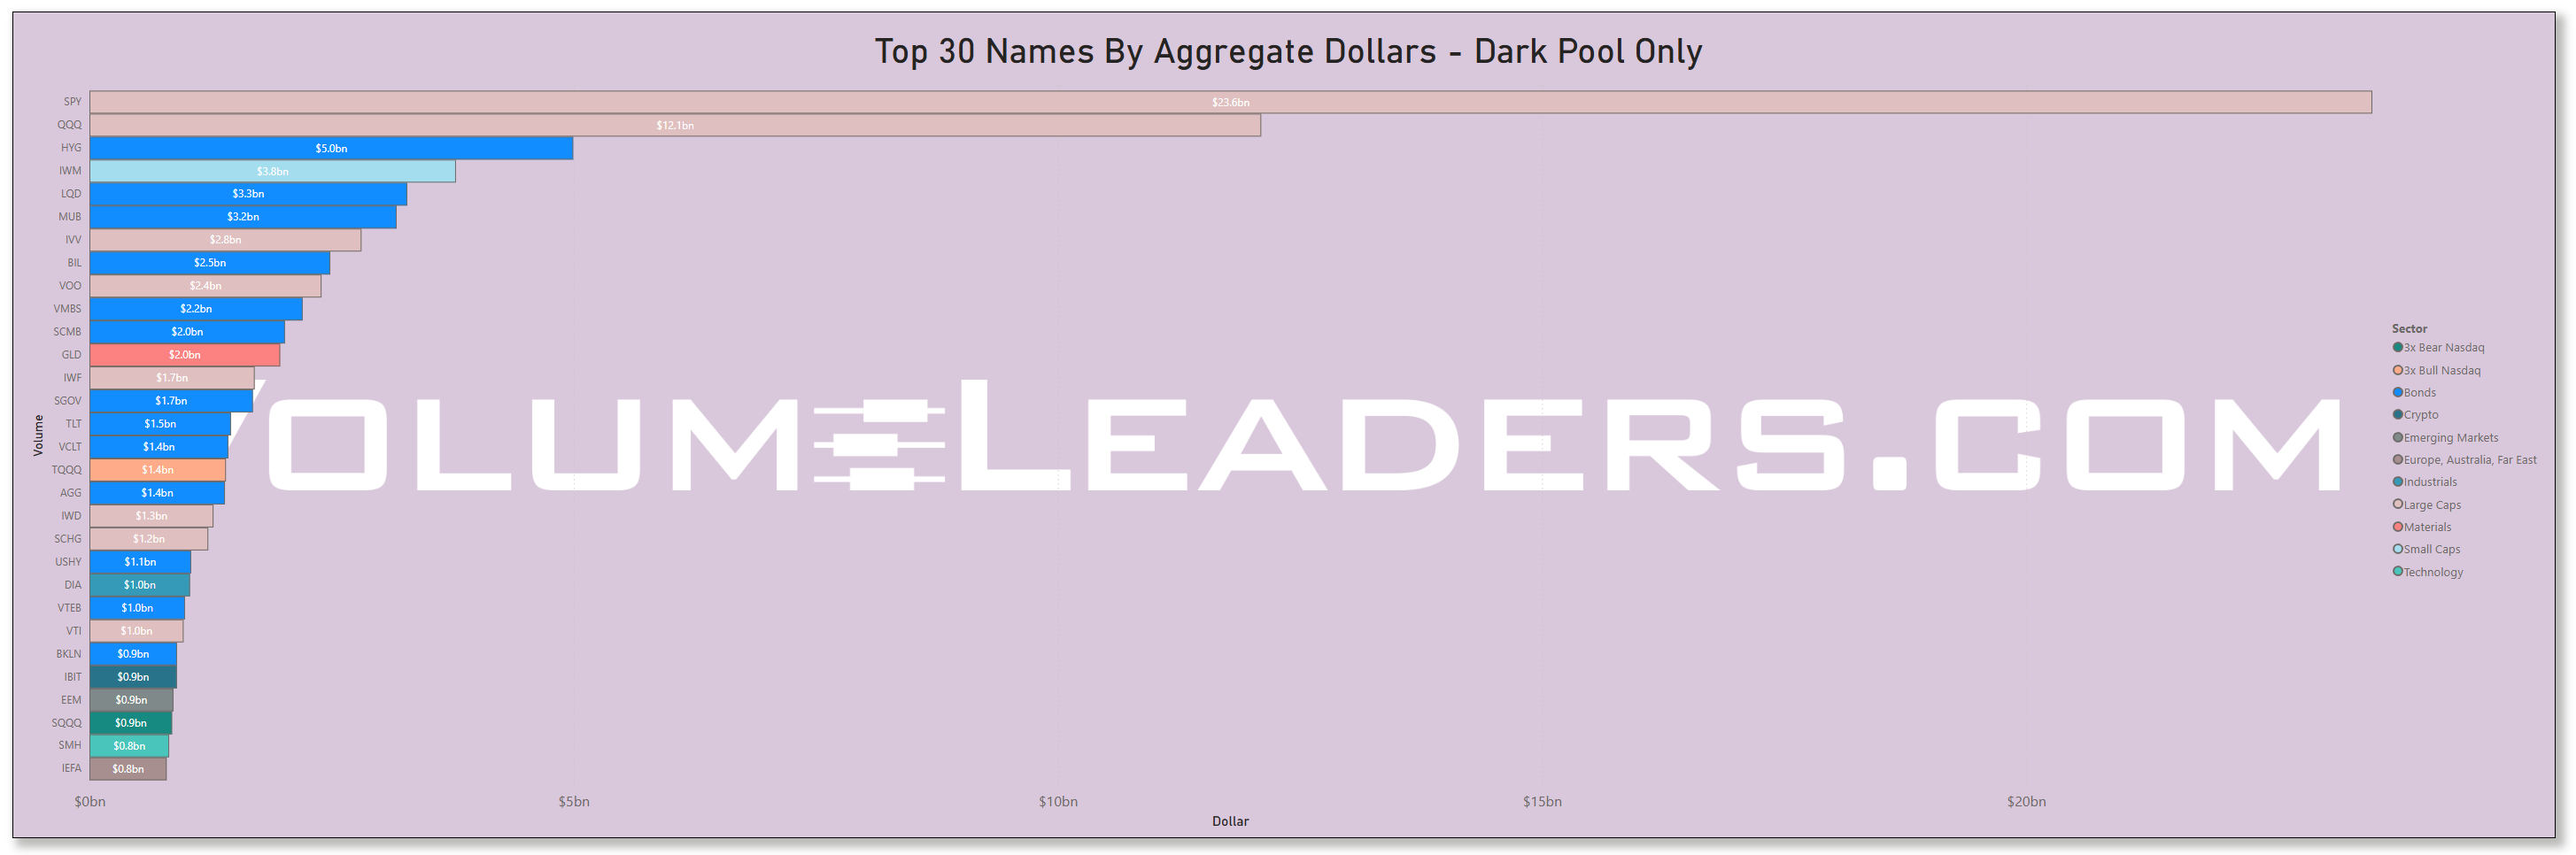
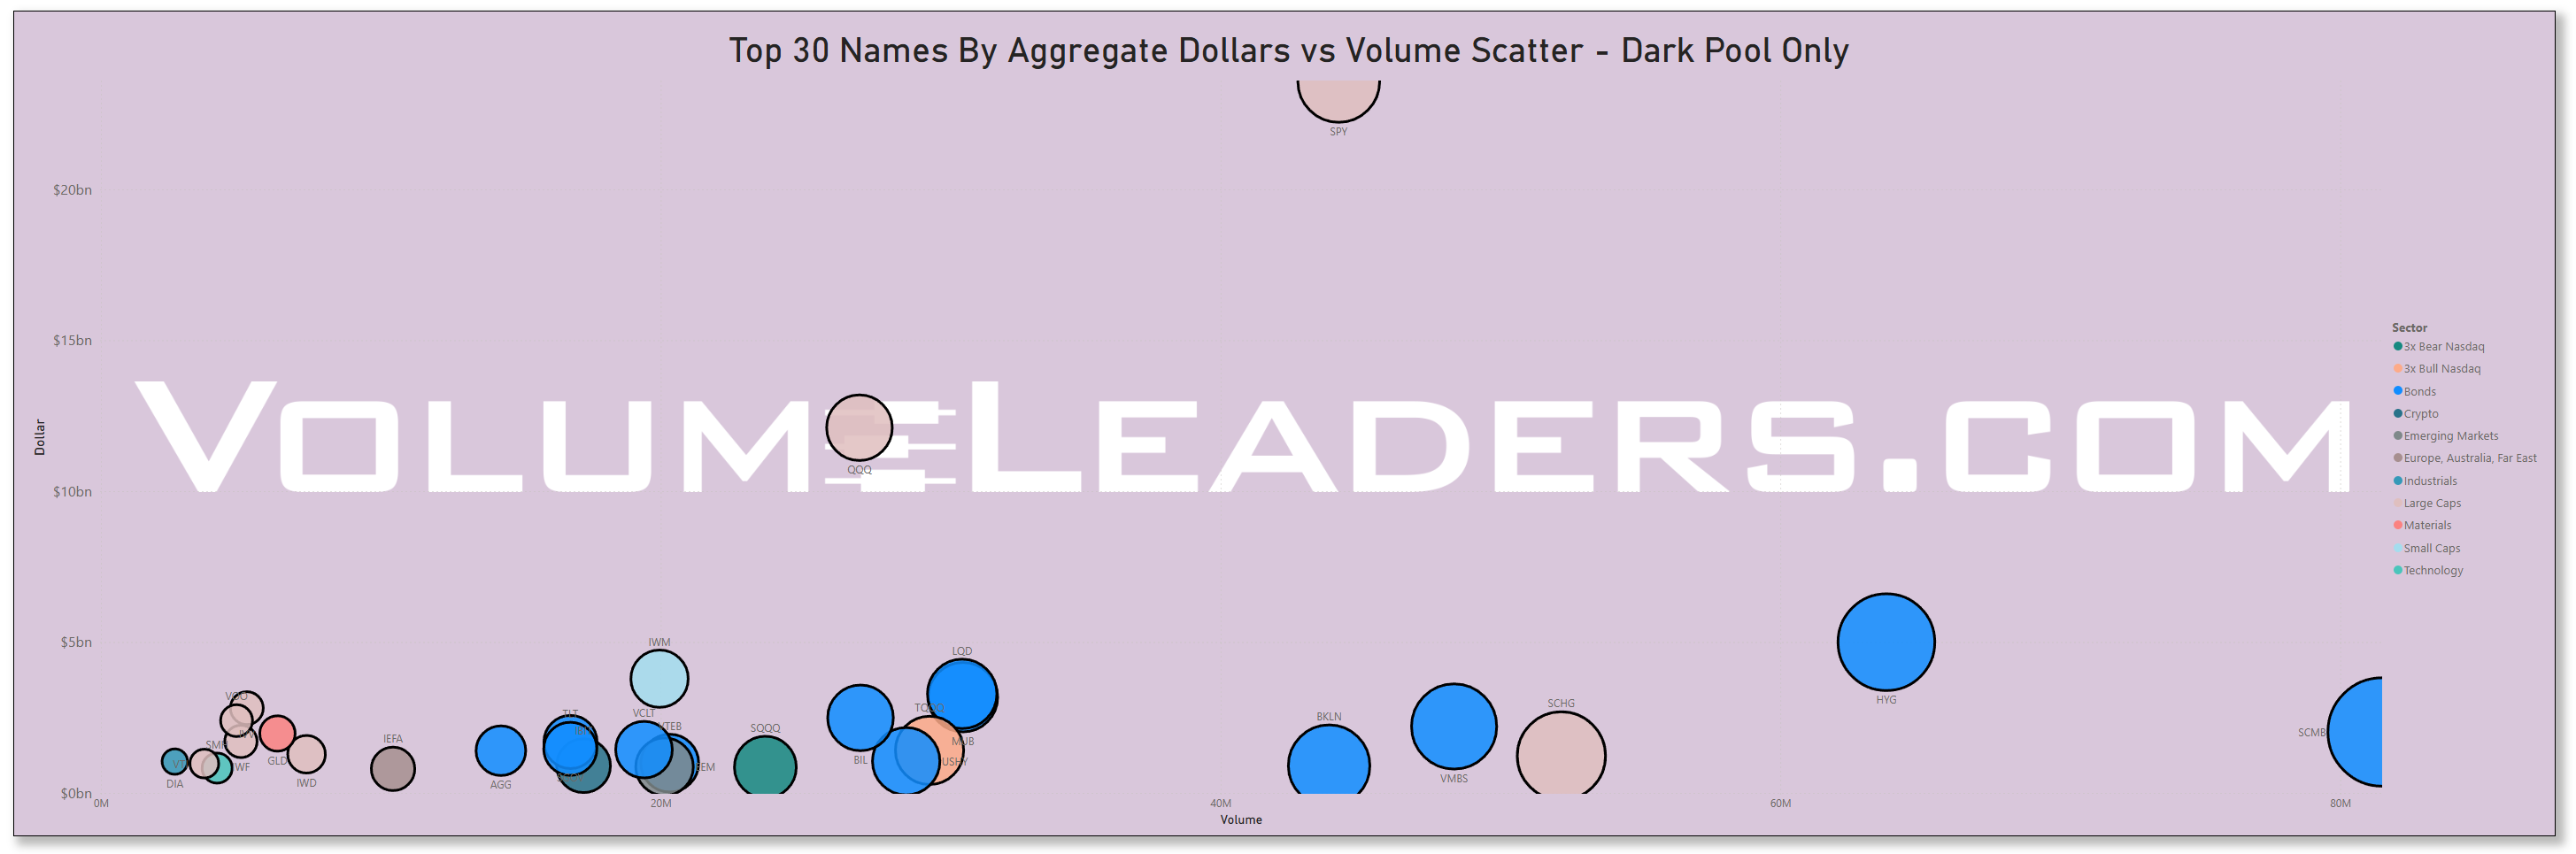
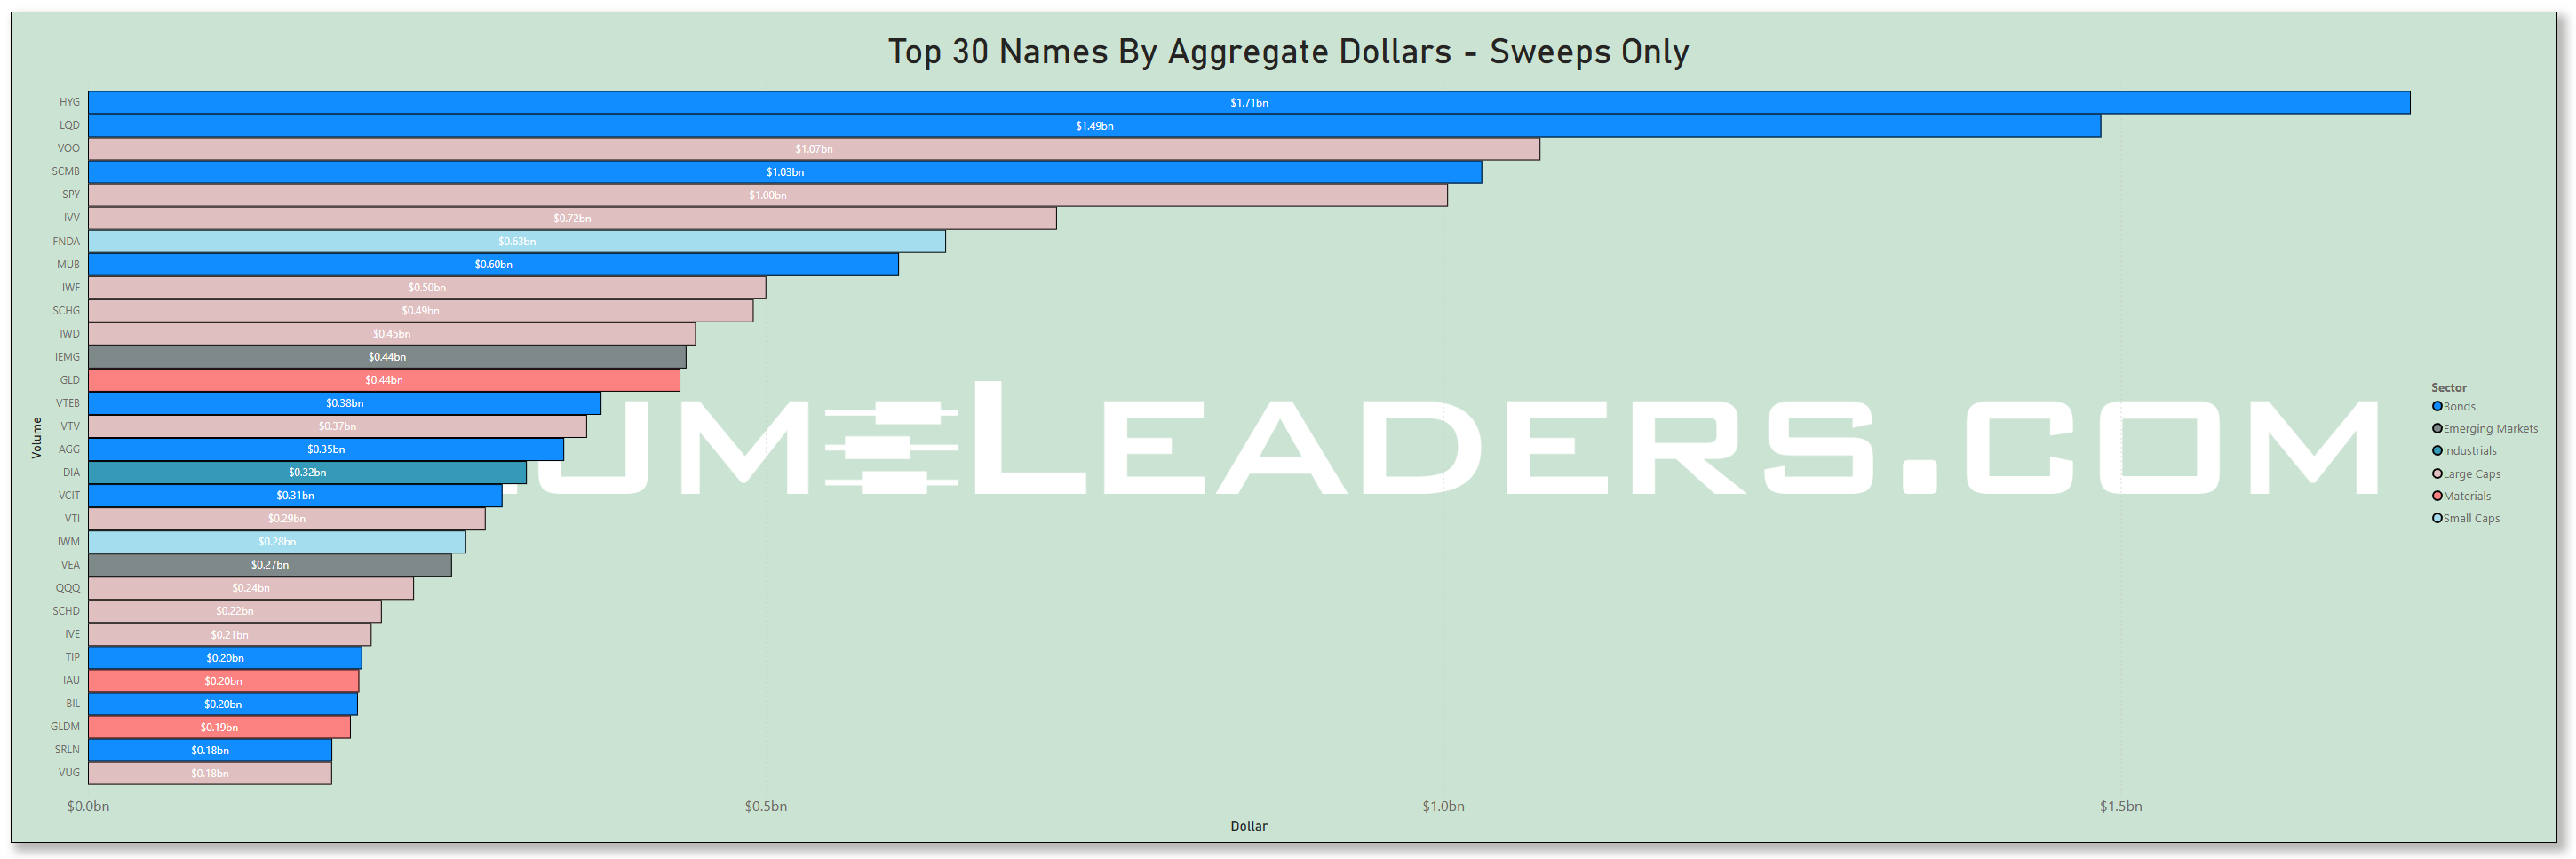
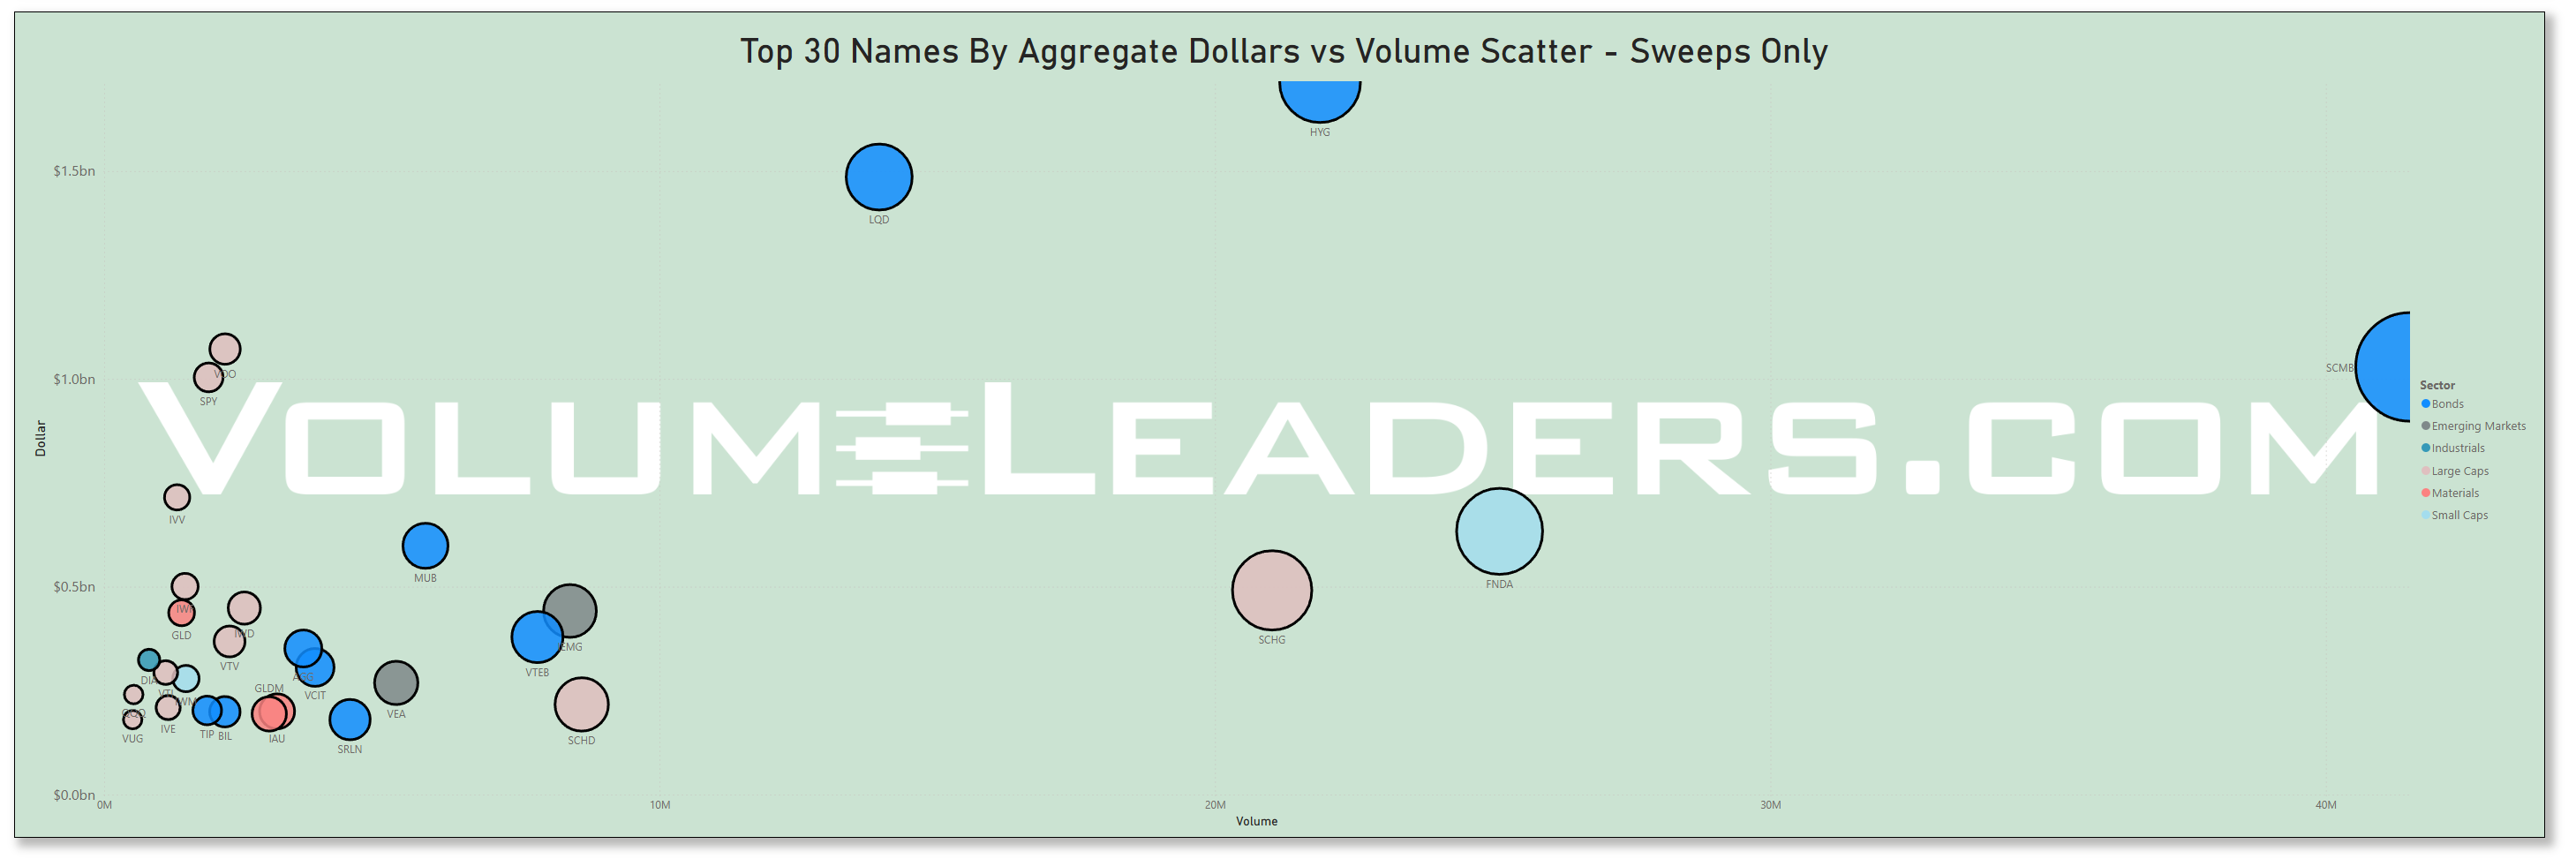
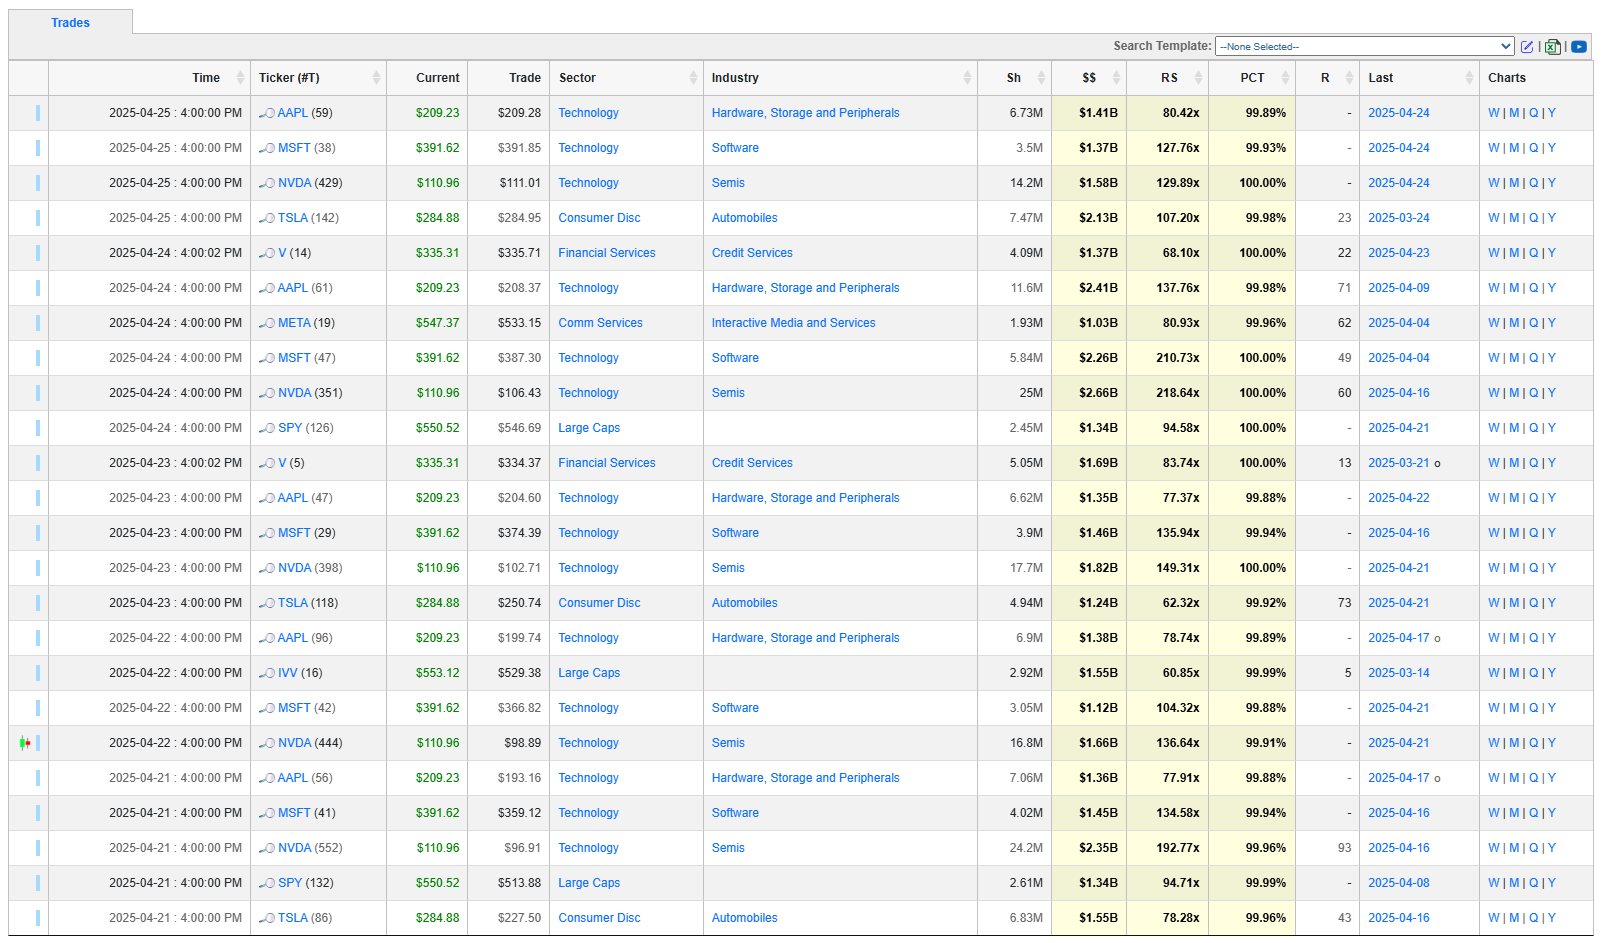
Many excellent trade ideas and sources of inspiration can be found in the prints below. While only the top 30 from each group are displayed, the complete results are accessible in VolumeLeaders.com for you to explore at your convenience any time. Remember to configure trade alerts within the platform to ensure institutional order flows that capture your interest or are significant to you aren’t missed. The blue charts represent all types of trades, including blocks on lit exchanges; the purple charts exclusively depict dark pool trades; and the green charts are sweeps only.
Top Institutional Order Flow In ETFs
Last Week’s Institutionally-Backed Gainers & Losers
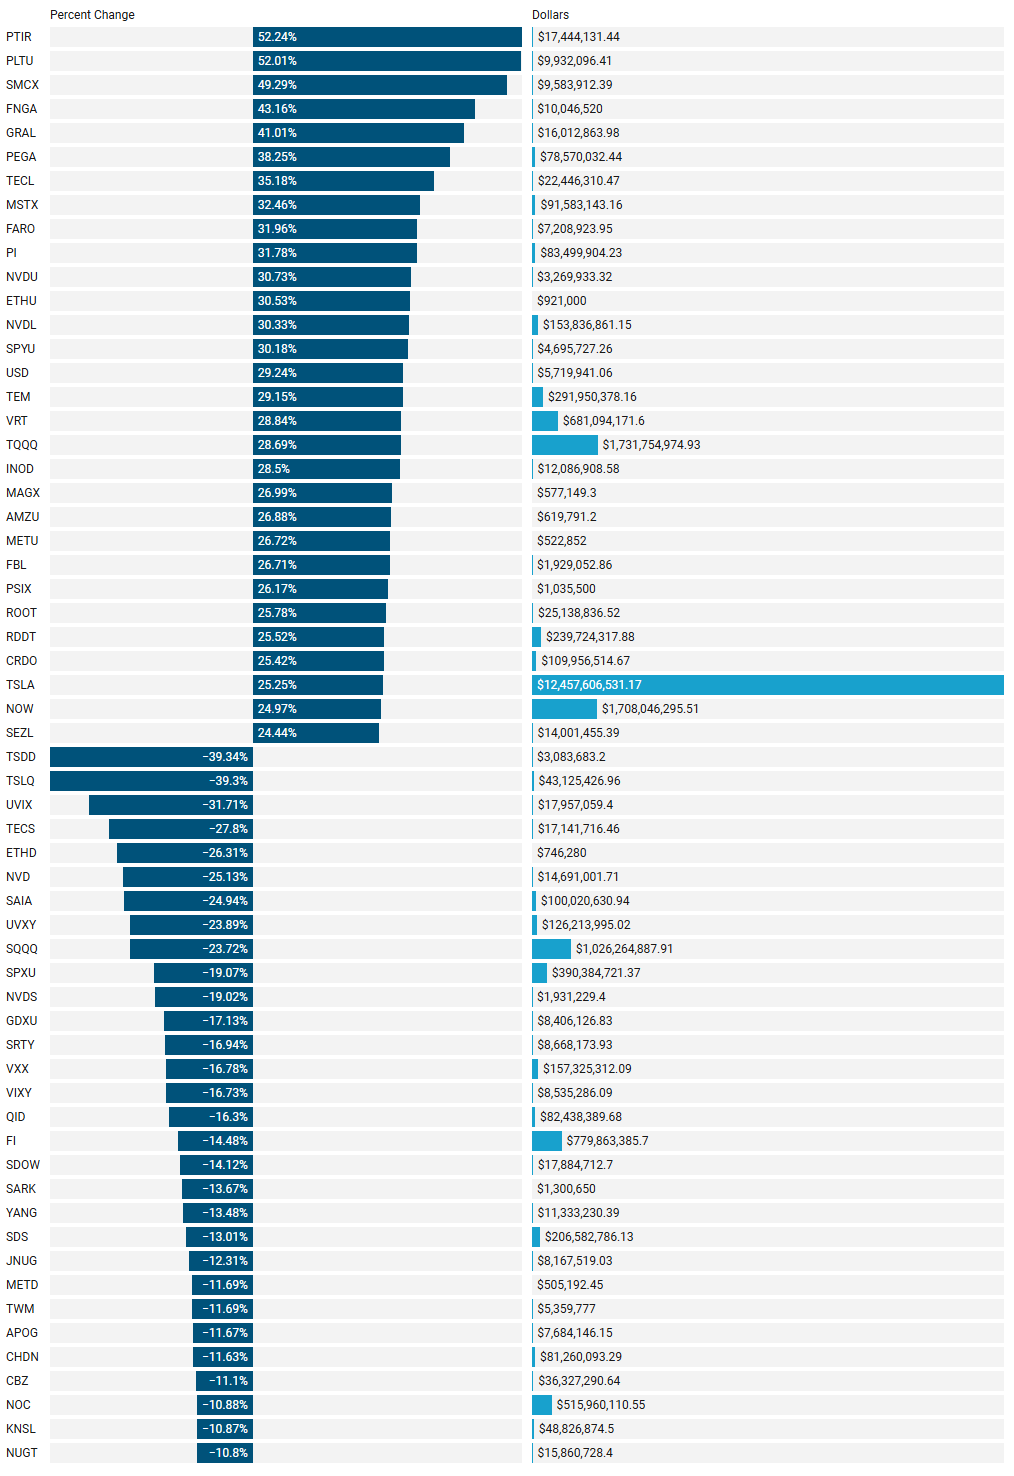
If you’re going to bet on a name, consider one that is officially endorsed by an institution! These are the top percent gainers (green) and percent losers (red) from this week’s open-to-close that had a trade price greater than $20 and institutional involvement. Continue watching tickers from this and prior stacks as these names frequently turn into multi-leg trades with a lot of movement!
Last Week’s Billion-Dollar Prints
Tickers that printed a trade worth at least $1B last week get a special shout-out. These are massive commitments by institutions that should not be ignored.
Analysis of This Week’s Top-25-Ranked Institutional Order Flow
This report presents a detailed statistical analysis of the VolumeLeaders.com Excel dataset, which contains trading data from April 21-25, 2025. The dataset includes 421 trading records with information on trade time, ticker symbols, trade prices, sectors, industries, trading volumes, dollar values, relative size metrics, and rank data. Important note: The dataset specifically captures the top-25-ranked institutional trades for each ticker during this week, with ranking being ticker-specific (Rank 1 represents the largest trade for that particular ticker, not comparable across different tickers).
Key findings include:
Higher trading activity at market close (43% of trades occur at 4:00 PM)
Bonds, Technology, and Large Caps sectors dominate trading activity
TSLA had the largest single trade by dollar value ($2.13B) on April 25, 2025
INSM showed significant trading activity with multiple high relative size trades
SCMB (Schwab Municipal Bond ETF) was the most frequently traded ticker with unusual volume patterns
1. Dataset Overview
The dataset contains 421 trading records spanning April 21-25, 2025 with the following distribution by day:
April 21, 2025: 76 trades (18.05%)
April 22, 2025: 105 trades (24.94%)
April 23, 2025: 80 trades (19.00%)
April 24, 2025: 92 trades (21.85%)
April 25, 2025: 68 trades (16.15%)
2. Basic Statistical Analysis
Descriptive Statistics for Numeric Variables
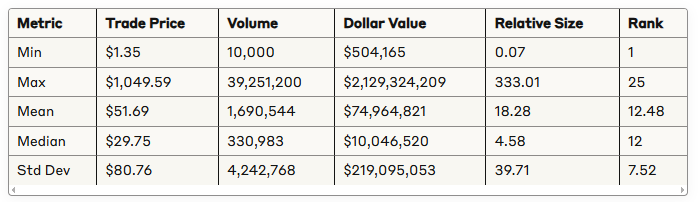
The data shows high variability in all metrics, with positive skew in the distribution of trade prices, volumes, dollar values, and relative sizes (means significantly higher than medians).
Correlation Analysis
Key correlations between metrics:
Trade Price vs Dollar Value: 0.4493 (moderate positive)
Volume vs Relative Size: 0.7487 (strong positive)
Dollar Value vs Relative Size: 0.6621 (strong positive)
Relative Size vs Rank: -0.3309 (moderate negative)
Volume vs Rank: -0.2824 (weak negative)
The strongest correlation exists between volume and relative size, suggesting that relative size is primarily driven by trading volume. The negative correlation between rank and relative size indicates that lower ranks (higher importance) are associated with larger relative size trades.
Distribution of Trading Volume
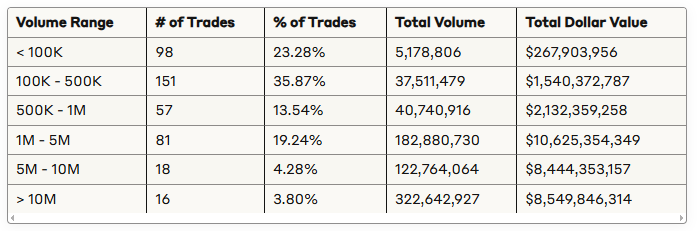
Although trades with volume > 10M represent only 3.80% of all trades, they account for 45.24% of total volume and 27.08% of total dollar value, indicating a high concentration of trading volume in a small number of large trades.
3. Sector and Industry Analysis
Top Sectors by Number of Trades
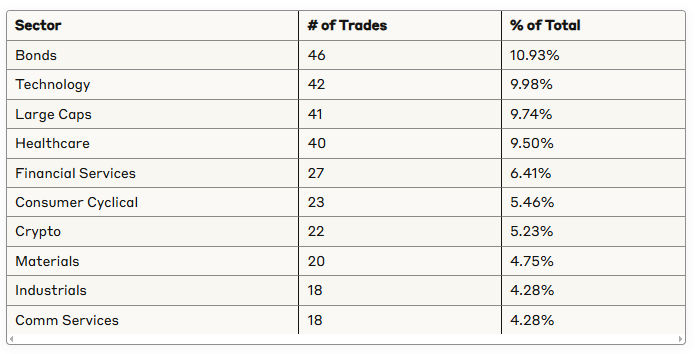
The Bonds sector dominates with the highest number of trades, followed by Technology and Large Caps, reflecting significant activity in fixed-income securities and large technology companies.
Top Sectors by Volume
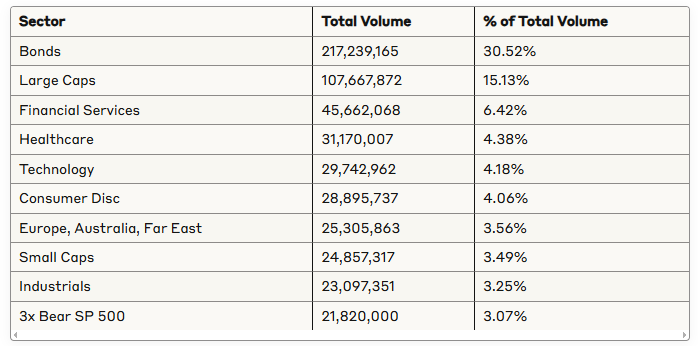
The Bonds sector is also dominant in terms of volume, accounting for nearly one-third of all traded shares, with Large Caps following at 15.13%.
Top Sectors by Dollar Value
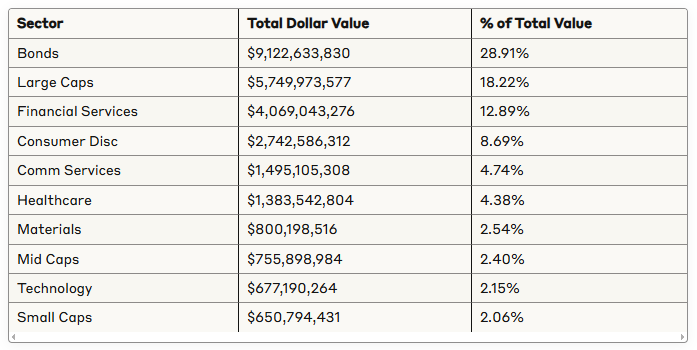
Bonds, Large Caps, and Financial Services sectors represent nearly 60% of the total dollar value traded, with Bonds leading at 28.91%.
Top Industries
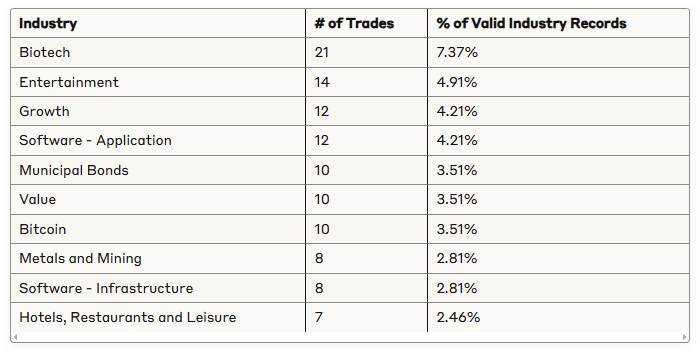
Among industries with available data, Biotech leads with the highest number of trades, followed by Entertainment and Growth/Software-Application.
4. Temporal Analysis
Trading Activity by Hour
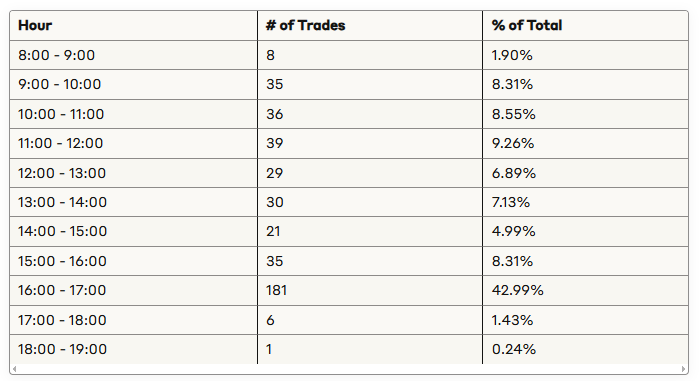
Trading activity shows a strong concentration around market close (4:00 PM), with 42.99% of all trades occurring in the 16:00-17:00 hour, indicating significant end-of-day trading activity.
Market on Close (MOC) Order Analysis
Trades executed exactly at 4:00:00 PM:
Count: 63 trades (14.96% of all trades)
Total volume: 41,991,989 shares (5.90% of total volume)
Total value: $5,168,587,386 (16.38% of total dollar value)
Average trade size: 666,539 shares
Average trade value: $82,041,070
MOC orders represent a significant portion of the total dollar value traded (16.38%) despite accounting for only 5.90% of the total volume, indicating higher-priced securities are more commonly traded at market close.
5. Key Ticker Analysis
Most Frequently Traded Tickers
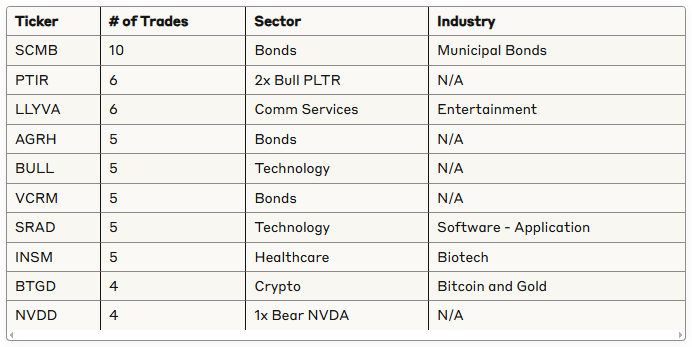
SCMB (Schwab Municipal Bond ETF) is the most frequently traded ticker with 10 occurrences, followed by PTIR and LLYVA with 6 trades each.
Top Tickers by Total Volume
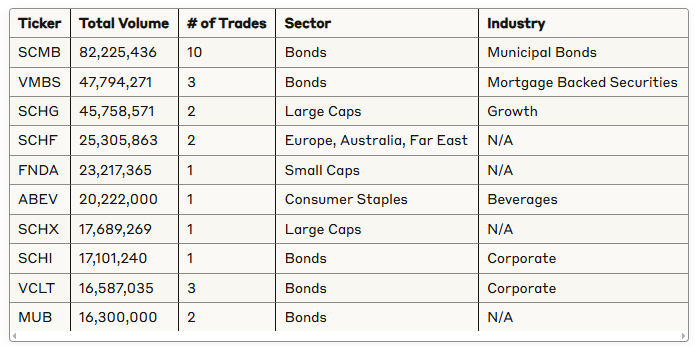
SCMB leads in total volume with over 82 million shares across 10 trades, followed by VMBS and SCHG. Bond-related ETFs dominate the high-volume list.
Top Tickers by Total Dollar Value
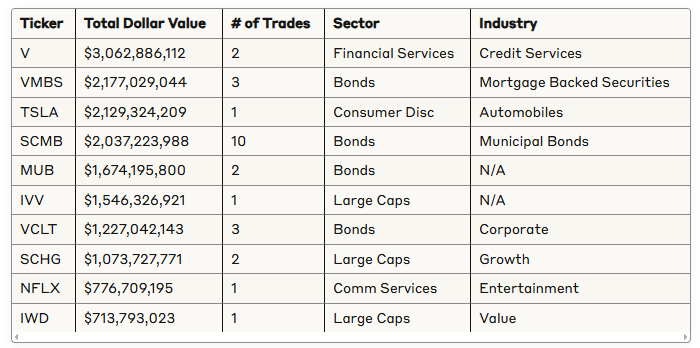
Visa (V) leads in total dollar value with over $3 billion traded across just 2 transactions, followed by bond ETFs (VMBS) and Tesla (TSLA).
Largest Individual Trades by Dollar Value
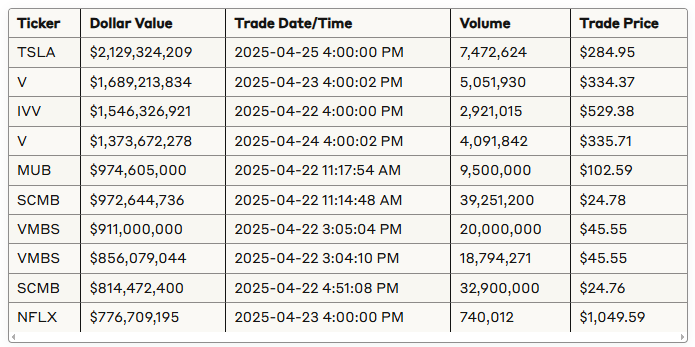
The largest single trade by dollar value was TSLA at over $2.1 billion on April 25, 2025, followed by two large Visa (V) trades exceeding $1.3 billion each.
Top Trades by Relative Size
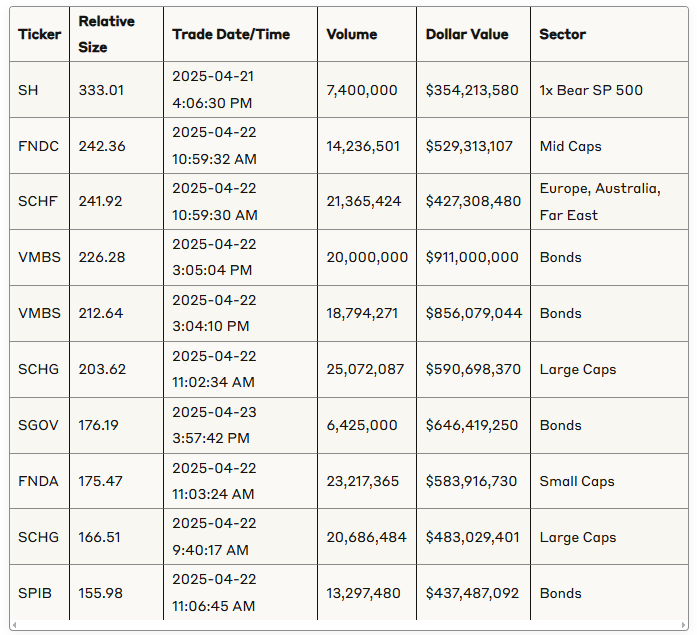
The highest relative size trade was SH (ProShares Short S&P 500 ETF) at 333.01, followed by FNDC and SCHF, both with relative sizes over 240. ETFs dominate the top relative size trades.
Volatility in Trading Volume
Tickers with the highest coefficient of variation (CV) in volume (indicating highly variable trading patterns):
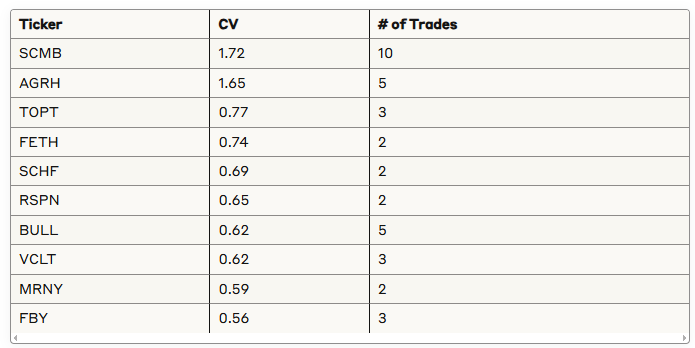
SCMB shows the highest volatility in trading volume (CV = 1.72) across its 10 trades, suggesting inconsistent block sizes and possible mixed institutional trading patterns.
6. Focus on Notable Tickers
Tesla (TSLA) Analysis
Tesla stands out with the largest single trade by dollar value at $2.13 billion on April 25, 2025, at 4:00:00 PM:
Trade Price: $284.95
Volume: 7,472,624 shares
Relative Size: 107.20
Rank: 4
This significant TSLA trade occurred during market close and represented 107.2 times the average trade size for similar stocks. According to recent market news, Tesla reported Q1 2025 earnings on April 22 that missed analyst expectations, with revenue declining 9% year-over-year to $19.34 billion and automotive revenue dropping 20%. The stock had been down 41% year-to-date prior to this large trade.
Insmed (INSM) Analysis
Insmed appeared 5 times in the dataset and had multiple high relative size trades on April 25, 2025:
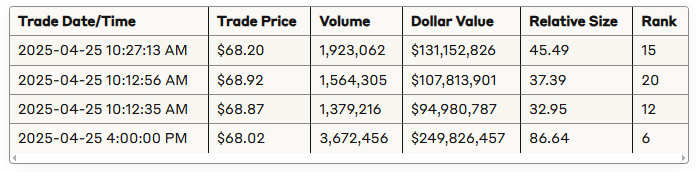
Insmed, a biopharmaceutical company focused on rare diseases, showed unusual trading activity on April 25, with four large trades accounting for 8.5 million shares. This activity coincides with positive news about the company's drug brensocatib, which received FDA Priority Review for the treatment of bronchiectasis with a target action date of August 12, 2025.
Schwab Municipal Bond ETF (SCMB) Analysis
SCMB was the most frequently traded ticker (10 trades) and showed the highest volume volatility:
SCMB is a low-cost ETF (0.03% expense ratio) launched in October 2022 that tracks the U.S. AMT-free municipal bond market. The fund underwent a 2-for-1 share split on October 11, 2024. The large volume variation (CV = 1.72) and presence of two extremely large trades on April 22 suggests potential institutional rebalancing or significant portfolio adjustments.
7. Rank Analysis
The dataset includes a "Rank" field (1-25 scale) that indicates the relative significance of trades within each ticker. For each ticker, Rank 1 represents its largest trade and Rank 25 its smallest (in this dataset, not in the platform), with rankings not comparable across different tickers.
Distribution of Ranks
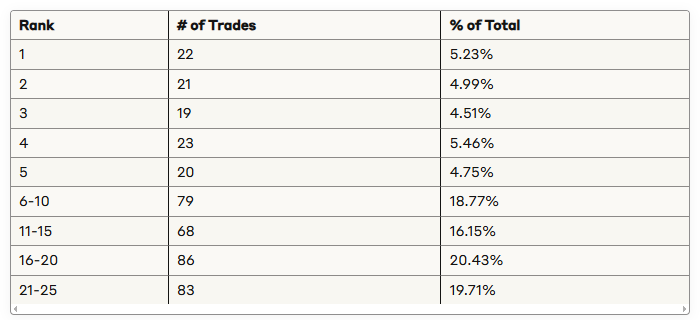
The fairly even distribution of ranks suggests we are seeing a representative sample of institutional trading activity across various rank levels for each included ticker.
Rank Analysis by Ticker
For tickers with multiple trades, we can analyze how the rank corresponds to trade characteristics:
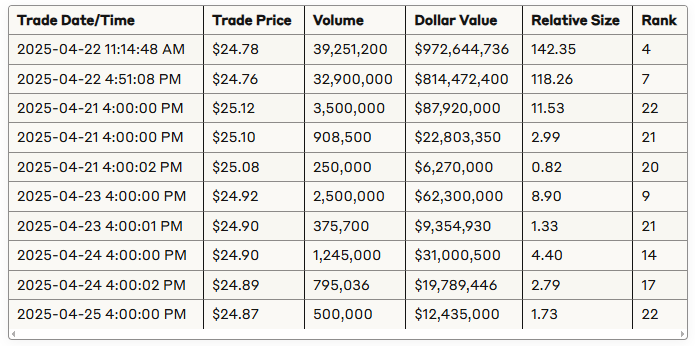
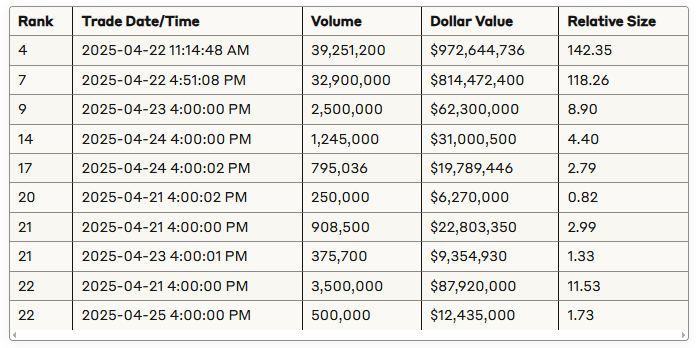
SCMB Rank Analysis (10 trades)
INSM Rank Analysis (5 trades)
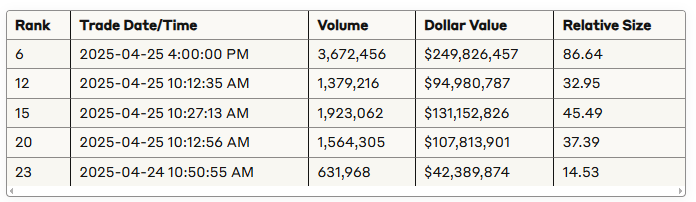
For INSM, the rank pattern is somewhat more aligned with trade size, with the highest volume trade (3.67M shares) having the best rank (6), though smaller trades don't follow a strict pattern based on size alone.
This pattern suggests that institutional rankings may incorporate factors beyond just trade size, potentially including market impact, timing relative to news events, or other qualitative assessments of trade significance.
8. Market Concentration Analysis
The Herfindahl-Hirschman Index (HHI) for sector volume concentration was calculated at 1339.48, indicating an unconcentrated market with diversified trading activity across many sectors. This suggests that while certain sectors (e.g., Bonds, Large Caps) account for a significant portion of trading volume, the market as a whole remains relatively competitive with no single sector dominating completely.
9. Bitcoin and Crypto Analysis
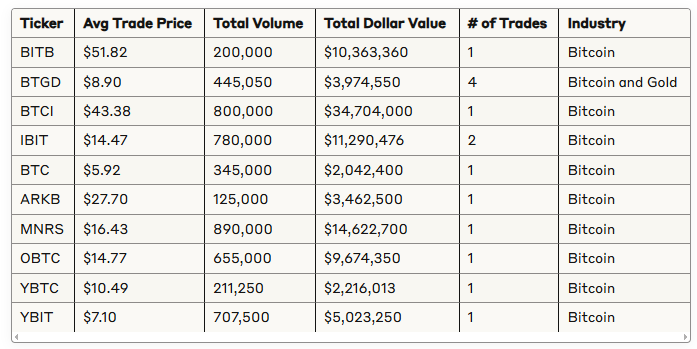
Bitcoin-related tickers showed significant trading activity with 14 trades total across 10 different tickers. The average relative size for crypto trades was 14.69, well above the overall average of 4.58, suggesting larger-than-normal block trades in this sector.
10. Recent Trading Patterns Analysis (April 25, 2025)
The most recent trading day (April 25, 2025) showed some notable patterns:
Volume by Hour (April 25)
8:00 hour: 489,000 shares
9:00 hour: 5,164,767 shares
10:00 hour: 10,354,091 shares
12:00 hour: 444,492 shares
13:00 hour: 1,496,358 shares
14:00 hour: 1,235,407 shares
15:00 hour: 1,275,182 shares
16:00 hour: 30,086,129 shares
The 10:00 hour showed unusually high volume (primarily due to INSM trades), but the 16:00 hour (market close) dominated with nearly 3x the volume of all other hours combined.
Recent Large Movers (April 25)
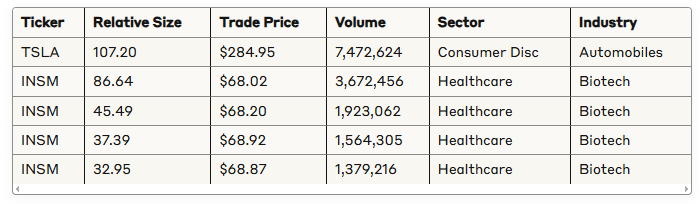
TSLA and INSM were the standout movers on April 25, with INSM appearing four times in the top five relative size trades. The healthcare sector (particularly biotech) showed strong activity on this day.
11. Conclusions and Key Insights
Dataset Composition: This dataset captures the top 25 institutional trades for various tickers during the week of April 21-25, 2025, with ranks being ticker-specific (Rank 1 is the largest trade for that particular ticker).
Trading Concentration: A significant portion (42.99%) of trading activity occurs in the hour before market close (4:00 PM), with market-on-close orders representing 16.38% of total dollar value.
Sector Analysis: Bonds dominate trading activity (10.93% of trades, 30.52% of volume, 28.91% of dollar value), followed by Large Caps, Technology, and Financial Services sectors. This suggests strong institutional interest in fixed-income securities during this period.
Key Tickers:
SCMB: Most frequently traded (10 times) with extremely variable volume (CV = 1.72)
TSLA: Largest single trade by dollar value ($2.13B) on April 25, potentially related to disappointing Q1 earnings
INSM: Notable concentration of large trades on April 25, coinciding with positive FDA developments for brensocatib
V (Visa): Two massive trades totaling $3.06B, making it the largest ticker by combined dollar value
Ranking Patterns: For tickers with multiple trades, the institutional ranking doesn't always perfectly correlate with trade size, suggesting that other factors beyond volume or dollar value may influence how institutions rank the significance of their trades.
Recent Activity: April 25, 2025, was dominated by healthcare sector moves, particularly INSM, which had four of the five largest relative size trades on that day.
Market Concentration: With an HHI of 1339.48, the market shows diversification across sectors without excessive concentration in any single area.
This analysis provides a comprehensive overview of trading patterns, highlighting unusual activity and potential market trends worth monitoring. The concentration of trading at market close, the dominance of bond sector activity, and the notable trades in TSLA and INSM represent the most significant findings after critically analyzing this week’s top-25-ranked trades.
Thank you for being part of our community and for dedicating your time to this edition. Your insights and engagement drive everything we do, and we’re honored to share this space with such committed, thoughtful readers. Here’s to a week filled with clear opportunities and strong performance. Wishing you many bags 💰💰💰
—VolumeLeaders