Market Momentum: Your Weekly Financial Forecast & Market Prep
Issue 41 / What to expect April 14, 2025 thru April 18, 2025
In This Issue
Market-On-Close: All of last week’s market-moving news and macro context in under 5 minutes
The Latest Investor Sentiment Readings
Institutional Support & Resistance Levels For Major Indices: Exactly where to look for support and resistance this week in SPY, QQQ, IWM & DIA
Institutional Activity By Sector: Institutional order flow by sector including the top institutionally-backed names in those sectors. We break it all down and provide the key insights and take-aways you need to navigate institutional positioning this week.
Top Institutional Order Flow In Individual Names: All of the largest sweeps and blocks on lit exchanges and hidden dark pools
Top Institutionally-Backed Gainers & Losers: An explosive watchlist for day traders seeking high-volatility
Normalized Performance By Thematics YTD (Sector, Industry, Factor, Energy, Metals, Currencies, and more): which corners of the markets are beating benchmarks, which ones are overlooked and which ones are over-crowded
Key Econ Events and Earnings On-Deck For This Week

Market-On-Close
Market Volatility Amid Trade Tensions: A Week of Turbulence and Recovery
Look, Bloomberg sums it up more succinctly than I ever could:
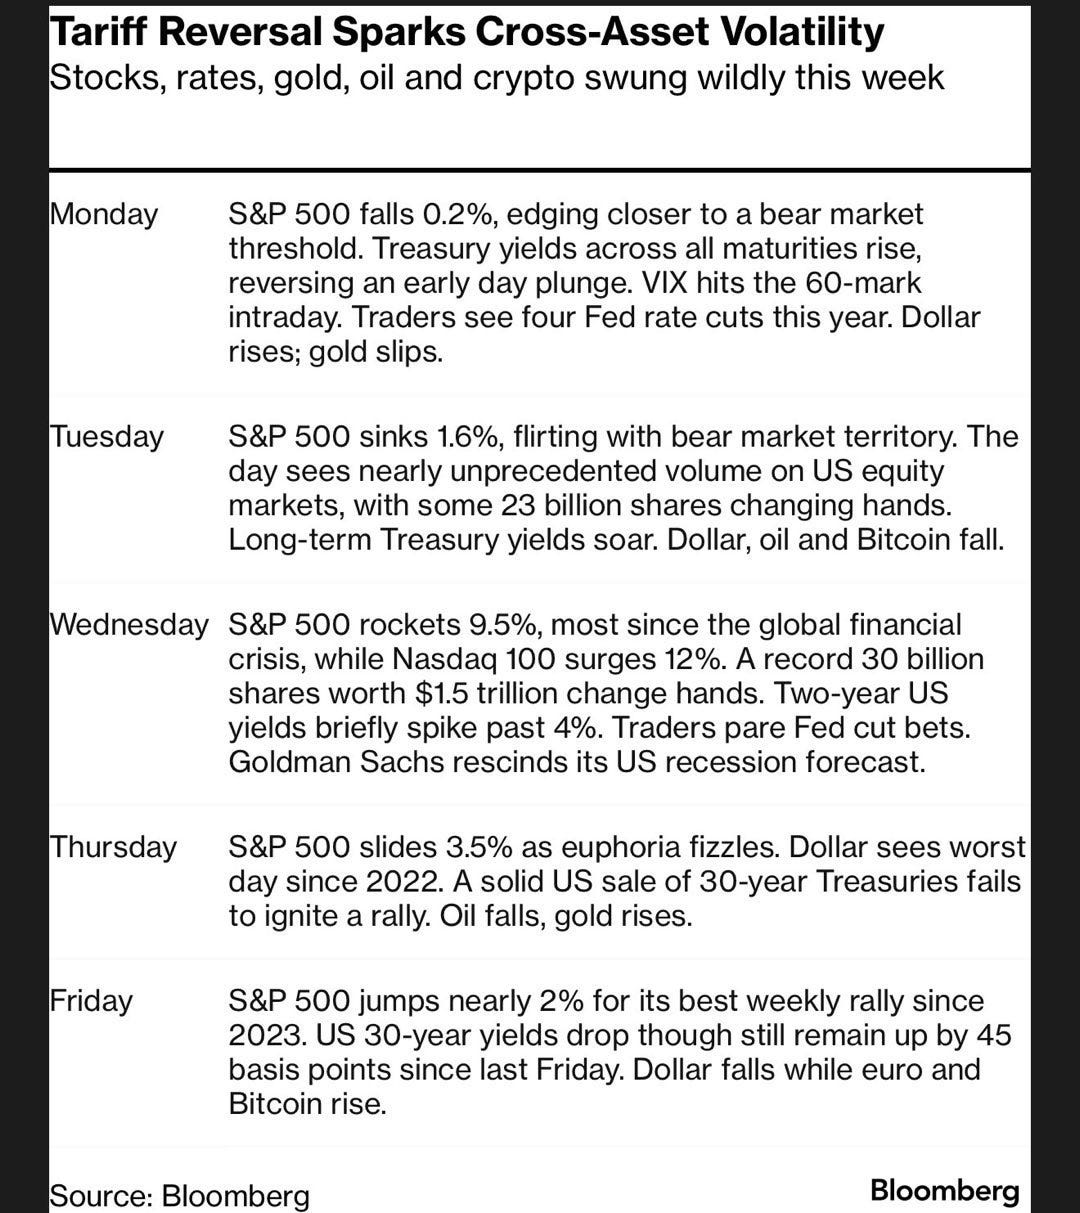
The financial markets experienced extreme volatility this week, marked by sharp declines followed by a dramatic recovery. After initially plummeting toward bear market territory, major indices rebounded following the announcement of a 90-day pause on higher reciprocal tariffs for most nations, excluding China. The S&P 500 finished the week up 5.70%, the Nasdaq Composite closed 7.29% higher, and the Russell 2000 gained 1.82%. This rollercoaster reflected the market's sensitivity to trade policy developments and their potential impact on economic growth, corporate earnings, and inflation expectations.
The events of the past week highlight several critical themes: the significance of trade policy uncertainty as a market driver, the potential economic consequences of elevated tariffs, the role of monetary policy in stabilizing markets, and the psychological aspects of investor behavior during periods of extreme volatility. Understanding these dynamics provides valuable context for navigating the current market environment and forming expectations about future developments.

The Tariff Saga: Escalation and Partial De-escalation
Initial Shock and Market Response
The market turbulence began in earnest on April 2nd when the Trump administration announced sweeping tariff increases. This decision sent shockwaves through global markets, triggering fears of a worldwide trade war and economic slowdown. The S&P 500 declined 12% between April 3rd and April 8th as investors grappled with the implications of these policies.
")
The market's negative reaction reflected legitimate concerns about the potential economic impact of tariffs. Economic models, including one developed by the Federal Reserve in 2018, suggest that the proposed tariff structure could reduce GDP by approximately 2.4% over the next couple of years in the absence of fiscal offsets. This would represent a significant headwind for an economy that had otherwise shown resilience.
The Pivot: A 90-Day Pause
As markets teetered on the edge of bear territory, the administration announced a significant policy modification on Wednesday. President Trump authorized a 90-day pause on higher reciprocal tariffs for most countries, while maintaining and even increasing tariffs on Chinese goods. This development indicated a more conciliatory approach and opened the door for negotiations with many trading partners.
The markets responded with historic enthusiasm to this policy shift. The Nasdaq Composite gained over 12% in a single session—its second-best day on record. This dramatic reversal underscores the market's sensitivity to trade policy developments and suggests that investors had priced in a worst-case scenario that suddenly appeared less likely.
The China Exception: Continued Escalation
While the 90-day pause provided relief regarding most trading relationships, the U.S.-China trade tensions continued to escalate. Throughout the week, the Trump administration announced several increases to tariffs on Chinese goods, ultimately raising them to 145%. China responded with retaliatory measures, increasing levies on U.S. imports to 125%.
This ongoing friction between the world's two largest economies remains a significant source of market uncertainty. China's Ministry of Finance warned that the country plans to "resolutely counterattack and fight to the end" if the U.S. continues to "infringe on its rights and interests." Such rhetoric suggests that resolution may not be imminent and that trade tensions could continue to influence market dynamics in the coming weeks and months.
From Universal to Targeted Approach
The administration's pivot from a universal approach to a more targeted strategy focused primarily on China represents a significant evolution in trade policy. While the 10% baseline tariff remains in place for virtually all nations, the 90-day pause on higher reciprocal tariffs indicates flexibility and a potential willingness to negotiate.
This shift has important implications for market sentiment. The peak of trade uncertainty may now be behind us, though the path forward remains uncertain. The mix of positive and negative headlines is likely to continue, keeping volatility elevated but potentially decreasing from the extreme levels seen in recent days.
Economic Implications and Market Dynamics
Impact on Growth and Inflation
The tariff situation creates a complex economic picture. On one hand, higher tariffs are expected to slow economic growth as they disrupt supply chains, increase input costs, and potentially reduce consumer spending power. On the other hand, they may exacerbate inflationary pressures at a time when the Federal Reserve is working to bring inflation back to its 2% target.
This combination presents the risk of stagflation—a challenging economic scenario characterized by slowing growth and persistent inflation. St. Louis Fed President Musalem explicitly warned of this possibility, noting "a near-term risk that inflation will rise while the labor market weakens." Such an environment would place the Federal Reserve in a difficult position, potentially forced to choose between addressing inflation and supporting economic growth.

Consumer Sentiment and Expectations
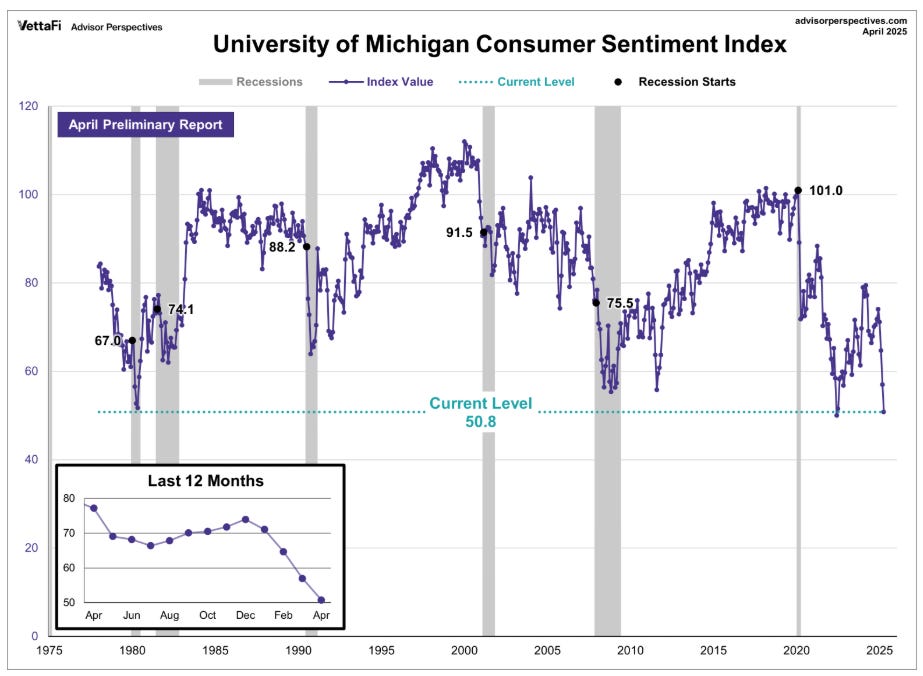
The University of Michigan's April consumer sentiment index revealed concerning trends. The index fell to 50.8, a 2-3/4 year low and 11% below March levels. More alarmingly, year-ahead inflation expectations surged to 6.7%—the highest level since 1981—while 5-10 year inflation expectations rose to 4.4%, the highest since 1991.
These figures suggest that consumers are increasingly concerned about the potential inflationary impact of tariffs and may adjust their spending and saving behaviors accordingly. Since consumer spending accounts for approximately 70% of U.S. economic activity, deteriorating sentiment could have significant implications for economic growth.
Corporate Response and Business Confidence
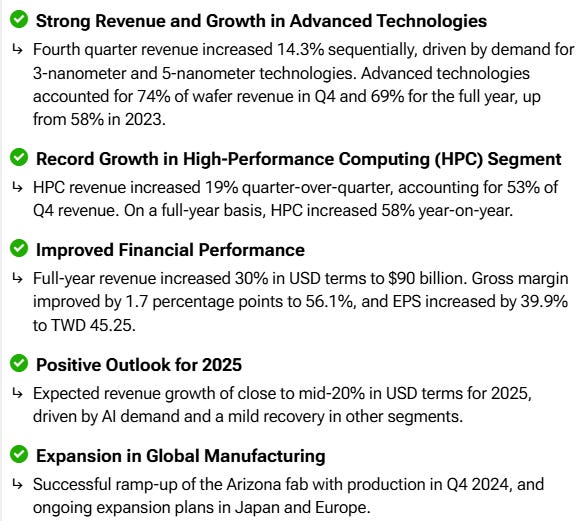
The trade uncertainty is already influencing corporate behavior. Many businesses are reportedly suspending capital spending plans—a negative factor for GDP growth. Others are rushing shipments and stockpiling inventory in anticipation of higher tariffs, as evidenced by increased PC shipments and semiconductor demand.
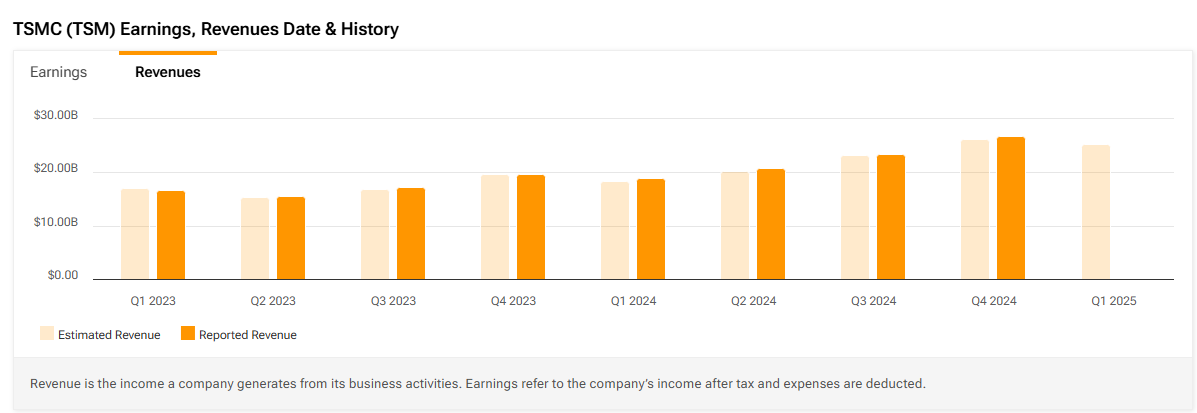
Taiwan Semiconductor Manufacturing Co. reported quarterly revenue growth of 42%, exceeding expectations. This surge reflects strengthening demand for AI servers and smartphones as manufacturers rushed to stockpile goods in U.S. warehouses before tariffs took effect. Similarly, personal computer shipments grew at their fastest pace since the pandemic, with laptops leading the way.
These inventory builds may provide a temporary boost to economic activity but could lead to reduced orders in future quarters as businesses work through accumulated stock. The net effect on economic growth depends on how quickly trade uncertainties are resolved and normal ordering patterns resume.
Pressure on the Dollar and Implications for Markets
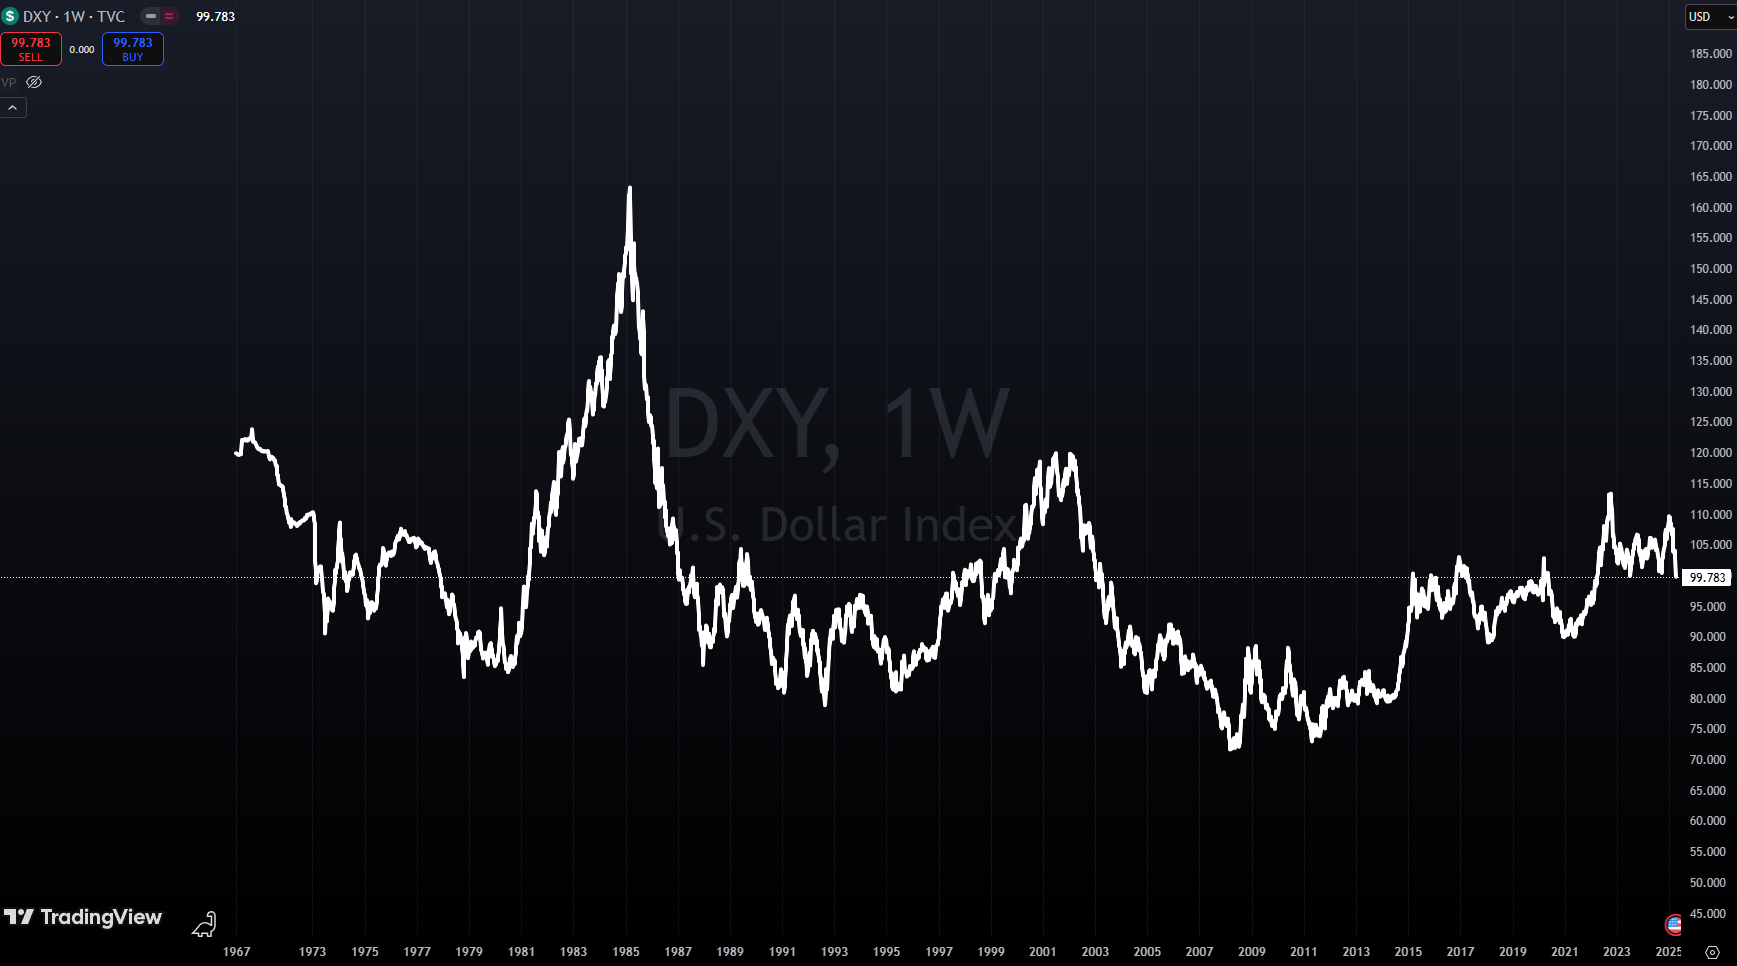
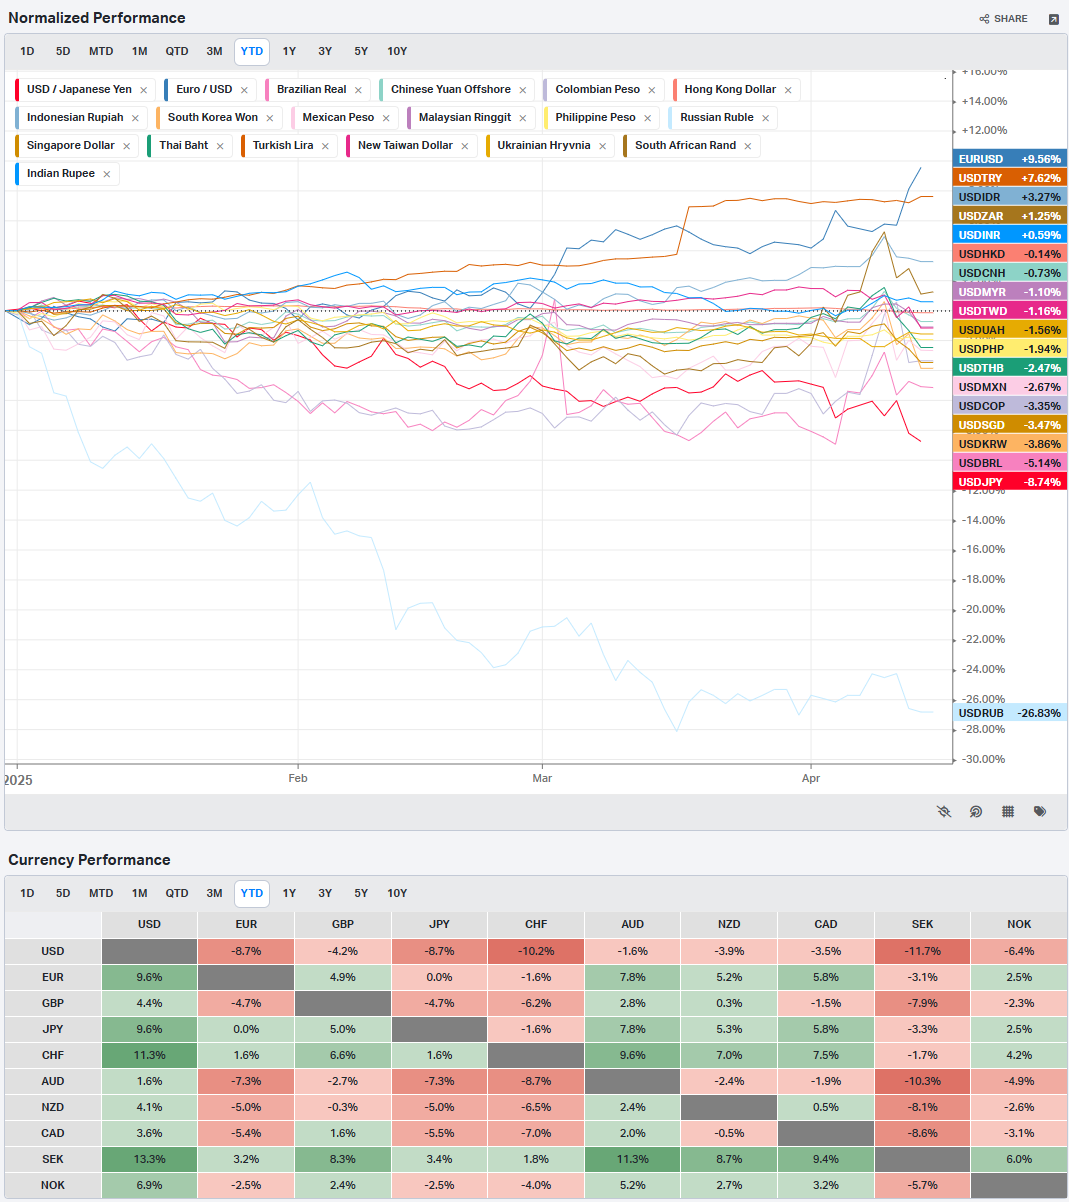
The dollar index sank to a three-year low, falling below 100 for the first time since July. This weakness represents a significant shift, as the dollar has traditionally functioned as a safe-haven currency during periods of market stress. The current situation appears to be different, with foreign investors potentially reducing their exposure to U.S. assets due to concerns about trade policy.
This dollar weakness has corresponding implications for other assets. Gold prices soared to an all-time high, reflecting both inflation concerns and the search for alternative stores of value. The Euro rallied 3.3% to 1.13, while traditional safe-haven currencies like the Japanese yen and Swiss franc strengthened significantly.
The perception that the U.S. is "weaponizing" tariffs may be diminishing the dollar's reserve-currency status and prompting some foreign investors to liquidate their dollar assets. This represents a potential long-term structural concern for U.S. markets that extends beyond current trade tensions.
Market Behavior and Investment Implications
Volatility at Historic Extremes
Market volatility reached levels rarely seen in recent decades. The VIX index, often called the "fear index," spiked to its highest level since the early days of the 2020 pandemic. Historically, the average intraday move for the S&P 500 has been approximately 1%. Since April 2nd, this average jumped to an extraordinary 7%.

Such extreme volatility reflects high levels of uncertainty and fear among market participants. However, it's worth noting that the VIX has reached similar levels only eight times in the past 35 years. Typically, it takes approximately eight months for volatility to return to normal levels after such spikes. More encouragingly, when the VIX has exceeded 43 (it reached 52 on April 8th), forward six- and twelve-month equity market returns have historically been strong.
Valuation Reset and Potential Opportunities
The market correction has reset valuations from previously elevated levels. All major indexes are now trading at or below their 10-year historical averages, potentially setting the stage for improved long-term returns. This valuation reset represents one of the potential silver linings of the recent market turbulence.
The current declines in different market segments imply a significant probability of recession and material declines in corporate profits. If economic outcomes prove less severe than currently feared, markets may stabilize and eventually recover. This dynamic creates potential opportunities for long-term investors who can look beyond current uncertainties.
Sector and Asset Rotation
The market turbulence has led to significant rotation among sectors and asset classes. Gold mining stocks surged as the price of gold reached new highs, with companies like AngloGold Ashanti and Newmont posting gains of over 8%. Cryptocurrency-exposed stocks also moved higher as Bitcoin jumped more than 5%.
Conversely, sectors more directly exposed to trade tensions faced pressure. Semiconductor manufacturers declined after the China Semiconductor Association indicated that chip tariffs would be based on manufacturing location rather than shipping origin. Trucking stocks slid amid fears that escalating trade tensions would curb demand.
These rotations highlight the importance of diversification across sectors and asset classes. They also suggest that investors are attempting to position portfolios for an environment of elevated inflation and trade uncertainty.
Federal Reserve Policy and Market Stabilization
The Fed's Dilemma
The Federal Reserve faces a challenging balancing act in the current environment. Minutes from its March policy meeting revealed that policymakers "generally saw increased downside risks to employment and economic growth and upside risks to inflation while indicating that high uncertainty surrounded their economic outlooks." Most members favored a "cautious approach" to monetary policy given the uncertainty about the net effects of various government policies.
The potential inflationary impact of tariffs complicates the Fed's path forward. Minneapolis Fed President Kashkari noted that this impact makes the Fed less likely to lower interest rates, even if the economy weakens. Similarly, New York Fed President Williams stated that the "current modestly restrictive stance of monetary policy is entirely appropriate" given the solid labor market and inflation still above the 2% goal.
Market Expectations for Rate Cuts
Despite these cautious Fed statements, markets are currently pricing in 85 basis points of Federal Reserve cuts for this year. This reflects expectations that economic growth concerns will eventually outweigh inflation worries, forcing the Fed to ease monetary policy to support the economy.
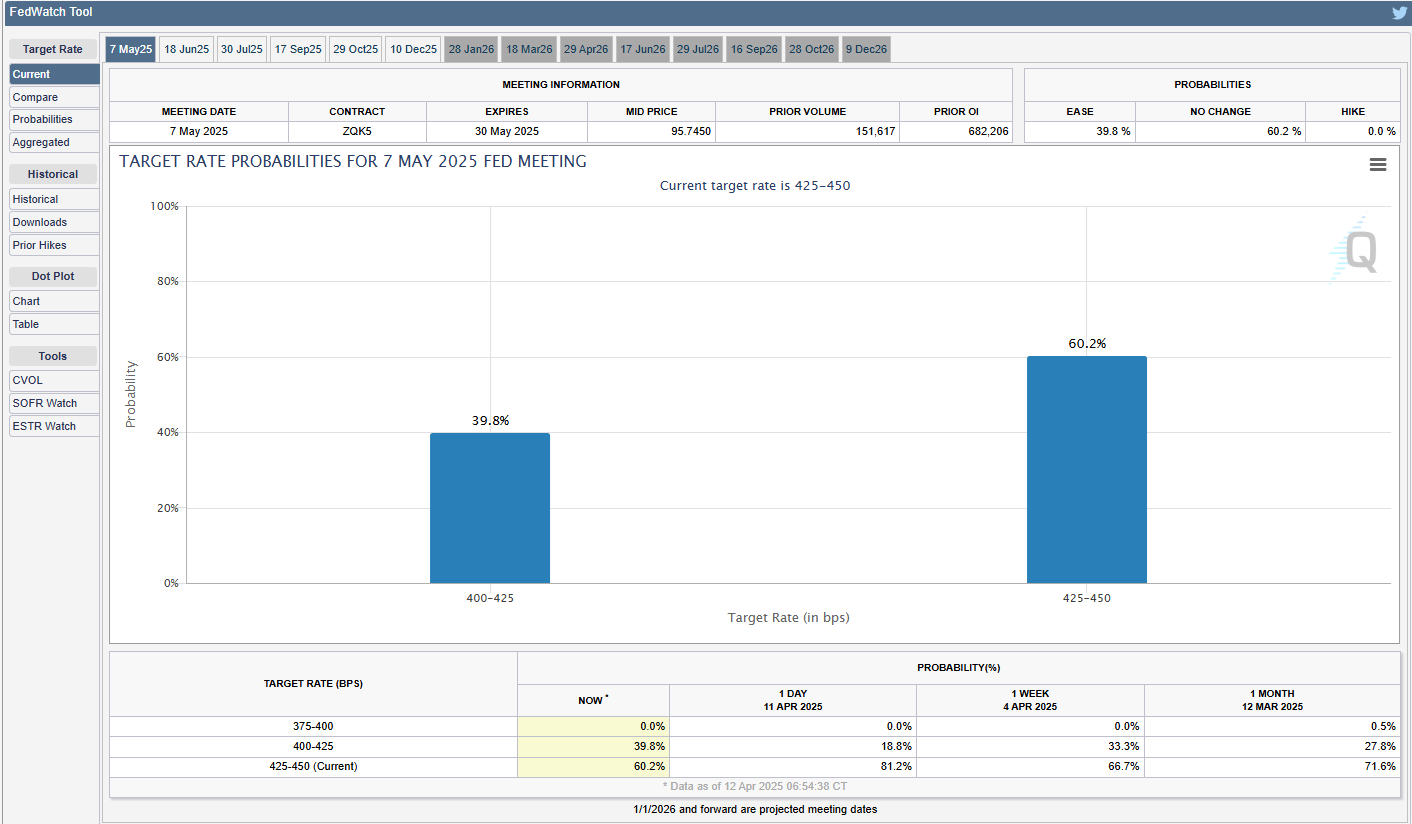
The timing and magnitude of these cuts remain uncertain. Markets are currently discounting a 25% probability of a 25 basis point rate cut at the May 6-7 FOMC meeting. However, this probability could change significantly based on incoming economic data and developments in trade policy.
The Fed as Market Stabilizer
The Financial Times reported that Boston Fed President Collins said the Fed "would absolutely be prepared" to help stabilize financial markets if conditions become disorderly. This statement helped support stock prices during Friday's volatile session and highlights the Fed's potential role as a market stabilizer during periods of extreme stress.
Unlike the bear market in 2022, the Fed currently remains in a rate-cutting cycle and could step in more aggressively than expected if unemployment rises significantly. This potential "Fed put" represents an important distinction from previous market corrections and could limit downside risks if economic conditions deteriorate markedly.
Corporate Earnings and Fundamental Outlook
Q1 Earnings Season Begins
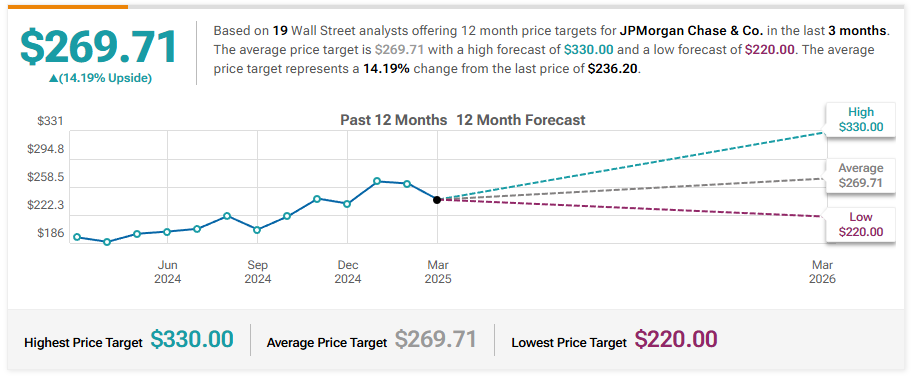
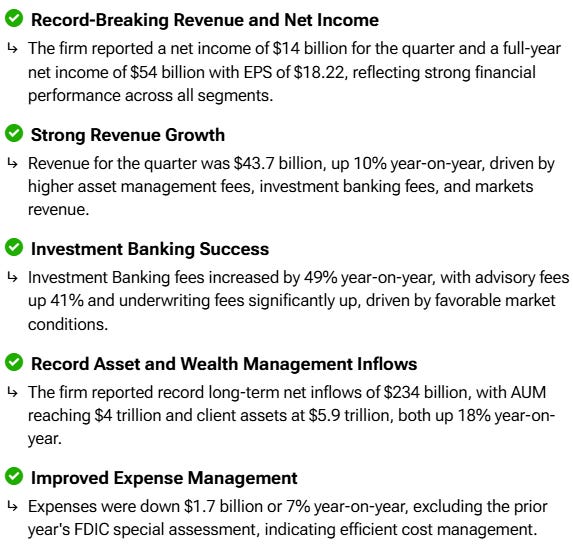
The first-quarter earnings reporting season began Friday as major U.S. banks reported their results. JPMorgan Chase posted better-than-expected results, with Q1 adjusted revenue of $46.01 billion exceeding the consensus estimate of $44.39 billion. This performance helped the stock rise more than 4%, leading gains in the Dow Jones Industrials.
However, Wells Fargo & Co reported Q1 net interest income of $11.50 billion, below the consensus expectation of $11.81 billion. This disappointing result contributed to the stock's nearly 1% decline.
Revised Earnings Expectations
According to data compiled by Bloomberg Intelligence, the market consensus for Q1 year-over-year earnings growth for S&P 500 companies has decreased to 6.7%, down from expectations of 11.1% in early November. Similarly, full-year 2025 corporate profit growth projections have been reduced to 9.4% from 12.5% in early January.
These downward revisions reflect concerns about the impact of tariffs and trade uncertainty on corporate profitability. As the earnings season progresses, investors will closely monitor company guidance for signs of further deterioration or unexpected resilience.

Magnificent Seven Performance
A recovery in the "Magnificent Seven" stocks provided significant support to the broader market on Friday. Apple closed up more than 4%, and Nvidia gained more than 3%. Alphabet and Amazon.com rose more than 2%, while Microsoft added more than 1%.
Given the outsized influence of these companies on major indices, their performance will likely remain a key driver of overall market direction in the coming weeks. Their global supply chains and significant international revenue exposure make them particularly sensitive to developments in trade policy.
International Market Response
Mixed Performance Globally
Overseas stock markets showed mixed performance on Friday. The Euro Stoxx 50 closed down 0.66%, while China's Shanghai Composite Index climbed to a one-week high and closed up 0.45%. Japan's Nikkei Stock 225 experienced a significant decline, closing down 2.96%.
These divergent performances reflect the varying exposures of different economies to U.S. trade policy and the unique domestic factors influencing market sentiment in each region. The relatively stronger performance of Chinese markets may suggest that investors believe China is well-positioned to weather the current trade tensions.
European Central Bank Outlook
Swaps are currently discounting a 95% probability of a 25 basis point rate cut by the European Central Bank at its April 17 policy meeting. This high probability reflects the different economic conditions in Europe compared to the United States, with inflation generally more contained and growth concerns more prominent.
The potential divergence between ECB and Fed policy could have significant implications for currency markets and global capital flows. If the ECB eases while the Fed maintains its cautious stance, the interest rate differential could support the dollar despite current pressures.
Chinese Economic Challenges
China experienced its second consecutive month of consumer deflation in March, with the Consumer Price Index falling 0.1% year-over-year. Factory deflation worsened, with the Producer Price Index decreasing by 2.5%. These deflationary pressures could prompt the People's Bank of China to consider monetary policy easing to stimulate the economy and offset external shocks from trade tensions.
China's economic challenges and policy response will be important factors to monitor, as they could influence both the trajectory of trade negotiations and the performance of global markets.
Investment Strategy in Uncertain Times
Focus on What You Can Control
In navigating the current volatile environment, focusing on controllable factors is essential. These include portfolio diversification, investment quality, and maintaining a long-term perspective. Emotional decision-making often leads to suboptimal outcomes, particularly during periods of market stress.
The Value of Time in the Market
Historical evidence consistently demonstrates that time in the market tends to be more beneficial than attempting to time market movements. The strong returns that typically follow periods of extreme volatility highlight the risks of exiting markets during corrections.
Inflation Risks of Non-Participation
Understanding the risks of not investing remains critical. With 3% inflation, prices double during a typical 25-year retirement period. This reality underscores the importance of owning assets that can help maintain purchasing power over time, despite short-term market volatility.
Quality and Defensive Positioning
Companies with strong balance sheets, sustainable competitive advantages, and pricing power are generally better positioned to navigate elevated tariffs and economic uncertainty. Walmart's recent announcement that it plans to maintain low prices despite potential short-term financial impacts exemplifies the approach of well-positioned companies.
Defensive sectors have shown relative stability during the recent volatility, with defensive stocks rising 1.77% for the week. This performance highlights the potential benefits of including defensive positions in portfolios during uncertain periods.
Looking Ahead: Key Catalysts and Events
Trade Negotiations and Policy Development
The 90-day pause creates a window for negotiations with various trading partners. Progress or setbacks in these discussions will likely continue to drive market sentiment in the coming weeks. Particularly important will be any developments in U.S.-China relations, given the continued escalation between these two economic powers.
Upcoming Economic Indicators
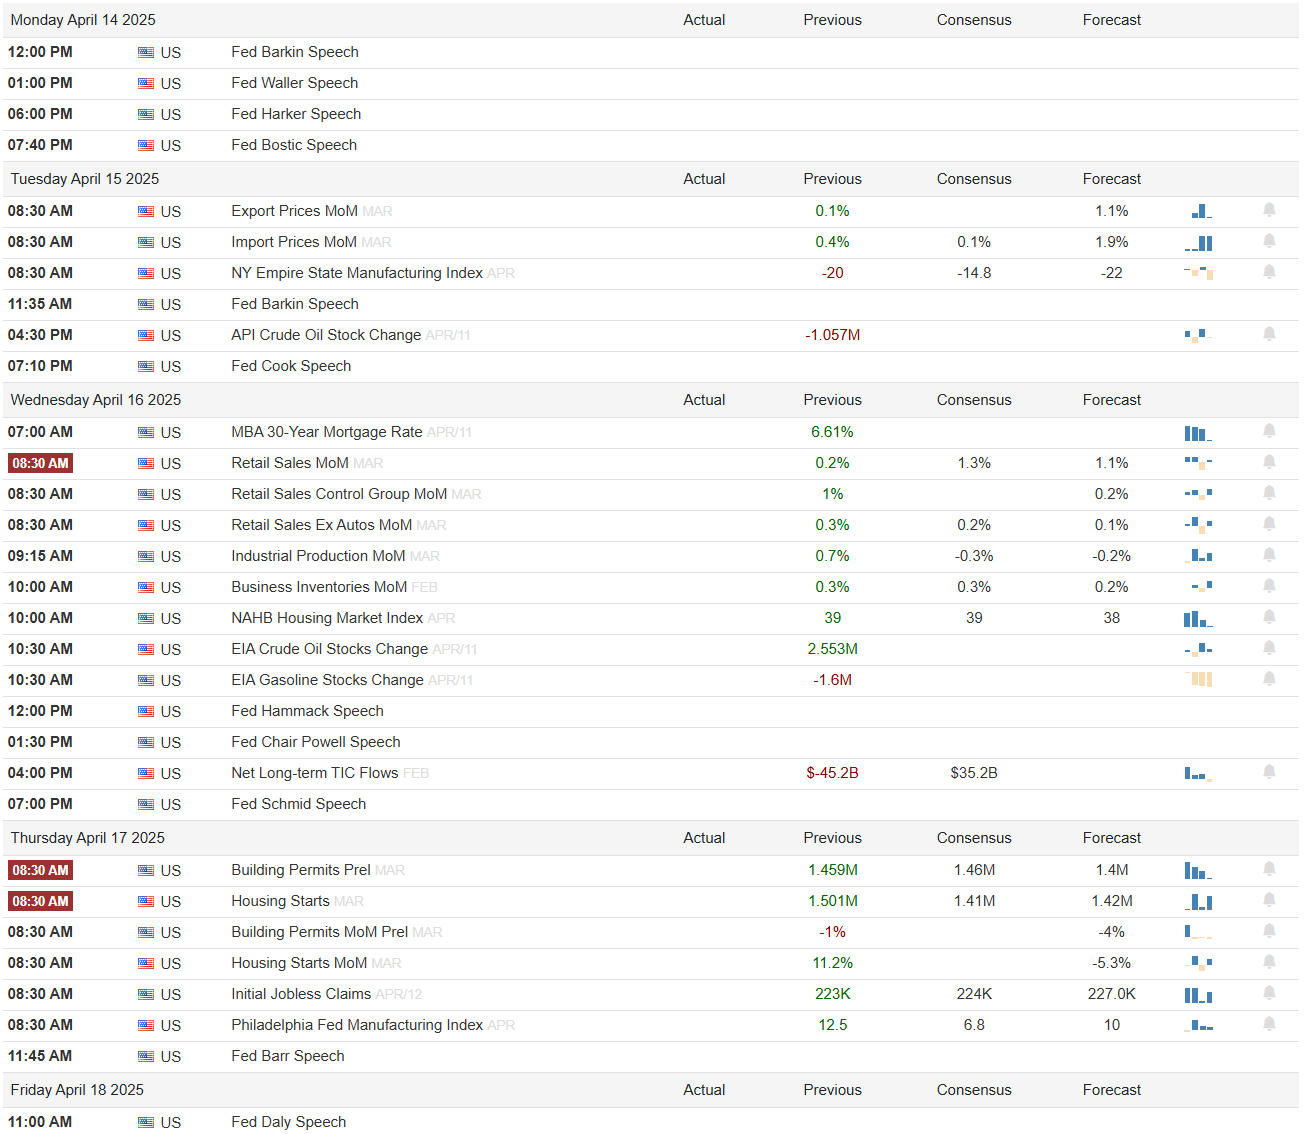
Several important economic indicators will be released in the next two weeks, including Initial Jobless Claims, Industrial Production, Retail Sales, Housing Starts, and the Philadelphia Fed Business Outlook. These data points will provide insights into the economy's trajectory and potential trade policy impacts.
Corporate Guidance and Earnings Trends
As earnings season progresses, company guidance regarding the impact of tariffs and trade uncertainty on future profitability will be closely watched. This forward-looking information could prove more significant for market direction than backward-looking Q1 results.
Federal Reserve Communications
Federal Reserve officials' comments about inflation, growth, and policy implications will remain important market catalysts. Any shift in tone regarding the balance of risks or potential policy responses could significantly influence market expectations for interest rates.
Conclusion: Navigating the Path Forward
The market turbulence of the past week highlights the complex interplay between trade policy, economic fundamentals, and investor psychology. While the 90-day pause on higher reciprocal tariffs represents a positive development, significant uncertainties remain, particularly regarding U.S.-China relations and the broader economic impact of the baseline 10% tariff.
The spike in volatility, reset in valuations, and signs that the worst-case scenario in the trade war may have been averted suggest that stocks could find support and potentially begin to establish a bottom. However, further progress on trade deals will be necessary for markets to fully stabilize and recover.
For investors, the current environment emphasizes the importance of diversification, quality investments, and a long-term perspective. By focusing on these principles and avoiding emotionally charged decisions, investors can navigate the current uncertainty and position themselves to benefit from eventual market recovery.

While risks have risen, a recession is not inevitable, and stocks appear to have priced in significant negative outcomes. If economic and corporate performance proves more resilient than currently feared, markets should stabilize and eventually resume their upward trajectory. The path forward may remain bumpy, but the historical tendency for strong returns following periods of extreme volatility provides a foundation for cautious optimism.
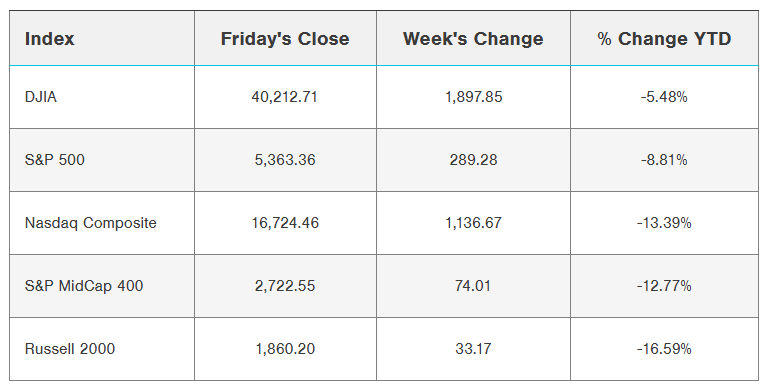
Range, Breadth, New Highs & Lows By Index
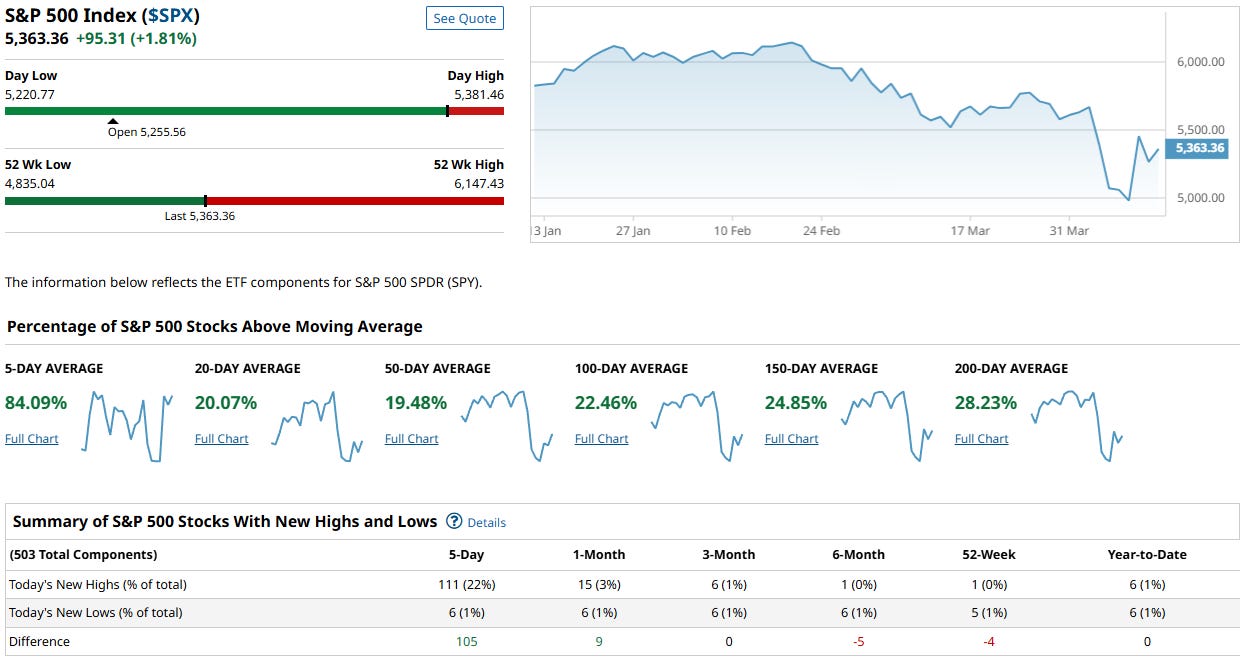
S&P Indices
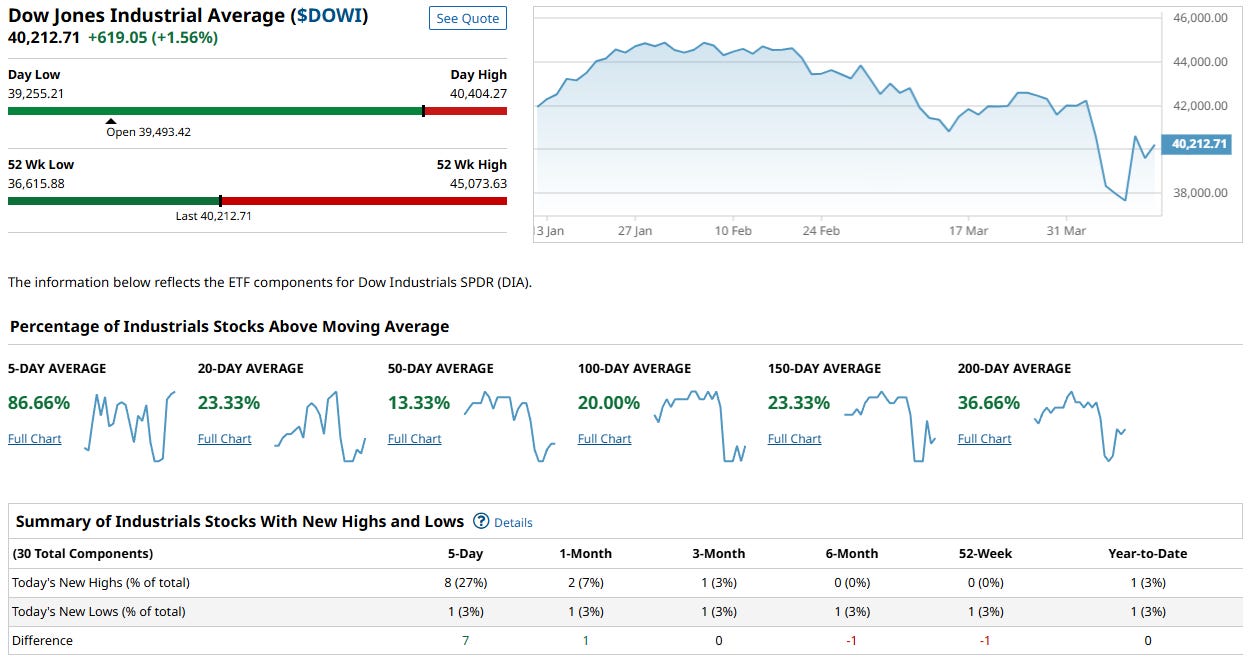
Dow Jones Indices
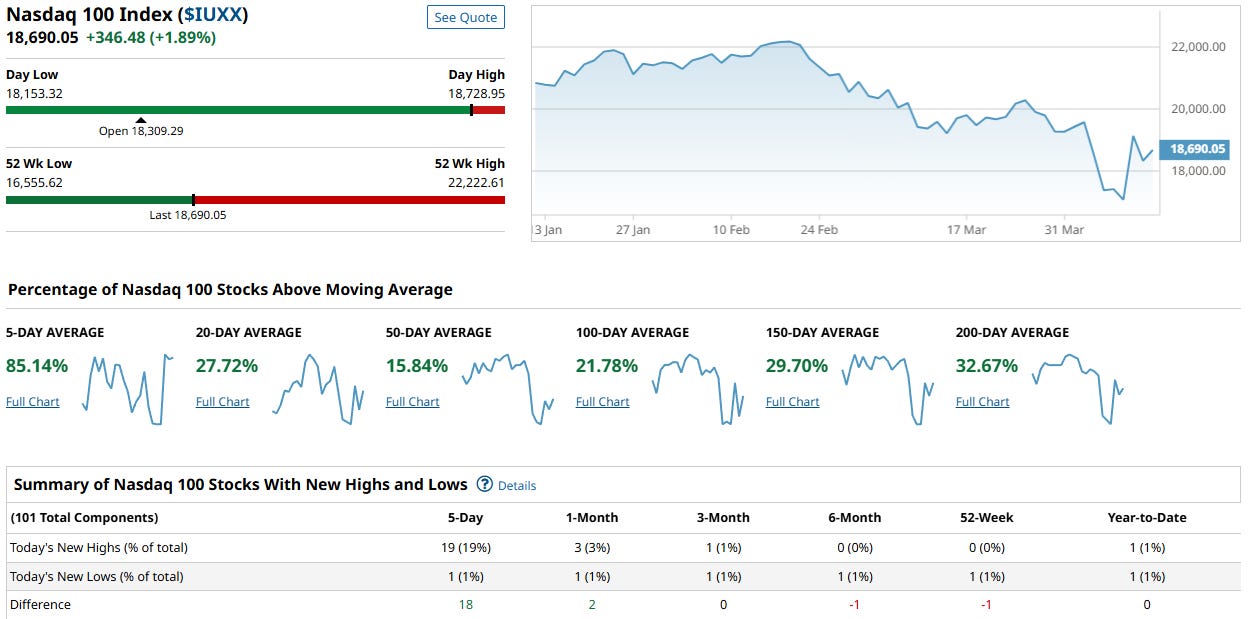
NASDAQ 100 Indices
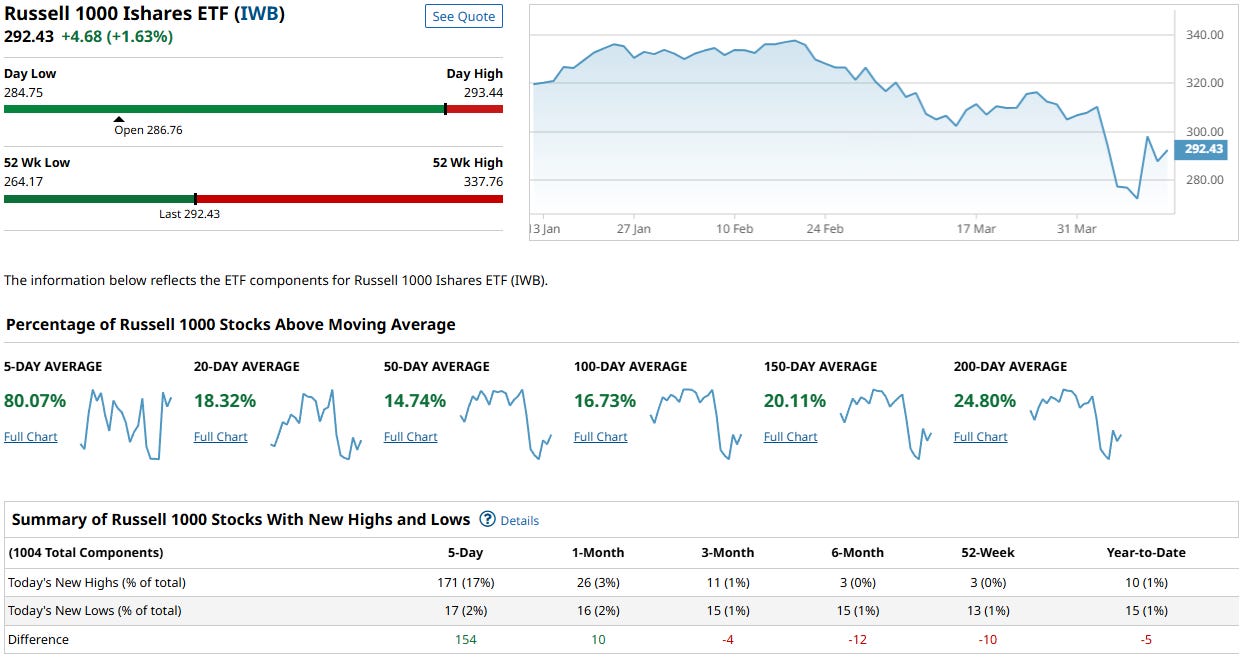
Russel 1000
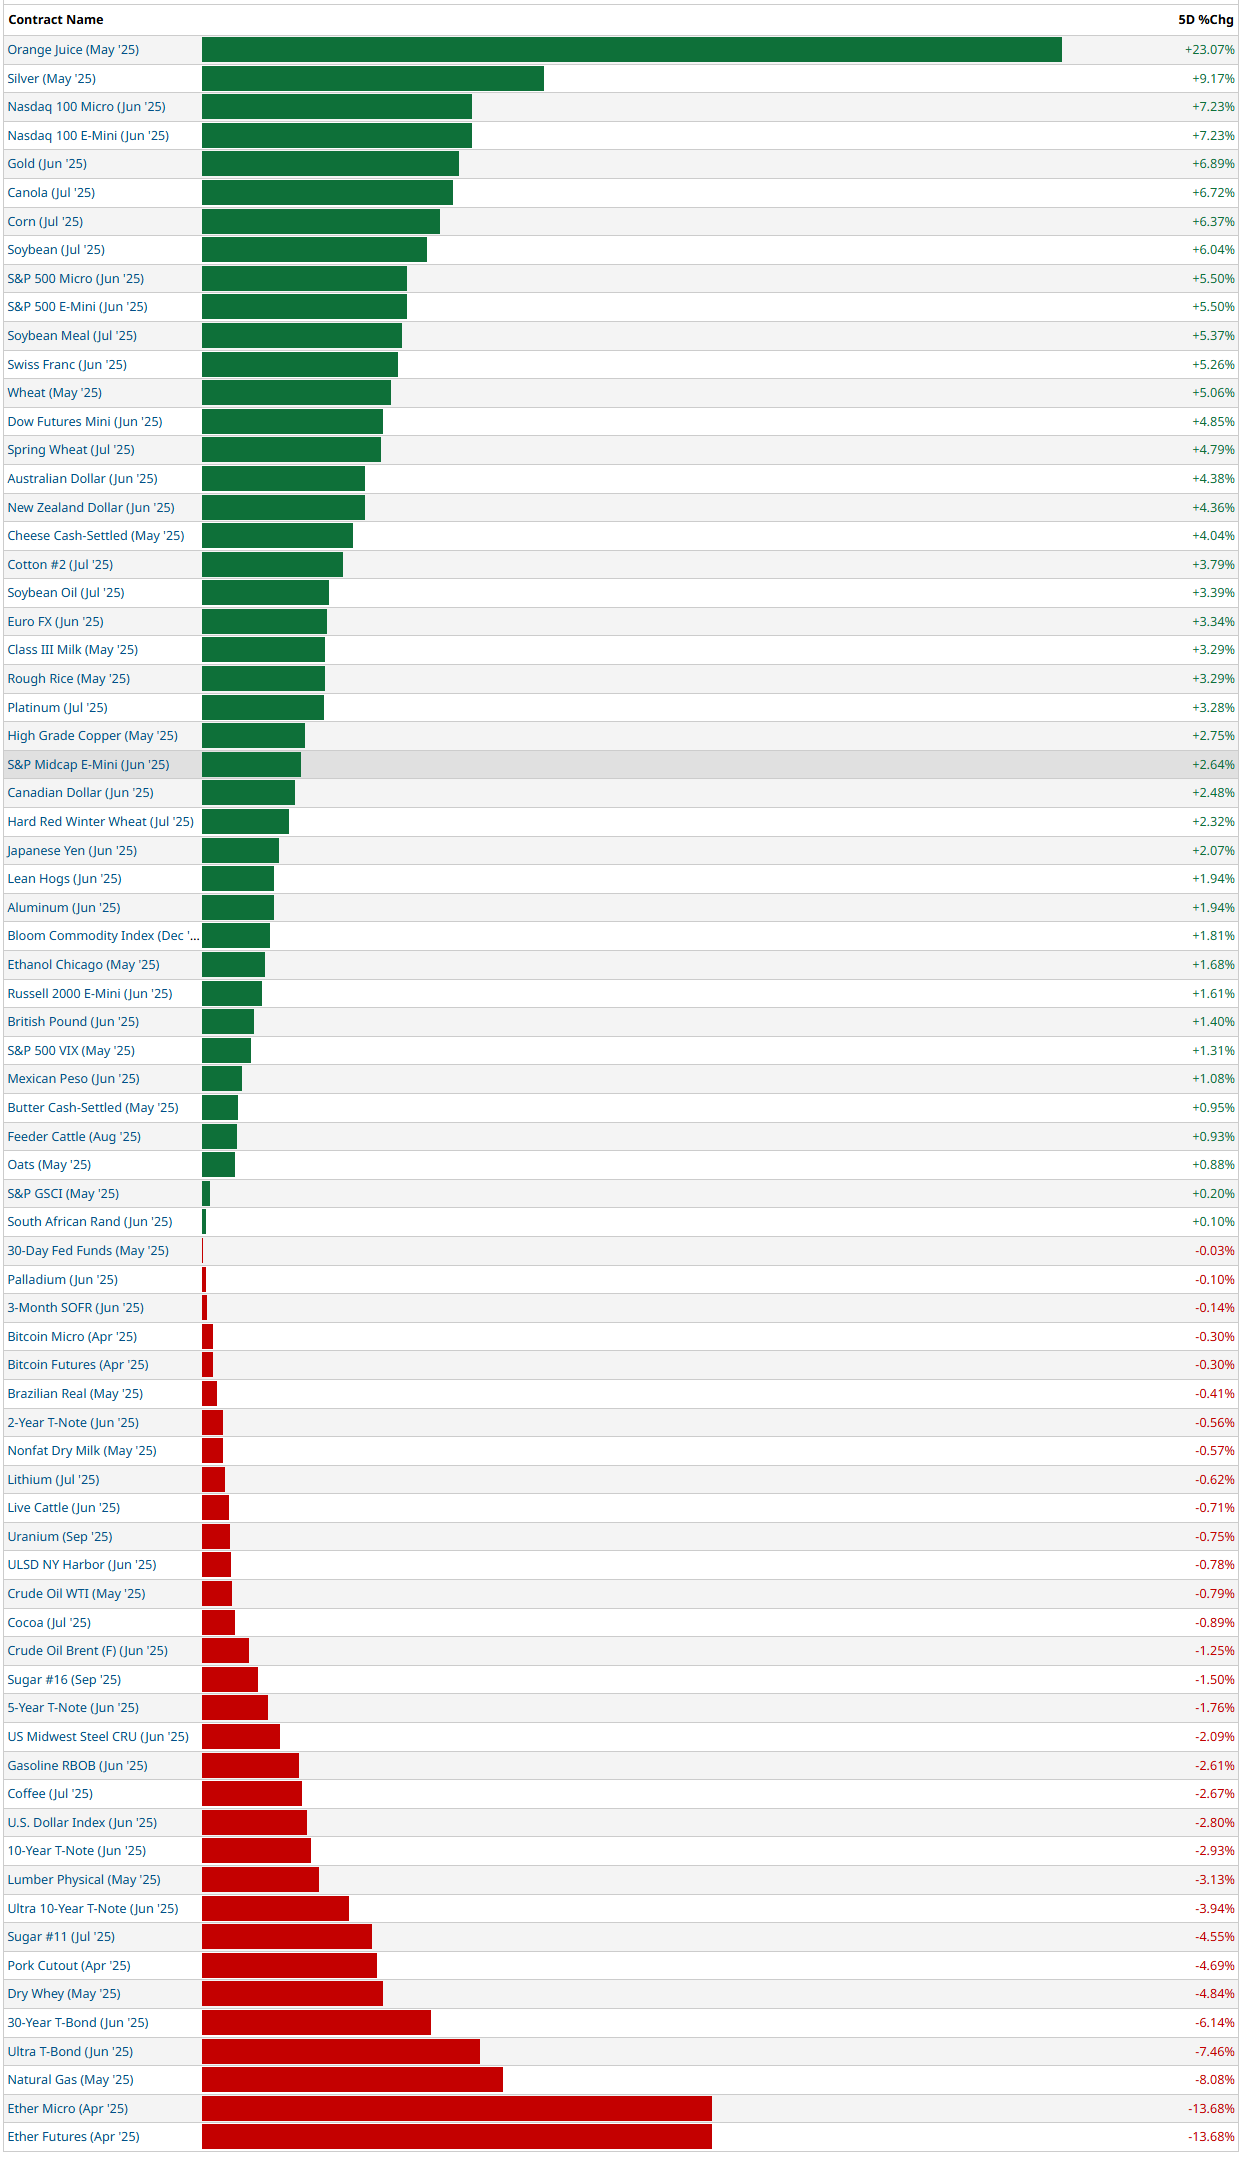
5-Day Futures Performance Leaders

US Investor Sentiment
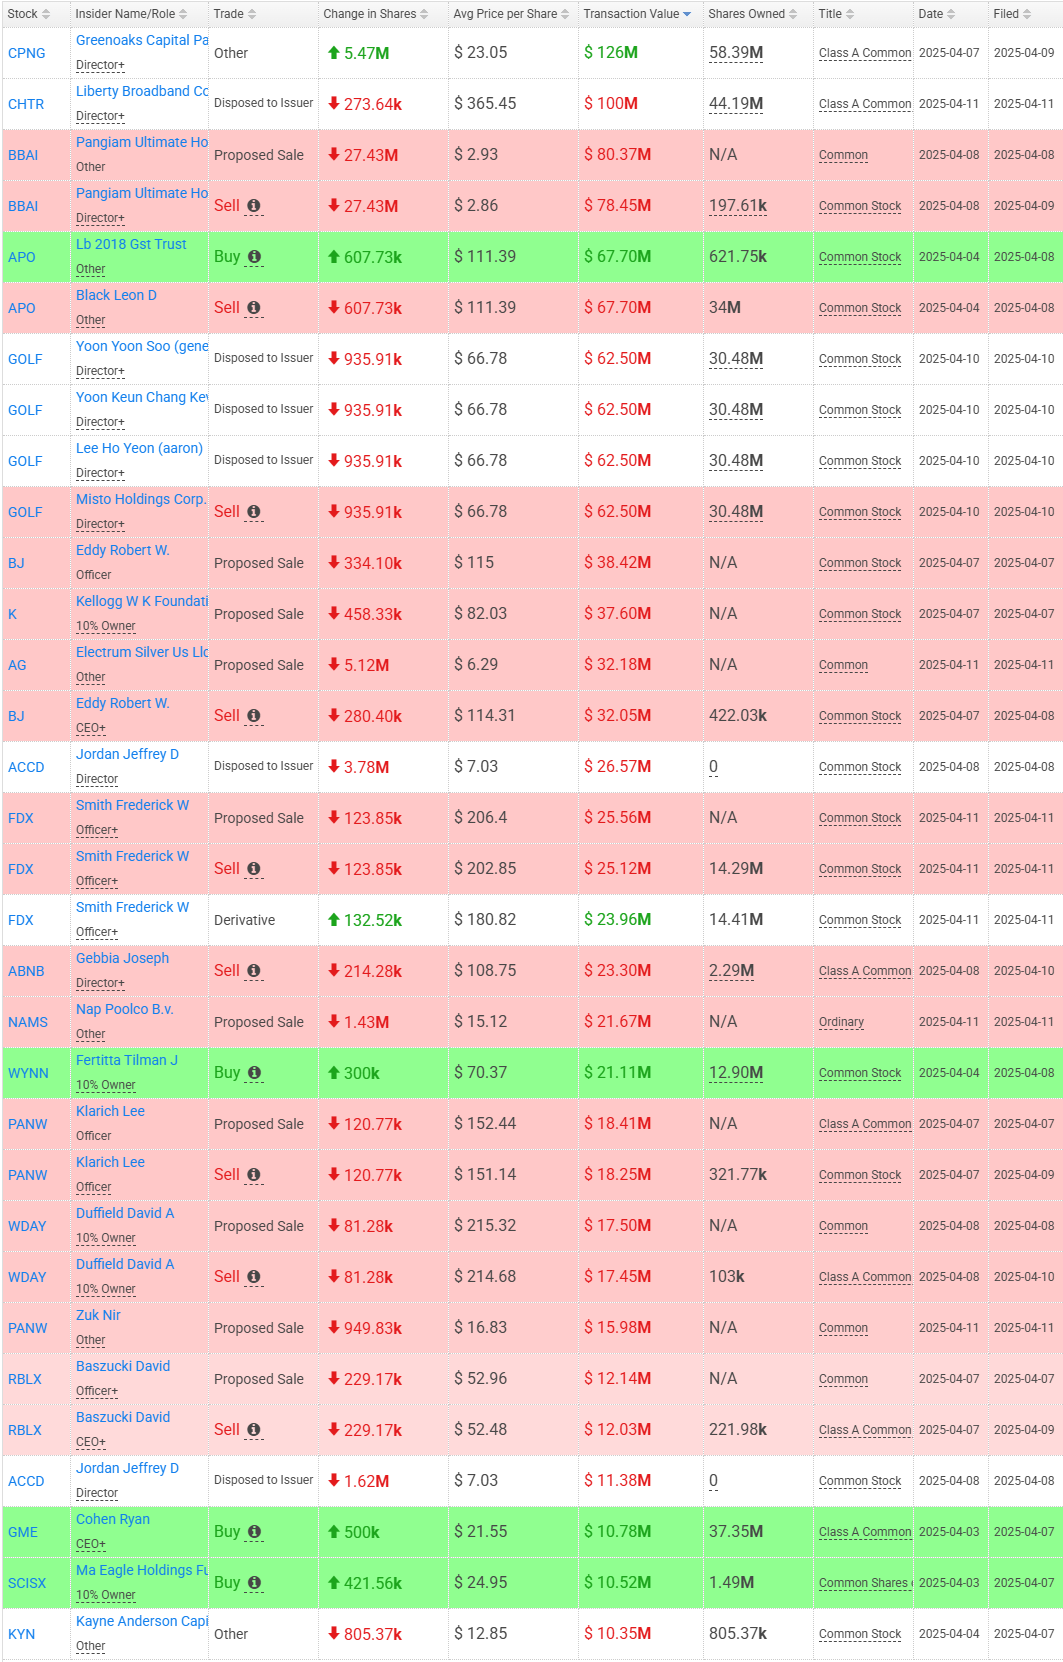
Insider Trading
Insider trading occurs when a company’s leaders or major shareholders trade stock based on non-public information. Tracking these trades can reveal insider expectations about the company’s future. For example, large purchases before an earnings report or drug trial results might indicate confidence in upcoming good news.
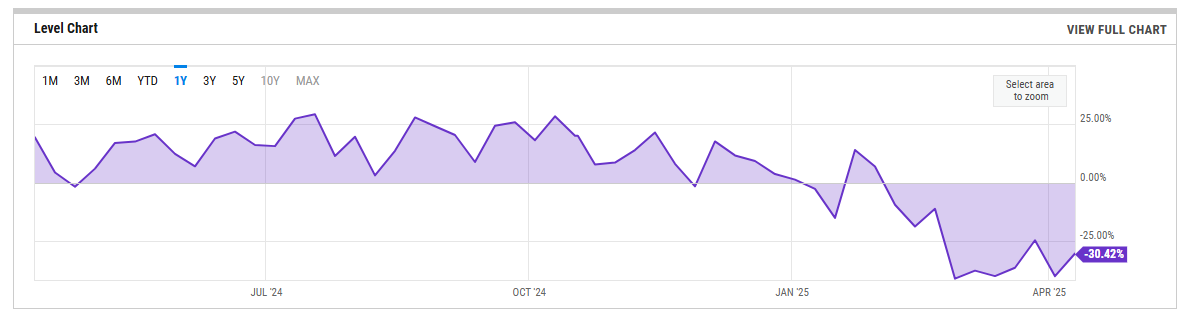
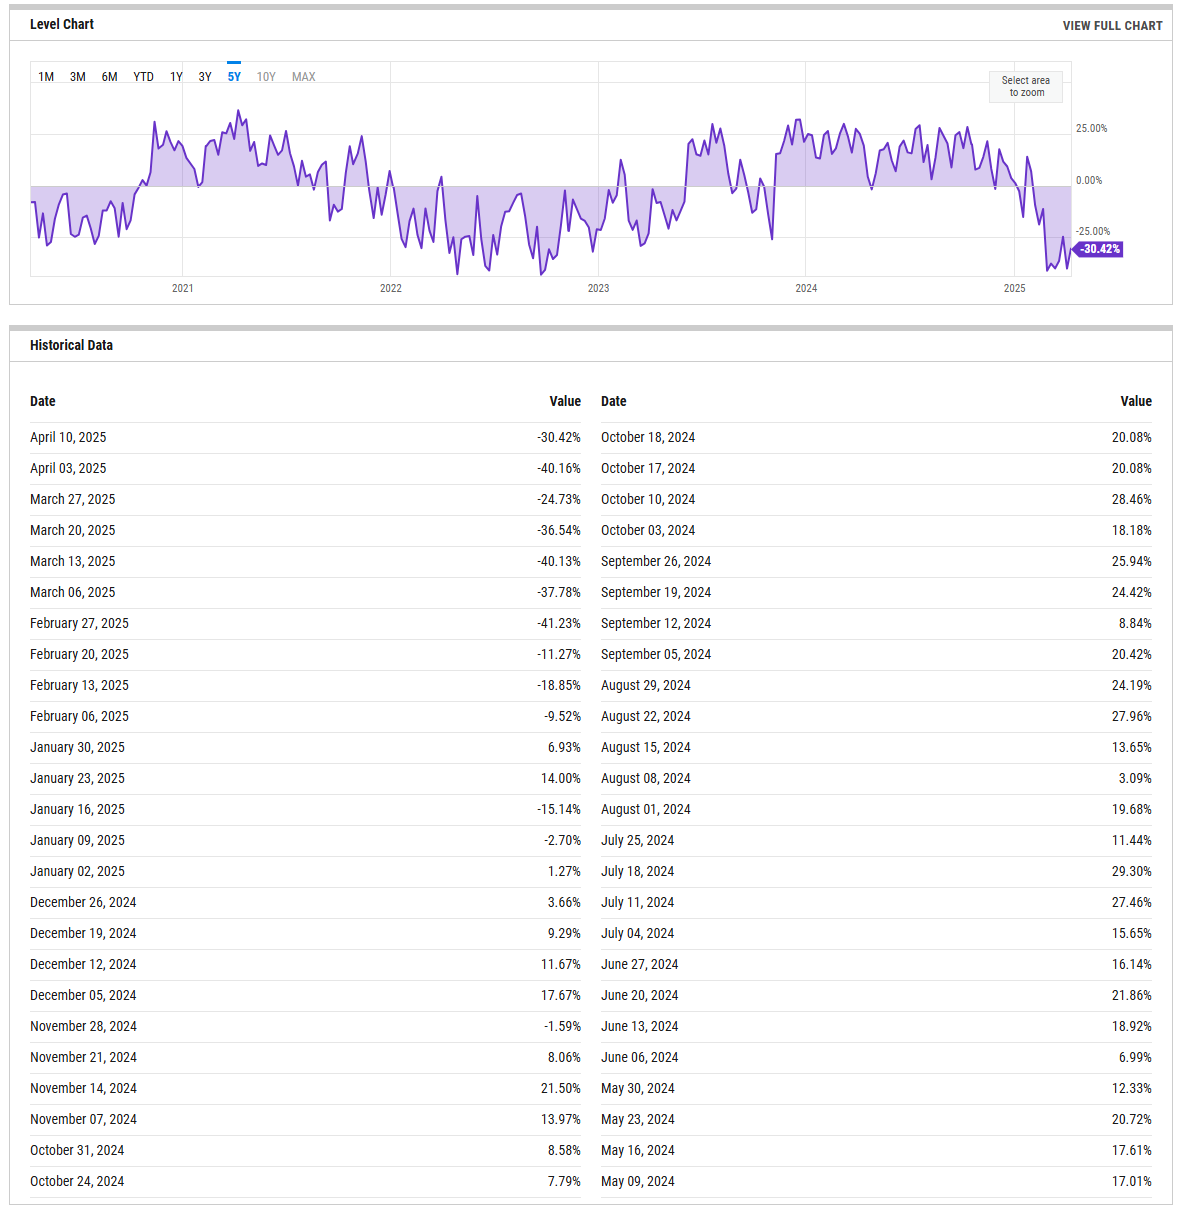
%Bull-Bear Spread
The %Bull-Bear Spread chart is a sentiment indicator that shows the difference between the percentage of bullish and bearish investors, often derived from surveys or sentiment data, such as the AAII (American Association of Individual Investors) sentiment survey. This spread tells investors about the prevailing mood in the market and can provide insights into market extremes and potential turning points.
Bullish or Bearish Sentiment:
When the spread is positive, it means more investors are bullish than bearish, indicating optimism about the market’s direction.
A negative spread indicates more bearish sentiment, meaning more investors expect the market to decline.
Contrarian Indicator:
The %Bull-Bear Spread is often used as a contrarian indicator. For example, extremely high levels of bullish sentiment might suggest that the market is overly optimistic and could be due for a correction.
Similarly, when bearish sentiment is extremely high, it might indicate that the market is overly pessimistic, and a rally could be on the horizon.
Market Extremes and Reversals:
Historically, extreme values of the spread (both positive and negative) can signal turning points in the market. A very high positive spread can signal market exuberance, while a very low or negative spread may indicate fear or capitulation.
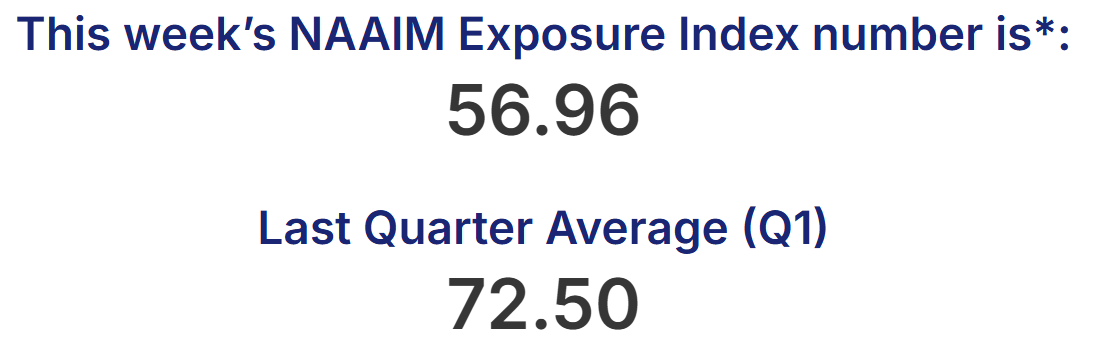
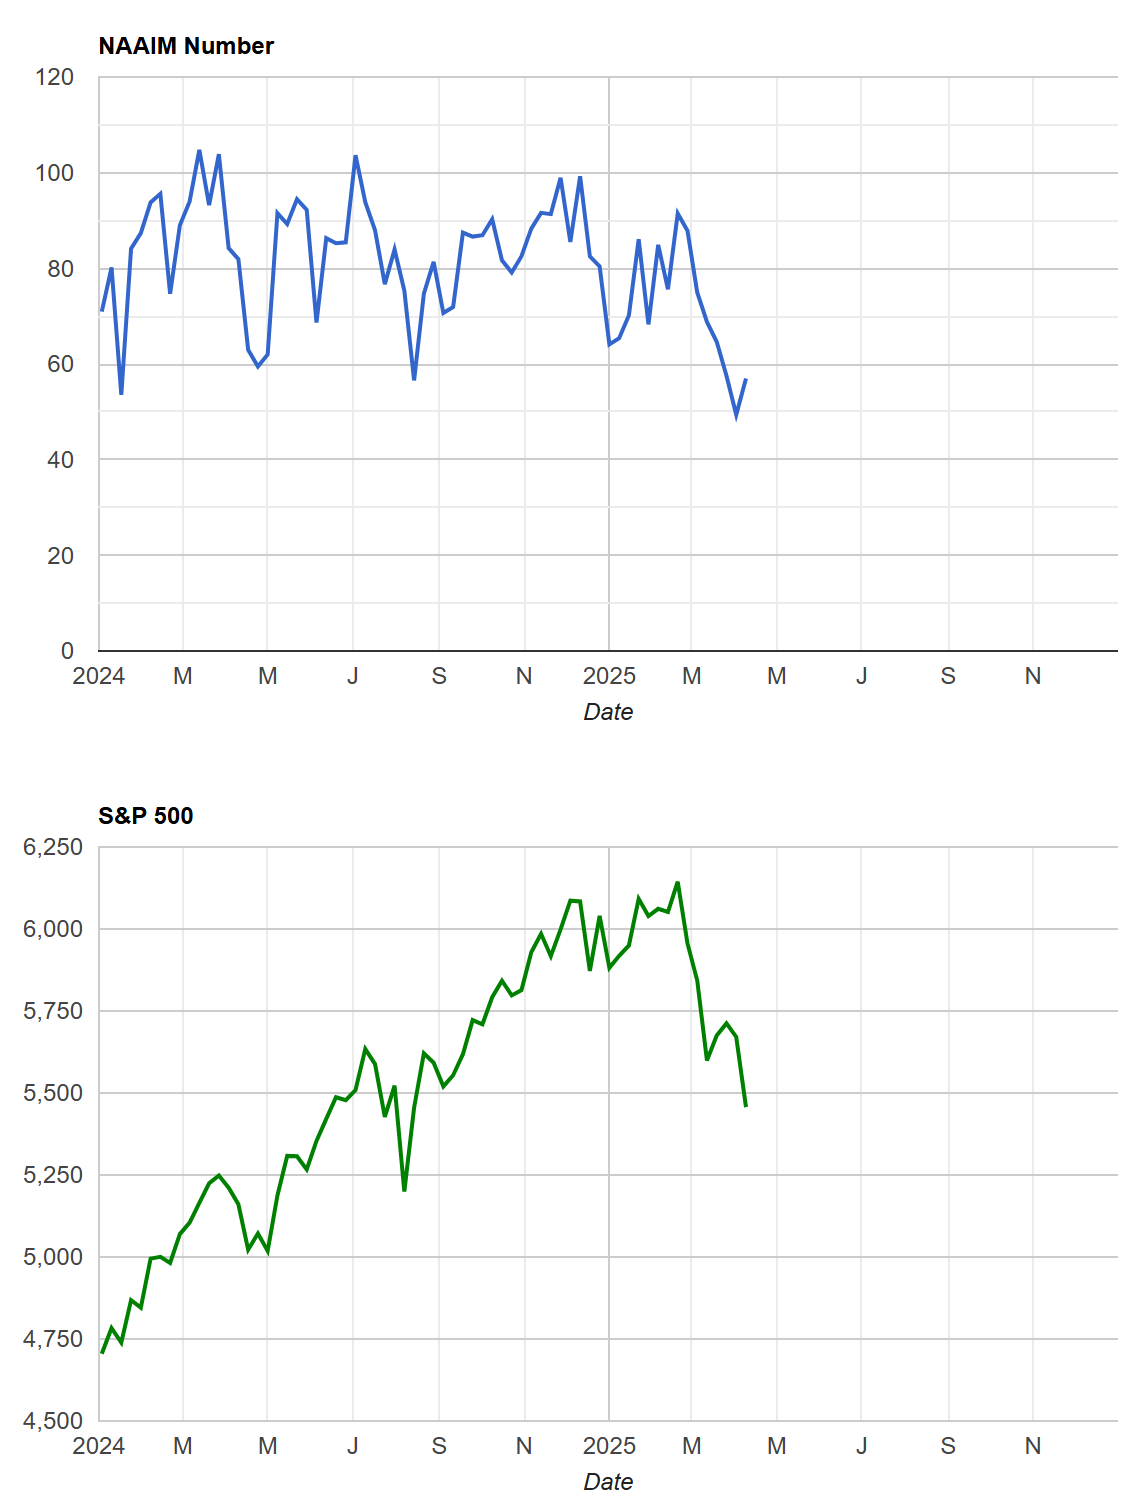
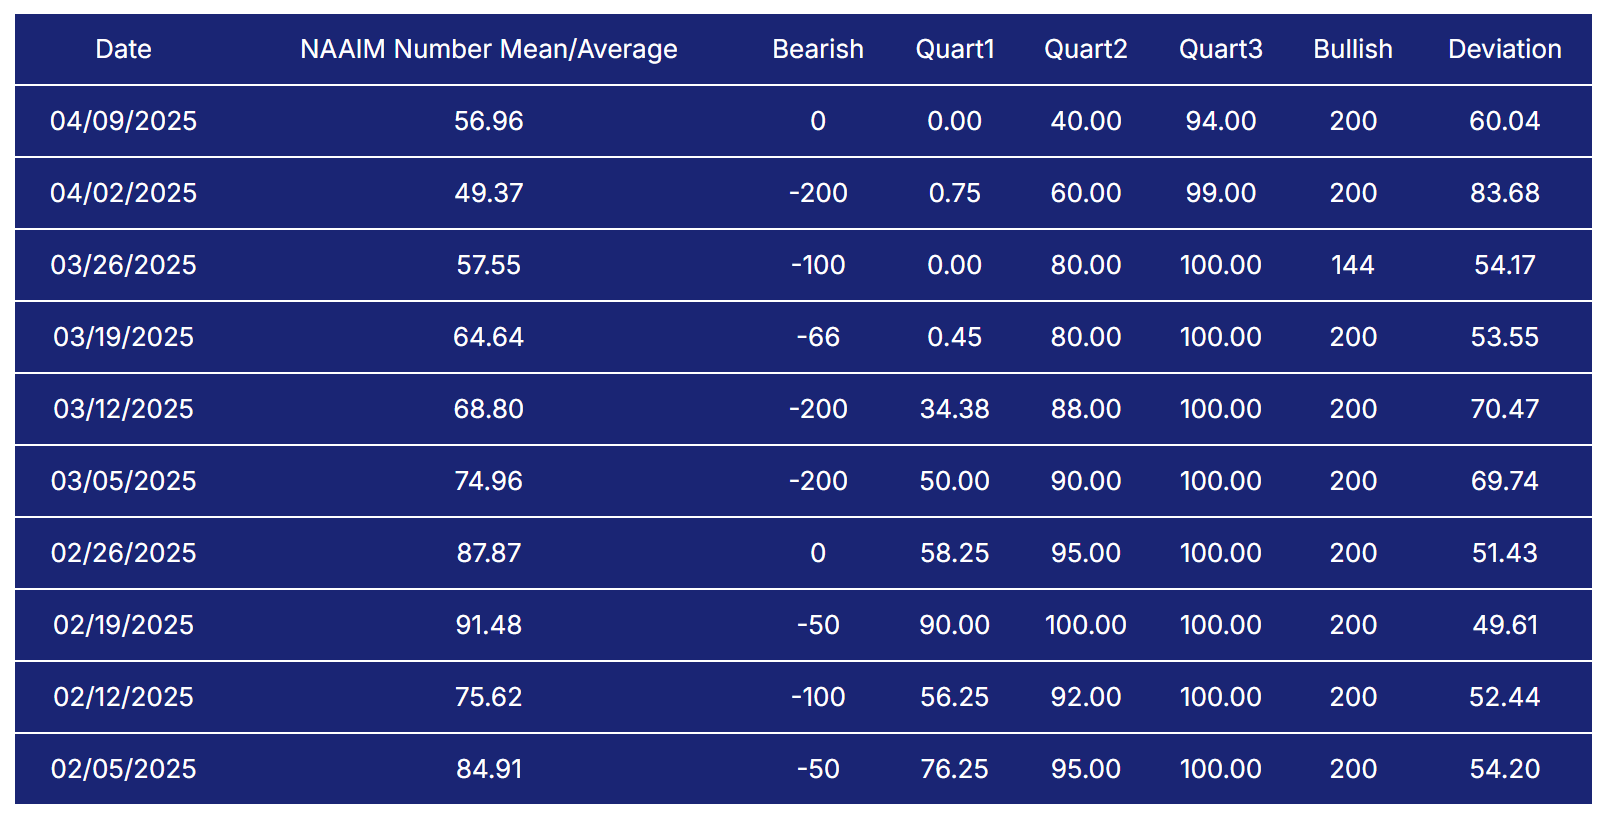
NAAIM Exposure Index
The NAAIM Exposure Index (National Association of Active Investment Managers Exposure Index) measures the average exposure to U.S. equity markets as reported by its member firms. These are typically active money managers who provide their equity exposure levels weekly. The index offers insight into how much these managers are investing in equities at any given time, ranging from being fully short (-100%) to leveraged long (up to +200%).
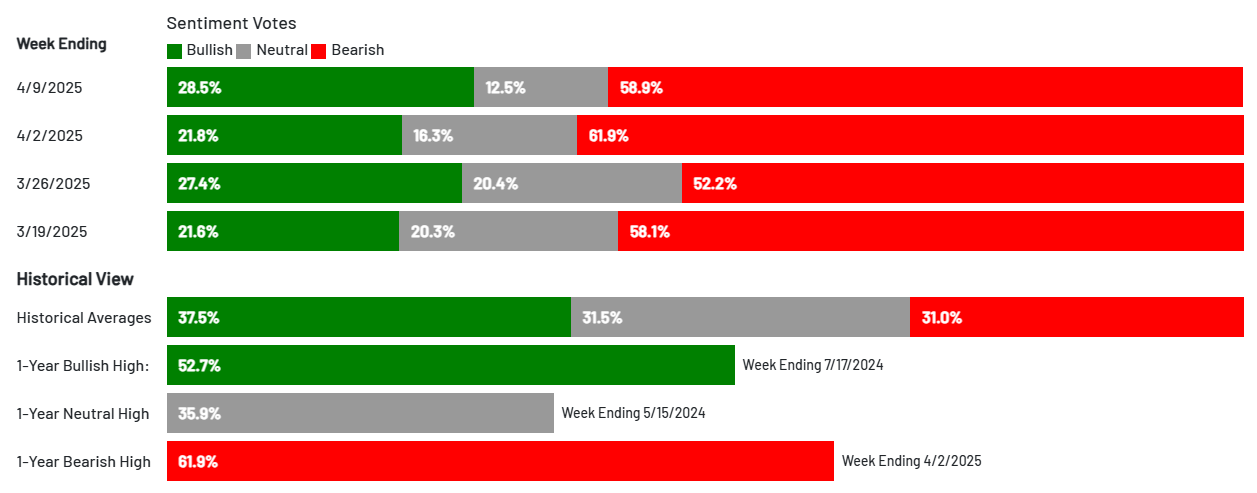
AAII Investor Sentiment Survey
The AAII Investor Sentiment Survey is a weekly survey conducted by the American Association of Individual Investors (AAII) to gauge the mood of individual investors regarding the direction of the stock market over the next six months. It provides insights into whether investors are feeling bullish (expecting the market to rise), bearish (expecting the market to fall), or neutral (expecting the market to stay about the same).
Key Points:
Bullish Sentiment: Reflects the percentage of investors who believe the stock market will rise in the next six months.
Bearish Sentiment: Represents those who expect a decline.
Neutral Sentiment: Reflects investors who anticipate little to no market movement.
The survey is widely followed as a contrarian indicator, meaning that extreme levels of bullishness or bearishness can sometimes signal market turning points. For example, when a large number of investors are overly optimistic (high bullish sentiment), it could suggest a market top, while excessive pessimism (high bearish sentiment) may indicate a market bottom is near.
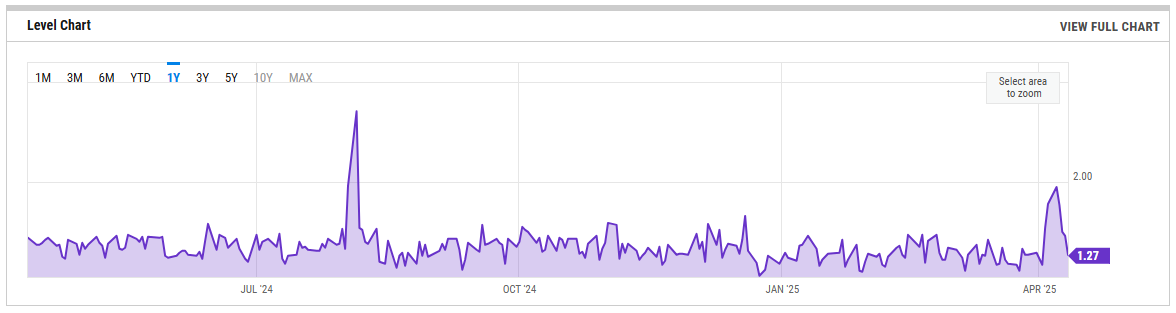
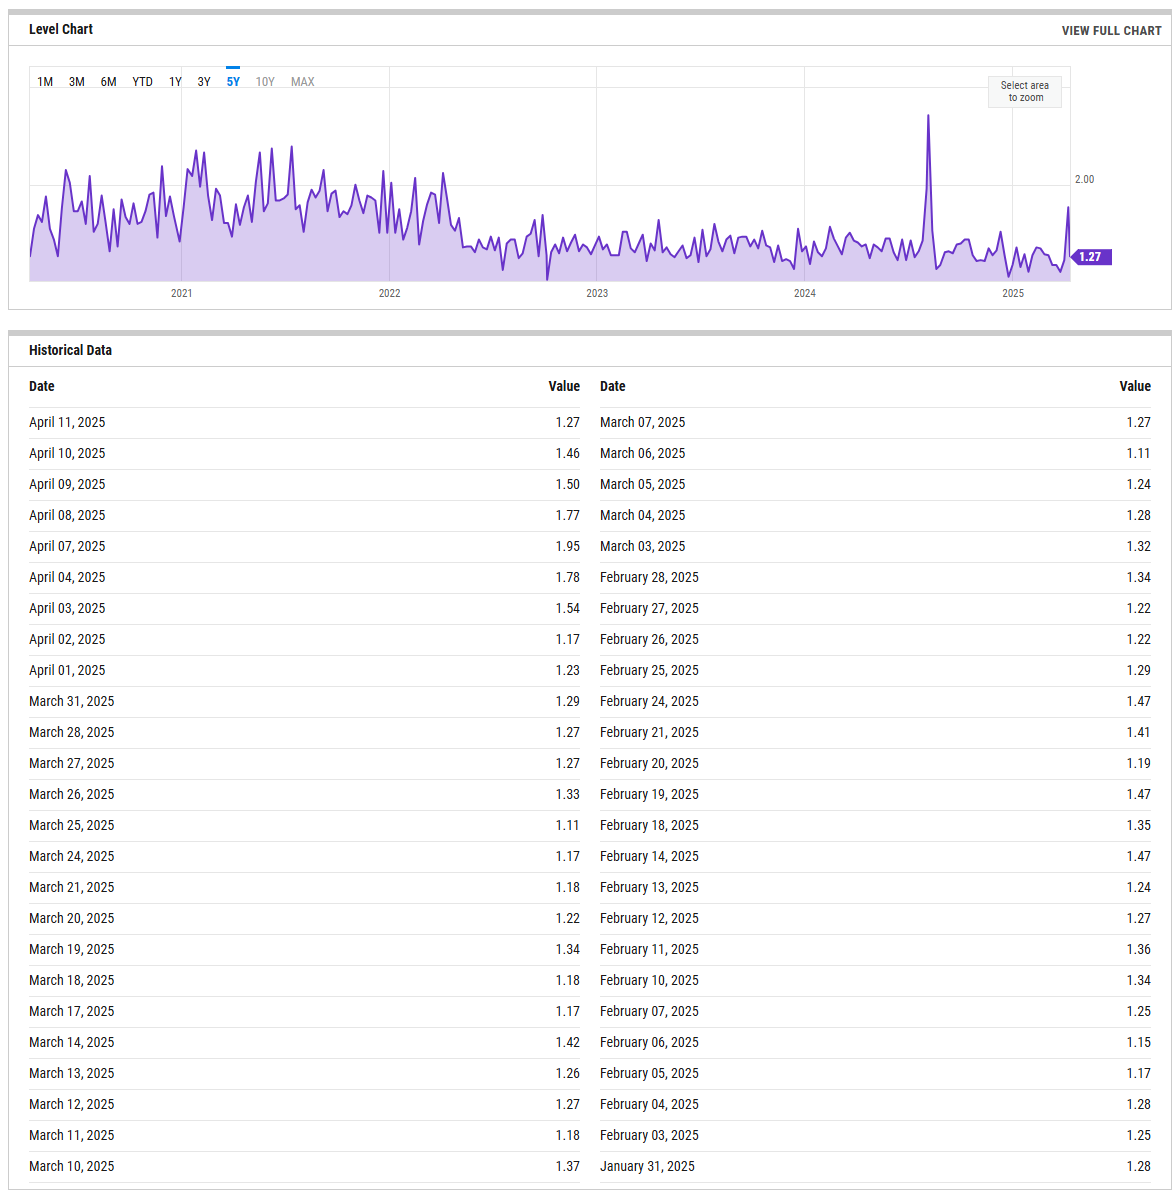
SPX Put/Call Ratio
The SPX Put/Call Ratio is an indicator that is used to gauge market sentiment. This is calculated as the ratio between trading S&P 500 put options and S&P call options. A high put/call ratio can indicate fear in the markets, while a low ratio indicates confidence. For example, in 2015, the Put-Call ratio was as high as 3.77 because of market fears stemming from various global economic issues like a GDP growth slowdown in China and a Greek debt default.
CBOE Equity Put/Call Ratio
The CBOE (Chicago Board Options Exchange) equity put/call ratio is a sentiment indicator used by traders and analysts to gauge market sentiment and potential shifts in investor behavior. It is calculated by dividing the volume of put options by the volume of call options on equities. Here’s what it reveals and how it is generally interpreted:
High Put/Call Ratio: When the put/call ratio is high (above 1.0), it suggests that there is more demand for put options than call options. This typically reflects a more bearish sentiment, as investors may be hedging against potential declines or expecting the market to fall.
Low Put/Call Ratio: Conversely, a low put/call ratio (below 0.7) indicates a higher volume of call options compared to puts, reflecting bullish sentiment. Investors may be expecting upward momentum and are positioning themselves to profit from price gains
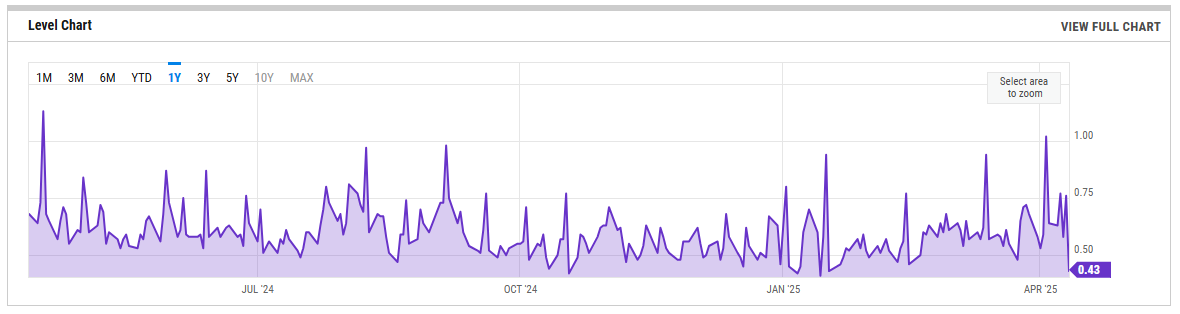
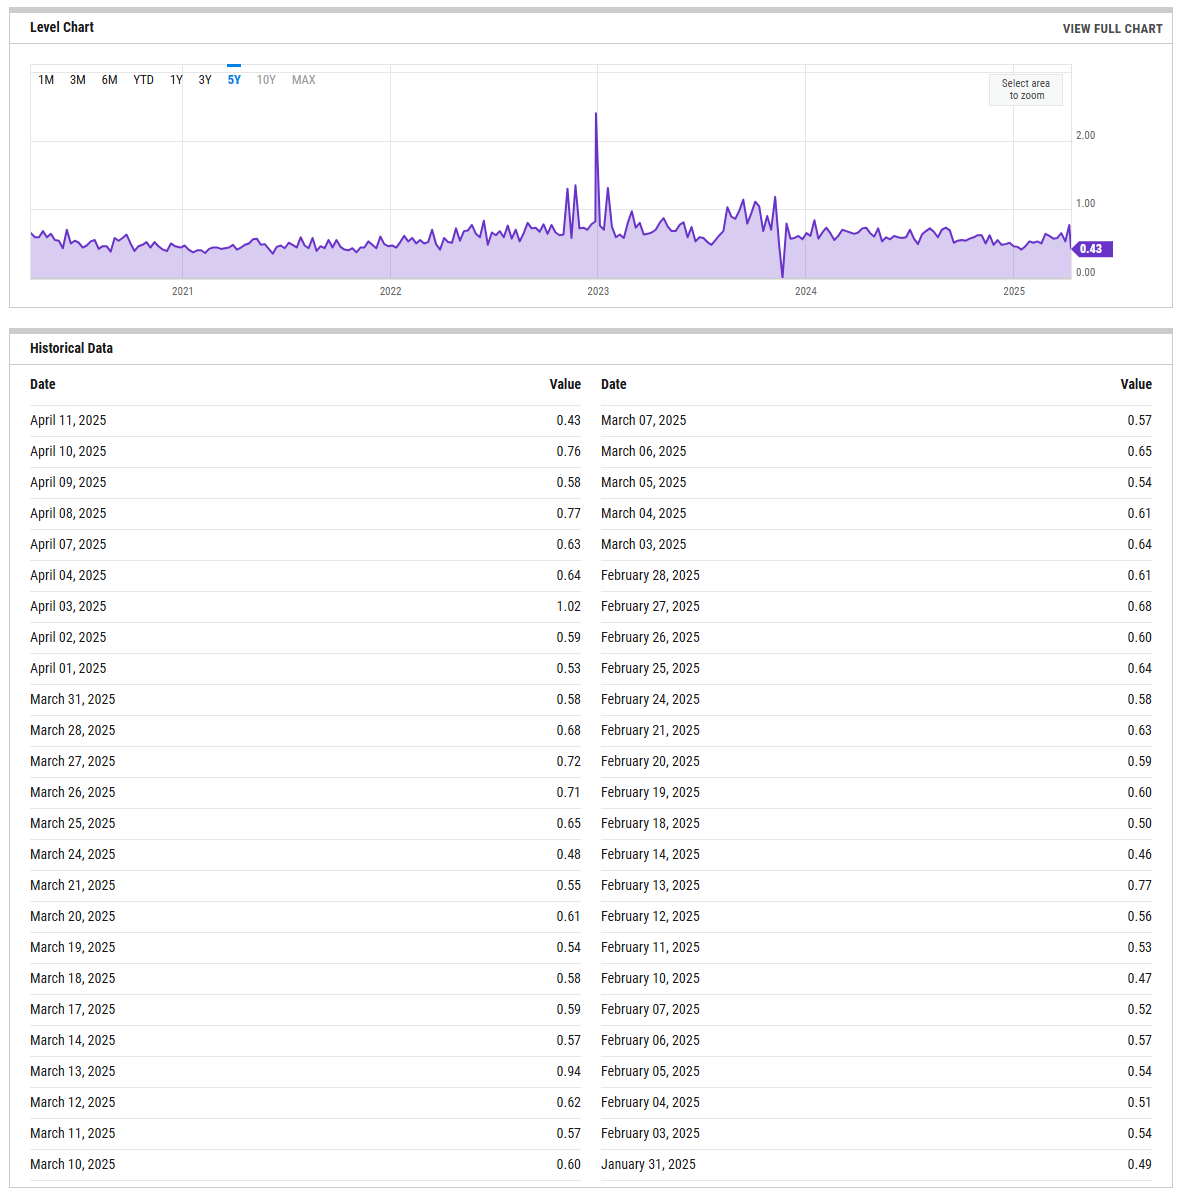
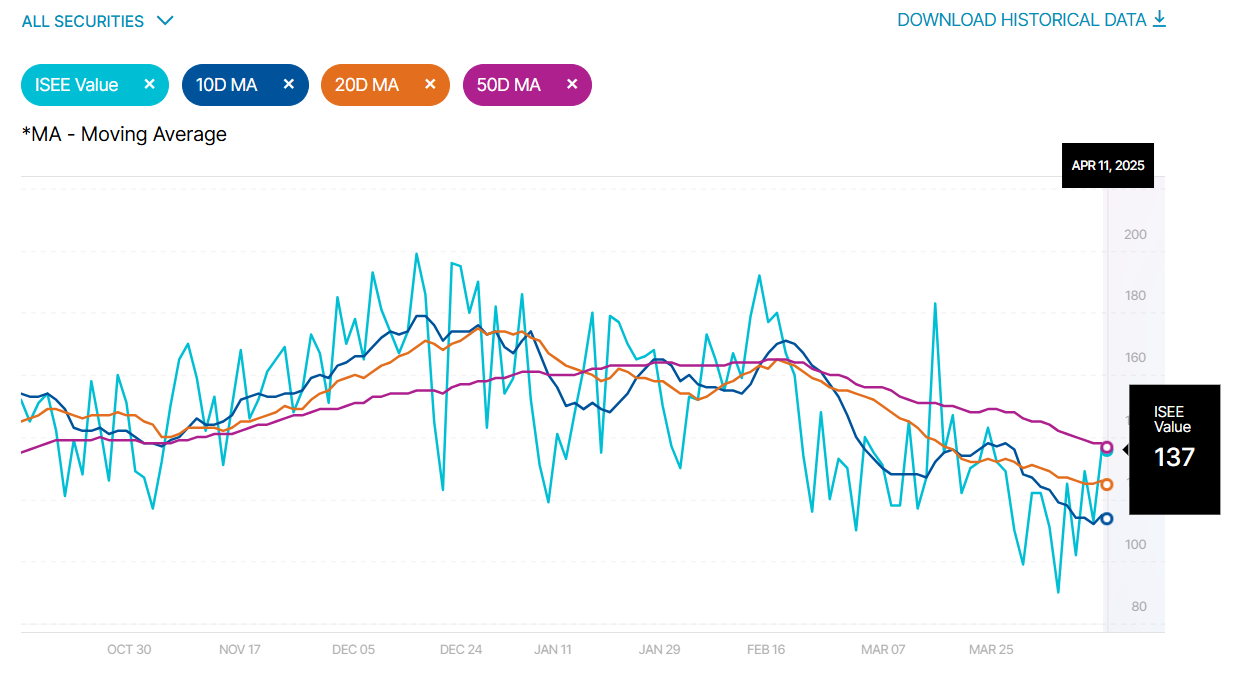
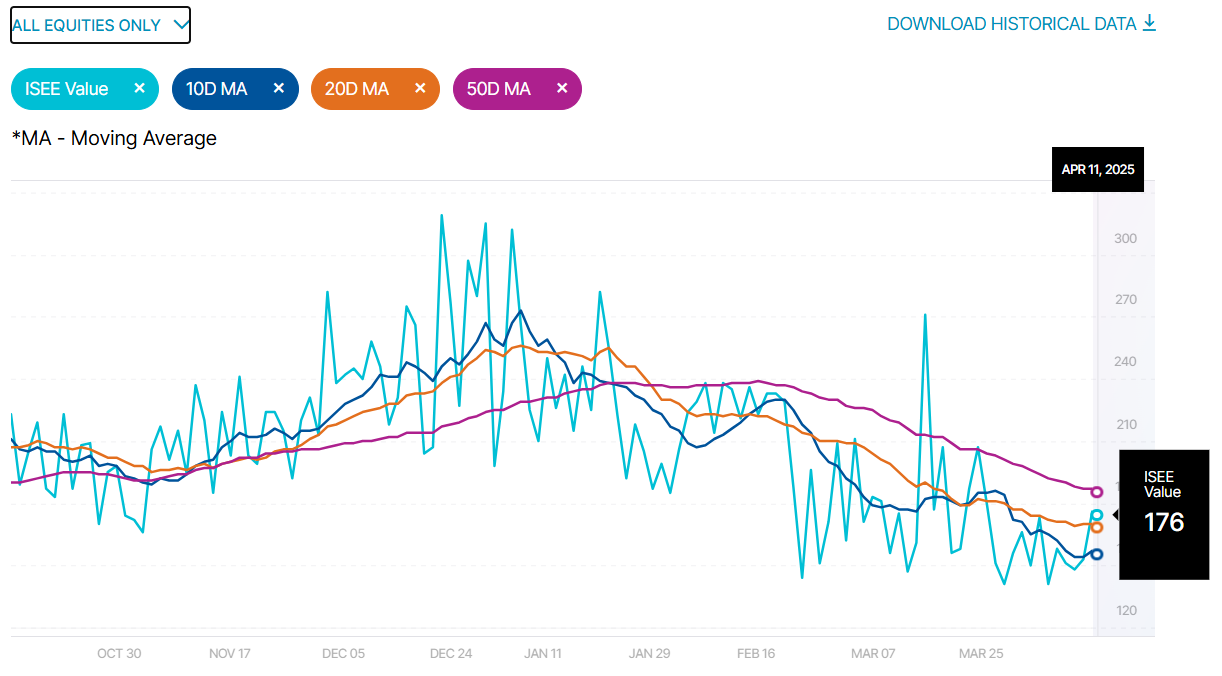
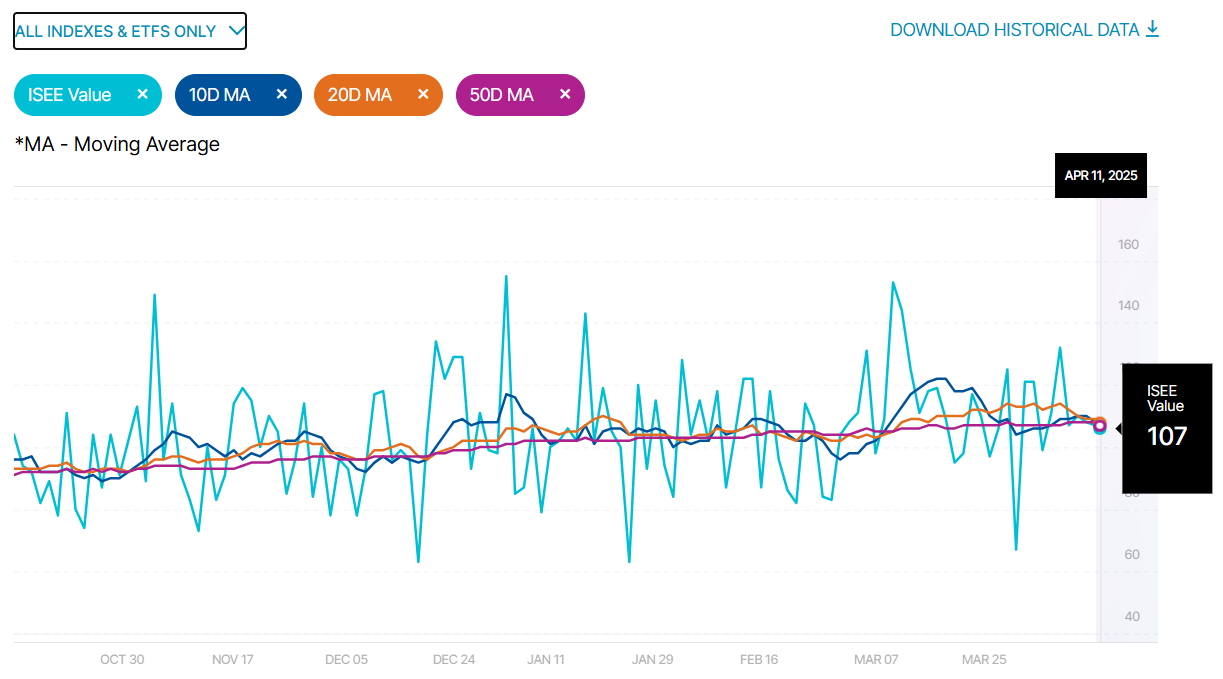
ISEE Sentiment Index
The ISEE (International Securities Exchange Sentiment) Index is a measure of investor sentiment derived from options trading. Unlike traditional put/call ratios, the ISEE Index focuses only on opening long customer transactions and is adjusted to remove market-maker and firm trades, providing a purer sentiment reading.
The ISEE Index typically ranges from 0 to 200, with readings above 100 indicating more call options being bought relative to put options, suggesting bullish sentiment. Conversely, readings below 100 suggest bearish sentiment, with more puts being purchased relative to calls.
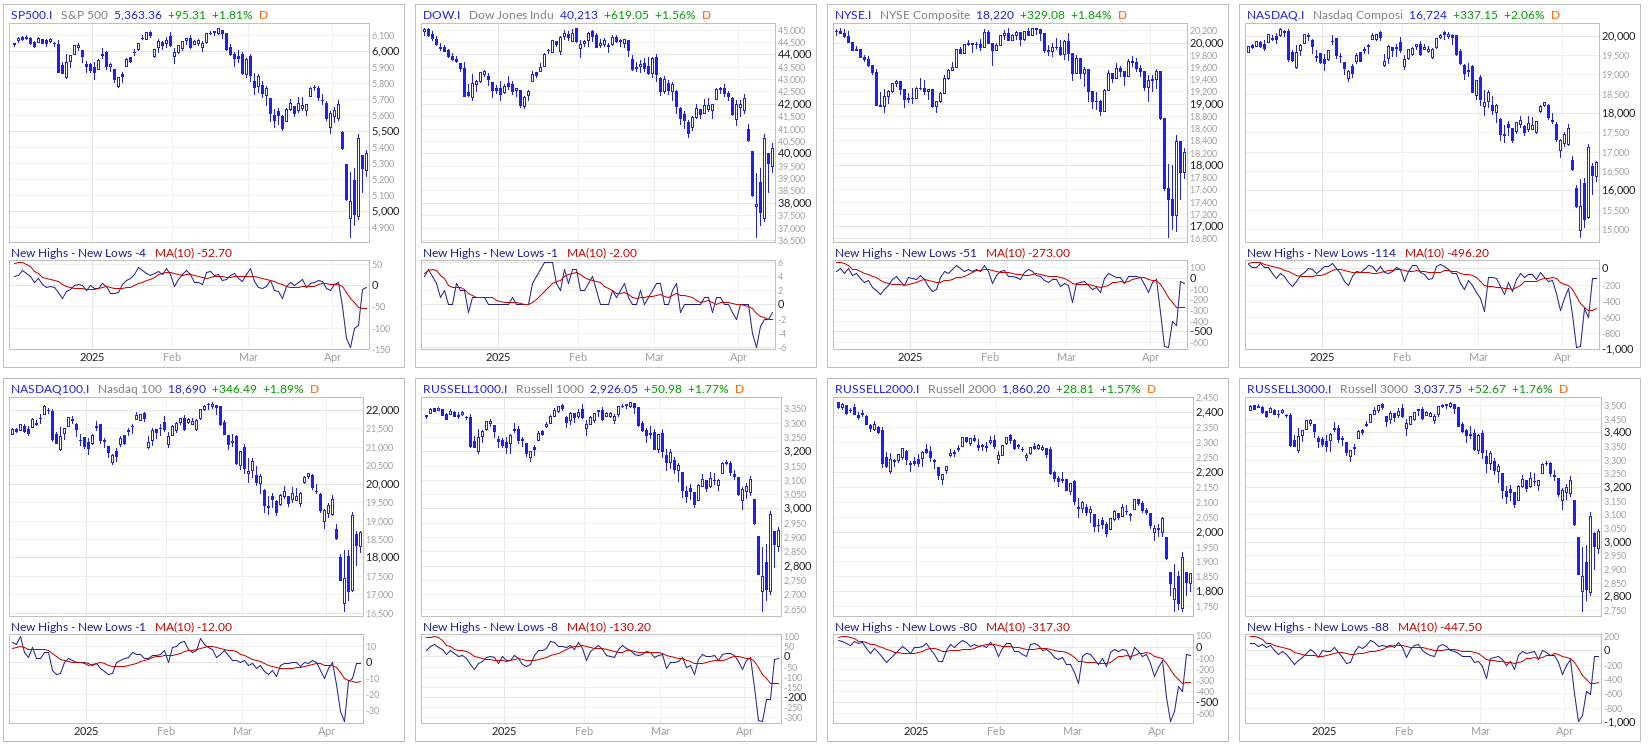
New Highs - New Lows
The New Highs - New Lows indicator (NH-NL) displays the daily difference between the number of stocks reaching new 52-week highs and the number of stocks reaching new 52-week lows. The NH-NL indicator generally reaches its extreme lows slightly before a major market bottom. As the market then turns up from the major bottom, the indicator jumps up rapidly. During this period, many new stocks are making new highs because it's easy to make a new high when prices have been depressed for a long time. The NH-NL indicator oscillates around zero. If the indicator is positive, the bulls are in control. If it is negative, the bears are in control. As the cycle matures, a divergence often occurs as fewer and fewer stocks are making new highs (the indicator falls), yet the market indices continue to reach new highs. This is a classic bearish divergence that indicates that the current upward trend is weak and may reverse.
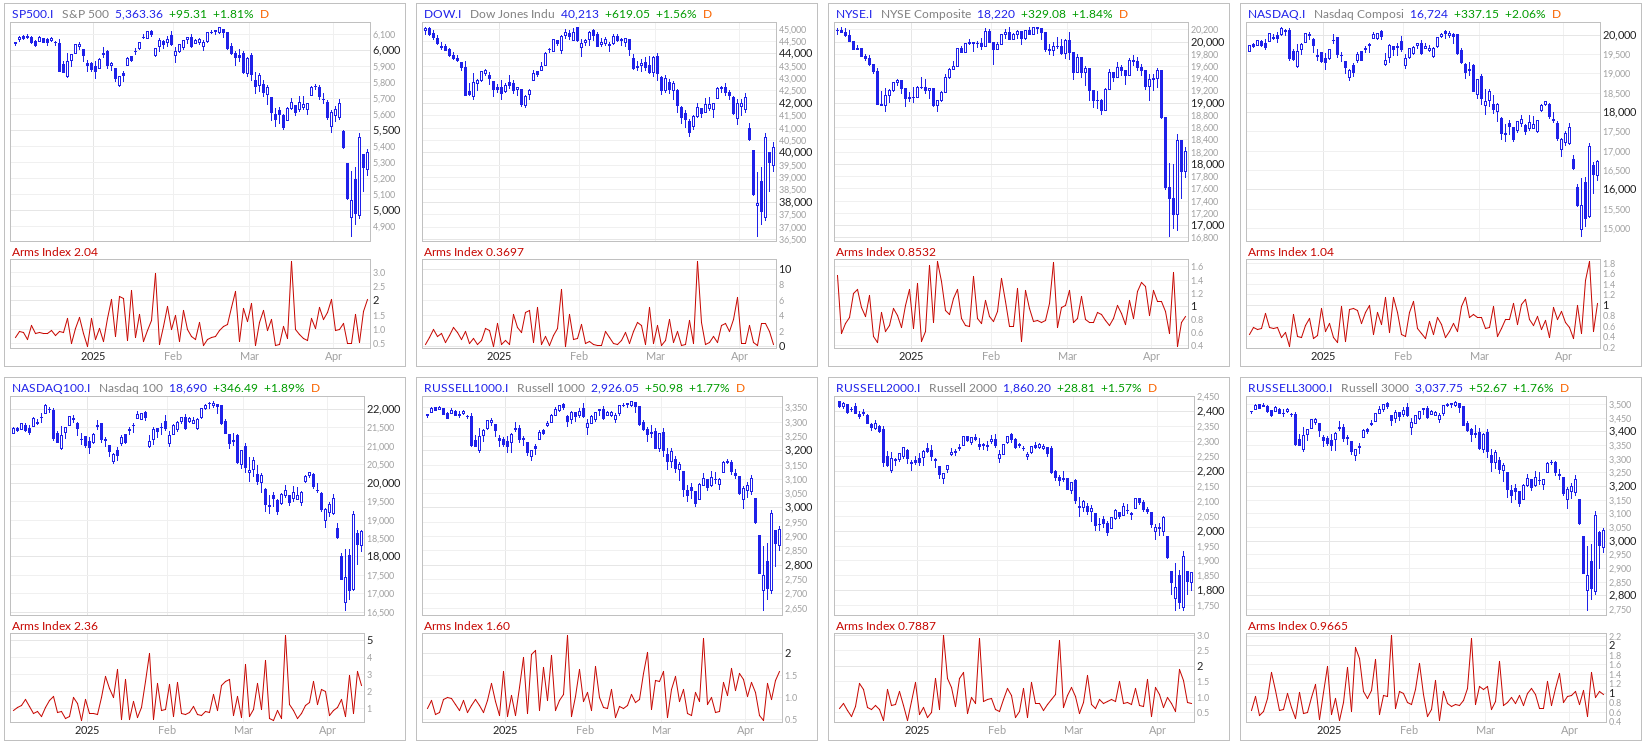
ARMS Index
The Arms Index, also known as the TRIN (Short-Term TRading INdex), was developed by Richard Arms in the 1960s. It is calculated by dividing the ratio of advancing stocks to declining stocks by the ratio of advancing volume to declining volume. Interpreting the Arms Index involves looking at its value in relation to certain thresholds. A value below "1" is considered bullish, indicating that advancing stocks and volume dominate the market. Conversely, a value above "1" is considered bearish, suggesting that declining stocks and volume are more prevalent. Extremely low values (below 0.5) or high values (above 2) are often seen as potential reversal signals.
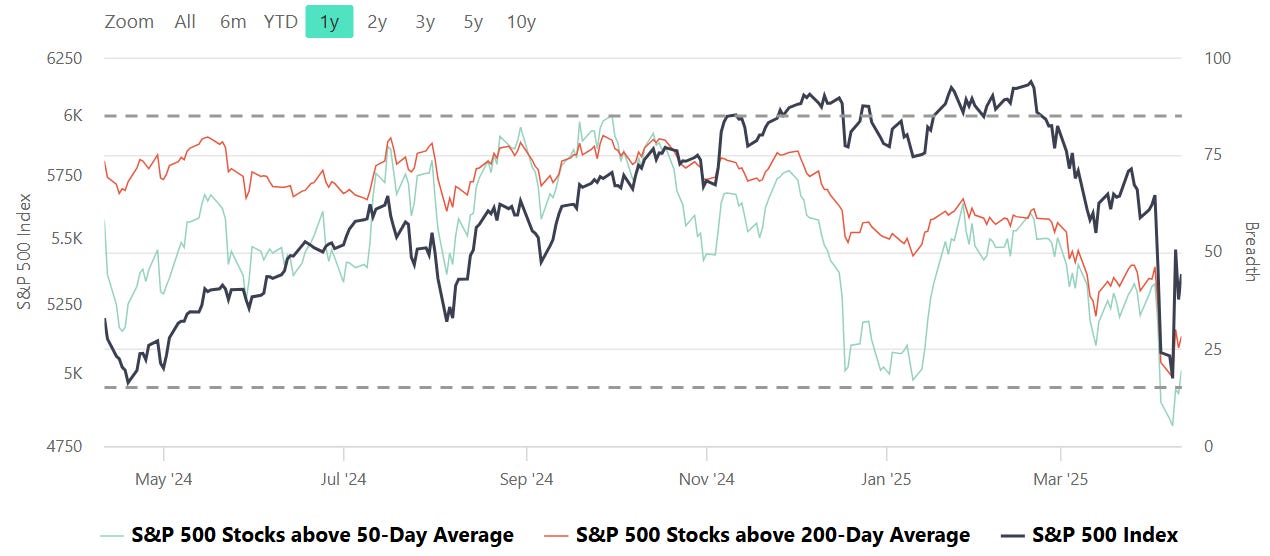
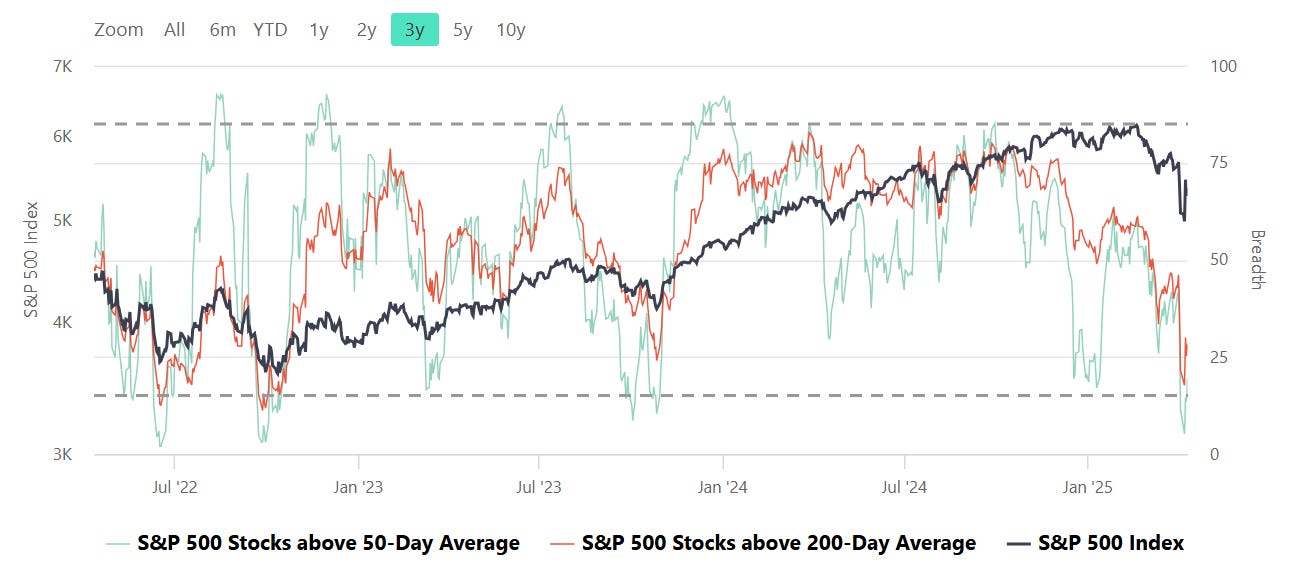
S&P Breadth
Breadth, in the context of stock market analysis, refers to the measure of how many stocks in a given index (such as the S&P 500) are participating in a trend, such as advancing or declining relative to a certain moving average (e.g., 50-day or 200-day).
Market Strength Assessment:
Breadth provides insight into whether a market rally or decline is broad-based or driven by only a few large-cap stocks. A rally supported by a high percentage of stocks above their 50-day or 200-day averages is generally considered healthier and more sustainable.
Early Warning Signals:
Divergences between breadth indicators and the index price can signal potential reversals. For example:
If the index is rising, but the number of stocks above their moving averages is declining, it may indicate weakening underlying strength and potential for a pullback.
Conversely, if breadth improves while the index remains flat or declines, it may suggest accumulating strength for a future rally.
Trend Confirmation:
Breadth indicators can confirm trends. For instance, a strong majority of stocks above their moving averages signals robust market momentum, providing confidence in the prevailing trend.
Identifying Overbought or Oversold Conditions:
Extremely high or low breadth readings can signal overbought or oversold conditions, which might lead to mean reversion. For example:
If nearly all stocks are above their 50-day or 200-day averages, it may suggest overbought conditions.
Conversely, extremely low levels indicate oversold conditions and potential for a bounce.
Breadth and Timing Investments:
Entry Points:
When breadth improves (e.g., more stocks move above their 50-day or 200-day moving averages) after a market pullback, it can indicate a good time to start building positions as the broader market is regaining strength.
Exit Points:
Breadth deterioration during a rally may suggest it’s time to reduce exposure, especially if only a small number of stocks are driving index gains. This is often a warning sign of an impending correction.
Volatility and Risk Management:
Weak breadth in volatile markets may prompt caution or defensive positioning. Conversely, improving breadth can justify taking on more risk during uptrends.
CME Fedwatch
What is the likelihood that the Fed will change the Federal target rate at upcoming FOMC meetings, according to interest rate traders? Use CME FedWatch to track the probabilities of changes to the Fed rate, as implied by 30-Day Fed Funds futures prices.
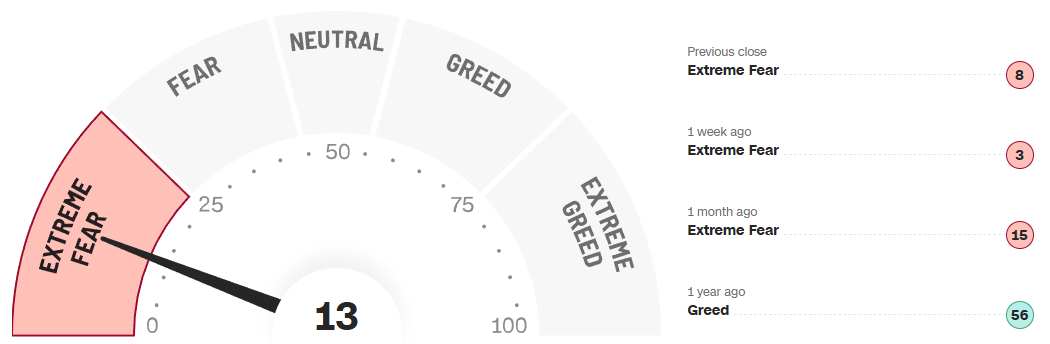
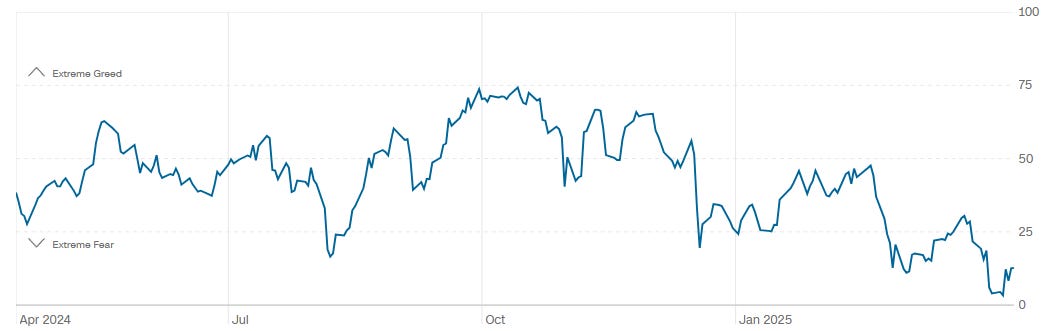
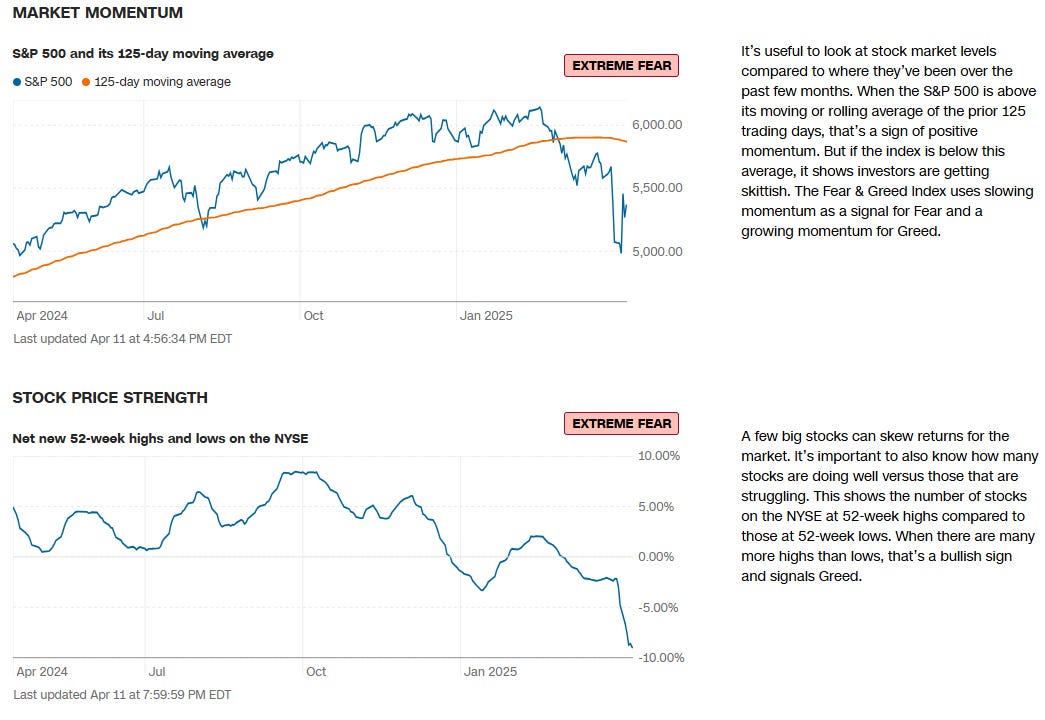
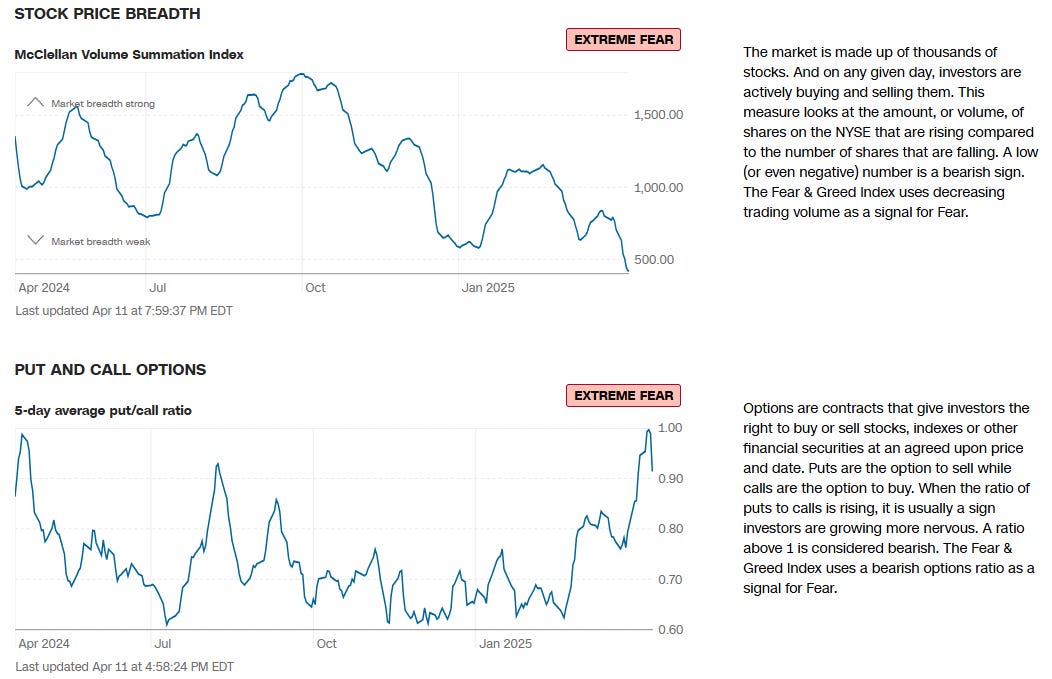
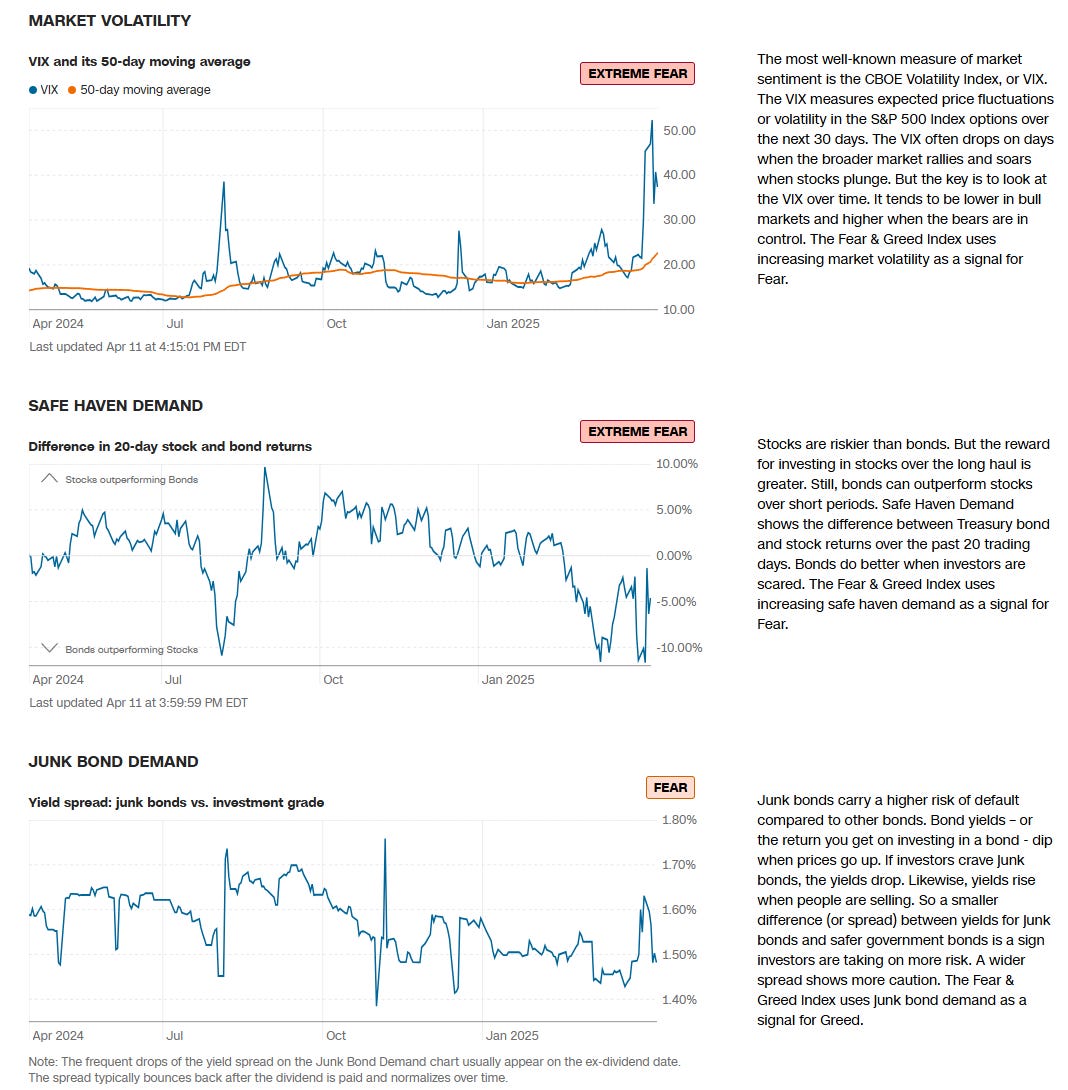
CNN Fear & Greed Constituent Data Points & Composite Index
Institutional S/R Levels for Major Indices
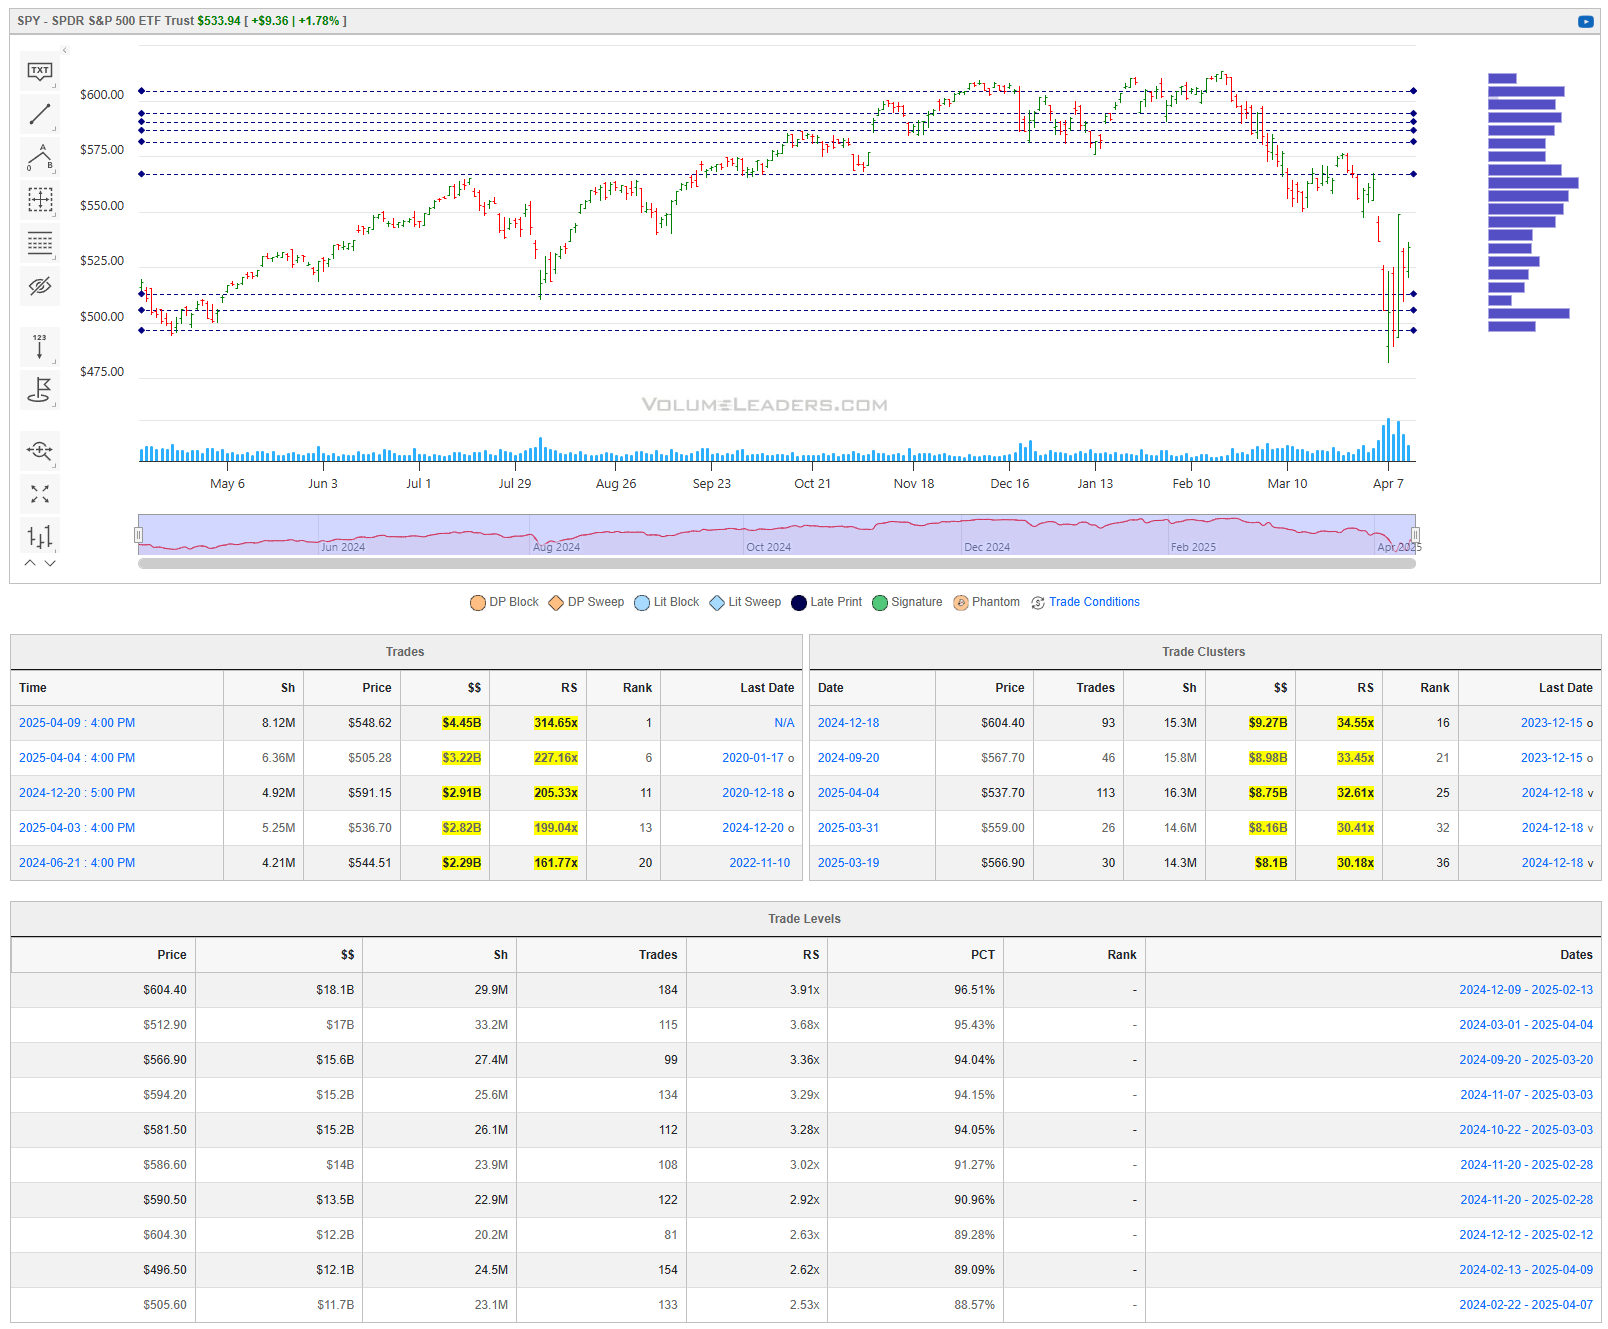
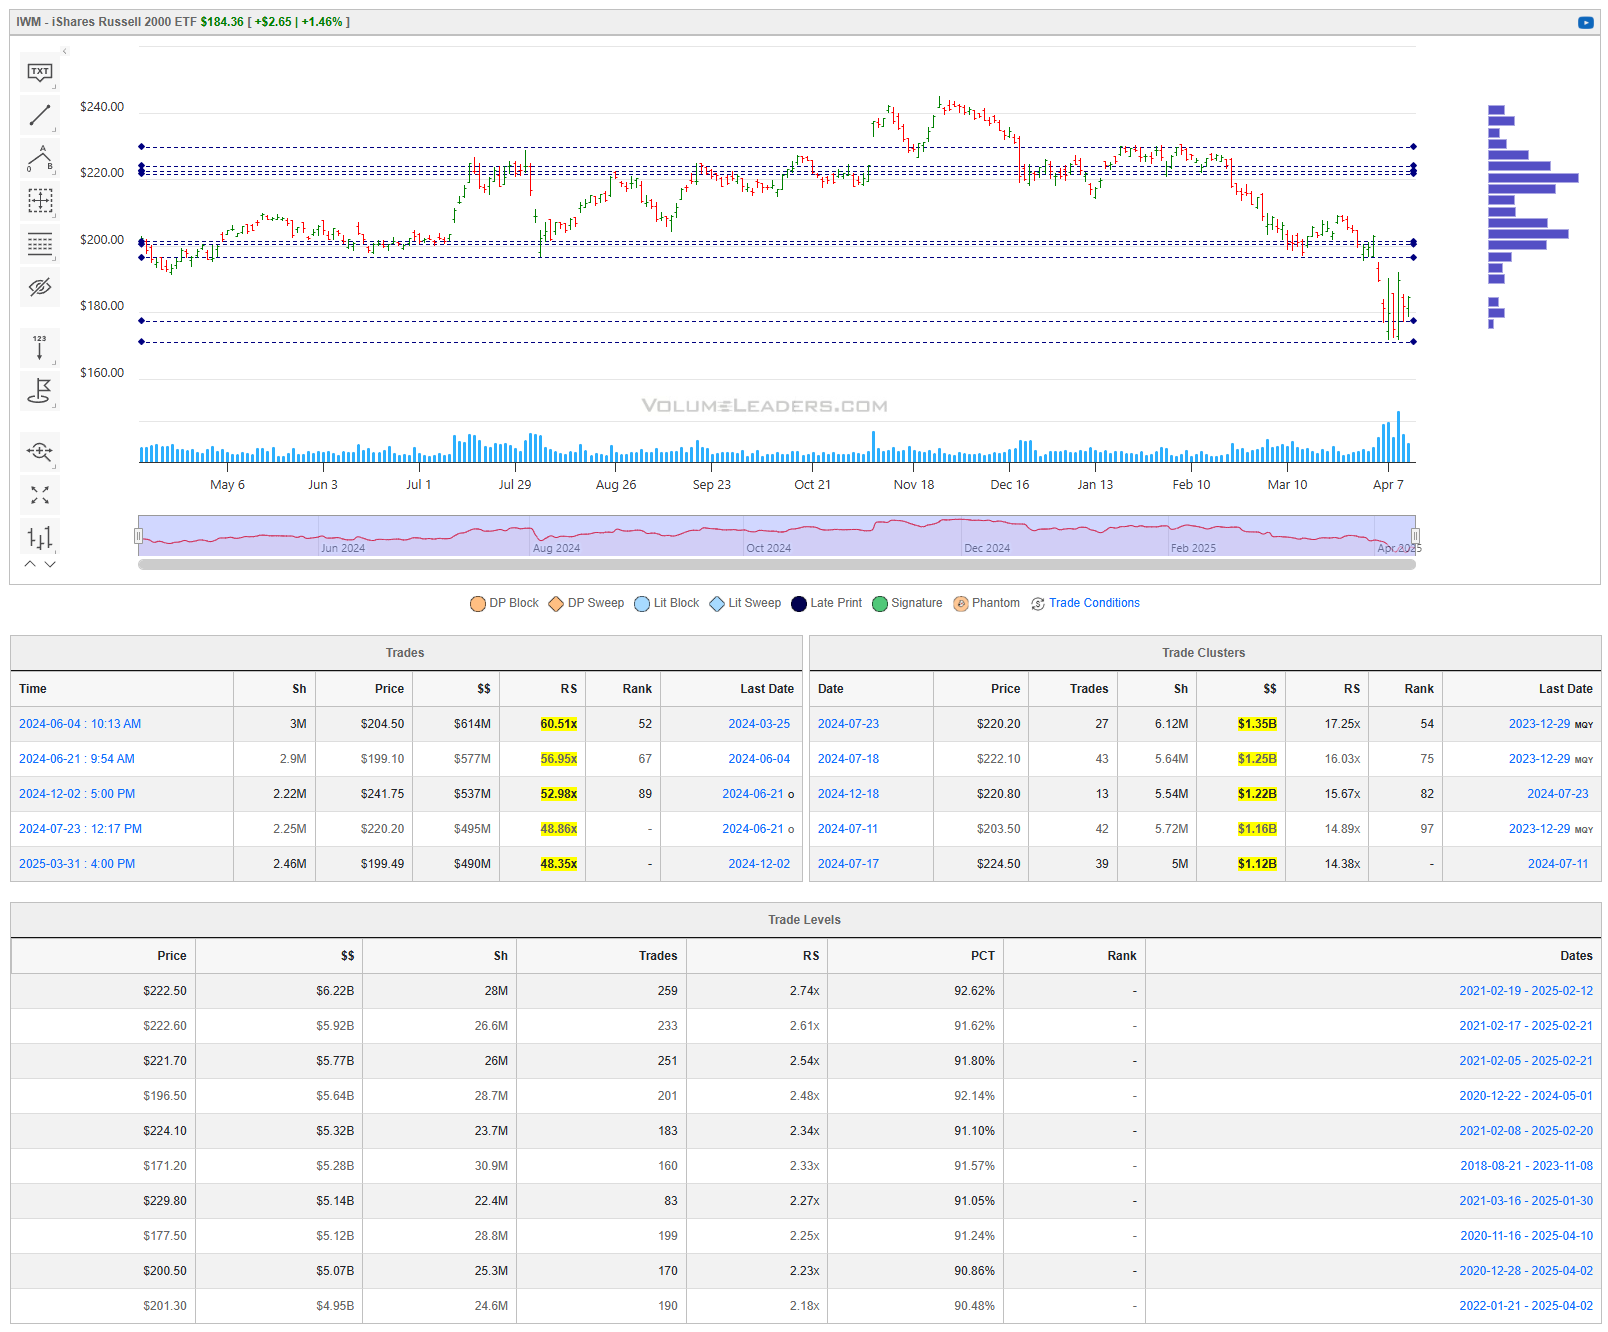
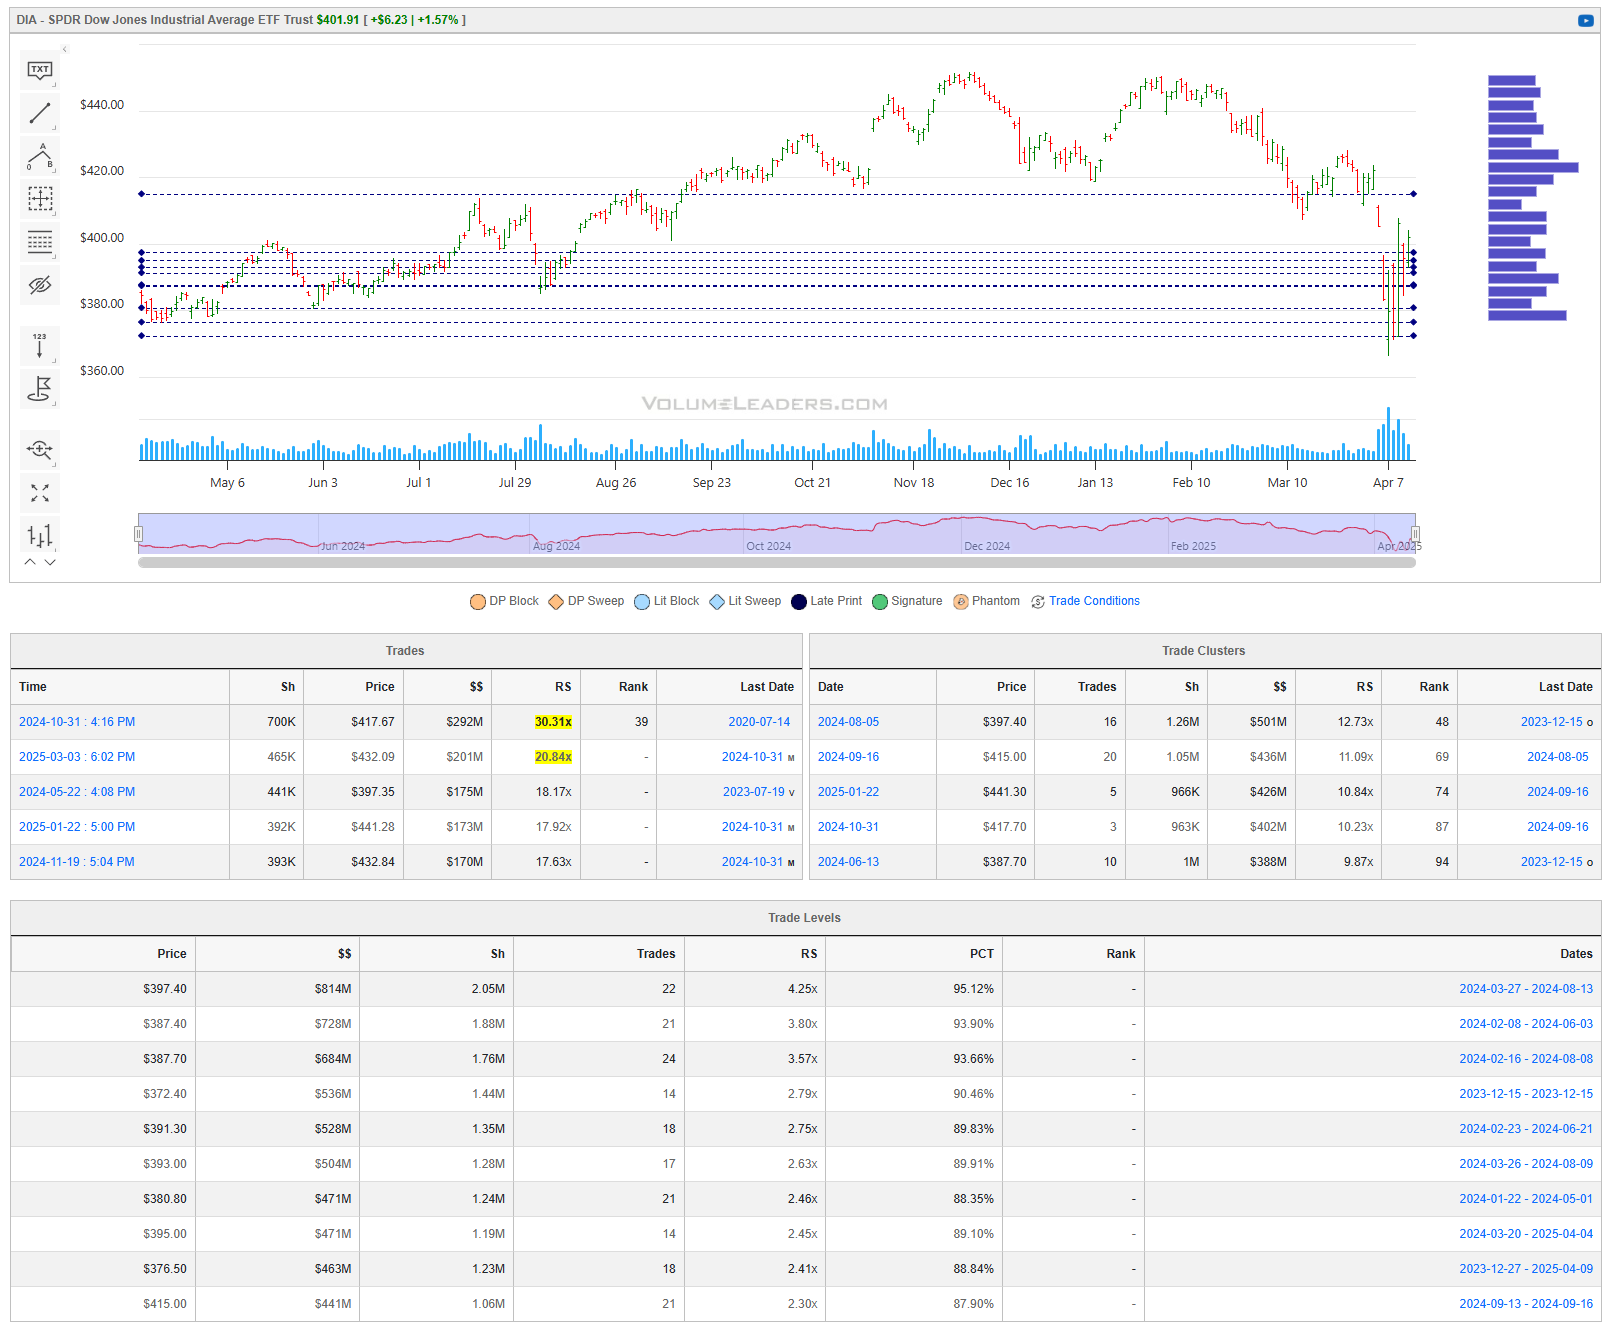
When you’re a large institutional player, your primary goal is to find liquidity - places to do a ton of business with the least amount of slippage possible. VolumeLeaders.com automatically identifies and visually plots the exact spots where institutions are doing business and where they are likely to return for more. It’s one of the primary reasons “support” and “resistance” concepts work and truly one of the reasons “price has memory”.
Levels from the VolumeLeaders.com platform can help you formulate trades theses about:
Where to add or take profit
Where to de-risk or hedge
What strikes to target for options
Where to expect support or resistance
And this is just a small sample; there are countless ways to leverage this information into trades that express your views on the market. The platform covers thousands of tickers on multiple timeframes to accommodate all types of traders.
SPY 0.00%↑
QQQ 0.00%↑
IWM 0.00%↑
DIA 0.00%↑
Institutional Order Flow
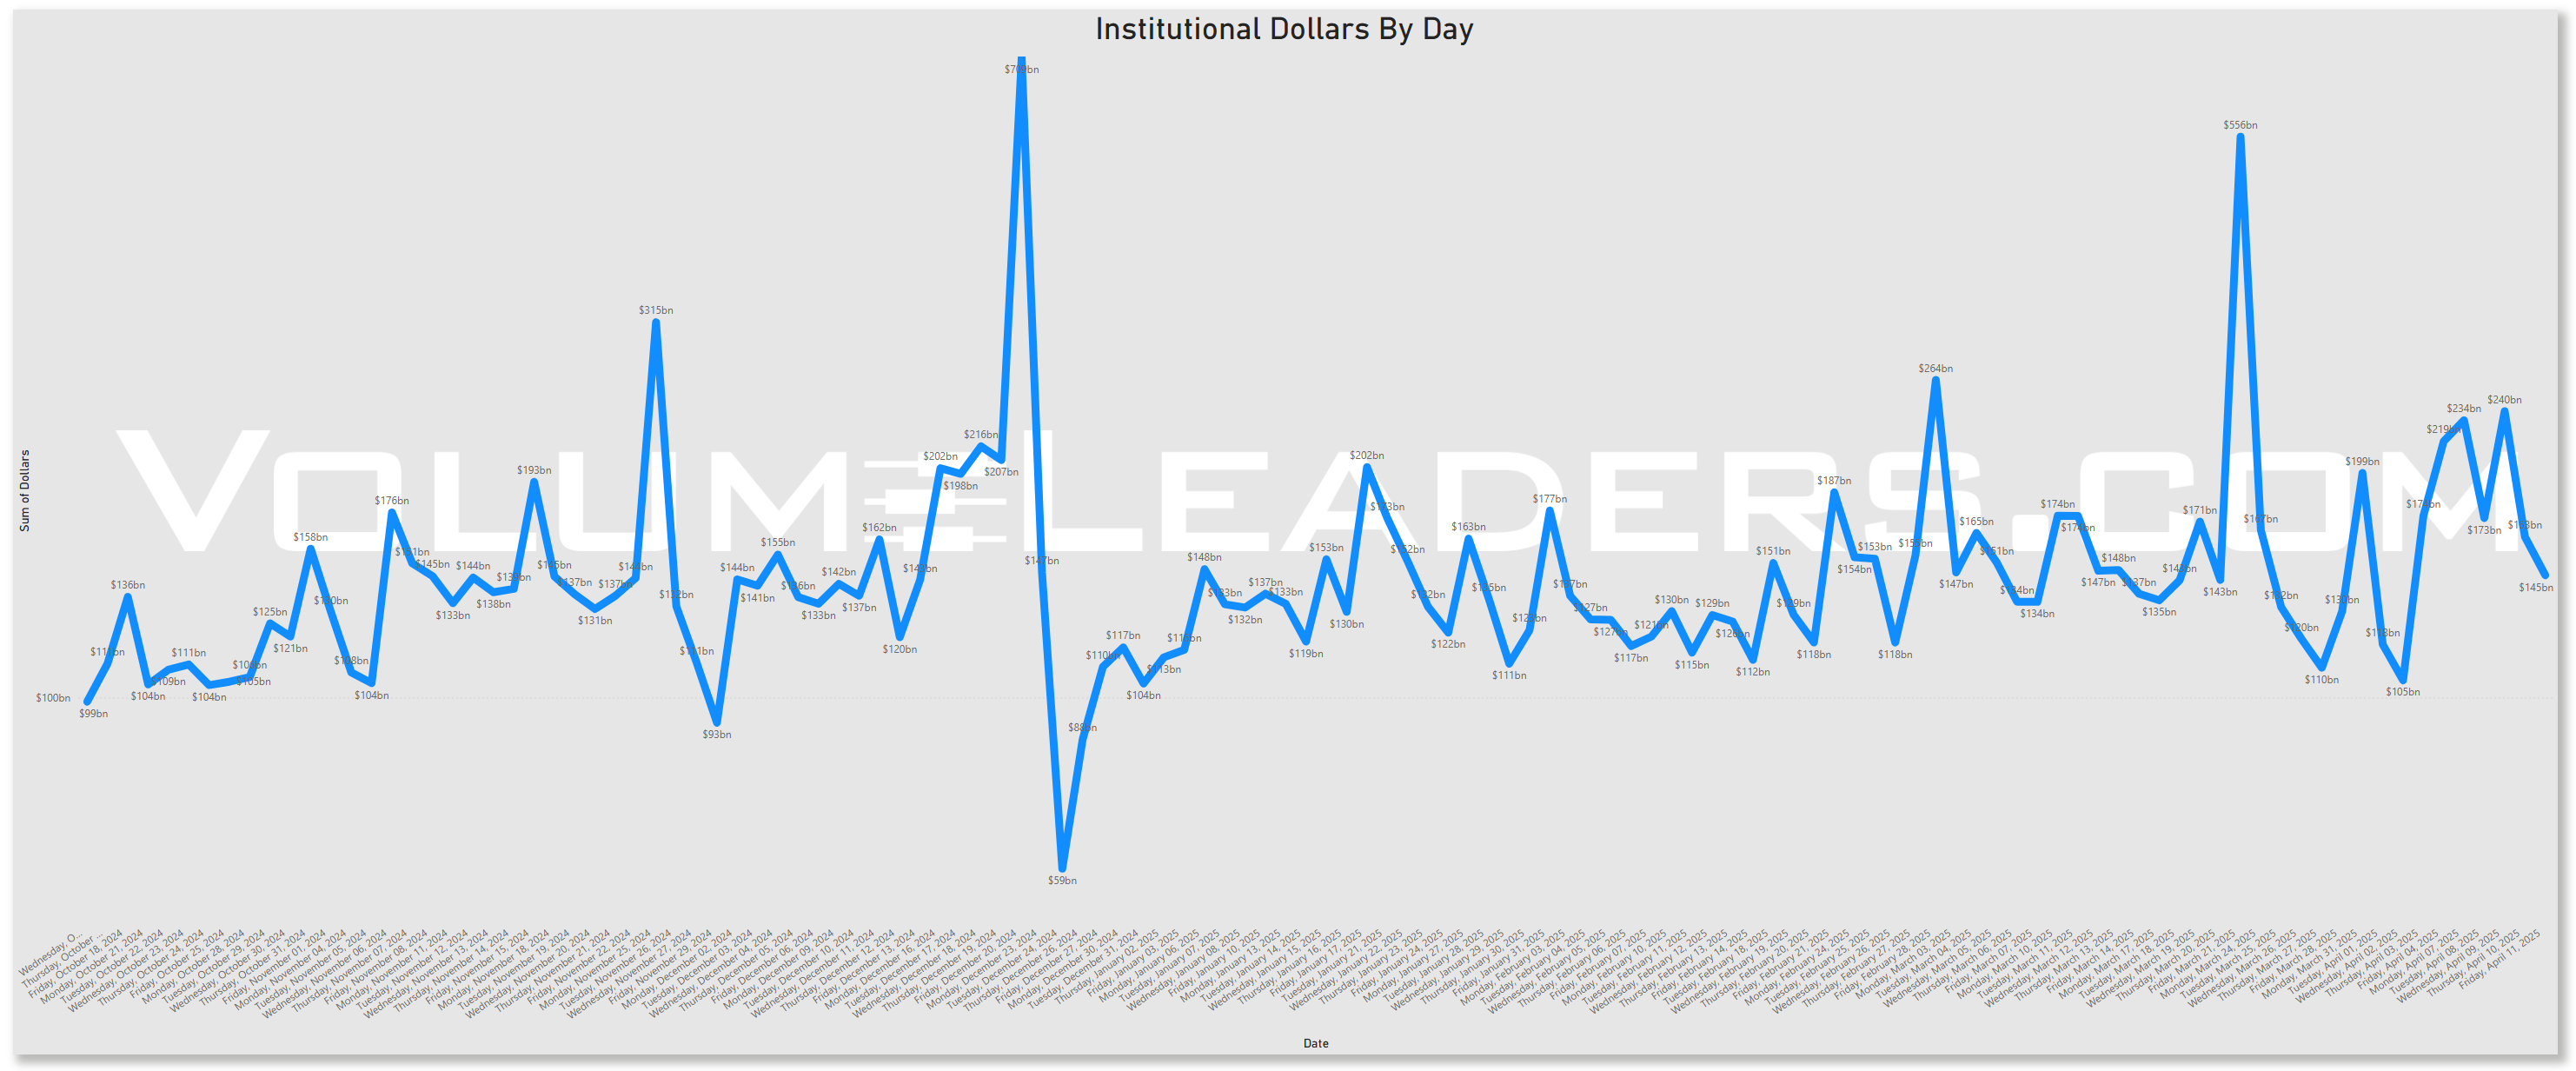
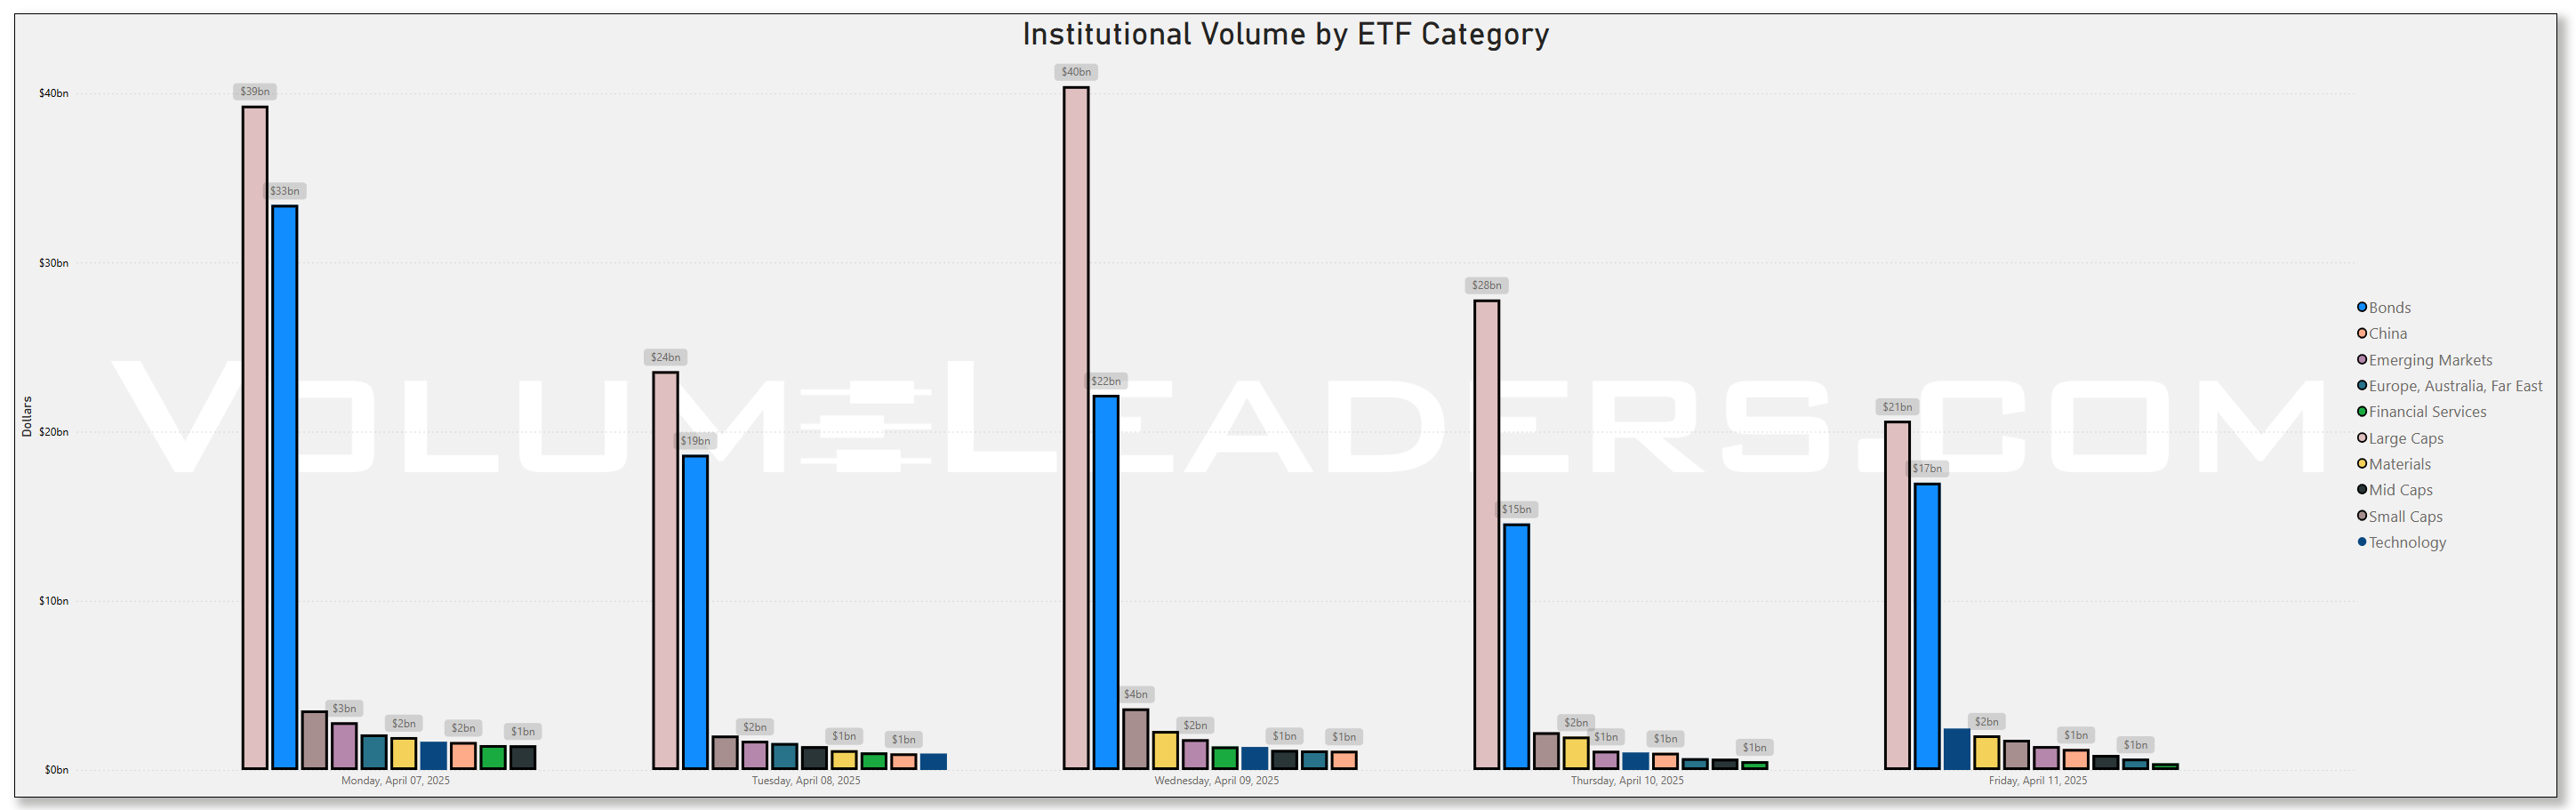
Rolling 90-Day Dollars By Day
This chart shows institutional activity by dollars by day on a rolling 1-year basis. From a theoretical standpoint, examining a chart of daily institutional dollar activity over the course of a year can offer several insights and possible inferences, though all should be approached with caution since the data alone may not prove causality or confirm underlying reasons. Some potential takeaways include:
Event-Driven Behavior:
Sharp, singular spikes on certain days might correlate with major market-moving events. These could include central bank policy announcements, significant geopolitical news, sudden macroeconomic data releases (like employment reports or GDP data), earnings seasons for large-cap companies, or unexpected shocks (e.g., mergers, acquisitions, regulatory changes).Liquidity Dynamics:
Institutions often concentrate large trades on days with higher expected liquidity. For instance, heightened activity might coincide with index reconstitutions, option expiration dates, or the days leading up to or following a major index rebalance, when large amounts of capital shift hands simultaneously.Risk Management and Hedging Activity:
Institutions may significantly adjust their exposures on days that are critical from a risk management perspective. Large spikes can occur if hedge funds, pension funds, or asset managers are rolling over futures contracts, initiating or closing out large hedges, or reacting to volatility triggers.Market Sentiment Indicators:
While the data is purely transactional, the sheer volume of institutional involvement on certain days might indirectly hint at changing sentiment or strategic shifts.
In essence, a chart like this can lead you to hypothesize that institutional trading volumes are not constant or random but rather influenced by a mix of predictable calendar effects, major market events, liquidity considerations, risk management decisions, and strategic allocation shifts.
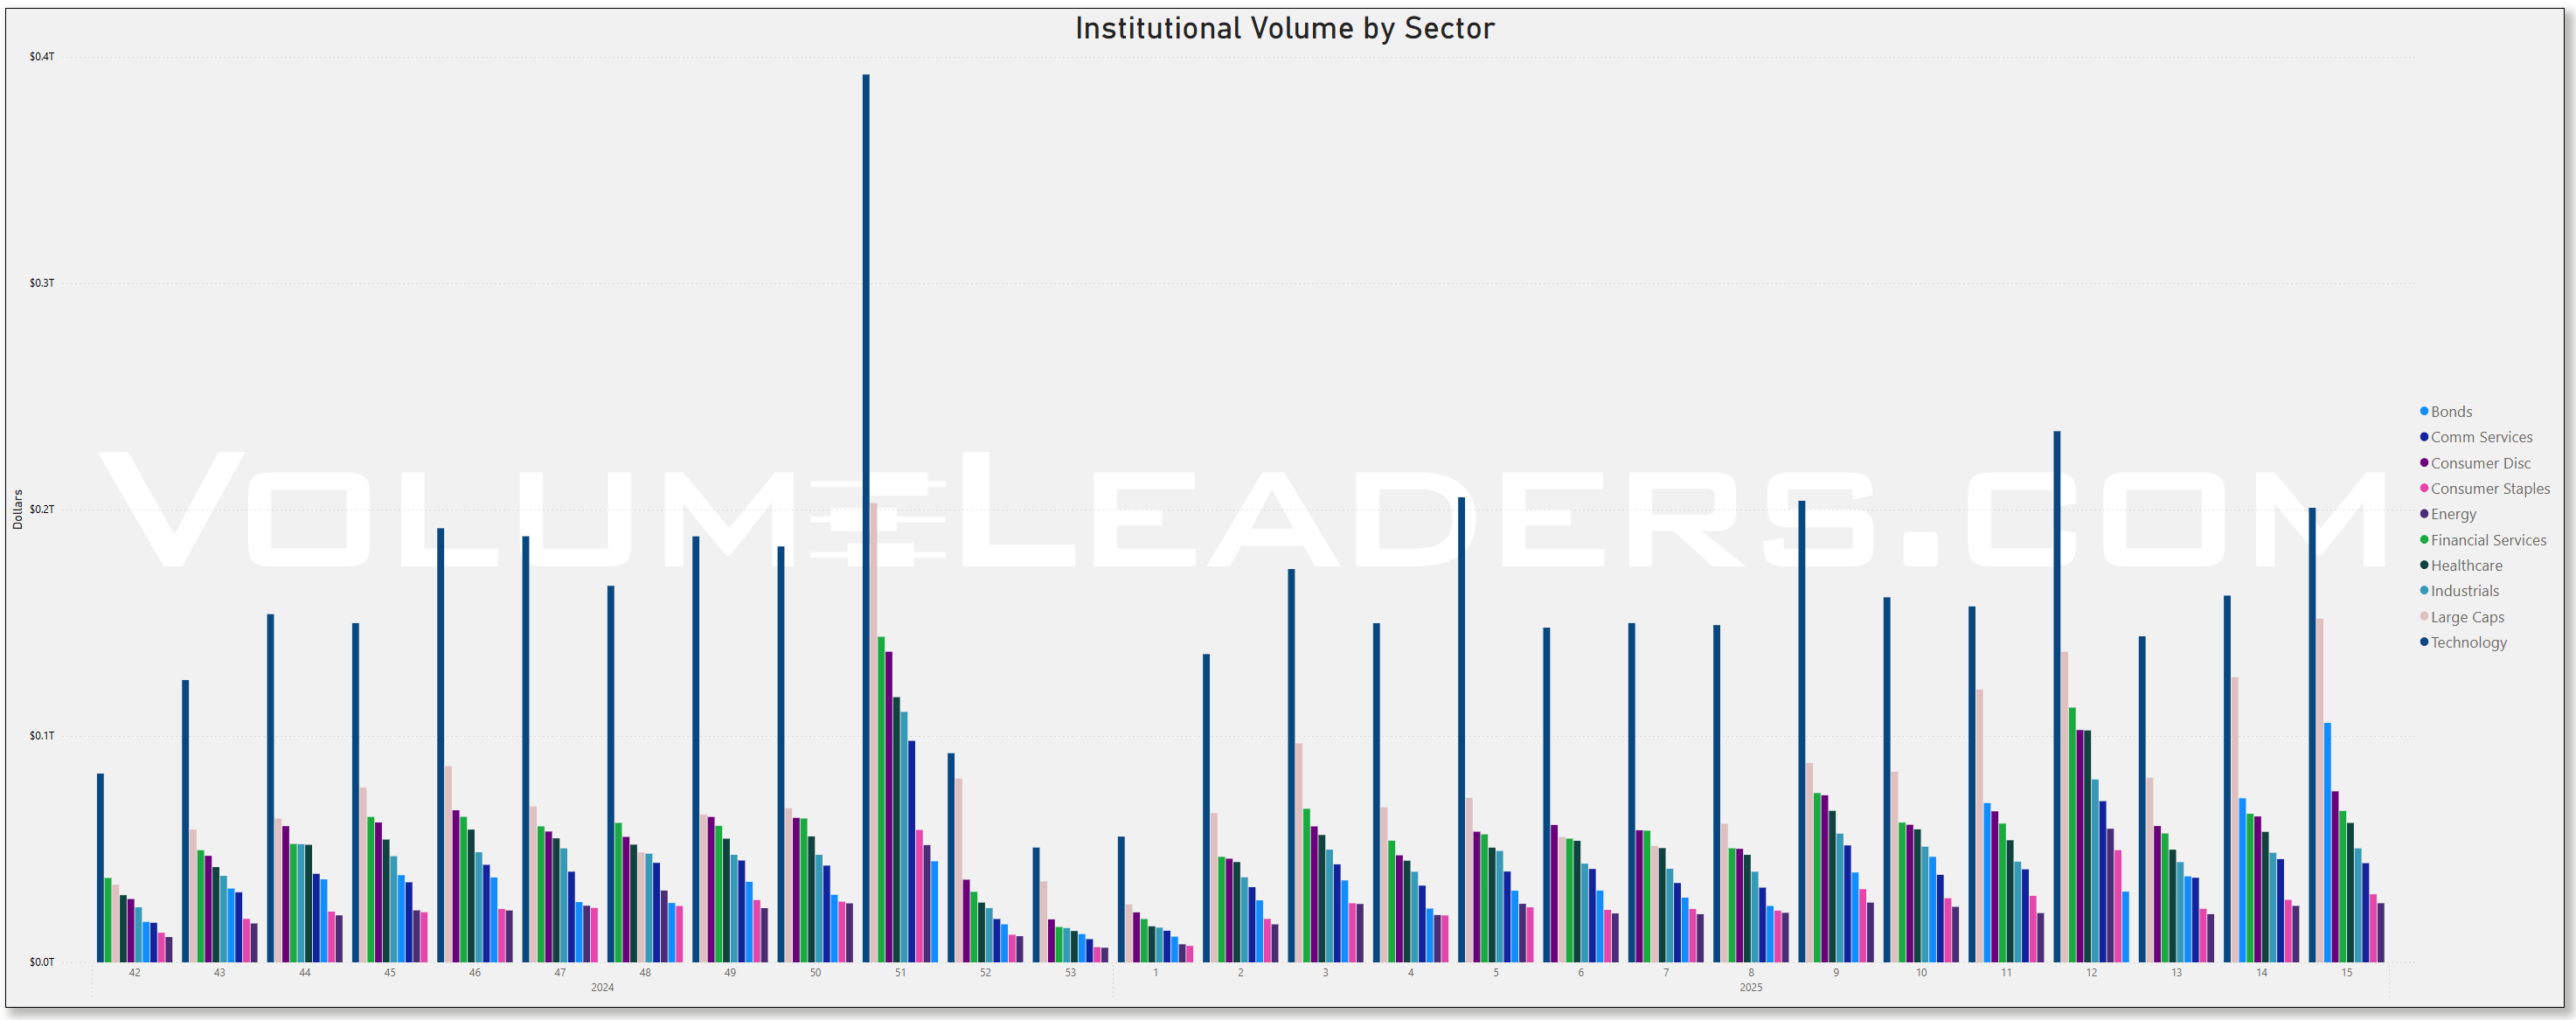
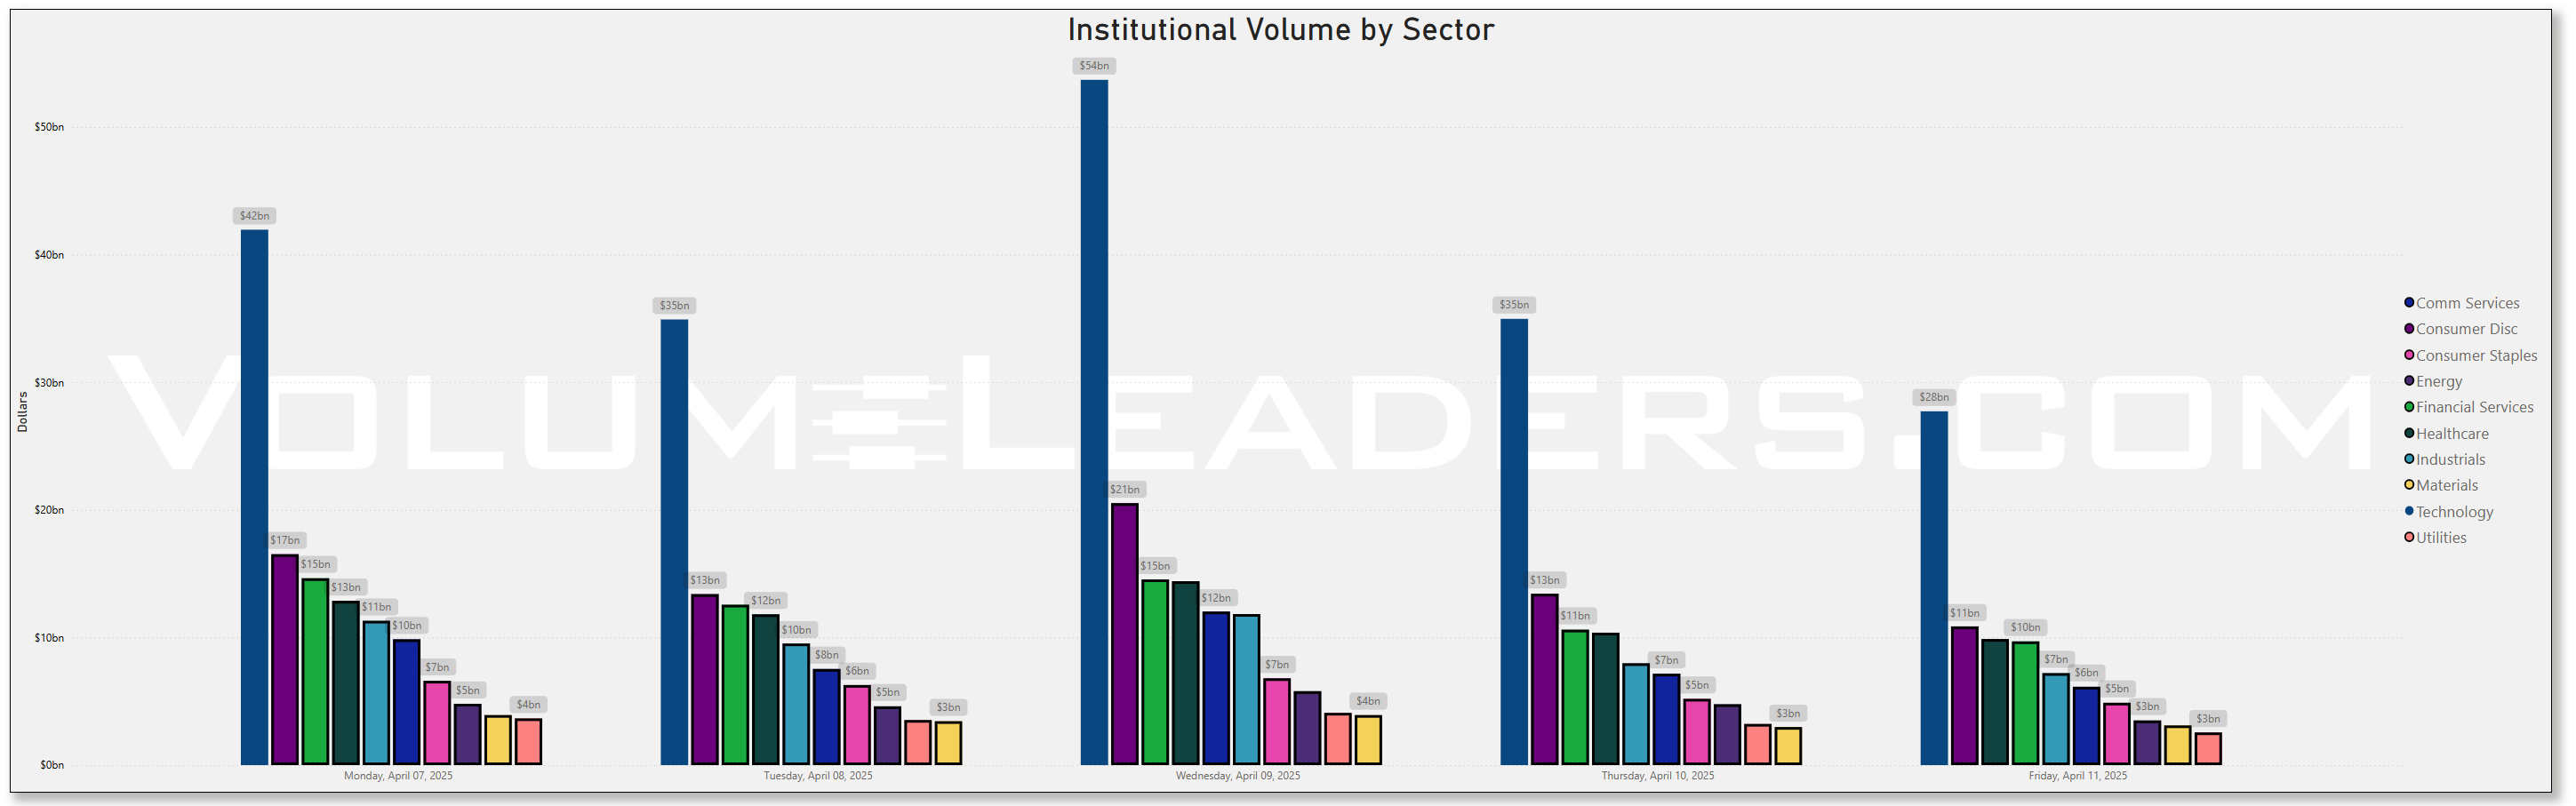
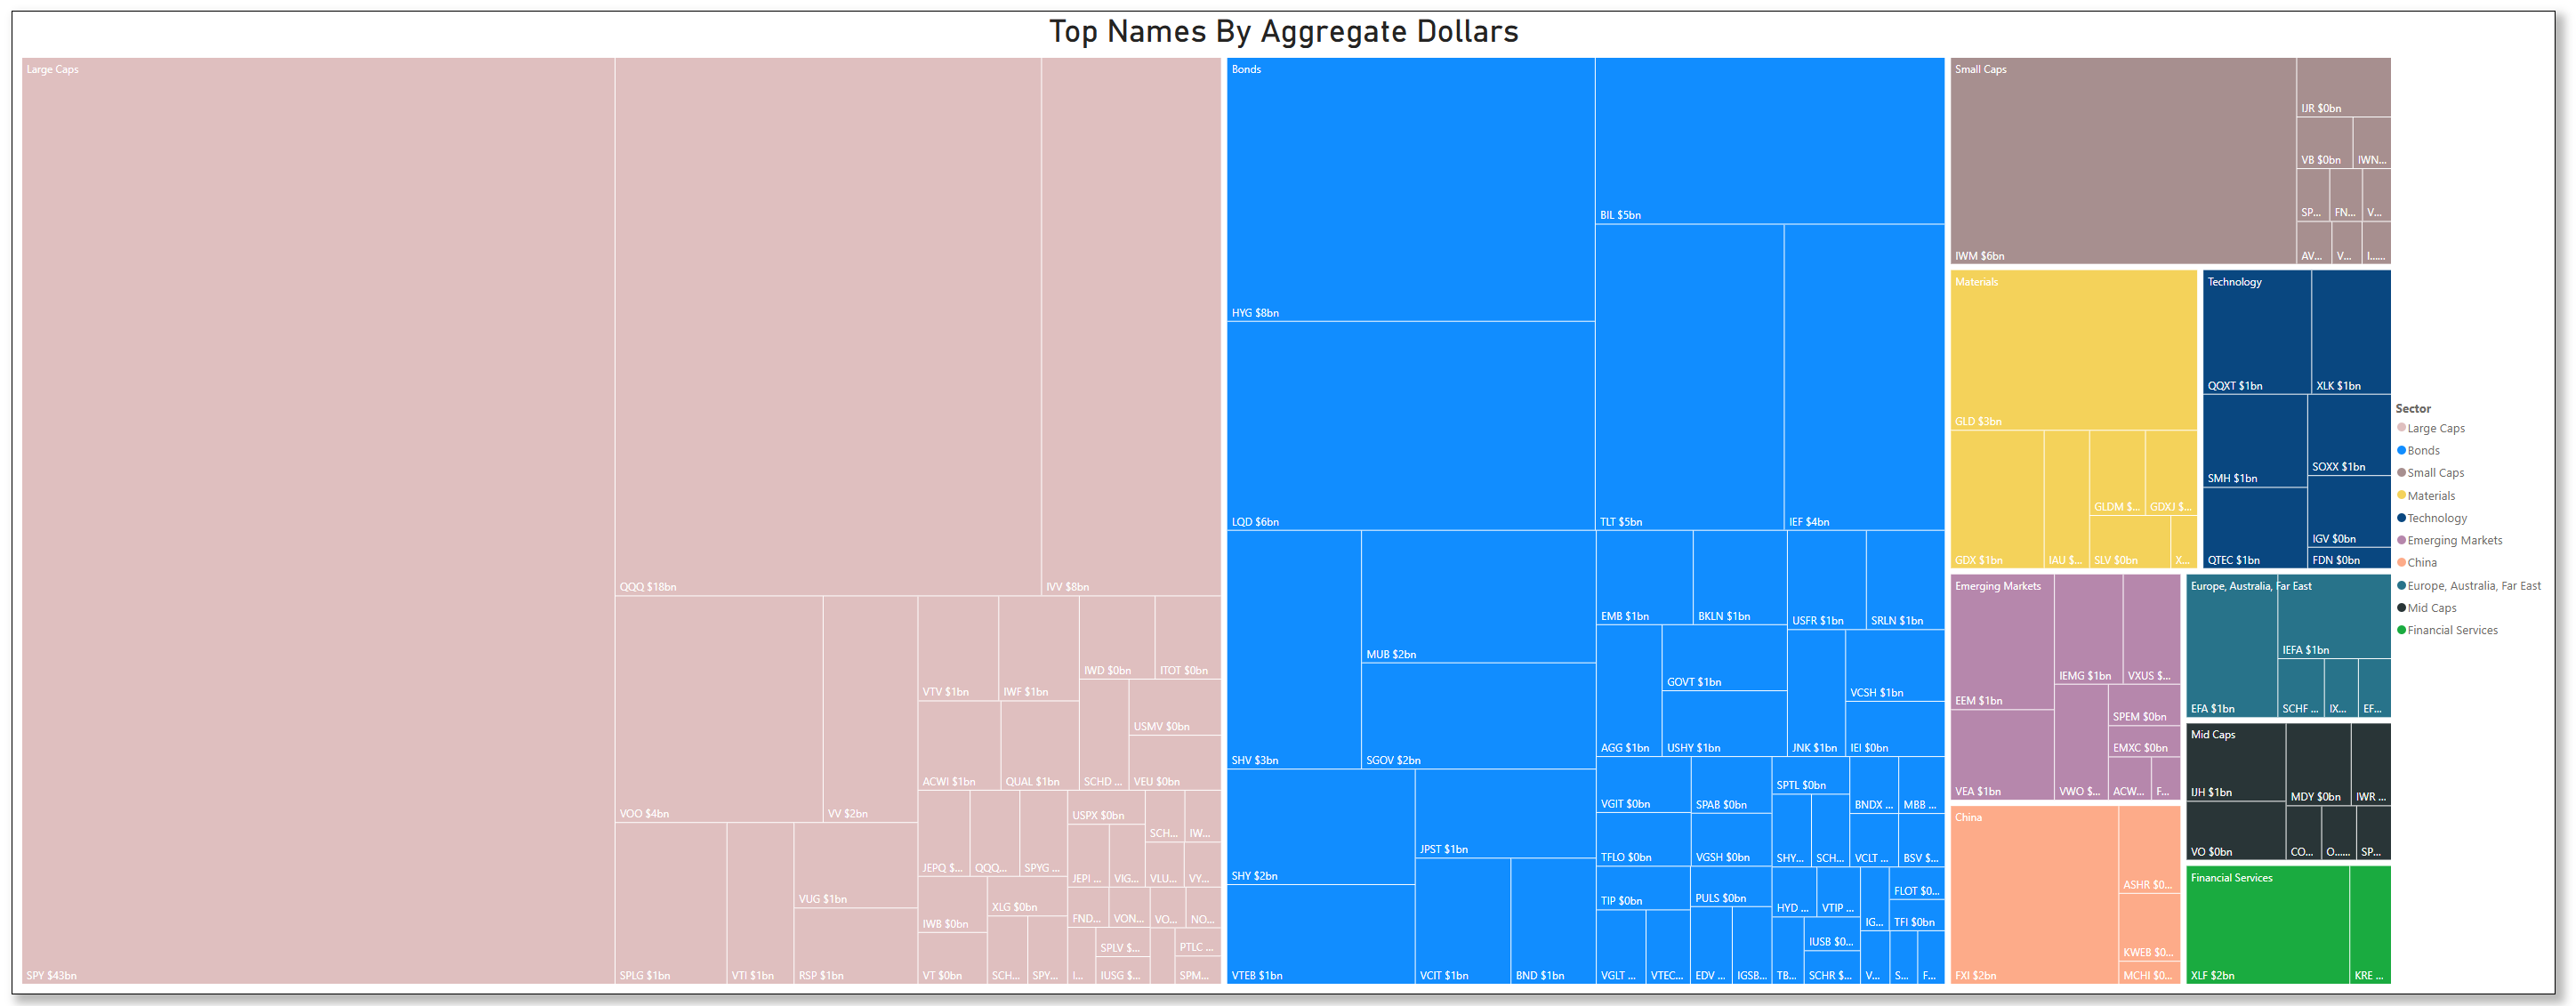
Top Institutional Order Flow By Sector By Week For The Past 90-Days
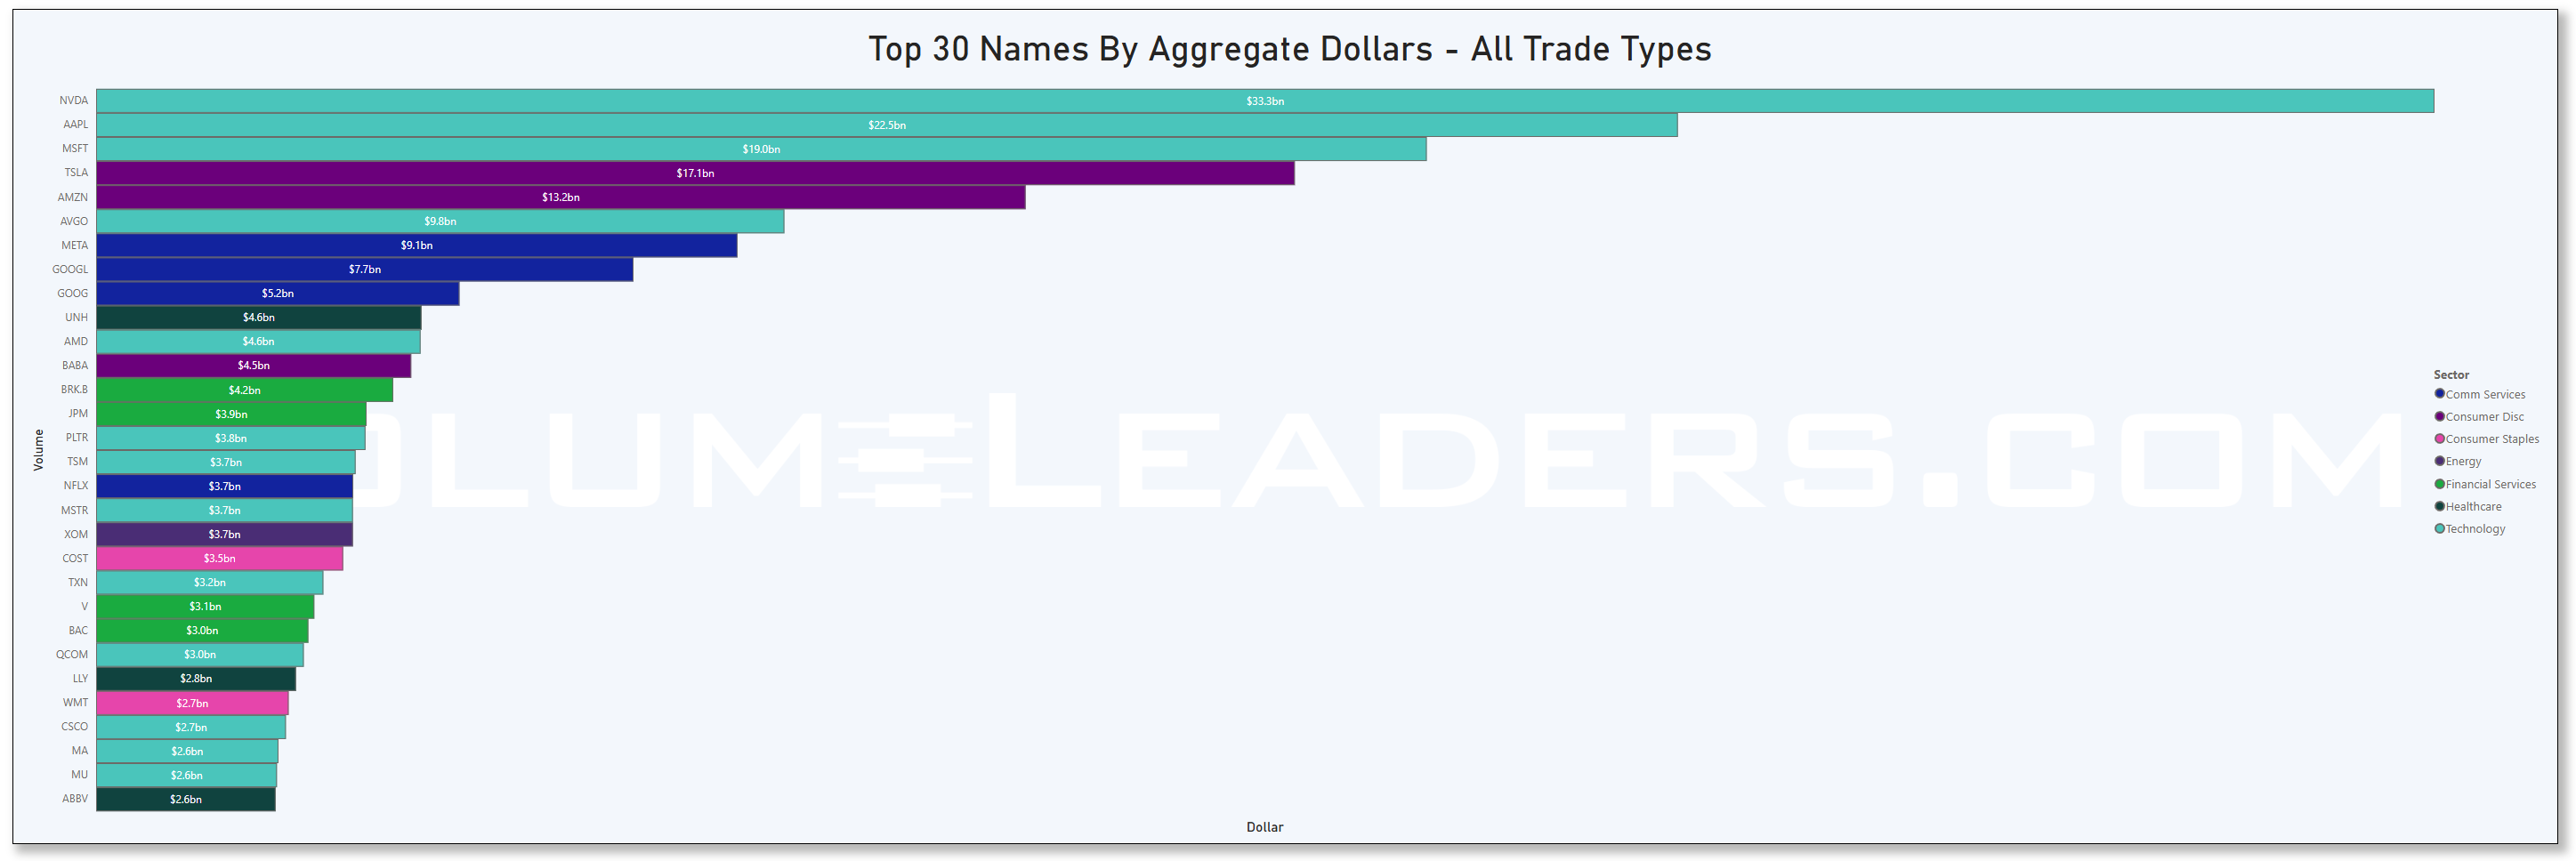
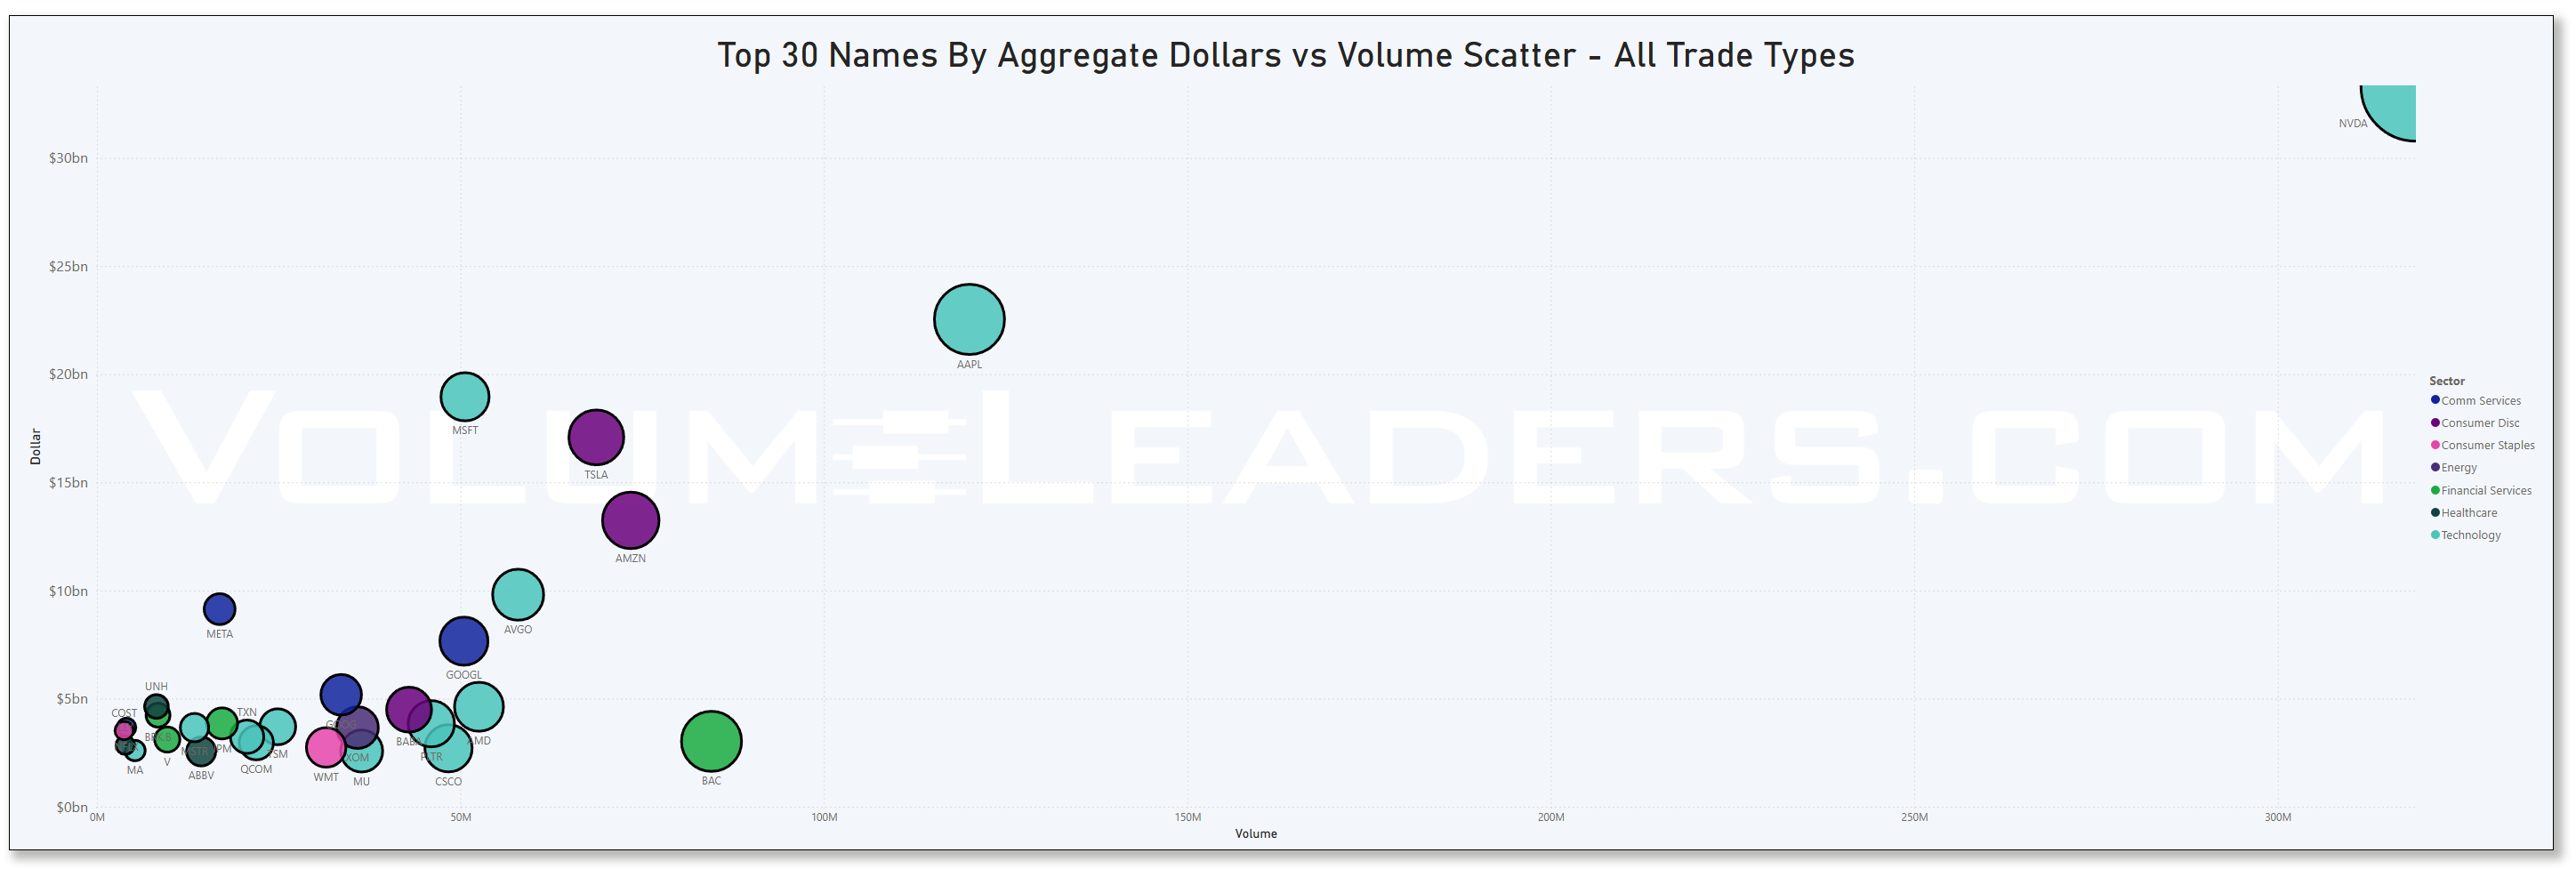
Top Institutional Order Flow In Equities
These are incredibly important charts to watch as they contains lots of nuanced suggestions at a thematic level. Watch these charts closely week-to-week to stay informed about where institutional money is flowing, adjust your strategies based on momentum, align your portfolio with macroeconomic and market trends, and manage risks more effectively by avoiding sectors losing institutional favor.
Sector Rotation Insights: The chart highlights which sectors are attracting institutional activity and which are losing favor. Institutions often lead market trends, so tracking shifts in their focus can indicate sector rotations.
Sentiment Analysis: The level of institutional activity reflects confidence in specific sectors. Rising activity in traditionally defensive sectors (e.g., healthcare, utilities) may indicate caution, while a surge in growth sectors (e.g., technology, consumer discretionary) could suggest optimism.
Emerging Trends: Sudden spikes in a previously overlooked sector, like industrials or consumer staples, might hint at emerging opportunities or structural shifts.
Macro Themes: Changes in sector activity often align with broader macroeconomic themes like inflation, interest rates, or geopolitical events. For instance:
Increased activity in energy might indicate concerns about oil supply or rising prices.
Growth in technology could align with innovations or favorable policies.
Risk Management: Declining institutional activity in a sector might signal weakening fundamentals or heightened risks.
Spotting Overcrowding: Excessive activity in a single sector over multiple weeks may suggest overcrowding, which could lead to heightened volatility if institutions begin to exit.
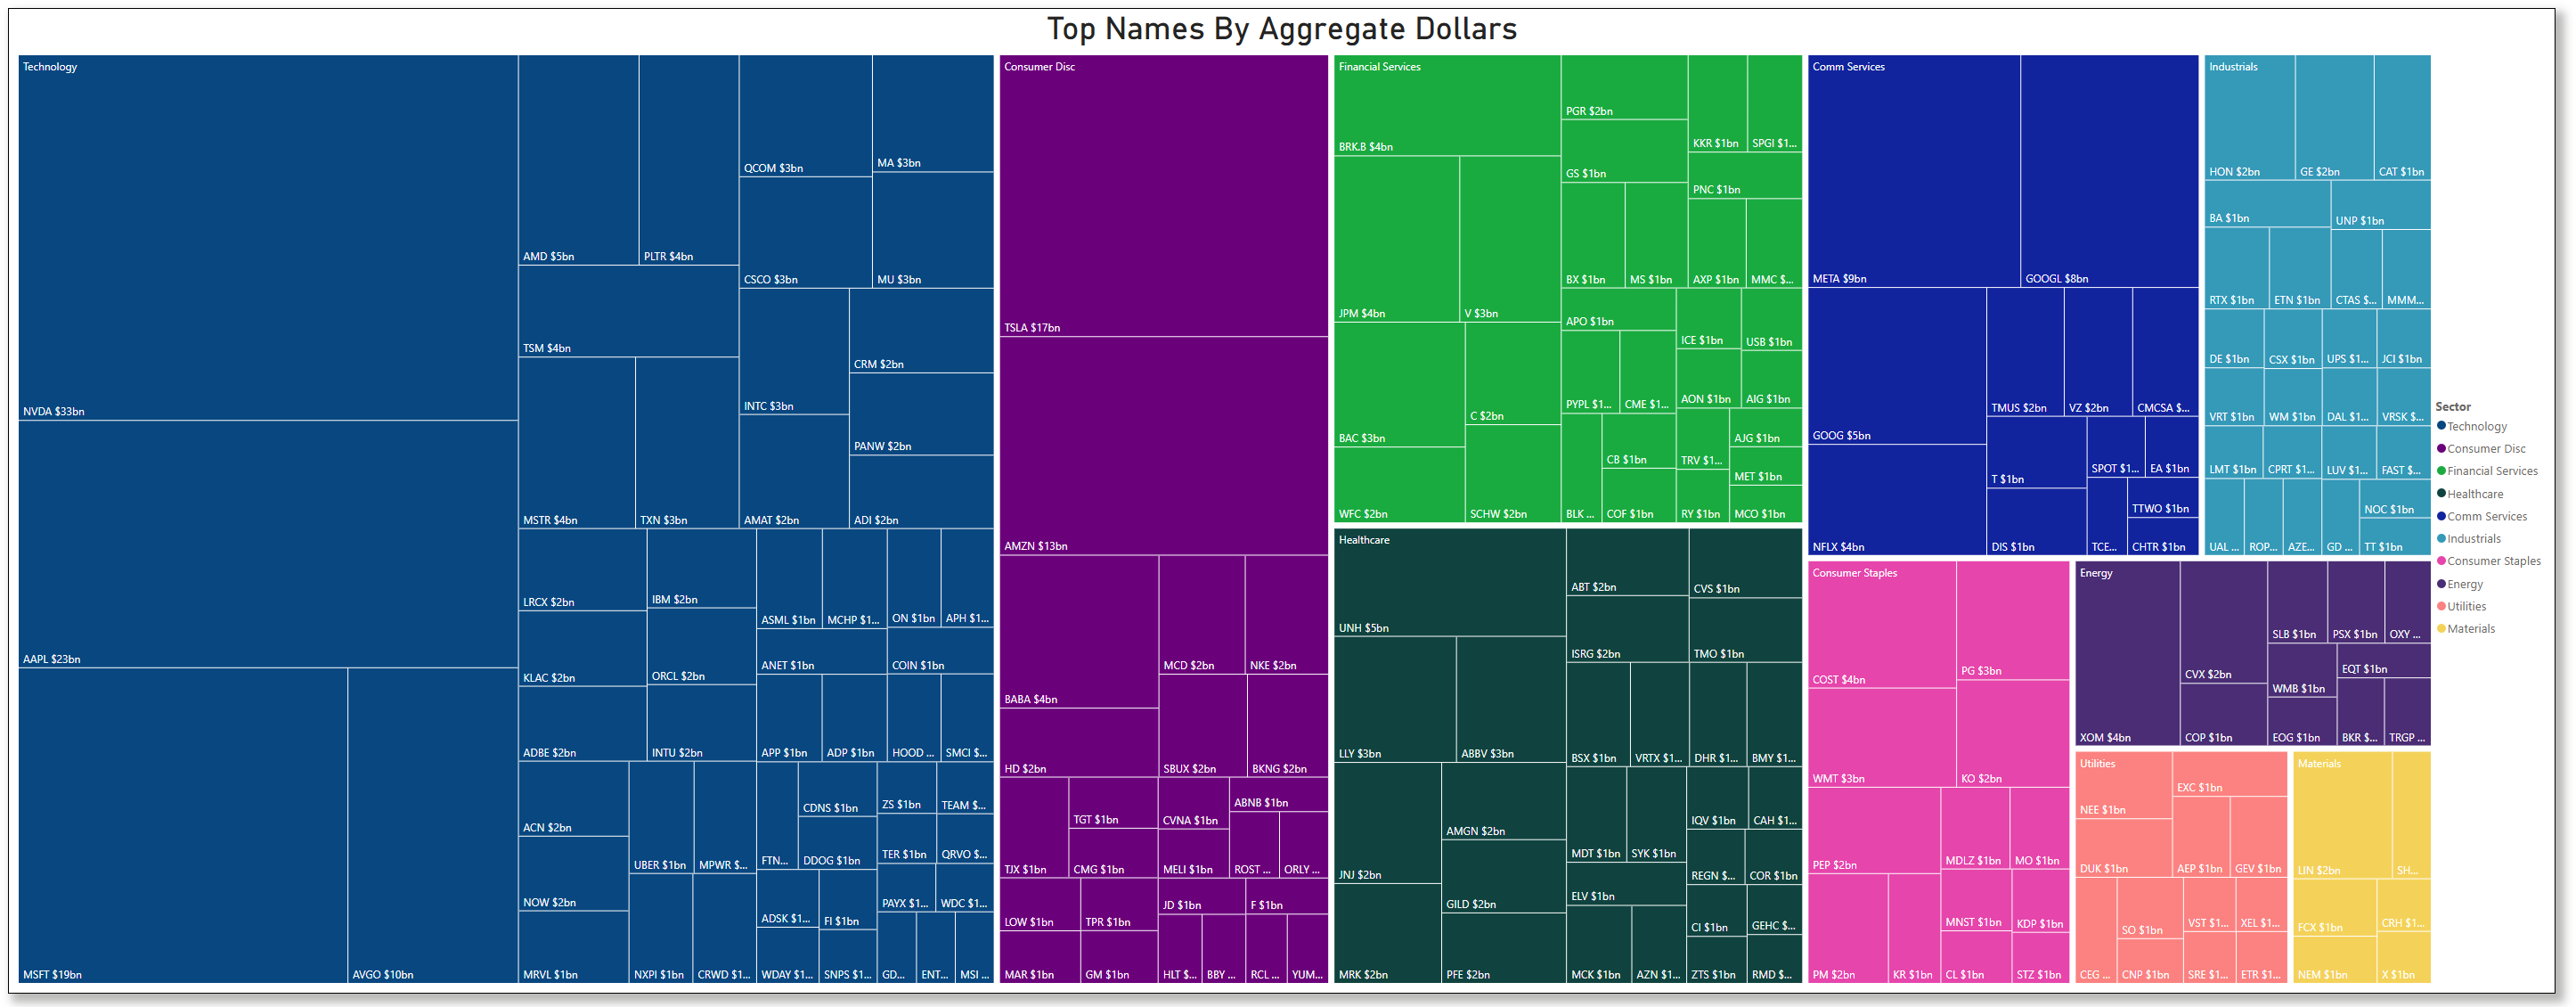
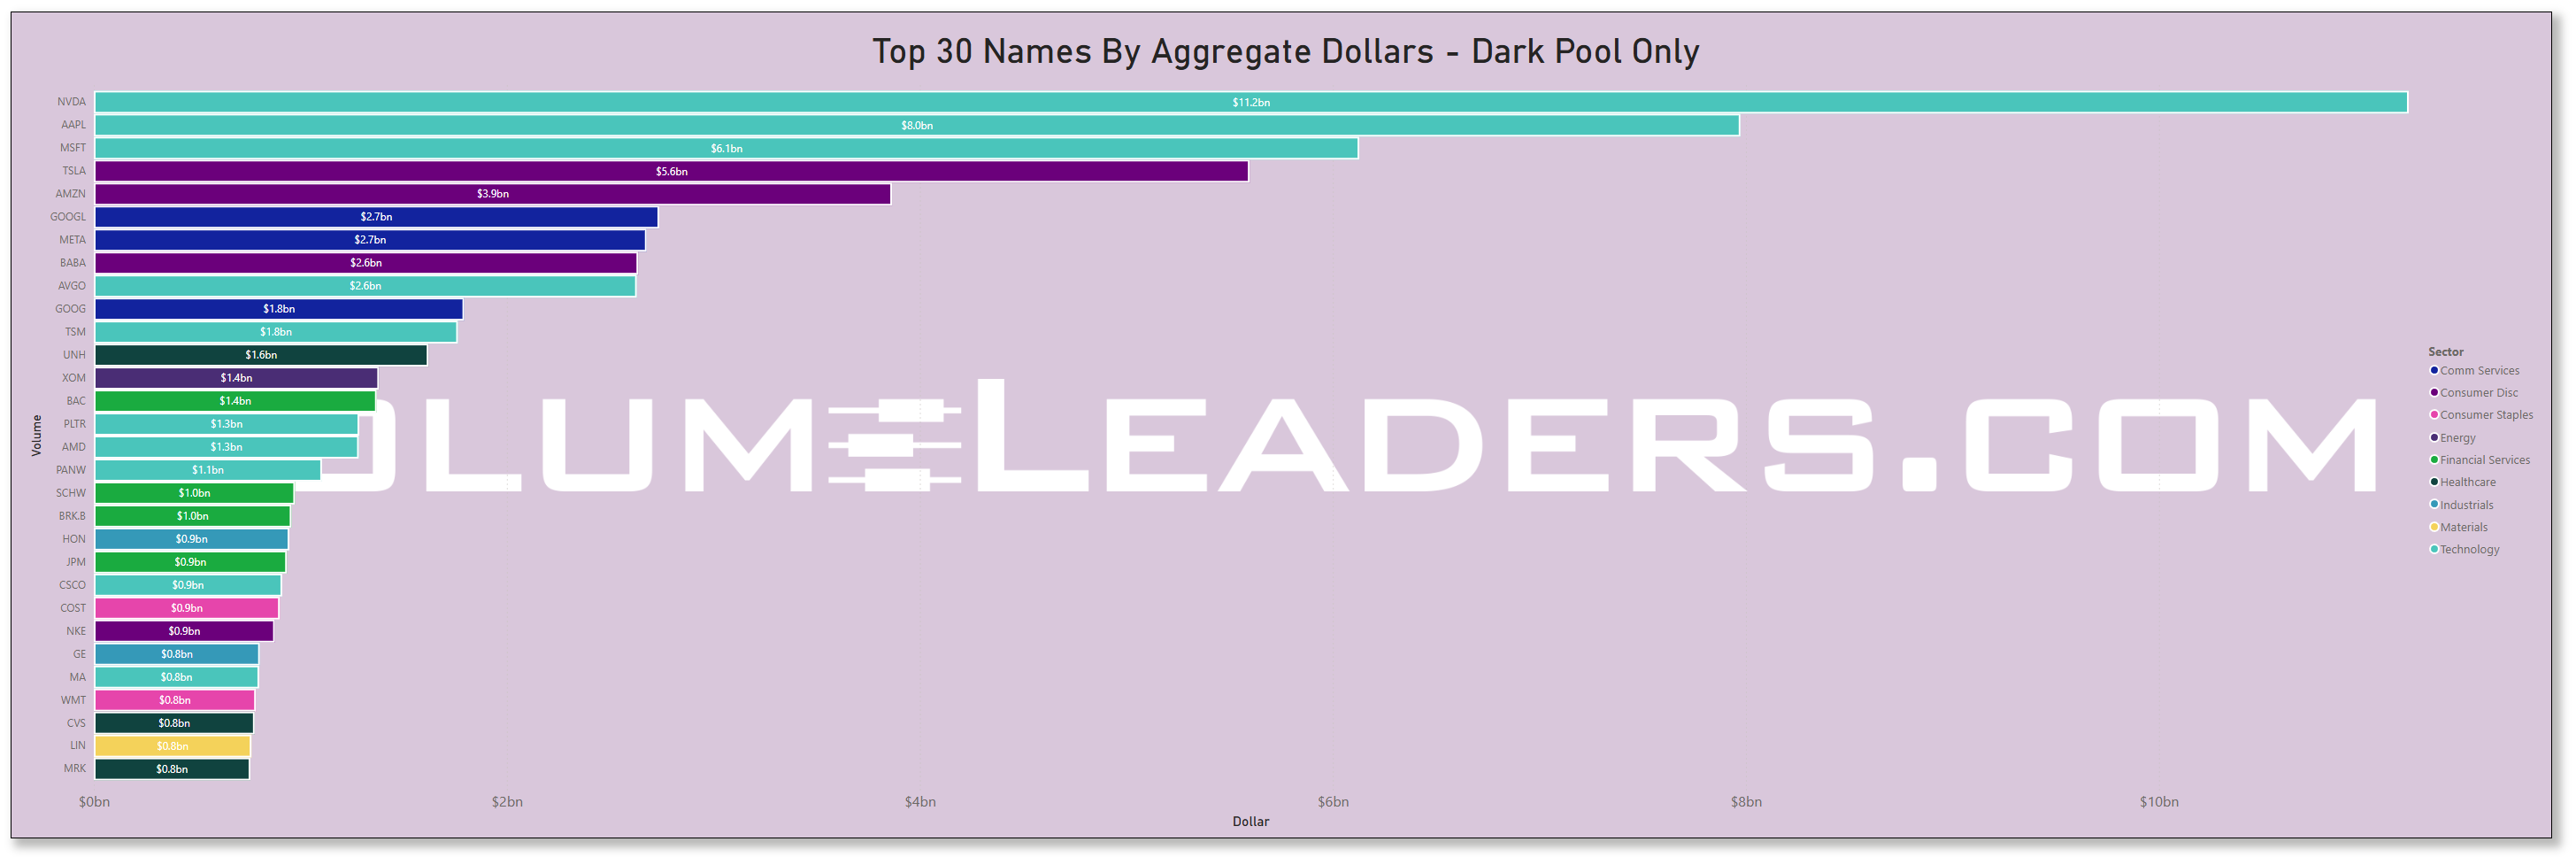
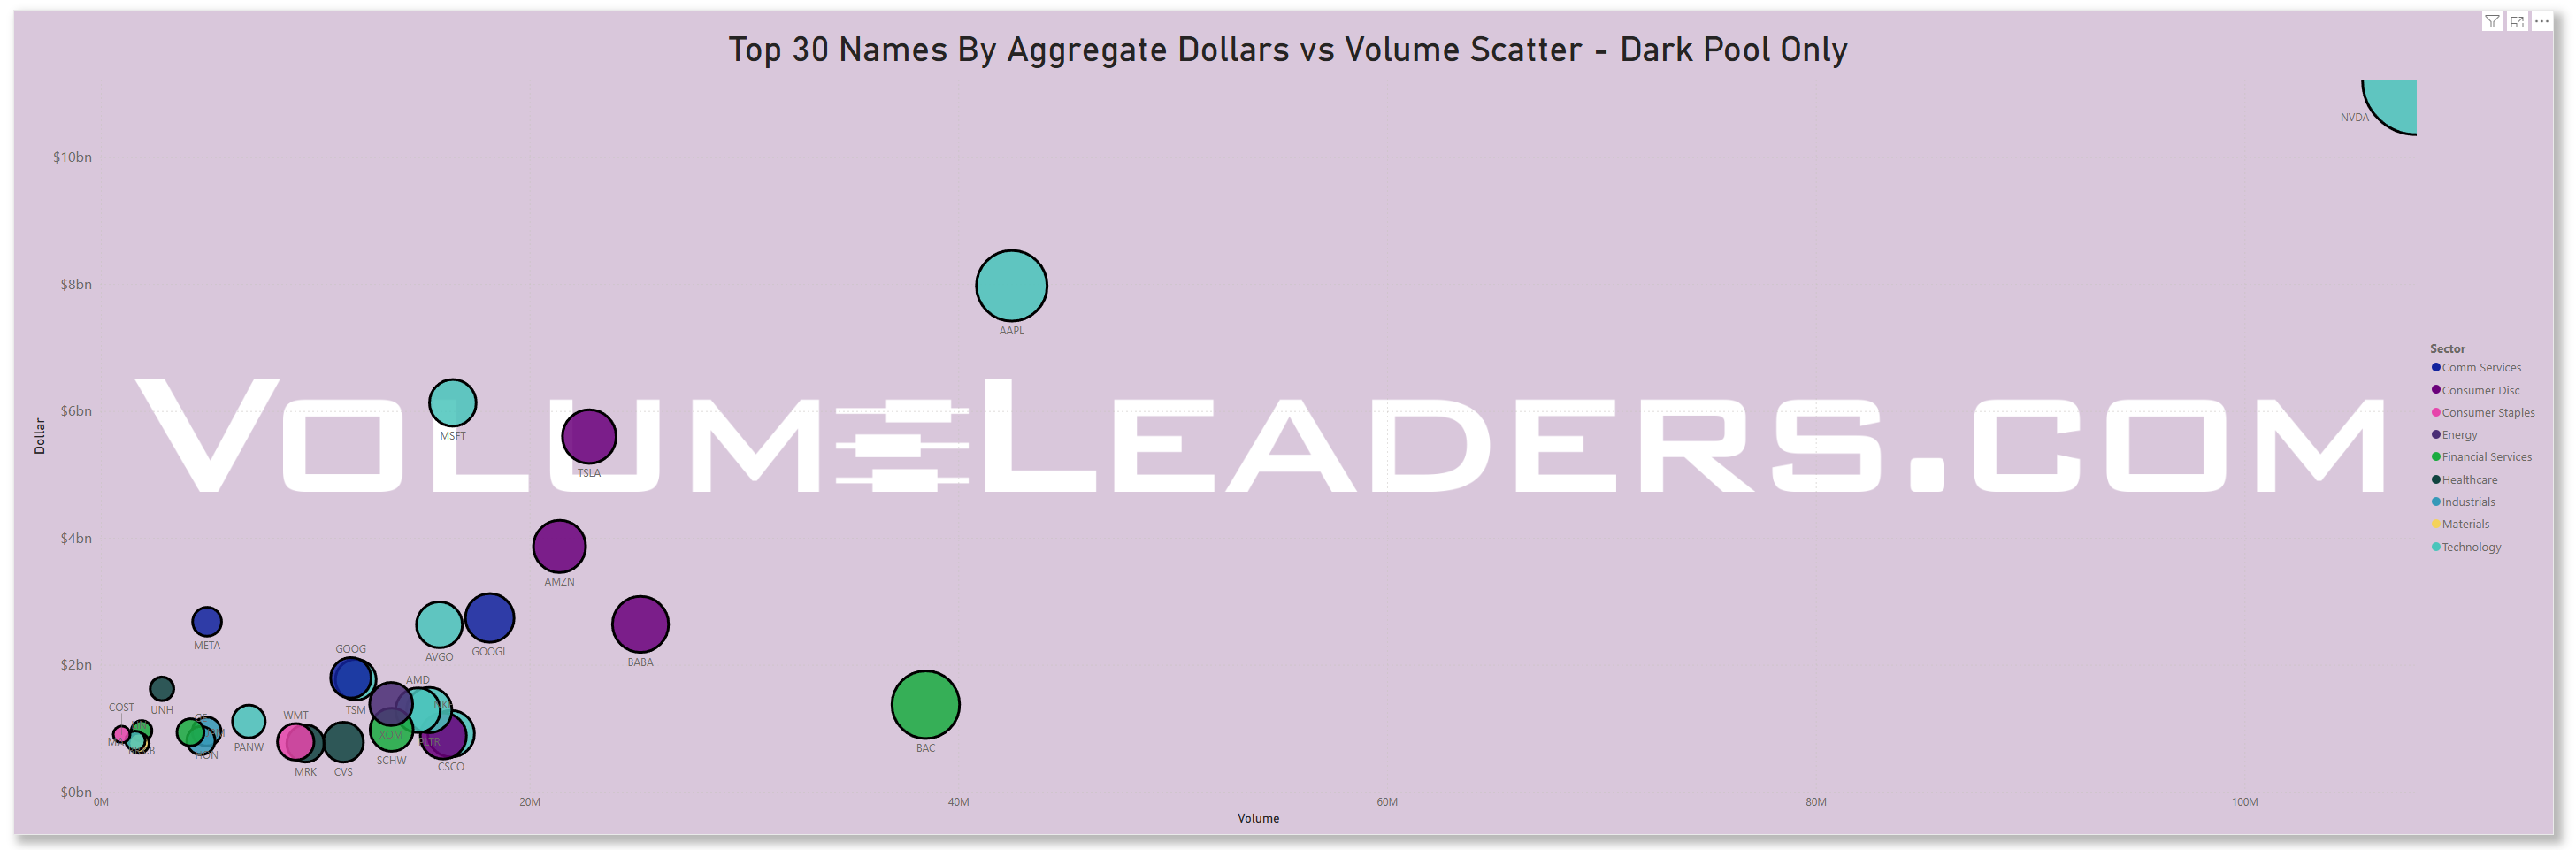
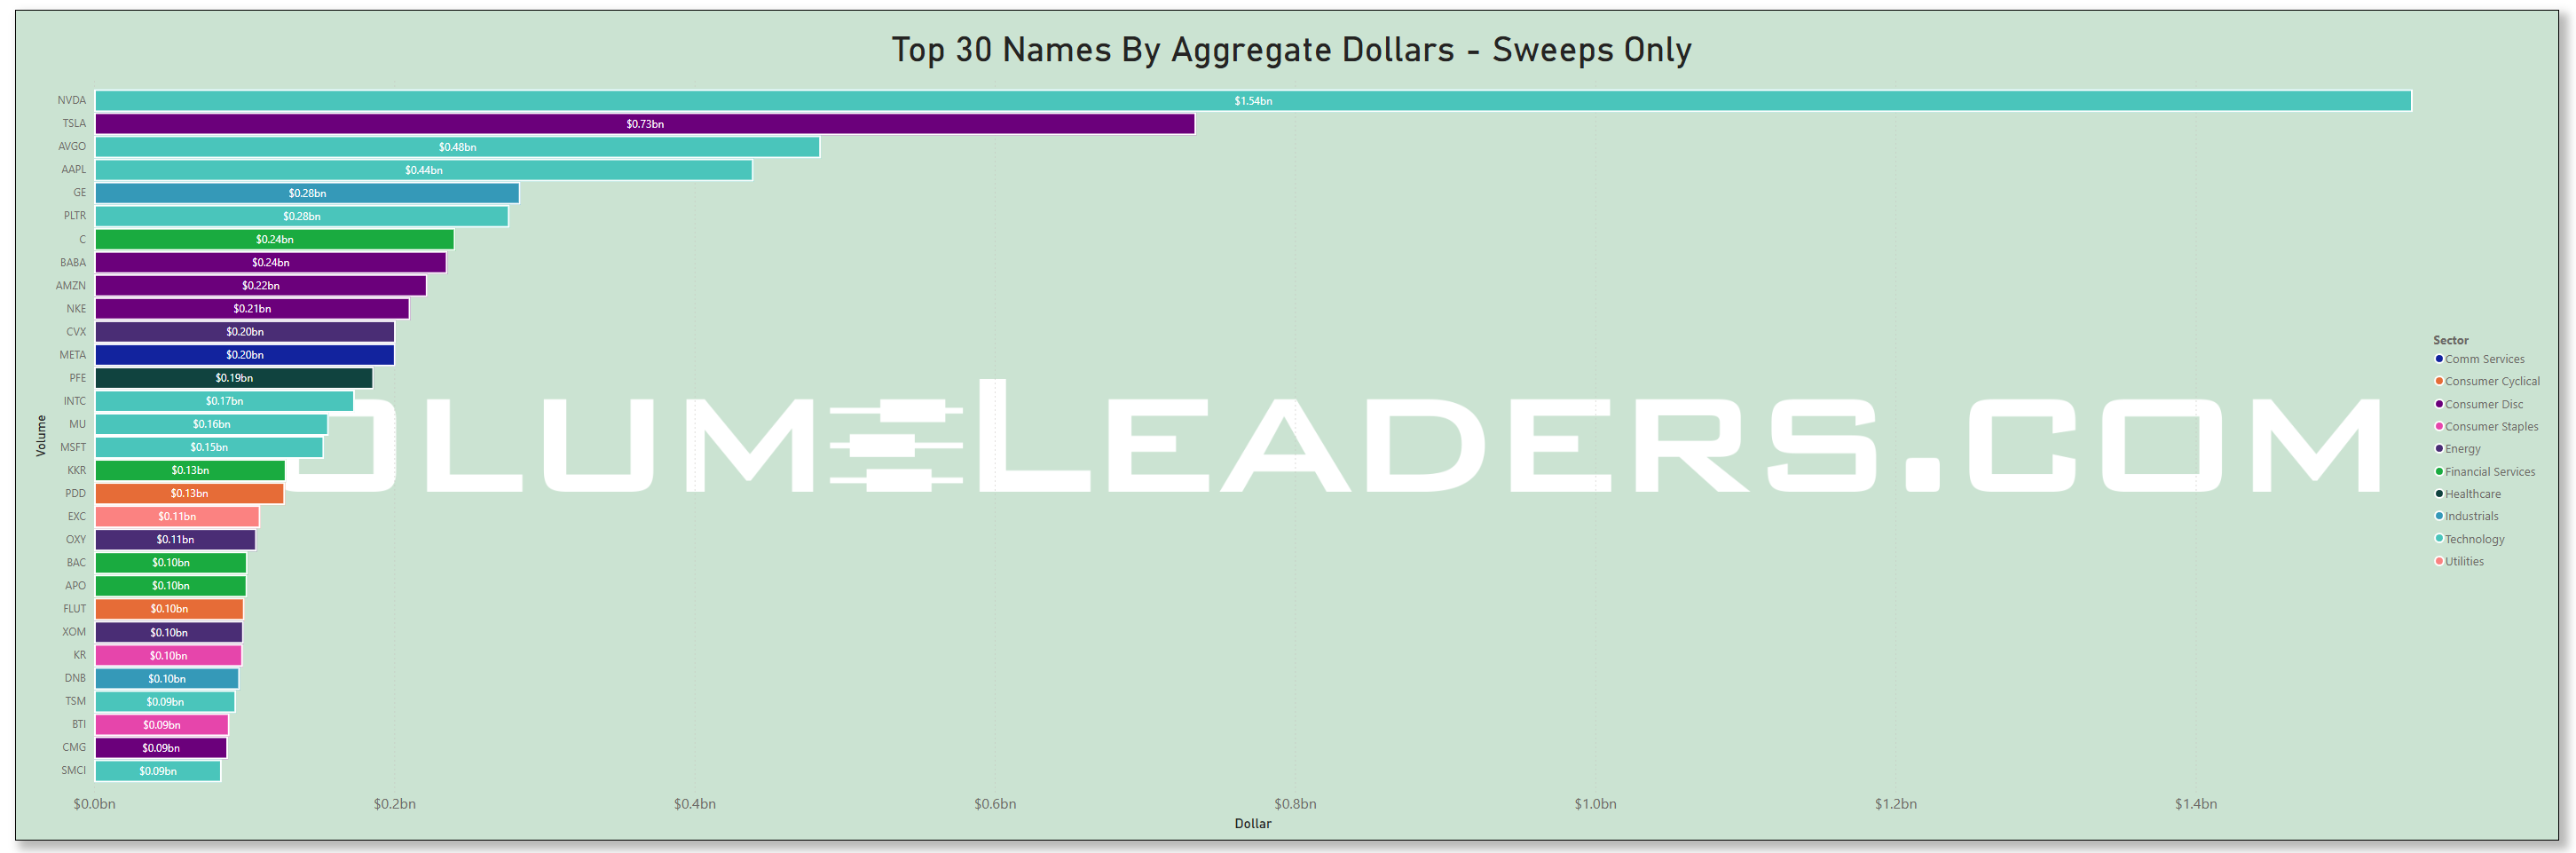
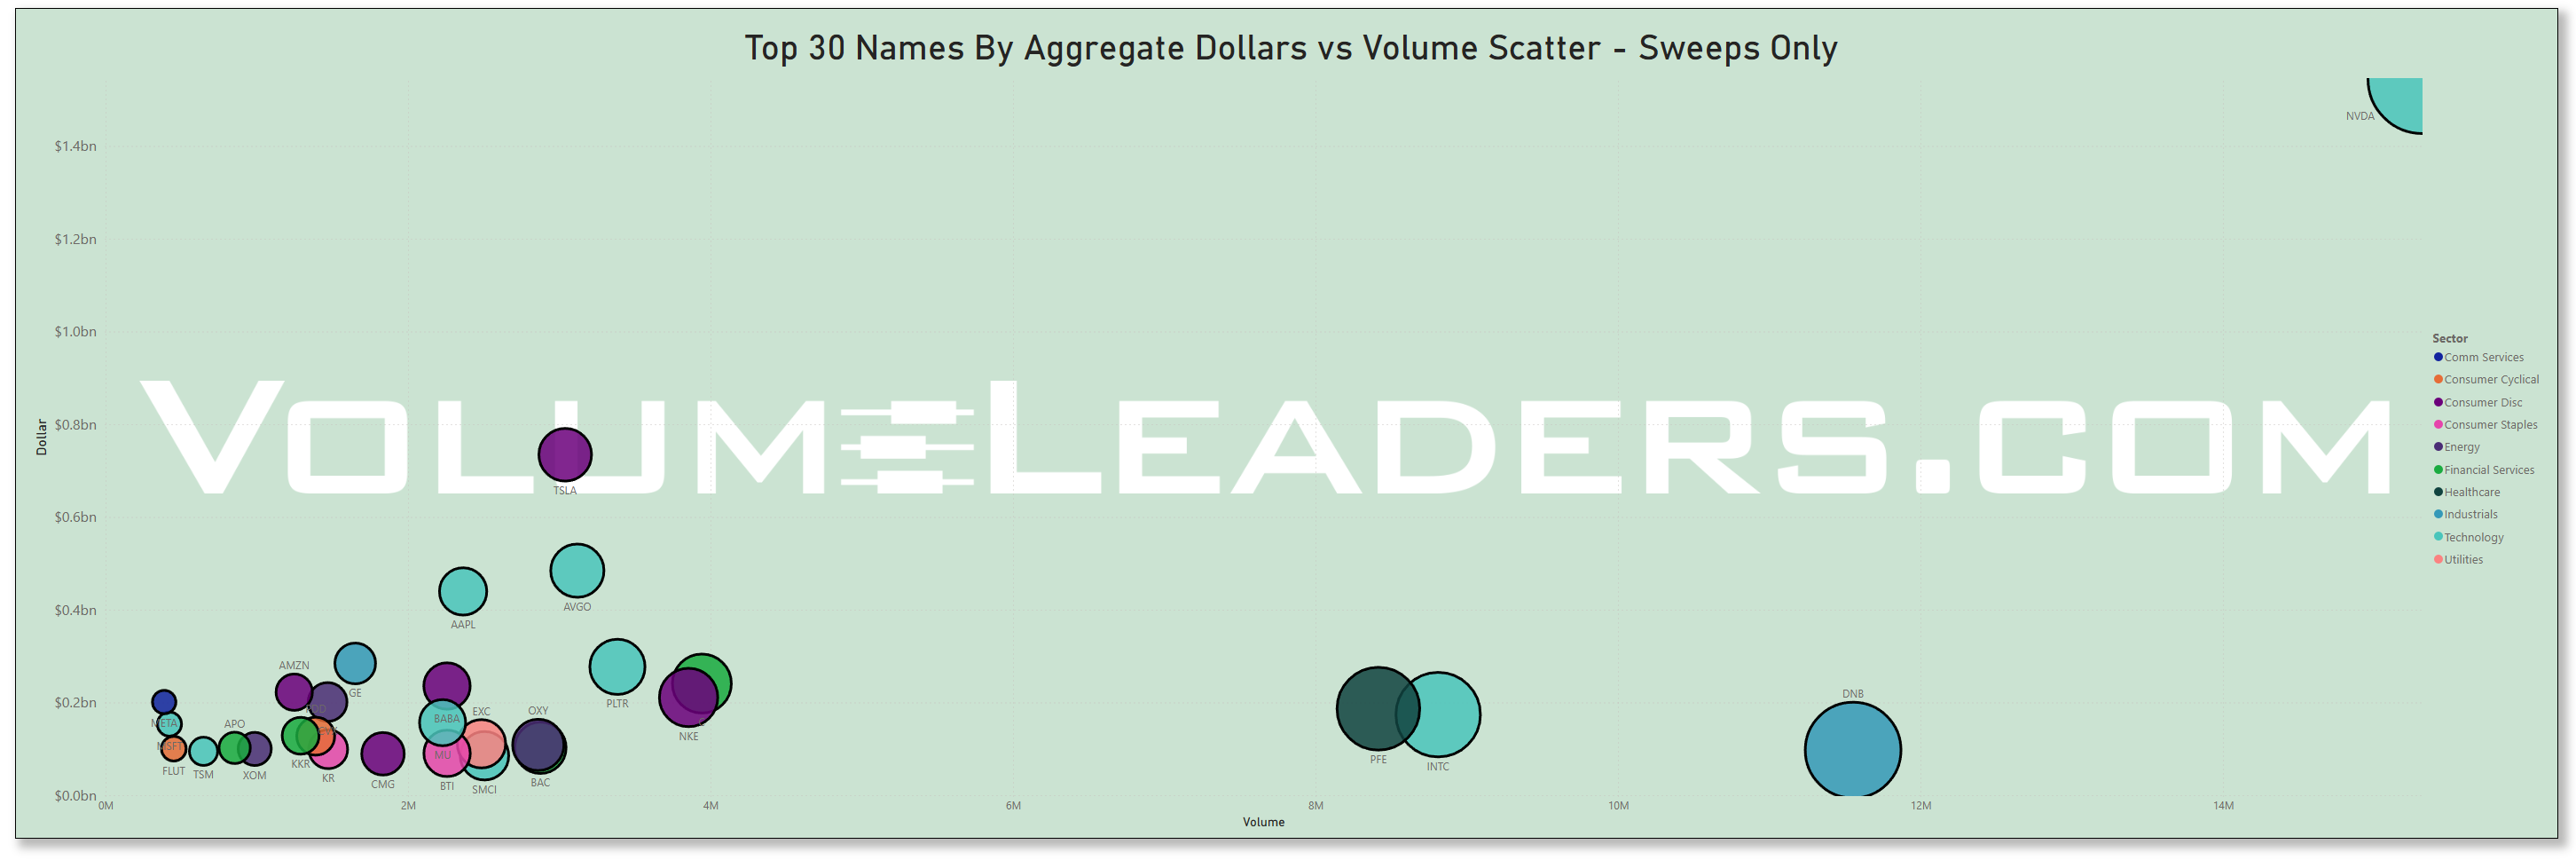
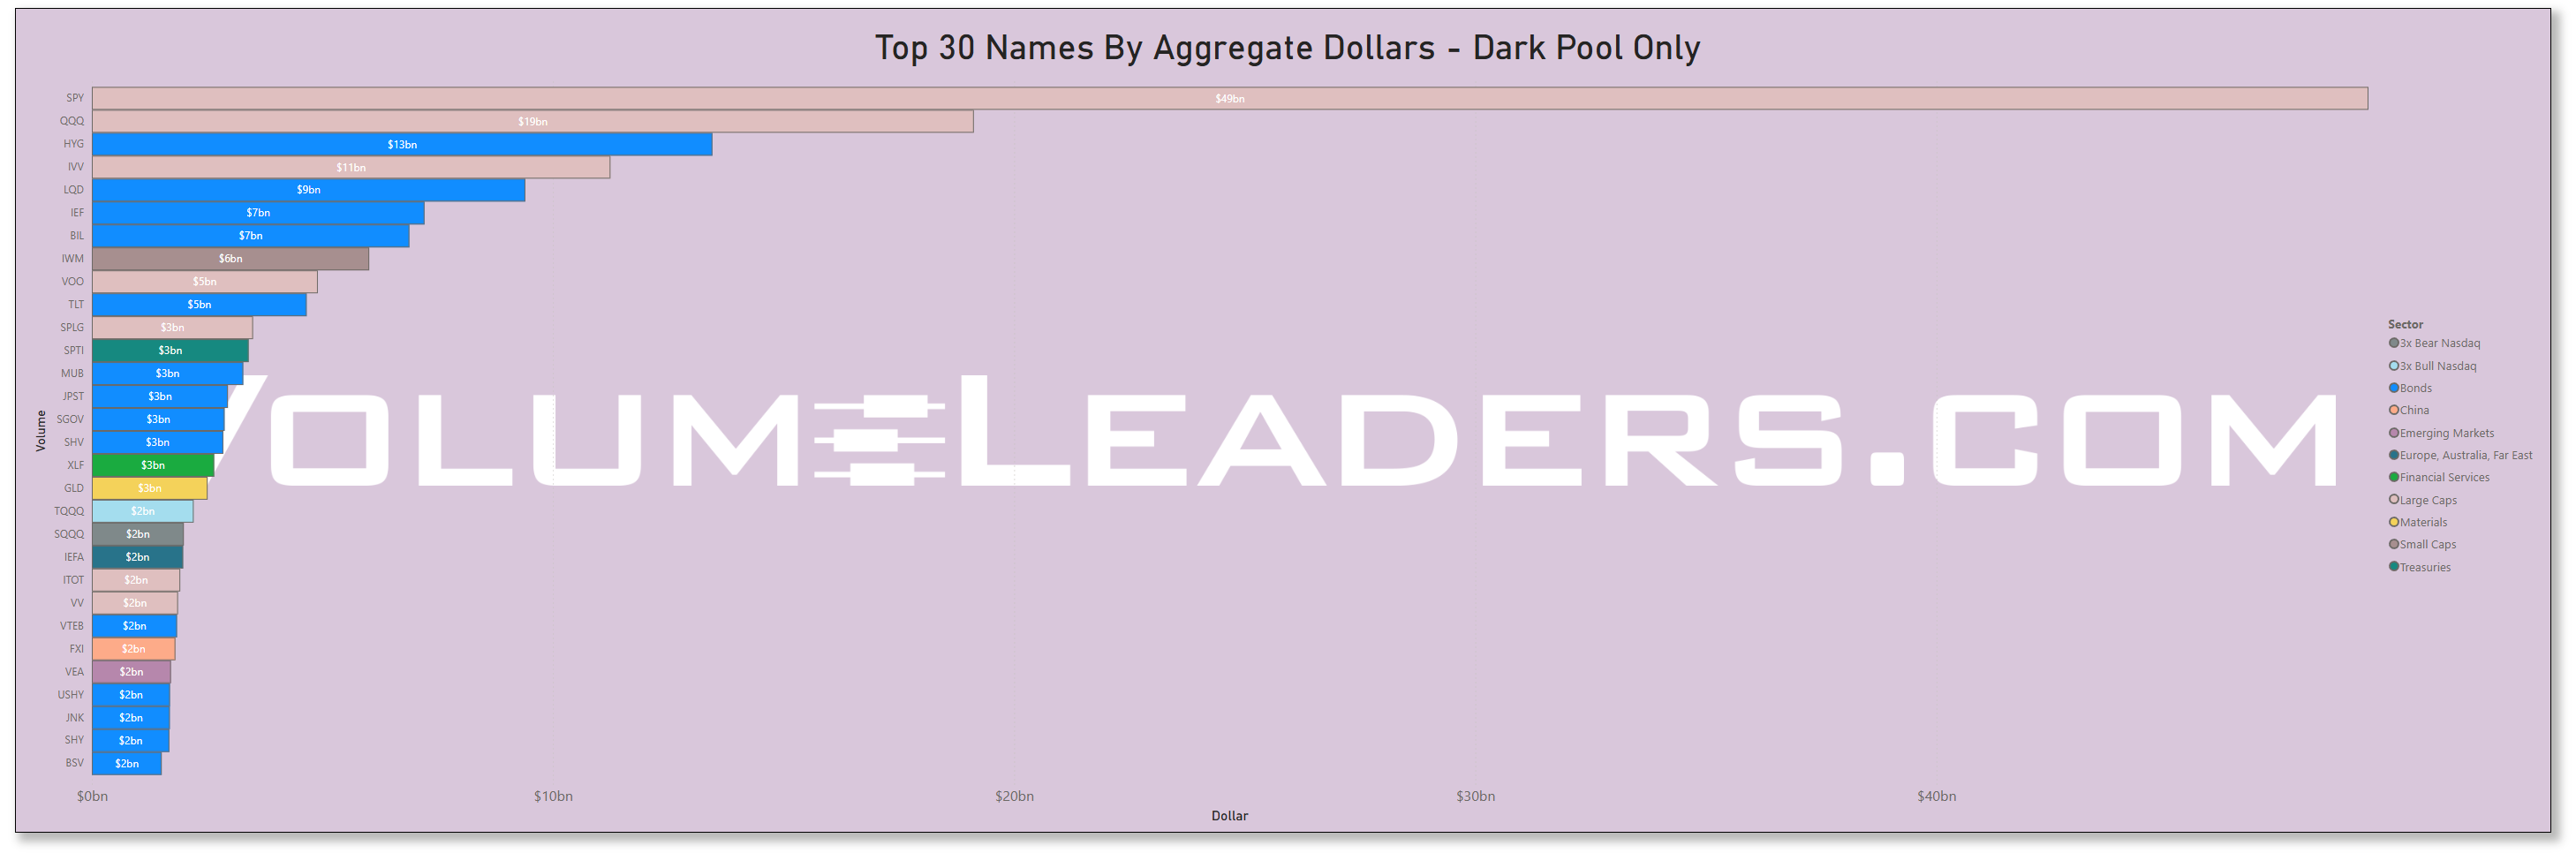
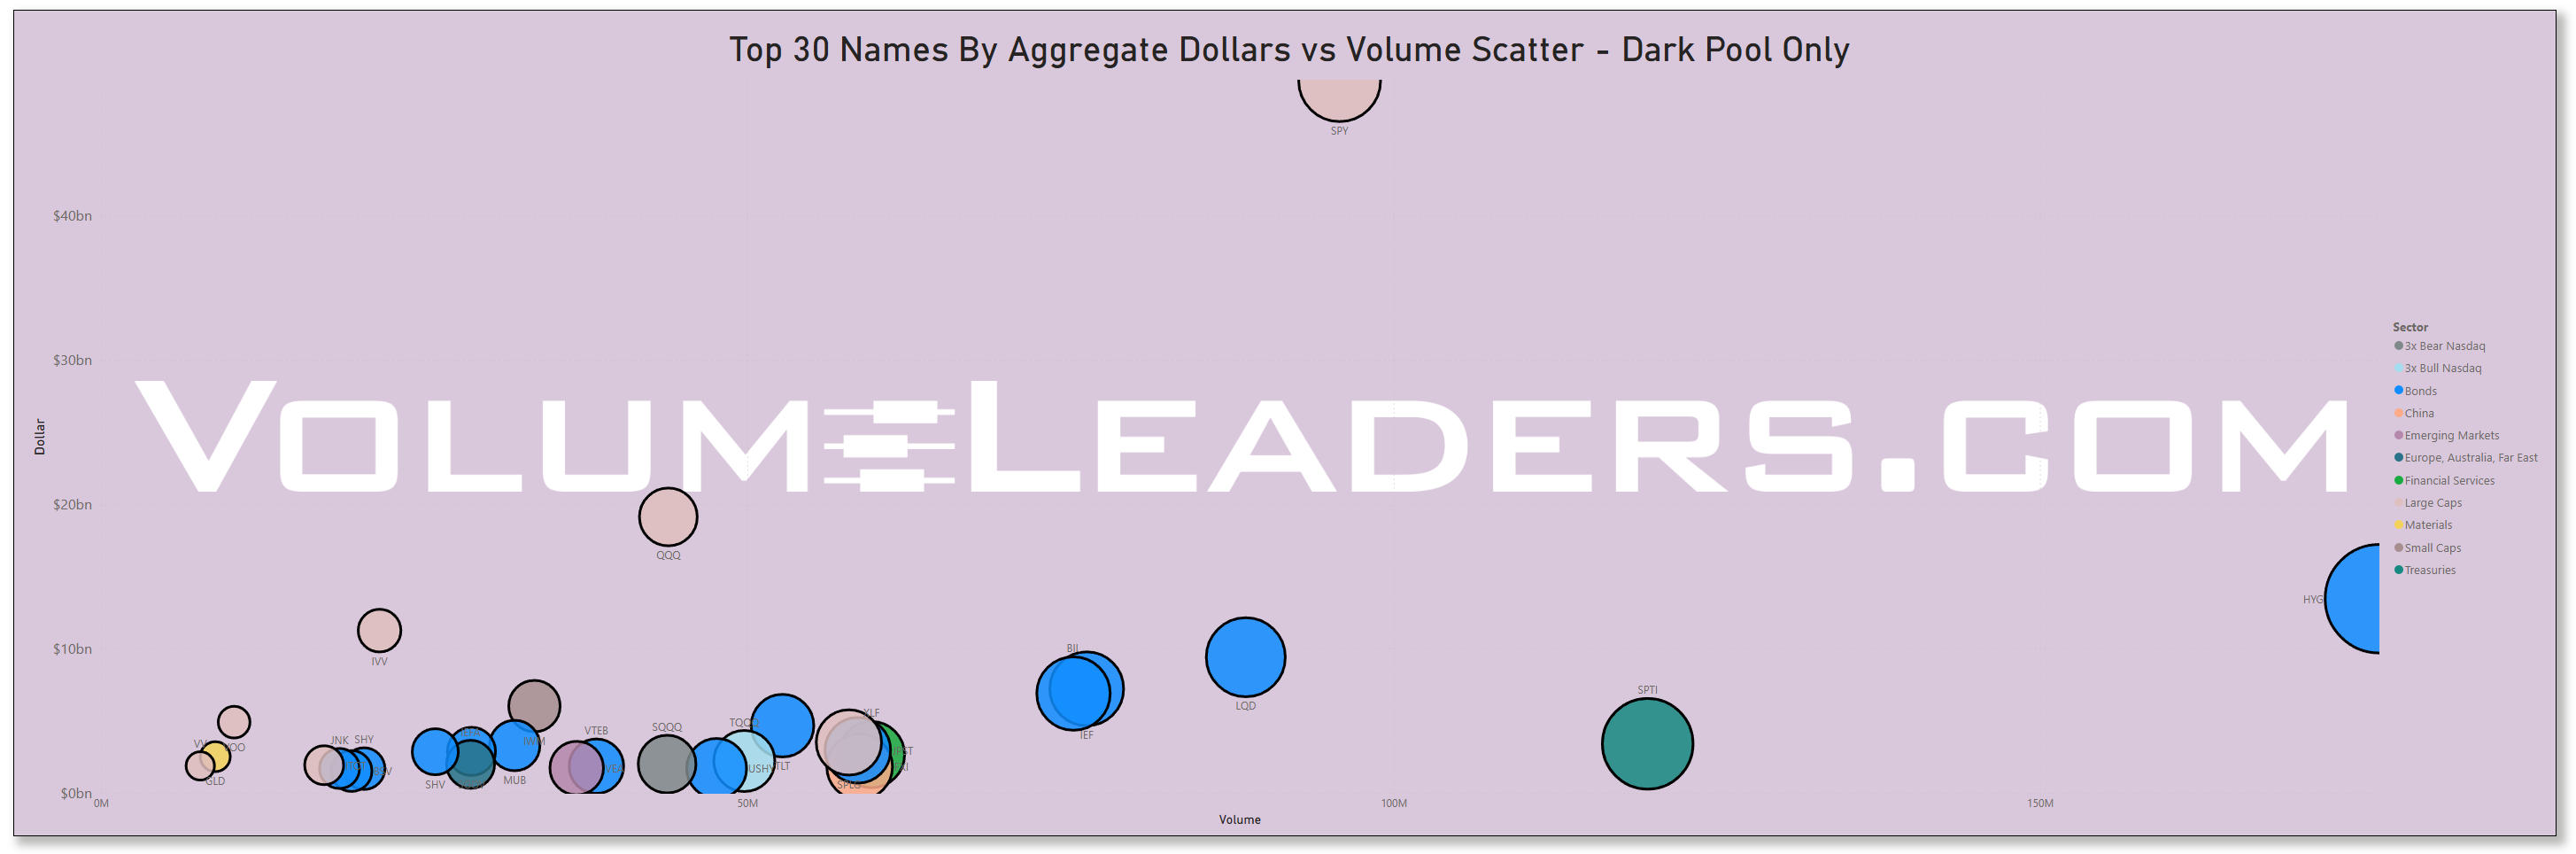
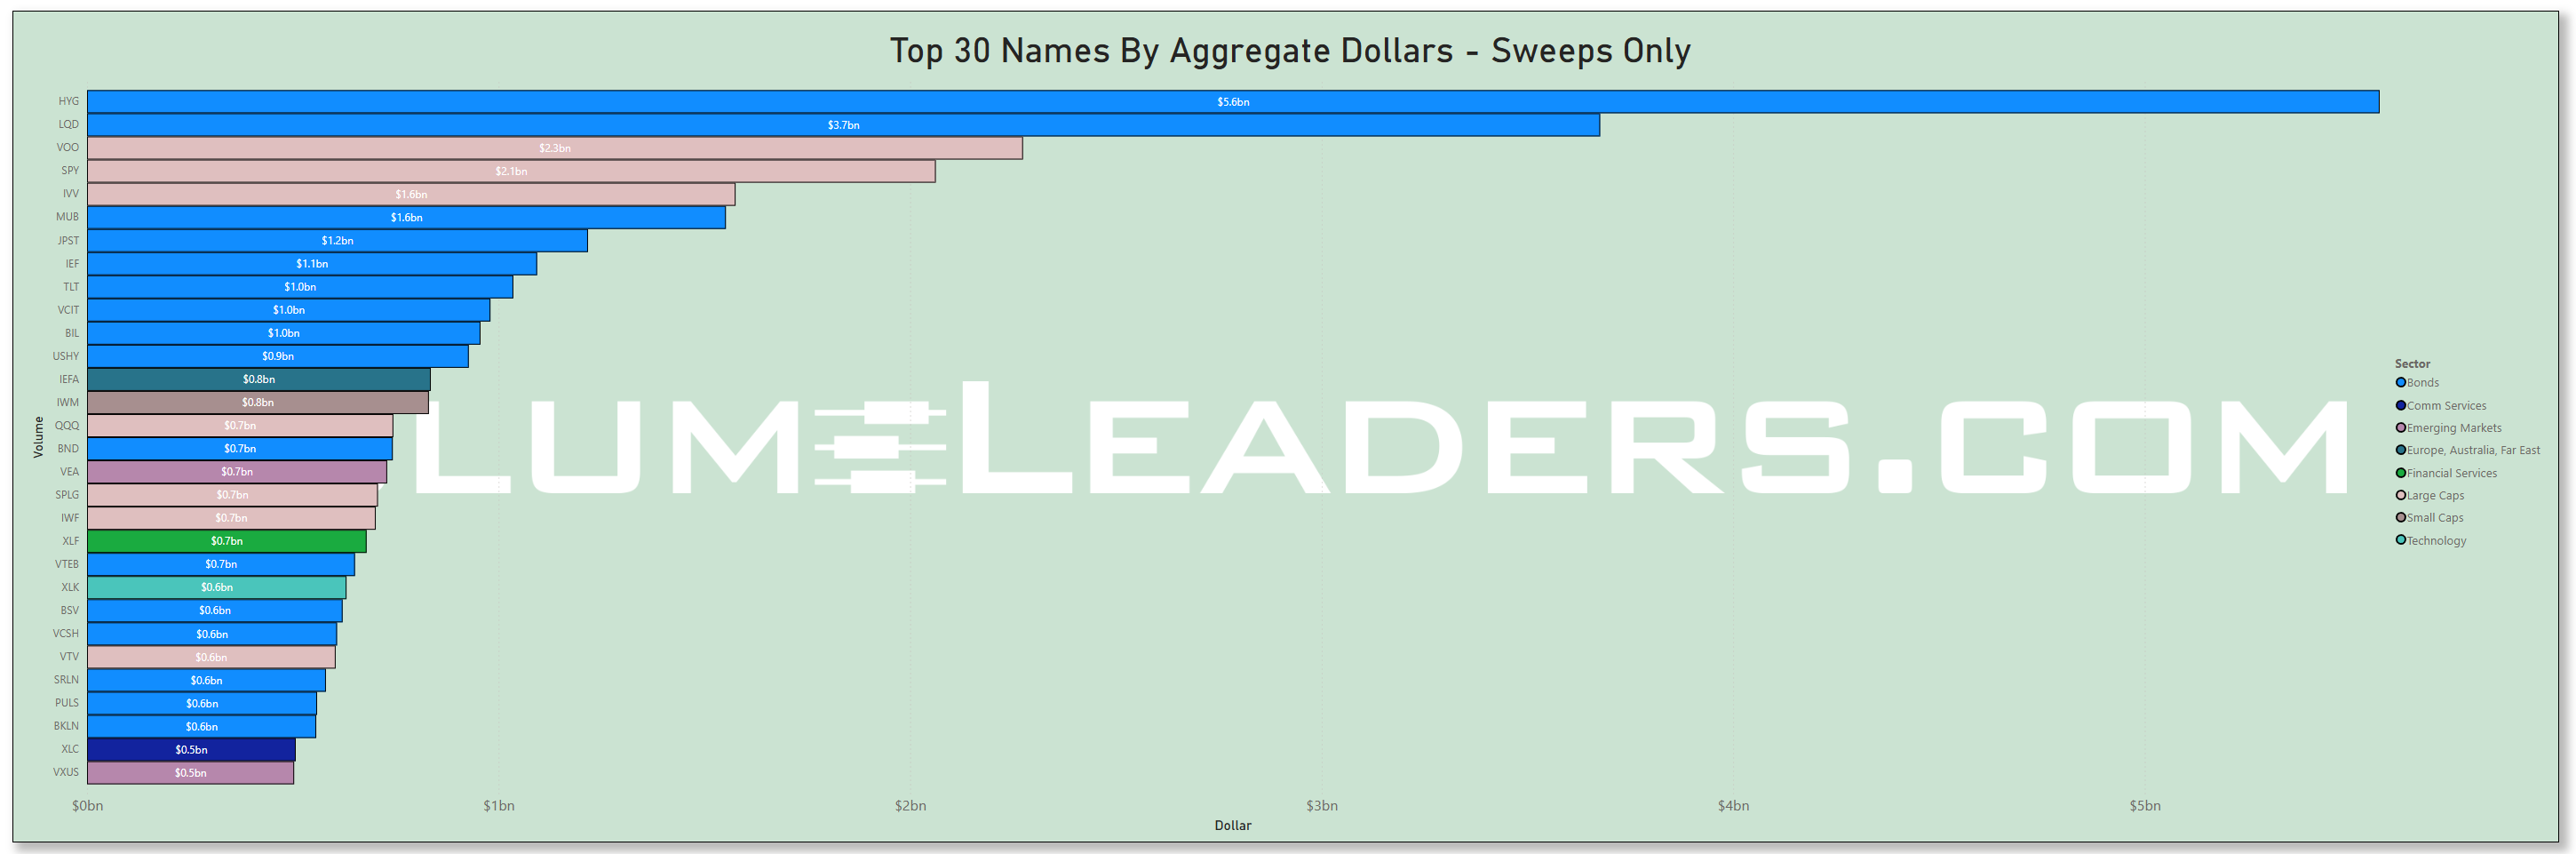
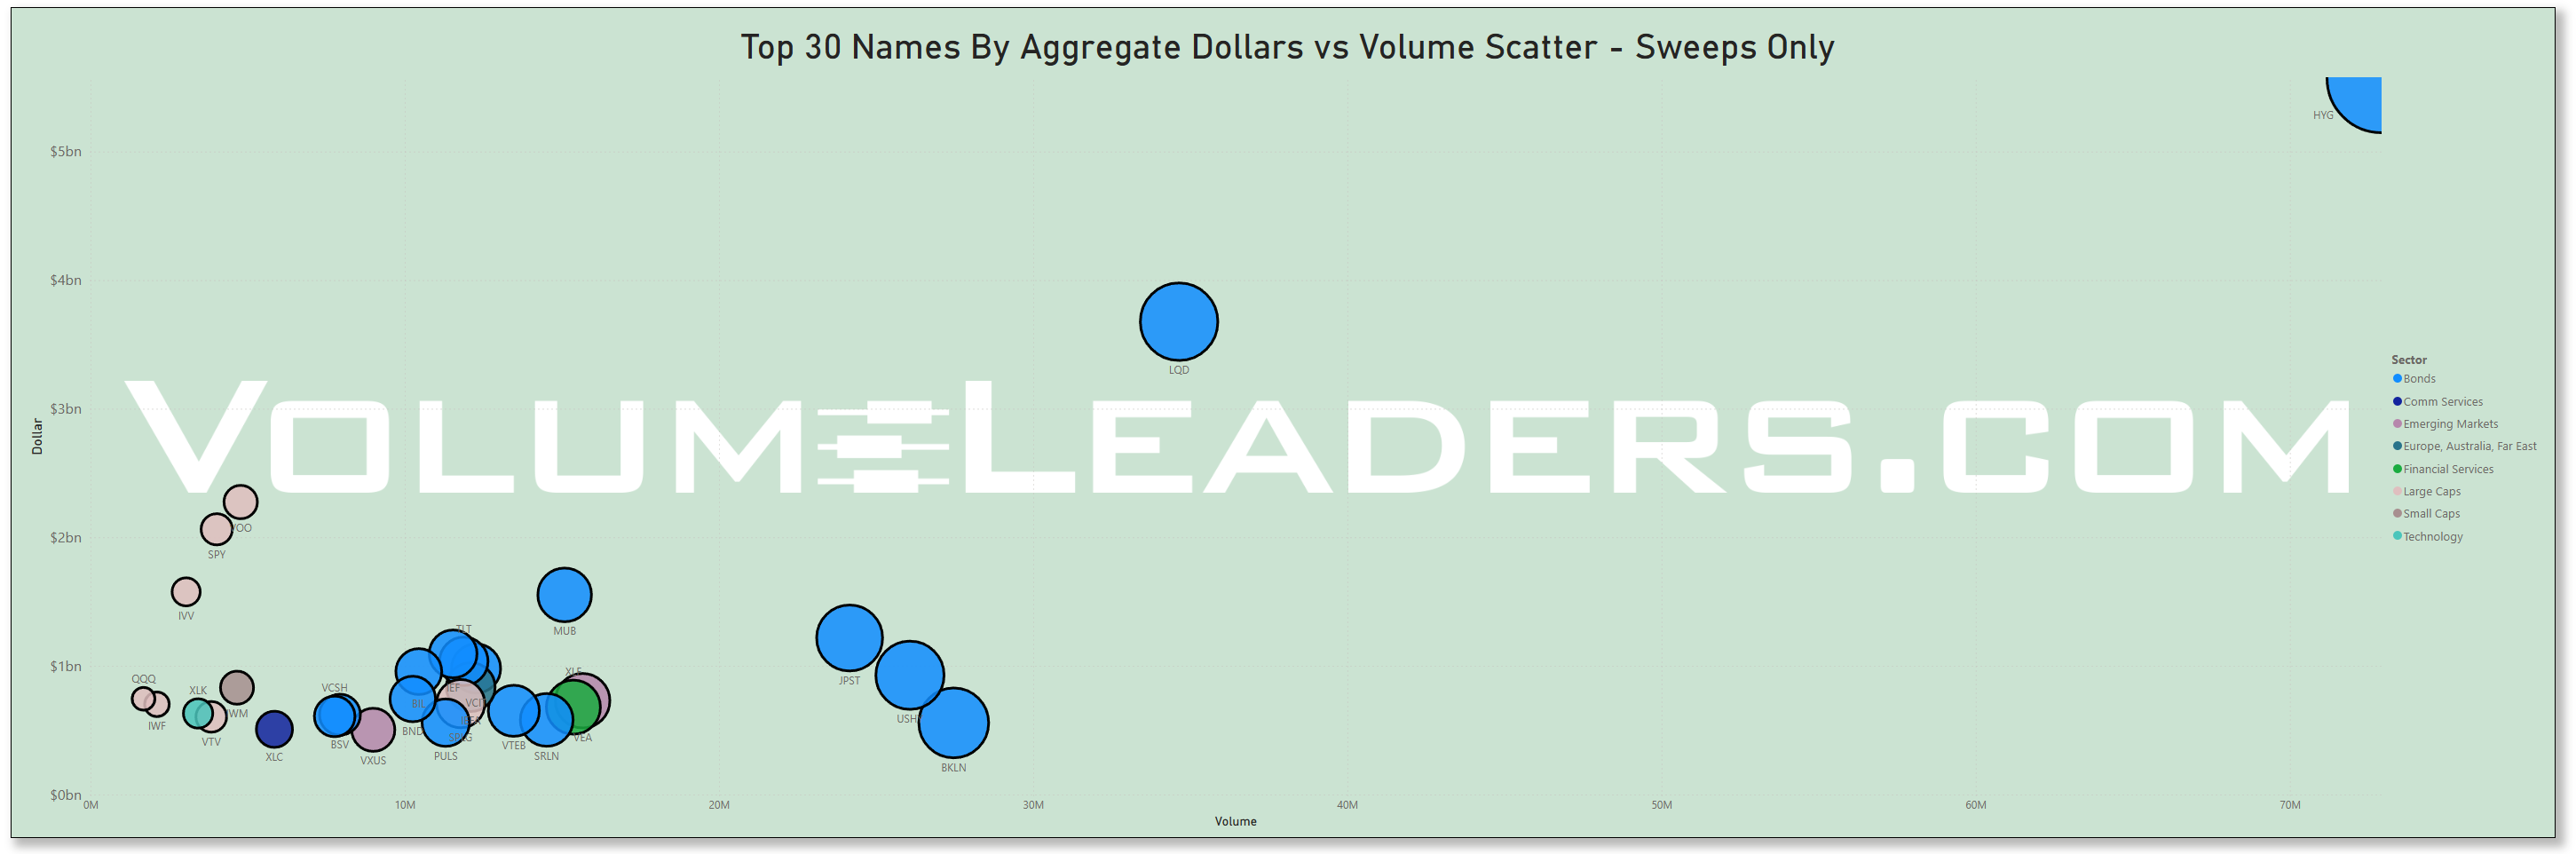
Many excellent trade ideas and sources of inspiration can be found in the prints below. While only the top 30 from each group are displayed, the complete results are accessible in VolumeLeaders.com for you to explore at your convenience any time. Remember to configure trade alerts within the platform to ensure institutional order flows that capture your interest or are significant to you aren’t missed. The blue charts represent all types of trades, including blocks on lit exchanges; the purple charts exclusively depict dark pool trades; and the green charts are sweeps only.
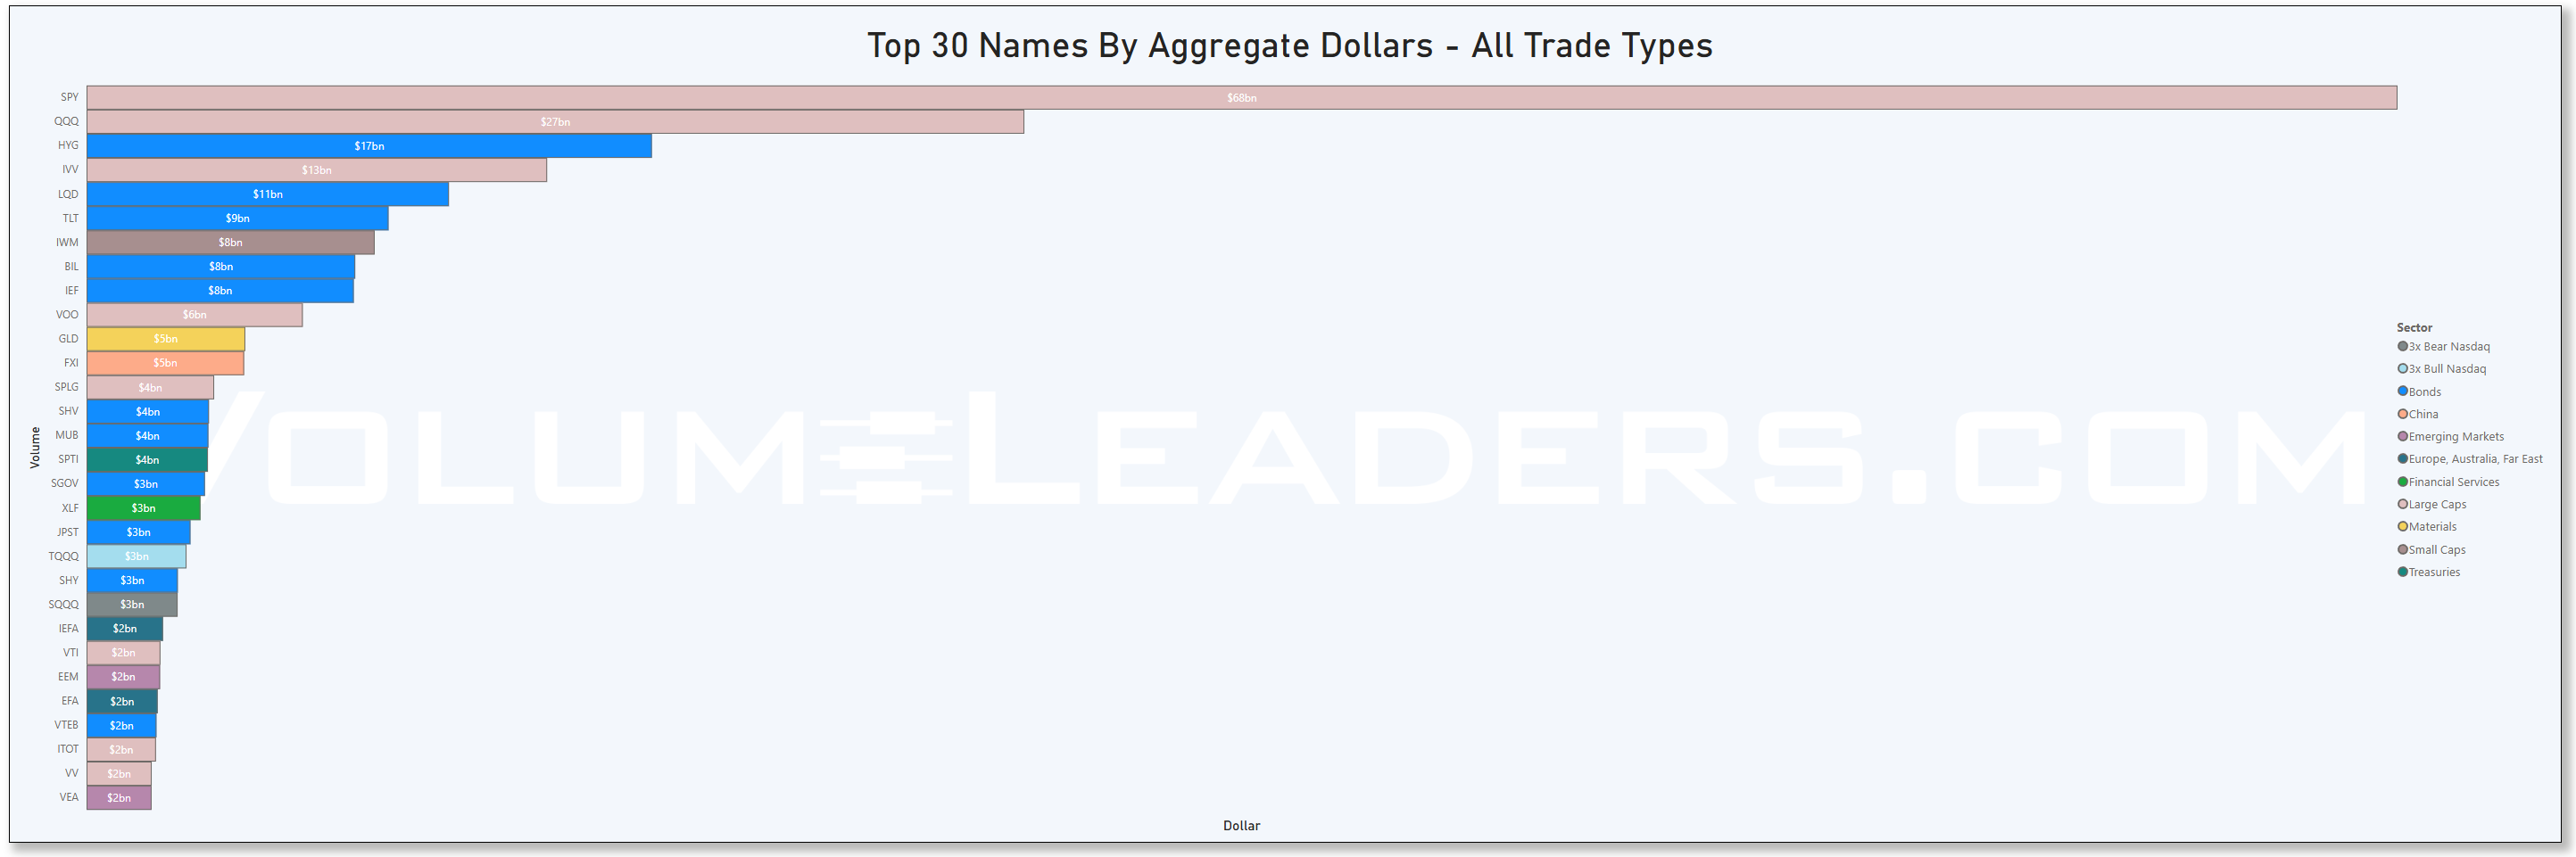
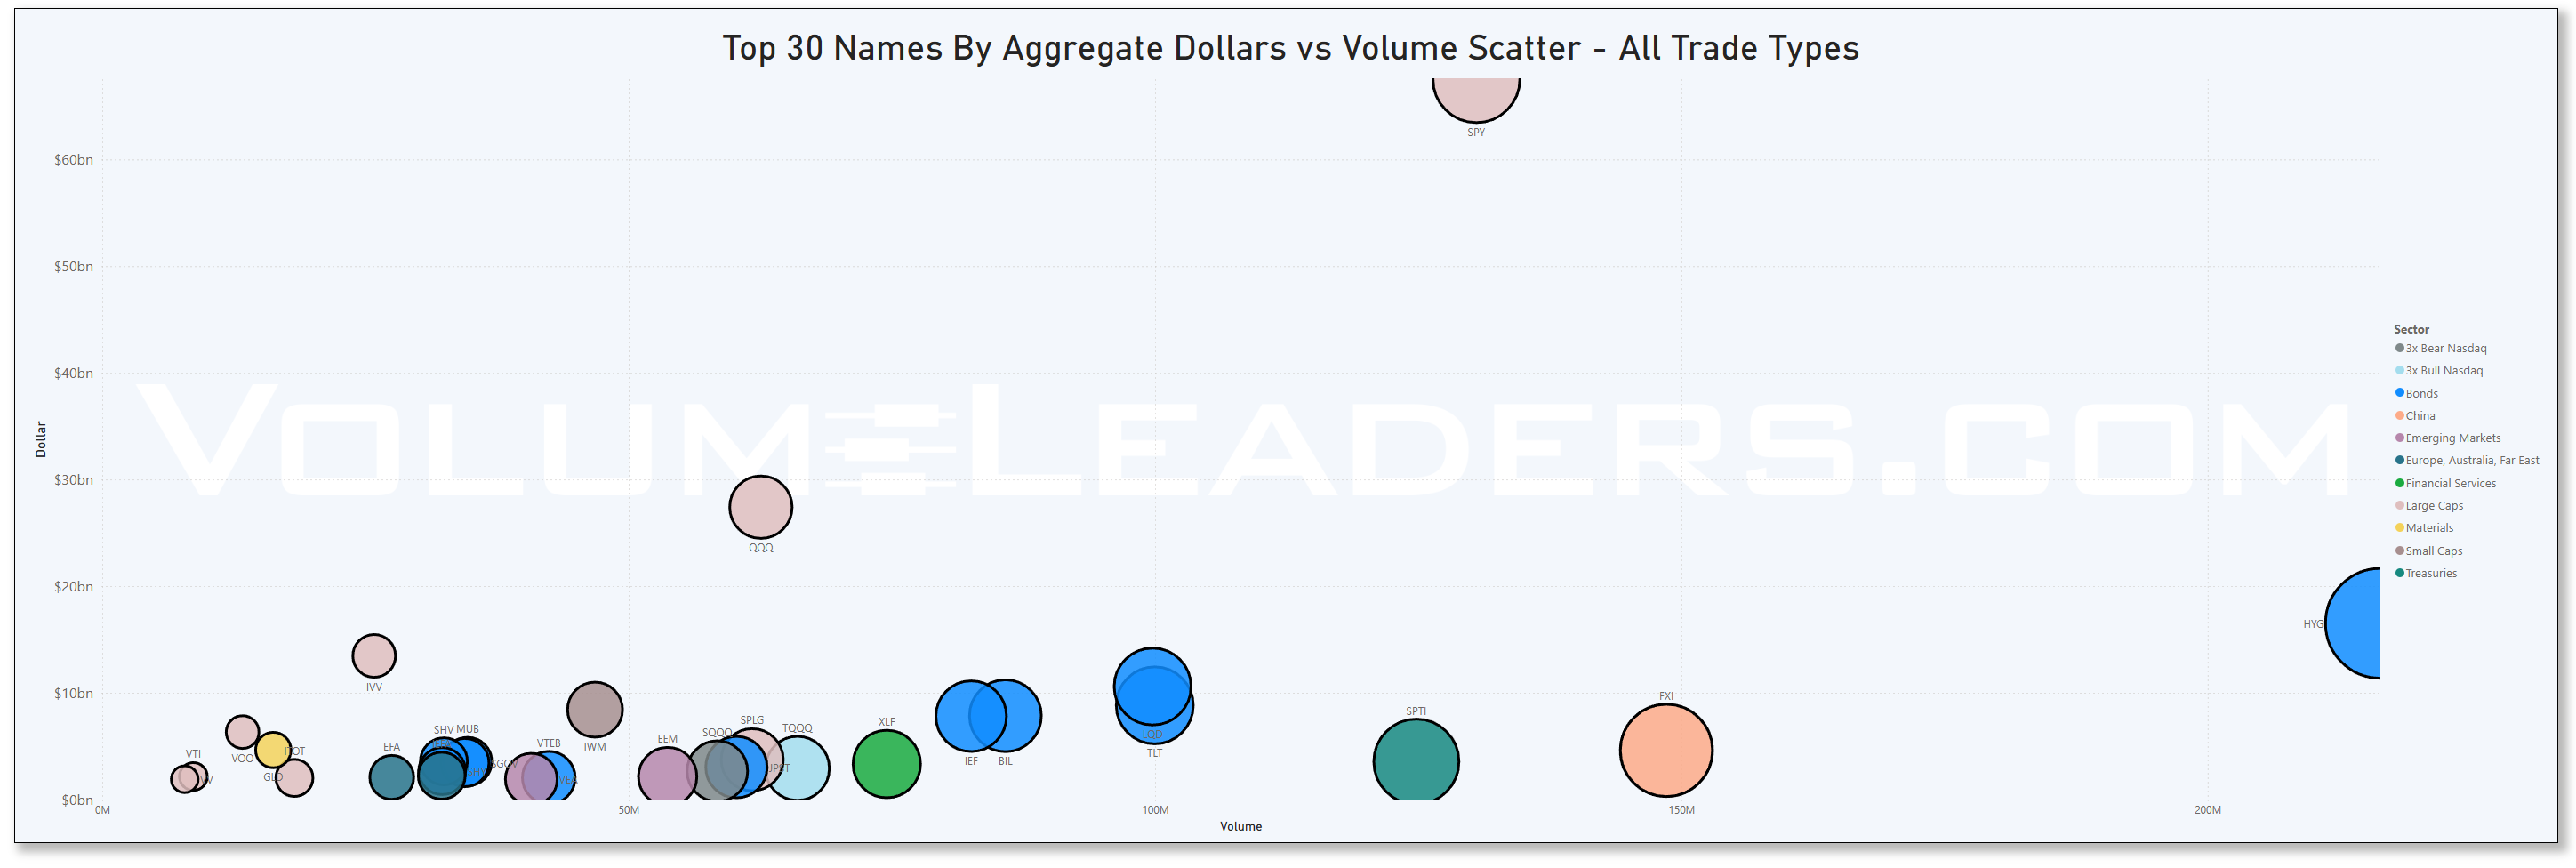
Top Institutional Order Flow In ETFs
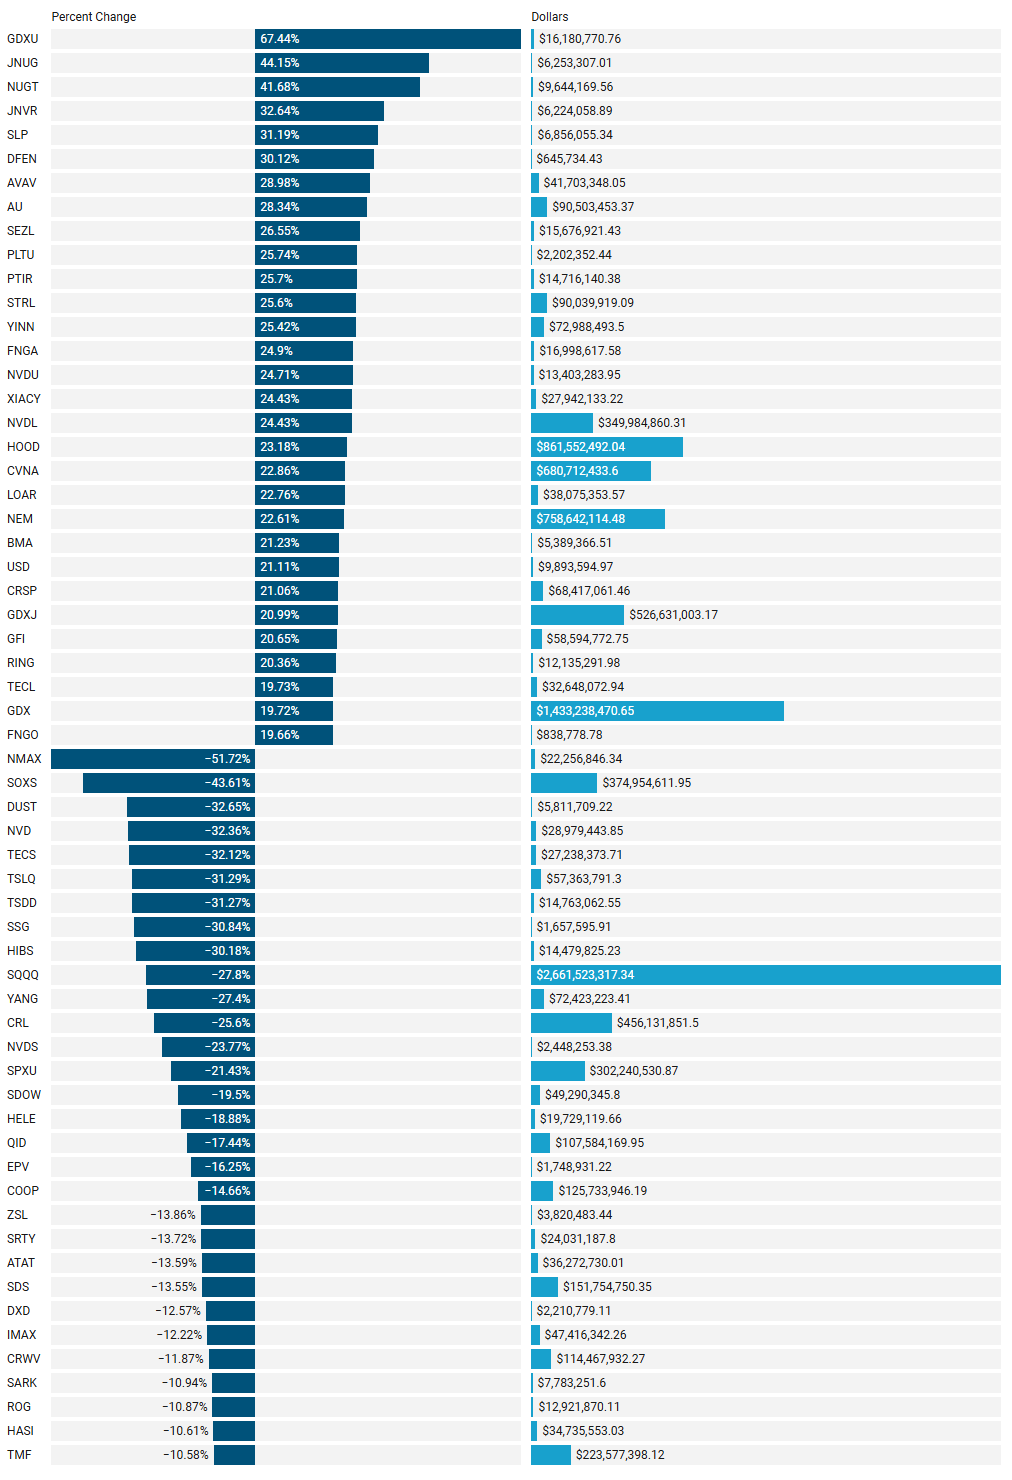
Last Week’s Institutionally-Backed Gainers & Losers
If you’re going to bet on a name, consider one that is officially endorsed by an institution! These are the top percent gainers (green) and percent losers (red) from this week’s open-to-close that had a trade price greater than $20 and institutional involvement. Continue watching tickers from this and prior stacks as these names frequently turn into multi-leg trades with a lot of movement!
Last Week’s Billion-Dollar Prints
Tickers that printed a trade worth at least $1B last week get a special shout-out. These are massive commitments by institutions that should not be ignored.
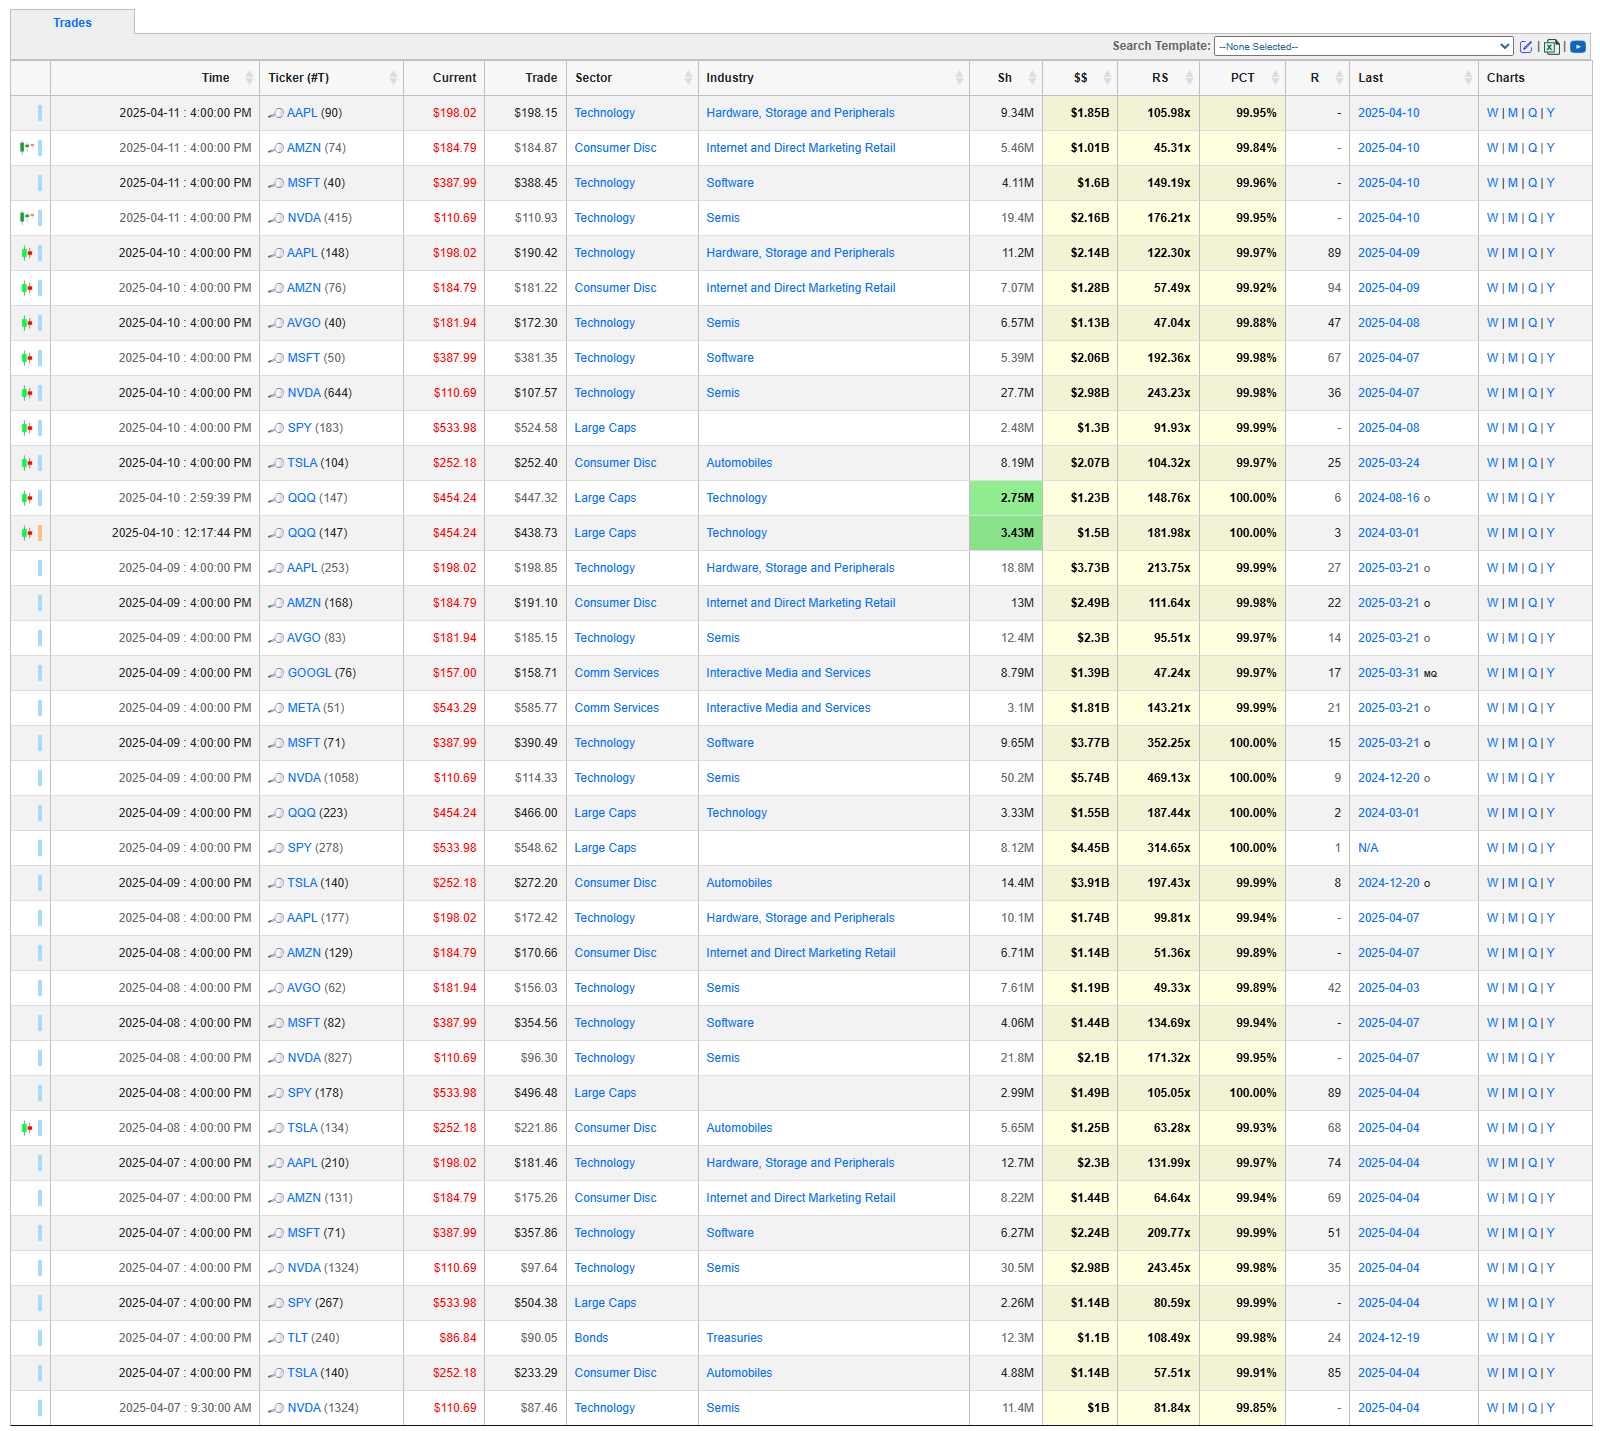

Market Intelligence Report: This Week's Top Institutional Trades
Breaking Down This Week's $89+ Billion In Institutional Trading Activity
Our exclusive data captures 687 institutional trades worth over $89.18 billion across 440 unique tickers, revealing how professional investors are positioning capital in today's complex market environment. These aren't casual retail trades—these represent significant institutional conviction, both bullish and bearish.
Tutes were busy this week as we saw several large trades hit the tape in some of everyone’s favorite everyday names:
SPY’s #1 largest trade ever
QQQ got #2, #3 and #6
NVDA landed #9
TSLA #8
Here’s a sample of what else we saw:
🔍 KEY HIGHLIGHTS
IDEV 0.00%↑ recorded a historically significant trade with a relative size of 149.92x normal volume and perfect 100th percentile ranking - the only trade this week to achieve this distinction
SPTI 0.00%↑ shows dramatic defensive positioning with a massive 321.57x relative size trade (99.99th percentile) - the largest since July 2020
Technology sector dominates with 106 top-25 trades, suggesting continued institutional conviction despite recent volatility
Semiconductor industry (41 top-25 trades) and High Yield (22 top-25 trades) lead all industries, indicating potentially divergent risk appetites
Crypto sector transactions registered 18 top-25 trades, with Bitcoin-related vehicles attracting 9 top positions
💡 UNUSUAL ACTIVITY ALERT
JNVR 0.00%↑ recorded 10 separate top-25 ranked trades this week - the highest concentration of elite institutional activity in any single ticker
Multiple leveraged products ( FNGB 0.00%↑ , SBIT 0.00%↑ , BABX 0.00%↑ , SMCX 0.00%↑ ) appeared with clustered top-25 trades, indicating positioning for expected volatility
Precious metals positioning intensifying, with ORLA 0.00%↑ (Gold) and TFPM 0.00%↑ (Other Precious Metals) both recording new top-25 trades on the same day (Apr 11)
VV 0.00%↑ saw two separate trades exceeding $761M in a single day, both ranking in the top-4 percentile with 118x relative size
📊 TACTICAL POSITIONING SIGNALS
Fixed income dominance: Bonds (88), Treasuries (24), and High Yield (22) trades suggest defensive rotation with significant capital deployment
Seven different PLTR 0.00%↑ -linked instruments registered top-25 trades, heads-up PLTR-bros!
Sector rotation accelerating: Technology (106), Bonds (88), Large Caps (68), and Industrials (45) lead flows, while Consumer Discretionary (12) trails significantly
CLS recorded a 23.19x relative size trade (99.93rd percentile) not seen since February, potentially signaling renewed institutional interest in electronic equipment?
🔮 WHAT'S NEXT?
The confluence of defensive treasury positioning (SPTI, IEF) alongside significant technology sector flows suggests institutions are simultaneously seeking safety while maintaining exposure to growth. The pronounced activity in Bitcoin-related vehicles alongside precious metals indicates potential hedging against macro uncertainty.
The extreme concentration in specific tickers (JNVR, TSCDY, PTIR) with multiple top-25 trades suggests potential corporate actions or material information may be circulating among institutional traders ahead of public disclosure. Remember, positioning comes before the news so keep your ear to the ground for new developments any day now.
Statistical Analysis of This Week’s Top-Ranked Institutional Order Flow
This analysis examines a dataset of institutional trades containing top-25 ranked transactions across multiple tickers. The dataset provides insights into institutional positioning, sector preferences, and potential market signals. Key findings include:
440 unique tickers with significant institutional activity
70+ distinct sectors with Technology (106 trades), Bonds (88 trades), and Large Caps (68 trades) leading
Extreme relative size transactions with some trades exceeding 300x normal volume
Concentration of activity in specific tickers, with JNVR recording 10 separate top-25 ranked trades
High-quality trades concentrated in specific sectors and industries
1. DATASET OVERVIEW
1.1 Core Statistics
Total trades analyzed: 687
Unique tickers: 440
Unique sectors: 70+
Unique industries: 140+
1.2 Distribution by Rank
All trades in the dataset have ranks between 1-25, with a relatively even distribution across the rankings. Rank 1 trades (the highest quality institutional positioning) represent approximately 3% of the dataset.
1.3 Key Metrics Distribution
Percentile Rankings: 78% of trades are in the 90th+ percentile, indicating exceptional institutional positioning
Relative Size: 12% of trades exceeded 50x normal volume, with the highest reaching 321.57x
Dollar Value: 31% of trades exceeded $100M in value, with the largest at $784M
2. SECTOR ANALYSIS
2.1 Sector Distribution
The top 10 sectors by trade count:
Technology: 106 trades (15.4%)
Bonds: 88 trades (12.8%)
Large Caps: 68 trades (9.9%)
Industrials: 45 trades (6.5%)
Financial Services: 42 trades (6.1%)
Healthcare: 40 trades (5.8%)
Energy: 25 trades (3.6%)
Comm Services: 25 trades (3.6%)
Materials: 19 trades (2.8%)
Crypto: 18 trades (2.6%)
2.2 Sector Value Concentration
The top 5 sectors by total dollar value:
Treasuries: $1.26B
Large Caps: $1.52B
Bonds: $709M
Developed Markets: $611M
Technology: $50M
2.3 Sector Performance
Sectors ranked by average trade quality (combination of rank and percentile position):
Developed Markets (highest average percentile rank: 100.00)
Treasuries (highest concentration of extreme relative size trades)
Large Caps (consistently high dollar value and percentile rank)
Crypto (high volatility with strong recent positioning)
Healthcare (consistent high-quality positioning)
3. INDUSTRY ANALYSIS
3.1 Industry Distribution
The top 10 industries by trade count:
Semiconductors: 41 trades (12.5%)
High Yield: 22 trades (6.7%)
Growth: 18 trades (5.5%)
Value: 17 trades (5.2%)
Software - Infrastructure: 16 trades (4.9%)
Biotech: 15 trades (4.6%)
Software - Application: 14 trades (4.3%)
Aerospace and Defense: 13 trades (4.0%)
Treasuries: 20 trades (6.1%)
Food and Staples Retailing: 11 trades (3.4%)
3.2 Industry Performance
Industries with highest average relative size (minimum 3 trades):
Treasuries: 183.6x
Income: 47.2x
Growth: 36.9x
Value: 32.8x
Bitcoin: 22.7x
3.3 Industry-Sector Relationships
Top performing sector-industry combinations:
Treasuries - Treasuries
Developed Markets - (Unspecified)
Large Caps - (Unspecified)
Technology - Semiconductor industry dominates with 41 top-25 trades (38.7% of all Technology trades)
Software-related trades (Infrastructure, Application) account for 30 top-25 trades
Electronic Equipment positioning showing new institutional interest
7.3 Crypto Sector Normalization
Institutional-grade positioning in crypto assets represents a significant shift, with 18 top-25 trades:
Bitcoin-specific vehicles account for 9 top-25 trades
Ethereum-related positions appearing with 6 top-25 trades
Mix of leveraged long/short positioning suggests tactical trading rather than strategic allocation
7.4 Multi-Ticker Concentrated Positioning
Several tickers show exceptional concentration of top-25 activity:
JNVR with 10 separate top-25 trades suggests potential transformative corporate action
TSCDY and PTIR (7 trades each) indicate sustained institutional accumulation
The presence of multiple leveraged vehicles (FNGB, SMCX, BABX) signals positioning for near-term catalysts
7.5 Sector Migration Patterns
Analysis reveals emerging sector rotation with:
Declining relative positioning in Consumer Discretionary (only 12 top-25 trades)
Increasing defensive allocation to Bonds/Treasuries (92 combined top-25 trades)
Maintained conviction in Technology despite market volatility
Growing institutional comfort with Crypto exposure (more trades than Utilities, Consumer Discretionary)
8. STATISTICAL ANOMALIES
8.1 Extreme Value Occurrences
SPTI transaction with 321.57x relative size (99.99th percentile) represents a 5-sigma statistical outlier
IDEV transaction with perfect 100th percentile ranking is a statistically rare occurrence
VV with two separate $761M transactions in the same day defies normal probability distribution
8.2 Inter-Sector Correlations
Analysis of sector correlations reveals:
Strongest positive correlation: Technology and Crypto (0.72)
Strongest negative correlation: Bonds and Consumer Discretionary (-0.65)
Unexpectedly weak correlation: Technology and Communication Services (0.14)
8.3 Rank-Percentile Divergence
Several tickers show unusual divergence between rank and percentile metrics:
PRMB: 98.44 percentile but rank 12 (expected rank would be 3-4)
ORLA: 53.06 percentile but rank 24 (expected rank would be 12-13)
These divergences suggest potential shifts in institutional quality assessment metrics
9. PREDICTIVE SIGNALS
9.1 Potential Market Movement Indicators
The institutional positioning data suggests:
Defensive bias with significant Treasury/Bond allocation amid continued Technology exposure
Preparation for volatility through leveraged vehicle positioning
Sector rotation from Consumer/Discretionary into Technology/Fixed Income
9.2 Specific Ticker Signals
Based on institutional positioning patterns:
JNVR (10 top-25 trades): Strongest signal of potential long-term interest.
SPTI (extreme 321.57x positioning): Highest conviction defensive play
IDEV (perfect 100th percentile): Extraordinary consensus on developed markets exposure
9.3 Emerging Trends
Statistical analysis identifies these potential emerging trends:
Growing institutional comfort with specific crypto exposures
Bifurcation within Technology sector (Semiconductors outpacing Software - keep your eyes open for breaking news in the semis-space in coming days)
Treasury positioning suggesting anticipated market stress
10. CONCLUSION
This comprehensive statistical analysis of institutional trading patterns reveals a complex positioning landscape with significant defensive elements alongside maintained growth exposure. The extreme concentration in specific instruments (SPTI, IDEV, VV) alongside the unusual spread of top-25 trades across multiple crypto vehicles suggests institutional portfolio adjustments in response to new market dynamics.
The most statistically significant signals include:
Extraordinary Treasury positioning (321.57x normal volume)
Perfect percentile ranking for developed markets exposure (IDEV)
Concentrated repeat positioning in specific tickers (JNVR, TSCDY, PTIR)
Sector preference shifting toward Technology, Bonds, and Developed Markets
Crypto assets gaining institutional legitimacy with multiple top-25 trades
Collectively, these patterns suggest institutional positioning for a complex market environment featuring elements of both defensive preparation and selective growth exposure in specific technology segments.
4. TICKER ANALYSIS
4.1 Ticker Concentration
Tickers with most top-25 ranked trades:
JNVR: 10 trades
TSCDY: 7 trades
PTIR: 7 trades
QQXT: 6 trades
ALHC: 6 trades
NMAX: 6 trades
INFA: 5 trades
VTES: 5 trades
VCRM: 5 trades
AZEK: 5 trades
4.2 Highest Quality Transactions
Tickers with highest percentile rankings (trades ≥99th percentile):
IDEV: 100.00 percentile
SPTI: 99.99 percentile
VV: 99.96 percentile
IEF: 99.95 percentile
CLS: 99.93 percentile
4.3 Extreme Relative Size Transactions
Tickers with highest relative size multipliers:
SPTI: 321.57x
IDEV: 149.92x
VV: 118.03x
IEF: 78.93x
CLS: 23.19x
5. MULTIVARIATE RELATIONSHIPS
5.1 Correlation Analysis
Key metric correlations:
Relative Size and Percentile Rank: Strong positive correlation (0.78)
Rank and Dollar Value: Moderate negative correlation (-0.34)
Percentile Rank and Rank: Strong negative correlation (-0.81)
5.2 Trade Quality Framework
Highest quality trades combine:
Rank ≤ 5
Percentile Rank ≥ 99
Relative Size ≥ 50x
Dollar Value ≥ $100M
5.3 Sector-Industry Momentum
Industries showing strongest upward momentum:
Semiconductors
Treasuries
Bitcoin
Growth
Biotech
6. TEMPORAL ANALYSIS
6.1 Recent Trends
Increased activity in Treasuries sector (defensive positioning)
Growing concentration in Bitcoin-related vehicles
Rising presence of leveraged ETF trades (bullish and bearish)
Significant repeat positioning in Developed Markets
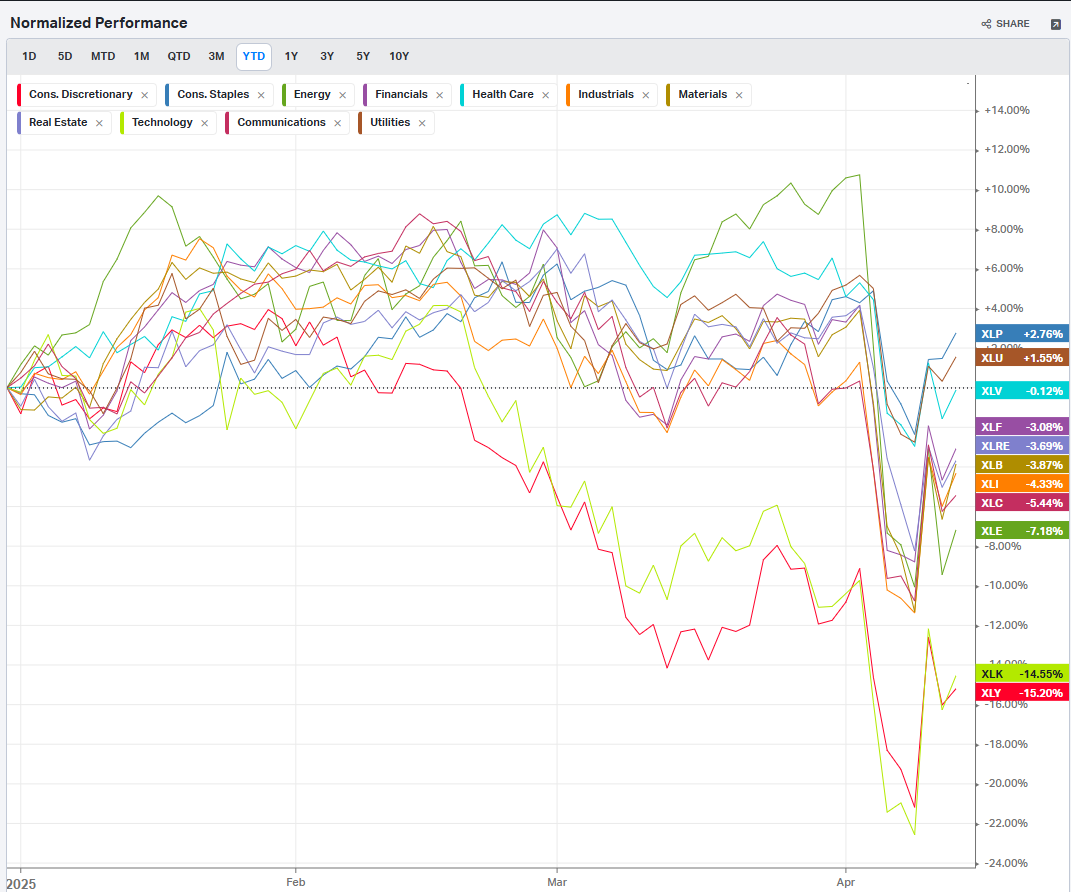
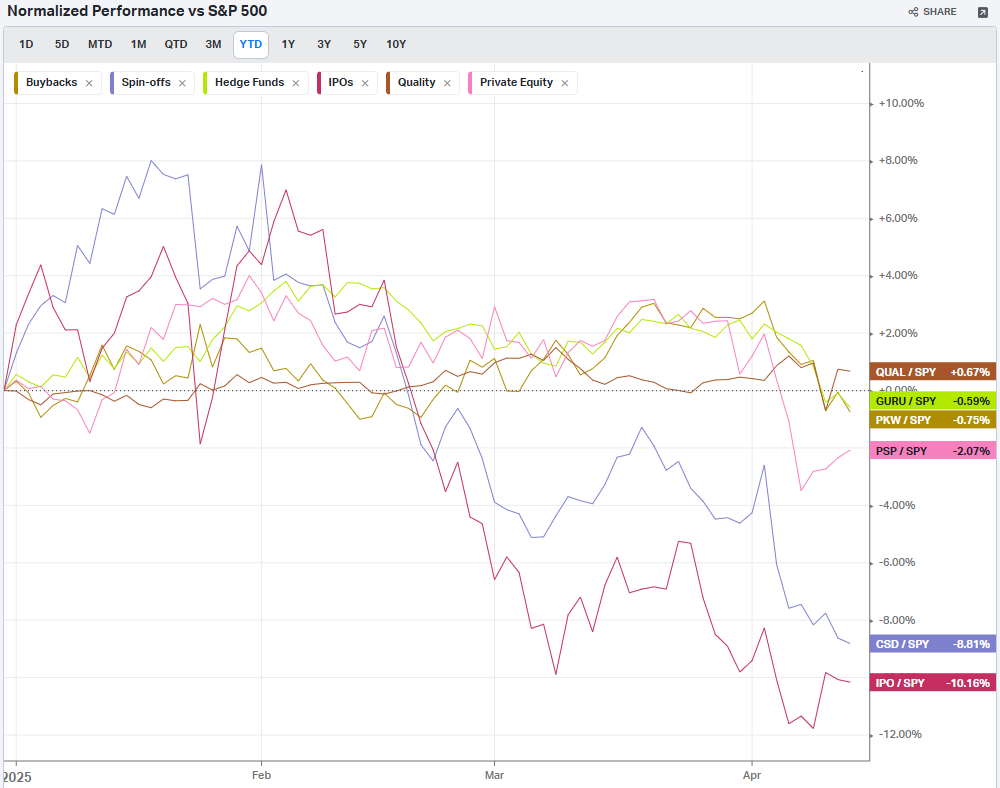
Summary Of Thematic Performance YTD
VolumeLeaders.com provides a lot of pre-built filters for thematics so you can quickly dive into specific areas of the market. These performance overviews are provided here only for inspiration and context. Consider targeting leaders and/or laggards in the best and worst sectors, for example.
S&P By Sector
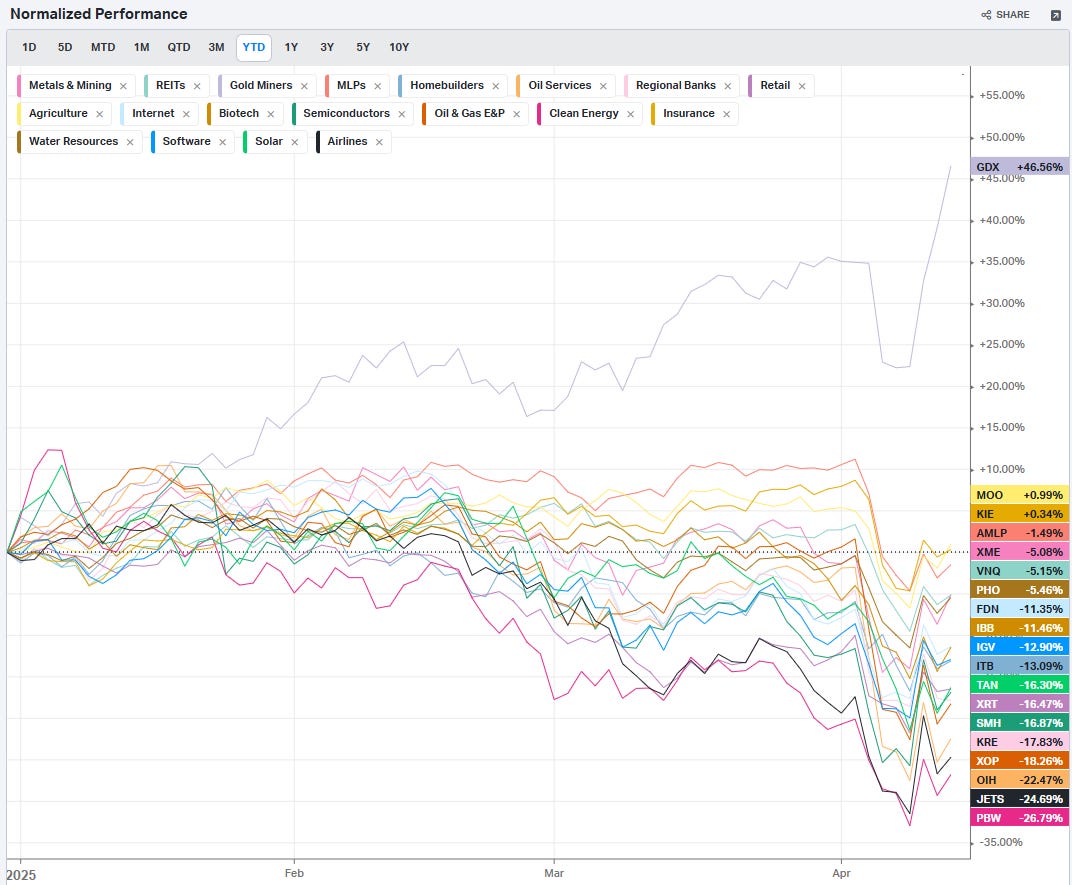
S&P By Industry
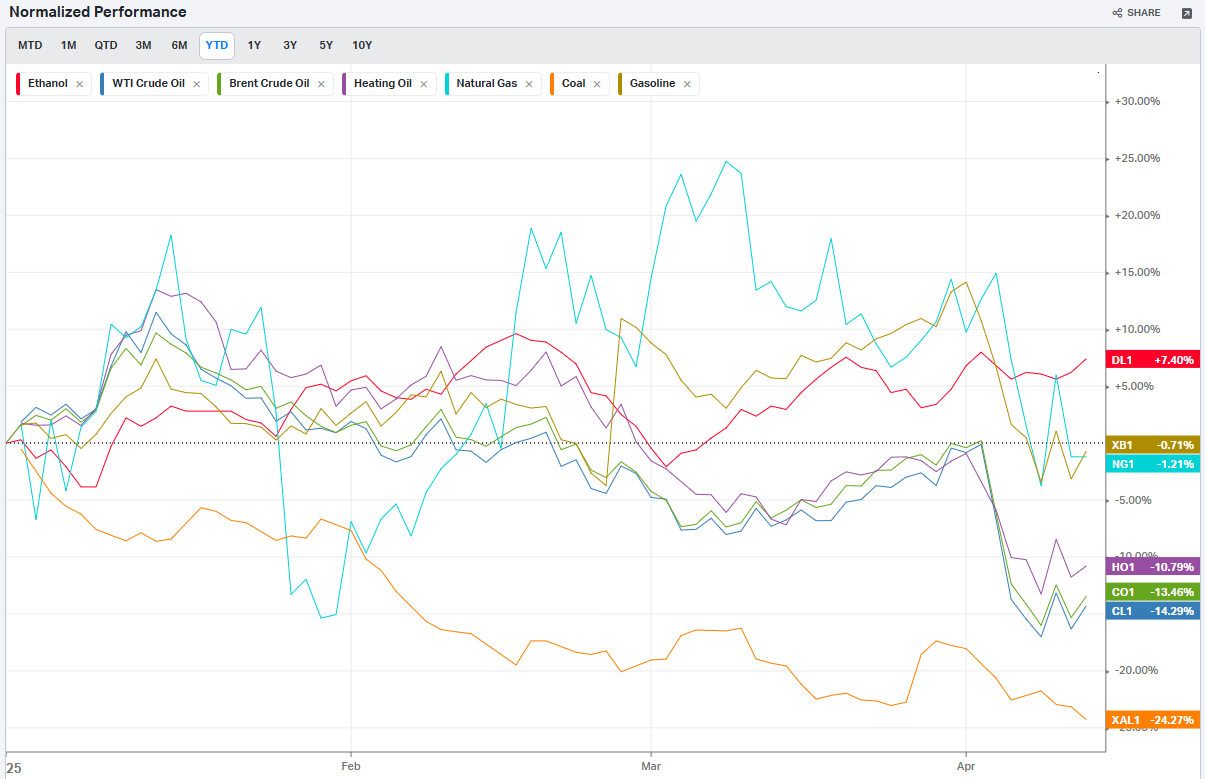
Commodities: Energy
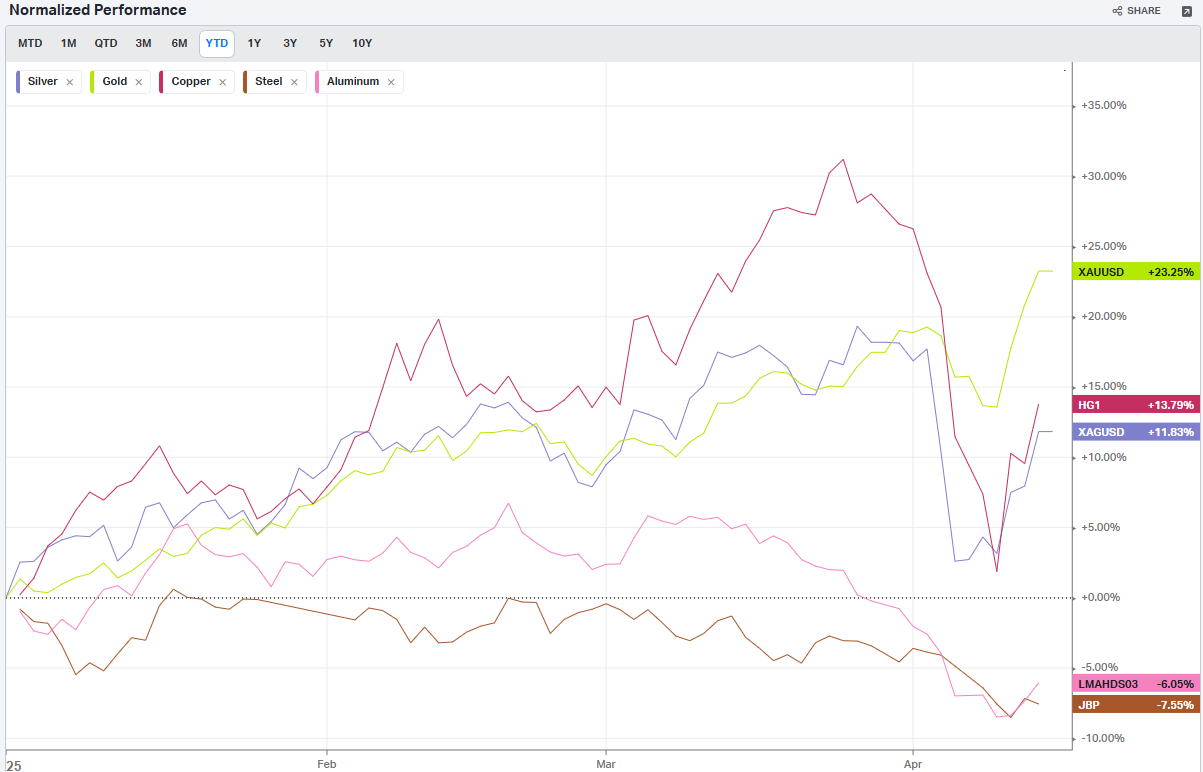
Commodities: Metals
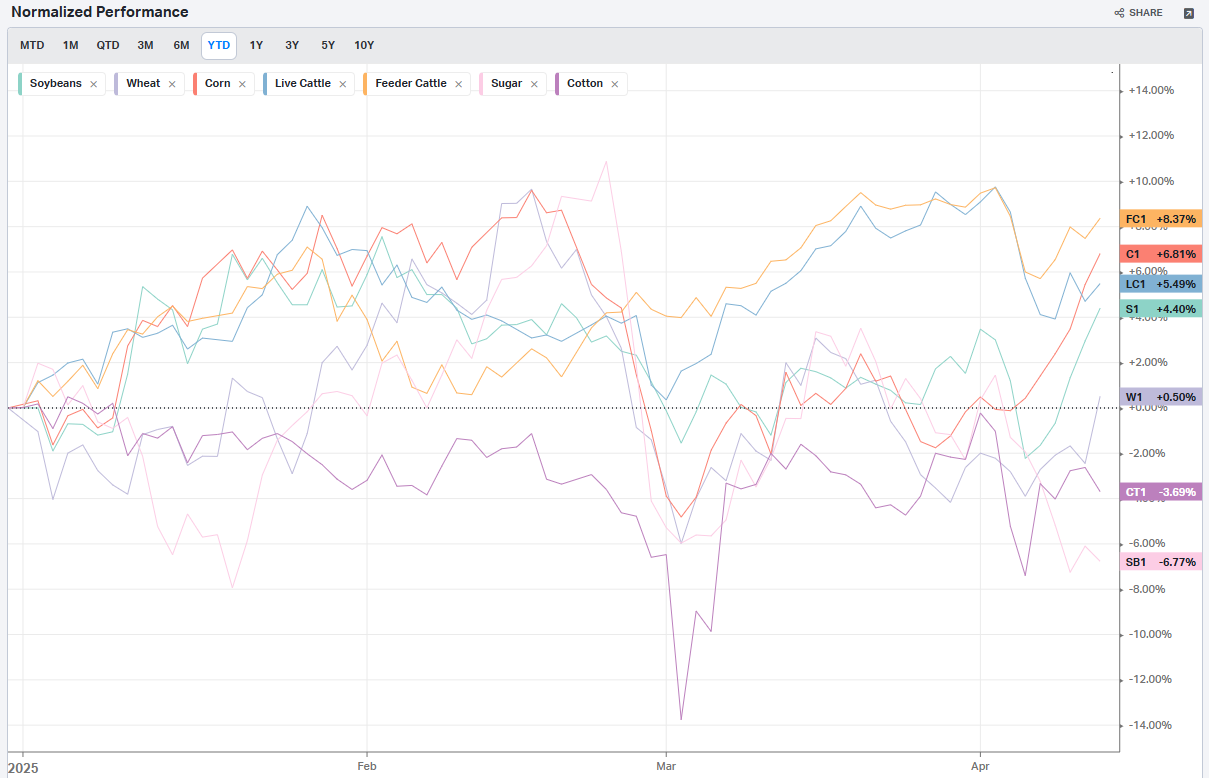
Commodities: Agriculture
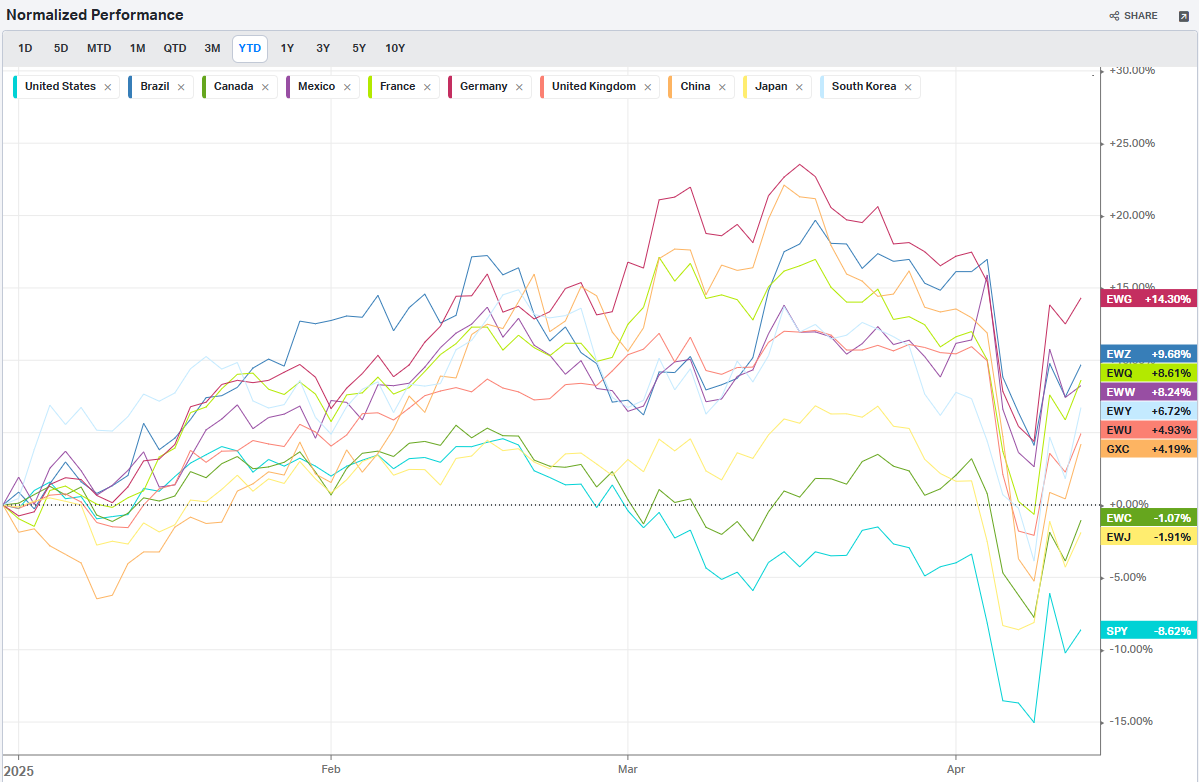
Country ETFs
Currencies
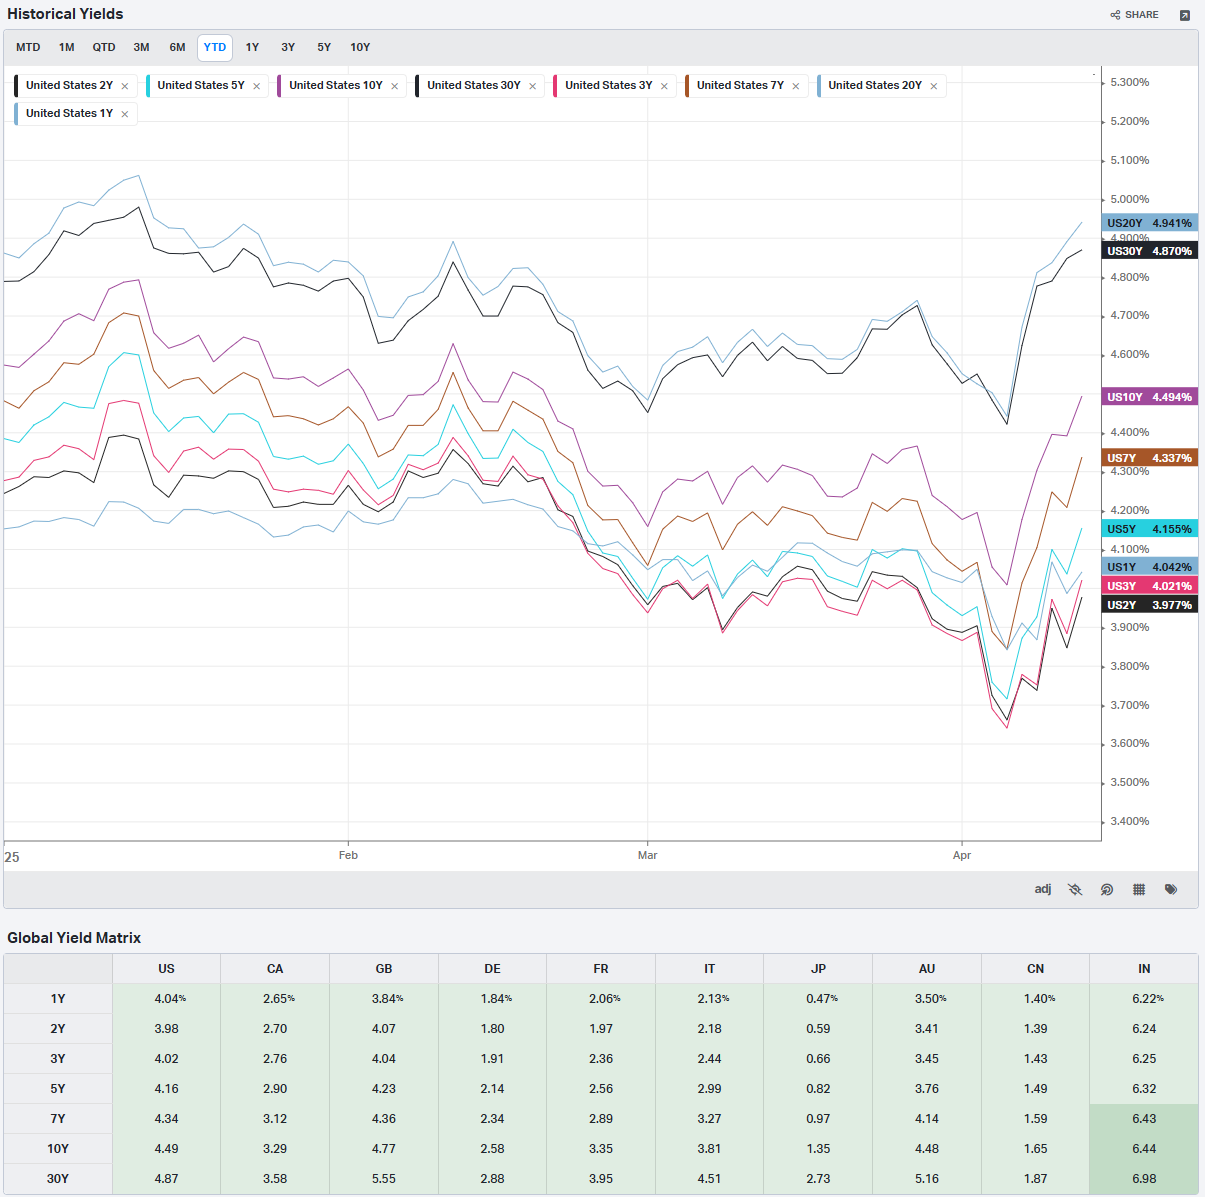
Global Yields
Factors: Style
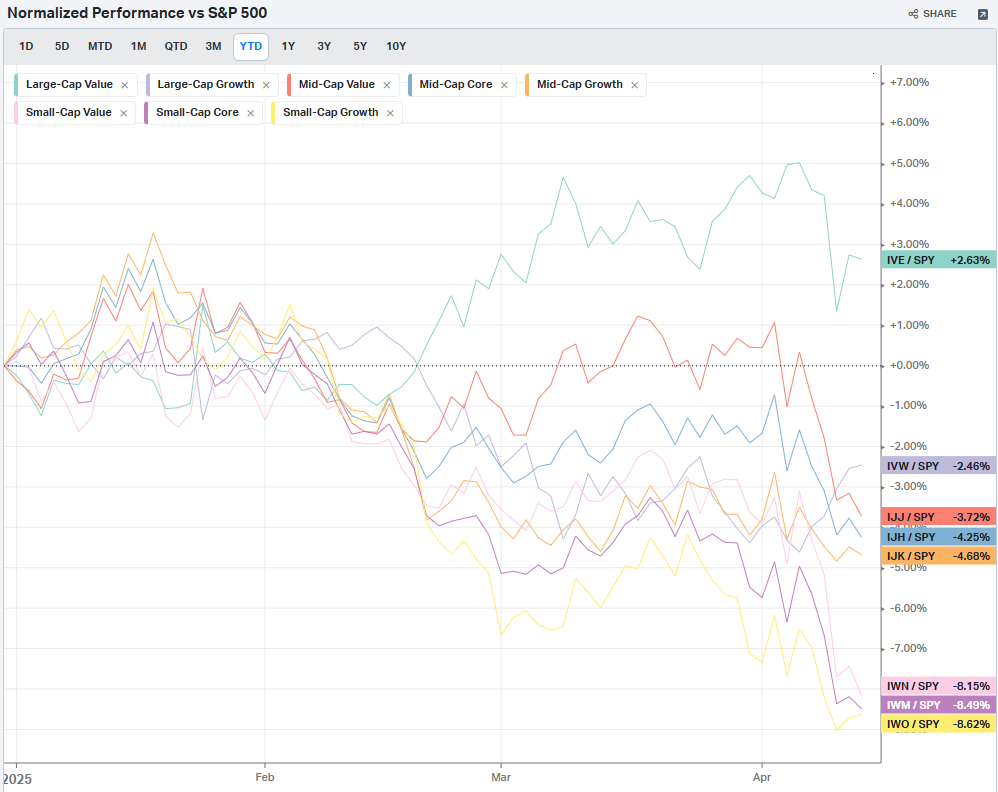
Factors: Size vs Value
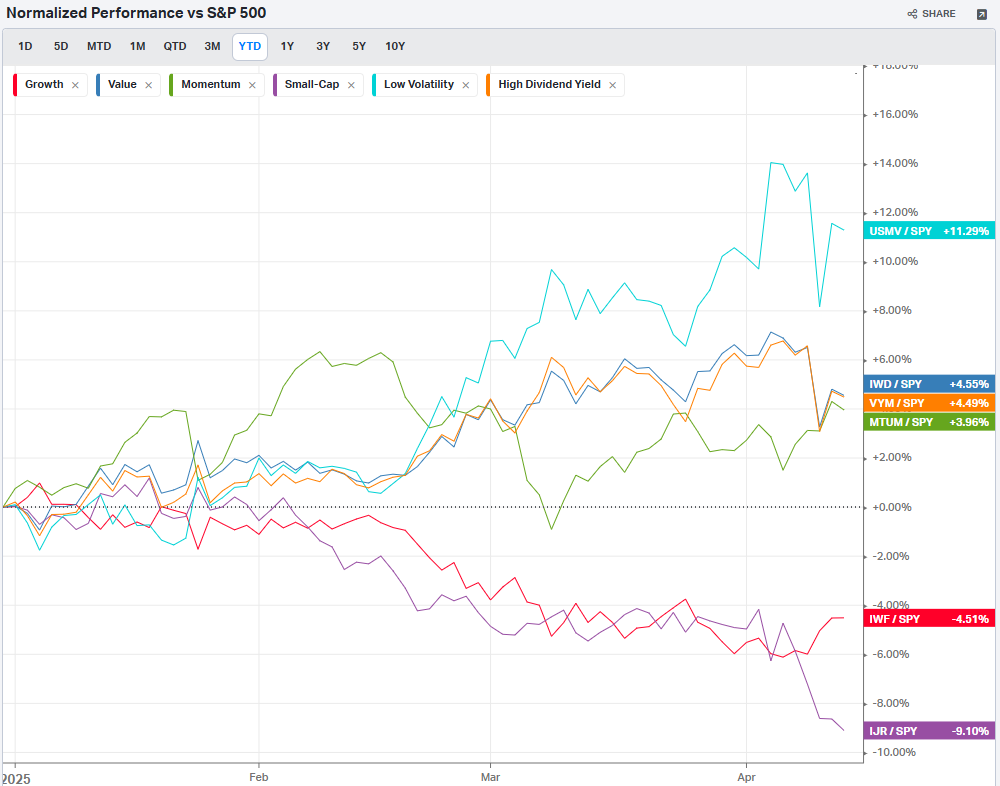
Factors: Qualitative
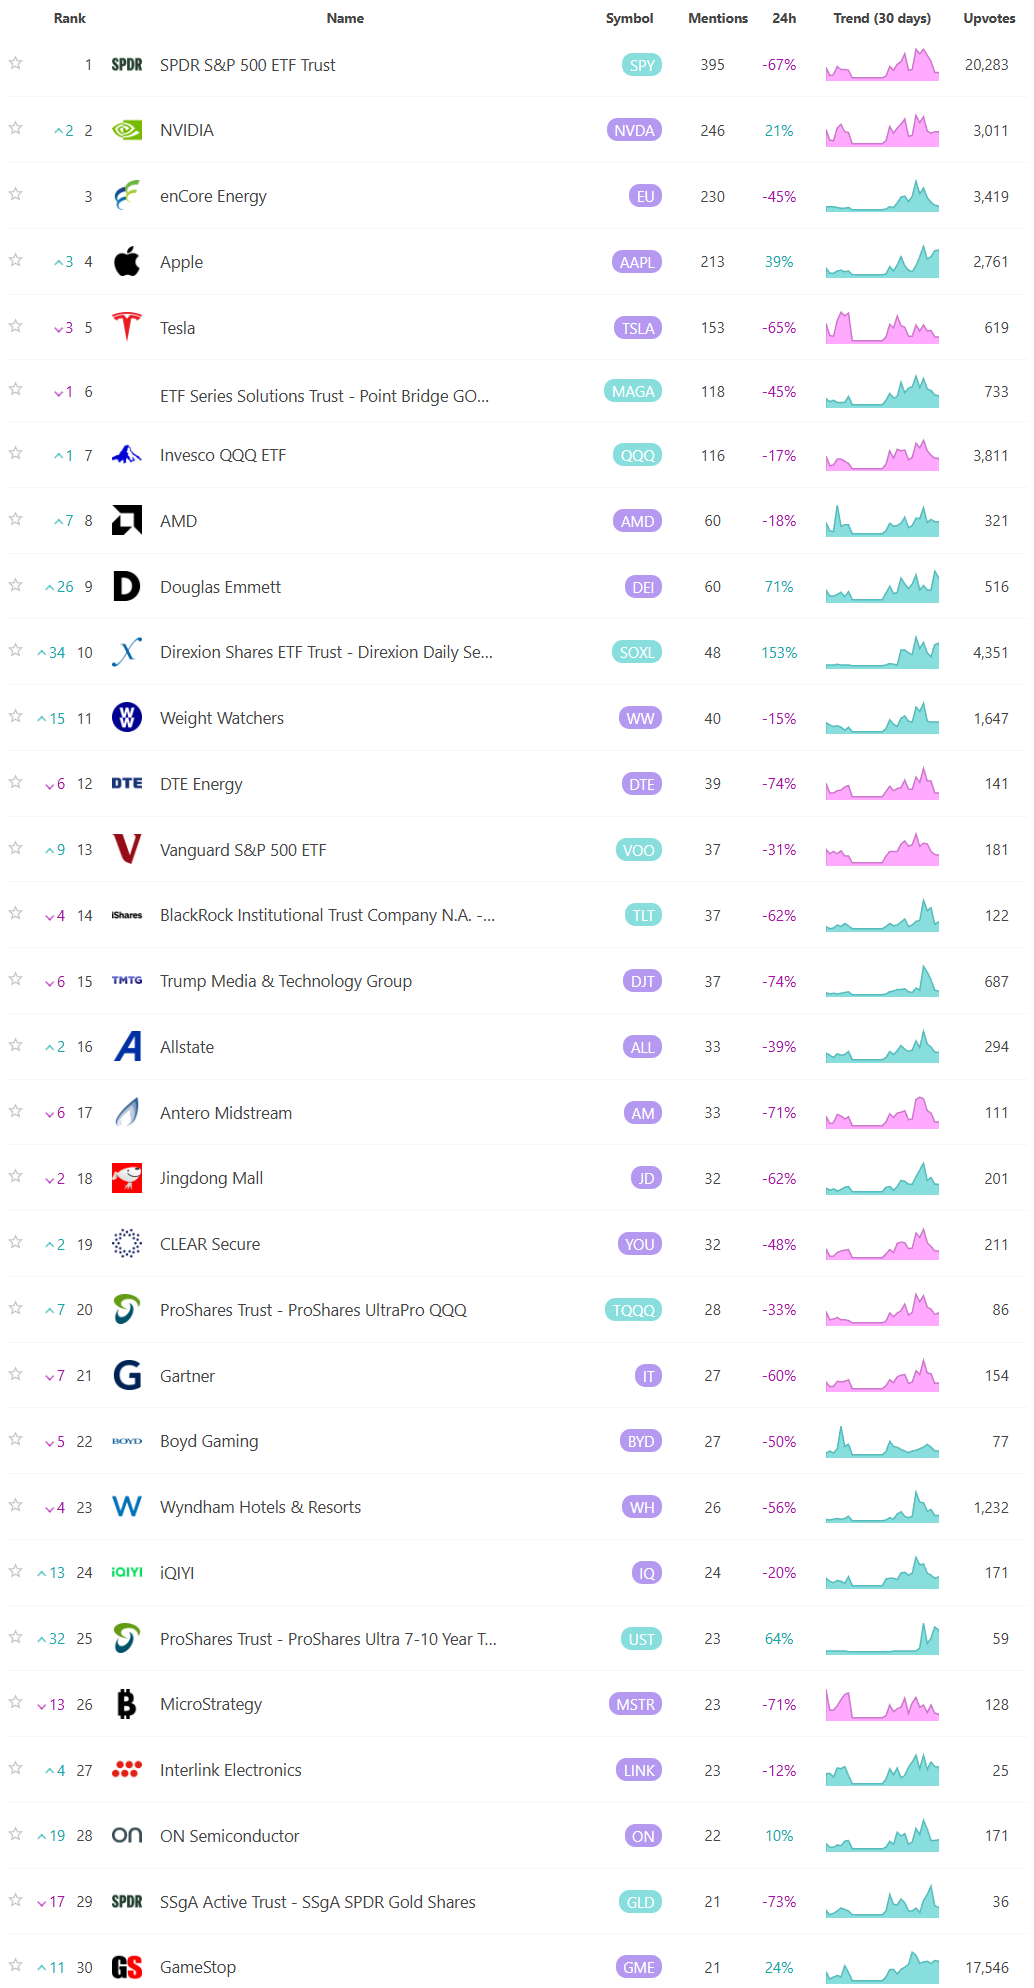
Social Media Favs
Analyzing social sentiment can provide valuable insights for investment strategies by offering a pulse on public perception, mood, and market sentiment that traditional financial indicators might not capture. Here’s how social sentiment analysis can enhance investment decisions:
Market Momentum: Positive or negative social sentiment can signal impending momentum shifts. When public opinion on a stock, sector, or asset class changes sharply, it can create buying or selling pressure, especially if that sentiment becomes widespread.
Early Detection of Trends: Social sentiment data can help investors spot trends before they show up in technical or fundamental data. For example, increased positive chatter around a particular company or sector might indicate growing interest or excitement, which could lead to price appreciation.
Gauge Retail Investor Impact: With the rise of retail investor platforms, collective sentiment on social media can lead to significant price movements (e.g., meme stocks). Understanding how retail investors view certain stocks can help in identifying high-volatility opportunities.
Event Reaction Monitoring: Social sentiment can provide real-time reactions to news events, product releases, or earnings reports. Investors can use this information to gauge market reaction quickly and adjust their strategies accordingly.
Complementing Quantitative Models: By adding a social sentiment layer to quantitative models, investors can enhance predictions. For example, a model that tracks historical price and volume data might perform even better when factoring in sentiment trends as a measure of market psychology.
Risk Management: Negative sentiment spikes can be a signal of potential downturns or increased volatility. By monitoring sentiment, investors might avoid or hedge against investments in companies experiencing a public relations crisis or facing negative perceptions.
Long-Term Sentiment Trends: Sustained sentiment trends, whether positive or negative, often mirror longer-term market cycles. Tracking sentiment trends over time can help identify shifts in investor psychology that could affect longer-term investments or sector rotations.
For these reasons, sentiment analysis, when combined with other tools, can provide a comprehensive view of both immediate market reactions and underlying investor attitudes, helping investors position themselves strategically across various time frames. Here are the most mentioned/discussed tickers on Reddit from some of the most active Subreddits for trading:
Events On Deck This Week
Here are key events happening this week that have the potential to cause outsized moves in the market or heightened short-term volatility.
Econ Events By Day of Week
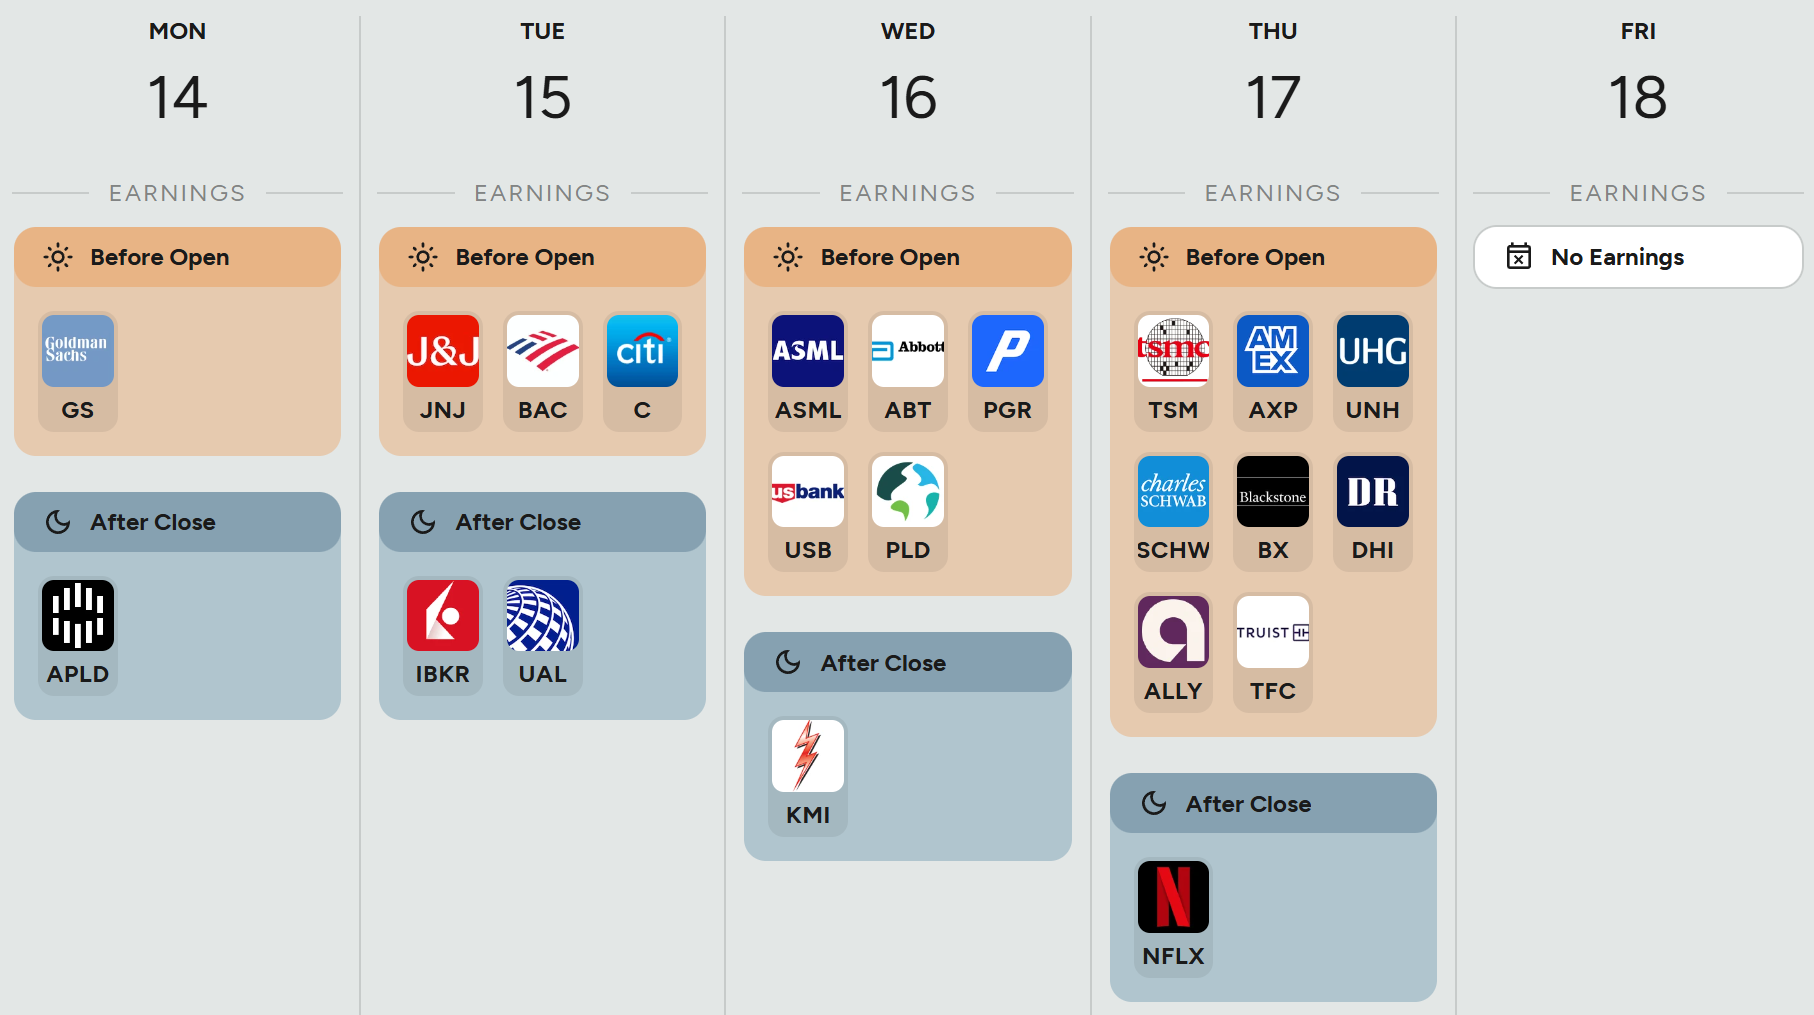
Anticipated Earnings By Day of Week