Market Momentum: Your Weekly Financial Forecast & Market Prep
Issue 40 / What to expect April 07, 2025 thru April 11, 2025
In This Issue
Market-On-Close: All of last week’s market-moving news and macro context in under 5 minutes + futures-at-a-glance
The Latest Investor Sentiment Readings
Institutional Support & Resistance Levels For Major Indices: Exactly where to look for support and resistance this week in SPY, QQQ, IWM & DIA
Institutional Activity By Sector: Institutional order flow by sector including the top institutionally-backed names in those sectors. We break it all down and provide the key insights and take-aways you need to navigate institutional positioning this week.
Top Institutional Order Flow In Individual Names: All of the largest sweeps and blocks on lit exchanges and hidden dark pools
Investments In Focus: Bull vs Bear arguments for PYCR, SARO, GBX
Top Institutionally-Backed Gainers & Losers: An explosive watchlist for day traders seeking high-volatility
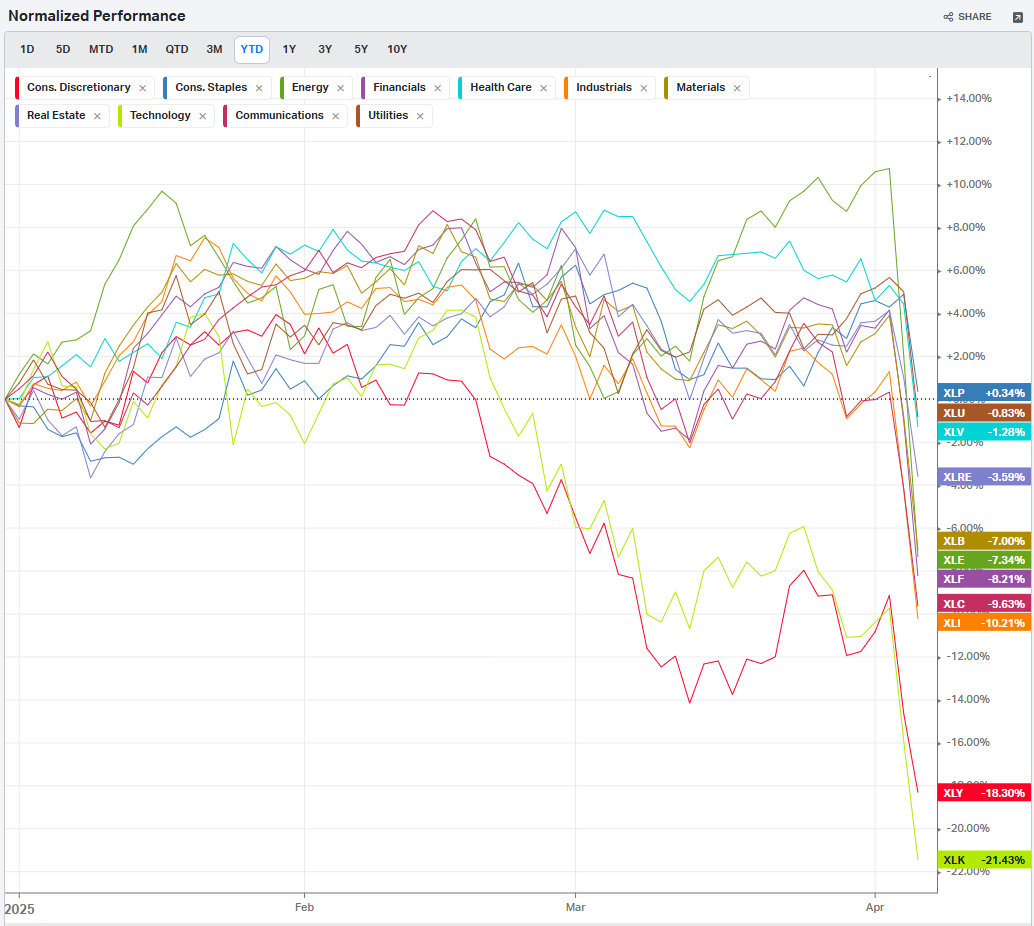
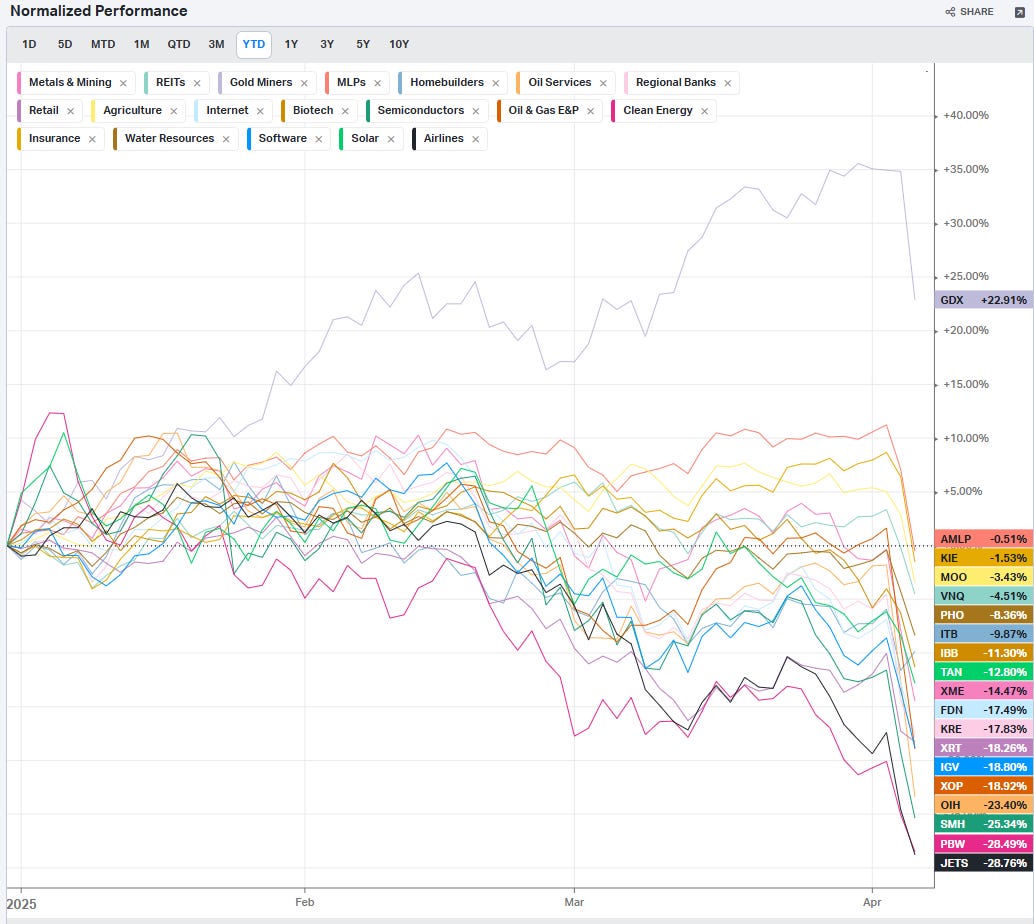
Normalized Performance By Thematics YTD (Sector, Industry, Factor, Energy, Metals, Currencies, and more): which corners of the markets are beating benchmarks, which ones are overlooked and which ones are over-crowded
Key Econ Events and Earnings On-Deck For This Week

Market-On-Close
Market Turbulence: Analyzing the Impact of Trade Policy on Global Financial Markets
Introduction
The financial markets experienced extraordinary volatility last week, culminating in the steepest weekly decline in five years. Investors watched with growing concern as major indices plummeted in response to unexpected trade policy announcements from the Trump administration. The S&P 500 shed nearly 6% in a single day, while the technology-heavy Nasdaq 100 suffered even steeper losses. This market reaction represents more than typical short-term volatility—it signals deep investor anxiety about potential economic disruption and global trade conflicts that could fundamentally alter the economic landscape.
The catalyst for this market turbulence was President Trump's April 2nd announcement of sweeping tariffs that exceeded market expectations in both scope and magnitude. What made this policy particularly impactful was its broad application across virtually all trading partners and its potential to raise effective tariff rates to levels not seen in over a century. While markets had been anticipating some form of protectionist measures, the comprehensive nature of these tariffs—coupled with China's swift retaliatory response—sent shockwaves through global financial systems.
The Tariff Announcement: A Policy Earthquake
On April 2nd, President Donald Trump unveiled a comprehensive tariff framework that immediately altered market expectations. The announcement outlined a minimum 10% tariff on virtually all countries, scheduled to take effect on April 5th, with significantly higher rates targeted at nations with which the United States maintains substantial trade deficits. The magnitude of these tariffs stunned market participants, who had anticipated more moderate and targeted measures.
The most severe tariffs were directed at China, with a 34% reciprocal tariff rate that, when combined with existing duties, brings the total tariff burden on Chinese imports to a staggering 67%. Other major trading partners faced substantial increases as well: the European Union received a 20% reciprocal tariff (bringing their total to 39%), while Japan was assigned a 24% reciprocal tariff (raising their total to 46%). Notably, Canada and Mexico were exempted from these new reciprocal tariffs, though they remain subject to previously announced 25% tariffs on certain goods.

What makes these tariffs particularly significant is their historical context. From 2000 to 2024, the average U.S. tariff rate on imports hovered around a modest 1.7%. The new measures are projected to raise the effective tariff rate to between 20% and 25%—the highest level in at least a century. Given that the United States imported approximately $3.3 trillion of goods in 2024, these tariffs could generate revenue of roughly $660 billion, equivalent to about 2.3% of GDP. The sheer scale of this policy shift represents a fundamental reorientation of U.S. trade strategy.
The market had barely begun processing these announcements when China delivered its counterpunch. On Friday, Beijing announced it would impose matching 34% tariffs on all U.S. imports beginning April 10th. This swift retaliation validated market fears about an escalating trade conflict and further intensified the sell-off in global equity markets.
Market Reaction: A Global Risk-Off Environment
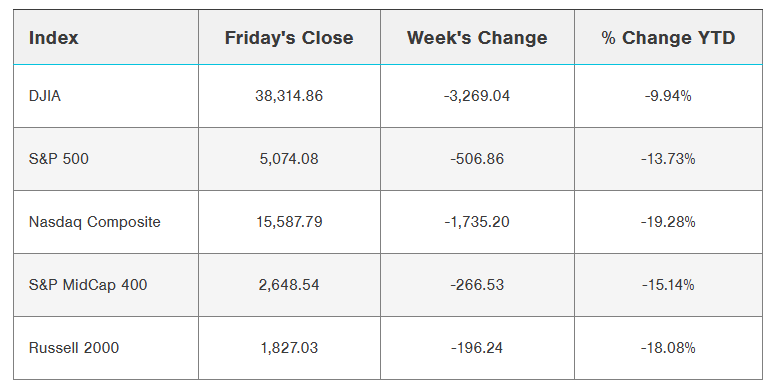
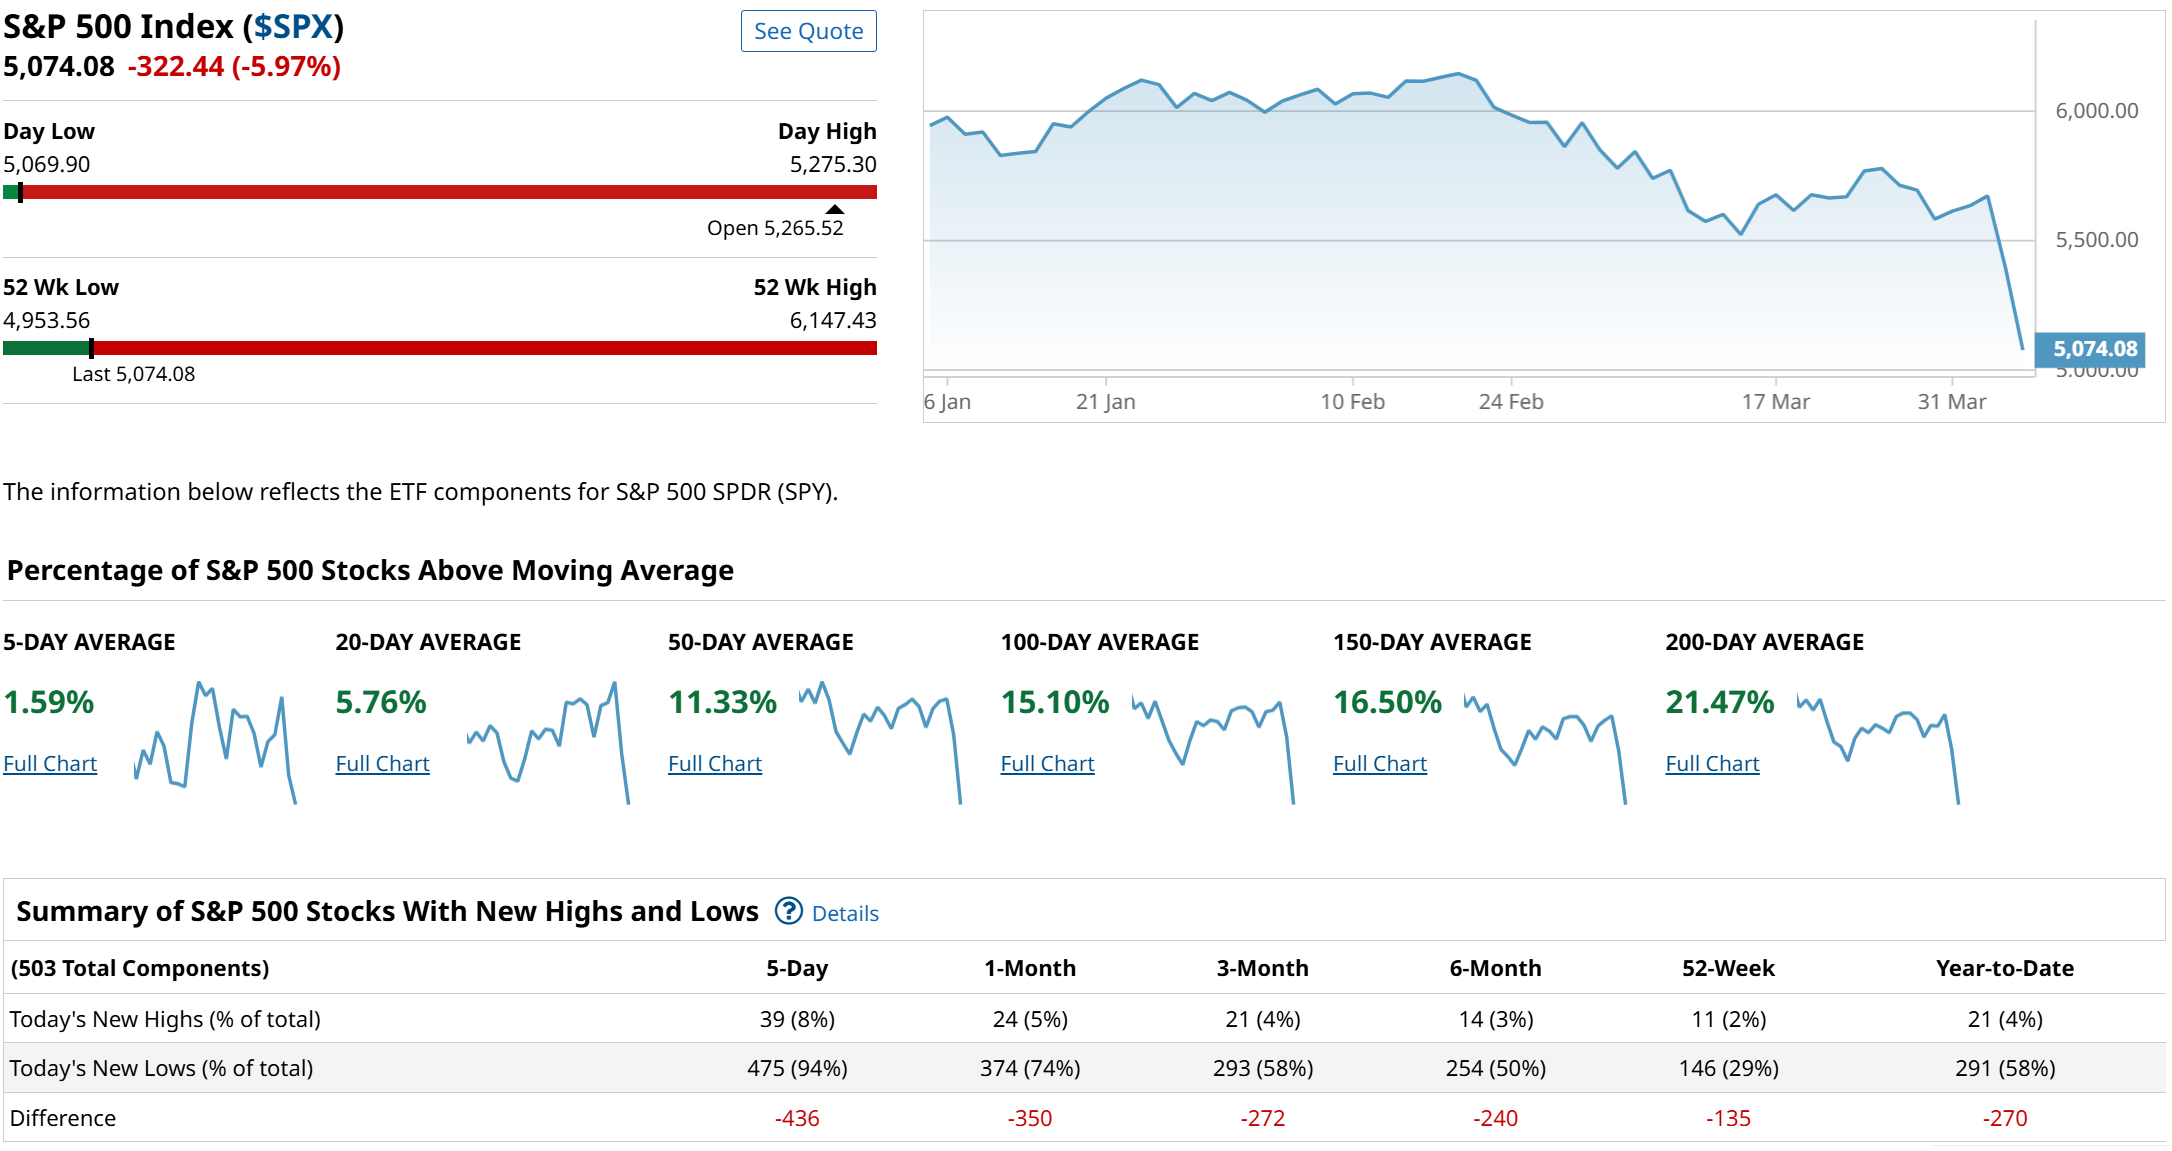
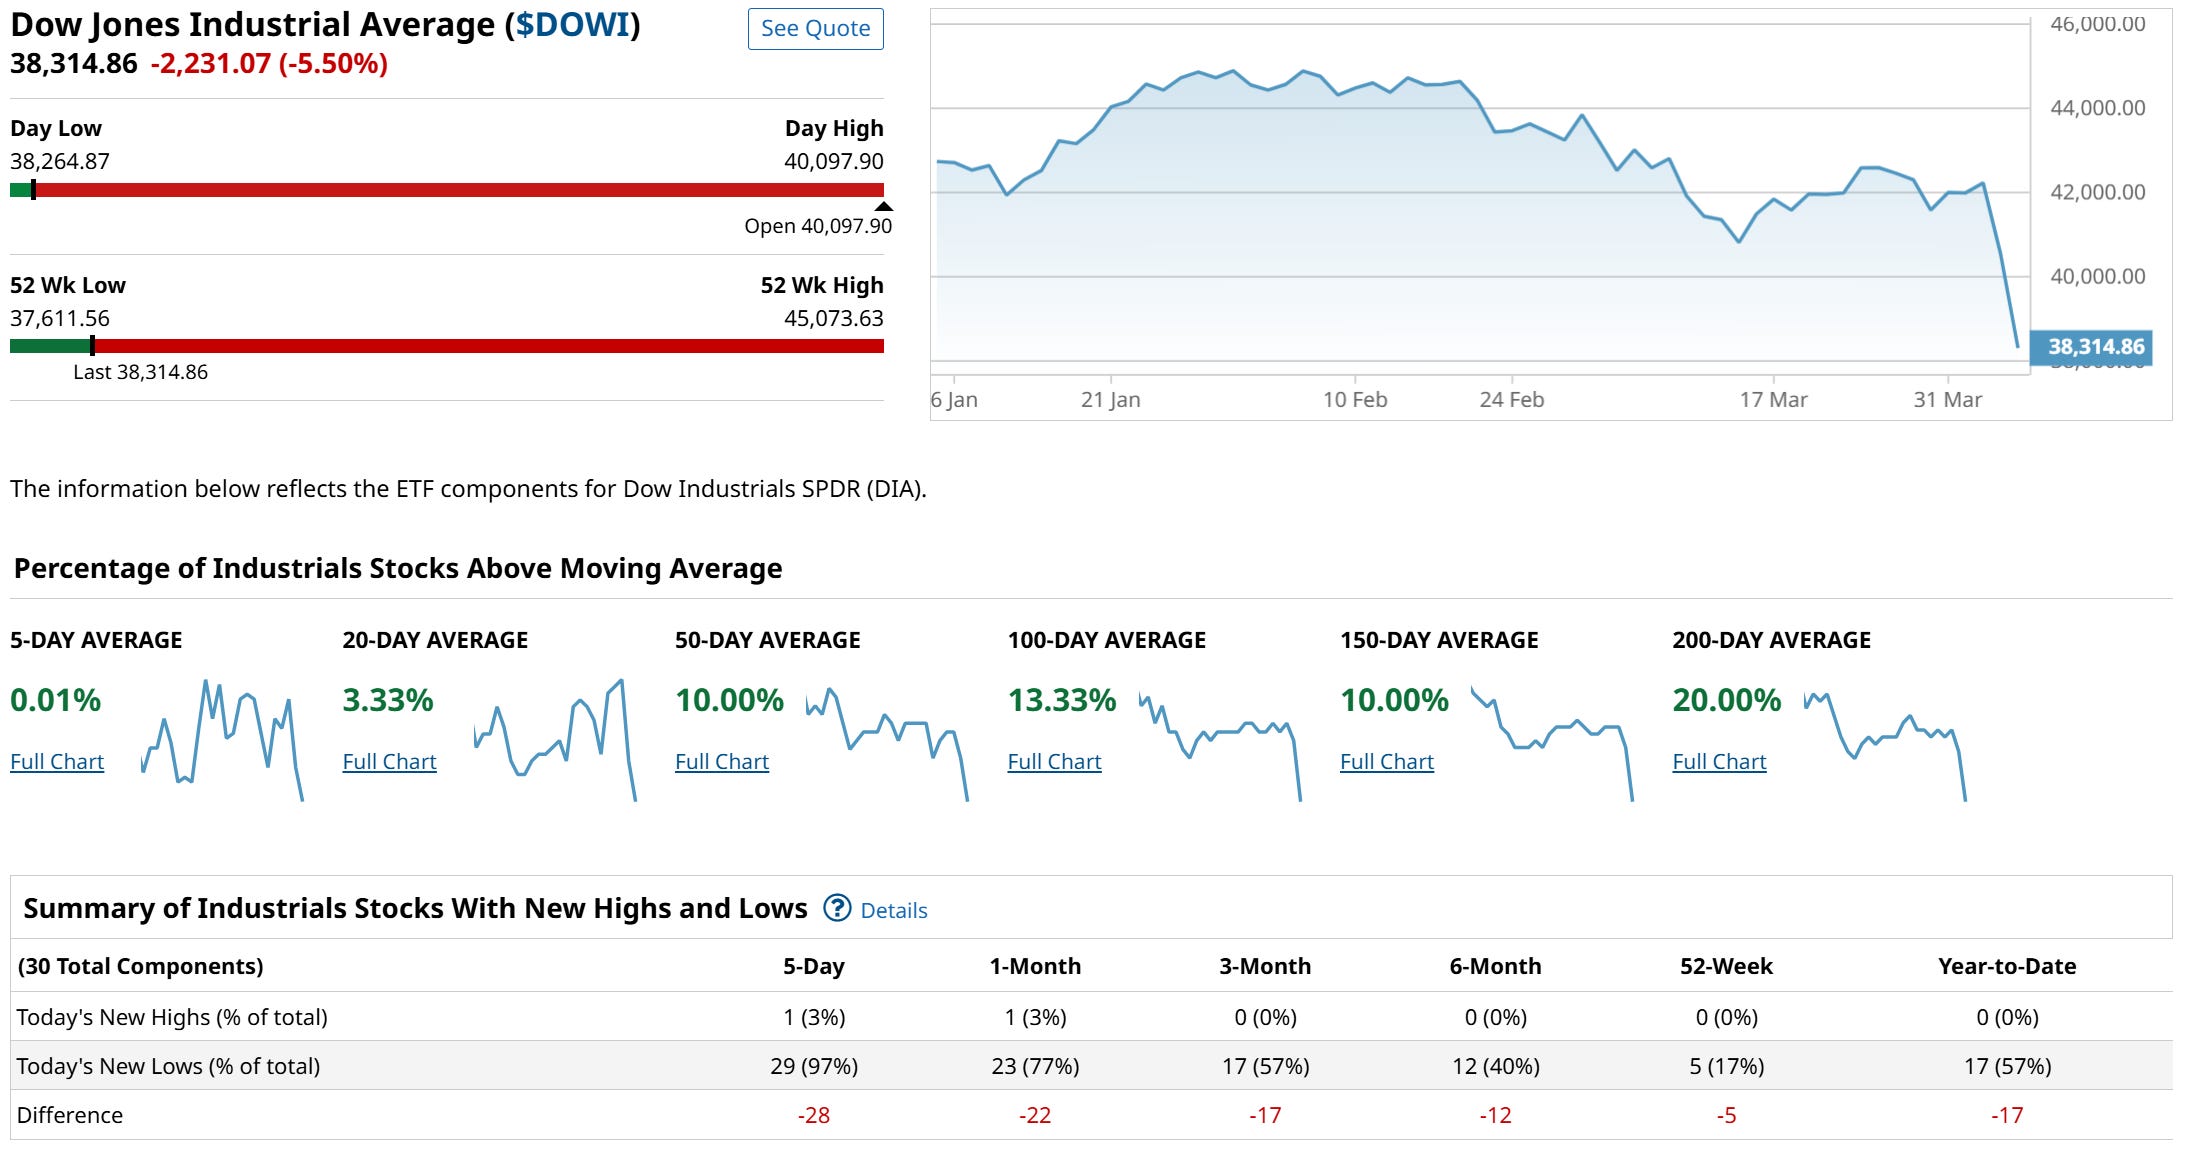
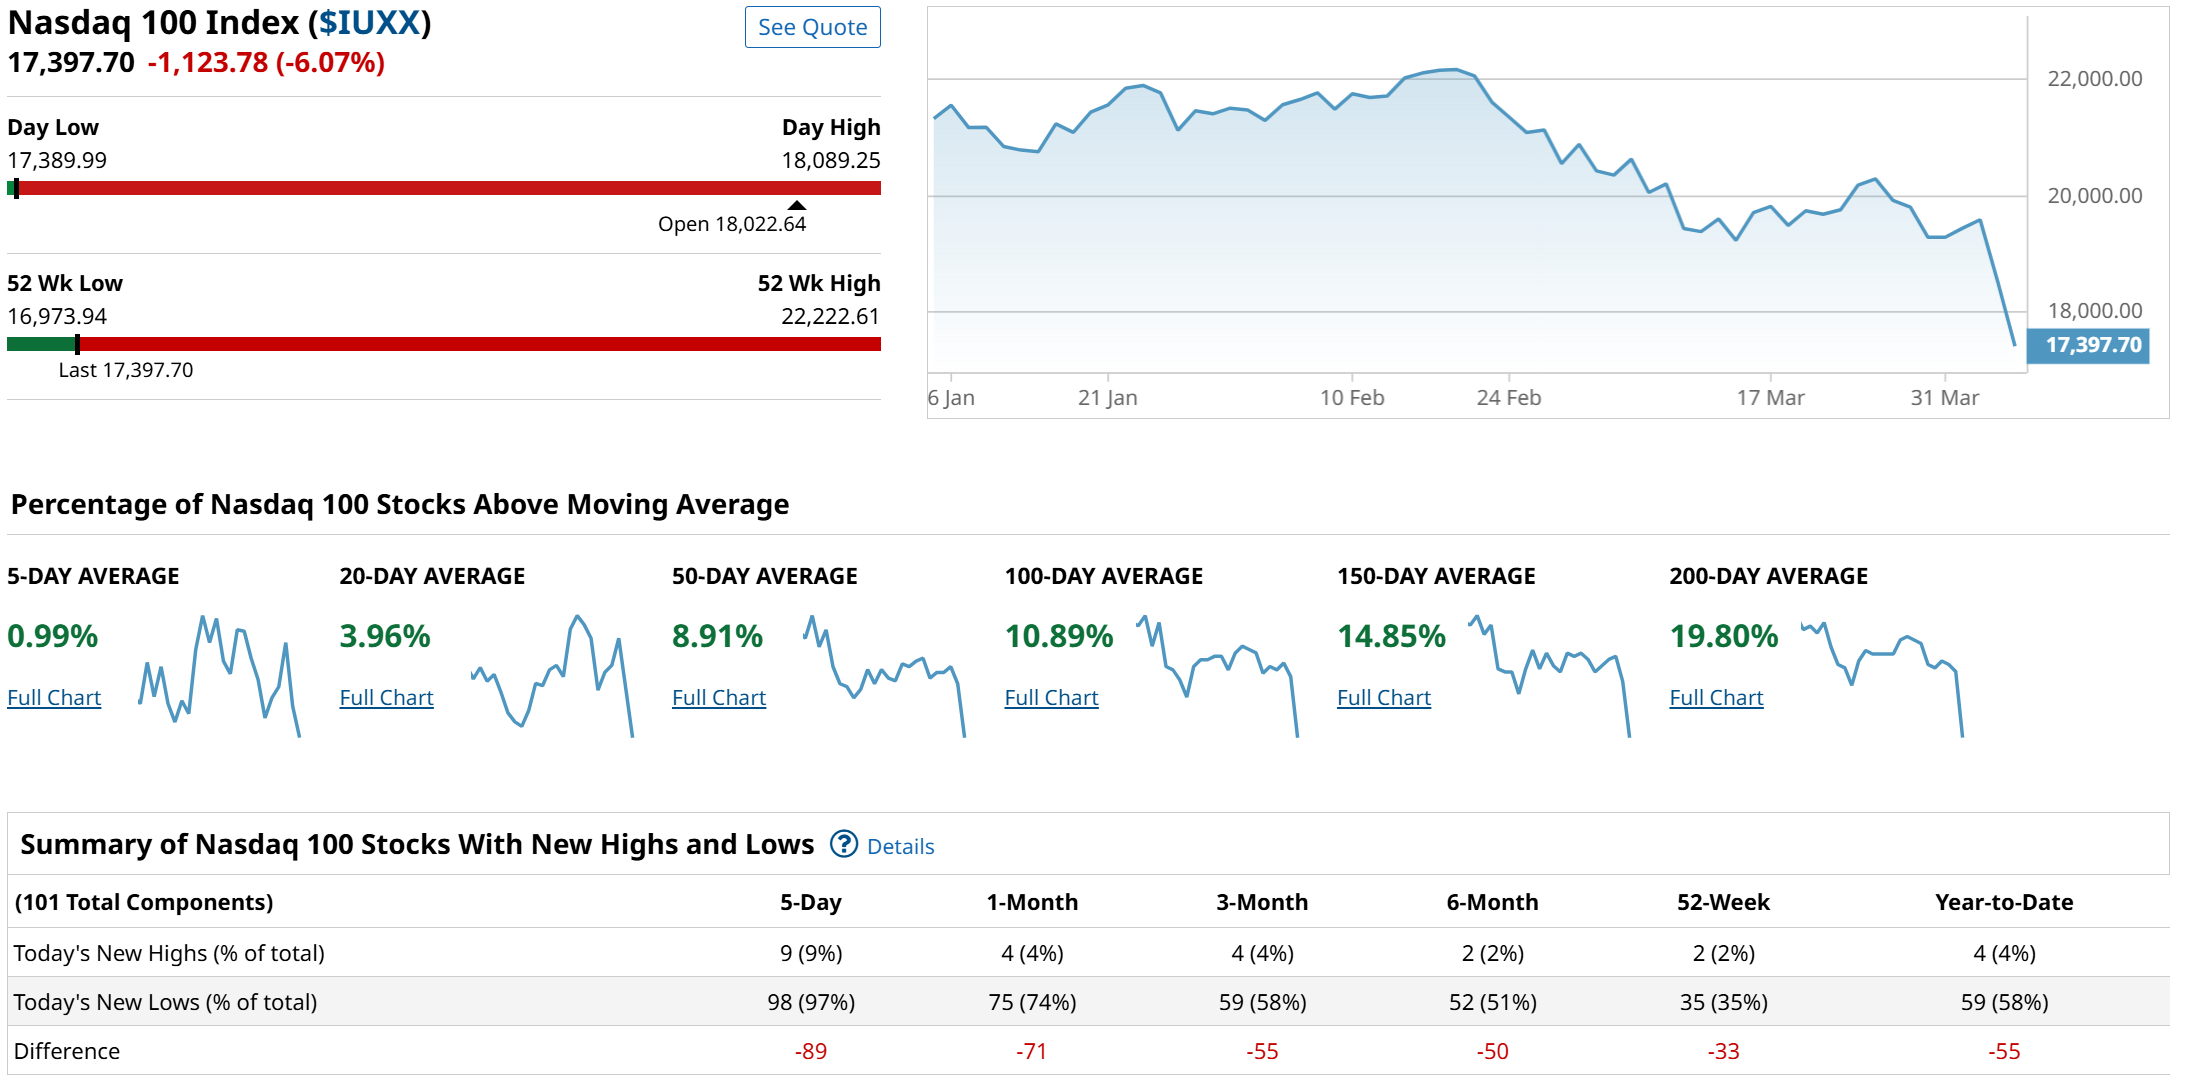
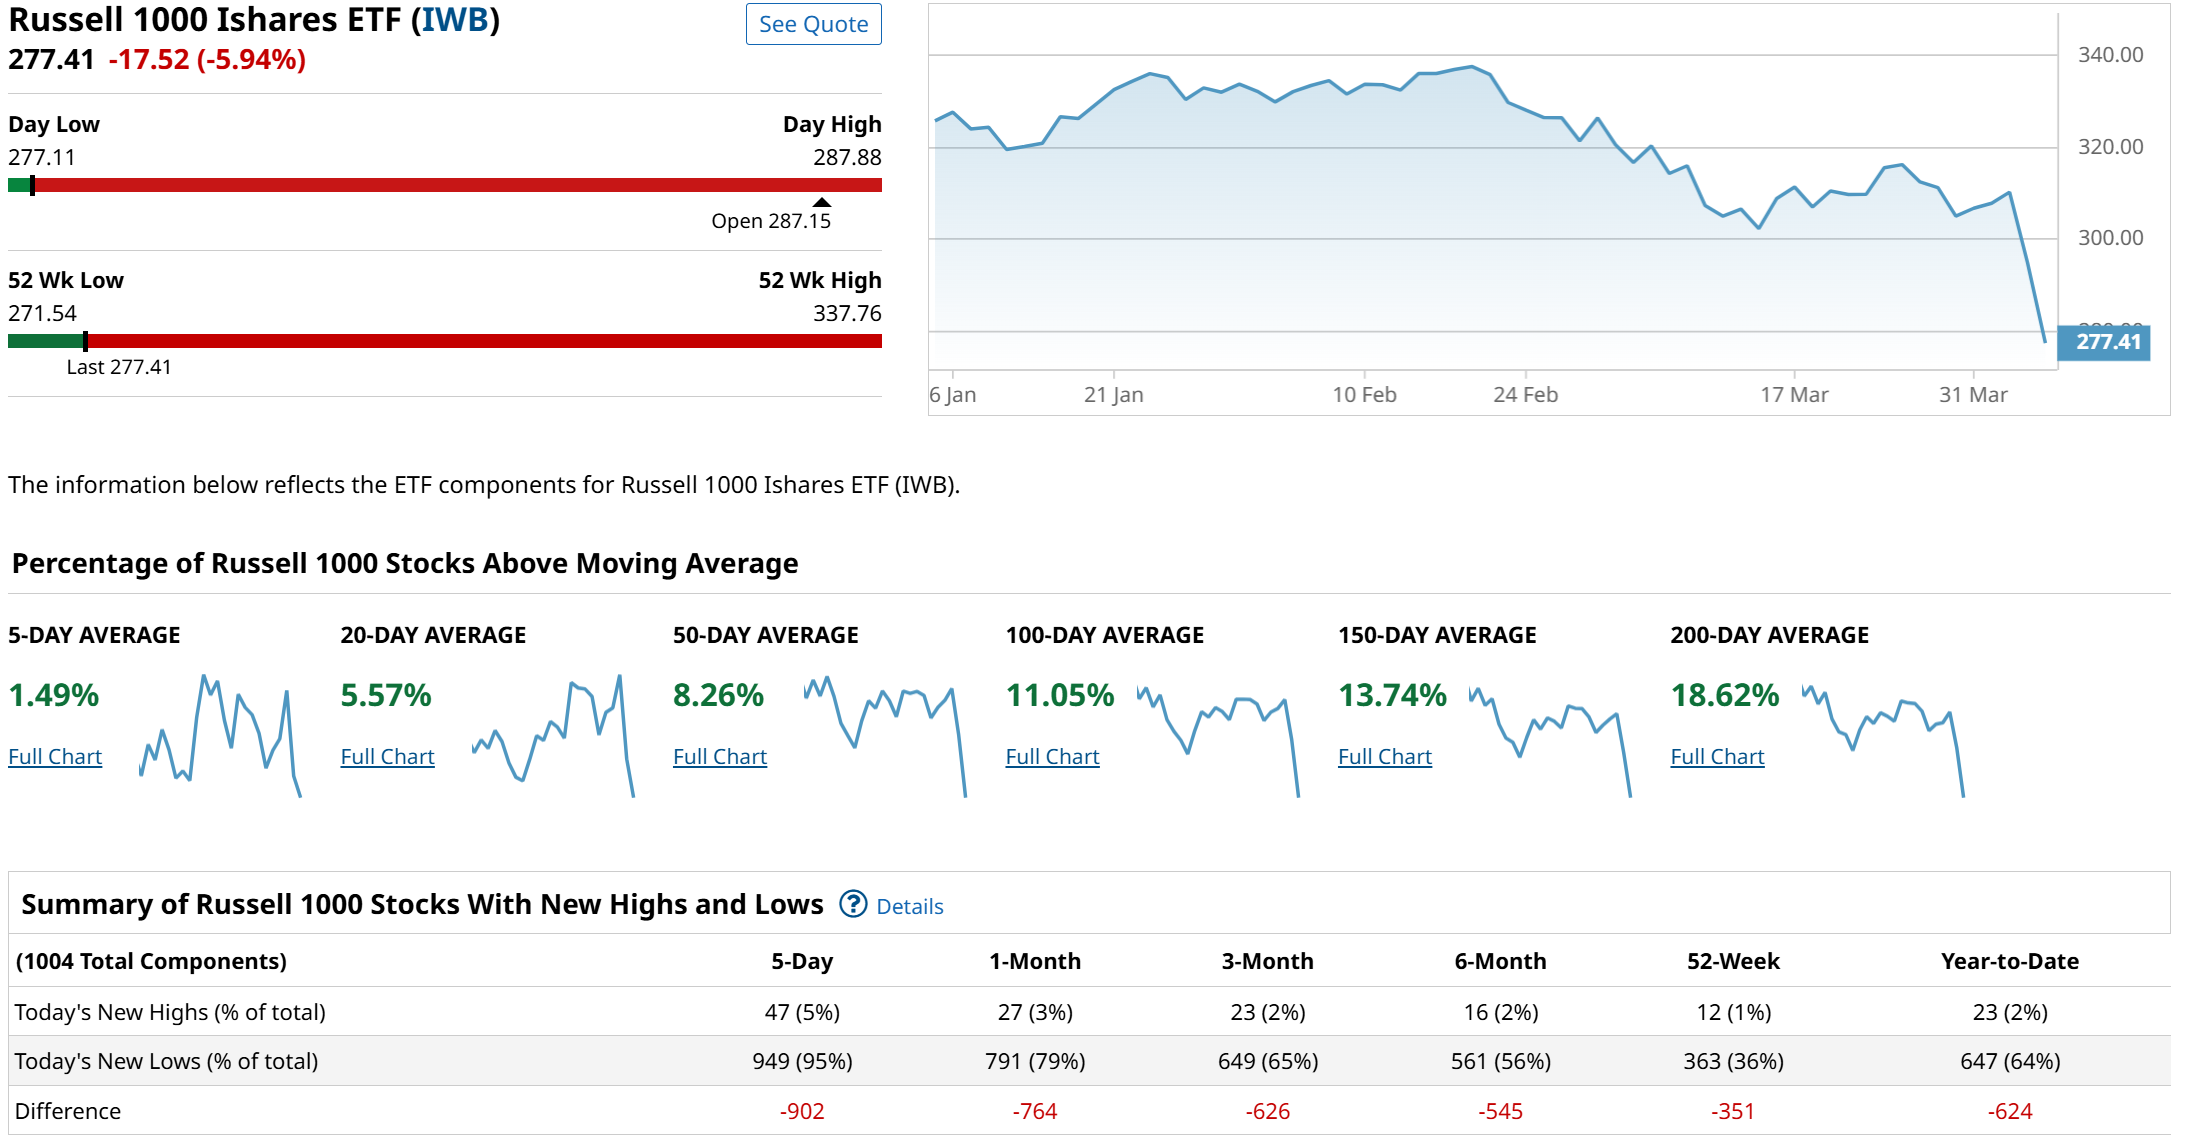
The market response to these trade policy developments was swift and severe. By Friday's close, the S&P 500 had fallen 5.97%, the Dow Jones Industrial Average had dropped 5.50%, and the Nasdaq 100 had plunged 6.07%. The weekly performance was even more striking, with the S&P 500 down 7.1% and the Nasdaq down 8.2%—marking the worst weekly performance for these indices in over five years. The Russell 2000, representing smaller companies, suffered disproportionately, losing approximately 10% for the week and ending more than 30% below its all-time high.
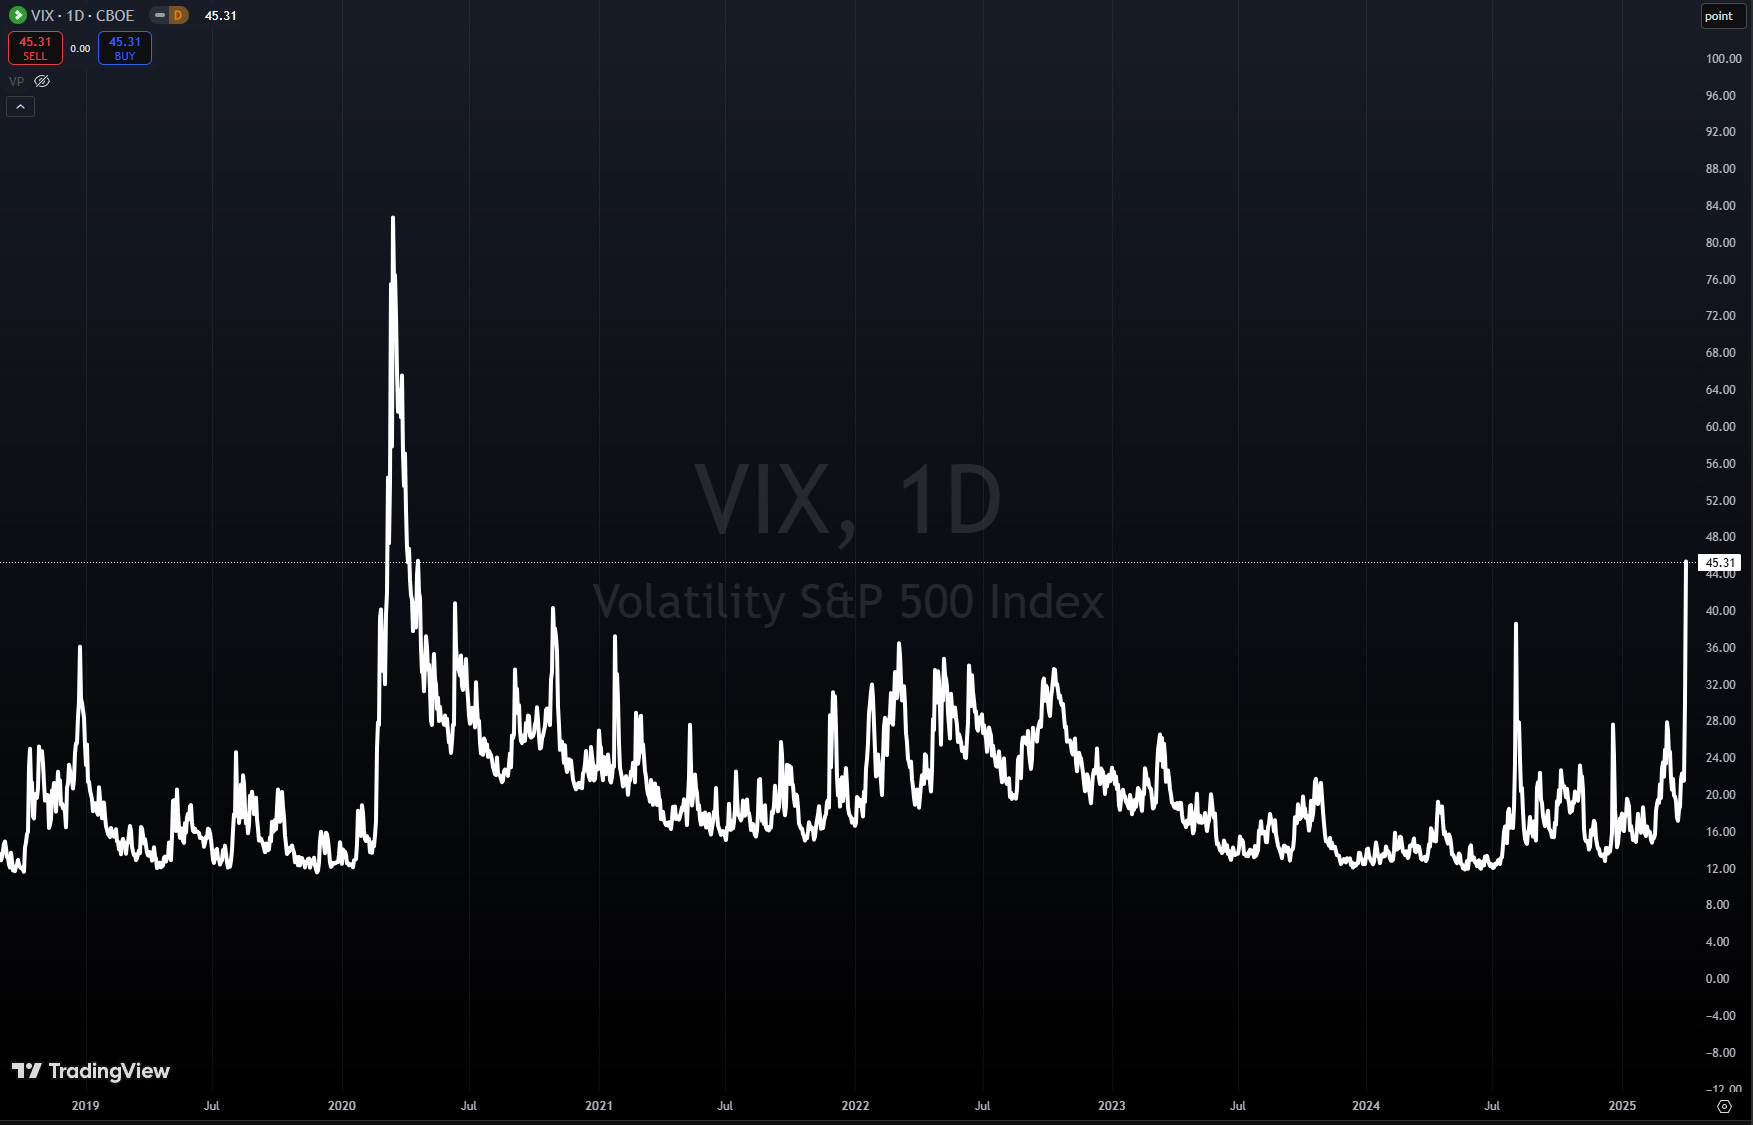
Volatility, as measured by the CBOE Volatility Index (VIX), spiked dramatically from 20 to over 45 before settling at 39.63—levels not seen since the market turbulence of early 2020. This surge in the "fear index" reflected profound uncertainty about the economic implications of these trade policies and their potential to disrupt global supply chains.
The selloff was not limited to U.S. markets. International equities also suffered substantial losses, with the Euro Stoxx 50 falling to a 3.5-month low and closing down 4.60%. Japan's Nikkei Stock 225 sank to a 7.75-month low, closing down 2.75%. The global nature of this market reaction underscores the interconnectedness of the modern economy and the far-reaching implications of U.S. trade policy.
Within equity markets, sector performance revealed interesting patterns that reflected investor assessments of tariff exposure. The "Magnificent Seven" technology stocks, which had been market leaders for much of the past few years, experienced particularly steep declines. Tesla fell more than 10%, while Nvidia and Apple dropped more than 7%. The semiconductor industry, with its heavy exposure to global supply chains and the Chinese market, suffered even more pronounced losses, with companies like Micron Technology falling more than 12% and Intel declining more than 11%.
Energy stocks also faced severe pressure as crude oil prices plummeted to four-year lows, with WTI crude falling more than 7%. Companies like APA Corp and Baker Hughes saw their shares drop more than 13%. Mining stocks similarly tumbled as commodity prices weakened, with Freeport-McMoRan falling more than 12%.
However, not all sectors suffered equally. Homebuilders showed relative strength, with companies like DR Horton gaining more than 4% as investors anticipated that lower Treasury yields would put downward pressure on mortgage rates, potentially supporting housing demand. Companies with substantial manufacturing operations in Vietnam, such as Nike and Lululemon Athletica, also performed relatively well after President Trump indicated that Vietnam was willing to negotiate to avoid new U.S. tariffs.
The risk-off sentiment extended beyond equity markets, triggering significant moves in fixed income and commodities. Investors sought safety in government bonds, pushing the yield on the 10-year Treasury note down 31 basis points for the week to 3.93%, with intraday lows reaching 3.856%—a six-month low. European government bond yields similarly declined, with the German 10-year bund yield falling to a one-month low of 2.479%.
In commodities markets, gold briefly touched another all-time high at $3,134 per ounce before settling at $3,022, reflecting its traditional role as a safe-haven asset during periods of market stress. Conversely, oil prices collapsed under the weight of concerns about global economic growth, with West Texas Intermediate crude falling 13.75% to $61.66 per barrel, its lowest level in four years.
Currency markets also reflected shifting economic expectations, with the dollar index (DXY) falling 1.66% for the week to its lowest level since October, effectively erasing all post-election gains. This dollar weakness came despite the traditional role of the U.S. currency as a safe haven during periods of market stress, suggesting that investors were reassessing the impact of trade policies on U.S. economic prospects.
Economic Implications: Growth, Inflation, and Monetary Policy
The market reaction to the tariff announcements reflects deep concern about their potential economic impact. Tariffs represent a complex economic intervention with multifaceted effects on growth, inflation, corporate margins, and household spending power.
The immediate economic concern is the potential impact on growth. Tariffs can pressure corporate profit margins through higher input costs, potentially leading to reduced investment and hiring. They can also weigh on household spending by increasing the cost of imported goods and reducing real purchasing power. Additionally, retaliatory measures from trading partners can harm U.S. exporters, further dampening economic activity.

These growth concerns were somewhat tempered by Friday's employment report, which showed that U.S. employers added 228,000 jobs in March—significantly above expectations of 140,000. This strong labor market data suggests that the U.S. economy entered this period of trade uncertainty from a position of relative strength. However, the unemployment rate did tick up slightly to 4.2% from 4.1%, indicating some potential softening in labor market conditions.
While growth concerns dominated market sentiment, inflation risks also factored into investor calculations. Tariffs essentially function as a tax on imports, and some portion of these costs will likely be passed on to consumers, potentially pushing prices higher. Evidence of this inflationary pressure was already visible in the ISM manufacturing survey, which showed that the prices index jumped seven percentage points to 69.4% in March, largely due to the impact of tariffs. Similarly, the ISM services survey indicated that the prices index remained firmly in expansion territory at 60.9%, with respondents specifically citing tariff activity as a driver of cost increases.
These conflicting growth and inflation signals create a challenging environment for monetary policy. Federal Reserve Chair Jerome Powell acknowledged these complexities in a speech on Friday, noting that the economic impact of new tariffs is likely to be "significantly larger than expected" and may lead to "slower growth and higher inflation." However, Powell also indicated that the Fed was "well-positioned to wait" before adjusting monetary policy, suggesting that the central bank wanted more clarity on the economic effects before committing to interest rate cuts.

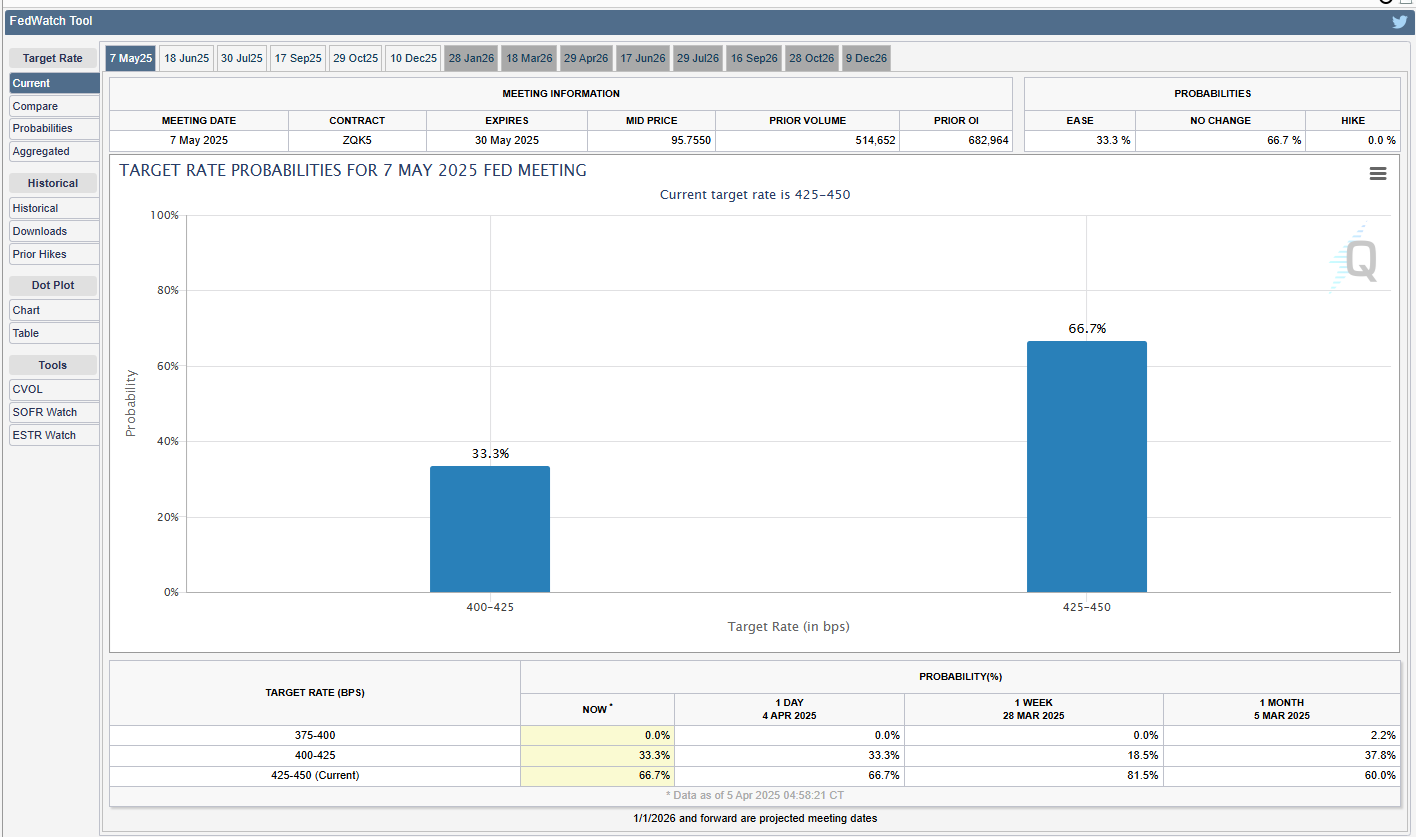
Despite Powell's measured stance, market expectations for Fed policy shifted dramatically in response to the tariff announcements. Interest rate futures now reflect expectations for multiple rate cuts in 2025, as investors anticipate that the negative growth effects from trade policies will force the Fed to ease monetary policy to support the labor market and stimulate economic activity. The markets are currently discounting the chances at 34% for a 25 basis point rate cut after the May 6-7 FOMC meeting.
International Dimensions: Global Response and Supply Chain Implications
The global nature of modern supply chains means that tariff policies have complex international ramifications. China's swift retaliatory tariffs represent just the beginning of what could become a broader international response. European officials have already begun advocating for a forceful retaliation to President Trump's measures, potentially targeting U.S. technology and service companies, as well as U.S. banks.
For China specifically, economists estimate that the higher U.S. tariffs could reduce China's 2025 GDP growth by 1% to 2.4%, potentially prompting additional stimulus measures from Beijing. These might include increased fiscal spending, special sovereign bond issuances, and adjustments to monetary policy such as cuts in the reserve requirement ratio for banks.
The United Kingdom is taking a slightly different approach, with Trade Secretary Jonathan Reynolds expressing confidence in the ability to negotiate a reduction in the new 10% tariff imposed on the country's exports. However, British officials are also consulting businesses about potential retaliatory tariffs if negotiations fail to yield results.
These international responses highlight the potential for cascading effects across the global economy. As countries adjust their trade policies in response to U.S. actions, new patterns of international commerce may emerge, with significant implications for global supply chains and investment flows.
Corporate Impact: Winners and Losers in a Shifting Trade Landscape
Beyond broad market movements, the tariff announcements have created distinct winners and losers at the corporate level. Companies deeply embedded in global supply chains or with significant exposure to affected markets face potential disruption to their business models and profit margins.
The technology sector, particularly semiconductor companies, appears especially vulnerable. The potential disruption to the semiconductor supply chain is illustrated by reports that Intel Corp. and Taiwan Semiconductor Manufacturing Co. (TSMC) have tentatively agreed to a joint venture to operate Intel's manufacturing plants. Under this arrangement, TSMC would receive a 20% stake in exchange for sharing its manufacturing techniques, reflecting strategic adjustments to a changing trade environment.

Social media companies also face uncertainty. President Trump has indicated that the U.S. is close to unveiling a plan to spare TikTok from a U.S. ban, with a proposal that would see new outside investors owning 50% of TikTok's U.S. business and ByteDance's stake falling below 20%. However, a broader measure of social media stocks ended the week down nearly 7%, reflecting investor concern about potential regulatory challenges in a more protectionist environment.
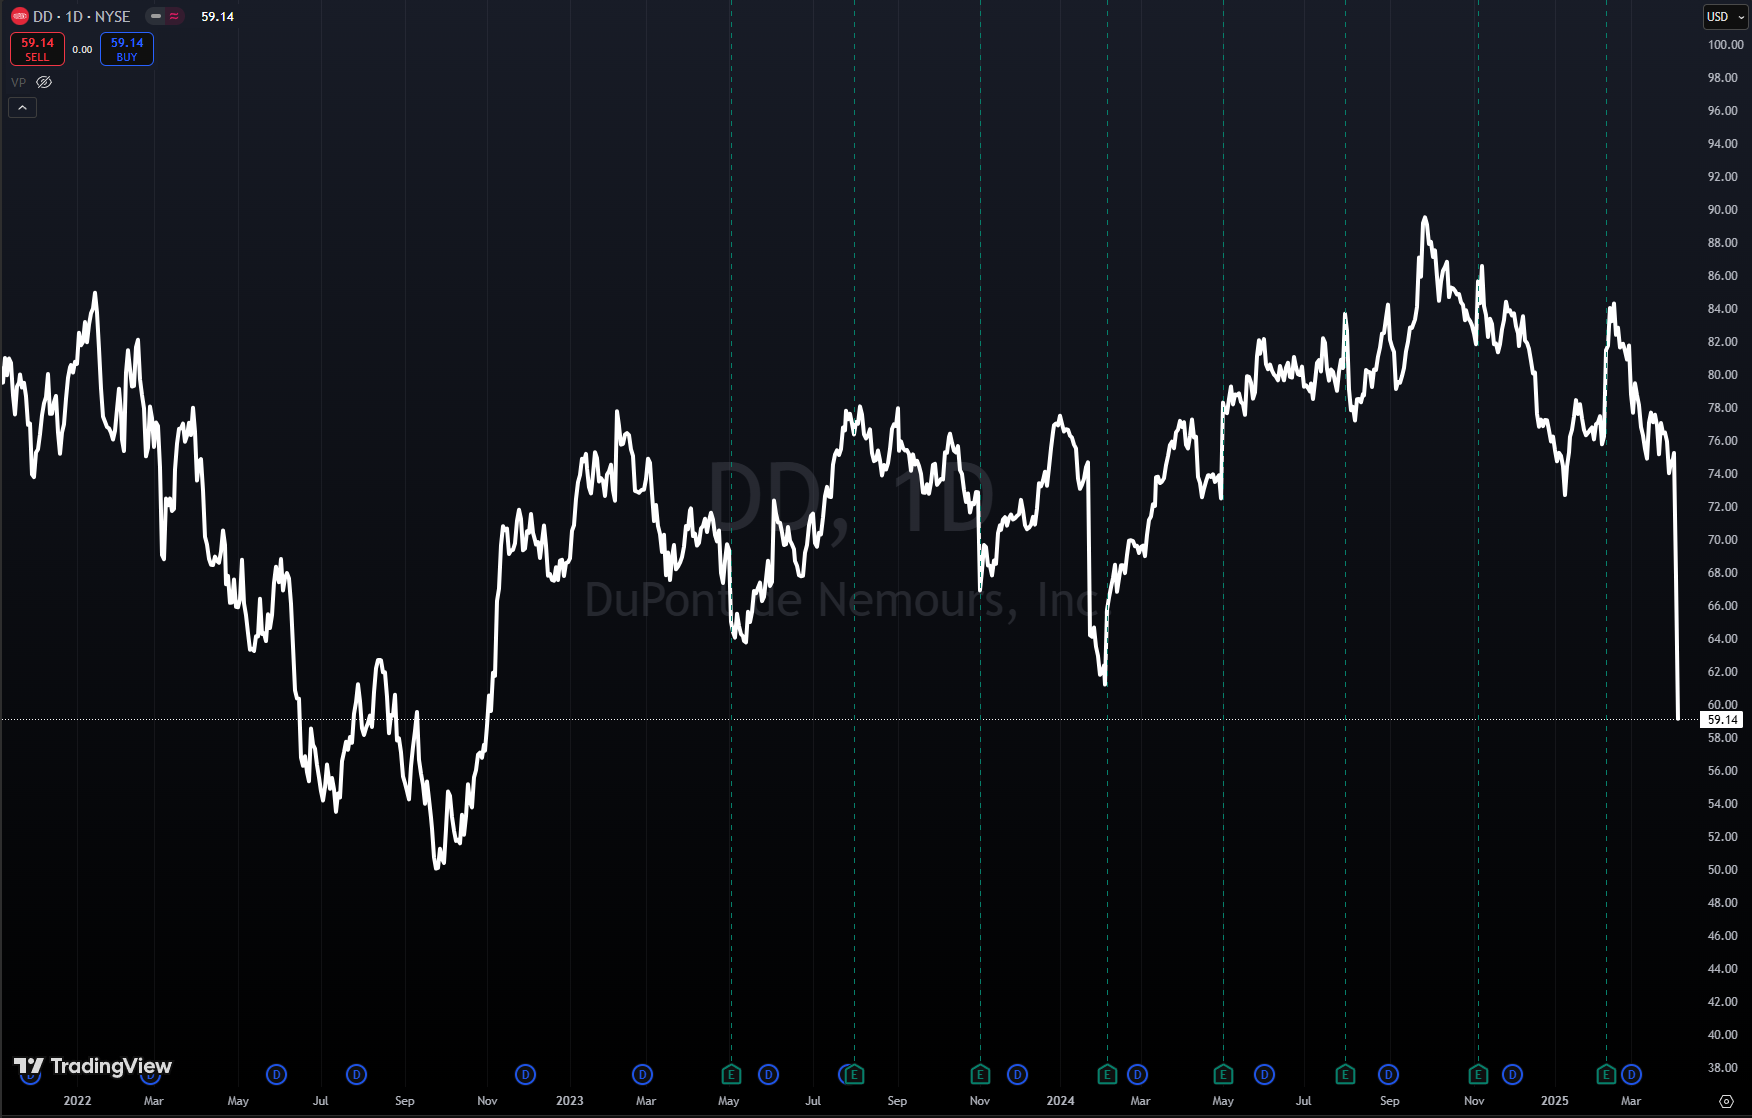
Some companies face direct regulatory threats from China. GE HealthCare Technologies saw its shares fall more than 15% after China initiated an anti-dumping investigation into imports of medical X-ray tubes from the U.S. Similarly, DuPont de Nemours dropped more than 12% after China's market regulator announced an investigation into alleged antitrust violations by the company.
On the positive side, companies with less exposure to international trade or those positioned to benefit from shifts in supply chains may find opportunities in this changing landscape. Consumer staples companies that import relatively few of their products, such as Dollar General, have seen stronger performance. Additionally, there appears to be a rotation into traditionally defensive sectors like food producers and utilities, reflecting investor preference for businesses less exposed to global trade disruptions.
Investment Implications: Navigating Uncertainty
For investors, the current market environment presents significant challenges. The combination of heightened volatility, policy uncertainty, and potential economic disruption demands a thoughtful investment approach focused on long-term objectives rather than short-term market movements.
History suggests that market reactions to policy shocks often involve overshooting, followed by adjustment as the actual economic impacts become clearer. While the magnitude of the current tariff proposals is unprecedented in recent decades, certain investment principles remain relevant for navigating this uncertainty.
First, diversification has demonstrated its value in 2025. Despite volatility in U.S. equity markets, international stocks and U.S. investment-grade bonds have posted positive returns year-to-date, helping to offset the impact of U.S. stock underperformance for investors with well-diversified portfolios. This pattern underscores the importance of maintaining exposure to a variety of asset classes to smooth periods of volatility and benefit from rotating market leadership.

Second, within U.S. equities, a balanced approach between growth and value investments may provide resilience. Sectors like healthcare and financials, which potentially have less direct exposure to tariffs, may offer relatively attractive opportunities. Additionally, maintaining a strategic allocation to U.S. investment-grade bonds, which have served as a safe haven during market volatility, could provide portfolio stability during turbulent periods.
Third, maintaining a long-term perspective remains essential. Market timing—attempting to exit the market before declines and re-enter before recoveries—has consistently proven difficult to execute successfully. Missing just the best few trading days over a multi-year period can significantly reduce overall returns, and many of the strongest market days occur during periods of heightened volatility. For instance, an investment of $10,000 in the S&P 500 from 1995 to 2024 would have grown substantially more if fully invested throughout the period compared to missing even a handful of the best market days.

Fourth, quality and resilience should be emphasized in investment selection. Companies with strong balance sheets, pricing power, and adaptable business models may be better positioned to navigate the challenges of a more protectionist trade environment. Additionally, businesses with predominantly domestic operations might face fewer disruptions from international trade tensions.
Looking Ahead
The market turmoil of the past week represents more than a typical correction—it signals a potential inflection point in global trade relations with far-reaching implications for economic growth, inflation, and investment returns. While the immediate market reaction has been severe, the longer-term impact will depend on multiple factors, including the implementation details of the tariff policies, international responses, and the adaptability of businesses and supply chains.
For now, significant uncertainty remains. President Trump has suggested openness to tariff reductions if foreign nations offer "phenomenal" concessions, indicating some potential flexibility in the U.S. position. Additionally, the actual economic impact of these policies may differ from initial market fears as businesses adjust strategies and supply chains evolve.
What seems clear is that volatility is likely to remain elevated in the near term as markets digest these policy changes and assess their implications. For investors, this environment demands patience, discipline, and a focus on long-term financial objectives rather than short-term market movements.
The coming weeks will be critical in determining whether this market correction represents a temporary disruption or the beginning of a more prolonged adjustment to a fundamentally different trade landscape. Either way, the events of the past week have served as a powerful reminder of how quickly market conditions can change and the importance of maintaining a resilient investment approach capable of weathering periods of heightened uncertainty.
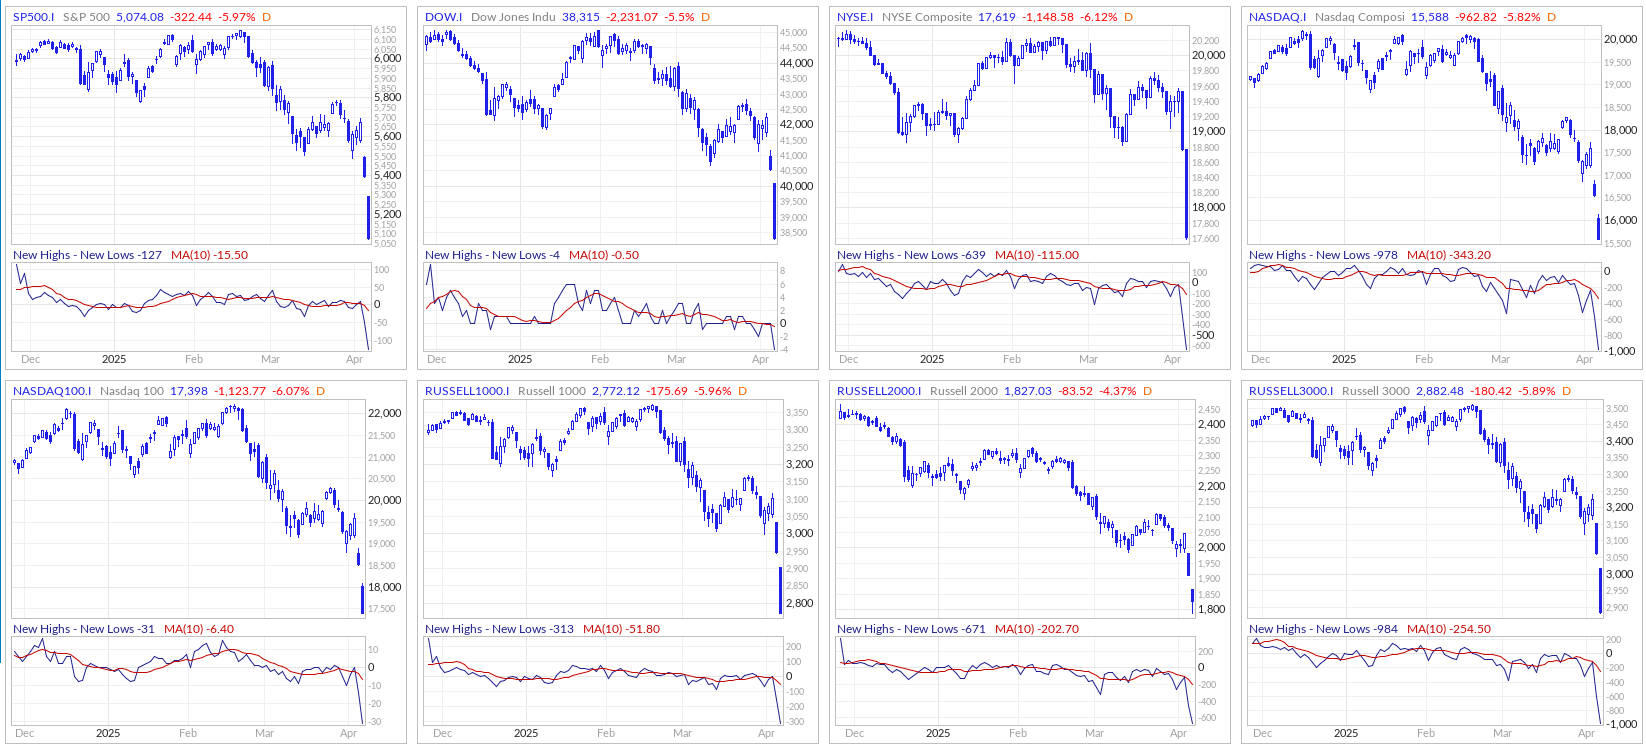
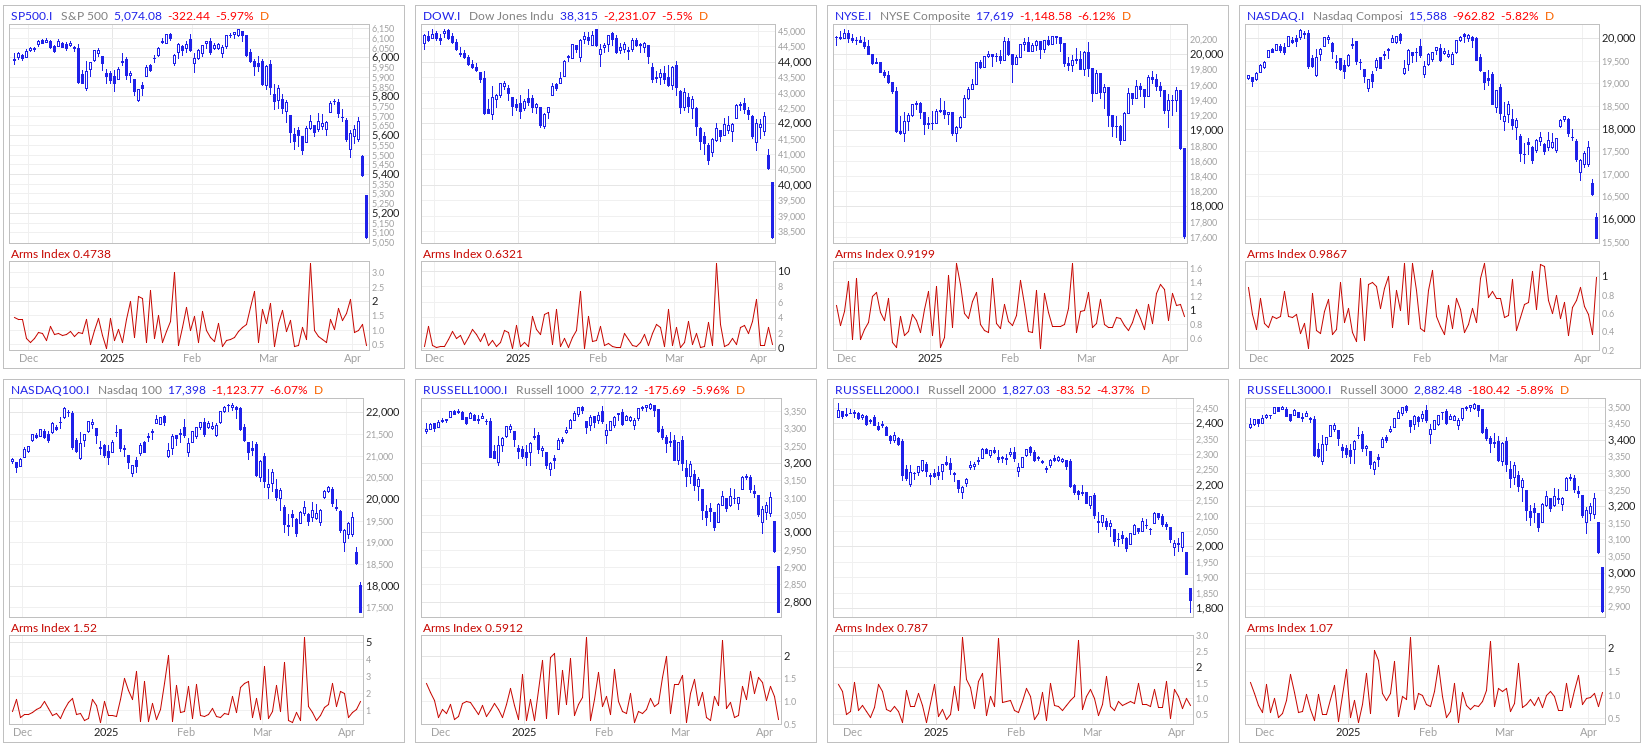
Range, Breadth, New Highs & Lows By Index
S&P Indices
Dow Jones Indices
NASDAQ 100 Indices
Russel 1000
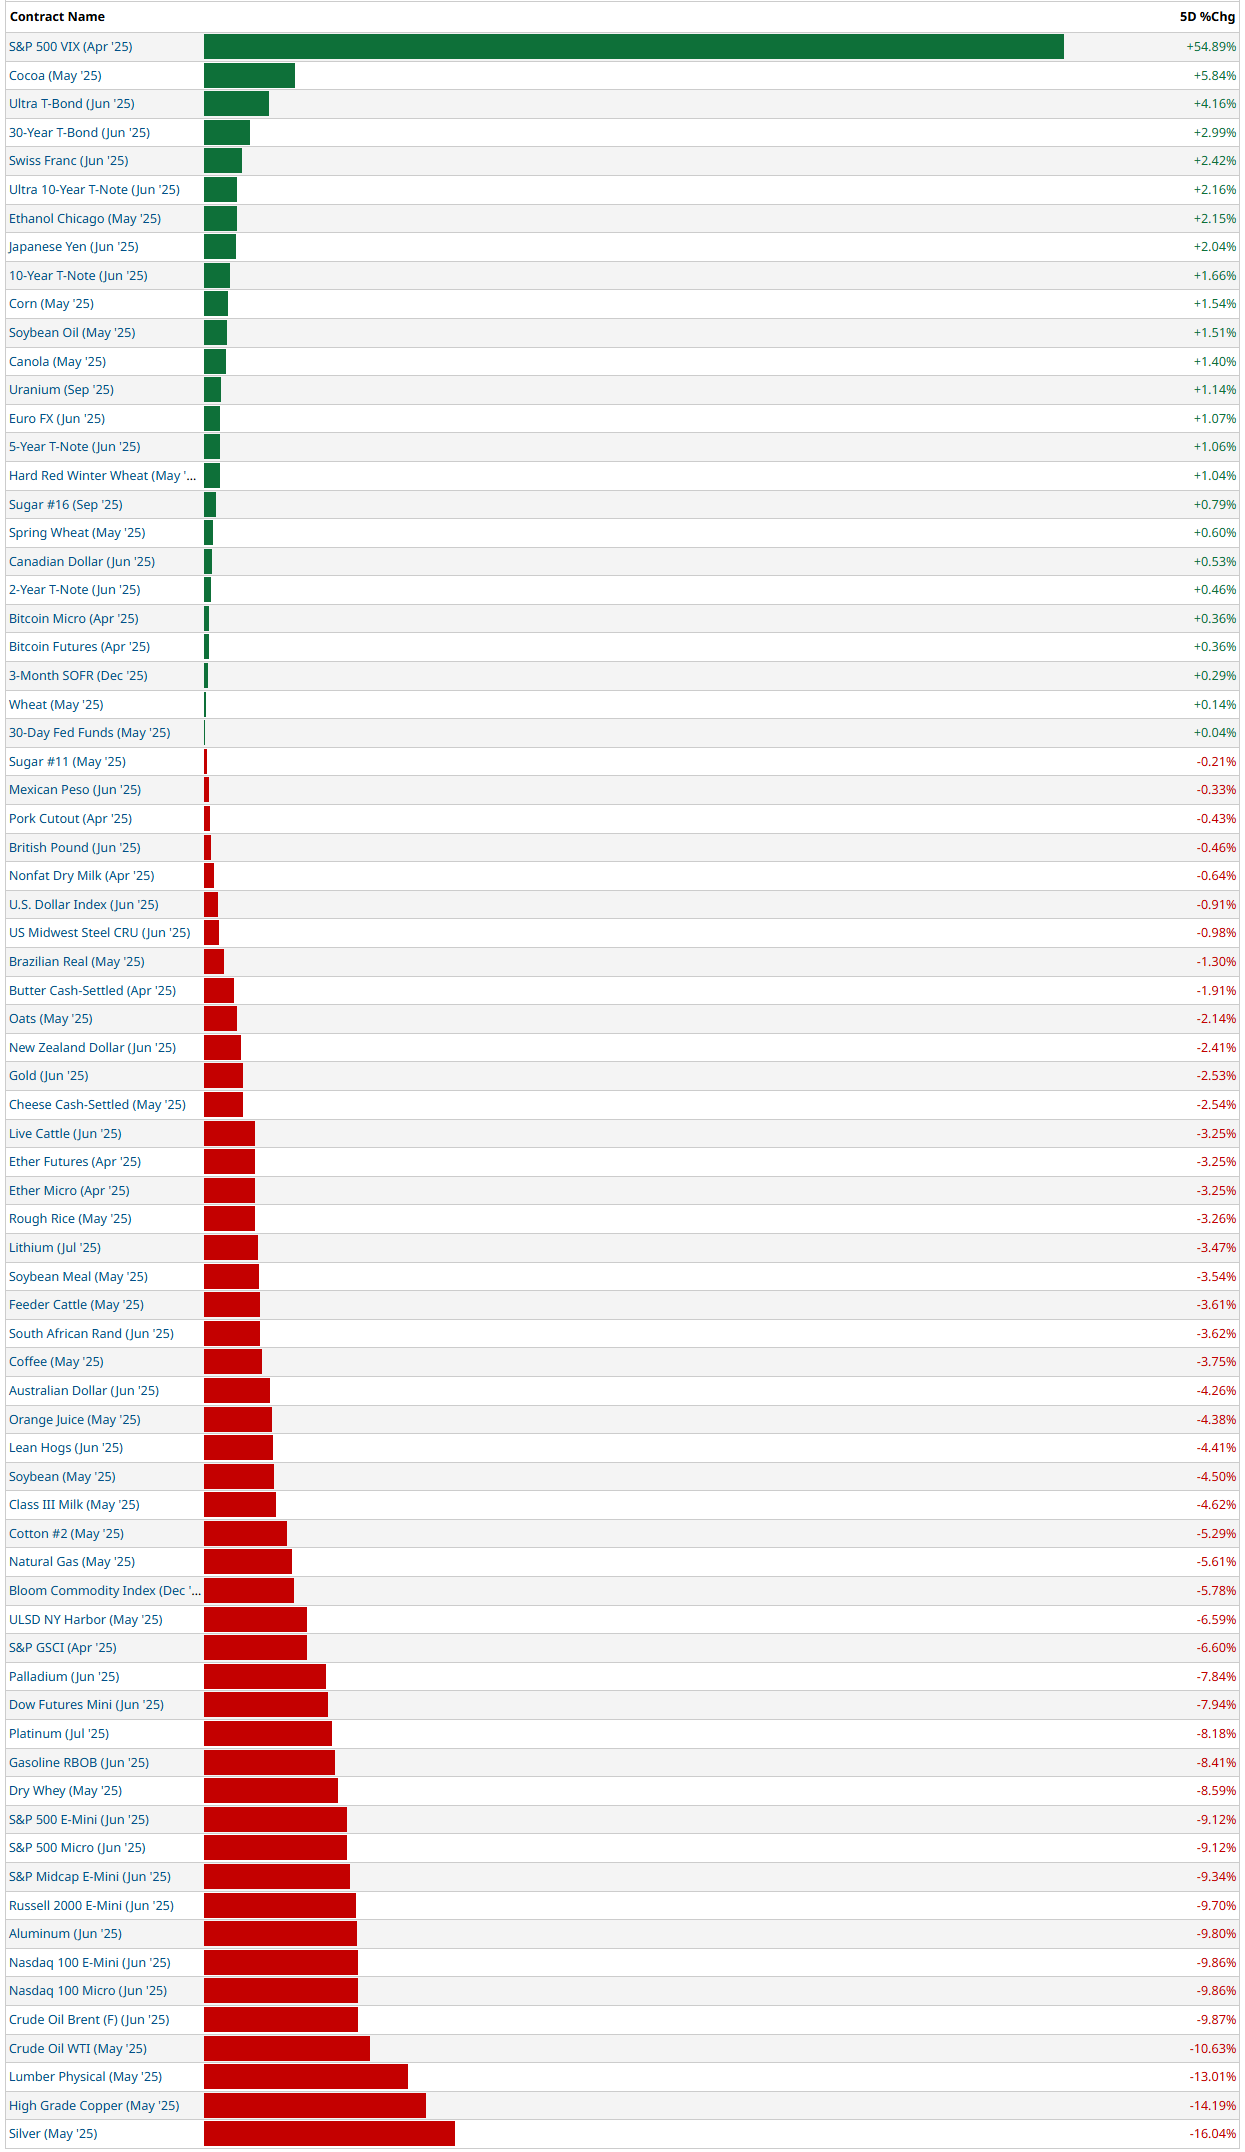
5-Day Futures Performance Leaders

Market Intelligence Report: An Insider Preview of This Week's Top Institutional Trades
Breaking Down This Week's $42+ Billion In Institutional Trading Activity
Our exclusive data captures 758 institutional trades worth over $42.75 billion across 469 unique tickers, revealing how professional investors are positioning capital in today's complex market environment. These aren't casual retail trades—these represent significant institutional conviction, both bullish and bearish.
Mega Movers: The Largest Capital Deployments
Microsoft (MSFT) leads with a massive $3.28 billion position showing extraordinary relative size (307.97x)—the largest single institutional trade this week. This positioning comes amid crucial AI developments, huge international headlines and a blowback in markets that has seen little in terms of relief. Are there still bullish expansion opportunities for this giant or lingering concerns about valuation after recent rallies?
S&P 500 Index ( SPY 0.00%↑ ) attracted multiple billion-dollar trades totaling $6.03 billion, reflecting intense institutional focus on broad market direction. With two SPY trades alone exceeding $3.2 billion and $2.8 billion respectively, institutions are taking decisive macro positions as market uncertainty persists.
Communication Services Under Scrutiny: Meta Platforms ( META 0.00%↑ ) and Alphabet ( GOOGL 0.00%↑ ) each saw institutional positions exceeding $1.4 billion, representing major bets on the future of digital advertising and AI competition within the space.
📈 Sector Positioning: The Institutional Battlegrounds
Large Caps Dominance: This sector attracted $11.23 billion across 58 trades with an average position size of $193.6 million—significantly higher than any other sector. The notable 20.7% of trades with top-tier rankings (1-5) indicates strong institutional conviction despite potential downside risks.
Communication Services Divergence: Institutions deployed $6.68 billion with an average relative size of 17.37x suggests conflicting institutional viewpoints on digital media and telecom prospects.
Bonds Strategic Positioning: With the second-highest average relative size (22.81x) across 48 trades worth $4.1 billion, fixed income is seeing institutional attention ahead of potential policy shifts. High-yield bonds attracted $988 million with unusually strong conviction (25% are top-ranked trades).
Utilities' Surprising Strength: Though modest in total value ($447.6 million), utilities show the best average rank (9.83) of any major sector. Are institutions ready to double-down in defensives or start putting money back to work in other sectors?
🎯 Hidden Intelligence: Revealing Institutional Conviction
Industry Leadership Rotation: Software ($3.39B), Interactive Media ($3.33B), and Entertainment ($2.06B) are seeing the highest institutional capital flows, but Entertainment shows dramatically stronger conviction with 40% of trades receiving top rankings versus 0% for Software and Interactive Media.
Broadcasting Signals: NMAX 0.00%↑ leads all stocks with 25 separate institutional trades including a top-ranked position, suggesting intense institutional focus on this communications player. After running up this name over 1700% only to give most of it back, you’re going to want to have a look at the data to see where institutions staked-out positions.
Aerospace & Defense Focus: This industry attracted $651 million across 16 trades, with particularly strong activity in SARO 0.00%↑ (6 trades totaling $152 million). This concentrated positioning comes amid escalating global tensions and defense spending increases.
Software Infrastructure Battleground: CRWV 0.00%↑ saw 22 institutional trades totaling $318 million, placing it among the most actively traded stocks by frequency. Our data shows you where institutions are positioned so you can figure out if you’re on the right side of their trade.
💎 Under-the-Radar Opportunities
Beacon Roofing Supply ( BECN 0.00%↑ ): This industrial distributor captured an institutional position with remarkable relative size (111.46x) and a #1 rank—the highest-conviction trade among non-index tickers. At $243 million, this position represents substantial institutional confidence in the housing and construction materials sector.
Live Nation Entertainment ( LYV 0.00%↑ ): A #2 ranked $362 million position with 98.64x relative size indicates major institutional positioning in the live events space. Is someone anticipating post-pandemic growth acceleration or industry consolidation?
Omnicom Group ( OMC 0.00%↑ ): This media agency attracted a $304 million position with 86.98x relative size and a high #6 rank, suggesting institutional expectations for significant movements in advertising spend allocation and the name itself.
🧠 The Bottom Line
Institutional capital is being deployed with precision across both broad market exposures and targeted sector plays. The concentration in large caps ($11.2B) alongside significant communication services positioning ($6.7B) reveals institutional investors positioning for continued market leadership from mega-caps while hedging with selective bond exposure ($4.1B).
What's particularly telling is the divergence between total capital deployed and conviction metrics—sectors receiving the most dollars aren't necessarily showing the strongest conviction signals. This suggests institutional investors are maintaining core large-cap exposure while building conviction positions in specific utilities, energy, and materials names.

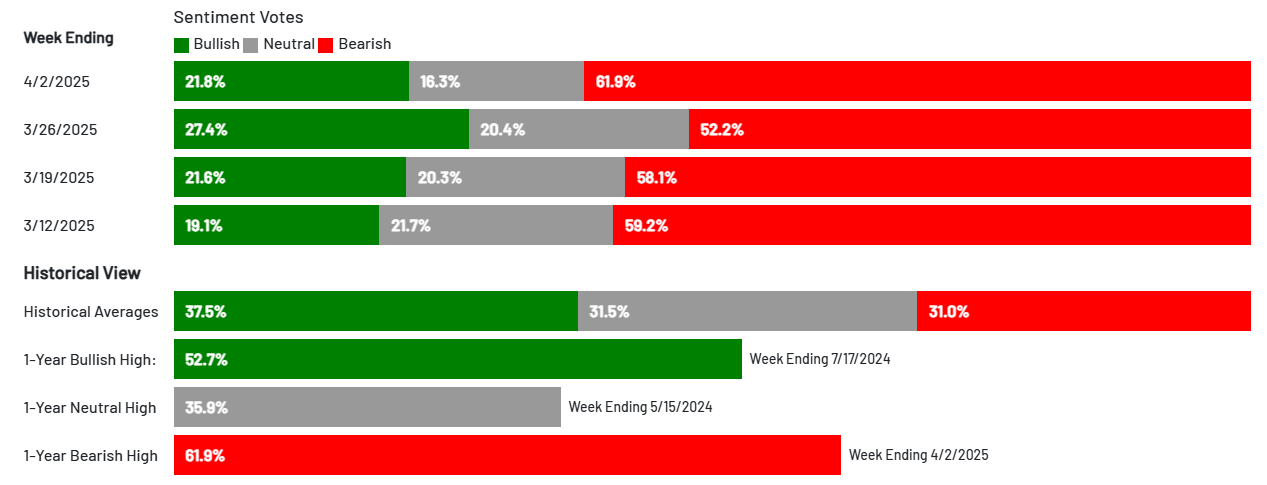
US Investor Sentiment
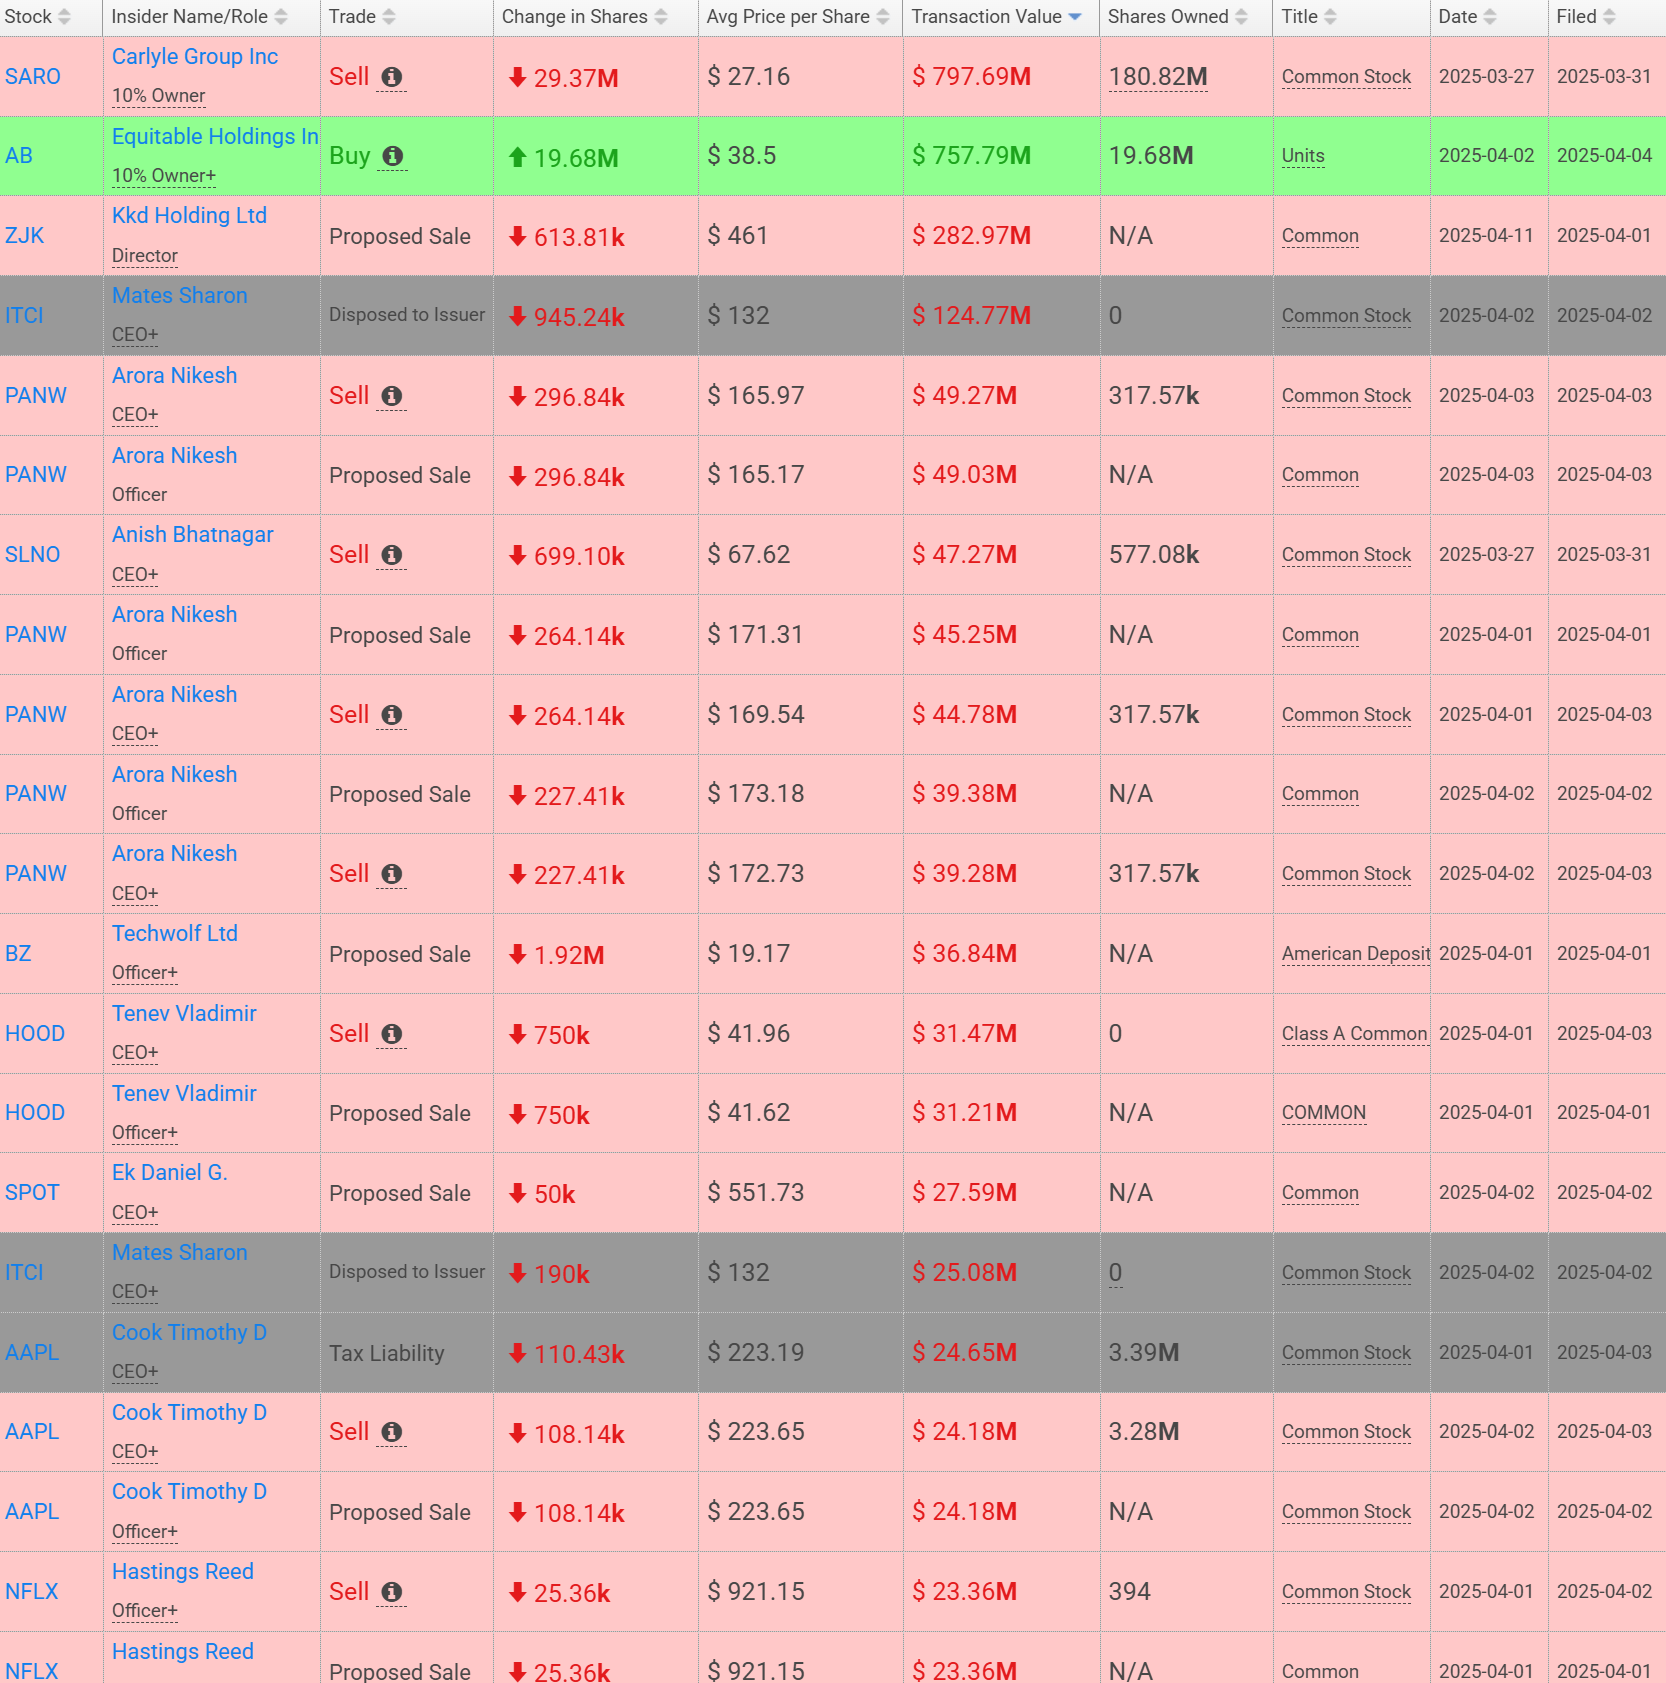
Insider Trading
Insider trading occurs when a company’s leaders or major shareholders trade stock based on non-public information. Tracking these trades can reveal insider expectations about the company’s future. For example, large purchases before an earnings report or drug trial results might indicate confidence in upcoming good news.
%Bull-Bear Spread
The %Bull-Bear Spread chart is a sentiment indicator that shows the difference between the percentage of bullish and bearish investors, often derived from surveys or sentiment data, such as the AAII (American Association of Individual Investors) sentiment survey. This spread tells investors about the prevailing mood in the market and can provide insights into market extremes and potential turning points.
Bullish or Bearish Sentiment:
When the spread is positive, it means more investors are bullish than bearish, indicating optimism about the market’s direction.
A negative spread indicates more bearish sentiment, meaning more investors expect the market to decline.
Contrarian Indicator:
The %Bull-Bear Spread is often used as a contrarian indicator. For example, extremely high levels of bullish sentiment might suggest that the market is overly optimistic and could be due for a correction.
Similarly, when bearish sentiment is extremely high, it might indicate that the market is overly pessimistic, and a rally could be on the horizon.
Market Extremes and Reversals:
Historically, extreme values of the spread (both positive and negative) can signal turning points in the market. A very high positive spread can signal market exuberance, while a very low or negative spread may indicate fear or capitulation.
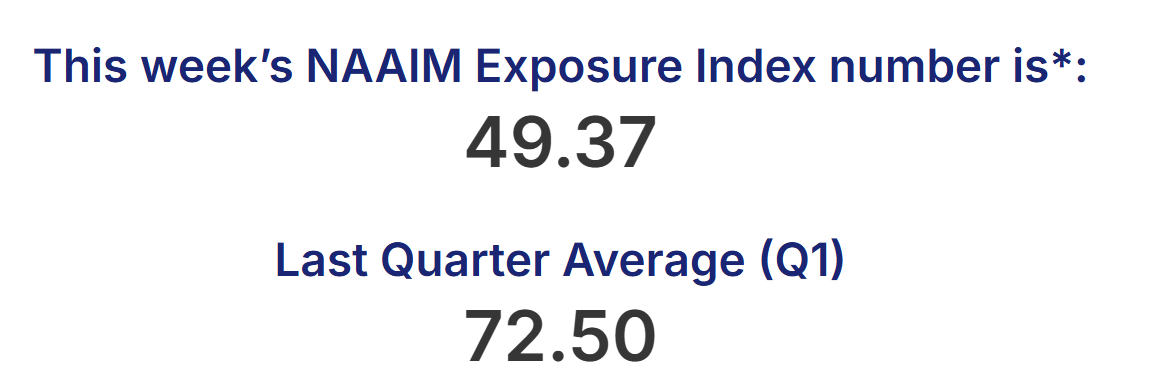
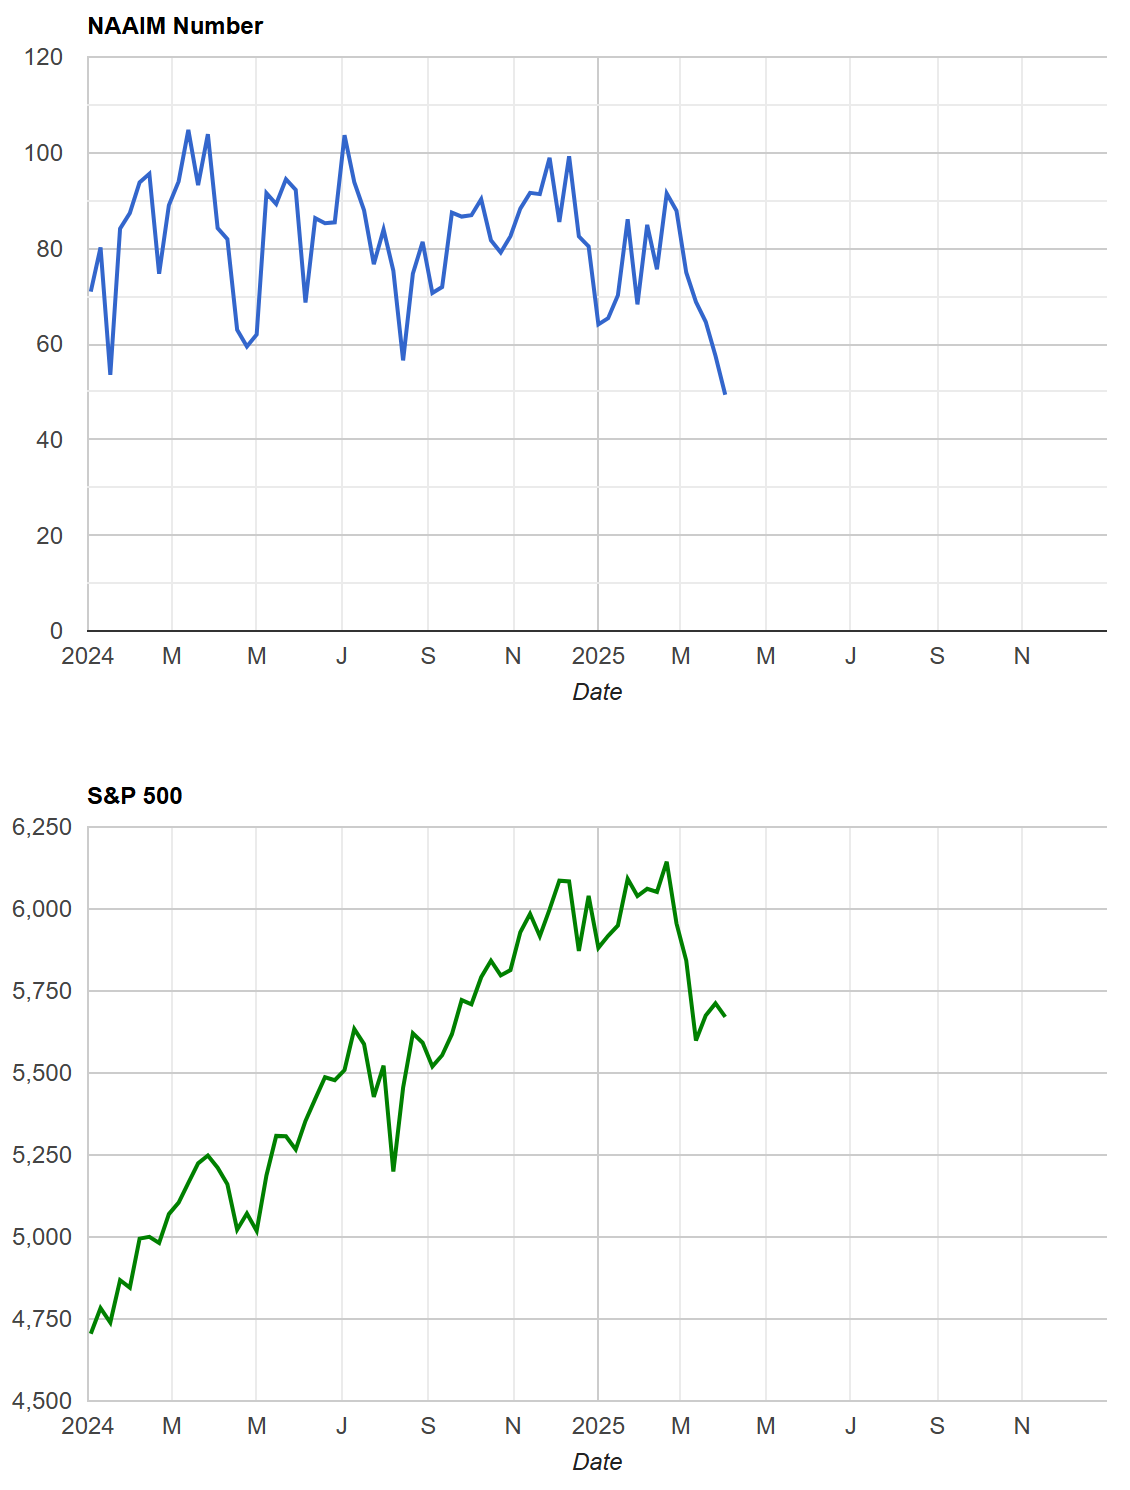
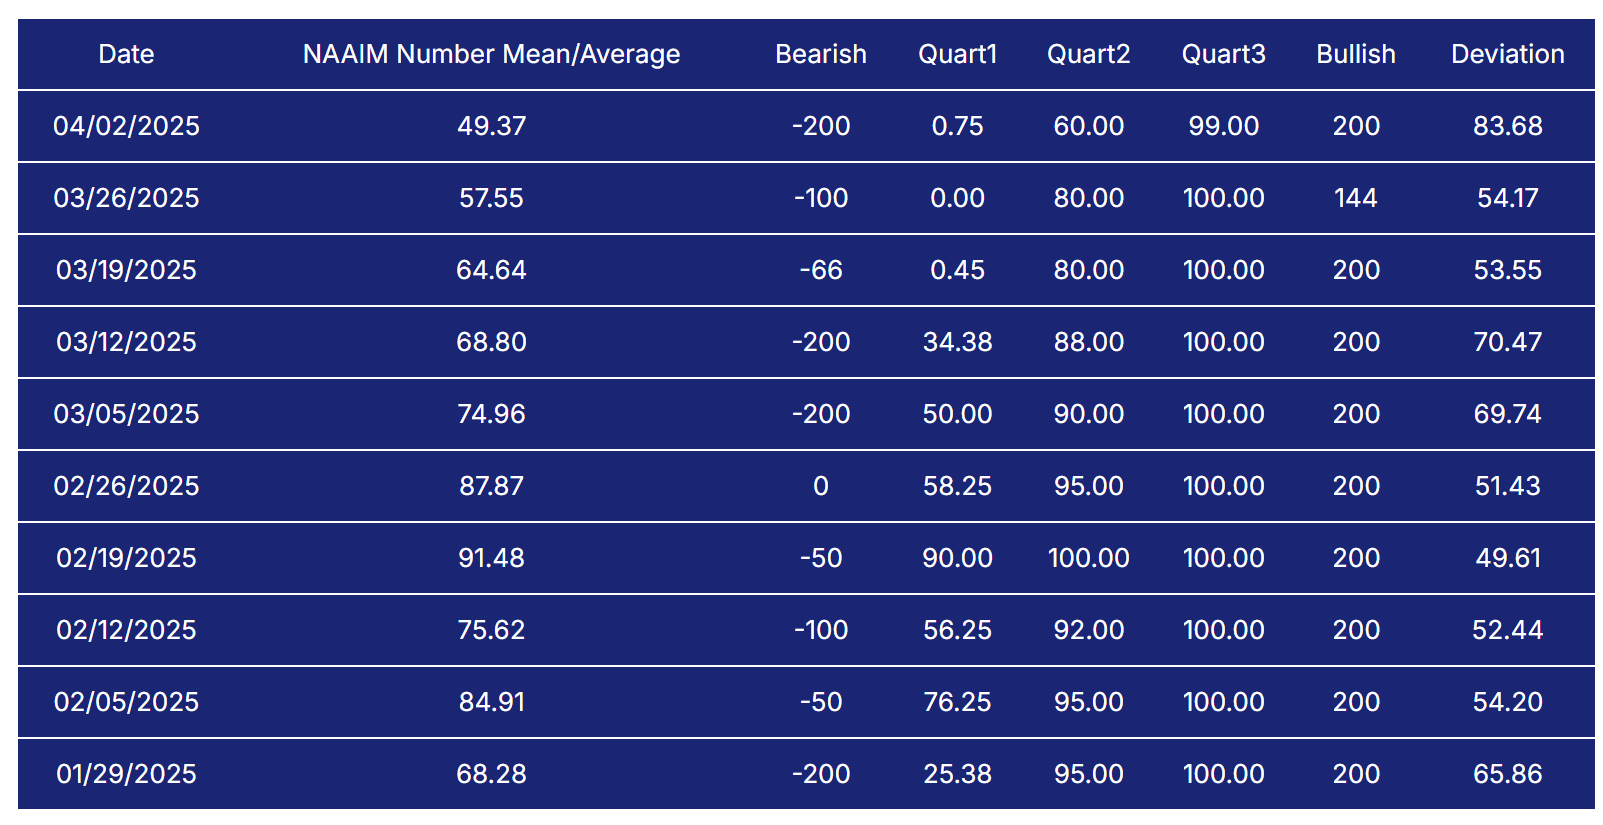
NAAIM Exposure Index
The NAAIM Exposure Index (National Association of Active Investment Managers Exposure Index) measures the average exposure to U.S. equity markets as reported by its member firms. These are typically active money managers who provide their equity exposure levels weekly. The index offers insight into how much these managers are investing in equities at any given time, ranging from being fully short (-100%) to leveraged long (up to +200%).
AAII Investor Sentiment Survey
The AAII Investor Sentiment Survey is a weekly survey conducted by the American Association of Individual Investors (AAII) to gauge the mood of individual investors regarding the direction of the stock market over the next six months. It provides insights into whether investors are feeling bullish (expecting the market to rise), bearish (expecting the market to fall), or neutral (expecting the market to stay about the same).
Key Points:
Bullish Sentiment: Reflects the percentage of investors who believe the stock market will rise in the next six months.
Bearish Sentiment: Represents those who expect a decline.
Neutral Sentiment: Reflects investors who anticipate little to no market movement.
The survey is widely followed as a contrarian indicator, meaning that extreme levels of bullishness or bearishness can sometimes signal market turning points. For example, when a large number of investors are overly optimistic (high bullish sentiment), it could suggest a market top, while excessive pessimism (high bearish sentiment) may indicate a market bottom is near.
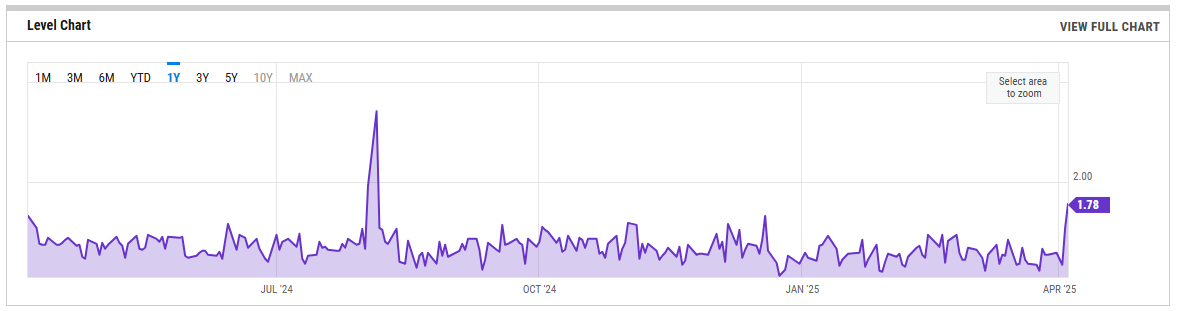
SPX Put/Call Ratio
The SPX Put/Call Ratio is an indicator that is used to gauge market sentiment. This is calculated as the ratio between trading S&P 500 put options and S&P call options. A high put/call ratio can indicate fear in the markets, while a low ratio indicates confidence. For example, in 2015, the Put-Call ratio was as high as 3.77 because of market fears stemming from various global economic issues like a GDP growth slowdown in China and a Greek debt default.
CBOE Equity Put/Call Ratio
The CBOE (Chicago Board Options Exchange) equity put/call ratio is a sentiment indicator used by traders and analysts to gauge market sentiment and potential shifts in investor behavior. It is calculated by dividing the volume of put options by the volume of call options on equities. Here’s what it reveals and how it is generally interpreted:
High Put/Call Ratio: When the put/call ratio is high (above 1.0), it suggests that there is more demand for put options than call options. This typically reflects a more bearish sentiment, as investors may be hedging against potential declines or expecting the market to fall.
Low Put/Call Ratio: Conversely, a low put/call ratio (below 0.7) indicates a higher volume of call options compared to puts, reflecting bullish sentiment. Investors may be expecting upward momentum and are positioning themselves to profit from price gains
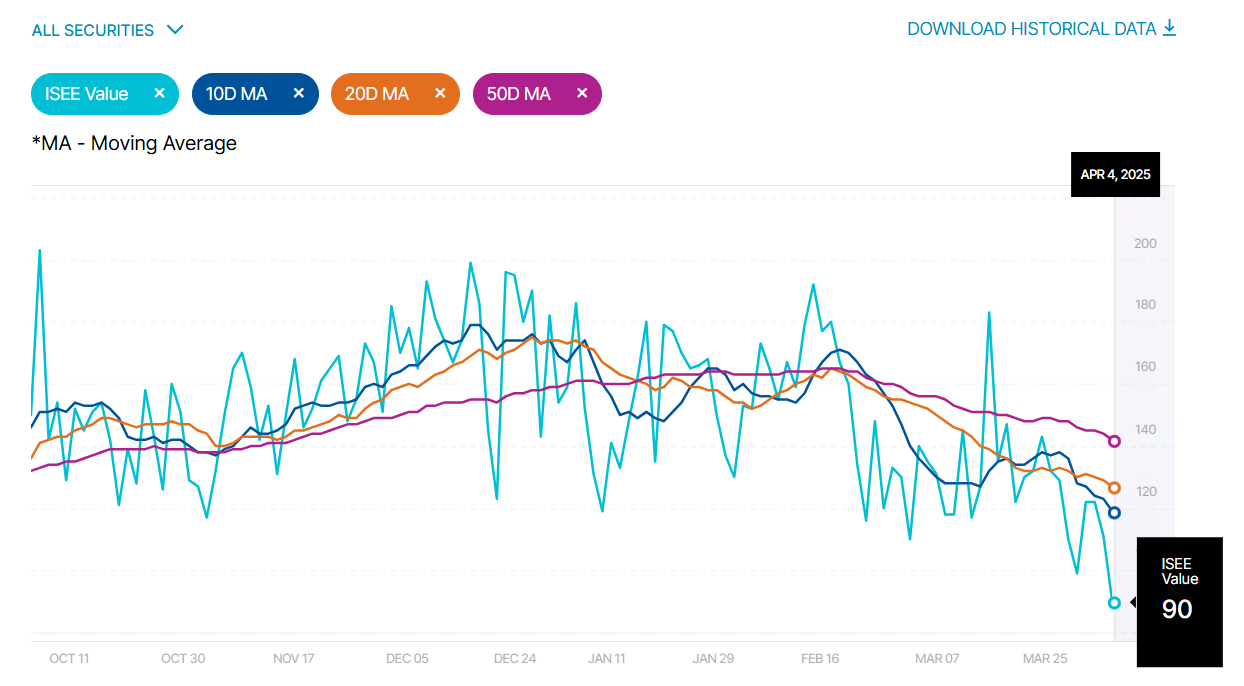
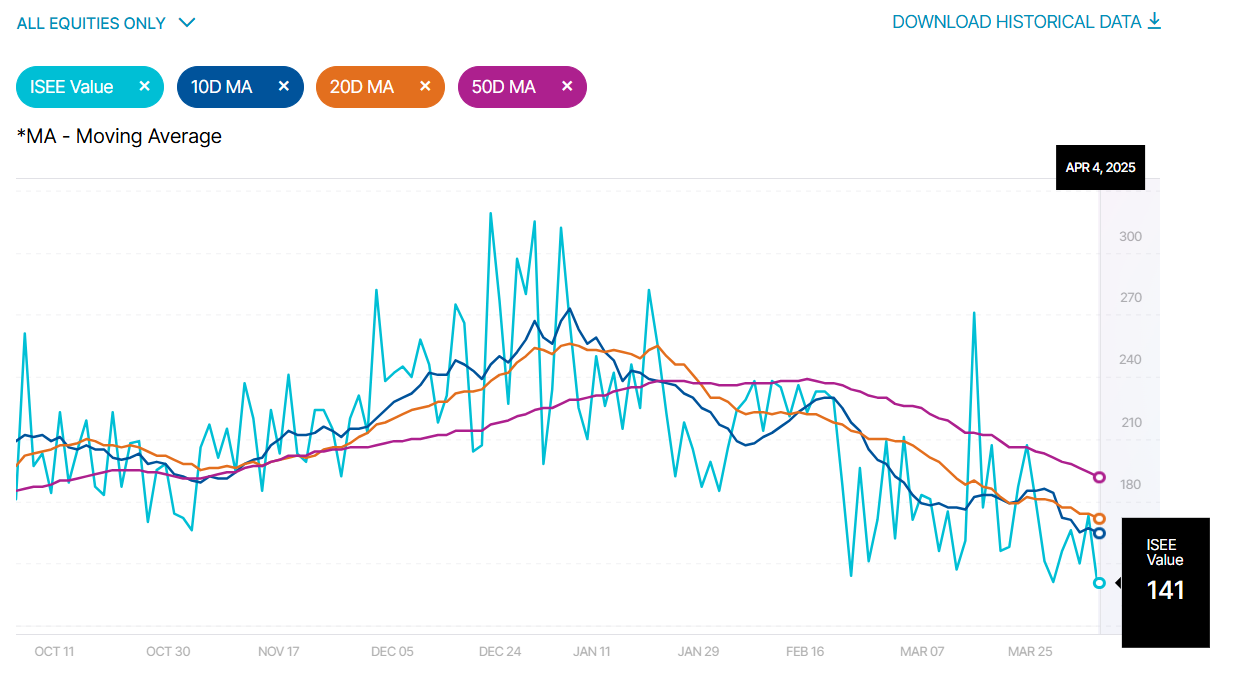
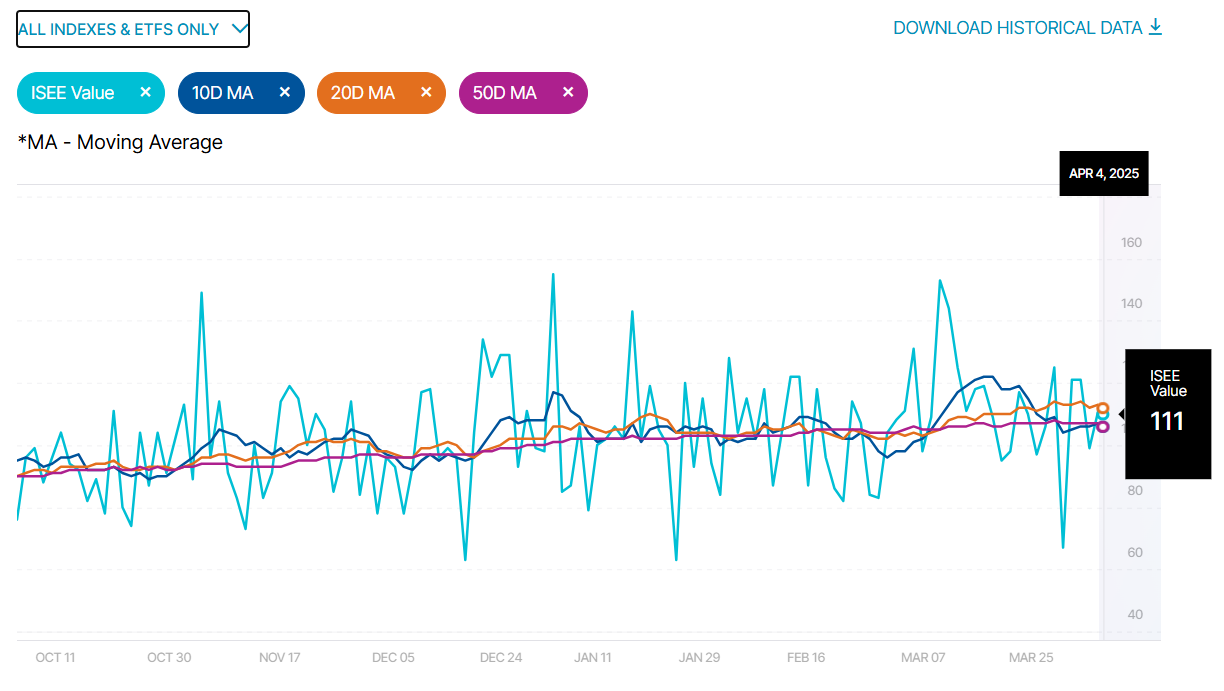
ISEE Sentiment Index
The ISEE (International Securities Exchange Sentiment) Index is a measure of investor sentiment derived from options trading. Unlike traditional put/call ratios, the ISEE Index focuses only on opening long customer transactions and is adjusted to remove market-maker and firm trades, providing a purer sentiment reading.
The ISEE Index typically ranges from 0 to 200, with readings above 100 indicating more call options being bought relative to put options, suggesting bullish sentiment. Conversely, readings below 100 suggest bearish sentiment, with more puts being purchased relative to calls.
New Highs - New Lows
The New Highs - New Lows indicator (NH-NL) displays the daily difference between the number of stocks reaching new 52-week highs and the number of stocks reaching new 52-week lows. The NH-NL indicator generally reaches its extreme lows slightly before a major market bottom. As the market then turns up from the major bottom, the indicator jumps up rapidly. During this period, many new stocks are making new highs because it's easy to make a new high when prices have been depressed for a long time. The NH-NL indicator oscillates around zero. If the indicator is positive, the bulls are in control. If it is negative, the bears are in control. As the cycle matures, a divergence often occurs as fewer and fewer stocks are making new highs (the indicator falls), yet the market indices continue to reach new highs. This is a classic bearish divergence that indicates that the current upward trend is weak and may reverse.
ARMS Index
The Arms Index, also known as the TRIN (Short-Term TRading INdex), was developed by Richard Arms in the 1960s. It is calculated by dividing the ratio of advancing stocks to declining stocks by the ratio of advancing volume to declining volume. Interpreting the Arms Index involves looking at its value in relation to certain thresholds. A value below "1" is considered bullish, indicating that advancing stocks and volume dominate the market. Conversely, a value above "1" is considered bearish, suggesting that declining stocks and volume are more prevalent. Extremely low values (below 0.5) or high values (above 2) are often seen as potential reversal signals.
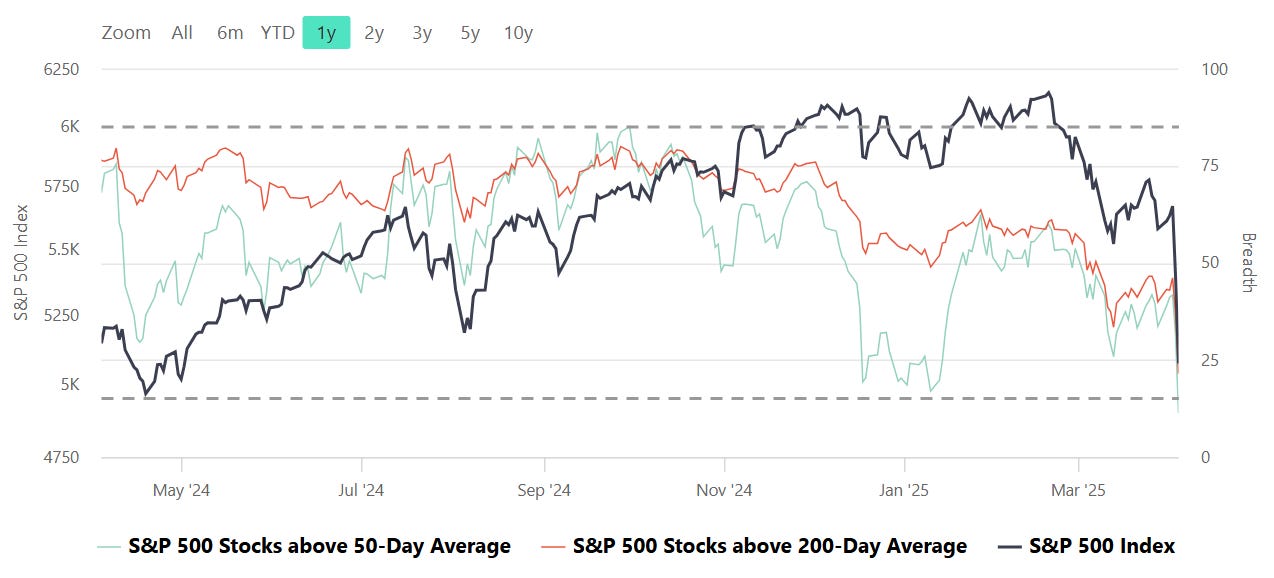
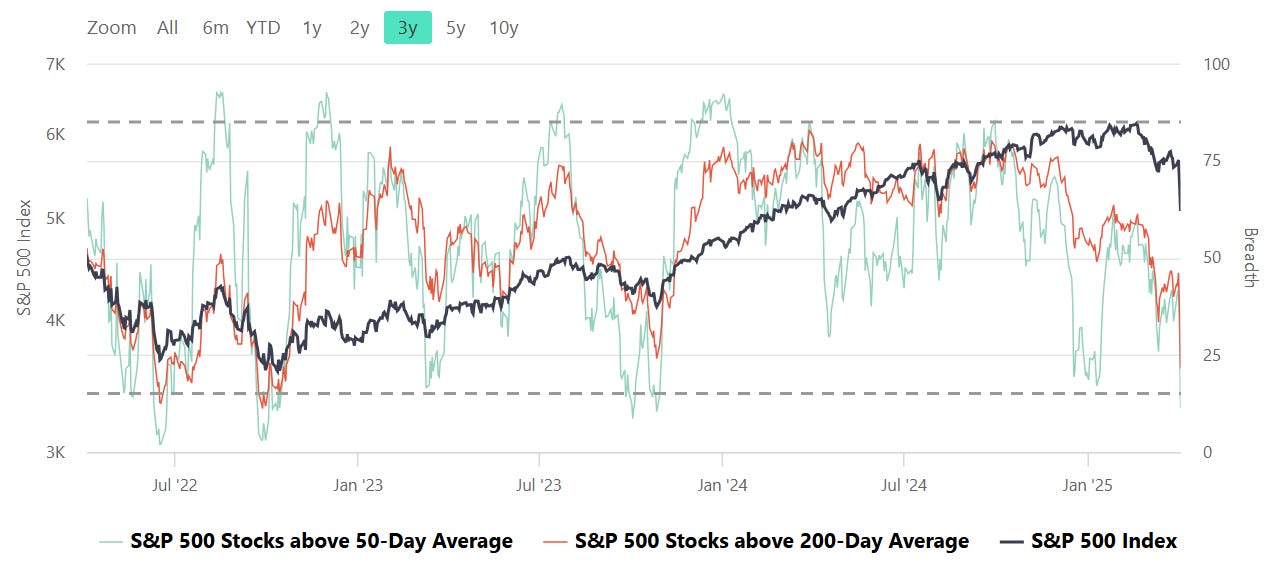
S&P Breadth
Breadth, in the context of stock market analysis, refers to the measure of how many stocks in a given index (such as the S&P 500) are participating in a trend, such as advancing or declining relative to a certain moving average (e.g., 50-day or 200-day).
Market Strength Assessment:
Breadth provides insight into whether a market rally or decline is broad-based or driven by only a few large-cap stocks. A rally supported by a high percentage of stocks above their 50-day or 200-day averages is generally considered healthier and more sustainable.
Early Warning Signals:
Divergences between breadth indicators and the index price can signal potential reversals. For example:
If the index is rising, but the number of stocks above their moving averages is declining, it may indicate weakening underlying strength and potential for a pullback.
Conversely, if breadth improves while the index remains flat or declines, it may suggest accumulating strength for a future rally.
Trend Confirmation:
Breadth indicators can confirm trends. For instance, a strong majority of stocks above their moving averages signals robust market momentum, providing confidence in the prevailing trend.
Identifying Overbought or Oversold Conditions:
Extremely high or low breadth readings can signal overbought or oversold conditions, which might lead to mean reversion. For example:
If nearly all stocks are above their 50-day or 200-day averages, it may suggest overbought conditions.
Conversely, extremely low levels indicate oversold conditions and potential for a bounce.
Breadth and Timing Investments:
Entry Points:
When breadth improves (e.g., more stocks move above their 50-day or 200-day moving averages) after a market pullback, it can indicate a good time to start building positions as the broader market is regaining strength.
Exit Points:
Breadth deterioration during a rally may suggest it’s time to reduce exposure, especially if only a small number of stocks are driving index gains. This is often a warning sign of an impending correction.
Volatility and Risk Management:
Weak breadth in volatile markets may prompt caution or defensive positioning. Conversely, improving breadth can justify taking on more risk during uptrends.
CME Fedwatch
What is the likelihood that the Fed will change the Federal target rate at upcoming FOMC meetings, according to interest rate traders? Use CME FedWatch to track the probabilities of changes to the Fed rate, as implied by 30-Day Fed Funds futures prices.
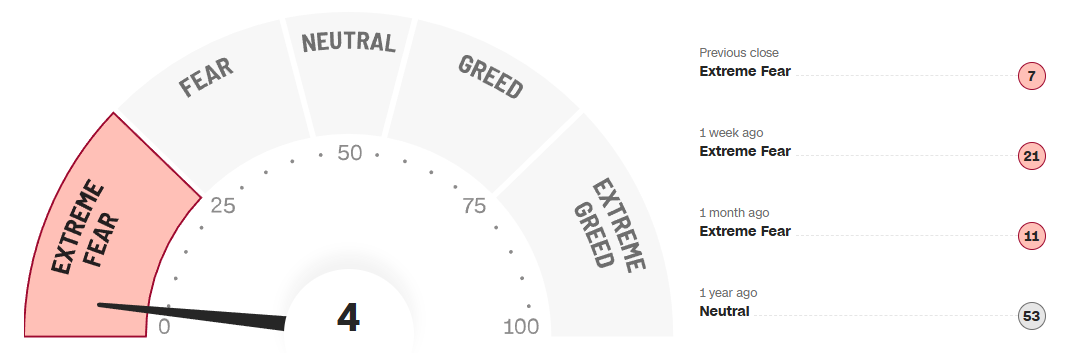
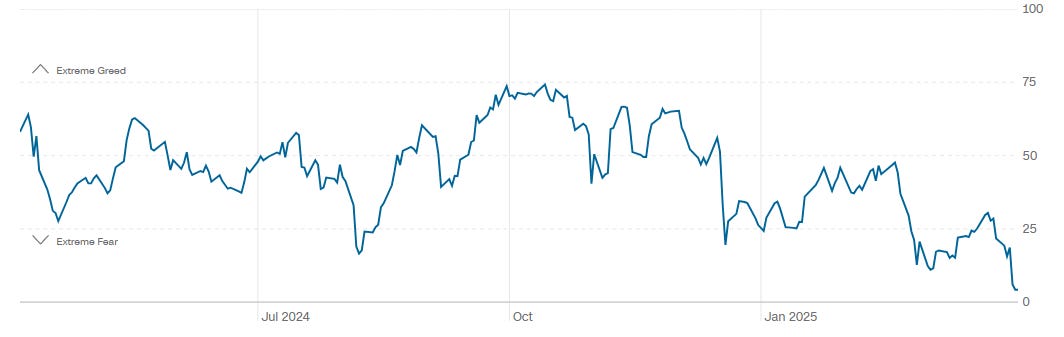
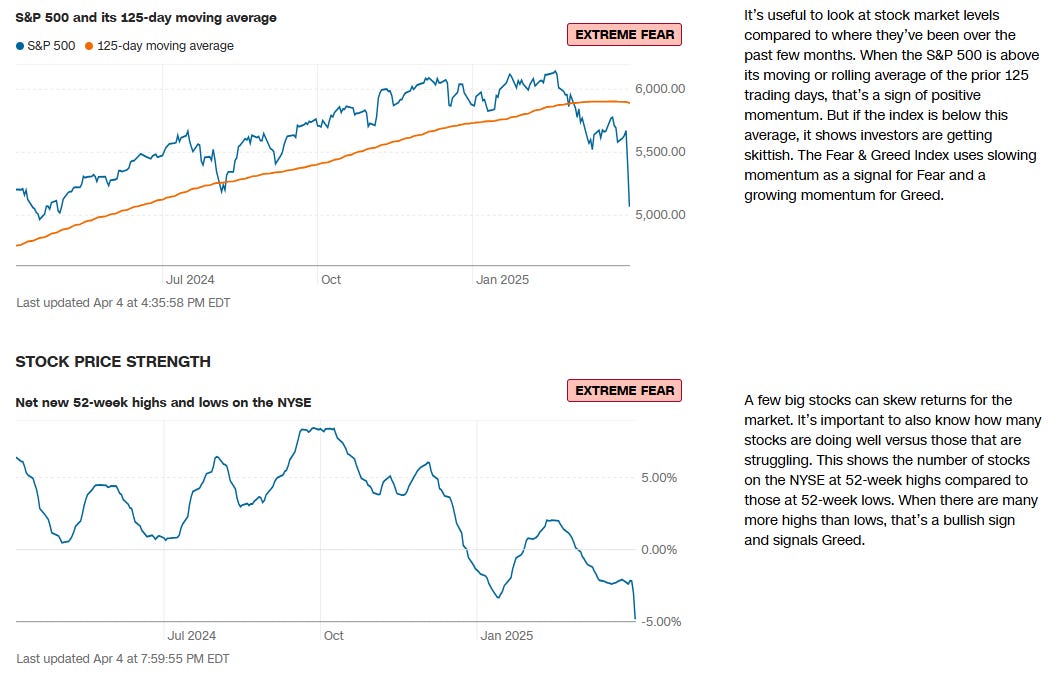
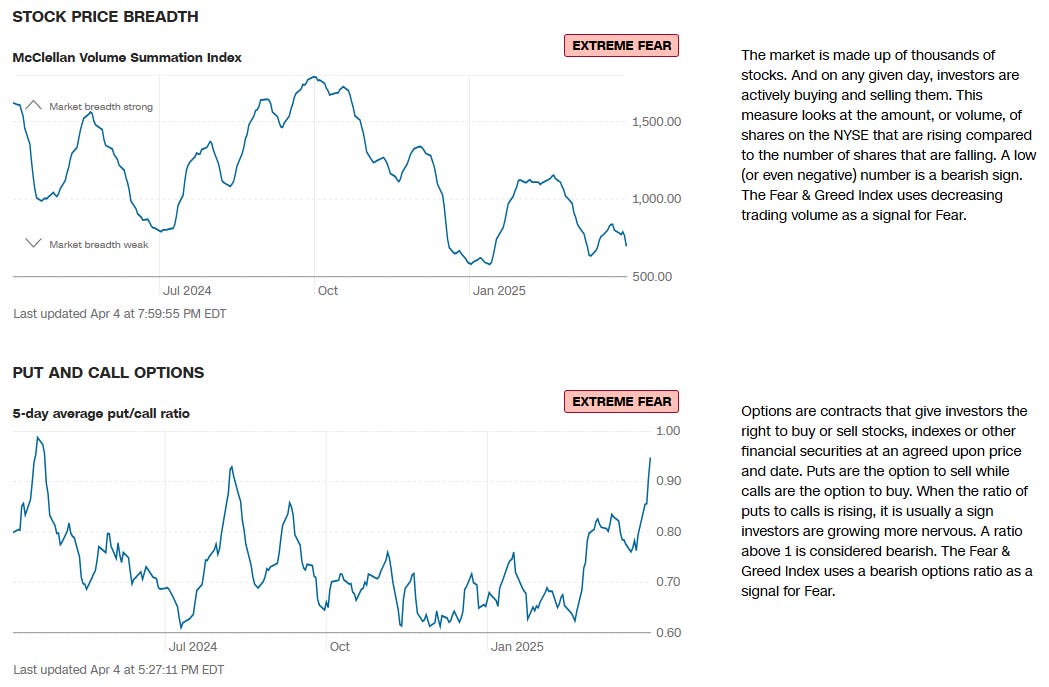
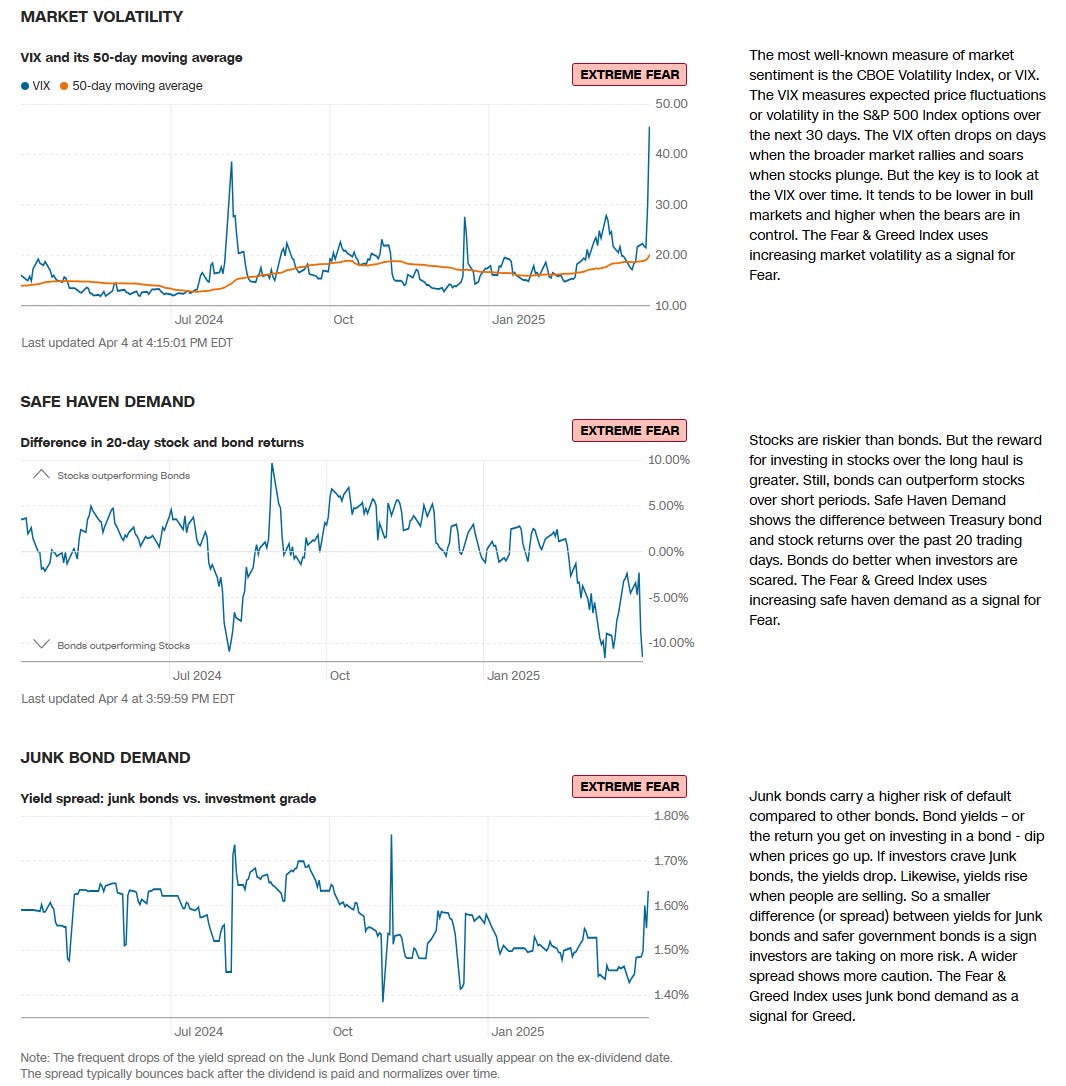
CNN Fear & Greed Constituent Data Points & Composite Index
Institutional S/R Levels for Major Indices
When you’re a large institutional player, your primary goal is to find liquidity - places to do a ton of business with the least amount of slippage possible. VolumeLeaders.com automatically identifies and visually plots the exact spots where institutions are doing business and where they are likely to return for more. It’s one of the primary reasons “support” and “resistance” concepts work and truly one of the reasons “price has memory”.
Levels from the VolumeLeaders.com platform can help you formulate trades theses about:
Where to add or take profit
Where to de-risk or hedge
What strikes to target for options
Where to expect support or resistance
And this is just a small sample; there are countless ways to leverage this information into trades that express your views on the market. The platform covers thousands of tickers on multiple timeframes to accommodate all types of traders.
SPY 0.00%↑
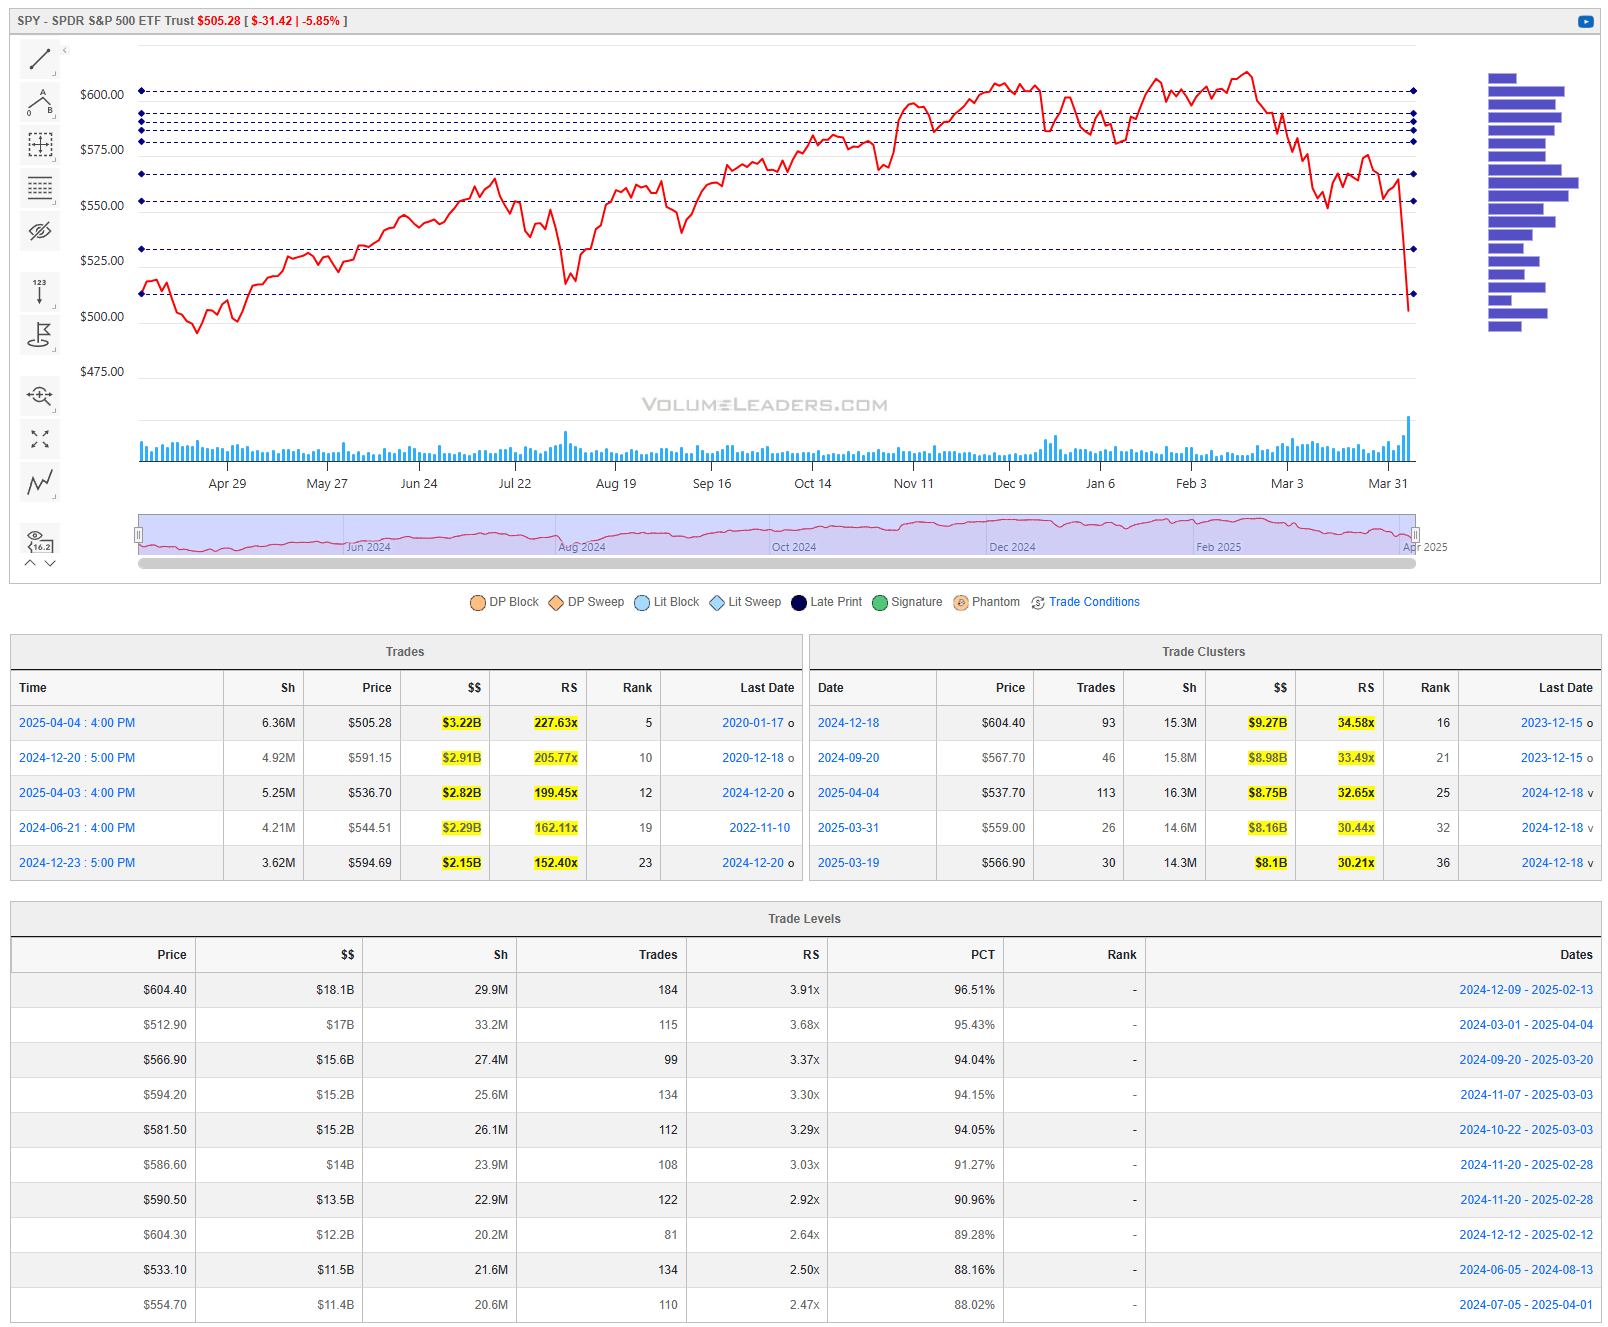
What started as an annoying time to be an investor turned into a terrible time to be invested. Price has moved swiftly to the last institutional area of interest in this chart of the past year. We don’t typically look at charts on timeframes this high but starting last week, due to the speed and conviction of the move down, we’ve been forced to zoom out. Sellers have once again closed on the lows suggesting they’ve not finished their business. There were a couple of bright spots in order flow though as we found buyers starting to step back in. SPY caught a #4-ranked trade…largest of that size seen in years; volume on the daily chart above shows what could end up being capitulatory volume but we’ll need to see some constructive structure develop quickly to start making that claim. In addition to these new developments, we saw interest in leverage in convincing size. The problems longs still face however include the fact that sellers have closed price on the lows; volatility is still elevated and above recent significant prints in related names.
Tariffs may present peak-uncertainty but everyone wants to know where that will take price?
There are lots of ways to answer this question, none come with guarantees. But I can present something that may be useful for contextualizing where we are on a relative basis. It’s very easy to visualize, easy to reproduce and easy to apply across timeframes on other instruments. Liquid markets have an unusual tendency to move in extensions. If we zoom out, order emerges from the randomness and 3 auctions, equal in range become apparent.
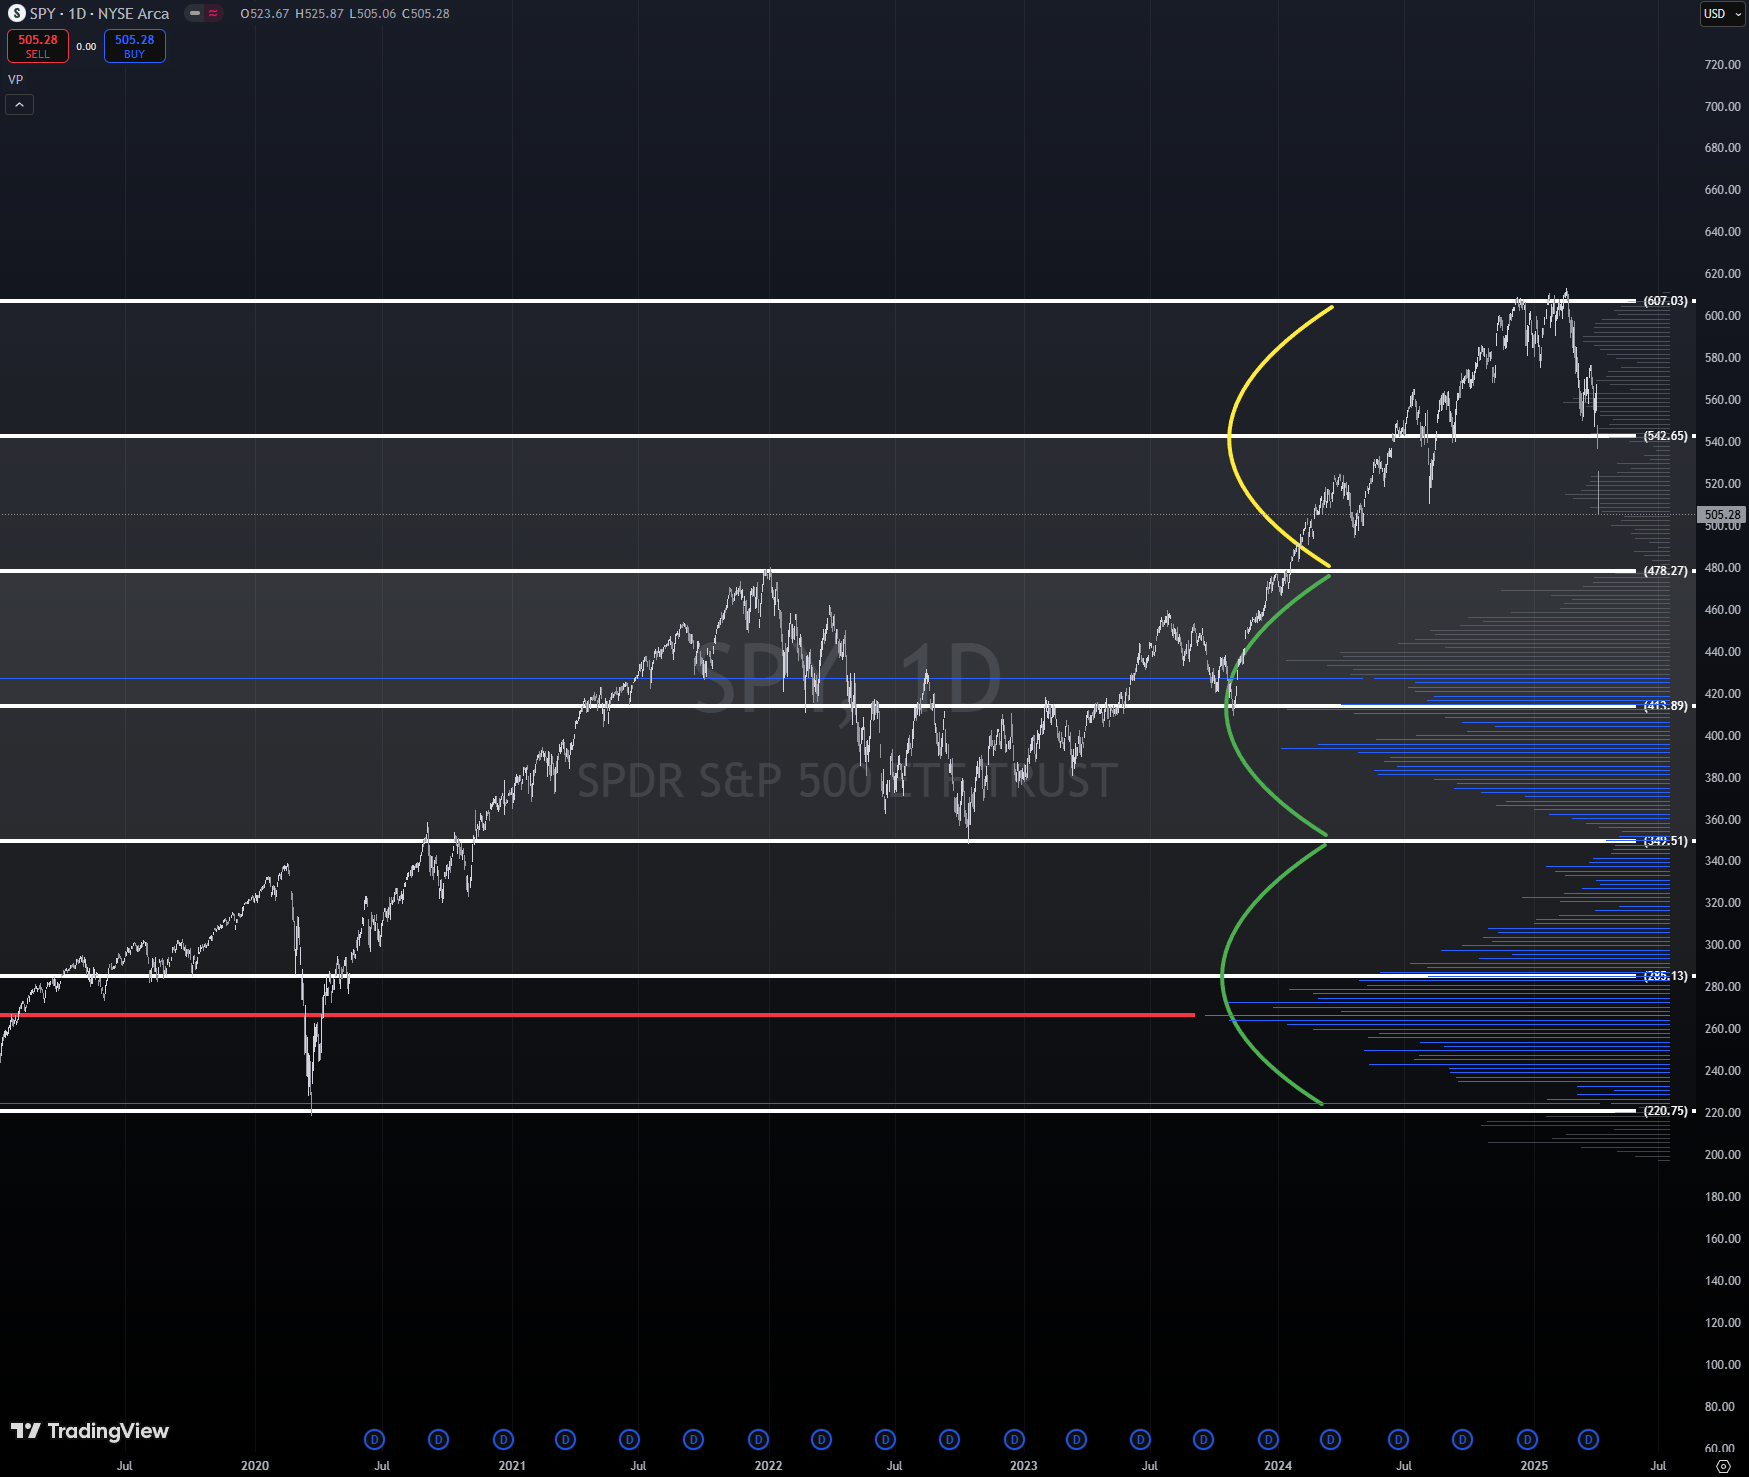
The latest auction, the one we’re in now, is clearly far less mature/developed than the two prior auctions below. The volume profile shows neat LVNs defining the end of one auction and the start of another but even if you’re not a profiling technician, the equidistant lines (use your platform’s fib tool but with fib extensions set to multiples of 1) neatly box in prices at regular/predictable distances.
I’m guessing that this range inside the yellow arc is probably our playground in SPY for some time, granted nothing exogenous happens. The pass/fail line is at $478’ish under which we’ll begin to seek/test prior value in the middle green arc; testing from above and holding invites the opportunity for longs to mount an attack on $540’ish…price is essentially in-position and we’ll need to see more trades than what we saw on Friday that suggest institutional interest to start making any qualified assumptions about inbound relief.
QQQ 0.00%↑
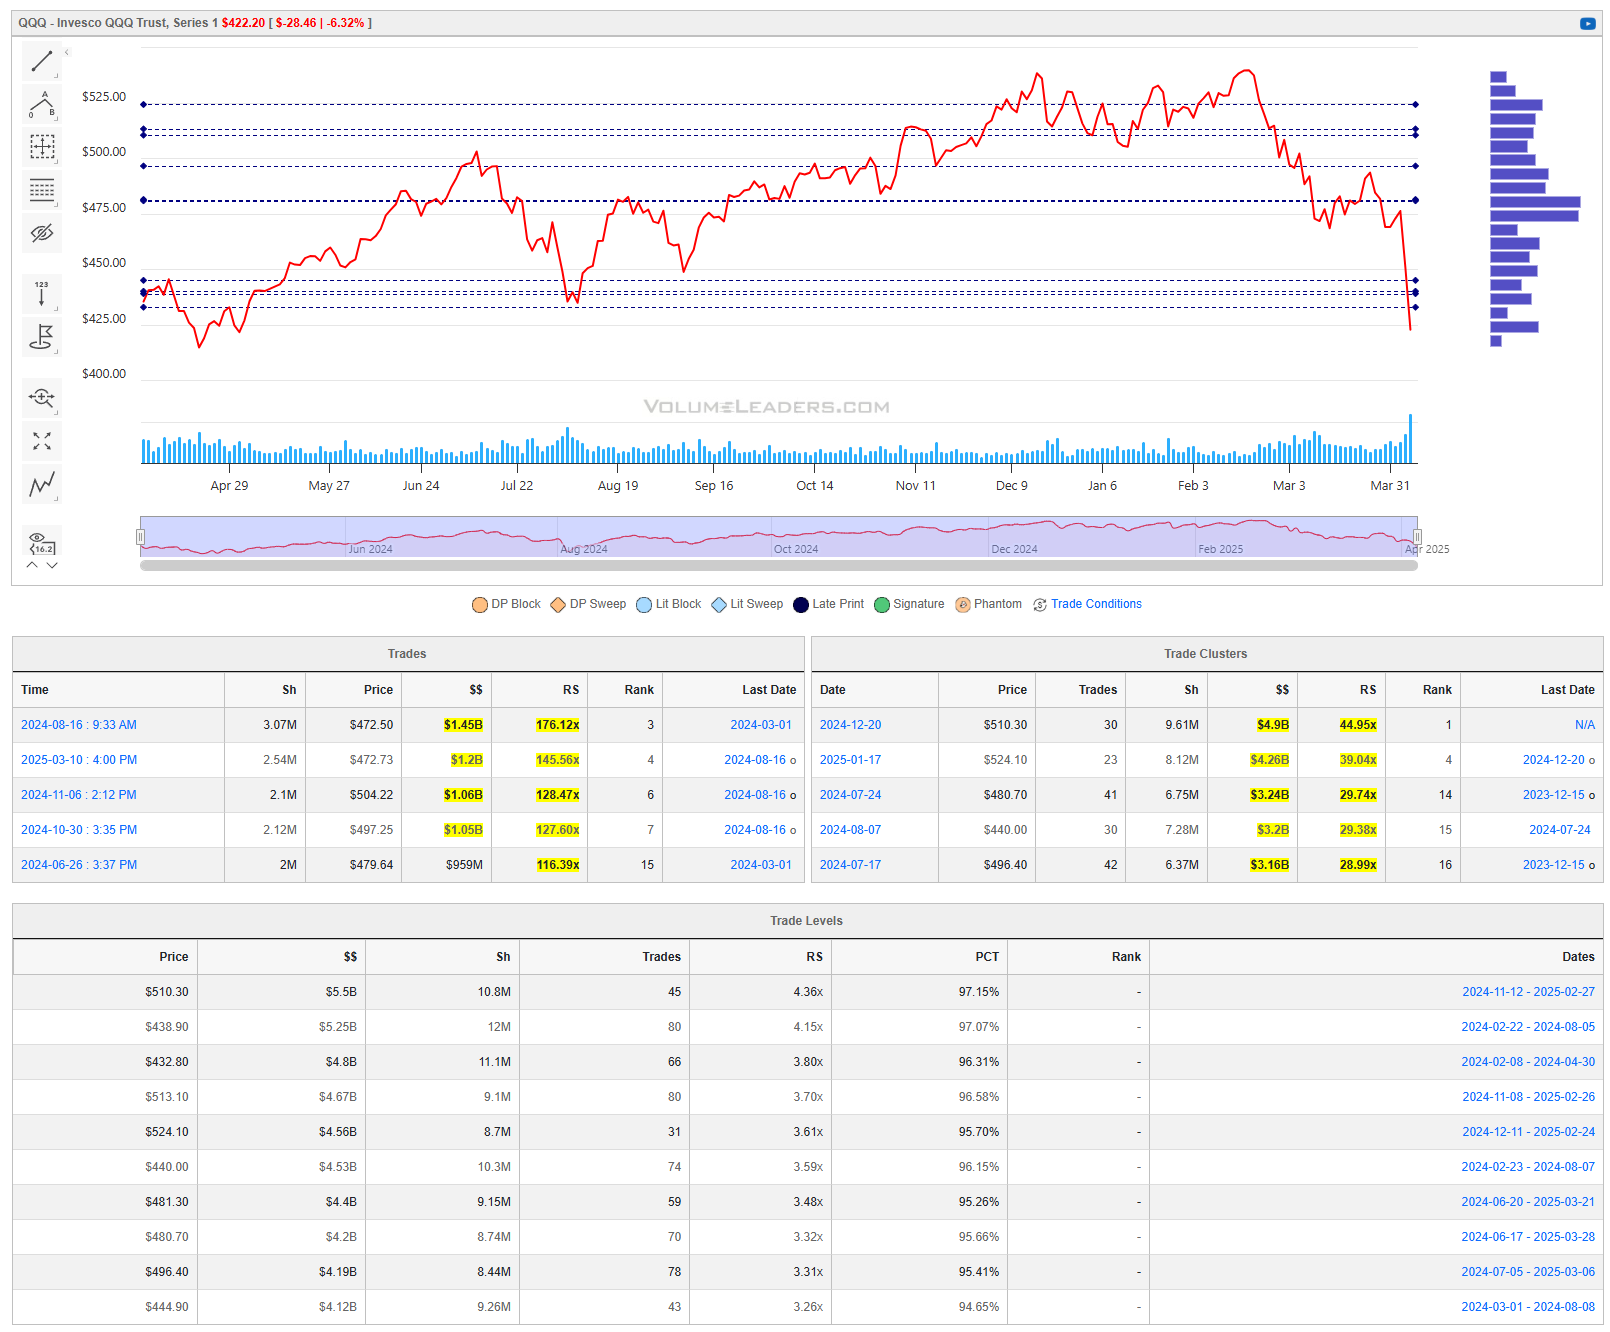
Price has dipped below a large cluster of levels on this 1-year chart of the Q’s. No prints of significance yet. Daily volume clearly heightened on Friday but price left bulls with nothing comforting going into the weekend. If you’re not already positioned to the downside, it starts getting incredibly risky to try and break off a piece of the short-action here. Longs are waiting for someone with deeper pockets to catch this knife, put in a tradeable bottom and to ideally reclaim some levels that we can use to define risk against. Structurally, you can see the clear significance of $412’ish in the chart below.
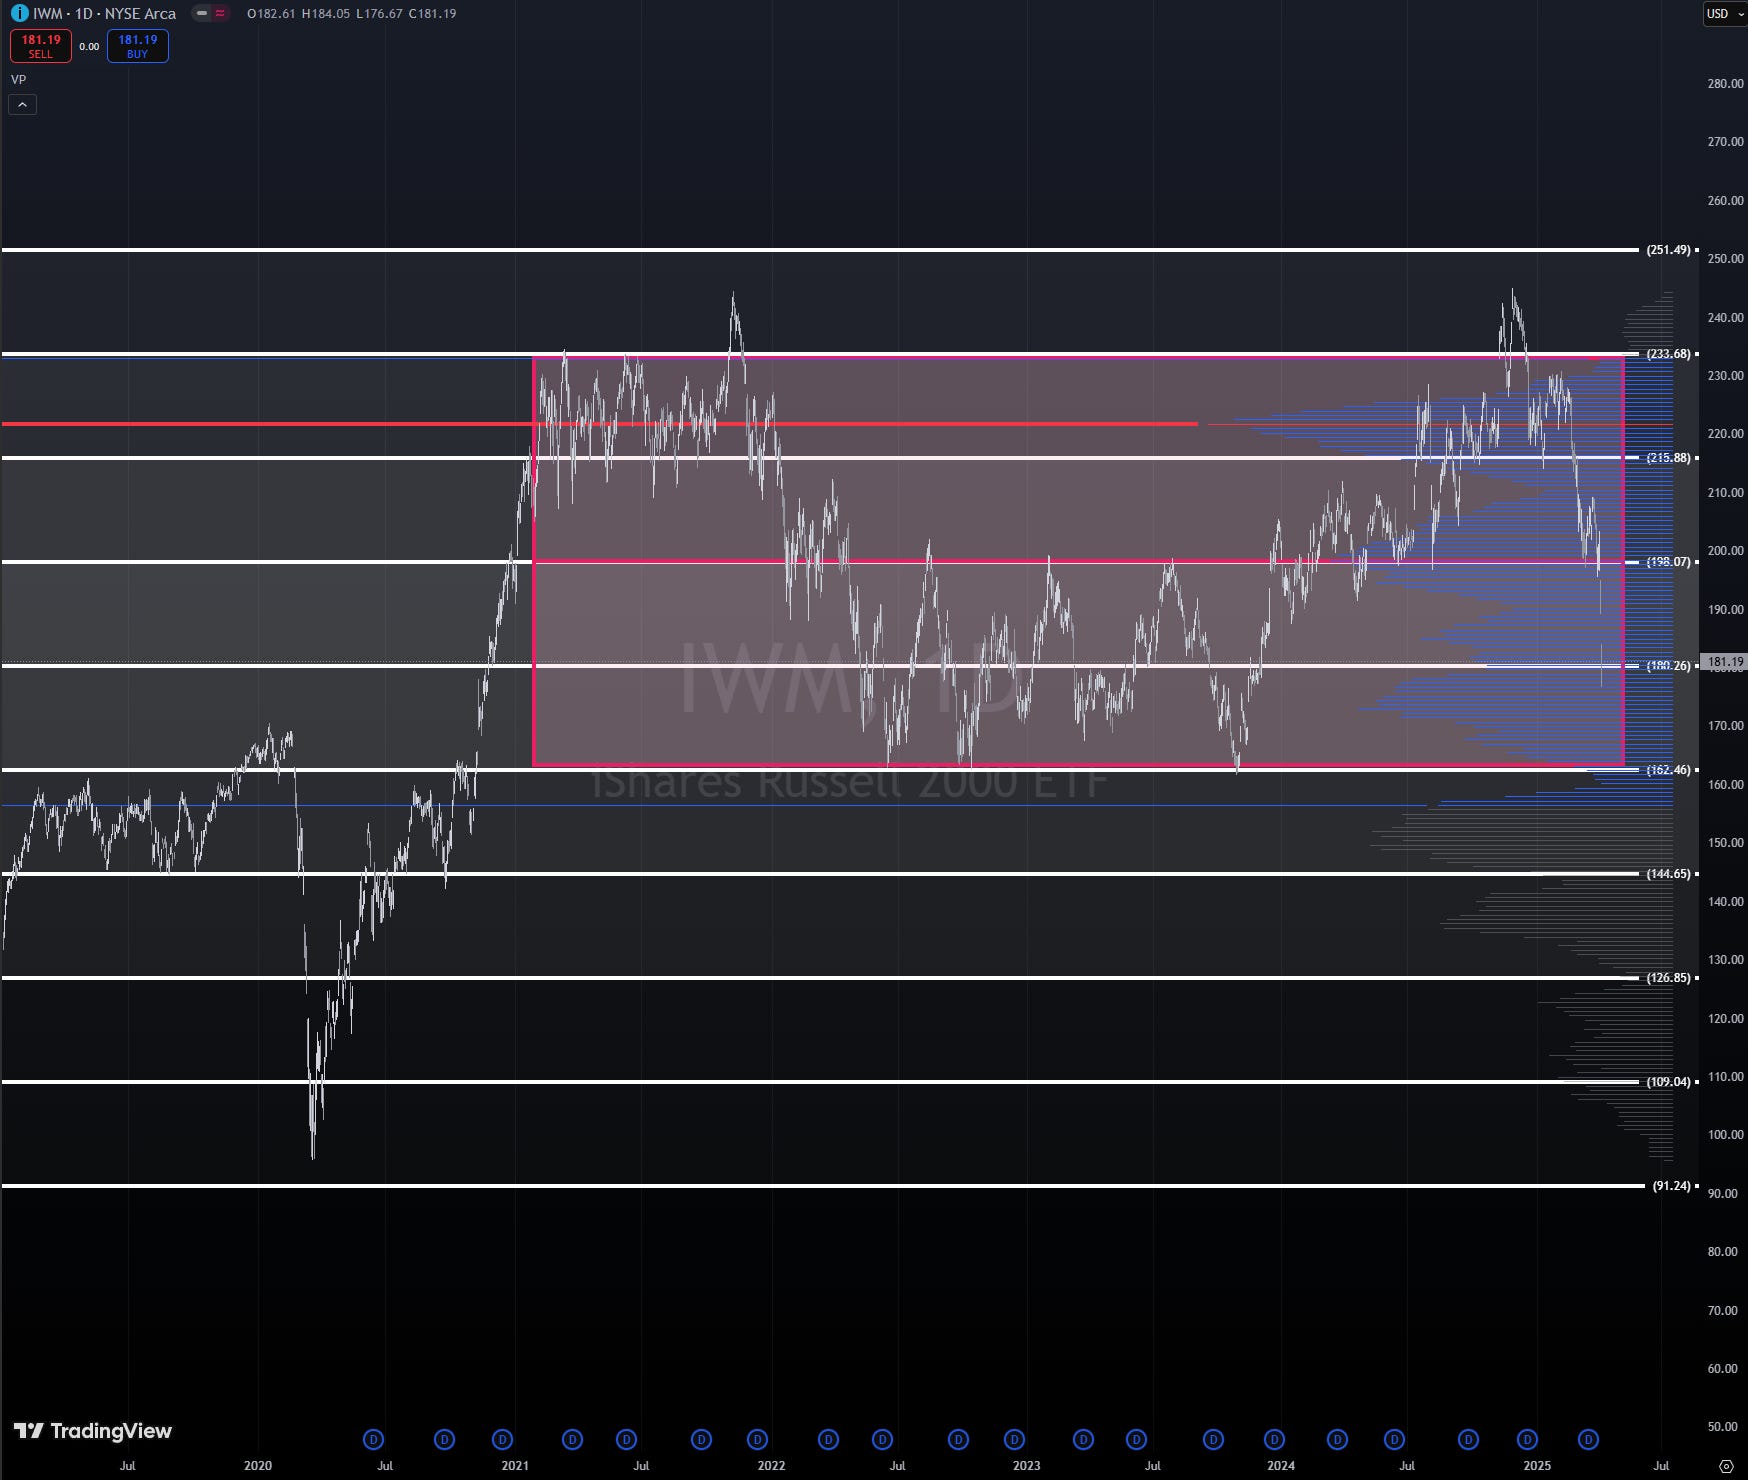
IWM 0.00%↑
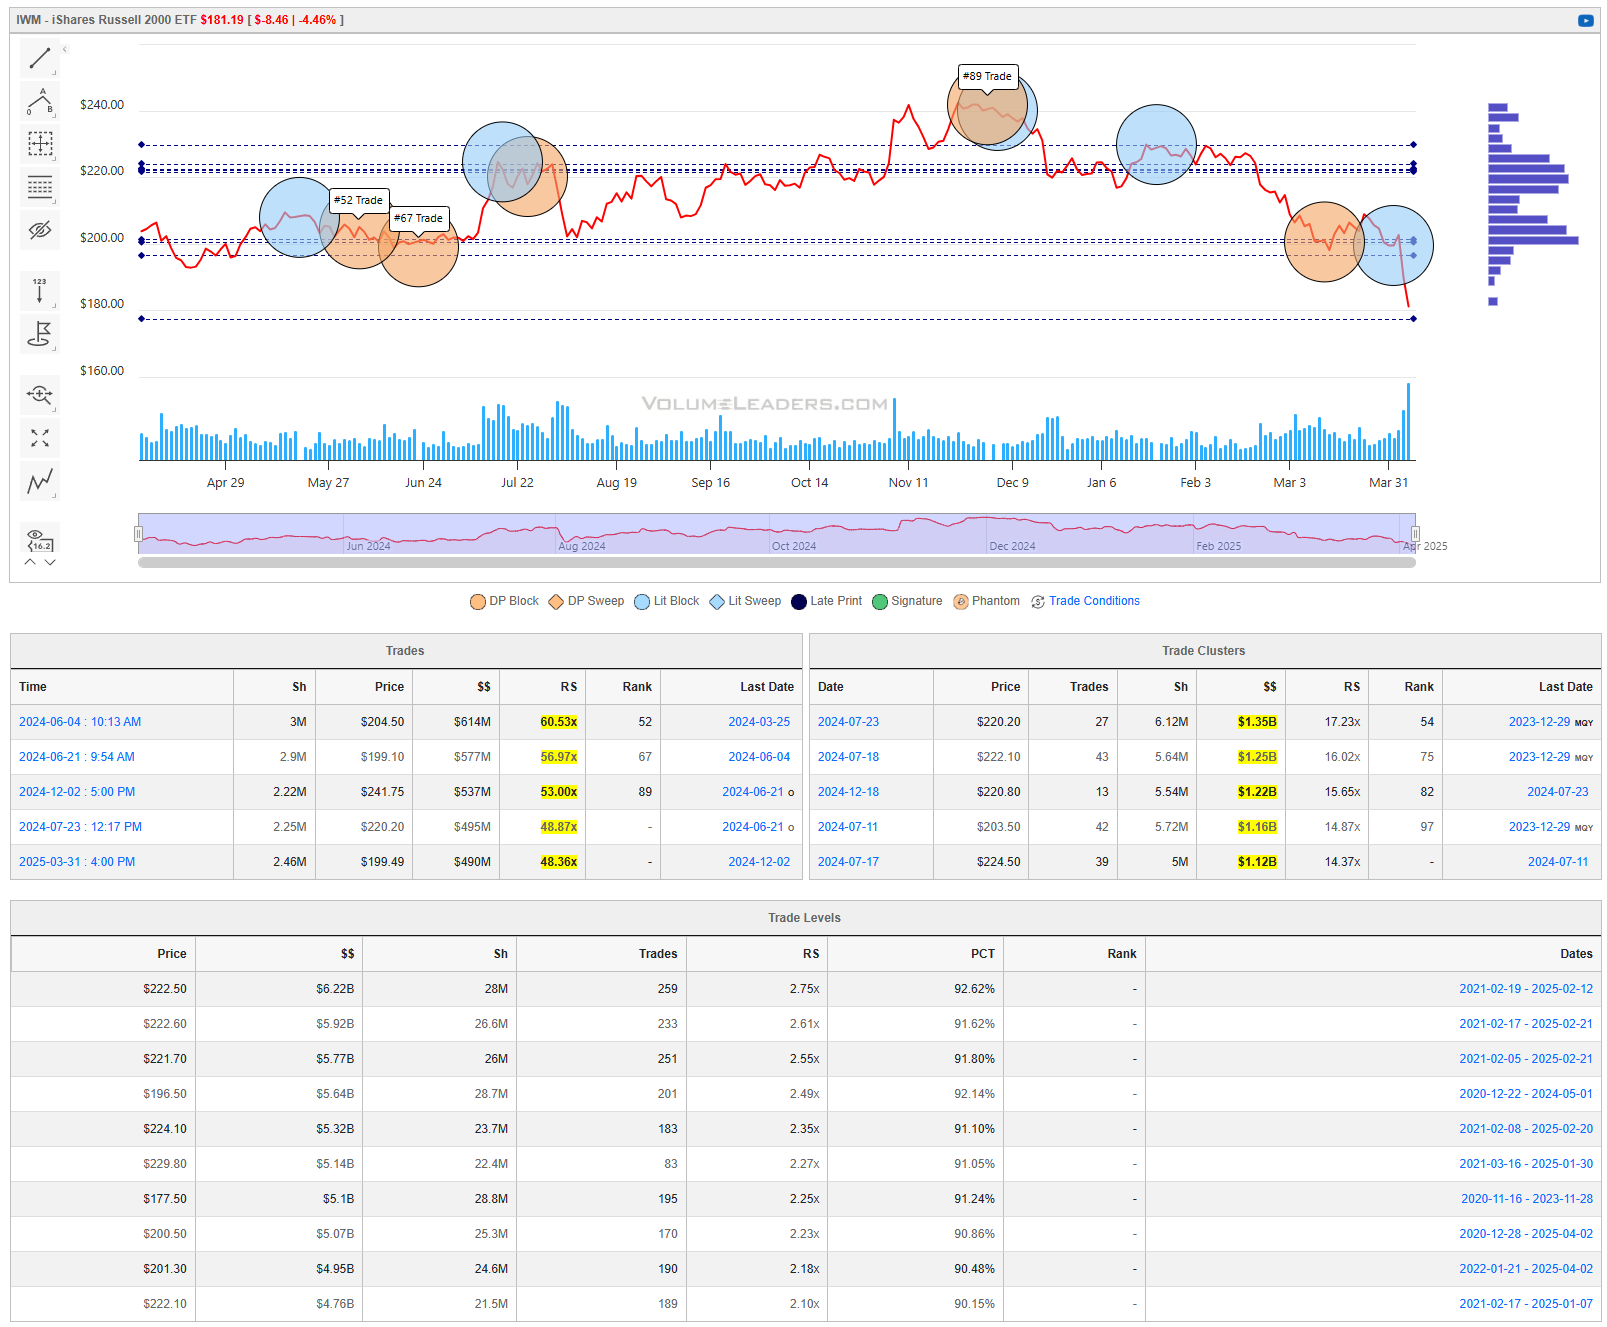
IWM also shows huge volume going into the close on Friday while pulling into area of interest on its 1-year chart. Under that 177 level, I think it’s pretty clear price is hunting the $162 level where there is significant structure of interest and price would complete the rotation back to the lows of the large trading range it’s been in. The last large print we saw in this name was at $199 on 3/31 and transacted in an area that is visually an obvious institutional area interest: $198, which itself represents the exact midpoint between the price-action boxed-in between $162 and $233. For this reason, I believe $198 is “in control” and my expectation would be to see continued balance and mean-reversion behavior until someone steps-in to carry this name to an area of new fair value outside of the current range.
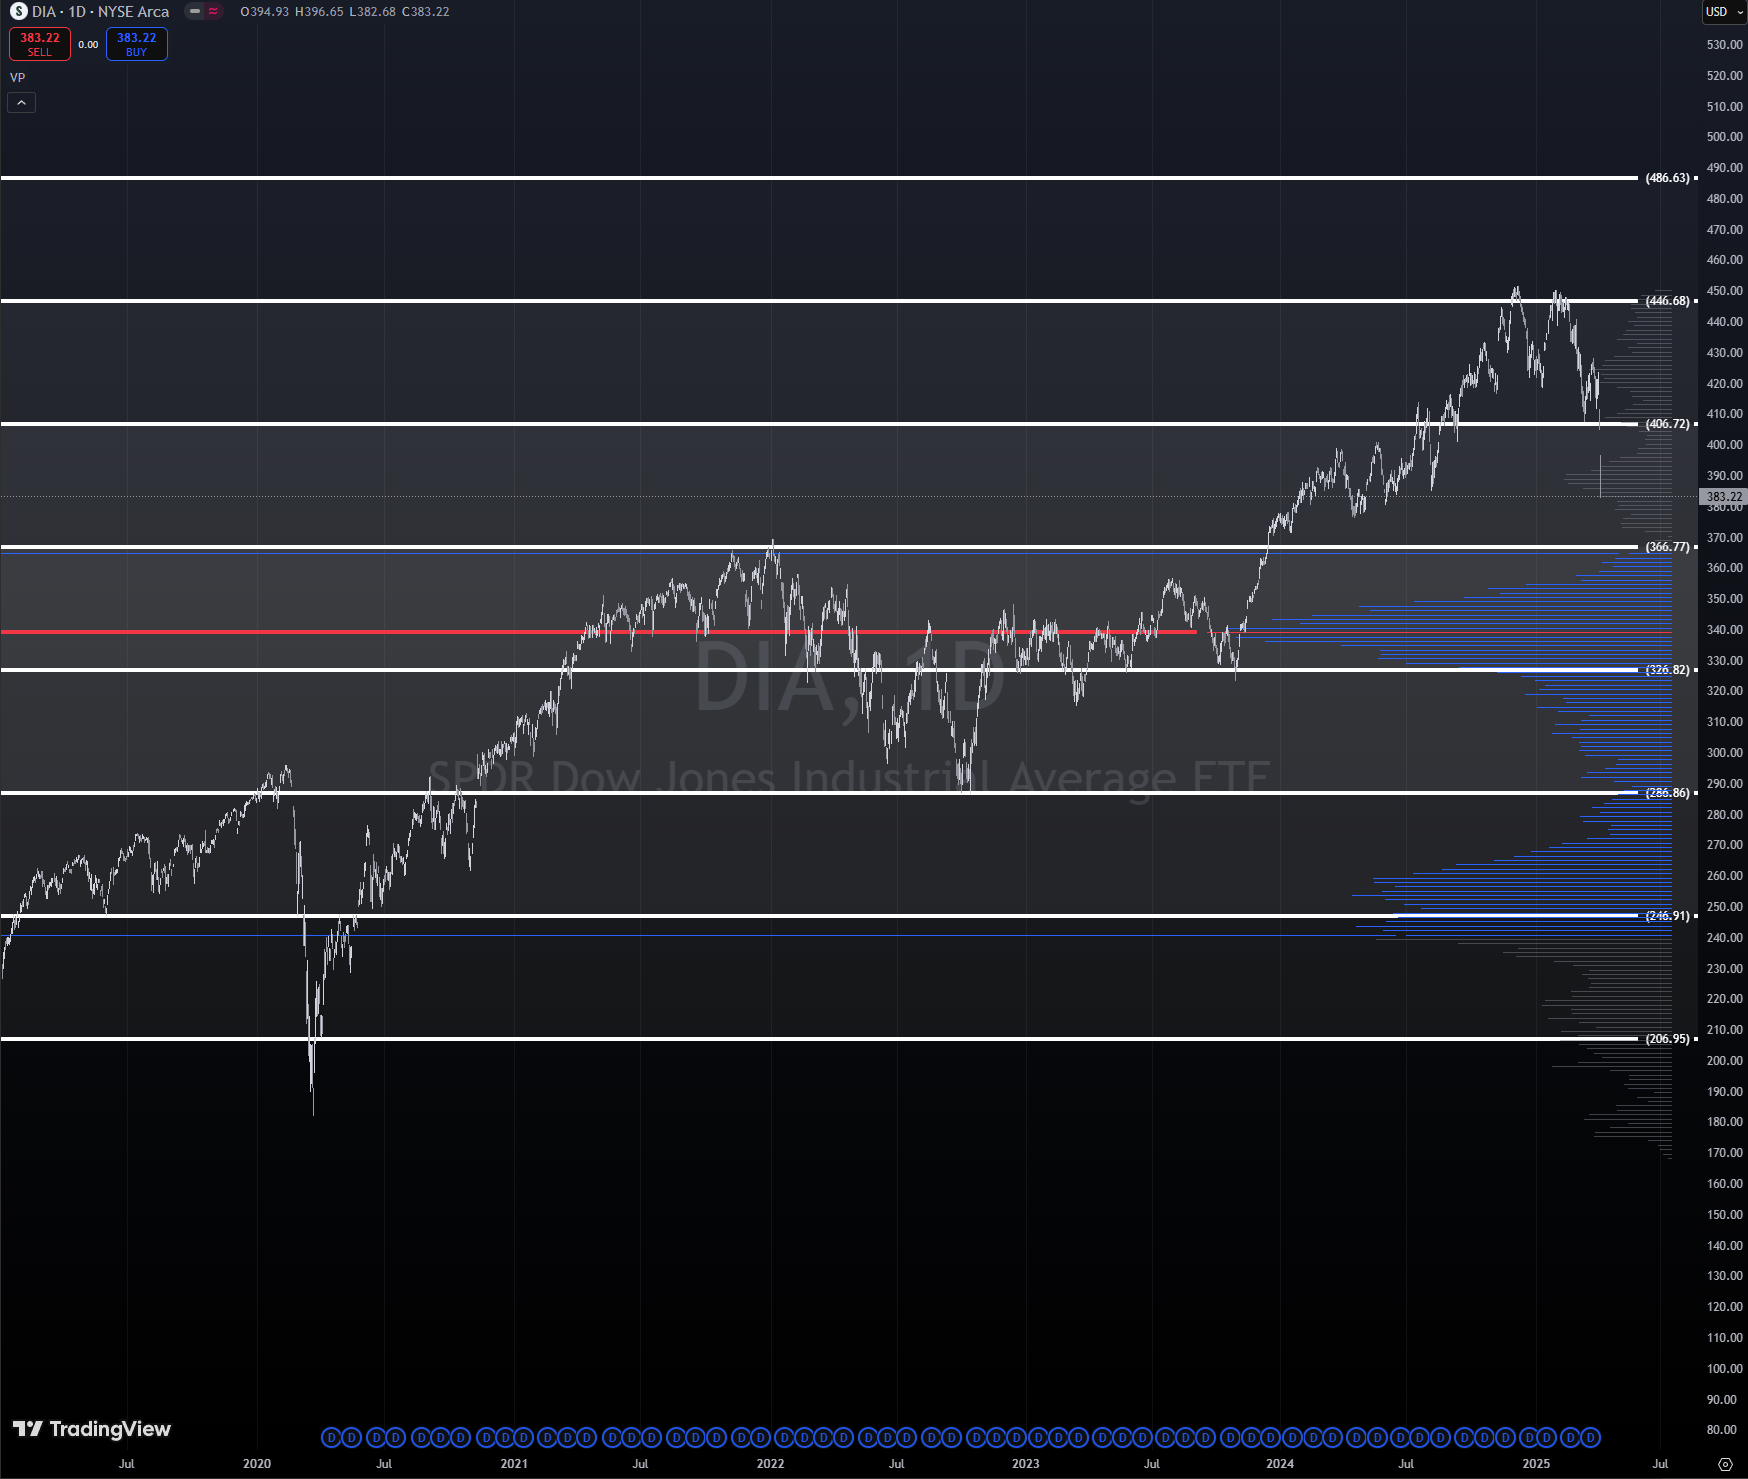
DIA 0.00%↑
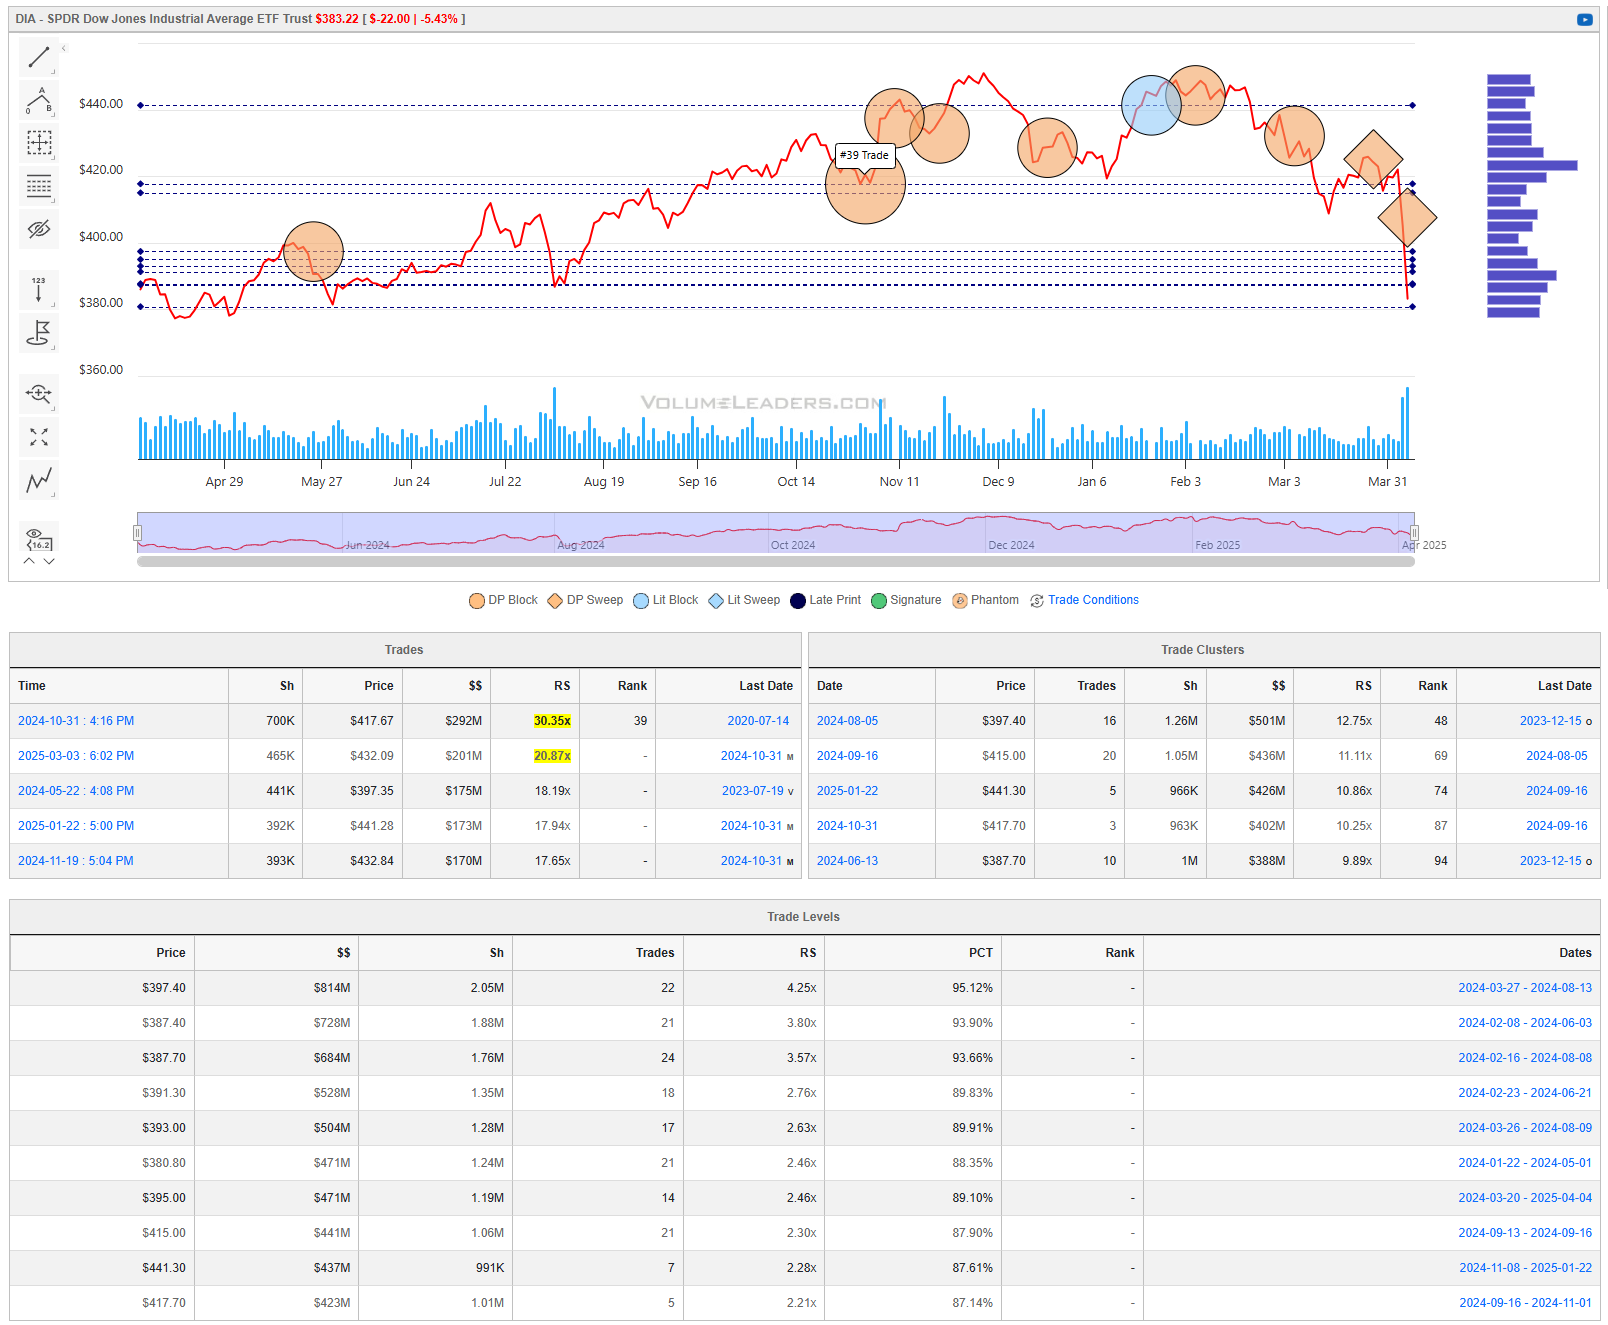
DIA is perhaps in the best shape in terms of where price landed at the close. I wouldn’t rule-out a test under this cluster of levels into $366’ish based on the success sellers are having right now. All of the top prints are above price right now (the last two of which were sweeps before the flush suggesting urgency and conviction) and we’re still waiting for institutions to step back in at this spot where they’ve historically done a bunch of business. Like QQQ and IWM, we’re waiting for prints and reclaims of prior levels before we start talking about conviction plays to the long-side.
Institutional Order Flow
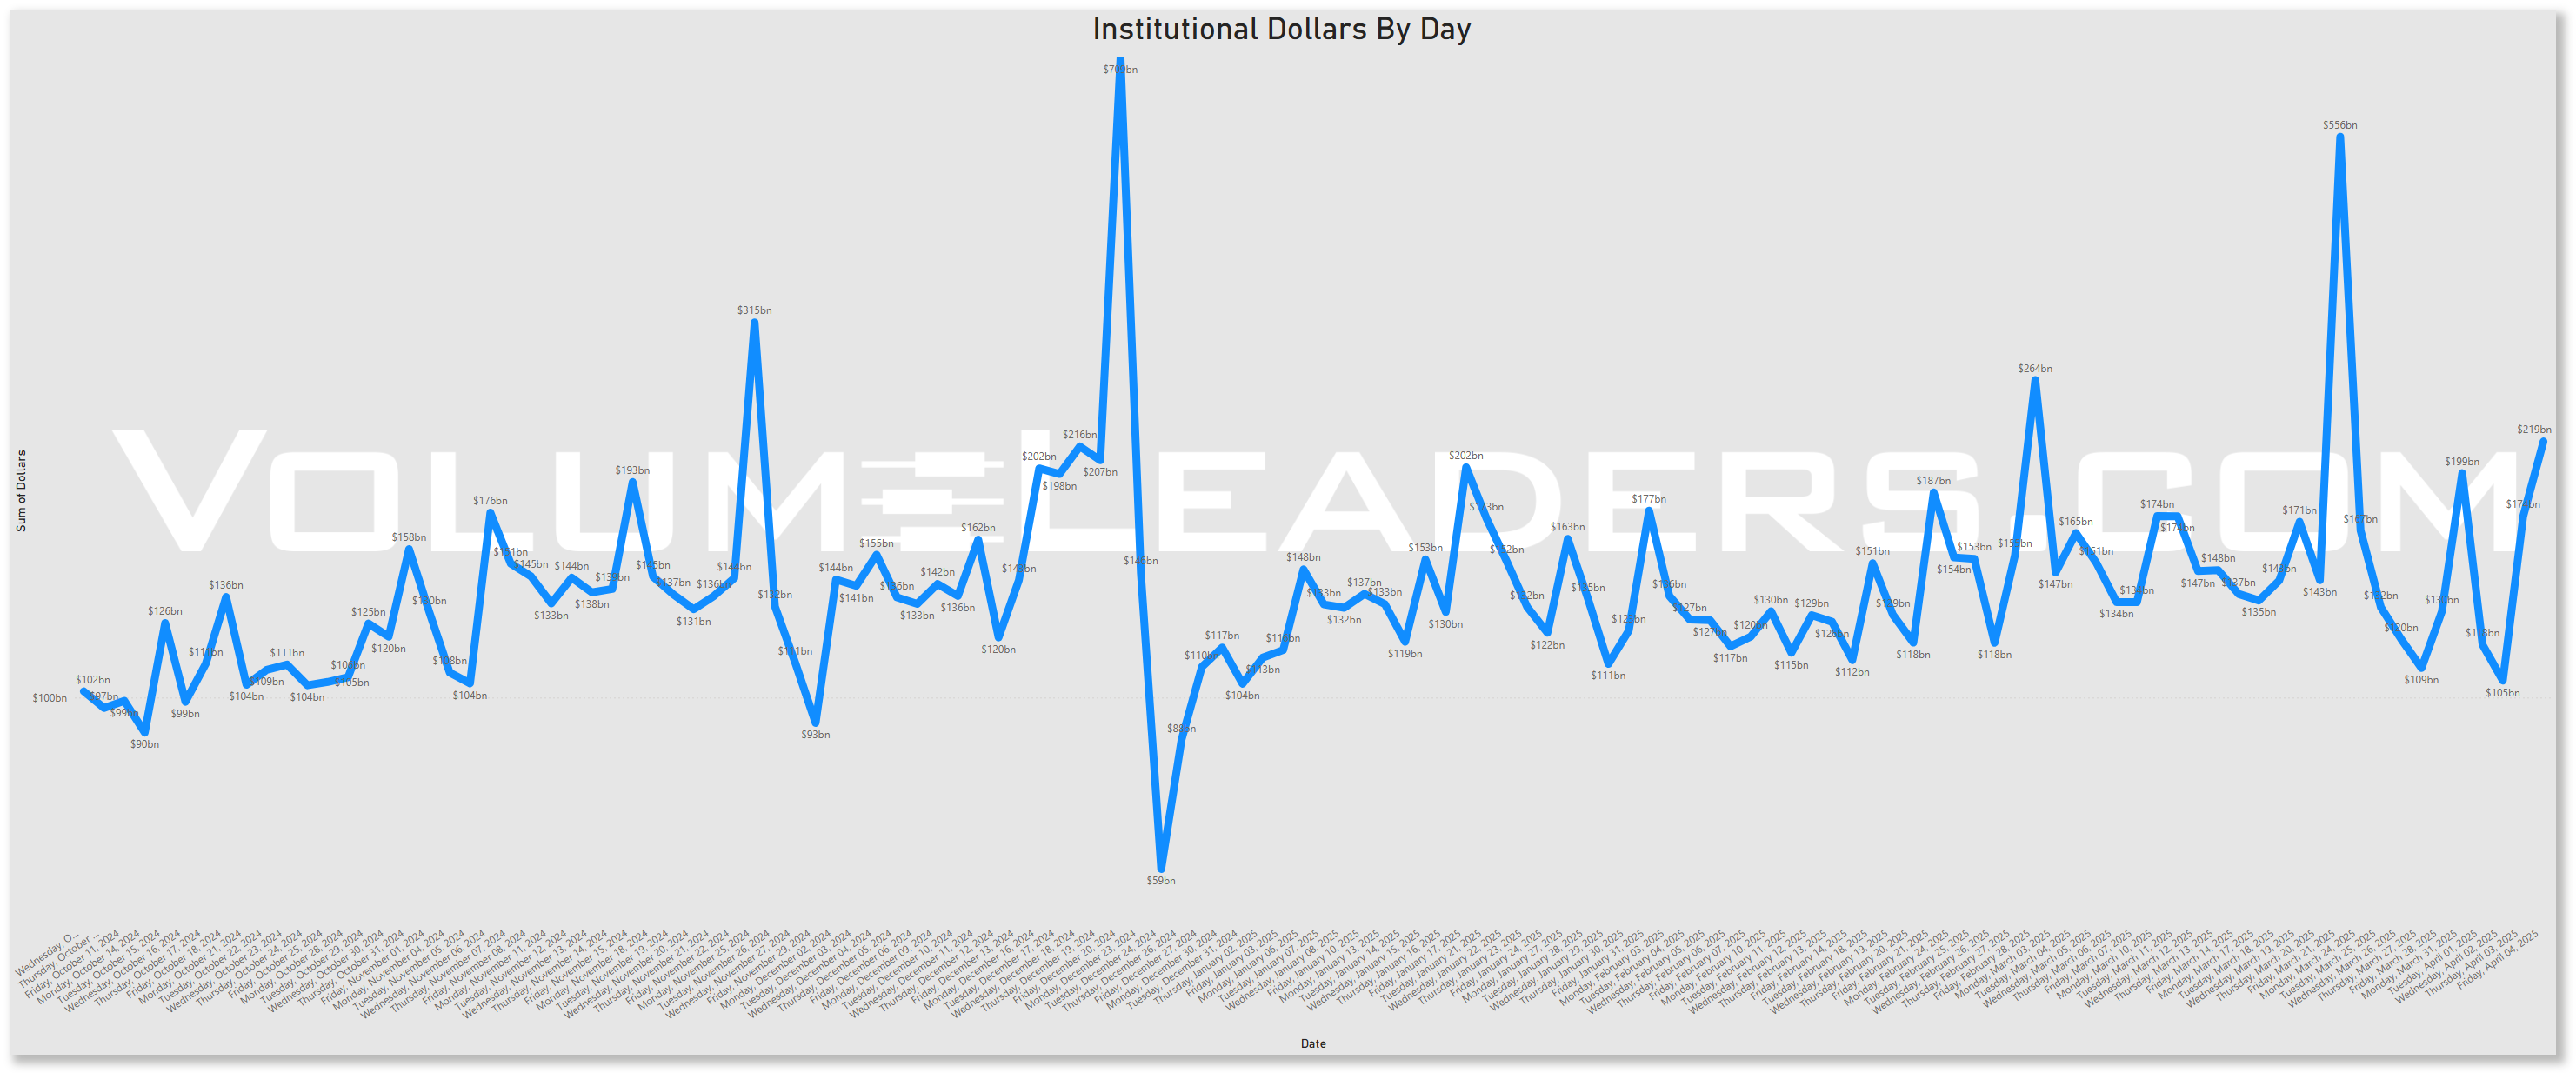
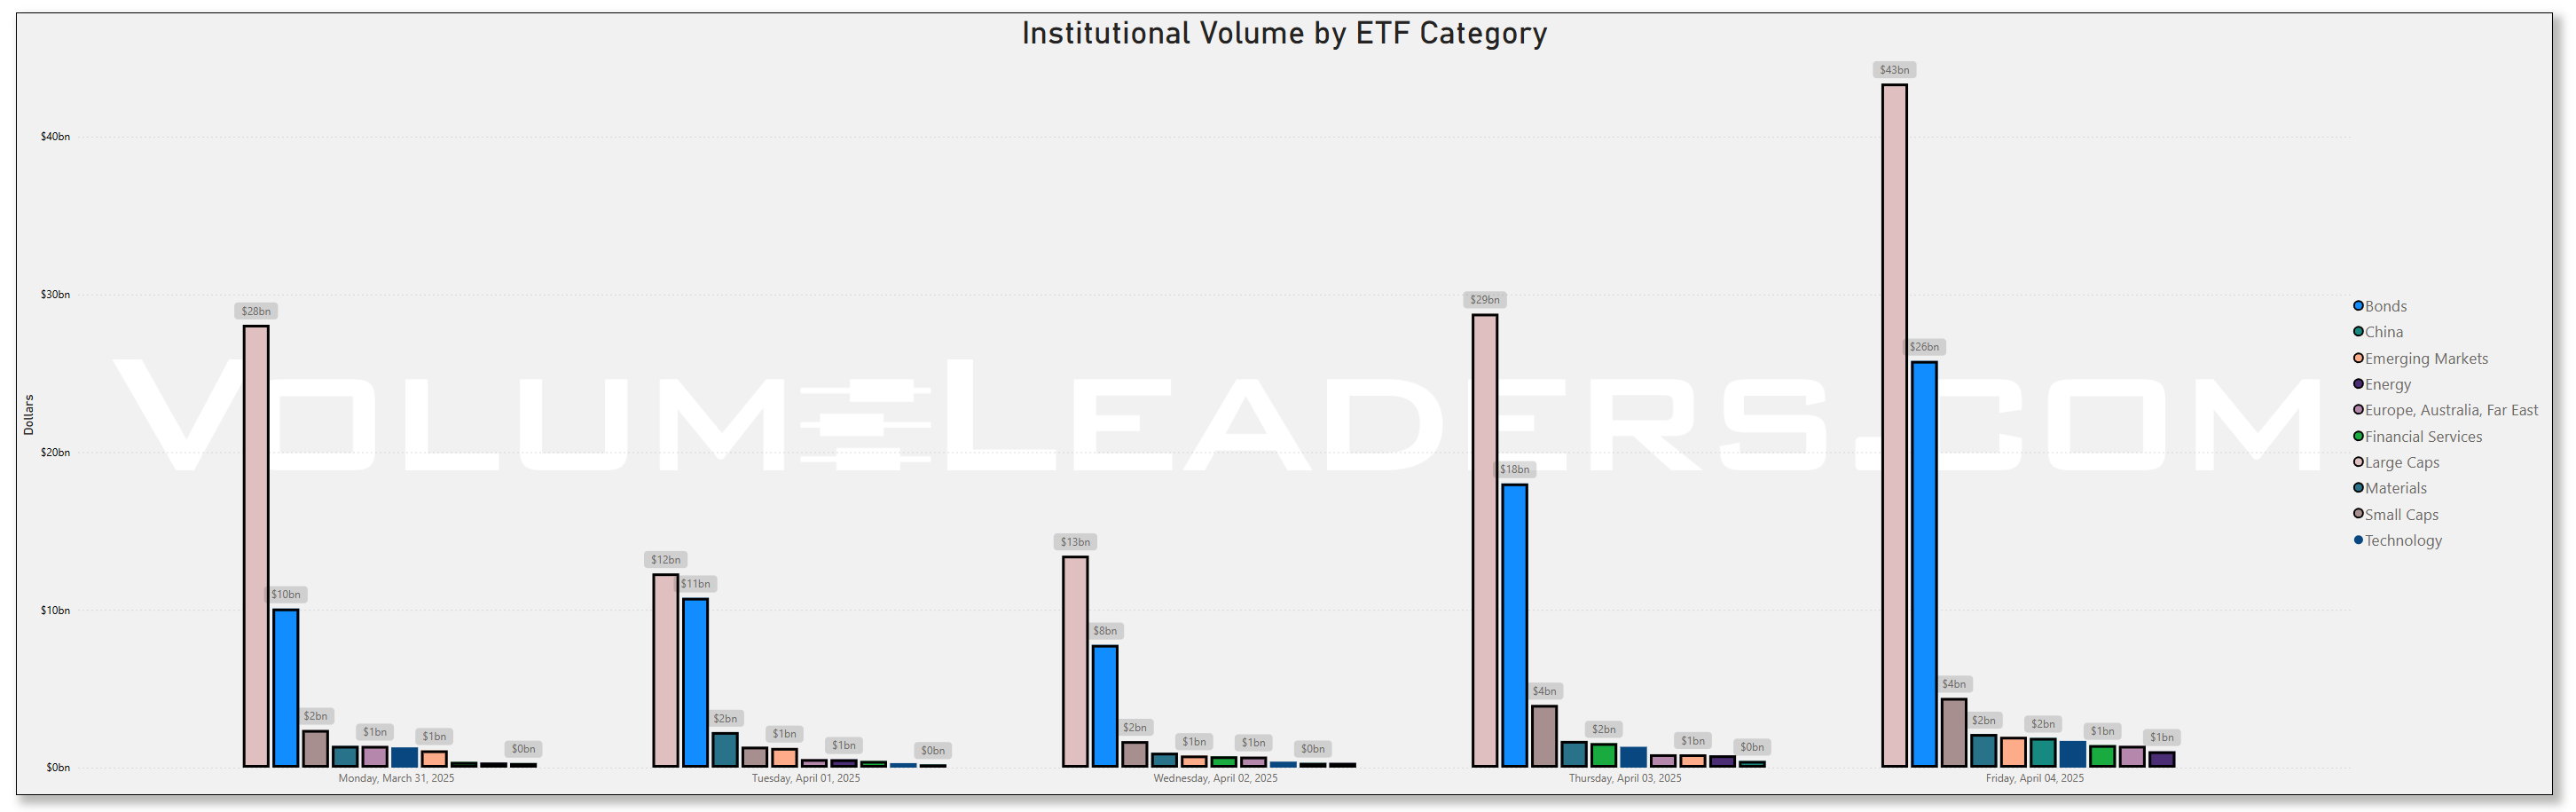
Rolling 90-Day Dollars By Day
This chart shows institutional activity by dollars by day on a rolling 1-year basis. From a theoretical standpoint, examining a chart of daily institutional dollar activity over the course of a year can offer several insights and possible inferences, though all should be approached with caution since the data alone may not prove causality or confirm underlying reasons. Some potential takeaways include:
Event-Driven Behavior:
Sharp, singular spikes on certain days might correlate with major market-moving events. These could include central bank policy announcements, significant geopolitical news, sudden macroeconomic data releases (like employment reports or GDP data), earnings seasons for large-cap companies, or unexpected shocks (e.g., mergers, acquisitions, regulatory changes).Liquidity Dynamics:
Institutions often concentrate large trades on days with higher expected liquidity. For instance, heightened activity might coincide with index reconstitutions, option expiration dates, or the days leading up to or following a major index rebalance, when large amounts of capital shift hands simultaneously.Risk Management and Hedging Activity:
Institutions may significantly adjust their exposures on days that are critical from a risk management perspective. Large spikes can occur if hedge funds, pension funds, or asset managers are rolling over futures contracts, initiating or closing out large hedges, or reacting to volatility triggers.Market Sentiment Indicators:
While the data is purely transactional, the sheer volume of institutional involvement on certain days might indirectly hint at changing sentiment or strategic shifts.
In essence, a chart like this can lead you to hypothesize that institutional trading volumes are not constant or random but rather influenced by a mix of predictable calendar effects, major market events, liquidity considerations, risk management decisions, and strategic allocation shifts.
Top Institutional Order Flow By Sector By Week For The Past 90-Days
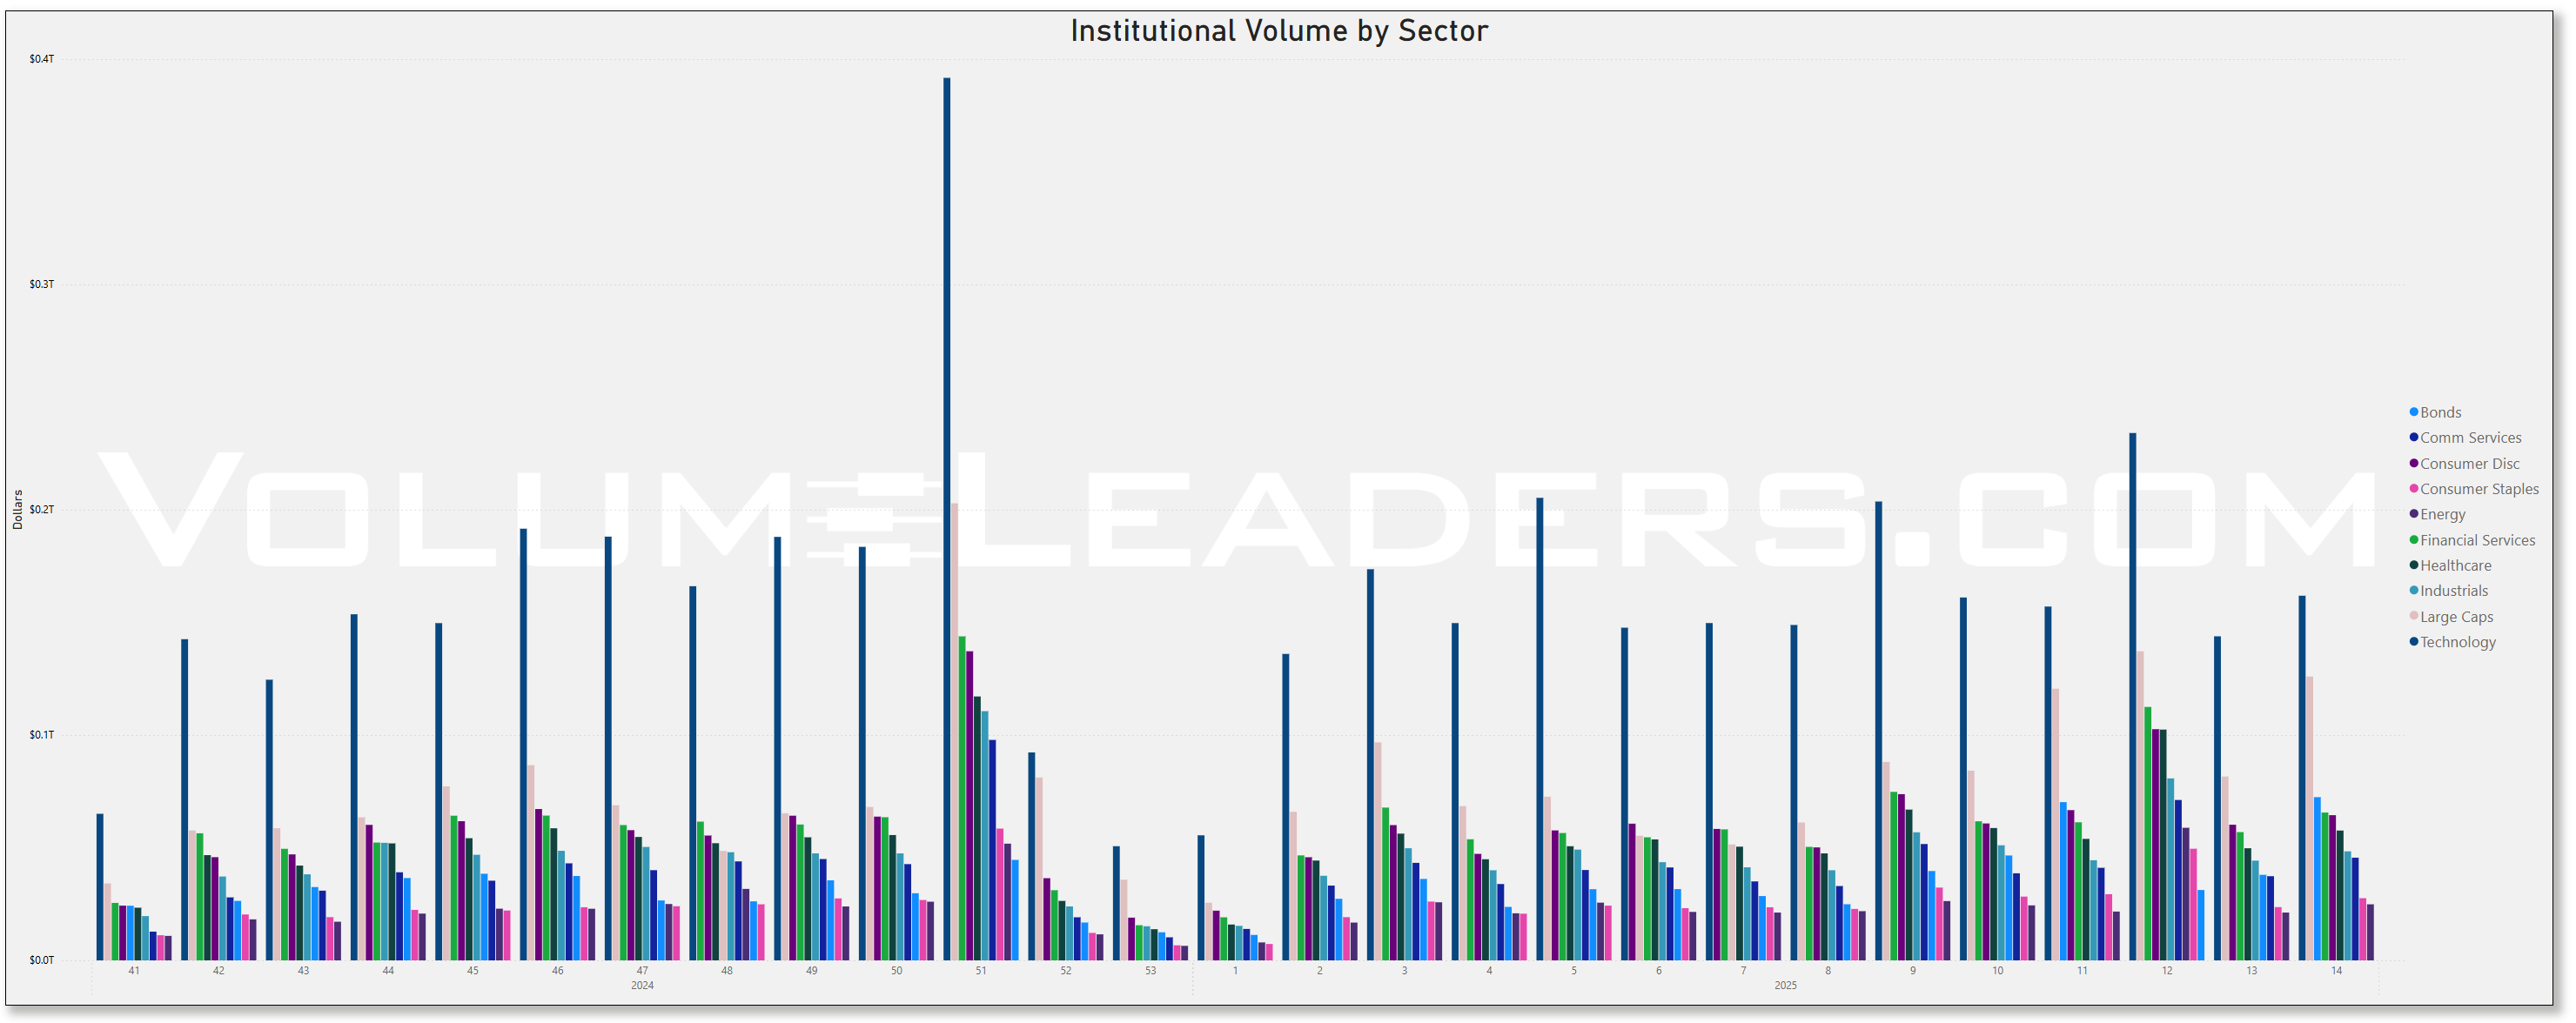
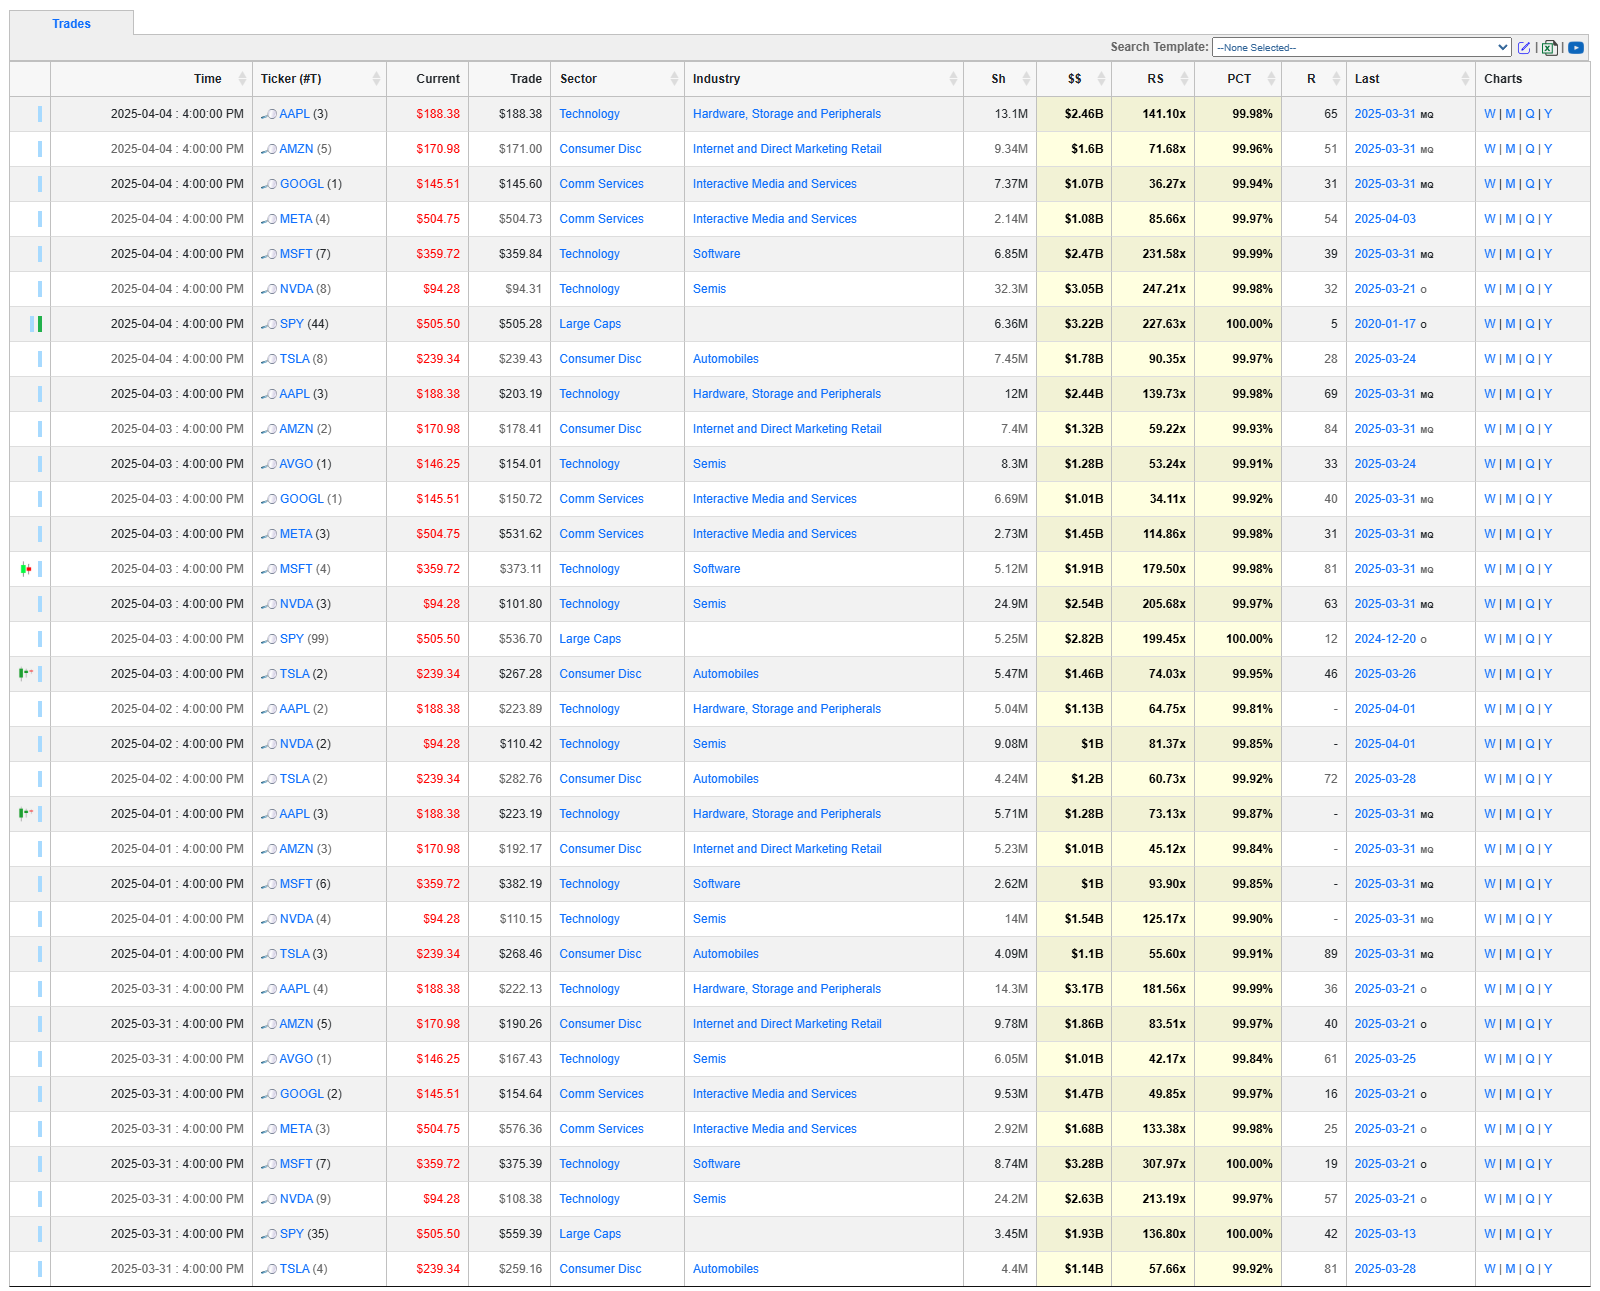
Top Institutional Order Flow In Equities
These are incredibly important charts to watch as they contains lots of nuanced suggestions at a thematic level. Watch these charts closely week-to-week to stay informed about where institutional money is flowing, adjust your strategies based on momentum, align your portfolio with macroeconomic and market trends, and manage risks more effectively by avoiding sectors losing institutional favor.
Sector Rotation Insights: The chart highlights which sectors are attracting institutional activity and which are losing favor. Institutions often lead market trends, so tracking shifts in their focus can indicate sector rotations.
Sentiment Analysis: The level of institutional activity reflects confidence in specific sectors. Rising activity in traditionally defensive sectors (e.g., healthcare, utilities) may indicate caution, while a surge in growth sectors (e.g., technology, consumer discretionary) could suggest optimism.
Emerging Trends: Sudden spikes in a previously overlooked sector, like industrials or consumer staples, might hint at emerging opportunities or structural shifts.
Macro Themes: Changes in sector activity often align with broader macroeconomic themes like inflation, interest rates, or geopolitical events. For instance:
Increased activity in energy might indicate concerns about oil supply or rising prices.
Growth in technology could align with innovations or favorable policies.
Risk Management: Declining institutional activity in a sector might signal weakening fundamentals or heightened risks.
Spotting Overcrowding: Excessive activity in a single sector over multiple weeks may suggest overcrowding, which could lead to heightened volatility if institutions begin to exit.
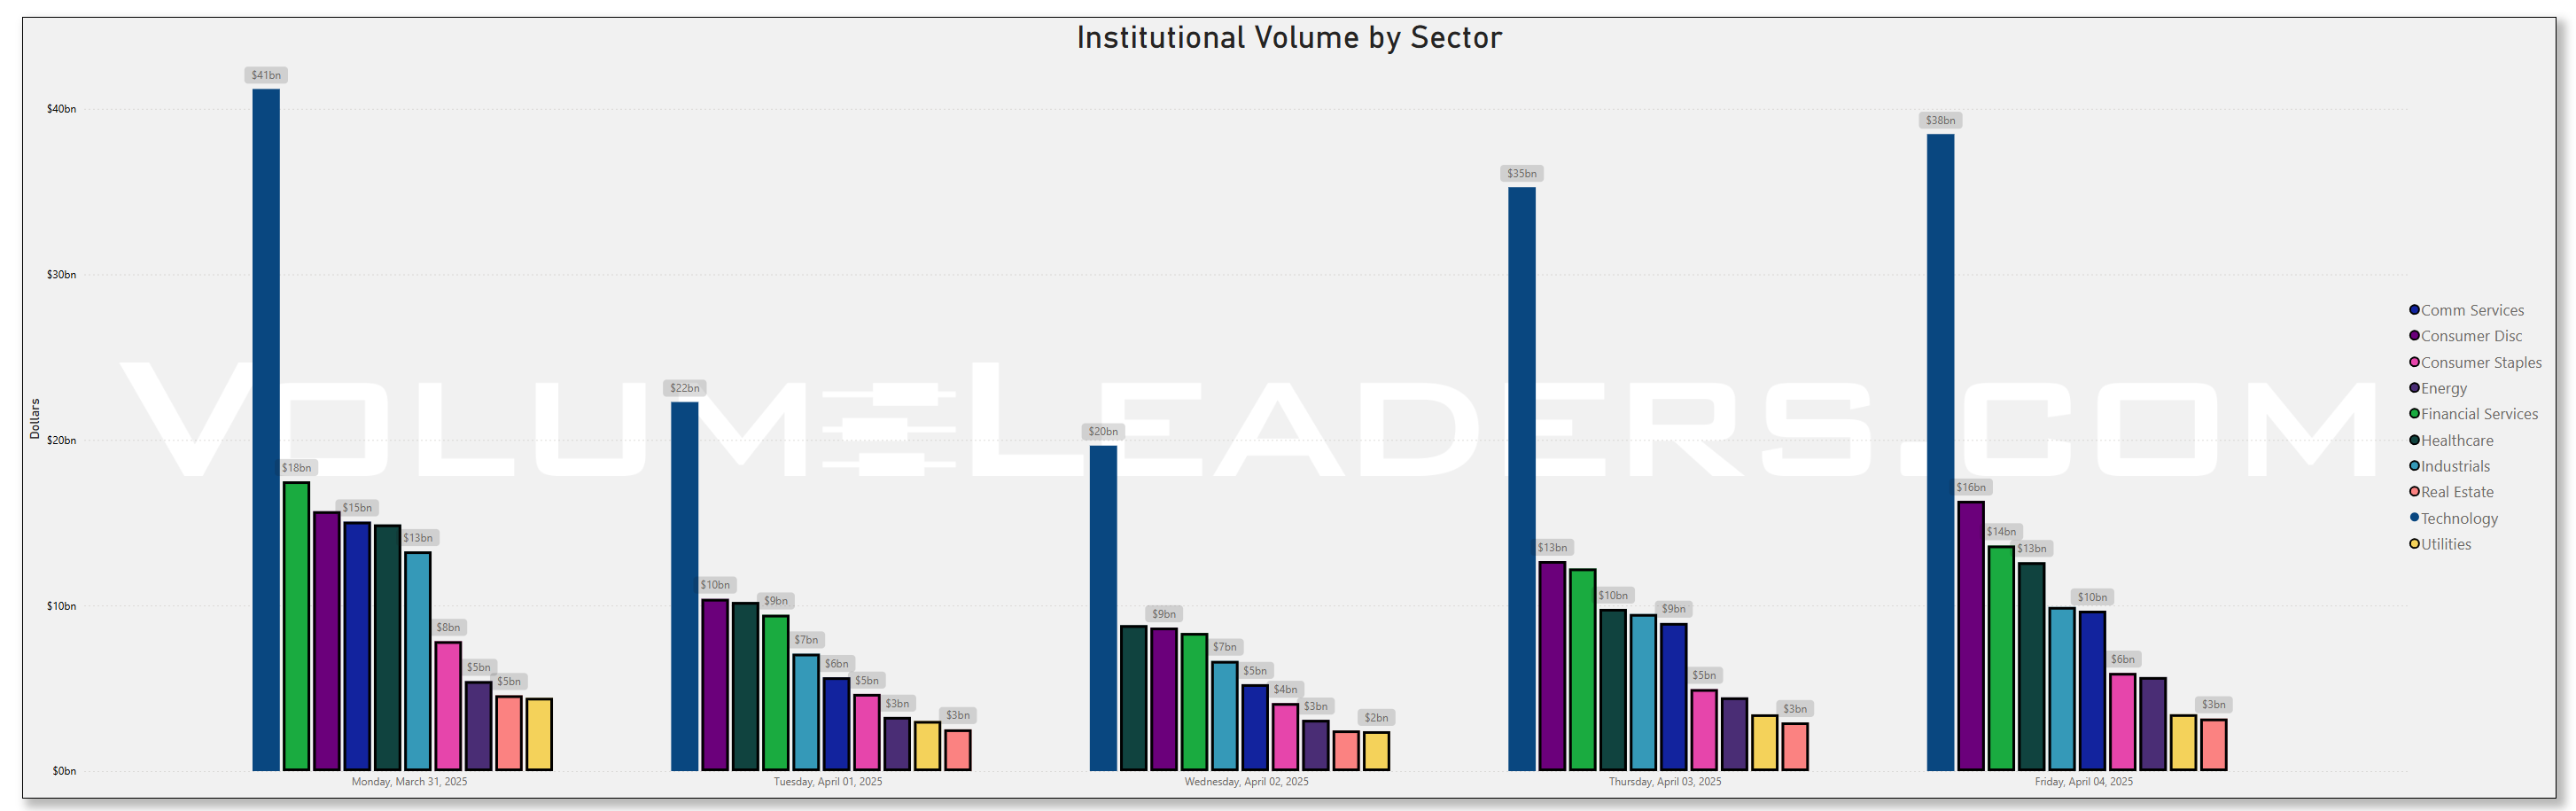
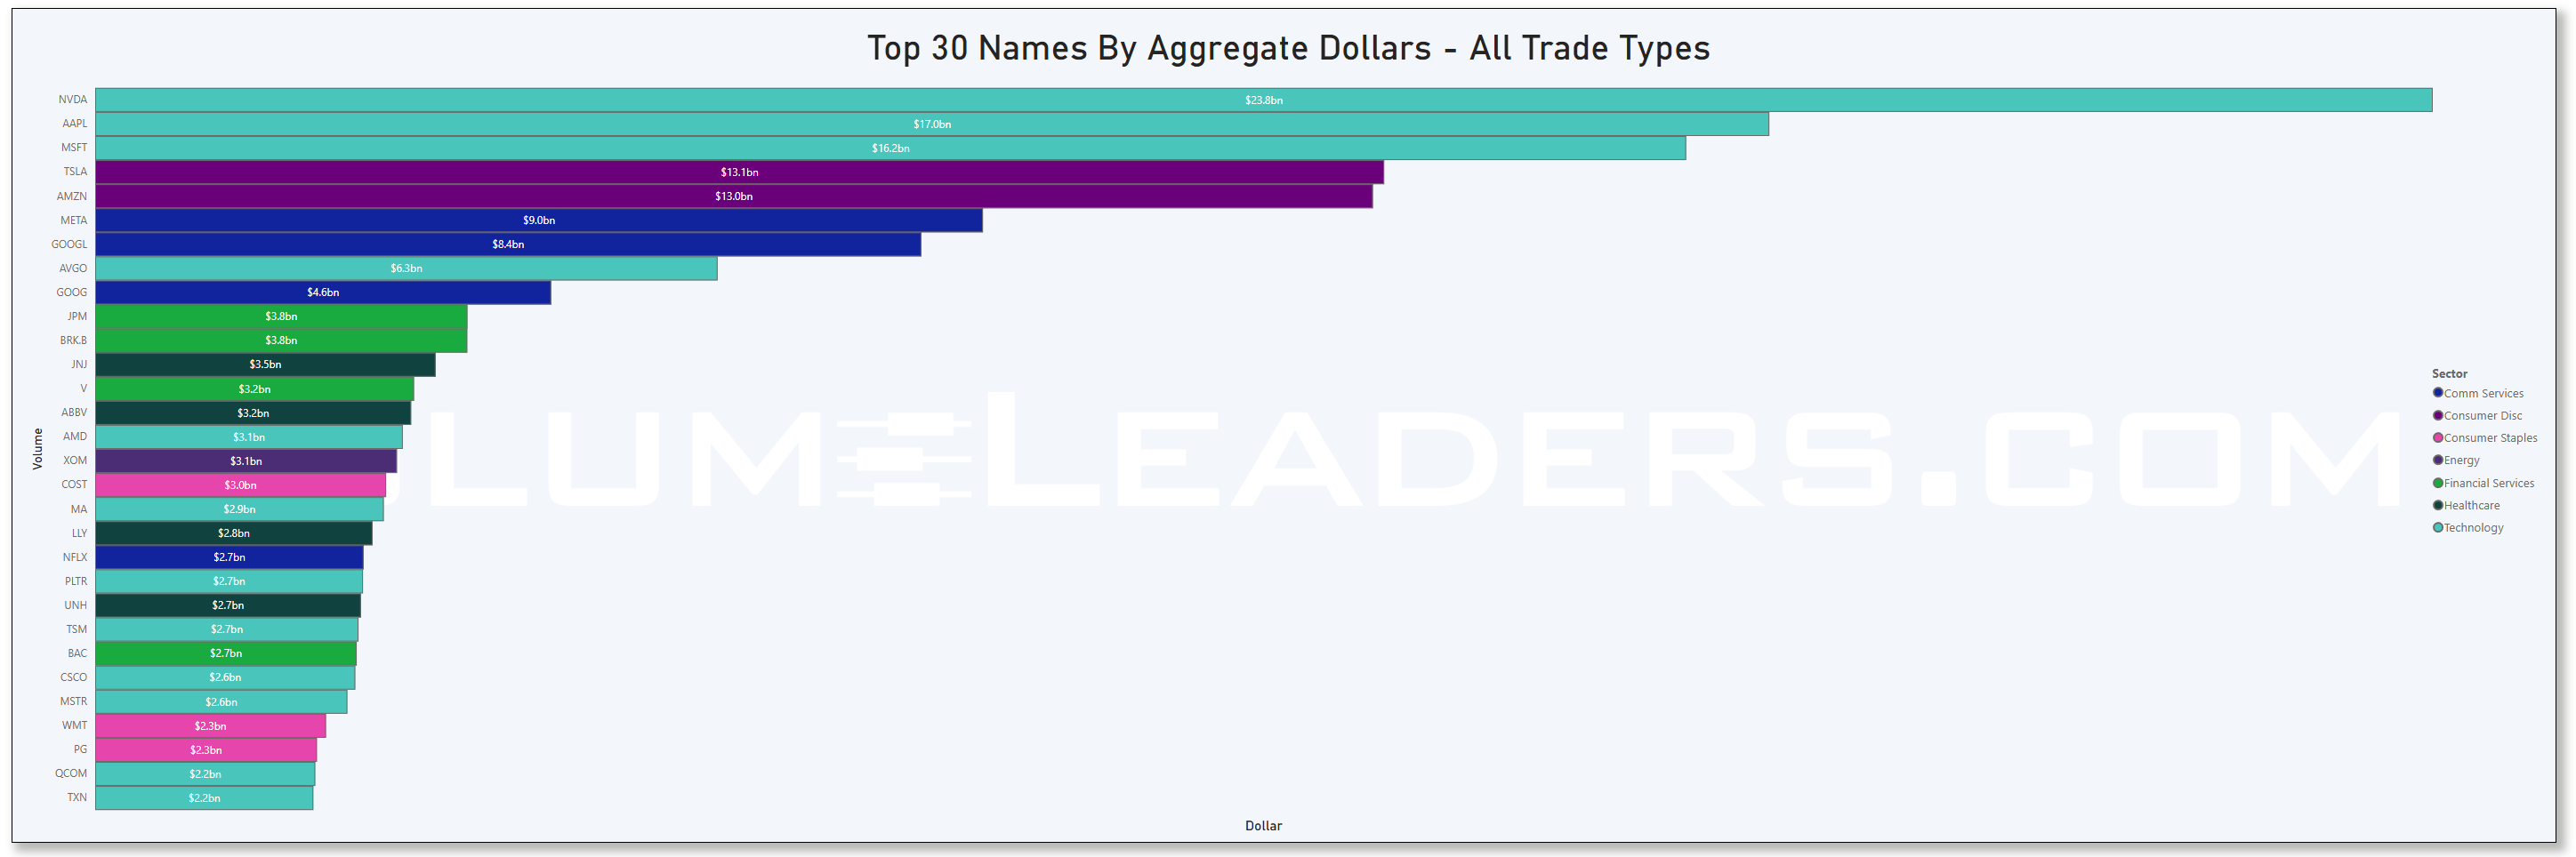
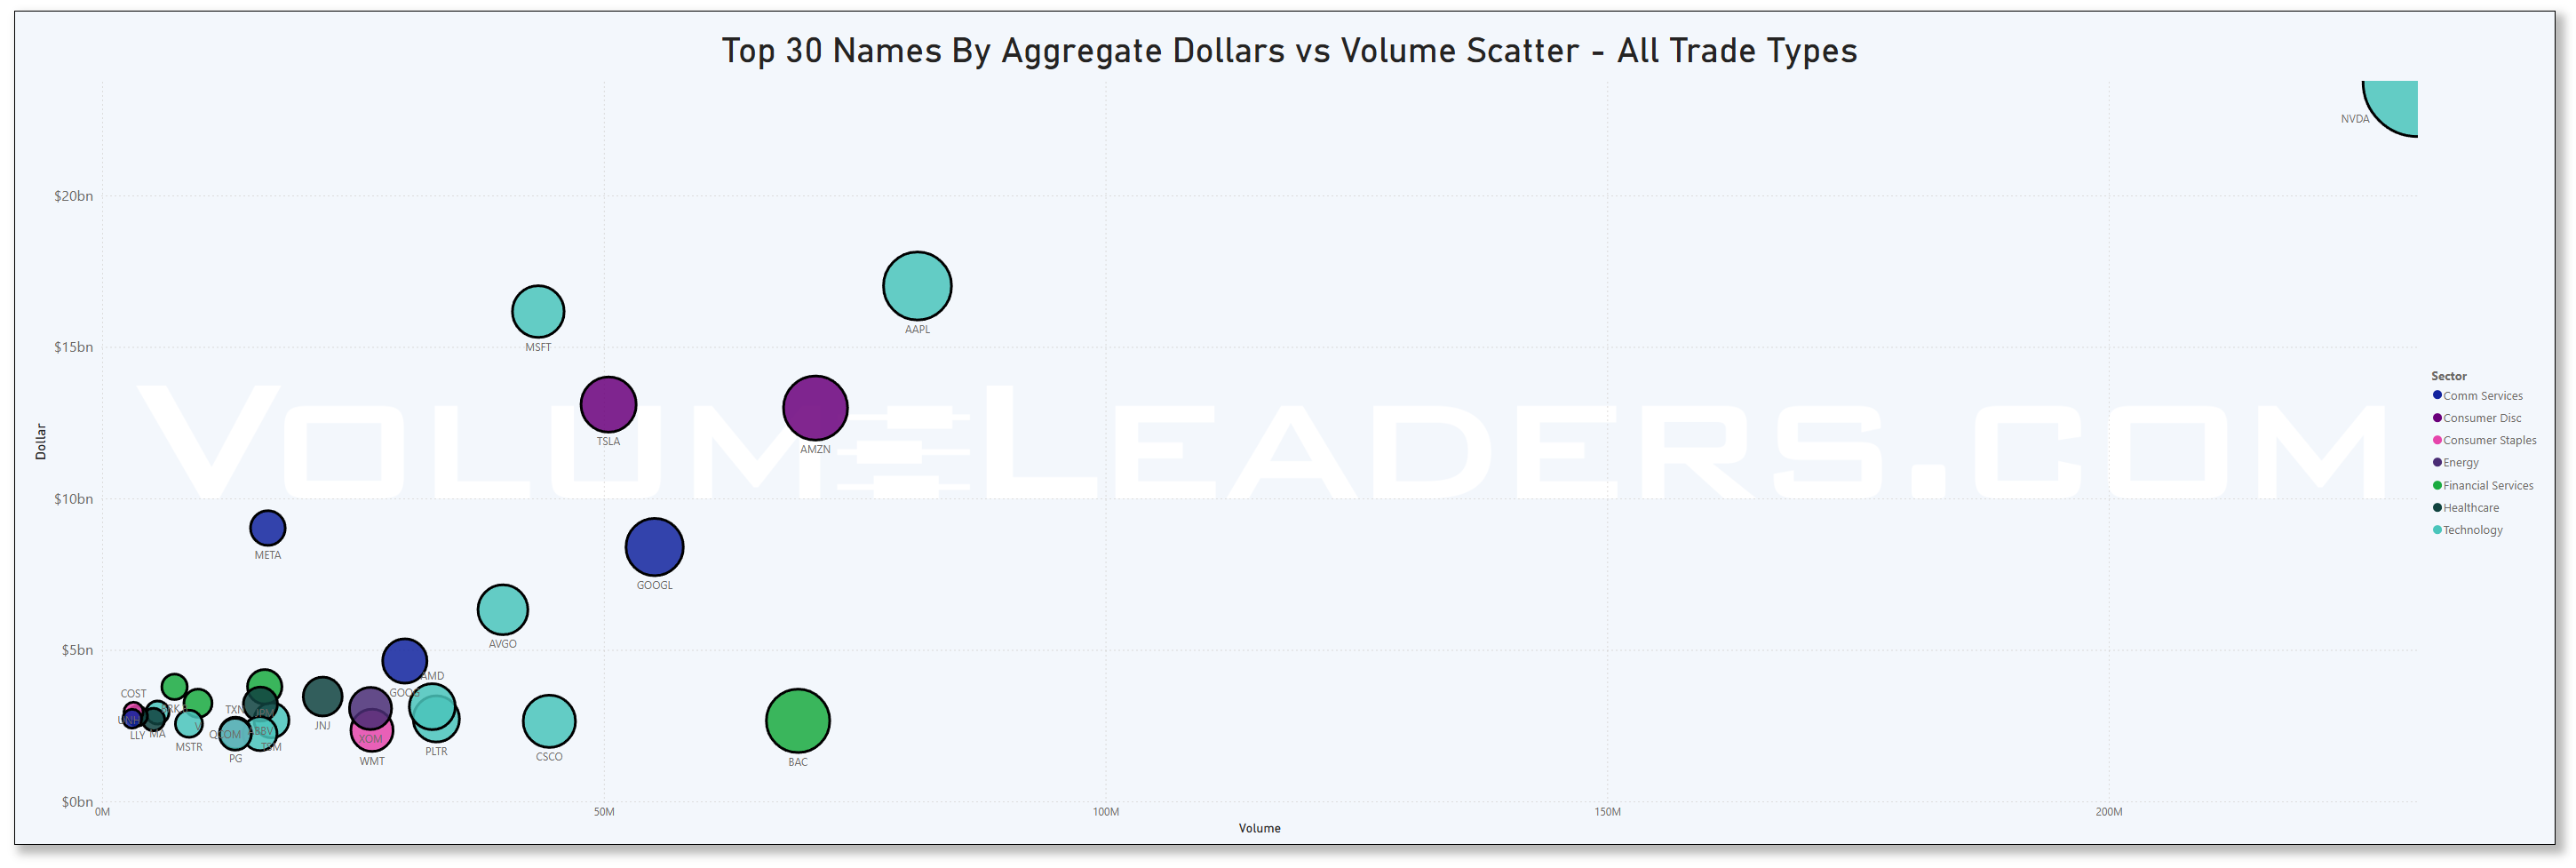
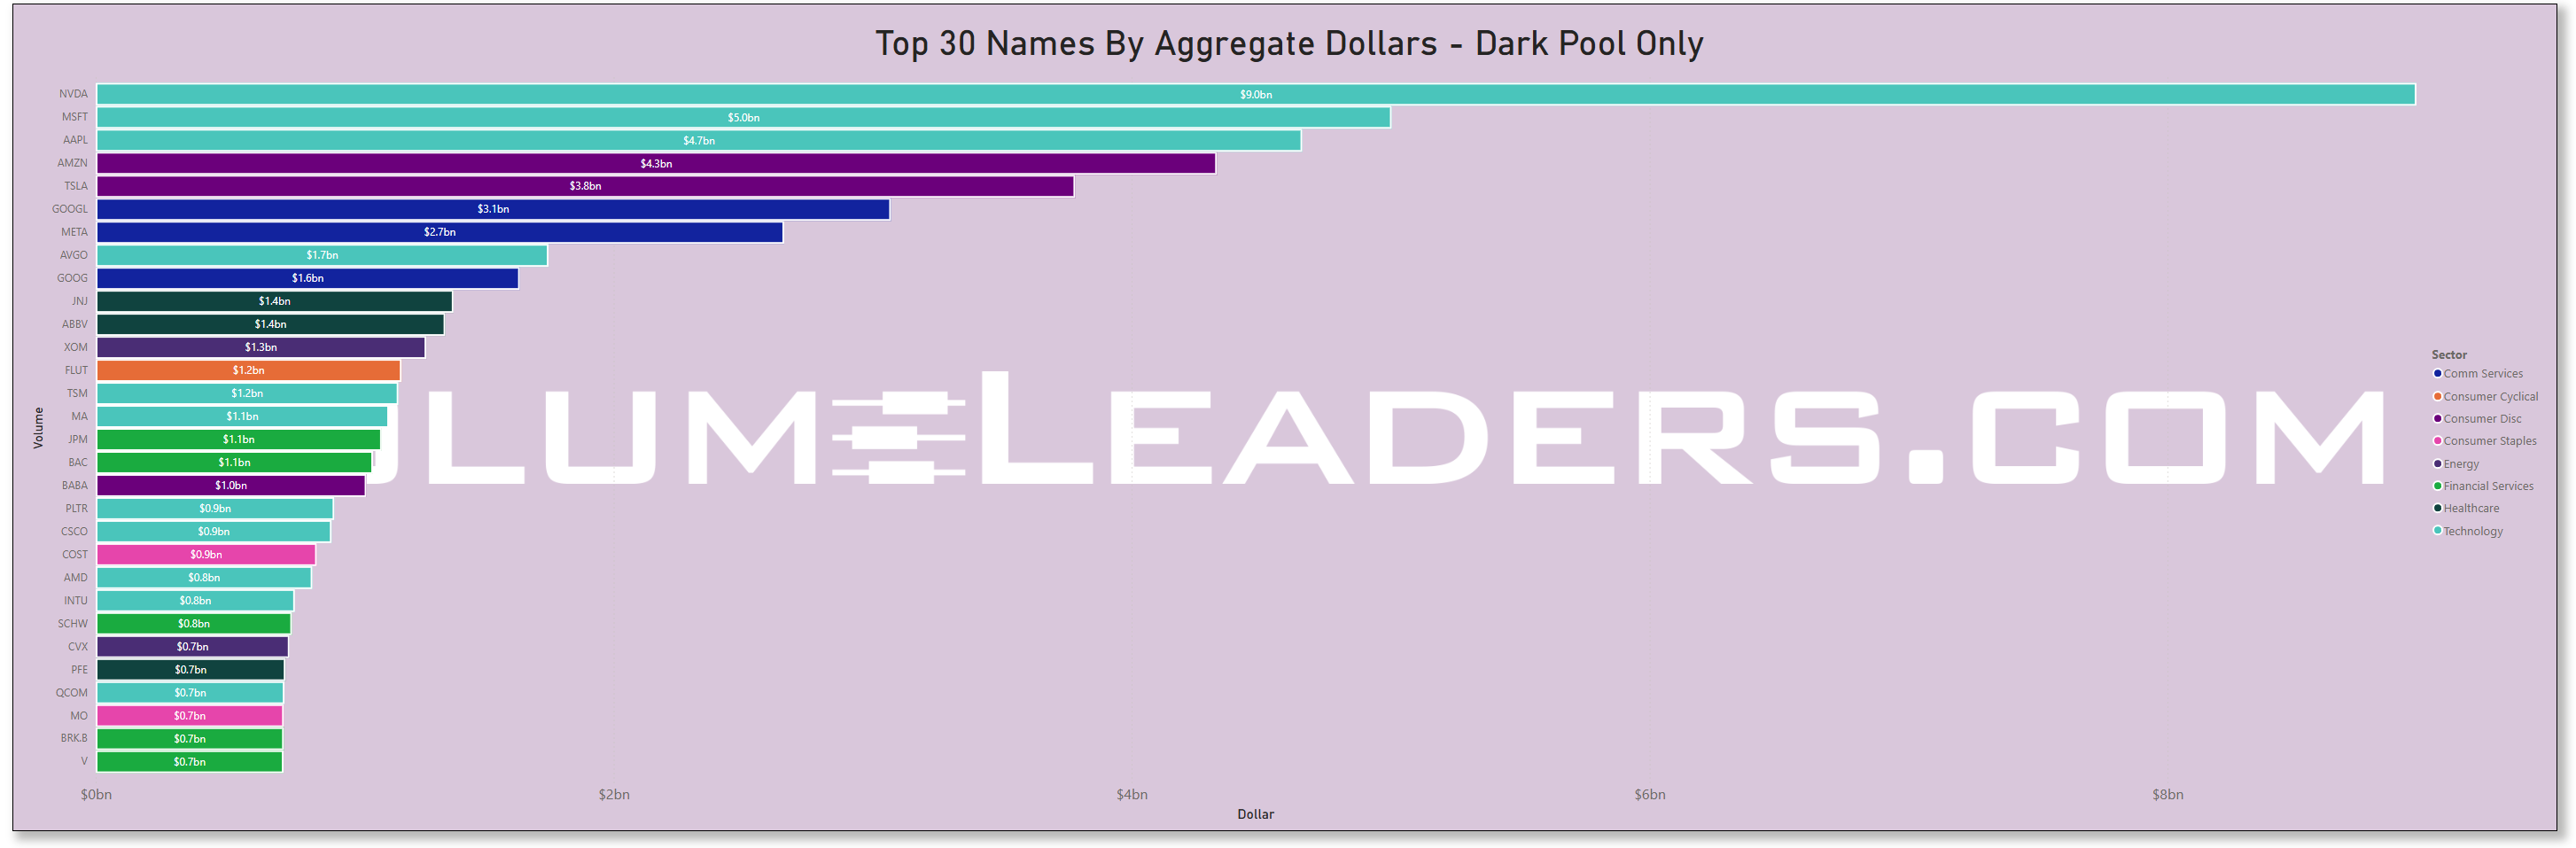
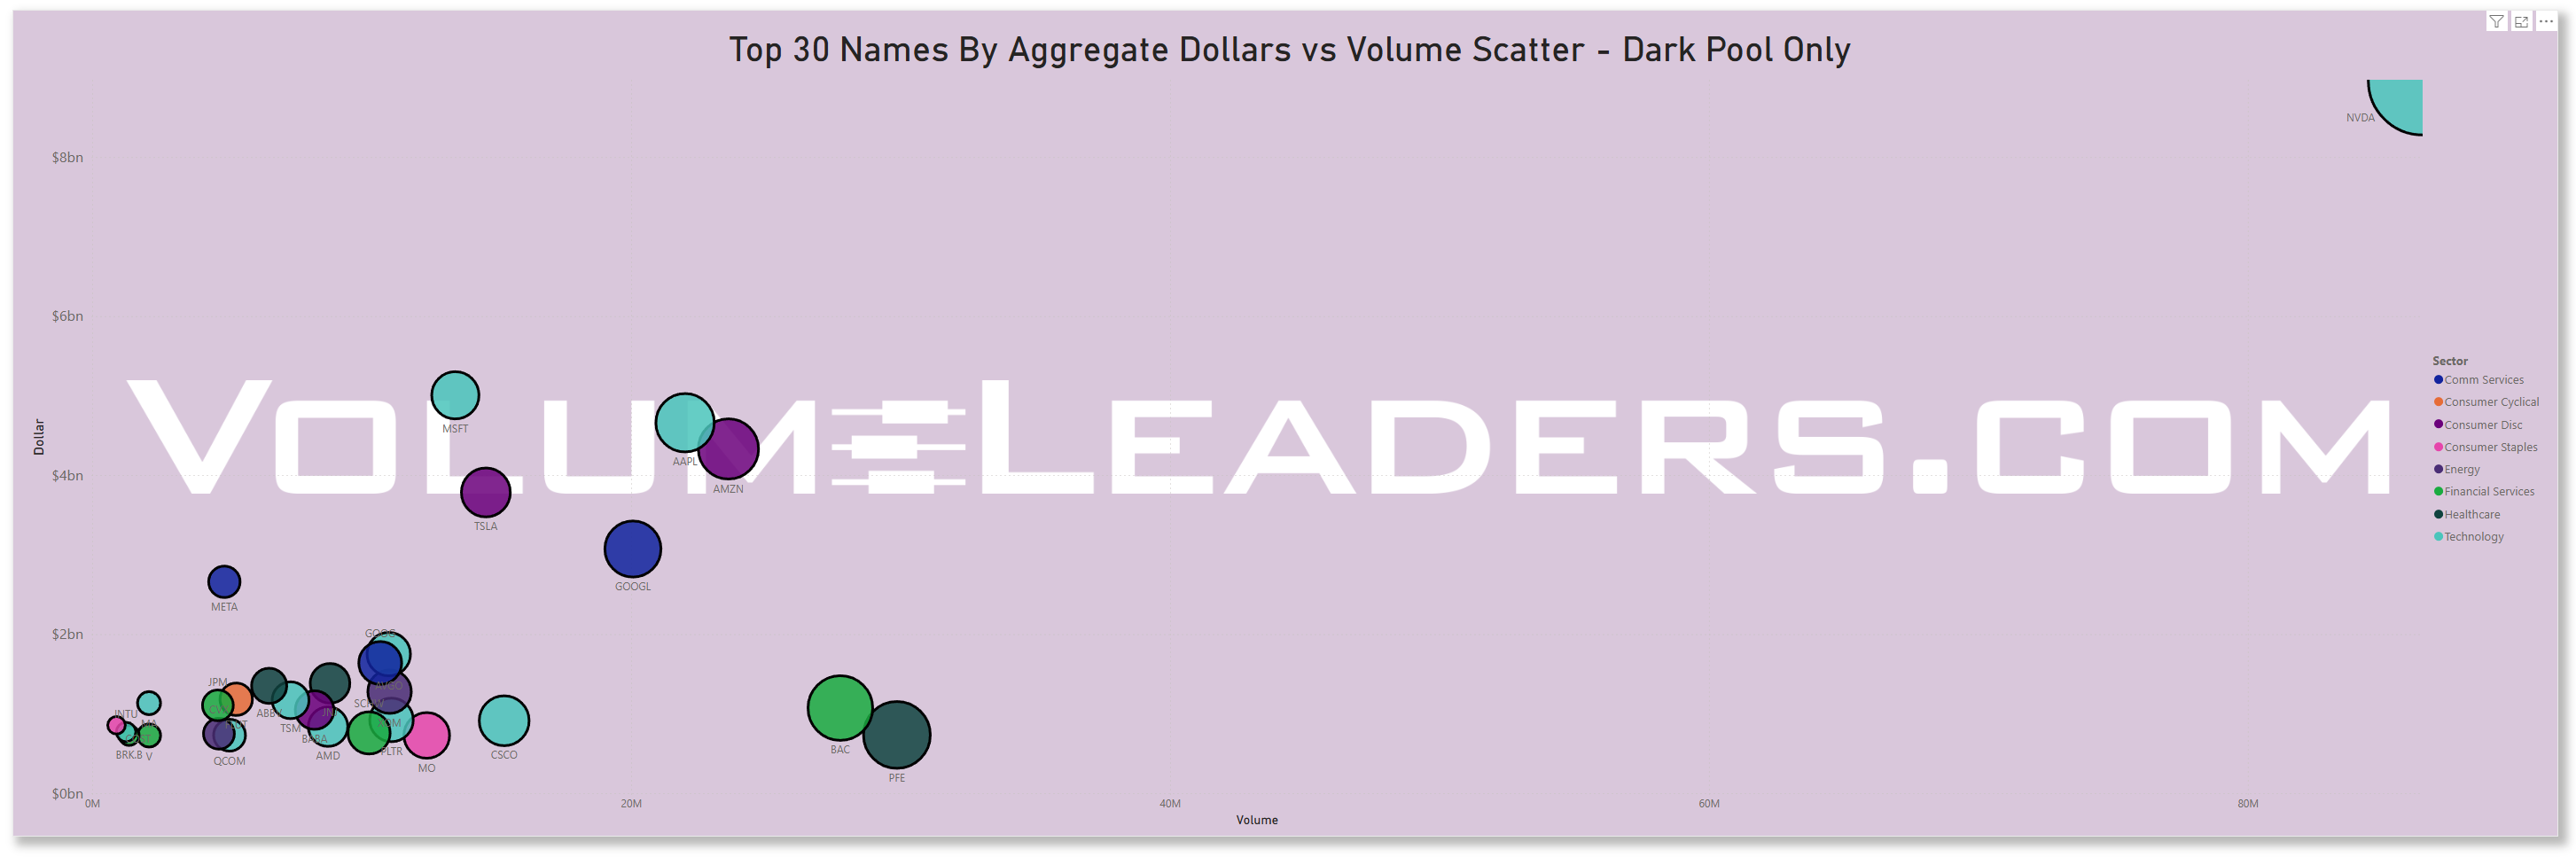
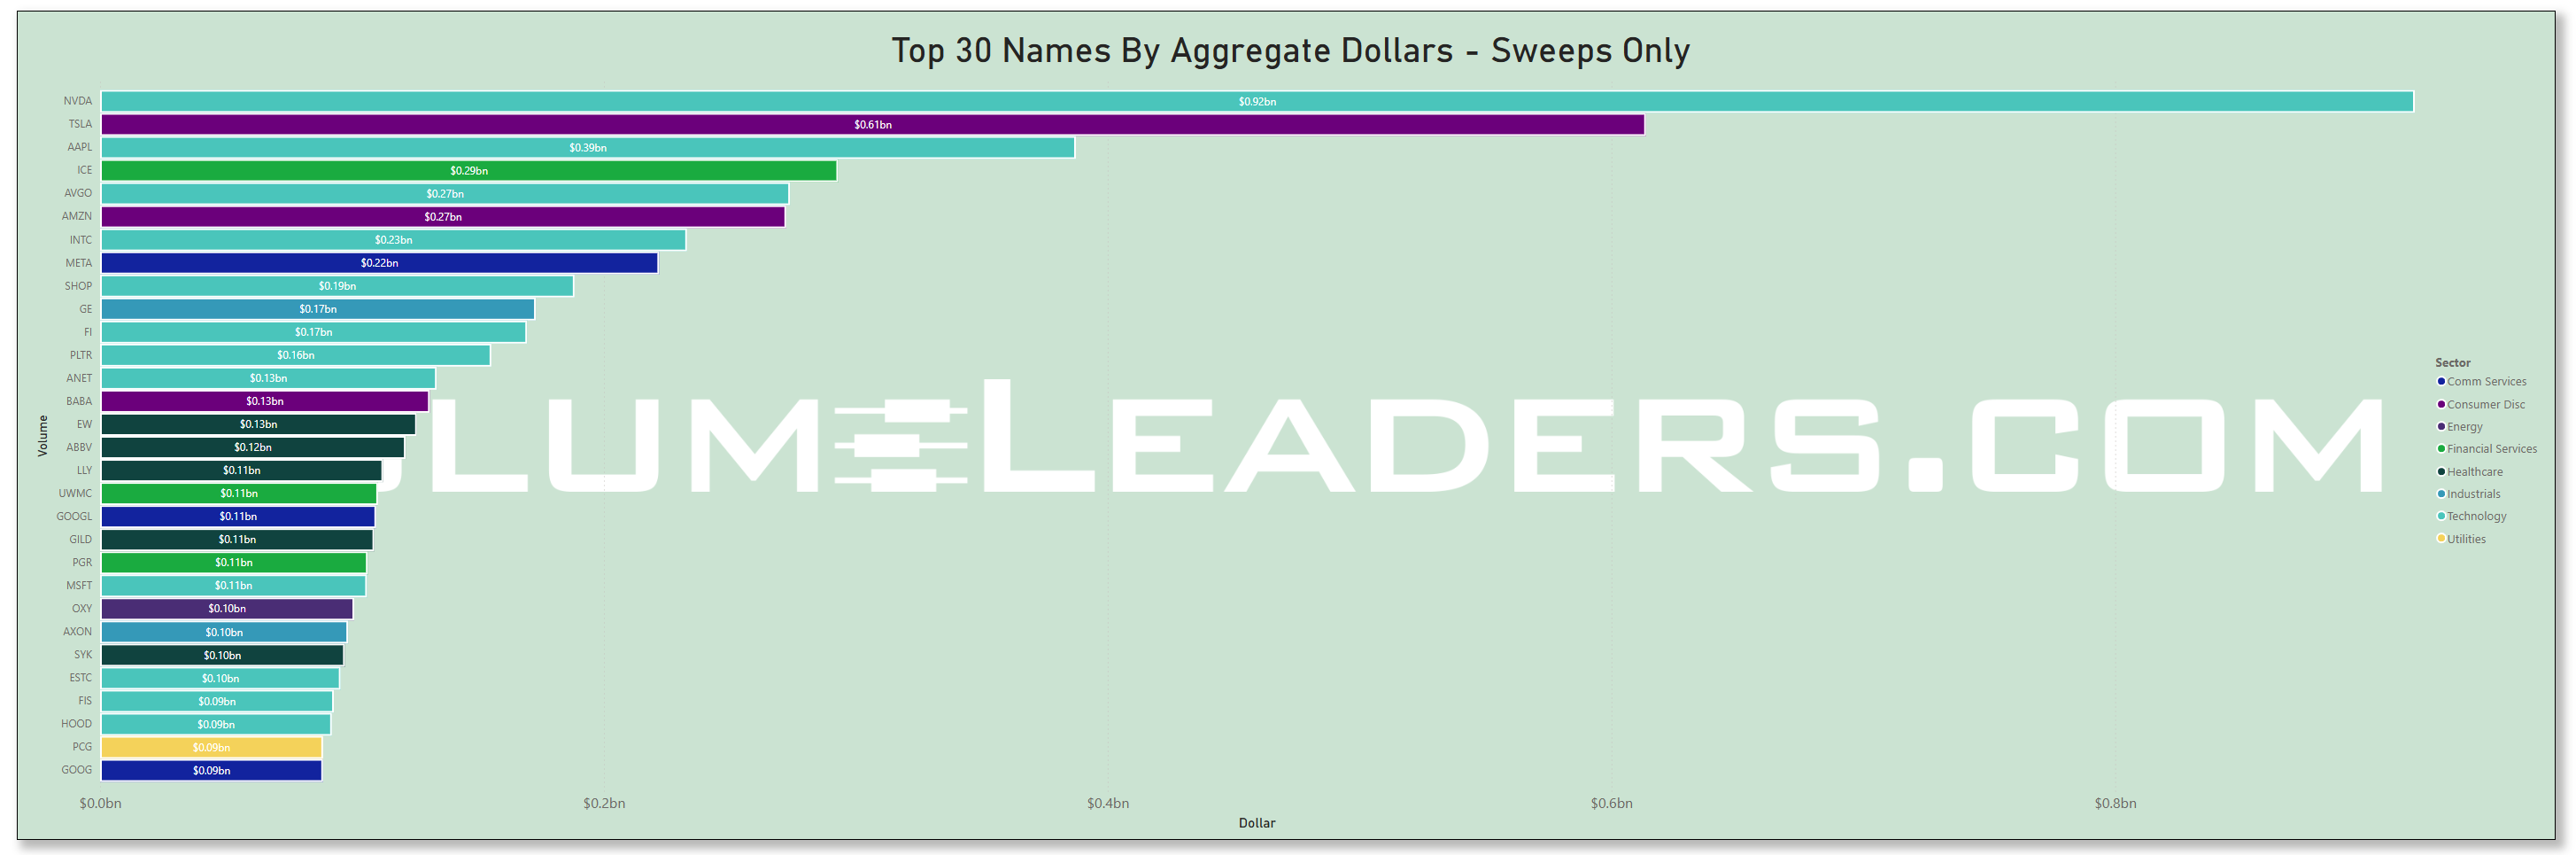
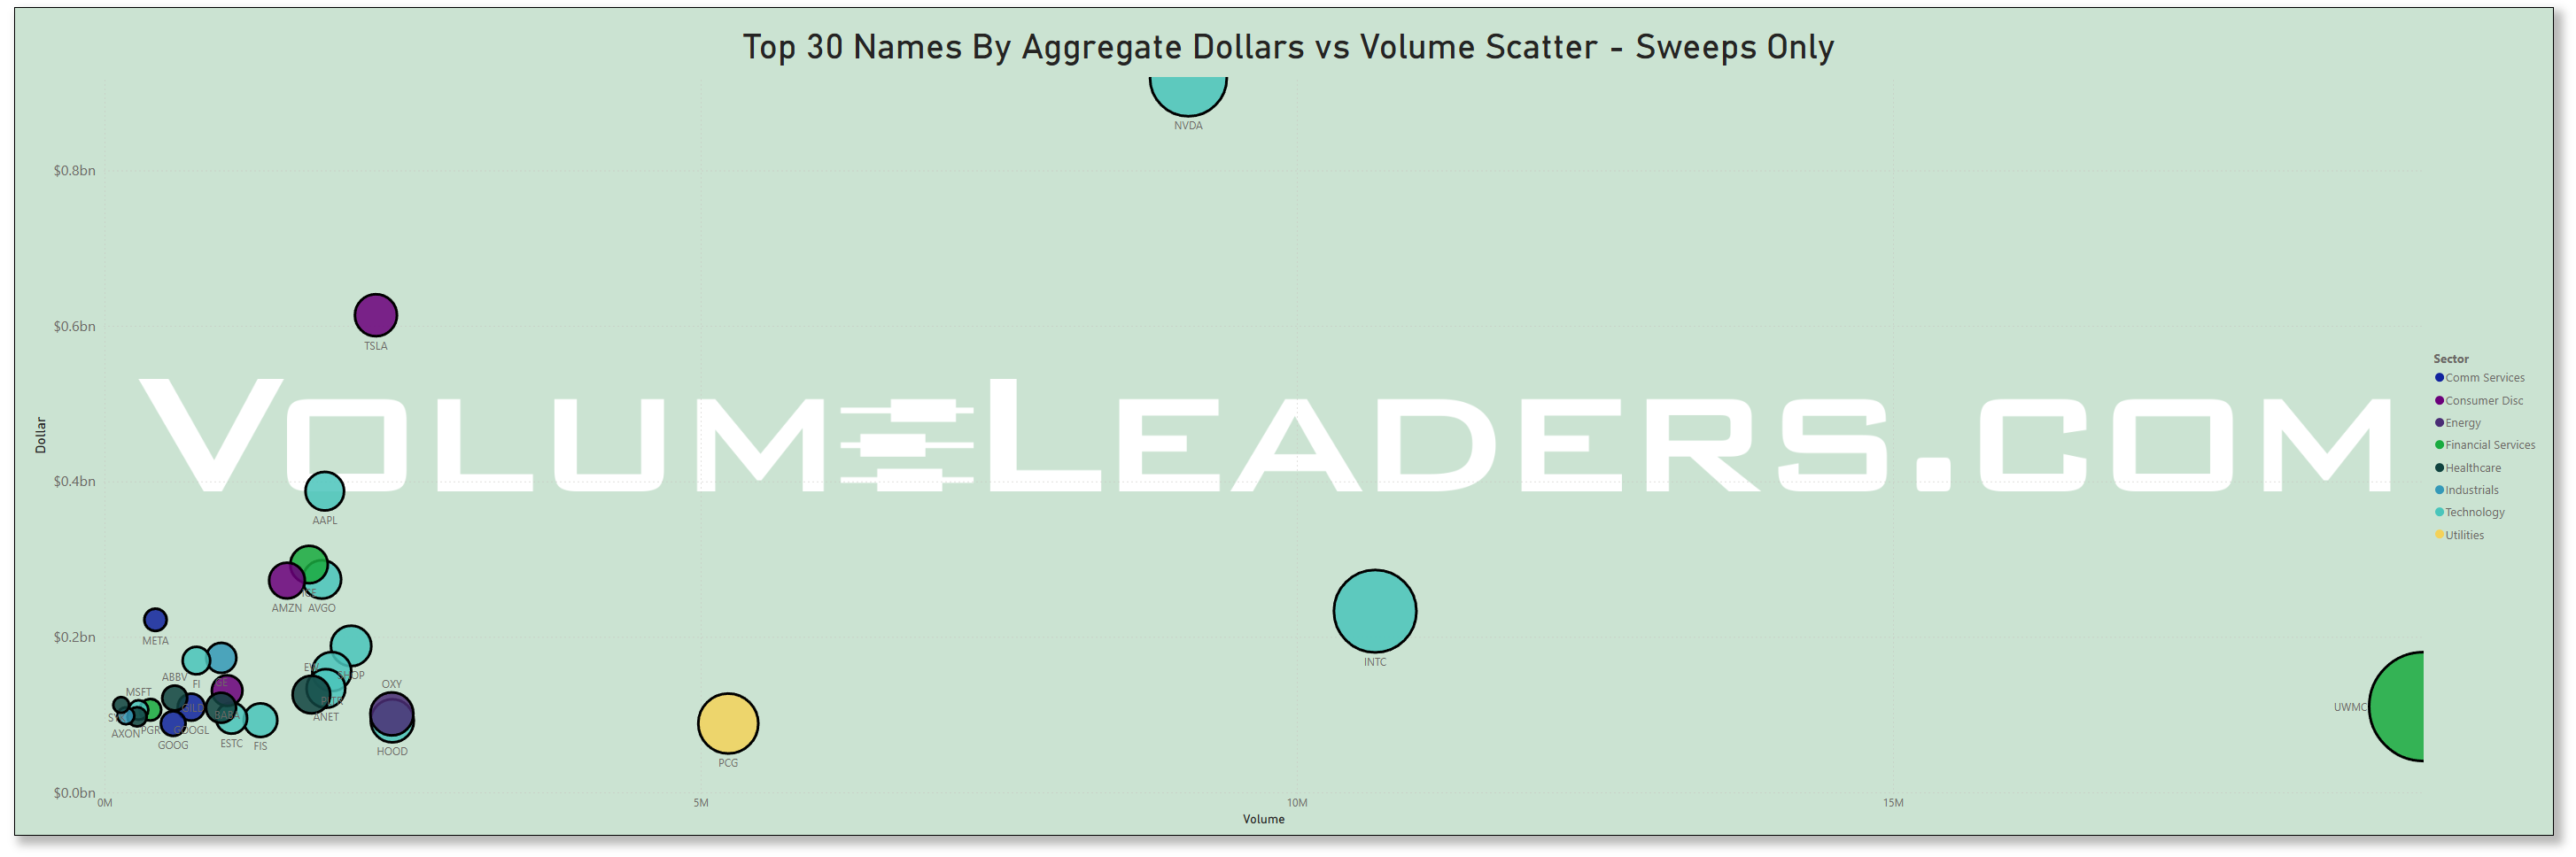
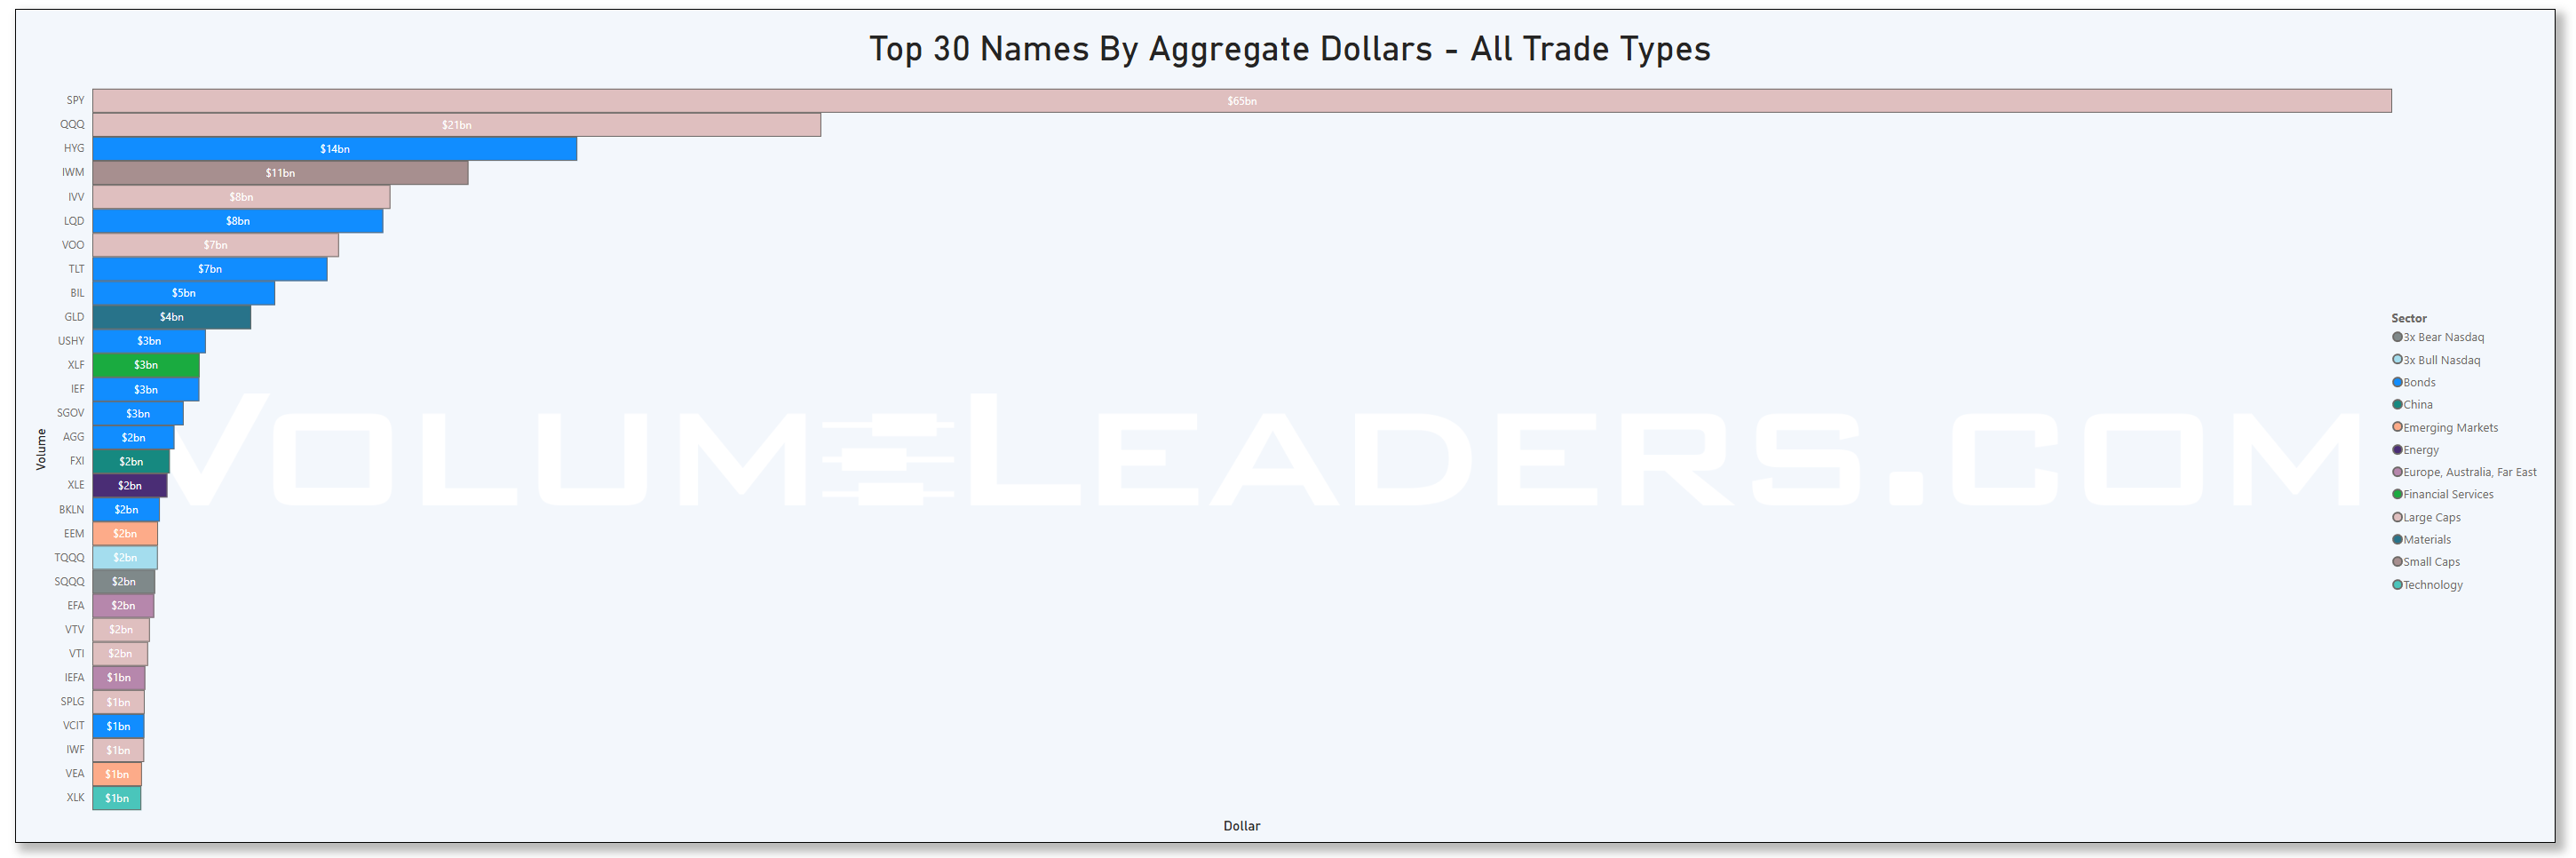
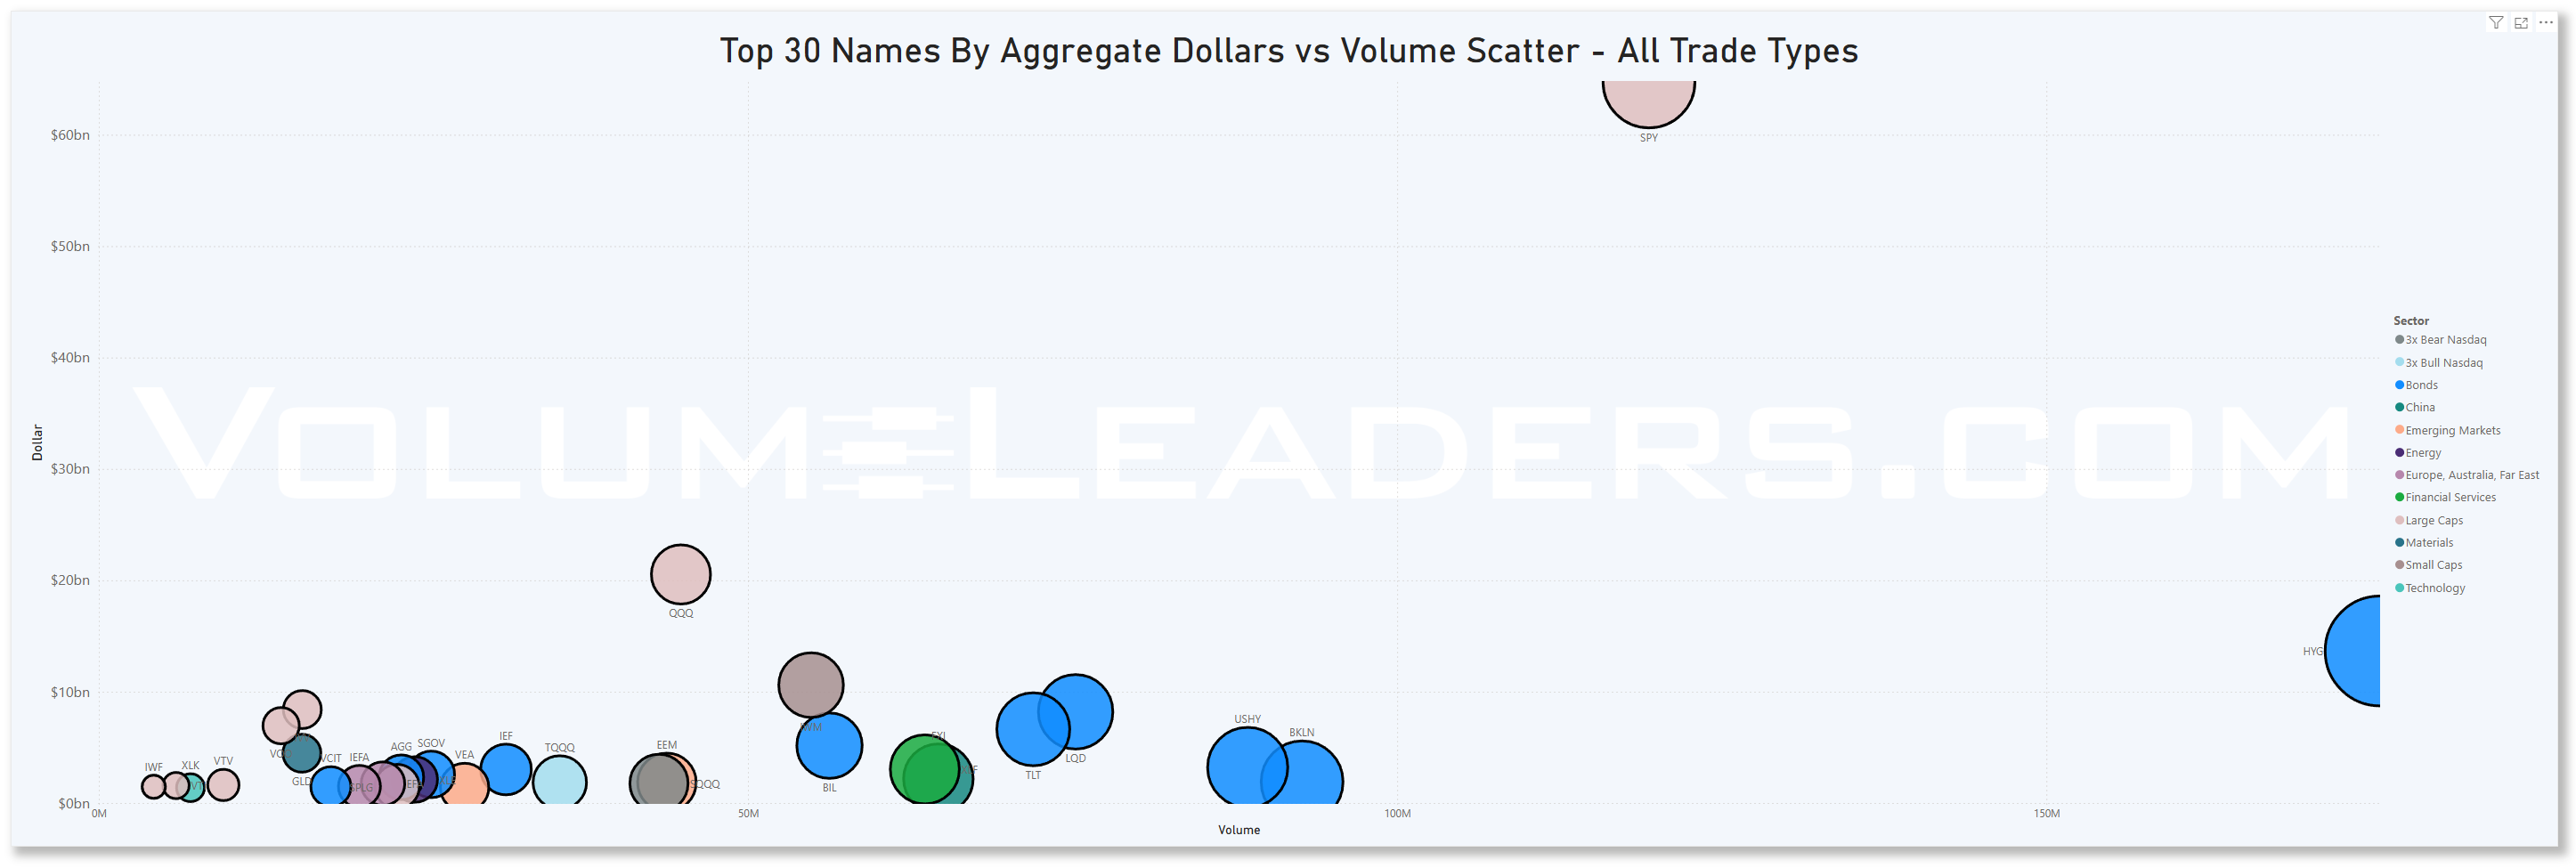
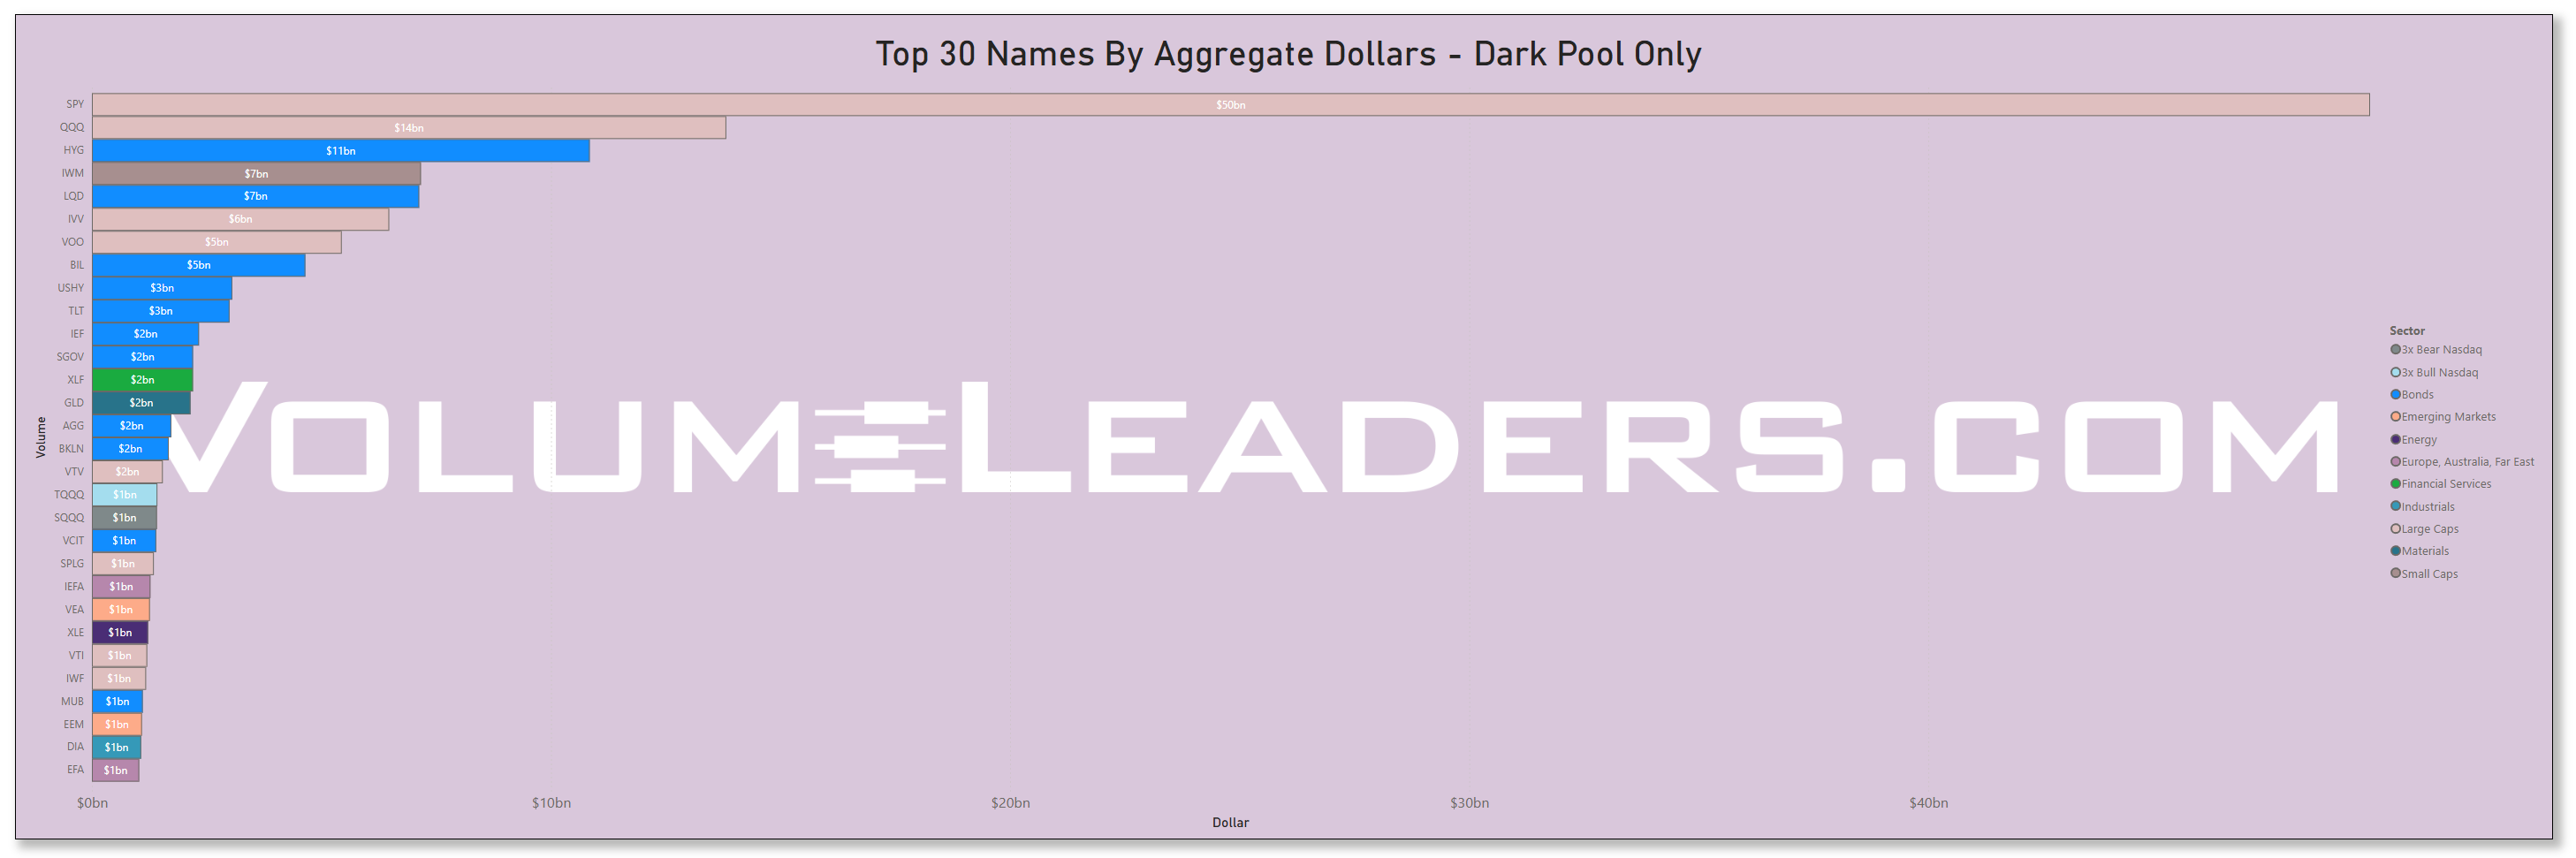
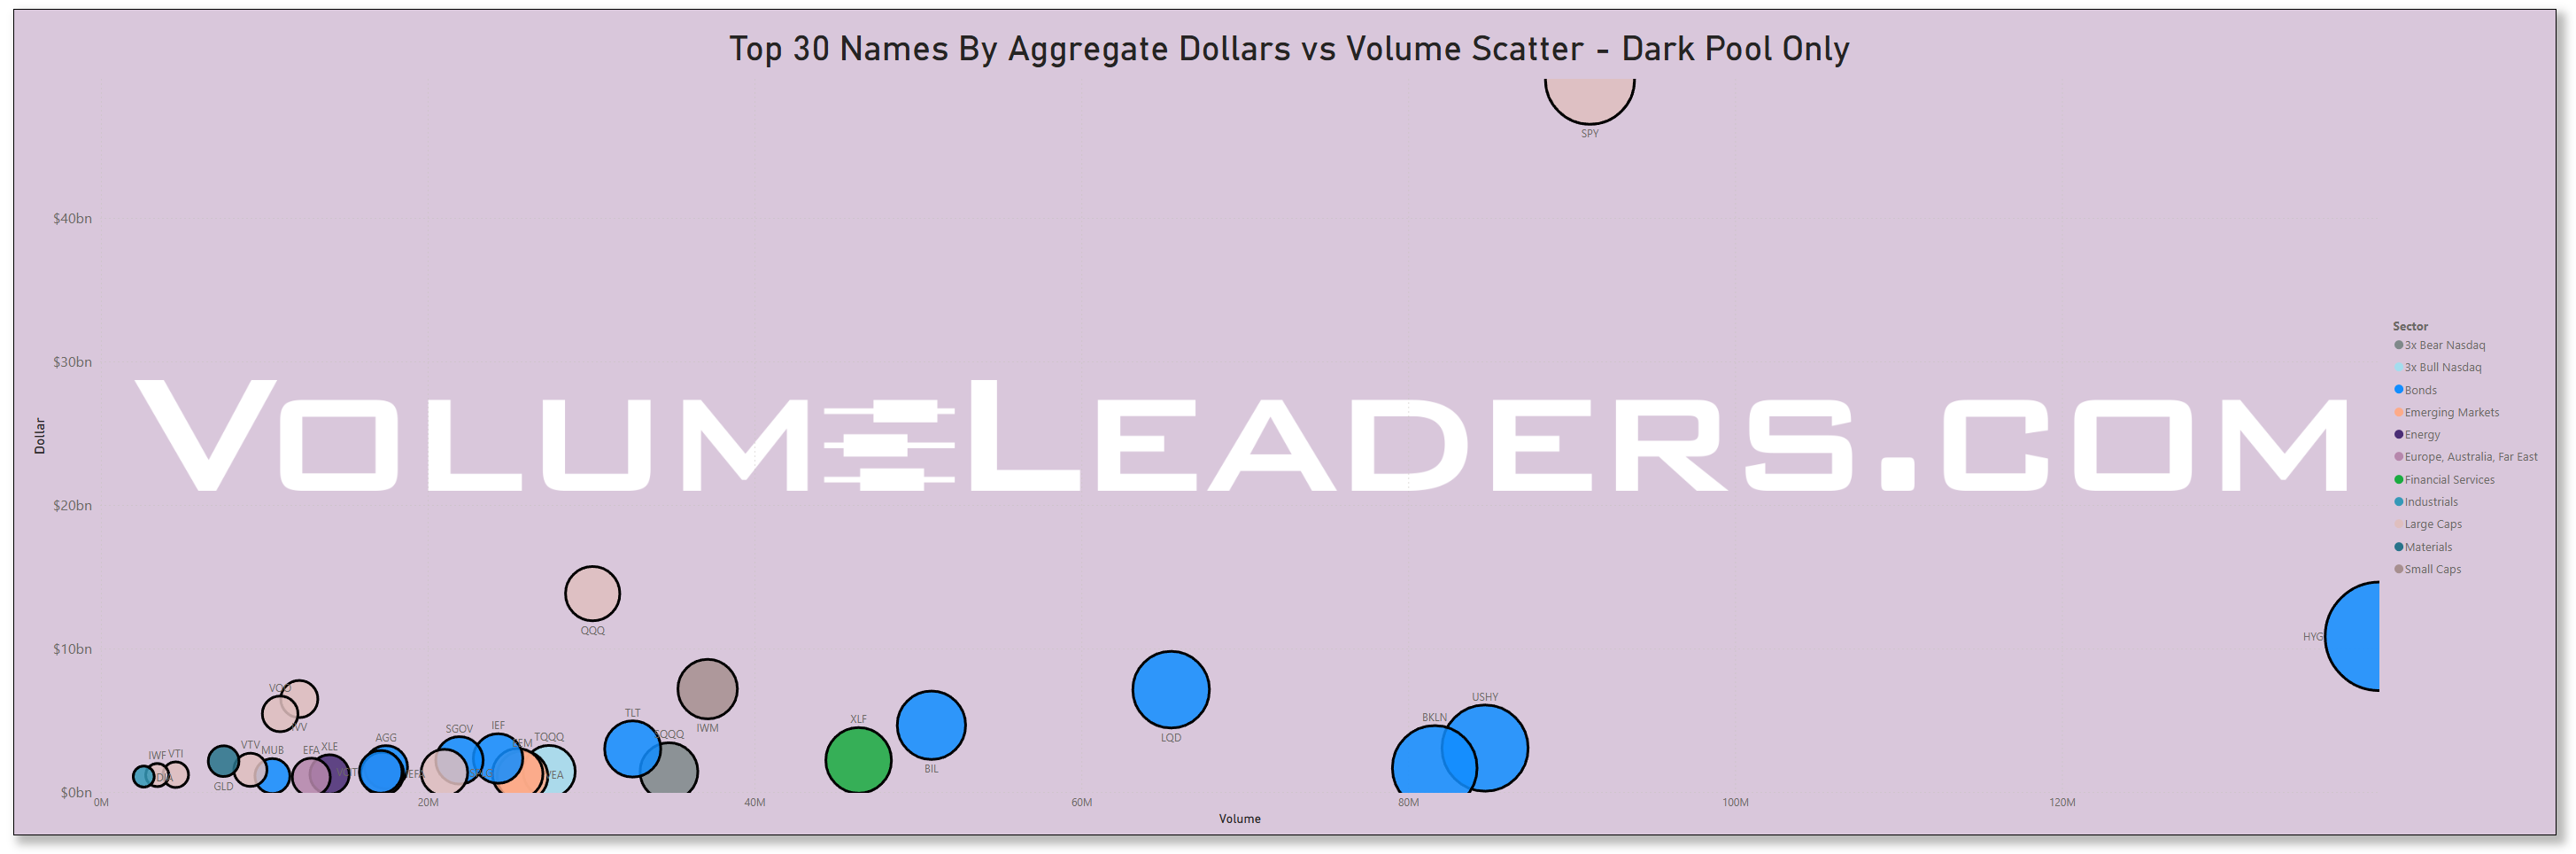
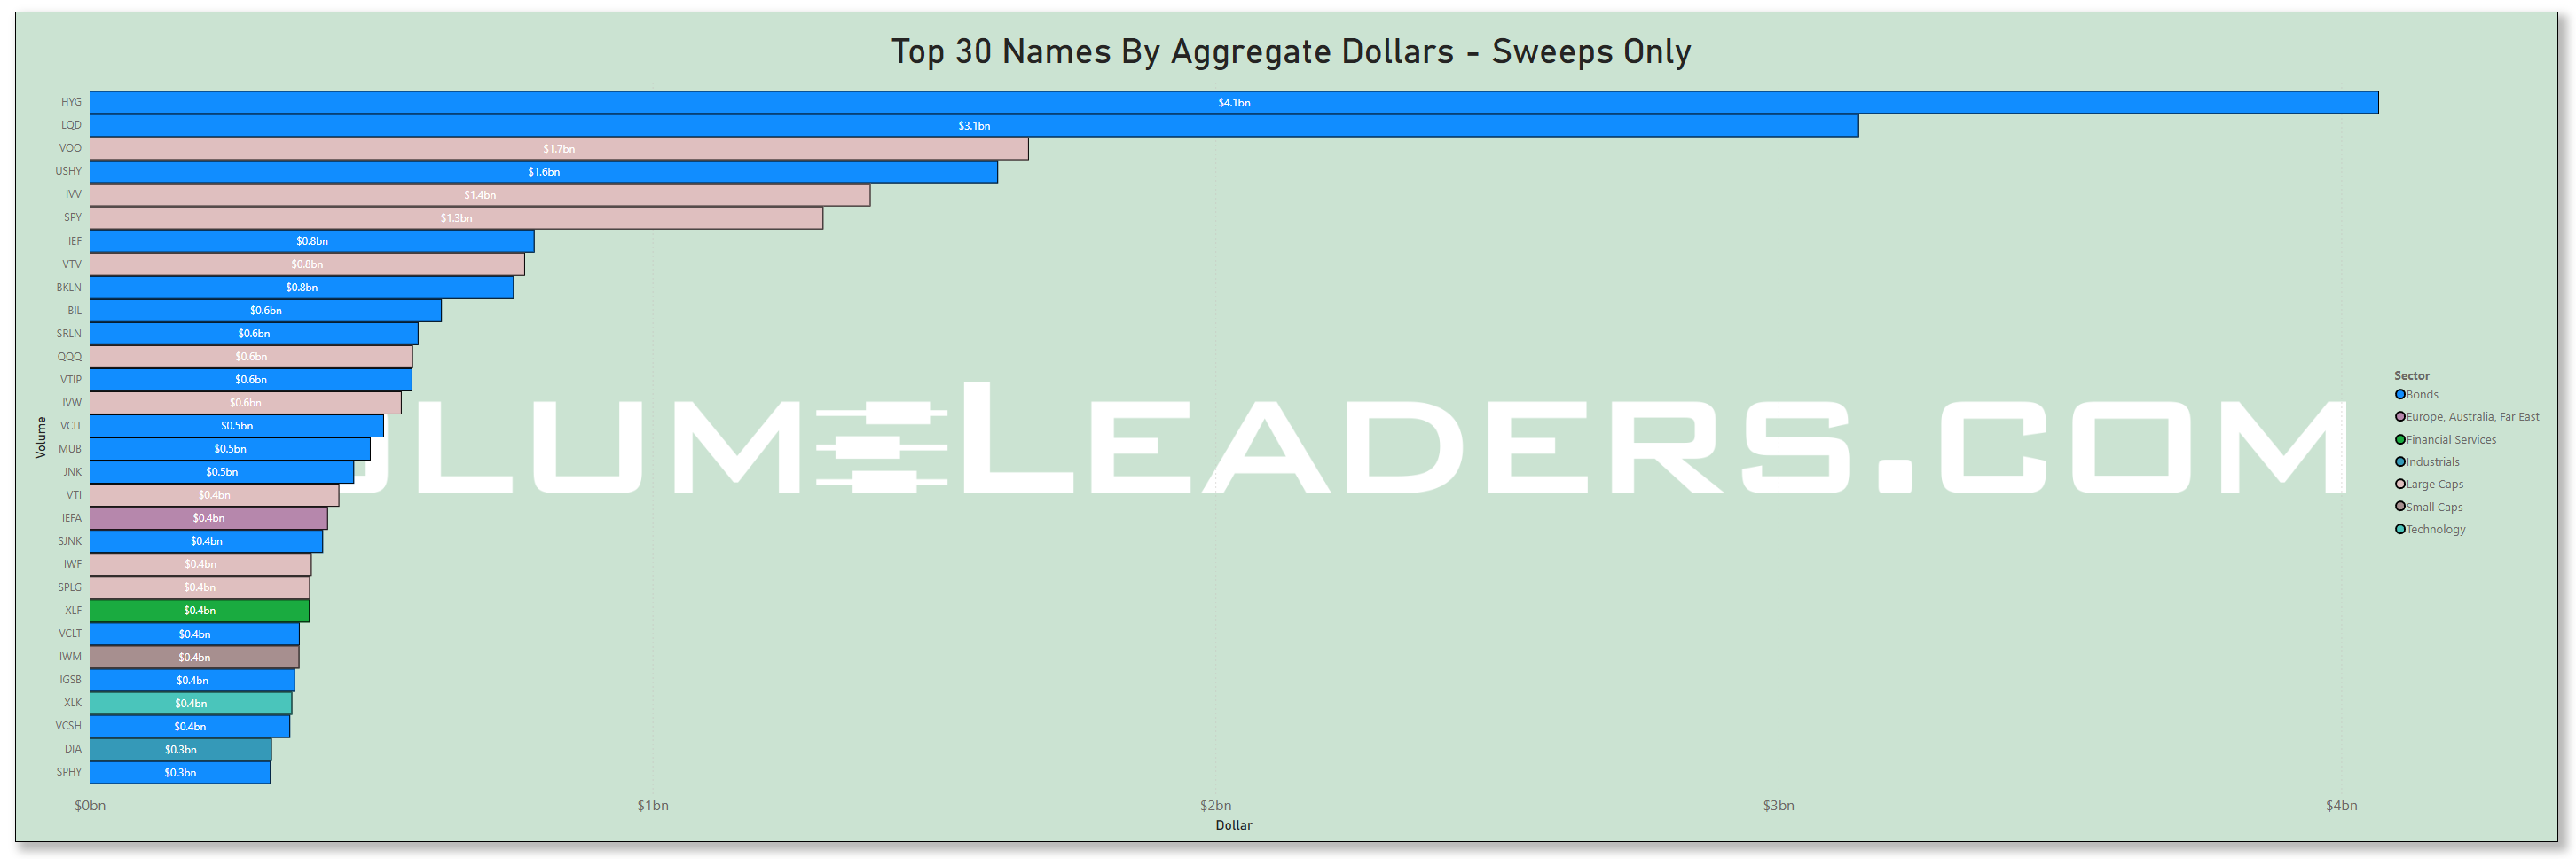
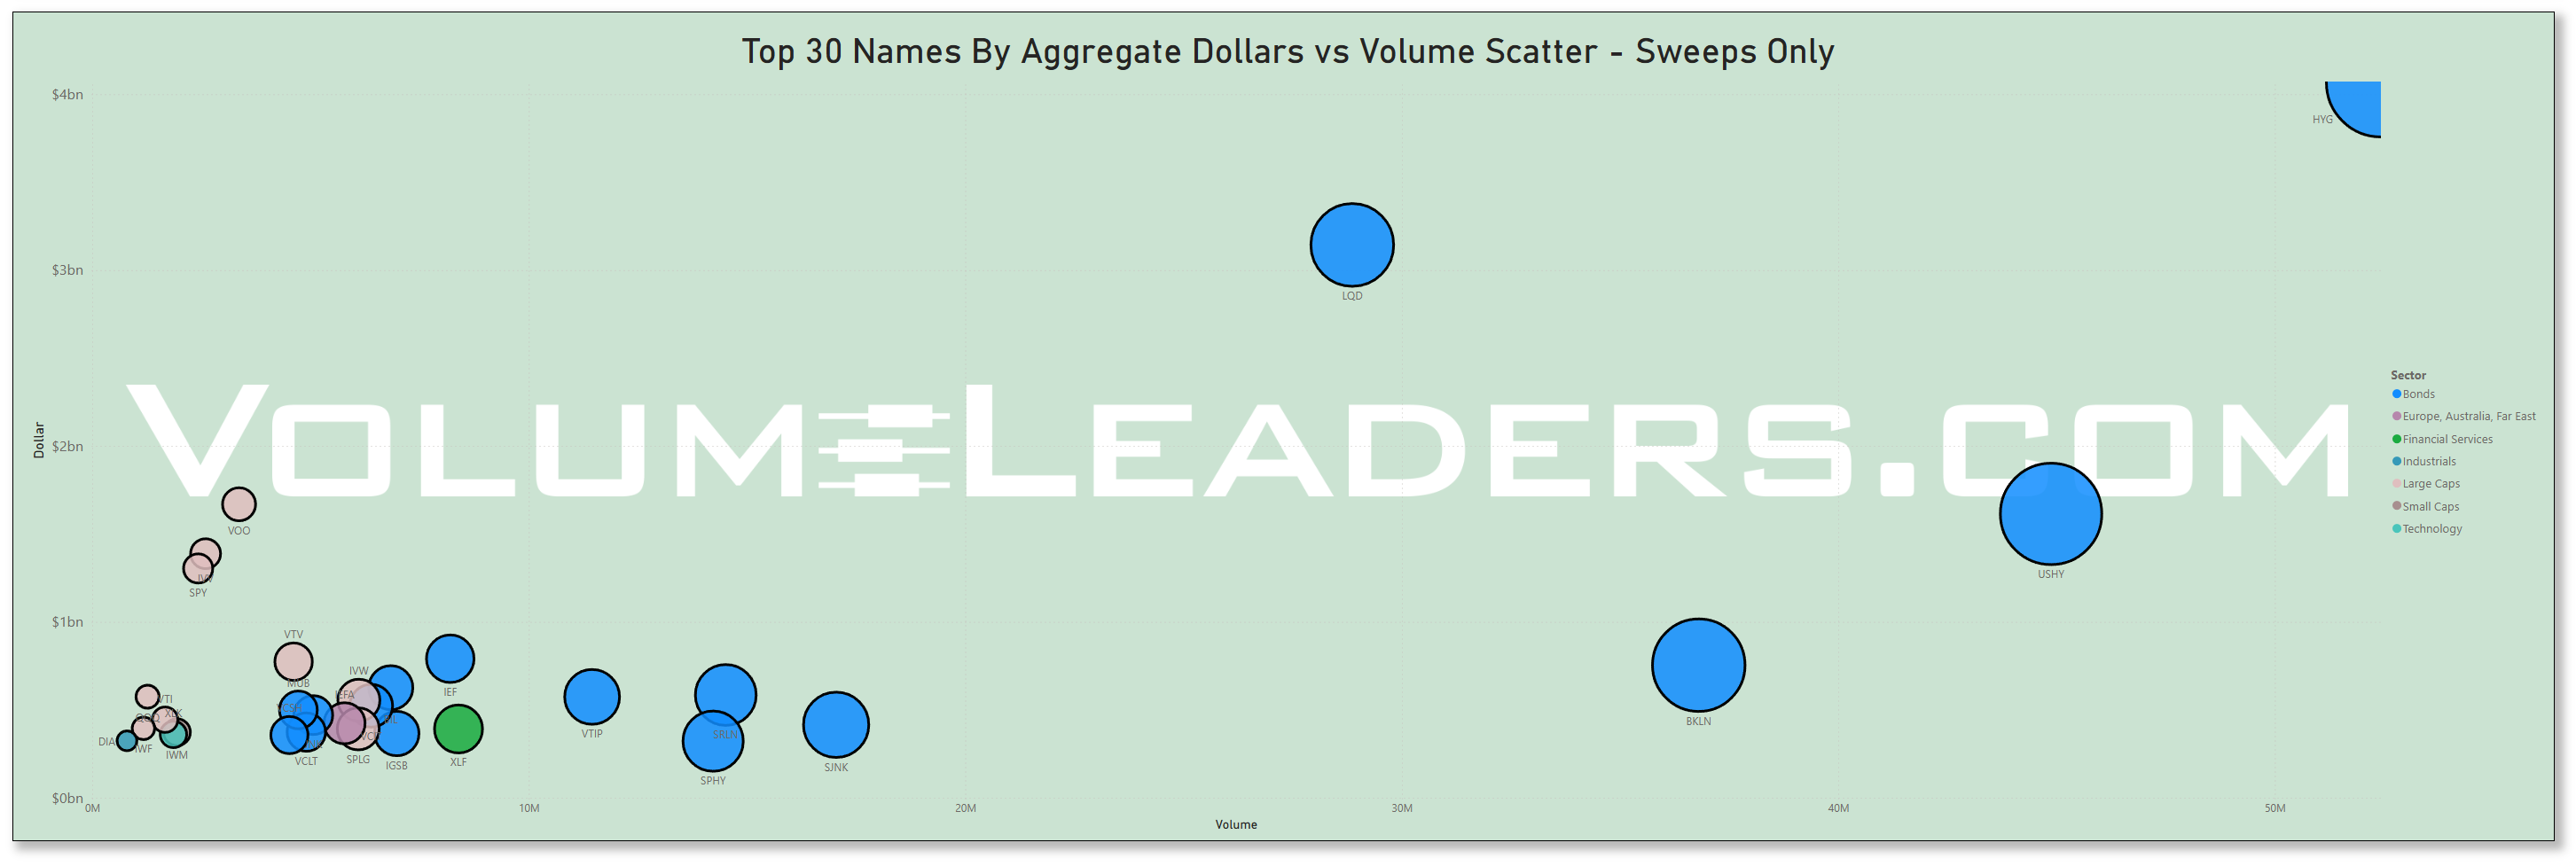
Many excellent trade ideas and sources of inspiration can be found in the prints below. While only the top 30 from each group are displayed, the complete results are accessible in VolumeLeaders.com for you to explore at your convenience any time. Remember to configure trade alerts within the platform to ensure institutional order flows that capture your interest or are significant to you aren’t missed. The blue charts represent all types of trades, including blocks on lit exchanges; the purple charts exclusively depict dark pool trades; and the green charts are sweeps only.
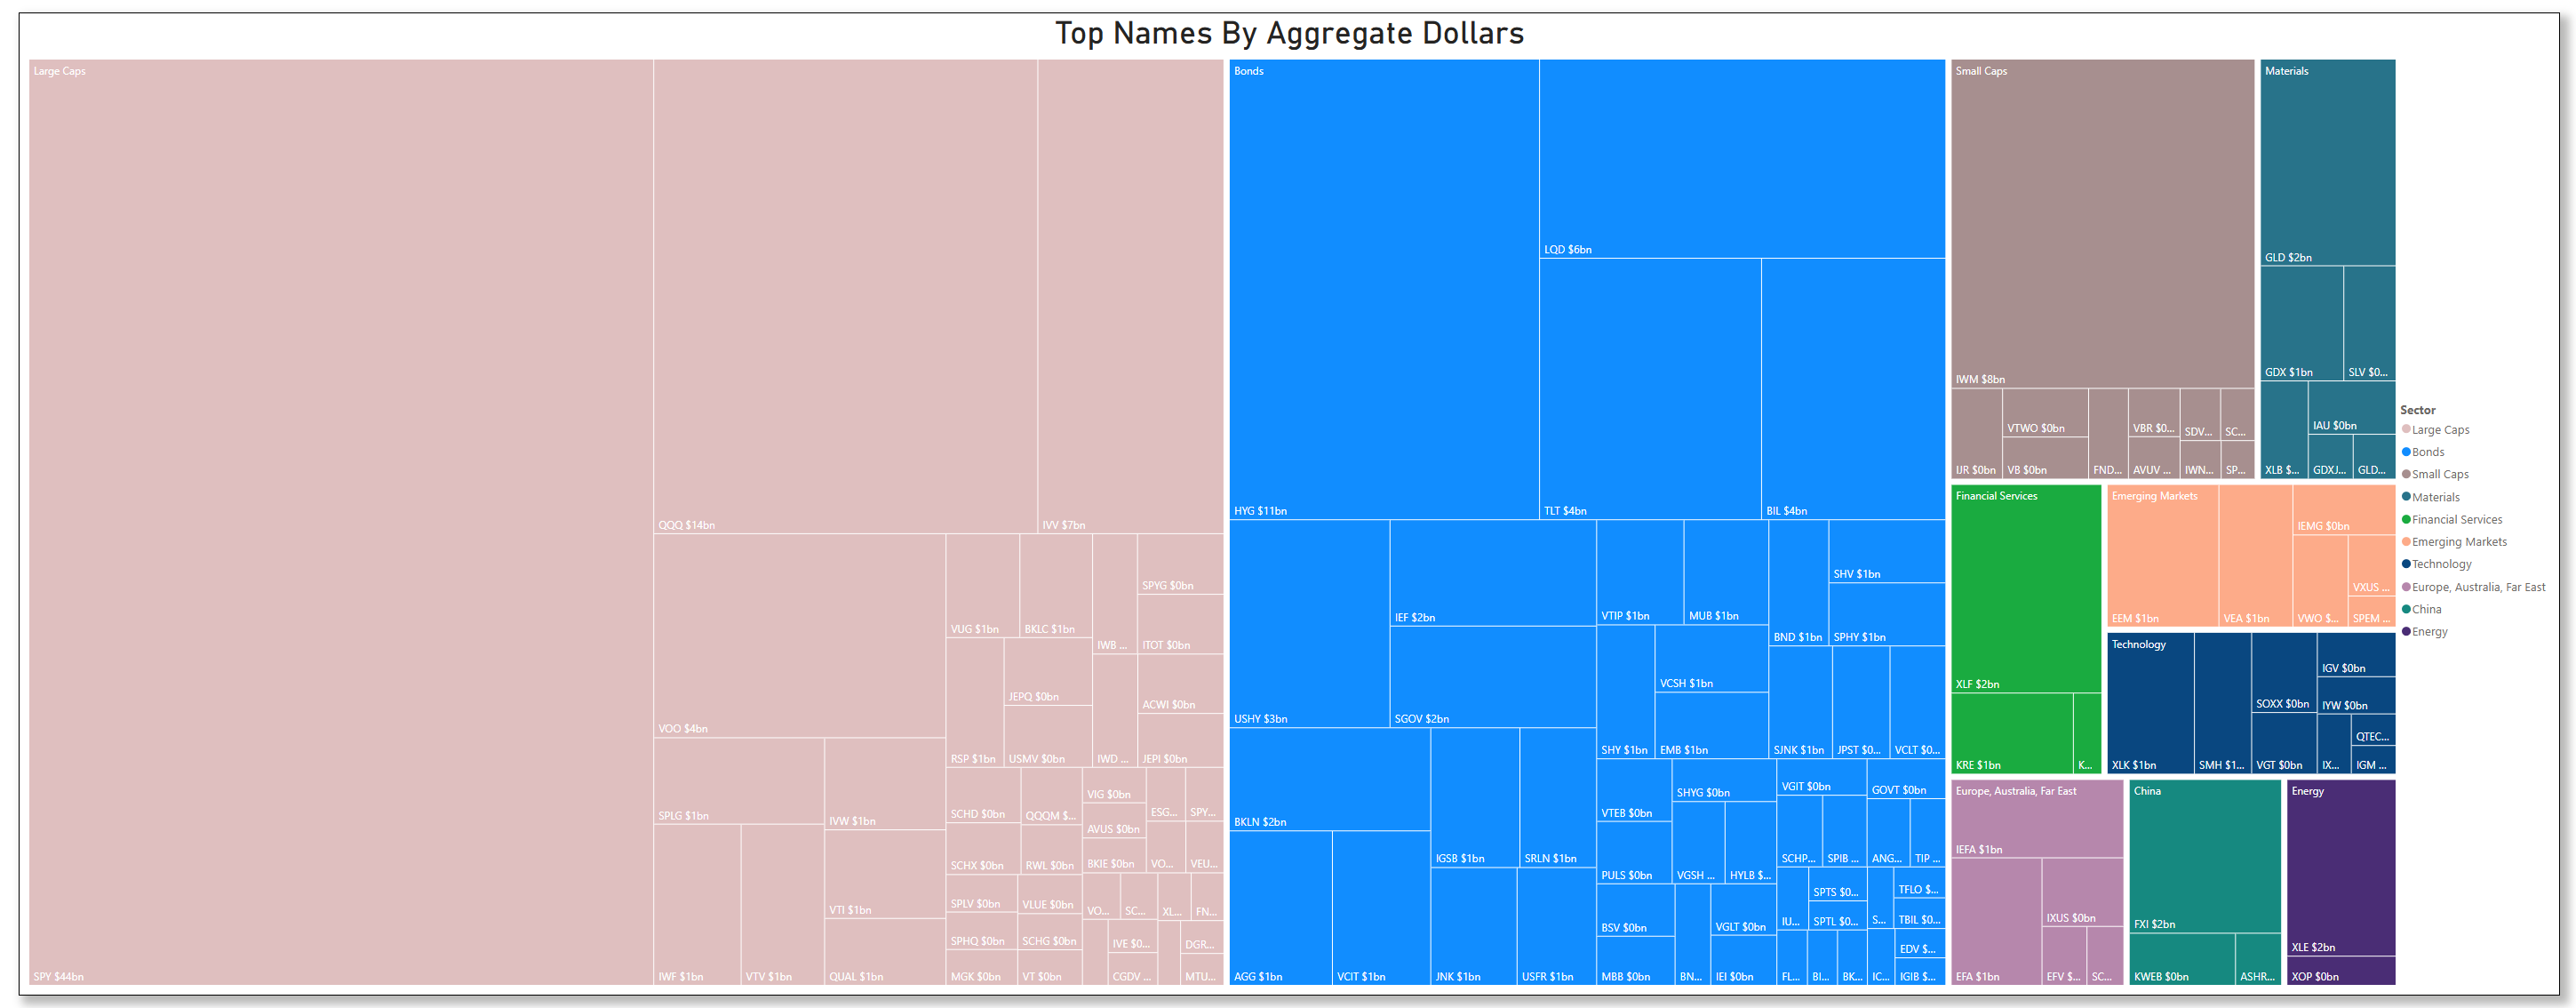
Top Institutional Order Flow In ETFs
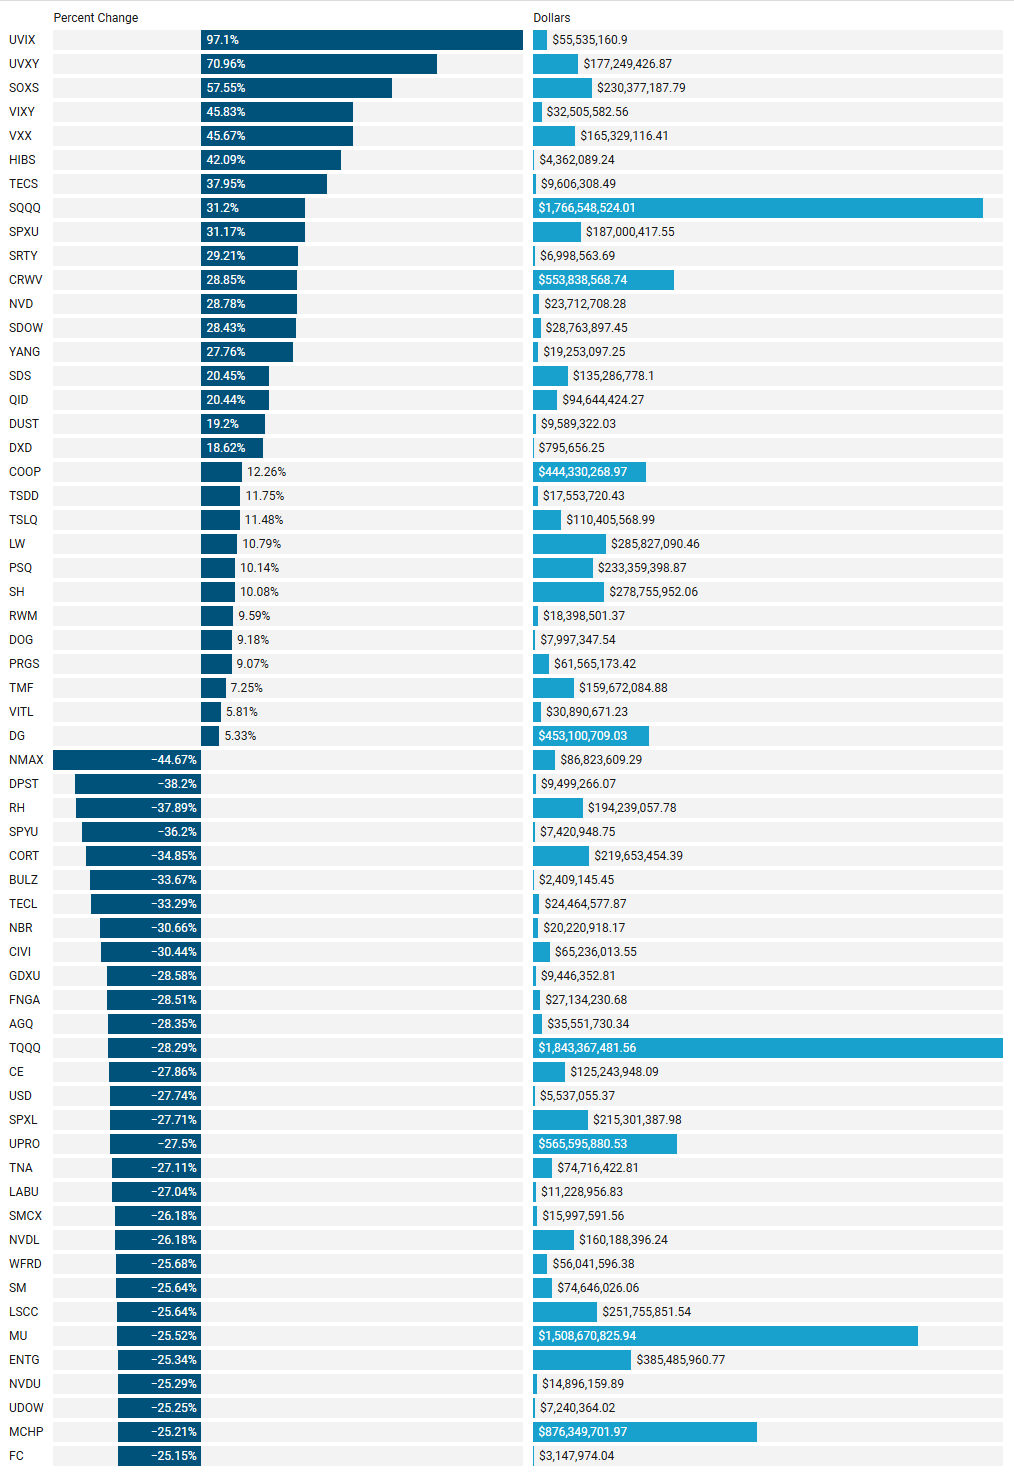
Last Week’s Institutionally-Backed Gainers & Losers
If you’re going to bet on a name, consider one that is officially endorsed by an institution! These are the top percent gainers (green) and percent losers (red) from this week’s open-to-close that had a trade price greater than $20 and institutional involvement. Continue watching tickers from this and prior stacks as these names frequently turn into multi-leg trades with a lot of movement!
Last Week’s Billion-Dollar Prints
Tickers that printed a trade worth at least $1B last week get a special shout-out. These are massive commitments by institutions that should not be ignored.
Analysis of This Week’s Top-Ranked Institutional Order Flow
1. Basic Dataset Overview
The institutional trading dataset consists of 758 trades ranked 25 or better, representing $42.75 billion in capital deployment across 469 unique tickers. The average trade size is $56.39 million, with significant variance in position sizes across sectors and individual trades.
2. Sector Analysis
Sector Capital Allocation
Large Caps Dominance: Accounts for 26.27% of all institutional capital ($11.23B), with notably large average trade sizes ($193.62M) and above-average top-rank percentages (20.69%).
Communication Services Focus: Received 15.63% of capital ($6.68B) with strong conviction metrics - 24.56% of trades in this sector have top rankings (1-5).
Technology's Broad Reach: Represents 13.73% of capital ($5.87B) but spread across the most tickers (56) with smaller average trade sizes ($52.89M), suggesting more diversified positioning.
Fixed Income Positioning: Bonds received 9.60% of capital ($4.10B) with high relative size metrics (14.58% high RS trades) and strong conviction (18.75% top-ranked).
Utilities' Surprising Strength: Despite modest total value ($0.45B), utilities show the best average rank (9.83) of all major sectors, indicating high institutional conviction despite smaller positions.
Sector Conviction Patterns
Highest Top-Rank %: Communication Services (24.56%), Large Caps (20.69%), Technology (19.82%)
Highest Relative Size Trades %: Bonds (14.58%), Large Caps (12.07%), Comm Services (12.28%)
Lowest Conviction Sectors: Consumer Staples (0% top-ranked trades despite $1.21B deployed)
3. Industry Analysis
Industry Capital Allocation
Software & Media Concentration: Software ($3.39B, 7.94%) and Interactive Media ($3.33B, 7.79%) received the most capital but show 0% top-ranked trades, suggesting large but lower-conviction positioning.
Entertainment's Strong Conviction: Despite ranking third in total value ($2.06B, 4.82%), entertainment shows remarkably high conviction with 40% top-ranked trades.
High-Yield Bond Focus: High Yield bond trades show strong institutional conviction (25% top-ranked) despite representing only 2.31% of total value ($0.99B).
Banking Sector Interest: Banks received $1.08B (2.52%) with 21.05% of trades having top rankings, indicating selective but high-conviction positioning.
4. Trade Size Distribution and Analysis
Relative Size Distribution
54.35% of trades have very low relative size (<5)
34.96% have low relative size (5-25)
Only 3.96% of trades have relative size >50, indicating these are exceptional positions
Rank Distribution
Trade distribution across rank categories is surprisingly even:
Ranks 1-5: 17.15%
Ranks 6-10: 19.39%
Ranks 11-15: 19.92%
Ranks 16-20: 21.90%
Ranks 21-25: 21.64%
5. Top Trades Analysis
Largest Dollar Value Trades
Microsoft ( MSFT 0.00%↑ ): $3.28B with extraordinary relative size (307.97), but only rank 19
S&P 500 ETF ( SPY 0.00%↑ ): Two massive trades of $3.22B and $2.82B with high relative sizes
Meta Platforms ( META 0.00%↑ ): $1.68B despite low rank (25), suggesting size but not conviction
Highest Conviction Trades (Rank 1)
Invesco Agriculture ETF ( PDBA 0.00%↑ ): $9.83M with modest relative size (4.92)
ICCT Technology: $2.26M with low relative size (2.38)
United Wholesale Mortgage ( UWMC 0.00%↑ ): $56.38M with strong relative size (31.55)
Highest Relative Size Trades
Microsoft ( MSFT 0.00%↑ ): 307.97 RS, $3.28B, Rank 19
ProShares Ultra QQQ ( QLD 0.00%↑ ): 244.2 RS, $510.93M, Rank 5
ProShares UltraPro S&P 500 ( UPRO 0.00%↑ ): 232.18 RS, $402.15M, Rank 3
6. Frequently Traded Ticker Analysis
Most Active Tickers
NMAX 0.00%↑ (Comm Services): 25 trades totaling $81.74M, best rank 1
CRWV 0.00%↑ (Technology): 22 trades totaling $318.20M, best rank 3
PLTD 0.00%↑ (1x Bear PLTR): 14 trades totaling $16.73M, best rank 9
Notable Frequently Traded Stocks
MLGO 0.00%↑ (Technology): 11 trades including a rank 1 position
VCRM 0.00%↑ (Bonds): 6 trades including a rank 1 position
WTF 0.00%↑ (Financial Services): 6 trades including a rank 1 position
7. Institutional Conviction Score Analysis
By combining rank and relative size metrics into a composite score, we identified the trades showing strongest institutional positioning:
ProShares UltraPro S&P 500 ( UPRO 0.00%↑ ): Rank 3, RS 232.18, $402.15M
SPDR S&P 500 ETF ( SPY 0.00%↑ ): Rank 5, RS 227.63, $3.22B
Vanguard Short-Term Inflation-Protected Securities ETF ( VTIP 0.00%↑ ): Rank 4, RS 181.36, $504.82M
Beacon Roofing Supply ( BECN 0.00%↑ ): Rank 1, RS 111.46, $243.29M
ProShares Ultra QQQ ( QLD 0.00%↑ ): Rank 5, RS 244.20, $510.93M
8. Sector Correlation Analysis
We investigated correlations between average trade size, relative size, and rank across sectors:
Large Caps: Avg $193.62M, Avg RS 21.90, Avg Rank 14.36, Top Rank % 20.69%
Comm Services: Avg $117.23M, Avg RS 17.37, Avg Rank 12.23, Top Rank % 24.56%
Utilities: Avg $37.30M, Avg RS 13.32, Avg Rank 9.83, Top Rank % 16.67%
This reveals that utilities show the best average rank despite lower average trade sizes, while large caps display both size and conviction.
9. Key Insights and Strategic Implications
ETF vs. Individual Stock Positioning: The data shows strong institutional positioning in broad market ETFs (SPY, QQQ) but with selective individual stock conviction in certain sectors.
Leveraged ETF Activity: Significant positioning in leveraged ETFs (QLD, UPRO) suggests institutions are taking amplified directional bets on major indices.
Sector Rotation Indicators: Communication services and large caps show both size and conviction metrics, while technology displays broader but less concentrated positioning.
Bond Market Positioning: Fixed income trades display surprisingly strong conviction metrics, particularly in high-yield bonds, suggesting institutional interest in specific segments of the fixed income market.
Most Compelling Signals: The strongest institutional positioning appears in Beacon Roofing Supply (BECN) - the only individual stock with both top rank (1) and very high relative size (111.46x).
This analysis provides valuable insights into institutional capital flows, conviction levels, and potential market leadership going forward. The data shows institutions are making significant directional bets on broad market indices while selectively positioning in specific sectors and individual stocks.
Investments In Focus: Bull vs Bear Arguments
Institutions leave footprints that VolumeLeaders.com can illustrate for you while providing context to assess things like institutional conviction and urgency. Theses and data given below are not financial advice; consult a certified financial advisor before making any investment decisions.
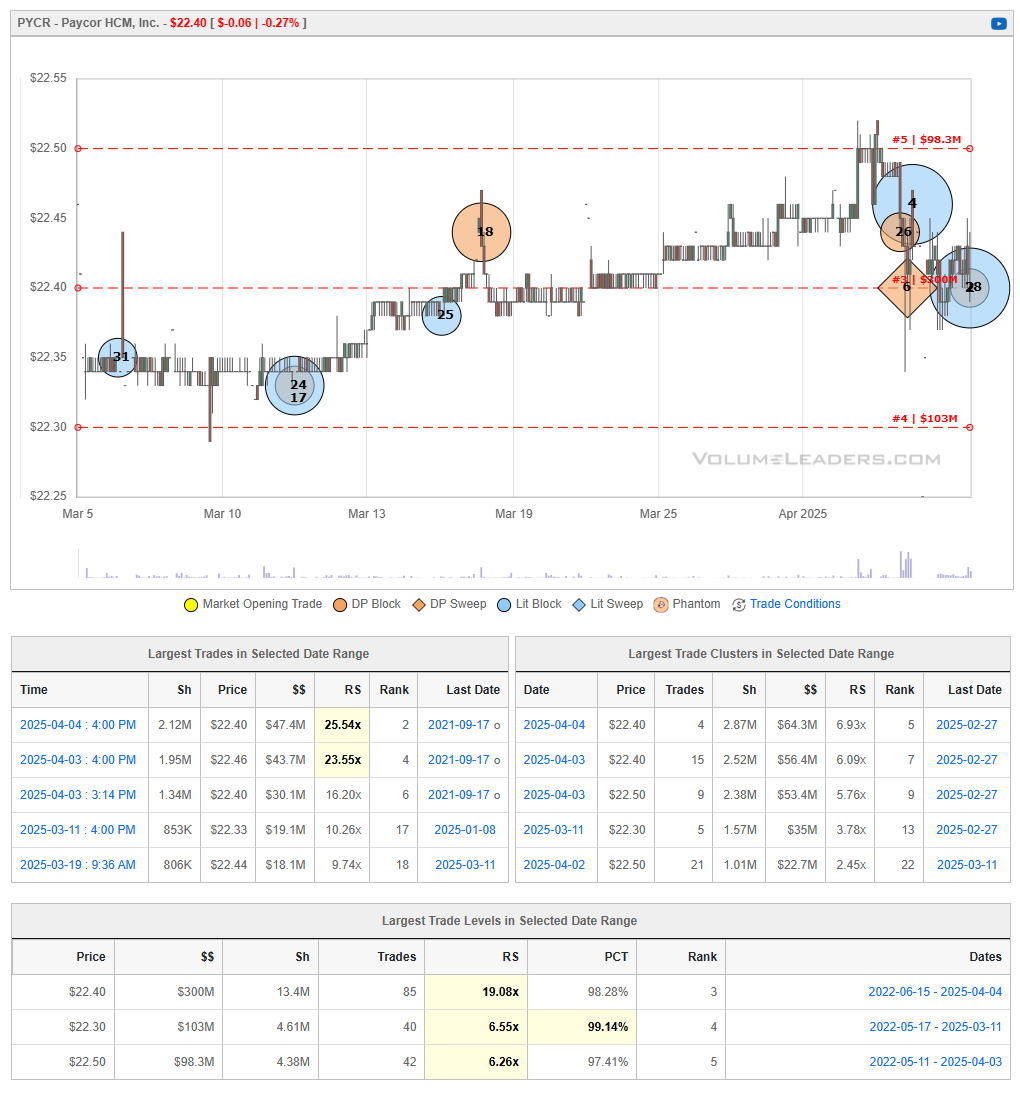
PYCR 0.00%↑
Paycor HCM, Inc. (NASDAQ: PYCR) is a provider of human capital management (HCM) solutions, offering cloud-based software for small and medium-sized businesses in the United States.
Recent Developments:
Financial Performance:
Fiscal Year 2024 Results: Paycor reported total revenues of $654.9 million, marking a 19% increase compared to the previous fiscal year. Adjusted operating income rose by 36% to $112 million.
Product Innovation:
Compensation Management Solution: The company launched a new Compensation Management solution, enabling leaders to streamline budgeting and pay cycles, fostering alignment across teams, and enhancing employee engagement.
Analyst Ratings:
Consensus Rating: As of April 2025, Paycor has a consensus "Hold" rating from 19 Wall Street analysts, with one "Sell," 16 "Hold," and two "Buy" recommendations. The average price target is $21.53, suggesting a slight downside from the current stock price.
Bullish Perspective:
Robust Revenue Growth: The 19% year-over-year increase in total revenues demonstrates strong demand for Paycor's HCM solutions and effective execution of growth strategies.
Product Innovation: The introduction of the Compensation Management solution reflects Paycor's commitment to enhancing its product offerings, potentially attracting new clients and retaining existing ones.
Operational Efficiency: The significant improvement in adjusted operating income indicates effective cost management and scalability of Paycor's business model.
Bearish Perspective:
Market Competition: The HCM software market is highly competitive, with established players potentially exerting pricing pressures and challenging Paycor's market share.
Analyst Sentiment: The predominance of "Hold" ratings and a consensus price target below the current stock price suggest limited short-term upside potential.
Economic Sensitivity: As a provider of services to small and medium-sized businesses, Paycor's performance may be sensitive to economic downturns that disproportionately affect these enterprises.
In summary, Paycor HCM has exhibited strong financial performance and continues to innovate its product offerings. However, competitive pressures and cautious analyst sentiment may temper expectations for near-term stock performance.
SARO 0.00%↑
StandardAero Inc. (NYSE: SARO) is a leading independent provider of aerospace engine aftermarket services for fixed and rotary-wing aircraft, serving commercial, military, and business aviation markets.
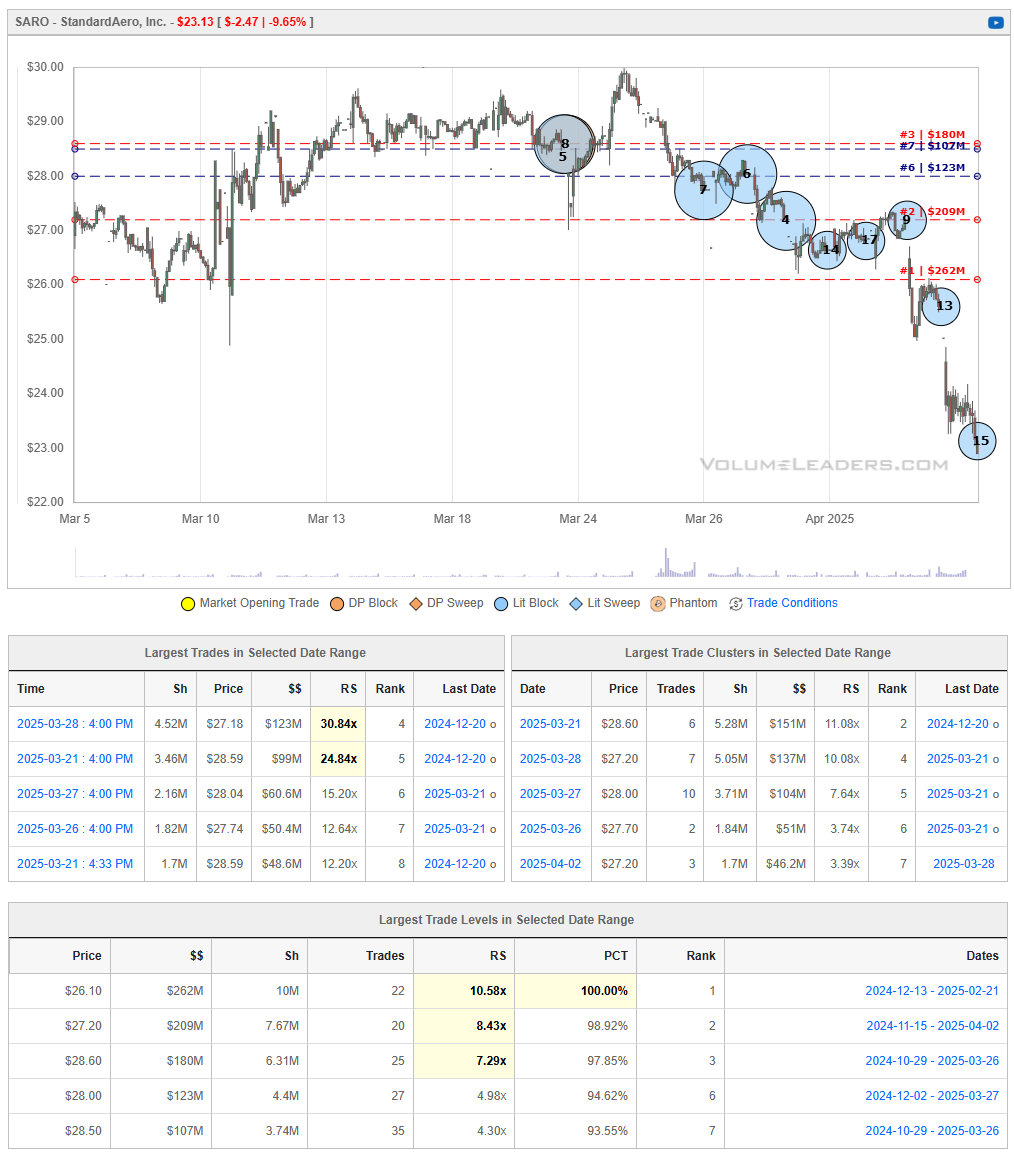
Recent Developments:
Financial Performance:
Fourth Quarter 2024 Results: StandardAero reported revenue of $1.41 billion for Q4 2024, a 21.8% increase compared to the same period in the previous year. Adjusted EBITDA rose by 37.2% to $186.2 million, reflecting strong demand across all end markets.
Full Year 2024 Results: The company achieved annual revenue of $5.24 billion, marking a 14.8% year-over-year growth. Net income was $11.0 million, with an Adjusted EBITDA of $690.5 million, up 23.1% from the prior year.
Initial Public Offering (IPO):
In October 2024, StandardAero completed its IPO, raising $1.7 billion. The net proceeds of $1.2 billion were utilized to pay down debt, significantly deleveraging the company's balance sheet.
Secondary Offering:
On March 25, 2025, affiliates of The Carlyle Group Inc. and GIC Private Limited announced the pricing of an upsized secondary offering of 36 million shares of StandardAero's common stock.
Bullish Perspective:
Robust Revenue Growth: The significant year-over-year revenue increases in both Q4 and the full year 2024 demonstrate strong demand for StandardAero's services across various aviation sectors.
Successful IPO and Debt Reduction: The completion of the IPO and subsequent debt repayment have strengthened the company's financial position, potentially reducing interest expenses and providing more flexibility for future investments.
Market Leadership: As an independent provider of aerospace engine aftermarket services, StandardAero holds a pivotal position in the industry, catering to a diverse clientele across commercial, military, and business aviation markets.
Bearish Perspective:
Recent Stock Performance: As of April 4, 2025, StandardAero's stock closed at $23.13, reflecting a decline of 9.65% from the previous close. This downturn may raise concerns among investors about short-term market sentiment.
Net Income Volatility: Despite strong revenue growth, the company's net income has experienced fluctuations, with a net loss of $14.1 million in Q4 2024 due to one-off transaction-related costs and investments.
Market Competition and Economic Sensitivity: Operating in the aerospace industry exposes StandardAero to intense competition and economic cycles that can impact demand for maintenance, repair, and overhaul services.
In summary, StandardAero has demonstrated strong revenue growth and improved financial stability through strategic initiatives like its IPO and debt reduction. However, recent stock performance and net income volatility highlight the need for investors to consider both the company's growth prospects and the inherent challenges within the aerospace sector.
GBX 0.00%↑
The Greenbrier Companies, Inc. (NYSE: GBX) is a leading international supplier of equipment and services to global freight transportation markets, specializing in the design, manufacturing, and marketing of railroad freight car equipment.
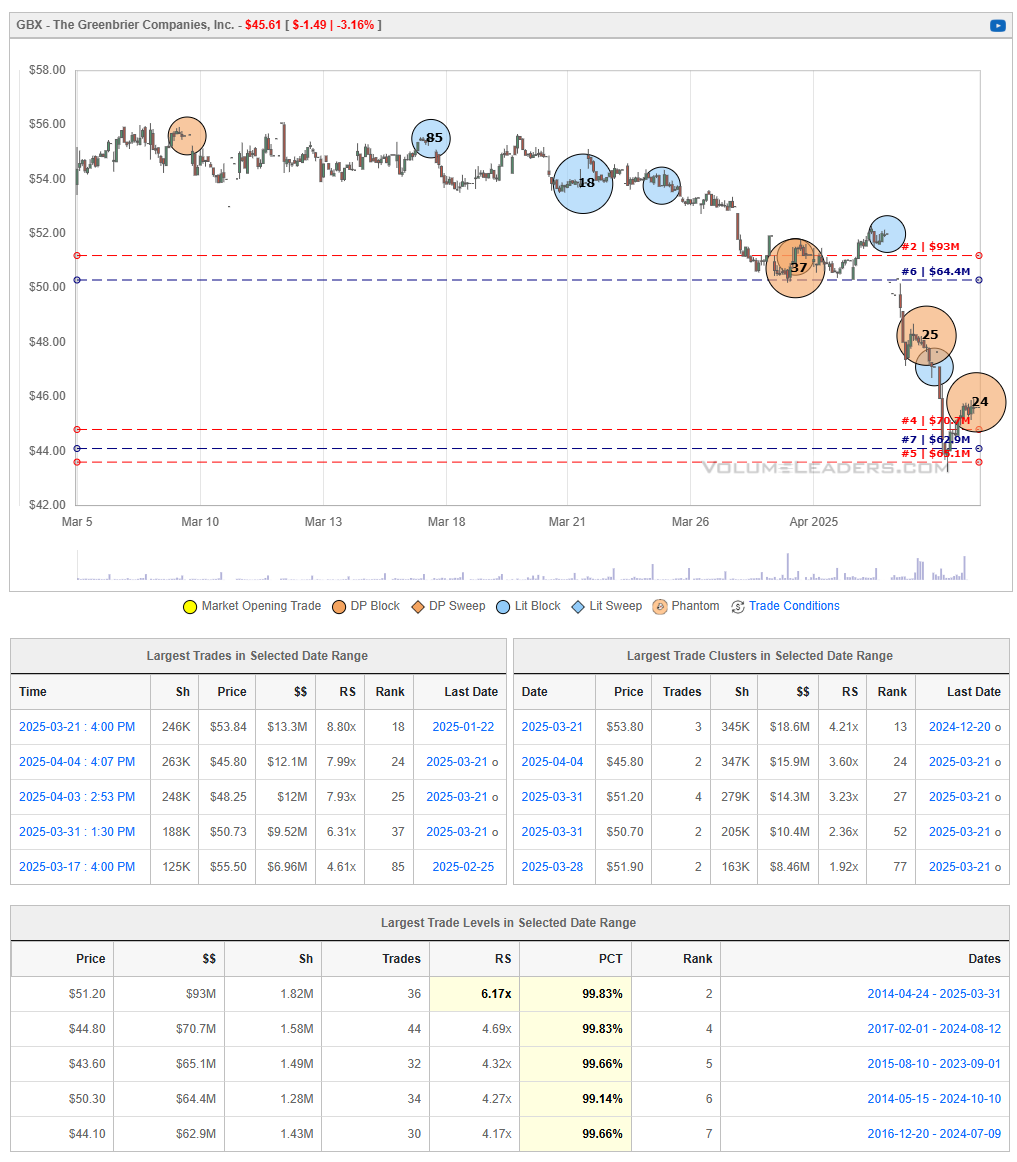
Recent Developments:
Financial Performance:
First Quarter Fiscal 2025 Results: For the quarter ending November 30, 2024, Greenbrier reported net earnings of $55 million, or $1.72 per diluted share, on revenue of $876 million. The company achieved an operating margin of 12.8% and generated EBITDA of $145 million, representing 16.6% of revenue.
Dividend Increase:
On April 3, 2025, Greenbrier announced a 7% increase in its quarterly dividend, raising it to $0.32 per share. This marks the 44th consecutive quarterly dividend, reflecting the company's commitment to returning value to shareholders.
Analyst Ratings:
As of April 2025, the consensus among four Wall Street analysts is a "Moderate Buy" rating for GBX, with an average price target of $63.00. This suggests a potential upside of approximately 38% from the current stock price.
Bullish Perspective:
Strong Financial Performance: Greenbrier's robust earnings and revenue growth, coupled with healthy operating and EBITDA margins, indicate effective management and operational efficiency.
Dividend Growth: The recent dividend increase demonstrates the company's financial strength and dedication to enhancing shareholder value.
Positive Analyst Outlook: The "Moderate Buy" consensus and significant upside potential reflect confidence in Greenbrier's future performance.
Bearish Perspective:
Market Volatility: The stock has experienced fluctuations, with a 52-week range between $41.40 and $71.06, indicating potential volatility.
Industry Challenges: As a supplier to the freight transportation sector, Greenbrier may be susceptible to economic cycles and shifts in demand for railcar equipment.
Competitive Pressures: The company operates in a competitive market, facing challenges from other manufacturers and service providers in the transportation equipment industry.
In summary, The Greenbrier Companies exhibit strong financial health, consistent dividend growth, and favorable analyst sentiment. However, potential investors should consider market volatility, industry-specific challenges, and competitive dynamics when evaluating the stock
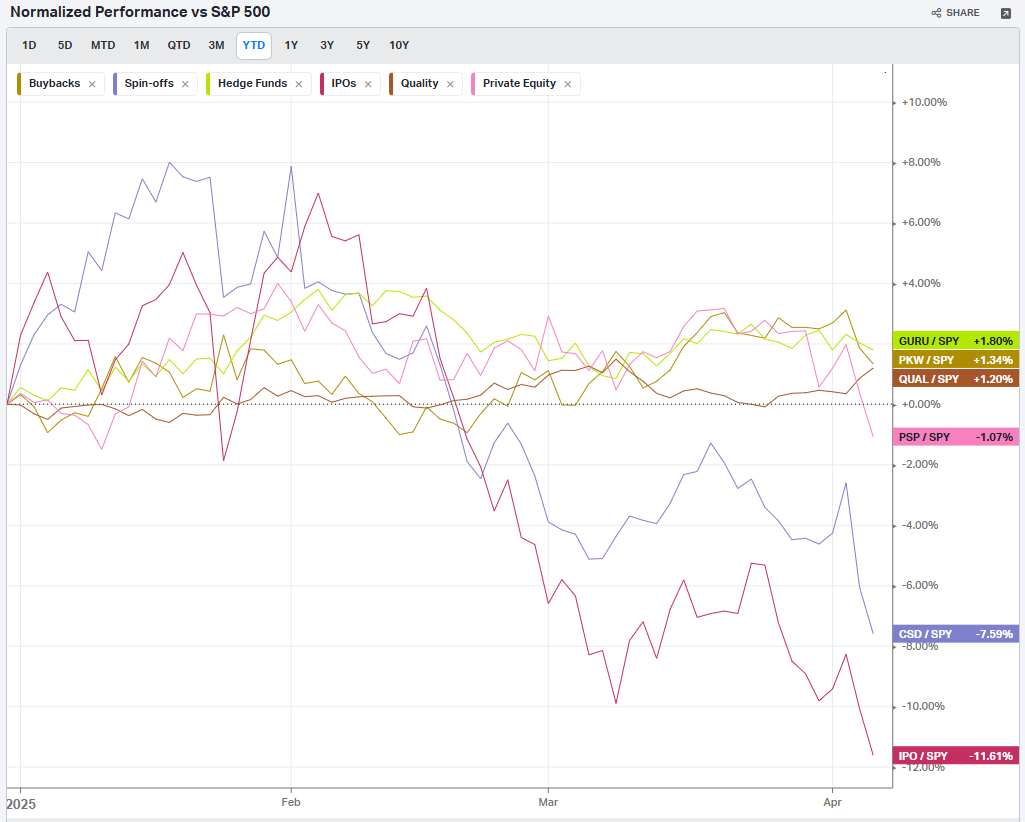
Summary Of Thematic Performance YTD
VolumeLeaders.com provides a lot of pre-built filters for thematics so you can quickly dive into specific areas of the market. These performance overviews are provided here only for inspiration and context. Consider targeting leaders and/or laggards in the best and worst sectors, for example.
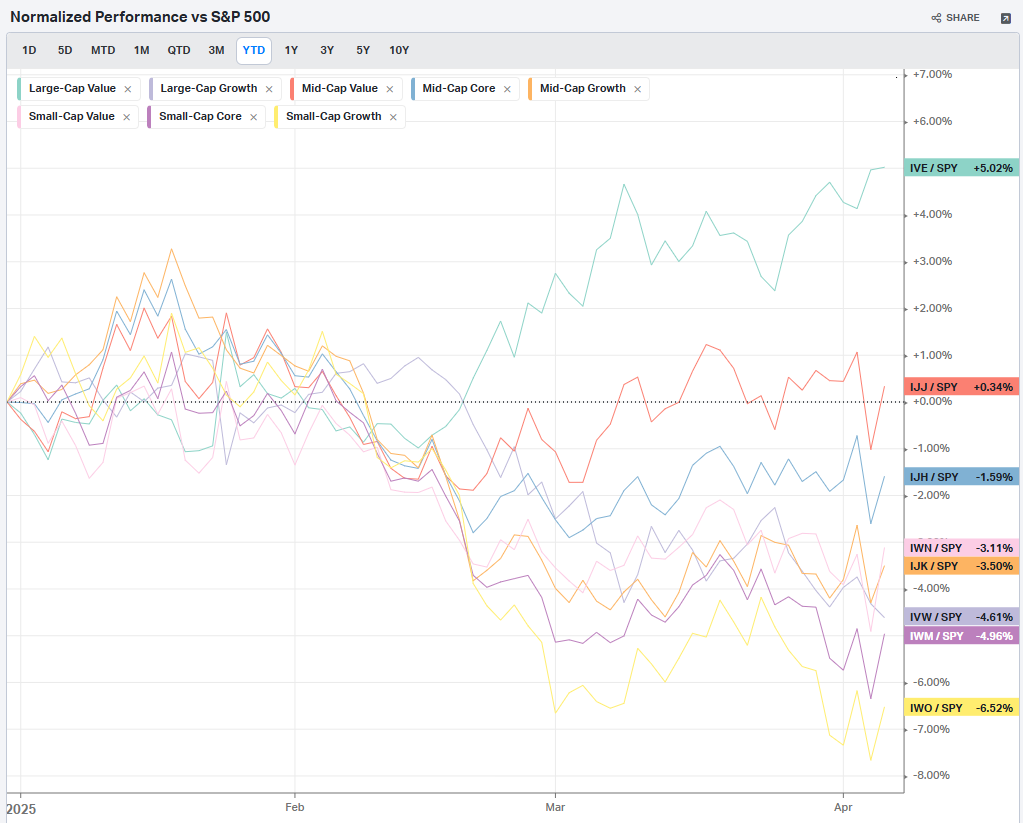
S&P By Sector
S&P By Industry
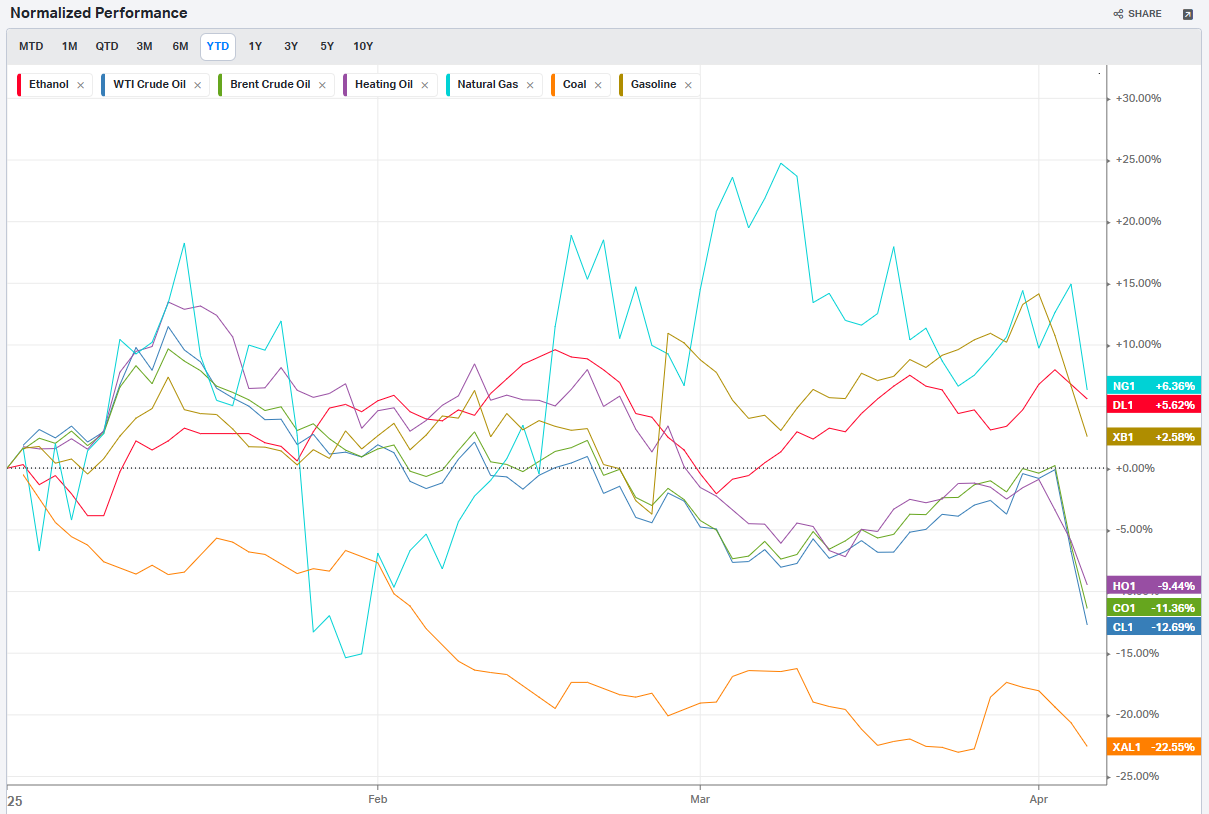
Commodities: Energy
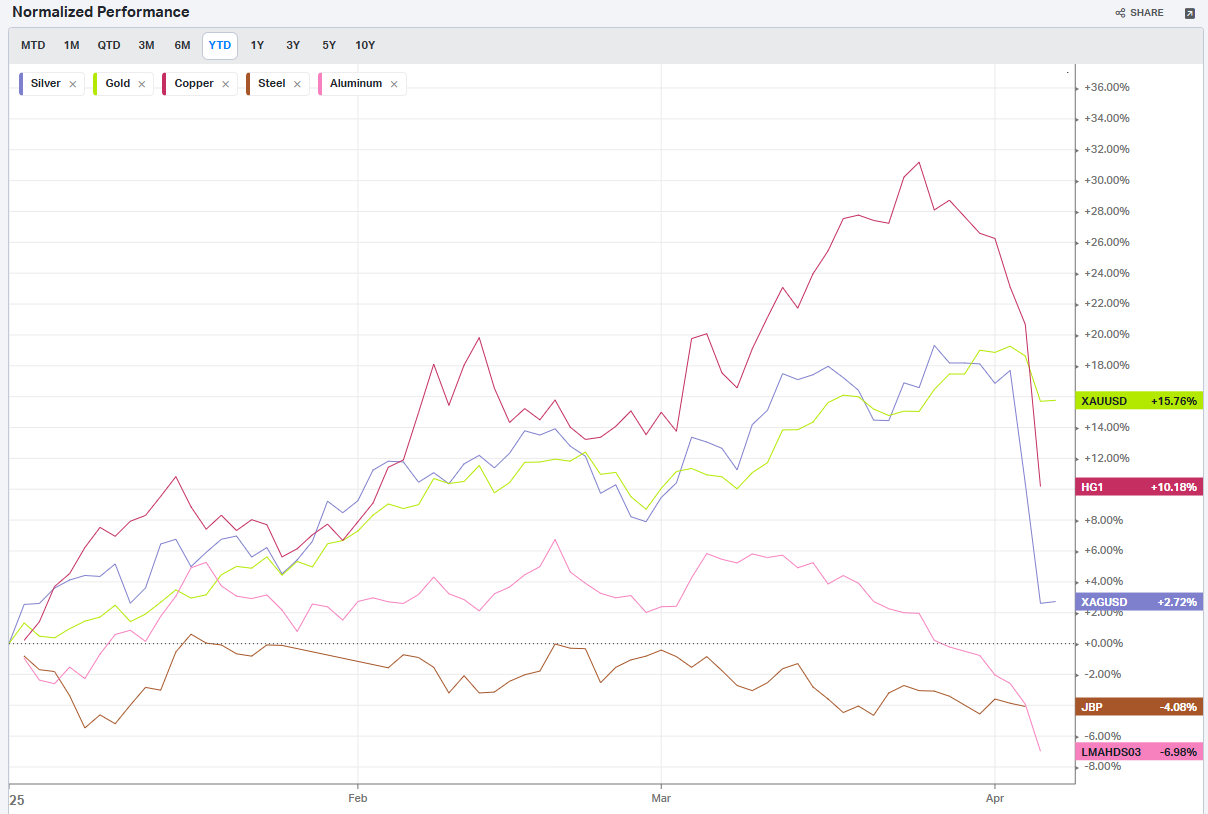
Commodities: Metals
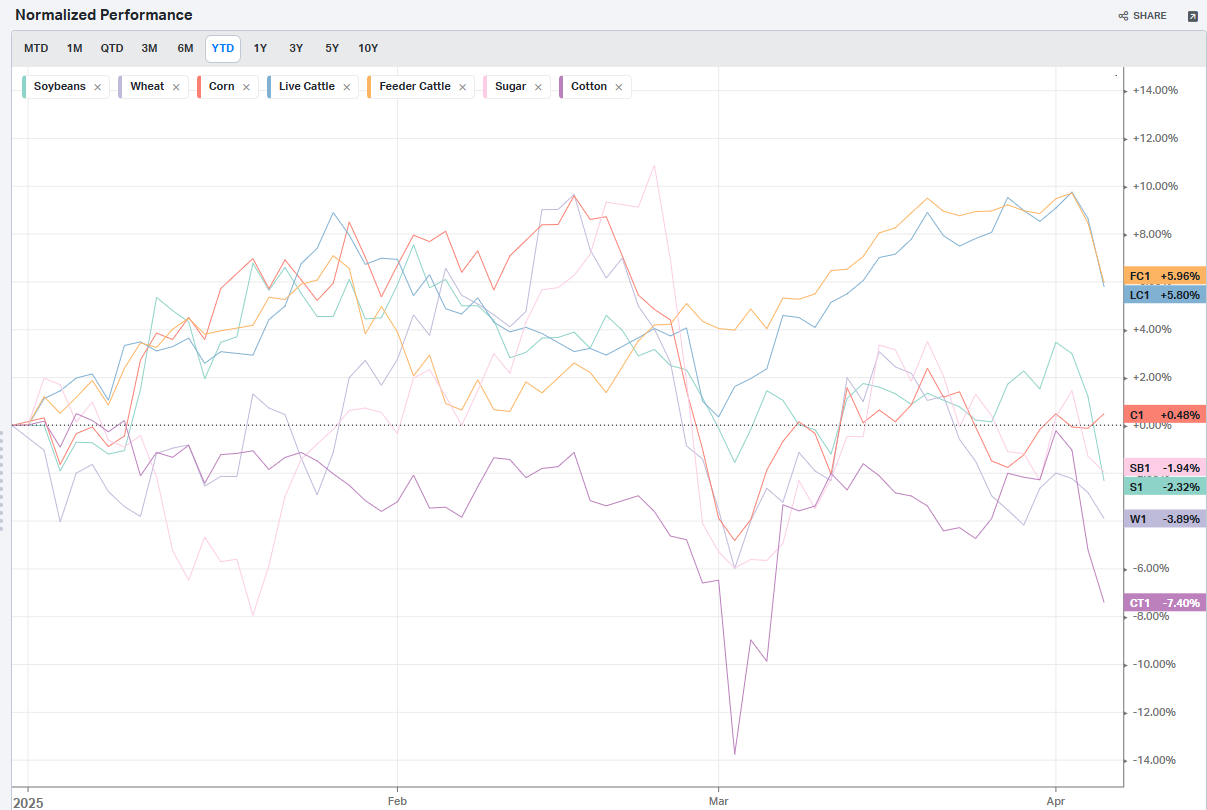
Commodities: Agriculture
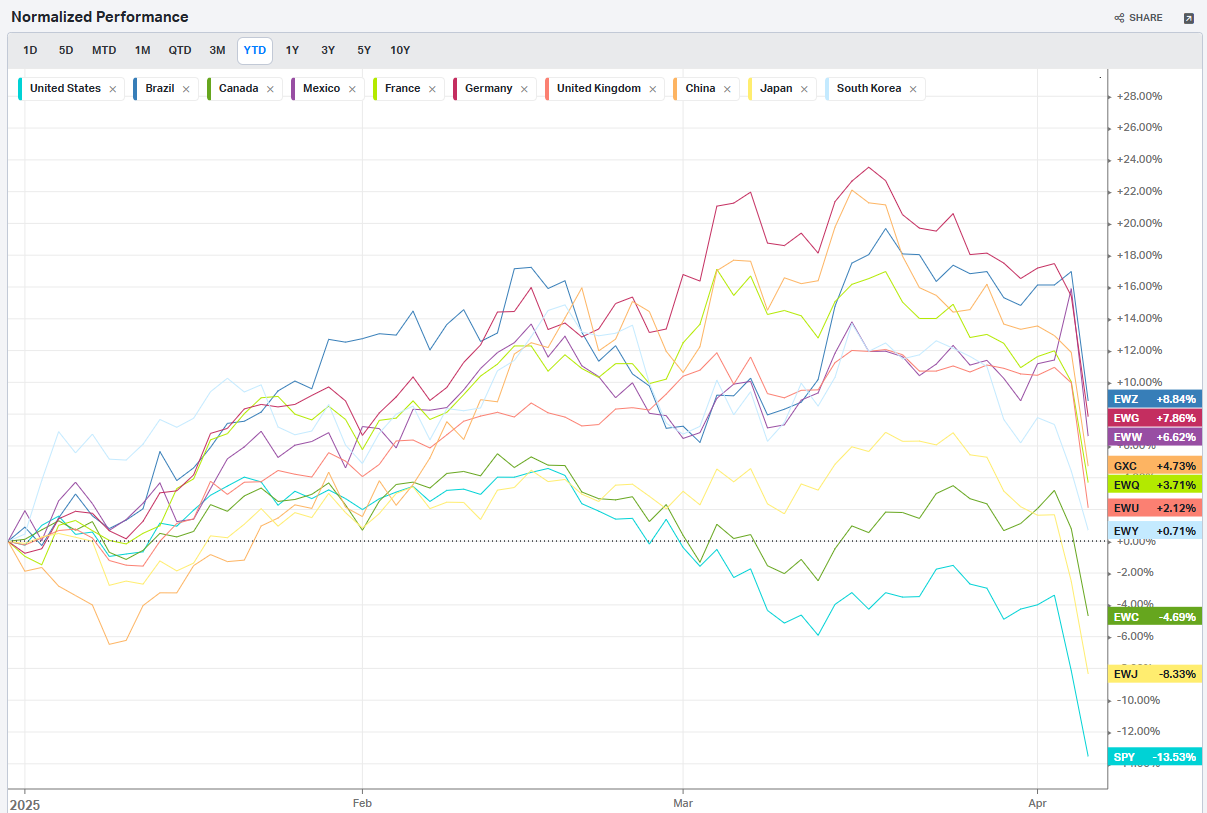
Country ETFs
Currencies
Global Yields
Factors: Style
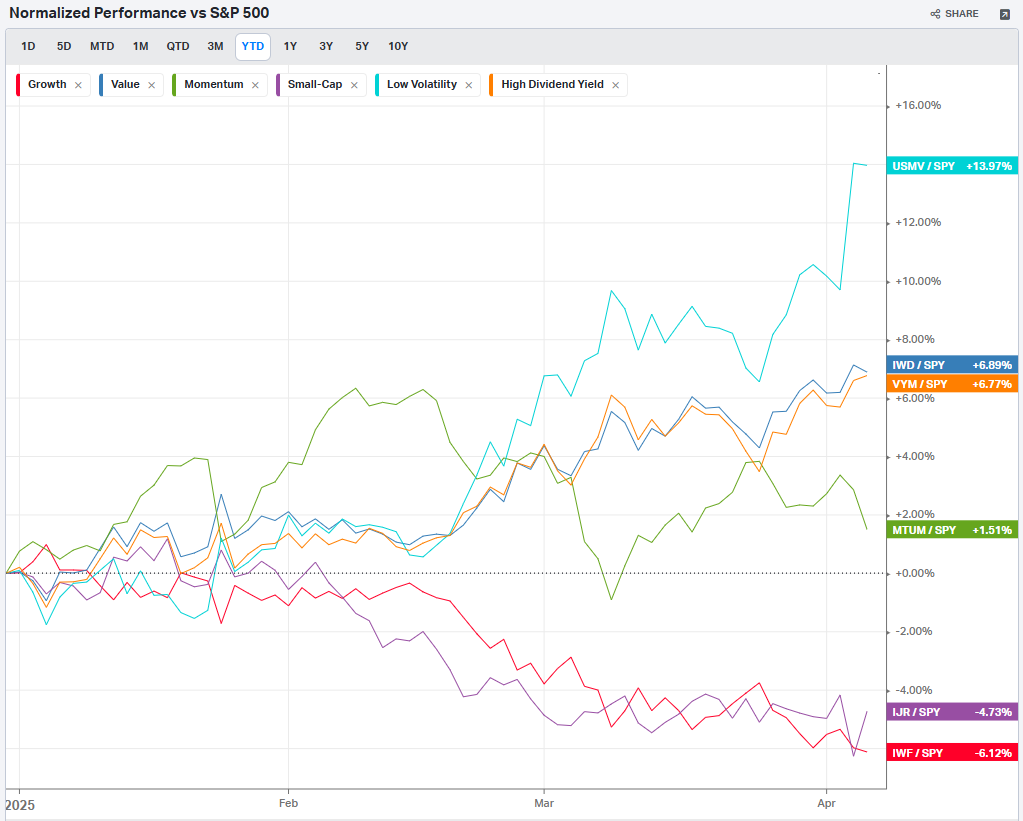
Factors: Size vs Value
Factors: Qualitative
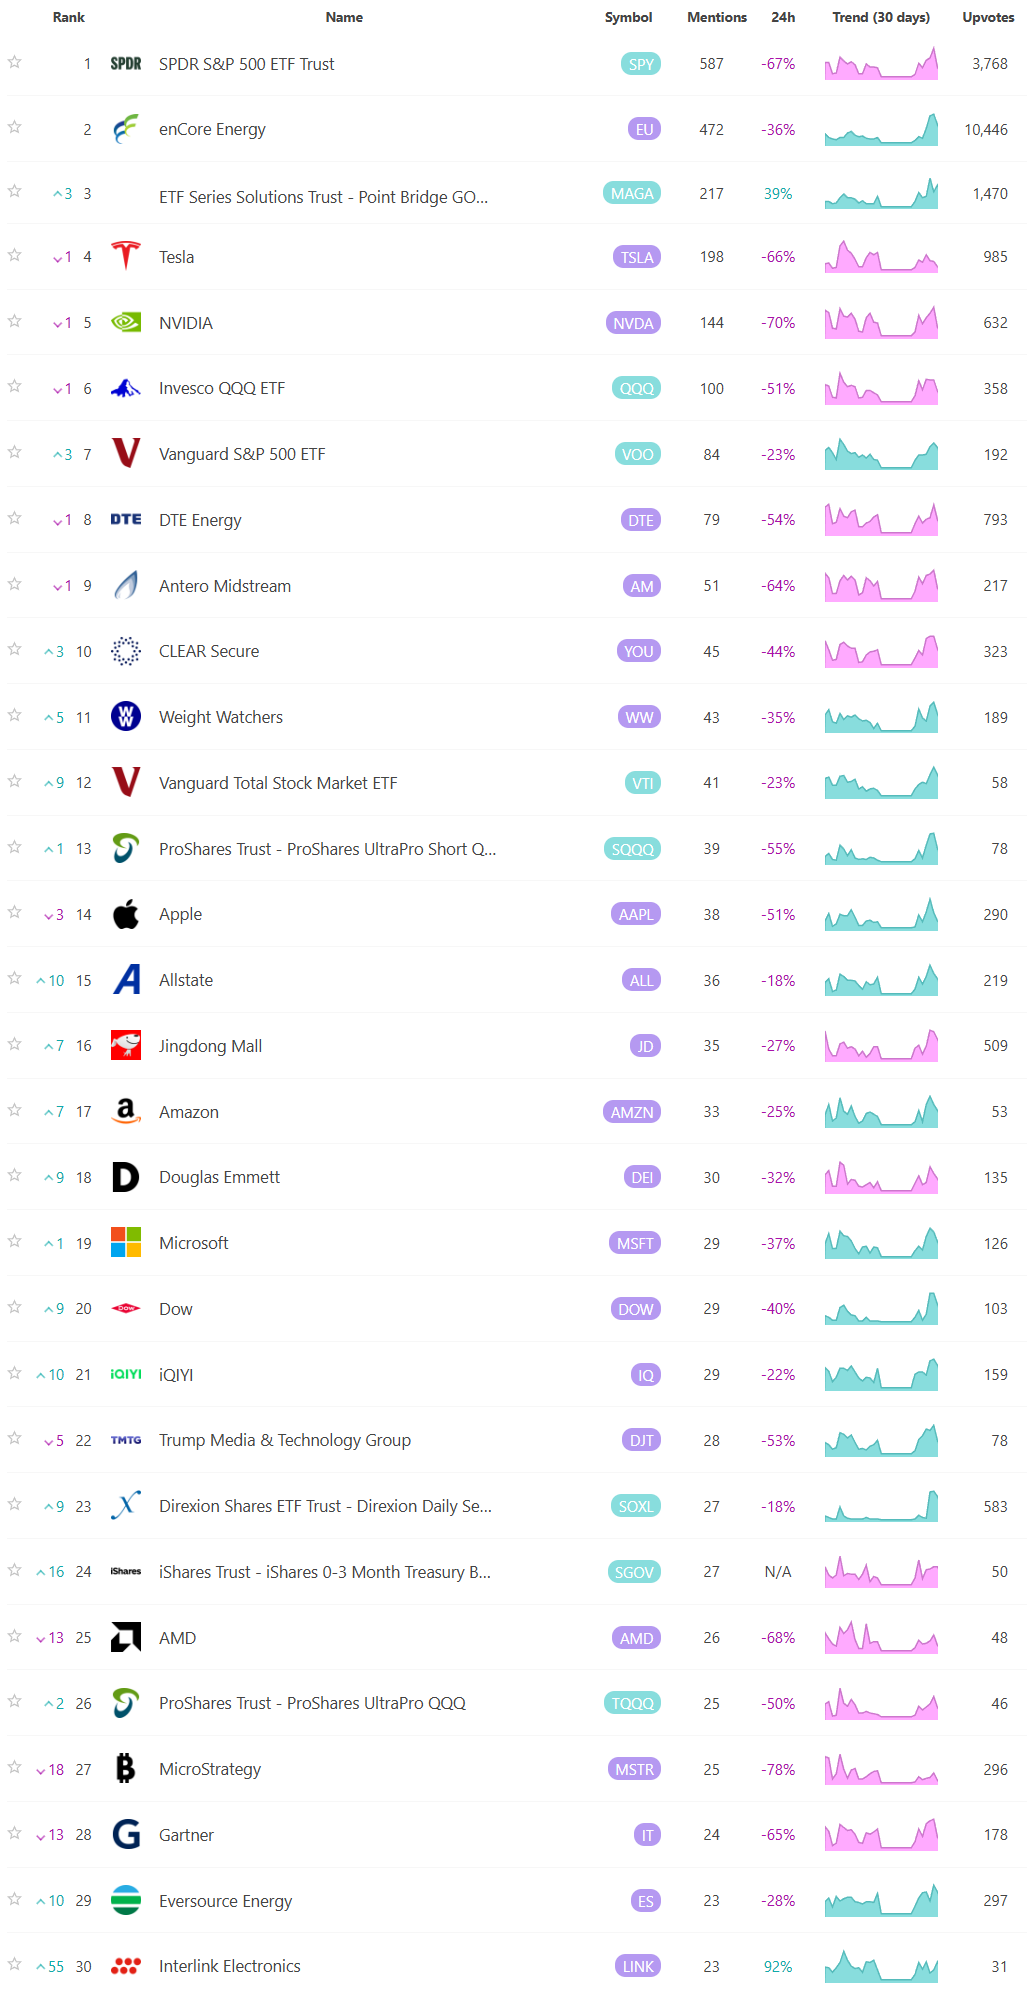
Social Media Favs
Analyzing social sentiment can provide valuable insights for investment strategies by offering a pulse on public perception, mood, and market sentiment that traditional financial indicators might not capture. Here’s how social sentiment analysis can enhance investment decisions:
Market Momentum: Positive or negative social sentiment can signal impending momentum shifts. When public opinion on a stock, sector, or asset class changes sharply, it can create buying or selling pressure, especially if that sentiment becomes widespread.
Early Detection of Trends: Social sentiment data can help investors spot trends before they show up in technical or fundamental data. For example, increased positive chatter around a particular company or sector might indicate growing interest or excitement, which could lead to price appreciation.
Gauge Retail Investor Impact: With the rise of retail investor platforms, collective sentiment on social media can lead to significant price movements (e.g., meme stocks). Understanding how retail investors view certain stocks can help in identifying high-volatility opportunities.
Event Reaction Monitoring: Social sentiment can provide real-time reactions to news events, product releases, or earnings reports. Investors can use this information to gauge market reaction quickly and adjust their strategies accordingly.
Complementing Quantitative Models: By adding a social sentiment layer to quantitative models, investors can enhance predictions. For example, a model that tracks historical price and volume data might perform even better when factoring in sentiment trends as a measure of market psychology.
Risk Management: Negative sentiment spikes can be a signal of potential downturns or increased volatility. By monitoring sentiment, investors might avoid or hedge against investments in companies experiencing a public relations crisis or facing negative perceptions.
Long-Term Sentiment Trends: Sustained sentiment trends, whether positive or negative, often mirror longer-term market cycles. Tracking sentiment trends over time can help identify shifts in investor psychology that could affect longer-term investments or sector rotations.
For these reasons, sentiment analysis, when combined with other tools, can provide a comprehensive view of both immediate market reactions and underlying investor attitudes, helping investors position themselves strategically across various time frames. Here are the most mentioned/discussed tickers on Reddit from some of the most active Subreddits for trading:
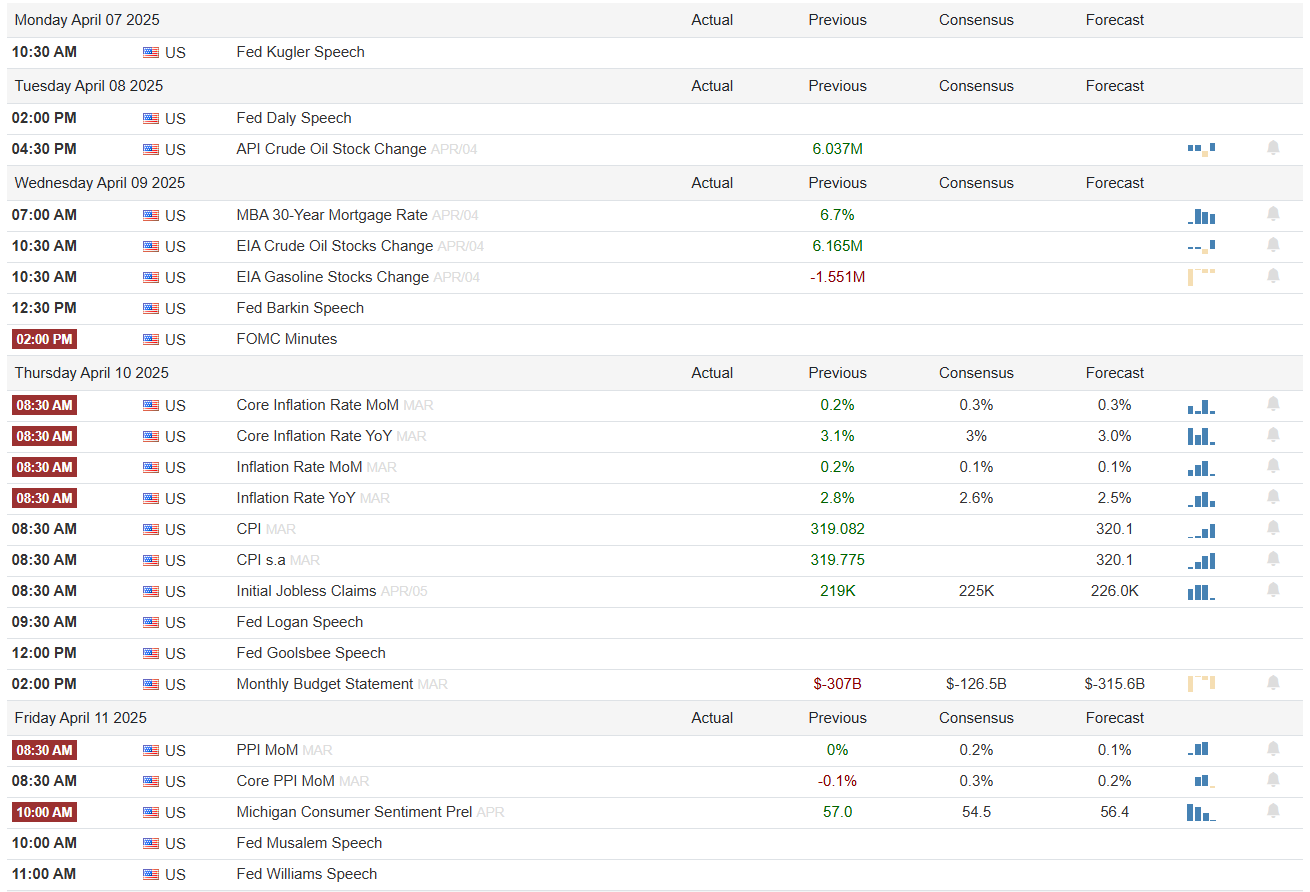
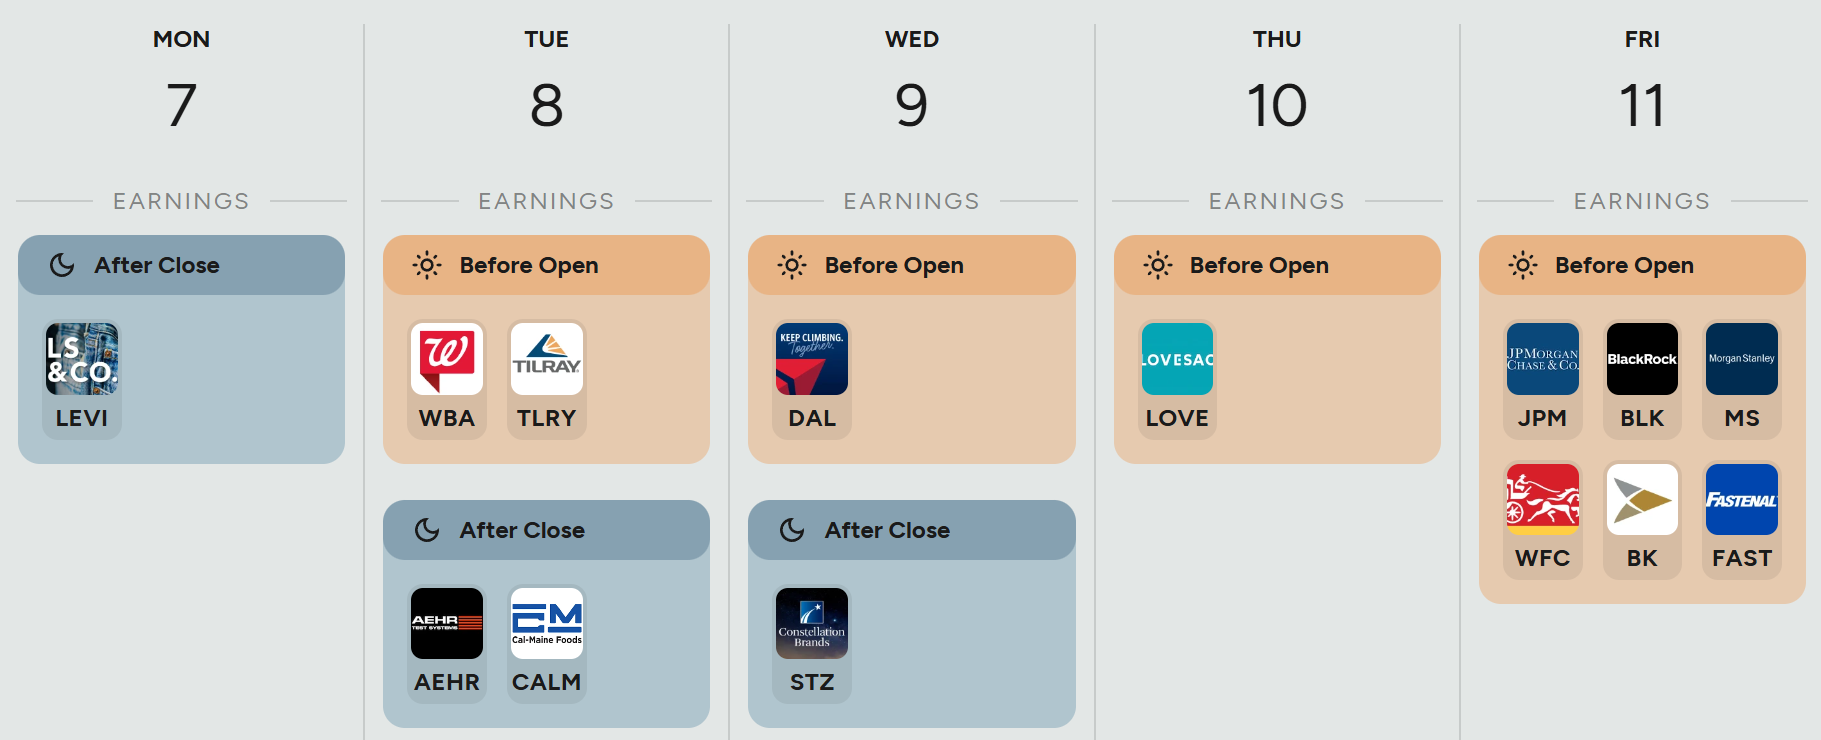
Events On Deck This Week
Here are key events happening this week that have the potential to cause outsized moves in the market or heightened short-term volatility.
Econ Events By Day of Week
Anticipated Earnings By Day of Week
Thank you for being part of our community and for taking the time to read this publication. Your engagement and insights mean a great deal to all of us, and we're genuinely grateful to share this space with such dedicated and thoughtful readers. Wishing you a productive and successful week ahead in the markets. May the coming days bring clarity and great opportunities. Happy trading!